quantification of groundwater-derived
TRANSCRIPT

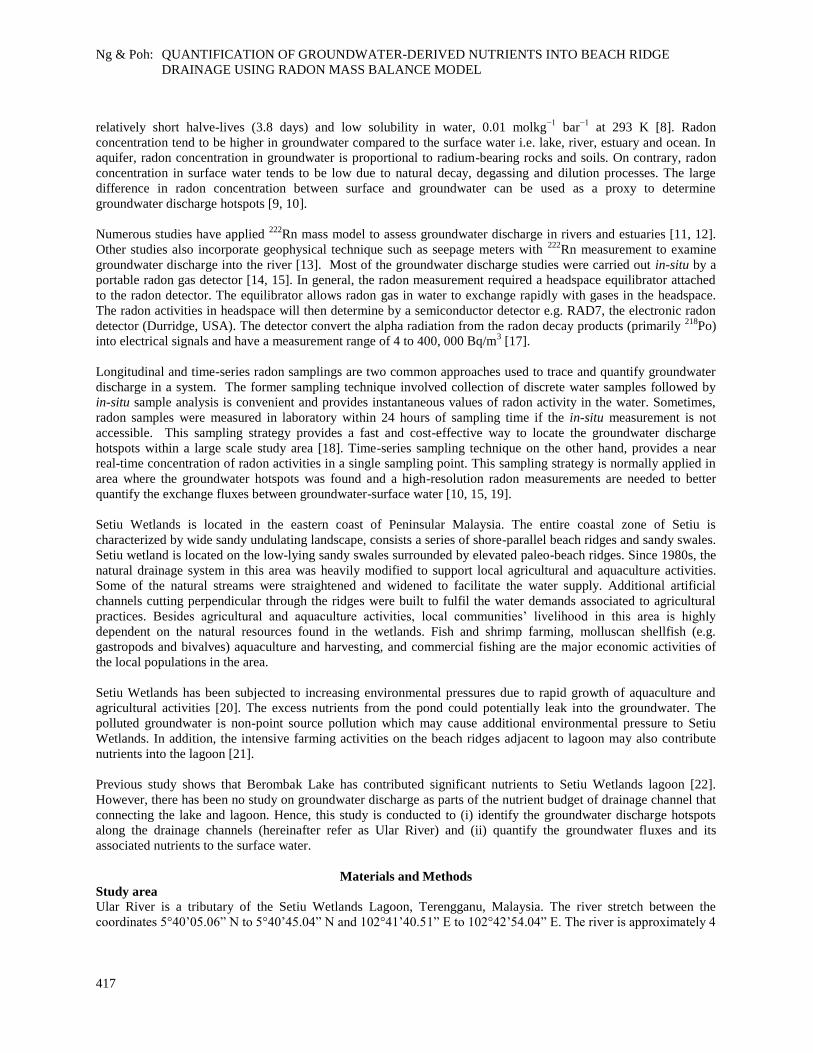
Malaysian Journal of Analytical Sciences, Vol 22 No 3 (2018): 416 - 428
DOI: https://doi.org/10.17576/mjas-2018-2203-06
416
MALAYSIAN JOURNAL OF ANALYTICAL SCIENCES
Published by The Malaysian Analytical Sciences Society
QUANTIFICATION OF GROUNDWATER-DERIVED NUTRIENTS INTO
BEACH RIDGE DRAINAGE USING RADON MASS BALANCE MODEL
(Kuantifikasi Nutrien Air Bawah Tanah ke Saluran Pematang Pasir dengan Model
Keseimbangan Jisim Radon)
Nicholas Chia Wei Ng and Seng-Chee Poh*
School of Marine and Environmental Sciences,
Universiti Malaysia Terengganu, 21030 Kuala Nerus, Terengganu, Malaysia
*Corresponding author: [email protected]
Received: 10 November 2017; Accepted: 22 May 2018
Abstract
Groundwater discharge can be a significant pathway for dissolved nutrients to surface water and thus can bring forth important
implications to the coastal biogeochemical cycles. Discrete sampling of radon concentrations at several locations along an inter-
ridge drainage off Setiu Wetlands were carried out to estimate the fluxes of groundwater discharge. The 222Rn mass balance
results show that groundwater discharge in the drainage is estimated to be 6649 m3day-1, made up of ~33% of total water
discharge and has contributed 2.88×10² molday-1, 1.23×10² molday-1 and 0.75molday-1 of ammonium-nitrogen, nitrate-nitrogen
and nitrite-nitrogen, respectively into the surface water drainage. Strong correlation between radon and ammonium suggested
that the source of nutrient in drainage is groundwater-based, derived probably from the nearby damaged or leaking residential
septic tanks and from agricultural practices of oil palm plantation.
Keywords: groundwater-surface water interaction, water quality, beach ridge drainage, Setiu, Malaysia
Abstrak
Pelepasan air bawah tanah merupakan satu laluan penting untuk nutrien ke air permukaan. Proses ini mampu membawa
implikasi yang penting terhadap kitaran biogeokimia di pesisiran pantai. Pensampelan radon di sepanjang saluran pematang
pasir telah dijalankan untuk menentukan kadar pelepasan air bawah tanah. Hasil model keseimbangan jisim 222Rn telah
menunjukkan kadar pelepasan air bawah tanah di saluran adalah sebanyak 6649 m3hari-1 dan nilai ini merangkumi ~33%
daripada jumlah pelepasan air. Pelepasan air bawah tanah juga menyumbang sebanyak 2.88×10² mol hari-1 amonium-nitrogen,
1.23×10² mol hari-1 nitrit-nitrogen dan 0.75 mol hari-1 dan nitrit-nitrogen ke air permukaan saluran. Kolerasi antara kepekatan
radon dan ammonium di saluran juga mencadangkan sumber nutrien berasal dari air bawah tanah yang kemungkinan tercemar
oleh sisa pembuangan kumbahan dari kawasan kediaman berdekatan dan rembesan pertanian dari ladang kelapa sawit di
sekitarnya.
Kata kunci: interaksi air bawah tanah-air permukaan, kualiti air, saluran pematang pasir, Setiu, Malaysia
Introduction
Importance of groundwater discharge as a nutrient source to the river and estuaries are often overlooked. Several
studies have demonstrated that groundwater discharge can be a significant contributor of nutrients to the coastal
environment and being recognized as a potential pathway for non-point pollution, especially when agricultural
practices or urban activities had impacted the groundwater quality [1-4]. Previous studies have shown that radon is a
great tool to study groundwater-surface water interaction in different environmental settings [5, 6, 7]. Radon has
ISSN
1394 - 2506
Ng & Poh: QUANTIFICATION OF GROUNDWATER-DERIVED NUTRIENTS INTO BEACH RIDGE
DRAINAGE USING RADON MASS BALANCE MODEL
417
relatively short halve-lives (3.8 days) and low solubility in water, 0.01 molkg−1
bar−1
at 293 K [8]. Radon
concentration tend to be higher in groundwater compared to the surface water i.e. lake, river, estuary and ocean. In
aquifer, radon concentration in groundwater is proportional to radium-bearing rocks and soils. On contrary, radon
concentration in surface water tends to be low due to natural decay, degassing and dilution processes. The large
difference in radon concentration between surface and groundwater can be used as a proxy to determine
groundwater discharge hotspots [9, 10].
Numerous studies have applied 222
Rn mass model to assess groundwater discharge in rivers and estuaries [11, 12].
Other studies also incorporate geophysical technique such as seepage meters with 222
Rn measurement to examine
groundwater discharge into the river [13]. Most of the groundwater discharge studies were carried out in-situ by a
portable radon gas detector [14, 15]. In general, the radon measurement required a headspace equilibrator attached
to the radon detector. The equilibrator allows radon gas in water to exchange rapidly with gases in the headspace.
The radon activities in headspace will then determine by a semiconductor detector e.g. RAD7, the electronic radon
detector (Durridge, USA). The detector convert the alpha radiation from the radon decay products (primarily 218
Po)
into electrical signals and have a measurement range of 4 to 400, 000 Bq/m3 [17].
Longitudinal and time-series radon samplings are two common approaches used to trace and quantify groundwater
discharge in a system. The former sampling technique involved collection of discrete water samples followed by
in-situ sample analysis is convenient and provides instantaneous values of radon activity in the water. Sometimes,
radon samples were measured in laboratory within 24 hours of sampling time if the in-situ measurement is not
accessible. This sampling strategy provides a fast and cost-effective way to locate the groundwater discharge
hotspots within a large scale study area [18]. Time-series sampling technique on the other hand, provides a near
real-time concentration of radon activities in a single sampling point. This sampling strategy is normally applied in
area where the groundwater hotspots was found and a high-resolution radon measurements are needed to better
quantify the exchange fluxes between groundwater-surface water [10, 15, 19].
Setiu Wetlands is located in the eastern coast of Peninsular Malaysia. The entire coastal zone of Setiu is
characterized by wide sandy undulating landscape, consists a series of shore-parallel beach ridges and sandy swales.
Setiu wetland is located on the low-lying sandy swales surrounded by elevated paleo-beach ridges. Since 1980s, the
natural drainage system in this area was heavily modified to support local agricultural and aquaculture activities.
Some of the natural streams were straightened and widened to facilitate the water supply. Additional artificial
channels cutting perpendicular through the ridges were built to fulfil the water demands associated to agricultural
practices. Besides agricultural and aquaculture activities, local communities’ livelihood in this area is highly
dependent on the natural resources found in the wetlands. Fish and shrimp farming, molluscan shellfish (e.g.
gastropods and bivalves) aquaculture and harvesting, and commercial fishing are the major economic activities of
the local populations in the area.
Setiu Wetlands has been subjected to increasing environmental pressures due to rapid growth of aquaculture and
agricultural activities [20]. The excess nutrients from the pond could potentially leak into the groundwater. The
polluted groundwater is non-point source pollution which may cause additional environmental pressure to Setiu
Wetlands. In addition, the intensive farming activities on the beach ridges adjacent to lagoon may also contribute
nutrients into the lagoon [21].
Previous study shows that Berombak Lake has contributed significant nutrients to Setiu Wetlands lagoon [22].
However, there has been no study on groundwater discharge as parts of the nutrient budget of drainage channel that
connecting the lake and lagoon. Hence, this study is conducted to (i) identify the groundwater discharge hotspots
along the drainage channels (hereinafter refer as Ular River) and (ii) quantify the groundwater fluxes and its
associated nutrients to the surface water.
Materials and Methods
Study area
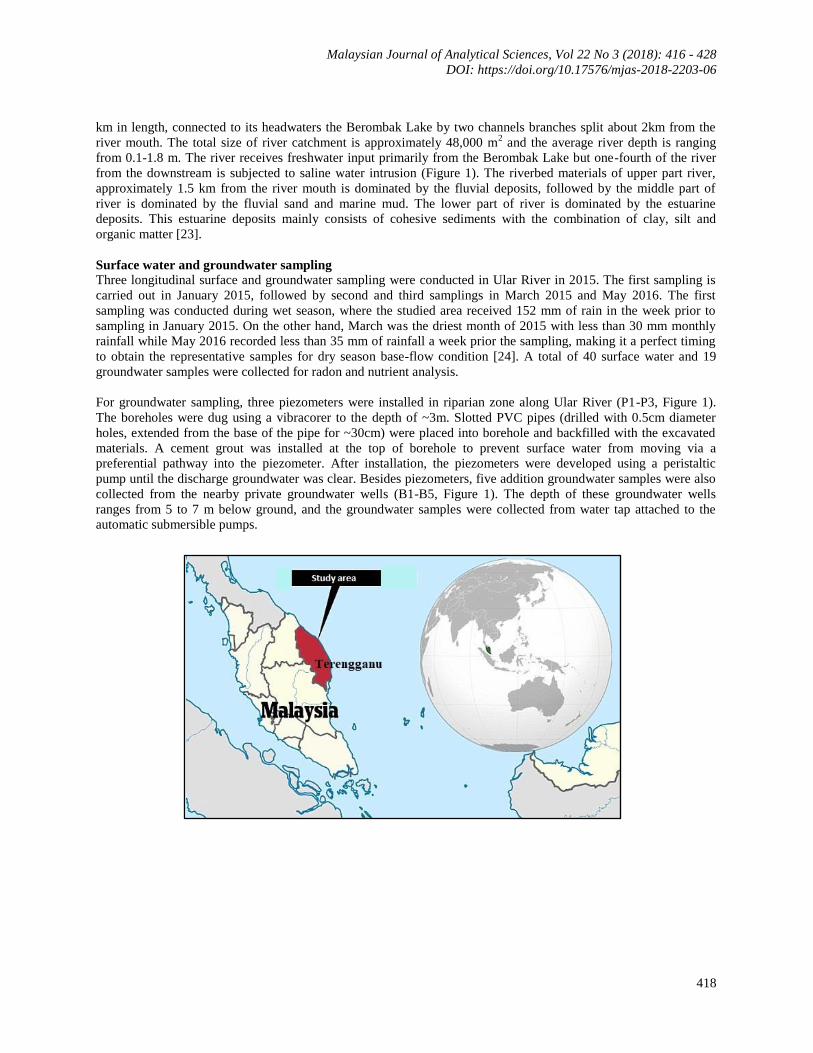
Ular River is a tributary of the Setiu Wetlands Lagoon, Terengganu, Malaysia. The river stretch between the
coordinates 5°40’05.06” N to 5°40’45.04” N and 102°41’40.51” E to 102°42’54.04” E. The river is approximately 4
Malaysian Journal of Analytical Sciences, Vol 22 No 3 (2018): 416 - 428
DOI: https://doi.org/10.17576/mjas-2018-2203-06
418
km in length, connected to its headwaters the Berombak Lake by two channels branches split about 2km from the
river mouth. The total size of river catchment is approximately 48,000 m2 and the average river depth is ranging
from 0.1-1.8 m. The river receives freshwater input primarily from the Berombak Lake but one-fourth of the river
from the downstream is subjected to saline water intrusion (Figure 1). The riverbed materials of upper part river,
approximately 1.5 km from the river mouth is dominated by the fluvial deposits, followed by the middle part of
river is dominated by the fluvial sand and marine mud. The lower part of river is dominated by the estuarine
deposits. This estuarine deposits mainly consists of cohesive sediments with the combination of clay, silt and
organic matter [23].
Surface water and groundwater sampling
Three longitudinal surface and groundwater sampling were conducted in Ular River in 2015. The first sampling is
carried out in January 2015, followed by second and third samplings in March 2015 and May 2016. The first
sampling was conducted during wet season, where the studied area received 152 mm of rain in the week prior to
sampling in January 2015. On the other hand, March was the driest month of 2015 with less than 30 mm monthly
rainfall while May 2016 recorded less than 35 mm of rainfall a week prior the sampling, making it a perfect timing
to obtain the representative samples for dry season base-flow condition [24]. A total of 40 surface water and 19
groundwater samples were collected for radon and nutrient analysis.
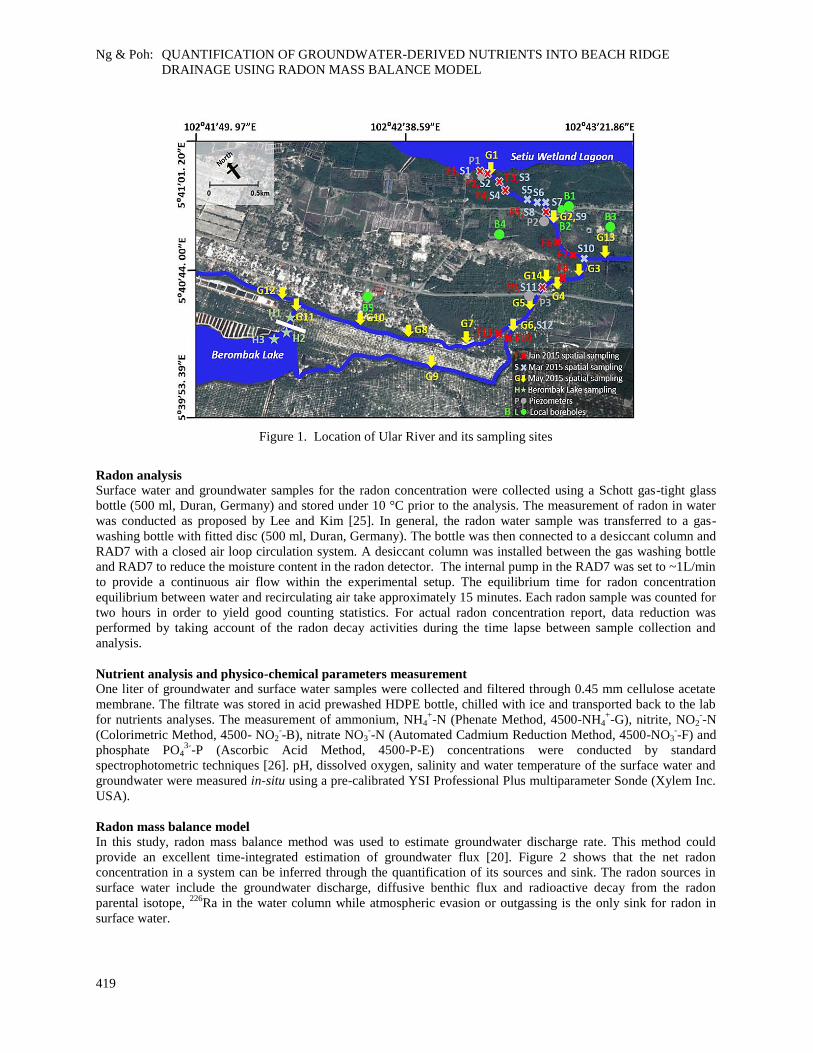
For groundwater sampling, three piezometers were installed in riparian zone along Ular River (P1-P3, Figure 1).
The boreholes were dug using a vibracorer to the depth of ~3m. Slotted PVC pipes (drilled with 0.5cm diameter
holes, extended from the base of the pipe for ~30cm) were placed into borehole and backfilled with the excavated
materials. A cement grout was installed at the top of borehole to prevent surface water from moving via a
preferential pathway into the piezometer. After installation, the piezometers were developed using a peristaltic
pump until the discharge groundwater was clear. Besides piezometers, five addition groundwater samples were also
collected from the nearby private groundwater wells (B1-B5, Figure 1). The depth of these groundwater wells
ranges from 5 to 7 m below ground, and the groundwater samples were collected from water tap attached to the
automatic submersible pumps.
Ng & Poh: QUANTIFICATION OF GROUNDWATER-DERIVED NUTRIENTS INTO BEACH RIDGE
DRAINAGE USING RADON MASS BALANCE MODEL
419
Figure 1. Location of Ular River and its sampling sites
Radon analysis
Surface water and groundwater samples for the radon concentration were collected using a Schott gas-tight glass
bottle (500 ml, Duran, Germany) and stored under 10 °C prior to the analysis. The measurement of radon in water
was conducted as proposed by Lee and Kim [25]. In general, the radon water sample was transferred to a gas-
washing bottle with fitted disc (500 ml, Duran, Germany). The bottle was then connected to a desiccant column and
RAD7 with a closed air loop circulation system. A desiccant column was installed between the gas washing bottle
and RAD7 to reduce the moisture content in the radon detector. The internal pump in the RAD7 was set to ~1L/min
to provide a continuous air flow within the experimental setup. The equilibrium time for radon concentration
equilibrium between water and recirculating air take approximately 15 minutes. Each radon sample was counted for
two hours in order to yield good counting statistics. For actual radon concentration report, data reduction was
performed by taking account of the radon decay activities during the time lapse between sample collection and
analysis.
Nutrient analysis and physico-chemical parameters measurement
One liter of groundwater and surface water samples were collected and filtered through 0.45 mm cellulose acetate
membrane. The filtrate was stored in acid prewashed HDPE bottle, chilled with ice and transported back to the lab
for nutrients analyses. The measurement of ammonium, NH4+-N (Phenate Method, 4500-NH4
+-G), nitrite, NO2
--N
(Colorimetric Method, 4500- NO2--B), nitrate NO3
--N (Automated Cadmium Reduction Method, 4500-NO3
--F) and
phosphate PO43-
-P (Ascorbic Acid Method, 4500-P-E) concentrations were conducted by standard
spectrophotometric techniques [26]. pH, dissolved oxygen, salinity and water temperature of the surface water and
groundwater were measured in-situ using a pre-calibrated YSI Professional Plus multiparameter Sonde (Xylem Inc.
USA).
Radon mass balance model
In this study, radon mass balance method was used to estimate groundwater discharge rate. This method could
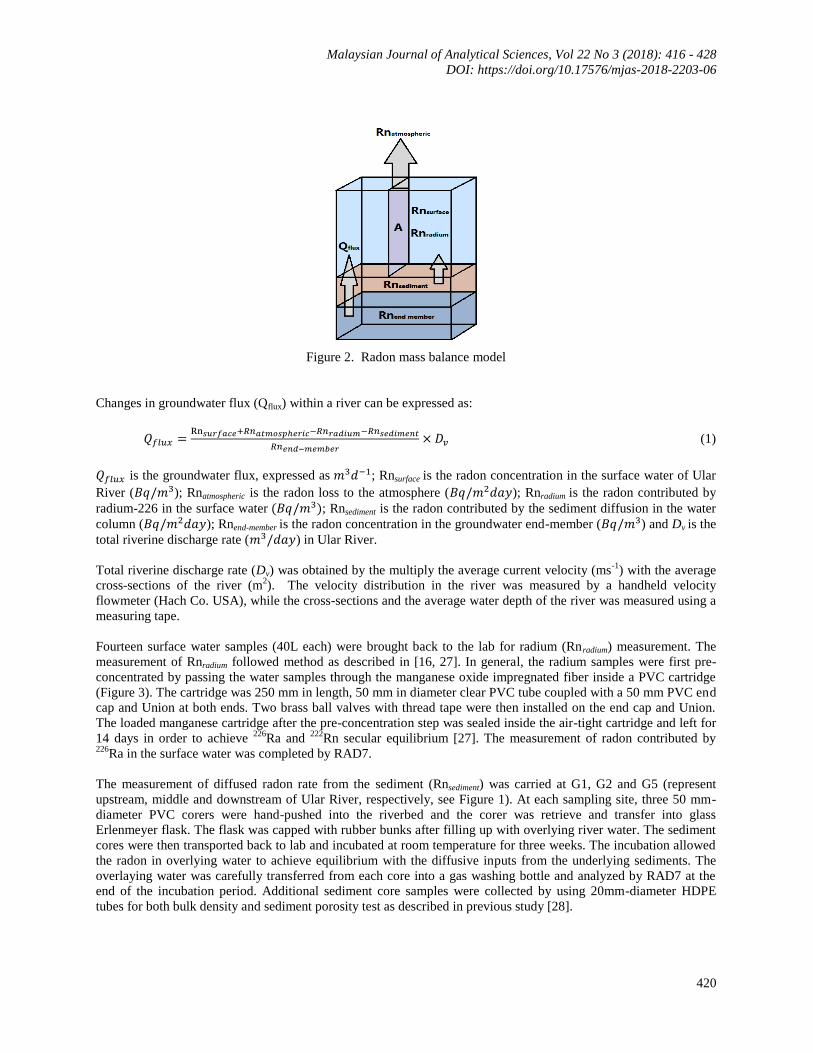
provide an excellent time-integrated estimation of groundwater flux [20]. Figure 2 shows that the net radon
concentration in a system can be inferred through the quantification of its sources and sink. The radon sources in
surface water include the groundwater discharge, diffusive benthic flux and radioactive decay from the radon
parental isotope, 226
Ra in the water column while atmospheric evasion or outgassing is the only sink for radon in
surface water.
B
Malaysian Journal of Analytical Sciences, Vol 22 No 3 (2018): 416 - 428
DOI: https://doi.org/10.17576/mjas-2018-2203-06
420
Figure 2. Radon mass balance model
Changes in groundwater flux (Qflux) within a river can be expressed as:
(1)
is the groundwater flux, expressed as ; Rnsurface is the radon concentration in the surface water of Ular
River ( ); Rnatmospheric is the radon loss to the atmosphere ( ); Rnradium is the radon contributed by
radium-226 in the surface water ; Rnsediment is the radon contributed by the sediment diffusion in the water
column ( ); Rnend-member is the radon concentration in the groundwater end-member ( ) and Dv is the
total riverine discharge rate ( ) in Ular River.
Total riverine discharge rate (Dv) was obtained by the multiply the average current velocity (ms-1
) with the average
cross-sections of the river (m2). The velocity distribution in the river was measured by a handheld velocity
flowmeter (Hach Co. USA), while the cross-sections and the average water depth of the river was measured using a
measuring tape.
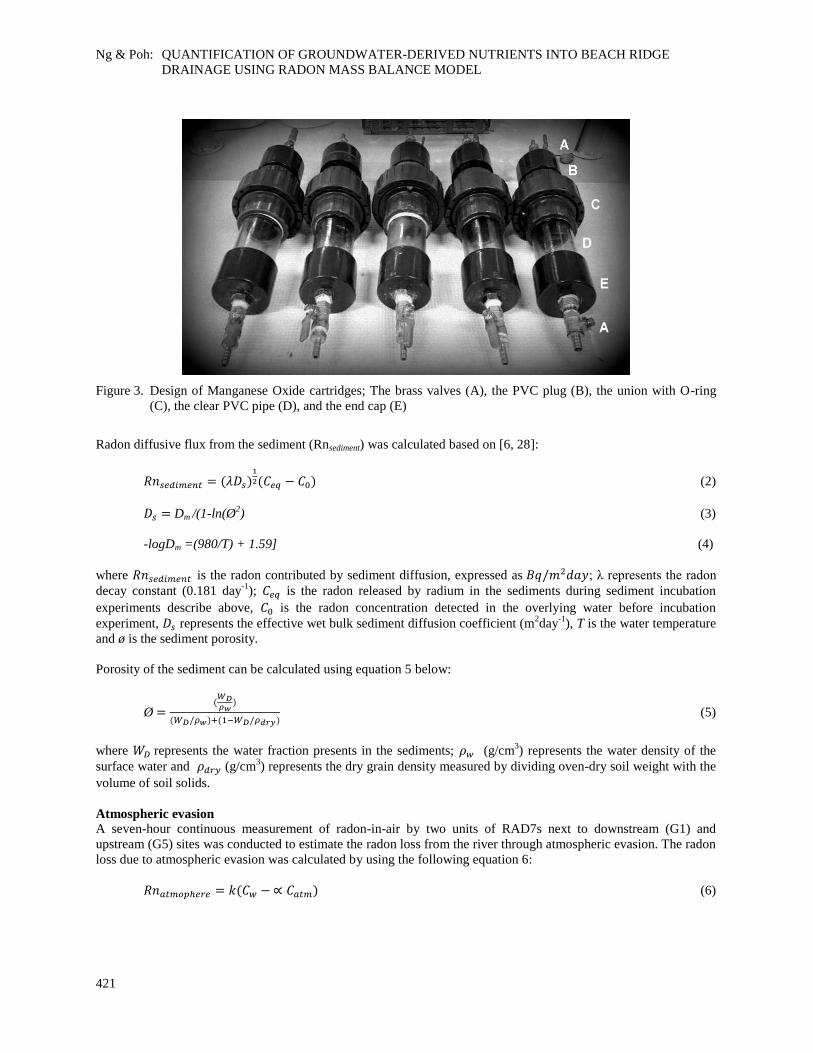
Fourteen surface water samples (40L each) were brought back to the lab for radium (Rnradium) measurement. The
measurement of Rnradium followed method as described in [16, 27]. In general, the radium samples were first pre-
concentrated by passing the water samples through the manganese oxide impregnated fiber inside a PVC cartridge
(Figure 3). The cartridge was 250 mm in length, 50 mm in diameter clear PVC tube coupled with a 50 mm PVC end
cap and Union at both ends. Two brass ball valves with thread tape were then installed on the end cap and Union.
The loaded manganese cartridge after the pre-concentration step was sealed inside the air-tight cartridge and left for
14 days in order to achieve 226
Ra and 222
Rn secular equilibrium [27]. The measurement of radon contributed by 226
Ra in the surface water was completed by RAD7.
The measurement of diffused radon rate from the sediment (Rnsediment) was carried at G1, G2 and G5 (represent
upstream, middle and downstream of Ular River, respectively, see Figure 1). At each sampling site, three 50 mm-
diameter PVC corers were hand-pushed into the riverbed and the corer was retrieve and transfer into glass
Erlenmeyer flask. The flask was capped with rubber bunks after filling up with overlying river water. The sediment
cores were then transported back to lab and incubated at room temperature for three weeks. The incubation allowed
the radon in overlying water to achieve equilibrium with the diffusive inputs from the underlying sediments. The
overlaying water was carefully transferred from each core into a gas washing bottle and analyzed by RAD7 at the
end of the incubation period. Additional sediment core samples were collected by using 20mm-diameter HDPE
tubes for both bulk density and sediment porosity test as described in previous study [28].
Ng & Poh: QUANTIFICATION OF GROUNDWATER-DERIVED NUTRIENTS INTO BEACH RIDGE
DRAINAGE USING RADON MASS BALANCE MODEL
421
Figure 3. Design of Manganese Oxide cartridges; The brass valves (A), the PVC plug (B), the union with O-ring
(C), the clear PVC pipe (D), and the end cap (E)
Radon diffusive flux from the sediment (Rnsediment) was calculated based on [6, 28]:
(2)
Dm /(1-ln(Ø2) (3)
-logDm =(980/T) + 1.59] (4)
where is the radon contributed by sediment diffusion, expressed as ; λ represents the radon
decay constant (0.181 day-1
); is the radon released by radium in the sediments during sediment incubation
experiments describe above, is the radon concentration detected in the overlying water before incubation
experiment, represents the effective wet bulk sediment diffusion coefficient (m2day
-1), T is the water temperature
and ø is the sediment porosity.
Porosity of the sediment can be calculated using equation 5 below:
Ø
(5)
where represents the water fraction presents in the sediments; (g/cm3) represents the water density of the
surface water and (g/cm3) represents the dry grain density measured by dividing oven-dry soil weight with the
volume of soil solids.
Atmospheric evasion
A seven-hour continuous measurement of radon-in-air by two units of RAD7s next to downstream (G1) and
upstream (G5) sites was conducted to estimate the radon loss from the river through atmospheric evasion. The radon
loss due to atmospheric evasion was calculated by using the following equation 6:
(6)
Malaysian Journal of Analytical Sciences, Vol 22 No 3 (2018): 416 - 428
DOI: https://doi.org/10.17576/mjas-2018-2203-06
422
where represents radon atmospheric evasion flux; is the radon concentration in river;
represents radon concentration in the air; is the Ostwald’s solubility coefficient (0.2 at 30 °C) [29]; k is the piston
velocity or gas transfer velocity at water-air boundary. The piston velocity of radon can be inferred from wind and
current velocity as mentioned in [30]. The k value is calculated using equation 7:
(7)
where is the water current velocity (cms-1
) in river measured by a handheld flowmeter (Hach, USA), is the
effective depth of water exchanging with the atmosphere (m), in this case, the average water depth of Ular River
was adopted. is the wind speed (ms-1
) recorded by a portable digital anemometer (Kanomax, USA) on hourly
basis during the radon-in-air sampling.
Results and Discussion
Variations of the water quality in Ular River during base flow and post-storm conditions
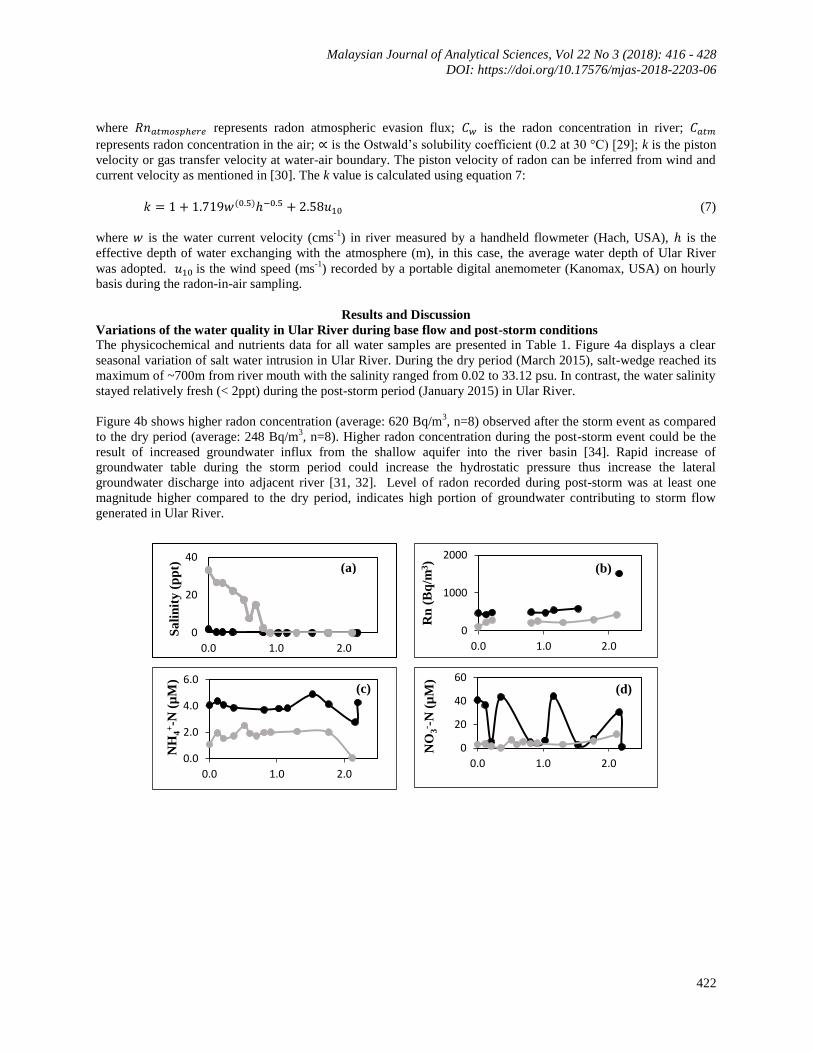
The physicochemical and nutrients data for all water samples are presented in Table 1. Figure 4a displays a clear
seasonal variation of salt water intrusion in Ular River. During the dry period (March 2015), salt-wedge reached its
maximum of ~700m from river mouth with the salinity ranged from 0.02 to 33.12 psu. In contrast, the water salinity
stayed relatively fresh (< 2ppt) during the post-storm period (January 2015) in Ular River.
Figure 4b shows higher radon concentration (average: 620 Bq/m3, n=8) observed after the storm event as compared
to the dry period (average: 248 Bq/m3, n=8). Higher radon concentration during the post-storm event could be the
result of increased groundwater influx from the shallow aquifer into the river basin [34]. Rapid increase of
groundwater table during the storm period could increase the hydrostatic pressure thus increase the lateral
groundwater discharge into adjacent river [31, 32]. Level of radon recorded during post-storm was at least one
magnitude higher compared to the dry period, indicates high portion of groundwater contributing to storm flow
generated in Ular River.
0
20
40
0.0 1.0 2.0
Sa
lin
ity
(p
pt)
(a)
0
1000
2000
0.0 1.0 2.0
Rn
(B
q/m
3)
0
20
40
60
0.0 1.0 2.0
NO
3- -
N (
µM
)
(b)
(d)
0.0
2.0
4.0
6.0
0.0 1.0 2.0
NH
4+-N
(µ
M)
(c)
Ng & Poh: QUANTIFICATION OF GROUNDWATER-DERIVED NUTRIENTS INTO BEACH RIDGE
DRAINAGE USING RADON MASS BALANCE MODEL
423
Figure 4. Longitudinal variation of salinity, radon and nutrient parameters in Ular River against distance from the
river mouth; post-storm period (Jan 2015) in black and dry period (March 2015) in grey
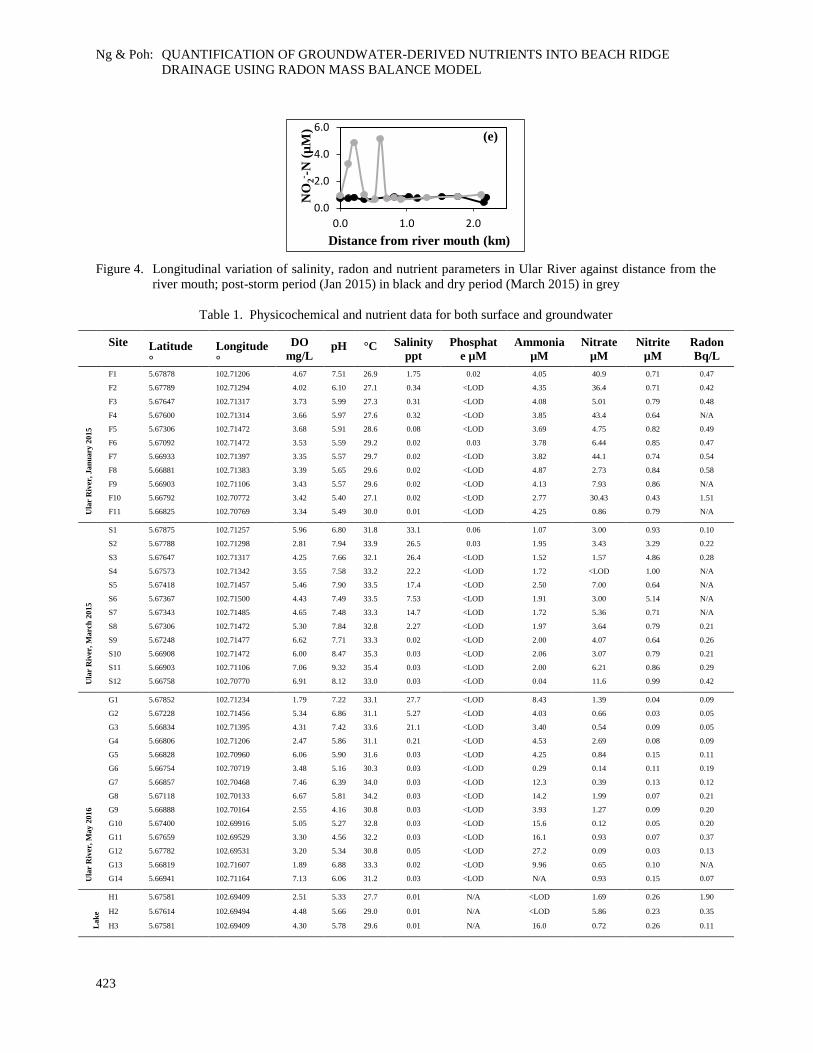
Table 1. Physicochemical and nutrient data for both surface and groundwater
Site Latitude
°
Longitude
°
DO
mg/L pH
°C
Salinity
ppt
Phosphat
e µM
Ammonia
µM
Nitrate
µM
Nitrite
µM
Radon
Bq/L
Ula
r R
iver
, Jan
uary
2015
F1 5.67878 102.71206 4.67 7.51 26.9 1.75 0.02 4.05 40.9 0.71 0.47
F2 5.67789 102.71294 4.02 6.10 27.1 0.34 <LOD 4.35 36.4 0.71 0.42
F3 5.67647 102.71317 3.73 5.99 27.3 0.31 <LOD 4.08 5.01 0.79 0.48
F4 5.67600 102.71314 3.66 5.97 27.6 0.32 <LOD 3.85 43.4 0.64 N/A
F5 5.67306 102.71472 3.68 5.91 28.6 0.08 <LOD 3.69 4.75 0.82 0.49
F6 5.67092 102.71472 3.53 5.59 29.2 0.02 0.03 3.78 6.44 0.85 0.47
F7 5.66933 102.71397 3.35 5.57 29.7 0.02 <LOD 3.82 44.1 0.74 0.54
F8 5.66881 102.71383 3.39 5.65 29.6 0.02 <LOD 4.87 2.73 0.84 0.58
F9 5.66903 102.71106 3.43 5.57 29.6 0.02 <LOD 4.13 7.93 0.86 N/A
F10 5.66792 102.70772 3.42 5.40 27.1 0.02 <LOD 2.77 30.43 0.43 1.51
F11 5.66825 102.70769 3.34 5.49 30.0 0.01 <LOD 4.25 0.86 0.79 N/A
Ula
r R
iver
, M
arc
h 2
015
S1 5.67875 102.71257 5.96 6.80 31.8 33.1 0.06 1.07 3.00 0.93 0.10
S2 5.67788 102.71298 2.81 7.94 33.9 26.5 0.03 1.95 3.43 3.29 0.22
S3 5.67647 102.71317 4.25 7.66 32.1 26.4 <LOD 1.52 1.57 4.86 0.28
S4 5.67573 102.71342 3.55 7.58 33.2 22.2 <LOD 1.72 <LOD 1.00 N/A
S5 5.67418 102.71457 5.46 7.90 33.5 17.4 <LOD 2.50 7.00 0.64 N/A S6 5.67367 102.71500 4.43 7.49 33.5 7.53 <LOD 1.91 3.00 5.14 N/A S7 5.67343 102.71485 4.65 7.48 33.3 14.7 <LOD 1.72 5.36 0.71 N/A S8 5.67306 102.71472 5.30 7.84 32.8 2.27 <LOD 1.97 3.64 0.79 0.21
S9 5.67248 102.71477 6.62 7.71 33.3 0.02 <LOD 2.00 4.07 0.64 0.26
S10 5.66908 102.71472 6.00 8.47 35.3 0.03 <LOD 2.06 3.07 0.79 0.21
S11 5.66903 102.71106 7.06 9.32 35.4 0.03 <LOD 2.00 6.21 0.86 0.29
S12 5.66758 102.70770 6.91 8.12 33.0 0.03 <LOD 0.04 11.6 0.99 0.42
Ula
r R
iver
, M
ay 2
016
G1 5.67852 102.71234 1.79 7.22 33.1 27.7 <LOD 8.43 1.39 0.04 0.09
G2 5.67228 102.71456 5.34 6.86 31.1 5.27 <LOD 4.03 0.66 0.03 0.05
G3 5.66834 102.71395 4.31 7.42 33.6 21.1 <LOD 3.40 0.54 0.09 0.05
G4 5.66806 102.71206 2.47 5.86 31.1 0.21 <LOD 4.53 2.69 0.08 0.09
G5 5.66828 102.70960 6.06 5.90 31.6 0.03 <LOD 4.25 0.84 0.15 0.11
G6 5.66754 102.70719 3.48 5.16 30.3 0.03 <LOD 0.29 0.14 0.11 0.19
G7 5.66857 102.70468 7.46 6.39 34.0 0.03 <LOD 12.3 0.39 0.13 0.12
G8 5.67118 102.70133 6.67 5.81 34.2 0.03 <LOD 14.2 1.99 0.07 0.21
G9 5.66888 102.70164 2.55 4.16 30.8 0.03 <LOD 3.93 1.27 0.09 0.20
G10 5.67400 102.69916 5.05 5.27 32.8 0.03 <LOD 15.6 0.12 0.05 0.20
G11 5.67659 102.69529 3.30 4.56 32.2 0.03 <LOD 16.1 0.93 0.07 0.37
G12 5.67782 102.69531 3.20 5.34 30.8 0.05 <LOD 27.2 0.09 0.03 0.13
G13 5.66819 102.71607 1.89 6.88 33.3 0.02 <LOD 9.96 0.65 0.10 N/A
G14 5.66941 102.71164 7.13 6.06 31.2 0.03 <LOD N/A 0.93 0.15 0.07
Lak
e
H1 5.67581 102.69409 2.51 5.33 27.7 0.01 N/A <LOD 1.69 0.26 1.90
H2 5.67614 102.69494 4.48 5.66 29.0 0.01 N/A <LOD 5.86 0.23 0.35
H3 5.67581 102.69409 4.30 5.78 29.6 0.01 N/A 16.0 0.72 0.26 0.11
0.0
2.0
4.0
6.0
0.0 1.0 2.0
NO
2- -
N (
µM
)
Distance from river mouth (km)
(e)
Malaysian Journal of Analytical Sciences, Vol 22 No 3 (2018): 416 - 428
DOI: https://doi.org/10.17576/mjas-2018-2203-06
424
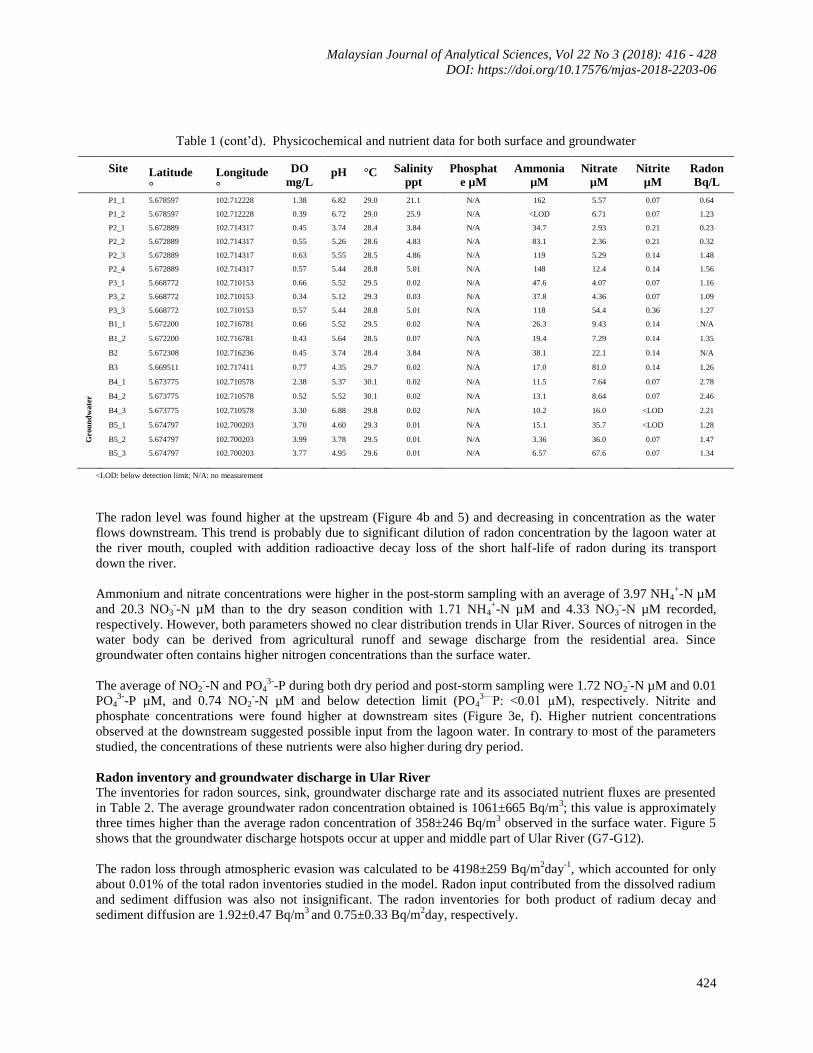
Table 1 (cont’d). Physicochemical and nutrient data for both surface and groundwater
Site Latitude
°
Longitude
°
DO
mg/L pH
°C
Salinity
ppt
Phosphat
e µM
Ammonia
µM
Nitrate
µM
Nitrite
µM
Radon
Bq/L
P1_1 5.678597 102.712228 1.38 6.82 29.0 21.1 N/A 162 5.57 0.07 0.64
P1_2 5.678597 102.712228 0.39 6.72 29.0 25.9 N/A <LOD 6.71 0.07 1.23
P2_1 5.672889 102.714317 0.45 3.74 28.4 3.84 N/A 34.7 2.93 0.21 0.23
P2_2 5.672889 102.714317 0.55 5.26 28.6 4.83 N/A 83.1 2.36 0.21 0.32
P2_3 5.672889 102.714317 0.63 5.55 28.5 4.86 N/A 119 5.29 0.14 1.48
P2_4 5.672889 102.714317 0.57 5.44 28.8 5.01 N/A 148 12.4 0.14 1.56
P3_1 5.668772 102.710153 0.66 5.52 29.5 0.02 N/A 47.6 4.07 0.07 1.16
P3_2 5.668772 102.710153 0.34 5.12 29.3 0.03 N/A 37.8 4.36 0.07 1.09
P3_3 5.668772 102.710153 0.57 5.44 28.8 5.01 N/A 118 54.4 0.36 1.27
Gro
un
dw
ate
r
B1_1 5.672200 102.716781 0.66 5.52 29.5 0.02 N/A 26.3 9.43 0.14 N/A
B1_2 5.672200 102.716781 0.43 5.64 28.5 0.07 N/A 19.4 7.29 0.14 1.35
B2 5.672308 102.716236 0.45 3.74 28.4 3.84 N/A 38.1 22.1 0.14 N/A
B3 5.669511 102.717411 0.77 4.35 29.7 0.02 N/A 17.0 81.0 0.14 1.26
B4_1 5.673775 102.710578 2.38 5.37 30.1 0.02 N/A 11.5 7.64 0.07 2.78
B4_2 5.673775 102.710578 0.52 5.52 30.1 0.02 N/A 13.1 8.64 0.07 2.46
B4_3 5.673775 102.710578 3.30 6.88 29.8 0.02 N/A 10.2 16.0 <LOD 2.21
B5_1 5.674797 102.700203 3.70 4.60 29.3 0.01 N/A 15.1 35.7 <LOD 1.28
B5_2 5.674797 102.700203 3.99 3.78 29.5 0.01 N/A 3.36 36.0 0.07 1.47
B5_3 5.674797 102.700203 3.77 4.95 29.6 0.01 N/A 6.57 67.6 0.07 1.34
<LOD: below detection limit; N/A: no measurement
The radon level was found higher at the upstream (Figure 4b and 5) and decreasing in concentration as the water
flows downstream. This trend is probably due to significant dilution of radon concentration by the lagoon water at
the river mouth, coupled with addition radioactive decay loss of the short half-life of radon during its transport
down the river.
Ammonium and nitrate concentrations were higher in the post-storm sampling with an average of 3.97 NH4+-N µM
and 20.3 NO3--N µM than to the dry season condition with 1.71 NH4
+-N µM and 4.33 NO3
--N µM recorded,
respectively. However, both parameters showed no clear distribution trends in Ular River. Sources of nitrogen in the
water body can be derived from agricultural runoff and sewage discharge from the residential area. Since
groundwater often contains higher nitrogen concentrations than the surface water.
The average of NO2--N and PO4
3--P during both dry period and post-storm sampling were 1.72 NO2
--N µM and 0.01
PO43-
-P µM, and 0.74 NO2--N µM and below detection limit (PO4
3—P: ˂0.01 µM), respectively. Nitrite and
phosphate concentrations were found higher at downstream sites (Figure 3e, f). Higher nutrient concentrations
observed at the downstream suggested possible input from the lagoon water. In contrary to most of the parameters
studied, the concentrations of these nutrients were also higher during dry period.
Radon inventory and groundwater discharge in Ular River
The inventories for radon sources, sink, groundwater discharge rate and its associated nutrient fluxes are presented
in Table 2. The average groundwater radon concentration obtained is 1061±665 Bq/m3; this value is approximately
three times higher than the average radon concentration of 358±246 Bq/m3 observed in the surface water. Figure 5
shows that the groundwater discharge hotspots occur at upper and middle part of Ular River (G7-G12).
The radon loss through atmospheric evasion was calculated to be 4198±259 Bq/m2day
-1, which accounted for only
about 0.01% of the total radon inventories studied in the model. Radon input contributed from the dissolved radium
and sediment diffusion was also not insignificant. The radon inventories for both product of radium decay and
sediment diffusion are 1.92±0.47 Bq/m3 and 0.75±0.33 Bq/m
2day, respectively.
Ng & Poh: QUANTIFICATION OF GROUNDWATER-DERIVED NUTRIENTS INTO BEACH RIDGE
DRAINAGE USING RADON MASS BALANCE MODEL
425
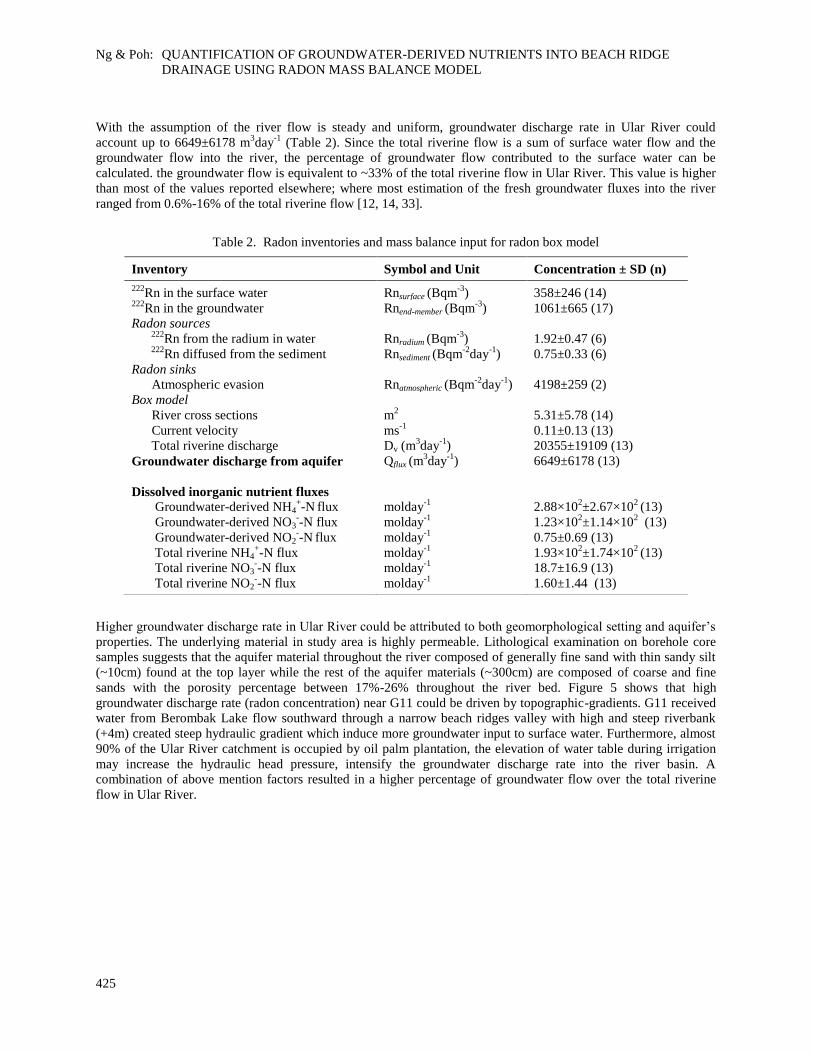
With the assumption of the river flow is steady and uniform, groundwater discharge rate in Ular River could
account up to 6649±6178 m3day
-1 (Table 2). Since the total riverine flow is a sum of surface water flow and the
groundwater flow into the river, the percentage of groundwater flow contributed to the surface water can be
calculated. the groundwater flow is equivalent to ~33% of the total riverine flow in Ular River. This value is higher
than most of the values reported elsewhere; where most estimation of the fresh groundwater fluxes into the river
ranged from 0.6%-16% of the total riverine flow [12, 14, 33].
Table 2. Radon inventories and mass balance input for radon box model
Higher groundwater discharge rate in Ular River could be attributed to both geomorphological setting and aquifer’s
properties. The underlying material in study area is highly permeable. Lithological examination on borehole core
samples suggests that the aquifer material throughout the river composed of generally fine sand with thin sandy silt
(~10cm) found at the top layer while the rest of the aquifer materials (~300cm) are composed of coarse and fine
sands with the porosity percentage between 17%-26% throughout the river bed. Figure 5 shows that high
groundwater discharge rate (radon concentration) near G11 could be driven by topographic-gradients. G11 received
water from Berombak Lake flow southward through a narrow beach ridges valley with high and steep riverbank
(+4m) created steep hydraulic gradient which induce more groundwater input to surface water. Furthermore, almost
90% of the Ular River catchment is occupied by oil palm plantation, the elevation of water table during irrigation
may increase the hydraulic head pressure, intensify the groundwater discharge rate into the river basin. A
combination of above mention factors resulted in a higher percentage of groundwater flow over the total riverine
flow in Ular River.
Inventory Symbol and Unit Concentration ± SD (n)
222Rn in the surface water
Rnsurface (Bqm
-3) 358±246 (14)
222Rn in the groundwater Rnend-member (Bqm
-3) 1061±665 (17)
Radon sources 222
Rn from the radium in water Rnradium (Bqm-3
) 1.92±0.47 (6) 222
Rn diffused from the sediment Rnsediment (Bqm-2
day-1
) 0.75±0.33 (6)
Radon sinks
Atmospheric evasion Rnatmospheric (Bqm-2
day-1
) 4198±259 (2)
Box model
River cross sections m2 5.31±5.78 (14)
Current velocity ms-1
0.11±0.13 (13)
Total riverine discharge Dv (m3day
-1) 20355±19109 (13)
Groundwater discharge from aquifer Qflux (m3day
-1) 6649±6178 (13)
Dissolved inorganic nutrient fluxes
Groundwater-derived NH4+-N flux molday
-1 2.88×10
2±2.67×10
2 (13)
Groundwater-derived NO3--N flux molday
-1 1.23×10
2±1.14×10
2 (13)
Groundwater-derived NO2--N flux molday
-1 0.75±0.69 (13)
Total riverine NH4+-N flux molday
-1 1.93×10
2±1.74×10
2 (13)
Total riverine NO3--N flux molday
-1 18.7±16.9 (13)
Total riverine NO2--N flux molday
-1 1.60±1.44 (13)
Malaysian Journal of Analytical Sciences, Vol 22 No 3 (2018): 416 - 428
DOI: https://doi.org/10.17576/mjas-2018-2203-06
426
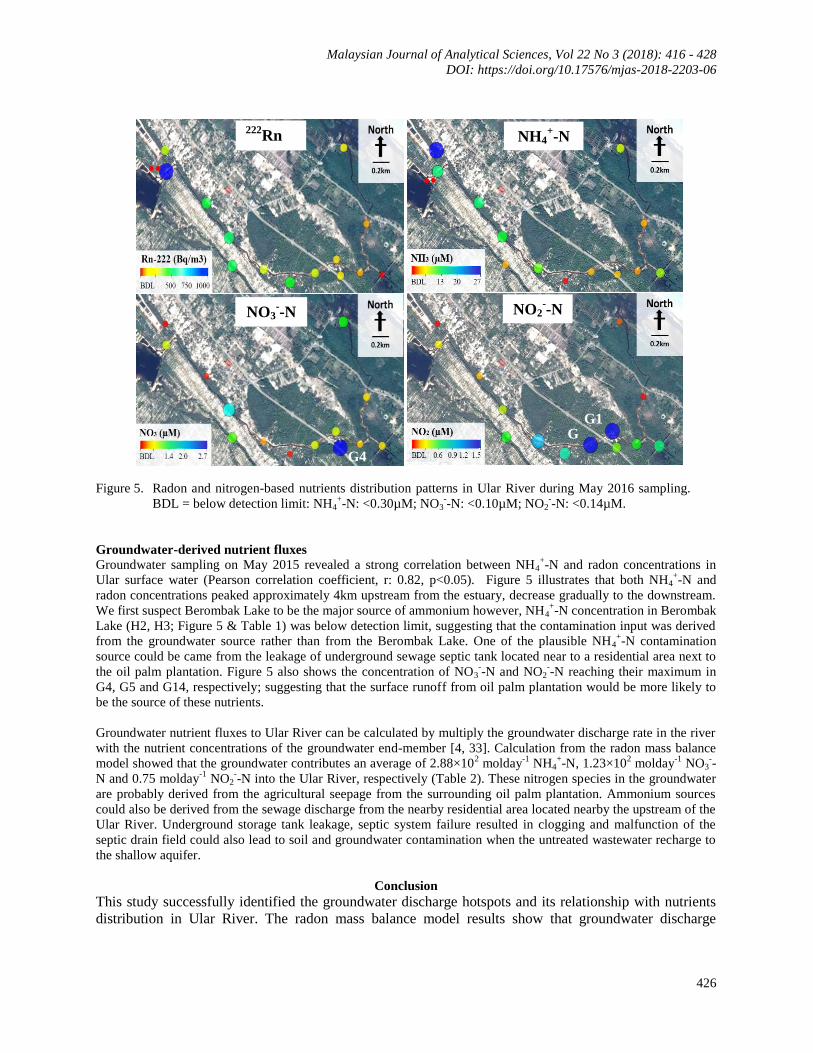
Figure 5. Radon and nitrogen-based nutrients distribution patterns in Ular River during May 2016 sampling.
BDL = below detection limit: NH4+-N: <0.30µM; NO3
--N: <0.10µM; NO2
--N: <0.14µM.
Groundwater-derived nutrient fluxes
Groundwater sampling on May 2015 revealed a strong correlation between NH4+-N and radon concentrations in
Ular surface water (Pearson correlation coefficient, r: 0.82, p<0.05). Figure 5 illustrates that both NH4+-N and
radon concentrations peaked approximately 4km upstream from the estuary, decrease gradually to the downstream.
We first suspect Berombak Lake to be the major source of ammonium however, NH4+-N concentration in Berombak
Lake (H2, H3; Figure 5 & Table 1) was below detection limit, suggesting that the contamination input was derived
from the groundwater source rather than from the Berombak Lake. One of the plausible NH4+-N contamination
source could be came from the leakage of underground sewage septic tank located near to a residential area next to
the oil palm plantation. Figure 5 also shows the concentration of NO3--N and NO2
--N reaching their maximum in
G4, G5 and G14, respectively; suggesting that the surface runoff from oil palm plantation would be more likely to
be the source of these nutrients.
Groundwater nutrient fluxes to Ular River can be calculated by multiply the groundwater discharge rate in the river
with the nutrient concentrations of the groundwater end-member [4, 33]. Calculation from the radon mass balance
model showed that the groundwater contributes an average of 2.88×10² molday
-1 NH4
+-N, 1.23×10
2 molday
-1 NO3
--
N and 0.75 molday-1
NO2--N into the Ular River, respectively (Table 2). These nitrogen species in the groundwater
are probably derived from the agricultural seepage from the surrounding oil palm plantation. Ammonium sources
could also be derived from the sewage discharge from the nearby residential area located nearby the upstream of the
Ular River. Underground storage tank leakage, septic system failure resulted in clogging and malfunction of the
septic drain field could also lead to soil and groundwater contamination when the untreated wastewater recharge to
the shallow aquifer.
Conclusion
This study successfully identified the groundwater discharge hotspots and its relationship with nutrients
distribution in Ular River. The radon mass balance model results show that groundwater discharge
NO2--N
222Rn NH4
+-N
NO3--N
G4
G1
4 G
5

Ng & Poh: QUANTIFICATION OF GROUNDWATER-DERIVED NUTRIENTS INTO BEACH RIDGE
DRAINAGE USING RADON MASS BALANCE MODEL
427
represents a significant component of surface water balance accounted for about 33% of the total riverine
flow. The strong correlation between radon and NH4+-N suggested that the source of ammonium in Ular
River is groundwater-derived. However, nitrate and nitrite showed insignificant correlation with radon
indicating that the origin of these nutrients could be derived from the surface runoff. However, this study
is only tracing the effects of groundwater-derived nutrient from one of the freshwater-fed drainage
channel or tributaries connected to the Setiu lagoon and its nutrients contribution percentage. There are
large portions of unaccounted groundwater-derived nutrients inputs from the other tributaries from the
lagoon itself which are yet to be studied as part of the nutrient budget in Setiu Wetlands which may
warrant further investigation by future studies. In overall, this investigation would allow coastal manager
to assess the magnitude of groundwater discharge and its nutrients contribution into the Setiu Wetlands
and highlighted significance of groundwater-based nutrients in riverine and estuarine nutrient budgets.
Acknowledgement
This work was also made possible through the funding from Ministry of Higher Education of Malaysia,
Niche Research Grant Scheme (NRGS-53131). NCW wished to thank Malaysian Government for
MyBrian15 scholarship.
References
1. Buddemeier, R. W. (1996). Groundwater discharge in the coastal zone. Ecological Economics, 35(200): 25–33.
Burnett, W. C. Taniguchi, M. and Oberdorfer, J. (2001). Measurement and significance of the direct discharge
of groundwater into the coastal zone. Journal of Sea Research, 46(2), 109–116.
2. Johnson, A. G., Glenn, C. R., Burnett, W. C., Peterson, R. N. and Lucey, P. G. (2008). Aerial infrared imaging
reveals large nutrient-rich groundwater inputs to the ocean. Geophysical Research Letters, 35 (15): 1–6.
3. Lee, Y. W., Hwang, D. W., Kim, G., Lee, W. C. and Oh, H. T. (2009). Nutrient input from submarine
groundwater discharge (SGD) in Masan Bay, an embayment surrounded by heavily industrialized cities, Korea.
Science of the Total Environment, 407: 3181–3188.
4. Burnett, W. C., Aggarwal, P. K., Aureli, A., Bokuniewicz, H., Cable, J. E., Charette, M. A., Kontar, E., Krupa,
S., Kulkarni, K. M. and Loveless, A. (2006). Quantifying submarine groundwater discharge in the coastal zone
via multiple methods. Science of the Total Environment, 367: 498–543.
5. Cable, J. E., Burnett, W. C., Chanton, J. P. and Weatherly, G. L. (1996). Estimating groundwater discharge into
the northeastern Gulf of Mexico using radon-222. Earth Planetary Science Letters, 144: 591-604.
6. Dulaiova, H., Gonneea, M. E., Henderson, P. B. and Charette, M. A. (2008). Geochemical and physical sources
of radon variation in a subterranean estuary–implication for groundwater radon activities in submarine
groundwater discharge studies. Marine Chemistry, 110, 120–127.
7. Lerman, A. (1979). Geochemical processes. Wiley-Interscience. New York: p. 481.
8. Schubert, M., Knoeller, K., Treutler, H.-C., Weiss, H. and Dehnert, J. (2006). 222
Rn as a tracer for the
estimation of infiltration of surface waters into aquifers, in Radionuclides in the environment Povinec, P. P. and
Sanchez-Cabeza,
9. J. A. (Editor). Radioactivity in the Environment, 8: 326–334.
10. Burnett, W. C. and Dulaiova, H. (2003). Estimating the dynamics of groundwater input into the coastal zone
via continuous radon-222 measurements. Journal of Environmental Radioactivity, 69 (1-2): 21–35.
11. Mullinger, N. J., Binley, A. M., Pates, J. M. and Crook, N. P. (2007). Radon in Chalk streams: Spatial and
temporal variation of groundwater sources in the Pang and Lambourn catchments, UK. Journal of Hydrology,
339: 172–182.
12. Schwartz, M. C. (2003). Significant groundwater input to a coastal plain estuary: Assessment from excess
radon. Estuarine, Coastal and Shelf Science, 56: 31–42.
13. Swarzenski, P.W., Orem, W.H., McPherson, B.F., Baskaran, M. and Wan, Y. (2006). Biogeochemical transport
in the Loxahatchee river estuary: the role of submarine groundwater discharge. Marine Chemistry, 101: 248–
265.
14. Santos, I. R. and Eyre, B. D. (2011). Radon tracing of groundwater discharge into an Australian estuary
surrounded by coastal acid sulphate soils. Journal Hydrology, 396: 246-257.
Malaysian Journal of Analytical Sciences, Vol 22 No 3 (2018): 416 - 428
DOI: https://doi.org/10.17576/mjas-2018-2203-06
428
15. Burnett, W. C., Peterson, R. N., Santos, I. R. and Hicks, R. W. (2010). Use of automated radon measurements
for rapid assessment of groundwater flow into Florida streams. Journal of Hydrology. 380: 298–304.
16. Peterson, R. N., Burnett, W. C., Dimova, N. and Santos, I. R. (2009). Comparing measurement methods for
radium-226 on manganese-fiber. Limnology and Oceanography. 7: 196–205.
17. Durridge Company Inc. (2014). RAD H2O user manual radon in water accessory.
18. Baskaran, M. (2016). Radon measurement techniques in: Radon: A tracer for geological, geophysical and
geochemical studies. Springer Geochemistry: pp. 15-35.
19. Dulaiova, H., Peterson, R. N., Burnett, W. C. and Lane-Smith, D. (2005). A multi-detector continuous monitor
for assessment of 222
Rn in the coastal ocean. Journal of Radioanalytical and Nuclear Chemistry, 263, 361–365.
20. Najilah, M., Nadirah, M., Sakri, I. and Shaharom-Harrison, F. (2010). Bacteria associated with wild mud crab
(Scylla serrata) from Setiu Malaysia with emphasis on antibiotic resistance. Pakistan Journal of Biological
Sciences, 13(6): 293–297.
21. Suratman, S., Mohd Tahir, N., Jusoh, S. R. and Ariffin, M. M. (2005). Assessment of anthropogenic effects on
water quality in Setiu Wetland, Terengganu. Sains Malaysiana, 34: 87–92.
22. Suratman, S., Hussein, A. N. A. R., Mohd Tahir, N., Latif, M. T., Mostapa, R. and Weston, K. (2016). Seasonal
and spatial variability of selected surface water quality parameters in Setiu Wetlands, Terengganu, Malaysia.
Sains Malaysiana, 45(4): 551–558.
23. Rosnan, Y., Mohd, L.H. and Noor, A. M. S. (1995). Grain-size distribution of sediment in the vicinity of Setiu
lagoon-estuary system. Pertanika Journal of Tropical Agricultural Science, 18(1): 71–76.
24. Department of Irrigation and Drainage Malaysia (2016). Flood information. Access from
http://infobanjir.water.gov.my/. [Access date on 10 October 2016].
25. Lee, J-M. and Kim, G. (2006). A simple and rapid method for analyzing radon in coastal and groundwaters
using a radon-in-air monitor. Journal of Environmental Radioactivity, 89(3): 219–228.
26. APHA. (2005). Standard methods for the examination of water and wastewater, 21st edition. American Public
Health Association, Washington, DC.
27. Kim, G., Burnett, W. C., Dulaiova, H., Swarzenski, P. W., Moore, W. S. (2001). Measurement of 224
Ra and 226
Ra activities in natural waters using a radon-in-air monitor. Environmental Science and Technology, 35:
4680–4683.
28. Corbett, D., Burnett, W., Cable, J. E. and Clark, S. B. (1998). A multiple approach to the determination of
radon fluxes from sediments. Journal of Radioanalytical and Nuclear Chemistry, 236: 247–252.
29. Clever, H. L. (1979). Solubility Data Series. Krypton, Xenon & Radon-Gas solubilities. Pergamon Press,
Oxford.
30. Dulaiova, H., and Burnett, W. C. (2006). Radon loss across the water–air interface (Gulf of Thailand) estimated
experimentally from 222
Rn-224
Ra. Geophysical Research Letters, 33(5): 1–4.
31. Hamada, H., Sukchan, S. and Putiso, M. (2005). Measurement of 222
Rn concentrations in surface water in
northern Thailand. Radioisotopes, 54: 315–320.
32. Fetter, C. W. (1994). Applied hydrogeology (3rd
Edition). McMillian, New York.
33. Charette, M. A. and Buesseler, K.O. (2004). Submarine groundwater discharge of nutrients and copper to an
urban sub estuary of Chesapeake Bay (Elizabeth River). Limnology and Oceanography, 49(2), 376–385.