groundwater deterioration of shallow groundwater aquifers due to overexploitation in northeast...
TRANSCRIPT
Ali El-Naqa1
Mohammad Al-Momani2
Suzan Kilani2
Nezar Hammouri1
1Faculty of Natural Resources andEnvironment, Hashemite University,Zarqa, Jordan.
2Ministry of Water and Irrigation, Amman,Jordan.
Research Article
Groundwater Deterioration of Shallow GroundwaterAquifers Due to Overexploitation in Northeast Jordan
Groundwater is the major water resource in Jordan and most of the groundwaterbasins are already exploited beyond their estimated safe yield. Azraq basin is one ofthe most important groundwater basins in Jordan, which supplies Amman with drin-king water. However, due to overpumping from the shallow groundwater aquifers,the water level dropped dramatically and signs of salinization and depletion are start-ing to occur. The severe drawdown in the Azraq well-field caused a reverse in thehydraulic gradient and consequently, the saltwater in the center of the basin (Qa-Azraq) started to move in the direction of the well-field. The salinization in the shal-low aquifer (basalt/B5/B4) is believed to result from one of the following scenarios: (i) areverse flow from Sabkha to the AWSA well field, (ii) an upward leakage from themiddle aquifer system (B2/A7) and the combined B3 Aquitard-B2/A7 aquifer, (iii) a dis-solution process between the water and rock matrix due to lowering of the dynamicwater levels during pumping which reached the mineralized formations underlyingthe Basalt. The salinization trend of some AWSA wells represented by the gradualincrease of major ions is associated with rather constant stable isotopic contents. Thisindicates that these constituents originate from the main minerals existing in thematrix of the aquifers and thus this scenario is the most likely to occur.
Keywords: Groundwater; Deterioration; Overexploitation; Isotopes;
Received: February 5, 2007; accepted: February 26, 2007
DOI: 10.1002/clen.200700012
1 Introduction
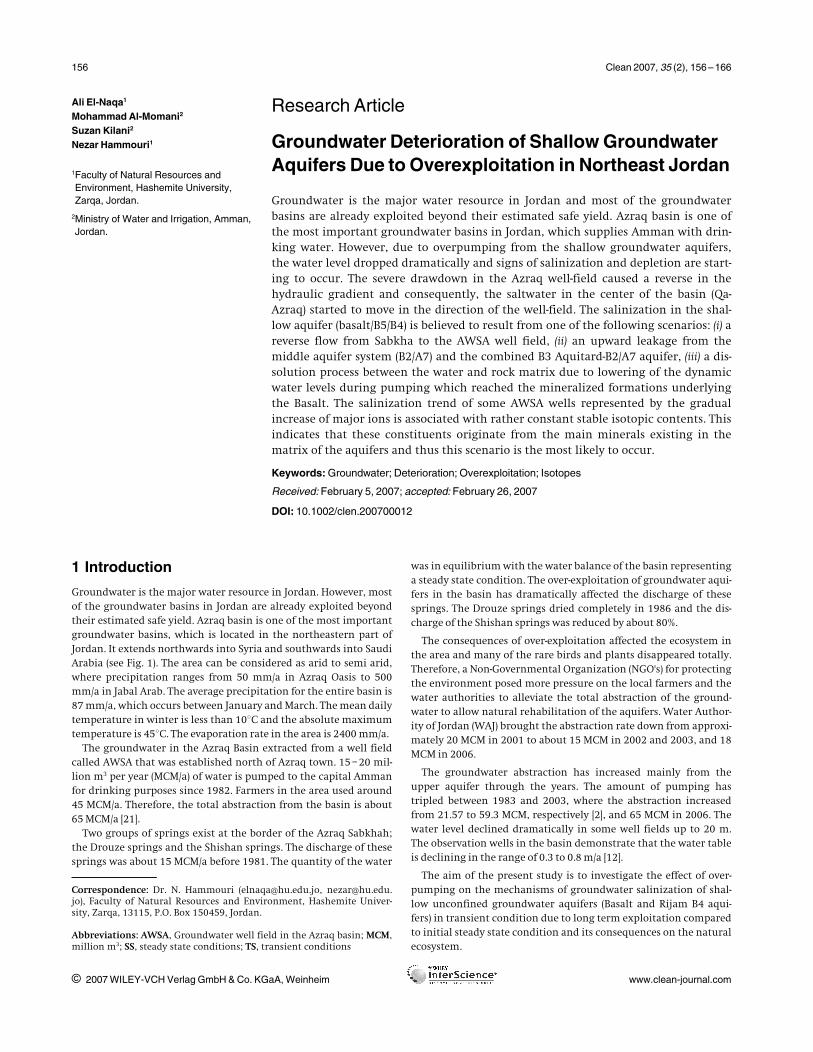
Groundwater is the major water resource in Jordan. However, mostof the groundwater basins in Jordan are already exploited beyondtheir estimated safe yield. Azraq basin is one of the most importantgroundwater basins, which is located in the northeastern part ofJordan. It extends northwards into Syria and southwards into SaudiArabia (see Fig. 1). The area can be considered as arid to semi arid,where precipitation ranges from 50 mm/a in Azraq Oasis to 500mm/a in Jabal Arab. The average precipitation for the entire basin is87 mm/a, which occurs between January and March. The mean dailytemperature in winter is less than 108C and the absolute maximumtemperature is 458C. The evaporation rate in the area is 2400 mm/a.
The groundwater in the Azraq Basin extracted from a well fieldcalled AWSA that was established north of Azraq town. 15 – 20 mil-lion m3 per year (MCM/a) of water is pumped to the capital Ammanfor drinking purposes since 1982. Farmers in the area used around45 MCM/a. Therefore, the total abstraction from the basin is about65 MCM/a [21].
Two groups of springs exist at the border of the Azraq Sabkhah;the Drouze springs and the Shishan springs. The discharge of thesesprings was about 15 MCM/a before 1981. The quantity of the water
was in equilibrium with the water balance of the basin representinga steady state condition. The over-exploitation of groundwater aqui-fers in the basin has dramatically affected the discharge of thesesprings. The Drouze springs dried completely in 1986 and the dis-charge of the Shishan springs was reduced by about 80%.
The consequences of over-exploitation affected the ecosystem inthe area and many of the rare birds and plants disappeared totally.Therefore, a Non-Governmental Organization (NGO's) for protectingthe environment posed more pressure on the local farmers and thewater authorities to alleviate the total abstraction of the ground-water to allow natural rehabilitation of the aquifers. Water Author-ity of Jordan (WAJ) brought the abstraction rate down from approxi-mately 20 MCM in 2001 to about 15 MCM in 2002 and 2003, and 18MCM in 2006.
The groundwater abstraction has increased mainly from theupper aquifer through the years. The amount of pumping hastripled between 1983 and 2003, where the abstraction increasedfrom 21.57 to 59.3 MCM, respectively [2], and 65 MCM in 2006. Thewater level declined dramatically in some well fields up to 20 m.The observation wells in the basin demonstrate that the water tableis declining in the range of 0.3 to 0.8 m/a [12].
The aim of the present study is to investigate the effect of over-pumping on the mechanisms of groundwater salinization of shal-low unconfined groundwater aquifers (Basalt and Rijam B4 aqui-fers) in transient condition due to long term exploitation comparedto initial steady state condition and its consequences on the naturalecosystem.
Correspondence: Dr. N. Hammouri ([email protected], [email protected]), Faculty of Natural Resources and Environment, Hashemite Univer-sity, Zarqa, 13115, P.O. Box 150459, Jordan.
Abbreviations: AWSA, Groundwater well field in the Azraq basin; MCM,million m3; SS, steady state conditions; TS, transient conditions
i 2007 WILEY-VCH Verlag GmbH & Co. KGaA, Weinheim www.clean-journal.com
156 Clean 2007, 35 (2), 156 –166
Clean 2007, 35 (2), 156 – 166 Groundwater Deterioration of Shallow Groundwater Aquifers 157
The salinization in the shallow aquifer (basalt/B5/B4) is believedto result from one of the following three different processes:
(i) The return flow from Sabkha to the AWSA well field resultingfrom a low hydraulic gradient of the aquifer water table and anincreased drawdown in the AWSA well field that would cause thenatural flow direction of the groundwater to be reversed.
(ii) The upward leakage from the middle aquifer system (B2/A7)and the combined B3 Aquitard-B2/A7 aquifer.
(iii) The local geochemical processes (dissolution, leaching, andreturn flow) due to specific local hydrological and geological pro-cesses leading to a hydrodynamic situation which changes thewater quality due to mineral dissolution in the aquifer matrix.
2 Geological Framework
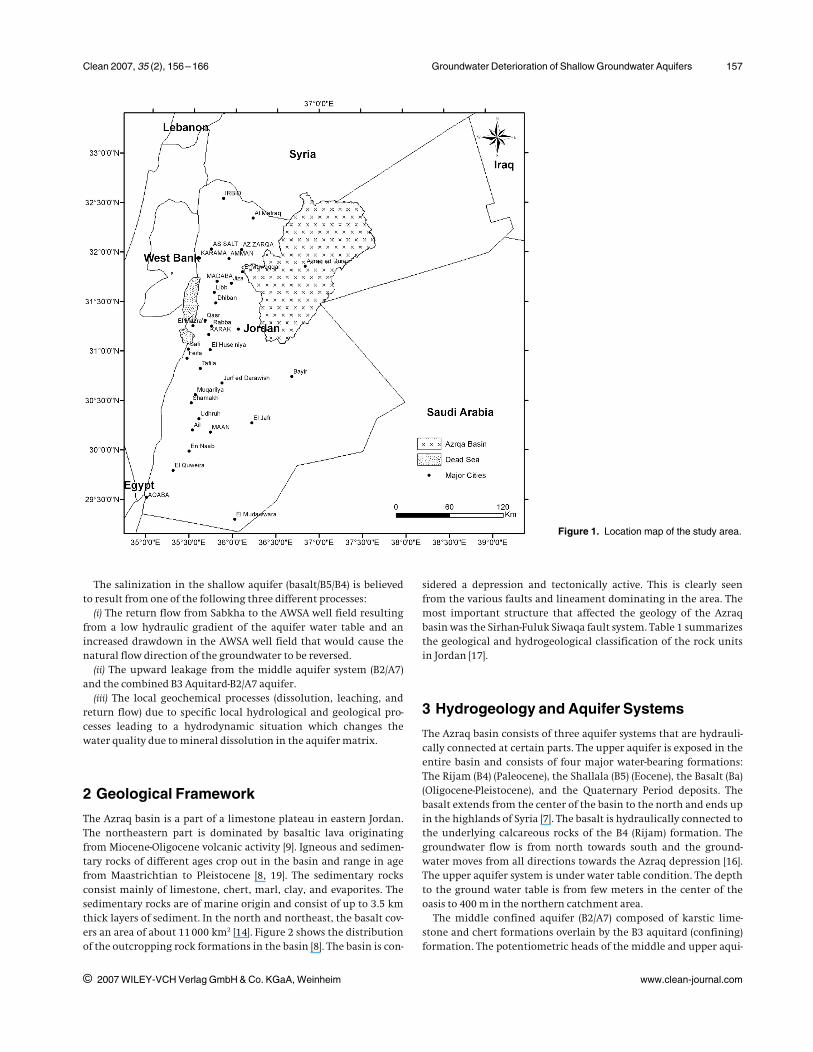
The Azraq basin is a part of a limestone plateau in eastern Jordan.The northeastern part is dominated by basaltic lava originatingfrom Miocene-Oligocene volcanic activity [9]. Igneous and sedimen-tary rocks of different ages crop out in the basin and range in agefrom Maastrichtian to Pleistocene [8, 19]. The sedimentary rocksconsist mainly of limestone, chert, marl, clay, and evaporites. Thesedimentary rocks are of marine origin and consist of up to 3.5 kmthick layers of sediment. In the north and northeast, the basalt cov-ers an area of about 11 000 km2 [14]. Figure 2 shows the distributionof the outcropping rock formations in the basin [8]. The basin is con-
sidered a depression and tectonically active. This is clearly seenfrom the various faults and lineament dominating in the area. Themost important structure that affected the geology of the Azraqbasin was the Sirhan-Fuluk Siwaqa fault system. Table 1 summarizesthe geological and hydrogeological classification of the rock unitsin Jordan [17].
3 Hydrogeology and Aquifer Systems
The Azraq basin consists of three aquifer systems that are hydrauli-cally connected at certain parts. The upper aquifer is exposed in theentire basin and consists of four major water-bearing formations:The Rijam (B4) (Paleocene), the Shallala (B5) (Eocene), the Basalt (Ba)(Oligocene-Pleistocene), and the Quaternary Period deposits. Thebasalt extends from the center of the basin to the north and ends upin the highlands of Syria [7]. The basalt is hydraulically connected tothe underlying calcareous rocks of the B4 (Rijam) formation. Thegroundwater flow is from north towards south and the ground-water moves from all directions towards the Azraq depression [16].The upper aquifer system is under water table condition. The depthto the ground water table is from few meters in the center of theoasis to 400 m in the northern catchment area.
The middle confined aquifer (B2/A7) composed of karstic lime-stone and chert formations overlain by the B3 aquitard (confining)formation. The potentiometric heads of the middle and upper aqui-
i 2007 WILEY-VCH Verlag GmbH & Co. KGaA, Weinheim www.clean-journal.com
Figure 1. Location map of the study area.
158 A. El-Naqa et al. Clean 2007, 35 (2), 156 –166
i 2007 WILEY-VCH Verlag GmbH & Co. KGaA, Weinheim www.clean-journal.com
Figure 2. Generalized geological map of the study area.Figure 3. Groundwater contour map of the upper aquifer unit in steadystate condition.
Table 1. Geological and hydrogeological classification of the rock units in Jordan [17].
Epoch Age Group Formation Symbol Rock type Thickness(m)
AquiferPotentiality
Permeability(m/s)
Tertiary Holocene Balqa Wadi Fill Soil, sand, and gravel 10–40 Good 2.4 N 10 – 7
Pleistocene Basalt V Basalt, clay 0 – 50 Good –
UpperCretaceous
Maestrichtain Muwaqqar B3 Chalk, marl, and chalkylimestone
60 – 70 Poor –
Campanian Amman B2 Chert, limestone withphosphate
80 – 120 Excellent 1 N 10 – 5 – 3 N 10 – 4
Santonian Ghudran B1 Chalk, marl, and marlylimestone
15 – 20 Poor –
Turonian Ajlun Wadi Sir A7 Hard Crystalline Limestone,dolomitic and some chert
90 – 110 Excellent 1 N 10 – 7 – 1 N 10 – 4
Cenomanian Shueib A5-6 Light grey limestone inter-beded with marls and marlylimestone
75 – 100 Fair to poor 6.3 N 10 – 5 – 7.2 N 10 – 4
Hummar A4 Hard dense limestone anddolomitic limestone
40 – 60 Good 8.1 N 10 – 7 – 7.6 N 10 – 4
Fuheis A3 Gary and olive green softmarl. Marly limestone andlimestone
60 – 80 Poor 5.3 N 10 – 7 – 1.7 N 10 – 5
Na'ur A1-2 Limestone interbeded witha thick sequence of marl andmarly limestone
150 – 220 Poor 2 N 10 – 8 – 3.1 N 10 – 5
LowerCretaceous
Albian-Aptian Kurnub K Massive white and vari-colored sandstone withlayers of reddish silt and shale
300 Good 6.9 N 10 – 3 – 5.2 N 10 – 2
Clean 2007, 35 (2), 156 – 166 Groundwater Deterioration of Shallow Groundwater Aquifers 159
fers in the AWSA well field area were 520 and 510 m above sea level(ASL), respectively, in steady state, becoming 520 and 495 m ASL intransient conditions. This increases the driving force of the upwardflow [21]. Figure 3 illustrates the potentiometric head in the upperaquifers in the steady state condition [10]. The aquifer is consideredconfined throughout the basin, and it is recharged mainly from theJebel (mountain) Druze recharge area in the north [10].
The deeper aquifer unit is known as the Kurnub Sandstone aqui-fer. The geological formations between B2/A7 and the Kurnub Sand-stone aquifer are mostly marly limestone and limestones and marl,all together acting as a semi-permeable layer.
The pressure in the Kurnub Sandstone aquifer is lower than thatof the middle aquifer [15].
The upper shallow fresh water basalt aquifer (i. e., the target aqui-fer of this study) is currently under the threat of salinization due tooverexploitation. The middle limestone brackish water aquifer (600to 15 000 mg/L) ages more than 30 000 years and the deep sandstoneaquifer has low yields and poor water quality.
The overpumping from a large number of wells existing in thebasin causes a dramatic drawdown of the local water table and con-sequently affects the groundwater resources in the area [18]. Theincrease in groundwater abstraction by the beginning of the 1980scan be considered as the major factor affecting the steady state con-ditions and leading to the current transient state. The degradationof the groundwater quality and salinization took place at some
wells in the AWSA well field, Azraq farms, and Azraq depression(Qa’a Azraq or Sabkha). The amount of pumping exceeds theamount of recharge estimated by various authors [1].
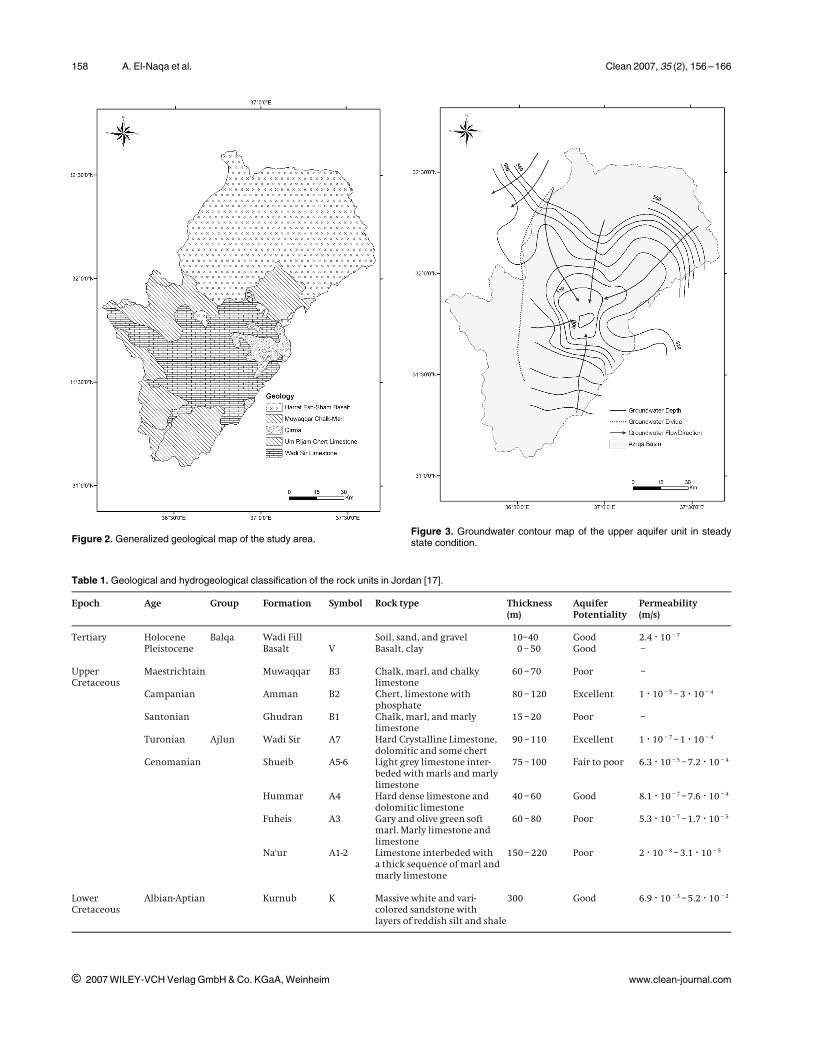
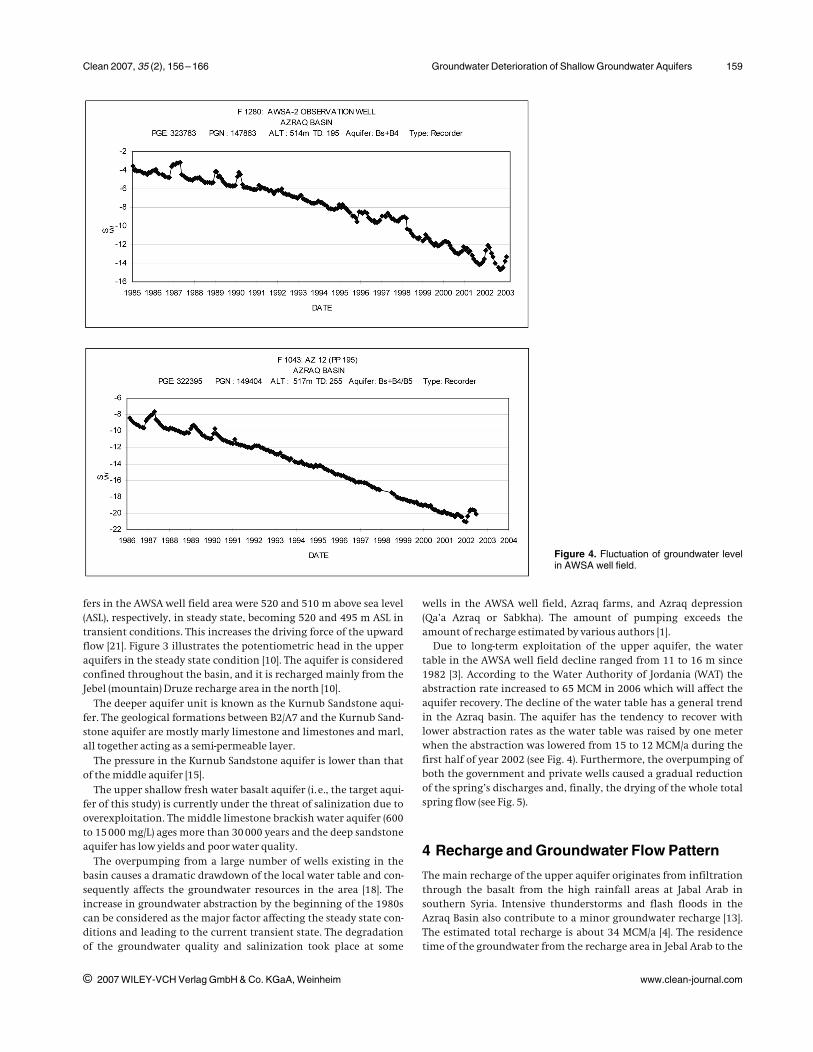
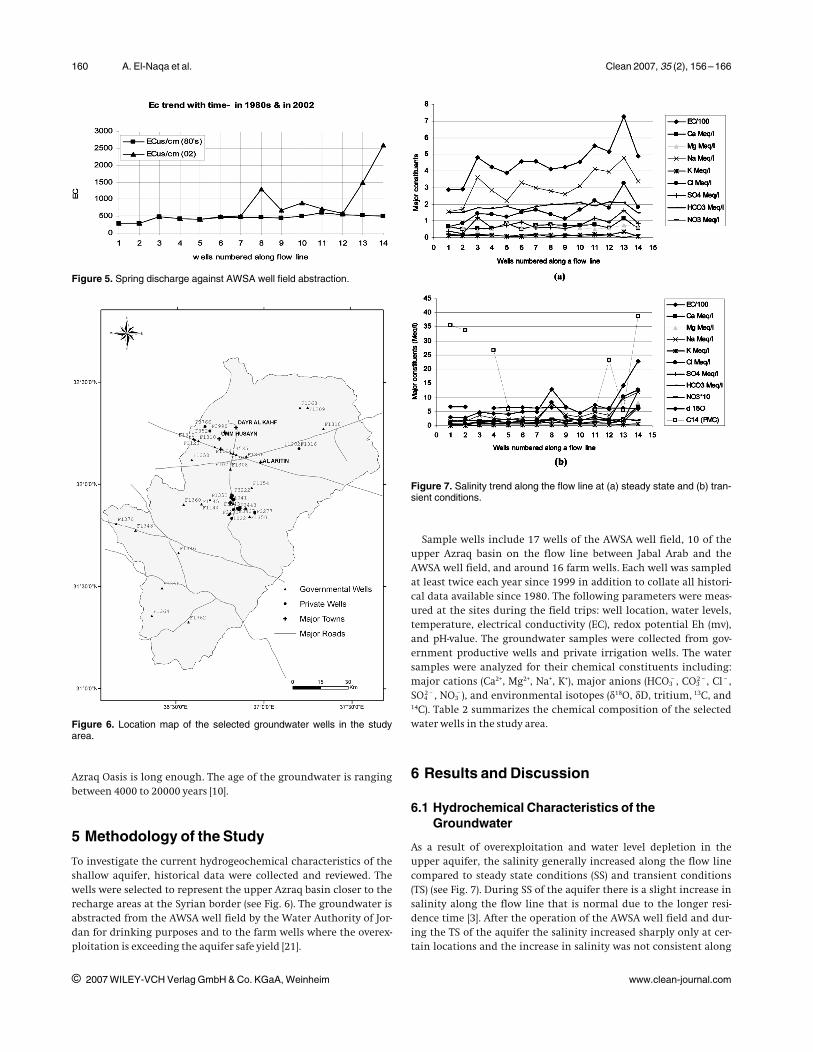
Due to long-term exploitation of the upper aquifer, the watertable in the AWSA well field decline ranged from 11 to 16 m since1982 [3]. According to the Water Authority of Jordania (WAT) theabstraction rate increased to 65 MCM in 2006 which will affect theaquifer recovery. The decline of the water table has a general trendin the Azraq basin. The aquifer has the tendency to recover withlower abstraction rates as the water table was raised by one meterwhen the abstraction was lowered from 15 to 12 MCM/a during thefirst half of year 2002 (see Fig. 4). Furthermore, the overpumping ofboth the government and private wells caused a gradual reductionof the spring’s discharges and, finally, the drying of the whole totalspring flow (see Fig. 5).
4 Recharge and Groundwater Flow Pattern
The main recharge of the upper aquifer originates from infiltrationthrough the basalt from the high rainfall areas at Jabal Arab insouthern Syria. Intensive thunderstorms and flash floods in theAzraq Basin also contribute to a minor groundwater recharge [13].The estimated total recharge is about 34 MCM/a [4]. The residencetime of the groundwater from the recharge area in Jebal Arab to the
i 2007 WILEY-VCH Verlag GmbH & Co. KGaA, Weinheim www.clean-journal.com
Figure 4. Fluctuation of groundwater levelin AWSA well field.
160 A. El-Naqa et al. Clean 2007, 35 (2), 156 –166
Azraq Oasis is long enough. The age of the groundwater is rangingbetween 4000 to 20000 years [10].
5 Methodology of the Study
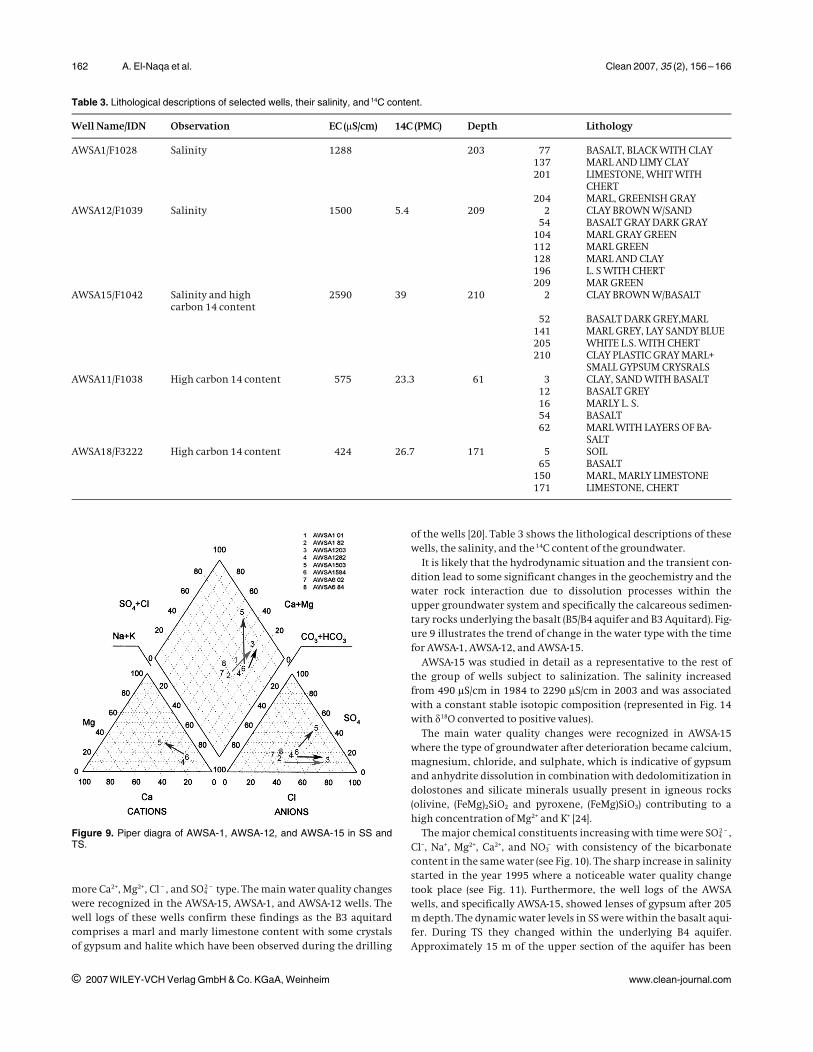
To investigate the current hydrogeochemical characteristics of theshallow aquifer, historical data were collected and reviewed. Thewells were selected to represent the upper Azraq basin closer to therecharge areas at the Syrian border (see Fig. 6). The groundwater isabstracted from the AWSA well field by the Water Authority of Jor-dan for drinking purposes and to the farm wells where the overex-ploitation is exceeding the aquifer safe yield [21].
Sample wells include 17 wells of the AWSA well field, 10 of theupper Azraq basin on the flow line between Jabal Arab and theAWSA well field, and around 16 farm wells. Each well was sampledat least twice each year since 1999 in addition to collate all histori-cal data available since 1980. The following parameters were meas-ured at the sites during the field trips: well location, water levels,temperature, electrical conductivity (EC), redox potential Eh (mv),and pH-value. The groundwater samples were collected from gov-ernment productive wells and private irrigation wells. The watersamples were analyzed for their chemical constituents including:major cations (Ca2+, Mg2+, Na+, K+), major anions (HCO3
– , CO32 – , Cl – ,
SO42 – , NO3
– ), and environmental isotopes (d18O, dD, tritium, 13C, and14C). Table 2 summarizes the chemical composition of the selectedwater wells in the study area.
6 Results and Discussion
6.1 Hydrochemical Characteristics of theGroundwater
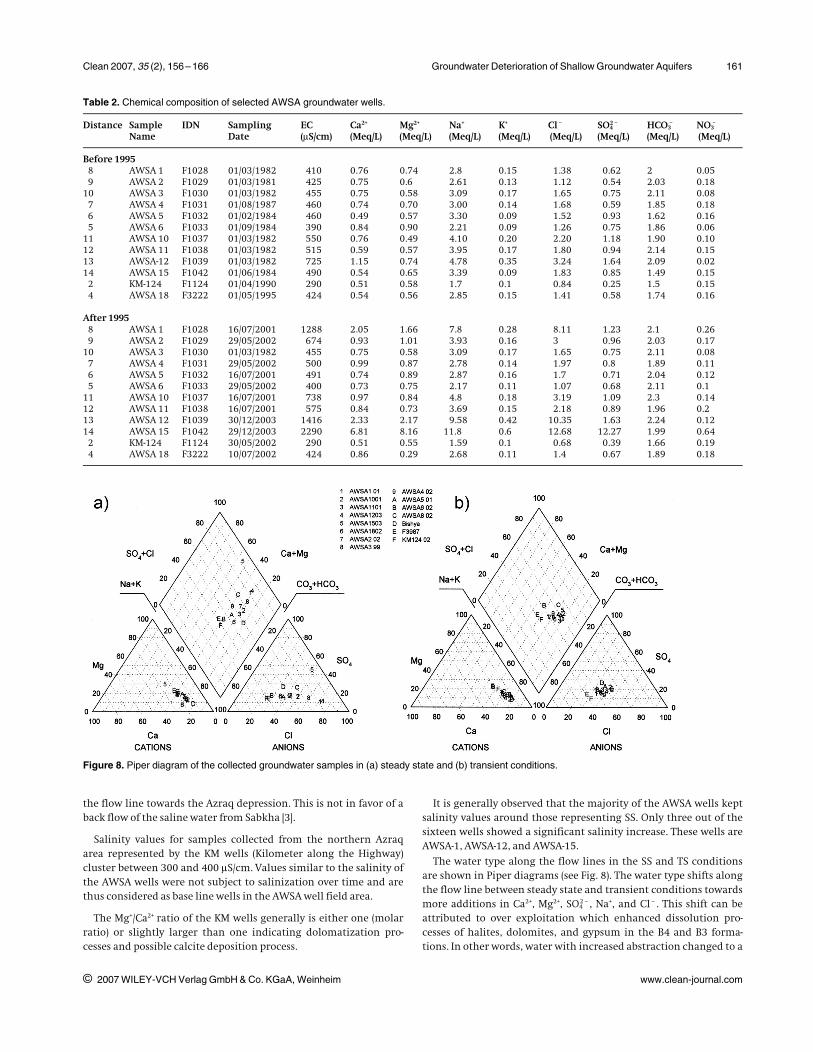
As a result of overexploitation and water level depletion in theupper aquifer, the salinity generally increased along the flow linecompared to steady state conditions (SS) and transient conditions(TS) (see Fig. 7). During SS of the aquifer there is a slight increase insalinity along the flow line that is normal due to the longer resi-dence time [3]. After the operation of the AWSA well field and dur-ing the TS of the aquifer the salinity increased sharply only at cer-tain locations and the increase in salinity was not consistent along
i 2007 WILEY-VCH Verlag GmbH & Co. KGaA, Weinheim www.clean-journal.com
Figure 5. Spring discharge against AWSA well field abstraction.
Figure 6. Location map of the selected groundwater wells in the studyarea.
Figure 7. Salinity trend along the flow line at (a) steady state and (b) tran-sient conditions.
Clean 2007, 35 (2), 156 – 166 Groundwater Deterioration of Shallow Groundwater Aquifers 161
the flow line towards the Azraq depression. This is not in favor of aback flow of the saline water from Sabkha [3].
Salinity values for samples collected from the northern Azraqarea represented by the KM wells (Kilometer along the Highway)cluster between 300 and 400 lS/cm. Values similar to the salinity ofthe AWSA wells were not subject to salinization over time and arethus considered as base line wells in the AWSA well field area.
The Mg+/Ca2+ ratio of the KM wells generally is either one (molarratio) or slightly larger than one indicating dolomatization pro-cesses and possible calcite deposition process.
It is generally observed that the majority of the AWSA wells keptsalinity values around those representing SS. Only three out of thesixteen wells showed a significant salinity increase. These wells areAWSA-1, AWSA-12, and AWSA-15.
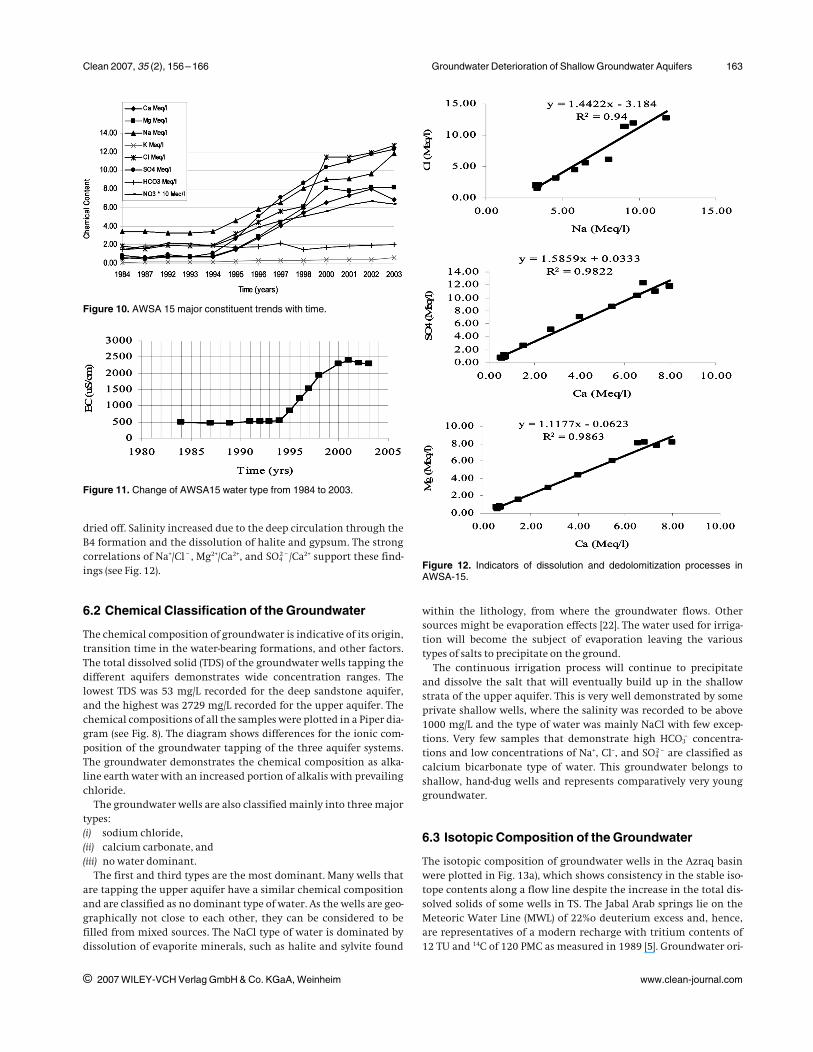
The water type along the flow lines in the SS and TS conditionsare shown in Piper diagrams (see Fig. 8). The water type shifts alongthe flow line between steady state and transient conditions towardsmore additions in Ca2+, Mg2+, SO4
2 – , Na+, and Cl – . This shift can beattributed to over exploitation which enhanced dissolution pro-cesses of halites, dolomites, and gypsum in the B4 and B3 forma-tions. In other words, water with increased abstraction changed to a
i 2007 WILEY-VCH Verlag GmbH & Co. KGaA, Weinheim www.clean-journal.com
Table 2. Chemical composition of selected AWSA groundwater wells.
Distance SampleName
IDN SamplingDate
EC(lS/cm)
Ca2+
(Meq/L)Mg2+
(Meq/L)Na+
(Meq/L)K+
(Meq/L)Cl –
(Meq/L)SO4
2 –
(Meq/L)HCO3
–
(Meq/L)NO3
–
(Meq/L)
Before 19958 AWSA 1 F1028 01/03/1982 410 0.76 0.74 2.8 0.15 1.38 0.62 2 0.059 AWSA 2 F1029 01/03/1981 425 0.75 0.6 2.61 0.13 1.12 0.54 2.03 0.18
10 AWSA 3 F1030 01/03/1982 455 0.75 0.58 3.09 0.17 1.65 0.75 2.11 0.087 AWSA 4 F1031 01/08/1987 460 0.74 0.70 3.00 0.14 1.68 0.59 1.85 0.186 AWSA 5 F1032 01/02/1984 460 0.49 0.57 3.30 0.09 1.52 0.93 1.62 0.165 AWSA 6 F1033 01/09/1984 390 0.84 0.90 2.21 0.09 1.26 0.75 1.86 0.06
11 AWSA 10 F1037 01/03/1982 550 0.76 0.49 4.10 0.20 2.20 1.18 1.90 0.1012 AWSA 11 F1038 01/03/1982 515 0.59 0.57 3.95 0.17 1.80 0.94 2.14 0.1513 AWSA-12 F1039 01/03/1982 725 1.15 0.74 4.78 0.35 3.24 1.64 2.09 0.0214 AWSA 15 F1042 01/06/1984 490 0.54 0.65 3.39 0.09 1.83 0.85 1.49 0.15
2 KM-124 F1124 01/04/1990 290 0.51 0.58 1.7 0.1 0.84 0.25 1.5 0.154 AWSA 18 F3222 01/05/1995 424 0.54 0.56 2.85 0.15 1.41 0.58 1.74 0.16
After 19958 AWSA 1 F1028 16/07/2001 1288 2.05 1.66 7.8 0.28 8.11 1.23 2.1 0.269 AWSA 2 F1029 29/05/2002 674 0.93 1.01 3.93 0.16 3 0.96 2.03 0.17
10 AWSA 3 F1030 01/03/1982 455 0.75 0.58 3.09 0.17 1.65 0.75 2.11 0.087 AWSA 4 F1031 29/05/2002 500 0.99 0.87 2.78 0.14 1.97 0.8 1.89 0.116 AWSA 5 F1032 16/07/2001 491 0.74 0.89 2.87 0.16 1.7 0.71 2.04 0.125 AWSA 6 F1033 29/05/2002 400 0.73 0.75 2.17 0.11 1.07 0.68 2.11 0.1
11 AWSA 10 F1037 16/07/2001 738 0.97 0.84 4.8 0.18 3.19 1.09 2.3 0.1412 AWSA 11 F1038 16/07/2001 575 0.84 0.73 3.69 0.15 2.18 0.89 1.96 0.213 AWSA 12 F1039 30/12/2003 1416 2.33 2.17 9.58 0.42 10.35 1.63 2.24 0.1214 AWSA 15 F1042 29/12/2003 2290 6.81 8.16 11.8 0.6 12.68 12.27 1.99 0.64
2 KM-124 F1124 30/05/2002 290 0.51 0.55 1.59 0.1 0.68 0.39 1.66 0.194 AWSA 18 F3222 10/07/2002 424 0.86 0.29 2.68 0.11 1.4 0.67 1.89 0.18
Figure 8. Piper diagram of the collected groundwater samples in (a) steady state and (b) transient conditions.
162 A. El-Naqa et al. Clean 2007, 35 (2), 156 –166
more Ca2+, Mg2+, Cl – , and SO42 – type. The main water quality changes
were recognized in the AWSA-15, AWSA-1, and AWSA-12 wells. Thewell logs of these wells confirm these findings as the B3 aquitardcomprises a marl and marly limestone content with some crystalsof gypsum and halite which have been observed during the drilling
of the wells [20]. Table 3 shows the lithological descriptions of thesewells, the salinity, and the 14C content of the groundwater.
It is likely that the hydrodynamic situation and the transient con-dition lead to some significant changes in the geochemistry and thewater rock interaction due to dissolution processes within theupper groundwater system and specifically the calcareous sedimen-tary rocks underlying the basalt (B5/B4 aquifer and B3 Aquitard). Fig-ure 9 illustrates the trend of change in the water type with the timefor AWSA-1, AWSA-12, and AWSA-15.
AWSA-15 was studied in detail as a representative to the rest ofthe group of wells subject to salinization. The salinity increasedfrom 490 lS/cm in 1984 to 2290 lS/cm in 2003 and was associatedwith a constant stable isotopic composition (represented in Fig. 14with d18O converted to positive values).
The main water quality changes were recognized in AWSA-15where the type of groundwater after deterioration became calcium,magnesium, chloride, and sulphate, which is indicative of gypsumand anhydrite dissolution in combination with dedolomitization indolostones and silicate minerals usually present in igneous rocks(olivine, (FeMg)2SiO2 and pyroxene, (FeMg)SiO3) contributing to ahigh concentration of Mg2+ and K+ [24].
The major chemical constituents increasing with time were SO42 – ,
Cl–, Na+, Mg2+, Ca2+, and NO3– with consistency of the bicarbonate
content in the same water (see Fig. 10). The sharp increase in salinitystarted in the year 1995 where a noticeable water quality changetook place (see Fig. 11). Furthermore, the well logs of the AWSAwells, and specifically AWSA-15, showed lenses of gypsum after 205m depth. The dynamic water levels in SS were within the basalt aqui-fer. During TS they changed within the underlying B4 aquifer.Approximately 15 m of the upper section of the aquifer has been
i 2007 WILEY-VCH Verlag GmbH & Co. KGaA, Weinheim www.clean-journal.com
Table 3. Lithological descriptions of selected wells, their salinity, and 14C content.
Well Name/IDN Observation EC (lS/cm) 14C (PMC) Depth Lithology
AWSA1/F1028 Salinity 1288 203 77 BASALT, BLACK WITH CLAY137 MARL AND LIMY CLAY201 LIMESTONE, WHIT WITH
CHERT204 MARL, GREENISH GRAY
AWSA12/F1039 Salinity 1500 5.4 209 2 CLAY BROWN W/SAND54 BASALT GRAY DARK GRAY
104 MARL GRAY GREEN112 MARL GREEN128 MARL AND CLAY196 L. S WITH CHERT209 MAR GREEN
AWSA15/F1042 Salinity and highcarbon 14 content
2590 39 210 2 CLAY BROWN W/BASALT
52 BASALT DARK GREY,MARL141 MARL GREY, LAY SANDY BLUE205 WHITE L.S. WITH CHERT210 CLAY PLASTIC GRAY MARL+
SMALL GYPSUM CRYSRALSAWSA11/F1038 High carbon 14 content 575 23.3 61 3 CLAY, SAND WITH BASALT
12 BASALT GREY16 MARLY L. S.54 BASALT62 MARL WITH LAYERS OF BA-
SALTAWSA18/F3222 High carbon 14 content 424 26.7 171 5 SOIL
65 BASALT150 MARL, MARLY LIMESTONE171 LIMESTONE, CHERT
Figure 9. Piper diagra of AWSA-1, AWSA-12, and AWSA-15 in SS andTS.
Clean 2007, 35 (2), 156 – 166 Groundwater Deterioration of Shallow Groundwater Aquifers 163
dried off. Salinity increased due to the deep circulation through theB4 formation and the dissolution of halite and gypsum. The strongcorrelations of Na+/Cl – , Mg2+/Ca2+, and SO4
2 – /Ca2+ support these find-ings (see Fig. 12).
6.2 Chemical Classification of the Groundwater
The chemical composition of groundwater is indicative of its origin,transition time in the water-bearing formations, and other factors.The total dissolved solid (TDS) of the groundwater wells tapping thedifferent aquifers demonstrates wide concentration ranges. Thelowest TDS was 53 mg/L recorded for the deep sandstone aquifer,and the highest was 2729 mg/L recorded for the upper aquifer. Thechemical compositions of all the samples were plotted in a Piper dia-gram (see Fig. 8). The diagram shows differences for the ionic com-position of the groundwater tapping of the three aquifer systems.The groundwater demonstrates the chemical composition as alka-line earth water with an increased portion of alkalis with prevailingchloride.
The groundwater wells are also classified mainly into three majortypes:(i) sodium chloride,(ii) calcium carbonate, and(iii) no water dominant.
The first and third types are the most dominant. Many wells thatare tapping the upper aquifer have a similar chemical compositionand are classified as no dominant type of water. As the wells are geo-graphically not close to each other, they can be considered to befilled from mixed sources. The NaCl type of water is dominated bydissolution of evaporite minerals, such as halite and sylvite found
within the lithology, from where the groundwater flows. Othersources might be evaporation effects [22]. The water used for irriga-tion will become the subject of evaporation leaving the varioustypes of salts to precipitate on the ground.
The continuous irrigation process will continue to precipitateand dissolve the salt that will eventually build up in the shallowstrata of the upper aquifer. This is very well demonstrated by someprivate shallow wells, where the salinity was recorded to be above1000 mg/L and the type of water was mainly NaCl with few excep-tions. Very few samples that demonstrate high HCO3
– concentra-tions and low concentrations of Na+, Cl–, and SO4
2 – are classified ascalcium bicarbonate type of water. This groundwater belongs toshallow, hand-dug wells and represents comparatively very younggroundwater.
6.3 Isotopic Composition of the Groundwater
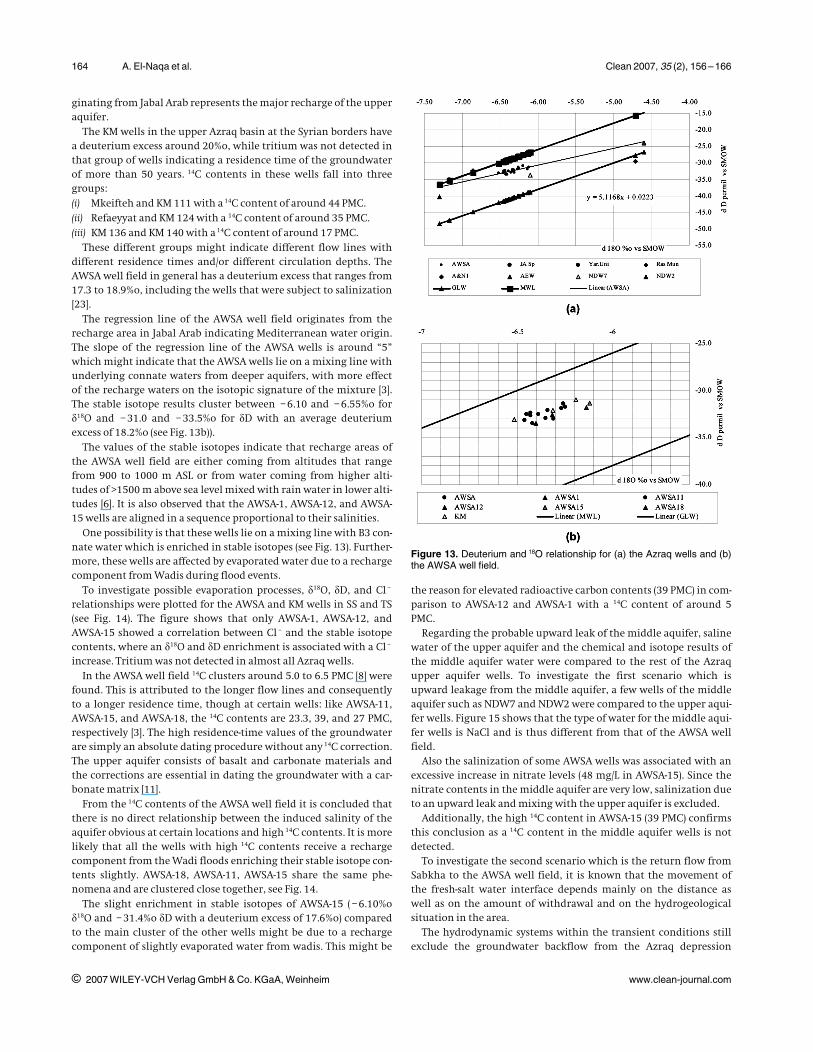
The isotopic composition of groundwater wells in the Azraq basinwere plotted in Fig. 13a), which shows consistency in the stable iso-tope contents along a flow line despite the increase in the total dis-solved solids of some wells in TS. The Jabal Arab springs lie on theMeteoric Water Line (MWL) of 22%o deuterium excess and, hence,are representatives of a modern recharge with tritium contents of12 TU and 14C of 120 PMC as measured in 1989 [5]. Groundwater ori-
i 2007 WILEY-VCH Verlag GmbH & Co. KGaA, Weinheim www.clean-journal.com
Figure 10. AWSA 15 major constituent trends with time.
Figure 11. Change of AWSA15 water type from 1984 to 2003.
Figure 12. Indicators of dissolution and dedolomitization processes inAWSA-15.
164 A. El-Naqa et al. Clean 2007, 35 (2), 156 –166
ginating from Jabal Arab represents the major recharge of the upperaquifer.
The KM wells in the upper Azraq basin at the Syrian borders havea deuterium excess around 20%o, while tritium was not detected inthat group of wells indicating a residence time of the groundwaterof more than 50 years. 14C contents in these wells fall into threegroups:(i) Mkeifteh and KM 111 with a 14C content of around 44 PMC.(ii) Refaeyyat and KM 124 with a 14C content of around 35 PMC.(iii) KM 136 and KM 140 with a 14C content of around 17 PMC.
These different groups might indicate different flow lines withdifferent residence times and/or different circulation depths. TheAWSA well field in general has a deuterium excess that ranges from17.3 to 18.9%o, including the wells that were subject to salinization[23].
The regression line of the AWSA well field originates from therecharge area in Jabal Arab indicating Mediterranean water origin.The slope of the regression line of the AWSA wells is around “5”which might indicate that the AWSA wells lie on a mixing line withunderlying connate waters from deeper aquifers, with more effectof the recharge waters on the isotopic signature of the mixture [3].The stable isotope results cluster between – 6.10 and – 6.55%o ford18O and – 31.0 and – 33.5%o for dD with an average deuteriumexcess of 18.2%o (see Fig. 13b)).
The values of the stable isotopes indicate that recharge areas ofthe AWSA well field are either coming from altitudes that rangefrom 900 to 1000 m ASL or from water coming from higher alti-tudes of >1500 m above sea level mixed with rain water in lower alti-tudes [6]. It is also observed that the AWSA-1, AWSA-12, and AWSA-15 wells are aligned in a sequence proportional to their salinities.
One possibility is that these wells lie on a mixing line with B3 con-nate water which is enriched in stable isotopes (see Fig. 13). Further-more, these wells are affected by evaporated water due to a rechargecomponent from Wadis during flood events.
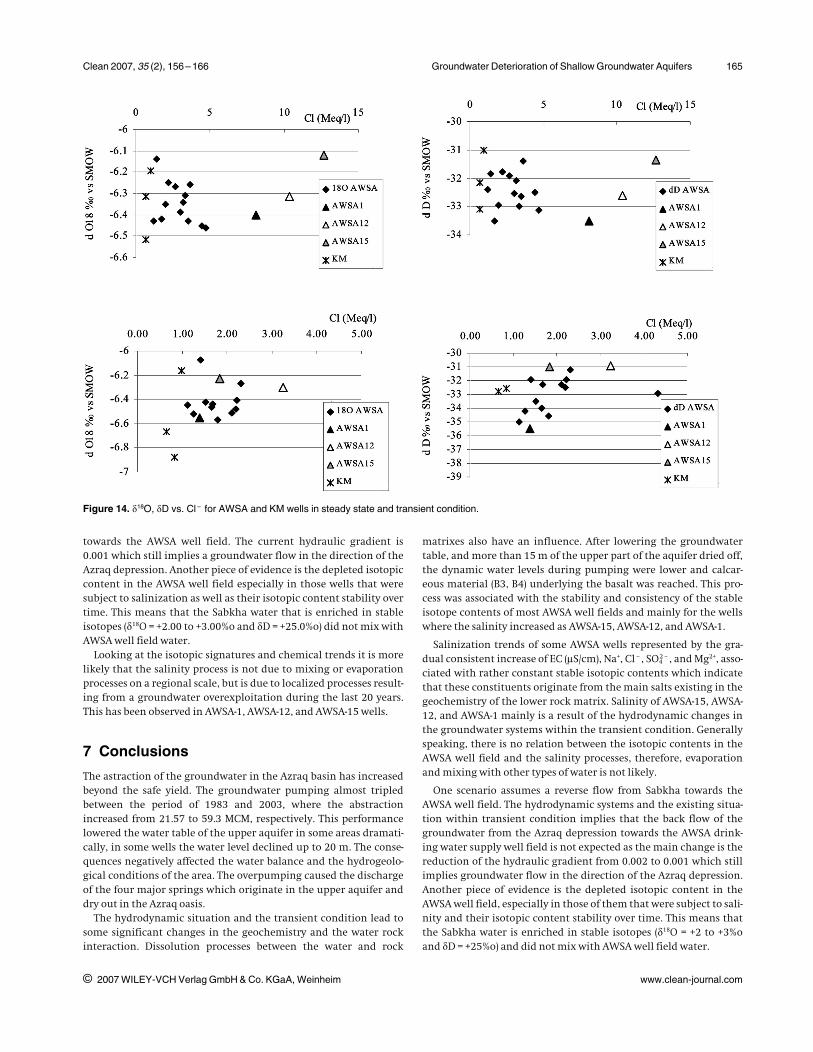
To investigate possible evaporation processes, d18O, dD, and Cl –
relationships were plotted for the AWSA and KM wells in SS and TS(see Fig. 14). The figure shows that only AWSA-1, AWSA-12, andAWSA-15 showed a correlation between Cl – and the stable isotopecontents, where an d18O and dD enrichment is associated with a Cl –
increase. Tritium was not detected in almost all Azraq wells.In the AWSA well field 14C clusters around 5.0 to 6.5 PMC [8] were
found. This is attributed to the longer flow lines and consequentlyto a longer residence time, though at certain wells: like AWSA-11,AWSA-15, and AWSA-18, the 14C contents are 23.3, 39, and 27 PMC,respectively [3]. The high residence-time values of the groundwaterare simply an absolute dating procedure without any 14C correction.The upper aquifer consists of basalt and carbonate materials andthe corrections are essential in dating the groundwater with a car-bonate matrix [11].
From the 14C contents of the AWSA well field it is concluded thatthere is no direct relationship between the induced salinity of theaquifer obvious at certain locations and high 14C contents. It is morelikely that all the wells with high 14C contents receive a rechargecomponent from the Wadi floods enriching their stable isotope con-tents slightly. AWSA-18, AWSA-11, AWSA-15 share the same phe-nomena and are clustered close together, see Fig. 14.
The slight enrichment in stable isotopes of AWSA-15 ( – 6.10%od18O and – 31.4%o dD with a deuterium excess of 17.6%o) comparedto the main cluster of the other wells might be due to a rechargecomponent of slightly evaporated water from wadis. This might be
the reason for elevated radioactive carbon contents (39 PMC) in com-parison to AWSA-12 and AWSA-1 with a 14C content of around 5PMC.
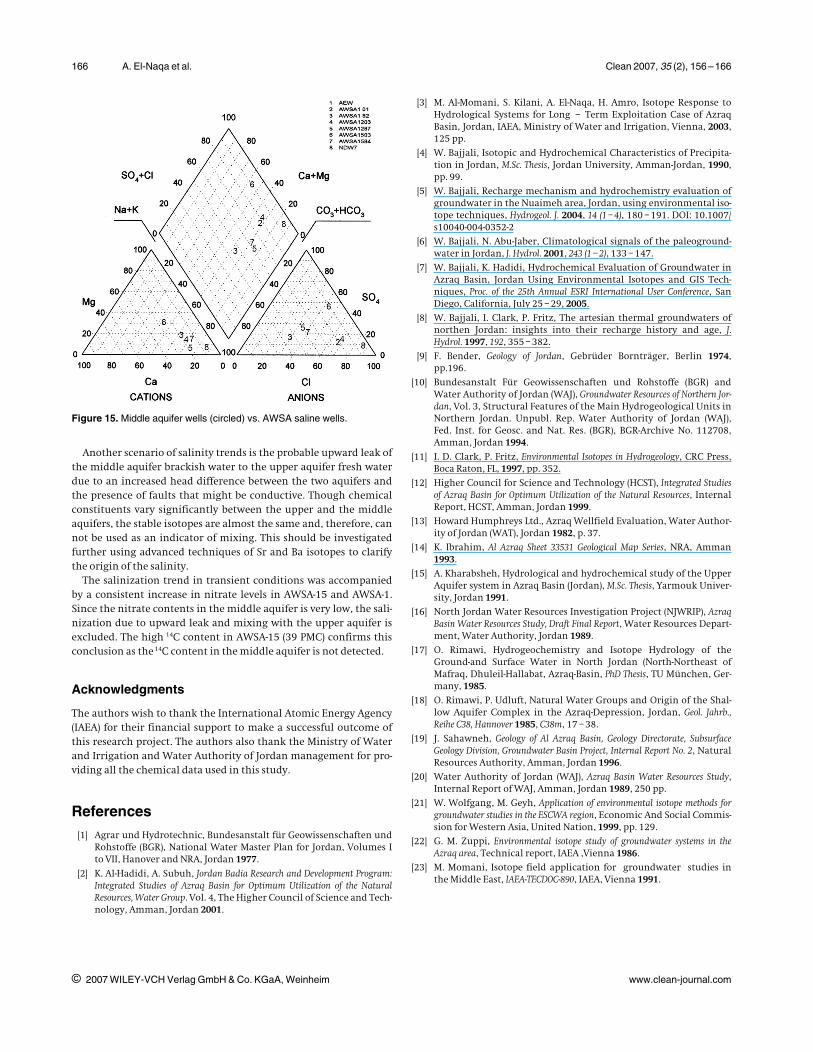
Regarding the probable upward leak of the middle aquifer, salinewater of the upper aquifer and the chemical and isotope results ofthe middle aquifer water were compared to the rest of the Azraqupper aquifer wells. To investigate the first scenario which isupward leakage from the middle aquifer, a few wells of the middleaquifer such as NDW7 and NDW2 were compared to the upper aqui-fer wells. Figure 15 shows that the type of water for the middle aqui-fer wells is NaCl and is thus different from that of the AWSA wellfield.
Also the salinization of some AWSA wells was associated with anexcessive increase in nitrate levels (48 mg/L in AWSA-15). Since thenitrate contents in the middle aquifer are very low, salinization dueto an upward leak and mixing with the upper aquifer is excluded.
Additionally, the high 14C content in AWSA-15 (39 PMC) confirmsthis conclusion as a 14C content in the middle aquifer wells is notdetected.
To investigate the second scenario which is the return flow fromSabkha to the AWSA well field, it is known that the movement ofthe fresh-salt water interface depends mainly on the distance aswell as on the amount of withdrawal and on the hydrogeologicalsituation in the area.
The hydrodynamic systems within the transient conditions stillexclude the groundwater backflow from the Azraq depression
i 2007 WILEY-VCH Verlag GmbH & Co. KGaA, Weinheim www.clean-journal.com
Figure 13. Deuterium and 18O relationship for (a) the Azraq wells and (b)the AWSA well field.
Clean 2007, 35 (2), 156 – 166 Groundwater Deterioration of Shallow Groundwater Aquifers 165
towards the AWSA well field. The current hydraulic gradient is0.001 which still implies a groundwater flow in the direction of theAzraq depression. Another piece of evidence is the depleted isotopiccontent in the AWSA well field especially in those wells that weresubject to salinization as well as their isotopic content stability overtime. This means that the Sabkha water that is enriched in stableisotopes (d18O = +2.00 to +3.00%o and dD = +25.0%o) did not mix withAWSA well field water.
Looking at the isotopic signatures and chemical trends it is morelikely that the salinity process is not due to mixing or evaporationprocesses on a regional scale, but is due to localized processes result-ing from a groundwater overexploitation during the last 20 years.This has been observed in AWSA-1, AWSA-12, and AWSA-15 wells.
7 Conclusions
The astraction of the groundwater in the Azraq basin has increasedbeyond the safe yield. The groundwater pumping almost tripledbetween the period of 1983 and 2003, where the abstractionincreased from 21.57 to 59.3 MCM, respectively. This performancelowered the water table of the upper aquifer in some areas dramati-cally, in some wells the water level declined up to 20 m. The conse-quences negatively affected the water balance and the hydrogeolo-gical conditions of the area. The overpumping caused the dischargeof the four major springs which originate in the upper aquifer anddry out in the Azraq oasis.
The hydrodynamic situation and the transient condition lead tosome significant changes in the geochemistry and the water rockinteraction. Dissolution processes between the water and rock
matrixes also have an influence. After lowering the groundwatertable, and more than 15 m of the upper part of the aquifer dried off,the dynamic water levels during pumping were lower and calcar-eous material (B3, B4) underlying the basalt was reached. This pro-cess was associated with the stability and consistency of the stableisotope contents of most AWSA well fields and mainly for the wellswhere the salinity increased as AWSA-15, AWSA-12, and AWSA-1.
Salinization trends of some AWSA wells represented by the gra-dual consistent increase of EC (lS/cm), Na+, Cl – , SO4
2 – , and Mg2+, asso-ciated with rather constant stable isotopic contents which indicatethat these constituents originate from the main salts existing in thegeochemistry of the lower rock matrix. Salinity of AWSA-15, AWSA-12, and AWSA-1 mainly is a result of the hydrodynamic changes inthe groundwater systems within the transient condition. Generallyspeaking, there is no relation between the isotopic contents in theAWSA well field and the salinity processes, therefore, evaporationand mixing with other types of water is not likely.
One scenario assumes a reverse flow from Sabkha towards theAWSA well field. The hydrodynamic systems and the existing situa-tion within transient condition implies that the back flow of thegroundwater from the Azraq depression towards the AWSA drink-ing water supply well field is not expected as the main change is thereduction of the hydraulic gradient from 0.002 to 0.001 which stillimplies groundwater flow in the direction of the Azraq depression.Another piece of evidence is the depleted isotopic content in theAWSA well field, especially in those of them that were subject to sali-nity and their isotopic content stability over time. This means thatthe Sabkha water is enriched in stable isotopes (d18O = +2 to +3%oand dD = +25%o) and did not mix with AWSA well field water.
i 2007 WILEY-VCH Verlag GmbH & Co. KGaA, Weinheim www.clean-journal.com
Figure 14. d18O, dD vs. Cl – for AWSA and KM wells in steady state and transient condition.
166 A. El-Naqa et al. Clean 2007, 35 (2), 156 –166
Another scenario of salinity trends is the probable upward leak ofthe middle aquifer brackish water to the upper aquifer fresh waterdue to an increased head difference between the two aquifers andthe presence of faults that might be conductive. Though chemicalconstituents vary significantly between the upper and the middleaquifers, the stable isotopes are almost the same and, therefore, cannot be used as an indicator of mixing. This should be investigatedfurther using advanced techniques of Sr and Ba isotopes to clarifythe origin of the salinity.
The salinization trend in transient conditions was accompaniedby a consistent increase in nitrate levels in AWSA-15 and AWSA-1.Since the nitrate contents in the middle aquifer is very low, the sali-nization due to upward leak and mixing with the upper aquifer isexcluded. The high 14C content in AWSA-15 (39 PMC) confirms thisconclusion as the 14C content in the middle aquifer is not detected.
Acknowledgments
The authors wish to thank the International Atomic Energy Agency(IAEA) for their financial support to make a successful outcome ofthis research project. The authors also thank the Ministry of Waterand Irrigation and Water Authority of Jordan management for pro-viding all the chemical data used in this study.
References[1] Agrar und Hydrotechnic, Bundesanstalt f�r Geowissenschaften und
Rohstoffe (BGR), National Water Master Plan for Jordan, Volumes Ito VII, Hanover and NRA, Jordan 1977.
[2] K. Al-Hadidi, A. Subuh, Jordan Badia Research and Development Program:Integrated Studies of Azraq Basin for Optimum Utilization of the NaturalResources, Water Group. Vol. 4, The Higher Council of Science and Tech-nology, Amman, Jordan 2001.
[3] M. Al-Momani, S. Kilani, A. El-Naqa, H. Amro, Isotope Response toHydrological Systems for Long – Term Exploitation Case of AzraqBasin, Jordan, IAEA, Ministry of Water and Irrigation, Vienna, 2003,125 pp.
[4] W. Bajjali, Isotopic and Hydrochemical Characteristics of Precipita-tion in Jordan, M.Sc. Thesis, Jordan University, Amman-Jordan, 1990,pp. 99.
[5] W. Bajjali, Recharge mechanism and hydrochemistry evaluation ofgroundwater in the Nuaimeh area, Jordan, using environmental iso-tope techniques, Hydrogeol. J. 2004, 14 (1 – 4), 180 – 191. DOI: 10.1007/s10040-004-0352-2
[6] W. Bajjali, N. Abu-Jaber, Climatological signals of the paleoground-water in Jordan, J. Hydrol. 2001, 243 (1 – 2), 133 – 147.
[7] W. Bajjali, K. Hadidi, Hydrochemical Evaluation of Groundwater inAzraq Basin, Jordan Using Environmental Isotopes and GIS Tech-niques, Proc. of the 25th Annual ESRI International User Conference, SanDiego, California, July 25 – 29, 2005.
[8] W. Bajjali, I. Clark, P. Fritz, The artesian thermal groundwaters ofnorthen Jordan: insights into their recharge history and age, J.Hydrol. 1997, 192, 355 – 382.
[9] F. Bender, Geology of Jordan, Gebr�der Borntr�ger, Berlin 1974,pp.196.
[10] Bundesanstalt F�r Geowissenschaften und Rohstoffe (BGR) andWater Authority of Jordan (WAJ), Groundwater Resources of Northern Jor-dan, Vol. 3, Structural Features of the Main Hydrogeological Units inNorthern Jordan. Unpubl. Rep. Water Authority of Jordan (WAJ),Fed. Inst. for Geosc. and Nat. Res. (BGR), BGR-Archive No. 112708,Amman, Jordan 1994.
[11] I. D. Clark, P. Fritz, Environmental Isotopes in Hydrogeology, CRC Press,Boca Raton, FL, 1997, pp. 352.
[12] Higher Council for Science and Technology (HCST), Integrated Studiesof Azraq Basin for Optimum Utilization of the Natural Resources, InternalReport, HCST, Amman, Jordan 1999.
[13] Howard Humphreys Ltd., Azraq Wellfield Evaluation, Water Author-ity of Jordan (WAT), Jordan 1982, p. 37.
[14] K. Ibrahim, Al Azraq Sheet 33531 Geological Map Series, NRA, Amman1993.
[15] A. Kharabsheh, Hydrological and hydrochemical study of the UpperAquifer system in Azraq Basin (Jordan), M.Sc. Thesis, Yarmouk Univer-sity, Jordan 1991.
[16] North Jordan Water Resources Investigation Project (NJWRIP), AzraqBasin Water Resources Study, Draft Final Report, Water Resources Depart-ment, Water Authority, Jordan 1989.
[17] O. Rimawi, Hydrogeochemistry and Isotope Hydrology of theGround-and Surface Water in North Jordan (North-Northeast ofMafraq, Dhuleil-Hallabat, Azraq-Basin, PhD Thesis, TU M�nchen, Ger-many, 1985.
[18] O. Rimawi, P. Udluft, Natural Water Groups and Origin of the Shal-low Aquifer Complex in the Azraq-Depression, Jordan, Geol. Jahrb.,Reihe C38, Hannover 1985, C38m, 17 – 38.
[19] J. Sahawneh, Geology of Al Azraq Basin, Geology Directorate, SubsurfaceGeology Division, Groundwater Basin Project, Internal Report No. 2, NaturalResources Authority, Amman, Jordan 1996.
[20] Water Authority of Jordan (WAJ), Azraq Basin Water Resources Study,Internal Report of WAJ, Amman, Jordan 1989, 250 pp.
[21] W. Wolfgang, M. Geyh, Application of environmental isotope methods forgroundwater studies in the ESCWA region, Economic And Social Commis-sion for Western Asia, United Nation, 1999, pp. 129.
[22] G. M. Zuppi, Environmental isotope study of groundwater systems in theAzraq area, Technical report, IAEA ,Vienna 1986.
[23] M. Momani, Isotope field application for groundwater studies inthe Middle East, IAEA-TECDOC-890, IAEA, Vienna 1991.
i 2007 WILEY-VCH Verlag GmbH & Co. KGaA, Weinheim www.clean-journal.com
Figure 15. Middle aquifer wells (circled) vs. AWSA saline wells.