microbiological assessment of private groundwater-derived potable water supplies in the mid-west...
TRANSCRIPT
Q1
1 © IWA Publishing 2014 Journal of Water and Health | in press | 2014
Uncorrected Proof
Microbiological assessment of private groundwater-
derived potable water supplies in the Mid-West Region
of Ireland
Jean O’Dwyer, Aideen Dowling and Catherine C. Adley
ABSTRACT
Determining the likelihood that groundwater contains faecal coliforms can aid water resource
management in facilitating the protection of drinking water supplies. This study assesses the
incidence of the faecal indicator organism Escherichia coli in 125 private water supplies (PWSs)
serving individual houses in the Midwestern region of Ireland. Two factors, aquifer type and rainfall
(mm), were chosen as independent variables that can affect the vulnerability of a groundwater body.
Using a geographical information system, the relative hydrogeological and climatological features
unique to each sampling location were derived. Utilising this information, a logistic regression (LR)
model was used to predict the probability of contamination of PWSs with E. coli. The model
contained two independent variables: rainfall (mm; p< 0.001) and aquifer characteristics (p¼ 0.001).
The full model, containing both predictors was statistically significant at p< 0.001, indicating that the
model distinguished between the independent variables’ relationship to the incidence of
contamination. The likelihood of E. coli contamination is greater with increased rainfall and in areas
where a bedrock aquifer is dominant. The LR model explained between 27.4% (Cox and Snell R
squared) and 36.8% (Nagelkerke R squared) of the variance in contamination and correctly classified
75.2% of cases.
doi: 10.2166/wh.2014.178
Jean O’Dwyer (corresponding author)Aideen DowlingCatherine C. AdleyDepartment of Chemical and Environmental
Sciences,Microbiology Laboratory,Centre for Environmental Research,University of Limerick,Limerick,IrelandE-mail: [email protected]
Key words | climatology, E. coli, geographical information system, groundwater vulnerability,
hydrogeology, logistic regression
INTRODUCTION
A precondition for water supplies to qualify as safe drinking
water sources is the absence of faecal coliforms (EU ;
Schmoll et al. ; Irish Statute ). Globally, ground-
water can be considered of good quality, mainly attributed
to natural purification processes (UNEP ). For this
reason, coupled with its accessibility, groundwater is a
major source of potable water worldwide. However, despite
its importance, groundwater is often misused, usually poorly
understood and rarely well managed. Although groundwater
is not easily contaminated, once this occurs it is difficult to
remediate (UNEP ). For this reason it is important to
identify which aquifer systems and settings are most vulner-
able to degradation because the replacement cost of a failing
local aquifer will be high and its loss may stress other water
resources looked to as a substitute.
This research uses geographic information systems
(GIS) technology to assess the microbiological contami-
nation of groundwater as a function of both aquifer type
and rainfall events in Ireland. This is achieved by the over-
laying of the microbiological analysis results of 125 private
wells, taken from numerous geographical locations, on
national aquifer classification data in conjunction with pre-
cipitation data from local weather stations. The application
of the statistical method ‘binary logistic regression (LR)’
assesses the impact of these factors on the likelihood of
contamination.
Q2
Q3
Q4
2 J. O’Dwyer et al. | Assessing groundwater vulnerability to microbiological contamination Journal of Water and Health | in press | 2014
Uncorrected Proof
Groundwater as a drinking water source in Ireland
Approximately 26% of the public and private drinking water
supply in Ireland is provided by groundwater or spring
sources (EPA a). These supplies can be categorised as
individual private water supplies (PWSs) serving singular
households or small private group scheme’s (SPGSs)
which are defined by two or more households coming
together to utilise a common water supply. As both PWSs
and SPGSs are categorised as individual water supplies pro-
viding an average of less than 10 m3/day or serving less than
50 persons, they are excluded from the European Commis-
sion Drinking Water Directive 98/83/EC. As a result, the
quality of each groundwater well is the sole responsibility
of the user and is not legislated under the Irish Statute.
Groundwater contamination
Groundwater contamination with pathogen containing
faecal waste may cause illness if consumed following
inadequate treatment (Raina et al. ; Said et al. ).
In Ireland, the occurrence of faecal contamination in
groundwater is among the highest in Europe, with contami-
nation reported in 34% of routine monitoring samples (EPA
; GSI ). Diffuse contamination sources, in the form
of farming practices, are frequently acknowledged as the
major sources of faecal pollution (Trevisan et al. ,
2004; Pachepsky et al. ; Goss & Richards ; Mosad-
deghi et al. ). Similarly, as a consequence of rural
infrastructure, a point pollution source in the form of dom-
estic waste water treatment systems (DWWTSs) also poses
a significant problem. Animal wastes have the potential to
disperse pathogens, like bacteria, viruses and protozoa, if
not properly contained, treated and managed (Sobsey
et al. 2006). This poses a significant threat in Ireland as
the utilisation of 191,799 groundwater-derived drinking
water supplies (CSO ) are predominantly in rural
areas where agricultural practices and DWWTSs are heavily
employed. Public health authorities, in both developed and
undeveloped countries rely on the use of sanitary set back
distances between animal and human waste disposal sites
and drinking water wells, with the intent of protecting
human health (Berger ). In Ireland these distances are
not based on the unique hydrogeological properties of the
area, despite the well-documented knowledge that the risk
of faecal contamination varies greatly in different aquifer
types and under different climatological conditions; this
suggests that many groundwater utilisers are at risk.
Escherichia coli as an indicator organism of faecal
contamination
Of all bacterial species, E. coli has had a dominant role in
water microbiology. It was introduced as an indicator bac-
terium, not because of the inherent pathogenicity of
certain serotypes but rather it was a convenient indicator
of faecal pollution. E. coli is found in the bowels of all
warm-blooded animals including human beings and is
almost always present in water which has been contami-
nated with human or animal faeces. The presence of a
solitary faecal coliform in a drinking water supply is a
breach of the Irish Drinking Water Regulations (Irish Sta-
tute ) as adopted from the EU Council Directive 98/
83/EC (EU ). While E. coli is a useful reference tool
in relation to overall contamination, the pathogenicity of
the actual organism should not be overlooked. Pathogenic
E. coli threatens human health and may cause kidney pro-
blems and failure, cramps, diarrhoea and even death
(Kuntz & Kuntz ). The most dangerous E. coli bacteria
contain the gene for producing Shiga toxin. E. coli O157:H7
is the most widespread, but at least 81 serotypes have been
identified (Prager et al. ). Release of this toxin into the
body can result in chronic bloody diarrhoea, kidney failure
and can be fatal even in normally healthy individuals and
particularly in immuno-compromised individuals, children
and the elderly (Jones ).
METHODS
Study area and microbiological sampling regime
Area and demographics
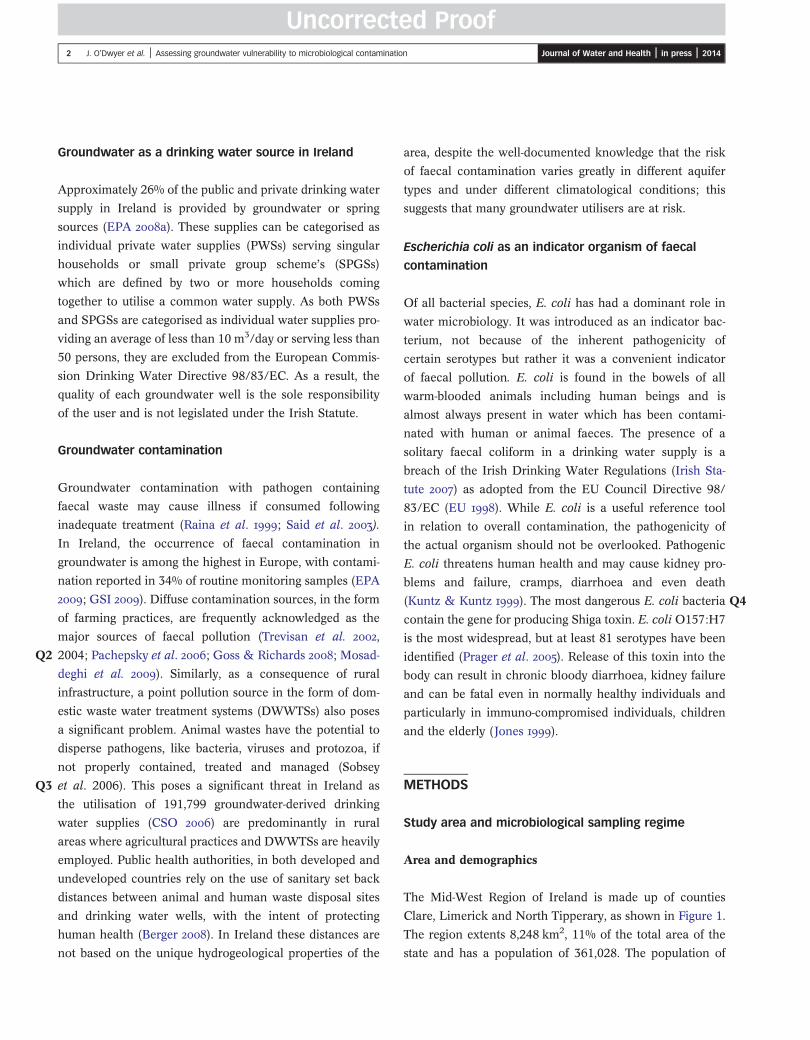
The Mid-West Region of Ireland is made up of counties
Clare, Limerick and North Tipperary, as shown in Figure 1.
The region extents 8,248 km2, 11% of the total area of the
state and has a population of 361,028. The population of
5
Figure 1 | Map of the research area: the Mid-Western Region of Ireland; Q10including counties Clare, Limerick and North Tipperary.
3 J. O’Dwyer et al. | Assessing groundwater vulnerability to microbiological contamination Journal of Water and Health | in press | 2014
Uncorrected Proof
the area is divided between town (163,620) and rural aggre-
gate (197,408) areas with 21,332 households which are
solely dependent on the abstraction of groundwater by
means of private boreholes and wells (CSO ).
Aquifer classification and rainfall
The aquifer classification system used in Ireland, which was
developed by the Geological Survey of Ireland, is defined in
the Groundwater Protection Schemes publication (DELG/
EPA/GSI ). It is intended to reflect the groundwater
flow type (flow through fissures, flow through karst systems
and intergranular flow through gravels) and to describe the
resource potential (e.g. regionally important, locally impor-
tant and poor). For the purpose of this study, the aquifer
systems have first been defined as either bedrock or a
sand/gravel aquifer. The bedrock aquifers are then sub-
sequently subdivided into ‘Fissure’ and ‘Karstic’ systems,
the aim being to predict groundwater vulnerability as a func-
tion of local hydrogeological features.
In relation to rainfall, the region has a typical west mar-
itime climate with relatively mild, moist winters and cool,
cloudy summers. The prevailing winds are westerly to
south-westerly and the average relative humidity is high.
Average annual precipitation is highest on the west coast
and in inland areas of high relief. Compared with the east
coast of Ireland, average annual rainfall and relative humid-
ity are higher, mean annual temperature is lower, and
annual duration of bright sunshine and frost-free periods
are shorter (Irish Meteorological Office 2013 Q).
Microbiological sampling and enumeration
Participants in the study were obtained by broadcasting an
announcement on a popular Irish discussion website
(www.boards.ie) offering microbiological analysis of drink-
ing water for households supplied by groundwater
abstracted via a PWS serving an individual household.
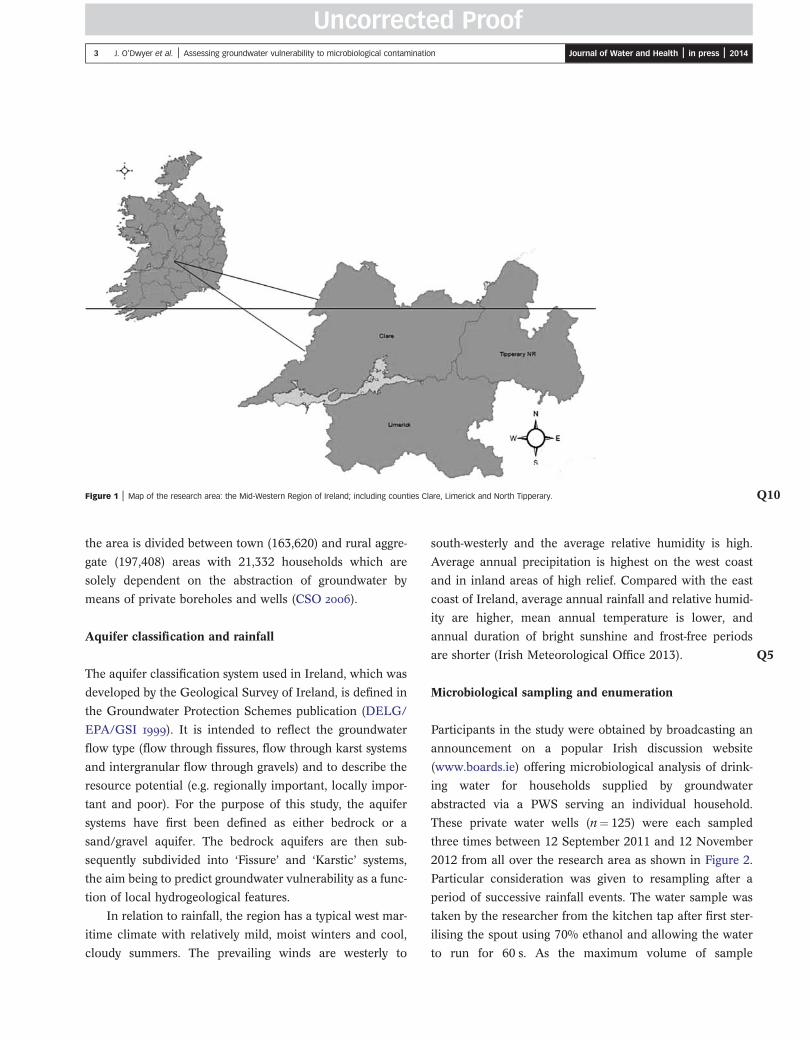
These private water wells (n¼ 125) were each sampled
three times between 12 September 2011 and 12 November
2012 from all over the research area as shown in Figure 2.
Particular consideration was given to resampling after a
period of successive rainfall events. The water sample was
taken by the researcher from the kitchen tap after first ster-
ilising the spout using 70% ethanol and allowing the water
to run for 60 s. As the maximum volume of sample
Figure 2 | Location Q11of the 125 sampling sites overlaid on the hydrogeological characteristics of that research area as obtained from geographical information system. Also shown is the
spatial distribution of weather stations utilised in the study.
4 J. O’Dwyer et al. | Assessing groundwater vulnerability to microbiological contamination Journal of Water and Health | in press | 2014
Uncorrected Proof
(100 mL) was required for zero-dilution bacteriological
analysis, well water samples were collected directly on site
in disposable 120 mL sterile vessels containing sodium thio-
sulphate to neutralise any chlorine that may be present in
the sample. All samples were stored in a cool environment
and were analysed within 4 hours.
The most probable number of E. coli was assayed using
a standard US Environmental Protection Agency (EPA)-
approved commercial culture kit (Colilert, IDEXX Labora-
tories Inc., Westbrook, ME, USA) according to the
manufacturer’s directions. The stated amount of the Colilert
reagent was added to the 100 mL water samples. The
reagent contains two carbon sources which are selectively
metabolised by either all coliforms present in the sample
or solely by E. coli colonies. The resulting reaction when
an indicator is cleaved through metabolism is a colour differ-
entiation; yellow for total counts and fluorescent for E. coli.
The samples were poured into a 51-well ‘Quanti-Tray’, heat
sealed and incubated for 24 hours at 35 WC. After the incu-
bation period, the number of positive fluorescent
compartments is counted; each compartment indicates
that a minimum of one indicator organism was initially
present. As a control, a sterile water sample was analysed
periodically.
Acquisition and interpretation of data
The aquifer characteristics were obtained from the Geologi-
cal Survey of Ireland. Two datasets were utilised in this
study, the National Draft Gravel Aquifer Map and the Bed-
rock Characteristics Aquifer Map. These two parameters
were uploaded into a GIS using ArcGIS ArcMap10. The
result is a map integrating geological information to defined
areas of the Republic at a scale of 1:100,000 (Figure 2). Aver-
age daily rainfall data was obtained from the Irish
Meteorological Office; 65 weather stations were plotted
onto the GIS using the location coordinates (Figure 2).
The station in closest proximity to the sampling location
was chosen as representative of that area. The location of
each individual microbiological sample analysis performed
in this study was input directly to the GIS by using the
GPS coordinates recorded at each sampling location via a
GPS navigational system (Garmin Nuvi 40LM). The
location of each sampling point was merged with the
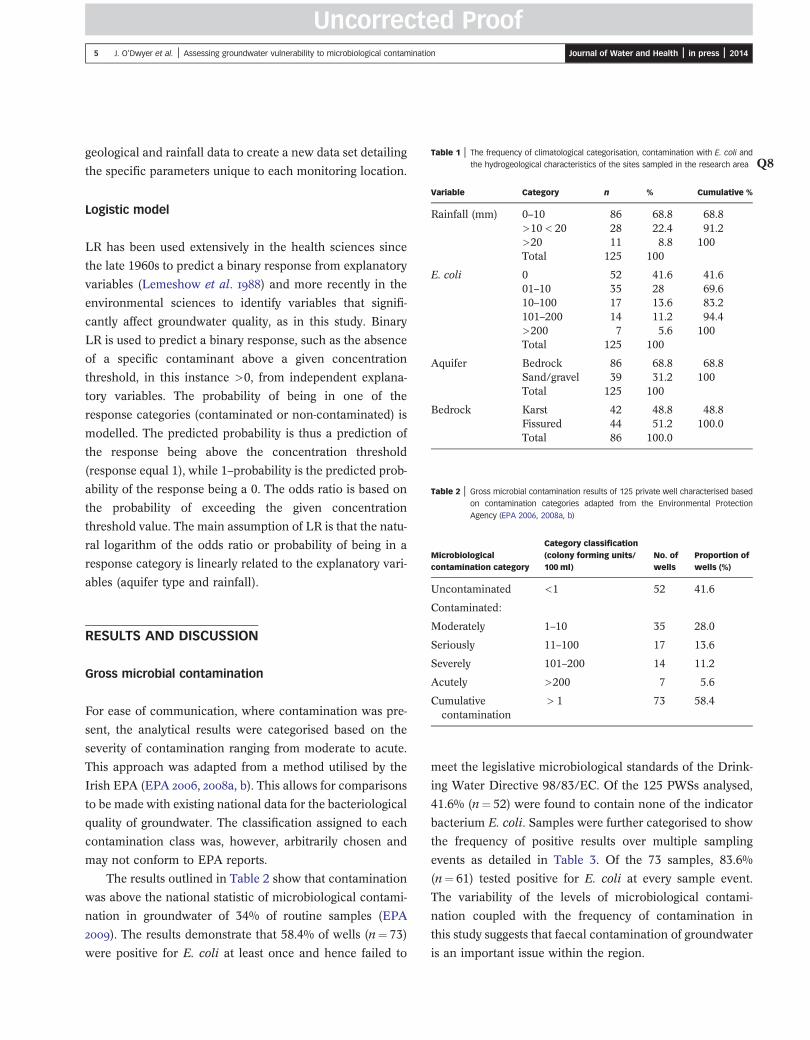
Table 1 | The frequency of climatological categorisation, contamination with E. coli and
the hydrogeological characteristics of the sites sampled in the research area Q8
Variable Category n % Cumulative %
Rainfall (mm) 0–10 86 68.8 68.8>10< 20 28 22.4 91.2>20 11 8.8 100Total 125 100
E. coli 0 52 41.6 41.601–10 35 28 69.610–100 17 13.6 83.2101–200 14 11.2 94.4>200 7 5.6 100Total 125 100
Aquifer Bedrock 86 68.8 68.8Sand/gravel 39 31.2 100Total 125 100
Bedrock Karst 42 48.8 48.8Fissured 44 51.2 100.0Total 86 100.0
Table 2 | Gross microbial contamination results of 125 private well characterised based
on contamination categories adapted from the Environmental Protection
Agency (EPA 2006, 2008a, b)
Microbiologicalcontamination category
Category classification(colony forming units/100 ml)
No. ofwells
Proportion ofwells (%)
Uncontaminated <1 52 41.6
5 J. O’Dwyer et al. | Assessing groundwater vulnerability to microbiological contamination Journal of Water and Health | in press | 2014
Uncorrected Proof
geological and rainfall data to create a new data set detailing
the specific parameters unique to each monitoring location.
Logistic model
LR has been used extensively in the health sciences since
the late 1960s to predict a binary response from explanatory
variables (Lemeshow et al. ) and more recently in the
environmental sciences to identify variables that signifi-
cantly affect groundwater quality, as in this study. Binary
LR is used to predict a binary response, such as the absence
of a specific contaminant above a given concentration
threshold, in this instance >0, from independent explana-
tory variables. The probability of being in one of the
response categories (contaminated or non-contaminated) is
modelled. The predicted probability is thus a prediction of
the response being above the concentration threshold
(response equal 1), while 1–probability is the predicted prob-
ability of the response being a 0. The odds ratio is based on
the probability of exceeding the given concentration
threshold value. The main assumption of LR is that the natu-
ral logarithm of the odds ratio or probability of being in a
response category is linearly related to the explanatory vari-
ables (aquifer type and rainfall).
Contaminated:
Moderately 1–10 35 28.0
Seriously 11–100 17 13.6
Severely 101–200 14 11.2
Acutely >200 7 5.6
Cumulativecontamination
> 1 73 58.4
RESULTS AND DISCUSSION
Gross microbial contamination
For ease of communication, where contamination was pre-
sent, the analytical results were categorised based on the
severity of contamination ranging from moderate to acute.
This approach was adapted from a method utilised by the
Irish EPA (EPA , a, b). This allows for comparisons
to be made with existing national data for the bacteriological
quality of groundwater. The classification assigned to each
contamination class was, however, arbitrarily chosen and
may not conform to EPA reports.
The results outlined in Table 2 show that contamination
was above the national statistic of microbiological contami-
nation in groundwater of 34% of routine samples (EPA
). The results demonstrate that 58.4% of wells (n¼ 73)
were positive for E. coli at least once and hence failed to
meet the legislative microbiological standards of the Drink-
ing Water Directive 98/83/EC. Of the 125 PWSs analysed,
41.6% (n¼ 52) were found to contain none of the indicator
bacterium E. coli. Samples were further categorised to show
the frequency of positive results over multiple sampling
events as detailed in Table 3. Of the 73 samples, 83.6%
(n¼ 61) tested positive for E. coli at every sample event.
The variability of the levels of microbiological contami-
nation coupled with the frequency of contamination in
this study suggests that faecal contamination of groundwater
is an important issue within the region.
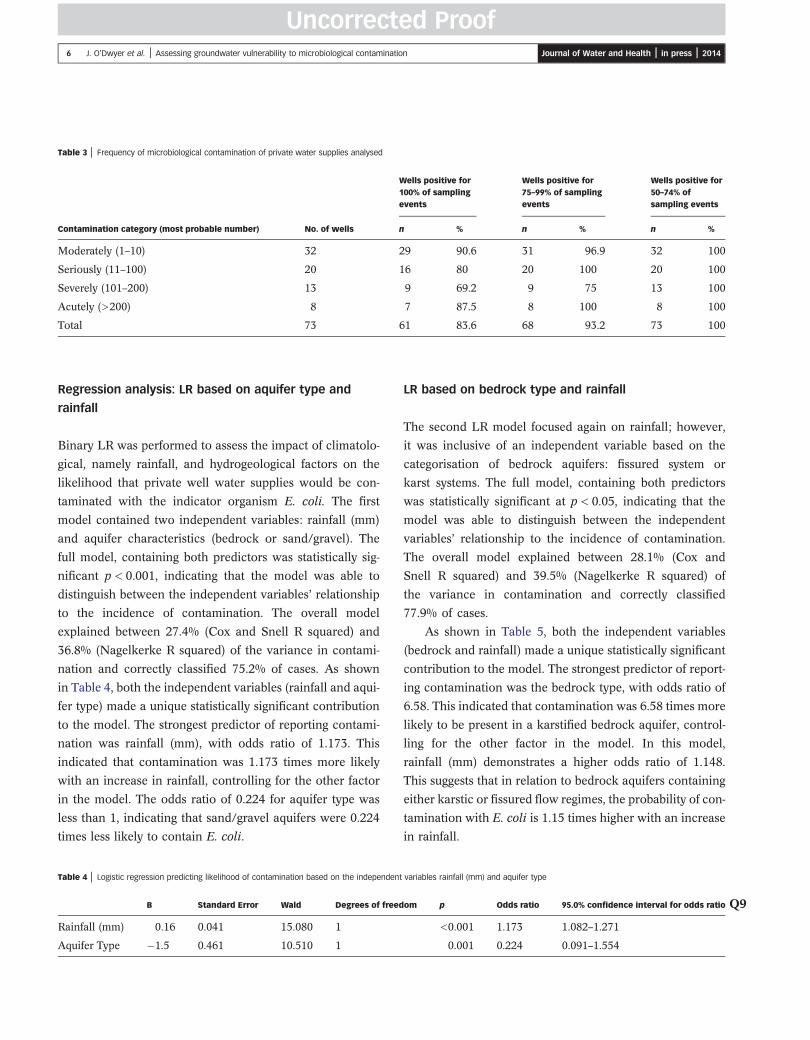
Table 3 | Frequency of microbiological contamination of private water supplies analysed
Wells positive for100% of samplingevents
Wells positive for75–99% of samplingevents
Wells positive for50–74% ofsampling events
Contamination category (most probable number) No. of wells n % n % n %
Moderately (1–10) 32 29 90.6 31 96.9 32 100
Seriously (11–100) 20 16 80 20 100 20 100
Severely (101–200) 13 9 69.2 9 75 13 100
Acutely (>200) 8 7 87.5 8 100 8 100
Total 73 61 83.6 68 93.2 73 100
6 J. O’Dwyer et al. | Assessing groundwater vulnerability to microbiological contamination Journal of Water and Health | in press | 2014
Uncorrected Proof
Regression analysis: LR based on aquifer type and
rainfall
Binary LR was performed to assess the impact of climatolo-
gical, namely rainfall, and hydrogeological factors on the
likelihood that private well water supplies would be con-
taminated with the indicator organism E. coli. The first
model contained two independent variables: rainfall (mm)
and aquifer characteristics (bedrock or sand/gravel). The
full model, containing both predictors was statistically sig-
nificant p< 0.001, indicating that the model was able to
distinguish between the independent variables’ relationship
to the incidence of contamination. The overall model
explained between 27.4% (Cox and Snell R squared) and
36.8% (Nagelkerke R squared) of the variance in contami-
nation and correctly classified 75.2% of cases. As shown
in Table 4, both the independent variables (rainfall and aqui-
fer type) made a unique statistically significant contribution
to the model. The strongest predictor of reporting contami-
nation was rainfall (mm), with odds ratio of 1.173. This
indicated that contamination was 1.173 times more likely
with an increase in rainfall, controlling for the other factor
in the model. The odds ratio of 0.224 for aquifer type was
less than 1, indicating that sand/gravel aquifers were 0.224
times less likely to contain E. coli.
Table 4 | Logistic regression predicting likelihood of contamination based on the independent
B Standard Error Wald Degrees of freed
Rainfall (mm) 0.16 0.041 15.080 1
Aquifer Type �1.5 0.461 10.510 1
LR based on bedrock type and rainfall
The second LR model focused again on rainfall; however,
it was inclusive of an independent variable based on the
categorisation of bedrock aquifers: fissured system or
karst systems. The full model, containing both predictors
was statistically significant at p< 0.05, indicating that the
model was able to distinguish between the independent
variables’ relationship to the incidence of contamination.
The overall model explained between 28.1% (Cox and
Snell R squared) and 39.5% (Nagelkerke R squared) of
the variance in contamination and correctly classified
77.9% of cases.
As shown in Table 5, both the independent variables
(bedrock and rainfall) made a unique statistically significant
contribution to the model. The strongest predictor of report-
ing contamination was the bedrock type, with odds ratio of
6.58. This indicated that contamination was 6.58 times more
likely to be present in a karstified bedrock aquifer, control-
ling for the other factor in the model. In this model,
rainfall (mm) demonstrates a higher odds ratio of 1.148.
This suggests that in relation to bedrock aquifers containing
either karstic or fissured flow regimes, the probability of con-
tamination with E. coli is 1.15 times higher with an increase
in rainfall.
variables rainfall (mm) and aquifer type
Q9om p Odds ratio 95.0% confidence interval for odds ratio
<0.001 1.173 1.082–1.271
0.001 0.224 0.091–1.554
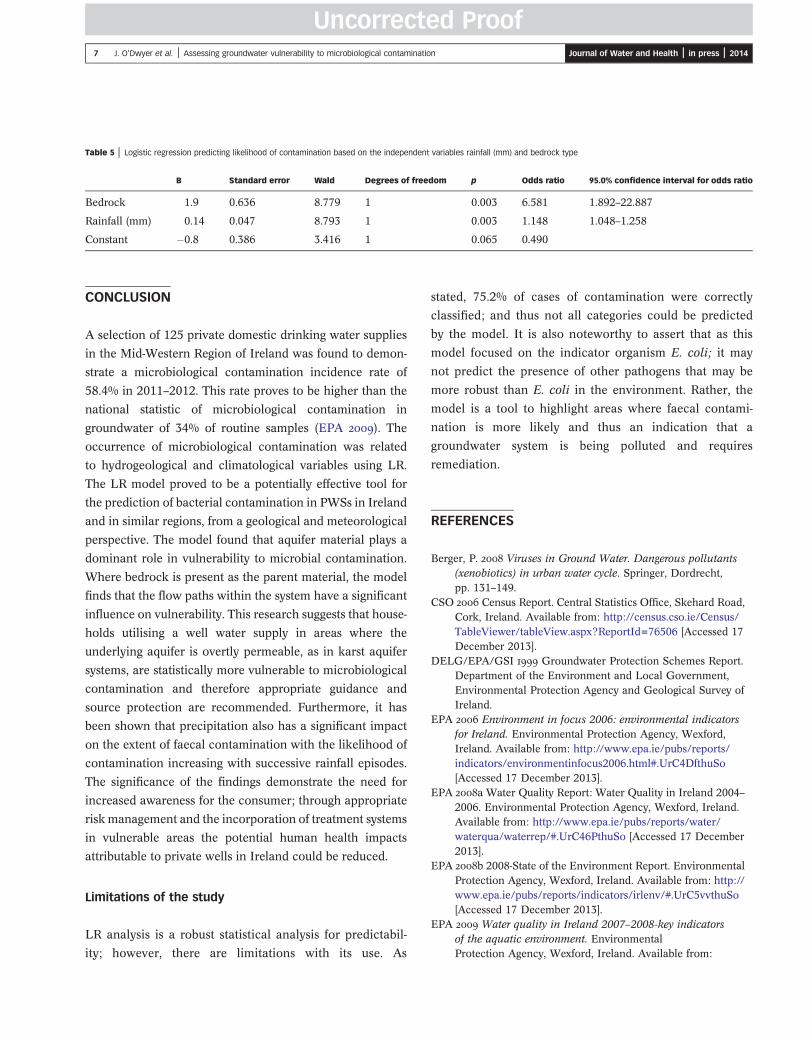
Table 5 | Logistic regression predicting likelihood of contamination based on the independent variables rainfall (mm) and bedrock type
B Standard error Wald Degrees of freedom p Odds ratio 95.0% confidence interval for odds ratio
Bedrock 1.9 0.636 8.779 1 0.003 6.581 1.892–22.887
Rainfall (mm) 0.14 0.047 8.793 1 0.003 1.148 1.048–1.258
Constant �0.8 0.386 3.416 1 0.065 0.490
7 J. O’Dwyer et al. | Assessing groundwater vulnerability to microbiological contamination Journal of Water and Health | in press | 2014
Uncorrected Proof
CONCLUSION
A selection of 125 private domestic drinking water supplies
in the Mid-Western Region of Ireland was found to demon-
strate a microbiological contamination incidence rate of
58.4% in 2011–2012. This rate proves to be higher than the
national statistic of microbiological contamination in
groundwater of 34% of routine samples (EPA ). The
occurrence of microbiological contamination was related
to hydrogeological and climatological variables using LR.
The LR model proved to be a potentially effective tool for
the prediction of bacterial contamination in PWSs in Ireland
and in similar regions, from a geological and meteorological
perspective. The model found that aquifer material plays a
dominant role in vulnerability to microbial contamination.
Where bedrock is present as the parent material, the model
finds that the flow paths within the system have a significant
influence on vulnerability. This research suggests that house-
holds utilising a well water supply in areas where the
underlying aquifer is overtly permeable, as in karst aquifer
systems, are statistically more vulnerable to microbiological
contamination and therefore appropriate guidance and
source protection are recommended. Furthermore, it has
been shown that precipitation also has a significant impact
on the extent of faecal contamination with the likelihood of
contamination increasing with successive rainfall episodes.
The significance of the findings demonstrate the need for
increased awareness for the consumer; through appropriate
risk management and the incorporation of treatment systems
in vulnerable areas the potential human health impacts
attributable to private wells in Ireland could be reduced.
Limitations of the study
LR analysis is a robust statistical analysis for predictabil-
ity; however, there are limitations with its use. As
stated, 75.2% of cases of contamination were correctly
classified; and thus not all categories could be predicted
by the model. It is also noteworthy to assert that as this
model focused on the indicator organism E. coli; it may
not predict the presence of other pathogens that may be
more robust than E. coli in the environment. Rather, the
model is a tool to highlight areas where faecal contami-
nation is more likely and thus an indication that a
groundwater system is being polluted and requires
remediation.
REFERENCES
Berger, P. Viruses in Ground Water. Dangerous pollutants(xenobiotics) in urban water cycle. Springer, Dordrecht,pp. 131–149.
CSO Census Report. Central Statistics Office, Skehard Road,Cork, Ireland. Available from: http://census.cso.ie/Census/TableViewer/tableView.aspx?ReportId=76506 [Accessed 17December 2013].
DELG/EPA/GSI Groundwater Protection Schemes Report.Department of the Environment and Local Government,Environmental Protection Agency and Geological Survey ofIreland.
EPA Environment in focus 2006: environmental indicatorsfor Ireland. Environmental Protection Agency, Wexford,Ireland. Available from: http://www.epa.ie/pubs/reports/indicators/environmentinfocus2006.html#.UrC4DfthuSo[Accessed 17 December 2013].
EPA a Water Quality Report: Water Quality in Ireland 2004–2006. Environmental Protection Agency, Wexford, Ireland.Available from: http://www.epa.ie/pubs/reports/water/waterqua/waterrep/#.UrC46PthuSo [Accessed 17 December2013].
EPA b 2008-State of the Environment Report. EnvironmentalProtection Agency, Wexford, Ireland. Available from: http://www.epa.ie/pubs/reports/indicators/irlenv/#.UrC5vvthuSo[Accessed 17 December 2013].
EPA Water quality in Ireland 2007–2008-key indicatorsof the aquatic environment. EnvironmentalProtection Agency, Wexford, Ireland. Available from:
Q6
Q7
8 J. O’Dwyer et al. | Assessing groundwater vulnerability to microbiological contamination Journal of Water and Health | in press | 2014
Uncorrected Proof
http://www.epa.ie/pubs/reports/water/waterqua/waterqualityreport2007-2008keyindicators.html#.UrC6QfthuSo [Accessed 17 December 2013].
EU Council Directive 98/83/EC of 3 November 1998 on thequality of water intended for human consumption. OfficialJournal of the European Communities, L330, 5.12 1998, 32–54.
EU Council Directive 2000/60/EC of the EuropeanParliament and of the Council of 23 October 2000establishing a framework for Community action in the field ofwater policy. Official Journal L/327, 22.12.2000, 1–72.
Goss, M. & Richards, C. Development of a risk-based indexfor source water protection planning, which supports thereduction of pathogens from agricultural activity enteringwater resources. Journal of Environment Management 87,623–632.
GSI Groundwater Pollution in Ireland—a brief assessment ofthe main causes. GSI Groundwater Newsletter 47, 7–11.Geological Survey of Ireland, Dublin. Available from http://www.gsi.ie/NR/rdonlyres/AF14D15F-D017-4031-B578-34966B93FA41/0/No47published.pdf [Accessed 17Decemeber 2013].
Irish Statute Statutory instrument No. 278 of 2007. Europeancommunities (drinkingwater) (no. 2) regulations 2007. Officeofthe AttorneyGeneral, House of theOireachtas, Government ofIreland. Available from: http://www.irishstatutebook.ie/2007/en/si/0278.html [Accessed 17 December 2013].
Jones, D. L. Potential health risks associated with thepersistence of E. coli O157 in agricultural environments.Journal of Soil Use Management 15, 76–83.
Kuntz, T. B. & Kuntz, S. T. Enterohaemorrhagic E. coliinfection. Primary Care Update Ob/Gyns 6, 192–195.
Lemeshow, S., Teres, J., Avrunin, S. & Pastides, H. Predictingthe outcome of intensive care unit patients. Journal ofAmerican Statics Association. 83, 348–356.
Mosaddeghi, M. R., Mahboubi, A. A., Zandsalimi, S. & Une, A. Influence of organic waste type and soil structure on the
bacterial filtration rates in unsaturated intact soil columns.Journal of Environment Management 90, 730–739.
Pachepsky, Y. A., Sadeghi, A. M., Bradford, S. A., Shelton, D. R.,Guber, A. K. & Dao, T. Transport and fate ofmanureborne pathogens: modelling perspective. AgricultureWater Management 86, 81–92.
Prager, R., Annemuller, S. & Tschape, H. Diversity ofvirulence patterns among shiga toxin-producing Escherichiacoli from human clinical cases—need for more detaileddiagnostics. International Journal of Medical Microbiology295, 29–38.
Raina, P. S., Pollari, F. L., Teare, G. F., Goss, M. J., Barry, D. A. J.& Wilson, J. B. The relationship between E. coliindicator bacteria in well-water and gastrointestinal illnessesin rural families. Canadian Journal of Public Health 90,172–175.
Said, B., Wright, F., Nichols, G. L., Reacher, M. & Rutter, M. Outbreaks of infectious disease associated with privatedrinking water supplies in England and Wales 1970–2000.Epidemiology Information 130, 469–479.
Schmoll, O., Howard, G., Chilton, J. & Chorus, I. (eds). Protecting groundwater for health—managing the quality ofdrinking-water sources. World Health Organization & IWAPublishing, London.
Taylor, R., Cronin, A., Pedley, S., Barker, J. & Atkinson, T. The implications of groundwater velocity variations onmicrobial transport and wellhead protection—review of fieldevidence. FEMS Microbiology and Ecology 49, 17–26.
Trevisan, D., Vansteelant, J. Y. & Dorioz, J. M. Survival andleaching of fecal bacteria after slurry spreading on mountainhay meadows: consequences for the management of watercontamination risk. Water Research 36, 275–283.
UNEP Groundwater and its susceptibility to degradation:a global assessment of the problem and options formanagement. Early warning and assessment report series.Nairobi, Kenya.
First received 16 September 2013; accepted in revised form 18 October 2013. Available online 6 January 2014
Author QueriesJournal: Journal of Water and Health
Manuscript: JWH-D-13-00178
Q1 Please confirm the change of citation from Schmoll (2006) to Schmoll et al. (2006) as per the reference list.
Q2 Trevisan et al. (2004) is not listed in the reference list. Please provide publication details to insert in the list.
Q3 Sobsey et al. (2006) is not listed in the reference list. Please provide publication details to insert in the list.
Q4 Please confirm the change of citation from Kuntz (1999) to Kuntz & Kuntz (1999) as per the reference list.
Q5 Irish Meteorological Office (2013) is not listed in the reference list. Please provide publication details to insertin the list.
Q6 EU (2000) is not cited in the text. Please cite else delete from the list.
Q7 Taylor et al. (2004) is not cited in the text. Please cite else delete from the list.
Q8 Please indicate where in the main text Table 1 should be mentioned.
Q9 Please provide the significance of ‘B’ in Table 4 column 2 heading.
Q10 In supplied Figure 1 is not sufficient print quality. Please resupply as a high resolution file (300 dpi or above)with sharp lines and text.
Q11 In supplied Figure 2 is not sufficient print quality. Please resupply as a high resolution file (300 dpi or above)with sharp lines and text.