submarine groundwater discharge-derived nutrient loads to san francisco bay: implications to future...
TRANSCRIPT

Submarine Groundwater Discharge-Derived Nutrient Loadsto San Francisco Bay: Implications to FutureEcosystem Changes
Kimberly A. Null & Natasha T. Dimova &
Karen L. Knee & Bradley K. Esser &
Peter W. Swarzenski & Michael J. Singleton &
Mark Stacey & Adina Paytan
Received: 11 December 2011 /Revised: 10 May 2012 /Accepted: 30 May 2012# Coastal and Estuarine Research Federation 2012
Abstract Submarine groundwater discharge (SGD) wasquantified at select sites in San Francisco Bay (SFB) fromradium (223Ra and 224Ra) and radon (222Rn) activities mea-sured in groundwater and surface water using simple massbalance box models. Based on these models, discharge ratesin South and Central Bays were 0.3–7.4 m3 day−1 m−1. Al-though SGD fluxes at the two regions (Central and SouthBays) of SFB were of the same order of magnitude, thedissolved inorganic nitrogen (DIN) species associated withSGD were different. In the South Bay, ammonium (NH4
+)concentrations in groundwater were three-fold higher than in
open bay waters, and NH4+ was the primary DIN form dis-
charged by SGD. At the Central Bay site, the primary DINform in groundwater and associated discharge was nitrate(NO3
−). The stable isotope signatures (δ15NNO3 andδ18ONO3) of NO3
− in the South Bay groundwater and surfacewaters were both consistent with NO3
− derived from NH4+
that was isotopically enriched in 15N by NH4+ volatilization.
Based on the calculated SGD fluxes and groundwater nutrientconcentrations, nutrient fluxes associated with SGD can ac-count for up to 16 % of DIN and 22 % of DIP in South andCentral Bays. The form of DIN contributed to surface watersfrom SGD may impact the ratio of NO3
− to NH4+ available to
phytoplankton with implications to bay productivity, phyto-plankton species distribution, and nutrient uptake rates. Thisassessment of nutrient delivery via groundwater discharge inSFB may provide vital information for future bay ecologicalwellbeing and sensitivity to future environmental stressors.
Keywords Submarine groundwater discharge . Radium .
Radon . Estuaries . Nutrient loading . San Francisco Bay
Introduction
Submarine groundwater discharge (SGD) transportsnutrients and other chemical constituents to receiving watersin many different coastal environments (e.g., Corbett et al.1999; Slomp and Van Cappellen 2004; Paytan et al. 2006;de Sieyes et al. 2008; Knee et al. 2010). In some locations,nutrient loading from SGD is greater than that from riversand surface runoff (Valiela et al. 1992; Corbett et al. 1999;Garrison et al. 2003; Hwang et al. 2005; Swarzenski et al.2007; Knee et al. 2008). SGD flux and chemical
K. A. Null (*) :N. T. Dimova (*) :A. PaytanInstitute of Marine Sciences, University of California Santa Cruz,Santa Cruz, CA, USAe-mail: [email protected]: [email protected]
N. T. DimovaDepartment of Geological Sciences, University of Alabama,Tuscaloosa, AL, USA
K. L. KneeSmithsonian Environmental Research Center,Edgewater, MD, USA
B. K. Esser :M. J. SingletonLawrence Livermore National Laboratory,Livermore, CA, USA
P. W. SwarzenskiUS Geological Survey, Pacific Coastal and Marine Science Center,Santa Cruz, CA, USA
M. StaceyDepartment of Civil and Environmental Engineering,University of California Berkeley,Berkeley, CA, USA
Estuaries and CoastsDOI 10.1007/s12237-012-9526-7
composition are spatially and temporally variable, andtherefore, the impacts of SGD on water quality and ecologyare site-specific (Taniguchi et al. 2002; Moore 2010). Withincreased coastal eutrophication worldwide due to denselypopulated coastlines and increasing demand on coastalresources (Paerl 2009), it is critical to assess SGD fluxesand evaluate their impact on coastal systems.
SGD to the coastal ocean includes both terrestrially derivedfreshwater and recirculated seawater from tidal and wavepumping, density differences, and bioirrigation (Burnett etal. 2003; Michael et al. 2005; Taniguchi et al. 2006). At manysites worldwide, particularly in arid or semi-arid locationswhere freshwater recharge is limited or groundwater is over-drawn, recirculated seawater may account for a significantcomponent of SGD (Burnett et al. 2003; Shellenbarger et al.2006; Taniguchi et al. 2006, 2007; Swarzenski and Izbicki2009). Although the volume contribution of SGD to coastaland estuarine systems is typically much smaller than that ofsurface runoff (rivers, streams, etc.), the nutrient loading viaSGD can be greater because groundwater is often enriched innutrients and other materials relative to surface water (Null etal. 2011). Therefore, SGD can account for a large fraction ofnutrient loading to a coastal system even when its contributionto the water budget is significantly lower (e.g., Valiela et al.1990; Slomp and Van Cappellen 2004; Shellenbarger et al.2006; Swarzenski et al. 2007; Knee et al. 2008; Breier et al.2009).
Naturally occurring radium (Ra) and radon (Rn) isotopesare recognized as valuable geochemical tracers of SGD inestuaries and coastal environments because they are consid-erably elevated in groundwater compared to surface water(Moore 1996, 2010; Burnett and Dulaiova 2003; Charette etal. 2001; Swarzenski et al. 2007). 222Rn activities can berelated to total groundwater discharge (Burnett andDulaiova 2003; Burnett et al. 2006), and radium isotopes,specifically 223Ra and 224Ra, are ideal tracers of brackishgroundwater input and can be used to estimate water massages on the continental shelf (Moore 1999, 2000; Charette etal. 2001; Krest and Harvey 2003; Burnett et al. 2006; Mooreand de Oliveira 2008; Moore 2010).
Previous work in San Francisco Bay (SFB) has modeledRn benthic exchange from sediments to the overlying watercolumn with focus on molecular diffusion and bioirrigation(Hammond and Fuller 1979; Hartman and Hammond 1984;Hammond et al. 1985). Based on Rn porewater profiles, thestudies demonstrate that advective processes (i.e., irrigation)must occur in addition to molecular diffusion. Porewater isexchanged to depths of >40 cm in the sediments at somelocations in SFB with advective flux estimated to accountfor 60 % of benthic exchange when considering bioirriga-tion compared to diffusional fluxes (Hammond et al. 1985).These studies indicate that SGD, mostly as recirculatedseawater discharged through bioirrigation of sediments in
SFB, is prevalent; however, other processes that may con-tribute to SGD and associated nutrient fluxes such as tidalpumping, wave action, salt dispersion, and seasonal oscil-lations were not accounted for and could be important(Michael et al. 2005).
We examined SGD and the associated nutrient fluxes inSouth and Central San Francisco Bay, California, using theactivities of two radium isotopes (223Ra and 224Ra) and thetemporal and spatial distribution of radon (222Rn) activity.For the purpose of this study, SGD is defined as the totalSGD flux regardless of the forcing mechanisms such asbioirrigation, diffusion, or other physical forces impactingseawater recirculation (i.e., tidal pumping, hydraulic head,wave action) as well as any meteoric fresh groundwaterdischarge. Fluxes of groundwater were evaluated using Raand Rn activities and a simple box model that constrainedall input and removal functions for these radionuclides in acoastal water column. SGD-derived nutrient fluxes werecompared to other nutrient sources to determine the relativenutrient contribution from SGD and their role in futureecosystem changes.
Study Sites
The SFB and Delta estuarine system is the largest estuary onthe Pacific coast of the USA and is one of the most impactedsystems due to anthropogenic activities (Nichols et al. 1986;Kennish 2001). The heavily populated SFB area (approxi-mately seven million people) puts stress on aquatic ecosys-tems with groundwater withdrawal, agriculture activities,and wastewater discharge. Ninety percent of freshwaterinput to SFB flows from the Sacramento–San Joaquin RiverDelta with the remaining 10 % of freshwater from seasonallocal streams, sewage input, and unquantified groundwaterdischarge (Porterfield et al. 1961; Conomos et al. 1985).South and Central Bays are both influenced by Delta flows,but the effects are lagged and dramatically reduced in SouthBay compared to Central Bay (Conomos et al. 1985).
The SFB ecosystem is undergoing changes (increasedchlorophyll concentrations, larger algal blooms, new sea-sonal blooms, and grazing intensity) (Cloern et al. 2007),and few studies regarding the role of SGD in SFB waterquality and ecosystem health have been conducted, particu-larly with respect to the understanding of the SGD relation-ship to these changes. Previous studies focused on theimpact of bioirrigation on SFB water quality (Hammond etal. 1985), but many of the studies have been conducted priorto the more recent documented changes in the bay ecosys-tem. The current understanding of productivity in the bay isthat phytoplankton blooms are limited by light caused byhigh turbidity in bay waters and increased grazing by intro-duced bivalves (Alpine and Cloern 1992; Cloern et al.
Estuaries and Coasts

2007). Phytoplankton biomass increased in SFB after 1999due to a decline in bivalve populations from a climaticallydriven increase in bivalve predator populations (Cloern et al.2007). This increase in phytoplankton biomass demon-strates that SFB is not immune to nutrient pollution andchanges in bay conditions can inherently increase the useof the current large stock of nutrients in bay waters. Otherchanges such as water clarity can also influence conditionsin SFB, and thus, its ecosystem may change as a result ofsudden decrease in suspended-sediment concentration(Schoellhamer 2011). An increase in water clarity couldeventually transition the SFB to a nutrient-limited systemthat will increase ecosystem sensitivity to nutrient inputsand nutrient stoichiometry, both of which may be signifi-cantly influenced by SGD. Despite decades of water qualityand ecosystem monitoring work in SFB (Baylosis et al.1997; Cloern et al. 2000), few estimates (Hammond et al.1985; Spinelli et al. 2002) and no direct measurements ofthe contribution of total SGD (i.e., including recirculatedseawater, tidal pumping, and wave action) to the systemexist. Such estimates are especially important in view ofthe current and predicted changes in sea level, rainfall, anddemand on freshwater sources in the bay (Knowles andCayan 2002).
Work reported here took place at three sites in South andCentral SFB representing different coastal settings commonto the entire SFB region (Fig. 1). Two sites, Marine ScienceInstitute (MSI) and Palo Alto Baylands State Park (PA),were located in South SFB (referred to as South Bay here-after), and the other site, Angel Island (AI), was located inCentral SFB (Central Bay). The hydrogeology of the studysites (described below), in terms of the surrounding topo-graphic relief, sediment characteristics, and coastal mor-phology, represents vast areas throughout the South andCentral Bays.
South Bay is a shallow embayment that has a maximumdepth of ~10 m in the channel and average depth of ~4.5 m(http://sfbay.wr.usgs.gov). South Bay receives very littlefreshwater from tributaries and has a water residence timeof several months during summer and approximately 30 daysduring winter (Walters et al. 1985). Circulation in South Bayis set by the interplay of tidal forcing modified by wind-forcing and intermittent density forcing due to freshwaterfrom Central Bay, wastewater discharge, and small streams(Conomos et al. 1985). South Bay is also tremendouslymodified and impacted by dense population and infrastruc-ture; for example, sewage discharge from wastewater treat-ment facilities is a major source of freshwater to South Bay(Conomos et al. 1985). The South Bay shoreline generallyconsists of fine-grained sediments and has a long coastalline that is dendritic and highly complex encompassingmany sloughs and ponds. The seafloor in this part of thebay is composed mostly of silt and clay sediments
(Conomos and Peterson 1977; Chin et al. 2010). At PA,two different intertidal and nearshore (including part of thesubtidal zone) settings were investigated, one in a sloughenvironment (PA–SP) and one adjacent to open bay waters(PA–NC). Samples for the nearshore (water depth up to1.5 m at high tide) were collected from the surface (upper0.5 m) at each location. Samples were collected from theintertidal area during low tide from wells installed to inter-sect the water table (water pumped from the upper 30 cm ofthe water table depth). The water table depth was approxi-mately the same depth at a site at any given sampling timebut varied between sites and tidal stages. PA and MSI arelocated on the west side of the South Bay with flat topog-raphy (<1 % slope calculated from the difference in eleva-tion from the water line to 5 km inland using a topographymap) that includes salt marshes and sloughs, and both sitesare characterized by a broad tidal zone with shallow gra-dients. The beaches sampled in the South Bay, in the sloughand adjacent to open bay, encompassed less than 1 km inlength of beach, but similar broad, shallow intertidal zonesexist along majority of the perimeters of South Bay.
The Central Bay site (AI) is located on the west side ofAngel Island and is characterized by considerable relief
Fig. 1 Map of San Francisco Bay and three sampling locations (Ma-rine Science Institute (MSI), Palo Alto Baylands (PA), and Angel Island(AI))
Estuaries and Coasts

(~4–10 % east Central Bay and 26 % gradient west CentralBay calculated from the difference in elevation from thewater line to 5 km inland using a topography map). At AI,the intertidal and nearshore setting was investigated at a beachof approximately 1 km length located in a cove with a shallowgradient. The topographic relief of Central Bay creates substan-tial hydraulic head gradients from land to sea and a smaller areathat is impacted by tidal inundation compared to South Bay.The average water depth in Central Bay is 13.4 m, which isdeep compared to the rest of SFB (~6 m) (http//:sfbay.wr.usgs.gov). Water in Central Bay is primarily composed of coastalPacific water, which is influenced to various degrees by Deltawater contribution. Density gradient drives estuarine circula-tion, and water residence time is on the order of days duringhigh river discharge periods and up to months during the dryseason (Walters et al. 1985). The surrounding coastline iscomprised of sandstone and shale along a narrow shoreline,and the Central Bay seafloor is comprised mostly of sand andsilty sand (Conomos and Peterson 1977; Chin et al. 2010).
Methods
Surface water and groundwater samples were collected fromeach of our sampling sites (Fig. 1) on several field campaignsbetween March 2009 and May 2010. MSI was sampled inMarch and April 2009; PA was sampled in March 2009,October 2009, and May 2010; and AI was sampled in May2010. The tides in SFB are semi-diurnal mixed, and sampleswere collected over varying tidal stages at each site. The tidesin South Bay near MSI and PA averaged 2.2 m for high and0.4 m for low tides during all sampling days. At AI, high tidesand low tides were 1.5 and 0.3 m, respectively (NOAA tidepredictions; http://tbone.biol.sc.edu/tide/worldmap.html).
At each location, surface water and groundwater sampleswere collected along shore-perpendicular transects. Eachtransect consisted of at least six discrete samples, three fromtemporary screened PVC wells installed at the beach face tothe water table (up to 1.25 m depth to the groundwatersampled depending on the site) and three or more fromsurface water at increasing distance from shore up to 20 moffshore. The water table depth at the wells was approxi-mately the same at a site but varied between sites. Waterfrom within the sloughs, if present, was also collected.Surface water samples from the mid-channel of the Baywere collected from surface and bottom water via a boatusing a submersible pump and were used to represent theoffshore (Bay water) Ra end-member (see flux calculationsin the following section). Samples were analyzed for a suiteof parameters including 223Ra, 224Ra, 222Rn, nutrients(NO3
−+NO2−, NH4
+, PO43−, Si(OH)4), and nitrate isotopic
composition (δ15NNO3 and δ18ONO3). Water quality param-eters (salinity, conductivity, temperature) were measured in
the field using a handheld YSI 85 multi-probe previouslycalibrated in the laboratory. In addition, we performed con-tinuous surveys of Rn, temperature, and salinity in thesurface water along the coast of South Bay.
Radium Activity
Groundwater and surface water samples (40 and 100 L eachsample, respectively) were collected using submersible pumpsand passed through MnO2-coated acrylic fiber at a flow rate<2 L min−1 to quantitatively scavenge the Ra isotopes (Moore1976). 223Ra and 224Ra activities were measured using adelayed coincidence counter (RaDeCC) (Moore and Arnold1996). The fibers were analyzed twice: immediately after col-lection and approximately 4 weeks after collection to assess228Th and correct for supported 224Ra (Moore and Arnold1996; Moore 2003). Standards were run on a monthly basisas part of the quality control protocol of the instrument. Theanalytical error of the calculated efficiencies of the RaDeCCsystems is typically <10 %. The average error associated withthe measurement of 224Ra and 223Ra activities for all samples is10 and 26 %, respectively. Error in measured activities wascalculated based on Garcia-Solsona et al. (2008).
Radon Activity
Rn activities were measured continuously for ~24 h (at leastthree tidal cycles) using a RAD7 radon-in-air monitor withRAD-AQUA accessory (Durridge, Inc) in one well and onesurface water location at each site: at MSI in April 2009, at PAin October 2009, and at AI in May 2010. The samples werepumped from ~0.3 m below the water table at a rate <1 Lmin−1
for Rn analysis. Detailed information about this instrumentationcan be found elsewhere (Burnett and Dulaiova 2003). In allcases, Rn data were recorded in 30-min intervals. Using thistime interval, observed analytical errors were 10–15 %,depending on the measured activities in water. Analytical errorsfor groundwater samples were consistently below 10 % as themeasured Rn activities in groundwater were much higher thanin surface water. Conductivity, temperature, and depth loggers(Van Essen instruments®) were deployed at each location tomonitor water level and salinity changes throughout the Rndata collection period. Surface water surveys of Rn were con-ducted from a boat following the coastline of South Bay duringMarch 2009 to map surface water Rn distribution in South Bay(the sample locations for the Rn transect are those shown inFig. 4).
Nutrient Concentration and Nitrate Isotope Ratios
Samples for nutrient concentrations (NO3−+NO2
−,NH4
+, PO43−, Si(HO)4) were filtered with 0.45 μm car-
tridge filters and collected in acid cleaned polyethylene
Estuaries and Coasts

bottles. Samples were frozen until analysis. Analyses weredone using a Lachat Quickchem 8000 Flow Injection Auto-analyzer at UCSC. Instrument error was <9 % for all nutrientsbased on duplicates analyzed every ten samples.
Samples for isotopic composition of nitrate (δ15NNO3 andδ18ONO3) were filtered (0.45 μm) in the field and keptfrozen until analysis. Samples were analyzed following aversion of the denitrifier method (Sigman et al. 2001; Sin-gleton et al. 2005). Isotopic analysis was conducted atLawrence Livermore National Laboratory on an IsoPrimecontinuous-flow mass spectrometer. Analytical precision forboth δ15NNO3 and δ
18ONO3 is 0.5‰. The denitrifier methodprovides the results of the combined NO3
− and NO2− sig-
natures and not solely NO3− (Wankel et al. 2006). However,
NO2− in our samples contributes much less than 5 % of total
oxidized nitrogen; thus, the impact of NO2− on the measured
isotopic signatures is expected to be small and is ignoredhere. Nitrate and nitrite were measured together and will bereported as NO3
−+NO2− hereafter.
SGD Flux Calculations
The SGD fluxes (cubic meters per day per meter) werecalculated based on the excess tracer (Ra and Rn)activities in the bay using established mass balancemodels (Moore 1996; Burnett and Dulaiova 2003).Two different scales for the mass balance model wereused to estimate SGD in South and Central Bays: (1) anearshore model: modeling the flux into a nearshoreprism for each site (1 m along shore×20 m offshore×1.5 m maximum depth) and (2) a bay basin model:modeling the combined basins of the South and CentralBays using volume estimates from Smith and Holli-baugh (2006). The first calculation provides a flux esti-mate representative of a specific shoreline length to thenearshore environment. The distance of shore definingthe near shore box was selected based on the distancewhere there was no measurable excess Ra compared tothe offshore end-member (the middle of the bay). SGDflux calculations are sensitive to the selected size of thebox; for example, if excess Ra is elevated to the samelevel at 30 m offshore, the calculated flux would be45 % higher. If the discharge zone extends more than20 m offshore, our calculations will constitute a conser-vative estimate particularly because about 80 % of thebay is classified as shallow shoals (Hammond et al.1985). These nearshore fluxes were extrapolated to theentire bay basin (South or Central) assuming these sitesare representative of similar settings along each bays’coastlines. The second calculation using the bay basinmodel integrates the combined flux over the basin scale(South and Central). For the mass balance mixing cal-culations, the end-members used were groundwater
(using temporally integrated average values) and eitheropen bay water (for the nearshore model) or coastalPacific seawater (for the bay basin model). The follow-ing equation was used to determine the SGD fluxesbased on excess Ra activity in the nearshore box (e.g.,Moore 1996; Krest et al. 2000; Paytan et al. 2006):
D ¼ Abox � Aoffshoreð ÞVbox
AGWtð1Þ
Discharge (D) (cubic meters per day) per meter ofshoreline is calculated from the excess activity (e.g.,Ra activity above that of the offshore water) and there-fore must be supplied from SGD; Abox is the averageRa activity in the box (disintegrations per minute per100 L−1); Aoffshore is the offshore activity in the openbay or coastal Pacific waters for the nearshore box orbay basin calculations, respectively (disintegrations perminute per 100 L−1); Vbox is the volume of the modelbox. For the nearshore model, Vbox is set at a 15 m3
prism (1 m along shore×20 m in the offshore direc-tion×the average depth of 0.75 m; the maximum depthat 20 m is 1.5 m). For the bay basin model, Vbox is setusing volume estimates from Smith and Hollibaugh(2006). τ is the water residence time (days) and wasestimated using two independent calculations (tidalprism replacement and apparent age of nearshorewaters) to better constrain the value. The water resi-dence time is estimated to be 1.03 day for the nearshoreboxes based on 50 % of the volume of the box beingexchanged with each tidal cycle, a value modeled fromthe fluxes of salinity and temperature (Hsu and Stacey2011). We assume alongshore transport is negligible.Residence times for the bay basin model for Southand Central Bays were based on estimates from Walterset al. (1985) and considering salinity data obtainedduring sampling were set at 60 days. We note, however,that this bay scale water balance residence time doesnot consider fluxes related to recirculated bay water andrecirculated submarine groundwater in the subterraneanestuary (Robinson et al. 2006). Excess activity in thebox (disintegrations per minute) was divided by themeasured Ra activity of the groundwater end-member(AGW disintegrations per minute per cubic meter) andthe respective residence time to obtain an estimate ofgroundwater discharge (cubic meters per day). It wasassumed the system is in steady state and therefore thedecay term was not included in Eq. 1. The total dis-charge to South and Central Bays was calculated bymultiplying the discharge per meter of shoreline derivedfrom the nearshore model by the length of the shorelineof each basin in addition to estimating it using the basinscale model. The diffusional flux is not considered
Estuaries and Coasts
independently in this calculation; rather, our model rep-resents the net overall SGD flux regardless of forcingmechanism (see “Discussion”).
We estimated the apparent age of nearshore waters indepen-dently, based on the difference in 224Ra/223Ra activity ratio(AR) between surface and groundwater (Moore 2000). Thismethod assumes that discharging groundwater has a constantand uniform AR, so that AR changes as a result of radioactivedecay as follows:
t¼ lnARsurf
ARGW
� �1
ðl224 � l223Þ ð2Þ
where t is the apparent age of waters (days), ARsurf is theaverage surface water AR, and ARGW is the average activityratio of groundwater for each site; λ224 is the
224Ra decay rate(0.191 day−1) and λ223 is the
223Ra decay rate (0.0608 day−1).This calculation yields a water age of 1.31 day for the nearshorecoast of AI, similar to the residence time based on tidal prismreplacement time (1.03 day). The average nearshore apparentage determined using AR changes in South Bay is 3.7 days atMSI and 1.8 day at PA, slightly longer than the tidal prismestimates (1.03 days). We report a flux range that encompassesthe various residence time estimates. We recognize that the Ra-based calculations account only for brackish SGD because lowRa freshwater discharge is not included; accordingly, this cal-culation might underestimate total SGD if freshwater dischargeis significant. In South Bay, we do not expect significantfreshwater discharge based on the saline nature of the ground-water observed and no evidence of channelized freshwaterflow.
The Rn-derived groundwater fluxes presented herewere calculated using a single-box Rn non-steady-statemass-balance model (Burnett and Dulaiova 2003). Inthis model, we monitor changes in Rn inventories overtime (~3 tidal cycles in 30 min increments) while ac-counting for losses (via gas evasion, mixing with off-shore water, and radioactive decay) and inputs (throughgroundwater and production from dissolved 226Ra in thewater column). The calculated Rn fluxes are then con-verted to an SGD rate by dividing by the groundwaterend-member Rn activity. This approach has proven tobe robust and has been used successfully in differentcoastal environments. Since the Rn activity in nearshoregroundwater oscillated with the tidal cycle, only averagemaximum values of the detected Rn activities overmultiple tidal cycles (usually associated with lowestsalinity values) were used as the groundwater end-member in the Rn model for assessing discharge rates.Using the maximum groundwater Rn activity is a con-servative approach to calculate SGD resulting in lowerfluxes than if the whole data set is used (Burnett andDulaiova 2003).
Statistical Analyses
Variance in sample type (groundwater, nearshore, and off-shore) and among sampling locations were analyzed usingKruskal–Wallis nonparametric one-way analysis of vari-ance. Correlation between samples and tides were deter-mined using simple linear regression. Statisticalsignificance was determined using a 95 % confidenceinterval with the probability (p)<0.05. All statistical anal-yses were conducted using StatCrunch (Integrated Ana-lytics, LLC).
Results
Ra and Rn Activities
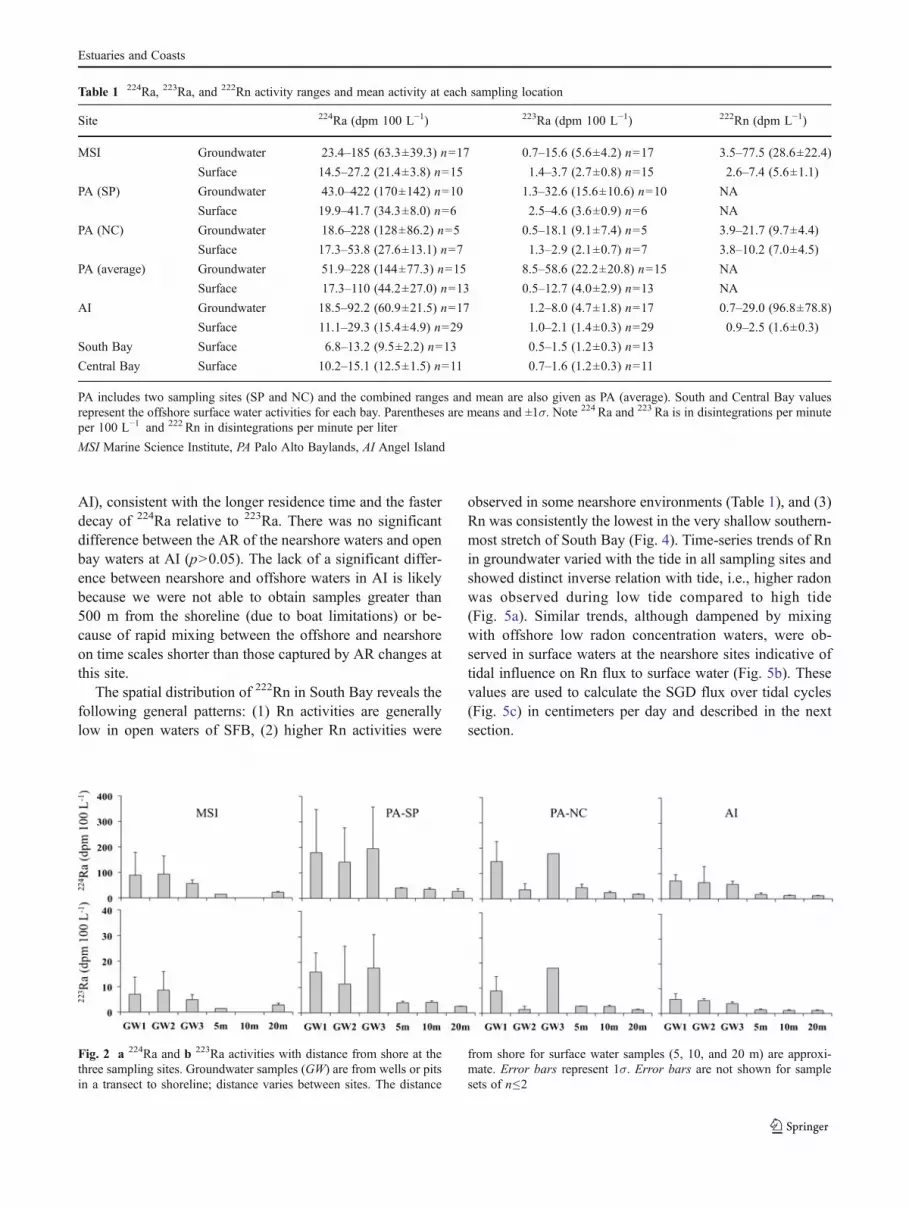
Averages and ranges of 224Ra, 223Ra, and 222Rn activitiesfor groundwater and surface water at the different sites arepresented in Table 1. Groundwater 224Ra activities werefound to be in the range of 18.5–422 dpm 100 L−1 and223Ra activities in the range of 0.5–58.6 dpm 100 L−1.Groundwater 224Ra, 223Ra, and 222Rn activities were signif-icantly higher (approximately three-fold) compared to sur-face water at all sites (p<0.0001). Figure 2 shows the 224Raand 223Ra activities in groundwater and with distance off-shore for each of the sampling locations. The groundwateractivities are averages of activity measured in samples fromeach well (GW1, GW2, GW3) over the tidal cycle (Fig. 2).We did not observe a significant decrease in 224Ra or 223Raactivities with distance from shore between the waterlineand 20 m (the seaward extent of our small nearshore box),suggesting the nearshore zone was well mixed on timescales representative by the Ra decay constants. The activ-ities in nearshore bay waters (<20 m) were significantlyhigher (approximately two-fold) relative to open bay watersin South Bay (p<0.0001 for MSI and p00.0003 for PA)(Table 1; Fig. 2). There was not a significant differencebetween nearshore and offshore activities at AI (p>0.05).Higher Ra activities in groundwater compared to surfacewater are typical to most coastal sites with brackish SGD(Moore 1999). The SGD flux was calculated based onaveraged Ra activities for each sample type over all tidalstages because Ra activities did not correlate significantlywith tidal stage (p>0.05).
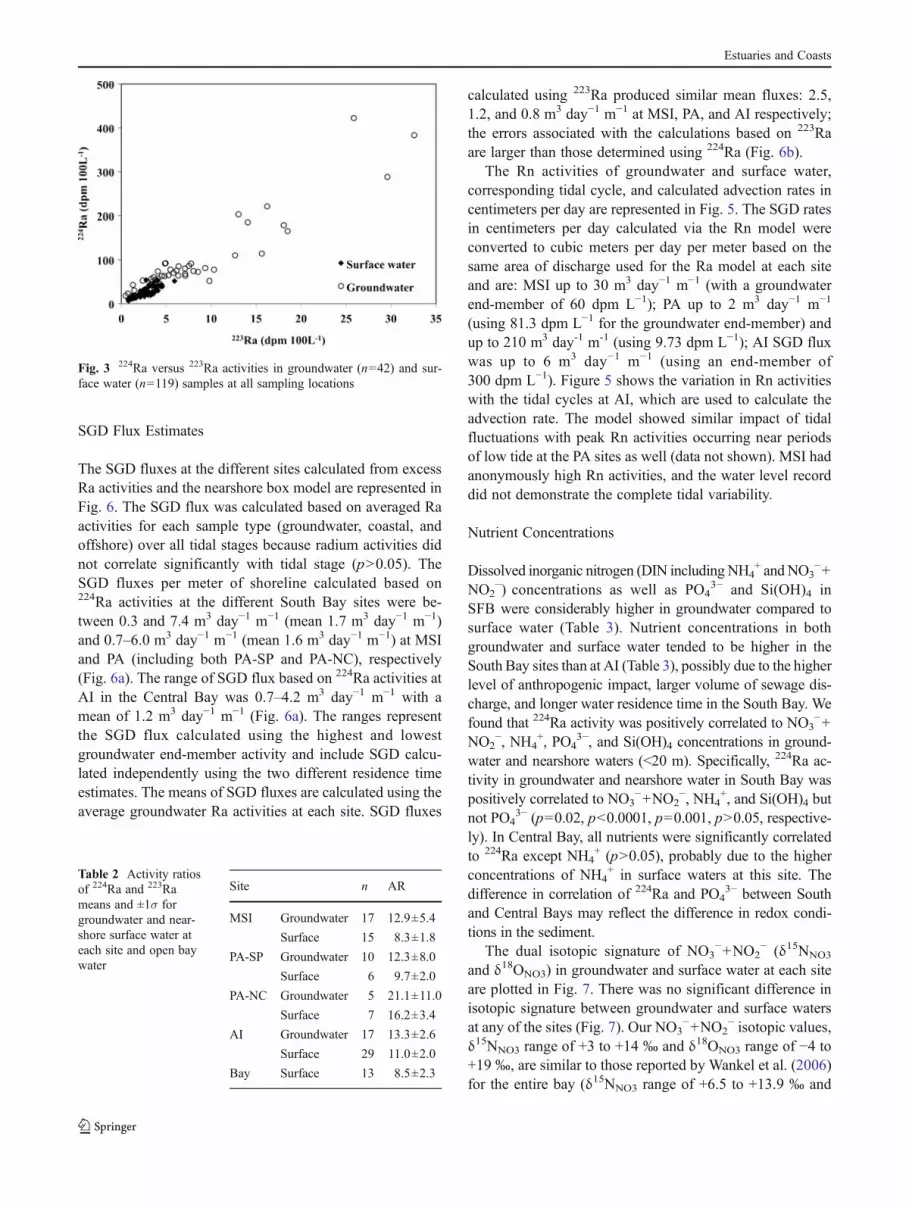
224Ra/223Ra AR in groundwater were similar (withinanalytical error) for all samples at the three study sites,indicating sources with similar AR contributing Ra to sur-face waters (Fig. 3). The ARs for samples within the smallnearshore zones were significantly lower than that ofgroundwater (p<0.05 for MSI and PA) (Table 2). The ARfor the open bay water was also significantly lower than thatof the groundwater (p<0.0001 for MSI and PA; p<0.05 for
Estuaries and Coasts
AI), consistent with the longer residence time and the fasterdecay of 224Ra relative to 223Ra. There was no significantdifference between the AR of the nearshore waters and openbay waters at AI (p>0.05). The lack of a significant differ-ence between nearshore and offshore waters in AI is likelybecause we were not able to obtain samples greater than500 m from the shoreline (due to boat limitations) or be-cause of rapid mixing between the offshore and nearshoreon time scales shorter than those captured by AR changes atthis site.
The spatial distribution of 222Rn in South Bay reveals thefollowing general patterns: (1) Rn activities are generallylow in open waters of SFB, (2) higher Rn activities were
observed in some nearshore environments (Table 1), and (3)Rn was consistently the lowest in the very shallow southern-most stretch of South Bay (Fig. 4). Time-series trends of Rnin groundwater varied with the tide in all sampling sites andshowed distinct inverse relation with tide, i.e., higher radonwas observed during low tide compared to high tide(Fig. 5a). Similar trends, although dampened by mixingwith offshore low radon concentration waters, were ob-served in surface waters at the nearshore sites indicative oftidal influence on Rn flux to surface water (Fig. 5b). Thesevalues are used to calculate the SGD flux over tidal cycles(Fig. 5c) in centimeters per day and described in the nextsection.
Table 1 224Ra, 223Ra, and 222Rn activity ranges and mean activity at each sampling location
Site 224Ra (dpm 100 L−1) 223Ra (dpm 100 L−1) 222Rn (dpm L−1)
MSI Groundwater 23.4–185 (63.3±39.3) n017 0.7–15.6 (5.6±4.2) n017 3.5–77.5 (28.6±22.4)
Surface 14.5–27.2 (21.4±3.8) n015 1.4–3.7 (2.7±0.8) n015 2.6–7.4 (5.6±1.1)
PA (SP) Groundwater 43.0–422 (170±142) n010 1.3–32.6 (15.6±10.6) n010 NA
Surface 19.9–41.7 (34.3±8.0) n06 2.5–4.6 (3.6±0.9) n06 NA
PA (NC) Groundwater 18.6–228 (128±86.2) n05 0.5–18.1 (9.1±7.4) n05 3.9–21.7 (9.7±4.4)
Surface 17.3–53.8 (27.6±13.1) n07 1.3–2.9 (2.1±0.7) n07 3.8–10.2 (7.0±4.5)
PA (average) Groundwater 51.9–228 (144±77.3) n015 8.5–58.6 (22.2±20.8) n015 NA
Surface 17.3–110 (44.2±27.0) n013 0.5–12.7 (4.0±2.9) n013 NA
AI Groundwater 18.5–92.2 (60.9±21.5) n017 1.2–8.0 (4.7±1.8) n017 0.7–29.0 (96.8±78.8)
Surface 11.1–29.3 (15.4±4.9) n029 1.0–2.1 (1.4±0.3) n029 0.9–2.5 (1.6±0.3)
South Bay Surface 6.8–13.2 (9.5±2.2) n013 0.5–1.5 (1.2±0.3) n013
Central Bay Surface 10.2–15.1 (12.5±1.5) n011 0.7–1.6 (1.2±0.3) n011
PA includes two sampling sites (SP and NC) and the combined ranges and mean are also given as PA (average). South and Central Bay valuesrepresent the offshore surface water activities for each bay. Parentheses are means and ±1σ. Note 224 Ra and 223 Ra is in disintegrations per minuteper 100 L−1 and 222 Rn in disintegrations per minute per liter
MSI Marine Science Institute, PA Palo Alto Baylands, AI Angel Island
Fig. 2 a 224Ra and b 223Ra activities with distance from shore at thethree sampling sites. Groundwater samples (GW) are from wells or pitsin a transect to shoreline; distance varies between sites. The distance
from shore for surface water samples (5, 10, and 20 m) are approxi-mate. Error bars represent 1σ. Error bars are not shown for samplesets of n≤2
Estuaries and Coasts
SGD Flux Estimates
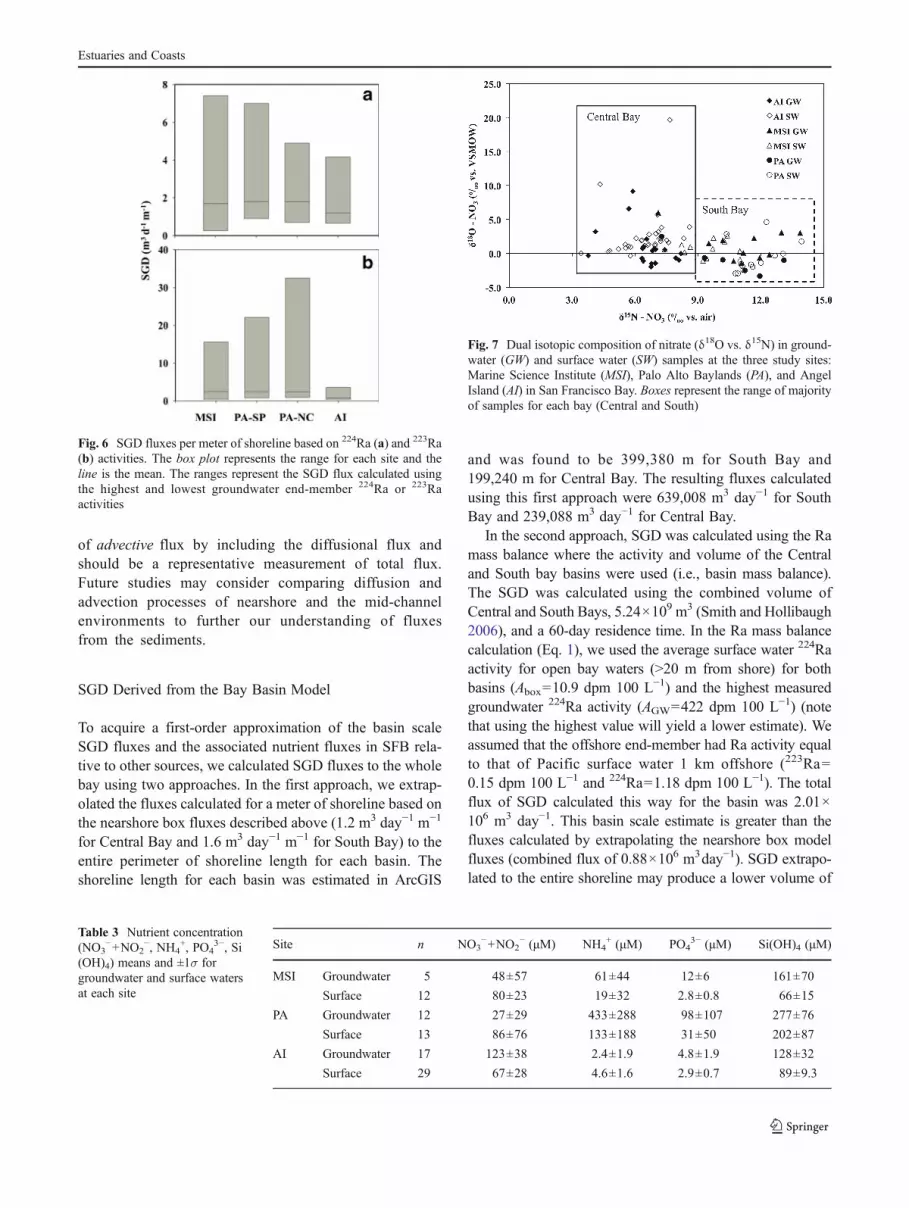
The SGD fluxes at the different sites calculated from excessRa activities and the nearshore box model are represented inFig. 6. The SGD flux was calculated based on averaged Raactivities for each sample type (groundwater, coastal, andoffshore) over all tidal stages because radium activities didnot correlate significantly with tidal stage (p>0.05). TheSGD fluxes per meter of shoreline calculated based on224Ra activities at the different South Bay sites were be-tween 0.3 and 7.4 m3 day−1 m−1 (mean 1.7 m3 day−1 m−1)and 0.7–6.0 m3 day−1 m−1 (mean 1.6 m3 day−1 m−1) at MSIand PA (including both PA-SP and PA-NC), respectively(Fig. 6a). The range of SGD flux based on 224Ra activities atAI in the Central Bay was 0.7–4.2 m3 day−1 m−1 with amean of 1.2 m3 day−1 m−1 (Fig. 6a). The ranges representthe SGD flux calculated using the highest and lowestgroundwater end-member activity and include SGD calcu-lated independently using the two different residence timeestimates. The means of SGD fluxes are calculated using theaverage groundwater Ra activities at each site. SGD fluxes
calculated using 223Ra produced similar mean fluxes: 2.5,1.2, and 0.8 m3 day−1 m−1 at MSI, PA, and AI respectively;the errors associated with the calculations based on 223Raare larger than those determined using 224Ra (Fig. 6b).
The Rn activities of groundwater and surface water,corresponding tidal cycle, and calculated advection rates incentimeters per day are represented in Fig. 5. The SGD ratesin centimeters per day calculated via the Rn model wereconverted to cubic meters per day per meter based on thesame area of discharge used for the Ra model at each siteand are: MSI up to 30 m3 day−1 m−1 (with a groundwaterend-member of 60 dpm L−1); PA up to 2 m3 day−1 m−1
(using 81.3 dpm L−1 for the groundwater end-member) andup to 210 m3 day-1 m-1 (using 9.73 dpm L−1); AI SGD fluxwas up to 6 m3 day−1 m−1 (using an end-member of300 dpm L−1). Figure 5 shows the variation in Rn activitieswith the tidal cycles at AI, which are used to calculate theadvection rate. The model showed similar impact of tidalfluctuations with peak Rn activities occurring near periodsof low tide at the PA sites as well (data not shown). MSI hadanonymously high Rn activities, and the water level recorddid not demonstrate the complete tidal variability.
Nutrient Concentrations
Dissolved inorganic nitrogen (DIN includingNH4+ andNO3
−+NO2
−) concentrations as well as PO43− and Si(OH)4 in
SFB were considerably higher in groundwater compared tosurface water (Table 3). Nutrient concentrations in bothgroundwater and surface water tended to be higher in theSouth Bay sites than at AI (Table 3), possibly due to the higherlevel of anthropogenic impact, larger volume of sewage dis-charge, and longer water residence time in the South Bay. Wefound that 224Ra activity was positively correlated to NO3
−+NO2
−, NH4+, PO4
3−, and Si(OH)4 concentrations in ground-water and nearshore waters (<20 m). Specifically, 224Ra ac-tivity in groundwater and nearshore water in South Bay waspositively correlated to NO3
−+NO2−, NH4
+, and Si(OH)4 butnot PO4
3− (p00.02, p<0.0001, p00.001, p>0.05, respective-ly). In Central Bay, all nutrients were significantly correlatedto 224Ra except NH4
+ (p>0.05), probably due to the higherconcentrations of NH4
+ in surface waters at this site. Thedifference in correlation of 224Ra and PO4
3− between Southand Central Bays may reflect the difference in redox condi-tions in the sediment.
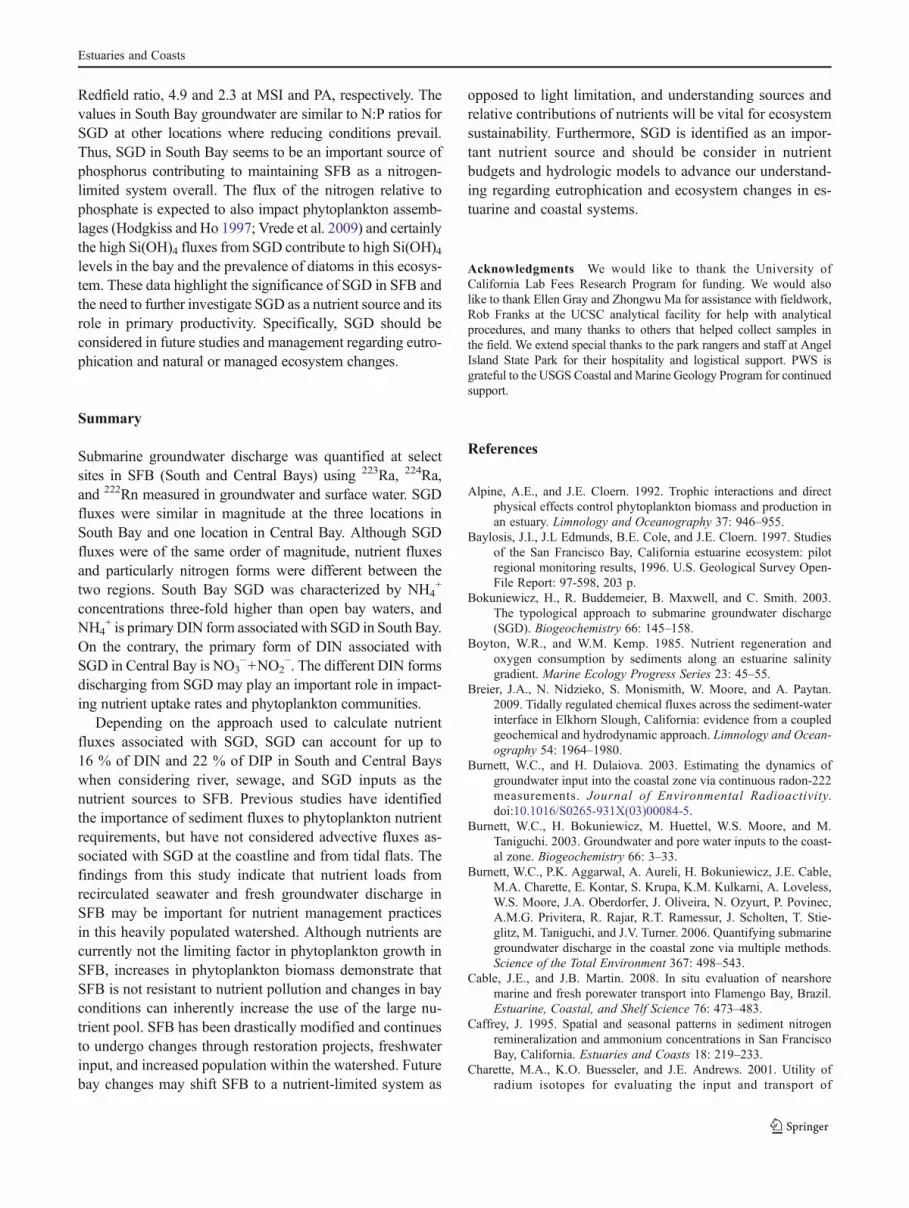
The dual isotopic signature of NO3−+NO2
− (δ15NNO3
and δ18ONO3) in groundwater and surface water at each siteare plotted in Fig. 7. There was no significant difference inisotopic signature between groundwater and surface watersat any of the sites (Fig. 7). Our NO3
−+NO2− isotopic values,
δ15NNO3 range of +3 to +14 ‰ and δ18ONO3 range of −4 to+19‰, are similar to those reported by Wankel et al. (2006)for the entire bay (δ15NNO3 range of +6.5 to +13.9 ‰ and
Fig. 3 224Ra versus 223Ra activities in groundwater (n042) and sur-face water (n0119) samples at all sampling locations
Table 2 Activity ratiosof 224Ra and 223Rameans and ±1σ forgroundwater and near-shore surface water ateach site and open baywater
Site n AR
MSI Groundwater 17 12.9±5.4
Surface 15 8.3±1.8
PA-SP Groundwater 10 12.3±8.0
Surface 6 9.7±2.0
PA-NC Groundwater 5 21.1±11.0
Surface 7 16.2±3.4
AI Groundwater 17 13.3±2.6
Surface 29 11.0±2.0
Bay Surface 13 8.5±2.3
Estuaries and Coasts

δ18ONO3 range of −5.0 to +11.6 ‰). However, the δ15NNO3
and δ18ONO3 values were significantly different betweenSouth Bay (MSI and PA) and Central Bay (AI) (δ15NNO3
p0<0.001, δ18ONO3 p0 .005) (Fig. 7).
Discussion
Higher Ra activities in groundwater compared to surfacewater are typical to most coastal sites with brackish SGD(Moore 1999) and were found in all sites in this studyconducted in SFB. Elevated Rn concentrations were alsofound in groundwater compared to surface water at our SFBsites, and therefore, we found Ra and Rn to be valuabletracers of SGD in SFB. These tracers along with the nutrientcharacteristics of groundwater at the different sites providevaluable insight to biogeochemical processes in the subter-ranean estuary which may have implications to SFB waterquality and ecosystem structure as discussed in the sectionsbelow.
SGD Derived from the Nearshore Model
Both Ra and Rn models were used to derive two independentestimates of SGD flux of the nearshore intertidal sites. The Ramodel produced SGD fluxes on the order of 1.7, 1.6, and1.2 m3 day−1 m−1, whereas the Rn model produced fluxes onthe order of 30, 2, and 6 m3 day−1 m−1 for MSI, PA, and AI,respectively. While using Ra as a SGD tracer yields informa-tion on the saline component of SGD, the Rn-derived SGDrates are representative of the total SGD (i.e., both fresh andrecirculated water). At MSI, the SGD calculated using the Rnmodel produced an order of magnitude higher SGD flux than
the Ra model; however, the Rn measurements at this site mayhave been compromised by local conditions during samplingresulting in higher than expected calculated fluxes. Specifi-cally, it is likely that strong winds (up to 40 kph) during theOctober sampling diminished the effectiveness of Rn as areliable SGD tracer at this site. At PA mean SGD flux calcu-lated using Rn was within the same range as the SGD fluxcalculated using Ra, as expected with little freshwater contri-bution. The Rn-derived SGD values in South Bay are consis-tent with minimal freshwater discharge and illustrate theimportance of recirculated seawater in this environment. AtAI, the SGD flux based on Rn was higher compared to theSGD flux based on Ra, suggesting some contribution offreshwater inputs at this site (indeed fresher groundwaterwas encountered).
Conditions such as topographic relief can play an impor-tant role in SGD, seawater infiltration, subsurface flow, andthe overall impact on transport mechanisms (Nakada et al.2011). Saltwater infiltration can be intensified at the beachface of a low-relief estuary, but infiltration has been shownto be even stronger at tidal flat settings (Mao et al. 2006).Also, at tidal flat locations, there is evidence that a freshwa-ter lens may not discharge offshore of the tidal flat like at asloping beach face because of seawater recirculation acrossthe vast flat. A large portion (~45 %) of SGD occurring atmildly sloping beaches and potentially tidal flats is fromtidal forcing (Robinson et al. 2007). The beach morphologyand slope are important characteristics that affect thestrength of flow and seawater recirculation in the subsurfaceintertidal zone and the extent of the tidal forcing; recircula-tion is additionally impacted by wind and terrestrial re-charge (Robinson et al. 2006). The environmental settingof sloughs and mudflats in South Bay resulted in muting of
Fig. 4 Distribution of 222Rnactivities in surface water inSouth Bay during March 2009
Estuaries and Coasts

the tidal variability in the water record at MSI and impactedthe measured Rn activities. It is possible that water in SouthBay nearshore environments, particularly at MSI, is notexchanged as rapidly as at other locations and stagnantwater is accumulating Rn from sediments, producing thehigh SGD flux. An additional factor that may impact themagnitude of the calculated SGD flux is the coastal waterresidence time. Our calculations produced residence timeson the order of one day; however, based on the tidal regimeand previous studies using a horizontal eddy diffusivitymodel, the residence time may be on the order of 0.5 day(Okubo 1971). Using the residence time of ~1 day calculat-ed in this study results in more conservative SGD fluxescompared to using a residence time of 0.5 day.
A potentially important transport mechanism for Ra, Rn,and nutrients other than advective processes of SGD isdiffusion from sediments. For this study, porewater
gradients of Rn or Ra were not measured, and therefore,the diffusion from sediments was not calculated separately.In high energy intertidal and nearshore subtidal zones, it hasbeen shown that fluxes of Rn and Ra are dominated byadvection instead of diffusion (Rama and Moore 1996).Cable and Martin (2008) found the diffusion of Rn toaccount for less than 3 % of the total flux from sedimentsin a nearshore environment. Hammond et al. (1985) esti-mated bioirrigation accounted for 60 % of the flux and theremaining flux occurred via diffusion, but other advectiveprocesses particularly in the intertidal zone were not con-sidered. Sediment characteristics and porewater concentra-tions are important factors affecting the importance ofdiffusion. At SFB, diffusion may be more important in thedeep, low-energy mid-channel of SFB than in the shallowintertidal zone representing the vast area of the bay. Ourestimates of SGD may therefore overestimate the magnitude
Fig. 5 a 222Rn activity ingroundwater at Angel Islandversus time. b Complementarysurface water 222Rn activityversus time. c Calculatedadvection rates based ongroundwater and surface water222Rn activities plotted withgroundwater salinity andsurface water depth over time
Estuaries and Coasts
of advective flux by including the diffusional flux andshould be a representative measurement of total flux.Future studies may consider comparing diffusion andadvection processes of nearshore and the mid-channelenvironments to further our understanding of fluxesfrom the sediments.
SGD Derived from the Bay Basin Model
To acquire a first-order approximation of the basin scaleSGD fluxes and the associated nutrient fluxes in SFB rela-tive to other sources, we calculated SGD fluxes to the wholebay using two approaches. In the first approach, we extrap-olated the fluxes calculated for a meter of shoreline based onthe nearshore box fluxes described above (1.2 m3 day−1 m−1
for Central Bay and 1.6 m3 day−1 m−1 for South Bay) to theentire perimeter of shoreline length for each basin. Theshoreline length for each basin was estimated in ArcGIS
and was found to be 399,380 m for South Bay and199,240 m for Central Bay. The resulting fluxes calculatedusing this first approach were 639,008 m3 day−1 for SouthBay and 239,088 m3 day−1 for Central Bay.
In the second approach, SGD was calculated using the Ramass balance where the activity and volume of the Centraland South bay basins were used (i.e., basin mass balance).The SGD was calculated using the combined volume ofCentral and South Bays, 5.24×10⁹ m3 (Smith and Hollibaugh2006), and a 60-day residence time. In the Ra mass balancecalculation (Eq. 1), we used the average surface water 224Raactivity for open bay waters (>20 m from shore) for bothbasins (Abox010.9 dpm 100 L−1) and the highest measuredgroundwater 224Ra activity (AGW0422 dpm 100 L−1) (notethat using the highest value will yield a lower estimate). Weassumed that the offshore end-member had Ra activity equalto that of Pacific surface water 1 km offshore (223Ra00.15 dpm 100 L−1 and 224Ra01.18 dpm 100 L−1). The totalflux of SGD calculated this way for the basin was 2.01×10⁶ m3 day−1. This basin scale estimate is greater than thefluxes calculated by extrapolating the nearshore box modelfluxes (combined flux of 0.88×10⁶ m3day−1). SGD extrapo-lated to the entire shoreline may produce a lower volume of
Fig. 6 SGD fluxes per meter of shoreline based on 224Ra (a) and 223Ra(b) activities. The box plot represents the range for each site and theline is the mean. The ranges represent the SGD flux calculated usingthe highest and lowest groundwater end-member 224Ra or 223Raactivities
Fig. 7 Dual isotopic composition of nitrate (δ18O vs. δ15N) in ground-water (GW) and surface water (SW) samples at the three study sites:Marine Science Institute (MSI), Palo Alto Baylands (PA), and AngelIsland (AI) in San Francisco Bay. Boxes represent the range of majorityof samples for each bay (Central and South)
Table 3 Nutrient concentration(NO3
−+NO2−, NH4
+, PO43−, Si
(OH)4) means and ±1σ forgroundwater and surface watersat each site
Site n NO3−+NO2
− (μM) NH4+ (μM) PO4
3− (μM) Si(OH)4 (μM)
MSI Groundwater 5 48±57 61±44 12±6 161±70
Surface 12 80±23 19±32 2.8±0.8 66±15
PA Groundwater 12 27±29 433±288 98±107 277±76
Surface 13 86±76 133±188 31±50 202±87
AI Groundwater 17 123±38 2.4±1.9 4.8±1.9 128±32
Surface 29 67±28 4.6±1.6 2.9±0.7 89±9.3
Estuaries and Coasts

SGD due to the underestimation of the basin perimeter inArcGIS. The many sloughs and large areas of shallow shoalsincrease the effective discharge zone that may not beaccounted for in the ArcGIS perimeter (Jaffe and Foxgrover2006). Another factor that may contribute to the discrepancybetween the two approaches is errors associated with using anaverage residence time. This residence time is based on salin-ity balance and could vary significantly on seasonal andinterannual timescales (Walters et al. 1985).
Nutrient Fluxes
Significant differences in nutrient fluxes and nitrate isotopiccompositions were found between South and Central Bays.The differences in environmental settings of each basin mayplay a role in these differences and impact the overallnutrient loading. The positive correlations between 224Raand nutrients suggest that SGD is an important source ofthese nutrients to nearshore surface waters at all the sites.We calculated SGD-associated nutrient fluxes by subtract-ing the average surface water nutrient concentrations fromthe average groundwater nutrient concentrations and multi-plying by the 224Ra-based SGD fluxes at each site (Fig. 8).Subtracting the surface water nutrient concentration fromthe groundwater nutrient concentration is a conservativeapproach and calculates the excess nutrients associated withSGD since a significant portion of SGD is recirculatedseawater. We used the SGD estimates calculated with224Ra activities to calculate nutrient fluxes as opposed to223Ra and 222Rn activities because of the higher error asso-ciated with 223Ra measurements and the anonymously highmeasurements of 222Rn-based fluxes at MSI. As previouslymentioned, SGD fluxes are averaged over tidal cycles, andtherefore, this average carries over to the nutrient fluxes. Asshown in Table 3, the concentration of the different DINspecies (NO3
−+NO2− or NH4
+) is site specific. Specifically,
NH4+ was high and NO3
−+NO2− was low in groundwater at
MSI and PA, which have broad tidally inundated muddycoastlines. At AI, where the coastline is narrow and thesediments are sandy, NH4
+ was low, and NO3−+NO2
− washigh (Table 3). This distribution likely results from thehighly anoxic conditions in groundwater circulating throughthe vast tidal mudflats in the South Bay area and the moreoxic groundwater at AI (Caffrey 1995). Under reducingconditions, NH4
+ generated from organic matter decayingin the sediment will not be oxidized as it might in the oxicAI sediments. Moreover, denitrification under anoxic con-ditions may further lower nitrate concentrations in ground-water at MSI and PA. NO3
−+NO2−, NH4
+, PO43−, and Si
(OH)4 fluxes were calculated for each of the sites (Fig. 8);however, as indicated above, NH4
+ did not contribute muchto the total DIN flux at AI, while NO3
−+NO2− did not
contribute much to the total DIN at PA and MSI. It appearsthat groundwater is not contributing to the increase of NH4
+
in Central Bay (Dugdale et al. 2007) but it is an importantsource of NH4
+ in South Bay. In both basins, groundwater iscontributing significant nutrients to surface waters that mayplay a role in primary productivity of the bay (see “EcologicalImplications of Nutrient Loading”).
If we assume that our sampling sites are representative ofsimilar settings throughout the South and Central Bays, wecan extrapolate the nutrient fluxes to the entire bay to acquirea first-order approximation of nutrient contributions associat-ed with SGD. Applying our calculated SGD flux using thenearshore extrapolation for each basin and the excess nutrientconcentration in groundwater, SGD contributed up to 113×103 mol NH4
+ day−1 in South Bay and 13.4×10³ mol NO3−+
NO2− day−1 in Central Bay. The PO4
3− fluxes were 21.7×10³
and 0.5×10³ mol day−1 for South and Central and Bays,respectively. When the nutrient fluxes were compared towastewater and river nutrient loading calculated by Smithand Hollibaugh (2006), we find that sewage effluent is the
Fig. 8 Excess nutrient fluxes(NO3
−+NO2−, NH4
+, PO43−, Si
(OH)4) per meter of shorelinefor each site (MSI, PA(including PA–SP and PA–NC),and AI). Excess fluxes arecalculated from 224Ra-basedSGD estimates. The averagenutrient concentration used ateach site is the surface waterconcentration subtracted fromthe groundwater concentration.Sites without bars indicategroundwater nutrientconcentration was lower thansurface water
Estuaries and Coasts

dominant source to both bays, but SGD contributed a signif-icant amount of nutrients as well: up to 9 % of DIN and up to15 % of DIP in the Central and South Bays, respectively(Table 4). It should be noted that the sewage effluent and riverinputs for Central Bay are estimated from San Pablo Bayvalues from Smith and Hollibaugh (2006) because of limitedCentral Bay data. Since the approach using the nearshoreextrapolation may underestimate SGD and the associated fluxof nutrients, we also calculated nutrient fluxes using the basinscale approach. If the SGD flux calculated using the bay basinscale (i.e., basin Ra mass balance) is applied to the averagegroundwater nutrient concentrations from both basins, thenSGD inputs are greater and account for 16% of DIN and 22%of DIP when considering combined inputs to Central andSouth Bays (Table 4).
These nutrient flux estimates to each basin are reasonablewhen considering (1) previous benthic flux studies con-ducted in SFB (Hammond et al. 1985) and other locationsand (2) that the relative contributions take into account onlyinputs from rivers, wastewater discharge, and SGD and donot consider other sources such as atmospheric depositionand other nonpoint sources. Sediments have been shown tobe an important source of nutrients to overlying water andphytoplankton requirements, contributing up to 50 % of thenitrogen required by phytoplankton in South Bay (Grenz etal. 2000). Other shallow coastal systems have also demon-strated the importance of sediments and benthic fluxes tophytoplankton nutrient requirements (e.g., 40 % of
phytoplankton nitrogen requirements in Chesapeake Bay;Boyton and Kemp 1985). Using an average benthic NH4
+
flux in South Bay measured by Hammond et al. (1985) of2.7 mmol m−2 day−1 and applying it to the benthic area ofthe basin, the resulting NH4
+ input is 702×103 mol day−1
compared to the SGD associated NH4+ input of 113×
103 mol day−1 in this study (Table 4). Note, however, thesefluxes are calculated over different areas and using dataobtained at different times. The fluxes from Hammond etal. (1985) are nutrient fluxes associated with irrigation anddiffusion and assumed to be similar across the entire basinwhile our calculations are restricted to discharge at thecoastline within the intertidal zone.
As with the forcing mechanisms of SGD, it is possible thatthe difference in topography may impact the nutrient fluxes(i.e., nitrogen form and ratios) being discharged with SGD(Bokuniewicz et al. 2003). Steeper coastlines can supporthigher hydraulic gradient to drive higher SGD fluxes, andthe groundwater residence time may thus be shorter. If indeedthis is the case, at sites like AI, the DIN is expected to bemostly NO3
− since there is less time for organic matter remi-neralization or for reducing conditions to develop in theshallow unconfined surficial aquifer. Although we did notfind greater SGD at the Central Bay site with more relief,the DIN was indeed primarily in the form of NO3
−+NO2−. In
areas similar to South Bay, with low relief and where SGDrecirculation is expected to be slow, high rates of remineral-ized nitrogen can be discharged (Spiteri et al. 2008). Indeedthis is the situation at the South Bay sites. The concentrationsof nutrient, Ra, and Rn and the associated nitrate isotopecomposition in groundwater may also be influenced by theshort residence time of recirculated seawater in the sediments.A short residence time would provide insufficient time forporewaters to equilibrate (Burnett and Dulaiova 2003). Thetidal stage (ebbing or flooding) may also impact the residencetime, as it is well-known that seawater infiltration occursduring high tide and drainage during low tide (Nielsen1990). Infiltration typically occurs faster than draining, result-ing in variable porewater residence time during tidal stages forwater to react with sediments and build higher concentrations(Nakada et al. 2011). Another explanation of lower-end nutri-ent concentrations in the groundwater samples may be theinfluence of pumping of groundwater during our study. Pump-ing can result in changes to the hydraulic head of the systemand introduce low concentration surface water into our bore-hole, diluting the high nutrient groundwater signal. However,we used minimum pumping rates required for the method anddid not sample any well that became inundated during hightide to minimize the impact of pumping.
The nitrate isotopic signature of groundwater may alsoproved insight to subsurface processes and transport mech-anisms occurring in SFB. The similarity in NO3
−+NO2−
isotopic signature between groundwater and surface water
Table 4 Nutrient loading (×103 mol day−1) and relative percent ofDIN and DIP in South and Central Bays considering river, sewage, andSGD inputs
DIN DIP %DIN %DIP
Approach 1: nearshore extrapolation
South River 45 3 3 2
Sewage 1,170 117 88 83
SGD 113 22 8 15
Total 1,328 142
Central River 0 0 0 0
Sewage 130 13 91 97
SGD 13 0.5 9 3
Total 143 13
Approach 2: bay basin scale
Both River 45 3 3 2
Sewage 1,300 130 81 76
SGD 261 37 16 22
Total 1,606 170
River and sewage inputs are estimated from Smith and Hollibaugh(2006) and SGD inputs from this study. The two approaches (1—nearshore extrapolation and 2—bay basin scale) for calculating SGDDIN and DIP fluxes are presented
DIN dissolved inorganic nitrogen, DIP dissolved inorganic phosphorus
Estuaries and Coasts

of SFB demonstrated in this study could indicate similarsources to and/or processes affecting groundwater and sur-face waters (Fig. 7). Specifically, in the South Bay NO3
−+NO2
− was enriched in 15N, which is a signature of NO3−+
NO2− derived from NH4
+ following isotopic enrichment dueto fractionation associated with NH4
+ volatilization. Thisisotopic signature is consistent with discharge of sewageand treated wastewater, which is a likely contributor ofNO3
−+NO2− in the South Bay. The consistent NO3
−+NO2
− isotopic signature in surface water and groundwatersamples suggests rapid recirculating seawater in the shallowsediments, which is the primary component of SGD in thelimited freshwater system of South Bay. It is interesting tonote that the DIN in the South Bay groundwater is domi-nated by NH4
+ rather than NO3−+NO2
−. The groundwaterNH4
+ may be oxidized after discharge and become a signif-icant contributor to NO3
−+NO2− in the South Bay surface
waters. Higher uptake rates of NO3− in the water column in
South Bay may also result in elevated isotopic values ofresidual NO3
− consistent with additional fall phytoplanktonblooms and increasing chlorophyll in South Bay (Cloernand Dugdale 2010). The South Bay δ15N-NO3 signaturewas more enriched compared to the AI values as expectedbased on the importance of treated wastewater discharge onNO3
−+NO2− concentrations in South Bay (Fig. 7). NO3
−+NO2
− in groundwater and surface water samples at theCentral Bay site also shared a common nitrogen and oxygenisotopic composition. However, the isotope compositions atthe Central Bay site are common to several potential sourcesof NO3
− (marine NO3−, soil NO3
−, precipitation, and somewastewaters). Thus, it is not possible to use the isotopicsignature of NO3
−+NO2− as a tracer of rapid seawater
recirculation at the Central Bay site.
Ecological Implications of Nutrient Loading
Nutrient fluxes associated with SGD may play an importantrole in primary productivity in SFB. In addition to the quantityof nutrients contributed to surface waters found in this study,the nutrient form and stoichiometry may influence the phyto-plankton assemblages and overall water quality. Throughoutmost of the year, primary productivity in the SFB is low due tolight limiting conditions (Cloern and Dufford 2005) and graz-ing (Alpine and Cloern 1992). As a result of light limitation,dissolved nutrients are in excess and SFB is classified as ahigh nutrient, low chlorophyll (HNLC) environment (Cloern2001; Jassby et al. 2002; Dugdale et al. 2007). In the CentralBay, blooms of mostly marine and brackish water diatoms andmicroflagellates occur in early summer (Cloern 1979; Cloernand Dufford 2005). In contrast, the South Bay has longerresidence time, lower turbidity, with maximum biomass ofmicroflagellates and small diatoms occurring in spring(Cloern 1979; Cloern et al. 1985). SGD may be playing a role
in contributing excess nutrients to the system and impactingthe phytoplankton assemblages.
More recent studies suggested that nutrient ratios alongwith irradiance might be an important factor influencingbloom events and regional ecosystem dynamics in CentralBay. Wilkerson et al. (2006) and Dugdale et al. (2007)suggested that the relative concentrations of NH4
+ andNO3
− can influence the phytoplankton bloom dynamics(size of phytoplankton cells and species distribution) andthat excess NH4
+ can inhibit the uptake of NO3− by phyto-
plankton. Although NH4+ is often a preferred source of
nitrogen by phytoplankton, it seems that in Central Baythe phytoplankton community uptakes NO3
− at higher ratesand as the preferred nitrogen source to form spring blooms(Dugdale et al. 2007). Therefore, increased irradiation anddecreased NH4
+ concentrations are critical for rapid uptakeof NO3
− and bloom development in Central Bay (Dugdale etal. 2007). Elevated NH4
+ concentrations and inhibited NO3−
uptake have been documented in other locations, e.g., in theDelaware Bay (Pennock 1987) and in Bodega Bay, Califor-nia (Dugdale et al. 2006). In contrast, it is possible that thehigh NH4
+ input from SGD in South Bay is instrumental inlimiting the frequency of algal blooms and contributing tomaintaining the South Bay as a HNLC environment. TheSGD at our Central Bay site (AI) does not contribute sig-nificant NH4
+ to surface waters but otherwise contributes tothe NO3
− pool that could be readily taken up by phytoplank-ton if NH4
+ concentrations are kept low (i.e., SGD does notcontribute to inhibiting NO3
− uptake in Central Bay).The relative stoichiometry of discharging nutrients from
sediments, such as the ratio of nitrogen and phosphorus (N:P),is also important to phytoplankton production and nutrientlimitation in estuarine environments. The N:P ratio requiredby marine pelagic phytoplankton is typically around 16:1(“Redfield ratio,” Redfield 1934), but SGD often has higherN:P ratio (Slomp and Van Cappellen 2004) and may beimportant in determining the overall nutrient limitation inshallow nearshore surface water environments. The N:P ratioin SGD can be dependent on the groundwater flow rates, theform and supply of nitrogen and phosphorus, and the redoxconditions of the environment immobilizing phosphorus rel-ative to nitrogen (Slomp and Van Cappellen 2004). The N:Pof groundwater in Central Bay is 28:1, similar to the surfacewater ratio, 25:1, when considering both NO3
− and NH4+ as
nitrogen sources (most of the nitrogen as NO3−). If we only
use NH4+ in calculating the N:P ratio assuming NO3
− uptakeis inhibited and only NH4
+ is bioavailable, then we findsimilar N:P as those recorded by Dugdale et al. (2007) insurface waters, ~ 2:1. At the South Bay sites, groundwater N:Pvalues (using the combined NO3
− and NH4+) were below the
Redfield ratio, 12 and 3.5 for MSI and PA, respectively. Whenconsidering only NH4
+ as the nitrogen form, the groundwaterN:P is higher than the Central Bay but still lower than the
Estuaries and Coasts
Redfield ratio, 4.9 and 2.3 at MSI and PA, respectively. Thevalues in South Bay groundwater are similar to N:P ratios forSGD at other locations where reducing conditions prevail.Thus, SGD in South Bay seems to be an important source ofphosphorus contributing to maintaining SFB as a nitrogen-limited system overall. The flux of the nitrogen relative tophosphate is expected to also impact phytoplankton assemb-lages (Hodgkiss and Ho 1997; Vrede et al. 2009) and certainlythe high Si(OH)4 fluxes from SGD contribute to high Si(OH)4levels in the bay and the prevalence of diatoms in this ecosys-tem. These data highlight the significance of SGD in SFB andthe need to further investigate SGD as a nutrient source and itsrole in primary productivity. Specifically, SGD should beconsidered in future studies and management regarding eutro-phication and natural or managed ecosystem changes.
Summary
Submarine groundwater discharge was quantified at selectsites in SFB (South and Central Bays) using 223Ra, 224Ra,and 222Rn measured in groundwater and surface water. SGDfluxes were similar in magnitude at the three locations inSouth Bay and one location in Central Bay. Although SGDfluxes were of the same order of magnitude, nutrient fluxesand particularly nitrogen forms were different between thetwo regions. South Bay SGD was characterized by NH4
+
concentrations three-fold higher than open bay waters, andNH4
+ is primary DIN form associatedwith SGD in South Bay.On the contrary, the primary form of DIN associated withSGD in Central Bay is NO3
−+NO2−. The different DIN forms
discharging from SGD may play an important role in impact-ing nutrient uptake rates and phytoplankton communities.
Depending on the approach used to calculate nutrientfluxes associated with SGD, SGD can account for up to16 % of DIN and 22 % of DIP in South and Central Bayswhen considering river, sewage, and SGD inputs as thenutrient sources to SFB. Previous studies have identifiedthe importance of sediment fluxes to phytoplankton nutrientrequirements, but have not considered advective fluxes as-sociated with SGD at the coastline and from tidal flats. Thefindings from this study indicate that nutrient loads fromrecirculated seawater and fresh groundwater discharge inSFB may be important for nutrient management practicesin this heavily populated watershed. Although nutrients arecurrently not the limiting factor in phytoplankton growth inSFB, increases in phytoplankton biomass demonstrate thatSFB is not resistant to nutrient pollution and changes in bayconditions can inherently increase the use of the large nu-trient pool. SFB has been drastically modified and continuesto undergo changes through restoration projects, freshwaterinput, and increased population within the watershed. Futurebay changes may shift SFB to a nutrient-limited system as
opposed to light limitation, and understanding sources andrelative contributions of nutrients will be vital for ecosystemsustainability. Furthermore, SGD is identified as an impor-tant nutrient source and should be consider in nutrientbudgets and hydrologic models to advance our understand-ing regarding eutrophication and ecosystem changes in es-tuarine and coastal systems.
Acknowledgments We would like to thank the University ofCalifornia Lab Fees Research Program for funding. We would alsolike to thank Ellen Gray and Zhongwu Ma for assistance with fieldwork,Rob Franks at the UCSC analytical facility for help with analyticalprocedures, and many thanks to others that helped collect samples inthe field. We extend special thanks to the park rangers and staff at AngelIsland State Park for their hospitality and logistical support. PWS isgrateful to the USGS Coastal andMarine Geology Program for continuedsupport.
References
Alpine, A.E., and J.E. Cloern. 1992. Trophic interactions and directphysical effects control phytoplankton biomass and production inan estuary. Limnology and Oceanography 37: 946–955.
Baylosis, J.I., J.L Edmunds, B.E. Cole, and J.E. Cloern. 1997. Studiesof the San Francisco Bay, California estuarine ecosystem: pilotregional monitoring results, 1996. U.S. Geological Survey Open-File Report: 97-598, 203 p.
Bokuniewicz, H., R. Buddemeier, B. Maxwell, and C. Smith. 2003.The typological approach to submarine groundwater discharge(SGD). Biogeochemistry 66: 145–158.
Boyton, W.R., and W.M. Kemp. 1985. Nutrient regeneration andoxygen consumption by sediments along an estuarine salinitygradient. Marine Ecology Progress Series 23: 45–55.
Breier, J.A., N. Nidzieko, S. Monismith, W. Moore, and A. Paytan.2009. Tidally regulated chemical fluxes across the sediment-waterinterface in Elkhorn Slough, California: evidence from a coupledgeochemical and hydrodynamic approach. Limnology and Ocean-ography 54: 1964–1980.
Burnett, W.C., and H. Dulaiova. 2003. Estimating the dynamics ofgroundwater input into the coastal zone via continuous radon-222measurements. Journal of Environmental Radioactivity.doi:10.1016/S0265-931X(03)00084-5.
Burnett, W.C., H. Bokuniewicz, M. Huettel, W.S. Moore, and M.Taniguchi. 2003. Groundwater and pore water inputs to the coast-al zone. Biogeochemistry 66: 3–33.
Burnett, W.C., P.K. Aggarwal, A. Aureli, H. Bokuniewicz, J.E. Cable,M.A. Charette, E. Kontar, S. Krupa, K.M. Kulkarni, A. Loveless,W.S. Moore, J.A. Oberdorfer, J. Oliveira, N. Ozyurt, P. Povinec,A.M.G. Privitera, R. Rajar, R.T. Ramessur, J. Scholten, T. Stie-glitz, M. Taniguchi, and J.V. Turner. 2006. Quantifying submarinegroundwater discharge in the coastal zone via multiple methods.Science of the Total Environment 367: 498–543.
Cable, J.E., and J.B. Martin. 2008. In situ evaluation of nearshoremarine and fresh porewater transport into Flamengo Bay, Brazil.Estuarine, Coastal, and Shelf Science 76: 473–483.
Caffrey, J. 1995. Spatial and seasonal patterns in sediment nitrogenremineralization and ammonium concentrations in San FranciscoBay, California. Estuaries and Coasts 18: 219–233.
Charette, M.A., K.O. Buesseler, and J.E. Andrews. 2001. Utility ofradium isotopes for evaluating the input and transport of
Estuaries and Coasts

groundwater-derived nitrogen to a Cape Cod Estuary. Limnologyand Oceanography 46: 465–470.
Chin, J.L., D.L. Woodrow, M. McGann, F.L. Wong, T. Fregoso, andB.E. Jaffe. 2010. Estuarine sedimentation, sediment character,and foraminiferal distribution in central San Francisco Bay,California: U.S. Geological Survey Open-File Report 2010-1130: 58 p.
Cloern, J.E. 1979. Phytoplankton ecology of the San Francisco baysystem: The status of our current understanding. In San FranciscoBay: the urbanized estuary, ed. T.J. Conomos, 247–264. SanFrancisco: Pacific Division, AAAS.
Cloern, J.E. 2001. Our evolving conceptual model of the coastal eutro-phication problem. Marine Ecology Progress Series 211: 223–253.
Cloern, J.E., and R. Dufford. 2005. Phytoplankton community ecolo-gy: principles applied in San Francisco Bay. Marine EcologyProgress Series 285: 11–28.
Cloern, J.E. and R. Dugdale. 2010. San Francisco Bay. In Nutrients inestuaries: A summary report of the National Estuarine ExpertsWorkgroup 2005–2007, ed. P.M. Glibert et al., 117–126. Wash-ington, DC: USEPA.
Cloern, J.E., B.E. Cole, R.L.J. Wong, and A.E. Alpine. 1985. Temporaldynamics of estuarine phytoplankton: A case study of San Fran-cisco Bay. Hydrobiologia 129: 153–176.
Cloern, J.E., B.E. Cole, J.L. Edmunds, T.S. Schraga, and A. Arnsberg.2000. Patterns of water-quality variability in San Francisco Bayduring the first six years of the regional monitoring program,1993–1998, in 1998 Annual Report, San Francisco estuary re-gional monitoring program for trace substances: San FranciscoEstuary Institute: 20 p.
Cloern, J.E., A.D. Jassby, J.K. Thompson, and K.A. Hieb. 2007. Acold phase of the East Pacific triggers new phytoplankton bloomsin San Francisco Bay. Proceedings of the National Academies ofScience. doi:10.1073/pnas.0706151104.
Conomos, T.J., and D.H. Peterson. 1977. Suspended-particle transportand circulation in San Francisco Bay: An overview. Estuarineprocesses vol. 2; circulation, sediments, and transfer of materialin the estuary, 82–97. New York: Academic.
Conomos, T.J., R.E. Smith, and J.W. Gartner. 1985. Environmentalsetting of San Francisco Bay. Hydrobiologia 129: 1–12.
Corbett, D.R., J. Chanton, W. Burnett, K. Dillon, C. Rutkowski, andJ.W. Fourqurean. 1999. Patterns of groundwater discharge intoFlorida Bay. Limnology and Oceanography 44: 1045–1055.
de Sieyes, N.R., K.M. Yamahara, B.A. Layton, E.H. Joyce, and A.B.Boehm. 2008. Submarine discharge of nutrient-enriched freshgroundwater at Stinson Beach, California is enhanced during neaptides. Limnology and Oceanography 53: 1434–1445.
Dugdale, R.C., F.P. Wilkerson, A. Marchi, and V. Hogue. 2006. Nu-trient controls on new production in the Bodega Bay, California,coastal upwelling plume. Deep-Sea Research II 53: 3049–3062.
Dugdale, R.C., F.P. Wilkerson, V.E. Hogue, and A. Marchi. 2007. Therole of ammonium and nitrate in spring bloom development in SanFrancisco Bay. Estuarine, Coastal, and Shelf Science 73: 17–29.
Garcia-Solsona, E., J. Garcia-Orellana, P. Masque, and H. Dulaiova.2008. Uncertainties associated with 223Ra and 224Ra measure-ments in water via a delayed coincidence counter (RaDeCC).Marine Chemistry. doi:org/10.1016/j.marchem.2007.11.006.
Garrison, G.H., C.R. Glenn, and G.M. McMurtry. 2003. Measurementof submarine groundwater discharge in Kahana Bay, O‘ahu,Hawai‘i. Limnology and Oceanography 48: 920–928.
Grenz, C., J.E. Cloern, S.W. Hager, and B.E. Cole. 2000. Dynamics ofnutrient cycling and related benthic nutrient and oxygen fluxesduring a spring phytoplankton bloom in South San Francisco Bay(USA). Marine Ecology Progress Series 197: 67–80.
Hammond, D.E., and C. Fuller. 1979. The use of radon-222 to estimatebenthic exchange and atmospheric exchange rates. In San Fran-cisco Bay, the urbanized estuary, ed. T.J. Conomos, 213–230.
Washington, D. C.: Pacific Division of the American Associationfor the Advancement of Science.
Hammond, D.E., C. Fuller, D. Harmon, B. Hartman, M. Korosec, L.G.Miller, R. Rea, S. Warren, W. Berelson, and S.W. Hager. 1985.Benthic fluxes in San Francisco Bay. Hydrobiologia 129: 69–90.
Hartman, B., and D.E. Hammond. 1984. Gas exchange rates across thesediment–water and air–water interfaces in south San FranciscoBay. Journal of Geophysical Research 89: 3593–3603.
Hodgkiss, I.J., and K.C. Ho. 1997. Are changes in N:P ratios in coastalwaters the key to increased red tide blooms? Hydrobiologia.doi:10.1023/A:1003046516964.
Hsu, K., and M. Stacey. 2011. Exchange between an estuary and anintertidal marsh and slough. Daytona Beach: Coastal and Estua-rine Research Federation.
Hwang, D., G. Kim, Y. Lee, and H. Yang. 2005. Estimating submarineinputs of groundwater and nutrients to a coastal bay using radiumisotopes. Marine Chemistry 96: 61–71.
Jaffe, B. and A. Foxgrover. 2006. A history of intertidal flat area inSouth San Francisco Bay, California: 1858 to 2005. USGS Open-File Report 2006-1262.
Jassby, A.D., J.E. Cloern, and B.E. Cole. 2002. Annual primary pro-duction: patterns and mechanisms of change in a nutrient-richtidal ecosystem. Limnology and Oceanography 47: 698–712.
Kennish, M.J. 2001. Coastal salt marsh systems in the U.S.: A review ofanthropogenic impacts. Journal of Coastal Research 17: 731–748.
Knee, K.L., B.A. Layton, J.H. Street, A.B. Boehm, and A. Paytan.2008. Sources of nutrients and fecal indicator bacteria to near-shore waters on the North Shore of Kaua’i (Hawai’i, USA).Estuaries and Coasts. doi:10.1007/s12237-008-9055-6.
Knee, K.L., J.H. Street, E.E. Grossman, A.B. Boehm, and A. Paytan.2010. Nutrient inputs to the coastal ocean from submarinegroundwater discharge in a groundwater-dominated system: rela-tion to land use (Kona coast, Hawaii, U.S.A.). Limnology andOceanography. doi:10.4319/lo.2010.55.3.1105.
Knowles, N., and D.R. Cayan. 2002. Potential effects of global warm-ing on Sacramento/San Joaquin watershed and the San Franciscoestuary. Geophysical Research Letters . doi:10.1029/2001GL014339.
Krest, J.M., and J.W. Harvey. 2003. Using natural distributions ofshort-lived radium isotopes to quantify groundwater dischargeand recharge. Limnology and Oceanography 48: 290–298.
Krest, J.M., W.S. Moore, L.R. Gardner, and J.T. Morris. 2000. Marshnutrient export supplied by groundwater discharge: evidence fromradium measurements. Global Biogeochemical Cycles 14: 167–176.
Mao, X., P. Enot, D.A. Barry, L. Li, A. Binley, and D.S. Jeng. 2006. Tidalinfluence on behavior of a coastal aquifer adjacent to a low-reliefestuary. Journal of Hydrology. doi:10.1016/j.jhydrol.2005.11.030.
Michael, H.A., A.E. Mulligan, and C.F. Harvey. 2005. Seasonal oscil-lations in water exchange between aquifers and the coastal ocean.Nature. doi:10.1038/nature03935.
Moore, W.S. 1976. Sampling 228Ra in the deep ocean. Deep SeaResearch and Oceanographic Abstracts 23: 647–651.
Moore, W.S. 1996. Large groundwater inputs to coastal watersrevealed by 226Ra enrichments. Nature 380: 612–614.
Moore, W.S. 1999. The subterranean estuary: A reaction zone ofground water and seawater. Marine Chemistry 65: 111–125.
Moore, W.S. 2000. Ages of continental shelf water determined from223Ra and 224Ra. Journal of Geophysical Research 105: 22,117–22,122.
Moore, W.S. 2003. Sources and fluxes of submarine groundwaterdischarge delineated by radium isotopes. Biogeochemistry 66:75–93.
Moore, W.S. 2010. The effect of submarine groundwater discharge onthe ocean. Annual Review of Marine Science. doi:10.1146/annurev-marine-120308-081019.
Estuaries and Coasts

Moore, W.S., and R. Arnold. 1996. Measurement of 223Ra and 224Rain coastal waters using a delayed coincidence counter. Journal ofGeophysical Research 101: 1321–1329.
Moore, W.S., and J. de Oliveira. 2008. Determination of residence timeand mixing processes of the Ubatuba, Brazil, inner shelf watersusing natural Ra isotopes. Estuarine, Coastal, and Shelf Science76: 512–521.
Nakada, S., J. Yasumoto, M. Taniguchi, and T. Ishitobi. 2011. Subma-rine groundwater discharge and seawater circulation in a subter-ranean estuary beneath a tidal flat. Hydrologic Processes.doi:10.1002/hyp.8016.
Nichols, F.H., J.E. Cloern, S.N. Luoma, and D.H. Peterson. 1986. Themodi f i ca t i on of an es tua ry. Sc i ence . do i :10 .1126 /science.231.4738.567.
Nielsen, P. 1990. Tidal dynamics of the water table in beaches. WaterResources Research 26: 2127–2134.
Null, K.A., D.R. Corbett, D.J. DeMaster, J.M. Burkholder, C.J. Thomas,and R.E. Reed. 2011. Porewater advection of ammonium into theNeuse River Estuary, North Carolina, USA. Estuarine, Coastal, andShelf Science. doi:10.1016/j.ecss.2011.09.016.
Okubo, A. 1971. Oceanic diffusion diagrams. Deep-Sea Research 18:789–802.
Paerl, H.W. 2009. Controlling eutrophication along the freshwater–marine continuum: dual nutrient (N and P) reductions are essen-tial. Estuaries and Coasts. doi:10.1007/s12237-009-9158-8.
Paytan, A., G.G. Shellenbarger, J.H. Street, M.E. Gonneea, K. Davis,M.B. Young, and W.S. Moore. 2006. Submarine groundwaterdischarge: an important source of new inorganic nitrogen to coralreef ecosystems. Limnology and Oceanography 51: 343–348.
Pennock, J.R. 1987. Temporal and spatial variability in phytoplanktonammonium and nitrate uptake in the Delaware Bay. Estuarine,Coastal and Shelf Science 24: 841–857.
Porterfield, G. N., L. Hawley and C. A. Dunnam. 1961. Fluvial sedi-ments transported by streams tributary to the San Francisco Bayarea. U.S. Geol. Survey Open-File Rep., 70 pp.
Rama, and W.S. Moore. 1996. Using the radium quartet for evaluatinggroundwater input and water exchange in salt marshes. Geochi-mica et Cosmochimica Acta 60: 4645–4652.
Redfield, A.C. 1934. On the proportions of organic derivatives inseawater and their relation to the composition of plankton. InJames Johnson memorial volume, ed. R.J. Daniel, 177–192. Liv-erpool: Liverpool Univ. Press.
Robinson, C., B. Gibbes, and L. Li. 2006. Driving mechanisms forgroundwater flow and salt transport in a subterranean estuary. Geo-physical Research Letters. doi:03410.01029/02005GL025247.
Robinson, C., L. Li, and D.A. Barry. 2007. Effect of tidal forcingon a subterranean estuary. Advances in Water Resources 30:851–865.
Schoellhamer, D.H. 2011. Sudden clearing of estuarine watersupon crossing the threshold from transport to supply regula-tion of sediment transport as an erodible sediment pool isdepleted: San Francisco Bay, 1999. Estuaries and Coasts.doi:10.1007/s12237-011-9382-x.
Shellenbarger, G.G., S. Monismith, A. Genin, and A. Paytan. 2006.The importance of submarine groundwater discharge to the near-shore nutrient supply in the Gulf of Aqaba (Israel). Limnology andOceanography 51: 1876–1886.
Sigman, D.M., K.L. Casciotti, M. Andreani, C. Barford, M. Galanter,and J.K. Bohlke. 2001. A bacterial method for the nitrogenisotopic analysis of nitrate in seawater and freshwater. AnalyticalChemistry. doi:10.1021/ac010088e.
Singleton, M.J., K.N. Woods, M.E. Conrad, D.J. Depaolo, and P.E.Dresel. 2005. Tracking sources of unsaturated zone and ground-water nitrate contamination using nitrogen and oxygen stableisotopes at the Hanford Site, Washington. Environmental ScienceTechnology. doi:10.1021/es0481070.
Slomp, C.P., and P. Van Cappellen. 2004. Nutrient inputs to the coastalocean through submarine groundwater discharge: controls andpotential impact. Journal of Hydrology 295: 64–86.
Smith, S.V., and J.T. Hollibaugh. 2006. Water, salt, and nutrientexchanges in San Francisco Bay. Limnology and Oceanography51: 504–517.
Spinelli, G.A., A.T. Fisher, C.G. Wheat, M.D. Tryon, K.M. Brown,and A.R. Flegal. 2002. Groundwater seepage into northern SanFrancisco Bay: implications for dissolved metals budgets. WaterResources Research. doi:10.1029/2001WR000827.
Spiteri, C., C.P. Slomp, M.A. Charette, K. Tuncay, and C. Meile. 2008.Flow and nutrient dynamics in a subterranean estuary (WaquoitBay, MA, USA): field data and reactive transport modeling. Geo-chimica et Cosmochimica Acta 72: 3398–3412.
Swarzenski, P.W., and J.A. Izbicki. 2009. Coastal groundwater dynam-ics off Santa Barbara, California: combining geochemical tracers,electromagnetic seepmeters, and electrical resistivity. Estuarine,Coastal, and Shelf Science. doi:10.1016/j.ecss.2009.03.027.
Swarzenski, P.W., C. Reich, K. Kroeger, and M. Baskaran. 2007. Raand Rn istotopes as natural tracers of submarine groundwaterdischarge in Tampa Bay, Florida. Marine Chemistry.doi:10.1016/j.marchem.2006.08.001.
Taniguchi, M., W.C. Burnett, J.E. Cable, and J.V. Turner. 2002. Inves-tigation of submarine groundwater discharge. Hydrologic Pro-cesses 16: 2115–2129.
Taniguchi, M., T. Ishitobi, W. Burnett, and G. Wattayakorn. 2007.Evaluating ground water-sea water via resistivity and seepagemeters. Ground water. doi:10.1111/j.1745-6584.2007.00343.x.
Taniguchi, M., T. Ishitobi, and J. Shimada. 2006. Dynamics ofsubmarine groundwater discharge and freshwater–seawaterinterface. Journal of Geophysical Research. doi:10.1029/2005JC002924.
Valiela, I., J. Costa, K. Foreman, J. Teal, B. Howes, and D. Aubrey.1990. Transport of groundwater-borne nutrients from watershedsand their effects on coastal waters. Biogeochemistry. doi:10.1007/BF00003143.
Valiela, I., K. Foreman, M. Lamontagne, D. Hersh, J. Costa, P. Peckol,B. DeMeo-Anderson, C. D’Avanzo, M. Babione, and C.C. Sham.1992. Couplings of watersheds and coastal waters: sources andconsequences of nutrient enrichment in Waquoit Bay, Massachu-setts. Estuaries and Coasts. doi:10.2307/1352389.
Vrede, T., A. Ballantyne, C. Mille-Lindblom, G. Algesten, C. Gudasz,S. Lindahl, and A.K. Brunberg. 2009. Effects of N:P loadingratios on phytoplankton community composition, primary pro-duction and N fixation in a eutrophic lake. Freshwater Biology54: 331–344.
Walters, R.A., R.T. Cheng, and J.T. Conomos. 1985. Time scales ofcirculation and mixing processes of San Francisco Bay waters.Hydrobiologia 129: 13–36.
Wankel, S.D., C. Kendall, C.A. Francis, and A. Paytan. 2006. Nitrogensources and cycling in the San Francisco Bay estuary: A nitratedual isotopic composition approach. Limnology and Oceanogra-phy 51: 1654–1664.
Wilkerson, F., R. Dugdale, V. Hogue, and A. Marchi. 2006. Phyto-plankton blooms and nitrogen productivity in San Francisco Bay.Estuaries and Coasts 29: 401–416.
Estuaries and Coasts