effect of truck loads on bridges
TRANSCRIPT
E F F E C T O F T R U C K L O A D S ON B R I D G E S
By Andrzej S. Nowak, s Hani Nassif, z and Leo DeFrain 3
(Reviewed by the Highway Division)
ABSTRACT: This paper determines the truck-load spectra for highway bridges. The weigh-in-motion data was collected at weigh stations located on Highways 1-75 and 1-94. The total number of trucks considered in this study is over 600,000. For each truck, the measured parameters include axle loads and axle spacings. Bridge load is considered in terms of moments and shears. Therefore, maximum moments and shears are calculated for each truck for various span lengths. The results are plotted on the normal-probability paper to facilitate statistical interpre- tations. The cumulative distribution functions of moments and shears are used to extrapolate the results to predict the maximum forces in longer time periods, up to 75 years. Truck counts were carried out on U.S.-23 and 1-94 to determine the number of trucks per lane and multiple presence frequency in lane and side by side.
INTRODUCTION
This study determines actual truck loads on interstate highways. The need for a reliable truck weight da ta has been recognized by many state depar t - ments of t ranspor ta t ion (DOTs) . For many years, truck-weight measure- ments were collected by s tat ionary weigh scales located on major highways. For example, the state of Michigan allows considerably higher truck loads than most of the other states, for example , for l l - a x l e trucks the weight limit is over 665 kN (150 kips) [versus 355 kN (80 kips)]; therefore, there is a need to know the actual loads.
Evaluation of bridges is an increasingly impor tant topic in the effort to deal with the deter iorat ing infrastructure. There is a need for accurate and inexpensive methods to de te rmine the actual strength of the bridge, its remaining life, and the actual load spectrum. M a j o r factors that have con- tributed to the present de ter iora t ion are age, inadequate maintenance, in- creasing load spectra, and environmenta l contaminat ion. Deficient bridges are posted, repaired, or replaced. The disposit ion of bridges involves clear economical and safety implications. To avoid high costs of rep lacement or repair, the evaluat ion must accurately reveal the present load-carrying ca- pacity of the structure and predict loads and any further changes in the capacity (deter iorat ion) in the applicable t ime span.
The knowledge of actual load spectra may reduce the uncertainty involved in the evaluation. It is needed in evaluat ion of the load-carrying capacity, prediction of the rate of de ter iora t ion (corrosion), and remaining life (fa- tigue). Therefore , the Federa l Highway Adminis t ra t ion ( F H W A ) sponsored an extensive weigh-in-motion (WIM) measurement program to develop a
1Prof. of Civ. Engrg., Univ. of Michigan, Ann Arbor, MI 48109. 2Asst. Prof., Dept. of Civ. Engrg. and Constr., Bradley Univ., Peoria, IL 61625;
formerly, Res. Asst., Dept. of Civ. Engrg., Univ. of Michigan, Ann Arbor, MI. 3Supervisor, Instrumentation Group, Michigan Dept. of Transportation, Lansing,
MI 48909. Note. Discussion open until May 1, 1994. To extend the closing date one month,
a written request must be filed with the ASCE Manager of Journals. The manuscript for this paper was submitted for review and possible publication on October 6, 1992. This paper is part of the Journal of Transportation Engineering, Vol. 119, No. 6, November/December, 1993. �9 ISSN 0733-947X/93/0006-0853/$1.00 + $.15 per page. Paper No. 4906.
853
J. T
rans
p. E
ng. 1
993.
119:
853-
867.
Dow
nloa
ded
from
asc
elib
rary
.org
by
Kyu
ng H
ee U
nive
rsity
on
06/2
6/12
. For
per
sona
l use
onl
y.N
o ot
her
uses
with
out p
erm
issi
on. C
opyr
ight
(c)
201
2. A
mer
ican
Soc
iety
of
Civ
il E
ngin
eers
. All
righ
ts r
eser
ved.
TABLE 1. Results of Truck Count on 1-94
Hour (1)
09-10 a.m. 10-11 a.m.l 11-12 a.m. 12-01 p.m.] 01-02 p.m.l 02-03 p.m. 03-04 p.m. 04-05 p.m. 05-06 p.m.;
[Total]
EASTBOUND
Side by Side
Right Left in Tan- lane lane lane dem Behind (2) (3) (4) (5) (6)
241 33 8 0 14 200 24 4 4 10 170 15 0 4 4 172 14 0 6 4 172 15 0 6 4 153 6 0 2 0 178 17 0 4 4 147 15 2 2 4 149 12 8 0 4
1,582 151 14 28 48
WESTBOUND
Side by Side
Right LeR lane lane (7) (8)
274 45 236 49 247 42 255 42 215 17 235 41 220 43 215 41 176 29
2,073 349
In Tan- lane dem Behind (9) (10) (11)
6 8 14 2 16 12 2 12 16 0 12 11 0 4 4 0 16 4 2 8 14 2 4 12 0 6 6
14 86 93
TABLE 2. Results of Truck Count on U.S.-23
SOUTHBOUND
SidebySide
NORTHBOUND
SidebySide
Right Left In Tan- Right Left Hour lane lane lane dem Behine lane lane (1) (2) (3) (4) (5) (6) (7) (8)
05-08 a.m. 273 63 0 14 4 222 68 08-09 a.m. 141 38 2 4 11 100 54 09-11 a.m. 317 57 8 2 15 211 114 11-01 p.m. 302 52 4 2 10 208 119 01-03 p.m. 302 50 2 10 10 227 94 03-05 p.m. 234 65 4 4 14 194 101 05-06 p.m. 116 46 0 4 12 85 51
[Total] 1,685 371 24 40 76 1,247 601
In Tan- lane dem Behind (9) (10) (11)
0 8 6 0 0 0 0 8 6 0 8 10 0 10 6 0 4 4 2 0 2 2 38 34
TABLE 3. Observed Number of Axles on U.S.-23
Number of axles (1)
2 3 4 5 6 7 8 9
10 11
Percentage of Trucks
Southbound (2)
16.3 5.5 4.8
64,4 3.7 1.6 0.6 1.0 0.3 1.8
No~hbound (3)
11.6 4.9 2.9
70.5 3.6 1.3 0.9 0.4 0.4 3.5
854
J. T
rans
p. E
ng. 1
993.
119:
853-
867.
Dow
nloa
ded
from
asc
elib
rary
.org
by
Kyu
ng H
ee U
nive
rsity
on
06/2
6/12
. For
per
sona
l use
onl
y.N
o ot
her
uses
with
out p
erm
issi
on. C
opyr
ight
(c)
201
2. A
mer
ican
Soc
iety
of
Civ
il E
ngin
eers
. All
righ
ts r
eser
ved.
TABLE 4. Multiple Truck Occurrence
Highway (1)
1-94 1-94 U.S.-23 U.S.-23 [Total]
Direction (2)
Eastbound Westbound Southbound Northbound
In lane (3) 0.8 0.6 1.1 0.1 0.6
MULTIPLE PRESENCE (%)
Side by Side
Tandem Behind (4) (5)
1.6 2.8 3.6 3.8 1.9 3.7 2.t 1.8 2.4 3.1
Total (6) 4 .4
7.4 5.6 3.9 5.5
TABLE 5. Number of Trucks in Survey on 1-75
Year Month North South Total (1) (2) (3) (4) (5)
1987 1987 1987 1987 1987 1987 1987 1987 1987 1987 1987 1988 1988 1988 1988
1987 and 1988
March April May June July August September October November December [Total] January February March [Total]
33,092 32,898 16,881 32,196 32,187 51,408 50,816 15,815 56,233 5,832
327,358 50,777 39,136 48,397
135,073 462,431
13,766 3,874
32,580 17,618
30,508 95,508 32,943 22,963 16,676 70,920
166,428
m
m
422,866
205,993 628,859
TABLE 6. Relationship between z and p
z p (1) (2) - 2 - 1
0 1 2 3 4 5 6
0.9772 0.841 0.5 0.159 0.0228 0.0135 0.0000317 0.000000287 0.000000000987
truck-weigh da ta base. Measurements were taken in various locations in the United States for long per iods of t ime. Processing the da ta was the object ive of N C H R P Project 12-28(11), called "Deve lopmen t of Site-Specific Live Load Models for Br idges ." However , it tu rned out that the available data base includes large errors ( 4 0 - 5 0 % ) and cannot be used.
855
J. T
rans
p. E
ng. 1
993.
119:
853-
867.
Dow
nloa
ded
from
asc
elib
rary
.org
by
Kyu
ng H
ee U
nive
rsity
on
06/2
6/12
. For
per
sona
l use
onl
y.N
o ot
her
uses
with
out p
erm
issi
on. C
opyr
ight
(c)
201
2. A
mer
ican
Soc
iety
of
Civ
il E
ngin
eers
. All
righ
ts r
eser
ved.
O
ffJ
0 r
6
5
4
3
2
i
0 '
-2
-3
-4 0
18 m (60 ft) i 27 m (90 ft)
m / / . ~1 (30 f~ , j /~j (150 ft)
9
/
|
2 3
M o m e n t / H S 2 0 M o m e n t
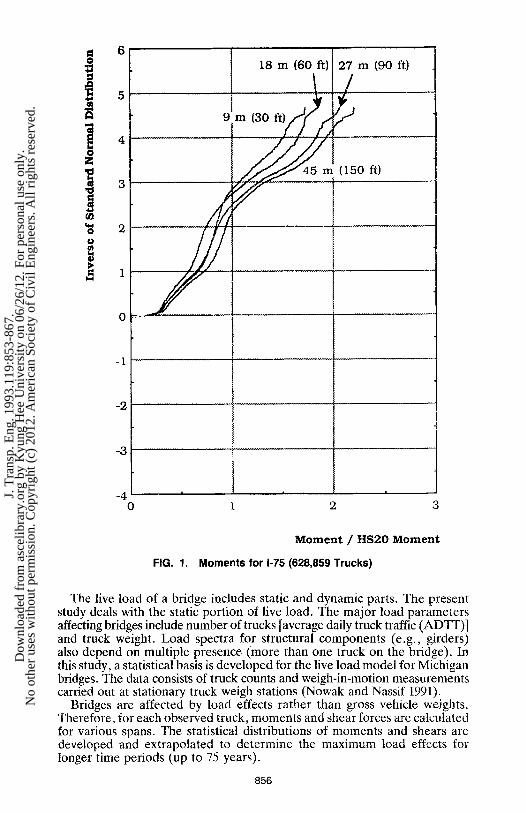
FIG. 1. Moments for 1-75 (628,859 Trucks)
The live load of a bridge includes static and dynamic parts. The present study deals with the static portion of live load. The major load parameters affecting bridges include number of trucks [average daily truck traffic (ADTF)] and truck weight. Load spectra for structural components (e.g., girders) also depend on multiple presence (more than one truck on the bridge). In this study, a statistical basis is developed for the live load model for Michigan bridges. The data consists of truck counts and weigh-in-motion measurements carried out at stationary truck weigh stations (Nowak and Nassif 1991).
Bridges are affected by load effects rather than gross vehicle weights. Therefore, for each observed truck, moments and shear forces are calculated for various spans. The statistical distributions of moments and shears are developed and extrapolated to determine the maximum load effects for longer time periods (up to 75 years).
856
J. T
rans
p. E
ng. 1
993.
119:
853-
867.
Dow
nloa
ded
from
asc
elib
rary
.org
by
Kyu
ng H
ee U
nive
rsity
on
06/2
6/12
. For
per
sona
l use
onl
y.N
o ot
her
uses
with
out p
erm
issi
on. C
opyr
ight
(c)
201
2. A
mer
ican
Soc
iety
of
Civ
il E
ngin
eers
. All
righ
ts r
eser
ved.
0
! 0 @
6
i i 8 ' m (60 it)' 27 m (90 ft} .... i
0
-2
-3
9 m (30 tt)~y 7 / / '~ ( / /
~ ~ m (150 ft)
/// (
-4 0 1 2 3
M o m e n t / H S 2 0 M o m e n t
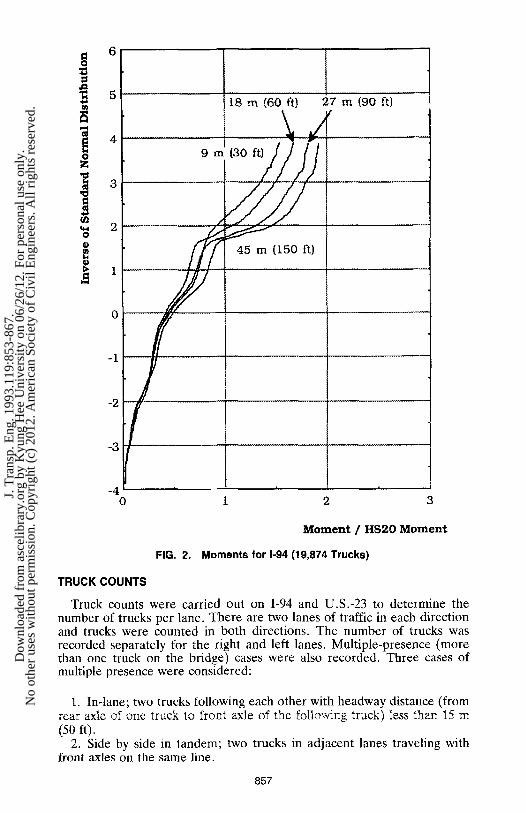
FIG. 2. Moments for 1-94 (19,874 Trucks)
TRUCK COUNTS
Truck counts were carried out on 1-94 and U.S.-23 to determine the number of trucks per lane. There are two lanes of traffic in each direction and trucks were counted in both directions. The number of trucks was recorded separately for the right and left lanes. Multiple-presence (more than one truck on the bridge) cases were also recorded. Three cases of multiple presence were considered:
1. In-lane; two trucks following each other with headway distance (from rear axle of one truck to front axle of the following truck) less than 15 m (50 ft).
2. Side by side in tandem; two trucks in adjacent lanes traveling with front axles on the same line.
857
J. T
rans
p. E
ng. 1
993.
119:
853-
867.
Dow
nloa
ded
from
asc
elib
rary
.org
by
Kyu
ng H
ee U
nive
rsity
on
06/2
6/12
. For
per
sona
l use
onl
y.N
o ot
her
uses
with
out p
erm
issi
on. C
opyr
ight
(c)
201
2. A
mer
ican
Soc
iety
of
Civ
il E
ngin
eers
. All
righ
ts r
eser
ved.
|
@
FIG. 3. (60 ft)
0
-2 / !
Southbound
Northbound
- 4 i i i
0 1 2 3
Moment / HS20 M o m e n t
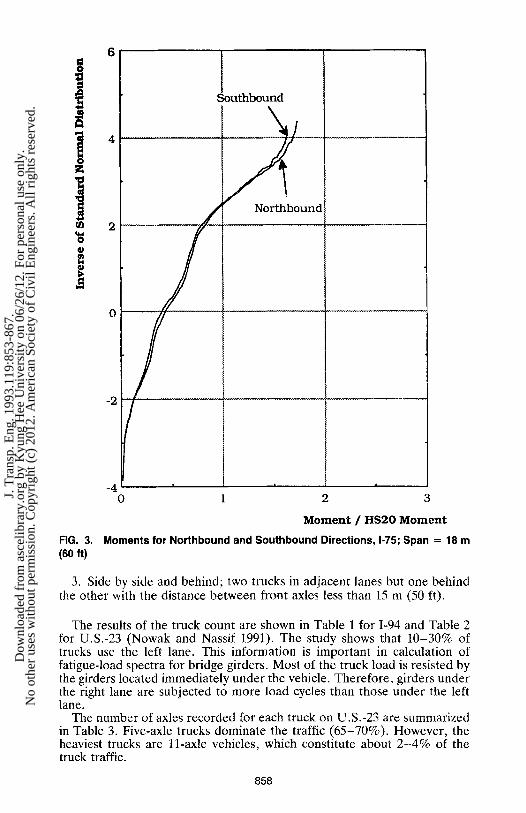
Moments for Northbound and Southbound Directions, 1-75; Span = 18 m
3. Side by side and behind; two trucks in adjacent lanes but one behind the other with the distance between front axles less than 15 m (50 ft).
The results of the truck count are shown in Table 1 for 1-94 and Table 2 for U.S.-23 (Nowak and Nassif 1991). The study shows that 10-30% of trucks use the left lane. This information is important in calculation of fatigue-load spectra for bridge girders. Most of the truck load is resisted by the girders located immediately under the vehicle. Therefore, girders under the right lane are subjected to more load cycles than those under the left lane.
Tile number of axles recorded for each truck on U.S.-23 are summarized in Table 3. Five-axle trucks dominate the traffic (65-70%). However, the heaviest trucks are ll-axle vehicles, which constitute about 2 -4% of the truck traffic.
858
J. T
rans
p. E
ng. 1
993.
119:
853-
867.
Dow
nloa
ded
from
asc
elib
rary
.org
by
Kyu
ng H
ee U
nive
rsity
on
06/2
6/12
. For
per
sona
l use
onl
y.N
o ot
her
uses
with
out p
erm
issi
on. C
opyr
ight
(c)
201
2. A
mer
ican
Soc
iety
of
Civ
il E
ngin
eers
. All
righ
ts r
eser
ved.
g
i ]
5 i .
I
4 i .....
3 1 .....
,,~ 2 ' ..... O
i 1 ' ~
1988 ~ , A - ~ ' - 1987
0
-1
-2
-3
- 4 u
0 1 2 3
M o m e n t / H S 2 0 M o m e n t
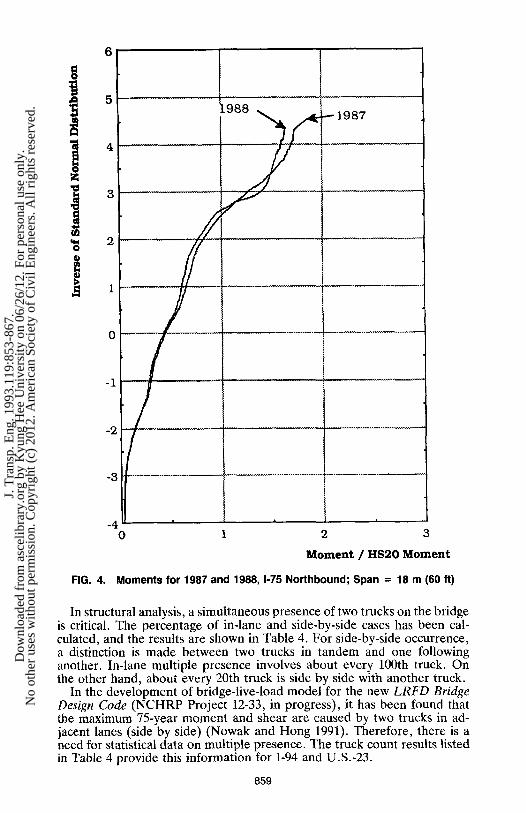
FIG. 4. Moments for 1987 and 1988, 1-75 Northbound; Span = 18 m (60 ft)
In structural analysis, a simultaneous presence of two trucks on the bridge is critical. The percentage of in-lane and side-by-side cases has been cal- culated, and the results are shown in Table 4. For side-by-side occurrence, a distinction is made between two trucks in tandem and one following another. In-lane multiple presence involves about every 100th truck. On the other hand, about every 20th truck is side by side with another truck.
In the development of bridge-live-load model for the new LRFD Bridge Design Code (NCHRP Project 12-33, in progress), it has been found that the maximum 75-year moment and shear are caused by two trucks in ad- jacent lanes (side by side) (Nowak and Hong 1991). Therefore, there is a need for statistical data on multiple presence. The truck count results listed in Table 4 provide this information for 1-94 and U.S.-23.
859
J. T
rans
p. E
ng. 1
993.
119:
853-
867.
Dow
nloa
ded
from
asc
elib
rary
.org
by
Kyu
ng H
ee U
nive
rsity
on
06/2
6/12
. For
per
sona
l use
onl
y.N
o ot
her
uses
with
out p
erm
issi
on. C
opyr
ight
(c)
201
2. A
mer
ican
Soc
iety
of
Civ
il E
ngin
eers
. All
righ
ts r
eser
ved.
6
o
,
2 o @
-I
-2
-3
.................... March
April
. . . . . May
.......... ,June
.......... July
August
September
October
November
December
0 i 2 3
M o m e n t / H S 2 0 M o m e n t
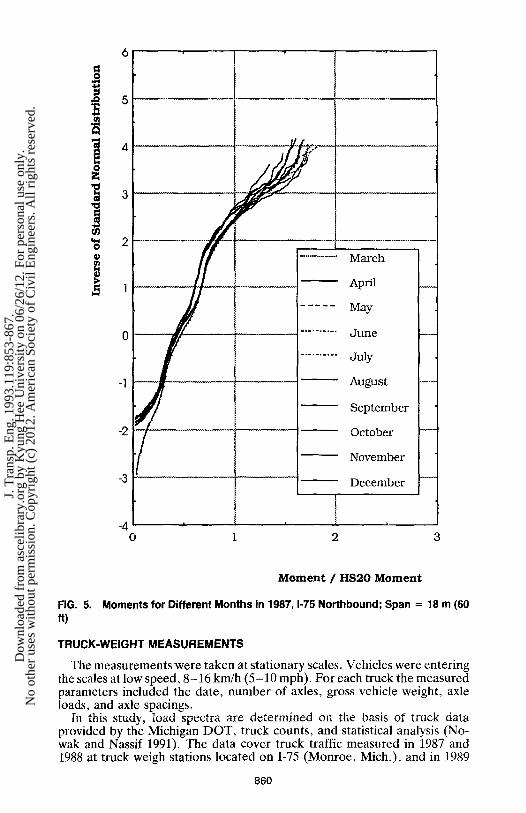
FIG. 5. Moments for Different Months in 1987, 1-75 Northbound; Span = 18 m (60 ft)
TRUCK-WEIGHT MEASUREMENTS
The measurements were taken at stationary scales. Vehicles were entering the scales at low speed, 8-16 km/h (5-10 mph). For each truck the measured parameters included the date, number of axles, gross vehicle weight, axle loads, and axle spacings.
In this study, load spectra are determined on the basis of truck data provided by the Michigan DOT, truck counts, and statistical analysis (No- wak and Nassif 1991). The data cover truck traffic measured in 1987 and 1988 at truck weigh stations located on 1-75 (Monroe, Mich.), and in 1989
860
J. T
rans
p. E
ng. 1
993.
119:
853-
867.
Dow
nloa
ded
from
asc
elib
rary
.org
by
Kyu
ng H
ee U
nive
rsity
on
06/2
6/12
. For
per
sona
l use
onl
y.N
o ot
her
uses
with
out p
erm
issi
on. C
opyr
ight
(c)
201
2. A
mer
ican
Soc
iety
of
Civ
il E
ngin
eers
. All
righ
ts r
eser
ved.
~ 6 O
4
0
3
~ 2 0
0
-1
-2
-3
-4 0
9 m (30 ft)
J
18 m 27 m ....... 60 ft . --90 ft.,,
~ 5 m (150 ~)
i
2
Shear / H S 2 0 Shear
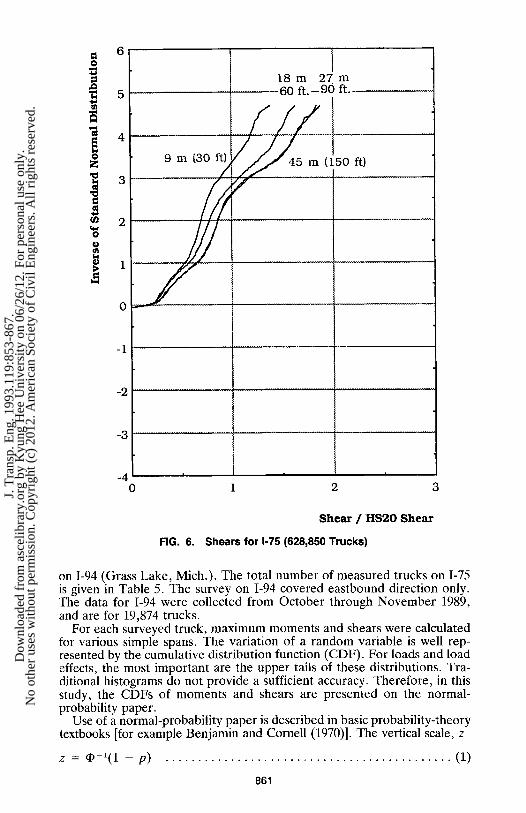
FIG. 6. Shears for 1-75 (628,850 Trucks)
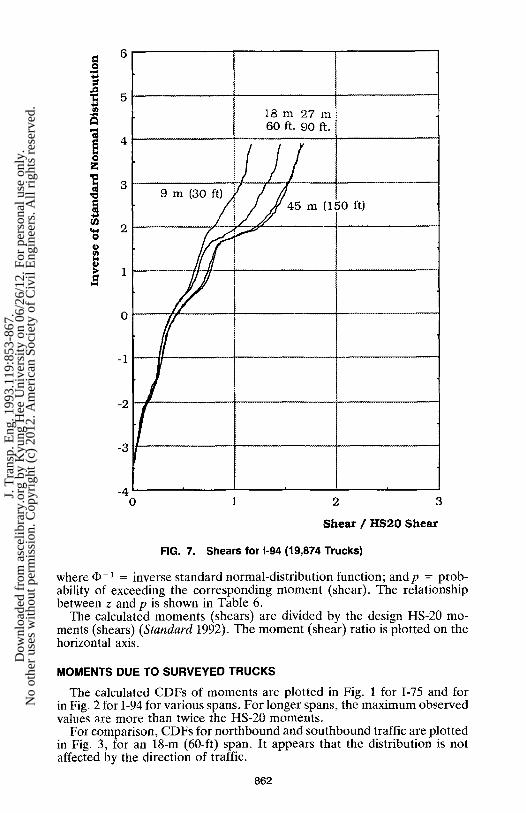
on 1-94 (Grass Lake, Mich.). The total number of measured trucks on 1-75 is given in Table 5. The survey on 1-94 covered eastbound direction only. The data for 1-94 were collected from October through November 1989, and are for 19,874 trucks.
For each surveyed truck, maximum moments and shears were calculated for various simple spans. The variation of a random variable is well rep- resented by the cumulative distribution function (CDF). For loads and load effects, the most important are the upper tails of these distributions. Tra- ditional histograms do not provide a sufficient accuracy. Therefore, in this study, the CDFs of moments and shears are presented on the normal- probability paper.
Use of a normal-probability paper is described in basic probability-theory textbooks [for example Benjamin and Cornell (1970)]. The vertical scale, z
= ~ - 1 ( 1 - p ) . . . . . . . . . . . . . . . . . . . . . . . . . . . . . . . . . . . . . . . . . . . . ( 1 )
861
J. T
rans
p. E
ng. 1
993.
119:
853-
867.
Dow
nloa
ded
from
asc
elib
rary
.org
by
Kyu
ng H
ee U
nive
rsity
on
06/2
6/12
. For
per
sona
l use
onl
y.N
o ot
her
uses
with
out p
erm
issi
on. C
opyr
ight
(c)
201
2. A
mer
ican
Soc
iety
of
Civ
il E
ngin
eers
. All
righ
ts r
eser
ved.
= 6
-a 4
0 Z
3
I 2
0
- i
1 8 m 2 7 m 60 ft. 90 ft.
i l l 9 m (30 f ? f / / 4 5 m (150 ft)
-2
-3
-4 0 1 2 3
S h e a r / H S 2 0 S h e a r
FIG. 7. Shears for 1-94 (19,874 Trucks)
where qb-1 = inverse standard normal-distribution function; and p = prob- ability of exceeding the corresponding moment (shear). The relationship between z and p is shown in Table 6.
The calculated moments (shears) are divided by the design HS-20 mo- ments (shears) (.Standard 1992). The moment (shear) ratio is plotted on the horizontal axis.
MOMENTS DUE TO SURVEYED TRUCKS
The calculated CDFs of moments are plotted in Fig. 1 for 1-75 and for in Fig. 2 for 1-94 for various spans. For longer spans, the maximum observed values are more than twice the HS-20 moments.
For comparison, CDFs for nor thbound and southbound traffic are plotted in Fig. 3, for an 18-m (60-ft) span. It appears that the distribution is not affected by the direction of traffic.
862
J. T
rans
p. E
ng. 1
993.
119:
853-
867.
Dow
nloa
ded
from
asc
elib
rary
.org
by
Kyu
ng H
ee U
nive
rsity
on
06/2
6/12
. For
per
sona
l use
onl
y.N
o ot
her
uses
with
out p
erm
issi
on. C
opyr
ight
(c)
201
2. A
mer
ican
Soc
iety
of
Civ
il E
ngin
eers
. All
righ
ts r
eser
ved.
6
i 3
2 .$
1
0
-1
-2
-3
-4 0
No bound. y
/ //
/ y
f
i
2
Southbound
Shear / HS20 Shear
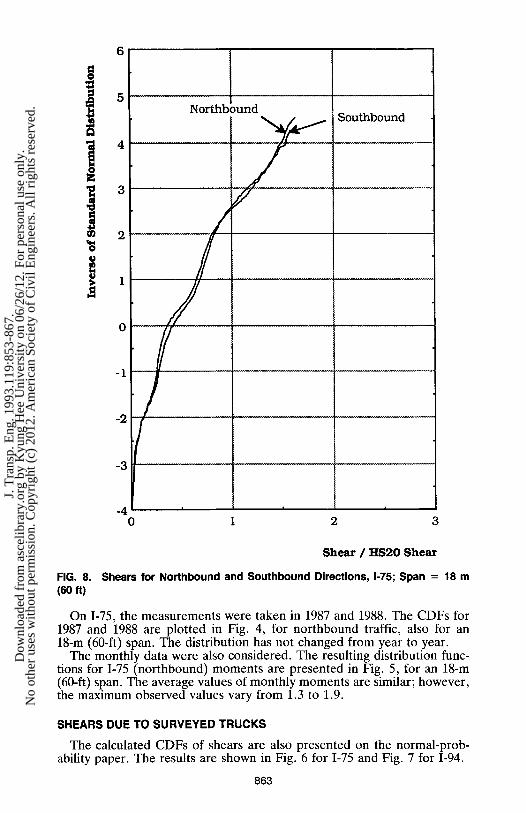
FIG. 8. Shears for Northbound and Southbound Directions, 1-75; Span = 18 m (60 ft)
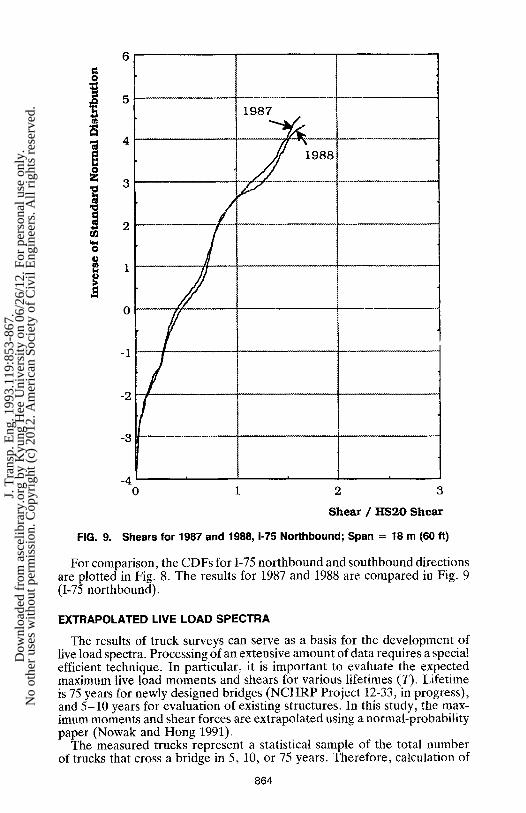
On 1-75, the measurements were taken in 1987 and 1988. The CDFs for 1987 and 1988 are plotted in Fig. 4, for northbound traffic, also for an 18-m (60-ft) span. The distribution has not changed from year to year.
The monthly data were also considered. The resulting distribution func- tions for 1-75 (northbound) moments are presented in Fig. 5, for an 18-m (60-ft) span. The average values of monthly moments are similar; however, the maximum observed values vary from 1.3 to 1.9.
SHEARS DUE TO SURVEYED TRUCKS
The calculated CDFs of shears are also presented on the normal-prob- ability paper. The results are shown in Fig. 6 for 1-75 and Fig. 7 for 1-94.
863
J. T
rans
p. E
ng. 1
993.
119:
853-
867.
Dow
nloa
ded
from
asc
elib
rary
.org
by
Kyu
ng H
ee U
nive
rsity
on
06/2
6/12
. For
per
sona
l use
onl
y.N
o ot
her
uses
with
out p
erm
issi
on. C
opyr
ight
(c)
201
2. A
mer
ican
Soc
iety
of
Civ
il E
ngin
eers
. All
righ
ts r
eser
ved.
5
3
2
1
0
-1
-2
O
0
ill
-3
1987
r 1988i
-4 0 1
i
2 3
Shear / H S 2 0 Shear
FIG. 9. Shears for 1987 and 1988, 1-75 Northbound; Span = 18 m (60 ft)
For comparison, the CDFs for 1-75 northbound and southbound directions are plotted in Fig. 8. The results for 1987 and 1988 are compared in Fig. 9 (I-75 northbound).
EXTRAPOLATED LIVE LOAD SPECTRA
The results of truck surveys can serve as a basis for the development of live load spectra. Processing of an extensive amount of data requires a special efficient technique. In particular, it is important to evaluate the expected maximum live load moments and shears for various lifetimes (T). Lifetime is 75 years for newly designed bridges (NCHRP Proiect 12-33, in progress), and 5-10 years for evaluation of existing structures. In this study, the max- imum moments and shear forces are extrapolated using a normal-probability paper (Nowak and Hong 1991).
The measured trucks represent a statistical sample of the total number of trucks that cross a bridge in 5, 10, or 75 years. Therefore, calculation of
864
J. T
rans
p. E
ng. 1
993.
119:
853-
867.
Dow
nloa
ded
from
asc
elib
rary
.org
by
Kyu
ng H
ee U
nive
rsity
on
06/2
6/12
. For
per
sona
l use
onl
y.N
o ot
her
uses
with
out p
erm
issi
on. C
opyr
ight
(c)
201
2. A
mer
ican
Soc
iety
of
Civ
il E
ngin
eers
. All
righ
ts r
eser
ved.
.wl 6
I 0
W,w O
2
0
z.5.7 i /
Z = 5.20 I
9 m ( ~ 1 5 0 ft)
/
-2 0 I 2 3
Moment / HS20 Moment
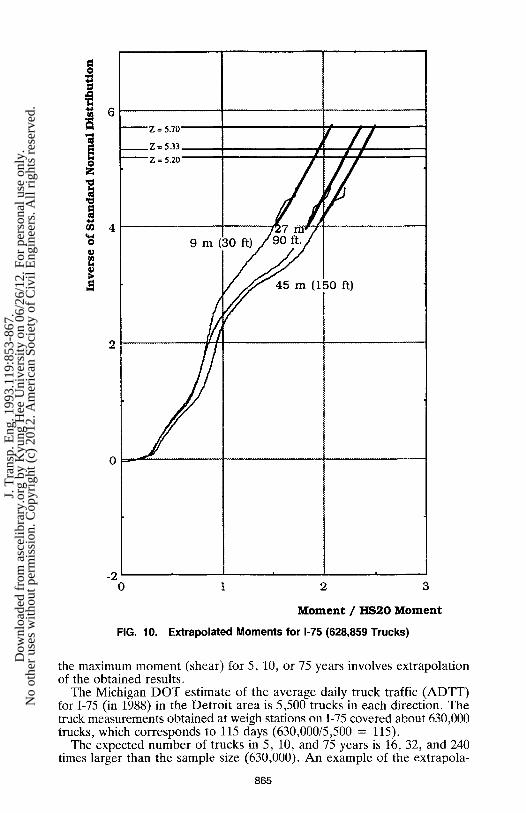
FIG. 10. Extrapolated Moments for 1-75 (628,859 Trucks)
the maximum moment (shear) for 5, 10, or 75 years involves extrapolation of the obtained results.
The Michigan DOT estimate of the average daily truck traffic (ADTT) for 1-75 (in 1988) in the Detroit area is 5,500 trucks in each direction. The truck measurements obtained at weigh stations on 1-75 covered about 630,000 trucks, which corresponds to 115 days (630,000/5,500 = 115).
The expected number of trucks in 5, 10, and 75 years is 16, 32, and 240 times larger than the sample size (630,000). An example of the extrapola-
865
J. T
rans
p. E
ng. 1
993.
119:
853-
867.
Dow
nloa
ded
from
asc
elib
rary
.org
by
Kyu
ng H
ee U
nive
rsity
on
06/2
6/12
. For
per
sona
l use
onl
y.N
o ot
her
uses
with
out p
erm
issi
on. C
opyr
ight
(c)
201
2. A
mer
ican
Soc
iety
of
Civ
il E
ngin
eers
. All
righ
ts r
eser
ved.
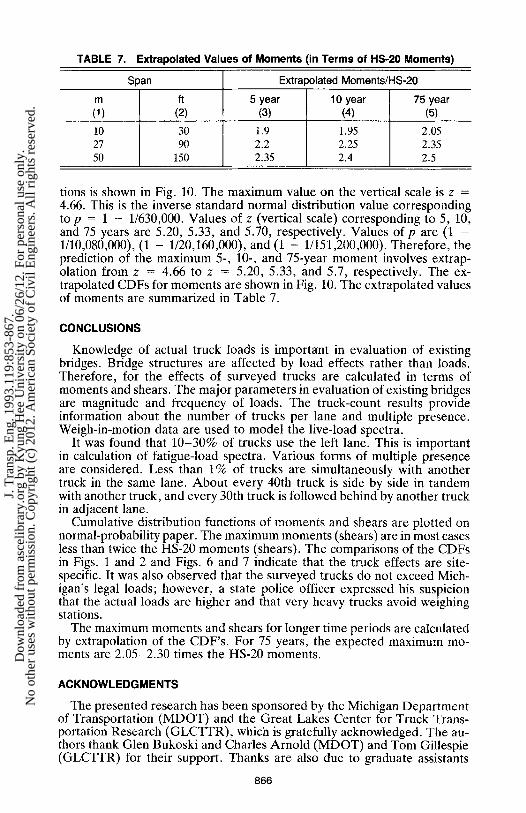
TABLE 7. Extrapolated Values of Moments (in Terms of HS-20 Moments)
Span Extrapolated Moments/HS-20
m ft 5 year 10 year 75 year (t) (2) (3) (4) (5)
10 30 1.9 1.95 2.05 27 90 2.2 2.25 2.35 50 150 2.35 2.4 2.5
tions is shown in Fig. 10. The maximum value on the vertical scale is z = 4.66. This is the inverse standard normal distribution value corresponding to p = 1 - 1/630,000. Values of z (vertical scale) corresponding to 5, 10, and 75 years are 5.20, 5.33, and 5.70, respectively. Values of p are (1 - 1/10,080,000), (1 - 1/20,160,000), and (1 - 1/151,200,000). Therefore, the prediction of the maximum 5-, 10-, and 75-year moment involves extrap- olation from z = 4.66 to z = 5.20, 5.33, and 5.7, respectively. The ex- trapolated CDFs for moments are shown in Fig. 10. The extrapolated values of moments are summarized in Table 7.
CONCLUSIONS
Knowledge of actual truck loads is important in evaluation of existing bridges. Bridge structures are affected by load effects rather than loads. Therefore, for the effects of surveyed trucks are calculated in terms of moments and shears. The major parameters in evaluation of existing bridges are magnitude and frequency of loads. The truck-count results provide information about the number of trucks per lane and multiple presence. Weigh-in-motion data are used to model the live-load spectra.
It was found that 10-30% of trucks use the left lane. This is important in calculation of fatigue-load spectra. Various forms of multiple presence are considered. Less than 1% of trucks are simultaneously with another truck in the same lane. About every 40th truck is side by side in tandem with another truck, and every 30th truck is followed behind by another truck in adjacent lane.
Cumulative distribution functions of moments and shears are plotted on normal-probability paper. The maximum moments (shears) are in most cases less than twice the HS-20 moments (shears). The comparisons of the CDFs in Figs. 1 and 2 and Figs. 6 and 7 indicate that the truck effects are site- specific. It was also observed that the surveyed trucks do not exceed Mich- igan's legal loads; however, a state police officer expressed his suspicion that the actual loads are higher and that very heavy trucks avoid weighing stations.
The maximum moments and shears for longer time periods are calculated by extrapolation of the CDF's. For 75 years, the expected maximum mo- ments are 2.05-2.30 times the HS-20 moments.
ACKNOWLEDGMENTS
The presented research has been sponsored by the Michigan Department of Transportation (MDOT) and the Great Lakes Center for Truck Trans- portation Research (GLCTTR), which is gratefully acknowledged. The au- thors thank Glen Bukoski and Charles Arnold (MDOT) and Tom Gillespie (GLCTTR) for their support. Thanks are also due to graduate assistants
866
J. T
rans
p. E
ng. 1
993.
119:
853-
867.
Dow
nloa
ded
from
asc
elib
rary
.org
by
Kyu
ng H
ee U
nive
rsity
on
06/2
6/12
. For
per
sona
l use
onl
y.N
o ot
her
uses
with
out p
erm
issi
on. C
opyr
ight
(c)
201
2. A
mer
ican
Soc
iety
of
Civ
il E
ngin
eers
. All
righ
ts r
eser
ved.
Tadeusz Alberski, Jeff Laman, Eui-Seung Hwang, and Nagi Aroichane for their help in data processing and truck count.
APPENDIX. REFERENCES
Benjamin, J., and Cornell, C. A. (1970). Probability, statistics and decision for civil engineers. McGraw-Hill, New York, N.Y.
Nowak, A. S., and Nassif, H. (1991). "Effect of truck loading on bridges." Rep. UMCE 91-11, Dept. of Civ. Engrg., Univ. of Michigan, Ann Arbor, Mich.
Nowak, A. S., and Hong, E.-S. (1991). "Bridge live load models." J. Struct. Engrg., ASCE, 117(9), 2757-2767.
Standard specifications for highway bridges. (1992). American Association of State Highway and Transportation Officials (AASHTO), Washington, D.C.
867
J. T
rans
p. E
ng. 1
993.
119:
853-
867.
Dow
nloa
ded
from
asc
elib
rary
.org
by
Kyu
ng H
ee U
nive
rsity
on
06/2
6/12
. For
per
sona
l use
onl
y.N
o ot
her
uses
with
out p
erm
issi
on. C
opyr
ight
(c)
201
2. A
mer
ican
Soc
iety
of
Civ
il E
ngin
eers
. All
righ
ts r
eser
ved.