california clean truck demonstration program
TRANSCRIPT
California Energy Commission Clean Transportation Program
FINAL PROJECT REPORT
California CLEAN Truck Demonstration Program
Prepared for: California Energy Commission Prepared by: CALSTART, Inc.
Gavin Newsom, Governor November 2019 | CEC-600-2019-056
California Energy Commission Michael Ippoliti Jasna Tomic Primary Authors
CALSTART Inc. 48 South Chester Avenue Pasadena, CA 91106 (626) 744-5600CALSTART website www.calstart.org
Grant Number: ARV-11-014
Eric Van Winkle Project Manager
Elizabeth John Office Manager ADVANCED FUELS & VEHICLE TECHNOLOGIES OFFICE
Kevin Barker Deputy Director FUELS AND TRANSPORTATION
Drew Bohan Executive Director
Disclaimer Staff members of the California Energy Commission prepared this report. As such, it does not necessarily represent the views of the Energy Commission, its employees, or the State of California. The Energy Commission, the State of California, its employees, contractors and subcontractors make no warrant, express or implied, and assume no legal liability for the information in this report; nor does any party represent that the uses of this information will not infringe upon privately owned rights. This report has not been approved or disapproved by the Energy Commission nor has the Commiss ion passed upon the accuracy or adequacy of the information in this report.
i
ACKNOWLEDGEMENTS Several CALSTART team members worked on this portfolio of projects and deserve notice because of their strong technical oversight, project partner relationship management and unceasing problem-solving activities. This solid work helped maintain the technical progress that led to important project outcomes over the course of this multi-year contract.
Program Manager Steve Sokolsky served as the staff lead for the off-road projects, notably the Caterpillar hydraulic hybrid excavator and the Volvo Hybrid Electric Wheel Loader. Both projects showed promising results, and one, the Caterpillar hybrid excavator, entered production following the demonstration. Project Manager Chase LeCroy managed and performed supporting survey work for the Odyne hybrid utility bucket truck demonstration. He also, with Project Manager Jean-Baptiste Gallo, provided data collection and analysis support to the Volvo plug in hybrid drayage truck project. Jean-Baptiste was also the staff lead for the Transpower electric class 8 truck. Senior Project Manager Kristian Jokinen assumed management of the Ballard Fuel Cell Bus project mid-way through and helped the team work through fueling issues and has maintained a strong and on-going working relationship with the fleet site host, U.C. Irvine. Research Director Jasna Tomic provided overall technical oversight for those projects where CALSTART acted as the data collection and analysis lead for the individual project. Notably, Senior Program Manager Mike Ippoliti served as the overall leader for the portfolio of projects under this contract, as well as being the project leader for several of the specific projects, among them the Artisan electric drayage truck, the Proterra electric transit bus project and the Motiv electric truck demonstration. CALSTART would also like to respectfully acknowledge the consistent support and adaptability of the California Energy Commission staff, specifically Project Manager Eric Van Winkle and former Office Manager John Butler. Energy Commission staff provided a welcome and ready willingness to listen to technical and contractual challenges that were encountered and “work the problem” with CALSTART staff to find solutions that maintained progress. Technology development is never a simple or straight-line process. CALSTART could not have managed this diverse array of projects to successful completion – including the several projects that led to commercial products – without the active partnership of Energy Commission staff.
ii
PREFACE Assembly Bill 118 (Núñez, Chapter 750, Statutes of 2007) created the Clean Transportation Program, formerly known as the Alternative and Renewable Fuel and Vehicle Technology Program. The statute authorizes the California Energy Commission (CEC) to develop and deploy alternative and renewable fuels and advanced transportation technologies to help attain the state’s climate change policies. Assembly Bill 8 (Perea, Chapter 401, Statutes of 2013) reauthorizes the Clean Transportation Program through January 1, 2024, and specifies that the CEC allocate up to $20 million per year (or up to 20 percent of each fiscal year’s funds) in funding for hydrogen station development until at least 100 stations are operational.
The Clean Transportation Program has an annual budget of about $100 million and provides financial support for projects that:
• Reduce California’s use and dependence on petroleum transportation fuels and increasethe use of alternative and renewable fuels and advanced vehicle technologies.
• Produce sustainable alternative and renewable low-carbon fuels in California.• Expand alternative fueling infrastructure and fueling stations.• Improve the efficiency, performance and market viability of alternative light-, medium-,
and heavy-duty vehicle technologies.• Retrofit medium- and heavy-duty on-road and nonroad vehicle fleets to alternative
technologies or fuel use.• Expand the alternative fueling infrastructure available to existing fleets, public transit,
and transportation corridors.• Establish workforce-training programs and conduct public outreach on the benefits of
alternative transportation fuels and vehicle technologies.
To be eligible for funding under the Clean Transportation Program, a project must be consistent with the CEC’s annual Clean Transportation Program Investment Plan Update. The CEC issued PON-10-603 to to provide funding opportunities for near-term commercial applications of alternative technologies and alternative fueled vehicles, for use in California’s commercial goods movement, transit, and other sectors. In response to PON-10-603, the recipient submitted an application which was proposed for funding in the CEC’s notice of proposed awards February 10, 2012 and the agreement was executed as ARV-11-014 on June 21, 2012.
iii
ABSTRACT This report summarizes the completion of nine projects under California Energy Commission PON-10-603, executed as ARV-11-014. The projects were managed as a single grant in a portfolio program managed by CALSTART. The purpose was to develop and deploy alternative and renewable fuels and advanced transportation technologies for medium- and heavy-duty on- and off-road vehicles.
Through the execution of ARV-11-014, nine projects were completed:
• Caterpillar: Off-road Large-size Hybrid Excavator• Odyne Systems, LLC Advanced Diesel Plug-in Hybrid Electric Truck Project• Motiv Power Systems, Inc.: Battery-electric Truck Pilot on a Traditional Truck Assembly
Line• Ballard Power Systems: UC Irvine Fuel Cell Bus • Volvo Technology of America, Inc.: Volvo Construction Equipment Hybrid Electric Wheel
Loader (LX1) Demonstration Project• Proterra, Inc.: Proterra EcoRide B#35 Electric Transit Bus• Transportation Power, Inc.: Electric Drayage Demonstration• Volvo Technology of America, Inc.: Demonstration of Plug-in Hybrid Electric Trucks in
Port Drayage Operation• Artisan Vehicle Systems, Inc.: Artisan Series Hybrid Class 8 Truck Production Readiness
Test
The report provides detailed results showcasing how each advanced vehicle and equipment strategy could provide meaningful environmental benefits as the technologies supported moved into production. Each project highlights the status of the different technology pathways, from hybrid to battery electric to fuel cell electric, and the benefit of targeted funding to help speed the pace of technical innovation and improvement. As important, the report identifies the specific steps toward commercialization, product launch and in some cases, California manufacturing each project achieved. The report also discusses the usefulness of “block grant” or program portfolio contracting structures to extend California Energy Commission staff and funding effectiveness.
Keywords: battery electric vehicle, hybrid electric vehicle, hydraulic hybrid vehicle, fuel cell electric vehicle, electric bus, hybrid wheel loader, hybrid excavator, alternative fuel vehicle, electric drayage truck, plug in hybrid electric vehicle, BEV, HEV, PHEV, FCEV
Please use the following citation for this report: Ippoliti, Michael; Tomic, Jasna. California CLEAN Truck Demonstration Program , 2019, California Energy Commission. Publication Number: CEC-600-2019-056.

iv
v
TABLE OF CONTENTS
Page Acknowledgements ............................................................................................................ i Preface ...........................................................................................................................ii Abstract ......................................................................................................................... iii Table of Contents ............................................................................................................. v List of Figures ................................................................................................................. vi Executive Summary........................................................................................................... 1 CHAPTER 1: Introduction .................................................................................................. 7 CHAPTER 2: Technical Descriptions.................................................................................... 10
2.1 Caterpillar ............................................................................................................................................ 10 2.2 Odyne ................................................................................................................................................. 11 2.3 Motiv ................................................................................................................................................... 13 2.4 Ballard................................................................................................................................................. 14 2.5 Volvo CE.............................................................................................................................................. 16 2.6 Proterra ............................................................................................................................................... 17 2.7 TransPower ......................................................................................................................................... 18 2.8 Volvo Trucks ........................................................................................................................................ 19 2.9 Artisan................................................................................................................................................. 21
CHAPTER 3: Conclusions ................................................................................................. 22 3.1 Caterpillar ............................................................................................................................................ 22 3.2 Odyne ................................................................................................................................................. 23 3.3 Motiv ................................................................................................................................................... 24 3.4 Ballard................................................................................................................................................. 24 3.5 Volvo CE.............................................................................................................................................. 25 3.6 Proterra ............................................................................................................................................... 26 3.7 TransPower ......................................................................................................................................... 26 3.8 Volvo Trucks ........................................................................................................................................ 27 3.9 Artisan................................................................................................................................................. 28
CHAPTER 4: Observations and Other Benefits ...................................................................... 30 4.1 Caterpillar ............................................................................................................................................ 30 4.2 Odyne ................................................................................................................................................. 31 4.3 Motiv ................................................................................................................................................... 32 4.4 Ballard................................................................................................................................................. 33 4.5 Volvo CE.............................................................................................................................................. 35 4.6 Proterra ............................................................................................................................................... 36 4.7 TransPower ......................................................................................................................................... 38
vi
4.8 Volvo Truck ......................................................................................................................................... 40 4.9 Artisan................................................................................................................................................. 41 4.10 CALSTART: California CLEAN Truck Project Management ...................................................................... 42
Glossary ....................................................................................................................... 44 APPENDIX A: Caterpillar Off-Road Large-Size Hybrid Excavator ................................................ A-1 APPENDIX B: Odyne: Advanced Diesel Plug-in Hybrid Electric Truck Project ................................ B-1 APPENDIX C: Motiv: Battery-Electric Truck Pilot on a Traditional Truck Assembly Line ................... C-1 APPENDIX D: Ballard: UC Irvine Fuel Cell Bus program Summary Report .................................... D-1 APPENDIX E: Volvo Construction Equipment Hybrid Electric Wheel Loader (LX1) Demonstration Project ................................................................................................................................. E-1 APPENDIX F: Proterra EcoRide BE35 Electric Transit Bus ........................................................ F-1 APPENDIX G: Transportation Power: Electric Drayage Demonstration ........................................ G-1 APPENDIX H: Volvo: Demonstration of Plug-in Hybrid Electric Trucks in Port Drayage Operation ...... H-1 APPENDIX I: Caterpillar Off-Road Large-Size Hybrid Excavator ..................................................I-1
LIST OF FIGURES
Page
Figure ES-1: California CLEAN Truck Demo Program ................................................................. 2 Figure 1.1: Map of Nine Projects within the California CLEAN Truck Demonstration .......................... 8 Figure 2.1: Caterpillar Large-sized Hybrid Excavator ............................................................... 10 Figure 2.2: Pictures of the PG&E and LA County Trucks Deployed in Program ............................... 12 Figure 2.3: The Work Truck using the electrif ied chassis .......................................................... 13 Figure 2.4: The 4 All-Electric Shuttle Buses Parked and Charging ............................................... 13 Figure 2.5: Fuel Cell Bus .................................................................................................. 15 Figure 2.6: Fuel Cell Bus at the University of California Irvine ................................................... 15 Figure 2.7: The LX1 Moves Ground Green Waste Material into Pile ............................................. 16 Figure 2.8: EV1 at the Downtown Transit Center in Stockton, California ....................................... 17 Figure 2.9: EDD-1 Hauling a Heavy load with SA Recycling....................................................... 18 Figure 2.10: Volvo PHEV Truck #1...................................................................................... 19 Figure 2.11: Volvo PHEV Truck #2...................................................................................... 20
1
EXECUTIVE SUMMARY
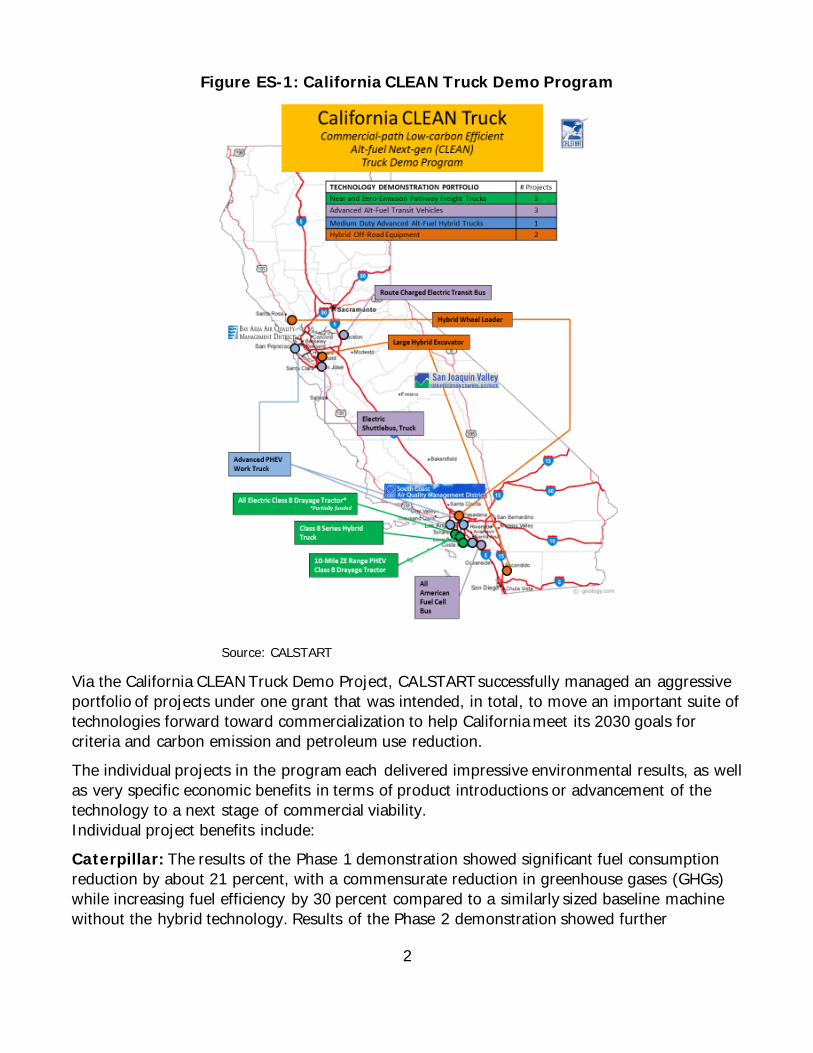
Over the course of six years, CALSTART, a California-based clean transportation non-profit organization, managed a portfolio of nine technology demonstration and validation projects under the Clean Transportation Program. The Energy Commission issued PON-10-603 to provide funding opportunities for these projects, and working with industry partners CALSTART reviewed, selected and assembled a portfolio of projects under the master framework called the California CLEAN (Commercialization-path Low-carbon Efficient Alternative-fuel Next-generation) Truck Demo Program.
The nine projects that were selected and minimally moved forward under this program included, see figure ES-1. • Caterpillar: Off-road Large-size Hybrid Excavator • Odyne Systems, LLC: Advanced Diesel Plug-in Hybrid Electric Truck Project • Motiv Power Systems, Inc.: Battery-electric Truck Pilot on a Traditional Truck Assembly
Line • Ballard Power Systems: UC Irvine Fuel Cell Bus • Volvo Technology of America, Inc.: Volvo Construction Equipment Hybrid Electric Wheel
Loader (LX1) Demonstration Project • Proterra, Inc.: Proterra EcoRide B#35 Electric Transit Bus • Transportation Power, Inc.: Electric Drayage Demonstration • Volvo Technology of America, Inc.: Demonstration of Plug-in Hybrid Electric Trucks in Port
Drayage Operation • Artisan Vehicle Systems, Inc.: Artisan Series Hybrid Class 8 Truck Production Readiness
Test
2
Figure ES-1: California CLEAN Truck Demo Program
Source: CALSTART
Via the California CLEAN Truck Demo Project, CALSTART successfully managed an aggressive portfolio of projects under one grant that was intended, in total, to move an important suite of technologies forward toward commercialization to help California meet its 2030 goals for criteria and carbon emission and petroleum use reduction. The individual projects in the program each delivered impressive environmental results, as well as very specific economic benefits in terms of product introductions or advancement of the technology to a next stage of commercial viability. Individual project benefits include: Caterpillar: The results of the Phase 1 demonstration showed significant fuel consumption reduction by about 21 percent, with a commensurate reduction in greenhouse gases (GHGs) while increasing fuel efficiency by 30 percent compared to a similarly sized baseline machine without the hybrid technology. Results of the Phase 2 demonstration showed further
3
improvement in fuel consumption reduction. Average fuel consumption reduction was approximately 24 percent while the fuel efficiency was increased by approximately 34 percent compared to a similarly sized baseline machine without the hybrid technology. Odyne Systems (Odyne): Night-time charging of the Odyne Plug-in Hybrid Vehicle (PHEV) batteries, using off-peak electrical grid energy, provide batteries that discharge during day use, with less diesel fuel use while driving, and no diesel fuel use during battery operation of hydraulics and climate controls at work sites. This provides up to 100 percent idle reduction (battery-powered), together with improved vehicle acceleration and fuel economy via launch assist using electric traction motor.
Motiv Power Systems (Motiv): The four vehicles demonstrated over the course of the grant were used for 142,000 miles, and this project has led to at least 310 Metric Tons CO2e (CO2 Equivalent) being reduced, 1.3 tons of NOx reduced, 0.07 tons of ROG reduced, and 0.04 tons of PM10 reduced. All four vehicles, along with two more shuttle bus vehicles of the same specification, are still in commercial use every day. Ballard: The Fuel Cell Bus ran more than 45,000 miles over the two-year period, carrying more than 208,000 passengers and consuming approximately 8,500 kilograms (kg) of hydrogen. On an energy equivalent basis, this represents a fuel economy of 6.4 miles/gallon diesel equivalent, as much as 50 percent better than many shuttle applications, while operating with zero emissions. Volvo Construction Equipment (CE): The LX1 hybrid electric wheel loader fuel efficiency tests at two sites exceeded the 35 percent fuel efficiency improvement target set for the project. The fuel efficiency test at the first site showed a fuel efficiency improvement of 55 percent, equating to a fuel consumption and greenhouse gas reduction of 35 percent, and an average fuel efficiency improvement of 50 percent at the second site equating to a fuel consumption and GHG emission reduction of 33 percent. Calculating what impact plug-in charging would have had on fuel efficiency shows that it would have gone from 55 to 75 percent at site 1 and from 50 to 67 percent at site 2.
Proterra: The Proterra electric transit buses ran a total of 63,550 miles over 24 months, using a total of 128,360 kilowatt-hours (kWh) of energy, with a resulting average equivalent mile per gallon of 19. Their use resulted in an estimated $29,730 savings in fuel and a greenhouse gas emissions savings of 237,400 pounds or 120 tons. The maintenance cost including all preventive and unscheduled maintenance for the buses and charger was $0.5 per mile, compared to $0.9 per mile for hybrid buses and $1.0 for diesel buses. Transportation Power (TransPower): Over the course of the Electric Drayage Demo project, the seven electric drayage trucks using the ElecTruck™ drive system accumulated more than 35,000 miles of testing and operation, most of it in actual operating service hauling heavy loads. To TransPower’s knowledge, this is far more miles than has been accumulated on any fleet of battery-electric trucks of this weight class in the U.S., and possibly anywhere in the world. More importantly, the trucks have generally met or exceeded project expectations once corrective actions had been taken via rapid tech improvement iterations during the project which helped address early design flaws.
4
Volvo Group (Trucks): After a combined demonstration period of eight months in daily revenue service the two concept Plugin Hybrid Electric Vehicle (PHEV) drayage trucks showed that a significant reduction in fuel use and engine operating time can be achieved, between 20-30 percent on average, despite the relatively small battery pack and without relying on opportunity charge. It also showed that a well-integrated hybrid driveline controls and exhaust aftertreatment controls can significantly reduce GHG and criteria pollutant emissions, both in brake specific and per-mile basis. Artisan: Both Artisan drayage trucks successfully completed their deployments, covering hundreds of miles over several months. The Battery Electric Vehicle (BEV) Truck performed best in power, speed, and efficiency, while the Hybrid Electric Vehicle (HEV) Truck was better equipped for extended range scenarios. Overall emissions and greenhouse gasses were reduced compared to their diesel counterparts, and areas of future improvements were identified. When comparing the aggregate efficiencies, the BEV Truck proved considerably more efficient than the HEV Truck.
From a commercialization outcome standpoint, the results of the California CLEAN Truck Demo were also exceptionally strong. The CALSTART-selected projects, approved by the Energy Commission, had an exceedingly high success rate when compared to the challenges inherent in the technology development process. Several companies have taken the technologies funded by this grant into partial or full commercialization. Among the product and commercialization results are these highlights:
• Proterra, which is now manufacturing electric buses in California and has moved its headquarters to the state as well. Proterra has become one of the early market leaders for electric transit buses and is showing the capability of being able to use its powertrain for other applications.
• Caterpillar, which moved its hybrid excavator immediately into production upon completion of the validation testing from this project. This success validates strongly the benefits of State funding’s ability to accelerate well- targeted investments.
• TransPower, which has continued to expand its powertrain applications to other platforms and applications, and has received funding from a major Tier 1 automotive industry supplier allowing it to both expand and become a component supplier.
• Motiv, which has become an Electric Qualified Vehicle Modifier for Ford Motor Company and is providing its powertrain to several chassis providers for shuttle bus and truck applications. Motiv opened an expanded California design and production facility during the course of this grant.
• Volvo Trucks, which has taken learnings from its experience and knowledge gained validating the plug-in hybrid drayage truck in field testing to support its development of a battery electric drayage truck being built for Europe and eventually North America.
• Volvo CE, which has taken the learnings from the hybrid electric wheel loader to refine its design for next generation products now in development.
5
• Odyne, which is selling versions of its plug-in hybrid trucks improved, refined and validated through this grant. Odyne also added a California field support partnership during the course of this grant
• Ballard, supported the refinement and market expansion of fuel cell buses, and specifically the improvement and validation of the American Fuel Cell Bus via this grant. The bus has now passed rigorous Federal Transit Administration Altoona testing to be qualified and approved for transit sales. El Dorado National is now building the first production buses in California and they have been delivered to Sunline Transit in Thousand Palms, California.
• Artisan was able to down-select technology to best match its deployed product plans, focusing as a result of this grant on the battery electric powertrain option.
The grant also served as an important test of the ability of a single grantee to manage a portfolio of projects for the California Energy Commission. While not formally a “block grant” its structure carried many of the elements of such a grant. The experience provides important lessons for using this contracting tool going forward.
Overall, ten total projects were part of the approved funding that made up the California CLEAN Truck Demo, as finally modified and approved. Of the ten, one company was unable to move forward, but the impacts were quickly mitigated as noted in the Observations chapter. The eventual success rate in terms of both completing the projects and more importantly moving forward to production or next stages of commercialization were an impressive 90 percent. This is unusual in the difficult world of technology commercialization and a sign of a strong process. CALSTART believes the benefits of block grant structures, as highlighted through the project selection, management and final outcomes in this portfolio grant, is a powerful tool. In this case, CALSTART’s specific knowledge of the technology, the industry, technology trends and deployment partners made it an invaluable augment of the Energy Commission staff. This portfolio grant, like a block grant, allowed a single qualified grantee to manage a large suite of projects. It can be a very effective tool to greatly expand the number of projects the grantee can manage, while driving very specific, high-value commercialization outcomes so vital to the State for air quality, climate change, petroleum reduction and economic vitality.

6
7
CHAPTER 1: Introduction
Medium- and heavy-duty on and off-road vehicles fueled by diesel are a major contributor to California’s extreme air quality problem. These work vehicles consume substantial amounts of fuel and emit excess emissions of criteria pollutants and GHGs. The California CLEAN (Commercial-path, Low-carbon Efficient Alternative-fuel Next-generation) Truck Demonstration Program was a state-wide portfolio of high-impact demonstration projects for advanced, alternative technology medium- and heavy-duty vehicles for near commercial on- and off-road applications. The program objective was to demonstrate and enhance market viability acceptance of near-term commercial application of alternative technologies and alternatively fueled vehicles.
The objectives were to: • Create and retain over 400 jobs with commercialization of the identified projects by
2015. • Create over 1,500 jobs associated with the identified projects by 2020. • Generate more than $15 million in estimated new annual sales. • Reduce up to 99 percent of NOx, 61 percent of CO, 61 percent of hydrocarbons, and
100 percent of particulate matter. • Reduce petroleum use by up to 6,000 gallons per year per vehicle depending on project
application.
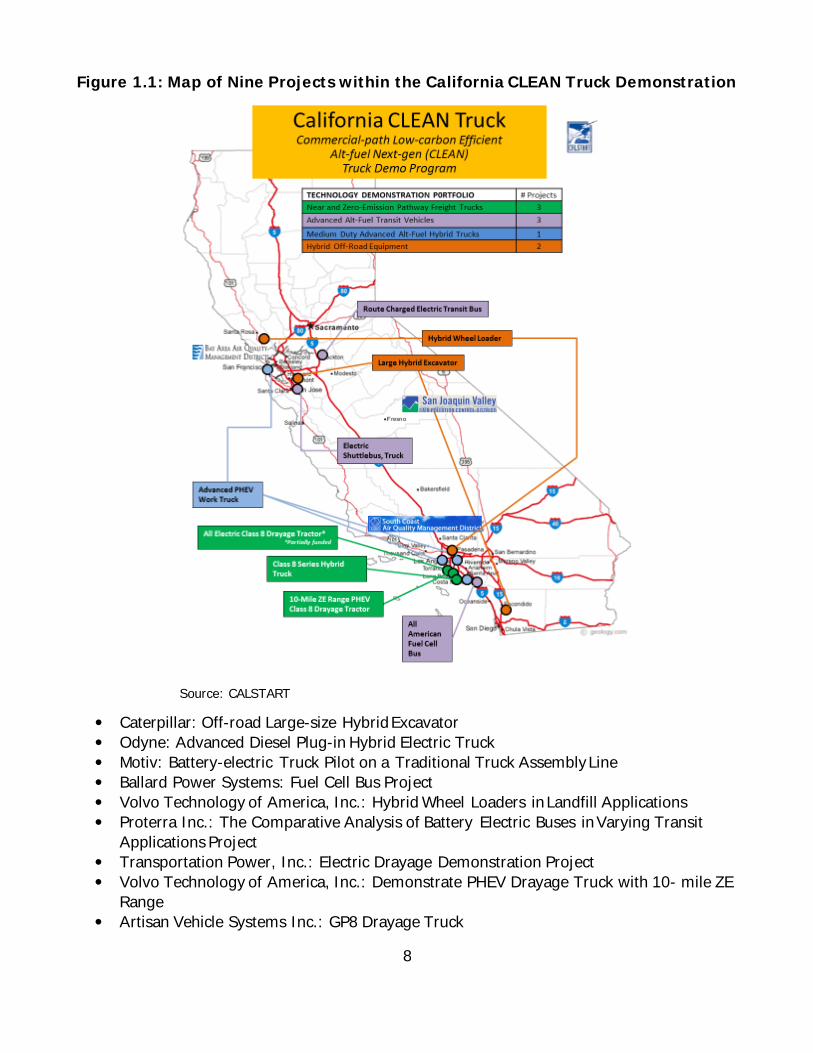
The program consisted of nine different projects that covered: 1) near-zero and zero-emission freight trucks, 2) alt-fueled transit vehicles, 3) medium-duty advanced fuel hybrid trucks, and 4) hybrid off-road equipment. Figure 1.1 below provides a visual overview of the nine projects and their demonstration locations within the state. The projects were regionally distributed and provided a mix of advanced on-road vehicle and off-road equipment technologies.
8
Figure 1.1: Map of Nine Projects within the California CLEAN Truck Demonstration
Source: CALSTART
• Caterpillar: Off-road Large-size Hybrid Excavator • Odyne: Advanced Diesel Plug-in Hybrid Electric Truck • Motiv: Battery-electric Truck Pilot on a Traditional Truck Assembly Line • Ballard Power Systems: Fuel Cell Bus Project • Volvo Technology of America, Inc.: Hybrid Wheel Loaders in Landfill Applications • Proterra Inc.: The Comparative Analysis of Battery Electric Buses in Varying Transit
Applications Project • Transportation Power, Inc.: Electric Drayage Demonstration Project • Volvo Technology of America, Inc.: Demonstrate PHEV Drayage Truck with 10- mile ZE
Range • Artisan Vehicle Systems Inc.: GP8 Drayage Truck
9
The above projects were submitted as part of broad portfolio of projects under PON-10-063, which encouraged submission of multiple projects to be managed under a single grant by a single entity. The intent was to streamline California Energy Commission contracting by using one grant recipient to manage for multiple sub-grantees. It was further intended to enable fewer staff to therefore effectively manage more in-the-field projects by utilizing the project management abilities of the prime grantee. CALSTART originally worked with a broad coalition of industry, reviewed multiple qualified projects with strong commercialization potential and proposed 16 projects to PON-10-603
under the master portfolio submission called California CLEAN Truck. Of those 16, four did not score high enough for selection under the Energy Commission technical screening process. One project which passed was then withdrawn by the project partner (Azure Dynamics) and one project which was awarded funding was withdrawn, leaving eight awarded full or partial funding in the original Notice of Proposed Awards.
When more funds became available, Amendment 1 to the agreement fully funded the partially funded TransPower project and two more finalist projects and also substituted Ballard as the sub-grantee on Task 6 for a total of ten funded projects. However, during the course of the contract one of the original ten projects cancelled when the technology provider (EVI) ceased operations. The final nine projects and their summarized results make up this report. Additional detail on findings around managing the portfolio of projects can be found at the end of the Observations chapter.

10
CHAPTER 2: Technical Descriptions
2.1 Caterpillar Caterpillar Inc. demonstrated an off-road large-sized excavator (Figure 2.1) that captures kinetic and potential energy of the earthmoving implement system via a hydraulic hybrid system and reuses that energy to reduce fuel consumption, noise, and exhaust emissions.
Figure 2.1: Caterpillar Large-sized Hybrid Excavator
Photo Credit: Caterpillar Inc.
The Caterpillar off-road large-size hybrid excavator project was planned and delivered as a two-phase demonstration:
• Phase 1 was the demonstration of an excavator with kinetic (swing) energy recovery hybrid technology, and
• Phase 2 was the demonstration of an excavator with both, kinetic (swing) and potential (boom) energy recovery hybrid technology.
The Phase 1 and Phase 2 excavators with hybrid technologies were evaluated by performance testing and field follow studies conducted at customer’s sites in California. Results of the Phase 1 demonstration showed significant fuel consumption reduction by about 21 percent while increasing fuel efficiency by 30 percent compared to a similarly sized baseline machine without the hybrid technology. Results of the Phase 2 demonstration showed further improvement in fuel consumption reduction.
11
Testing was completed in multiple locations and the average fuel consumption reduction was approximately 24 percent while the fuel efficiency was increased by approximately 34 percent compared to a similarly sized baseline machine without the hybrid technology. This substantial fuel savings was accomplished without any decrease in machine productivity as tested in customer applications. These demonstrations clearly showed the technology’s potential to reduce greenhouse gas (GHG) emissions and petroleum use if implemented widely across a product line. Both, Phase 1 and Phase 2 machines were developed at Caterpillar Inc. facilities and then transported to customer sites in California where they performed various types of earthwork. The technology and machine that was developed in Phase 1 was successfully commercialized as the 336E H hybrid excavator, which has been selling world-wide for almost two years. Commercialization of the 336E H hybrid machine demonstrated excellent customer payback, without a need for government subsidized voucher support. Phase 2 exhibited promising results with potential for future commercialization. Discoveries and various technological developments enabled Caterpillar Inc. to file over 300 patents. Additionally, there are forward looking opportunities for technology advancements and further reductions in GHG.
2.2 Odyne Odyne’s plug-in hybrid electric (PHEV) system enables diesel-fueled work trucks to rely on clean, energy-efficient battery power to achieve greater fuel economy while driving and to power the hydraulic systems for aerial booms and other truck-mounted equipment while at a job site. Additionally, the advanced lithium-ion (Li-ion) batteries incorporated in the hybrid system provide power to electrical equipment needed at the job site, and power the climate controls (heating and air conditioning) while at the job site. The batteries are recharged from the utility grid, typically at night, using off-peak electrical energy from the grid. The system is also fuel neutral, since the minimally intrusive design does not impact the existing engine or transmission. This project’s goal was to advance diesel plug-in hybrid work trucks. The project demonstrated four Advanced Diesel Pre-Commercial Plug-in Hybrid Electric Trucks in two California air basins within two fleets (PG&E and LA County), as shown in figure 2.2. The program developed a streamlined approach to analyze the duty cycle and determine the most viable battery size to optimize the solution and maximize fuel and emission results.

12
Figure 2.2: Pictures of the PG&E and LA County Trucks Deployed in Program
Photo Credit: CALSTART
Local California installation capabilities were also established to develop a path to commercialization and serviceability of the product with a partner in California (Valley Power). Dynamometer testing at UC Riverside was completed to validate the fuel and emission results and the vehicles were monitored in the field via telematics to validate the fuel and emissions savings. Finally, customer satisfaction surveys were completed to gain a further understanding from the end users yielding critical new insights to advance commercialization. This project and funding from Energy Commission covered the incremental cost differential of the plug-in hybrid electric system and its installation, accelerated the availability of the technology by (i) getting customers to try it sooner, (ii) reducing risks to fleet purchasers of adopting the pre-commercial technology; (iii) enabling demonstrations of a small number of trucks with a new technology, allowing them to gain familiarity and experience with the technology, which established the confidence needed for larger future purchases. The Advanced Diesel Plug-in Hybrid Electric Truck Project enabled Odyne to study real world PHEV fleet use and evaluate key business processes prior to moving into full commercialization. Specifically, Odyne evaluated a new Energy Management System for calibrating software to match Odyne’s hybrid systems to a fleet’s duty cycle; test the needed size of the battery in the hybrid system; and implement and de-bug local installation of the hybrid systems, in California.
The purpose of the Energy Commission project was to prepare Odyne’s Gen 2 technology for commercialization, by (i) demonstrating four Odyne Gen 2 PHEV work trucks in California fleets, in two Air Basins, gaining sufficient “real world” experience to verify and validate the vehicle’s operating performance, emissions and fuel reduction benefits; (ii) testing a new, streamlined approach for matching software configurations with fleet duty cycle requirements (to lower costs); (iii) testing two sizes of battery packs in real world applications, and assessing customer satisfaction with each (to determine whether a smaller, lower cost battery pack meets the customer needs); and (iv) initiating local installation of hybrid systems on
13
trucks in California, with a local partner – as a strategy to reduce costs and accelerate commercial deployment.
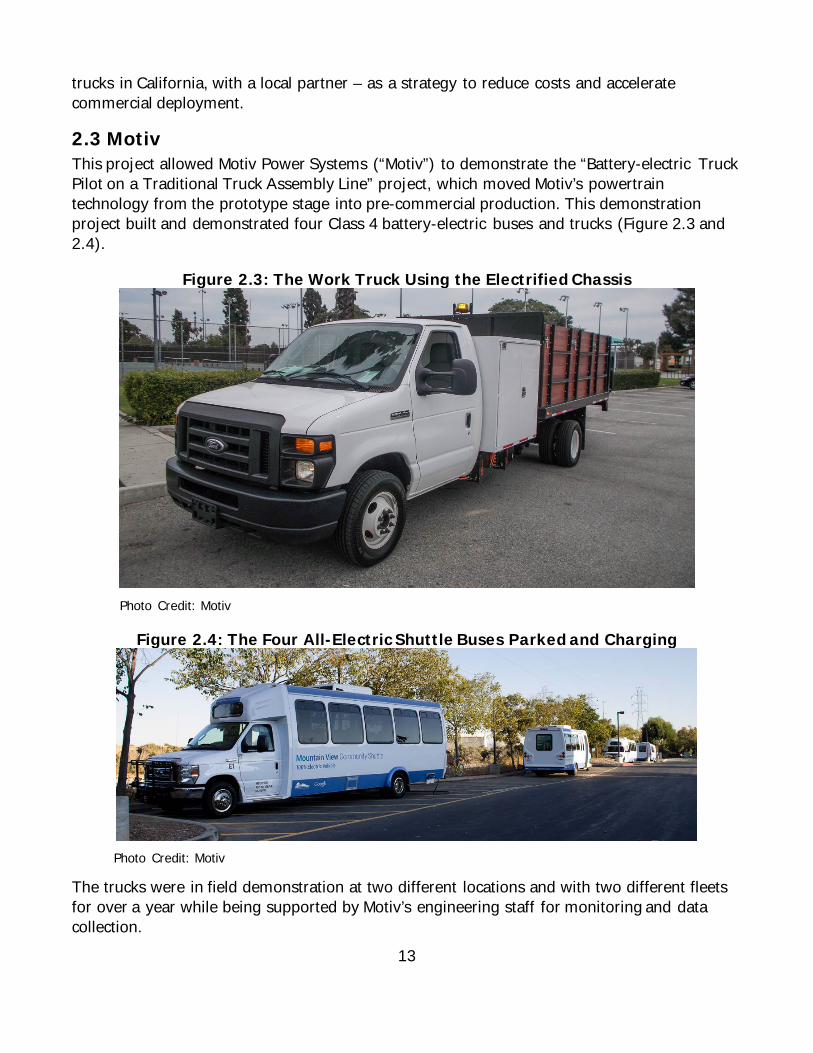
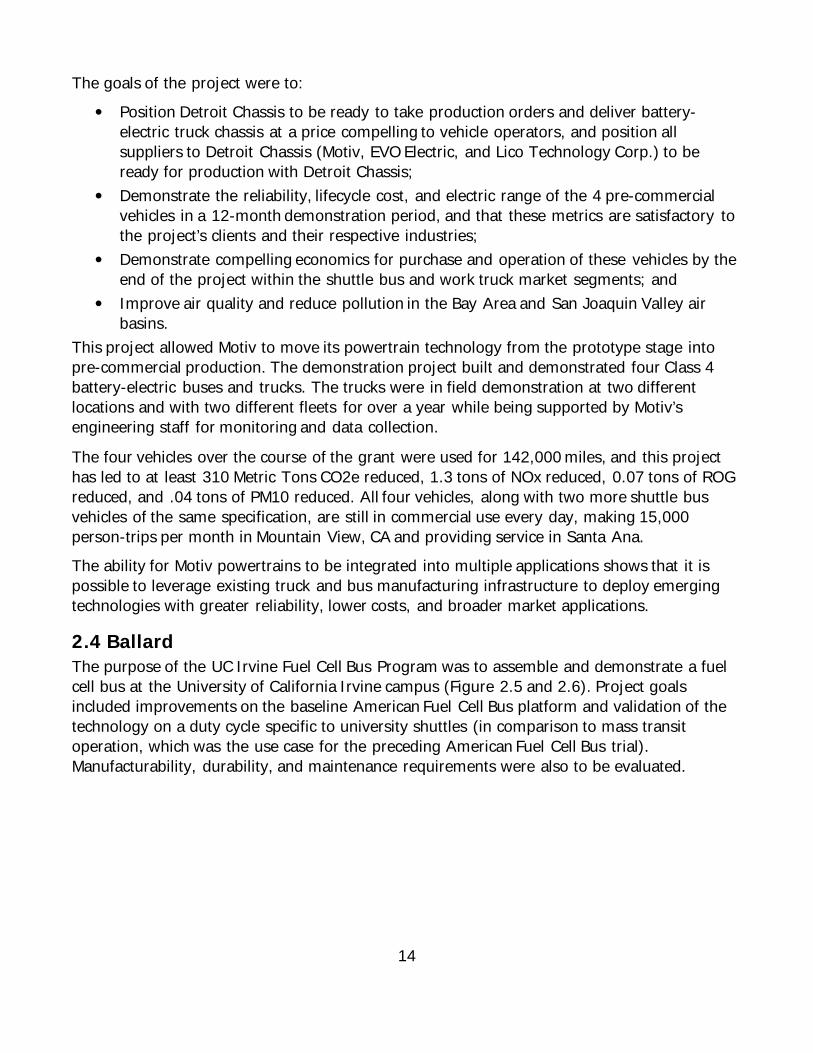
2.3 Motiv This project allowed Motiv Power Systems (“Motiv”) to demonstrate the “Battery-electric Truck Pilot on a Traditional Truck Assembly Line” project, which moved Motiv’s powertrain technology from the prototype stage into pre-commercial production. This demonstration project built and demonstrated four Class 4 battery-electric buses and trucks (Figure 2.3 and 2.4).
Figure 2.3: The Work Truck Using the Electrified Chassis
Photo Credit: Motiv
Figure 2.4: The Four All-Electric Shuttle Buses Parked and Charging
Photo Credit: Motiv
The trucks were in field demonstration at two different locations and with two different fleets for over a year while being supported by Motiv’s engineering staff for monitoring and data collection.
14
The goals of the project were to: • Position Detroit Chassis to be ready to take production orders and deliver battery-
electric truck chassis at a price compelling to vehicle operators, and position all suppliers to Detroit Chassis (Motiv, EVO Electric, and Lico Technology Corp.) to be ready for production with Detroit Chassis;
• Demonstrate the reliability, lifecycle cost, and electric range of the 4 pre-commercial vehicles in a 12-month demonstration period, and that these metrics are satisfactory to the project’s clients and their respective industries;
• Demonstrate compelling economics for purchase and operation of these vehicles by the end of the project within the shuttle bus and work truck market segments; and
• Improve air quality and reduce pollution in the Bay Area and San Joaquin Valley air basins.
This project allowed Motiv to move its powertrain technology from the prototype stage into pre-commercial production. The demonstration project built and demonstrated four Class 4 battery-electric buses and trucks. The trucks were in field demonstration at two different locations and with two different fleets for over a year while being supported by Motiv’s engineering staff for monitoring and data collection.
The four vehicles over the course of the grant were used for 142,000 miles, and this project has led to at least 310 Metric Tons CO2e reduced, 1.3 tons of NOx reduced, 0.07 tons of ROG reduced, and .04 tons of PM10 reduced. All four vehicles, along with two more shuttle bus vehicles of the same specification, are still in commercial use every day, making 15,000 person-trips per month in Mountain View, CA and providing service in Santa Ana. The ability for Motiv powertrains to be integrated into multiple applications shows that it is possible to leverage existing truck and bus manufacturing infrastructure to deploy emerging technologies with greater reliability, lower costs, and broader market applications.
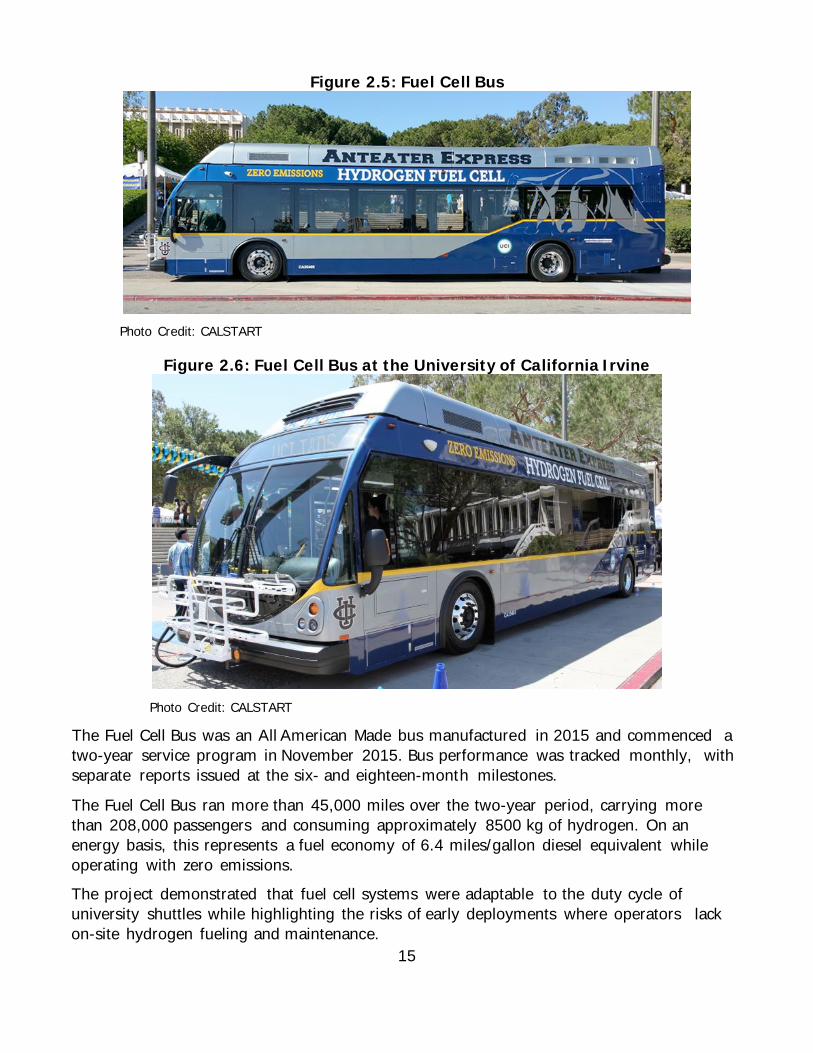
2.4 Ballard The purpose of the UC Irvine Fuel Cell Bus Program was to assemble and demonstrate a fuel cell bus at the University of California Irvine campus (Figure 2.5 and 2.6). Project goals included improvements on the baseline American Fuel Cell Bus platform and validation of the technology on a duty cycle specific to university shuttles (in comparison to mass transit operation, which was the use case for the preceding American Fuel Cell Bus trial). Manufacturability, durability, and maintenance requirements were also to be evaluated.
15
Figure 2.5: Fuel Cell Bus
Photo Credit: CALSTART
Figure 2.6: Fuel Cell Bus at the University of California Irvine
Photo Credit: CALSTART
The Fuel Cell Bus was an All American Made bus manufactured in 2015 and commenced a two-year service program in November 2015. Bus performance was tracked monthly, with separate reports issued at the six- and eighteen-month milestones.
The Fuel Cell Bus ran more than 45,000 miles over the two-year period, carrying more than 208,000 passengers and consuming approximately 8500 kg of hydrogen. On an energy basis, this represents a fuel economy of 6.4 miles/gallon diesel equivalent while operating with zero emissions. The project demonstrated that fuel cell systems were adaptable to the duty cycle of university shuttles while highlighting the risks of early deployments where operators lack on-site hydrogen fueling and maintenance.
16
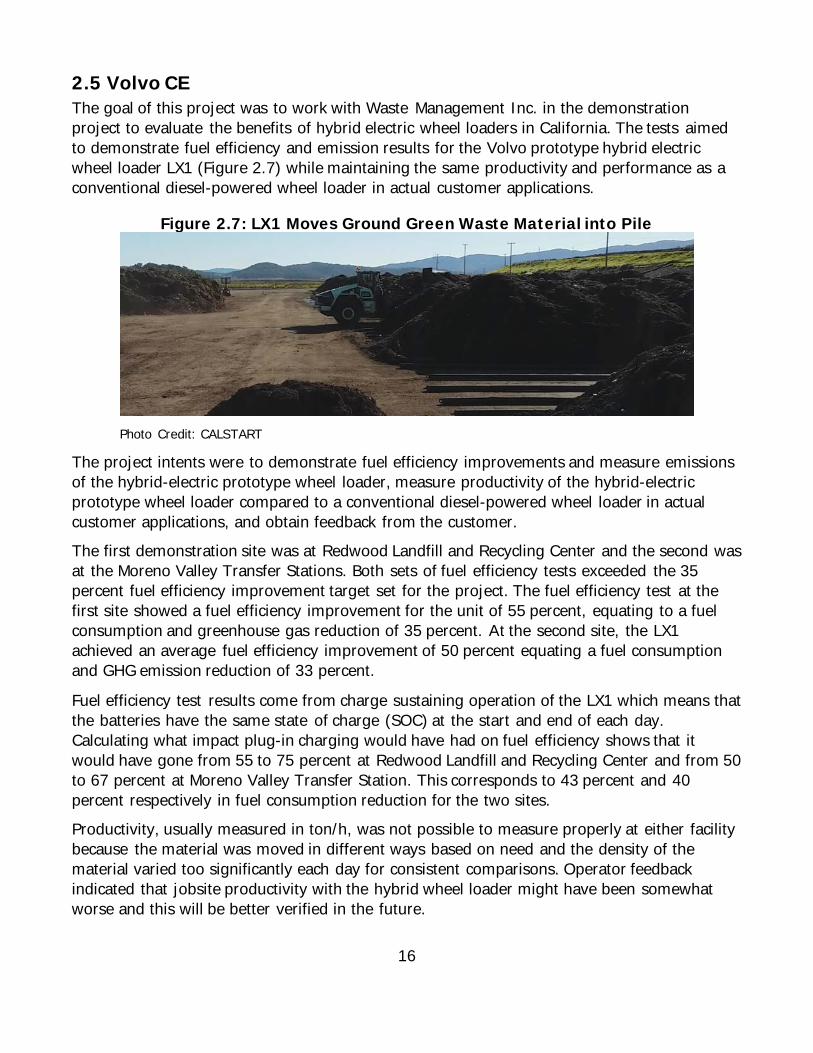
2.5 Volvo CE The goal of this project was to work with Waste Management Inc. in the demonstration project to evaluate the benefits of hybrid electric wheel loaders in California. The tests aimed to demonstrate fuel efficiency and emission results for the Volvo prototype hybrid electric wheel loader LX1 (Figure 2.7) while maintaining the same productivity and performance as a conventional diesel-powered wheel loader in actual customer applications.
Figure 2.7: LX1 Moves Ground Green Waste Material into Pile
Photo Credit: CALSTART
The project intents were to demonstrate fuel efficiency improvements and measure emissions of the hybrid-electric prototype wheel loader, measure productivity of the hybrid-electric prototype wheel loader compared to a conventional diesel-powered wheel loader in actual customer applications, and obtain feedback from the customer. The first demonstration site was at Redwood Landfill and Recycling Center and the second was at the Moreno Valley Transfer Stations. Both sets of fuel efficiency tests exceeded the 35 percent fuel efficiency improvement target set for the project. The fuel efficiency test at the first site showed a fuel efficiency improvement for the unit of 55 percent, equating to a fuel consumption and greenhouse gas reduction of 35 percent. At the second site, the LX1 achieved an average fuel efficiency improvement of 50 percent equating a fuel consumption and GHG emission reduction of 33 percent.
Fuel efficiency test results come from charge sustaining operation of the LX1 which means that the batteries have the same state of charge (SOC) at the start and end of each day. Calculating what impact plug-in charging would have had on fuel efficiency shows that it would have gone from 55 to 75 percent at Redwood Landfill and Recycling Center and from 50 to 67 percent at Moreno Valley Transfer Station. This corresponds to 43 percent and 40 percent respectively in fuel consumption reduction for the two sites. Productivity, usually measured in ton/h, was not possible to measure properly at either facility because the material was moved in different ways based on need and the density of the material varied too significantly each day for consistent comparisons. Operator feedback indicated that jobsite productivity with the hybrid wheel loader might have been somewhat worse and this will be better verified in the future.
17
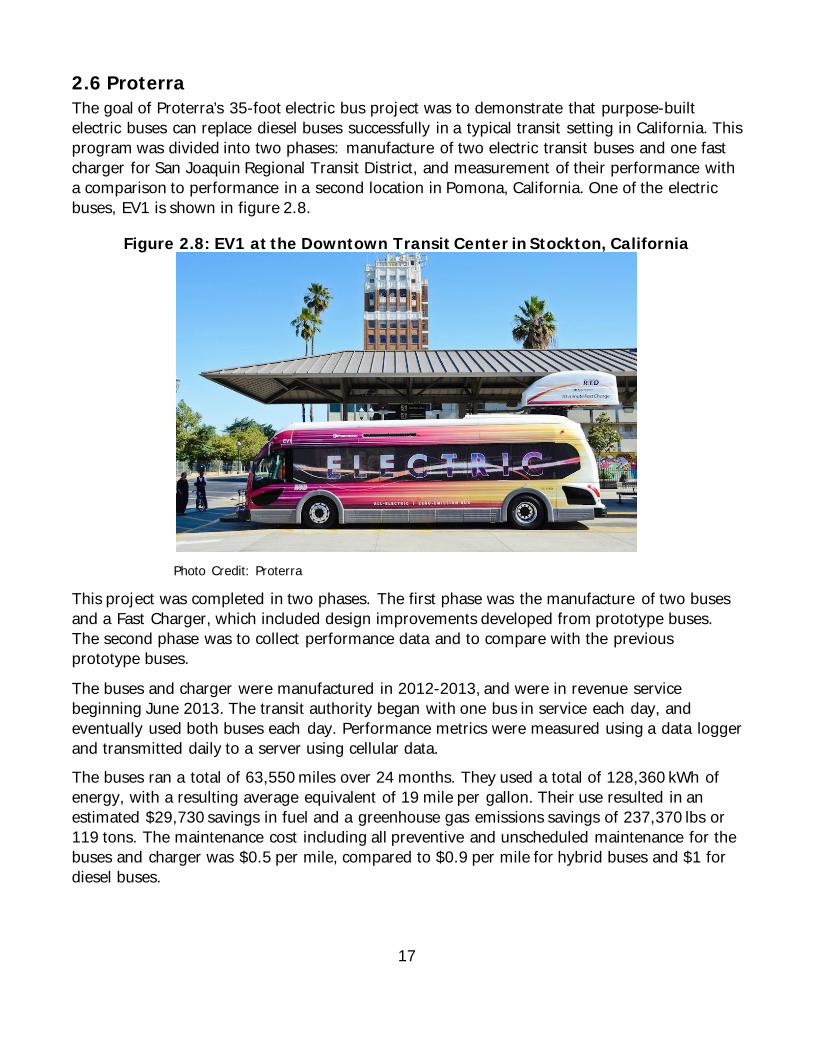
2.6 Proterra The goal of Proterra’s 35-foot electric bus project was to demonstrate that purpose-built electric buses can replace diesel buses successfully in a typical transit setting in California. This program was divided into two phases: manufacture of two electric transit buses and one fast charger for San Joaquin Regional Transit District, and measurement of their performance with a comparison to performance in a second location in Pomona, California. One of the electric buses, EV1 is shown in figure 2.8.
Figure 2.8: EV1 at the Downtown Transit Center in Stockton, California
Photo Credit: Proterra
This project was completed in two phases. The first phase was the manufacture of two buses and a Fast Charger, which included design improvements developed from prototype buses. The second phase was to collect performance data and to compare with the previous prototype buses.
The buses and charger were manufactured in 2012-2013, and were in revenue service beginning June 2013. The transit authority began with one bus in service each day, and eventually used both buses each day. Performance metrics were measured using a data logger and transmitted daily to a server using cellular data. The buses ran a total of 63,550 miles over 24 months. They used a total of 128,360 kWh of energy, with a resulting average equivalent of 19 mile per gallon. Their use resulted in an estimated $29,730 savings in fuel and a greenhouse gas emissions savings of 237,370 lbs or 119 tons. The maintenance cost including all preventive and unscheduled maintenance for the buses and charger was $0.5 per mile, compared to $0.9 per mile for hybrid buses and $1 for diesel buses.
18
After the start of this project, other locations purchased similar models. A total of 60 buses of similar models are in service at the time of this report. The experience from this project also contributed to the development of a new, improved 40-foot electric bus, which has already been purchased by five transit authorities including Foothill Transit and San Joaquin Regional Transit Authority. Additional development opportunities exist to further improve fuel efficiency and air quality, and to develop the supply chain for this technology.
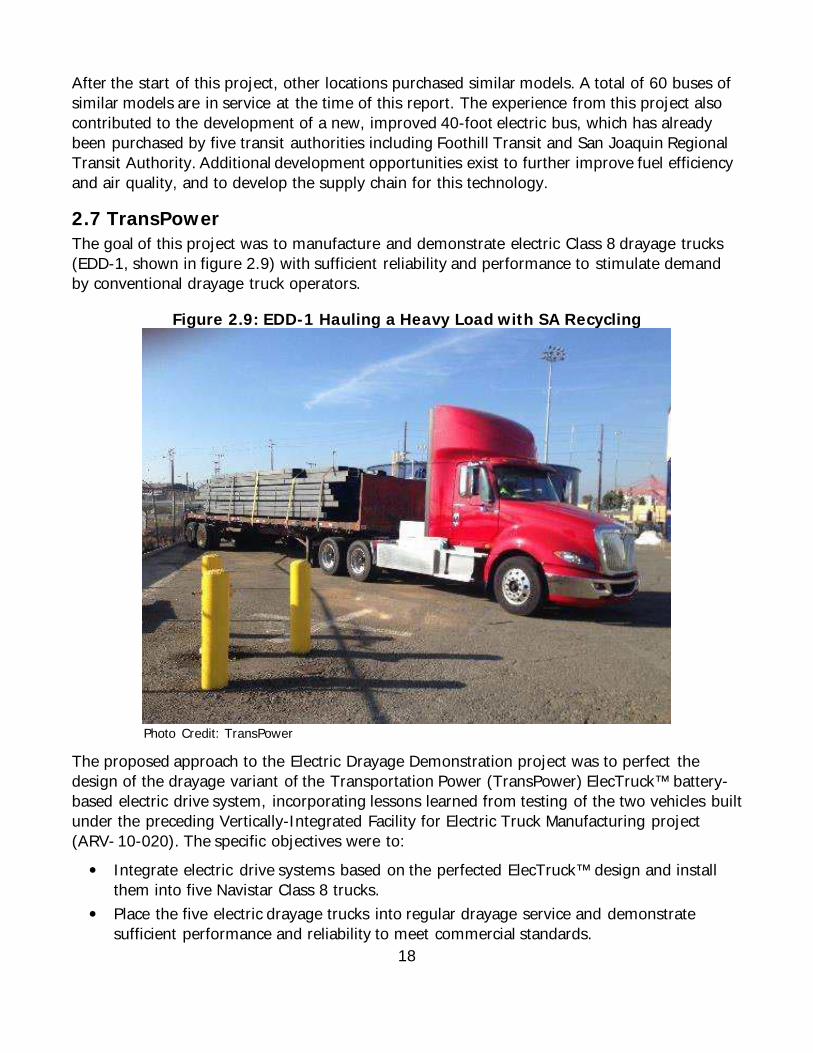
2.7 TransPower The goal of this project was to manufacture and demonstrate electric Class 8 drayage trucks (EDD-1, shown in figure 2.9) with sufficient reliability and performance to stimulate demand by conventional drayage truck operators.
Figure 2.9: EDD-1 Hauling a Heavy Load with SA Recycling
Photo Credit: TransPower
The proposed approach to the Electric Drayage Demonstration project was to perfect the design of the drayage variant of the Transportation Power (TransPower) ElecTruck™ battery-based electric drive system, incorporating lessons learned from testing of the two vehicles built under the preceding Vertically-Integrated Facility for Electric Truck Manufacturing project (ARV- 10-020). The specific objectives were to:
• Integrate electric drive systems based on the perfected ElecTruck™ design and install them into five Navistar Class 8 trucks.
• Place the five electric drayage trucks into regular drayage service and demonstrate sufficient performance and reliability to meet commercial standards.
19
• Through meticulous data collection and independent analysis, demonstrate that the electric drayage vehicles produce the greatest total carbon reductions and fossil fuel displacement of any available drayage transportation technology or product.
• Secure at least one large-scale (100+) commercial order for electric Class 8 drayage trucks to provide conclusive validation that all key project objectives have been met.
Deployment of an additional two trucks was made possible by separate grants from the South Coast Air Quality Management District (SCAQMD) and the Port of Los Angeles. In total, seven trucks of the electric drayage design were manufactured and deployed during the grant period of performance. The Electric Drayage Demo project sought to achieve major technology advances in two key areas: (1) vehicle control and integration and (2) advanced energy storage. The project not only made major advances in these two areas, but also achieved significant advances in the area of electric vehicle propulsion, and moderate advances in several other technology areas. The combined effect of electric drayage technology advances is expected to have a transformative effect on the heavy-duty vehicle industry.
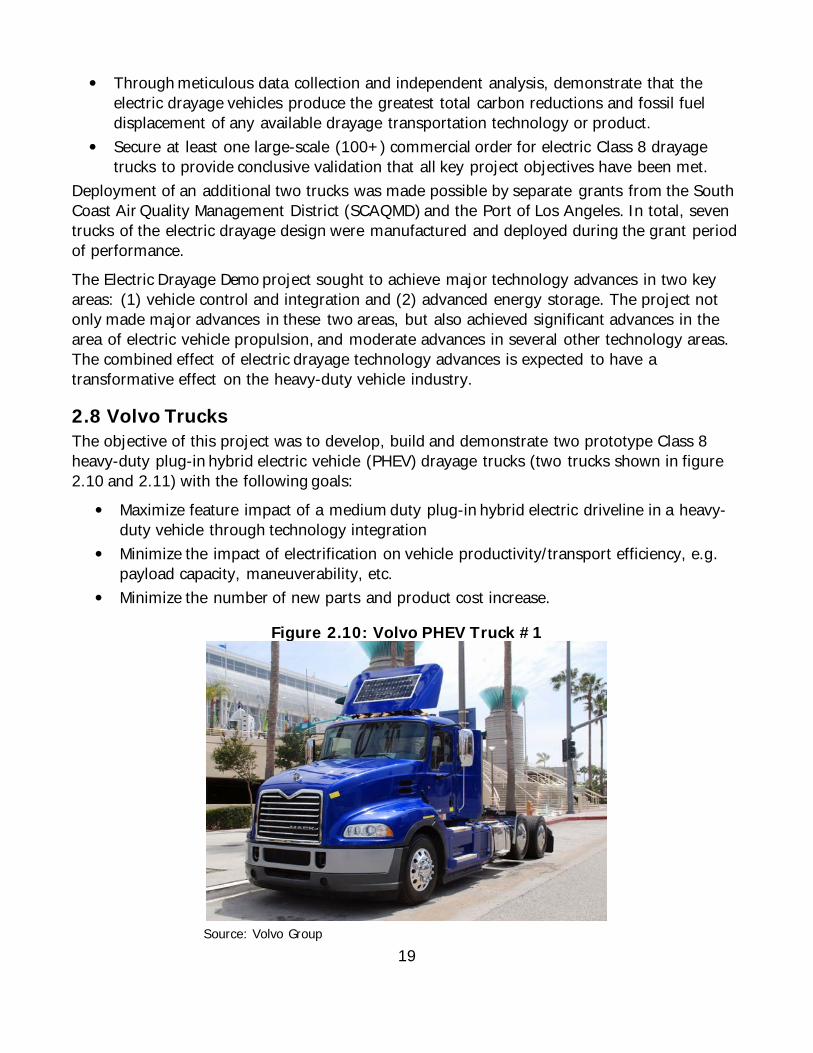
2.8 Volvo Trucks The objective of this project was to develop, build and demonstrate two prototype Class 8 heavy-duty plug-in hybrid electric vehicle (PHEV) drayage trucks (two trucks shown in figure 2.10 and 2.11) with the following goals:
• Maximize feature impact of a medium duty plug-in hybrid electric driveline in a heavy-duty vehicle through technology integration
• Minimize the impact of electrification on vehicle productivity/transport efficiency, e.g. payload capacity, maneuverability, etc.
• Minimize the number of new parts and product cost increase.
Figure 2.10: Volvo PHEV Truck #1
Source: Volvo Group
20
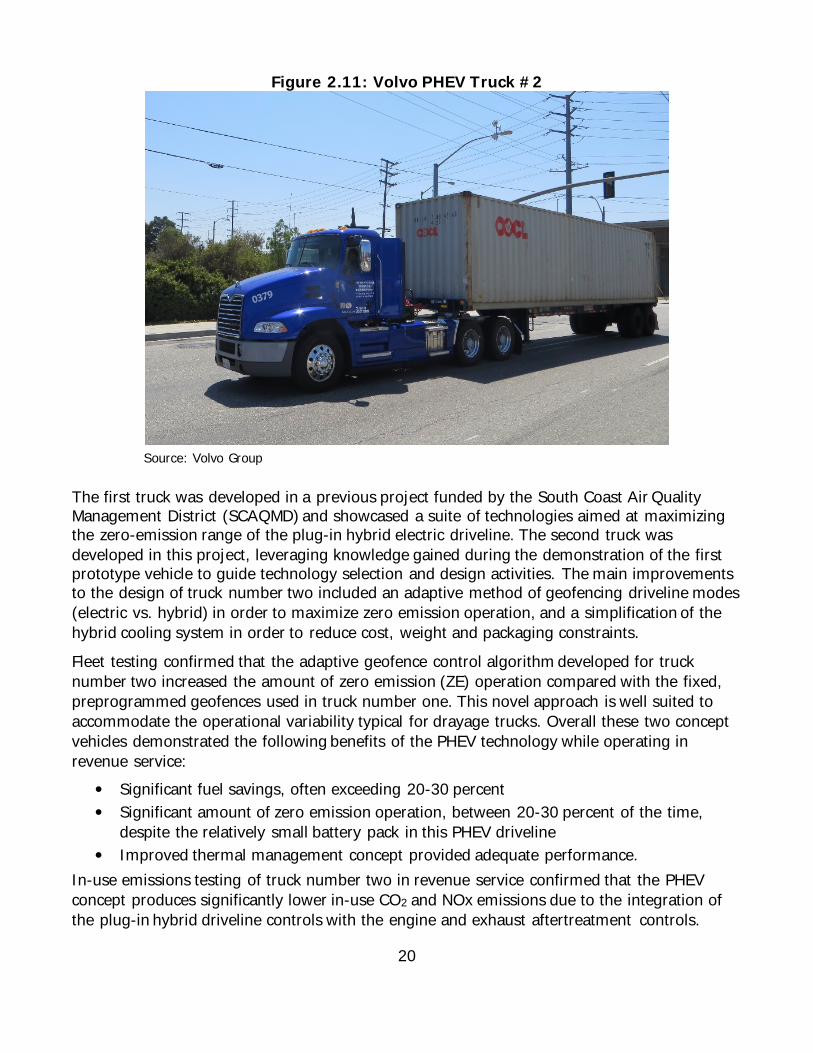
Figure 2.11: Volvo PHEV Truck #2
Source: Volvo Group
The first truck was developed in a previous project funded by the South Coast Air Quality Management District (SCAQMD) and showcased a suite of technologies aimed at maximizing the zero-emission range of the plug-in hybrid electric driveline. The second truck was developed in this project, leveraging knowledge gained during the demonstration of the first prototype vehicle to guide technology selection and design activities. The main improvements to the design of truck number two included an adaptive method of geofencing driveline modes (electric vs. hybrid) in order to maximize zero emission operation, and a simplification of the hybrid cooling system in order to reduce cost, weight and packaging constraints. Fleet testing confirmed that the adaptive geofence control algorithm developed for truck number two increased the amount of zero emission (ZE) operation compared with the fixed, preprogrammed geofences used in truck number one. This novel approach is well suited to accommodate the operational variability typical for drayage trucks. Overall these two concept vehicles demonstrated the following benefits of the PHEV technology while operating in revenue service:
• Significant fuel savings, often exceeding 20-30 percent • Significant amount of zero emission operation, between 20-30 percent of the time,
despite the relatively small battery pack in this PHEV driveline • Improved thermal management concept provided adequate performance.
In-use emissions testing of truck number two in revenue service confirmed that the PHEV concept produces significantly lower in-use CO2 and NOx emissions due to the integration of the plug-in hybrid driveline controls with the engine and exhaust aftertreatment controls.
21
2.9 Artisan Artisan Vehicle Systems, based in Camarillo, California, built two Class 8 commercial drayage trucks with alternative fuel powertrain systems: one with a hybrid compressed natural gas turbine and battery electric powertrain, and the other with a battery electric powertrain. Together with Kenworth Trucks, Inland Kenworth, and Thompson Building Materials, the two trucks were deployed in real-world scenarios and compared with existing diesel-based trucks of the same class. The trucks were evaluated for performance, reliability, operating costs, and reductions in emissions.
The objective of the project is to demonstrate the commercial and environmental viability of two alternative drive systems in short-haul drayage applications by testing the systems for performance and reliability, analyzing the potential return on investment, and comparing their emissions and greenhouse gas footprints with their conventional diesel counterparts. Personal experiences from the deployment partners as well as quantitative analysis of data logs provide the basis for considering the viability of the technologies. In a demonstration of the commercial and environmental viability of alternative propulsion systems in Class 8 drayage trucks, the Hybrid Electric Vehicle is referred to as the HEV Truck, while the Battery Electric Vehicle is referred to as the BEV Truck. Artisan Vehicle Systems led the project and developed the powertrains for both drayage trucks using their battery electric drive system normally deployed in commercial underground mining applications. Inland Kenworth provided support for servicing the gliders and an on-location charging bay for the BEV truck. Both trucks were deployed at Thompson Building Materials, where they transported various building materials such as concrete and stone between distribution centers and suppliers in the Southern California region.
22
CHAPTER 3: Conclusions
3.1 Caterpillar Results of Phase 1 demonstration showed significant fuel consumption reduction while increasing fuel efficiency compared to a similarly sized baseline machine without the hybrid technology. Results of Phase 2 demonstration showed further improvement in fuel consumption reduction. This substantial fuel savings was accomplished without any decrease in machine productivity as tested in customer applications. These demonstrations clearly showed the technology’s potential to reduce GHG (greenhouse gases) emissions and petroleum use if implemented widely across a product line.
Phase 1 field follow excavators with swing hybrid technology were located at customer’s sites in San Francisco and Sacramento areas over the period of 7.5 months. Two 336E H machines accumulated a total of 1,160 hours. The machines were performing typical earthwork functions such as mass excavation, trenching, truck loading, slope shaping, leveling and general cleanup. In Phase 1 performance testing of same level 90° truck loading was conducted comparing the 336E H to the standard 336E hydraulic excavator. There were no statistically significant differences in productivity between the hybrid and standard machines. This is consistent with the design intent as the hybrid objective was to maintain productivity while lowering fuel consumption. On average the hybrid excavator consumed 21 percent less fuel (Liters per hour: L/hour) [with ±3 percent confidence interval] and therefore produced 21 percent less GHG emissions (Kilograms per hour: kg/hour) compared to the standard machine. The hybrid excavator was 30 percent more fuel efficient (ton of material moved per liter of fuel burned) [with ±3.5 percent confidence interval] and therefore produced 30 percent less GHG emissions (ton of material moved per kilogram of greenhouse gases produced) compared to the standard machine. A scientifically-based comparative performance test was completed at the second customer site during the Phase 2 field follow. Same level 90° truck loading and bench 90° truck loading tests were conducted comparing the hybrid to a non-hybrid, base-line (Tier 4 Final) machine. There was no significant statistical difference in productivity between the hybrid and the standard machine. This was accomplished by design as the hybrid objective is to maintain productivity while lowering fuel consumption. Compared to the standard machine, the hybrid excavator consumed on average 24 percent less fuel (L/hour) and therefore produced 24 percent less GHG emissions (kg/hour). The hybrid excavator was on average 34 percent more fuel efficient (ton of material moved per liter of fuel burned). Therefore, the hybrid produced 34 percent less GHG emissions (tons of material moved per kg of greenhouse gases produced) than the baseline. Based on the added fuel savings of the Phase 2 hybrid excavator as well as the positive customer feedback from the field follow, the commercial viability of the Phase 2 demonstration machines is also expected to be positive.
23
It is important to note that the reported fuel efficiency improvements are relative differences from back-to-back, “controlled” tests between a hybrid and non-hybrid machine for a specific set of conditions (machine configuration, job site, operator, soil type, application, etc.). If those conditions substantially change, the comparison can become invalid. For that reason, Phase 2 fuel savings should NOT be compared to the Phase 1 fuel savings. The results may imply that the Phase 2 technologies are only slightly more efficient than the Phase 1 technologies, but this is not the case. The Phase 2 testing was conducted on a different machine with different operators and different site applications making a comparison to Phase 1 results not practical.
3.2 Odyne This project and funding from energy commission accelerated the availability of the technology by (i) getting customers to try it sooner, (ii) reducing risks to fleet purchasers of adopting the pre-commercial technology; (iii) enabling demonstrations of a small number of trucks with a new technology, allowing them to gain familiarity and experience with the technology, which established the confidence needed for larger future purchases.
Overall the project was a success. Odyne was able to develop a tool to help better understand the duty cycle of the application and provide the best calibration while the vehicle is being built. Although the calibration can be changed in the field, the closer the vehicle is set up to meet fleet needs right from the factory the better. Odyne was also able to develop an installation and service partner in California with Valley Power. Since then project Valley Power has completed additional installations for California customers and has serviced all the Odyne systems that are operated in California. Odyne has continued to build and sell the G2 product that was deployed with this program. Customers from around North America have continued to embrace the technology and have purchased multiple repeat orders.
Pacific Gas and Electric purchased two additional Odyne plug-in hybrid systems after they deployed the two digger derrick applications in this program. These vehicles have been built and are deployed in San Jose and San Francisco. Los Angeles County (LA County) has also shown additional interest in additional Odyne systems. They are currently in the process of purchasing an Odyne Bookmobile application. This application eliminates the need of a generator, eliminating noise and emissions for the school aged children that use the County-provided bookmobile. Although the technology has been well received Odyne has continued to advance the technology. Currently Odyne is in a 3-year DOE project that is working to increase fuel efficiency while driving by 50 percent while also reducing the incremental cost to a 5-year payback of less.
Odyne’s PHEV system enables diesel-fueled work trucks to rely on clean, energy-efficient battery power to achieve greater fuel economy while driving and to power the hydraulic
24
systems for aerial booms and other truck-mounted equipment while at a job site, eliminating most and in some cases, all idling emissions.
3.3 Motiv This project has been very successful at achieving Motiv’s goals. Despite project modifications to include new partners, all defined objectives have been accomplished. The four vehicles over the course of the grant were used for 142,000 miles, and this project has led to at least 310 Metric Tons CO2e reduced, 1.3 tons of NOx reduced, 0.07 tons of ROG reduced, and 0.04 tons of PM10 reduced.
Based upon the total project mileage, over the course of the project the vehicles were used for 142,000 miles, with the average miles per gallon of the equivalent shuttle bus or work truck at five mpg, an estimate of 28,400 gallons of diesel would have been used. If we use the average from 2016, a shuttle on this route travels 18,700 miles annually and would have used 3,700 gallons of diesel per year. The Motiv powertrain’s overall efficiency is about 90-92 percent with the majority of power loss occurring in the motor and inverter. The Adaptive Power Controller has an efficiency of about 97 percent. The Semikron motor inverters have an efficiency of 92 percent. The charger efficiency has been 90 percent. There are a mixture of hardware and software improvements that have been investigated over the course of the project to improve the efficiency from these levels. Based upon the project success Motiv staff believes this project will help the next generation of technology providers as they continue to demonstrate pre-commercial technologies, in field conditions, here in California.
Full commercialization will lead to the actualization of emission reduction targets, air quality improvement, and economic development within the State of California, and this market is still in its infancy. To grow to its full potential there are a variety of areas the state can support which would enable technology providers to reduce the time between pre-commercial proof of concept to market viability. These include: accessory system integration, streamlining compliance mechanisms, increased funding for design iterations and testing, including infrastructure costs, and support field testing of larger numbers of demonstration vehicles.
3.4 Ballard The project demonstrated that fuel cell systems were adaptable to the duty cycle of university shuttles while highlighting the risks of early deployments where operators lack on-site hydrogen fueling and maintenance. The UC Irvine Fuel Cell Bus Program highlighted the value of on-site maintenance and fueling infrastructure. Benefits to California included the advancement of fuel cell technology and related jobs, a first deployment in the transit-adjacent university shuttle market, and the efficient use of funds, as the Fuel Cell Bus Program leveraged existing hydrogen fueling infrastructure.

25
3.5 Volvo CE While fuel consumption improvements were impressive, it was not possible to properly measure productivity, and therefore productivity gains, at the sites. However, since the LX1 actually replaced the L150H machine and was able to carry out the same tasks as the L150H, it is assumed that the productivity for the two machines is equal in the tests.
Productivity was not possible to measure properly at either facility, partly because the operators used the machines in very variable applications. As a result, such a productivity measure was not relevant since the site material was moved in different ways (pushed, stacked in piles, carried, packed down) and the density of the material as well as the distance it moved varied significantly from day to day. Operator feedback from both facilities indicated that the jobsite productivity was somewhat worse with the hybrid electric wheel loader. On average, the hybrid electric wheel loader was 55 percent more fuel efficient compared to the reference machine. For a 95 percent confidence interval, the fuel efficiency improvement is between 41 percent and 68 percent. The hybrid electric wheel loader had 35 percent lower average fuel consumption than the reference machine and therefore produced 35 percent less GHG emissions, a reduction corresponding to roughly 45.2 pounds per hour (lb/hour). The in-service emission test at Redwood Landfill and Recycling Center showed a 38 percent reduction in fuel consumption and greenhouse gas emissions, a slightly better result compared to the longer fuel efficiency test. Both machines performed well in NOx, PM and THC emissions relative to their respective engine emission standard. As expected, the LX1 with its Tier 4 Interim engine had higher emissions in absolute numbers than the L150H, which has a Tier 4 Final engine.
Phase 2 demonstration began at the Moreno Valley Transfer Station. The two machines accumulated representative data used for the fuel economy results. Both machines performed typical functions which included pushing material left by garbage trucks into piles and pushing material into holes in the floor leading down to tunnels where trucks stop to be loaded. On average, the hybrid electric wheel loader was 50 percent more fuel efficient compared to the reference machine. For a 95 percent confidence interval, the fuel efficiency improvement is between 38 percent and 60 percent. The hybrid electric wheel loader had 33 percent lower average fuel consumption than the reference machine and therefore produced 33 percent less GHG emissions, a reduction corresponding to roughly 47.0 lb/hour. Productivity was not possible to measure properly at either facility, as noted above.
Fuel efficiency test results came from charge sustaining operation of the LX1 which means that the batteries have the same state of charge at the start and end of each day. Calculating what impact plug-in charging would have had on fuel efficiency shows that it would have gone from 55 to 75 percent at Redwood Landfill and Recycling Center and from 50 to 67 percent at Moreno Valley Transfer Station. This corresponds to 43 percent and 40 percent respectively in fuel consumption reduction for the two sites.
26
3.6 Proterra The Proterra project clearly demonstrated both the monetary and environmental benefits of electric buses, especially when implemented on a large scale. This project demonstrated that electric transit buses can be a one-for-one replacement for diesel, compressed natural gas (CNG) or hybrid buses, with significant operational cost and greenhouse gas savings. This technology allows transit agencies to provide service to their customers more cost- effectively, more efficiently, and more sustainably. This project also directly benefits California by improving the air quality of the San Joaquin Valley, and creating jobs throughout California to support the electric vehicles. Much of the comparative maintenance data provided by San Joaquin RTD in the final report refers to their hybrid fleet.
This project demonstrated that electric transit buses can be a one-for-one replacement for diesel, CNG or hybrid buses, with significant operational cost and greenhouse gas savings. This project successfully replaced two conventional transit buses with electric buses in Stockton, California. Design improvements implemented during this time allowed for Proterra’s electric bus to develop from proof-of-concept to full implementation. The project reduced fuel costs for the transit authority and assisted in improving air quality for the region. The savings found in this report were further demonstrated during the grant period at other U.S. locations using later iterations of this bus model, showing that the technology is not only viable but desirable for this application. The conventional bus to electric bus replacement in RTD was successful, allowing the transit authority to generate monetary savings and to reduce environmentally-damaging emissions. Both buses and the Fast Charger from this grant are still in service today, and will remain in service through at least the standard 12-year transit bus lifetime.
3.7 TransPower The Electric Drayage Demo project sought to achieve major technology advances in two key areas: (1) vehicle control and integration and (2) advanced energy storage. The project not only made major advances in these two areas, but also achieved significant advances in the area of electric vehicle propulsion, and moderate advances in several other technology areas. Specific accomplishments that are particularly noteworthy include:
• Demonstration and refinement of an advanced inverter that can also serve as a high power onboard battery charger.
• Development and demonstration of an improved method of providing the high tractive power (300 kW) peak required for large vehicles, using a combination of two smaller, mass-produced motors that greatly reduces the cost of achieving this performance level.
• Demonstration and refinement of a unique automated manual transmission that provides a blend of improved road performance and higher operating efficiency than automatic transmissions.
• Development of advanced battery management software and hardware, enabling low-cost batteries to be used safely and effectively in demanding road vehicle applications.
27
• Evaluation and characterization of several different sizes of lithium-ion batteries, providing valuable insights into which battery sizes work best in vehicle applications.
• Attraction of several millions of dollars in additional funding to demonstration projects that will field trucks and tractors using TransPower’s ElecTruck™ drive system over the next two years.
During the course of the project, TransPower successfully built and tested fully functional electric Class 8 trucks to further the development of its pioneering ElecTruck™ drive system. Following 20 months of design and initial prototype development, TransPower deployed the first electric drayage truck using an initial variant of the ElecTruck™ drive system which provided many lessons learned during assembly and testing, enabling TransPower to pursue many improvements in the ElecTruck™ drive system as the next six trucks were built and deployed between August 2014 and the end of 2015.
3.8 Volvo Trucks After a combined demonstration period of eight months in daily revenue service these two concept vehicles showed that a significant reduction in fuel use and engine operating time can be achieved, between 20-30 percent on average, despite the relatively small battery pack and without relying on opportunity charge. It also showed that a well-integrated hybrid driveline controls and exhaust aftertreatment controls can significantly reduce GHG and criteria pollutant emissions, both in brake specific and per-mile basis. The demonstration of truck number one (truck#1) early in this project allowed the team to identify areas of improvements in zero emission range and system cost in time to be incorporated into the design of truck number two (truck#2), including:
• An adaptive method of controlling the operational modes of the truck (electric and hybrid modes) in order to extend zero emission operation beyond fixed geofences in order to accommodate the operational variability typical for drayage trucks. This impact was confirmed through analysis of operating mode distribution in both trucks during each demonstration period.
• A simplification of the hybrid cooling system in order to reduce cost, weight and packaging constraints. Analysis of the data logged during fleet testing of both trucks confirmed that the thermal management concept developed for truck#2 provided adequate performance.
In-use testing of exhaust emissions from truck#2 and a reference truck from the same fleet proved that well-integrated hybrid driveline controls and exhaust aftertreatment controls can significantly reduce GHG and criteria pollutant emissions, both in brake specific and per-mile basis.
After a combined eight months of testing in daily revenue service these two concept vehicles demonstrated that PHEV technology can provide significant reduction of fuel use and exhaust emissions despite a relatively small battery pack and without relying on opportunity charge.

28
Fleet testing confirmed that the adaptive geofence control algorithm developed for truck#2 increased the amount of ZE operation compared with the fixed, preprogrammed geofences used in truck#1. Overall these two concept vehicles demonstrated the following benefits of the PHEV technology while operating in revenue service:
• Significant fuel savings, often exceeding 20-30 percent • Significant amount of zero emission operation, between 20-30 percent of the time,
despite the relatively small battery pack in this PHEV driveline In-use emissions testing of truck#2 in revenue service confirmed that the PHEV concept produces significantly lower in-use CO2 and NOx emissions due to the integration of the plug-in hybrid driveline controls with the engine and exhaust aftertreatment controls.
3.9 Artisan Both trucks successfully completed their deployments, covering hundreds of miles over several months. The Battery Electric Truck performed best in power, speed, and efficiency, while the Hybrid Electric Truck was better equipped for extended range scenarios. Both trucks were tested to their limits, giving valuable insight on the viability of each platform in different scenarios and reliability of the components. Overall emissions and greenhouse gasses were reduced compared to their diesel counterparts, and areas of future improvements were identified. When comparing the aggregate efficiencies for both trucks, the BEV Truck is considerably more efficient than the HEV Truck. While the Hybrid Electric Truck was initially the more attractive platform due to the familiar comfort of refilling a tank with fuel, its additional complexity and lower power density proved to be the main factors that made it less ideal and harder to operate than the Battery Electric Truck for short-haul applications. While the range of the Battery Electric Truck would preclude its use in long-haul scenarios, for short-haul drayage applications this platform performed exceptionally well in terms of power, ease of use, and operational costs. Return on investment is sensitive to diesel fuel prices, so any projections are dependent on market swings. Despite this, the return on investment projection at current market prices is reasonable. Emissions and greenhouse gas reductions are significant for both trucks tested, with the Battery Electric Truck providing the biggest reductions. Decreased emissions and operating costs provide return on investment that positively motivates fleets to consider alternative fuel drayage trucks for their operations. Both trucks performed admirably during deployment, and although the project wasn’t without its challenges and setbacks, much valuable experience was gained for future development of alternative fuel Class 8 drayage trucks. The outcome of the project defines a clear path towards successful commercialization, one that Artisan Vehicle Systems plans on continuing with their battery electric drive systems. Specific directions in electric motor and battery selection, cooling system optimizations, control algorithm tuning, and simplification for the operators and maintenance staff will lead to a better performing and more environmentally friendly product that also reduces operating costs throughout its lifetime. The improvements in emissions and greenhouse gasses that were observed in both trucks are critical to the future
29
of clean air in California and worldwide, and are poised to make a positive impact in the drayage industry. It is apparent that efficiency increases with less load and higher speeds. When cruising at a steady state, the efficiency generally improves. At slow speeds, and especially with larger loads, the BEV Truck shows less efficiency than the HEV Truck. This is a consequence of the HEV Truck’s lower power drive system capability that simply cannot provide more power during acceleration. The BEV Truck can provide more power during acceleration, and the operators often utilized it at the cost of lower efficiency. When optimizing efficiency, the motor controller algorithm can be set to the lowest power limit possible while providing acceptable acceleration.

30
CHAPTER 4: Observations and Other Benefits
4.1 Caterpillar This two-phase project provided valuable customer field experience that helped accelerate those advancements. This project has helped build the foundation on which the next generation of Cat® excavators will continue to grow. The new technology significantly reduces the customers’ owning and operating costs with the improvements in fuel efficiency without sacrificing productivity.
Caterpillar’s commitment to sustainability is resonated through the development and success of these hybrid excavators. The lower fuel consumption directly impacts the GHG released from these construction machines and reduces their carbon footprint. The hybrid system additionally generates lower cab and spectator sound. The ability of the team to leverage scale of standard Cat® components to keep costs down made this a marketable machine that customers would purchase. The sales from the 336E H Hybrid excavator show the value customers see in this technology, and the continued positive responses from the field indicate customers are experiencing a significant reduction in fuel consumption. This advanced hybrid demonstration project was focused on demonstrating reduced customer owning and operating costs through fuel savings. The successful demonstration helped to accelerate the commercialization of this advanced hybrid technology and therefore will allow our California customers to be more cost efficient and economically stable and provide them with a competitive advantage in the marketplace. This will result in more California jobs needed to support these customers and their suppliers. Enhancing the financial health of these California contractors also provides an opportunity for them to expand their operations and increase their employment. Another expected benefit is job training and skill enhancement. Field mechanics and shop technicians receive significant training from Caterpillar in state-of-the-art systems, upgrading their skill set and ultimately enhancing their productivity and wages. Technical training of this kind has a positive impact that cascades from the dealership to both customers and Caterpillar, as customers receive better support and Cat benefits from repeat sales. Caterpillar employs 3,700 people in the State of California in a mix of manufacturing, marketing and logistics occupations. Caterpillar’s dealers employ an additional 3,000 people in the state, also in a range of different jobs. Thousands of earthmoving contractors, their employees, and the combined 6,700 Caterpillar and Cat dealer employees in the State of California stand to benefit from this program.
Caterpillar Inc. has filed PON-14-605 as an additional project proposal for the continuation of improving the performance of large-size hybrid excavators. The project goal will be the development and demonstration of new technology with an objective to improve fuel efficiency by 40 percent or more, which will result in proportional reduction of GHG emissions. Caterpillar
31
will accomplish this reduction by the development and integration of the following technologies to be explored in PON-14-605.
• Optimized and integrated hydraulic hybrid systems that will capture and reuse the available kinetic (swing) and potential (boom) energy.
• Technology that will support automated engine shutdown and restarting (idle time reduction) and therefore GHG emission reduction.
• Optimized power density for the machine based on deep integration with hybrid technology for improved fuel economy at a lower cost.
• Worksite management and operator assist features such as semi-autonomous control to improve operator and machine efficiency.
• Biodiesel fuel to power the engine and reduce machine carbon footprint.
4.2 Odyne Odyne targeted California as a key, initial market for its PHEV work trucks. The Energy Commission project demonstrated four Advanced Diesel Pre-Commercial Plug-in Hybrid Electric Trucks in two California air basins tested streamlined systems, viable battery size, and local California installation, yielding critical new insights to advance commercialization prospects:
• Advanced Diesel Pre-Commercial PHEVs were demonstrated in two different work truck applications – including street light repair (LA County), and digger derrick work trucks (PG&E), broadening the market and establishing a sizeable database of real world operating experience.
• For the first time, two different Lithium Ion battery packs (a 28 kilowatt hour - kWh - battery pack, similar to those used in the DOE-funded project, and a smaller sized 14 kWh battery pack) were demonstrated, side by side, at LA County, to ascertain how each battery pack meets customer needs, enabling Odyne to match system costs to customer needs;
• Local California installation of the hybrid system was implemented (vs. installation of PHEV systems in Wisconsin). Odyne relied upon a trusted equipment repairer to install the plug-in hybrid electric system on the chassis at its facility in Ontario, California, building California workforce expertise in assembly, service and sales. This local installation approach is designed to lower costs, by avoiding transportation costs to and from Wisconsin.
• A new, streamlined approach for optimizing Energy Management Software was developed, and tested, on the four Pre-commercial Energy Commission vehicles and demonstrated. The software matched a vehicle’s duty-cycle demands to minimize diesel fuel use and maximize electricity use. (In earlier projects, energy management software was optimized by first monitoring comparable vehicles for six months; this strategy is well suited to a research and development project, but does not position Odyne for commercial success).
32
Odyne’s Advanced PHEV work trucks will help California achieve its energy and air quality goals, and help fleets realize lower fuel and maintenance costs, due to:
• Night-time charging of batteries, using off-peak electrical grid energy. Batteries discharge during day use, with less diesel fuel use while driving, and no diesel fuel use during battery operation of hydraulics and climate controls at work site.
• Incremental emissions benefits via plugging into California’s grid, due to renewable energy, low carbon fuels policies. Up to 100 percent idle reduction (battery-powered).
• Improved vehicle acceleration and fuel economy via launch assist using electric traction motor.
• Reduced diesel fuel consumption, through energy efficient regenerative braking as well as battery-powered operation of truck-mounted equipment and climate controls.
• Reduced emissions of GHGs and criteria pollutants vs. conventional diesel vehicle. • Quiet worksite operation: highly beneficial in residential neighborhoods or at night. • Lower maintenance – less engine idle time and reduced brake wear. • Unique Power Take-Off interface reduces installation time and provides redundant power
for auxiliary components (patents pending). Provides parallel hybrid system connection with transmission.
• Original drive train is not modified, and interfaces with vehicle power train system; no changes to OEM transmission or engine certification: California Air Resources Board compliant (as a regular truck).
• The hybrid system is fuel neutral and can be adapted to alternative fuel engines. • Modular design facilitates rapid scale to high volume versus highly integrated designs
requiring changes to the transmission or other power train components. • Can be installed during final stage manufacturing process. • Reduction of emissions inhaled by workers in closed spaces such as tunnels.
In addition to emission benefits, economic benefits could also be realized if this technology is deployed in large quantities. Installation could occur in California creating additional labor per vehicle to install the system on the chassis. Also, service techs would need to be trained and available to service the technology within California. Infrastructure would also have to be installed per vehicle creating opportunities for installers of electric vehicles charging stations.
4.3 Motiv Based upon the project success Motiv staff believes this project will help the next generation of technology providers as they continue to demonstrate pre-commercial technologies, in field conditions, here in California. Full commercialization will lead to the actualization of emission reduction targets, air quality improvement, and economic development within the State of California, and this market is still in its infancy. To grow to its full potential there are a variety of areas the state can support which would enable technology providers to reduce the time between pre-commercial proof of concept to market viability.

33
Additional integration and testing of the accessories which impact the performance of work vehicles will be needed to bring zero-emission offerings into many duty cycles. Until the accessory system components are scaled, ruggedized, and tested in the field, powertrain solutions will be limited to applications such as delivery where the vehicle’s driving performance is the key use to productive commercial applications. During this project, infrastructure costs were not a key barrier thanks in large part to Google sponsoring the shuttle operations, and having chargers installed on their facility. However, having a large company with significant assets available in both facility and finances is not normal in areas with poor air quality. The more disadvantaged communities in California have significantly older facilities where power limitations and the cost of upgrades can be a barrier to selecting a zero-emission electric vehicle.
As the project progressed many clean cities coalitions, air districts, fleets, prospective customers, and government agencies requested the ability to have a shuttle demonstrated or brought to their event to show to key stakeholders. While this level of interest is key to expanding the market for zero-emission vehicles, we were unable to meet these needs using the vehicles in this project as the shuttles were needed in service in order to fulfill their fleet obligations. The benefit of real world fleet engagement which aided engineers in getting better feedback during the development process, was also the barrier to showcasing the new and improved technologies to other audiences. If California is going to meet our air quality goals, we will need vehicles that fleets can try out, have their drivers take out for test drives on their own routes, and see in trade shows while planning procurement. Such demonstrations remain an unfunded part of the portfolio. This hands-on experience is key for fleet managers and decision makers to see the technology as truly viable, and a barrier that can be overcome with proper resources. These policy recommendations would all build stronger products with a pipeline to communities that need clean technologies the most. While Motiv is proud of the work under this grant to deploy these pre-commercial vehicles, the learnings from this demonstration lead us to urge the state to consider the limitations on the demand side. A balanced approach that accounts for new technologies, emerging markets, the evolution of compliance standards, and the economic factors around the industry, especially in infrastructure, must all be considered in bringing zero-emission vehicles out of the lab and onto the streets. Note: As of this writing, Motiv is an Electric Qualified Vehicle Modifier for Ford Motor Company and is providing its electric power train to multiple vehicle chassis makers for shuttle buses and step vans.
4.4 Ballard As Ballard Power Systems and BAE Systems continue to improve the fuel cell system, cost reductions and policy support have enabled larger-scale fuel cell bus deployments around the United States. As the bus market matures, other sectors such as port vehicles and trucking offer additional opportunities for zero-emission transportation to replace combustion-based incumbents.
34
As California’s first deployment of fuel cell buses in a shuttle / university setting, the UC Irvine Fuel Cell Bus Program offered lessons for future deployments of the technology in this use case.
• Higher than expected service outages generally related to fuel cell system components, perhaps indicative of the different stresses of the university shuttle and mass transit duty cycles. It is expected that design changes can resolve these, and that technology development would not be required.
• Expectations for future projects should account for the fact that shuttle operators commonly rely on third parties for maintenance. This means that troubleshooting and the diagnosis of problems takes longer. Issues that could be quickly addressed by an on-site maintenance team might have prevented the loss of service days in some cases. This is evidenced by the lower availability for the UCI bus (83 percent) when compared to other El Dorado fuel cell electric buses operating in the United States.
• Depending on contracts signed with industrial gas suppliers, shared fueling stations may not have the same uptime as dedicated stations, such as those commonly installed by larger transit operators during their trials.
• Operating a single demonstration vehicle may not provide the optimal conditions for developing preventative and corrective maintenance processes and policy.
The American Fuel Cell Bus program provided the following benefits to the state of California: • Advancing Fuel Cell technology and jobs: Continued support for the deployment of fuel
cell buses has allowed the industry to iterate improvements to the fuel cell stack and system, readying these for wider deployment. The tipping point may have arrived with the JIVE and JIVE2 projects from Europe’s Fuel Cell Joint Undertaking (FCH JU) calling for a total of 291 fuel cell buses. The human capital California has developed around hydrogen and fuel cells offers state businesses economic opportunities to consult with other regions shifting to zero emission mass transit.
• Fuel Cell technology evaluation for a new market: Fuel cell bus deployments to date had been conducted by large-scale mass transit service operators. The UCI Fuel Cell Bus program was the first evaluation of the technology for the shuttle market, with its distinct duty cycle and where smaller transit operators commonly rely on third-party maintenance and existing infrastructure. Insights from this first university deployment will improve outcomes of future fuel cell bus deployments in transit shuttle markets.
• Efficient use of California funds for transit: The UC Irvine Fuel Cell Bus Program refueled its bus from an existing automotive hydrogen fueling station. While station uptime was lower than would have been the case for a dedicated station, considerable program savings resulted from not having to purchase dedicated fueling infrastructure.
Future areas of development include the following: • Cost reduction: historically, fuel cell bus costs have been high owing to the need to
recover costs across small deployments. The trend towards more and larger fuel cell bus deployments will allow costs to be amortized over higher production volumes and unlock learning curve effects to decrease costs.
35
• Battery-fuel cell hybridization: the rapid decline in lithium ion battery costs opens the possibility for battery-fuel cell hybrid buses in which the battery is used for primary propulsion and the fuel cell is used as a range extender. In this configuration, the fuel cell system can be smaller and run at gentler conditions, allowing cost reductions as the system can be smaller and does not require the same degree of robustness.
• Light rail: the resurgence in interest in light rail among city planners provides another opportunity for fuel cell systems, which are highly suitable for tram- style applications. Though light rail has a distinct duty cycle, the technological expertise gained from fuel cell bus programs will help domestic firms compete for zero emission light rail projects nationally and around the world.
While this grant focused on transit, fuel cell technology has established itself in material handling (warehouse forklifts) and can be adapted for use in adjacent sectors including shipping, trucking (long haul, drayage and delivery vehicles) and ground support at seaports and airports. Fuel cell policy support has been provided for pilot programs in many of these use cases, which are generally unamenable to battery-only solutions. State businesses developing early expertise with zero- compromise, zero-emission solutions stand to benefit California’s economy by exporting their products and services to other states and across the seas.
Note: As of this writing, the American Fuel Cell Bus has completed validation testing via the Federal Transit Administration’s Altoona test process and is eligible for transit district sales. The first production units have been sold and deployed to Sunland Transit, in Thousand Palms, California. The bus is assembled and sold by El Dorado National, a California bus maker.
4.5 Volvo CE The prototype hybrid electric wheel loader project was focused on demonstrating new technologies that show a competitive advantage for our customers by reducing customer owning and operating costs through fuel savings. The success of this demonstration will also benefit in the continued development of technologies that will be implemented in the commercialization of a hybrid electric wheel loader. In addition, this has also shown potential for other product types and segments which will increase the portfolio of Electromobility products available on the market. In our ongoing efforts to fulfill our aggressive triple zero initiative (zero emissions, zero accidents, and zero downtime); the results of this demonstration confirmed a significantly reduced reliance on fossil fuels as well as reducing the GHG emitted from this machine. Additionally, this demonstration has provided valuable operator feedback on the machine performance and productivity relative to a conventional machine.
This project also provided valuable knowledge on how to develop machines, wheel loaders and other products, with completely decoupled systems (meaning engine operation is decoupled from direct power demand) enabling a breakthrough in efficiency improvement for wheel loaders. Advancements have been made in the electrification of drivelines, hydraulics and
36
energy storage which are sub-systems and components that will build the base for future hybrid and electric off highway machines. In line with the Volvo Group’s vision to become the world leader in sustainable transport solutions, Volvo CE is committed to contributing to sustainable development. Volvo CE was the first construction equipment company in the industry to join the World Wide Fund for Nature’s Climate Savers program – an initiative that requires participating corporations to commit to cutting CO2 emissions in their operations.
Volvo CE has a ‘triple zero’ vision which connects to the company’s core values – zero downtime reflects its commitment to quality, zero accidents represent safety and zero emissions denotes environmental care. Future technology like this will help the company to achieve these ambitious goals. Although Electromobility technology is still under development and testing, it has the potential to drastically reduce fuel consumption, environmental impact and the cost of machine usage, as well as increase efficiency. The electrification of construction equipment will produce cleaner, quieter and more efficient machines and represents the future of the industry. The possibilities are truly exciting and the results from this project will boost technological innovation at Volvo CE for years to come. This project will support improvements to the LX1 prototype machine demonstrated in California to support future demonstration and our new product development projects underway today. Volvo CE has long-term plans to develop products and services for Electromobility, including electric hybrids and electric sites. Electromobility at Volvo CE provides opportunities across all product lines and the company has projects or research underway in most product categories beyond Wheel Loaders (i.e. Electric Site and EX02). The LX1 demonstration project provides Volvo with valuable feedback as input to our future demonstration project Electric Site. Also, the technology development in the LX1 supports control functionality, power distribution, and high voltage systems development which can be used in other products planned for future market offer and commercialization.
4.6 Proterra The experience from the Proterra project contributed to the development of a new, improved 40-foot electric bus, which has already been purchased by five transit authorities including Foothill Transit and San Joaquin Regional Transit Authority. Additional development opportunities exist to further improve fuel efficiency and air quality, and to develop the supply chain for this technology. The EcoRide electric bus project provided the following benefits to California:
• Reduced GHG emissions in the San Joaquin Valley. This region of California is both highly populated and highly agricultural, presenting a greater strain on resources than other areas of California or the US. These buses are a big step towards reducing emissions in this region.
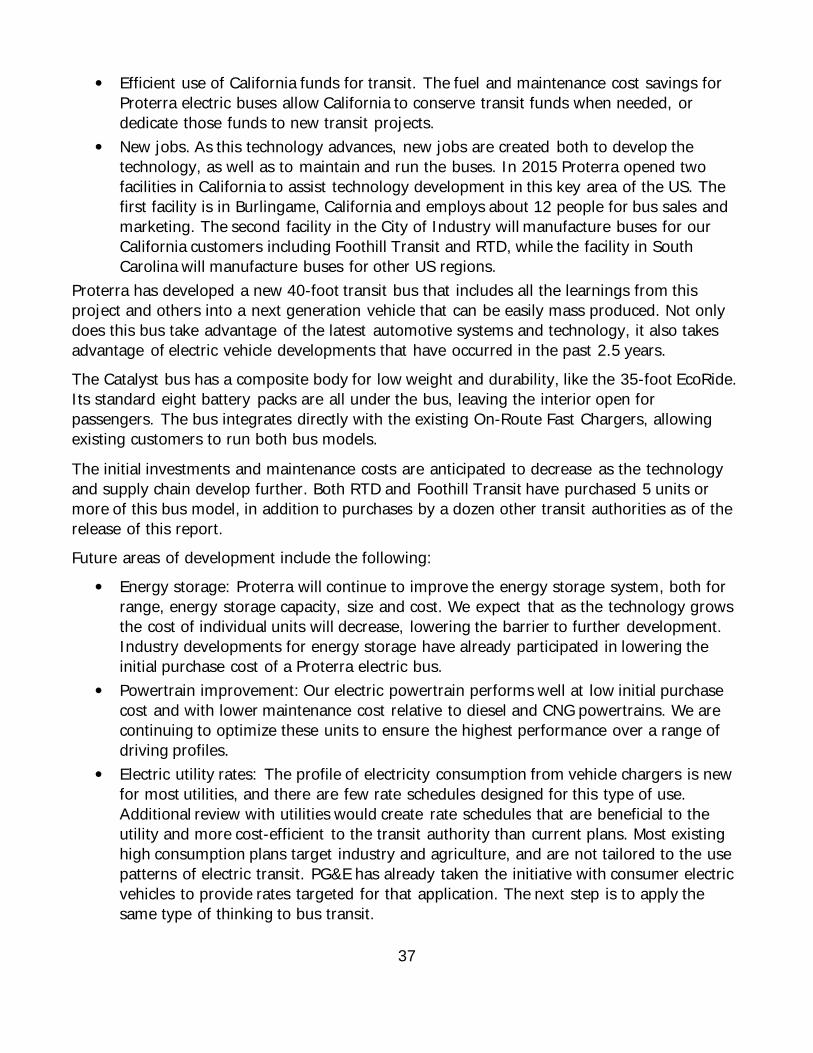
37
• Efficient use of California funds for transit. The fuel and maintenance cost savings for Proterra electric buses allow California to conserve transit funds when needed, or dedicate those funds to new transit projects.
• New jobs. As this technology advances, new jobs are created both to develop the technology, as well as to maintain and run the buses. In 2015 Proterra opened two facilities in California to assist technology development in this key area of the US. The first facility is in Burlingame, California and employs about 12 people for bus sales and marketing. The second facility in the City of Industry will manufacture buses for our California customers including Foothill Transit and RTD, while the facility in South Carolina will manufacture buses for other US regions.
Proterra has developed a new 40-foot transit bus that includes all the learnings from this project and others into a next generation vehicle that can be easily mass produced. Not only does this bus take advantage of the latest automotive systems and technology, it also takes advantage of electric vehicle developments that have occurred in the past 2.5 years. The Catalyst bus has a composite body for low weight and durability, like the 35-foot EcoRide. Its standard eight battery packs are all under the bus, leaving the interior open for passengers. The bus integrates directly with the existing On-Route Fast Chargers, allowing existing customers to run both bus models.
The initial investments and maintenance costs are anticipated to decrease as the technology and supply chain develop further. Both RTD and Foothill Transit have purchased 5 units or more of this bus model, in addition to purchases by a dozen other transit authorities as of the release of this report. Future areas of development include the following:
• Energy storage: Proterra will continue to improve the energy storage system, both for range, energy storage capacity, size and cost. We expect that as the technology grows the cost of individual units will decrease, lowering the barrier to further development. Industry developments for energy storage have already participated in lowering the initial purchase cost of a Proterra electric bus.
• Powertrain improvement: Our electric powertrain performs well at low initial purchase cost and with lower maintenance cost relative to diesel and CNG powertrains. We are continuing to optimize these units to ensure the highest performance over a range of driving profiles.
• Electric utility rates: The profile of electricity consumption from vehicle chargers is new for most utilities, and there are few rate schedules designed for this type of use. Additional review with utilities would create rate schedules that are beneficial to the utility and more cost-efficient to the transit authority than current plans. Most existing high consumption plans target industry and agriculture, and are not tailored to the use patterns of electric transit. PG&E has already taken the initiative with consumer electric vehicles to provide rates targeted for that application. The next step is to apply the same type of thinking to bus transit.

38
Note: The California Public Utilities Commission is as of this writing reviewing new utility rates cases that could allow targeted electricity rates, demand charge structures and infrastructure investments that could be of huge benefit addressing the items noted above. Proterra would like to expand to other route-based applications in both public and private sectors. Some examples are universities or airports, where buses also run fixed routes with specific schedules. These locations stand to gain significant cost savings from lower fuel and maintenance costs, which would directly benefit their bottom line and increase profitability in the long term.
4.7 TransPower Over the course of the Electric Drayage Demo project, the seven electric drayage trucks using the ElecTruck™ drive system accumulated more than 35,000 miles of testing and operation, most of it in actual operating service hauling heavy loads. To TransPower’s knowledge, this is far more miles than has been accumulated on any fleet of battery-electric trucks of this weight class in the U.S., and possibly anywhere in the world. More importantly, the trucks have generally met or exceeded project expectations once corrective actions had been taken to address early design flaws. TransPower plans to expand demonstration mileage with its latest designs. This zero emission benefit, applied across the drayage sector, would be invaluable in helping to meet the greenhouse gas emissions limits established by the California Air Resources Board (ARB). As the ARB’s “business as usual” estimate of 2020 carbon emissions is 600 million tons, a reduction of 173 million tons is required from this level to meet the ARB goal. Therefore, approximately 0.2 percent of the statewide carbon reduction could potentially be achieved with the commercialization and relatively focused application of this one technology. More widespread commercial adoption of the technology could multiply this benefit. In addition to reducing carbon emissions as just describe, electric trucks will also reduce emissions of criteria pollutants such as oxides of nitrogen, carbon monoxide, and hydrocarbons. If these emissions reductions come anywhere near the 90 percent reduction in carbon emissions that has been calculated, the overall environmental benefits of electric truck adoption will be enormous. The actual and projected economic benefits of the project include:
• The project provided significant short-term business opportunities for its two principal California-based participants, TransPower and EPC. The grant was one of the first sources of income for both TransPower and EPC when the project began in 2012, but since receipt of the grant, TransPower has secured more than $40 million in additional business and has grown from 15 to more than 40 employees.
• Deployment of the seven electric drayage trucks is expected to accelerate adoption of electric propulsion technology by large trucks, thereby helping to expand the electric vehicle industry and to enable California to develop a leading role in its growth.

39
• The innovations enabled by the electric drayage demo project, such as the Inverter-Charger Unit, low-cost battery subsystems, and adaptable control architecture, will make electric trucks more affordable.
• Deployment of electric trucks using the technology developed under the project will enable continued growth of the Los Angeles and Long Beach Ports, which contribute to the stabilization of economically distressed areas, by providing the first practical, zero-emission alternative for port drayage.
• Building on the success of the project, TransPower is developing innovative financing methods to make higher end electric trucks more affordable to independent owner-operators, who are generally among the lowest-paid workers in the logistics industry.
• Commercialization of electric drayage technology will serve as a catalyst for U.S. truck manufacturers to convert assembly capacity to electric drive integration, helping U.S. truck companies maintain global technology leadership.
The types of jobs that will be created by this project are permanent and varied. Most of these jobs will be high-paying professional jobs related to engineering and assembly of high-tech drive systems, and associated business management functions such as marketing, program management, and financial and supply chain management. TransPower has already started talking with non-profit training organizations such as the Cleantech Institute about creating training programs for mechanics, so they can be retrained to work on high-voltage electrical systems. Independent owner-operators who take advantage of such innovative financing programs will have a unique opportunity to lease and eventually own higher-end trucks that will increase their earning potential, based on the demonstrated willingness of cargo owners to pay premiums for use of “green” transportation solutions. In the longer term, if TransPower’s commercialization goal of producing 2,500 electric drive systems/year is achieved by 2020, specific economic impacts could include:
• Creation of approximately 300 jobs directly related to drive system kit assembly, plus another 600 in indirect support jobs (900 jobs total).
• Creation of about 400 jobs related to converters and battery modules. This estimate is based on creation of one person-month of direct and indirect employment for each converter and vehicle battery subsystem produced.
• Creation of about 100 jobs at California-based suppliers of wiring, cabling, machined assemblies, and other small parts used in TransPower drive systems.
• Creation of about 100 jobs related to servicing and support of electric trucks, based on production of 7,875 electric trucks through 2020, of which an estimated 5,000 to 6,000 would be based in California.
This adds up to a total of 1,500 new jobs, and does not include additional jobs created in the trucking industry if electric propulsion opens up new growth opportunities. Based on an average taxable income of $70,000/year and a tax rate of 9 percent, this level of job creation would generate $9.5 million/year in additional state income tax revenue.
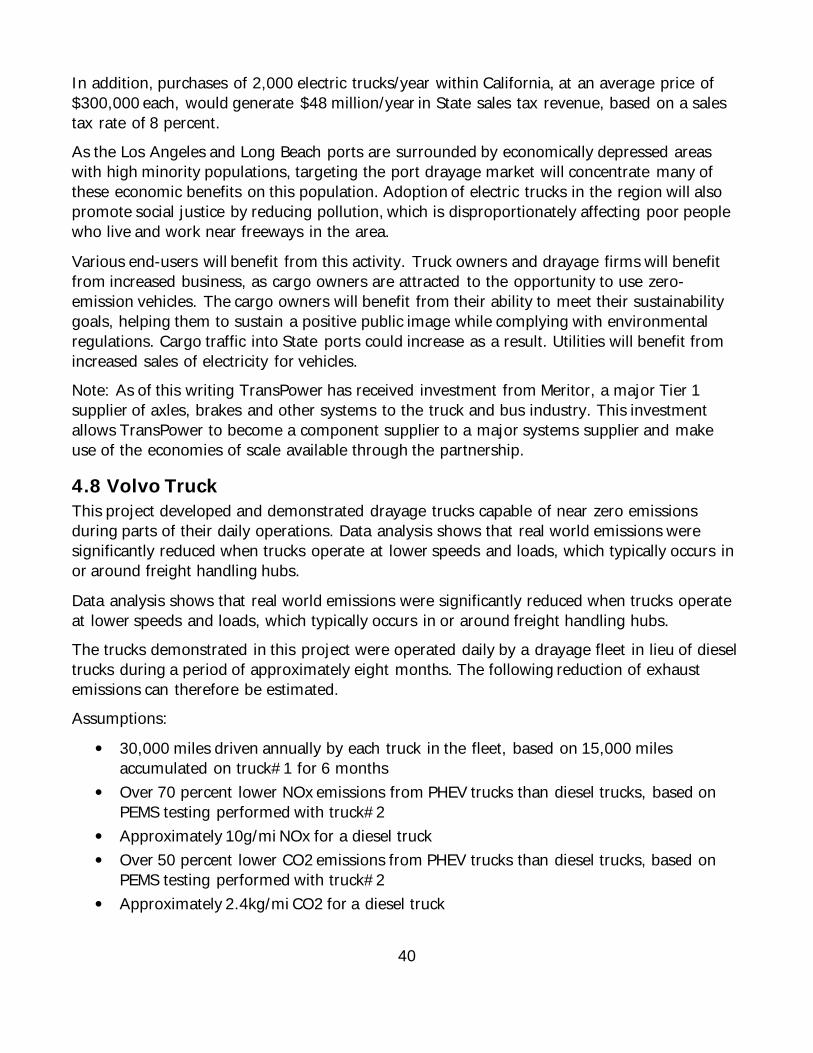
40
In addition, purchases of 2,000 electric trucks/year within California, at an average price of $300,000 each, would generate $48 million/year in State sales tax revenue, based on a sales tax rate of 8 percent. As the Los Angeles and Long Beach ports are surrounded by economically depressed areas with high minority populations, targeting the port drayage market will concentrate many of these economic benefits on this population. Adoption of electric trucks in the region will also promote social justice by reducing pollution, which is disproportionately affecting poor people who live and work near freeways in the area.
Various end-users will benefit from this activity. Truck owners and drayage firms will benefit from increased business, as cargo owners are attracted to the opportunity to use zero-emission vehicles. The cargo owners will benefit from their ability to meet their sustainability goals, helping them to sustain a positive public image while complying with environmental regulations. Cargo traffic into State ports could increase as a result. Utilities will benefit from increased sales of electricity for vehicles. Note: As of this writing TransPower has received investment from Meritor, a major Tier 1 supplier of axles, brakes and other systems to the truck and bus industry. This investment allows TransPower to become a component supplier to a major systems supplier and make use of the economies of scale available through the partnership.
4.8 Volvo Truck This project developed and demonstrated drayage trucks capable of near zero emissions during parts of their daily operations. Data analysis shows that real world emissions were significantly reduced when trucks operate at lower speeds and loads, which typically occurs in or around freight handling hubs.
Data analysis shows that real world emissions were significantly reduced when trucks operate at lower speeds and loads, which typically occurs in or around freight handling hubs. The trucks demonstrated in this project were operated daily by a drayage fleet in lieu of diesel trucks during a period of approximately eight months. The following reduction of exhaust emissions can therefore be estimated. Assumptions:
• 30,000 miles driven annually by each truck in the fleet, based on 15,000 miles accumulated on truck#1 for 6 months
• Over 70 percent lower NOx emissions from PHEV trucks than diesel trucks, based on PEMS testing performed with truck#2
• Approximately 10g/mi NOx for a diesel truck • Over 50 percent lower CO2 emissions from PHEV trucks than diesel trucks, based on
PEMS testing performed with truck#2 • Approximately 2.4kg/mi CO2 for a diesel truck
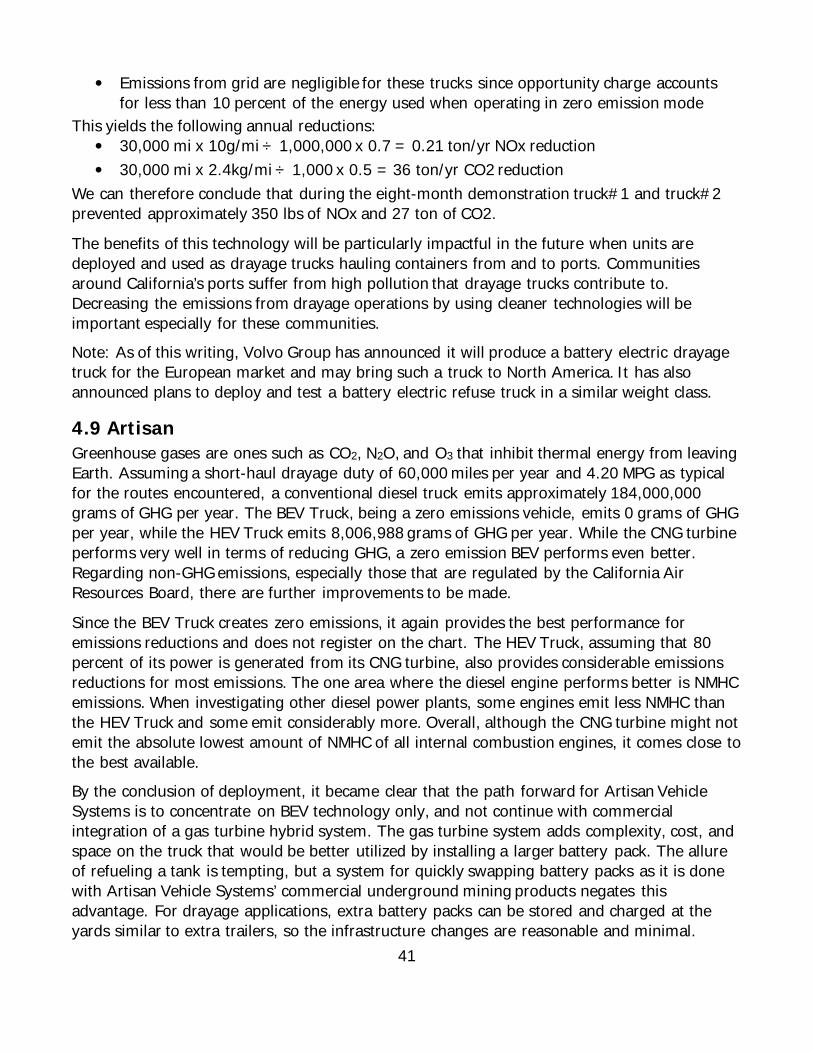
41
• Emissions from grid are negligible for these trucks since opportunity charge accounts for less than 10 percent of the energy used when operating in zero emission mode
This yields the following annual reductions: • 30,000 mi x 10g/mi ÷ 1,000,000 x 0.7 = 0.21 ton/yr NOx reduction • 30,000 mi x 2.4kg/mi ÷ 1,000 x 0.5 = 36 ton/yr CO2 reduction
We can therefore conclude that during the eight-month demonstration truck#1 and truck#2 prevented approximately 350 lbs of NOx and 27 ton of CO2.
The benefits of this technology will be particularly impactful in the future when units are deployed and used as drayage trucks hauling containers from and to ports. Communities around California’s ports suffer from high pollution that drayage trucks contribute to. Decreasing the emissions from drayage operations by using cleaner technologies will be important especially for these communities. Note: As of this writing, Volvo Group has announced it will produce a battery electric drayage truck for the European market and may bring such a truck to North America. It has also announced plans to deploy and test a battery electric refuse truck in a similar weight class.
4.9 Artisan Greenhouse gases are ones such as CO2, N2O, and O3 that inhibit thermal energy from leaving Earth. Assuming a short-haul drayage duty of 60,000 miles per year and 4.20 MPG as typical for the routes encountered, a conventional diesel truck emits approximately 184,000,000 grams of GHG per year. The BEV Truck, being a zero emissions vehicle, emits 0 grams of GHG per year, while the HEV Truck emits 8,006,988 grams of GHG per year. While the CNG turbine performs very well in terms of reducing GHG, a zero emission BEV performs even better. Regarding non-GHG emissions, especially those that are regulated by the California Air Resources Board, there are further improvements to be made.
Since the BEV Truck creates zero emissions, it again provides the best performance for emissions reductions and does not register on the chart. The HEV Truck, assuming that 80 percent of its power is generated from its CNG turbine, also provides considerable emissions reductions for most emissions. The one area where the diesel engine performs better is NMHC emissions. When investigating other diesel power plants, some engines emit less NMHC than the HEV Truck and some emit considerably more. Overall, although the CNG turbine might not emit the absolute lowest amount of NMHC of all internal combustion engines, it comes close to the best available. By the conclusion of deployment, it became clear that the path forward for Artisan Vehicle Systems is to concentrate on BEV technology only, and not continue with commercial integration of a gas turbine hybrid system. The gas turbine system adds complexity, cost, and space on the truck that would be better utilized by installing a larger battery pack. The allure of refueling a tank is tempting, but a system for quickly swapping battery packs as it is done with Artisan Vehicle Systems’ commercial underground mining products negates this advantage. For drayage applications, extra battery packs can be stored and charged at the yards similar to extra trailers, so the infrastructure changes are reasonable and minimal.
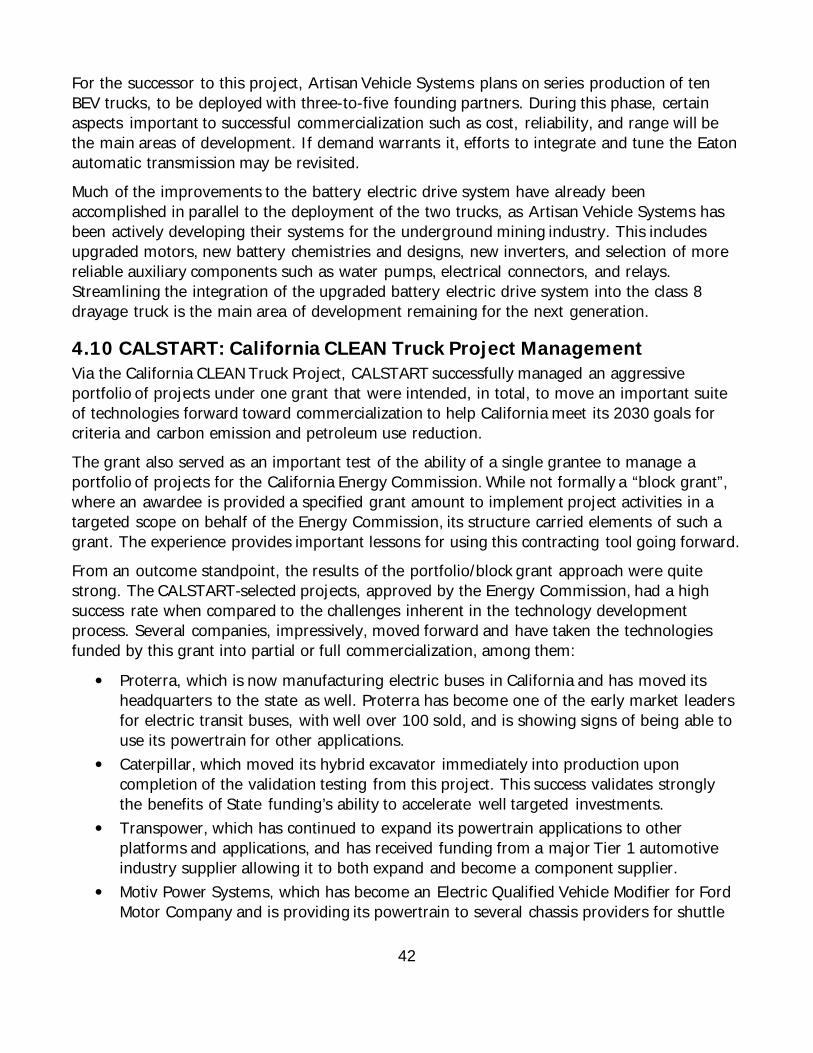
42
For the successor to this project, Artisan Vehicle Systems plans on series production of ten BEV trucks, to be deployed with three-to-five founding partners. During this phase, certain aspects important to successful commercialization such as cost, reliability, and range will be the main areas of development. If demand warrants it, efforts to integrate and tune the Eaton automatic transmission may be revisited. Much of the improvements to the battery electric drive system have already been accomplished in parallel to the deployment of the two trucks, as Artisan Vehicle Systems has been actively developing their systems for the underground mining industry. This includes upgraded motors, new battery chemistries and designs, new inverters, and selection of more reliable auxiliary components such as water pumps, electrical connectors, and relays. Streamlining the integration of the upgraded battery electric drive system into the class 8 drayage truck is the main area of development remaining for the next generation.
4.10 CALSTART: California CLEAN Truck Project Management Via the California CLEAN Truck Project, CALSTART successfully managed an aggressive portfolio of projects under one grant that were intended, in total, to move an important suite of technologies forward toward commercialization to help California meet its 2030 goals for criteria and carbon emission and petroleum use reduction. The grant also served as an important test of the ability of a single grantee to manage a portfolio of projects for the California Energy Commission. While not formally a “block grant”, where an awardee is provided a specified grant amount to implement project activities in a targeted scope on behalf of the Energy Commission, its structure carried elements of such a grant. The experience provides important lessons for using this contracting tool going forward. From an outcome standpoint, the results of the portfolio/block grant approach were quite strong. The CALSTART-selected projects, approved by the Energy Commission, had a high success rate when compared to the challenges inherent in the technology development process. Several companies, impressively, moved forward and have taken the technologies funded by this grant into partial or full commercialization, among them:
• Proterra, which is now manufacturing electric buses in California and has moved its headquarters to the state as well. Proterra has become one of the early market leaders for electric transit buses, with well over 100 sold, and is showing signs of being able to use its powertrain for other applications.
• Caterpillar, which moved its hybrid excavator immediately into production upon completion of the validation testing from this project. This success validates strongly the benefits of State funding’s ability to accelerate well targeted investments.
• Transpower, which has continued to expand its powertrain applications to other platforms and applications, and has received funding from a major Tier 1 automotive industry supplier allowing it to both expand and become a component supplier.
• Motiv Power Systems, which has become an Electric Qualified Vehicle Modifier for Ford Motor Company and is providing its powertrain to several chassis providers for shuttle
43
bus and truck applications. Motiv opened an expanded California design and production facility during the course of this grant.
• Volvo Trucks, which has taken learnings from its experience and knowledge validating the plug-in hybrid drayage truck in field testing to support its development of a battery electric drayage truck being built for Europe and eventually North America.
• Volvo CE, which has taken the learnings from the hybrid electric wheel loader to refine its design for next generation products now in development.
• Odyne Systems, which is selling versions of its plug-in hybrid trucks improved, refined and validated through this grant. Odyne also added a California field support partnership during the course of this grant
• Ballard supported the refinement and market expansion of fuel cell buses, specifically the improvement and validation of the American Fuel Cell Bus via this grant. The bus has passed Federal Transit Administration Altoona testing to be qualified and approved for transit sales. El Dorado National is now building the first production buses in California which have been delivered to Sunline Transit in Thousand Palms, California.
• Artisan has able to down-select technology to best match its deployed product plans, focusing as a result of this grant on the battery electric powertrain option.
While one company that was awarded was unable to move forward, the issues in that project were identified early in the grant timeline and impacts mitigated, including not incurring project costs. Indeed, CALSTART worked with several potential alternative partner structures to restructure the project to meet its initial intent, and believes it could have created a valuable substitute project, but was limited by some of the highly specific requirements under the grant language. Some of these restrictions included requirements to have the same number of vehicles, same end-use partners and same geographic regions as identified in the proposal. Some flexibility to staff and grantee to be allowed to meet comparable goals in restructuring projects under future grants would prove valuable. Additionally, more clarity requiring sub-grantees to manage their project issues directly through the grantee, rather than going directly to the Energy Commission staff (as happened on one or two occasions), would benefit all sides and further streamline and reduce Energy Commission staff time, allowing staff to focus more on managing outcomes. In total, CALSTART believes benefits of block grant structures, as highlighted through the project selection, management and final outcomes in this portfolio grant, is a powerful tool. In this case, CALSTART’s specific knowledge of the technology, the industry, technology trends and deployment partners made it an invaluable augment of the Energy Commission staff. Given funding and travel limitations, and the limited size of its transportation staff, Energy Commission personnel cannot be expected to be experts in all the emerging technologies and know the range of companies and technology providers.
This portfolio grant, like a block grant, allowed a single qualified grantee to manage a large suite of projects. It can be a very effective tool to greatly expand the number of projects the grantee can manage, while driving very specific, high-value commercialization outcomes so vital to the State for air quality, climate change, petroleum reduction and economic vitality.

44
GLOSSARY
AMPERE-HOUR (Ah) – A unit of electric charge, usually used for batteries. This unit combines the amount of current with how long that current can be sustained until the battery completely discharges. Large batteries have several ampere hours but cell phones and other small devices have batteries with a total charge measured in milliampere hours. This measured quantity is called battery capacity.1 ASSEMBLY BILL (AB) - A proposed law, introduced during a session for consideration by the Legislature, and identified numerically in order of presentation; also, a reference that may include joint, concurrent resolutions, and constitutional amendments, by Assembly, the house of the California Legislature consisting of 80 members, elected from districts determined on the basis of population. Two Assembly districts are situated within each Senate district.
AUTOMATED MANUAL TRANSMISSION (AMT) – A key new technology that enables the TransPower ElecTruck™ Main Propulsion System (MPS) to achieve superior road performance and efficiency, while enhancing drivability. The AMT provides improved road performance at both high and low speeds, while enabling the use of a more efficient manual transmission, which reduces energy consumption and increases operating range. Shifting is accomplished smoothly and automatically, resulting in a favorable driver experience.2 BATTERY ELECTRIC VEHICLE (BEV) - Also known as an “All-electric” vehicle (AEV), BEVs utilize energy that is stored in rechargeable battery packs. BEVs sustain their power through the batteries and therefore must be plugged into an external electricity source in order to recharge. BATTERY MANAGEMENT SYSTEM (BMS) – Systems encompassing not only the monitoring and protection of the battery but also methods for keeping it ready to deliver full power when called upon and methods for prolonging its life. This includes everything from controlling the charging regime to planned maintenance.
CALIFORNIA AIR RESOURCES BOARD (ARB) – The "clean air agency" in the government of California, whose main goals include attaining and maintaining healthy air quality; protecting the public from exposure to toxic air contaminants; and providing innovative approaches for complying with air pollution rules and regulations. CALIFORNIA CARTAGE COMPANY – the largest drayage company in the Los Angeles/Long Beach port region. CALIFORNIA ENERGY COMMISSION (CEC) - The state agency established by the Warren-Alquist State Energy Resources Conservation and Development Act in 1974 (Public Resources
1 University of Calgary, Energy Education Website (https://energyeducation.ca/encyclopedia/Ampere_hour) 2 Transpower website (http://www.transpowerusa.com/automated-manual-transmission/)
45
Code, Sections 25000 et seq.) responsible for energy policy. The Energy Commission's five major areas of responsibilities are: • Forecasting future statewide energy needs
• Licensing power plants sufficient to meet those needs • Promoting energy conservation and efficiency measures • Developing renewable and alternative energy resources, including providing assistance
to develop clean transportation fuels
• Planning for and directing state response to energy emergencies. CALSTART – A nonprofit organization working nationally and internationally with businesses and governments to develop clean, efficient transportation solutions. CALSTART is a network that connects companies and government agencies and helps them do their jobs better. CALSTART is located in Pasadena, California.3 CARBON DIOXIDE EQUIVALENT (CO2e) - A metric used to compare emissions of various greenhouse gases. It is the mass of carbon dioxide that would produce the same estimated radiative forcing as a given mass of another greenhouse gas. Carbon dioxide equivalents are computed by multiplying the mass of the gas emitted by its global warming potential.
COMPRESSED NATURAL GAS (CNG) - Natural gas that has been compressed under high pressure, typically between 2,000 and 3,600 pounds per square inch, held in a container. The gas expands when released for use as a fuel. DIESEL GALLON EQUIVALENT (DGE) – The amount of alternative fuel it takes to equal the energy content of one liquid gallon of diesel gasoline. DOWNTOWN TRANSIT CENTER (DTC) - The transit center, located at 421 E. Weber Avenue, is Stockton's downtown public transit hub. Nearly all RTD routes connect at the DTC, with 20 sheltered, off-street bus stops on two passenger boarding platforms, and additional stops on Channel Street and Weber Avenue.
ELECTRIC VEHICLES (EV) – A broad category that includes all vehicles that are fully powered by electricity or an electric motor. ELECTRIC VEHICLE SUPPLY EQUIPMENT (EVSE) – Infrastructure designed to supply power to EVs. EVSE can charge a wide variety of EVs including BEVs and PHEVs. ELECTRONIC CONTROL MODULE (ECM) – A system that controls a series of actuators in the diesel engine to ensure optimal engine performance through electronic control. Modern diesel engines have a number of sensors within the engine and machine, which provide readings to the ECU.
3 CALSTART (https://calstart.org/)
46
ENERGY STORAGE SUBSYSTEM (ESS) - TransPower’s Systems that employ many technological advances to safely accommodate the large quantities of batteries required for large electric vehicles. Each ESS is custom-designed for its intended vehicle application, utilizing battery cells and packaging concepts tailored to vehicle operating needs and space constraints. ENGINE CONTROL UNIT (ECU) - A type of electronic control unit that controls a series of actuators on an internal combustion engine to ensure optimal engine performance. It does this by reading values from a multitude of sensors within the engine bay, interpreting the data using multidimensional performance maps (called lookup tables), and adjusting the engine actuators. Before ECUs, air-fuel mixture, ignition timing, and idle speed were mechanically set and dynamically controlled by mechanical and pneumatic means.
GEOFENCE CONTROL MODULE (GCM) – a program that uses a virtual geographic boundary, defined by GPS or RFID technology (geofence), to enable software to trigger a response when a mobile device enters or leaves a particular area. GLOBAL POSITIONING SYSTEM (GPS) - an accurate worldwide navigational and surveying facility based on the reception of signals from an array of orbiting satellites. GREENHOUSE GASES (GHG) – Any gas that absorbs infra-red radiation in the atmosphere. Greenhouse gases include water vapor, carbon dioxide (CO2), methane (CH4), nitrous oxide (N2O), halogenated fluorocarbons (HCFCs), ozone (O3), perfluorinated carbons (PFCs), and hydrofluorocarbons (HFCs).
HORSEPOWER (HP) - A unit for measuring the rate of doing work. One horsepower equals about three-fourths of a kilowatt (745.7 watts). HYBRID ELECTRIC VEHICLE (HEV) -- A vehicle that combines an internal combustion engine with a battery and electric motor. This combination offers the range and refueling capabilities of a conventional vehicle, while providing improved fuel economy and lower emissions. HYDROGEN (H2) - A colorless, odorless, highly flammable gas, the chemical element of atomic number 1.
INVERTER-CHARGER UNIT (ICU) - A TransPower’s system that automatically regulates the recharging of the vehicle’s batteries, and safely terminates the charging process when the batteries are brought up to a full charge. KILOGRAM (kg) - The base unit of mass in the International System of Units that is equal to the mass of a prototype agreed upon by international convention and that is nearly equal to the mass of 1000 cubic centimeters of water at the temperature of its maximum density. KILOWATT-HOUR (kWh) -- The most commonly-used unit of measure telling the amount of electricity consumed over time. It means one kilowatt of electricity supplied for one hour. In 1989, a typical California household consumes 534 kWh in an average month.
47
LA COUNTY DEPARTMENT OF PUBLIC WORKS (LACDPW) - The Department responsible for the construction and operation of Los Angeles County's roads, building safety, sewerage, and flood control.4 LIGHT-EMITTING DIODE (LED) - a semiconductor diode which glows when a voltage is applied.
LITER (L) - A metric unit of capacity equal to one cubic decimeter. LOS ANGELES COUNTY (LA County) - One of California’s original 27 counties, was established on Feb. 18, 1850. It is one of the nation's largest counties with 4,080 square miles, and has the largest population of any county in the nation - nearly 10 million residents who account for approximately 27 percent of California’s population. LITHIUM-ION (Li-Ion) BATTERY - A type of rechargeable battery. In the batteries lithium ions move from the negative electrode to the positive electrode during discharge and back when charging.
MAIN PROPULSION SUBSYSTEM (MPS) – A TransPower’s system that converts electrical power from the battery subsystem into mechanical power to drive the vehicle’s wheels.5 MEGAJOULE (MJ) – A joule is a unit of work or energy equal to the amount of work done when the point of application of force of one newton is displaced one meter in the direction of the force. It takes 1,055 joules to equal a British thermal unit. It takes about one million joules to make a pot of coffee. A megajoule itself totals one million joules. MILES PER GALLON – (MPG) - Miles per gallon (a measurement of a vehicle's rate of fuel consumption).
MILES PER GALLON GASOLINE EQUIVALENT (MPGe) - a measure of the average distance traveled per unit of energy consumed. MPGe is used by the United States Environmental Protection Agency (EPA) to compare energy consumption of alternative fuel vehicles, plug-in electric vehicles and other advanced technology vehicles with the energy consumption of conventional internal combustion vehicles rated in miles per US gallon. NOx - Oxides of nitrogen that are a chief component of air pollution that can be produced by the burning of fossil fuels. Also called nitrogen oxides. ORIGINAL EQUIPMENT MANUFACTURER (OEM) – Makes equipment or components that are then marketed by its client, another manufacturer or a reseller, usually under that reseller’s own name.
4 LACDPW Website (https://www.pw.lacounty.gov/)
5 TransPower’s Main Propulsion Subsystem webpage http://www.transpowerusa.com/transportation-products-services/main-propulsion-subsystems/
48
PARTICULATE MATTER (PM) - Unburned fuel particles that form smoke or soot and stick to lung tissue when inhaled. A chief component of exhaust emissions from heavy-duty diesel engines. PG&E - The acronym for Pacific Gas and Electric Company an electric and natural gas utility serving the central and northern California region.
PLUG-IN HYBRID ELECTRIC VEHICLE (PHEV) - PHEVs are powered by an internal combustion engine and an electric motor that uses energy stored in a battery. The vehicle can be plugged in to an electric power source to charge the battery. Some can travel nearly 100 miles on electricity alone, and all can operate solely on gasoline (similar to a conventional hybrid). PORTABLE EMISSIONS MEASUREMENT SYSTEM (PEMS) – A device that measures emissions from combustion engine as the vehicle or the equipment is being used, which allows real-world in-use testing. PEMS provides a complete and very accurate real-time monitoring of the pollutants emitted by the engines (HC, CO, CO2, NOx, PM) together with the associated engine, vehicle and ambient parameters. POUNDS PER SQUARE INCH (PSI) – A unit of pressure or stress based on avoirdupois units. It is the pressure resulting from a force of one pound-force applied to an area of one square inch.
POWER CONTROL AND ACCESSORY SUBSYSTEM (PCAS) - A TransPower’s system that contains most of the power and control electronics used in the ElecTruck™ system, along with the electrically-driven accessories that enable operation of power steering, braking, air conditioning, and other accessories using stored battery energy. POWER TAKE-OFF (PTO) - Secondary engine shaft (or equivalent) that provides substantial auxiliary power for purposes unrelated to vehicle propulsion or normal vehicle accessories such as air conditioning, power steering, and basic electrical accessories. A typical PTO uses a secondary shaft on the engine to transmit power to a hydraulic pump that powers auxiliary equipment, such as a boom on a bucket truck. You may ask us to consider other equivalent auxiliary power configurations (such as those with hybrid vehicles) as power take-off systems.6 PREVENTIVE MAINTENANCE INSPECTION (PMI) – A routine inspection for the equipment to make it from one planned service to the next planned service without any failures caused by fatigue, neglect, or normal wear (preventable items).
REACTIVE ORGANIC GAS (ROG) -- A photochemically reactive chemical gas, composed of non-methane hydrocarbons, that may contribute to the formation of smog. Also sometimes referred to as Non-Methane Organic Gases (NMOGs).
6 EPA Glossary (https://ofmpub.epa.gov/sor_internet/registry/termreg/searchandretrieve/termsandacronyms/search.do?search=&term=power%20take-off&matchCriteria=Contains&checkedAcronym=true&checkedTerm=true&hasDefinitions=false)
49
RETURN ON INVESTMENT (ROI): The interest rate at which the net present value of a project is zero. Multiple values are possible.7 REVOLUTIONS PER MINUTE (RPM) – The number of turns in one minute. It is a unit of rotational speed or the frequency of rotation around a fixed axis.
SAN JOAQUIN REGIONAL TRANSIT DISTRICT (RTD) - The Regional Transit Provider for San Joaquin County, provides public transit services in the Stockton Metropolitan Area, as well as Intercity, Interregional, and Rural Transit Services countywide. SERIAL NUMBER (SN#) - A number indicating place in a series and used as a means of identification. SOUTH COAST AIR QUALITY MANAGEMENT DISTRICT (SCAQMD) - the air pollution control agency for all of Orange County and the urban portions of Los Angeles, Riverside and San Bernardino counties. This area of 10,740 square miles is home to over 17 million people–about half the population of the whole state of California. It is the second most populated urban area in the United States and one of the smoggiest. Its mission is to clean the air and protect the health of all residents in the South Coast Air District through practical and innovative strategies.
STATE OF CHARGE (SOC) – available capacity expressed as a percentage of its rated capacity.8 TIME-OF-USE (TOU) – PG&E rate plans that can reduce expenses by shifting energy use to partial-peak or off-peak hours of the day. Rates during partial-peak and off-peak hours are lower than rates during peak hours. TOTAL HYDROCARBON (THC) -- Total hydrocarbon emissions that also serve as a surrogate for the emissions of organic hazardous air pollutant compounds.
TOTAL TRANSPORTATION SERVICES, INC. (TTSI) – A company that provides asset based logistics services. The Company offers drayage, warehousing, less-than-truckload, freight management, infrastructure supply chain management, and security and safety services for cargoes. Total Transportation Services serves customers in the United States.9 TRANSPORTATION POWER, INC. (TRANSPOWER) - A California Corporation offering a broad range of energy-related products and services related to advanced clean transportation and energy storage.
7 Office of Energy Efficiency and Renewable Energy (https://www.energy.gov/eere/bioenergy/full-text-glossary#R) 8 State of Charge Definition (https://www.mpoweruk.com/soc.html)
9 Bloomberg company profile https://www.bloomberg.com/profile/company/4146197Z:US
50
UC IRVINE FUEL CELL BUS (FC-1) – An All American Bus Buses incorporating a Ballard Power Systems fuel cell stack and BAE Systems (BAE) fuel cell system in a 40-foot El Dorado Altoona-qualified Axess Fuel Cell Transit Bus. UNITED STATES DEPARTMENT OF ENERGY (DOE) – The federal department established by the Department of Energy Organization Act to consolidate the major federal energy functions into one cabinet-level department that would formulate a comprehensive, balanced national energy policy. DOE's main headquarters are in Washington, D.C.
UNIVERSITY OF CALIFORNIA, IRVINE (UC Irvine/UCI) - A public research university located in Irvine, California. It is one of the 10 campuses in the University of California (UC) system. UNIVERSITY OF CALIFORNIA, RIVERSIDE (UCR) – A public research university located in Irvine, California. It is one of the 10 campuses in the University of California (UC) system. URBAN DYNAMOMETER DRIVING SCHEDULE (UDDS) - The 1372 second transient speed driving sequence used by EPA to simulate typical urban driving.10
VOLVO CONSTRUCTION EQUIPMENT (Volvo CE) – A major international company that develops, manufactures and markets equipment for construction and related industries. It is a subsidiary and business area of the Volvo Group.11 ZERO EMISSION (ZE) - An engine, motor, process, or other energy source, that emits no waste
10 EPA Glossary (https://ofmpub.epa.gov/sor_internet/registry/termreg/searchandretrieve/termsandacronyms/search.do?search=&term=urban%20dynamometer&matchCriteria=Contains&checkedAcronym=true&checkedTerm=true&hasDefinitions=false) 11 Wikipedia (https://en.wikipedia.org/wiki/Volvo_Construction_Equipment)
A-1
APPENDIX A: Caterpillar Off-Road Large-Size Hybrid Excavator
Prepared for: California Energy Commission Prepared by: Caterpillar Inc.
Gavin Newsom, Governor
A-2
Wiley Mosley Randy Peterson Aleksandar Egelja Primary Authors
Caterpillar Inc. 100 N.E. Adams St. Peoria, IL 61629 888-614-4328 Caterpillar website: www.caterpillar.com
Disclaimer Staff members of the California Energy Commission prepared this report. As such, it does not necessarily represent the views of the Energy Commission, its employees, or the State of California. The Energy Commission, the State of California, its employees, contractors and subcontractors make no warrant, express or implied, and assume no legal liability for the information in this report; nor does any party represent that the uses of this information will not infringe upon privately owned rights. This report has not been approved or disapproved by the Energy Commission nor has the Commiss ion passed upon the accuracy or adequacy of the information in this report.
A-3
TABLE OF CONTENTS Table of Contents ............................................................................................................. 3 List of Figures .................................................................................................................. 3 List of Tables ................................................................................................................... 4 Executive Summary........................................................................................................... 5 CHAPTER 1: Large-Sized Hybrid Excavator ............................................................................ 7
1.1 Statement of Work .................................................................................................................................7 1.1.1 Deliverable Tasks.............................................................................................................................7
1.1.1.1 Products.......................................................................................................................................................................... 7 1.1.2 Report Content ................................................................................................................................7
CHAPTER 2: Performance and Field Follow Testing with Results .................................................. 8 2.1 Phase 1 Performance Testing..................................................................................................................8
2.1.1 Test Background and Method ...........................................................................................................8 2.1.2 Performance Results ...................................................................................................................... 11
2.2 Phase 1 Field Follow Testing & Customer Feedback ................................................................................ 14 2.2.1 Field Follow Results 336E H Machine 1 SN#RZA00170 ..................................................................... 14 Field Follow Results 336E H Machine 2 SN#RZA00171 2.2.2 ..................................................................... 16
2.3 Phase 2 Field Follow and Performance Testing ....................................................................................... 18 2.3.1 Phase 2 Machine Field Follow ......................................................................................................... 18 2.3.2 Phase 2 Performance Test Background and Method ......................................................................... 21 2.3.3 Phase 2 Performance Results.......................................................................................................... 24
CHAPTER 3: Project Achievements and Success .................................................................... 28 3.1 Advancements in Science and Success .................................................................................................. 28
3.2.1 Fuel Consumption and Greenhouse Gas Reduction........................................................................... 29 CHAPTER 4: Future Projects and Improvements ................................................................... 30
LIST OF FIGURES Page
Figure 1: Same Level 90° Truck Loading Depiction.................................................................... 8 Figure 2: Temperature Readings from Study ......................................................................... 10 Figure 3: Overall Average of Machine Productivity Results......................................................... 11 Figure 4: Indiv idual Operator Machine Productivity Results........................................................ 12 Figure 5: Individual Operator Machine Fuel Consumption Results ............................................... 13 Figure 6: Individual Operator Machine Fuel Efficiency Results .................................................... 14 Figure 7: Customer Site Operation for RZA00170 336E H Hybrid Excavator ................................... 16 Figure 8: BART’s Warm Springs Extension Worksite................................................................. 17 Figure 9: Customer Site Bench Loading for RZA00171 336E H Hybrid Excavator............................. 18

A-4
Figure 10: Carlsbad Desalinization Project Phase 2 Hybrid Excavator ........................................... 19 Figure 11: Carlsbad Desalinization Project Phase 2 Hybrid Excavator ........................................... 20 Figure 12: Bench Loading Representation ............................................................................. 21 Figure 13: Same Level 90° Truck Loading Representation......................................................... 22 Figure 14: Same Level 90° Truck Loading Representation......................................................... 23 Figure 15: Phase 2 Productivity Results ................................................................................ 26 Figure 16: Phase 2 Fuel Consumption Results ........................................................................ 27 Figure 17: Phase 2 Fuel Efficiency Results............................................................................. 27
LIST OF TABLES
Page Table 1: Machine Specifications ............................................................................................ 9 Table 2: RZA00170 336E H Hybrid Excavator Machine Summary ................................................ 15 Table 3: RZA00171 336E H Hybrid Excavator Machine Summary ................................................ 17 Table 4: Carlsbad Desalinization Project Phase 2 Hybrid Excavator Machine Summary ..................... 19 Table 5: Miramar Landfill Phase 2 Hybrid Excavator Machine Summary ........................................ 20 Table 6: Phase 2 Hybrid Excavator and Baseline Machine Summary ............................................ 22 Table 7: Hybrid Performance Compared to Baseline ................................................................ 25
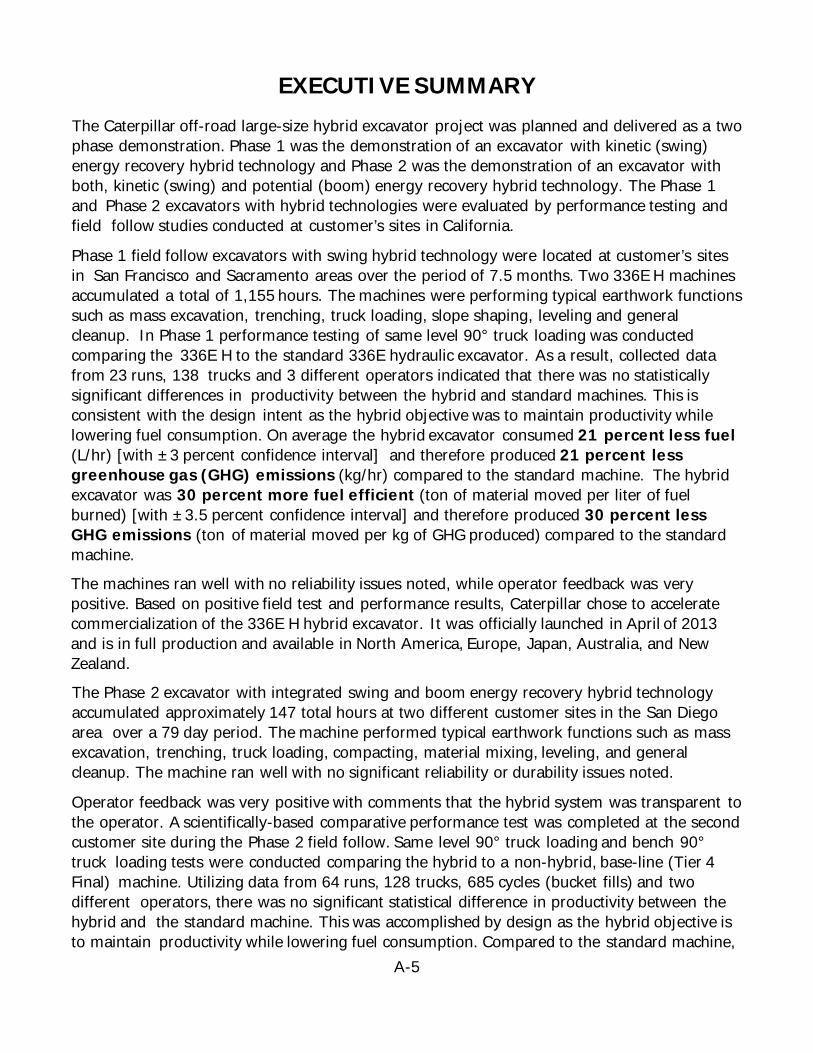
A-5
EXECUTIVE SUMMARY The Caterpillar off-road large-size hybrid excavator project was planned and delivered as a two phase demonstration. Phase 1 was the demonstration of an excavator with kinetic (swing) energy recovery hybrid technology and Phase 2 was the demonstration of an excavator with both, kinetic (swing) and potential (boom) energy recovery hybrid technology. The Phase 1 and Phase 2 excavators with hybrid technologies were evaluated by performance testing and field follow studies conducted at customer’s sites in California.
Phase 1 field follow excavators with swing hybrid technology were located at customer’s sites in San Francisco and Sacramento areas over the period of 7.5 months. Two 336E H machines accumulated a total of 1,155 hours. The machines were performing typical earthwork functions such as mass excavation, trenching, truck loading, slope shaping, leveling and general cleanup. In Phase 1 performance testing of same level 90° truck loading was conducted comparing the 336E H to the standard 336E hydraulic excavator. As a result, collected data from 23 runs, 138 trucks and 3 different operators indicated that there was no statistically significant differences in productivity between the hybrid and standard machines. This is consistent with the design intent as the hybrid objective was to maintain productivity while lowering fuel consumption. On average the hybrid excavator consumed 21 percent less fuel (L/hr) [with ±3 percent confidence interval] and therefore produced 21 percent less greenhouse gas (GHG) emissions (kg/hr) compared to the standard machine. The hybrid excavator was 30 percent more fuel efficient (ton of material moved per liter of fuel burned) [with ±3.5 percent confidence interval] and therefore produced 30 percent less GHG emissions (ton of material moved per kg of GHG produced) compared to the standard machine. The machines ran well with no reliability issues noted, while operator feedback was very positive. Based on positive field test and performance results, Caterpillar chose to accelerate commercialization of the 336E H hybrid excavator. It was officially launched in April of 2013 and is in full production and available in North America, Europe, Japan, Australia, and New Zealand. The Phase 2 excavator with integrated swing and boom energy recovery hybrid technology accumulated approximately 147 total hours at two different customer sites in the San Diego area over a 79 day period. The machine performed typical earthwork functions such as mass excavation, trenching, truck loading, compacting, material mixing, leveling, and general cleanup. The machine ran well with no significant reliability or durability issues noted.
Operator feedback was very positive with comments that the hybrid system was transparent to the operator. A scientifically-based comparative performance test was completed at the second customer site during the Phase 2 field follow. Same level 90° truck loading and bench 90° truck loading tests were conducted comparing the hybrid to a non-hybrid, base-line (Tier 4 Final) machine. Utilizing data from 64 runs, 128 trucks, 685 cycles (bucket fills) and two different operators, there was no significant statistical difference in productivity between the hybrid and the standard machine. This was accomplished by design as the hybrid objective is to maintain productivity while lowering fuel consumption. Compared to the standard machine,
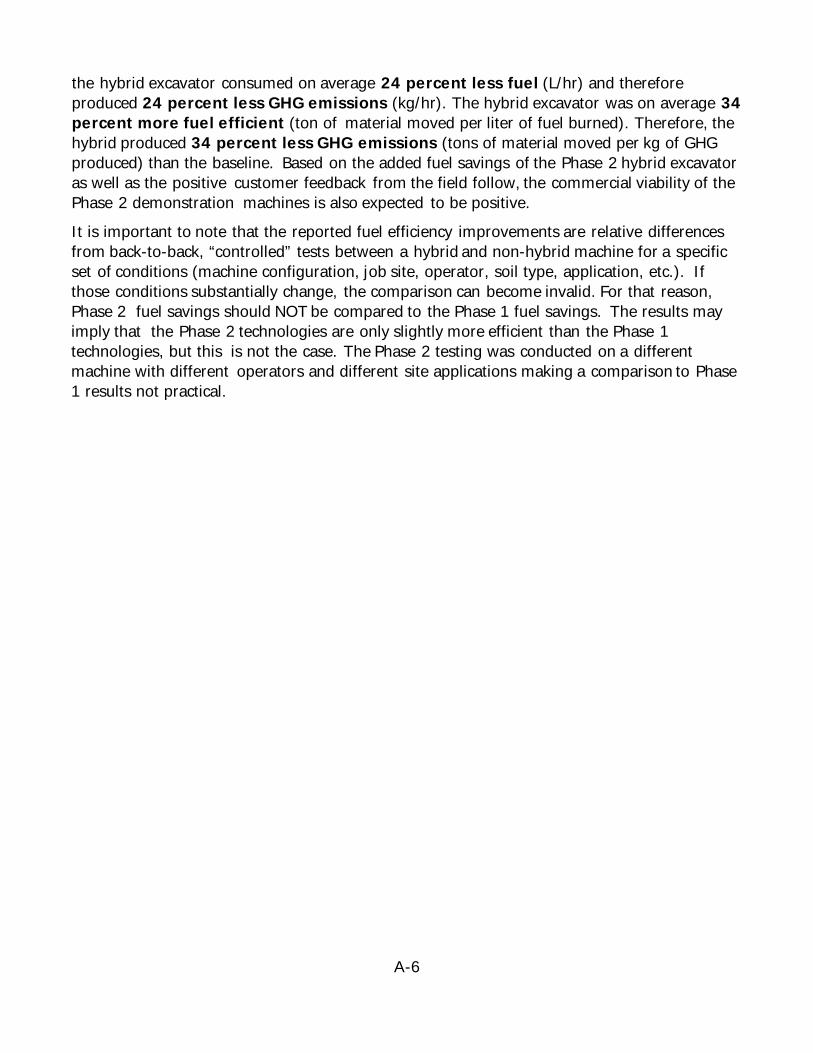
A-6
the hybrid excavator consumed on average 24 percent less fuel (L/hr) and therefore produced 24 percent less GHG emissions (kg/hr). The hybrid excavator was on average 34 percent more fuel efficient (ton of material moved per liter of fuel burned). Therefore, the hybrid produced 34 percent less GHG emissions (tons of material moved per kg of GHG produced) than the baseline. Based on the added fuel savings of the Phase 2 hybrid excavator as well as the positive customer feedback from the field follow, the commercial viability of the Phase 2 demonstration machines is also expected to be positive. It is important to note that the reported fuel efficiency improvements are relative differences from back-to-back, “controlled” tests between a hybrid and non-hybrid machine for a specific set of conditions (machine configuration, job site, operator, soil type, application, etc.). If those conditions substantially change, the comparison can become invalid. For that reason, Phase 2 fuel savings should NOT be compared to the Phase 1 fuel savings. The results may imply that the Phase 2 technologies are only slightly more efficient than the Phase 1 technologies, but this is not the case. The Phase 2 testing was conducted on a different machine with different operators and different site applications making a comparison to Phase 1 results not practical.
A-7
CHAPTER 1: Large-Sized Hybrid Excavator
1.1 Statement of Work The goal of this task is to successfully administer an agreement with Caterpillar Inc. to demonstrate an off-road large-sized excavator that captures kinetic and potential energy of the earthmoving implement system and reuses that energy to reduce fuel consumption, noise, and exhaust emissions. The agreement tasks include: Calibrating, tuning, and testing existing prototype excavators which have (Phase 1) swing energy recovery hybrid technology and (Phase 2) swing and boom energy recovery hybrid technology and integrating the results into pre-commercial demonstration excavators for each hybrid technology system; building and shipping pre-commercial hybrid excavators for demonstration; and field testing the demonstration excavators at California sites consistent with Caterpillar’s proposal submitted in the CALSTART California CLEAN Truck Demonstration Program.
1.1.1 Deliverable Tasks • Provide substantiation of the achievement of tasks in the project schedule in
Caterpillar’s application as follows: o Conduct a comparative productivity test of a Phase 1 demonstration machine and
prepare and submit a phase 1 comparative performance test report. o Submit a summary report of Phase 1 including commercial viability potential. o Conduct a comparative productivity test of a Phase 2 demonstration machine and
prepare and submit a Phase 2 comparative performance test report. o Submit a summary report of Phase 2 including commercial viability potential.
1.1.1.1 Products • Phase 1 Comparative Performance Test Report • Phase 1 Summary Report • Phase 2 Comparative Performance Test Report • Phase 2 Summary Report
1.1.2 Report Content The following report is a complete document outlining testing and results to satisfy deliverable tasks and products as described in the Statement of Work. This comprehensive report will combine both Phase 1 and Phase 2 to complete the Energy Commission issued solicitation PON- 10-603 to provide funding opportunities under the Alternative and Renewable Fuel and Vehicle Technology Program for a comparative performance of a large hybrid excavator versus a similarly configured non-hybrid (standard) excavator as the machines are used in typical earth moving applications.
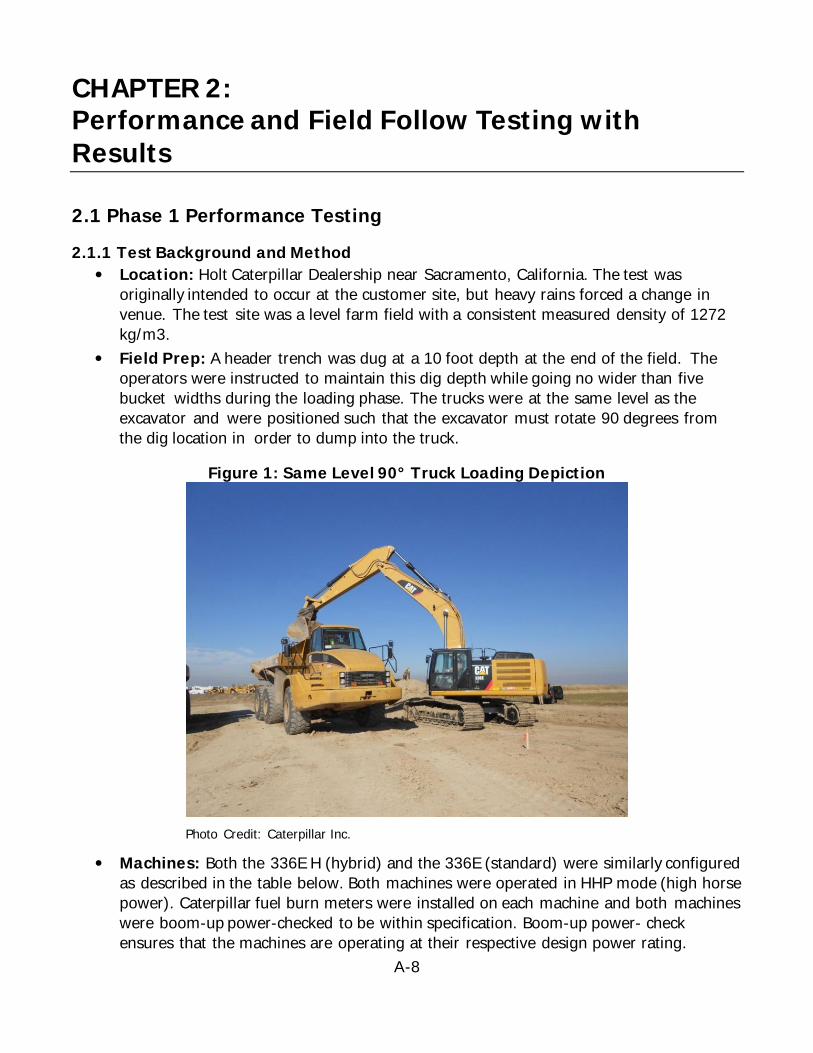
A-8
CHAPTER 2: Performance and Field Follow Testing with Results
2.1 Phase 1 Performance Testing
2.1.1 Test Background and Method • Location: Holt Caterpillar Dealership near Sacramento, California. The test was
originally intended to occur at the customer site, but heavy rains forced a change in venue. The test site was a level farm field with a consistent measured density of 1272 kg/m3.
• Field Prep: A header trench was dug at a 10 foot depth at the end of the field. The operators were instructed to maintain this dig depth while going no wider than five bucket widths during the loading phase. The trucks were at the same level as the excavator and were positioned such that the excavator must rotate 90 degrees from the dig location in order to dump into the truck.
Figure 1: Same Level 90° Truck Loading Depiction
Photo Credit: Caterpillar Inc.
• Machines: Both the 336E H (hybrid) and the 336E (standard) were similarly configured as described in the table below. Both machines were operated in HHP mode (high horse power). Caterpillar fuel burn meters were installed on each machine and both machines were boom-up power-checked to be within specification. Boom-up power- check ensures that the machines are operating at their respective design power rating.
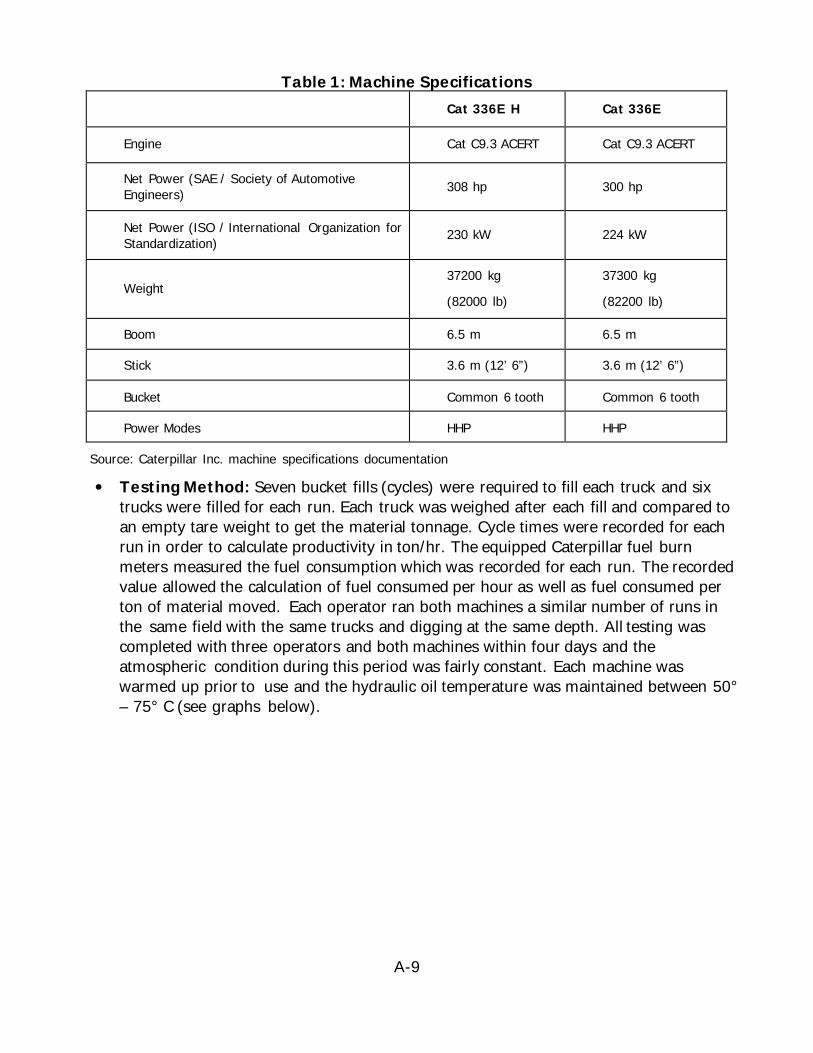
A-9
Table 1: Machine Specifications Cat 336E H Cat 336E
Engine Cat C9.3 ACERT Cat C9.3 ACERT
Net Power (SAE / Society of Automotive Engineers)
308 hp 300 hp
Net Power (ISO / International Organization for Standardization) 230 kW 224 kW
Weight 37200 kg
(82000 lb)
37300 kg
(82200 lb)
Boom 6.5 m 6.5 m
Stick 3.6 m (12’ 6”) 3.6 m (12’ 6”)
Bucket Common 6 tooth Common 6 tooth
Power Modes HHP HHP
Source: Caterpillar Inc. machine specifications documentation
• Testing Method: Seven bucket fills (cycles) were required to fill each truck and six trucks were filled for each run. Each truck was weighed after each fill and compared to an empty tare weight to get the material tonnage. Cycle times were recorded for each run in order to calculate productivity in ton/hr. The equipped Caterpillar fuel burn meters measured the fuel consumption which was recorded for each run. The recorded value allowed the calculation of fuel consumed per hour as well as fuel consumed per ton of material moved. Each operator ran both machines a similar number of runs in the same field with the same trucks and digging at the same depth. All testing was completed with three operators and both machines within four days and the atmospheric condition during this period was fairly constant. Each machine was warmed up prior to use and the hydraulic oil temperature was maintained between 50° – 75° C (see graphs below).

A-10
Figure 2: Temperature Readings from Study
Source: Caterpillar Inc. testing conditions documentation
• Statistical Method: Statistical calculation of 95 percent confidence interval: The confidence interval was calculated based on the standard deviation of the results using the runs and trucks as the sample sizing for each operator. If alpha is assumed to be 0.05, the calculated area under the standard normal curve that equals (1 - alpha), or 95 percent is ± 1.96. The confidence interval is therefore: 𝜒𝜒 ± 1.96 (𝜎𝜎/√𝑛𝑛) where σ is the standard deviation, n is the sample size, and 𝜒𝜒 is the average.
• Interpretation of Results: The results of the study are shown as relative differences between the standard machine and the hybrid for an individual operator. The mean relative difference (hybrid vs standard) of each operator is then averaged again to get an overall average performance difference. This is the best method for comparing the relative performance difference between two machines irrespective of operator style and capability. Results shows the hybrid is 30 percent more fuel efficient than the standard machine with a 95 percent confidence interval of +3.5 percent. The reader should keep in mind that this confidence interval is for the same operator, at the same job site, having the same soil conditions, with the same machine configurations, and using the same testing processes. Attempting to compare absolute results with different operators, soil, test methods, job site conditions, etc., would result in significantly larger confidence intervals. For example, in this study the standard machine absolute efficiency (ton/liter)
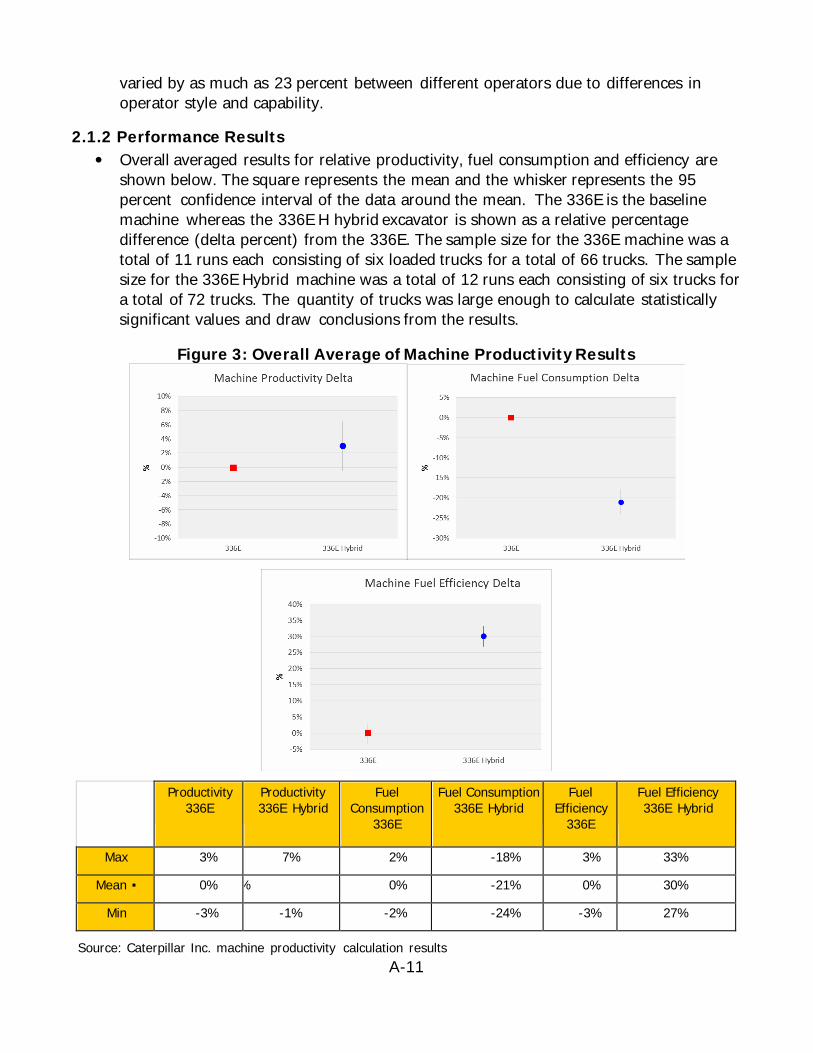
A-11
varied by as much as 23 percent between different operators due to differences in operator style and capability.
2.1.2 Performance Results • Overall averaged results for relative productivity, fuel consumption and efficiency are
shown below. The square represents the mean and the whisker represents the 95 percent confidence interval of the data around the mean. The 336E is the baseline machine whereas the 336E H hybrid excavator is shown as a relative percentage difference (delta percent) from the 336E. The sample size for the 336E machine was a total of 11 runs each consisting of six loaded trucks for a total of 66 trucks. The sample size for the 336E Hybrid machine was a total of 12 runs each consisting of six trucks for a total of 72 trucks. The quantity of trucks was large enough to calculate statistically significant values and draw conclusions from the results.
Figure 3: Overall Average of Machine Productivity Results
Productivity 336E
Productivity 336E Hybrid
Fuel Consumption
336E
Fuel Consumption 336E Hybrid
Fuel Efficiency
336E
Fuel Efficiency 336E Hybrid
Max 3% 7% 2% -18% 3% 33%
Mean ▪ 0% % 0% -21% 0% 30%
Min -3% -1% -2% -24% -3% 27%
Source: Caterpillar Inc. machine productivity calculation results
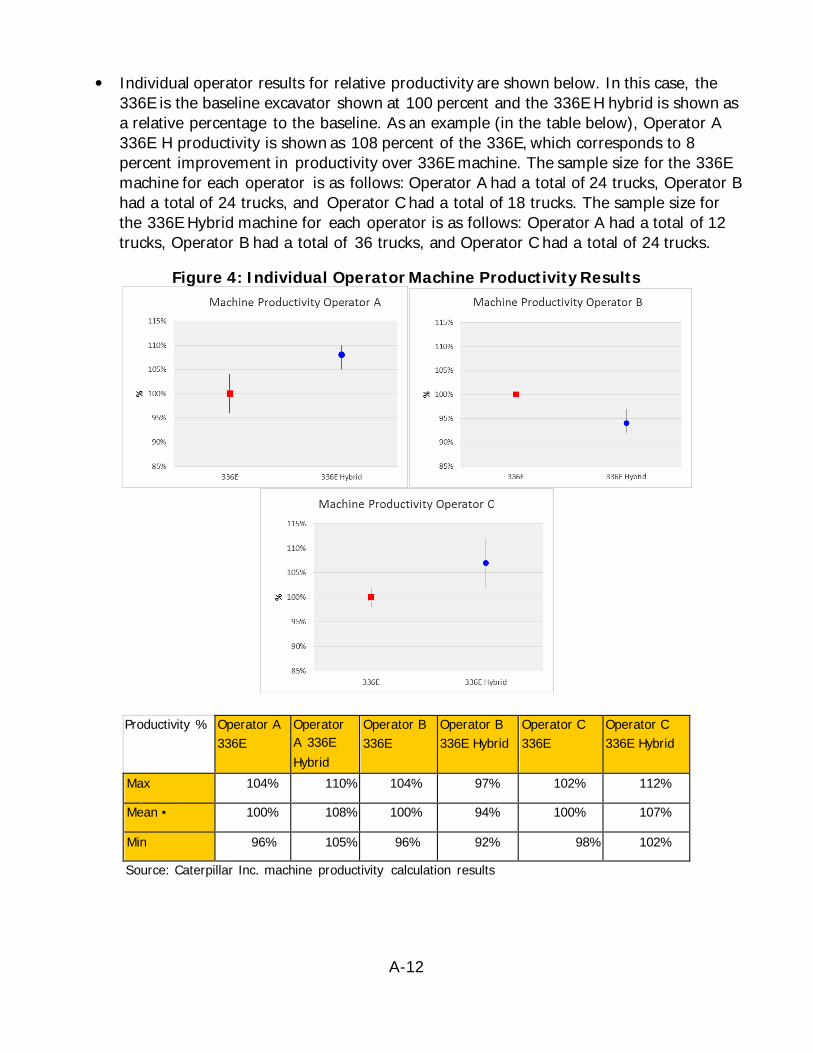
A-12
• Individual operator results for relative productivity are shown below. In this case, the 336E is the baseline excavator shown at 100 percent and the 336E H hybrid is shown as a relative percentage to the baseline. As an example (in the table below), Operator A 336E H productivity is shown as 108 percent of the 336E, which corresponds to 8 percent improvement in productivity over 336E machine. The sample size for the 336E machine for each operator is as follows: Operator A had a total of 24 trucks, Operator B had a total of 24 trucks, and Operator C had a total of 18 trucks. The sample size for the 336E Hybrid machine for each operator is as follows: Operator A had a total of 12 trucks, Operator B had a total of 36 trucks, and Operator C had a total of 24 trucks.
Figure 4: Individual Operator Machine Productivity Results
Source: Caterpillar Inc. machine productivity calculation results
Productivity % Operator A 336E
Operator A 336E Hybrid
Operator B 336E
Operator B 336E Hybrid
Operator C 336E
Operator C 336E Hybrid
Max 104% 110% 104% 97% 102% 112%
Mean ▪ 100% 108% 100% 94% 100% 107%
Min 96% 105% 96% 92% 98% 102%
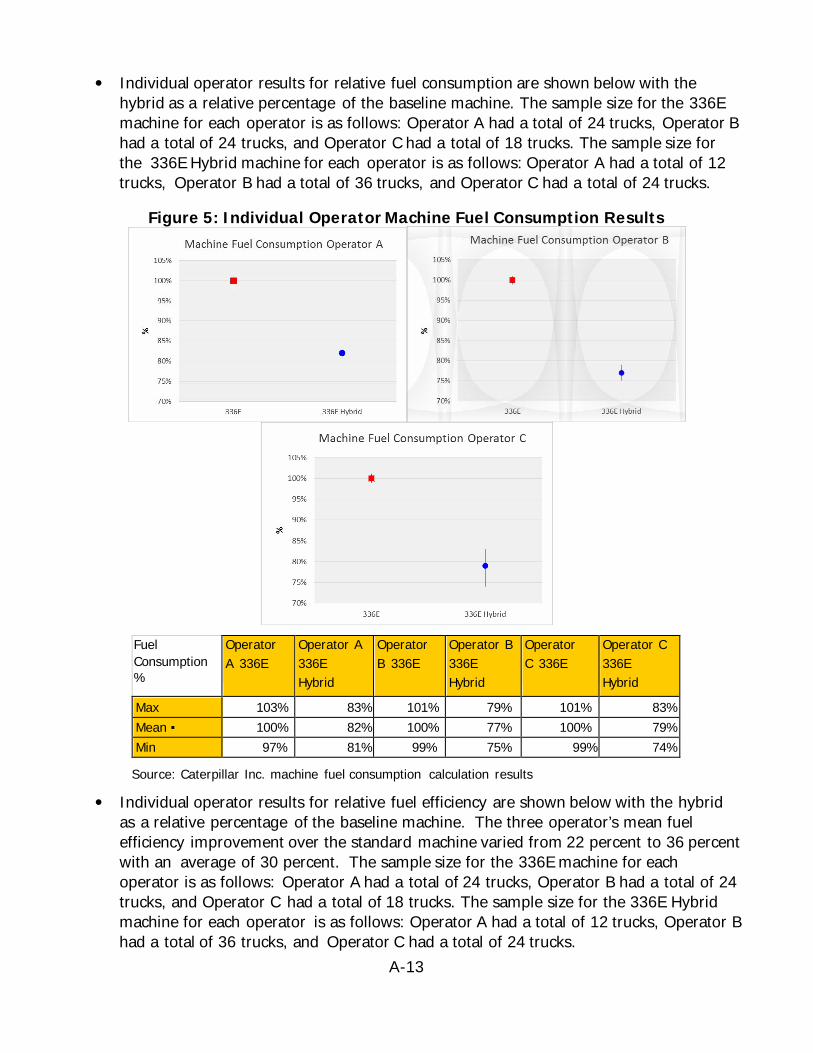
A-13
• Individual operator results for relative fuel consumption are shown below with the hybrid as a relative percentage of the baseline machine. The sample size for the 336E machine for each operator is as follows: Operator A had a total of 24 trucks, Operator B had a total of 24 trucks, and Operator C had a total of 18 trucks. The sample size for the 336E Hybrid machine for each operator is as follows: Operator A had a total of 12 trucks, Operator B had a total of 36 trucks, and Operator C had a total of 24 trucks.
Figure 5: Individual Operator Machine Fuel Consumption Results
Fuel Consumption %
Operator A 336E
Operator A 336E Hybrid
Operator B 336E
Operator B 336E Hybrid
Operator C 336E
Operator C 336E Hybrid
Max 103% 83% 101% 79% 101% 83% Mean ▪ 100% 82% 100% 77% 100% 79% Min 97% 81% 99% 75% 99% 74%
Source: Caterpillar Inc. machine fuel consumption calculation results
• Individual operator results for relative fuel efficiency are shown below with the hybrid as a relative percentage of the baseline machine. The three operator’s mean fuel efficiency improvement over the standard machine varied from 22 percent to 36 percent with an average of 30 percent. The sample size for the 336E machine for each operator is as follows: Operator A had a total of 24 trucks, Operator B had a total of 24 trucks, and Operator C had a total of 18 trucks. The sample size for the 336E Hybrid machine for each operator is as follows: Operator A had a total of 12 trucks, Operator B had a total of 36 trucks, and Operator C had a total of 24 trucks.
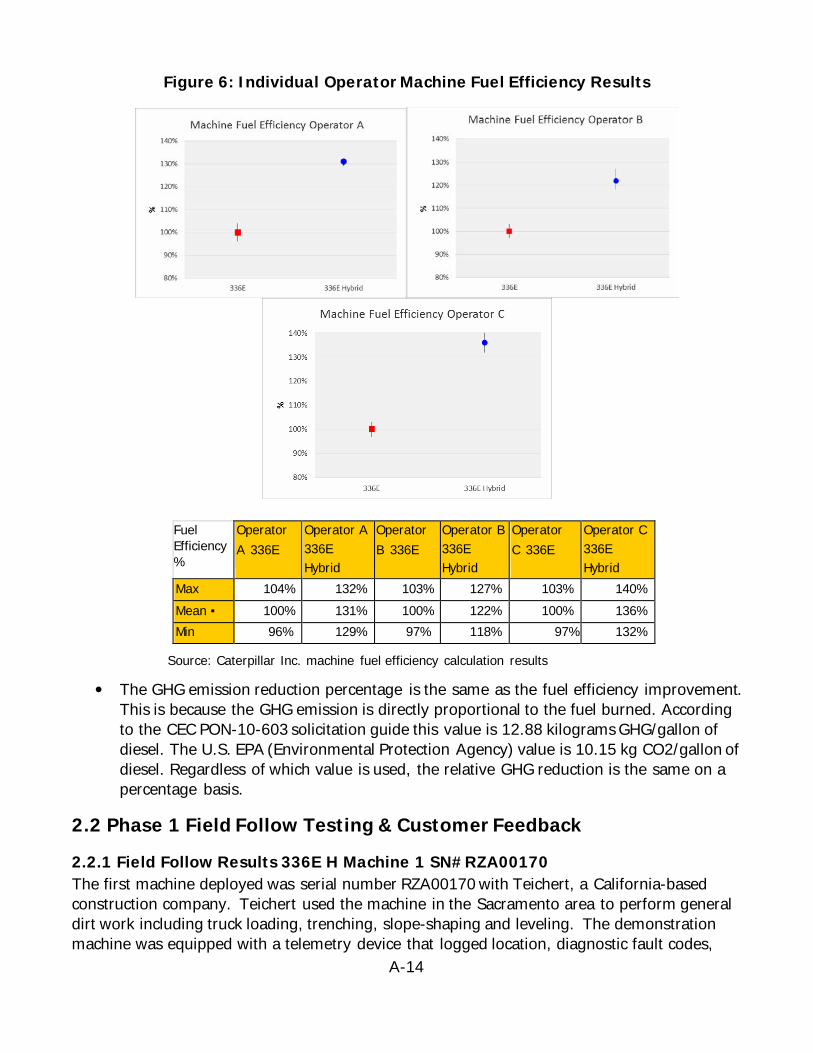
A-14
Figure 6: Individual Operator Machine Fuel Efficiency Results
Fuel Efficiency %
Operator A 336E
Operator A 336E Hybrid
Operator B 336E
Operator B 336E Hybrid
Operator C 336E
Operator C 336E Hybrid
Max 104% 132% 103% 127% 103% 140% Mean ▪ 100% 131% 100% 122% 100% 136% Min 96% 129% 97% 118% 97% 132%
Source: Caterpillar Inc. machine fuel efficiency calculation results
• The GHG emission reduction percentage is the same as the fuel efficiency improvement. This is because the GHG emission is directly proportional to the fuel burned. According to the CEC PON-10-603 solicitation guide this value is 12.88 kilograms GHG/gallon of diesel. The U.S. EPA (Environmental Protection Agency) value is 10.15 kg CO2/gallon of diesel. Regardless of which value is used, the relative GHG reduction is the same on a percentage basis.
2.2 Phase 1 Field Follow Testing & Customer Feedback
2.2.1 Field Follow Results 336E H Machine 1 SN#RZA00170 The first machine deployed was serial number RZA00170 with Teichert, a California-based construction company. Teichert used the machine in the Sacramento area to perform general dirt work including truck loading, trenching, slope-shaping and leveling. The demonstration machine was equipped with a telemetry device that logged location, diagnostic fault codes,
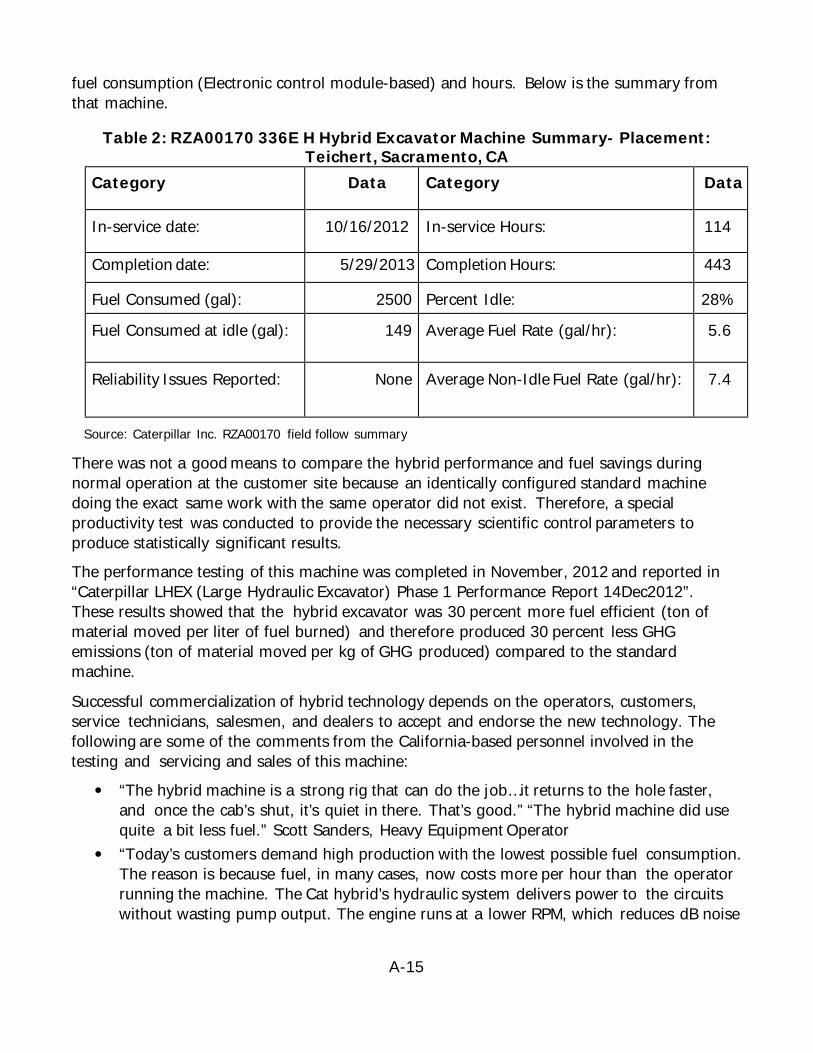
A-15
fuel consumption (Electronic control module-based) and hours. Below is the summary from that machine.
Table 2: RZA00170 336E H Hybrid Excavator Machine Summary- Placement: Teichert, Sacramento, CA
Category Data Category Data
In-service date: 10/16/2012 In-service Hours: 114
Completion date: 5/29/2013 Completion Hours: 443
Fuel Consumed (gal): 2500 Percent Idle: 28%
Fuel Consumed at idle (gal): 149 Average Fuel Rate (gal/hr): 5.6
Reliability Issues Reported: None Average Non-Idle Fuel Rate (gal/hr): 7.4
Source: Caterpillar Inc. RZA00170 field follow summary
There was not a good means to compare the hybrid performance and fuel savings during normal operation at the customer site because an identically configured standard machine doing the exact same work with the same operator did not exist. Therefore, a special productivity test was conducted to provide the necessary scientific control parameters to produce statistically significant results. The performance testing of this machine was completed in November, 2012 and reported in “Caterpillar LHEX (Large Hydraulic Excavator) Phase 1 Performance Report 14Dec2012”. These results showed that the hybrid excavator was 30 percent more fuel efficient (ton of material moved per liter of fuel burned) and therefore produced 30 percent less GHG emissions (ton of material moved per kg of GHG produced) compared to the standard machine.
Successful commercialization of hybrid technology depends on the operators, customers, service technicians, salesmen, and dealers to accept and endorse the new technology. The following are some of the comments from the California-based personnel involved in the testing and servicing and sales of this machine:
• “The hybrid machine is a strong rig that can do the job…it returns to the hole faster, and once the cab’s shut, it’s quiet in there. That’s good.” “The hybrid machine did use quite a bit less fuel.” Scott Sanders, Heavy Equipment Operator
• “Today’s customers demand high production with the lowest possible fuel consumption. The reason is because fuel, in many cases, now costs more per hour than the operator running the machine. The Cat hybrid’s hydraulic system delivers power to the circuits without wasting pump output. The engine runs at a lower RPM, which reduces dB noise
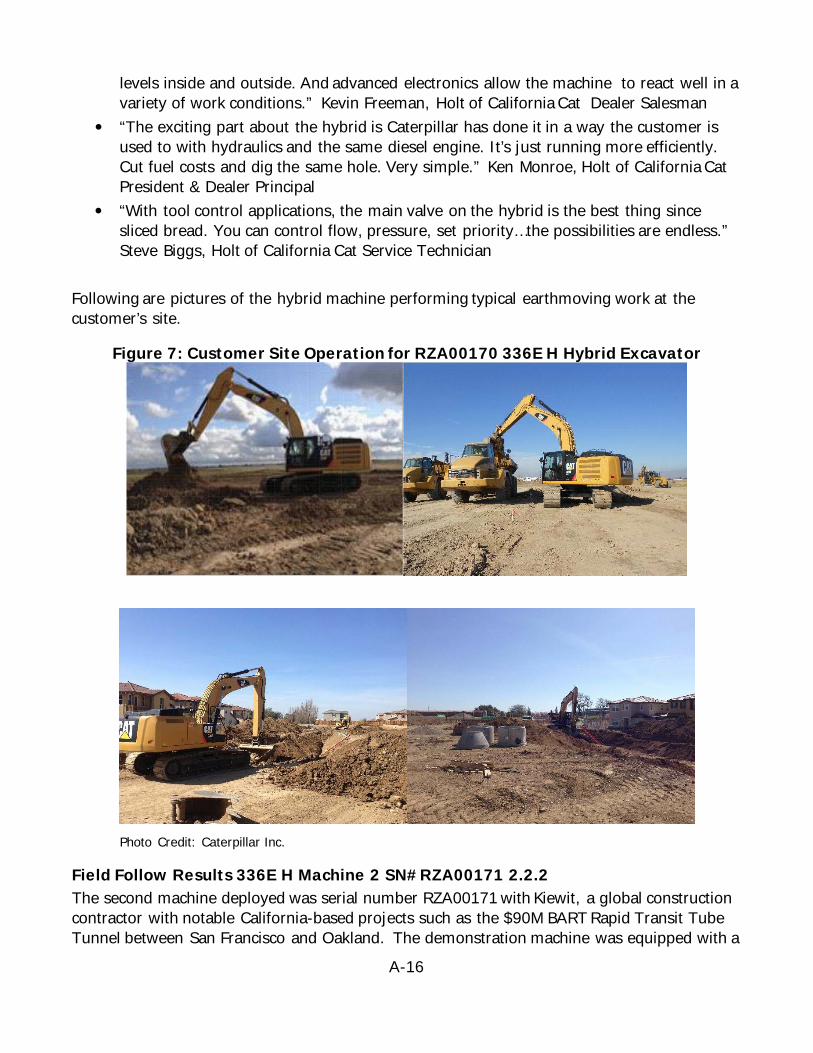
A-16
levels inside and outside. And advanced electronics allow the machine to react well in a variety of work conditions.” Kevin Freeman, Holt of California Cat Dealer Salesman
• “The exciting part about the hybrid is Caterpillar has done it in a way the customer is used to with hydraulics and the same diesel engine. It’s just running more efficiently. Cut fuel costs and dig the same hole. Very simple.” Ken Monroe, Holt of California Cat President & Dealer Principal
• “With tool control applications, the main valve on the hybrid is the best thing since sliced bread. You can control flow, pressure, set priority…the possibilities are endless.” Steve Biggs, Holt of California Cat Service Technician
Following are pictures of the hybrid machine performing typical earthmoving work at the customer’s site.
Figure 7: Customer Site Operation for RZA00170 336E H Hybrid Excavator
Photo Credit: Caterpillar Inc.
Field Follow Results 336E H Machine 2 SN#RZA00171 2.2.2 The second machine deployed was serial number RZA00171 with Kiewit, a global construction contractor with notable California-based projects such as the $90M BART Rapid Transit Tube Tunnel between San Francisco and Oakland. The demonstration machine was equipped with a
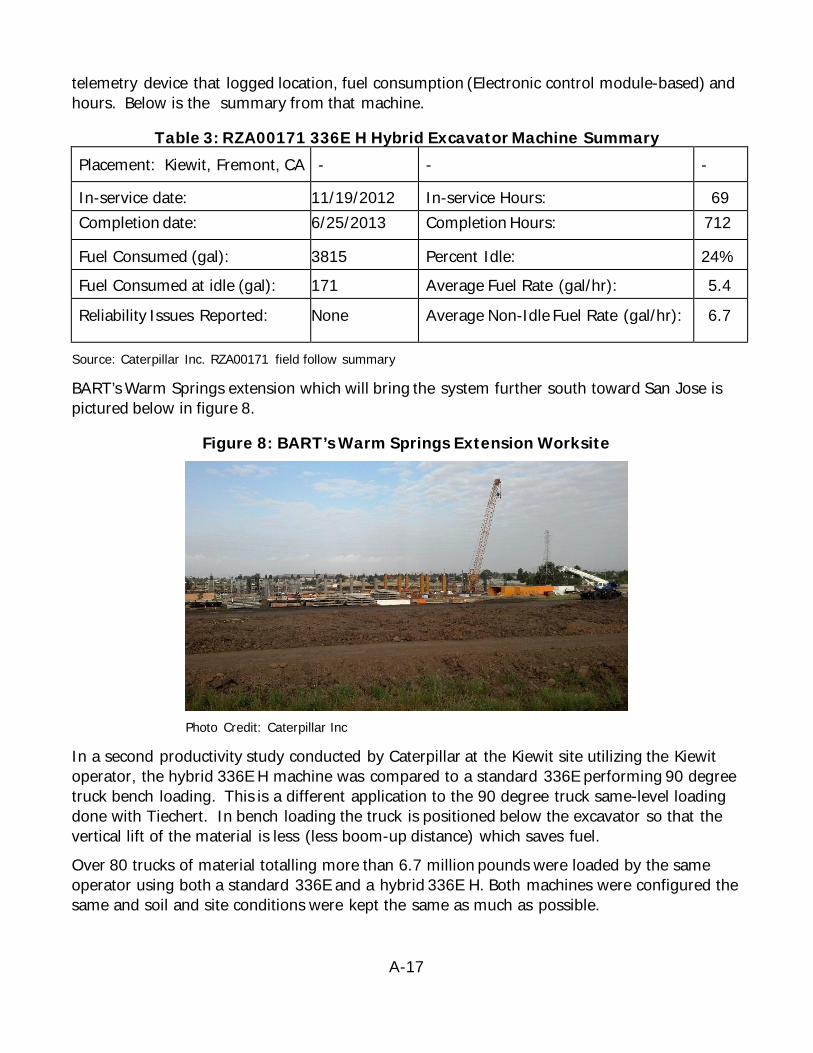
A-17
telemetry device that logged location, fuel consumption (Electronic control module-based) and hours. Below is the summary from that machine.
Table 3: RZA00171 336E H Hybrid Excavator Machine Summary Placement: Kiewit, Fremont, CA - - -
In-service date: 11/19/2012 In-service Hours: 69 Completion date: 6/25/2013 Completion Hours: 712
Fuel Consumed (gal): 3815 Percent Idle: 24% Fuel Consumed at idle (gal): 171 Average Fuel Rate (gal/hr): 5.4
Reliability Issues Reported: None Average Non-Idle Fuel Rate (gal/hr): 6.7
Source: Caterpillar Inc. RZA00171 field follow summary
BART’s Warm Springs extension which will bring the system further south toward San Jose is pictured below in figure 8.
Figure 8: BART’s Warm Springs Extension Worksite
Photo Credit: Caterpillar Inc
In a second productivity study conducted by Caterpillar at the Kiewit site utilizing the Kiewit operator, the hybrid 336E H machine was compared to a standard 336E performing 90 degree truck bench loading. This is a different application to the 90 degree truck same-level loading done with Tiechert. In bench loading the truck is positioned below the excavator so that the vertical lift of the material is less (less boom-up distance) which saves fuel. Over 80 trucks of material totalling more than 6.7 million pounds were loaded by the same operator using both a standard 336E and a hybrid 336E H. Both machines were configured the same and soil and site conditions were kept the same as much as possible.

A-18
The results showed that the 336E H hybrid burned 27 percent less fuel (liter/hr), was 7 percent more productive (ton/hr) and therefore was 46 percent more efficient (ton/liter) as compared to the standard 336E. Likewise, the hybrid produced 46 percent less GHG emissions (ton of material moved per kg of GHG produced) compared to the standard machine.
Figure 9: Customer Site Bench Loading for RZA00171 336E H Hybrid Excavator
Photo Credit: Caterpillar Inc.
A video was taken and produced about the work at the BART rail project. Again, successful commercialization depends on good feedback from the people buying this equipment, so some of their input has been included in this video and paraphrased below. The video can be found on the Cat youtube page at: http://www.youtube.com/watch?feature=player_embedded&v=NyFjpWeY6A8 • “It’s the smoothest machine I’ve ever ran, …. fine grade, lifting, I don’t notice any lag in
the machine when I’m lifting with it – even with a heavy load or cycling with it.” Thomas Brown, Heavy Equipment Operator
• “It’s a nice machine. It’s quiet inside, comfortable – you can work a lot longer shift when you are comfortable inside the cab.” Troy Porter, Heavy Equipment Operator
2.3 Phase 2 Field Follow and Performance Testing
2.3.1 Phase 2 Machine Field Follow The Phase 2 large sized excavator equipped with both swing and boom energy recovery and reuse (hybrid) was first deployed with Kiewit, a global construction contractor with notable California-based projects. The hybrid excavator was placed in service on September 17, 2014
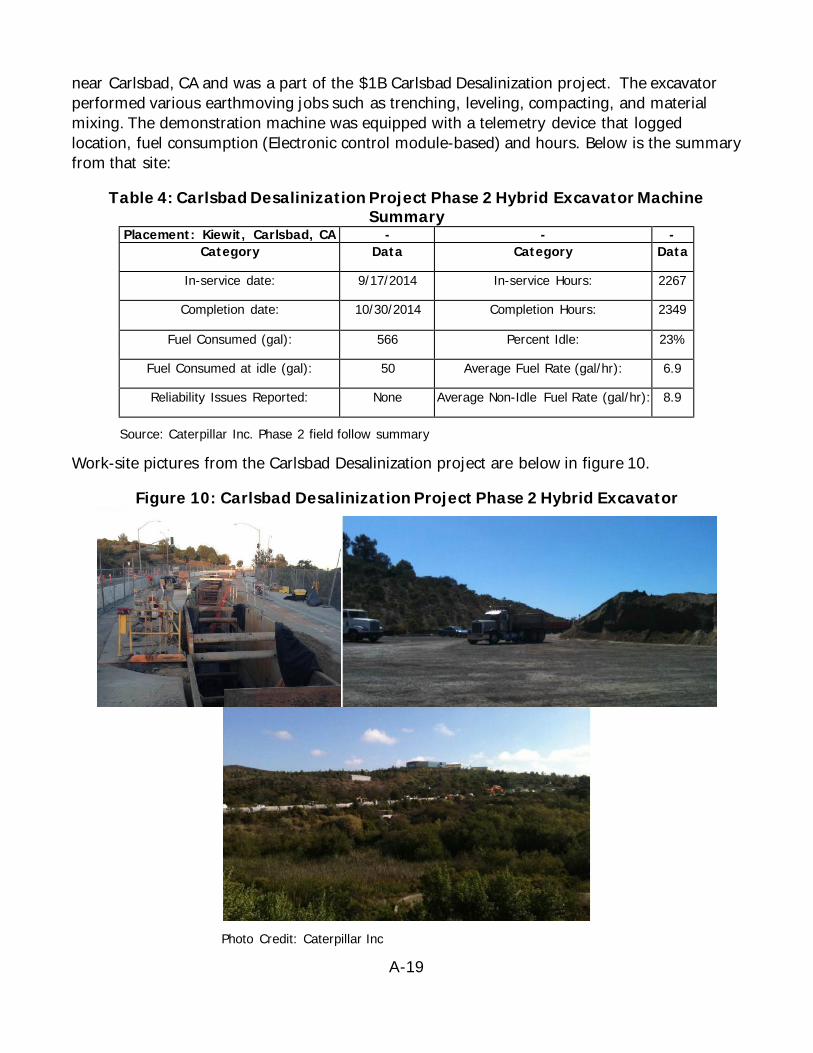
A-19
near Carlsbad, CA and was a part of the $1B Carlsbad Desalinization project. The excavator performed various earthmoving jobs such as trenching, leveling, compacting, and material mixing. The demonstration machine was equipped with a telemetry device that logged location, fuel consumption (Electronic control module-based) and hours. Below is the summary from that site:
Table 4: Carlsbad Desalinization Project Phase 2 Hybrid Excavator Machine Summary
Placement: Kiewit, Carlsbad, CA - - - Category Data Category Data
In-service date: 9/17/2014 In-service Hours: 2267
Completion date: 10/30/2014 Completion Hours: 2349
Fuel Consumed (gal): 566 Percent Idle: 23%
Fuel Consumed at idle (gal): 50 Average Fuel Rate (gal/hr): 6.9
Reliability Issues Reported: None Average Non-Idle Fuel Rate (gal/hr): 8.9
Source: Caterpillar Inc. Phase 2 field follow summary
Work-site pictures from the Carlsbad Desalinization project are below in figure 10.
Figure 10: Carlsbad Desalinization Project Phase 2 Hybrid Excavator
Photo Credit: Caterpillar Inc
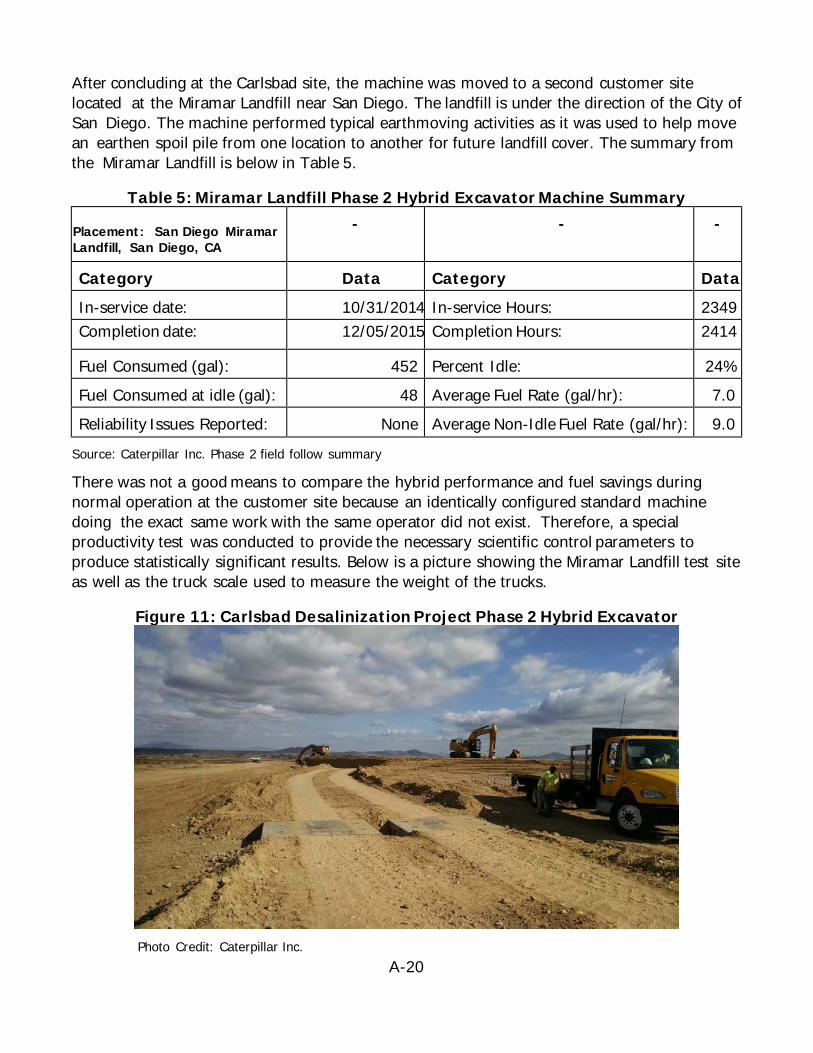
A-20
After concluding at the Carlsbad site, the machine was moved to a second customer site located at the Miramar Landfill near San Diego. The landfill is under the direction of the City of San Diego. The machine performed typical earthmoving activities as it was used to help move an earthen spoil pile from one location to another for future landfill cover. The summary from the Miramar Landfill is below in Table 5.
Table 5: Miramar Landfill Phase 2 Hybrid Excavator Machine Summary
Placement: San Diego Miramar Landfill, San Diego, CA
- - -
Category Data Category Data In-service date: 10/31/2014 In-service Hours: 2349 Completion date: 12/05/2015 Completion Hours: 2414
Fuel Consumed (gal): 452 Percent Idle: 24% Fuel Consumed at idle (gal): 48 Average Fuel Rate (gal/hr): 7.0 Reliability Issues Reported: None Average Non-Idle Fuel Rate (gal/hr): 9.0
Source: Caterpillar Inc. Phase 2 field follow summary
There was not a good means to compare the hybrid performance and fuel savings during normal operation at the customer site because an identically configured standard machine doing the exact same work with the same operator did not exist. Therefore, a special productivity test was conducted to provide the necessary scientific control parameters to produce statistically significant results. Below is a picture showing the Miramar Landfill test site as well as the truck scale used to measure the weight of the trucks.
Figure 11: Carlsbad Desalinization Project Phase 2 Hybrid Excavator
Photo Credit: Caterpillar Inc.
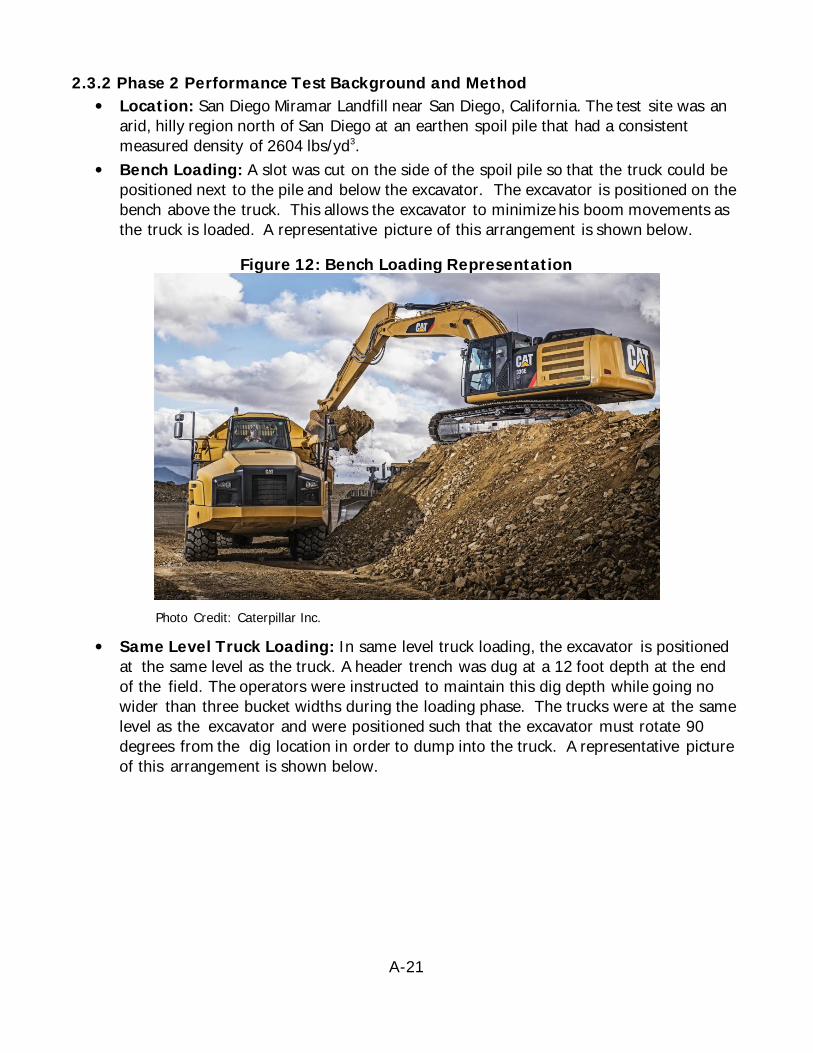
A-21
2.3.2 Phase 2 Performance Test Background and Method • Location: San Diego Miramar Landfill near San Diego, California. The test site was an
arid, hilly region north of San Diego at an earthen spoil pile that had a consistent measured density of 2604 lbs/yd3.
• Bench Loading: A slot was cut on the side of the spoil pile so that the truck could be positioned next to the pile and below the excavator. The excavator is positioned on the bench above the truck. This allows the excavator to minimize his boom movements as the truck is loaded. A representative picture of this arrangement is shown below.
Figure 12: Bench Loading Representation
Photo Credit: Caterpillar Inc.
• Same Level Truck Loading: In same level truck loading, the excavator is positioned at the same level as the truck. A header trench was dug at a 12 foot depth at the end of the field. The operators were instructed to maintain this dig depth while going no wider than three bucket widths during the loading phase. The trucks were at the same level as the excavator and were positioned such that the excavator must rotate 90 degrees from the dig location in order to dump into the truck. A representative picture of this arrangement is shown below.
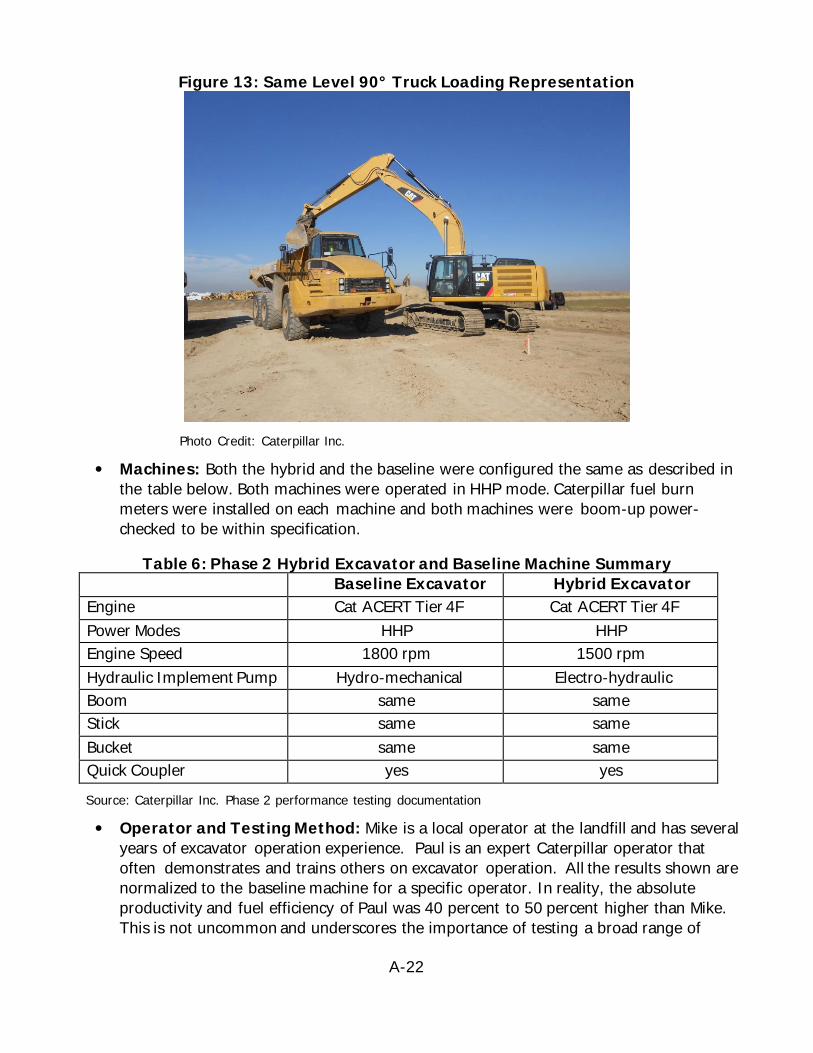
A-22
Figure 13: Same Level 90° Truck Loading Representation
Photo Credit: Caterpillar Inc.
• Machines: Both the hybrid and the baseline were configured the same as described in the table below. Both machines were operated in HHP mode. Caterpillar fuel burn meters were installed on each machine and both machines were boom-up power-checked to be within specification.
Table 6: Phase 2 Hybrid Excavator and Baseline Machine Summary Baseline Excavator Hybrid Excavator Engine Cat ACERT Tier 4F Cat ACERT Tier 4F Power Modes HHP HHP Engine Speed 1800 rpm 1500 rpm Hydraulic Implement Pump Hydro-mechanical Electro-hydraulic Boom same same Stick same same Bucket same same Quick Coupler yes yes
Source: Caterpillar Inc. Phase 2 performance testing documentation
• Operator and Testing Method: Mike is a local operator at the landfill and has several years of excavator operation experience. Paul is an expert Caterpillar operator that often demonstrates and trains others on excavator operation. All the results shown are normalized to the baseline machine for a specific operator. In reality, the absolute productivity and fuel efficiency of Paul was 40 percent to 50 percent higher than Mike. This is not uncommon and underscores the importance of testing a broad range of
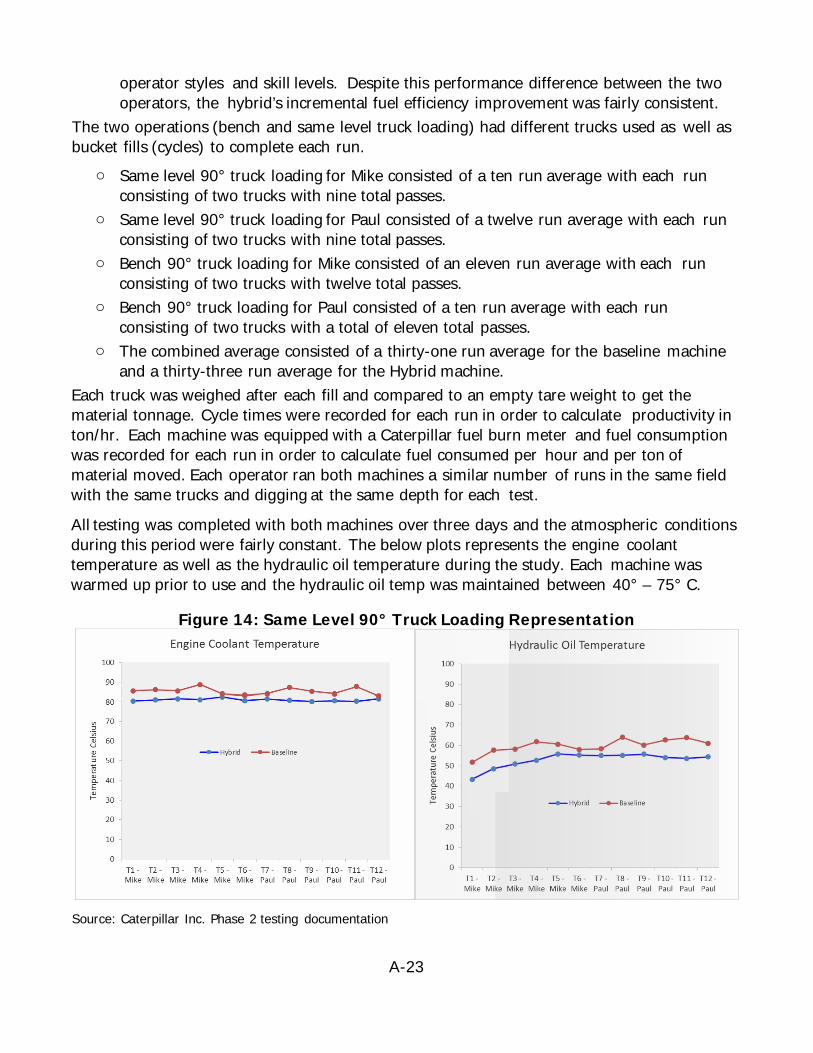
A-23
operator styles and skill levels. Despite this performance difference between the two operators, the hybrid’s incremental fuel efficiency improvement was fairly consistent.
The two operations (bench and same level truck loading) had different trucks used as well as bucket fills (cycles) to complete each run.
o Same level 90° truck loading for Mike consisted of a ten run average with each run consisting of two trucks with nine total passes.
o Same level 90° truck loading for Paul consisted of a twelve run average with each run consisting of two trucks with nine total passes.
o Bench 90° truck loading for Mike consisted of an eleven run average with each run consisting of two trucks with twelve total passes.
o Bench 90° truck loading for Paul consisted of a ten run average with each run consisting of two trucks with a total of eleven total passes.
o The combined average consisted of a thirty-one run average for the baseline machine and a thirty-three run average for the Hybrid machine.
Each truck was weighed after each fill and compared to an empty tare weight to get the material tonnage. Cycle times were recorded for each run in order to calculate productivity in ton/hr. Each machine was equipped with a Caterpillar fuel burn meter and fuel consumption was recorded for each run in order to calculate fuel consumed per hour and per ton of material moved. Each operator ran both machines a similar number of runs in the same field with the same trucks and digging at the same depth for each test.
All testing was completed with both machines over three days and the atmospheric conditions during this period were fairly constant. The below plots represents the engine coolant temperature as well as the hydraulic oil temperature during the study. Each machine was warmed up prior to use and the hydraulic oil temp was maintained between 40° – 75° C.
Figure 14: Same Level 90° Truck Loading Representation
Source: Caterpillar Inc. Phase 2 testing documentation
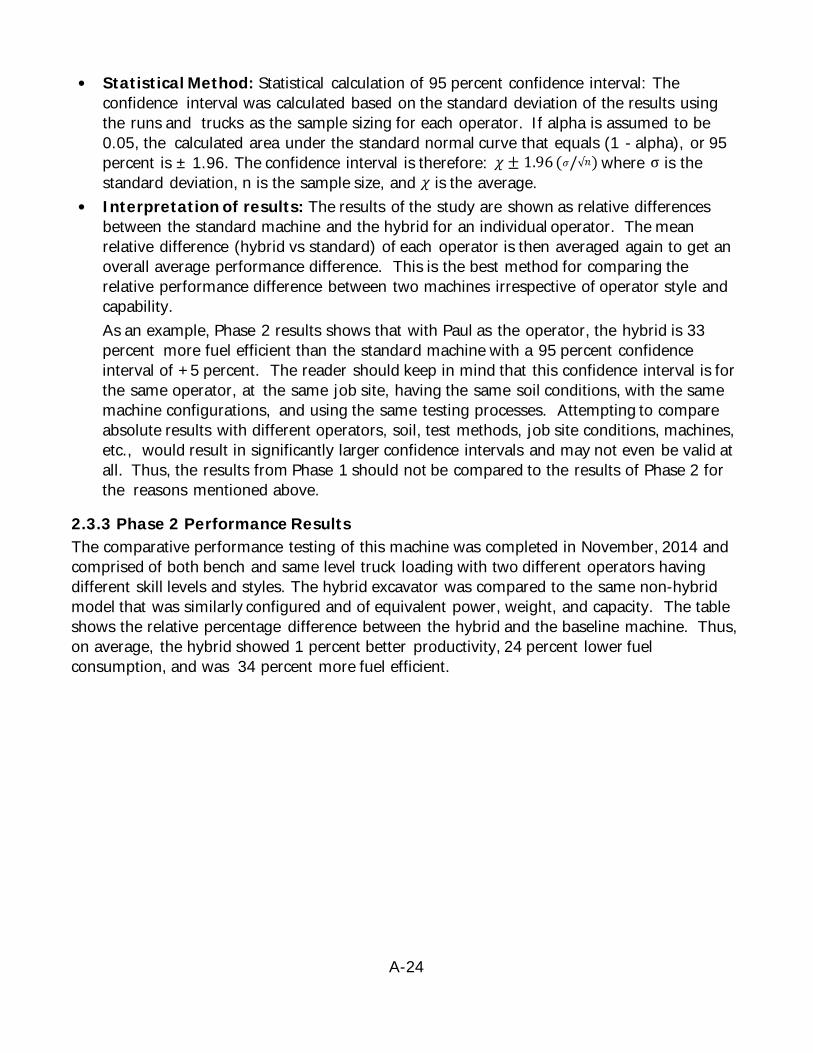
A-24
• Statistical Method: Statistical calculation of 95 percent confidence interval: The confidence interval was calculated based on the standard deviation of the results using the runs and trucks as the sample sizing for each operator. If alpha is assumed to be 0.05, the calculated area under the standard normal curve that equals (1 - alpha), or 95 percent is ± 1.96. The confidence interval is therefore: 𝜒𝜒 ± 1.96 (𝜎𝜎/√𝑛𝑛) where σ is the standard deviation, n is the sample size, and 𝜒𝜒 is the average.
• Interpretation of results: The results of the study are shown as relative differences between the standard machine and the hybrid for an individual operator. The mean relative difference (hybrid vs standard) of each operator is then averaged again to get an overall average performance difference. This is the best method for comparing the relative performance difference between two machines irrespective of operator style and capability. As an example, Phase 2 results shows that with Paul as the operator, the hybrid is 33 percent more fuel efficient than the standard machine with a 95 percent confidence interval of +5 percent. The reader should keep in mind that this confidence interval is for the same operator, at the same job site, having the same soil conditions, with the same machine configurations, and using the same testing processes. Attempting to compare absolute results with different operators, soil, test methods, job site conditions, machines, etc., would result in significantly larger confidence intervals and may not even be valid at all. Thus, the results from Phase 1 should not be compared to the results of Phase 2 for the reasons mentioned above.
2.3.3 Phase 2 Performance Results The comparative performance testing of this machine was completed in November, 2014 and comprised of both bench and same level truck loading with two different operators having different skill levels and styles. The hybrid excavator was compared to the same non-hybrid model that was similarly configured and of equivalent power, weight, and capacity. The table shows the relative percentage difference between the hybrid and the baseline machine. Thus, on average, the hybrid showed 1 percent better productivity, 24 percent lower fuel consumption, and was 34 percent more fuel efficient.

A-25
Table 7: Hybrid Performance Compared to Baseline Hybrid
Performance Productivity:
Mike
Productivity:
Paul
Productivity:
Average
Fuel
Consumption:
Mike
Fuel
Consumption:
Paul
Fuel
Consumption:
Average
Fuel
Efficiency:
Mike
Fuel
Efficiency:
Paul
Fuel
Efficiency:
Average
Bench
Loading
-3% -2% -3% -21% -25% 23% 22% 30% 26%
Same Level
Loading
16% -6% 5% -22% -29% -26% 50% 33% 42%
Average 7% -4% 1% -22% -27% -24% 36% 32% 34%
Source: Caterpillar Inc. Phase 2 testing results
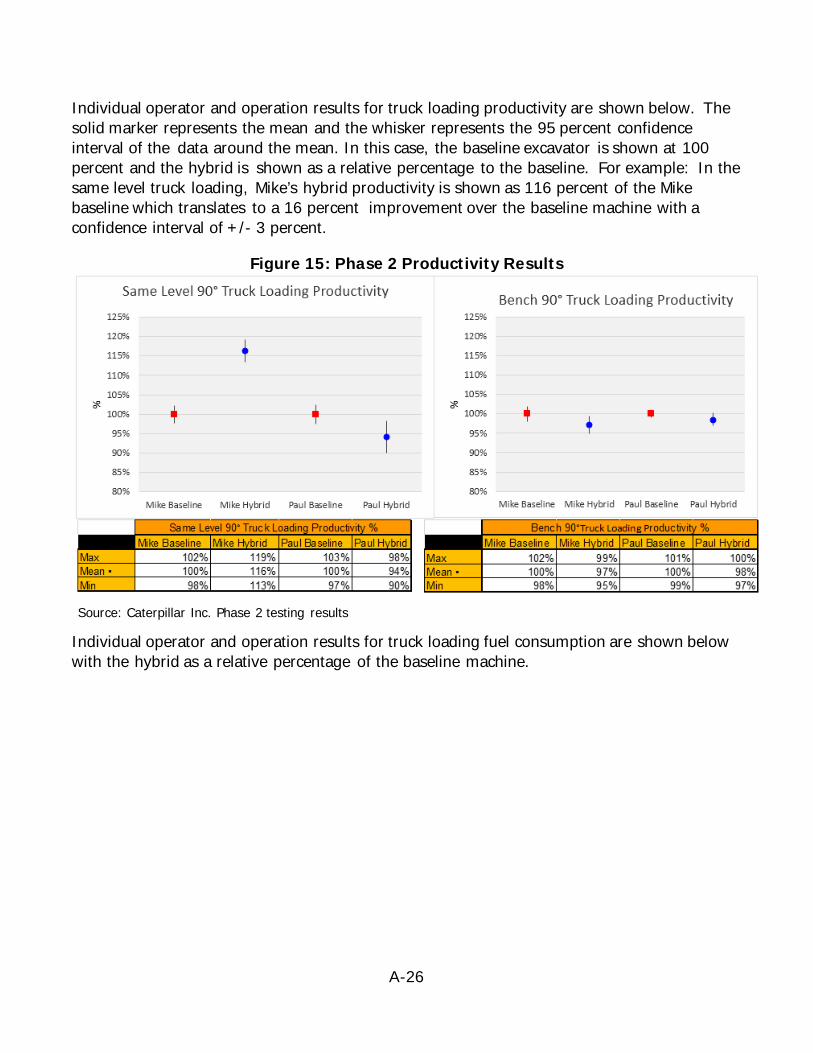
A-26
Individual operator and operation results for truck loading productivity are shown below. The solid marker represents the mean and the whisker represents the 95 percent confidence interval of the data around the mean. In this case, the baseline excavator is shown at 100 percent and the hybrid is shown as a relative percentage to the baseline. For example: In the same level truck loading, Mike’s hybrid productivity is shown as 116 percent of the Mike baseline which translates to a 16 percent improvement over the baseline machine with a confidence interval of +/- 3 percent.
Figure 15: Phase 2 Productivity Results
Source: Caterpillar Inc. Phase 2 testing results
Individual operator and operation results for truck loading fuel consumption are shown below with the hybrid as a relative percentage of the baseline machine.
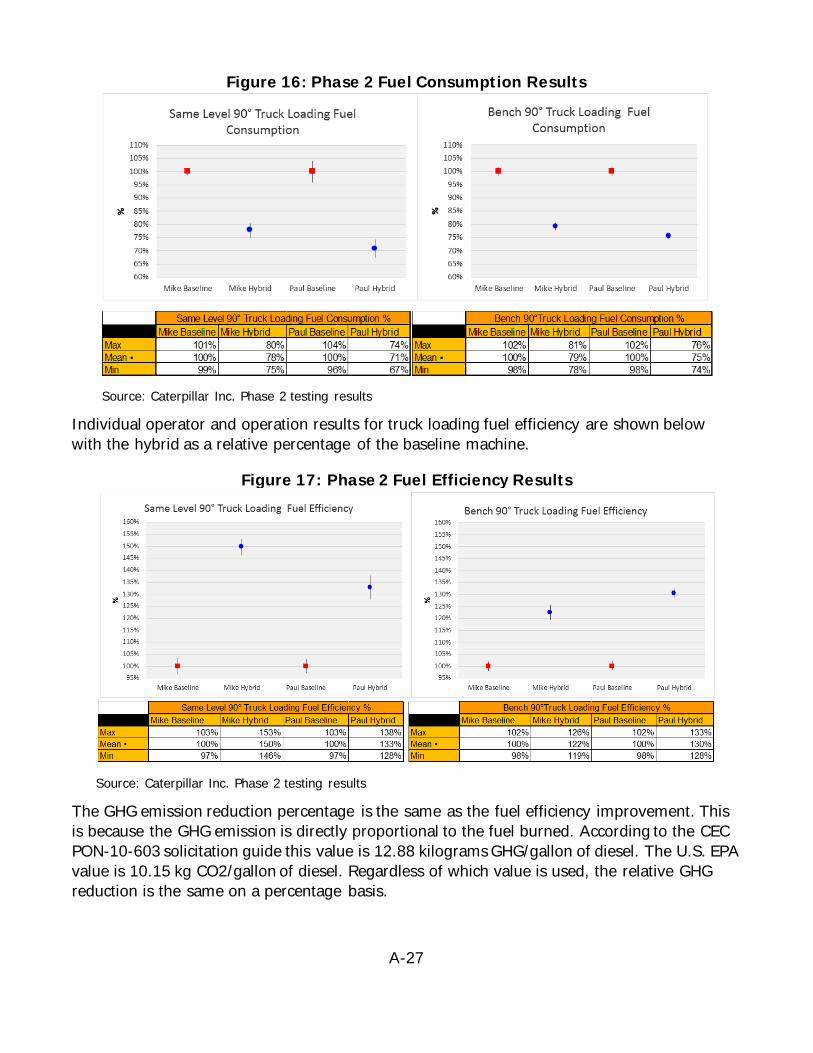
A-27
Figure 16: Phase 2 Fuel Consumption Results
Source: Caterpillar Inc. Phase 2 testing results
Individual operator and operation results for truck loading fuel efficiency are shown below with the hybrid as a relative percentage of the baseline machine.
Figure 17: Phase 2 Fuel Efficiency Results
Source: Caterpillar Inc. Phase 2 testing results
The GHG emission reduction percentage is the same as the fuel efficiency improvement. This is because the GHG emission is directly proportional to the fuel burned. According to the CEC PON-10-603 solicitation guide this value is 12.88 kilograms GHG/gallon of diesel. The U.S. EPA value is 10.15 kg CO2/gallon of diesel. Regardless of which value is used, the relative GHG reduction is the same on a percentage basis.
A-28
CHAPTER 3: Project Achievements and Success
3.1 Advancements in Science and Success Over 300 patents were filed as a result of the advancements made in the technologies employed on the 336E H hybrid excavator. This two-phase project provided valuable customer field experience that helped accelerate those advancements. This project has helped build the foundation on which the next generation of Cat® excavators will continue to grow upon. The new technology significantly reduces the customers’ owning and operating costs with the improvements in fuel efficiency without sacrificing productivity. Caterpillar’s commitment to sustainability is resonated through the development and success of these hybrid excavators. The lower fuel consumption directly impacts the GHG released from these construction machines and reduces their carbon footprint. The hybrid system additionally generates lower cab and spectator sound. The ability of the team to leverage scale of standard Cat® components to keep costs down made this a marketable machine that customers would purchase. The sales from the 336E H Hybrid excavator show the value customers see in this technology, and the continued positive responses from the field indicate customers are experiencing a significant reduction in fuel consumption. Since commercial availability in April of 2013, the 336E H hybrid excavator has received numerous industry awards whish demonstrate some of the commercial success of this game- changing machine. Listed below are some of the awards received: • Diesel Progress; CONEXPO 2014 Innovation Award sponsored by ZDF • Edison Universe Silver Award for Innovation • Equipment World’s 2013 Innovation Award • Equipment Today’s 2013 Contractors’ Top 50 New Products • Utility Contractor’s 2013 Top Product • International Construction Economic Forum Construction Equipment Innovation Award • Illinois Governor’s Sustainability Awards • Better Roads 2013 Top 25 Rollouts • Earthmover and Civil Contractor Top Finalist for Environmental Choice Award • TPI Publishing Group 2013 Power Award • Platts 2013 Global Energy Leading Technology Award in Commercialization • Construction Equipment Magazine’s Top 100 New products for 2013 • Finalist for the Caterpillar Chairman’s 2013 Sustainability Award • CALSTART 2014 Blue Sky Award Winner • Winner of the Caterpillar Chairman’s 2014 Delivered Innovation Award
A-29
3.2 Benefits to California This advanced hybrid demonstration project was focused on demonstrating reduced customer owning and operating costs through fuel savings. The successful demonstration helped to accelerate the commercialization of this advanced hybrid technology and therefore will allow our California customers to be more cost efficient and economically stable and provide them with a competitive advantage in the marketplace. This will result in more California jobs needed to support these customers and their suppliers. Enhancing the financial health of these California contractors also provides an opportunity for them to expand their operations and increase their employment. Another expected benefit is job training and skill enhancement. Field mechanics and shop technicians receive significant training from Caterpillar in state-of-the-art systems, upgrading their skill set and ultimately enhancing their productivity and wages. Technical training of this kind has a positive impact that cascades from the dealership to both customers and Caterpillar, as customers receive better support and Cat benefits from repeat sales. Caterpillar employs 3,700 people in the State of California in a mix of manufacturing, marketing and logistics occupations. Caterpillar’s dealers employ an additional 3,000 people in the state, also in a range of different jobs. Thousands of earthmoving contractors, their employees, and the combined 6,700 Caterpillar and Cat dealer employees in the State of California stand to benefit from this program.
3.2.1 Fuel Consumption and Greenhouse Gas Reduction Caterpillar is committed to sustainable progress evidenced by our inclusion of Sustainability as one of our “Values in Action,” in the Caterpillar Worldwide Code of Conduct (www.caterpillar.com/en/company/code-of-conduct.html). In fact, the 336E H hybrid excavator utilized in this project was featured on page 67 of Caterpillar’s 2013 Sustainability Report found at www.caterpillar.com/en/company/sustainability/sustainability-report.html.
GHG reduction is directly proportional to fuel reduction, thus a 25 percent reduction in fuel consumption will reduce GHG by 25 percent. Based on the test results, assuming a 25 percent reduction in fuel consumption over the standard, non-hybrid model, California will potentially realize more than a 5,900 gallon/machine annual reduction in petroleum usage and an associated reduction of GHG’s by 66 tons/machine annually for this size machine (depending on job conditions and usage). Furthermore, as this hybrid technology migrates across our product line, the environmental benefits to California will be significant.
A-30
CHAPTER 4: Future Projects and Improvements
Caterpillar Inc. has filed PON-14-605 as an additional project proposal for the continuation of improving the performance of large-size hybrid excavators. The project goal will be the development and demonstration of new technology with an objective to improve fuel efficiency by 40 percent or more, which will result in proportional reduction of GHG emissions. Caterpillar will accomplish this reduction by the development and integration of the following technologies to be explored in PON-14-605. • Optimized and integrated hydraulic hybrid systems that will capture and reuse the
available kinetic (swing) and potential (boom) energy. • Technology that will support automated engine shutdown and restarting (idle time
reduction) and therefore GHG emission reduction. • Optimized power density for the machine based on deep integration with hybrid
technology for improved fuel economy at a lower cost. • Worksite management and operator assist features such as semi-autonomous control to
improve operator and machine efficiency. • Biodiesel fuel to power the engine and reduce machine carbon footprint.
Should Caterpillar be awarded the grant, the proposed technology developed by Caterpillar will be demonstrated in California and supported by Caterpillar dealers and customers. This future project would build on the successfully completed project PON-10-603 as reported in this report.
APPENDIX B: Odyne: Advanced Diesel Plug-in Hybrid Electric Truck Project
Prepared for: California Energy Commission Prepared by: Odyne Systems LLC
ne
B-2
Matt Jarmuz Primary Author
Odyne Systems LLC W237 N2878 Woodgate Road Pewaukee, WI 53072 (262) 544-8405 Odyne website: www.odyne.com
Disclaimer Staff members of the California Energy Commission prepared this report. As such, it does not necessarily represent the views of the Energy Commission, its employees, or the State of California. The Energy Commission, the State of California, its employees, contractors and subcontractors make no warrant, express or implied, and assume no legal liability for the information in this report; nor does any party represent that the uses of this information will not infringe upon privately owned rights. This report has not been approved or disapproved by the Energy Commission nor has the Commiss ion passed upon the accuracy or adequacy of the information in this report.
B-3
TABLE OF CONTENTS Page
Table of Contents .......................................................................................................... B-3 List of Figures ............................................................................................................... B-3 List of Tables ................................................................................................................ B-3 Executive Summary........................................................................................................ B-4 CHAPTER 1: Project Overview .......................................................................................... B-6 CHAPTER 2: Optimize Energy Management Software ........................................................... B-11 CHAPTER 3: Manufacture and Assemble ........................................................................... B-12 CHAPTER 4: Fuel and Emission Testing............................................................................. B-14 CHAPTER 5: Data Acquisition ......................................................................................... B-16 CHAPTER 6: Customer Feedback ..................................................................................... B-20 CHAPTER 7: Findings and Conclusions .............................................................................. B-22 APPENDIX B-A: Vehicle Calibration .................................................................................. B-23 APPENDIX B-B: Fuel and Emission Testing ........................................................................ B-27 APPENDIX B-C: Customer Survey Report.................................................................................... B-39
LIST OF FIGURES
Page Figure 1: Odyne’s Minimally Intrusive Design Interfacing the Electric Motor to the PTO.................. B-7 Figure 2: Odyne Subassemblies Installed on OEM Chassis. ...................................................... B-8 Figure 3: Odyne Subassemblies Shipped to California for Installation. ........................................ B-8 Figure 4: Diagram of how Odyne’s Plug-in Hybrid Electric System Functions.............................. B-10 Figure 5: Pictures of the PGE and LA County Trucks Deployed in Program ................................ B-12 Figure 6: Fuel and Emission Data from both Vehicles ........................................................... B-14
LIST OF TABLES
Page Table 1: Vehicle Information .......................................................................................... B-12 Table 2: Telematics Data............................................................................................... B-16 Table 3: PGE Emission Reductions ................................................................................... B-18 Table 4: LA County Emission Reductions ........................................................................... B-19
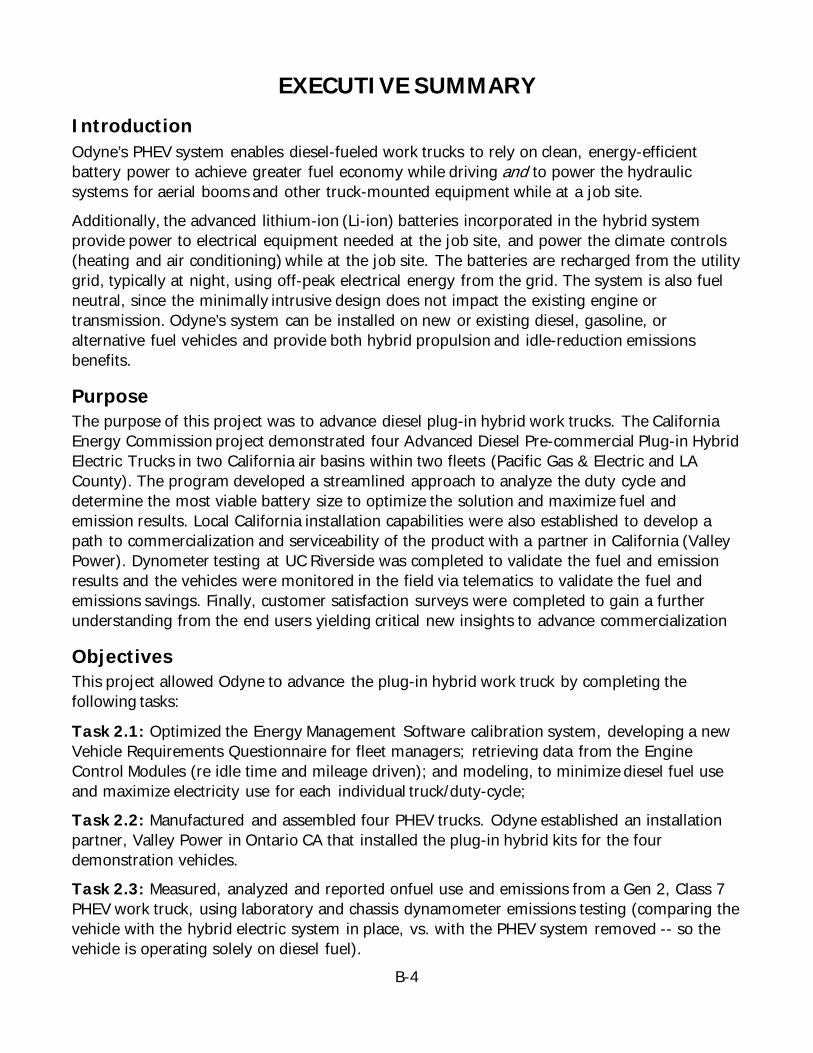
B-4
EXECUTIVE SUMMARY Introduction Odyne’s PHEV system enables diesel-fueled work trucks to rely on clean, energy-efficient battery power to achieve greater fuel economy while driving and to power the hydraulic systems for aerial booms and other truck-mounted equipment while at a job site. Additionally, the advanced lithium-ion (Li-ion) batteries incorporated in the hybrid system provide power to electrical equipment needed at the job site, and power the climate controls (heating and air conditioning) while at the job site. The batteries are recharged from the utility grid, typically at night, using off-peak electrical energy from the grid. The system is also fuel neutral, since the minimally intrusive design does not impact the existing engine or transmission. Odyne’s system can be installed on new or existing diesel, gasoline, or alternative fuel vehicles and provide both hybrid propulsion and idle-reduction emissions benefits.
Purpose The purpose of this project was to advance diesel plug-in hybrid work trucks. The California Energy Commission project demonstrated four Advanced Diesel Pre-commercial Plug-in Hybrid Electric Trucks in two California air basins within two fleets (Pacific Gas & Electric and LA County). The program developed a streamlined approach to analyze the duty cycle and determine the most viable battery size to optimize the solution and maximize fuel and emission results. Local California installation capabilities were also established to develop a path to commercialization and serviceability of the product with a partner in California (Valley Power). Dynometer testing at UC Riverside was completed to validate the fuel and emission results and the vehicles were monitored in the field via telematics to validate the fuel and emissions savings. Finally, customer satisfaction surveys were completed to gain a further understanding from the end users yielding critical new insights to advance commercialization
Objectives This project allowed Odyne to advance the plug-in hybrid work truck by completing the following tasks:
Task 2.1: Optimized the Energy Management Software calibration system, developing a new Vehicle Requirements Questionnaire for fleet managers; retrieving data from the Engine Control Modules (re idle time and mileage driven); and modeling, to minimize diesel fuel use and maximize electricity use for each individual truck/duty-cycle; Task 2.2: Manufactured and assembled four PHEV trucks. Odyne established an installation partner, Valley Power in Ontario CA that installed the plug-in hybrid kits for the four demonstration vehicles. Task 2.3: Measured, analyzed and reported onfuel use and emissions from a Gen 2, Class 7 PHEV work truck, using laboratory and chassis dynamometer emissions testing (comparing the vehicle with the hybrid electric system in place, vs. with the PHEV system removed -- so the vehicle is operating solely on diesel fuel).
B-5
Task 2.4: Acquired, analyzed, and reported on the data gathered from the on-board data acquisition system (telematics) that were installed on each demonstration vehicle – capturing information on fuel use, miles driven, and other parameters; Task 2.5: CALSTART performed Customer Satisfaction Surveys of demonstration participants, analyzing and reporting findings; assessments range from satisfaction recustomer training, to down time and maintenance, to battery size and mission “fit”.
Conclusions This project and funding from the Energy Commission accelerated the availability of the technology by (i) getting customers to try it sooner, (ii) reducing risks to fleet purchasers of adopting the pre-commercial technology; (iii) enabling demonstrations of a small number of trucks with a new technology, allowing them to gain familiarity and experience with the technology, which established the confidence needed for larger future purchases.
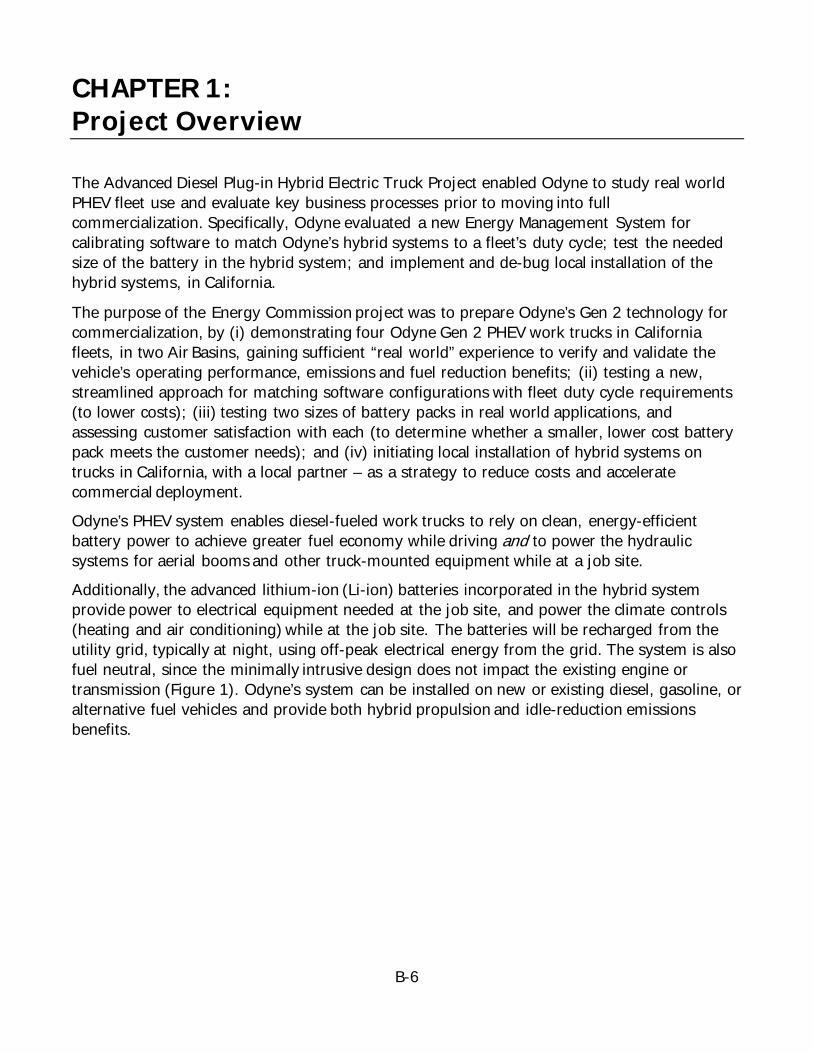
B-6
CHAPTER 1: Project Overview
The Advanced Diesel Plug-in Hybrid Electric Truck Project enabled Odyne to study real world PHEV fleet use and evaluate key business processes prior to moving into full commercialization. Specifically, Odyne evaluated a new Energy Management System for calibrating software to match Odyne’s hybrid systems to a fleet’s duty cycle; test the needed size of the battery in the hybrid system; and implement and de-bug local installation of the hybrid systems, in California.
The purpose of the Energy Commission project was to prepare Odyne’s Gen 2 technology for commercialization, by (i) demonstrating four Odyne Gen 2 PHEV work trucks in California fleets, in two Air Basins, gaining sufficient “real world” experience to verify and validate the vehicle’s operating performance, emissions and fuel reduction benefits; (ii) testing a new, streamlined approach for matching software configurations with fleet duty cycle requirements (to lower costs); (iii) testing two sizes of battery packs in real world applications, and assessing customer satisfaction with each (to determine whether a smaller, lower cost battery pack meets the customer needs); and (iv) initiating local installation of hybrid systems on trucks in California, with a local partner – as a strategy to reduce costs and accelerate commercial deployment. Odyne’s PHEV system enables diesel-fueled work trucks to rely on clean, energy-efficient battery power to achieve greater fuel economy while driving and to power the hydraulic systems for aerial booms and other truck-mounted equipment while at a job site. Additionally, the advanced lithium-ion (Li-ion) batteries incorporated in the hybrid system provide power to electrical equipment needed at the job site, and power the climate controls (heating and air conditioning) while at the job site. The batteries will be recharged from the utility grid, typically at night, using off-peak electrical energy from the grid. The system is also fuel neutral, since the minimally intrusive design does not impact the existing engine or transmission (Figure 1). Odyne’s system can be installed on new or existing diesel, gasoline, or alternative fuel vehicles and provide both hybrid propulsion and idle-reduction emissions benefits.
B-7
Figure 1: Odyne’s Minimally Intrusive Design Interfacing the Electric Motor to the PTO
Source: Odyne Systems LLC
A “work truck” is defined, in this project, as a Class 5, 6, 7 or 8 medium or heavy-duty truck, with truck-mounted aerial equipment such as a bucket truck, digger derrick, underground utility truck, bridge repair truck, and/or tunnel repair truck. The duty cycle of a work truck consists of two parts: (1) driving to and from the job site, and (2) stationary work while at the job site. The plug-in hybrid electric system interfaces through the transmission power take-off (PTO) to provide launch assist and regenerative braking for improved fuel economy and reduced emissions while driving. At the jobsite, the hybrid system powers all jobsite functions (hydraulic, electrical, and climate control loads) without having to run the diesel engine. Odyne targeted California as a key, initial market for its PHEV work trucks. The Energy Commission project demonstrated four Advanced Diesel Pre-Commercial Plug-in Hybrid Electric Trucks in two California air basins tested streamlined systems, viable battery size, and local California installation, yielding critical new insights to advance commercialization prospects: • Advanced Diesel Pre-Commercial PHEVs were demonstrated in two different work truck applications – including street light repair (LA County), and digger derrick work trucks (PG&E), broadening the market and establishing a sizeable database of real world operating experience. • For the first time, two different Lithium Ion battery packs (a 28 kWh battery pack, similar to those used in the DOE-funded project, and a smaller sized 14 kWh battery pack) were demonstrated, side by side, at LA County, to ascertain how each battery pack meets customer needs, enabling Odyne to match system costs to customer needs; • Local California installation of the hybrid system was implemented (vs. installation of PHEV systems in Wisconsin). Odyne relied upon a trusted equipment repairer to install the plug-in hybrid electric system on the chassis at its facility in Ontario, California, building California workforce expertise in assembly, service and sales. This local installation approach is designed to lower costs, by avoiding transportation costs to and from Wisconsin. See figure 2 and figure 3.
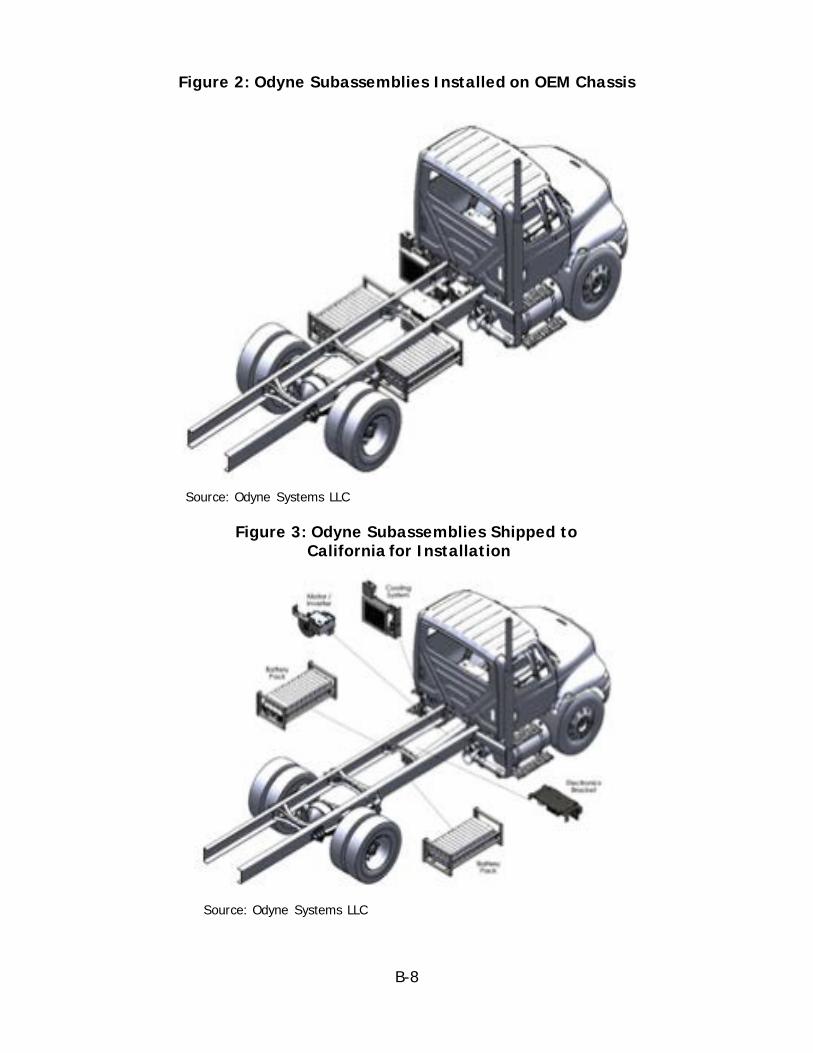
B-8
Figure 2: Odyne Subassemblies Installed on OEM Chassis
Source: Odyne Systems LLC
Figure 3: Odyne Subassemblies Shipped to California for Installation
Source: Odyne Systems LLC
B-9
• A new, streamlined approach for optimizing Energy Management Software was developed, and tested, on the four Pre-commercial Energy Commission vehicles and demonstrated. The software matched a vehicle’s duty-cycle demands to minimize diesel fuel use and maximize electricity use. (In earlier projects, energy management software was optimized by first monitoring comparable vehicles for six months; this strategy is well- suited to an R&D project, but does not position Odyne for commercial success).
Odyne’s Advanced PHEV work trucks will help California achieve its energy and air quality goals, and help fleets realize lower fuel and maintenance costs, due to:
• Night-time charging of batteries, using off-peak electrical grid energy. Batteries discharge during day use, with less diesel fuel use while driving, and no diesel fuel use during battery operation of hydraulics and climate controls at work site.
• Incremental emissions benefits via plugging into California’s grid, due to renewable energy, low carbon fuels policies. Up to 100 percent idle reduction (battery-powered).
• Improved vehicle acceleration and fuel economy via launch assist using electric traction motor.
• Reduced diesel fuel consumption, through energy efficient regenerative braking as well as battery-powered operation of truck-mounted equipment and climate controls.
• Reduced emissions of GHGs and criteria pollutants vs. conventional diesel vehicle. • Quiet worksite operation: highly beneficial in residential neighborhoods or at night. • Lower maintenance – less engine idle time and reduced brake wear. • Unique PTO interface reduces installation time and provides redundant power for
auxiliary components (patents pending). Provides parallel hybrid system connection with transmission.
• Original drive train is not modified, and interfaces with vehicle power train system; no changes to OEM transmission or engine certification: ARB compliant (as a regular truck).
• The hybrid system is fuel neutral and can be adapted to alternative fuel engines. • Modular design facilitates rapid scale to high volume vs. highly integrated designs
requiring changes to the transmission or other power train components. • Can be installed during final stage manufacturing process. • Reduction of emissions inhaled by workers in closed spaces such as tunnels.
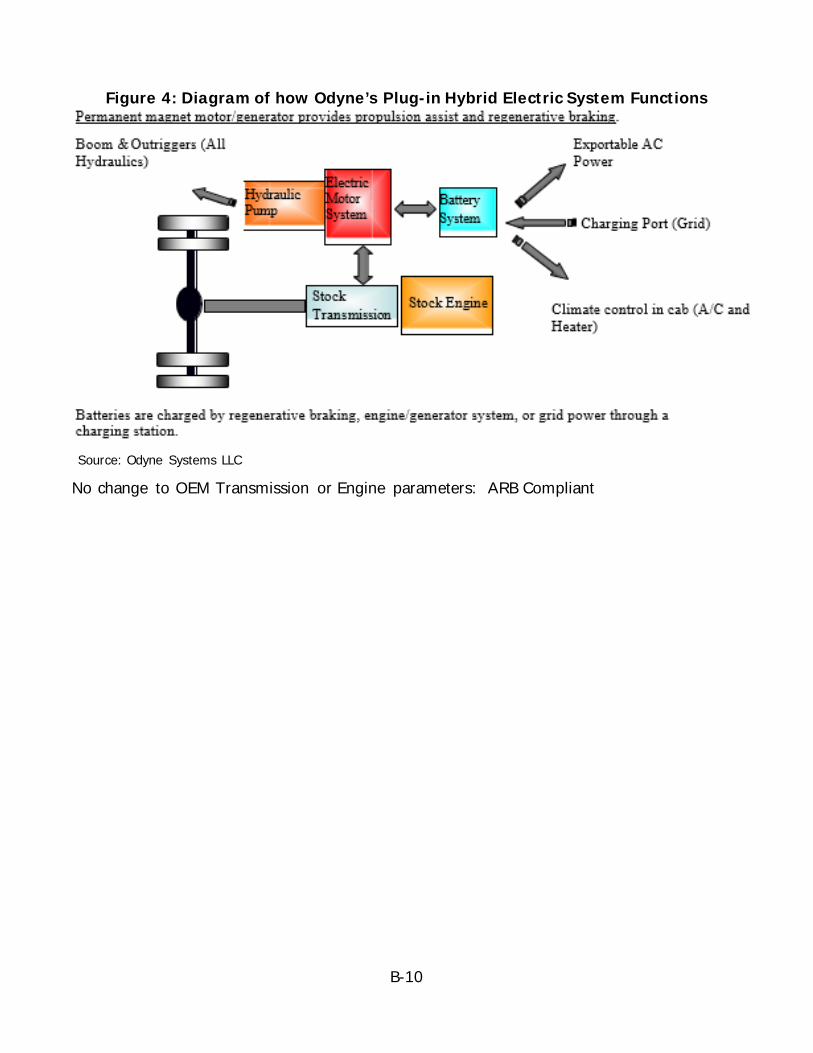
B-10
Figure 4: Diagram of how Odyne’s Plug-in Hybrid Electric System Functions
Source: Odyne Systems LLC
No change to OEM Transmission or Engine parameters: ARB Compliant
B-11
CHAPTER 2: Optimize Energy Management Software
When deploying a plug-in hybrid truck it is optimal to maximize the energy from the onboard energy storage system. The onboard storage system, or the battery, is an expensive piece of the plug-in hybrid system and must be optimized to maximize the fuel and emissions savings of the system. To maximize the value of the plug-in hybrid system the battery pack should not be too small that the engine has to run too often or too large that the entire batteries energy is not used. To determine the size of the battery pack for the application the projected duty cycle must be understood. In a work truck application, the duty cycle consists of both driving and stationary functions. The most inefficient portion of the duty cycle is while the vehicle is stationary powering the air conditioning, heat, and auxiliary loads. To maximize the efficiency the energy should be used to minimize any stationary run time. The additional stored energy should be used to offset fuel while the vehicle is driving.
Develop a new, streamlined approach for Energy Management Software assessment This new system relied on (i) an initial Fleet Management Questionnaire, (ii) evaluation of data from the Engine Control Module of comparable fleet vehicles to assess information about mileage driven and idle time, and (iii) modeling. The Vehicle Optimization Calculator for these four vehicles is included in Appendix A. The Calculator collects information on the duty cycle and the application. The duty cycle of a comparable vehicle uses the engine control module data the amount of days used to determine an overview of the typical duty cycle of a comparable vehicle. This is combined with the Application Data (equipment horsepower, HVAC loads, and exportable power loads) to determine the amount of energy required at the worksite. With a good understanding of the duty cycle and application the Energy Management software can be optimized to the particular vehicle. Odyne is able, via the use of customized Energy Management software, to maximize the diesel fuel savings of each vehicle, given its specific duty-cycle and unique application. Odyne used the data previously obtained by monitoring Gen 1 vehicles to develop a Vehicle Systems Requirements questionnaire, to be discussed with fleet management, prior to final design of each Pre-Commercial PHEV work truck. In addition, Odyne extracted data from the Engine Control Modules of comparable fleet vehicles, to corroborate mileage driven and idle time information obtained in the questionnaires. This data, in combination with modeling, was used to customize the Energy Management software to match specific vehicle duty-cycles.
This approach eliminated months of data-logging and analyses in the field. Typically, Odyne would have deployed a plug-in hybrid vehicle in the field and used months of data collection and analysis to determine the duty cycle and application loads. After the analysis the software was than updated in the field to optimize the software for that particular vehicle. With this project, Odyne was be able to configure the Pre-Commercial PHEV system to optimize performance while minimizing diesel fuel use in sync with commercialization goals.
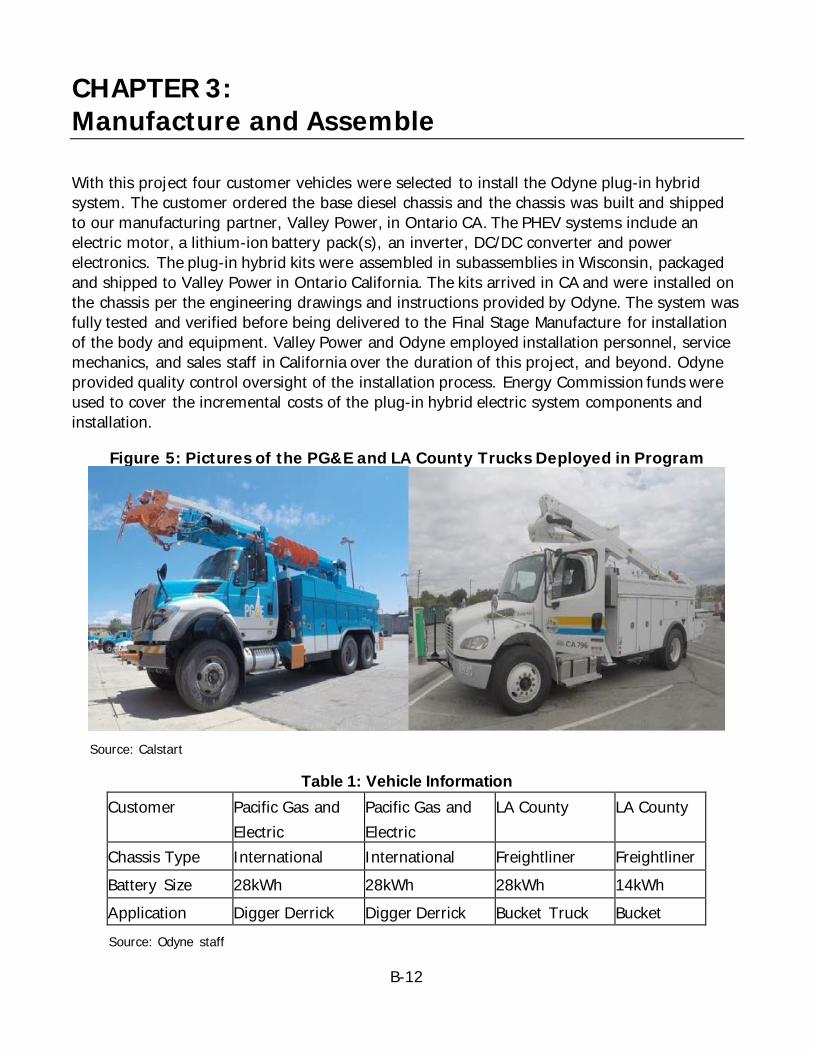
B-12
CHAPTER 3: Manufacture and Assemble
With this project four customer vehicles were selected to install the Odyne plug-in hybrid system. The customer ordered the base diesel chassis and the chassis was built and shipped to our manufacturing partner, Valley Power, in Ontario CA. The PHEV systems include an electric motor, a lithium-ion battery pack(s), an inverter, DC/DC converter and power electronics. The plug-in hybrid kits were assembled in subassemblies in Wisconsin, packaged and shipped to Valley Power in Ontario California. The kits arrived in CA and were installed on the chassis per the engineering drawings and instructions provided by Odyne. The system was fully tested and verified before being delivered to the Final Stage Manufacture for installation of the body and equipment. Valley Power and Odyne employed installation personnel, service mechanics, and sales staff in California over the duration of this project, and beyond. Odyne provided quality control oversight of the installation process. Energy Commission funds were used to cover the incremental costs of the plug-in hybrid electric system components and installation.
Figure 5: Pictures of the PG&E and LA County Trucks Deployed in Program
Source: Calstart
Table 1: Vehicle Information Customer Pacific Gas and
Electric Pacific Gas and Electric
LA County LA County
Chassis Type International International Freightliner Freightliner Battery Size 28kWh 28kWh 28kWh 14kWh Application Digger Derrick Digger Derrick Bucket Truck Bucket
Source: Odyne staff

B-13
Overall the process of performing the installations in California for the first time went well. The installation took slightly longer in California because Valley Power did not have an end of line tester that automates the 2-day testing process. The end of line test had to be performed manually by mechanics. Valley power also did not have an air conditioning machine that works with high voltage systems so the truck had to be sent to a local car dealership for the air conditioning system to be charged. To perform high volume installations in California the installer would need an end of line tester to test the system and a high voltage air conditioning machine.
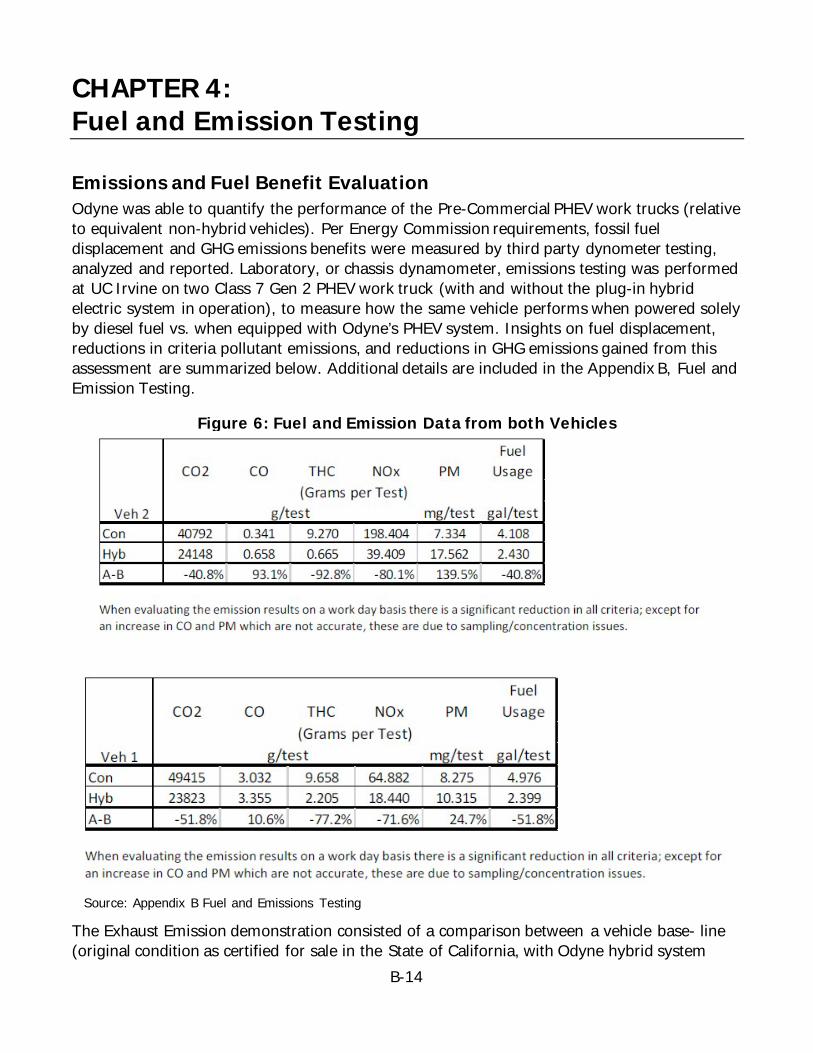
B-14
CHAPTER 4: Fuel and Emission Testing
Emissions and Fuel Benefit Evaluation Odyne was able to quantify the performance of the Pre-Commercial PHEV work trucks (relative to equivalent non-hybrid vehicles). Per Energy Commission requirements, fossil fuel displacement and GHG emissions benefits were measured by third party dynometer testing, analyzed and reported. Laboratory, or chassis dynamometer, emissions testing was performed at UC Irvine on two Class 7 Gen 2 PHEV work truck (with and without the plug-in hybrid electric system in operation), to measure how the same vehicle performs when powered solely by diesel fuel vs. when equipped with Odyne’s PHEV system. Insights on fuel displacement, reductions in criteria pollutant emissions, and reductions in GHG emissions gained from this assessment are summarized below. Additional details are included in the Appendix B, Fuel and Emission Testing.
Figure 6: Fuel and Emission Data from both Vehicles
Source: Appendix B Fuel and Emissions Testing
The Exhaust Emission demonstration consisted of a comparison between a vehicle base- line (original condition as certified for sale in the State of California, with Odyne hybrid system
B-15
installed but disabled), referred to as Conventional Mode in this report; and the same vehicle with the only difference being the hybrid system is enabled, referred to as Hybrid Mode in this report. Otherwise known as an A to B Comparison, the emission demonstration is intended to show that the ODYNE aftermarket plug-in parallel hybrid system does not have an adverse impact on the vehicles exhaust emissions. The demonstration contained both Transient and Stationary Cycles performed on a chassis dynamometer that adequately represent real-world usage of the applications. Inclusion of stationary testing was proposed to and accepted by ARB. The transient segment of the demonstration retains the Urban Dynamometer Drive Schedule (UDDS) as required. This report is included in Appendix B.
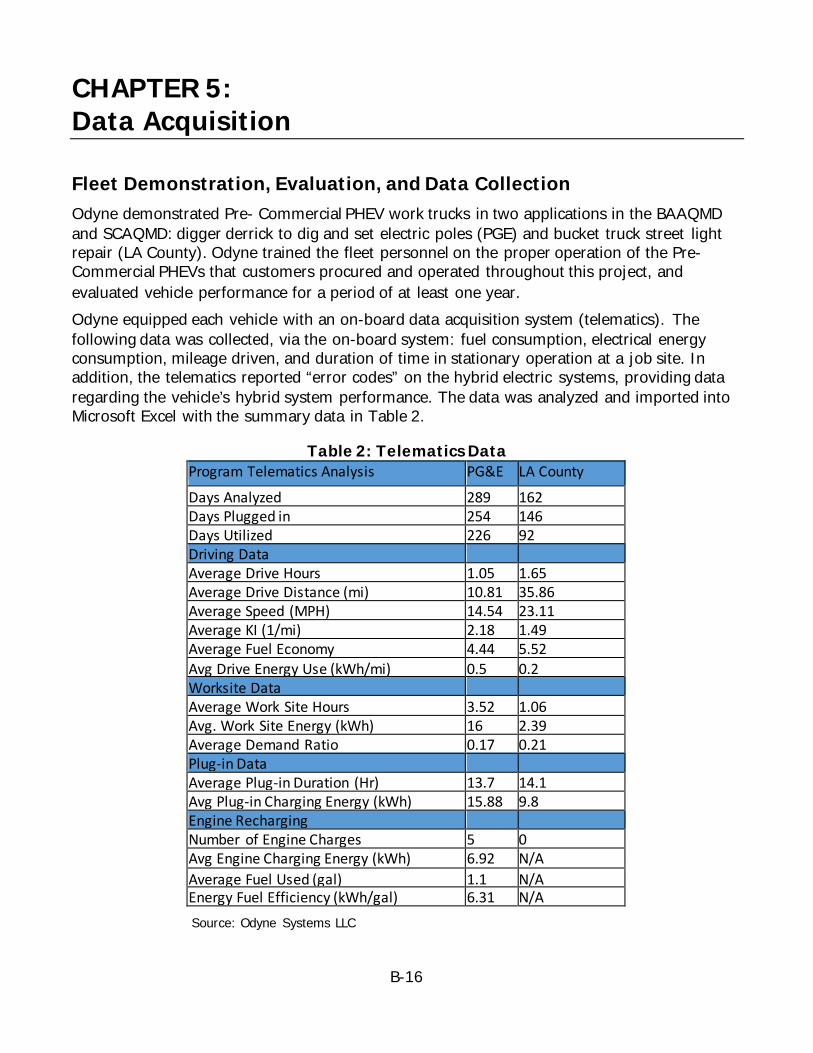
B-16
CHAPTER 5: Data Acquisition
Fleet Demonstration, Evaluation, and Data Collection Odyne demonstrated Pre- Commercial PHEV work trucks in two applications in the BAAQMD and SCAQMD: digger derrick to dig and set electric poles (PGE) and bucket truck street light repair (LA County). Odyne trained the fleet personnel on the proper operation of the Pre- Commercial PHEVs that customers procured and operated throughout this project, and evaluated vehicle performance for a period of at least one year. Odyne equipped each vehicle with an on-board data acquisition system (telematics). The following data was collected, via the on-board system: fuel consumption, electrical energy consumption, mileage driven, and duration of time in stationary operation at a job site. In addition, the telematics reported “error codes” on the hybrid electric systems, providing data regarding the vehicle’s hybrid system performance. The data was analyzed and imported into Microsoft Excel with the summary data in Table 2.
Table 2: Telematics Data Program Telematics Analysis PG&E LA County
Days Analyzed 289 162 Days Plugged in 254 146 Days Utilized 226 92 Driving Data Average Drive Hours 1.05 1.65 Average Drive Distance (mi) 10.81 35.86 Average Speed (MPH) 14.54 23.11 Average KI (1/mi) 2.18 1.49 Average Fuel Economy 4.44 5.52 Avg Drive Energy Use (kWh/mi) 0.5 0.2 Worksite Data Average Work Site Hours 3.52 1.06 Avg. Work Site Energy (kWh) 16 2.39 Average Demand Ratio 0.17 0.21 Plug-in Data Average Plug-in Duration (Hr) 13.7 14.1 Avg Plug-in Charging Energy (kWh) 15.88 9.8 Engine Recharging Number of Engine Charges 5 0 Avg Engine Charging Energy (kWh) 6.92 N/A Average Fuel Used (gal) 1.1 N/A Energy Fuel Efficiency (kWh/gal) 6.31 N/A Source: Odyne Systems LLC
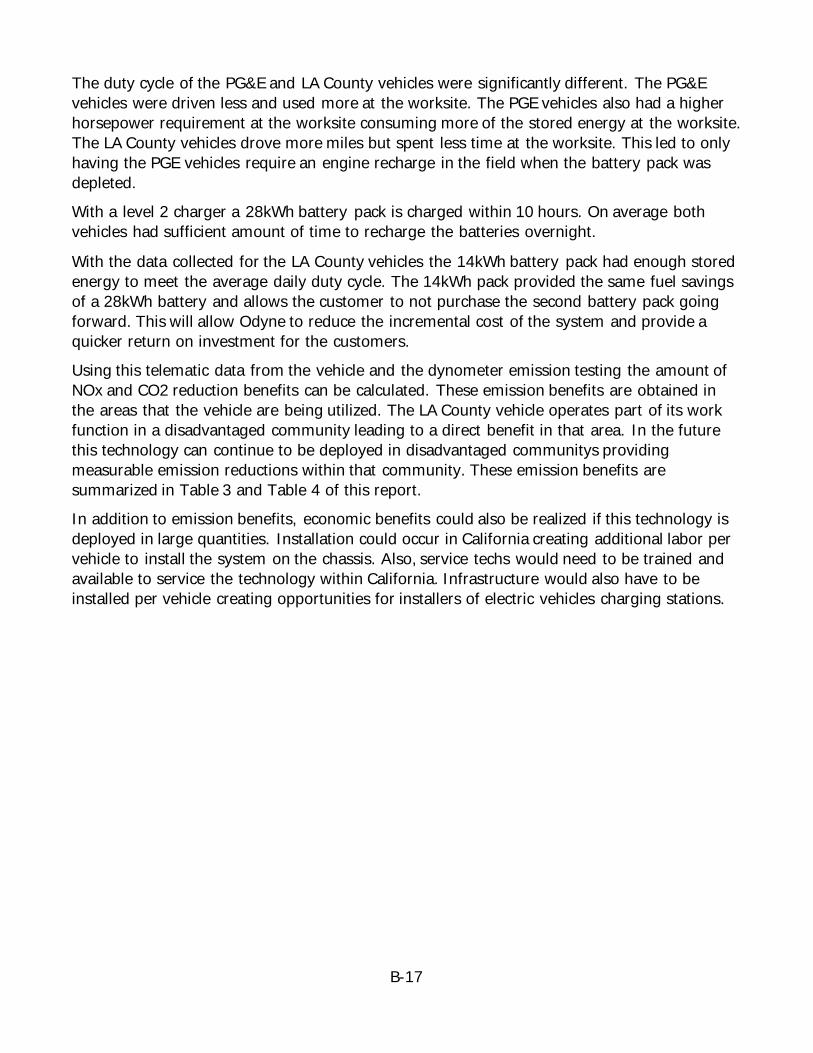
B-17
The duty cycle of the PG&E and LA County vehicles were significantly different. The PG&E vehicles were driven less and used more at the worksite. The PGE vehicles also had a higher horsepower requirement at the worksite consuming more of the stored energy at the worksite. The LA County vehicles drove more miles but spent less time at the worksite. This led to only having the PGE vehicles require an engine recharge in the field when the battery pack was depleted. With a level 2 charger a 28kWh battery pack is charged within 10 hours. On average both vehicles had sufficient amount of time to recharge the batteries overnight.
With the data collected for the LA County vehicles the 14kWh battery pack had enough stored energy to meet the average daily duty cycle. The 14kWh pack provided the same fuel savings of a 28kWh battery and allows the customer to not purchase the second battery pack going forward. This will allow Odyne to reduce the incremental cost of the system and provide a quicker return on investment for the customers. Using this telematic data from the vehicle and the dynometer emission testing the amount of NOx and CO2 reduction benefits can be calculated. These emission benefits are obtained in the areas that the vehicle are being utilized. The LA County vehicle operates part of its work function in a disadvantaged community leading to a direct benefit in that area. In the future this technology can continue to be deployed in disadvantaged communitys providing measurable emission reductions within that community. These emission benefits are summarized in Table 3 and Table 4 of this report. In addition to emission benefits, economic benefits could also be realized if this technology is deployed in large quantities. Installation could occur in California creating additional labor per vehicle to install the system on the chassis. Also, service techs would need to be trained and available to service the technology within California. Infrastructure would also have to be installed per vehicle creating opportunities for installers of electric vehicles charging stations.
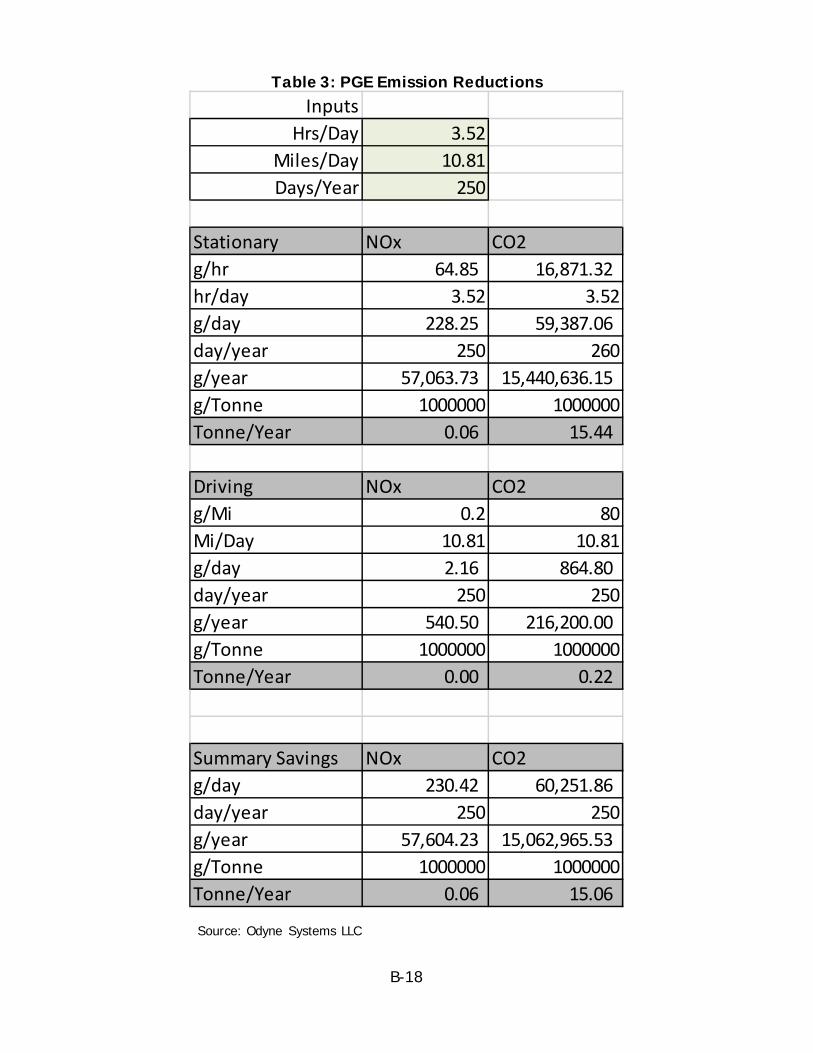
B-18
Table 3: PGE Emission Reductions
Source: Odyne Systems LLC
InputsHrs/Day 3.52
Miles/Day 10.81Days/Year 250
Stationary NOx CO2g/hr 64.85 16,871.32 hr/day 3.52 3.52g/day 228.25 59,387.06 day/year 250 260g/year 57,063.73 15,440,636.15 g/Tonne 1000000 1000000Tonne/Year 0.06 15.44
Driving NOx CO2g/Mi 0.2 80Mi/Day 10.81 10.81g/day 2.16 864.80 day/year 250 250g/year 540.50 216,200.00 g/Tonne 1000000 1000000Tonne/Year 0.00 0.22
Summary Savings NOx CO2g/day 230.42 60,251.86 day/year 250 250g/year 57,604.23 15,062,965.53 g/Tonne 1000000 1000000Tonne/Year 0.06 15.06
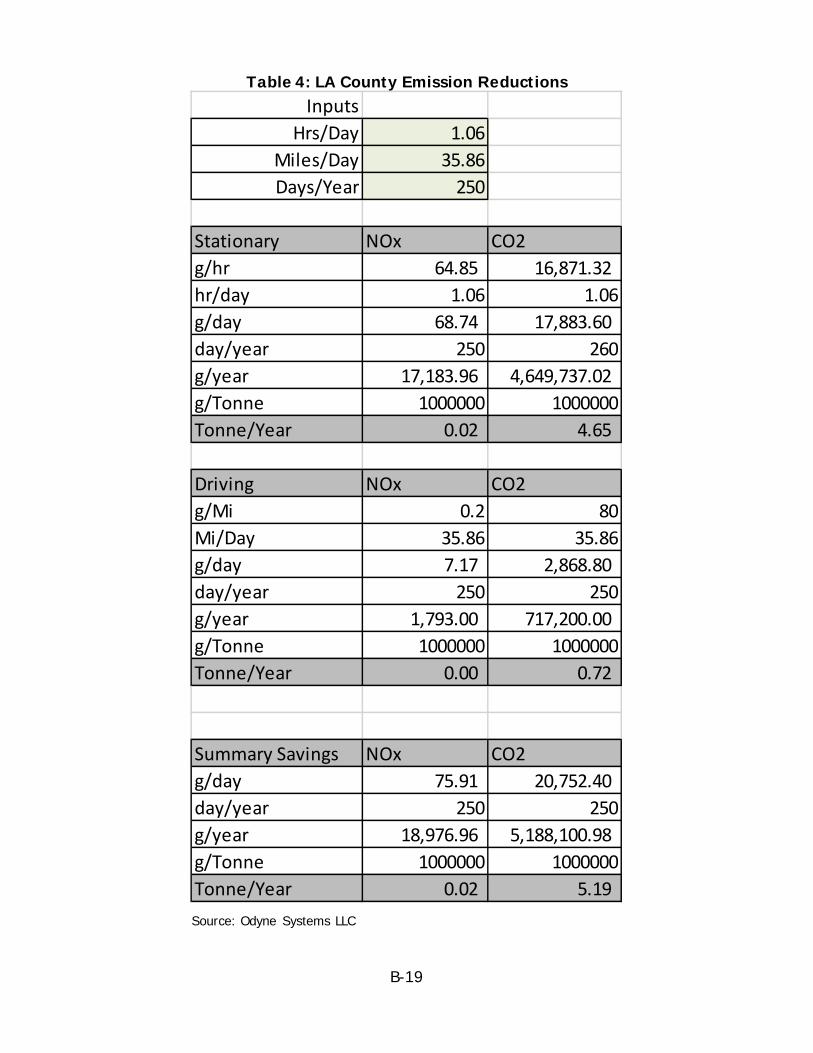
B-19
Table 4: LA County Emission Reductions
Source: Odyne Systems LLC
InputsHrs/Day 1.06
Miles/Day 35.86Days/Year 250
Stationary NOx CO2g/hr 64.85 16,871.32 hr/day 1.06 1.06g/day 68.74 17,883.60 day/year 250 260g/year 17,183.96 4,649,737.02 g/Tonne 1000000 1000000Tonne/Year 0.02 4.65
Driving NOx CO2g/Mi 0.2 80Mi/Day 35.86 35.86g/day 7.17 2,868.80 day/year 250 250g/year 1,793.00 717,200.00 g/Tonne 1000000 1000000Tonne/Year 0.00 0.72
Summary Savings NOx CO2g/day 75.91 20,752.40 day/year 250 250g/year 18,976.96 5,188,100.98 g/Tonne 1000000 1000000Tonne/Year 0.02 5.19
B-20
CHAPTER 6: Customer Feedback
Odyne demonstrated a family of plug-in hybrid utility work trucks featuring an electric power take-off device capable of shutting off the engine at the work site so that work can be performed without burning fuel, producing emissions, or causing noise pollution. Instead, an on-board battery and electric motor power the boom while also providing a launch assist and regenerative braking. Two utility fleets, Pacific Gas & Electric (PG&E) and LA County Department of Public Works (LACDPW), acquired trucks with the Odyne technology and put them in operation. The PG&E fleet in San Jose, CA received two Class 8 hybrid digger-derrick trucks used for removing and setting telephone poles and other utility equipment. LACDPW received two smaller Class 6 utility bucket trucks. The utility bucket trucks are used for repair traffic signals and other electric signage. CALSTART collected operator and fleet manager feedback to evaluate the satisfaction of the user fleets with the vehicles and their interest in a larger adoption of the technology.
Multiple operators at PG&E tested the truck as they rotated it through a few teams. Many operators were initially unsure about trying the new technology. This widespread skepticism is due in part to previous unsuccessful attempts with alternative fuel vehicles. For example, some of the interviewed operators had experience with hybrid work trucks that either did not work properly or they could disable the hybrid functionality, preventing any environmental or economic benefits from being registered. While the operators did want a cleaner, less polluting truck, but they prefer not to modify their work patterns or be exposed to mechanical problems often attributed to early production units. However, the launch-assist and quiet jobsite operation features that the Odyne technology provide eventually won over the operators; by the end of the demonstration period, they preferred this new truck to the conventional trucks on the yard. The ability to charge tools from the truck’s battery via the inverter was also very beneficial to the users because the team no longer has to run an auxiliary generator for this purpose. The battery capacity was specifically evaluated for this project, and the PG&E fleet showed that sufficient capacity remained at the end of their daily operation. The truck regularly returned to the yard with a high state of charge (SOC) after a duty cycle including approximately 20 miles of driving and an hour and a half of boom use at a job site. Despite initial skepticism, the benefits of the new trucks outweighed any challenges by the end of the demonstration period. At the other fleet, LACDPW, a single operator was assigned to the truck. He enthusiastically accepted the challenge of learning a new technology and did not have any previous experience with hybrids. The initial feedback was positive, with the extra power at take-off and the regenerative braking assistance as a valuable feature in urban driving conditions. Like with PG&E, the operator’s use pattern was not very demanding of the truck’s technology- a full shift only used about 25 percent of the battery, allowing the operator to park the truck closer to his home overnight. Even though the truck was not charged overnight, this was made up by
B-21
opportunity charging for about an hour at the beginning and end of each shift. The boom functioned very well in the fleet’s duty cycle that required 5-20 min of boom operation time per jobsite. The technology on this truck together with the operator planning ahead seemed to fit the demands of the workload very well. Some technical difficulties were observed. At the initial demonstration for PG&E, the truck experienced an overspeed error which caused the engine to turn on in order to support the operation of the boom and interfered with driving the truck. Similarly, at LACDPW’s initial demonstration, the boom made a loud grinding noise which was attributed to a faulty valve. Both problems were solved. PG&E’s truck also experienced problems with the engine turning on while the boom was in use even when the truck had sufficient SOC to run off of battery power, although this decreased over time. Specific to LACDPW, the lengthy acceptance and deployment processes delayed the truck’s use by two years and severely limited the time the operator had to gain experience with the truck and necessitated project extensions. Despite these setbacks, the mechanic teams at both fleets were optimistic of their ability to learn how to service the truck. Overall, the collected staff feedback ultimately indicated that these trucks are a great improvement on conventional work trucks and can fit seamlessly into a utility fleet’s operations.
Please see Appendix B-C for the Customer Survey Report.
B-22
CHAPTER 7: Findings and Conclusions
Overall the project was a success. Odyne was able to develop a tool to help better understand the duty cycle of the application and provide the best calibration while the vehicle is being built. Although the calibration can be changed in the field, the closer the vehicle is set up from the factory the better. Odyne was also able to develop an installation and service partner in California with Valley Power. Since the project, Valley Power has completed additional installations for California customers and has serviced all the Odyne systems that are operated in California. Odyne has continued to build and sell the G2 product that was deployed with this program. Customers from around North America have continued to embrace the technology and have purchased multiple repeat orders. Pacific Gas and Electric purchased two additional Odyne plug-in hybrid systems after they deployed the two digger derrick applications in this program. These vehicles have been built and are deployed in San Jose and San Francisco. LA County has also shown additional interest in additional Odyne systems. They are currently in the process of purchasing an Odyne Bookmobile application. This application eliminates the need of a generator, eliminating noise and emissions for the school aged children that use the County provided bookmobile. Although the technology has been well received Odyne has continued to advance the technology. Currently Odyne is in a 3-year DOE project that is working to increase fuel efficiency while driving by 50 percent while also reducing the incremental cost to a 5 year payback of less. Install, and evaluate, the use of different size Lithium Ion Battery Packs on Advanced PHEV work trucks in this demonstration. The LA County demonstration of two Pre- Commercial Class 7 PHEV work trucks as part of this project was extremely beneficial. One work truck was equipped with a 28 kWh Lithium Ion battery pack, while the other has a 14 kWh battery pack. The LA County trucks shared the same Class size and application, with only moderately different duty-cycles and terrain. This side-by-side comparison enabled Odyne to evaluate the ability of the work trucks to perform reliably in their missions, with each size battery pack. The analysis showed similar fuel and emissions saved between the two vehicles. This allows Odyne to better “right size” the battery pack. With missions proven reliably served by a 14 kWh battery pack, incremental PHEV costs are greatly lowered, increasing commercial opportunities for additional customers in the future.
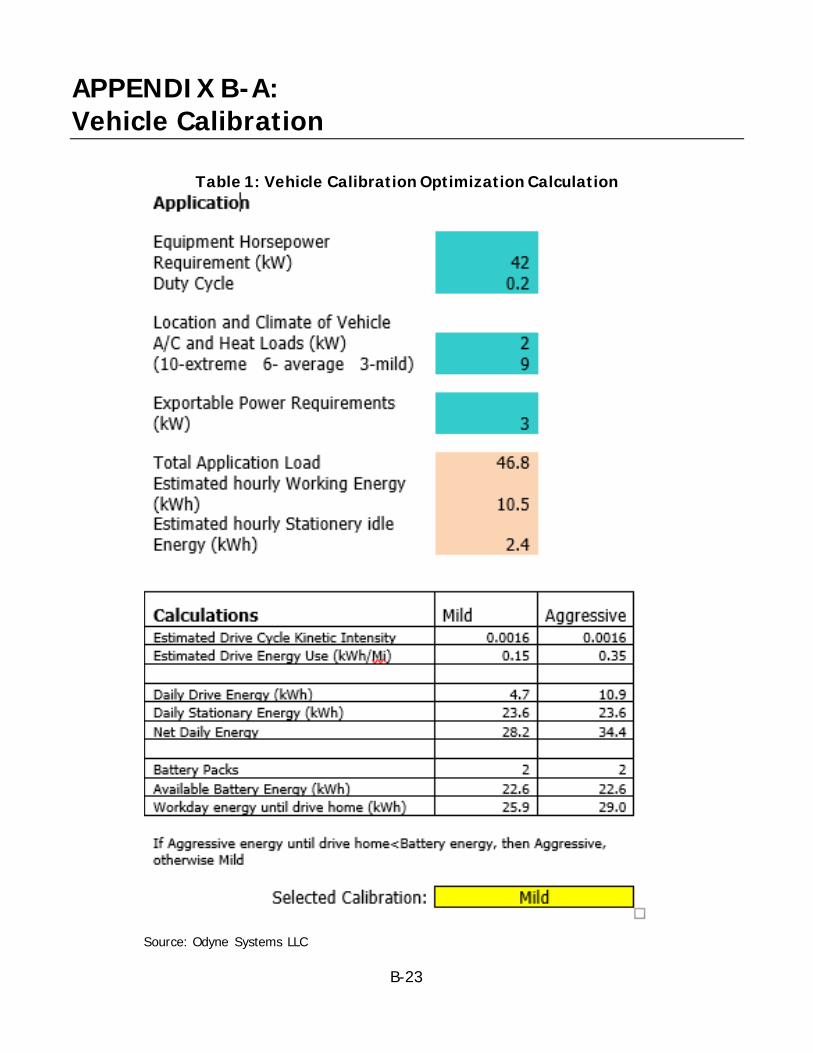
B-23
APPENDIX B-A: Vehicle Calibration
Table 1: Vehicle Calibration Optimization Calculation
Source: Odyne Systems LLC
B-27
APPENDIX B-B: Fuel and Emission Testing
2015 MODEL YEAR PLUG-IN PARALLEL HYBRID EMISSION
TESTING CARB A-2014-356
ODYNE SYSTEMS LLC
W237N2878 Woodgate Rd, Suite #2 Pewaukee, WI
53072 USA
B-28
TABLE OF CONTENTS
SUMMARY ................................................................................................................. B-29 EMISSION TEST CYCLE ............................................................................................... B-31 TRANSIENT CYCLE ..................................................................................................... B-31 STATIONARY CYCLE ................................................................................................... B-31 CONVENTIONAL MODE ............................................................................................... B-31 HYBRID MODE ........................................................................................................... B-32 NAVISTAR EMISSION DEMONSTRATION (Vehicle 1)......................................................... B-34 TEST RESULTS IN CONVENTIONAL MODE ...................................................................... B-35 TRANSIENT TEST RESULTS.......................................................................................... B-35 STATIONARY TEST RESULTS........................................................................................ B-36 TEST RESULTS IN HYBRID MODE ................................................................................. B-36 TRANSIENT TEST RESULTS.......................................................................................... B-36 STATIONARY TEST RESULTS........................................................................................ B-37 TOTAL “WORK DAY” MASS EMISSIONS .......................................................................... B-37 CUMMINS EMISSION DEMONSTRATION (Vehicle 2) ......................................................... B-38 TEST RESULTS IN CONVENTIONAL MODE ...................................................................... B-39 TRANSIENT TEST RESULTS.......................................................................................... B-40 STATIONARY TEST RESULTS........................................................................................ B-41 TEST RESULTS IN HYBRID MODE ................................................................................. B-41 TRANSIENT TEST RESULTS.......................................................................................... B-42 STATIONARY TEST RESULTS........................................................................................ B-43 TOTAL “WORK DAY” MASS EMISSIONS .......................................................................... B-43
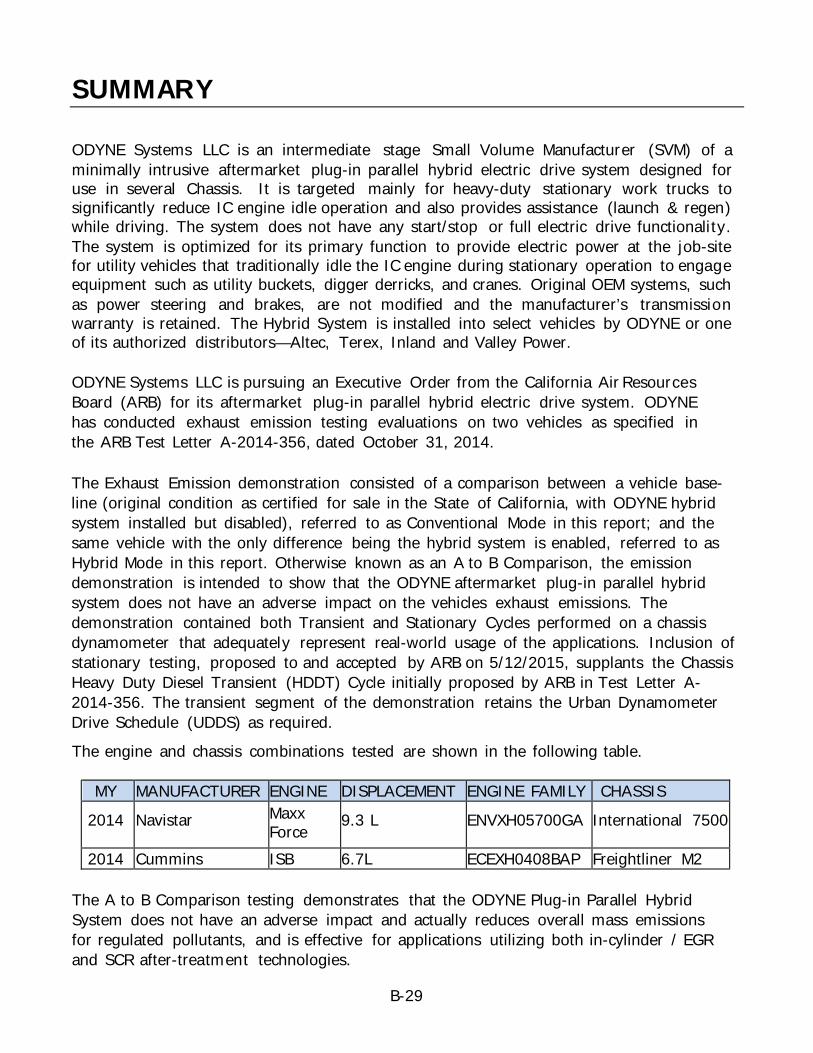
B-29
SUMMARY
ODYNE Systems LLC is an intermediate stage Small Volume Manufacturer (SVM) of a minimally intrusive aftermarket plug-in parallel hybrid electric drive system designed for use in several Chassis. It is targeted mainly for heavy-duty stationary work trucks to significantly reduce IC engine idle operation and also provides assistance (launch & regen) while driving. The system does not have any start/stop or full electric drive functionality. The system is optimized for its primary function to provide electric power at the job-site for utility vehicles that traditionally idle the IC engine during stationary operation to engage equipment such as utility buckets, digger derricks, and cranes. Original OEM systems, such as power steering and brakes, are not modified and the manufacturer’s transmission warranty is retained. The Hybrid System is installed into select vehicles by ODYNE or one of its authorized distributors—Altec, Terex, Inland and Valley Power. ODYNE Systems LLC is pursuing an Executive Order from the California Air Resources Board (ARB) for its aftermarket plug-in parallel hybrid electric drive system. ODYNE has conducted exhaust emission testing evaluations on two vehicles as specified in the ARB Test Letter A-2014-356, dated October 31, 2014. The Exhaust Emission demonstration consisted of a comparison between a vehicle base-line (original condition as certified for sale in the State of California, with ODYNE hybrid system installed but disabled), referred to as Conventional Mode in this report; and the same vehicle with the only difference being the hybrid system is enabled, referred to as Hybrid Mode in this report. Otherwise known as an A to B Comparison, the emission demonstration is intended to show that the ODYNE aftermarket plug-in parallel hybrid system does not have an adverse impact on the vehicles exhaust emissions. The demonstration contained both Transient and Stationary Cycles performed on a chassis dynamometer that adequately represent real-world usage of the applications. Inclusion of stationary testing, proposed to and accepted by ARB on 5/12/2015, supplants the Chassis Heavy Duty Diesel Transient (HDDT) Cycle initially proposed by ARB in Test Letter A-2014-356. The transient segment of the demonstration retains the Urban Dynamometer Drive Schedule (UDDS) as required.
The engine and chassis combinations tested are shown in the following table.
MY MANUFACTURER ENGINE DISPLACEMENT ENGINE FAMILY CHASSIS 2014 Navistar Maxx
Force 9.3 L ENVXH05700GA International 7500
2014 Cummins ISB 6.7L ECEXH0408BAP Freightliner M2
The A to B Comparison testing demonstrates that the ODYNE Plug-in Parallel Hybrid System does not have an adverse impact and actually reduces overall mass emissions for regulated pollutants, and is effective for applications utilizing both in-cylinder / EGR and SCR after-treatment technologies.
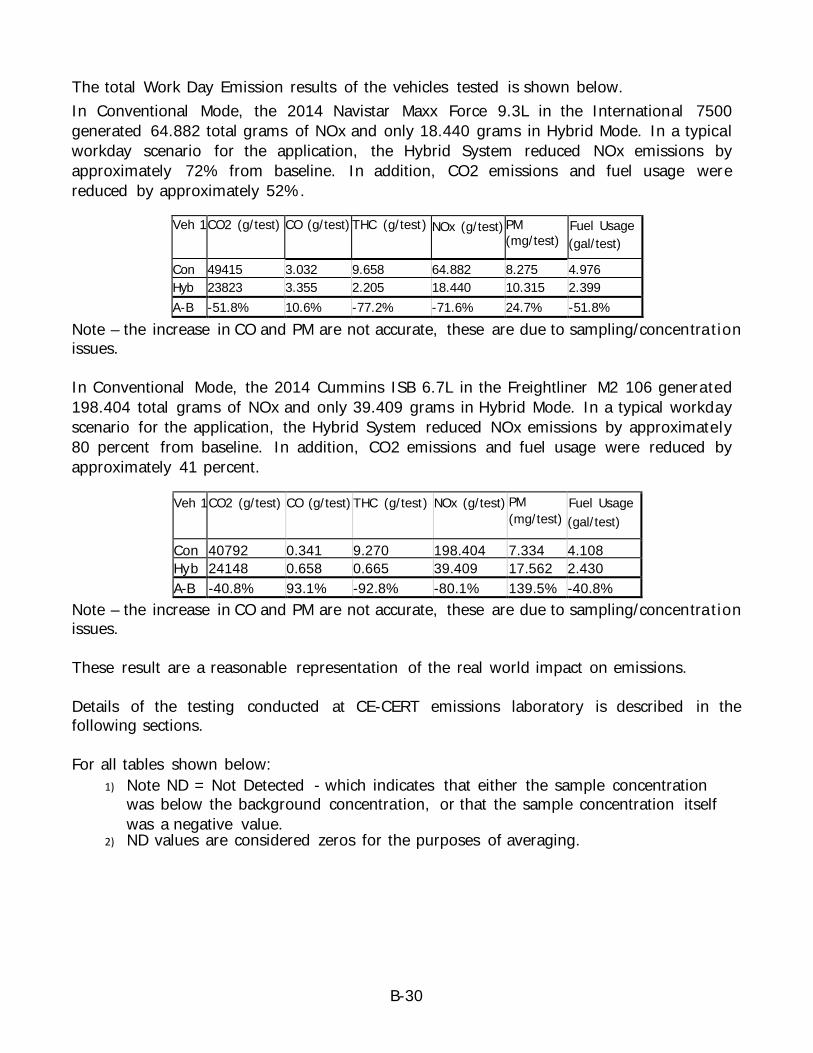
B-30
The total Work Day Emission results of the vehicles tested is shown below. In Conventional Mode, the 2014 Navistar Maxx Force 9.3L in the International 7500 generated 64.882 total grams of NOx and only 18.440 grams in Hybrid Mode. In a typical workday scenario for the application, the Hybrid System reduced NOx emissions by approximately 72% from baseline. In addition, CO2 emissions and fuel usage were reduced by approximately 52%.
Veh 1 CO2 (g/test) CO (g/test) THC (g/test) NOx (g/test) PM (mg/test)
Fuel Usage (gal/test)
Con 49415 3.032 9.658 64.882 8.275 4.976 Hyb 23823 3.355 2.205 18.440 10.315 2.399 A-B -51.8% 10.6% -77.2% -71.6% 24.7% -51.8%
Note – the increase in CO and PM are not accurate, these are due to sampling/concentration issues. In Conventional Mode, the 2014 Cummins ISB 6.7L in the Freightliner M2 106 generated 198.404 total grams of NOx and only 39.409 grams in Hybrid Mode. In a typical workday scenario for the application, the Hybrid System reduced NOx emissions by approximately 80 percent from baseline. In addition, CO2 emissions and fuel usage were reduced by approximately 41 percent.
Veh 1 CO2 (g/test) CO (g/test) THC (g/test) NOx (g/test) PM (mg/test)
Fuel Usage (gal/test)
Con 40792 0.341 9.270 198.404 7.334 4.108 Hyb 24148 0.658 0.665 39.409 17.562 2.430 A-B -40.8% 93.1% -92.8% -80.1% 139.5% -40.8%
Note – the increase in CO and PM are not accurate, these are due to sampling/concentration issues. These result are a reasonable representation of the real world impact on emissions. Details of the testing conducted at CE-CERT emissions laboratory is described in the following sections. For all tables shown below:
1) Note ND = Not Detected - which indicates that either the sample concentration was below the background concentration, or that the sample concentration itself was a negative value.
2) ND values are considered zeros for the purposes of averaging.
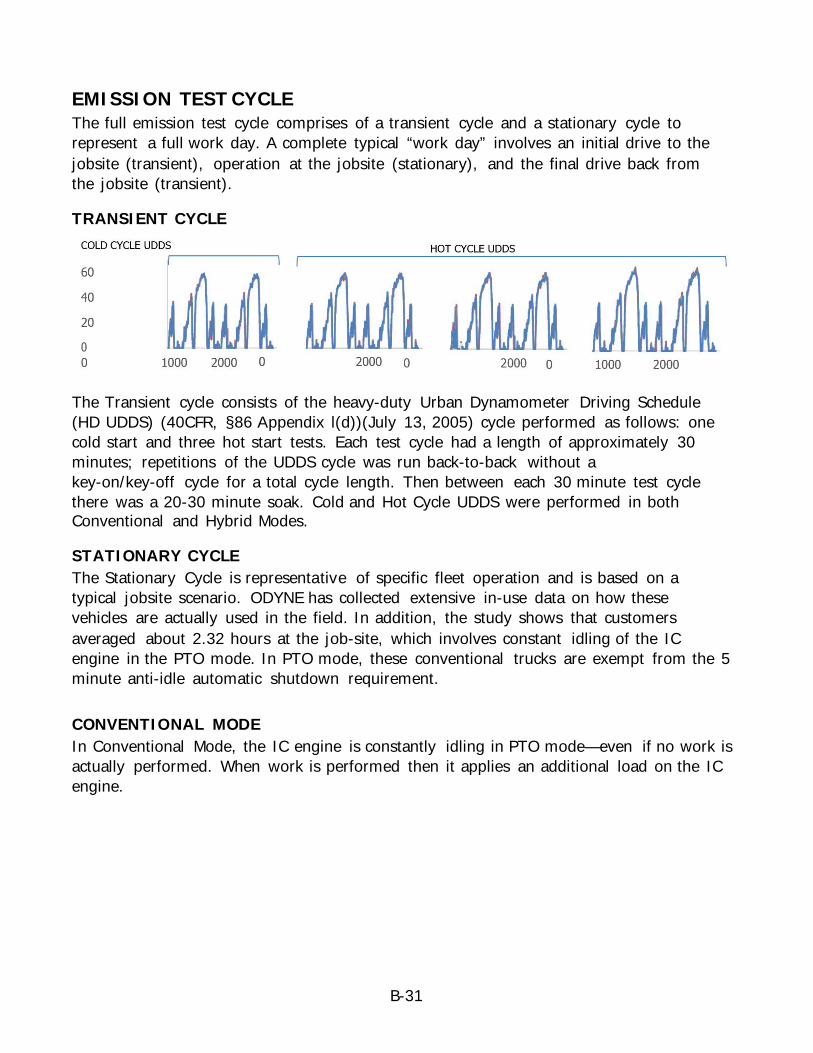
B-31
EMISSION TEST CYCLE The full emission test cycle comprises of a transient cycle and a stationary cycle to represent a full work day. A complete typical “work day” involves an initial drive to the jobsite (transient), operation at the jobsite (stationary), and the final drive back from the jobsite (transient).
TRANSIENT CYCLE
The Transient cycle consists of the heavy-duty Urban Dynamometer Driving Schedule (HD UDDS) (40CFR, §86 Appendix l(d))(July 13, 2005) cycle performed as follows: one cold start and three hot start tests. Each test cycle had a length of approximately 30 minutes; repetitions of the UDDS cycle was run back-to-back without a key-on/key-off cycle for a total cycle length. Then between each 30 minute test cycle there was a 20-30 minute soak. Cold and Hot Cycle UDDS were performed in both Conventional and Hybrid Modes.
STATIONARY CYCLE The Stationary Cycle is representative of specific fleet operation and is based on a typical jobsite scenario. ODYNE has collected extensive in-use data on how these vehicles are actually used in the field. In addition, the study shows that customers averaged about 2.32 hours at the job-site, which involves constant idling of the IC engine in the PTO mode. In PTO mode, these conventional trucks are exempt from the 5 minute anti-idle automatic shutdown requirement.
CONVENTIONAL MODE In Conventional Mode, the IC engine is constantly idling in PTO mode—even if no work is actually performed. When work is performed then it applies an additional load on the IC engine.
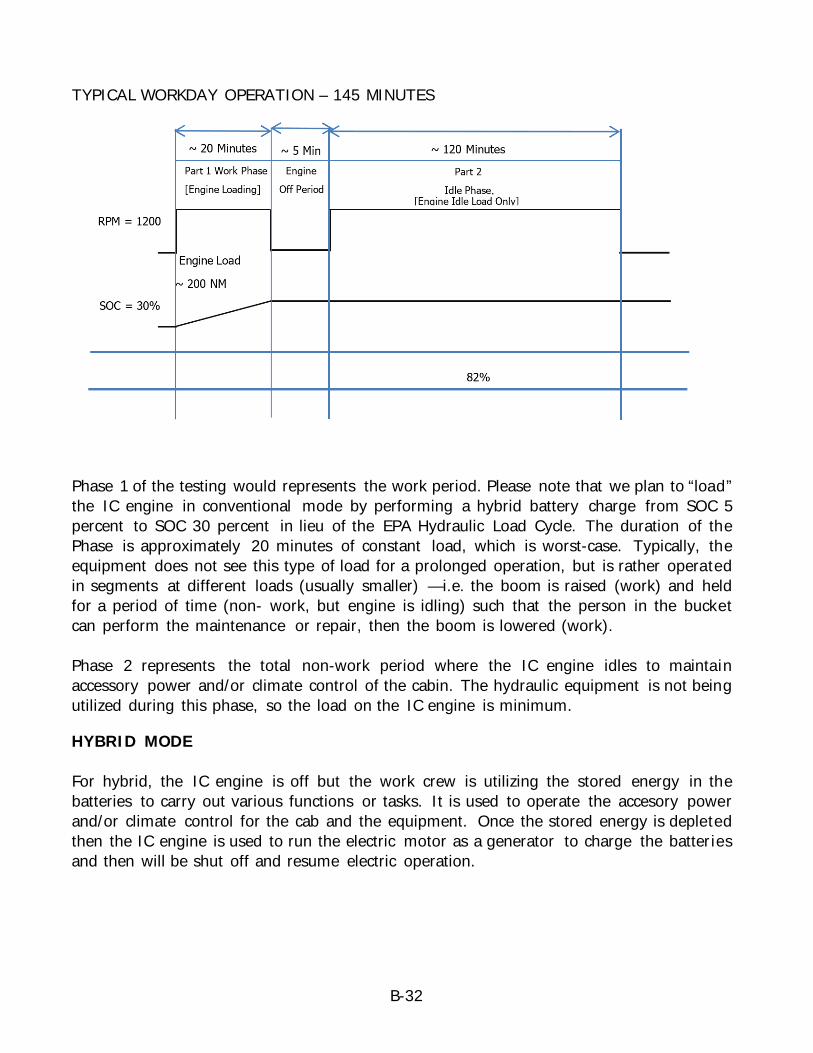
B-32
TYPICAL WORKDAY OPERATION – 145 MINUTES
Phase 1 of the testing would represents the work period. Please note that we plan to “load” the IC engine in conventional mode by performing a hybrid battery charge from SOC 5 percent to SOC 30 percent in lieu of the EPA Hydraulic Load Cycle. The duration of the Phase is approximately 20 minutes of constant load, which is worst-case. Typically, the equipment does not see this type of load for a prolonged operation, but is rather operated in segments at different loads (usually smaller) —i.e. the boom is raised (work) and held for a period of time (non- work, but engine is idling) such that the person in the bucket can perform the maintenance or repair, then the boom is lowered (work). Phase 2 represents the total non-work period where the IC engine idles to maintain accessory power and/or climate control of the cabin. The hydraulic equipment is not being utilized during this phase, so the load on the IC engine is minimum.
HYBRID MODE For hybrid, the IC engine is off but the work crew is utilizing the stored energy in the batteries to carry out various functions or tasks. It is used to operate the accesory power and/or climate control for the cab and the equipment. Once the stored energy is depleted then the IC engine is used to run the electric motor as a generator to charge the batteries and then will be shut off and resume electric operation.
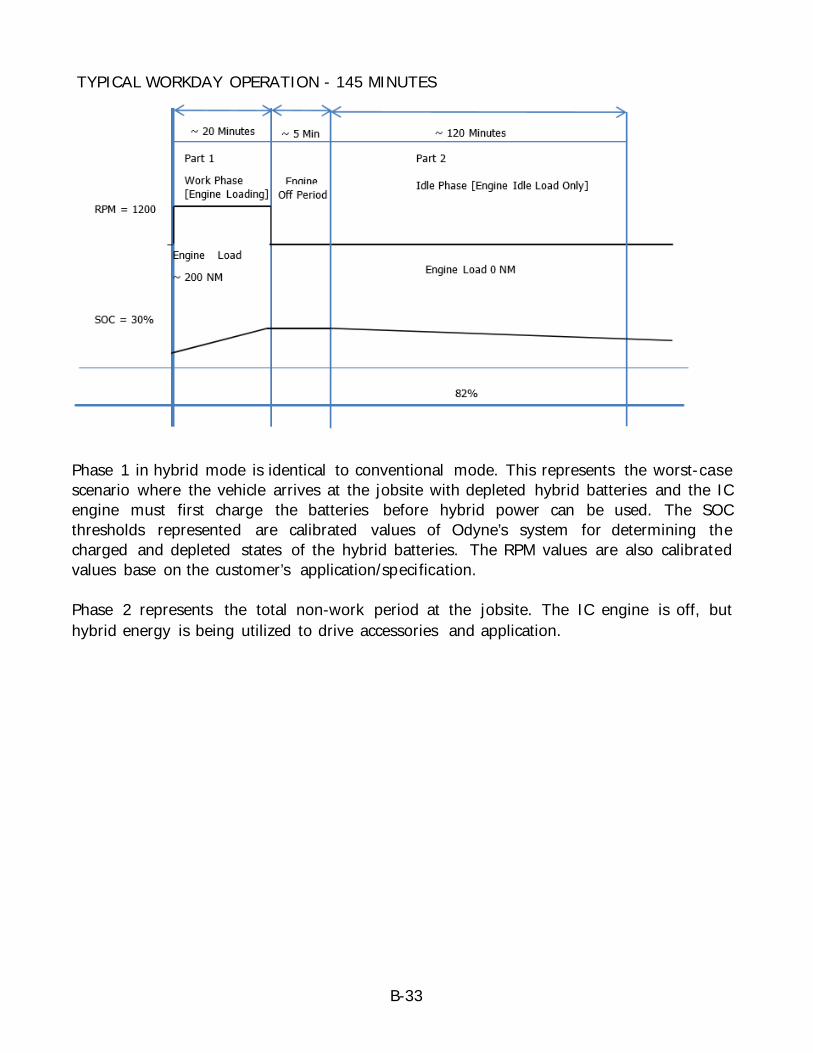
B-33
TYPICAL WORKDAY OPERATION - 145 MINUTES
Phase 1 in hybrid mode is identical to conventional mode. This represents the worst-case scenario where the vehicle arrives at the jobsite with depleted hybrid batteries and the IC engine must first charge the batteries before hybrid power can be used. The SOC thresholds represented are calibrated values of Odyne’s system for determining the charged and depleted states of the hybrid batteries. The RPM values are also calibrated values base on the customer’s application/specification. Phase 2 represents the total non-work period at the jobsite. The IC engine is off, but hybrid energy is being utilized to drive accessories and application.
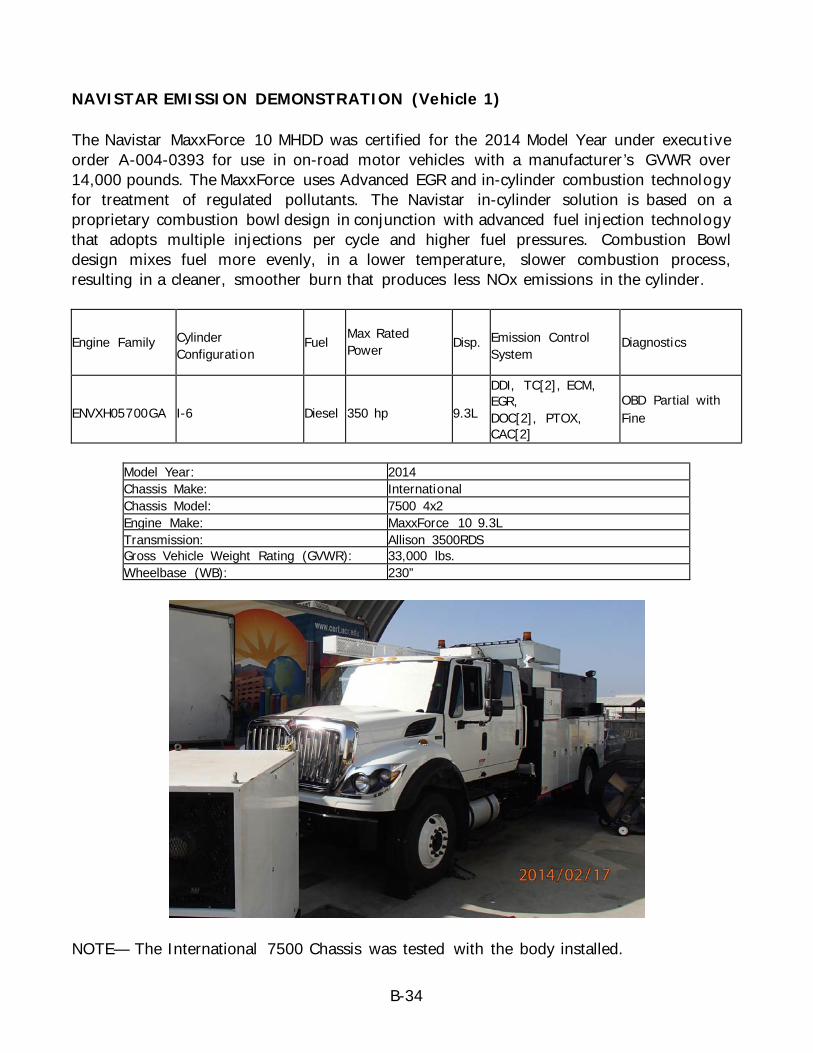
B-34
NAVISTAR EMISSION DEMONSTRATION (Vehicle 1) The Navistar MaxxForce 10 MHDD was certified for the 2014 Model Year under executive order A-004-0393 for use in on-road motor vehicles with a manufacturer’s GVWR over 14,000 pounds. The MaxxForce uses Advanced EGR and in-cylinder combustion technology for treatment of regulated pollutants. The Navistar in-cylinder solution is based on a proprietary combustion bowl design in conjunction with advanced fuel injection technology that adopts multiple injections per cycle and higher fuel pressures. Combustion Bowl design mixes fuel more evenly, in a lower temperature, slower combustion process, resulting in a cleaner, smoother burn that produces less NOx emissions in the cylinder.
Engine Family Cylinder Configuration
Fuel Max Rated Power Disp. Emission Control
System Diagnostics
ENVXH05700GA I-6 Diesel 350 hp 9.3L
DDI, TC[2], ECM, EGR, DOC[2], PTOX, CAC[2]
OBD Partial with Fine
Model Year: 2014 Chassis Make: International Chassis Model: 7500 4x2 Engine Make: MaxxForce 10 9.3L Transmission: Allison 3500RDS Gross Vehicle Weight Rating (GVWR): 33,000 lbs. Wheelbase (WB): 230”
NOTE— The International 7500 Chassis was tested with the body installed.
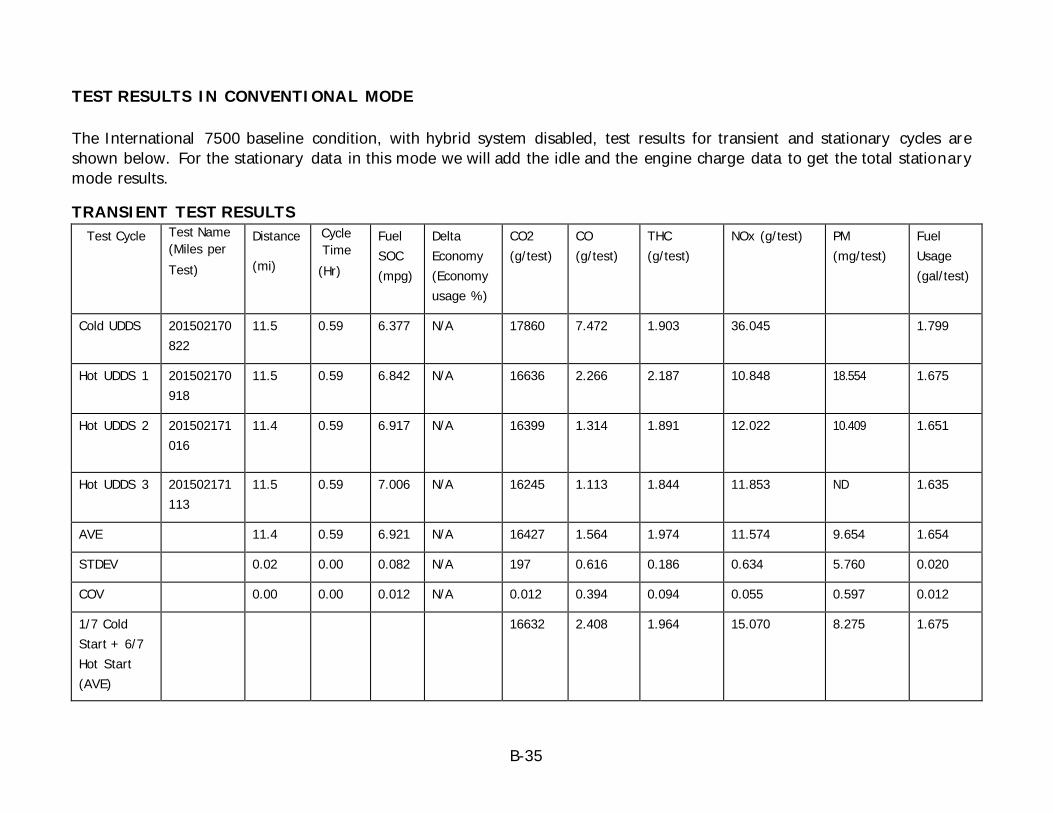
B-35
TEST RESULTS IN CONVENTIONAL MODE The International 7500 baseline condition, with hybrid system disabled, test results for transient and stationary cycles are shown below. For the stationary data in this mode we will add the idle and the engine charge data to get the total stationary mode results.
TRANSIENT TEST RESULTS Test Cycle Test Name
(Miles per Test)
Distance
(mi)
Cycle Time (Hr)
Fuel SOC (mpg)
Delta Economy (Economy usage %)
CO2 (g/test)
CO (g/test)
THC (g/test)
NOx (g/test) PM (mg/test)
Fuel Usage (gal/test)
Cold UDDS 201502170822
11.5 0.59 6.377 N/A 17860 7.472 1.903 36.045 1.799
Hot UDDS 1 201502170918
11.5 0.59 6.842 N/A 16636 2.266 2.187 10.848 18.554 1.675
Hot UDDS 2 201502171016
11.4 0.59 6.917 N/A 16399 1.314 1.891 12.022 10.409 1.651
Hot UDDS 3 201502171113
11.5 0.59 7.006 N/A 16245 1.113 1.844 11.853 ND 1.635
AVE 11.4 0.59 6.921 N/A 16427 1.564 1.974 11.574 9.654 1.654
STDEV 0.02 0.00 0.082 N/A 197 0.616 0.186 0.634 5.760 0.020
COV 0.00 0.00 0.012 N/A 0.012 0.394 0.094 0.055 0.597 0.012
1/7 Cold Start + 6/7 Hot Start (AVE)
16632 2.408 1.964 15.070 8.275 1.675
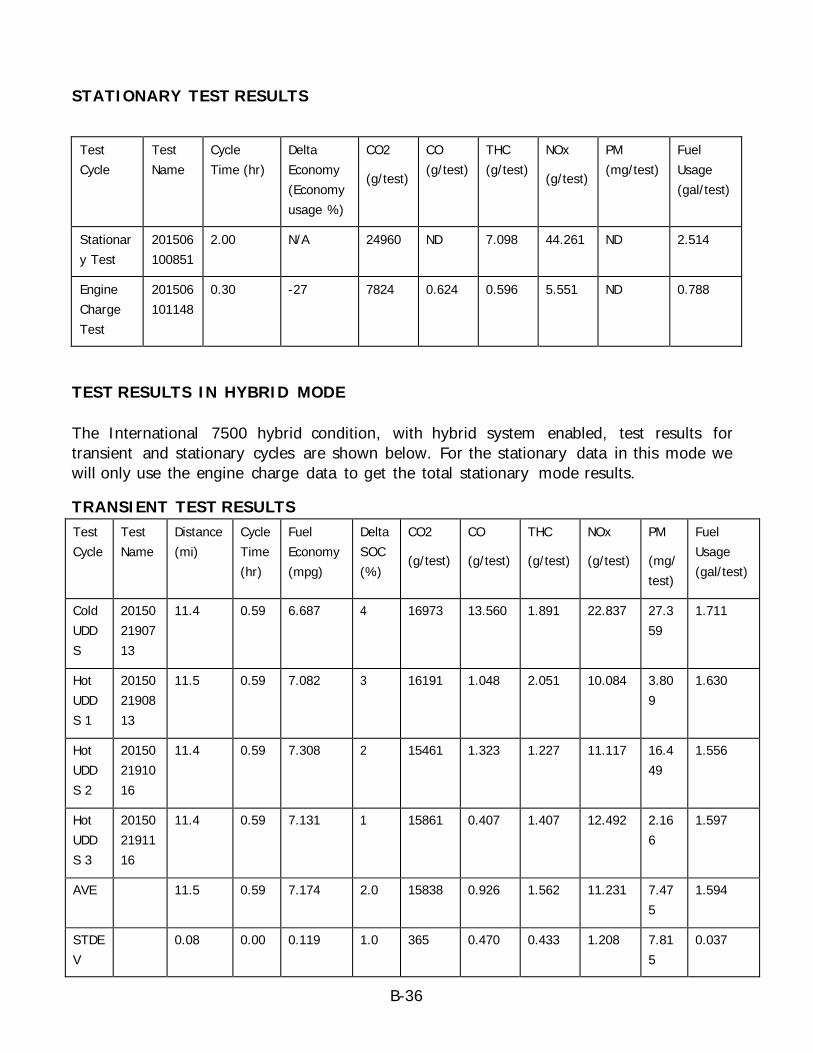
B-36
STATIONARY TEST RESULTS
Test Cycle
Test Name
Cycle Time (hr)
Delta Economy (Economy usage %)
CO2
(g/test)
CO (g/test)
THC (g/test)
NOx
(g/test)
PM (mg/test)
Fuel Usage (gal/test)
Stationary Test
201506100851
2.00 N/A 24960 ND 7.098 44.261 ND 2.514
Engine Charge Test
201506101148
0.30 -27 7824 0.624 0.596 5.551 ND 0.788
TEST RESULTS IN HYBRID MODE The International 7500 hybrid condition, with hybrid system enabled, test results for transient and stationary cycles are shown below. For the stationary data in this mode we will only use the engine charge data to get the total stationary mode results.
TRANSIENT TEST RESULTS Test Cycle
Test Name
Distance (mi)
Cycle Time (hr)
Fuel Economy (mpg)
Delta SOC (%)
CO2
(g/test)
CO
(g/test)
THC
(g/test)
NOx
(g/test)
PM
(mg/test)
Fuel Usage (gal/test)
Cold UDDS
201502190713
11.4 0.59 6.687 4 16973 13.560 1.891 22.837 27.359
1.711
Hot UDDS 1
201502190813
11.5 0.59 7.082 3 16191 1.048 2.051 10.084 3.809
1.630
Hot UDDS 2
201502191016
11.4 0.59 7.308 2 15461 1.323 1.227 11.117 16.449
1.556
Hot UDDS 3
201502191116
11.4 0.59 7.131 1 15861 0.407 1.407 12.492 2.166
1.597
AVE 11.5 0.59 7.174 2.0 15838 0.926 1.562 11.231 7.475
1.594
STDEV
0.08 0.00 0.119 1.0 365 0.470 0.433 1.208 7.815
0.037
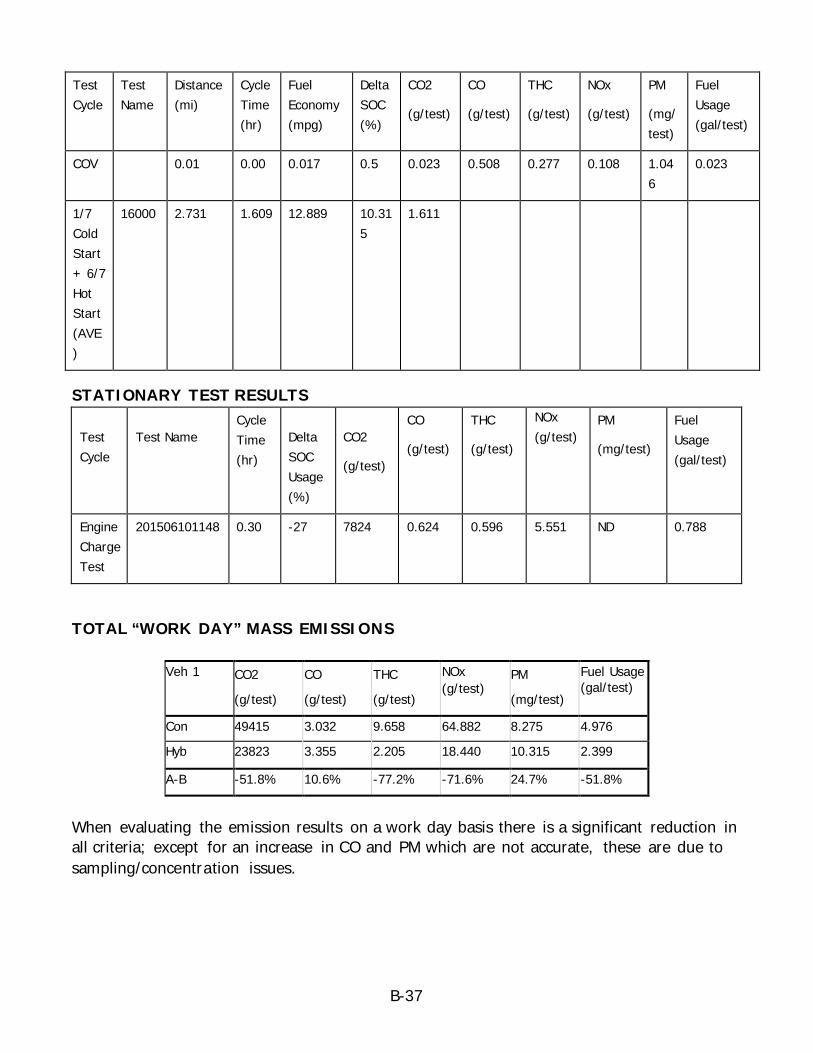
B-37
Test Cycle
Test Name
Distance (mi)
Cycle Time (hr)
Fuel Economy (mpg)
Delta SOC (%)
CO2
(g/test)
CO
(g/test)
THC
(g/test)
NOx
(g/test)
PM
(mg/test)
Fuel Usage (gal/test)
COV 0.01 0.00 0.017 0.5 0.023 0.508 0.277 0.108 1.046
0.023
1/7 Cold Start + 6/7 Hot Start (AVE)
16000 2.731 1.609 12.889 10.315
1.611
STATIONARY TEST RESULTS Test Cycle
Test Name
Cycle Time (hr)
Delta SOC Usage (%)
CO2
(g/test)
CO
(g/test)
THC
(g/test)
NOx (g/test)
PM
(mg/test)
Fuel Usage (gal/test)
Engine Charge Test
201506101148 0.30 -27 7824 0.624 0.596 5.551 ND 0.788
TOTAL “WORK DAY” MASS EMISSIONS
Veh 1 CO2
(g/test)
CO
(g/test)
THC
(g/test)
NOx (g/test)
PM
(mg/test)
Fuel Usage (gal/test)
Con 49415 3.032 9.658 64.882 8.275 4.976
Hyb 23823 3.355 2.205 18.440 10.315 2.399
A-B -51.8% 10.6% -77.2% -71.6% 24.7% -51.8%
When evaluating the emission results on a work day basis there is a significant reduction in all criteria; except for an increase in CO and PM which are not accurate, these are due to sampling/concentration issues.
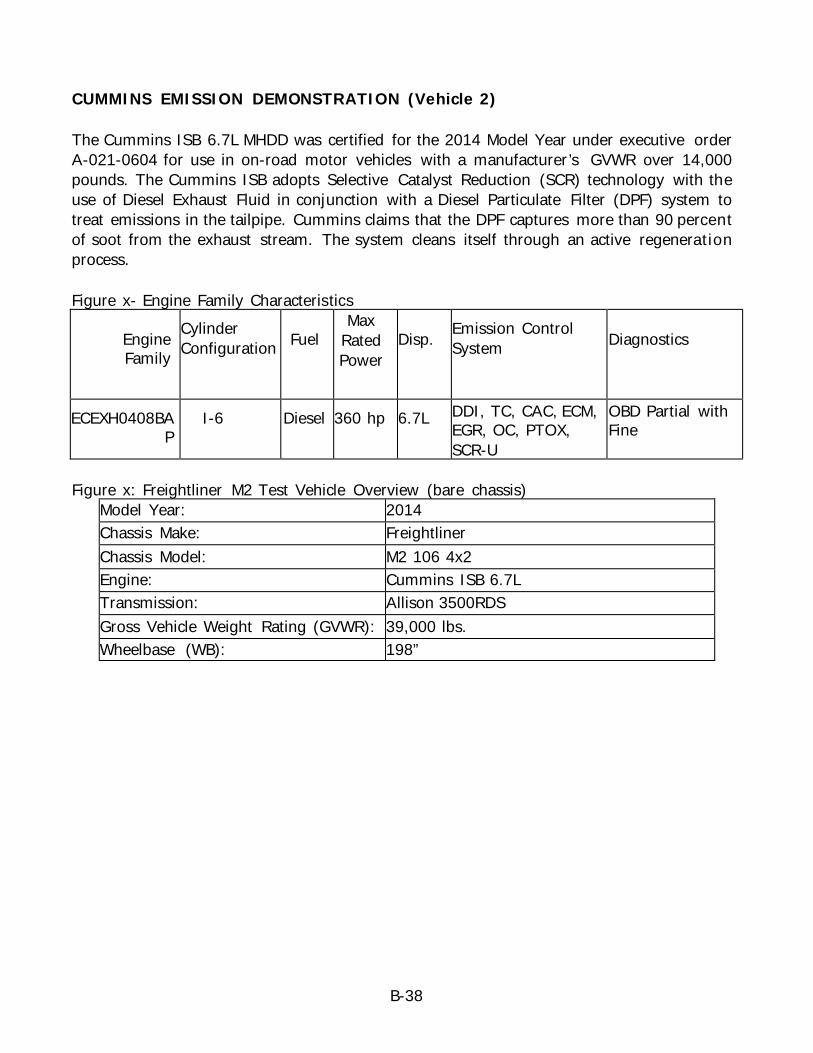
B-38
CUMMINS EMISSION DEMONSTRATION (Vehicle 2) The Cummins ISB 6.7L MHDD was certified for the 2014 Model Year under executive order A-021-0604 for use in on-road motor vehicles with a manufacturer’s GVWR over 14,000 pounds. The Cummins ISB adopts Selective Catalyst Reduction (SCR) technology with the use of Diesel Exhaust Fluid in conjunction with a Diesel Particulate Filter (DPF) system to treat emissions in the tailpipe. Cummins claims that the DPF captures more than 90 percent of soot from the exhaust stream. The system cleans itself through an active regeneration process. Figure x- Engine Family Characteristics
Engine Family
Cylinder Configuration
Fuel
Max Rated Power
Disp. Emission Control
System Diagnostics
ECEXH0408BAP
I-6 Diesel 360 hp 6.7L DDI, TC, CAC, ECM, EGR, OC, PTOX, SCR-U
OBD Partial with Fine
Figure x: Freightliner M2 Test Vehicle Overview (bare chassis)
Model Year: 2014 Chassis Make: Freightliner Chassis Model: M2 106 4x2 Engine: Cummins ISB 6.7L Transmission: Allison 3500RDS Gross Vehicle Weight Rating (GVWR): 39,000 lbs. Wheelbase (WB): 198”
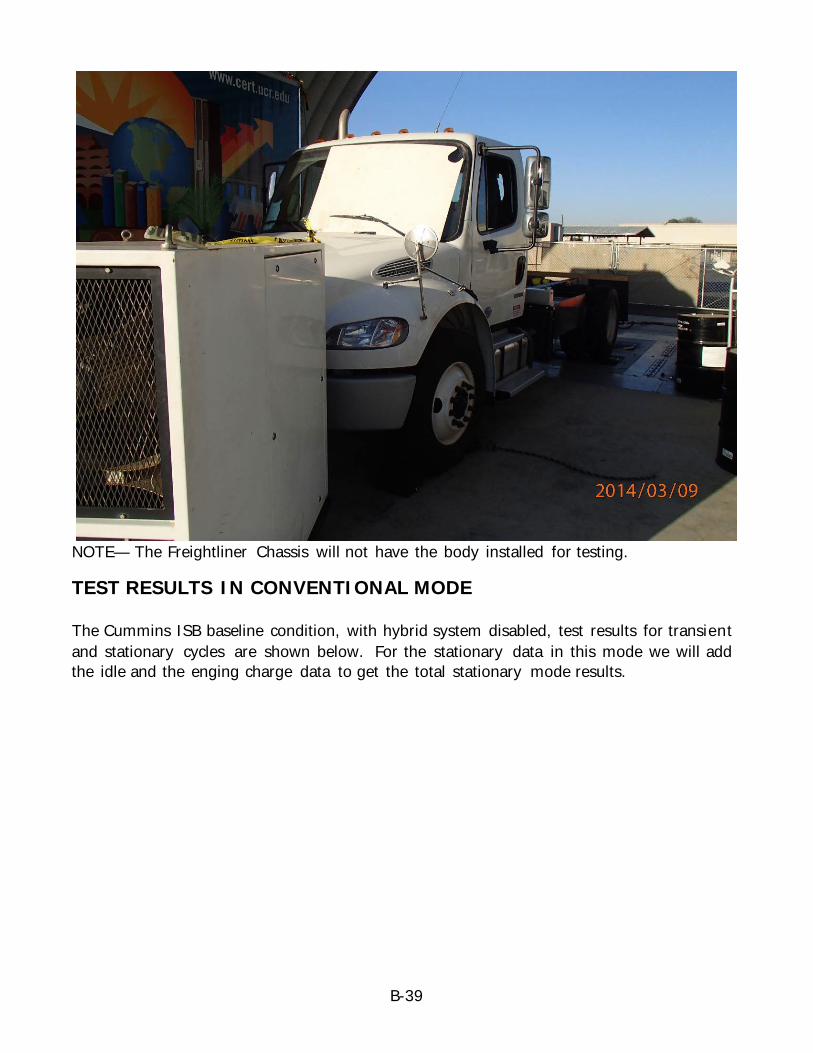
B-39
NOTE— The Freightliner Chassis will not have the body installed for testing.
TEST RESULTS IN CONVENTIONAL MODE The Cummins ISB baseline condition, with hybrid system disabled, test results for transient and stationary cycles are shown below. For the stationary data in this mode we will add the idle and the enging charge data to get the total stationary mode results.

B-40
TRANSIENT TEST RESULTS Test Cycle Test Name
(Miles per Test)
Distance
(mi)
Cycle Time (Hr)
Fuel SOC (mpg)
Delta Economy (Economy usage %)
CO2 (g/test)
CO (g/test)
THC (g/test)
NOx (g/test) PM (mg/test)
Fuel (gal/test)
Cold UDDS 201503100648
11.4 0.59 6.376 N/A 17799 ND 0.517 12.046 1.979 1.792
Hot UDDS 1 201503100750
11.3 0.59 6.546 N/A 17219 0.822 0.217 1.819 ND 1.733
Hot UDDS 2 201503100850
11.5 0.59 6.604 N/A 17235 0.144 0.181 1.415 15.688 1.735
Hot UDDS 3 201503100948
11.5 0.59 6.352 N/A 17705 0.227 0.151 1.557 8.990 1.782
AVE 11.4 0.59 6.501 N/A 17386 0.398 0.183 1.597 8.226 1.750
STDEV 0.0 0.00 0.132 N/A 276 0.369 0.033 0.205 7.872 0.028
COV 0.01 0.00 0.020 N/A 0.016 0.928 0.181 0.128 0.957 0.016
1/7 Cold Start + 6/7 Hot Start (AVE)
17445 0.341 0.231 3.090 7.334 1.756
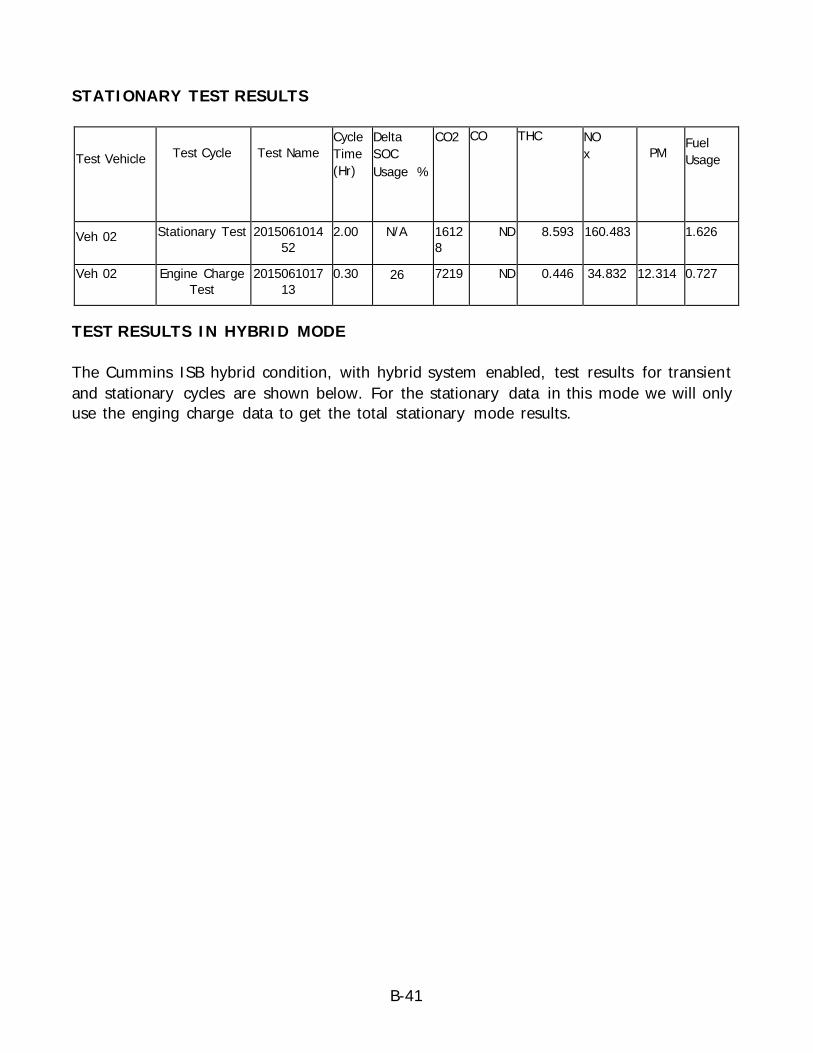
B-41
STATIONARY TEST RESULTS Test Vehicle
Test Cycle
Test Name
Cycle Time (Hr)
Delta SOC Usage %
CO2 CO THC NOx
PM
Fuel Usage
Veh 02 Stationary Test 201506101452
2.00 N/A 16128
ND 8.593 160.483 1.626
Veh 02 Engine Charge Test
201506101713
0.30 26 7219 ND 0.446 34.832 12.314 0.727
TEST RESULTS IN HYBRID MODE The Cummins ISB hybrid condition, with hybrid system enabled, test results for transient and stationary cycles are shown below. For the stationary data in this mode we will only use the enging charge data to get the total stationary mode results.
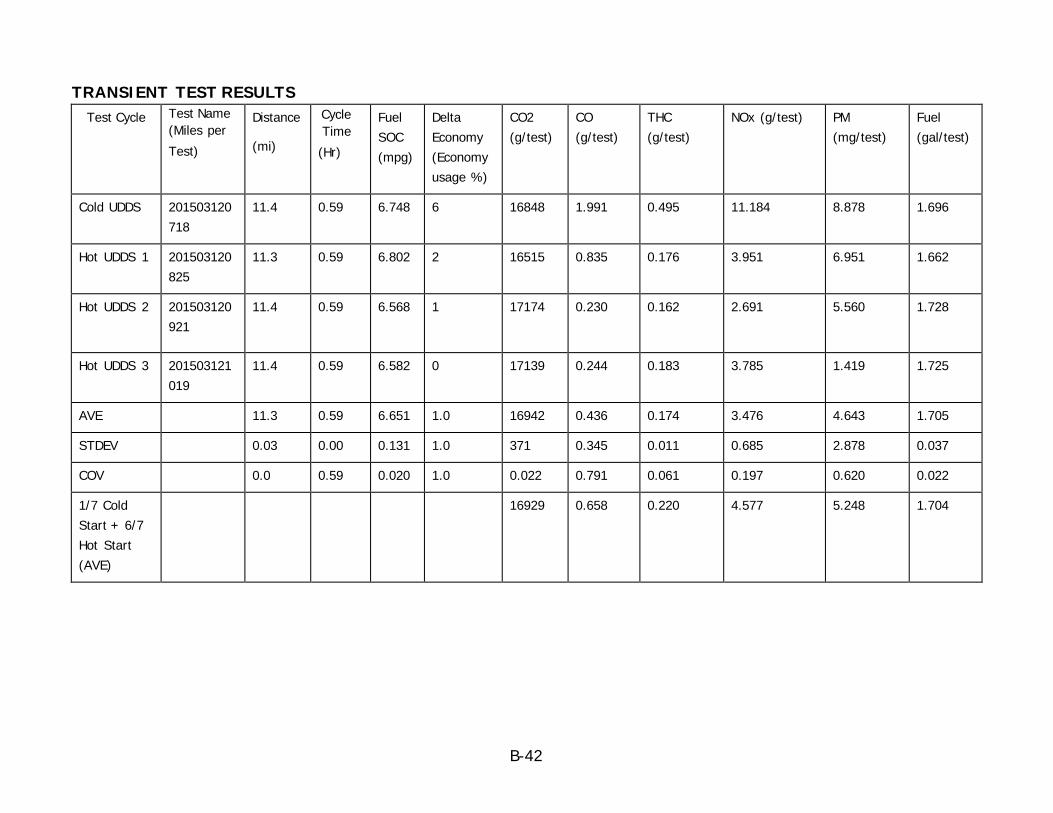
B-42
TRANSIENT TEST RESULTS Test Cycle Test Name
(Miles per Test)
Distance
(mi)
Cycle Time (Hr)
Fuel SOC (mpg)
Delta Economy (Economy usage %)
CO2 (g/test)
CO (g/test)
THC (g/test)
NOx (g/test) PM (mg/test)
Fuel (gal/test)
Cold UDDS 201503120718
11.4 0.59 6.748 6 16848 1.991 0.495 11.184 8.878 1.696
Hot UDDS 1 201503120825
11.3 0.59 6.802 2 16515 0.835 0.176 3.951 6.951 1.662
Hot UDDS 2 201503120921
11.4 0.59 6.568 1 17174 0.230 0.162 2.691 5.560 1.728
Hot UDDS 3 201503121019
11.4 0.59 6.582 0 17139 0.244 0.183 3.785 1.419 1.725
AVE 11.3 0.59 6.651 1.0 16942 0.436 0.174 3.476 4.643 1.705
STDEV 0.03 0.00 0.131 1.0 371 0.345 0.011 0.685 2.878 0.037
COV 0.0 0.59 0.020 1.0 0.022 0.791 0.061 0.197 0.620 0.022
1/7 Cold Start + 6/7 Hot Start (AVE)
16929 0.658 0.220 4.577 5.248 1.704

B-43
STATIONARY TEST RESULTS
Test
Vehicle
Test Cycle
Test Name
Cycle Time (Hr)
Delta SOC Usage
%
CO2 CO THC NOx PM Fuel Usage
Veh 02 Engine Charge Test
201506101713 0.30 26 7219 ND 0.446 34.832 12.314 0.727
TOTAL “WORK DAY” MASS EMISSIONS Veh 2 CO2 CO THC NOx PM
mg/test Fuel Usage
gal/test
Con 40792 0.341 9.270 198.404 7.334 4.108 Hyb 24148 0.658 0.665 39.409 17.562 2.430
A-B -40.8% 93.1% -92.8% -80.1% 139.5% -40.8%
When evaluating the emission results on a work day basis there is a significant reduction in all criteria; except for an increase in CO and PM which are not accurate, these are due to sampling/concentration issues
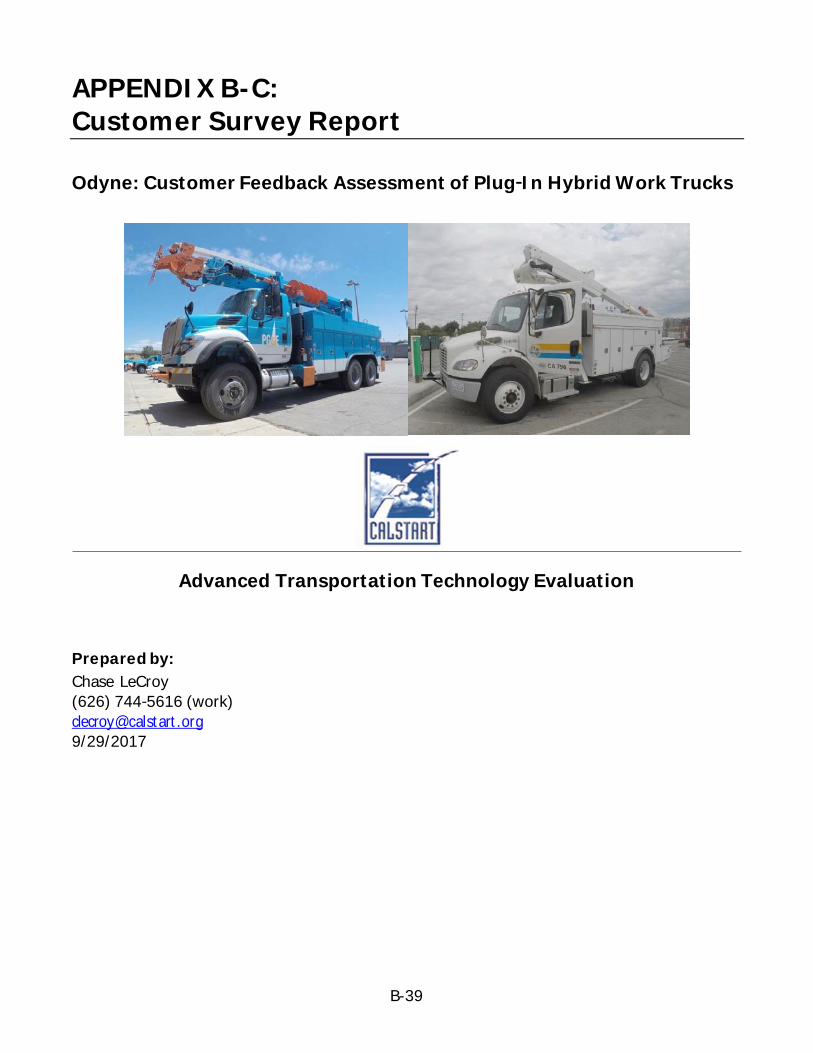
B-39
APPENDIX B-C: Customer Survey Report
Odyne: Customer Feedback Assessment of Plug‐In Hybrid Work Trucks
Advanced Transportation Technology Evaluation
Prepared by: Chase LeCroy (626) 744‐5616 (work) [email protected] 9/29/2017

B-40
TABLE OF CONTENTS Page
Table of Contents ..................................................................................................... B-40 List of Figures .......................................................................................................... B-41 List of Tables............................................................................................................ B-41 Executive Summary .................................................................................................. B-42 CHAPTER 1: Introduction ............................................................................................. B-44 CHAPTER 2: Technology Overview................................................................................... B-45 3.1 Calibration ............................................................................................................ B-46 CHAPTER 4: Methodology Used ..................................................................................... B-47 CHAPTER 5: Pacific Gas & Electric ................................................................................... B-48 5.1 Fleet Description..................................................................................................... B-48 5.2 Fleet Duty Cycle ..................................................................................................... B-49 5.3 Performance.......................................................................................................... B-50 5.3.1 Advantages ........................................................................................................ B-50 5.3.2 User Acceptance as Emergency Replacement Truck – Redding, CA .................................. B-52 5.3.3 Challenges.......................................................................................................... B-53 CHAPTER 6: LA County Department of Public Works – Electric Sign Div ision ............................ B-57 1.1 Fleet Description .................................................................................................... B-57 6.2 Fleet Duty Cycle ..................................................................................................... B-58 6.3 Performance.......................................................................................................... B-60 6.3.1Advantages ......................................................................................................... B-60 6.3.1 Challenges.......................................................................................................... B-60 CHAPTER 7: Conclusion ................................................................................................ B-62 Sources ..................................................................................................................... B-62 Appendix A – Operator Survey ........................................................................................ B-63
B-41
LIST OF FIGURES Page
Figure 1: Digger‐derrick with Auger Drilling a Test Hole (Left); Bucket Truck Raised (right) .......... B-45 Figure 2: Matt Jarmuz of Odyne Introduces PG&E Operators and Managers to the New Truck ....... B-50 Figure 3: Location of Capston on New Truck (left); Capston Compartment, Reverse Angle (right). . B-55 Figure 4: PG&E Crew Use Truck to Drill Hole (left) then Set New Telephone Pole in Hole (right). ... B-56 Figure 5: Matt Jarmuz of Odyne Showing LACDPW Team the Truck (Left); Demonstrating the Boom (Right) ...................................................................................................................... B-58 Figure 6: Brand New Chargers at the LACDPW Truck Yard in Downtown Los Angeles .................. B-58 Figure 7: Front Angle of New Odyne Truck; Charger in Foreground and Assigned Operator in the Bucket ...................................................................................................................... B-61
LIST OF TABLES
Page Table 1: Truck Specifications for the Two Models Deployed in this Project ................................ B-46 Table 2: PG&E Fleet Characteristics, Edenvale Truck Yard ..................................................... B-48 Table 3: Estimated Daily Work for Digger-Derricks at PG&E, Edenvale Truck Yard ...................... B-49 Table 4: Estimated Daily Work for Digger‐derricks at PG&E, Redding Truck Yard ........................ B-52 Table 5: LACDWP, Electric Signs Div ision Fleet Characteristics................................................ B-57 Table 6: Estimated Daily Work for Bucket Trucks at LACDPW, Electric Signs Div ision ................... B-59
B-42
EXECUTIVE SUMMARY Odyne demonstrated a family of plug‐in hybrid utility work trucks featuring an electric power take‐off device capable of shutting off the engine at the work site so that work can be performed without burning fuel, producing emissions, or causing noise pollution. Instead, an on‐board battery and electric motor power the boom while also providing a launch assist and regenerative braking. Two utility fleets, Pacific Gas & Electric (PG&E) and LA County Department of Public Works (LACDPW), acquired trucks with the Odyne technology and put them in operation. The PG&E fleet in San Jose, CA received two Class 8 hybrid digger‐derrick trucks used for removing and setting telephone poles and other utility equipment. LACDPW received two smaller Class 6 utility bucket trucks. The utility bucket trucks are used for repair traffic signals and other electric signage. CALSTART collected operator and fleet manager feedback to evaluate the satisfaction of the user fleets with the vehicles and their interest in a larger adoption of the technology.
Multiple operators at PG&E tested the truck as they rotated it through a few teams. Many operators were initially unsure about trying the new technology. This widespread skepticism is due in part to previous unsuccessful attempts with alternative fuel vehicles. For example, some of the interviewed operators had experience with hybrid work trucks that either did not work properly or they could disable the hybrid functionality, preventing any environmental or economic benefits from being registered. While the operators did want a cleaner, less polluting truck, but they prefer not to modify their work patterns or be exposed to mechanical problems often attributed to early production units. However, the launch‐assist and quiet jobsite operation features that the Odyne technology provide eventually won over the operators; by the end of the demonstration period, they preferred this new truck to the conventional trucks on the yard. The ability to charge tools from the truck’s battery via the inverter was also very beneficial to the users because the team no longer has to run an auxiliary generator for this purpose. The battery capacity was specifically evaluated for this project, and the PG&E fleet showed that sufficient capacity remained at the end of their daily operation. The truck regularly returned to the yard with a high SOC after a duty cycle including approximately 20 miles of driving and an hour and a half of boom use at a job site. Despite initial skepticism, the benefits of the new trucks outweighed any challenges by the end of the demonstration period.
At the other fleet, LACDPW, a single operator was assigned to the truck. He enthusiastically accepted the challenge of learning a new technology and did not have any previous experience with hybrids. The initial feedback was positive, with the extra power at take‐off and the regenerative braking assistance as a valuable feature in urban driving conditions. Like with PG&E, the operator’s use pattern was not very demanding of the truck’s technology‐ a full shift only used about 25 percent of the battery, allowing the operator to park the truck closer to his home overnight. Even though the truck was not charged overnight, this was made up by opportunity charging for about an hour at the beginning and end of each shift. The boom functioned very well in the fleet’s duty cycle that required 5‐20 min of boom operation time per jobsite. The technology on this truck together with the operator planning ahead seemed to
B-43
fit the demands of the workload very well. Some technical difficulties were observed. At the initial demonstration for PG&E, the truck experienced an overspeed error which caused the engine to turn on in order to support the operation of the boom and interfered with driving the truck. Similarly, at LACDPW’s initial demonstration, the boom made a loud grinding noise which was attributed to a faulty valve. Both problems were solved. PG&E’s truck also experienced problems with the engine turning on while the boom was in use even when the truck had sufficient SOC to run off of battery power, although this decreased over time. Specific to LACDPW, the lengthy acceptance and deployment processes delayed the truck’s use by two years and severely limited the time the operator had to gain experience with the truck and necessitated project extensions. Despite these setbacks, the mechanic teams at both fleets were optimistic of their ability to learn how to service the truck. Overall, the collected staff feedback ultimately indicated that these trucks are a great improvement on conventional work trucks and can fit seamlessly into a utility fleet’s operations.
B-44
CHAPTER 1: Introduction
User experience feedback is critical to any developing technology. While it can be difficult for a manufacturer to know exactly how their products are working or what challenges they are presenting, the feedback can dramatically improve the product’s design and future commercial success. This project sought to directly collect user experience feedback by interviewing the truck operators, fleet managers, and mechanics as they gained experience in using hybrid boom trucks.
Utility trucks are often equipped with overhead boom arms which are used for a variety of tasks, whether lifting a worker up so they can repair something high above the ground (as in a bucket truck, figure 1, right) or using a large auger (drill) and clamp to drill holes and set telephone poles (as in a digger‐derrick truck, figure 1, left). Conventional boom trucks use the diesel engine to operate a standard power take‐off device (PTO), which transfers power from the engine to the hydraulic system that controls the overhead boom. This means the engine must run for the entire time that the boom is being operated, creating a nuisance from the engine noise, consuming fuel, and polluting the air. The operator is continuously subjected to emissions as they operate the vehicle throughout the work day. Odyne, a manufacturer of hybrid systems, won a grant from the California Energy Commission (CEC) to provide hybrid utility work trucks for two California utility fleets using their hybrid system that can power a truck’s boom using a battery rather than the diesel engine. New technology always faces some challenges in being accepted by the users, so CALSTART was brought in to investigate these barriers along with the overall acceptance and performance of Odyne’s system. In order to understand user acceptance, CALSTART interviewed vehicle operators and fleet managers at regular intervals during the demonstration period. Three interviews were completed with employees at Pacific Gas and Electric’s (PG&E) Edenvale truck yard in San Jose, CA. Three interviews were also completed to the Los Angeles County Department of Public Works (LACDPW) Electric Sign Division truck yard in Los Angeles, CA. PG&E’s fleet had their truck for a longer duration, allowing for more complete responses to be collected. The timeline of the demonstration period with the LACDPW fleet was limited due to long delays in truck deployment, so the fleet had less experience with the truck overall. Responses from both fleets were collected and synthesized, providing the data for this report.
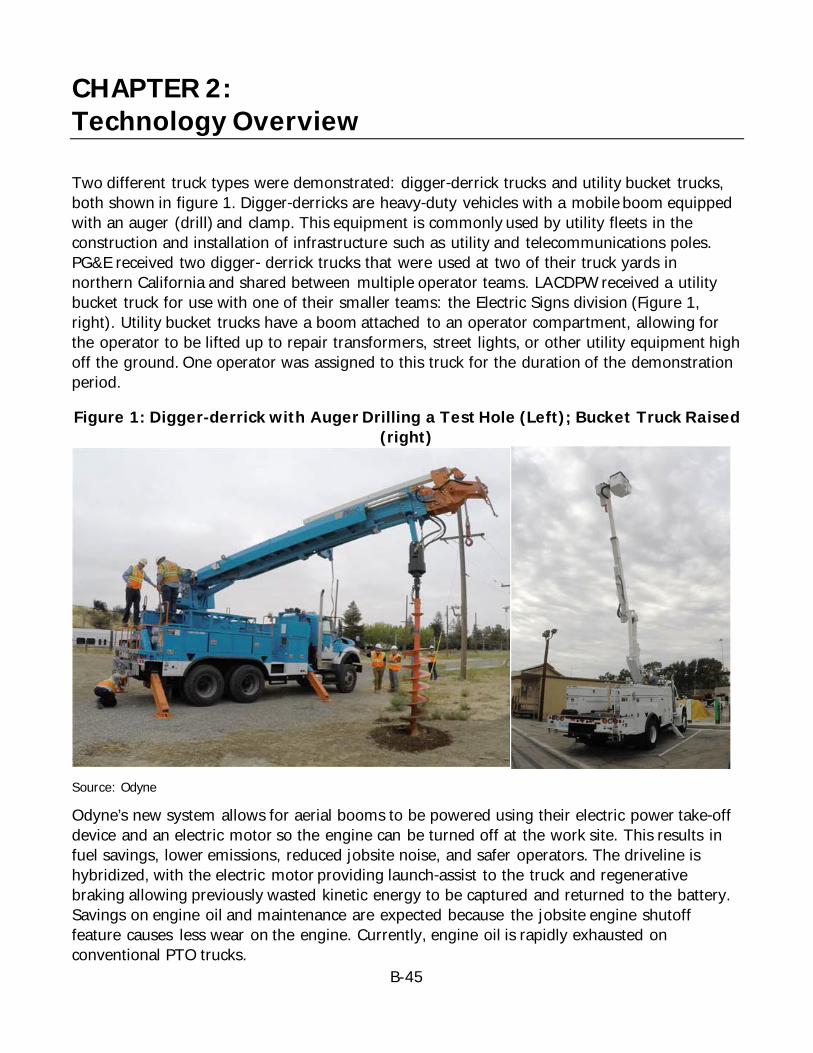
B-45
CHAPTER 2: Technology Overview
Two different truck types were demonstrated: digger‐derrick trucks and utility bucket trucks, both shown in figure 1. Digger‐derricks are heavy‐duty vehicles with a mobile boom equipped with an auger (drill) and clamp. This equipment is commonly used by utility fleets in the construction and installation of infrastructure such as utility and telecommunications poles. PG&E received two digger‐ derrick trucks that were used at two of their truck yards in northern California and shared between multiple operator teams. LACDPW received a utility bucket truck for use with one of their smaller teams: the Electric Signs division (Figure 1, right). Utility bucket trucks have a boom attached to an operator compartment, allowing for the operator to be lifted up to repair transformers, street lights, or other utility equipment high off the ground. One operator was assigned to this truck for the duration of the demonstration period.
Figure 1: Digger‐derrick with Auger Drilling a Test Hole (Left); Bucket Truck Raised (right)
Source: Odyne
Odyne’s new system allows for aerial booms to be powered using their electric power take‐off device and an electric motor so the engine can be turned off at the work site. This results in fuel savings, lower emissions, reduced jobsite noise, and safer operators. The driveline is hybridized, with the electric motor providing launch‐assist to the truck and regenerative braking allowing previously wasted kinetic energy to be captured and returned to the battery. Savings on engine oil and maintenance are expected because the jobsite engine shutoff feature causes less wear on the engine. Currently, engine oil is rapidly exhausted on conventional PTO trucks.
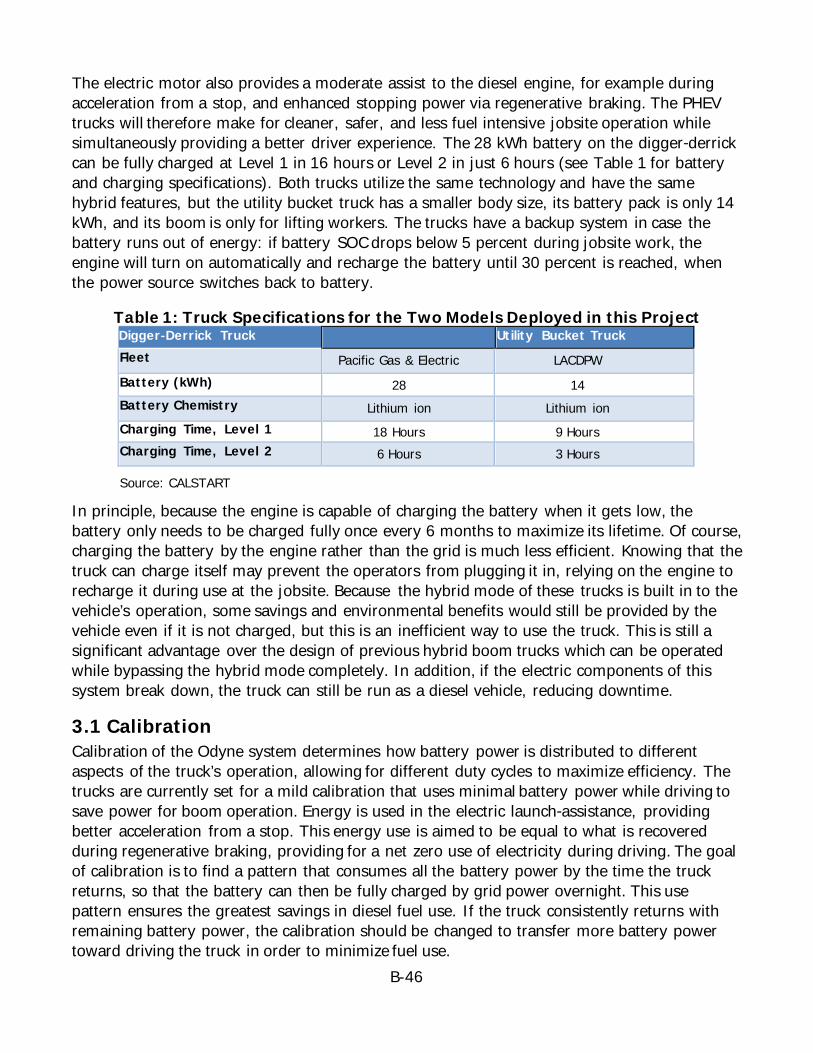
B-46
The electric motor also provides a moderate assist to the diesel engine, for example during acceleration from a stop, and enhanced stopping power via regenerative braking. The PHEV trucks will therefore make for cleaner, safer, and less fuel intensive jobsite operation while simultaneously providing a better driver experience. The 28 kWh battery on the digger‐derrick can be fully charged at Level 1 in 16 hours or Level 2 in just 6 hours (see Table 1 for battery and charging specifications). Both trucks utilize the same technology and have the same hybrid features, but the utility bucket truck has a smaller body size, its battery pack is only 14 kWh, and its boom is only for lifting workers. The trucks have a backup system in case the battery runs out of energy: if battery SOC drops below 5 percent during jobsite work, the engine will turn on automatically and recharge the battery until 30 percent is reached, when the power source switches back to battery.
Table 1: Truck Specifications for the Two Models Deployed in this Project Digger‐Derrick Truck
Utility Bucket Truck Fleet Pacific Gas & Electric LACDPW Battery (kWh) 28 14 Battery Chemistry Lithium ion Lithium ion Charging Time, Level 1 18 Hours 9 Hours Charging Time, Level 2 6 Hours 3 Hours
Source: CALSTART
In principle, because the engine is capable of charging the battery when it gets low, the battery only needs to be charged fully once every 6 months to maximize its lifetime. Of course, charging the battery by the engine rather than the grid is much less efficient. Knowing that the truck can charge itself may prevent the operators from plugging it in, relying on the engine to recharge it during use at the jobsite. Because the hybrid mode of these trucks is built in to the vehicle’s operation, some savings and environmental benefits would still be provided by the vehicle even if it is not charged, but this is an inefficient way to use the truck. This is still a significant advantage over the design of previous hybrid boom trucks which can be operated while bypassing the hybrid mode completely. In addition, if the electric components of this system break down, the truck can still be run as a diesel vehicle, reducing downtime.
3.1 Calibration Calibration of the Odyne system determines how battery power is distributed to different aspects of the truck’s operation, allowing for different duty cycles to maximize efficiency. The trucks are currently set for a mild calibration that uses minimal battery power while driving to save power for boom operation. Energy is used in the electric launch‐assistance, providing better acceleration from a stop. This energy use is aimed to be equal to what is recovered during regenerative braking, providing for a net zero use of electricity during driving. The goal of calibration is to find a pattern that consumes all the battery power by the time the truck returns, so that the battery can then be fully charged by grid power overnight. This use pattern ensures the greatest savings in diesel fuel use. If the truck consistently returns with remaining battery power, the calibration should be changed to transfer more battery power toward driving the truck in order to minimize fuel use.
B-47
CHAPTER 4: Methodology Used
User acceptance feedback for this project was recorded by interviewing and surveying those involved with the truck. The operator survey can be found in Attachment A. The operators were the focus of this project as they usually have the most direct contact with the trucks and therefore a more complete understanding of the advantages and shortcomings in contrast to conventional trucks. In addition to operators, supervisors and fleet managers were interviewed when possible. Each fleet was interviewed at three time points throughout the project. By repeatedly eliciting feedback, any progress or challenges in the fleet’s use of the vehicle over time could be captured.
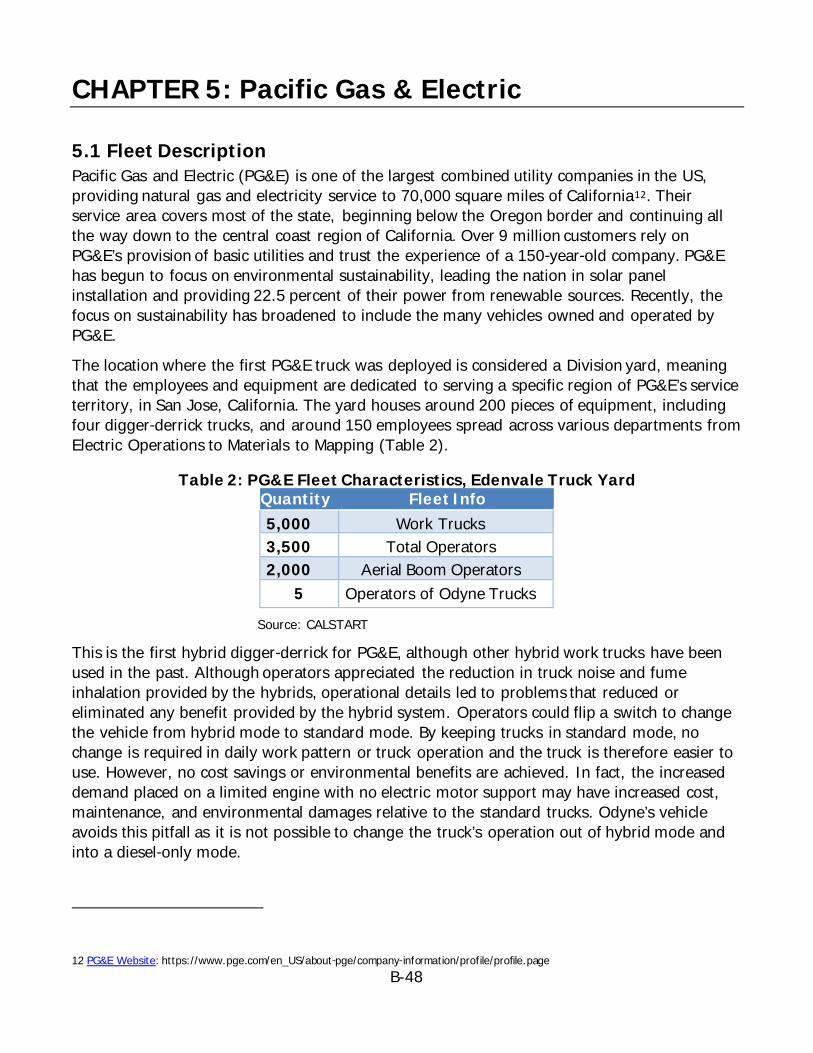
B-48
CHAPTER 5: Pacific Gas & Electric
5.1 Fleet Description Pacific Gas and Electric (PG&E) is one of the largest combined utility companies in the US, providing natural gas and electricity service to 70,000 square miles of California12. Their service area covers most of the state, beginning below the Oregon border and continuing all the way down to the central coast region of California. Over 9 million customers rely on PG&E’s provision of basic utilities and trust the experience of a 150‐year‐old company. PG&E has begun to focus on environmental sustainability, leading the nation in solar panel installation and providing 22.5 percent of their power from renewable sources. Recently, the focus on sustainability has broadened to include the many vehicles owned and operated by PG&E.
The location where the first PG&E truck was deployed is considered a Division yard, meaning that the employees and equipment are dedicated to serving a specific region of PG&E’s service territory, in San Jose, California. The yard houses around 200 pieces of equipment, including four digger‐derrick trucks, and around 150 employees spread across various departments from Electric Operations to Materials to Mapping (Table 2).
Table 2: PG&E Fleet Characteristics, Edenvale Truck Yard Quantity
Fleet Info 5,000 Work Trucks 3,500 Total Operators 2,000 Aerial Boom Operators
5 Operators of Odyne Trucks
Source: CALSTART
This is the first hybrid digger‐derrick for PG&E, although other hybrid work trucks have been used in the past. Although operators appreciated the reduction in truck noise and fume inhalation provided by the hybrids, operational details led to problems that reduced or eliminated any benefit provided by the hybrid system. Operators could flip a switch to change the vehicle from hybrid mode to standard mode. By keeping trucks in standard mode, no change is required in daily work pattern or truck operation and the truck is therefore easier to use. However, no cost savings or environmental benefits are achieved. In fact, the increased demand placed on a limited engine with no electric motor support may have increased cost, maintenance, and environmental damages relative to the standard trucks. Odyne’s vehicle avoids this pitfall as it is not possible to change the truck’s operation out of hybrid mode and into a diesel‐only mode.
12 PG&E Website: https://www.pge.com/en_US/about‐pge/company‐information/profile/profile.page
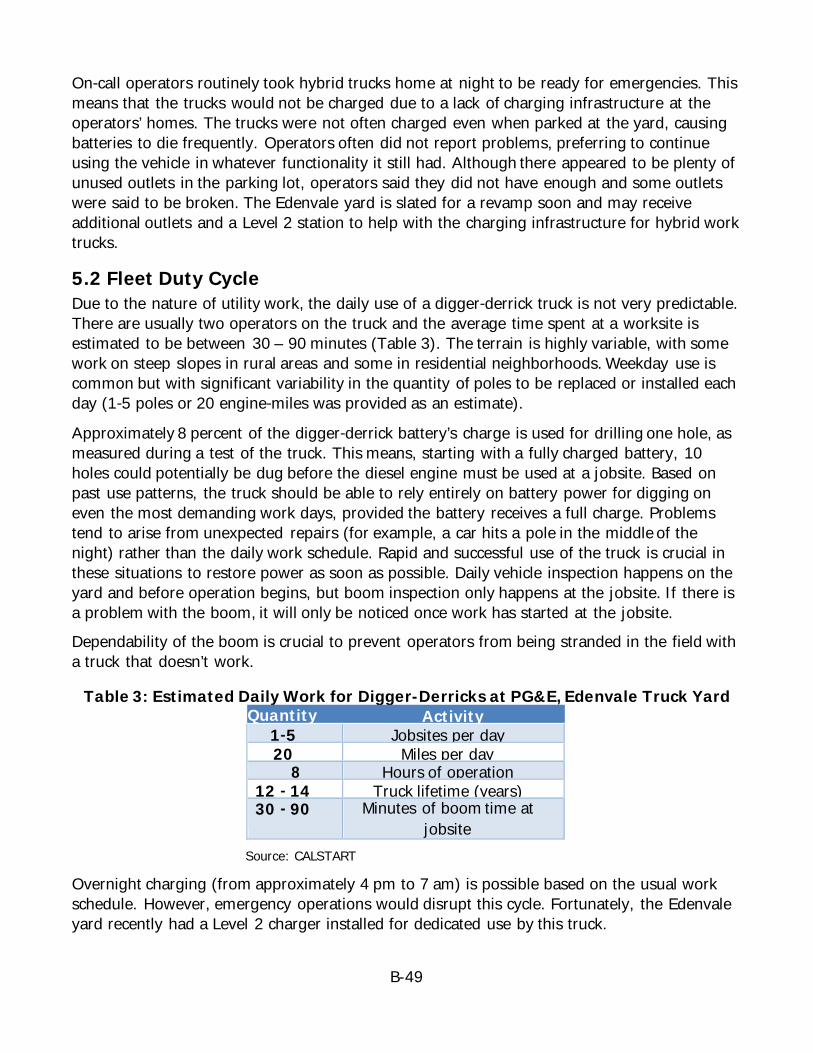
B-49
On‐call operators routinely took hybrid trucks home at night to be ready for emergencies. This means that the trucks would not be charged due to a lack of charging infrastructure at the operators’ homes. The trucks were not often charged even when parked at the yard, causing batteries to die frequently. Operators often did not report problems, preferring to continue using the vehicle in whatever functionality it still had. Although there appeared to be plenty of unused outlets in the parking lot, operators said they did not have enough and some outlets were said to be broken. The Edenvale yard is slated for a revamp soon and may receive additional outlets and a Level 2 station to help with the charging infrastructure for hybrid work trucks.
5.2 Fleet Duty Cycle Due to the nature of utility work, the daily use of a digger‐derrick truck is not very predictable. There are usually two operators on the truck and the average time spent at a worksite is estimated to be between 30 – 90 minutes (Table 3). The terrain is highly variable, with some work on steep slopes in rural areas and some in residential neighborhoods. Weekday use is common but with significant variability in the quantity of poles to be replaced or installed each day (1‐5 poles or 20 engine‐miles was provided as an estimate).
Approximately 8 percent of the digger‐derrick battery’s charge is used for drilling one hole, as measured during a test of the truck. This means, starting with a fully charged battery, 10 holes could potentially be dug before the diesel engine must be used at a jobsite. Based on past use patterns, the truck should be able to rely entirely on battery power for digging on even the most demanding work days, provided the battery receives a full charge. Problems tend to arise from unexpected repairs (for example, a car hits a pole in the middle of the night) rather than the daily work schedule. Rapid and successful use of the truck is crucial in these situations to restore power as soon as possible. Daily vehicle inspection happens on the yard and before operation begins, but boom inspection only happens at the jobsite. If there is a problem with the boom, it will only be noticed once work has started at the jobsite. Dependability of the boom is crucial to prevent operators from being stranded in the field with a truck that doesn’t work.
Table 3: Estimated Daily Work for Digger-Derricks at PG&E, Edenvale Truck Yard Quantity
Activity 1‐5 Jobsites per day 20 Miles per day
8 Hours of operation 12 ‐ 14 Truck lifetime (years) 30 ‐ 90 Minutes of boom time at
jobsite Source: CALSTART
Overnight charging (from approximately 4 pm to 7 am) is possible based on the usual work schedule. However, emergency operations would disrupt this cycle. Fortunately, the Edenvale yard recently had a Level 2 charger installed for dedicated use by this truck.
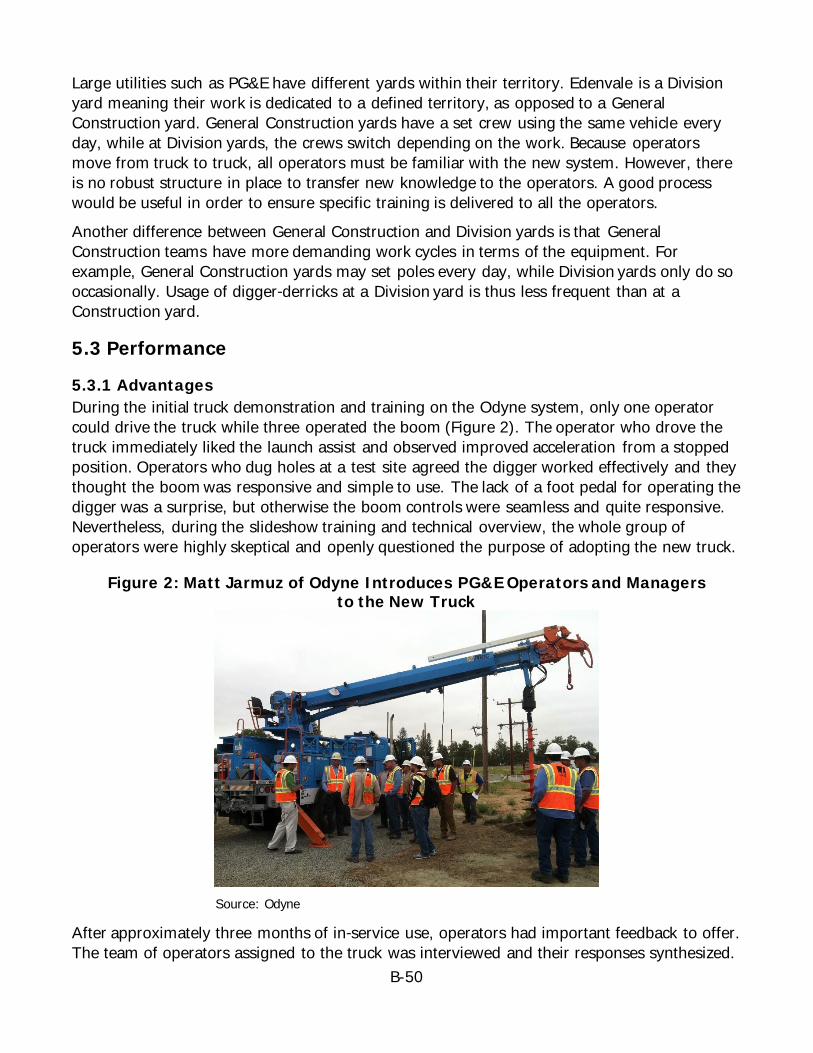
B-50
Large utilities such as PG&E have different yards within their territory. Edenvale is a Division yard meaning their work is dedicated to a defined territory, as opposed to a General Construction yard. General Construction yards have a set crew using the same vehicle every day, while at Division yards, the crews switch depending on the work. Because operators move from truck to truck, all operators must be familiar with the new system. However, there is no robust structure in place to transfer new knowledge to the operators. A good process would be useful in order to ensure specific training is delivered to all the operators. Another difference between General Construction and Division yards is that General Construction teams have more demanding work cycles in terms of the equipment. For example, General Construction yards may set poles every day, while Division yards only do so occasionally. Usage of digger‐derricks at a Division yard is thus less frequent than at a Construction yard.
5.3 Performance
5.3.1 Advantages During the initial truck demonstration and training on the Odyne system, only one operator could drive the truck while three operated the boom (Figure 2). The operator who drove the truck immediately liked the launch assist and observed improved acceleration from a stopped position. Operators who dug holes at a test site agreed the digger worked effectively and they thought the boom was responsive and simple to use. The lack of a foot pedal for operating the digger was a surprise, but otherwise the boom controls were seamless and quite responsive. Nevertheless, during the slideshow training and technical overview, the whole group of operators were highly skeptical and openly questioned the purpose of adopting the new truck.
Figure 2: Matt Jarmuz of Odyne Introduces PG&E Operators and Managers to the New Truck
Source: Odyne
After approximately three months of in‐service use, operators had important feedback to offer. The team of operators assigned to the truck was interviewed and their responses synthesized.
B-51
The first improvement mentioned by the operators was the improved driving exhibited in the following positive evaluations:
• The acceleration from stop was much improved and made the drivers feel more assured in urban, stop‐and‐go driving on the way to a jobsite
• The increased speed due was also appreciated • The braking ability was judged to be about the same as the older diesel models.
The engine‐off jobsite capability was also very highly valued. While no direct time savings were noticed or recorded, the operators did note that it was far easier to communicate without a diesel engine running. Oftentimes a jobsite will demand up to three workers in three different vehicles. If one operator is in a bucket, it is very difficult to communicate over an idling diesel engine. Because of the electric boom operation, communication was improved between the operators. These trucks often operate at night and in emergencies, so quiet operation would benefit these especially trying circumstances as well. Although not explicitly quantified, there is likely to be an efficiency gain in having smoother communication among the staff. Safety may also be boosted by more comfortable communication. When pressed for a comparison, the operators agreed that the quieter jobsite was the most favored improvement.
Charging presented no extra burden to the drivers. The vehicle gets plugged in every night and the recently installed Level 2 charger and dedicated parking spot ensure that the truck is fully charged every morning. Battery capacity seems more than adequate. The vehicle has occasionally returned to the yard with more than 90 percent of the charge left, but on most days, it is closer to 50 percent. Increasing battery size is therefore unnecessary for this duty cycle. The vehicle efficiency may improve with smaller batteries or a different calibration that directs more energy towards supporting the diesel engine while driving. The inverter that allows for auxiliary power is a benefit to operators as well; there is no longer a need to run a separate generator to charge tools at a jobsite. The operators were overall pleased with the truck and no longer viewed it as a nuisance. The cautious optimism expressed by operators and mechanics was a big change from their initial reaction. Despite a few initial technical hiccups and skepticism from the operators, the truck was soon praised as, “the best truck on the yard”. As more operators were exposed to it, they all indicated their preference of the Odyne hybrid system compared to the diesel counterpart. Everything about truck operation – acceleration, braking, ergonomics, boom and auger operation – was evaluated as same or better on the Odyne truck. It is incorporated into the fleet as a regular line truck, seeing equivalent or slightly more mileage than the other trucks. Everyone appreciates the silent boom operation, allowing for better communication among the work team. Although only about 50 percent of the SOC is consumed on most days, the truck has been plugged in reliably without interfering with operations in any way. The yard’s mechanics had a more detailed training on the technical functions of the truck and a walkthrough of the telematics system. Overall, the mechanics seemed to develop a thorough understanding of the different systems and their interaction during the brief training session. They appeared comfortable with the new technology and confident in its design.
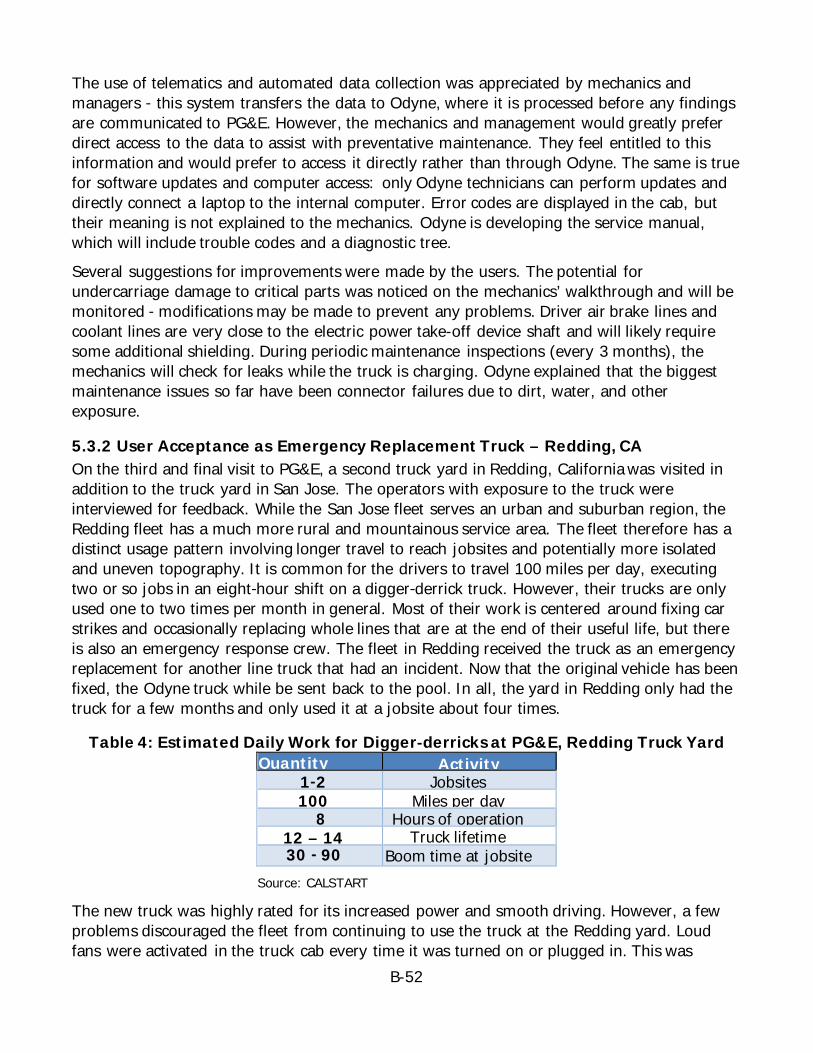
B-52
The use of telematics and automated data collection was appreciated by mechanics and managers ‐ this system transfers the data to Odyne, where it is processed before any findings are communicated to PG&E. However, the mechanics and management would greatly prefer direct access to the data to assist with preventative maintenance. They feel entitled to this information and would prefer to access it directly rather than through Odyne. The same is true for software updates and computer access: only Odyne technicians can perform updates and directly connect a laptop to the internal computer. Error codes are displayed in the cab, but their meaning is not explained to the mechanics. Odyne is developing the service manual, which will include trouble codes and a diagnostic tree. Several suggestions for improvements were made by the users. The potential for undercarriage damage to critical parts was noticed on the mechanics’ walkthrough and will be monitored ‐ modifications may be made to prevent any problems. Driver air brake lines and coolant lines are very close to the electric power take-off device shaft and will likely require some additional shielding. During periodic maintenance inspections (every 3 months), the mechanics will check for leaks while the truck is charging. Odyne explained that the biggest maintenance issues so far have been connector failures due to dirt, water, and other exposure.
5.3.2 User Acceptance as Emergency Replacement Truck – Redding, CA On the third and final visit to PG&E, a second truck yard in Redding, California was visited in addition to the truck yard in San Jose. The operators with exposure to the truck were interviewed for feedback. While the San Jose fleet serves an urban and suburban region, the Redding fleet has a much more rural and mountainous service area. The fleet therefore has a distinct usage pattern involving longer travel to reach jobsites and potentially more isolated and uneven topography. It is common for the drivers to travel 100 miles per day, executing two or so jobs in an eight‐hour shift on a digger‐derrick truck. However, their trucks are only used one to two times per month in general. Most of their work is centered around fixing car strikes and occasionally replacing whole lines that are at the end of their useful life, but there is also an emergency response crew. The fleet in Redding received the truck as an emergency replacement for another line truck that had an incident. Now that the original vehicle has been fixed, the Odyne truck while be sent back to the pool. In all, the yard in Redding only had the truck for a few months and only used it at a jobsite about four times.
Table 4: Estimated Daily Work for Digger‐derricks at PG&E, Redding Truck Yard Quantity
Activity 1‐2 Jobsites 100 Miles per day
8 Hours of operation 12 – 14 Truck lifetime
30 ‐ 90
Boom time at jobsite Source: CALSTART
The new truck was highly rated for its increased power and smooth driving. However, a few problems discouraged the fleet from continuing to use the truck at the Redding yard. Loud fans were activated in the truck cab every time it was turned on or plugged in. This was
B-53
described as an insurmountable problem and discouraged charging or using the truck at all. Compounding this problem, only Level 1 chargers are available in the yard, so charging is slow. The operators noted that “feathering” the boom, or making small adjustments to fine‐tune the position, seemed more difficult than on the standard trucks. Even though they will be sending the truck back to the vehicle pool in Davis now that their old truck is complete, the operators suggested that, barring the fan issue, “with more time on the truck [they] would get used to it”.
5.3.3 Challenges As with any new technology, a few issues were found in the initial three months of operation. All the problems described, however, seemed surmountable. Operators revealed that some degree of their initial resistance to the truck was due to both bad experiences with hybrids in the past and because they are somewhat attached to their team’s older trucks. Their trucks are familiar and configured just how they like them, so being mandated to adopt any new vehicle is perceived as a burden. Hybrid or not, having to learn to operate a new vehicle is always a source of frustration, so some level of disappointment with a new work truck is almost guaranteed. The operators would be almost as averse to being assigned a new diesel vehicle as they were to being assigned this new hybrid truck.
Furthermore, maintaining their routine operations is important to the PG&E truck operators. Successful deployment can therefore be defined as seamless entry of the new technology into the operators’ workflow. This may not be a realistic expectation because any new technology will have some new attribute that requires learning or adaptation. A few issues were encountered early in the demonstration phase. During the first site visit, 15‐ 16 operators were trained on the truck system by Matt Jarmuz from Odyne. Although the training was brief, there was a general feeling of frustration at having to learn another hybrid system having had some bad experiences with hybrids in the past. Convincing most of the operators that this truck was an improvement was an uphill battle. The truck was driven to a test dig site for hands‐on training. An operator dug a test hole and praised the boom operation, but was still concerned about reliability issues because of past hybrid experiences. While drilling a second test hole, when the auger was used at high speed and in harder dirt, an error caused the engine to turn on to support the auger. This was later attributed to an overspeed error or RPM mismatch between the motor and hydraulic pump. The electric motor RPM may be adjustable; Odyne is investigating. A similar error occurred while driving the truck, this time with disagreement between the diesel engine and electric motor. Specialists from the two manufacturing partners, Allison (transmission) and International (chassis), were consulted. The errors were determined to be software‐related and a solution was implemented.
Likewise, an early issue with the inverter took the truck out of service for the first two weeks that it was at PG&E’s yard. As with the over‐torqueing problem during the demonstration, repairs took longer because experts from multiple companies (Odyne, Allison, International) all needed to be on‐site to fix the problem. The problem was eventually solved (an incorrectly installed fuse was found to be the cause), but the reliance on experts who must travel long distances and work across their respective subsystems is worrying to the mechanics. Naturally,
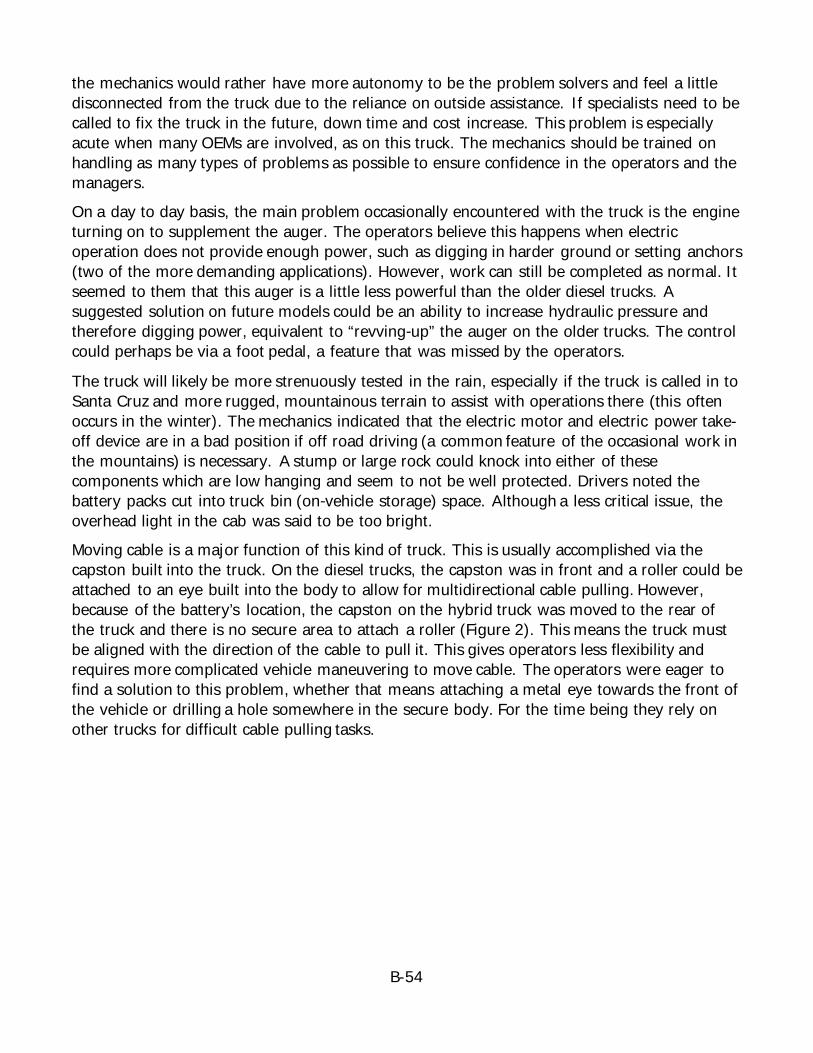
B-54
the mechanics would rather have more autonomy to be the problem solvers and feel a little disconnected from the truck due to the reliance on outside assistance. If specialists need to be called to fix the truck in the future, down time and cost increase. This problem is especially acute when many OEMs are involved, as on this truck. The mechanics should be trained on handling as many types of problems as possible to ensure confidence in the operators and the managers. On a day to day basis, the main problem occasionally encountered with the truck is the engine turning on to supplement the auger. The operators believe this happens when electric operation does not provide enough power, such as digging in harder ground or setting anchors (two of the more demanding applications). However, work can still be completed as normal. It seemed to them that this auger is a little less powerful than the older diesel trucks. A suggested solution on future models could be an ability to increase hydraulic pressure and therefore digging power, equivalent to “revving‐up” the auger on the older trucks. The control could perhaps be via a foot pedal, a feature that was missed by the operators.
The truck will likely be more strenuously tested in the rain, especially if the truck is called in to Santa Cruz and more rugged, mountainous terrain to assist with operations there (this often occurs in the winter). The mechanics indicated that the electric motor and electric power take-off device are in a bad position if off road driving (a common feature of the occasional work in the mountains) is necessary. A stump or large rock could knock into either of these components which are low hanging and seem to not be well protected. Drivers noted the battery packs cut into truck bin (on‐vehicle storage) space. Although a less critical issue, the overhead light in the cab was said to be too bright. Moving cable is a major function of this kind of truck. This is usually accomplished via the capston built into the truck. On the diesel trucks, the capston was in front and a roller could be attached to an eye built into the body to allow for multidirectional cable pulling. However, because of the battery’s location, the capston on the hybrid truck was moved to the rear of the truck and there is no secure area to attach a roller (Figure 2). This means the truck must be aligned with the direction of the cable to pull it. This gives operators less flexibility and requires more complicated vehicle maneuvering to move cable. The operators were eager to find a solution to this problem, whether that means attaching a metal eye towards the front of the vehicle or drilling a hole somewhere in the secure body. For the time being they rely on other trucks for difficult cable pulling tasks.
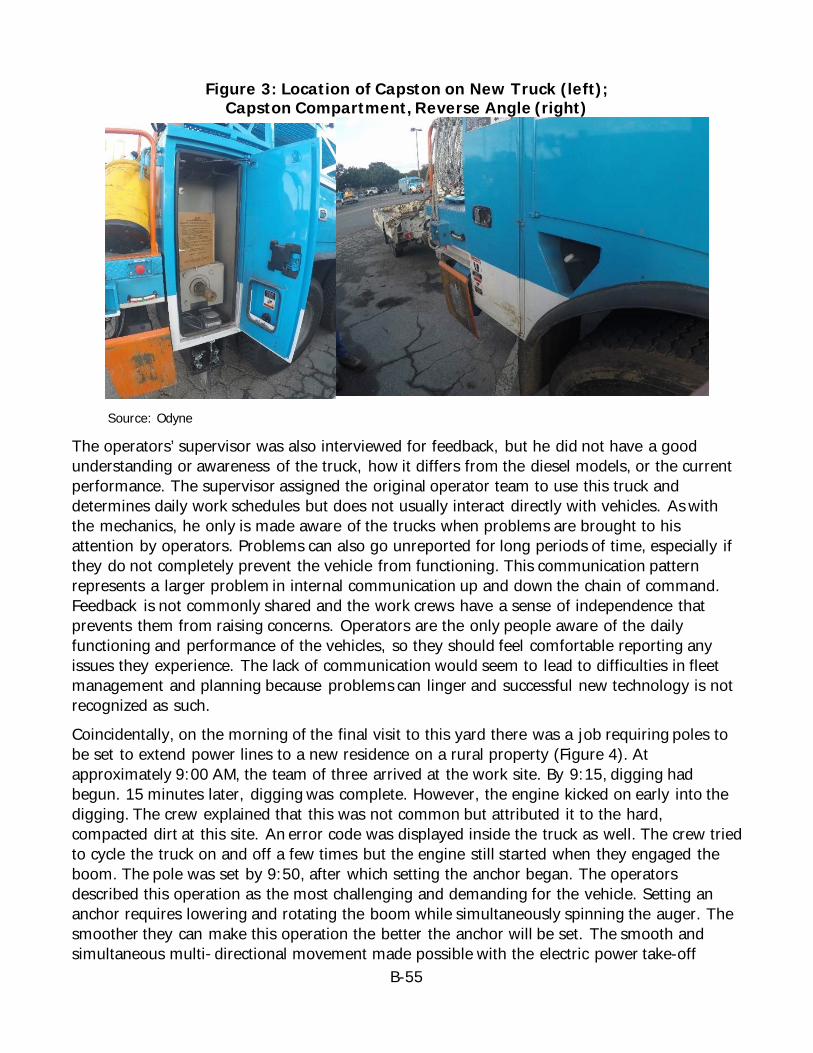
B-55
Figure 3: Location of Capston on New Truck (left); Capston Compartment, Reverse Angle (right)
Source: Odyne
The operators’ supervisor was also interviewed for feedback, but he did not have a good understanding or awareness of the truck, how it differs from the diesel models, or the current performance. The supervisor assigned the original operator team to use this truck and determines daily work schedules but does not usually interact directly with vehicles. As with the mechanics, he only is made aware of the trucks when problems are brought to his attention by operators. Problems can also go unreported for long periods of time, especially if they do not completely prevent the vehicle from functioning. This communication pattern represents a larger problem in internal communication up and down the chain of command. Feedback is not commonly shared and the work crews have a sense of independence that prevents them from raising concerns. Operators are the only people aware of the daily functioning and performance of the vehicles, so they should feel comfortable reporting any issues they experience. The lack of communication would seem to lead to difficulties in fleet management and planning because problems can linger and successful new technology is not recognized as such. Coincidentally, on the morning of the final visit to this yard there was a job requiring poles to be set to extend power lines to a new residence on a rural property (Figure 4). At approximately 9:00 AM, the team of three arrived at the work site. By 9:15, digging had begun. 15 minutes later, digging was complete. However, the engine kicked on early into the digging. The crew explained that this was not common but attributed it to the hard, compacted dirt at this site. An error code was displayed inside the truck as well. The crew tried to cycle the truck on and off a few times but the engine still started when they engaged the boom. The pole was set by 9:50, after which setting the anchor began. The operators described this operation as the most challenging and demanding for the vehicle. Setting an anchor requires lowering and rotating the boom while simultaneously spinning the auger. The smoother they can make this operation the better the anchor will be set. The smooth and simultaneous multi‐ directional movement made possible with the electric power take-off
B-56
device boom on the Odyne vehicle was praised as helpful to this complex operation. The engine remained silent as the boom is powered by the battery.
Figure 4: PG&E Crew Use Truck to Drill Hole (left) then Set New Telephone Pole in Hole (right)
Source: Odyne
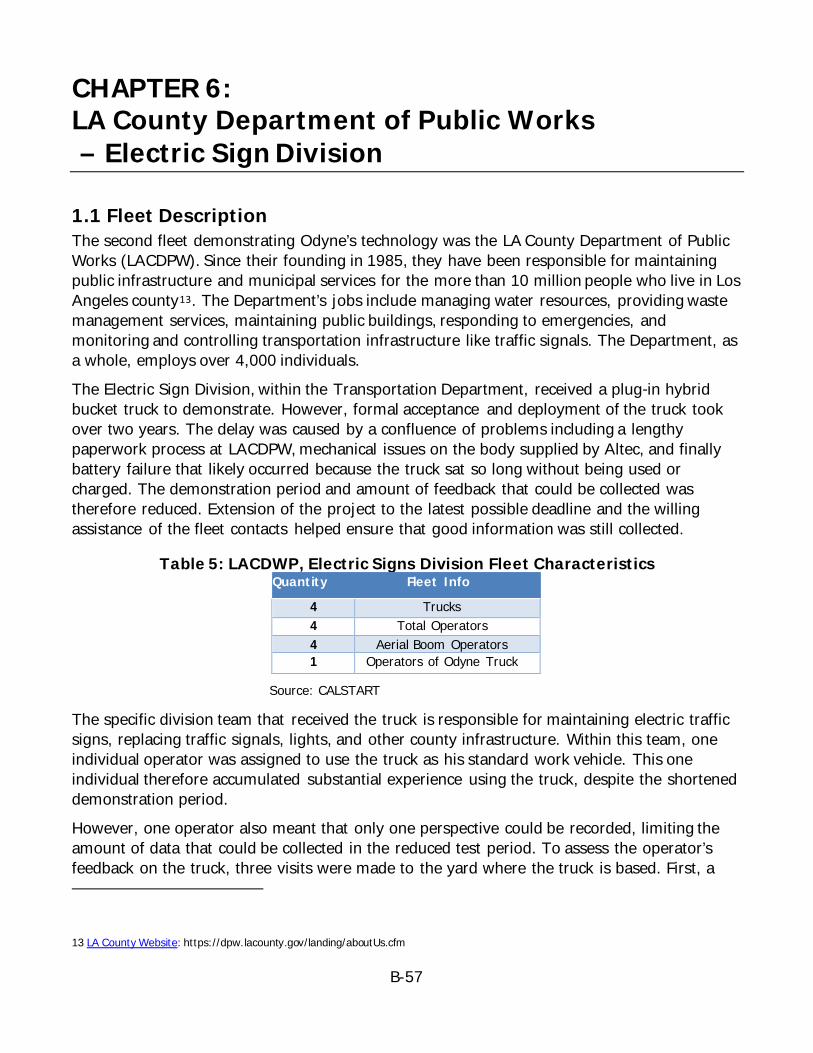
B-57
CHAPTER 6: LA County Department of Public Works – Electric Sign Division
1.1 Fleet Description The second fleet demonstrating Odyne’s technology was the LA County Department of Public Works (LACDPW). Since their founding in 1985, they have been responsible for maintaining public infrastructure and municipal services for the more than 10 million people who live in Los Angeles county13. The Department’s jobs include managing water resources, providing waste management services, maintaining public buildings, responding to emergencies, and monitoring and controlling transportation infrastructure like traffic signals. The Department, as a whole, employs over 4,000 individuals. The Electric Sign Division, within the Transportation Department, received a plug‐in hybrid bucket truck to demonstrate. However, formal acceptance and deployment of the truck took over two years. The delay was caused by a confluence of problems including a lengthy paperwork process at LACDPW, mechanical issues on the body supplied by Altec, and finally battery failure that likely occurred because the truck sat so long without being used or charged. The demonstration period and amount of feedback that could be collected was therefore reduced. Extension of the project to the latest possible deadline and the willing assistance of the fleet contacts helped ensure that good information was still collected.
Table 5: LACDWP, Electric Signs Division Fleet Characteristics Quantity
Fleet Info
4 Trucks 4 Total Operators 4 Aerial Boom Operators 1 Operators of Odyne Truck
Source: CALSTART
The specific division team that received the truck is responsible for maintaining electric traffic signs, replacing traffic signals, lights, and other county infrastructure. Within this team, one individual operator was assigned to use the truck as his standard work vehicle. This one individual therefore accumulated substantial experience using the truck, despite the shortened demonstration period. However, one operator also meant that only one perspective could be recorded, limiting the amount of data that could be collected in the reduced test period. To assess the operator’s feedback on the truck, three visits were made to the yard where the truck is based. First, a
13 LA County Website: https://dpw.lacounty.gov/landing/aboutUs.cfm
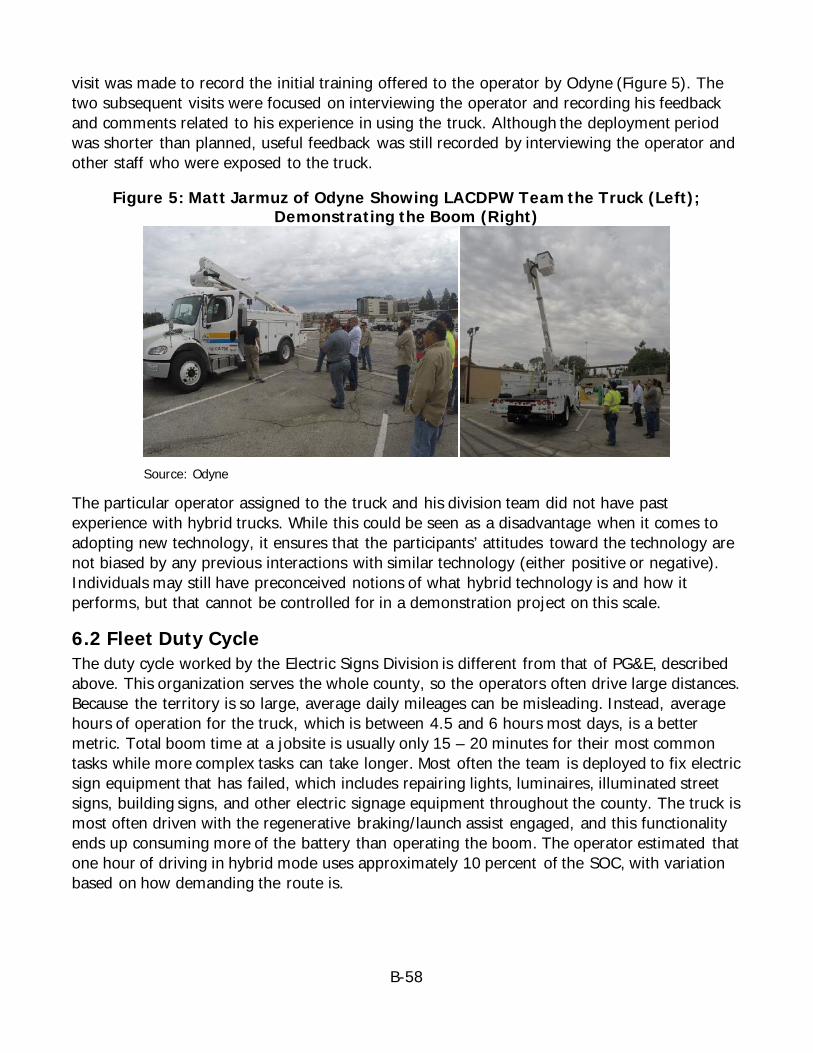
B-58
visit was made to record the initial training offered to the operator by Odyne (Figure 5). The two subsequent visits were focused on interviewing the operator and recording his feedback and comments related to his experience in using the truck. Although the deployment period was shorter than planned, useful feedback was still recorded by interviewing the operator and other staff who were exposed to the truck.
Figure 5: Matt Jarmuz of Odyne Showing LACDPW Team the Truck (Left); Demonstrating the Boom (Right)
Source: Odyne
The particular operator assigned to the truck and his division team did not have past experience with hybrid trucks. While this could be seen as a disadvantage when it comes to adopting new technology, it ensures that the participants’ attitudes toward the technology are not biased by any previous interactions with similar technology (either positive or negative). Individuals may still have preconceived notions of what hybrid technology is and how it performs, but that cannot be controlled for in a demonstration project on this scale.
6.2 Fleet Duty Cycle The duty cycle worked by the Electric Signs Division is different from that of PG&E, described above. This organization serves the whole county, so the operators often drive large distances. Because the territory is so large, average daily mileages can be misleading. Instead, average hours of operation for the truck, which is between 4.5 and 6 hours most days, is a better metric. Total boom time at a jobsite is usually only 15 – 20 minutes for their most common tasks while more complex tasks can take longer. Most often the team is deployed to fix electric sign equipment that has failed, which includes repairing lights, luminaires, illuminated street signs, building signs, and other electric signage equipment throughout the county. The truck is most often driven with the regenerative braking/launch assist engaged, and this functionality ends up consuming more of the battery than operating the boom. The operator estimated that one hour of driving in hybrid mode uses approximately 10 percent of the SOC, with variation based on how demanding the route is.
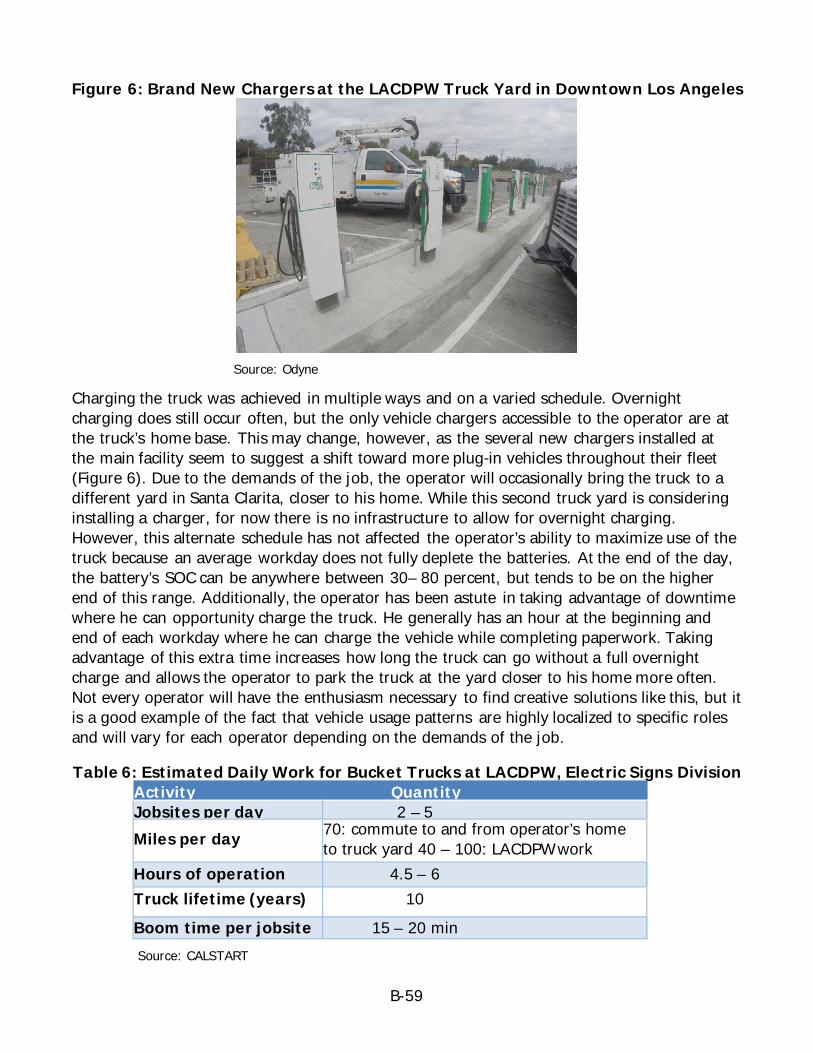
B-59
Figure 6: Brand New Chargers at the LACDPW Truck Yard in Downtown Los Angeles
Source: Odyne
Charging the truck was achieved in multiple ways and on a varied schedule. Overnight charging does still occur often, but the only vehicle chargers accessible to the operator are at the truck’s home base. This may change, however, as the several new chargers installed at the main facility seem to suggest a shift toward more plug‐in vehicles throughout their fleet (Figure 6). Due to the demands of the job, the operator will occasionally bring the truck to a different yard in Santa Clarita, closer to his home. While this second truck yard is considering installing a charger, for now there is no infrastructure to allow for overnight charging. However, this alternate schedule has not affected the operator’s ability to maximize use of the truck because an average workday does not fully deplete the batteries. At the end of the day, the battery’s SOC can be anywhere between 30– 80 percent, but tends to be on the higher end of this range. Additionally, the operator has been astute in taking advantage of downtime where he can opportunity charge the truck. He generally has an hour at the beginning and end of each workday where he can charge the vehicle while completing paperwork. Taking advantage of this extra time increases how long the truck can go without a full overnight charge and allows the operator to park the truck at the yard closer to his home more often. Not every operator will have the enthusiasm necessary to find creative solutions like this, but it is a good example of the fact that vehicle usage patterns are highly localized to specific roles and will vary for each operator depending on the demands of the job.
Table 6: Estimated Daily Work for Bucket Trucks at LACDPW, Electric Signs Division Activity
Quantity Jobsites per day 2 – 5 Miles per day 70: commute to and from operator’s home
to truck yard 40 – 100: LACDPW work Hours of operation 4.5 – 6 Truck lifetime (years) 10 Boom time per jobsite 15 – 20 min Source: CALSTART
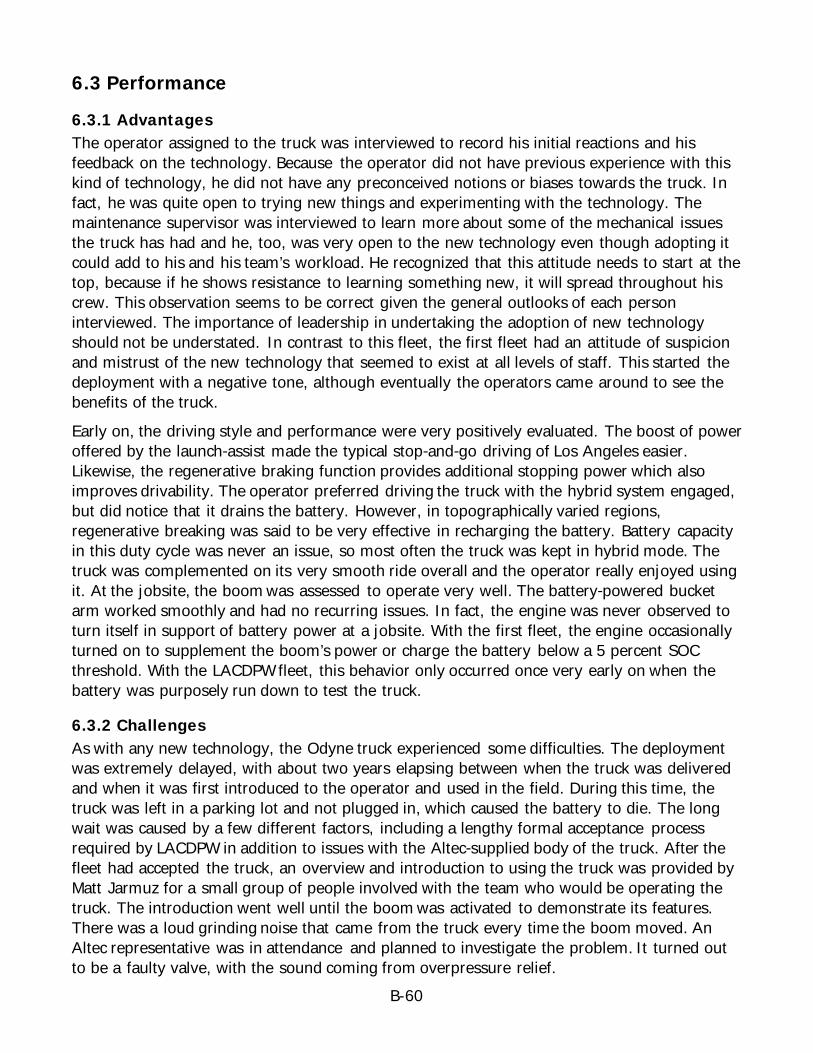
B-60
6.3 Performance
6.3.1 Advantages The operator assigned to the truck was interviewed to record his initial reactions and his feedback on the technology. Because the operator did not have previous experience with this kind of technology, he did not have any preconceived notions or biases towards the truck. In fact, he was quite open to trying new things and experimenting with the technology. The maintenance supervisor was interviewed to learn more about some of the mechanical issues the truck has had and he, too, was very open to the new technology even though adopting it could add to his and his team’s workload. He recognized that this attitude needs to start at the top, because if he shows resistance to learning something new, it will spread throughout his crew. This observation seems to be correct given the general outlooks of each person interviewed. The importance of leadership in undertaking the adoption of new technology should not be understated. In contrast to this fleet, the first fleet had an attitude of suspicion and mistrust of the new technology that seemed to exist at all levels of staff. This started the deployment with a negative tone, although eventually the operators came around to see the benefits of the truck. Early on, the driving style and performance were very positively evaluated. The boost of power offered by the launch‐assist made the typical stop‐and‐go driving of Los Angeles easier. Likewise, the regenerative braking function provides additional stopping power which also improves drivability. The operator preferred driving the truck with the hybrid system engaged, but did notice that it drains the battery. However, in topographically varied regions, regenerative breaking was said to be very effective in recharging the battery. Battery capacity in this duty cycle was never an issue, so most often the truck was kept in hybrid mode. The truck was complemented on its very smooth ride overall and the operator really enjoyed using it. At the jobsite, the boom was assessed to operate very well. The battery‐powered bucket arm worked smoothly and had no recurring issues. In fact, the engine was never observed to turn itself in support of battery power at a jobsite. With the first fleet, the engine occasionally turned on to supplement the boom’s power or charge the battery below a 5 percent SOC threshold. With the LACDPW fleet, this behavior only occurred once very early on when the battery was purposely run down to test the truck.
6.3.2 Challenges As with any new technology, the Odyne truck experienced some difficulties. The deployment was extremely delayed, with about two years elapsing between when the truck was delivered and when it was first introduced to the operator and used in the field. During this time, the truck was left in a parking lot and not plugged in, which caused the battery to die. The long wait was caused by a few different factors, including a lengthy formal acceptance process required by LACDPW in addition to issues with the Altec‐supplied body of the truck. After the fleet had accepted the truck, an overview and introduction to using the truck was provided by Matt Jarmuz for a small group of people involved with the team who would be operating the truck. The introduction went well until the boom was activated to demonstrate its features. There was a loud grinding noise that came from the truck every time the boom moved. An Altec representative was in attendance and planned to investigate the problem. It turned out to be a faulty valve, with the sound coming from overpressure relief.
B-61
Once the truck was finally put into service, there were a few more hiccups. About three months into the demonstration period, the on‐board charger was found to be defective. The truck could still be used, and regenerative braking could help charge the battery, but the efficiency is highest when the truck uses grid power to charge. At about the same time, a transmission issue required the truck to be towed in from the field. The truck had to be sent to the local Odyne installer to repair both issues. While the job was supposed to be simple, the repair ended up taking three months. It turned out that the problem was a bad charging module from a supplier. The first replacement part also did not work, but after working with the supplier, they found a solution and were able to repair the truck. After this fix, the operator could again charge the truck and had more confidence in taking it further afield and even taking it overnight to a yard closer to his house, which did not have a charger. While these mechanical setbacks were frustrating, the operator and LACDPW mechanics remained optimistic about the technology’s future. They understood that there may be more problems in the future and they were open to learning more in order so they could service these advanced vehicles.
Figure 7: Front Angle of New Odyne Truck; Charger in Foreground and Assigned Operator in the Bucket
Source: Odyne
Challenges in using the truck were minor. The operator did feel this particular truck was a little oversized for the exact duty cycle he works. He may have preferred a smaller truck with a tighter turning radius and that wouldn’t block traffic as much when parked at a jobsite. He also felt the truck was a little underpowered, at least while climbing hills. Stop‐and‐go driving seemed to run the battery capacity down very quickly, but the overall battery capacity was adequate for the operator’s work demands.

B-62
CHAPTER 7: Conclusion
Any new technology is likely to experience issues during its deployment. The Odyne hybrid technology evaluated in this project did have some mechanical challenges to overcome, especially early in the demonstration period. Both fleets had problems that required removing the truck from service, whether due to issues caused by supplied parts, subsystems not acting correctly together, or simply not operating the truck for too long. Some of these issues could potentially have been mitigated with more extensive local service options to reduce turnaround time on repairs. Providing an extra backup truck could limit down time and provide a fleet with more confidence in testing new technologies.
Going forward, fleets can do more to educate their operators on the need to adopt clean transportation. A better understanding of the bigger picture may improve morale when new equipment does have difficulties. Helping operators see how advanced vehicle technology like Odyne’s hybrid system can improve their work should increase enthusiasm for these projects. It is also vital for fleets to maintain open lines of communication to help anticipate and react to problems that do arise. Despite the technical difficulties, the benefits of this technology were shown to greatly outweigh the issues. Over time, the trucks began operating more and more reliably. Even the operators at PG&E, who initially resisted adopting these vehicles, were very positive about them by the end of the project. The improved drivability due to the launch‐assist and regenerative braking made their jobs easier. Working at jobsites without having to run the engine has made improved communication between coworkers while also saving fuel and reducing the pollutants emitted. Ensuring the trucks are charged regularly did not require any additional effort by the operators. The LACDPW operator even devised an alternative charging schedule that allowed him to maintain his workplace flexibility while keeping the vehicle charged.
SOURCES Pacific Gas & Electric Company. “Company profile”. Accessed 6/21/17. https://www.pge.com/en_US/about‐pge/company‐information/profile/profile.page
Los Angeles County Department of Public Works. “About Us”. Accessed 8/30/17. https://

B-63
Appendix A – Operator Survey
This appendix is for APPENDIX B-C: Customer Survey Report in Odyne’s report Plug‐in Diesel Hybrid Digger‐Derrick: Operator Evaluation Survey We appreciate your time and assistance with this evaluation of the Plug-In Diesel Hybrid Utility Vehicle (PHEV). If you have any questions about the content of this survey, please contact Chase LeCroy at (626) 744-5616 or at [email protected] .
.

B-64

B-65
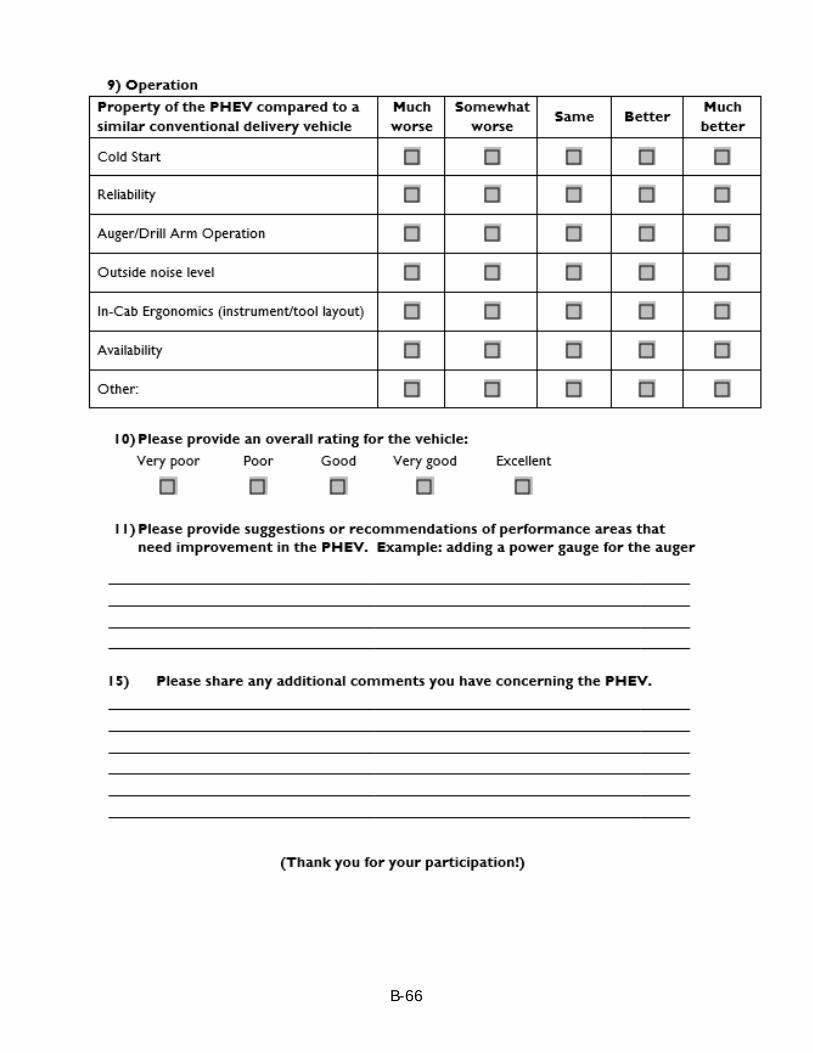
B-66
APPENDIX C: Motiv: Battery-Electric Truck Pilot on a Traditional Truck Assembly Line
Prepared for: California Energy Commission Prepared by: Motiv Power Systems, Inc.

C-2
Urvashi Nagrani Jim Castelaz Patricia Huang Primary Authors
Motiv Power Systems, Inc. 330 Hatch Drive Foster City, CA 94404 www.motivps.com
Disclaimer Staff members of the California Energy Commission prepared this report. As such, it does not necessarily represent the views of the Energy Commission, its employees, or the State of California. The Energy Commission, the State of California, its employees, contractors and subcontractors make no warrant, express or implied, and assume no legal liability for the information in this report; nor does any party represent that the uses of this information will not infringe upon privately owned rights. This report has not been approved or disapproved by the Energy Commission nor has the Commiss ion passed upon the accuracy or adequacy of the information in this report.
C-3
TABLE OF CONTENTS Page
Table of Contents .......................................................................................................... C-3 List of Figures ............................................................................................................... C-4 List of Tables ................................................................................................................ C-5 CHAPTER 1: Work Performed, Data and Results .................................................................. C-6
Vehicle Build Process................................................................................................................................ C-6 Post Assembly Test Results ...................................................................................................................... C-7 Shuttle Testing ........................................................................................................................................ C-8 Work Truck Testing.................................................................................................................................C-12 Vehicle Performance ...............................................................................................................................C-13 Field Data Collection ...............................................................................................................................C-16 Vehicle Mileage.......................................................................................................................................C-16 Battery State of Charge ...........................................................................................................................C-19 Energy Consumption While Driving ..........................................................................................................C-21 Reliability and Maintenance Data Collection ..............................................................................................C-23
Santa Ana Work Truck .........................................................................................................................C-23 Mountain View Shuttles .......................................................................................................................C-23
User Experiences ....................................................................................................................................C-25 Lifetime Cost & Maintenance ...................................................................................................................C-27 Projected Battery Life..............................................................................................................................C-28 Powertrain Efficiency...............................................................................................................................C-30
CHAPTER 2: Assessment of Project Success ...................................................................... C-31 Benefits Analysis .....................................................................................................................................C-31
Petroleum Reduction ...........................................................................................................................C-31 Greenhouse Gas & Criteria Emissions Reductions ..................................................................................C-31
Project Goal Accomplishment...................................................................................................................C-31 CHAPTER 3: Conclusions and Recommendations ................................................................ C-35
Summary of Results ................................................................................................................................C-35 Conclusions and Recommendations..........................................................................................................C-35
Accessory System Integration ..............................................................................................................C-35 Streamlining Compliance Mechanisms...................................................................................................C-36 Increase Testing .................................................................................................................................C-36 Infrastructure Must Be Considered .......................................................................................................C-36 Demonstration Vehicles Are Needed .....................................................................................................C-37
Appendix C-A: Vehicle Incoming Inspection Issues ............................................................. C-38 Appendix C-B: Vehicle Drive Data for the Mountain View Shuttles ......................................... C-48
C-4
LIST OF FIGURES Page
Figure 1: Electrif ied Ford E450 Chassis Prior to the Truck Body Install ....................................... C-6 Figure 2: The Work Truck Using the Electrif ied Chassis in Figure 1 ............................................ C-7 Figure 3: The 4 All-Electric Shuttle Buses Parked and Charging ................................................ C-7 Figure 4: Simulated Route used for Post Assembly Drive Testing .............................................. C-8 Figure 5: Motiv Drive Test Report ...................................................................................... C-9 Figure 6: Driver Feedback Form ...................................................................................... C-10 Figure 6: Driver Feedback Form (continued) ..................................................................... C-11 Figure 7: Work Truck at Customer Site ............................................................................. C-12 Figure 8: Work Truck Visual Inspection ............................................................................. C-12 Figure 9: A Motiv Powered All-Electric Ameritrans Shuttle Bus Charging in Mountain View, CA ...... C-14 Table 1: Shuttle Lifetime Mileage (as of 1/20/2017)............................................................. C-14 Figure 10: Motiv Powered All-Electric CTEC Work Truck ........................................................ C-15 Figure 11: Shuttle E1 Daily Mileage Chart.......................................................................... C-16 Figure 12: Shuttle E2 Daily Mileage Chart.......................................................................... C-17 Figure 13: Shuttle E3 Daily Mileage Chart.......................................................................... C-17 Figure 14: Shuttle E4 Daily Mileage Chart.......................................................................... C-18 Figure 15: Shuttle Fleet Average Daily Mileage Chart ........................................................... C-18 Figure 16: Shuttle E1 Battery State of Charge Record .......................................................... C-19 Figure 17: Shuttle E2 Battery State of Charge Record .......................................................... C-19 Figure 18: Shuttle E3 Battery State of Charge Record .......................................................... C-20 Figure 19: Shuttle E4 Battery State of Charge Record .......................................................... C-20 Figure 20: Vehicle 1 Energy Consumption ......................................................................... C-21 Figure 21: Vehicle 2 Energy Consumption ......................................................................... C-22 Figure 22: Motiv Service Log for the Santa Ana Work Truck................................................... C-23 Table 2: Average In-Service Days of the Four Mountain View Shuttles ..................................... C-24 Figure 23: Sample Motiv Service Logs for the Mountain View Shuttles...................................... C-24 Figure 23: Sample Motiv Service Logs for the Mountain View Shuttles (continued) ...................... C-25 Figure 24: Mountain View Community Shuttle Ridership Data ................................................ C-26 Table 3: Battery Nameplate Cycles .................................................................................. C-29 Figure 25: Various applications of Motiv Powertrains on All-Electric Zero-Emission Vehicles ........... C-34

C-5
LIST OF TABLES Page
Table 1: Shuttle Lifetime Mileage (as of 1/20/2017)............................................................. C-14 Table 2: Average In-Service Days of the Four Mountain View Shuttles ..................................... C-24 Table 3: Battery Nameplate Cycles .................................................................................. C-29

C-6
CHAPTER 1: Work Performed, Data and Results
This chapter reviews the activities performed as a part of the project, presents data collected during the project.
Vehicle Build Process This project allowed Motiv Power Systems (“Motiv”) to administer, manage, and demonstrate the “Battery-electric Truck Pilot on a Traditional Truck Assembly Line” project, which moved Motiv’s powertrain technology from the prototype stage into pre-commercial production. The demonstration project built and demonstrated four Class 4 battery-electric buses and trucks using the Ford E450 Chassis as a base for multiple vehicle applications. After being built, the vehicles were in field demonstration at two different locations and with two different fleets for over a year while being supported by Motiv’s engineering staff for monitoring and data collection. The traditional truck chassis used in both vehicle types, the Ford E450, was decontented, a process in which the fuel system was removed, prior to the installation of the Motiv Powertrain. The all-electric chassis was then shipped to a body builder who built the body in the same manner as a fossil fuel vehicle.
Figure 1: Electrified Ford E450 Chassis Prior to the Truck Body Install
Source: Motiv Power Systems, Inc.
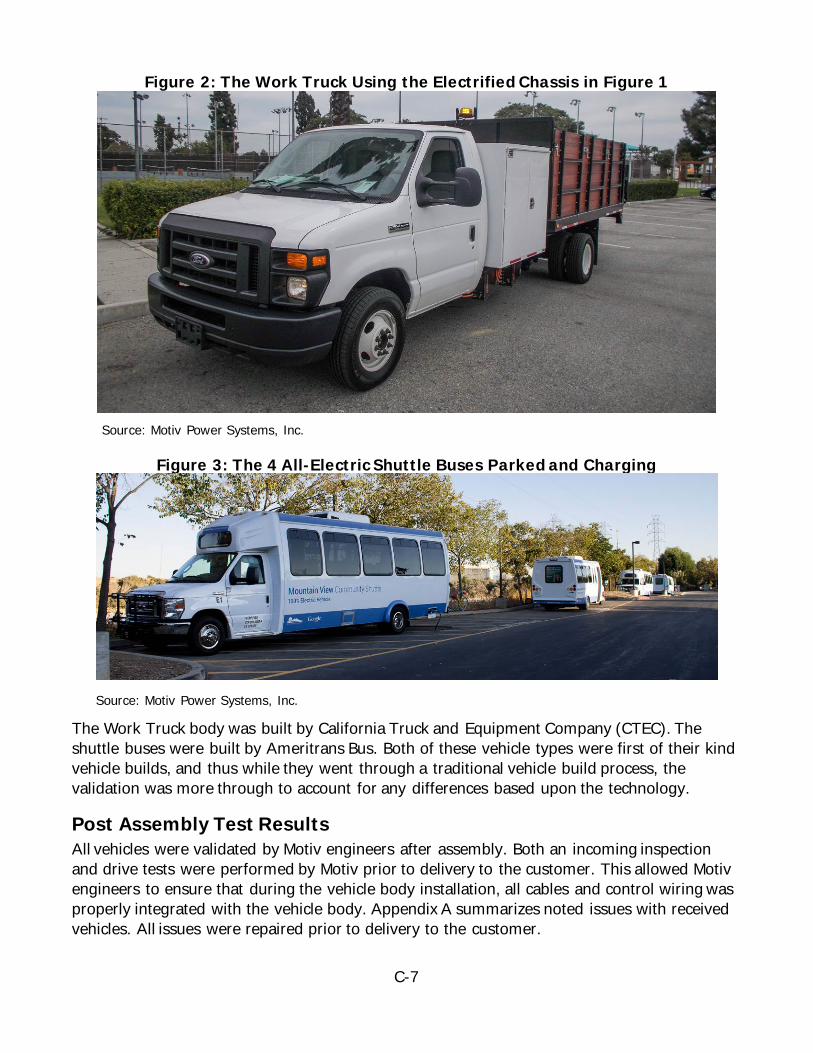
C-7
Figure 2: The Work Truck Using the Electrified Chassis in Figure 1
Source: Motiv Power Systems, Inc.
Figure 3: The 4 All-Electric Shuttle Buses Parked and Charging
Source: Motiv Power Systems, Inc.
The Work Truck body was built by California Truck and Equipment Company (CTEC). The shuttle buses were built by Ameritrans Bus. Both of these vehicle types were first of their kind vehicle builds, and thus while they went through a traditional vehicle build process, the validation was more through to account for any differences based upon the technology.
Post Assembly Test Results All vehicles were validated by Motiv engineers after assembly. Both an incoming inspection and drive tests were performed by Motiv prior to delivery to the customer. This allowed Motiv engineers to ensure that during the vehicle body installation, all cables and control wiring was properly integrated with the vehicle body. Appendix A summarizes noted issues with received vehicles. All issues were repaired prior to delivery to the customer.
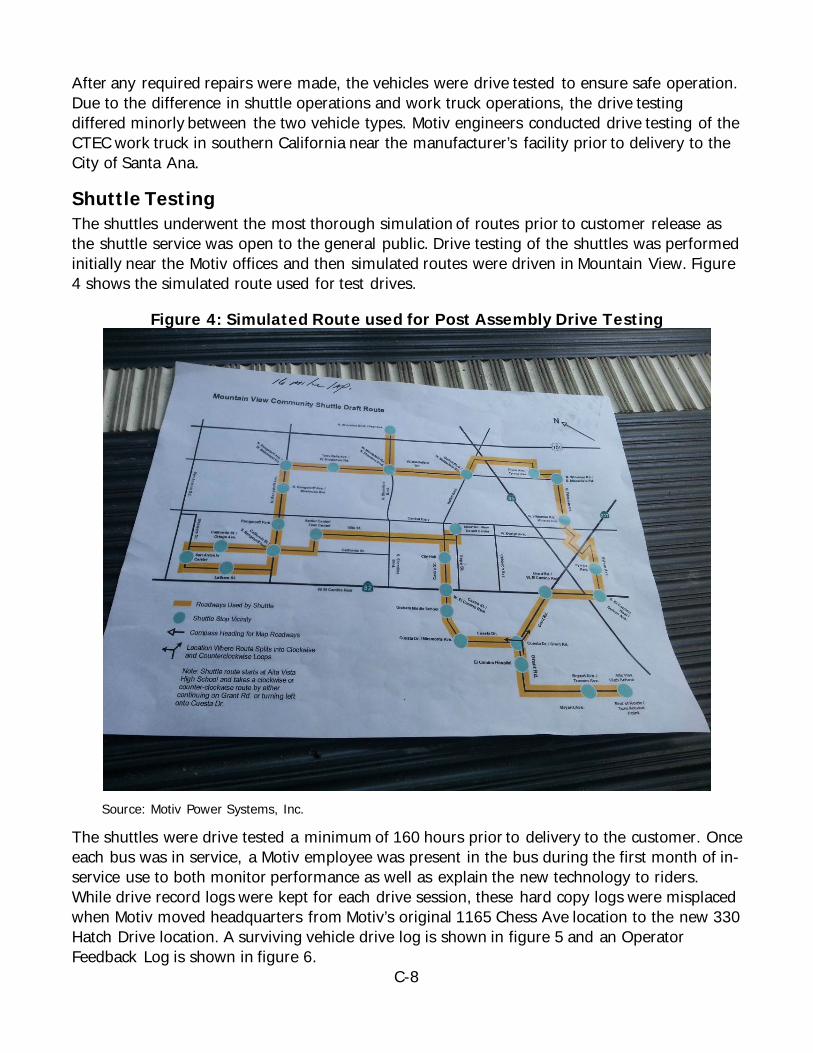
C-8
After any required repairs were made, the vehicles were drive tested to ensure safe operation. Due to the difference in shuttle operations and work truck operations, the drive testing differed minorly between the two vehicle types. Motiv engineers conducted drive testing of the CTEC work truck in southern California near the manufacturer’s facility prior to delivery to the City of Santa Ana.
Shuttle Testing The shuttles underwent the most thorough simulation of routes prior to customer release as the shuttle service was open to the general public. Drive testing of the shuttles was performed initially near the Motiv offices and then simulated routes were driven in Mountain View. Figure 4 shows the simulated route used for test drives.
Figure 4: Simulated Route used for Post Assembly Drive Testing
Source: Motiv Power Systems, Inc.
The shuttles were drive tested a minimum of 160 hours prior to delivery to the customer. Once each bus was in service, a Motiv employee was present in the bus during the first month of in-service use to both monitor performance as well as explain the new technology to riders. While drive record logs were kept for each drive session, these hard copy logs were misplaced when Motiv moved headquarters from Motiv’s original 1165 Chess Ave location to the new 330 Hatch Drive location. A surviving vehicle drive log is shown in figure 5 and an Operator Feedback Log is shown in figure 6.
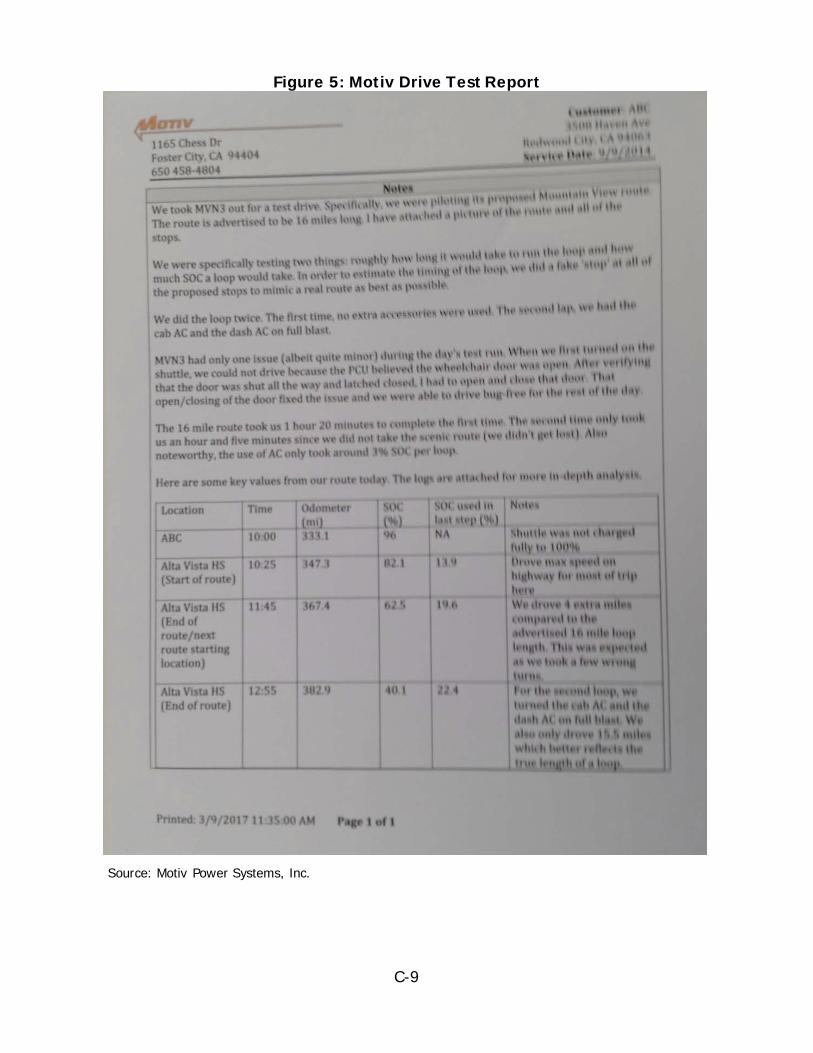
C-9
Figure 5: Motiv Drive Test Report
Source: Motiv Power Systems, Inc.
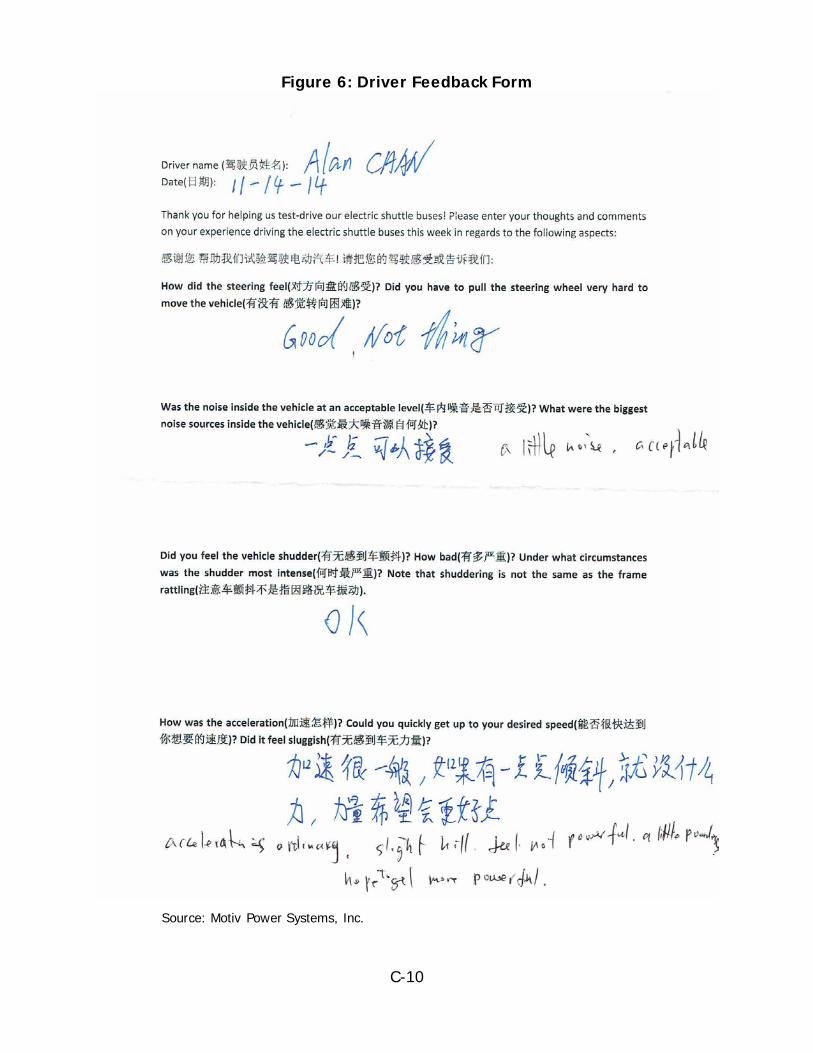
C-10
Figure 6: Driver Feedback Form
Source: Motiv Power Systems, Inc.

C-11
Figure 6: Driver Feedback Form (continued)
Source: Motiv Power Systems, Inc.
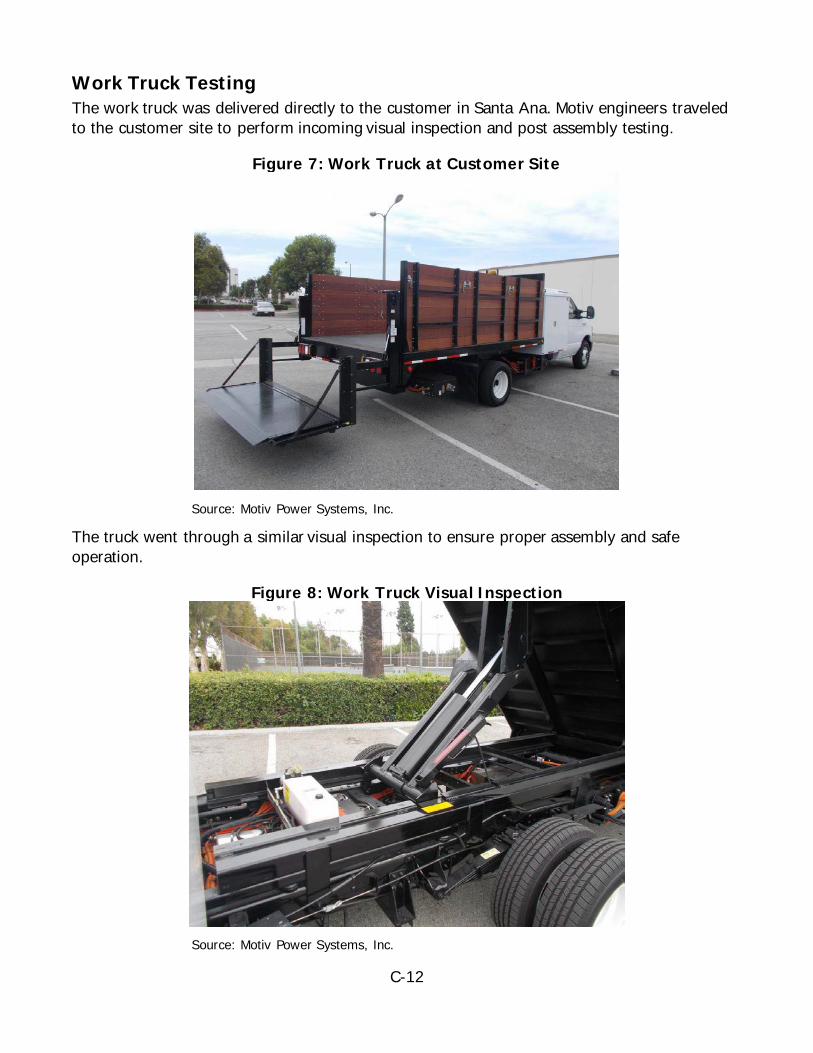
C-12
Work Truck Testing The work truck was delivered directly to the customer in Santa Ana. Motiv engineers traveled to the customer site to perform incoming visual inspection and post assembly testing.
Figure 7: Work Truck at Customer Site
Source: Motiv Power Systems, Inc.
The truck went through a similar visual inspection to ensure proper assembly and safe operation.
Figure 8: Work Truck Visual Inspection
Source: Motiv Power Systems, Inc.

C-13
Motiv engineers performed approximately 40 hours of drive testing to validate proper vehicle operation. This was deemed appropriate based on the narrow focus of the application and the limited number of operators interfacing with the vehicle. While drive record logs were kept for each drive session, these hard copy logs were misplaced when Motiv moved headquarters from Motiv’s original 1165 Chess Ave location to the new 330 Hatch Drive location. Vehicle Performance Over the course of this agreement, Motiv Power Systems worked with Ameritrans Bus (Ameritrans) and CTEC to build the vehicles demonstrated over the course of this project. While the grant had funding for four vehicles, the data collection and demonstration period included 5 vehicles, with an additional shuttle purchased using a voucher from the Hybrid and Zero-Emission Truck and Bus Voucher Incentive Project. This meant over the course of the data collection period, data was gathered for four zero-emission Ameritrans shuttle buses, and one work truck with a dump bed built by CTEC.
These vehicles were deployed in two completely different applications with different use cases, the shuttle buses were used in a Community Shuttle program. The Mountain View Free Community Shuttle provides transportation connections between residential neighborhoods, senior residences and services, city offices, library, park and recreational facilities, medical offices, shopping centers, and entertainment venues throughout Mountain View. The goal of the city’s shuttle project is to reduce single occupancy vehicle traffic in key Mountain View traffic corridors with a clean transportation alternative and reduce demands on parking in downtown. This demonstration was a multi-stakeholder project to run shuttle buses for the City of Mountain View with daily operation funded by Google, technology developed by Motiv Power Systems, research and grant activities under this project funded by the California Energy Commission, administered by CALSTART, deployed by ABC Companies on routes developed by Altrans. Operation began in January 2015 and is ongoing. As this Energy Commission grant finishes, the shuttles will continue to be operated in Mountain View, allowing for ongoing traffic reduction and air quality improvement. This project has demonstrated to locals the potential of zero-emission vehicles to reduce harmful emissions and use of fossil fuels while providing communities with better transit options to reduce the need for residents to drive locally. The two routes through Mountain View have 30 stops in a 13-mile loop, clockwise and counter clockwise with shuttles doing between five to six loops per day. Each shuttle has 102 kWh of useable power. The average usage per shuttle is about 65-85 miles per day. The stop and go of residential streets is ideally suited for regenerative braking allowing about 22 percent of battery power to be recovered. During hotter summer months the AC on the vehicle can use as much as 20 percent of available charge. This service was initially launched with four shuttles, and another two shuttles were later added to enhance the service for residents.
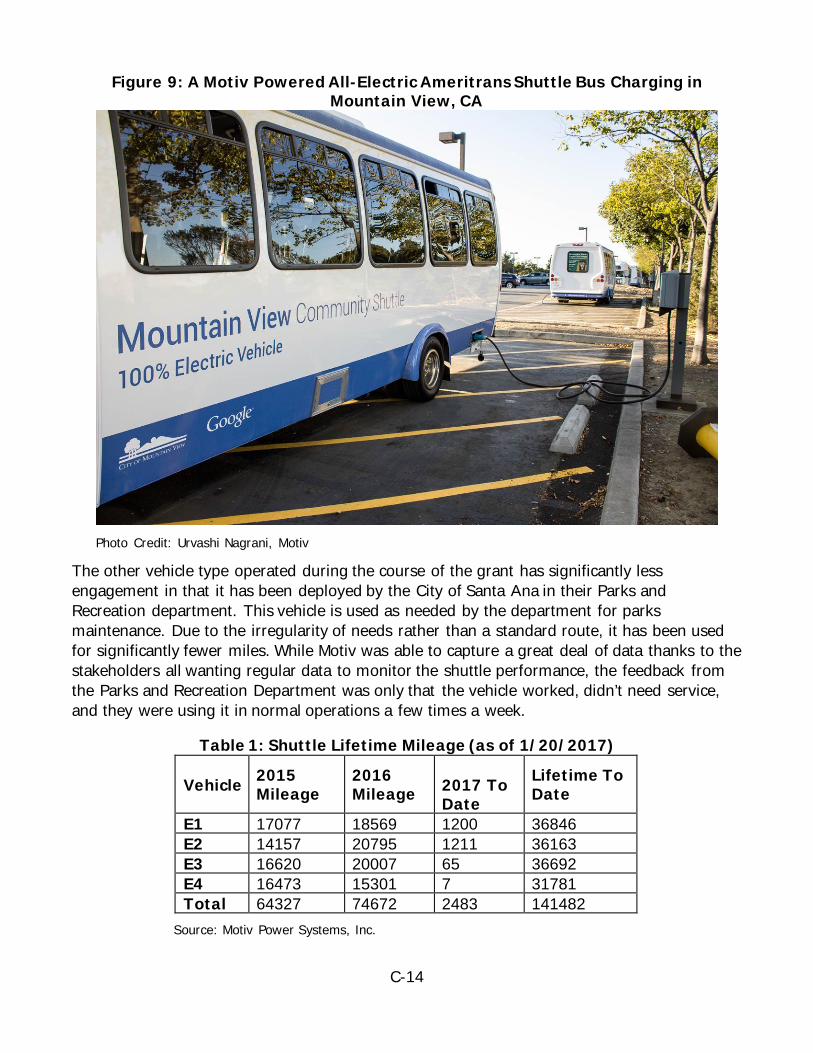
C-14
Figure 9: A Motiv Powered All-Electric Ameritrans Shuttle Bus Charging in Mountain View, CA
Photo Credit: Urvashi Nagrani, Motiv
The other vehicle type operated during the course of the grant has significantly less engagement in that it has been deployed by the City of Santa Ana in their Parks and Recreation department. This vehicle is used as needed by the department for parks maintenance. Due to the irregularity of needs rather than a standard route, it has been used for significantly fewer miles. While Motiv was able to capture a great deal of data thanks to the stakeholders all wanting regular data to monitor the shuttle performance, the feedback from the Parks and Recreation Department was only that the vehicle worked, didn’t need service, and they were using it in normal operations a few times a week.
Table 1: Shuttle Lifetime Mileage (as of 1/20/2017)
Vehicle 2015 Mileage
2016 Mileage
2017 To Date
Lifetime To Date
E1 17077 18569 1200 36846 E2 14157 20795 1211 36163 E3 16620 20007 65 36692 E4 16473 15301 7 31781 Total 64327 74672 2483 141482
Source: Motiv Power Systems, Inc.
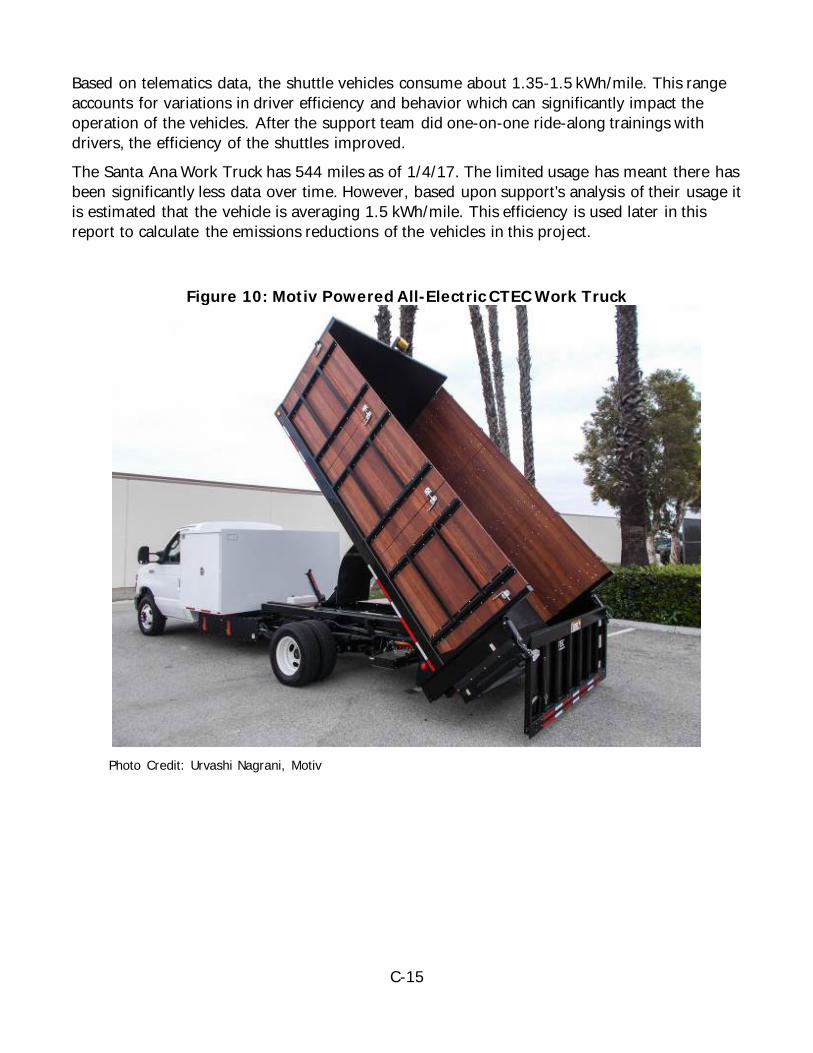
C-15
Based on telematics data, the shuttle vehicles consume about 1.35-1.5 kWh/mile. This range accounts for variations in driver efficiency and behavior which can significantly impact the operation of the vehicles. After the support team did one-on-one ride-along trainings with drivers, the efficiency of the shuttles improved. The Santa Ana Work Truck has 544 miles as of 1/4/17. The limited usage has meant there has been significantly less data over time. However, based upon support’s analysis of their usage it is estimated that the vehicle is averaging 1.5 kWh/mile. This efficiency is used later in this report to calculate the emissions reductions of the vehicles in this project.
Figure 10: Motiv Powered All-Electric CTEC Work Truck
Photo Credit: Urvashi Nagrani, Motiv
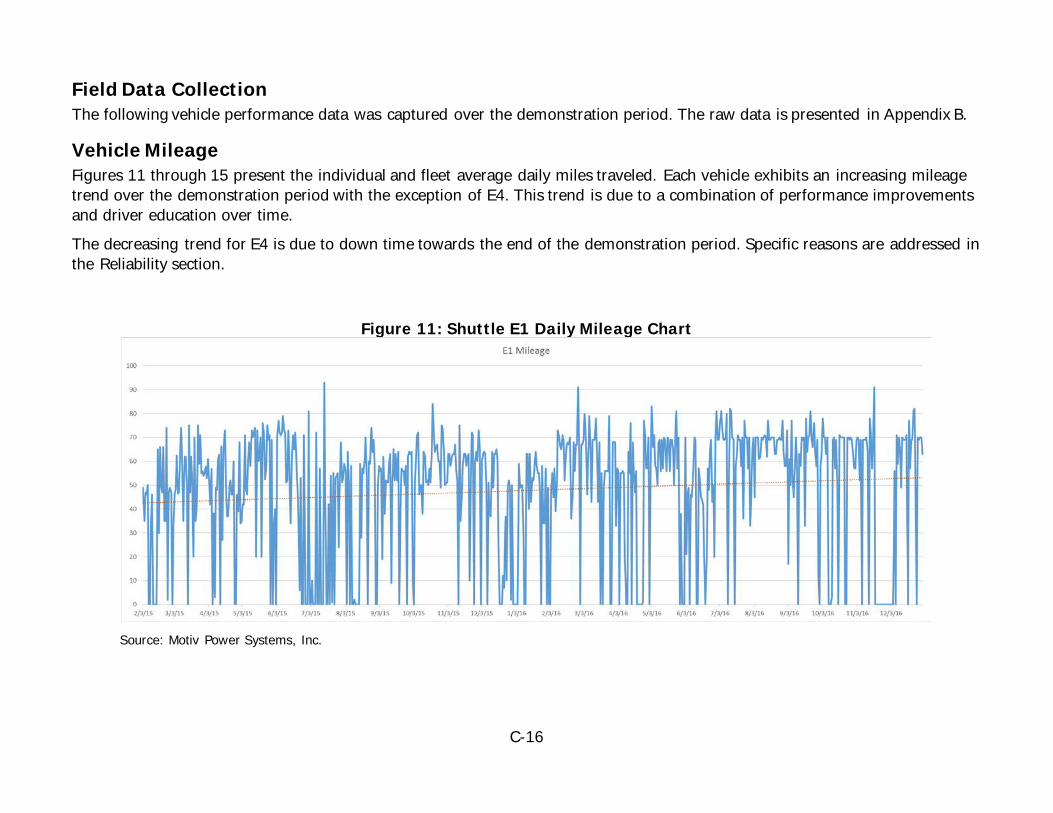
C-16
Field Data Collection The following vehicle performance data was captured over the demonstration period. The raw data is presented in Appendix B.
Vehicle Mileage Figures 11 through 15 present the individual and fleet average daily miles traveled. Each vehicle exhibits an increasing mileage trend over the demonstration period with the exception of E4. This trend is due to a combination of performance improvements and driver education over time. The decreasing trend for E4 is due to down time towards the end of the demonstration period. Specific reasons are addressed in the Reliability section.
Figure 11: Shuttle E1 Daily Mileage Chart
Source: Motiv Power Systems, Inc.
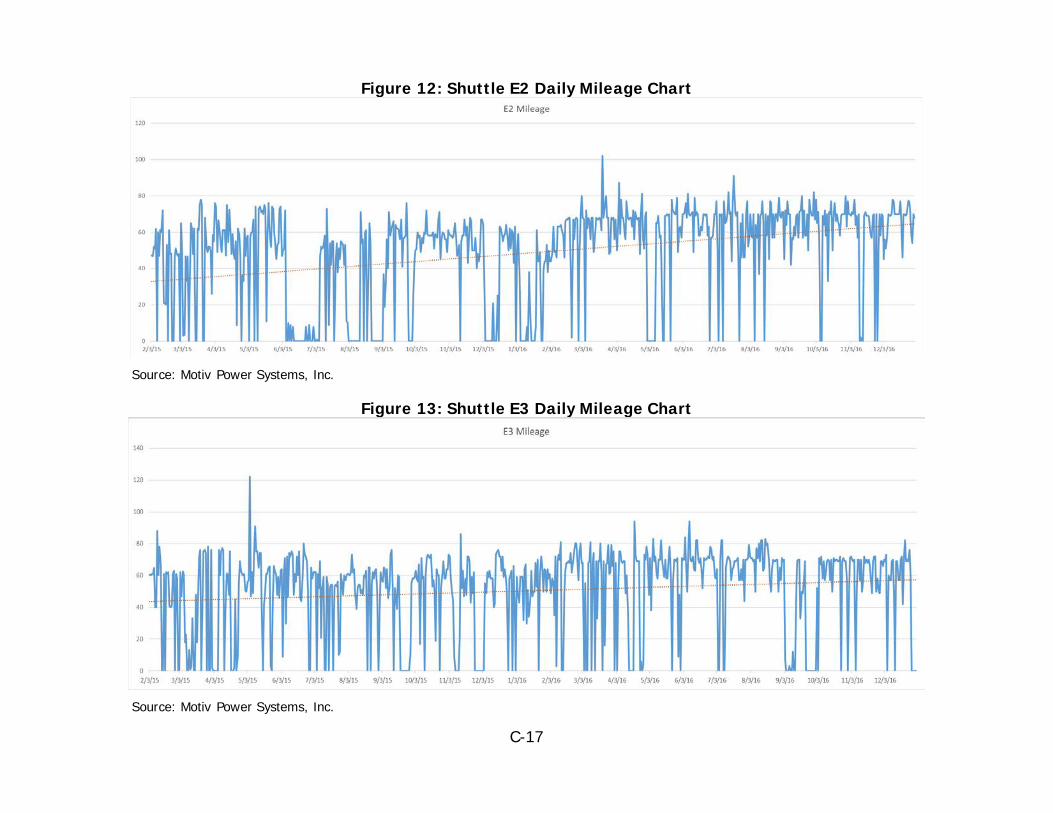
C-17
Figure 12: Shuttle E2 Daily Mileage Chart
Source: Motiv Power Systems, Inc.
Figure 13: Shuttle E3 Daily Mileage Chart
Source: Motiv Power Systems, Inc.
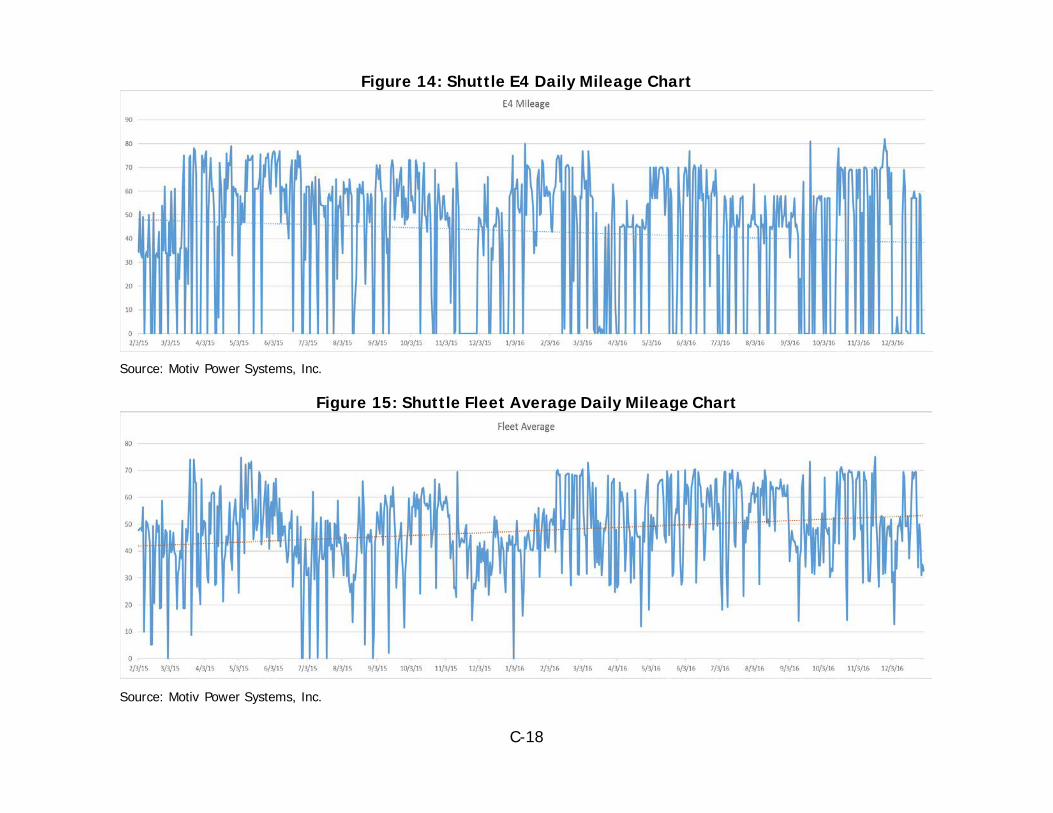
C-18
Figure 14: Shuttle E4 Daily Mileage Chart
Source: Motiv Power Systems, Inc.
Figure 15: Shuttle Fleet Average Daily Mileage Chart
Source: Motiv Power Systems, Inc.
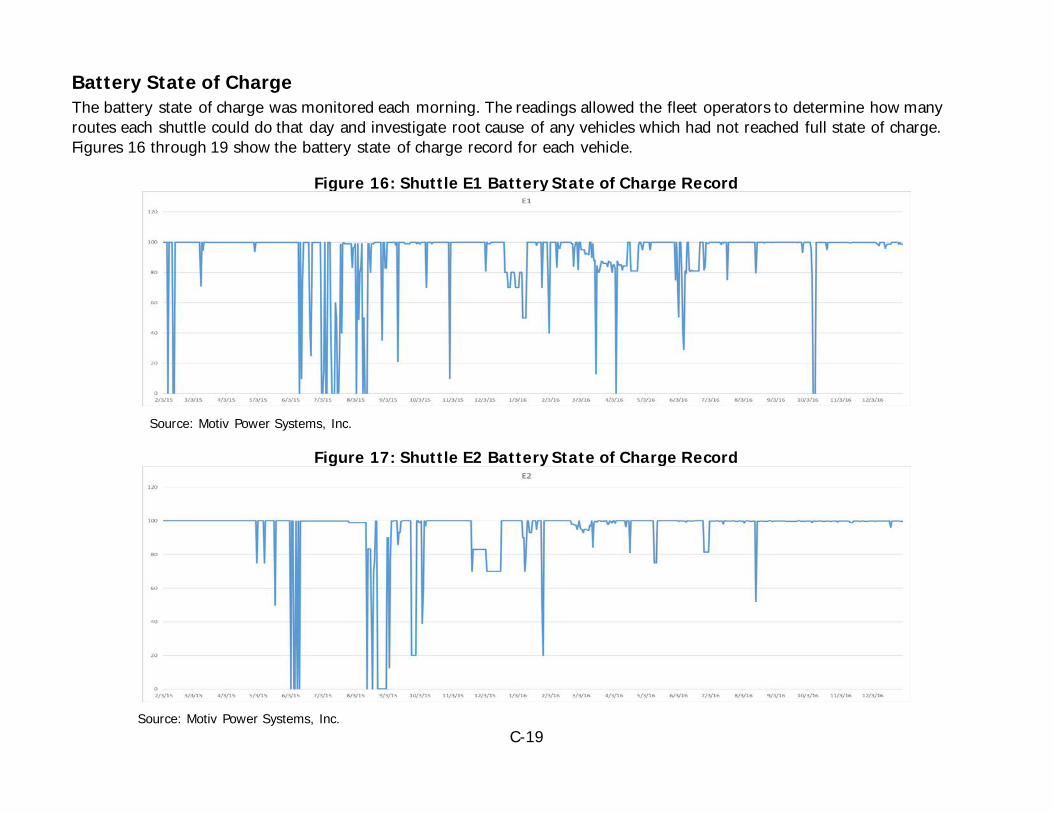
C-19
Battery State of Charge The battery state of charge was monitored each morning. The readings allowed the fleet operators to determine how many routes each shuttle could do that day and investigate root cause of any vehicles which had not reached full state of charge. Figures 16 through 19 show the battery state of charge record for each vehicle.
Figure 16: Shuttle E1 Battery State of Charge Record
Source: Motiv Power Systems, Inc.
Figure 17: Shuttle E2 Battery State of Charge Record
Source: Motiv Power Systems, Inc.
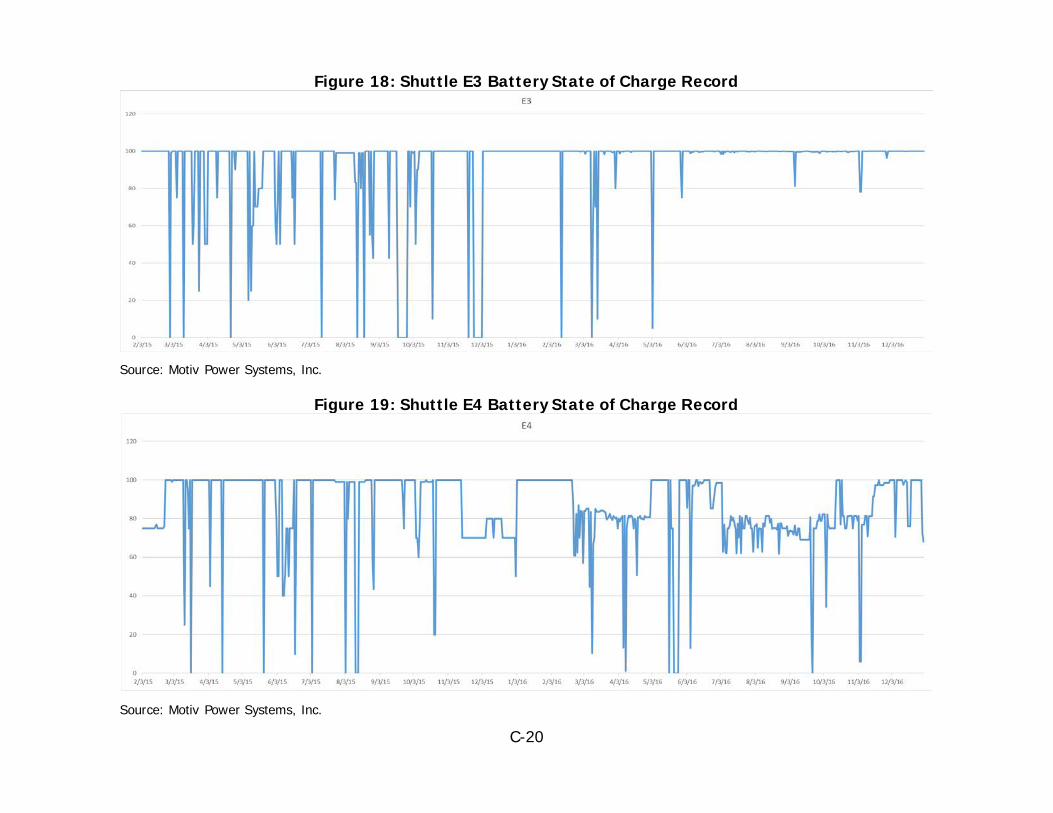
C-20
Figure 18: Shuttle E3 Battery State of Charge Record
Source: Motiv Power Systems, Inc.
Figure 19: Shuttle E4 Battery State of Charge Record
Source: Motiv Power Systems, Inc.
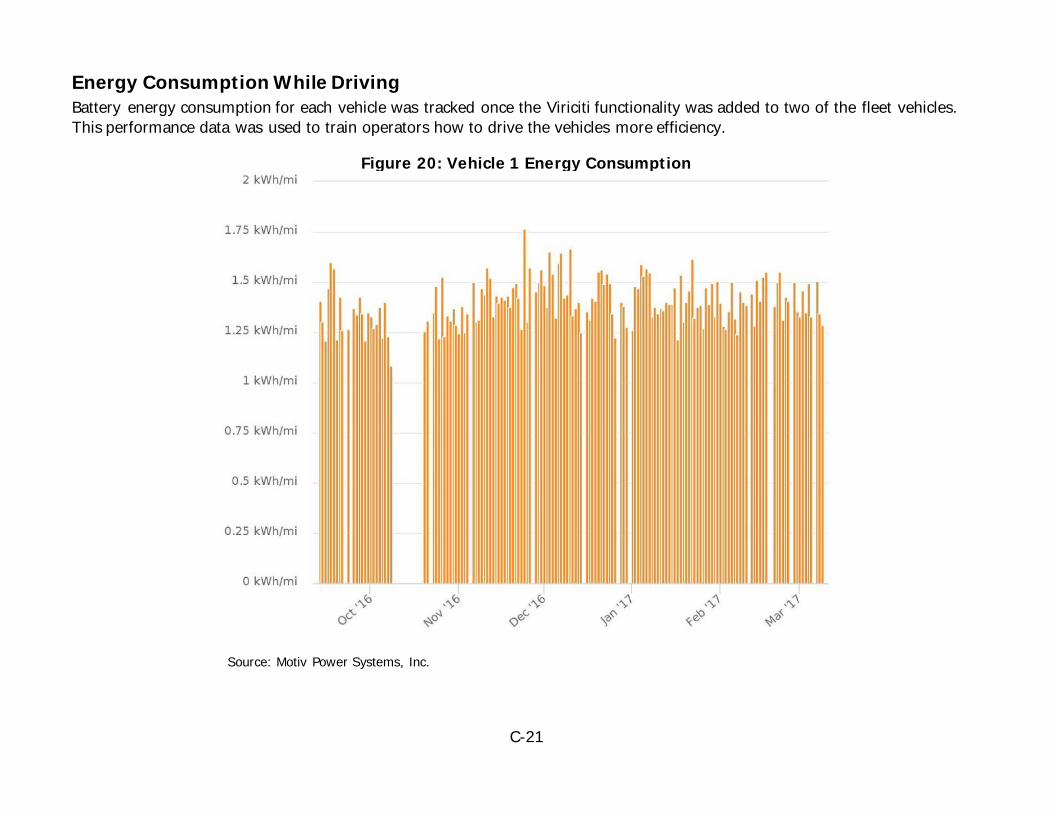
C-21
Energy Consumption While Driving Battery energy consumption for each vehicle was tracked once the Viriciti functionality was added to two of the fleet vehicles. This performance data was used to train operators how to drive the vehicles more efficiency.
Figure 20: Vehicle 1 Energy Consumption
Source: Motiv Power Systems, Inc.

C-22
Figure 21: Vehicle 2 Energy Consumption
Source: Motiv Power Systems, Inc.
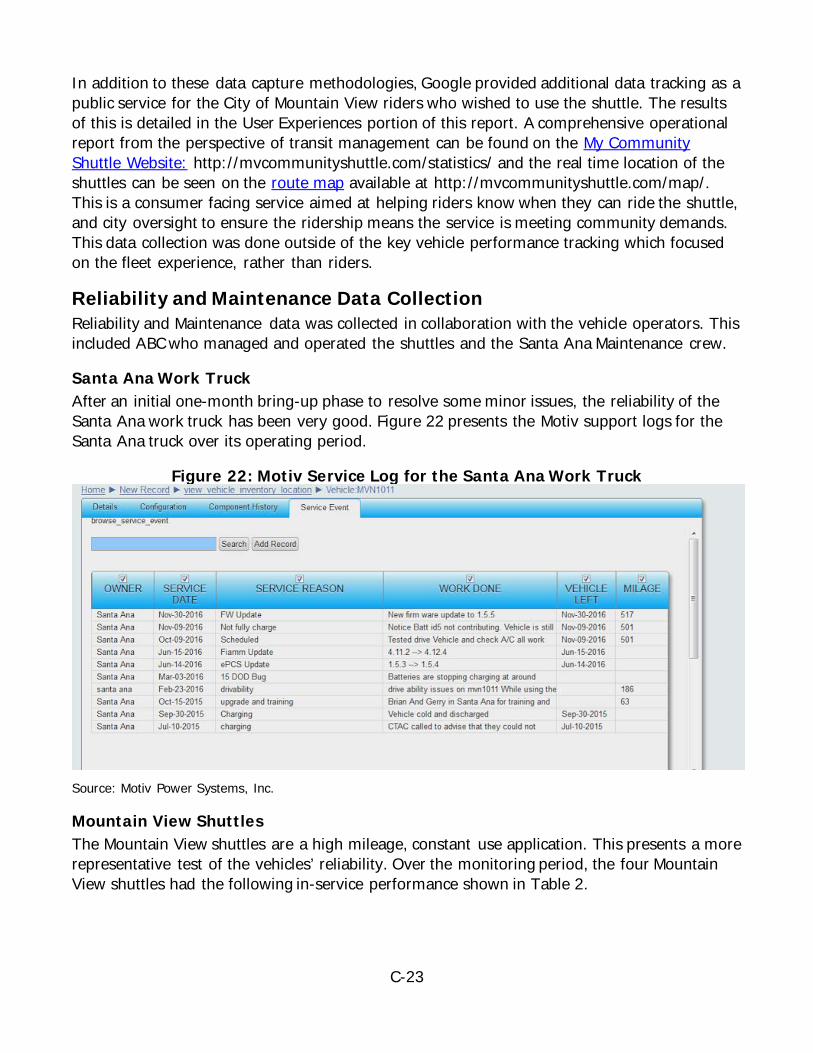
C-23
In addition to these data capture methodologies, Google provided additional data tracking as a public service for the City of Mountain View riders who wished to use the shuttle. The results of this is detailed in the User Experiences portion of this report. A comprehensive operational report from the perspective of transit management can be found on the My Community Shuttle Website: http://mvcommunityshuttle.com/statistics/ and the real time location of the shuttles can be seen on the route map available at http://mvcommunityshuttle.com/map/. This is a consumer facing service aimed at helping riders know when they can ride the shuttle, and city oversight to ensure the ridership means the service is meeting community demands. This data collection was done outside of the key vehicle performance tracking which focused on the fleet experience, rather than riders.
Reliability and Maintenance Data Collection Reliability and Maintenance data was collected in collaboration with the vehicle operators. This included ABC who managed and operated the shuttles and the Santa Ana Maintenance crew.
Santa Ana Work Truck After an initial one-month bring-up phase to resolve some minor issues, the reliability of the Santa Ana work truck has been very good. Figure 22 presents the Motiv support logs for the Santa Ana truck over its operating period.
Figure 22: Motiv Service Log for the Santa Ana Work Truck
Source: Motiv Power Systems, Inc.
Mountain View Shuttles The Mountain View shuttles are a high mileage, constant use application. This presents a more representative test of the vehicles’ reliability. Over the monitoring period, the four Mountain View shuttles had the following in-service performance shown in Table 2.
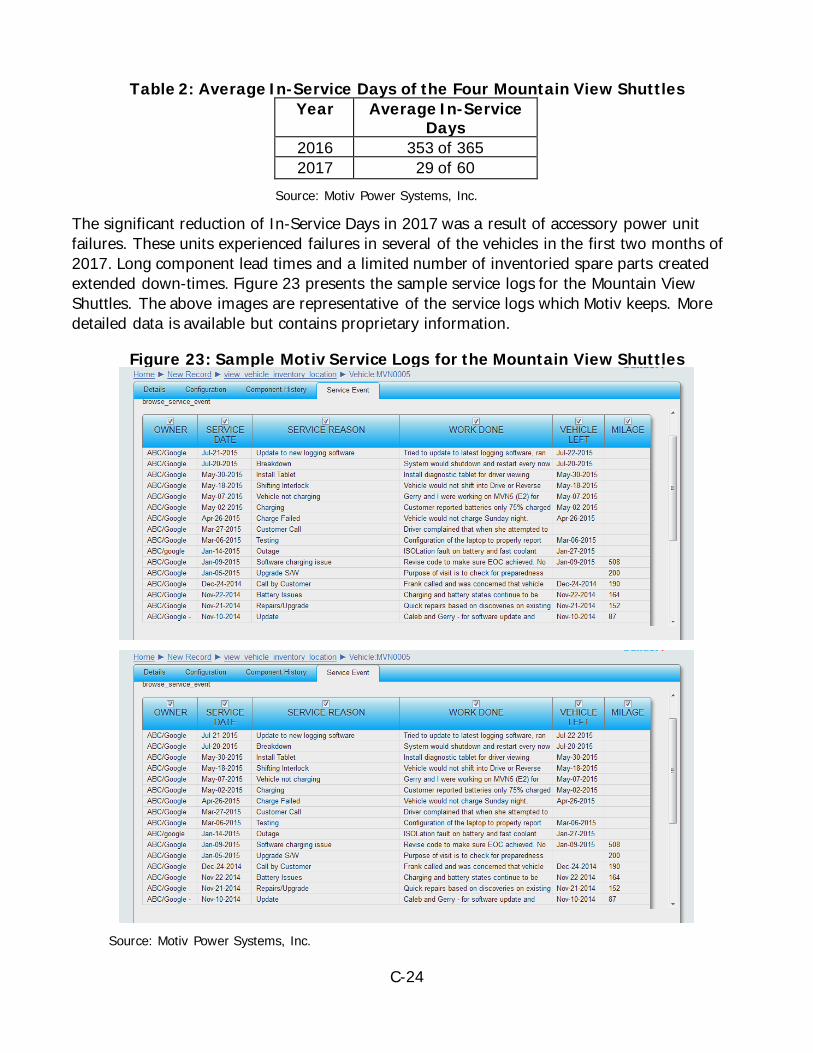
C-24
Table 2: Average In-Service Days of the Four Mountain View Shuttles Year Average In-Service
Days 2016 353 of 365 2017 29 of 60
Source: Motiv Power Systems, Inc.
The significant reduction of In-Service Days in 2017 was a result of accessory power unit failures. These units experienced failures in several of the vehicles in the first two months of 2017. Long component lead times and a limited number of inventoried spare parts created extended down-times. Figure 23 presents the sample service logs for the Mountain View Shuttles. The above images are representative of the service logs which Motiv keeps. More detailed data is available but contains proprietary information.
Figure 23: Sample Motiv Service Logs for the Mountain View Shuttles
Source: Motiv Power Systems, Inc.
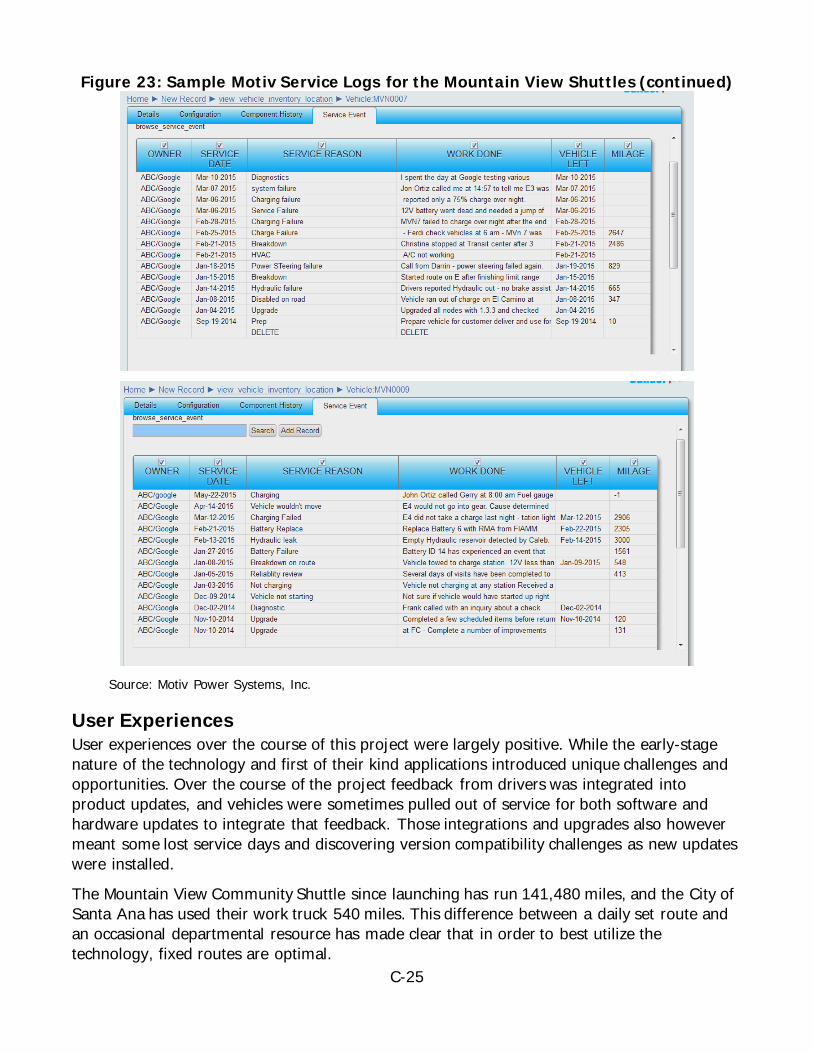
C-25
Figure 23: Sample Motiv Service Logs for the Mountain View Shuttles (continued)
Source: Motiv Power Systems, Inc.
User Experiences User experiences over the course of this project were largely positive. While the early-stage nature of the technology and first of their kind applications introduced unique challenges and opportunities. Over the course of the project feedback from drivers was integrated into product updates, and vehicles were sometimes pulled out of service for both software and hardware updates to integrate that feedback. Those integrations and upgrades also however meant some lost service days and discovering version compatibility challenges as new updates were installed.
The Mountain View Community Shuttle since launching has run 141,480 miles, and the City of Santa Ana has used their work truck 540 miles. This difference between a daily set route and an occasional departmental resource has made clear that in order to best utilize the technology, fixed routes are optimal.

C-26
From an operational perspective, the number of down days per month has been a key metric to determine if software or hardware issues were impacting the fleet experience. The City of Santa Ana has had very few unplanned down days, with less than five over the course of the project. However, the heavier usage and multiple software versions with early testing made the Google Shuttles experience an average of four unplanned down days per vehicle per month due to Motiv-related failures. This number reflects the inclusion of issues with new beta software as well as supply chain issues in getting parts to repair any problems in the field. However, in the last quarter that average number on system performance has been one down day per vehicle per month with the newest software release. One key learning was a key cause of down days is supply chain issues, after diagnosing a problem the lag based on part procurement can take a vehicle out of service for several days even if the fix itself is only an hour of technician time. This learning has lead Motiv to including a spare parts budget for support in more recent grants and deployments to ensure customers are not impacted. All of the vehicles in this project were first of their kind, and as such there was no additional inventory at the time of their deployment. Despite the nature of the early stage technology, user satisfaction has been high. The Mountain View Community Shuttle by virtue of being a publicly facing project had many more opportunities for feedback. Over the course of the project Caltrans and Google have maintained a statistics page where the public can see data on the project from the consumer facing level at:
This includes passenger and ridership data such as:
Figure 24: Mountain View Community Shuttle Ridership Data
Source: Motiv Power Systems, Inc., Data from Mountain View & Google
C-27
A comprehensive user feedback survey also was done in 2016 and out of survey respondents asked, “Would you recommend the Mountain View Community Shuttle to others to use?” 98 percent responded “Yes” and only 2 percent said “No”. Multiple staff reported in the early launch period of the shuttles when they had two gasoline shuttles alongside the electric vehicle options, passengers would often wait an additional 15 minutes to catch the next shuttle if a gas powered shuttle arrived before a zero-emission vehicle. This feedback lead to two additional zero-emission vehicles being purchased to replace the gasoline powered shuttles so today the six shuttle service is 100 percent electric across the fleet.
Lifetime Cost & Maintenance One of the key goals of this project was not only to deploy a pre-commercial technology, but demonstrate that the costs and maintenance would perform in such a way that the metrics tracking such performance would be satisfactory to the project’s clients and their respective industries. The fleet usage of these two vehicle types: as a sponsored free-to-use people moving service and a municipal department tool meant that traditional revenue and operational metrics were unavailable as there were no fares to measure, or baseline of existing service to compare to.
However, we have analyzed the costs to show that despite the lack of a baseline, the costs and service performed to the liking of the clients. For the Mountain View Community Shuttles, according to ABC Companies, maintenance cost has averaged $650 per quarter per vehicle, which has placed the annual cost at around $2,600 per vehicle. Due to the multiple variations of software and hardware in these pre-commercial shuttles, we have seen substantial variance in these numbers, and no obvious signs of these costs necessarily trending either downward or upward as time goes on. Based upon an assumed steady maintenance costs over the 12-year life of the vehicle we’d expect to see $31,200 per vehicle in costs. This cost analysis from ABC showed most of their maintenance has not been directly related to the Motiv powertrain, but rather standard work on the wheelchair lifts, air conditioning, medical supplies, and seat belts, etc. All of these costs related to standard wear and tear on a public facing shuttle service. Motiv-related repairs have largely been around the auxiliary system and not the vehicle’s drivetrain, with several 12V battery replacements over the course of the project. Motiv has looked into solutions to improve this in future builds. The other area which we’ve seen increased service needs has been in tire-related maintenance which is caused by the combination of the Motiv vehicles’ added weight and regular maintenance. The work truck for the City of Santa Ana has had very little work needed in part because of the vehicle’s low usage. Due to the fact the chargers for these vehicles not being on a separate meter, and the data tracking coming from the vehicle component and system level, not from the Google facility, we’ve had to estimate the charging costs. Because Google also has their own site power – this information is atypical, so for analysis we’ve used a Pacific Gas & Electric (PGE) rate PGE A1 Commercial Plan Cost: $0.21/kWh summer (May-Oct) and $0.20/kWh winter (Nov-Apr). We estimate about 2,900 kWh/month/vehicle charged energy from the grid, mostly overnight because the shuttles are driven during the day. This means over 12 years the power usage would be 417,600 kWh/vehicle total. The estimate of 2,900 kWh per month was based off of
C-28
charged energy totals from the onboard telematics system averaged over a three-month period. With these rates and energy usage over the year a fleet would be expected to pay approximately $7,000 for their electricity to operate the vehicles. Had this program been operated with diesel vehicles based on the calculations in the benefit analysis section – we can assume 3,700 gallons of diesel would have been used if the 2016 mileage was the baseline of miles traveled. In 2015 the average price per gallon was $3.0214, and in 2016 the price went down to $2.7. Assuming the average of these two years and a price of $2.8 for the 3,700 gallons that would have been used, had a shuttle fleet used diesel shuttles for the full year with the same mileage, they would have spent $127,000. A more efficient shuttle could have a lower operating cost, however in this use case a fleet could expect to save $112,000 in fuel costs annually if fuel prices were relatively stable. Given that price fluctuation has historically been higher it’s not unreasonable to assume there are potentially much greater operational savings.
Projected Battery Life Over the course of the project, the battery health on the vehicles was monitored. The shuttles and work truck both used a Fiamm SoNick® Battery. This Sodium Nickle Battery is composed of series and parallel connected single cells. According to the Fiamm Battery Handbook, the battery technology “has been shown in laboratory tests that it provides a calendar life of more than 10 years and a cycle life of 1000-2000 nameplate cycles. This data is supported by batteries in the field that are still in operation after more than 1000 nameplate cycles.”
Over the course of this demonstration period, Motiv and its end users have not noticed any degradation in battery capacity or performance. The team tracked the number of battery nameplate cycles on a periodic basis. The shuttles have an average of about 328 nameplate cycles on their batteries due to regular usage for two years in service. The vehicles have six batteries, so with power being pulled from multiple packs, a full cycle is not necessarily used every day. With this type of usage if a battery deteriorated at the low end of the Fiamm estimates, a heavily used vehicle would have six years of battery at full capacity, however if the battery lasted on the longer side of the battery life it would be expected to last a full 12 years. Because the Motiv system uses an Adaptive Power Converter to balance usage between the battery packs in order to optimize both power efficiency and battery health, our data suggests the 12-year battery life is not an unreasonable assumption for a fleet.
14 U.S. Energy Information Administration, “Weekly Retail Gasoline and Diesel Prices”. https://www.eia.gov/dnav/pet/pet_pri_gnd_dcus_sca_a.htm Accessed February 3, 2017.
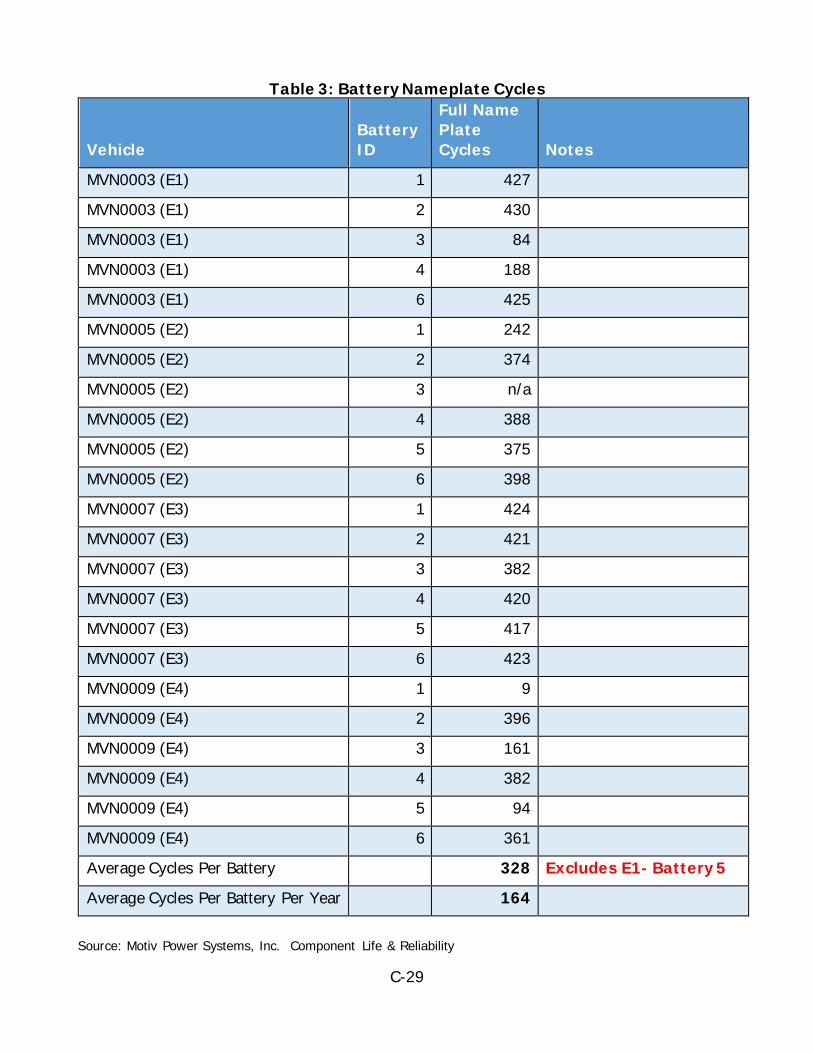
C-29
Table 3: Battery Nameplate Cycles
Source: Motiv Power Systems, Inc. Component Life & Reliability
Vehicle Battery ID
Full Name Plate Cycles Notes
MVN0003 (E1) 1 427
MVN0003 (E1) 2 430
MVN0003 (E1) 3 84
MVN0003 (E1) 4 188
MVN0003 (E1) 6 425
MVN0005 (E2) 1 242
MVN0005 (E2) 2 374
MVN0005 (E2) 3 n/a
MVN0005 (E2) 4 388
MVN0005 (E2) 5 375
MVN0005 (E2) 6 398
MVN0007 (E3) 1 424
MVN0007 (E3) 2 421
MVN0007 (E3) 3 382
MVN0007 (E3) 4 420
MVN0007 (E3) 5 417
MVN0007 (E3) 6 423
MVN0009 (E4) 1 9
MVN0009 (E4) 2 396
MVN0009 (E4) 3 161
MVN0009 (E4) 4 382
MVN0009 (E4) 5 94
MVN0009 (E4) 6 361
Average Cycles Per Battery 328 Excludes E1- Battery 5
Average Cycles Per Battery Per Year 164
C-30
In assessing the Motiv electric Powertrain Control System (ePCS) components, we have inconclusive data on the component life. Over the course of this demonstration Motiv ePCS components have gone from a generation 2 design to 4.5, with software updates along the way.
Different components had different reliability expectations. The Adaptive Power Unit which provides power for auxiliary systems was found to be the least reliable component, and was the cause of the majority of field failures. By replacing the Adaptive Power Unit in a system architecture change to other vehicles, field reliability has improved. Another major improvement to these precommercial units was changing the power connector from cable glands, which were unreliable, did not seal well and took extensive service hours to connect and disconnect, with connectors which were ruggedized and weatherized and prevented water ingress into the power components. The Power Control Unit has been shown to be the most reliable unit and over the course of the project that component has never needed a unit replaced. The Power Control Unit contains the software that runs the system, and functions largely as the brains of the system. Over the course of the project a variety of supplier issues were also discovered which impacted customer experience despite not being part of the core technology demonstrated. For example, the first batch of coolant pumps used on the vehicles were defective due to a manufacturing flaw from our supplier, after discovering the issue from field failures, steps were taken to replace all the coolant pumps to working units and since then reliability has improved.
The most replaced component in the system has been the 12v battery. Due to accessory power usage draining the 12v, this has been the first point of failure similar to in passenger cars. Improvements in software to recharge these batteries from the larger high-voltage Fiamm batteries has improved their reliability. The HVAC refrigerant lines on the vehicles have had issues with leaking that required changing the lines and repair of the lines. This has increased the maintenance costs on the vehicles; however, these lines are not unique to the electric vehicle and are on gasoline vehicles as well. Overall the consistent monitoring, preventative maintenance, diagnosing and replacing of supplier units, and offering both hardware and software upgrades has enabled a satisfactory customer experience, yet leaves inconclusive data on the lifetime durability of components which have since been updated
Powertrain Efficiency The Motiv Powertrain’s overall powertrain efficiency is about 90-92 percent with the majority of power loss happening in the motor and inverter. The APC which has an efficiency of about 97 percent. The Semikron motor inverters have an efficiency of 92 percent. The charger efficiency has been 90 percent. There are a mixture of hardware and software improvements that have been investigated over the course of the project to improve the efficiency from these levels.
C-31
CHAPTER 2: Assessment of Project Success
Here, we discuss the benefits of the project and analysis related to the work performed, and the degree to which the goals and objectives were achieved.
Benefits Analysis
Petroleum Reduction Based upon the total project mileage, over the course of the project the vehicles were used for 142,000 miles, with the average miles per gallon of the equivalent shuttle bus or work truck at 5 mpg, an estimate of 28,400 gallons of diesel would have been used. If we use the average from 2016, a shuttle on this route travels 18,700 miles annually and would have used 3,700 gallons of diesel per year.
Greenhouse Gas & Criteria Emissions Reductions Based upon the methodology for determining emission reductions and cost-effectiveness in the California Air Resources Board (ARB) Air Quality Improvement Program And Low Carbon Transportation Greenhouse Gas Reduction Fund Investments, the 142,000 miles traveled with a 5 mpg efficiency for diesel vs. 0.67 MPkWh would compare the wells to wheels emissions of 28,400 gallons of diesel vs. 212,000 kWh. Based upon the Carbon Intensity of those fuel types this would be 393 Metric Tons CO2e as compared to 80 Metric Tons CO2e. This would result in 312 Metric Tons CO2e reduced. Based upon the grams per gallon of diesel being 41 for NOx emissions, this would result in 1.3 tons of NOx reduced. The Reactive Organic Gases (ROG) is approximately 2.1 grams per gallon, or 0.07 tons of ROG reduced. And the 1.3 grams per gallon of Particulate Matter would total .04 tons of PM10 reduced.
The Emissions of PM10 are significantly more harmful, hence in this model there is also an annual weighted emission reduction that is calculated by taking the sum of the project's pollutant reductions following formula below: Weighted Emission Reductions = NOx reductions (tons/yr) + ROG reductions (tons/yr) + [20 * (PM reductions (tons/yr)] While emissions of oxides of nitrogen (NOx) and ROG are given equal weight, emissions of particulate matter (PM) carry a greater weight in the calculation. Using the previous annual tons reduced the Weighted Emission Reductions per vehicle would be 2.2 metric tons.
Project Goal Accomplishment While the fleet partners have changed over the course of the project, all the core objectives of the grant have been met from the original applications.
C-32
As originally stated in the application: The goals of the project are:
• Position Detroit Chassis to be ready to take production orders and deliver battery-electric truck chassis at a price compelling to vehicle operators, and position all suppliers to Detroit Chassis (Motiv, EVO Electric, and Lico Technology Corp.) to be ready for production with Detroit Chassis
• Demonstrate the reliability, lifecycle cost, and electric range of the four pre-commercial vehicles in 12-month demonstration period, and that these metrics are satisfactory to the project’s clients and their respective industries
• Demonstrate compelling economics for purchase and operation of these vehicles by the end of the project within the shuttle bus and work truck market segments
• Improve air quality and reduce pollution in the Bay Area and San Joaquin Valley air basins
To accomplish these goals, the project team will: • Have four battery-electric trucks produced and assembled (10 months) • Verify the performance of the zero-emission vehicles and the benefits of Motiv’s
powertrain in a 12-month field application by collecting the following data: o Operating cost data o Emission reduction data o Component, including battery health and status data, which can be used to
infer lifetime and degradation effects, and costs over the vehicle’s 10 year projected life
o Vehicle reliability o Service and maintenance costs
• Use field-collected data and the vehicle’s commercial price to build a compelling economic case study for the purchase of these vehicles, including their payback period of less than 5 years
• Demonstrate over 80,000 miles of emission free driving • Create a production plan for the commercial production of these battery-electric
chassis Going through each of these goals it is clear the project has been successful. “Position Detroit Chassis to be ready to take production orders and deliver battery-electric truck chassis at a price compelling to vehicle operators, and position all suppliers to Detroit Chassis (Motiv, EVO Electric, and Lico Technology Corp.) to be ready for production with Detroit Chassis”
While the partners have all changed, our upfit partner Roush has been positioned and can now take production orders and deliver electrified truck chassis at a price compelling to vehicle operators, and we have positioned all suppliers (Motiv, EVO Electric, and Fiamm) to be ready for production. Proof that this is now the case is that the Motiv Electrified Vehicle Platform is now a ARB approved zero-emission vehicle option and has made commercial sales since this grant began.
C-33
• Demonstrate the reliability, lifecycle cost, and electric range of the four pre-commercial vehicles in 12-month demonstration period, and that these metrics are satisfactory to the project’s clients and their respective industries
This has been done with The City of Mountain View and the City of Santa Ana. While some of the data is inadequate to do a full lifecycle analysis, both customers have been satisfied and are using the vehicles in their operations. Further proof of satisfaction in their respective industries can be seen by the purchase of additional shuttles to enhance their service, and the highly positive user feedback of the shuttle system.
• Demonstrate compelling economics for purchase and operation of these vehicles by the end of the project within the shuttle bus and work truck market segments
Based upon the calculated savings of $120,000 annually in fuel costs, a shuttle application was show to have significant savings which would cover the additional capital expenses within 2 years of operation. The work truck application had much fewer miles and a lack of comprehensive data, thus fuel savings would not be enough to justify that market segment at this time unless the fleet had more regular vehicle usage in line closer to the mileage at which the shuttle segment operates.
• Improve air quality and reduce pollution in the Bay Area and San Joaquin Valley air basins
Through reduction of fossil fuels burned, this project has led to at least 312 Metric Tons CO2e reduced, 1.3 tons of NOx reduced, 0.07 tons of ROG reduced, and 0.04 tons of PM10 reduced. This number could however be even greater as the over 150,000 riders also used a zero-emission vehicle to get around the city, reducing single occupancy vehicle usage and any emissions cause by those vehicles and added congestion from such vehicle usage. In addition to the goals, Motiv outlined the steps needed to accomplish those actions and was successful in meeting those steps as well. Over the course of the project Motiv:
• Produced and assembled four battery-electric trucks • Verified the performance of the zero-emission vehicles and the benefits of Motiv’s
powertrain in a 12-month field application by collecting the data described above. • Used field-collected data and the vehicle’s commercial price to build a compelling
economic case study for the purchase of these vehicles, including their payback period of less than 5 years
• Demonstrated over 80,000 miles of emission free driving (142,000 miles) • Created a production plan for the commercial production of these battery-electric
chassis
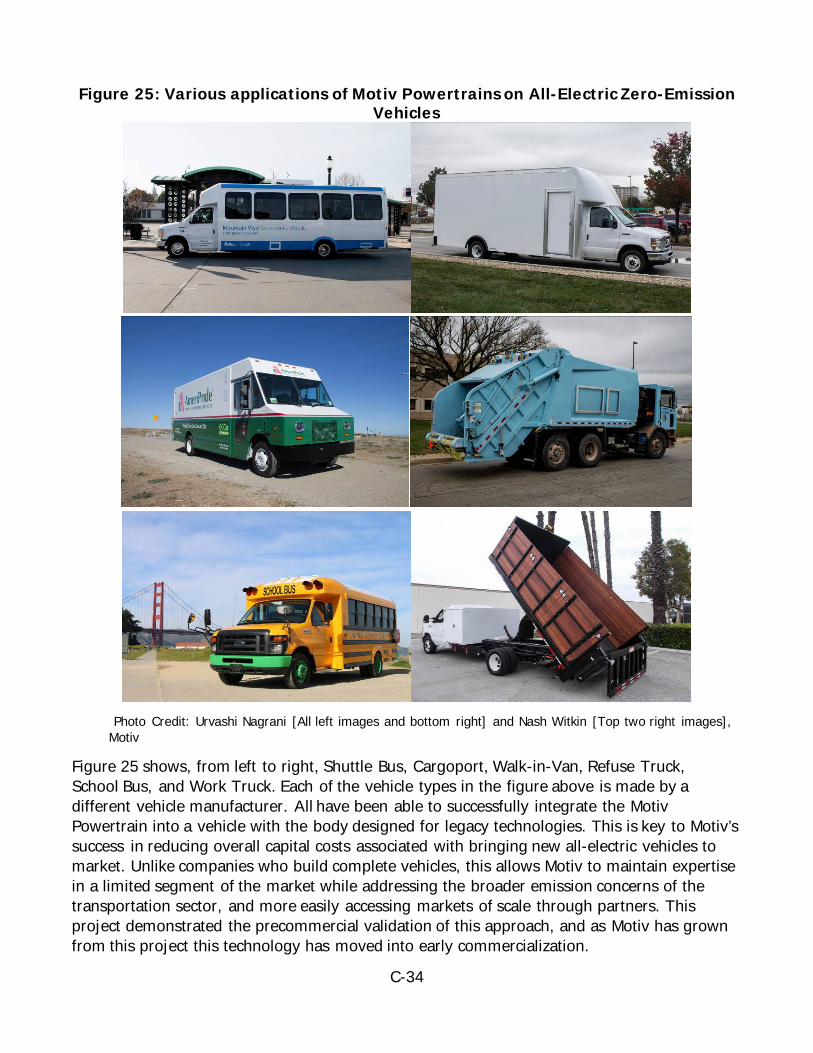
C-34
Figure 25: Various applications of Motiv Powertrains on All-Electric Zero-Emission Vehicles
Photo Credit: Urvashi Nagrani [All left images and bottom right] and Nash Witkin [Top two right images],
Motiv
Figure 25 shows, from left to right, Shuttle Bus, Cargoport, Walk-in-Van, Refuse Truck, School Bus, and Work Truck. Each of the vehicle types in the figure above is made by a different vehicle manufacturer. All have been able to successfully integrate the Motiv Powertrain into a vehicle with the body designed for legacy technologies. This is key to Motiv’s success in reducing overall capital costs associated with bringing new all-electric vehicles to market. Unlike companies who build complete vehicles, this allows Motiv to maintain expertise in a limited segment of the market while addressing the broader emission concerns of the transportation sector, and more easily accessing markets of scale through partners. This project demonstrated the precommercial validation of this approach, and as Motiv has grown from this project this technology has moved into early commercialization.
C-35
CHAPTER 3: Conclusions and Recommendations
Summary of Results This project successfully achieved Motiv’s goals. Despite project modifications to include new partners, staff achieved all defined objectives. The four vehicles involved in the project over the course of the grant were used for 142,000 miles, and this project led to a reduction of at least 312 Metric Tons of CO2e, 1.3 tons of NOx, 0.07 tons of ROG, and 0.04 tons of PM10.
Conclusions and Recommendations Based upon the project success Motiv staff believes this project will help the next generation of technology providers as they continue to demonstrate pre-commercial technologies, in field conditions, here in California. Full commercialization will lead to the actualization of emission reduction targets, air quality improvement, and economic development within the State of California, and this market is still in its infancy. To grow to its full potential there are a variety of areas that can support technology providers to reduce the time between pre-commercial proof of concept to market viability. Motiv’s suggestions on how to best do this as well as analysis detailing how we arrived at this suggestion are discussed below.
Accessory System Integration Field data showed that accessory systems outside of the emerging technology were often the cause of lost service days. Accessory components such as the hydraulic cooling pumps and HVAC units were key barriers to early customer satisfaction and required more engineering time than initially planned. While the Motiv Powertrain could easily power the vehicles, the heating and cooling needs of passenger vehicles, and some of the auxiliary systems for work trucks require components that are not yet ruggedized and/or have few suppliers. The lack of options on high powered components has been a barrier to providing the same quality level fleets expect, and is a barrier to growing the portfolio of zero-emissions vehicle offerings. The powertrain performance only accounts for the driving needs of fleets, and with the diversity of truck and bus applications, development of more robust accessories would reduce that barrier. This is a key ingredient to market viability of the technology beyond the base vehicle technology.
Furthermore, systems like air conditioning and hydraulic motors for accessory functions require substantial engineering integration efforts, and such components and the function of integrating them into existing vehicle platforms are both areas which need further development. In addition, test accessories which impact the performance of work vehicles will be needed to bring zero-emission offerings into many duty cycles. Until the accessory system components are scaled, ruggedized, and tested in the field, powertrain solutions will be limited to applications such as delivery where the vehicle’s driving performance is the key use to productive commercial applications.
C-36
Streamlining Compliance Mechanisms Certification of Zero-Emissions vehicles is an evolving process. While the lack of emissions means no such certification is needed to sell a vehicle in California, to be eligible for programs such as The California Hybrid and Zero-Emission Truck and Bus Voucher Incentive Project , vehicles must receive a letter from ARB indicating the vehicle itself is zero-emission. Within this last calendar year, the process has continued to evolve and streamlining compliance measures would allow companies working on emerging technologies to focus their limited resources on product development vs. program compliance. This issue was discovered during the project when the City of Mountain View wanted an additional two shuttles for the service and needed to wait for the approval letter to access funding needed to expand the service. While it wasn’t a barrier to the specific vehicles for this project, it did impact customer impression of the barriers to get the technology, and took fleet resources that wouldn’t be needed for a fossil fueled counterpart.
Increase Testing As clean technologies evolve, there is a gap between the steps of the pipeline which include R&D level research, initial deployments, and large pilots. Customer feedback showed there were opportunities to revisit initial component design to make better components based on service needs. Improvement of tools, cable accessibility, and other suggestions can take significant engineering resources to integrate into the design of the powertrain. Design improvements can lead to greater efficiencies, cost reductions in the end product, and better serve both customer fleets and the communities in which they operate; however, the cost of design improvements can be high. Small companies who are using grants often cannot afford immediate design improvements, and so they delay such improvements. The result is that more early-design-stage products get on the road, which may ultimately become a liability.
Given the state’s long-term interest in high quality zero-emission offerings which can beat diesel products in both price and performance without incentives, additional design improvements and testing would help ensure technology progresses to a place where it’s truly viable. Based on its learning, Motiv would challenge all young companies to test as vigorously as fossil fuel counterparts. Better-developed and better-tested products would help early fleet adopters seeking alternative fuels find better, more reliable and robust solutions. Better products make the difference between a one-time demonstration customer and a recurring customer who scales up their clean air efforts.
Infrastructure Must Be Considered During this project, infrastructure costs were not a key barrier thanks in large part to Google sponsoring the shuttle operations, and having chargers installed on their facility. However, having a large company with significant assets available in both facility and finances is not normal in areas with poor air quality. The more disadvantaged communities in California have significantly older facilities where power limitations and the cost of upgrades can be a barrier to selecting a zero-emission electric vehicle. While working with potential fleets, a key barrier to selecting a zero-emission electric vehicle we encountered, was the cost of upgrading facilities to account for the charging needs. Due to
C-37
the vehicle costs and without enough advanced budgeting for infrastructure, it made sense to select a fleet partner who had access to more resources to prevent project delays. Beyond the cost of the charge station, fleets in disadvantaged communities also had to account for older facilities with less power in the building than modern industrial spaces. While incentives such as HVIP help with the vehicle side once a product is commercialized, there is currently less assistance with industrial charging infrastructure, and many programs for charge stations specifically focus on residential light duty needs. This demand-side concern can range from an additional $5,000 for a charger only in an area with adequate power access to hundreds of thousands of dollars for new substations, trenching, wiring, and construction costs.
Demonstration Vehicles Are Needed As the project progressed many clean cities coalitions, air districts, fleets, prospective customers, and government agencies requested the ability to have a shuttle demonstrated or brought to their event to show to key stakeholders. While this level of interest is key to expanding the market for zero-emission vehicles, we were unable to meet these needs using the vehicles in this project as the shuttles were needed in service in order to fulfill their fleet obligations. The benefit of real world fleet engagement which aided engineers in getting better feedback during the development process, was also the barrier to showcasing the new and improved technologies to other audiences. If California is going to meet our air quality goals, we will need vehicles that fleets can try out, have their drivers take out for test drives on their own routes, and see in trade shows while planning procurement. This hands-on experience is key for fleet managers and decision makers to see the technology as truly viable.
These five recommendations would contribute to building stronger products with a pipeline to communities that need clean technologies the most.
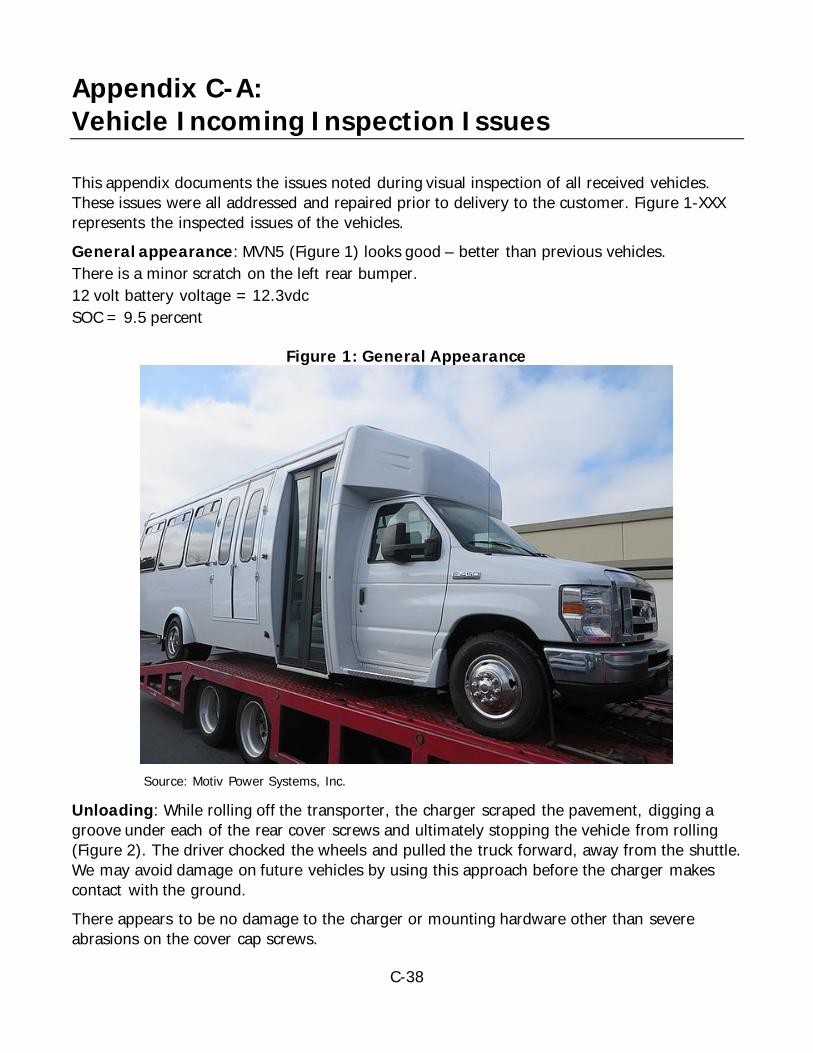
C-38
Appendix C-A: Vehicle Incoming Inspection Issues
This appendix documents the issues noted during visual inspection of all received vehicles. These issues were all addressed and repaired prior to delivery to the customer. Figure 1-XXX represents the inspected issues of the vehicles. General appearance: MVN5 (Figure 1) looks good – better than previous vehicles. There is a minor scratch on the left rear bumper. 12 volt battery voltage = 12.3vdc SOC = 9.5 percent
Figure 1: General Appearance
Source: Motiv Power Systems, Inc.
Unloading: While rolling off the transporter, the charger scraped the pavement, digging a groove under each of the rear cover screws and ultimately stopping the vehicle from rolling (Figure 2). The driver chocked the wheels and pulled the truck forward, away from the shuttle. We may avoid damage on future vehicles by using this approach before the charger makes contact with the ground. There appears to be no damage to the charger or mounting hardware other than severe abrasions on the cover cap screws.

C-39
Figure 2: Scratches of Batter and Pavement when Unloading
Source: Motiv Power Systems, Inc.
Figure 3: Inside Inspection
Source: Motiv Power Systems, Inc.
General: The luggage rack prevents removing the doghouse (Figure 3). This should be left unattached at the factory

C-40
Under Dash:
Figure 4: Behind Cover Panel
Source: Motiv Power Systems, Inc.
Issues found under dash behind cover panel (Figure 4): • A brown believed to be the e-Stop to Power Control Unit wire is bare and
disconnected. • A/C relays well-taped but need to be secured • CAN cable was buried under the driver door frame.
Electrical compartment (over driver): Complete, but metal bits from drilling, etc. not cleaned out (Figure 5).
Figure 5: Electrical compartment
Source: Motiv Power Systems, Inc.
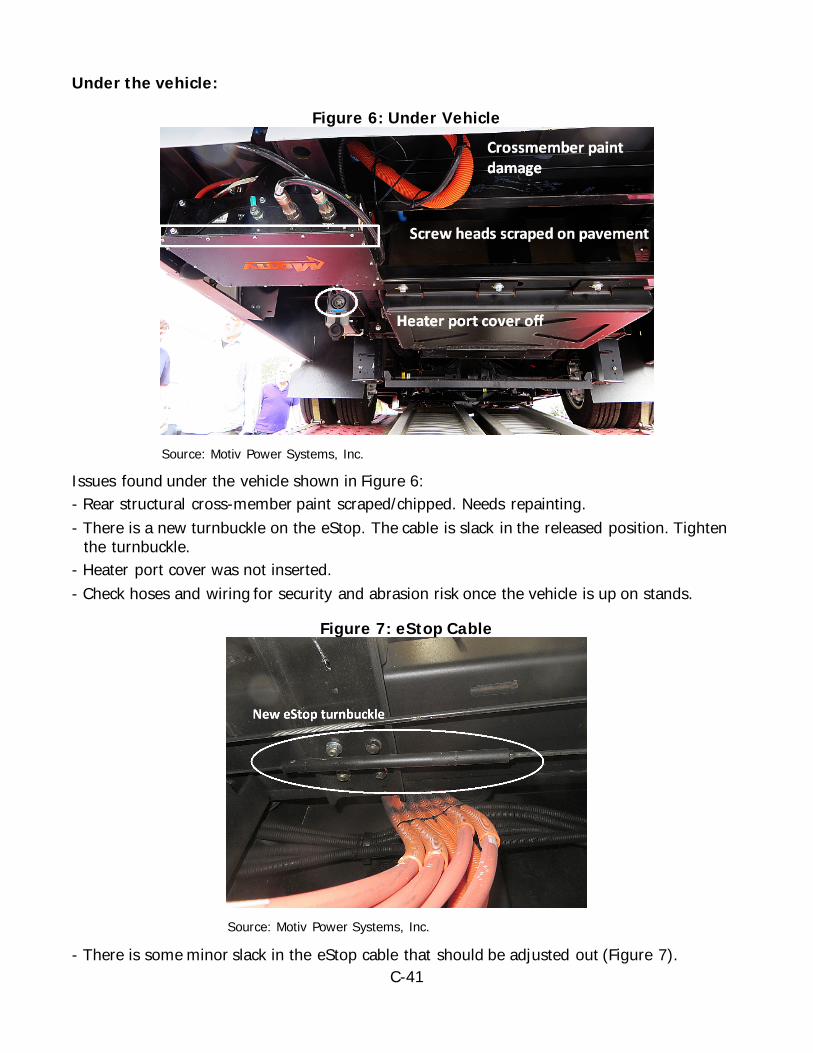
C-41
Under the vehicle:
Figure 6: Under Vehicle
Source: Motiv Power Systems, Inc.
Issues found under the vehicle shown in Figure 6: - Rear structural cross-member paint scraped/chipped. Needs repainting. - There is a new turnbuckle on the eStop. The cable is slack in the released position. Tighten
the turnbuckle. - Heater port cover was not inserted. - Check hoses and wiring for security and abrasion risk once the vehicle is up on stands.
Figure 7: eStop Cable
Source: Motiv Power Systems, Inc.
- There is some minor slack in the eStop cable that should be adjusted out (Figure 7).
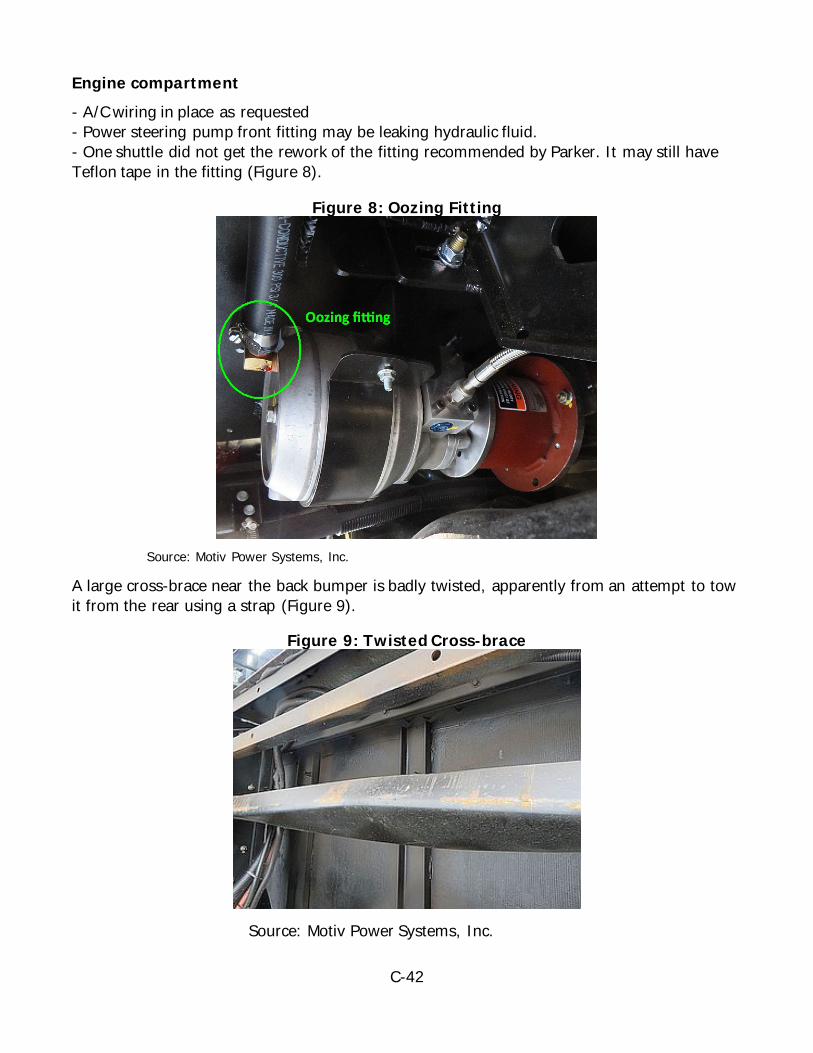
C-42
Engine compartment - A/C wiring in place as requested - Power steering pump front fitting may be leaking hydraulic fluid. - One shuttle did not get the rework of the fitting recommended by Parker. It may still have Teflon tape in the fitting (Figure 8).
Figure 8: Oozing Fitting
Source: Motiv Power Systems, Inc.
A large cross-brace near the back bumper is badly twisted, apparently from an attempt to tow it from the rear using a strap (Figure 9).
Figure 9: Twisted Cross-brace
Source: Motiv Power Systems, Inc.
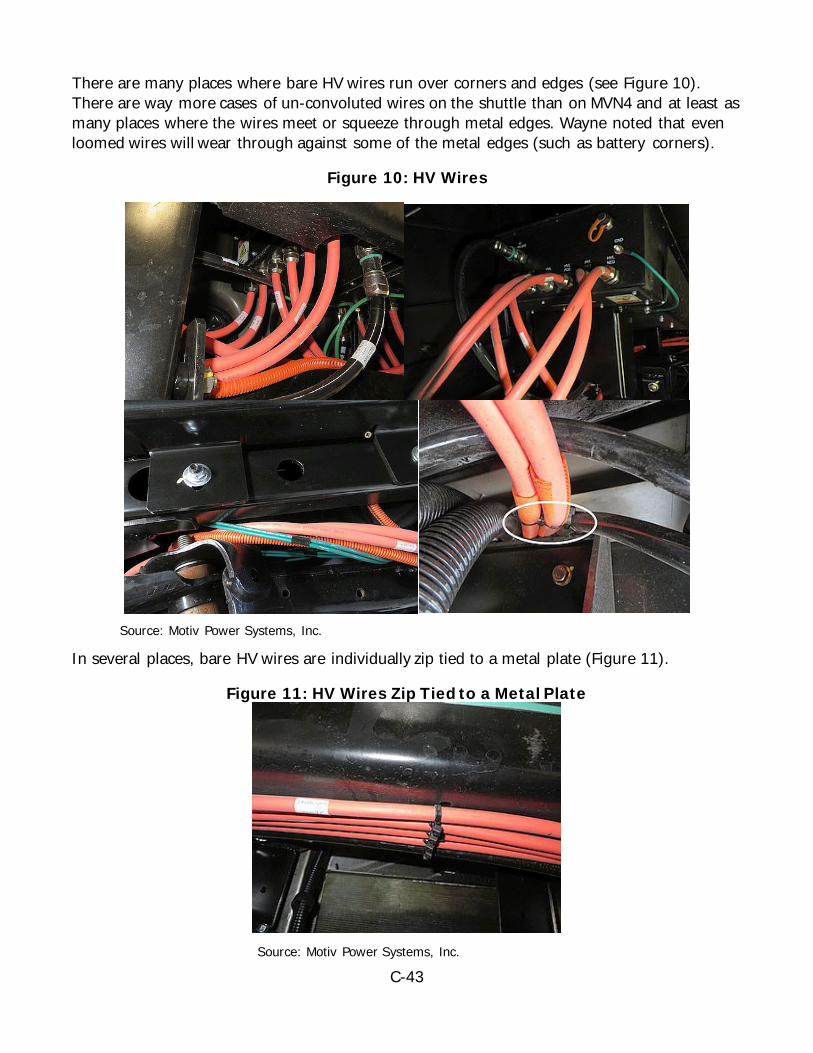
C-43
There are many places where bare HV wires run over corners and edges (see Figure 10). There are way more cases of un-convoluted wires on the shuttle than on MVN4 and at least as many places where the wires meet or squeeze through metal edges. Wayne noted that even loomed wires will wear through against some of the metal edges (such as battery corners).
Figure 10: HV Wires
Source: Motiv Power Systems, Inc.
In several places, bare HV wires are individually zip tied to a metal plate (Figure 11).
Figure 11: HV Wires Zip Tied to a Metal Plate
Source: Motiv Power Systems, Inc.
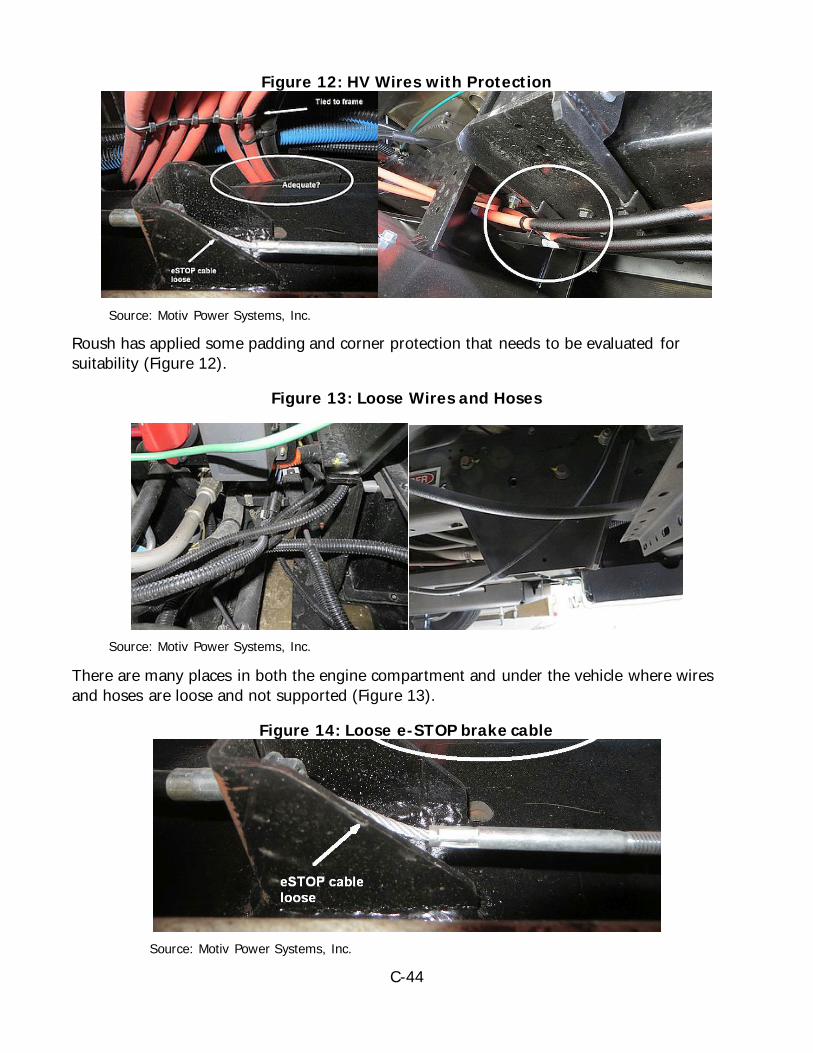
C-44
Figure 12: HV Wires with Protection
Source: Motiv Power Systems, Inc.
Roush has applied some padding and corner protection that needs to be evaluated for suitability (Figure 12).
Figure 13: Loose Wires and Hoses
Source: Motiv Power Systems, Inc.
There are many places in both the engine compartment and under the vehicle where wires and hoses are loose and not supported (Figure 13).
Figure 14: Loose e-STOP brake cable
Source: Motiv Power Systems, Inc.
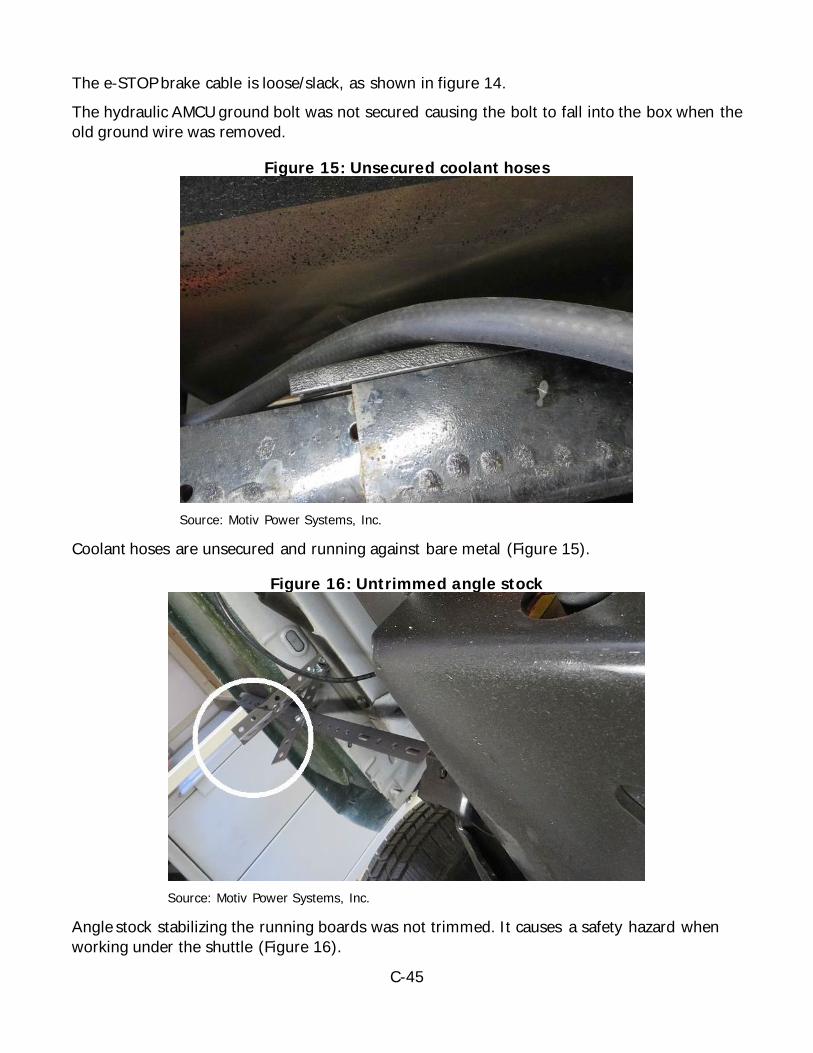
C-45
The e-STOP brake cable is loose/slack, as shown in figure 14. The hydraulic AMCU ground bolt was not secured causing the bolt to fall into the box when the old ground wire was removed.
Figure 15: Unsecured coolant hoses
Source: Motiv Power Systems, Inc.
Coolant hoses are unsecured and running against bare metal (Figure 15).
Figure 16: Untrimmed angle stock
Source: Motiv Power Systems, Inc.
Angle stock stabilizing the running boards was not trimmed. It causes a safety hazard when working under the shuttle (Figure 16).
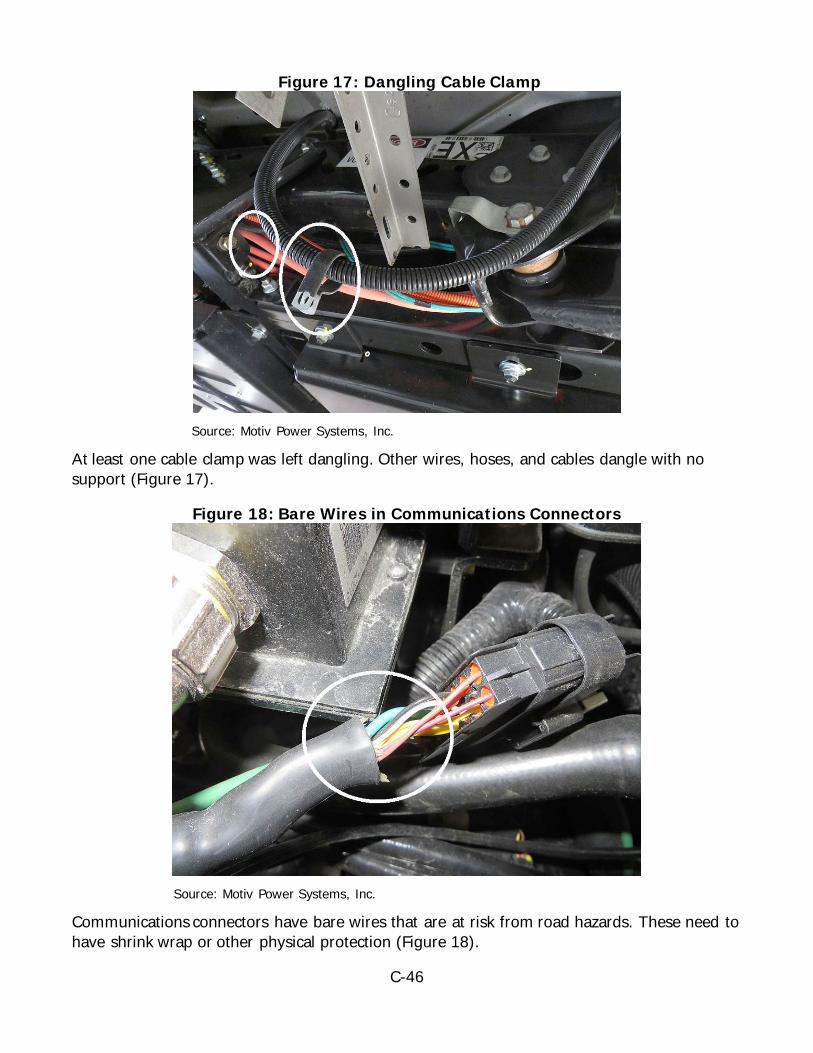
C-46
Figure 17: Dangling Cable Clamp
Source: Motiv Power Systems, Inc.
At least one cable clamp was left dangling. Other wires, hoses, and cables dangle with no support (Figure 17).
Figure 18: Bare Wires in Communications Connectors
Source: Motiv Power Systems, Inc.
Communications connectors have bare wires that are at risk from road hazards. These need to have shrink wrap or other physical protection (Figure 18).
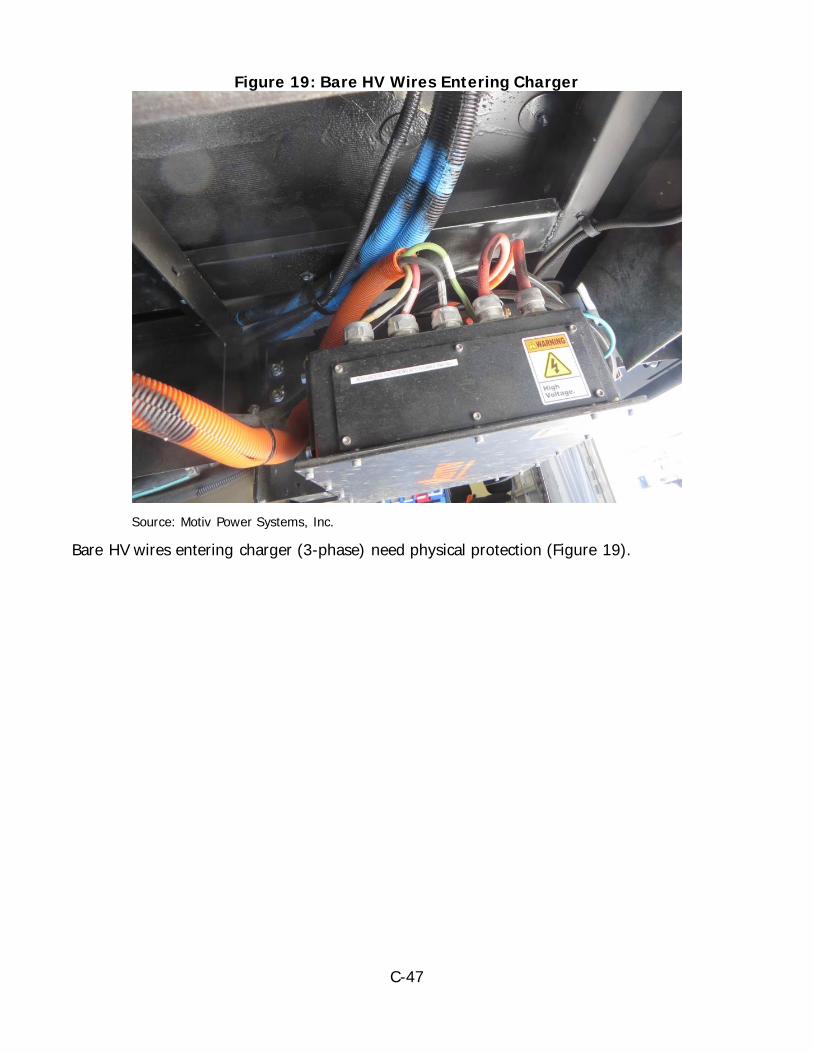
C-47
Figure 19: Bare HV Wires Entering Charger
Source: Motiv Power Systems, Inc.
Bare HV wires entering charger (3-phase) need physical protection (Figure 19).
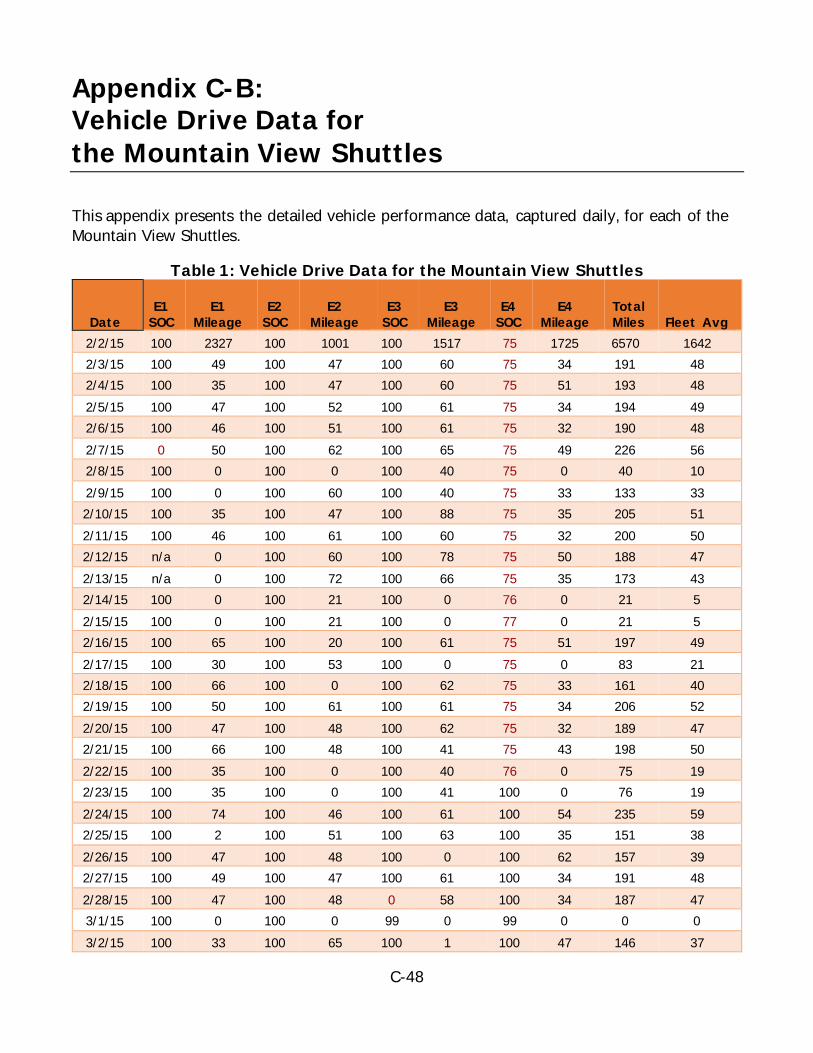
C-48
Appendix C-B: Vehicle Drive Data for the Mountain View Shuttles
This appendix presents the detailed vehicle performance data, captured daily, for each of the Mountain View Shuttles.
Table 1: Vehicle Drive Data for the Mountain View Shuttles
Date E1
SOC E1
Mileage E2
SOC E2
Mileage E3
SOC E3
Mileage E4
SOC E4
Mileage Total Miles Fleet Avg
2/2/15 100 2327 100 1001 100 1517 75 1725 6570 1642 2/3/15 100 49 100 47 100 60 75 34 191 48 2/4/15 100 35 100 47 100 60 75 51 193 48 2/5/15 100 47 100 52 100 61 75 34 194 49 2/6/15 100 46 100 51 100 61 75 32 190 48 2/7/15 0 50 100 62 100 65 75 49 226 56 2/8/15 100 0 100 0 100 40 75 0 40 10 2/9/15 100 0 100 60 100 40 75 33 133 33 2/10/15 100 35 100 47 100 88 75 35 205 51 2/11/15 100 46 100 61 100 60 75 32 200 50 2/12/15 n/a 0 100 60 100 78 75 50 188 47 2/13/15 n/a 0 100 72 100 66 75 35 173 43 2/14/15 100 0 100 21 100 0 76 0 21 5 2/15/15 100 0 100 21 100 0 77 0 21 5 2/16/15 100 65 100 20 100 61 75 51 197 49 2/17/15 100 30 100 53 100 0 75 0 83 21 2/18/15 100 66 100 0 100 62 75 33 161 40 2/19/15 100 50 100 61 100 61 75 34 206 52 2/20/15 100 47 100 48 100 62 75 32 189 47 2/21/15 100 66 100 48 100 41 75 43 198 50 2/22/15 100 35 100 0 100 40 76 0 75 19 2/23/15 100 35 100 0 100 41 100 0 76 19 2/24/15 100 74 100 46 100 61 100 54 235 59 2/25/15 100 2 100 51 100 63 100 35 151 38 2/26/15 100 47 100 48 100 0 100 62 157 39 2/27/15 100 49 100 47 100 61 100 34 191 48 2/28/15 100 47 100 48 0 58 100 34 187 47 3/1/15 100 0 100 0 99 0 99 0 0 0 3/2/15 100 33 100 65 100 1 100 47 146 37
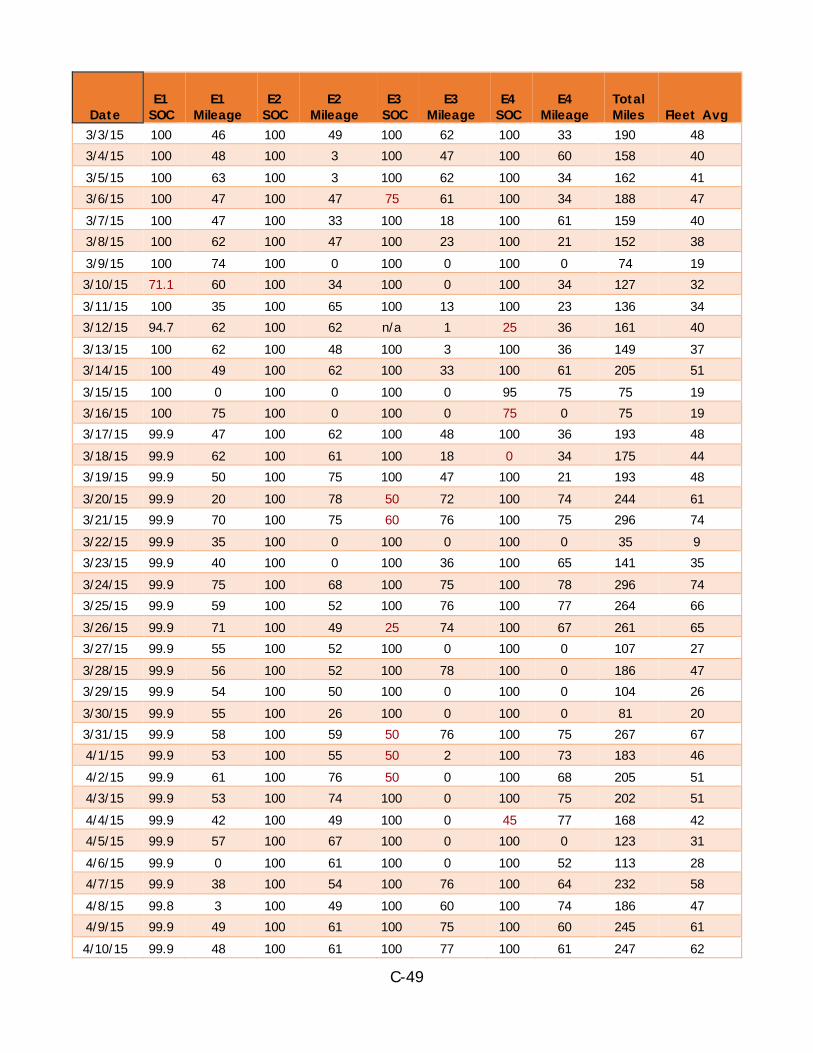
C-49
Date E1
SOC E1
Mileage E2
SOC E2
Mileage E3
SOC E3
Mileage E4
SOC E4
Mileage Total Miles Fleet Avg
3/3/15 100 46 100 49 100 62 100 33 190 48 3/4/15 100 48 100 3 100 47 100 60 158 40 3/5/15 100 63 100 3 100 62 100 34 162 41 3/6/15 100 47 100 47 75 61 100 34 188 47 3/7/15 100 47 100 33 100 18 100 61 159 40 3/8/15 100 62 100 47 100 23 100 21 152 38 3/9/15 100 74 100 0 100 0 100 0 74 19 3/10/15 71.1 60 100 34 100 0 100 34 127 32 3/11/15 100 35 100 65 100 13 100 23 136 34 3/12/15 94.7 62 100 62 n/a 1 25 36 161 40 3/13/15 100 62 100 48 100 3 100 36 149 37 3/14/15 100 49 100 62 100 33 100 61 205 51 3/15/15 100 0 100 0 100 0 95 75 75 19 3/16/15 100 75 100 0 100 0 75 0 75 19 3/17/15 99.9 47 100 62 100 48 100 36 193 48 3/18/15 99.9 62 100 61 100 18 0 34 175 44 3/19/15 99.9 50 100 75 100 47 100 21 193 48 3/20/15 99.9 20 100 78 50 72 100 74 244 61 3/21/15 99.9 70 100 75 60 76 100 75 296 74 3/22/15 99.9 35 100 0 100 0 100 0 35 9 3/23/15 99.9 40 100 0 100 36 100 65 141 35 3/24/15 99.9 75 100 68 100 75 100 78 296 74 3/25/15 99.9 59 100 52 100 76 100 77 264 66 3/26/15 99.9 71 100 49 25 74 100 67 261 65 3/27/15 99.9 55 100 52 100 0 100 0 107 27 3/28/15 99.9 56 100 52 100 78 100 0 186 47 3/29/15 99.9 54 100 50 100 0 100 0 104 26 3/30/15 99.9 55 100 26 100 0 100 0 81 20 3/31/15 99.9 58 100 59 50 76 100 75 267 67 4/1/15 99.9 53 100 55 50 2 100 73 183 46 4/2/15 99.9 61 100 76 50 0 100 68 205 51 4/3/15 99.9 53 100 74 100 0 100 75 202 51 4/4/15 99.9 42 100 49 100 0 45 77 168 42 4/5/15 99.9 57 100 67 100 0 100 0 123 31 4/6/15 99.9 0 100 61 100 0 100 52 113 28 4/7/15 99.9 38 100 54 100 76 100 64 232 58 4/8/15 99.8 3 100 49 100 60 100 74 186 47 4/9/15 99.9 49 100 61 100 75 100 60 245 61 4/10/15 99.9 48 100 61 100 77 100 61 247 62
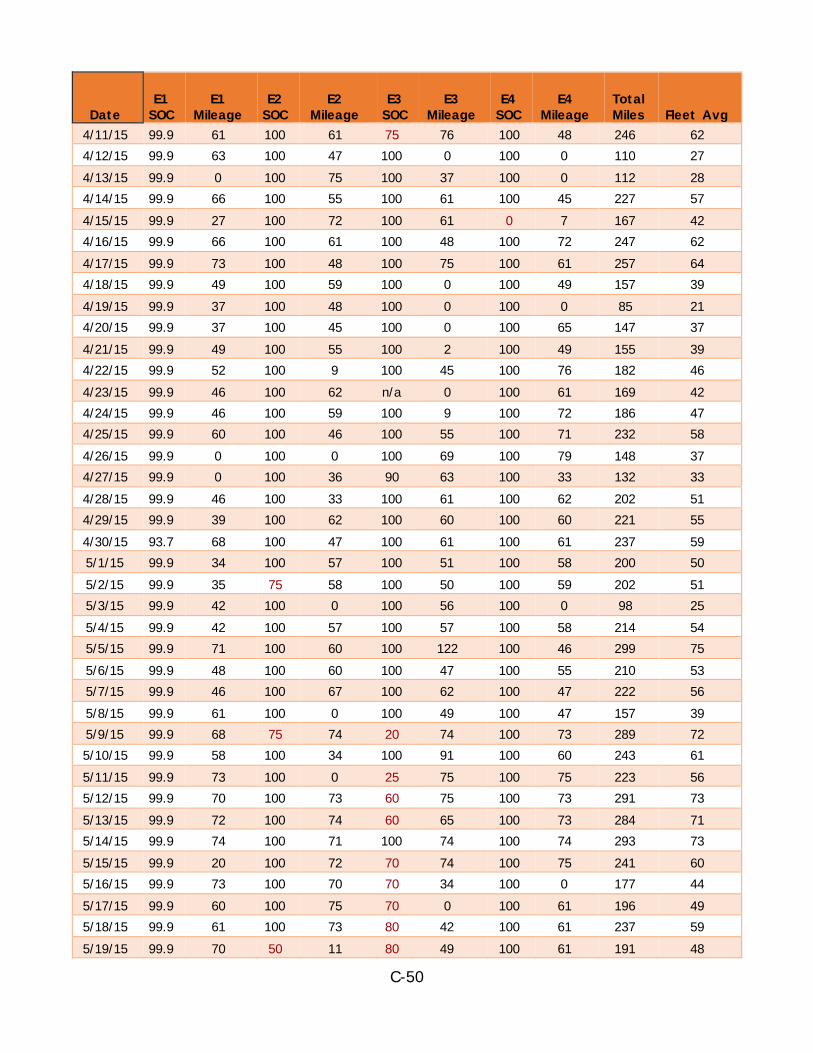
C-50
Date E1
SOC E1
Mileage E2
SOC E2
Mileage E3
SOC E3
Mileage E4
SOC E4
Mileage Total Miles Fleet Avg
4/11/15 99.9 61 100 61 75 76 100 48 246 62 4/12/15 99.9 63 100 47 100 0 100 0 110 27 4/13/15 99.9 0 100 75 100 37 100 0 112 28 4/14/15 99.9 66 100 55 100 61 100 45 227 57 4/15/15 99.9 27 100 72 100 61 0 7 167 42 4/16/15 99.9 66 100 61 100 48 100 72 247 62 4/17/15 99.9 73 100 48 100 75 100 61 257 64 4/18/15 99.9 49 100 59 100 0 100 49 157 39 4/19/15 99.9 37 100 48 100 0 100 0 85 21 4/20/15 99.9 37 100 45 100 0 100 65 147 37 4/21/15 99.9 49 100 55 100 2 100 49 155 39 4/22/15 99.9 52 100 9 100 45 100 76 182 46 4/23/15 99.9 46 100 62 n/a 0 100 61 169 42 4/24/15 99.9 46 100 59 100 9 100 72 186 47 4/25/15 99.9 60 100 46 100 55 100 71 232 58 4/26/15 99.9 0 100 0 100 69 100 79 148 37 4/27/15 99.9 0 100 36 90 63 100 33 132 33 4/28/15 99.9 46 100 33 100 61 100 62 202 51 4/29/15 99.9 39 100 62 100 60 100 60 221 55 4/30/15 93.7 68 100 47 100 61 100 61 237 59 5/1/15 99.9 34 100 57 100 51 100 58 200 50 5/2/15 99.9 35 75 58 100 50 100 59 202 51 5/3/15 99.9 42 100 0 100 56 100 0 98 25 5/4/15 99.9 42 100 57 100 57 100 58 214 54 5/5/15 99.9 71 100 60 100 122 100 46 299 75 5/6/15 99.9 48 100 60 100 47 100 55 210 53 5/7/15 99.9 46 100 67 100 62 100 47 222 56 5/8/15 99.9 61 100 0 100 49 100 47 157 39 5/9/15 99.9 68 75 74 20 74 100 73 289 72 5/10/15 99.9 58 100 34 100 91 100 60 243 61 5/11/15 99.9 73 100 0 25 75 100 75 223 56 5/12/15 99.9 70 100 73 60 75 100 73 291 73 5/13/15 99.9 72 100 74 60 65 100 73 284 71 5/14/15 99.9 74 100 71 100 74 100 74 293 73 5/15/15 99.9 20 100 72 70 74 100 75 241 60 5/16/15 99.9 73 100 70 70 34 100 0 177 44 5/17/15 99.9 60 100 75 70 0 100 61 196 49 5/18/15 99.9 61 100 73 80 42 100 61 237 59 5/19/15 99.9 70 50 11 80 49 100 61 191 48
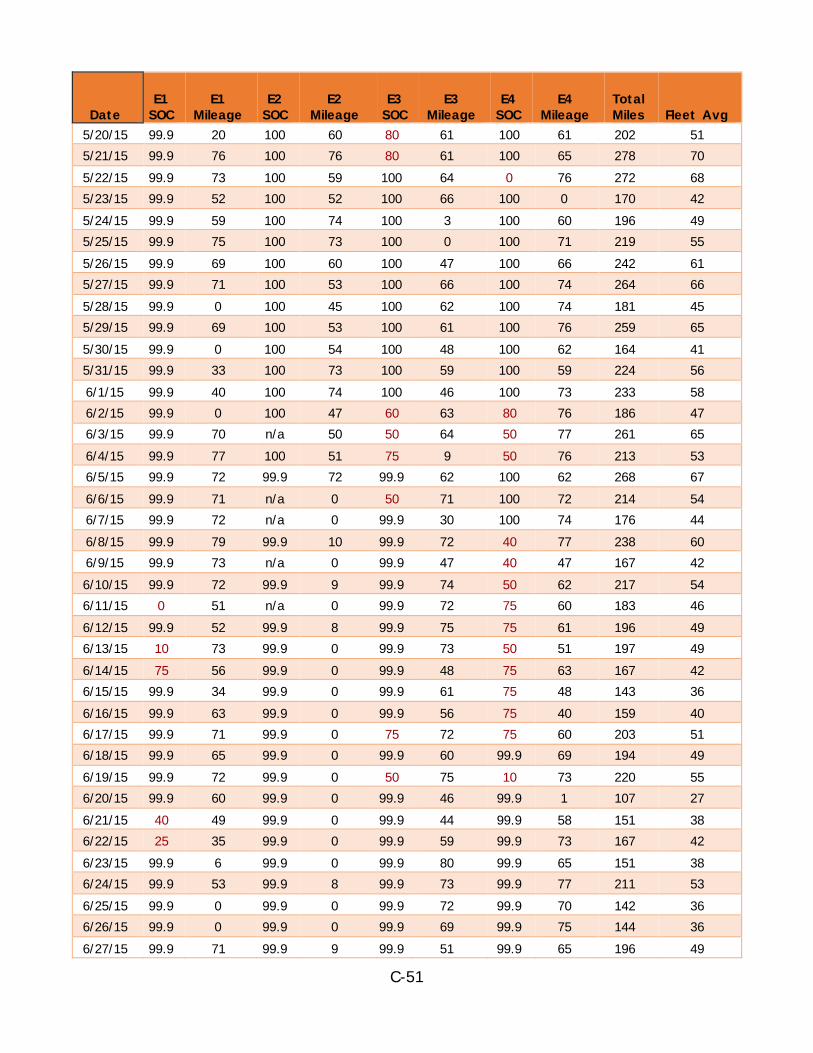
C-51
Date E1
SOC E1
Mileage E2
SOC E2
Mileage E3
SOC E3
Mileage E4
SOC E4
Mileage Total Miles Fleet Avg
5/20/15 99.9 20 100 60 80 61 100 61 202 51 5/21/15 99.9 76 100 76 80 61 100 65 278 70 5/22/15 99.9 73 100 59 100 64 0 76 272 68 5/23/15 99.9 52 100 52 100 66 100 0 170 42 5/24/15 99.9 59 100 74 100 3 100 60 196 49 5/25/15 99.9 75 100 73 100 0 100 71 219 55 5/26/15 99.9 69 100 60 100 47 100 66 242 61 5/27/15 99.9 71 100 53 100 66 100 74 264 66 5/28/15 99.9 0 100 45 100 62 100 74 181 45 5/29/15 99.9 69 100 53 100 61 100 76 259 65 5/30/15 99.9 0 100 54 100 48 100 62 164 41 5/31/15 99.9 33 100 73 100 59 100 59 224 56 6/1/15 99.9 40 100 74 100 46 100 73 233 58 6/2/15 99.9 0 100 47 60 63 80 76 186 47 6/3/15 99.9 70 n/a 50 50 64 50 77 261 65 6/4/15 99.9 77 100 51 75 9 50 76 213 53 6/5/15 99.9 72 99.9 72 99.9 62 100 62 268 67 6/6/15 99.9 71 n/a 0 50 71 100 72 214 54 6/7/15 99.9 72 n/a 0 99.9 30 100 74 176 44 6/8/15 99.9 79 99.9 10 99.9 72 40 77 238 60 6/9/15 99.9 73 n/a 0 99.9 47 40 47 167 42 6/10/15 99.9 72 99.9 9 99.9 74 50 62 217 54 6/11/15 0 51 n/a 0 99.9 72 75 60 183 46 6/12/15 99.9 52 99.9 8 99.9 75 75 61 196 49 6/13/15 10 73 99.9 0 99.9 73 50 51 197 49 6/14/15 75 56 99.9 0 99.9 48 75 63 167 42 6/15/15 99.9 34 99.9 0 99.9 61 75 48 143 36 6/16/15 99.9 63 99.9 0 99.9 56 75 40 159 40 6/17/15 99.9 71 99.9 0 75 72 75 60 203 51 6/18/15 99.9 65 99.9 0 99.9 60 99.9 69 194 49 6/19/15 99.9 72 99.9 0 50 75 10 73 220 55 6/20/15 99.9 60 99.9 0 99.9 46 99.9 1 107 27 6/21/15 40 49 99.9 0 99.9 44 99.9 58 151 38 6/22/15 25 35 99.9 0 99.9 59 99.9 73 167 42 6/23/15 99.9 6 99.9 0 99.9 80 99.9 65 151 38 6/24/15 99.9 53 99.9 8 99.9 73 99.9 77 211 53 6/25/15 99.9 0 99.9 0 99.9 72 99.9 70 142 36 6/26/15 99.9 0 99.9 0 99.9 69 99.9 75 144 36 6/27/15 99.9 71 99.9 9 99.9 51 99.9 65 196 49
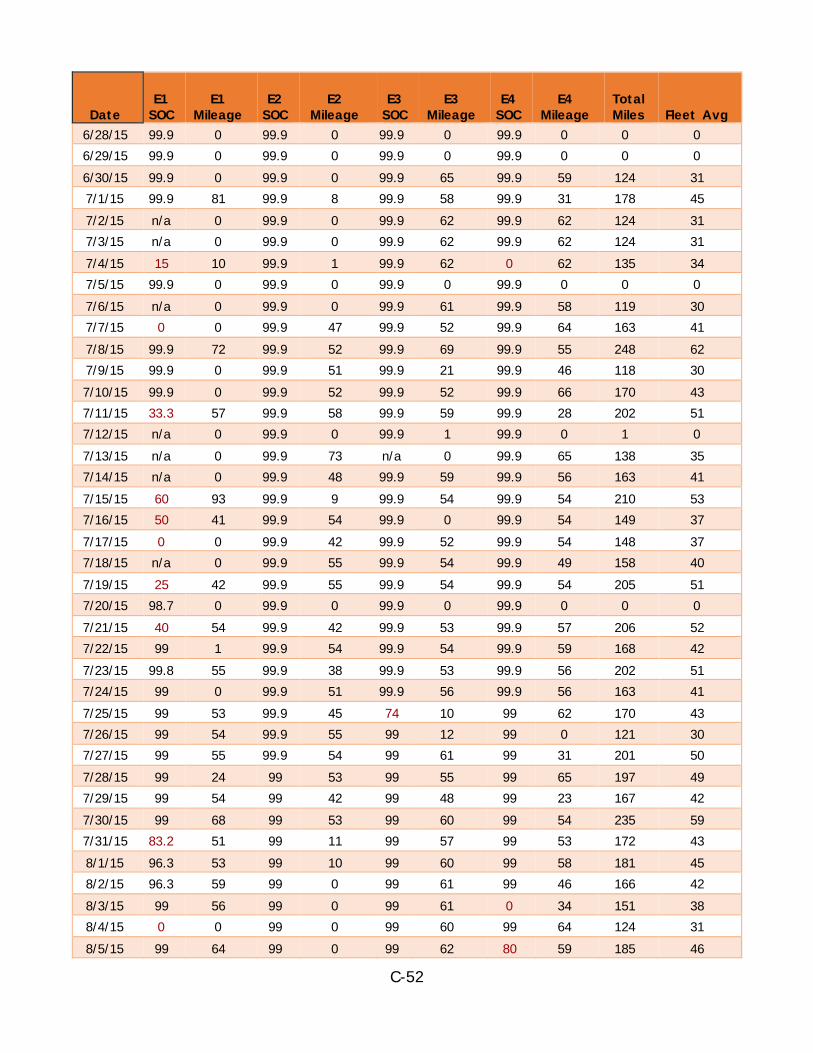
C-52
Date E1
SOC E1
Mileage E2
SOC E2
Mileage E3
SOC E3
Mileage E4
SOC E4
Mileage Total Miles Fleet Avg
6/28/15 99.9 0 99.9 0 99.9 0 99.9 0 0 0 6/29/15 99.9 0 99.9 0 99.9 0 99.9 0 0 0 6/30/15 99.9 0 99.9 0 99.9 65 99.9 59 124 31 7/1/15 99.9 81 99.9 8 99.9 58 99.9 31 178 45 7/2/15 n/a 0 99.9 0 99.9 62 99.9 62 124 31 7/3/15 n/a 0 99.9 0 99.9 62 99.9 62 124 31 7/4/15 15 10 99.9 1 99.9 62 0 62 135 34 7/5/15 99.9 0 99.9 0 99.9 0 99.9 0 0 0 7/6/15 n/a 0 99.9 0 99.9 61 99.9 58 119 30 7/7/15 0 0 99.9 47 99.9 52 99.9 64 163 41 7/8/15 99.9 72 99.9 52 99.9 69 99.9 55 248 62 7/9/15 99.9 0 99.9 51 99.9 21 99.9 46 118 30 7/10/15 99.9 0 99.9 52 99.9 52 99.9 66 170 43 7/11/15 33.3 57 99.9 58 99.9 59 99.9 28 202 51 7/12/15 n/a 0 99.9 0 99.9 1 99.9 0 1 0 7/13/15 n/a 0 99.9 73 n/a 0 99.9 65 138 35 7/14/15 n/a 0 99.9 48 99.9 59 99.9 56 163 41 7/15/15 60 93 99.9 9 99.9 54 99.9 54 210 53 7/16/15 50 41 99.9 54 99.9 0 99.9 54 149 37 7/17/15 0 0 99.9 42 99.9 52 99.9 54 148 37 7/18/15 n/a 0 99.9 55 99.9 54 99.9 49 158 40 7/19/15 25 42 99.9 55 99.9 54 99.9 54 205 51 7/20/15 98.7 0 99.9 0 99.9 0 99.9 0 0 0 7/21/15 40 54 99.9 42 99.9 53 99.9 57 206 52 7/22/15 99 1 99.9 54 99.9 54 99.9 59 168 42 7/23/15 99.8 55 99.9 38 99.9 53 99.9 56 202 51 7/24/15 99 0 99.9 51 99.9 56 99.9 56 163 41 7/25/15 99 53 99.9 45 74 10 99 62 170 43 7/26/15 99 54 99.9 55 99 12 99 0 121 30 7/27/15 99 55 99.9 54 99 61 99 31 201 50 7/28/15 99 24 99 53 99 55 99 65 197 49 7/29/15 99 54 99 42 99 48 99 23 167 42 7/30/15 99 68 99 53 99 60 99 54 235 59 7/31/15 83.2 51 99 11 99 57 99 53 172 43 8/1/15 96.3 53 99 10 99 60 99 58 181 45 8/2/15 96.3 59 99 0 99 61 99 46 166 42 8/3/15 99 56 99 0 99 61 0 34 151 38 8/4/15 0 0 99 0 99 60 99 64 124 31 8/5/15 99 64 99 0 99 62 80 59 185 46
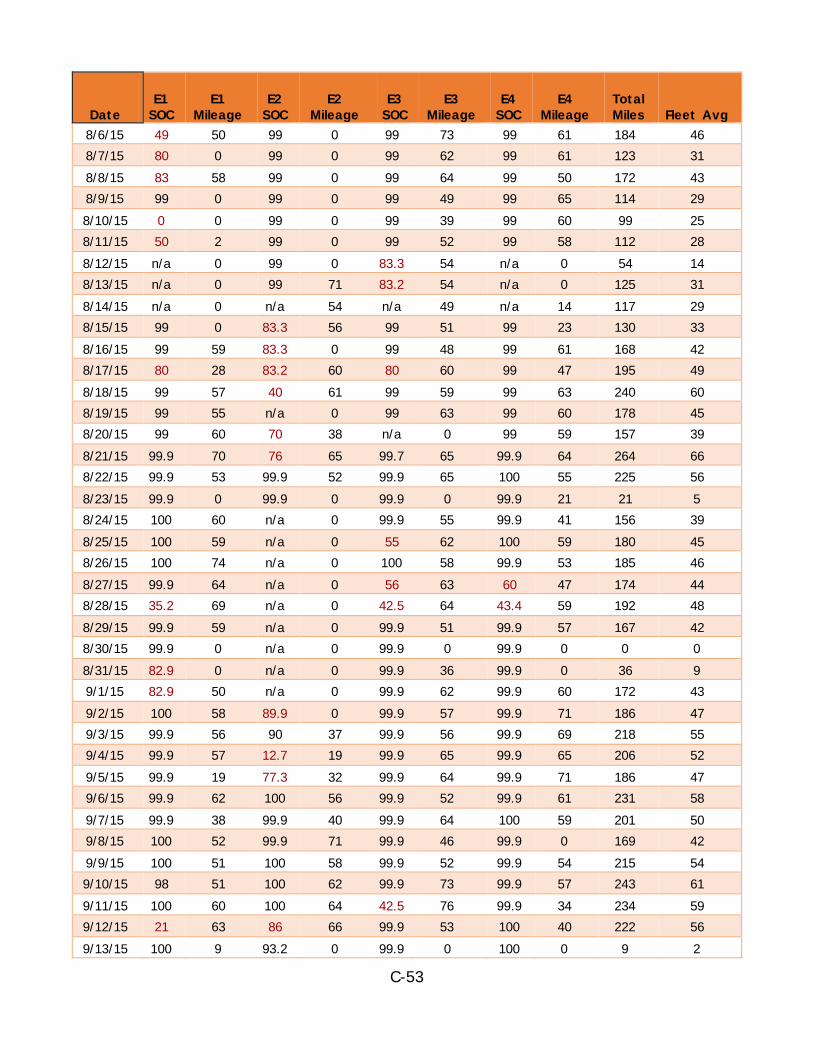
C-53
Date E1
SOC E1
Mileage E2
SOC E2
Mileage E3
SOC E3
Mileage E4
SOC E4
Mileage Total Miles Fleet Avg
8/6/15 49 50 99 0 99 73 99 61 184 46 8/7/15 80 0 99 0 99 62 99 61 123 31 8/8/15 83 58 99 0 99 64 99 50 172 43 8/9/15 99 0 99 0 99 49 99 65 114 29 8/10/15 0 0 99 0 99 39 99 60 99 25 8/11/15 50 2 99 0 99 52 99 58 112 28 8/12/15 n/a 0 99 0 83.3 54 n/a 0 54 14 8/13/15 n/a 0 99 71 83.2 54 n/a 0 125 31 8/14/15 n/a 0 n/a 54 n/a 49 n/a 14 117 29 8/15/15 99 0 83.3 56 99 51 99 23 130 33 8/16/15 99 59 83.3 0 99 48 99 61 168 42 8/17/15 80 28 83.2 60 80 60 99 47 195 49 8/18/15 99 57 40 61 99 59 99 63 240 60 8/19/15 99 55 n/a 0 99 63 99 60 178 45 8/20/15 99 60 70 38 n/a 0 99 59 157 39 8/21/15 99.9 70 76 65 99.7 65 99.9 64 264 66 8/22/15 99.9 53 99.9 52 99.9 65 100 55 225 56 8/23/15 99.9 0 99.9 0 99.9 0 99.9 21 21 5 8/24/15 100 60 n/a 0 99.9 55 99.9 41 156 39 8/25/15 100 59 n/a 0 55 62 100 59 180 45 8/26/15 100 74 n/a 0 100 58 99.9 53 185 46 8/27/15 99.9 64 n/a 0 56 63 60 47 174 44 8/28/15 35.2 69 n/a 0 42.5 64 43.4 59 192 48 8/29/15 99.9 59 n/a 0 99.9 51 99.9 57 167 42 8/30/15 99.9 0 n/a 0 99.9 0 99.9 0 0 0 8/31/15 82.9 0 n/a 0 99.9 36 99.9 0 36 9 9/1/15 82.9 50 n/a 0 99.9 62 99.9 60 172 43 9/2/15 100 58 89.9 0 99.9 57 99.9 71 186 47 9/3/15 99.9 56 90 37 99.9 56 99.9 69 218 55 9/4/15 99.9 57 12.7 19 99.9 65 99.9 65 206 52 9/5/15 99.9 19 77.3 32 99.9 64 99.9 71 186 47 9/6/15 99.9 62 100 56 99.9 52 99.9 61 231 58 9/7/15 99.9 38 99.9 40 99.9 64 100 59 201 50 9/8/15 100 52 99.9 71 99.9 46 99.9 0 169 42 9/9/15 100 51 100 58 99.9 52 99.9 54 215 54 9/10/15 98 51 100 62 99.9 73 99.9 57 243 61 9/11/15 100 60 100 64 42.5 76 99.9 34 234 59 9/12/15 21 63 86 66 99.9 53 100 40 222 56 9/13/15 100 9 93.2 0 99.9 0 100 0 9 2
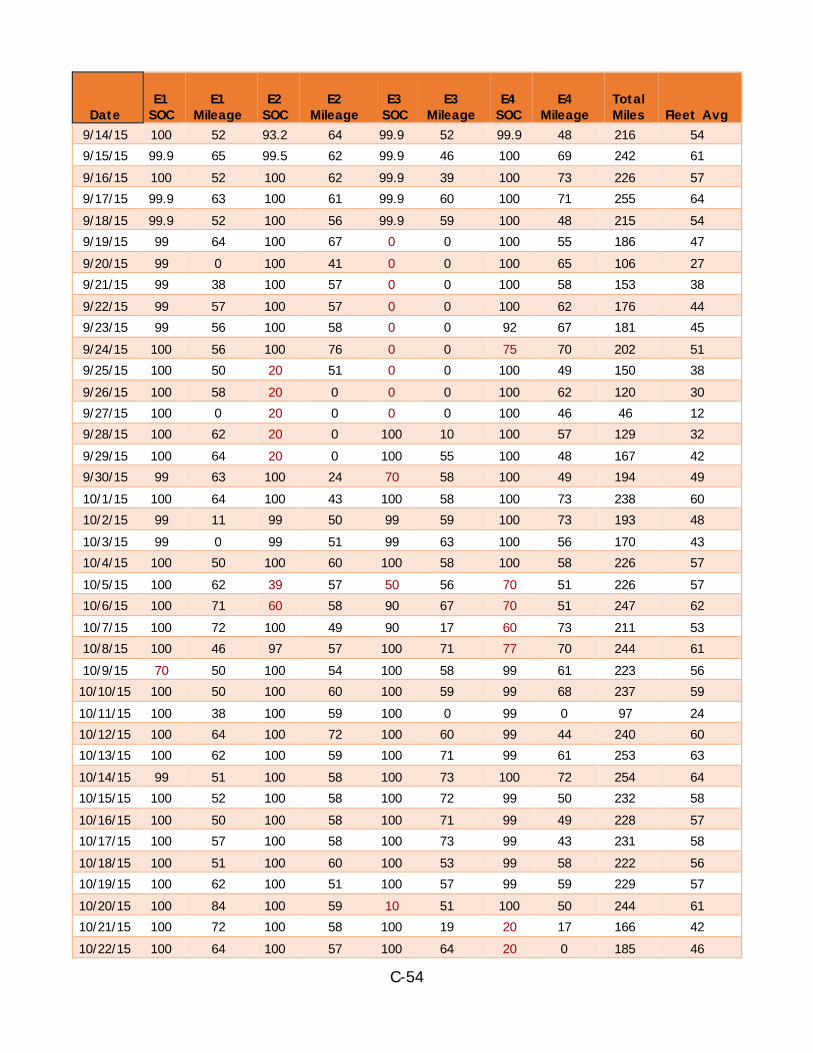
C-54
Date E1
SOC E1
Mileage E2
SOC E2
Mileage E3
SOC E3
Mileage E4
SOC E4
Mileage Total Miles Fleet Avg
9/14/15 100 52 93.2 64 99.9 52 99.9 48 216 54 9/15/15 99.9 65 99.5 62 99.9 46 100 69 242 61 9/16/15 100 52 100 62 99.9 39 100 73 226 57 9/17/15 99.9 63 100 61 99.9 60 100 71 255 64 9/18/15 99.9 52 100 56 99.9 59 100 48 215 54 9/19/15 99 64 100 67 0 0 100 55 186 47 9/20/15 99 0 100 41 0 0 100 65 106 27 9/21/15 99 38 100 57 0 0 100 58 153 38 9/22/15 99 57 100 57 0 0 100 62 176 44 9/23/15 99 56 100 58 0 0 92 67 181 45 9/24/15 100 56 100 76 0 0 75 70 202 51 9/25/15 100 50 20 51 0 0 100 49 150 38 9/26/15 100 58 20 0 0 0 100 62 120 30 9/27/15 100 0 20 0 0 0 100 46 46 12 9/28/15 100 62 20 0 100 10 100 57 129 32 9/29/15 100 64 20 0 100 55 100 48 167 42 9/30/15 99 63 100 24 70 58 100 49 194 49 10/1/15 100 64 100 43 100 58 100 73 238 60 10/2/15 99 11 99 50 99 59 100 73 193 48 10/3/15 99 0 99 51 99 63 100 56 170 43 10/4/15 100 50 100 60 100 58 100 58 226 57 10/5/15 100 62 39 57 50 56 70 51 226 57 10/6/15 100 71 60 58 90 67 70 51 247 62 10/7/15 100 72 100 49 90 17 60 73 211 53 10/8/15 100 46 97 57 100 71 77 70 244 61 10/9/15 70 50 100 54 100 58 99 61 223 56 10/10/15 100 50 100 60 100 59 99 68 237 59 10/11/15 100 38 100 59 100 0 99 0 97 24 10/12/15 100 64 100 72 100 60 99 44 240 60 10/13/15 100 62 100 59 100 71 99 61 253 63 10/14/15 99 51 100 58 100 73 100 72 254 64 10/15/15 100 52 100 58 100 72 99 50 232 58 10/16/15 100 50 100 58 100 71 99 49 228 57 10/17/15 100 57 100 58 100 73 99 43 231 58 10/18/15 100 51 100 60 100 53 99 58 222 56 10/19/15 100 62 100 51 100 57 99 59 229 57 10/20/15 100 84 100 59 10 51 100 50 244 61 10/21/15 100 72 100 58 100 19 20 17 166 42 10/22/15 100 64 100 57 100 64 20 0 185 46
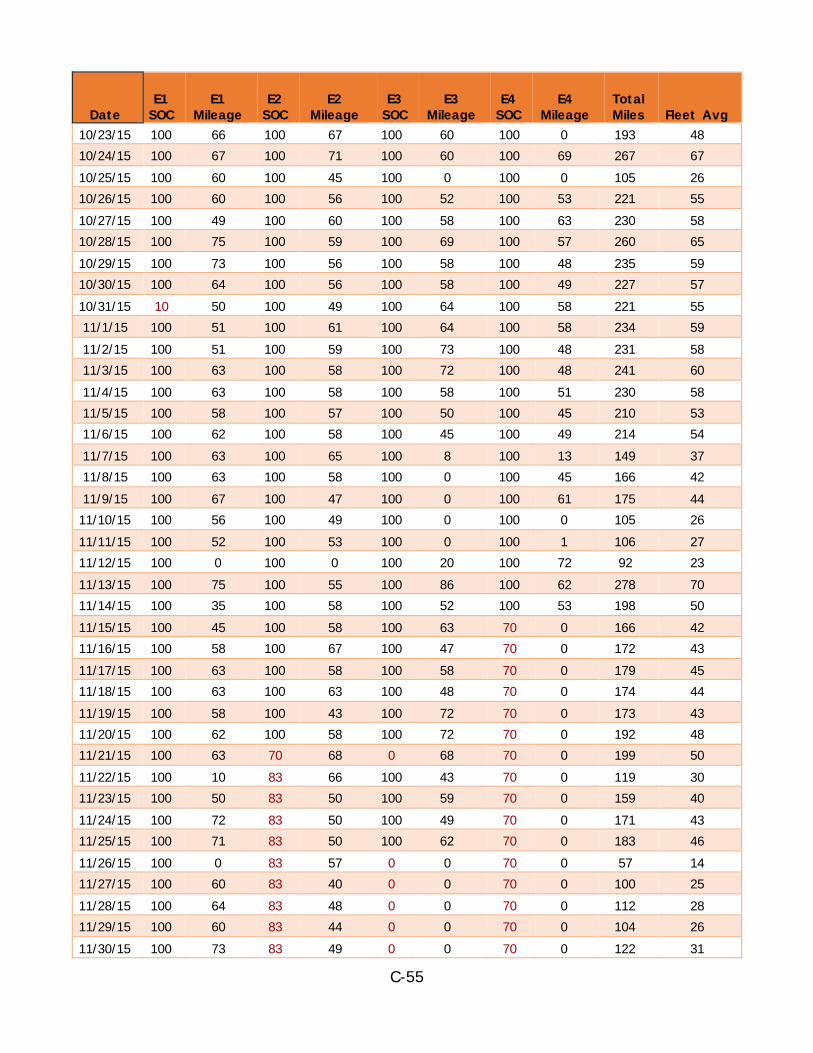
C-55
Date E1
SOC E1
Mileage E2
SOC E2
Mileage E3
SOC E3
Mileage E4
SOC E4
Mileage Total Miles Fleet Avg
10/23/15 100 66 100 67 100 60 100 0 193 48 10/24/15 100 67 100 71 100 60 100 69 267 67 10/25/15 100 60 100 45 100 0 100 0 105 26 10/26/15 100 60 100 56 100 52 100 53 221 55 10/27/15 100 49 100 60 100 58 100 63 230 58 10/28/15 100 75 100 59 100 69 100 57 260 65 10/29/15 100 73 100 56 100 58 100 48 235 59 10/30/15 100 64 100 56 100 58 100 49 227 57 10/31/15 10 50 100 49 100 64 100 58 221 55 11/1/15 100 51 100 61 100 64 100 58 234 59 11/2/15 100 51 100 59 100 73 100 48 231 58 11/3/15 100 63 100 58 100 72 100 48 241 60 11/4/15 100 63 100 58 100 58 100 51 230 58 11/5/15 100 58 100 57 100 50 100 45 210 53 11/6/15 100 62 100 58 100 45 100 49 214 54 11/7/15 100 63 100 65 100 8 100 13 149 37 11/8/15 100 63 100 58 100 0 100 45 166 42 11/9/15 100 67 100 47 100 0 100 61 175 44 11/10/15 100 56 100 49 100 0 100 0 105 26 11/11/15 100 52 100 53 100 0 100 1 106 27 11/12/15 100 0 100 0 100 20 100 72 92 23 11/13/15 100 75 100 55 100 86 100 62 278 70 11/14/15 100 35 100 58 100 52 100 53 198 50 11/15/15 100 45 100 58 100 63 70 0 166 42 11/16/15 100 58 100 67 100 47 70 0 172 43 11/17/15 100 63 100 58 100 58 70 0 179 45 11/18/15 100 63 100 63 100 48 70 0 174 44 11/19/15 100 58 100 43 100 72 70 0 173 43 11/20/15 100 62 100 58 100 72 70 0 192 48 11/21/15 100 63 70 68 0 68 70 0 199 50 11/22/15 100 10 83 66 100 43 70 0 119 30 11/23/15 100 50 83 50 100 59 70 0 159 40 11/24/15 100 72 83 50 100 49 70 0 171 43 11/25/15 100 71 83 50 100 62 70 0 183 46 11/26/15 100 0 83 57 0 0 70 0 57 14 11/27/15 100 60 83 40 0 0 70 0 100 25 11/28/15 100 64 83 48 0 0 70 0 112 28 11/29/15 100 60 83 44 0 0 70 0 104 26 11/30/15 100 73 83 49 0 0 70 0 122 31
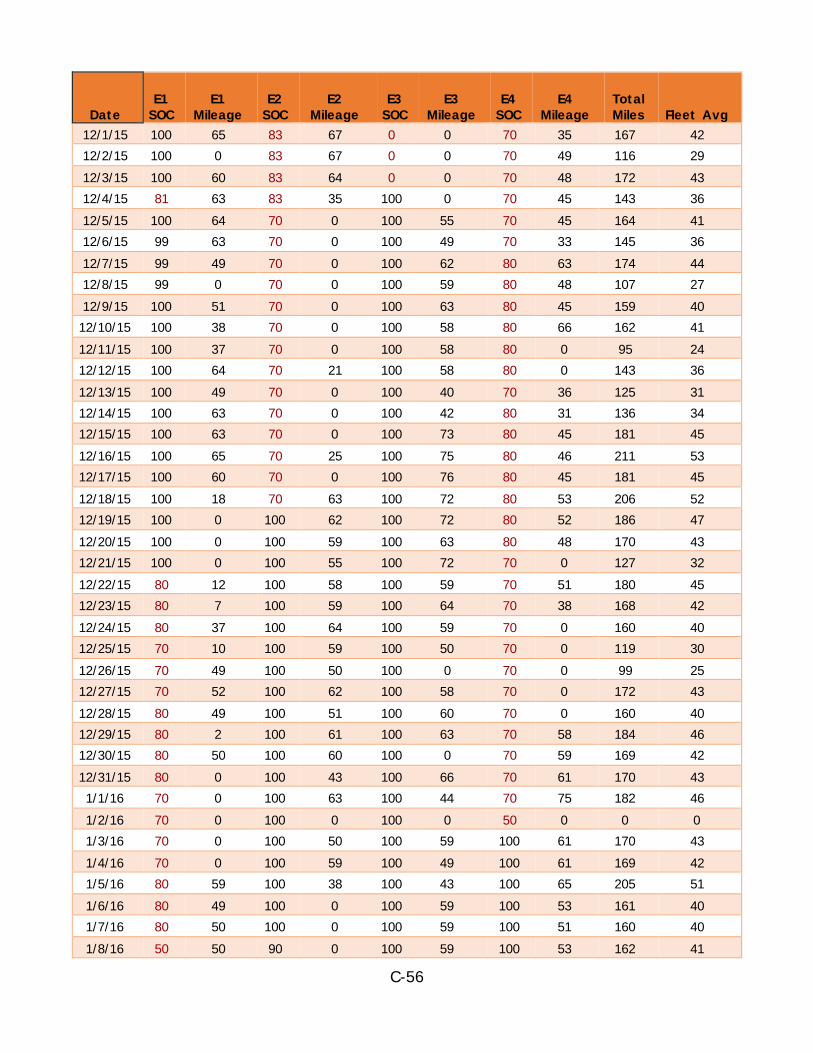
C-56
Date E1
SOC E1
Mileage E2
SOC E2
Mileage E3
SOC E3
Mileage E4
SOC E4
Mileage Total Miles Fleet Avg
12/1/15 100 65 83 67 0 0 70 35 167 42 12/2/15 100 0 83 67 0 0 70 49 116 29 12/3/15 100 60 83 64 0 0 70 48 172 43 12/4/15 81 63 83 35 100 0 70 45 143 36 12/5/15 100 64 70 0 100 55 70 45 164 41 12/6/15 99 63 70 0 100 49 70 33 145 36 12/7/15 99 49 70 0 100 62 80 63 174 44 12/8/15 99 0 70 0 100 59 80 48 107 27 12/9/15 100 51 70 0 100 63 80 45 159 40 12/10/15 100 38 70 0 100 58 80 66 162 41 12/11/15 100 37 70 0 100 58 80 0 95 24 12/12/15 100 64 70 21 100 58 80 0 143 36 12/13/15 100 49 70 0 100 40 70 36 125 31 12/14/15 100 63 70 0 100 42 80 31 136 34 12/15/15 100 63 70 0 100 73 80 45 181 45 12/16/15 100 65 70 25 100 75 80 46 211 53 12/17/15 100 60 70 0 100 76 80 45 181 45 12/18/15 100 18 70 63 100 72 80 53 206 52 12/19/15 100 0 100 62 100 72 80 52 186 47 12/20/15 100 0 100 59 100 63 80 48 170 43 12/21/15 100 0 100 55 100 72 70 0 127 32 12/22/15 80 12 100 58 100 59 70 51 180 45 12/23/15 80 7 100 59 100 64 70 38 168 42 12/24/15 80 37 100 64 100 59 70 0 160 40 12/25/15 70 10 100 59 100 50 70 0 119 30 12/26/15 70 49 100 50 100 0 70 0 99 25 12/27/15 70 52 100 62 100 58 70 0 172 43 12/28/15 80 49 100 51 100 60 70 0 160 40 12/29/15 80 2 100 61 100 63 70 58 184 46 12/30/15 80 50 100 60 100 0 70 59 169 42 12/31/15 80 0 100 43 100 66 70 61 170 43 1/1/16 70 0 100 63 100 44 70 75 182 46 1/2/16 70 0 100 0 100 0 50 0 0 0 1/3/16 70 0 100 50 100 59 100 61 170 43 1/4/16 70 0 100 59 100 49 100 61 169 42 1/5/16 80 59 100 38 100 43 100 65 205 51 1/6/16 80 49 100 0 100 59 100 53 161 40 1/7/16 80 50 100 0 100 59 100 51 160 40 1/8/16 50 50 90 0 100 59 100 53 162 41
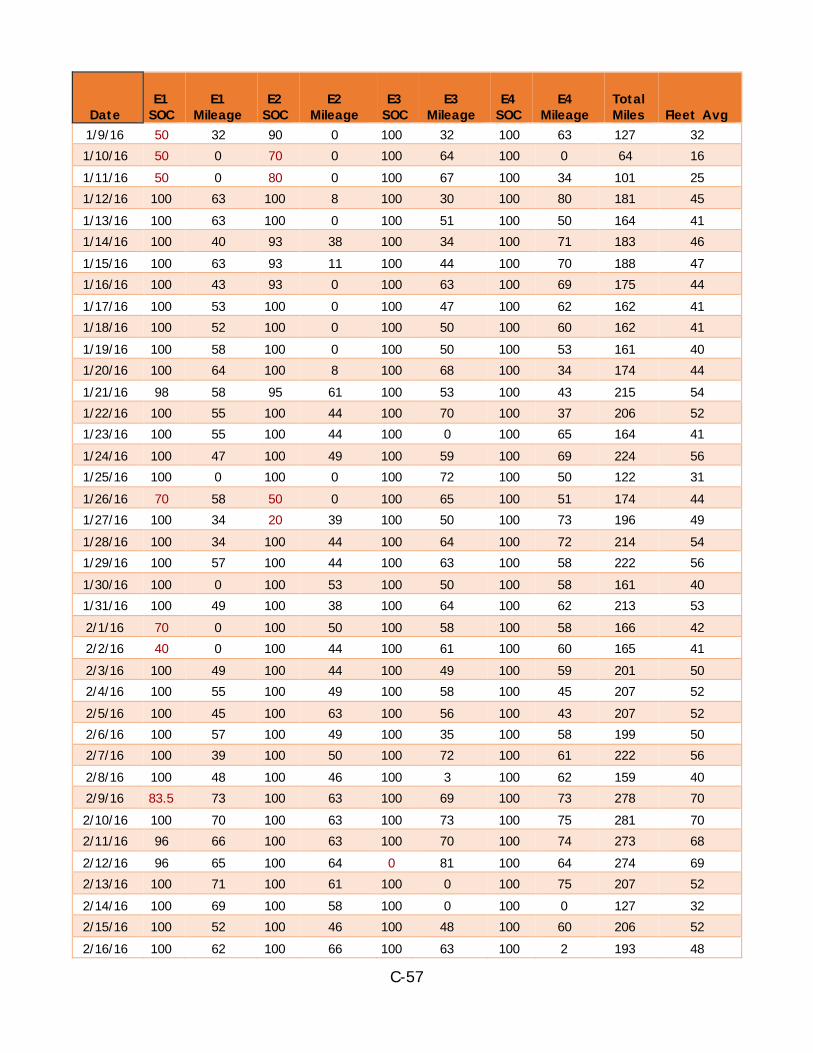
C-57
Date E1
SOC E1
Mileage E2
SOC E2
Mileage E3
SOC E3
Mileage E4
SOC E4
Mileage Total Miles Fleet Avg
1/9/16 50 32 90 0 100 32 100 63 127 32 1/10/16 50 0 70 0 100 64 100 0 64 16 1/11/16 50 0 80 0 100 67 100 34 101 25 1/12/16 100 63 100 8 100 30 100 80 181 45 1/13/16 100 63 100 0 100 51 100 50 164 41 1/14/16 100 40 93 38 100 34 100 71 183 46 1/15/16 100 63 93 11 100 44 100 70 188 47 1/16/16 100 43 93 0 100 63 100 69 175 44 1/17/16 100 53 100 0 100 47 100 62 162 41 1/18/16 100 52 100 0 100 50 100 60 162 41 1/19/16 100 58 100 0 100 50 100 53 161 40 1/20/16 100 64 100 8 100 68 100 34 174 44 1/21/16 98 58 95 61 100 53 100 43 215 54 1/22/16 100 55 100 44 100 70 100 37 206 52 1/23/16 100 55 100 44 100 0 100 65 164 41 1/24/16 100 47 100 49 100 59 100 69 224 56 1/25/16 100 0 100 0 100 72 100 50 122 31 1/26/16 70 58 50 0 100 65 100 51 174 44 1/27/16 100 34 20 39 100 50 100 73 196 49 1/28/16 100 34 100 44 100 64 100 72 214 54 1/29/16 100 57 100 44 100 63 100 58 222 56 1/30/16 100 0 100 53 100 50 100 58 161 40 1/31/16 100 49 100 38 100 64 100 62 213 53 2/1/16 70 0 100 50 100 58 100 58 166 42 2/2/16 40 0 100 44 100 61 100 60 165 41 2/3/16 100 49 100 44 100 49 100 59 201 50 2/4/16 100 55 100 49 100 58 100 45 207 52 2/5/16 100 45 100 63 100 56 100 43 207 52 2/6/16 100 57 100 49 100 35 100 58 199 50 2/7/16 100 39 100 50 100 72 100 61 222 56 2/8/16 100 48 100 46 100 3 100 62 159 40 2/9/16 83.5 73 100 63 100 69 100 73 278 70 2/10/16 100 70 100 63 100 73 100 75 281 70 2/11/16 96 66 100 63 100 70 100 74 273 68 2/12/16 96 65 100 64 0 81 100 64 274 69 2/13/16 100 71 100 61 100 0 100 75 207 52 2/14/16 100 69 100 58 100 0 100 0 127 32 2/15/16 100 52 100 46 100 48 100 60 206 52 2/16/16 100 62 100 66 100 63 100 2 193 48
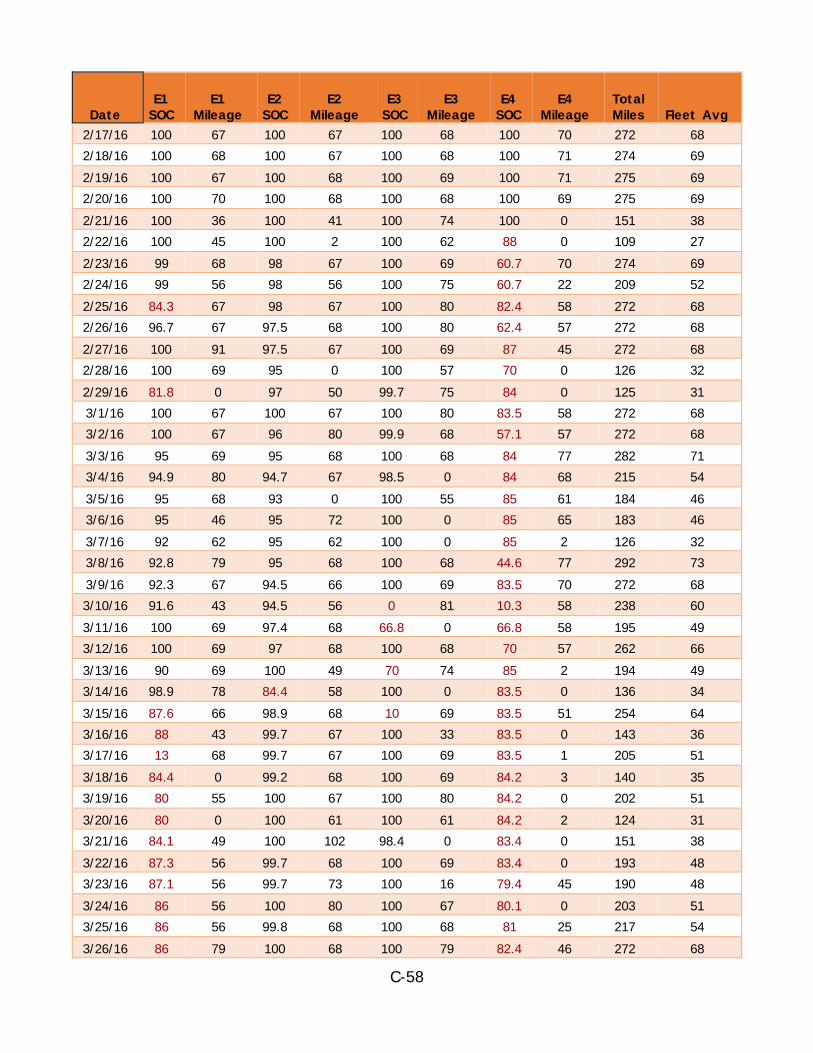
C-58
Date E1
SOC E1
Mileage E2
SOC E2
Mileage E3
SOC E3
Mileage E4
SOC E4
Mileage Total Miles Fleet Avg
2/17/16 100 67 100 67 100 68 100 70 272 68 2/18/16 100 68 100 67 100 68 100 71 274 69 2/19/16 100 67 100 68 100 69 100 71 275 69 2/20/16 100 70 100 68 100 68 100 69 275 69 2/21/16 100 36 100 41 100 74 100 0 151 38 2/22/16 100 45 100 2 100 62 88 0 109 27 2/23/16 99 68 98 67 100 69 60.7 70 274 69 2/24/16 99 56 98 56 100 75 60.7 22 209 52 2/25/16 84.3 67 98 67 100 80 82.4 58 272 68 2/26/16 96.7 67 97.5 68 100 80 62.4 57 272 68 2/27/16 100 91 97.5 67 100 69 87 45 272 68 2/28/16 100 69 95 0 100 57 70 0 126 32 2/29/16 81.8 0 97 50 99.7 75 84 0 125 31 3/1/16 100 67 100 67 100 80 83.5 58 272 68 3/2/16 100 67 96 80 99.9 68 57.1 57 272 68 3/3/16 95 69 95 68 100 68 84 77 282 71 3/4/16 94.9 80 94.7 67 98.5 0 84 68 215 54 3/5/16 95 68 93 0 100 55 85 61 184 46 3/6/16 95 46 95 72 100 0 85 65 183 46 3/7/16 92 62 95 62 100 0 85 2 126 32 3/8/16 92.8 79 95 68 100 68 44.6 77 292 73 3/9/16 92.3 67 94.5 66 100 69 83.5 70 272 68 3/10/16 91.6 43 94.5 56 0 81 10.3 58 238 60 3/11/16 100 69 97.4 68 66.8 0 66.8 58 195 49 3/12/16 100 69 97 68 100 68 70 57 262 66 3/13/16 90 69 100 49 70 74 85 2 194 49 3/14/16 98.9 78 84.4 58 100 0 83.5 0 136 34 3/15/16 87.6 66 98.9 68 10 69 83.5 51 254 64 3/16/16 88 43 99.7 67 100 33 83.5 0 143 36 3/17/16 13 68 99.7 67 100 69 83.5 1 205 51 3/18/16 84.4 0 99.2 68 100 69 84.2 3 140 35 3/19/16 80 55 100 67 100 80 84.2 0 202 51 3/20/16 80 0 100 61 100 61 84.2 2 124 31 3/21/16 84.1 49 100 102 98.4 0 83.4 0 151 38 3/22/16 87.3 56 99.7 68 100 69 83.4 0 193 48 3/23/16 87.1 56 99.7 73 100 16 79.4 45 190 48 3/24/16 86 56 100 80 100 67 80.1 0 203 51 3/25/16 86 56 99.8 68 100 68 81 25 217 54 3/26/16 86 79 100 68 100 79 82.4 46 272 68
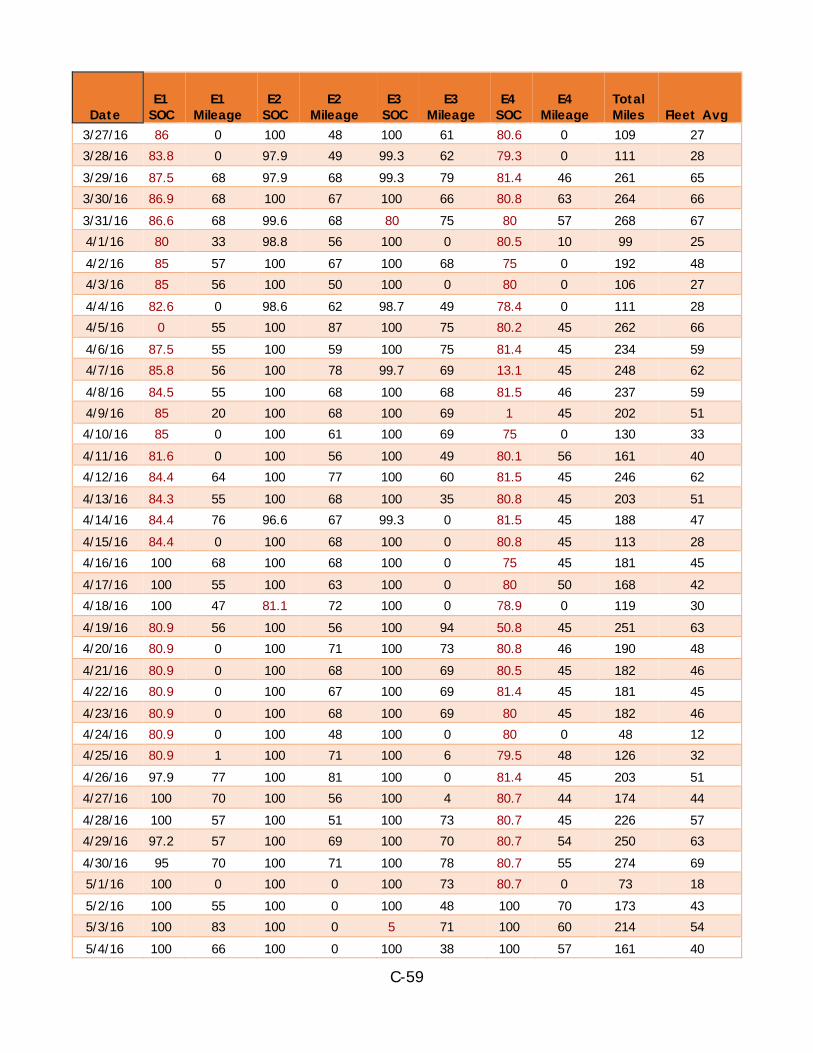
C-59
Date E1
SOC E1
Mileage E2
SOC E2
Mileage E3
SOC E3
Mileage E4
SOC E4
Mileage Total Miles Fleet Avg
3/27/16 86 0 100 48 100 61 80.6 0 109 27 3/28/16 83.8 0 97.9 49 99.3 62 79.3 0 111 28 3/29/16 87.5 68 97.9 68 99.3 79 81.4 46 261 65 3/30/16 86.9 68 100 67 100 66 80.8 63 264 66 3/31/16 86.6 68 99.6 68 80 75 80 57 268 67 4/1/16 80 33 98.8 56 100 0 80.5 10 99 25 4/2/16 85 57 100 67 100 68 75 0 192 48 4/3/16 85 56 100 50 100 0 80 0 106 27 4/4/16 82.6 0 98.6 62 98.7 49 78.4 0 111 28 4/5/16 0 55 100 87 100 75 80.2 45 262 66 4/6/16 87.5 55 100 59 100 75 81.4 45 234 59 4/7/16 85.8 56 100 78 99.7 69 13.1 45 248 62 4/8/16 84.5 55 100 68 100 68 81.5 46 237 59 4/9/16 85 20 100 68 100 69 1 45 202 51 4/10/16 85 0 100 61 100 69 75 0 130 33 4/11/16 81.6 0 100 56 100 49 80.1 56 161 40 4/12/16 84.4 64 100 77 100 60 81.5 45 246 62 4/13/16 84.3 55 100 68 100 35 80.8 45 203 51 4/14/16 84.4 76 96.6 67 99.3 0 81.5 45 188 47 4/15/16 84.4 0 100 68 100 0 80.8 45 113 28 4/16/16 100 68 100 68 100 0 75 45 181 45 4/17/16 100 55 100 63 100 0 80 50 168 42 4/18/16 100 47 81.1 72 100 0 78.9 0 119 30 4/19/16 80.9 56 100 56 100 94 50.8 45 251 63 4/20/16 80.9 0 100 71 100 73 80.8 46 190 48 4/21/16 80.9 0 100 68 100 69 80.5 45 182 46 4/22/16 80.9 0 100 67 100 69 81.4 45 181 45 4/23/16 80.9 0 100 68 100 69 80 45 182 46 4/24/16 80.9 0 100 48 100 0 80 0 48 12 4/25/16 80.9 1 100 71 100 6 79.5 48 126 32 4/26/16 97.9 77 100 81 100 0 81.4 45 203 51 4/27/16 100 70 100 56 100 4 80.7 44 174 44 4/28/16 100 57 100 51 100 73 80.7 45 226 57 4/29/16 97.2 57 100 69 100 70 80.7 54 250 63 4/30/16 95 70 100 71 100 78 80.7 55 274 69 5/1/16 100 0 100 0 100 73 80.7 0 73 18 5/2/16 100 55 100 0 100 48 100 70 173 43 5/3/16 100 83 100 0 5 71 100 60 214 54 5/4/16 100 66 100 0 100 38 100 57 161 40
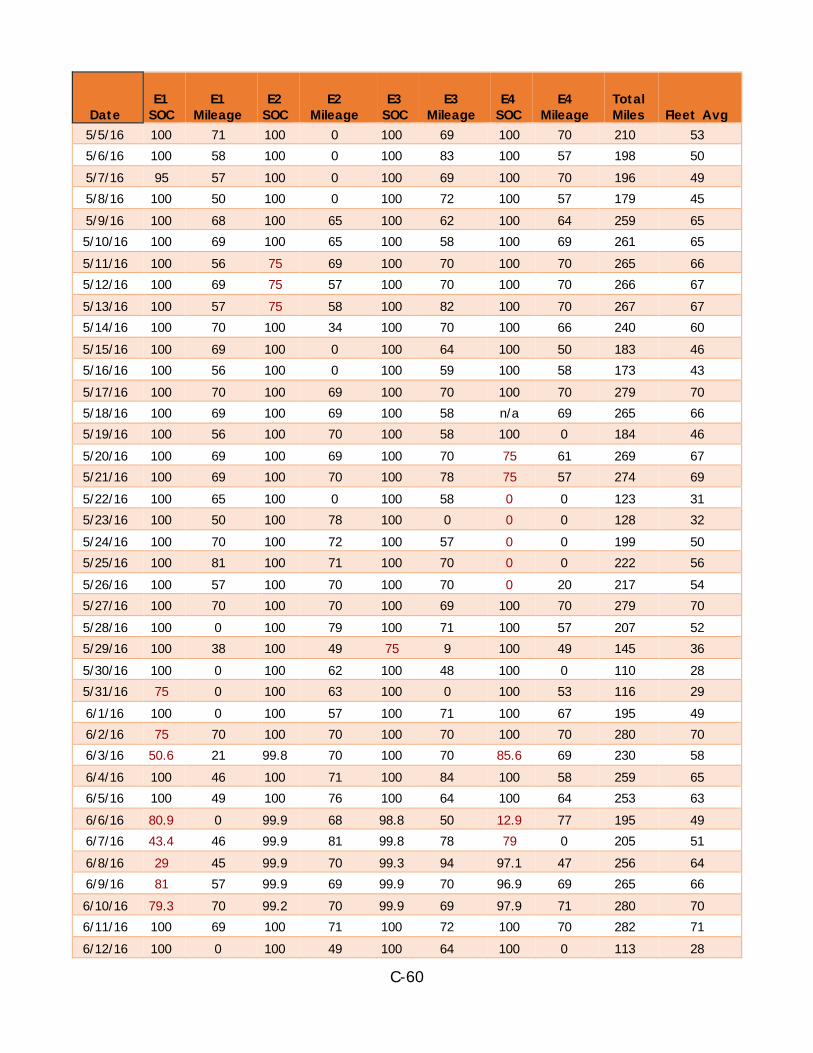
C-60
Date E1
SOC E1
Mileage E2
SOC E2
Mileage E3
SOC E3
Mileage E4
SOC E4
Mileage Total Miles Fleet Avg
5/5/16 100 71 100 0 100 69 100 70 210 53 5/6/16 100 58 100 0 100 83 100 57 198 50 5/7/16 95 57 100 0 100 69 100 70 196 49 5/8/16 100 50 100 0 100 72 100 57 179 45 5/9/16 100 68 100 65 100 62 100 64 259 65 5/10/16 100 69 100 65 100 58 100 69 261 65 5/11/16 100 56 75 69 100 70 100 70 265 66 5/12/16 100 69 75 57 100 70 100 70 266 67 5/13/16 100 57 75 58 100 82 100 70 267 67 5/14/16 100 70 100 34 100 70 100 66 240 60 5/15/16 100 69 100 0 100 64 100 50 183 46 5/16/16 100 56 100 0 100 59 100 58 173 43 5/17/16 100 70 100 69 100 70 100 70 279 70 5/18/16 100 69 100 69 100 58 n/a 69 265 66 5/19/16 100 56 100 70 100 58 100 0 184 46 5/20/16 100 69 100 69 100 70 75 61 269 67 5/21/16 100 69 100 70 100 78 75 57 274 69 5/22/16 100 65 100 0 100 58 0 0 123 31 5/23/16 100 50 100 78 100 0 0 0 128 32 5/24/16 100 70 100 72 100 57 0 0 199 50 5/25/16 100 81 100 71 100 70 0 0 222 56 5/26/16 100 57 100 70 100 70 0 20 217 54 5/27/16 100 70 100 70 100 69 100 70 279 70 5/28/16 100 0 100 79 100 71 100 57 207 52 5/29/16 100 38 100 49 75 9 100 49 145 36 5/30/16 100 0 100 62 100 48 100 0 110 28 5/31/16 75 0 100 63 100 0 100 53 116 29 6/1/16 100 0 100 57 100 71 100 67 195 49 6/2/16 75 70 100 70 100 70 100 70 280 70 6/3/16 50.6 21 99.8 70 100 70 85.6 69 230 58 6/4/16 100 46 100 71 100 84 100 58 259 65 6/5/16 100 49 100 76 100 64 100 64 253 63 6/6/16 80.9 0 99.9 68 98.8 50 12.9 77 195 49 6/7/16 43.4 46 99.9 81 99.8 78 79 0 205 51 6/8/16 29 45 99.9 70 99.3 94 97.1 47 256 64 6/9/16 81 57 99.9 69 99.9 70 96.9 69 265 66 6/10/16 79.3 70 99.2 70 99.9 69 97.9 71 280 70 6/11/16 100 69 100 71 100 72 100 70 282 71 6/12/16 100 0 100 49 100 64 100 0 113 28
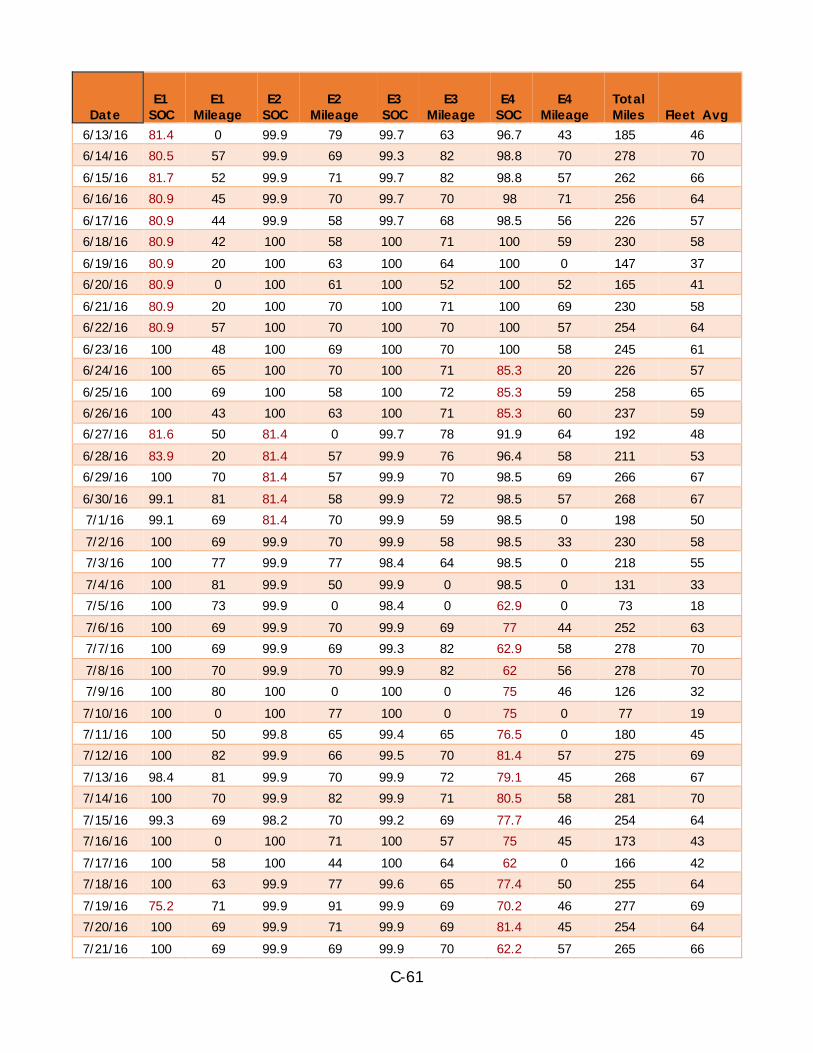
C-61
Date E1
SOC E1
Mileage E2
SOC E2
Mileage E3
SOC E3
Mileage E4
SOC E4
Mileage Total Miles Fleet Avg
6/13/16 81.4 0 99.9 79 99.7 63 96.7 43 185 46 6/14/16 80.5 57 99.9 69 99.3 82 98.8 70 278 70 6/15/16 81.7 52 99.9 71 99.7 82 98.8 57 262 66 6/16/16 80.9 45 99.9 70 99.7 70 98 71 256 64 6/17/16 80.9 44 99.9 58 99.7 68 98.5 56 226 57 6/18/16 80.9 42 100 58 100 71 100 59 230 58 6/19/16 80.9 20 100 63 100 64 100 0 147 37 6/20/16 80.9 0 100 61 100 52 100 52 165 41 6/21/16 80.9 20 100 70 100 71 100 69 230 58 6/22/16 80.9 57 100 70 100 70 100 57 254 64 6/23/16 100 48 100 69 100 70 100 58 245 61 6/24/16 100 65 100 70 100 71 85.3 20 226 57 6/25/16 100 69 100 58 100 72 85.3 59 258 65 6/26/16 100 43 100 63 100 71 85.3 60 237 59 6/27/16 81.6 50 81.4 0 99.7 78 91.9 64 192 48 6/28/16 83.9 20 81.4 57 99.9 76 96.4 58 211 53 6/29/16 100 70 81.4 57 99.9 70 98.5 69 266 67 6/30/16 99.1 81 81.4 58 99.9 72 98.5 57 268 67 7/1/16 99.1 69 81.4 70 99.9 59 98.5 0 198 50 7/2/16 100 69 99.9 70 99.9 58 98.5 33 230 58 7/3/16 100 77 99.9 77 98.4 64 98.5 0 218 55 7/4/16 100 81 99.9 50 99.9 0 98.5 0 131 33 7/5/16 100 73 99.9 0 98.4 0 62.9 0 73 18 7/6/16 100 69 99.9 70 99.9 69 77 44 252 63 7/7/16 100 69 99.9 69 99.3 82 62.9 58 278 70 7/8/16 100 70 99.9 70 99.9 82 62 56 278 70 7/9/16 100 80 100 0 100 0 75 46 126 32 7/10/16 100 0 100 77 100 0 75 0 77 19 7/11/16 100 50 99.8 65 99.4 65 76.5 0 180 45 7/12/16 100 82 99.9 66 99.5 70 81.4 57 275 69 7/13/16 98.4 81 99.9 70 99.9 72 79.1 45 268 67 7/14/16 100 70 99.9 82 99.9 71 80.5 58 281 70 7/15/16 99.3 69 98.2 70 99.2 69 77.7 46 254 64 7/16/16 100 0 100 71 100 57 75 45 173 43 7/17/16 100 58 100 44 100 64 62 0 166 42 7/18/16 100 63 99.9 77 99.6 65 77.4 50 255 64 7/19/16 75.2 71 99.9 91 99.9 69 70.2 46 277 69 7/20/16 100 69 99.9 71 99.9 69 81.4 45 254 64 7/21/16 100 69 99.9 69 99.9 70 62.2 57 265 66
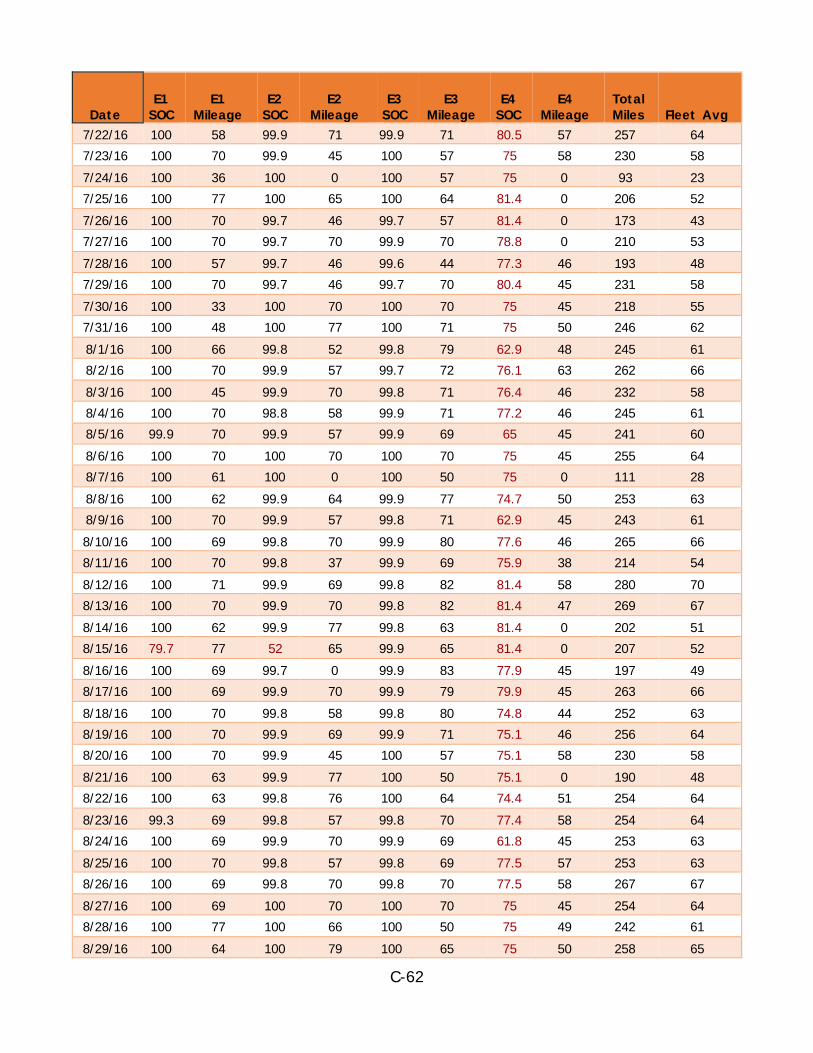
C-62
Date E1
SOC E1
Mileage E2
SOC E2
Mileage E3
SOC E3
Mileage E4
SOC E4
Mileage Total Miles Fleet Avg
7/22/16 100 58 99.9 71 99.9 71 80.5 57 257 64 7/23/16 100 70 99.9 45 100 57 75 58 230 58 7/24/16 100 36 100 0 100 57 75 0 93 23 7/25/16 100 77 100 65 100 64 81.4 0 206 52 7/26/16 100 70 99.7 46 99.7 57 81.4 0 173 43 7/27/16 100 70 99.7 70 99.9 70 78.8 0 210 53 7/28/16 100 57 99.7 46 99.6 44 77.3 46 193 48 7/29/16 100 70 99.7 46 99.7 70 80.4 45 231 58 7/30/16 100 33 100 70 100 70 75 45 218 55 7/31/16 100 48 100 77 100 71 75 50 246 62 8/1/16 100 66 99.8 52 99.8 79 62.9 48 245 61 8/2/16 100 70 99.9 57 99.7 72 76.1 63 262 66 8/3/16 100 45 99.9 70 99.8 71 76.4 46 232 58 8/4/16 100 70 98.8 58 99.9 71 77.2 46 245 61 8/5/16 99.9 70 99.9 57 99.9 69 65 45 241 60 8/6/16 100 70 100 70 100 70 75 45 255 64 8/7/16 100 61 100 0 100 50 75 0 111 28 8/8/16 100 62 99.9 64 99.9 77 74.7 50 253 63 8/9/16 100 70 99.9 57 99.8 71 62.9 45 243 61 8/10/16 100 69 99.8 70 99.9 80 77.6 46 265 66 8/11/16 100 70 99.8 37 99.9 69 75.9 38 214 54 8/12/16 100 71 99.9 69 99.8 82 81.4 58 280 70 8/13/16 100 70 99.9 70 99.8 82 81.4 47 269 67 8/14/16 100 62 99.9 77 99.8 63 81.4 0 202 51 8/15/16 79.7 77 52 65 99.9 65 81.4 0 207 52 8/16/16 100 69 99.7 0 99.9 83 77.9 45 197 49 8/17/16 100 69 99.9 70 99.9 79 79.9 45 263 66 8/18/16 100 70 99.8 58 99.8 80 74.8 44 252 63 8/19/16 100 70 99.9 69 99.9 71 75.1 46 256 64 8/20/16 100 70 99.9 45 100 57 75.1 58 230 58 8/21/16 100 63 99.9 77 100 50 75.1 0 190 48 8/22/16 100 63 99.8 76 100 64 74.4 51 254 64 8/23/16 99.3 69 99.8 57 99.8 70 77.4 58 254 64 8/24/16 100 69 99.9 70 99.9 69 61.8 45 253 63 8/25/16 100 70 99.8 57 99.8 69 77.5 57 253 63 8/26/16 100 69 99.8 70 99.8 70 77.5 58 267 67 8/27/16 100 69 100 70 100 70 75 45 254 64 8/28/16 100 77 100 66 100 50 75 49 242 61 8/29/16 100 64 100 79 100 65 75 50 258 65

C-63
Date E1
SOC E1
Mileage E2
SOC E2
Mileage E3
SOC E3
Mileage E4
SOC E4
Mileage Total Miles Fleet Avg
8/30/16 99.8 58 99.8 69 99.8 57 75 58 242 61 8/31/16 100 58 99.8 68 99.8 71 76 45 242 61 9/1/16 100 73 99.9 71 99.8 69 70.9 45 258 65 9/2/16 100 17 99.9 71 99.8 70 73.5 47 205 51 9/3/16 100 61 99.9 45 99.8 7 74 32 145 36 9/4/16 100 50 99.9 72 99.8 0 73.5 51 173 43 9/5/16 100 77 99.9 64 99.8 0 73.5 49 190 48 9/6/16 100 51 99.9 77 99.8 0 71.7 50 178 45 9/7/16 100 45 99.9 70 81.3 3 76.7 57 175 44 9/8/16 100 58 99.9 70 99.4 0 71.4 45 173 43 9/9/16 100 70 99.9 42 99.4 0 71.4 46 158 40 9/10/16 100 57 99.9 57 99.4 12 75 41 167 42 9/11/16 100 0 99.9 56 99.4 0 75 0 56 14 9/12/16 100 63 99.9 63 99.4 0 69 23 149 37 9/13/16 100 58 99.7 58 99.8 45 69 0 161 40 9/14/16 100 70 99.7 69 99.8 69 69 46 254 64 9/15/16 100 69 99.9 70 99.8 70 69 64 273 68 9/16/16 100 70 99.8 57 99.9 70 69 0 197 49 9/17/16 100 33 99.8 71 99.9 33 69 0 137 34 9/18/16 100 78 99.8 72 99.9 50 69 0 200 50 9/19/16 100 64 99.8 80 99.9 49 69 0 193 48 9/20/16 100 70 99.7 57 99.8 57 69 0 184 46 9/21/16 100 71 99.8 72 99.8 69 80.7 81 293 73 9/22/16 100 81 99.8 58 99.5 0 18.6 45 184 46 9/23/16 99.6 70 99.9 58 99.5 0 n/a 0 128 32 9/24/16 100 66 100 70 99.5 0 75 58 194 49 9/25/16 100 76 100 50 99.5 0 75 0 126 32 9/26/16 100 64 99.9 78 99.8 0 75 50 192 48 9/27/16 100 58 99.8 71 99.5 0 78.5 57 186 47 9/28/16 93.2 69 99.9 69 99.4 0 79.1 57 195 49 9/29/16 99.2 12 99.9 69 98.9 0 82.3 58 139 35 9/30/16 100 0 99.8 82 99.7 0 78.9 56 138 35 10/1/16 100 58 99.9 67 99.9 0 78.9 58 183 46 10/2/16 100 64 99.9 78 99.9 52 82.3 22 216 54 10/3/16 100 78 99.9 65 99.9 0 82.3 0 143 36 10/4/16 100 70 99.9 71 99.9 71 82.3 57 269 67 10/5/16 100 70 99.9 58 99.7 67 34.3 0 195 49 10/6/16 95.7 63 99.8 0 99.7 72 82.3 57 192 48 10/7/16 77.8 70 99 0 99.8 58 76.5 57 185 46
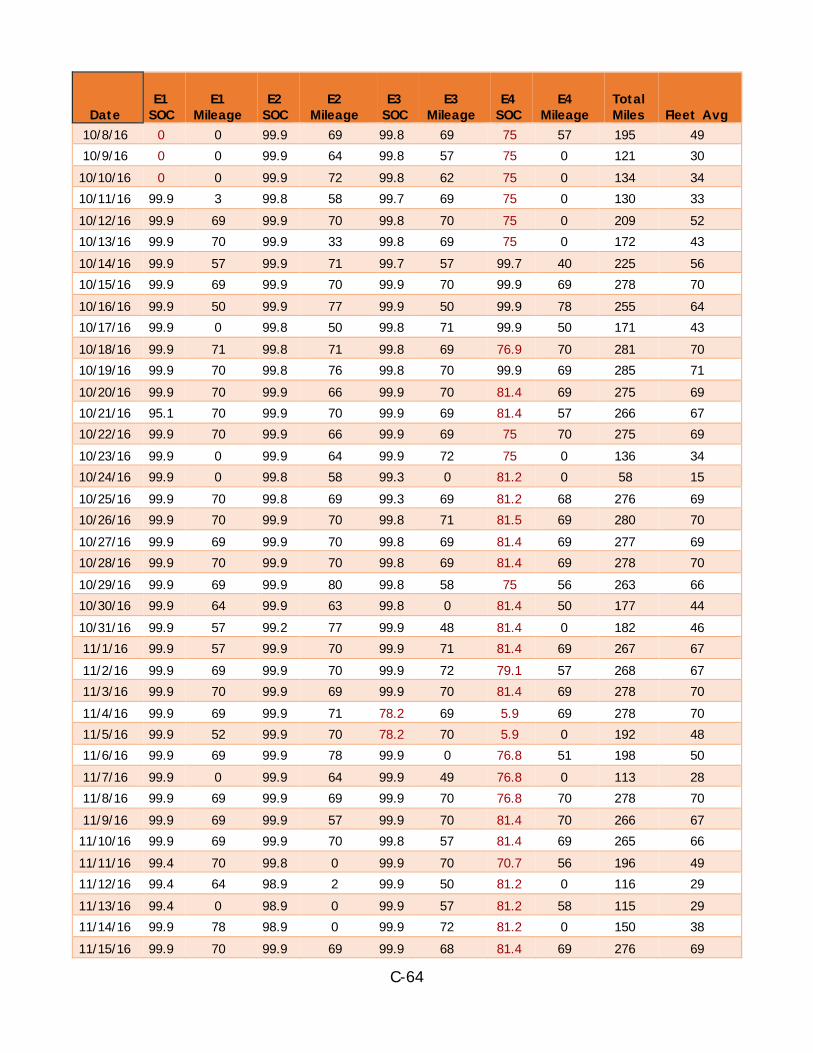
C-64
Date E1
SOC E1
Mileage E2
SOC E2
Mileage E3
SOC E3
Mileage E4
SOC E4
Mileage Total Miles Fleet Avg
10/8/16 0 0 99.9 69 99.8 69 75 57 195 49 10/9/16 0 0 99.9 64 99.8 57 75 0 121 30 10/10/16 0 0 99.9 72 99.8 62 75 0 134 34 10/11/16 99.9 3 99.8 58 99.7 69 75 0 130 33 10/12/16 99.9 69 99.9 70 99.8 70 75 0 209 52 10/13/16 99.9 70 99.9 33 99.8 69 75 0 172 43 10/14/16 99.9 57 99.9 71 99.7 57 99.7 40 225 56 10/15/16 99.9 69 99.9 70 99.9 70 99.9 69 278 70 10/16/16 99.9 50 99.9 77 99.9 50 99.9 78 255 64 10/17/16 99.9 0 99.8 50 99.8 71 99.9 50 171 43 10/18/16 99.9 71 99.8 71 99.8 69 76.9 70 281 70 10/19/16 99.9 70 99.8 76 99.8 70 99.9 69 285 71 10/20/16 99.9 70 99.9 66 99.9 70 81.4 69 275 69 10/21/16 95.1 70 99.9 70 99.9 69 81.4 57 266 67 10/22/16 99.9 70 99.9 66 99.9 69 75 70 275 69 10/23/16 99.9 0 99.9 64 99.9 72 75 0 136 34 10/24/16 99.9 0 99.8 58 99.3 0 81.2 0 58 15 10/25/16 99.9 70 99.8 69 99.3 69 81.2 68 276 69 10/26/16 99.9 70 99.9 70 99.8 71 81.5 69 280 70 10/27/16 99.9 69 99.9 70 99.8 69 81.4 69 277 69 10/28/16 99.9 70 99.9 70 99.8 69 81.4 69 278 70 10/29/16 99.9 69 99.9 80 99.8 58 75 56 263 66 10/30/16 99.9 64 99.9 63 99.8 0 81.4 50 177 44 10/31/16 99.9 57 99.2 77 99.9 48 81.4 0 182 46 11/1/16 99.9 57 99.9 70 99.9 71 81.4 69 267 67 11/2/16 99.9 69 99.9 70 99.9 72 79.1 57 268 67 11/3/16 99.9 70 99.9 69 99.9 70 81.4 69 278 70 11/4/16 99.9 69 99.9 71 78.2 69 5.9 69 278 70 11/5/16 99.9 52 99.9 70 78.2 70 5.9 0 192 48 11/6/16 99.9 69 99.9 78 99.9 0 76.8 51 198 50 11/7/16 99.9 0 99.9 64 99.9 49 76.8 0 113 28 11/8/16 99.9 69 99.9 69 99.9 70 76.8 70 278 70 11/9/16 99.9 69 99.9 57 99.9 70 81.4 70 266 67 11/10/16 99.9 69 99.9 70 99.8 57 81.4 69 265 66 11/11/16 99.4 70 99.8 0 99.9 70 70.7 56 196 49 11/12/16 99.4 64 98.9 2 99.9 50 81.2 0 116 29 11/13/16 99.4 0 98.9 0 99.9 57 81.2 58 115 29 11/14/16 99.9 78 98.9 0 99.9 72 81.2 0 150 38 11/15/16 99.9 70 99.9 69 99.9 68 81.4 69 276 69
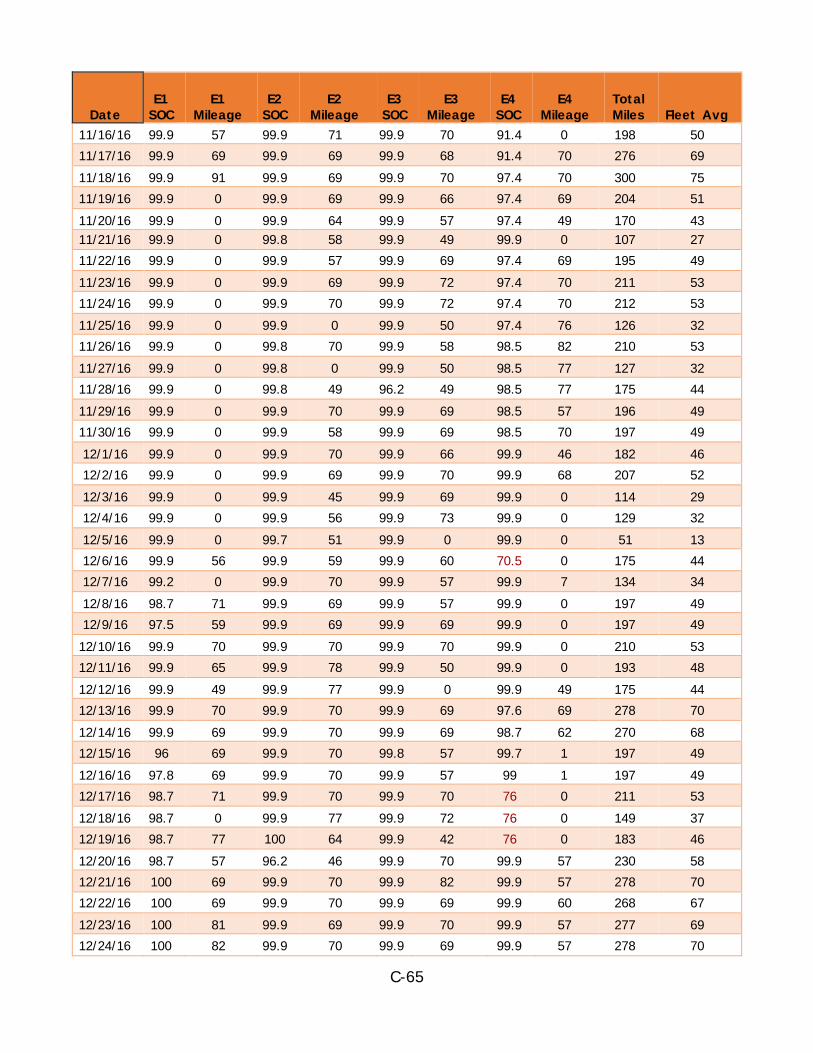
C-65
Date E1
SOC E1
Mileage E2
SOC E2
Mileage E3
SOC E3
Mileage E4
SOC E4
Mileage Total Miles Fleet Avg
11/16/16 99.9 57 99.9 71 99.9 70 91.4 0 198 50 11/17/16 99.9 69 99.9 69 99.9 68 91.4 70 276 69 11/18/16 99.9 91 99.9 69 99.9 70 97.4 70 300 75 11/19/16 99.9 0 99.9 69 99.9 66 97.4 69 204 51 11/20/16 99.9 0 99.9 64 99.9 57 97.4 49 170 43 11/21/16 99.9 0 99.8 58 99.9 49 99.9 0 107 27 11/22/16 99.9 0 99.9 57 99.9 69 97.4 69 195 49 11/23/16 99.9 0 99.9 69 99.9 72 97.4 70 211 53 11/24/16 99.9 0 99.9 70 99.9 72 97.4 70 212 53 11/25/16 99.9 0 99.9 0 99.9 50 97.4 76 126 32 11/26/16 99.9 0 99.8 70 99.9 58 98.5 82 210 53 11/27/16 99.9 0 99.8 0 99.9 50 98.5 77 127 32 11/28/16 99.9 0 99.8 49 96.2 49 98.5 77 175 44 11/29/16 99.9 0 99.9 70 99.9 69 98.5 57 196 49 11/30/16 99.9 0 99.9 58 99.9 69 98.5 70 197 49 12/1/16 99.9 0 99.9 70 99.9 66 99.9 46 182 46 12/2/16 99.9 0 99.9 69 99.9 70 99.9 68 207 52 12/3/16 99.9 0 99.9 45 99.9 69 99.9 0 114 29 12/4/16 99.9 0 99.9 56 99.9 73 99.9 0 129 32 12/5/16 99.9 0 99.7 51 99.9 0 99.9 0 51 13 12/6/16 99.9 56 99.9 59 99.9 60 70.5 0 175 44 12/7/16 99.2 0 99.9 70 99.9 57 99.9 7 134 34 12/8/16 98.7 71 99.9 69 99.9 57 99.9 0 197 49 12/9/16 97.5 59 99.9 69 99.9 69 99.9 0 197 49 12/10/16 99.9 70 99.9 70 99.9 70 99.9 0 210 53 12/11/16 99.9 65 99.9 78 99.9 50 99.9 0 193 48 12/12/16 99.9 49 99.9 77 99.9 0 99.9 49 175 44 12/13/16 99.9 70 99.9 70 99.9 69 97.6 69 278 70 12/14/16 99.9 69 99.9 70 99.9 69 98.7 62 270 68 12/15/16 96 69 99.9 70 99.8 57 99.7 1 197 49 12/16/16 97.8 69 99.9 70 99.9 57 99 1 197 49 12/17/16 98.7 71 99.9 70 99.9 70 76 0 211 53 12/18/16 98.7 0 99.9 77 99.9 72 76 0 149 37 12/19/16 98.7 77 100 64 99.9 42 76 0 183 46 12/20/16 98.7 57 96.2 46 99.9 70 99.9 57 230 58 12/21/16 100 69 99.9 70 99.9 82 99.9 57 278 70 12/22/16 100 69 99.9 70 99.9 69 99.9 60 268 67 12/23/16 100 81 99.9 69 99.9 70 99.9 57 277 69 12/24/16 100 82 99.9 70 99.9 69 99.9 57 278 70
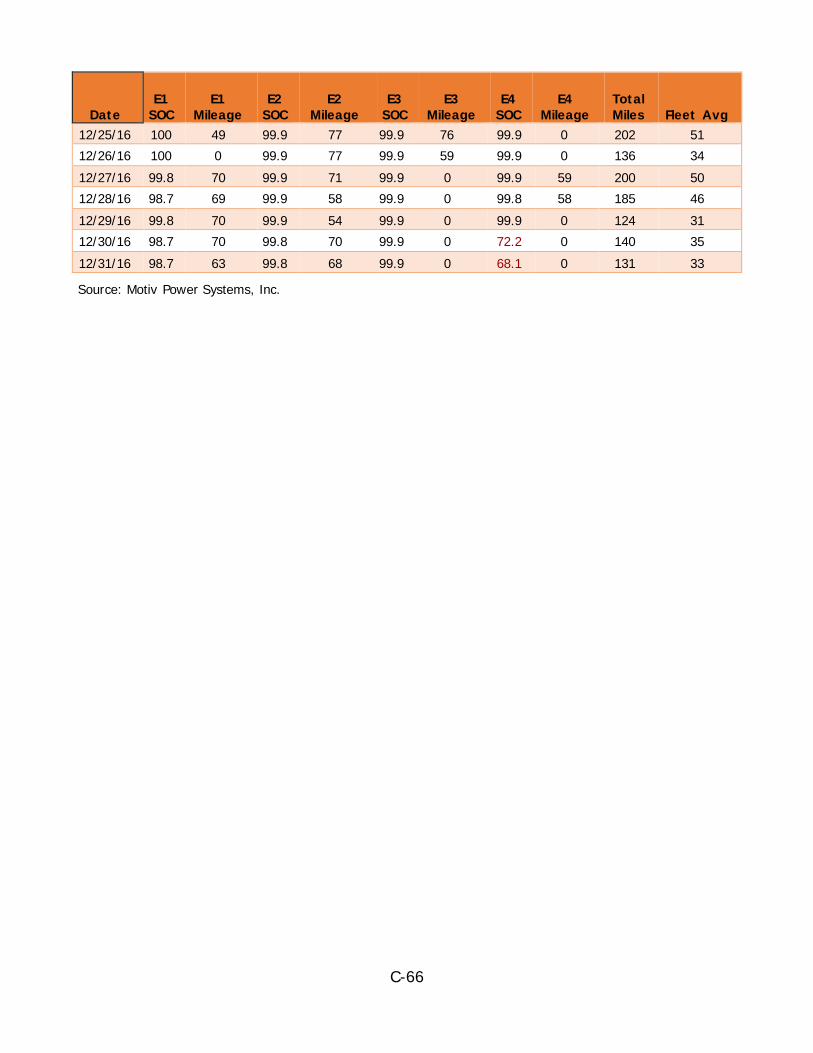
C-66
Date E1
SOC E1
Mileage E2
SOC E2
Mileage E3
SOC E3
Mileage E4
SOC E4
Mileage Total Miles Fleet Avg
12/25/16 100 49 99.9 77 99.9 76 99.9 0 202 51 12/26/16 100 0 99.9 77 99.9 59 99.9 0 136 34 12/27/16 99.8 70 99.9 71 99.9 0 99.9 59 200 50 12/28/16 98.7 69 99.9 58 99.9 0 99.8 58 185 46 12/29/16 99.8 70 99.9 54 99.9 0 99.9 0 124 31 12/30/16 98.7 70 99.8 70 99.9 0 72.2 0 140 35 12/31/16 98.7 63 99.8 68 99.9 0 68.1 0 131 33
Source: Motiv Power Systems, Inc.
D-21
APPENDIX D: Ballard: UC Irvine Fuel Cell Bus program Summary Report
Prepared for: California Energy Commission Prepared by: Zen Clean Energy Solutions on behalf of Ballard Power System
Gavin Newsom, Governor
D-2
Matthew Klippenstein, P.E. Primary Author
Zen Clean Energy Solutions 4522 Quebec Street Vancouver BC Sub-Grantee: Ballard Power Systems 9000 Glenlyon Parkway Burnaby, BC V5J 5J9 Canada
(604) 454-0900 Ballard website: www.ballard.com
Disclaimer Staff members of the California Energy Commission prepared this report. As such, it does not necessarily represent the views of the Energy Commission, its employees, or the State of California. The Energy Commission, the State of California, its employees, contractors and subcontractors make no warrant, express or implied, and assume no legal liability for the information in this report; nor does any party represent that the uses of this information will not infringe upon privately owned rights. This report has not been approved or disapproved by the Energy Commission nor has the Commiss ion passed upon the accuracy or adequacy of the information in this report.

D-3
TABLE OF CONTENTS Page
Table of Contents .......................................................................................................... D-3 List of Figures ............................................................................................................... D-4 List of Tables ................................................................................................................ D-4 Executive Summary........................................................................................................ D-5 CHAPTER 1: UC Irvine Fuel Cell Bus Program ...................................................................... D-6
1.1 Statement of Work ............................................................................................................................ D-6 1.1.1 Deliverable Tasks......................................................................................................................... D-6
1.2 Technology Development at Start of Grant Period................................................................................ D-6 CHAPTER 2: Performance Analysis .................................................................................... D-8
2.1 Engineering ....................................................................................................................................... D-8 2.2 Manufacturing.................................................................................................................................... D-8 2.3 Testing and Verification ..................................................................................................................... D-9
2.3.3 Bus Route.................................................................................................................................... D-9 2.4 Operational.......................................................................................................................................D-10
2.4.1 Monthly Summary .......................................................................................................................D-10 2.4.2 Safety Incidents ..........................................................................................................................D-12 2.4.3 Service Outage Summary ............................................................................................................D-12 2.4.3.1 Scheduled Maintenance ............................................................................................................D-12 2.4.3.3 Road Service ..........................................................................................................................D-14 2.4.4 Fuel Economy .............................................................................................................................D-15 2.4.5 Lessons Learned .........................................................................................................................D-17 2.4.6 UC Irvine Project Feedback .........................................................................................................D-17
CHAPTER 3: Achievements ........................................................................................... D-18 3.1 Benefits to Transit .............................................................................................................................D-18 3.2 Benefits to California .........................................................................................................................D-19
CHAPTER 4: Future Developments.................................................................................. D-20 4.1 Project Conclusion.............................................................................................................................D-20 4.2 Fuel Cell Buses..................................................................................................................................D-20 4.3 Industry Advancement ......................................................................................................................D-20 4.4 Other Opportunities...........................................................................................................................D-21
D-4
LIST OF FIGURES Page
Figure 1: FC-1 Bus, Side View ......................................................................................... D-8 Figure 2: FC-1 Bus, Three-Quarters View .......................................................................... D-9 Figure 3: Anteater Express W Line Route ........................................................................ D-10 Figure 4: FC-1 Bus Availability During Program................................................................. D-11 Figure 5: FC-1 Bus Availability in Program ....................................................................... D-14 Figure 6: Service Days Lost Due To Road Service Incidents ................................................ D-15
LIST OF TABLES Page
Table 1: Summary of Monthly Performance Reports for FC-1 .............................................. D-10 Table 2: FC-1 Safety Incidents ...................................................................................... D-12 Table 3: FC-1 Scheduled Maintenance ............................................................................ D-12 Table 4: FC-1 Unscheduled Maintenance ......................................................................... D-13 Table 5: FC-1 Road Service........................................................................................... D-14 Table 6: Fueling Statistics for FC-1 ................................................................................. D-16
D-5
EXECUTIVE SUMMARY The goal of the UC Irvine Fuel Cell Bus Program was to demonstrate the use of a fuel cell bus as a continuation of the American Fuel Cell Bus Program. The agreed tasks were fuel cell bus assembly and demonstration in a university shuttle setting and duty cycle.
The UC Irvine Fuel Cell Bus (FC-1) is an All American Bus Buses incorporating a Ballard Power Systems fuel cell stack and BAE Systems (BAE) fuel cell system in a 40-foot El Dorado Altoona-qualified Axess Fuel Cell Transit Bus.
Program Results FC-1 operated from Nov 2015 to Nov 2017, and UC Irvine intends to continue using the vehicle as long as the economics warrant. Monthly reports were submitted to CALSTART to track progress; six- and eighteen-month reports were also issued. During the Program the bus traveled more than 45,000 miles and carried more than 208,000 passengers. It consumed approximately 8500 kg of hydrogen (H2) for a fuel economy of 5.4 miles/kg H2 equivalent on an energy basis to 6.4 miles/gallon diesel, but without the carbon dioxide, nitrogen or sulfur oxides, or diesel particulate matter.
FC-1 was available for service for 371 of 445 potential service days for an availability ratio of 83 percent. Failures of long lead-time components and the transit operator’s reliance on third-party maintenance contractors (delaying problem diagnosis) contributed to availability being lower than seen in previous fuel cell bus deployments. The UC Irvine Fuel Cell Bus Program demonstrated that fuel cell buses are feasible for university shuttle duty cycles, while highlighting the value of on-site maintenance and fueling infrastructure. Benefits to California included the advancement of fuel cell technology and related jobs, a first deployment in the transit-adjacent university shuttle market, and the efficient use of funds, as the Fuel Cell Bus Program leveraged existing hydrogen fueling infrastructure.
Next Steps As Ballard Power Systems and BAE continue to improve the fuel cell system, cost reductions and policy support have enabled larger-scale fuel cell bus deployments around the United States. As the bus market matures, other sectors such as port vehicles and trucking offer additional opportunities for zero-emission transportation to replace combustion-based incumbents.
D-6
CHAPTER 1: UC Irvine Fuel Cell Bus Program
1.1 Statement of Work The goal of this project is to successfully demonstrate an American Fuel Cell Bus. Consistent with the original proposal (City and County of San Francisco, Airport Commission’s proposal, taken over by Ballard Power Systems as project lead) submitted in the CALSTART Program, the agreed tasks are fuel cell bus assembly and demonstration. Project goals included improvements on the baseline American Fuel Cell Bus platform and validation of the technology on a duty cycle specific to university shuttles (in comparison to mass transit operation, which was the use case for the preceding American Fuel Cell Bus trial). Manufacturability, durability, and maintenance requirements were also to be evaluated.
1.1.1 Deliverable Tasks Provide substantiation of the achievement of tasks in the project schedule in the original City and Country of San Francisco, Airport Commission’s (now Ballard Power Systems’) application as follows:
• Compile and update various aspects of the bus design, including but not limited to weight reduction, component space claim, vehicle component layout, maintainability and operability and prepare and submit design documentation
• Put the bus in operation and compile 6 and 18 month in-service reviews and performance reports.
Deliverables are to include: • Documentation to reflect updated bus design, relating to weight reductions, component
layout, and other improvements to prototype bus design • 6 and 18 month in-service review and performance reports, with the fleet testing
partner to provide reports summarizing data collected, focusing on improvement of quality, reliability, performance and durability
• A final report including a description of the engineering, manufacturing, testing, verification and operational phases of the project.
1.2 Technology Development at Start of Grant Period The University of California Irvine (UC Irvine, or UCI) Fuel Cell Bus Program builds on past American Fuel Cell Bus deployments executed in partnership with CALSTART. SunLine Transit Agency, with both Ballard Power Systems (Ballard) and BAE conducted the previous Project as participants.

D-7
The SunLine project advanced the pathway to commercialization of fuel cell buses, addressing challenges of cost competitiveness, reliability, durability, integration and manufacturing. It also identified the need to drive down vehicle capital costs, among other recommendations.
Fuel Cell bus deployments to date had been conducted by large-scale transit operators with dedicated maintenance and infrastructure, such as fueling stations. The UCI Fuel Cell Bus program evaluated the maturing technology with a more challenging use case, with a smaller transit operator lacking dedicated maintenance and infrastructure resources.
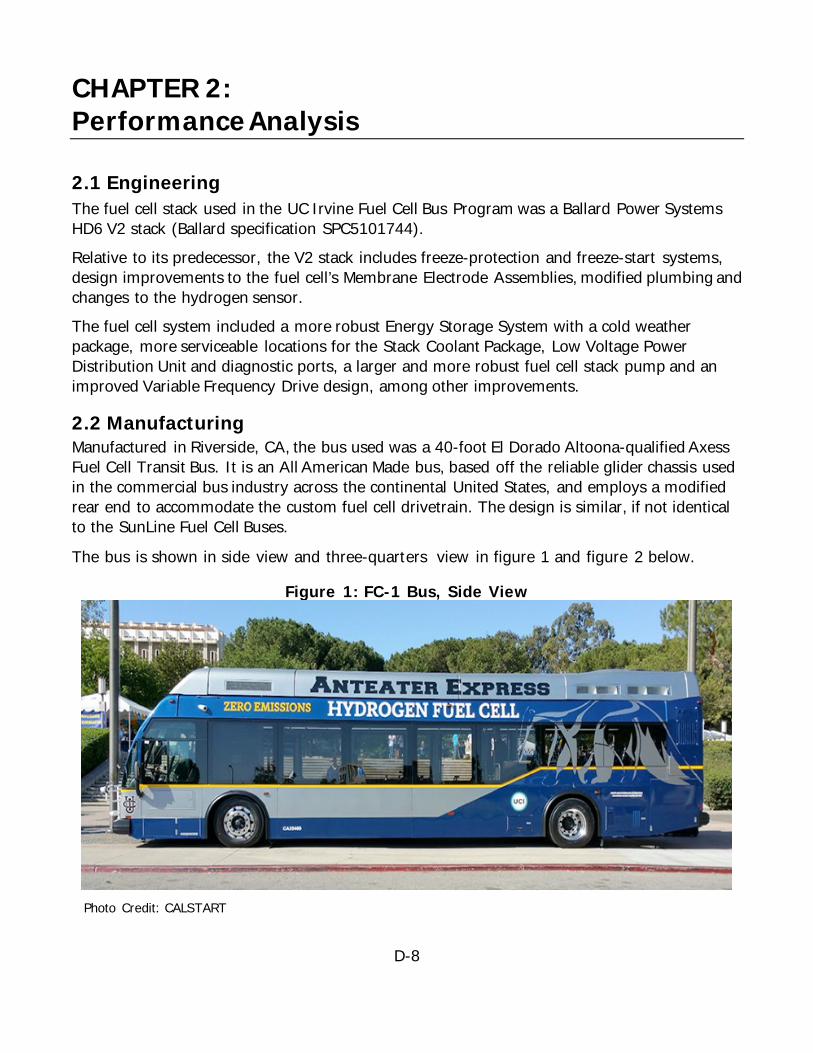
D-8
CHAPTER 2: Performance Analysis
2.1 Engineering The fuel cell stack used in the UC Irvine Fuel Cell Bus Program was a Ballard Power Systems HD6 V2 stack (Ballard specification SPC5101744). Relative to its predecessor, the V2 stack includes freeze-protection and freeze-start systems, design improvements to the fuel cell’s Membrane Electrode Assemblies, modified plumbing and changes to the hydrogen sensor. The fuel cell system included a more robust Energy Storage System with a cold weather package, more serviceable locations for the Stack Coolant Package, Low Voltage Power Distribution Unit and diagnostic ports, a larger and more robust fuel cell stack pump and an improved Variable Frequency Drive design, among other improvements.
2.2 Manufacturing Manufactured in Riverside, CA, the bus used was a 40-foot El Dorado Altoona-qualified Axess Fuel Cell Transit Bus. It is an All American Made bus, based off the reliable glider chassis used in the commercial bus industry across the continental United States, and employs a modified rear end to accommodate the custom fuel cell drivetrain. The design is similar, if not identical to the SunLine Fuel Cell Buses.
The bus is shown in side view and three-quarters view in figure 1 and figure 2 below.
Figure 1: FC-1 Bus, Side View
Photo Credit: CALSTART
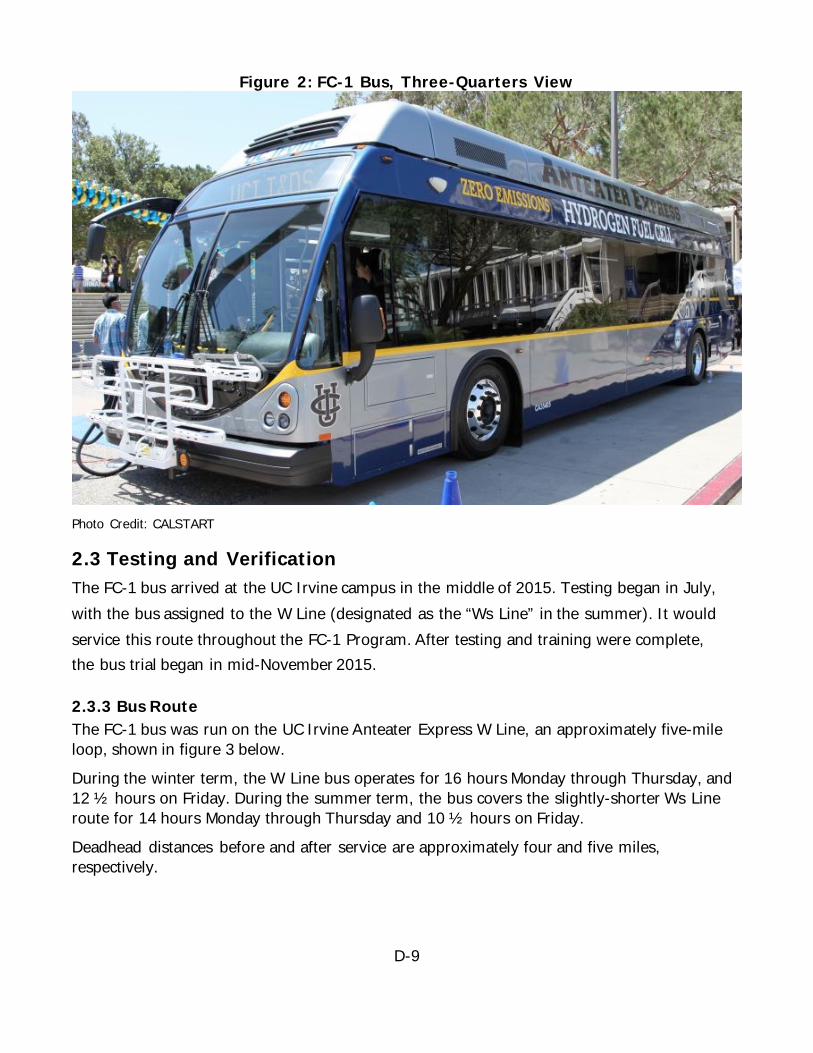
D-9
Figure 2: FC-1 Bus, Three-Quarters View
Photo Credit: CALSTART
2.3 Testing and Verification The FC-1 bus arrived at the UC Irvine campus in the middle of 2015. Testing began in July, with the bus assigned to the W Line (designated as the “Ws Line” in the summer). It would service this route throughout the FC-1 Program. After testing and training were complete, the bus trial began in mid-November 2015.
2.3.3 Bus Route The FC-1 bus was run on the UC Irvine Anteater Express W Line, an approximately five-mile loop, shown in figure 3 below. During the winter term, the W Line bus operates for 16 hours Monday through Thursday, and 12 ½ hours on Friday. During the summer term, the bus covers the slightly-shorter Ws Line route for 14 hours Monday through Thursday and 10 ½ hours on Friday. Deadhead distances before and after service are approximately four and five miles, respectively.
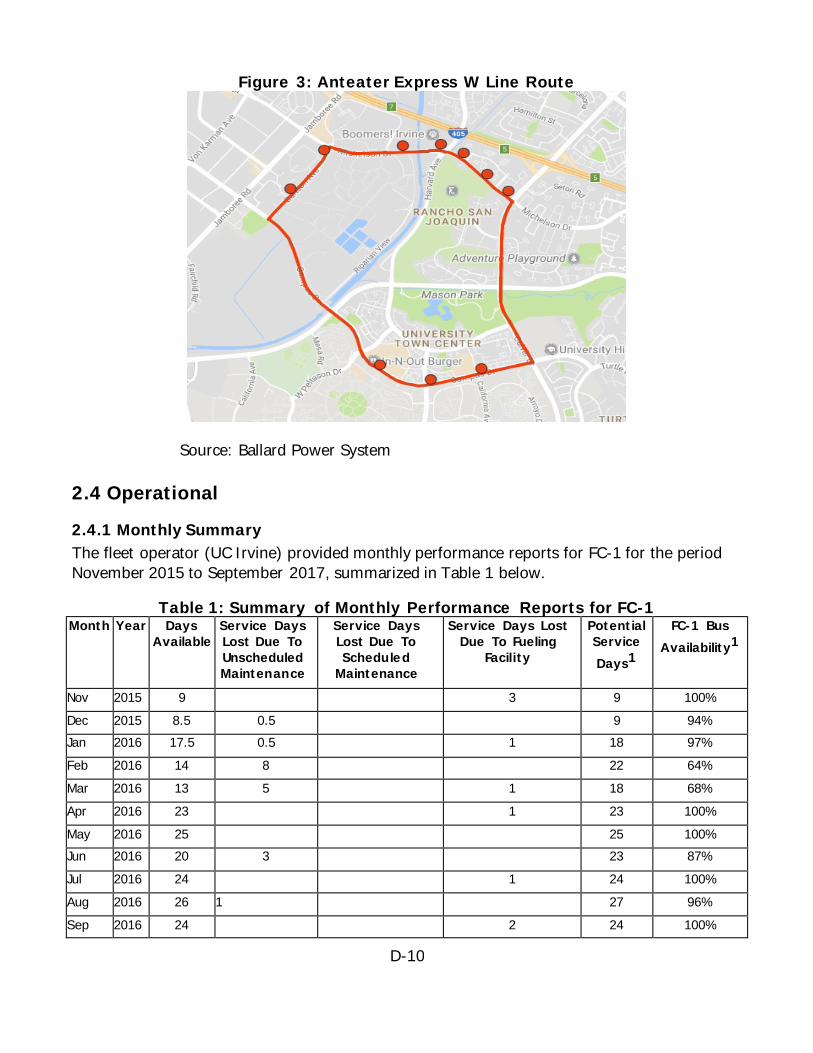
D-10
Figure 3: Anteater Express W Line Route
Source: Ballard Power System
2.4 Operational
2.4.1 Monthly Summary The fleet operator (UC Irvine) provided monthly performance reports for FC-1 for the period November 2015 to September 2017, summarized in Table 1 below.
Table 1: Summary of Monthly Performance Reports for FC-1 Month Year Days
Available Service Days Lost Due To Unscheduled Maintenance
Service Days Lost Due To Scheduled
Maintenance
Service Days Lost Due To Fueling
Facility
Potential Service Days1
FC-1 Bus Availability1
Nov 2015 9 3 9 100% Dec 2015 8.5 0.5 9 94% Jan 2016 17.5 0.5 1 18 97% Feb 2016 14 8 22 64% Mar 2016 13 5 1 18 68% Apr 2016 23 1 23 100% May 2016 25 25 100% Jun 2016 20 3 23 87% Jul 2016 24 1 24 100% Aug 2016 26 1 27 96% Sep 2016 24 2 24 100%
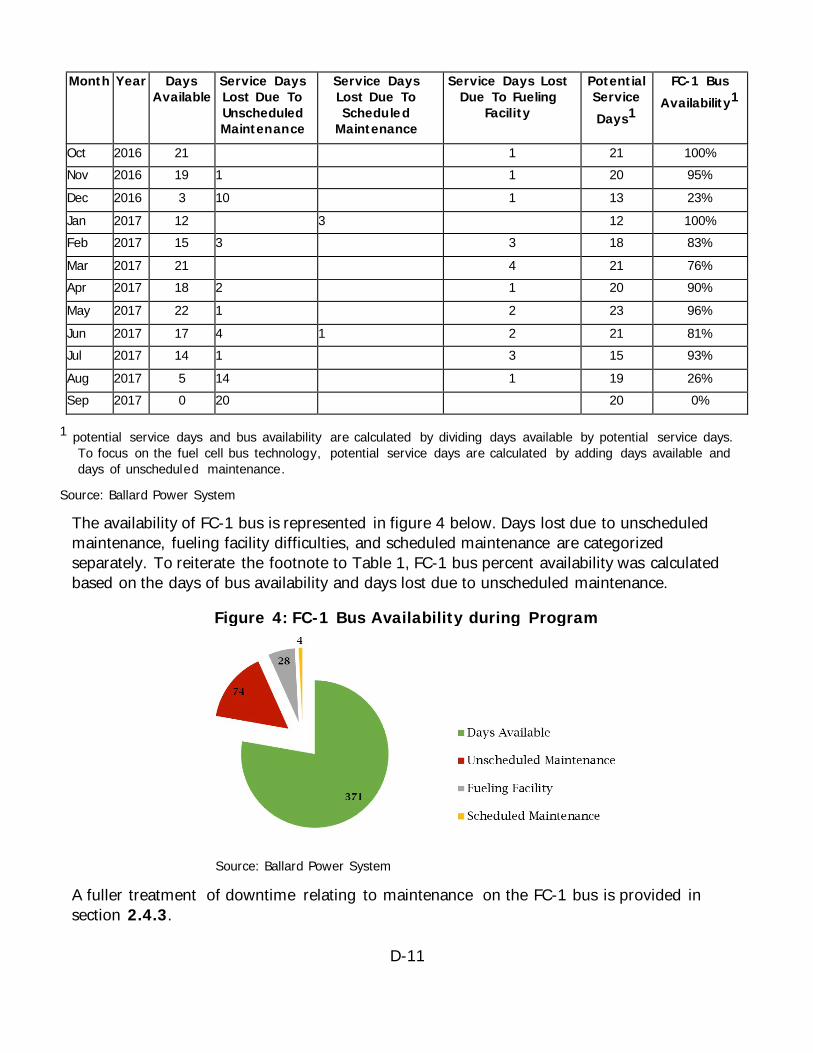
D-11
Month Year Days Available
Service Days Lost Due To Unscheduled Maintenance
Service Days Lost Due To Scheduled
Maintenance
Service Days Lost Due To Fueling
Facility
Potential Service Days1
FC-1 Bus Availability1
Oct 2016 21 1 21 100% Nov 2016 19 1 1 20 95% Dec 2016 3 10 1 13 23% Jan 2017 12 3 12 100% Feb 2017 15 3 3 18 83% Mar 2017 21 4 21 76% Apr 2017 18 2 1 20 90% May 2017 22 1 2 23 96% Jun 2017 17 4 1 2 21 81% Jul 2017 14 1 3 15 93% Aug 2017 5 14 1 19 26% Sep 2017 0 20 20 0%
1 potential service days and bus availability are calculated by dividing days available by potential service days. To focus on the fuel cell bus technology, potential service days are calculated by adding days available and days of unscheduled maintenance.
Source: Ballard Power System
The availability of FC-1 bus is represented in figure 4 below. Days lost due to unscheduled maintenance, fueling facility difficulties, and scheduled maintenance are categorized separately. To reiterate the footnote to Table 1, FC-1 bus percent availability was calculated based on the days of bus availability and days lost due to unscheduled maintenance.
Figure 4: FC-1 Bus Availability during Program
Source: Ballard Power System
A fuller treatment of downtime relating to maintenance on the FC-1 bus is provided in section 2.4.3.
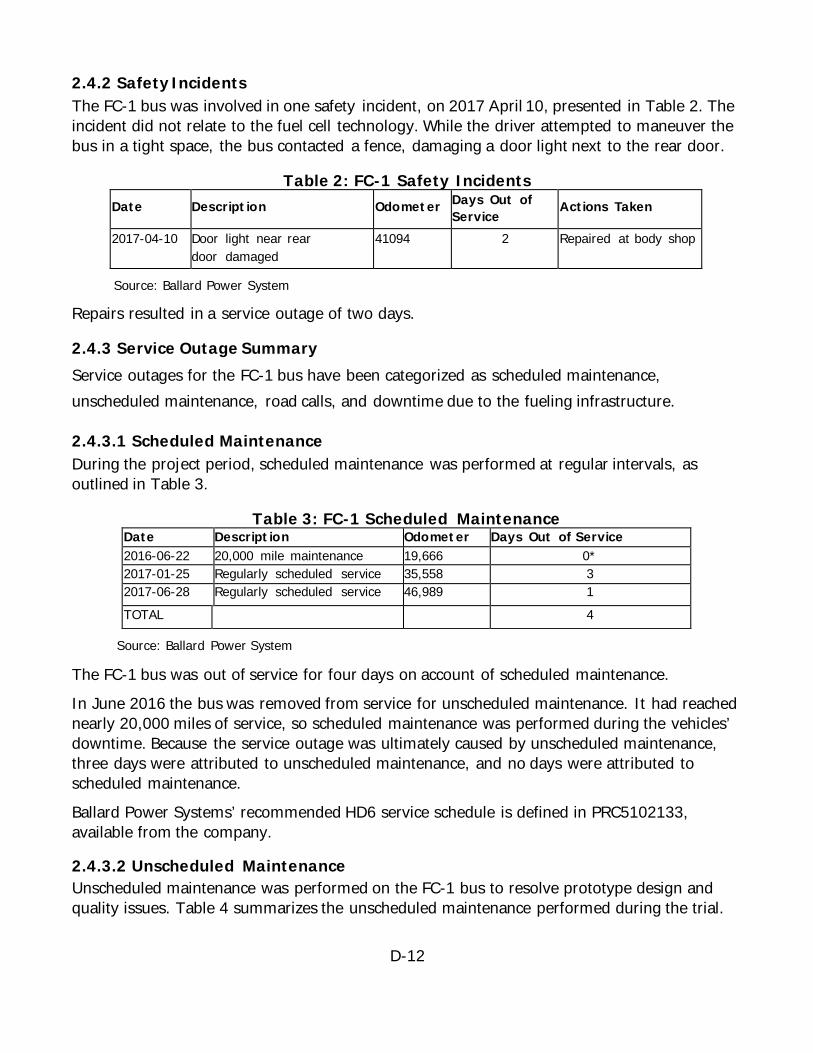
D-12
2.4.2 Safety Incidents The FC-1 bus was involved in one safety incident, on 2017 April 10, presented in Table 2. The incident did not relate to the fuel cell technology. While the driver attempted to maneuver the bus in a tight space, the bus contacted a fence, damaging a door light next to the rear door.
Table 2: FC-1 Safety Incidents Date Descript ion Odometer Days Out of
Service Actions Taken
2017-04-10 Door light near rear door damaged
41094 2 Repaired at body shop
Source: Ballard Power System
Repairs resulted in a service outage of two days.
2.4.3 Service Outage Summary Service outages for the FC-1 bus have been categorized as scheduled maintenance, unscheduled maintenance, road calls, and downtime due to the fueling infrastructure.
2.4.3.1 Scheduled Maintenance During the project period, scheduled maintenance was performed at regular intervals, as outlined in Table 3.
Table 3: FC-1 Scheduled Maintenance Date Descript ion Odometer Days Out of Service 2016-06-22 20,000 mile maintenance 19,666 0* 2017-01-25 Regularly scheduled service 35,558 3 2017-06-28 Regularly scheduled service 46,989 1 TOTAL 4
Source: Ballard Power System
The FC-1 bus was out of service for four days on account of scheduled maintenance. In June 2016 the bus was removed from service for unscheduled maintenance. It had reached nearly 20,000 miles of service, so scheduled maintenance was performed during the vehicles’ downtime. Because the service outage was ultimately caused by unscheduled maintenance, three days were attributed to unscheduled maintenance, and no days were attributed to scheduled maintenance. Ballard Power Systems’ recommended HD6 service schedule is defined in PRC5102133, available from the company.
2.4.3.2 Unscheduled Maintenance Unscheduled maintenance was performed on the FC-1 bus to resolve prototype design and quality issues. Table 4 summarizes the unscheduled maintenance performed during the trial.

D-13
Table 4: FC-1 Unscheduled Maintenance Date Descript ion Odometer Days Out
of Service Actions Taken
2015-11-18 Red Stop HEV light 3031 0 Restarting bus resolved issue
2015-12-09 BAE repairs required 4439 0.5 BAE repairs 2016-01-04 Bus battery appeared
dead (beginning of shift)
4819 0 Battery jumped ($69.11 parts, 0.5 h labor)
2016-01-19 Low coolant light 6102 0.5 Coolant topped up
2016-02-08 Stop HEV and Red Stop Fuel Cell lights on dash
8064 8 Repairs to coolant system
2016-08-08 Horn would honk like car alarm
23456 0 Broken wires repaired ($276.03 parts, 2 h labor)
2016-12-06 Power steering system failed, due to circuit breaker failure
34373 10 Circuit breaker and wiring harness replaced ($354 parts)
2017-02-07 Stop Fuel Cell light 36670 1 Maintenance
2017-02-21 Check and Stop Fuel Cell lights; bus entered degraded mode
37774 2 Air bubble removed from Stack Coolant Package coolant loop
2017-05-02 Bus battery dead 42652 1 Battery replaced
2017-06-12 Check HEV light 46191 1 Bus idled to bring battery state-of-charge up
2017-06-16 Check and Stop Fuel Cell lights; bus entered degraded mode
46360 3 Air bubble removed from Stack Coolant Package coolant loop
2017-07-10 Air pressure gauge reads zero
46973 1 Power cycled bus, inspected brake transducers for proper fit
2017-08-14 Low Coolant light 47642 34 (to Sep 30)
Stack Coolant Package radiator leak, 12 weeks for replacement
TOTAL 62
Source: Ballard Power System
The FC-1 bus was out of service for 54 days on account of unscheduled maintenance. Almost all of the service interruptions (45 days or 83 percent) were on account of three incidents: a Stack Coolant Package radiator leak (34 days through end-September 2017), a circuit breaker failure (10 days) and coolant system repairs (eight days).
Figure 5 below shows the distribution of causes for unscheduled maintenance.
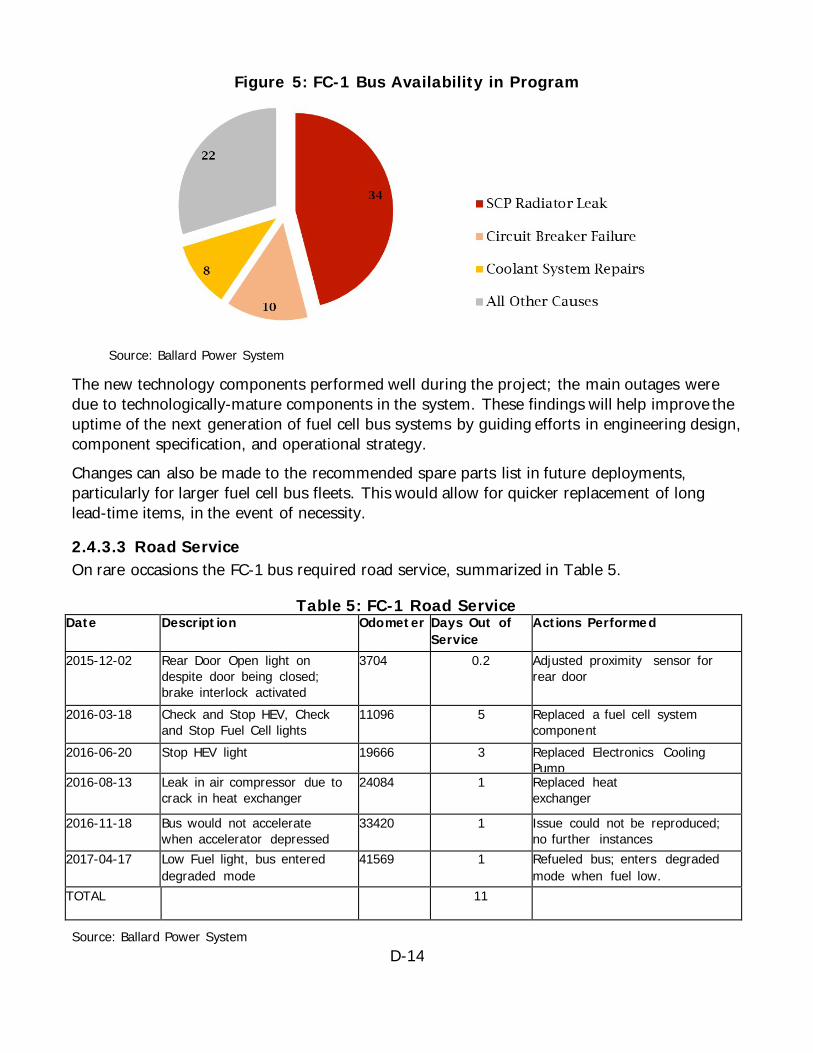
D-14
Figure 5: FC-1 Bus Availability in Program
Source: Ballard Power System
The new technology components performed well during the project; the main outages were due to technologically-mature components in the system. These findings will help improve the uptime of the next generation of fuel cell bus systems by guiding efforts in engineering design, component specification, and operational strategy. Changes can also be made to the recommended spare parts list in future deployments, particularly for larger fuel cell bus fleets. This would allow for quicker replacement of long lead-time items, in the event of necessity.
2.4.3.3 Road Service On rare occasions the FC-1 bus required road service, summarized in Table 5.
Table 5: FC-1 Road Service Date Descript ion Odometer Days Out of
Service Actions Performed
2015-12-02 Rear Door Open light on despite door being closed; brake interlock activated
3704 0.2 Adjusted proximity sensor for rear door
2016-03-18 Check and Stop HEV, Check and Stop Fuel Cell lights
11096 5 Replaced a fuel cell system component
2016-06-20 Stop HEV light 19666 3 Replaced Electronics Cooling Pump
2016-08-13 Leak in air compressor due to crack in heat exchanger
24084 1
Replaced heat exchanger
2016-11-18 Bus would not accelerate when accelerator depressed
33420 1 Issue could not be reproduced; no further instances
2017-04-17 Low Fuel light, bus entered degraded mode
41569 1 Refueled bus; enters degraded mode when fuel low.
TOTAL 11
Source: Ballard Power System
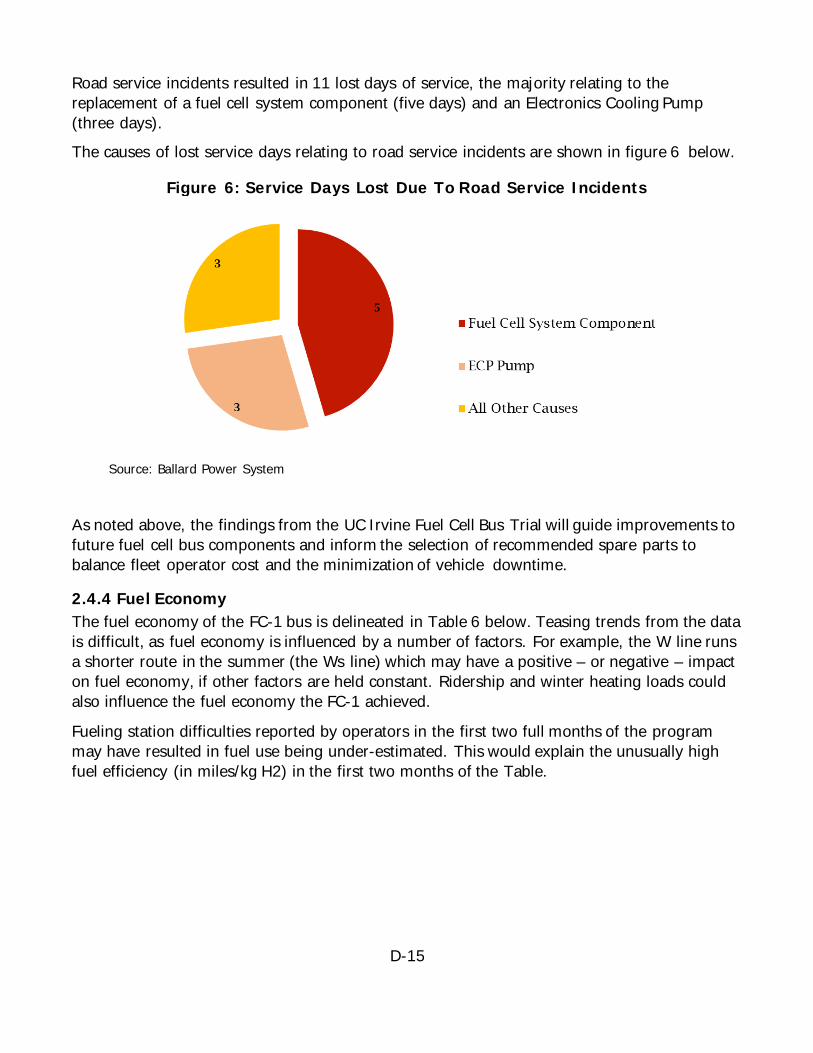
D-15
Road service incidents resulted in 11 lost days of service, the majority relating to the replacement of a fuel cell system component (five days) and an Electronics Cooling Pump (three days). The causes of lost service days relating to road service incidents are shown in figure 6 below.
Figure 6: Service Days Lost Due To Road Service Incidents
Source: Ballard Power System
As noted above, the findings from the UC Irvine Fuel Cell Bus Trial will guide improvements to future fuel cell bus components and inform the selection of recommended spare parts to balance fleet operator cost and the minimization of vehicle downtime.
2.4.4 Fuel Economy The fuel economy of the FC-1 bus is delineated in Table 6 below. Teasing trends from the data is difficult, as fuel economy is influenced by a number of factors. For example, the W line runs a shorter route in the summer (the Ws line) which may have a positive – or negative – impact on fuel economy, if other factors are held constant. Ridership and winter heating loads could also influence the fuel economy the FC-1 achieved.
Fueling station difficulties reported by operators in the first two full months of the program may have resulted in fuel use being under-estimated. This would explain the unusually high fuel efficiency (in miles/kg H2) in the first two months of the Table.
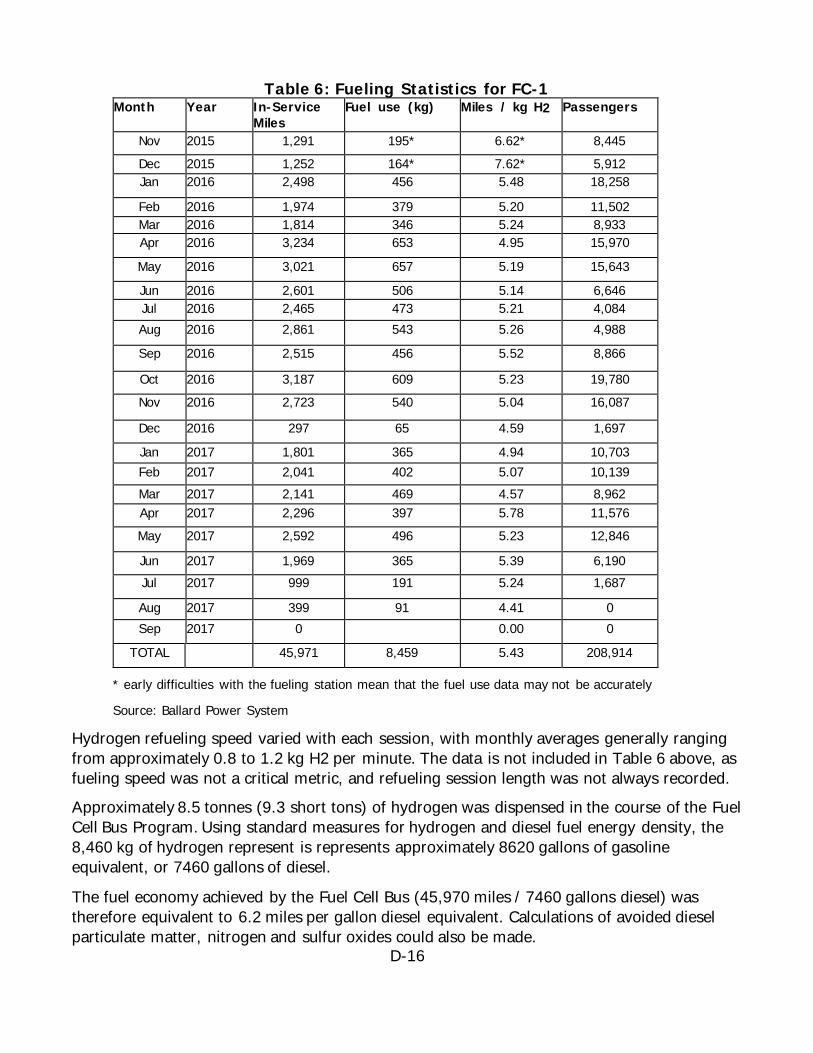
D-16
Table 6: Fueling Statistics for FC-1 Month Year In-Service
Miles
Fuel use (kg) Miles / kg H2 Passengers
Nov 2015 1,291 195* 6.62* 8,445 Dec 2015 1,252 164* 7.62* 5,912 Jan 2016 2,498 456 5.48 18,258
Feb 2016 1,974 379 5.20 11,502 Mar 2016 1,814 346 5.24 8,933 Apr 2016 3,234 653 4.95 15,970
May 2016 3,021 657 5.19 15,643
Jun 2016 2,601 506 5.14 6,646 Jul 2016 2,465 473 5.21 4,084 Aug 2016 2,861 543 5.26 4,988
Sep 2016 2,515 456 5.52 8,866
Oct 2016 3,187 609 5.23 19,780 Nov 2016 2,723 540 5.04 16,087
Dec 2016 297 65 4.59 1,697
Jan 2017 1,801 365 4.94 10,703 Feb 2017 2,041 402 5.07 10,139 Mar 2017 2,141 469 4.57 8,962 Apr 2017 2,296 397 5.78 11,576 May 2017 2,592 496 5.23 12,846
Jun 2017 1,969 365 5.39 6,190 Jul 2017 999 191 5.24 1,687
Aug 2017 399 91 4.41 0 Sep 2017 0 0.00 0
TOTAL 45,971 8,459 5.43 208,914
* early difficulties with the fueling station mean that the fuel use data may not be accurately
Source: Ballard Power System
Hydrogen refueling speed varied with each session, with monthly averages generally ranging from approximately 0.8 to 1.2 kg H2 per minute. The data is not included in Table 6 above, as fueling speed was not a critical metric, and refueling session length was not always recorded. Approximately 8.5 tonnes (9.3 short tons) of hydrogen was dispensed in the course of the Fuel Cell Bus Program. Using standard measures for hydrogen and diesel fuel energy density, the 8,460 kg of hydrogen represent is represents approximately 8620 gallons of gasoline equivalent, or 7460 gallons of diesel.
The fuel economy achieved by the Fuel Cell Bus (45,970 miles / 7460 gallons diesel) was therefore equivalent to 6.2 miles per gallon diesel equivalent. Calculations of avoided diesel particulate matter, nitrogen and sulfur oxides could also be made.

D-17
2.4.5 Lessons Learned As California’s first deployment of fuel cell buses in a shuttle / university setting, the UC Irvine Fuel Cell Bus Program offered lessons for future deployments of the technology in this use case.
• Higher than expected service outages generally related to fuel cell system components, perhaps indicative of the different stresses of the university shuttle and mass transit duty cycles. It is expected that design changes can resolve these, and that technology development would not be required.
• Expectations for future projects should account for the fact that shuttle operators commonly rely on third parties for maintenance. This means that troubleshooting and the diagnosis of problems takes longer. Issues that could be quickly addressed by an on-site maintenance team might have prevented the loss of service days in some cases. This is evidenced by the lower availability for the UCI bus (83 percent) when compared to other El Dorado fuel cell electric buses operating in the United States.
• Depending on contracts signed with industrial gas suppliers, shared fueling stations may not have the same uptime as dedicated stations, such as those commonly installed by larger transit operators during their trials.
• Operating a single demonstration vehicle may not provide the optimal conditions for developing preventative and corrective maintenance processes and policy.
2.4.6 UC Irvine Project Feedback UCI Irvine had the following feedback on this project:
“Overall, the UCI Fuel cell bus has been a success. While we've had some minor struggles with the availability of parts and the reliability of the fueling infrastructure, passengers and operators alike have enjoyed the quiet and smooth ride the bus provides. With time, we are hopeful that the technology advances and that the costs of both fuel and availability of replacement parts decline making the bus more economical to operate.” UCI intends to continue operation of the bus and is investigating additional buses to operate on their longer routes where battery electric buses are not suitable.
D-18
CHAPTER 3: Achievements
3.1 Benefits to Transit The Project demonstrated the following benefits to the UC Irvine community:
• Zero tailpipe emissions: Fuel cell buses do not generate tailpipe emissions, whereas diesel emissions have received growing attention from international health organizations. As early as 1998, the ARB had identified diesel particulate emissions as a toxic air contaminant, and in 2012 the World Health Organization–affiliated International Agency for Research on Cancer identified diesel engine exhaust as “carcinogenic to humans”. Further adoption of fuel cell buses, among other measures, would contribute to ARB achieving its goal of halving petroleum use by 2030, which would entail a similar decline for diesel particulate emissions.
• Same operation than conventional buses allowing buses to operate on long routes during long service hours and fast refilling. Fuel cell electric bus can operate on any route at any time.
• Greenhouse gas emission reductions: The EPA estimates that transportation represents 27 percent of total US greenhouse gas emissions. Targeting transit vehicles for emissions reduction is highly effective, as they suffer poor fuel economy (owing to their weight) and are in steady use throughout the day and week. To ensure fuel cell vehicles’ well-to-wheels emissions are lower than those of combustion vehicles, hydrogen stations funded by the California Energy Commission are required to source 33 percent of their hydrogen from renewable sources.
• Innovation leadership: The American Fuel Cell bus program added to UC Irvine’s track record of innovation and environmental leadership, which has won top 10 rankings from publications as diverse as US News & World Report and Sierra. Given the pioneering work of UC Irvine’s Blake-Rowland laboratory studying worldwide air quality – work undertaken in conjunction with NASA and referenced by the World Meteorological Organization and Intergovernmental Panel on Climate Change – the Fuel Cell bus program was a fit with the UC Irvine campus, on several levels.
• Noise reduction on urban routes: The noise from diesel buses is disruptive and can be particularly aggravating to community stakeholders during the early morning and late evening portions of a bus route. Quiet fuel cell buses circumvent this issue.
D-19
3.2 Benefits to California The American Fuel Cell Bus program provided the following benefits to the state of California:
• Advancing Fuel Cell technology and jobs: Continued support for the deployment of fuel cell buses has allowed the industry to iterate improvements to the fuel cell stack and system, readying these for wider deployment. The tipping point may have arrived with the JIVE and JIVE2 projects from Europe’s Fuel Cell Joint Undertaking calling for a total of 291 fuel cell buses. The human capital California has developed around hydrogen and fuel cells offers state businesses economic opportunities to consult with other regions shifting to zero emission mass transit.
• Fuel Cell technology evaluation for a new market: Fuel cell bus deployments to date had been conducted by large-scale mass transit service operators. The FC-1 program was the first evaluation of the technology for the shuttle market, with its distinct duty cycle and where smaller transit operators commonly rely on third-party maintenance and existing infrastructure. Insights from this first university deployment will improve outcomes of future fuel cell bus deployments in transit shuttle markets.
• Efficient use of California funds for transit: The UC Irvine Fuel Cell Bus Program refueled its bus from an existing automotive hydrogen fueling station. While station uptime was lower than would have been the case for a dedicated station, considerable program savings resulted from not having to purchase dedicated fueling infrastructure.
D-20
CHAPTER 4: Future Developments
4.1 Project Conclusion The UC Irvine Fuel Cell Bus Program successfully placed an American Made fuel cell bus in regular rotation on a university shuttle bus route. The bus received positive feedback from the transit operator and riders and reduced greenhouse gas emissions and diesel particulate matter in the community. Service outages due to unscheduled maintenance were higher than expected, perhaps relating to the necessity of small transit operators to rely on third-party maintenance, and the stresses of a new duty cycle on components optimized for use in mass transit applications. UC Irvine plans to continue using FC-1 after the completion of the Program as long as the economics prove viable.
4.2 Fuel Cell Buses With increased awareness of the acute impacts of diesel pollution as well as the longer- term impacts of greenhouse gas-induced climate change, governments around the world have redoubled their commitments to zero emission mass transit. In California, the Center for Transportation and the Environment, won an ARB AQIP award for deploying 10 New Flyer fuel cell electric buses with each of AC Transit and the Orange County Transit Authority. The buses will feature Ballard’s HD7 fuel cell module in New Flyer’s XHE fuel cell electric bus platform. SunLine Transit also won an award for five fuel cell electric buses under the same New Flyer/Ballard configuration.
The Stark Area Regional Transit Authority in Ohio is also expecting to deploy 13 fuel cell electric buses in 2018 using a similar Ballard, BAE, ElDorado National bus platform from the UCI program. These deployments will be important to ensure the competitiveness of these California made, Buy America compliant buses as vendors in other regions of the world adopt fuel cell technology. In addition to the aforementioned JIVE and JIVE2 calls in Europe for 291 fuel cell buses, China has become a leading fuel cell bus market. Ballard’s fuel cell engines are being integrated by several of the country’s bus original equipment manufacturers, with more than 90 fuel cell buses between them entering service in 2018.
4.3 Industry Advancement Future areas of development include the following:
• Cost reduction: historically, fuel cell bus costs have been high owing to the need to recover costs across small deployments. The trend towards more and larger fuel cell bus deployments will allow costs to be amortized over higher production volumes and unlock learning curve effects to decrease costs.

D-21
• Battery-fuel cell hybridization: the rapid decline in lithium ion battery costs opens the possibility for battery-fuel cell hybrid buses in which the battery is used for primary propulsion and the fuel cell is used as a range extender. In this configuration, the fuel cell system can be smaller and run at gentler conditions, allowing cost reductions as the system can be smaller and does not require the same degree of robustness.
• Light rail: the resurgence in interest in light rail among city planners provides another opportunity for fuel cell systems, which are highly suitable for tram- style applications. Though light rail has a distinct duty cycle, the technological expertise gained from fuel cell bus programs will help domestic firms compete for zero emission light rail projects nationally and around the world.
4.4 Other Opportunities While this grant focused on transit, fuel cell technology has established itself in material handling (warehouse forklifts) and can be adapted for use in adjacent sectors including shipping, trucking (long haul, drayage and delivery vehicles) and ground support at seaports and airports. Fuel cell policy support has been provided for pilot programs in many of these use cases, which are generally unamenable to battery-only solutions.
The Ports of Los Angeles and Long Beach have proposed to eliminate combustion trucks, ships and container-moving equipment by 2035 at substantial cost, but still greater economic opportunity. State businesses developing early expertise with zero- compromise, zero-emission solutions stand to benefit California’s economy by exporting their products and services to other states and across the seas.
APPENDIX E: Volvo Construction Equipment Hybrid Electric Wheel Loader (LX1) Demonstration Project
Prepared for: California Energy Commission Prepared by: Volvo Technology of America, Inc.
E-2
Johan Lokrantz Colleen Anderson Scott Young Primary Authors
Volvo Construction Equipment North America, LLC 312 Volvo Way Shippensburg, PA 17257 717-385-2643 Volvo website: https://www.volvoce.com/united-states/
Disclaimer Staff members of the California Energy Commission prepared this report. As such, it does not necessarily represent the views of the Energy Commission, its employees, or the State of California. The Energy Commission, the State of California, its employees, contractors and subcontractors make no warrant, express or implied, and assume no legal liability for the information in this report; nor does any party represent that the uses of this information will not infringe upon privately owned rights. This report has not been approved or disapproved by the Energy Commission nor has the Commiss ion passed upon the accuracy or adequacy of the information in this report.
E-3
TABLE OF CONTENTS Page
Table of Contents .......................................................................................................... E-3 List of Figures ............................................................................................................... E-4 List of Tables ................................................................................................................ E-4 Executive Summary........................................................................................................ E-5 CHAPTER 1: Hybrid Electric Wheel Loader .......................................................................... E-7
1.1 Statement of Work ..............................................................................................................................E-7 1.1.1 Deliverable Tasks..........................................................................................................................E-7 1.1.2 Report Content .............................................................................................................................E-7
CHAPTER 2: Fuel Efficiency Tests with Results .................................................................... E-8 2.1 Background and Method ......................................................................................................................E-8 2.2 Test Setup ..........................................................................................................................................E-9 2.3 Test Site Application Descriptions ....................................................................................................... E-10 Moreno Valley Transfer Station ................................................................................................................ E-13 2.4 Data Collection and Post Processing ................................................................................................... E-16 2.5 Test Results ...................................................................................................................................... E-17 2.6 Statistical Analysis of Test Results ...................................................................................................... E-20 2.7 Productivity....................................................................................................................................... E-23 2.8 Plug-in Charging Potential.................................................................................................................. E-26 2.9 Conclusion ........................................................................................................................................ E-27
CHAPTER 3: In-Service Emissions Executive Summary .........................................................E-28 CHAPTER 4: Customer Feedback .....................................................................................E-30
4.1 Redwood Landfill............................................................................................................................... E-30 4.2 Moreno Valley Transfer Station .......................................................................................................... E-30
CHAPTER 5: Project Achievements and Success ..................................................................E-31 5.1 Advancements in Science and Success ............................................................................................... E-31 5.2 Benefits to California ......................................................................................................................... E-32
CHAPTER 6: Market Implications .....................................................................................E-34 CHAPTER 7: Future Projects and Improvements .................................................................E-36
E-4
LIST OF FIGURES Page
Figure 1: Truck Leaving Green Waste Material.....................................................................E-11 Figure 2: LX1 Pushing Green Waste Material Within Reach for the Excavator ..............................E-11 Figure 3: LX1 Lifting Green Waste Material into a Pile ...........................................................E-11 Figure 4: Ground Material Moving on Conveyor Belt to Pile Which LX1 Lifts into Larger Piles ..........E-12 Figure 5: Air Pipes Visible in Empty Space before LX1 Makes Pile .............................................E-12 Figure 6: LX1 Moves Material into Pile for Covered Aerated Static Pile Composting.......................E-12 Figure 7: Garbage Truck Leaving Waste.............................................................................E-13 Figure 8: LX1 Pushing Waste Material towards a Hole in the Ground ........................................E-14 Figure 9: LX1 Reaches the Hole .......................................................................................E-14 Figure 10: LX1 Pushes Material Down Through Hole .............................................................E-14 Figure 11: LX1 Compacts Material on the Truck By Pushing Down the Bucket Through the Hole .....E-15 Figure 12: Truck Positioned In a Tunnel Waiting To Be Loaded ...............................................E-15 Figure 13: Truck Being Top Loaded By the LX1 ...................................................................E-15
LIST OF TABLES Page
Table 1: Machine Specifications for Hybrid Electric LX1 and L150H ............................................ E-9 Table 2: Amount of Recorded Representative Data Used For Project Results ..............................E-16 Table 3: Measured Fuel Consumption at Redwood Landfill and Recycling Center .........................E-18 Table 4: Measured fuel consumption at Moreno Valley Transfer Station.....................................E-19 Table 5: Statistical Analysis from Redwood Landfill and Recycling Center...................................E-21 Table 6: Statistical Analysis from Moreno Valley Transfer Station .............................................E-22 Table 7: Averages at Redwood Landfill and Recycling Center ..................................................E-24 Table 8: Averages at Moreno Valley Transfer Station ............................................................E-25 Table 9: Summary of Emission Results for Conventional and Hybrid Wheel Loaders .....................E-29 Table 10: Emission Standards for Hybrid and Conventional Wheel Loaders’ Engines .....................E-29
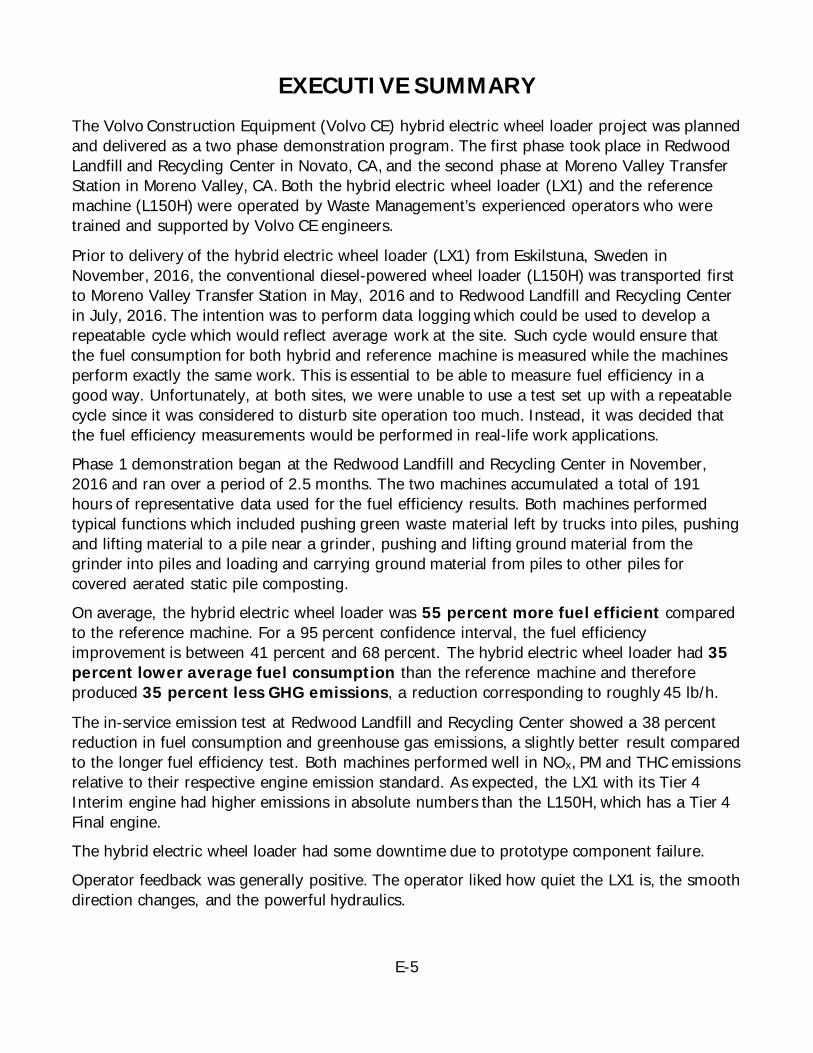
E-5
EXECUTIVE SUMMARY The Volvo Construction Equipment (Volvo CE) hybrid electric wheel loader project was planned and delivered as a two phase demonstration program. The first phase took place in Redwood Landfill and Recycling Center in Novato, CA, and the second phase at Moreno Valley Transfer Station in Moreno Valley, CA. Both the hybrid electric wheel loader (LX1) and the reference machine (L150H) were operated by Waste Management’s experienced operators who were trained and supported by Volvo CE engineers.
Prior to delivery of the hybrid electric wheel loader (LX1) from Eskilstuna, Sweden in November, 2016, the conventional diesel-powered wheel loader (L150H) was transported first to Moreno Valley Transfer Station in May, 2016 and to Redwood Landfill and Recycling Center in July, 2016. The intention was to perform data logging which could be used to develop a repeatable cycle which would reflect average work at the site. Such cycle would ensure that the fuel consumption for both hybrid and reference machine is measured while the machines perform exactly the same work. This is essential to be able to measure fuel efficiency in a good way. Unfortunately, at both sites, we were unable to use a test set up with a repeatable cycle since it was considered to disturb site operation too much. Instead, it was decided that the fuel efficiency measurements would be performed in real-life work applications. Phase 1 demonstration began at the Redwood Landfill and Recycling Center in November, 2016 and ran over a period of 2.5 months. The two machines accumulated a total of 191 hours of representative data used for the fuel efficiency results. Both machines performed typical functions which included pushing green waste material left by trucks into piles, pushing and lifting material to a pile near a grinder, pushing and lifting ground material from the grinder into piles and loading and carrying ground material from piles to other piles for covered aerated static pile composting. On average, the hybrid electric wheel loader was 55 percent more fuel efficient compared to the reference machine. For a 95 percent confidence interval, the fuel efficiency improvement is between 41 percent and 68 percent. The hybrid electric wheel loader had 35 percent lower average fuel consumption than the reference machine and therefore produced 35 percent less GHG emissions, a reduction corresponding to roughly 45 lb/h.
The in-service emission test at Redwood Landfill and Recycling Center showed a 38 percent reduction in fuel consumption and greenhouse gas emissions, a slightly better result compared to the longer fuel efficiency test. Both machines performed well in NOx, PM and THC emissions relative to their respective engine emission standard. As expected, the LX1 with its Tier 4 Interim engine had higher emissions in absolute numbers than the L150H, which has a Tier 4 Final engine. The hybrid electric wheel loader had some downtime due to prototype component failure. Operator feedback was generally positive. The operator liked how quiet the LX1 is, the smooth direction changes, and the powerful hydraulics.
E-6
To demonstrate renewable diesel fuel, Golden Gate Petroleum set up the fuel tanker on-site, and the renewable diesel fuel was used in both the hybrid electric wheel loader and the conventional diesel-powered wheel loader for the entirety of the demonstration period. The renewable diesel fuel was easily incorporated and did not affect performance of either machine. Phase 2 demonstration began at the Moreno Valley Transfer Station in March, 2017 and ran over a period of two months. The two machines accumulated a total of 184 hours of representative data used for the fuel economy results. Both machines performed typical functions which included pushing material left by garbage trucks into piles and pushing material into holes in the floor leading down to tunnels where trucks stop to be loaded.
On average, the hybrid electric wheel loader was 50 percent more fuel efficient compared to the reference machine. For a 95 percent confidence interval, the fuel efficiency improvement is between 38 percent and 60 percent. The hybrid electric wheel loader had 33 percent lower average fuel consumption than the reference machine and therefore produced 33 percent less GHG emissions, a reduction corresponding to roughly 47 lb/h. The hybrid electric wheel loader had some battery issues at Moreno Valley Transfer Station with some downtime. Operator feedback was mostly positive. Good acceleration, low in-cab noise level, smooth direction changes and visibility were appreciated features of the LX1.
Productivity, usually measured in ton/h, was not possible to measure properly at either facility. Such a productivity measure was not relevant in this type of application since the material was moved in different ways (pushed, stacked in piles, carried, packed down) and the density of the material as well as the distance it moved varied significantly from day to day. Operator feedback from both facilities indicated that the jobsite productivity was somewhat worse with the hybrid electric wheel loader. Fuel efficiency test results come from charge sustaining operation of the LX1 which means that the batteries have the same state of charge at the start and end of each day. Calculating what impact plug-in charging would have had on fuel efficiency shows that it would have gone from 55 percent to 75 percent at Redwood Landfill and Recycling Center and from 50 percent to 67 percent at Moreno Valley Transfer Station. This corresponds to 43 percent and 40 percent respectively in fuel consumption reduction for the two sites.
E-7
CHAPTER 1: Hybrid Electric Wheel Loader
1.1 Statement of Work The goal of this project is to work with Waste Management Inc. in the demonstration project to evaluate the benefits of hybrid electric wheel loaders in the State of California. The tests aim to demonstrate fuel efficiency and emission results for the Volvo prototype hybrid electric wheel loader while maintaining the same productivity and performance as a conventional diesel-powered wheel loader in actual customer applications.
1.1.1 Deliverable Tasks • Provide substantiation of the achievement of tasks in the project schedule in Volvo CE’s
application as follows: o Conduct fuel efficiency tests of the hybrid electric wheel loader versus the
conventional diesel-powered wheel loader. o Conduct emission tests of the hybrid electric wheel loader versus the
conventional diesel-powered wheel loader. o Measure productivity of the Hybrid-Electric prototype wheel loader compared to a
conventional diesel-powered wheel loader in actual customer applications. o Obtain feedback from the customer on the Hybrid-Electric prototype wheel
loader performance.
1.1.1.1 Products • Redwood Landfill Test Report • Moreno Valley Test Report • In-Service Emissions Summary Report • Productivity Summary Report • Operator Feedback Summary Report
1.1.2 Report Content The following report is a complete document outlining testing and results to satisfy deliverable tasks and products as described in the Statement of Work. This comprehensive report will complete the Energy Commission issued solicitation PON-10-603 to provide funding opportunities under the Alternative and Renewable Fuel and Vehicle Technology Program for a comparative performance of a prototype hybrid electric wheel loader versus a conventional diesel-powered wheel loader in actual customer applications.
E-8
CHAPTER 2: Fuel Efficiency Tests with Results
2.1 Background and Method Fuel efficiency for wheel loaders is defined as how much material can be moved per unit burned fuel, e.g. tonne per liter or ton per gallon. Fuel efficiency is therefore highly application dependent and a relevant quantity mostly in applications where productivity can be measured in amount of moved material per unit time, e.g. ton per hour. In this project’s waste applications, ton per hour is not a good way to quantify useful work. The inbound material to the site is not simply moved from point A to point B, but there are often several steps of interaction with the material before it leaves the application. The material is moved in different ways, for example pushed, stacked in piles or carried, and the density of the material as well as the distance it is moved varies significantly from day to day. Furthermore, there is no practical way to weigh the material the wheel loaders in these applications move. Initially, the plan was to handle this difficulty by setting up short repeatable tests to mimic parts of the normal work at the site, but making sure that the prototype hybrid electric wheel loader named LX1 and the conventional diesel-powered wheel loader named L150H could do exactly the same work with the same material. Comparing measurement data from the short tests with data from reference measurements for entire days of ordinary work would ensure the relevance of the short repeatable tests. Unfortunately, such a test setup would have disturbed the site production too much and was not possible to use.
Therefore, a different approach was necessary: it is assumed that the average productivity for the LX1 and L150H is the same. This is in some sense justifiable since it is possible to replace the L150H with the LX1 in the studied applications, but it is quite clear that while the two machines use the same bucket, the L150H has a larger capacity when it comes to pushing material. An explanation for some of the capacity difference is that the L150H is a heavier machine with one size bigger tires. With assumed equal productivity, it is possible to calculate the LX1’s fuel efficiency improvement over the L150H only from the fuel consumption numbers alone. Fuel efficiency improvement for the LX1 over the L150H is calculated as:
[𝑡𝑡𝑡𝑡𝑛𝑛/𝑔𝑔𝑔𝑔𝑔𝑔𝑔𝑔𝑡𝑡𝑛𝑛]𝐿𝐿𝐿𝐿1[𝑡𝑡𝑡𝑡𝑛𝑛/𝑔𝑔𝑔𝑔𝑔𝑔𝑔𝑔𝑡𝑡𝑛𝑛]𝐿𝐿150𝐻𝐻
− 1 =
[𝑡𝑡𝑡𝑡𝑛𝑛/ℎ𝑡𝑡𝑜𝑜𝑜𝑜]𝐿𝐿𝐿𝐿1[𝑔𝑔𝑔𝑔𝑔𝑔𝑔𝑔𝑡𝑡𝑛𝑛/ℎ𝑡𝑡𝑜𝑜𝑜𝑜]𝐿𝐿𝐿𝐿1[𝑡𝑡𝑡𝑡𝑛𝑛/ℎ𝑡𝑡𝑜𝑜𝑜𝑜]𝐿𝐿150𝐻𝐻
[𝑔𝑔𝑔𝑔𝑔𝑔𝑔𝑔𝑡𝑡𝑛𝑛/ℎ𝑡𝑡𝑜𝑜𝑜𝑜]𝐿𝐿150𝐻𝐻
− 1
If the productivity in ton per hour for the machines’ is equal the equations simplifies to: [𝑔𝑔𝑔𝑔𝑔𝑔𝑔𝑔𝑡𝑡𝑛𝑛/ℎ𝑡𝑡𝑜𝑜𝑜𝑜]𝐿𝐿150𝐻𝐻[𝑔𝑔𝑔𝑔𝑔𝑔𝑔𝑔𝑡𝑡𝑛𝑛/ℎ𝑡𝑡𝑜𝑜𝑜𝑜]𝐿𝐿𝐿𝐿1
− 1
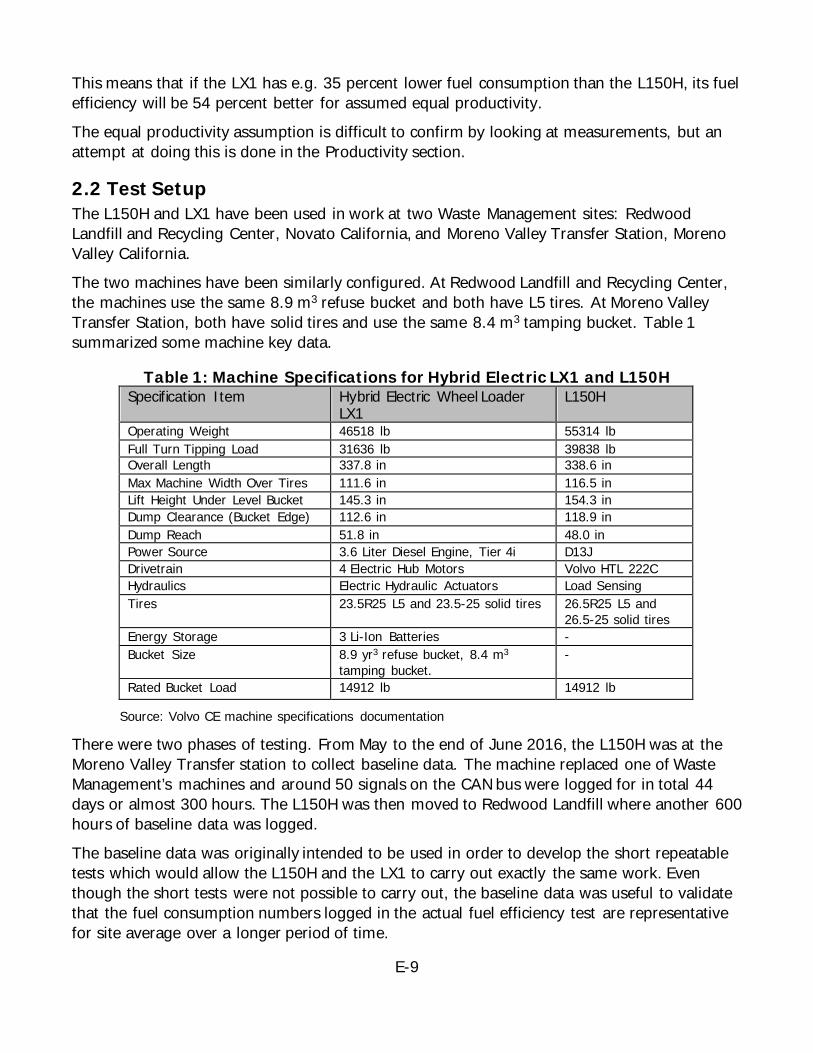
E-9
This means that if the LX1 has e.g. 35 percent lower fuel consumption than the L150H, its fuel efficiency will be 54 percent better for assumed equal productivity. The equal productivity assumption is difficult to confirm by looking at measurements, but an attempt at doing this is done in the Productivity section.
2.2 Test Setup The L150H and LX1 have been used in work at two Waste Management sites: Redwood Landfill and Recycling Center, Novato California, and Moreno Valley Transfer Station, Moreno Valley California. The two machines have been similarly configured. At Redwood Landfill and Recycling Center, the machines use the same 8.9 m3 refuse bucket and both have L5 tires. At Moreno Valley Transfer Station, both have solid tires and use the same 8.4 m3 tamping bucket. Table 1 summarized some machine key data.
Table 1: Machine Specifications for Hybrid Electric LX1 and L150H Specification Item Hybrid Electric Wheel Loader
LX1 L150H
Operating Weight 46518 lb 55314 lb Full Turn Tipping Load 31636 lb 39838 lb Overall Length 337.8 in 338.6 in Max Machine Width Over Tires 111.6 in 116.5 in Lift Height Under Level Bucket 145.3 in 154.3 in Dump Clearance (Bucket Edge) 112.6 in 118.9 in Dump Reach 51.8 in 48.0 in Power Source 3.6 Liter Diesel Engine, Tier 4i D13J Drivetrain 4 Electric Hub Motors Volvo HTL 222C Hydraulics Electric Hydraulic Actuators Load Sensing Tires 23.5R25 L5 and 23.5-25 solid tires 26.5R25 L5 and
26.5-25 solid tires Energy Storage 3 Li-Ion Batteries - Bucket Size 8.9 yr3 refuse bucket, 8.4 m3
tamping bucket. -
Rated Bucket Load 14912 lb 14912 lb
Source: Volvo CE machine specifications documentation
There were two phases of testing. From May to the end of June 2016, the L150H was at the Moreno Valley Transfer station to collect baseline data. The machine replaced one of Waste Management’s machines and around 50 signals on the CAN bus were logged for in total 44 days or almost 300 hours. The L150H was then moved to Redwood Landfill where another 600 hours of baseline data was logged. The baseline data was originally intended to be used in order to develop the short repeatable tests which would allow the L150H and the LX1 to carry out exactly the same work. Even though the short tests were not possible to carry out, the baseline data was useful to validate that the fuel consumption numbers logged in the actual fuel efficiency test are representative for site average over a longer period of time.
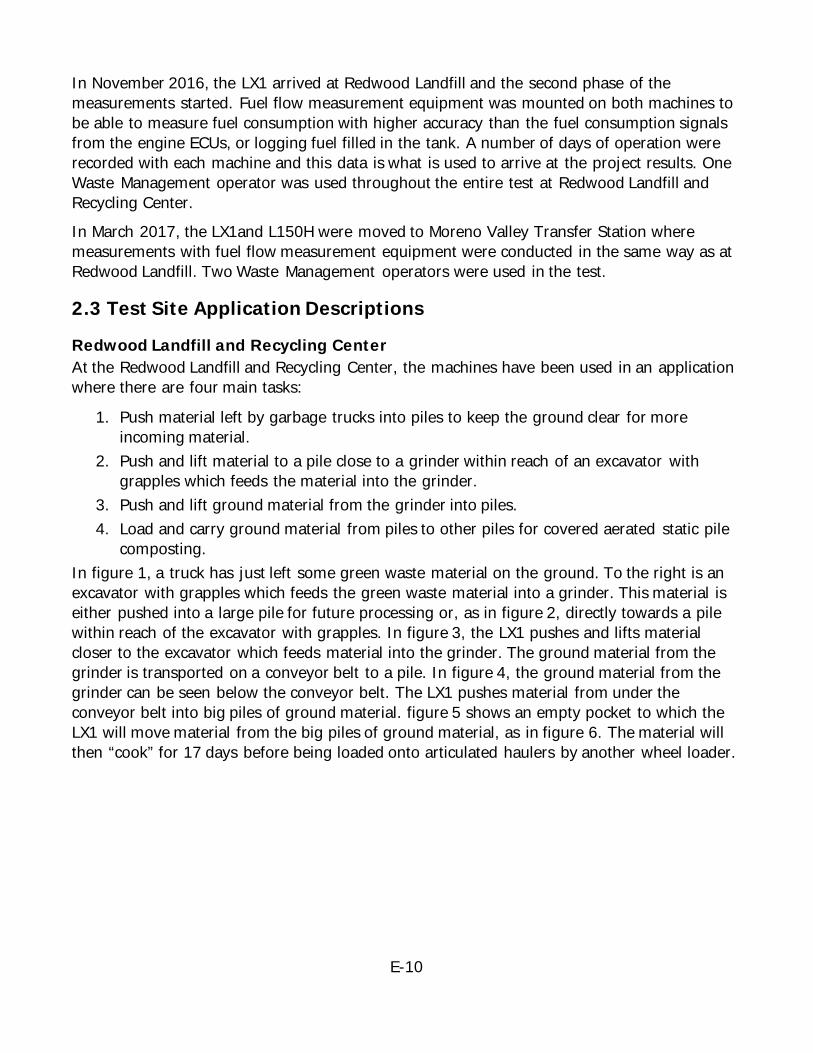
E-10
In November 2016, the LX1 arrived at Redwood Landfill and the second phase of the measurements started. Fuel flow measurement equipment was mounted on both machines to be able to measure fuel consumption with higher accuracy than the fuel consumption signals from the engine ECUs, or logging fuel filled in the tank. A number of days of operation were recorded with each machine and this data is what is used to arrive at the project results. One Waste Management operator was used throughout the entire test at Redwood Landfill and Recycling Center. In March 2017, the LX1and L150H were moved to Moreno Valley Transfer Station where measurements with fuel flow measurement equipment were conducted in the same way as at Redwood Landfill. Two Waste Management operators were used in the test.
2.3 Test Site Application Descriptions
Redwood Landfill and Recycling Center At the Redwood Landfill and Recycling Center, the machines have been used in an application where there are four main tasks:
1. Push material left by garbage trucks into piles to keep the ground clear for more incoming material.
2. Push and lift material to a pile close to a grinder within reach of an excavator with grapples which feeds the material into the grinder.
3. Push and lift ground material from the grinder into piles. 4. Load and carry ground material from piles to other piles for covered aerated static pile
composting. In figure 1, a truck has just left some green waste material on the ground. To the right is an excavator with grapples which feeds the green waste material into a grinder. This material is either pushed into a large pile for future processing or, as in figure 2, directly towards a pile within reach of the excavator with grapples. In figure 3, the LX1 pushes and lifts material closer to the excavator which feeds material into the grinder. The ground material from the grinder is transported on a conveyor belt to a pile. In figure 4, the ground material from the grinder can be seen below the conveyor belt. The LX1 pushes material from under the conveyor belt into big piles of ground material. figure 5 shows an empty pocket to which the LX1 will move material from the big piles of ground material, as in figure 6. The material will then “cook” for 17 days before being loaded onto articulated haulers by another wheel loader.
E-11
Figure 1: Truck Leaving Green Waste Material
Photo Credit: Volvo CE
Figure 2: LX1 Pushing Green Waste Material Within Reach for the Excavator
Photo Credit: Volvo CE
Figure 3: LX1 Lifting Green Waste Material into a Pile
Photo Credit: Volvo CE
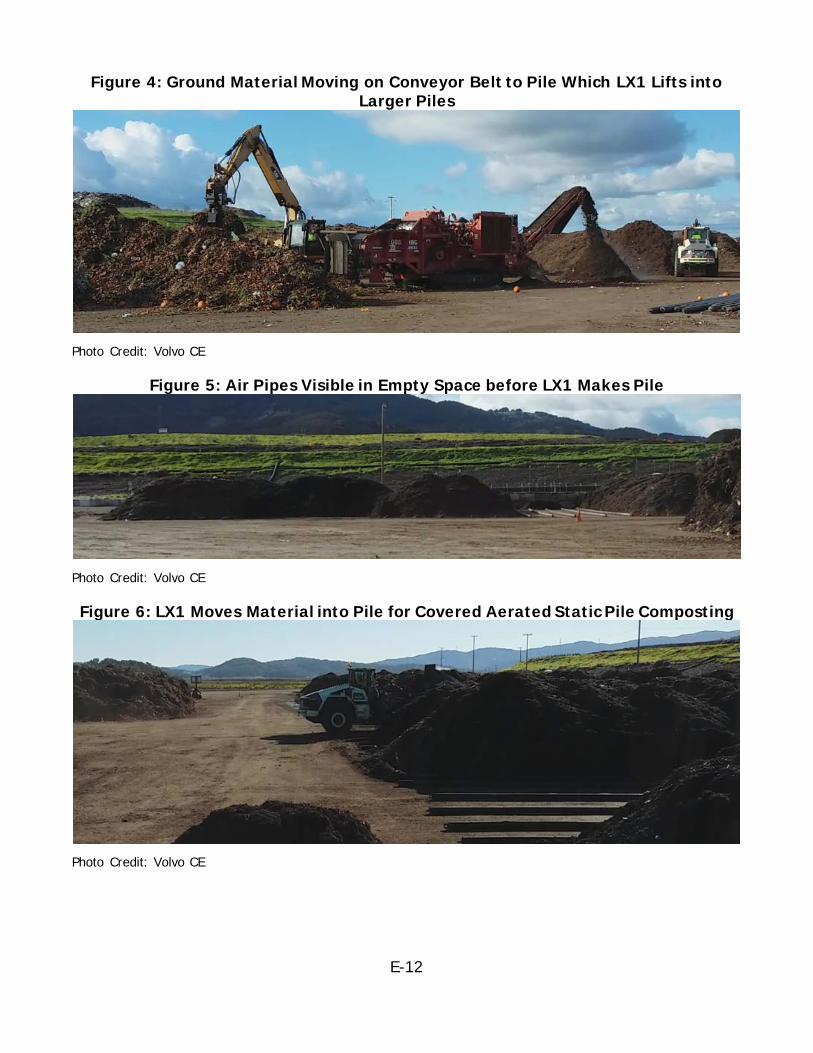
E-12
Figure 4: Ground Material Moving on Conveyor Belt to Pile Which LX1 Lifts into Larger Piles
Photo Credit: Volvo CE
Figure 5: Air Pipes Visible in Empty Space before LX1 Makes Pile
Photo Credit: Volvo CE
Figure 6: LX1 Moves Material into Pile for Covered Aerated Static Pile Composting
Photo Credit: Volvo CE
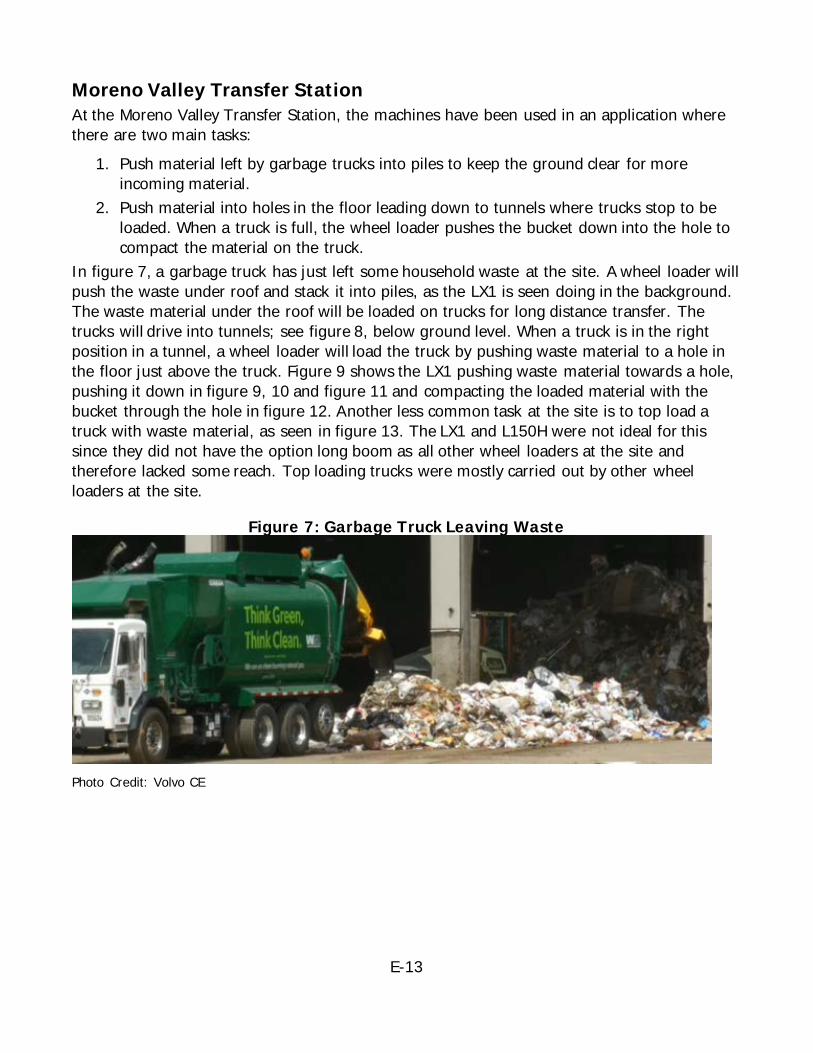
E-13
Moreno Valley Transfer Station At the Moreno Valley Transfer Station, the machines have been used in an application where there are two main tasks:
1. Push material left by garbage trucks into piles to keep the ground clear for more incoming material.
2. Push material into holes in the floor leading down to tunnels where trucks stop to be loaded. When a truck is full, the wheel loader pushes the bucket down into the hole to compact the material on the truck.
In figure 7, a garbage truck has just left some household waste at the site. A wheel loader will push the waste under roof and stack it into piles, as the LX1 is seen doing in the background. The waste material under the roof will be loaded on trucks for long distance transfer. The trucks will drive into tunnels; see figure 8, below ground level. When a truck is in the right position in a tunnel, a wheel loader will load the truck by pushing waste material to a hole in the floor just above the truck. Figure 9 shows the LX1 pushing waste material towards a hole, pushing it down in figure 9, 10 and figure 11 and compacting the loaded material with the bucket through the hole in figure 12. Another less common task at the site is to top load a truck with waste material, as seen in figure 13. The LX1 and L150H were not ideal for this since they did not have the option long boom as all other wheel loaders at the site and therefore lacked some reach. Top loading trucks were mostly carried out by other wheel loaders at the site.
Figure 7: Garbage Truck Leaving Waste
Photo Credit: Volvo CE
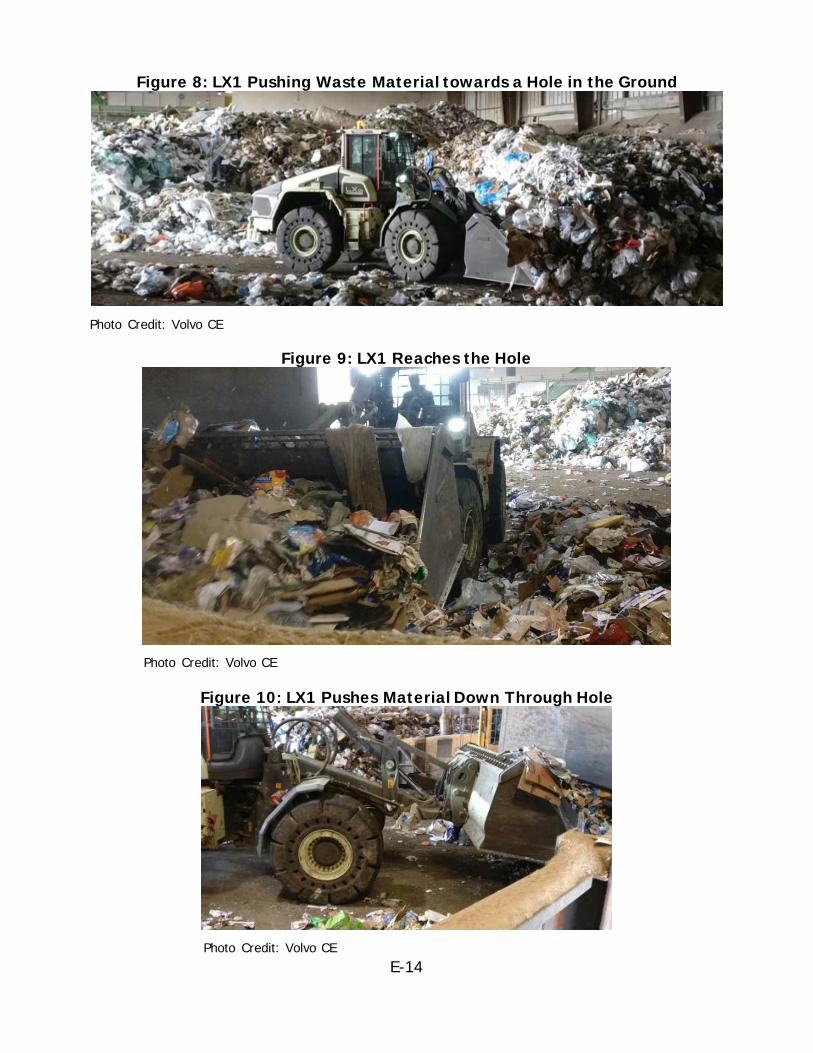
E-14
Figure 8: LX1 Pushing Waste Material towards a Hole in the Ground
Photo Credit: Volvo CE
Figure 9: LX1 Reaches the Hole
Photo Credit: Volvo CE
Figure 10: LX1 Pushes Material Down Through Hole
Photo Credit: Volvo CE
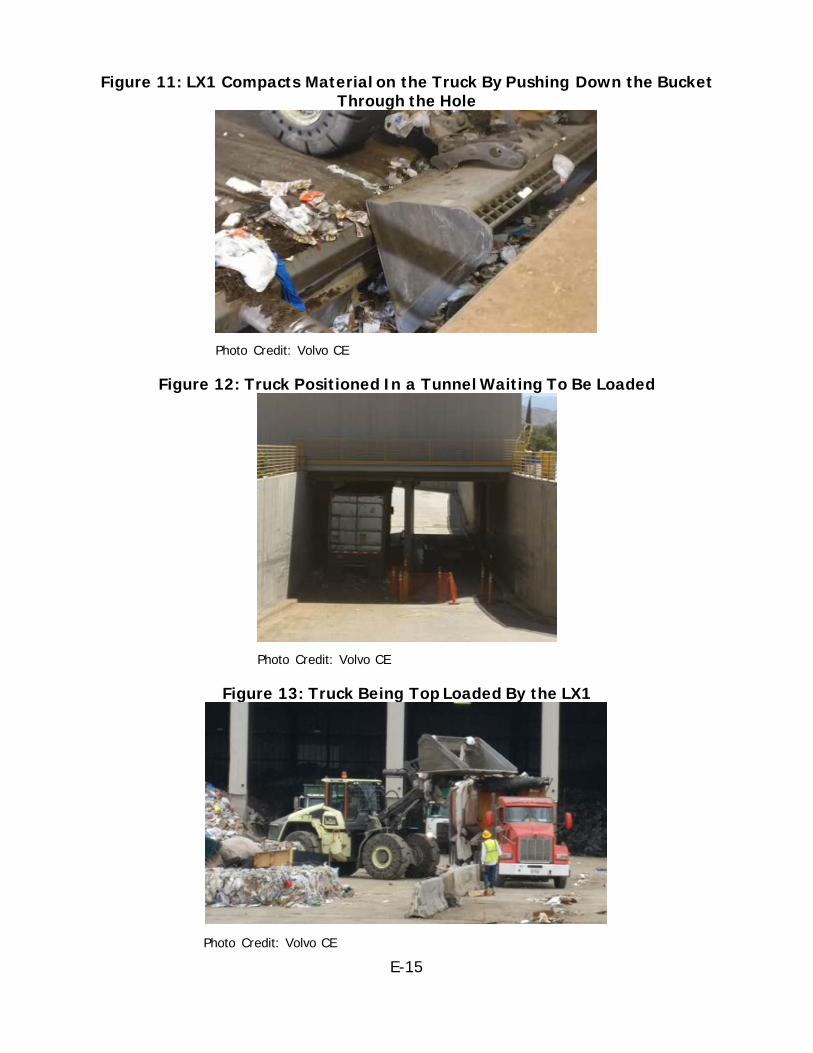
E-15
Figure 11: LX1 Compacts Material on the Truck By Pushing Down the Bucket Through the Hole
Photo Credit: Volvo CE
Figure 12: Truck Positioned In a Tunnel Waiting To Be Loaded
Photo Credit: Volvo CE
Figure 13: Truck Being Top Loaded By the LX1
Photo Credit: Volvo CE
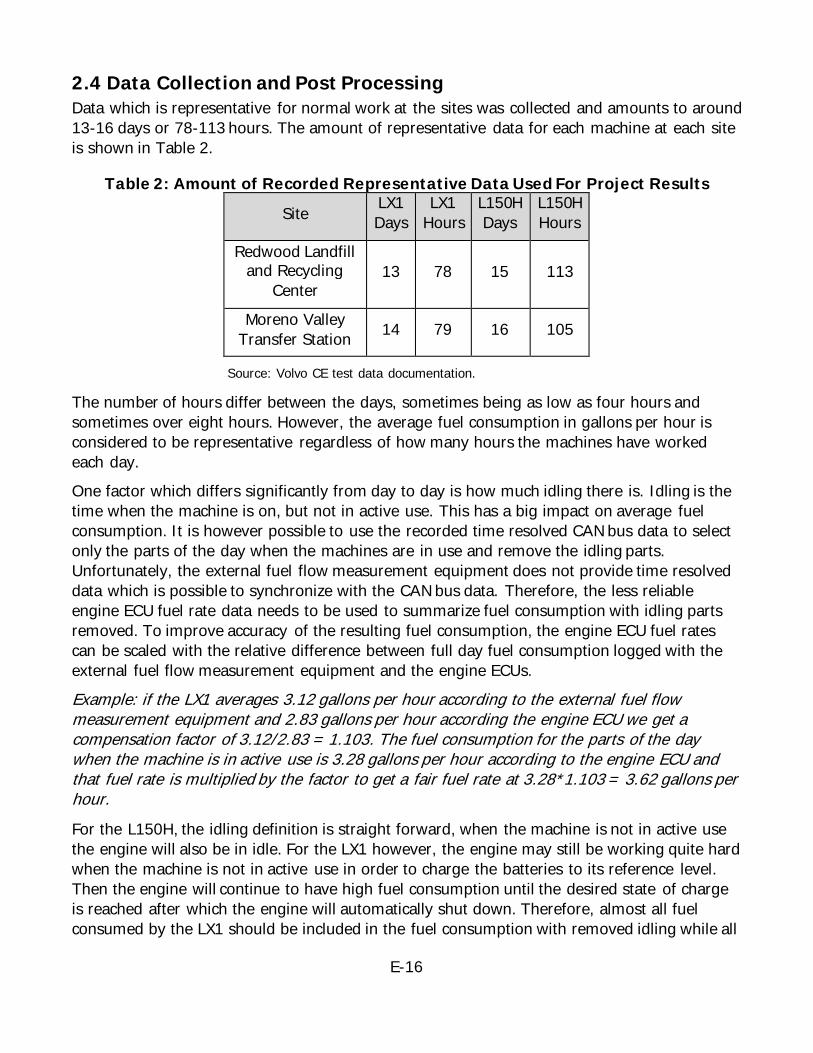
E-16
2.4 Data Collection and Post Processing Data which is representative for normal work at the sites was collected and amounts to around 13-16 days or 78-113 hours. The amount of representative data for each machine at each site is shown in Table 2.
Table 2: Amount of Recorded Representative Data Used For Project Results
Site LX1 Days
LX1 Hours
L150H Days
L150H Hours
Redwood Landfill and Recycling
Center 13 78 15 113
Moreno Valley Transfer Station 14 79 16 105
Source: Volvo CE test data documentation.
The number of hours differ between the days, sometimes being as low as four hours and sometimes over eight hours. However, the average fuel consumption in gallons per hour is considered to be representative regardless of how many hours the machines have worked each day. One factor which differs significantly from day to day is how much idling there is. Idling is the time when the machine is on, but not in active use. This has a big impact on average fuel consumption. It is however possible to use the recorded time resolved CAN bus data to select only the parts of the day when the machines are in use and remove the idling parts. Unfortunately, the external fuel flow measurement equipment does not provide time resolved data which is possible to synchronize with the CAN bus data. Therefore, the less reliable engine ECU fuel rate data needs to be used to summarize fuel consumption with idling parts removed. To improve accuracy of the resulting fuel consumption, the engine ECU fuel rates can be scaled with the relative difference between full day fuel consumption logged with the external fuel flow measurement equipment and the engine ECUs. Example: if the LX1 averages 3.12 gallons per hour according to the external fuel flow measurement equipment and 2.83 gallons per hour according the engine ECU we get a compensation factor of 3.12/2.83 = 1.103. The fuel consumption for the parts of the day when the machine is in active use is 3.28 gallons per hour according to the engine ECU and that fuel rate is multiplied by the factor to get a fair fuel rate at 3.28*1.103 = 3.62 gallons per hour. For the L150H, the idling definition is straight forward, when the machine is not in active use the engine will also be in idle. For the LX1 however, the engine may still be working quite hard when the machine is not in active use in order to charge the batteries to its reference level. Then the engine will continue to have high fuel consumption until the desired state of charge is reached after which the engine will automatically shut down. Therefore, almost all fuel consumed by the LX1 should be included in the fuel consumption with removed idling while all
E-17
idling fuel consumption is removed for the L150H. The total active time for the LX1 is calculated in exactly the same way as for the L150H looking at machine speed and operator commands. Example: the operator uses the L150H for 7 hours one day. For 2 hours of that time the machine is not in active use. When calculating fuel rate for that day with idling removed the only the fuel consumption during the 5 active hours is used and is divided by 5 to get the fuel rate in gallons per hour. If the LX1 is also operated for 7 hours with 2 hours when it is not in active use, the engine may have been in active use for a longer time, e.g. 5.5 hours. Then the LX1 fuel consumption will be calculated from these 5.5 hours, but divided by 5 hours to get the fuel rate in gallons per hour.
2.5 Test Results Table 3 shows fuel rates for the LX1 and L150H at Redwood Landfill and Recycling Center in three ways: from the external fuel flow measurement equipment, from the engine ECU and with idling removed using engine ECU (Adjusted engine ECU) results but scaling with the relative difference between external fuel flow measurement equipment and engine ECU (as described in previous chapter). The fuel rate numbers on the last row are weighed with the data recording time for each day. They are therefore not identical with the average of the numbers in the table.
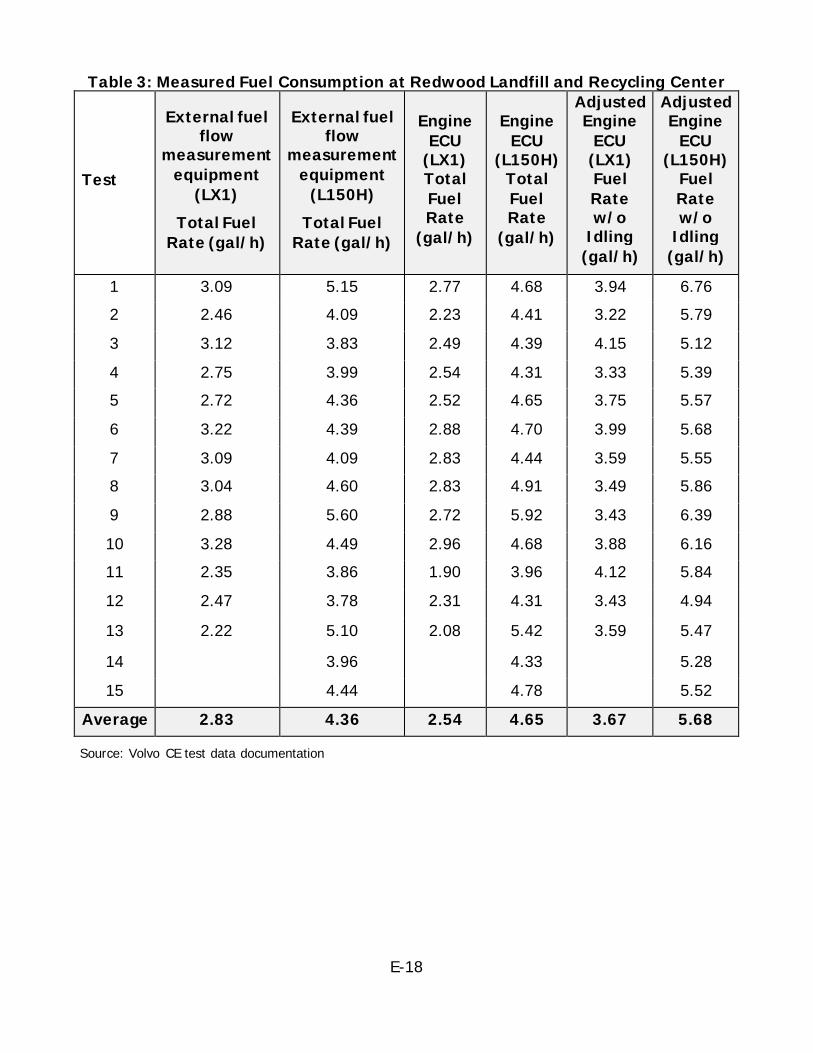
E-18
Table 3: Measured Fuel Consumption at Redwood Landfill and Recycling Center
Test
External fuel flow
measurement equipment
(LX1) Total Fuel
Rate (gal/h)
External fuel flow
measurement equipment
(L150H) Total Fuel
Rate (gal/h)
Engine ECU
(LX1) Total Fuel Rate
(gal/h)
Engine ECU
(L150H) Total Fuel Rate
(gal/h)
Adjusted Engine
ECU (LX1) Fuel Rate w/o
Idling (gal/h)
Adjusted Engine
ECU (L150H)
Fuel Rate w/o
Idling (gal/h)
1 3.09 5.15 2.77 4.68 3.94 6.76 2 2.46 4.09 2.23 4.41 3.22 5.79 3 3.12 3.83 2.49 4.39 4.15 5.12 4 2.75 3.99 2.54 4.31 3.33 5.39 5 2.72 4.36 2.52 4.65 3.75 5.57 6 3.22 4.39 2.88 4.70 3.99 5.68 7 3.09 4.09 2.83 4.44 3.59 5.55 8 3.04 4.60 2.83 4.91 3.49 5.86 9 2.88 5.60 2.72 5.92 3.43 6.39 10 3.28 4.49 2.96 4.68 3.88 6.16 11 2.35 3.86 1.90 3.96 4.12 5.84 12 2.47 3.78 2.31 4.31 3.43 4.94
13 2.22 5.10 2.08 5.42 3.59 5.47
14 3.96 4.33 5.28 15 4.44 4.78 5.52
Average 2.83 4.36 2.54 4.65 3.67 5.68
Source: Volvo CE test data documentation
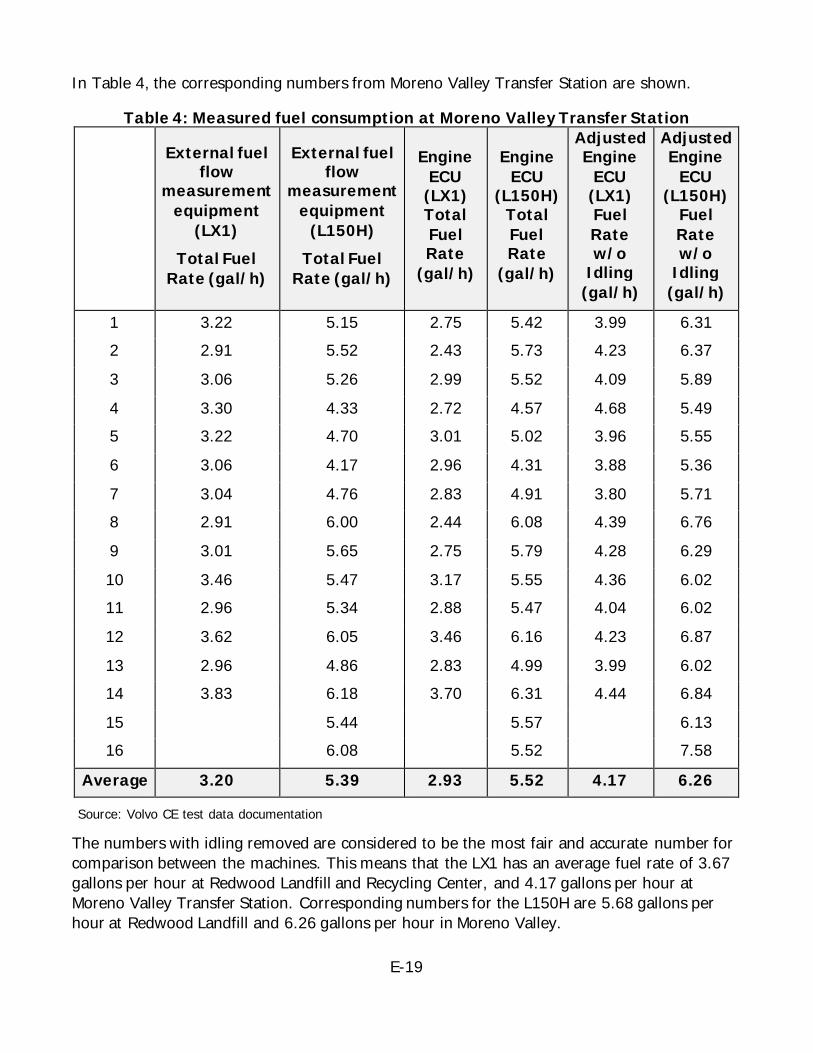
E-19
In Table 4, the corresponding numbers from Moreno Valley Transfer Station are shown.
Table 4: Measured fuel consumption at Moreno Valley Transfer Station
External fuel flow
measurement equipment
(LX1) Total Fuel
Rate (gal/h)
External fuel flow
measurement equipment
(L150H) Total Fuel
Rate (gal/h)
Engine ECU
(LX1) Total Fuel Rate
(gal/h)
Engine ECU
(L150H) Total Fuel Rate
(gal/h)
Adjusted Engine
ECU (LX1) Fuel Rate w/o
Idling (gal/h)
Adjusted Engine
ECU (L150H)
Fuel Rate w/o
Idling (gal/h)
1 3.22 5.15 2.75 5.42 3.99 6.31 2 2.91 5.52 2.43 5.73 4.23 6.37 3 3.06 5.26 2.99 5.52 4.09 5.89 4 3.30 4.33 2.72 4.57 4.68 5.49 5 3.22 4.70 3.01 5.02 3.96 5.55 6 3.06 4.17 2.96 4.31 3.88 5.36 7 3.04 4.76 2.83 4.91 3.80 5.71 8 2.91 6.00 2.44 6.08 4.39 6.76 9 3.01 5.65 2.75 5.79 4.28 6.29 10 3.46 5.47 3.17 5.55 4.36 6.02 11 2.96 5.34 2.88 5.47 4.04 6.02 12 3.62 6.05 3.46 6.16 4.23 6.87 13 2.96 4.86 2.83 4.99 3.99 6.02 14 3.83 6.18 3.70 6.31 4.44 6.84 15 5.44 5.57 6.13 16 6.08 5.52 7.58
Average 3.20 5.39 2.93 5.52 4.17 6.26
Source: Volvo CE test data documentation
The numbers with idling removed are considered to be the most fair and accurate number for comparison between the machines. This means that the LX1 has an average fuel rate of 3.67 gallons per hour at Redwood Landfill and Recycling Center, and 4.17 gallons per hour at Moreno Valley Transfer Station. Corresponding numbers for the L150H are 5.68 gallons per hour at Redwood Landfill and 6.26 gallons per hour in Moreno Valley.
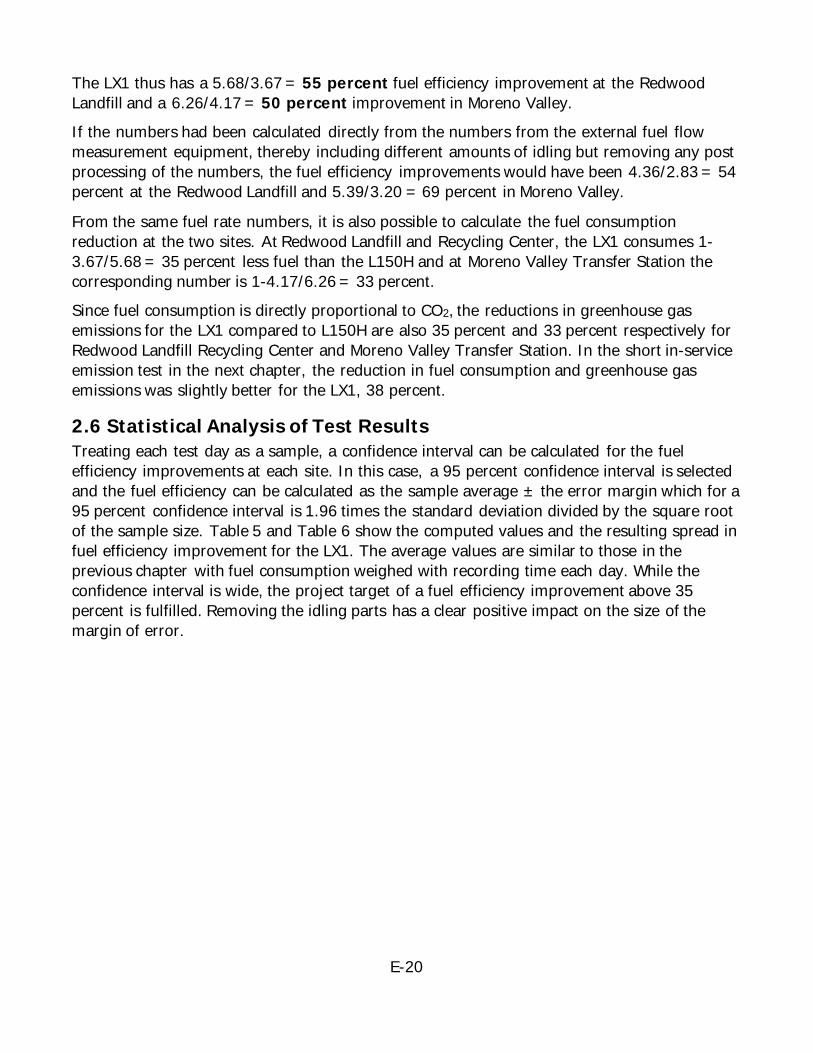
E-20
The LX1 thus has a 5.68/3.67 = 55 percent fuel efficiency improvement at the Redwood Landfill and a 6.26/4.17 = 50 percent improvement in Moreno Valley. If the numbers had been calculated directly from the numbers from the external fuel flow measurement equipment, thereby including different amounts of idling but removing any post processing of the numbers, the fuel efficiency improvements would have been 4.36/2.83 = 54 percent at the Redwood Landfill and 5.39/3.20 = 69 percent in Moreno Valley.
From the same fuel rate numbers, it is also possible to calculate the fuel consumption reduction at the two sites. At Redwood Landfill and Recycling Center, the LX1 consumes 1-3.67/5.68 = 35 percent less fuel than the L150H and at Moreno Valley Transfer Station the corresponding number is 1-4.17/6.26 = 33 percent. Since fuel consumption is directly proportional to CO2, the reductions in greenhouse gas emissions for the LX1 compared to L150H are also 35 percent and 33 percent respectively for Redwood Landfill Recycling Center and Moreno Valley Transfer Station. In the short in-service emission test in the next chapter, the reduction in fuel consumption and greenhouse gas emissions was slightly better for the LX1, 38 percent.
2.6 Statistical Analysis of Test Results Treating each test day as a sample, a confidence interval can be calculated for the fuel efficiency improvements at each site. In this case, a 95 percent confidence interval is selected and the fuel efficiency can be calculated as the sample average ± the error margin which for a 95 percent confidence interval is 1.96 times the standard deviation divided by the square root of the sample size. Table 5 and Table 6 show the computed values and the resulting spread in fuel efficiency improvement for the LX1. The average values are similar to those in the previous chapter with fuel consumption weighed with recording time each day. While the confidence interval is wide, the project target of a fuel efficiency improvement above 35 percent is fulfilled. Removing the idling parts has a clear positive impact on the size of the margin of error.
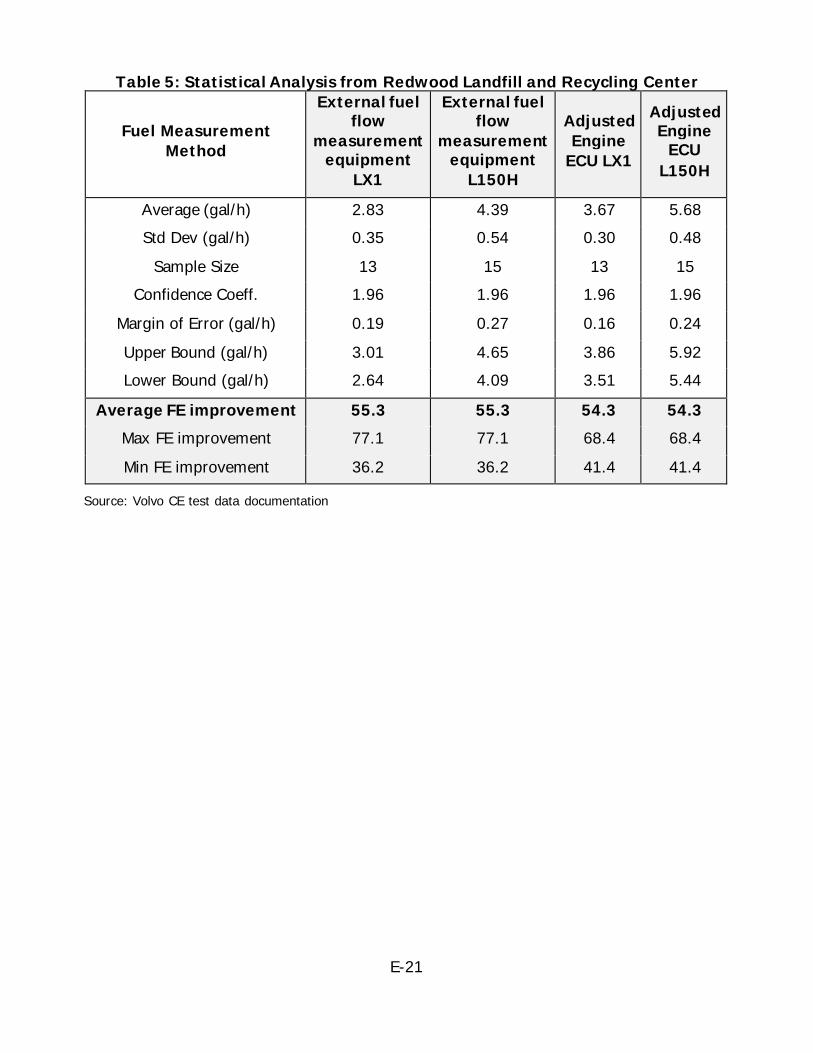
E-21
Table 5: Statistical Analysis from Redwood Landfill and Recycling Center
Fuel Measurement Method
External fuel flow
measurement equipment
LX1
External fuel flow
measurement equipment
L150H
Adjusted Engine
ECU LX1
Adjusted Engine
ECU L150H
Average (gal/h) 2.83 4.39 3.67 5.68 Std Dev (gal/h) 0.35 0.54 0.30 0.48
Sample Size 13 15 13 15 Confidence Coeff. 1.96 1.96 1.96 1.96
Margin of Error (gal/h) 0.19 0.27 0.16 0.24 Upper Bound (gal/h) 3.01 4.65 3.86 5.92 Lower Bound (gal/h) 2.64 4.09 3.51 5.44
Average FE improvement 55.3 55.3 54.3 54.3 Max FE improvement 77.1 77.1 68.4 68.4 Min FE improvement 36.2 36.2 41.4 41.4
Source: Volvo CE test data documentation
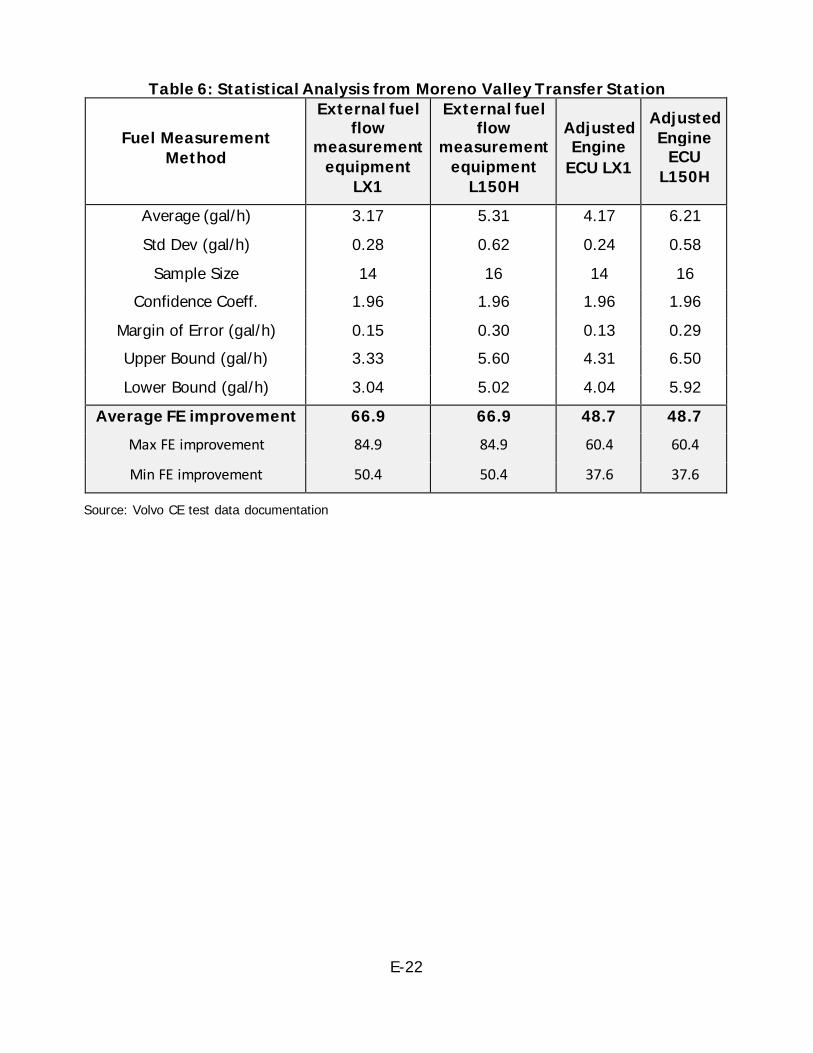
E-22
Table 6: Statistical Analysis from Moreno Valley Transfer Station
Fuel Measurement Method
External fuel flow
measurement equipment
LX1
External fuel flow
measurement equipment
L150H
Adjusted Engine
ECU LX1
Adjusted Engine
ECU L150H
Average (gal/h) 3.17 5.31 4.17 6.21 Std Dev (gal/h) 0.28 0.62 0.24 0.58
Sample Size 14 16 14 16 Confidence Coeff. 1.96 1.96 1.96 1.96
Margin of Error (gal/h) 0.15 0.30 0.13 0.29 Upper Bound (gal/h) 3.33 5.60 4.31 6.50 Lower Bound (gal/h) 3.04 5.02 4.04 5.92
Average FE improvement 66.9 66.9 48.7 48.7 Max FE improvement 84.9 84.9 60.4 60.4
Min FE improvement 50.4 50.4 37.6 37.6
Source: Volvo CE test data documentation
E-23
2.7 Productivity Productivity is a broad concept which can mean different things in different workplaces. Productivity for wheel loaders is almost always measured as the weight of the material the machine can move during a certain time, e.g. measured in tons per hour. Productivity in the waste applications in this project cannot be expressed simply as a ton per hour number, as explained in the Background and Method: “The inbound material to the site is not simply moved from point A to point B, but there are often several steps of interaction with the material before it leaves the application. The material is moved in different ways, for example pushed, stacked in piles or carried and the density of the material as well as the distance it is moved varies significantly from day to day. Furthermore there is no practical way to weigh the material the wheel loaders in these applications move”.
Therefore, it has not been possible to measure and compare productivity properly in this project. In the fuel efficiency measurements, it has been assumed that the productivity is equal for the LX1 and the L150H at both sites. While it is difficult even to find out a relevant quantification of productivity at these sites, some investigations can be done to try to validate the assumption. By removing the idling parts, differences in amount of idling between the two machines is eliminated. As shown in section Data Collection and Post Processing, this had a significant impact on the fuel efficiency improvement for LX1 in Moreno Valley, but not as much at Redwood Landfill. At both sites, there is a clear difference in amount of idling in the measured machine operation: at the Redwood Landfill the LX1 is in active use 76 percent of the time compared to 67 percent for the L150H. In Moreno Valley, the situation is the opposite; LX1 is in active use 75 percent of the time and the L150H 83 percent of the time.
However, even with idling removed, the machines may have had different productivity while being in active use. It would be feasible to estimate actual output mechanical work on the wheels for the two machines, but there would be big uncertainties and productivity at the site is not directly proportional to output mechanical work on the wheels. Two more easily accessible indicators of machine activity are the average machine speed and number of forwards and reverse stints the machine completes per hour. While neither indicator is directly connected to site productivity, it gives an idea about which days the machines have been used in a similar way. Table 7 and Table 8 show the average machine speeds, average forward and reverse stints per hour and average fuel rates for all test days. Comparing these results for the L150H and LX1, we see that the average speed is slightly higher for the L150H at both Redwood Landfill and in Moreno Valley. At Redwood Landfill, the LX1 has a higher number of stints per hour, but slightly lower than the L150H in Moreno Valley.
Comparing test days at Redwood Landfill with similar average speed and number of stints per hour, LX1 test 12 is similar to L150H tests 2, 8 and 15. Average fuel rate for the LX1 is 3.43
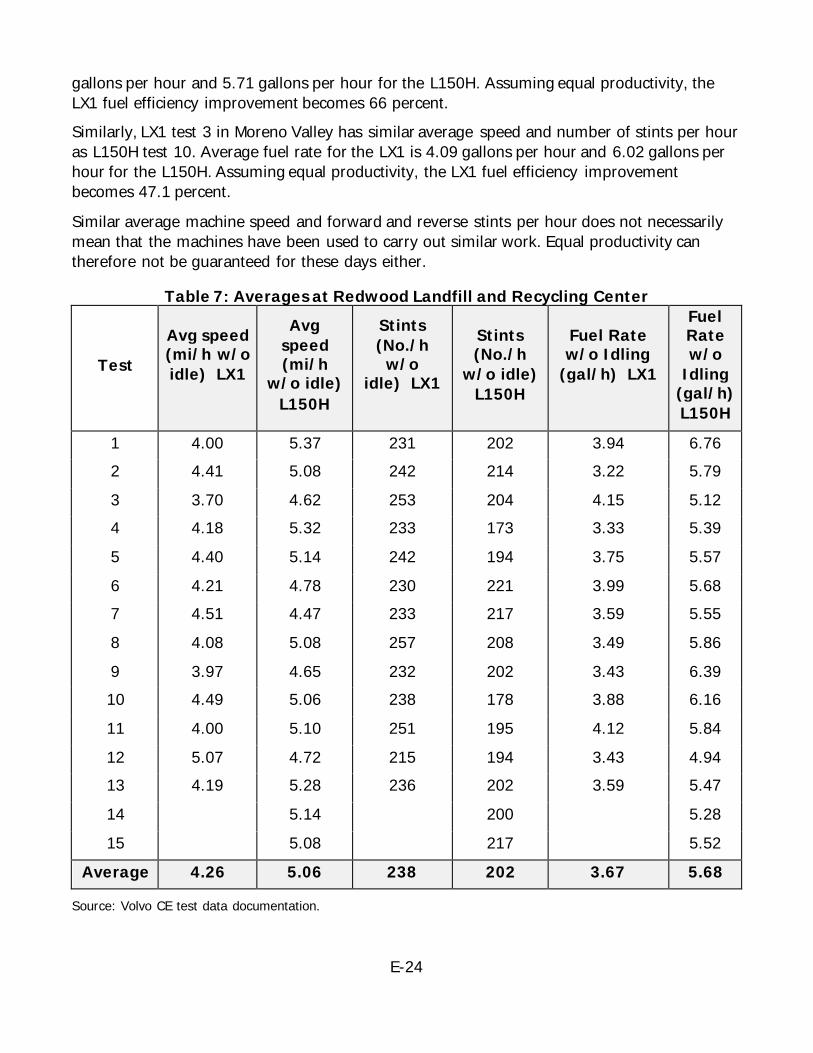
E-24
gallons per hour and 5.71 gallons per hour for the L150H. Assuming equal productivity, the LX1 fuel efficiency improvement becomes 66 percent. Similarly, LX1 test 3 in Moreno Valley has similar average speed and number of stints per hour as L150H test 10. Average fuel rate for the LX1 is 4.09 gallons per hour and 6.02 gallons per hour for the L150H. Assuming equal productivity, the LX1 fuel efficiency improvement becomes 47.1 percent.
Similar average machine speed and forward and reverse stints per hour does not necessarily mean that the machines have been used to carry out similar work. Equal productivity can therefore not be guaranteed for these days either.
Table 7: Averages at Redwood Landfill and Recycling Center
Test
Avg speed (mi/h w/o idle)5LX1
5
Avg speed (mi/h
w/o idle) L150H
Stints (No./h
w/o idle)5LX1
5
Stints (No./h
w/o idle) L150H
Fuel Rate w/o Idling
(gal/h)5LX15
Fuel Rate w/o
Idling (gal/h) L150H
1 4.00 5.37 231 202 3.94 6.76 2 4.41 5.08 242 214 3.22 5.79 3 3.70 4.62 253 204 4.15 5.12 4 4.18 5.32 233 173 3.33 5.39 5 4.40 5.14 242 194 3.75 5.57 6 4.21 4.78 230 221 3.99 5.68 7 4.51 4.47 233 217 3.59 5.55 8 4.08 5.08 257 208 3.49 5.86 9 3.97 4.65 232 202 3.43 6.39 10 4.49 5.06 238 178 3.88 6.16 11 4.00 5.10 251 195 4.12 5.84 12 5.07 4.72 215 194 3.43 4.94 13 4.19 5.28 236 202 3.59 5.47 14 5.14 200 5.28 15 5.08 217 5.52
Average 4.26 5.06 238 202 3.67 5.68
Source: Volvo CE test data documentation.

E-25
Table 8: Averages at Moreno Valley Transfer Station
Test
5 Avg speed (mi/h w/o idle) LX15
Avg speed (mi/h
w/o idle) L150H
5 Stints (No./h
w/o idle) LX15
Stints (No./h
w/o idle) L150H
5 Fuel Rate w/o
Idling (gal/h) LX15
Fuel Rate w/o
Idling (gal/h) L150H
1 3.32 4.62 242 276 3.99 6.31 2 3.44 4.08 266 258 4.23 6.37 3 3.91 4.10 259 264 4.09 5.89 4 3.69 5.39 245 233 4.68 5.49 5 3.57 4.94 260 230 3.96 5.55 6 3.77 4.57 255 238 3.88 5.36 7 3.49 4.18 241 221 3.80 5.71 8 3.53 4.57 219 246 4.39 6.76 9 3.80 4.57 242 258 4.28 6.29 10 3.85 3.98 244 260 4.36 6.02 11 3.83 4.06 229 239 4.04 6.02 12 3.51 4.31 283 308 4.23 6.87 13 3.61 5.06 240 212 3.99 6.02 14 4.11 4.20 258 282 4.44 6.84 15 4.56 239 6.13 16 4.77 240 7.58
Average 3.71 4.44 247 255 4.17 6.26
Source: Volvo CE test data documentation
Another way to look at relative productivity for the machines is to get the operators’ intuitive feeling for the difference. At both sites, the operators agree that the L150H, mainly due to its higher weight, can push more material in front of it before the wheels start to slip. The friction force between tires and ground is proportional to the machine weight which indicates that the L150H theoretically should be able to push 20 percent more load than the LX1. This difference of course only affects productivity while pushing, so the total productivity increase from using the heavier L150H instead of the LX1 should be lower than 20 percent. If the L150H has about half that productivity advantage over the LX1, 10 percent, the fuel efficiency improvement would go from 55 percent at Redwood Landfill to 41 percent. In Moreno Valley, the fuel efficiency improvement would go from 50 percent to 36 percent.
E-26
All operators agree that the L150H has a better size for their applications indicating that the LX1 does not reach its full fuel efficiency potential in these applications. Internal Volvo CE tests have shown that the LX1 can be as productive as an L150H in a re-handling application, but in waste applications, a heavier machine can push more loads and thereby gain productivity. The calculations and considerations in this section have not been able to quantify a difference in productivity for the LX1 and L150H and it has not been possible to show that the machines have equal productivity. In a hypothetical calculation example, we have seen that that project target to reach a 35 percent fuel efficiency improvement for the LX1 would be reached even if the L150H has a 10 percent higher productivity than the LX1.
2.8 Plug-in Charging Potential In the fuel efficiency measurements in this project, the LX1 has been run in charge sustaining mode, meaning that the batteries have the same state of charge at start-up and shut-down of the machine. However, the batteries are large enough to be able to get a significant benefit from plug in charging overnight and during longer stops, such as lunch break. The batteries can store approximately 25 kWh of usable electric energy, and with a realistic buffer, about 18 kWh from each full charge would be used in real applications with the engine shut off. Diesel has an energy content of 38.5 kWh/gallon and with the LX1 relatively modest conversion efficiency from diesel fuel to electric energy at around 35 percent means that 18 kWh of battery energy from the grid replaces 18/38.5/0.35 = 1.34 gallons of diesel. To fully charge the batteries overnight would not be a problem at one shift sites. Even if the charging efficiency would be as low as 90 percent from grid to battery, they could easily be charged from a standard 120 V outlet. Assuming a current at 15 A, the batteries would be fully charged in just above 11 hours. To be able to get any significant benefit from charging the batteries over lunch, a higher charge capacity from the grid is needed. To fully charge the batteries in an hour would take an average electric power from the grid at 20 kW, assuming 90 percent charging efficiency. The cost for installing a charge capacity around 10 kW is not very high and would probably not be a problem at most sites with electricity grid access. It should therefore be fair to assume that it would be possible to fully charge the batteries overnight, at both Redwood Landfill and Recycling Center and at Moreno Valley Transfer Station, and at least charge the batteries to 50 percent, i.e. 9 kWh, during the day. That means saving 1.34*1.5 = 2.00 gallons of diesel per day.
At Redwood Landfill, the LX1 consumed 219 gallons of diesel during 13 days of measurements. With the calculated fuel saving from plug-in charging, this would be reduced by 13*2.00 = 26.0 gallons down to 193 gallons. For the 78 hours of total operation, this would reduce the average fuel consumption, including idling, from 2.83 gallons per hour to 2.48 gallons per hour. Looking at the adjusted EECU fuel consumption from the operation with idling removed, the fuel rate would go down from 3.67 gal/h to 3.25 gal/h. This would mean that the LX1 fuel efficiency improvement would go from 5.68/3.67 = 55 percent to 5.68/3.25 = 75 percent. Fuel consumption reduction would go from 1-3.67/5.68 = 35 percent to 1-3.25/5.68 = 43 percent.
E-27
At Moreno Valley Transfer Station, the LX1 consumed 252 gallons of diesel during 14 days of measurements. With the calculated fuel saving from plug-in charging, this would be reduced by 14*2.00 = 28.0 gallons down to 224 gallons. For the 79 hours of total operation, this would reduce the average fuel consumption, including idling, from 3.20 gallons per hour to 2.83 gallons per hour. Looking at the adjusted EECU fuel consumption from the operation with idling removed, the fuel rate would go down from 4.17 gal/h to 3.75 gal/h. This would mean that the LX1 fuel efficiency improvement would go from 6.26/4.17 = 50 percent to 6.26/3.75 = 67 percent. Fuel consumption reduction would go from 1-4.17/6.26 = 33 percent to 1-3.75/6.26 = 40 percent. The plug-in charge potential impact on greenhouse gas emissions depends on how the electricity is generated and transported.
2.9 Conclusion It has not been possible to properly measure productivity at the sites. Since the LX1 actually replaced the L150H machine and was able to carry out the same tasks as the L150H, it is assumed that the productivity for the two machines is equal in the tests. For that assumption, the LX1 has a 55 percent higher fuel efficiency than the L150H at Redwood Landfill and Recycling Center, and 50 percent higher fuel efficiency than the L150H at Moreno Valley Transfer Station. The fuel efficiency improvements correspond to a fuel consumption and greenhouse gas reduction of 35 percent at the Redwood Landfill and Recycling Center and 33 percent at Moreno Valley Transfer Station.
The project target of 35 percent fuel efficiency improvement is reached at both sites for a 95 percent confidence interval. The operators taking part in the tests agree that the L150H has higher productivity than the LX1 when pushing material in the waste applications it has been used in. Even if this would mean that the L150H has a 10 percent higher productivity than the LX1, the project target of 35 percent fuel efficiency improvement is still fulfilled at both sites. With plug-in charge potential captured in calculations, the LX1 fuel efficiency advantage over the L150H would be 75 percent at Redwood Landfill and Recycling Center and 67 percent at Moreno Valley Transfer Station. This corresponds to a fuel consumption reduction of 43 percent at the Redwood Landfill and Recycling Center and 40 percent at Moreno Valley Transfer Station. The greenhouse gas impact of the plug-in charge potential depends on how the electricity is generated and transported.
E-28
CHAPTER 3: In-Service Emissions Executive Summary
Volvo CE has developed and is demonstrating a hybrid wheel loader with a capacity similar to the conventional L150H front-end loader. The series hybrid drive train for this loader includes a 3.6 L diesel engine driving an electric generator, batteries, and electric motors for propulsion and hydraulics. Funding for this project was provided by the California Energy Commission, and the project is being managed by CALSTART. CALSTART contracted with Engine, Fuel, and Emissions Engineering, Inc. to measure in-use pollutant emissions from both the hybrid loader and a conventional vehicle, using Engine, Fuel, and Emissions Engineering, Inc.’s Ride-Along Vehicle Emission Measurement system. While the hybrid vehicle was built to Tier 4 Interim emission standards, the L150H conventional vehicle was built to Tier 4 Final standards. This difference between the experimental and control vehicles was due to logistical problems in locating a Tier 4 Interim wheel loader of comparable size to the hybrid vehicle. Because we were unable to test a wheel loader with directly comparable emission standards, we used the next closest model – the L150H. The two machines were expected to have differing emission profiles. While the hybrid should have less fuel consumption and thus less CO2 emissions, we were aware that NOx and PM emissions could be higher because the hybrid lacks emission control devices that the L150H has installed as part of Tier 4 Final regulations.
Measurements were conducted on each vehicle while it operated in normal service as part of the green waste composting operation at the Waste Management Redwood Landfill in Novato, California. Mass emissions of carbon dioxide (CO2), carbon monoxide (CO), oxides of nitrogen (NOx), particulate matter (PM), and total hydrocarbons (THC) were measured during a series of 30-minute periods, during which the loader carried out its normal duties. The results are summarized in Table 9 below.
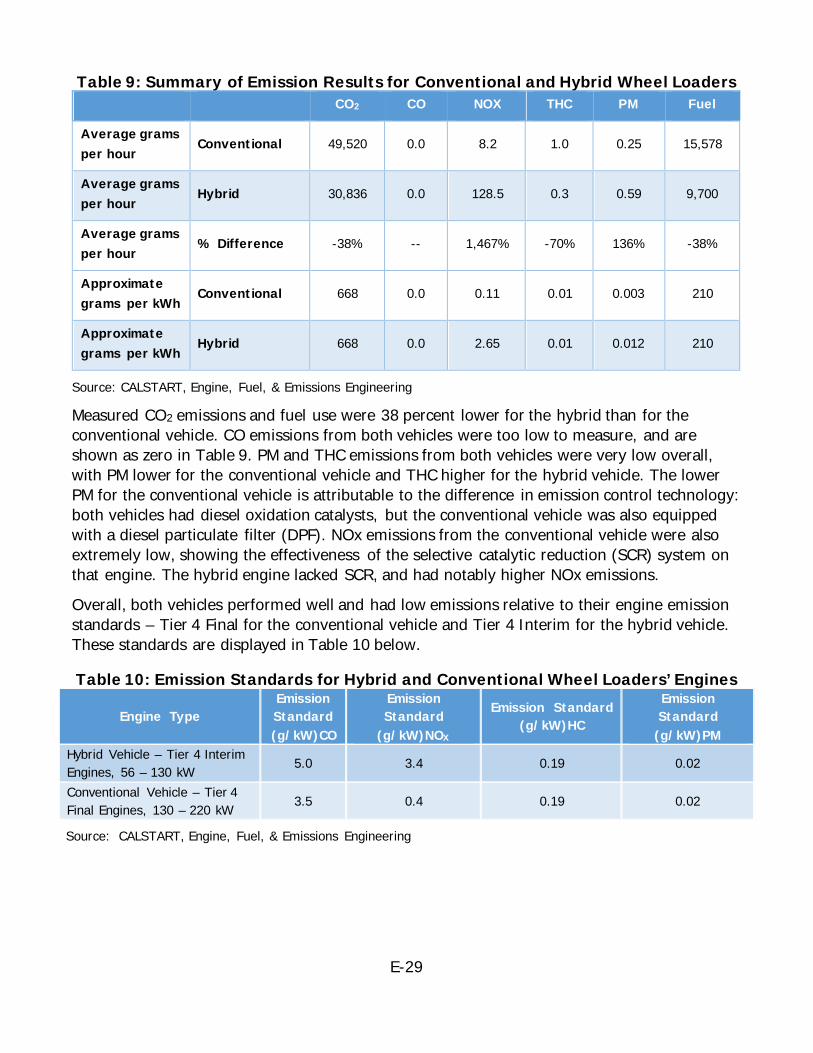
E-29
Table 9: Summary of Emission Results for Conventional and Hybrid Wheel Loaders CO2 CO NOX THC PM Fuel
Average grams per hour
Conventional 49,520 0.0 8.2 1.0 0.25 15,578
Average grams per hour
Hybrid 30,836 0.0 128.5 0.3 0.59 9,700
Average grams per hour
% Difference -38% -- 1,467% -70% 136% -38%
Approximate grams per kWh
Conventional 668 0.0 0.11 0.01 0.003 210
Approximate grams per kWh
Hybrid 668 0.0 2.65 0.01 0.012 210
Source: CALSTART, Engine, Fuel, & Emissions Engineering
Measured CO2 emissions and fuel use were 38 percent lower for the hybrid than for the conventional vehicle. CO emissions from both vehicles were too low to measure, and are shown as zero in Table 9. PM and THC emissions from both vehicles were very low overall, with PM lower for the conventional vehicle and THC higher for the hybrid vehicle. The lower PM for the conventional vehicle is attributable to the difference in emission control technology: both vehicles had diesel oxidation catalysts, but the conventional vehicle was also equipped with a diesel particulate filter (DPF). NOx emissions from the conventional vehicle were also extremely low, showing the effectiveness of the selective catalytic reduction (SCR) system on that engine. The hybrid engine lacked SCR, and had notably higher NOx emissions.
Overall, both vehicles performed well and had low emissions relative to their engine emission standards – Tier 4 Final for the conventional vehicle and Tier 4 Interim for the hybrid vehicle. These standards are displayed in Table 10 below.
Table 10: Emission Standards for Hybrid and Conventional Wheel Loaders’ Engines
Engine Type Emission Standard (g/kW)CO
Emission Standard
(g/kW)NOX
Emission Standard (g/kW)HC
Emission Standard
(g/kW)PM Hybrid Vehicle – Tier 4 Interim Engines, 56 – 130 kW 5.0 3.4 0.19 0.02
Conventional Vehicle – Tier 4 Final Engines, 130 – 220 kW 3.5 0.4 0.19 0.02
Source: CALSTART, Engine, Fuel, & Emissions Engineering
E-30
CHAPTER 4: Customer Feedback
The following are some of the comments from the California-based personnel involved in the testing of the prototype hybrid electric wheel loader.
4.1 Redwood Landfill • “I loved the LX1; could work all day in it.” Rhonda Lepori, Heavy Equipment Operator • “I loved how quiet the LX1 is; the in-cab ergonomics (instrument / tool layout) is much
better than the L150H.” Rhonda Lepori, Heavy Equipment Operator • “The direction change is better than L150H; I like the forward / reverse function
without brakes.” Rhonda Lepori, Heavy Equipment Operator • “The power is good.” Rhonda Lepori, Heavy Equipment Operator • “The reach is a bit short; I need more reach with the bucket.” Rhonda Lepori, Heavy
Equipment Operator • “The jobsite productivity is somewhat worse than the L150H; delayed shift to first gear
impacts pushing of material.” Rhonda Lepori, Heavy Equipment Operator
4.2 Moreno Valley Transfer Station • “I think it is a great loader. The acceleration and in-cab noise level is better than the
L150H.” Miguel Medina, Heavy Equipment Operator • The acceleration is better than the L150H.” Andy Vercniano, Heavy Equipment
Operator • “Direction change is great. I mean, you don't have to come to a stop change direction,
like that. There is no, less risk in braking something mechanically, and you can change the direction with the throttle, rather than using the brakes.” Miguel Medina, Heavy Equipment Operator
• “Jobsite productivity is somewhat worse than the L150H; more pushing power needed.” Andy Vercniano, Heavy Equipment Operator
• “Very smooth handling with the LX1.” Miguel Medina, Heavy Equipment Operator • “The visibility and in-cab ergonomics is much better than the L150H.” Miguel Medina,
Heavy Equipment Operator • “The loading and unloading material is worse than the L150H because the packing of
material down into the trailer takes more time.” Andy Vercniano, Heavy Equipment Operator
E-31
CHAPTER 5: Project Achievements and Success
5.1 Advancements in Science and Success In our ongoing efforts to fulfill our aggressive triple zero initiative (zero emissions, zero accidents, and zero downtime); the results of this demonstration confirmed a significantly reduced reliance on fossil fuels as well as reducing the GHG emitted from this machine. Additionally, this demonstration has provided valuable operator feedback on the machine performance and productivity relative to a conventional machine. Throughout the duration of the demonstration, engineers from Sweden were onsite to ensure that the machine was continuously running. There were a few times the machine was down, and when problems did surface, there were engineers in Sweden on call to help troubleshoot and get the machine back up and running. In total, the LX1 accumulated over 200 of actual field test hours. This project also provided valuable knowledge on how to develop machines, wheel loaders and other products, with completely decoupled systems enabling a breakthrough in efficiency improvement for Wheel loaders. Advancements have been made in the electrification of Drivelines, Hydraulics and Energy Storage which are sub-systems and components that will build the base for future hybrid and electric Off Highway machines.
An additional achievement was the successful use of renewable diesel fuel in both the LX1 and L150 machine for the complete test period at the Redwood Landfill. Renewable diesel fuel was used in both machines with no issues or downtime. Several patents have originated from the project as a result of the advancements made in the technologies employed on the Hybrid Electric Wheel Loader. Events that have been held for the Hybrid Electric Wheel Loader:
• Volvo CE Leadership Summit, September, 2015 • Xploration Forum, Eskilstuna 9-14 September, 2016 • ConExpo, Las Vegas, 7-11 March, 2017 • Capital Market Days, Eskilstuna, 23 May, 2017 • LX1 press event, Redwood Landfill, California, 12 July, 2017
LX1 videos available online: In connection with the Xploration Forum:
• Xploration forum by Volvo Construction Equipment: https://www.youtube.com/watch?v=7NM8r4B0ytQ
• Xploration forum by Equipment Today Magazine: https://www.youtube.com/watch?v=cxdt5zWcbVw
E-32
• LpDtfs6qvGE Xploration forum by ForConstructionPros: https://www.youtube.com/watch?v=
• Xploration forum by ForConstructionPros: https://www.youtube.com/watch?v=if8Jl91DSoA
In connection with the LX1 press event: • LX1 press event by Volvo Construction Equipment:
https://www.youtube.com/watch?v=IaU3BU_WWTE • LX1 press event by Volvo Construction Equipment:
https://www.youtube.com/watch?v=H0YfMNQbqlE • LX1 press event by Volvo Construction Equipment:
https://www.youtube.com/watch?v=3TSkGOwNlbE • LX1 press event by Volvo Construction Equipment:
https://www.youtube.com/watch?v=X4FuPxFktNE • LX1 press event by Volvo Construction Equipment:
https://www.youtube.com/watch?v=IaU3BU_WWTE • LX1 press event by Forester Media: https://www.youtube.com/watch?v=ER-Z8g7Jgow • LX1 press event by Forester Media: https://www.youtube.com/watch?v=W5m_kzR4El8 • LX1 press event by Waste Management:
https://www.youtube.com/watch?v=zMDoCsYCJJA • LX1 press event by Waste Management:
https://www.youtube.com/watch?v=U5enrG_2DxA • LX1 press event by Greg Sitek: https://www.youtube.com/watch?v=_M0Yaqqyu50 • LX1 press event by Equipment World https://www.youtube.com/watch?v=XZ9EAixv7ew • LX1 press event by Marcia Doyle: https://www.youtube.com/watch?v=xOU9oZjNHH0
Other:
• Video from Volvo Construction Equipment North America: https://www.youtube.com/watch?v=WMHlhkc1-F0
5.2 Benefits to California The prototype hybrid electric wheel loader project was focused on demonstrating new technologies that show a competitive advantage for our customers by reducing customer owning and operating costs through fuel savings. The success of this demonstration will also benefit in the continued development of technologies that will be implemented in the commercialization of a hybrid electric wheel loader. In addition, this has also shown potential for other product types and segments which will increase the portfolio of Electromobility products available on the market. While it is difficult to calculate benefits in fuel consumption and greenhouse gas reduction for a future commercialized hybrid electric wheel loader, especially for an entire fleet of machines
E-33
of different sizes performing a wide spectrum of jobs, it is possible to calculate the benefits for the particular situation in this demonstration project. At Redwood Landfill and Recycling Center, the fuel efficiency tests showed that LX1 saves 2.0 gal/h compared to the L150H if idling is removed. During idling, the LX1 saves approximately 0.92 gal/h compared to the L150H. According to the L150H reference measurements, idling is about 30 percent of the total machine operation time at the site and the machine is used for around 2,000 hours per year. The yearly fuel savings with the LX1 is therefore 2000*(2.0*0.7+0.92*0.3) = 3,366 gallons. The greenhouse gas emission reduction is proportional to fuel reduction and for burning diesel CO2 is the only GHG of importance. Burning 1 gallon of diesel produces 22.5 lb CO2, which means that the 3,366 fuel consumption reduction equates to a 37.9 ton reduction in CO2 emissions per year.
In Moreno Valley, the LX1 saves 2.1 gal/h compared to the L150H if idling is removed. During idling, the LX1 saves approximately 0.92 gal/h compared to the L150H. According to the L150H reference measurements, idling is about 14 percent of the total machine operation time at the site and the machine is used for around 2,000 hours per year. The yearly fuel savings with the LX1 is therefore 2000*(2.1*0.86+0.92*0.14) = 3870 gallons which equates to a 43.5 ton reduction in CO2 emissions per year.

E-34
CHAPTER 6: Market Implications
The commercial construction equipment sector is more difficult than others to organize and assess due to the broad nature of end-use applications that utilize these pieces of equipment. For example, loaders alone are used in road building, civil construction, mining, landfills, agriculture, and landscaping among many others. Each industry uses the equipment differently, with different requirements, load factors, and duty cycles. However, most end-use applications face the same issues and challenges when it comes to fuel use and emissions.
In addition, this sector differs from the on-road sector in that there are significantly more original equipment manufacturers (OEM) and engine manufacturers offering off-road products. Over 800 different OEMs and 60 engine manufacturers are participating in this sector, far more than those working in the on-road sector. Some other factors that differentiate this sector from the on-road sector include:
• Off-road operators must deal with operational issues related to remote sites (applicable to the availability of fuel),
• Seasonal applications impact equipment use and duty cycles, • Equipment operate in severe environments, • Low-speed operations often result in poor conditions for engine cooling, • Equipment configurations often result in severe packaging constraints, • Manufacturers experience low production runs while at the same time offering broad
product lines. Another factor that is unique to this end-use sector is that a significant percentage of construction equipment purchases are made by rental companies. This reduces the risk and exposure of the construction companies (the end user). Rental companies however, face obstacles from both ends: higher equipment costs resulting from new regulations and lower demand resulting from sluggish growth in the sector. The added complication therefore is that the end user cares more about operating and fuel costs, while the equipment owner (the rental company) cares more about capital costs. All this adds up to a unique industry that is saddled with a broad range of operational and business constraints.
It is difficult to forecast the exact market impact of the wheel loader and the hybrid-electric technologies that were demonstrated in this project. Any projections will be based on two different potential outcomes: (1) the hybrid-electric configuration is utilized in other size wheel loaders, and (2) the hybrid-electric technology is transferred to other types of construction, mining, and agriculture euqipment. Hybridization is an intriguing feature since different types of construction equipment offer the potential of energy recovery and reuse in both the traction function and the utilization of attachments. As shown in this project, hybridization can bring improvements to both fuel economy and productivity. One of the key factors that make this sector unique is that the

E-35
equipment’s traction functions are mostly secondary to its work functions. Whether the equipment moves on wheels or tracks, the horsepower required to move the overall vehicle is often less important than the horsepower required to operate the attached specialty equipment (bucket, boom, arm, roller, scraper, etc.). A hybrid-electric configuration can take advantage of those factors. The wheel loader is one of the most versatile pieces of off-road equipment. Wheel loaders of different sizes and configurations are used in the following applications:
• Heavy Infrastructure • Industrial Material Handling • Road Construction • Building • Forestry • Mining • Quarries & Aggregates • Recycling and Waste • Agriculture & Landscaping • Demolition • Utilities • Major Pipeline and Energy Related Industry (Oil and Gas)
While the LX1’s hybrid-electric technology would not be applicable or suitable to all of these applications, it is possible that it could eventually find a place in many of them. Wheel loaders come in a wide variety of sizes and configurations. Compact wheel loaders are sized from approximately 50 horsepower to 120 horsepower with carrying capacities from approximately 0.75 cubic yards to 2.25 cubic yards. Operating weights run from 12,000 to 22,000 pounds. Large wheel loaders cover an even wider range of sizes and capacities. Power can range from 160 horsepower to over 500 horsepower. Carrying capacities range from 2 to 20 cubic yards, and operating weights can reach 120,000 pounds. Volvo alone currently sells 15 different models of wheel loaders. The potential for the utilization of hybrid-electric technology similar to what was used in the LX1 also exists in other types of construction equipment. Excavators (compact, wheeled, and crawler), skid steer loaders, and compact track loaders all are potential candidates for hybridization. Each have duty cycles that include repetiton and start-stop operations. There has been some early market introductions of hybrid-electric technology by some of Volvo’s competitors and as can be seen in Chapter 7,

E-36
CHAPTER 7: Future Projects and Improvements
In line with the Volvo Group’s vision to become the world leader in sustainable transport solutions, Volvo CE is committed to contributing to sustainable development. Volvo CE was the first construction equipment company in the industry to join the World Wide Fund for Nature’s Climate Savers program – an initiative that requires participating corporations to commit to cutting CO2 emissions in their operations.
Volvo CE has a ‘triple zero’ vision which connects to the company’s core values – zero downtime reflects its commitment to quality, zero accidents represents safety and zero emissions denotes environmental care. Future technology like this will help the company to achieve these ambitious goals. Although Electromobility technology is still under development and testing, it has the potential to drastically reduce fuel consumption, environmental impact and the cost of machine usage, as well as increase efficiency. The electrification of construction equipment will produce cleaner, quieter and more efficient machines and represents the future of the industry. The possibilities are truly exciting and the results from this project will boost technological innovation at Volvo CE for years to come. This project will support improvements to the LX1 prototype machine demonstrated in California to support future demonstration and our new product development projects underway today. Volvo CE has long-term plans to develop products and services for Electromobility, including electric hybrids and electric sites. Electromobility at Volvo CE provides opportunities across all product lines and the company has projects or research underway in most product categories beyond Wheel Loaders (i.e. Electric Site and EX02). The LX1 demonstration project provides us with valuable feedback as input to our future demonstration project Electric Site. Also, the technology development in the LX1 supports control functionality, power distribution, and high voltage systems development which can be used in other products planned for future market offer and commercialization.
F-1
APPENDIX F: Proterra EcoRide BE35 Electric Transit Bus
Prepared for: California Energy Commission Prepared by: Proterra
Gavin Newsom, Governor

F-2
Sarah Hulseman Primary Author
Proterra 1 Whitlee Court Greenville, SC 29607 864-438-0000 www.proterra.com
Disclaimer Staff members of the California Energy Commission prepared this report. As such, it does not necessarily represent the views of the Energy Commission, its employees, or the State of California. The Energy Commission, the State of California, its employees, contractors and subcontractors make no warrant, express or implied, and assume no legal liability for the information in this report; nor does any party represent that the uses of this information will not infringe upon privately owned rights. This report has not been approved or disapproved by the Energy Commission nor has the Commiss ion passed upon the accuracy or adequacy of the information in this report.
F-3
TABLE OF CONTENTS Page
Table of Contents .......................................................................................................... F-3 List of Figures ............................................................................................................... F-4 List of Tables ................................................................................................................ F-4 Executive Summary........................................................................................................ F-5 CHAPTER 1: Proterra BE35 EcoRide Electric Transit Bus......................................................... F-7
1.1 Statement of Work ..............................................................................................................................F-7 1.1.1 Deliverable Tasks..........................................................................................................................F-7
1.2 Technology Development at Start of Grant Period .................................................................................F-7 1.2.1 Status at Proterra, the OEM ...........................................................................................................F-7 1.2.2 Status at RTD, the Transit Authority ...............................................................................................F-8
CHAPTER 2: Performance Analysis .................................................................................... F-9 2.1 Implementation at San Joaquin RTD.....................................................................................................F-9
2.1.1 Bus Manufacture...........................................................................................................................F-9 2.1.2 Charger Manufacture and Installation........................................................................................... F-10 2.1.3 Transit Routes ............................................................................................................................ F-13 2.1.4 Driver Training............................................................................................................................ F-14 2.1.5 Maintenance Training .................................................................................................................. F-14 2.1.6 Onsite Service Technician ............................................................................................................ F-14 2.1.7 RTD Performance Summary......................................................................................................... F-14 2.1.8 RTD Maintenance Summary......................................................................................................... F-19
2.1.8.1 Preventive Maintenance ........................................................................... F-20 2.1.8.2 Unscheduled Maintenance ....................................................................... F-21 2.1.8.3 Service Bulletins ..................................................................................... F-25
2.2 Implementation at Foothill Transit ...................................................................................................... F-25 2.2.1 Prototype Buses 2001-2003 ......................................................................................................... F-26 2.2.2 Redesigned Buses 2004-2015 ...................................................................................................... F-27
CHAPTER 3: Achievements ............................................................................................F-29 3.1 Benefits to Transit ............................................................................................................................. F-29 3.2 Benefits to California ......................................................................................................................... F-29
CHAPTER 4: Future Developments...................................................................................F-31 4.1 Project Conclusion ............................................................................................................................. F-31 4.2 Catalyst Bus ...................................................................................................................................... F-31
Table 9: Cost of Ownership Estimate Comparison: Electric vs Diesel ..........................................F-31 4.3 Industry Advancement....................................................................................................................... F-32 4.4 Other Opportunities........................................................................................................................... F-32
F-4
LIST OF FIGURES Page
Figure 1: Prototype Bus Foothill FT2002 .............................................................................. F-8 Figure 2. EV1 at the Downtown Transit Center in Stockton, California ........................................F-10 Figure 3: RTD Fast Charger and Docking Station at the DTC ...................................................F-11 Figure 4: Route 60 and 55 Maps.......................................................................................F-13 Figure 5: Summary of RTD Mileage and Energy, by Quarter ....................................................F-16 Figure 6: RTD Miles Energy and Savings Comparison August 2013 & 2014..................................F-17 Figure 7: RTD MPGe Summary by Month ............................................................................F-17 Figure 8: RTD Fuel Savings by Month ................................................................................F-18 Figure 9: RTD GHG Savings by Month ................................................................................F-19 Figure 10: Unscheduled Bus Parts Summary by Quantity ........................................................F-21 Figure 11: Unscheduled Bus Parts Summary by Cost .............................................................F-22 Figure 12: Unscheduled Charger Parts Summary by Quantity...................................................F-22 Figure 13: Unscheduled Charger Parts Summary by Cost ........................................................F-23 Figure 14: Foothill Prototype Performance, June 16 2013 to March 15 2014 ................................F-26 Figure 15: Foothill Prototype MPGe, June 16 2013 to March 15 2014 .........................................F-26 Figure 16: Foothill Redesigned Bus....................................................................................F-27 Figure 17: Foothill FT2004-FT2015 Performance Summary, 3/16/14-6/20/15 ..............................F-28
LIST OF TABLES Page
Table 1: Summary of RTD Bus Improvements from Pomona Prototypes ...................................... F-9 Table 2: Summary of Proterra Electric Bus Initial Cost vs Diesel Initial Cost .................................. F-9 Table 3: Comparison Scheduled vs Actual Budget for DTC Fast Charger .....................................F-12 Table 4: Cost summary PG&E Non-TOU Schedule A-1 Rates ....................................................F-13 Table 5: Values Used to Determine Fuel and GHG Savings ......................................................F-15 Table 6: Bus PMI Parts and Cost.......................................................................................F-20 Table 7: Charger Monthly PMI Parts and Cost ......................................................................F-20 Table 8: Total Maintenance Cost Summary..........................................................................F-24 Table 9: Cost of Ownership Estimate Comparison: Electric vs Diesel ..........................................F-31

F-5
EXECUTIVE SUMMARY The goal of Proterra’s 35-foot electric bus project was to demonstrate that purpose-built electric buses can replace diesel buses successfully in a typical transit setting in California. This project was completed in two phases. The first phase was the manufacture of two buses and a Fast Charger, which included design improvements developed from prototype buses. The second phase was to collect performance data and to compare with the previous prototype buses.
Proterra manufactured two 35 foot electric buses in 2012 for San Joaquin Regional Transit District (RTD). The buses were manufactured at the company’s facility in Greenville, South Carolina. These buses included design improvements based on learnings from three prototype buses used in Pomona, California at Foothill Transit during 2011-2012. These improvements focused on the front entrance door, the rear exit door, the transmission, and the battery management system. Buses were accepted through the standard RTD transit inspection process and began revenue service in mid-June 2013. Proterra also manufactured and installed an On-Route Fast Charger to recharge the buses between trips. This charger allows the bus to recharge in as little as 5 minutes, enabling virtually limitless range. The Fast Charger was installed at the Downtown Transit Center in Stockton during the spring of 2013. The buses and On-Route Fast Charger were monitored in operation for two years, from June 16, 2013 to June 20, 2015. Mileage and energy used were tracked by onboard data loggers. Proterra reviewed this data weekly and submitted a report each month to CALSTART to track progress.
During this time, the buses ran a total of 63,550 miles and used 128,360 kWh of energy. The buses were used on one route only for the first year of the reporting period, with 1 bus used each day. During the second year of the reporting period both buses were used each day. The buses had an average equivalent fuel economy of 19.0 MPGe for this period, compared to a typical fuel economy of 3.9 MPG for diesel buses. Using RTD’s average cost of electricity of $0.20/ kWh, the buses saved the transit authority a total of $29,730. The buses also prevented 237,370 lbs or 119 tons of greenhouse gas emissions, after accounting for emissions from energy generation. The maintenance cost for the system including all preventive and unscheduled maintenance for the buses and charger was $0.50 / mile, compared to $0.90 / mile for RTD’s hybrid fleet, and $0.99 / mile for diesel fleets. The maintenance cost for preventive maintenance only on the buses and charger was $0.15 / mile. RTD was already heavily invested in green technology at the start of this project, and only runs hybrid buses in addition to its electric vehicles from this project. Much of the comparative maintenance data provided by RTD in this report refers to their hybrid fleet. Proterra compared the performance of the buses at RTD with that of three prototype buses built prior to this project and in service at Foothill Transit. The prototype buses at Foothill Transit completed a total of 58,940 miles during the reporting period, using 125,160 kWh of energy for an MPGe of 17.7. Relative to RTD, the buses at Foothill ran more miles each week,
F-6
but consumed more energy, resulting in lower fuel economy. Proterra determined several reasons for this difference:
• The Foothill prototype buses were on longer duration routes than those at RTD, running 15 hours a day and 7 days a week.
• The prototype buses ran in warmer climate with increased HVAC use. • Route profile differences between locations yielded different base vehicle energy
consumption. This project demonstrated that electric transit buses can be a one-for-one replacement for diesel, CNG or hybrid buses, with significant operational cost and greenhouse gas savings. This technology allows transit agencies to provide service to their customers more cost-effectively, more efficiently, and more sustainably. This project also directly benefits California by improving the air quality of the San Joaquin Valley, and creating jobs throughout California to support the electric vehicles.
Next steps are to continue improving the efficiency of the electric transit buses, and to build a support infrastructure similar to that of traditional buses.
F-7
CHAPTER 1: Proterra BE35 EcoRide Electric Transit Bus
1.1 Statement of Work The goal of this project is to successfully replace traditional transit buses with all-electric transit buses, and to demonstrate the cost, energy and GHG savings from that replacement. The agreed tasks include:
• Redesign key systems from the Proterra prototype buses and install on buses for RTD • Manufacture two fast charge battery electric transit buses and operate for a minimum of
two years at RTD • Manufacture, install and operate one Fast Charge Station for a minimum of two years at
RTD • Train drivers and operations at RTD to support the electric buses and Fast Charger • Collect operational data from RTD on a daily basis and measure fuel and GHG savings
compared to diesel buses • Compare operational data from RTD to that of the Proterra prototype buses at Foothill
Transit in Pomona, CA
1.1.1 Deliverable Tasks Provide substantiation of the achievement of tasks in the project schedule in Proterra’s application as follows:
• Issue Monthly Project Progress Reports during the grant period including operational data and information on project milestones. Report format was determined at project acceptance.
• Issue final report comparing RTD operational data to traditional buses, and to Proterra prototype buses at Foothill Transit.
1.2 Technology Development at Start of Grant Period
1.2.1 Status at Proterra, the OEM An early version of Proterra’s BE35 electric transit bus was already in service at the start of this grant period at Foothill Transit in Pomona, California. Three additional buses of this model were sold to StarMetro in Tallahassee, Florida and three to VIA in San Antonio, Texas.
The three buses in Pomona ran everyday on route 291, which is 16.7 miles long with an average speed of 10 mph. At the time this grant began, these vehicles had demonstrated that the concept of electric vehicles in regular transit use was viable, but further demonstration was needed to make improvements and revisions that enabled commercial scale production of the bus.

F-8
Figure 1: Prototype Bus Foothill FT2002
Photo Credit: Proterra
Each of the first three sites had an AeroVironment Fast Charger installed and were actively supporting service before RTD received their buses.
1.2.2 Status at RTD, the Transit Authority At the start of this project, RTD had already replaced its entire diesel fleet with hybrid transit buses. These buses have both a diesel motor and an electric motor with a large battery pack. Like hybrid passenger cars, the battery pack recaptures the energy lost on a diesel vehicle during braking. This recaptured energy is used to supplement the energy provided by diesel, and increase the MPG of the hybrid vehicle compared to a standard diesel vehicle. A typical diesel transit bus has an MPG of 3.9, compared to 4.8 for a typical hybrid transit bus. This vehicle replacement at RTD represented their commitment to keeping the fleet as efficient as possible using new vehicle technologies.
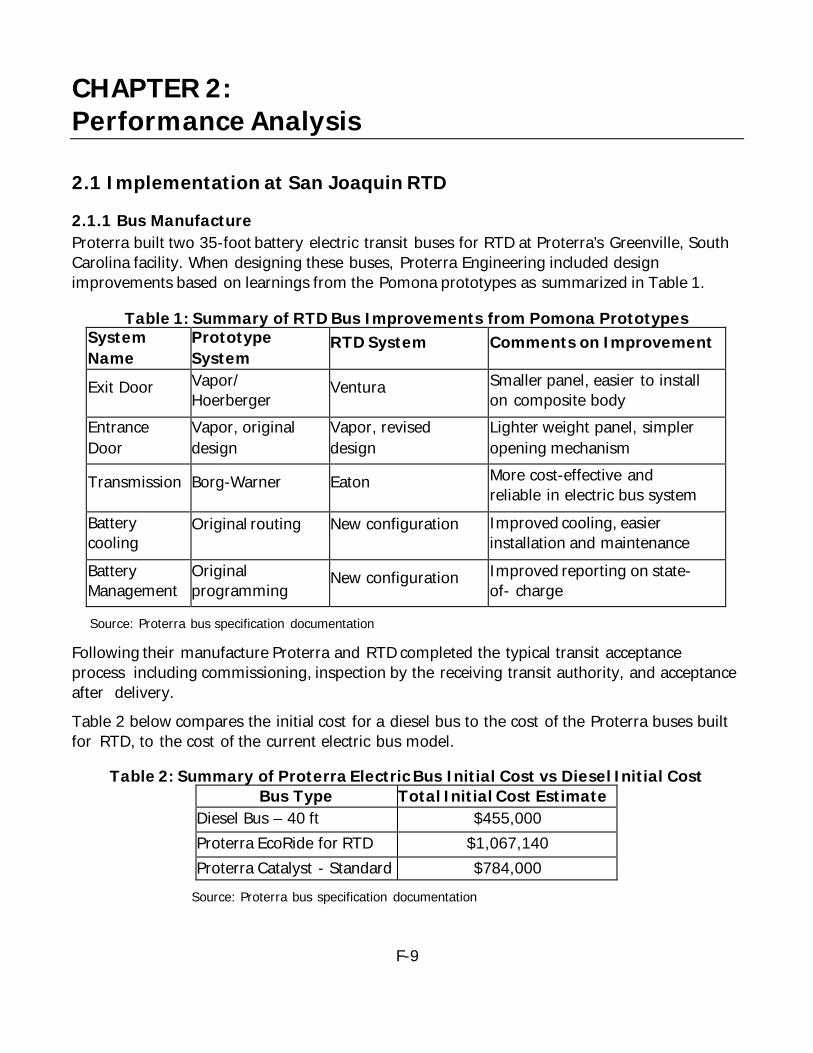
F-9
CHAPTER 2: Performance Analysis
2.1 Implementation at San Joaquin RTD
2.1.1 Bus Manufacture Proterra built two 35-foot battery electric transit buses for RTD at Proterra’s Greenville, South Carolina facility. When designing these buses, Proterra Engineering included design improvements based on learnings from the Pomona prototypes as summarized in Table 1.
Table 1: Summary of RTD Bus Improvements from Pomona Prototypes System Name
Prototype System
RTD System Comments on Improvement
Exit Door Vapor/ Hoerberger
Ventura Smaller panel, easier to install on composite body
Entrance Door
Vapor, original design
Vapor, revised design
Lighter weight panel, simpler opening mechanism
Transmission Borg-Warner Eaton More cost-effective and reliable in electric bus system
Battery cooling
Original routing New configuration Improved cooling, easier installation and maintenance
Battery Management
Original programming
New configuration Improved reporting on state-of- charge
Source: Proterra bus specification documentation
Following their manufacture Proterra and RTD completed the typical transit acceptance process including commissioning, inspection by the receiving transit authority, and acceptance after delivery. Table 2 below compares the initial cost for a diesel bus to the cost of the Proterra buses built for RTD, to the cost of the current electric bus model.
Table 2: Summary of Proterra Electric Bus Initial Cost vs Diesel Initial Cost Bus Type Total Initial Cost Estimate
Diesel Bus – 40 ft $455,000 Proterra EcoRide for RTD $1,067,140 Proterra Catalyst - Standard
f $784,000
Source: Proterra bus specification documentation
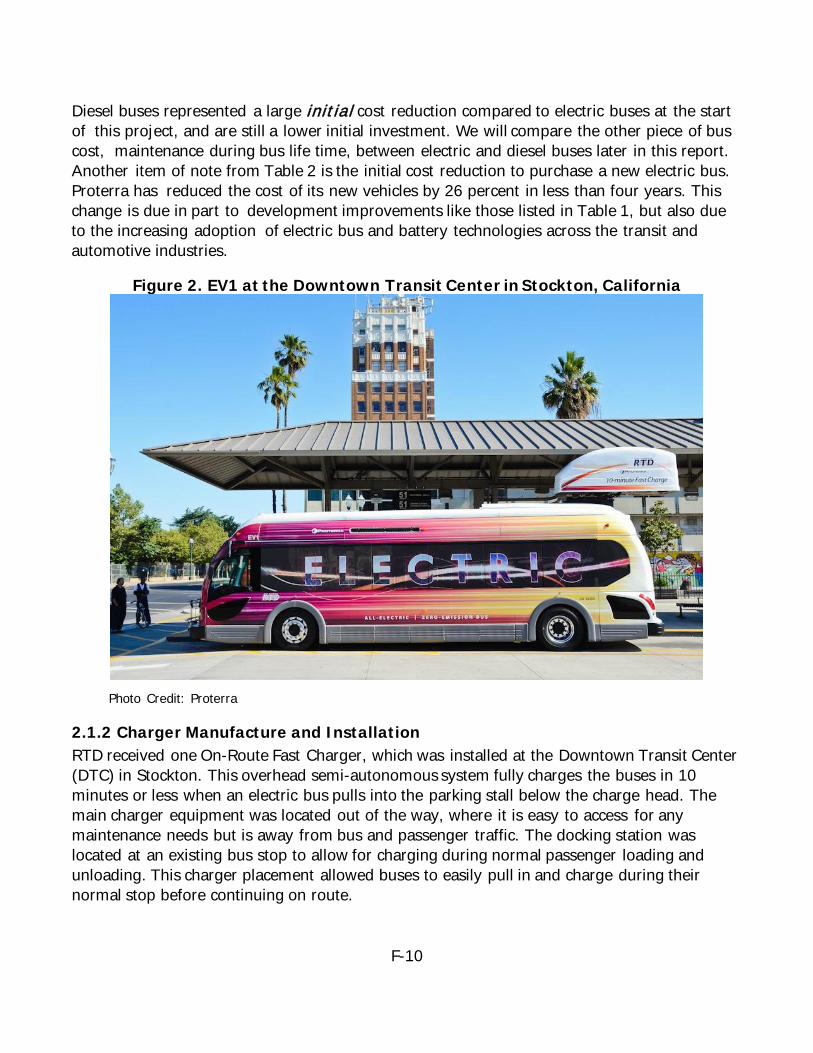
F-10
Diesel buses represented a large init ia l cost reduction compared to electric buses at the start of this project, and are still a lower initial investment. We will compare the other piece of bus cost, maintenance during bus life time, between electric and diesel buses later in this report. Another item of note from Table 2 is the initial cost reduction to purchase a new electric bus. Proterra has reduced the cost of its new vehicles by 26 percent in less than four years. This change is due in part to development improvements like those listed in Table 1, but also due to the increasing adoption of electric bus and battery technologies across the transit and automotive industries.
Figure 2. EV1 at the Downtown Transit Center in Stockton, California
Photo Credit: Proterra
2.1.2 Charger Manufacture and Installation RTD received one On-Route Fast Charger, which was installed at the Downtown Transit Center (DTC) in Stockton. This overhead semi-autonomous system fully charges the buses in 10 minutes or less when an electric bus pulls into the parking stall below the charge head. The main charger equipment was located out of the way, where it is easy to access for any maintenance needs but is away from bus and passenger traffic. The docking station was located at an existing bus stop to allow for charging during normal passenger loading and unloading. This charger placement allowed buses to easily pull in and charge during their normal stop before continuing on route.
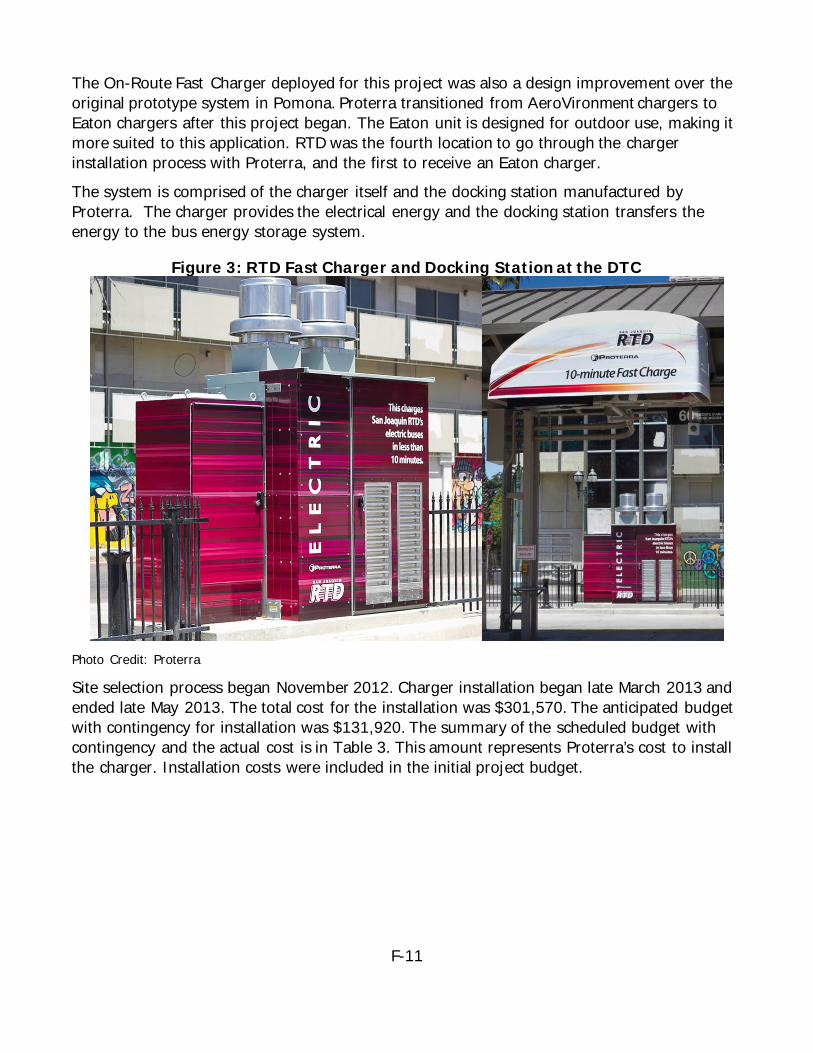
F-11
The On-Route Fast Charger deployed for this project was also a design improvement over the original prototype system in Pomona. Proterra transitioned from AeroVironment chargers to Eaton chargers after this project began. The Eaton unit is designed for outdoor use, making it more suited to this application. RTD was the fourth location to go through the charger installation process with Proterra, and the first to receive an Eaton charger. The system is comprised of the charger itself and the docking station manufactured by Proterra. The charger provides the electrical energy and the docking station transfers the energy to the bus energy storage system.
Figure 3: RTD Fast Charger and Docking Station at the DTC
Photo Credit: Proterra
Site selection process began November 2012. Charger installation began late March 2013 and ended late May 2013. The total cost for the installation was $301,570. The anticipated budget with contingency for installation was $131,920. The summary of the scheduled budget with contingency and the actual cost is in Table 3. This amount represents Proterra’s cost to install the charger. Installation costs were included in the initial project budget.
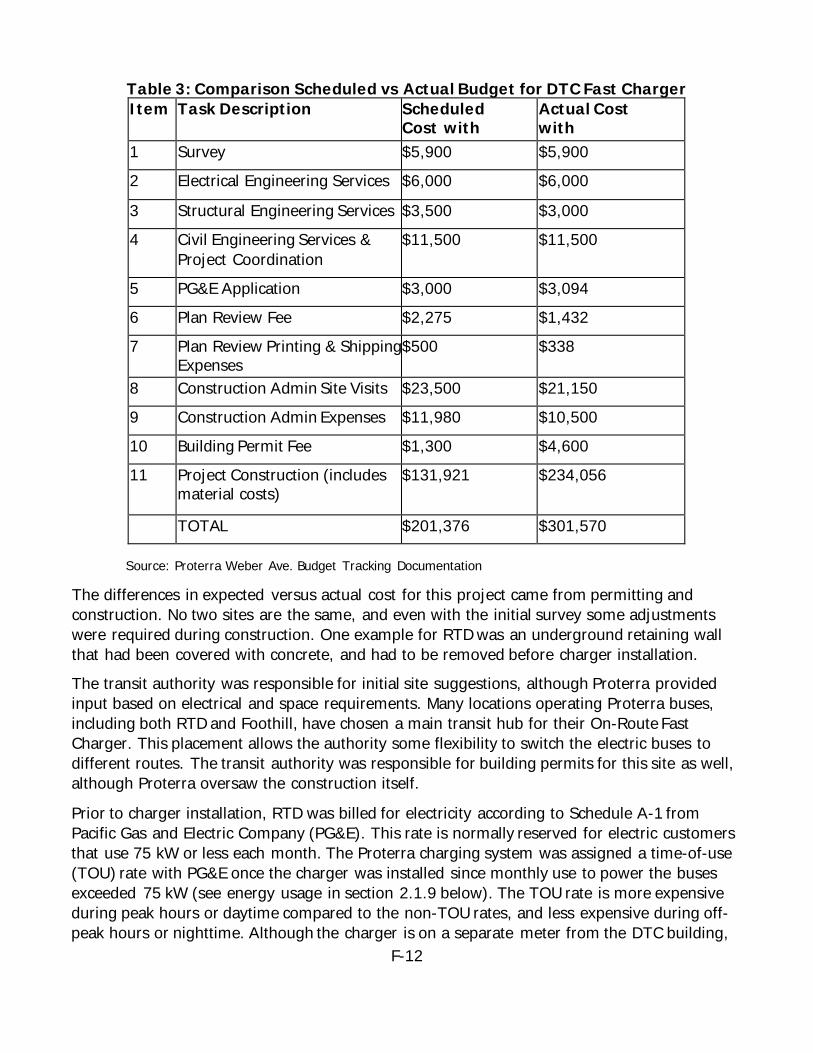
F-12
Table 3: Comparison Scheduled vs Actual Budget for DTC Fast Charger Item Task Description Scheduled
Cost with C ti
Actual Cost with
i 1 Survey $5,900 $5,900 2 Electrical Engineering Services $6,000 $6,000
3 Structural Engineering Services $3,500 $3,000 4 Civil Engineering Services &
Project Coordination $11,500 $11,500
5 PG&E Application $3,000 $3,094 6 Plan Review Fee $2,275 $1,432 7 Plan Review Printing & Shipping
Expenses $500 $338
8 Construction Admin Site Visits $23,500 $21,150 9 Construction Admin Expenses $11,980 $10,500 10 Building Permit Fee $1,300 $4,600 11 Project Construction (includes
material costs) $131,921 $234,056
TOTAL $201,376 $301,570
Source: Proterra Weber Ave. Budget Tracking Documentation
The differences in expected versus actual cost for this project came from permitting and construction. No two sites are the same, and even with the initial survey some adjustments were required during construction. One example for RTD was an underground retaining wall that had been covered with concrete, and had to be removed before charger installation. The transit authority was responsible for initial site suggestions, although Proterra provided input based on electrical and space requirements. Many locations operating Proterra buses, including both RTD and Foothill, have chosen a main transit hub for their On-Route Fast Charger. This placement allows the authority some flexibility to switch the electric buses to different routes. The transit authority was responsible for building permits for this site as well, although Proterra oversaw the construction itself.
Prior to charger installation, RTD was billed for electricity according to Schedule A-1 from Pacific Gas and Electric Company (PG&E). This rate is normally reserved for electric customers that use 75 kW or less each month. The Proterra charging system was assigned a time-of-use (TOU) rate with PG&E once the charger was installed since monthly use to power the buses exceeded 75 kW (see energy usage in section 2.1.9 below). The TOU rate is more expensive during peak hours or daytime compared to the non-TOU rates, and less expensive during off- peak hours or nighttime. Although the charger is on a separate meter from the DTC building,
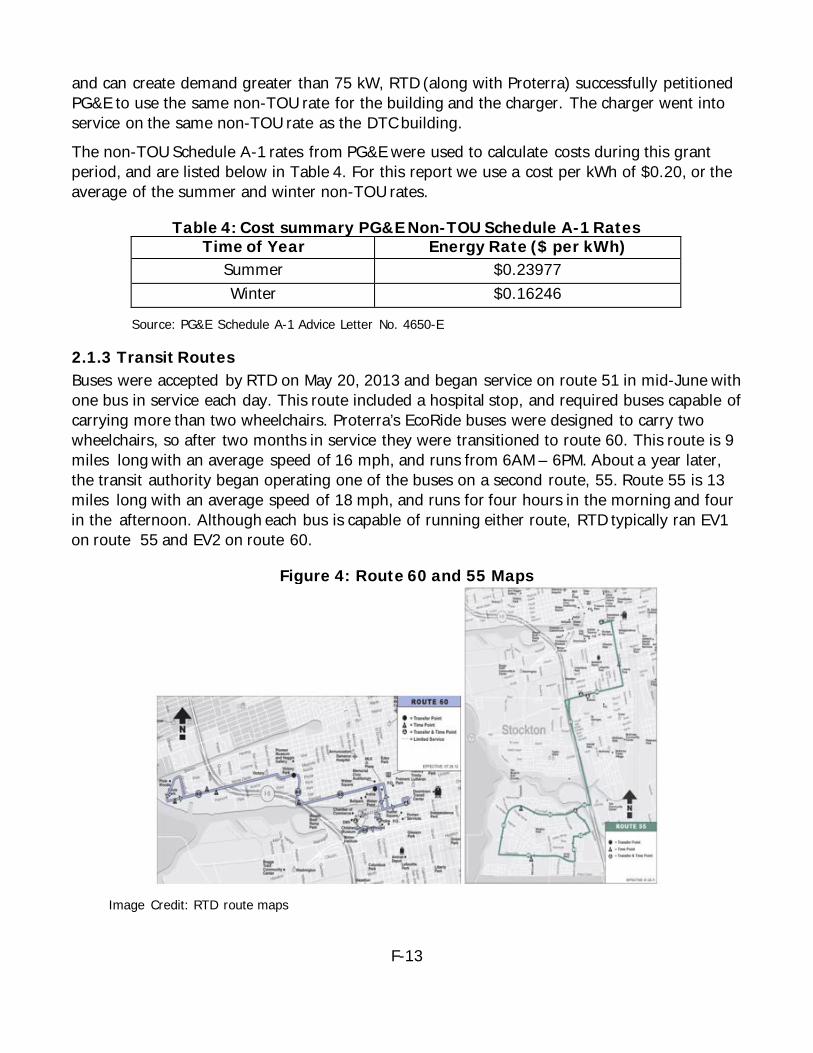
F-13
and can create demand greater than 75 kW, RTD (along with Proterra) successfully petitioned PG&E to use the same non-TOU rate for the building and the charger. The charger went into service on the same non-TOU rate as the DTC building. The non-TOU Schedule A-1 rates from PG&E were used to calculate costs during this grant period, and are listed below in Table 4. For this report we use a cost per kWh of $0.20, or the average of the summer and winter non-TOU rates.
Table 4: Cost summary PG&E Non-TOU Schedule A-1 Rates Time of Year Energy Rate ($ per kWh)
Summer $0.23977 Winter $0.16246
Source: PG&E Schedule A-1 Advice Letter No. 4650-E
2.1.3 Transit Routes Buses were accepted by RTD on May 20, 2013 and began service on route 51 in mid-June with one bus in service each day. This route included a hospital stop, and required buses capable of carrying more than two wheelchairs. Proterra’s EcoRide buses were designed to carry two wheelchairs, so after two months in service they were transitioned to route 60. This route is 9 miles long with an average speed of 16 mph, and runs from 6AM – 6PM. About a year later, the transit authority began operating one of the buses on a second route, 55. Route 55 is 13 miles long with an average speed of 18 mph, and runs for four hours in the morning and four in the afternoon. Although each bus is capable of running either route, RTD typically ran EV1 on route 55 and EV2 on route 60.
Figure 4: Route 60 and 55 Maps
Image Credit: RTD route maps

F-14
These routes are mostly city driving with urban stops, although route 55 includes a short section of highway driving. These two routes represent typical transit speeds and lengths, and were ideal to validate electrical buses for urban transportation.
2.1.4 Driver Training Driver training was completed in May 2013 after bus delivery with Proterra’s driver trainer was on location. This training familiarized drivers with the operation of the bus, the lack of noise or vibration while driving, and the charging/docking procedure. Most of the training focused on docking and charging, since this procedure is the least familiar part of the electric buses. Drivers were instructed how to align the bus with the docking station, and were familiarized with each stage of the docking procedure.
2.1.5 Maintenance Training Maintenance training was completed in June 2014 by Proterra’s maintenance trainer. This training covered the items below:
• Alignment • Air System and Brakes • Cooling System • Powertrain: Traction Motor and Transmission • High-Voltage System • Low-Voltage System
The maintenance training focused on the areas of the bus that are different from standard diesel buses, or are key to safety.
2.1.6 Onsite Service Technician During bus acceptance and the initial 6 months of service, Proterra’s service technician from Pomona traveled up to Stockton to assist with any setup and maintenance issues. In 2014 Proterra hired a retired RTD maintenance technician as dedicated onsite service. Both employees were able to answer questions about the bus, assist with driver training, and perform maintenance tasks and training.
2.1.7 RTD Performance Summary Proterra tracked the performance of EV1 and EV2 from June 16, 2013 to June 20, 2015. Mileage and energy were tracked using a data logger on each bus and one in the charge station. Data collected by these devices was relayed back to a server on a daily basis using 3G cellular data services. The information was then reviewed and analyzed once a week. Table 5 summarizes the values Proterra uses to calculate fuel and GHG savings in this section.
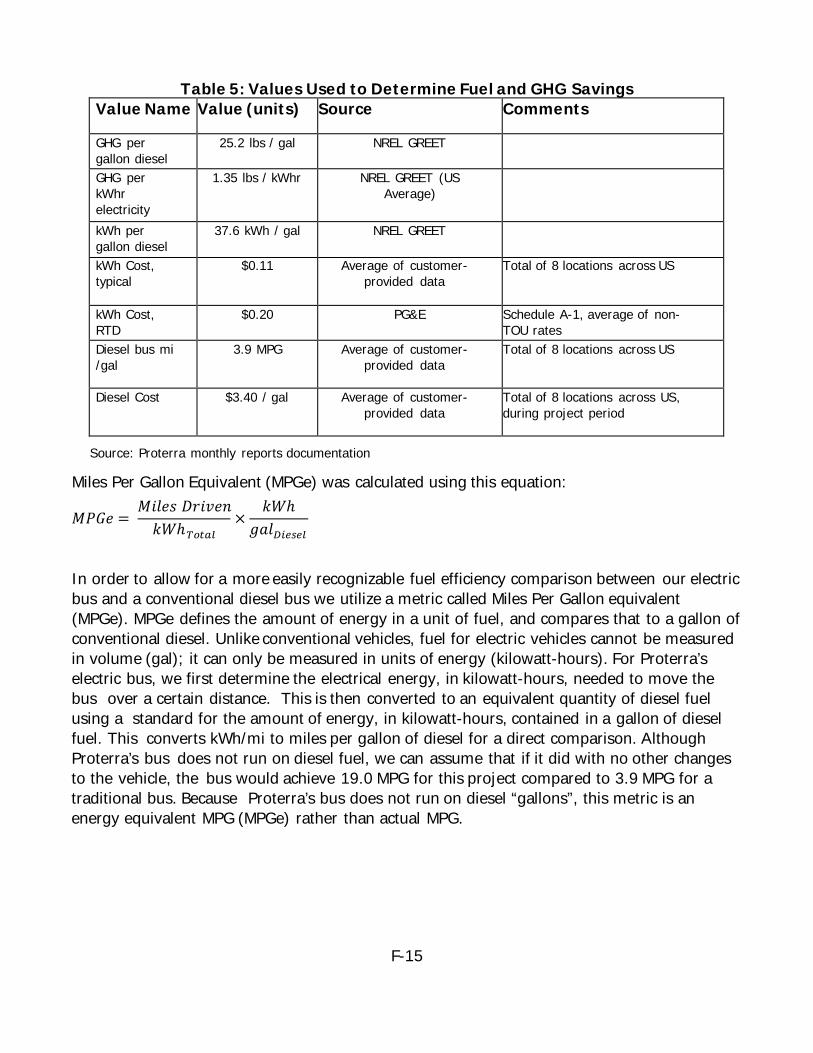
F-15
Table 5: Values Used to Determine Fuel and GHG Savings Value Name Value (units) Source Comments
GHG per gallon diesel
25.2 lbs / gal NREL GREET
GHG per kWhr electricity
1.35 lbs / kWhr NREL GREET (US Average)
kWh per gallon diesel
37.6 kWh / gal NREL GREET
kWh Cost, typical
$0.11 Average of customer-provided data
Total of 8 locations across US
kWh Cost, RTD
$0.20 PG&E Schedule A-1, average of non-TOU rates
Diesel bus mi /gal
3.9 MPG Average of customer-provided data
Total of 8 locations across US
Diesel Cost $3.40 / gal Average of customer-provided data
Total of 8 locations across US, during project period
Source: Proterra monthly reports documentation
Miles Per Gallon Equivalent (MPGe) was calculated using this equation:
𝑀𝑀𝑀𝑀𝑀𝑀𝑀𝑀 = 𝑀𝑀𝑀𝑀𝑔𝑔𝑀𝑀𝑀𝑀 𝐷𝐷𝑜𝑜𝑀𝑀𝐷𝐷𝑀𝑀𝑛𝑛𝑘𝑘𝑘𝑘ℎ𝑇𝑇𝑇𝑇𝑇𝑇𝑇𝑇𝑇𝑇
×𝑘𝑘𝑘𝑘ℎ
𝑔𝑔𝑔𝑔𝑔𝑔𝐷𝐷𝐷𝐷𝐷𝐷𝐷𝐷𝐷𝐷𝑇𝑇
In order to allow for a more easily recognizable fuel efficiency comparison between our electric bus and a conventional diesel bus we utilize a metric called Miles Per Gallon equivalent (MPGe). MPGe defines the amount of energy in a unit of fuel, and compares that to a gallon of conventional diesel. Unlike conventional vehicles, fuel for electric vehicles cannot be measured in volume (gal); it can only be measured in units of energy (kilowatt-hours). For Proterra’s electric bus, we first determine the electrical energy, in kilowatt-hours, needed to move the bus over a certain distance. This is then converted to an equivalent quantity of diesel fuel using a standard for the amount of energy, in kilowatt-hours, contained in a gallon of diesel fuel. This converts kWh/mi to miles per gallon of diesel for a direct comparison. Although Proterra’s bus does not run on diesel fuel, we can assume that if it did with no other changes to the vehicle, the bus would achieve 19.0 MPG for this project compared to 3.9 MPG for a traditional bus. Because Proterra’s bus does not run on diesel “gallons”, this metric is an energy equivalent MPG (MPGe) rather than actual MPG.
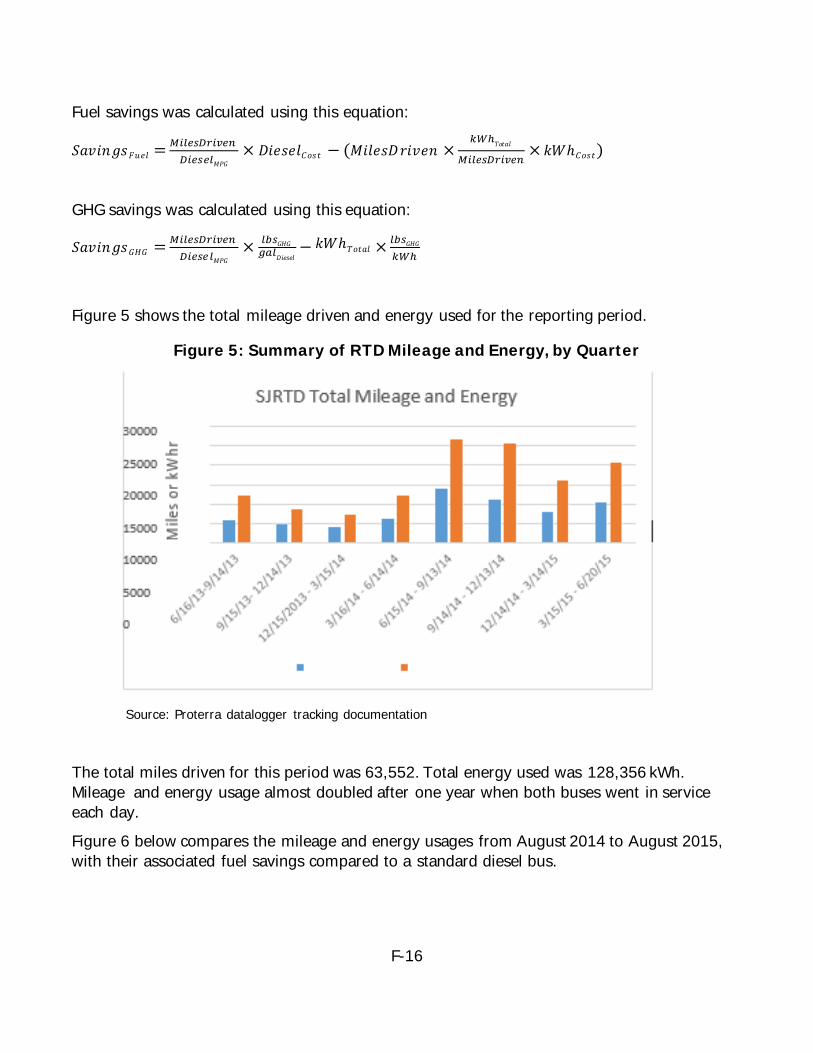
F-16
Fuel savings was calculated using this equation:
𝑆𝑆𝑔𝑔𝐷𝐷𝑀𝑀𝑛𝑛𝑔𝑔𝑀𝑀𝐹𝐹𝑜𝑜𝑀𝑀𝑔𝑔 = 𝑀𝑀𝐷𝐷𝑇𝑇𝐷𝐷𝐷𝐷𝐷𝐷𝑀𝑀𝐷𝐷𝑀𝑀𝐷𝐷𝑀𝑀 𝐷𝐷𝐷𝐷𝐷𝐷𝐷𝐷𝐷𝐷𝑇𝑇𝑀𝑀𝑀𝑀𝑀𝑀
× 𝐷𝐷𝑀𝑀𝑀𝑀𝑀𝑀𝑀𝑀𝑔𝑔𝐶𝐶𝑡𝑡𝑀𝑀𝑡𝑡 − (𝑀𝑀𝑀𝑀𝑔𝑔𝑀𝑀𝑀𝑀𝐷𝐷𝑜𝑜𝑀𝑀𝐷𝐷𝑀𝑀𝑛𝑛 ×𝑘𝑘𝑊𝑊ℎ𝑇𝑇𝑡𝑡𝑡𝑡𝑔𝑔𝑔𝑔
𝑀𝑀𝐷𝐷𝑇𝑇𝐷𝐷𝐷𝐷𝐷𝐷𝑀𝑀𝐷𝐷𝑀𝑀𝐷𝐷𝑀𝑀× 𝑘𝑘𝑘𝑘ℎ𝐶𝐶𝑡𝑡𝑀𝑀𝑡𝑡)
GHG savings was calculated using this equation:
𝑆𝑆𝑔𝑔𝐷𝐷𝑀𝑀𝑛𝑛𝑔𝑔𝑀𝑀𝑀𝑀𝐺𝐺𝑀𝑀 = 𝑀𝑀𝐷𝐷𝑇𝑇𝐷𝐷𝐷𝐷𝐷𝐷𝑀𝑀𝐷𝐷𝑀𝑀𝐷𝐷𝑀𝑀 𝐷𝐷𝐷𝐷𝐷𝐷𝐷𝐷𝐷𝐷𝑇𝑇𝑀𝑀𝑀𝑀𝑀𝑀
× 𝑇𝑇𝑙𝑙𝐷𝐷𝑀𝑀𝐺𝐺𝑀𝑀 𝑔𝑔𝑇𝑇𝑇𝑇𝐷𝐷𝑀𝑀𝑀𝑀𝑀𝑀𝑀𝑀𝑔𝑔− 𝑘𝑘𝑘𝑘ℎ𝑇𝑇𝑡𝑡𝑡𝑡𝑔𝑔𝑔𝑔 × 𝑇𝑇𝑙𝑙𝐷𝐷𝑀𝑀𝐺𝐺𝑀𝑀
𝑘𝑘𝑊𝑊ℎ
Figure 5 shows the total mileage driven and energy used for the reporting period.
Figure 5: Summary of RTD Mileage and Energy, by Quarter
Source: Proterra datalogger tracking documentation
The total miles driven for this period was 63,552. Total energy used was 128,356 kWh. Mileage and energy usage almost doubled after one year when both buses went in service each day. Figure 6 below compares the mileage and energy usages from August 2014 to August 2015, with their associated fuel savings compared to a standard diesel bus.
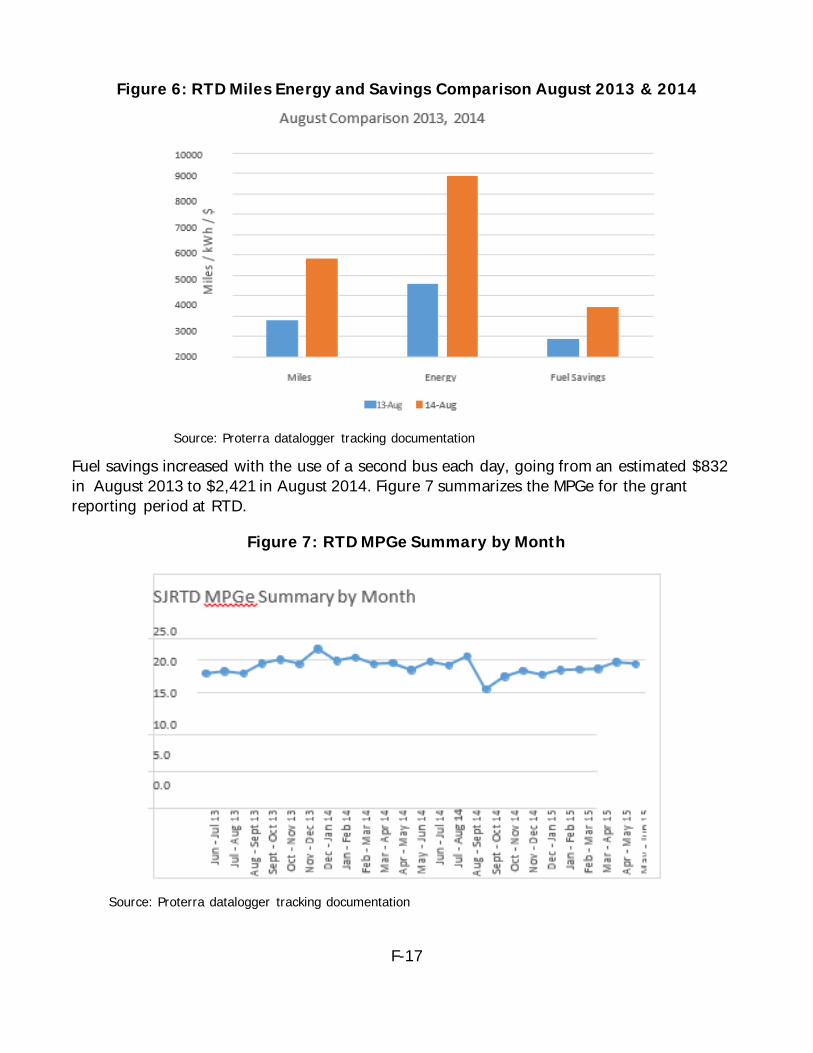
F-17
Figure 6: RTD Miles Energy and Savings Comparison August 2013 & 2014
Source: Proterra datalogger tracking documentation
Fuel savings increased with the use of a second bus each day, going from an estimated $832 in August 2013 to $2,421 in August 2014. Figure 7 summarizes the MPGe for the grant reporting period at RTD.
Figure 7: RTD MPGe Summary by Month
Source: Proterra datalogger tracking documentation
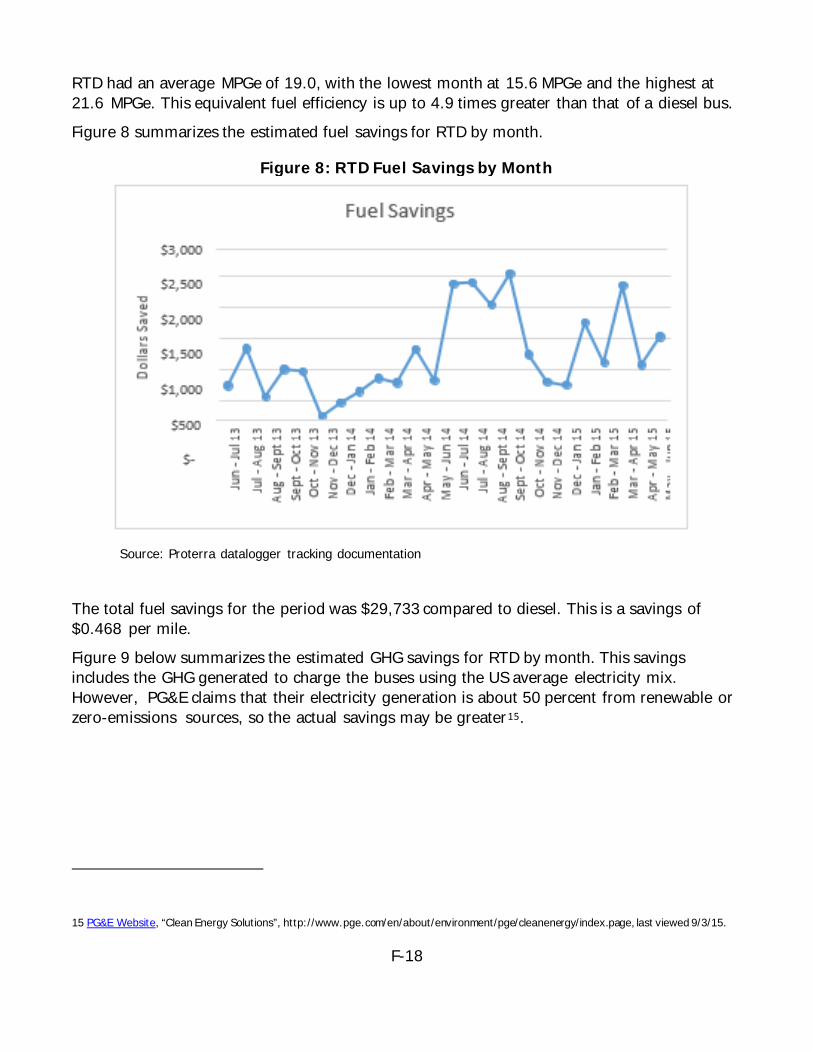
F-18
RTD had an average MPGe of 19.0, with the lowest month at 15.6 MPGe and the highest at 21.6 MPGe. This equivalent fuel efficiency is up to 4.9 times greater than that of a diesel bus. Figure 8 summarizes the estimated fuel savings for RTD by month.
Figure 8: RTD Fuel Savings by Month
Source: Proterra datalogger tracking documentation
The total fuel savings for the period was $29,733 compared to diesel. This is a savings of $0.468 per mile. Figure 9 below summarizes the estimated GHG savings for RTD by month. This savings includes the GHG generated to charge the buses using the US average electricity mix. However, PG&E claims that their electricity generation is about 50 percent from renewable or zero-emissions sources, so the actual savings may be greater15.
15 PG&E Website, “Clean Energy Solutions”, http://www.pge.com/en/about/environment/pge/cleanenergy/index.page, last viewed 9/3/15.
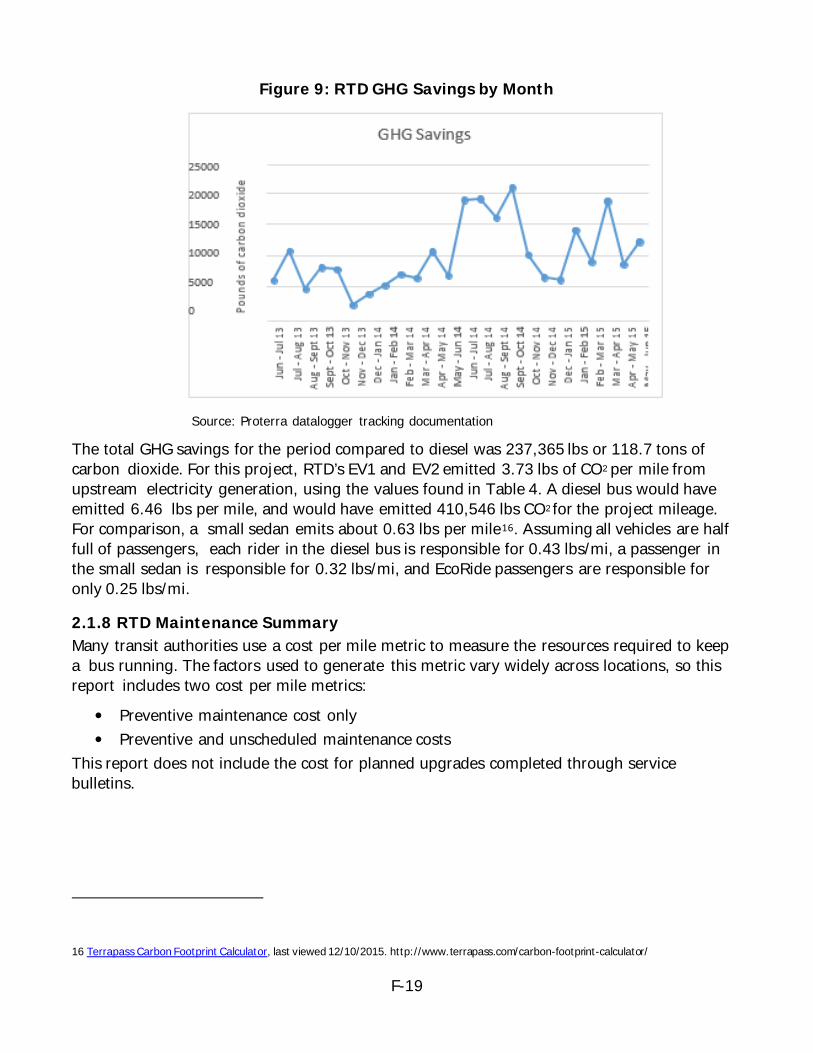
F-19
Figure 9: RTD GHG Savings by Month
Source: Proterra datalogger tracking documentation
The total GHG savings for the period compared to diesel was 237,365 lbs or 118.7 tons of carbon dioxide. For this project, RTD’s EV1 and EV2 emitted 3.73 lbs of CO2 per mile from upstream electricity generation, using the values found in Table 4. A diesel bus would have emitted 6.46 lbs per mile, and would have emitted 410,546 lbs CO2 for the project mileage. For comparison, a small sedan emits about 0.63 lbs per mile16. Assuming all vehicles are half full of passengers, each rider in the diesel bus is responsible for 0.43 lbs/mi, a passenger in the small sedan is responsible for 0.32 lbs/mi, and EcoRide passengers are responsible for only 0.25 lbs/mi.
2.1.8 RTD Maintenance Summary Many transit authorities use a cost per mile metric to measure the resources required to keep a bus running. The factors used to generate this metric vary widely across locations, so this report includes two cost per mile metrics:
• Preventive maintenance cost only • Preventive and unscheduled maintenance costs
This report does not include the cost for planned upgrades completed through service bulletins.
16 Terrapass Carbon Footprint Calculator, last viewed 12/10/2015. http://www.terrapass.com/carbon-footprint-calculator/
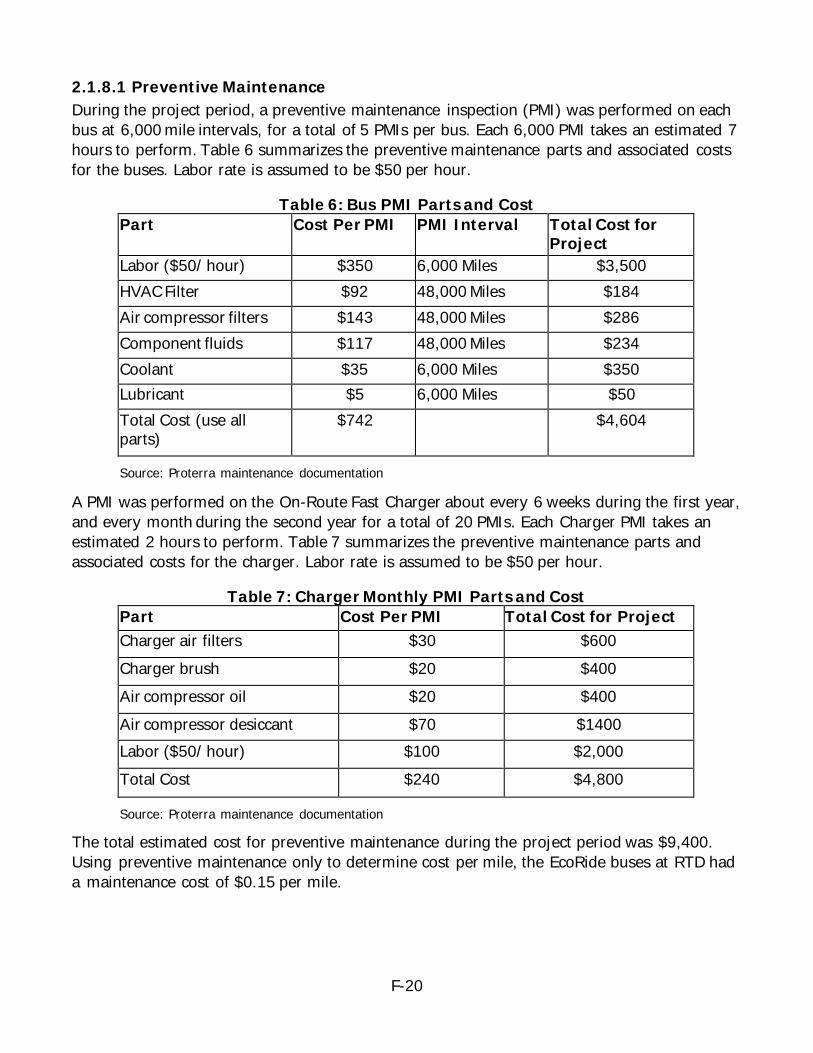
F-20
2.1.8.1 Preventive Maintenance During the project period, a preventive maintenance inspection (PMI) was performed on each bus at 6,000 mile intervals, for a total of 5 PMIs per bus. Each 6,000 PMI takes an estimated 7 hours to perform. Table 6 summarizes the preventive maintenance parts and associated costs for the buses. Labor rate is assumed to be $50 per hour.
Table 6: Bus PMI Parts and Cost Part Cost Per PMI PMI Interval Total Cost for
Project Labor ($50/ hour) $350 6,000 Miles $3,500 HVAC Filter $92 48,000 Miles $184 Air compressor filters $143 48,000 Miles $286 Component fluids $117 48,000 Miles $234 Coolant $35 6,000 Miles $350 Lubricant $5 6,000 Miles $50 Total Cost (use all parts)
$742 $4,604
Source: Proterra maintenance documentation
A PMI was performed on the On-Route Fast Charger about every 6 weeks during the first year, and every month during the second year for a total of 20 PMIs. Each Charger PMI takes an estimated 2 hours to perform. Table 7 summarizes the preventive maintenance parts and associated costs for the charger. Labor rate is assumed to be $50 per hour.
Table 7: Charger Monthly PMI Parts and Cost Part Cost Per PMI Total Cost for Project Charger air filters $30 $600 Charger brush $20 $400 Air compressor oil $20 $400 Air compressor desiccant $70 $1400 Labor ($50/ hour) $100 $2,000 Total Cost $240 $4,800
Source: Proterra maintenance documentation
The total estimated cost for preventive maintenance during the project period was $9,400. Using preventive maintenance only to determine cost per mile, the EcoRide buses at RTD had a maintenance cost of $0.15 per mile.
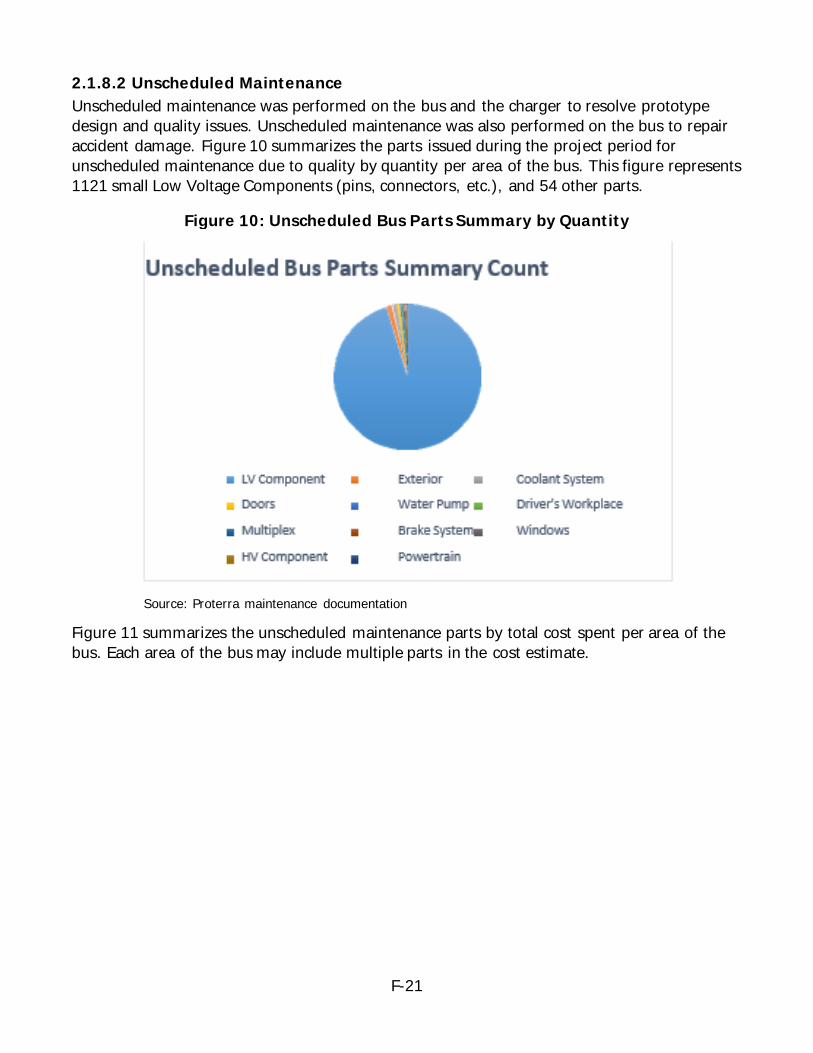
F-21
2.1.8.2 Unscheduled Maintenance Unscheduled maintenance was performed on the bus and the charger to resolve prototype design and quality issues. Unscheduled maintenance was also performed on the bus to repair accident damage. Figure 10 summarizes the parts issued during the project period for unscheduled maintenance due to quality by quantity per area of the bus. This figure represents 1121 small Low Voltage Components (pins, connectors, etc.), and 54 other parts.
Figure 10: Unscheduled Bus Parts Summary by Quantity
Source: Proterra maintenance documentation
Figure 11 summarizes the unscheduled maintenance parts by total cost spent per area of the bus. Each area of the bus may include multiple parts in the cost estimate.
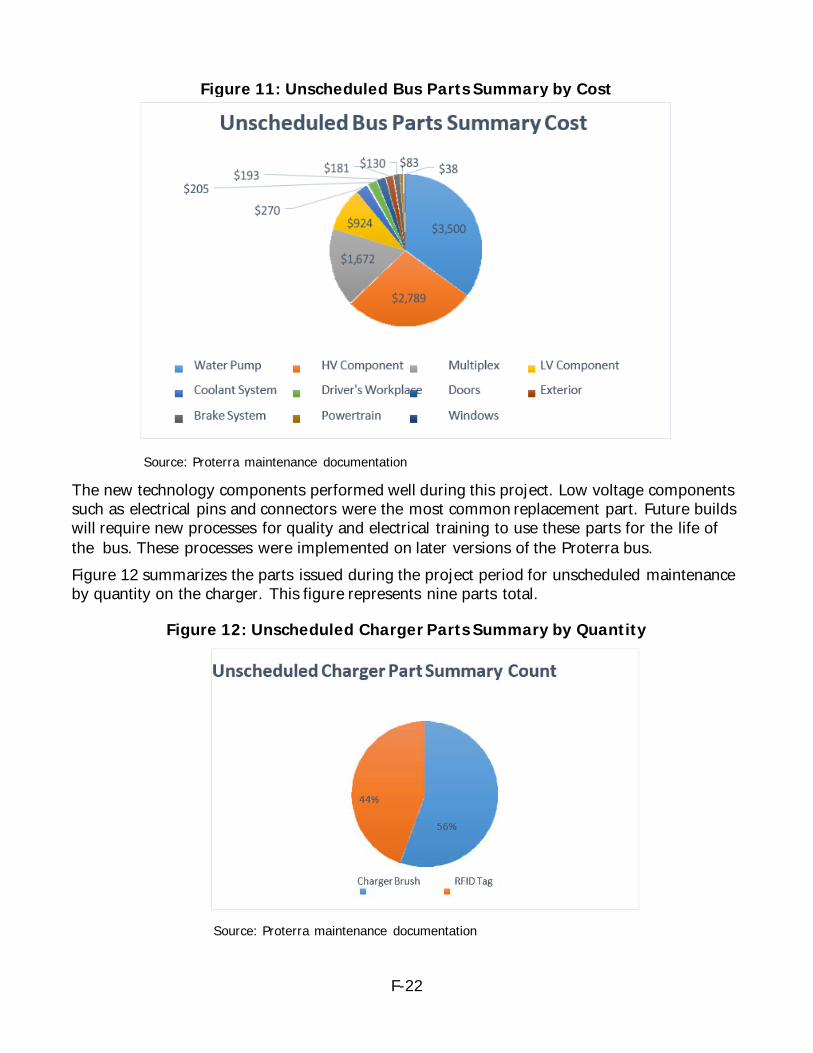
F-22
Figure 11: Unscheduled Bus Parts Summary by Cost
Source: Proterra maintenance documentation
The new technology components performed well during this project. Low voltage components such as electrical pins and connectors were the most common replacement part. Future builds will require new processes for quality and electrical training to use these parts for the life of the bus. These processes were implemented on later versions of the Proterra bus. Figure 12 summarizes the parts issued during the project period for unscheduled maintenance by quantity on the charger. This figure represents nine parts total.
Figure 12: Unscheduled Charger Parts Summary by Quantity
Source: Proterra maintenance documentation
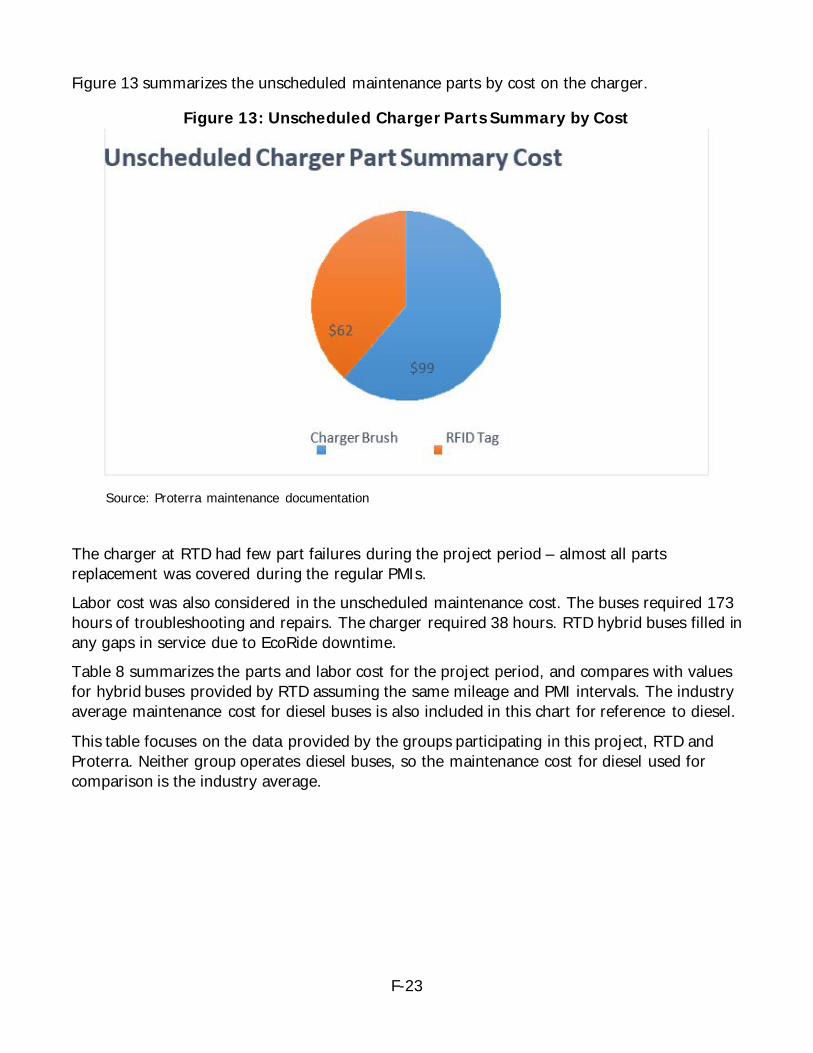
F-23
Figure 13 summarizes the unscheduled maintenance parts by cost on the charger.
Figure 13: Unscheduled Charger Parts Summary by Cost
Source: Proterra maintenance documentation
The charger at RTD had few part failures during the project period – almost all parts replacement was covered during the regular PMIs. Labor cost was also considered in the unscheduled maintenance cost. The buses required 173 hours of troubleshooting and repairs. The charger required 38 hours. RTD hybrid buses filled in any gaps in service due to EcoRide downtime. Table 8 summarizes the parts and labor cost for the project period, and compares with values for hybrid buses provided by RTD assuming the same mileage and PMI intervals. The industry average maintenance cost for diesel buses is also included in this chart for reference to diesel.
This table focuses on the data provided by the groups participating in this project, RTD and Proterra. Neither group operates diesel buses, so the maintenance cost for diesel used for comparison is the industry average.
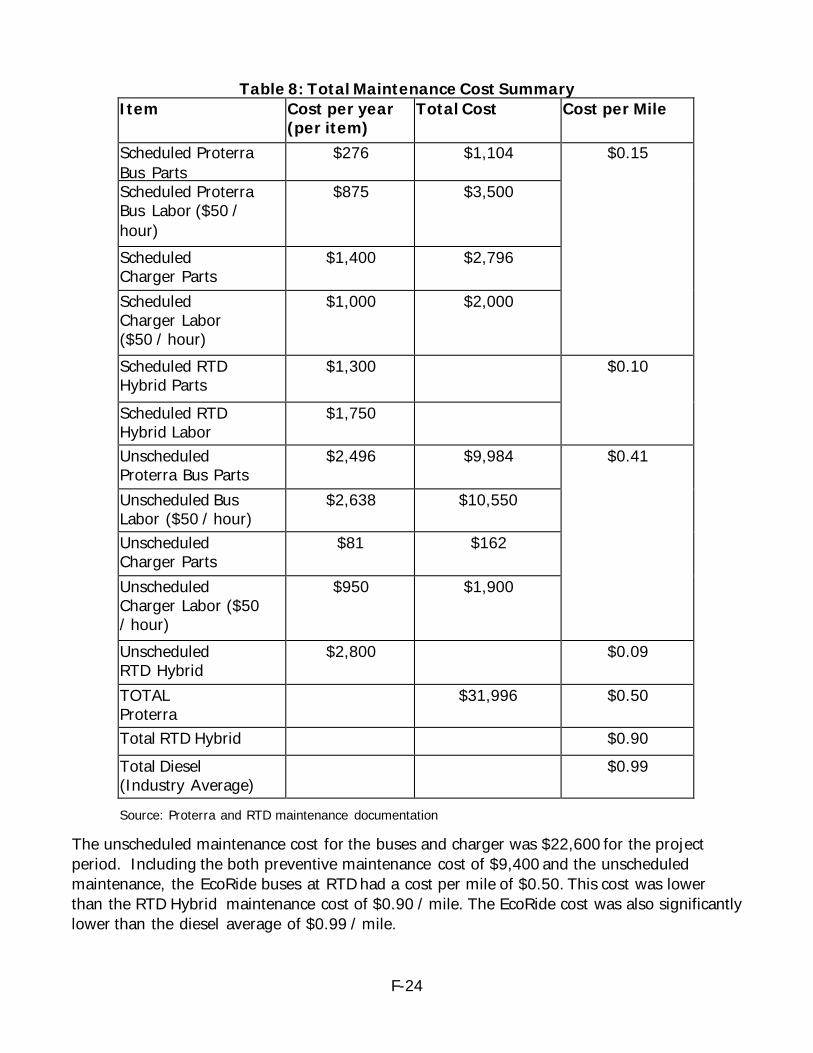
F-24
Table 8: Total Maintenance Cost Summary Item Cost per year
(per item) Total Cost Cost per Mile
Scheduled Proterra Bus Parts
$276 $1,104 $0.15
Scheduled Proterra Bus Labor ($50 / hour)
$875 $3,500
Scheduled Charger Parts
$1,400 $2,796
Scheduled Charger Labor ($50 / hour)
$1,000 $2,000
Scheduled RTD Hybrid Parts
$1,300 $0.10
Scheduled RTD Hybrid Labor
$1,750
Unscheduled Proterra Bus Parts
$2,496 $9,984 $0.41
Unscheduled Bus Labor ($50 / hour)
$2,638 $10,550
Unscheduled Charger Parts
$81 $162
Unscheduled Charger Labor ($50 / hour)
$950 $1,900
Unscheduled RTD Hybrid P t
$2,800 $0.09
TOTAL Proterra E Rid
$31,996 $0.50
Total RTD Hybrid $0.90 Total Diesel (Industry Average)
$0.99
Source: Proterra and RTD maintenance documentation
The unscheduled maintenance cost for the buses and charger was $22,600 for the project period. Including the both preventive maintenance cost of $9,400 and the unscheduled maintenance, the EcoRide buses at RTD had a cost per mile of $0.50. This cost was lower than the RTD Hybrid maintenance cost of $0.90 / mile. The EcoRide cost was also significantly lower than the diesel average of $0.99 / mile.

F-25
Donna DeMartino, General Manager/CEO for San Joaquin RTD, had the following feedback on this project: “RTD is pleased with the results of this project that demonstrates electric vehicles can reduce RTD’s environmental impact by eliminating direct air-pollution and reducing greenhouse gas emissions. Even better, this is accomplished at a lower lifetime cost when compared to any diesel powered bus. This allows RTD to invest savings into its service while supporting its mission to provide a sustainable transportation solution for a county that has extraordinary air-quality and socio-economic challenges.”
2.1.8.3 Service Bulletins Proterra continued development of the EcoRide and the On-Route Fast Charger during this project. Most design improvements developed after the manufacture of these vehicles were installed at RTD through service bulletins and planned upgrades. Proterra completed 98 service bulletins on the two buses and charger during the project period. These service bulletins included:
• Body controller and powertrain software updates • Charger software updates • Front door actuator change – from door manufacturer • Charger fuse changes • Bus fuse changes • Charger air compressor timer & desiccant installation • Traction motor cover installation – from motor manufacturer • Energy storage management software updates • Battery monitoring unit hardware improved securement • Headlight high-beam connector change – from headlight manufacturer • Electrical connection improved sealing and securement • Transmission improvements from product part approval process
Many of these design improvements were identified through this project. Proterra was responsible for all labor and parts for these service bulletins.
2.2 Implementation at Foothill Transit The conventional bus to electric bus replacement in RTD was successful, allowing the transit authority to generate monetary savings and to reduce environmentally-damaging emissions. Both buses and the Fast Charger from this grant are still in service today, and will remain in service through at least the standard 12-year transit bus lifetime. At the beginning of this grant period, Proterra electric buses were running in three US locations. At the submission of this report, Proterra has buses running in nine US locations with at least one additional authority to begin service by the end of 2015. The next section of this report compares RTD performance to other locations.
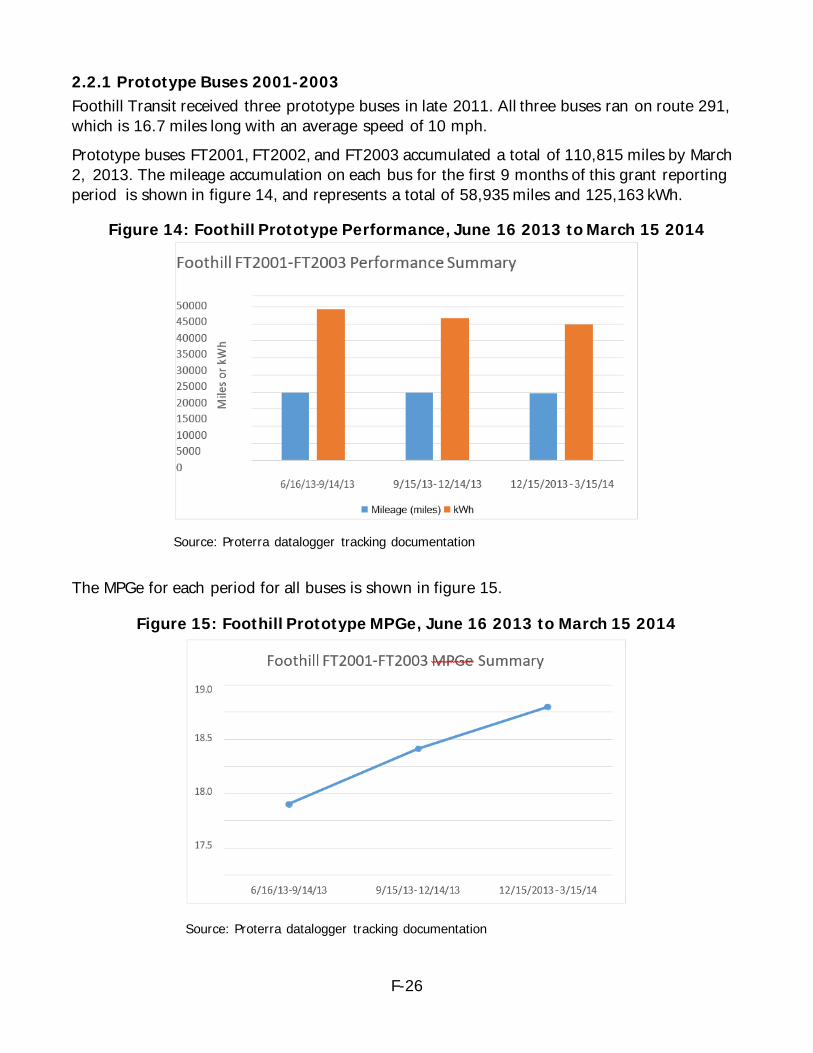
F-26
2.2.1 Prototype Buses 2001-2003 Foothill Transit received three prototype buses in late 2011. All three buses ran on route 291, which is 16.7 miles long with an average speed of 10 mph. Prototype buses FT2001, FT2002, and FT2003 accumulated a total of 110,815 miles by March 2, 2013. The mileage accumulation on each bus for the first 9 months of this grant reporting period is shown in figure 14, and represents a total of 58,935 miles and 125,163 kWh.
Figure 14: Foothill Prototype Performance, June 16 2013 to March 15 2014
Source: Proterra datalogger tracking documentation
The MPGe for each period for all buses is shown in figure 15.
Figure 15: Foothill Prototype MPGe, June 16 2013 to March 15 2014
Source: Proterra datalogger tracking documentation
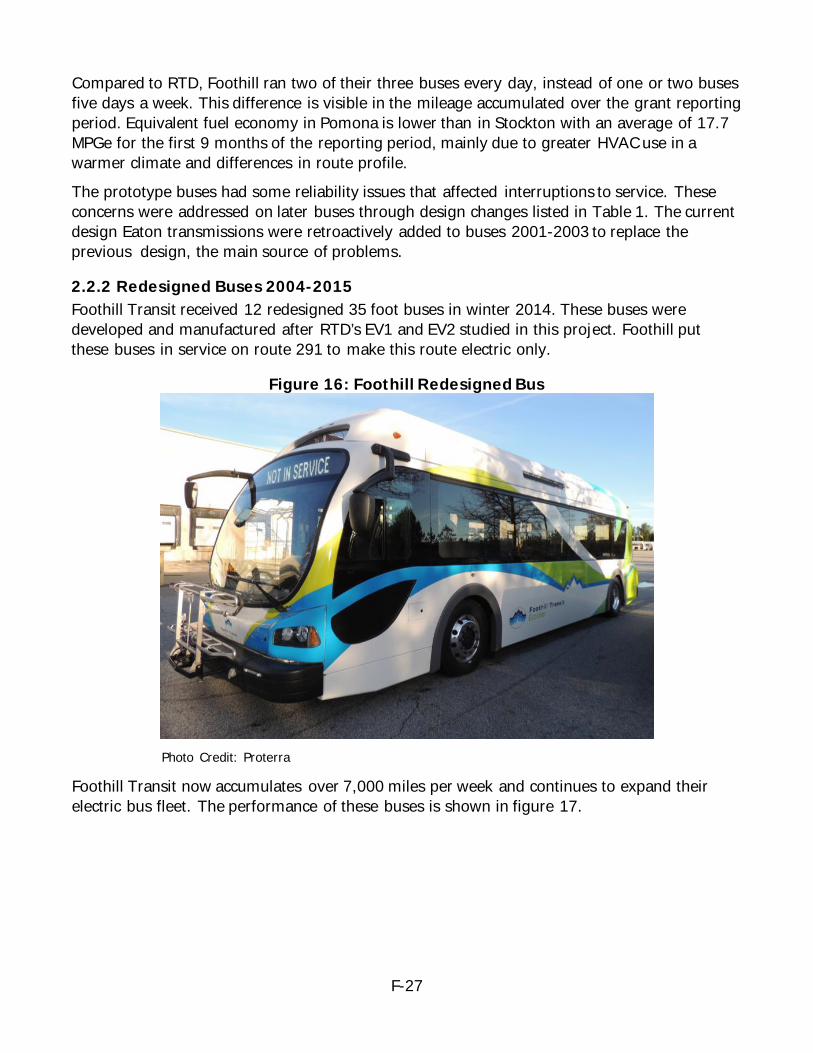
F-27
Compared to RTD, Foothill ran two of their three buses every day, instead of one or two buses five days a week. This difference is visible in the mileage accumulated over the grant reporting period. Equivalent fuel economy in Pomona is lower than in Stockton with an average of 17.7 MPGe for the first 9 months of the reporting period, mainly due to greater HVAC use in a warmer climate and differences in route profile. The prototype buses had some reliability issues that affected interruptions to service. These concerns were addressed on later buses through design changes listed in Table 1. The current design Eaton transmissions were retroactively added to buses 2001-2003 to replace the previous design, the main source of problems.
2.2.2 Redesigned Buses 2004-2015 Foothill Transit received 12 redesigned 35 foot buses in winter 2014. These buses were developed and manufactured after RTD’s EV1 and EV2 studied in this project. Foothill put these buses in service on route 291 to make this route electric only.
Figure 16: Foothill Redesigned Bus
Photo Credit: Proterra
Foothill Transit now accumulates over 7,000 miles per week and continues to expand their electric bus fleet. The performance of these buses is shown in figure 17.
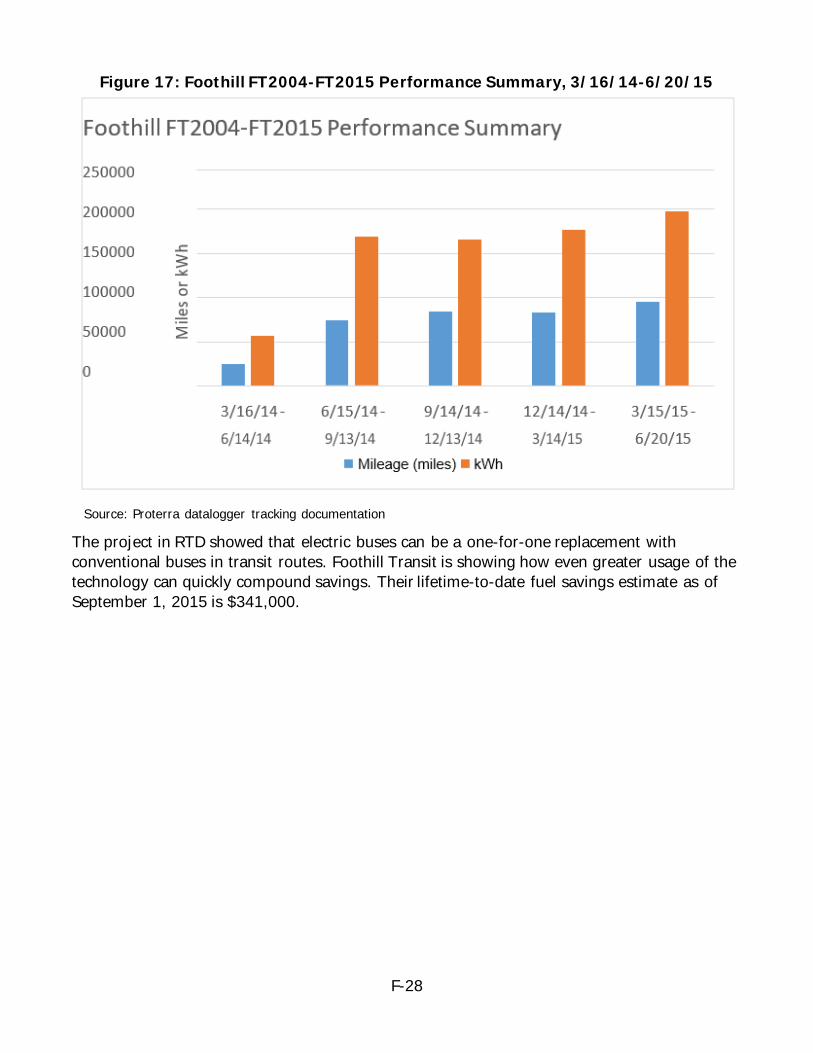
F-28
Figure 17: Foothill FT2004-FT2015 Performance Summary, 3/16/14-6/20/15
Source: Proterra datalogger tracking documentation
The project in RTD showed that electric buses can be a one-for-one replacement with conventional buses in transit routes. Foothill Transit is showing how even greater usage of the technology can quickly compound savings. Their lifetime-to-date fuel savings estimate as of September 1, 2015 is $341,000.
F-29
CHAPTER 3: Achievements
3.1 Benefits to Transit The project demonstrated the following benefits to bus transit:
• Operational and maintenance cost savings. Proterra’s electric buses represent a significant cost savings for fuel and maintenance compared to diesel, CNG or hybrid buses. Transit authorities require government funding to cover some of their expenses. These buses allow more of those funds to go towards other projects, new routes, and employee benefits instead of fuel.
• Fuel savings. These electric buses are up to five times more efficient than diesel buses, depending on driving conditions. This efficiency allows the same amount of fuel to power more routes, with a positive impact on operational cost and greenhouse gas emissions.
• Greenhouse gas emission savings. According to the EPA, transportation represents 27 percent of the total GHG emissions in the US. Diesel buses are among the worst emitters in this category. Reducing emissions from transit buses, which can be on the road 24/7, brings the greatest benefit for the effort in overall emissions reduction.
• Noise reduction for urban routes. Transit buses mainly run urban routes to provide convenient transportation between homes and businesses. The noise from diesel buses can be very disruptive, encouraging potential bus riders to live and work farther away from the noise. Quiet electric buses eliminate this disruption.
Since the beginning of this grant period, the number of transit authorities using Proterra electric buses has grown from three locations to nine. The total number of Proterra buses has grown from 9 to 60. The transit industry is tasked with moving large amounts of people safely, efficiently and as affordably as possible. This technology greatly increases the safety of transit by dramatically reducing emissions, while reducing the cost of moving people.
3.2 Benefits to California The EcoRide electric bus project provided the following benefits to California:
• Reduced GHG emissions in the San Joaquin Valley. This region of California is both highly populated and highly agricultural, presenting a greater strain on resources than other areas of California or the US. These buses are a big step towards reducing emissions in this region.
• Efficient use of California funds for transit. The fuel and maintenance cost savings for Proterra electric buses allow California to conserve transit funds when needed, or dedicate those funds to new transit projects.
• New jobs. As this technology advances, new jobs are created both to develop the technology, as well as to maintain and run the buses. In 2015 Proterra opened two facilities in California to assist technology development in this key area of the US. The

F-30
first facility is in Burlingame, California and employs about 12 people for bus sales and marketing. The second facility in the City of Industry will manufacture buses for our California customers including Foothill Transit and RTD, while the facility in South Carolina will manufacture buses for other US regions.
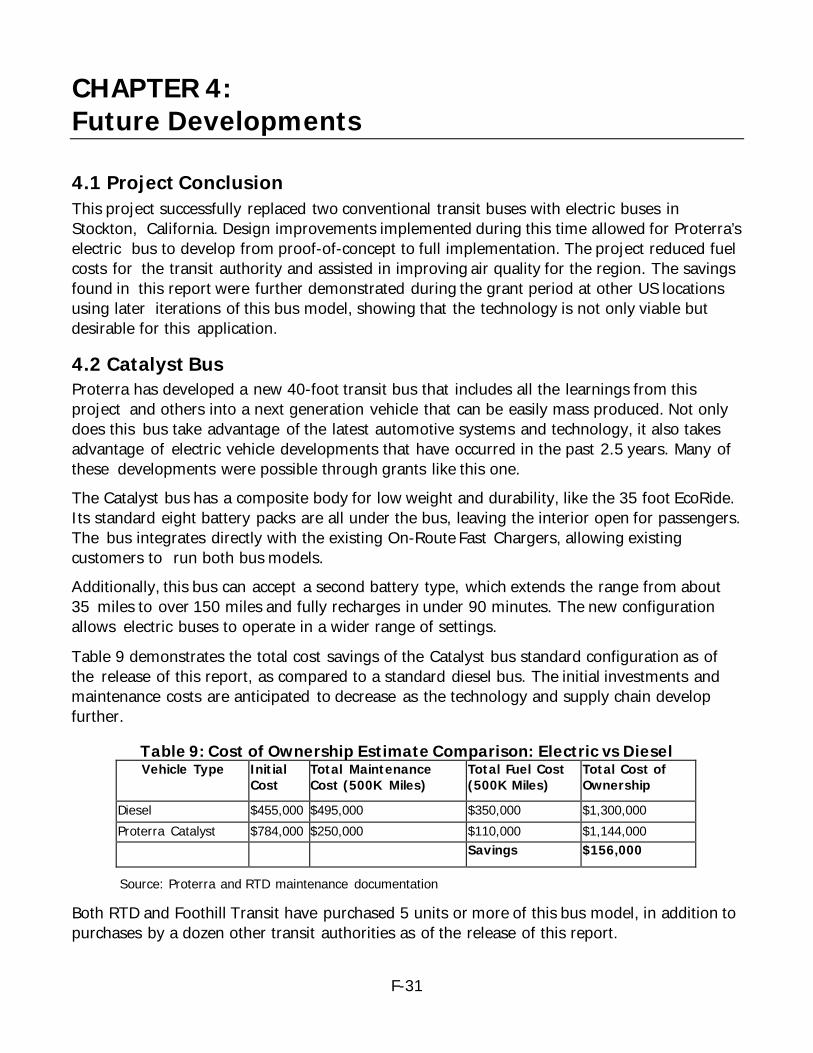
F-31
CHAPTER 4: Future Developments
4.1 Project Conclusion This project successfully replaced two conventional transit buses with electric buses in Stockton, California. Design improvements implemented during this time allowed for Proterra’s electric bus to develop from proof-of-concept to full implementation. The project reduced fuel costs for the transit authority and assisted in improving air quality for the region. The savings found in this report were further demonstrated during the grant period at other US locations using later iterations of this bus model, showing that the technology is not only viable but desirable for this application.
4.2 Catalyst Bus Proterra has developed a new 40-foot transit bus that includes all the learnings from this project and others into a next generation vehicle that can be easily mass produced. Not only does this bus take advantage of the latest automotive systems and technology, it also takes advantage of electric vehicle developments that have occurred in the past 2.5 years. Many of these developments were possible through grants like this one. The Catalyst bus has a composite body for low weight and durability, like the 35 foot EcoRide. Its standard eight battery packs are all under the bus, leaving the interior open for passengers. The bus integrates directly with the existing On-Route Fast Chargers, allowing existing customers to run both bus models. Additionally, this bus can accept a second battery type, which extends the range from about 35 miles to over 150 miles and fully recharges in under 90 minutes. The new configuration allows electric buses to operate in a wider range of settings.
Table 9 demonstrates the total cost savings of the Catalyst bus standard configuration as of the release of this report, as compared to a standard diesel bus. The initial investments and maintenance costs are anticipated to decrease as the technology and supply chain develop further.
Table 9: Cost of Ownership Estimate Comparison: Electric vs Diesel Vehicle Type Initial
Cost Total Maintenance Cost (500K Miles)
Total Fuel Cost (500K Miles)
Total Cost of Ownership
Diesel $455,000 $495,000 $350,000 $1,300,000 Proterra Catalyst $784,000 $250,000 $110,000 $1,144,000 Savings $156,000
Source: Proterra and RTD maintenance documentation
Both RTD and Foothill Transit have purchased 5 units or more of this bus model, in addition to purchases by a dozen other transit authorities as of the release of this report.
F-32
4.3 Industry Advancement Future areas of development include the following:
• Energy storage: Proterra will continue to improve the energy storage system, both for range, energy storage capacity, size and cost. We expect that as the technology grows the cost of individual units will decrease, lowering the barrier to further development. Industry developments for energy storage have already participated in lowering the initial purchase cost of a Proterra electric bus.
• Powertrain improvement: Our electric powertrain performs well at low initial purchase cost and with lower maintenance cost relative to diesel and CNG powertrains. We are continuing to optimize these units to ensure the highest performance over a range of driving profiles.
• Electric utility rates: The profile of electricity consumption from vehicle chargers is new for most utilities, and there are few rate schedules designed for this type of use. Additional review with utilities would create rate schedules that are beneficial to the utility and more cost-efficient to the transit authority than current plans. Most existing high consumption plans target industry and agriculture, and are not tailored to the use patterns of electric transit. PG&E has already taken the initiative with consumer electric vehicles to provide rates targeted for that application. The next step is to apply the same type of thinking to bus transit17.
4.4 Other Opportunities Thanks to this grant, the transit industry has been validated as an application for electric buses. Proterra would like to expand to other route-based applications in both public and private sectors. Some examples are universities or airports, where buses also run fixed routes with specific schedules. These locations stand to gain significant cost savings from lower fuel and maintenance costs, which would directly benefit their bottom line and increase profitability in the long term.
17 PG&E Website, “Plug-in with Electric Vehicles and PG&E”, http://www.pge.com/en/myhome/saveenergymoney/pev/index.page, last viewed 9/1/15.
F-1
APPENDIX G: Transportation Power: Electric Drayage Demonstration
Prepared for: California Energy Commission Prepared by: Transportation Power, Inc.
Gavin Newsom, Governor
G-2
Michael Simon James Burns Frank Falcone Primary Authors
Transportation Power, Inc. 13000 Danielson Street Poway, CA 92064 858-248-4412 Transportation Power, Inc. website: www.transpowerusa.com CALSTART Sub-Grantee Agreement No. MI082012
Disclaimer Staff members of the California Energy Commission prepared this report. As such, it does not necessarily represent the views of the Energy Commission, its employees, or the State of California. The Energy Commission, the State of California, its employees, contractors and subcontractors make no warrant, express or implied, and assume no legal liability for the information in this report; nor does any party represent that the uses of this information will not infringe upon privately owned rights. This report has not been approved or disapproved by the Energy Commission nor has the Commiss ion passed upon the accuracy or adequacy of the information in this report.
G-3
TABLE OF CONTENTS Page
Table of Contents .......................................................................................................... G-3 List of Figures ............................................................................................................... G-4 List of Tables ................................................................................................................ G-4 Executive Summary........................................................................................................ G-5 CHAPTER 1: Major Technology Advances Enabled by Electric Drayage Demonstration................... G-6
1.1 Vehicle Control and Integration ........................................................................................................... G-6 1.2 Energy Storage .................................................................................................................................. G-9 1.3 Electric Vehicle Propulsion ..................................................................................................................G-13 1.4 Continuous Improvement Process .......................................................................................................G-16
CHAPTER 2: Progression of the ElecTruck™ Design ............................................................ G-17 2.1 EDD-1 ..............................................................................................................................................G-17 2.2 EDD-2 ..............................................................................................................................................G-19 2.3 EDD-3 and EDD-4..............................................................................................................................G-22 2.4 EDD-5, EDD-6, and EDD-7 .................................................................................................................G-23
CHAPTER 3: Results of Testing and Operations.................................................................. G-25 3.1 Pre-Operational Testing of Electric Drayage Trucks ..............................................................................G-25 3.2 Testing in Operational Service............................................................................................................G-31
CHAPTER 4: Project Benefits ......................................................................................... G-38 4.1 Transition from Petroleum Fuels .........................................................................................................G-38 4.2 Emissions Benefits .............................................................................................................................G-39 4.3 Economic Benefits .............................................................................................................................G-40 4.4 Opportunities for Drive System Cost Reduction ....................................................................................G-41
4.4.1 Main Propulsion Subsystem Cost Reduction ..................................................................................G-42 4.4.2 Inverter-Charger Subsystem (ICU) Cost Reduction........................................................................G-43 4.4.3 Energy Storage Subsystem Cost Reduction ...................................................................................G-44 4.4.4 PCAS Cost Reduction...................................................................................................................G-44 4.4.5 Cost Reduction Assessment Conclusions.......................................................................................G-45
CHAPTER 5: Conclusions and Recommendations ................................................................ G-46
G-4
LIST OF FIGURES Page
Figure 1: Interior of ICU.................................................................................................. G-7 Figure 2: PCAS Assemblies for EDD-3 and EDD-4 .................................................................. G-8 Figure 3: Mile-Max™ Module Using 700 Ah Lithium-Ion Battery Cells ....................................... G-10 Figure 4: Previous Battery Pack Design (left) and New Design (right)....................................... G-11 Figure 5: Net Energy Cost/Savings of Batteries vs. Diesel Fuel ............................................... G-12 Figure 6: First New Battery Module Housing New Cylindrical Batteries...................................... G-13 Figure 7: Complete Dynamometer Assembly ...................................................................... G-14 Figure 8: High-Power Main Propulsion System on Dynamometer, Featuring 10-Speed AMT ........... G-15 Figure 9: PCAS Installed into EDD-1 ................................................................................. G-18 Figure 10: EDD-1 Hauling a Heavy Load with SA Recycling .................................................... G-19 Figure 11: Large Battery Module of the Type First Used on EDD-2........................................... G-20 Figure 12: Comparison of Battery Module Designs on Pilot Truck, EDD-1, and EDD-2 .................. G-21 Figure 13: EDD-2 During Initial Performance Tests, Hauling Concrete Blocks ............................. G-21 Figure 14: EDD-4 Recharging at NRT ............................................................................... G-22 Figure 15: Inverter-Only Unit installed into EDD-5 ............................................................... G-23 Figure 16: EDD-1 Being Exhibited at UC Riverside in May 2014 .............................................. G-26 Figure 17: Map of 10-Mile Test Route Used for Local Testing of EDD-1 .................................... G-27 Figure 18: Accessory Power Consumption .......................................................................... G-28 Figure 19: Motor Coolant Pump Response to Motor Temperature............................................ G-29 Figure 20: EDD-2 During Dynamometer Testing at UC Riverside, Fall 2015 ............................... G-30 Figure 21: Estimates of ElecTruck™ Energy Cost Savings, Based on UC Riverside Test Data ......... G-31 Figure 22: EDD-1 in Operation with SA Recycling ................................................................ G-32 Figure 23: EDD-3 in Operation with Cal Cartage.................................................................. G-34 Figure 24: EDD-4 at NRT ............................................................................................... G-35 Figure 25: EDD-6 Moving Freight at SA Recycling, CNN Camera Crew at Pasha’s Terminal ........... G-36
LIST OF TABLES
Page Table 1: TransPower Test Loop Test Drive Detail ................................................................ G-27 Table 2: Summary of Electric Drayage Bus Fleet Operational Status as of December 9, 2016 ........ G-37 Table 3: Calculation of Carbon Emissions Reductions from Trucks using ElecTruck™ Drive System G-39 Table 4: Near-Term and Tong-term Cost Reduction Potential - ElecTruck™ Drive System ............. G-45
G-5
EXECUTIVE SUMMARY This Electric Drayage Demonstration Final Report documents TransPower’s research and development under this project, funded by California Energy Commission (CEC) Agreement Number ARV‐11‐014, Task 9. The goal of this Agreement was to manufacture and demonstrate electric Class 8 drayage trucks with sufficient reliability and performance to stimulate demand by conventional drayage truck operators. The proposed approach to this project was to perfect the design of the drayage variant of TransPower’s ElecTruck™ battery‐based electric drive system, incorporating lessons learned from testing of the two vehicles built under the preceding Vertically‐Integrated Facility for Electric Truck Manufacturing project (ARV‐10‐020). The specific objectives of this Agreement were to: • Integrate electric drive systems based on the perfected ElecTruck™ design and install
them into five Navistar Class 8 trucks. • Place the five electric drayage trucks into regular drayage service and demonstrate
sufficient performance and reliability to meet commercial standards. • Through meticulous data collection and independent analysis, demonstrate that the
electric drayage vehicles produce the greatest total carbon reductions and fossil fuel displacement of any available drayage transportation technology or product.
• Secure at least one large‐scale (100+) commercial order for electric Class 8 drayage trucks to provide conclusive validation that all key project objectives have been met.
The performance began on August 22, 2012 and was originally scheduled to end on March 31, 2016, but was extended to December 31, 2016 to allow more time for testing of all five fully‐functional Class 8 electric trucks built under this grant. Deployment of an additional two trucks was made possible by separate grants from the South Coast Air Quality Management District (SCAQMD) and the Port of Los Angeles, so in total, seven trucks of the Electric Drayage Demonstration design were manufactured and deployed during the grant period of performance. The project sought to achieve major technology advances in two key areas: (1) vehicle control and integration and (2) advanced energy storage. As discussed in more detail in Chapter 1 of this report, the project not only made major advances in these two areas, but also achieved significant advances in the area of electric vehicle (EV) propulsion, and moderate advances in several other technology areas. The combined effect of Electric Drayage technology advances is expected to have a transformative effect on the heavy‐duty vehicle industry.
G-6
CHAPTER 1: Major Technology Advances Enabled by Electric Drayage Demonstration
1.1 Vehicle Control and Integration The term “Vehicle Control and Integration” refers to the functions of achieving smooth, reliable control of an EV and assuring that the integrated electric drive system works seamlessly with the vehicle’s power system, controls, and displays. As shown by recent experience with the Toyota Prius, achieving reliable electric drive control is a challenge even when the drive system is designed to work with just one vehicle model. The New York Times reported on February 12, 2014 that “Toyota Motor is recalling all of the 1.9 million newest‐ generation Prius vehicles it has sold worldwide because of a programming error that could cause their gas‐electric hybrid systems to shut down, the automaker said Wednesday.”18 TransPower’s challenge was intensified by the fact that its system must work in many different vehicle models to achieve commercial viability and transportation transformation. To be implemented across multiple vehicle models cost‐effectively, the drive system must have a flexible architecture and programmable functions so the system layout and functionality can be quickly and easily customized to meet differing design and operating requirements. TransPower’s approach to solving the control and integration problem was to develop a proprietary Power Control and Accessory Subsystem (PCAS) based on two key technologies:
• An advanced network control architecture, which provides a fine degree of vehicle control and accommodates a multitude of vehicle components.
• An advanced inverter-charger unit (ICU), developed jointly with partner EPC Power Corp., to improve on the efficiency and weight of existing inverters, and to eliminate the need for a separate battery charger.
The selected network control architecture uses Controller Area Network protocols that are standard throughout the automotive industry. This enables the network to communicate with most standard devices on commercial buses and trucks, such as dashboard displays, accelerator and brake pedals, and gearshift mechanisms. In testing and validation during the project, this control architecture demonstrated high reliability and unparalleled flexibility. Inexpensive, standardized microprocessor platforms interface each drive system component with the control network, similar to how PCs and peripherals can be linked in an office IT network using Ethernet connections. Over the course of the project, TransPower has already shown how this control network can be applied to multiple types of vehicles, employing modules that also enable new components to interact with the network.
18 Hiroki Tabuchi and Jaclyn Trop, “Toyota Recalls Newest Priuses Over Software,” New York Times, February 12, 2014
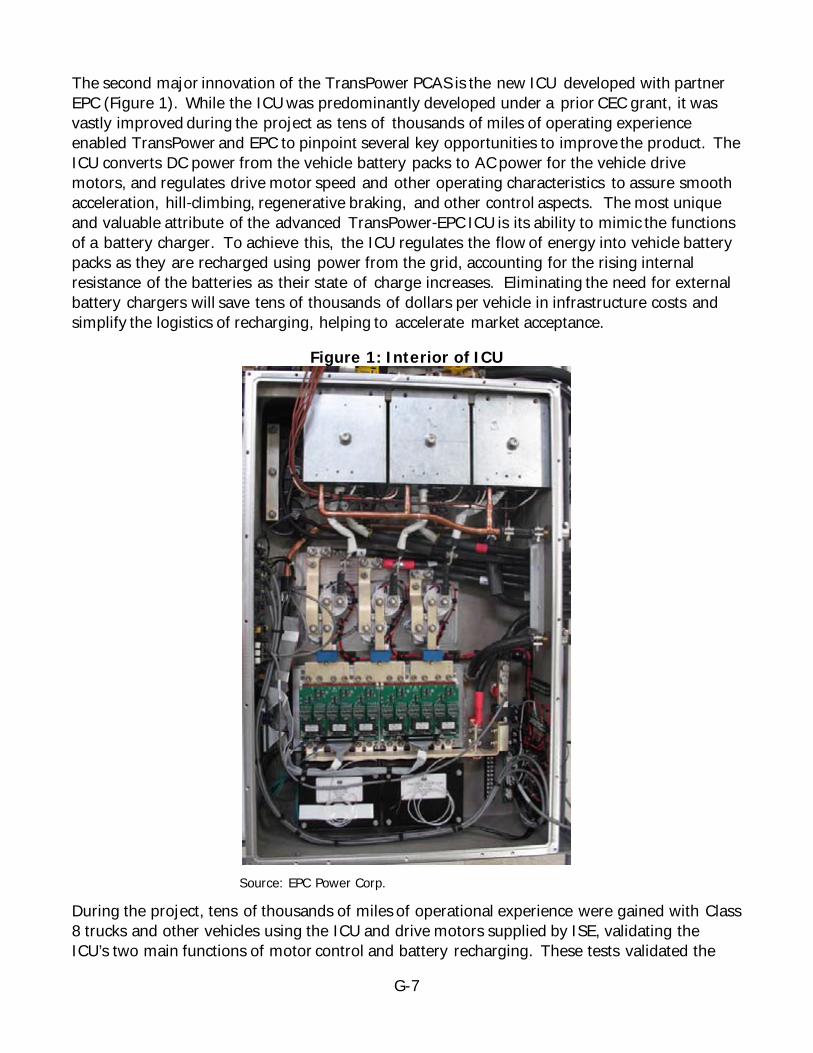
G-7
The second major innovation of the TransPower PCAS is the new ICU developed with partner EPC (Figure 1). While the ICU was predominantly developed under a prior CEC grant, it was vastly improved during the project as tens of thousands of miles of operating experience enabled TransPower and EPC to pinpoint several key opportunities to improve the product. The ICU converts DC power from the vehicle battery packs to AC power for the vehicle drive motors, and regulates drive motor speed and other operating characteristics to assure smooth acceleration, hill‐climbing, regenerative braking, and other control aspects. The most unique and valuable attribute of the advanced TransPower‐EPC ICU is its ability to mimic the functions of a battery charger. To achieve this, the ICU regulates the flow of energy into vehicle battery packs as they are recharged using power from the grid, accounting for the rising internal resistance of the batteries as their state of charge increases. Eliminating the need for external battery chargers will save tens of thousands of dollars per vehicle in infrastructure costs and simplify the logistics of recharging, helping to accelerate market acceptance.
Figure 1: Interior of ICU
Source: EPC Power Corp.
During the project, tens of thousands of miles of operational experience were gained with Class 8 trucks and other vehicles using the ICU and drive motors supplied by ISE, validating the ICU’s two main functions of motor control and battery recharging. These tests validated the
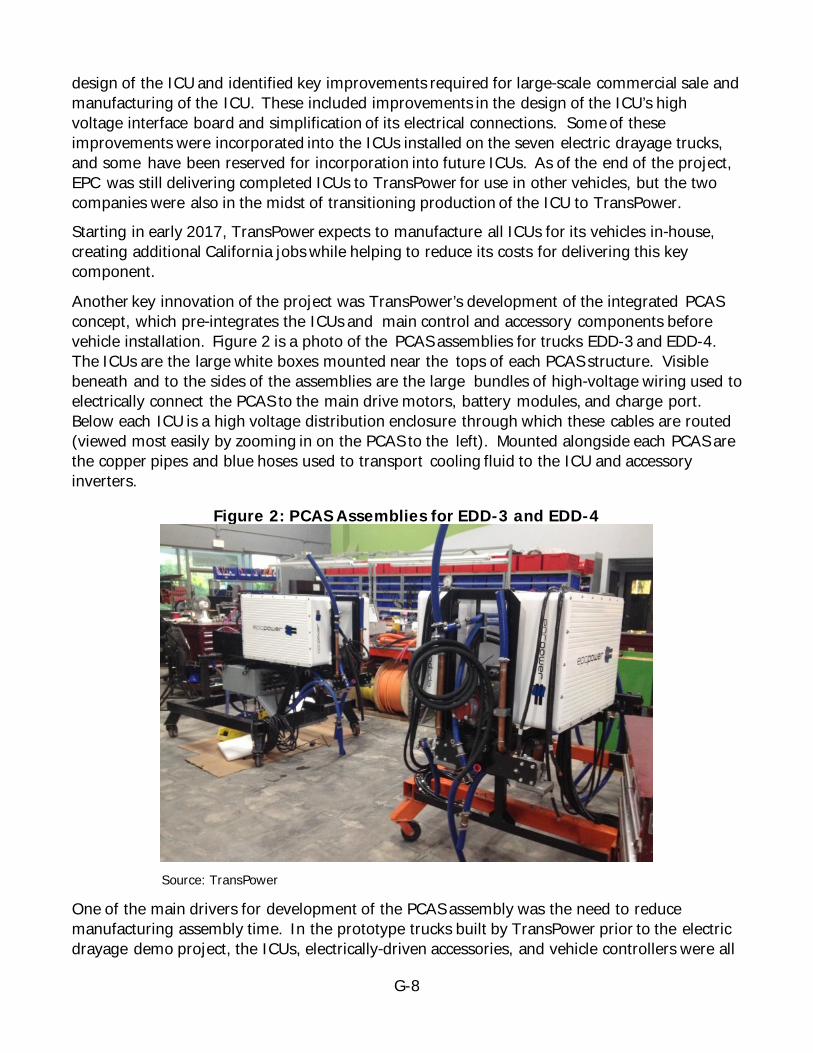
G-8
design of the ICU and identified key improvements required for large‐scale commercial sale and manufacturing of the ICU. These included improvements in the design of the ICU’s high voltage interface board and simplification of its electrical connections. Some of these improvements were incorporated into the ICUs installed on the seven electric drayage trucks, and some have been reserved for incorporation into future ICUs. As of the end of the project, EPC was still delivering completed ICUs to TransPower for use in other vehicles, but the two companies were also in the midst of transitioning production of the ICU to TransPower. Starting in early 2017, TransPower expects to manufacture all ICUs for its vehicles in‐house, creating additional California jobs while helping to reduce its costs for delivering this key component.
Another key innovation of the project was TransPower’s development of the integrated PCAS concept, which pre‐integrates the ICUs and main control and accessory components before vehicle installation. Figure 2 is a photo of the PCAS assemblies for trucks EDD-3 and EDD-4. The ICUs are the large white boxes mounted near the tops of each PCAS structure. Visible beneath and to the sides of the assemblies are the large bundles of high‐voltage wiring used to electrically connect the PCAS to the main drive motors, battery modules, and charge port. Below each ICU is a high voltage distribution enclosure through which these cables are routed (viewed most easily by zooming in on the PCAS to the left). Mounted alongside each PCAS are the copper pipes and blue hoses used to transport cooling fluid to the ICU and accessory inverters.
Figure 2: PCAS Assemblies for EDD-3 and EDD-4
Source: TransPower
One of the main drivers for development of the PCAS assembly was the need to reduce manufacturing assembly time. In the prototype trucks built by TransPower prior to the electric drayage demo project, the ICUs, electrically‐driven accessories, and vehicle controllers were all
G-9
mounted directly to the vehicle in various locations. It was estimated that it required nearly a mile of wiring to string all these components together and hundreds of hours to install them into a typical truck. The resulting configuration was also difficult to service, with components spread out in many different locations. It was difficult to judge whether the PCAS concept reduced the effort required to build the first electric drayage truck, EDD‐1, because this vehicle was midway through manufacturing when the decision was made to switch to the PCAS design. This resulted in a delay in completion of EDD‐1 and undoubtedly made its manufacturing less efficient. However, the hours required to manufacture the remaining electric drayage trucks indicate that the PCAS has contributed to a significant reduction in manufacturing labor.
1.2 Energy Storage The second major technology thrust of the electric drayage demonstration project was energy storage, recognized as the most critical component of electric‐vehicle technology. Conventional lead‐acid batteries are impractical for most vehicle applications because of their low energy density. Lead‐acid batteries also have other issues in heavy‐duty vehicle applications, such as power drop‐off as they become discharged, and greater chances of fires or explosions when used in large high‐ voltage strings. Lithium battery cells are widely viewed as the most promising alternative to lead‐acid battery chemistry because they can offer energy densities greater than 100 watt‐ hours/kilogram, greatly reducing weight. However, prior to the project, lithium batteries were very expensive, typically on the order of ten times more expensive than lead‐acid batteries per unit of energy stored. In addition, lithium battery cells must be manufactured to high quality standards to avoid potentially dangerous cell failures, and integration of lithium cells into the kinds of high‐energy packs required for large EVs presents additional safety and reliability challenges.
From early 2011 through mid‐2013, TransPower developed several different designs for integrated battery energy storage modules, utilizing lithium iron phosphate cells that will last an expected 3,000 to 5,000 cycles, depending on how deeply they are cycled. Modules were developed and tested using cells rated at 260 ampere-hours (Ah), 300 Ah, and 700 Ah. The 260 Ah cells were utilized on TransPower’s first prototype truck, and the 700 Ah cells (Figure 3) were used on the first truck (EDD-1). To achieve a 100‐mile operating range, EDD-1 was designed to utilize 120 cells, with a total rated energy storage capacity of 269 kilowatt‐hours (kWh). These cells were integrated into 20 “Mile‐Max™” modules, each containing six of the very large 700 Ah cells and weighing nearly 400 lb. This design approach, consisting of installing batteries into 18‐20 relatively small modules, each weighing 300‐400 lb., was employed in EDD‐1, which was completed in April 2014. However, by this time, it was obvious that a major redesign of the ESS was required, to simplify the assembly and servicing of TransPower’s electric trucks. This led to development of larger, more rugged battery enclosures that were first used in EDD‐2 and that were subsequently used in the remaining electric drayage trucks. Figure 4 illustrates the evolution of TransPower’s battery pack design over the course of the project. The left photo in figure 4 shows three of the modules installed into the last prototype truck built by TransPower prior to the seven electric drayage trucks, a “Pilot Truck” funded
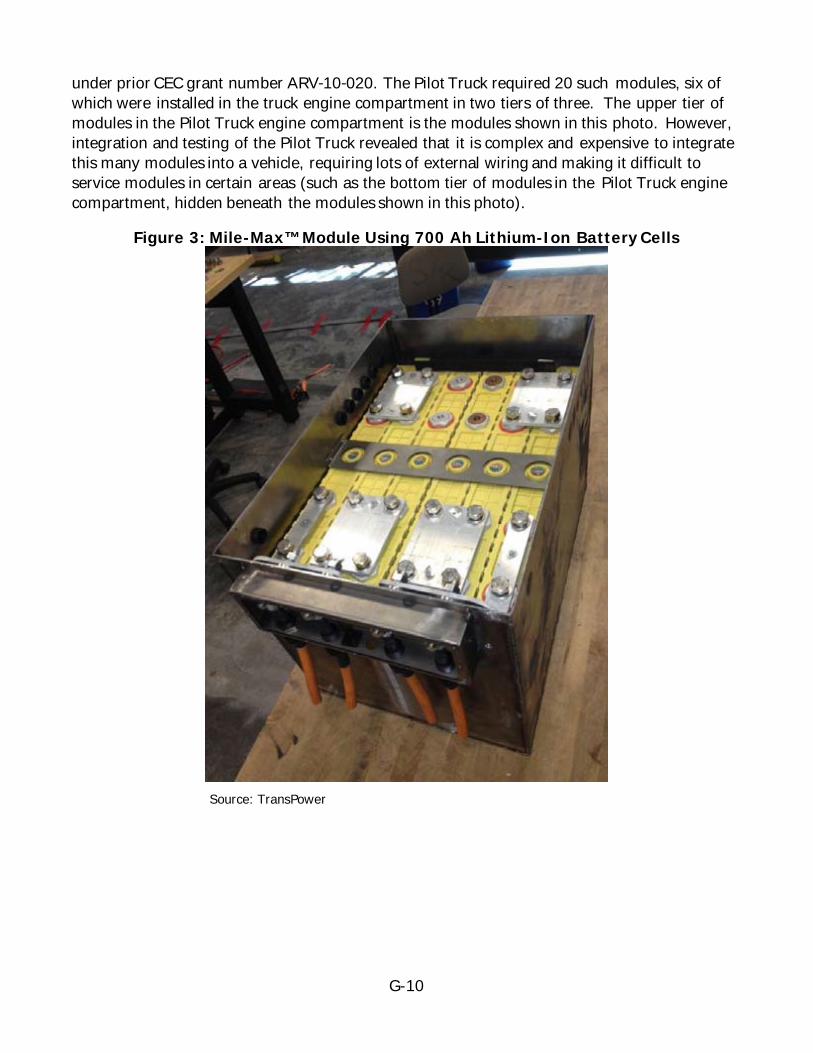
G-10
under prior CEC grant number ARV‐10‐020. The Pilot Truck required 20 such modules, six of which were installed in the truck engine compartment in two tiers of three. The upper tier of modules in the Pilot Truck engine compartment is the modules shown in this photo. However, integration and testing of the Pilot Truck revealed that it is complex and expensive to integrate this many modules into a vehicle, requiring lots of external wiring and making it difficult to service modules in certain areas (such as the bottom tier of modules in the Pilot Truck engine compartment, hidden beneath the modules shown in this photo).
Figure 3: Mile-Max™ Module Using 700 Ah Lithium-Ion Battery Cells
Source: TransPower

G-11
Figure 4: Previous Battery Pack Design (left) and New Design (right)
Source: TransPower
To address these issues, TransPower designed and developed larger, more rugged battery enclosures, first installed into the second electric drayage truck, “EDD‐2,” shown in the right photo of figure 4. New larger battery enclosures were also designed and developed in 2013‐14 for use in TransPower’s electric yard tractors. Starting with EDD‐2, TransPower also elected to implement a radically new battery management system (BMS), which TransPower and EPC Power started developing in mid‐2013. The new “Cell‐Saver™” BMS is designed to install more easily, communicate more reliably, and balance cells more rapidly and efficiently than competing BMS sensor systems such as the Balqon BMS sensing boards used on the EDD‐1 – which also turned out to be highly unreliable. Initial testing of the new Cell‐Saver™ BMS on EDD‐2 identified a few embryonic design flaws that had to be corrected, so it was decided in the fourth quarter of 2014 to defer further production of the new BMS sensor boards until the boards could be redesigned to eliminate these problems. As an interim measure, a third BMS solution was selected for EDD‐3 and EDD‐4, a BMS combining sensor boards from Flux Power with TransPower BMS controls. Flux Power BMS boards were previously used on three earlier TransPower vehicles – two electric yard tractors deployed in 2013 and an electric school bus deployed in 2014, and they were made to work reliably on these vehicles by utilizing TransPower’s own EV) control software to control them. The Flux BMS boards do not monitor temperature or voltage as accurately as the new boards developed by EPC, nor do they support active cell balancing – the “shuffling of charge from one cell to another, which can be more efficient than the charge “shunting” done with resistors on the Flux and other commercially‐available BMS products. However, the Flux boards met the basic requirements of EDD‐3 and EDD‐4 for the duration of the project and enabled TransPower to devote more time to perfecting the Cell‐Saver™ boards without delaying deployment of these two trucks. The Cell‐Saver™ board was ultimately perfected in 2015 and installed onto the last three electric drayage trucks, EDD‐5, EDD‐6, and EDD‐7.
The TransPower energy storage technology can have a transformational impact on the transportation market by enabling large trucks to become economically cost competitive with
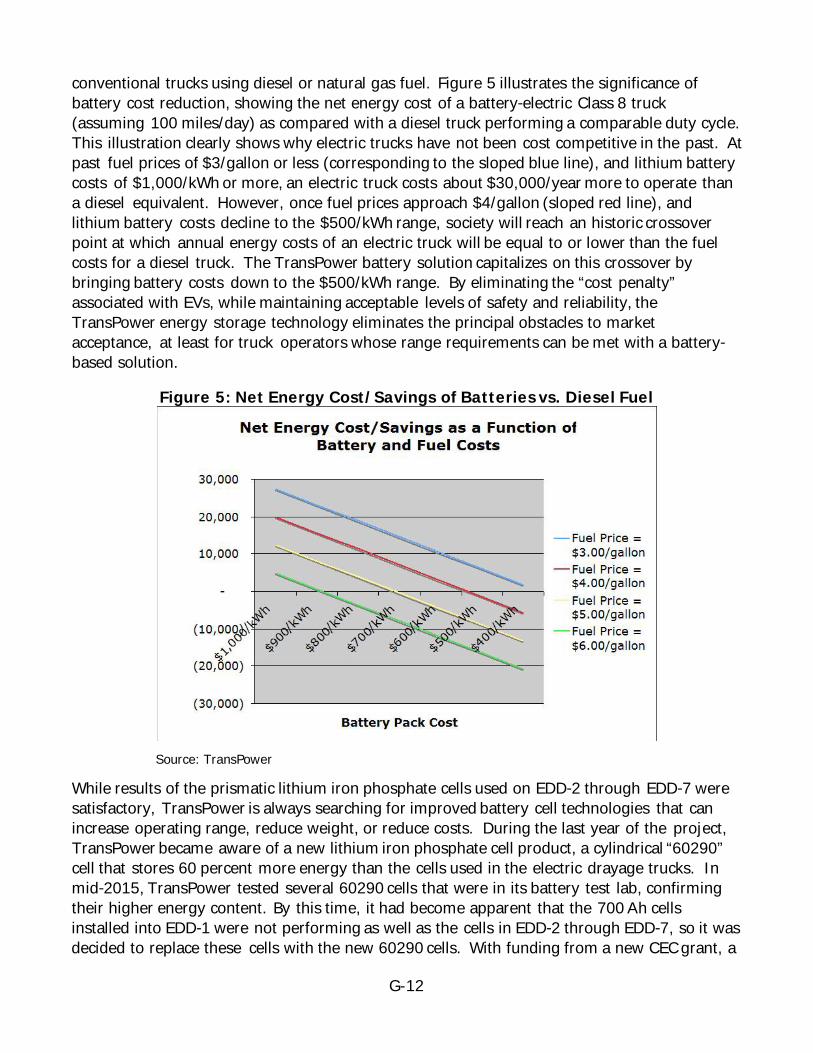
G-12
conventional trucks using diesel or natural gas fuel. Figure 5 illustrates the significance of battery cost reduction, showing the net energy cost of a battery‐electric Class 8 truck (assuming 100 miles/day) as compared with a diesel truck performing a comparable duty cycle. This illustration clearly shows why electric trucks have not been cost competitive in the past. At past fuel prices of $3/gallon or less (corresponding to the sloped blue line), and lithium battery costs of $1,000/kWh or more, an electric truck costs about $30,000/year more to operate than a diesel equivalent. However, once fuel prices approach $4/gallon (sloped red line), and lithium battery costs decline to the $500/kWh range, society will reach an historic crossover point at which annual energy costs of an electric truck will be equal to or lower than the fuel costs for a diesel truck. The TransPower battery solution capitalizes on this crossover by bringing battery costs down to the $500/kWh range. By eliminating the “cost penalty” associated with EVs, while maintaining acceptable levels of safety and reliability, the TransPower energy storage technology eliminates the principal obstacles to market acceptance, at least for truck operators whose range requirements can be met with a battery‐based solution.
Figure 5: Net Energy Cost/Savings of Batteries vs. Diesel Fuel
Source: TransPower
While results of the prismatic lithium iron phosphate cells used on EDD‐2 through EDD‐7 were satisfactory, TransPower is always searching for improved battery cell technologies that can increase operating range, reduce weight, or reduce costs. During the last year of the project, TransPower became aware of a new lithium iron phosphate cell product, a cylindrical “60290” cell that stores 60 percent more energy than the cells used in the electric drayage trucks. In mid‐2015, TransPower tested several 60290 cells that were in its battery test lab, confirming their higher energy content. By this time, it had become apparent that the 700 Ah cells installed into EDD‐1 were not performing as well as the cells in EDD‐2 through EDD‐7, so it was decided to replace these cells with the new 60290 cells. With funding from a new CEC grant, a
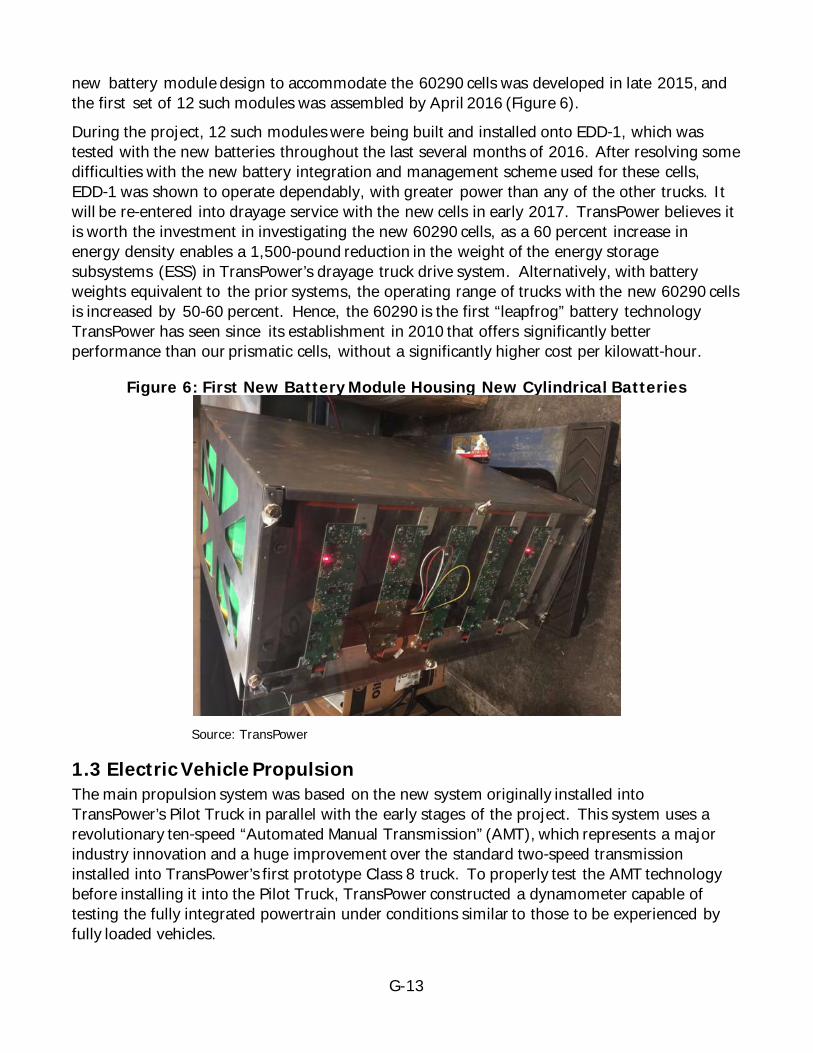
G-13
new battery module design to accommodate the 60290 cells was developed in late 2015, and the first set of 12 such modules was assembled by April 2016 (Figure 6). During the project, 12 such modules were being built and installed onto EDD‐1, which was tested with the new batteries throughout the last several months of 2016. After resolving some difficulties with the new battery integration and management scheme used for these cells, EDD‐1 was shown to operate dependably, with greater power than any of the other trucks. It will be re‐entered into drayage service with the new cells in early 2017. TransPower believes it is worth the investment in investigating the new 60290 cells, as a 60 percent increase in energy density enables a 1,500‐pound reduction in the weight of the energy storage subsystems (ESS) in TransPower’s drayage truck drive system. Alternatively, with battery weights equivalent to the prior systems, the operating range of trucks with the new 60290 cells is increased by 50‐60 percent. Hence, the 60290 is the first “leapfrog” battery technology TransPower has seen since its establishment in 2010 that offers significantly better performance than our prismatic cells, without a significantly higher cost per kilowatt‐hour.
Figure 6: First New Battery Module Housing New Cylindrical Batteries
Source: TransPower
1.3 Electric Vehicle Propulsion The main propulsion system was based on the new system originally installed into TransPower’s Pilot Truck in parallel with the early stages of the project. This system uses a revolutionary ten‐speed “Automated Manual Transmission” (AMT), which represents a major industry innovation and a huge improvement over the standard two‐speed transmission installed into TransPower’s first prototype Class 8 truck. To properly test the AMT technology before installing it into the Pilot Truck, TransPower constructed a dynamometer capable of testing the fully integrated powertrain under conditions similar to those to be experienced by fully loaded vehicles.
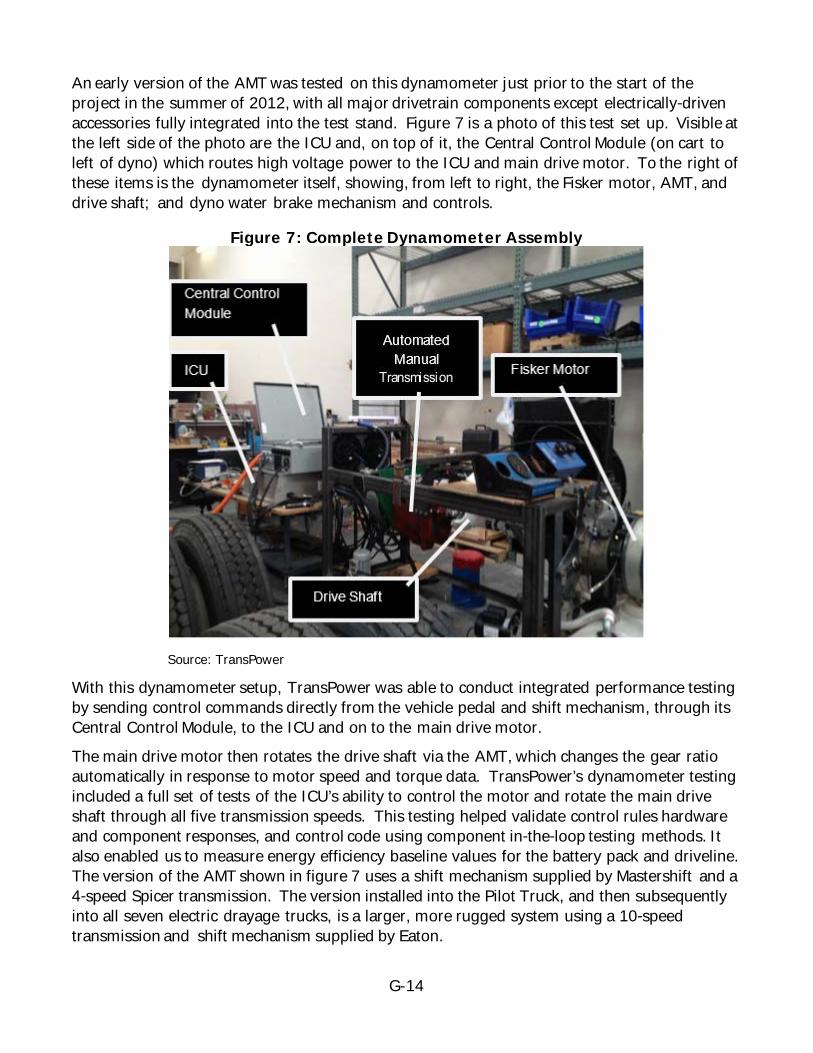
G-14
An early version of the AMT was tested on this dynamometer just prior to the start of the project in the summer of 2012, with all major drivetrain components except electrically‐driven accessories fully integrated into the test stand. Figure 7 is a photo of this test set up. Visible at the left side of the photo are the ICU and, on top of it, the Central Control Module (on cart to left of dyno) which routes high voltage power to the ICU and main drive motor. To the right of these items is the dynamometer itself, showing, from left to right, the Fisker motor, AMT, and drive shaft; and dyno water brake mechanism and controls.
Figure 7: Complete Dynamometer Assembly
Source: TransPower
With this dynamometer setup, TransPower was able to conduct integrated performance testing by sending control commands directly from the vehicle pedal and shift mechanism, through its Central Control Module, to the ICU and on to the main drive motor. The main drive motor then rotates the drive shaft via the AMT, which changes the gear ratio automatically in response to motor speed and torque data. TransPower’s dynamometer testing included a full set of tests of the ICU’s ability to control the motor and rotate the main drive shaft through all five transmission speeds. This testing helped validate control rules hardware and component responses, and control code using component in‐the‐loop testing methods. It also enabled us to measure energy efficiency baseline values for the battery pack and driveline. The version of the AMT shown in figure 7 uses a shift mechanism supplied by Mastershift and a 4‐speed Spicer transmission. The version installed into the Pilot Truck, and then subsequently into all seven electric drayage trucks, is a larger, more rugged system using a 10‐speed transmission and shift mechanism supplied by Eaton.
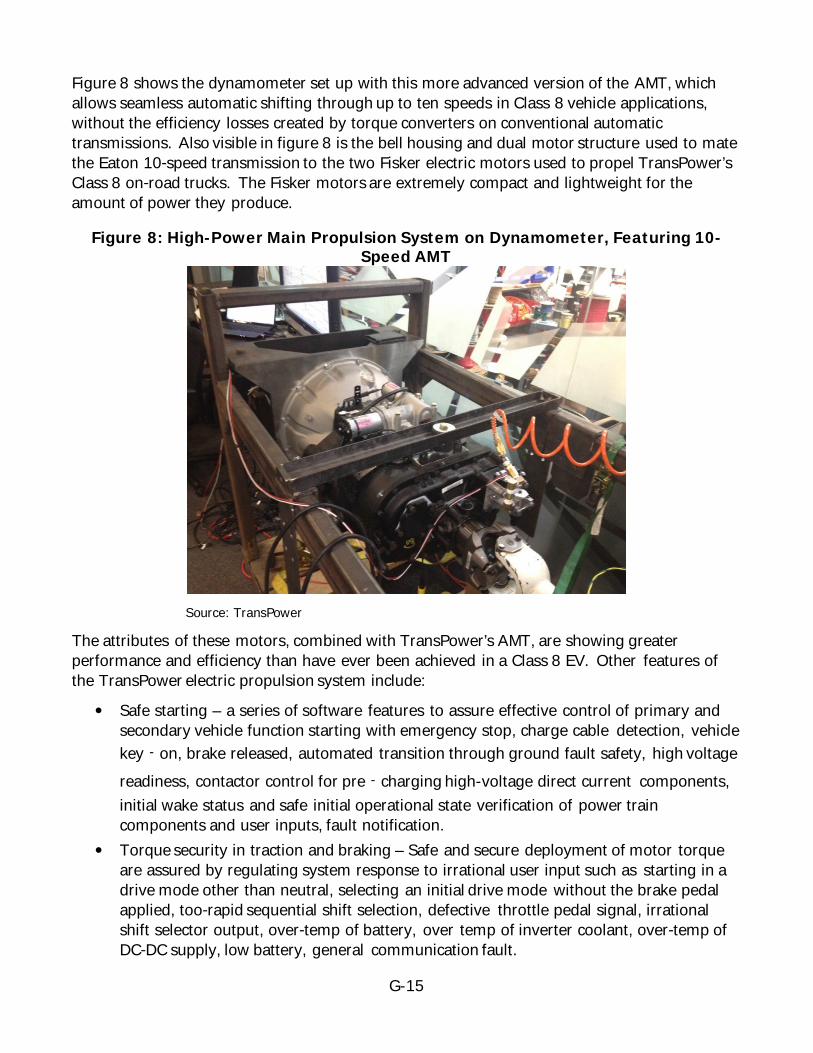
G-15
Figure 8 shows the dynamometer set up with this more advanced version of the AMT, which allows seamless automatic shifting through up to ten speeds in Class 8 vehicle applications, without the efficiency losses created by torque converters on conventional automatic transmissions. Also visible in figure 8 is the bell housing and dual motor structure used to mate the Eaton 10‐speed transmission to the two Fisker electric motors used to propel TransPower’s Class 8 on‐road trucks. The Fisker motors are extremely compact and lightweight for the amount of power they produce.
Figure 8: High-Power Main Propulsion System on Dynamometer, Featuring 10-Speed AMT
Source: TransPower
The attributes of these motors, combined with TransPower’s AMT, are showing greater performance and efficiency than have ever been achieved in a Class 8 EV. Other features of the TransPower electric propulsion system include:
• Safe starting – a series of software features to assure effective control of primary and secondary vehicle function starting with emergency stop, charge cable detection, vehicle key‐on, brake released, automated transition through ground fault safety, high voltage readiness, contactor control for pre‐charging high-voltage direct current components, initial wake status and safe initial operational state verification of power train components and user inputs, fault notification.
• Torque security in traction and braking – Safe and secure deployment of motor torque are assured by regulating system response to irrational user input such as starting in a drive mode other than neutral, selecting an initial drive mode without the brake pedal applied, too‐rapid sequential shift selection, defective throttle pedal signal, irrational shift selector output, over‐temp of battery, over temp of inverter coolant, over‐temp of DC‐DC supply, low battery, general communication fault.
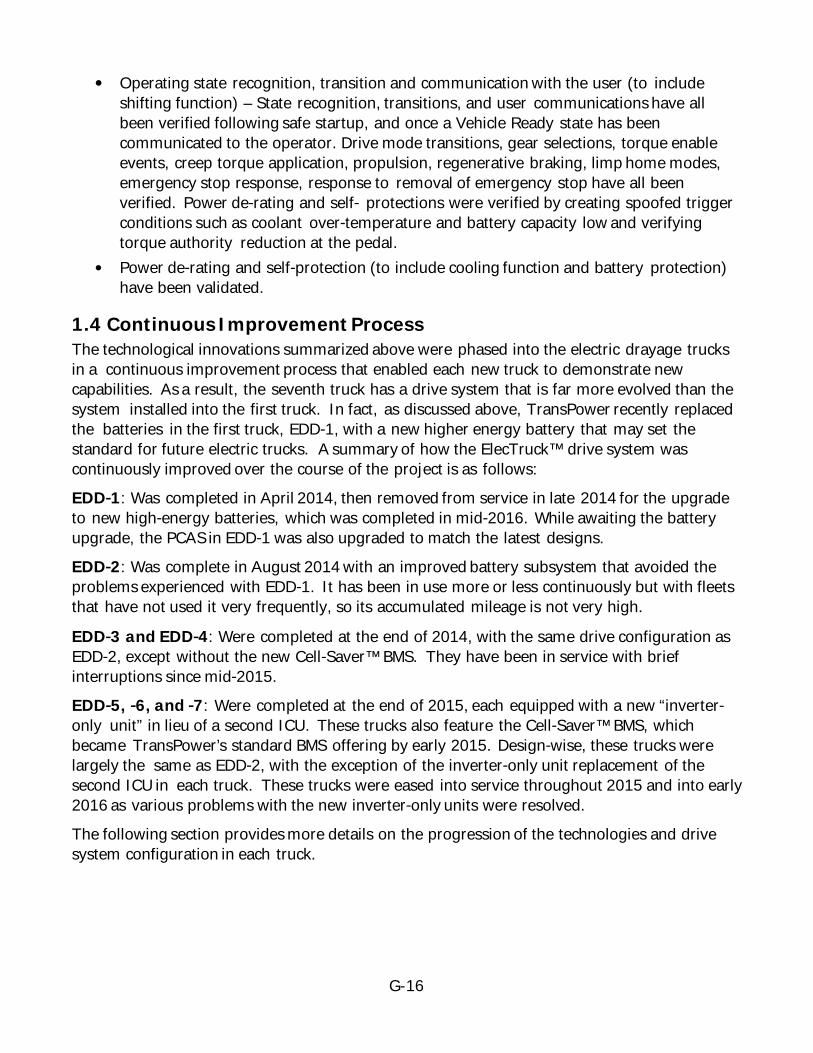
G-16
• Operating state recognition, transition and communication with the user (to include shifting function) – State recognition, transitions, and user communications have all been verified following safe startup, and once a Vehicle Ready state has been communicated to the operator. Drive mode transitions, gear selections, torque enable events, creep torque application, propulsion, regenerative braking, limp home modes, emergency stop response, response to removal of emergency stop have all been verified. Power de‐rating and self‐ protections were verified by creating spoofed trigger conditions such as coolant over‐temperature and battery capacity low and verifying torque authority reduction at the pedal.
• Power de‐rating and self‐protection (to include cooling function and battery protection) have been validated.
1.4 Continuous Improvement Process The technological innovations summarized above were phased into the electric drayage trucks in a continuous improvement process that enabled each new truck to demonstrate new capabilities. As a result, the seventh truck has a drive system that is far more evolved than the system installed into the first truck. In fact, as discussed above, TransPower recently replaced the batteries in the first truck, EDD‐1, with a new higher energy battery that may set the standard for future electric trucks. A summary of how the ElecTruck™ drive system was continuously improved over the course of the project is as follows: EDD‐1: Was completed in April 2014, then removed from service in late 2014 for the upgrade to new high‐energy batteries, which was completed in mid‐2016. While awaiting the battery upgrade, the PCAS in EDD‐1 was also upgraded to match the latest designs. EDD‐2: Was complete in August 2014 with an improved battery subsystem that avoided the problems experienced with EDD‐1. It has been in use more or less continuously but with fleets that have not used it very frequently, so its accumulated mileage is not very high.
EDD‐3 and EDD‐4: Were completed at the end of 2014, with the same drive configuration as EDD‐2, except without the new Cell‐Saver™ BMS. They have been in service with brief interruptions since mid‐2015. EDD‐5, ‐6, and ‐7: Were completed at the end of 2015, each equipped with a new “inverter‐only unit” in lieu of a second ICU. These trucks also feature the Cell‐Saver™ BMS, which became TransPower’s standard BMS offering by early 2015. Design‐wise, these trucks were largely the same as EDD‐2, with the exception of the inverter‐only unit replacement of the second ICU in each truck. These trucks were eased into service throughout 2015 and into early 2016 as various problems with the new inverter‐only units were resolved. The following section provides more details on the progression of the technologies and drive system configuration in each truck.

G-17
CHAPTER 2: Progression of the ElecTruck™ Design
New lessons were learned with the deployment of each new truck in TransPower’s EDD sequence, so the ElecTruck™ electric drive system design was updated several times over the course of the project. The main propulsion system, consisting of two JJE/Fisker motors and an Eaton ten‐speed AMT, remained relatively unchanged over the course of the project, although the transmission control software and inverter controls transmitted to the drive motors were certainly refined throughout the project. However, most other major elements of the ElecTruck™ system underwent substantial changes during the electric drayage demo project. The following subsections describe the lessons learned during manufacturing and testing of each electric drayage truck, and explain how the ElecTruck™ system was evolved to reflect these lessons learned.
2.1 EDD-1 The first electric drayage truck, EDD‐1, was originally intended to be a replica of the Pilot Truck built in 2012‐13 under a prior CEC grant (ARV‐10‐020). This prior grant overlapped with the project by about one year, so the initial drive system design was developed more or less in parallel with manufacturing of the Pilot Truck. Some of the components used in EDD‐1 had to be purchased before completion of the Pilot Truck, and in these cases EDD‐1 used similar components to those installed on the Pilot Truck. This is why EDD‐1 used the same 700 Ah batteries installed into the Pilot Truck. However, in cases where the purchases of EDD‐1 components could be delayed, significant changes were made based on lessons learned during manufacturing of the Pilot Truck. This is why EDD‐1 was the first truck to utilize TransPower’s new integrated PCAS design to simplify the installation of ICUs, controls, and electrically‐driven accessories. The difficulty of installing all these components into trucks individually was made obvious during the integration of the Pilot Truck, and there was still time to test a new integration approach in EDD‐1, so the PCAS concept was quickly developed in late 2013, in time to test in EDD‐1. As a result of these factors, EDD‐1 became a transitional vehicle of sorts, embodying some of the design features of the earlier Pilot Truck, while demonstrating the first of the new technologies and integrated methods developed during the project. The truck was completed in April 2014, emulating to a large extent the design of the predecessor “Pilot Truck” previously funded separately by the CEC and South Coast Air Quality Management District. As discussed above, the Pilot Truck was the first vehicle to use the Fisker‐Eaton AMT propulsion combination, and the positive road performance of the Pilot Truck reinforced the decision to stick with these propulsion concepts in the electric drayage trucks. However, based on experience gained during manufacturing and operation of the Pilot Truck in 2012‐13, TransPower elected to remove all batteries from the engine compartment to free up engine compartment space for the integrated PCAS assembly. Figure 9 shows the PCAS assembly shortly after its installation into EDD‐1. The large white box visible under the windshield is the ICU, the largest component of the PCAS.
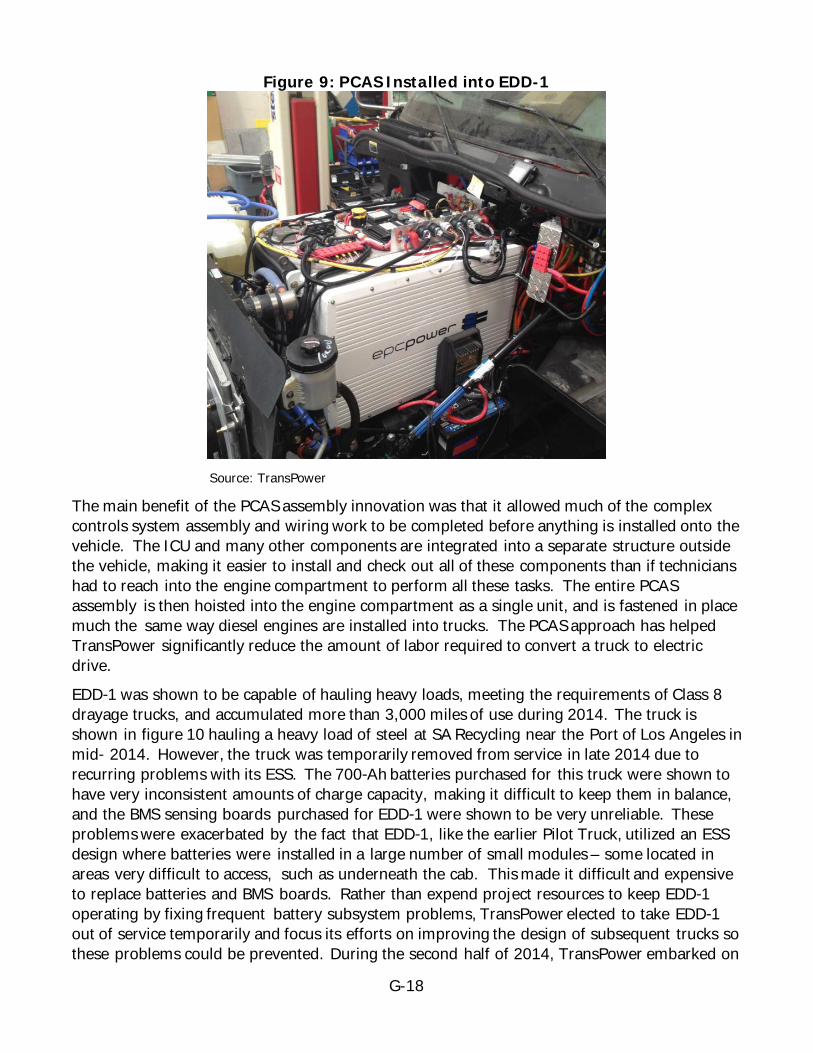
G-18
Figure 9: PCAS Installed into EDD-1
Source: TransPower
The main benefit of the PCAS assembly innovation was that it allowed much of the complex controls system assembly and wiring work to be completed before anything is installed onto the vehicle. The ICU and many other components are integrated into a separate structure outside the vehicle, making it easier to install and check out all of these components than if technicians had to reach into the engine compartment to perform all these tasks. The entire PCAS assembly is then hoisted into the engine compartment as a single unit, and is fastened in place much the same way diesel engines are installed into trucks. The PCAS approach has helped TransPower significantly reduce the amount of labor required to convert a truck to electric drive. EDD‐1 was shown to be capable of hauling heavy loads, meeting the requirements of Class 8 drayage trucks, and accumulated more than 3,000 miles of use during 2014. The truck is shown in figure 10 hauling a heavy load of steel at SA Recycling near the Port of Los Angeles in mid‐ 2014. However, the truck was temporarily removed from service in late 2014 due to recurring problems with its ESS. The 700‐Ah batteries purchased for this truck were shown to have very inconsistent amounts of charge capacity, making it difficult to keep them in balance, and the BMS sensing boards purchased for EDD‐1 were shown to be very unreliable. These problems were exacerbated by the fact that EDD‐1, like the earlier Pilot Truck, utilized an ESS design where batteries were installed in a large number of small modules – some located in areas very difficult to access, such as underneath the cab. This made it difficult and expensive to replace batteries and BMS boards. Rather than expend project resources to keep EDD‐1 operating by fixing frequent battery subsystem problems, TransPower elected to take EDD‐1 out of service temporarily and focus its efforts on improving the design of subsequent trucks so these problems could be prevented. During the second half of 2014, TransPower embarked on
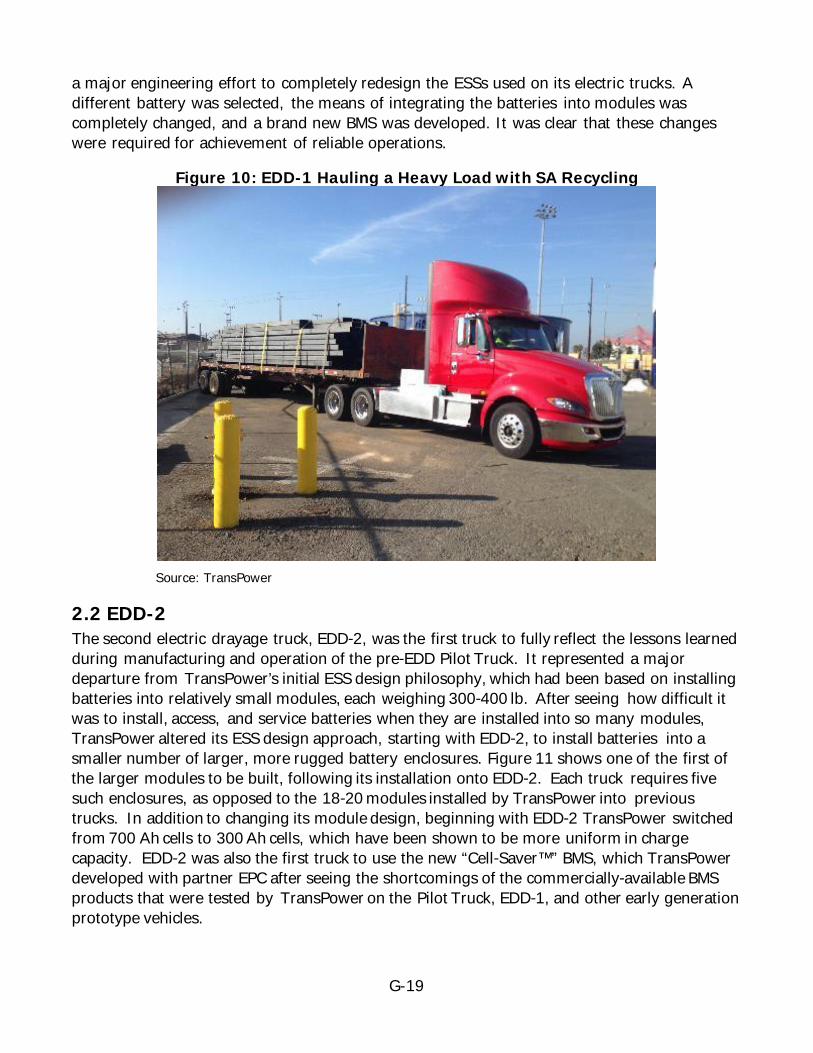
G-19
a major engineering effort to completely redesign the ESSs used on its electric trucks. A different battery was selected, the means of integrating the batteries into modules was completely changed, and a brand new BMS was developed. It was clear that these changes were required for achievement of reliable operations.
Figure 10: EDD-1 Hauling a Heavy Load with SA Recycling
Source: TransPower
2.2 EDD-2 The second electric drayage truck, EDD‐2, was the first truck to fully reflect the lessons learned during manufacturing and operation of the pre‐EDD Pilot Truck. It represented a major departure from TransPower’s initial ESS design philosophy, which had been based on installing batteries into relatively small modules, each weighing 300‐400 lb. After seeing how difficult it was to install, access, and service batteries when they are installed into so many modules, TransPower altered its ESS design approach, starting with EDD‐2, to install batteries into a smaller number of larger, more rugged battery enclosures. Figure 11 shows one of the first of the larger modules to be built, following its installation onto EDD‐2. Each truck requires five such enclosures, as opposed to the 18‐20 modules installed by TransPower into previous trucks. In addition to changing its module design, beginning with EDD‐2 TransPower switched from 700 Ah cells to 300 Ah cells, which have been shown to be more uniform in charge capacity. EDD‐2 was also the first truck to use the new “Cell‐Saver™” BMS, which TransPower developed with partner EPC after seeing the shortcomings of the commercially‐available BMS products that were tested by TransPower on the Pilot Truck, EDD‐1, and other early generation prototype vehicles.
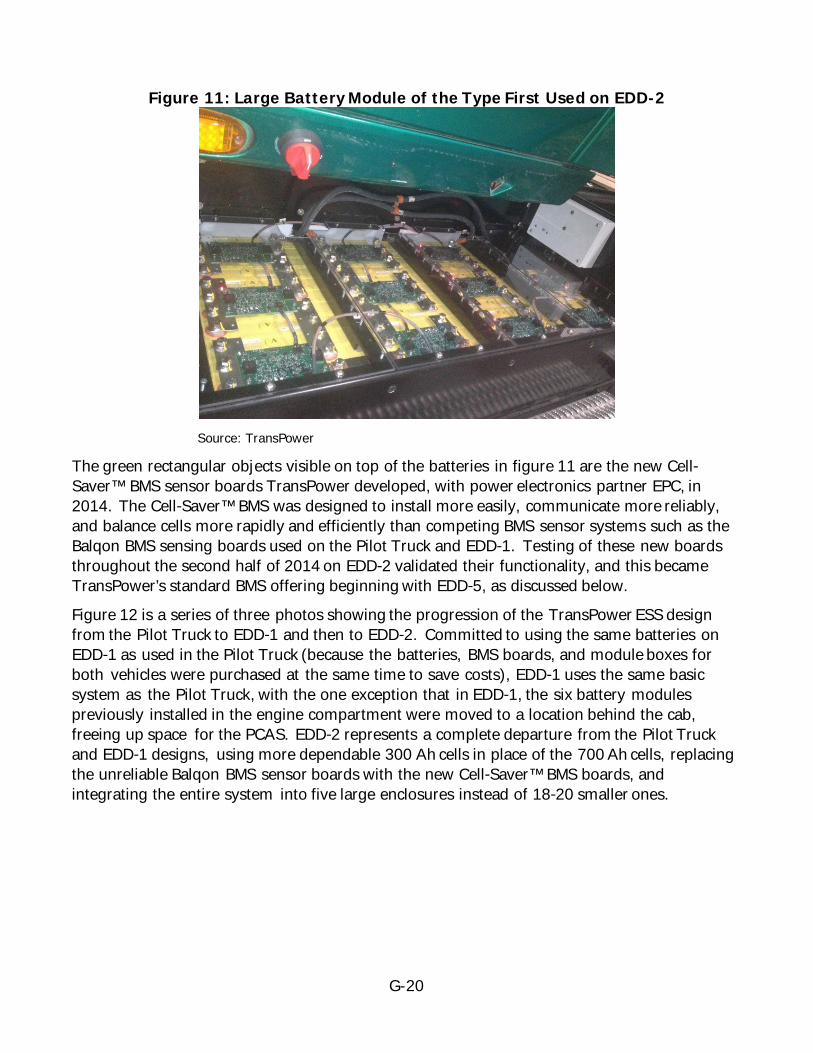
G-20
Figure 11: Large Battery Module of the Type First Used on EDD-2
Source: TransPower
The green rectangular objects visible on top of the batteries in figure 11 are the new Cell‐ Saver™ BMS sensor boards TransPower developed, with power electronics partner EPC, in 2014. The Cell‐Saver™ BMS was designed to install more easily, communicate more reliably, and balance cells more rapidly and efficiently than competing BMS sensor systems such as the Balqon BMS sensing boards used on the Pilot Truck and EDD‐1. Testing of these new boards throughout the second half of 2014 on EDD‐2 validated their functionality, and this became TransPower’s standard BMS offering beginning with EDD‐5, as discussed below. Figure 12 is a series of three photos showing the progression of the TransPower ESS design from the Pilot Truck to EDD‐1 and then to EDD‐2. Committed to using the same batteries on EDD‐1 as used in the Pilot Truck (because the batteries, BMS boards, and module boxes for both vehicles were purchased at the same time to save costs), EDD‐1 uses the same basic system as the Pilot Truck, with the one exception that in EDD‐1, the six battery modules previously installed in the engine compartment were moved to a location behind the cab, freeing up space for the PCAS. EDD‐2 represents a complete departure from the Pilot Truck and EDD‐1 designs, using more dependable 300 Ah cells in place of the 700 Ah cells, replacing the unreliable Balqon BMS sensor boards with the new Cell‐Saver™ BMS boards, and integrating the entire system into five large enclosures instead of 18‐20 smaller ones.

G-21
Figure 12: Comparison of Battery Module Designs on Pilot Truck, EDD-1, and EDD-2
Source: TransPower
Equipped with the integrated PCAS controls and accessory concept first demonstrated in EDD‐1 and this new ESS, EDD‐2 demonstrated significantly greater reliability than EDD‐1, and was easier to service. It showed the same superior performance characteristics demonstrated by the Pilot Truck and EDD-1-shown in figure 13 hauling concrete blocks during initial testing at TransPower’s facilities in mid‐2014.
Figure 13: EDD-2 During Initial Performance Tests, Hauling Concrete Blocks
Source: TransPower
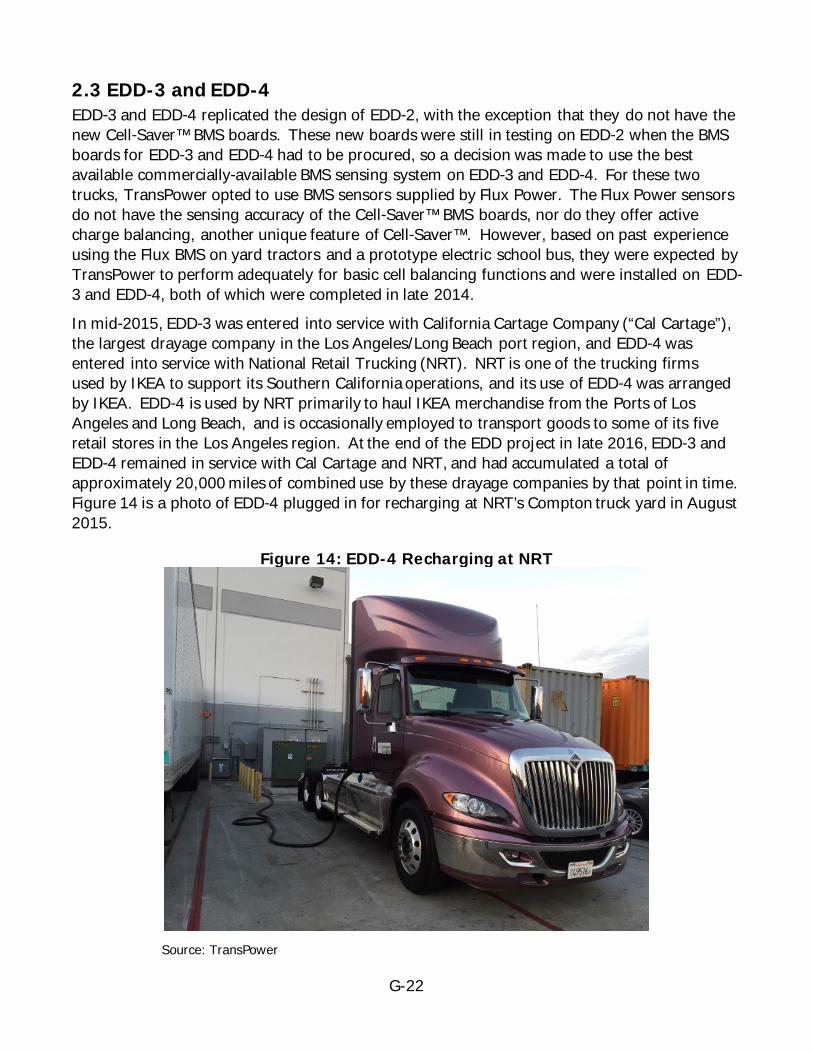
G-22
2.3 EDD-3 and EDD-4 EDD‐3 and EDD‐4 replicated the design of EDD‐2, with the exception that they do not have the new Cell‐Saver™ BMS boards. These new boards were still in testing on EDD‐2 when the BMS boards for EDD‐3 and EDD‐4 had to be procured, so a decision was made to use the best available commercially‐available BMS sensing system on EDD‐3 and EDD‐4. For these two trucks, TransPower opted to use BMS sensors supplied by Flux Power. The Flux Power sensors do not have the sensing accuracy of the Cell‐Saver™ BMS boards, nor do they offer active charge balancing, another unique feature of Cell‐Saver™. However, based on past experience using the Flux BMS on yard tractors and a prototype electric school bus, they were expected by TransPower to perform adequately for basic cell balancing functions and were installed on EDD‐3 and EDD‐4, both of which were completed in late 2014. In mid‐2015, EDD‐3 was entered into service with California Cartage Company (“Cal Cartage”), the largest drayage company in the Los Angeles/Long Beach port region, and EDD‐4 was entered into service with National Retail Trucking (NRT). NRT is one of the trucking firms used by IKEA to support its Southern California operations, and its use of EDD‐4 was arranged by IKEA. EDD‐4 is used by NRT primarily to haul IKEA merchandise from the Ports of Los Angeles and Long Beach, and is occasionally employed to transport goods to some of its five retail stores in the Los Angeles region. At the end of the EDD project in late 2016, EDD‐3 and EDD‐4 remained in service with Cal Cartage and NRT, and had accumulated a total of approximately 20,000 miles of combined use by these drayage companies by that point in time. Figure 14 is a photo of EDD‐4 plugged in for recharging at NRT’s Compton truck yard in August 2015.
Figure 14: EDD-4 Recharging at NRT
Source: TransPower
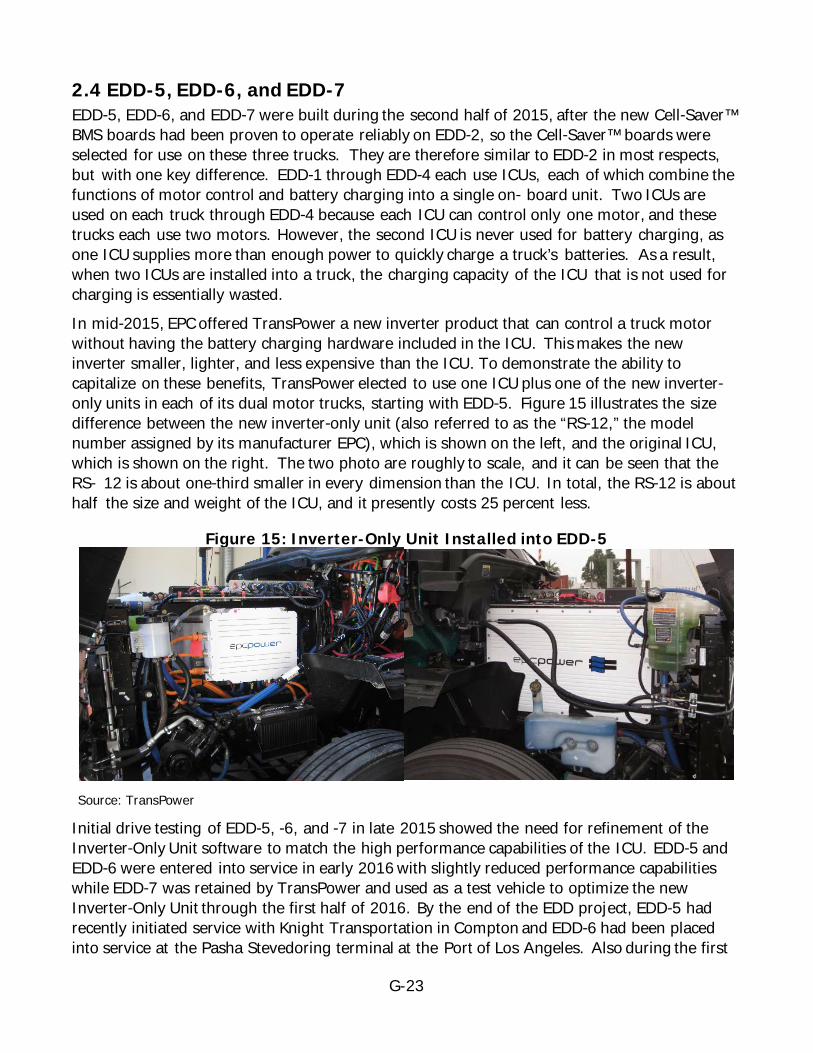
G-23
2.4 EDD-5, EDD-6, and EDD-7 EDD‐5, EDD‐6, and EDD‐7 were built during the second half of 2015, after the new Cell‐Saver™ BMS boards had been proven to operate reliably on EDD‐2, so the Cell‐Saver™ boards were selected for use on these three trucks. They are therefore similar to EDD‐2 in most respects, but with one key difference. EDD‐1 through EDD‐4 each use ICUs, each of which combine the functions of motor control and battery charging into a single on‐ board unit. Two ICUs are used on each truck through EDD‐4 because each ICU can control only one motor, and these trucks each use two motors. However, the second ICU is never used for battery charging, as one ICU supplies more than enough power to quickly charge a truck’s batteries. As a result, when two ICUs are installed into a truck, the charging capacity of the ICU that is not used for charging is essentially wasted. In mid‐2015, EPC offered TransPower a new inverter product that can control a truck motor without having the battery charging hardware included in the ICU. This makes the new inverter smaller, lighter, and less expensive than the ICU. To demonstrate the ability to capitalize on these benefits, TransPower elected to use one ICU plus one of the new inverter‐ only units in each of its dual motor trucks, starting with EDD‐5. Figure 15 illustrates the size difference between the new inverter‐only unit (also referred to as the “RS‐12,” the model number assigned by its manufacturer EPC), which is shown on the left, and the original ICU, which is shown on the right. The two photo are roughly to scale, and it can be seen that the RS‐ 12 is about one‐third smaller in every dimension than the ICU. In total, the RS‐12 is about half the size and weight of the ICU, and it presently costs 25 percent less.
Figure 15: Inverter-Only Unit Installed into EDD-5
Source: TransPower
Initial drive testing of EDD‐5, ‐6, and ‐7 in late 2015 showed the need for refinement of the Inverter‐Only Unit software to match the high performance capabilities of the ICU. EDD‐5 and EDD‐6 were entered into service in early 2016 with slightly reduced performance capabilities while EDD‐7 was retained by TransPower and used as a test vehicle to optimize the new Inverter‐Only Unit through the first half of 2016. By the end of the EDD project, EDD‐5 had recently initiated service with Knight Transportation in Compton and EDD‐6 had been placed into service at the Pasha Stevedoring terminal at the Port of Los Angeles. Also during the first
G-24
half of 2016, EDD‐2 was moved from Total Transportation Services, Inc. (TTSI), where it was not being used very frequently, to 3 Rivers Trucking near the Port of Los Angeles. EDD‐7 was being operated by TerminaLift, a terminal operator at the Port of San Diego at the end of the project. TransPower plans to deliver EDD‐7 to TTSI in early 2017, as TTSI recently secured a new operating location at the Port of Los Angeles and is expected to use EDD‐7 more regularly than it had been using EDD‐2 at its old facility in Rancho Dominguez. The results of testing and operation of all seven trucks are described in more detail in the following section.
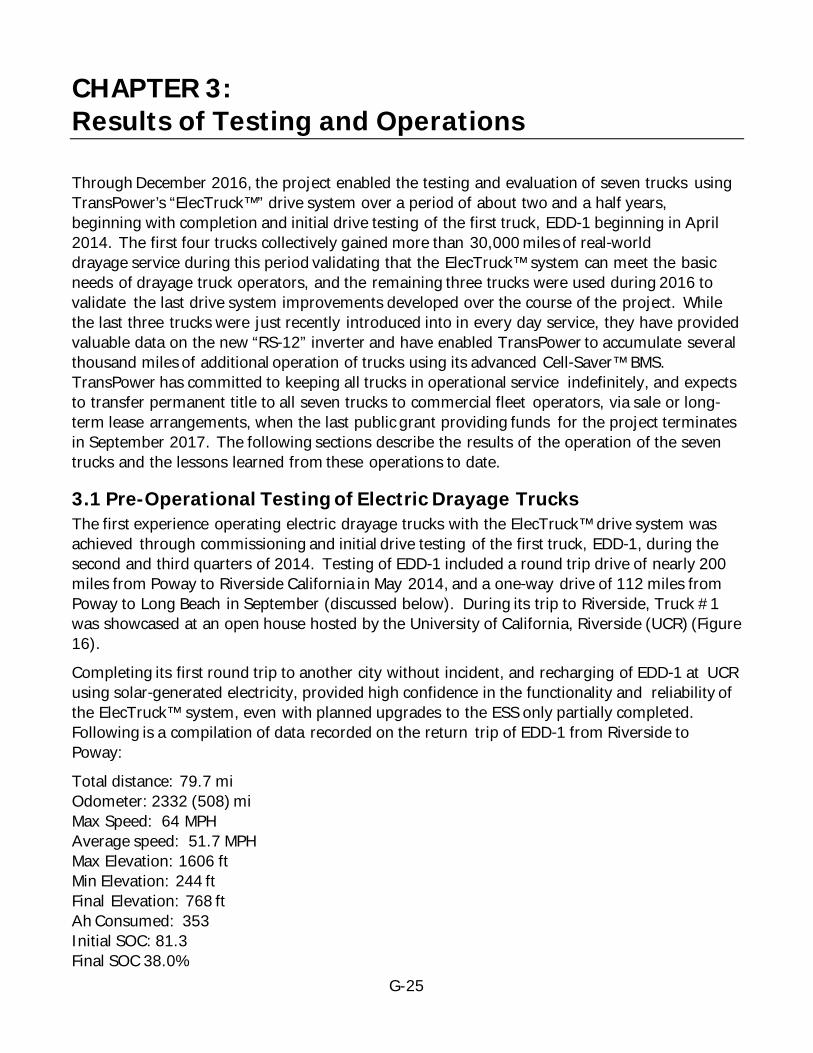
G-25
CHAPTER 3: Results of Testing and Operations
Through December 2016, the project enabled the testing and evaluation of seven trucks using TransPower’s “ElecTruck™” drive system over a period of about two and a half years, beginning with completion and initial drive testing of the first truck, EDD‐1 beginning in April 2014. The first four trucks collectively gained more than 30,000 miles of real‐world drayage service during this period validating that the ElecTruck™ system can meet the basic needs of drayage truck operators, and the remaining three trucks were used during 2016 to validate the last drive system improvements developed over the course of the project. While the last three trucks were just recently introduced into in every day service, they have provided valuable data on the new “RS‐12” inverter and have enabled TransPower to accumulate several thousand miles of additional operation of trucks using its advanced Cell‐Saver™ BMS. TransPower has committed to keeping all trucks in operational service indefinitely, and expects to transfer permanent title to all seven trucks to commercial fleet operators, via sale or long‐term lease arrangements, when the last public grant providing funds for the project terminates in September 2017. The following sections describe the results of the operation of the seven trucks and the lessons learned from these operations to date.
3.1 Pre-Operational Testing of Electric Drayage Trucks The first experience operating electric drayage trucks with the ElecTruck™ drive system was achieved through commissioning and initial drive testing of the first truck, EDD‐1, during the second and third quarters of 2014. Testing of EDD‐1 included a round trip drive of nearly 200 miles from Poway to Riverside California in May 2014, and a one‐way drive of 112 miles from Poway to Long Beach in September (discussed below). During its trip to Riverside, Truck #1 was showcased at an open house hosted by the University of California, Riverside (UCR) (Figure 16). Completing its first round trip to another city without incident, and recharging of EDD‐1 at UCR using solar‐generated electricity, provided high confidence in the functionality and reliability of the ElecTruck™ system, even with planned upgrades to the ESS only partially completed. Following is a compilation of data recorded on the return trip of EDD‐1 from Riverside to Poway: Total distance: 79.7 mi Odometer: 2332 (508) mi Max Speed: 64 MPH Average speed: 51.7 MPH Max Elevation: 1606 ft Min Elevation: 244 ft Final Elevation: 768 ft Ah Consumed: 353 Initial SOC: 81.3 Final SOC 38.0%
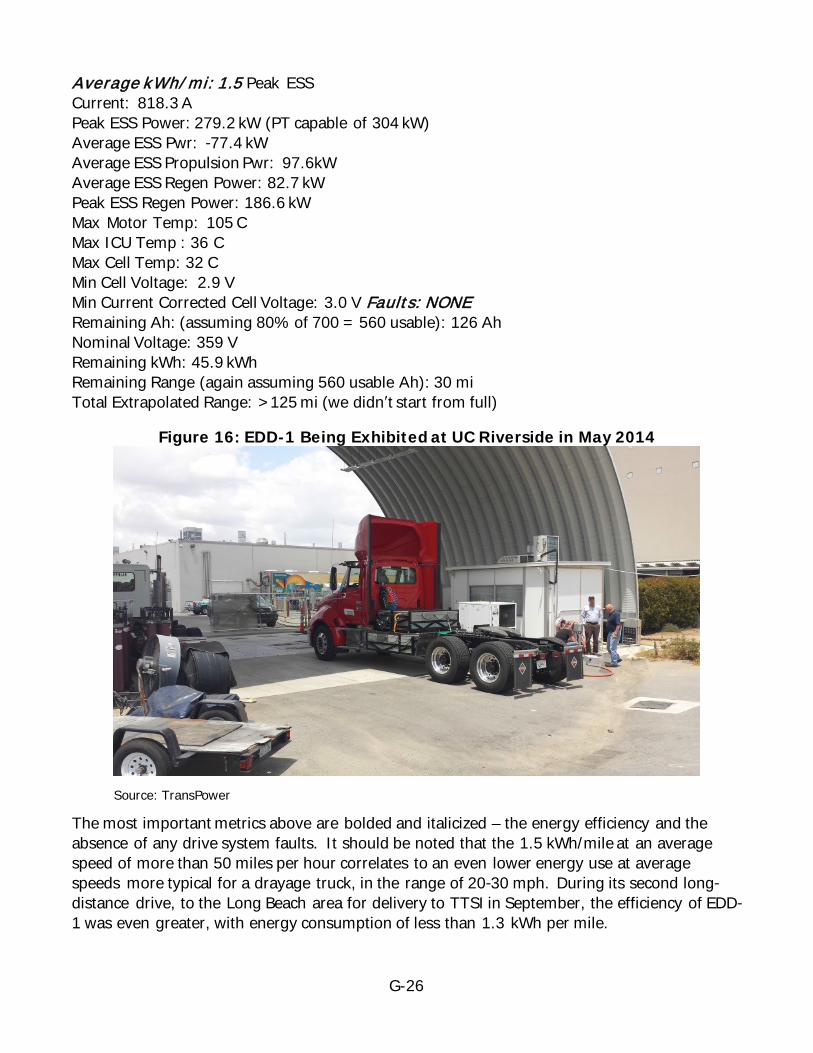
G-26
A verage kWh/ mi: 1.5 Peak ESS Current: 818.3 A Peak ESS Power: 279.2 kW (PT capable of 304 kW) Average ESS Pwr: ‐77.4 kW Average ESS Propulsion Pwr: 97.6kW Average ESS Regen Power: 82.7 kW Peak ESS Regen Power: 186.6 kW Max Motor Temp: 105 C Max ICU Temp : 36 C Max Cell Temp: 32 C Min Cell Voltage: 2.9 V Min Current Corrected Cell Voltage: 3.0 V Faults: NONE Remaining Ah: (assuming 80% of 700 = 560 usable): 126 Ah Nominal Voltage: 359 V Remaining kWh: 45.9 kWh Remaining Range (again assuming 560 usable Ah): 30 mi Total Extrapolated Range: >125 mi (we didnʹt start from full)
Figure 16: EDD-1 Being Exhibited at UC Riverside in May 2014
Source: TransPower
The most important metrics above are bolded and italicized – the energy efficiency and the absence of any drive system faults. It should be noted that the 1.5 kWh/mile at an average speed of more than 50 miles per hour correlates to an even lower energy use at average speeds more typical for a drayage truck, in the range of 20‐30 mph. During its second long‐distance drive, to the Long Beach area for delivery to TTSI in September, the efficiency of EDD‐1 was even greater, with energy consumption of less than 1.3 kWh per mile.
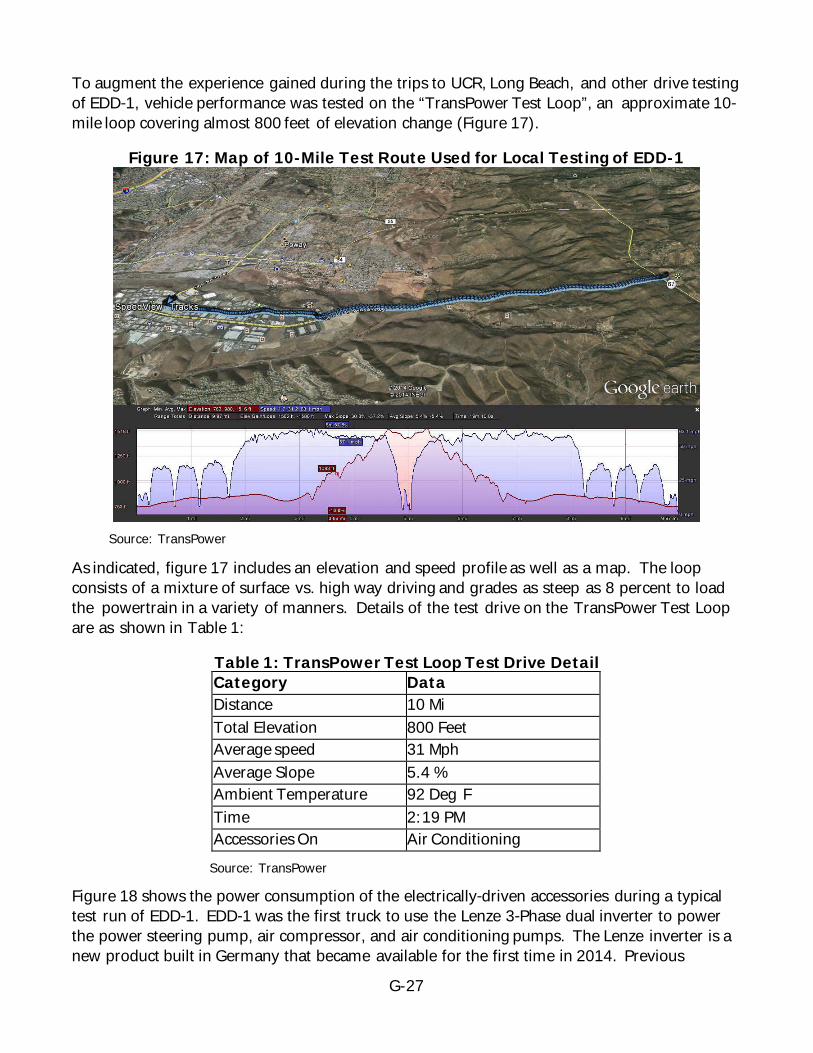
G-27
To augment the experience gained during the trips to UCR, Long Beach, and other drive testing of EDD‐1, vehicle performance was tested on the “TransPower Test Loop”, an approximate 10‐mile loop covering almost 800 feet of elevation change (Figure 17).
Figure 17: Map of 10-Mile Test Route Used for Local Testing of EDD-1
Source: TransPower
As indicated, figure 17 includes an elevation and speed profile as well as a map. The loop consists of a mixture of surface vs. high way driving and grades as steep as 8 percent to load the powertrain in a variety of manners. Details of the test drive on the TransPower Test Loop are as shown in Table 1:
Table 1: TransPower Test Loop Test Drive Detail Category Data Distance 10 Mi Total Elevation 800 Feet Average speed 31 Mph Average Slope 5.4 % Ambient Temperature 92 Deg F Time 2:19 PM Accessories On Air Conditioning Source: TransPower
Figure 18 shows the power consumption of the electrically‐driven accessories during a typical test run of EDD‐1. EDD‐1 was the first truck to use the Lenze 3‐Phase dual inverter to power the power steering pump, air compressor, and air conditioning pumps. The Lenze inverter is a new product built in Germany that became available for the first time in 2014. Previous
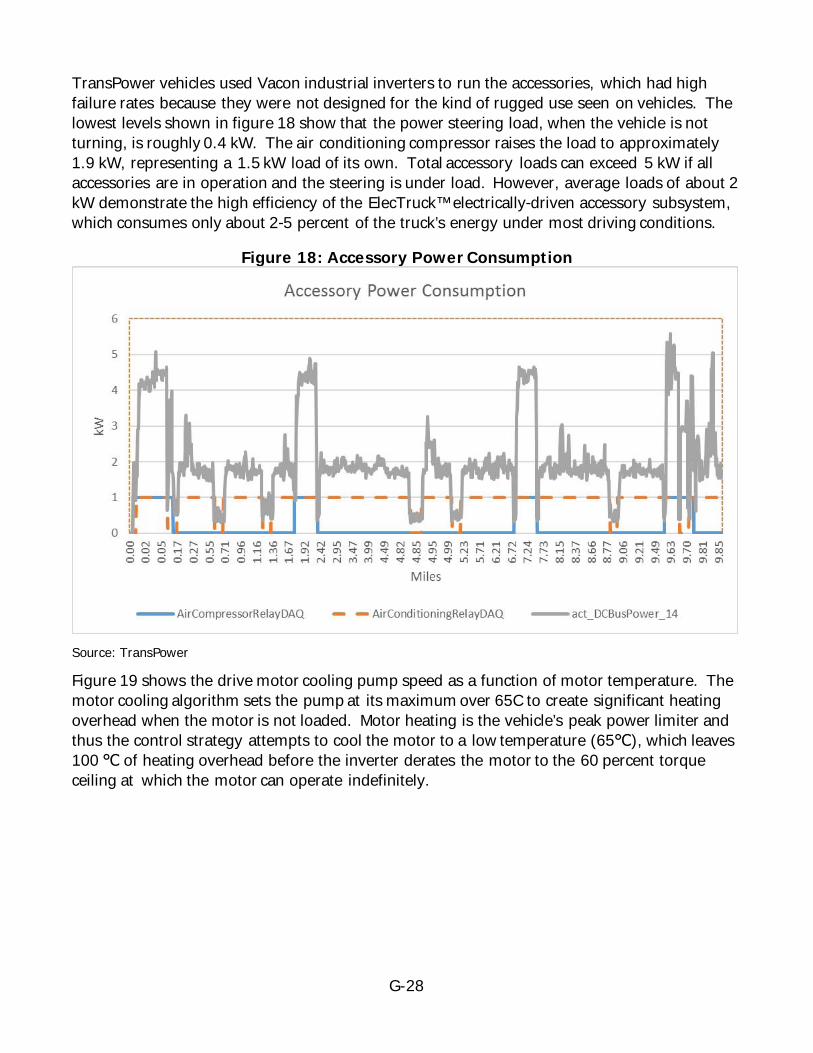
G-28
TransPower vehicles used Vacon industrial inverters to run the accessories, which had high failure rates because they were not designed for the kind of rugged use seen on vehicles. The lowest levels shown in figure 18 show that the power steering load, when the vehicle is not turning, is roughly 0.4 kW. The air conditioning compressor raises the load to approximately 1.9 kW, representing a 1.5 kW load of its own. Total accessory loads can exceed 5 kW if all accessories are in operation and the steering is under load. However, average loads of about 2 kW demonstrate the high efficiency of the ElecTruck™ electrically‐driven accessory subsystem, which consumes only about 2‐5 percent of the truck’s energy under most driving conditions.
Figure 18: Accessory Power Consumption
Source: TransPower
Figure 19 shows the drive motor cooling pump speed as a function of motor temperature. The motor cooling algorithm sets the pump at its maximum over 65C to create significant heating overhead when the motor is not loaded. Motor heating is the vehicle’s peak power limiter and thus the control strategy attempts to cool the motor to a low temperature (65℃), which leaves 100 ℃ of heating overhead before the inverter derates the motor to the 60 percent torque ceiling at which the motor can operate indefinitely.
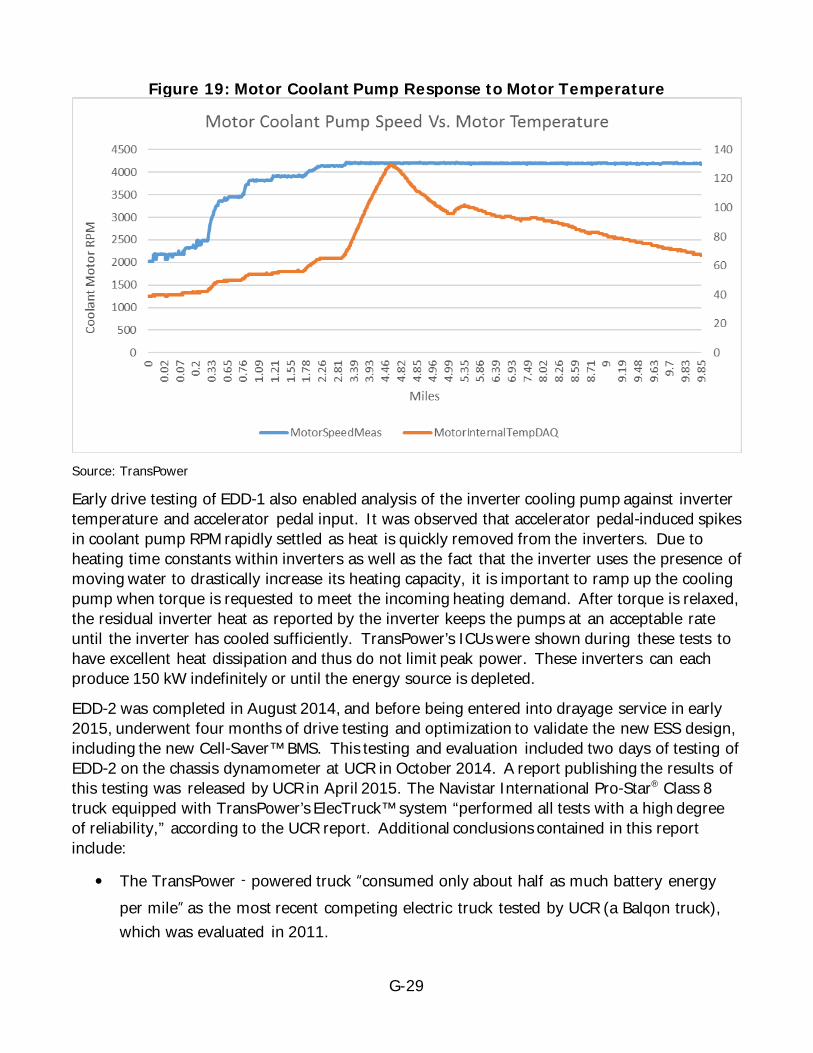
G-29
Figure 19: Motor Coolant Pump Response to Motor Temperature
Source: TransPower
Early drive testing of EDD‐1 also enabled analysis of the inverter cooling pump against inverter temperature and accelerator pedal input. It was observed that accelerator pedal‐induced spikes in coolant pump RPM rapidly settled as heat is quickly removed from the inverters. Due to heating time constants within inverters as well as the fact that the inverter uses the presence of moving water to drastically increase its heating capacity, it is important to ramp up the cooling pump when torque is requested to meet the incoming heating demand. After torque is relaxed, the residual inverter heat as reported by the inverter keeps the pumps at an acceptable rate until the inverter has cooled sufficiently. TransPower’s ICUs were shown during these tests to have excellent heat dissipation and thus do not limit peak power. These inverters can each produce 150 kW indefinitely or until the energy source is depleted.
EDD‐2 was completed in August 2014, and before being entered into drayage service in early 2015, underwent four months of drive testing and optimization to validate the new ESS design, including the new Cell‐Saver™ BMS. This testing and evaluation included two days of testing of EDD‐2 on the chassis dynamometer at UCR in October 2014. A report publishing the results of this testing was released by UCR in April 2015. The Navistar International Pro‐Star® Class 8 truck equipped with TransPower’s ElecTruck™ system “performed all tests with a high degree of reliability,” according to the UCR report. Additional conclusions contained in this report include:
• The TransPower‐powered truck “consumed only about half as much battery energy per mile” as the most recent competing electric truck tested by UCR (a Balqon truck), which was evaluated in 2011.

G-30
• Accounting for the greenhouse gases (“GHG”) produced by power plants to generate the electricity used by the TransPower‐powered truck, the vehicle “is expected to reduce GHG in typical drayage drive cycles by 67‐68 percent.” This represents a net reduction of more than a ton of GHG for every 1,000 miles the truck is driven, as compared with an equivalent diesel truck.
Figure 20 is a photo of EDD-2 during the dynamometer testing of this vehicle at UCR.
Figure 20: EDD-2 During Dynamometer Testing at UC Riverside, Fall 2015
Source: TransPower
Figure 21 is a bar graph summarizing additional conclusions of the UCR dynamometer testing of EDD‐2 and a TransPower yard tractor, which was tested a few weeks before EDD‐2. As indicated in the graph on the left, EDD‐2 was shown to incur less than 1/6th of the energy cost per mile of an equivalent diesel truck. Tests of EDD‐2 were performed at equivalent total vehicle weights of up to 72,000 pounds, confirming the high performance of the ElecTruck™ system. These favorable results provided confidence in the design improvements introduced with EDD‐2, and paved the way for entry of EDD‐2 and subsequent trucks into operational service.

G-31
Figure 21: Estimates of ElecTruck™ Energy Cost Savings, Based on UC Riverside Test Data
Source: TransPower. Data from: UC Riverside/CE-CERT dynamometer lab
3.2 Testing in Operational Service Following the pre‐operational testing of EDD‐1 described above in Section 3.1, EDD‐1 performed several months of demonstration operations during the second half of 2014, with TTSI in Long Beach and with SA Recycling at their Port of Long Beach, Pier T terminal (Figure 22). The truck was primarily used for large brake bulk goods movement including tons of recycled floor mats from Toyota’s Torrance Plant. EDD‐1 accumulated more than 3,300 miles in roughly 6 months of limited demonstration operation. The truck was well received by SA Recycling and operators provided many comments about how powerful the truck was and its smooth, quiet operation. SA Recycling also partnered with TransPower and the US Department of Energy (DOE) to host a video shoot of the truck in simulated operation for use by DOE and the public for footage for zero emissions goods movement. However, EDD‐1 had insufficient operating range to carry SA Recycling’s heavy metal loads the distances typically required (about 100 miles). In lighter duty use at TTSI, range limitation wasn’t a problem, but the poor quality 700 Ah cells and Balqon BMS used in this truck created reliability problems that were frustrating to TTSI and costly for TransPower to resolve.
Specific problems experienced with EDD‐1 at TTSI and SA Recycling included: • Battery Cell Loss of Capacity – Balqon, the supplier of the cells for EDD-1, provided poor
quality “leaker” cells that resulted in range limitations. • BMS Lockup – Balqon provided a BMS which would fail in a manner that could drain a
cell when the truck was in rest. • Battery Cell and BMS servicing was very difficult – As discussed previously, TransPower’s
early ESS design placed battery modules in places that are difficult to service. Starting with EDD-2, battery packs were redesigned and relocated for ease of manufacture and service.
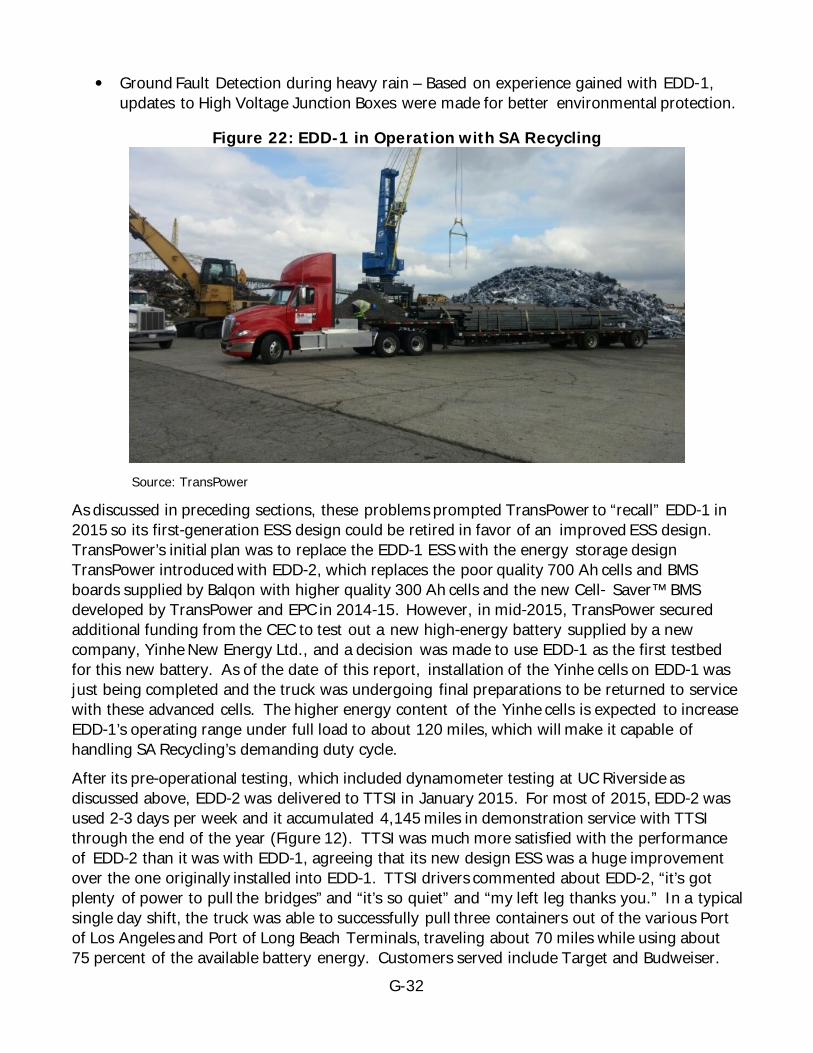
G-32
• Ground Fault Detection during heavy rain – Based on experience gained with EDD-1, updates to High Voltage Junction Boxes were made for better environmental protection.
Figure 22: EDD-1 in Operation with SA Recycling
Source: TransPower
As discussed in preceding sections, these problems prompted TransPower to “recall” EDD‐1 in 2015 so its first‐generation ESS design could be retired in favor of an improved ESS design. TransPower’s initial plan was to replace the EDD‐1 ESS with the energy storage design TransPower introduced with EDD‐2, which replaces the poor quality 700 Ah cells and BMS boards supplied by Balqon with higher quality 300 Ah cells and the new Cell‐ Saver™ BMS developed by TransPower and EPC in 2014‐15. However, in mid‐2015, TransPower secured additional funding from the CEC to test out a new high‐energy battery supplied by a new company, Yinhe New Energy Ltd., and a decision was made to use EDD‐1 as the first testbed for this new battery. As of the date of this report, installation of the Yinhe cells on EDD‐1 was just being completed and the truck was undergoing final preparations to be returned to service with these advanced cells. The higher energy content of the Yinhe cells is expected to increase EDD‐1’s operating range under full load to about 120 miles, which will make it capable of handling SA Recycling’s demanding duty cycle. After its pre‐operational testing, which included dynamometer testing at UC Riverside as discussed above, EDD‐2 was delivered to TTSI in January 2015. For most of 2015, EDD‐2 was used 2‐3 days per week and it accumulated 4,145 miles in demonstration service with TTSI through the end of the year (Figure 12). TTSI was much more satisfied with the performance of EDD‐2 than it was with EDD‐1, agreeing that its new design ESS was a huge improvement over the one originally installed into EDD‐1. TTSI drivers commented about EDD‐2, “it’s got plenty of power to pull the bridges” and “it’s so quiet” and “my left leg thanks you.” In a typical single day shift, the truck was able to successfully pull three containers out of the various Port of Los Angeles and Port of Long Beach Terminals, traveling about 70 miles while using about 75 percent of the available battery energy. Customers served include Target and Budweiser.
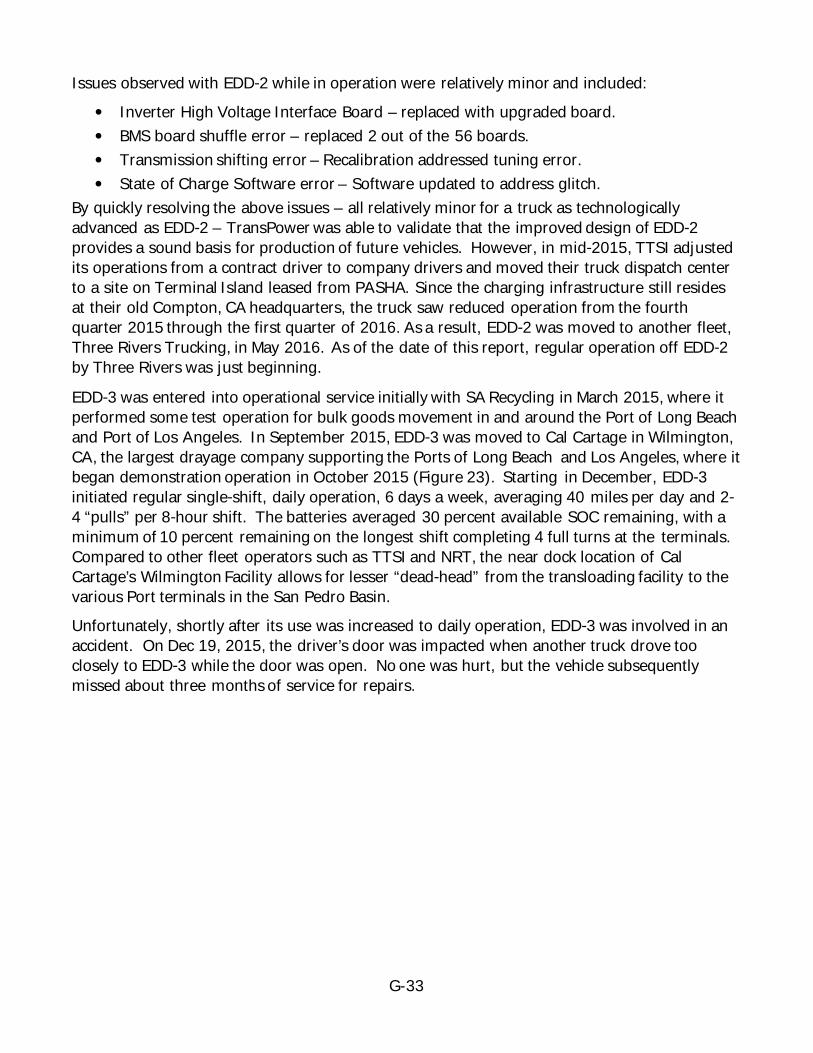
G-33
Issues observed with EDD‐2 while in operation were relatively minor and included: • Inverter High Voltage Interface Board – replaced with upgraded board. • BMS board shuffle error – replaced 2 out of the 56 boards. • Transmission shifting error – Recalibration addressed tuning error. • State of Charge Software error – Software updated to address glitch.
By quickly resolving the above issues – all relatively minor for a truck as technologically advanced as EDD‐2 – TransPower was able to validate that the improved design of EDD‐2 provides a sound basis for production of future vehicles. However, in mid‐2015, TTSI adjusted its operations from a contract driver to company drivers and moved their truck dispatch center to a site on Terminal Island leased from PASHA. Since the charging infrastructure still resides at their old Compton, CA headquarters, the truck saw reduced operation from the fourth quarter 2015 through the first quarter of 2016. As a result, EDD‐2 was moved to another fleet, Three Rivers Trucking, in May 2016. As of the date of this report, regular operation off EDD‐2 by Three Rivers was just beginning.
EDD‐3 was entered into operational service initially with SA Recycling in March 2015, where it performed some test operation for bulk goods movement in and around the Port of Long Beach and Port of Los Angeles. In September 2015, EDD‐3 was moved to Cal Cartage in Wilmington, CA, the largest drayage company supporting the Ports of Long Beach and Los Angeles, where it began demonstration operation in October 2015 (Figure 23). Starting in December, EDD‐3 initiated regular single‐shift, daily operation, 6 days a week, averaging 40 miles per day and 2‐4 “pulls” per 8‐hour shift. The batteries averaged 30 percent available SOC remaining, with a minimum of 10 percent remaining on the longest shift completing 4 full turns at the terminals. Compared to other fleet operators such as TTSI and NRT, the near dock location of Cal Cartage’s Wilmington Facility allows for lesser “dead‐head” from the transloading facility to the various Port terminals in the San Pedro Basin. Unfortunately, shortly after its use was increased to daily operation, EDD‐3 was involved in an accident. On Dec 19, 2015, the driver’s door was impacted when another truck drove too closely to EDD‐3 while the door was open. No one was hurt, but the vehicle subsequently missed about three months of service for repairs.
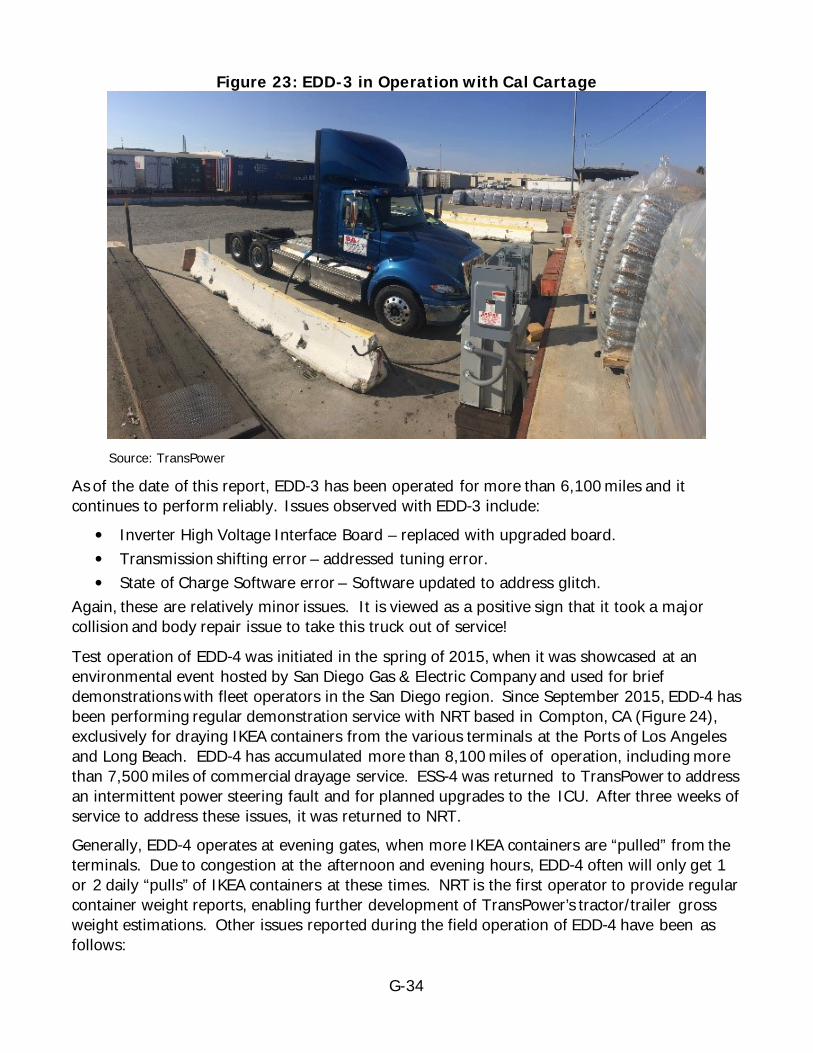
G-34
Figure 23: EDD-3 in Operation with Cal Cartage
Source: TransPower
As of the date of this report, EDD‐3 has been operated for more than 6,100 miles and it continues to perform reliably. Issues observed with EDD‐3 include:
• Inverter High Voltage Interface Board – replaced with upgraded board. • Transmission shifting error – addressed tuning error. • State of Charge Software error – Software updated to address glitch.
Again, these are relatively minor issues. It is viewed as a positive sign that it took a major collision and body repair issue to take this truck out of service!
Test operation of EDD‐4 was initiated in the spring of 2015, when it was showcased at an environmental event hosted by San Diego Gas & Electric Company and used for brief demonstrations with fleet operators in the San Diego region. Since September 2015, EDD‐4 has been performing regular demonstration service with NRT based in Compton, CA (Figure 24), exclusively for draying IKEA containers from the various terminals at the Ports of Los Angeles and Long Beach. EDD‐4 has accumulated more than 8,100 miles of operation, including more than 7,500 miles of commercial drayage service. ESS‐4 was returned to TransPower to address an intermittent power steering fault and for planned upgrades to the ICU. After three weeks of service to address these issues, it was returned to NRT. Generally, EDD‐4 operates at evening gates, when more IKEA containers are “pulled” from the terminals. Due to congestion at the afternoon and evening hours, EDD‐4 often will only get 1 or 2 daily “pulls” of IKEA containers at these times. NRT is the first operator to provide regular container weight reports, enabling further development of TransPower’s tractor/trailer gross weight estimations. Other issues reported during the field operation of EDD‐4 have been as follows:
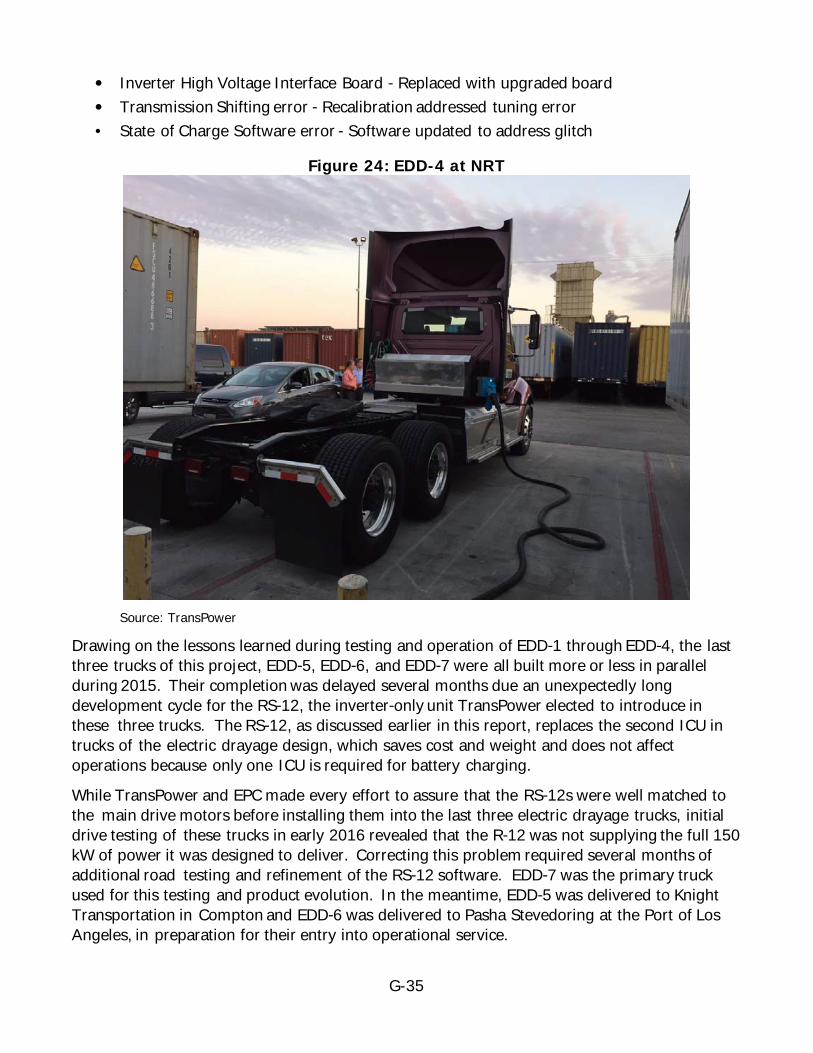
G-35
• Inverter High Voltage Interface Board ‐ Replaced with upgraded board • Transmission Shifting error ‐ Recalibration addressed tuning error • State of Charge Software error ‐ Software updated to address glitch
Figure 24: EDD-4 at NRT
Source: TransPower
Drawing on the lessons learned during testing and operation of EDD‐1 through EDD‐4, the last three trucks of this project, EDD‐5, EDD‐6, and EDD‐7 were all built more or less in parallel during 2015. Their completion was delayed several months due an unexpectedly long development cycle for the RS‐12, the inverter‐only unit TransPower elected to introduce in these three trucks. The RS‐12, as discussed earlier in this report, replaces the second ICU in trucks of the electric drayage design, which saves cost and weight and does not affect operations because only one ICU is required for battery charging.
While TransPower and EPC made every effort to assure that the RS‐12s were well matched to the main drive motors before installing them into the last three electric drayage trucks, initial drive testing of these trucks in early 2016 revealed that the R‐12 was not supplying the full 150 kW of power it was designed to deliver. Correcting this problem required several months of additional road testing and refinement of the RS‐12 software. EDD‐7 was the primary truck used for this testing and product evolution. In the meantime, EDD‐5 was delivered to Knight Transportation in Compton and EDD‐6 was delivered to Pasha Stevedoring at the Port of Los Angeles, in preparation for their entry into operational service.

G-36
During the first half of 2016, while the RS‐12 power shortcoming was addressed through testing of EDD‐7, EDD‐5 and EDD‐6 were used for a series of demonstrations and tests that did not require full‐power use of the RS‐12. EDD‐6 was test operated at SA Recycling for several weeks while awaiting installation of permanent charging infrastructure at its long‐term home, Pasha’s Port of Los Angeles terminal. In March 2016, a CNN news team visited Pasha and recorded video of EDD‐6 speeding across the Pasha terminal, as part of a report on sustainability initiatives at the Port of Los Angeles. The video can be viewed on the CNN Youtube page: (https://www.youtube.com/watch?v=wlyhpOJpTpQ&feature=youtu.be). Figure 25 shows EDD‐6 moving freight during its testing at SA Recycling in February 2016 and with the CNN camera crew at Pasha’s Terminal a month later.
Figure 25: EDD-6 Moving Freight at SA Recycling (left), CNN Camera Crew at Pasha’s Terminal (right)
Source: TransPower
Over the course of the project, the seven electric drayage trucks using the ElecTruck™ drive system accumulated more than 35,000 miles of testing and operation, most of it in actual operating service hauling heavy loads. To TransPower’s knowledge, this is far more miles than has been accumulated on any fleet of battery‐electric trucks of this weight class in the U.S., and possibly anywhere in the world. More important, the trucks have generally met or exceeded project expectations once corrective actions have been taken to address early design flaws. Table 2 is a service log summarizing the status of the fleet as of December 9, 2016. As indicated, all seven trucks were fully functional on that date, including EDD‐1 with the new high energy batteries installed into it earlier in the year. The problems experienced in adopting the RS‐12 were largely alleviated by the end of 2016. During 2016, TransPower also took the opportunity to upgrade the internal design of the ICU, replacing a high voltage interface board that began to show problems in several vehicles after a few thousand miles of use. It is expected that such refinements to the drive system will continue to be made over the next few months and possibly for another year or two, eventually resulting in a perfected electric drive system that can be mass marketed for thousands of Class 8 trucks worldwide.
TransPower expects the 35,000 miles achieved with the seven electric drayage trucks to increase at the rate of at least 100,000 miles per year starting in 2017. In the meantime, the
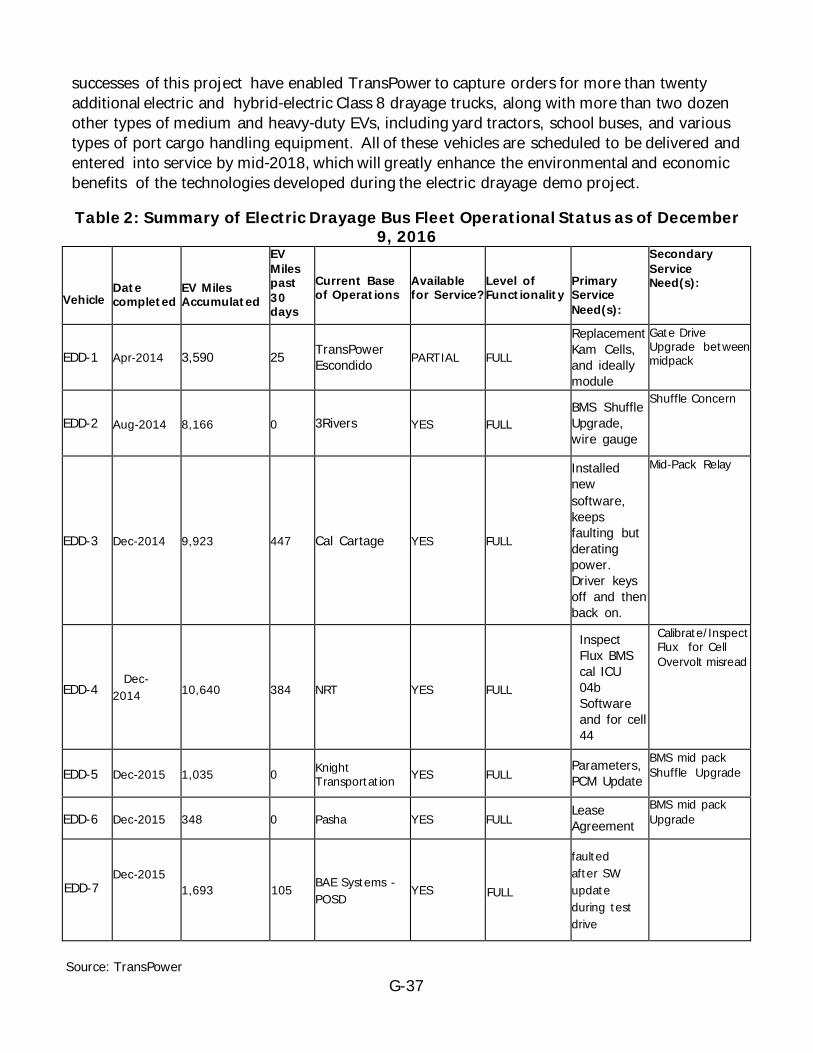
G-37
successes of this project have enabled TransPower to capture orders for more than twenty additional electric and hybrid‐electric Class 8 drayage trucks, along with more than two dozen other types of medium and heavy‐duty EVs, including yard tractors, school buses, and various types of port cargo handling equipment. All of these vehicles are scheduled to be delivered and entered into service by mid‐2018, which will greatly enhance the environmental and economic benefits of the technologies developed during the electric drayage demo project.
Table 2: Summary of Electric Drayage Bus Fleet Operational Status as of December 9, 2016
Vehicle
Date completed
EV Miles Accumulated
EV Miles past 30 days
Current Base of Operations
Available for Service?
Level of Functionality
Primary Service Need(s):
Secondary Service Need(s):
EDD-1 Apr-2014 3,590 25 TransPower Escondido PARTIAL FULL
Replacement Kam Cells, and ideally module
Gate Drive Upgrade between midpack
EDD-2 Aug-2014 8,166 0 3Rivers YES FULL BMS Shuffle Upgrade, wire gauge
Shuffle Concern
EDD-3 Dec-2014 9,923 447 Cal Cartage YES FULL
Installed new software, keeps faulting but derating power. Driver keys off and then back on.
Mid-Pack Relay
EDD-4 Dec-2014 10,640 384 NRT YES FULL
Inspect Flux BMS cal ICU 04b Software and for cell 44
Calibrate/Inspect Flux for Cell Overvolt misread
EDD-5 Dec-2015 1,035 0 Knight Transportation YES FULL
Parameters, PCM Update
BMS mid pack Shuffle Upgrade
EDD-6 Dec-2015 348 0 Pasha YES FULL Lease Agreement
BMS mid pack Upgrade
EDD-7
Dec-2015
1,693 105 BAE Systems - POSD
YES FULL
faulted after SW update during test drive
Source: TransPower
G-38
CHAPTER 4: Project Benefits
In its original proposal for funding of the electric drayage demo Project, TransPower argued that the project deserved State funding because it is consistent with the objectives of the AB118. Electric trucks enabled by this project will provide a measurable transition from use of petroleum fuels and significant petroleum reduction, along with significant environmental and economic benefits.
4.1 Transition from Petroleum Fuels A drayage truck operating 100 miles/day, 300 days/year, and averaging 5 mpg will consume 6,000 gallons of diesel fuel each year. Gross Petroleum Reduction, 2015‐2022 – To estimate petroleum reduction over the 2015‐2022 period, TransPower made the following simplifying assumptions:
• Commercial electric truck deployments ramp up from 25 vehicles in 2015 to 2,500 vehicles in 2022. Our assumed ramp‐up is to 100 trucks in 2016, 250 in 2017, 500 in 2018, with subsequent increases of 500 each year until reaching 2,500 in 2022.
• This equates to 19,900 truck operating years. Given the uncertainty in these projections, we round this figure to 20,000 for convenience.
• Based on the above estimate of 6,000 gallons of diesel saved per truck year, this results in 20,000 x 6,000 = 120 million gallons of gross fuel use reduction from 2013 through 2020.
Divided by the grant‐funding amount of $2,296,170, this equates to 52.3 gallons of petroleum saved per dollar of grant funding provided under this project.
Net Petroleum Reduction, 2013‐2020 – A stricter way of estimating petroleum reduction, which accounts for the fuels used to produce the electricity used to recharge EV batteries, is to estimate the amount of fuel used for this purpose and to deduct this amount from the gross fuel savings calculated above, resulting in a calculation of “net” petroleum reduction. Using CEC data, EVs provide a 69 percent net reduction in carbon emissions, based on an average mix of California grid energy. This figure will probably increase as we expand our use of renewable energy. However, using the current 69 percent figure as an approximation of net reduction in petroleum use, net savings over 2015‐2022 = .69 x 52.3 million = 36 million gallons. This equates to 15.7 gallons saved for each $1 invested by the CEC in this program. Over subsequent years, this payback could be multiplied many times over.
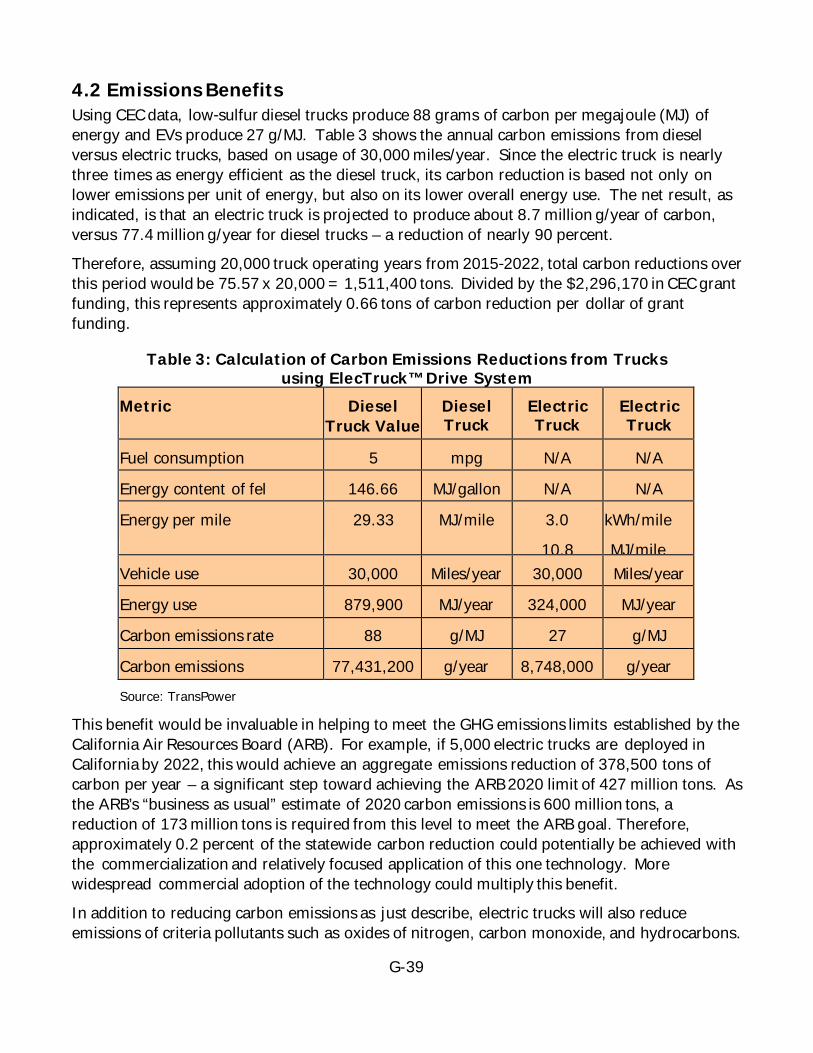
G-39
4.2 Emissions Benefits Using CEC data, low‐sulfur diesel trucks produce 88 grams of carbon per megajoule (MJ) of energy and EVs produce 27 g/MJ. Table 3 shows the annual carbon emissions from diesel versus electric trucks, based on usage of 30,000 miles/year. Since the electric truck is nearly three times as energy efficient as the diesel truck, its carbon reduction is based not only on lower emissions per unit of energy, but also on its lower overall energy use. The net result, as indicated, is that an electric truck is projected to produce about 8.7 million g/year of carbon, versus 77.4 million g/year for diesel trucks – a reduction of nearly 90 percent. Therefore, assuming 20,000 truck operating years from 2015‐2022, total carbon reductions over this period would be 75.57 x 20,000 = 1,511,400 tons. Divided by the $2,296,170 in CEC grant funding, this represents approximately 0.66 tons of carbon reduction per dollar of grant funding.
Table 3: Calculation of Carbon Emissions Reductions from Trucks using ElecTruck™ Drive System
Metric Diesel Truck Value
Diesel Truck U it
Electric Truck V l
Electric Truck U it
Fuel consumption 5 mpg N/A N/A
Energy content of fel 146.66 MJ/gallon N/A N/A
Energy per mile 29.33 MJ/mile 3.0
10.8
kWh/mile
MJ/mile Vehicle use 30,000 Miles/year 30,000 Miles/year
Energy use 879,900 MJ/year 324,000 MJ/year
Carbon emissions rate 88 g/MJ 27 g/MJ
Carbon emissions 77,431,200 g/year 8,748,000 g/year Source: TransPower
This benefit would be invaluable in helping to meet the GHG emissions limits established by the California Air Resources Board (ARB). For example, if 5,000 electric trucks are deployed in California by 2022, this would achieve an aggregate emissions reduction of 378,500 tons of carbon per year – a significant step toward achieving the ARB 2020 limit of 427 million tons. As the ARB’s “business as usual” estimate of 2020 carbon emissions is 600 million tons, a reduction of 173 million tons is required from this level to meet the ARB goal. Therefore, approximately 0.2 percent of the statewide carbon reduction could potentially be achieved with the commercialization and relatively focused application of this one technology. More widespread commercial adoption of the technology could multiply this benefit. In addition to reducing carbon emissions as just describe, electric trucks will also reduce emissions of criteria pollutants such as oxides of nitrogen, carbon monoxide, and hydrocarbons.
G-40
If these emissions reductions come anywhere near the 90 percent reduction in carbon emissions that has been calculated, the overall environmental benefits of electric truck adoption will be enormous.
4.3 Economic Benefits The actual and projected economic benefits of this project include:
• The electric drayage demo project provided significant short‐term business opportunities for its two principal California‐based participants, TransPower and EPC. The grant was one of the first sources of income for both TransPower and EPC when the project began in 2012, but since receipt of the grant, TransPower has secured more than $40 million in additional business and has grown from 15 to more than 40 employees.
• Deployment of the seven electric drayage trucks is expected to accelerate adoption of electric propulsion technology by large trucks, thereby helping to expand the EV industry and to enable California to develop a leading role in its growth.
• The innovations enabled by the project, such as the ICU, low‐cost battery subsystems, and adaptable control architecture, will make electric trucks more affordable.
• Deployment of electric trucks using the technology developed under the project will enable continued growth of the Los Angeles and Long Beach Ports, which contribute to the stabilization of economically distressed areas, by providing the first practical, zero‐emission alternative for port drayage.
• Building on the success of the project, TransPower is developing innovative financing methods to make higher end electric trucks more affordable to independent owner‐operators, who are generally among the lowest‐paid workers in the logistics industry.
• Commercialization of electric drayage technology will serve as a catalyst for U.S. truck manufacturers to convert assembly capacity to electric drive integration, helping U.S. truck companies maintain global technology leadership.
• The ElecTruck™ drive system developed under the project will reduce the cost of truck operations by eliminating fuel use and reducing maintenance costs.
The types of jobs that will be created by this project are permanent and varied. Most of these jobs will be high‐paying professional jobs related to engineering and assembly of high‐tech drive systems, and associated business management functions such as marketing, program management, and financial and supply chain management. TransPower has already started talking with non‐profit training organizations such as the Cleantech Institute about creating training programs for mechanics, so they can be retrained to work on high‐voltage electrical systems. Independent owner‐operators who take advantage of such innovative financing programs will have a unique opportunity to lease and eventually own higher‐end trucks that will increase their earning potential, based on the demonstrated willingness of cargo owners to pay premiums for use of “green” transportation solutions. In the longer term, if TransPower’s commercialization goal of producing 2,500 electric drive systems/year is achieved by 2020, specific economic impacts could include:
G-41
• Creation of approximately 300 jobs directly related to drive system kit assembly, plus another 600 in indirect support jobs (900 jobs total).
• Creation of about 400 jobs related to converters and battery modules. This estimate is based on creation of one person‐month of direct and indirect employment for each converter and vehicle battery subsystem produced.
• Creation of about 100 jobs at California‐based suppliers of wiring, cabling, machined assemblies, and other small parts used in TransPower drive systems.
• Creation of about 100 jobs related to servicing and support of electric trucks, based on production of 7,875 electric trucks through 2020, of which an estimated 5,000 to 6,000 would be based in California.
This adds up to a total of 1,500 new jobs, and does not include additional jobs created in the trucking industry if electric propulsion opens up new growth opportunities. Based on an average taxable income of $70,000/year and a tax rate of 9 percent, this level of job creation would generate $9.5 million/year in additional state income tax revenue. In addition, purchases of 2,000 electric trucks/year within California, at an average price of $300,000 each, would generate $48 million/year in State sales tax revenue, based on a sales tax rate of 8 percent.
As the Los Angeles and Long Beach ports are surrounded by economically depressed areas with high minority populations, targeting the port drayage market will concentrate many of these economic benefits on this population. Adoption of electric trucks in the region will also promote social justice by reducing pollution, which is disproportionately affecting poor people who live and work near freeways in the area. Various end‐users will benefit from this activity. Truck owners and drayage firms such as TTSI will benefit from increased business, as cargo owners are attracted to the opportunity to use zero‐emission vehicles. The cargo owners will benefit from their ability to meet their sustainability goals, helping them to sustain a positive public image while complying with environmental regulations. Cargo traffic into State ports could increase as a result. Utilities will benefit from increased sales of electricity for vehicles.
4.4 Opportunities for Drive System Cost Reduction TransPower believes that ElecTruck™ drive systems and components must be justified on economic grounds to achieve significant market acceptance. Over the last two decades, a number of alternative fuel technologies have penetrated the heavy‐duty vehicle markets solely due to their environmental benefits, including thousands of natural gas and hybrid vehicles.
However, today’s gasoline and diesel engines have dramatically lower emissions than they produced ten or twenty years ago, so the game is changing. In the long term, TransPower does not believe that EVs or hybrids will attract large subsidies or command high price premiums based on emissions reductions alone. Therefore, TransPower’s approach is to provide drive systems that enable vehicles to be acquired and operated for life‐cycle costs equal to or lower than the costs of owning conventional vehicles.
G-42
This is the primary reason TransPower is focusing on battery‐electric and battery‐dominant hybrid vehicles. The engine‐dominant hybrid vehicles commercialized to date typically do not offer significant economic benefits. They reduce fuel consumption, but generally only by 10 to 30 percent, which is not enough of a fuel saving for a typical user to recover the higher cost of the hybrid system. At the other end of the “EV spectrum,” a pure battery‐electric system eliminates all fuel consumption, maximizing operating savings. In addition to net energy savings, we believe that properly‐designed electric trucks will offer other major advantages that will quickly speed their adoption. In particular, electric trucks will have much less brake wear and will not require oil changes or engine tune‐ups. Quiet operation and ease of maintenance are examples of other key advantages of electric trucks. The flip side of the coin in this case is that many of the vehicle attributes that will enable electric trucks to offer significant operational cost savings also present issues that will increase the capital cost of these vehicles. The key to commercial success will be to reduce these capital costs to acceptable levels in the marketplace while preserving the expected operational cost savings. With these as our guiding principles, and incorporating the experience gained in building TransPower’s first generation electric trucks and tractors, TransPower has completed a design cost reduction assessment. An updated report on the results of this assessment is contained in the following subsections, organized by major subsystem.
4.4.1 Main Propulsion Subsystem Cost Reduction The ElecTruck™ main propulsion subsystem represents about 15 percent of the cost of the complete drive system. The MPS does not offer much opportunity for cost reduction because it is already a comparatively cost‐effective subsystem, based on the following considerations: Main drive motors – The Fisker main drive motors, more accurately “JJE/Fisker” motors because JJE is the name of the company in China that manufactures them. At the beginning of the electric drayage project, TransPower purchased these motors from Quantum, which added a steep markup. However, following the purchase of the 14 motors required for the electric drayage project, TransPower began purchasing these motors directly from JJE, at a price nearly 50 percent lower than the price TransPower previously paid to Quantum. Therefore, developing a direct relationship with JJE is already saving TransPower nearly five thousand dollars per drive system. During the EDD project, the cost of the two main drive motors represented about 40 percent of the cost of the MPS. With the lower prices currently being paid to JJE, the cost of the two motors is now about 30 percent of the cost of the MPS. TransPower is continuing to explore other possibilities for reducing motor costs, but as a share of the cost of the entire electric drive system, the current cost of buying two motors from JJE is actually a relatively small percentage – about 3‐4 percent.
Adapting a different motor design may offer the potential to save another few thousand dollars per drive system in the long term. Switched reluctance and brushless DC motors and other motors that eliminate expensive magnetic materials appear to have the potential to drive motor material costs down, but no such motors are in production today that can meet the performance requirements of Class 8 trucks. However, this would require a large up‐front
G-43
investment, at least on the order of $1 million and potentially significantly more, so these are not options for near term projects. Transmissions –With the recent reductions in TransPower’s cost for securing main drive motors, the Eaton transmission is now the highest cost element in the MPS, representing more than 40percent of its cost. TransPower does not see much likelihood of reducing this cost in the near future. These transmissions are already in high rates of production and Eaton’s pricing reflects this. The transmissions do have design features driven specifically by the requirements of internal combustion engines, and some of these features could potentially be removed from transmissions used in EVs such as TransPower’s. Toward the end of the electric drayage demo project, Eaton invited TransPower to support it on an R&D project to develop a version of its AMT that would eliminate unnecessary features and meet the requirements of EVs more cost‐effectively. However, the up‐front cost to design these features out of the motor are presently cost prohibitive. If this collaboration is successful, a transmission custom‐designed for heavy EVs could potentially become available within the next few years, for as much as $3,000‐4,000 less than the Eaton transmission, if produced in sufficient quantities.
Other MPS elements – The only other MPS element with a significant cost is the dual motor structure used to connect the two JJE/Fisker motors to each other and mount them to the transmission. These structural elements currently comprise about 12‐15 percent of the cost of the MPS. This cost could potentially be reduced by as much as $2,500 per MPS if the structures were forged instead of machined. This is a possibility for large scale production but would require prohibitive tooling costs for a small‐scale project such as the 7‐truck electric drayage demonstration program. MPS summary – In high rates of production, with changes to the designs of the motor and dual motor structure, the cost of the MPS could be reduced by as much as about one‐third, saving about $10,000 per drive system. In the nearer term, changes in how the JJE/Fisker motors are procured and modified, and location of a lower cost vendor for the dual motor structure, could potentially save as much as about $3,000 to $4,000 per vehicle. While none of these changes could be implemented for the project, the electric drayage design does represent a cost advantage over the dual motor design used in TransPower’s earlier prototype trucks, as the combining gearbox and mounting structure used on that vehicle cost about $5,000 more than the dual motor structure and shaft assembly designed for the electric drayage trucks. Combined with the cost reductions TransPower has achieved by developing a direct relationship with motor supplier JJE, future trucks will cost at least $10,000 less for MPS manufacturing than the first electric trucks TransPower built in 2011‐12.
4.4.2 Inverter-Charger Subsystem (ICU) Cost Reduction ICUs– ICUs originally used in the ElecTruck™ inverter‐charger subsystem represented about 25‐30 percent of the cost of the complete electric drive system, so they are a significant cost driver. Eliminating one ICU in favor of the RS‐12 inverter‐ only unit reduced the total cost of the inverter‐charger subsystem by about 12.5 percent. Additional cost reductions are being sought by improving the design of the ICU and transferring its manufacturing from EPC subcontractors to TransPower. Going forward, these changes are expected to save about $5,000 per ICU in small production quantities, and $10,000 per ICU in larger volumes.
G-44
TransPower expects that another $5,000 will be reduced from the price of purchasing the RS‐12 from EPC, as its production volumes increase. In total, TransPower expects the inverter‐charger subsystem to cost half as much in the future as it did for the first four electric drayage trucks, saving about $30,000 per vehicle.
4.4.3 Energy Storage Subsystem Cost Reduction The ESS is by far the most costly element of the ElecTruck™ drive system, representing approximately 50 percent of the total ElecTruck™ cost.
ESS battery cells – As might be expected, the cost of the ElecTruck™ ESS is driven by the cost of the battery cells used the ESS. TransPower has addressed this cost and achieved some cost reductions for the electric drayage project by finding suppliers offering the lowest cell cost (measured in cost per kWh of cell capacity). Even with these cells procured for the comparatively low price of about $340/kWh, the cells still represent about 40 percent of the total cost of the ElecTruck™ drive system. Experts differ on whether costs of lithium and other high‐ power batteries can fall much further, but some believe that cells will eventually become available for $200/kWh or less. TransPower is exploring the possibility of manufacturing the new Yinhe cells being tested in EDD‐1 in the U.S., under license to Yinhe. This could enable TransPower to get down to the $200/kWh cell cost, which would save about $30,000 for each EDD‐class electric drive system. BMS – TransPower has reduced BMS costs by locating lower cost manufacturers of sensor/balancing boards used in its Cell‐Saver™ BMS. TransPower is also developing software that will enable elimination of the central BMS controller it presently buys from EPC at a price of about $1,750 per vehicle – which costs about another $2,000 for TransPower to install. As BMS production volumes increase, TransPower expects these steps to eventually reduce the cost of the complete Cell‐Saver™ BMS from the initial cost of about $16,000 for EDD‐2 to a total of less than $5,000 per truck in low volumes, and potentially to as low as $1,500/truck in very high volumes. Battery support structures – Battery support structures remain a major ESS cost item, as their total cost exceeds $10,000, representing more than 10 percent of the cost of the ESS and about 5 percent of the cost of the entire drive system. These structures are expensive because in low production volumes they are welded rather than stamped or forged. Going into higher production volumes, the cost of these elements should be reduced by at least 50 percent, saving a minimum of $5,000. Other ESS elements – Bus bars, cables, connectors, and other miscellaneous ESS items add about another $5,000 in costs for each ESS. TransPower believes this cost can be reduced to about $1,000 to $2,000 in higher production volumes.
4.4.4 PCAS Cost Reduction The PCAS, excluding the ICU and RS‐12, represents about 10 percent of the hardware cost of the ElecTruck™ drive system, and there is the potential to reduce this cost by $5,000 to $10,000 as production volumes increase. There is also the potential to reduce the TransPower
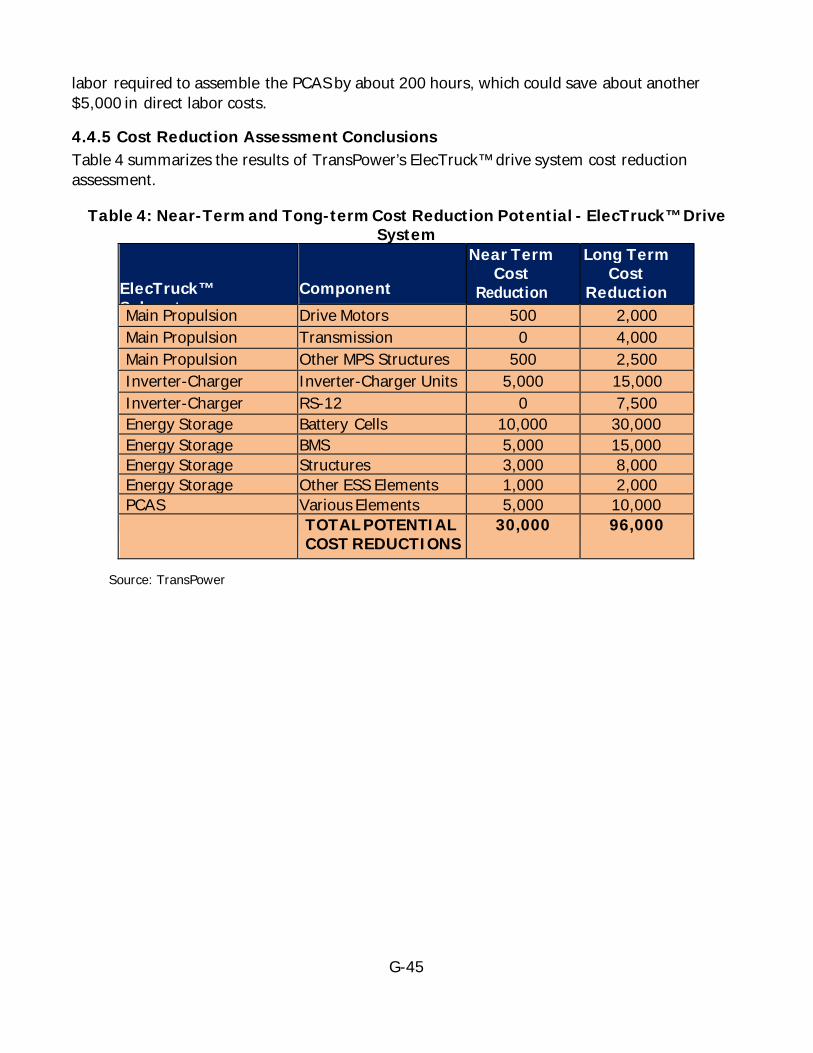
G-45
labor required to assemble the PCAS by about 200 hours, which could save about another $5,000 in direct labor costs.
4.4.5 Cost Reduction Assessment Conclusions Table 4 summarizes the results of TransPower’s ElecTruck™ drive system cost reduction assessment.
Table 4: Near-Term and Tong-term Cost Reduction Potential - ElecTruck™ Drive System
ElecTruck™ Subsystem
Component
Near Term Cost
Reduction
Long Term Cost
Reduction Main Propulsion Drive Motors 500 2,000
Main Propulsion Transmission 0 4,000 Main Propulsion Other MPS Structures 500 2,500 Inverter-Charger Inverter-Charger Units 5,000 15,000 Inverter-Charger
RS-12 0 7,500 Energy Storage Battery Cells 10,000 30,000
Energy Storage BMS 5,000 15,000 Energy Storage Structures 3,000 8,000 Energy Storage Other ESS Elements 1,000 2,000 PCAS Various Elements 5,000 10,000 TOTAL POTENTIAL
COST REDUCTIONS 30,000 96,000
Source: TransPower
G-46
CHAPTER 5: Conclusions and Recommendations
The electric drayage demo project sought to achieve major technology advances in two key areas: (1) vehicle control and integration and (2) advanced energy storage. The project not only made major advances in these two areas, but also achieved significant advances in the area of EV propulsion, and moderate advances in several other technology areas. Specific accomplishments that are particularly noteworthy include:
• Demonstration and refinement of an advanced inverter that can also serve as a high power onboard battery charger.
• Development and demonstration of an improved method of providing the high tractive power (300 kW) peak required for large vehicles, using a combination of two smaller, mass‐produced motors that greatly reduces the cost of achieving this performance level.
• Demonstration and refinement of a unique AMT that provides a blend of improved road performance and higher operating efficiency than automatic transmissions.
• Development of advanced battery management software and hardware, enabling low‐cost batteries to be used safely and effectively in demanding road vehicle applications.
• Evaluation and characterization of several different sizes of lithium‐ion batteries, providing valuable insights into which battery sizes work best in vehicle applications.
• Attraction of several millions of dollars in additional funding to demonstration projects that will field trucks and tractors using TransPower’s ElecTruck™ drive system over the next two years.
During the course of the project, TransPower successfully built and tested fully functional electric Class 8 trucks to further the development of its pioneering ElecTruck™ drive system. Following 20 months of design and initial prototype development, TransPower deployed the first electric drayage truck using an initial variant of the ElecTruck™ drive system which provided many lessons learned during assembly and testing, enabling TransPower to pursue many improvements in the ElecTruck™ drive system as the next six trucks were built and deployed between August 2014 and the end of 2015. The combined effect of electric drayage technology advances is expected to have a transformative effect on the heavy‐duty vehicle industry. As of the date of this report, TransPower is engaged in the testing of a third generation ElecTruck™ drive system design, reflecting lessons learned during assembly and initial testing of EDD‐2 on this project, which is reflected in EDD‐5, EDD‐6, and EDD‐7. TransPower recommends continued funding for development and demonstration of electric and hybrid‐electric propulsion technologies for heavy‐duty vehicles, with emphasis on helping to fund the ramp‐up to large scale commercial manufacturing and deployment. Key areas of research and development that require additional support include:
G-47
• Continued evaluation and characterization of advanced battery chemistries, with specific emphasis on testing cells in real‐world vehicle applications.
• Continued development of advanced battery monitoring and battery management technologies.
• Development of low cost electric motor technologies capable of handling the power and torque requirements of heavy‐duty trucks.
• Continued evolution of vehicle control and diagnostic capabilities. • Further development of various means of extending the operating range of battery‐EVs,
including use of battery‐dominant hybrid systems using various types of internal combustion engines, micro turbines, and fuel cells.
• Support for development of manufacturing facilities capable of producing electric and hybrid‐EV components on a larger scale, including development of vertically integrated manufacturing facilities that can combine component manufacturing with integration of vehicle subsystems and integration of components and subsystems into medium and heavy‐duty vehicles.
• Accumulation of a large number of miles of “real world” experience in the operation of large trucks and other vehicles using battery‐electric and battery‐ dominant hybrid‐electric propulsion technologies.
• Exploration of opportunities to enhance the value proposition for operation of EVs, including provision of vehicle‐to‐grid ancillary services and the use of vehicle batteries for stationary energy storage applications following the end of the useful lives of batteries in vehicle applications.
TransPower is grateful for the support of the CEC for the electric drayage demonstration project, and is confident that this investment will yield large and increasing dividends in the years to come.
H-1
APPENDIX H: Volvo: Demonstration of Plug-in Hybrid Electric Trucks in Port Drayage Operation
Prepared for: California Energy Commission
Prepared by: Volvo Technology of America
Gavin Newsom, Governor
H-2
Pascal Amar Primary Author
Volvo Technology of America 7900 National Service Rd Greensboro, NC (336) 393-2000 www.volvogroup.com
Disclaimer Staff members of the California Energy Commission prepared this report. As such, it does not necessarily represent the views of the Energy Commission, its employees, or the State of California. The Energy Commission, the State of California, its employees, contractors and subcontractors make no warrant, express or implied, and assume no legal liability for the information in this report; nor does any party represent that the uses of this information will not infringe upon privately owned rights. This report has not been approved or disapproved by the Energy Commission nor has the Commiss ion passed upon the accuracy or adequacy of the information in this report.
H-3
TABLE OF CONTENTS Page
Table of Contents ....................................................................................................... H-3 List of Figures ............................................................................................................ H-3 List of Tables ............................................................................................................. H-4 Execuive Summary ..................................................................................................... H-5 CHAPTER 1: Technical Description of the Trucks ........................................................... H-6 CHAPTER 2: Customer Field Testing and Demonstration .............................................. H-25 CHAPTER 3: Conclusions and Lessons Learned ........................................................... H-36 APPENDIX A: Detailed PEMS testing data ................................................................... H-38
LIST OF FIGURES
Page Figure 1: Truck#1 ....................................................................................................... H-6 Figure 2: Typical Energy Analysis for Drayage Truck on Local Haul Cycle ........................... H-8 Figure 3: Truck#1 Integrated Thermal Management, Final Layout .................................. H-11 Figure 4: Air Production Calculation for Transmission-Mounted Air Compressor ................ H-13 Figure 5: Implementation of the Energy Management Panel .......................................... H-14 Figure 6: Overview of ZE Technologies Retrofitted onto Truck#1 .................................... H-16 Figure 7: Truck#2 ..................................................................................................... H-17 Figure 8: Truck#2 Integrated Thermal Management ..................................................... H-19 Figure 9: One of the Dynamic Geofence Maps – Green areas are ZE zones ...................... H-21 Figure 10: Driver Display Showing Driveline Mode Status............................................... H-22 Figure 11: Overview of ZE Technologies Retrofitted onto Truck#2 .................................. H-24 Figure 12: View of Parking Spot near Charging Station .................................................. H-25 Figure 13: Chart Showing Operational Characteristics.................................................... H-26 Figure 14: Operational Characteristics on March 1 ........................................................ H-27 Figure 15: Picture of Truck#1 ..................................................................................... H-28 Figure 16: Distribution of Gross Vehicle Weight (per 10,000 lbs.) during Demonstration of Truck#1................................................................................................................... H-30 Figure 17: Summary of Daily Fuel Consumption during Truck#1 Demonstration (in Gallons)H-30 Figure 18: DC/DC Converter Temperature during Demonstration of Truck#1 (top) and Truck#2 (bottom).................................................................................................................. H-31

H-4
Figure 19: Average Distribution of Operation Modes during Drayage: Truck#1 Top and Truck#2 Bottom .................................................................................................................... H-32 .............................................................................................................................. H-32 Figure 20: Truck Equipped with Emissions Testing Equipment ........................................ H-34 Figure 21: Average Vehicle Speed during PEMs Testing ................................................. H-38 Figure 22: Average Distance Travelled during PEMs Testing ........................................... H-38 Figure 23: Cumulative Cyclic Engine Work during PEMs Testing ...................................... H-39 Figure 24: Cumulative Cyclic Fuel Economy during PEMs Testing .................................... H-39 Figure 25: Cyclic CO2 Emissions during PEMs Testing (g/mile) ....................................... H-40 Figure 26: Cyclic CO2 Emissions during PEMs Testing (g/bhp-hr) .................................... H-40 Figure 27: Cyclic NOx Emissions during PEMs Testing (g/mile) ....................................... H-41 Figure 28: Cyclic NOx Emissions during PEMs Testing (g/bhp-hr) .................................... H-41
LIST OF TABLES
Page Table 1: Truck#1 Hybrid Driveline Components .............................................................. H-7 Table 2: Truck#1 Auxiliary Systems ............................................................................... H-8 Table 3: Power Saving Potential with LED Headlamp ....................................................... H-9 Table 4: Truck#2 Hybrid Driveline Components ............................................................ H-18 Table 5: Truck#2 Auxiliary Systems ............................................................................. H-18 Table 6: Sample Shift Summary from Truck Operation Analysis Tool ................................ H-29 Table 7: Specification of Trucks used for PEMs Testing .................................................. H-33
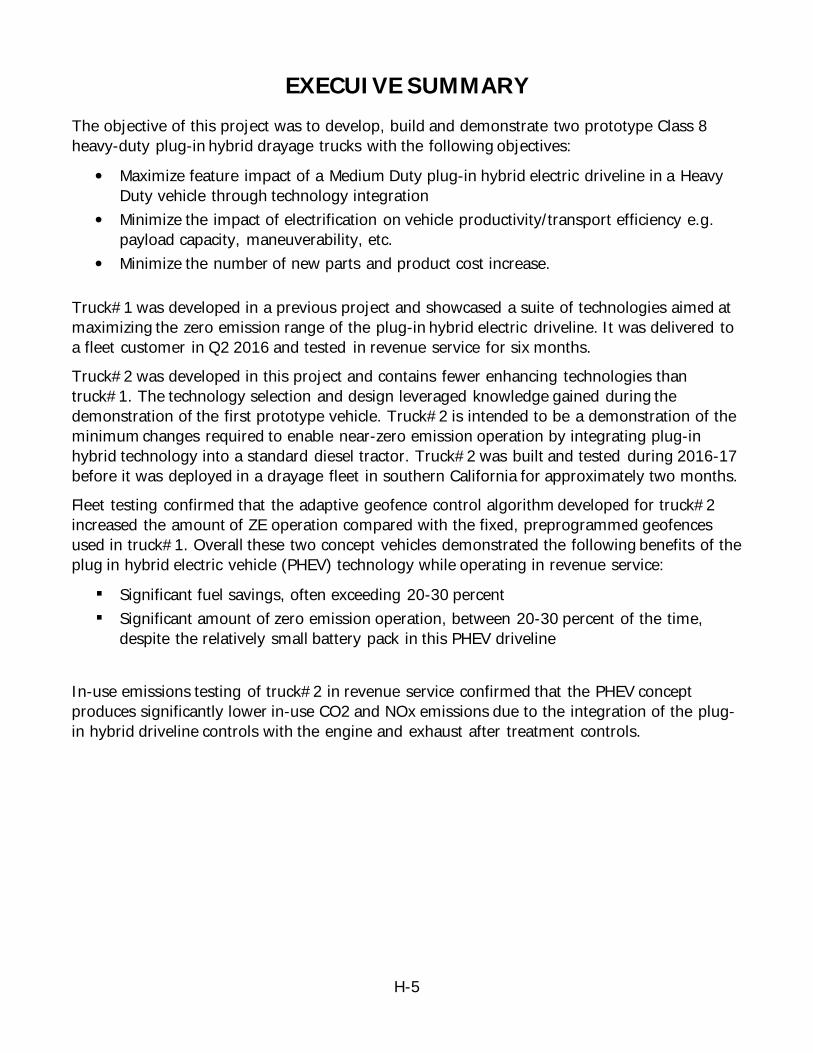
H-5
EXECUIVE SUMMARY The objective of this project was to develop, build and demonstrate two prototype Class 8 heavy-duty plug-in hybrid drayage trucks with the following objectives:
• Maximize feature impact of a Medium Duty plug-in hybrid electric driveline in a Heavy Duty vehicle through technology integration
• Minimize the impact of electrification on vehicle productivity/transport efficiency e.g. payload capacity, maneuverability, etc.
• Minimize the number of new parts and product cost increase.
Truck#1 was developed in a previous project and showcased a suite of technologies aimed at maximizing the zero emission range of the plug-in hybrid electric driveline. It was delivered to a fleet customer in Q2 2016 and tested in revenue service for six months. Truck#2 was developed in this project and contains fewer enhancing technologies than truck#1. The technology selection and design leveraged knowledge gained during the demonstration of the first prototype vehicle. Truck#2 is intended to be a demonstration of the minimum changes required to enable near-zero emission operation by integrating plug-in hybrid technology into a standard diesel tractor. Truck#2 was built and tested during 2016-17 before it was deployed in a drayage fleet in southern California for approximately two months. Fleet testing confirmed that the adaptive geofence control algorithm developed for truck#2 increased the amount of ZE operation compared with the fixed, preprogrammed geofences used in truck#1. Overall these two concept vehicles demonstrated the following benefits of the plug in hybrid electric vehicle (PHEV) technology while operating in revenue service: Significant fuel savings, often exceeding 20-30 percent Significant amount of zero emission operation, between 20-30 percent of the time,
despite the relatively small battery pack in this PHEV driveline In-use emissions testing of truck#2 in revenue service confirmed that the PHEV concept produces significantly lower in-use CO2 and NOx emissions due to the integration of the plug-in hybrid driveline controls with the engine and exhaust after treatment controls.
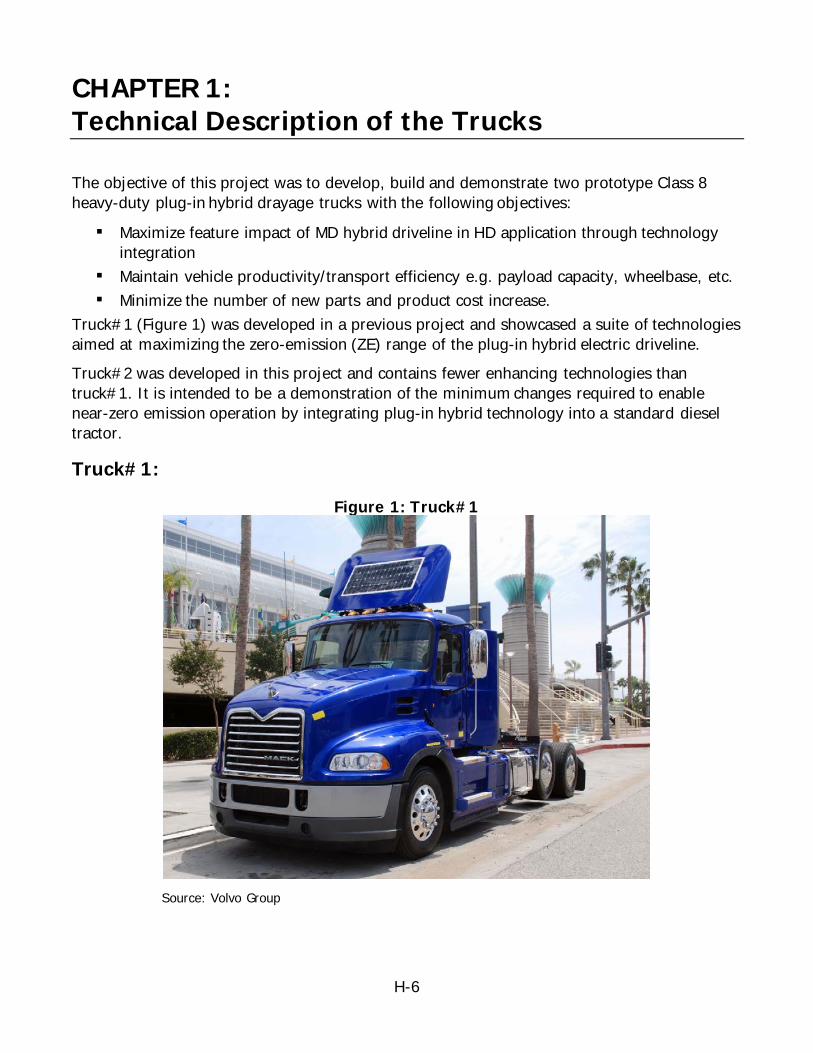
H-6
CHAPTER 1: Technical Description of the Trucks
The objective of this project was to develop, build and demonstrate two prototype Class 8 heavy-duty plug-in hybrid drayage trucks with the following objectives: Maximize feature impact of MD hybrid driveline in HD application through technology
integration Maintain vehicle productivity/transport efficiency e.g. payload capacity, wheelbase, etc. Minimize the number of new parts and product cost increase.
Truck#1 (Figure 1) was developed in a previous project and showcased a suite of technologies aimed at maximizing the zero-emission (ZE) range of the plug-in hybrid electric driveline. Truck#2 was developed in this project and contains fewer enhancing technologies than truck#1. It is intended to be a demonstration of the minimum changes required to enable near-zero emission operation by integrating plug-in hybrid technology into a standard diesel tractor.
Truck#1:
Figure 1: Truck#1
Source: Volvo Group
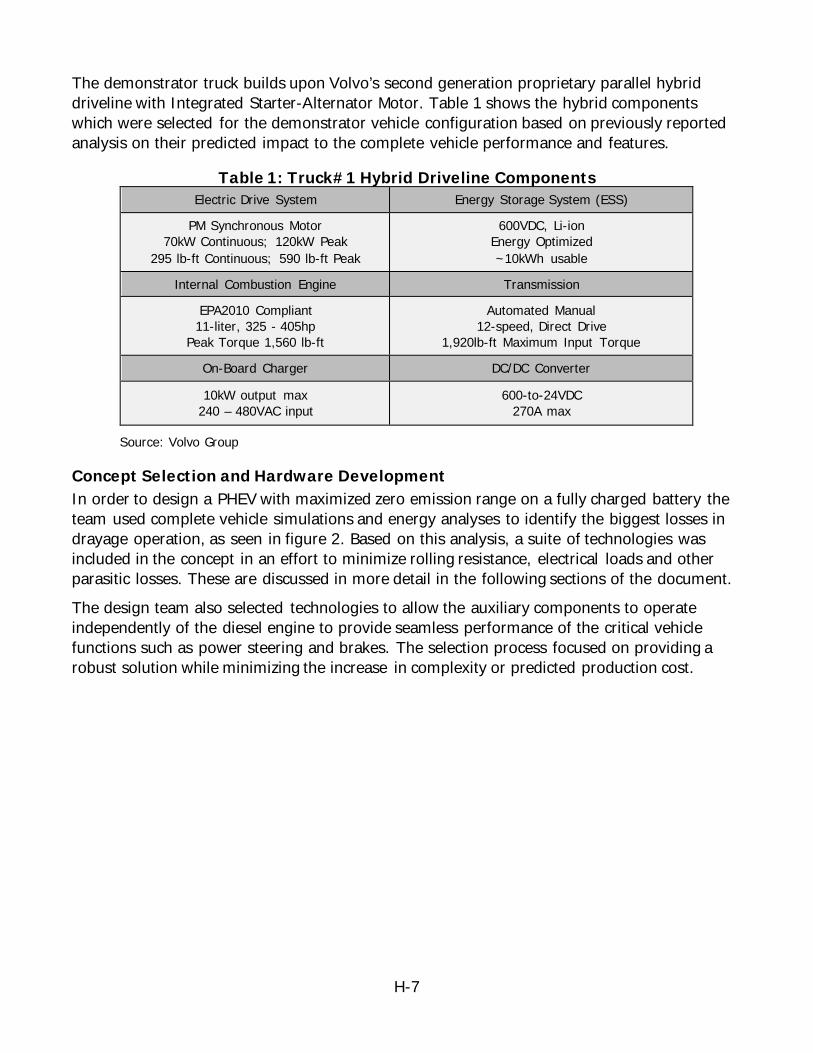
H-7
The demonstrator truck builds upon Volvo’s second generation proprietary parallel hybrid driveline with Integrated Starter-Alternator Motor. Table 1 shows the hybrid components which were selected for the demonstrator vehicle configuration based on previously reported analysis on their predicted impact to the complete vehicle performance and features.
Table 1: Truck#1 Hybrid Driveline Components Electric Drive System Energy Storage System (ESS)
PM Synchronous Motor 70kW Continuous; 120kW Peak
295 lb-ft Continuous; 590 lb-ft Peak
600VDC, Li-ion Energy Optimized ~10kWh usable
Internal Combustion Engine Transmission
EPA2010 Compliant 11-liter, 325 - 405hp
Peak Torque 1,560 lb-ft
Automated Manual 12-speed, Direct Drive
1,920lb-ft Maximum Input Torque
On-Board Charger DC/DC Converter
10kW output max 240 – 480VAC input
600-to-24VDC 270A max
Source: Volvo Group
Concept Selection and Hardware Development In order to design a PHEV with maximized zero emission range on a fully charged battery the team used complete vehicle simulations and energy analyses to identify the biggest losses in drayage operation, as seen in figure 2. Based on this analysis, a suite of technologies was included in the concept in an effort to minimize rolling resistance, electrical loads and other parasitic losses. These are discussed in more detail in the following sections of the document. The design team also selected technologies to allow the auxiliary components to operate independently of the diesel engine to provide seamless performance of the critical vehicle functions such as power steering and brakes. The selection process focused on providing a robust solution while minimizing the increase in complexity or predicted production cost.
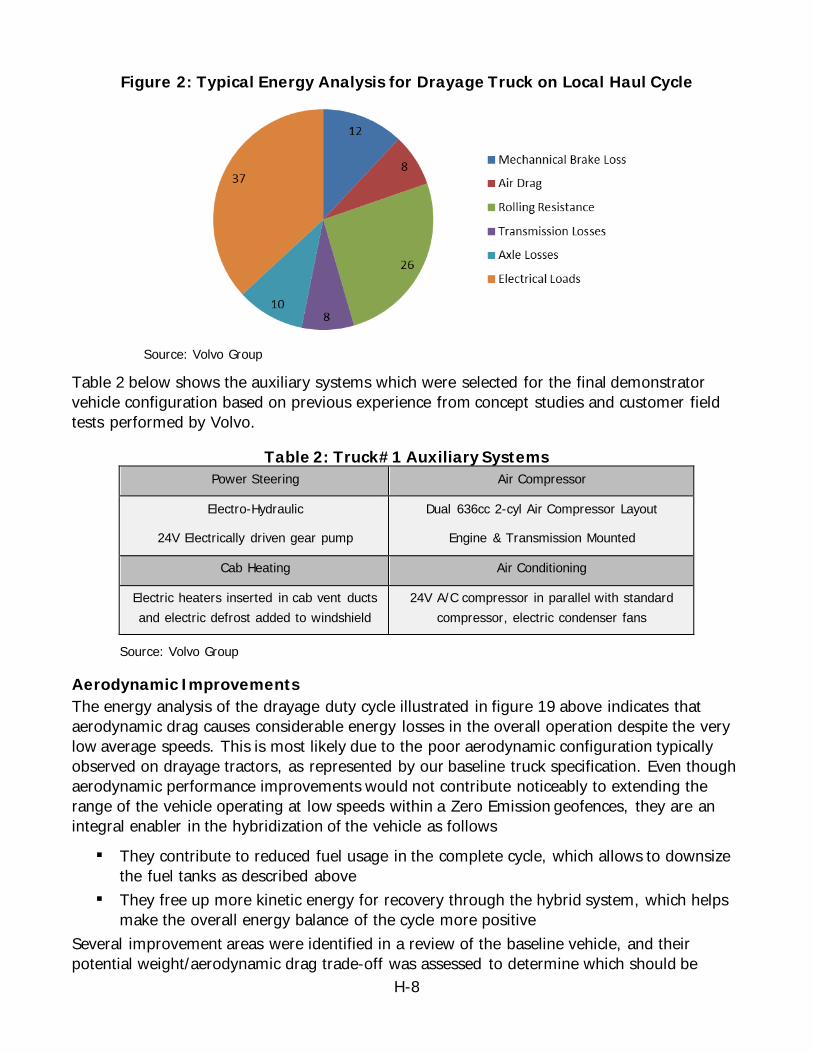
H-8
Figure 2: Typical Energy Analysis for Drayage Truck on Local Haul Cycle
Source: Volvo Group
Table 2 below shows the auxiliary systems which were selected for the final demonstrator vehicle configuration based on previous experience from concept studies and customer field tests performed by Volvo.
Table 2: Truck#1 Auxiliary Systems Power Steering Air Compressor
Electro-Hydraulic
24V Electrically driven gear pump
Dual 636cc 2-cyl Air Compressor Layout
Engine & Transmission Mounted
Cab Heating Air Conditioning
Electric heaters inserted in cab vent ducts and electric defrost added to windshield
24V A/C compressor in parallel with standard compressor, electric condenser fans
Source: Volvo Group
Aerodynamic Improvements The energy analysis of the drayage duty cycle illustrated in figure 19 above indicates that aerodynamic drag causes considerable energy losses in the overall operation despite the very low average speeds. This is most likely due to the poor aerodynamic configuration typically observed on drayage tractors, as represented by our baseline truck specification. Even though aerodynamic performance improvements would not contribute noticeably to extending the range of the vehicle operating at low speeds within a Zero Emission geofences, they are an integral enabler in the hybridization of the vehicle as follows They contribute to reduced fuel usage in the complete cycle, which allows to downsize
the fuel tanks as described above They free up more kinetic energy for recovery through the hybrid system, which helps
make the overall energy balance of the cycle more positive Several improvement areas were identified in a review of the baseline vehicle, and their potential weight/aerodynamic drag trade-off was assessed to determine which should be
H-9
deployed on the concept vehicle. The aerodynamic enhancements that were installed on the vehicle include new bumper ground effects, new wheel well enclosure, front chassis fairings, wheel covers, D-shaped fuel tank, recirculation shield around the front radiator, cab side deflectors, low profile roof marker lights, removal of the air horn from the roof, and an adjustable roof fairing.
Rolling Resistance Third party analysis of drayage operation shows that over 75 percent of the drayage trip transaction types (trip “legs”) would only require two axles (in-lieu-of three) on the tractor unit to carry the load. Furthermore many “loaded” trips, depending on the container weight, may not require all three axles on the tractor as well. A 6x2 axle configuration with liftable “pusher” auxiliary axle was therefore chosen to reduce axle losses. The auxiliary axle is only deployed when dictated by vehicle load requirements, thereby reducing rolling resistance when only utilizing two axles instead of three. As an additional benefit this non-driven “pusher” axle can provide a more stable vehicle and better load distribution than the more common non-driven “tag” (rear-of-drive axle) 6x2 axle configuration.
Weight Reduction The hybrid components add approximately 1,700 lb. to the truck when compared to a typical drayage tractor. In order to prevent this curb weight increase from reducing payload capacity or increase energy consumption, the team explored changes that could offset the weight of the hybrid components. Several lightweight alternatives were identified in the list of customer options available for production such as aluminum fifth wheel, aluminum fuel and air tanks, aluminum cross members and wheels, and aluminum rear carrier housing. The incremental cost associated with these modifications was factored into the final cost/benefit calculation for the concept. The most significant weight reduction came from the conversion from a 6x4 to a 6x2 axle configuration, the switch from double wheels to wide base single wheels on the rear axles, and the optimization of the fuel tank size thanks for drayage operation.
All of these improvements added up almost exactly to the weight of the hybrid components, and all were included in the demonstrator vehicle. The curb weight of the final vehicle is approximately 18,000 lb., which is slightly higher than the base vehicle as a result of the weight increase from other vehicle improvements including aerodynamic enhancements and modification of auxiliary systems. This first concept vehicle does however contain several redundant systems for reliability reasons and does not accurately represent the exact weight of a mature hybrid vehicle.
Parasitic Electrical Consumption Exterior lighting is one of the main electrical loads on a day-cab tractor especially if the headlamps are used, which is expected to be typical in drayage operation. Therefore, the team is partnering with Grote to demonstrate a high-efficiency LED light engine, which will replace the incandescent baseline headlamps. Table 3 below shows a breakdown of the energy savings possible with this retrofit.
Table 3: Power Saving Potential with LED Headlamp
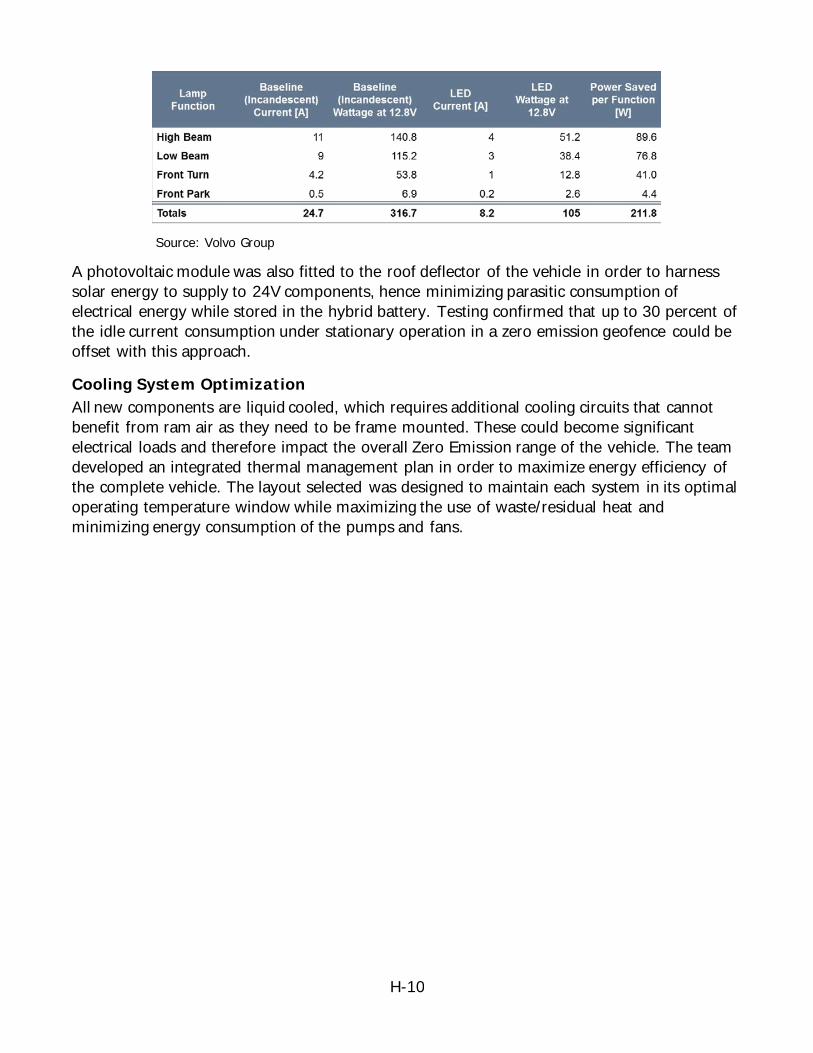
H-10
Source: Volvo Group
A photovoltaic module was also fitted to the roof deflector of the vehicle in order to harness solar energy to supply to 24V components, hence minimizing parasitic consumption of electrical energy while stored in the hybrid battery. Testing confirmed that up to 30 percent of the idle current consumption under stationary operation in a zero emission geofence could be offset with this approach.
Cooling System Optimization All new components are liquid cooled, which requires additional cooling circuits that cannot benefit from ram air as they need to be frame mounted. These could become significant electrical loads and therefore impact the overall Zero Emission range of the vehicle. The team developed an integrated thermal management plan in order to maximize energy efficiency of the complete vehicle. The layout selected was designed to maintain each system in its optimal operating temperature window while maximizing the use of waste/residual heat and minimizing energy consumption of the pumps and fans.
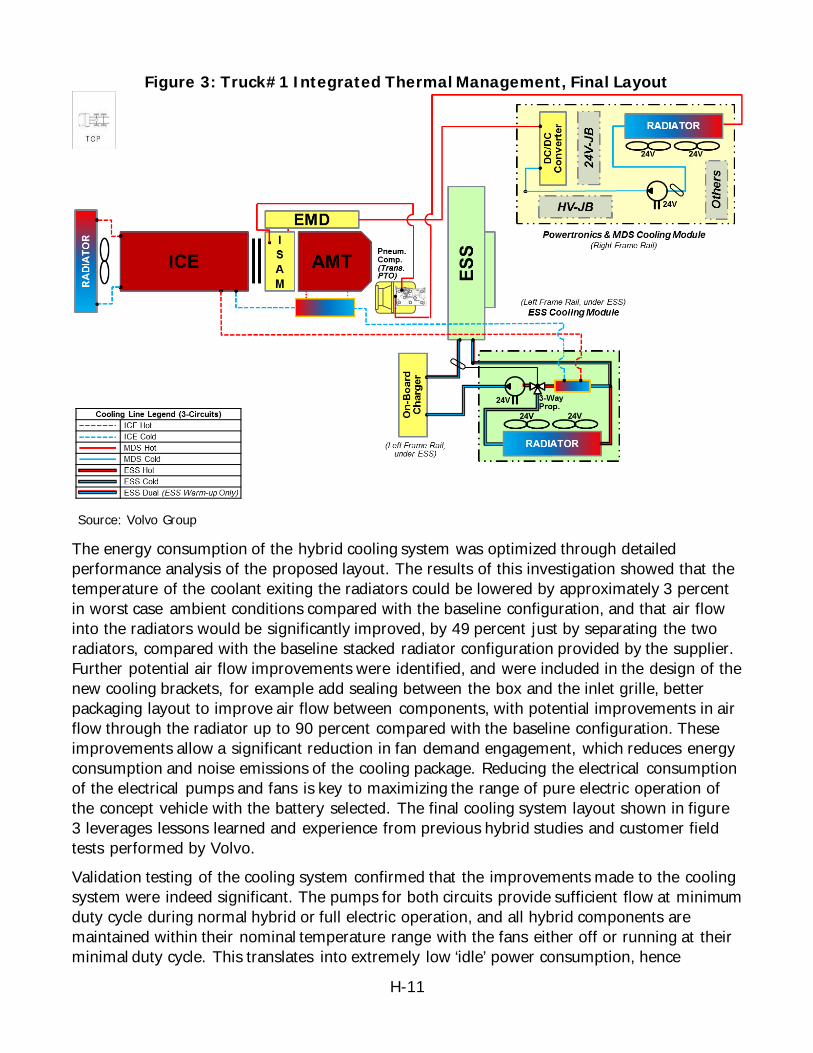
H-11
Figure 3: Truck#1 Integrated Thermal Management, Final Layout
Source: Volvo Group
The energy consumption of the hybrid cooling system was optimized through detailed performance analysis of the proposed layout. The results of this investigation showed that the temperature of the coolant exiting the radiators could be lowered by approximately 3 percent in worst case ambient conditions compared with the baseline configuration, and that air flow into the radiators would be significantly improved, by 49 percent just by separating the two radiators, compared with the baseline stacked radiator configuration provided by the supplier. Further potential air flow improvements were identified, and were included in the design of the new cooling brackets, for example add sealing between the box and the inlet grille, better packaging layout to improve air flow between components, with potential improvements in air flow through the radiator up to 90 percent compared with the baseline configuration. These improvements allow a significant reduction in fan demand engagement, which reduces energy consumption and noise emissions of the cooling package. Reducing the electrical consumption of the electrical pumps and fans is key to maximizing the range of pure electric operation of the concept vehicle with the battery selected. The final cooling system layout shown in figure 3 leverages lessons learned and experience from previous hybrid studies and customer field tests performed by Volvo. Validation testing of the cooling system confirmed that the improvements made to the cooling system were indeed significant. The pumps for both circuits provide sufficient flow at minimum duty cycle during normal hybrid or full electric operation, and all hybrid components are maintained within their nominal temperature range with the fans either off or running at their minimal duty cycle. This translates into extremely low ‘idle’ power consumption, hence
H-12
preserving energy from the battery for propulsion and maximizing the range of full electric operation.
Electro-Hydraulic Power Steering The power-steering concept consists of an Electro-Hydraulic system which replaces the baseline mechanically driven gear pump. This solution not only provides power steering seamlessly between Hybrid and Zero Emission operation, it also provides energy savings compared with the conventional engine-driven system thanks to active hydraulic flow control. A prototype was delivered in January 2014 and was installed in the vehicle. It operates seamlessly between hybrid and full electric operation, and test drivers have been positively impressed with the overall performance of the system compared with conventional mechanically driven power steering pumps. Even though the system is an early prototype and hasn’t been optimized specifically for drayage operation it has demonstrated minimal power consumption at idle conditions, which confirms the assumptions made during the selection of this technology.
Air Compressor After confirming that the predicted performance of our proposed system matched the demanding requirements of the drayage application due to frequent stops and trailer connections we selected a 636cc, 2-cylinder compressor currently available on our commercial trucks as a base for the auxiliary system. A countershaft power take-off speed ratio of 1:1 to 1.3:1 was selected in order to achieve compressor speeds similar to those observed on the standard engine-mounted compressors in the range of engine speed typical of cruise conditions regardless of gear ratio at a given vehicle speed, as shown in figure 4.
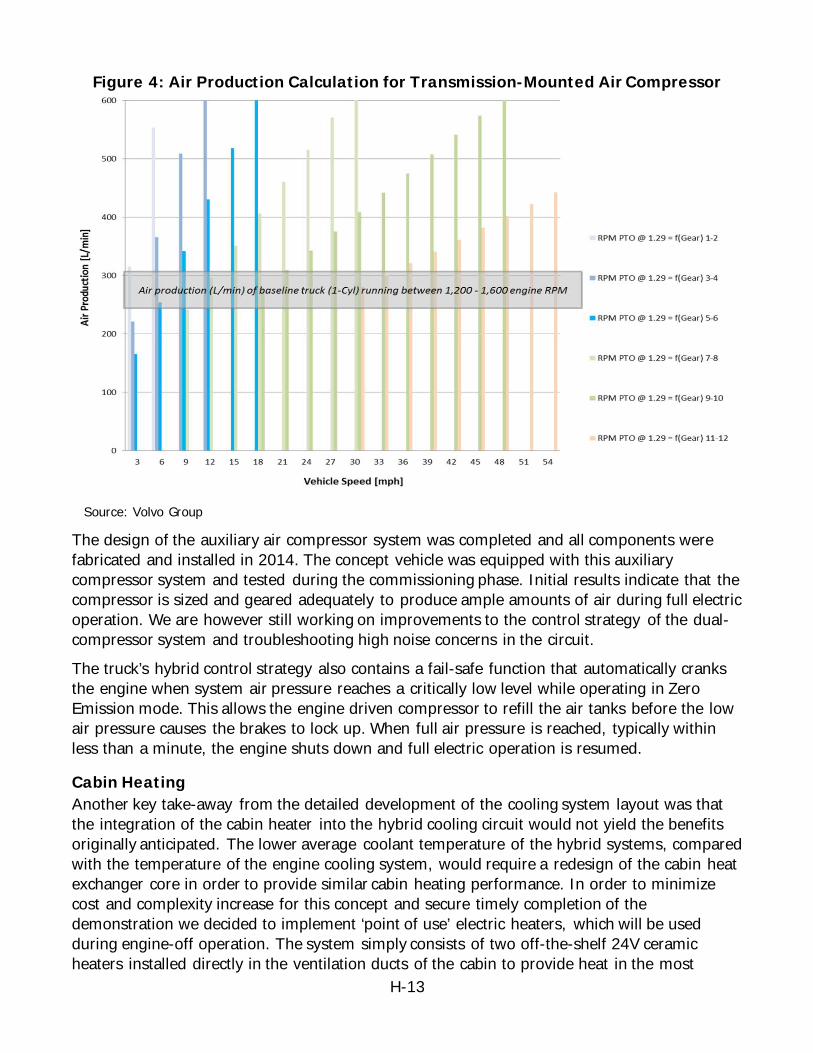
H-13
Figure 4: Air Production Calculation for Transmission-Mounted Air Compressor
Source: Volvo Group
The design of the auxiliary air compressor system was completed and all components were fabricated and installed in 2014. The concept vehicle was equipped with this auxiliary compressor system and tested during the commissioning phase. Initial results indicate that the compressor is sized and geared adequately to produce ample amounts of air during full electric operation. We are however still working on improvements to the control strategy of the dual-compressor system and troubleshooting high noise concerns in the circuit. The truck’s hybrid control strategy also contains a fail-safe function that automatically cranks the engine when system air pressure reaches a critically low level while operating in Zero Emission mode. This allows the engine driven compressor to refill the air tanks before the low air pressure causes the brakes to lock up. When full air pressure is reached, typically within less than a minute, the engine shuts down and full electric operation is resumed.
Cabin Heating Another key take-away from the detailed development of the cooling system layout was that the integration of the cabin heater into the hybrid cooling circuit would not yield the benefits originally anticipated. The lower average coolant temperature of the hybrid systems, compared with the temperature of the engine cooling system, would require a redesign of the cabin heat exchanger core in order to provide similar cabin heating performance. In order to minimize cost and complexity increase for this concept and secure timely completion of the demonstration we decided to implement ‘point of use’ electric heaters, which will be used during engine-off operation. The system simply consists of two off-the-shelf 24V ceramic heaters installed directly in the ventilation ducts of the cabin to provide heat in the most

H-14
critical vents (driver feet and windshield diffuser) when the defrost switch is activated. This approach is successfully used in passenger cars today, and our experience in this project proved that cost and complexity of this implementation were minimal.
Cabin Cooling In order to provide seamless air conditioning to the driver while inside or outside of a Zero Emission geofences we selected a hybrid dual-compressor solution. The goal of this approach was to minimize the number of new components as well as utilize the existing A/C system whenever possible in order to minimize electrical energy consumption. The components highlighted in blue are the only additions required to the existing system. Since the electric part of the A/C system is only required to provide cooling performance while in geofences we were able to downsize the compressor. This allowed us to select a 24V component which does not require additional power electronics, and can easily be packaged within the cab.
The complete system was tested on bench and showed very positive energy consumption and cooling performance figures. The components were assembled by the supplier upon completion of bench testing, and the unit was installed in the vehicle.
Zero Emission Mode Control The simulation studies performed early in the design phase identified significant potential benefits from the implementation of geofences to determine Zero Emission areas. This approach led to the need to develop of a new driver interface, the Energy Management Panel, which allows the driver to define multiple geofences where Zero Emission operation is required or desired, and request pure electric operation if needed while outside of pre-defined geofences. The Energy Management Panel concept is illustrated in figure 5.
Figure 5: Implementation of the Energy Management Panel
Source: Volvo Group
The system is implemented using a rapid prototyping approach in order to minimize cost and allow for quick development loops of the functionality. It consists of a Microsoft tablet mounted on the dashboard which communicates with the embedded driveline software using
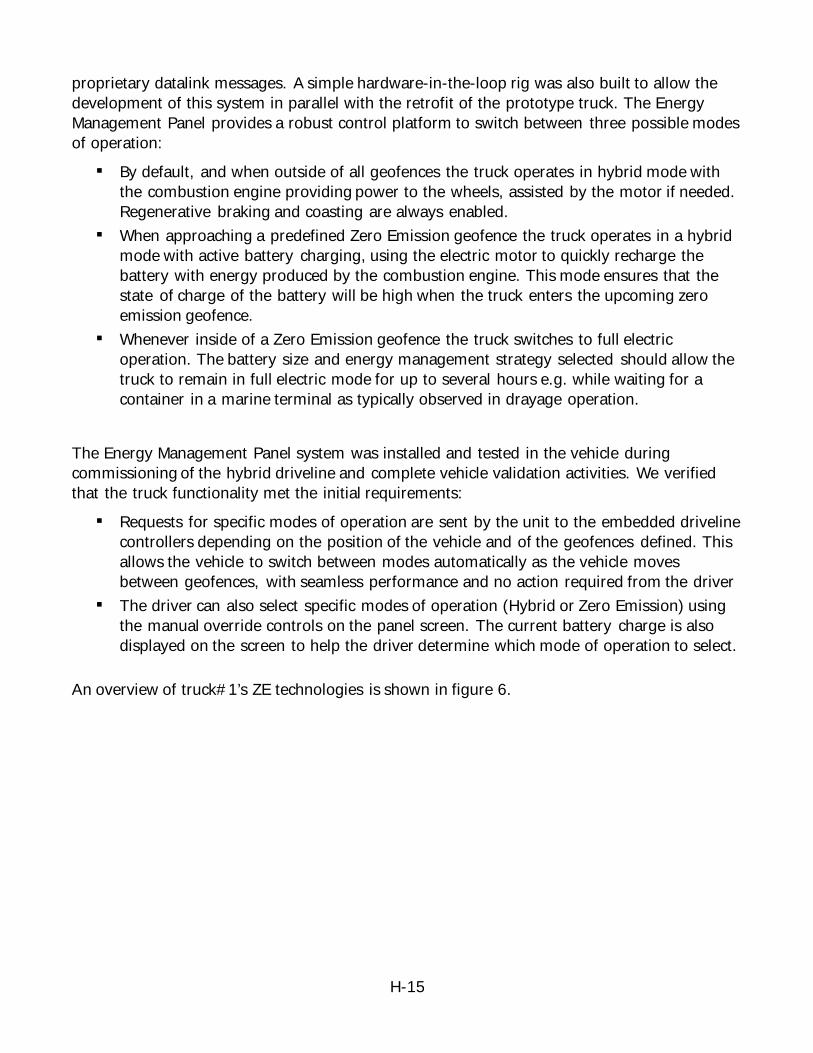
H-15
proprietary datalink messages. A simple hardware-in-the-loop rig was also built to allow the development of this system in parallel with the retrofit of the prototype truck. The Energy Management Panel provides a robust control platform to switch between three possible modes of operation: By default, and when outside of all geofences the truck operates in hybrid mode with
the combustion engine providing power to the wheels, assisted by the motor if needed. Regenerative braking and coasting are always enabled.
When approaching a predefined Zero Emission geofence the truck operates in a hybrid mode with active battery charging, using the electric motor to quickly recharge the battery with energy produced by the combustion engine. This mode ensures that the state of charge of the battery will be high when the truck enters the upcoming zero emission geofence.
Whenever inside of a Zero Emission geofence the truck switches to full electric operation. The battery size and energy management strategy selected should allow the truck to remain in full electric mode for up to several hours e.g. while waiting for a container in a marine terminal as typically observed in drayage operation.
The Energy Management Panel system was installed and tested in the vehicle during commissioning of the hybrid driveline and complete vehicle validation activities. We verified that the truck functionality met the initial requirements: Requests for specific modes of operation are sent by the unit to the embedded driveline
controllers depending on the position of the vehicle and of the geofences defined. This allows the vehicle to switch between modes automatically as the vehicle moves between geofences, with seamless performance and no action required from the driver
The driver can also select specific modes of operation (Hybrid or Zero Emission) using the manual override controls on the panel screen. The current battery charge is also displayed on the screen to help the driver determine which mode of operation to select.
An overview of truck#1’s ZE technologies is shown in figure 6.

H-16
Figure 6: Overview of ZE Technologies Retrofitted onto Truck#1
Source: Volvo Group
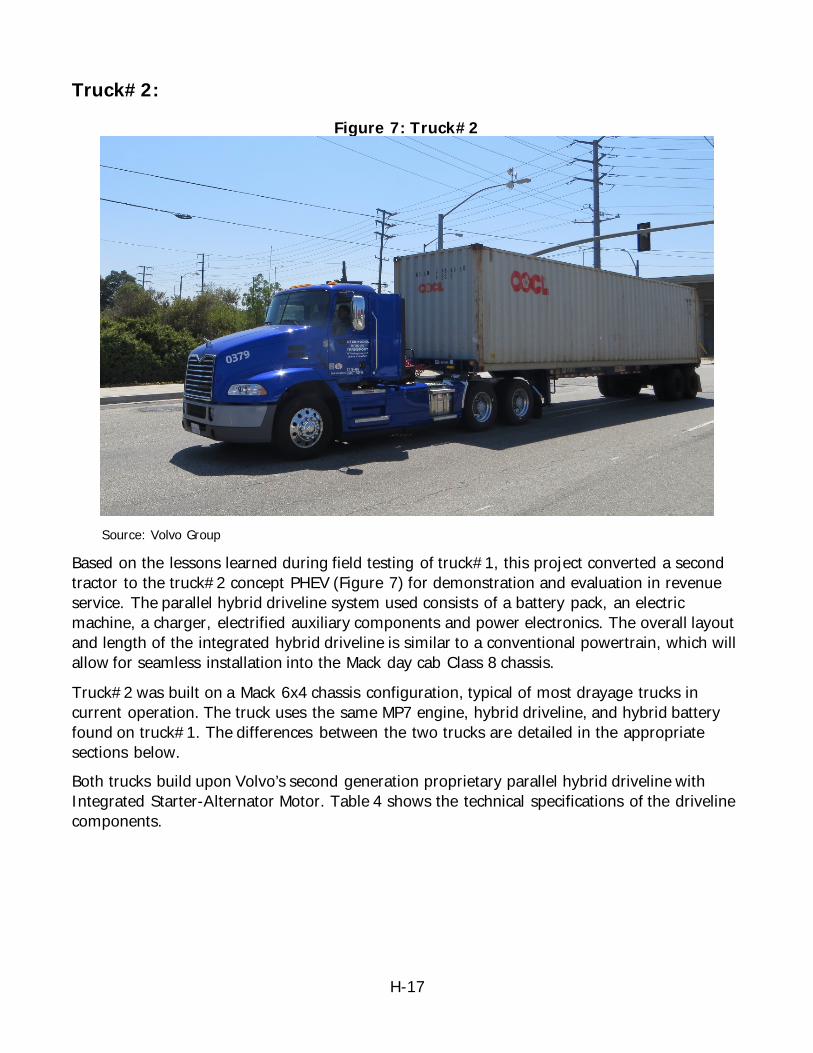
H-17
Truck#2:
Figure 7: Truck#2
Source: Volvo Group
Based on the lessons learned during field testing of truck#1, this project converted a second tractor to the truck#2 concept PHEV (Figure 7) for demonstration and evaluation in revenue service. The parallel hybrid driveline system used consists of a battery pack, an electric machine, a charger, electrified auxiliary components and power electronics. The overall layout and length of the integrated hybrid driveline is similar to a conventional powertrain, which will allow for seamless installation into the Mack day cab Class 8 chassis.
Truck#2 was built on a Mack 6x4 chassis configuration, typical of most drayage trucks in current operation. The truck uses the same MP7 engine, hybrid driveline, and hybrid battery found on truck#1. The differences between the two trucks are detailed in the appropriate sections below. Both trucks build upon Volvo’s second generation proprietary parallel hybrid driveline with Integrated Starter-Alternator Motor. Table 4 shows the technical specifications of the driveline components.
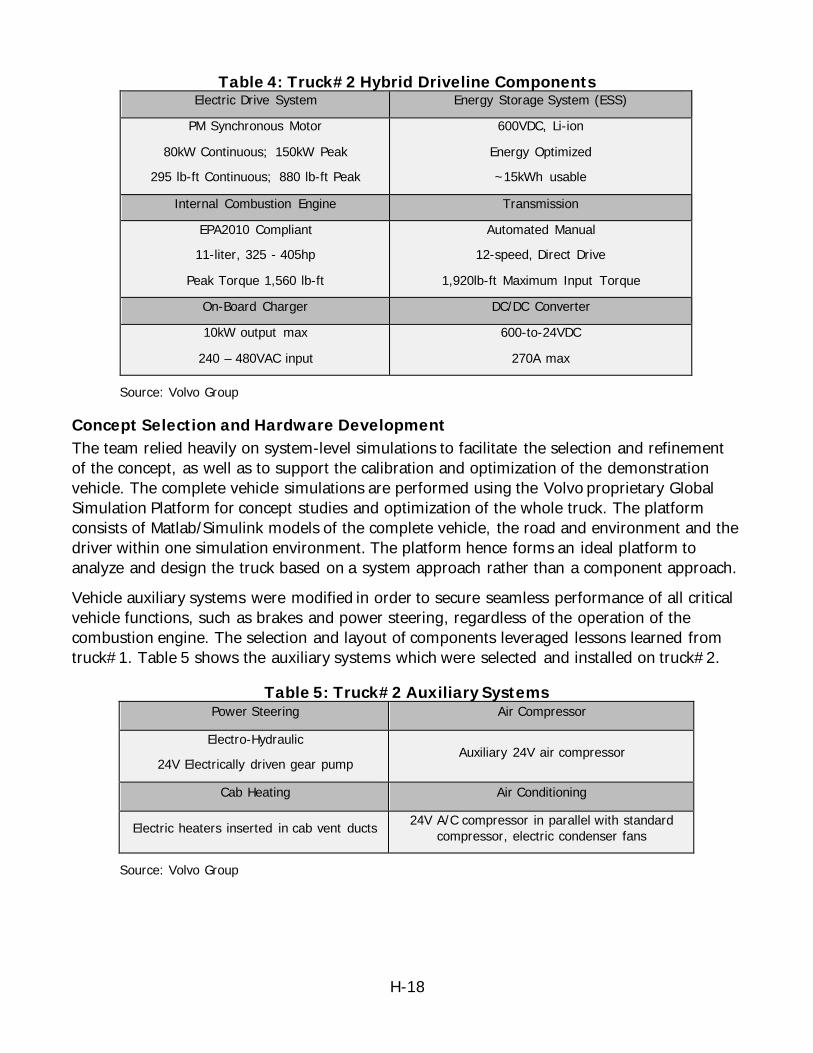
H-18
Table 4: Truck#2 Hybrid Driveline Components Electric Drive System Energy Storage System (ESS)
PM Synchronous Motor
80kW Continuous; 150kW Peak
295 lb-ft Continuous; 880 lb-ft Peak
600VDC, Li-ion
Energy Optimized
~15kWh usable
Internal Combustion Engine Transmission
EPA2010 Compliant
11-liter, 325 - 405hp
Peak Torque 1,560 lb-ft
Automated Manual
12-speed, Direct Drive
1,920lb-ft Maximum Input Torque
On-Board Charger DC/DC Converter
10kW output max
240 – 480VAC input
600-to-24VDC
270A max
Source: Volvo Group
Concept Selection and Hardware Development The team relied heavily on system-level simulations to facilitate the selection and refinement of the concept, as well as to support the calibration and optimization of the demonstration vehicle. The complete vehicle simulations are performed using the Volvo proprietary Global Simulation Platform for concept studies and optimization of the whole truck. The platform consists of Matlab/Simulink models of the complete vehicle, the road and environment and the driver within one simulation environment. The platform hence forms an ideal platform to analyze and design the truck based on a system approach rather than a component approach.
Vehicle auxiliary systems were modified in order to secure seamless performance of all critical vehicle functions, such as brakes and power steering, regardless of the operation of the combustion engine. The selection and layout of components leveraged lessons learned from truck#1. Table 5 shows the auxiliary systems which were selected and installed on truck#2.
Table 5: Truck#2 Auxiliary Systems Power Steering Air Compressor
Electro-Hydraulic
24V Electrically driven gear pump Auxiliary 24V air compressor
Cab Heating Air Conditioning
Electric heaters inserted in cab vent ducts 24V A/C compressor in parallel with standard compressor, electric condenser fans
Source: Volvo Group
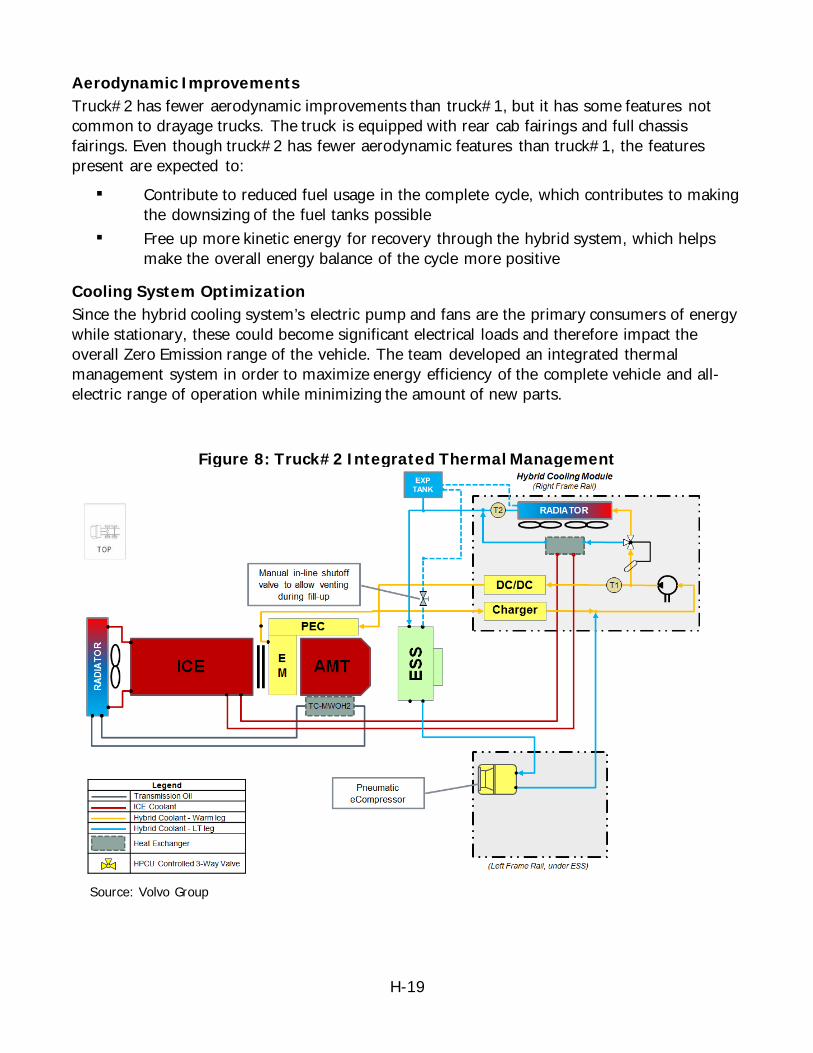
H-19
Aerodynamic Improvements Truck#2 has fewer aerodynamic improvements than truck#1, but it has some features not common to drayage trucks. The truck is equipped with rear cab fairings and full chassis fairings. Even though truck#2 has fewer aerodynamic features than truck#1, the features present are expected to: Contribute to reduced fuel usage in the complete cycle, which contributes to making
the downsizing of the fuel tanks possible Free up more kinetic energy for recovery through the hybrid system, which helps
make the overall energy balance of the cycle more positive
Cooling System Optimization Since the hybrid cooling system’s electric pump and fans are the primary consumers of energy while stationary, these could become significant electrical loads and therefore impact the overall Zero Emission range of the vehicle. The team developed an integrated thermal management system in order to maximize energy efficiency of the complete vehicle and all-electric range of operation while minimizing the amount of new parts.
Figure 8: Truck#2 Integrated Thermal Management
Source: Volvo Group
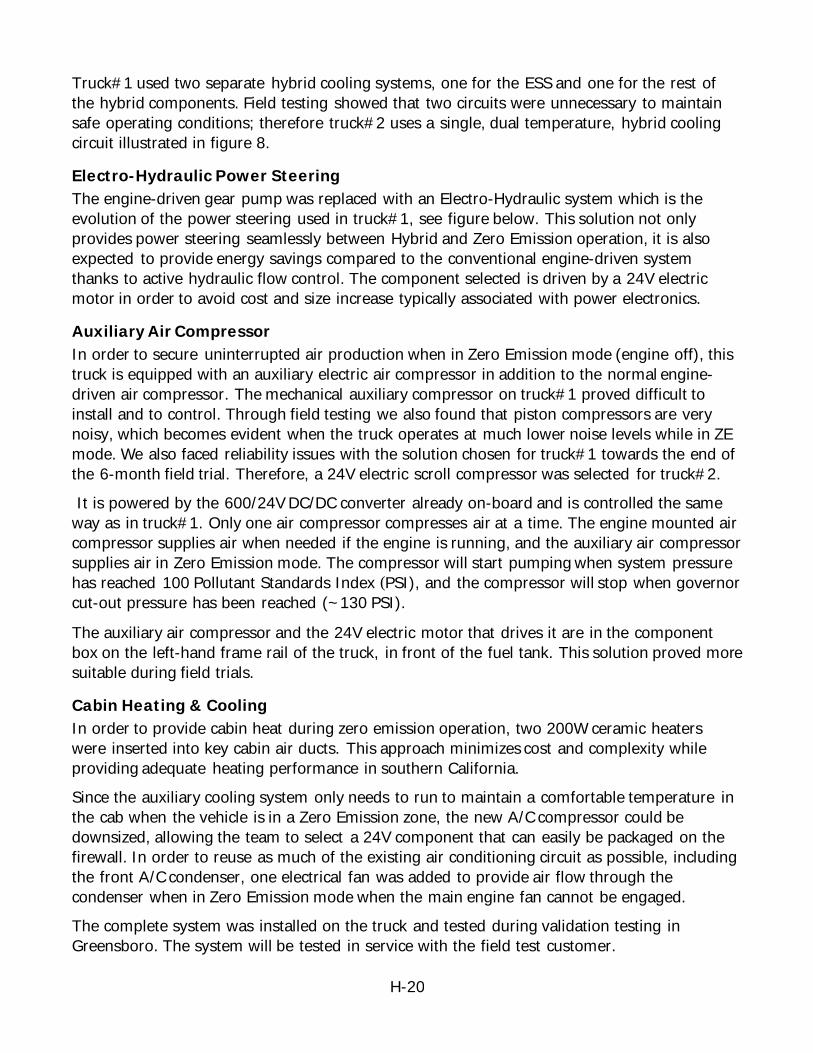
H-20
Truck#1 used two separate hybrid cooling systems, one for the ESS and one for the rest of the hybrid components. Field testing showed that two circuits were unnecessary to maintain safe operating conditions; therefore truck#2 uses a single, dual temperature, hybrid cooling circuit illustrated in figure 8.
Electro-Hydraulic Power Steering The engine-driven gear pump was replaced with an Electro-Hydraulic system which is the evolution of the power steering used in truck#1, see figure below. This solution not only provides power steering seamlessly between Hybrid and Zero Emission operation, it is also expected to provide energy savings compared to the conventional engine-driven system thanks to active hydraulic flow control. The component selected is driven by a 24V electric motor in order to avoid cost and size increase typically associated with power electronics.
Auxiliary Air Compressor In order to secure uninterrupted air production when in Zero Emission mode (engine off), this truck is equipped with an auxiliary electric air compressor in addition to the normal engine-driven air compressor. The mechanical auxiliary compressor on truck#1 proved difficult to install and to control. Through field testing we also found that piston compressors are very noisy, which becomes evident when the truck operates at much lower noise levels while in ZE mode. We also faced reliability issues with the solution chosen for truck#1 towards the end of the 6-month field trial. Therefore, a 24V electric scroll compressor was selected for truck#2. It is powered by the 600/24V DC/DC converter already on-board and is controlled the same way as in truck#1. Only one air compressor compresses air at a time. The engine mounted air compressor supplies air when needed if the engine is running, and the auxiliary air compressor supplies air in Zero Emission mode. The compressor will start pumping when system pressure has reached 100 Pollutant Standards Index (PSI), and the compressor will stop when governor cut-out pressure has been reached (~130 PSI).
The auxiliary air compressor and the 24V electric motor that drives it are in the component box on the left-hand frame rail of the truck, in front of the fuel tank. This solution proved more suitable during field trials.
Cabin Heating & Cooling In order to provide cabin heat during zero emission operation, two 200W ceramic heaters were inserted into key cabin air ducts. This approach minimizes cost and complexity while providing adequate heating performance in southern California. Since the auxiliary cooling system only needs to run to maintain a comfortable temperature in the cab when the vehicle is in a Zero Emission zone, the new A/C compressor could be downsized, allowing the team to select a 24V component that can easily be packaged on the firewall. In order to reuse as much of the existing air conditioning circuit as possible, including the front A/C condenser, one electrical fan was added to provide air flow through the condenser when in Zero Emission mode when the main engine fan cannot be engaged. The complete system was installed on the truck and tested during validation testing in Greensboro. The system will be tested in service with the field test customer.
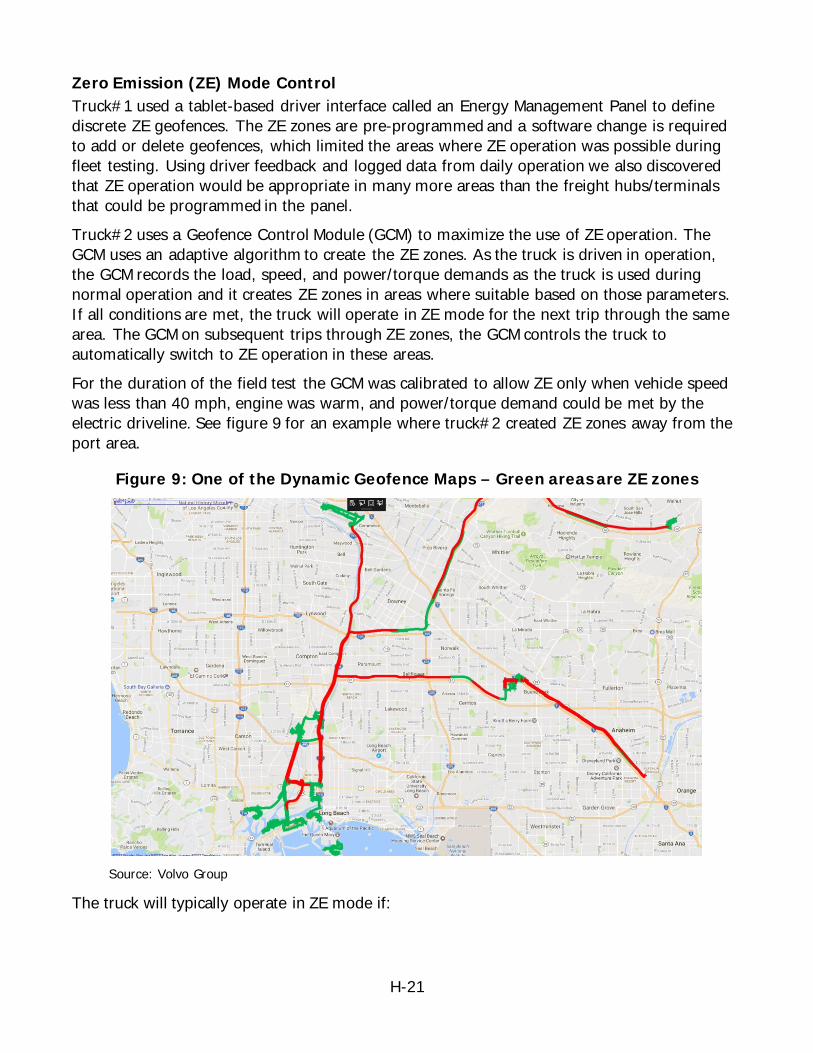
H-21
Zero Emission (ZE) Mode Control Truck#1 used a tablet-based driver interface called an Energy Management Panel to define discrete ZE geofences. The ZE zones are pre-programmed and a software change is required to add or delete geofences, which limited the areas where ZE operation was possible during fleet testing. Using driver feedback and logged data from daily operation we also discovered that ZE operation would be appropriate in many more areas than the freight hubs/terminals that could be programmed in the panel. Truck#2 uses a Geofence Control Module (GCM) to maximize the use of ZE operation. The GCM uses an adaptive algorithm to create the ZE zones. As the truck is driven in operation, the GCM records the load, speed, and power/torque demands as the truck is used during normal operation and it creates ZE zones in areas where suitable based on those parameters. If all conditions are met, the truck will operate in ZE mode for the next trip through the same area. The GCM on subsequent trips through ZE zones, the GCM controls the truck to automatically switch to ZE operation in these areas. For the duration of the field test the GCM was calibrated to allow ZE only when vehicle speed was less than 40 mph, engine was warm, and power/torque demand could be met by the electric driveline. See figure 9 for an example where truck#2 created ZE zones away from the port area.
Figure 9: One of the Dynamic Geofence Maps – Green areas are ZE zones
Source: Volvo Group
The truck will typically operate in ZE mode if:
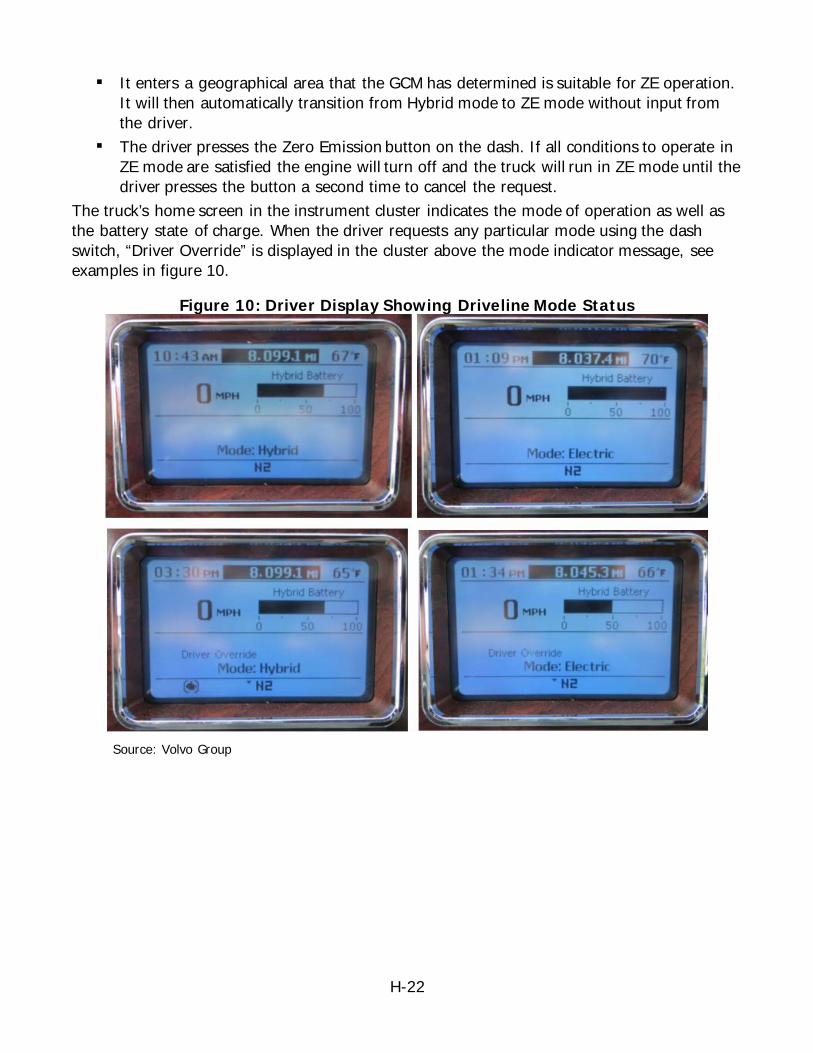
H-22
It enters a geographical area that the GCM has determined is suitable for ZE operation. It will then automatically transition from Hybrid mode to ZE mode without input from the driver.
The driver presses the Zero Emission button on the dash. If all conditions to operate in ZE mode are satisfied the engine will turn off and the truck will run in ZE mode until the driver presses the button a second time to cancel the request.
The truck’s home screen in the instrument cluster indicates the mode of operation as well as the battery state of charge. When the driver requests any particular mode using the dash switch, “Driver Override” is displayed in the cluster above the mode indicator message, see examples in figure 10.
Figure 10: Driver Display Showing Driveline Mode Status
Source: Volvo Group
H-23
Vehicle Build, Testing and Verification The base vehicle for truck#2 was built at the Mack factory in Macungie, PA and the integration of the hybrid system took place at the Volvo Group Technical Center in Greensboro, NC. Conversion activities included: Fabrication of components needed to mount hybrid components. Installation of electric machine. Installation of hybrid electrical components. Installation of hybrid control units. Installation of electrical auxiliaries, including power steering pump, A/C system and
auxiliary air compressor Construction and installation of wiring harnesses
Software development, commissioning and calibration of the hybrid components and of the prototype GCM took place in Hagerstown, MD and Greensboro, NC.
Engineering testing of truck#2 started in 2016Q4 in Greensboro, NC. The truck then went to Hagerstown, MD for further calibration of the hybrid system in early 2017, and final GCM programming and testing took place in Greensboro, NC during 2017Q2. The testing included various loads and duty cycles, with the intent of simulating drayage operation as closely as possible. The truck accumulated approximately 8,000 miles during the engineering development phase. The truck was delivered to Long Beach, CA in 2017Q2 to begin field testing. The performance of truck#2 will be compared to the data obtained from truck#1. The performance evaluation shall include comparative testing to quantify the change in fossil fuel consumption and criteria pollutant emissions.
Figure 11 next page shows the overview technologies on truck#2.
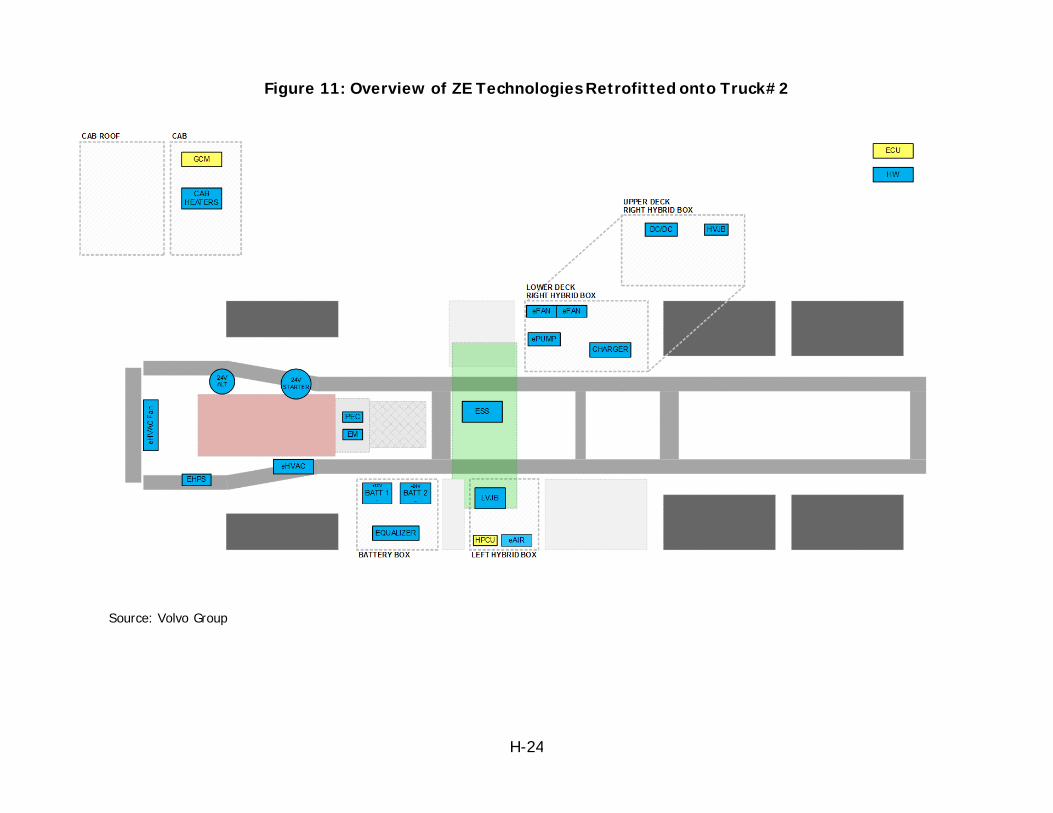
H-24
Figure 11: Overview of ZE Technologies Retrofitted onto Truck#2
Source: Volvo Group
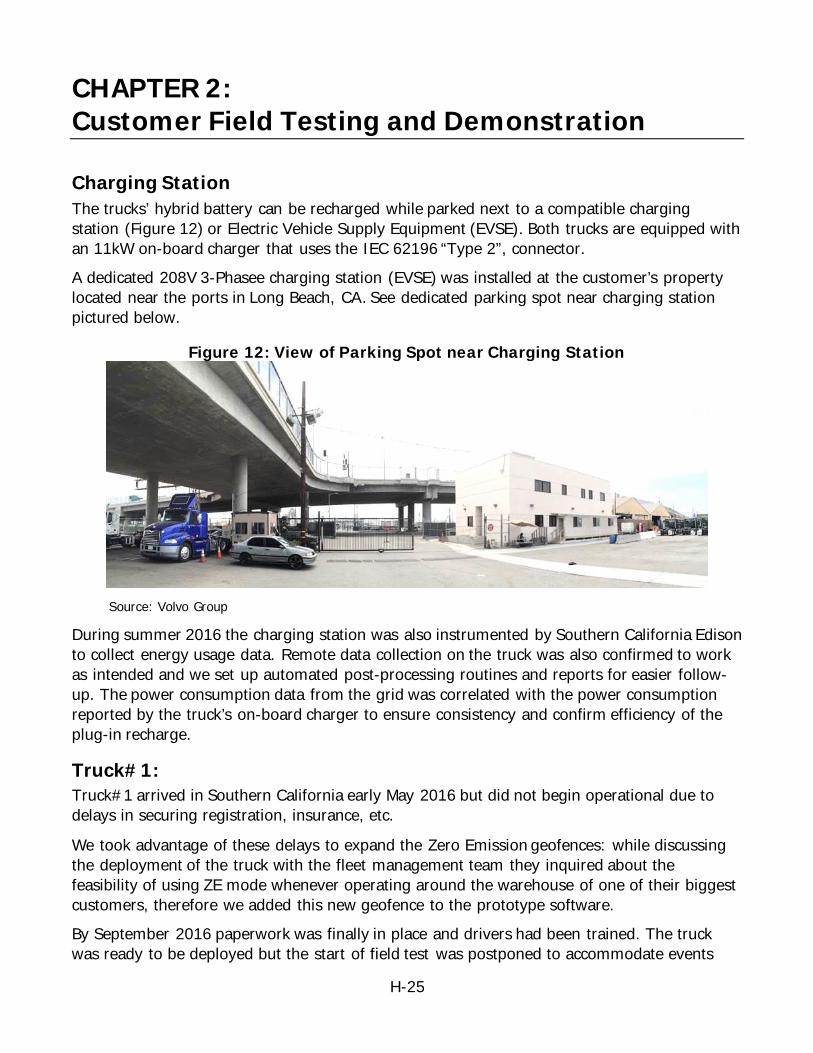
H-25
CHAPTER 2: Customer Field Testing and Demonstration
Charging Station The trucks’ hybrid battery can be recharged while parked next to a compatible charging station (Figure 12) or Electric Vehicle Supply Equipment (EVSE). Both trucks are equipped with an 11kW on-board charger that uses the IEC 62196 “Type 2”, connector. A dedicated 208V 3-Phasee charging station (EVSE) was installed at the customer’s property located near the ports in Long Beach, CA. See dedicated parking spot near charging station pictured below.
Figure 12: View of Parking Spot near Charging Station
Source: Volvo Group
During summer 2016 the charging station was also instrumented by Southern California Edison to collect energy usage data. Remote data collection on the truck was also confirmed to work as intended and we set up automated post-processing routines and reports for easier follow-up. The power consumption data from the grid was correlated with the power consumption reported by the truck’s on-board charger to ensure consistency and confirm efficiency of the plug-in recharge.
Truck#1: Truck#1 arrived in Southern California early May 2016 but did not begin operational due to delays in securing registration, insurance, etc.
We took advantage of these delays to expand the Zero Emission geofences: while discussing the deployment of the truck with the fleet management team they inquired about the feasibility of using ZE mode whenever operating around the warehouse of one of their biggest customers, therefore we added this new geofence to the prototype software. By September 2016 paperwork was finally in place and drivers had been trained. The truck was ready to be deployed but the start of field test was postponed to accommodate events
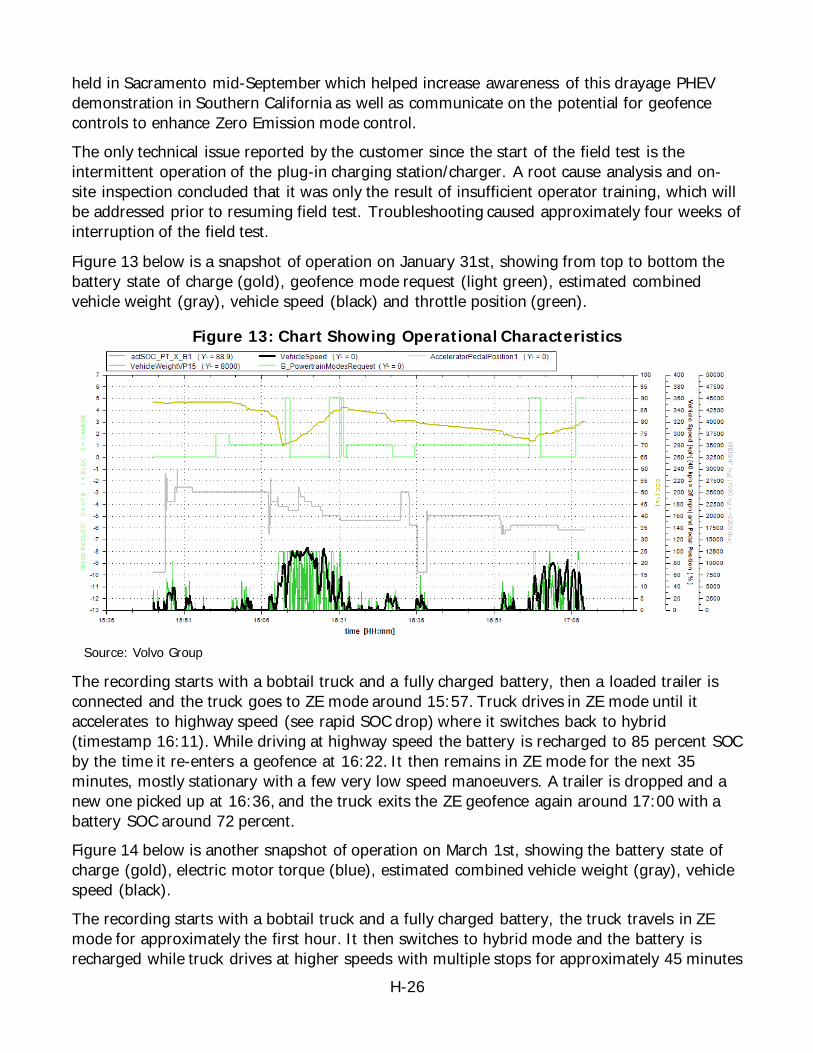
H-26
held in Sacramento mid-September which helped increase awareness of this drayage PHEV demonstration in Southern California as well as communicate on the potential for geofence controls to enhance Zero Emission mode control. The only technical issue reported by the customer since the start of the field test is the intermittent operation of the plug-in charging station/charger. A root cause analysis and on-site inspection concluded that it was only the result of insufficient operator training, which will be addressed prior to resuming field test. Troubleshooting caused approximately four weeks of interruption of the field test.
Figure 13 below is a snapshot of operation on January 31st, showing from top to bottom the battery state of charge (gold), geofence mode request (light green), estimated combined vehicle weight (gray), vehicle speed (black) and throttle position (green).
Figure 13: Chart Showing Operational Characteristics
Source: Volvo Group
The recording starts with a bobtail truck and a fully charged battery, then a loaded trailer is connected and the truck goes to ZE mode around 15:57. Truck drives in ZE mode until it accelerates to highway speed (see rapid SOC drop) where it switches back to hybrid (timestamp 16:11). While driving at highway speed the battery is recharged to 85 percent SOC by the time it re-enters a geofence at 16:22. It then remains in ZE mode for the next 35 minutes, mostly stationary with a few very low speed manoeuvers. A trailer is dropped and a new one picked up at 16:36, and the truck exits the ZE geofence again around 17:00 with a battery SOC around 72 percent. Figure 14 below is another snapshot of operation on March 1st, showing the battery state of charge (gold), electric motor torque (blue), estimated combined vehicle weight (gray), vehicle speed (black). The recording starts with a bobtail truck and a fully charged battery, the truck travels in ZE mode for approximately the first hour. It then switches to hybrid mode and the battery is recharged while truck drives at higher speeds with multiple stops for approximately 45 minutes
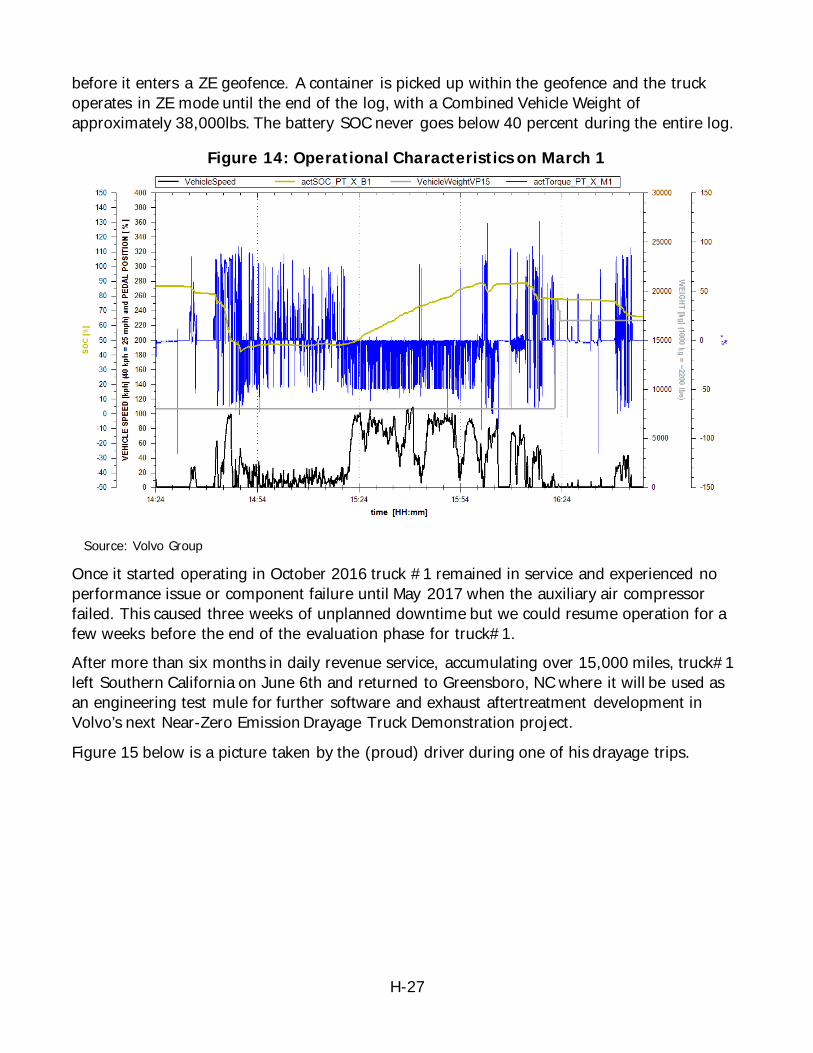
H-27
before it enters a ZE geofence. A container is picked up within the geofence and the truck operates in ZE mode until the end of the log, with a Combined Vehicle Weight of approximately 38,000lbs. The battery SOC never goes below 40 percent during the entire log.
Figure 14: Operational Characteristics on March 1
Source: Volvo Group
Once it started operating in October 2016 truck #1 remained in service and experienced no performance issue or component failure until May 2017 when the auxiliary air compressor failed. This caused three weeks of unplanned downtime but we could resume operation for a few weeks before the end of the evaluation phase for truck#1. After more than six months in daily revenue service, accumulating over 15,000 miles, truck#1 left Southern California on June 6th and returned to Greensboro, NC where it will be used as an engineering test mule for further software and exhaust aftertreatment development in Volvo’s next Near-Zero Emission Drayage Truck Demonstration project.
Figure 15 below is a picture taken by the (proud) driver during one of his drayage trips.
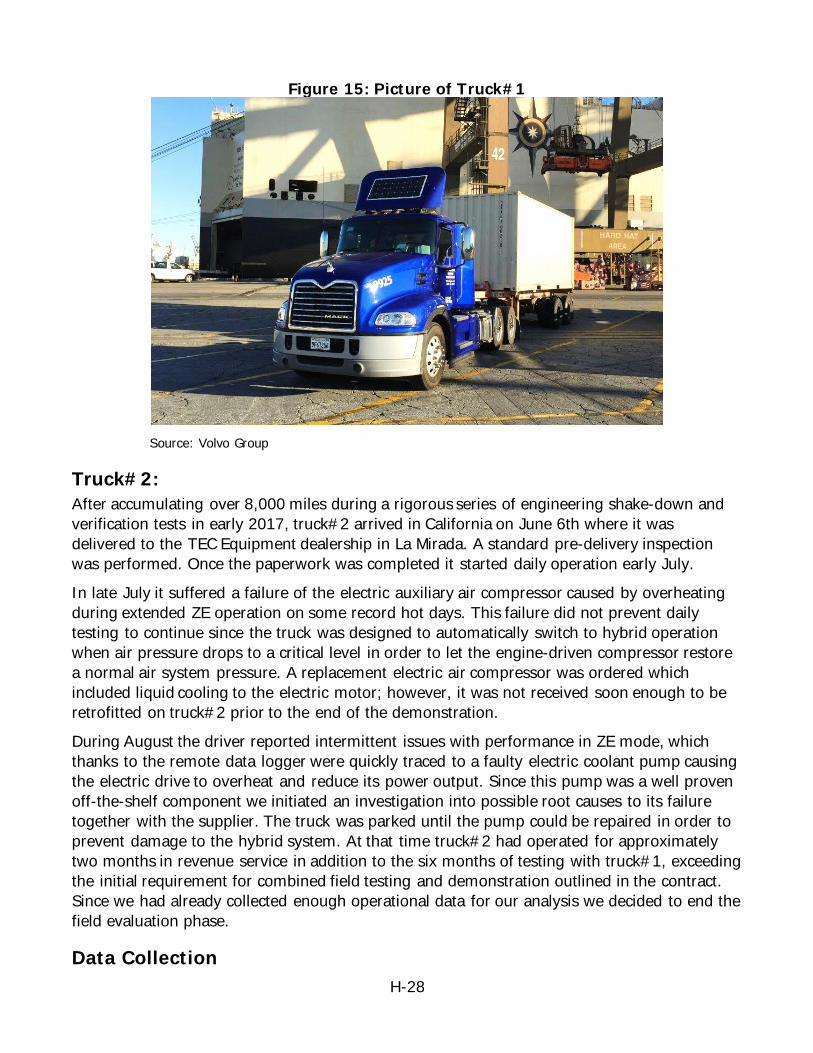
H-28
Figure 15: Picture of Truck#1
Source: Volvo Group
Truck#2: After accumulating over 8,000 miles during a rigorous series of engineering shake-down and verification tests in early 2017, truck#2 arrived in California on June 6th where it was delivered to the TEC Equipment dealership in La Mirada. A standard pre-delivery inspection was performed. Once the paperwork was completed it started daily operation early July. In late July it suffered a failure of the electric auxiliary air compressor caused by overheating during extended ZE operation on some record hot days. This failure did not prevent daily testing to continue since the truck was designed to automatically switch to hybrid operation when air pressure drops to a critical level in order to let the engine-driven compressor restore a normal air system pressure. A replacement electric air compressor was ordered which included liquid cooling to the electric motor; however, it was not received soon enough to be retrofitted on truck#2 prior to the end of the demonstration. During August the driver reported intermittent issues with performance in ZE mode, which thanks to the remote data logger were quickly traced to a faulty electric coolant pump causing the electric drive to overheat and reduce its power output. Since this pump was a well proven off-the-shelf component we initiated an investigation into possible root causes to its failure together with the supplier. The truck was parked until the pump could be repaired in order to prevent damage to the hybrid system. At that time truck#2 had operated for approximately two months in revenue service in addition to the six months of testing with truck#1, exceeding the initial requirement for combined field testing and demonstration outlined in the contract. Since we had already collected enough operational data for our analysis we decided to end the field evaluation phase.
Data Collection
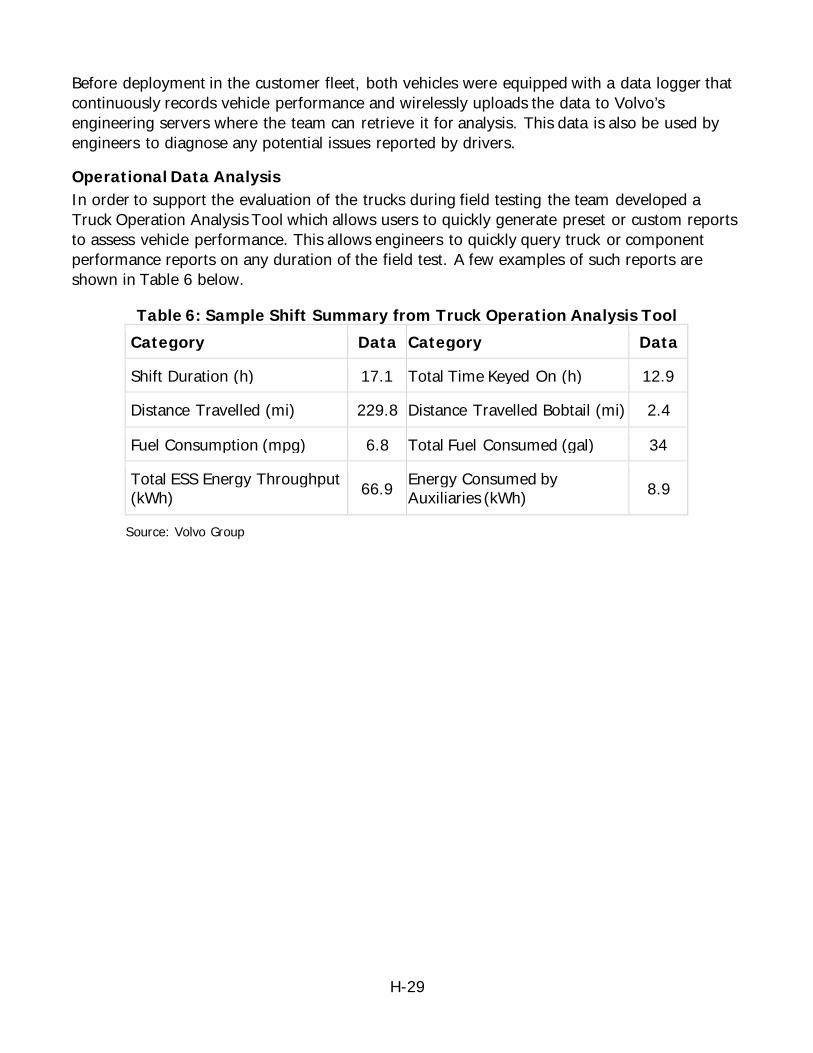
H-29
Before deployment in the customer fleet, both vehicles were equipped with a data logger that continuously records vehicle performance and wirelessly uploads the data to Volvo’s engineering servers where the team can retrieve it for analysis. This data is also be used by engineers to diagnose any potential issues reported by drivers.
Operational Data Analysis In order to support the evaluation of the trucks during field testing the team developed a Truck Operation Analysis Tool which allows users to quickly generate preset or custom reports to assess vehicle performance. This allows engineers to quickly query truck or component performance reports on any duration of the field test. A few examples of such reports are shown in Table 6 below.
Table 6: Sample Shift Summary from Truck Operation Analysis Tool Category Data Category Data
Shift Duration (h) 17.1 Total Time Keyed On (h) 12.9
Distance Travelled (mi) 229.8 Distance Travelled Bobtail (mi) 2.4
Fuel Consumption (mpg) 6.8 Total Fuel Consumed (gal) 34
Total ESS Energy Throughput (kWh) 66.9 Energy Consumed by
Auxiliaries (kWh) 8.9
Source: Volvo Group

H-30
Figure 16: Distribution of Gross Vehicle Weight (per 10,000 lbs.) during Demonstration of Truck#1
Source: Volvo Group
The first bar on the left of figure 16 represents bobtail operation.
Figure 17: Summary of Daily Fuel Consumption during Truck#1 Demonstration (in Gallons)
Source: Volvo Group Figure 17 illustrates the significant variability in day-to-day usage of drayage trucks.
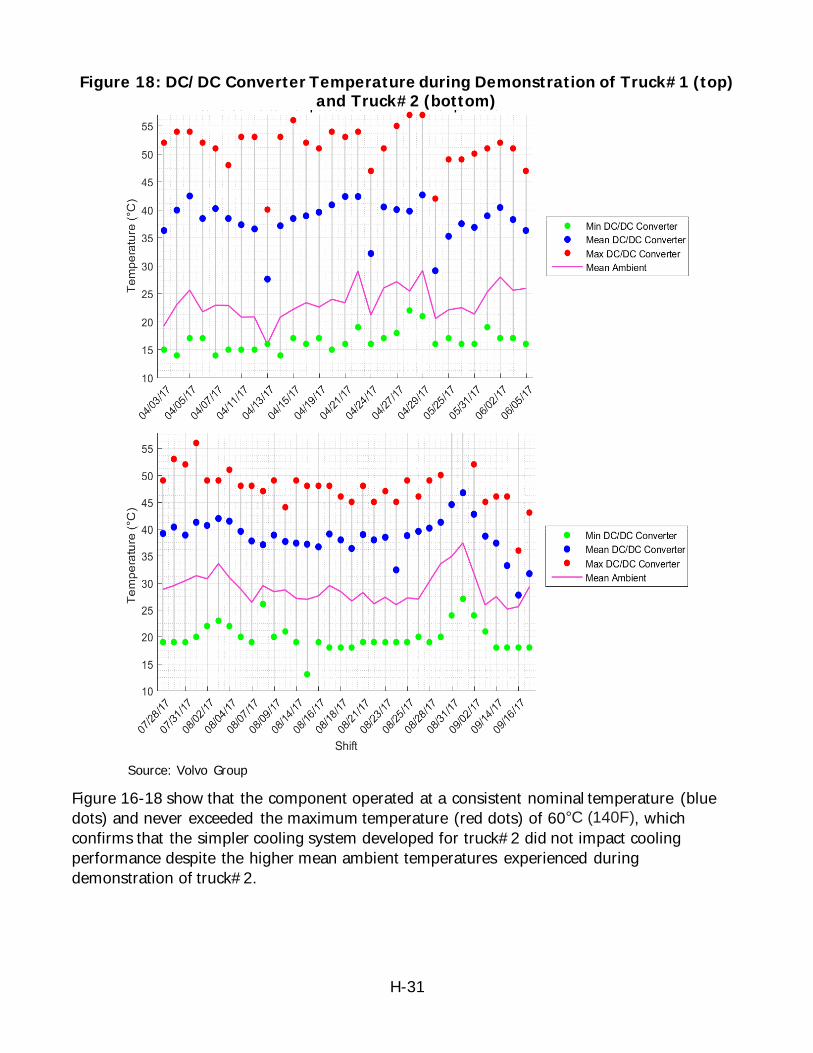
H-31
Figure 18: DC/DC Converter Temperature during Demonstration of Truck#1 (top) and Truck#2 (bottom)
Source: Volvo Group
Figure 16-18 show that the component operated at a consistent nominal temperature (blue dots) and never exceeded the maximum temperature (red dots) of 60°C (140F), which confirms that the simpler cooling system developed for truck#2 did not impact cooling performance despite the higher mean ambient temperatures experienced during demonstration of truck#2.
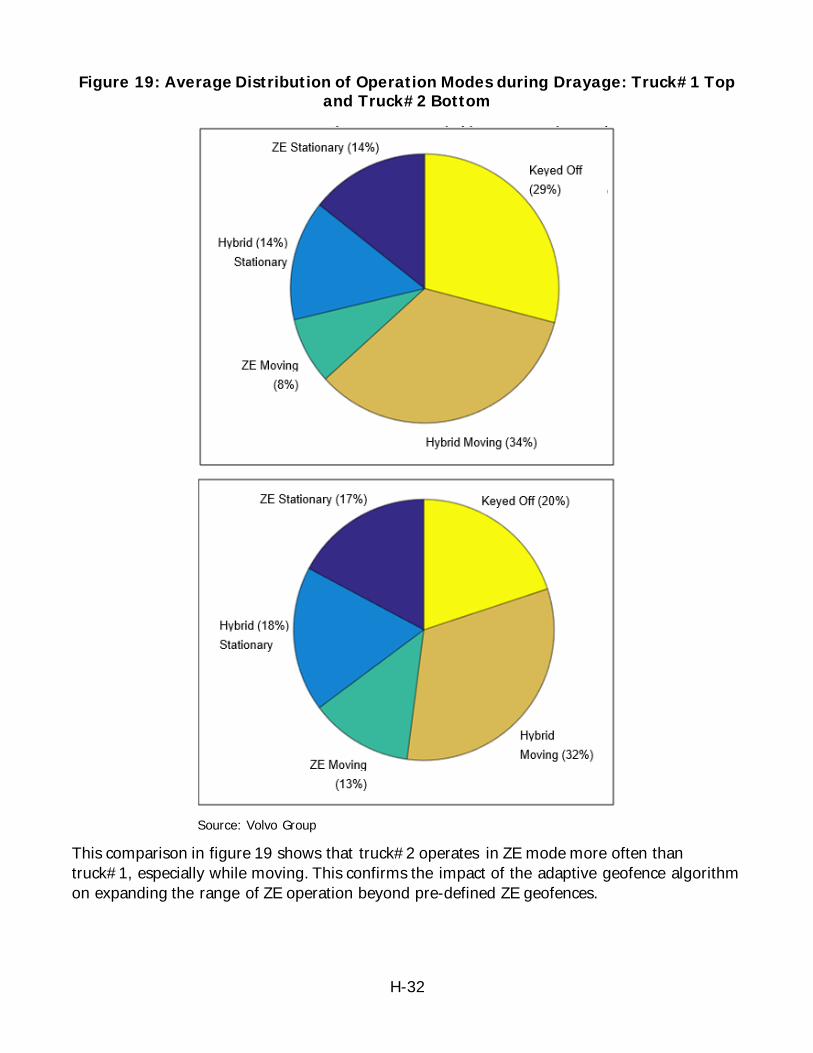
H-32
Figure 19: Average Distribution of Operation Modes during Drayage: Truck#1 Top and Truck#2 Bottom
Source: Volvo Group
This comparison in figure 19 shows that truck#2 operates in ZE mode more often than truck#1, especially while moving. This confirms the impact of the adaptive geofence algorithm on expanding the range of ZE operation beyond pre-defined ZE geofences.
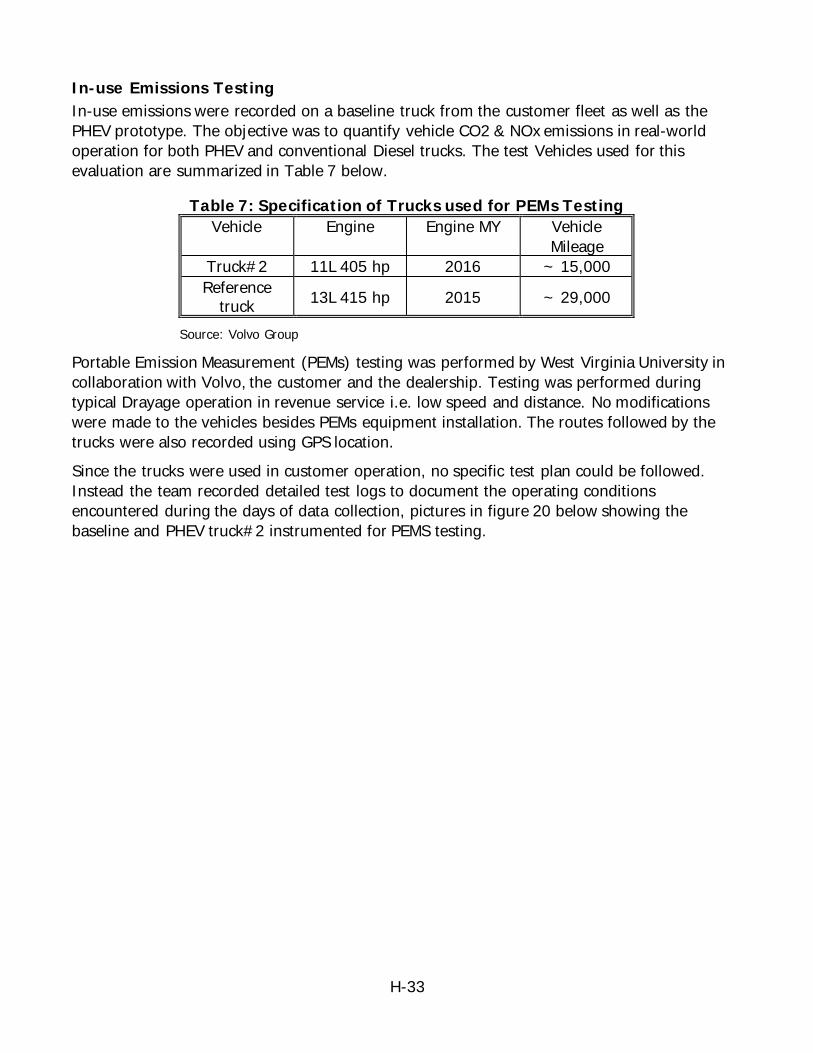
H-33
In-use Emissions Testing In-use emissions were recorded on a baseline truck from the customer fleet as well as the PHEV prototype. The objective was to quantify vehicle CO2 & NOx emissions in real-world operation for both PHEV and conventional Diesel trucks. The test Vehicles used for this evaluation are summarized in Table 7 below.
Table 7: Specification of Trucks used for PEMs Testing Vehicle Engine Engine MY Vehicle
Mileage Truck#2 11L 405 hp 2016 ~ 15,000 Reference
truck 13L 415 hp 2015 ~ 29,000
Source: Volvo Group
Portable Emission Measurement (PEMs) testing was performed by West Virginia University in collaboration with Volvo, the customer and the dealership. Testing was performed during typical Drayage operation in revenue service i.e. low speed and distance. No modifications were made to the vehicles besides PEMs equipment installation. The routes followed by the trucks were also recorded using GPS location. Since the trucks were used in customer operation, no specific test plan could be followed. Instead the team recorded detailed test logs to document the operating conditions encountered during the days of data collection, pictures in figure 20 below showing the baseline and PHEV truck#2 instrumented for PEMS testing.
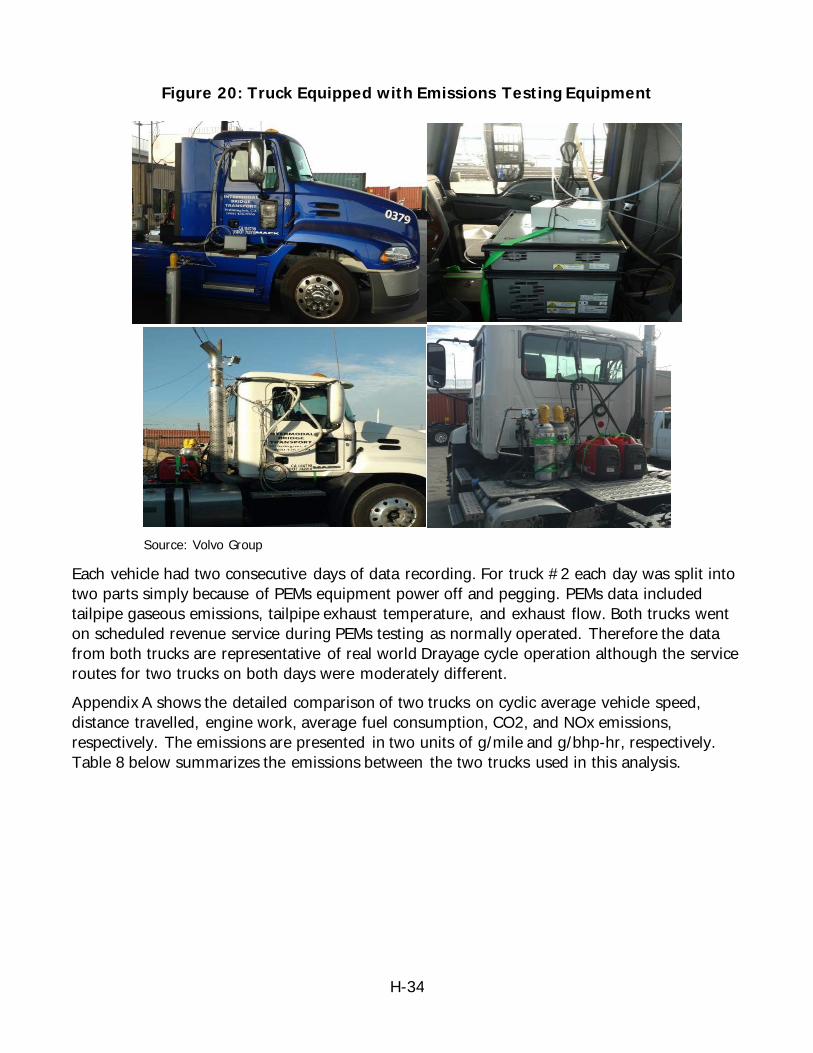
H-34
Figure 20: Truck Equipped with Emissions Testing Equipment
Source: Volvo Group
Each vehicle had two consecutive days of data recording. For truck #2 each day was split into two parts simply because of PEMs equipment power off and pegging. PEMs data included tailpipe gaseous emissions, tailpipe exhaust temperature, and exhaust flow. Both trucks went on scheduled revenue service during PEMs testing as normally operated. Therefore the data from both trucks are representative of real world Drayage cycle operation although the service routes for two trucks on both days were moderately different. Appendix A shows the detailed comparison of two trucks on cyclic average vehicle speed, distance travelled, engine work, average fuel consumption, CO2, and NOx emissions, respectively. The emissions are presented in two units of g/mile and g/bhp-hr, respectively. Table 8 below summarizes the emissions between the two trucks used in this analysis.
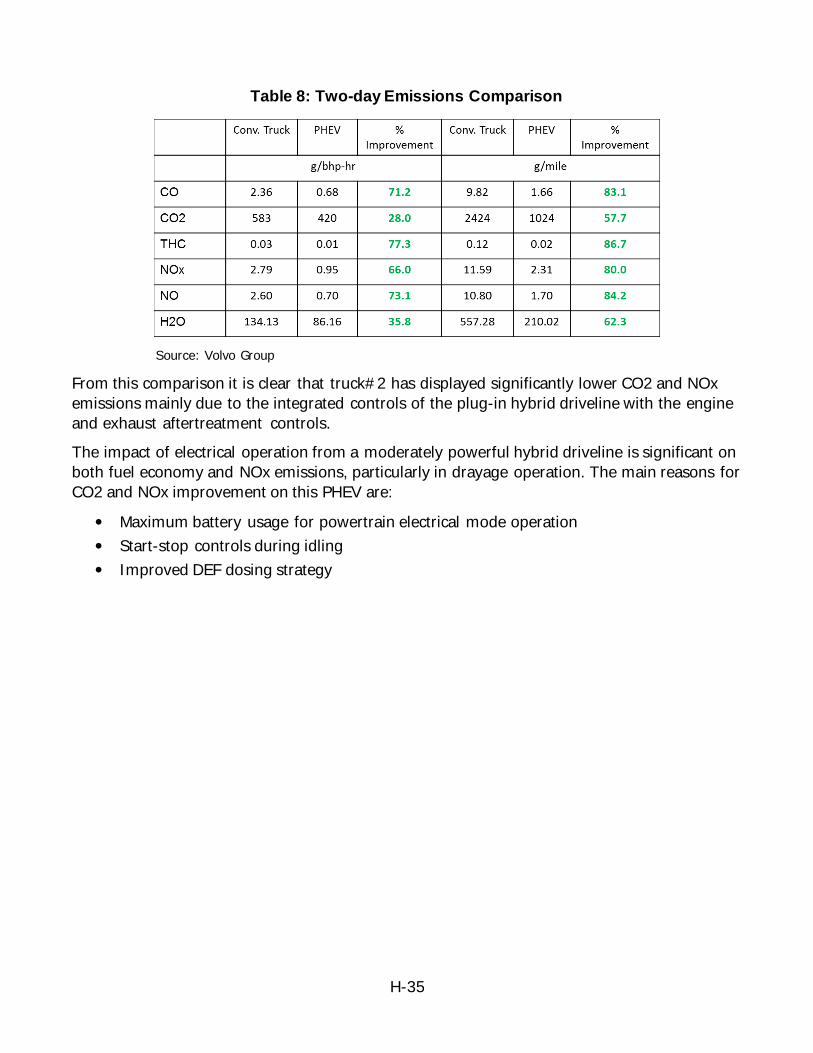
H-35
Table 8: Two-day Emissions Comparison
Source: Volvo Group
From this comparison it is clear that truck#2 has displayed significantly lower CO2 and NOx emissions mainly due to the integrated controls of the plug-in hybrid driveline with the engine and exhaust aftertreatment controls. The impact of electrical operation from a moderately powerful hybrid driveline is significant on both fuel economy and NOx emissions, particularly in drayage operation. The main reasons for CO2 and NOx improvement on this PHEV are:
• Maximum battery usage for powertrain electrical mode operation • Start-stop controls during idling • Improved DEF dosing strategy
H-36
CHAPTER 3: Conclusions and Lessons Learned
The demonstration of truck#1 upfront in this project allowed the team to identify areas of improvements in zero emission range and system cost in time to be incorporated into the design of truck#2, including An adaptive method of controlling the operational modes of the truck (electric and
hybrid modes) in order to extend zero emission operation beyond fixed geofences in order to accommodate operational variability typical for drayage trucks. This impact was confirmed through analysis of operating mode distribution in both trucks during each demonstration period.
A simplification of the hybrid cooling system in order to reduce cost, weight and packaging constraints. Analysis of the data logged during fleet testing of both trucks confirmed that the thermal management concept developed for truck#2 provided adequate performance.
In-use testing of exhaust emissions from truck#2 and a reference truck from the same fleet proved that well-integrated hybrid driveline controls and exhaust aftertreatment controls can significantly reduce GHG and criteria pollutant emissions, both in brake specific and per-mile basis. After a combined eight months of testing in daily revenue service these two concept vehicles demonstrated that PHEV technology can provide significant reduction of fuel use and exhaust emissions despite a relatively small battery pack and without relying on opportunity charge.
Environmental and Economic Benefits to California This project developed and demonstrated drayage trucks capable of near zero emissions during parts of their daily operations. Data analysis shows that real world emissions were significantly reduced when trucks operate at lower speeds and loads, which typically occurs in or around freight handling hubs.
Impact of this demonstration on air quality The trucks demonstrated in this project were operated daily by a drayage fleet in lieu of diesel trucks during a period of approximately eight months. The following reduction of exhaust emissions can therefore be estimated. Assumptions: 30,000 miles driven annually by each truck in the fleet, based on 15,000 miles
accumulated on truck#1 for six months Over 70 percent lower NOx emissions from PHEV trucks than diesel trucks, based on
PEMS testing performed with truck#2 Approximately 10g/mi NOx for a diesel truck
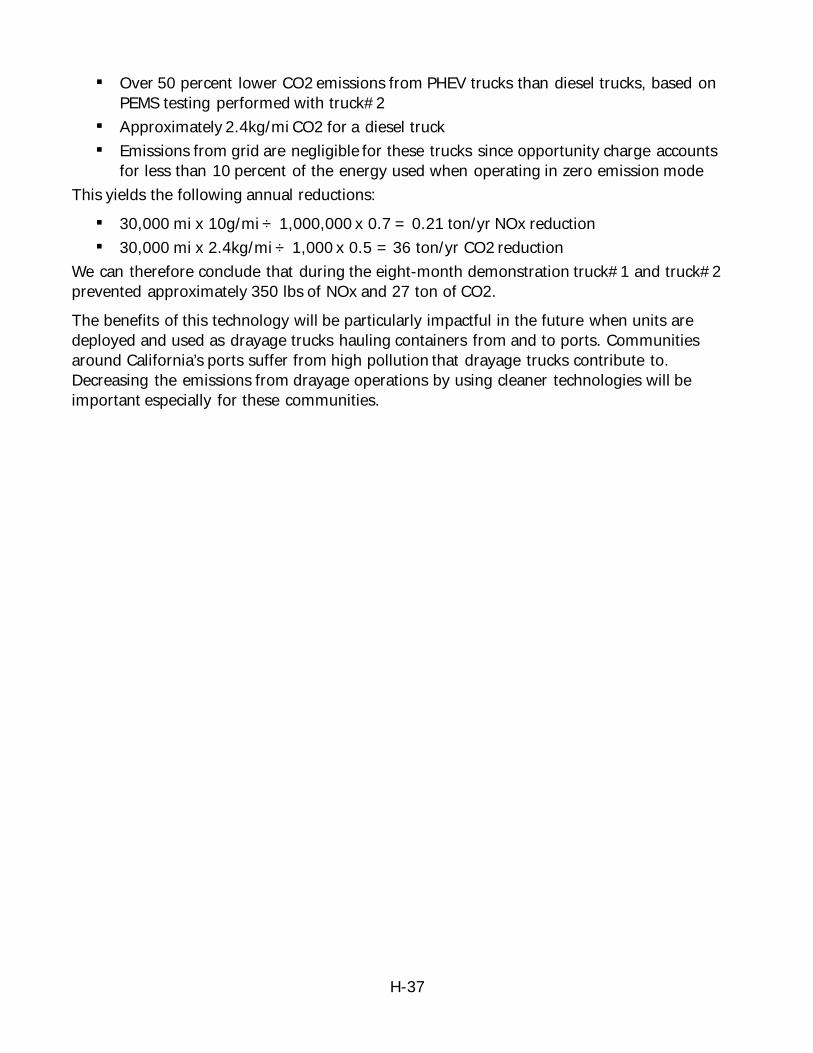
H-37
Over 50 percent lower CO2 emissions from PHEV trucks than diesel trucks, based on PEMS testing performed with truck#2
Approximately 2.4kg/mi CO2 for a diesel truck Emissions from grid are negligible for these trucks since opportunity charge accounts
for less than 10 percent of the energy used when operating in zero emission mode This yields the following annual reductions: 30,000 mi x 10g/mi ÷ 1,000,000 x 0.7 = 0.21 ton/yr NOx reduction 30,000 mi x 2.4kg/mi ÷ 1,000 x 0.5 = 36 ton/yr CO2 reduction
We can therefore conclude that during the eight-month demonstration truck#1 and truck#2 prevented approximately 350 lbs of NOx and 27 ton of CO2. The benefits of this technology will be particularly impactful in the future when units are deployed and used as drayage trucks hauling containers from and to ports. Communities around California’s ports suffer from high pollution that drayage trucks contribute to. Decreasing the emissions from drayage operations by using cleaner technologies will be important especially for these communities.
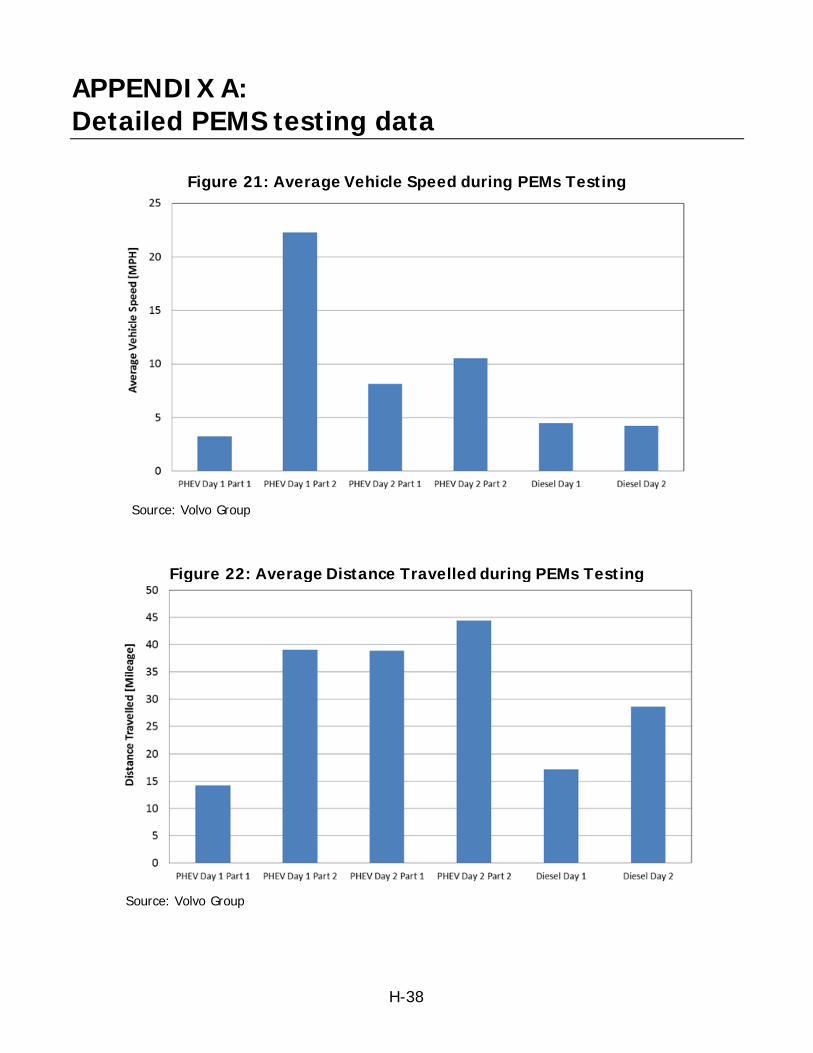
H-38
APPENDIX A: Detailed PEMS testing data
Figure 21: Average Vehicle Speed during PEMs Testing
Source: Volvo Group
Figure 22: Average Distance Travelled during PEMs Testing
Source: Volvo Group
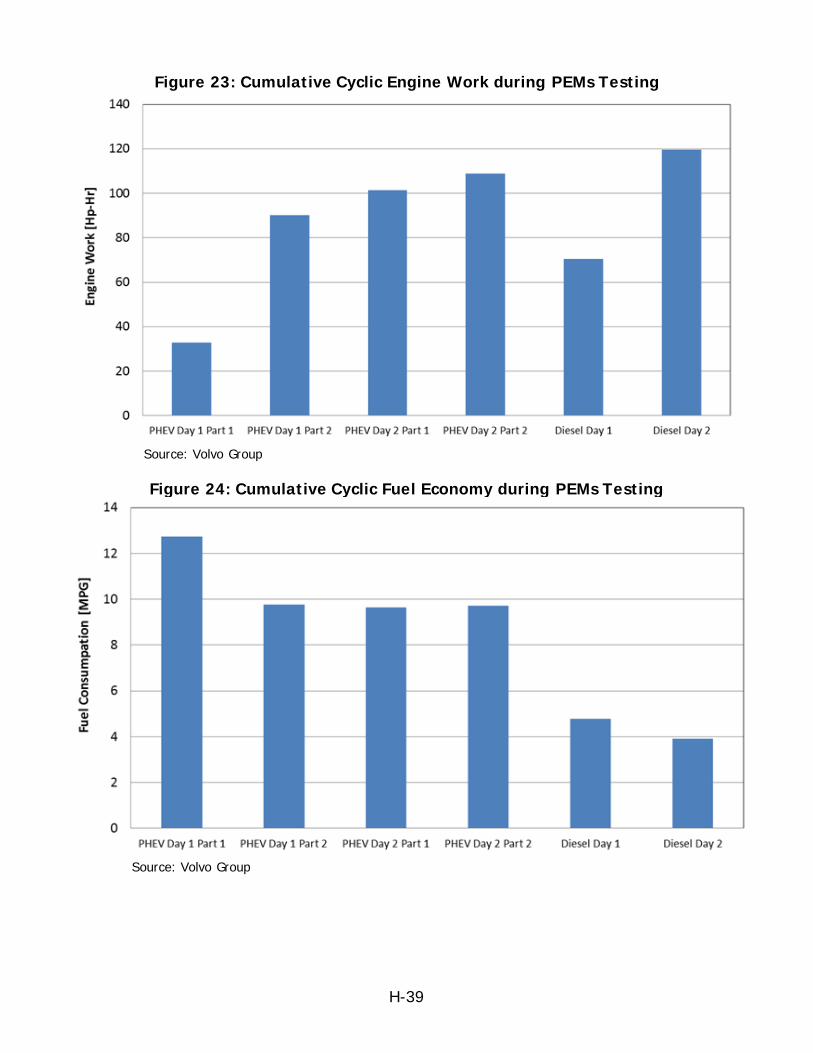
H-39
Figure 23: Cumulative Cyclic Engine Work during PEMs Testing
Source: Volvo Group
Figure 24: Cumulative Cyclic Fuel Economy during PEMs Testing
Source: Volvo Group
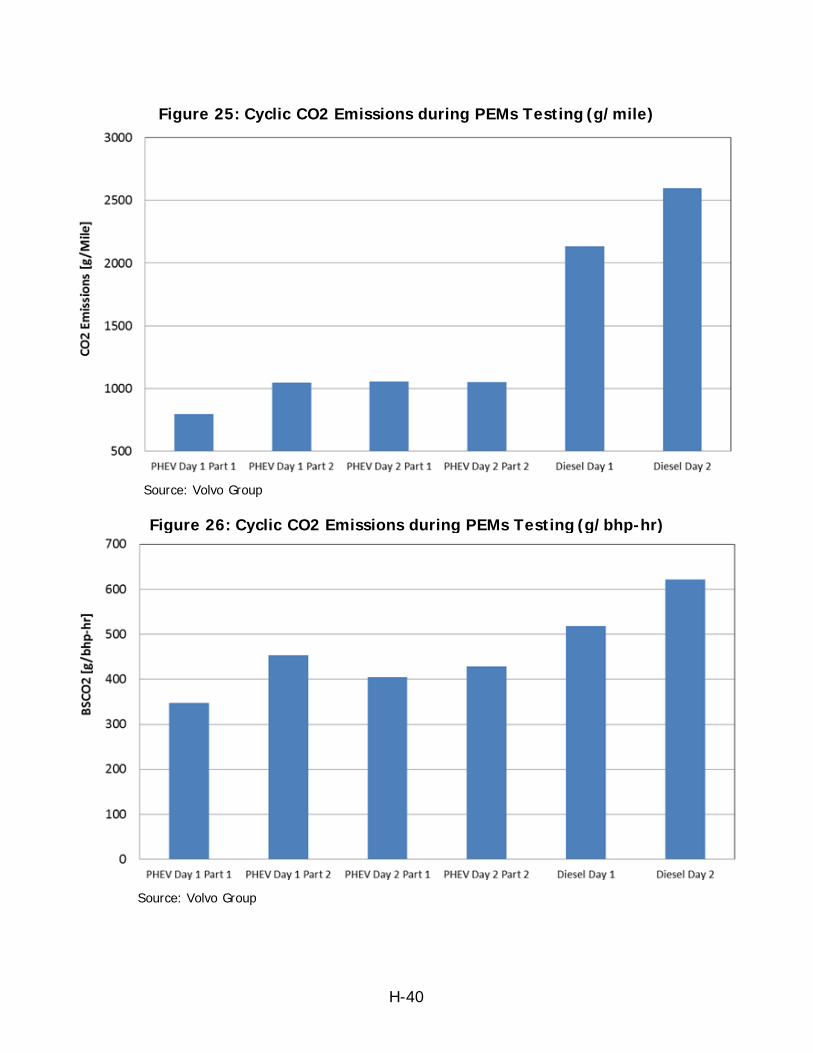
H-40
Figure 25: Cyclic CO2 Emissions during PEMs Testing (g/mile)
Source: Volvo Group
Figure 26: Cyclic CO2 Emissions during PEMs Testing (g/bhp-hr)
Source: Volvo Group

H-41
Figure 27: Cyclic NOx Emissions during PEMs Testing (g/mile)
Source: Volvo Group
Figure 28: Cyclic NOx Emissions during PEMs Testing (g/bhp-hr)
Source: Volvo Group
I-1
APPENDIX I: Caterpillar Off-Road Large-Size Hybrid Excavator
Prepared for: California Energy Commission Prepared by: Artisan Vehicle Systems
I-2
Henry Chea Mike Kasaba Michael Biron Primary Authors
Artisan Vehicle Systems 2385 Pleasant Valley Road Camarillo, CA 93012 805-512-9955 Artisan website: ArtisanVS.com
Disclaimer Staff members of the California Energy Commission prepared this report. As such, it does not necessarily represent the views of the Energy Commission, its employees, or the State of California. The Energy Commission, the State of California, its employees, contractors and subcontractors make no warrant, express or implied, and assume no legal liability for the information in this report; nor does any party represent that the uses of this information will not infringe upon privately owned rights. This report has not been approved or disapproved by the Energy Commission nor has the Commiss ion passed upon the accuracy or adequacy of the information in this report.
I-3
TABLE OF CONTENTS Page
Table of Contents ...........................................................................................................I-3 List of Figures ................................................................................................................I-3 List of Tables .................................................................................................................I-4 Executive Summary.........................................................................................................I-5 Chapter 1: Introduction...................................................................................................I-6 Chapter 2: Deployment ................................................................................................. I-17 Chapter 3: Results ....................................................................................................... I-22 Chapter 4: Conclusions ................................................................................................. I-49
LIST OF FIGURES
Page
Figure 1: HEV Truck en Route to Picking up a Trailer at Thompson Building Materials.....................I-7 Figure 2: HEV Truck CNG Pressure Meters and Refueling Ports..................................................I-8 Figure 3: HEV Truck’s Interior without the Touchscreen Computer Installed .................................I-9 Figure 4: HEV Truck Hauling 33,000 lb. of Concrete for Thompson Building Materials ................... I-10 Figure 5: BEV Truck ...................................................................................................... I-10 Figure 6: E-Stop Switch Installed in the BEV Truck ............................................................... I-11 Figure 7: BEV Truck’s Interior .......................................................................................... I-12 Table 2: Battery Electric Vehicle (BEV) Truck ...................................................................... I-12 Figure 8: BEV Truck Hauling 45,000 lb. of Materials to Thompson Building Materials .................... I-13 Figure 9: Main Dashboard Display Screen........................................................................... I-13 Figure 10: One of the Artisan Control Interface Status Screens ............................................... I-14 Figure 11: Battery Monitoring Screen ................................................................................ I-14 Figure 12: Screen in the Artisan Control Interface Where Parameters and Settings Can Be Adjusted I-15 Figure 13: CNG Turbine Info and Control Screen.................................................................. I-15 Figure 14: BEV Truck Picking Up a Load for Thompson Building Materials .................................. I-17 Figure 15: Typical test route around Camarillo .................................................................... I-18 Figure 16: Distance versus Speed Graph of a Typical Test Route in Camarillo ............................. I-18 Figure 17: Typical Route between Inland Kenworth, Thompson Building Materials, and Distribution I-19 Figure 18: Distance versus Speed Graph of a Typical Test Route between Inland Kenworth, Thompson Building Materials, and Distribution Yards ........................................................................... I-19 Figure 19: Test Route in the Pomona and San Bernardino Valleys ............................................ I-20 Figure 20: Distance versus Speed Graph of a Test Route in the Pomona and San Bernardino ValleysI-20 Figure 21: HEV Truck Being Loaded at Thompson Building Materials ........................................ I-21 Figure 22: A Driver Operating the BEV Truck ...................................................................... I-22
I-4
Figure 23: Eaton Manual Transmission in the BEV Truck ........................................................ I-23 Figure 24: The HEV Truck Refueling its CNG Tank ................................................................ I-24 Figure 25: The BEV Truck Recharging its Battery Pack at Inland Kenworth Fontana ..................... I-24 Figure 26: View of the Flooded Conditions near Fontana........................................................ I-25 Figure 27: BEV Truck at Inland Kenworth Fontana ............................................................... I-25 Figure 28: Inspecting Electrical Cables in the BEV Truck ........................................................ I-26 Figure 29: Tuning the Eaton UltraShift PLUS Automatic Transmission in the BEV Truck ................. I-29 Figure 30: The BEV Truck’s Electric Motor Fits Completely between the Frame Rails..................... I-30 Figure 31: The BEV Truck’s Battery Pack Location ................................................................ I-31 Figure 32: BEV Truck’s Electrical Connections to the Battery Pack ............................................ I-32 Figure 33: The HEV Truck Battery Packs Location ................................................................ I-32 Figure 34: Artisan Vehicle Systems Water-Cooled Inverter ..................................................... I-33 Figure 35: Water Flow Meters Installed to Aid in Tuning the Cooling Systems ............................. I-34 Figure 36: HEV Truck’s Gas Turbine and CNG Tank .............................................................. I-35 Figure 37: Touchscreen Computer in the BEV Truck ............................................................. I-36 Figure 38: BEV Truck’s Efficiency (kWh/mi) with Regards to Speed .......................................... I-37 Figure 39: HEV Truck’s Efficiency (kWh/mi) with Regards to Speed .......................................... I-37 Figure 40: HEV Truck’s Efficiency (MPG) with Regards to Speed .............................................. I-38 Figure 41: Aggregate Efficiencies for all Routes Driven .......................................................... I-39 Figure 42: HEV Truck versus BEV Truck, While Bobtailing ...................................................... I-40 Figure 43: HEV Truck versus BEV Truck, with an Unloaded Trailer ........................................... I-40 Figure 44: HEV Truck versus BEV Truck, with a Fully Loaded Trailer ......................................... I-41 Figure 45: HEV Truck and Diesel Truck Efficiency (MPG) with Regards to Speed.......................... I-42 Figure 46: Diesel Prices versus ROI for the HEV and BEV Trucks ............................................. I-45 Figure 47: Diesel Prices versus ROI for the BEV truck with Regards to Changes in Efficiency .......... I-46 Figure 48: Emissions per Year Comparison ......................................................................... I-48 Figure 49: BEV and HEV Trucks Parked and Awaiting Dispatch ................................................ I-49
LIST OF TABLES Page
Table 1: Hybrid Electric Vehicle (HEV) Truck .........................................................................I-9 Table 2: Battery Electric Vehicle (BEV) Truck ...................................................................... I-12 Table 3: Aggregate Efficiencies. ....................................................................................... I-41 Table 4: Expected ROI Calculation from Project Proposal. ...................................................... I-42 Table 5: Actual ROI Calculation after Completing Deployment. ................................................ I-43 Table 6: Reduction of Greenhouse Gasses. ......................................................................... I-46
I-5
EXECUTIVE SUMMARY
Background
Artisan Vehicle Systems, based in Camarillo, California, built two Class 8 commercial drayage trucks with alternative fuel powertrain systems: one with a hybrid compressed natural gas (CNG) turbine and battery electric powertrain, and the other with a battery electric powertrain. Together with Kenworth Trucks, Inland Kenworth, and Thompson Building Materials, the two trucks were deployed in real-world scenarios and compared with existing diesel-based trucks of the same class. The trucks were evaluated for performance, reliability, operating costs, and reductions in emissions. Results Both trucks successfully completed their deployments, covering hundreds of miles over several months. The Battery Electric Truck performed best in power, speed, and efficiency, while the Hybrid Electric Truck was better equipped for extended range scenarios. Both trucks were tested to their limits, giving valuable insight on the viability of each platform in different scenarios and reliability of the components. Overall emissions and greenhouse gasses were reduced compared to their diesel counterparts, and areas of future improvements were identified.
Conclusions While the Hybrid Electric Truck was initially the more attractive platform due to the familiar comfort of refilling a tank with fuel, its additional complexity and lower power density proved to be the main factors that made it less ideal and harder to operate than the Battery Electric Truck for short-haul applications. While the range of the Battery Electric Truck would preclude its use in long-haul scenarios, for short-haul drayage applications this platform performed exceptionally well in terms of power, ease of use, and operational costs. ROI is sensitive to diesel fuel prices, so any projections are dependent on market swings. Despite this, the ROI projection at current market prices is reasonable. Emissions and greenhouse gas reductions are significant for both trucks tested, with the Battery Electric Truck providing the biggest reductions. Decreased emissions and operating costs provide ROI that positively motivates fleets to consider alternative fuel drayage trucks for their operations.

I-6
CHAPTER 1: Introduction
In a demonstration of the commercial and environmental viability of alternative propulsion systems in Class 8 drayage trucks, Artisan Vehicle Systems along with Kenworth Truck Company, Inland Kenworth, and Thompson Building Materials partnered in developing and testing two electric trucks. One truck employed a hybrid CNG turbine and battery electric powertrain, while the other employed a battery electric powertrain. The Hybrid Electric Vehicle is referred to as the HEV Truck, while the Battery Electric Vehicle is referred to as the BEV Truck.
Artisan Vehicle Systems led the project and developed the powertrains for both drayage trucks using their battery electric drive system normally deployed in commercial underground mining applications. Inland Kenworth provided support for servicing the gliders and an on-location charging bay for the BEV truck. Both trucks were deployed at Thompson Building Materials, where they transported various building materials such as concrete and stone between distribution centers and suppliers in the Southern California region.
Objective The objective of the project is to demonstrate the commercial and environmental viability of two alternative drive systems in short-haul drayage applications by testing the systems for performance and reliability, analyzing the potential ROI, and comparing their emissions and greenhouse gas footprints with their conventional diesel counterparts. Personal experiences from the deployment partners as well as quantitative analysis of data logs provide the basis for considering the viability of the technologies.
Artisan Vehicle Systems Based in Camarillo, California, Artisan Vehicle Systems specializes in battery electric drive systems for heavy industrial vehicles. Their products have been deployed commercially in the underground mining industry for several years before being adapted for use above-ground in Class 8 drayage trucks. In 2016, Artisan Vehicle Systems introduced their new all-electric 1.5-yard class underground earth mover, now being sold domestically and internationally.
Kenworth Truck Company Kenworth Truck Company was founded in 1923 in Seattle, Washington. The company produced 80 trucks in its second year since establishment. In the course of over 90 years, Kenworth has greatly expanded and produced over one million trucks driven worldwide. Their trucks are used in many different industries, from local deliveries to firefighting to long-haul applications.
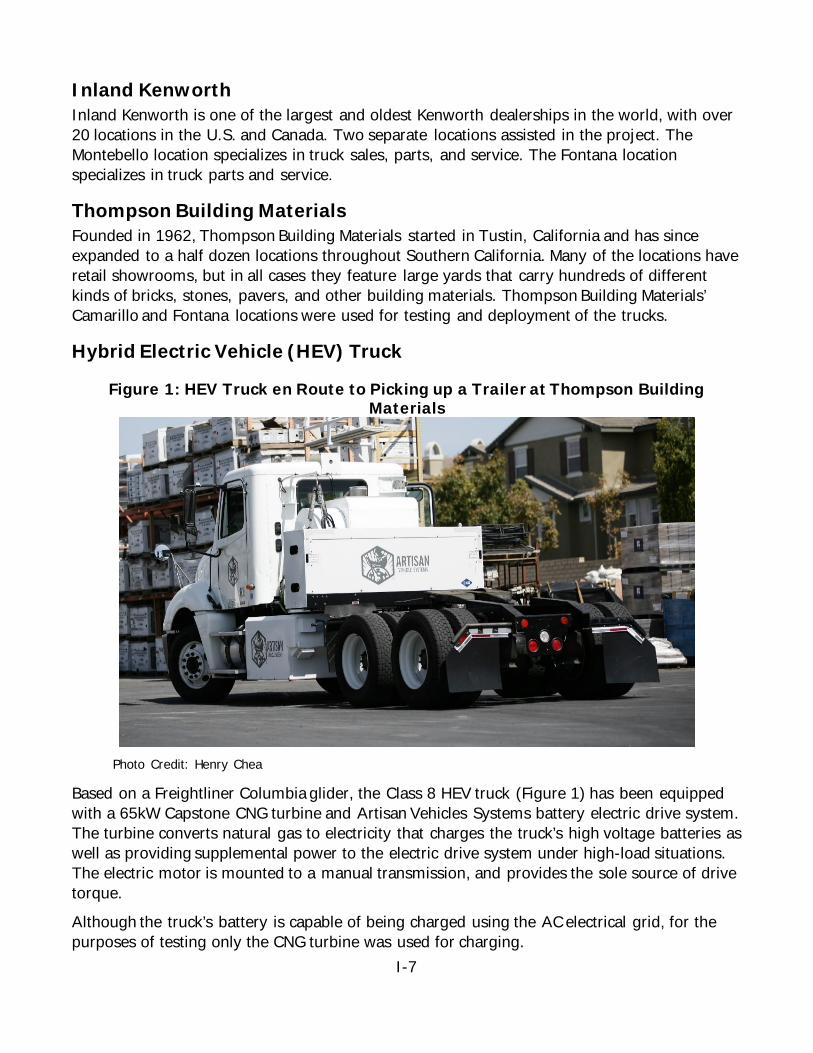
I-7
Inland Kenworth Inland Kenworth is one of the largest and oldest Kenworth dealerships in the world, with over 20 locations in the U.S. and Canada. Two separate locations assisted in the project. The Montebello location specializes in truck sales, parts, and service. The Fontana location specializes in truck parts and service.
Thompson Building Materials Founded in 1962, Thompson Building Materials started in Tustin, California and has since expanded to a half dozen locations throughout Southern California. Many of the locations have retail showrooms, but in all cases they feature large yards that carry hundreds of different kinds of bricks, stones, pavers, and other building materials. Thompson Building Materials’ Camarillo and Fontana locations were used for testing and deployment of the trucks.
Hybrid Electric Vehicle (HEV) Truck
Figure 1: HEV Truck en Route to Picking up a Trailer at Thompson Building Materials
Photo Credit: Henry Chea
Based on a Freightliner Columbia glider, the Class 8 HEV truck (Figure 1) has been equipped with a 65kW Capstone CNG turbine and Artisan Vehicles Systems battery electric drive system. The turbine converts natural gas to electricity that charges the truck’s high voltage batteries as well as providing supplemental power to the electric drive system under high-load situations. The electric motor is mounted to a manual transmission, and provides the sole source of drive torque. Although the truck’s battery is capable of being charged using the AC electrical grid, for the purposes of testing only the CNG turbine was used for charging.
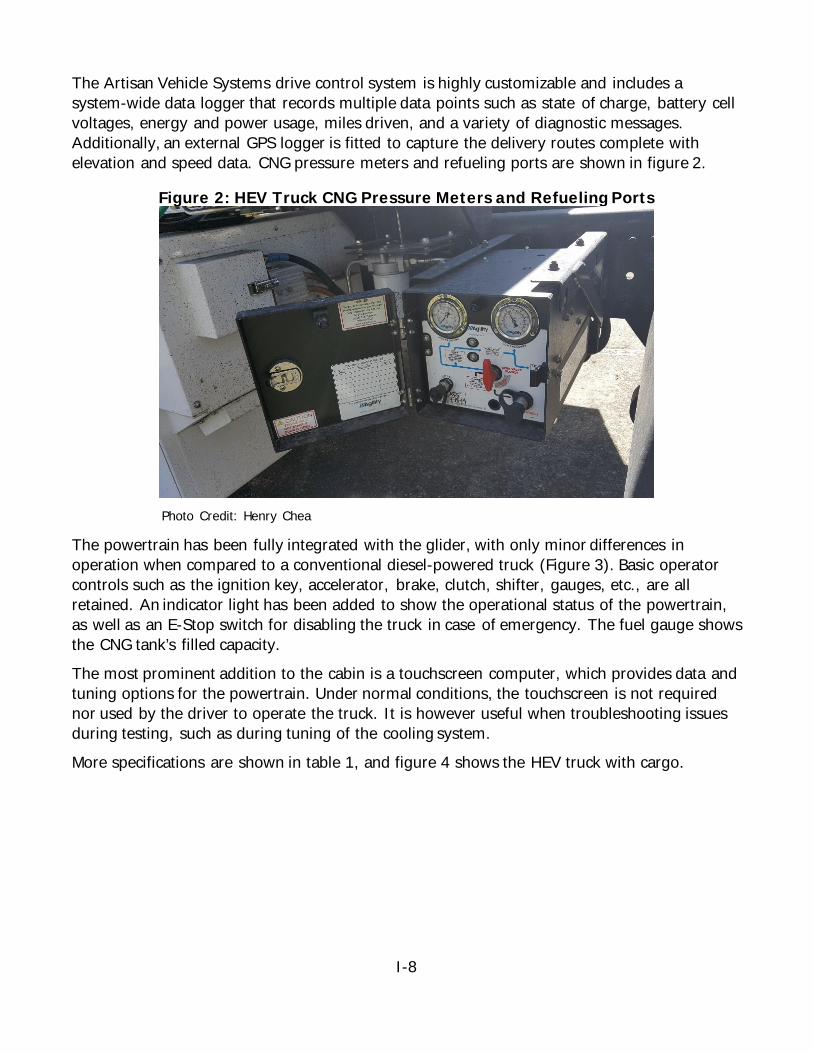
I-8
The Artisan Vehicle Systems drive control system is highly customizable and includes a system-wide data logger that records multiple data points such as state of charge, battery cell voltages, energy and power usage, miles driven, and a variety of diagnostic messages. Additionally, an external GPS logger is fitted to capture the delivery routes complete with elevation and speed data. CNG pressure meters and refueling ports are shown in figure 2.
Figure 2: HEV Truck CNG Pressure Meters and Refueling Ports
Photo Credit: Henry Chea
The powertrain has been fully integrated with the glider, with only minor differences in operation when compared to a conventional diesel-powered truck (Figure 3). Basic operator controls such as the ignition key, accelerator, brake, clutch, shifter, gauges, etc., are all retained. An indicator light has been added to show the operational status of the powertrain, as well as an E-Stop switch for disabling the truck in case of emergency. The fuel gauge shows the CNG tank’s filled capacity. The most prominent addition to the cabin is a touchscreen computer, which provides data and tuning options for the powertrain. Under normal conditions, the touchscreen is not required nor used by the driver to operate the truck. It is however useful when troubleshooting issues during testing, such as during tuning of the cooling system. More specifications are shown in table 1, and figure 4 shows the HEV truck with cargo.
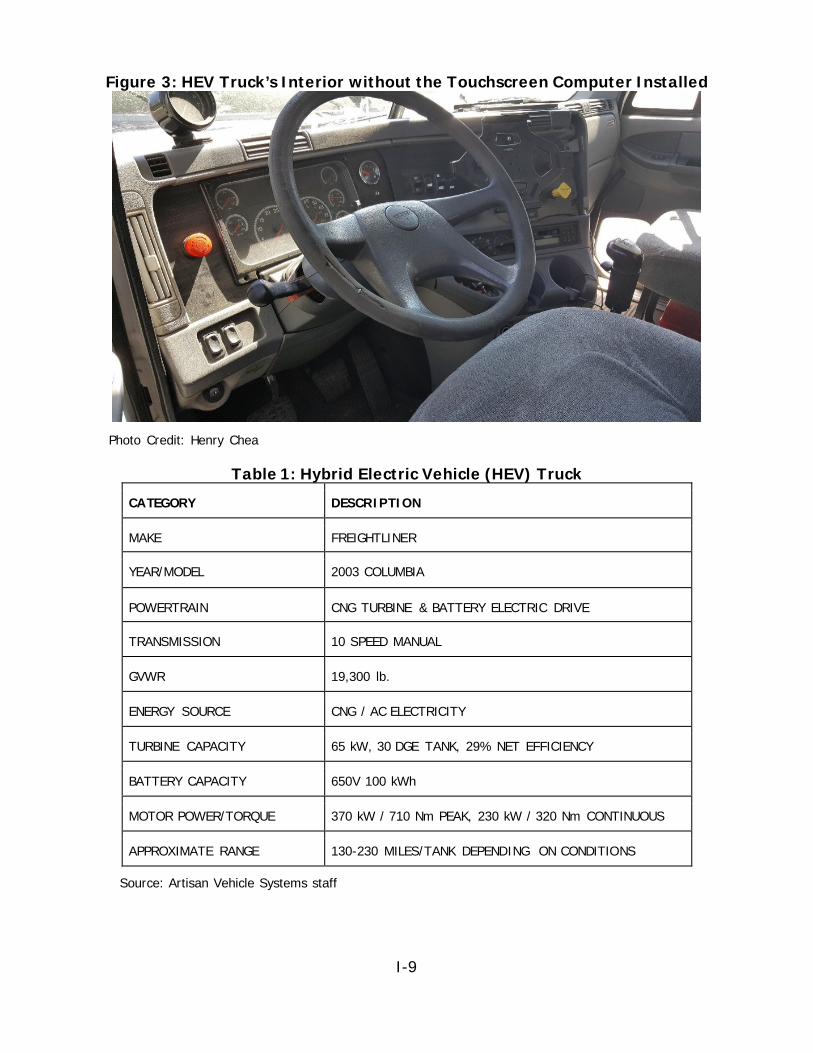
I-9
Figure 3: HEV Truck’s Interior without the Touchscreen Computer Installed
Photo Credit: Henry Chea
Table 1: Hybrid Electric Vehicle (HEV) Truck CATEGORY DESCRIPTION
MAKE FREIGHTLINER
YEAR/MODEL 2003 COLUMBIA
POWERTRAIN CNG TURBINE & BATTERY ELECTRIC DRIVE
TRANSMISSION 10 SPEED MANUAL
GVWR 19,300 lb.
ENERGY SOURCE CNG / AC ELECTRICITY
TURBINE CAPACITY 65 kW, 30 DGE TANK, 29% NET EFFICIENCY
BATTERY CAPACITY 650V 100 kWh
MOTOR POWER/TORQUE 370 kW / 710 Nm PEAK, 230 kW / 320 Nm CONTINUOUS
APPROXIMATE RANGE 130-230 MILES/TANK DEPENDING ON CONDITIONS
Source: Artisan Vehicle Systems staff
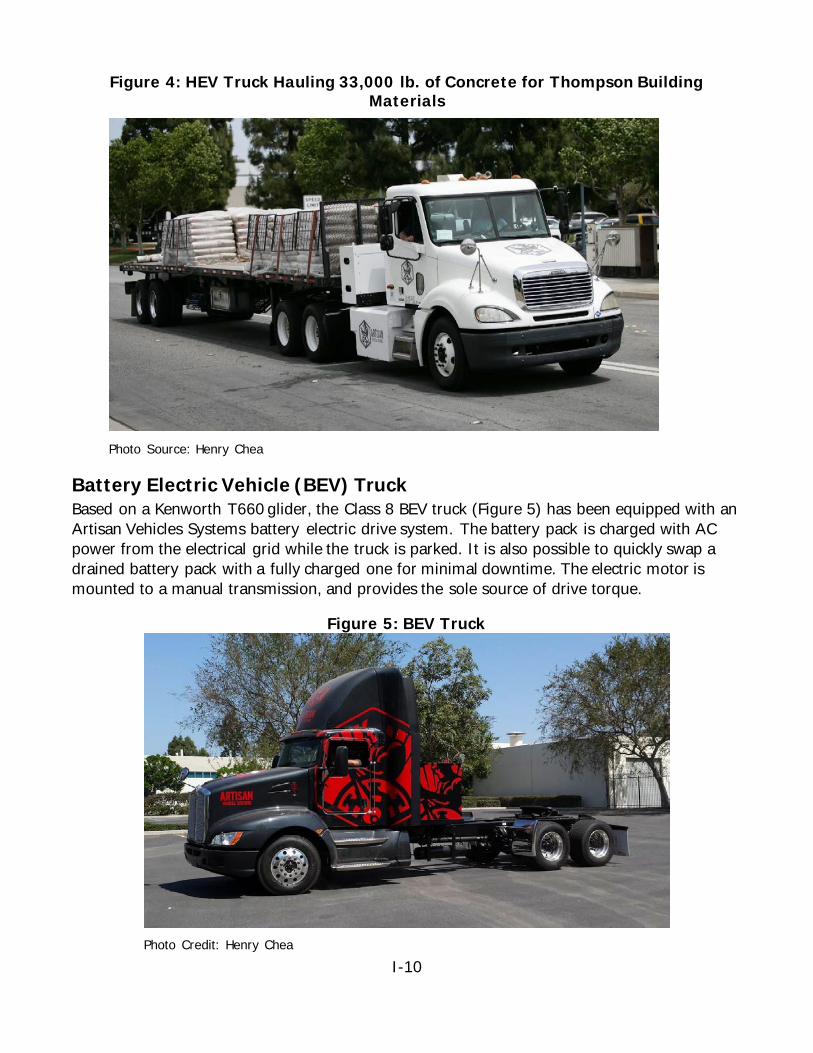
I-10
Figure 4: HEV Truck Hauling 33,000 lb. of Concrete for Thompson Building Materials
Photo Source: Henry Chea
Battery Electric Vehicle (BEV) Truck Based on a Kenworth T660 glider, the Class 8 BEV truck (Figure 5) has been equipped with an Artisan Vehicles Systems battery electric drive system. The battery pack is charged with AC power from the electrical grid while the truck is parked. It is also possible to quickly swap a drained battery pack with a fully charged one for minimal downtime. The electric motor is mounted to a manual transmission, and provides the sole source of drive torque.
Figure 5: BEV Truck
Photo Credit: Henry Chea
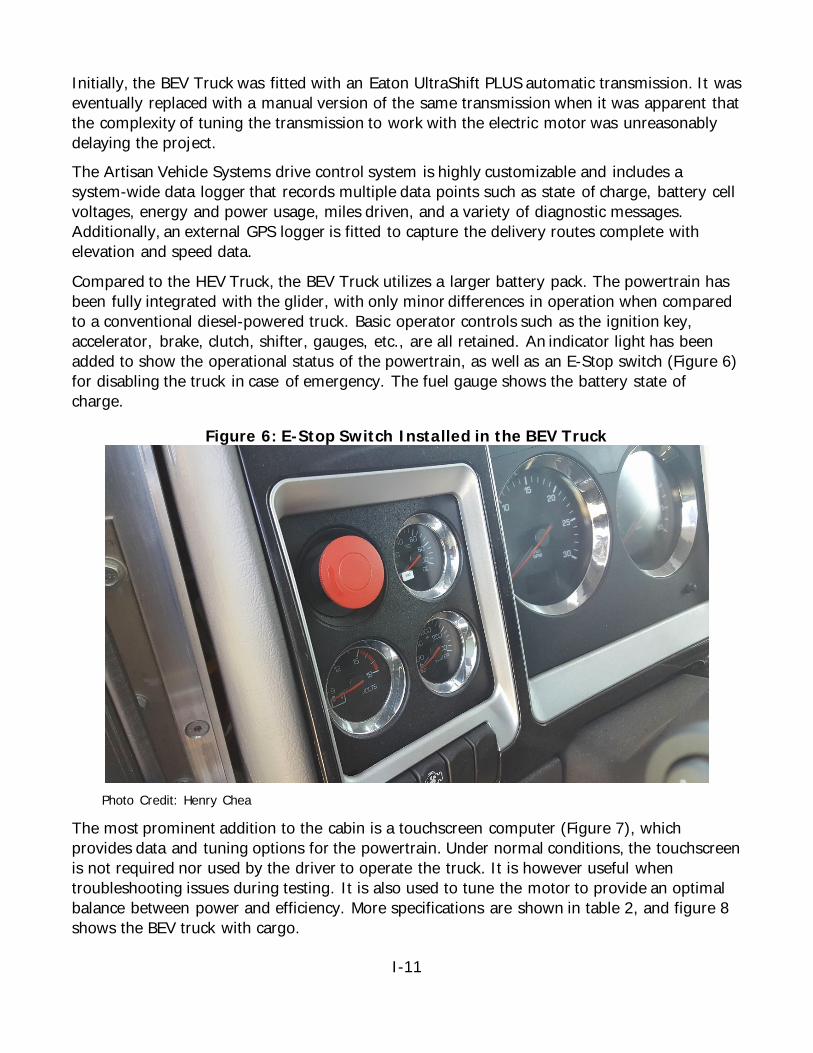
I-11
Initially, the BEV Truck was fitted with an Eaton UltraShift PLUS automatic transmission. It was eventually replaced with a manual version of the same transmission when it was apparent that the complexity of tuning the transmission to work with the electric motor was unreasonably delaying the project. The Artisan Vehicle Systems drive control system is highly customizable and includes a system-wide data logger that records multiple data points such as state of charge, battery cell voltages, energy and power usage, miles driven, and a variety of diagnostic messages. Additionally, an external GPS logger is fitted to capture the delivery routes complete with elevation and speed data.
Compared to the HEV Truck, the BEV Truck utilizes a larger battery pack. The powertrain has been fully integrated with the glider, with only minor differences in operation when compared to a conventional diesel-powered truck. Basic operator controls such as the ignition key, accelerator, brake, clutch, shifter, gauges, etc., are all retained. An indicator light has been added to show the operational status of the powertrain, as well as an E-Stop switch (Figure 6) for disabling the truck in case of emergency. The fuel gauge shows the battery state of charge.
Figure 6: E-Stop Switch Installed in the BEV Truck
Photo Credit: Henry Chea
The most prominent addition to the cabin is a touchscreen computer (Figure 7), which provides data and tuning options for the powertrain. Under normal conditions, the touchscreen is not required nor used by the driver to operate the truck. It is however useful when troubleshooting issues during testing. It is also used to tune the motor to provide an optimal balance between power and efficiency. More specifications are shown in table 2, and figure 8 shows the BEV truck with cargo.

I-12
Figure 7: BEV Truck’s Interior
Photo Credit: Henry Chea
The touchscreen computer is mounted onto a removable and lockable bracket. Together with a mobile internet hotspot installed in the truck, the touchscreen computer is able to send data logs directly to Artisan Vehicle Systems servers and provide real time communications and remote tuning capabilities.
Table 2: Battery Electric Vehicle (BEV) Truck CATEGORY DESCRIPTION
MAKE KENWORTH
YEAR/MODEL 2014 T660
POWERTRAIN BATTERY ELECTRIC DRIVE
TRANSMISSION 18 SPEED MANUAL
GVWR 23,600 lb.
ENERGY SOURCE AC ELECTRICITY
BATTERY CAPACITY 650V 260 kWh
MOTOR POWER/TORQUE 300 kW / 2300 Nm PEAK, 230 kW / 1400 Nm CONTINUOUS
APPROXIMATE RANGE 50-160 MILES/CHARGE DEPENDING ON CONDITIONS
Source: Artisan Vehicle Systems staff
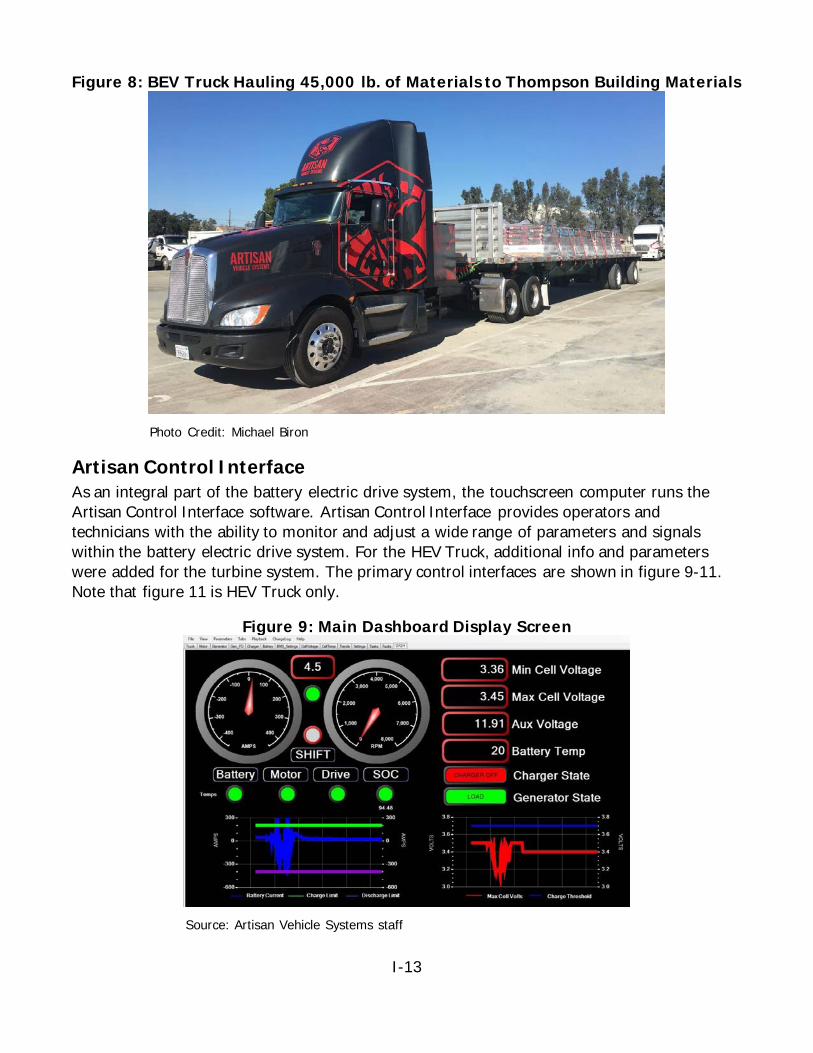
I-13
Figure 8: BEV Truck Hauling 45,000 lb. of Materials to Thompson Building Materials
Photo Credit: Michael Biron
Artisan Control Interface As an integral part of the battery electric drive system, the touchscreen computer runs the Artisan Control Interface software. Artisan Control Interface provides operators and technicians with the ability to monitor and adjust a wide range of parameters and signals within the battery electric drive system. For the HEV Truck, additional info and parameters were added for the turbine system. The primary control interfaces are shown in figure 9-11. Note that figure 11 is HEV Truck only.
Figure 9: Main Dashboard Display Screen
Source: Artisan Vehicle Systems staff
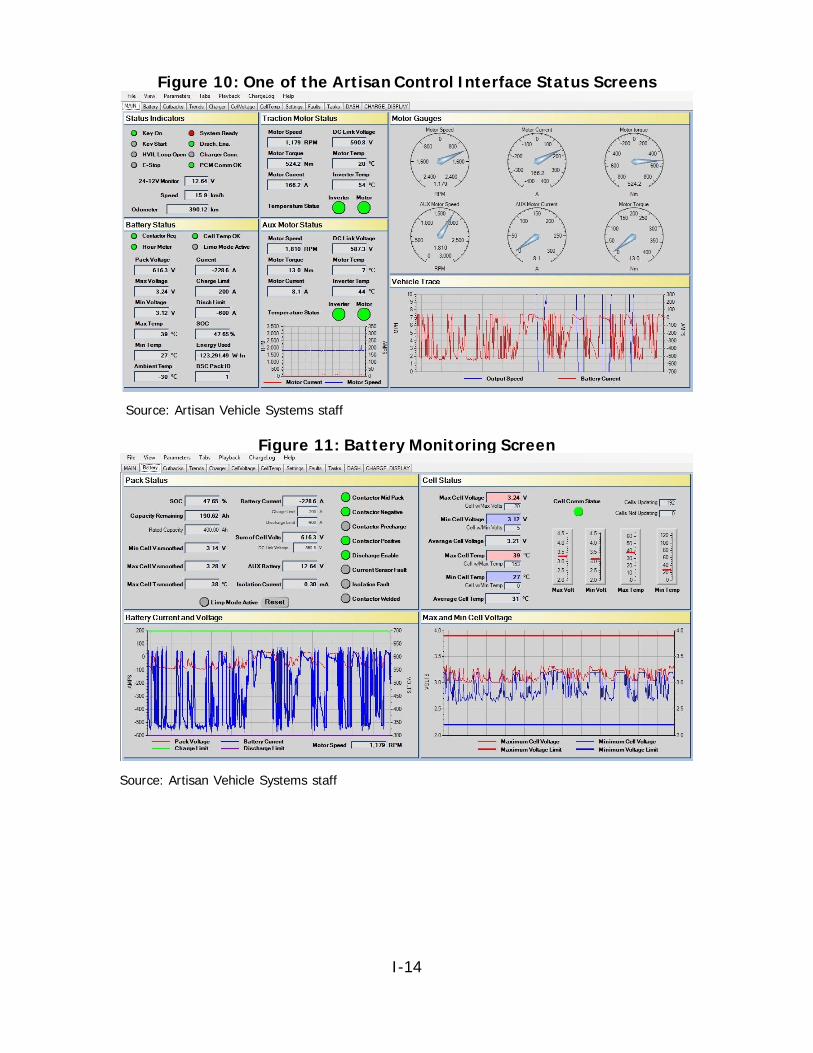
I-14
Figure 10: One of the Artisan Control Interface Status Screens
Source: Artisan Vehicle Systems staff
Figure 11: Battery Monitoring Screen
Source: Artisan Vehicle Systems staff
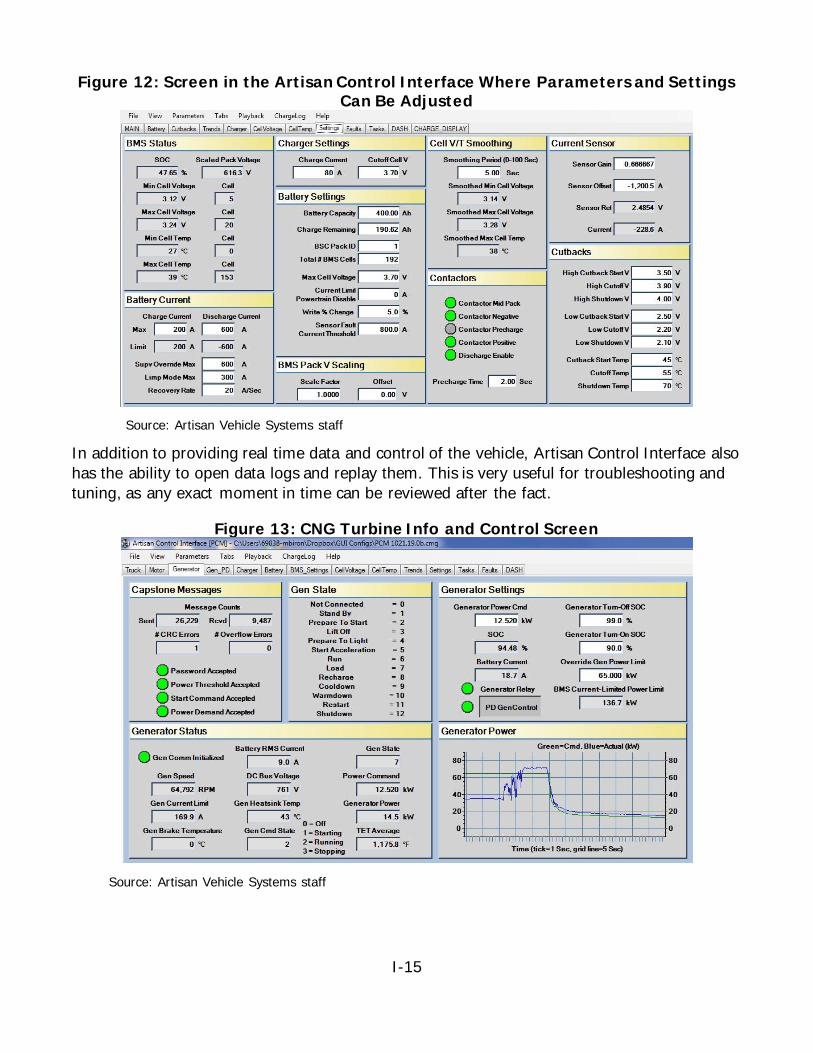
I-15
Figure 12: Screen in the Artisan Control Interface Where Parameters and Settings Can Be Adjusted
Source: Artisan Vehicle Systems staff
In addition to providing real time data and control of the vehicle, Artisan Control Interface also has the ability to open data logs and replay them. This is very useful for troubleshooting and tuning, as any exact moment in time can be reviewed after the fact.
Figure 13: CNG Turbine Info and Control Screen
Source: Artisan Vehicle Systems staff

I-16
The HEV Truck’s Artisan Control Interface also has info and settings screens for the turbine system. Directly from the touchscreen, one can manually control the turbine, adjust power settings, and see in real time the output from the turbine to the electric drive system.

I-17
Chapter 2: Deployment
Deployment and data collection for both trucks began in April 2016 between Thompson Building Materials’ Camarillo and Fontana locations as well as at Inland Kenworth Fontana. Deployment completed in February 2017. Deployment involved transporting various amounts of building materials between distribution centers and suppliers for Thompson Building Materials (Figure 14).
Figure 14: BEV Truck Picking Up a Load for Thompson Building Materials
Photo Credit: Michael Biron
Locations and Routes During the testing and demonstration phases of the project, the trucks were mainly driven around the Camarillo and Oxnard areas surrounding Artisan Vehicle systems (Figure 15). For such routes, the top speeds were typically 55 MPH, with 1,300 feet of ascent over 50 miles (see detailed speed graph in figure 16). The grades were mostly less than 2.5 percent, with the occasional short grade up to 10 percent.
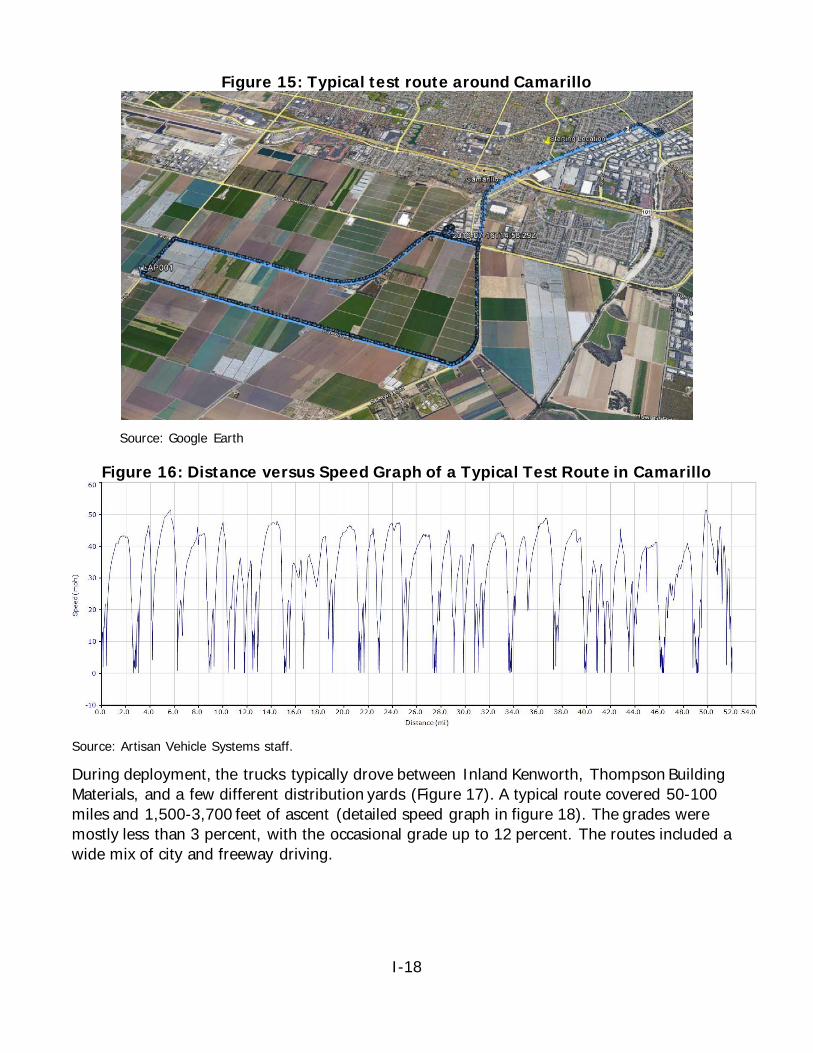
I-18
Figure 15: Typical test route around Camarillo
Source: Google Earth
Figure 16: Distance versus Speed Graph of a Typical Test Route in Camarillo
Source: Artisan Vehicle Systems staff.
During deployment, the trucks typically drove between Inland Kenworth, Thompson Building Materials, and a few different distribution yards (Figure 17). A typical route covered 50-100 miles and 1,500-3,700 feet of ascent (detailed speed graph in figure 18). The grades were mostly less than 3 percent, with the occasional grade up to 12 percent. The routes included a wide mix of city and freeway driving.
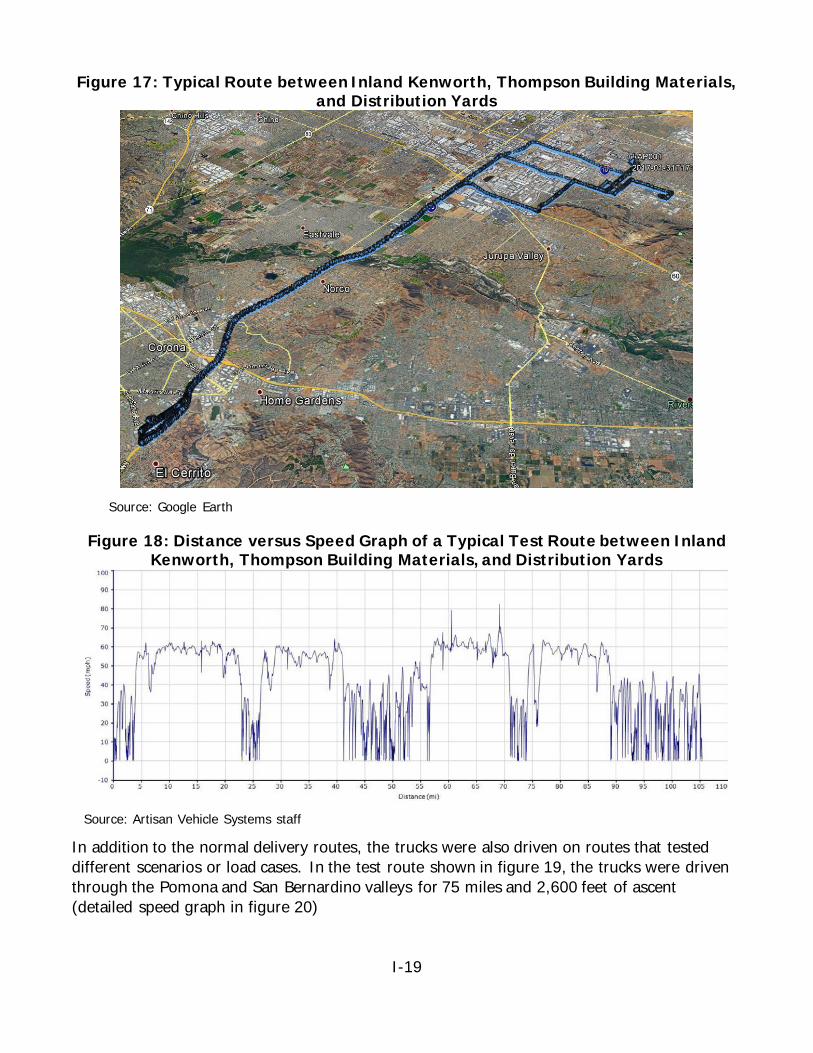
I-19
Figure 17: Typical Route between Inland Kenworth, Thompson Building Materials, and Distribution Yards
Source: Google Earth
Figure 18: Distance versus Speed Graph of a Typical Test Route between Inland Kenworth, Thompson Building Materials, and Distribution Yards
Source: Artisan Vehicle Systems staff
In addition to the normal delivery routes, the trucks were also driven on routes that tested different scenarios or load cases. In the test route shown in figure 19, the trucks were driven through the Pomona and San Bernardino valleys for 75 miles and 2,600 feet of ascent (detailed speed graph in figure 20)
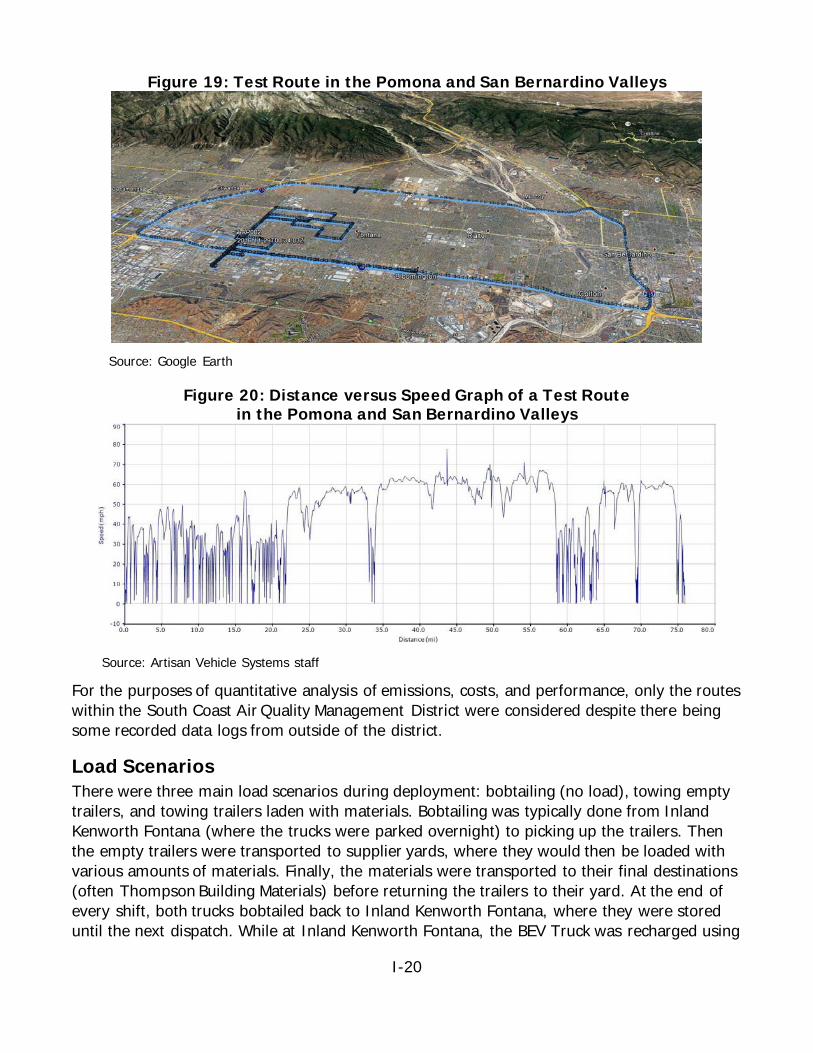
I-20
Figure 19: Test Route in the Pomona and San Bernardino Valleys
Source: Google Earth
Figure 20: Distance versus Speed Graph of a Test Route in the Pomona and San Bernardino Valleys
Source: Artisan Vehicle Systems staff
For the purposes of quantitative analysis of emissions, costs, and performance, only the routes within the South Coast Air Quality Management District were considered despite there being some recorded data logs from outside of the district.
Load Scenarios There were three main load scenarios during deployment: bobtailing (no load), towing empty trailers, and towing trailers laden with materials. Bobtailing was typically done from Inland Kenworth Fontana (where the trucks were parked overnight) to picking up the trailers. Then the empty trailers were transported to supplier yards, where they would then be loaded with various amounts of materials. Finally, the materials were transported to their final destinations (often Thompson Building Materials) before returning the trailers to their yard. At the end of every shift, both trucks bobtailed back to Inland Kenworth Fontana, where they were stored until the next dispatch. While at Inland Kenworth Fontana, the BEV Truck was recharged using
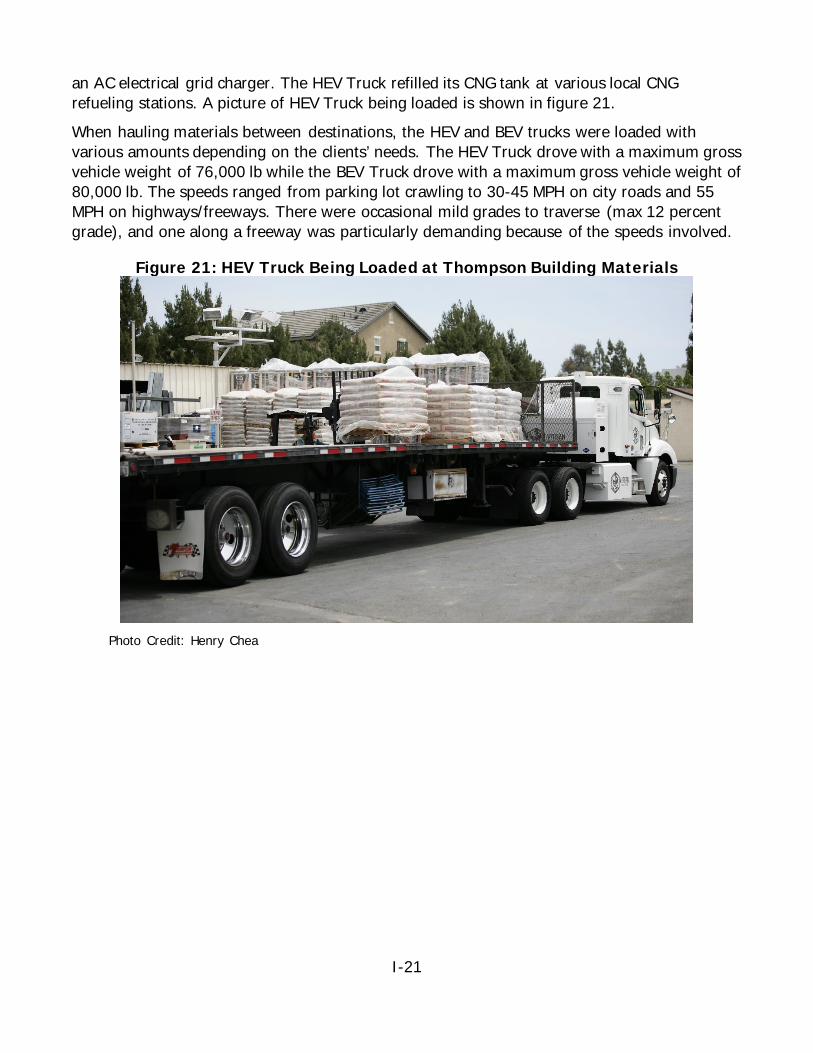
I-21
an AC electrical grid charger. The HEV Truck refilled its CNG tank at various local CNG refueling stations. A picture of HEV Truck being loaded is shown in figure 21. When hauling materials between destinations, the HEV and BEV trucks were loaded with various amounts depending on the clients’ needs. The HEV Truck drove with a maximum gross vehicle weight of 76,000 lb while the BEV Truck drove with a maximum gross vehicle weight of 80,000 lb. The speeds ranged from parking lot crawling to 30-45 MPH on city roads and 55 MPH on highways/freeways. There were occasional mild grades to traverse (max 12 percent grade), and one along a freeway was particularly demanding because of the speeds involved.
Figure 21: HEV Truck Being Loaded at Thompson Building Materials
Photo Credit: Henry Chea
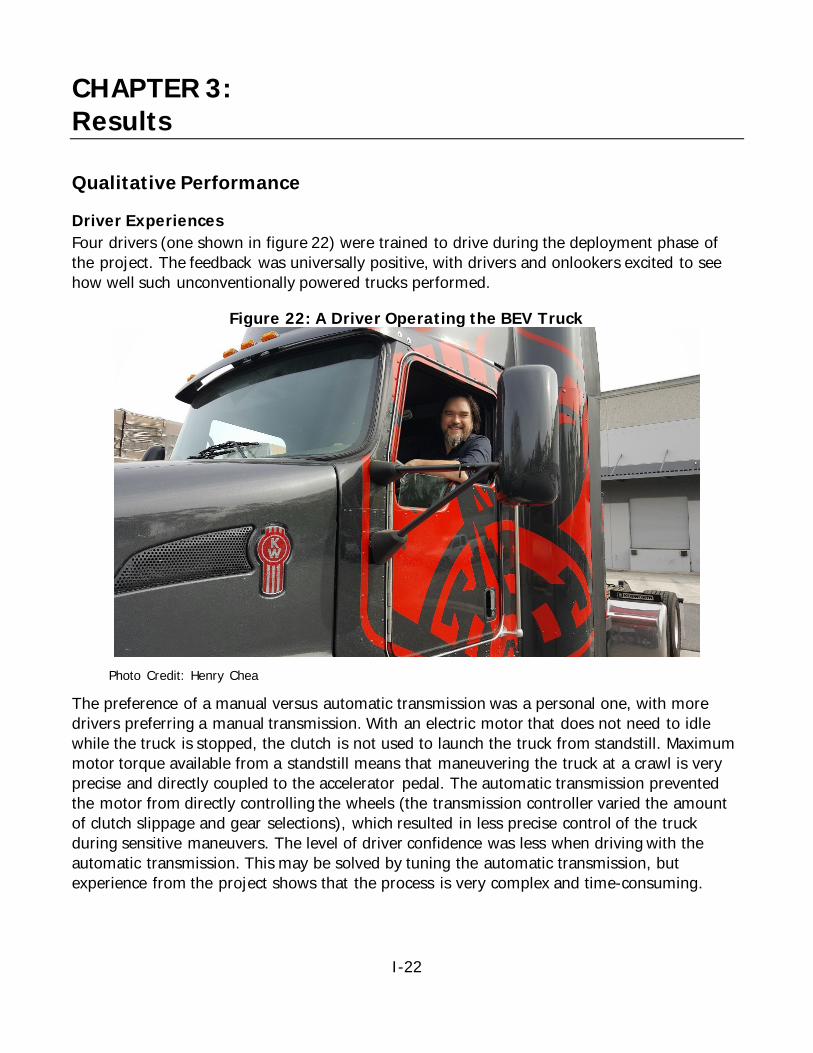
I-22
CHAPTER 3: Results
Qualitative Performance
Driver Experiences Four drivers (one shown in figure 22) were trained to drive during the deployment phase of the project. The feedback was universally positive, with drivers and onlookers excited to see how well such unconventionally powered trucks performed.
Figure 22: A Driver Operating the BEV Truck
Photo Credit: Henry Chea
The preference of a manual versus automatic transmission was a personal one, with more drivers preferring a manual transmission. With an electric motor that does not need to idle while the truck is stopped, the clutch is not used to launch the truck from standstill. Maximum motor torque available from a standstill means that maneuvering the truck at a crawl is very precise and directly coupled to the accelerator pedal. The automatic transmission prevented the motor from directly controlling the wheels (the transmission controller varied the amount of clutch slippage and gear selections), which resulted in less precise control of the truck during sensitive maneuvers. The level of driver confidence was less when driving with the automatic transmission. This may be solved by tuning the automatic transmission, but experience from the project shows that the process is very complex and time-consuming.
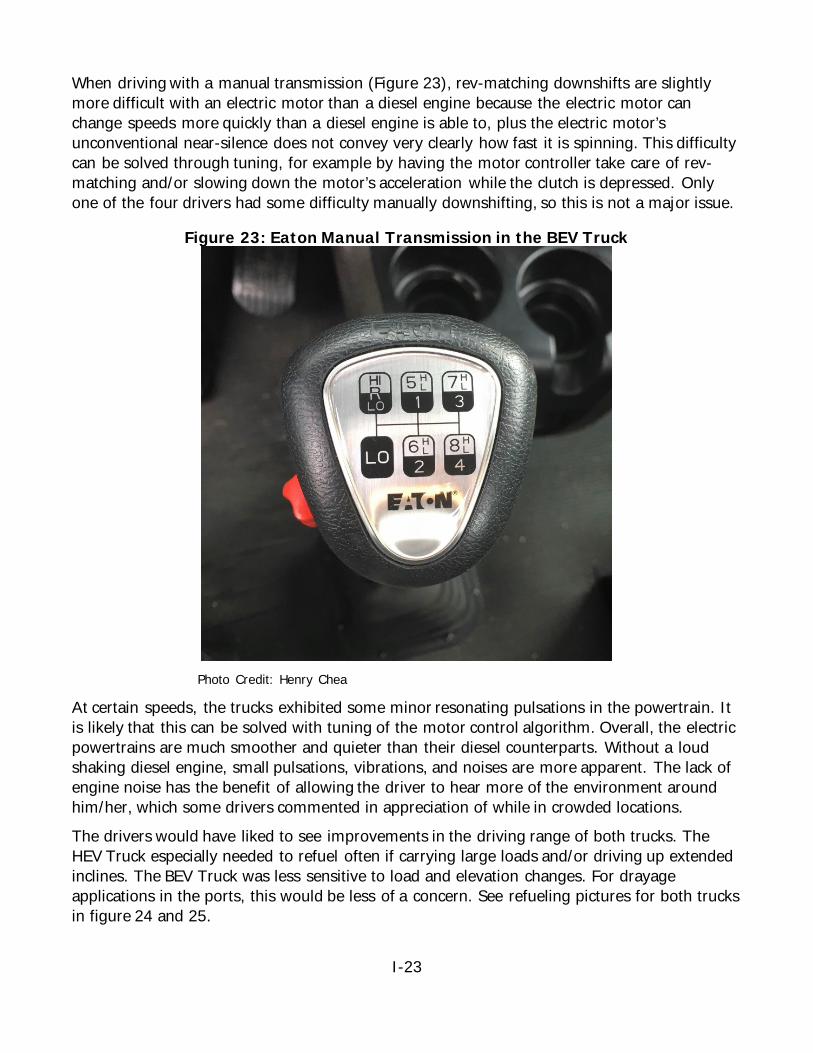
I-23
When driving with a manual transmission (Figure 23), rev-matching downshifts are slightly more difficult with an electric motor than a diesel engine because the electric motor can change speeds more quickly than a diesel engine is able to, plus the electric motor’s unconventional near-silence does not convey very clearly how fast it is spinning. This difficulty can be solved through tuning, for example by having the motor controller take care of rev-matching and/or slowing down the motor’s acceleration while the clutch is depressed. Only one of the four drivers had some difficulty manually downshifting, so this is not a major issue.
Figure 23: Eaton Manual Transmission in the BEV Truck
Photo Credit: Henry Chea
At certain speeds, the trucks exhibited some minor resonating pulsations in the powertrain. It is likely that this can be solved with tuning of the motor control algorithm. Overall, the electric powertrains are much smoother and quieter than their diesel counterparts. Without a loud shaking diesel engine, small pulsations, vibrations, and noises are more apparent. The lack of engine noise has the benefit of allowing the driver to hear more of the environment around him/her, which some drivers commented in appreciation of while in crowded locations. The drivers would have liked to see improvements in the driving range of both trucks. The HEV Truck especially needed to refuel often if carrying large loads and/or driving up extended inclines. The BEV Truck was less sensitive to load and elevation changes. For drayage applications in the ports, this would be less of a concern. See refueling pictures for both trucks in figure 24 and 25.
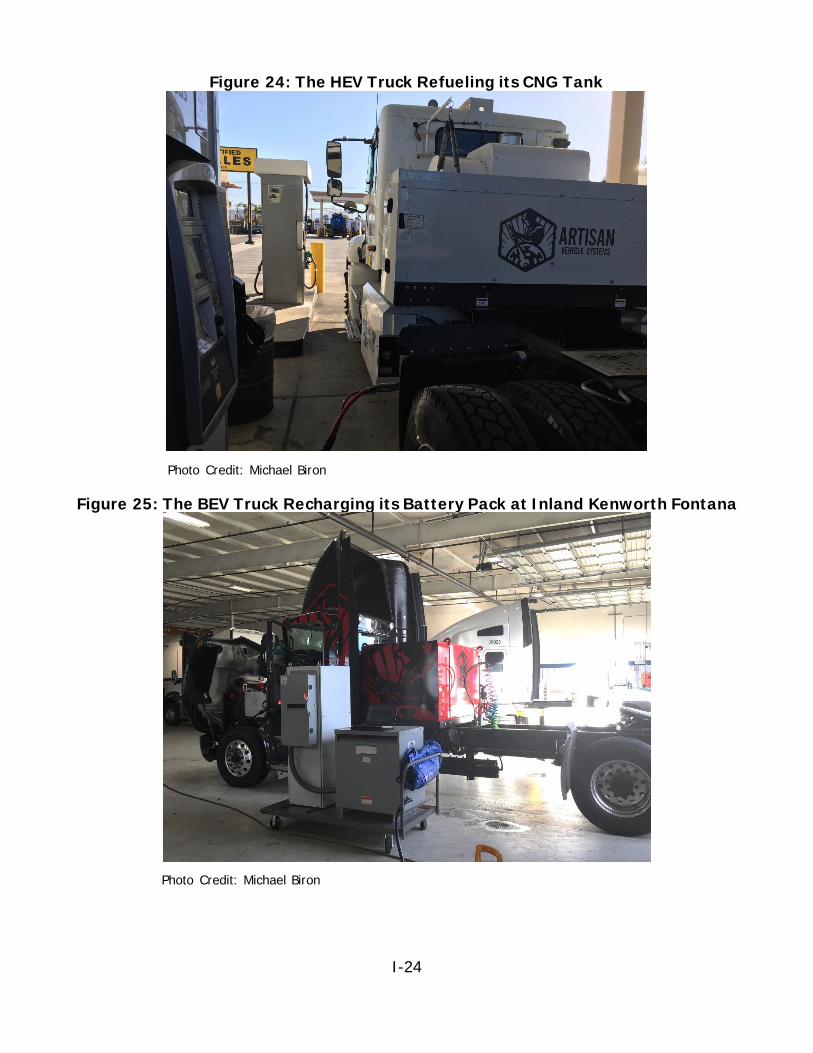
I-24
Figure 24: The HEV Truck Refueling its CNG Tank
Photo Credit: Michael Biron
Figure 25: The BEV Truck Recharging its Battery Pack at Inland Kenworth Fontana
Photo Credit: Michael Biron
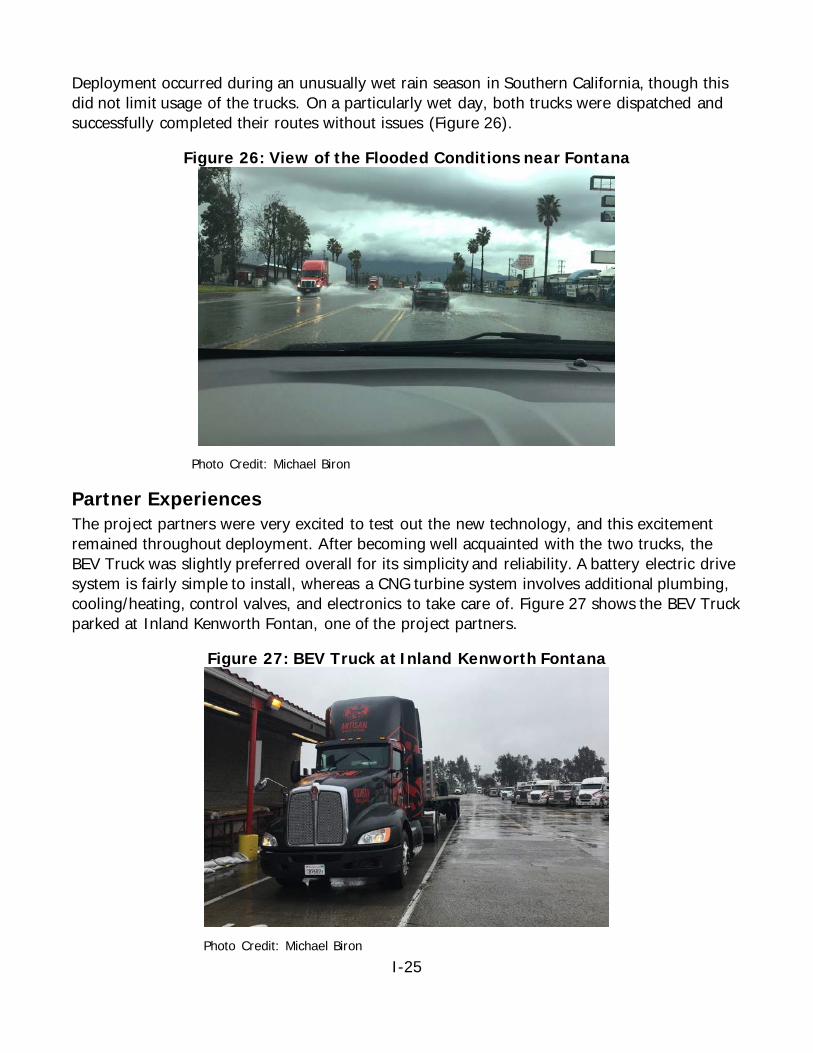
I-25
Deployment occurred during an unusually wet rain season in Southern California, though this did not limit usage of the trucks. On a particularly wet day, both trucks were dispatched and successfully completed their routes without issues (Figure 26).
Figure 26: View of the Flooded Conditions near Fontana
Photo Credit: Michael Biron
Partner Experiences The project partners were very excited to test out the new technology, and this excitement remained throughout deployment. After becoming well acquainted with the two trucks, the BEV Truck was slightly preferred overall for its simplicity and reliability. A battery electric drive system is fairly simple to install, whereas a CNG turbine system involves additional plumbing, cooling/heating, control valves, and electronics to take care of. Figure 27 shows the BEV Truck parked at Inland Kenworth Fontan, one of the project partners.
Figure 27: BEV Truck at Inland Kenworth Fontana
Photo Credit: Michael Biron
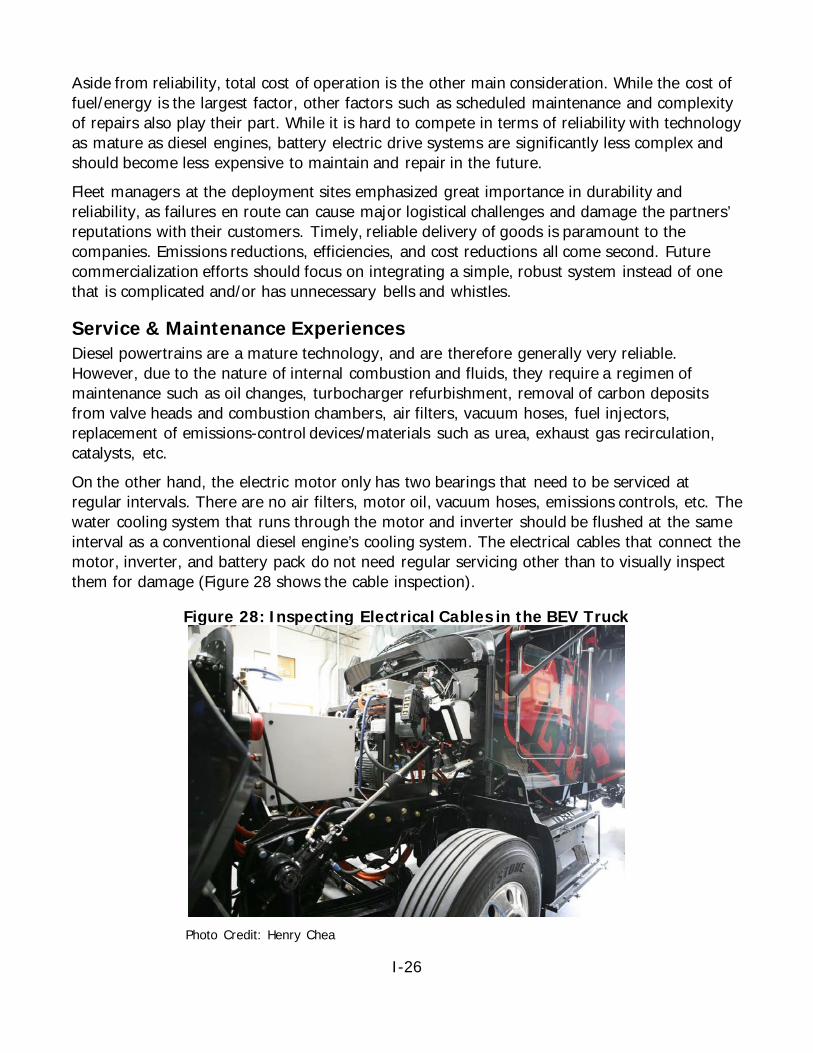
I-26
Aside from reliability, total cost of operation is the other main consideration. While the cost of fuel/energy is the largest factor, other factors such as scheduled maintenance and complexity of repairs also play their part. While it is hard to compete in terms of reliability with technology as mature as diesel engines, battery electric drive systems are significantly less complex and should become less expensive to maintain and repair in the future. Fleet managers at the deployment sites emphasized great importance in durability and reliability, as failures en route can cause major logistical challenges and damage the partners’ reputations with their customers. Timely, reliable delivery of goods is paramount to the companies. Emissions reductions, efficiencies, and cost reductions all come second. Future commercialization efforts should focus on integrating a simple, robust system instead of one that is complicated and/or has unnecessary bells and whistles.
Service & Maintenance Experiences Diesel powertrains are a mature technology, and are therefore generally very reliable. However, due to the nature of internal combustion and fluids, they require a regimen of maintenance such as oil changes, turbocharger refurbishment, removal of carbon deposits from valve heads and combustion chambers, air filters, vacuum hoses, fuel injectors, replacement of emissions-control devices/materials such as urea, exhaust gas recirculation, catalysts, etc. On the other hand, the electric motor only has two bearings that need to be serviced at regular intervals. There are no air filters, motor oil, vacuum hoses, emissions controls, etc. The water cooling system that runs through the motor and inverter should be flushed at the same interval as a conventional diesel engine’s cooling system. The electrical cables that connect the motor, inverter, and battery pack do not need regular servicing other than to visually inspect them for damage (Figure 28 shows the cable inspection).
Figure 28: Inspecting Electrical Cables in the BEV Truck
Photo Credit: Henry Chea
I-27
The battery pack is one area that requires more effort to maintain and service properly. Although the process is not messy with no fluids to remove or replace, methodical processes for inspecting and maintaining good electrical connections between the battery cells is crucial for reliable performance. Safety is another concern, and the battery packs designed by Artisan Vehicle Systems include multiple methods of preventing access to high voltages. Although swapping battery packs was not needed during deployment, all modern Artisan Vehicle Systems battery packs are designed for quick and simple swapping. This allows for minimal downtime after a truck has depleted a battery pack, and it also minimizes the truck’s downtime when a battery pack needs to be serviced.
The CNG turbine system requires its own maintenance schedule, and this mainly involves periodic replacement of valves, hoses, and the fuel tank. The system is not as complex to service as a diesel engine, but does require specialized knowledge of the technology. The turbine spins on air bearings, which require no fluids or maintenance. Regarding servicing and maintaining the gliders, most the components such as suspension, transmission, brakes, operator controls, etc., are unchanged and familiar to technicians.
Reliability / Breakdowns While there were relatively few situations we can call a breakdown, there were some that required the system to be restarted / reset. The HEV had a few occasions where the traction motor temp rose to the point where the system protected itself and disabled the powertrain. It was determined that the HEV is not able to carry a full 80,000 GVW at freeways speeds for any longer than a couple minutes due to limitations in the traction motor and cooling system.
The HEV also stalled during testing with an empty trailer while in EV mode. The system self-protected when a low voltage threshold in the battery pack settings was reached. The system was reset and generator started which raised the voltage of the cells. This allowed the vehicle to be driven from the location where is stalled after about 2 mins of recovery. There was an instance where the generator on the HEV shut down unexpectedly which required a system reset and was able to restart. The traction motor on the HEV at one point went to max rpm and required the use of the stop switch. After shutdown and recovery, the situation was not able to be replicated. Also, the BEV had a couple of instances where the powertrain disabled at slow speed while steering. This was caused by the RPM of the auxiliary motor dropping down under load. The settings in the software were set to disable the traction motor inverter when the auxiliary motor dropped below a specific threshold. Those settings have been changed and is corrected.
During deployment, the EV truck had a utilization rate of 40 percent of the days that the truck was available for work. During those days the truck was dispatched, about 60 percent of each day was operations and 40 percent charging. If a spare battery pack was available, it would be possible to increase utilization rate.

I-28
The HEV was used 47 percent of the days available for dispatch, and for each of the days it was dispatched it was run on average 75 percent of each day. Downtime was minimal at 4.4 percent. Both vehicles have been available for testing since the end of April 2016 and only small tasks required for maintenance and prep for deployment to Fontana.
Technical Experiences Testing and deployment of the trucks provided insight that will be valuable during the future commercialization phase of the project. While both trucks successfully completed their deployments, there were some technical challenges and opportunities for future optimizations that are described below.
Transmission Selection By far the largest challenge for the project was integration of the Eaton UltraShift PLUS automatic transmission in the BEV Truck. The transmission has an extremely complicated control algorithm that attempts to predict the optimal amount of clutch slippage and gear selection for a multitude of scenarios such as hill-starts, crawling, strong acceleration, etc. The transmission assumes that the propulsion source is a large diesel engine, and is tuned specifically for this. This means that there is excessive clutch slippage during shifts to compensate for a diesel engine’s extra rotational inertia, slow gear shifts in anticipation of the diesel engine changing its rotational speed slowly, and attempts to keep a diesel engine from stalling. In practice, these diesel-based adaptations led to some unwanted behaviors when mated to an electric motor that has much less rotational inertia and quicker rotational speed changes. At times, the transmission would excessively slip the clutch then suddenly slam it with full engagement. While shifting gears, the transmission occasionally had difficulty with rev-matching because the electric motor would change speeds much faster than the transmission was expecting. Once out of the envelope for rev-matching, the transmission either slipped the clutch, suddenly engaged the clutch, applied full throttle while engaging the clutch, or didn’t shift at all until the truck came to a complete stop. The seemingly random combinations of these actions led to surges of acceleration that were not predictable or desirable, especially when driving at low speed in crowded locations. Figure 29 shows the tuning data graphs of the Eaton UltraShift PLUS automatic transmission.
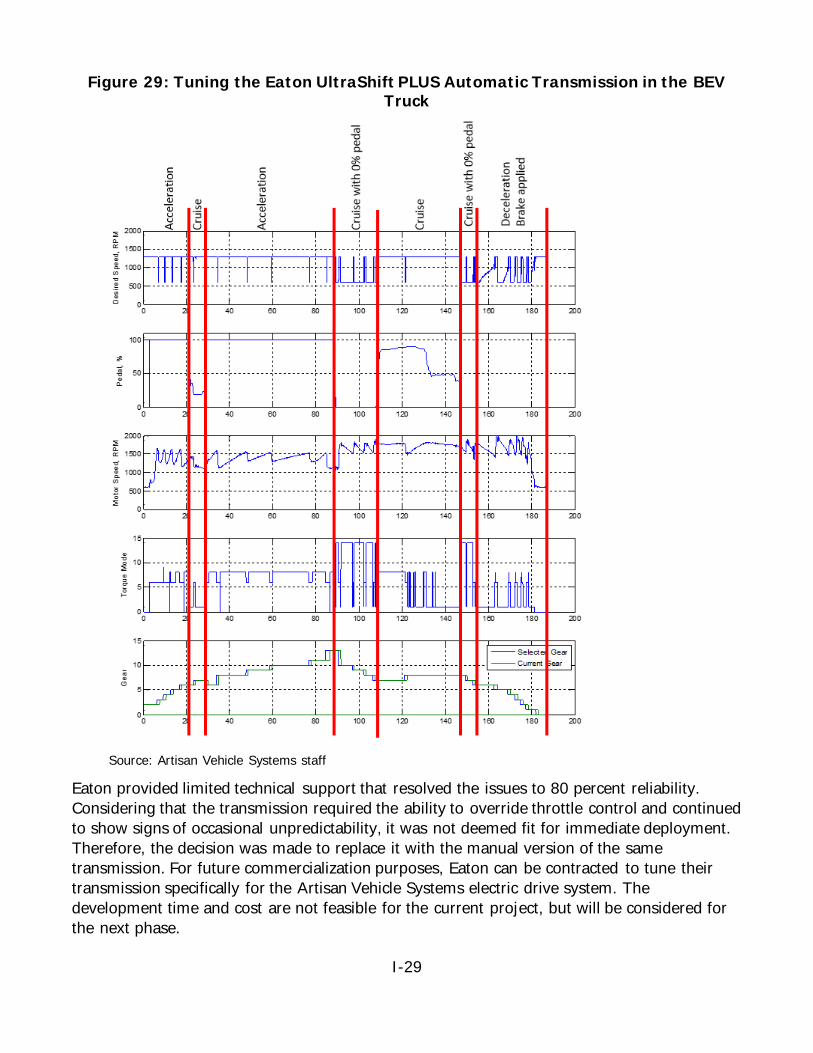
I-29
Figure 29: Tuning the Eaton UltraShift PLUS Automatic Transmission in the BEV Truck
Source: Artisan Vehicle Systems staff
Eaton provided limited technical support that resolved the issues to 80 percent reliability. Considering that the transmission required the ability to override throttle control and continued to show signs of occasional unpredictability, it was not deemed fit for immediate deployment. Therefore, the decision was made to replace it with the manual version of the same transmission. For future commercialization purposes, Eaton can be contracted to tune their transmission specifically for the Artisan Vehicle Systems electric drive system. The development time and cost are not feasible for the current project, but will be considered for the next phase.

I-30
Another unforeseen detail from using the Eaton UltraShift PLUS transmission was the requirement of a pull-type clutch. The stock Artisan Vehicle Systems electric motor was not compatible with pull-type clutches, as it would get its rotor position sensor pulled out of alignment every time the clutch engaged. The solution involved modifying and rebuilding the electric motor to accept pull-type clutches.
Electric Motor Before the project began, the HEV Truck existed as a BEV with a very early generation electric motor. During the project, in addition to being retrofitted with the gas turbine, the electric motor was upgraded to the next generation. This was done to avoid reliability issues common with the older electric motor, the most serious being demagnetization of the stator. The upgraded motor proved to be a reliable performer during testing and deployment, though it was at a disadvantage from a less-than-optimal battery and cooling system (as described below). The HEV Truck’s electric motor occasionally reached its thermal limit under high load, which triggered the control system to apply motor torque limits to control the temperature.
The BEV Truck was fitted with an even newer motor than the HEV (Figure 30), and its performance was adequate for all situations encountered. Other than the issue with the pull-type clutch described in the previous section, the BEV Truck’s electric motor performed without any thermal cutbacks or reliability issues. Combined with low maintenance (only two bearings need to be serviced occasionally), the new generation electric motor proves its cost effectiveness, performance, and reliability.
Figure 30: The BEV Truck’s Electric Motor Fits Completely between the Frame Rails
Photo Credit: Henry Chea
Battery Selection
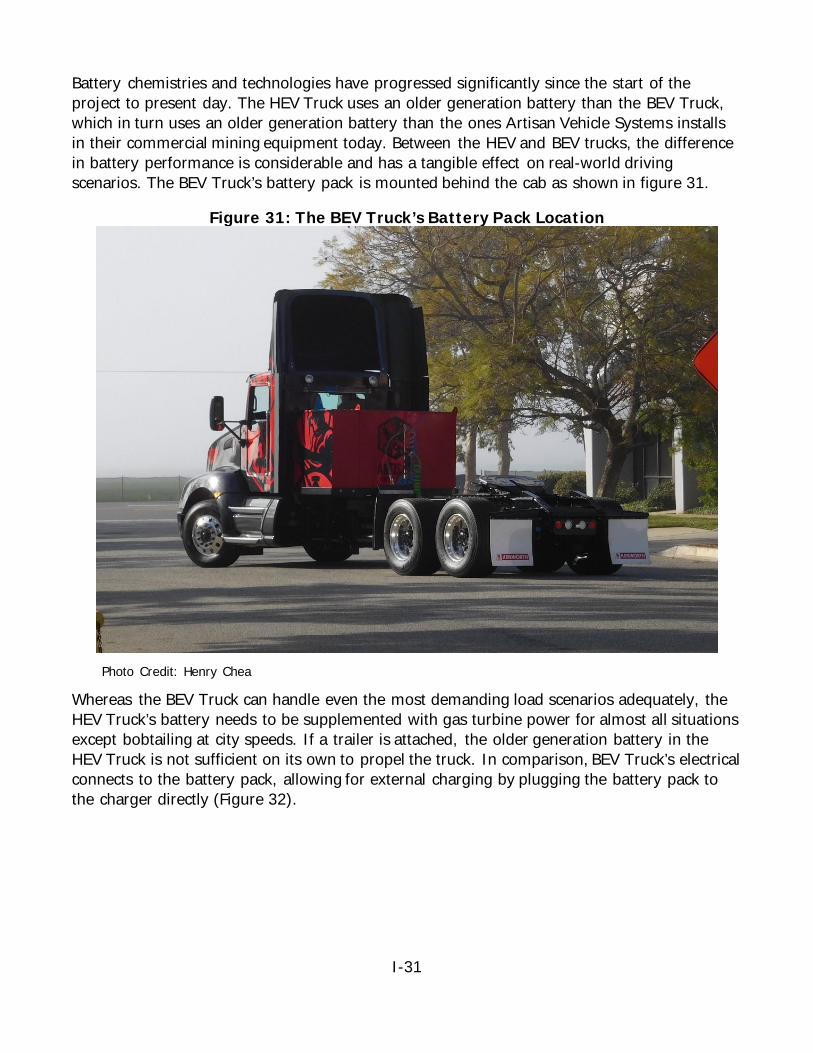
I-31
Battery chemistries and technologies have progressed significantly since the start of the project to present day. The HEV Truck uses an older generation battery than the BEV Truck, which in turn uses an older generation battery than the ones Artisan Vehicle Systems installs in their commercial mining equipment today. Between the HEV and BEV trucks, the difference in battery performance is considerable and has a tangible effect on real-world driving scenarios. The BEV Truck’s battery pack is mounted behind the cab as shown in figure 31.
Figure 31: The BEV Truck’s Battery Pack Location
Photo Credit: Henry Chea
Whereas the BEV Truck can handle even the most demanding load scenarios adequately, the HEV Truck’s battery needs to be supplemented with gas turbine power for almost all situations except bobtailing at city speeds. If a trailer is attached, the older generation battery in the HEV Truck is not sufficient on its own to propel the truck. In comparison, BEV Truck’s electrical connects to the battery pack, allowing for external charging by plugging the battery pack to the charger directly (Figure 32).

I-32
Figure 32: BEV Truck’s Electrical Connections to the Battery Pack
Photo Credit: Henry Chea
Another effect of the older battery technology is the reduction in energy efficiency. The efficiency of the HEV Truck’s battery is less than the BEV Truck’s battery, leading to less range and greater heat build-up. The heat build-up leads to even less efficiency. The gas turbine in the HEV is unable to efficiently recharge the truck’s battery after it has built up significant heat. Since the gas turbine needs to be used under almost all load scenarios and the older battery is relatively inefficient, gas mileage is not as efficient as it could be. For commercialization purposes, the solution is to implement new battery technologies and focus on maintaining high efficiencies. In retrospect, if newer battery technologies were available when the HEV Truck was built, the gas turbine would have been needed much less and the truck would have been able to haul most (if not all) loads under battery power only. As a result, the HEV Truck has two battery packs, mounted where the diesel fuel tanks normally sit (Figure 33).
Figure 33: The HEV Truck Battery Packs Location
Photo Credit: Avinash Pai
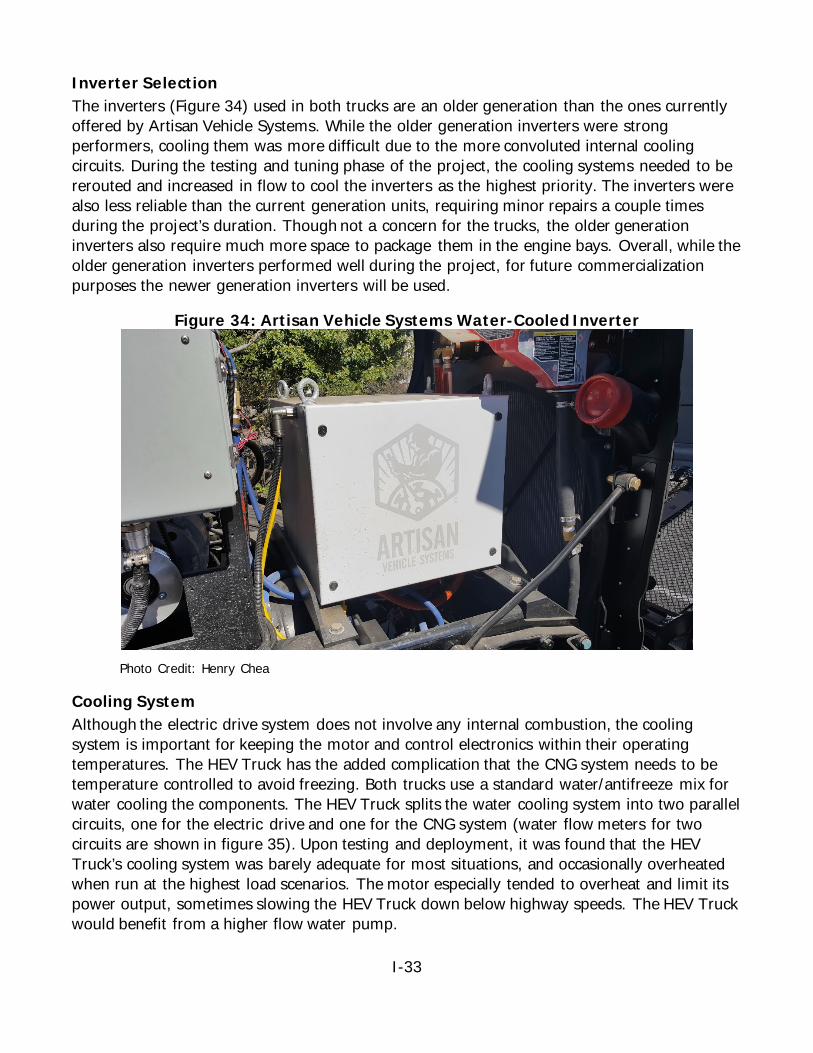
I-33
Inverter Selection The inverters (Figure 34) used in both trucks are an older generation than the ones currently offered by Artisan Vehicle Systems. While the older generation inverters were strong performers, cooling them was more difficult due to the more convoluted internal cooling circuits. During the testing and tuning phase of the project, the cooling systems needed to be rerouted and increased in flow to cool the inverters as the highest priority. The inverters were also less reliable than the current generation units, requiring minor repairs a couple times during the project’s duration. Though not a concern for the trucks, the older generation inverters also require much more space to package them in the engine bays. Overall, while the older generation inverters performed well during the project, for future commercialization purposes the newer generation inverters will be used.
Figure 34: Artisan Vehicle Systems Water-Cooled Inverter
Photo Credit: Henry Chea
Cooling System Although the electric drive system does not involve any internal combustion, the cooling system is important for keeping the motor and control electronics within their operating temperatures. The HEV Truck has the added complication that the CNG system needs to be temperature controlled to avoid freezing. Both trucks use a standard water/antifreeze mix for water cooling the components. The HEV Truck splits the water cooling system into two parallel circuits, one for the electric drive and one for the CNG system (water flow meters for two circuits are shown in figure 35). Upon testing and deployment, it was found that the HEV Truck’s cooling system was barely adequate for most situations, and occasionally overheated when run at the highest load scenarios. The motor especially tended to overheat and limit its power output, sometimes slowing the HEV Truck down below highway speeds. The HEV Truck would benefit from a higher flow water pump.
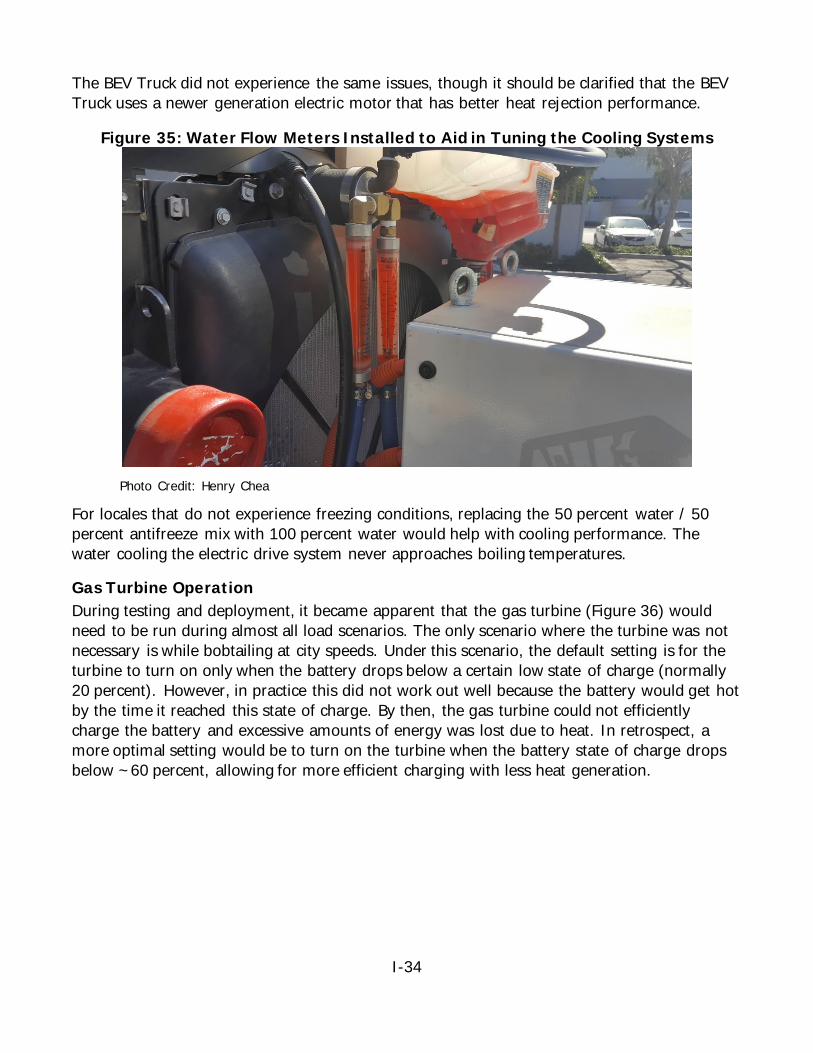
I-34
The BEV Truck did not experience the same issues, though it should be clarified that the BEV Truck uses a newer generation electric motor that has better heat rejection performance.
Figure 35: Water Flow Meters Installed to Aid in Tuning the Cooling Systems
Photo Credit: Henry Chea
For locales that do not experience freezing conditions, replacing the 50 percent water / 50 percent antifreeze mix with 100 percent water would help with cooling performance. The water cooling the electric drive system never approaches boiling temperatures.
Gas Turbine Operation During testing and deployment, it became apparent that the gas turbine (Figure 36) would need to be run during almost all load scenarios. The only scenario where the turbine was not necessary is while bobtailing at city speeds. Under this scenario, the default setting is for the turbine to turn on only when the battery drops below a certain low state of charge (normally 20 percent). However, in practice this did not work out well because the battery would get hot by the time it reached this state of charge. By then, the gas turbine could not efficiently charge the battery and excessive amounts of energy was lost due to heat. In retrospect, a more optimal setting would be to turn on the turbine when the battery state of charge drops below ~60 percent, allowing for more efficient charging with less heat generation.
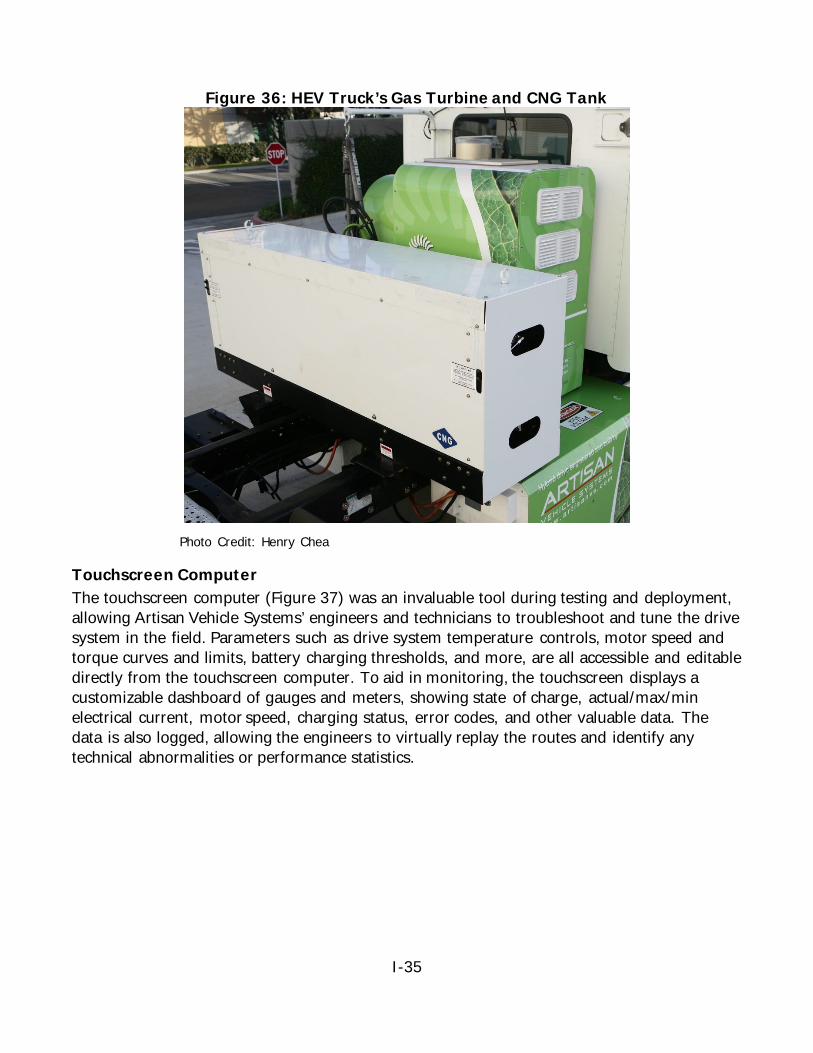
I-35
Figure 36: HEV Truck’s Gas Turbine and CNG Tank
Photo Credit: Henry Chea
Touchscreen Computer The touchscreen computer (Figure 37) was an invaluable tool during testing and deployment, allowing Artisan Vehicle Systems’ engineers and technicians to troubleshoot and tune the drive system in the field. Parameters such as drive system temperature controls, motor speed and torque curves and limits, battery charging thresholds, and more, are all accessible and editable directly from the touchscreen computer. To aid in monitoring, the touchscreen displays a customizable dashboard of gauges and meters, showing state of charge, actual/max/min electrical current, motor speed, charging status, error codes, and other valuable data. The data is also logged, allowing the engineers to virtually replay the routes and identify any technical abnormalities or performance statistics.
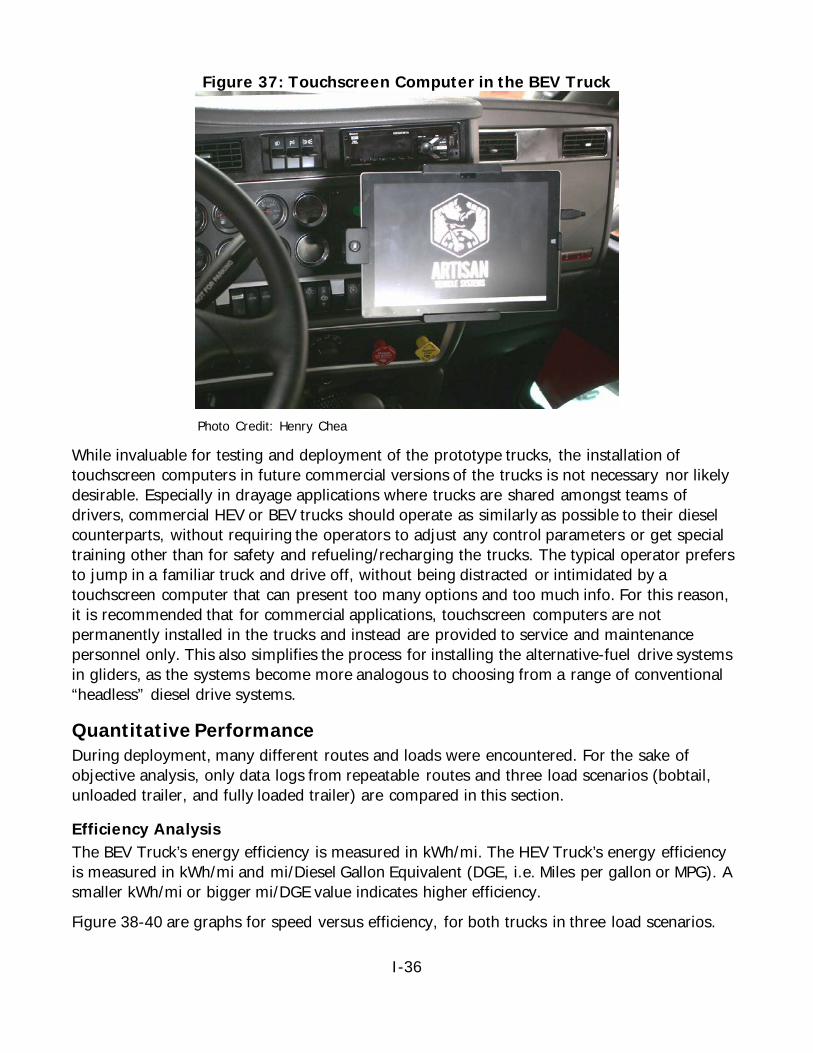
I-36
Figure 37: Touchscreen Computer in the BEV Truck
Photo Credit: Henry Chea
While invaluable for testing and deployment of the prototype trucks, the installation of touchscreen computers in future commercial versions of the trucks is not necessary nor likely desirable. Especially in drayage applications where trucks are shared amongst teams of drivers, commercial HEV or BEV trucks should operate as similarly as possible to their diesel counterparts, without requiring the operators to adjust any control parameters or get special training other than for safety and refueling/recharging the trucks. The typical operator prefers to jump in a familiar truck and drive off, without being distracted or intimidated by a touchscreen computer that can present too many options and too much info. For this reason, it is recommended that for commercial applications, touchscreen computers are not permanently installed in the trucks and instead are provided to service and maintenance personnel only. This also simplifies the process for installing the alternative-fuel drive systems in gliders, as the systems become more analogous to choosing from a range of conventional “headless” diesel drive systems.
Quantitative Performance During deployment, many different routes and loads were encountered. For the sake of objective analysis, only data logs from repeatable routes and three load scenarios (bobtail, unloaded trailer, and fully loaded trailer) are compared in this section.
Efficiency Analysis The BEV Truck’s energy efficiency is measured in kWh/mi. The HEV Truck’s energy efficiency is measured in kWh/mi and mi/Diesel Gallon Equivalent (DGE, i.e. Miles per gallon or MPG). A smaller kWh/mi or bigger mi/DGE value indicates higher efficiency.
Figure 38-40 are graphs for speed versus efficiency, for both trucks in three load scenarios.

I-37
Figure 38: BEV Truck’s Efficiency (kWh/mi) with Regards to Speed
Source: Artisan Vehicle Systems staff
Figure 39: HEV Truck’s Efficiency (kWh/mi) with Regards to Speed
Source: Artisan Vehicle Systems staff
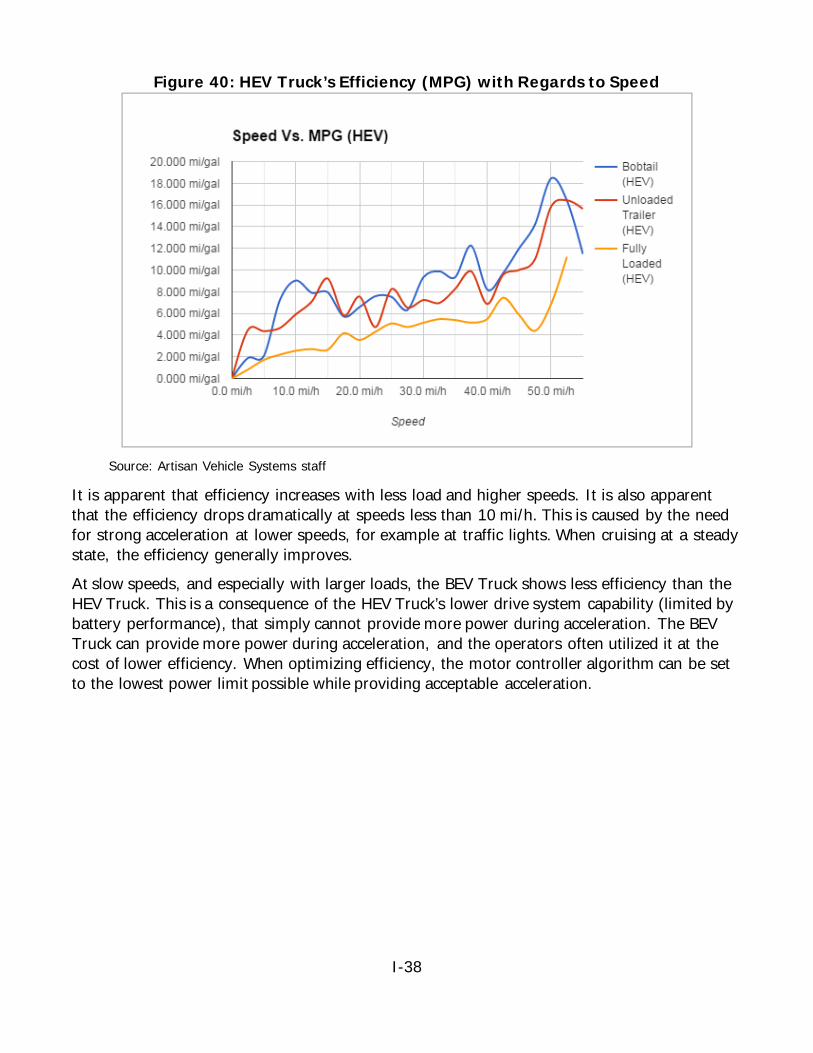
I-38
Figure 40: HEV Truck’s Efficiency (MPG) with Regards to Speed
Source: Artisan Vehicle Systems staff
It is apparent that efficiency increases with less load and higher speeds. It is also apparent that the efficiency drops dramatically at speeds less than 10 mi/h. This is caused by the need for strong acceleration at lower speeds, for example at traffic lights. When cruising at a steady state, the efficiency generally improves. At slow speeds, and especially with larger loads, the BEV Truck shows less efficiency than the HEV Truck. This is a consequence of the HEV Truck’s lower drive system capability (limited by battery performance), that simply cannot provide more power during acceleration. The BEV Truck can provide more power during acceleration, and the operators often utilized it at the cost of lower efficiency. When optimizing efficiency, the motor controller algorithm can be set to the lowest power limit possible while providing acceptable acceleration.
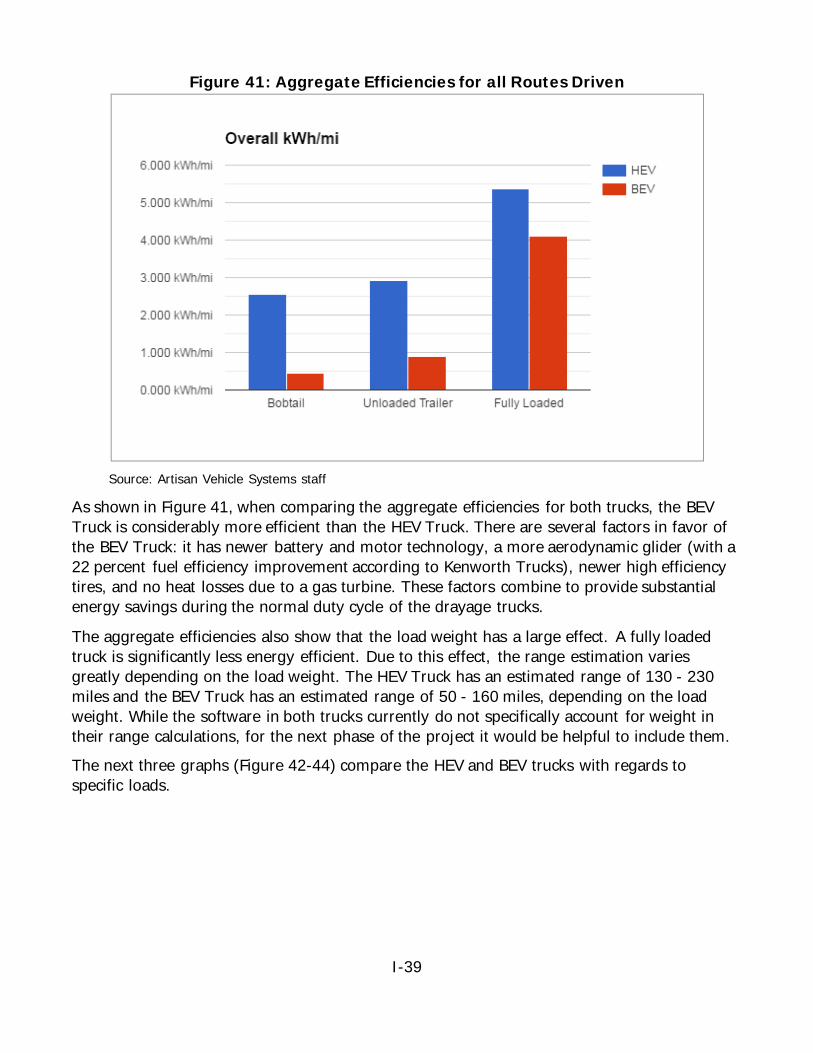
I-39
Figure 41: Aggregate Efficiencies for all Routes Driven
Source: Artisan Vehicle Systems staff
As shown in Figure 41, when comparing the aggregate efficiencies for both trucks, the BEV Truck is considerably more efficient than the HEV Truck. There are several factors in favor of the BEV Truck: it has newer battery and motor technology, a more aerodynamic glider (with a 22 percent fuel efficiency improvement according to Kenworth Trucks), newer high efficiency tires, and no heat losses due to a gas turbine. These factors combine to provide substantial energy savings during the normal duty cycle of the drayage trucks.
The aggregate efficiencies also show that the load weight has a large effect. A fully loaded truck is significantly less energy efficient. Due to this effect, the range estimation varies greatly depending on the load weight. The HEV Truck has an estimated range of 130 - 230 miles and the BEV Truck has an estimated range of 50 - 160 miles, depending on the load weight. While the software in both trucks currently do not specifically account for weight in their range calculations, for the next phase of the project it would be helpful to include them. The next three graphs (Figure 42-44) compare the HEV and BEV trucks with regards to specific loads.
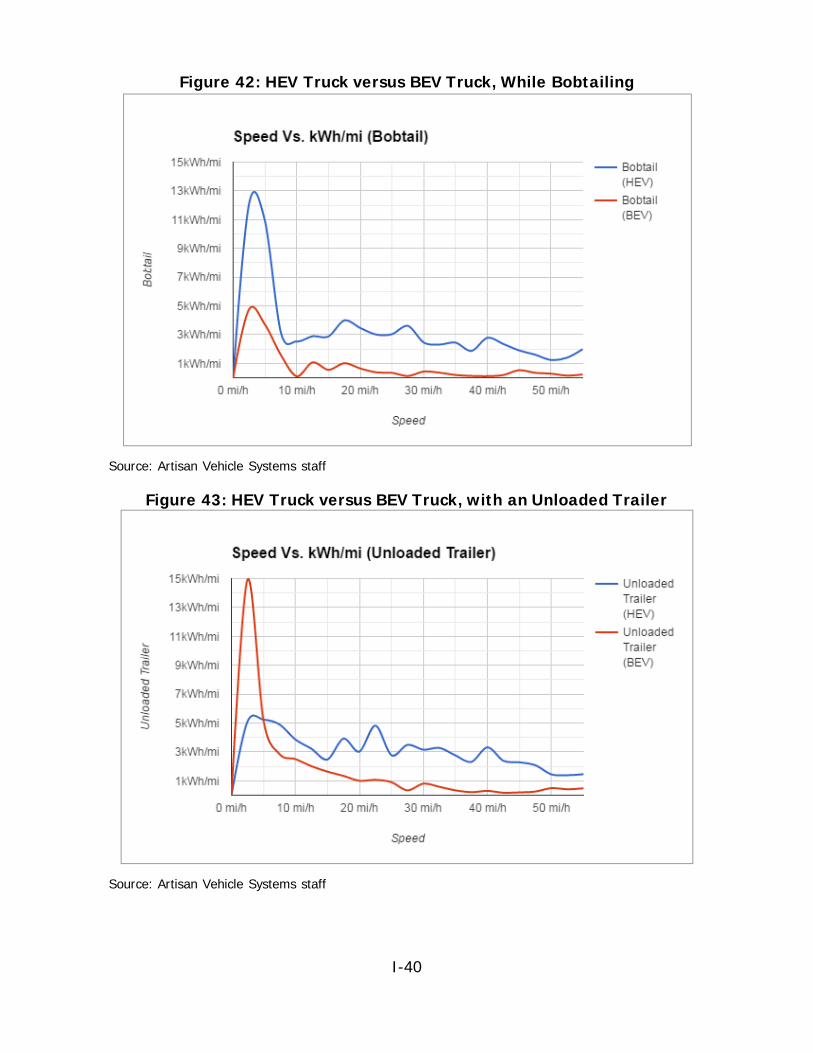
I-40
Figure 42: HEV Truck versus BEV Truck, While Bobtailing
Source: Artisan Vehicle Systems staff
Figure 43: HEV Truck versus BEV Truck, with an Unloaded Trailer
Source: Artisan Vehicle Systems staff
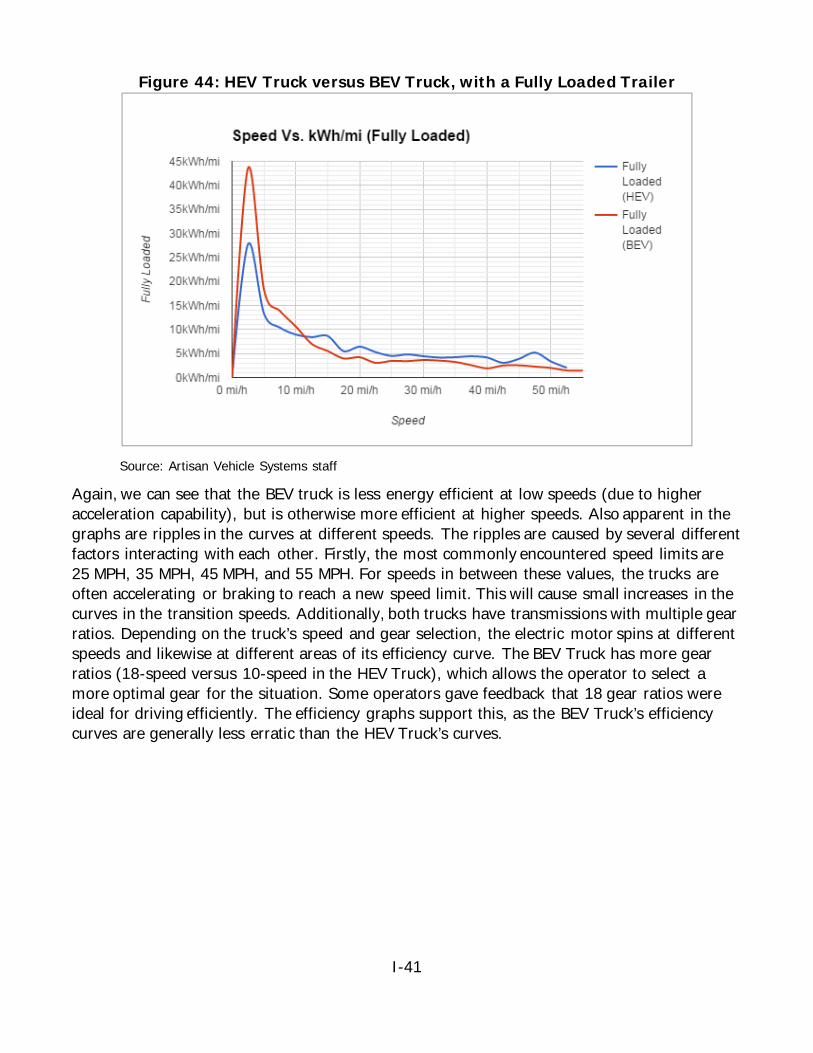
I-41
Figure 44: HEV Truck versus BEV Truck, with a Fully Loaded Trailer
Source: Artisan Vehicle Systems staff
Again, we can see that the BEV truck is less energy efficient at low speeds (due to higher acceleration capability), but is otherwise more efficient at higher speeds. Also apparent in the graphs are ripples in the curves at different speeds. The ripples are caused by several different factors interacting with each other. Firstly, the most commonly encountered speed limits are 25 MPH, 35 MPH, 45 MPH, and 55 MPH. For speeds in between these values, the trucks are often accelerating or braking to reach a new speed limit. This will cause small increases in the curves in the transition speeds. Additionally, both trucks have transmissions with multiple gear ratios. Depending on the truck’s speed and gear selection, the electric motor spins at different speeds and likewise at different areas of its efficiency curve. The BEV Truck has more gear ratios (18-speed versus 10-speed in the HEV Truck), which allows the operator to select a more optimal gear for the situation. Some operators gave feedback that 18 gear ratios were ideal for driving efficiently. The efficiency graphs support this, as the BEV Truck’s efficiency curves are generally less erratic than the HEV Truck’s curves.
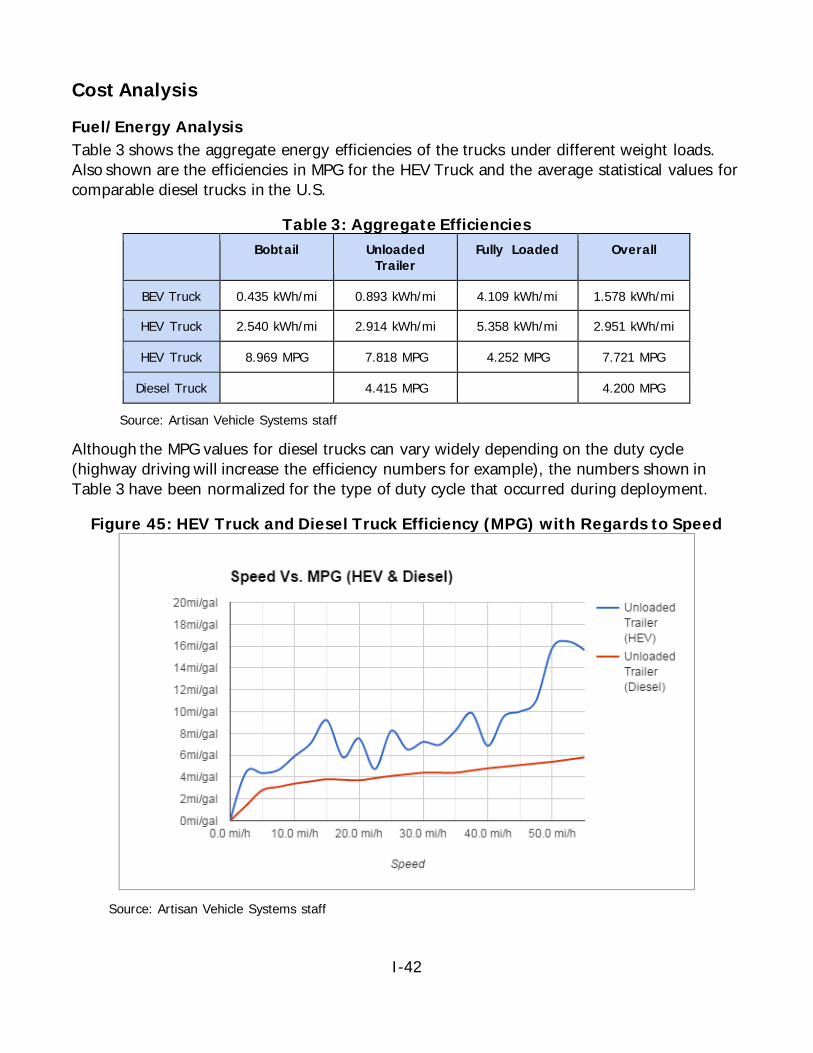
I-42
Cost Analysis
Fuel/Energy Analysis Table 3 shows the aggregate energy efficiencies of the trucks under different weight loads. Also shown are the efficiencies in MPG for the HEV Truck and the average statistical values for comparable diesel trucks in the U.S.
Table 3: Aggregate Efficiencies Bobtail Unloaded
Trailer Fully Loaded Overall
BEV Truck 0.435 kWh/mi 0.893 kWh/mi 4.109 kWh/mi 1.578 kWh/mi
HEV Truck 2.540 kWh/mi 2.914 kWh/mi 5.358 kWh/mi 2.951 kWh/mi
HEV Truck 8.969 MPG 7.818 MPG 4.252 MPG 7.721 MPG
Diesel Truck 4.415 MPG 4.200 MPG
Source: Artisan Vehicle Systems staff
Although the MPG values for diesel trucks can vary widely depending on the duty cycle (highway driving will increase the efficiency numbers for example), the numbers shown in Table 3 have been normalized for the type of duty cycle that occurred during deployment.
Figure 45: HEV Truck and Diesel Truck Efficiency (MPG) with Regards to Speed
Source: Artisan Vehicle Systems staff

I-43
Looking at just the scenario of the HEV Truck and a comparable diesel truck towing an unloaded trailer in figure 45, the HEV Truck is more efficient at all speeds despite large dips in its curve. Although diesel fuel prices have decreased during recent years, CNG fuel prices have also decreased and consistently remain ~$1 less than the price of diesel fuel per gallon. Due to higher efficiency of the HEV Truck’s powertrain, the price of diesel would have to drop below the price of CNG before diesel trucks become less expensive per mile.
Return on Investment (ROI) Analysis At the outset of the project, the target Return on Investment (ROI) was 3 years. As can be seen from Table 4, both trucks were expected to meet this goal.
Table 4: Expected ROI Calculation from Project Proposal
What Amount (HEV)
Amount (BEV)
Cost of the GP8 all-electric truck $195,550 $211,750
Cost of Conventional Diesel Truck $115,000 $115,000
GP8 Cost Premium $80,550 $96,750
Miles driven per year 60,000 mi 60,000 mi Conventional MPG 5.25 mpg 5.25 mpg
Series Hybrid MPG 7.50 mpg
kWhs expended per mile 1.80 kWh/mi 1.80 kWh/mi Cost per gallon of Diesel $5.00 $5.00
Cost per gallon of CNG $4.00
Cost per kWh $0.15 $0.15
Conventional Fuel Costs per year $57,143 $57,143
Hybrid Fuel/yr (HEV assume 60% operation) $19,200
Electric Fuel/yr (HEV assume 40% operation) $6,480 $16,200
Battery pack replacement reserve/yr $3,600 $3,600
Annual savings all-electric $27,863 $37,343
Market Required ROI (in years) 2.9 yr 2.6 yr Or subsidy required to meet ROI target $0.00 $0.00
Source: Artisan Vehicle Systems staff
Considering that the Expected ROI table was generated in 2011, many numbers have changed since then. Adjusting for the fuel and electricity prices in 2017, plus updating the efficiency values with actual data from deployment, Table 5 in the next page shows the Actual ROI.
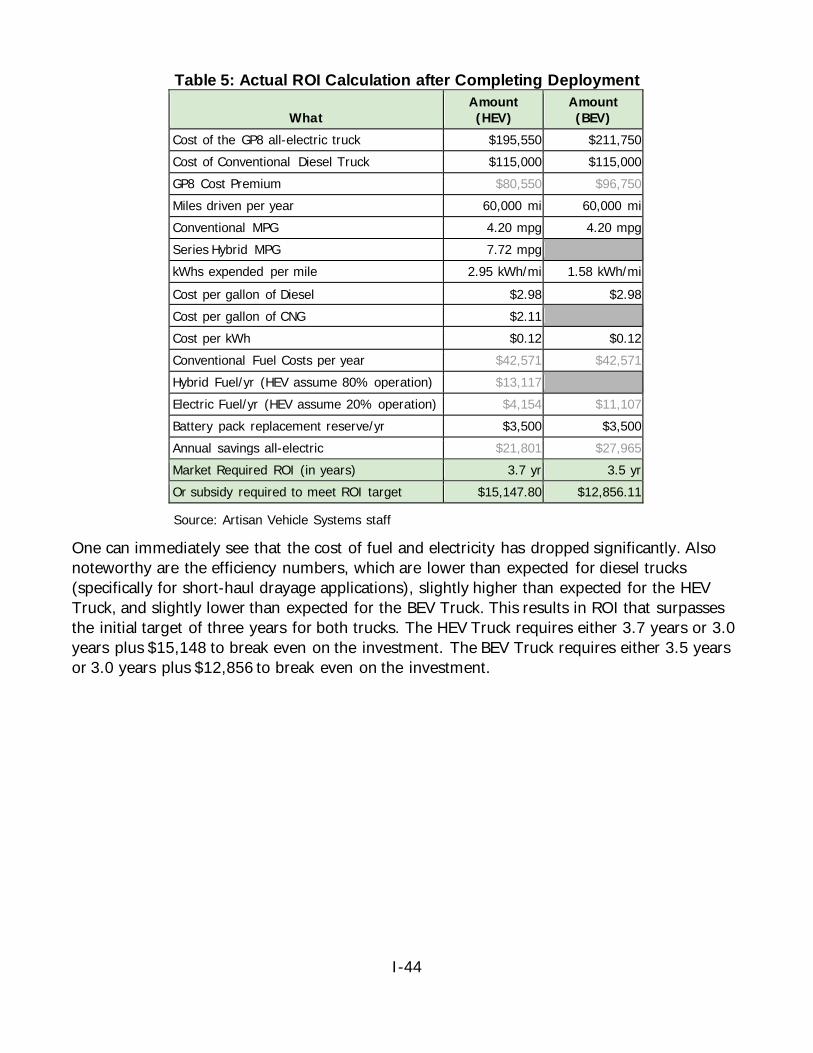
I-44
Table 5: Actual ROI Calculation after Completing Deployment
What Amount (HEV)
Amount (BEV)
Cost of the GP8 all-electric truck $195,550 $211,750 Cost of Conventional Diesel Truck $115,000 $115,000 GP8 Cost Premium $80,550 $96,750 Miles driven per year 60,000 mi 60,000 mi Conventional MPG 4.20 mpg 4.20 mpg Series Hybrid MPG 7.72 mpg kWhs expended per mile 2.95 kWh/mi 1.58 kWh/mi Cost per gallon of Diesel $2.98 $2.98 Cost per gallon of CNG $2.11 Cost per kWh $0.12 $0.12 Conventional Fuel Costs per year $42,571 $42,571 Hybrid Fuel/yr (HEV assume 80% operation) $13,117 Electric Fuel/yr (HEV assume 20% operation) $4,154 $11,107 Battery pack replacement reserve/yr $3,500 $3,500 Annual savings all-electric $21,801 $27,965 Market Required ROI (in years) 3.7 yr 3.5 yr Or subsidy required to meet ROI target $15,147.80 $12,856.11
Source: Artisan Vehicle Systems staff
One can immediately see that the cost of fuel and electricity has dropped significantly. Also noteworthy are the efficiency numbers, which are lower than expected for diesel trucks (specifically for short-haul drayage applications), slightly higher than expected for the HEV Truck, and slightly lower than expected for the BEV Truck. This results in ROI that surpasses the initial target of three years for both trucks. The HEV Truck requires either 3.7 years or 3.0 years plus $15,148 to break even on the investment. The BEV Truck requires either 3.5 years or 3.0 years plus $12,856 to break even on the investment.
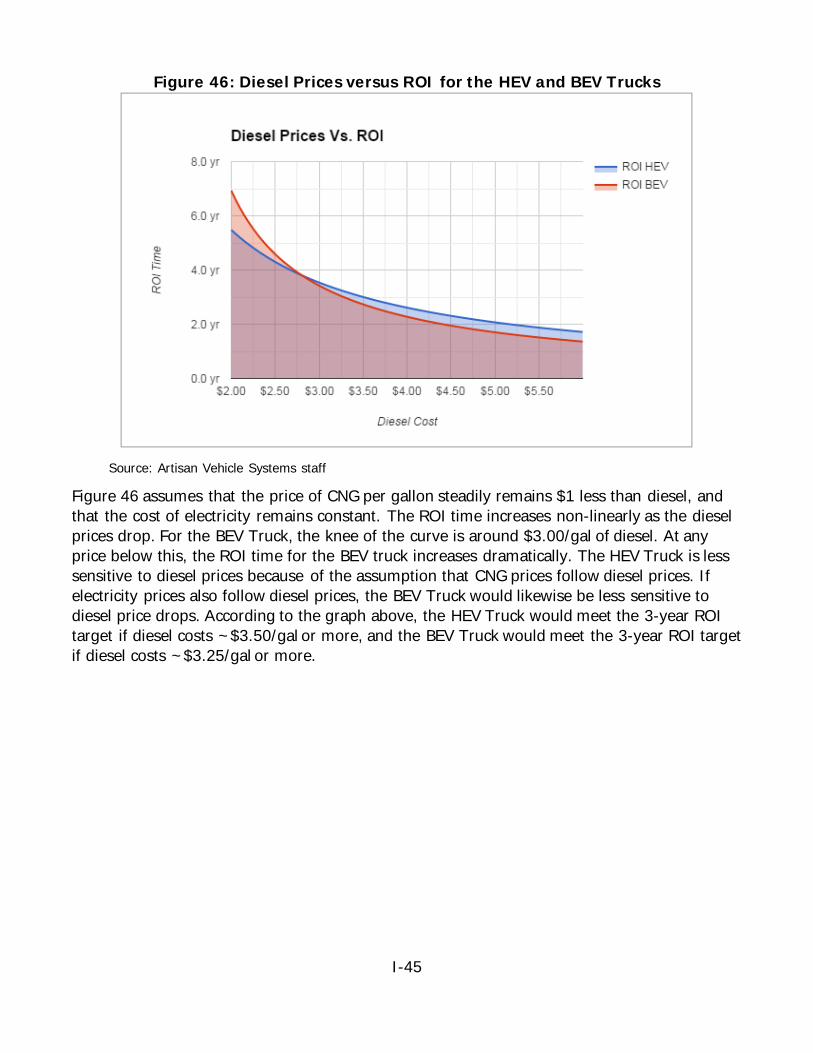
I-45
Figure 46: Diesel Prices versus ROI for the HEV and BEV Trucks
Source: Artisan Vehicle Systems staff
Figure 46 assumes that the price of CNG per gallon steadily remains $1 less than diesel, and that the cost of electricity remains constant. The ROI time increases non-linearly as the diesel prices drop. For the BEV Truck, the knee of the curve is around $3.00/gal of diesel. At any price below this, the ROI time for the BEV truck increases dramatically. The HEV Truck is less sensitive to diesel prices because of the assumption that CNG prices follow diesel prices. If electricity prices also follow diesel prices, the BEV Truck would likewise be less sensitive to diesel price drops. According to the graph above, the HEV Truck would meet the 3-year ROI target if diesel costs ~$3.50/gal or more, and the BEV Truck would meet the 3-year ROI target if diesel costs ~$3.25/gal or more.
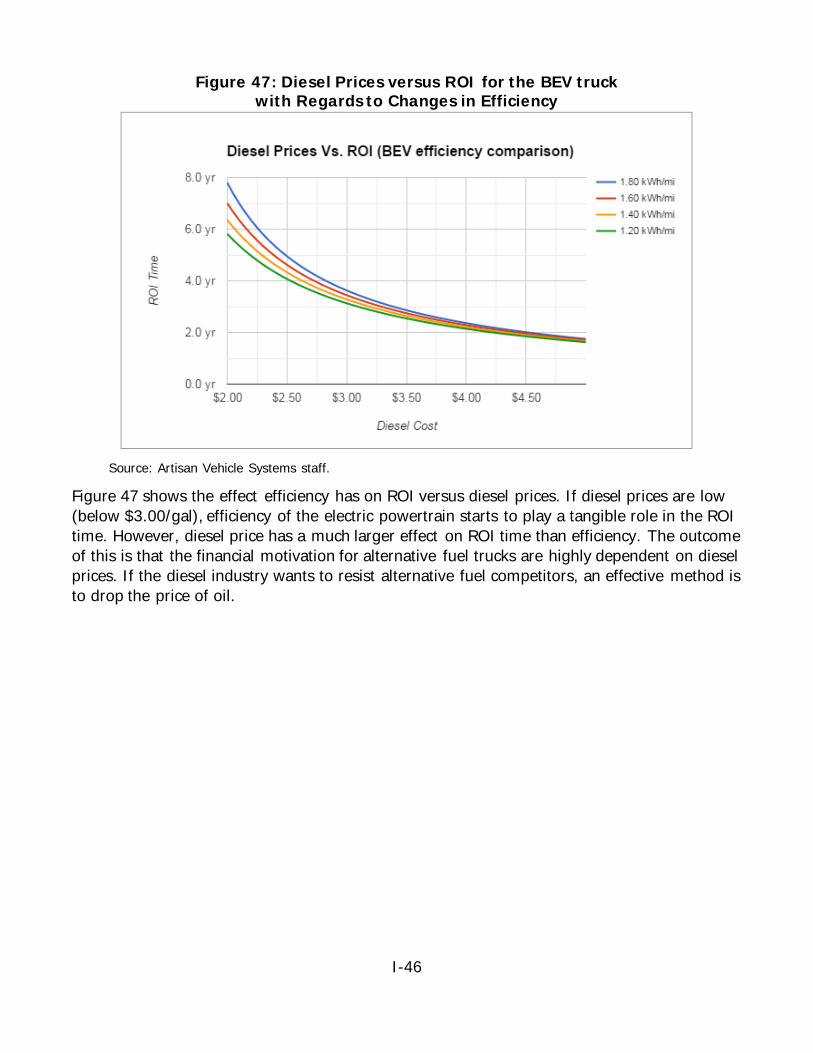
I-46
Figure 47: Diesel Prices versus ROI for the BEV truck with Regards to Changes in Efficiency
Source: Artisan Vehicle Systems staff.
Figure 47 shows the effect efficiency has on ROI versus diesel prices. If diesel prices are low (below $3.00/gal), efficiency of the electric powertrain starts to play a tangible role in the ROI time. However, diesel price has a much larger effect on ROI time than efficiency. The outcome of this is that the financial motivation for alternative fuel trucks are highly dependent on diesel prices. If the diesel industry wants to resist alternative fuel competitors, an effective method is to drop the price of oil.

I-47
Emissions Analysis Regarding air quality improvements, there are two main areas of discussion: greenhouse gasses (GHG) and other emissions reductions. Table 6 shows GHG reductions.
Table 6: Reduction of Greenhouse Gasses What Amount (HEV) Amount (BEV)
Miles driven per year 60,000 mi 60,000 mi Conventional Diesel MPG 4.20 mpg 4.20 mpg Conventional Diesel Truck Gallons per year 14,286 gal/yr 14,286 gal/yr All-Electric Reduction in GHG (HEV assume 20% operation) 36,800,000 g/yr 184,000,000 g/yr Series Hybrid MPG 7.72 mpg Natural Gas Consumed in Gallons equivalent (assume 80% operation) 6,217 gal/yr Series Hybrid Reduction in GHG (HEV assume 80% operation) 139,193,012 g/yr Total Reduction in GHG 175,993,012 g/yr 184,000,000 g/yr
Source: Artisan Vehicle Systems staff
Greenhouse gasses are ones such as CO2, N2O, and O3 that inhibit thermal energy (usually in the form of infrared radiation) from leaving Earth. Assuming a short-haul drayage duty of 60,000 miles per year and 4.20 MPG as typical for the routes encountered, a conventional diesel truck emits approximately 184,000,000 grams of GHG per year. The BEV Truck, being a zero emissions vehicle, emits 0 grams of GHG per year, while the HEV Truck emits 8,006,988 grams of GHG per year (assuming 80 percent of the miles are powered by the turbine, and 20 percent are powered by AC electricity grid). While the CNG turbine performs very well in terms of reducing GHG, a zero emissions BEV performs even better.
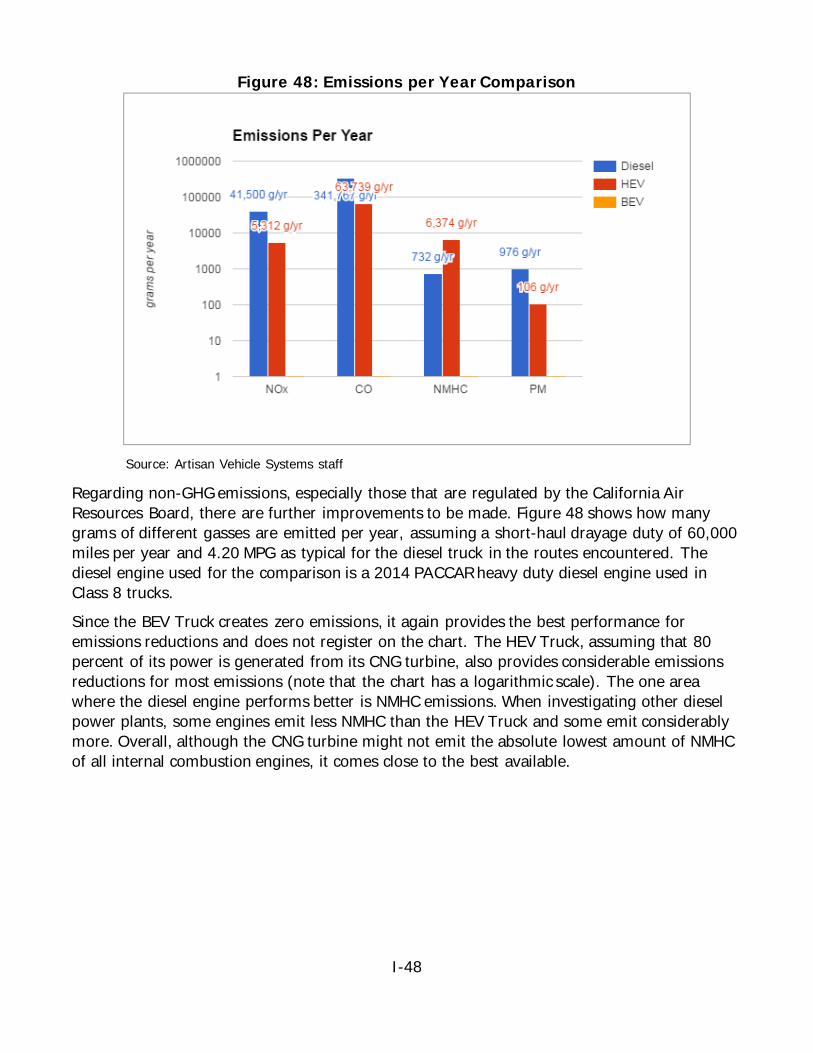
I-48
Figure 48: Emissions per Year Comparison
Source: Artisan Vehicle Systems staff
Regarding non-GHG emissions, especially those that are regulated by the California Air Resources Board, there are further improvements to be made. Figure 48 shows how many grams of different gasses are emitted per year, assuming a short-haul drayage duty of 60,000 miles per year and 4.20 MPG as typical for the diesel truck in the routes encountered. The diesel engine used for the comparison is a 2014 PACCAR heavy duty diesel engine used in Class 8 trucks. Since the BEV Truck creates zero emissions, it again provides the best performance for emissions reductions and does not register on the chart. The HEV Truck, assuming that 80 percent of its power is generated from its CNG turbine, also provides considerable emissions reductions for most emissions (note that the chart has a logarithmic scale). The one area where the diesel engine performs better is NMHC emissions. When investigating other diesel power plants, some engines emit less NMHC than the HEV Truck and some emit considerably more. Overall, although the CNG turbine might not emit the absolute lowest amount of NMHC of all internal combustion engines, it comes close to the best available.
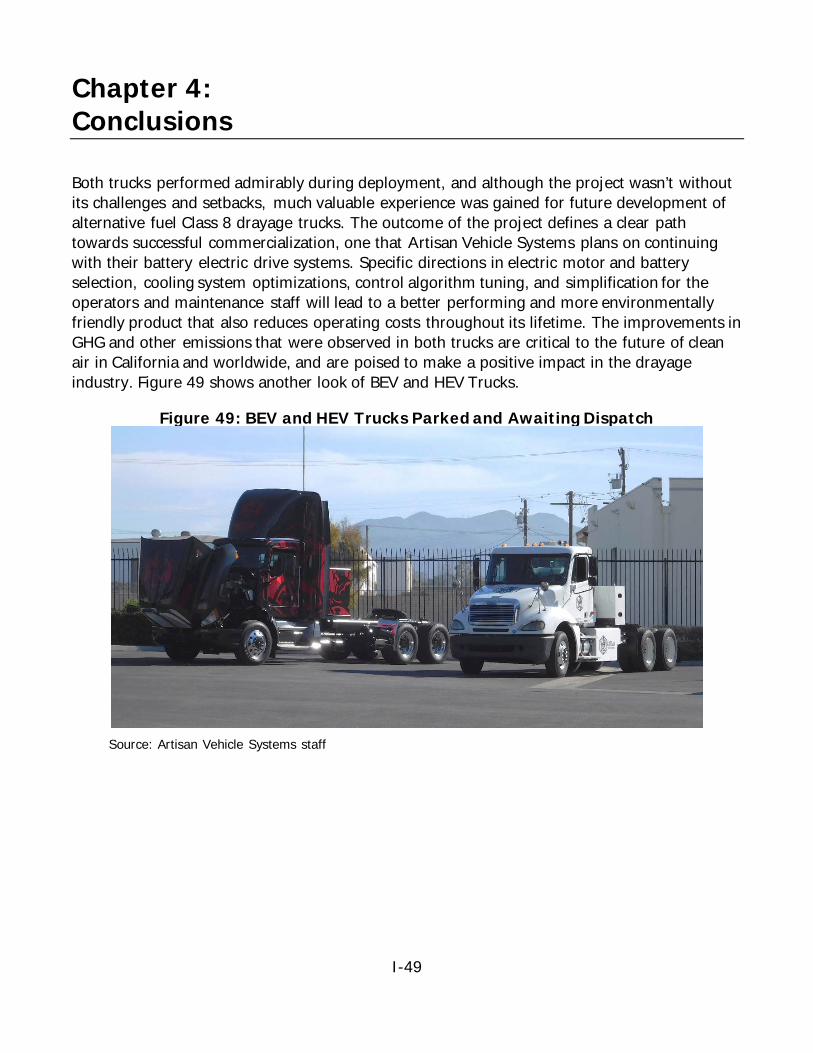
I-49
Chapter 4: Conclusions
Both trucks performed admirably during deployment, and although the project wasn’t without its challenges and setbacks, much valuable experience was gained for future development of alternative fuel Class 8 drayage trucks. The outcome of the project defines a clear path towards successful commercialization, one that Artisan Vehicle Systems plans on continuing with their battery electric drive systems. Specific directions in electric motor and battery selection, cooling system optimizations, control algorithm tuning, and simplification for the operators and maintenance staff will lead to a better performing and more environmentally friendly product that also reduces operating costs throughout its lifetime. The improvements in GHG and other emissions that were observed in both trucks are critical to the future of clean air in California and worldwide, and are poised to make a positive impact in the drayage industry. Figure 49 shows another look of BEV and HEV Trucks.
Figure 49: BEV and HEV Trucks Parked and Awaiting Dispatch
Source: Artisan Vehicle Systems staff
I-49
The Next Phase: Path to Commercialization By the conclusion of deployment, it became clear that the path forward for Artisan Vehicle Systems is to concentrate on BEV technology only, and not continue with commercial integration of a gas turbine hybrid system. The gas turbine system adds complexity, cost, and space on the truck that would be better utilized by installing a larger battery pack. The allure of refueling a tank is tempting, but a system for quickly swapping battery packs as it is done with Artisan Vehicle Systems’ commercial underground mining products negates this advantage. For drayage applications, extra battery packs can be stored and charged at the yards similar to extra trailers, so the infrastructure changes are reasonable and minimal. For the successor to this project, Artisan Vehicle Systems plans on series production of 10 BEV trucks, to be deployed with three to five founding partners. During this phase, certain aspects important to successful commercialization such as cost, reliability, and range will be the main areas of development. If demand warrants it, efforts to integrate and tune the Eaton automatic transmission may be revisited.
Much of the improvements to the battery electric drive system have already been accomplished in parallel to the deployment of the two trucks, as Artisan Vehicle Systems has been actively developing their systems for the underground mining industry. This includes upgraded motors, new battery chemistries and designs, new inverters, and selection of more reliable auxiliary components such as water pumps, electrical connectors, and relays. Streamlining the integration of the upgraded battery electric drive system into the class 8 drayage truck is the main area of development remaining for the next generation.