currents in monterey submarine canyon
TRANSCRIPT

Currents in Monterey Submarine Canyon
J. P. Xu1 and Marlene A. Noble2
Received 27 June 2008; revised 13 November 2008; accepted 31 December 2008; published 5 March 2009.
[1] Flow fields of mean, subtidal, and tidal frequencies between 250 and 3300 m waterdepths in Monterey Submarine Canyon are examined using current measurementsobtained in three yearlong field experiments. Spatial variations in flow fields are mainlycontrolled by the topography (shape and width) of the canyon. The mean currents flowupcanyon in the offshore reaches (>1000 m) and downcanyon in the shallow reaches(<800 m) of the canyon. Tidal currents, especially the semidiurnal components, aredominant and account for more than 90% of total energy. Pulses of strong currents nearthe canyon floor, which last several days at a time and have a magnitude as high as60+ cm/s, are attributed to intense baroclinic processes occurring within the canyon. TheV-shaped canyon walls and the near-critical slope of the canyon floor focus thebaroclinic tides of semidiurnal and higher frequencies to the canyon bottom to produce the>100-m amplitude isotherm oscillations and associated high-speed rectilinear currents.The 15-day spring-neap cycle and a ‘‘3-day’’ band are the two prominent frequencies insubtidal flow field. Neither of them seems directly correlated with the spring-neapcycle of the sea level.
Citation: Xu, J. P., and M. A. Noble (2009), Currents in Monterey Submarine Canyon, J. Geophys. Res., 114, C03004,
doi:10.1029/2008JC004992.
1. Introduction
[2] Monterey submarine canyon (MSC) is the largestsubmarine canyon off the west coast of the United States[Shepard et al., 1979]. It starts with its head directly off thebeach of Moss Landing, California, and zigzags across thecontinental shelf and slope of Monterey Bay (MB) due westand southwest for more than 150 km before reaching theoffshore boundary of its fan valley at 4000 m water depth(Figure 1). Like many other submarine canyons [Hunkins,1988; Noble and Butman, 1989; Puig et al., 2000], MSCplays an important role, through advective circulations andinternal wave processes, in influencing the phytoplanktonecology and other physical-biological coupling on theshelves of the whole MB [Ryan et al., 2005]. The existenceof a canyon across the shelf cannot only potentially enhancethe cross-shore (along-canyon) flow by an order of magni-tude [Allen, 1996], but also generate and trap internal tideenergy such that the related mixing inside the canyon isorders of magnitude higher than in the open ocean. Thisgreatly enhances the primary production within the canyonand on the surrounding shelves [Shea and Broenkow, 1982;Kunze et al., 2002]. A dynamical scale analysis suggeststhat upwelling in Monterey Canyon contributes significantlyto the circulation in the MB region [Breaker and Broenkow,1994]. Unlike many submarine canyons, especially those off
the U.S. east coast where cross-margin sediment transportcapability has been dramatically reduced or diminished sincethe last sea level low stand �18000 years ago, MSC is stillvery active to date. This is mainly because the head of theMSC lies in close proximity to the coast, hence the canyondirectly receives sediments from both fluvial and littoralsources [Johnson et al., 2001; Paull et al., 2003; Xu et al.,2004]. It has been shown that multimillion tons of sedimentare transported down the MSC either by river-flood-inducedunderflows [Johnson et al., 2001] or by pulses of turbiditycurrents [Rosenberger et al., 2006; Xu et al., 2004]. Suchcross-margin sediment transport events are believed tosignificantly contribute to the biogeochemical cycles ingeneral, and carbon budget in particular, of the continentalslope [Johnson et al., 2001; Khripounoff et al., 2003].[3] Understanding canyon circulation is required to deter-
mine the cross-margin transport of water and sedimentthrough submarine canyons. In many coastal systems themere existence of a canyon plays important roles in influ-encing the circulation of the region [Breaker and Broenkow,1994]. In MSC, Shepard et al. [1939] collected the first flowmeasurement, but the record was only a few hours long. Inthe following four decades, short current-meter recordsranging from hours to weeks were collected near the headof the canyon during several Naval Postgraduate Schoolstudies (see summary by Breaker and Broenkow [1994])and in deeper water by Shepard et al. [1979]. Since the1990s, technological advances have allowed longer deploy-ment periods, more discrete vertical resolutions, and fastersampling frequencies for the current meters and temperature/salinity sensors deployed in the canyon [Chavez et al., 1991;Petruncio et al., 1998; Kunze et al., 2002; Paull et al., 2003].These site-specific measurements, however, were only ade-
JOURNAL OF GEOPHYSICAL RESEARCH, VOL. 114, C03004, doi:10.1029/2008JC004992, 2009
1Pacific Science Center, U.S. Geological Survey, Santa Cruz,California, USA.
2Coastal and Marine Geology, U.S. Geological Survey, Menlo Park,California, USA.
This paper is not subject to U.S. copyright.Published in 2009 by the American Geophysical Union.
C03004 1 of 20
quate to address specific oceanographic problems (e.g.,internal waves/tides or synoptic monitoring), and they cannotbe easily used to characterize the circulation within the majorpart of theMSC. To overcome this problem, the USGS begana field program in 1993 to measure vertical profiles of bothcurrents and temperature/salinity within the MSC simulta-neously at three sites for at least one year at a time. In the threeexperiments conducted in 1993, 2002, and 2005, yearlongcurrent profiles from the floor to the canyon rim weremeasured at six sites in water depths ranging from 250 to3300 m along the canyon axis. This paper synthesizes thesedata to characterize the mean, subtidal, and tidal flow fieldswithin the MSC and the potential implication of the flowfields in cross-margin transport of water, sediments, andpollutants.
2. Settings and Methods
[4] The sinuous MSC runs its 150-km-long course all theway from the beach at Moss Landing, a terminus of water-sheds that have drained large areas of coastal and perhapscentral California in the past [Greene, 1990], to �4000 m
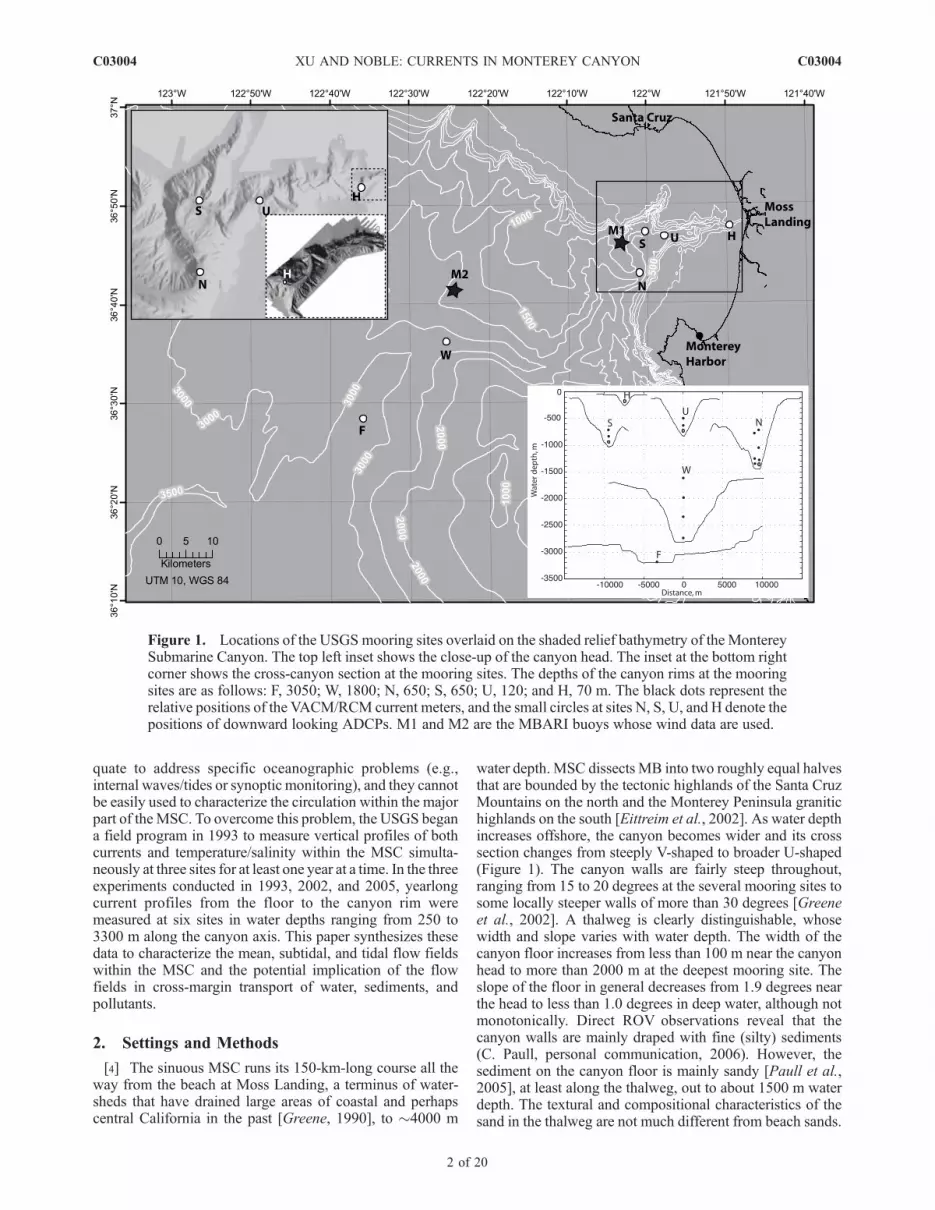
water depth. MSC dissects MB into two roughly equal halvesthat are bounded by the tectonic highlands of the Santa CruzMountains on the north and the Monterey Peninsula granitichighlands on the south [Eittreim et al., 2002]. As water depthincreases offshore, the canyon becomes wider and its crosssection changes from steeply V-shaped to broader U-shaped(Figure 1). The canyon walls are fairly steep throughout,ranging from 15 to 20 degrees at the several mooring sites tosome locally steeper walls of more than 30 degrees [Greeneet al., 2002]. A thalweg is clearly distinguishable, whosewidth and slope varies with water depth. The width of thecanyon floor increases from less than 100 m near the canyonhead to more than 2000 m at the deepest mooring site. Theslope of the floor in general decreases from 1.9 degrees nearthe head to less than 1.0 degrees in deep water, although notmonotonically. Direct ROV observations reveal that thecanyon walls are mainly draped with fine (silty) sediments(C. Paull, personal communication, 2006). However, thesediment on the canyon floor is mainly sandy [Paull et al.,2005], at least along the thalweg, out to about 1500 m waterdepth. The textural and compositional characteristics of thesand in the thalweg are not much different from beach sands.
Figure 1. Locations of the USGS mooring sites overlaid on the shaded relief bathymetry of the MontereySubmarine Canyon. The top left inset shows the close-up of the canyon head. The inset at the bottom rightcorner shows the cross-canyon section at the mooring sites. The depths of the canyon rims at the mooringsites are as follows: F, 3050; W, 1800; N, 650; S, 650; U, 120; and H, 70 m. The black dots represent therelative positions of the VACM/RCM current meters, and the small circles at sites N, S, U, and H denote thepositions of downward looking ADCPs. M1 and M2 are the MBARI buoys whose wind data are used.
C03004 XU AND NOBLE: CURRENTS IN MONTEREY CANYON
2 of 20
C03004

Multibeam mapping and ROV observations showed thatsandwaves of O (10 m) long and O (1 m) high in the thalwegexist from the canyon head [Smith et al., 2007; Xu et al.,2008] out to at least 600m (C. Paull, personal communication,2006). Even at a water depth of 1100 m, sand ripples andgravel patches are observed on the canyon floor. These clearlysuggest that the canyon thalweg is a high-energy environment.[5] Circulation within MB, wide open to the coastal
ocean, is strongly influenced by processes offshore, namelythe California Current, the California Undercurrent, anddifferent scales of upwelling [Breaker and Broenkow,1994], which vary seasonally, interannually, and evendecadally. The tides in MB are mixed, with a tidal rangeof 1.6 m. Tidal current amplitudes on the shelf are fairlyweak (�10 cm/s), but they at times become very strong(�100 cm/s) within MSC owing to generation or amplifi-cation of internal tidal currents by the narrowing topography,similar to tidal amplification found in other large canyons[Hotchkiss and Wunsch, 1982]. Winds measured within andoutside of the MB are predominantly from the northwestthroughout the year except during some winter storms whenthey may come from the southwest. Daily average windsoffshore of MB are in general stronger than within MB, butboth rarely reach speed of greater than 10 m/s. In the summermonths, diurnal heating in the nearby Salinas Valley gener-ates pronounced oscillating sea/land breezes that affect thesurface circulation in the MB [Blaskovich, 1973]. Surfacewaves enteringMB aremostly correlated to the regional windfields. The local wind-generated seas predominantly comefrom the northwest all year-round, but during summermonths long-period swells originating from the south Pacificapproach MB from S–SW. Therefore the northern andsouthern MB, sheltered by the headlands at the two ends ofthe MB, experience different wave climates [Xu, 1999].
[6] The data described in this paper are from threeseparate yearlong experiments, in 1993, 2002, and 2005(Table 1). The field program in 1993 deployed six mooringsat three sites (F, W, and N) at 3223, 2837, and 1445 m waterdepth, respectively, with one mooring in the canyon axis ateach site and the rest of moorings on one or both walls[Xu et al., 2002]. Only the data from the axis moorings areused in this paper. These moorings were designed to measureflow (with vector averaging current meters (VACM)) andwater properties (temperature, salinity, and clarity) from thefloor to the rim of the canyon. To avoid instrumentdamage or loss by turbidity currents in the canyon, the lowestcurrent meter was 100 m above the canyon floor or bed(MAB), except on the mooring at site F (the fan valley site),where the current meter was put at 10 MAB on the basis ofthe assumption that turbidity currents would be much lessenergetic on the flatter fan valley. The mooring at the F sitewas reoccupied for two more years in 1994 and 1995, witha second current meter added to the mooring at 50 MAB.These data are also included in this paper.[7] The field program in 2002 moved the observations
upcanyon with three moorings, all on the axis of the canyon.We reoccupied sites N at 1445 m, and added sites S and U at1020, and 820 m water depth, respectively (Figure 1 andTable 1). The configuration of these moorings were similarto those used in 1993, except that the lowest current meter oneach mooring at �70 MAB was replaced with a downwardlooking acoustic Doppler current profiler (ADCP) thatmeasured flows at 2-m vertical resolution [Xu et al., 2004].Above the ADCP on each mooring were 2 or 3 AanderaaRCM single-point current meters and temperature/salinitysensors.[8] The 2005 deployment had only one mooring near the
head of the canyon, site H, at 255 m water depth. The only
Table 1. Nominal Parameters of the Six Mooring Sites in Figure 1a
Site
WaterDepth(m) Position
a, FloorSlope
b, WallSlopes
ThalwegWidth(m)
2L/RRatiob
CanyonOrientation Duration
SensorDepths(m)
SensorHeights(MAB) Instruments
SamplingRegime
F 3223 36� 27.470N;122� 37.530W
0.7� 45�/45� 4000 2.7 17� 8/93–8/96 3175 48 1. VACM 15-min average3213 10 2. VACM
W 2837 36� 36.470N;122� 22.130W
1.1� 18�/14� 2100 0.6 85� 8/93–8/94 1612c 1215 1. VACM 15-min average1982 845 2. VACM2342 495 3. VACM2737 100 4. VAcm
N 1445 36� 43.170N;122� 00.750W
2.9� 27�/29� 700 0.3 10� 8/93–8/94 770 675 1. VACM 15-min average1250 195 2. VACM1350 95 3. VACM
12/02–11/03 710 735 1. RCM 15-min average1050 395 2. RCM1270 165 3. RCM1378 67 4. ADCP
S 1020 36� 46.820N;122� 00.810W
1.7� 17�/16� 400 0.4 134� 12/02–11/03 710 310 1. RCM 15-min average840 180 2. RCM953 67 3. ADCP
U 820 36� 46.300N;121� 57.790W
1.7� 19�/17� <100 0.4 20� 12/02–11/03 500 320 1. RCM 15-min average630 190 2. RCM753 67 3. ADCP
H 255 36� 47.450N;121� 50.190W
1.9� 10�/11� <100 0.5 113� 5/05–7/06 190 65 1. ADCP 6-min average
aBoth vector average current meters (VACM) and Aanderaa’s RCM are single-point current meters. At site F, there was one VACM in 1993 and twoVACMs in 1994, and 1995 experiments.
bL is the canyon width (rim to rim); R is the internal Rossby radius of deformation. At site F and W, the height (rim to floor) instead of the water depth(d) is used in calculating R = fNd/f, where f = 8.7 � 10�5 is the Coriolis parameter of this latitude and fN = 3 � 10�3 is the buoyancy frequency.
cThis current meter is located above the canyon rim.
C03004 XU AND NOBLE: CURRENTS IN MONTEREY CANYON
3 of 20
C03004

current meter, a downward looking ADCP, was at 65 MAB,and had the same setting as in 2002. There was no currentmeasurement above the ADCP in the 2005 study.[9] Hourly data was built by time-averaging the raw data.
The hourly data was then rotated, separately at eachmooring site, to align with canyon axis (Table 1). Theserotated hourly data formed the base data from which all theanalyses are carried out. Subtidal records were obtained byfiltering the hourly data with a 33-h low-pass filter to removetides and higher-frequency signals. The time average of thewhole subtidal time series for each instrument produced themean currents. Error bars were computed using (stM�1,a/2)/ffiffiffiffiffi
Mp
, where s is standard deviation, M is the number ofdegree of freedom, and tM�1,a/2 is the Student’s t distributionat the confidence level (1-a)% = 95%. The degree of free-dom was determined by autocorrelation time scale of eachtime series, t.M = n/t, where n is the length of data. A freeMATLAB program downloaded from http://www.pol.ac.uk/home/research/waveletcoherence/ is used for waveletanalysis [Grinsted et al., 2004], and the wavelet powerspectrum is rectified as suggested by Liu et al. [2007].
3. Flow Patterns Within MSC
3.1. Mean Flow Patterns
[10] Eulerian statistics were computed for the currentrecords at each mooring (Table 2). The mean current atthe fan valley site (F) was small, about 0.5 cm/s, in all three
measurements (1993–1996), but they were statisticallysignificant in magnitude and stable in time and direction.The mean currents, all measured below the canyon rims at10 or 50 MAB, consistently flowed upcanyon, but crossingthe canyon in an almost 50� angle and toward the canyonwall. This suggests that the topography of the canyon at siteF, which is wide (4 km) and shallow (�200 m), has a verylimited steering effect on the mean current field, especiallyat such low current speeds. The mean currents at site W werealso very weak, mostly <0.5 cm/s, and only the data fromthe two lower current meters were statistically significant.The near-bed (100 MAB) mean current at site W flowedupcanyon, roughly aligned with the canyon axis. However,the current at 400 m above flowed mainly cross canyon.This indicates that topographic steering is predominatelynear the floor where the canyon is much narrower.[11] Site N is the only site where current measurements
were repeated in 1993 and 2002, although the instrumentheights were slightly different (Figure 1 and Table 2). Themagnitudes of the mean speed at site N were higher thanat the two offshore sites (F and W), varying between 1 and4 cm/s. There appear to be directional shears in the meanvelocity profile at this site. Above 1100 m water depth themean current flowed upcanyon. The three current metersbelow, at 1250, 1270, and 1350 m, respectively, showeddowncanyon and cross-canyon flows with higher speed.Moreover, the downward looking ADCP showed that, from�70 MAB down to the canyon floor, the mean current flows
Table 2. Mean Values of the Measured Currents During the Whole Deploymenta
Site Duration Sensor Depth
Mean (cm/s) PCA
Along Canyon Cross Canyon Speed Direction Major Minor Azimuth
Site F 3223 m 1993–1994 3213 0.5 ± 0.2 0.4 ± 0.1 0.6 334 2.0 0.9 161994–1995 3175 0.3 ± 0.2 0.3 ± 0.1 0.4 338 2.0 0.5 14
3213 0.3 ± 0.3 0.4 ± 0.1 0.5 325 2.0 0.7 111995–1996 3175 0.4 ± 0.2 0.2 ± 0.1 0.4 344 2.0 0.5 16
3213 0.4 ± 0.2 0.3 ± 0.1 0.5 339 2.4 0.8 5Site W 2837 m 1993–1994 1612b � � � � 2.7 1.4 175
1982 � � � � 1.3 1.1 832342 � �0.3 ± 0.1 0.3 193 1.3 0.8 832737 0.5 ± 0.2 � 0.5 93 1.6 0.8 75
Site N 1445 m 1993–1994 770 1.2 ± 0.2 0.2 ± 0.1 1.2 2 1.8 0.9 61250 �3.3 ± 0.2 �1.1 ± 0.1 3.5 171 2.3 1.1 01350 �1.3 ± 0.2 �1.4 ± 0.1 1.9 143 2.0 1.0 �25
2002–2003 710 0.6 ± 0.4 �0.4 ± 0.1 0.7 44 2.0 0.9 171050 0.8 ± 0.2 - 0.8 19 1.8 0.9 41270 �1.8 ± 0.2 �1.8 ± 0.1 2.6 145 2.0 1.0 �61382 2.0 ± 0.2 �0.4 ± 0.1 2.0 23 1.9 1.0 171410 3.5 ± 0.3 �0.3 ± 0.1 3.5 15 3.6 0.9 121436 3.5 ± 0.4 - 3.5 10 3.8 1.0 6
Site S 1020 m 2002–2003 710 � 1.1 ± 0.2 1.1 33 2.1 1.6 106840 � � � � 2.1 1.1 111957 1.9 ± 0.4 0.6 ± 0.1 2 118 2.7 0.9 120985 2.5 ± 0.5 0.4 ± 0.1 2.6 126 3.5 0.9 1221011 2.6 ± 0.6 �0.3 ± 0.1 2.6 141 4.3 1 134
Site U 820 m 2002–2003 500 �2.0 ± 0.3 �0.2 ± 0.1 2 195 2.7 1.1 39630 1.2 ± 0.2 �2.3 ± 0.1 2.6 83 1.8 1.2 30757 2.7 ± 0.7 0.7 ± 0.1 2.9 5 3.4 0.6 16785 0.9 ± 0.8 0.7 ± 0.1 1.2 341 3.7 0.6 19811 �1.3 ± 0.9 0.7 ± 0.1 1.5 227 4 0.6 19
Site H 255 m 2005–2006 194 �1.7 ± 0.6 � 1.7 293 3.7 0.9 114222 �1.0 ± 0.8 0.7 ± 0.1 1.2 327 3.5 0.9 123248 �1.2 ± 1.0 1.5 ± 0.1 1.9 343 4.5 1 125
aSee Table 1 for data length of each sensor. The bold entries are data from the downward looking ADCP. Only bins 1, 15, and 28 are shown. Positive isupcanyon. The ‘‘�’’ symbol represents data that are insignificant. The last three columns are the parameters of the subtidal ellipses. The sensor heights(meters above bed) can be obtained by subtracting the sensor depth from the water depth.
bAbove canyon rim.
C03004 XU AND NOBLE: CURRENTS IN MONTEREY CANYON
4 of 20
C03004

upcanyon with even higher speed (3+ cm/s). Either the 2002data alone or the combined data of 1993 and 2002 clearlydemonstrated this is a three-layer system, although it isunclear where the boundaries between layers, which alsovary with time, should be drawn. The boundary between thetop two layers, 1100 m, appears to coincide with topographyof the western canyon wall (Figure 1). A terrace of more than500 m wide at 1100 m water depth and the gentler wall slopeabove made the canyon much wider. Overall, the meancurrent speed tended to increase toward the canyon floor(bottom intensification) but this increase was not clear in theADCP record. And there appeared a slight decrease towardthe floor within the bottom 10 m.[12] At site S, the top current meter at 710 showed mean
current flowing NNE into the Soquel Canyon, and the 840-mone was hardly significant. The ADCP data, however,showed consistent upcanyon flow of 2–3 cm/s in all ADCPbins from 957 m down to 1011 m (or 9 MAB). Bottomintensification was also suggested. The mean current field ofthe canyon bottom (ADCP data) at site S was upcanyon,consistent with the flow at site N.[13] At site U, the two RCMs showed a relatively strong
mean current of more than 2 cm/s. However, they pointed intwo very different directions that were neither upcanyon nordowncanyon. The ADCP appeared to show a simplifiedtwo-layer structure. From 757 m down to 785 m the meancurrent was upcanyon while the magnitude decreased withdepth. Below that was a transition zone in which the currentwas miniscule and insignificant. From 807 m down to thefloor, the mean current of > 1 cm/s flowed in the oppositedirection: downcanyon. The ADCP at site H showed thatthe mean current flowed generally downcanyon in thewhole measured profile from 194 m down to the canyonfloor. However, the mean current appeared to align morewith the axis of the canyon further down than the canyonaxis at the site, likely owing to the sharp turn of the canyon.[14] The monthly mean currents at sites U and H not only
revealed seasonal changes of current magnitude and direc-tion, but also showed the temporal variation of the velocityshear in the water column (Figure 2). At site U there weretwo layers of water in the bottom 60 m in which the upperlayer flowed upcanyon and the lower layer flowed down-canyon. The location of the interface gradually varied withseason: it fell closer to the seafloor from December 2002 toJune 2003, reached the lowest position in June, beforegradually rising back up in July–November 2003. Theupcanyon flows in the upper layer were several timesstronger than the downcanyon flows in the lower layerduring the summer months (4–6 cm/s versus <1.0 cm/s).The monthly means at site H showed a different pattern ofseasonal changes; they flowed somewhat upcanyon fromJanuary–April 2006, but strongly downcanyon from May–December 2005. The winter months also had the largestmagnitude for the monthly mean currents at site H.[15] It needs to be pointed out that there are not enough
data to systematically see whether these monthly means arethe same from one year to another. However, at site N,where current measurements were collected in two separateyearlong deployments in 1993 and 2002, monthly meansfrom the two measurements may be compared. For instance,the data from a VACM at 1250 m in the 1993 deploymentmay be compared with the RCM at 1270 m in the 2002
deployment (Figure 2c). The monthly means from the twoseparate years appear to be qualitatively similar: bothdowncanyon with speeds of the same order of magnitudedespite the fact that the 2002 monthly means were slightlyweaker and veered to the right of the downcanyon direction.[16] In summary, the mean currents in the MSC are rather
weak, ranging between 0 and 4 cm/s. The mean currentswere not steered by the canyon at the two deeper sites (Fand W), although site W was dynamically narrow (Table 1).The strongest, and more stable mean currents were found atsite N where the canyon was dynamically the narrowest.Since topography asserts more controls to stronger currents,it is also more manifested at canyon sites like N. The near-bed (up to 60 MAB) mean currents at sites U and H weredowncanyon, opposite the mean currents at sites S and N,suggesting a convergence zone between sites S and U if theEulerian means are equal to the Lagrangian means.
3.2. Subtidal Flow Patterns
[17] Overall the subtidal currents (mean plus fluctuationswith periods of 33+ h) in MSC were weak and onlyaccounted for a small portion of the total energy. Exceptfor site F and the topmost current meters at sites W and N,the subtidal currents accounted for less than 10% of totalvariance in each time series. This percentage decreasedtoward the canyon head horizontally and the canyon floorvertically. The smallest was only 2–3%, and the largest, atsite F, was nearly 20%.[18] Principal component analysis [Emery and Thomson,
2001] was applied to the subtidal data to obtain the majorand minor amplitude and the azimuth of the fluctuationportion of the subtidal flow field (Figure 3 and Table 2). Ingeneral the major axis of the subtidal ellipses was in thesame order of magnitude (1–5 cm/s) as the means. It tendsto increase going onshore as the canyon becomes narrower,and toward the canyon floor owing to bottom intensificationuntil �10 MAB. The subtidal ellipses are almost all parallelto the canyon axis, even at the fan valley site (F) wheremean current showed consistent cross-canyon flows. Theonly exception is the top VACM at site W that was abovethe canyon rim (Figure 1). This current meter, representingflow field above the canyon, showed current ellipse that hasthe amplitude twice as much as the ellipses from inside thecanyon. In the 2002 data of both RCM and ADCP (sites N,S, and U), it is apparent that the subtidal ellipses from theRCMs are markedly different from the ADCP ellipses, inboth amplitude and eccentricity. The RCMs are smaller inamplitude with lower eccentricity (‘‘rounder’’). These dif-ferences between the RCMs and ADCPs may be attributedto the fact that the downward looking ADCPs were placedmuch closer to the canyon floor. The narrower, V-shapedcanyon not only caused bottom intensification of the flowmagnitude, but also conceivably prevented the subtidalcurrent from deviating from the canyon axis; thereforeproduced ‘‘thinner’’ ellipses (greater eccentricity).[19] The subtidal flow field varied both spatially among
mooring sites and vertically at each mooring. Such varia-tions can be easily assessed in Figure 3. If the mean currenthas magnitudes as high as the semimajor axis of the subtidalellipses, subtidal currents are mainly unidirectional (upcan-yon or downcanyon). The subtidal currents are oscillatory ifthe magnitudes of mean current are less than the semimajor
C03004 XU AND NOBLE: CURRENTS IN MONTEREY CANYON
5 of 20
C03004

of the ellipses. In the 1993 data, the two offshore sites (F andW) shared similar patterns; subtidal currents of less than5 cm/s were roughly along the canyon axis with frequentreversals. The 1995–1996 data at site F also showed verysimilar fluctuations. This pattern stopped at site N, wherethe three current meters in the water column showedunidirectional subtidal flows. The current at 770 m flowedpredominantly upcanyon while the bottom two current
meters at 1250 m and 1350 m both showed consistentdowncanyon flows. The maximum magnitude of the sub-tidal current at site N was �10 cm/s.[20] The 2002 data extended the flow measurement to the
floor of the canyon by using downward looking ADCPs.The bottom 60 m of the water column at site N sawoverwhelmingly upcanyon currents. Above this bottomlayer there existed a downcanyon flow layer that was
Figure 2. The monthly mean along-canyon velocities measured by a downward looking ADCP at(a) site U during 2002–2003 and (b) site H during 2005–2006. Each symbol (diamonds for upcanyonand circles for downcanyon flows) on the vertical axis denotes an ADCP bin. The size of the symbolsrepresents flow magnitude (the largest size is 7 cm/s). (c) The monthly means measured at site N byVACM/RCMs during the 1993–1994 and 2002–2003 studies at a similar height are compared.
C03004 XU AND NOBLE: CURRENTS IN MONTEREY CANYON
6 of 20
C03004

measured in both the 1993 (1250 m) and 2002 (1270 m)experiments. There was not enough information to deter-mine the thickness of the transition zone, but the dataindirectly suggested that the depth of the transition zonemust have varied. A similar argument was described earlierin the mean flow section. The subtidal flows in the bottom60 m at site S were very similar to those at site N,predominantly upcanyon except for some episodic, short-lived reversals of smaller speed. Unlike site N, there wasno evidence of a layer of opposite flow above. There wasclear bottom intensification at both sites N and S, and thispattern did not seem to change over the 1-year period ofmeasurement.[21] In contrast to sites N and S, the bottom 60 m at site U
showed a gradual transition; from downcanyon dominancenear the canyon floor to upcanyon dominance at the firstdown looking bin of the ADCP at 744 m. The subtidalspeed at site U was in general weaker than at sites N and S,except for the period of May–July 2003, during whichthe maximum speed reached nearly 10 cm/s. During this3-month period all ADCP bins in the bottom 60 m showedupcanyon flows, and the speed decreased toward the canyonfloor, the opposite of bottom intensification. Unsurprisingly
the two RCMs in the upper water column, although stillbelow the canyon rims, showed different current patterns,with dominant downcanyon flows at 500 m and more cross-canyon flow at 630 m. The ADCP measurement at site Halso occupied the bottom 60 m, and showed overwhelmingdowncanyon subtidal flows that were intensified toward thecanyon floor.[22] A common characteristic of the data from the four
sites (N, S, U, and H) is that the ADCP velocities at eachsite were well correlated across the water column, regardlessof unidirectional or reversal flows. However, the ADCPmeasurements were apparently not correlated with the RCMmeasurements above, and the multiple RCMs at each site(Figure 3) were not correlated with each other. This couldbe due to the much longer distance between RCMs(hundreds of meters apart) than between ADCP bins (60 mbetween the topmost and the lowest bins). Also, the flows inthe upper water column may not be as constrained as in thecanyon bottom where the canyon is a lot narrower. Empir-ical orthogonal function (EOF) analysis (Table 3) showedthe existence of multiple subtidal modes in the 1993 data atsites W and N, indicating the presence of different indepen-dent current patterns in the region. The 2002 modal struc-
Figure 3. The principal component ellipses of the subtidal currents, computed from the whole record ofeach sensor (see Table 1 for data length), are plotted over the shaded relief of MSC. The mean currentvelocities (RCM/VACMandADCPbins 1 (top), 15, and 28 (bottom)) are plotted as arrows in the center of theellipses. RCM/VACM data are plotted in light gray. The curved arrows indicate the rotation of the ellipses’azimuth varying with depth (toward the canyon floor). Note that the scales are different between sites.
C03004 XU AND NOBLE: CURRENTS IN MONTEREY CANYON
7 of 20
C03004

ture at site N revealed that the currents at the two or threeRCMs levels above the ADCP were hardly in the samemode of the ADCP data. The canyon mode (mode 1) wasdominant in the ADCP data, but it accounted for progres-sively less of the variance in the top 10 m of the ADCP data
(70–50%) and for minimal variance at the RCMs above theADCP (<12%). This suggests that the current patterns atdepths within 50 MAB are independent from flows muchhigher in the canyon.[23] The auto spectra of each along-canyon subtidal time
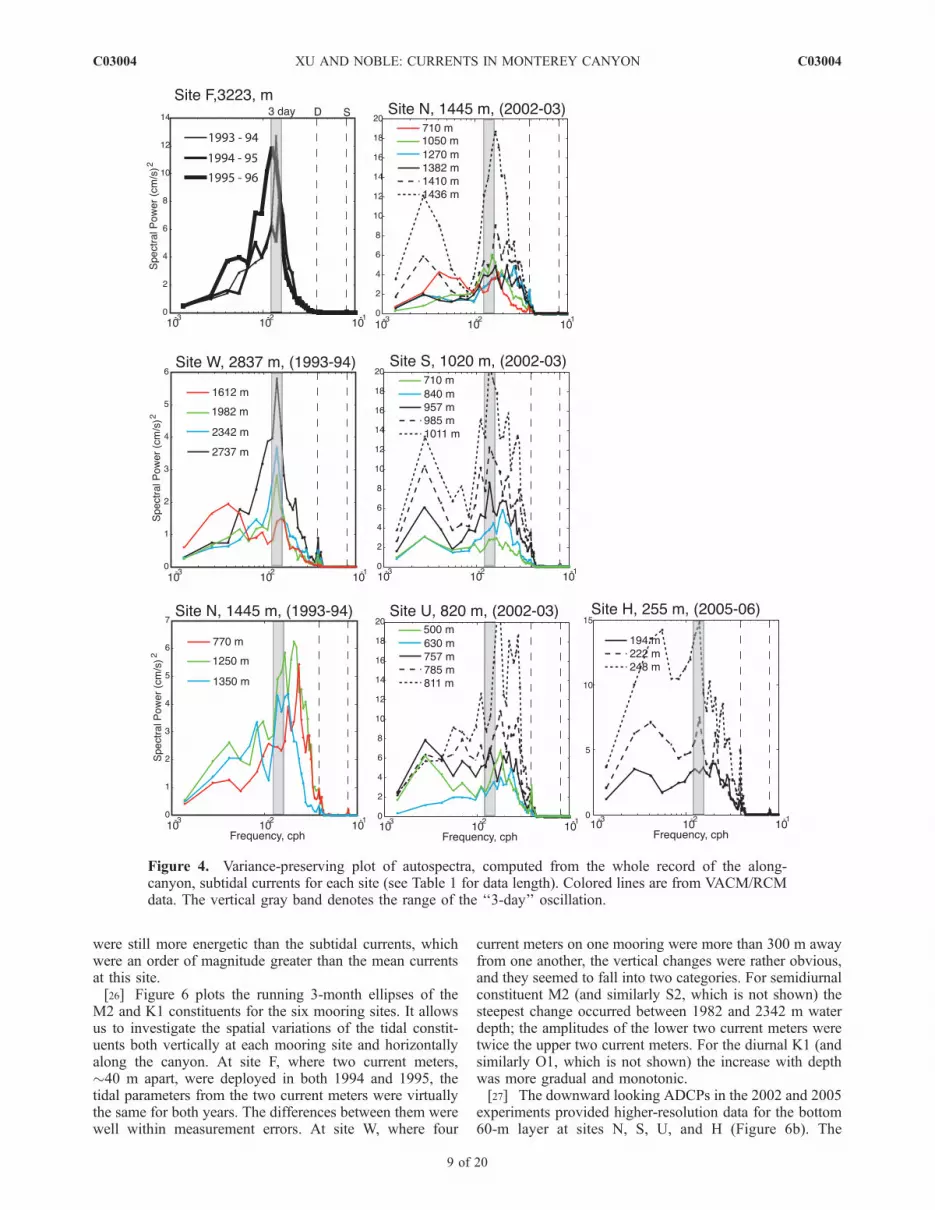
series (Figure 4) clearly show both the lateral and verticalvariation of the subtidal flows. At the deep ocean sites(F and W) where the canyon depths were a small fraction ofthe total water depth, the predominant energy centered on a3-day band (frequencies 0.0125 cph-0.0153 cph). The closerto the canyon floor, the higher the energy became. Since theVACMs at site F were 10 MAB, compared with 100 MABat site W, the subtidal energy at site F was also markedlyhigher than at site W (note the scale difference). At theshallower sites (N, S, U, and H) where the canyon occupiesmore than half of the water depth, the frequency of thedominant energy band became higher in the upcanyondirection. Meanwhile, a secondary energy band developedat frequencies centered on 0.0028 cph (roughly 15 days inthe period), suggesting stronger nonlinear subtidal energyproduction associated with tidal spring-neap cycles aregenerated in the narrower portions of the canyon and inshallower water depths [Hotchkiss and Wunsch, 1982].[24] Rectified wavelet power spectrum [Liu et al., 2007]
was used to illustrate the temporal variation of the subtidalenergy field (Figure 5). A ‘‘3-day oscillation’’ was found atall sites, a persistent feature in the data (see Figure 4)although it was not continuously present during the year.It shut down for weeks at a time and then reappeared forseveral weeks. These on-and-off variations were neithercorrelated among sites nor across the water column at eachindividual mooring. The 15-day oscillation, a period nearthe beat frequency between pairs of the 4 major tidalconstituents (O1+K1, M2+S2), was more apparent in the2002–2003 data (sites N, S, U). While the peak energy ofthis band occurred in April–May and September–Octoberat sites N and S, the highest energy of this band tookplace in May–June at site U. The timing appears to more orless match the surface tidal spring-neap cycle (a beatingfrequency of M2 and S2 only) on the California coast wherethe highest spring and lowest neap tides occur in April–May–June and October–November–December (seeFigure 6 in section 3.3).
3.3. Tidal Flow Patterns
[25] Harmonic analysis [Foreman, 1978; Pawlowicz etal., 2002] of the measured currents from MSC confirmedthe dominance of the semidiurnal tidal constituents. Amongthe 53 constituents that were resolved, the four largest ones(O1, K1, M2, and S2) accounted for more than 90% of totalenergy. Except for site W where M2, S2, and K1 all hadcomparable amplitudes, M2 was the dominant frequency inthe study area. The amplitude of M2, ranging between 5 and15 cm/s, was 2–5 times greater than the amplitude of eitherK1 or S2, ranging between 1 to 5 cm/s. If we sum M2 andS2 to represent semidiurnal and similarly K1 and O1 for thediurnal band, the semidiurnal currents were at least twice aslarge as the diurnal, but could be more than an order ofmagnitude greater, especially in the deeper sites (F and N,for instance). Unlike any other sites, the semidiurnal anddiurnal at site W are almost equally weak (�3 cm/s). It isnoted, though, that even these weak tidal currents at site W
Table 3. EOF Modes of the Along-Canyon Subtidal Currents
Measured at Sites F, W, and N in 1993 and 2002 Experimentsa
Depth
Mode 1 Mode 2 Mode 3
Amp % Amp % Amp %
Site F, 1995Modal var. 9.8 97 0.3 3Site var.
3175 2.8 96 �0.6 43213 3.4 98 � �
Site W, 1993Modal var. 2.9 37 2.1 27 1.8 22Site var.
1612 0.7 12 1.5 52 �1.1 311982 0.8 18 1.0 30 0.7 152342 1.1 35 � � 1.2 412737 1.9 70 �1.1 23 �0.6 7
Site N, 1993Modal var. 5.4 48 3.1 27 2.7 24Site var.
770 �0.9 13 2.3 83 �0.5 41250 3.0 91 � � �0.8 71350 0.9 15 0.7 9 2.1 76
Site N, 2002Modal var. 215 86 21 8 4 2Site var.
710b � � � � 2.7 891050b � � � � �1.1 201270b �1.0 12 0.3 1 � �1382 1.9 52 1.6 39 � �1384 2.2 60 1.7 36 � �1386 2.4 64 1.7 33 � �1388 2.5 68 1.6 30 � �1390 2.6 72 1.6 27 � �1392 2.7 75 1.5 24 � �1394 2.8 78 1.4 21 � �1396 2.9 82 1.4 18 � �1398 3.0 85 1.2 14 � �1400 3.1 87 1.2 12 � �1402 3.2 90 1.1 9 � �1404 3.3 92 0.9 7 � �1406 3.4 93 0.8 5 � �1408 3.5 95 0.7 3 � �1410 3.6 96 � � � �1412 3.8 97 � � � �1414 3.9 98 � � � �1416 4.0 98 � � � �1418 4.1 99 � � � �1420 4.2 99 � � � �1422 4.3 98 � � � �1424 4.4 98 � � � �1426 4.6 97 � � � �1428 4.6 96 �0.9 3 � �1430 4.8 95 �1.1 5 � �1432 4.9 94 �1.2 6 � �1434 5.0 92 �1.4 7 � �1436 5.1 90 �1.6 9 � �1438 5.1 87 �1.8 11 � �1440 4.2 75 �1.9 15 � �aSee Table 1 for data length of each sensor. The modal structures of
currents from sites S, U, and H are similar to that of site N; therefore, theyare not listed here. The ‘‘�’’ symbol denotes insignificance. Amplitude hasthe unit of (cm/s)2.
bRCM single-point current meters.
C03004 XU AND NOBLE: CURRENTS IN MONTEREY CANYON
8 of 20
C03004
were still more energetic than the subtidal currents, whichwere an order of magnitude greater than the mean currentsat this site.[26] Figure 6 plots the running 3-month ellipses of the
M2 and K1 constituents for the six mooring sites. It allowsus to investigate the spatial variations of the tidal constit-uents both vertically at each mooring site and horizontallyalong the canyon. At site F, where two current meters,�40 m apart, were deployed in both 1994 and 1995, thetidal parameters from the two current meters were virtuallythe same for both years. The differences between them werewell within measurement errors. At site W, where four
current meters on one mooring were more than 300 m awayfrom one another, the vertical changes were rather obvious,and they seemed to fall into two categories. For semidiurnalconstituent M2 (and similarly S2, which is not shown) thesteepest change occurred between 1982 and 2342 m waterdepth; the amplitudes of the lower two current meters weretwice the upper two current meters. For the diurnal K1 (andsimilarly O1, which is not shown) the increase with depthwas more gradual and monotonic.[27] The downward looking ADCPs in the 2002 and 2005
experiments provided higher-resolution data for the bottom60-m layer at sites N, S, U, and H (Figure 6b). The
Figure 4. Variance-preserving plot of autospectra, computed from the whole record of the along-canyon, subtidal currents for each site (see Table 1 for data length). Colored lines are from VACM/RCMdata. The vertical gray band denotes the range of the ‘‘3-day’’ oscillation.
C03004 XU AND NOBLE: CURRENTS IN MONTEREY CANYON
9 of 20
C03004

variations among the ADCP bins were small and gradually,monotonically change with depth. The differences of tidalparameters between the ADCP and the two or three RCMsabove the ADCP were much greater, primarily owing to thelarge distances between RCMs and the ADCP. In each ofthe three 2002 moorings (sites N, S, and U) the topmostRCM appeared quite different from the other RCMs and theADCP on the same mooring. Not including the data of thetopmost RCM, a fairly clear change in trend for the tidalcurrents could be found. However, it is interesting to notethat the tidal current magnitude did not always increase withdepth. For instance, the M2 amplitude actually decreasedtoward the canyon floor for site N (2002) and site H (2005).The vertical variations of K1 did not seem to follow thesame trend as M2.[28] There were also profound variations of tidal ampli-
tudes among the mooring sites in the two concurrent datasets, sites F, W, and N for 1993, and sites N, S, and U for2002 (Figure 6). In 1993, the amplitude of semidiurnal M2
current near the canyon floor (50–100 MAB) was signifi-cantly higher at site N than at the other two deeper sites: twoand three times that of site F and site W, respectively.However, the same trend did not hold for the diurnal K1 inwhich the amplitude at site F was markedly smaller thanthat of either site W or site F. The horizontal variation in the2002 data was similarly complicated. The largest ampli-tudes of both diurnal and semidiurnal were found at site S.[29] In addition to the spatial variations of amplitude
described above, Figure 6 also shows the temporal, bothinterannual and seasonal, changes of the tidal currents in thecanyon. At site F, the M2 ellipses were quite similarthroughout the three years in terms of amplitude, orienta-tion, and eccentricity (the ratio of major to minor). The onlyexception was the last three months at the end of thedeployment in 1996. Thus both seasonal and interannualchanges at site F were categorically minimal for the M2frequency. It is also interesting to note that the eccentricitiesvaried in a small range between 1.5 and 2.0, which is very
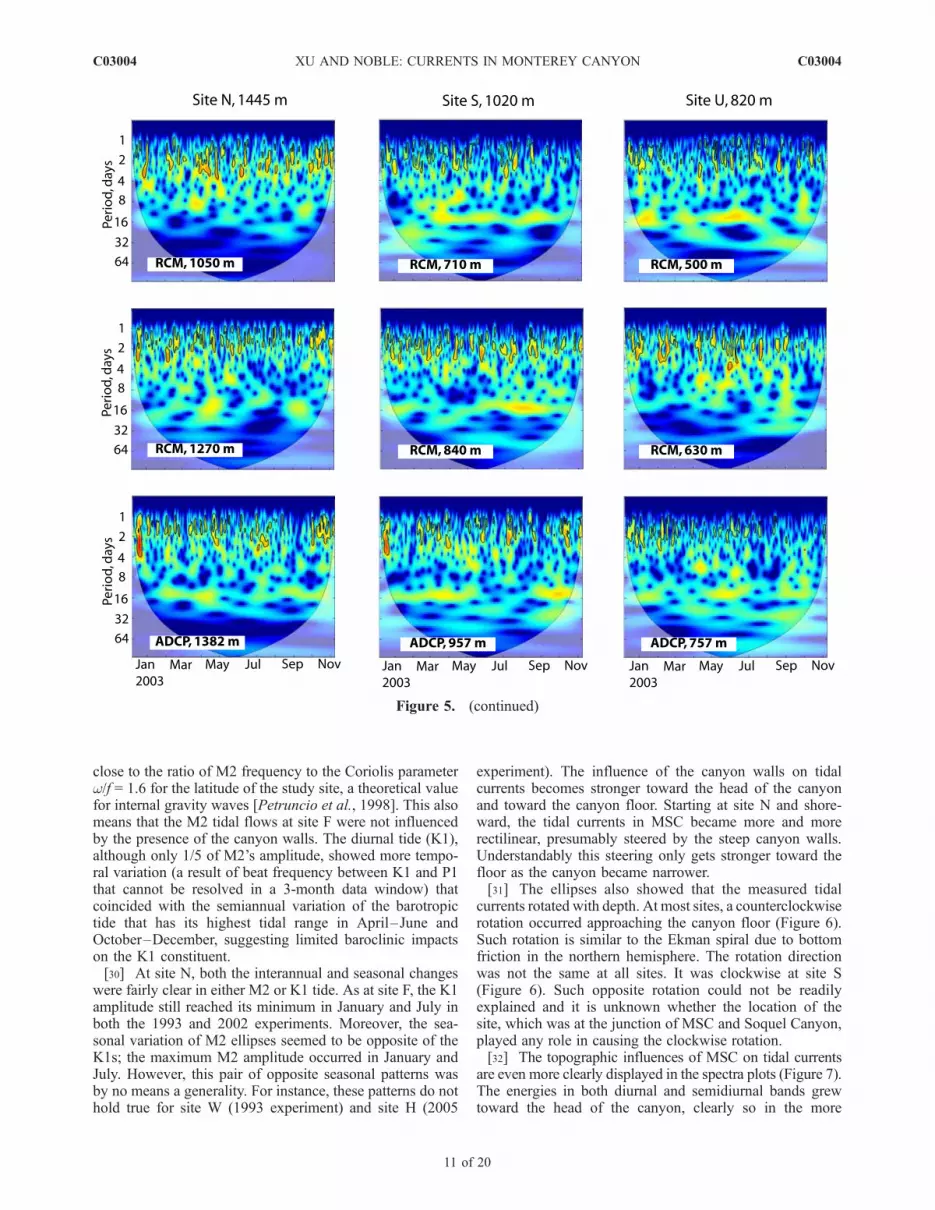
Figure 5. Continuous wavelet power spectra of the along-canyon, subtidal currents at each site. Thethick black contour denotes the 5% significance level against red noise; i.e., only the areas within thethick black contour are significant. The cone of influence where edge effects might distort the picture isshown as a lighter shade. The units on the color bar scale are nominal (red is maximum and blue isminimum energy).
C03004 XU AND NOBLE: CURRENTS IN MONTEREY CANYON
10 of 20
C03004
close to the ratio of M2 frequency to the Coriolis parameterw/f = 1.6 for the latitude of the study site, a theoretical valuefor internal gravity waves [Petruncio et al., 1998]. This alsomeans that the M2 tidal flows at site F were not influencedby the presence of the canyon walls. The diurnal tide (K1),although only 1/5 of M2’s amplitude, showed more tempo-ral variation (a result of beat frequency between K1 and P1that cannot be resolved in a 3-month data window) thatcoincided with the semiannual variation of the barotropictide that has its highest tidal range in April–June andOctober–December, suggesting limited baroclinic impactson the K1 constituent.[30] At site N, both the interannual and seasonal changes
were fairly clear in either M2 or K1 tide. As at site F, the K1amplitude still reached its minimum in January and July inboth the 1993 and 2002 experiments. Moreover, the sea-sonal variation of M2 ellipses seemed to be opposite of theK1s; the maximum M2 amplitude occurred in January andJuly. However, this pair of opposite seasonal patterns wasby no means a generality. For instance, these patterns do nothold true for site W (1993 experiment) and site H (2005
experiment). The influence of the canyon walls on tidalcurrents becomes stronger toward the head of the canyonand toward the canyon floor. Starting at site N and shore-ward, the tidal currents in MSC became more and morerectilinear, presumably steered by the steep canyon walls.Understandably this steering only gets stronger toward thefloor as the canyon became narrower.[31] The ellipses also showed that the measured tidal
currents rotated with depth. At most sites, a counterclockwiserotation occurred approaching the canyon floor (Figure 6).Such rotation is similar to the Ekman spiral due to bottomfriction in the northern hemisphere. The rotation directionwas not the same at all sites. It was clockwise at site S(Figure 6). Such opposite rotation could not be readilyexplained and it is unknown whether the location of thesite, which was at the junction of MSC and Soquel Canyon,played any role in causing the clockwise rotation.[32] The topographic influences of MSC on tidal currents
are even more clearly displayed in the spectra plots (Figure 7).The energies in both diurnal and semidiurnal bands grewtoward the head of the canyon, clearly so in the more
Figure 5. (continued)
C03004 XU AND NOBLE: CURRENTS IN MONTEREY CANYON
11 of 20
C03004

confined part of the MSC from site N to site H. On averagethe energy at the shallowest site (H) was multiple times theenergy at site N, but less than one decadal scale on the
semilogarithmic axis. This is more or less in conformitywith the results from Hudson canyon where Hotchkiss andWunsch [1982] found that the energy of internal wavefield
Figure 6. Running 3-month (left) M2 and (right) K1 tidal ellipses at the mooring sites for (a) 1993 and(b) 2002 and 2005 experiments. The top two plots are the M2 and K1 constituents calculated from sealevel measured at Monterey Harbor. The 2005 sea level data are similar to either 1993 or 2002 andtherefore are not presented here. The upcanyon directions are also plotted for each mooring site. Ellipsesfrom ADCP bins 1 (top), 15, and 28 (bottom) are plotted. Scales are presented on top of each plot. Notethe different scales between M2 and K1.
C03004 XU AND NOBLE: CURRENTS IN MONTEREY CANYON
12 of 20
C03004

grew by a factor of 5 from the mouth of the canyon to aposition well inside the canyon. The along-canyon tidalcurrents increased, and the cross-canyon currents decreasedtoward the canyon floor owing to increased steering by thecanyon walls (Figure 7, comparing the plots on the left,for near canyon rim flows, to those on the right, for near
floor flows). This anisotropy in the near-bottom flows greweven stronger toward the canyon head for tidal and longerperiod waves. From site F to site H the difference of along-canyon and cross-canyon currents near the canyon floorincreased by at least one decadal scale. The rotary spectra(not plotted) confirmed that the observed tidal currents,
Figure 6. (continued)
C03004 XU AND NOBLE: CURRENTS IN MONTEREY CANYON
13 of 20
C03004
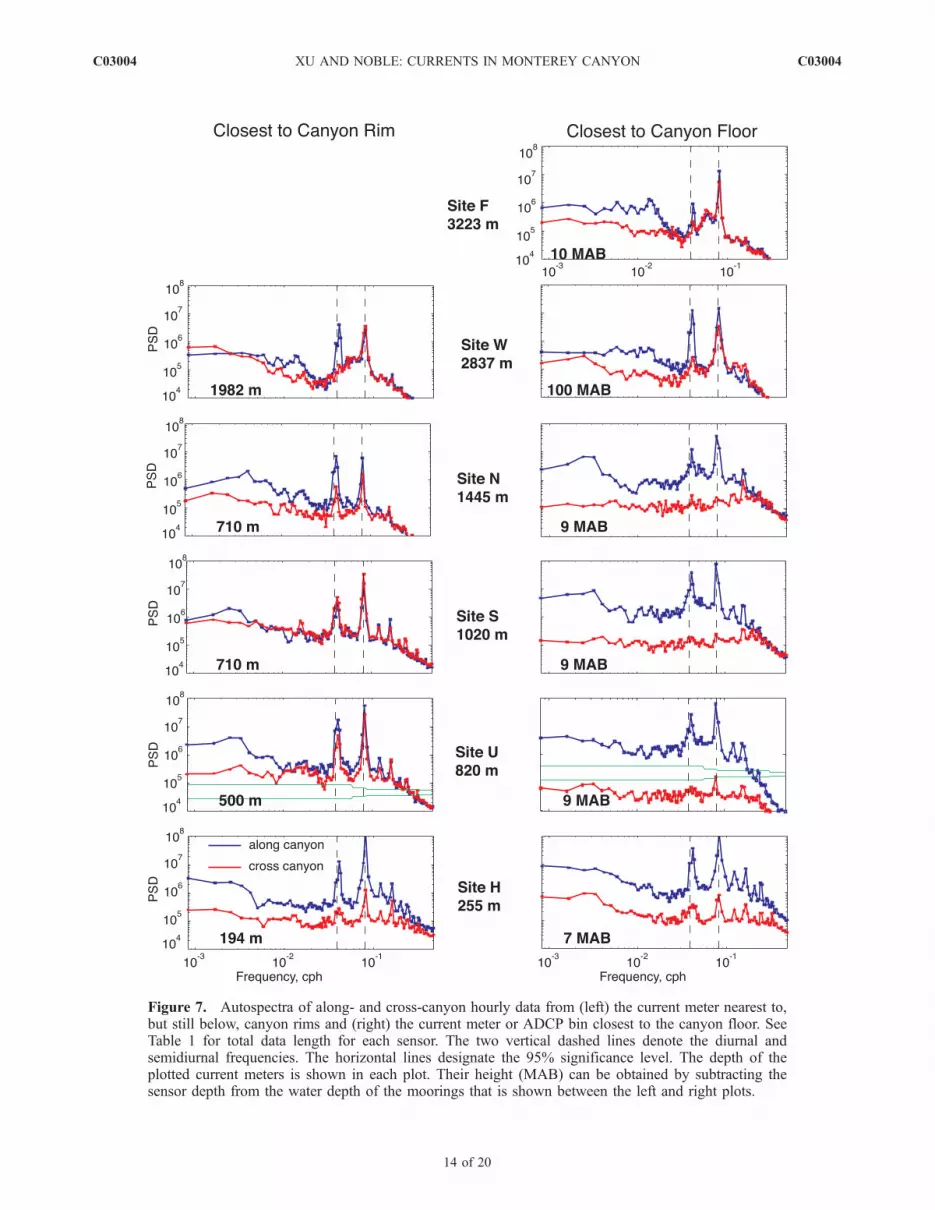
Figure 7. Autospectra of along- and cross-canyon hourly data from (left) the current meter nearest to,but still below, canyon rims and (right) the current meter or ADCP bin closest to the canyon floor. SeeTable 1 for total data length for each sensor. The two vertical dashed lines denote the diurnal andsemidiurnal frequencies. The horizontal lines designate the 95% significance level. The depth of theplotted current meters is shown in each plot. Their height (MAB) can be obtained by subtracting thesensor depth from the water depth of the moorings that is shown between the left and right plots.
C03004 XU AND NOBLE: CURRENTS IN MONTEREY CANYON
14 of 20
C03004

either near the canyon rim or the canyon floor, were mostlyrectilinear. The only exception was at site F where, forunknown reasons, the diurnal current had apparent counter-clockwise rotations while the semidiurnal currents rotated,as expected, clockwise.
4. Discussions
4.1. Upcanyon Versus Downcanyon
[33] In general the along-canyon (upcanyon or down-canyon) subtidal currents are driven by a cross-shelf pres-sure gradient in geostrophic equilibrium with along-shelfcurrents over the shelf or upper slope, which in turn couldbe generated by large-scale eddies and/or winds [Denmanand Freeland, 1985; Hickey, 1997; Noble and Butman,1989]. The equilibrium varies in time depending on thetime scale of the driving forces, and so does the along-canyon currents. But since such eddies or wind events aretypically long and persistent, especially during the upwell-ing season, the annual average, for instance, is likely to holdthe same sign of the monthly average. On the west coast ofthe United States, upwelling is a significant mechanism thathas continent-scale impact on shelf/slope and canyon cur-rents [Breaker and Broenkow, 1994; Hickey, 1997]. Theupcanyon and downcanyon mean currents in MSC should
also be influenced by the cross-shelf pressure gradients thatultimately cause the upwelling, except in regions wherelocalized perturbations overcome the pressure gradient.[34] Both the annual and monthly means of the canyon
currents showed a complicated pattern of flow directions inthe MSC, even when only the sites with well-definedcanyon walls (N-H, from deep to shallow) were considered(Table 2 and Figure 2). The currents were upcanyon at thetwo deeper sites (N and S), but downcanyon at the shal-lower sites (U and H). This appears to be different fromwhat Hickey [1997] found in Astoria Canyon where ‘‘up-welling within the canyon is simultaneous and spatiallyuniform to zeroth order’’ or Breaker and Broenkow [1994],who concluded that there were more upcanyon flows thandowncanyon flows in the depth range of 100- to 1200-mwater depth in MSC. Also, the monthly wind (Figure 8)measured at MBARI’s two buoys (M1 and M2) (Figure 1)does not correlate well with the mean currents at sitesdeeper than site U (Figure 2). The correlation between themonthly winds and canyon currents were high at site H, butthe relationship seems to be the opposite of wind-currentrelationship during typical upwelling. Here, when thesoutheastward (upwelling favorable) wind was persistentlystrong during May–October, the mean currents at site Hwere also the strongest, but the direction was downcanyon.
Figure 8. Monthly mean wind vector measured at MBARI’s M1 and M2 buoys. Upwelling-favorable(southeastward) winds are prevalent May–October in each year, at both locations.
C03004 XU AND NOBLE: CURRENTS IN MONTEREY CANYON
15 of 20
C03004

From November to April, when the winds were muchweaker and directionally unstable, the mean currents weremore in the upcanyon direction (Figures 2 and 8).[35] A possible explanation for this phenomenon is the
baroclinic pressure gradient. Figure 9 plots the verticalprofiles of temperature, salinity, and density obtained fromCTD casts near the previously mentioned sites taken on26 November 2003. The close-up plot (bottom right corner)clearly showed that the water density of the same waterdepth between 30 m and 300 m was greater at site H than atsites U and S. The presence of this horizontal densitygradient (or baroclinic pressure gradient) could well beresponsible for driving the observed downcanyon currentsat site H, and to a certain extent, site U. Apparently thebarotropic pressure gradient generated by the �5 m/ssoutheastward winds were not enough to overcome theopposite baroclinic pressure gradient [Cannon, 1972]. It ispossible that other factors also played a role, such as higherwater level caused by divergence over the canyon head andconvergence over the shelf [Inman et al., 1976], but thereare not data to support the existence of these effects. Thisflow pattern (downcanyon currents near the canyon headbut upcanyon currents in deeper water) was also observed inBaltimore [Hunkins, 1988; Gardner, 1989] and Lydonia[Noble and Butman, 1989] submarine canyons. Thus thebaroclinic explanation for this pattern may be general.
4.2. Barotropic Versus Baroclinic
[36] The majority of measured currents had magnitudesgreater than 5 cm/s. But the magnitude of the along-canyonhourly currents occasionally reached 60–80 cm/s, exclud-ing the time period of turbidity currents whose down-canyon currents were almost 200 cm/s [Xu et al., 2004].Such strong currents were likely the results of internal tidespropagating within the MSC. Figure 10 shows a 2-day timeseries of composite plots of hourly current vector withisotherm oscillations computed from temperature measure-ments at several heights on each mooring. Such isothermalsurfaces have been treated as material surfaces used forestimating the internal vertical oscillation [Lafuente et al.,1999]. In addition to showing tidal currents of > 40 cm/s,which increase toward the canyon floor, it displays thestrong correlations between tidal currents and isothermoscillation. The amplitude of the isotherm oscillation alsoincreases with depth: from 100 m near the top of themooring at 800-m water depth to nearly 200 m just abovethe canyon floor. It is also noted in Figure 10 that theupcanyon current reached its maximum roughly 3–4 h be-fore the maximum upward displacement of the isotherms.For semidiurnal tides this means a 1/4 cycle or 90-degreephase lead, which in turn indicates an internal tidal wavepropagating in both horizontal and vertical directions [Gill,1982]. Similar phase relationship between upcanyon current
Figure 9. Vertical profiles of temperature, salinity, and density obtained from CTD casts near thementioned sites taken on 26 November 2003. The close-up plot (bottom right) clearly shows that thewater density of the same water depth between 30 m and 300 m was greater at site H than at sites U andS, suggesting the presence of baroclinic pressure gradient.
C03004 XU AND NOBLE: CURRENTS IN MONTEREY CANYON
16 of 20
C03004

and isopycnal oscillations was found in previous studies inMSC, although at a different location [Petruncio et al.,1998].[37] Submarine canyons act like funnels moving water
onto the shelf [Huthnance, 1989]. Most internal waves aretrapped and funneled farther upcanyon by the canyon wallsthat are supercritical for all but the shortest period [Petruncioet al., 1998]. When/where the canyon floor slope becomescritical for a tidal constituent (typically M2 in the studyregion), bottom intensification of the tidal currents, or eveninternal tidal bores, may occur [Petruncio et al., 1998;Cacchione et al., 2002; Key, 1999]. Hotchkiss and Wunsch[1982] showed that V-shaped submarine canyons focus theenergy of internal waves that enter the canyon from theoffshore boundary toward the canyon head if the internalwave frequencies are greater than a critical value wc
2 = ( f 2 +a2 fN
2 )/(a2 + 1). Here fN is buoyancy frequency, f the Coriolis
parameter, and a the slope of the canyon floor. For internalwaves that enter from above the canyon, the V-shapedcanyons, whose sidewalls have an average slope of b, focusthe internal wave energy toward the canyon floor if thefrequencies are less than wc. At the three MSC mooring sitesconsidered here, site N has the steepest wall slope, b = 0.53(tan[28�]; see Table 1 for wall and floor slopes). The wallslopes at sites S and U are much gentler at 0.31 and 0.32,respectively. The floor slopes for the three sites are 0.051 forsite N and 0.030 for sites S and U. Given that f = 8.7 � 10�5
for MSC and fN = 2.0 � 10�3, which was computed fromCTD casts near the mooring sites, the critical frequencies ofthe walls are between 0.54 cph (site N) and 0.35 cph (sites Sand U). The critical frequencies of the canyon floors arebetween 0.075 cph (site N) and 0.060 cph (sites S and U).Thus, internal waves in the range of frequencies between
Figure 10. A 2-day time series of hourly current vector overlaid on the isotherms computed fromtemperature measurements at several heights on each mooring. Isotherm oscillations of greater than 100 mindicate the presence of internal tides in MSC, which has strong impacts on the along-canyon currents.
C03004 XU AND NOBLE: CURRENTS IN MONTEREY CANYON
17 of 20
C03004

0.060 cph and 0.35 cph should focus into the canyon bothfrom above and from the canyon mouth.
5. Conclusions
[38] The flows in the Monterey Submarine Canyon aredominated by tidal currents, especially the semidiurnalconstituents (M2 and S2). The magnitude of the semidiurnalcurrents vary profoundly depending on locations in thecanyon, ranging from �5 cm/s in the MSC fan and valleysection to >10 cm/s in the much narrower section fartherupcanyon. The speeds of these constituents, however, aresubstantially less than the observed instantaneous (hourly)speed, which frequently exceeds 60 cm/s in the upperreaches of the MSC. Such high current speeds, mostly inthe bottom 60 m of the canyon, are attributed to intensebaroclinic processes occurring in the MSC. The V-shapedcanyon walls and the near-critical slope of the canyon floorfocus baroclinic tides of semidiurnal and higher frequenciesto the canyon bottom to produce the > 100-m amplitudeisotherm oscillations and associated high-speed, rectilinearcurrents. Such strong currents not only keep the canyonfloor clear of fine-grain sediment (mud and silts), evidenced
by a ‘‘river of sand’’ along the canyon floor [Paull et al.,2005], but also contribute to produce and maintain theprevalent sandwaves on the canyon floor [Xu et al., 2008].[39] The subtidal and mean currents in the MSC are rather
weak, typically less than 5 cm/s. The topography of thecanyon clearly influences the mean current field, with muchhigher along-canyon speed in the narrow upper reaches (2–4 cm/s) than in the fan valley part (<1 cm/s) of the canyon.The mean (both annual and monthly) current field is dis-tinctly directed upcanyon in most of the MSC, especiallyduring the upwelling favorable months. Near the canyonhead, the mean current is primarily directed downcanyon(offshore), probably caused by a baroclinic pressure gradientin the upper reaches (<800 m) of the canyon. The 15-dayspring-neap cycle in the subtidal current field grows moreenergetic toward the canyon head, matches the variation ofthe spring-neap cycle of sea level in the region (strongestsprings in April–June and October–December), suggestinglimited baroclinic impacts in the subtidal currents. Thehighest energy of the subtidal flows resides in a so-called‘‘3-day’’ band that, although not continuously present, is apersistent feature of the measured records. It is distinctively
Figure 10. (continued)
C03004 XU AND NOBLE: CURRENTS IN MONTEREY CANYON
18 of 20
C03004

strong especially in the deeper reaches of the canyon. We areunable to explain the origin of this energy band beyondimplicating the possible relation between the 3-day band andperturbations of ocean-basin scale [Schrage and Clayson,2001], or nonlinear interaction between the 3-day oscillationand tidal currents.
[40] Acknowledgments. We thank Marinna Martini, Joanne Ferreira,Kurt Rosenberger, Jonathan Borden, Rick Rendigs, Marla Stone, FranLightsom, and the crews of R/Vs Robert Gordon Sproul, David StarrJordan, Pt. Sur, Shana Rae, and McArthur II for making the several fieldcruises possible. The 1993 study was funded by USGS and ONR, and the2002 study was cosponsored by USGS and NPS. Ian Hartwell and NOAAgraciously provided ship time for the 2005 fieldwork. The manuscriptbenefited from frequent discussions with Charlie Paull and the insightfulcomments from Dan Hanes, Eric Geist, and two anonymous reviewers.
ReferencesAllen, S. E. (1996), Topographically generated, subinertial flows within afinite length canyon, J. Phys. Oceanogr., 26, 1608–1632, doi:10.1175/1520-0485(1996)026<1608:TGSFWA>2.0.CO;2.
Blaskovich, D. D. (1973), A drift card study in Monterey Bay, California:September 1971 to April 1973, Tech. Pub. 73-4, Moss Landing Mar.Lab., Moss Landing, Calif.
Breaker, L. C., and W. W. Broenkow (1994), The circulation of MontereyBay and related processes, Oceanogr. Mar. Biol., 32, 1–64.
Cacchione, D. A., L. F. Pratson, and A. S. Ogston (2002), The shaping ofcontinental slopes by internal tides, Science, 296, 724–727, doi:10.1126/science.1069803.
Cannon, G. A. (1972), Wind effects on currents observed in Juan de Fucasubmarine canyon, J. Phys. Oceanogr., 2, 281–285, doi:10.1175/1520-0485(1972)002<0281:WEOCOI>2.0.CO;2.
Chavez, F. P., H. W. Jannasch, K. S. Johnson, C. M. Sakamoto, G. E.Friedrich, G. D. Thurmond, R. A. Herlien, and L. A. Codispoti (1991),The MBARI program for obtaining real-time measurements in MontereyBay, inOCEANS’91, Ocean Technologies and Opportunities in the Pacificfor the 90’s, Proceedings, vol. 1, pp. 327–333, Inst. of Electr. and Electr.Eng., New York.
Denman, K. L., and H. J. Freeland (1985), Correlation scales, objectivemapping and a statistical test of geostrophy over the continental shelf,J. Mar. Res., 43, 517–539.
Eittreim, S. L., R. J. Anima, and A. J. Stevenson (2002), Seafloor geologyof the Monterey Bay area continental shelf, Mar. Geol., 181, 3 –34,doi:10.1016/S0025-3227(01)00259-6.
Emery, W. J., and R. E. Thomson (2001), Data Analysis Methods in Phy-sical Oceanography, 2nd rev. ed., 638 pp., Elsevier, Amsterdam.
Foreman, M. (1978), Manual for tidal currents analysis and prediction,Tech. Rep. Pac. Mar. Sci. Rep. 77-10, Inst. of Ocean Sci., Sidney, Canada.
Gardner, W. (1989), Baltimore Canyon as a modern conduit of sediment tothe deep sea, Deep Sea Res. Part A, 36, 323–358, doi:10.1016/0198-0149(89)90041-1.
Gill, A. E. (1982), Atmosphere-Ocean Dynamics, 662 pp., Academic,New York.
Greene, H. G. (1990), Regional tectonics and structural evolution of theMonterey Bay region, central California, in Geology and Tectonics of theCentral California Coastal Region, San Francisco to Monterey, vol. GB67, edited by R. E. Garrision et al., pp. 31–56, Pac. Sect. Am. Assoc. ofPet. Geol., Bakersfield, Calif.
Greene, H. G., N. M. Maher, and C. K. Paull (2002), Physiography of theMonterey Bay Marine National Marine Sanctuary and implications aboutcontinental margin development, Mar. Geol., 181, 55–82, doi:10.1016/S0025-3227(01)00261-4.
Figure 10. (continued)
C03004 XU AND NOBLE: CURRENTS IN MONTEREY CANYON
19 of 20
C03004

Grinsted, A., J. C. Moore, and S. Jevrejeva (2004), Application of the crosswavelet transform and wavelet coherence to geophysical time series,Nonlinear Processes Geophys., 11, 561–566.
Hickey, B. M. (1997), The response of a steep-sided, narrow canyon totime-variable wind forcing, J. Phys. Oceanogr., 27, 697 – 726,doi:10.1175/1520-0485(1997)027<0697:TROASS>2.0.CO;2.
Hotchkiss, F. S., and C. Wunsch (1982), Internal waves in HudsonCanyon with possible geological implications, Deep Sea Res. Part A,29, 415–442, doi:10.1016/0198-0149(82)90068-1.
Hunkins, K. (1988), Mean and tidal currents in Baltimore Canyon, J. Geo-phys. Res., 93(C6), 6917–6929, doi:10.1029/JC093iC06p06917.
Huthnance, J. M. (1989), Internal tides and waves near the continental shelfedge, Geophys. Astrophys. Fluid Dyn., 48, 81 – 106, doi:10.1080/03091928908219527.
Inman, D. L., C. E. Nordstrom, and E. F. Reinhard (1976), Currents insubmarine canyons: An air-sea-land interaction, Annu. Rev. Fluid Mech.,8, 275–310, doi:10.1146/annurev.fl.08.010176.001423.
Johnson, K. S., C. K. Paull, J. P. Barry, and F. P. Chavez (2001), A decadalrecord of underflows from a coastal river into the deep sea,Geology, 29(11),1019–1022, doi:10.1130/0091-7613(2001)029<1019:ADROUF>2.0.CO;2.
Key, S. (1999), Internal tidal bores in the Monterey Canyon, thesis, 91 pp.,Nav. Postgrad. Sch., Monterey, Calif.
Khripounoff, A., A. Vangriesheim, N. Babonneau, P. Crassous, B. Dennielou,and B. Savoye (2003), Direct observation of intense turbidity current activ-ity in the Zaire submarine valley at 4000 m water depth, Mar. Geol., 194,151–158, doi:10.1016/S0025-3227(02)00677-1.
Kunze, E., L. K. Rosenfeld, G. S. Carter, and M. C. Gregg (2002),Internal waves in Monterey Submarine Canyon, J. Phys. Oceanogr., 32,1890 – 1913, doi:10.1175/1520-0485(2002)032<1890:IWIMSC>2.0.CO;2.
Lafuente, J. G., T. Sarhan, M. Vargas, and J. M. Vargas (1999), Tidalmotions and tidally induced fluxes through La Linea submarine canyon,western Alboran Sea, J. Geophys. Res., 104(C2), 3109 – 3119,doi:10.1029/1998JC900039.
Liu, Y., X. S. Liang, and R. H. Weisberg (2007), Rectification of the biasin the wavelet power spectrum, J. Atmos. Oceanic Technol., 24(12),2093–2102, doi:10.1175/2007JTECHO511.1.
Noble, M., and B. Butman (1989), The structure of subtidal currents withinand around Lydonia Canyon: Evidence for enhanced cross-shelf fluctua-tions over the mouth of the canyon, J. Geophys. Res., 94(C6), 8091–8110,doi:10.1029/JC094iC06p08091.
Paull, C. K., I. I. I. W. Ussler, H. G. Greene, R. Keaten, P. Mitts, and J. Barry(2003), Caught in the act: The 20 December 2001 gravity flow event inMonterey Canyon, Geo Mar. Lett., 22, 227–232.
Paull, C. K., P. Mitts, I. I. I. W. Ussler, R. Keaten, and H. G. Greene (2005),Trail of sand in upper Monterey Canyon: Offshore California, Geol. Soc.Am. Bull., 117(9–10), 1134–1145, doi:10.1130/B25390.1.
Pawlowicz, R., B. Beardsley, and S. Lentz (2002), Classical tidal harmonicanalysis including error estimates in MATLAB using T-TIDE, Comput.Geosci., 28, 929–937, doi:10.1016/S0098-3004(02)00013-4.
Petruncio, E. T., L. K. Rosenfeld, and J. D. Paduan (1998), Observationsof the internal tide in Monterey Canyon, J. Phys. Oceanogr., 28,1873–1903,doi:10.1175/1520-0485(1998)028<1873:OOTITI>2.0.CO;2.
Puig, P., A. Palanques, J. Guillen, and E. Garcialadona (2000), Deep slopecurrents and suspended particle fluxes in and around the Foix submarinecanyon (NW Mediterranean), Deep Sea Res., Part I, 47, 343–366,doi:10.1016/S0967-0637(99)00062-X.
Rosenberger, K., J. P. Xu, and M. A. Noble (2006), Estimating the volumeof down-canyon sediment transport by turbidity currents, Eos Trans.AGU, 87(36), Ocean Sci. Meet. Suppl., Abstract OS45A-06.
Ryan, J. P., F. P. Chavez, and J. G. Bellingham (2005), Physical-biologicalcoupling inMontereyBay,California: Topographic influences on phytoplank-ton ecology, Mar. Ecol. Prog. Ser., 287, 23–32, doi:10.3354/meps287023.
Schrage, J. M., and C. A. Clayson (2001), Statistical properties of episodes ofenhanced 2–3-day convection in the Indian and Pacific Oceans, J. Clim.,14, 3482–3494, doi:10.1175/1520-0442(2001)014<3482:SPOEOE>2.0.CO;2.
Shea, R. E., and W. W. Broenkow (1982), The role of internal tides in thenutrient enrichment of Monterey Bay, California, Estuarine Coastal ShelfSci., 15, 57–66, doi:10.1016/0272-7714(82)90036-1.
Shepard, F. P., R. Revell, and R. S. Dietz (1939), Ocean-bottom currents offthe California coast, Science, 89, 488 – 489, doi:10.1126/science.89.2317.488.
Shepard, F. P., N. F. Marshall, P. A. McLoughlin, and G. G. Sullivan(1979), Currents in Submarine Canyons and Other Seavalleys, AAPGStud. Geol., vol. 8, 173 pp.
Smith, D. P., R. Kvitek, P. J. Iampietro, and K. Wong (2007), Twenty-ninemonths of geomorphic change in upper Monterey Canyon (2002–2005),Mar. Geol., 236, 79–94, doi:10.1016/j.margeo.2006.09.024.
Xu, J. P. (1999), Local wave climate and long-term bed shear stress char-acteristics in Monterey Bay, California, Mar. Geol., 159, 341 –353,doi:10.1016/S0025-3227(98)00192-3.
Xu, J. P., M. A. Noble, S. L. Eittreim, L. K. Rosenfeld, F. B. Schwing, andC. H. Pilskaln (2002), Distribution and transport of suspended particulatematter in Monterey Canyon, California, Mar. Geol., 181, 215–234,doi:10.1016/S0025-3227(01)00268-7.
Xu, J. P., M. A. Noble, and L. K. Rosenfeld (2004), In-situ measurementsof velocity structure within turbidity currents, Geophys. Res. Lett., 31,L09311, doi:10.1029/2004GL019718.
Xu, J. P., F. L. Wong, R. Kvitek, D. P. Smith, and C. K. Paull (2008),Sandwave migration in Monterey Submarine Canyon, central California,Mar. Geol., 248, 193–212, doi:10.1016/j.margeo.2007.11.005.
�����������������������M. A. Noble, Coastal and Marine Geology, U.S. Geological Survey,
Menlo Park, CA 94025, USA.J. P. Xu, Pacific Science Center, U.S. Geological Survey, 400 Natural
Bridges Drive, Santa Cruz, CA 95060, USA. ([email protected])
C03004 XU AND NOBLE: CURRENTS IN MONTEREY CANYON
20 of 20
C03004