the summer assemblage of large pelagic crustacea in the gully submarine canyon: major patterns
TRANSCRIPT
The summer assemblage of large pelagic Crustacea in theGully submarine canyon: Major patterns
K.G. MacIsaac n, T.J. Kenchington, E.L.R. Kenchington, M. BestDepartment of Fisheries and Oceans, Bedford Institute of Oceanography, 1 Challenger Drive, Dartmouth, Nova Scotia, B2Y 4A2 Canada
Keywords:MicronektonMacrozooplanktonMesopelagic zoneBathypelagic zoneDeep seaContinental slopeNorth AtlanticAtlantic Canada
a b s t r a c t
We describe the trawl-vulnerable crustacean micronekton and macrozooplankton of the Gully, a large,shelf-incising submarine canyon off Nova Scotia, Canada, and a Marine Protected Area. Over 68 species ofpelagic crustacea were collected with an International Young Gadoid Pelagic Trawl during three annualsummer surveys at one fixed station in the canyon. Depths sampled ranged from the surface to the upperbathypelagic zone, concentrated in the upper 1250 m, with a maximum depth of 1500 m. The crustaceanfauna was dominated by cold temperate species typical of mid- to higher-latitudes in the North Atlantic.Meganyctiphanes norvegica and Eusergestes arcticuswere particularly dominant in terms of both observedbiomass and abundance above 750 m depth. At least 17 species were new records for Canadian waters.The species assemblage of the station varied primarily with depth and diel cycle, the only dominantmembers of the assemblage showing pronounced inter-annual variations in catch being M. norvegica andThemisto gaudichaudii, both relatively shallow living species.
Crown Copyright & 2013 Published by Elsevier Ltd. All rights reserved.
1. Introduction
The pelagic realm of the world's oceans accounts for approxi-mately 99% of all habitable space on Earth (Herring, 2002), mostbeing in the deep open ocean beyond the neritic zone. Verticallymigrating micronekton and zooplankton are central to the func-tioning of ecosystems in this enormous volume and are foundcircumglobally at epi- and mesopelagic depths (conventionallydefined as 0–200 and 200–1000 m respectively: DeForest andDrazen, 2009; Hopkins et al., 1994; Sutton et al., 2008). Themigrants not only play a key role in the transfer of primary andsecondary production to higher trophic levels but also transportenergy to depths below the photic zone (Angel, 1985; Longhurstand Harrison; 1989; Longhurst et al., 1990), where the ecosystemsare exclusively heterotrophic and allochthonous (Angel, 2003;Company et al., 2008; Sutton et al., 2008).
The vast oceanic space is interrupted by topography, includingcontinental and island margins (Benoit-Bird and Au, 2006; Gartner
Jr. et al., 2008; Hargreaves, 1984, 1985a), ocean ridge systems(Sutton et al., 2008), and sea mounts (DeForest and Drazen, 2009).The sloping continental margins are narrow but extensive, and liewithin the depth range of the vertically migrating fauna (GartnerJr. et al., 2008). Submarine canyons are common along thosemargins, increasing the effective size of the boundaries betweenthe neritic and oceanic zones, while introducing steep slopes andheterogeneous substrates atypical of comparable depths alongundissected continental slopes (Hickey, 1995; Levin and Gooday,2003). Continental margins are generally sites of upwelling anddownwelling, often with increased productivity, all of which maybe further augmented by the canyons, though the ecologicalsignificance of the latter is probably as variable as is theirmorphology. Compared with the adjacent continental slope, somecanyons have enhanced concentrations of pelagic species (e.g.,Genin (2004), Hickey (1995), Youngbluth et al. (1989)), supporthigher benthic biomass and productivity (e.g., De Leo et al. (2010),Hecker et al. (1983)), and sustain greater biomass or abundance ofhigher trophic level predators (e.g., Bosely et al. (2004), Genin(2004), Moors-Murphy, in this issue; Whitehead et al. (1998)).They can be areas of greatly elevated mixing and act as upwellingand downwelling conduits between continental shelves and thedeep ocean (Allen and de Madron, 2009; Greenan et al., in thisissue). Despite their importance, knowledge of the role of sub-marine canyons in deep-sea ecosystems remains sparse (De Leoet al., 2010), though recent concerted efforts have been advancingour understanding of specific canyons of interest and canyonecology in general.
Contents lists available at ScienceDirect
journal homepage: www.elsevier.com/locate/dsr2
Deep-Sea Research II
0967-0645/$ - see front matter Crown Copyright & 2013 Published by Elsevier Ltd. All rights reserved.http://dx.doi.org/10.1016/j.dsr2.2013.08.017
Abbreviations: CCGS, Canadian Coast Guard Ship; CIL, cold intermediate layer;DVM, diel vertical migration; IYGPT, International Young Gadoid Pelagic Trawl;LSW, Labrador Sea Water; NACW, North Atlantic Central Water; SIMPROF,Similarity Profile; WSW, Warm Slope Water
n Corresponding author. Tel.: þ1 902 426 9825; fax: þ1 902 426 6695.E-mail addresses: [email protected] (K.G. MacIsaac),
[email protected] (T.J. Kenchington),[email protected] (E.L.R. Kenchington),[email protected] (M. Best).
Please cite this article as: MacIsaac, K.G., et al., The summer assemblage of large pelagic Crustacea in the Gully submarine canyon: Majorpatterns. Deep-Sea Res. II (2013), http://dx.doi.org/10.1016/j.dsr2.2013.08.017i
Deep-Sea Research II ∎ (∎∎∎∎) ∎∎∎–∎∎∎
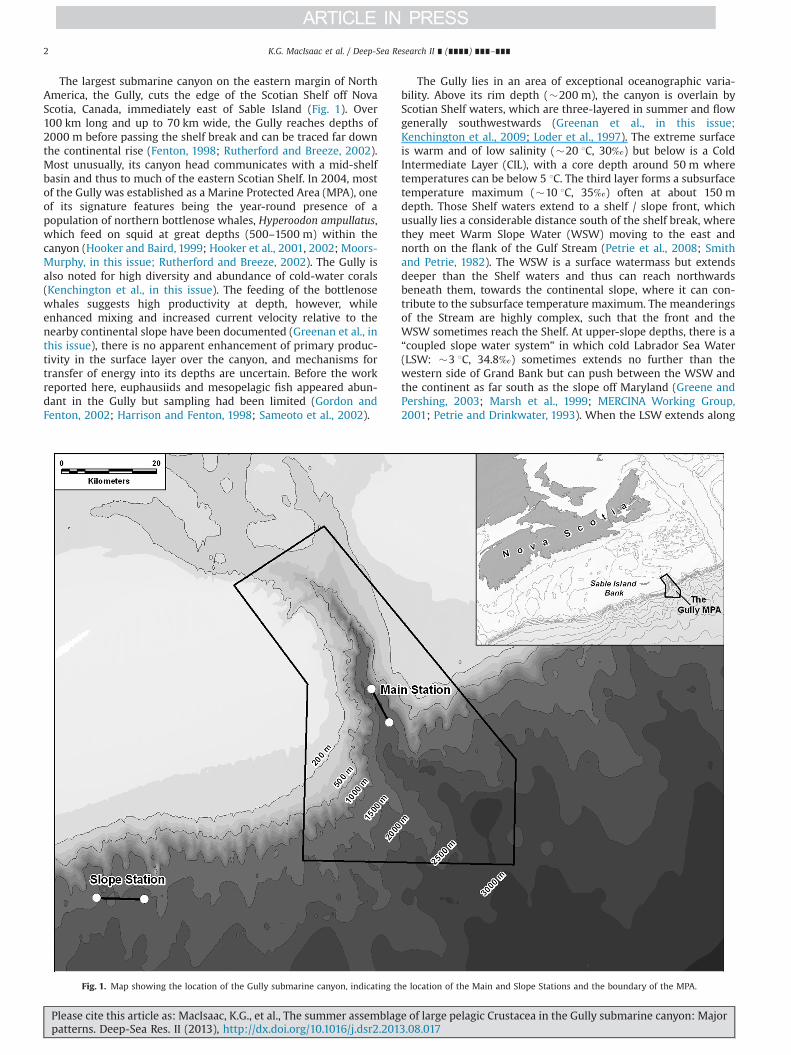
The largest submarine canyon on the eastern margin of NorthAmerica, the Gully, cuts the edge of the Scotian Shelf off NovaScotia, Canada, immediately east of Sable Island (Fig. 1). Over100 km long and up to 70 km wide, the Gully reaches depths of2000 m before passing the shelf break and can be traced far downthe continental rise (Fenton, 1998; Rutherford and Breeze, 2002).Most unusually, its canyon head communicates with a mid-shelfbasin and thus to much of the eastern Scotian Shelf. In 2004, mostof the Gully was established as a Marine Protected Area (MPA), oneof its signature features being the year-round presence of apopulation of northern bottlenose whales, Hyperoodon ampullatus,which feed on squid at great depths (500–1500 m) within thecanyon (Hooker and Baird, 1999; Hooker et al., 2001, 2002; Moors-Murphy, in this issue; Rutherford and Breeze, 2002). The Gully isalso noted for high diversity and abundance of cold-water corals(Kenchington et al., in this issue). The feeding of the bottlenosewhales suggests high productivity at depth, however, whileenhanced mixing and increased current velocity relative to thenearby continental slope have been documented (Greenan et al., inthis issue), there is no apparent enhancement of primary produc-tivity in the surface layer over the canyon, and mechanisms fortransfer of energy into its depths are uncertain. Before the workreported here, euphausiids and mesopelagic fish appeared abun-dant in the Gully but sampling had been limited (Gordon andFenton, 2002; Harrison and Fenton, 1998; Sameoto et al., 2002).
The Gully lies in an area of exceptional oceanographic varia-bility. Above its rim depth (�200 m), the canyon is overlain byScotian Shelf waters, which are three-layered in summer and flowgenerally southwestwards (Greenan et al., in this issue;Kenchington et al., 2009; Loder et al., 1997). The extreme surfaceis warm and of low salinity (�20 1C, 30‰) but below is a ColdIntermediate Layer (CIL), with a core depth around 50 m wheretemperatures can be below 5 1C. The third layer forms a subsurfacetemperature maximum (�10 1C, 35‰) often at about 150 mdepth. Those Shelf waters extend to a shelf / slope front, whichusually lies a considerable distance south of the shelf break, wherethey meet Warm Slope Water (WSW) moving to the east andnorth on the flank of the Gulf Stream (Petrie et al., 2008; Smithand Petrie, 1982). The WSW is a surface watermass but extendsdeeper than the Shelf waters and thus can reach northwardsbeneath them, towards the continental slope, where it can con-tribute to the subsurface temperature maximum. The meanderingsof the Stream are highly complex, such that the front and theWSW sometimes reach the Shelf. At upper-slope depths, there is a“coupled slope water system” in which cold Labrador Sea Water(LSW: �3 1C, 34.8‰) sometimes extends no further than thewestern side of Grand Bank but can push between the WSW andthe continent as far south as the slope off Maryland (Greene andPershing, 2003; Marsh et al., 1999; MERCINA Working Group,2001; Petrie and Drinkwater, 1993). When the LSW extends along
Fig. 1. Map showing the location of the Gully submarine canyon, indicating the location of the Main and Slope Stations and the boundary of the MPA.
K.G. MacIsaac et al. / Deep-Sea Research II ∎ (∎∎∎∎) ∎∎∎–∎∎∎2
Please cite this article as: MacIsaac, K.G., et al., The summer assemblage of large pelagic Crustacea in the Gully submarine canyon: Majorpatterns. Deep-Sea Res. II (2013), http://dx.doi.org/10.1016/j.dsr2.2013.08.017i
the slope past the Gully, it may flood the canyon but the WSWdoes not reach such depths. When WSW displaces the LSW atupper-slope depths, the deeper portions of the canyon may still befilled by the latter water mass, but observations during the surveysreported here suggested instead the presence of North AtlanticCentral Water (NACW) that had passed under the Gulf Stream. CTDrecords from the Gully show a gradual decline in temperaturebelow the subsurface maximum, reaching about 4 1C, with sali-nities around 35‰, below 1000 m depth. Recent work on circula-tion and hydrography in the canyon, including predictivemodelling, have begun to more accurately quantify such spatialand temporal variations (Greenan et al., in this issue; Shan et al., inthis issue).
While those are typical conditions, major deviations from themdo occur. In 2007, there was exceptional development of the CIL,resulting in temperature anomalies along the shelf break of asmuch as �6 1C at some depths (Petrie et al., 2008). During thetrawling that summer, the core temperature was as low as 0 1Cwhile the shelf / slope front lay far south of the shelf break(Kenchington et al., 2009). The spring bloom that year wasexceptionally enhanced (Harrison et al., 2008), perhaps increasingherbivore biomasses in summer. Oceanographic conditions during2008 were less anomalous but limited CTD data hinted at anintrusion of LSW at depth in the canyon, replacing the apparentNACW seen there in the other years.1 During the 2009 survey, atongue of WSW pushed north near the Gully, such that the shelf/slope front lay close to the shelf break, while a subsurface lens ofWSW entered the canyon itself, though none was observed as farnorth as the trawling described here.
In 2007, a research programme commenced with the dualobjectives of firstly understanding the pelagic ecosystems of theMPA, particularly that supporting the northern bottlenose whales,in support of management and secondly examining the Gullyas an example of such systems in submarine canyons generally(Kenchington et al., 2009). Fieldwork to date has emphasizedmidwater trawling for nekton, micronekton and larger zooplank-ton at meso- and bathypelagic depths to document the distribu-tion of biomass and abundance of larger (trawl-vulnerable) pelagicCrustacea, fish and Cephalopoda. In this paper, we examine thedominant species of, and major patterns of variation in, theCrustacea taken at one fixed station in the canyon, denoted “MainStation”, during three summer surveys (2007–2009), as a founda-tion for later spatial and seasonal comparisons. We also make alimited comparison between the fauna at Main Station and thatover the adjacent continental slope, outside the canyon.
2. Materials and methods
2.1. Sampling methods
Midwater trawling was conducted in the Gully on three surveysfrom September 7 to September 19, 2007, August 30 to September6, 2008 and August 13 to August 21, 2009; the first two aboard thestern trawler Canadian Coast Guard Ship (CCGS) Wilfred Temple-man and the third on its sister ship CCGS Alfred Needler. Trawlingwas based on a fixed-station, depth stratified design, Main Stationlying inside the canyon proper along the canyon thalweg, withinthe summer distribution of the bottlenose whales (Kenchingtonet al., 2009: see Fig. 1). Three replicate sets were made in eachstratum and each of day and night in 2007, but there was so littleset-to-set variation in catch that the design was reduced to two
replicates (except a single set above 250 m in daylight) in 2008and 2009 (Table 1). In order to avoid the periods of most activediel vertical migration (DVM), none of the standard sets began orended within one hour of either sunrise or sunset. The standardsampling gear was an International Young Gadoid Pelagic Trawl(IYGPT): a mid-sized, pelagic otter trawl with a net opening of�60 m2 and mesh size graded from 100 mm at the headline to12.7 mm in the codend. That net design has been used successfullyin other surveys of deep pelagic nekton (Moore et al., 2003, 2004;Themelis and Halliday, 2012), facilitating comparability of ourresults. In 2007 and 2008, standard IYGPTs were used. In 2009,they were replaced by a net made of green, knotless meshintended to reduce both net avoidance and damage to specimens.In 2007, the trawl had a normal mesh codend. Subsequent surveysused a rigid “aquarium” codend, designed to minimize specimendamage. Some comparative fishing with mesh and aquariumcodends was conducted in 2007, using a prototype aquarium(Kenchington et al., 2009).
The uppermost stratum was defined as 0–250 m depth, largelycorresponding to the epipelagic zone, while the other strata wereeach 500 m in thickness. The maximum depth on Main Stationwas �1800 m and risk of bottom contact meant that only the250–750 m and 750–1250 m strata were available at this station.
By design, each standard set that fished below 250 m com-prised a 60-min double-oblique tow within its nominal stratum,spanning the entire stratum. The IYGPT is an open net and fishescontinuously while in the water. For the 2007 survey, the intentwas to shoot and haul the net swiftly, such that catches fromabove each set's nominal stratum were negligible. In practice, thatcould not be achieved and above-stratum fishing times weresubstantial—an average of 26.4 min for those nominally in the250–750 m stratum and 53.75 min for those in the 750–1250 mstratum (Kenchington et al. 2009).
In 2008 and 2009 shooting and hauling were slowed, the trawlfollowing a steady double-oblique profile throughout, such thatnominally 250–750 m sets fished above 250 m for 30 min bydesign, while nominally 750–1250 m sets fished above 750 m for90 min. Limitations on winch controls precluded making 60 mindouble-oblique tows in the 0–250 m stratum. Instead, the earlysets of the 2007 survey, including all six on Main Station (Table 1),followed a stepped-oblique profile (five steps at 50 m intervals).That technique was replaced with a “W” profile, the net hauled to
Table 1IYGPT sets made on Main and Slope Stations.
Year Station Diel phase Depths fished (m) Set numbersa
2007 Main Day 0–250 24, 31, 360–750 21, 23, 300–1250 22, 29, 350–1500 80
Night 0–250 19, 41, 430–750 27, 33, 420–1250 26, 28, 34
2008 Main Day 0–250 220–750 15, 390–1250 14, 53
Night 0–250 21, 380–750 19, 360–1250 20, 37
2009 Main Day 0–250 340–750 31, 35, 400–1250 46
Night 0–250 17, 250–750 18, 270–1250 19, 39
Slope Day 0–750 1, 3
a Set numbers are allocated sequentially within each survey.
1 A report on the 2008 and 2009 surveys, paralleling the work of Kenchingtonet al. (2009) on the 2007 survey, is in preparation. We make extensive use of theunpublished information in that report throughout this paper.
K.G. MacIsaac et al. / Deep-Sea Research II ∎ (∎∎∎∎) ∎∎∎–∎∎∎ 3
Please cite this article as: MacIsaac, K.G., et al., The summer assemblage of large pelagic Crustacea in the Gully submarine canyon: Majorpatterns. Deep-Sea Res. II (2013), http://dx.doi.org/10.1016/j.dsr2.2013.08.017i
a depth of 50 m between double-oblique portions. It was reasonedthat net inefficiencies resulting from reduced wingspread as thegear neared the ship and active avoidance of the ship by thenekton meant that little would be caught in the top few tens ofmetres of the water column (Kenchington et al., 2009). Hence,each 60 min “W” set should have caught twice as much as thedeeper “V” sets took when passing through the 0–250 m stratumin 30 min during shooting and hauling.
Set profiles were maintained by adjusting ship and winchspeeds. Merging those, but ignoring the effects of current sheer,suggests that the speed of the net through the water variedbetween 1.0 and 2.0 m s�1, averaging higher in 2008 and lowerin 2009 when compared to 2007.
In addition to the standard sets of the formal survey design,other IYGPT sets were conducted. The sole non-standard setsuccessfully made on Main Station was an exploratory tow below1250 m depth in 2007 (Table 1). The net spent �30 min below1250 m, reaching a maximum depth of 1500 m. In 2009, a “SlopeStation” was established �45 kmwest of the Gully thalweg (Fig. 1)—deemed far enough for the fauna to be independent of theinfluence of the canyon and yet not biogeographically distinct.Slope Station was selected to have the same seabed depths as MainStation. Two standard sets to 750 m depth were made in daylighton Slope in 2009.
2.2. Laboratory methods
All Crustacea were sorted and identified to the lowest taxo-nomic level possible at sea. Total wet weight per taxon per set wasdetermined using motion-compensating balances. Most speci-mens were returned to shore, either fixed in 4% buffered formal-dehyde or frozen. Large catches of the decapod Eusergestesarcticus, the euphausiid Meganyctiphanes norvegica and the hyper-iid amphipod Themisto gaudichaudii were sub-sampled. In 2007,those species were separated at sea and each was weighed beforesubsampling. In 2008 and 2009 they were weighed as a groupat sea and one subsample per set (containing the three speciestogether) was taken.
In the laboratory ashore, unidentified specimens were identi-fied to species level where possible, weighed (wet weight per set)and counted. Where group weights had been determined at sea,the at-sea weight was apportioned by the ratio of the laboratorywet weights of each species. At-sea weights or apportioned at-seaweights, not laboratory weights, were used in analyses. Abun-dances of M. norvegica, E. arcticus and T. gaudichaudii wereestimated. The catch of smaller species of euphausiids (i.e., notM. norvegica, Thysanopoda acutifrons, or Bentheuphausia amblyops)could not be confidently identified to species due to net damage,and were grouped together as “unidentified Euphausiacea”.
2.3. Analytical methods
Catches from sets in the 0–250 m stratum were divided in halfto correct for having twice the fishing time per metre of watercolumn sampled, when compared with the deeper sets. Unlessotherwise specified, results are in that adjusted form.
To estimate the catch (total and by species biomass andabundance) taken by each set from its nominal stratum, anaverage of what was caught above was subtracted. In practice,catches from all replicate sets in a given stratum, year and phase ofthe diel cycle (i.e. daylight or night) were averaged, and theaverage treated as a “control haul” (cf. Shih (1969), Holden(1981)). The “control haul” was an estimate of the above-stratumcatch taken by each set made in the next-deeper stratum duringthe same year and diel phase. The result is termed the estimatednominal stratum catch. Averages were expected to be robust
estimates because of the moderately large net and long distancetowed, serving to homogenize patchiness (cf. Hargreaves (1985b)and references therein), as well as the temporally close replicationof sets made on the same station. Negative values for the estimatednominal stratum catch were treated as zero. The same calcula-tions were performed for the one 1500 m set, using the averageof the catches by sets made to the 750–1250 m stratum as the“control haul”.
Estimated nominal stratum catches from the 750 to 1250 mstratum in 2008 and 2009 are expected to represent the catchesactually taken in that stratum quite well. The faster shooting andhauling in 2007 will have reduced the catch taken above 750 m,causing the calculation to bias estimated catches from the 750 to1250 m stratum downwards. For all but a few species, catchestaken during daylight from the 250 to 750 m stratum should bewell estimated; amounts caught above 250 m were generally verysmall. Estimates of night catches from the 250 to 750 m stratummay be problematic, however, because of unrepresentative sam-pling of the 0–250 m stratum, especially for species that concen-trate above 50 m depth but below the immediate influence of thetrawler. Estimated nominal stratum catch for the 1500 m set isproblematic, as random variations in the catch taken above1250 m by the single set, though expected to be small, cannot beaveraged.
Eleven species, plus the unidentified euphausiids, each com-prised 45% of the total catch from one or more strata. For each ofthose principal taxa, the mean estimated nominal stratum catch(per set), both biomass and abundance, was determined for eachstratum and diel phase, with their standard deviations.
Patterns in the species assemblage on Main Station wereexamined using the PRIMER v.6.1.6 software package (Clarke andGorley, 2006). Abundance and biomass values spanned severalorders of magnitude, so the data were log(xþ1) transformed priorto analysis to down-weight dominant species which could other-wise dictate assemblage patterns (Clarke and Warwick, 2001;DeForest and Drazen, 2009; Sutton et al., 2008). Principal compo-nent analyses (PCAs) of the (non-normalized) covariance matricesof log-transformed species estimated nominal stratum catcheswere used to examine the variability within the assemblage,separate PCAs being calculated for catch biomass and abundance.Only those species accounting for 42% of total biomass or 43% oftotal abundance were included in the PCAs, providing a total of 21and 24 taxa respectively. The three major survey design factors—year, stratum and diel phase—were used to visualize influences onthe observed patterns. Significant clustering of trawl sets wasexamined using Similarity Profile (SIMPROF) permutation testsbased on cluster analyses of Bray–Curtis species similaritymatrices biomass and abundance data, imposed on ordinatedMultidimensional Scaling (MDS) two-dimensional spatial plots(Clarke and Warwick, 2001).
Comparisons between Main and Slope Stations used unad-justed catch data from sets made to 750 m during daylight in2009, integrating across the upper two nominal strata of thesurvey design. PCAs were calculated following the same approachdescribed above except that they were based on the unadjustedcatches of species accounting for 41% of catch biomass andabundance.
3. Results
3.1. General description of the fauna on Main Station
At least 68 species (including four large meroplanktonic larvalforms) plus one species variant from eight orders of Crustaceawere identified in the catches of the 41 Main Station sets (Table 2,
K.G. MacIsaac et al. / Deep-Sea Research II ∎ (∎∎∎∎) ∎∎∎–∎∎∎4
Please cite this article as: MacIsaac, K.G., et al., The summer assemblage of large pelagic Crustacea in the Gully submarine canyon: Majorpatterns. Deep-Sea Res. II (2013), http://dx.doi.org/10.1016/j.dsr2.2013.08.017i
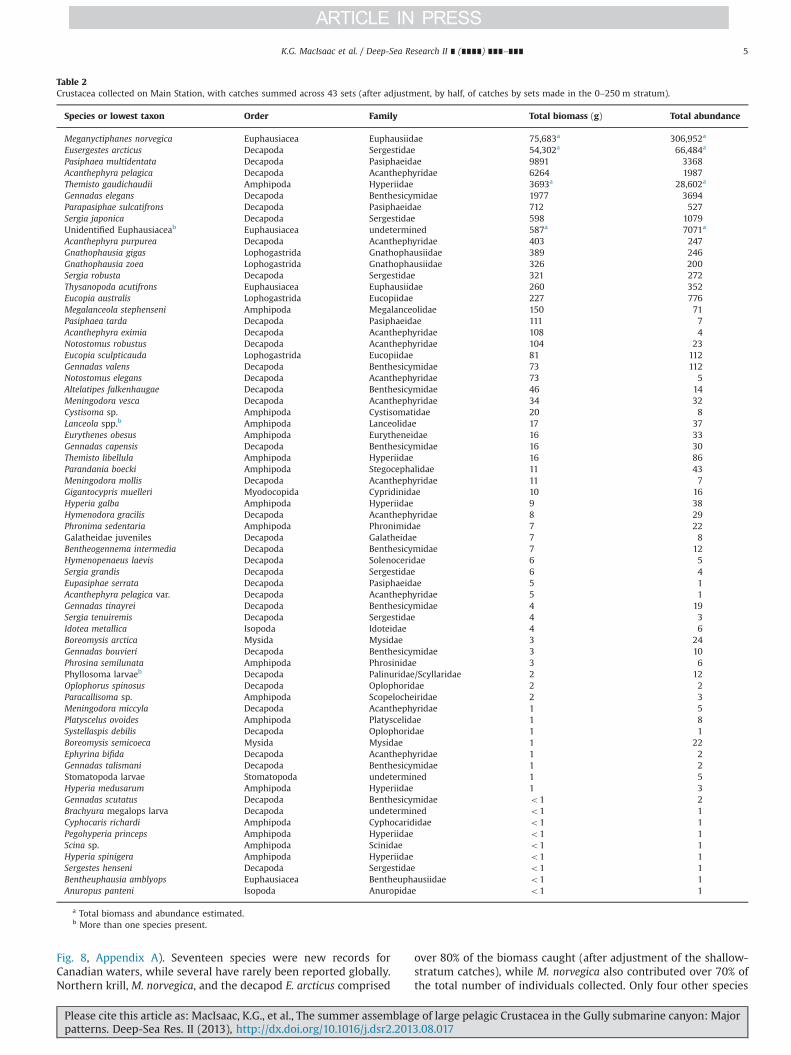
Fig. 8, Appendix A). Seventeen species were new records forCanadian waters, while several have rarely been reported globally.Northern krill, M. norvegica, and the decapod E. arcticus comprised
over 80% of the biomass caught (after adjustment of the shallow-stratum catches), while M. norvegica also contributed over 70% ofthe total number of individuals collected. Only four other species
Table 2Crustacea collected on Main Station, with catches summed across 43 sets (after adjustment, by half, of catches by sets made in the 0–250 m stratum).
Species or lowest taxon Order Family Total biomass (g) Total abundance
Meganyctiphanes norvegica Euphausiacea Euphausiidae 75,683a 306,952a
Eusergestes arcticus Decapoda Sergestidae 54,302a 66,484a
Pasiphaea multidentata Decapoda Pasiphaeidae 9891 3368Acanthephyra pelagica Decapoda Acanthephyridae 6264 1987Themisto gaudichaudii Amphipoda Hyperiidae 3693a 28,602a
Gennadas elegans Decapoda Benthesicymidae 1977 3694Parapasiphae sulcatifrons Decapoda Pasiphaeidae 712 527Sergia japonica Decapoda Sergestidae 598 1079Unidentified Euphausiaceab Euphausiacea undetermined 587a 7071a
Acanthephyra purpurea Decapoda Acanthephyridae 403 247Gnathophausia gigas Lophogastrida Gnathophausiidae 389 246Gnathophausia zoea Lophogastrida Gnathophausiidae 326 200Sergia robusta Decapoda Sergestidae 321 272Thysanopoda acutifrons Euphausiacea Euphausiidae 260 352Eucopia australis Lophogastrida Eucopiidae 227 776Megalanceola stephenseni Amphipoda Megalanceolidae 150 71Pasiphaea tarda Decapoda Pasiphaeidae 111 7Acanthephyra eximia Decapoda Acanthephyridae 108 4Notostomus robustus Decapoda Acanthephyridae 104 23Eucopia sculpticauda Lophogastrida Eucopiidae 81 112Gennadas valens Decapoda Benthesicymidae 73 112Notostomus elegans Decapoda Acanthephyridae 73 5Altelatipes falkenhaugae Decapoda Benthesicymidae 46 14Meningodora vesca Decapoda Acanthephyridae 34 32Cystisoma sp. Amphipoda Cystisomatidae 20 8Lanceola spp.b Amphipoda Lanceolidae 17 37Eurythenes obesus Amphipoda Eurytheneidae 16 33Gennadas capensis Decapoda Benthesicymidae 16 30Themisto libellula Amphipoda Hyperiidae 16 86Parandania boecki Amphipoda Stegocephalidae 11 43Meningodora mollis Decapoda Acanthephyridae 11 7Gigantocypris muelleri Myodocopida Cypridinidae 10 16Hyperia galba Amphipoda Hyperiidae 9 38Hymenodora gracilis Decapoda Acanthephyridae 8 29Phronima sedentaria Amphipoda Phronimidae 7 22Galatheidae juveniles Decapoda Galatheidae 7 8Bentheogennema intermedia Decapoda Benthesicymidae 7 12Hymenopenaeus laevis Decapoda Solenoceridae 6 5Sergia grandis Decapoda Sergestidae 6 4Eupasiphae serrata Decapoda Pasiphaeidae 5 1Acanthephyra pelagica var. Decapoda Acanthephyridae 5 1Gennadas tinayrei Decapoda Benthesicymidae 4 19Sergia tenuiremis Decapoda Sergestidae 4 3Idotea metallica Isopoda Idoteidae 4 6Boreomysis arctica Mysida Mysidae 3 24Gennadas bouvieri Decapoda Benthesicymidae 3 10Phrosina semilunata Amphipoda Phrosinidae 3 6Phyllosoma larvaeb Decapoda Palinuridae/Scyllaridae 2 12Oplophorus spinosus Decapoda Oplophoridae 2 2Paracallisoma sp. Amphipoda Scopelocheiridae 2 3Meningodora miccyla Decapoda Acanthephyridae 1 5Platyscelus ovoides Amphipoda Platyscelidae 1 8Systellaspis debilis Decapoda Oplophoridae 1 1Boreomysis semicoeca Mysida Mysidae 1 22Ephyrina bifida Decapoda Acanthephyridae 1 2Gennadas talismani Decapoda Benthesicymidae 1 2Stomatopoda larvae Stomatopoda undetermined 1 5Hyperia medusarum Amphipoda Hyperiidae 1 3Gennadas scutatus Decapoda Benthesicymidae o1 2Brachyura megalops larva Decapoda undetermined o1 1Cyphocaris richardi Amphipoda Cyphocarididae o1 1Pegohyperia princeps Amphipoda Hyperiidae o1 1Scina sp. Amphipoda Scinidae o1 1Hyperia spinigera Amphipoda Hyperiidae o1 1Sergestes henseni Decapoda Sergestidae o1 1Bentheuphausia amblyops Euphausiacea Bentheuphausiidae o1 1Anuropus panteni Isopoda Anuropidae o1 1
a Total biomass and abundance estimated.b More than one species present.
K.G. MacIsaac et al. / Deep-Sea Research II ∎ (∎∎∎∎) ∎∎∎–∎∎∎ 5
Please cite this article as: MacIsaac, K.G., et al., The summer assemblage of large pelagic Crustacea in the Gully submarine canyon: Majorpatterns. Deep-Sea Res. II (2013), http://dx.doi.org/10.1016/j.dsr2.2013.08.017i
each accounted for more than 1% of total biomass caught: thedecapods Pasiphaea multidentata, Acanthephyra pelagica, Gennadaselegans, and the hyperiid amphipod T. gaudichaudii. When exam-ined by nominal stratum, other species became more prominentwith increasing depth (Tables 3–6). Thirty-six of the 68 specieseach occurred in less than a quarter of the sets, 12 species being
recorded from only one set each, all a mixture of shallow anddeep-living forms.
The catch of Euphausiacea, like that of the Crustacea as a whole,was dominated by M. norvegica. Two other large euphausiids wererecorded, in addition to the pooled smaller species which wouldhave been considerably more prominent in the catches of finer-
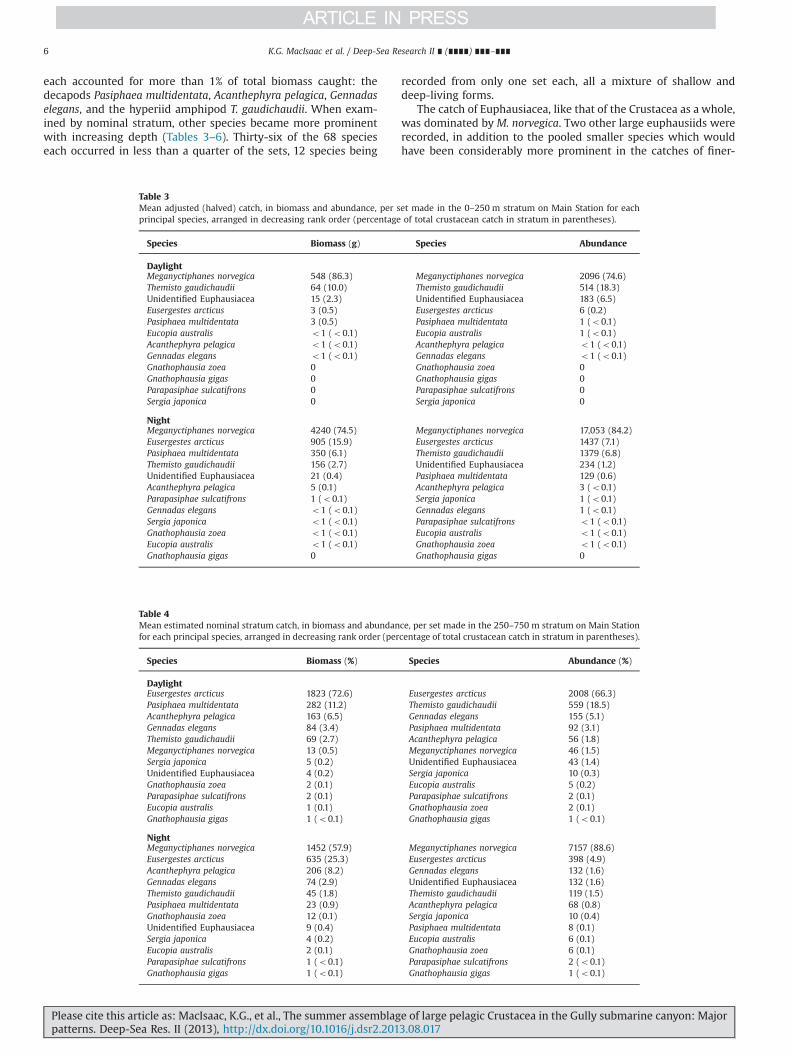
Table 3Mean adjusted (halved) catch, in biomass and abundance, per set made in the 0–250 m stratum on Main Station for eachprincipal species, arranged in decreasing rank order (percentage of total crustacean catch in stratum in parentheses).
Species Biomass (g) Species Abundance
DaylightMeganyctiphanes norvegica 548 (86.3) Meganyctiphanes norvegica 2096 (74.6)Themisto gaudichaudii 64 (10.0) Themisto gaudichaudii 514 (18.3)Unidentified Euphausiacea 15 (2.3) Unidentified Euphausiacea 183 (6.5)Eusergestes arcticus 3 (0.5) Eusergestes arcticus 6 (0.2)Pasiphaea multidentata 3 (0.5) Pasiphaea multidentata 1 (o0.1)Eucopia australis o1 (o0.1) Eucopia australis 1 (o0.1)Acanthephyra pelagica o1 (o0.1) Acanthephyra pelagica o1 (o0.1)Gennadas elegans o1 (o0.1) Gennadas elegans o1 (o0.1)Gnathophausia zoea 0 Gnathophausia zoea 0Gnathophausia gigas 0 Gnathophausia gigas 0Parapasiphae sulcatifrons 0 Parapasiphae sulcatifrons 0Sergia japonica 0 Sergia japonica 0
NightMeganyctiphanes norvegica 4240 (74.5) Meganyctiphanes norvegica 17,053 (84.2)Eusergestes arcticus 905 (15.9) Eusergestes arcticus 1437 (7.1)Pasiphaea multidentata 350 (6.1) Themisto gaudichaudii 1379 (6.8)Themisto gaudichaudii 156 (2.7) Unidentified Euphausiacea 234 (1.2)Unidentified Euphausiacea 21 (0.4) Pasiphaea multidentata 129 (0.6)Acanthephyra pelagica 5 (0.1) Acanthephyra pelagica 3 (o0.1)Parapasiphae sulcatifrons 1 (o0.1) Sergia japonica 1 (o0.1)Gennadas elegans o1 (o0.1) Gennadas elegans 1 (o0.1)Sergia japonica o1 (o0.1) Parapasiphae sulcatifrons o1 (o0.1)Gnathophausia zoea o1 (o0.1) Eucopia australis o1 (o0.1)Eucopia australis o1 (o0.1) Gnathophausia zoea o1 (o0.1)Gnathophausia gigas 0 Gnathophausia gigas 0
Table 4Mean estimated nominal stratum catch, in biomass and abundance, per set made in the 250–750 m stratum on Main Stationfor each principal species, arranged in decreasing rank order (percentage of total crustacean catch in stratum in parentheses).
Species Biomass (%) Species Abundance (%)
DaylightEusergestes arcticus 1823 (72.6) Eusergestes arcticus 2008 (66.3)Pasiphaea multidentata 282 (11.2) Themisto gaudichaudii 559 (18.5)Acanthephyra pelagica 163 (6.5) Gennadas elegans 155 (5.1)Gennadas elegans 84 (3.4) Pasiphaea multidentata 92 (3.1)Themisto gaudichaudii 69 (2.7) Acanthephyra pelagica 56 (1.8)Meganyctiphanes norvegica 13 (0.5) Meganyctiphanes norvegica 46 (1.5)Sergia japonica 5 (0.2) Unidentified Euphausiacea 43 (1.4)Unidentified Euphausiacea 4 (0.2) Sergia japonica 10 (0.3)Gnathophausia zoea 2 (0.1) Eucopia australis 5 (0.2)Parapasiphae sulcatifrons 2 (0.1) Parapasiphae sulcatifrons 2 (0.1)Eucopia australis 1 (0.1) Gnathophausia zoea 2 (0.1)Gnathophausia gigas 1 (o0.1) Gnathophausia gigas 1 (o0.1)
NightMeganyctiphanes norvegica 1452 (57.9) Meganyctiphanes norvegica 7157 (88.6)Eusergestes arcticus 635 (25.3) Eusergestes arcticus 398 (4.9)Acanthephyra pelagica 206 (8.2) Gennadas elegans 132 (1.6)Gennadas elegans 74 (2.9) Unidentified Euphausiacea 132 (1.6)Themisto gaudichaudii 45 (1.8) Themisto gaudichaudii 119 (1.5)Pasiphaea multidentata 23 (0.9) Acanthephyra pelagica 68 (0.8)Gnathophausia zoea 12 (0.1) Sergia japonica 10 (0.4)Unidentified Euphausiacea 9 (0.4) Pasiphaea multidentata 8 (0.1)Sergia japonica 4 (0.2) Eucopia australis 6 (0.1)Eucopia australis 2 (0.1) Gnathophausia zoea 6 (0.1)Parapasiphae sulcatifrons 1 (o0.1) Parapasiphae sulcatifrons 2 (o0.1)Gnathophausia gigas 1 (o0.1) Gnathophausia gigas 1 (o0.1)
K.G. MacIsaac et al. / Deep-Sea Research II ∎ (∎∎∎∎) ∎∎∎–∎∎∎6
Please cite this article as: MacIsaac, K.G., et al., The summer assemblage of large pelagic Crustacea in the Gully submarine canyon: Majorpatterns. Deep-Sea Res. II (2013), http://dx.doi.org/10.1016/j.dsr2.2013.08.017i
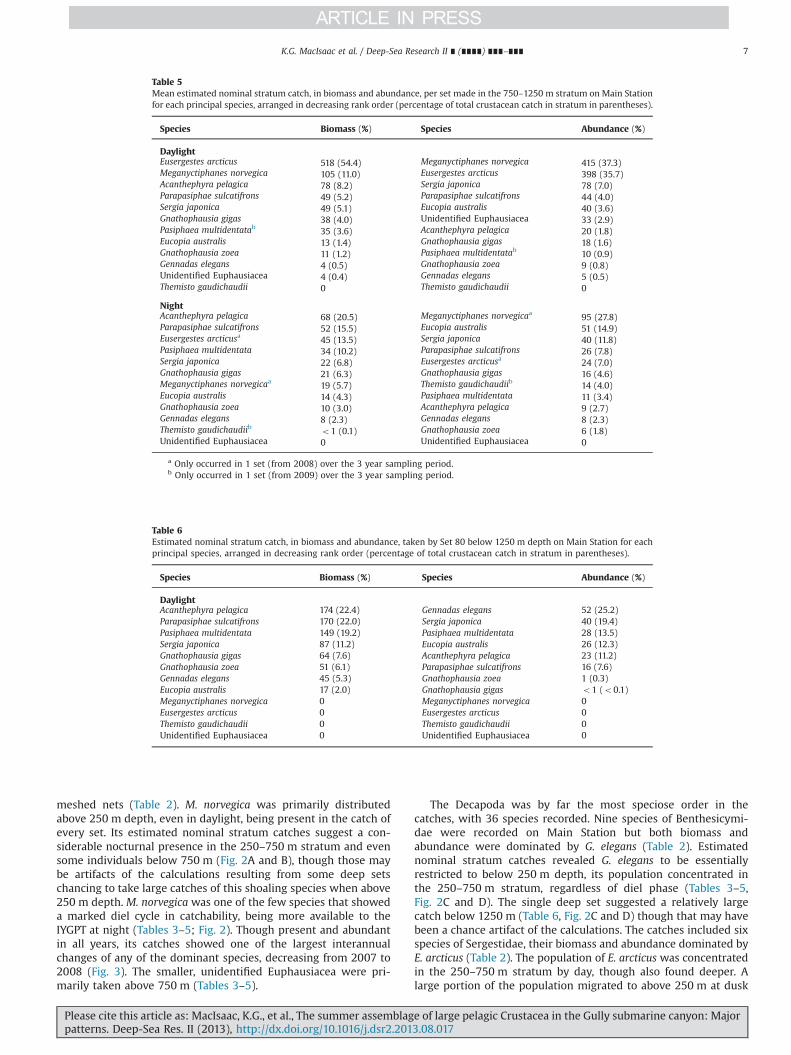
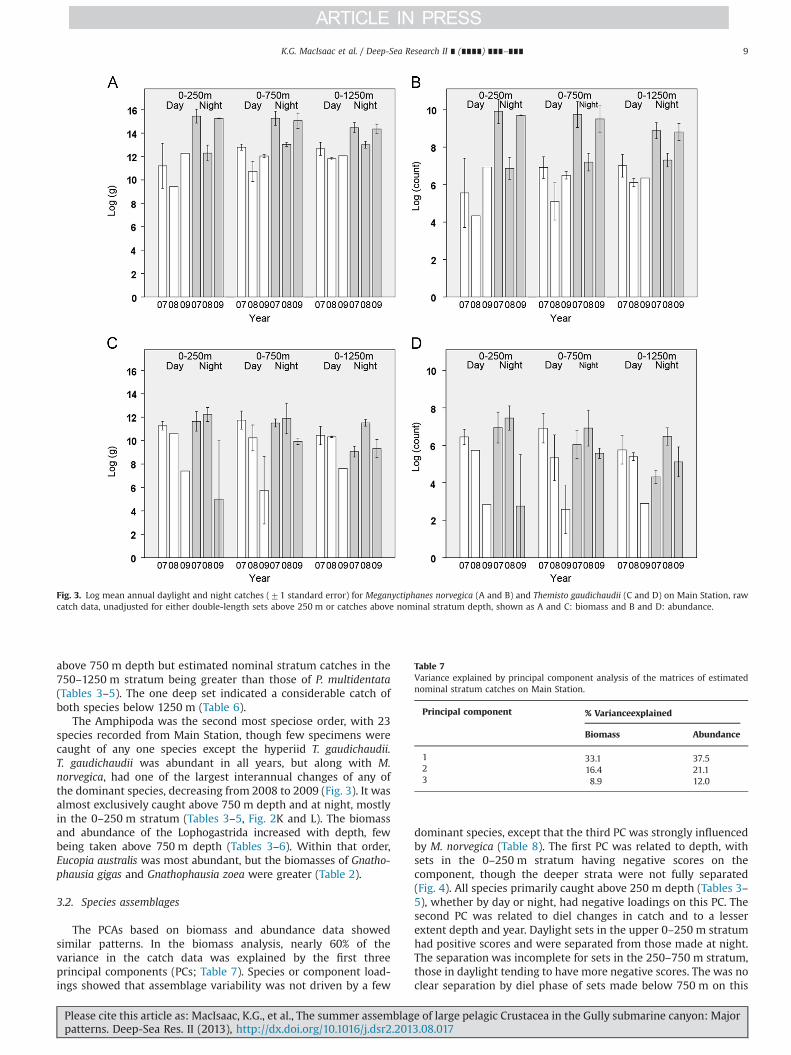
meshed nets (Table 2). M. norvegica was primarily distributedabove 250 m depth, even in daylight, being present in the catch ofevery set. Its estimated nominal stratum catches suggest a con-siderable nocturnal presence in the 250–750 m stratum and evensome individuals below 750 m (Fig. 2A and B), though those maybe artifacts of the calculations resulting from some deep setschancing to take large catches of this shoaling species when above250 m depth. M. norvegica was one of the few species that showeda marked diel cycle in catchability, being more available to theIYGPT at night (Tables 3–5; Fig. 2). Though present and abundantin all years, its catches showed one of the largest interannualchanges of any of the dominant species, decreasing from 2007 to2008 (Fig. 3). The smaller, unidentified Euphausiacea were pri-marily taken above 750 m (Tables 3–5).
The Decapoda was by far the most speciose order in thecatches, with 36 species recorded. Nine species of Benthesicymi-dae were recorded on Main Station but both biomass andabundance were dominated by G. elegans (Table 2). Estimatednominal stratum catches revealed G. elegans to be essentiallyrestricted to below 250 m depth, its population concentrated inthe 250–750 m stratum, regardless of diel phase (Tables 3–5,Fig. 2C and D). The single deep set suggested a relatively largecatch below 1250 m (Table 6, Fig. 2C and D) though that may havebeen a chance artifact of the calculations. The catches included sixspecies of Sergestidae, their biomass and abundance dominated byE. arcticus (Table 2). The population of E. arcticus was concentratedin the 250–750 m stratum by day, though also found deeper. Alarge portion of the population migrated to above 250 m at dusk
Table 5Mean estimated nominal stratum catch, in biomass and abundance, per set made in the 750–1250 m stratum on Main Stationfor each principal species, arranged in decreasing rank order (percentage of total crustacean catch in stratum in parentheses).
Species Biomass (%) Species Abundance (%)
DaylightEusergestes arcticus 518 (54.4) Meganyctiphanes norvegica 415 (37.3)Meganyctiphanes norvegica 105 (11.0) Eusergestes arcticus 398 (35.7)Acanthephyra pelagica 78 (8.2) Sergia japonica 78 (7.0)Parapasiphae sulcatifrons 49 (5.2) Parapasiphae sulcatifrons 44 (4.0)Sergia japonica 49 (5.1) Eucopia australis 40 (3.6)Gnathophausia gigas 38 (4.0) Unidentified Euphausiacea 33 (2.9)Pasiphaea multidentatab 35 (3.6) Acanthephyra pelagica 20 (1.8)Eucopia australis 13 (1.4) Gnathophausia gigas 18 (1.6)Gnathophausia zoea 11 (1.2) Pasiphaea multidentatab 10 (0.9)Gennadas elegans 4 (0.5) Gnathophausia zoea 9 (0.8)Unidentified Euphausiacea 4 (0.4) Gennadas elegans 5 (0.5)Themisto gaudichaudii 0 Themisto gaudichaudii 0
NightAcanthephyra pelagica 68 (20.5) Meganyctiphanes norvegicaa 95 (27.8)Parapasiphae sulcatifrons 52 (15.5) Eucopia australis 51 (14.9)Eusergestes arcticusa 45 (13.5) Sergia japonica 40 (11.8)Pasiphaea multidentata 34 (10.2) Parapasiphae sulcatifrons 26 (7.8)Sergia japonica 22 (6.8) Eusergestes arcticusa 24 (7.0)Gnathophausia gigas 21 (6.3) Gnathophausia gigas 16 (4.6)Meganyctiphanes norvegicaa 19 (5.7) Themisto gaudichaudiib 14 (4.0)Eucopia australis 14 (4.3) Pasiphaea multidentata 11 (3.4)Gnathophausia zoea 10 (3.0) Acanthephyra pelagica 9 (2.7)Gennadas elegans 8 (2.3) Gennadas elegans 8 (2.3)Themisto gaudichaudiib o1 (0.1) Gnathophausia zoea 6 (1.8)Unidentified Euphausiacea 0 Unidentified Euphausiacea 0
a Only occurred in 1 set (from 2008) over the 3 year sampling period.b Only occurred in 1 set (from 2009) over the 3 year sampling period.
Table 6Estimated nominal stratum catch, in biomass and abundance, taken by Set 80 below 1250 m depth on Main Station for eachprincipal species, arranged in decreasing rank order (percentage of total crustacean catch in stratum in parentheses).
Species Biomass (%) Species Abundance (%)
DaylightAcanthephyra pelagica 174 (22.4) Gennadas elegans 52 (25.2)Parapasiphae sulcatifrons 170 (22.0) Sergia japonica 40 (19.4)Pasiphaea multidentata 149 (19.2) Pasiphaea multidentata 28 (13.5)Sergia japonica 87 (11.2) Eucopia australis 26 (12.3)Gnathophausia gigas 64 (7.6) Acanthephyra pelagica 23 (11.2)Gnathophausia zoea 51 (6.1) Parapasiphae sulcatifrons 16 (7.6)Gennadas elegans 45 (5.3) Gnathophausia zoea 1 (0.3)Eucopia australis 17 (2.0) Gnathophausia gigas o1 (o0.1)Meganyctiphanes norvegica 0 Meganyctiphanes norvegica 0Eusergestes arcticus 0 Eusergestes arcticus 0Themisto gaudichaudii 0 Themisto gaudichaudii 0Unidentified Euphausiacea 0 Unidentified Euphausiacea 0
K.G. MacIsaac et al. / Deep-Sea Research II ∎ (∎∎∎∎) ∎∎∎–∎∎∎ 7
Please cite this article as: MacIsaac, K.G., et al., The summer assemblage of large pelagic Crustacea in the Gully submarine canyon: Majorpatterns. Deep-Sea Res. II (2013), http://dx.doi.org/10.1016/j.dsr2.2013.08.017i
(Tables 3–5, Fig. 2E and F). Below 750 m depth, the biomass andabundance of the confamilial Sergia japonica were higher than inshallower strata (Tables 3–5), the single deep exploratory setindicating a relatively large catch of this species below 1250 m,where S. japonica replaced E. arcticus as the most abundantsergestid (Table 6).
The Acanthephyridae was the most species rich family ofCrustacea in Main Station catches with 11 species (Table 2), theirbiomass and abundance being dominated by A. pelagica. A. pelagicawas essentially restricted to depths below 250 m, its population
concentrated in the 250–750 m stratum but with a considerableportion found deeper, including apparently below 1250 m(Tables 3–6, Fig. 2G and H). Only four species of Pasiphaeidaewere recorded, catches of P. multidentata exceeding those ofall other Crustacea except M. norvegica and E. arcticus (Table 2).P. multidentata probably occurred throughout the water column tobelow 1250 m but was concentrated by day in the 250–750 mstratum, with most of the population migrating to above 250 m atdusk (Tables 3–6, Fig. 2I and J). Catches of the confamilialParapasiphae sulcatifrons increased with depth, few being taken
Fig. 2. Daylight and night vertical distributions of the six principal species of Crustacea taken on Main Station, based on mean estimated nominal stratum catches(71 standard error), shown as biomass (left) and abundance (right), and including data from all three surveys years.
K.G. MacIsaac et al. / Deep-Sea Research II ∎ (∎∎∎∎) ∎∎∎–∎∎∎8
Please cite this article as: MacIsaac, K.G., et al., The summer assemblage of large pelagic Crustacea in the Gully submarine canyon: Majorpatterns. Deep-Sea Res. II (2013), http://dx.doi.org/10.1016/j.dsr2.2013.08.017i
above 750 m depth but estimated nominal stratum catches in the750–1250 m stratum being greater than those of P. multidentata(Tables 3–5). The one deep set indicated a considerable catch ofboth species below 1250 m (Table 6).
The Amphipoda was the second most speciose order, with 23species recorded from Main Station, though few specimens werecaught of any one species except the hyperiid T. gaudichaudii.T. gaudichaudii was abundant in all years, but along with M.norvegica, had one of the largest interannual changes of any ofthe dominant species, decreasing from 2008 to 2009 (Fig. 3). It wasalmost exclusively caught above 750 m depth and at night, mostlyin the 0–250 m stratum (Tables 3–5, Fig. 2K and L). The biomassand abundance of the Lophogastrida increased with depth, fewbeing taken above 750 m depth (Tables 3–6). Within that order,Eucopia australis was most abundant, but the biomasses of Gnatho-phausia gigas and Gnathophausia zoea were greater (Table 2).
3.2. Species assemblages
The PCAs based on biomass and abundance data showedsimilar patterns. In the biomass analysis, nearly 60% of thevariance in the catch data was explained by the first threeprincipal components (PCs; Table 7). Species or component load-ings showed that assemblage variability was not driven by a few
dominant species, except that the third PC was strongly influencedby M. norvegica (Table 8). The first PC was related to depth, withsets in the 0–250 m stratum having negative scores on thecomponent, though the deeper strata were not fully separated(Fig. 4). All species primarily caught above 250 m depth (Tables 3–5), whether by day or night, had negative loadings on this PC. Thesecond PC was related to diel changes in catch and to a lesserextent depth and year. Daylight sets in the upper 0–250 m stratumhad positive scores and were separated from those made at night.The separation was incomplete for sets in the 250–750 m stratum,those in daylight tending to have more negative scores. The was noclear separation by diel phase of sets made below 750 m on this
Fig. 3. Log mean annual daylight and night catches (71 standard error) for Meganyctiphanes norvegica (A and B) and Themisto gaudichaudii (C and D) on Main Station, rawcatch data, unadjusted for either double-length sets above 250 m or catches above nominal stratum depth, shown as A and C: biomass and B and D: abundance.
Table 7Variance explained by principal component analysis of the matrices of estimatednominal stratum catches on Main Station.
Principal component % Varianceexplained
Biomass Abundance
1 33.1 37.52 16.4 21.13 8.9 12.0
K.G. MacIsaac et al. / Deep-Sea Research II ∎ (∎∎∎∎) ∎∎∎–∎∎∎ 9
Please cite this article as: MacIsaac, K.G., et al., The summer assemblage of large pelagic Crustacea in the Gully submarine canyon: Majorpatterns. Deep-Sea Res. II (2013), http://dx.doi.org/10.1016/j.dsr2.2013.08.017i
PC, though it largely separated them from those in the 250–750 mstratum. For each stratum and diel phase, there was a tendency for2007 sets to have more positive scores on this second PC thanthose made in 2008 or 2009 (Fig. 4).
The first three principal components of the PCA based onabundance data explained over 70% of the variance in the catchdata (Table 7). Unlike the biomass components, the PCs werestrongly driven by the numerically dominant species M. norvegica,T. gaudichaudii (first and third PCs), and E. arcticus (second PC:Table 9). The first two PCs were again primarily related to depthand time of day but the third did not appear linked to any factor ofthe survey design. SIMPROF based on this data revealed significantclustering closely corresponding to the three depth strata at a
similarity level of 51% (Fig. 5). Stress level was relatively low,suggesting the plot was an acceptable visualization.
3.3. Comparison between Main and Slope Stations
Daylight catches from the top 750 m of the water column onSlope Station in 2009 averaged smaller than comparable sets onMain Station, in both biomass and abundance, also showing alower mean per-set species density (Table 10). Given so little data,the differences were not statistically significant. Species composi-tion also differed—E. arcticus, P. multidentata and the unidentifiedeuphausiids being more prominent on Main Station, whereas M.norvegica, A. pelagica, and T. gaudichaudii comprised larger propor-tions of the catches on Slope Station (Table 11). Of eight benthe-sicymid species taken, four were found only on Main Station,while three of 11 recorded hyperiid taxa were only caught onSlope. The rarely reported, large hyperiid Megalanceola stephen-seni, known to be associated with gelatinous plankton, was takenby three sets on Main Station, including both large and small
Fig. 4. Scores for the sets, and loadings by the species, on the principal componentsof the correlation matrix of Main Station estimated nominal stratum catches ofmajor species, for biomass data. Sets identified by nominal stratum, diel phase andyear. Equilibrium circle indicated. Ape¼Acanthephyra pelagica; Afa¼Altelatipesfalkenhaugae; Apu¼Acanthephyra purpurea; Ear¼Eusergestes arcticus; Eau¼Eucopiaaustralis; Eup¼Unidentified Euphausiacea; Esc¼Eucopia sculpticauda; Gel¼Gennadas elegans; Ggi¼Gnathophausia gigas; Gzo¼Gnathophausia zoea; Mno¼Meganyctiphanes norvegica; Mst¼Megalanceola stephenseni; Nro¼Notostomus robus-tus; Pmu¼Pasiphaea multidentata; Psu¼Parapasiphae sulcatifrons; Pta¼Pasiphaeatarda; Sja¼Sergia japonica; Sro¼Sergia robusta; Tac¼Thysanopoda acutifrons;Tga¼Themisto gaudichaudii; Tli¼Themisto libellula.
Table 9Species (component) loadings on principal components of the matrix of estimatednominal stratum catches abundance data, on Main Station.
Species PC1 PC2 PC3
Gennadas elegans 0.094 0.430 �0.015Eusergestes arcticus �0.219 0.668 0.390Sergia japonica 0.236 �0.068 0.180Sergia tenuiremis 0.012 �0.009 0.000Sergia robusta 0.013 0.165 0.044Acanthephyra pelagica 0.115 0.226 0.097Acanthephyra purpurea 0.018 0.199 0.092Hymenodora gracilis 0.050 �0.050 0.019Parapasiphae sulcatifrons 0.213 �0.109 0.087Pasiphaea multidentata �0.129 0.252 �0.164Pasiphaea tarda 0.008 0.009 �0.025Meganyctiphanes norvegica �0.346 �0.012 0.687Thysanopoda acutifrons 0.149 0.058 0.185Unidentified Euphausiacea �0.244 �0.040 0.088Eucopia australis 0.218 �0.063 0.104Eucopia sculpticauda 0.119 �0.076 0.062Gnathophausia zoea 0.110 �0.004 0.083Gnathophausia gigas 0.165 �0.124 0.062Boreomysis semicoeca 0.047 �0.042 0.016Eurythenes obesus 0.030 0.004 �0.001Themisto gaudichaudii �0.437 0.091 �0.626Themisto libellula �0.084 �0.065 �0.054Lanceola spp. 0.036 �0.005 0.041Megalanceola stephenseni �0.067 �0.024 0.061
Fig. 5. Statistically significant (po0.05) clusters of sets on Main Station, identifiedby SIMPROF permutation tests of cluster analysis, imposed on plots of the setsordinated by MDS, shown for catches in Biomass. Similarity level 51%. Setsidentified by nominal stratum, diel phase and year (indicated by the last two digitsof the calendar year).
Table 8Species (component) loadings on principal components of the matrix of estimatednominal stratum catches, biomass data, on Main Station.
Species PC1 PC2 PC3
Gennadas elegans 0.127 �0.468 0.126Altelatipes falkenhaugae 0.095 �0.070 �0.294Eusergestes arcticus �0.068 �0.476 �0.332Sergia japonica 0.277 �0.029 �0.053Sergia robusta 0.180 �0.271 0.095Acanthephyra pelagica 0.226 �0.252 �0.127Acanthephyra purpurea 0.113 �0.300 �0.007Notostomus robustus 0.165 0.025 0.058Parapasiphae sulcatifrons 0.290 0.147 0.008Pasiphaea multidentata �0.119 �0.432 0.304Pasiphaea tarda 0.062 0.057 0.127Meganyctiphanes norvegica �0.346 �0.012 �0.687Thysanopoda acutifrons 0.256 �0.165 �0.294Unidentified Euphausiacea �0.161 0.050 �0.126Eucopia australis 0.256 0.040 �0.023Eucopia sculpticauda 0.246 0.111 �0.082Gnathophausia zoea 0.253 0.031 �0.049Gnathophausia gigas 0.281 0.203 �0.062Themisto gaudichaudii �0.346 �0.113 0.211Themisto libellula �0.138 0.105 �0.068Megalanceola stephenseni 0.220 �0.010 �0.132
K.G. MacIsaac et al. / Deep-Sea Research II ∎ (∎∎∎∎) ∎∎∎–∎∎∎10
Please cite this article as: MacIsaac, K.G., et al., The summer assemblage of large pelagic Crustacea in the Gully submarine canyon: Majorpatterns. Deep-Sea Res. II (2013), http://dx.doi.org/10.1016/j.dsr2.2013.08.017i
specimens, while only small specimens were taken by just oneSlope set. The giant ostracod Gigantocypris muelleri was alsoobserved only on Main Station. Conversely, the extremely raredecapod genus Cerataspis sp. (known only as a larval form) was notobserved on Main Station during three years of sampling but onewas collected from Slope Station with just two sets made. PCAshowed the stations separated on the first PC, with 50% and 70% ofvariation in biomass and abundance catch data explained, respec-tively (Table 12). Species loadings were strong for T. gaudichaudii,P. sulcatifrons, and the amphipods Phrosina semilunata and M.stephenseni, in the biomass-based analysis (Fig. 6), and particularlyby T. gaudichaudii and P. multidentata in the analysis based onabundance data (Table 13). SIMPROF showed differences in com-position between the stations were significant at Po0.05, in termsof both biomass and abundance (Fig. 7).
4. Discussion
In summer, the Main Station in the Gully submarine canyonsupports a diverse fauna of large pelagic Crustacea, 68 species
being recorded from the 41 IYGPT sets made there during thethree surveys. In comparison, Moore et al. (2003) reported 46species, including benthic forms, taken in 20 sets made with threedifferent designs of nets (the IYGPT being one), while fishingdown to 2500 m on and over Bear Seamount—�1000 km south-west of the Gully. In biomass and abundance terms, the Main
Table 10Summary of catches by sets made between the surface and 750 m depth, in daylight in 2009, on Main and Slope Stations.
Set Main Station Set Slope Station
Biomass (g) Abundance Species density Biomass (g) Abundance Species density
31 1813 3144 33 1 1832 3647 3035 3329 4864 25 3 748 1122 2340 3099 4409 23 – – –
Mean 2747 4139 30 Mean 1290 2384 26
Table 11Mean catches, in biomass and abundance, by sets made between the surface and 750 m depth, indaylight in 2009, on Main and Slope Stations for each principal species, arranged in decreasing rankorder (percentage of total crustacean catch in stratum in parentheses).
Species Biomass (g) Species Abundance
Main StationEusergestes arcticus 2154 (79.5) Eusergestes arcticus 2936 (70.9)Meganyctiphanes norvegica 172 (6.4) Meganyctiphanes norvegica 688 (16.6)Acanthephyra pelagica 132 (4.9) Unidentified Euphausiacea 180 (4.4)Pasiphaea multidentata 110 (4.1) Gennadas elegans 134 (3.2)Gennadas elegans 67 (2.5) Acanthephyra pelagica 47 (1.1)Unidentified Euphausiacea 16 (0.6) Pasiphaea multidentata 41 (o1.0)Themisto gaudichaudii 4 (0.1) Themisto gaudichaudii 32 (o1.0)
Slope StationEusergestes arcticus 445 (35.6) Meganyctiphanes norvegica 1127 (47.3)Meganyctiphanes norvegica 408 (32.7) Eusergestes arcticus 663 (27.8)Acanthephyra pelagica 235 (18.8) Themisto gaudichaudii 221 (9.3)Gennadas elegans 61 (4.9) Gennadas elegans 118 (4.9)Themisto gaudichaudii 25 (2.1) Acanthephyra pelagica 86 (3.6)Pasiphaea multidentata 8 (o0.1) Unidentified Euphausiacea 46 (1.9)Unidentified Euphausiacea 4 (o0.1) Pasiphaea multidentata 2 (o0.1)
Table 12Variance explained by principal component analysis of the matrices of catches, inbiomass and abundance, by sets made between the surface and 750 m depth, indaylight in 2009, on Main and Slope Stations.
Principal component% Variance explained
Biomass Abundance
1 49.6 72.72 34.0 13.23 14.1 7.7
Fig. 6. Scores for the sets, and loadings by the species, on the principal componentsof the correlation matrix of Main and Slope Station estimated nominal stratumcatches of major species, for biomass data. Sets identified by nominal stratum,diel phase and year. Equilibrium circle indicated. Ape¼Acanthephyra pelagica;Apu¼Acanthephyra purpurea; Ear¼Eusergestes arcticus; Eup¼UnidentifiedEuphausiacea; Gva¼Gennadas valens; Mno¼Meganyctiphanes norvegica; Mst¼Megalanceola stephenseni; Nel¼Notostomus elegans; Pmu¼Pasiphaea multidentata;Psu¼Parapasiphae sulcatifrons; Pse¼Phronima sedentaria; Sro¼Sergia robusta;Tac¼Thysanopoda acutifrons; Tga¼Themisto gaudichaudii.
K.G. MacIsaac et al. / Deep-Sea Research II ∎ (∎∎∎∎) ∎∎∎–∎∎∎ 11
Please cite this article as: MacIsaac, K.G., et al., The summer assemblage of large pelagic Crustacea in the Gully submarine canyon: Majorpatterns. Deep-Sea Res. II (2013), http://dx.doi.org/10.1016/j.dsr2.2013.08.017i
Station pelagic crustacean fauna was dominated by two diurnally-migratory species of the epipelagic and upper mesopelagic zones:M. norvegica and E. arcticus. Collectively, they are a prominentcomponent of the pelagic ecosystem, comprising about half of thebiomass caught by the IYGPT, exclusive of gelatinous plankton(Kenchington et al., 2009).
The IYGPT has both advantages and limitations for presentpurposes. Among the latter, it is an open net and fishes throughouteach set. The results reported here have shown that useful coarsedepth distributions can be determined using shallower sets as“control hauls” and estimating catches from nominal strata bysubtraction. That approach requires care in design of set profiles,which evolved as the work reported here progressed. Secondly,both requirements to protect the seabed within the Gully MPA andthe steepness of the canyon walls preclude bottom trawling inmost of the area. Given the constricted space and the very longwarps needed when towing midwater trawls at great depth,avoidance of damage to net and benthos prevented deploymentof the IYGPT in close proximity to the seabed. Thus, we lackinformation on the benthic boundary layer assemblages that haveproven important in other canyons (Cartes et al., 1994; Sabatiniet al., 2007), on mid-ocean ridges (Sutton et al., 2008), andpossibly on continental margins more generally (Gartner Jr.et al., 2008; Genin, 2004; Hargreaves, 1985a; Mauchline, 1986;Merrett, 1986).
Within the assemblage that was sampled, the major axis ofvariation was by depth, while the second related to diel changeabove 750 m depth, the species compositions in the epipelagic andupper mesopelagic zones tending to vary in opposite directions.The predominance of those two factors was not unexpected,similar results having been reported elsewhere, including fromthe eastern North Atlantic and the Mid-Atlantic Ridge (e.g.,Domanski (1984), Sutton et al. (2008)). Depth is a major controlon the distributions of all marine biota and likely most of the dielchange was driven by DVM between the survey strata. Diel andperhaps depth-related variations in behaviours, including activenet avoidance during the day (Hargreaves and Herring, 1992;Hargreaves et al., 1993; Hovekamp, 1989) and shoaling or swarm-ing at night (Hovekamp, 1989; Kaartvedt, 2010; MacIsaac, 2011)will also have contributed to the observed diel change. Notably,night catches of M. norvegica were greater than those taken indaylight. Active net avoidance has been reported for that species(Sameoto et al., 1993), which is also known to swarm (Nicol, 1984).
Unexpected was the limited inter-annual variation among thecatches of the three surveys, despite modifications to the trawldesign and set profiles, the enlarged CIL in 2007, and the presenceof WSW in the canyon in 2009, though the second PC did indicatesome difference between 2007 and later years. M. norvegica hadnotably lower biomass and abundance in 2008 than the previousyear but recovered by 2009, which was inconsistent with thechanges in either oceanographic conditions or survey methodol-ogy. The lower catches of T. gaudichaudii in 2009 could be relatedto the WSW in the canyon but the warmer water was not detectedas far up the canyon as Main Station, so a direct link to water massis lacking. Temperature has been demonstrated to partially explainbroad geographic distributions of pelagic Crustacea (Foxton, 1972),to influence species distributions at smaller scales across oceanfronts (Fasham and Foxton, 1979) and to affect or structure DVM(Foxton, 1972; Flock and Hopkins, 1992; Kaartvedt, 2010), thoughdistributions are not always affected by seasonal or regionalvariations in the presence or depth of temperature clines(Donaldson, 1975; Hopkins et al., 1989). The coarse depth strati-fication of the Gully surveys can only show that the diel migrantspassed 250 m, not whether they penetrated the CIL. Thus, it is notknown whether they experienced near-freezing temperaturesdaily during the summer of 2007 without their numbers beingaffected, or conversely were unaffected because they remainedbelow the cold water. It may be that the deep water mass occupiedduring daylight, rather than that experienced at shallow depths atnight, determines the distributions of pelagic Decapoda, as sug-gested by Fasham and Foxton (1979).
M. norvegica is endemic to the North Atlantic, where it is verycommon at mid- to high latitudes (Baker et al., 1990; Mauchline,1971) and is ecologically comparable to Antarctic krill, Euphausiasuperba (Simard and Lavoie, 1999; Tarling et al., 2010). It isprincipally associated with continental margins (Cochrane et al.,1994; Einarsson, 1945; Tarling et al., 2010) and had previouslybeen reported abundant at the head of the Gully (Sameoto et al.,2002). Populations are concentrated from 200 to 500–600 mduring daylight though surface swarming has been reported(Nicol, 1984), while the total depth range extends into the bath-ypelagic zone (Angel et al., 1982; Einarsson, 1945; Hargreaves,1985b). DVM moves most of the population into the upper 100 mat dusk (Einarsson, 1945; Mauchline, 1971; James, 1987; Sameotoet al., 1993).M. norvegica is known to aggregate close to the seabedduring the day (Mauchline, 1971; Sameoto et al., 1993) and mayassume a benthonic or benthopelagic habit, in some places andtimes, to depths of at least several hundred metres, includingwithin submarine canyons (Greene et al., 1988; Kaartvedt, 2010;Youngbluth et al., 1989). Observations in the Gully were consistent,within the limitations of the survey design, which excluded
Table 13Species (component) loadings on first principal components of the matrices ofcatches, in biomass and abundance, by sets made between the surface and 750 mdepth, in daylight in 2009, on Main and Slope Stations.
Biomass Abundance
Species PC1 Species PC1
Gennadas elegans 0.005 Gennadas elegans �0.107Gennadas valens �0.170 Gennadas valens �0.231Eusergestes arcticus 0.126 Eusergestes arcticus 0.238Sergia robusta 0.005 Sergia japonica 0.004Acanthephyra pelagica �0.047 Sergia robusta 0.045Acanthephyra purpurea 0.013 Acanthephyra pelagica �0.107Notostomus elegans �0.067 Acanthephyra purpurea �0.003Parapasiphae sulcatifrons �0.533 Parapasiphae sulcatifrons �0.289Pasiphaea multidentata 0.196 Pasiphaea multidentata 0.461Meganyctiphanes norvegica �0.023 Eucopia australis �0.114Thysanopoda acutifrons �0.043 Meganyctiphanes norvegica �0.016Unidentified Euphausiacea 0.103 Thysanopoda acutifrons �0.108Megalanceola stephenseni 0.337 Unidentified Euphausiacea 0.244Phrosina semilunata �0.460 Phrosina semilunata �0.298Themisto gaudichaudii �0.536 Themisto gaudichaudii �0.639
Fig. 7. Statistically significant (po0.05) clusters of sets on Main Station, identifiedby SIMPROF permutation tests of cluster analysis, imposed on plots of the setsordinated by MDS, shown for catches in abundance. Similarity level 86%. Setsidentified by location, Slope vs. Main Station.
K.G. MacIsaac et al. / Deep-Sea Research II ∎ (∎∎∎∎) ∎∎∎–∎∎∎12
Please cite this article as: MacIsaac, K.G., et al., The summer assemblage of large pelagic Crustacea in the Gully submarine canyon: Majorpatterns. Deep-Sea Res. II (2013), http://dx.doi.org/10.1016/j.dsr2.2013.08.017i
near-bottom sampling and estimated depth distributions only bybroad strata. Estimated nominal stratum catches suggested arather large proportion of the population below 250 m at night,but that may have been an artifact of the calculations necessitatedby the use of an open net.
Of the principal decapods, G. elegans is abundant in the NorthAtlantic (Burkenroad, 1936; Fasham and Foxton, 1979; Lagardere,1978; Murray et al., 1912; Sund, 1920). In daylight, the populationis concentrated between 600 and 1000 m, though individuals havebeen reported as shallow as 100 m. At night, most of the popula-tion reportedly remains in the lower mesopelagic zone, from400 to 900 m, though some reach 10 m depth (Foxton, 1970;Hargreaves, 1985b; Omori, 1974). G. elegans has been reportedfrom as deep as 2100 m and possibly to 3000 m (Hargreaves, 1984,1985b; Squires, 1990). Estimated nominal stratum catches indi-cated a rather shallower distribution on Main Station, G. elegansbeing concentrated in the 250–750 m stratum. The species wasonly weakly migratory, as observed elsewhere. E. arcticus is verycommon in the North Atlantic (Lagardere, 1978; Squires, 1990;Sund, 1920). It is strongly migratory, typically centred between600 and 1000 m in daylight, with a maximum depth of at least1700 m, and between 100 and 400 m at night (Hargreaves, 1984,1985b, 1999; Omori, 1974; Squires, 1990). On Main Station, theestimated nominal stratum catches suggested a distributiontowards the shallow end of those reported ranges, centred above750 m by day and above 250 m at night, with none caught by thesingle set below 1250 m. That shallowness will be, at least in part,an artifact of the tow profiles the 2007 survey. A. pelagica is
common in the North Atlantic, with a range extending furthernorth than any of its congeners (Chace, 1940; Foxton, 1972; Rice,1967). By day, it is restricted to below 600 m depth and typicallyconcentrated at 700–1100 m, while at night it can be shallow as200 m, though typically concentrated at 450–700 m. The fulldepth range of the species reportedly extends to 2500 m (Chace,1940; Fasham and Foxton, 1979; Foxton, 1972; Omori, 1974;Pequegnat and Wicksten, 2006; Roe, 1984; Sivertsen andHolthuis, 1956). A. pelagica has been collected along the NovaScotian Slope by bottom trawls fished at depths between 736 and1200 m (Markle et al., 1988). On Main Station, it was estimated tobe centred in the 250–750 m stratum, both day and night,shallower than elsewhere and locally as reported with bottomtrawl gear, though that may in part be an artefact. P. multidentata isalso wide-spread in the North Atlantic, with a distribution similarto E. arcticus (Matthews and Pinnoi, 1973; Sivertsen and Holthuis,1956; Sund, 1920). It is found at depths from the near-surface toover 2000 m but concentrated between 300 and 800 m, at leastalong continental margins (Aguzzi et al., 2007; Cartes, 1993; Cartesand Sarda, 1993; Fasham and Foxton, 1979; Matthews and Pinnoi,1973; Rice, 1967; Sivertsen and Holthuis, 1956; Squires, 1990).Smaller individuals are known to undergo a DVM, at least alongcontinental margins, but the largest individuals reportedly adopt abenthic or benthopelagic existence (Aguzzi et al., 2007). In theMediterranean, large individuals do not migrate off bottom butfollow sloping seabeds, occupying upper slope depths at night andmoving deeper for the day (Aguzzi et al., 2007; Aguzzi andCompany, 2010). On the Nova Scotia Slope, the species has been
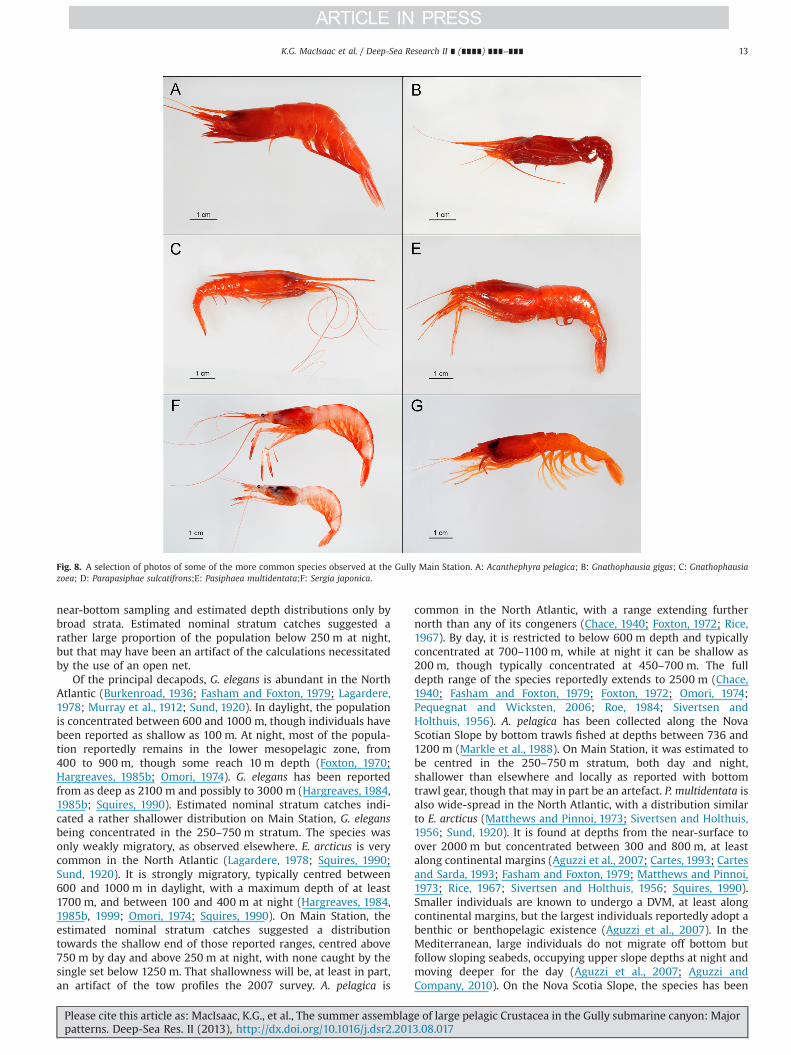
Fig. 8. A selection of photos of some of the more common species observed at the Gully Main Station. A: Acanthephyra pelagica; B: Gnathophausia gigas; C: Gnathophausiazoea; D: Parapasiphae sulcatifrons;E: Pasiphaea multidentata;F: Sergia japonica.
K.G. MacIsaac et al. / Deep-Sea Research II ∎ (∎∎∎∎) ∎∎∎–∎∎∎ 13
Please cite this article as: MacIsaac, K.G., et al., The summer assemblage of large pelagic Crustacea in the Gully submarine canyon: Majorpatterns. Deep-Sea Res. II (2013), http://dx.doi.org/10.1016/j.dsr2.2013.08.017i
caught by bottom trawls fished between 375 and 840 m (Markleet al., 1988). On Main Station, P. multidentata was concentrated inthe 250–750 m stratum by day, in keeping with published reports,but above 250 m at night, while the one set made below 1250 msuggested a significant presence there.
The hyperiid amphipod T. gaudichaudii is another cold-waterspecies, distributed widely in the North Atlantic (Bowman, 1960;Dunbar, 1963; Vinogradov et al., 1996). It is reported from depthsof at least 1400 m, but mainly above 500 m. Daytime concentra-tions have been reported as shallow as 25 to 50 m, while at night itcan be very abundant in surface swarms (Bowman et al., 1982;Vinogradov et al., 1996; Williams and Robins, 1981; Zeidler andDeBroyer, 2009). On Main Station in daylight, it was about equallyabundant in the 0–250 m and 250–750 m strata but mostly in theformer at night, indicating either DVM or active net avoidanceduring the day by individuals in the epipelagic zone.
While the comparison was very limited in extent, catches oflarge pelagic crustaceans at the Main and Slope Stations were atonce broadly similar and yet notably different in species composi-tion. Differences in the fauna above 750 m in daylight is confirmedfor the survey time and station locations, but broader surveyswould be needed to demonstrate that it is a general differencebetween the canyon and the open continental slope. Previousmidwater surveys in the Gully have focused on plankton, findingM. norvegica to be abundant over the canyon walls and at its headbut otherwise nothing remarkable (Gordon and Fenton, 2002;Head and Harrison, 1998; Sameoto et al., 2002). Elsewhere,micronekton and zooplankton, including M. norvegica, have beenreported abundant or aggregated in and along the walls or at theheads of canyons (Bosely et al., 2004; Genin, 2004; Macquart-Moulin and Patriti, 1996), including those on the edge of GeorgesBank (Greene et al., 1988; Youngbluth et al., 1989). No fullexplanation for the differences observed between stations canyet be offered but certain details are notable. During the 2009survey, the WSW of southern origin which lay at the mouth of theGully (but did not reach Main Station) overlay Slope Station. Thatoceanographic contrast may account for some faunal differences,such as the presence of circumtropical Platyscelus ovoides on SlopeStation and for the additional benthesicymids on Main Station.
All pelagic sampling gears are variously selective, the tendencyfor each species to evade the net or escape through its meshesbeing characteristic of both species and gear, if not also of dielphase, light level, temperature and other factors (e.g., Heino et al.(2011), Kaartvedt et al. (2012), Sutton et al. (2008)). The assem-blage represented by the IYGPT catches on Main Station isnecessarily specific to that gear, the limited sampling we havedone in the Gully with both larger and smaller nets yieldingcatches with very different relative abundances of species. Besidesits comparability with other surveys in the surrounding region,however, the IYGPT takes the particular fraction of the pelagicbiota that, through its DVM, is responsible for much of thedownwards flux of energy in the mesopelagic zone. Nevertheless,that is but one of the fractions which should be studied.
5. Conclusions
(1) At depths above 1250 m, the diverse summer assemblage oftrawl-vulnerable pelagic Crustacea in the central portion(Main Station) of the Gully submarine canyon is dominatedby species widespread in the North Atlantic but more abun-dant in cold-temperate waters at mid- to higher latitudes.
(2) The species assemblage on Main Station is structured primar-ily by depth and diel changes in depths occupied, with onlyminor interannual variation, despite substantial change inoceanographic conditions in the epipelagic zone.
Acknowledgements
We thank Hal Whitehead, Sandra Walde, and Ian McLaren(Dalhousie University), for significant input throughout the Mas-ter's Thesis fromwhich this manuscript was derived, Tracey Sutton(Virginia Institute of Marine Science), for insightful comments andquestions concerning the thesis and the study of deep-sea organ-isms in general, Eric Lazo-Wasem (Peabody Museum of NaturalHistory), for the identification of juvenile and adult Anuropuspanteni, and all the other taxonomists and parataxonomists whosework made this study possible. We also thank the dedicatedmembers of the Gully mesopelagic research team at the BedfordInstitute of Oceanography, as well as the captains and crews of theCCGSs Templeman and Needler. All were instrumental in thecollection of the data utilized in this study. The research pro-gramme is primarily funded by the Department of Fisheries andOceans, while the work reported here was supported by a CoxFisheries Scientist in Residence award to ELRK from DalhousieUniversity.
Appendix A. Supplementary materials
Supplementary data associated with this article can be found inthe online version at http://dx.doi.org/10.1016/j.dsr2.2013.08.017.
References
Aguzzi, J., Company, J.B., 2010. Chronobiology off deep-water decapod crustaceanson continental margins. Adv. Mar. Biol. 58, 155–225.
Aguzzi, J., Company, J.B., Abelló, P., Garcia, J.A., 2007. Ontogenetic changes invertical migratory rhythms of benthopelagic shrimps Pasiphaea multidentataand P. sivado. Mar. Ecol. Prog. Ser. 335, 167–174.
Allen, S.E., de Madron, X.D., 2009. A review of the role of submarine canyons indeep-ocean exchange with the shelf. Ocean Sci. 5, 607–620.
Angel, M.V., 1985. Vertical migrations in the oceanic realm: possible causes andprobable effects. In: Rankin, M.A. (Ed.), Migration, Mechanisms and AdaptiveSignificance. Contrib. Mar. Sci., vol. 27 (supplement), Texas, pp. 45–70.
Angel, M.V., 2003. The pelagic environment of the open ocean. In: Tyler, P.A. (Ed.),Ecosystems of the World, vol. 28. Ecosystems of the Deep Ocean, Elsevier, NewYork, pp. 39–79.
Angel, M.V., Hargreaves, P., Kirkpatrick, P., Domanski, P., 1982. Low variability inplankton and micronektonic populations at 1000 m depth in the vicinity of421N, 171W; evidence against diel migratory behavior in the majority of species.Biol. Oceanogr. 1, 287–319.
Baker, A.C., Boden, B.P., Brinton, E., 1990. A Practical Guide to the Euphausiids of theWorld. Natural History Museum Publications, London.
Benoit-Bird, K., Au, W.W.L., 2006. Extreme diel horizontal migrations by a tropicalnearshore resident micronekton community. Mar. Ecol. Prog. Ser. 319, 1–14.
Bosely, K.L., Lavelle, J.W., Brodeur, R.D., Wakefield, W.W., Emmett, R.L., Baker, E.T.,Rehmhe, K.M., 2004. Biological and physical processes in and around Astoriasubmarine canyon, Oregon, USA. J. Mar. Syst. 50, 21–37.
Bowman, T.E., 1960. The pelagic amphipod genus Parathemisto (Hyperiidea:Hyperiidae) in the North Pacific and adjacent Arctic Ocean. Proc. US Natl.Mus. 112, 343–392.
Bowman, T.E., Cohen, A.C., McGuiness, M.M.C.M., 1982. Vertical distribution ofThemisto gaudichaudii (Amphipoda: Hyperiidea) in deepwater dumpsite 106 offthe mouth of Delaware Bay. Smith Control Zool. 351, 1–24.
Burkenroad, M.D., 1936. The Aristaeinae, Solenocerinae and pelagic Penaeidae ofthe Bingham Oceanographic Collection. Bull. Bing. Oceangr. Collect. 5 (2),1–151.
Cartes, J.E., 1993. Feeding habits of pasiphaeid shrimps close to the bottom on theWestern Mediterranean slope. Mar. Biol. 117, 459–468.
Cartes, J.E., Company, J.B., Maynou, F., 1994. Deep-water decapod crustaceancommunities in the northwestern Mediterranean: influence of submarinecanyons and season. Mar. Biol. 120, 221–229.
Cartes, J.E., Sarda, F., 1993. Zonation of deep-sea decapod fauna in the Catalan Sea(Western Mediterranean). Mar. Ecol. Prog. Ser. 94, 27–34.
Chace, F.A., 1940. Plankton of the Bermuda oceanographic expeditions. IX. Thebathypelagic caridean Crustacea. Zoologica 25 (2), 117–209.
Clarke, K.R., Gorley, R.N., 2006. PRIMER v6: User Manual/Turorial. PRIMER–E,Plymouth.
Clarke, K.R., Warwick, R.M., 2001. Change in Marine Communities: An Approach toStatistical Analysis and Interpretation, second ed. PRIMER-E, Plymouth.
Cochrane, N.A., Sameoto, D.D., Belliveau, D.J., 1994. Temporal variability of eupha-siid concentrations in a Nova Scotia shelf basin using a bottom-mountedacoustic Doppler current profiler. Mar. Ecol. Prog. Ser. 107, 55–66.
K.G. MacIsaac et al. / Deep-Sea Research II ∎ (∎∎∎∎) ∎∎∎–∎∎∎14
Please cite this article as: MacIsaac, K.G., et al., The summer assemblage of large pelagic Crustacea in the Gully submarine canyon: Majorpatterns. Deep-Sea Res. II (2013), http://dx.doi.org/10.1016/j.dsr2.2013.08.017i
Company, J.B., Puig, P., Sarda, F., Palanquentes, A., Latasa, M., Scharek, R., 2008.Climate influence on deep sea populations. PloS One 3 (1), e1431, http://dx.doi.org/10.1371/journal.pone.0001431.
De Leo, F.C., Smith, C.R., Rowden, A.A., Bowden, D.A., Clark, M.R., 2010. Submarinecanyons: hotspots of benthic biomass and productivity in the deep sea. Proc.Biol. Sci. 277 (1695), 2783–2792.
DeForest, L., Drazen, J., 2009. The influence of a Hawaiian seamount on mesopelagicmicronekton. Deep-Sea Res. I 56, 232–250.
Domanski, P., 1984. The diel migrations and distributions within a mesopelagiccommunity in the north east atlantic. 8. A multivariate analysis of communitystructure. Prog. Oceanogr. 13, 491–511.
Donaldson, H.A., 1975. Vertical distribution and feeding of sergestid shrimps(Decapoda: Natantia) collected near Bermuda. Mar. Biol. 31, 37–50.
Dunbar, M.J., 1963. Amphipoda sub-order: Hyperiidea, Family: Hyperiidae. ConseilInternational pour l'Exploration de la Mer Fiches d′Identification du Zooplanc-ton, pp. 103.
Einarsson, H., 1945. Euphausiacea. 1. Northern Atlantic species. Dana-Rep. 27, 1–185.Fasham, M.J.R., Foxton, P., 1979. Zonal distribution of pelagic Decapoda (Crustacea)
in the Eastern North Atlantic and its relation to physical oceanography. J. Exp.Mar. Biol. Ecol. 37, 225–253.
Fenton, D.G., 1998. Geographical setting and conservation efforts. In: Harrison, G.W.,Fenton, D.G. (Eds.), The Gully: a scientific review of its environment andecosystem. Department of Fisheries and Oceans Stock Assessment SecretaryResearch Document 98/83.
Flock, M.E., Hopkins, T.L., 1992. Species composition, vertical distribution, and foodhabits of the sergestid shrimp assemblage in the eastern Gulf of Mexico.J. Crustacean Biol. 12 (2), 210–223.
Foxton, P., 1970. The vertical distribution of pelagic decapods (Crustacea Natantia)collected on the SOND Cruise 1965. II. The Penaeidea and general discussion.J. Mar. Biol. Assoc. UK 50, 961–1000.
Foxton, P., 1972. Observations on the vertical distribution of the genus Acanthephyra(Crustacea: Decapoda) in the eastern North Atlantic, with particular referenceto the “purpurea” group. Proc. R. Soc. Edinburgh B 33, 301–313.
Gartner Jr., J.V., Sulak, K.J., Ross, S.W., 2008. Persistent near-bottom aggregations ofmesopelagic animals along the North Carolina and Virginia continental slopes.Mar. Biol. 153, 825–841.
Genin, A., 2004. Bio-physical coupling in the formation of zooplankton and fishaggregations over abrupt topographies. J. Mar. Syst. 50, 3–20.
Gordon Jr., D.C., Fenton, D.C. (Eds.), 2002. Advances in understanding The Gullyecosystem: a summary of research projects conducted at the Bedford Instituteof Oceanography (1999–2001). Canadian Technical Report of Fisheries andAquatic Sciences, pp. 2377.
Greenan, B.J.W., Petrie, B., Cardoso, D.A., 2013. Mean circulation and high-frequencyflow amplification in the Sable Gully. Deep-Sea Res. II. (in this issue).
Greene, C.H., Pershing, A.J., 2003. The flip-side of the North Atlantic Oscillation andmodal shifts in slope-water circulation patterns. Limnol. Oceanogr. 48, 39–322.
Greene, C.H., Wiebe, P.H., Burczynski, J., Youngbluth, M.J., 1988. Acoustical detectionof high-density krill demersal layers in the submarine canyons off GeorgesBank. Science 241, 359–361.
Hargreaves, P.M., 1984. The distribution of Decapoda (Crustacea) in the open oceanand near-bottom over an adjacent slope in the northern north-east Atlanticduring 1979. J. Mar. Biol. Assoc. UK 64, 829–857.
Hargreaves, P.M., 1985a. The distribution of Mysidacea in the open ocean and near-bottom over an adjacent slope in the northern north-east Atlantic during 1979.J. Plankton Res. 7, 241–261.
Hargreaves, P.M., 1985b. Vertical distribution of Decapoda, Euphausiacea andMysidacea at 42oN, 17oW. Biol. Oceanogr. 3, 431–464.
Hargreaves, P.M., 1999. The vertical distribution of micronektonic decapod andmydid crustaceans across the Goban Spur of the Porcupine Seabight. Sarsia 84,1–18.
Hargreaves, P.M., Herring, P.J., 1992. The response of decapod and mysid crusta-ceans to artificially lighted trawls. J. Mar. Biol. Assoc. UK 72, 621–631.
Hargreaves, P.M., Herring, P.J., Greenway, H., 1993. The response of tropical Atlanticdecapod crustacens to artificially lighted trawls. J. Plankton Res. 15 (7),835–853.
Harrison, G.W., Fenton, D.G. (Eds.), 1998. The Gully: a scientific review of itsenvironment and ecosystem. Department of Fisheries and Oceans StockAssessment Secretary Research Document 98/83.
Harrison, G., Johnson, C., Head, E., Spry, J., Pauley, K., Maass, H., Kennedy, M., Porter,C., Soukhovtsev, V.V., 2008. Optical, chemical and biological oceanographicconditions in the Maritimes region in 2007. CSAS Research Document 2008/044.
Head, E.J.H., Harrison, W.G., 1998. Biological Oceanography—Plankton. In:Harrison, G.W., Fenton, D.G. (Eds.), The Gully: a scientific review of itsenvironment and ecosystem. Department of Fisheries and Oceans StockAssessment Secretary Research Document 98/83.
Hecker, B., Logan, D.T., Gandarilles, F.E., Gibson, P.R., 1983. Megafaunal assemblagesin Lydonia Canyon, Baltimore Canyon, and selected slope areas, in Canyon andSlope Processes Study, Final Report. Prepared for US Department of the Interior,Minerals Management Service, vol. 3, Washington, DC, under Contractno. 14-12-001-29178.
Heino, M., Porteiro, F.M., Sutton, T.T., Falkenhaug, T., Godø, O.R., Piatkowski, U., 2011.Catchability of pelagic trawls for sampling deep-living nekton in the mid-NorthAtlantic. ICES J. Mar. Sci. 68 (2), 377–389.
Herring, P., 2002. The Biology of the Deep Ocean. Oxford University Press, NewYork.
Hickey, B.M., 1995. Coastal submarine canyons. In: Muller, P., Henderson, D. (Eds.),Topographic Effects in the Ocean. Proceedings of the ‘Aha Huliko′a HawaiiWorkshop, University of Hawaii at Manoa, pp. 95–110.
Holden, M.J., 1981. The North Sea International 0—group gadoid surveys 1969–1978.ICES Cooperative Research Reports, pp. 99.
Hooker, S.K., Baird, R.W., 1999. Deep-diving behaviour of the northern bottlenosewhale, Hyperoodon ampullatus (Cetacea: Ziphiidae). Proc. R. Soc. Lond. B 266,671–676.
Hooker, S.K., Iverson, S.J., Ostrom, P., Smith, S.G., 2001. Diet of northern bottlenosewhales inferred from fatty-acid and stable-isotope analyses of biopsy samples.Can. J. Zool. 79, 1442–1454.
Hooker, S.K., Whitehead, H., Gowans, S., Baird, R.W., 2002. Fluctuations indistribution and patterns of individual range use of northern bottlenosewhales. Mar. Ecol. Prog. Ser. 225, 287–297.
Hopkins, T.L., Flock, M.E., Gartner, J.V., Torres, J.J., 1994. Structure and trophicecology of a low latitude midwater decapod and mysid assemblage. Mar. Ecol.Prog. Ser. 109, 143–156.
Hopkins, T.L., Gartner, J.V., Flock, M.E., 1989. The caridean shrimp (Decapoda:Natantia) assemblage in the mesopelagic zone of the eastern Gulf of Mexico.Bull. Mar. Sci. 45, 1–14.
Hovekamp, S., 1989. Avoidance of nets by Euphausia pacifica in Dabob Bay.J. Plankton Res. 11, 907–924.
James, P.T., 1987. Euphausiids of the north-east Atlantic. Inst. Oceanogr. Sci. Rep.Wormley 240, 1–103.
Kaartvedt, S., 2010. Diel vertical migration behaviour of the northern krill (Mega-nyctiphanes norvegica Sars). Adv. Mar. Biol. 57, 255–275.
Kaartvedt, S., Staby, A., Aksnes, D.L., 2012. Efficient trawl avoidance by mesopelagicfishes causes large underestimation of their biomass. Mar. Ecol. Prog. Ser. 456,1–6.
Kenchington, T.J., Best, M., Bourbonnaise-Boyce, C., Clement, P., Cogswell, A.,MacDonald, B., MacEachern, W.J., MacIsaac, K., MacNab, P., Paon, L., Reid, J.,Roach, S., Shea, L., Themelis, D., Kenchington, E.L.R., 2009. Methodology of the2007 Survey of the meso- and bathypelagic micronekton of the Sable Gully:cruise TEM768. Canadian Technical Report of Fisheries and Aquatic Sciences,Fisheries and Oceans Dartmouth, NS, pp. 2853.
Kenchington, E., Cogswell, A., MacIsaac, K., Beazley, L., Law, B., Kenchington, T.,2013. Bathyal and epibenthic megafauna of the Gully submarine canyon,northwest Atlantic. Deep-Sea Res. II. (in this issue).
Lagardere, J.P., 1978. Crustacea pelagiques. Fiches d′Identification Zooplankton 155–157, 1–15.
Levin, L.A., Gooday, J., 2003. The deep Atlantic Ocean. In: Tyler, P.A. (Ed.), Ecosystemsof the World. Ecosystems of the Deep Ocean, Elsevier, New York, p. 28.
Loder, J.W., Han, G., Hannah, C.G., Greenberg, D.A., Smith, P.C., 1997. Hydrographyand baroclinic circulation in the Scotian shelf region: winter versus summer.Can. J. Fish. Aquat. Sci 54 (Suppl. 1), 40–56.
Longhurst, A.R., Bedo, A.W., Harrison, W.G., Head, E.J.H., Sameoto, D.D., 1990.Vertical flux of respiratory carbon by oceanic diel migrant biota. Deep-SeaRes. 37, 685–694.
Longhurst, A.R., Harrison, W.G., 1989. Vertical nitrogen flux from the oceanic photiczone by diel migrant zooplankton and nekton. Deep-Sea Res. 35, 881–889.
MacIsaac, K.G., 2011. The Larger Pelagic Crustacea of the Gully Submarine Canyon(MSc. Thesis) Dalhousie University, Halifax, Nova Scotia, Canada, 294 pp.
Macquart-Moulin, C., Patriti, G., 1996. Accumulation of migratory micronektoncrustaceans over the upper slope and submarine canyons of the northwesternMediterranean. Deep-Sea Res. 42, 579–601.
Markle, D.F., Dadswell, M.J., Halliday, R.G., 1988. Demersal fish and decapodcrustacean fauna of the upper continental slope off Nova Scotia from Lahaveto St. Pierre Banks. Can. J. Zool. 66, 1952–1960.
Marsh, R., Petrie, B., Weidman, C.R., Dickson, R.R., Loder, J.W., Hannah, C.G., Frank,K., Drinkwater, K., 1999. The 1882 tilefish kill—a cold event in shelf waters offthe north-eastern United States? Fish. Oceanogr. 8, 39–49.
Matthews, J.B.L., Pinnoi, S., 1973. Ecological studies on the deep-water pelagiccommunity of Korsfjorden, western Norway. The species of Pasiphaea andSergestes (Crustacea: Decapoda) recoreded in 1968 and 1969. Sarsia 52,123–144.
Mauchline, J., 1971. Euphausiacea adults. Conseil International pour l'Exploration dela Mer Fiches d′Identification du Zooplancton, pp. 134.
Mauchline, J., 1986. The biology of the deep-sea species of Mysidacea (Crustacea) ofthe Rockall Trough. J. Mar. Biol. Assoc. UK 66, 881–890.
MERCINA Working Group, 2001. Oceanographic responses to climate in the north-west Atlantic. Oceanography 14, 76–82.
Merrett, N.R., 1986. Biogeography and the oceanic rim: a poorly known zone ofichthyofauna interaction. Pelagic Biogeography UNESCO Technical Paper, vol.49, pp. 201–209.
Moore, J.A., Vecchione, M., Collete, B.B., Gibbons, R., Hartel, K.E., Galbraith, J.K.,Turnipseed, M., Southworth, M., Watkins, E., 2003. Biodiversity of BearSeamount. New England seamount chain: results of exploratory trawling.J. Northwest Atl. Fish. Soc. 31, 363–372.
Moore, J.A., Vecchione, M., Collete, B.B., Gibbons, R., Hartel, K.E., 2004. Selectedfauna of Bear Seamount (New England Seamount chain), and the presence of“natural invader” species. Arch. Fish. Mar. Res. 51 (1–3), 241–250.
Moors-Murphy, H.B., 2013. Submarine canyons as important whale habitat: areview of cetacean associations with the Gully and other submarine canyons.Deep-Sea Res. II. (in this issue).
Murray, J., Hjort, J., Appellöf, J.J.A., Gran, H.H., Helland-Hansen, B., 1912. The Depthsof the Ocean: A General Account of the Modern Science of Oceanography Based
K.G. MacIsaac et al. / Deep-Sea Research II ∎ (∎∎∎∎) ∎∎∎–∎∎∎ 15
Please cite this article as: MacIsaac, K.G., et al., The summer assemblage of large pelagic Crustacea in the Gully submarine canyon: Majorpatterns. Deep-Sea Res. II (2013), http://dx.doi.org/10.1016/j.dsr2.2013.08.017i
Largely on the Scientific Researches of the Norwegian Steamer Michael Sars inthe North Atlantic, vol. 37. McMillan, London. (821 pp.þplates).
Nicol, S., 1984. Population structure of daytime surface swarms of the euphausiidMeganyctiphanes norvegica in the Bay of Fundy. Mar. Ecol. Prog. Ser. 18,241–251.
Omori, M., 1974. The biology of pelagic shrimps in the ocean. Adv. Mar. Biol. 12,233–324.
Petrie, B., Drinkwater, K., 1993. Temperature and salinity variability on the ScotianShelf and in the Gulf of Maine 1945–1990. J. Geophys. Res. 98 (C11),20079–20089.
Petrie, B., Pettipas, R.G., Petrie, W.M., Soukhovtsev, V.V., 2008. Physical oceano-graphic conditions on the Scotian Shelf and in the Gulf of Maine during 2007.CSAS Research Document 2008/017.
Pequegnat, L.H., Wicksten, M.K., 2006. Oplophorid shrimps (Decapoda: Caridea:Opophoridae) in the Gulf of Mexico and Caribbean Sea from the collecions ofthe research vessels Alaminos, Oregon and Oregon II. Crustacean Res. 35,92–107.
Rice, A.L., 1967. Crustacea (pelagic adults) Order: Decapoda V. Caridea Families:Pasiphaeidae, Oplophoridae, Hippolytidae and Pandalidae. Conseil Interna-tional pour l'Exploration de la Mer, Zooplankton Sheet, pp. 112.
Roe, H.S.J., 1984. The diel migrations and distribution within a mesopelagiccommunity in the North East Atlantic. 2. Vertical migrations and feeding ofmysids and decapod Crustacea. Prog. Oceanogr. 13, 269–318.
Rutherford, R.J., Breeze, H., 2002. The Gully ecosystem. Canadian Manuscript Reportof Fisheries and Aquatic Sciences, pp. 2615.
Sabatini, A., Follesa, M.C., Locci, I., Pendugiu, A.A., Pesci, P., Cau, A., 2007.Assemblages in a submarine canyon: influence of depth and time. Hydrobilogia580, 265–271.
Sameoto, D., Cochrane, N., Herman, A., 1993. Convergence of acoustic, optical andnet-catch estimates of euphausiid abundance: Use of artificial light to reducenet avoidance. Can. J. Fish. Aquat. Sci. 50, 334–346.
Sameoto, D., Cochrane, N., Kennedy, M., 2002. Season abundance, vertical andgeographical distribution of mesozooplankton, mactozooplankton and micro-nekton in the Gully and Western Scotian Shelf, (1999–2000). CanadianTechnical Report of Fisheries and Aquatic Sciences, vol. 2427. Bedford Instituteof Oceanography, Department of Fisheries and Oceans, Dartmouth, NS.
Shan, S., Sheng, J., Greenan, B.J.W., 2013. Physical processes affecting circulation andhydrography in the Sable Gully of Nova Scotia. Deep-Sea Res. II. (in this issue).
Shih, C.T., 1969. The systematics and biology of the family Phronimidae (Crustacea:Amphipoda). Dana Rep. 74, 1–100.
Simard, Y., Lavoie, D., 1999. The rich krill aggregation of the Saguenay—St. LawrenceMarine Park: hydroacoustic and geostatistical biomass estimates, structure,variability, and significance for whales. Can. J. Fish. Aquat. Sci. 56, 1182–1197.
Sivertsen, E., Holthuis, L.B., 1956. Crustacea Deacapoda (the Penaeidea andStenopodidea Excepted). Report on the scientific results of the Michael SarsNorth Atlantic Deep-Sea Expedition 1910, vol. 5(12), pp. 1–54.
Smith, P.C., Petrie, B.D., 1982. Low-frequency circulation at the edge of the ScotianShelf. J. Phys. Oceanogr. 12, 28–46.
Squires, H.J., 1990. Decapod Crustacea of the Atlantic Coast of Canada. Can. Bull.Fish. Aquat. Sci. 221, 1–532.
Sund, O., 1920. Peneides and Stenopides from the “Michael Sars” North AtlanticDeep-Sea Expedition. Report on the scientific results of the Michael Sars NorthAtlantic Deep-Sea Expedition, vol. 3(7), pp. 1–32.
Sutton, T.T., Porteiro, F.M., Heino, M., Byrkjedal, I., Langhelle, G., Anderson, C.I.H.,Horne, J., Soiland, H., Falkehaug, T., Godo, O.R., Bergstad, O.A., 2008. Verticalstructure, biomass and topographic association of deep pelagic fishes inrelation to a mid-ocean ridge system. Deep-Sea Res. II 55, 161–184.
Tarling, G.A., Matthews, J.B.L., Dabid, P., Guerin, O., Buchholz, F., 2010. The swarmdynamics of northern krill (Meganyctiphanes norvegica) and pteropods (Cavo-lonia inflexa) during vertical migration in the Ligurian Sea observed by anacoustic Doppler current profiler. Deep-Sea Res. I 48, 1671–1686.
Themelis, D.E., Halliday, R.G., 2012. Species composition and relative abundance ofthe mesopelagic fish fauna in the Slope Sea off Nova Scotia. Northeastern Nat.19 (2), 177–200.
Vinogradov, M.E., Volkov, A.F., Semenova, T.N., 1996. Hyperiid amphipods (Amphi-poda: Hyperiidea) of the world oceans (translated from the Russian). Smithso-nian Institution Libraries, 632 pp.
Whitehead, H., Bowen, D.W., Hooker, S.K., Gowans, S., 1998. Marine mammals. In:Harrison, G.W., Fenton, D.G. (Eds.), The Gully: a scientific review of itsenvironmental and ecosystem. Department of Fisheries and Oceans CanadianStock Assessment Secretariat Research Document 98/83.
Williams, R., Robins, D., 1981. Seasonal variability in abundance and verticaldistribution of Parathemisto gaudichaudii (Amphipoda: Hyperiidea) in the NorthEast Atlantic Ocean. Mar. Ecol. 4, 289–298.
Youngbluth, M.J., Bailey, T.G., Davoli, P.J., Jacoby, C.A., Blades-Eckelbarger, P.I.,Griswold, C.A., 1989. Fecal pellet production and diel migratory behavior bythe euphausiid Meganyctiphanes norvegica effect benthic-pelagic coupling.Deep-Sea Res. 36 (10), 1491–1501.
Zeidler, W., DeBroyer, C., 2009. Catalogue of the Hyperiidean Amphipoda (Crusta-cea) of the southern ocean with distribution and ecological data. Bull. Inst. R.Sci. Nat. Belgique 79 (1), 1–104.
K.G. MacIsaac et al. / Deep-Sea Research II ∎ (∎∎∎∎) ∎∎∎–∎∎∎16
Please cite this article as: MacIsaac, K.G., et al., The summer assemblage of large pelagic Crustacea in the Gully submarine canyon: Majorpatterns. Deep-Sea Res. II (2013), http://dx.doi.org/10.1016/j.dsr2.2013.08.017i