diablo canyon power plant - nuclear regulatory commission
TRANSCRIPT

Pacific Gas and Electric Company
Diablo Canyon Power Plant
Final ReportThermal Effects Monitoring ProgramVolume I
April 28, 1988
OTENERAEnvironmentol Servces
1995 University Avenue, Berkeley, Calilornia 94704, (415) 845-5200Telec6py: (415) 845-8453
TABLE OF CONTENTS
Volume I
SECTION PAGE
SU M M ARY OF FINDIN GS ....................................................................... 1
1.0 PR OJECT DESCRIPTION ........................................................................... 1-1
1.1 Plant Description ............................................................................................ 1-2
1.1.1 N ormal Operation Therm al Discharge ............................................ 1-5
1.1.2 Heat Treatment Therm al Discharge ............................................... 1-7
1.2 M arine Research Background ...................................................................... 1-12
1.3 Environm ental Setting ................................................................................. 1-13
1.3.1 General Description of the Diablo Canyon Power PlantEnvirons .......................................................................................... 1-13
1.3.2 Oceanographic Setting ................................................................... 1-17
1.3.3 M arine Environment ...................................................................... 1-22
1.3.3.1 Intertidal Com m unity .................................................... 1-23
1.3.3.2 Subtidal Com munity ...................................................... 1-26
2.0 TH ERM AL PLUM E STU DIES .................................................................... 2-1
2.1 Surface Thermal Plum e .................................................................................. 2-4
2.1.1 N ormal Operation ............................................................................ 2-5
2.1.1.1 Plum e Depth and Distribution ........................................ 2-8
2.1.1.2 Tem perature Decay ........................................................ 2-10
2.1.1.3 Downwelling ................................................................... 2-11
2.1.1.4 Plum e Bottom Lift-Off ................................................... 2-11
2.1.2 H eat Treatm ent Operation ............................................................. 2-12
2.1.2.1 Plum e Depth and Distribution ...................................... 2-12
2.1.2.2 Tem perature Decay ................................................... 2-12
2.1.2.3 Downwelling ................................................................... 2-12
2.1.2.4 Plum e Lift-Off ................................................................ 2-13
2.2 Shoreline and Bottom Thermal Plum e ........................................................ 2-13
2.2.1 Preliminary M odel Verification ..................................................... 2-13
E8-316.0
TABLE OF CONTENTS - ContinuedSECTION PAGE
2.2.2 Model Bottom Temperature Verification Methods ....................... 2-14
2.2.3 Comparison and Analysis ............................................................... 2-14
2.2.3.1 Model Runs 4 and 5 (MSL andLow Waves) ..................................................................... 2-14
2.2.3.2 Model Run 8 (MSL and High Waves) ............................ 2-20
2.2.3.3 Model Run 10 (MLLW and HighW aves) ............................................................................. 2-20
3.0 BIOLOGICAL EFFECTS STUDIES ........................................................... 3-1
3.1 Description of Biological Sampling ................................................................ 3-1
3.2 Thermal Discharge Assessments ................................................................... 3-4
3.2.1 Methods and Analysis ...................................................................... 3-6
3.2.2 Thermal Dose .................................................................................... 3-7
3.2.2.1 Thermal Dose Frequency ................................................. 3-7
3.2.2.2 Thermal Dose Distribution ............................................ 3-10
3.2.3 Assessment of Thermal Impact for SelectedS pecies ............................................................................................. 3-14
A lgae ............................................................................... 3-16
Invertebrates ................................................................ 3-106
F ish ............................................................................... 3-163
O ther .................................................... 3-193
3.2.3.30 Summary of Thermal Impacts on SelectedSpecies .......................................................................... 3-227
3.2.4 Marine Community Thermal ImpactA ssessm ent ................................................................................... 3-234
3.2.4.1 Changes Prior to Thermal Discharge(1966-1984) .................................................................. 3-235
3.2.4.2 Changes During Power Plant Operation(1984-1987) .................................................................. 3-237
3.2.4.3 Analyses of Changes in theCommunity .................................................................. 3-240
E8-316.0 ii
TABLE OF CONTENTS - ContinuedSECTION PAGE
4.0 SUMMARY OF THERMAL EFFECTS ....................................................... 4-1
4.1 Therm al Changes ............................................................................................ 4-1
4.2 Protection of Beneficial Uses .......................................................................... 4-3
5.0 LITERATU RE CITED .................................................................................. 5-1
EVALUATION OF NPDES PERMIT TEMPERATUREL IM IT S ........................................................................................................... I
This volume contains the text of the final report for the Thermal EffectsMonitoring Program at the Diablo Canyon Power Plant. A second volumecontains the appendices, two of which (Appendices G and H) are on microficheand can be found in plastic pockets in the binder. The appendices containdetailed information on methods, analyses, and documentation, and are notincluded in all copies of this report.
E8-316.0 iii
LIST OF FIGURES
Volume INUMBER PAGE
1.1-1 The Diablo Canyon Power Plant Site ............................................................ 1-3
1.1-2 Thermal Effects Monitoring Program Study Area ........................................ 1-4
1.1.1-1 Average Daily Power Level Unit 1 and Unit 2 .............................................. 1-6
1.1.1-2 Weekly Average Discharge Flow Both Units Combined ............................... 1-8
1.1.1-3 Diablo Canyon Power Plant Weekly Average Delta T andIntake and Discharge Temperatures for 1984 - 1987 .................................. 1-9
1.1.2-1 Idealized Heat Treatment Cycle at DCPP ................................................... 1-11
1.3.2-1 Bathym etry of Diablo Cove .......................................................................... 1-19
1.3.2-2 Diagram of Upwelling Off Coast .................................................................. 1-21
1.3.3.1-1 Profiles of Diablo Cove Intertidal and Subtidal AlgalCom m unities ................................................................................................. 1-25
2.0-1 Layout of the Physical M odel ......................................................................... 2-2
2.1.1-1 Surface Isotherm Areas with Downcoast Current andW in d ................................................................................................................. 2-6
2.1.1-2 Surface Isotherm Areas with Upcoast Current and Wind ........................... 2-7
2.2.1-1 Bottom Excess Temperatures in Model Run 4 ............................................ 2-16
2.2.1-2 Bottom Excess Temperature Isotherms in Model Run 5 ............................ 2-17
2.2.1-3 Bottom Excess Temperatures in Model Run 8 ............................................ 2-18
2.2.1-4 Bottom Excess Temperatures in Model Run 10 .......................................... 2-19
3.1-1 Locations of Intertidal and Subtidal Biological SamplingS tation s ........................................................................................................... 3-2
3.2.2.1-1 Number of Quarterly Subtidal Dose Events in WhichTemperature Was Continuously Greater Than 17 C for 24, 48,or 96 H ours ...................................................................................................... 3-9
3.2.2.1-2 Frequency of Intertidal Thermal Dose Events Calculated byQuarter as the Percent of Time Temperatures Exceeded 17 Cfor 80 Percent or More of Each Tidal Submergence Period ........................ 3-11
3.2.2.2-1 Map of the Probability of a 96-Hour/17 C Dose from SeptemberThrough N ovem ber, 1987 ............................................................................. 3-13
3.2.3.1-1 Representative SLC Abundance Data for Ruffled Seaweed(Botryoglossum farlowianum ) ...................................................................... 3-18
E8-316.0 iv
LIST OF FIGURES - ContinuedNUMBER PAGE
3.2.3.1-2 Map of the Distribution of Affected and Non-Affected RuffledSeaweed (Botryoglossum farlowianum) ....................................................... 3-20
3.2.3.2-1 Representative SLC Abundance Data for CBS-Complex(Articulated Coralline Algae) ....................................................................... 3-24
3.2.3.2-2 Map of the Distribution of Affected and Non-AffectedCBS-Complex (Articulated Coralline Algae) ............................................... 3-25
3.2.3.3-1 Representative SLC Abundance Data for Hidden Rib Seaweed(Cryptopleura violacea) ................................................................................. 3-29
3.2.3.3-2 Map of the Distribution of Affected and Non-Affected HiddenRib Seaweed (Cryptopleura violacea) ........................................................... 3-30
3.2.3.4-1 Seasonal Changes in the Production of Erect Stipes fromBladder Chain Kelp (Cystoseira osmundacea) ............................................ 3-32
3.2.3.4-2 Representative SAQ Abundance Data for Bladder Chain Kelp(Cystoseira osmr undacea) .............................................................................. 3-34
3.2.3.4-3 Map of the Distribution of Affected and Non-Affected BladderChain Kelp (Cystoseira osmundacea) .......................................................... 3-36
3.2.3.5-1 Representative IBT and SAQ Abundance Data forFeather Boa Kelp (Egregia menziesii) ......................................................... 3-40
3.2.3.5-2 Map of the Distribution of Affected and Non-Affected FeatherBoa Kelp (Egregia m enziesii) ........................................................................ 3-42
3.2.3.6-1 Representative IBT Abundance Data for Naflbrush Seaweed(Endocladia m uricata) .................................................................................. 3-45
3.2.3.6-2 Map of the Distribution of Affected and Non-Affected NailbrushSeaweed (Endocladia muricata) .................................................................. 3-46
3.2.3.7-1 Representative IBT Abundance Data for Hollow BranchSeaweed (Gastroclonium coulteri) ............................................................... 3-50
3.2.3.7-2 Map of the Distribution of Affected and Non-Affected HollowBranch Seaweed (Gastroclonium coulteri) .................................................. 3-52
3.2.3.8-1 Representative IBT Abundance Data for Christmas TreeSeaweed (Gigartina canaliculata) ............................................................... 3-56
3.2.3.8-2 Map of the Distribution of Affected and Non-AffectedChristmas Tree Seaweed (Gigartina canaliculata) .................................... 3-58
3.2.3.9-1 Representative IBT Abundance Data for Iridescent Seaweed(Iridaea flaccida) ........................................................................................... 3-61
E8-316.0 V

LIST OF FIGURES - ContinuedNUMBER PAGE
3.2.3.9-2 Densities Over Time of Iridescent Seaweed (Iridaea flaccida)B lades ........................................................................................................... 3-63
3.2.3.9-3 Average Blade Lengths Over Time in Iridescent Seaweed(Iridaea fl accida) ........................................................................................... 3-64
3.2.3.9-4 Map of the Distribution of Affected and Non-Affected IridescentSeaw eed (Iridaea flaccida) ........................................................................... 3-66
3.2.3.10-1 Recruitment Abundances of Oar Kelp (Laminaria dentigera) onAnnually Placed Bare Test Panels .............................................................. 3-69
3.2.3.10-2 Representative SAQ Abundance Data for Oar Kelp (Laminariadentigera ) ....................................................................................................... 3-71
3.2.3.10-3 Percentage Over Time of the Oar Kelp (Laminaria dentigera)Population with Blades in Shallow Water .................................................. 3-72
3.2.3.10-4 Map of the Distribution of Affected and Non-Affected Oar Kelp(Lam inaria dentigera) .................................................................................. 3-75
3.2.3.11-1 Representative IBT Abundance Data for Grapestone Seaweed(M astocarpuspapillatus) .............................................................................. 3-78
3.2.3.11-2 Map of the Distribution of Affected and Non-AffectedGrapestone Seaweed (Mastocarpus papillatus) .......................................... 3-79
3.2.3.12-1 Number of Bull Kelp (Nereocystis luetkeana) Plants Observedin Diablo Cove During Fall Cliff-Top Surveys ............................................ 3-84
3.2.3.12-2 Representative SAQ Abundance Data for Bull Kelp (Nereocystisluetkeana) ...................................................................................................... 3-86
3.2.3.12-3 Laboratory Mortality of Bull Kelp (Nereocystis luetkeana)Sporophytes at Various Temperatures ........................................................ 3-87
3.2.3.12-4 Laboratory Growth of Bull Kelp (Nereocystis luetkeana)Sporophytes Under Seven Different Test Temperatures ........................... 3-88
3.2.3.12-5 Map of the Distribution of Affected and Non-AffectedBull Kelp (Nereocystis luetkeana) in Diablo Cove (A) andV icinity (B ) .................................................................................................... 3-90
3.2.3.13-1 Representative IBT and SLC Abundance Data for Surf Grass(Phyllospadix scouleri) .................................................................................. 3-94
3.2.3.13-2 Map of the Distribution of Affected and Non-Affected SurfGrass (Phyllospadix scouleri) ....................................................................... 3-95
3.2.3.14-1 Representative SAQ Abundance Data for Tree Kelp(Pterygophora californica) ............................................................................ 3-98
E8-316.0 Vi
LIST OF FIGURES - ContinuedNUMBER PAGE
3.2.3.14-2 Percentage Over Time of the Tree Kelp (Pterygophoracalifornica) Population With Blades in Shallow Water ............................ 3-100
3.2.3.14-3 Laboratory Thermal Effects on Terminal Blade Growth of TreeKelp (Pterygophora californica) ................................................................. 3-101
3.2.3.14-4 Laboratory Thermal Effects on Sporophyll Growth of Tree Kelp(Pterygophora californica) ......................................................................... 3-102
3.2.3.14-5 Map of the Distribution of Affected and Non-Affected Tree Kelp(Pterygophora californica) .......................................................................... 3-105
3.2.3.15-1 Representative IBT and SAQ Abundance Data for AggregatingSea Anemone (Anthopleura elegantissima) ............................................... 3-107
3.2.3.15-2 Map of the Distribution of Affected and Non-AffectedAggregating Sea Anemone (Anthopleura elegantissima) .......................... 3-109
3.2.3.16-1 Catch Per Unit Effort for Rock Crabs in Diablo Cove andV icinity ........................................................................................................ 3-112
3.2.3.16-2a Catch Per Unit Effort for Rock Crabs in Deep Areas ............................... 3-115
3.2.3.16-2b Catch Per Unit Effort for Rock Crabs in Shallow Areas .......................... 3-115
3.2.3.16-3 Catch Per Unit Effort Comparison Between Shallow Rock CrabTrapping Areas in North and South Diablo Cove ..................................... 3-116
3.2.3.16-4a Mean Carapace Width for Male Rock Crabs in Diablo Cove andV icinity ........................................................................................................ 3-117
3.2.3.16-4b Mean Carapace Width for Female Rock Crabs in Diablo Coveand V icinity ................................................................................................. 3-117
3.2.3.16-5 Map of the Distribution of Affected and Non-Affected RockCrab (Cancer antennarius) ......................................................................... 3-119
3.2.3.17-1 Representative IBT Abundance Data for Acorn Barnacle(Chtham alus fissus) .................................................................................... 3-122
3.2.3.17-2 Map of the Distribution of Affected and Non-Affected AcornBarnacle (Chthamalus fissus) .................................................................... 3-123
3.2.3.18-1 Representative IBT Abundance Data for Rough Limpet(Collisella scabra) ....................................................................................... 3-126
3.2.3.18-2 Map of the Distribution of Affected and Non-Affected RoughLim pet (Collisella scabra) .......................................................................... 3-128
3.2.3.19-1 Representative IBT Abundance Data for Black Abalone(H aliotis cracherodii) .................................................................................. 3-131
E8-316.0 vii

LIST OF FIGURES - ContinuedNUMBER PAGE
3.2.3.19-2 Map of the Distribution of Affected and Non-Affected BlackAbalone (Haliotis cracherodii) .................................................................... 3-134
3.2.3.20-1 Representative SAQ Abundance Data for Red Abalone (Haliotisrufescens) ..................................................................................................... 3-140
3.2.3.20-2 Map of the Distribution of Affected and Non-Affected RedAbalone (H aliotis rufescens) ....................................................................... 3-146
3.2.3.21-1 Representative SAQ Abundance Data for Bat Star (Patiriam inia ta ) ....................................................................................................... 3-149
3.2.3.21-2 Map of the Distribution of Affected and Non-Affected Bat Star(Patiria m iniata) ......................................................................................... 3-151
3.2.3.22-1 Representative IBT and SAQ Abundance Data for BrownTurban Snail (Tegula brunnea) .................................................................. 3-153
3.2.3.22-2 Map of the Distribution of Affected and Non-Affected BrownTurban Snail (Tegula brunnea) .................................................................. 3-155
3.2.3.23-1 Representative IBT Abundance Data for Black Turban Snail(Tegula funebralis) ...................................................................................... 3-159
3.2.3.23-2 Map of the Distribution of Affected and Non-Affected BlackTurban Snail (Tegula funebralis) ............................................................... 3-162
3.2.3.24-1 Mean Number of Adult and Juvenile Surfperch Sampled bySubtidal Fish Observations (Benthic) ....................................................... 3-165
3.2.3.24-2 Map of the Distribution of Affected and Non-Affected Striped,Black, and Pile Surfperch (Embiotoca lateralis, E. jacksoni, andD am alichthys vacca) ................................................................................... 3-168
3.2.3.25-1 Representative SFO Abundance Data for Lingcod (Ophiodonelongatus) .................................................................................................... 3-171
3.2.3.25-2 Map of the Distribution of Affected and Non-Affected Lingcod(Ophiodon elongatus) .................................................................................. 3-172
3.2.3.26-1 Representative SFO Abundance Data for Cabezon(Scorpaenichthys m armoratus) .................................................................. 3-175
3.2.3.26-2 Map of the Distribution of Affected and Non-Affected Cabezon(Scorpaenichthys m armoratus) .................................................................. 3-176
3.2.3.27-1 Mean Number of Adult Rockfish Sampled by the BenthicSubtidal Fish Observations ........................................................................ 3-181
3.2.3.27-2 Map of the Distribution of Affected and Non-Affected BlueRockfish (Sebastes mystinus) and Olive Rockfish (Sebastesserranoides) ................................................................................................. 3-183
E8-316.0 viii

LIST OF FIGURES - ContinuedNUMBER PAGE
3.2.3.27-3 Map of the Distribution of Affected and Non-Affected Black andYellow Rockfish (Sebastes chrysomelas) and Kelp Rockfish(Sebastes atrovirens) .................................................................................. 3-184
3.2.2.27-4 Map of the Distribution of Affected and Non-Affected JuvenileRockfish (Sebastes spp.) .............................................................................. 3-185
3.2.3.28-1 Intertidal Fish Abundance Data for Adult Black Prickleback(Xiphister atropurpureus) ........................................................................... 3-188
3.2.3.28-2 Intertidal Fish Abundance Data for Adult Rock Prickleback(Xiphister m ucosus) .................................................................................... 3-189
3.2.3.28-3 Intertidal Fish Abundance Data for AdultCebidichthys/Anoplarchus Complex .......................... 3-190
3.2.3.28-4 Map of the Distribution of Affected and Non-AffectedPricklebacks (Stichaeidae) ......................................................................... 3-192
3.2.3.29-1 Representative IBT Abundance Data of Corallinavancouveriensis ........................................................................................... 3-201
3.2.3.29-2 Representative IBT Abundance Data forGelidium coulteri ........................................................................................ 3-202
3.2.3.29-3 Representative IBT Abundance Data forGigartina agardhii ...................................................................................... 3-203
3.2.3.29-4 Representative IPC Abundance Data for Non-Coralline CrustA ssem blage .................................................................................................. 3-205
3.2.3.29-5 Representative SLC Abundance Data for Desmarestia ligulatavar. lig ulata ................................................................................................. 3-210
3.2.3.29-6 Representative SLC Abundance Data forFarlow ia compressa .................................................................................... 3-211
3.2.3.29-7 Representative SLC Abundance Data for Gigartina exasperataplus G. corym bifera ..................................................................................... 3-213
3.2.3.29-8 Representative SLC Abundance Data forIridaea cordata ............................................................................................ 3-215
3.2.3.29-9 Representative SLC Abundance Data forLaurencia spectabilis .................................................................................. 3-216
3.2.3.29-10 Representative SLC Abundance Data forR hodym enia spp .......................................................................................... 3-217
3.2.3.29-11 Representative SFQ Abundance Data for Colonial/SocialT unicates ..................................................................................................... 3-220
E8-316.0 ix
LIST OF FIGURES - ContinuedNUMBER PAGE
3.2.3.29-12 Representative SAQ and SFQ Abundance Data for Sea Stars(P isaster spp.) .............................................................................................. 3-222
3.2.3.29-13 Representative SFQ Abundance Data for Sea Urchin(Strongylocentrotus spp.) ............................................................................ 3-225
3.2.4-1 Shannon-Weiner Diversity Index (H') for Algae at Selected IBTStation s ....................................................................................................... 3-243
3.2.4-2 Mean Number of Algal Species Per One Square Meter QuadratOver Tim e at Selected IBT Stations .......................................................... 3-245
E8-316.0 X
LIST OF TABLES
Volume INUMBER PAGE
1.2-1 M arine Environmental Studies .................................................................... 1-14
2.2.1-1 Operating Conditions for Model Runs (Equivalent Conditionsin Prototype) .................................................................................................. 2-15
3.1-1 Cumulative Effort for the Major TEMP Biological SamplingM ethods ........................................................................................................... 3-5
3.2.3-1 Assessment of Thermal Impact for Selected Species .................................. 3-15
3.2.3.19-1 Black Abalone (Haliotis cracherodii) Random IntertidalSurveys ....................................................................................................... 3-132
3.2.3.20-1 Summary Statistics per Station per Survey (SAQ Method) forRed Abalone (Haliotis rufescens) ............................................................... 3-141
3.2.3.20-2 Summary Statistics per Station per Survey (SFQ Method) forRed Abalone (Haliotis rufescens) ............................................................... 3-142
3.2.3.20-3 Red Abalone Random Station Surveys 1984 - 1987 ................................. 3-143
3.2.3.24-1 Summary of Abundance and Species Composition of Young andAdult Surfperch in Diablo Cove and South Cove from July 1976to D ecem ber 1987 ........................................................................................ 3-166
3.2.3.27-1 Summary of Abundance and Species Composition of Young andAdult Rockfish in Diablo Cove and South Cove from July 1976to D ecem ber 1987 ........................................................................................ 3-180
3.2.3.29-1 Mean Percent Cover Per Square Meter for the Algal Taxa at +1ft MLLW Level in North Diablo Cove ........................................................ 3-194
3.2.3.29-2 Mean Percent Cover Per Square Meter for the Algal Taxa at +1ft MLLW Level in South Diablo Cove ........................................................ 3-195
3.2.3.29-3 Mean Percent Cover Per Square Meter for the Algal Taxa at +1ft MLLW Level Outside Diablo Cove ......................................................... 3-196
3.2.3.29-4 Mean Percent Cover Per Square Meter for the Algal Taxa at +3ft MLLW Level in North Diablo Cove ........................................................ 3-197
3.2.3.29-5 Mean Percent Cover Per Square Meter for the Algal Taxa at +3ft MLLW Level in South Diablo Cove ........................................................ 3-198
3.2.3.29-6 Mean Percent Cover Per Square Meter for the Algal Taxa at +3ft MLLW Level Outside Diablo Cove ......................................................... 3-199
3.2.3.29-7 North Diablo Cove SLC Subtidal Algal Taxa with Overall MeanPercentage Cover/Station/Survey Values forThree P eriods .............................................................................................. 3-206
E8-316.0 xi
LIST OF TABLES - ContinuedNUMBER PAGE
3.2.3.29-8 South Diablo Cove SLC Subtidal Algal Taxa with Overall MeanPercentage Cove/Station/Survey Values forThree P eriods .............................................................................................. 3-207
3.2.3.29-9 Non-Diablo Cove SLC Subtidal Algal Taxa with Overall MeanPercentage Cover/Station/Survey Values forThree P eriods .............................................................................................. 3-208
3.2.3.30-1 Summary of Selected Algal, Invertebrate, and Fish SpeciesAbundance Changes in Diablo Cove During Power PlantOperation (1985-1987) ............................................................................... 3-228
3.2.4-1 Percent Frequency of Occurrence for Selected Intertidal AlgalSpecies in North Diablo Cove IBT Quadrats Over Time .......................... 3-246
E8-316.0 xii
DIABLO CANYON POWER PLANT
THERMAL EFFECTS MONITORING PROGRAM REPORT
SUMMARY OF FINDINGS
Introduction
This report presents the findings of an eleven-year study of marine organisms livingin and near the cooling water discharge of a nuclear power plant located on thecentral California coast near San Luis Obispo. The study, known as the ThermalEffects Monitoring Program (TEMP), examined population changes among severalhundred species of marine plants (algae), invertebrates, and fish in a study areacentered at the site of Pacific Gas and Electric Company's Diablo Canyon PowerPlant. The study established the natural abundance patterns of the monitoredpopulations before the start-up of the power plant and documented the changes inthe population patterns after the introduction of the plant's cooling system thermaleffluent.
The Diablo Canyon Power Plant, a two-unit, 2190 MWe nuclear-fueled facility, islocated on a marine terrace 85 feet above a rocky open coast section of Pacific Oceanshoreline in central California. The power plant pumps approximately two and ahalf billion gallons of ocean water per day through its cooling water system, thepurpose of which is to condense the steam after it propels the plant's steam turbinegenerator. The heat from the condensed steam is absorbed by the cooler seawater,which is discharged into the ocean at the shoreline of Diablo Cove. Along thissection of coastline, the ocean water is naturally cooler than most other Californiacoastal waters, owing to localized upwelling currents. The addition of normal powerplant heat to the ocean water used for cooling raises the temperature of this waterabout 11 C. The power plant-produced temperature increase, when combined withthe seasonally changing ocean water temperatures, produces a dischargetemperature range of from 18 to 29 C. The warmest discharge temperatures occurin the late summer and fall, when higher ambient water temperatures combine withfull-power operating temperatures. The velocity and momentum of the dischargedwater quickly carry the heat to the deep offshore area in a surface thermal plumethat is less than 20 feet deep.
The first eight years of thethermal effects study, May 1976 to April 1984, observedthe populations and community of marine species in Diablo Cove without the warmwater discharge. This baseline information was vital to the study's objective ofassessing the effects of the thermal discharge as distinguished from other, naturally
E8-316.0 1
occurring changes. The baseline data have revealed many statistically significantnatural changes in the study area's community of marine species. Some of thesechanges resulted from catastrophic storm waves and collapsing cliffs, some weremore gradual changes associated with the natural ocean-warming during theunusual El Nino, and some were the direct and indirect effects of sea otterpredation. This report describes these natural changes and compares them tochanges that were observed following the increases in Diablo Cove's ambient watertemperatures, which resulted from the power plant's thermal discharge.
In addition to documenting the abundances of species in the discharge area throughtime, the study also documented changes in populations outside the cove, allowingcomparisons of abundance changes in species occurring in similar habitats in bothlocations. The abundance patterns of marine species documented before and duringpower plant operation were compared to the temperature distribution patterns towhich the organisms were exposed to provide comparisons of normal changes inabundance to temperature-related changes in abundance following the start-up ofthe power plant.
The primary objective of the study was to answer the question of whether or not thetemperature limits that the Regional Water Quality Control Board (RWQCB) hadplaced on the discharge protect the receiving water's beneficial uses. The beneficialuses of the Diablo Cove receiving water as defined by the RWQCB include industrialcooling water, marine habitat, water contact sports, and recreational andcommercial fisheries. To answer the question, a study was designed to gatherinformation on three principal topics:
* The temperature and distribution of the discharge plume
The pre-discharge baseline abundances of Diablo Cove's community ofmarine species and their natural abundance changes over time
The qualitative and quantitative effects of the thermal plume temperatureson the abundance, distribution, and natural changes of the species in thereceiving water.
The information gathered from these three study programs is briefly summarized bytopic below.
Thermal Plume Studies
A research program which combined oceanographic field studies with a physical andmathematical modeling effort focused on the description of the temperature anddistribution of the thermal discharge plume. The objective of the thermal plumestudies was to determine the distribution and ultimate fate of the power plant'sdischarged waste heat. Since 80 percent of the discharged heat leaves Diablo Covein a matter of minutes, the thermal plume studies focused on the measurement andanalysis of the offshore, "far-field," portion of the thermal plume. For this reason,although it is the nearshore portion of the plume which impacts the cove's shoreline
E8-316.0- 2
and bottom-dwelling organisms, the biological thermal effects assessment relied oncove bottom temperature data from a far-field physical model.
The thermal plume discharge studies found that the factors which influence thetemperature and distribution of the thermal plume in Diablo Cove and the offshoreareas include:
The near-field plume behavior is dominated by momentum forces. Theseforces are produced by the velocity head created within the dischargestructure. As the plume moves through Diablo Cove, the momentum forceis reduced by several factors, including bottom drag friction and interactionof the high velocity discharge water with that of the lower velocity receivingwaters. Within Diablo Cove the high momentum of the discharge induces areentrainment flow, which begins the temperature dilution process. Thisreentrainment is always occurring on either side of the plume, and occursfrom the bottom depending on the tidal stage.
As the plume exits the cove, momentum is decreased and the buoyancyforces begin to dominate. The buoyancy effect is a result of the densitychange in the waters of the plume; although the salinity of the waterremains unchanged, the addition of heat results in a plume less dense thanits receiving waters. In the far-field region, the plume is typically less than20 ft deep. As the plume moves farther offshore from Diablo Cove, theexcess heat is both diluted in the receiving waters and transferred to theatmosphere.
* The size and shape of the thermal plume are determined by numerousfactors, including winds, waves, and currents. The plume position can varyfrom downcoast, upcoast, or directly offshore from Diablo Canyon. Theplume position can change quickly, sometimes in a matter of hours.
* The thermal plume does not recirculate, that is, move from the dischargestructure to the intake structure.
The thermal plume at Diablo Canyon Power Plant exhibits characteristics that arevery similar to numerous other once-through discharges (in marine environments)studied both in the United States and elsewhere in the world.
Marine Community Baseline Studies
The research objectives of the TEMP marine community survey were to catalog thecove's species, quantify their abundances by habitat and location in the cove, andmeasure the temporal changes in their populations inside and outside Diablo Cove.The survey methods were designed to collect a sample of information on the keyspecies and habitats at selected points in the cove and surrounding areas. Thebiological field surveys were designed with the assistance and overview of theCalifornia Regional Water Quality Control Board, Central Coast Region and theCalifornia Department of Fish and Game. The studies which were conducted
E8-316.0 3
continuously from May 1976 to December 1987 have collected over 26,500 samples ofquantitative information on hundreds of species living in Diablo Cove.
The abundance and distribution of the cove's species remained relatively constantduring the eight-year baseline study prior to the thermal discharge. During theextended baseline studies period, the seasonal fluctuations of abundance in severalspecies were quantitatively measured for the first time. Abundances of theiridescent seaweed, for example, were found to follow a regular seasonal patternsimilar to that of terrestrial plants. However, the majority of the plant and animalspecies did not exhibit any regular or predictable cycle of abundance.
In addition to seasonal abundance patterns, unexplained long-term, gradualabundance increases or declines were observed among several species during the 11-year study. The abundance of tree kelp in Diablo Cove slowly and steadily declinedfrom its highest recorded level of abundance in 1976 to its present lowest level ofabundance.
The population abundance data collected during the baseline period formed the basisfor a quantitative definition of natural change among Diablo Cove's marine species,and made it possible to statistically separate natural changes from power plant-induced changes. From an ecological point of view, the most significant naturalchanges in species abundances recorded during the baseline studies were associatedwith three independent coastwide events:
Sea Otter Predation
Baseline studies by CDF&G and PG&E prior to 1976 recorded the migrationof the southern sea otter into the Diablo Cove area. The otters preyed uponthe cove's abundant populations of red abalone and sea urchins; in a veryshort period of time, adult abalone and urchins were nearly eliminated fromthe cove's subtidal community. With the disappearance of the urchins,which feed ravenously on underwater algae, the abundance of someunderwater algal species increased tremendously, particularly the kelp bed-forming species. The sea otter's continued predatory activities in the areahave also reduced the abundance of other prey species, following the seaotter's shift to less preferred prey items. The abundance of the sea otter andthe abundance of its prey species in Diablo Cove over the past few yearshave apparently been in a state of dynamic equilibrium.
Winter Storm Waves
In 1983, powerful winter storm waves lashed the central California coastand caused widespread damage to man-made structures and the nearshoremarine habitats and communities. Waves as high as 26 feet were recordedat the power plant breakwater. In south Diablo Cove, a nearshore pinnacleisland collapsed, and its wave-strewn rock rubble was deposited on theintertidal zone in south Diablo Cove. The intertidal populations that werepart of the baseline studies were smothered with up to three feet of rock
E8-316.0 4

debris. The natural succession of recolonizing species at this location hasbeen monitored in the continuing studies; the return of species to pre-stormabundances has been slower than expected, possibly due to the instability ofthe new substrate.
El Nino Ocean Warming
In late 1983, a natural widespread ocean warming due to current changesoccurred in the north Pacific Ocean. This warming period, known as the 'ElNino," produced ocean temperatures which were not significantly warmerthan those which had been recorded in Diablo Cove during a previous warmperiod in 1976. However, when the 1976 and 1983 El Nino watertemperatures were converted to temperature dose (duration of temperatureexposure), the 1983 El Nino temperature doses in Diablo Cove weresignificantly greater than those measured in 1976. The natural El Ninotemperature doses of 1983 produced measurable thermal effects on theabundance of several species of algae and invertebrates. The El Ninoaltered the flow of ocean currents. The resultant warmer watertemperatures encouraged the immigration of warm-water fish species intothe Diablo Cove area from more southerly locations. Residual ecologicaleffects of the El Nino event are still observable in Diablo Cove, but havegenerally disappeared from the surrounding areas. The elevatedtemperatures in Diablo Cove produced by the start-up of power plantoperations shortly after the El Nino period may have sustained the effects ofthe El Nino and favored the residence of the warm-water species introducedby the El Nino currents.
These ecological events preceding the thermal plume warming of Diablo Covedetermined the ecological setting of the cove, in terms of species abundances anddistributions, which forms the basis of this report's thermal effects assessments.The sea otters affected their prey species, storm waves eliminated local populations,and the El Nino thermal doses may have selectively pre-conditioned the Diablo Covecommunity for a higher thermal tolerance. The biological effects of the DCPPthermal discharge are assessed against the background of these pre-operationalevents.
Thermal Plume Effects
The third stage of the study analyzed the thermal tolerance of important species inthe cove and the thermal effects on the abundances of the cove's species. At thebeginning, very little information was available on the thermal tolerances of thecove's important species. To gather the information, an on-site laboratory wasspecially designed and constructed for thermal effects research. Over a period ofnearly four years, 37 species were cultured and tested over a wide range of elevatedtemperature conditions. A variety of species' life stages were tested in conjunctionwith a variety of pre-experimental acclimation water temperatures.
E8-316.0 5
Methods
The abundances and distributions of Diablo Cove's species studied during the past11 years were examined for patterns of change through time which appeared torelate to the start-up and operation of the power plant. The graphs which indicatedpossible thermal effects changes were examined further using statistical techniquesto test the significance of the observed change. These techniques included timeseries analysis of the species' abundances at a fixed location and analysis of variancetests for significant thermal plume-related abundance changes between affected andunaffected study areas.
To assess the effects of the thermal plume in areas between the fixed biologicalsampling points, a predictive technique was used to extrapolate the thermal effectsobserved among the sample points. The probability of a thermal dose which hadbeen observed to cause a thermal effects change among the sampling points wascalculated from the continually recorded water temperatures at the biologicalsampling points. Using the relationship between temperature dose and laboratorythermal tolerances, and the observed field thermal effects changes, the cove-widethermal effect for a particular species was projected along modeled contour lines ofequal bottom temperatures in the areas where the particular species wasdistributed.
Findings
In the approximately two and a half years of power plant commercial operation, thenumber of species in Diablo Cove has remained relatively unchanged, and therehave not been detectable differences in the abundances of the majority of thesespecies before or following power plant start-up. A small percentage, less than tenpercent, of the over 500 species which were monitored exhibited abundance changesin the period following the power plant start-up. Among the 65 important speciesselected for analysis in this report, 28 percent increased in abundance in the thermalplume, 20 percent decreased and 26 percent remained unchanged. These changescan be attributed to thermal plume effects because comparable increases or declineshad not been seen in the species' abundances during the previous eight years ofbaseline studies.
Algae
Thermal plume temperatures, which fluctuate seasonally with theincreasing ambient water temperatures, are the warmest during the periodof October to December. Earlier than normal seasonal warming induced bythe thermal discharge has caused an early senescence (loss of tissue) of thebull kelp's surface canopy-forming blades. Bull kelp plants inside DiabloCove and north of Diablo Cove were affected in the summer of 1986 and1987. Revegetation in these areas by this annual species is apparentlyunaffected, as it has returned in normal abundance in both years followingits early senescence. The early senescence of the bull kelp surface canopy isthe only thermal effect known to occur outside Diablo Cove.
E8-316.0 6
Inside Diablo Cove, the thermal plume temperatures have caused a declinein the abundance and distribution in three species of underwater kelp andseveral species of intertidal red and brown algae. In contrast, the elevatedthermal plume temperatures are linked with a marked increase in asubtidal red algae species in the nearshore discharge area.
An analysis comparing the frequency and distribution of the dischargeplume's thermal doses and the biological thermal effects demonstrated thata 20 percent probability of a 17 C/96-hour thermal dose produced significanteffects on several of the cove's algal species. Similar temperature dosesaccompanying the natural ocean warming of the El Nino also producedbiological effects similar to those which resulted from the discharge plumedoses. Invertebrate and fish species, as predicted in laboratory tests, weregenerally unaffected by the 17 C/96-hour dose.
Invertebrates
The abundances of invertebrate species have remained generally unchangedor in some cases, such as the acorn barnacle and the aggregating anemone,have increased significantly in the areas contacted by the thermal plume.There have been no changes detected in the abundance or distribution of redor black abalone in the cove; the rock crab, based on trapping and taggingstudies, appears to avoid the warmest areas in the cove.
A single episode of acute thermal mortality in October 1987 occurred in asmall population of red abalone that were present in the immediatedischarge area. Other species, including the brown turban snail, sun stars,and rockfish, were also observed in a stressed condition.
Fish
The changes in the distribution patterns of several fish species in DiabloCove also indicate a behavioral response to the temperature and velocity ofthe plume. In a few cases, the observed shift in the abundance ordistribution of a species may be due to a change in habitat quality or aplume avoidance response, but in most cases, the fish species which haveresponded to the presence of the discharge have done so to take advantageof new feeding opportunities in the plume.
Conclusions
The temperatures of the DCPP thermal discharge have produced observablechanges, both increases and decreases, in the abundance and distribution of severalspecies in Diablo Cove's intertidal and subtidal marine habitat; the majority ofspecies have remained unaffected by the discharge water temperatures. Moderateshifts in these abundance and distribution patterns are expected as long-termsuccessional processes in a state of dynamic change continue among the Cove's pre-operational species and species which are later attracted to the cove by its warmerwater temperatures.
E8-316.0 7
The summary of thermal effects findings from the Diablo Canyon discharge studieslead finally to a review and assurance that the discharge temperature limitsestablished by the RWQCB in the discharge permit protect, in a balanced way, thebeneficial uses of Diablo Cove's receiving water, particularly the beneficial use of thecove as a marine habitat. Beyond a transition zone at the point of discharge, thedischarge temperature limits protect a balanced use of the cove's receiving water forboth marine habitat and cooling water purposes.
Temperature increases have occurred in many of the intertidal and subtidal areas ofthe cove which have discouraged the presence of species which avoid warmtemperatures and encouraged the success of species which tolerate or prefer warmerwater. The established temperature limits of the discharge appear to be protectiveof the cove's marine habitat, based on the operating data gathered to date and thepopulation responses of the habitat's species.
Evidence of the protected nature of the cove's marine habitat has been demonstratedby the continued presence of marine algal, invertebrate, and fish species whosecomposition, abundance, and distribution, though different than those previouslyfound at the site, are representative of natural marine habitat.
E8-316.0 8
1.0 PROJECT DESCRIPTION
This report presents the results of long-term studies of the effects of the dischargefrom the Diablo Canyon Power Plant (DCPP) on the receiving water in Diablo Coveand the surrounding coastal area. The Thermal Effects Monitoring Program(TEMP) studies focused upon the elevated temperatures that occur in the receivingwater, and were designed to identify their levels, extent, variation with time andplant operation, and their effects on the biological communities.
The studies upon which this report is based were initiated in 1976 under section316(a) of the Federal Water Pollution Control Act Amendments of 1972 (PL 92-500)and are currently required by Provision D.4(a) of the National Pollutant DischargeElimination System (NPDES) permit for the DCPP, issued by the CaliforniaRegional Water Quality Control Board - Central Coast Region (RWQCB-CCR), onJuly 12, 1985 (Order No. 85-101).
The original TEMP Work Plan, which was submitted to the Board in 1975 (entitled"316(a) Demonstration Work Plan"), provided a detailed description of theimplementation, control, and analysis of investigations necessary for the TEMP finalreport. The biological studies were designed to obtain extensive information on therepresentative, important species that occur in the coastal area adjacent to theDCPP discharge, and consisted of two major study elements: field sampling used toobtain detailed information from the naturally occurring populations, and laboratoryexperimental studies to determine the thermal tolerance of the species. Thephysical studies described in the Work Plan emphasized the thermal aspects of thedischarge plume and encompassed three major elements: mathematical modeling,physical modeling, and plant pre-operational and operational monitoring. Thisreport consists of an integrated analysis that addresses the interactive aspects ofeach of the study elements to determine whether the effluent limitations protect thereceiving water beneficial uses.
Since the Work Plan was submitted to the Board, the field data gathering elementsof the plan have continued, with some additions and modifications, through 1987, sothat field data could be collected during various conditions at DCPP. The name ofthe program was changed to Thermal Effects Monitoring Program to reflect changesin the requirement for the studies, but field biological sampling was maintained on abimonthly schedule from 1976 through 1987. All of the study elements originallyproposed in the Work Plan have been completed, and the original objectives of theWork Plan have been fulfilled.
During the period encompassed by the study, a series of substantial reports havebeen prepared and submitted to RWQCB-CCR that have described interim fieldbiological data results, laboratory experimental results, predictive assessments ofthermal discharges (normal operations and heat treatment), alternatives to thecooling water system, alternative demusselling technologies, numerous physical andmathematical model study results, and reports on the effluent plume based on fieldmeasurements.
E8-316.0 1-1
This report presents the results of an integrated analysis of all of this information.The objective of the analysis was to determine the effects of the thermal dischargeon the abundance and distribution of a selected group of indigenous species and onthe organization of these species' communities. Analysis of the species wasaccomplished as follows:
1. Temperature data from field monitoring and physical and mathematicalmodeling were considered in constructing maps of the distribution ofthermal dose in Diablo Cove under various sea and power plant operatingconditions.
2. The distributions of the species as determined from the field samplingstudies were overlaid on the thermal dose distribution maps.
3. The-thermal tolerance temperatures for the species, determined from thelaboratory experimental studies, were used to delineate on maps thoseportions of the species' populations that were theoretically affected by thetemperatures to which the populations were exposed.
4. The areas of theoretical impact were then compared with the observedresponses of the populations as determined from statistical analyses of thefield sampling data to provide a comprehensive picture of the impact of thethermal discharge on the species' populations.
5. The results of the individual species' analyses were considered together withthe results from statistical analyses of the intertidal and subtidalcommunities to provide an overall thermal impact assessment of the marinecommunities in Diablo Cove.
The report concludes with a discussion of the short-term changes and anticipatedlong-term effects of the thermal discharge on the biological communities in DiabloCove.
1.1 Plant Description
DCPP is sited on a coastal marine terrace about 1,000 feet wide, with elevationsranging from 60 to 150 feet above mean sea level (MSL). The plant grade elevationis located at 85 feet above MSL. The shoreline in the plant vicinity is characterizedby sheer wave-eroded cliffs, jutting headlands, and massive offshore rocks and reefswhose topographical features form a highly irregular coastline. The plant layout onthe site is shown in Figure 1.1-1. The 750-acre site is located on the centralCalifornia coast midway between San Francisco and Los Angeles, more specificallybetween Point Buchon and Point San Luis, and approximately 12 miles west of SanLuis Obispo (see Figure 1.1-2).
The power plant consists of two units, each of which uses a four-loop pressurized-water nuclear reactor as a steam supply system. Although each of the units has anindependent seawater cooling system, they share common intake and discharge
E8-316.0 1-2
structures. The reactors, structures, and auxiliary equipment are substantiallyidentical for both units; however, the rated difference in capability of the turbinegenerators (3,338 MWt for Unit 1; 3,411 MWt for Unit 2) accounts for net electricaloutput ratings of 1,084 and 1,106 MWe for Units 1 and 2, respectively. Commercialoperation commenced for Unit 1 during May 1985 and for Unit 2 during March 1986.
During normal operation of the power plant, seawater is drawn from the intake coveinto the intake structure and pumped approximately 85 feet above sea level, throughthe two condenser halves (one condenser for each unit). When the units areoperating, the seawater is heated as it passes through the condensers and flowsthrough conduits back down to sea level, where it is discharged to Diablo Cove at theshoreline. The cooling water for each unit is conveyed in separate conduits from thetime it enters the pumps until it enters the lower portion of the discharge structureafter the throttling gates. As the water flows down the discharge structure, itencounters three weirs, which act to dissipate the hydraulic force produced by the77-foot drop in elevation. Partway down the discharge structure, two large openingsin the wall separating the discharge flows of the two units potentially allow mixingbetween them (but when the flows are the same on either side of the wall, little ifany significant mixing is likely to occur). At the base of the discharge structure, thewall separating the flows from the two units terminates a short distance before theweir (a wall located at the point of discharge into Diablo Cove). Some mixing of theflows from the two units occurs in the basin formed by the weir, prior to dischargeinto Diablo Cove. The width of the discharge flow as it emerges into Diablo Cove is27.5 feet for each unit, with the depth depending on the tide stage. Thus, thedischarge may be defined as a surface jet, promoting the mixing of the thermaleffluent with Diablo Cove receiving waters.
Each unit is served by two circulating water pumps which produce a combined ratedflow from Unit 1 of between 778,000 gpm and 854,000 gpm and from Unit 2 ofbetween 811,000 gpm and 895,000 gpm (two-unit combined flow is 1,589,000 gpmminimum and 1,749,000 gpm maximum). The removal of heat from the condensersof both units (15.2 x 10⁹ Btu/hour at full design power) results in a dischargetemperature about 11 C warmer than the incoming seawater temperature. Thetemperature of the discharge varies as the ambient incoming seawater temperaturewarms and cools with the seasons. The average discharge water temperature willrange between 21 C (between February and July) and 25 C (between August andJanuary).
1.1.1 Normal Operation Thermal Discharge
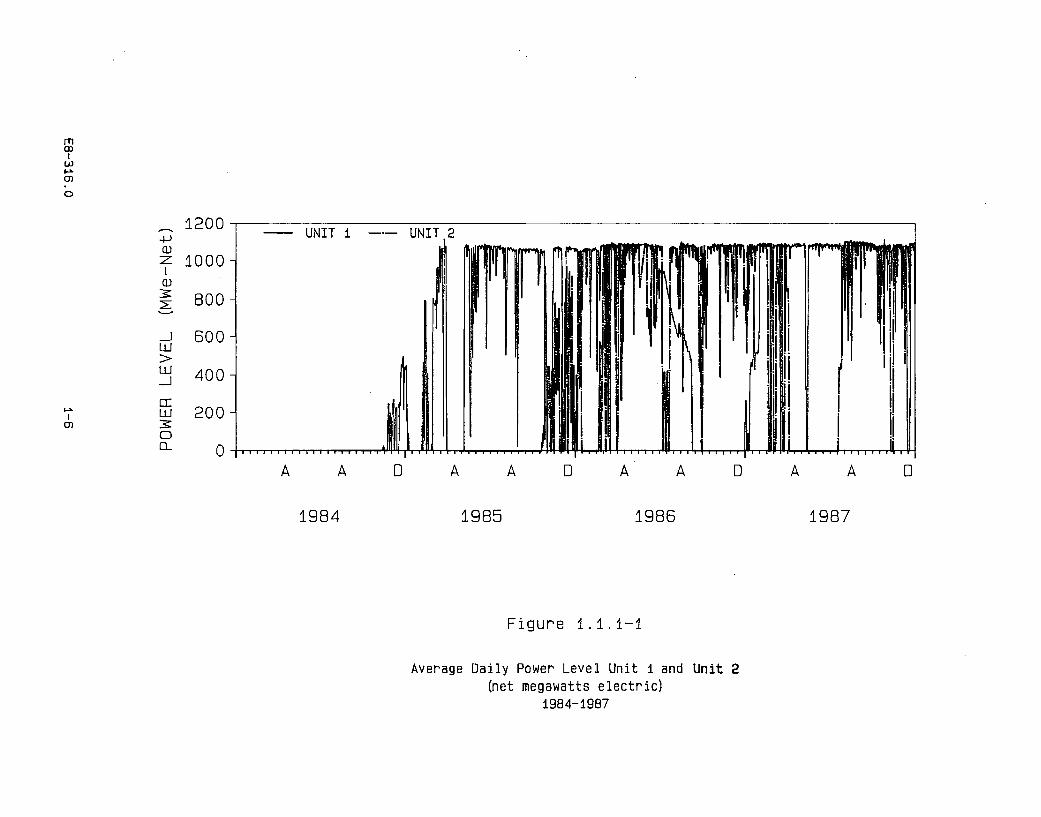
Unit 1 of the Diablo Canyon Power Plant began commercial operation on May 7,1985. Unit 2 began commercial operation on March 13, 1986. Unit 1 underwentrefueling from August 29, 1986, to December 29, 1986. Refueling of Unit 2 tookplace from April 3 to July 14, 1987. A summary of the average daily power level fbreach unit is shown in Figure 1.1.1-1.
E8-316.0 1-5
MCI
W
0)
12004* UNIT I UNIT 2
z 1000 -CD
E800
-j 600LU>
LU 40
Tu 200
0
A A D A A D A A D A
1984 1985 1986 1987
Figure 1.1.1-1
Average Daily Power Level Unit i and Unit 2(net megawatts electric)
1984-19B7
D
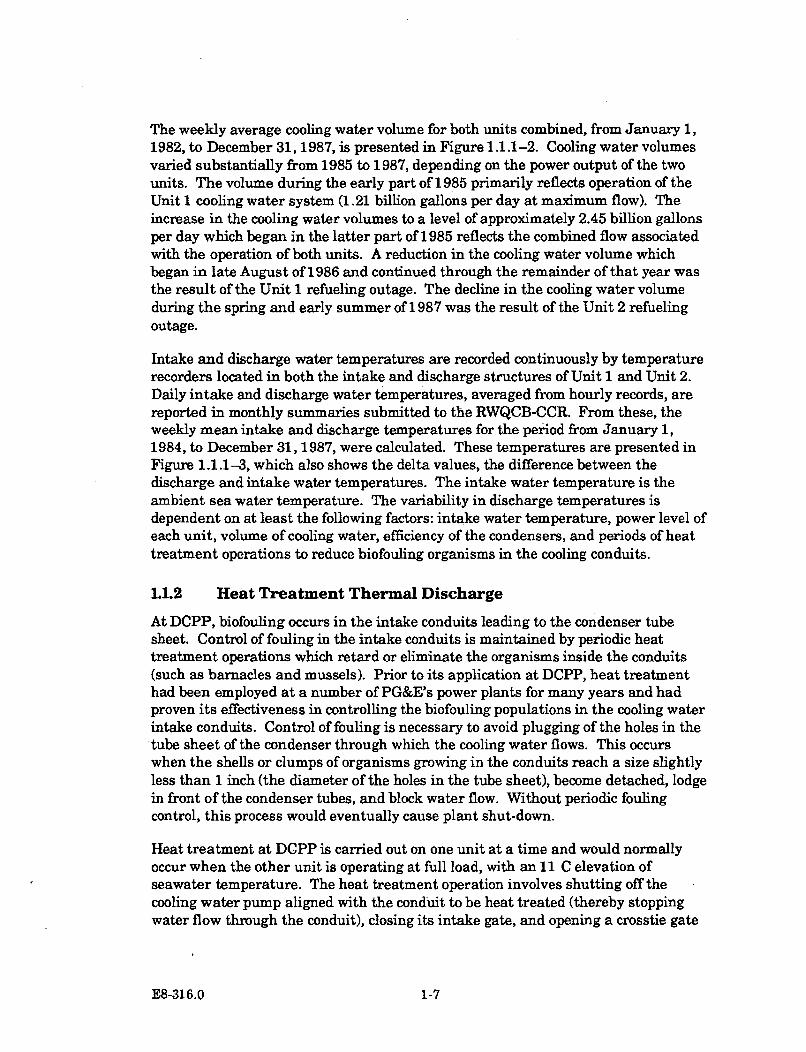
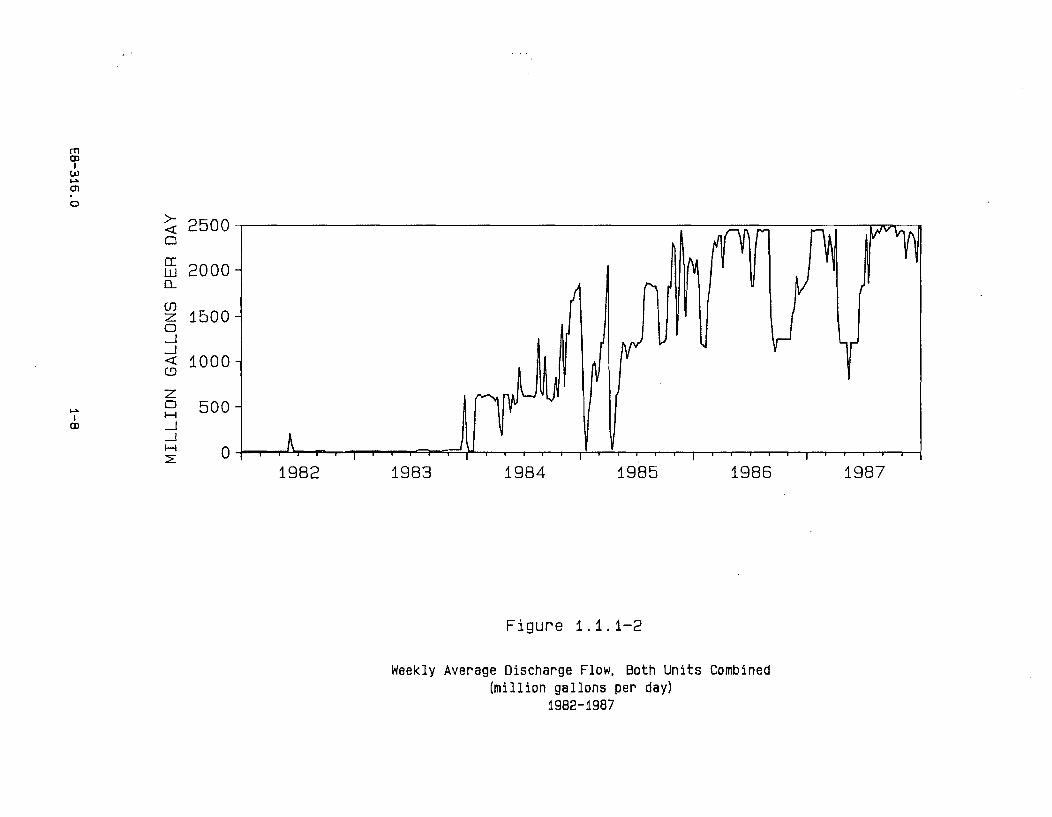
The weekly average cooling water volume for both units combined, from January 1,1982, to December 31, 1987, is presented in Figure 1.1.1-2. Cooling water volumesvaried substantially from 1985 to 1987, depending on the power output of the twounits. The volume during the early part of 1985 primarily reflects operation of theUnit 1 cooling water system (1.21 billion gallons per day at maximum flow). Theincrease in the cooling water volumes to a level of approximately 2.45 billion gallonsper day which began in the latter part of 1985 reflects the combined flow associatedwith the operation of both units. A reduction in the cooling water volume whichbegan in late August of 1986 and continued through the remainder of that year wasthe result of the Unit 1 refueling outage. The decline in the cooling water volumeduring the spring and early summer of 1987 was the result of the Unit 2 refuelingoutage.
Intake and discharge water temperatures are recorded continuously by temperaturerecorders located in both the intake and discharge structures of Unit 1 and Unit 2.Daily intake and discharge water temperatures, averaged from hourly records, arereported in monthly summaries submitted to the RWQCB-CCR. From these, theweekly mean intake and discharge temperatures for the period from January 1,1984, to December 31,1987, were calculated. These temperatures are presented inFigure 1.1.1-3, which also shows the delta values, the difference between thedischarge and intake water temperatures. The intake water temperature is theambient sea water temperature. The variability in discharge temperatures isdependent on at least the following factors: intake water temperature, power level ofeach unit, volume of cooling water, efficiency of the condensers, and periods of heattreatment operations to reduce biofouling organisms in the cooling conduits.
1.1.2 Heat Treatment Thermal Discharge
At DCPP, biofouling occurs in the intake conduits leading to the condenser tubesheet. Control of fouling in the intake conduits is maintained by periodic heattreatment operations which retard or eliminate the organisms inside the conduits(such as barnacles and mussels). Prior to its application at DCPP, heat treatmenthad been employed at a number of PG&E's power plants for many years and hadproven its effectiveness in controlling the biofouling populations in the cooling waterintake conduits. Control of fouling is necessary to avoid plugging of the holes in thetube sheet of the condenser through which the cooling water flows. This occurswhen the shells or clumps of organisms growing in the conduits reach a size slightlyless than 1 inch (the diameter of the holes in the tube sheet), become detached, lodgein front of the condenser tubes, and block water flow. Without periodic foulingcontrol, this process would eventually cause plant shut-down.
Heat treatment at DCPP is carried out on one unit at a time and would normallyoccur when the other unit is operating at full load, with an 11 C elevation ofseawater temperature. The heat treatment operation involves shutting off thecooling water pump aligned with the conduit to be heat treated (thereby stoppingwater flow through the conduit), closing its intake gate, and opening a crosstie gate
E8-316.0 1-7
M!
Cn
0
2500-
Lu 2000
z 15000-J
< 10000CD 500-
-JA
1982 1983 1984 1985 1986
Figure 1.1.1-2
Weekly Average Discharge Flow, Both Units Combined(million gallons per day)
1982-1987
1987
between it and the adjacent operating pump. Simultaneously, discharge throttlegates downstream of the unit's condenser are closed sufficiently to allow only onehalf of the operating pump's flow (500 cfs) to exit the discharge structure. The otherhalf of its flow is forced back through the other condenser half and down the conduitof the inactivated pump. When the seawater reaches the inactive pump, it flowsacross to the active pump and is diluted with incoming ambient seawater. Once thisconfiguration of the cooling water system has been established, the water flowingtoward the condenser in the conduit aligned with the active pump is also at atemperature elevated slightly over the ambient incoming water. The temperature ofthe water flowing into the heat-treated conduit is regulated by varying the electricaloutput of the main unit, which directly affects the amount of heat transferred to thewater flowing through the condenser.
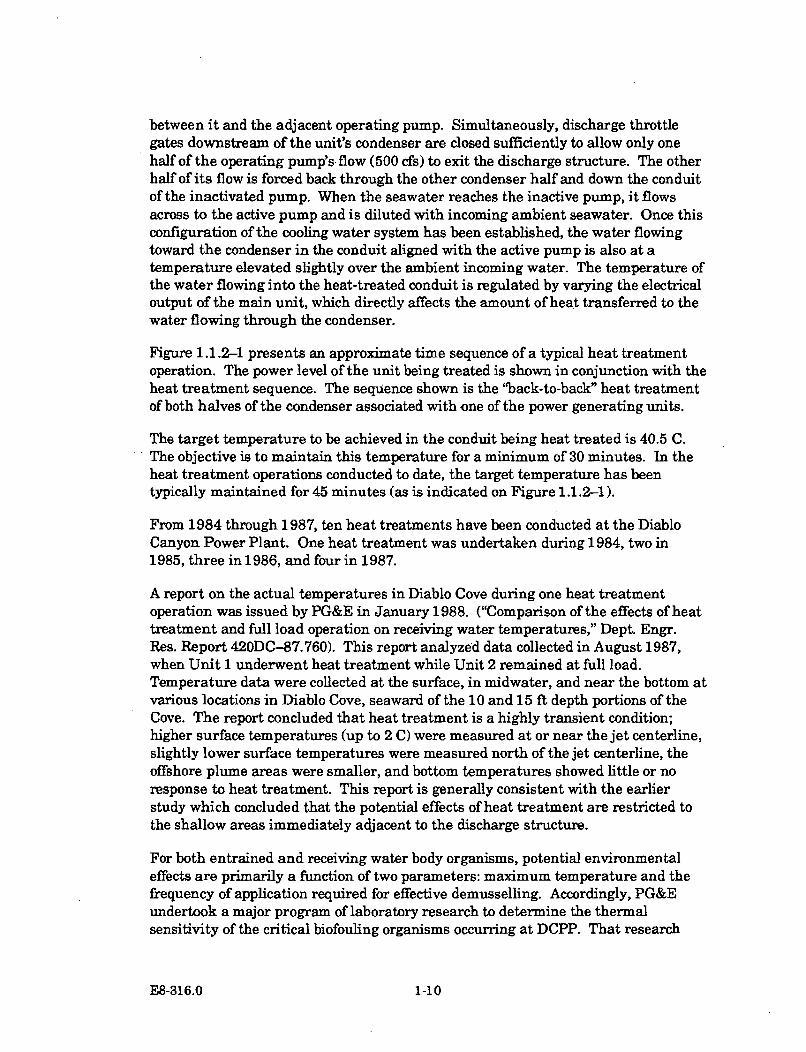
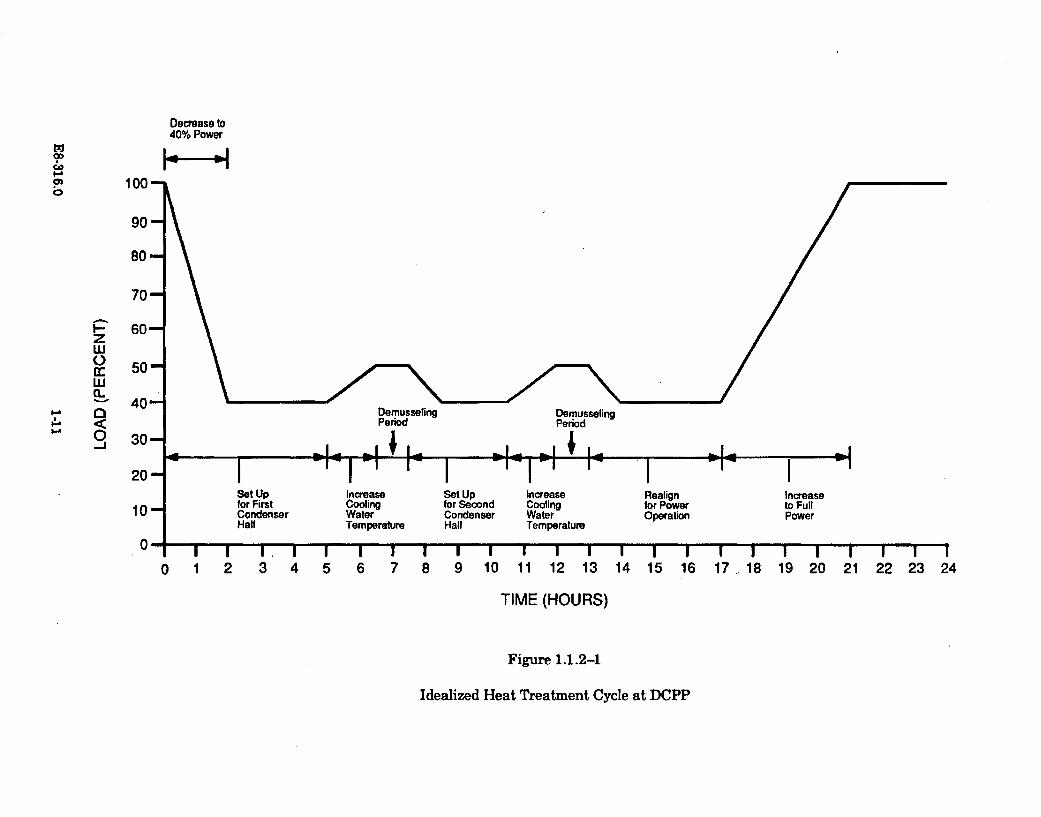
Figure 1.1.2-1 presents an approximate time sequence of a typical heat treatmentoperation. The power level of the unit being treated is shown in conjunction with theheat treatment sequence. The sequence shown is the "back-to-back" heat treatmentof both halves of the condenser associated with one of the power generating units.
The target temperature to be achieved in the conduit being heat treated is 40.5 C.The objective is to maintain this temperature for a minimum of 30 minutes. In theheat treatment operations conducted to date, the target temperature has beentypically maintained for 45 minutes (as is indicated on Figure 1.1.2-1).
From 1984 through 1987, ten heat treatments have been conducted at the DiabloCanyon Power Plant. One heat treatment was undertaken during 1984, two in1985, three in 1986, and four in 1987.
A report on the actual temperatures in Diablo Cove during one heat treatmentoperation was issued by PG&E in January 1988. ("Comparison of the effects of heattreatment and full load operation on receiving water temperatures," Dept. Engr.Res. Report 420DC-87.760). This report analyzed data collected in August 1987,when Unit 1 underwent heat treatment while Unit 2 remained at full load.Temperature data were collected at the surface, in midwater, and near the bottom atvarious locations in Diablo Cove, seaward of the 10 and 15 ft depth portions of theCove. The report concluded that heat treatment is a highly transient condition;higher surface temperatures (up to 2 C) were measured at or near the jet centerline,slightly lower surface temperatures were measured north of the jet centerline, theoffshore plume areas were smaller, and bottom temperatures showed little or noresponse to heat treatment. This report is generally consistent with the earlierstudy which concluded that the potential effects of heat treatment are restricted tothe shallow areas immediately adjacent to the discharge structure.
For both entrained and receiving water body organisms, potential environmentaleffects are primarily a function of two parameters: maximum temperature and thefrequency of application required for effective demusselling. Accordingly, PG&Eundertook a major program of laboratory research to determine the thermalsensitivity of the critical biofouling organisms occurring at DCPP. That research
E8-316.0 1-10
Decrease to40% Power
'-A100-
90-
80-
70-
- 60-zwCC 50-w040a Demusseting Demusseling<• Period Period
0 30- - 1
Set Up Increase Set Up Increase Realign Increasefor First Cooling for Second Cooling for Power to Full10 ==Cndne Water Condenser Water Operation Power
Hall Temperature Hall Temperature0- ' I I I.1 I I I I I I I I I I I I l I
0 1 2 3 4 5 6 7 8 9 10 11 12 13 14 15 16 17 18 19 20 21 22 23 24
TIME (HOURS)
Figure 1.1.2-1
Idealized Heat Treatment Cycle at DCPP
has defined the minimum times and temperatures needed to produce an effectivedemusselling. This information has been used in establishing the targettemperatures and durations of heat treatment operations conducted at DCPP todate.
In continuing studies, PG&E has designed and operated an experimental facility atthe DCPP site that provides an indication of fouling levels in the conduits. Thisfacility is used to determine when heat treatment is necessary. The initial results ofthese studies have indicated that the experimental facility provides a good index ofthe timing and rates of settlement of the species of concern. This information isprocessed through a mathematical model that predicts growth rates and thusprovides an indication of the time at which the organisms will reach a critical sizerequiring heat treatment.
1.2 Marine Research Background
Marine environmental studies at Diablo Canyon have been pursued since 1966. Onesuch study, which has been conducted by Dr. Wheeler North periodically since 1968,has provided an extensive inventory of intertidal and subtidal species.
In 1975, PG&E submitted to the Regional Board and began to implement a plan fora thermal effects study program pursuant to Section 316(a) of the Clean Water Act.The study plan outlined a wide range of research strategies to assess both thegeneral ecological effect of the power plant discharge and the effect of the dischargeon a set of the 21 representative, important species identified by the CaliforniaDepartment of Fish and Game. Procedures for these studies were documented andaccompanied a tabular presentation of field data in annual progress reports to theRegional Board. A review of the literature on the 21 representative, importantspecies was presented in a 1981 report, and complete results of the Thermal EffectsLaboratory experiments were presented in a three-volume Compendium submittedin 1982.
Thousands of hours have been spent by scientists counting, cataloging, measuring,and analyzing the marine biota in Diablo Cove and the surrounding area. Threeprincipal teams, PG&E, CDF&G, and PG&E's consultants, have continuouslyconducted research programs on the site's marine ecology since 1976, and some ofthe studies were begun as early as 1966. It can be confidently stated that no otherdischarge site on the Pacific Coast has as extensive a baseline data base as DiabloCanyon. Additionally, no other coastal discharger has constructed a marinelaboratory of the size and sophistication of the DCPP thermal effects marinelaboratory, specifically to study the potential effects of a discharge.
The marine monitoring and laboratory research initiated in 1976 by implementationof the 316(a) Demonstration Study Plan was continued as the NPDES PermitThermal Effects Monitoring Program (TEMP) in 1982. In January 1988, a long-termMarine Environmental Monitoring Program (MEMP) was initiated, which willcontinue to monitor many of the historical biological and physical data stations, both
E8-316.0 1-12
intertidal and subtidal, in Diablo Cove and surrounding areas. The CaliforniaDepartment of Fish and Game conducted studies from 1969-1982. In addition tothese programs, PG&E has supported a number of other marine research programsat Diablo Canyon, including studies of intertidal fishes and offshore fisheries,impingement and entrainment of organisms in the power plant cooling watersystem, chlorine and heat effects on selected species, temperature, wave, andcurrent regimes, thermal plume modeling, breakwater reconstruction activities,emplacement and biological development of an artificial reef, intertidal algal andinvertebrate association studies, and Dr. Wheeler North's transect studies. Achronology and brief description of some of these studies follows in Table 1.2-1.
1.3 Environmental Setting
This section of the report describes the environmental setting of the Diablo CanyonPower Plant (DCPP) for the purpose of establishing a perspective from which onemay assess the environmental changes in Diablo Cove which have resulted from theoperation of the power plant's cooling water system. The description focuses on thethree environmental elements of geography, oceanography, and biology that incombination and interaction create the environmental setting of the power plant.Section 1.3.1 describes the geography and the environmental implications of thesite's location, Section 1.3.2 describes the oceanographic setting, and Section 1.3.3describes the intertidal and subtidal portions of the marine communities comprisingthe site's biological setting.
L3.1 General Description of the Diablo Canyon Power PlantEnvirons
The Diablo Canyon Power Plant (DCPP) is located on a narrow coastal terraceapproximately 85 feet above the rocky shores of the Pacific Ocean. Approximately1,000 ft inland the terrain rises steeply, reaching elevations of 1,200 ft along theeastern boundary of the plant. This ridge is oriented parallel to the coast in asoutheast-northwest direction. A map and diagram of the power plant'sgeographical location and a layout of the power plant site and the area's shorelinefeatures are shown in Figure 1.1-1. The coastal terrace extends along the shorelinefor approximately 15 miles between the towns of Morro Bay to the north and AvilaBeach to the south. The power plant is located roughly in the middle of this rockyshoreline section of the coast. The closest large city, San Luis Obispo, is locatedapproximately 12 miles east and inland from the power plant. To the north andsouth of this 15-mile section of steep cliffs and rocky shores, the coastline consists ofsandy beaches and the shallow offshore shelves of two large bays.
The shoreline in the immediate vicinity of the plant is a series of semiprotectedsmall coves. As shown in Figure 1.1-2, they are identified as Field's (North) Cove,Diablo Cove, and South Cove. Intake Cove was formed by adding breakwaters to anatural indentation between Diablo Cove and South Cove. Heavy wave action,strong and persistent currents, and a wide variety of shoreline and seabed features
E8-316.0 1-13
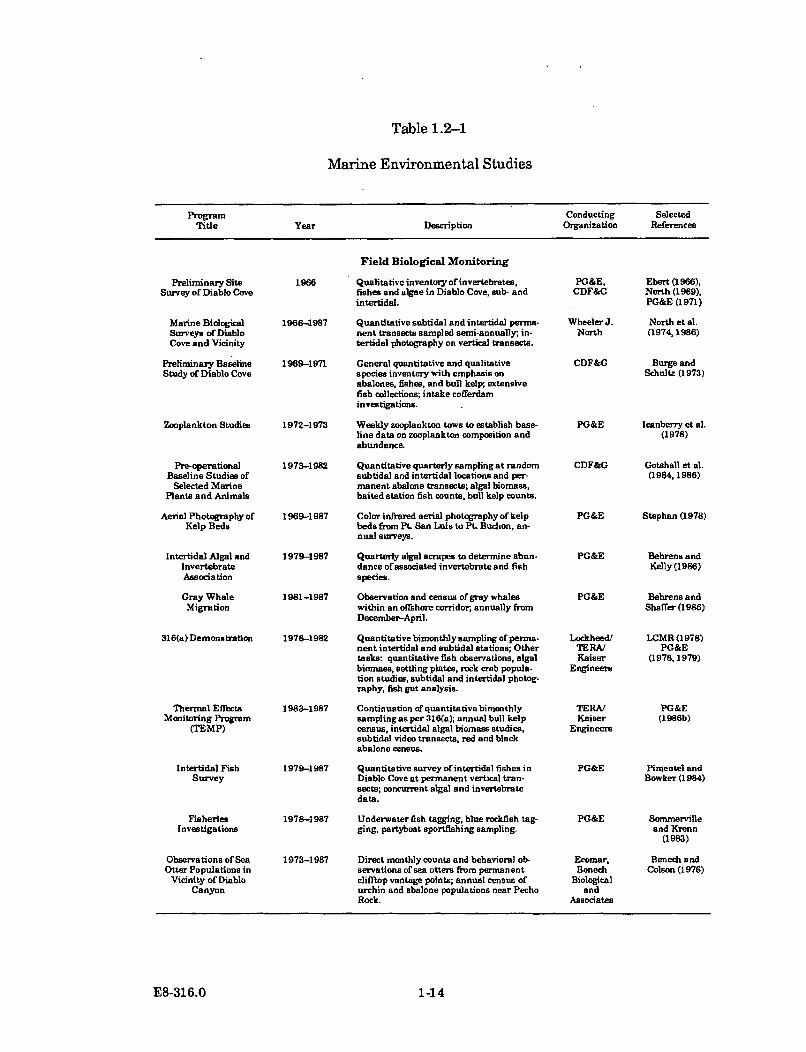
Table 1.2-1
Marine Environmental Studies
Program Conducting SelectedTitle Year Description Organization References
Preliminary SiteSurvey of Diablo Cove
Marine BiologicalSurveys of DiabloCove and Vicinity
Preliminary BaselineStudy of Diablo Cove
Zooplankton Studies
Pre-operationalBaseline Studies of
Selected MarinePlants and Animals
Aerial Photography ofKelp Beds
Intertidal Algal andInvertebrateAssociation
Gray WhaleMigration
316(a) Demonstration
1966
Field Biological Monitoring
Qualitative inventory of invertebrates,fishes and algae in Diablo Cove, sub- andintertidal.
PG&E,CDF&G
Ebert (1966),North (1969),PG&E (1971)
1968-1987 Quantitative subtidal and intertidal perma-nent transects sampled semi-annually- in-tertidal photography on vertical transects.
1969-1971 General quantitative and qualitativespecies inventory with emphasis onabalones, fishes, and bull kelp; extensivefish collections; intake cofferdaminvestigations.
1972-1973 Weekly zooplankton tows to establish base-line date on zooplankton composition andabundance.
1973-1982 Quantitative quarterly sampling at randomsubtidal and intertidal locations and per-manent abalone transects; algal biomass,baited station fish counts, bull kelp counts.
1969-1987 Color infrared aerial photography of kelpbeds from Pt. San Luis to Pt. Buchon, an-nual surveys.
1979-1987 Quarterly algal scrapes to determine abun-dance ofassociated invertebrate and fishspecies.
1981-1987 Observation and census of gray whaleswithin an offshore corridor, annually fromDecember-April.
1976-1982 Quantitative bimonthly sampling of perma-nent intertidal and subtidal stations; Othertasks: quantitative fish observations, algalbiomass, settling plates, rock crab popula-tion studies, subtidal and intertidal photog-raphy, fish gut analysis.
1983-1987 Continuation of quantitative bimonthlysampling as per 316(a); annual bull kelpcensus, intertidal algal biomass studies,subtidal video transects, red and blackabalone census.
1979-1987 Quantitative survey of intertidal fishes inDiablo Cove at permanent vertical tran-sects; concurrent algal and invertebratedata.
1978-1987 Underwater fish tagging, blue rockfish tag-ging, partyboat sportfishing sampling.
1973-1987 Direct monthly counts and behavioral ob-servations of sea otters from permanentclifftop vantage points; annual census ofurchin and abalone populations near PechoRock.
WheelerJ. North et al.North (1974, 1986)
CDF&G Burge andSchultz (1973)
PG&E Icanberry et al.(1978)
CDF&G Gotshall et al.(1984,1986)
PG&E Stephan (1978)
Thermal EffectsMonitoring Program
(TEMP)
Intertidal FishSurvey
FisheriesInvestigations
Observations of SeaOtter Populations in
Vicinity of DiabloCanyon
PG&E
PG&E
Lockheed/TERA/Kaiser
Engineers
TERA/Kaiser
Engineers
PG&E
PG&E
Ecomar,Benech
Biologicaland
Associates
Behrens andKelly (1986)
Behrens andShaffer (1986)
LCMR (1978)PG&E
(1978,1979)
PG&E(1986b)
Pimentel andBowker (1984)
Sommervilleand Krenn
(1983)
Benech andColson (1976)
E8-316.0 1-14
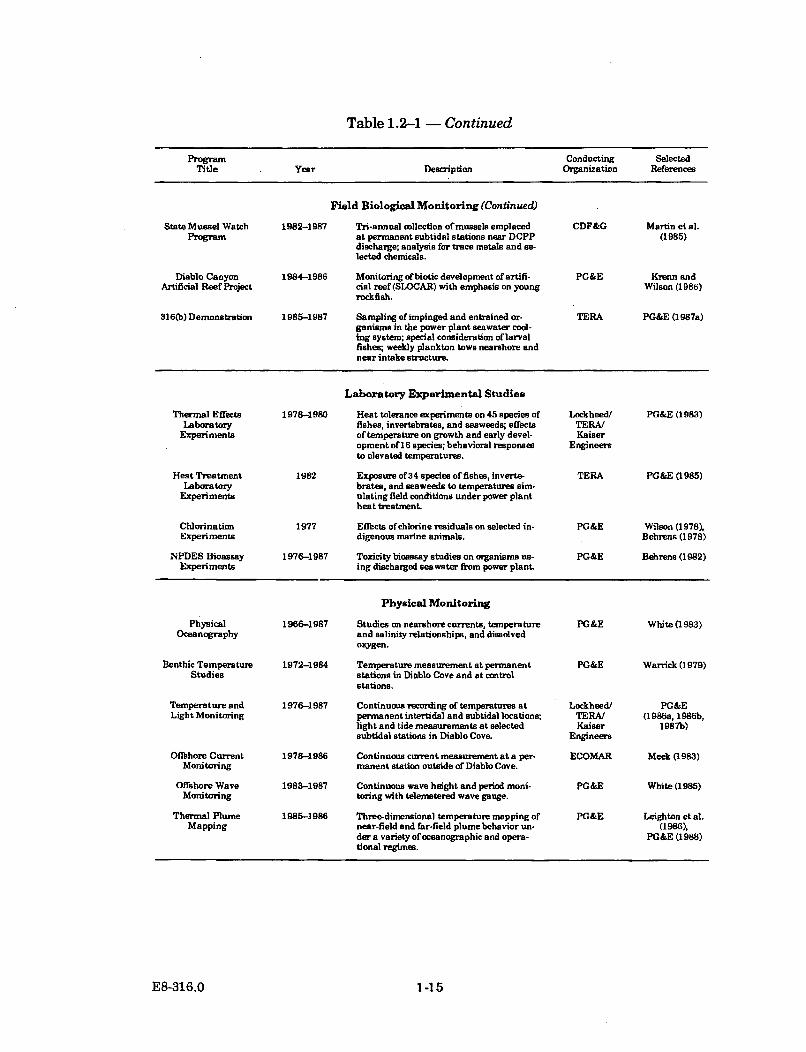
Table 1.2-1 - Continued
Program Conducting SelectedTitle Year Description Organization References
Field Biological Monitoring (Continued)
State Mussel Watch 1982-1987 Tri-annual collection of mussels emplaced CDF&G Martin et al.Program at permanent subtidal stations near DCPP (1985)
discharge; analysis for trace metals and se-lected chemicals.
Diablo Canyon 1984-1986 Monitoring ofbiotic development of artifi- PG&E Krenn andArtificial Reef Project cial reef(SLOCAR) with emphasis on young Wilson (1986)
rockfish.
316(b) Demonstration 1985-1987 Sampling of impinged and entrained or- TERA PG&E (1987a)ganisms in the power plant seawater cool-ing system; special consideration of larvalfishes; weekly plankton tows nearshore andnear intake structure.
Laboratory Experimental Studies
Thermal Effects 1978-1980 Heat tolerance experiments on 45 species of Lockheed/ PG&E (1983)Laboratory fishes, invertebrates, and seaweeds; effects TERA/
Experiments oftemperature on growth and early devel- Kaiseropment of16 species; behavioral responses Engineersto elevated temperatures.
Heat Treatment 1982 Exposure of734 species of fishes, inverte- TERA PG&E (1985)Laboratory brates, and seaweeds to temperatures sim-
Experi ments ulating field conditions under power plantheat treatment.
Chlorination 1977 Effects of'chlorine residuals on selected in- PG&E Wilson (1978),Experi ments digenous marine animals. Behrens (1978)
NPDES Bioassay 1976-1987 Toxicity bioassay studies on organisms us- PG&E Behrens (1982)Experiments ing discharged seawater from power plant.
Physical Monitoring
Physical 1966-1987 Studies on nearshore currents, temperature PG&E White (1983)Oceanography and salinity relationships, and dissolved
oxygen.
Benthic Temperature 1972-1984 Temperature measurement at permanent PG&E Warrick (1979)Studies stations in Diablo Cove and at control
stations.
Temperature and 1976-1987 Continuous recording of temperatures at Lockheed/ PG&ELight Monitoring permanent intertidal and subtidal locations; TERA/ (1986s, 1986b,
light and tide measurements at selected Kaiser 1987b)subtidal stations in Diablo Cove. Engineers
Oflshore Current 1978-1986 Continuous current measurement at a per- ECOMAR Meek (1983)Monitoring manent station outside of Diablo Cove.
Offshore Wave 1983-1987 Continuous wave height and period moni- PG&E White (1985)Monitoring toring with telemetered wave geuge,
Thermal Plume 1985-1986 Three-dimensional temperature mapping of PG&E Leighton etal.Mapping near-field and far-field plume behavior un- (1986),
der a variety of oceanographic and opera- PG&E (1988)tional regimes.
E8-316.0 1-15
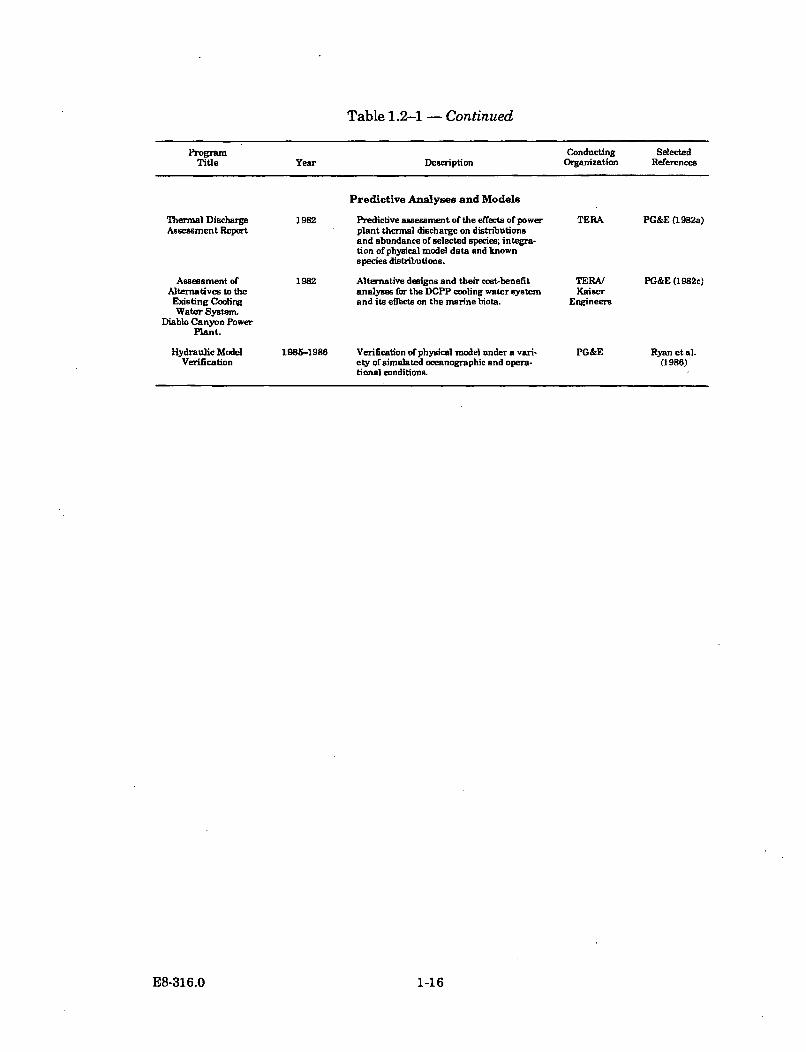
Table 1.2-1 - Continued
Program Conducting SelectedTitle Year Description Organization References
Predictive Analyses and Models
Thermal Discharge 1982 Predictive assessment of the effects of power TERA PG&E (1982a)Assessment Report plant thermal discharge on distributions
and abundance of selected species; integra-tion of physical model data and knownspecies distributions.
Assessment of 1982 Alternative designs and their cost-benefit TERA/ PG&E (I982c)Alternatives to the analyses far the DCPP cooling water system KaiserEdsting Cooling and its effects on the marine biota. EngineersWater System.
Diablo Canyon PowerPlant.
Hydraulic Model 1985-1986 Verification of physical model under a vari- PG&E Ryan etal.Verification ety of simulated oceanographic and opera- (1986)
tional conditions.
E8-316.0 1-16
produce a dynamic and complex nearshore habitat. The convoluted rocky shorelinehas a high vertical relief of broken cliffs, boulders and cobble, bedrock channels, andoffshore pinnacles. Few tidepools are found in the area due to the friable nature ofthe cliff materials and the absence of bedrock shelves along this shoreline. Thecoastline is unprotected from the ocean swells of the Pacific Ocean. North Pacificstorms in the Gulf of Alaska generate enormous winter storm waves which reachDiablo Cove with average heights of 10 to 15 feet, and maximum heights of 25 to 30feet. This high wave energy tears apart the shoreline cliffs, rolls boulders around inthe intertidal and shallow subtidal, and creates a very rigorous habitat in which onlyspecially adapted plants and animals can survive. This same wave energy hascarved inlets and indentations in the coastline and leaves only coarse gravel andcobble beaches. Some of the larger coves such as Diablo Cove have a small sandybar or beach.
The major portion of Diablo Cove is less than 25 feet (8 m) deep, and the bottom iscomposed of bedrock traversed by surge channels, boulders, and rock pinnacles. Theintertidal and subtidal rocky substrate is generally covered by dense growths ofseaweeds and invertebrates which are common along hundreds of miles of Californiacoastline. The numerous species of large seaweeds in the area, ranging in size fromred seaweeds 1 to 2 feet in length to the giant kelp over 90 feet long, provide habitatfor other smaller seaweeds, invertebrates, and fish. The seaweeds are similarlyimportant as food for abalone, urchins, and fish, which in turn become the preyitems of larger organisms such as rockfish and sea otters.
1.3.2 Oceanographic Setting
Climatology
The climate of the Diablo Canyon area is typical of the central California coastalregion. In the dry season, usually May through September, a high pressure area islocated off the California coast. This high pressure ridge deflects storms coming outof the North Pacific away from the coast. In the wet season, usually Novemberthrough March, the high pressure area weakens and moves southward, allowingPacific storms to enter. Over 80 percent of the average annual 16 in. of rainfalloccurs during these months. During the dry season, surface winds are generallyfrom the northwest; in the wet season, southwest winds are most common.Afternoon onshore winds are frequent during the dry season, followed at night byweak offshore winds.
Storm systems during the wet season are accompanied by strong winds. Winds atDiablo Canyon normally blow parallel to shore at speeds ranging from 10-15 milespre hour from the northwest and from 5-8 miles per hour from the southwest.
Coastal fog or low stratus clouds during the dry season are common. Airtemperatures are relatively constant due to the marine influence, with a typicalmean minimum of 7 C in winter and 13-15 C in summer, and a mean maximum of15.5 C in winter and 19 C in summer.
E8-316.0 1-17
Bathymetry
The underwater shape of Diablo Cove has been computer contoured in threedimensions and is illustrated in Figure 1.3.2-1. The DCPP discharge enters DiabloCove, then flows into open ocean approximately 1,800 feet from the discharge point.The major portion of Diablo Cove is less than 25 ft (8 m) in depth, and theunderwater seabed is composed primarily of bedrock, overlain with boulders, cobble,and sand. About halfway across the cove, the bottom drops rapidly to a depth ofapproximately 60 ft at the cove entrance. Beyond the cove in the nearshore region,the seabed continues to slope downward for approximately 50 miles across thenarrow continental shelf to a depth of 3,000 ft.
Inside the cove the prominent features include rock pinnacles, channeled bedrock,and large boulders. Bifurcating the entrance to Diablo Cove is Diablo Rock, whichhas an elevation of approximately 100 ft. In the southern portion of Diablo Cove,there are sandy bottom areas where sand transported by local currents collects inchanneled areas. The source of the cove's sand is believed to be the Diablo Creekwatershed, which enters Diablo Cove just north of the DCPP discharge. Duringmost of the year, the currents in the cove move in a semicircular north-to-southpattern. This pattern tends to carry sand from Diablo Creek to the southern portionof the cove and deposit it as the current velocity and waves decrease. The northportion of the cove has practically no large sand deposits.
Waves
As previously noted, Diablo Cove is located along an exposed portion of the centralcoast of California. The coastline consists of steep cliffs, which provide littleprotection from wave shock. During the winter, large storms in the North Pacificcan generate waves out of the north-northwest that reach heights of up to 25 ft inthe Diablo Canyon area. The area is also exposed to south-southwesterly swells thatare generated from summer storms off Mexico.
To the south-southwest and north-northwest is a region that is subject to virtuallyunlimited fetch, i.e., no land obstructions. Because of this and the previouslydescribed climatological characteristics, locally generated seas can be intense.
Currents
Coastal winds are responsible for the nearshore ocean currents along the Californiacoast. These winds, as previously mentioned, are predominantly from the northwestwhen a high pressure system is off the coast and move the surface of the water inthe general direction of the wind. The rotation of the earth causes any motion in thenorthern hemisphere to appear to move in a clockwise direction, i.e., to bend to thewest when the motion is in the direction of the equator. This effect, known as theCoriolis force, causes the surface water moved by the wind to bend in a clockwisedirection. Therefore, the surface water moves to the right of the wind directionalong the California coastline. With the winds blowing from north to south, the
E8-316.0 1-18
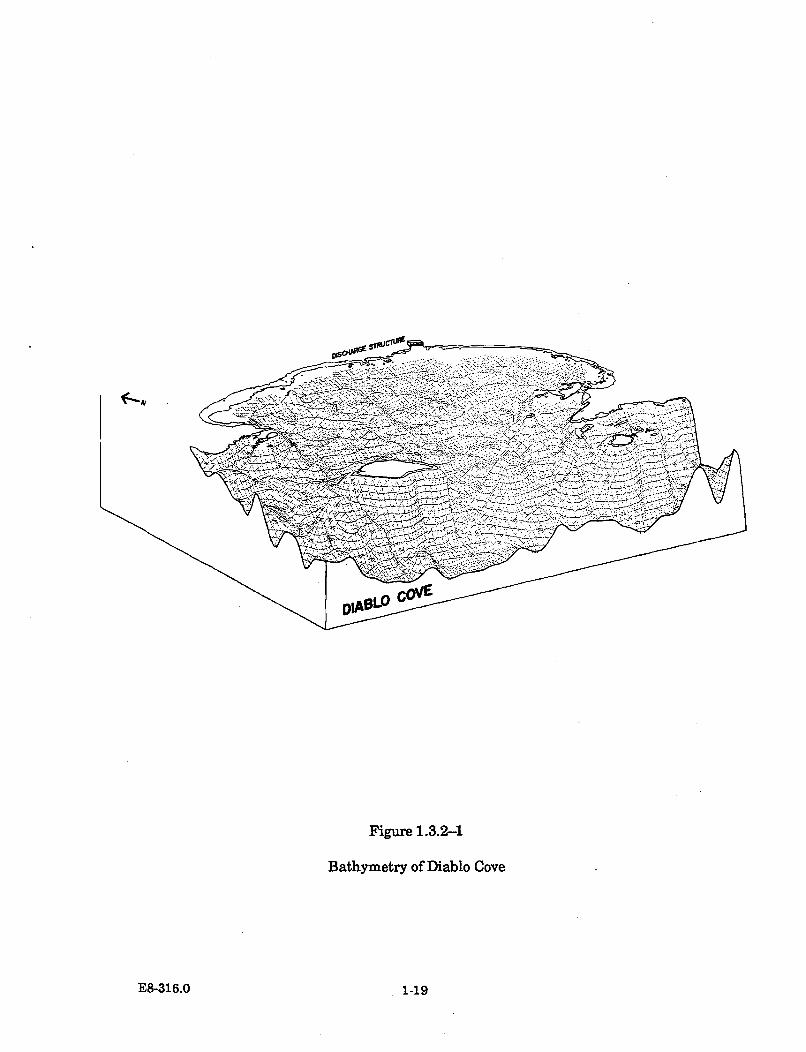
Figure 1.3.2-1
Bathymetry of Diablo Cove
E8-316.0 1-19
water at the surface is transported offshore. As this surface water moves offshore, itis replaced by cold bottom water coming from ocean depths of 1,000 to 3,000 ft. Thiscold bottom water, known as upwelling water, moves onshore and producesunusually low water temperatures along California's coast. Similar coastal windpatterns produce very cold nearshore water of a comparable upwelling volume andpersistence in only three other areas of the world, namely, the west coast of Europe,the west coast of Africa, and the west coast of South America. June and July are thecoldest seawater months of the year along the California coast, because upwelling isthen strongest.
The nearshore current process is illustrated schematically in Figure 1.3.2-2. Asillustrated, the winds which blow from north to south appear from February throughJuly. This wind causes the water at the surface to move offshore and be replaced bycold bottom water. Normally, during this ocean season a temperature difference ofalmost 8 C (18 C offshore and 10 C onshore) exists between the offshore and onshorewaters in the coastal region of Diablo Canyon. During the other ocean season,August to January, the winds and the strong upwelling coastal current abate and attimes nearly cease. At this time of the year the temperature difference betweenoffshore and onshore waters is approximately 2.7 C. The change in nearshore watertemperature indicates the presence or absence of the upwelling process. Thephenomenon of upwelling is one of the two oceanographic periods observed nearDiablo Canyon.
Upwelling also occurs during the Oceanic Period, the second ocean season, but at amuch reduced level. The Oceanic Period is better characterized by the behavior ofthe ocean currents offshore of Diablo Canyon (about 35°N). These currents are apart of the broad California current, which flows slowly in a clockwise circulation inthe North Pacific Ocean. The California current flows generally toward the equatoruntil it reaches a latitude of about 25°N, when it begins to turn westward andbecomes a part of the west-flowing North Equatorial Current. When the inshoreportion of this current flows immediately adjacent to the coast, from the NW to theSE in the vicinity of Diablo Canyon, this is termed the Oceanic Period.
There is also a deepwater (subsurface) countercurrent flowing poleward, part ofwhich under certain meteorological and other conditions flows as a surface currentalong the coast inshore of the California current. This normally occurs during thewinter months (December-January). The prevailing winds off the Pacific Coast ofthe U.S. shift during the late fall and winter. The stress exerted on the sea surfaceby these winds becomes southerly north of about 42°N, although the northwesterlywinds south of about 40°N decrease in their strength. The poleward-flowing surfacenearshore current is known as the Davidson Current.
Generally, the two oceanographic periods, and the currents within each, are
delimited as follows:
0 Upwelling Period: February to July
E8-316.0 1-20
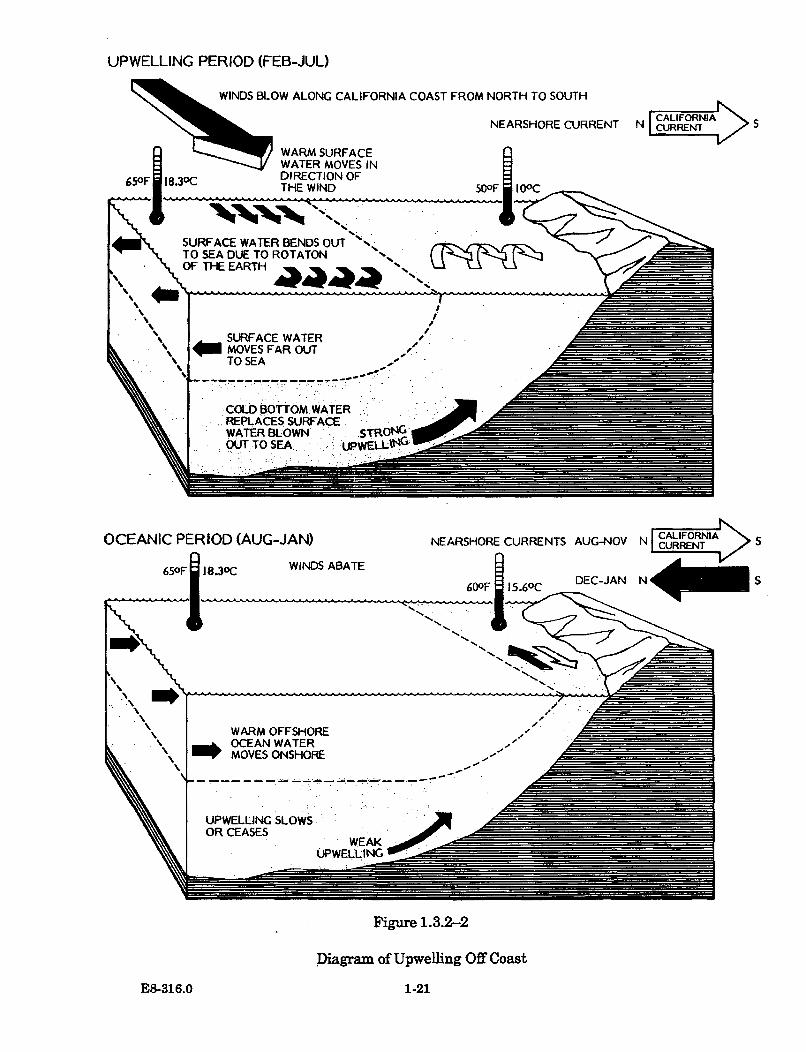
UPWELLING PERIOD (FEB-JUL)
WINDS BLOW ALONG CALIFORNIA COAST FROM NORTH TO SOUTH
WARM SURFACEWATER MOVES INDIRECTION OFTHE WIND
NEARSHORE CURRENT N I s
50OFI 10C
SURFACE WATER BENDS OUT'%K.TO SEA DUE TO ROTATONOF THE EARTH cF~
II
I/,
SURFACE WATERMOVES FAR OUTTO SEA
COLD BOTTOM WATERREPLACES SURFACEWATER BLOWNOUTTO SEA ".
STROt4*WELLvt4G
OCEANIC PERIOD (AUG-JAN) NEARSHORE CURRENTS AUG-NOV N CURFENIA 5n m
S
Figure 1.3.2-2
Diagram of Upwelling Off Coast
E8-316.0 1-21
Oceanic Period: August to January
- California Current: August to November
- Davidson Current: December to January
The currents nearshore to Diablo Canyon have been measured and observed. BothEulerian and Lagrangian methods have been used to determine the speed anddirection of the currents. The currents flow south 47% of the time and north 37% ofthe time.
These "classical" patterns have been observed:
* The currents flow south when the California current dominates thenearshore regime in the late winter through late summer months.
* The currents flow north during the fall and winter months, when theCalifornia current weakens and the deepwater countercurrent (Davidson)predominates in the nearshore waters.
The currents at Diablo Canyon exhibit characteristics typical for nearshore, exposedcoastal locations. Among these are:
" The currents are the sum of at least these forces:
- wind-induced currents
- tidal currents
- littoral currents
* The currents can exhibit direction reversals within short time spans.
1.3.3 Marine Environment
Diablo Cove supports a wide variety of marine plants (algae) and invertebrate, fish,and mammal species that are commonly found in other central California open coastenvironments. The species are adapted to colonize, grow, and reproduce in thepresence of waves which continually sweep the shore. The invertebrate and algalspecies are derived from and maintained by an enormous seasonal supply of larvaeand spores that are carried by the persistent longshore currents that continuallycontact the shores. If the physical characteristics (wave exposure, duration of tidalexposure, substrate stability, light, and temperature) and biological characteristics(food resources and low numbers of competitors) are favorable in the area, thosespecies which are best suited to survive in the habitat will become established.
Based on a definition involving proximity and interactions, the collective plant andanimal species in a given area are commonly referred to as a community. Ecologistscommonly define a biological community by the presence of key species which, bytheir ecological role, largely determine the characteristics of that community. Manybiological interactions, such as competition for space, grazing, and predation, etc.,
E8-316.0 1-22
determine the relative abundances of the organisms and their distributions(community structure).
The relative importance of the many factors that structure open coast communitiesis often difficult to assess because of the complexity of the physical and biologicalinteractions. However, the factors themselves are recognized. Substrate availabilityand spore and larval availability are interrelated factors that are all required for therecruitment of many benthic species. The amount of open substrate available forcolonization by these species is often seasonal and patchy, strongly associated withrecurrent winter storms. Other important factors that may affect growth,development, and behavior include temperature, light, and nutrient availability,which also change seasonally. The upwelling oceanographic period beginning inspring provides cold and nutrient-rich water from oceanic depths to the nearershoreline marine communities. This coincides with longer days, and thecombination of these factors stimulates growth in the marine plants. The plants areoften disrupted later by the winter storms. Animals which consume detached algalmaterial benefit by the winter disturbances, which result in greater food resourcesbeing made available to them. Although such physical and biological interactionscan affect the abundances of organisms, habitat type (geographical relief, substratetype, presence of algae, etc.) also generally creates patchy species distributions.These are but a few factors that shape Diablo Cove's marine community and othernearshore marine communities along the open coast of central California.
Diablo Cove is about 40 acres in area, and is rimmed by a rocky shoreline. DiabloRock is situated near the mouth of the cove. Various amounts of fresh water,depending on rain activity, are emptied into the cove via Diablo Creek, whose mouthis located near the head of the cove. The DCPP discharge structure is located justsouth of Diablo Creek. Approximately 80 percent of the subtidal area in Diablo Coveis at a depth of 20 ft MLLW or less. The maximum depth of Diablo Cove is about55 ft.
The following topics are treated in greater detail for both the intertidal and subtidalcommunities in Diablo Cove: predominant physical characteristics, the generaldistribution and abundance of the biota prior to power plant operation, and some ofthe important ecological interactions. Some of the large-scale shifts that occurred inthese areas prior to power plant operation are briefly described at the end of thissection. Further information on the changes, as well as on smaller-scale importantevents, is presented later in this report in the individual species documents (Section3.2.3) and in the assessments of thermal impacts on the community (Section 3.2.4).
L3.3.1 Intertidal Community
The intertidal zone within Diablo Cove is partially protected by Diablo Rock fromthe predominant northwest swell and waves. On the other hand, the rockyheadlands on either side of the cove are fully exposed to the wave energy of the opensea. Within the cove there are large differences between the north and south areasin several physical characteristics. In general, the north area is composed mainly of
E8-316.0 1-23
bench rock and boulders that create moderately high bathymetric relief, whereas inthe south portion of the cove the substrate is largely low-relief bench rock and cobblefields. However, during the 1982/1983 winter storms a portion of south Diablo Cove(TEMP intertidal Station 12) became covered with fragmented cobble that wasderived from the erosion of a nearby pinnacle. Higher in the intertidal zone on bothsides of the cove are cobble fields and large boulders, which extend to the bases ofthe terrestrial cliffs. Wave impact on the north shores is greater than on the southshores. On the other hand, the south shores are subject to greater scouring by sand,which comes from sand channels that are located immediately offshore. Accordingly,disturbance-related changes in the intertidal biota have occurred over larger areason the south than on the north shores due to unstable cobble and sand scour. Incertain areas in north Diablo Cove, some small-scale sand scouring has occurred, aswell as boulder overturnings.
Many intertidal species are restricted to certain elevations (horizontal bands) alongthe shoreline. The upper vertical limit of a species is largely determined by itsability to withstand desiccation. Competition, predation, presence/absence of certainspecies, microhabitat differences, and disturbances are other important factors thatdetermine where species occur. On wave-exposed shores, such as the north andsouth headlands of Diablo Cove, wave run-up and splash enables intertidal speciesto survive at elevations higher than those at which they are normally found in theintertidal zone. Some species are adapted to high water motion and are moreabundant where it is prevalent, while others prefer to live in more protectedhabitats.
A representative vertical distribution profile of conspicuous intertidal organisms inDiablo Cove is depicted in Figure 1.3.3.1-1. The diversity of algal and invertebratespecies tends to increase from high to low intertidal areas. The high intertidal, onlyoccasionally splashed by waves, is generally very sparse in algal cover, with largeexpanses of barren rock. In these areas periwinkle snails (Littorina spp.) may befound in the rock crevices, while turban snails (Tegula spp.) and lined shore crabs(Pachygrapsus crassipes) may be found in the shade of boulders. Lower in theintertidal (about +4 ft MLLW) algal cover becomes more conspicuous, although theremay still be extensive areas of barren rock. This level is generally occupied withscattered clumps of rockweed species (Fucus distichus and Pelvetia fastigiata) andnailbrush seaweed (Endocladia muricata). Owl limpets (Lottia spp.) areconspicuous, and sometimes they use the algal cover for protection from desiccation.The +3 ft MLLW elevations are typically populated with the same species found inthe higher elevations, plus iridescent seaweed (Iridaea flaccida) and grapestoneseaweed (Mastocarpus papillatus). Crustose algal species commonly occur as abasement layer beneath the more upright foliose algal species in this and lowerelevation areas. Occasionally a high intertidal tidepool will contain species morecommonly found in lower elevation habitats. Hermit crabs (Pagurus spp.), blackabalone (Haliotis cracherodii), other snails, motile and tube-forming worms,encrusting bryozoans, sponges, and tunicates all become more common in the lowerintertidal regions, where longer periods of submergence occur. Fish species such as
E8-316.0 1-24
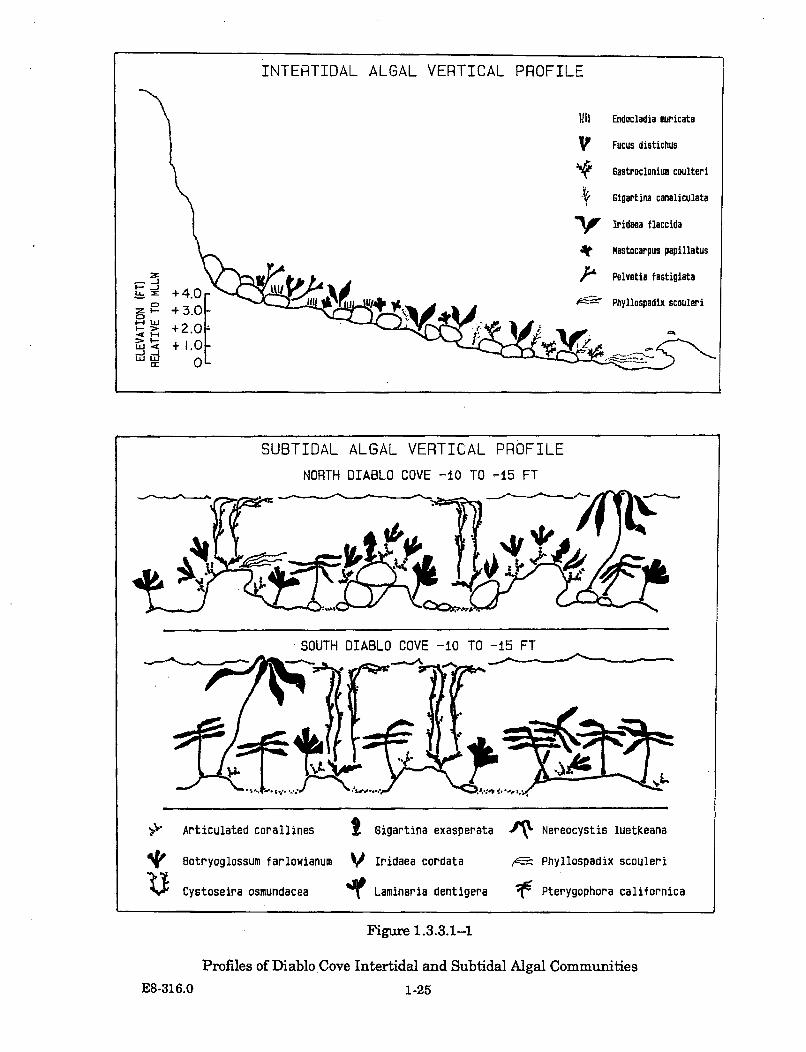
INTERTIDAL ALGAL VERTICAL PROFILE
till
Endacladia auricata
Fucus distichus
6astroclaninu coulteri
Gigaptina canaliculata
Iridaea flaccida
Mastocarpus papillatus
Pelvetia fastiglata
Phyflospadix scouleriS+4.(
03Z-02.
LU -ýUjc
SUBTIDAL ALGAL VERTICAL PROFILE
NORTH DIABLO COVE -10 TO -15 FT
SOUTH DIABLO COVE -10 TO -15 FT
Articulated corallines
W Botryoglossum farlowianum
SCystoseira osmundacea
Gigartina exasperata
V Iridaea cordata
Laminaria dentigera
*P Nereocystis luetkeana
/ Phyllospadix scouleri
-11 Pterygophora californica
Figure 1.3.3.1-1
Profiles of Diablo Cove Intertidal and Subtidal Algal Communities
1-25E8-316.0
pricklebacks (Xiphister spp.) are also relatively common in the low intertidalunderneath cobbles, within small pockets of water, and underneath the cover ofalgae. Algal cover becomes greater on the rocks in the zone of about +1 ft MLLWand includes the following species: iridescent seaweed, grapestone seaweed, hollowbranch seaweed (Gastroclonium coulteri), and Christmas tree seaweed (Gigartinacanaliculata). Surfgrass (Phyllospadix scouleri) commonly fringes the shoreline atthe lower boundary of the intertidal zone at about the MLLW tidal level.
1.3.3.2 Subtidal Community
The topographical relief and substrate composition in shallow subtidal portions ofDiablo Cove (10 to 15 ft) is a continuum of what is present in the intertidal. As withthe intertidal, the subtidal on the north side is generally higher in relief, and isexposed to greater water motion than the south side. Surfgrass occurs in thetransition zone between the low intertidal and shallow subtidal, and forms grass-likemeadows to depths of about 5 ft. Below this zone, mats of articulated coralline algaeoccur which harbor numerous small snails and crustaceans among their entangledbranches. The common foliose red algal species Botryoglossum farlowianumcommonly grows on the branch tips of the articulated corallines in depths shallowerthan about 25 ft. Most of the red algal species occur in this zone because thepenetration of light, important for growth, is greatest in these areas. Brown turbansnails (Tegula brunnea), rock crabs (Cancer antennarius), and a variety of sea starsare common inhabitants of this zone. Encrusting invertebrates, including sponges,tunicates, bryozoans, and tube-dwelling worms, are also common on the rocks in allportions of Diablo Cove. Due to the lack of sediment accumulation and lesser algalgrowth, it is the vertical surfaces of the rocks which are typically colonized by thesespecies.
Tree kelp (Pterygophora californica) and oar kelp (Laminaria dentigera) areperennial kelps which also occur throughout all depths in Diablo Cove. In highdensities the canopies formed by these species have inhibited algal growth beneaththem by shading out necessary sunlight. Bull kelp (Nereocystis luetkeana) andbladder chain kelp (Cystoseira osmundacea) are two kelp species which grow to thesea surface annually in spring-fall. Because their canopies are annual, they havenot been important shade producers in Diablo Cove. Another kelp species, giantkelp (Macrocystis pyrifera), also occurs in Diablo Cove, but in limited numbers. Inthe deepest portions of the cove (25 to 50 ft), tree kelps and oar kelps stand aboutone meter tall, forming a canopy which predominates over the sparse understory.Many fish in Diablo Cove (primarily rockfish, Sebastes spp.) prefer to live nearirregularities over the bottom and in the water column. The canopies and stipes ofall the kelp species in Diablo Cove provide much of this habitat for these fishes,particularly the juveniles, which closely associate themselves with the kelp forprotection, while other species, such as senoritas (Oxyjulis californica) andsurfperches (embiotocids), swim more freely about the cove. Rock crevices at alldepths provide shelter for many animals, such as red abalone and benthicrockfishes.
E8-316.0 1-26
Figure 1.3.3.1-1 depicts the general bottom relief and distributions of the majoralgal species in the 10 to 15 ft depths in north and south Diablo Cove where TEMPsubtidal stations are located. In south Diablo Cove a notable change in speciesabundances occurred prior to power plant operation. Because of the low reliefbottom, all smaller algal forms were obligated to occur under the dense canopiesformed by the tree kelp and oar kelp species. The dense canopies, in fact, inhibitedthe growth of the algae beneath them by shading out necessary sunlight. As naturalreductions in these kelp species occurred, the abundances of the understory speciesincreased. In contrast, in the north portion of the cove, the kelp canopies have notbeen so extensively developed as to fully limit the abundance of the smaller algae.This was because many of the smaller algal forms were able to flourish on top of thehigher relief rocky outcroppings where the kelps could not persist because of thegreater water motion. Instead, the kelp species tended to occur at the bases of therocky outcroppings. This substratum-related partitioning of the kelps and smalleralgal forms created patches of foliose red algae dispersed around the kelp canopies innorth Diablo Cove.
Other large-scale changes occurred prior to power plant operation. In areas deeperthan about 15 ft, concentrations of red sea urchins grazed on and limited theabundance of algal species (North 1969). Sea otters, which arrived in the coveduring the mid-1970's, consumed many of the urchins, and kelp abundances soonincreased (Gotshall et al. 1984). The kelp species have persisted since that time.Also, prior to the mid-1 970's red abalone populations in Diablo Cove werecommercially harvested. They were also reduced by the sea otters, and theremaining abalone occurred primarily within protective crevices rather than out inthe open.
The winter of 1982/1983 brought extraordinarily severe storms (associated with the1983 El Nino event). In the intertidal, severe damages occurred primarily on thesouth shores of Diablo Cove. Several areas there become inundated with cobble andscoured by sand. This reduced the abundance of all biota living in these areas. Theshores of north Diablo Cove were less impacted, which resulted in most of thespecies being more abundant along the north shores. In the subtidal, the stormscaused large reductions in sea star species abundances. The following 1982/1983 ElNino event brought unusually warm, nutrient-depleted water into Diablo Cove. Thisaffected primarily the annual occurrence of bull kelp in Diablo Cove. The continuumof these changes during power plant operation is presented in Sections 3.2.3 and3.2.4.
E8-316.0 1-27
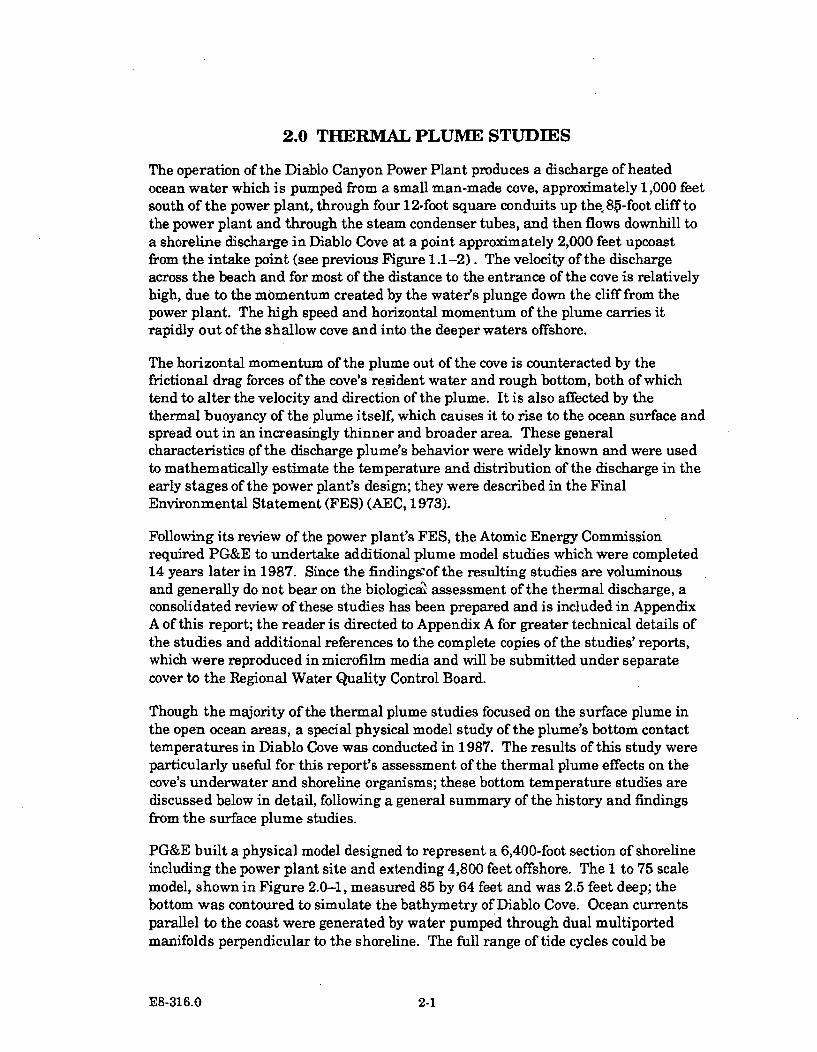
2.0 THERMAL PLUME STUDIES
The operation of the Diablo Canyon Power Plant produces a discharge of heatedocean water which is pumped from a small man-made cove, approximately 1,000 feetsouth of the power plant, through four 12-foot square conduits up theý 85-foot cliff tothe power plant and through the steam condenser tubes, and then flows downhill toa shoreline discharge in Diablo Cove at a point approximately 2,000 feet upcoastfrom the intake point (see previous Figure 1.1-2). The velocity of the dischargeacross the beach and for most of the distance to the entrance of the cove is relativelyhigh, due to the momentum created by the water's plunge down the cliff from thepower plant. The high speed and horizontal momentum of the plume carries itrapidly out of the shallow cove and into the deeper waters offshore.
The horizontal momentum of the plume out of the cove is counteracted by thefrictional drag forces of the cove's resident water and rough bottom, both of whichtend to alter the velocity and direction of the plume. It is also affected by thethermal buoyancy of the plume itself, which causes it to rise to the ocean surface andspread out in an increasingly thinner and broader area. These generalcharacteristics of the discharge plume's behavior were widely known and were usedto mathematically estimate the temperature and distribution of the discharge in theearly stages of the power plant's design; they were described in the FinalEnvironmental Statement (FES) (AEC, 1973).
Following its review of the power plant's FES, the Atomic Energy Commissionrequired PG&E to undertake additional plume model studies which were completed14 years later in 1987. Since the findingsrof the resulting studies are voluminousand generally do not bear on the biologica& assessment of the thermal discharge, aconsolidated review of these studies has been prepared and is included in AppendixA of this report; the reader is directed to Appendix A for greater technical details ofthe studies and additional references to the complete copies of the studies' reports,which were reproduced in microfilm media and will be submitted under separatecover to the Regional Water Quality Control Board.
Though the majority of the thermal plume studies focused on the surface plume inthe open ocean areas, a special physical model study of the plume's bottom contacttemperatures in Diablo Cove was conducted in 1987. The results of this study wereparticularly useful for this report's assessment of the thermal plume effects on thecove's underwater and shoreline organisms; these bottom temperature studies arediscussed below in detail, following a general summary of the history and findingsfrom the surface plume studies.
PG&E built a physical model designed to represent a 6,400-foot section of shorelineincluding the power plant site and extending 4,800 feet offshore. The 1 to 75 scalemodel, shown in Figure 2.0-1, measured 85 by 64 feet and was 2.5 feet deep; thebottom was contoured to simulate the bathymetry of Diablo Cove. Ocean currentsparallel to the coast were generated by water pumped through dual multiportedmanifolds perpendicular to the shoreline. The full range of tide cycles could be
E8-316.0 2-1
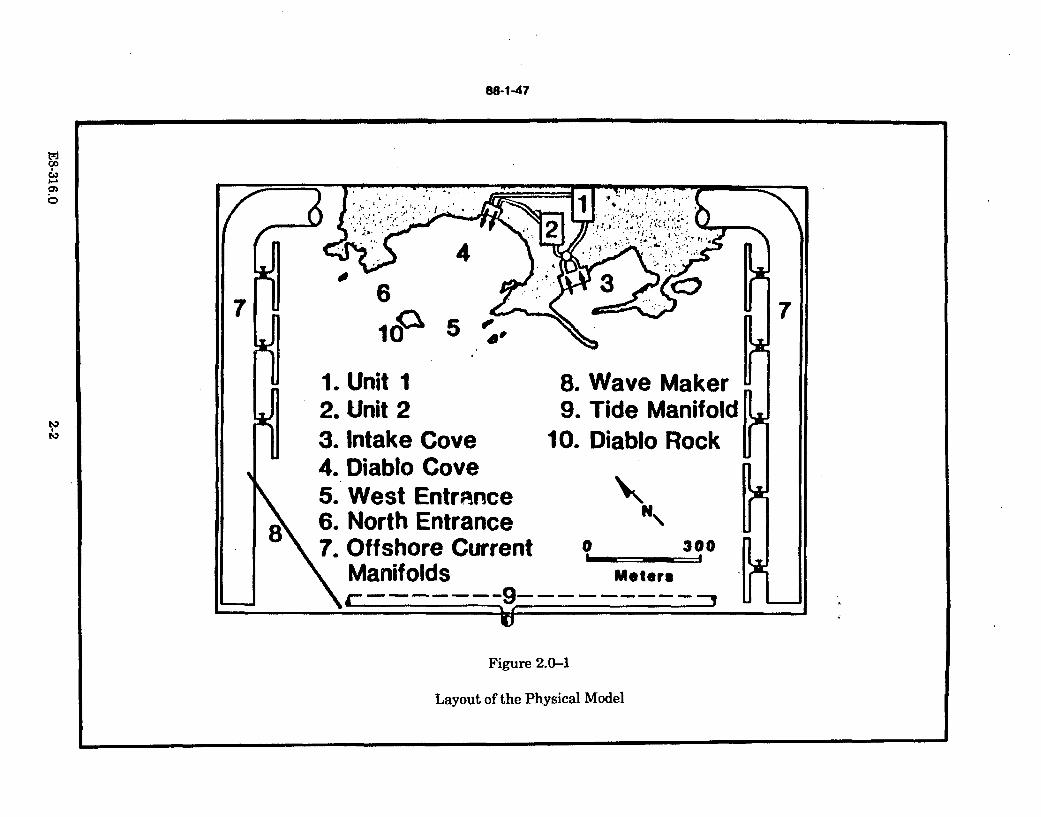
88-1-47
7 6 5-o0
1. Unit I2. Unit 29
3. Intake Cove 10
4. Diablo Cove5. West Entrance6. North Entrance7. Offshore Current
Manifolds
Figure 2.0-1
Layout of the Physical Model
generated, as well as a uniformly shaped wave of different heights. Heated waterwas produced to simulate the thermal discharge and was introduced into the modelthrough a scale-model discharge structure. A wide array of computer-managedtemperature sensing equipment was installed in the model basin. A travellingoverhead frame of temperature sensors was added to gather data more rapidly overa wide area of the model.
The finished model was hydraulically verified by comparing discharge currents inthe model and in Diablo Cove using patterns of tracer dye. The results from thehydraulically verified model which were reported as an addendum to the FinalEnvironmental Statement concluded that:
The temperature and area of the thermal plume would vary with the tidalcycle and offshore currents; the most adverse conditions would exist whenthe offshore current moved in a northerly direction.
" The temperature and area of the thermal plume was discovered to begreater than had previously been calculated.
* Outside Diablo Cove, the thermal plume would be no deeper than 10 feet.
Between 1984 and 1986, PG&E conducted a series of field studies to thermally verifythe model results.
Data obtained during Diablo Canyon power ascension testing of Units I and 2 wereused to calibrate and verify the model. In addition, data were analyzed to study theplume characteristics with respect to the effect of various environmental conditions.The jet/plume temperature distribution, centerline temperature decay, lateralspreading, penetration depth (lift-off depth), detachment distance, near-field and far-field surface isotherms, and stratification level were discussed in the light ofdifferent discharge and ambient conditions (such as tides, waves, and winds).
Field tests of the actual warm water discharge plume demonstrated reasonableagreement with the model's predictions of plume temperature and distributionoffshore; however, the field tests also indicated a significant disagreement betweenthe model's predicted plume temperature and distributions inside Diablo Cove. Themodel results had predicted that the thermal plume would constantly contact thesouthern shoreline of Diablo Cove with persistently higher temperatures than innorth Diablo Cove. The field tests showed that the highest shoreline and subtidalplume temperatures were recorded in north Diablo Cove and that the plume wasmost persistently in contact with that area; south Diablo Cove remainedsignificantly cooler than north Diablo Cove even after the start-up of Unit 2.
The model was redesigned to more accurately represent the cove's bathymetry,particularly the northwest-trending bedrock channels in the shallow area of theinitial discharge zone. Field data had shown that these underwater topographicfeatures acted to direct the discharge plume toward the north entrance of DiabloCove, particularly during low tide. The modified model was reverified with field test
E8-316.0 2-3
results and was employed in the special heat treatment studies in 1987, a portion ofwhich produced the only set of bottom contour temperatures from the model. Sincethese bottom contour results from the model are a basis of this report's findings,they are described separately in Section 2.2. A summary of the surface plumefindings are summarized in the following Section 2.1.
2.1 Surface Thermal Plume
The initial effects of the Unit 1 discharge on the receiving water temperatureregimes were studied extensively during the 1985 operational period following thestart of Unit 1 commercial operation. These special studies of the thermal plumewere conducted to evaluate the temperature mixing and decay process, and to mapthe thermal plume's geometry and dispersion patterns. These operational fieldsurvey data were compared in a series of analyses and reports to the earlierexperimental results obtained from the mathematical and physical model tests.During the thermal plume field studies, research vessels were equipped withspecialized electronic temperature-sensing and navigational equipment for theprecise concurrent collection of temperature and location data. The surfacedischarge plume was mapped inside and outside Diablo Cove.
Start-up tests of Unit 1 were completed during 1985, and commercial operation wasbegun in May. Following the introduction of the discharge to the cove, the intertidaland subtidal water temperatures in the northern areas of the cove and at theinshore base of Diablo Rock became significantly warmer than in the surroundingareas. The discharge temperature from Unit 1 varied with the unit's power level,but was generally 19 F (10 C) warmer than the intake water temperature dur.ngfull power conditions. During most of the year, the Unit 2 discharge was oper•ted atfull flow without heat; this cold water flow from Unit 2 mixed partially with the Unit1 heated flow at the base of the discharge and produced a slightly cooler dischargeeffect in the cove than was seen before Unit 2 pump operation. Plume studies haveshown that there is relatively little mixing between the two parallel discharge flowsfrom Unit 1 and Unit 2 as they exit the cove. A summary of the power productionand average intake and discharge water temperatures is illustrated graphically inFigures 1.1.1-1 and 1.1.1-3.
Periodic increases in the discharge temperatures in October 1985 reflect the effectsof the start-up power tests of Unit 2. The Unit 2 tests continued through the firstmonths of 1986 until the unit was placed in commercial operation on March 13,1986. The unit operated at full capacity for the remainder of 1986, with a fewperiods of reduced capacity for system adjustments; heat treatment of the unit wasperformed on August 10 and November 8. Heat treatment of Unit 1 conduits wasperformed March 28. From the end of June until August 29, the Unit 1 power levelwas decreased slowly before the start of refueling; Unit 1 was returned to serviceDecember 29. With the return of Unit 1 to service, the first normal two-unitoperations began in 1987, except for 2 1/2 months in the spring of 1986. Normallyhigh ambient water temperatures in fall and the heat from both operating units
E8-316.0 2-4
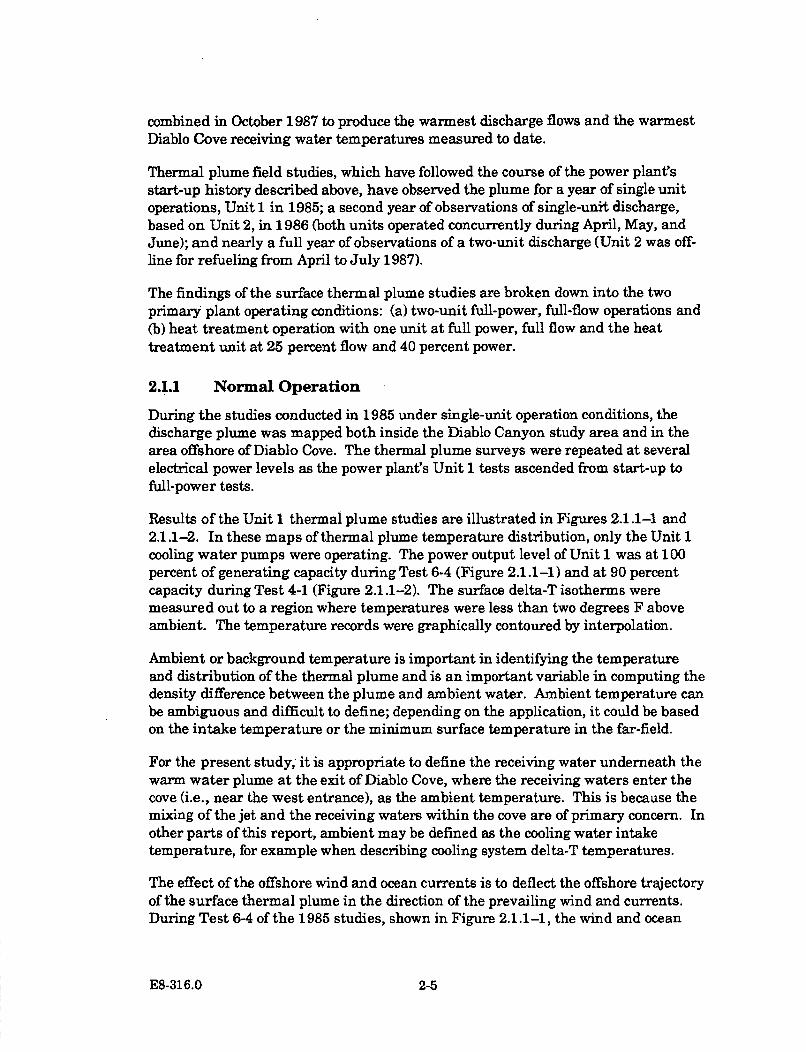
combined in October 1987 to produce the warmest discharge flows and the warmestDiablo Cove receiving water temperatures measured to date.
Thermal plume field studies, which have followed the course of the power plant'sstart-up history described above, have observed the plume for a year of single unitoperations, Unit 1 in 1985; a second year of observations of single-unit discharge,based on Unit 2, in 1986 (both units operated concurrently during April, May, andJune); and nearly a full year of observations of a two-unit discharge (Unit 2 was off-line for refueling from April to July 1987).
The findings of the surface thermal plume studies are broken down into the twoprimary plant operating conditions: (a) two-unit full-power, full-flow operations and(b) heat treatment operation with one unit at full power, full flow and the heattreatment unit at 25 percent flow and 40 percent power.
2.1.1 Normal Operation
During the studies conducted in 1985 under single-unit operation conditions, thedischarge plume was mapped both inside the Diablo Canyon study area and in thearea offshore of Diablo Cove. The thermal plume surveys were repeated at severalelectrical power levels as the power plant's Unit 1 tests ascended from start-up tofull-power tests.
Results of the Unit 1 thermal plume studies are illustrated in Figures 2.1.1-1 and2.1.1-2. In these maps of thermal plume temperature distribution, only the Unit 1cooling water pumps were operating. The power output level of Unit 1 was at 100percent of generating capacity during Test 6-4 (Figure 2.1.1-1) and at 90 percentcapacity during Test 4-1 (Figure 2.1.1-2). The surface delta-T isotherms weremeasured out to a region where temperatures were less than two degrees F aboveambient. The temperature records were graphically contoured by interpolation.
Ambient or background temperature is important in identifying the temperatureand distribution of the thermal plume and is an important variable in computing thedensity difference between the plume and ambient water. Ambient temperature canbe ambiguous and difficult to define; depending on the application, it could be basedon the intake temperature or the minimum surface temperature in the far-field.
For the present study, it is appropriate to define the receiving water underneath thewarm water plume at the exit of Diablo Cove, where the receiving waters enter thecove (i.e., near the west entrance), as the ambient temperature. This is because themixing of the jet and the receiving waters within the cove are of primary concern. Inother parts of this report, ambient may be defined as the cooling water intaketemperature, for example when describing cooling system delta-T temperatures.
The effect of the offshore wind and ocean currents is to deflect the offshore trajectoryof the surface thermal plume in the direction of the prevailing wind and currents.During Test 6-4 of the 1985 studies, shown in Figure 2.1.1-1, the wind and ocean
E8-316.0 2-5
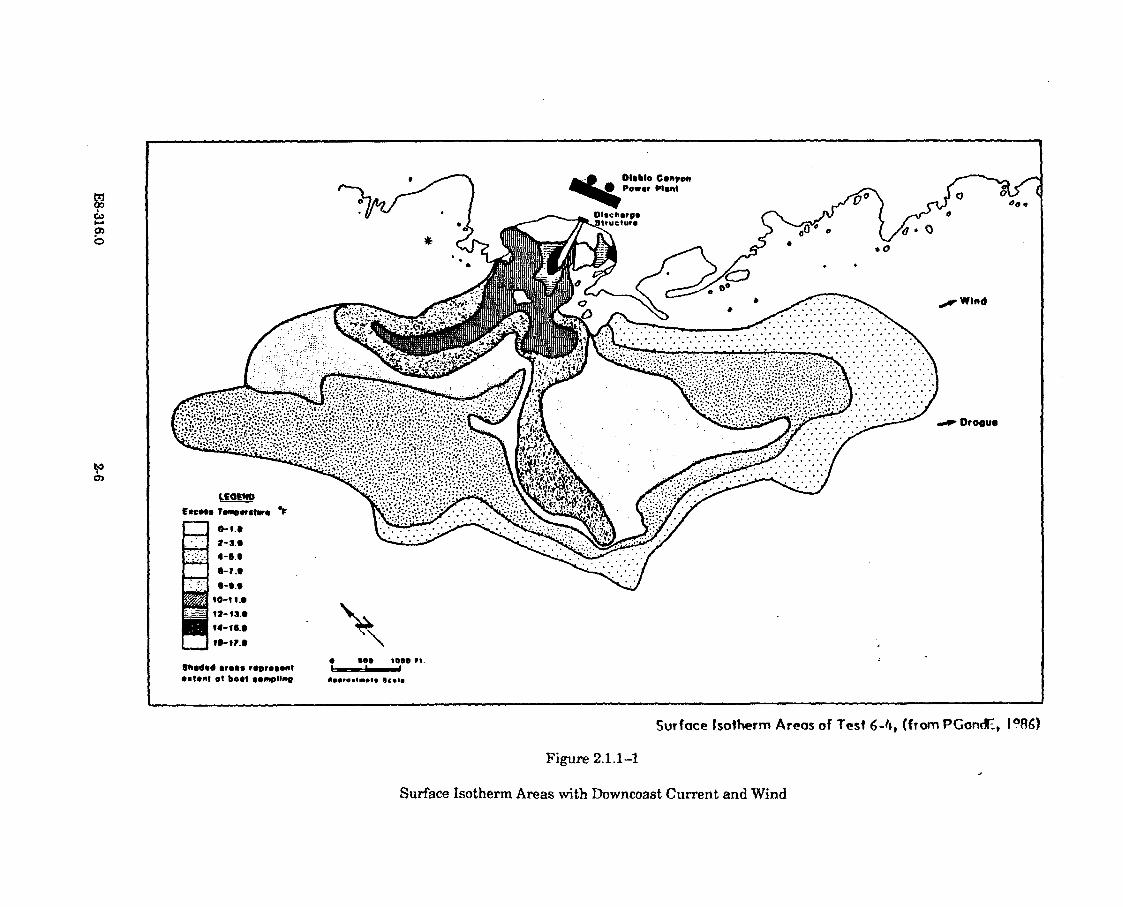
Diablo Compfot
00 00I
DIS~he.0
0 *0 Va.
4-44
'0-',..
shaded areas represent * s. oo.Pt*$fortt ot boot oem'i~na. 5e"...Im.4 stele
Surface Isoiherm Areas of Test 6-4s, (from PGandFE, I98M)
Figure 2.1.1-
Surface Isotherm Areas with Downcoast Current and Wind
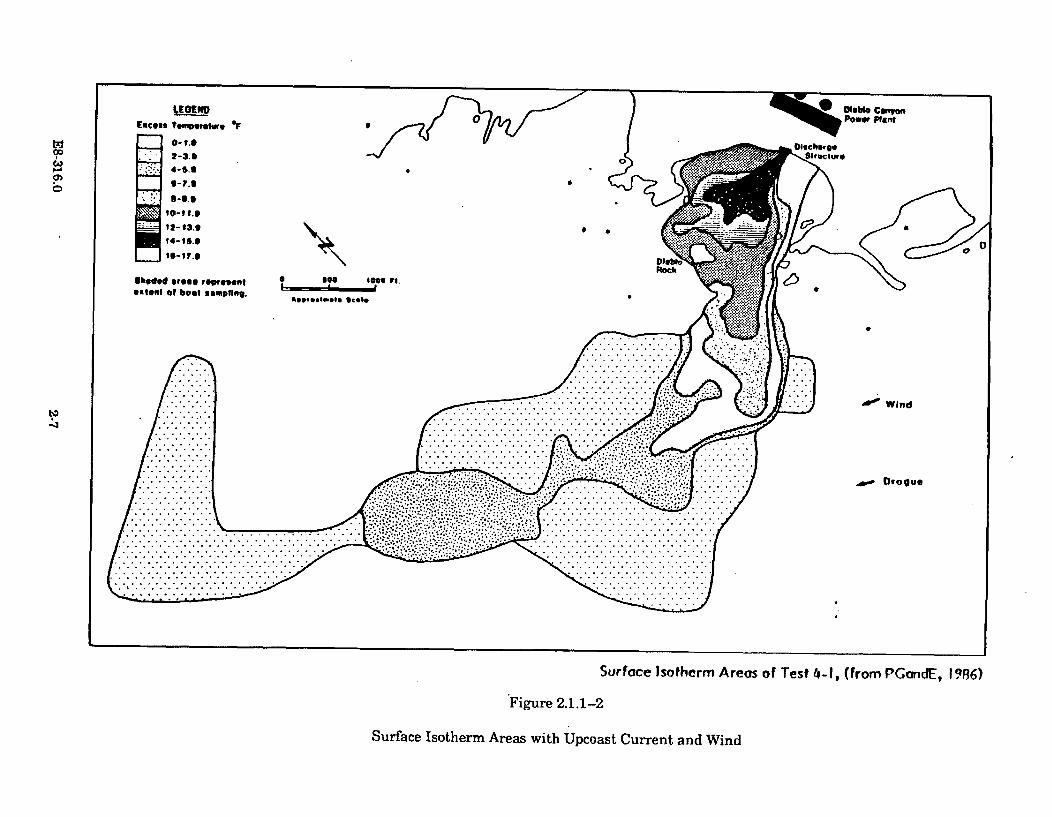
ti1
90
CA)I.-
Excess Tomporetuv.1/"
XAoca
Sbeded St... representextent of boat sampling.
avgevgmslael leels
C7
. . . . . . . . . .
...........
............
- * .. .. . . . .. . . . . . . .. ..............................
. . . . . . . . . . . . . . . . . . I . . . . . . . ...................
.......................... . . . . . . . . . . . . . . , . . . . . . . .. . . . . . . . . . . . . . . I . . . . . .. . . . . . . . . . . . . * . . . . . . .................. ..................................... ...................
.......................................................................... ..................
.. .... ... . . . .. ..... . . . . . . . . . . . . I . . . . . . . . . . .. ......................... ................................................... . . . . . . . . . ... . . .. .... .... ... ..... .
A' Wind
.. . . . . . . . . . . . . . . ...... . . . . . ....... .......... ... ... .. ... ... . ...... ..... ... .. ...
. .... ... . ... . . . . . . . . . . . . . * . . . . ..
. . . . . . . . . . . . . . .. .. . . . . . . . . . . . . . . . . . . . .
0.0 Drogue
Surface Isotherm Areas of Test 4-1, (from PGandE, 1986)
Figure 2.1.1-2
Surface Isotherm Areas with Upcoast Current and Wind
currents were moving from northwest to southeast, causing a moderate deflection ofthe surface plume in a southerly direction. During test 4-1, shown in Figure 2.1.1-2,the direction of the wind and ocean currents were reversed and the plume trajectorywas deflected in the opposite direction. The magnitude of the deflection, seen inboth figures, dependsmainly on the strength and direction of the offshore wind andocean currents.
The analysis of the Unit 1 studies was completed in 1986 and generally confirmedthe far-field plume patterns that had been predicted by the physical andmathematical model studies. In addition, the results of these field studies providedfurther insight into the characteristics and behavior of the discharge plume inconjunction with various sea states, tide heights, and offshore currents. Thoughthese single-unit results were not representative of the combined Unit 1 and 2operating conditions (Unit 2 was either not operating or at other times pumpingambient temperature water), the results revealed several new details of thenearshore behavior and temperature distribution of the thermal plume.
Among these were the following:.
The trajectory and dispersion of the thermal plume from its point ofshoreline discharge is strongly influenced by both tidal depth andunderwater features of the cove's bottom (bedrock channels and pinnacles).The bottom friction varies between high and low tide and causes the plumeto swing south and north, respectively, in a searchlight-like pattern.
" During high tide conditions, the thermal plume trajectory in Diablo Cove isgenerally perpendicular to the shoreline; during low tide conditions, theplume shifts to a trajectory north of that produced at high tide.
" The Unit 1 low tide plume trajectories and mixing characteristics increasethe area of shoreline contact of the thermal plume in north Diablo Covemore than was expected based on the results of the physical model tests.
" The surface plume is occasionally bifurcated by the midstream presence ofDiablo Rock at the exit from Diablo Cove.
" The strong exit velocity of the warm surface plume from Diablo Coveinduces a counterflow of cold, deep ocean water, beneath the plume, whichreplaces the cove's water that has been pulled out by the plume's flow.
The following description of the full-operation surface plume is a brief summary ofits characteristic temperature depth and distribution, temperature decay,downwelling behavior, and bottom lift-off points.
2..1.1 Plume Depth and Distribution
The depth and distribution of the thermal plume is affected by the amount ofrecirculation and mixing with ambient water in Diablo Cove, the number ofoperating pumps and heated power units, bottom bathymetry and flow obstacles,
E8-316.0 2-8
wave mixing, and offshore weather and sea state conditions. The effect of each ofthese factors on the depth and distribution of the thermal plume is briefly reviewed.
The thermal discharge plume is recirculated and mixes with itself within DiabloCove. The degree of recirculation is affected by the length and depth of the cove,which varies with changing tide elevations, and by the number of operating pumps.
Shallow water at the discharge during low tide significantly reduces the mixing ofthe plume at its boundaries with surrounding cove water (entrainment). The waterlevel difference between Mean Higher High Water (MHHW) and Mean Lower LowWater (MLLW) is typically about 6 ft, which would increase the water depth within450 ft of the outfall by more than 50 percent. The cove's water volume at high tidedepths allows greater contact of the plume's surface area with the surrounding covewater volumes. -High tide plumes thus allow initial entrainment, beyond whichtemperatures decay gradually. Low tide plumes retain a high temperature levelnear the discharge point, and mixing takes place at some distance from it. However,both processes occur primarily within Diablo Cove, since during both high and lowtides the temperature levels at the exit of the cove were approximately the same.
The amount of recirculation and plume mixing in the cove also varies depending onwhether there are two or four pumps operating. The incoming net flow of ambientwater varied from 2,800 cfs to 6,000 cfs for four-pump tests and from 3600 cfs to5000 cfs for two-pump tests. The ambient water entrained into Diablo Covepractically all occurred in the deep water column along the west entrance. Thecross-sectional average excess temperatures in the north entrance were consistentlyhigher than those in the west entrance.
Not only the plume's mixing and distribution, but also its trajectory is affected byvariation in water level. The high tide plume seemed to head toward Diablo Rock,but the low tide plume seemed to flow towards the north entrance to the cove. Also,a portion of the plume at low tide is bifurcated to the southern portion of the cove.The more northerly orientation and the near-field bifurcation of the low tide plumeis primarily caused by the near-field bathymetry. In the vicinity of the outfall, rockridges (striations with an orientation angle about 20 degrees to the north of thedischarge) are exposed during low tide and act as guidance vanes to direct the flowtoward the north.
Bifurcation occurs at low tides both for four-pump and two-pump dischargeoperations. The bifurcation is more evident for higher waves. Waves are observedto break near the southern portion of the cove, where large pinnacle rocks exist.These breaking waves appear to cause destratification. In fact, the case of lowwaves showed a relatively stratified plume. This indicates that wavedestratification occurs only within the southern portion of the cove where breakingwaves occurred. Destratification occurs for both the two-pump and the four-pumpcondition.
E8-316.0 2-9
The discharge flow is expected to have more direct impact in the near-field (i.e.,within Diablo Cove). A heat balance calculation was performed for all the selectedtests using the discharge cove as the control volume. Cross-sectional temperaturesand velocities were compiled from two representative data sets, one for a high tideand one for a low tide plume. At the west exit from the cove, the thickness of theplume at the centerline during high tide was about 22 ft; the thickness-was about32 ft for the low tide. The plume thickness is defined here as the point where thetemperatures at the seaward edge of the plume exceed 1 degree Celsius above theambient level.
The estimated heat flux, the integrated product of the mass flow and the excesstemperature within the plume, showed in general that the west entrance containedabout 70 percent to 80 percent of the total discharge heat flux. About 80 percent ofthe discharge heat flux was included in the top 10 ft of the water column. The resultimplies that the heat losses of the thermal plume within Diablo Cove are relativelysmall (<5 percent).
The plume surface area is generally smaller when only one unit is in operation thanwhen two units are operating, since the buoyancy flux, the integrated mass flowinduced by density difference, is less. Since the vertical depth, or "thickness," of theplume as it exits the cove is larger for the extreme low tide than for the extreme hightide, it is expected that the offshore surface area would be smaller for the extremelow tides than for the extreme high tides; the data from full-power conditionsconfirmed this expectation.
The ambient sea and weather conditions will have more direct impact in the far-field, namely the offshore region, than in the cove. Typically, the ambient conditionsinclude the winds, cross currents, and waves. These effects are often related.Higher winds (which increase surface heat transfer losses) introduce higher wavesand higher currents (both of which would cause more mixing). When winds areweak, other mechanisms such as the off-coast regional currents and the tidal currentmay become important factors. All the high wind cases had smaller plume surfaceareas relative to the low wind cases. For all the cases, the plumes in the offshorearea are essentially surface phenomena. The offshore plume depth as defined bytemperatures less than 1.0 F above ambient is always less than 20 ft (6 meters).
2.1.1.2 Temperature Decay
The dispersion and decay of the thermal plume also vary as a function of the tidallyvarying volumes of ambient temperature water available in Diablo Cove for mixing.The warmest plume surface temperatures in Diablo Cove are produced during theminimum basin volumes at low tide, when greater portions of the plume exit thecove unmixed with ambient temperature water.
The centerline surface excess temperature has exhibited distinctive behavior due totidal variations. During high tide, an initial dilution occurred which reduced thesurface centerline temperature rapidly to an approximately normalized temperature
E8-316.0 2-10
of 0.8 of the initial discharge temperatures, followed by a region of zero decay untilthe exits of Diablo Cove were reached. Beyond that, the plume's temperature decaycontinued in the offshore area. Minimal initial dilution was found at extreme lowtide, and the discharge temperature was preserved to a distance of 400 ft from theoutfall before any significant entrainment occurred.
2.1.1.3 Downwelling
Plume contact with Diablo Rock causes strong downwelling of the plume on theshoreward side of Diablo Rock. Bottom water temperatures in this area aresignificantly warmer than in other areas at the same depth and distance from thedischarge.
In studies of circulation around coastal islands, it has been shown that the wakesbehind coastal islands under stratified conditions represent a complicatedinteraction between the classical two-dimensional wake and the bottom boundarylayer. As a consequence, it is believed that upwelling directly in the wake of anisland is not uncommon.
The upwelling phenomenon, which brings cold water from the subsurface upwards tothe surface, has been measured in the seaward wake of Diablo Rock. Whileupwelling occurs in the wake zone of the plume, thermal plume downwelling isobserved near the front side of Diablo Rock (facing the outfall). This downwellingcauses the subtidal temperatures at Station 6-10 (10 ft below MLLW at the inshorebase of Diablo Rock) to be the warmest among all the subtidal temperaturemonitoring stations within the cove.
2.1.1.4 Plume Bottom Lift-Off
The thermal buoyancy of the discharge plume causes it to remain at the surface andtherefore lose contact with the cove's bottom as the cove's depth increases toapproximately 25 ft (8 m).
A free plume will lift off when the momentum flux has been reduced to a degree thatthe negative gravitational force (the buoyancy force) dominates the inertial force (inthe forward motion) and creates an upward motion. In shallow waters, when bottomdepths increase rapidly and are larger than the natural divergence of the plume, aseparation, often called the boundary separation, will take place even without thepresence of the buoyancy effect. In general, the term "detachment" is used in thissection to avoid any confusion, because both "lift-off' and "separation" may occur inDiablo Cove.
The DCPP outfall is an open channel discharge structure, and the discharge exitvelocity is related to the water depth of the receiving water, which fluctuatesbecause of tidal changes. For the high tide case the plume is likely to lift off fr-omthe bottom, while for the low tides the jet behaves like a momentum jet and is likelyto follow the bottom boundary until separation occurs. In all cases, when the plume
E8-316.0 2-11
detaches from the bottom, the buoyancy force becomes increasingly important and*the plume essentially evolves into a surface phenomena.
Waves also affect the plume detachment. Breaking waves introduce turbulence andcause mixing within the plume in the shallow areas. As a result of this, thedetachment occurs farther from the outfall. For low tides, waves can'd6lay thedetachment distance from the outfall from 1100 feet to 1300 feet; for high tides, thedetachment distance varies from 900 feet to 1100 feet.
2.1.2 Heat Treatment Operation
The DCPP cooling water system can be operated in a heat treatment mode forbiofouling control, in which case the flow rate per unit is reduced from 2000 to 500cfs, and the temperature in the condenser is as high as 108 F for the unit beingtreated. The more buoyant plume produced in the heat treatment mode will resultin plume behavior different from that under normal operation conditions.
It is noted that the discharge structure was modified in 1982 by constructingopenings in the center wall separating the Unit 1 and Unit 2 flows. The primaryreason was to promote crossflow mixing of normal operation and heat treatmentwater within the structure so as to reduce the exit temperatures when one unit isbeing heat treated and the other unit is in normal operation.
2.1.2.1 Plume Depth and Distribution
Model results showed that heat treatment and normal operations during warmambient conditions (16 C) result in less bottom contact than during cool ambientconditions (11 C). Low tide conditions and high wave conditions both result inincreased bottom contact compared to the MSL, low wave conditions, but in all casesthe heat treatment case resulted in less bottom contact than normal operation underthe same wave and tide conditions.
2.1.2.2 Temperature Decay
Model and field test results showed that during Unit 1 heat treatment conditions,excess Unit 1 plume temperature was confined to the combined Unit 1 and Unit 2centerline. The excess temperature decayed rapidly along the north margin of theplume due to a gyre effect.
2.1.2.3 Downwelling
No significant differences from the plume's downwelling behavior during normaloperations have been associated with the heat treatment operations. It is presumedthat the lower heat treatment discharge flows would produce significantly lowerplume velocities in the region of Diablo Rock,and therefore downwelling heat flux atthis point would be reduced.
E8-316.0 2-12
2.1.2.4 Plume Lift-Off
Model results of heat treatment conditions showed that heat treatment on one unitwith normal load and flow in the second unit results in 10-20% less bottom contactthan normal two-unit operations. It is. apparent from the model results that theheat treatment plume has less impact on the bottom than the normal operation'splume. Breaking waves in shallow areas of the cove cause more turb'ulent mixing ofthe plume and a delay to the lift-off; the bottom contact area is larger than thatunder the calm wave condition. The scenario which produces the maximum area ofplume bottom contact during heat treatment occurs with low tide water levels andhigh waves.
2.2 Shoreline and Bottom Thermal Plume
The following section presents intact a PG&E study of the shoreline and bottomthermal plume, specially prepared for this report's thermal dose computations andbiological thermal effects assessments in Section 3.0. The results of this study havenot been previously published and are includedin Appendix A.8. The studyobjective was to attempt to validate, for the first time, the results of the physicalmodel bottom contact predicted plume temperatures which had been reported in arecent heat treatment model study. The following study presents the results of agraphical method of model validation which compares the contoured model bottomtemperatures to field-collected bottom temperatures that were computer-selected tomatch the wave, tide, and power plant operating conditions of the model test.
Temperature data from inside Diablo Cove in areas with a water depth of less than10 feet are limited to those from selccted subtidal and intertidal stations. Long-termTEMP monitoring stations provide continuous data, but isotherm contours in finerspatial resolution are lacking. It is impractical to obtain such information in thefield. The results from a physical model are compared to the available field data.After such verification, the physical model may be utilized as a tool to providenecessary information for the biological assessment.
2.2.1 Preliminary Model Verification
The UC Berkeley DCPP physical model was calibrated and verified against fielddata for both normal and heat treatment operation (Ryan et al. 1986, 1987a). Theverification was focused on the deeper areas of Diablo Cove (greater than 10 feetMLLW) where field data were available (Leighton et al. 1986, Tu et al. 1986). Sincethe model was verified conclusively for the deeper areas but to a much lesser degreefor the shallow areas, it was necessary to model results with existing field data fromthe TEMP subtidal stations. Data from 10 ft MLLW were compared. This provideda link between the long-term monitoring temperature distribution (temporal) andthe model bottom temperature patterns (spatial).
After the completion of the initial model verification, this model was used for a seriesof runs to simulate different scenarios of heat treatment tests (Ryan et al. 1987b).
E8-316.0 2-13
Among them, model runs 4, 5, 8, and 10 were made when both units were operatingnormally at full power, with no wind and static tide. The conditions for the runs aregiven in Table 2.2.1-1. Contour maps of excess temperature (if above ambient) areshown in Figures 2.2.1-1, 2.2.1-2, 2.2.1-3, and 2.2.1-4.
2.2.2 Model Bottom Temperature Verification Methods-
A data base including wind, wave, and tide data is available for the Diablo CanyonPower Plant site. A computer program was developed to select the dates and thetimes in 1986 during which environmental conditions closely matched those modeledfor Runs 4, 5, 8, and 10. The data base and the program descriptions are given inKenzler (1987). The following ranges are specified as the bandwidth forenvironmental condition variation from model conditions.
" Wind speed 0-5 MPH
" Wind direction (no limit because of low wind speeds)
* Wave height - 25 cm (0.82 ft)
" Tide height - 0.5 ft
The list of match times (times in 1986 when conditions within the above rangesexisted) were then screened for times of two-unit normal operation, and for thosetimes when the tide was close to static. The ambient temperature was determinedfrom data collected by a Sea Data temperature recorder located 50 feet west of andnear the center of the intake structure, when available. Where this data was notavailable, data from South Cove (subtidal Station 19-10) was used.
TEMP subtidal station temperature were processed for comparison with the modelisotherm contours. Typically, three or four separate match times were selected fromthe subtidal temperature data for each model run (see Table 2.2.1-1). Data from atwo- to three-hour period around the match time were used: i.e., about six samplepoints (at twenty-minute intervals). The average value and the standard deviationwere calculated. These data and the corresponding model results are presented inFigures 2.2.1-1,2.2.1-3, and 2.2.1-4.
2.2.3 Comparison and Analysis
2.2.3.1 Model Runs 4 and 5 (MSL and Low Waves)
Model runs 4 and 5 were both made at mean sea level (2.7 ft above MLLW) and withlow waves (1.5 feet), but with different ambient temperatures: run 4 usedTamb = 50 F (10 C) and Run 5 used 66 F (18.9 C). Since the bottom excesstemperature isotherms for these cases revealed little difference (Ryan et al. 1987),and the ambient temperatures from the prototype runs were much closer to 50 F(10 C) (range 53.4 F (11.9 C) to 56.1 F (13.4 C)), the model results based on 50 F(10 C) ambient temperature are used for comparison.
E8-316.0 2-14
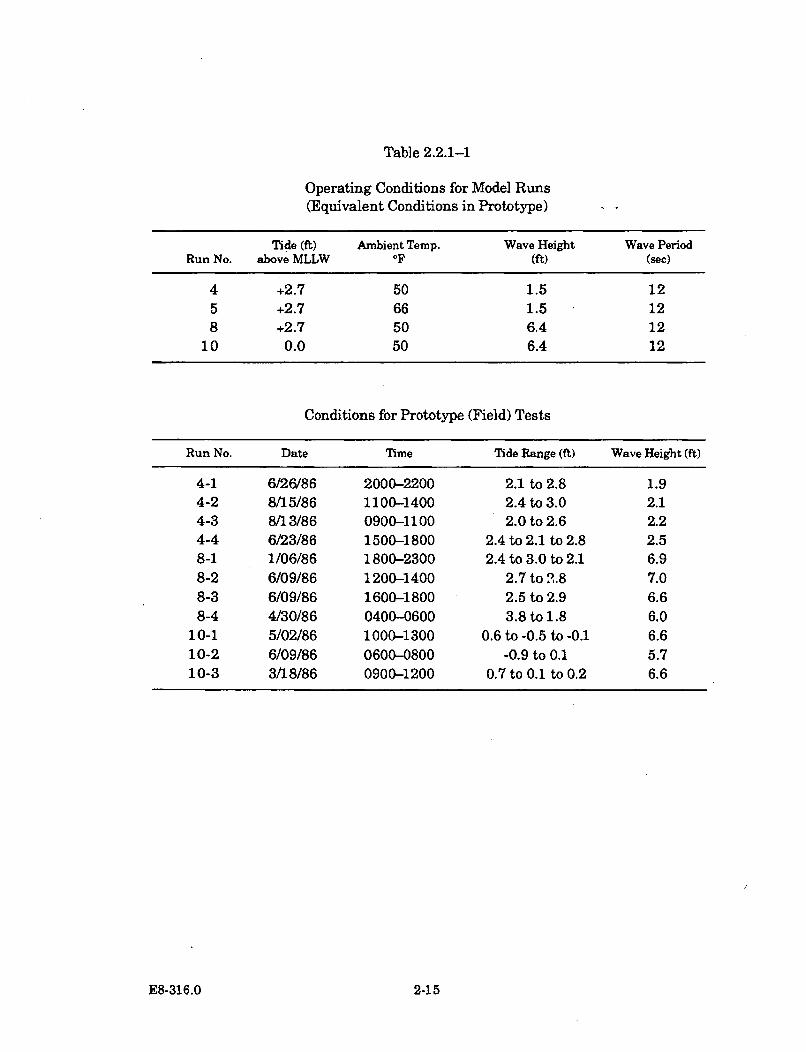
Table 2.2.1-1
Operating Conditions for Model Runs(Equivalent Conditions in Prototype)
Tide (ft) Ambient Temp. Wave Height Wave PeriodRun No. above MLLW OF (ft) (sec)
4 +2.7 50 1.5 125 +2.7 66 1.5 128 +2.7 50 6.4 12
10 0.0 50 6.4 12
Conditions for Prototype (Field) Tests
Run No. Date Time Tide Range (ft) Wave Height (ft)
4-1 6/26/86 2000-2200 2.1 to 2.8 1.94-2 8/15/86 1100-1400 2.4 to 3.0 2.14-3 8/13/86 0900-1100 2.0 to 2.6 2.24-4 6/23/86 1500-1800 2.4 to 2.1 to 2.8 2.58-1 1/06/86 1800-2300 2.4 to 3.0 to 2.1 6.98-2 6/09/86 1200-1400 2.7 to 2.8 7.08-3 6/09/86 1600-1800 2.5 to 2.9 6.68-4 4/30/86 0400-0600 3.8 to 1.8 6.0
10-1 5/02/86 1000-1300 0.6 to -0.5 to -0.1 6.610-2 6/09/86 0600-0800 -0.9 to 0.1 5.710-3 3/18/86 0900-1200 0.7 to 0.1 to 0.2 6.6
E8-316.0 2-15
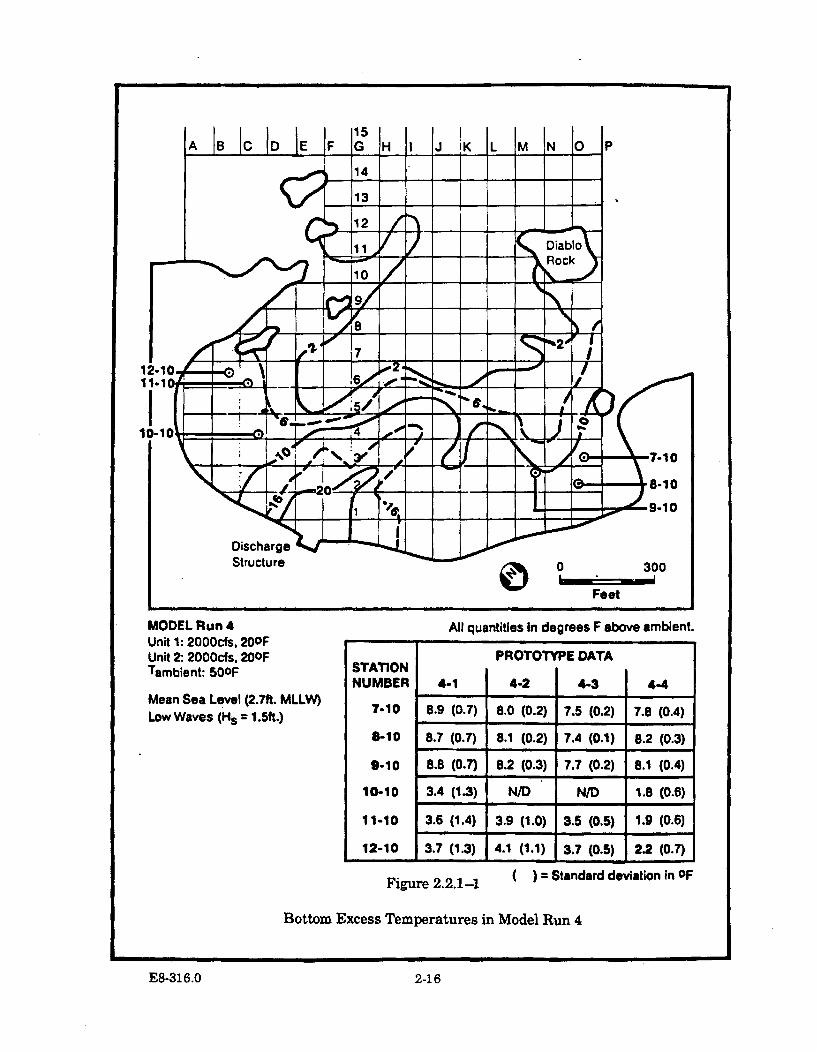
MODEL Run 4 All quantities In degrees F above ambient.Unit 1: 2000cfs, 20OFUnit 2: 2000cfs, 20OFTambient: 50OF
Mean Sea Level (2.7ft. MLLW)Low Waves (Hs = 1.5ft.)
*1
PROTOTYPE DATASTATIONNUMBER 4-1 4-2 4-3 4-4
7-10 8.9 (0.7) 8.0 (0.2) 7.5 (0.2) 7.8 (0.4)
8-10 8.7 (0.7) 8.1 (0.2) 7.4 (0.1) 8.2 (0.3)
9-10 8.8 (0.7) 8.2 (0.3) 7.7 (0.2) 8.1 (0.4)
10-10 3.4 (1.3) N/D N/D 1.8 (0.6)
11-10 3.6 (1.4) 3.9 (1.0) 3.5 (0.5) 1.9 (0.6)
12-10 3.7 (1.3) 4.1 (1.1) 3.7 (0.5) 2.2 (0.7)
( ) : Standard deviation in OFFigure 2.2.1-1
Bottom Excess Temperatures in Model Run 4
E8-316.O 2.16
E8-316.0 2-16
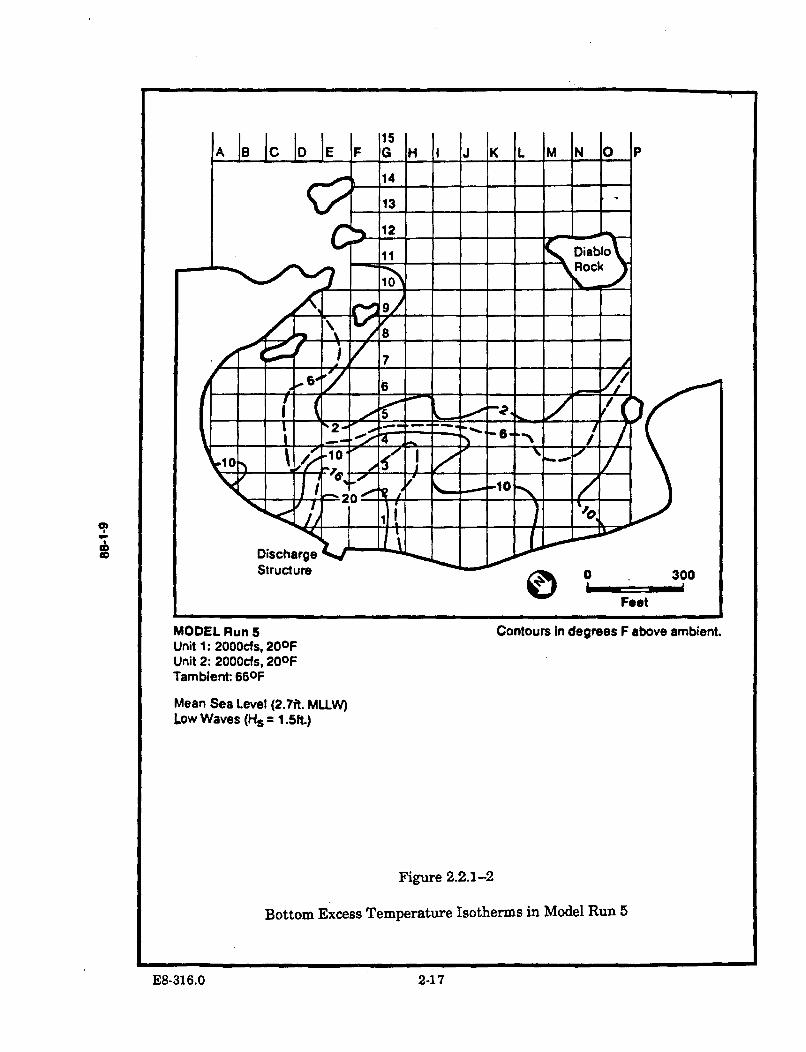
C,
MODEL Run 5 Contours in degrees F above ambient.Unit 1: 2000cfs, 20OFUnit 2: 2000cfs, 20OFTambient: 660F
Mean Sea Level (2.7ft. MLLW)Low Waves (Hs = 1.5ft.)
Figure 2.2.1-2
Bottom Excess Temperature Isotherms in Model Run 5
E8-316.0 2-17
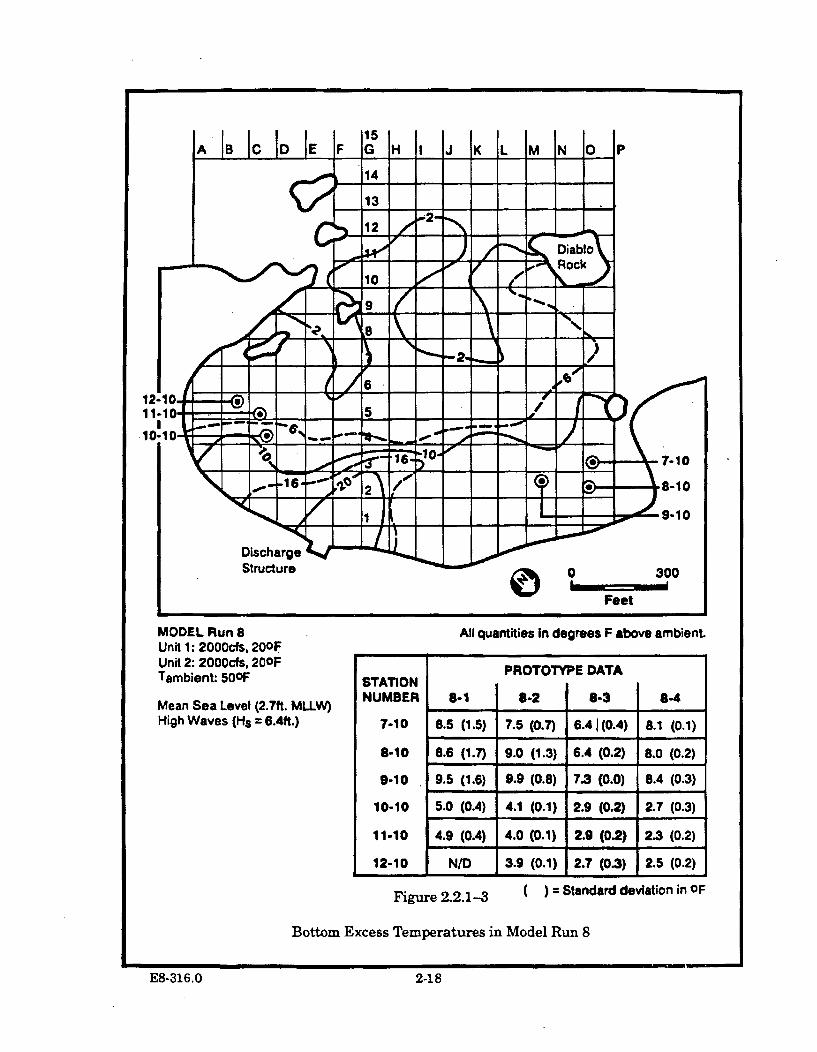
I~ 4t
I .1
MODEL Run 8Unit 1: 2000cfs, 20OFUnit 2: 2000cfs, 20OFTambient 50oF
Mean Sea Level (2.7ft. MLLW)High Waves (Hs = 6.4ft.)
All quantities In degrees F above ambient.
PROTOTYPE DATASTATIONNUMBER 8-1 8-2 8-3 8-4
7-10 8.5 (1.5) 7.5 (0.7) 6.41(0.4) 8.1 (0.1)
8-10 8.6 (1.7) 9.0 (1.3) 6.4 (0.2) 8.0 (0.2)
9-10 9.5 (1.6) 9.9 (0.8) 7.3 (0.0) 8.4 (0.3)
10-10 5.0 (0.4) 4.1 (0.1) 2.9 (0.2) 2.7 (0.3)
11-10 4.9 (0.4) 4.0 (0.1) 2.9 (0.2) 2.3 (0.2)
12-10 N/D 3.9 (0.1) 2.7 (0.3) 2.5 (0.2)- m & I
( ) = Standard deviation in OFFigure 2.2.1-3
Bottom Excess Temperatures in Model Run 8
E8.316.O 2-18
E8-316.0 2-18
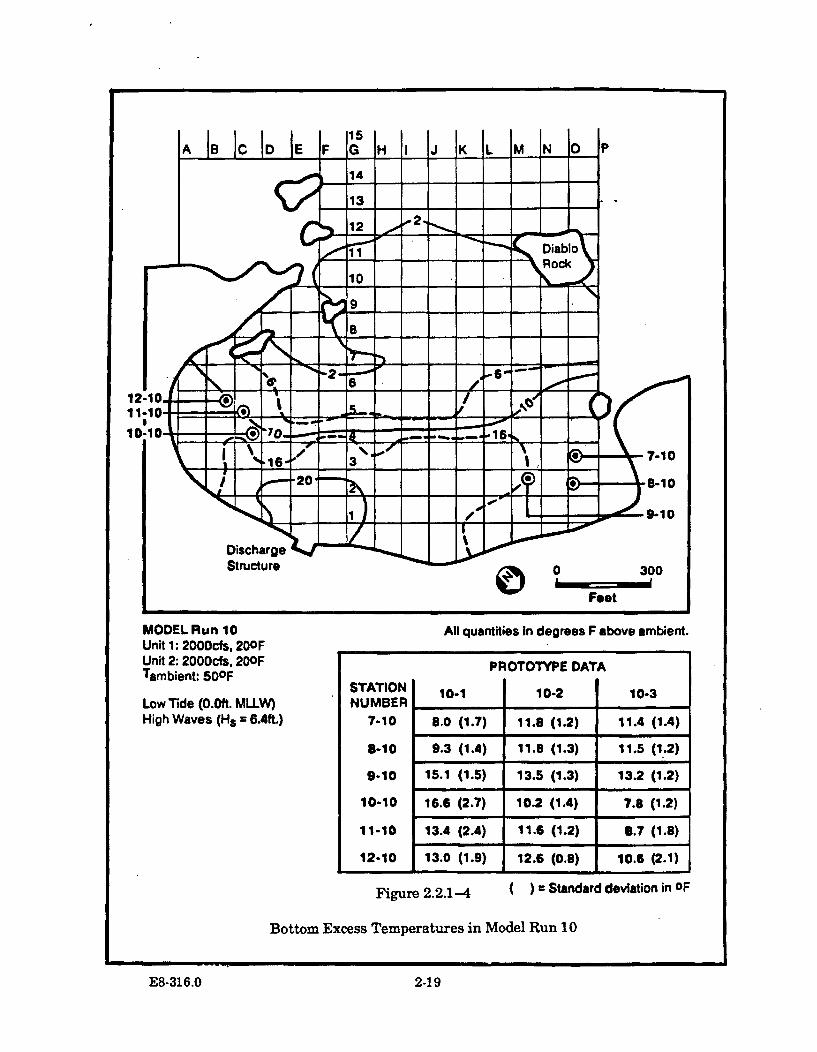
MODEL Run 10Unit 1: 2000cfs, 20OFUnit 2: 2000cfs, 20OFTambient: 50OF
Low Tide (O.Oft. MILLW)High Waves (Hs = 6.4ft.)
All quantities In degrees F above ambient.
PROTOTYPE DATA
STATION 10-1 10-2 10-3NUMBER
7-10 8.0 (1.7) 11.8 (1.2) 11.4 (1.4)
8-10 9.3 (1.4) 11.8 (1.3) 11.5 (1.2)
9-10 15.1 (1.5) 13.5 (1.3) 13.2 (1.2)
10-10 16.6 (2.7) 10.2 (1.4) 7.8 (1.2)
11-10 13.4 (2.4) 11.6 (1.2) B.7 (1.8)
12-10 13.0 (1.9) 12.6 (0.8) 10.6 (2.1)
( ) = Standard deviation in OFFigure 2.2.1-4
Bottom Excess Temperatures in Model Run 10
E8.31 6.0 2-19
E8-316.0 2-19
The prototype for this case produced four data sets (Figure 2.2.1-1). Data arepresented as excess temperatures; the average of the individual station valuesminus the ambient (intake) temperature. Agreement was reasonable betweenprototype replicates, with three of them (runs 4-1, 4-2, and 4-3) showing an averageexcess temperature of 3.6 F (2 C), with a variation of less than 0.7 F (0.4 C), in thesouth part of Diablo Cove, and all four showing an average value of 87.1'F (4.5 C),with a range of less than 1.5 F (0.8 C), among stations in the north part of DiabloCove. One replicate (4-4) showed temperatures in the south cove to be around 1.5 F(0.8 C) lower than the others. This difference may be explained by the location ofthe sample on the tidal curve. Runs 4-1 to 4-3 were at near static tides just after lowtide. Run 4-4 occurred during an ebb tide following a major high. The precedinghigher tide level with the consequent higher dilution of the jet (Tu et al. 1986) maybe responsible for the lower excess temperature at the south cove subtidal samplinglocations.
Agreement was even better between the model run and prototype runs if 100 feetvariation in distance is allowed. In the north part of the cove, both the model andprototype had a mild lateral temperature gradient, indicating a gyre motion asreported by Tu et al. (1986).
2.2.3.2 Model Run 8 (MSL and High Waves)
Model run 8 was made with the tide at mean sea level and with high waves (6.4feet). Two sets of prototype data (Runs 8-1 and 8-2) at near static tide conditionswere obtained, and two prototype cases (Runs 8-3 and 8-4) were selected which showdynamic tidal effect. Considering the static tide runs only, variability between runswas within 2.5 F.
Run 8-3 occurred during a flooding tide after MSL (tide variation between 2.5 and2.9), and Run 8-4 has a large tide variation ebbing from high tide (3.8 to 1.8 feet).The excess temperatures in the southern part of the cove for both cases are lowerthan for Runs 8-1 and 8-2. This result is consistent with the data from Run 4-4(MSL, low wave, and fluctuating tide level) with respect to Runs 4-1, 4-2, and 4-3(more static tide level).
Good agreement exists between the model and prototype data if a shift of 100 feet isdeemed allowable (see Figure 2.2.1-3). Agreement is best with prototype data fromnear static tide condition. Warmer temperatures and a mild lateral temperaturegradient (but slightly sharper than the low-wave case) were observed in the northpart of the cove.
2.2.3.3 Model Run 10 (MLLW and High Waves)
Model run 10 was made with low tide level (0.0 ft MLLW) and high waves (6.4 ft).This condition caused the largest bottom excess temperatures. There were threecases in the prototype with similar conditions; they all exhibited warmertemperatures throughout the cove. This was expected, because at low tide there is
E8-316.0 2-20
less water in the cove to mix with the plume. In addition, a substantial increase oftemperature was found in the south part of the cove. This is because the near-fieldstriations that are exposed to the air during low tides act as a guidance vane todirect a small portion of the plume to the south part of the cove. The bifurcation ofthe plume at low tide exists both for the prototype study (Tu et al. 1986) and themodel study (Ryan et al. 1986). Greater variability exists among prototype data atthis lower tide level. The standard deviation was 1.2 (0.6 C) to 2.7 F (1.5 C)compared to 0.1 (0.05 C) to 1.5 F (0.8 C) for MSL condition.
Agreement between the model isotherms and prototype data is reasonable (seeFigure 2.2.1-4). It is noted that a sharp temperature gradient exists betweenprototype Station 9-10 and Stations 8-10 and 7-10. The model plume appears toprogress further into the south portion of the cove relative to the MSL case (seecontour 10 F in Figures 2.2.1-1, 2.2.1-3, and 2.2.1-4).
E8-316.0 2-21
3.0 BIOLOGICAL EFFECTS STUDIES
The biological effects of the DCPP thermal discharge were first predicted in PG&E's1973 Final Environmental Statement for the Atomic Energy Commission (AEC),based on the available thermal tolerance literature and a simplified thermal plumetemperature distribution model. Subsequently, a physical model was built to refinethe thermal plume map and an on-site thermal effects laboratory was constructed toexpand the thermal tolerance information on Diablo Cove's species. Based on thethermal plume maps from the model and the Thermal Effects Laboratory thermaltolerance studies of Diablo Cove's indigenous species, an expanded biological effectsprediction was prepared in 1983 for the Regional Water Quality Control Board in theThermal Discharge Assessment Report. During this predictive period of laboratorythermal plume modeling and effects testing, extensive field studies were underwayto gather detailed receiving water information on the distribution and abundance ofthe cove's marine species. The patterns of species abundance measured prior to thewarm water discharge provide the baseline data for a comparison with anyabundance changes following the 1985 start-up of the power plant. To date, thebiological field studies have produced over eight years of baseline information andthree years of data during power plant operation.
Section 3.0 summarizes the results of the biological field studies and examineschanges in species abundance patterns with respect to the distribution of thermaldose events in Diablo Cove. A variety of graphical and statistical methods areemployed in the analyses of the abundance and thermal dose patterns. This sectioncontains the description of field sampling methods (3.1), methods of analysis (3.2.1),receiving water thermal dose measurements and results (3.2.2), assessments ofthermal impact on individual species (3.2.3), and a community-level assessment ofthermal impact (3.2.4).
More detailed information on the scope and methods of the biological field studies isprovided in Appendix B. Detailed field data and statistical results relating to theassessment of thermal impacts can be found in Appendices C, D, and E.
3.1 Description of Biological Sampling
The primary data for the Diablo Canyon TEMP biological studies were collectedusing non-destructive quantitative sampling methods at permanent intertidal andsubtidal stations (Figure 3.1-1). Non-destructive field observation methods werenecessary to ensure a minimum of sampling disturbance to plants and animals inthe relatively small areas sampled in Diablo Cove and outlying reference areas,particularly when carried out over a period of several years. Stations were generallysampled on a bimonthly schedule to track seasonal and longer-term changes(temporal variations) in species abundances, and replicate observations were madewithin areas and stations during each survey to describe the spatial variations inspecies abundances. This section briefly describes each method of data collectionand summarizes the respective sampling efforts from 1976 to 1987. The results of
E8-316.0 3-1
the biological sampling effort are presented and discussed in depth in subsequentsections.
Intertidal sampling was done at stations consisting of paired horizontal transects,one at the +3 ft MLLW and one at the +1 ft MLLW elevations, representative of theupper and lower elevational intertidal biological community in each area. Eachstation is designated by two numbers; the first is the number of the station, and thesecond identifies its elevation above MLLW. For example, Station 8+3 representsthe sampling area of Station 8 at the +3 ft MLLW level. At each station, tenpermanently located 1 m 2 areas (quadrats) were examined bimonthly, and thepercent coverage of algal species was estimated and the number of animals wascounted (IBT method). Because of the wide variation in animal sizes, certain verysmall species were only recorded as present or absent. Generally, only individualslarger than 1 in. were counted, except for some designated taxa (in five quadrats) inwhich all individuals were counted regardless of size. During the initial surveys in1976, up to 30 quadrats were sampled per station. In 1977, this number wasreduced to 15 quadrats until 1979, when the number was further reduced to tenquadrats. All analyses in this report are based on the same ten (or five) quadrats foreach station from 1976 to 1987. Three smaller 1/4 m 2 (0.25 m 2 ) quadrats wereexamined at each station using a random sampling technique (IPC method), amethod which yielded even more precise algal coverage estimates than the IBTmethod. Also, in several areas outside of these permanent stations, 1/16 m2 (0.06M2 ) quantitative samples of algae were collected quarterly and returned to thelaboratory for determination of species composition and biomass. Thus, in theintertidal zone, several complementary methods were employed to examine differentaspects of the distribution and abundance of the biological community.
In the subtidal areas of Diablo Cove and vicinity, the seasonal abundances of plantsand animals were recorded at permanent stations 28 m 2 in area and located indepths ranging from 10 ft MLLW to 55 ft MLLW. The numbering of the subtidalstations is analogous to that of the intertidal stations as explained above, the onlydifference being that the second number in a station designation indicates the depthof the station below MLLW. Thus, Station 8-15 represents the sampling area ofStation 8 at the -15 ft MLLW level.
As for the intertidal, in the subtidal various methods were employed to sampleparticular size groups and the habitats of the organisms. Algal coverage and speciescomposition were monitored using random points on a movable radius line aroundthe center of each subtidal station (SLC method). Large invertebrates (greater than1 in. in largest dimension) and kelp species were counted in the four arc quadrants(SAQ method), and another method which quantified all invertebrates regardless ofsize was used in four smaller fixed 1/4 m 2 areas within each station quadrant (SFQmethod). Each shallow subtidal station (10 ft MLLW) also held sets of removablesettling plates which were periodically examined in the laboratory for evidence ofrecent algal and invertebrate colonization. The subtidal stations appearing onFigure 3.1-1 represent the core study stations sampled from 1976 to 1987, but
E8-316.0
additional stations were sampled during the initial surveys to characterize the biotain a wider variety of depths and areas. A complete listing of the locations andsampling efforts for all TEMP subtidal and intertidal stations is presented inAppendix B.
Fish abundances and species composition were monitored with another- method,again designed to provide information on differences between areas and seasons(SFO method). Individuals of all fish species along permanent transects 50 x 4meters in area were counted during bimonthly surveys. This method was highlydependent upon adequate underwater visibility, and several winter surveys were notcompleted due to poor conditions.
Some individual species of interest were targeted for more specialized samplingprograms to supplement the data from the permanent benthic stations. Rock crabswere trapped on a bimonthly schedule at 49 locations, and data were collected on thesize, weight, sex, and reproductive condition of each crab (SCT method). In addition,individuals were tagged and released so that information on their growth andmovement could be obtained if they were recaptured in subsequent surveys. Redabalone abundances in Diablo Cove were estimated using a random samplingmethod whereby 30 m 2 areas in a variety of locations and depths inside Diablo Covewere examined annually. A similar random technique was used in the intertidalzone of Diablo Cove to census the black abalone populations from year to year. Bothabalone census methods were initiated in the early 1980's.
Table 3.1-1 summarizes the cumulative effort for the major TEMP biologicalsampling methods. Further discussion on sampling effort and statistical propertiesof the data is presented in Appendices C and E, respectively.
3.2 Thermal Discharge Assessments
The impact of the DCPP thermal plume on selected individual species and thecommunities of Diablo Cove is assessed based on analyses of the field monitoringdata from the TEMP fixed sampling stations, unpublished studies by Dr. Wheeler J.North, and other field studies. The in situ temperature data collected from locationsamong the biological sampling stations are analyzed and presented in terms oftemperature dose for comparison to the results of the on-site laboratory thermaleffects studies. The actual thermal dose information measured in the field iscombined with the thermal plume modeling results to produce a thermal dose mapof Diablo Cove. The use of the thermal dose map, when combined with the biologicalthermal effects data, allows an extrapolated cove-wide assessment of thermal effectsin areas between sampling points. The relationships between thermal dose in thefield and the biological effects are analyzed through changes in the abundancepatterns of individual species and in the diversity patterns of species at thecommunity level, and are discussed in Sections 3.2.3 and 3.2.4, respectively. Themethods used to analyze the thermal effects are described in Section 3.2.1.
E8-316.0 3-4
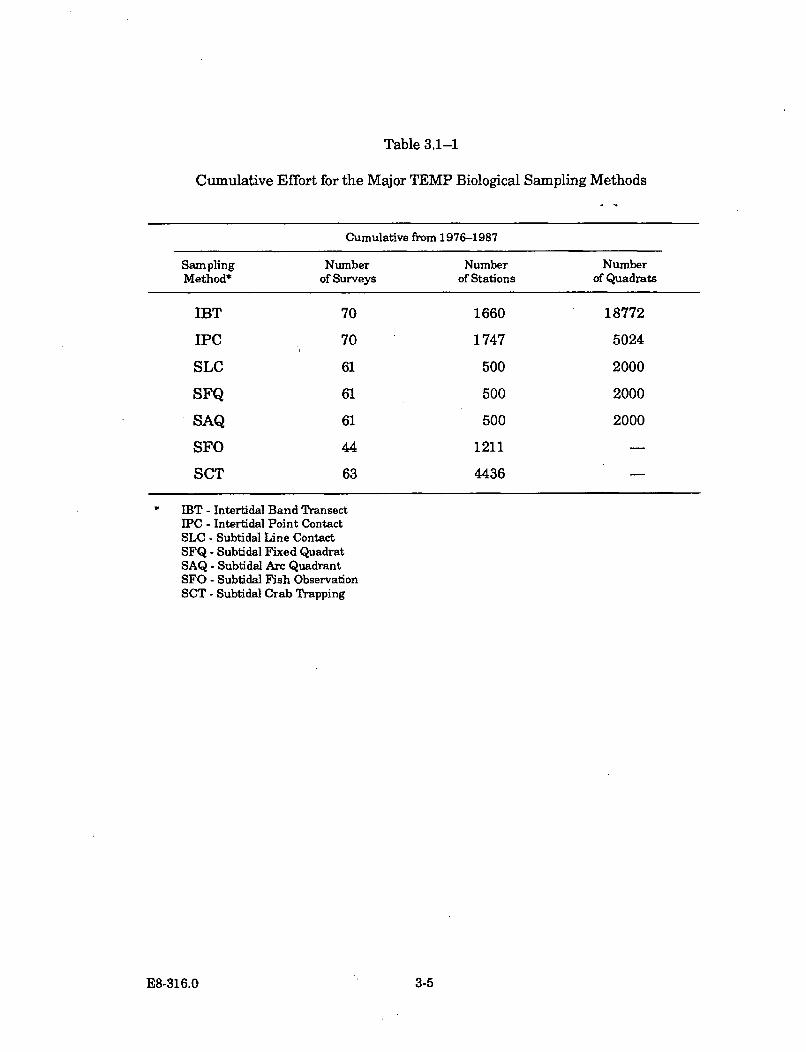
Table 3.1-1
Cumulative Effort for the Major TEMP Biological Sampling Methods
Cumulative from 1976-1987
Sampling Number Number NumberMethod* of Surveys of Stations of Quadrats
IBT 70 1660 18772
IPC 70 1747 5024
SLC 61 500 2000
SFQ 61 500 2000
SAQ 61 500 2000
SFO 44 1211 -
SCT 63 4436
IBT - Intertidal Band TransectIPC - Intertidal Point ContactSLC - Subtidal Line ContactSFQ - Subtidal Fixed QuadratSAQ - Subtidal Arc QuadrantSFO - Subtidal Fish ObservationSCT - Subtidal Crab Trapping
E8-316.0 3-5
3.2.1 Methods and Analysis
The field and laboratory results of the Thermal Effects Monitoring Program arepresented using a wide range of summary tables and graphics, and have beenanalyzed using a variety of statistical techniques. The abundance patterns ofindividual species on the TEMP stations form the primary basis of the thlermaleffects assessment. A total of 29 individual species (or groups of species) of algae,invertebrates, and fish were selected for separate thermal effects analysis. Thesespecies were selected from a broader set of individual species which had beenreviewed in working papers which examined the individual species' life histories,laboratory thermal tolerance results, and ecological, commercial, or recreationalimportance in the Diablo Cove area. Species were selected from the working paperstudies based on a combination of these various criteria.
At the individual species levels, abundance patterns from the fixed sampling stationdata were examined graphically for trends that appeared to relate to the increasedthermal doses of the discharge plume. Abundance-through-time plots of theimportant species at each station and level are included in Appendix D; examples ofthe notable trends in these plots are presented in the individual species' thermalassessments in Section .3.2.3. In the cases of a notable abundance increase ordecline, statistical tests comparing pre-operational and operational periods andareas inside and outside the influence of thermal plume were applied to the fixedstation abundance data. These statistical test procedures included a time seriesanalysis of within-station temporal variance and a one-way ANOVA test of theannual Diablo Cove abundance variance normalized by abundance data fromreference areas outside the thermal plume's influence.
The TEMP sampling design located sample points along constant intertidalelevations and at fixed subtidal depths to eliminate, when possible, variance in thesample data due to known sources of variations. Consequently, the results from theTEMP intertidal fixed stations which are at the +1 and +3 ft levels MLLW arefocused on wide horizontal bands along the shoreline of Diablo Cove. It is possiblethat a change in a species' abundance at either of the two sampling elevations mightnot accurately represent a species' abundance change at elevations above and belowthe sampling elevations. At the time of the initial TEMP design, an existing fieldsurvey designed and implemented by Dr. Wheeler J. North was providing periodicintertidal species' abundances from samples that spanned the tide elevations alongvertical transect lines across the intertidal zone in north and south Diablo Cove. Dr.North's sampling effort continued through 1987, and his vertical elevation intertidalabundance data was available for use in the individual species' thermal assessmentsin this report. The intertidal vertical abundance patterns of algal, invertebrate, andfish species was also sampled in a PG&E fish transect study in Diablo Cove during1979-1983, 1986, and 1987. Both the fish transect results and Dr. North's surveydata were analyzed by visual inspection for significant changes in abundancepatterns related to the presence and dose of the discharge's thermal plume.
E8-316.0 3-6
In order to extrapolate the assessment of thermal effects on the individual speciesfrom fixed sample points in the cove to a cove-wide assessment, an analyticalmethod was developed for use with the individual species' fixed station results. Therelationship between the thermal dose and the observed effects from both thelaboratory and field studies was used to extrapolate thermal effects to other areas inDiablo Cove. The method of constructing the isothermal dose maps using the TEMPin situ temperature data in combination with the results of the physical modelstudies is described below in Section 3.2.2, Thermal Dose. The thermal effects zonefor each individual species was determined graphically by the intersection of thearea of the species' significant dose and the area of the species' pre-dischargedistribution in Diablo Cove. The results are displayed graphically in a three-dimensional view of Diablo Cove's shoreline and bottom topography within eachindividual species' thermal assessment in Section 3.2.3.
3.2.2 Thermal Dose
The thermal effects of the DCPP discharge water cannot be predicted accuratelyfrom water temperature values, since organisms respond to cumulative temperatureexposures over time, not instantaneous temperatures. Thermal dose, the termdescribing cumulative temperature exposures, expresses the nature of a thermaleffect as a function of both the exposure temperature and its duration. Nearly all ofthe scientific data on the thermal tolerance of organisms is measured and reportedin terms of temperature dose; a duration of 24, 48, and 96 hours for bioassaylaboratory tests has been agreed upon among researchers as a standard. Themajority of the on-site DCPP thermal tolerance bioassay tests on the indigenousDiablo Cove species were performed to measure the species' temperature responsesover the standard bioassay exposure times and a range of potential dischargetemperatures, during both normal operation and heat treatment conditions.Predicted thermal effects changes were discussed in the Thermal DischargeAssessment Report (PG&E 1982a). In that report, the predicted DCPP dischargeinstantaneous temperatures were applied to the presumed tolerances of laboratoryspecies in order to predict areas of thermal risk in Diablo Cove, because dosecalculations from field measurements were not available at the time that theThermal Discharge Assessment Report was being prepared.
3.2.2.1 Thermal Dose Frequency
The TEMP study employed a large number of underwater self-containedtemperature recorders which monitored the instantaneous water temperaturesevery 20 minutes at intertidal and subtidal stations in and out of the area of theDCPP discharge plume. All instruments were calibrated at yearly intervals, and thecorrected temperature measurements provided recordings accurate to ±0.2 C. Thesefield temperatures recorded in the TEMP studies are useful for the calculations ofreceiving water temperature doses; the TEMP data described in Section B.1.16 inAppendix B, and stored in magnetic media files at DCPP, form the basis of the
E8-316.0 3-7
following temperature dose analysis and the related biological assessment of thethermal plume effects in Sections 3.2.3 and 3.2.4.
Over 7 million in situ temperature records were recorded magnetically at 20-minuteintervals, converted to digital temperature values, and stored in an on-siteminicomputer. The computer records were analyzed with custom software whichcomputed temperature dose from the instantaneous temperature data. The durationof a subtidal dose event was determined by choosing a target temperature value anddetermining the continuous length of time that the recorded temperatures exceededthe target temperature. The termination of a dose event occurred when thetemperature decreased more than 1 C from the target temperature, or when thetemperature decreased less than 1 C from the target temperature for a periodgreater than one hour. The results of the analyses were computed in terms of thepercent frequency of the time that the temperature continuously exceeded aspecified value for a given length of time. Although it is possible to analyze the datafor a large number of different combinations of temperature and duration, all of theanalyses were standardized to a dose of 17 C or greater for a period of at least 96hours. This standard dose (96 hrs @ 17 C) was selected because it was found to bean approximate temperature tolerance threshold in the laboratory studies of DiabloCove's algal species. Longer duration exposures at higher temperatures are commonin the data, particularly during fall months of warmer ambient water temperatures.Since discharge temperature doses were recorded that were greater than theselected standard dose value, separate analyses were performed which computed thelongest duration of a continuous 17 C exposure, as well as the highest temperatureof a 96-hour duration. These additional analyses identified temperature doses whichmay have been potentially damaging to species that were tolerant of the standardtemperature dose.
The temperature monitoring data from the TEMP subtidal sampling stations wereanalyzed for significant temperature dose (96 hrs @ 17 C). For the purpose ofanalysis, the subtidal temperature monitoring data were examined in five studyregions (see Figure 3.1-1): north Diablo Cove, south Diablo Cove, Diablo Rock, theDCPP discharge, and South Cove (ambient). The subtidal frequency of the standarddose event was calculated quarterly as the percent of time that the recordedtemperatures exceeded 17 C for periods greater than 96 hours; in the event that theduration of the dose exceeded a multiple of 96 hours, the total dose frequency wasincreased by one for each additional 96 hours of dose. The results of the subtidalthermal dose analyses are illustrated graphically in Figure 3.2.2.1-1. Temperaturedata from the DCPP discharge are not presented in this figure, because there wereonly approximately one and one-half years of data recorded which are similar to theTEMP temperature data base. The thermal dose analysis shown in Figure 3.2.2.1-1illustrates the occurrence of significant thermal dose events in 1976, 1983, and 1984,prior to the power plant start-up, which were recorded at all of the study areas;these area-wide dose events occurred during the El Nino ocean warming periods.The frequency of thermal dose was significantly higher at Diablo Rock during powerplant operation than at any other location sampled. The greatest increases in the
E8-316.0 3-8
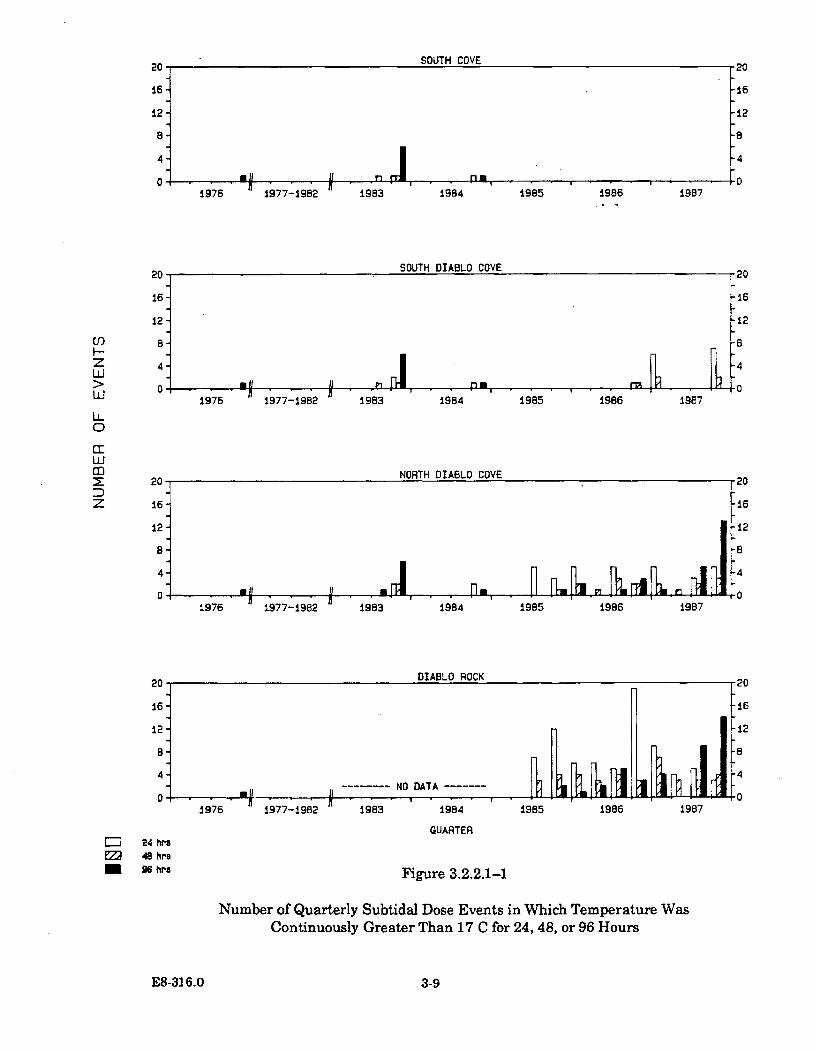
SOUTH COVESOUTH COVE Pn
16
12
B
4
0
20
-16
-12
-4
If - II
i - I-, i , , a,-,II I I1976 1977- 1982 1983 1984 1985 1986 1987
SOUTH DIABLO COVE
U)I--
zuLJ
LL0
uJ
z
16-
12-
8-
4-
0
-16
-12
oil if~~~I 130J 11976 1977-1982 1983 1984 1985 1986 19E7
NORTH DIABLO COVE
DIABLO ROCK20
165
12-
4.
0,[ rhR1
-12
-4NO DATA
iIf 1IM II ]~~ ~~~~~ n i tV
S ' n ' '1976 1977-1982 1983 1984 1985 1986 1987
24 hra
48 hre
96 bra
QUARTER
Figure 3.2.2.1-1
Number of Quarterly Subtidal Dose Events in Which Temperature WasContinuously Greater Than 17 C for 24, 48, or 96 Hours
E8-316.0 3-9
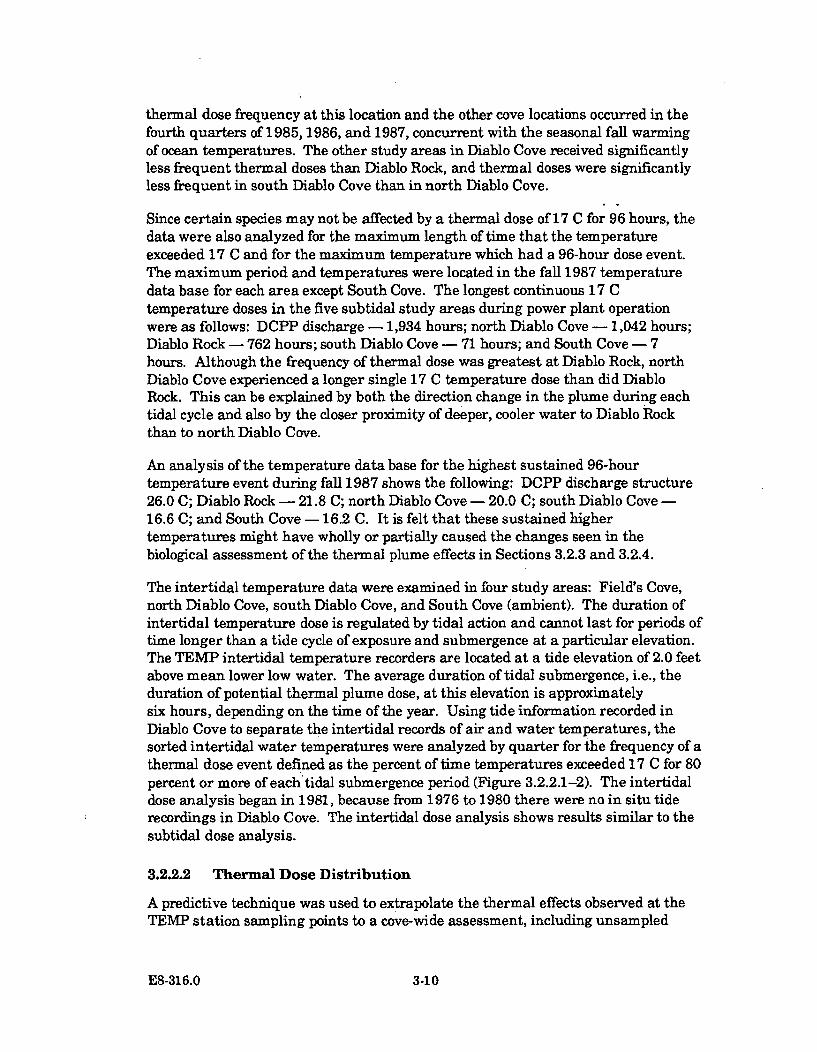
thermal dose frequency at this location and the other cove locations occurred in thefourth quarters of 1985, 1986, and 1987, concurrent with the seasonal fall warmingof ocean temperatures. The other study areas in Diablo Cove received significantlyless frequent thermal doses than Diablo Rock, and thermal doses were significantlyless frequent in south Diablo Cove than in north Diablo Cove.
Since certain species may not be affected by a thermal dose of 17 C for 96 hours, thedata were also analyzed for the maximum length of time that the temperatureexceeded 17 C and for the maximum temperature which had a 96-hour dose event.The maximum period and temperatures were located in the fall 1987 temperaturedata base for each area except South Cove. The longest continuous 17 Ctemperature doses in the five subtidal study areas during power plant operationwere as follows: DCPP discharge - 1,934 hours; north Diablo Cove - 1,042 hours;Diablo Rock - 762 hours; south Diablo Cove - 71 hours; and South Cove - 7hours. Although the frequency of thermal dose was greatest at Diablo Rock, northDiablo Cove experienced a longer single 17 C temperature dose than did DiabloRock. This can be explained by both the direction change in the plume during eachtidal cycle and also by the closer proximity of deeper, cooler water to Diablo Rockthan to north Diablo Cove.
An analysis of the temperature data base for the highest sustained 96-hourtemperature event during fall 1987 shows the following: DCPP discharge structure26.0 C; Diablo Rock - 21.8 C; north Diablo Cove - 20.0 C; south Diablo Cove -16.6 C; and South Cove - 16.2 C. It is felt that these sustained highertemperatures might have wholly or partially caused the changes seen in thebiological assessment of the thermal plume effects in Sections 3.2.3 and 3.2.4.
The intertidal temperature data were examined in four study areas: Field's Cove,north Diablo Cove, south Diablo Cove, and South Cove (ambient). The duration ofintertidal temperature dose is regulated by tidal action and cannot last for periods oftime longer than a tide cycle of exposure and submergence at a particular elevation.The TEMP intertidal temperature recorders are located at a tide elevation of 2.0 feetabove mean lower low water. The average duration of tidal submergence, i.e., theduration of potential thermal plume dose, at this elevation is approximatelysix hours, depending on the time of the year. Using tide information recorded inDiablo Cove to separate the intertidal records of air and water temperatures, thesorted intertidal water temperatures were analyzed by quarter for the frequency of athermal dose event defined as the percent of time temperatures exceeded 17 C for 80percent or more of each tidal submergence period (Figure 3.2.2.1-2). The intertidaldose analysis began in 1981, because from 1976 to 1980 there were no in situ tiderecordings in Diablo Cove. The intertidal dose analysis shows results similar to thesubtidal dose analysis.
3.2.2.2 Thermal Dose Distribution
A predictive technique was used to extrapolate the thermal effects observed at theTEMP station sampling points to a cove-wide assessment, including unsampled
E8-316.0 3-10
SOUTH COVE INTERTIDAL•VV
80-
60- -8000
0
4
20- -4
1981 1982 1983 1984 1985 1986 1987
SOUTH DIABLO COVE INTERTIDAL
80 -
60 -
40-
20-
-80
-60
-40
-20I mEIIUUJIii
z
0~
fl.& -¶ - -t 1 t11 -' 1 - ~fl
1981 1982 1983 1984 1985 1986 1987
1981 0982 1983 1984 1985 1986 1987
FIELD'S COVE INTERTIDAL
60-
40-
20-
-80
*60
-40
-20I0*4 ~I ~I q.n
19B8 1982 1983 1984
QUARTER
1985 1986 1987
Figure 3.2.2.1-2
Frequency of Intertidal Thermal Dose Events Calculated by Quarteras the Percent of Time Temperatures Exceeded 17 C
for 80 Percent or More of Each Tidal Submergence Period
E8-316.0 3-11
areas of the cove. The probability of a thermal dose among the sampling points wascalculated as described in section 3.2.2.1, using the water temperatures recorded atthe TEMP biological sampling points. The probability of a 96-hour/17 C thermaldose was calculated for each of the four study areas within the cove. The highestprobability of this thermal dose occurs during the late summer and fall, the periodwith the warmest ambient water temperatures. The thermal dose probabilityduring the fall of 1987 for each of the study areas was projected from the samplingpoints in the study area along bottom isotherm contour lines which were contiguouswith the sampling sites. The bottom isotherm contours were based on the results ofphysical model studies of the worst-case two-unit test thermal plume (model run 10,low tide and high waves) described in Section 2.2 (see Figure 2.2.1-4). Intermediatethermal dose probabilities were estimated by inspection of the lines of isotherm andtheir relationship to the gradient of differences in thermal dose values between thestudy areas. A check of the intermediate thermal dose contours was performed bycalculating probabilities of thermal dose in each of the study areas for doses 2 Cabove and below the 96-hour/17 C dose. These resulting dose probabilities wereapplied to the 2 C bottom isotherm contours on the neighboring sides of the studyarea bottom isotherm. The projected bottom contours of equal probability of a 96-hour/1 7 C thermal dose are illustrated in Figure 3.2.2.2-1.
The cove-wide thermal effects for selected species analyzed in Section 3.2.3 belowwere projected based on the relationship between laboratory temperature dose andthermal tolerance, the observed field thermal effects among the same species, thecove-wide distribution of the species, and the thermal dose distribution shown inFigure 3.2.2.2--1. The results of the intersecting areas of the species' covedistribution, its thermal tolerance, and the thermal dose distribution in the covewere used to estimate areas of probable thermal effects. The cove-wideextrapolations were adjusted by comparing them with field observations at the fixedTEMP sampling stations and field spot-checks in the affected areas. Three-dimensional graphical techniques have been employed to display the results of thethermal dose estimates of cove-wide thermal effects for each selected species.
E8-316.0 3-12
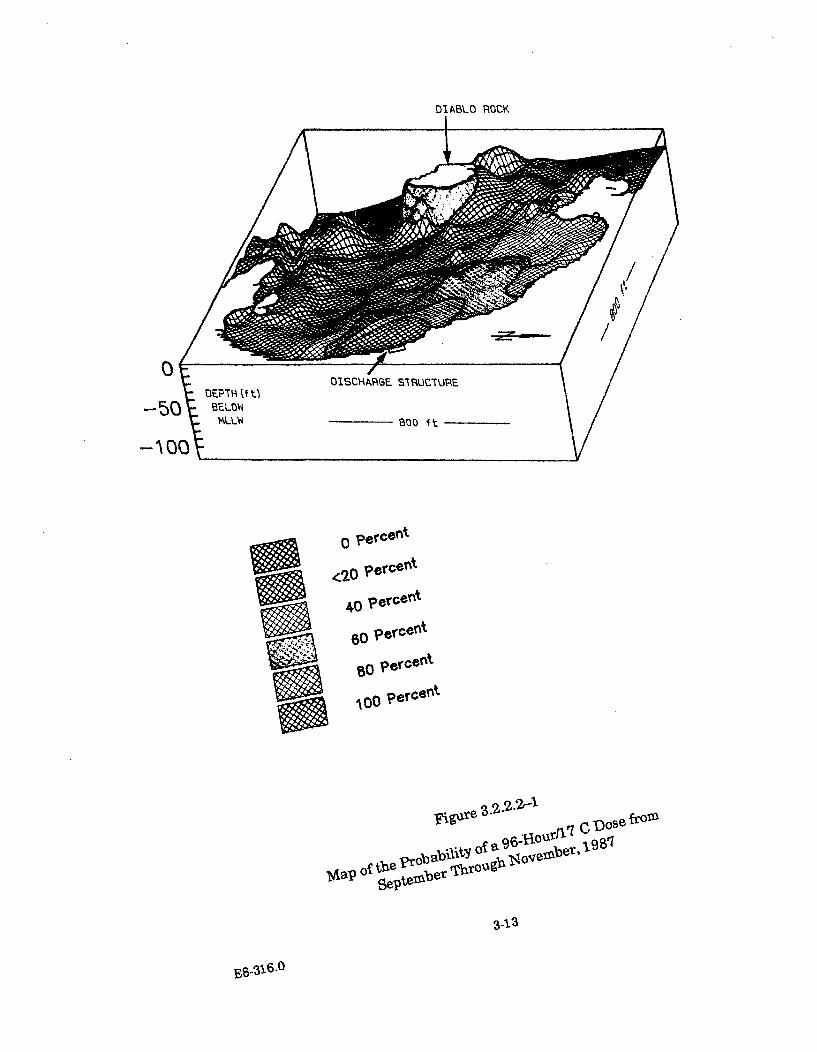
DISCHARPGE SItRUCTURE
VALOW 800 f t
opercev~t
<20 percent
80 percent
~~1re
~ A 9 i t he P C ob a b it-Y ofa 6, ,' ,Zu r 9l -C 9 8 i oh
AOIOfSepb--ra TVb3O1ah
3.2.3 Assessment of Thermal Impact for Selected Species
The following species accounts describe those intertidal and subtidal species whichwere selected for more detailed discussion because of their ecological importance,sport or commercial fishery value, or observed response to elevated temperaturesduring power plant operation. The sections contain the following information oneach species: physical description, distribution, life history, environmentalrequirements, spatial and temporal abundance patterns from the TEMP fieldstudies, and cove-wide thermal impact assessment maps. Certain species wereselected for time series analyses and analysis of variance tests to examine changesin their abundances within and between specific stations. The test results arepresented in Appendix E, and are referred to in the selected species accounts.
Graphs of the selected species' changes in abundance in the TEMP stations arepresented in the following pages and in Appendix D. For the algae, the intertidalspecies' abundances obtained by the IBT method are represented as their meanpercentage cover values per 1 m2 calculated from the same ten quadrats sampledover time at each station. Mean percentage cover values for the subtidal algalspecies (SLC method) are based on the same four 7 m2 quadrants sampled perstation. The mean coverage values and standard error bars in the algal graphs arebased on untransformed percentage cover data from the quadrats and quadrants. Inaddition to algal coverage measurements, densities of kelp plants were measured inthe subtidal stations (SAQ method).
Graphs for the selected intertidal invertebrates, excluding black abalone, depicttheir changes in abundance within the same five 1 m2 quadrats per station. Theblack abalone graphs depict changes within all ten 1 m2 quadrats per station.SLbtidal invertebrate abundance values over time were based on measurements inthe same four 7 m2 quadrants (SAQ method), or the same four 0.25 m2 quadrats(SFQ method), at each station.
The principal taxonomic keys used in the TEMP study were Abbott and Hollenberg(1976) and Sparling (1977) for the algae; Smith and Carlton (1975), Morris et al.(1980), and Ricketts et al. (1985) for the invertebrates; and Eschmeyer et al. (1983)for the fish. Several species names have changed since publication of these keys;however, since this document is the final report of a series, the initial names havebeen retained for consistency. The exceptions are Gigartina papillata, nowMastocarpus papillatus (Guiry et al. 1984), and Petrocelis franciscana, now P.middendorphii (Polanshek and West 1975). These changes have been adopted inthis report, since they are more widely recognized.
Table 3.2.3-1 lists the selected species, their scientific and common names, and theirlocation in the report. It was impractical to treat all of the hundreds of other speciesin the TEMP data base in detail. However, there are brief descriptions of responsesto elevated temperatures for several of these species (Section 3.2.3.29). Section3.2.3.30 summarizes the assessments of thermal impact on the selected species.
E8-316.0 3-14
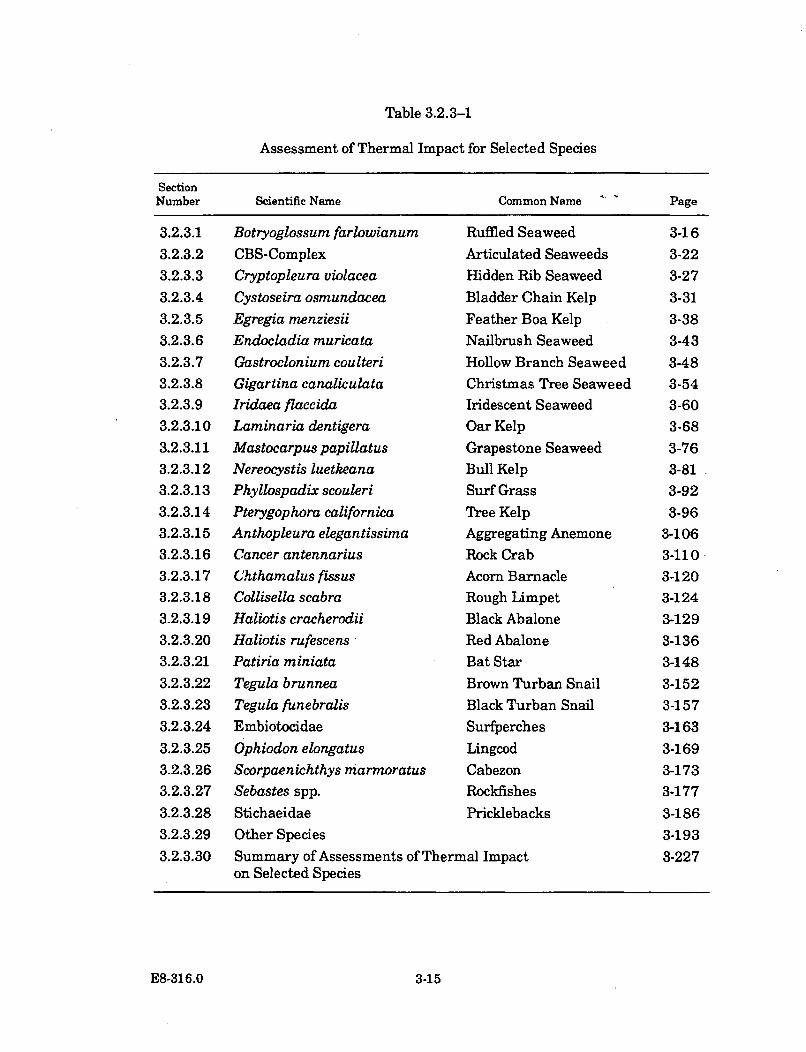
Table 3.2.3-1
Assessment of Thermal Impact for Selected Species
SectionNumber Scientific Name Common Name Page
3.2.3.1
3.2.3.2
3.2.3.3
3.2.3.4
3.2.3.5
3.2.3.6
3.2.3.7
3.2.3.8
3.2.3.9
3.2.3.10
3.2.3.11
3.2.3.12
3.2.3.13
3.2.3.14
3.2.3.15
3.2.3.16
3.2.3.17
3.2.3.18
3.2.3.19
3.2.3.20
3.2.3.21
3.2.3.22
3.2.3.23
3.2.3.24
3.2.3.25
3.2.3.26
3.2.3.27
3.2.3.28
3.2.3.29
3.2.3.30
Botryoglossum farlowianum Ruffled Seaweed
CBS-Complex Articulated Seaweeds
Cryptopleura violacea Hidden Rib Seaweed
Cystoseira osmundacea Bladder Chain Kelp
Egregia menziesii Feather Boa Kelp
Endocladia muricata Nailbrush Seaweed
Gastroclonium coulteri Hollow Branch Seaweed
Gigartina canaliculata Christmas Tree SeaweedIridaea flaccida Iridescent Seaweed
Laminaria dentigera Oar Kelp
Mastocarpus papillatus Grapestone Seaweed
Nereocystis luetkeana Bull Kelp
Phyllospadix scouleri Surf Grass
Pterygophora californica Tree Kelp
Anthopleura elegantissima Aggregating Anemone
Cancer antennarius Rock Crab
C(hthamalus fissus Acorn Barnacle
Collisella scabra Rough Limpet
Haliotis cracherodii Black Abalone
Haliotis rufescens Red Abalone
Patiria miniata Bat Star
Tegula brunnea Brown Turban Snail
Tegula funebralis Black Turban SnailEmbiotocidae Surfperches
Ophiodon elongatus Lingcod
Scorpaenichthys marmoratus Cabezon
Sebastes spp. Rockfishes
Stichaeidae Pricklebacks
Other Species
Summary of Assessments of Thermal Impacton Selected Species
3-16
3-22
3-27
3-31
3-38
3-43
3-48
3-54
3-60
3-68
3-76
3-81
3-92
3-96
3-106
3-110
3-120
3-124
3-129
3-136
3-148
3-152
3-157
3-163
3-169
3-173
3-177
3-186
3-193
3-227
E8-316.0 3-15
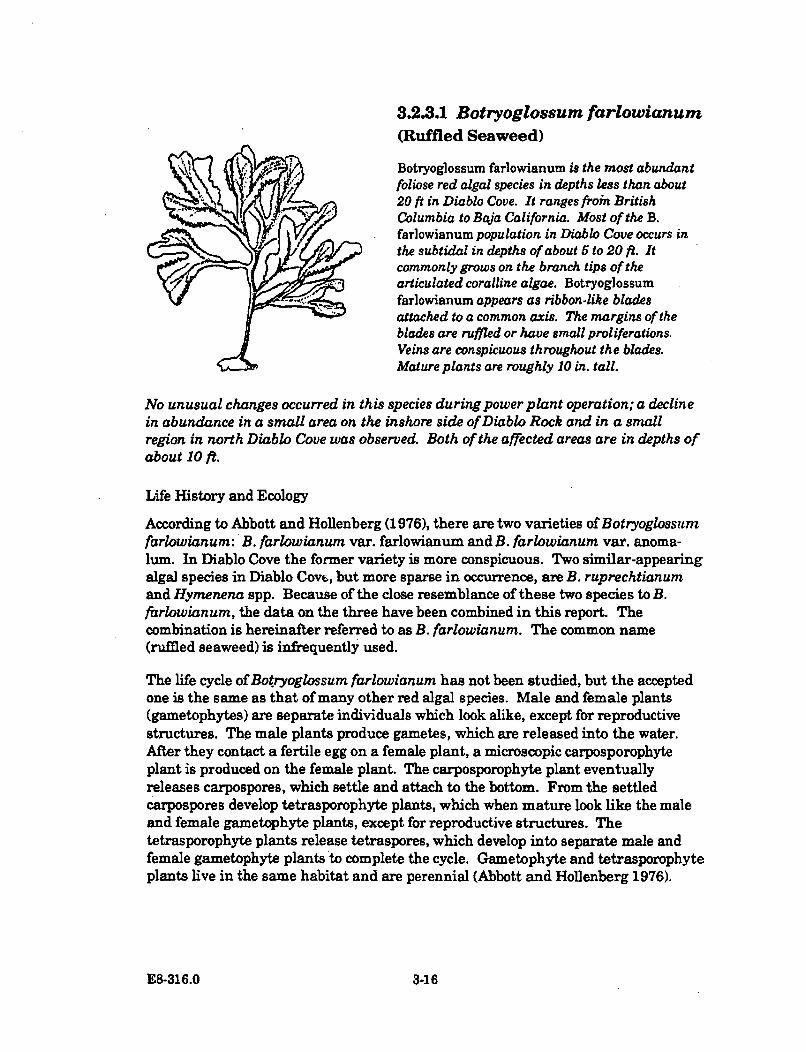
3.2.3.1 Botryoglossum farlowianum(Ruffled Seaweed)
Botryoglossum farlowianum is the most abundantX ',foliose red algal species in depths less than about
20 ft in Diablo Cove. It ranges froin BritishColumbia to Baja California. Most of the B.farlowianum population in Diablo Cove occurs inthe subtidal in depths of about 5 to 20 ft. Itcommonly grows on the branch tips of the
.7 articulated coralline algae. Botryoglossumfarlowianum appears as ribbon-like bladesattached to a common axis. The margins of theblades are ruffled or have small proliferations.Veins are conspicuous throughout the blades.Mature plants are roughly 10 in. tall.
No unusual changes occurred in this species during power plant operation; a declinein abundance in a small area on the inshore side of Diablo Rock and in a smallregion in north Diablo Cove was observed. Both of the affected areas are in depths ofabout 10 ft.
Life History and Ecology
According to Abbott and Hollenberg (1976), there are two varieties of Botryoglossumfarlowianum: B. farlowianum var. farlowianum and B. farlowianum var. anoma-lum. In Diablo Cove the former variety is more conspicuous. Two similar-appearingalgal species in Diablo Covc, but more sparse in occurrence, are B. ruprechtianumand Hymenena spp. Because of the close resemblance of these two species to B.farlowianum, the data on the three have been combined in this report. Thecombination is hereinafter referred to as B. farlowianum. The common name(ruffled seaweed) is infrequently used.
The life cycle of Botryoglossum farlowianum has not been studied, but the acceptedone is the same as that of many other red algal species. Male and female plants(gametophytes) are separate individuals which look alike, except for reproductivestructures. The male plants produce gametes, which are released into the water.After they contact a fertile egg on a female plant, a microscopic carposporophyteplant is produced on the female plant. The carposporophyte plant eventuallyreleases carpospores, which settle and attach to the bottom. From the settledcarpospores develop tetrasporophyte plants, which when mature look like the maleand female gametophyte plants, except for reproductive structures. Thetetrasporophyte plants release tetraspores, which develop into separate male andfemale gametophyte plants to complete the cycle. Gametophyte and tetrasporophyteplants live in the same habitat and are perennial (Abbott and Hollenberg 1976).
E8-316.0 3-16
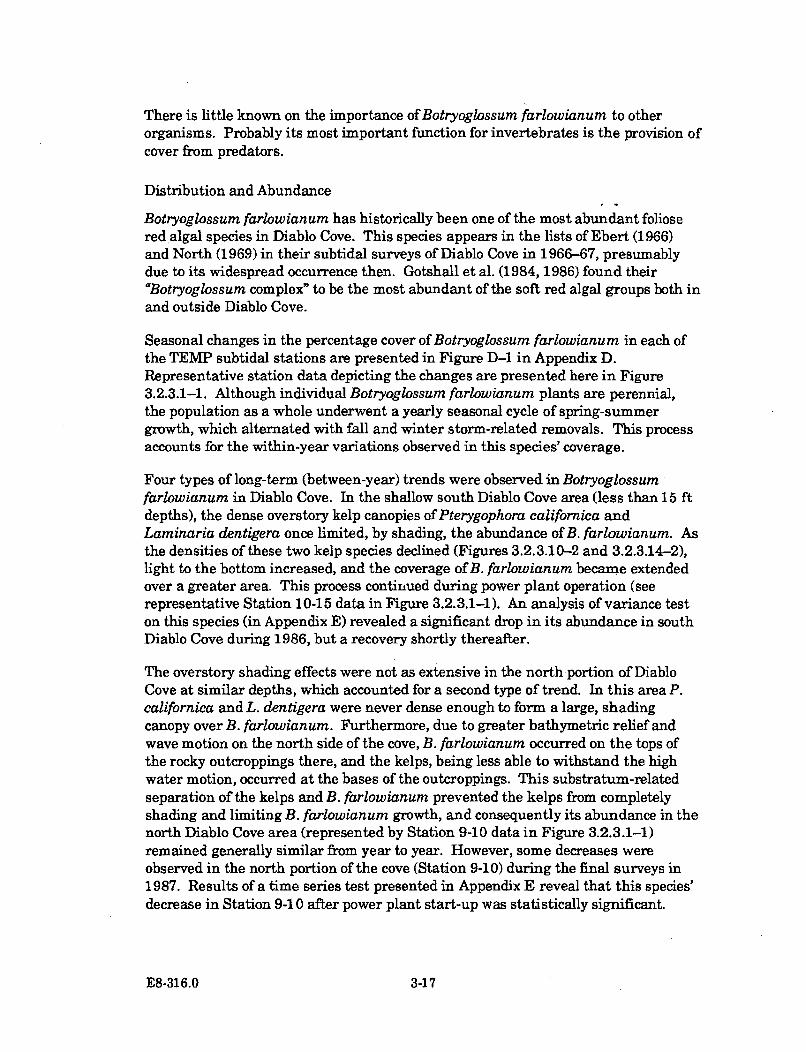
There is little known on the importance of Botryoglossum farlowianum to otherorganisms. Probably its most important function for invertebrates is the provision ofcover from predators.
Distribution and Abundance
Botryoglossum farlowianum has historically been one of the most abundant folioseredalgal species in Diablo Cove. This species appears in the lists of Ebert (1966)and North (1969) in their subtidal surveys of Diablo Cove in 1966-67, presumablydue to its widespread occurrence then. Gotshall et al. (1984, 1986) found theiraBotryoglossum complex" to be the most abundant of the soft red algal groups both inand outside Diablo Cove.
Seasonal changes in the percentage cover of Botryoglossum farlowianum in each ofthe TEMP subtidal stations are presented in Figure D-1 in Appendix D.Representative station data depicting the changes are presented here in Figure3.2.3.1-1. Although individual Botryoglossum farlowianum plants are perennial,the population as a whole underwent a yearly seasonal cycle of spring-summergrowth, which alternated with fall and winter storm-related removals. This processaccounts for the within-year variations observed in this species' coverage.
Four types of long-term (between-year) trends were observed in Botryoglossumfarlowianum in Diablo Cove. In the shallow south Diablo Cove area (less than 15 ftdepths), the dense overstory kelp canopies of Pterygophora californica andLaminaria dentigera once limited, by shading, the abundance of B. farlowianum. Asthe densities of these two kelp species declined (Figures 3.2.3.10-2 and 3.2.3.14-2),light to the bottom increased, and the coverage of B. farlowianum became extendedover a greater area. This process continued during power plant operation (seerepresentative Station 10-15 data in Figure 3.2.3.1-1). An analysis of variance teston this species (in Appendix E) revealed a significant drop in its abundance in southDiablo Cove during 1986, but a recovery shortly thereafter.
The overstory shading effects were not as extensive in the north portion of DiabloCove at similar depths, which accounted for a second type of trend. In this area P.californica and L. dentigera were never dense enough to form a large, shadingcanopy over B. farlowianum. Furthermore, due to greater bathymetric relief andwave motion on the north side of the cove, B. farlowianum occurred on the tops ofthe rocky outcroppings there, and the kelps, being less able to withstand the highwater motion, occurred at the bases of the outcroppings. This substratum-relatedseparation of the kelps and B. farlowianum prevented the kelps from completelyshading and limiting B. farlowianum growth, and consequently its abundance in thenorth Diablo Cove area (represented by Station 9-10 data in Figure 3.2.3.1-1)remained generally similar from year to year. However, some decreases wereobserved in the north portion of the cove (Station 9-10) during the final surveys in1987. Results of a time series test presented in Appendix E reveal that this species'decrease in Station 9-10 after power plant start-up was statistically significant.
E8-316.0 3-17
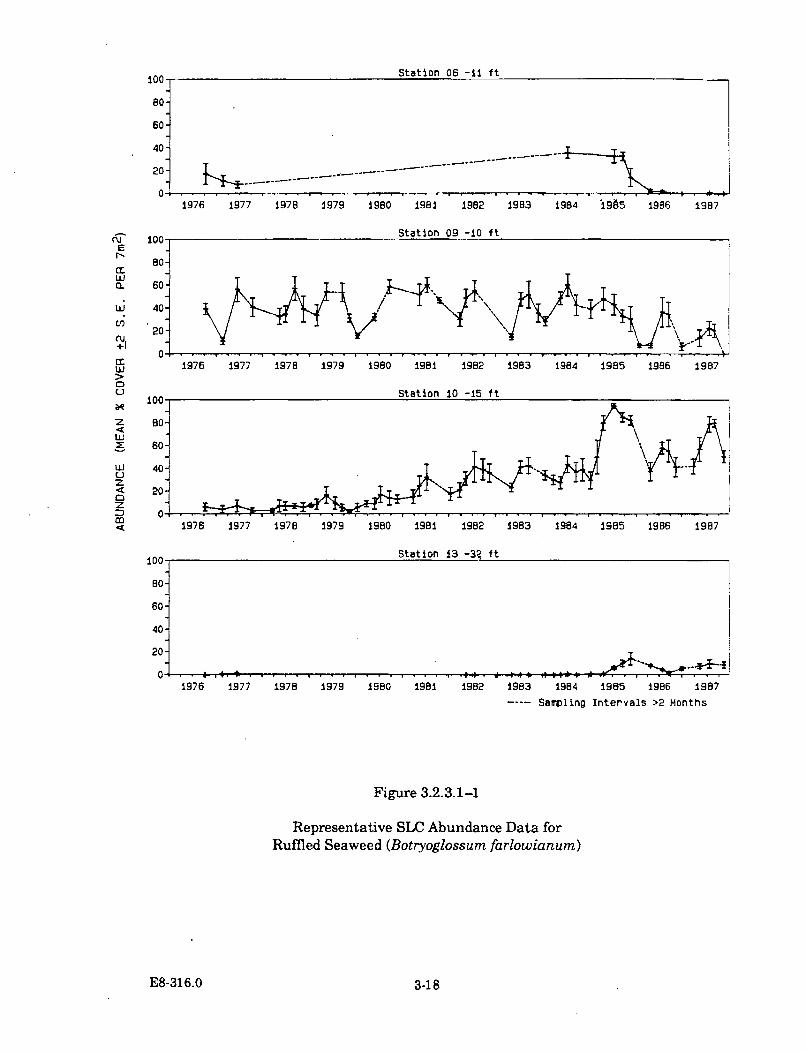
Station 06 -il fti lS t 0 -i -
80-
60.
40-
20-
1976 1977 1978 1979 1980 1981 1982 1983 1984 19§5 1986 1987
CT- 100E
r• 80
LLJ0. 60
wý 40
Cr)20
rc
UX 100
z so,LU0 60.
4J 40 -uz4 20ýz03 0.M
1976 1977 1978 1979 1980 1981 1982 1983 1984 1985 1986 1987
100 Station 13 -32 ft
80-
6So
40
20"
1976 1977 1978 1979 1980 1981 1982 1983 1984 1985 1986 1987
---- Sampling Intervals >2 Months
Figure 3.2.3.1-1
Representative SLC Abundance Data forRuffled Seaweed (Botryoglossum farlowianum)
E8-316.0 3-18
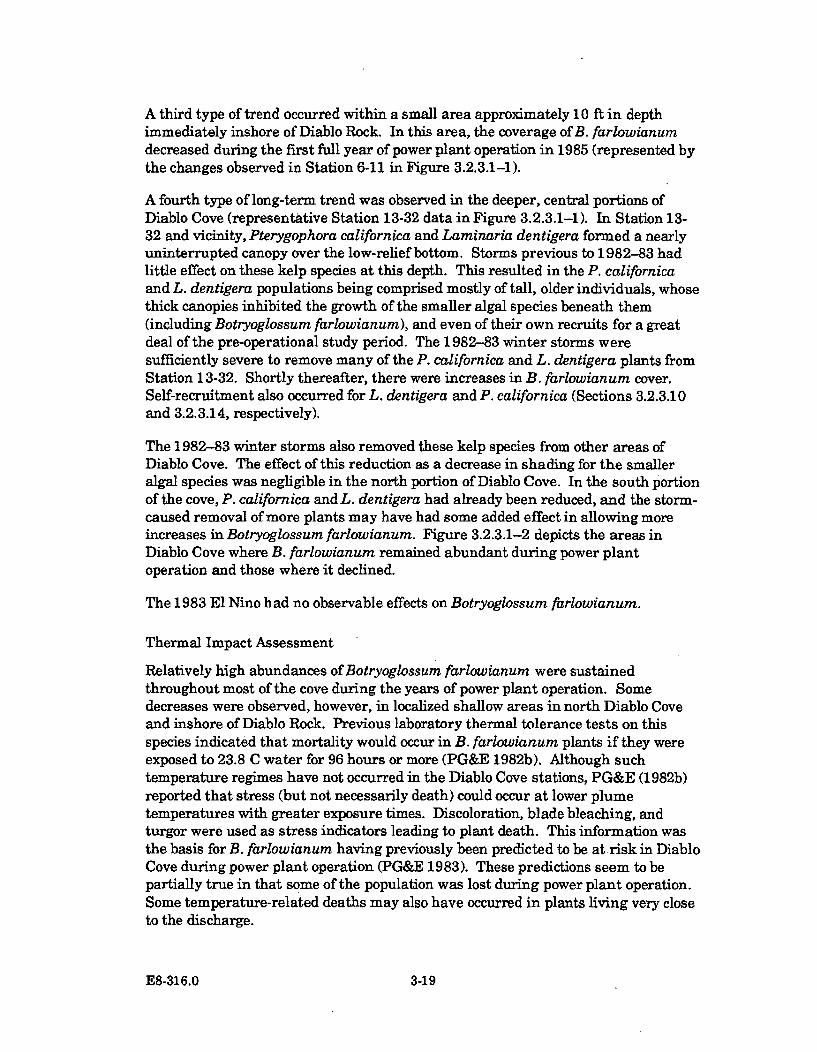
A third type of trend occurred within a small area approximately 10 ft in depthimmediately inshore of Diablo Rock. In this area, the coverage of B. farlowianumdecreased during the first full year of power plant operation in 1985 (represented bythe changes observed in Station 6-11 in Figure 3.2.3.1-1).
A fourth type of long-term trend was observed in the deeper, central portions ofDiablo Cove (representative Station 13-32 data in Figure 3.2.3.1-1). In Station 13-32 and vicinity, Pterygophora californica and Laminaria dentigera formed a nearlyuninterrupted canopy over the low-relief bottom. Storms previous to 1982-83 hadlittle effect on these kelp species at this depth. This resulted in the P. californicaand L. dentigera populations being comprised mostly of tall, older individuals, whosethick canopies inhibited the growth of the smaller algal species beneath them(including Botryoglossum farlowianum), and even of their own recruits for a greatdeal of the pre-operational study period. The 1982-83 winter storms weresufficiently severe to remove many of the P. californica and L. dentigera plants fromStation 13-32. Shortly thereafter, there were increases in B. farlowianum cover.Self-recruitment also occurred for L. dentigera and P. californica (Sections 3.2.3.10and 3.2.3.14, respectively).
The 1982-83 winter storms also removed these kelp species from other areas ofDiablo Cove. The effect of this reduction as a decrease in shading for the smalleralgal species was negligible in the north portion of Diablo Cove. In the south portionof the cove, P. californica and L. dentigera had already been reduced, and the storm-caused removal of more plants may have had some added effect in allowing moreincreases in Botryoglossum farlowianum. Figure 3.2.3.1-2 depicts the areas inDiablo Cove where B. farlowianum remained abundant during power plantoperation and those where it declined.
The 1983 El Nino had no observable effects on Botryoglossum farlowianum.
Thermal Impact Assessment
Relatively high abundances of Botryoglossum farlowianum were sustainedthroughout most of the cove during the years of power plant operation. Somedecreases were observed, however, in localized shallow areas in north Diablo Coveand inshore of Diablo Rock. Previous laboratory thermal tolerance tests on thisspecies indicated that mortality would occur in B. farlowianum plants if they wereexposed to 23.8 C water for 96 hours or more (PG&E 1982b). Although suchtemperature regimes have not occurred in the Diablo Cove stations, PG&E (1982b)reported that stress (but not necessarily death) could occur at lower plumetemperatures with greater exposure times. Discoloration, blade bleaching, andturgor were used as stress indicators leading to plant death. This information wasthe basis for B. farlowianum having previously been predicted to be at risk in DiabloCove during power plant operation (PG&E 1983). These predictions seem to bepartially true in that some of the population was lost during power plant operation.Some temperature-related deaths may also have occurred in plants living very closeto the discharge.
E8-316.0 3-19
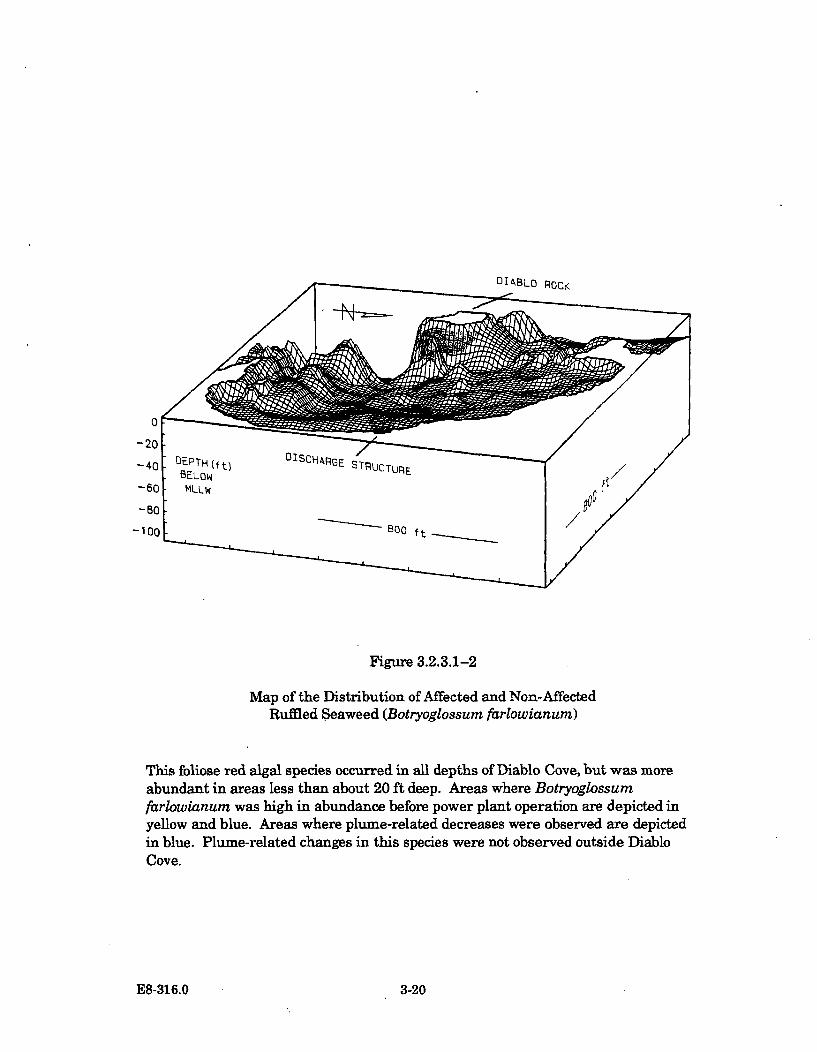
DIABLO ROCK
Figure 3.2,3.1-2
Map of the Distribution of Affected and Non-AffectedRuffled Seaweed (Botryoglossum farlowianum)
This foliose red algal species occurred in all depths of Diablo Cove, but was moreabundant in areas less than about 20 ft deep. Areas where Botryoglossumfarlowianum was high in abundance before power plant operation are depicted inyellow and blue. Areas where plume-related decreases were observed are depictedin blue. Plume-related changes in this species were not observed outside DiabloCove.
E8-316.0 3-20
The remainder of Diablo Cove's Botryoglossum farlowianum population maycontinue, over the long term, to be a major component of the foliose red algalunderstory in the shallow areas of Diablo Cove. However, proximal to B.farlowianum during power plant operation were sudden increases in Cryptopleuraviolacea, a similar-appearing close relative of B. farlowianum. The occurrence ofboth these species over the long term may depend on their abilities to out-competeone another for attachment points. It is possible that some of the decreases in B.farlowianum in the north portion of Diablo Cove at the end of 1987 were related tothe increases in C. violacea.
E8-316.0 3-21
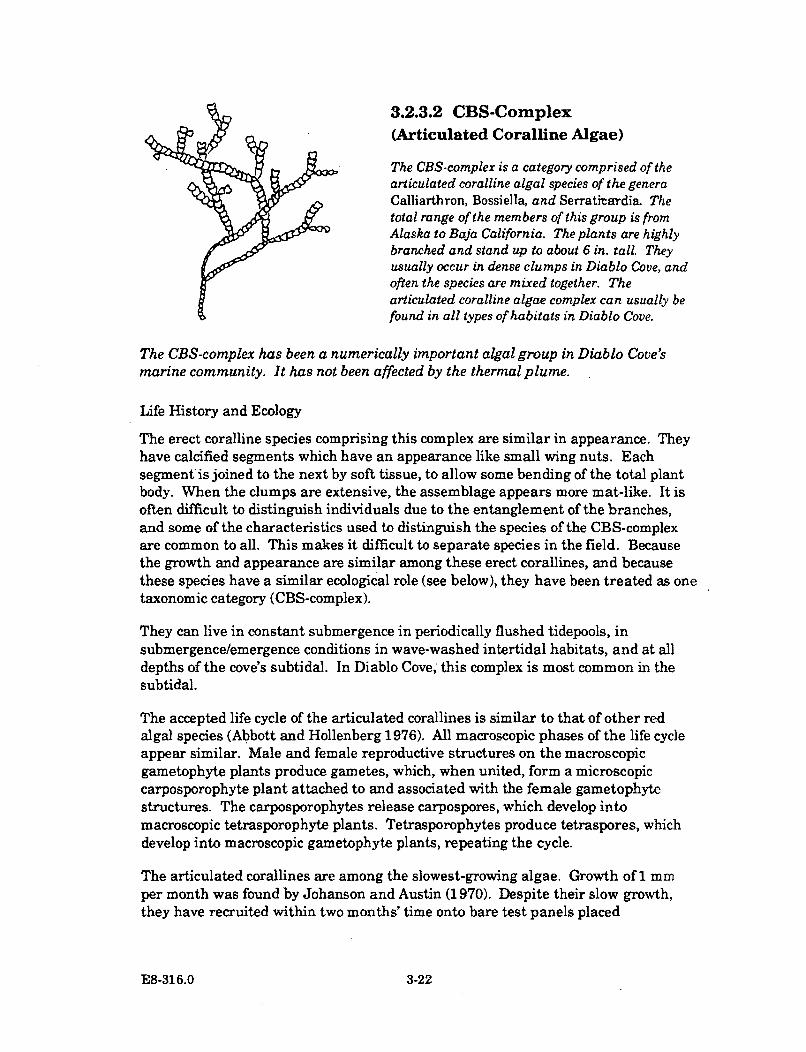
3.2.3.2 CBS-Complex(Articulated Coralline Algae)
The CBS-complex is a category comprised of thearticulated coralline algal species of the generaCalliarthron, Bossiella, and Serratitardia. Thetotal range of the members of this group is fromAlaska to Baja California. The plants are highlybranched and stand up to about 6 in. tall. Theyusually occur in dense clumps in Diablo Cove, andoften the species are mixed together. Thearticulated coralline algae complex can usually befound in all types of habitats in Diablo Cove.
The CBS-complex has been a numerically important algal group in Diablo Cove'smarine community. It has not been affected by the thermal plume.
Life History and Ecology
The erect coralline species comprising this complex are similar in appearance. Theyhave calcified segments which have an appearance like small wing nuts. Eachsegment is joined to the next by soft tissue, to allow some bending of the total plantbody. When the clumps are extensive, the assemblage appears more mat-like. It isoften difficult to distinguish individuals due to the entanglement of the branches,and some of the characteristics used to distinguish the species of the CBS-complexare common to all. This makes it difficult to separate species in the field. Becausethe growth and appearance are similar among these erect corallines, and becausethese species have a similar ecological role (see below), they have been treated as onetaxonomic category (CBS-complex).
They can live in constant submergence in periodically flushed tidepools, insubmergence/emergence conditions in wave-washed intertidal habitats, and at alldepths of the cove's subtidal. In Diablo Cove; this complex is most common in thesubtidal.
The accepted life cycle of the articulated corallines is similar to that of other redalgal species (Abbott and Hollenberg 1976). All macroscopic phases of the life cycleappear similar. Male and female reproductive structures on the macroscopicgametophyte plants produce gametes, which, when united, form a microscopiccarposporophyte plant attached to and associated with the female gametophytestructures. The carposporophytes release carpospores, which develop intomacroscopic tetrasporophyte plants. Tetrasporophytes produce tetraspores, whichdevelop into macroscopic gametophyte plants, repeating the cycle.
The articulated corallines are among the slowest-growing algae. Growth of 1 mmper month was found by Johanson and Austin (1970). Despite their slow growth,they have recruited within two months' time onto bare test panels placed
E8-316.0 3-22
periodically into the Diablo Cove shallow subtidal. The early growth found on thetest panels indicates that high recruitment may compensate for their slow growth.
The articulated corallines are resistant to grazing because of their calcified bodysegments. They usually form the majority of the species left in areas heavily grazedby sea urchins. Dense clumps or mats of entangled branches form an ideal habitatfor small invertebrates.
Patches of articulated corallines are resistant to invasion by other algal species(Reed and Foster 1984, Dayton et al. 1984). Both studies postulated that the smallgrazers living in the articulated coralline mats may eat any new algal materialentrapped by the branches, and that the branches themselves may effectively shadethe bottom and inhibit smaller algal growth. On the other hand, the tops of thebranches provide attachment and growth sites for some foliose red algal species. InDiablo Cove the foliose red algae Botryoglossum farlowianum (Section 3.2.3.1) andCryptopleura violacea (Section 3.2.3.3) grow abundantly on the tops of the CBS-complex.
Distribution and Abundance
In the marine surveys in Diablo Cove in 1966, North (1969) noted that the crustosecoralline algae were the principal species remaining in the areas heavily grazed byred sea urchins (Strongylocentrotus franciscanus). Presumably the grazer-resistantarticulated corallines were present also. Changes in the cover of this group ofarticulated corallines in the TEMP subtidal stations from 1976 to 1987 are depictedin Figure D-2 in Appendix D. Representative station graphs depicting the changesare presented in Figure 3.2.3.2-1. The relatively stable trends noted on the stationsprior to power plant start-up in 1984 suggest that this assemblage may haveoccurred in similar abundances during previous years. In south Diablo Cove thisassemblage was affected in early 1984 by an algal bleaching period (PG&E 1985).Decreases in the cover of the CBS-complex were observed later in this portion of thecove (represented by Station 10-10 data), indicating that the bleaching adverselyaffected some plants. In the north portion of Diablo Cove, abundances remainedconstant throughout the TEMP studies (represented by Station 8-10 data in Figure3.2.3.2-1). The 1982-83 severe storms and the following 1983 El Nino event did notnoticeably alter the coverage of the CBS-complex. The patterns in the north andsouth portions of Diablo Cove are similarly described by the time series and analysisof variance tests presented in Appendix E. A map depicting the total area of thecove where the articulated coralline members can be found is presented in Figure3.2.3.2-2.
Thermal Impact Assessment
Although there were some decreases in the coverage of the articulated corallinecomplex during power plant operation, they are apparently residual effects from anearlier algal bleaching period. The stable abundances observed in the unaffectedareas of Diablo Cove throughout the study phase when the power plant was
E8-316.0 3-23
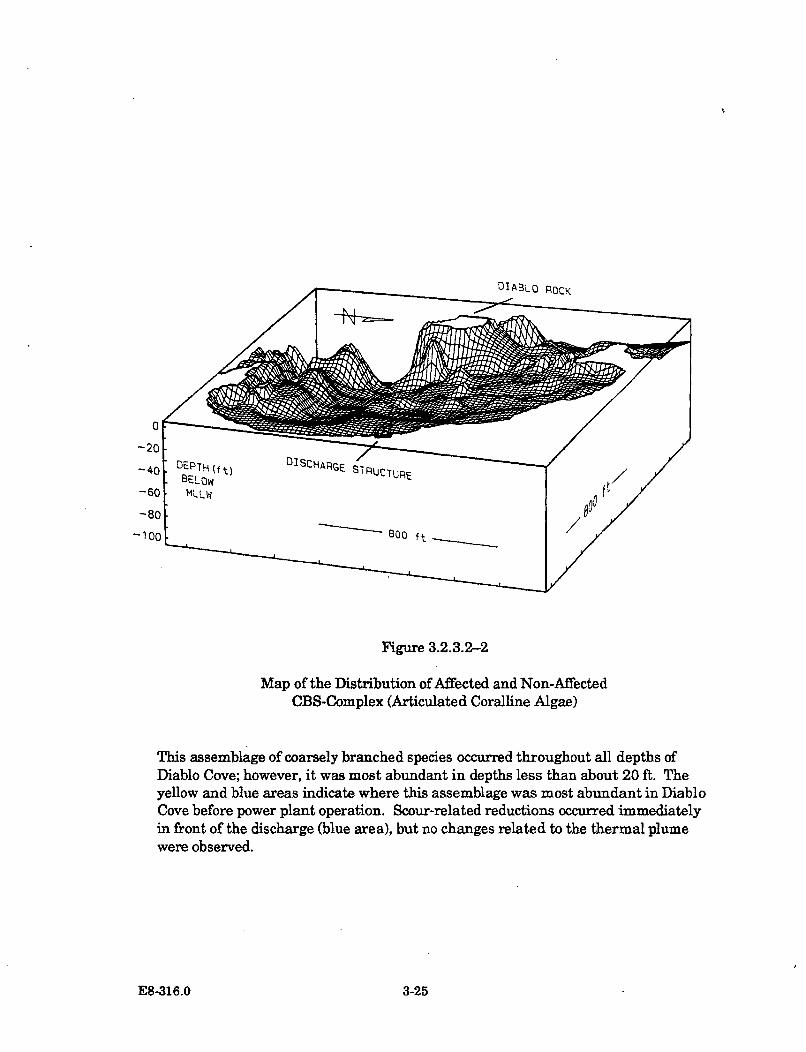
OIABLO AOCK
Figure 3.2.3.2-2
Map of the Distribution of Affected and Non-AffectedCBS-Complex (Articulated Coralline Algae)
This assemblage of coarsely branched species occurred throughout all depths ofDiablo Cove; however, it was most abundant in depths less than about 20 ft. Theyellow and blue areas indicate where this assemblage was most abundant in DiabloCove before power plant operation. Scour-related reductions occurred immediatelyin front of the discharge (blue area), but no changes related to the thermal plumewere observed.
E8-316.0 3-25
operational indicate that this species is tolerant of the warm water plume. This isconsistent with the lack of thermal effects predicted by previous laboratoryexperiments. Although laboratory tests showed that plants began to bleach after216 hours of exposure to 23.8 C (PG&E 1982b), this temperature dose has not yetbeen measured in the TEMP stations. Also, the laboratory tests could not determineif the indications of plant stress (bleaching, color change) would actuiwy result inplant mortalities in the field.
Since the coverage of the articulated corallines did not change markedly duringpower plant operation, there have probably not been any changes in the amount ofhabitat this complex provides for small invertebrate species.
E8-316.0 3-26
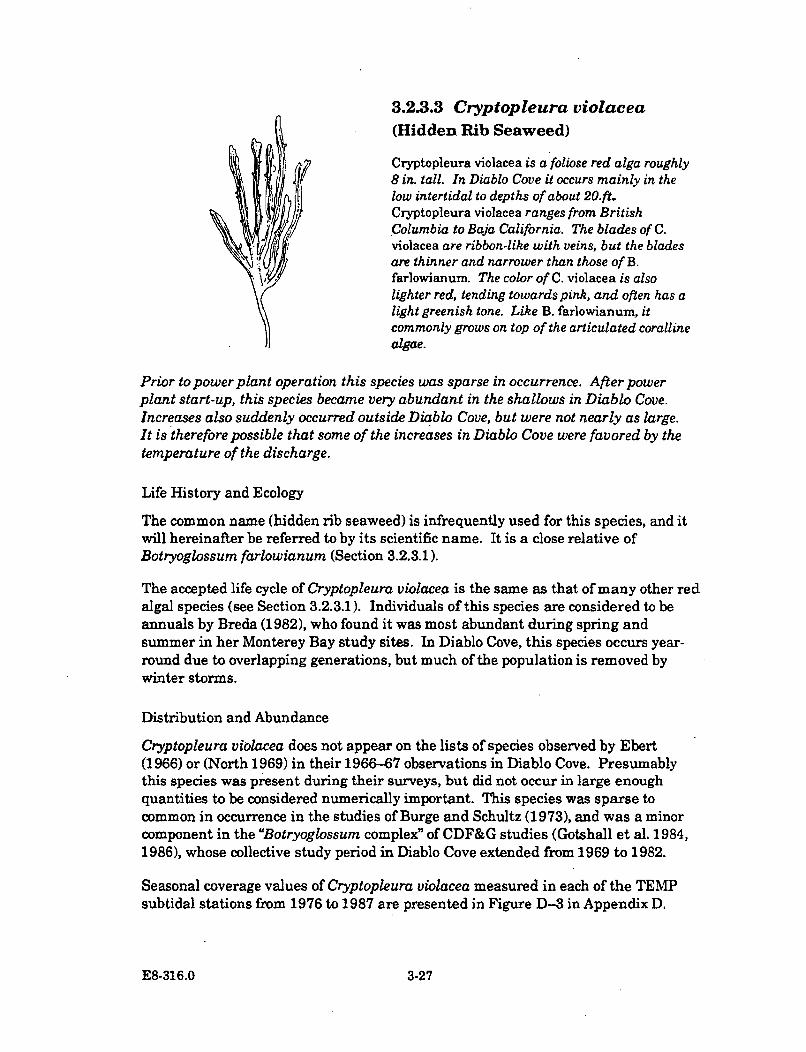
3.2.3.3 Cryptopleura violacea
(Hidden Rib Seaweed)
Cryptopleura violacea is a foliose red alga roughly8 in. tall. In Diablo Cove it occurs mainly in thelow intertidal to depths of about 20.ft.
/Cryptopleura violacea ranges from BritishColumbia to Baja California. The blades of C.violacea are ribbon-like with veins, but the bladesare thinner and narrower than those of B.farlowianum. The color of C. violacea is alsolighter red, tending towards pink, and often has alight greenish tone. Like B. farlowianum, itcommonly grows on top of the articulated corallinealgae.
Prior to power plant operation this species was sparse in occurrence. After powerplant start-up, this species became very abundant in the shallows in Diablo Cove.Increases also suddenly occurred outside Diablo Cove, but were not nearly as large.It is therefore possible that some of the increases in Diablo Cove were favored by thetemperature of the discharge.
Life History and Ecology
The common name (hidden rib seaweed) is infrequently used for this species, and itwill hereinafter be referred to by its scientific name. It is a close relative ofBotryoglossum farlowianum (Section 3.2.3.1).
The accepted life cycle of Cryptopleura violacea is the same as that of many other redalgal species (see Section 3.2.3.1). Individuals of this species are considered to beannuals by Breda (1982), who found it was most abundant during spring andsummer in her Monterey Bay study sites. In Diablo Cove, this species occurs year-round due to overlapping generations, but much of the population is removed bywinter storms.
Distribution and Abundance
Cryptopleura violacea does not appear on the lists of species observed by Ebert(1966) or (North 1969) in their 1966-67 observations in Diablo Cove. Presumablythis species was present during their surveys, but did not occur in large enoughquantities to be considered numerically important. This species was sparse tocommon in occurrence in the studies of Burge and Schultz (1973), and was a minorcomponent in the "Botryoglossum complex" of CDF&G studies (Gotshall et al. 1984,1986), whose collective study period in Diablo Cove extended from 1969 to 1982.
Seasonal coverage values of Cryptopleura violacea measured in each of the TEMPsubtidal stations from 1976 to 1987 are presented in Figure D-3 in Appendix D.
E8-316.0 3-27
Data from Station 9-10 representing the increases observed in Diablo Cove, and datafrom Station 19-10 representing the increases observed outside the cove, arepresented in Figure 3.2.3.3-1. From 1976 to 1984, individuals of this species werefound frequently throughout the Diablo Canyon study area, but were separated byseveral yards. Consequently, the seasonal abundances in the TEMP stations wereconsistently low. The severe 1982-83 winter storms and subsequent 1983 El Ninoevent did not change the sparse abundance of C. violacea.
During power plant operation, the coverage of C. violacea increased substantially inregions of the cove at depths less than about 15 ft. The majority of the C. violaceapopulation was attached to the branch tips of the articulated coralline algae. Largeincreases were also observed in the intertidal, on downsloping portions of the rockybench immediately downcoast from and adjacent to the discharge structure. In thisarea C. violacea plants were mostly attached to Gastroclonium coulteri (hollowbranched seaweed). During this same period, minor increases were evident in thestations outside Diablo Cove.
Thermal Impact Assessment
The largest increases in Cryptopleura violacea during power plant operation wereobserved in Diablo Cove. These were likely part of a geographically widespreadincrease in abundance of this species, because increases also occurred outside DiabloCove. However, the increases outside the cove were much smaller. Because of this,it is possible that the increases in the cove's population were facilitated by theelevated temperatures from the plume. Since C. violacea also increased on theintertidal bench proximal to the discharge structure, it seems evident that thisspecies is highly tolerant of warm water. A map depicting the areas where C.violacea increased in Diablo Cove is presented in Figure 3.2.3.3-2.
There is no known information on temperature tolerances in Cryptopleura violacea.Other species of Cryptopleura are cited as being tolerant of warm water by Abbottand North (1971).
The new Cryptopleura violacea plants in the shallow subtidal portions of DiabloCove occurred with the highly abundant Botryoglossum farlowianum species(Section 3.2.3.1). Because these two species occupy the same habitat, future changesin their abundances may be related to competition between them.
E8-316.0 3-28
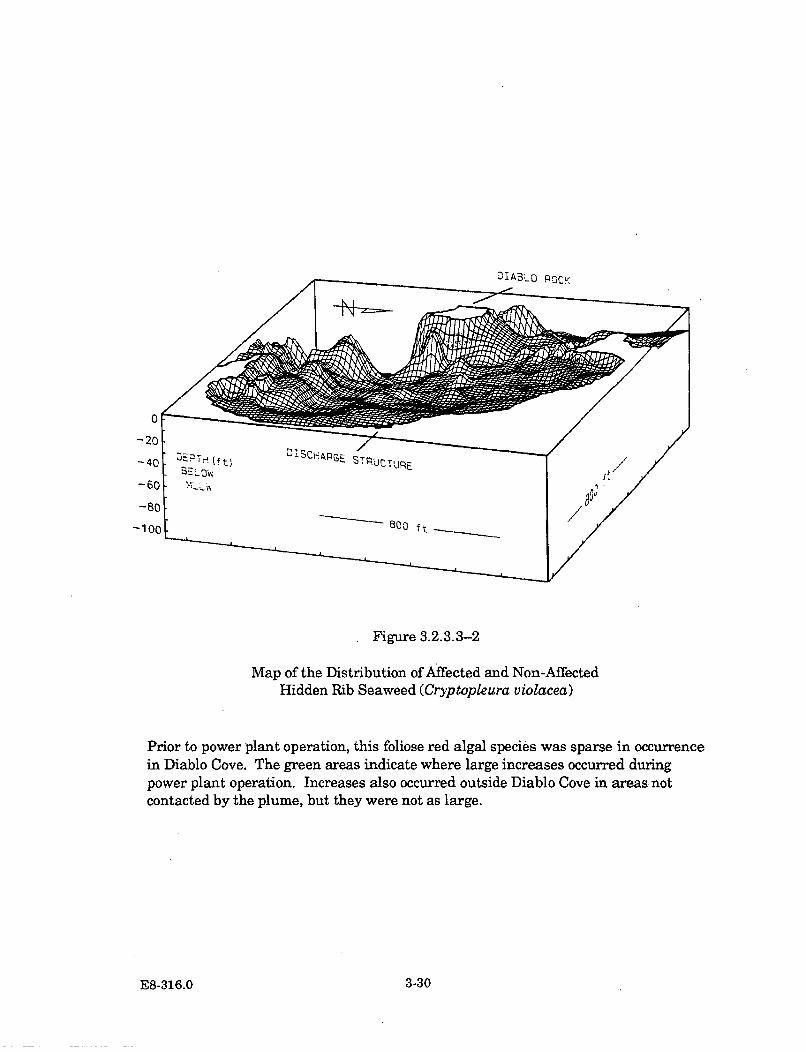
DIAB:jO fOCK
Figure 3.2.3.3-2
Map of the Distribution of Affected and Non-AffectedHidden Rib Seaweed (Cryptopleura violacea)
Prior to power plant operation, this foliose red algal species was sparse in occurrencein Diablo Cove. The green areas indicate where large increases occurred duringpower plant operation. Increases also occurred outside Diablo Cove in areas notcontacted by the plume, but they were not as large.
E8-316.0 3-30
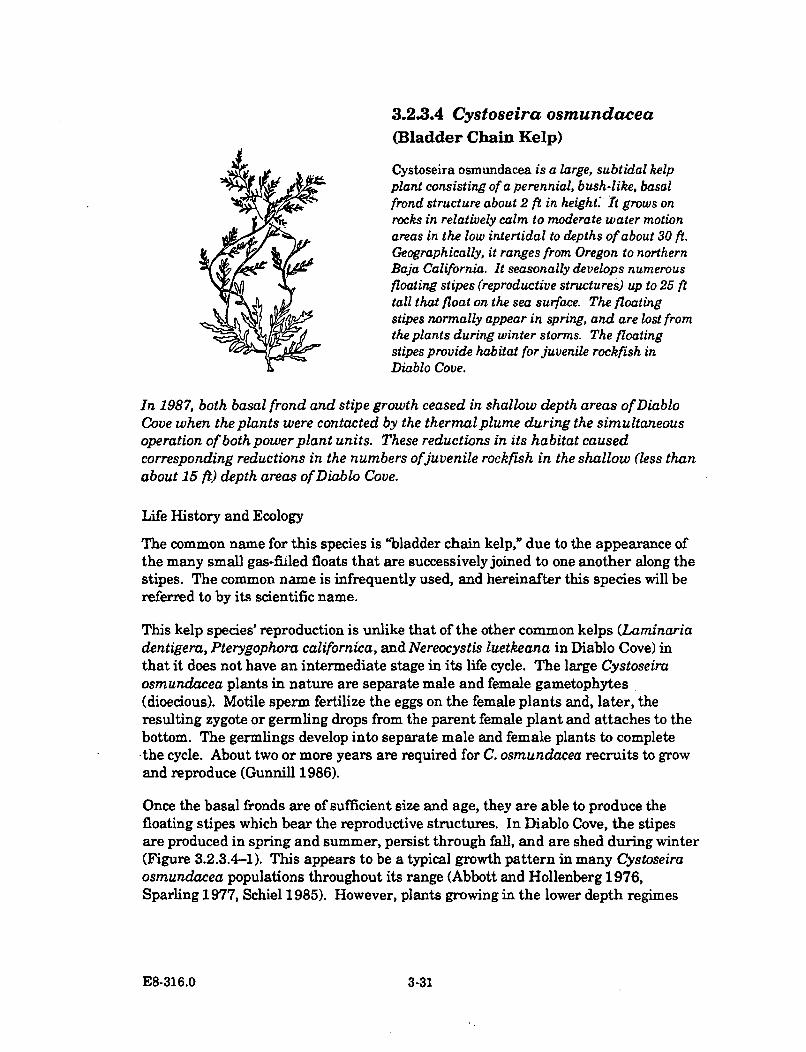
3.2.3.4 Cystoseira osmundacea(Bladder Chain Kelp)
Cystoseira osmundacea is a large, subtidal kelpplant consisting of a perennial, bush-like, basalfrond structure about 2 ft in height.' t grows onrocks in relatively calm to moderate water motionareas in the low intertidal to depths of about 30 ft.Geographically, it ranges from Oregon to northernBaja California. It seasonally develops numerousfloating stipes (reproductive structures) up to 25 fttall that float on the sea surface. The floatingstipes normally appear in spring, and are lost fromthe plants during winter storms. The floatingstipes provide habitat for juvenile rockfish inDiablo Cove.
In 1987, both basal frond and stipe growth ceased in shallow depth areas of DiabloCove when the plants were contacted by the thermal plume during the simultaneousoperation of both power plant units. These reductions in its habitat causedcorresponding reductions in the numbers ofjuvenile rockfish in the shallow (less thanabout 15 ft) depth areas of Diablo Cove.
Life History and Ecology
The common name for this species is "bladder chain kelp," due to the appearance ofthe many small gas-filed floats that are successively joined to one another along thestipes. The common name is infrequently used, and hereinafter this species will bereferred to by its scientific name.
This kelp species' reproduction is unlike that of the other common kelps (Laminariadentigera, Pterygophora californica, and Nereocystis luetkeana in Diablo Cove) inthat it does not have an intermediate stage in its life cycle. The large Cystoseiraosmundacea plants in nature are separate male and female gametophytes(dioecious). Motile sperm fertilize the eggs on the female plants and, later, theresulting zygote or germling drops from the parent female plant and attaches to thebottom. The germlings develop into separate male and female plants to completethe cycle. About two or more years are required for C. osmundacea recruits to growand reproduce (Gunnill 1986).
Once the basal fronds are of sufficient size and age, they are able to produce thefloating stipes which bear the reproductive structures. In Diablo Cove, the stipesare produced in spring and summer, persist through fall, and are shed during winter(Figure 3.2.3.4-1). This appears to be a typical growth pattern in many Cystoseiraosmundacea populations throughout its range (Abbott and Hollenberg 1976,Sparling 1977, Schiel 1985). However, plants growing in the lower depth regimes
E8-316.0 3-31
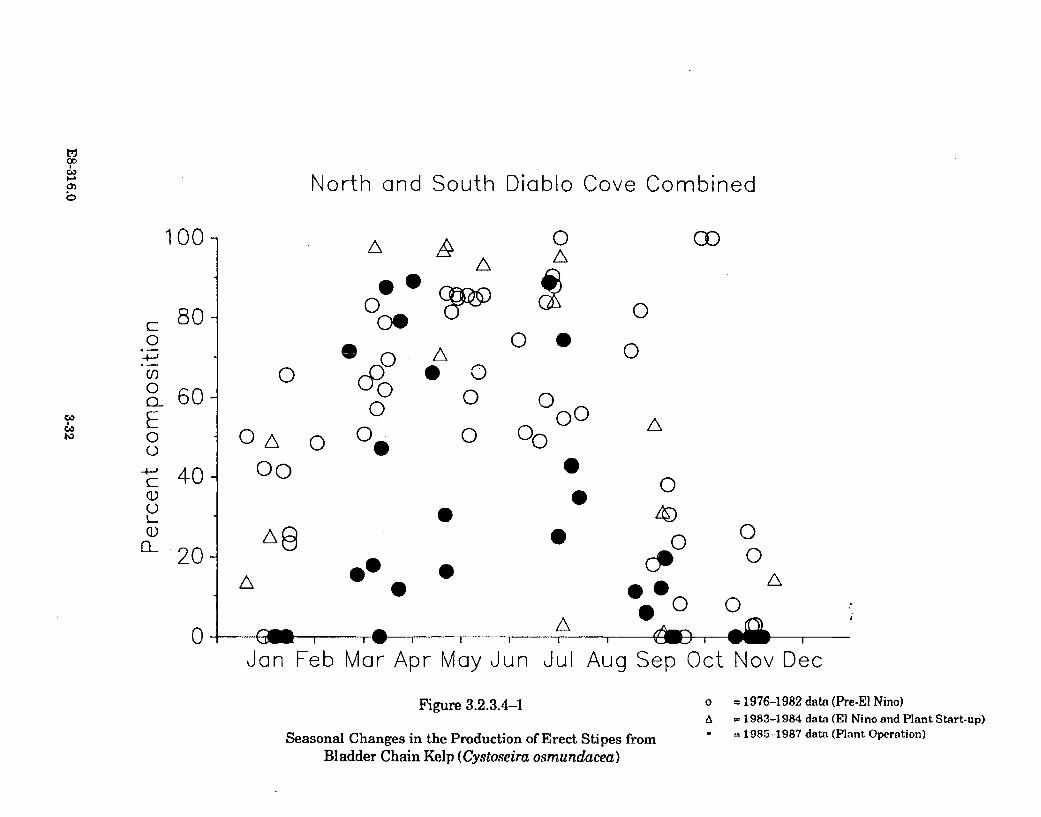
9o
North and South Diablo Cove Combined
100 A
400
O0
0
AEAW
OD
CoCoto
0
0/0-
0~
0
()
a_
80-
60-
40-
20-
0 0
0
OAO00
0wo0
000.
A0
0 0 no
0
0
0 00v A
0000
do00 0
00
00
A
0A
0 i. m-I. Jan I M w I I I
J an Feb Mar Apr May JunJl A Se O
Jul Aug Sep Oct Nov Dec
Figure 3.2.3.4-1
Seasonal Changes in the Production of Erect Stipes fromBladder Chain Kelp (Cystoseira osmundacea)
o - 1976-1982 data (Pre-EI Nino)A = 1983-1984 data (El Nino and Plant Start-up)° = 1985-1987 data (Plant Operation)
(about 30 ft) are generally unable to produce the floating stipes, presumably becauseof an insufficient amount of light for this aspect of growth (Schiel 1985).
Because recruitment in this species during the TEMP studies occurred on only a fewoccasions, the Cystoseira osmundacea population in Diablo Cove appears to rely onlong-lived adults for persistence. This appears to be a common strategy among otherC. osmundacea populations elsewhere in its range (Schiel 1985). Although thisspecies has great potential in the release of spores for recruitment, the successfulgrowth of newly settled plants is strongly dependent upon the absence of competingalgae (Dayton et al. 1984, Schiel 1985), and because of this, successful recruitmentmay not always occur, despite the availability of germlings.
In Diablo Cove, the most noticeable relationship Cystoseira osmundacea has withother organisms is that its stipes are utilized as a habitat by juvenile rockfish. Thebundles of stipes are probably the most commonly used habitat of juvenile rockfishesin the nearshore areas (shallower than about 15 ft) along the coast surroundingDiablo Canyon (Section 3.2.3.26).
Although Cystoseira osmundacea can serve as a food source, it is not known if it isnecessarily a preferred food item for invertebrates in Diablo Cove. Fewinvertebrates are seen clinging to the attached plants. The plants themselves maybe fed on more as drift algae or beach wrack, where they may be more accessible tobenthic invertebrates such as abalone and sea urchins. Some herbivorous fishes andthe brown turban snail may, however, graze on portions of the plants while they arestill attached.
No studies have been done to determine the importance of bottom shading by thesurface canopy of Cystoseira osmundacea and its influence on the composition andabundance of the understory flora. In Diablo Cove, at least, bottom shading has notoccurred because most of the C. osmundacea population appeared in scatteredclumps, and therefore the plants were unable to form a large-area surface canopythat could effectively block out light.
Distribution and Abundance
Cystoseira osmundacea was historically a conspicuous kelp plant in Diablo Cove(Ebert 1966, North 1969, Burge and Schultz 1973, Gotshall et al. 1984, 1986).Densities of C. osmundacea plants on all TEMP subtidal stations from 1976 to 1987are depicted in Figure D-4 in Appendix D. Data from representative stations arepresented in Figure 3.2.3.4-2. Abundances of C. osmundacea from 1976 to 1984remained somewhat constant. Much of the seasonal variations in the abundance ofthese plants is largely a sampling artifact, resulting from the difficulty ofdistinguishing one individual plant from another. This occurs when the basalportions, which are used to distinguish individuals, are growing very close to oneanother, and especially when understory algae obscure the individual holdfasts. Theabundance of C. osmundacea was largely unaffected by the 1982-83 winter stormsand the subsequent 1983 El Nino event. During early 1984 this species was involved
E8-316.0 3-33
in an "algal bleaching incident" that occurred in south Diablo Cove (PG&E 1985).Some plants died from the incident (Station 10-10 in Figure 3.2.3.4-2). Thisdecrease was detected in the time series and analysis of variance tests discussed inAppendix E.
During the first full year of plant operation (1985), healthy-appearing Cystoseiraosmundacea plants were observed immediately in front of the discharge in depthsless than 15 ft. These plants were exposed to the undiluted thermal plume. Healthyplants were also observed on the inshore side of Diablo Rock in 15 ft of water, anarea that is also persistently exposed to the plume. Based on these observations, itwas anticipated that C. osmundacea would be tolerant of the warm water plume.However, during the third full year of power plant operation (1987), it appeared thatthe growth of the basal fronds and stipes of plants in depths less than about 15 ftdeep in Diablo Cove had stopped. The erect stipes and basal portions appearedragged, lacked fresh growth, and the basal fronds were covered with other algalspecies (epiphytes). The covering of the basal fronds with epiphytes indicated thatthe basal fronds had become weakened. Some of the plants subsequently died (seerepresentative Station 9-15 in Figure 3.2.3.4-2). Of the plants that remained, alesser number of basal fronds produced the erect stipes than usual Figure 3.2.3.4-1).Concurrently, outside Diablo Cove and away from the thermal plume, C.osmundacea abundances remained relatively constant in Station 20-20, and therewere some increases in Station 19-10 (Figure 3.2.3.4-2).
Thermal Impact Assessment
Prior to power plant operation, Cystoseira osmundacea was a conspicuous speciesover time in all of the TEMP stations within and outside Diablo Cove. During thethird full year of power plant operation (1987), some decreases became evident onsome stations in Diablo Cove. This change suggests that this species was sensitiveto the thermal plume. Although production of stipes from the basal fronds recurredduring all years of power plant operation, fewer stipes were produced in 1987. Amap depicting the general area where the growth of C. osmundacea ceased in 1987 ispresented in Figure 3.2.3.4-3.
There is no known information on the effects of elevated temperature on growth inCystoseira osmundaea. Abbott and North (1971) considered C. osmundacea tolerantof warm water based on the fact that its southern range extends to Baja California.However, the only known information on whether increased temperatures can affectcold-water adapted C. osmundacea plants is from a laboratory study by PG&E(1982b). In this study, it was presumed that C. osmundacea plants would tolerateplume temperatures under "normal" power plant operating conditions, but it was notcertain what would happen to them if they were exposed to even highertemperatures for a short duration, such as those that may occur during intermittentdemusseling operations (heat treatment). In this experiment, field-collected plantswere adjusted to increasing temperatures from ambient (12.0 C) to 16.1 C at 1 Cincrements per day. Within one hour after reaching a temperature of 16.1 C, sets of
E8-316.0 3-35
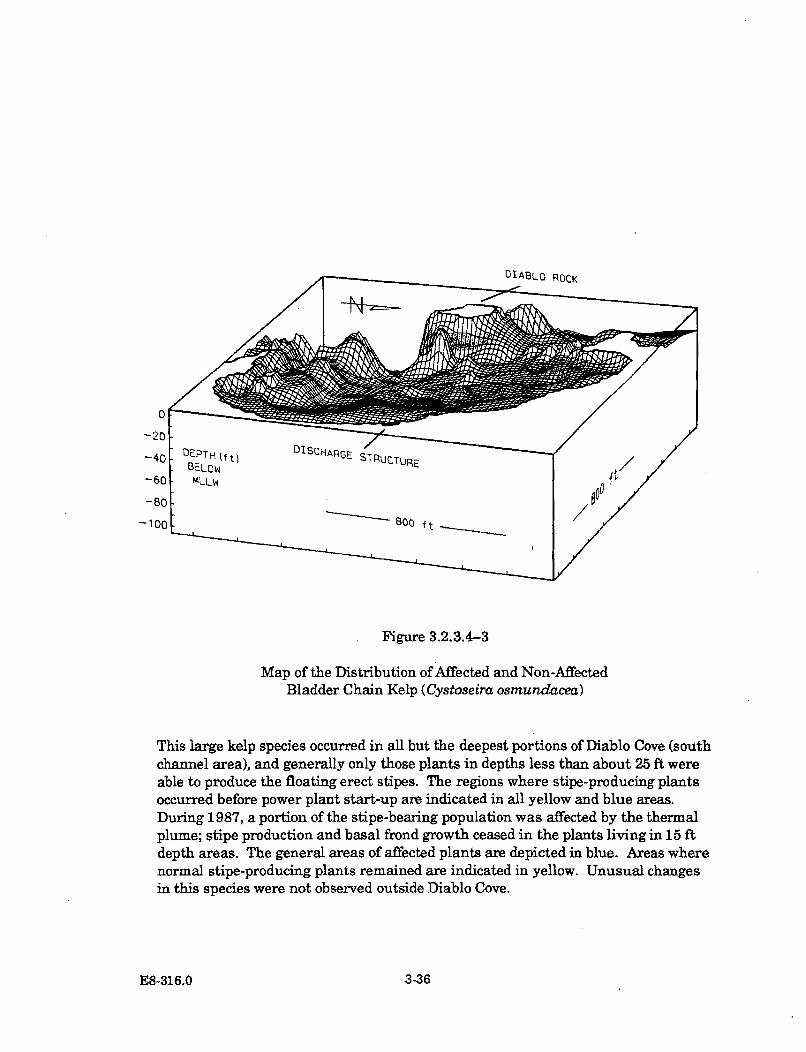
DIABLO ROCK
Figure 3.2.3.4-3
Map of the Distribution of Affected and Non-AffectedBladder Chain Kelp (Cystoseira osmundacea)
This large kelp species occurred in all but the deepest portions of Diablo Cove (southchannel area), and generally only those plants in depths less than about 25 ft wereable to produce the floating erect stipes. The regions where stipe-producing plantsoccurred before power plant start-up are indicated in all yellow and blue areas.During 1987, a portion of the stipe-bearing population was affected by the thermalplume; stipe production and basal frond growth ceased in the plants living in 15 ftdepth areas. The general areas of affected plants are depicted in blue. Areas wherenormal stipe-producing plants remained are indicated in yellow. Unusual changesin this species were not observed outside Diablo Cove.
E8-316.0 3-36
plants were subjected to temperatures ranging from 16.1 to 30.0 C for one hour.Temperatures were then reduced to 16.1 C, and the plants were inspected for 13days to monitor recovery or other changes. The plants tested at 30.0 C exhibitedextensive disintegration and nearly complete discoloration 13 days after the acutetemperature exposure. Plants exposed to 27.0 C exhibited little (ten percent) fronddisintegration and discoloration (15 percent). Plants tested at 25.3 C and belowexhibited no discoloration or disintegration. The above temperature doses were notobserved in areas where the growth of C. osmundacea was interrupted.
The combination of a greater heat load in the cove from both units operatingtogether and the high ambient temperatures in fall 1987 account for the cessation ofthis species' growth in 1987. It is anticipated that the affected plants will soon belost from the population.
The effects of elevated temperatures on Cystoseira osmundacea occurred mainly onthe larger adult plants. Small, healthy recruits were present on the bottom nearthe affected adult plants, which indicated that the young plants were either moretolerant of elevated temperatures than the adults were, or that there was aboundary layer of colder water on the bottom in shallow areas. Many recruits werealso commonly seen in deeper portions of Diablo Cove. Since C. osmundacea is foundnaturally in warm water habitats, it may recover in the cove if a sufficient number ofrecruits tolerant of the warm water are able to survive. However, this species doesnot recruit readily, and its persistence is strongly dependent on the survivorship ofadult plants.
The decreases in Cystoseira osmundacea and the stipe habitat this species providesfor fish resulted in an important loss of habitat for juvenile rockfish in the shallowareas (less than about 15 ft in depth), particularly in south Diablo Cove (Section3.2.3.27).
E8-316.0 3-37
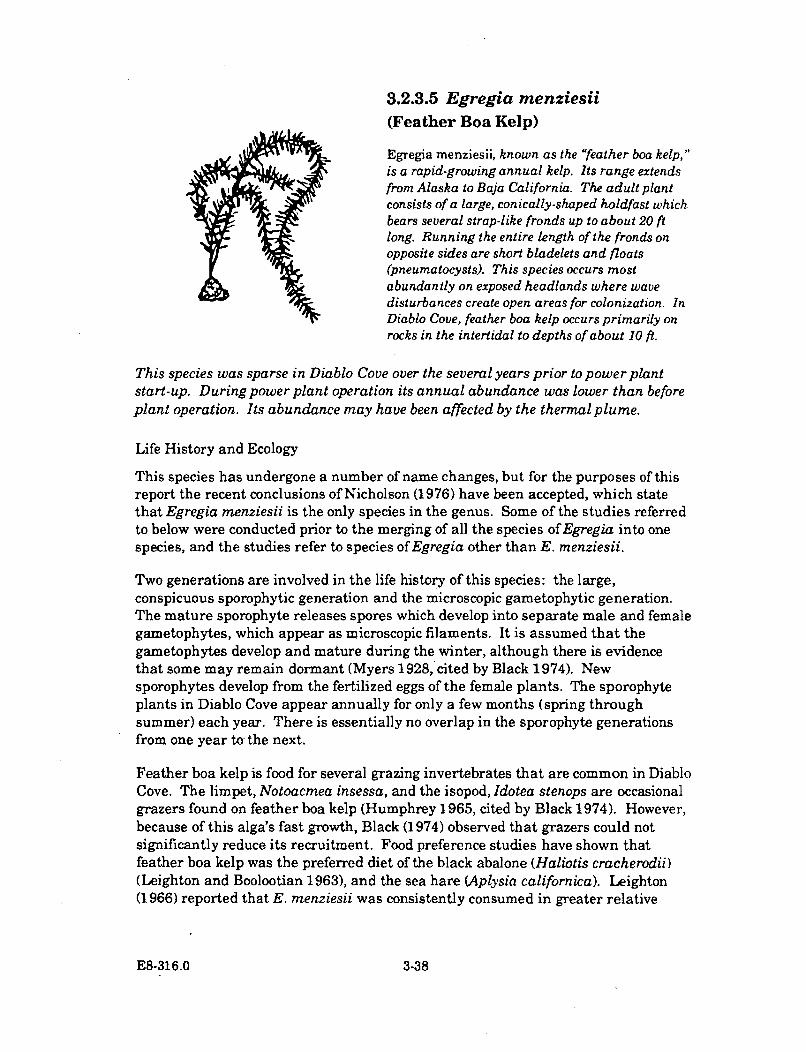
3.2.3.5 Egregia menziesii(Feather Boa Kelp)
Egregia menziesii, known as the "feather boa kelp,"is a rapid-growing annual kelp. Its range extendsfrom Alaska to Baja California. The adult plantconsists of a large, conically-shaped holdfast whichbears several strap-like fronds up to about 20 ftlong. Running the entire length of the fronds onopposite sides are short bladelets and floats(pneumatocysts). This species occurs mostabundantly on exposed headlands where wavedisturbances create open areas for colonization. InDiablo Cove, feather boa kelp occurs primarily onrocks in the intertidal to depths of about 10 ft.
This species was sparse in Diablo Cove over the several years prior to power plantstart-up. During power plant operation its annual abundance was lower than beforeplant operation. Its abundance may have been affected by the thermal plume.
Life History and Ecology
This species has undergone a number of name changes, but for the purposes of thisreport the recent conclusions of Nicholson (1976) have been accepted, which statethat Egregia menziesii is the only species in the genus. Some of the studies referredto below were conducted prior to the merging of all the species of Egregia into onespecies, and the studies refer to species of Egregia other than E. menziesii.
Two generations are involved in the life history of this species: the large,conspicuous sporophytic generation and the microscopic gametophytic generation.The mature sporophyte releases spores which develop into separate male and femalegametophytes, which appear as microscopic filaments. It is assumed that thegametophytes develop and mature during the winter, although there is evidencethat some may remain dormant (Myers 1928, cited by Black 1974). Newsporophytes develop from the fertilized eggs of the female plants. The sporophyteplants in Diablo Cove appear annually for only a few months (spring throughsummer) each year. There is essentially no overlap in the sporophyte generationsfrom one year to- the next.
Feather boa kelp is food for several grazing invertebrates that are common in DiabloCove. The limpet, Notoacmea insessa, and the isopod, Idotea stenops are occasionalgrazers found on feather boa kelp (Humphrey 1965, cited by Black 1974). However,because of this alga's fast growth, Black (1974) observed that grazers could notsignificantly reduce its recruitment. Food preference studies have shown thatfeather boa kelp was the preferred diet of the black abalone (Haliotis cracherodii)(Leighton and Boolootian 1963), and the sea hare (Aplysia californica). Leighton(1966) reported that E. menziesii was consistently consumed in greater relative
E8-316.0 3-38
amounts by kelp crabs (Pugettia producta) and red abalone (Haliotis rufescens) thanthe other algae presented. Field observations indicate that sea urchins activelygraze on E. menziesii (Widdowson 1972).
Distribution and Abundance
In the first biological surveys of Diablo Cove in 1966, Ebert (1966) and North (1969)found feather boa kelp to be a common alga in certain intertidal and subtidalportions of Diablo Cove. Abundance data on this species in the TEMP subtidalstations are presented in Figure D-5 in Appendix D. Representative station dataare presented in Figure 3.2.3.5-1, including those intertidal stations where thisspecies was most abundant. During the initial surveys of the TEMP program in1976 and 1977, feather boa kelp was more common in the intertidal than in theshallow subtidal in Diablo Cove. In the intertidal it was most abundant in the northportion of the cove (Stations 9+1 and 8-10 in Figure 3.2.3.5-1). For the remainder ofthe TEMP study through 1987, feather boa kelp was not as abundant on the TEMPDiablo Cove stations. After power plant start-up, the annual recurrence of thisspecies was not as large. Outside Diablo Cove, feather boa abundances did notdecrease after power plant start-up as greatly as within the cove (representativeintertidal Station 17+3 and subtidal Station 19-10 in Figure 3.2.3.5-1).
Thermal Impact Assessment
Some decreases occurred in feather boa kelp after power plant start-up. However,due to the low abundances of feather boa kelp in the TEMP intertidal and subtidalstations in previous years, the decreases were not large.
The feather boa kelp decline in Diablo Cove prior to power plant start-up may havebeen due to the fact that the cove is not an ideal habitat for this species, whichprefers more wave-exposed areas, such as those around rock headlands (Station17+3 in Figure 3.2.3.5-1). The high abundance of feather boa kelp during the late1970's in Diablo Cove may have been due to an episodic recruitment event. Thegradual reductions since then may have been caused by less spore production, whichresulted in smaller and smaller populations each year, or it could be that the featherboa kelp was out-competed for space by other algal species.
There is little information on the thermal responses of this species. Scholm (1966)gave an upper value for survival of 36 C (96.8 F) in a 30-minute exposure period.Abbott and North (1971) classified feather boa kelp as a warm-water tolerant speciesbased on its vertical distribution and geographical range. According to their criteria,this alga may be capable of surviving extended exposures to 20 C (68 F). Incontrast, Devinny (1975) observed that feather boa kelp was absent in the proximityof a thermal outfall, yet present in surrounding areas. However, this may have beendue to habitat unavailability or other factors, rather than temperature.
E8-316.0 3-39
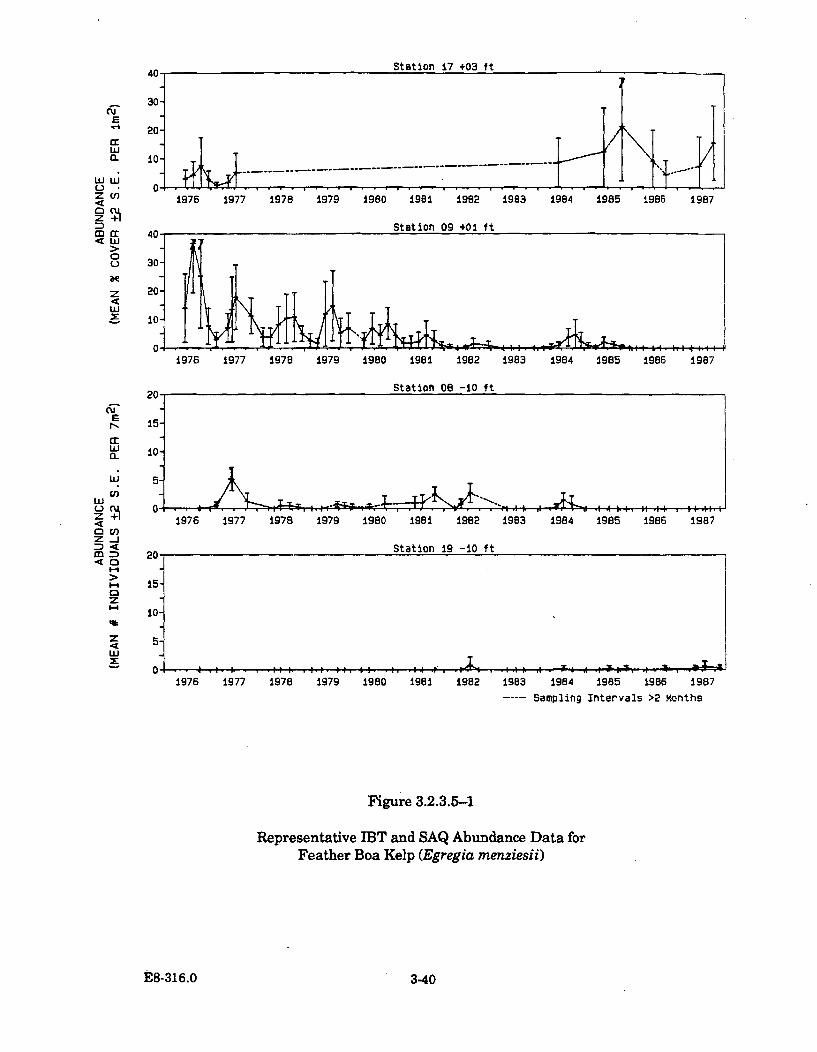
30E4 20-
a: JW
CL 10 17 97 17 99 180O-
1976 1977 1978 1979 1980 1981 1982 1983 1984 1985 1986 1987
Station 09 +01 ftMa: 40•w
0o 30-
z 20-
w
1976 1977 1978 1979 1980 1981 1982 1983 1984 1985 1986 1987
20 Station 06 -10 ft
r=N 15-
10
w 10
U ,
1976 1977 1978 1979 1980 1981 1982 1983 1984 1985 1986 1987z-1
Station 19 -10 ftm 2040
- 15-
z10-
z 5-w
1976 1977 1978 1979 1980 1981 1982 1983 1984 1985 1986 1987
---- Sampling Intervals >2 Months
Figure 3.2.3.5-1
Representative IBT and SAQ Abundance Data forFeather Boa Kelp (Egregia menziesii)
E8-316.0 3.40
Laboratory experiments by Lining and Neushul (1978) revealed that gametophytefertility could be completely inhibited at exposures of 20 C for two weeks. The nextlowest test temperature (17 C) permitted fertility. Temperatures between 17 and20 C for about two weeks may also decrease gametophyte fertility. Thistemperature regime for this exposure period occurred at the subtidal TEMP stationsat Diablo Rock and in north Diablo Cove during the fall of 1987. Thus, annualrecruitment and development of new sporophytes of feather boa kelp in parts ofDiablo Cove could have been inhibited during power plant operation. A mapdepicting the areas of thermal risk in this species is presented in Figure 3.2.3.5-2.
E8-316.0 3-41
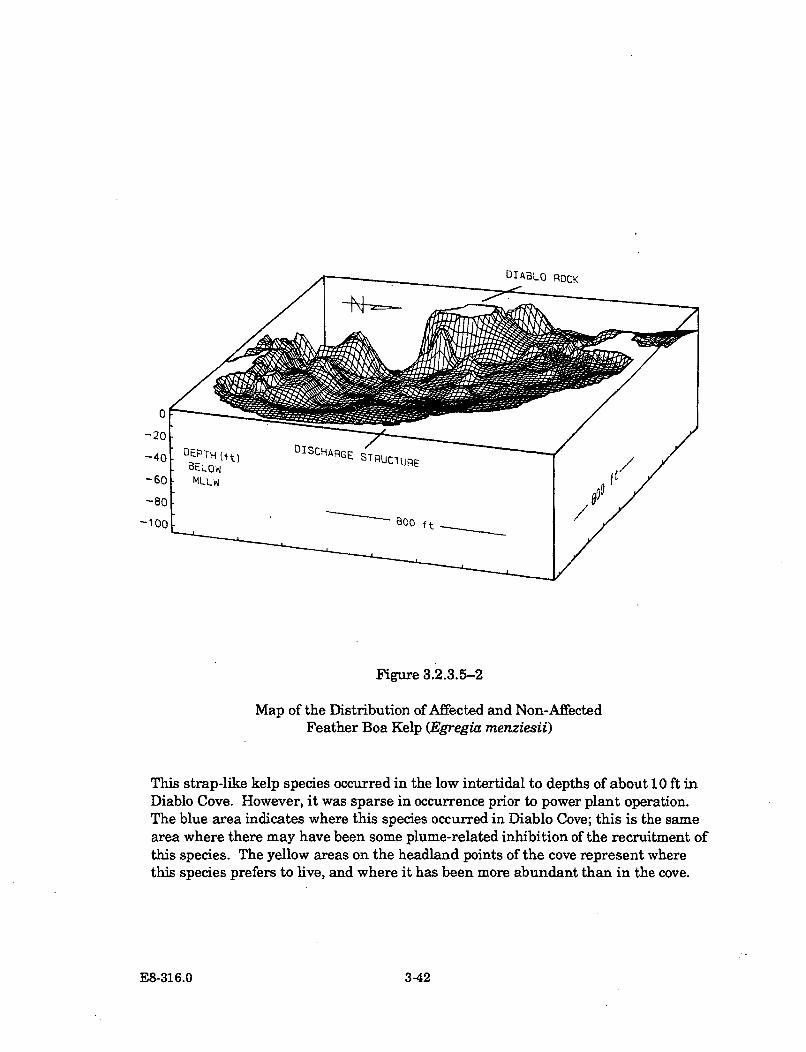
DIABLO RDCK
Figure 3.2.3.5-2
Map of the Distribution of Affected and Non-AffectedFeather Boa Kelp (Egregia menziesii)
This strap-like kelp species occurred in the low intertidal to depths of about 10 ft inDiablo Cove. However, it was sparse in occurrence prior to power plant operation.The blue area indicates where this species occurred in Diablo Cove; this is the samearea where there may have been some plume-related inhibition of the recruitment ofthis species. The yellow areas on the headland points of the cove represent wherethis species prefers to live, and where it has been more abundant than in the cove.
E8-316.0 3-42
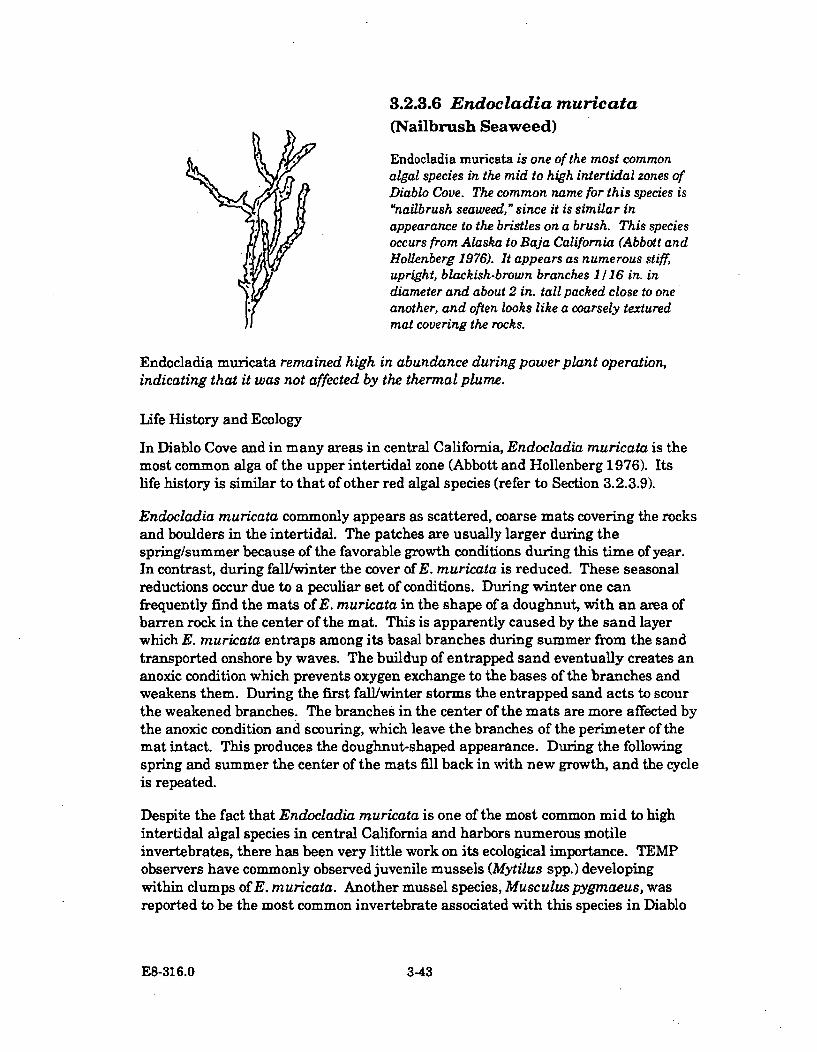
3.2.3.6 Endocladia muricata(Nailbrush Seaweed)
Endocladia muricata is one of the most commonalgal species in the mid to high intertidal zones ofDiablo Cove. The common name for this species isunailbrush seaweed," since it is similar inappearance to the bristles on a brush. This speciesoccurs from Alaska to Baja California (Abbott andHollenberg 1976). It appears as numerous stiff,upright, blackish-brown branches 1/16 in. indiameter and about 2 in. tall packed close to oneanother, and often looks like a coarsely texturedmat covering the rocks.
Endocladia muricata remained high in abundance during power plant operation,indicating that it was not affected by the thermal plume.
Life History and Ecology
In Diablo Cove and in many areas in central California, Endocladia muricata is themost common alga of the upper intertidal zone (Abbott and Hollenberg 1976). Itslife history is similar to that of other red algal species (refer to Section 3.2.3.9).
Endocladia muricata commonly appears as scattered, coarse mats covering the rocksand boulders in the intertidal. The patches are usually larger during thespring/summer because of the favorable growth conditions during this time of year.In contrast, during fall/winter the cover of E. muricata is reduced. These seasonalreductions occur due to a peculiar set of conditions. During winter one canfrequently find the mats of E. muricata in the shape of a doughnut, with an area ofbarren rock in the center of the mat. This is apparently caused by the sand layerwhich E. muricata entraps among its basal branches during summer from the sandtransported onshore by waves. The buildup of entrapped sand eventually creates ananoxic condition which prevents oxygen exchange to the bases of the branches andweakens them. During the first fall/winter storms the entrapped sand acts to scourthe weakened branches. The branches in the center of the mats are more affected bythe anoxic condition and scouring, which leave the branches of the perimeter of themat intact. This produces the doughnut-shaped appearance. During the followingspring and summer the center of the mats fill back in with new growth, and the cycleis repeated.
Despite the fact that Endocladia muricata is one of the most common mid to highintertidal algal species in central California and harbors numerous motileinvertebrates, there has been very little work on its ecological importance. TEMPobservers have commonly observed juvenile mussels (Mytilus spp.) developingwithin clumps of E. muricata. Another mussel species, Musculuspygmaeus, wasreported to be the most common invertebrate associated with this species in Diablo
E8-316.0 3-43
Cove (Kelly and Behrens 1981, Behrens and Kelly 1986, Dearn 1988). It is possiblethat the upright branches of this species act as an insulator for young developingattached invertebrates by protecting them from dessication and physical removal bywaves.
Distribution and Abundance
Endocladia muricata received attention in the early Diablo Canyon biological studyreport of North (1969), presumably due to its widespread occurrence in the highintertidal. Seasonal changes in the percentage cover of E. muricata in the TEMP +1and +3 ft MLLW intertidal stations from 1976 to 1987 are depicted in Figures D-6to D-9 in Appendix D. The data show that this species has been more abundant inthe +3 ft stations. Representative graphs showing the changes in this species'abundance over time in north Diablo Cove (Station 9+3) and in south Diablo Cove(Station 12+3) are presented in Figure 3.2.3.6-1. In general, the abundance of E.muricata in the TEMP stations has been relatively consistent from year to year.Slight increases occurred during the favorable summer growth periods, whichalternated with slight winter storm-related decreases. In south Diablo Cove(represented by Station 12+3 data in Figure 3.2.3.6-1) this species was reduced bythe 1982-83 storms.
The substrate in Station 12+3 was once mostly boulders and bedrock that supportedlarge patches of E. muricata. During the 1982-83 storms the area became buriedunder cobble. After the storms E. muricata was slow to recover, possibly because theunstable cobble was unsuitable for its growth and persistence. Increases did occur,however, in the very low intertidal zone nearby in PG&E vertical transect Station H(Table F-47 in Appendix F). The following 1983 El Nino did not appreciably alterthe after-storm abundance of this species.
During power plant operation no unusual changes were observed in the seasonalabundances of Endoctadia muricata in Diablo Cove, except on the rocky benchproximal to the discharge, where some decreases occurred. A map depicting thisspecies' distribution in Diablo Cove is presented in Figure 3.2.3.6-2.
Thermal Impact Assessment
The quantitative data obtained on Endocladia muricata in the TEMP intertidalsampling sites gives no reason to suspect that this species was affected by thethermal plume. Results of a heat treatment study by PG&E (1983) providelaboratory evidence that this species is highly tolerant of warm water, at least overshort time intervals. Plants exposed to test temperatures of 31.3 C and above forone hour exhibited extensive bleaching of the growing tips and disintegration.Plants exposed to lower temperatures did not change appreciably. These laboratoryfindings were the reason that this species was not considered in the predictions ofheat treatment thermal discharge effects (PG&E 1985). The temperature dosewhich caused deleterious effects in the laboratory heat treatment studies has not
E8-316.0 3.-44
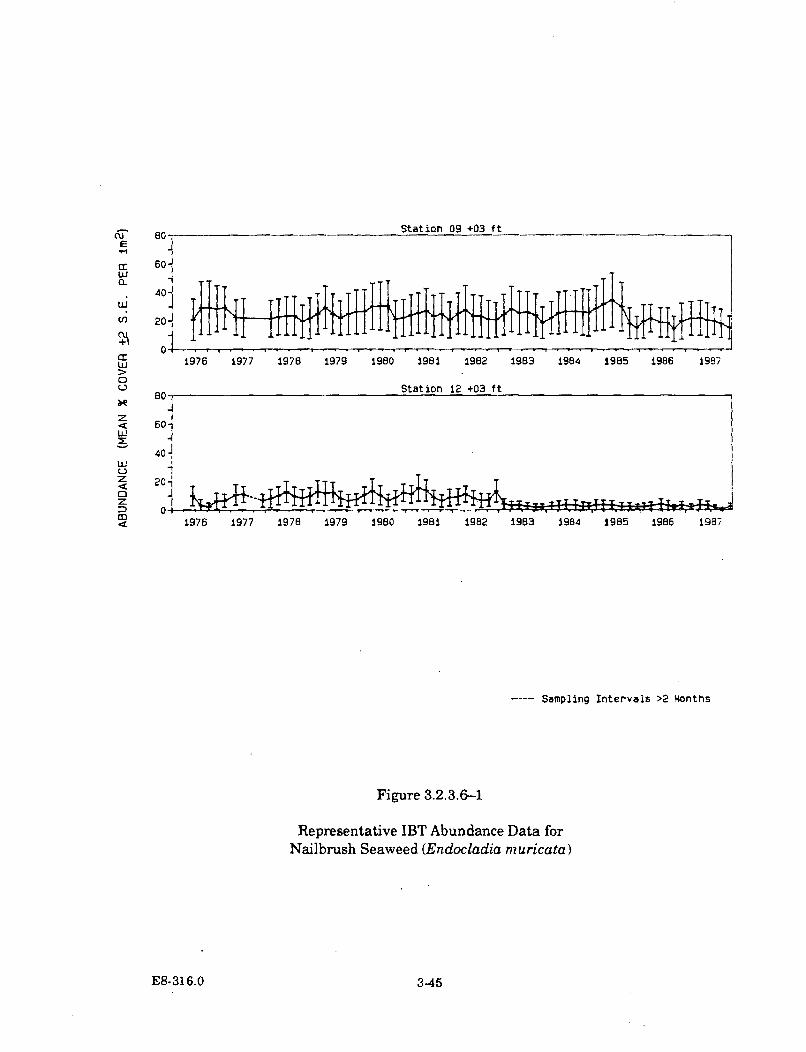
E*1
LU
I)
LUJ
0U
z
LU1
LU
1978 1979 1980 1981 1982 1983 1984 1985 1986
Station 12 +03 ft
601
40
20l~U:
1976 1977 1978 1979 1980 1981 1982 1983 1984 1985 1986 1987
---- Sampling Intervals >2 Months
Figure 3.2.3.6-1
Representative IBT Abundance Data forNailbrush Seaweed (Endocladia muricata)
E8-316.0 3-45
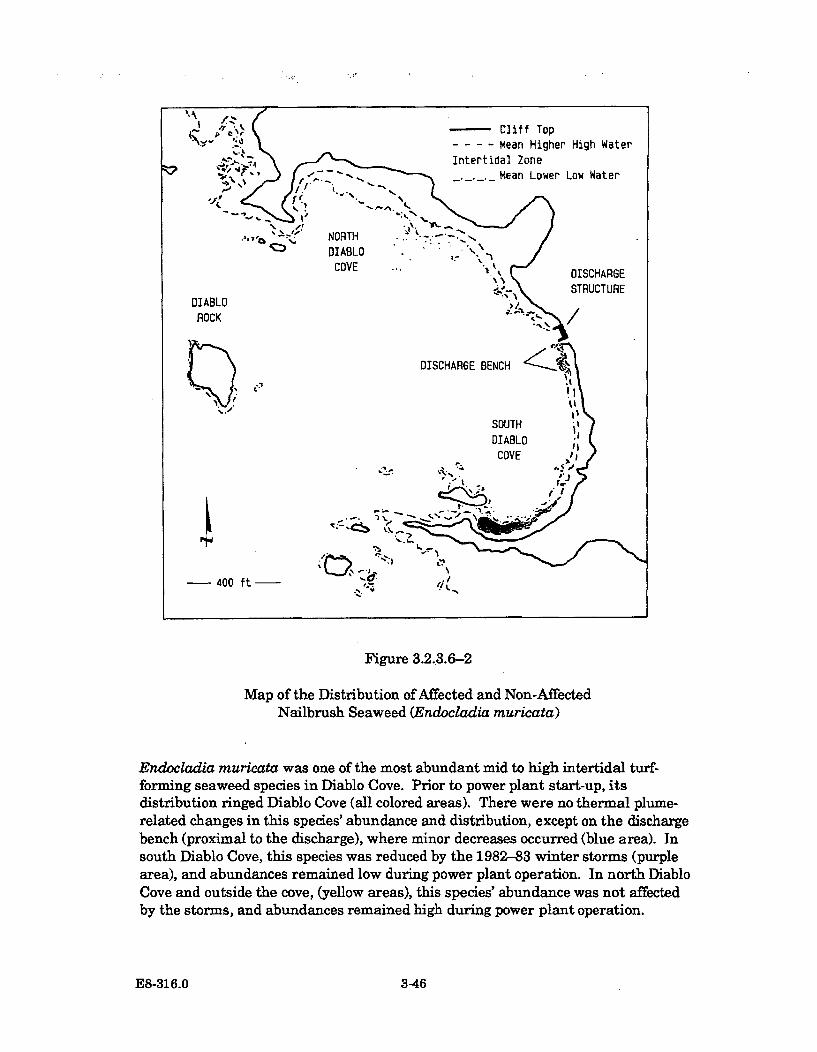
Figure 3.2.3.6-2
Map of the Distribution of Affected and Non-AffectedNailbrush Seaweed (Endocladia muricata)
Endocladia muricata was one of the most abundant mid to high intertidal turf-forming seaweed species in Diablo Cove. Prior to power plant start-up, itsdistribution ringed Diablo Cove (all colored areas). There were no thermal plume-related changes in this species' abundance and distribution, except on the dischargebench (proximal to the discharge), where minor decreases occurred (blue area). Insouth Diablo Cove, this species was reduced by the 1982-83 winter storms (purplearea), and abundances remained low during power plant operation. In north DiabloCove and outside the cove, (yellow areas), this species' abundance was not affectedby the storms, and abundances remained high during power plant operation.
E8-316.0 3-46
been measured in the field. Although there is no known study concerning changeswhich may occur if lower temperature regimes are sustained over a longer period oftime, as is the situation during normal power plant operation, the high temperaturetolerance E. muricata exhibited during the laboratory heat treatment studies isindicative of a species generally tolerant of warm temperatures. Supporting this isthe classification of E. muricata as a species tolerant of warm water based on itsoccurrence in natural warm water habitats south of Point Conception (Abbott andNorth 1971).
Endocladia muricata was selected for the time series and analysis of variance(ANOVA) tests presented in Appendix E. The time series analysis revealed nosignificant changes in this species' abundance in the tested stations. The ANOVAtest, however, revealed that this species' abundance in Diablo Cove decreasedsignificantly relative to the changes in the non-Diablo Cove stations used in theanalysis. However, the conclusions were misleading in that many of the non-testedstations outside Diablo Cove exhibited abundance patterns similar to those of thecove stations which showed significant changes. Although, for example, the ANOVAdetected that E. muricata decreased at Station 8+3 in Diablo Cove during powerplant operation, it increased shortly after the reduction. This change substantiatesthe graphical interpretations of the data that the warm water plume has had nonegative impact on this species.
Based on its persistence throughout power plant operation, Endocladia muricata ispredicted to remain as one of the most common intertidal algal species in DiabloCove.
E8-316.0 3-47
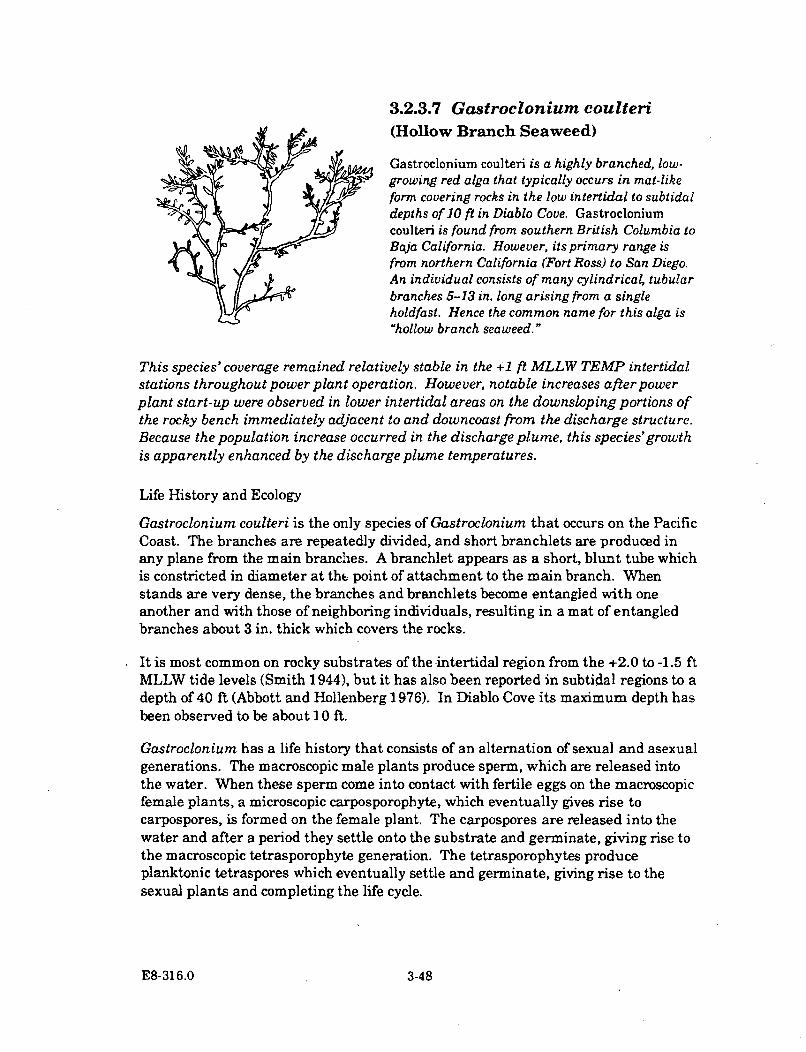
3.2.3.7 Gastroclonium coulteri(Hollow Branch Seaweed)
r Gastroclonium coulteri is a highly branched, low-growing red alga that typically occurs in mat-likeform covering rocks in the low intertidal to subtidaldepths of 10 ft in Diablo Cove. Gastrocloniumcoulteri is found from southern British Columbia toBaja California. However, its primary range isfrom northern California (Fort Ross) to San Diego.An individual consists of many cylindrical, tubularbranches 5-13 in. long arising from a singleholdfast. Hence the common name for this alga is"hollow branch seaweed."
This species' coverage remained relatively stable in the ÷1 ft MLLW TEMP intertidalstations throughout power plant operation. However, notable increases after power
plant start-up were observed in lower intertidal areas on the downsloping portions ofthe rocky bench immediately adjacent to and downcoast from the discharge structure.Because the population increase occurred in the discharge plume, this species'growthis apparently enhanced by the discharge plume temperatures.
Life History and Ecology
Gastroclonium coulteri is the only species of Gastroclonium that occurs on the PacificCoast. The branches are repeatedly divided, and short branchlets are produced inany plane from the main branches. A branchlet appears as a short, blunt tube whichis constricted in diameter at the point of attachment to the main branch. Whenstands are very dense, the branches and branchlets become entangled with oneanother and with those of neighboring individuals, resulting in a mat of entangledbranches about 3 in. thick which covers the rocks.
It is most common on rocky substrates of the intertidal region from the +2.0 to -1.5 ftMLLW tide levels (Smith 1944), but it has also been reported in subtidal regions to adepth of 40 ft (Abbott and Hollenberg 1976). In Diablo Cove its maximum depth has
been observed to be about 10 ft.
Gastroclonium has a life history that consists of an alternation of sexual and asexualgenerations. The macroscopic male plants produce sperm, which are released intothe water. When these sperm come into contact with fertile eggs on the macroscopicfemale plants, a microscopic carposporophyte, which eventually gives rise tocarpospores, is formed on the female plant. The carpospores are released into thewater and after a period they settle onto the substrate and germinate, giving rise to
the macroscopic tetrasporophyte generation. The tetrasporophytes produceplanktonic tetraspores which eventually settle and germinate, giving rise to the
sexual plants and completing the life cycle.
E8-316.0 3-48
No information in the literature was found concerning this species as a food sourcefor herbivores. However, the interstices formed by the dense branches harbornumerous species of small gastropods and crustaceans in Diablo Cove (Kelly andBehrens 1981, Dearn 1988). In high densities and in mat form, Gastrocloniumcoulteri is able to entrap and stabilize sand (TEMP, unpublished observation).
Distribution and Abundance
Gastroclonium coulteri is listed as being a conspicuous intertidal algal species inDiablo Cove observed by North (1969) during the first intertidal studies of the areain 1967. Subsequent surveys conducted by the California Department of Fish andGame from 1969 to 1982 concurred with North on the abundance of this species inDiablo Cove and in areas outside the cove (Burge and Schultz 1973, Gotshall et al.1984, 1986). Although some variation in this species' abundance over time wasobserved, it always ranked among the most abundant algal forms in the lowintertidal sampling areas in Diablo Cove. Abbott and Hollenberg (1976) noted thatin winter, plants are commonly eroded back to the basal portions, presumably as aresult of storm activity and/or exposure to dessication.
Data depicting the abundances over time of Gastroclonium coulteri cover in theTEMP intertidal stations are presented in Figures D-10 to D-13 in Appendix D.Representative station data are presented in Figure 3.2.3.7-1. During the TEMPstudies, G. coulteri was one of the most conspicuous low-growing algal species inDiablo Cove's low intertidal zones. On several occasions during the TEMP studies,this species became severely desiccated and bleached when the tides were low onhot, sunny days. Several days after these events the bleaching was no longerpresent. The bleached material was probably shed from the plants, exposing theunaffected, normal-appearing basal branc&es. Coverage measurements during thesubsequent bimonthly sampling surveys detected little change in G. coulteri coverafter the bleaching episodes. Similar events were noted by Burge and Schultz (1973)in their earlier (1969-72) studies in Diablo Cove. Short-term recovery fromdessication and/or erosion and persistence in this species presumably results mainlyfrom vegetative regrowth of the perennial basal portions of plants, rather than fromrecolonization and growth of newly recruited individuals. In a study conducted inMonterey, Northcraft (1948) found that G. coulteri was slow in recruiting back intocleared areas, even though the species was abundant in areas immediately adjacentto the cleared plots. Hodgson (1981) noted that tissues of G. coulteri can recoverfrom moderate desiccation.
One of the largest changes observed in Gastroclonium coulteri occurred when the1982-83 winter storms severely reduced its abundance within certain areas of thecove. In south Diablo Cove, storm-derived cobble buried the intertidal and sandscoured the shoreline (Station 12+1, Figure 3.2.3.7-1). Some storm-relateddecreases were also observed in north Diablo Cove. In contrast, after power plantstart-up very large increases occurred in the very low intertidal areas of DiabloCove. Most increases occurred below the +1 ft MLLW TEMP stations. However,
E8-316.0 3.-49
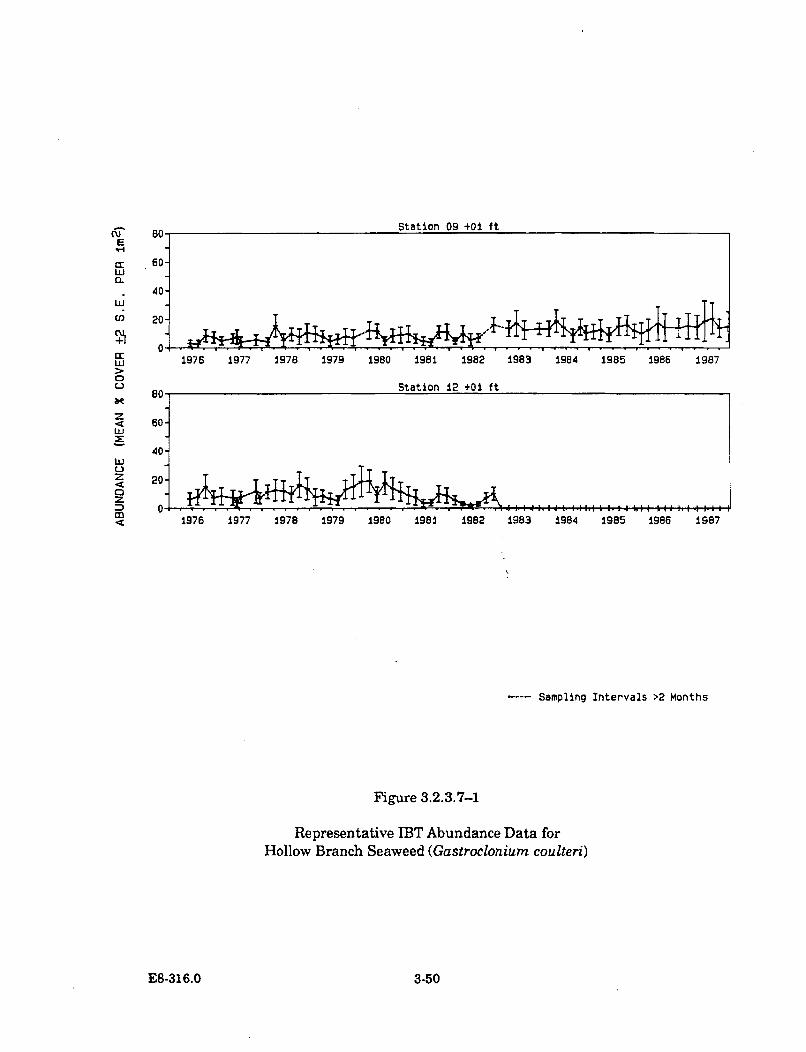
Station 09 +01 ft
CI)
w)
0tz
zD4
an.
60-
40-
20-
1976 1977 1978 1979 1980 1981 1982 1983 1984 1985 1986 1987
80 Station 12 +01 ft
60-
40-
20-
0 I-: . , "1 -L . .IIIIt lII- .
1976 1977 1978 1979 1980 1981 1982 1983 1984 1985 1986 1987
---- Sampling Intervals >2 Months
Figure 3.2.3.7-1
Representative IBT Abundance Data forHollow Branch Seaweed (Gastroclonium coulteri)
E8-316.0 3-50
some increases were observed in Station 9+1, located in north Diablo Cove (Figure3.2.3.7-1). This station is slightly lower in elevation than the rest of the stations. Atime series test detected no significant change in this species' gradual long-termincrease in Diablo Cove. This species also increased in non-Diablo Cove stations,and an analysis of variance test did not detect any significant differences betweenthe north Diablo Cove and non-Diablo Cove stations. The results of these tests arepresented in Appendix E.
Other large increases were obvious in Diablo Cove on the very low intertidal,downsloping portions of the rocky bench (discharge bench) adjacent to anddowncoast from the discharge structure. Large increases also occurred offshore ofintertidal Station 10 in south Diablo Cove, where surf grass (Phyllospadix scouleri,Section 3.2.3.13) was removed by the 1982-83 winter storms. A map showing thelocations of the increases is presented in Figure 3.2.3.7-2.
Thermal Impact Assessment
The increases in Gastroclonium observed in Diablo Cove during power plantoperation strongly indicate that this species is tolerant of the warm water plumeunder a variety of power plant operating conditions, including the simultaneousoperation of both units in fall, when ambient water temperatures are highest.Gastroclonium coulteri also appears to be tolerant of elevated temperatures fromheat treatment operations.
The lack of negative thermal effects on Gastroclonium coulteri in Diablo Cove isconsistent with the temperature tolerance of this species evidenced in laboratoryexperiments. Thermal effects tests on G. coulteri by PG&E (1 982b) found that nomortality was observed in plants constantly exposed to 23.8 C for 216 hours.Although some disintegration of the tissues occurred in plants exposed to the twohighest experimental temperatures (21.0 and 23.8 C), it was not clear whether theeffect would have resulted in complete detachment or death of the plants, inasmuchas the remaining portions appeared to be normal. The disintegration may haverepresented normal limited senescence, which was hastened by elevatedtemperatures.
A second laboratory experiment by PG&E (1983) examined the effects of heattreatment temperatures from demusseling operations on the power plant conduits.In this experiment, field-collected plants were gradually exposed from ambient up to20.9 C at 1 C incremental increases per day. Plants were not acclimated tominimize artificial results produced by prolonged holding in the laboratoryenvironment. Groups of plants were then exposed to five elevated temperaturesranging from 20.9 (control) to 35.3 C for one hour, then returned to their beginningtemperature of 20.9 C and monitored for another 93 hours. Light exposure duringthe tests was continuous between 10-22 microEinsteins/m 2/sec. At the end of thetest, bleaching was observed only in the plants exposed to 35.3 C, of which aboutthree-fourths were bleached. At the end of the other heat treatment tests, 10 to 18percent of the plant tips were discolored, which was lower than the percentages had
E8-316.0 3-51
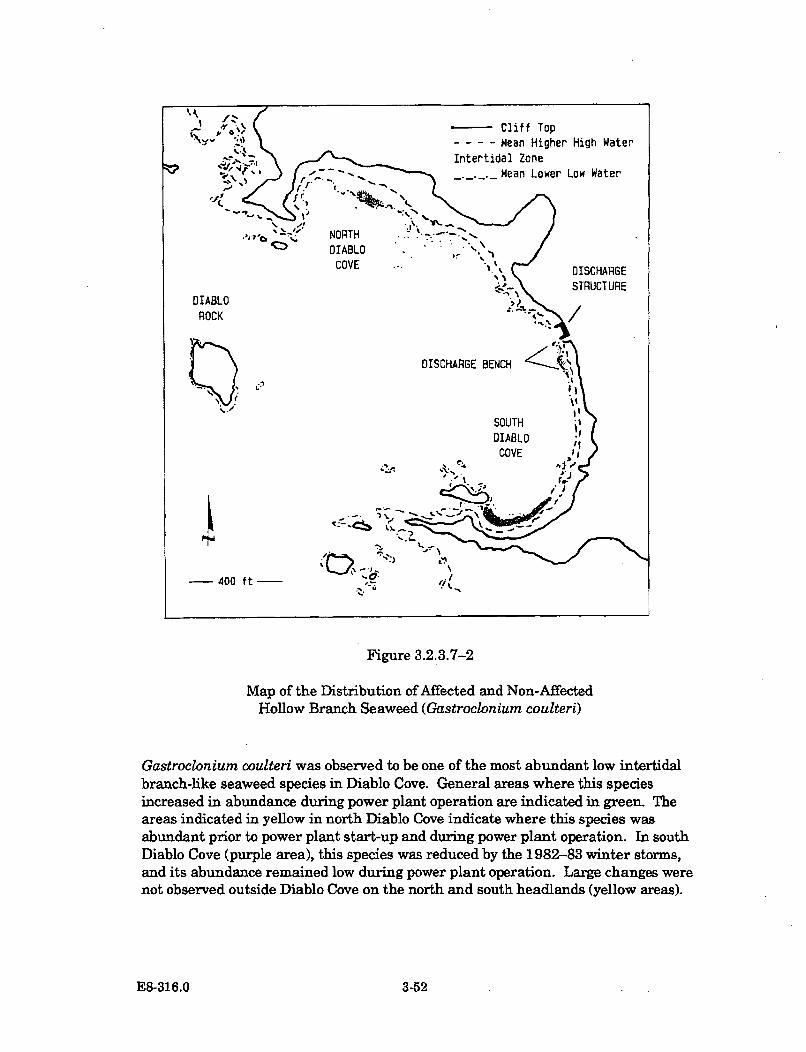
Figure 3.2.3.7-2
Map of the Distribution of Affected and Non-AffectedHollow Branch Seaweed (Gastroclonium coulteri)
Gastroclonium coulteri was observed to be one of the most abundant low intertidalbranch-like seaweed species in Diablo Cove. General areas where this speciesincreased in abundance during power plant operation are indicated in green. Theareas indicated in yellow in north Diablo Cove indicate where this species wasabundant prior to power plant start-up and during power plant operation. In southDiablo Cove (purple area), this species was reduced by the 1982-83 winter storms,and its abundance remained low during power plant operation. Large changes werenot observed outside Diablo Cove on the north and south headlands (yellow areas).
E8-316.0 3-52
been immediately after the heat treatment exposures. This indicated that somerecovery had occurred after short-term exposures to heat treatment temperaturesless than 35.3 C.
In terms of the ecological consequences, the increase in Gastroclonium coulteri willprovide more habitat for invertebrates, such as small snails and crustaceans, thatcommonly occur within the interstices of the entangled basal branches. Theincreases in algal habitat for invertebrates provided by G. coulteri probablycompensated for the decreases in Gigartina canaliculata in Diablo Cove (Section3.2.3.8), which provided similar habitats for the same invertebrate species.
Based on the maintenance of cover and distribution of Gastroclonium coulteri withinareas contacted by the thermal plume, this species will probably remain anumerically important alga in Diablo Cove.
E8-316.0 3-53
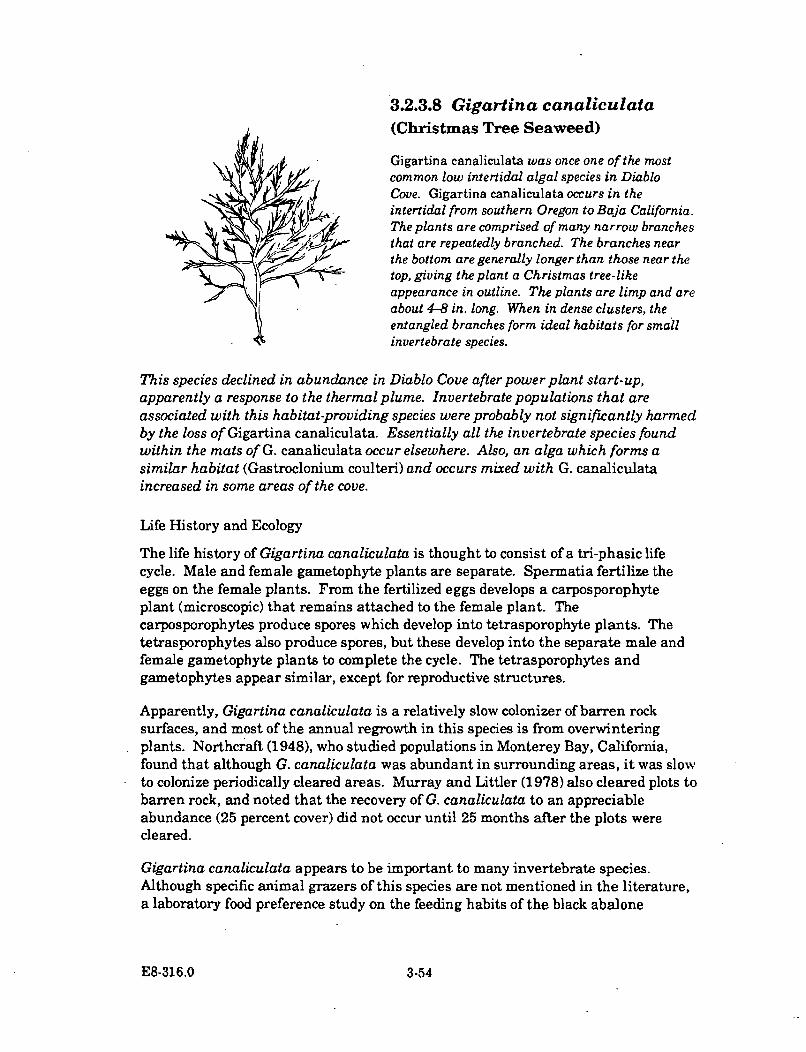
3.2.3.8 Gigartina canaliculata(Christmas Tree Seaweed)
Gigartina canaliculata was once one of the mostcommon low intertidal algal species in DiabloCove. Gigartina cana]iculata occurs in theintertidal from southern Oregon to Baja California.The plants are comprised of many narrow branchesthat are repeatedly branched. The branches nearthe bottom are generally longer than those near thetop, giving the plant a Christmas tree-like4appearance in outline. The plants are limp and areabout 4-8 in. long. When in dense clusters, theentangled branches form ideal habitats for smallinvertebrate species.
This species declined in abundance in Diablo Cove after power plant start-up,apparently a response to the thermal plume. Invertebrate populations that areassociated with this habitat-providing species were probably not significantly harmedby the loss of Gigartina canaliculata. Essentially all the invertebrate species foundwithin the mats of G. canaliculata occur elsewhere. Also, an alga which forms asimilar habitat (Gastroclonium coulteri) and occurs mixed with G. canaliculataincreased in some areas of the cove.
Life History and Ecology
The life history of Gigartina canaliculata is thought to consist of a tri-phasic lifecycle. Male and female gametophyte plants are separate. Spermatia fertilize theeggs on the female plants. From the fertilized eggs develops a carposporophyteplant (microscopic) that remains attached to the female plant. Thecarposporophytes produce spores which develop into tetrasporophyte plants. Thetetrasporophytes also produce spores, but these develop into the separate male andfemale gametophyte plants to complete the cycle. The tetrasporophytes andgametophytes appear similar, except for reproductive structures.
Apparently, Gigartina canaliculata is a relatively slow colonizer of barren rocksurfaces, and most of the annual regrowth in this species is from overwinteringplants. Northcraft (1948), who studied populations in Monterey Bay, California,found that although G. canaliculata was abundant in surrounding areas, it was slowto colonize periodically cleared areas. Murray and Littler (1978) also cleared plots tobarren rock, and noted that the recovery of G. canaliculata to an appreciableabundance (25 percent cover) did not occur until 25 months after the plots werecleared.
Gigartina canaliculata appears to be important to many invertebrate species.Although specific animal grazers of this species are not mentioned in the literature,a laboratory food preference study on the feeding habits of the black abalone
E8-316.0 3-54
(Haliotis cracherodii) indicated that of the algal species tested, G. canaliculata wasits second most preferred food (Leighton and Boolootian 1963). Gigartinacanaliculata individuals, when closely compacted, provide microhabitats fornumerous species of small gastropods and crustaceans in Diablo Cove (Kelly andBehrens 1981). Some of these organisms may feed directly on this alga.
Distribution and Abundance
Gigartina canaliculata appears in the original species list of Diablo Cove's biota(North 1969), presumably because of its relatively high abundance and widespreaddistribution throughout Diablo Cove at that time. Later studies by Burge andSchultz (1973) and Gotshall et al.(1984, 1986) further documented its ubiquitousdistribution and abundances up to 1982.
Seasonal abundances of Gigartina canaliculata from 1976 to 1987 are seen in theTEMP intertidal monitoring stations (Figures D-14 to D-17 in Appendix D). Thisspecies was most abundant in low intertidal +1 ft stations. Selected stationsrepresenting the various changes in this species are presented in Figure 3.2.3.8-1.Occasionally during the surveys, bleaching occurred in this species when, on hot,sunny days, the tide was low and the plants were exposed to air. Some loss of plantmaterial may have occurred due to the bleaching, but not enough to result inappreciable decreases in coverage. The largest pre-operational changes occurredalong the south shores of Diablo Cove (representative Station 12+1 data in Figure3.2.3.8-1), when all algal cover in this area was reduced because of cobble burialduring the 1982-83 winter storms. The following 1983 El Nino event did notnoticeably change the coverage of G. canaliculata.
Beginning in 1985, decreases in Gigartina canaliculata cover occurred in the TEMPstations located inside Diablo Cove (represented by Station 9+1 data in Figure3.2.3.8-1). Concurrently, in the majority of the sample sites outside Diablo Cove, G.canaliculata did not decrease (represented by Station 1+1 data in Figure 3.2.3.8-1).Prior to the decrease in G. canaliculata in Diablo Cove, there were no signs, such asbleaching or degenerating plant material, that indicated that the plants werebecoming stressed. Apparently, the affected plants were quickly lost from the cove'spopulation. The remaining G. canaliculata plants at the end of 1987 appearednormal, but were smaller.
Time series and analysis of variance tests were performed on the station abundancesof Gigartina canaliculata (Appendix E). The decreases observed in Diablo Cove bygraphical inspection of the data were substantiated by these tests. In addition,decreases were also observed in some non-Diablo Cove stations (excluding Station1+1 discussed above). However, at the end of the TEMP studies in 1987, thedecreases noted in the tested stations outside Diablo Cove were not as substantial asthe decreases that occurred inside the cove.
The abundance of the intertidal algae (and invertebrates) in Diablo Cove andvicinity has also been monitored by Dr. W.J. North. His observations provide species
E8-316.0 3-55
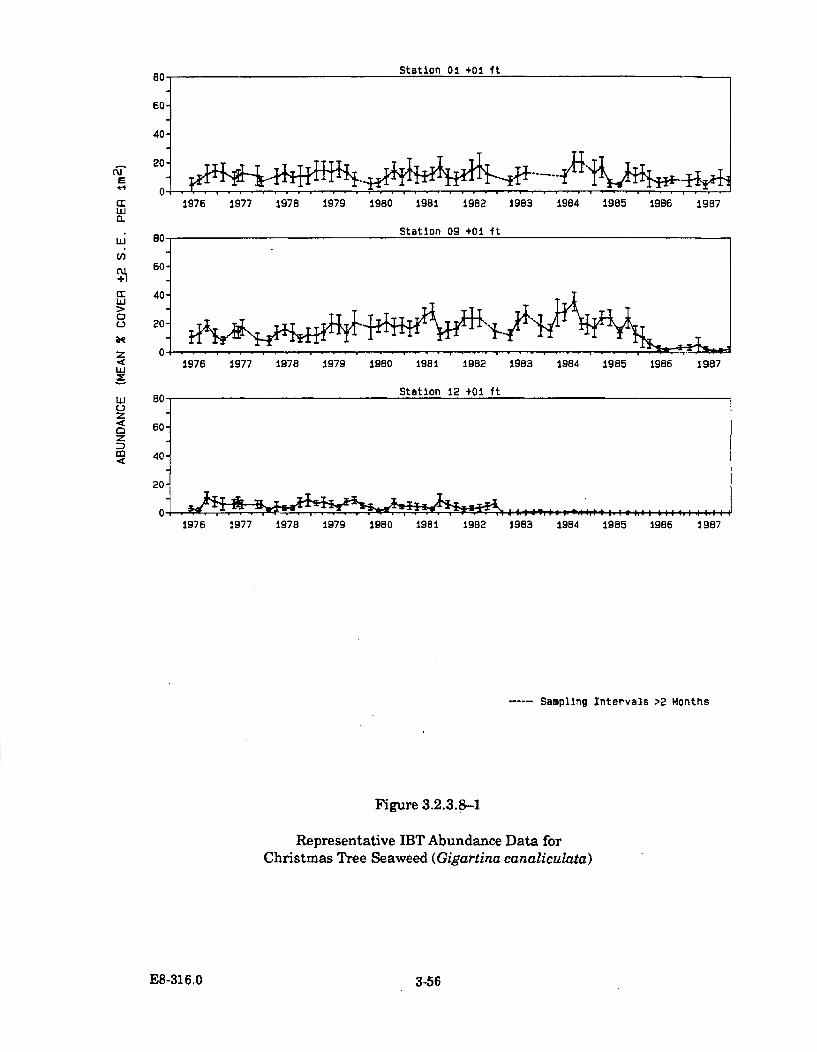
Station 01 +01 ftA~n
60.
40-
20-
E
cc
U,
0
L)
2j
z
0z
4o
1976 1977 1978 1979 1980 1981 1982 1983 1984 1985 1986 1987
Station 09 +01 ft
60-
40-
20-O- ?,"
01976 1977 1978 1979 19BO 1981 1982 1983 1984 1985 1986 1987
Station 12 +01 ftso
60-
40
20
1976 1977 1978 1979 1980 1981 1982 1983 1984 1985 1986 19B7
Sampling Intervals >2 Months
Figure 3.2.3.8-1
Representative IBT Abundance Data forChristmas Tree Seaweed (Gigartina canaliculata)
E8-316,0 3-56
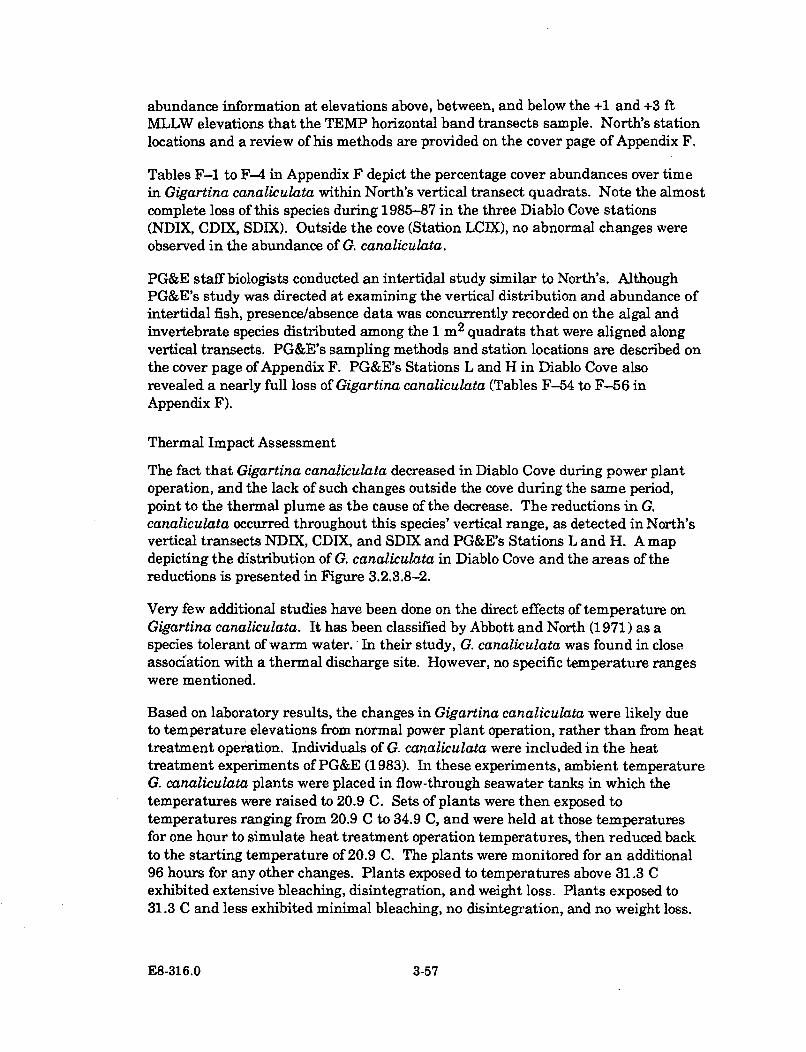
abundance information at elevations above, between, and below the +1 and +3 ftMLLW elevations that the TEMP horizontal band transects sample. North's stationlocations and a review of his methods are provided on the cover page of Appendix F.
Tables F-1 to F-4 in Appendix F depict the percentage cover abundances over timein Gigartina canaliculata within North's vertical transect quadrats. Note the almostcomplete loss of this species during 1985-87 in the three Diablo Cove stations(NDIX, CDIX, SDIX). Outside the cove (Station LCIX), no abnormal changes wereobserved in the abundance of G. canaliculata.
PG&E staff biologists conducted an intertidal study similar to North's. AlthoughPG&E's study was directed at examining the vertical distribution and abundance ofintertidal fish, presence/absence data was concurrently recorded on the algal andinvertebrate species distributed among the 1 m 2 quadrats that were aligned alongvertical transects. PG&E's sampling methods and station locations are described onthe cover page of Appendix F. PG&E's Stations L and H in Diablo Cove alsorevealed a nearly full loss of Gigartina canaliculata (Tables F-54 to F-56 inAppendix F).
Thermal Impact Assessment
The fact that Gigartina canaliculata decreased in Diablo Cove during power plantoperation, and the lack of such changes outside the cove during the same period,point to the thermal plume as the cause of the decrease. The reductions in G.canaliculata occurred throughout this species' vertical range, as detected in North'svertical transects NDIX, CDIX, and SDIX and PG&E's Stations L and H. A mapdepicting the distribution of G. canaliculata in Diablo Cove and the areas of thereductions is presented in Figure 3.2.3.8-2.
Very few additional studies have been done on the direct effects of temperature onGigartina canaliculata. It has been classified by Abbott and North (1971) as aspecies tolerant of warm water. - In their study, G. canaliculata was found in closeassociation with a thermal discharge site. However, no specific temperature rangeswere mentioned.
Based on laboratory results, the changes in Gigartina canaliculata were likely dueto temperature elevations from normal power plant operation, rather than from heattreatment operation. Individuals of G. canaliculata were included in the heattreatment experiments of PG&E (1983). In these experiments, ambient temperatureG. canaliculata plants were placed in flow-through seawater tanks in which thetemperatures were raised to 20.9 C. Sets of plants were then exposed totemperatures ranging from 20.9 C to 34.9 C, and were held at those temperaturesfor one hour to simulate heat treatment operation temperatures, then reduced backto the starting temperature of 20.9 C. The plants were monitored for an additional96 hours for any other changes. Plants exposed to temperatures above 31.3 Cexhibited extensive bleaching, disintegration, and weight loss. Plants exposed to31.3 C and less exhibited minimal bleaching, no disintegration, and no weight loss.
E8-316.0 3-57
Figure 3.2.3.8-2
Map of the Distribution of Affected and Non-Affected ChristmasTree Seaweed (Gigartina canaliculata)
This highly branched alga was once one of the most abundant low intertidal seaweedspecies in Diablo Cove. The major areas of its occurrence prior to power plant start-up in Diablo Cove are indicated in blue. During power plant operation, largedecreases occurred in this species' abundance in these areas as a response to thethermal plume. In south Diablo Cove (purple area), this species was abundant, butwas reduced prior to power plant start-up by the 1982-83 winter storms. It did notrecover in this area. Unaffected plants occurred on the headland points (yellowareas).
E8-316.0 3-58
Plants tested at the lowest temperatures exhibited some weight gain. Since 31.3 Cwater temperatures have not been measured in Diablo Cove where the decreases inG. canaliculata occurred, it is likely that the decreases were not caused by any heattreatment operation.
The decline in Gigartina canaliculata probably represents a loss of algal habitat forsmall invertebrate species. However, none of these species are considered uniquelyassociated with G. canaliculata, as they occur elsewhere. In addition, an alga whichforms a similar habitat, Gastroclonium coulteri (Section 3.2.3.7), increased inabundance upon power plant start-up. This species provides shelter for the samesmall invertebrates among its entangled basal branches as does G. canaliculata(Kelly and Behrens 1981, Behrens and Kelly 1986, Dearn 1988). The decrease in G.canaliculata habitat may have been compensated for by the increases in G. coulterihabitat.
Since some populations of Gigartina canaliculata are known to be tolerant of warmwater (Abbott and North 1971), and since some individuals remained in Diablo Coveduring power plant operation, it appears that there is considerable variation intemperature tolerance among individuals of this species. If so, it is possible that G.canaliculata will remain in the cove. Whether this species will be able to recover topre-operational abundances will depend on recruitment success. With adequaterecruitment, it is possible that the increased water temperatures in Diablo Covecould select for the recruits tolerant of warmer water, thereby allowing potentialrecovery in this species. If this occurs, the G. canaliculata population in the covewould be a strain of plants slightly different from those present during the pre-operation period, and from those existing outside Diablo Cove.
E8-316.0 3-59
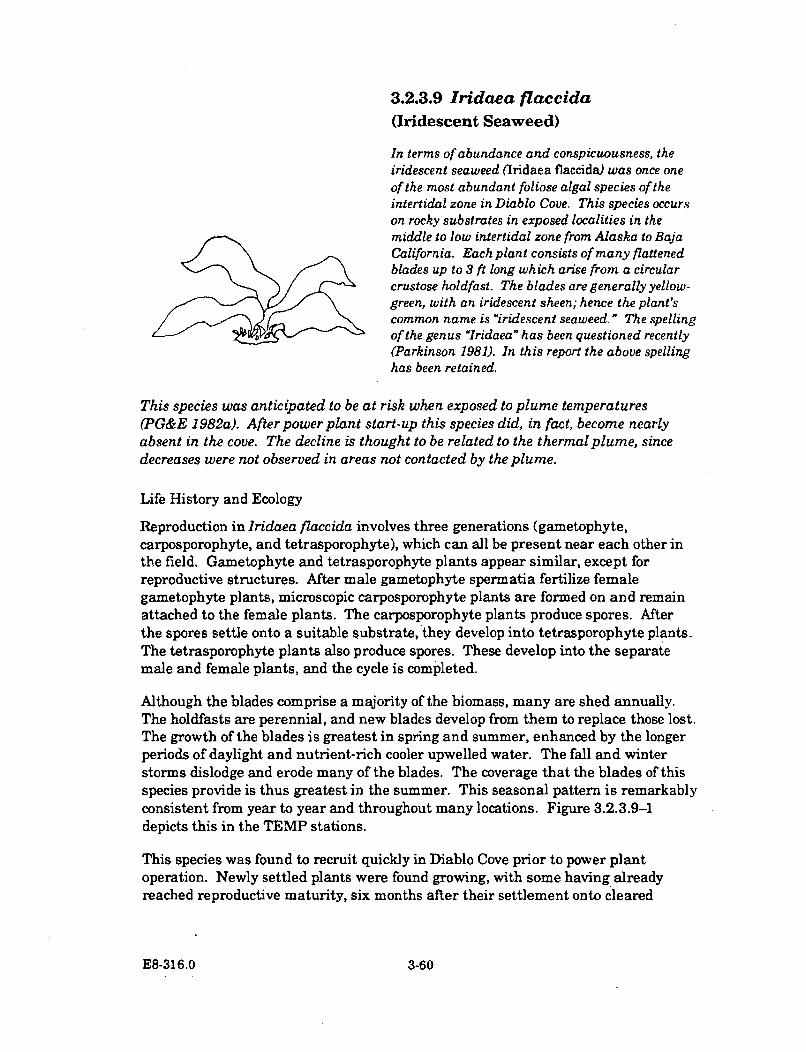
3.2.3.9 Irdaea flaccida(Iridescent Seaweed)
In terms of abundance and conspicuousness, theiridescent seaweed (Iridaea flaccida) was once oneof the most abundant foliose algal species of theintertidal zone in Diablo Cove. This species occurson rocky substrates in exposed localities in themiddle to low intertidal zone from Alaska to BajaCalifornia. Each plant consists of many flattenedblades up to 3 ft long which arise from a circularcrustose holdfast. The blades are generally yellow-green, with an iridescent sheen; hence the plant'scommon name is "iridescent seaweed." The spellingof the genus "Iridaea" has been questioned recently(Parkinson 1981). In this report the above spellinghas been retained.
This species was anticipated to be at risk when exposed to plume temperatures(PG&E 1982a). After power plant start-up this species did, in fact, become nearlyabsent in the cove. The decline is thought to be related to the thermal plume, sincedecreases were not observed in areas not contacted by the plume.
Life History and Ecology
Reproduction in Iridaea flaccida involves three generations (gametophyte,carposporophyte, and tetrasporophyte), which can all be present near each other inthe field. Gametophyte and tetrasporophyte plants appear similar, except forreproductive structures. After male gametophyte spermatia fertilize femalegametophyte plants, microscopic carposporophyte plants are formed on and remainattached to the female plants. The carposporophyte plants produce spores. Afterthe spores settle onto a suitable substrate, they develop into tetrasporophyte plants.The tetrasporophyte plants also produce spores. These develop into the separatemale and female plants, and the cycle is completed.
Although the blades comprise a majority of the biomass, many are shed annually.The holdfasts are perennial, and new blades develop from them to replace those lost.The growth of the blades is greatest in spring and summer, enhanced by the longerperiods of daylight and nutrient-rich cooler upwelled water. The fall and winterstorms dislodge and erode many of the blades. The coverage that the blades of thisspecies provide is thus greatest in the summer. This seasonal pattern is remarkablyconsistent from year to year and throughout many locations. Figure 3.2.3.9-1depicts this in the TEMP stations.
This species was found to recruit quickly in Diablo Cove prior to power plantoperation. Newly settled plants were found growing, with some having alreadyreached reproductive maturity, six months after their settlement onto cleared
E8-316.0 3-60
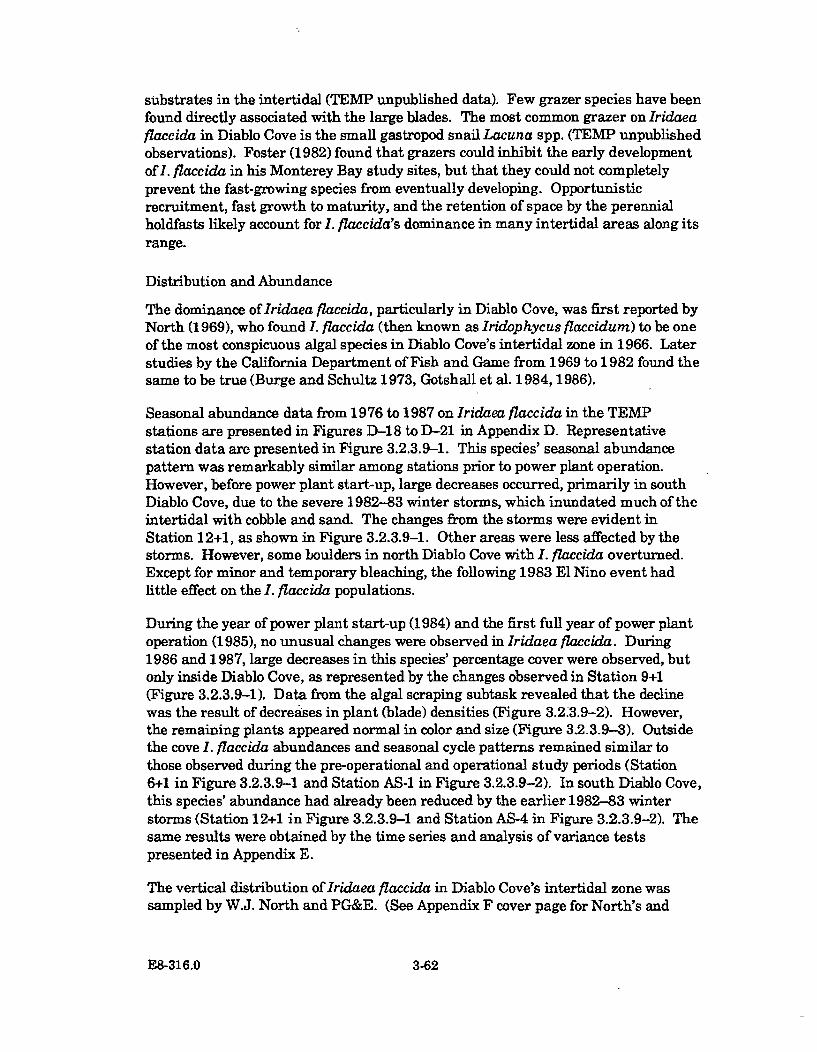
substrates in the intertidal (TEMP unpublished data). Few grazer species have beenfound directly associated with the large blades. The most common grazer on Iridaeaflaccida in Diablo Cove is the small gastropod snail Lacuna spp. (TEMP unpublishedobservations). Foster (1982) found that grazers could inhibit the early developmentof I. flaccida in his Monterey Bay study sites, but that they could not completelyprevent the fast-growing species from eventually developing. Opportunisticrecruitment, fast growth to maturity, and the retention of space by the perennialholdfasts likely account for I. flaccida's dominance in many intertidal areas along itsrange.
Distribution and Abundance
The dominance of Iridaea flaccida, particularly in Diablo Cove, was first reported byNorth (1969), who found I. flaccida (then known as Iridophycus flaccidum) to be oneof the most conspicuous algal species in Diablo Cove's intertidal zone in 1966. Laterstudies by the California Department of Fish and Game from 1969 to 1982 found thesame to be true (Burge and Schultz 1973, Gotshall et al. 1984, 1986).
Seasonal abundance data from 1976 to 1987 on Iridaea flaccida in the TEMPstations are presented in Figures D-18 to D-21 in Appendix D. Representativestation data are presented in Figure 3.2.3.9-1. This species' seasonal abundancepattern was remarkably similar among stations prior to power plant operation.However, before power plant start-up, large decreases occurred, primarily in southDiablo Cove, due to the severe 1982-83 winter storms, which inundated much of theintertidal with cobble and sand. The changes from the storms were evident inStation 12+1, as shown in Figure 3.2.3.9-1. Other areas were less affected by thestorms. However, some boulders in north Diablo Cove with I. flaccida overturned.Except for minor and temporary bleaching, the following 1983 El Nino event hadlittle effect on the I. flaccida populations.
During the year of power plant start-up (1984) and the first full year of power plantoperation (1985), no unusual changes were observed in Iridaea flaccida. During1986 and 1987, large decreases in this species' percentage cover were observed, butonly inside Diablo Cove, as represented by the changes observed in Station 9+1(Figure 3.2.3.9-1). Data from the algal scraping subtask revealed that the declinewas the result of decreases in plant (blade) densities (Figure 3.2.3.9-2). However,the remaining plants appeared normal in color and size (Figure 3.2.3.9-3). Outsidethe cove I. flaccida abundances and seasonal cycle patterns remained similar tothose observed during the pre-operational and operational study periods (Station6+1 in Figure 3.2.3.9-1 and Station AS-1 in Figure 3.2.3.9-2). In south Diablo Cove,this species' abundance had already been reduced by the earlier 1982-83 winterstorms (Station 12+1 in Figure 3.2.3.9-1 and Station AS-4 in Figure 3.2.3.9-2). Thesame results were obtained by the time series and analysis of variance testspresented in Appendix E.
The vertical distribution of Iridaea flaccida in Diablo Cove's intertidal zone wassampled by W.J. North and PG&E. (See Appendix F cover page for North's and
E8-316.0 3-62
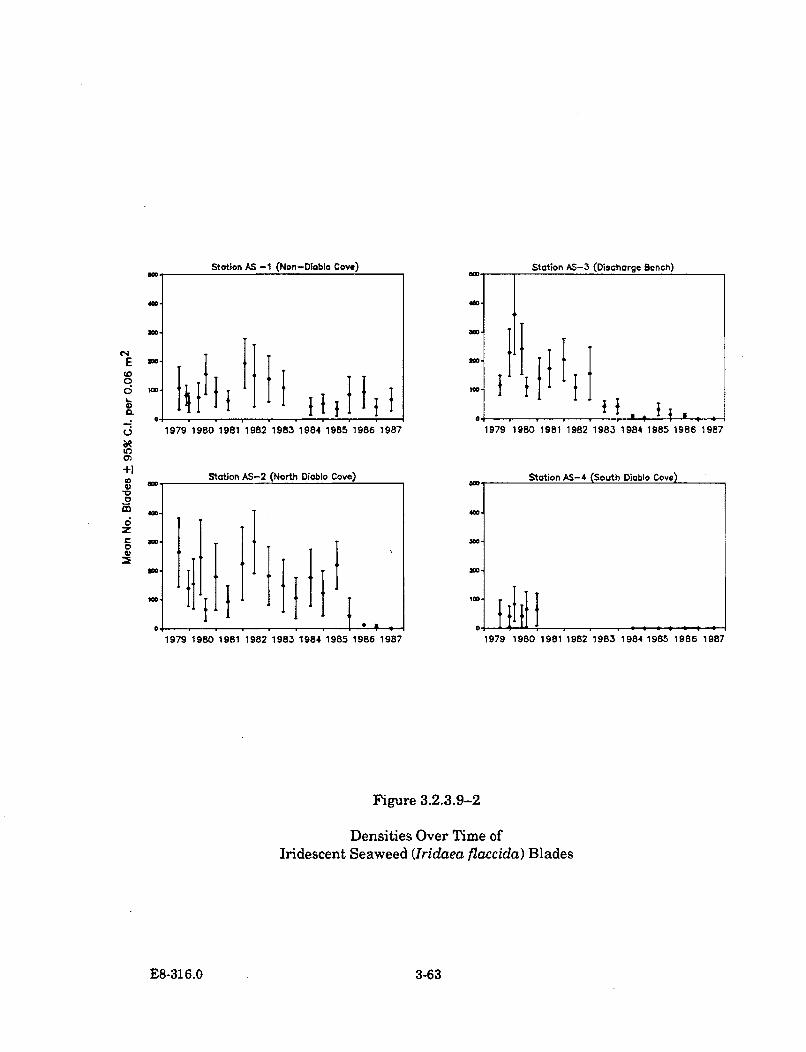
Stat;on AS -1 (Non-Diablo Cove) StaVion AS-3 (Dischorge Bench)am. -
C4
Eloo- 1W.'+
1979 1980 1981 1982 1983 1984 1985 1986 1987 1979 1980 1981 1982 1983 1984 1985 1986 1987
LO
+1 Station AS-2 (North Dioblo Cove) Station AS-4 (South Diablo Cove)
4)e
im 40-
C 3WM
1979 1980 1981 1982 1983 1984 1985 1986 1987 1979 1980 1981 1982 1983 1984 1985 1985 1987
Figure 3.2.3.9-2
Densities Over Time of
Iridescent Seaweed (Iridaea flaccida) Blades
E8-316.0 3-63
N~E
0
LO
0)
E
0
M)
Station AS-1 (Non-Dioblo Cove)
Mlo.
'U
10, 1
1979 1980 1981 1982 1983 1984 1985 1988 1987
Station AS-2 (North Diablo Cove)
.OR
1979 1980 1981 1982 1983 1984 1985 1 988 1987
Station AS-3 (Discharge Bench)
W.
M I I i
1979 1980 1981 1982 1983 1984 1985 1986 1987
Station AS-4 (South Diablo Cove)U1.
U- I
too - 8 9 8 9 9 4 5
1979 1980 1981 1982 1983 1984 1985 1986 1997
Figure 3.2.3.9-3
Average Blade Lengths Over Time inIridescent Seaweed (Iridaea /faccida)
E8-316.0 3-64
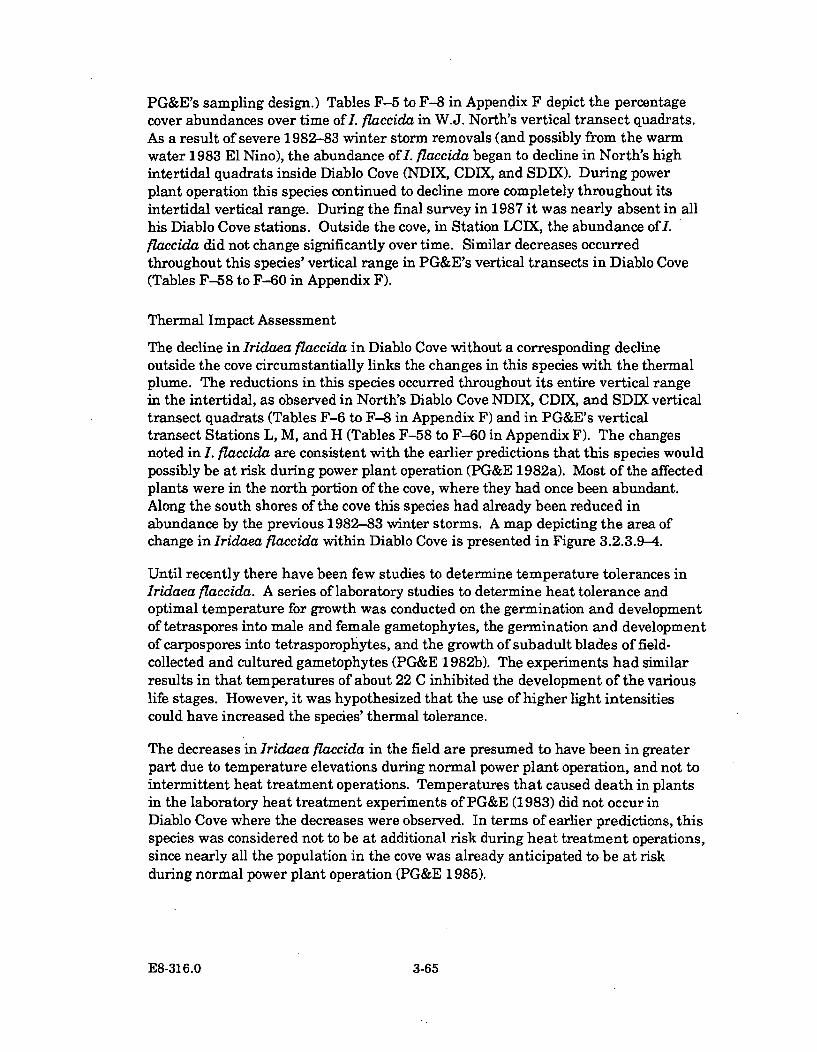
PG&E's sampling design.) Tables F-5 to F-8 in Appendix F depict the percentagecover abundances over time of I. flaccida in W.J. North's vertical transect quadrats.As a result of severe 1982-83 winter storm removals (and possibly from the warmwater 1983 El Nino), the abundance of . flaccida began to decline in North's highintertidal quadrats inside Diablo Cove (NDIX, CDIX, and SDIX). During powerplant operation this species continued to decline more completely throughout itsintertidal vertical range. During the final survey in 1987 it was nearly absent in allhis Diablo Cove stations. Outside the cove, in Station LCIX, the abundance of .flaccida did not change significantly over time. Similar decreases occurredthroughout this species' vertical range in PG&E's vertical transects in Diablo Cove(Tables F-58 to F-60 in Appendix F).
Thermal Impact Assessment
The decline in Iridaea flaccida in Diablo Cove without a corresponding declineoutside the cove circumstantially links the changes in this species with the thermalplume. The reductions in this species occurred throughout its entire vertical rangein the intertidal, as observed in North's Diablo Cove NDIX, CDIX, and SDIX verticaltransect quadrats (Tables F-6 to F-8 in Appendix F) and in PG&E's verticaltransect Stations L, M, and H (Tables F-58 to F-60 in Appendix F). The changesnoted in I. flaccida are consistent with the earlier predictions that this species wouldpossibly be at risk during power plant operation (PG&E 1982a). Most of the affectedplants were in the north portion of the cove, where they had once been abundant.Along the south shores of the cove this species had already been reduced inabundance by the previous 1982-83 winter storms. A map depicting the area ofchange in Iridaea flaccida within Diablo Cove is presented in Figure 3.2.3.9-4.
Until recently there have been few studies to determine temperature tolerances inIridaea flaccida. A series of laboratory studies to determine heat tolerance andoptimal temperature for growth was conducted on the germination and developmentof tetraspores into male and female gametophytes, the germination and developmentof carpospores into tetrasporophytes, and the growth of subadult blades of field-collected and cultured gametophytes (PG&E 1982b). The experiments had similarresults in that temperatures of about 22 C inhibited the development of the variouslife stages. However, it was hypothesized that the use of higher light intensitiescould have increased the species' thermal tolerance.
The decreases in Iridaea flaccida in the field are presumed to have been in greaterpart due to temperature elevations during normal power plant operation, and not tointermittent heat treatment operations. Temperatures that caused death in plantsin the laboratory heat treatment experiments of PG&E (1983) did not occur inDiablo Cove where the decreases were observed. In terms of earlier predictions, thisspecies was considered not to be at additional risk during heat treatment operations,since nearly all the population in the cove was already anticipated to be at riskduring normal power plant operation (PG&E 1985).
E8-316.0 3-65
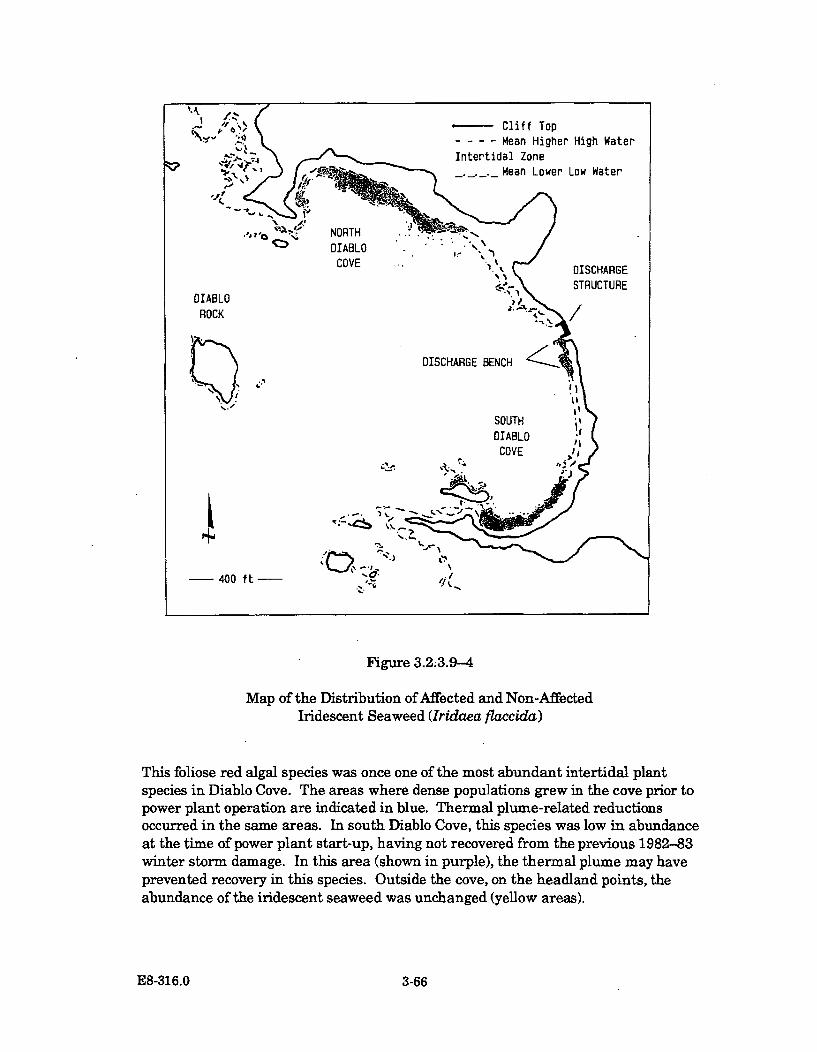
Figure 3.2.3.9-4
Map of the Distribution of Affected and Non-AffectedIridescent Seaweed (Iridaea flaccida)
This foliose red algal species was once one of the most abundant intertidal plantspecies in Diablo Cove. The areas where dense populations grew in the cove prior topower plant operation are indicated in blue. Thermal plume-related reductionsoccurred in the same areas. In south Diablo Cove, this species was low in abundanceat the time of power plant start-up, having not recovered from the previous 1982-83winter storm damage. In this area (shown in purple), the thermal plume may haveprevented recovery in this species. Outside the cove, on the headland points, theabundance of the iridescent seaweed was unchanged (yellow areas).
E8-316.0 3-66
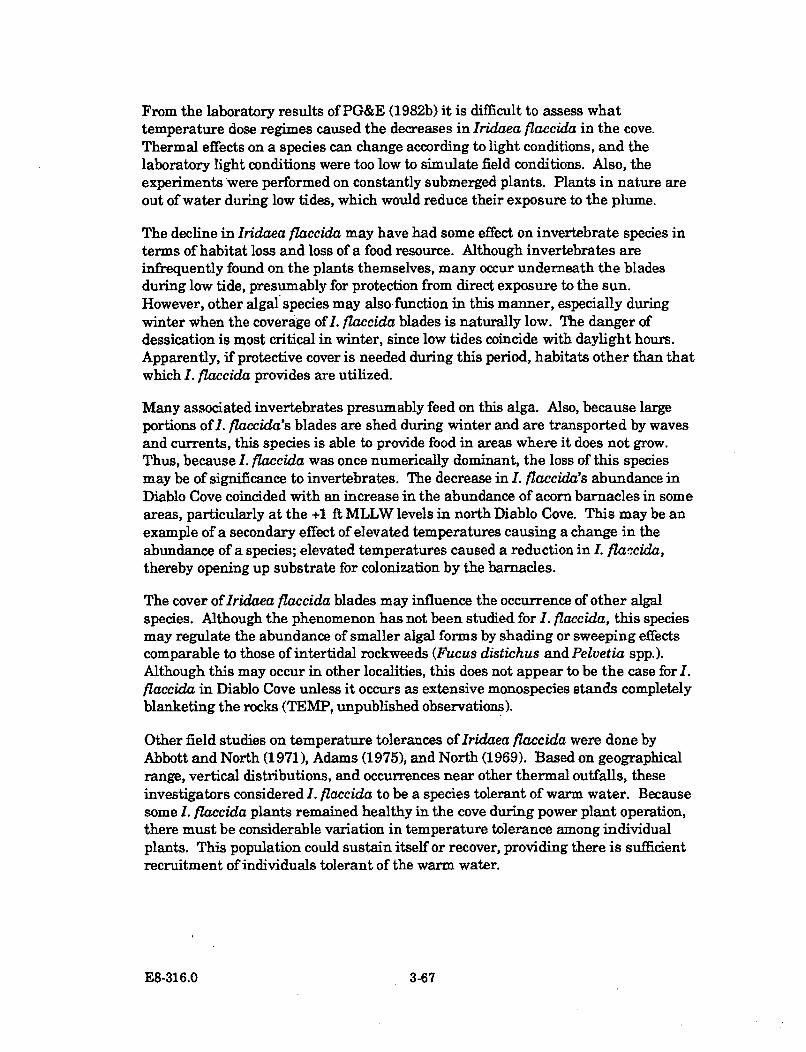
From the laboratory results of PG&E (1982b) it is difficult to assess whattemperature dose regimes caused the decreases in Iridaea flaccida in the cove.Thermal effects on a species can change according to light conditions, and thelaboratory light conditions were too low to simulate field conditions. Also, theexperiments were performed on constantly submerged plants. Plants in nature areout of water during low tides, which would reduce their exposure to the plume.
The decline in Iridaea flaccida may have had some effect on invertebrate species interms of habitat loss and loss of a food resource. Although invertebrates areinfrequently found on the plants themselves, many occur underneath the bladesduring low tide, presumably for protection from direct exposure to the sun.However, other algal species may also-function in this manner, especially duringwinter when the coverage of 1. flaccida blades is naturally low. The danger ofdessication is most critical in winter, since low tides coincide with daylight hours.Apparently, if protective cover is needed during this period, habitats other than thatwhich I. flaccida provides are utilized.
Many associated invertebrates presumably feed on this alga. Also, because largeportions of I. flaccida's blades are shed during winter and are transported by wavesand currents, this species is able to provide food in areas where it does not grow.Thus, because I. flaccida was once numerically dominant, the loss of this speciesmay be of significance to invertebrates. The decrease in . flaccida's abundance inDiablo Cove coincided with an increase in the abundance of acorn barnacles in someareas, particularly at the +1 ft MLLW levels in north Diablo Cove. This may be anexample of a secondary effect of elevated temperatures causing a change in theabundance of a species; elevated temperatures caused a reduction in . fla-cida,thereby opening up substrate for colonization by the barnacles.
The cover of Iridaea flaccida blades may influence the occurrence of other algalspecies. Although the phenomenon has not been studied for I. flaccida, this speciesmay regulate the abundance of smaller algal forms by shading or sweeping effectscomparable to those of intertidal rockweeds (Fucus distichus and Pelvetia spp.).Although this may occur in other localities, this does not appear to be the case for I.flaccida in Diablo Cove unless it occurs as extensive monospecies stands completelyblanketing the rocks (TEMP, unpublished observations).
Other field studies on temperature tolerances of Iridaea flaccida were done byAbbott and North (1971), Adams (1975), and North (1969). Based on geographicalrange, vertical distributions, and occurrences near other thermal outfalls, theseinvestigators considered I. flaccida to be a species tolerant of warm water. Becausesome I. flaccida plants remained healthy in the cove during power plant operation,there must be considerable variation in temperature tolerance among individualplants. This population could sustain itself or recover, providing there is sufficientrecruitment of individuals tolerant of the warm water.
E8-316.0 3-67
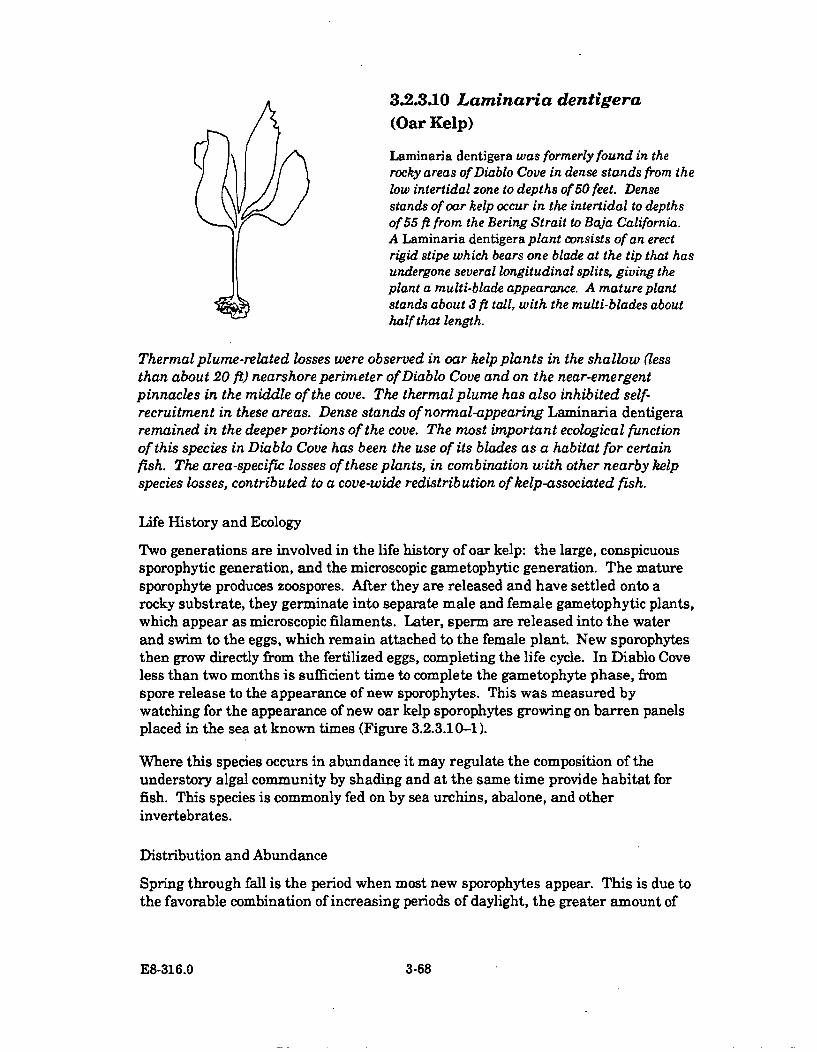
3.2.3.10 Laminaria dentigera
(Oar Kelp)
Laminaria dentigera was formerly found in therocky areas of Diablo Cove in dense stands from thelow intertidal zone to depths of 50 feet. Densestands of oar kelp occur in the intertidal to depthsof 55 ft from the Bering Strait to Baja California.A Laminaria dentigera plant consists of an erectrigid stipe which bears one blade at the tip that hasundergone several longitudinal splits, giving theplant a multi-blade appearance. A mature plantstands about 3 ft tall, with the multi-blades abouthalf that length.
Thermal plume-related losses were observed in oar kelp plants in the shallow (lessthan about 20 ft) nearshore perimeter of Diablo Cove and on the near-emergentpinnacles in the middle of the cove. The thermal plume has also inhibited self-recruitment in these areas. Dense stands of normal-appearing Laminaria dentigeraremained in the deeper portions of the cove. The most important ecological functionof this species in Diablo Cove has been the use of its blades as a habitat for certainfish. The area-specific losses of these plants, in combination with other nearby kelpspecies losses, contributed to a cove-wide redistribution of kelp-associated fish.
Life History and Ecology
Two generations are involved in the life history of oar kelp: the large, conspicuoussporophytic generation, and the microscopic gametophytic generation. The maturesporophyte produces zoospores. After they are released and have settled onto arocky substrate, they germinate into separate male and female gametophytic plants,which appear as microscopic filaments. Later, sperm are released into the waterand swim to the eggs, which remain attached to the female plant. New sporophytesthen grow directly from the fertilized eggs, completing the life cycle. In Diablo Coveless than two months is sufficient time to complete the gametophyte phase, fromspore release to the appearance of new sporophytes. This was measured bywatching for the appearance of new oar kelp sporophytes growing on barren panelsplaced in the sea at known times (Figure 3.2.3.10-1).
Where this species occurs in abundance it may regulate the composition of theunderstory algal community by shading and at the same time provide habitat forfish. This species is commonly fed on by sea urchins, abalone, and otherinvertebrates.
Distribution and Abundance
Spring through fall is the period when most new sporophytes appear. This is due tothe favorable combination of increasing periods of daylight, the greater amount of
E8-316.0 3-68
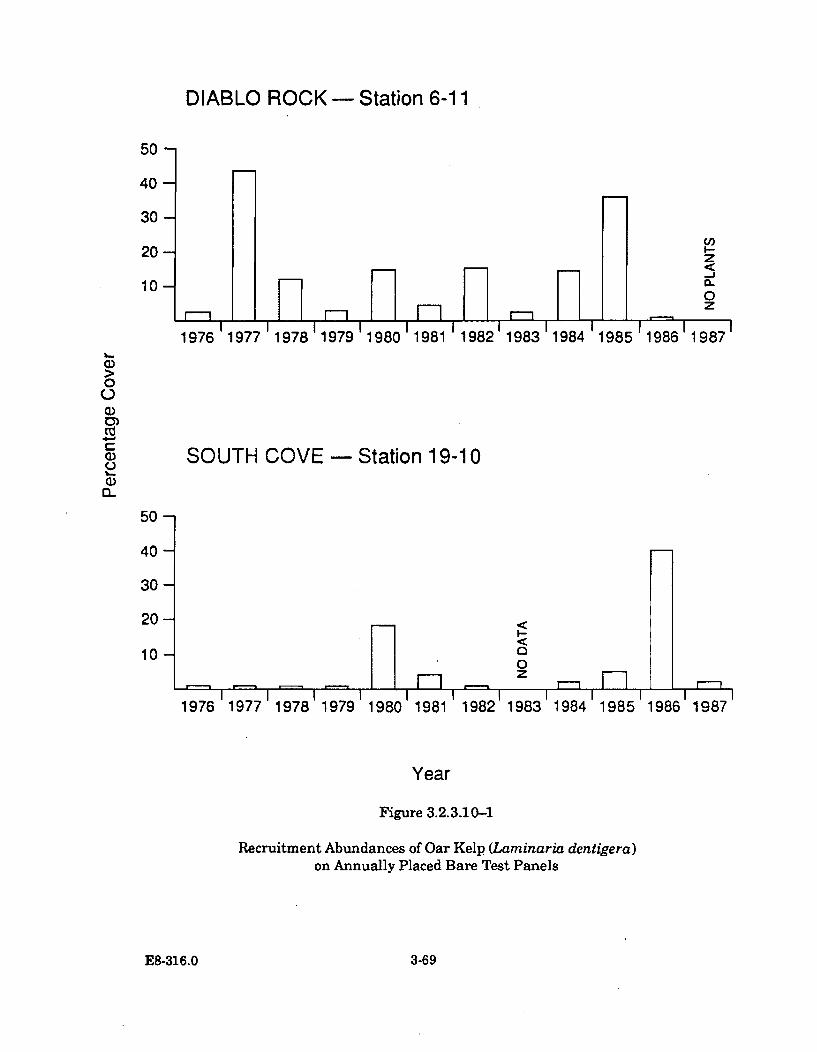
DIABLO ROCK - Station 6-11
50-
40-
30-
20-
10-
PFr-H 1-7 r-Hf2z
0~
zI"--1
1976 1977 1978 11979 11980 119811 1982 11983 1984' 1985 11986 11987
0.0
C
C-, SOUTH COVE - Station 19-10
50-
40-
30-
20-
10- H 0zF-- r--1Fl r--1
1976 1977 11978 11979 11980 1981 11982 11983 1984 1985 1986 1987
Year
Figure 3.2.3.10-1
Recruitment Abundances of Oar Kelp (Laminaria dentigera)on Annually Placed Bare Test Panels
E8-316.0 3-69
nutrients in the colder upwelled water, and the provision of new open space bypreceding winter storm disturbances. The sporophytes are perennial, and their fatein Diablo Cove is generally determined by grazing and winter storm removals.Using growth rings as tracers of annual growth, it has been estimated that some ofthe oldest oar kelp plants in Diablo Cove reach 5-8 years of age. During their lifethey occasionally shed their blade. Stored photoassimilates in the stipe later initiatenew blade growth (Schmitz and Lobban 1976). The cycle time for blade sheddingand regeneration has not been studied for oar kelp, but all stages of this process inDiablo Cove can be found throughout the year.
Oar kelp beds were conspicuous in Diablo Cove during the surveys by North (1969)in 1966. During this time its distribution, along with that of other algae in thecentral deeper portions of the cove, was limited due to grazing by red sea urchin(Strongylocentrotus franciscanus). Oar kelp began to flourish in this central areaduring the mid-1970's, shortly after many of the red sea urchins had been eaten byforaging sea otters (Enhydra lutris).
Following these increases, the largest changes from 1976 to 1984 were mainlypopulation turnover events in the form of winter storm-related mortalitiesalternating with recruitment in spring. This periodic replenishment sustained theoar kelp population in variable quantities from year to year in Diablo Cove. Theseasonal changes in Laminaria dentigera densities in the TEMP subtidal stationsare presented in Figure D-22 in Appendix D. Station data that are representative ofthe types of changes observed in all the stations are presented here in Figure3.2.3.10-2. The severe 1982-83 winter storms disturbed much more of the bottomthan did previous winter storms. This allowed for large increases in oar kelp insome of the TEMP stations (representative Station 13-32 in Figure 3.2.3.10-2).
The subsequent El Nino event in 1983 did not adversely affect oar kelp in DiabloCove. The unusually warm, nutrient-depleted water did cause some plants in DiabloCove to lose their blades. However, the meristematic regions which regenerate theblades were not damaged, and new blades soon developed.
In 1985 (the first full year of power plant operation), oar kelp plants growing indepths less than about 15 ft in Diablo Cove lost their terminal blade in synchrony.The loss was not atypical, but the synchrony was. It was first noticed on plantsalong the inshore side of Diablo Rock, a region which is most persistently exposed tothe thermal plume. Plants growing in other shallow areas were affected in the samemanner weeks later. During the end of 1985, further damage occurred along thestipes of the affected plants, destroying the growing tip which regenerates newblades. The bare stipes became further weakened and more vulnerable to grazing bythe brown turban snail, Tegula brunnea. This eventually led to their becomingdetached from the bottom in 1986, as represented by the decreases observed inStation 9-10 in Figure 3.2.3.10-2. Figure 3.2.3.10-3 depicts the average percentageof the oar kelp population with blades in the 10- and 15-ft depth stations in DiabloCove by month for the year classes 1976-1982 (pre-El Nino), 1983-1984 (El Ninoand plant start-up) and 1985-1987 (plant operation). The lower percentages of
E8-316.0 3-70
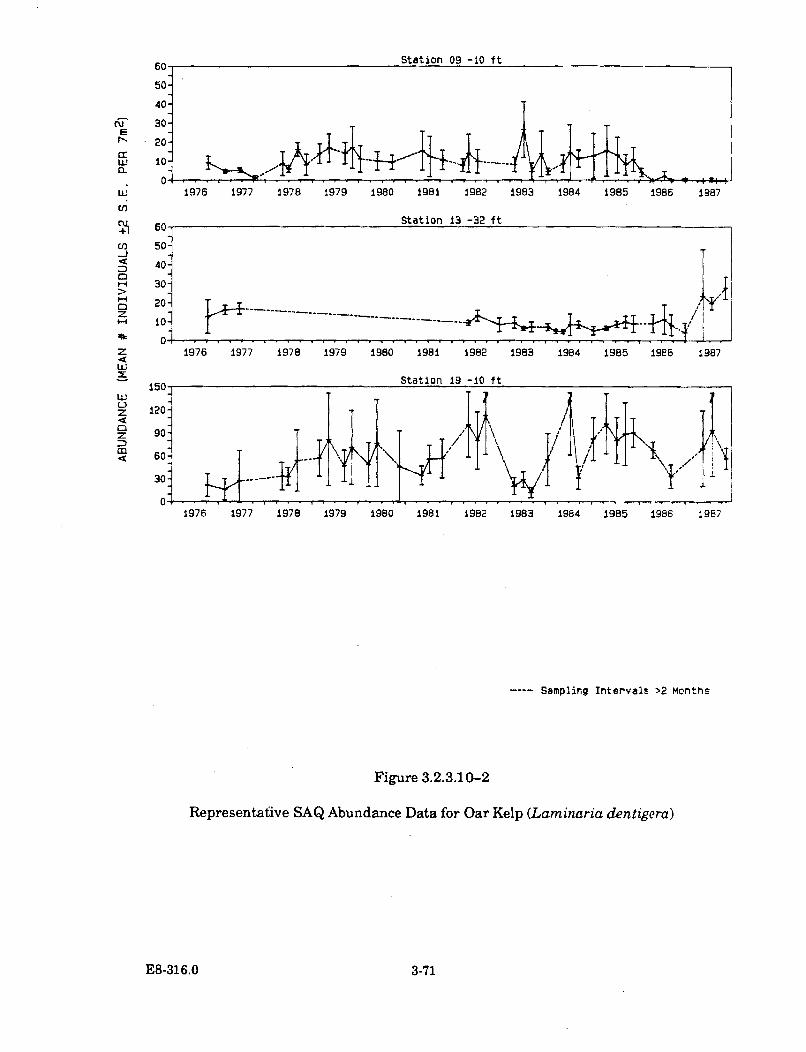
Station 09 -10 fth) tto 9-0f
.;UErý
CrU1CLa
CO
Ul)I-J
4k
z
0
z0
z
M
0
z
wJ
4U
50-
40-
30-
20-
10-
u.tv
1976 1977 1978 1979 1980 1981 1982 1983 1984 1985 1986 1987
Station 13 -32 ftbUq
40;
30]
20] -sol
1• 97 17 1 9 8 1
1976 1977 1978 1979 1980 1981 1982 1983 1984 1985 19E6 1987
1976 1977 1978 1979 1980 1981 1982 1983 1984 1985 1986 1987
Sampling Intervals >2 Months
Figure 3.2.3.10-2
Representative SAQ Abundance Data for Oar Kelp (Lam inaria dentigera)
E8-316.0 3-71
plants with blades during power plant operation in Diablo Cove's shallows revealsthat a greater frequency of blade losses occurred during the times of total plantlosses.
The plants living in deeper portions of the cove were not affected by the plume. Infact, oar kelp increased in abundance during power plant operation in Station 13-32,which is located at a depth of 32 ft (Figure 3.2.3.10-2). This occurred as a result ofthe severe 1982-83 winter storms' having opened up new areas for L. dentigerarecruitment. Outside Diablo Cove this species' abundance varied according to thelevels of storm-related mortalities and recruitment (representative Station 19-10 inFigure 3.2.3.10-2). Time series and analysis of variance test results on thesechanges are presented in Appendix E.
The depth of this apparently plume-related change was graduated throughout thecove. In the northern portion of the cove, the depth of change ended at about 15 ft;in the southern portion of the cove at about 10 ft. On the inshore side of Diablo Rocka downwelling of the plume occurs, and affected plants were observed at depthsdown to 25 ft. Most of the remaining portions of the cove's oar kelp population wereunaffected. During 1987 a large number of oar kelp plants without blades wereobserved for the first time in the central-northern portion of Diablo Cove at a depthof about 25 ft. This indicated that mortalities in these plants may soon occur.
Thermal Impact Assessment
The synchronous blade losses followed by mortalities among the shallow-water oarkelp plants, concomitant with power plant operation, strongly point to the thermalplume as the cause. Additionally, recruitment no longer occurred in the affectedareas (Figure 3.2.3.10-1), indicating that microscopic stages were also affected bythe plume. Laboratory tests performed by PG&E (1982b) found that sporegermination was impaired between 18.0 and 20.6 C and prevented at 24.8 C, andthat subsequent gametophyte fertility from the developed spores did not occur tospecimens exposed to 20.1 C for several days. Lining and Neushul (1978) foundsimilar results in specimens exposed to 17 C'for two weeks. They also found thatexposures at 17 C prevented gametophyte reproductive maturity. Similartemperature regimes have occurred in Diablo Cove during power plant operation,and are presumed to account for the lack of sporophyte recruitment in the shallowsof the cove. However, it is also possible that recruitment did not occur because theareas were more heavily covered with foliose algae (Section 3.2.3.1), or because of aninsufficient supply of spores.
The shallow-water losses of adult plants were caused in large part by normal powerplant operation and not by intermittent heat treatment operations. This conclusionis derived from the fact that the temperature doses (27 C for one hour) whichinduced adverse changes in blade condition in the laboratory heat treatment testspecimens (PG&E 1983) have not been measured in the field, where the changesoccurred. Since the species had already been predicted to be at risk during normal
E8:316.0 3-73
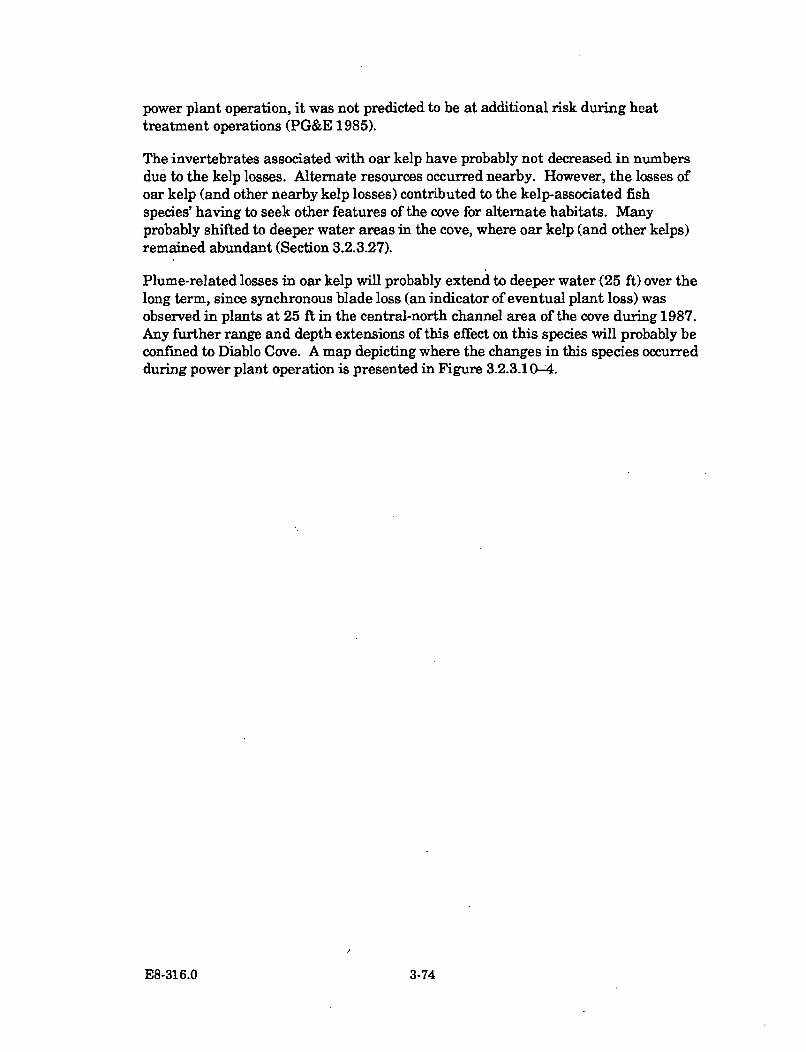
power plant operation, it was not predicted to be at additional risk during heattreatment operations (PG&E 1985).
The invertebrates associated with oar kelp have probably not decreased in numbersdue to the kelp losses. Alternate resources occurred nearby. However, the losses ofoar kelp (and other nearby kelp losses) contributed to the kelp-associated fishspecies' having to seek other features of the cove for alternate habitats. Manyprobably shifted to deeper water areas in the cove, where oar kelp (and other kelps)remained abundant (Section 3.2.3.27).
Plume-related losses in oar kelp will probably extend to deeper water (25 ft) over thelong term, since synchronous blade loss (an indicator of eventual plant loss) wasobserved in plants at 25 ft in the central-north channel area of the cove during 1987.Any further range and depth extensions of this effect on this species will probably beconfined to Diablo Cove. A map depicting where the changes in this species occurredduring power plant operation is presented in Figure 3.2.3.10-4.
E8-316.0 3-74
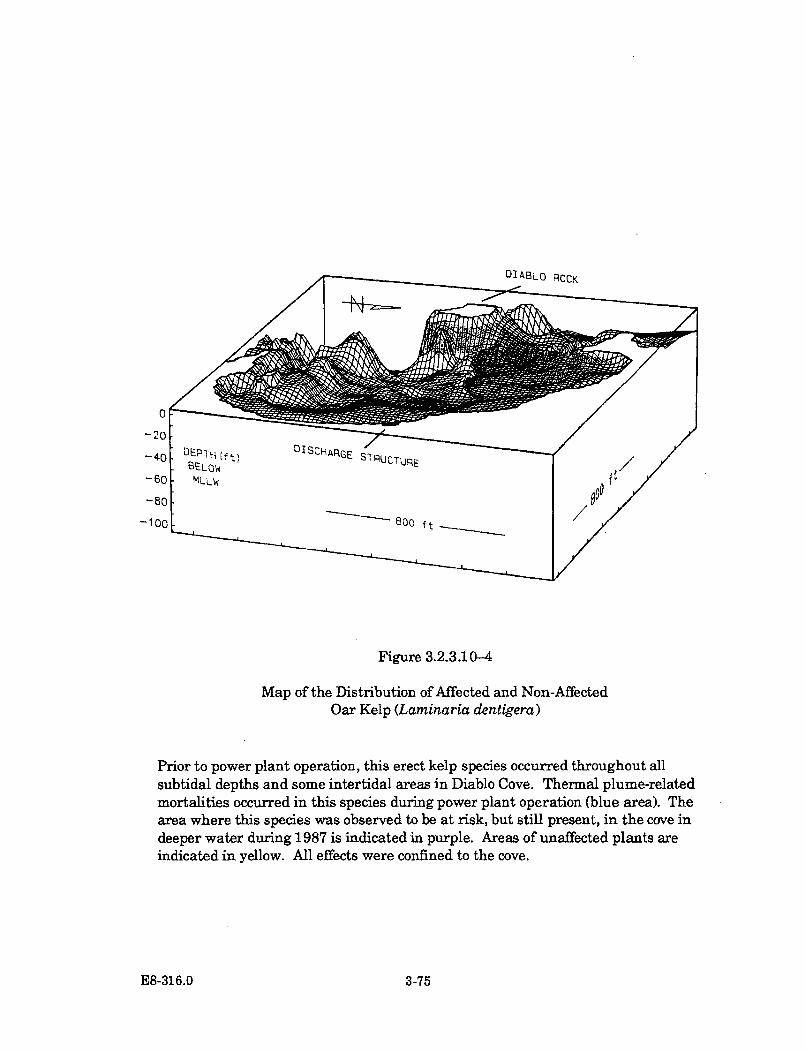
DIABLO ROCK
Figure 3.2.3.10-4
Map of the Distribution of Affected and Non-AffectedOar Kelp (Laminaria dentigera)
Prior to power plant operation, this erect kelp species occurred throughout allsubtidal depths and some intertidal areas in Diablo Cove. Thermal plume-relatedmortalities occurred in this species during power plant operation (blue area). Thearea where this species was observed to be at risk, but still present, in the cove indeeper water during 1987 is indicated in purple. Areas of unaffected plants areindicated in yellow. All effects were confined to the cove.
E8-316.0 3-75
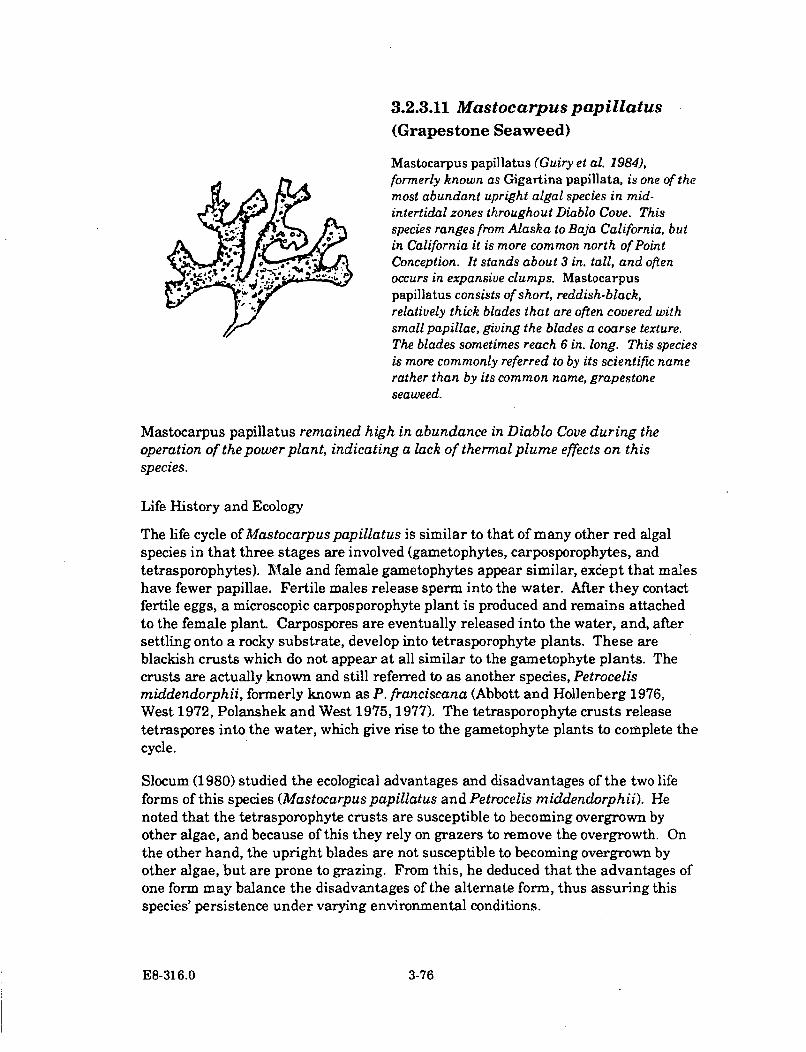
3.2.3.11 Mastocarpus pap illatus
(Grapestone Seaweed)
Mastocarpus papillatus (Guiry et al. 1984),formerly known as Gigartina papillata, is one of themost abundant upright algal species in mid-intertidal zones throughout Diablo Cove. Thisspecies ranges from Alaska to Baja California, butin California it is more common north of PointConception. It stands about 3 in. tall, and often
voccurs in expansive clumps. Mastocarpus.0• papillatus consists of short, reddish-black,
relatively thick blades that are often covered withsmall papillae, giving the blades a coarse texture.The blades sometimes reach 6 in. long. This speciesis more commonly referred to by its scientific namerather than by its common name, grapestoneseaweed.
Mastocarpus papillatus remained high in abundance in Diablo Cove during theoperation of the power plant, indicating a lack of thermal plume effects on thisspecies.
Life History and Ecology
The life cycle of Mastocarpuspapillatus is similar to that of many other red algalspecies in that three stages are involved (gametophytes, carposporophytes, andtetrasporophytes). Male and female gametophytes appear similar, except that maleshave fewer papillae. Fertile males release sperm into the water. After they contactfertile eggs, a microscopic carposporophyte plant is produced and remains attachedto the female plant. Carpospores are eventually released into the water, and, aftersettling onto a rocky substrate, develop into tetrasporophyte plants. These areblackish crusts which do not appear at all similar to the gametophyte plants. Thecrusts are actually known and still referred to as another species, Petrocelismiddendorphii, formerly known as P. franciscana (Abbott and Hollenberg 1976,West 1972, Polanshek and West 1975, 1977). The tetrasporophyte crusts releasetetraspores into the water, which give rise to the gametophyte plants to complete thecycle.
Slocum (1980) studied the ecological advantages and disadvantages of the two lifeforms of this species (Mastocarpus papillatus and Petrocelis middendorphii). Henoted that the tetrasporophyte crusts are susceptible to becoming overgrown byother algae, and because of this they rely on grazers to remove the overgrowth. Onthe other hand, the upright blades are not susceptible to becoming overgrown byother algae, but are prone to grazing. From this, he deduced that the advantages ofone form may balance the disadvantages of the alternate form, thus assuring thisspecies' persistence under varying environmental conditions.
E8-316.0 3-76
Distribution and Abundance
In the first intertidal biological surveys of Diablo Cove in 1967, North (1969) notedMastocarpus papillatus (Gigartina papillata) as having been one of the mostabundant algal species in the cove's intertidal zone. Later studies (1969-1982) bythe California Department of Fish and Game found this to be true (Burge andSchultz 1973, Gotshall et al. 1984, 1986). Under the TEMP program, more frequentsampling over a greater area was conducted from 1976 to 1987. Coveragemeasurements of M. papillatus in the TEMP stations are presented in Figures D-23to D-26 in Appendix D. Stations representing the changes observed in Diablo Coveare presented in Figure 3.2.3.11-1. These data reveal that the percentage cover ofM. papillatus varied seasonally, with peak abundances coinciding with summer.This pattern was remarkably similar among sampling sites.
Time series analyses revealed that the abundance of Mastocarpuspapillatus inDiablo Cove declined slightly in some of the +3 ft stations, and increased slightly insome of the +1 ft stations after power plant start-up. Similar shifts occurred in thenon-Diablo Cove sampling locations. An analysis of variance test, which tested fordifferences between the Diablo Cove and non-Diablo Cove station/levels, revealedthat the changes in the Diablo Cove and non-Diablo Cove station levels were notsignificantly different from one anther, thus indicating that the shifts observed inDiablo Cove were not related to the operation of the power plant. Results of thesestatistical tests are presented in greater detail in Appendix E.
Large decreases occurred in south Diablo Cove from 1982-83 winter stormdisturbances (illustrated by the changes observed in Station 12+3 in Figure3.2.3.11-1). However, following the storms the abundance of Mastocarpus papillatusrecovered. Abundances were nct as dramatically affected by the storms in northDiablo Cove (Station 9+3). The 1983 El Nino event did not have an effect on theabundance of M. papillatus, although it did cause some temporary discoloration inthe plants. No abnormal changes were observed either in the cover of Mastocarpuspapillatus or in its natural seasonal pattern of change after power plant start-up in1984. A map depicting the distribution of M. papillatus in Diablo Cove is presentedin Figure 3.2.3.11-2
Thermal Impact Assessment
Based on the fact that the TEMP data did not depict any unusual changes in thecoverage of Mastocarpus papillatus in Diablo Cove after power plant start-up in1984, it is concluded that this species has not been thermally affected by the plume.Abbott and North (1971) found M. papillatus to be a species tolerant of warm water,because of its occurrence near other thermal discharges. There is very littleinformation in the literature on thermal tolerance test results for M. papillatus. Theonly test of this sort is from PG&E (1983); tests were conducted on M. papillatus todetermine if populations already living in elevated temperatures from the plumewould exhibit deleterious effects if briefly exposed to even higher temperatures, suchas those that may occur during demusseling operations of the power plant (heat
E8-316.0 3-77
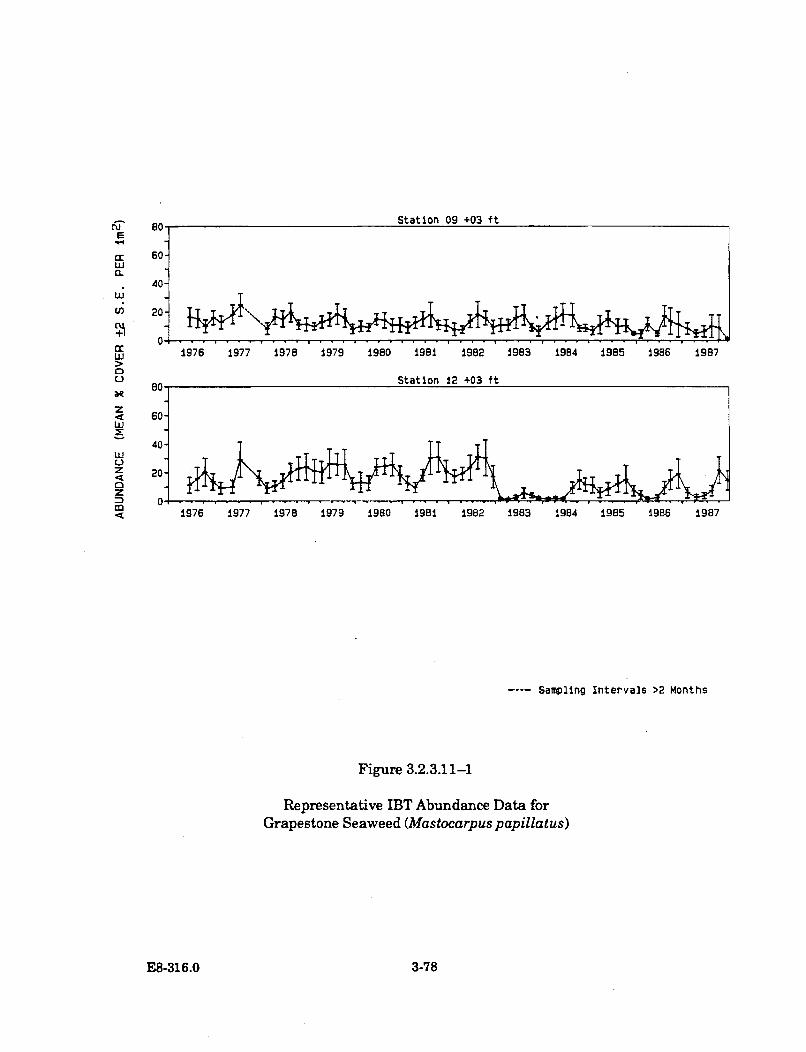
Station 09 +03 ftE
a.
U!
0
Uj
zzM
60-
20-
1976 1977 1978 1979 1980 1981 1982 1983
Station 12 +03 ft
1984 1985 1986 1987
1976 1977 1978 1979 1980 1981 1982 1983 1984 1985 1986 1987
---- Sampling Intervals >2 Months
Figure 3.2.3.11-1
Representative IBT Abundance Data forGrapestone Seaweed (Mastocarpus papillatus)
E8-316.0 3-78
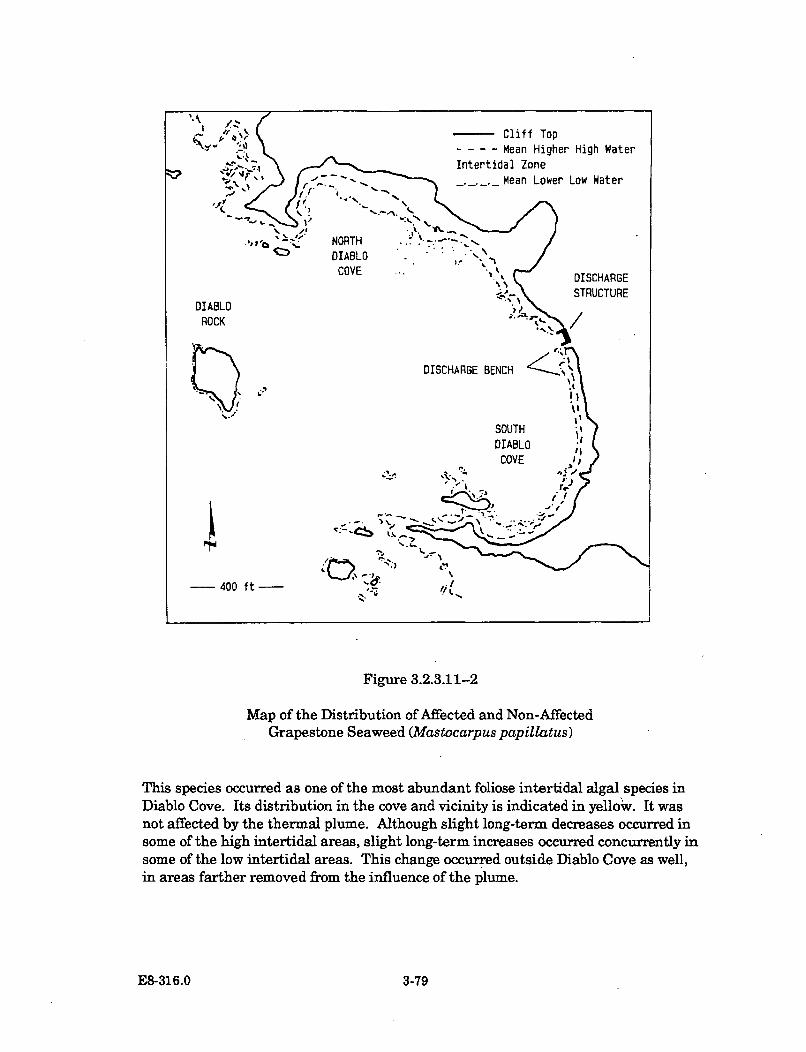
Figure 3.2.3.11-2
Map of the Distribution of Affected and Non-AffectedGrapestone Seaweed (Mastocarpus pap illatus)
This species occurred as one of the most abundant foliose intertidal algal species inDiablo Cove. Its distribution in the cove and vicinity is indicated in yellow. It wasnot affected by the thermal plume. Although slight long-term decreases occurred insome of the high intertidal areas, slight long-term increases occurred concurrently insome of the low intertidal areas. This change occurred outside Diablo Cove as well,in areas farther removed from the influence of the plume.
E8-316.0 3-79
treatment operations). In these experiments, only the M. papillatus plants thatwere exposed to 35.3 C exhibited extensive discoloration and deterioration. Theplants that were exposed to the next lower temperature of 31.9 C and lowertemperatures exhibited much less discoloration and deterioration. Some of thediscoloration observed in all test and control groups was attributed to the relativelylow laboratory light conditions. The high thermal tolerances found in M. papillatusby these one-hour acute temperature exposure tests partially clarify the lack oftemperature-related changes in this species in the field. Intuitively, this specieswould be thought of as being a highly temperature-tolerant alga, since it occurs inhigh intertidal zones where the inhabitants are prone to becoming heated by thesun.
Since the overall abundance of Mastocarpus papillatus remained relativelyunchanged from year to year during power plant operation, this species maycontinue to be a conspicuous alga in Diablo Cove in the future.
E8-316.0 3-80
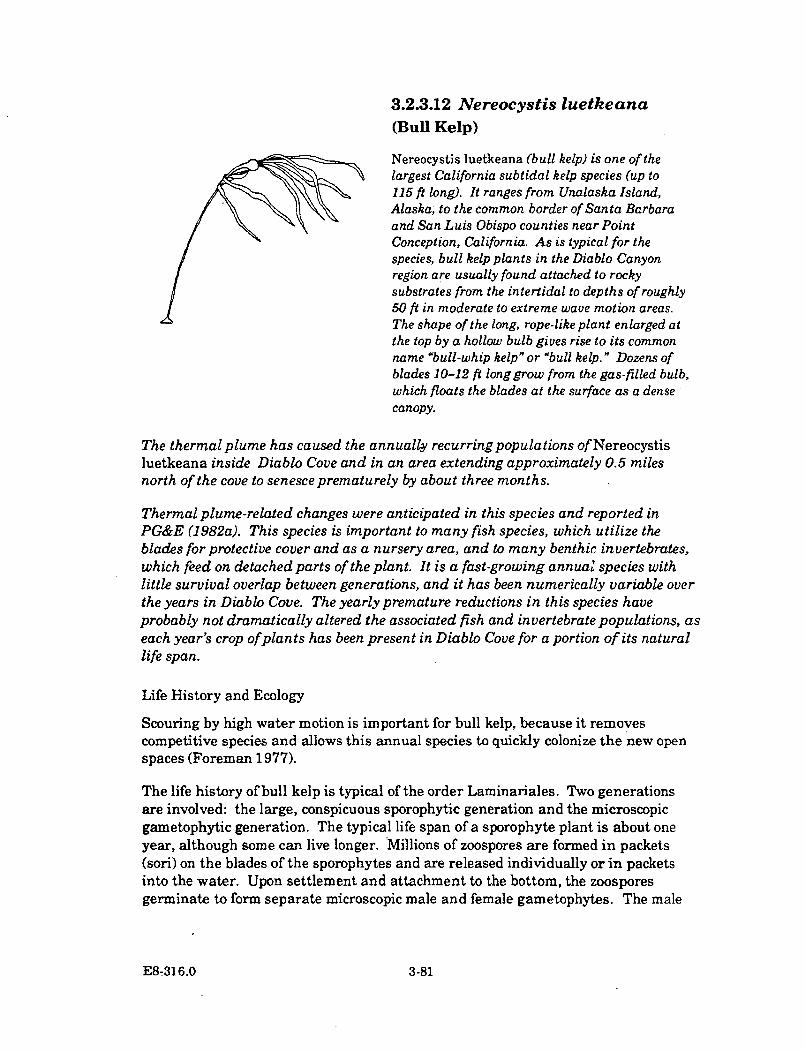
3.2.3.12 Nereocystis luetkeana(Bull Kelp)
Nereocystis luetkeana (bull kelp) is one of thelargest California subtidal kelp species (up to115 ft long). It ranges from Unalaska Island,Alaska, to the common border of Santa Barbaraand San Luis Obispo counties near PointConception, California. As is typical for thespecies, bull kelp plants in the Diablo Canyonregion are usually found attached to rocky
substrates from the intertidal to depths of roughly50 ft in moderate to extreme wave motion areas.The shape of the long, rope-like plant enlarged atthe top by a hollow bulb gives rise to its commonname "bull-whip kelp" or "bull kelp." Dozens ofblades 10-12 ft long grow from the gas-filled bulb,which floats the blades at the surface as a densecanopy.
The thermal plume has caused the annuall recurring populations of Nereocystisluetkeana inside Diablo Cove and in an area extending approximately 0.5 milesnorth of the cove to senesce prematurely by about three months.
Thermal plume-related changes were anticipated in this species and reported inPG&E (1982a). This species is important to many fish species, which utilize theblades for protective cover and as a nursery area, and to many benthic invertebrates,which feed on detached parts of the plant. It is a fast-growing annual species withlittle survival overlap between generations, and it has been numerically variable overthe years in Diablo Cove. The yearly premature reductions in this species haveprobably not dramatically altered the associated fish and invertebrate populations, aseach year's crop of plants has been present in Diablo Cove for a portion of its naturallife span.
Life History and Ecology
Scouring by high water motion is important for bull kelp, because it removescompetitive species and allows this annual species to quickly colonize the new openspaces (Foreman 1977).
The life history of bull kelp is typical of the order Laminariales. Two generationsare involved: the large, conspicuous sporophytic generation and the microscopicgametophytic generation. The typical life span of a sporophyte plant is about oneyear, although some can live longer. Millions of zoospores are formed in packets(sori) on the blades of the sporophytes and are released individually or in packetsinto the water. Upon settlement and attachment to the bottom, the zoosporesgerminate to form separate microscopic male and female gametophytes. The male
E8-:316.0 3-81
plants at maturity produce planktonic sperm that are released into the water. Thesperm swim to and fertilize mature eggs on the female gametophytes. A sporophytegrows directly from a fertilized egg, completing the life cycle.
Throughout its range, juvenile bull kelp sporophytes generally appear from thespring through the summer. Sporophyte plants grow quickly, and a maximum dailygrowth rate of 10 in./d has been recorded by Foreman (1970) at his British Columbiastudy sites. Sorus development usually begins after plants have reached the surface(Nicholson 1970), in the spring to fall months. The majority of the sporophyticpopulation is lost during fall and winter, when whole plants become uprooted bystorms. These drift plants accumulate on the sea floor and on beaches.
The bull kelp material that is transported various distances by currents providesfood for many other benthic animals. Red abalone (Haliotis rufescens) commonlyfeed on bull kelp. Laboratory studies have shown that bull kelp was one of thepreferred food items of the black turban snail, Tegula funebralis (Best 1964). Thissnail occurs primarily in intertidal habitats, and bull kelp becomes a food source forthis species when plants drift into the intertidal. Drift bull kelp also provides somefood for deep water, offshore animal communities that occur in areas where algalgrowth is sparse.
Many animals benefit from intact bull kelp , and many previously reportedrelationships appear to be true for Diablo Canyon populations. The bull kelp canopyprovides habitat primarily for various rockfish species, such as blue rockfish(Sebastes mystinus) and olive rockfish (S. serranoides), as noted by Burge andSchultz (1973). They also noted that surface fronds provide a substrate for varioushydroids and the bryozoans. Markham (1969) recorded 23 algal epiphyte speciesrepresenting 14 genera growing on bull kelp. The holdfast of bull kelp providesnumerous microhabitats for invertebrates (McLean 1962). The snails Calliostomaligatum, C. annulatum, and Tegula montereyi graze on the stipes (Burge andSchultz 1973).
Distribution and Abundance
Ebert (1966), North (1969), and Burge and Schultz (1973) noted that abundances ofbull kelp prior to 1973 were suppressed in Diablo Cove due to heavy grazing by redsea urchins (Strongylocentrotus franciscanus). At that time, much of the center ofthe cove was dominated by red sea urchins, and the distribution of kelp species wasrestricted to "urchin-free areas" around Diablo Cove's perimeter. During the mid-1970's sea otters (Enhydra lutris) arrived in Diablo Cove, and predation of red seaurchins by sea otters resulted in quick expansions of bull kelp and other kelp speciesto the center of Diablo Cove.
An annual census of the bull kelp population in Diablo Cove was conducted eachOctober (from 1970 to 1987 at two permanent cliff top stations), when most of eachyear's crop had reached the surface and before winter storms had removed most ofthe plants. Two teams of two observers positioned on opposite sides of the cove
E8-316.0 3-82
counted and mapped the distributions of bull kelp plants. The census total was theaverage of the individual counts. After the peak years of abundance in 1974/75, bullkelp gradually declined (Figure 3.2.3.12-1), presumably as a result of the increasesin and greater persistence of the perennial kelp species oar kelp (Laminariadentigera) and tree kelp (Pterygophora californica). Although bull kelp becamelargely displaced from the center of Diablo Cove, scattered but dense bull kelp bedsstill recurred each year along the perimeter of Diablo Cove in areas of high watermotion where tree kelp and oar kelp were less dense. Bull kelp continued torepopulate the same high water motion areas from about 1980 to 1982 (roughly1,000 plants each October).
The severe 1982-83 winter storms disturbed much more of the bottom in DiabloCove than had previous storms. This permitted bull kelp, later in the spring of 1983,to increase in abundance over recent years (about 10,000 plants in Diablo Cove).The increases were largely expansions of historical patch borders rather thanoutcroppings of plants in new areas of Diablo Cove. The 1983 population, however,was severely affected by the El Nino oceanographic event. Unusually warm water,which typically is nutrient-depleted (Jackson 1977), caused all bull kelp plants alongthe Diablo Canyon coast and in Diablo Cove to senesce (loss of turgor, color, andblades) prematurely in July. Normal senescence in this species usually occurs inlate fall. Some plants did reach fertility and presumably released some sporesbefore becoming affected by the El Nino, as sporophyte populations reappeared thefollowing year (1984), the year of power plant start-up. The October 1984 cliff-topsurvey counted 841 plants in Diablo Cove, with all plants appearing healthy. Thistotal is considerably less than the roughly 10,000 plants in Diablo Cove during theprevious El Nino year. The decrease was not due to the operation of the powerplant, but was likely due to the limited amount of reproductive material produced bythe El Nino year population. The recurrence of a new sporophyte population afterthe El Nino provides field evidence that the intermediate microscopic stages of thisspecies' life cycle may be more tolerant of warm water than are the sporophytes.
Although there were no unusual changes in the health of plants during power plantstart-up in 1984, during each of the subsequent three years of commercial powerplant operation (1985-1987), each year's crop of bull kelp plants growing insideDiablo Cove and those outside Diablo Cove toward the head of Field's Cove senescedearly (lost blades) by about two to four months. Since these occurrences coincidedwith power plant operation, this strongly suggests that the unusual changes werecaused by the thermal plume. The same interruption of growth occurred during the1983 El Nino event, which also exposed the plants to warm water. Althoughthousands of plants repopulated the cove during the early parts of each power plantoperation year, their early senescence (as early as July) resulted in early deaths, lossof plants, and correspondingly low population counts by the October cliff-top census.Only 24 plants were counted during the October 1987 cliff-top census. This is thelowest total ever recorded by this method.
E8-316.0 3-83
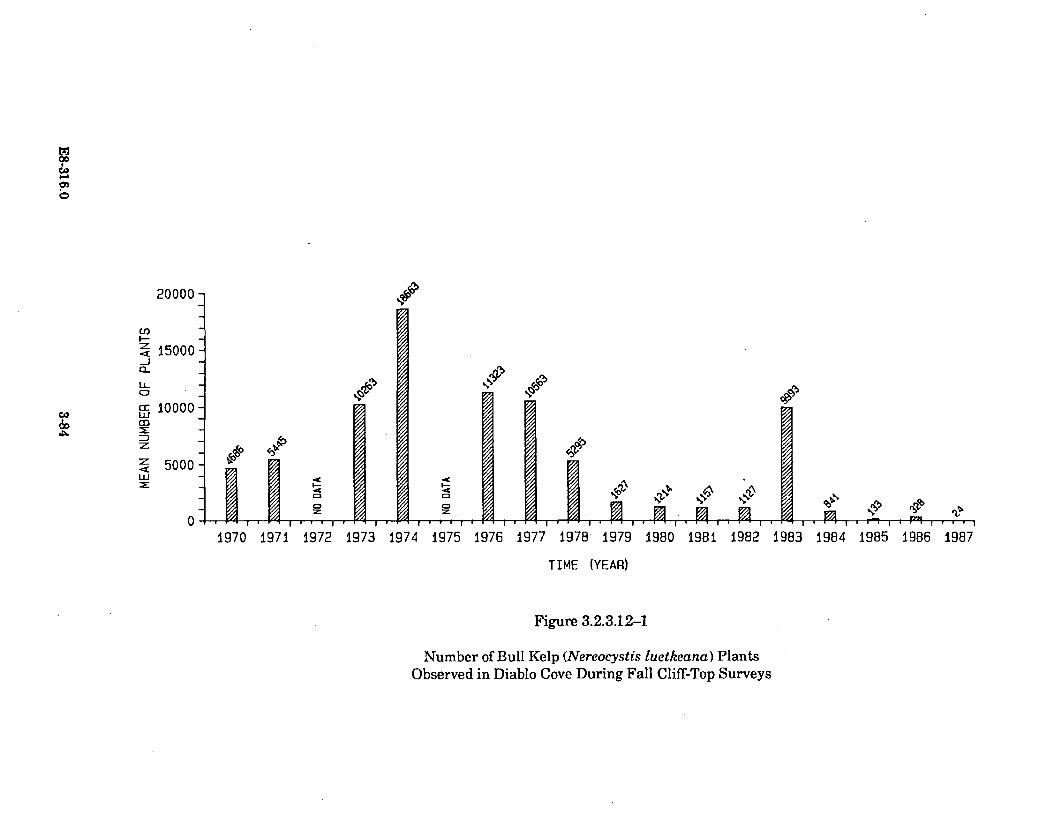
912
000,,
200002,
< 15000-
I000LL -
1 50000
W
., 5000-
0-CD
I--
0D
AIv~
1970 0971 1972 1973 1974 1975 1976 1977 1978 1979 1980 1981 1982 1983 1984 1985 1986 1987
TIME (YEAR)
Figure 3.2.3.12-1
Number of Bull Kelp (Nereocystis luetkeana) PlantsObserved in Diablo Cove During Fall Cliff-Top Surveys
Counts of bull kelp plants were obtained in the TEMP subtidal stations from 1976 to1987 (Figure D-27 in Appendix D). Representative station data are presented inFigure 3.2.3.12-2. Most of the stations were not located in areas where bull kelptypically grows (high water motion areas), and only a few plants generally recurredannually in the stations. However, the absence of plants in Station 9-10 after about1985 (Figure 3.2.3.12-2) indicated that this species was unable to recruit into theshallow areas of Diablo Cove (less than about 10-15 ft depth) during power plantoperation. Outside Diablo Cove, this species continued to repopulate the stations(representative Station 20-20 in Figure 3.2.3.12-2). During power plant operation,increases did occur in the deeper portions (about 30-50 ft) of Diablo Cove, asrepresented by the changes observed at Station 13-32 in Figure 3.2.3.12-2. Theseplants, however, also senesced prematurely when they encountered the thermalplume at the surface.
Thermal Impact Assessment
Prior to the commercial operation of the Diablo Canyon power plant, Ebert (1966),North (1969), and PG&E (1982a) predicted that this alga would be an excellentbiological indicator of the thermal plume, since it is a cold-water species which mightbe expected to exhibit deterioration in the heated effluent. Because bull kelp cangrow from depths of about 55 ft, and because the greater part of the plant thallusoccurs near the surface when mature, it was anticipated that the thermal plumewould contact this species over a greater area than it would low-growing species,since only the shallow-water portions of low-growing species would come in contactwith the thermal plume.
Although early senescence was observed each year of power plant operation, theactual timing and occurrences of the changes varied according to distance from thedischarge. The first plants affected were those inshore of Diablo Rock. Plants inthis area grew upwards in a normal fashion (when small and well beneath theplume), but degenerated when they came into contact with the upper 10-15 feet ofthe surface where the plume occurred. Farther away from the discharge, plantswere not affected until they had been on the'sea surface for several weeks. Sincebull kelp naturally grows to the sea surface, nearly all plants in Diablo Cove and innearby areas have deteriorated. Many plants, however, became fertile beforedegenerating in the plume.
It appears from laboratory thermal effects studies that bull kelp sporophytes do notgrow well at temperatures above 16 C (PG&E 1982b). In one experiment, sets ofbull kelp plants were gradually exposed to, then held at, seven different testtemperatures for 44 days. Many of the plants held at temperatures over 15.9 C died(Figures 3.2.3.12-3 and 3.2.3.12-4). Decreasing growth rates leading to death wereevident on the fourth to eighth observation days in temperature treatment groupsabove 15.9 C. Temperature effects can be altered by light conditions, and if therehad been more light available to the plants than was used in the experiments (85 to165 microEinsteins/m2/sec), survivorship and growth might have been better.
E8-316.0 3-85
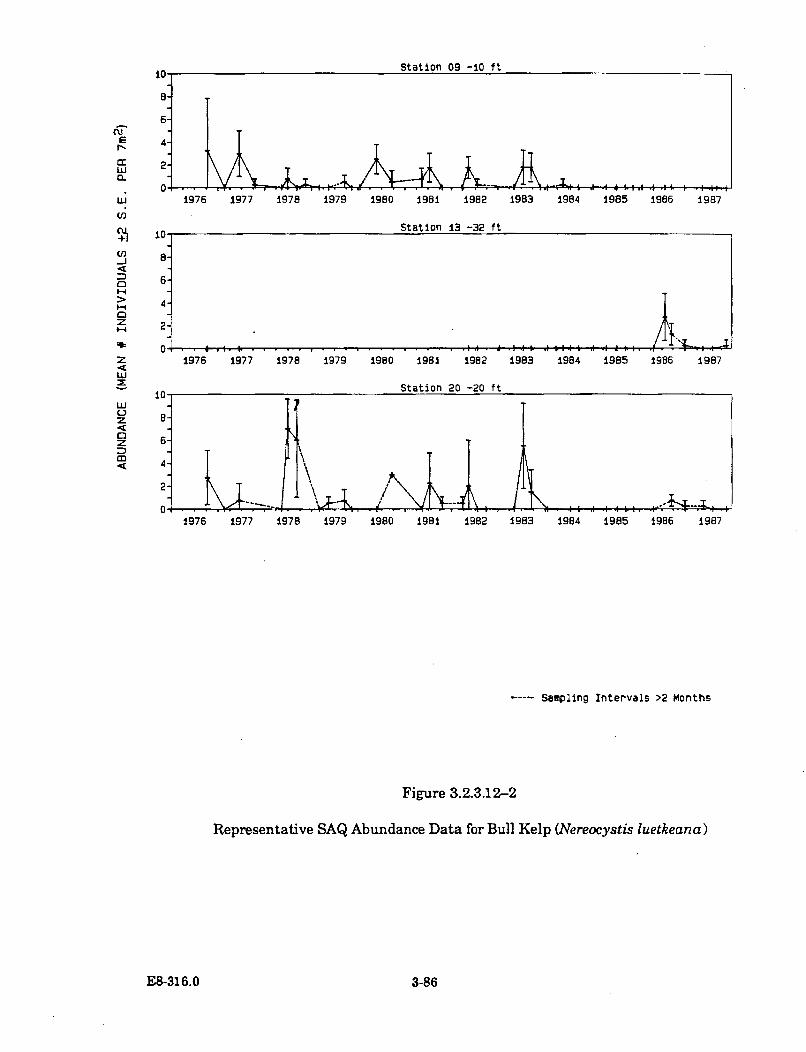
(;U,
-LJ
4h
z
zDw
1976 1977 1978 1979 1980 1981 1982 1983 1984 1985 1986 1987
Station 13 -32 ftA•i*
6]
4ý
2I I . I I . . - . I1 I..I 4 0.4 h
1976 1977 1978 1979 1980 1981 1982 1983 1984 1985 1986 1987
1976 1977 1978 1979 1980 1981 1982 1983 1984 1985 1986 1987
Sampling Intervals >2 Months
Figure 3.2.3.12-2
Representative SAQ Abundance Data for Bull Kelp (Nereocystis luetkeana)
3-86E8-316.0
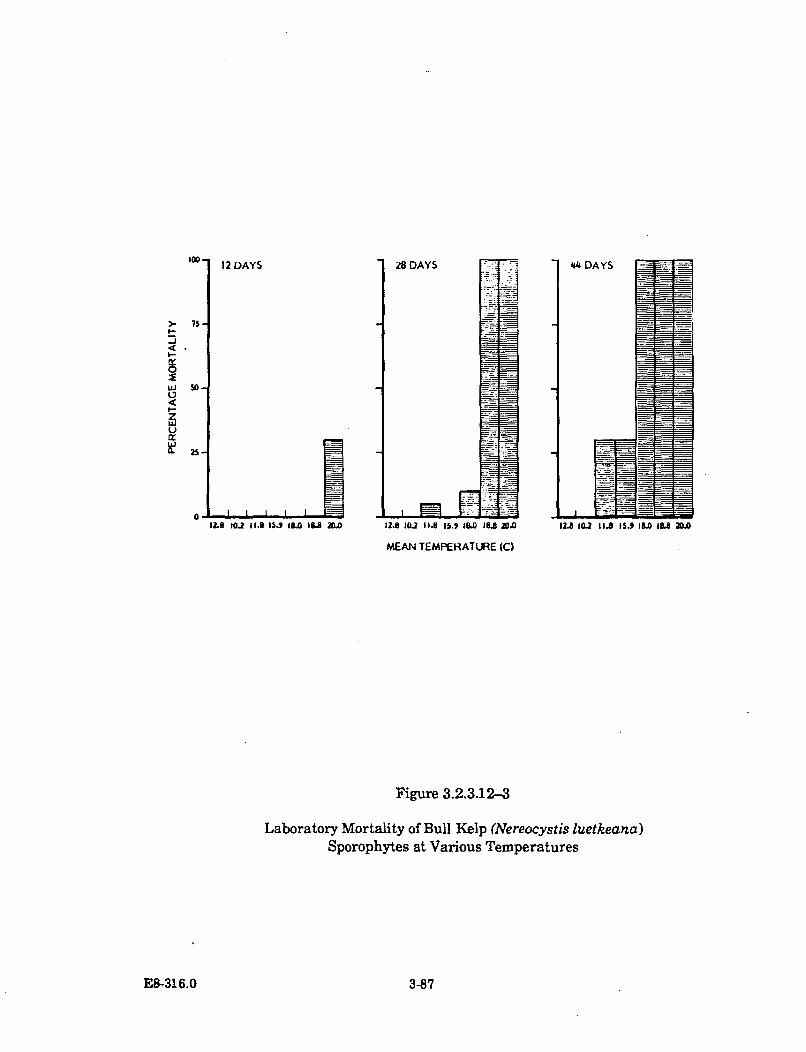
12 DAYS
I-
I--
Ux-
ie
7S-
2S-
0*.L.=l ==I L ••A L1.
12.8 102 11.0 15.9 1 88l 2a. 12.0 102 11.8 15.9 2". 0 lo •O 12.8 10.2 Ili 15.9
MEAN TEMPERATURE (C)
Figure 3.2.3.12-3
Laboratory Mortality of Bull Kelp (Nereocystis luetkeana)Sporophytes at Various Temperatures
.0 18. 2U.
E8-316.0 3-87
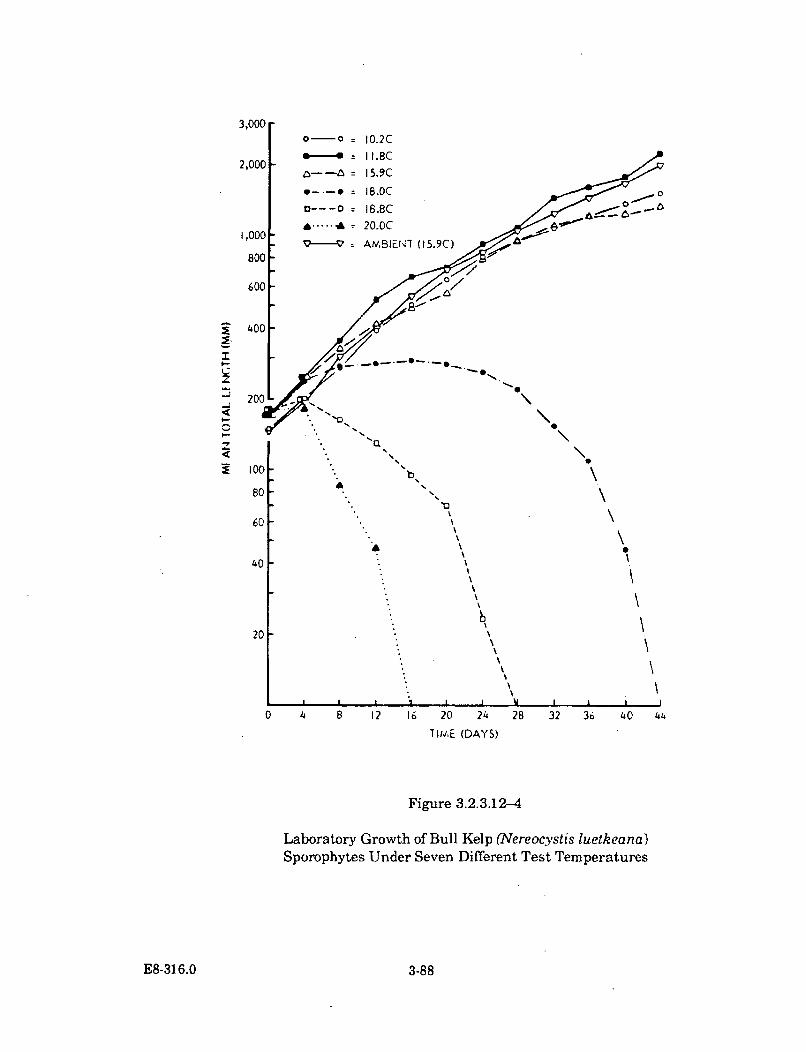
3,0000-0
2,000
A --- A
*b .... S
10.2C11I.8C15.9C
1 8.0c
16.8c20.OC
800
600
=AMBIENT (15.9C)
iI
z
-J4I-.
4
400
~0-- S
-S.
100
80A I
60
40 F
£ S
I I
20 F
0 4 8 12 16 20 24 28
lit¢E (DAYS)
32 36 40 44
Figure 3.2.3.12-4
Laboratory Growth of Bull Kelp (Nereoc~ystis luetkeana)Sporophytes Under Seven Different Test Temperatures
E8-316.0 3-88
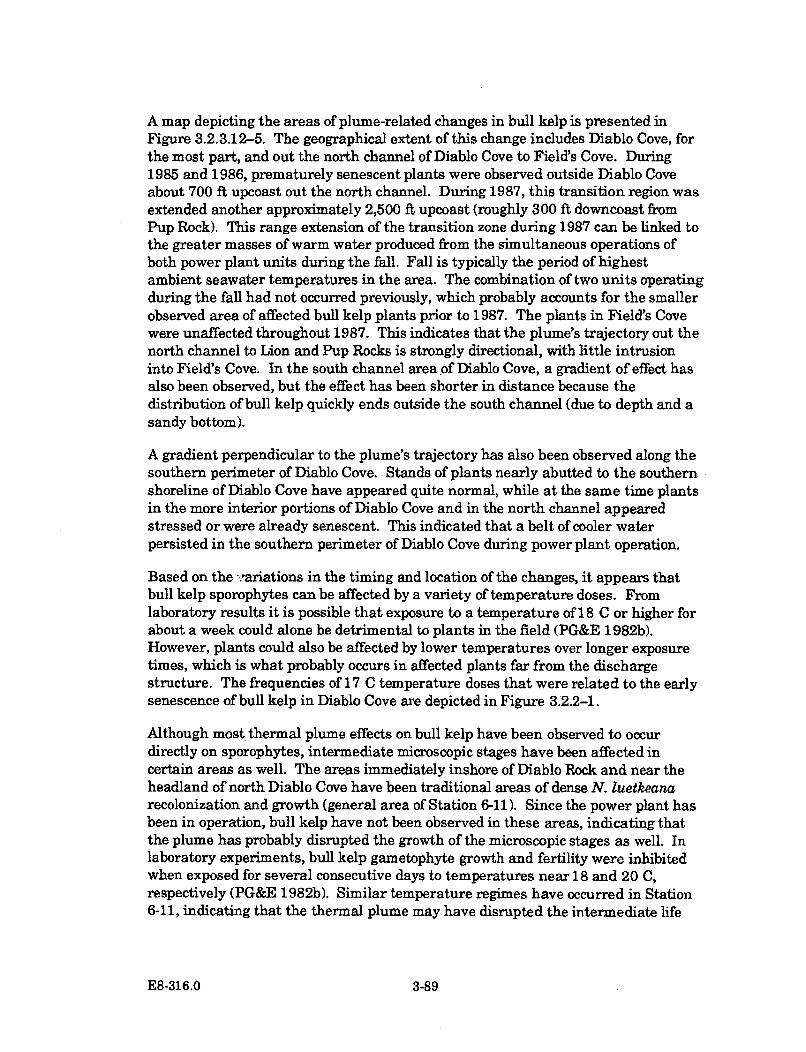
A map depicting the areas of plume-related changes in bull kelp is presented inFigure 3.2.3.12-5. The geographical extent of this change includes Diablo Cove, forthe most part, and out the north channel of Diablo Cove to Field's Cove. During1985 and 1986, prematurely senescent plants were observed outside Diablo Coveabout 700 ft upcoast out the north channel. During 1987, this transition region wasextended another approximately 2,500 ft upcoast (roughly 300 ft downcoast fromPup Rock). This range extension of the transition zone during 1987 can be linked tothe greater masses of warm water produced from the simultaneous operations ofboth power plant units during the fall. Fall is typically the period of highestambient seawater temperatures in the area. The combination of two units operatingduring the fall had not occurred previously, which probably accounts for the smallerobserved area of affected bull kelp plants prior to 1987. The plants in Field's Covewere unaffected throughout 1987. This indicates that the plume's trajectory out thenorth channel to Lion and Pup Rocks is strongly directional, with little intrusioninto Field's Cove. In the south channel area of Diablo Cove, a gradient of effect hasalso been observed, but the effect has been shorter in distance because thedistribution of bull kelp quickly ends outside the south channel (due to depth and asandy bottom).
A gradient perpendicular to the plume's trajectory has also been observed along thesouthern perimeter of Diablo Cove. Stands of plants nearly abutted to the southernshoreline of Diablo Cove have appeared quite normal, while at the same time plantsin the more interior portions of Diablo Cove and in the north channel appearedstressed or were already senescent. This indicated that a belt of cooler waterpersisted in the southern perimeter of Diablo Cove during power plant operation.
Based on the -!ariations in the timing and location of the changes, it appears thatbull kelp sporophytes can be affected by a variety of temperature doses. Fromlaboratory results it is possible that exposure to a temperature of 18 C or higher forabout a week could alone be detrimental to plants in the field (PG&E 1982b).However, plants could also be affected by lower temperatures over longer exposuretimes, which is what probably occurs in affected plants far from the dischargestructure. The frequencies of 17 C temperature doses that were related to the earlysenescence of bull kelp in Diablo Cove are depicted in Figure 3.2.2-1.
Although most thermal plume effects on bull kelp have been observed to occurdirectly on sporophytes, intermediate microscopic stages have been affected incertain areas as well. The areas immediately inshore of Diablo Rock and near theheadland of north Diablo Cove have been traditional areas of dense N. luetkeanarecolonization and growth (general area of Station 6-11). Since the power plant hasbeen in operation, bull kelp have not been observed in these areas, indicating thatthe plume has probably disrupted the growth of the microscopic stages as well. Inlaboratory experiments, bull kelp gametophyte growth and fertility were inhibitedwhen exposed for several consecutive days to temperatures near 18 and 20 C,respectively (PG&E 1982b). Similar temperature regimes have occurred in Station6-11, indicating that the thermal plume may have disrupted the intermediate life
E8-316.0 3-89
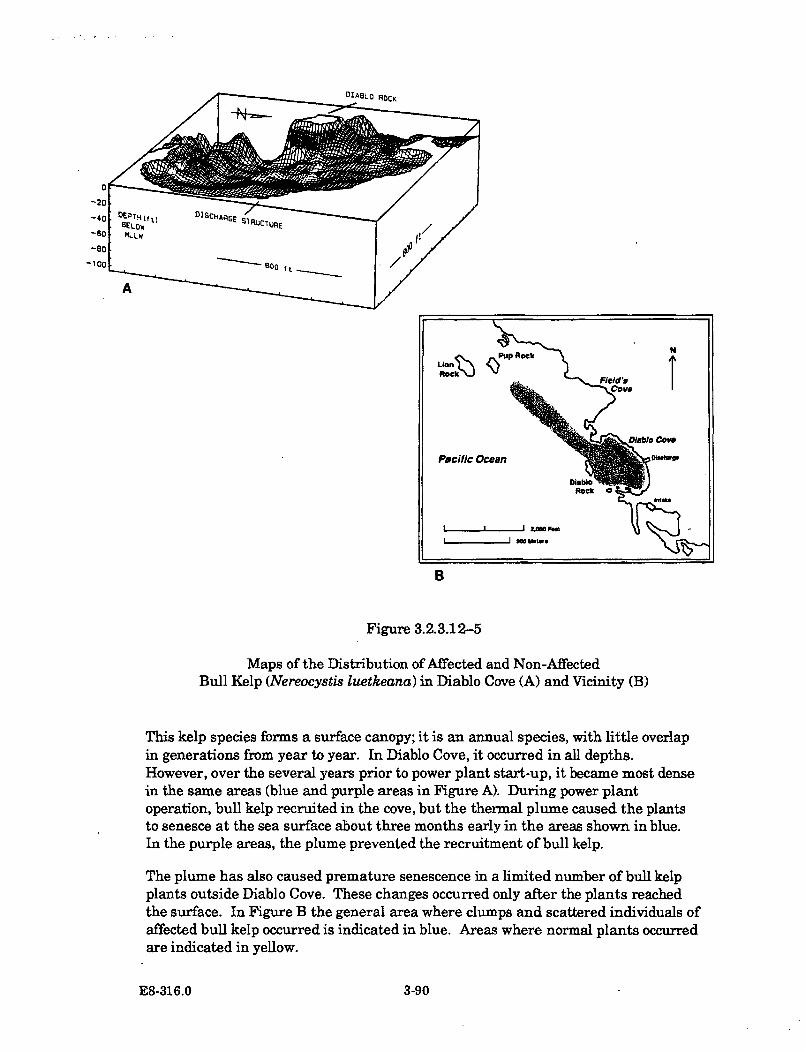
-1c
B
Figure 3.2.3.12-5
Maps of the Distribution of Affected and Non-AffectedBull Kelp (Nereocystis luetkeana) in Diablo Cove (A) and Vicinity (B)
This kelp species forms a surface canopy; it is an annual species, with little overlapin generations from year to year. In Diablo Cove, it occurred in all depths.However, over the several years prior to power plant start-up, it became most densein the same areas (blue and purple areas in Figure A). During power plantoperation, bull kelp recruited in the cove, but the thermal plume caused the plantsto senesce at the sea surface about three months early in the areas shown in blue.In the purple areas, the plume prevented the recruitment of bull kelp.
The plume has also caused premature senescence in a limited number of bull kelpplants outside Diablo Cove. These changes occurred only after the plants reachedthe surface. In Figure B the general area where clumps and scattered individuals ofaffected bull kelp occurred is indicated in blue. Areas where normal plants occurredare indicated in yellow.
E8-316.0 3-90
phases necessary for sporophyte recruitment in this general area. Recruitment wasalso absent during power plant operation in some of the shallow (10 and 15 ft)stations in Diablo Cove, which suggests that the plume may have interrupted themicroscopic stages of growth at these stations also.
The overall effects on bull kelp were probably due to temperature elevations during"normal" one- and two-unit operations. By integrating laboratory heat toleranceresults for bull kelp and model results of thermal plume temperature distributionsunder various heat treatment conditions, PG&E (1985) predicted that the bull kelpplants growing in areas contacted by heat treatment temperatures would havealready been affected by normal power plant operation temperatures.
The premature losses of bull kelp in Diablo Cove have probably affected associatedorganisms only to a moderate extent. Since bull kelp plants have been able torepopulate Diablo Cove for at least some portion of their life cycles, the ecologicaluses of this species in the cove have never been completely lost. However, someareas of Diablo Cove (inshore of Diablo Rock and the north Diablo Cove headland),which typically became repopulated with dense bull kelp beds each year, have beenlargely devoid of bull kelp throughout the years of power plant operation.
It is anticipated that bull kelp will continue to repopulate Diablo Cove each year, butplants are expected to senesce prematurely in the same manner as has beenobserved during the first three full years of power plant operation.
E8-316.0 3-91
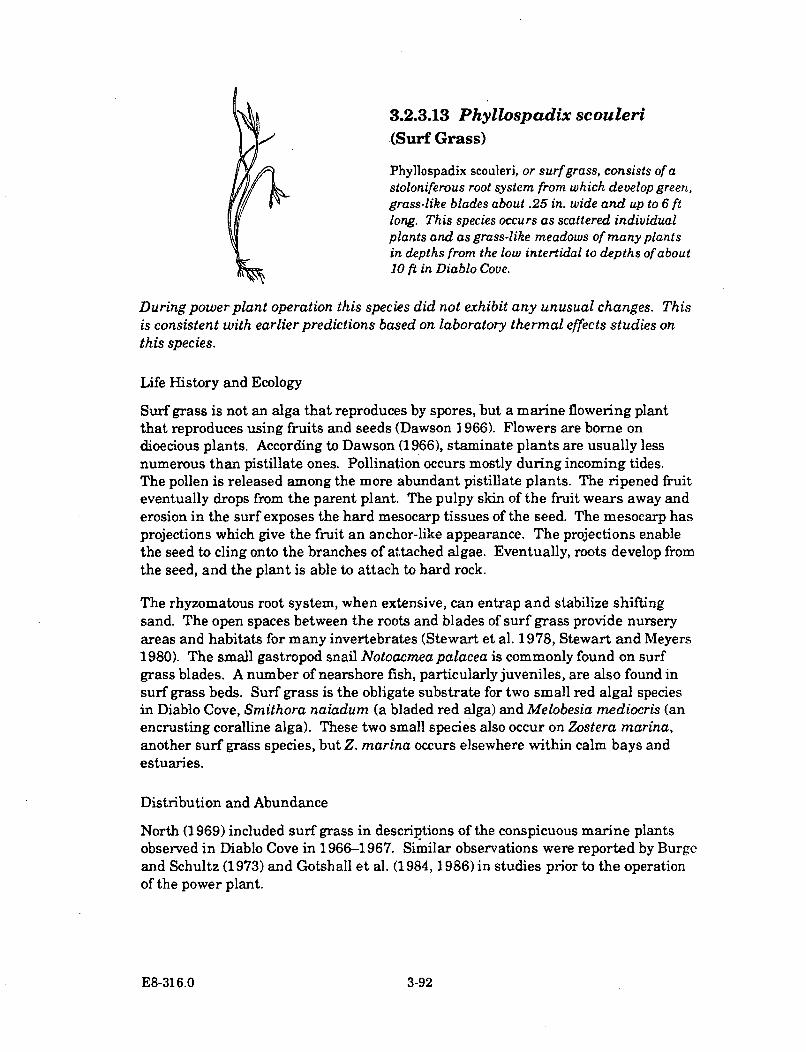
3.2.3.13 Phyllospadix scouleri(Surf Grass)
Phyllospadix scouleri, or surf grass, consists of astoloniferous root system from which develop green,grass-like blades about .25 in. wide and up to 6 ftlong. This species occurs as scattered individualplants and as grass-like meadows of many plantsin depths from the low intertidal to depths of about10 ft in Diablo Cove.
During power plant operation this species did not exhibit any unusual changes. Thisis consistent with earlier predictions based on laboratory thermal effects studies onthis species.
Life History and Ecology
Surf grass is not an alga that reproduces by spores, but a marine flowering plantthat reproduces using fruits and seeds (Dawson 1966). Flowers are borne ondioecious plants. According to Dawson (1966), staminate plants are usually lessnumerous than pistillate ones. Pollination occurs mostly during incoming tides.The pollen is released among the more abundant pistillate plants. The ripened fruiteventually drops from the parent plant. The pulpy skin of the fruit wears away anderosion in the surf exposes the hard mesocarp tissues of the seed. The mesocarp hasprojections which give the fruit an anchor-like appearance. The projections enablethe seed to cling onto the branches of attached algae. Eventually, roots develop fromthe seed, and the plant is able to attach to hard rock.
The rhyzomatous root system, when extensive, can entrap and stabilize shiftingsand. The open spaces between the roots and blades of surf grass provide nurseryareas and habitats for many invertebrates (Stewart et al. 1978, Stewart and Meyers1980). The small gastropod snail Notoacmea palacea is commonly found on surfgrass blades. A number of nearshore fish, particularly juveniles, are also found insurf grass beds. Surf grass is the obligate substrate for two small red algal speciesin Diablo Cove, Smithora naiadum (a bladed red alga) and Melobesia mediocris (anencrusting coralline alga). These two small species also occur on Zostera marina,another surf grass species, but Z. marina occurs elsewhere within calm bays andestuaries.
Distribution and Abundance
North (1969) included surf grass in descriptions of the conspicuous marine plantsobserved in Diablo Cove in 1966-1967. Similar observations were reported by Burgeand Schultz (1973) and Gotshall et al. (1984, 1986) in studies prior to the operationof the power plant.
E8-316.0 3-92
In the TEMP studies, the abundances of Phyllospadix scouleri have been added tothose of the much less abundant, but similar-looking, surf grass P. torreyi. The twoare treated in this study as P. scouleri (surf grass). The largest changes in surf grassin Diablo Cove occurred during the severe 1982-83 winter storms, when portions ofa large emergent rocky pinnacle broke in the south portion of the cove. Theresultant fragmented rock and shifting of sand buried and scoured surf grass innearly all intertidal and shallow subtidal areas in south Diablo Cove (represented byStations 11+1 and 12-10 in Figure 3.2.3.13-1), but only in the subtidal in northDiablo Cove (represented by Station 8-10 in Figure 3.2.3.13-1). Further stationgraphs appear in Figures D-28 and D-29 in Appendix D. This species remainedrelatively abundant in the intertidal in north Diablo Cove during power plantoperation (Station 9+1 in Figure 3.2.3.13-1), but analysis of variance testing on thisspecies' abundance (see Appendix E) detected an overall decrease in intertidalStation 9+1 during this period. However, some quadrats remained high in surfgrass abundance in this station. Intertidal Station 8+1, adjacent to Station 9+1, didnot exhibit any significant decreases in this species' abundance (Figure D-28 inAppendix D.)
The 1983 El Nino event did not have an important effect on surf grass.
Thermal Impact Assessment
The addition of thermal effluent in Diablo Cove did not have any notable effect onsurf grass. Its abundance and distribution during power plant operation wererelatively unchanged from conditions after the 1982-83 storms. A map depictingthis species' distribution in Diablo Cove after the storms and during power plantoperation is presented in Figure 3.2.3.13-2.
A heat tolerance test was conducted on surf grass to determine if this species couldsurvive temperature exposures of 24 C (PG&E 1982b). In summary, field-collectedplants were placed into two flow-through tanks, one with ambient temperatureseawater (11.7 C) and the other with 24.3 C water. Continuous light intensity of120-160 microEinsteins/m 2/sec was supplied to the plants. The experiment lastedfor nine days. At the end of this period, the plants constantly exposed to 24.3 Cwater did not exhibit any deleterious changes. In addition, because of someequipment malfunctions during the experiment, it was discovered that the testplants withstood a 3-hour exposure to 34 C water.
It is anticipated that surf grass will remain a conspicuous marine plant in DiabloCove over the long term.
E8-316.0 3-93
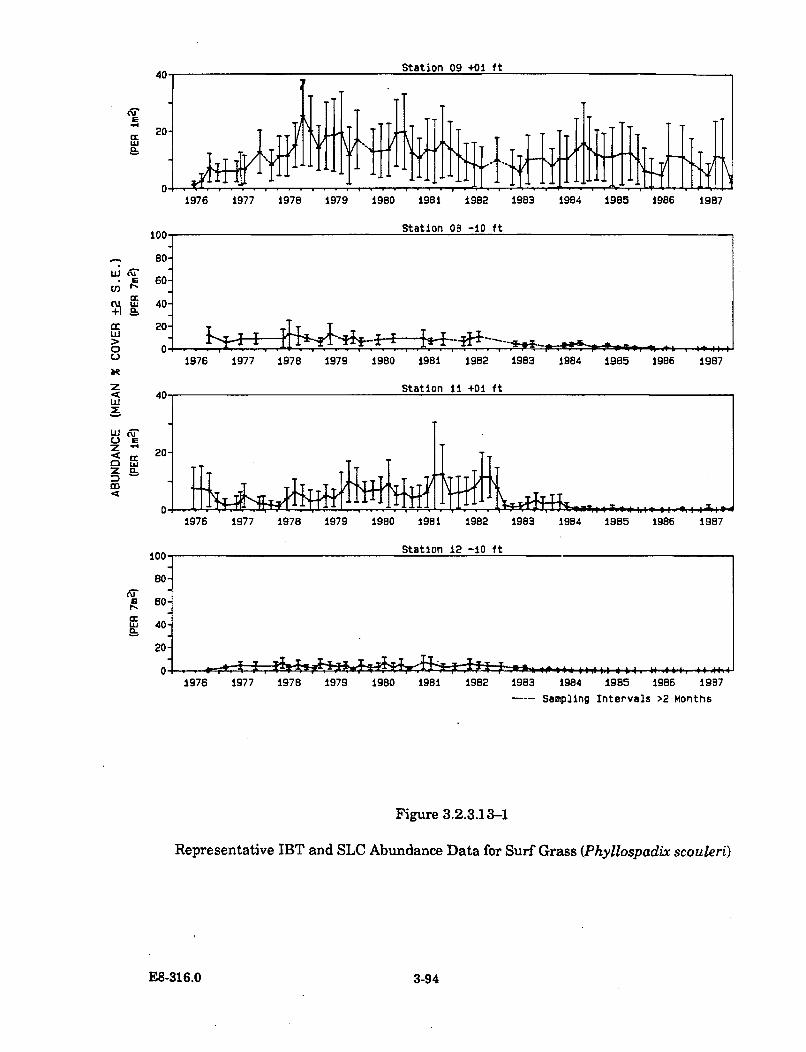
cc 20-
1976 1977 1978 1979 1950 1951 1982 1983 1984 1985 1986 1987
100 Station 05 -10 ft
- 80
. F 60
O 0 114
1976 1977 '1978 1979 1980 1981 1952 1983 1984 1985 96 97z
40 Station 11 +01 ftLU
>
z-.02
z o-
U1976 1977 1978 1979 1980 1981 1982 1983 1984 1985 1986 1987
O Station 12 -01 ft
E 60-
Cc 40-< 20-
1976 1977 1978 1979 1980 1981 1982 1983 1984 1985 1986 1987
.Samplng Snteataos >2 -onths
Figure 3.2.3.13--1
Representative IBT and SLC Abundance Data for Surf Grass (Phyllospadix scouleri)
E8-316.0 3-94
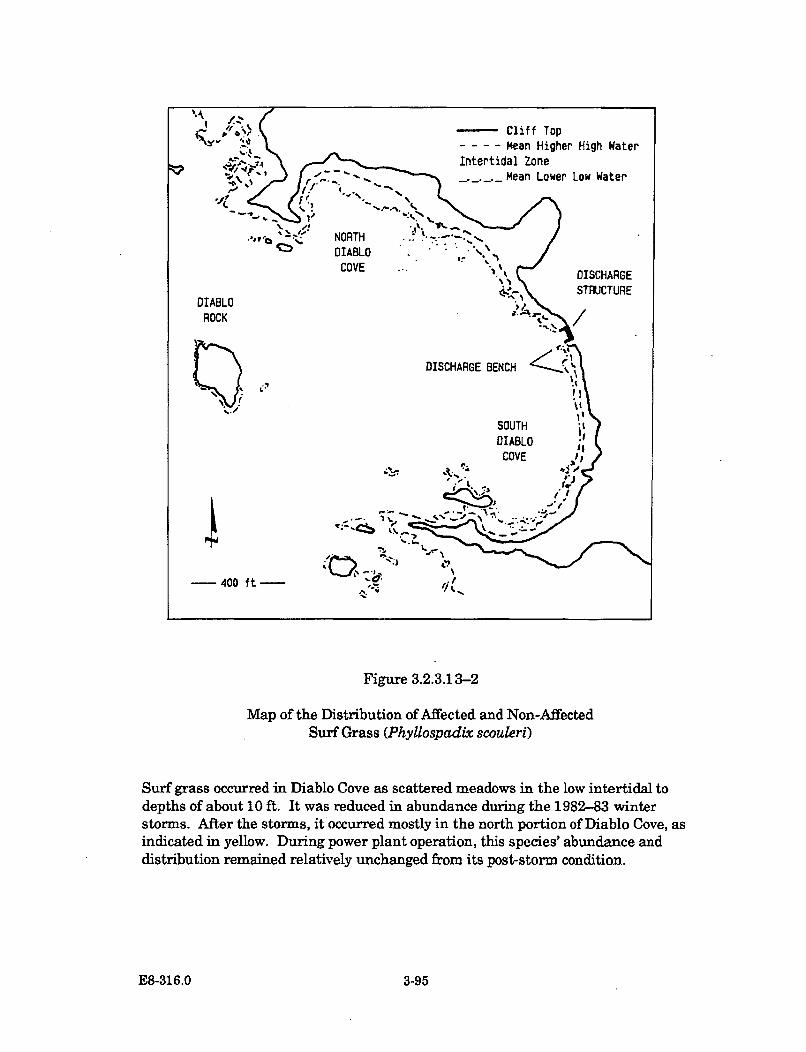
Figure 3.2.3.13-2
Map of the Distribution of Affected and Non-AffectedSurf Grass (Phyllospadix scouleri)
Surf grass occurred in Diablo Cove as scattered meadows in the low intertidal todepths of about 10 ft. It was reduced in abundance during the 1982-83 winterstorms. After the storms, it occurred mostly in the north portion of Diablo Cove, asindicated in yellow. During power plant operation, this species' abundance anddistribution remained relatively unchanged from its post-storm condition.
E8-316.0 3-95
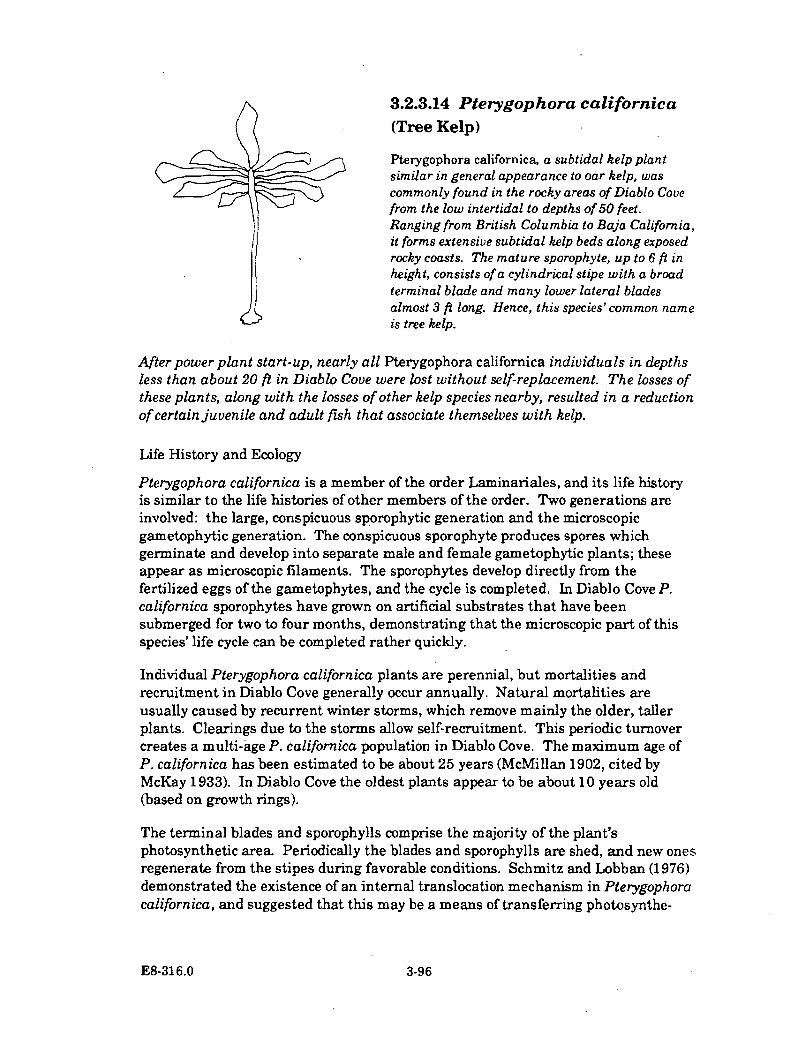
3.2.3.14 Pterygophora californica
(Tree Kelp)
Pterygophora californica, a subtidal kelp plantsimilar in general appearance to oar kelp, wascommonly found in the rocky areas of Diablo Covefrom the low intertidal to depths of 50 feet.Ranging from British Columbia to Baja California,it forms extensive subtidal kelp beds along exposedrocky coasts. The mature sporophyte, up to 6 ft inheight, consists of a cylindrical stipe with a broadterminal blade and many lower lateral bladesalmost 3 ft long. Hence, this species' common nameis tree kelp.
After power plant start-up, nearly all Pterygophora californica individuals in depthsless than about 20 ft in Diablo Cove were lost without self-replacement. The losses ofthese plants, along with the losses of other kelp species nearby, resulted in a reductionof certain juvenile and adult fish that associate themselves with kelp.
Life History and Ecology
Pterygophora californica is a member of the order Laminariales, and its life historyis similar to the life histories of other members of the order. Two generations areinvolved: the large, conspicuous sporophytic generation and the microscopicgametophytic generation. The conspicuous sporophyte produces spores whichgerminate and develop into separate male and female gametophytic plants; theseappear as microscopic filaments. The sporophytes develop directly from thefertilized eggs of the gametophytes, and the cycle is completed. In Diablo Cove P.californica sporophytes have grown on artificial substrates that have beensubmerged for two to four months, demonstrating that the microscopic part of thisspecies' life cycle can be completed rather quickly.
Individual Pterygophora californica plants are perennial, but mortalities andrecruitment in Diablo Cove generally occur annually. Natural mortalities areusually caused by recurrent winter storms, which remove mainly the older, tallerplants. Clearings due to the storms allow self-recruitment. This periodic turnovercreates a multi-age P. californica population in Diablo Cove. The maximum age ofP. californica has been estimated to be about 25 years (McMillan 1902, cited byMcKay 1933). In Diablo Cove the oldest plants appear to be about 10 years old(based on growth rings).
The terminal blades and sporophylls comprise the majority of the plant'sphotosynthetic area. Periodically the blades and sporophylls are shed, and new onesregenerate from the stipes during favorable conditions. Schmitz and Lobban (1976)demonstrated the existence of an internal translocation mechanism in Pterygophoracalifornica, and suggested that this may be a means of transferring photosynthe-
ES-316.0 3-96
sized assimilates to the stipes to be stored and utilized for new blade and sporophyllproduction. Blade growth and shedding among Diablo Cove P. californica plantshave been offset among individuals such that all stages of this process can bepresent among neighboring plants. This is presumably due to the age mix of thepopulation and to individual variability.
North (1969) considered Pterygophora californica to be one of the more importantprimary producers in Diablo Cove. In Diablo Cove, shading canopies of this speciesonce limited the abundance of soft red algal understory species (Section 3.2.3.1). Aswith other kelp species, the canopy of P. californica provides a midwater habitat forcertain fish (North and Hubbs 1968), reduces the foraging efficiencies of predatorsupon invertebrates (Dayton 1975), decreases water turbulence (Larkum 1972), andprovides a substrate for bryozoans and hydroids (McLean 1962). The holdfasts alsoprovide microhabitats for various invertebrate species (Aleem 1973, McLean 1962).As with many other kelp species, detached and drifting P. californica plants canprovide food for many other organisms in other areas.
Species found inhabiting the stipes and blades of Pterygophora californica in DiabloCove include turban snails (Tegula brunnea, T. montereyi, T. pulligo), kelp crabs(Pugettia producta, P. richii), and various boring amphipods. Many of these speciesare able to feed directly on this alga. Pterygophora californica in Diablo Cove wasonce grazed upon heavily by red sea urchins (Strongylocentrotus franciscanus)(North 1969), before the urchins were removed by sea otters. This species wasabundant in adjacent and surrounding areas where sea urchins were less prevalent.
Distribution and Abundance
Studies conducted by the California Department of Fish and Game (Gotshall, et al.1984) found that the density of Pterygophora californica in Diablo Cove increased inthe heavily grazed areas after the urchins were consumed by foraging sea otters(Enhydra lutris). The densities of P. californica in the TEMP subtidal stations from1976 to 1987 are presented in Figure D-30 in Appendix D. Station datarepresenting the various changes are shown in Figure 3.2.3.14-1. After 1976, thedensities of P. californica in most shallow areas of Diablo Cove gradually declined(Station 10-10 in Figure 3.2.3.14-1). Some increases occurred in clearings made bythe 1982-83 severe winter storms, but declined again later during power plantoperation (Station 9-10 in Figure 3.2.3.14-1). Concurrently, in areas outside DiabloCove not contacted by the plume, the densities of P. californica increased duringpower plant operation (representative Station 19-10 in Figure 3.2.3.14-1). (Thesechanges are described by significance testing of the data in the time series andanalysis of variance tests presented in Appendix E.) Densities also increased inareas beneath the plume in Diablo Cove (Station 13-32 in Figure 3.2.3.14-1). Theincreases in these two areas were related to large self-recruitment sets on rockscleared by the 1982-83 storms. The depth of the plume-related losses of plants inthe cove's shallows was about 15 ft in the north portion, and about 10 ft in the south
E8-316.0 3-97
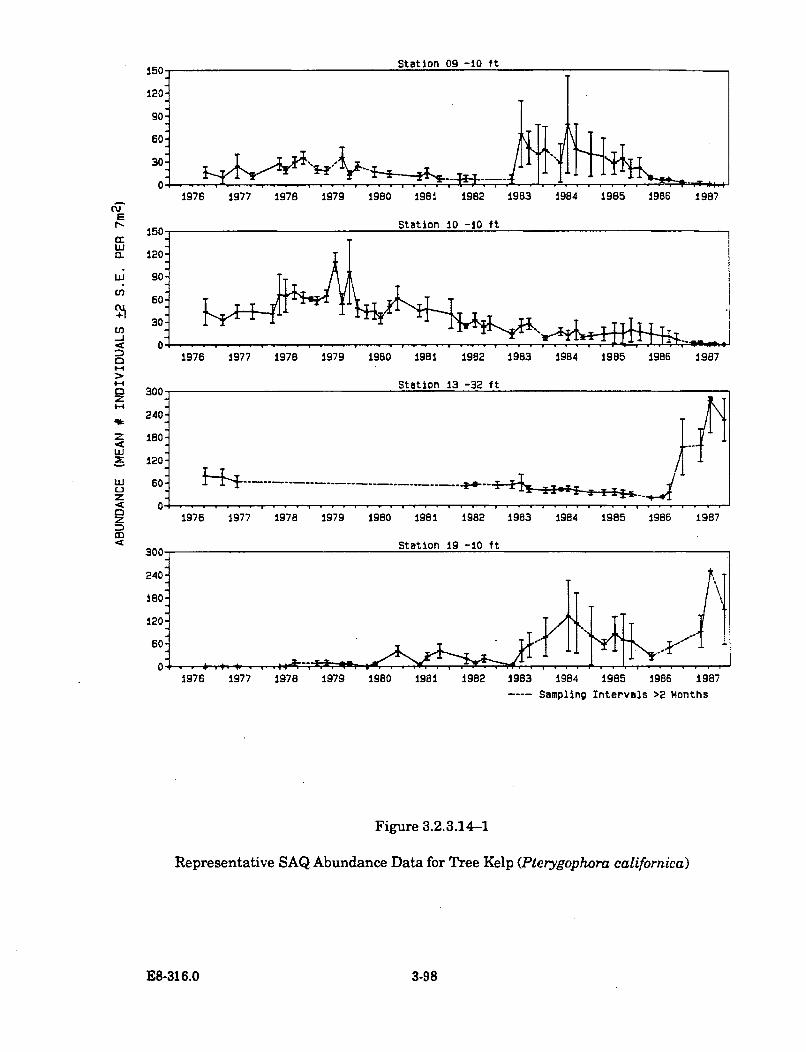
Station 09 -10 ft
120-
goo:
60:
30:
0*
E150
w, -
CL 120:
w; 9o:
60-
30U)
49 0o
I.-
4-4D 300z4-4 240240.
z I8O-LU
W 60:L,)z< 0~0z
4
q.T-.6, ,
1976 1977 1978 1979 1980 1981 1982 1983 1984 1985 1986 1987
1976 1977 1978 1979 1980 1981 1982 1983 1984 1985 1986 1987
Station 13 -32 ft
1976 1977 1978 1979 1980 1981 1982 1983 1984 1985 1986 1987
1976 1977 1978 1979 1980 1981 1982 1983 1984 1985 1986 1987---- Sampling Intervals >2 Months
Figure 3.2.3.14-1
Representative SAQ Abundance Data for Tree Kelp (Pterygophora californica)
E8-316.0 3-98
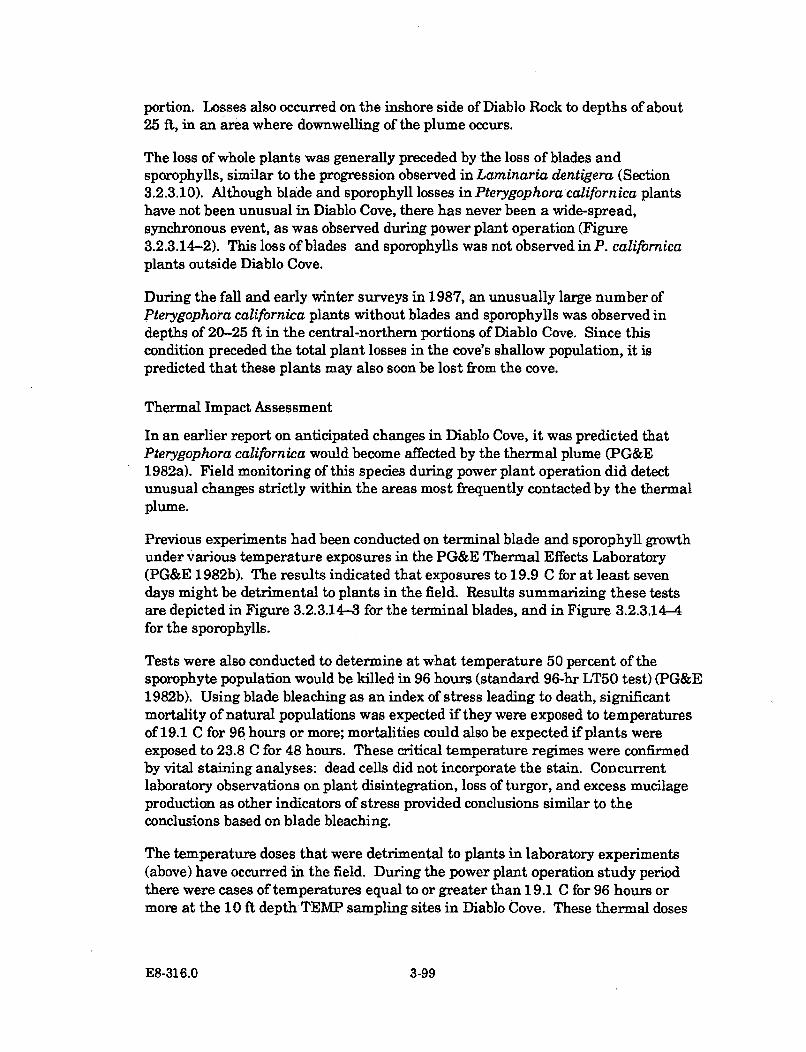
portion. Losses also occurred on the inshore side of Diablo Rock to depths of about25 ft, in an area where downwelling of the plume occurs.
The loss of whole plants was generally preceded by the loss of blades andsporophylls, similar to the progression observed in Laminaria dentigera (Section3.2.3.10). Although blade and sporophyll losses in Pterygophora californica plantshave not been unusual in Diablo Cove, there has never been a wide-spread,synchronous event, as was observed during power plant operation (Figure3.2.3.14-2). This loss of blades and sporophylls was not observed in P. californicaplants outside Diablo Cove.
During the fall and early winter surveys in 1987, an unusually large number ofPterygophora californica plants without blades and sporophylls was observed indepths of 20-25 ft in the central-northern portions of Diablo Cove. Since thiscondition preceded the total plant losses in the cove's shallow population, it ispredicted that these plants may also soon be lost from the cove.
Thermal Impact Assessment
In an earlier report on anticipated changes in Diablo Cove, it was predicted thatPterygophora californica would become affected by the thermal plume (PG&E1982a). Field monitoring of this species during power plant operation did detectunusual changes strictly within the areas most frequently contacted by the thermalplume.
Previous experiments had been conducted on terminal blade and sporophyll growthunder various temperature exposures in the PG&E Thermal Effects Laboratory(PG&E 1982b). The results indicated that exposures to 19.9 C for at least sevendays might be detrimental to plants in the field. Results summarizing these testsare depicted in Figure 3.2.3.14-3 for the terminal blades, and in Figure 3.2.3.14-4for the sporophylls.
Tests were also conducted to determine at what temperature 50 percent of thesporophyte population would be killed in 96 hours (standard 96-hr LT50 test) (PG&E1982b). Using blade bleaching as an index of stress leading to death, significantmortality of natural populations was expected if they were exposed to temperaturesof 19.1 C for 96 hours or more; mortalities could also be expected if plants wereexposed to 23.8 C for 48 hours. These critical temperature regimes were confirmedby vital staining analyses: dead cells did not incorporate the stain. Concurrentlaboratory observations on plant disintegration, loss of turgor, and excess mucilageproduction as other indicators of stress provided conclusions similar to theconclusions based on blade bleaching.
The temperature doses that were detrimental to plants in laboratory experiments(above) have occurred in the field. During the power plant operation study periodthere were cases of temperatures equal to or greater than 19.1 C for 96 hours ormore at the 10 ft depth-TEMP sampling sites in Diablo Cove. These thermal doses
E8-316.0 3-99
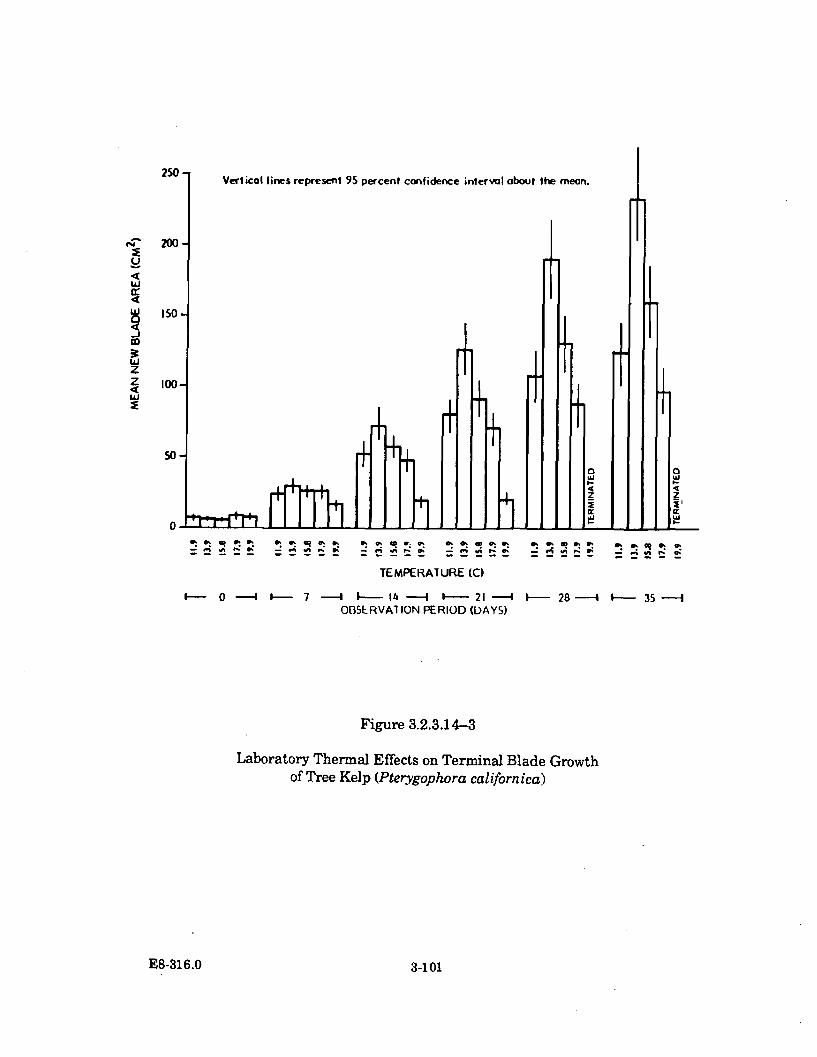
250Vertical lines represent 9S percent confidence interval about the mean.
ccJ
Li
X
UJ
4
WZr
CDJ
200
150,
I0.
50
0 rI+Tth[- . . 0. _- - , -!! 0R.- - - - --.•- - - - - - - - - - - - - - -
TEMPERATURE (C)
I- 0 -4 8- 7 -- I- 14 -- I I-- 21 -4 I- 28 - --1 35 -IOBSLRVAI ION PERIOD (DAYS)
Figure 3.2.3.14-3
Laboratory Thermal Effects on Terminal Blade Growthof Tree Kelp (Pterygophora californica)
E8-316.0 3-101
50.
Number above column indicates number ot plants
40
U
4
-j
00CL
z4LuE
30
20
10
2
3 2 32 1 4 1±I I.... r " --
0' ~ ~ ~ C 0' 00' C',0 .. m .0 C' 0.I mý a' a,0 Cý R 0.1 1: 0 'W 0' Cli1
TEMPERATURE (C)
I- 0 --- I---- 7 --- 4 1-- 14 ---- -- 21 -4OBSERVATION PERIOD (DAYS)
i- 28--4 -- 35 ---- 4
Figure 3.2.3.14-4
Laboratory Thermal Effects on Sporophyll Growthof Tree Kelp (Pterygophora californica)
E8-316.0 3-102
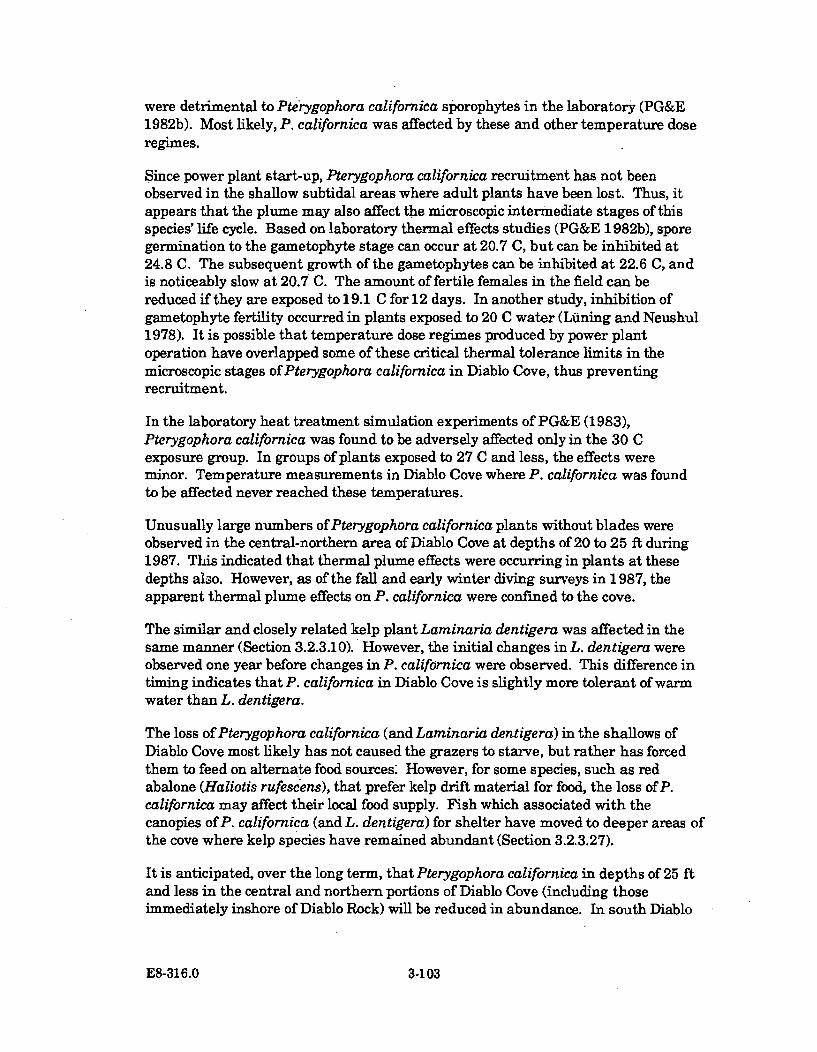
were detrimental to Pteiygophora californica sporophytes in the laboratory (PG&E1982b). Most likely, P. californica was affected by these and other temperature doseregimes.
Since power plant start-up, Pterygophora californica recruitment has not beenobserved in the shallow subtidal areas where adult plants have been lost. Thus, itappears that the plume may also affect the microscopic intermediate stages of thisspecies' life cycle. Based on laboratory thermal effects studies (PG&E 1982b), sporegermination to the gametophyte stage can occur at 20.7 C, but can be inhibited at24.8 C. The subsequent growth of the gametophytes can be inhibited at 22.6 C, andis noticeably slow at 20.7 C. The amount of fertile females in the field can bereduced if they are exposed to 19.1 C for 12 days. In another study, inhibition ofgametophyte fertility occurred in plants exposed to 20 C water (L~ining and Neushul1978). It is possible that temperature dose regimes produced by power plantoperation have overlapped some of these critical thermal tolerance limits in themicroscopic stages of Pterygophora californica in Diablo Cove, thus preventingrecruitment.
In the laboratory heat treatment simulation experiments of PG&E (1983),Pterygophora californica was found to be adversely affected only in the 30 Cexposure group. In groups of plants exposed to 27 C and less, the effects wereminor. Temperature measurements in Diablo Cove where P. californica was foundto be affected never reached these temperatures.
Unusually large numbers of Pterygophora californica plants without blades wereobserved in the central-northern area of Diablo Cove at depths of 20 to 25 ft during1987. This indicated that thermal plume effects were occurring in plants at thesedepths also. However, as of the fall and early winter diving surveys in 1987, theapparent thermal plume effects on P. californica were confined to the cove.
The similar and closely related kelp plant Laminaria dentigera was affected in thesame manner (Section 3.2.3.10). However, the initial changes in L. dentigera wereobserved one year before changes in P. californica were observed. This difference intiming indicates that P. californica in Diablo Cove is slightly more tolerant of warmwater than L. dentigera.
The loss of Pterygophora californica (and Laminaria dentigera) in the shallows ofDiablo Cove most likely has not caused the grazers to starve, but rather has forcedthem to feed on alternate food sources: However, for some species, such as redabalone (Haliotis rufescens), that prefer kelp drift material for food, the loss of P.californica may affect their local food supply. Fish which associated with thecanopies of P. californica (and L. dentigera) for shelter have moved to deeper areas ofthe cove where kelp species have remained abundant (Section 3.2.3.27).
It is anticipated, over the long term, that Pterygophora californica in depths of 25 ftand less in the central and northern portions of Diablo Cove (including thoseimmediately inshore of Diablo Rock) will be reduced in abundance. In south Diablo
E8-316.0 3-103

Cove, temperature effects on P. californica will be at shallower depths. A mapdepicting the areas of thermal plume-related changes in P. californica in DiabloCove during power plant operation is presented in Figure 3.2.3.14-5.
E8-316.0 3-104
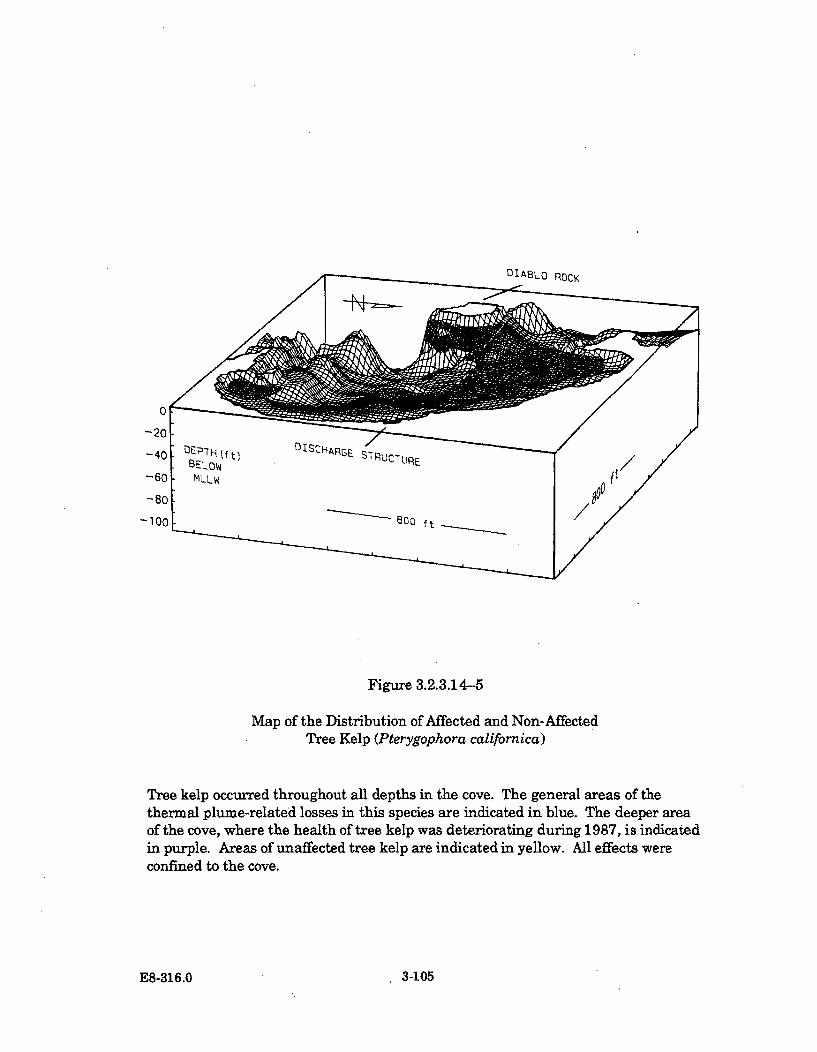
DIABLO ROCK
-•80.•ILjlfl••f-100,
Figure 3.2.3.14-5
Map of the Distribution of Affected and Non-AffectedTree Kelp (Pterygophora californica)
Tree kelp occurred throughout all depths in the cove. The general areas of thethermal plume-related losses in this species are indicated in blue. The deeper areaof the cove, where the health of tree kelp was deteriorating during 1987, is indicatedin purple. Areas of unaffected tree kelp are indicated in yellow. All effects wereconfined to the cove.
E8-316.0 3-105
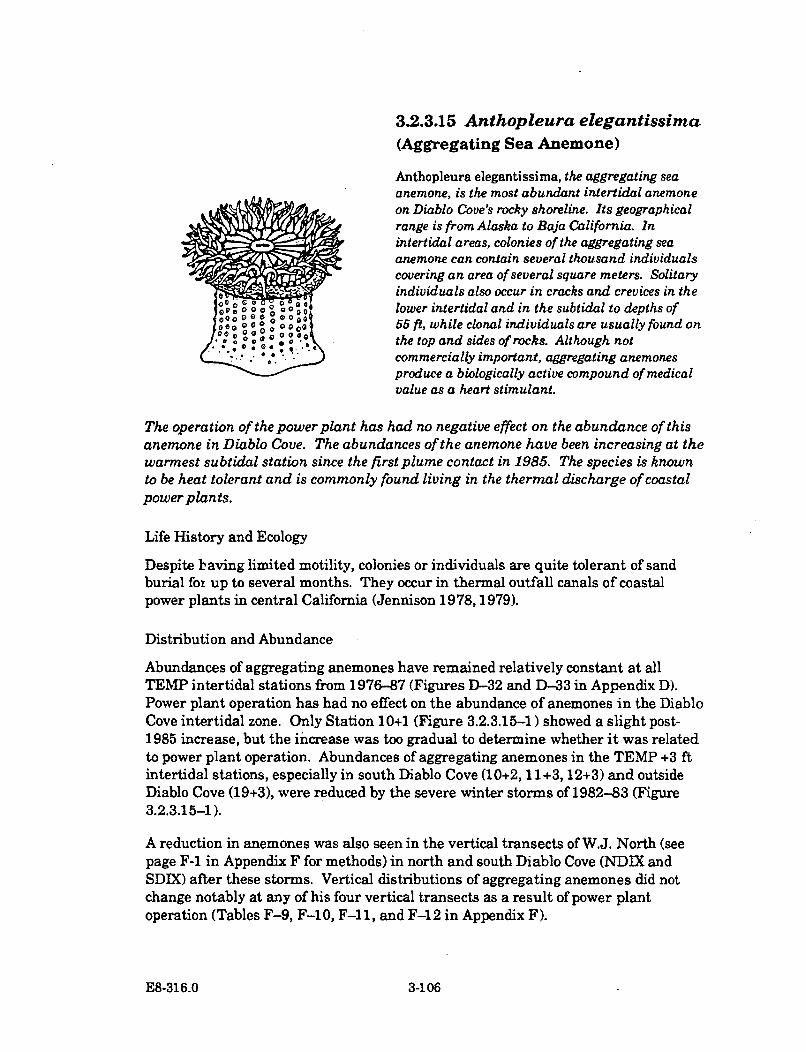
3.2.3.15 Anthopleura elegantissima(Aggregating Sea Anemone)
Anthopleura elegantissima, the aggregating seaanemone, is the most abundant intertidal anemoneon Diablo Cove's rocky shoreline. Its geographicalrange is from Alaska to Baja California. Inintertidal areas, colonies of the aggregating seaanemone can contain several thousand individualscovering an area of several square meters. Solitaryindividuals also occur in cracks and crevices in thelower intertidal and in the subtidal to depths of
oo 08: 0 0000 55 ft, while clonal individuals are usually found onS0the top and sides of rocks. Although not
commercially important, aggregating anemonesproduce a biologically active compound of medicalvalue as a heart stimulant.
The operation of the power plant has had no negative effect on the abundance of thisanemone in Diablo Cove. The abundances of the anemone have been increasing at thewarmest subtidal station since the first plume contact in 1985. The species is knownto be heat tolerant and is commonly found living in the thermal discharge of coastalpower plants.
Life History and Ecology
Despite baying limited motility, colonies or individuals are quite tolerant of sandburial for up to several months. They occur in thermal outfall canals of coastalpower plants in central California (Jennison 1978,1979).
Distribution and Abundance
Abundances of aggregating anemones have remained relatively constant at allTEMP intertidal stations from 1976-87 (Figures D-32 and D-33 in Appendix D).Power plant operation has had no effect on the abundance of anemones in the DiabloCove intertidal zone. Only Station 10+1 (Figure 3.2.3.15-1) showed a slight post-1985 increase, but the increase was too gradual to determine whether it was relatedto power plant operation. Abundances of aggregating anemones in the TEMP +3 ftintertidal stations, especially in south Diablo Cove (10+2, 11+3, 12+3) and outsideDiablo Cove (19+3), were reduced by the severe winter storms of 1982-83 (Figure3.2.3.15-1).
A reduction in anemones was also seen in the vertical transects of W.J. North (seepage F-1 in Appendix F for methods) in north and south Diablo Cove (NDIX andSDIX) after these storms. Vertical distributions of aggregating anemones did notchange notably at any of his four vertical transects as a result of power plantoperation (Tables F-9, F-10, F-11, and F-12 in Appendix F).
E8-316.0 3-106
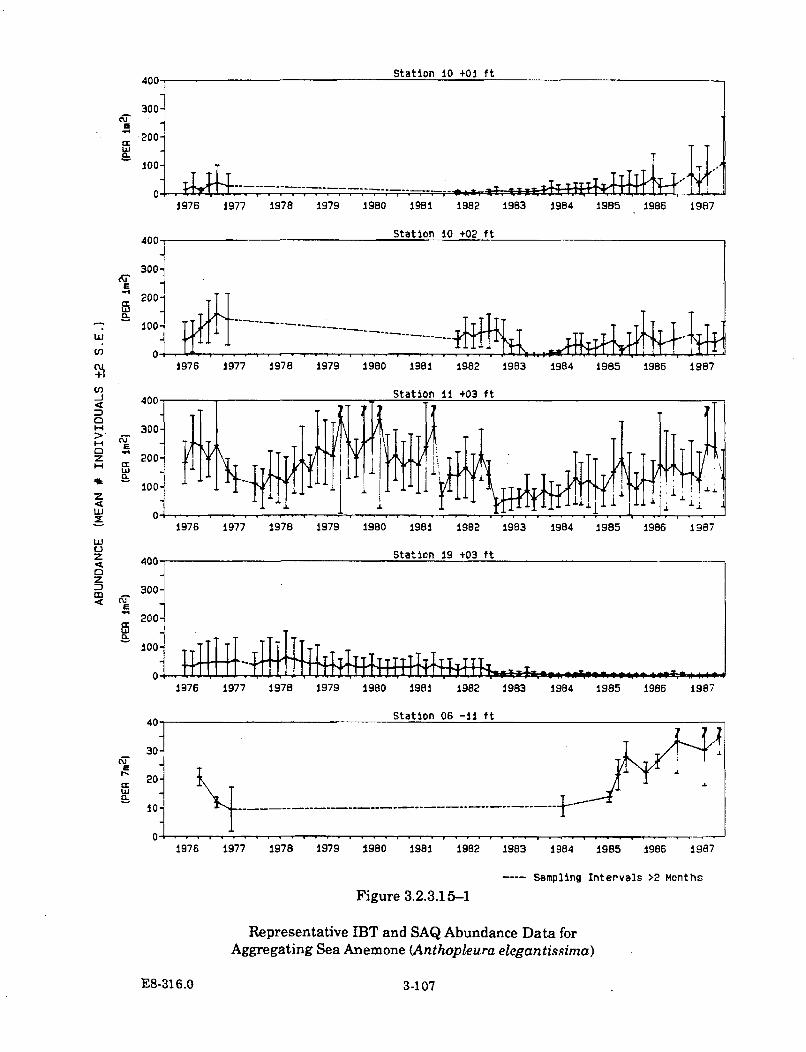
300-
200-w-
100-
0*
400-
300-E -
200-r'mw -
-7 100-wý -
U)-J 400-
C0- 300->, -C Ez 200-
w -
100-zLa.J 0 '
wLU.z43
0
wa:
1976 1977 1978 1979 1980 198i 1982 1983 1984 1985 1986 1987
400- Station 19 +03 ft
300-
2004
1004
1976 1977 1978 1979 1980 1981 1982 1983 1984 1985 1986 1987
2=
wJ
1976 1977 1978 1979 1980 1981 1982 1983 1984 1985 1986 1987
---- Sampling Intervals >2 Months
Figure 3.2.3.15-1
Representative IBT and SAQ Abundance Data forAggregating Sea Anemone (Anthopleura elegantissima)
E8-316.0 3-107
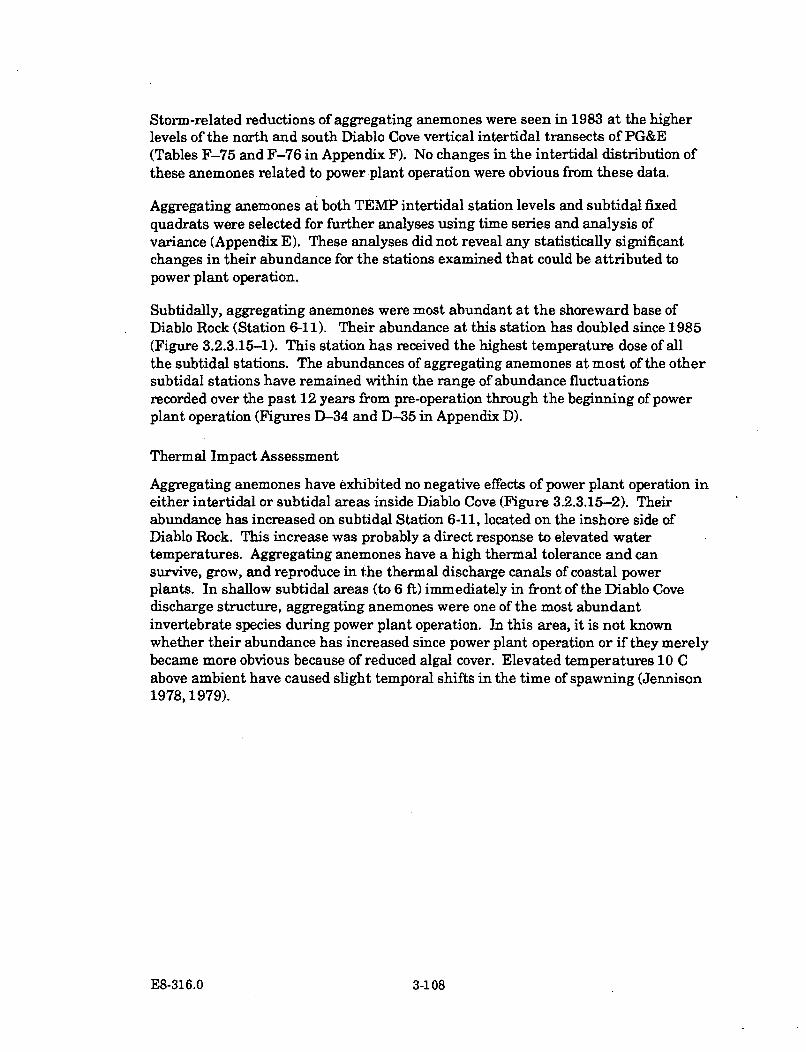
Storm-related reductions of aggregating anemones were seen in 1983 at the higherlevels of the north and south Diablo Cove vertical intertidal transects of PG&E(Tables F-75 and F-76 in Appendix F). No changes in the intertidal distribution ofthese anemones related to power plant operation were obvious from these data.
Aggregating anemones at both TEMP intertidal station levels and subtidal fixedquadrats were selected for further analyses using time series and analysis ofvariance (Appendix E). These analyses did not reveal any statistically significantchanges in their abundance for the stations examined that could be attributed topower plant operation.
Subtidally, aggregating anemones were most abundant at the shoreward base ofDiablo Rock (Station 6-11). Their abundance at this station has doubled since 1985(Figure 3.2.3.15-1). This station has received the highest temperature dose of allthe subtidal stations. The abundances of aggregating anemones at most of the othersubtidal stations have remained within the range of abundance fluctuationsrecorded over the past 12 years from pre-operation through the beginning of powerplant operation (Figures D-34 and D-35 in Appendix D).
Thermal Impact Assessment
Aggregating anemones have exhibited no negative effects of power plant operation ineither intertidal or subtidal areas inside Diablo Cove (Figure 3.2.3.15-2). Theirabundance has increased on subtidal Station 6-11, located on the inshore side ofDiablo Rock. This increase was probably a direct response to elevated watertemperatures. Aggregating anemones have a high thermal tolerance and cansurvive, grow, and reproduce in the thermal discharge canals of coastal powerplants. In shallow subtidal areas (to 6 ft) immediately in front of the Diablo Covedischarge structure, aggregating anemones were one of the most abundantinvertebrate species during power plant operation. In this area, it is not knownwhether their abundance has increased since power plant operation or if they merelybecame more obvious because of reduced algal cover. Elevated temperatures 10 Cabove ambient have caused slight temporal shifts in the time of spawning (Jennison1978,1979).
E8-316.0 3-108
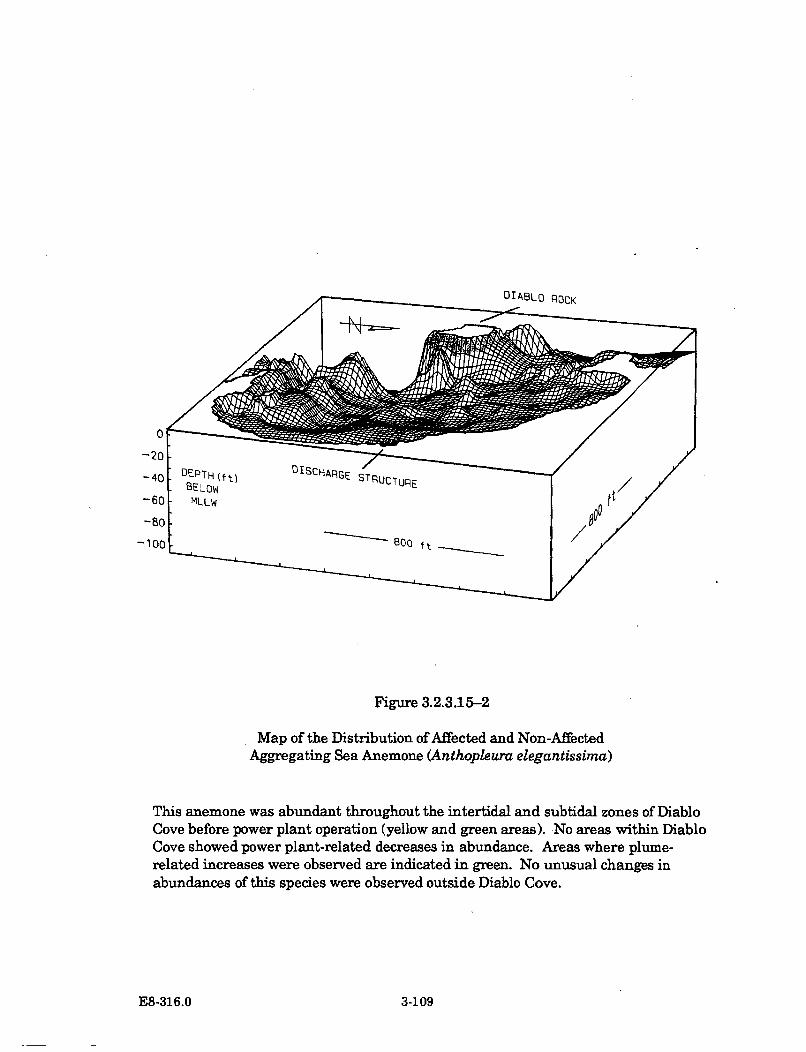
Figure 3.2.3.15-2
Map of the Distribution of Affected and Non-AffectedAggregating Sea Anemone (Anthopleura elegantissima)
This anemone was abundant throughout the intertidal and subtidal zones of DiabloCove before power plant operation (yellow and green areas). No areas within DiabloCove showed power plant-related decreases in abundance. Areas where plume-related increases were observed are indicated in green. No unusual changes inabundances of this species were observed outside Diablo Cove.
E8-316.0 3-109
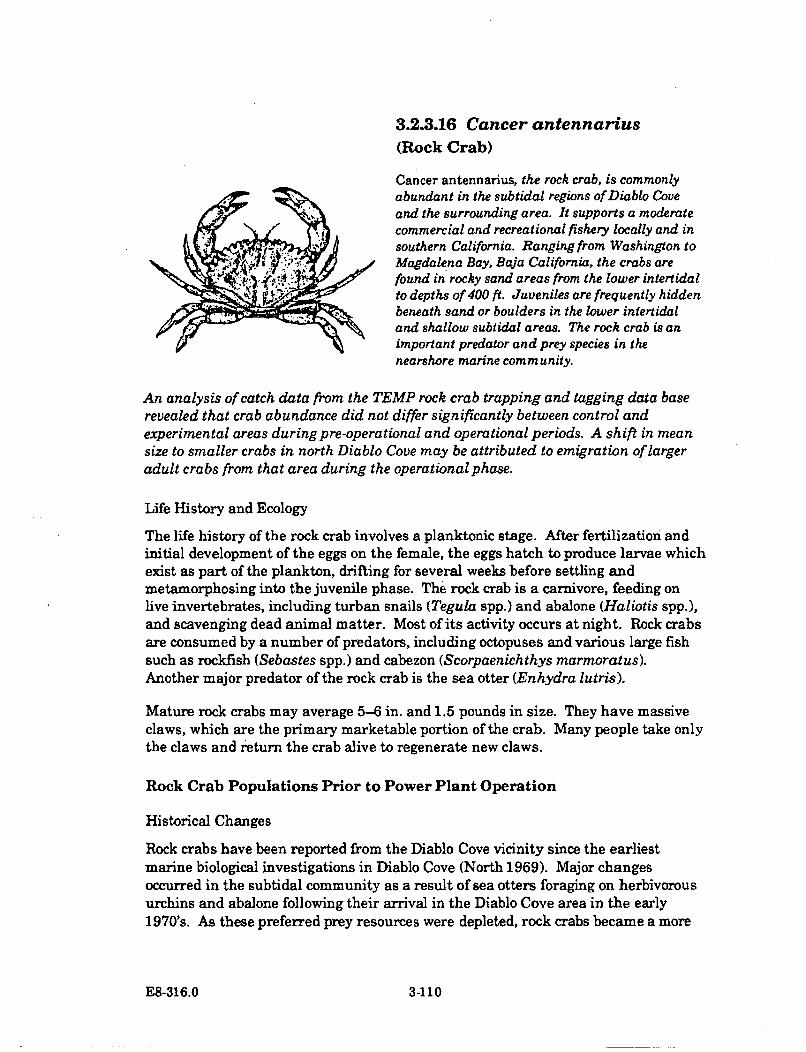
3.2.3.16 Cancer antennarius(Rock Crab)
Cancer antennarius, the rock crab, is commonlyabundant in the subtidal regions of Diablo Coveand the surrounding area. It supports a moderatecommercial and recreational fishery locally and insouthern California. Ranging from Washington toMagdalena Bay, Baja California, the crabs arefound in rocky sand areas from the lower intertidalto depths of 400 ft. Juveniles are frequently hidden
-. beneath sand or boulders in the lower intertidaland shallow subtidal areas. The rock crab is animportant predator and prey species in thenearshore marine community.
An analysis of catch data from the TEMP rock crab trapping and tagging data baserevealed that crab abundance did not differ significantly between control andexperimental areas during pre-operational and operational periods. A shift in meansize to smaller crabs in north Diablo Cove may be attributed to emigration of largeradult crabs from that area during the operational phase.
Life History and Ecology
The life history of the rock crab involves a planktonic stage. After fertilization andinitial development of the eggs on the female, the eggs hatch to produce larvae whichexist as part of the plankton, drifting for several weeks before settling andmetamorphosing into the juvenile phase. The rock crab is a carnivore, feeding onlive invertebrates, including turban snails (Tegula spp.) and abalone (Haliotis spp.),and scavenging dead animal matter. Most of its activity occurs at night. Rock crabsare consumed by a number of predators, including octopuses and various large fishsuch as rockfish (Sebastes spp.) and cabezon (Scorpaenichthys marmoratus).Another major predator of the rock crab is the sea otter (Enhydra lutris).
Mature rock crabs may average 5-6 in. and 1.5 pounds in size. They have massiveclaws, which are the primary marketable portion of the crab. Many people take onlythe claws and return the crab alive to regenerate new claws.
Rock Crab Populations Prior to Power Plant Operation
Historical Changes
Rock crabs have been reported from the Diablo Cove vicinity since the earliestmarine biological investigations in Diablo Cove (North 1969). Major changesoccurred in the subtidal community as a result of sea otters foraging on herbivorousurchins and abalone following their arrival in the Diablo Cove area in the early1970's. As these preferred prey resources were depleted, rock crabs became a more
E8-316.0 3-110
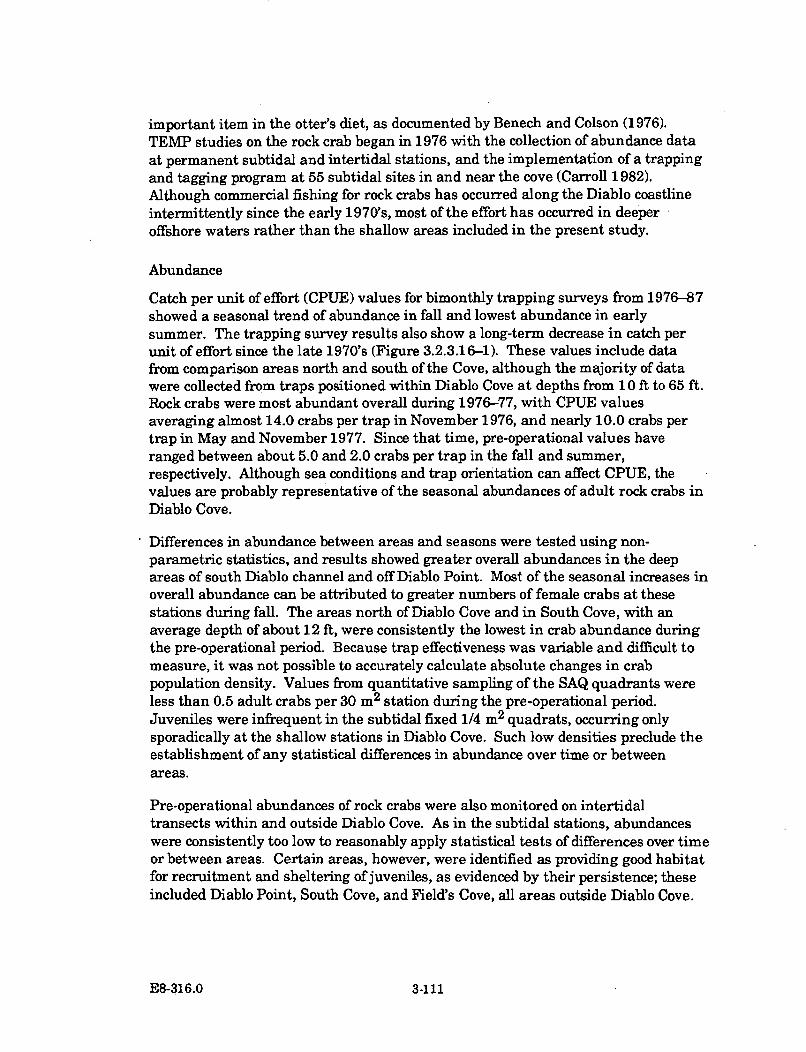
important item in the otter's diet, as documented by Benech and Colson (1976).TEMP studies on the rock crab began in 1976 with the collection of abundance dataat permanent subtidal and intertidal stations, and the implementation of a trappingand tagging program at 55 subtidal sites in and near the cove (Carroll 1982).Although commercial fishing for rock crabs has occurred along the Diablo coastlineintermittently since the early 1970's, most of the effort has occurred in deeperoffshore waters rather than the shallow areas included in the present study.
Abundance
Catch per unit of effort (CPUE) values for bimonthly trapping surveys from 1976-87showed a seasonal trend of abundance in fall and lowest abundance in earlysummer. The trapping survey results also show a long-term decrease in catch perunit of effort since the late 1970's (Figure 3.2.3.16-1). These values include datafrom comparison areas north and south of the Cove, although the majority of datawere collected from traps positioned within Diablo Cove at depths from 10 ft to 65 ft.Rock crabs were most abundant overall during 1976-77, with CPUE valuesaveraging almost 14.0 crabs per trap in November 1976, and nearly 10.0 crabs pertrap in May and November 1977. Since that time, pre-operational values haveranged between about 5.0 and 2.0 crabs per trap in the fall and summer,respectively. Although sea conditions and trap orientation can affect CPUE, thevalues are probably representative of the seasonal abundances of adult rock crabs inDiablo Cove.
Differences in abundance between areas and seasons were tested using non-
parametric statistics, and results showed greater overall abundances in the deepareas of south Diablo channel and off Diablo Point. Most of the seasonal increases inoverall abundance can be attributed to greater numbers of female crabs at thesestations during fall. The areas north of Diablo Cove and in South Cove, with anaverage depth of about 12 ft, were consistently the lowest in crab abundance duringthe pre-operational period. Because trap effectiveness was variable and difficult tomeasure, it was not possible to accurately calculate absolute changes in crabpopulation density. Values from quantitative sampling of the SAQ quadrants wereless than 0.5 adult crabs per 30 m 2 station during the pre-operational period.Juveniles were infrequent in the subtidal fixed 1/4 m2 quadrats, occurring onlysporadically at the shallow stations in Diablo Cove. Such low densities preclude theestablishment of any statistical differences in abundance over time or betweenareas.
Pre-operational abundances of rock crabs were also monitored on intertidaltransects within and outside Diablo Cove. As in the subtidal stations, abundanceswere consistently too low to reasonably apply statistical tests of differences over timeor between areas. Certain areas, however, were identified as providing good habitatfor recruitment and sheltering of juveniles, as evidenced by their persistence; theseincluded Diablo Point, South Cove, and Field's Cove, all areas outside Diablo Cove.
E8-316.0 3-111
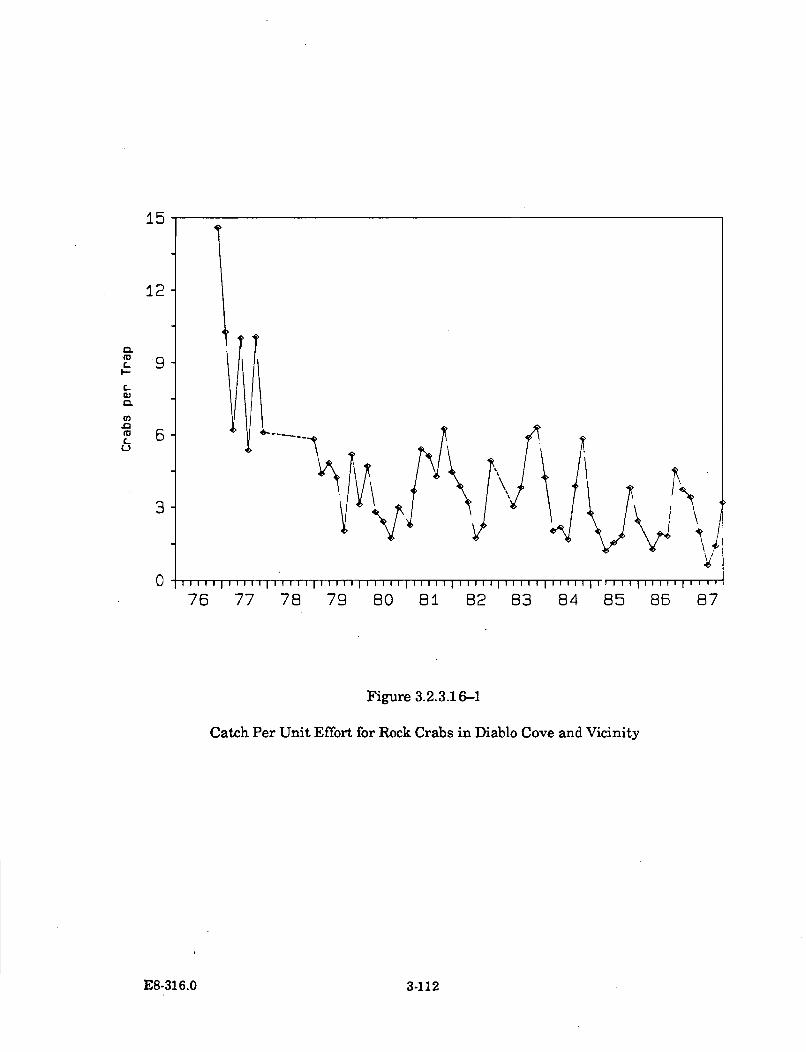
15
12
0.
L
9-
fn.0m 6
0 1ii 11111 1lilt 1I 1 1u1 I-rTT11111111
76 77 78 79 80 81 82 83 84 85
Figure 3.2.3.16-1
Catch Per Unit Effort for Rock Crabs in Diablo Cove and Vicinity
86 87
E8-316.0 3-112
Size Frequency
The overall mean size of males and females was 119.0 mm and 110.6 mm carapacewidth, respectively. Size frequency histograms were unimodal and skewed towardthe smaller size classes. This observed size composition resulted from trapselectivity for large adult crabs. Less than 3 percent of tagged crabs in the 95-105mm size range were recaptured, as compared to more than 15 percent in the135-145 mm range. Furthermore, juvenile rock crabs were commonly observed insubtidal trapping areas and intertidal areas. Factors which may have contributed tothe paucity of juveniles in the traps were limited mobility of smaller crabs, difficultyof entry into the traps, or non-attractiveness of bait.
Sex Ratios
Males generally outnumbered females in catches, as indicated by the overall sexratio of 1.3:1. Annual peaks in percentages of females occurred in fall, at which timefemales almost always outnumbered males in the catches. This was primarily theresult of increased numbers of females in addition to relatively stable numbers ofmales. Sex ratios were often highly variable at individual stations, with eithermales or females predominating in certain catches.
Fecundity
Ovigerous (egg-bearing) females were present during all months of the year, butwere consistently the most abundant in winter.
Movement Pattern
Directed rock crab movements, inferred from tag returns, can potentially revealavoidance or attractant responses to the thermal discharge. During the pre-operational period, movements occurred predominantly along the deep southernchannel leading into Diablo Cove, but no seasonal trends in tag returns wereapparent to indicate any annual migratory patterns. Crabs at liberty from 1-5 daystended to remain in the immediate vicinity of release, with less than 4 percentrecaptured in adjacent trapping areas. Over longer periods of time, from 2-18months, between-area movement increased, although many crabs were stillrecaptured near their original release site. Such data did not accurately depict theoverall movement patterns of the population because of the bias which resulted fromspecific trap placement. Yet the results suggested that even though crabs arecapable of moving several kilometers, they often remained in the same location,including Diablo Cove, for several months at a time. Sex ratio and abundance datasuggested that the increased numbers of female crabs appearing in fall resulted froman inshore movement of a portion of the female population, perhaps in response towarmer water or calmer sea conditions at that time of the year.
E8-316.0 3-113
Changes During Power Plant Operation
Abundance
During the operational years 1985-87, overall abundances continued to follow thehistorical pattern of highest abundance in fall and lowest abundance in summer. Acomparison of CPUE data between deep reference stations and deep cove stations(Figure 3.2.3.16-2a), and between shallow reference stations and shallow covestations (Figure 3.2.3.1 6-2b) yielded no discernable differences in overall abundance.However, a comparison of shallow stations in Diablo Cove showed a decline inabundance in the north area as compared to the south area during 1987 (Figure3.2.3.16-3).
Size Frequency
Mean size of male and female crabs decreased in the shallow areas of Diablo Coveduring the operational period, but a long-term decline in size was detected in theseareas as early as 1983 (Figure 3.2.3.16-4a, 4b). Size frequencies in north DiabloCove, an area with consistent thermal influence, decreased considerably in 1987.These data suggest that large crabs were moving away from the area of thermalinfluence, most likely into deeper areas outside the cove.
Sex Ratios
No significant difference in sex ratios was evident when comparing crabs inside andoutside Diablo Cove during different seasons.
Fecundity
Too few egg-bearing females were trapped in experimental and control areas todetermine any statistical differences between areas. However, ovigerous femalescontinued to occur occasionally within Diablo Cove, and were most abundant duringwinter months, as in the pre-operational surveys.
Movement Patterns
No movement patterns were detected by the direct recovery of tagged animals whichwould suggest avoidance of the areas under thermal influence (north and southDiablo Cove). Too few tagged crabs were recaptured to statistically test thedifferences in immigration rate between pre-operational and operational periodswithin the cove. Indirect evidence from the size frequency measurements, however,suggested that larger crabs were less abundant in north Diablo Cove, presumablyavoiding the warmer waters by moving into deeper areas below the thermocline.During the operational period, some individuals which were tagged and released innorth Diablo Cove were subsequently recaptured there, indicating that crabs werenot consistently avoiding the warmer areas.
E8-316.0 3-114
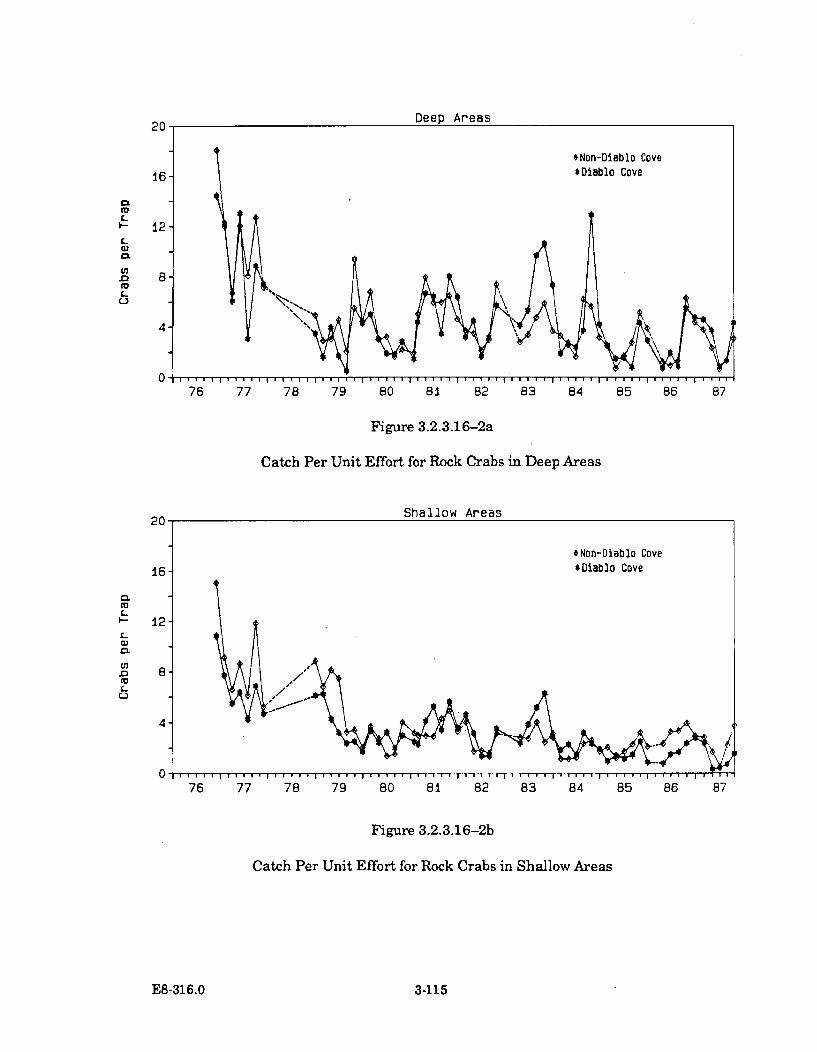
20
16- 9 UIU
-12-
0.
U)
B -
4-
076 77 78 79 80 81 82 83 84
Figure 3.2.3.16-2a
Catch Per Unit Effort for Rock Crabs in Deep Areas
20 Shallow Areas
*Non-Dii16- $Diablo
0.C-
S12-L
.0 8"
0!
4-
76 77 78 79 80 81 82 83 84
Figure 3.2.3.16-2b
Catch Per Unit Effort for Rock Crabs in Shallow Areas
85 86
85 86 87
E8-316.0 3-115
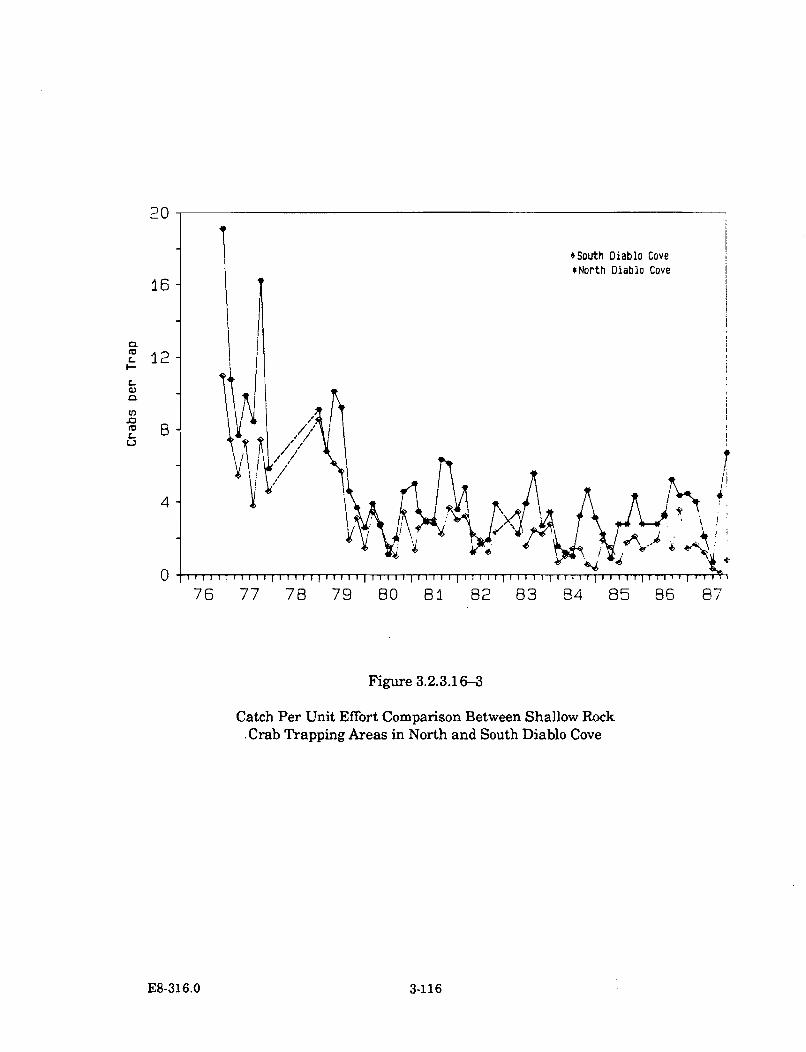
20
#South Diablo Cove*North Diablo Cove
2- 12-I--
L
(Da.-
d4
0 I1 ] | 1 I I I#| l l [ I I l I I I I I I I I1 I I I I I 1 I I | I | 1 I I ! I I r l l l |
76 77 78 79 80 81 82 83 84 85 66 87
Figure 3.2.3.16-3
Catch Per Unit Effort Comparison Between Shallow Rock, Crab Trapping Areas in North and South Diablo Cove
E8-316.0 3-116

Males130 1
EE
.4-,0
a,'V0~'aL'UU
120-
11.0-
100-
90-
8076 77 7B 79 80 8:1 B2 83 84 85 86 87
Figure 3.2.3.16-4a
Mean Carapace Width for Male Rock Crabs in Diablo Cove and Vicinity
Females130
2
U
CL
1201
±00
O0I90-
*South Cove*North Diablo Cove*South Diablo Cove
76 77 7B 79 80 81 82 83 84 85 86 87
Figure 3.2.3.16-4b
Mean Carapace Width for Female Rock Crabs in Diablo Cove and Vicinity
E8-316.0 3-117
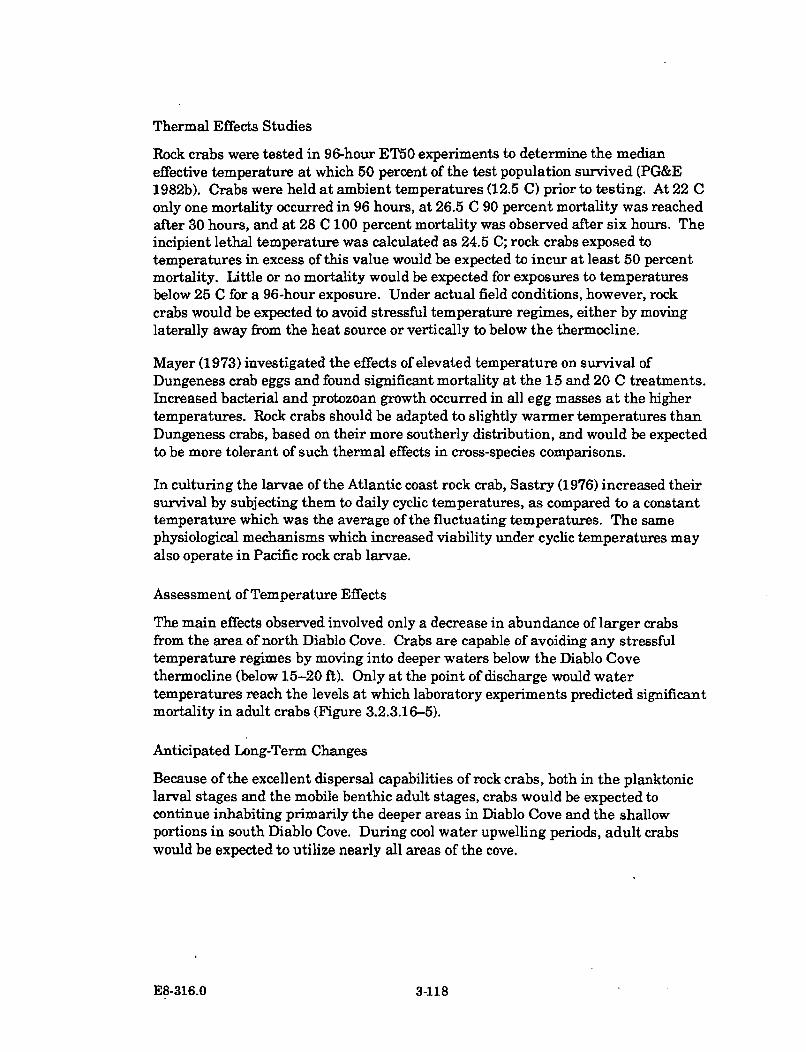
Thermal Effects Studies
Rock crabs were tested in 96-hour ET50 experiments to determine the medianeffective temperature at which 50 percent of the test population survived (PG&E1982b). Crabs were held at ambient temperatures (12.5 C) prior to testing. At 22 Conly one mortality occurred in 96 hours, at 26.5 C 90 percent mortality was reachedafter 30 hours, and at 28 C 100 percent mortality was observed after six hours. Theincipient lethal temperature was calculated as 24.5 C; rock crabs exposed totemperatures in excess of this value would be expected to incur at least 50 percentmortality. Little or no mortality would be expected for exposures to temperaturesbelow 25 C for a 96-hour exposure. Under actual field conditions, however, rockcrabs would be expected to avoid stressful temperature regimes, either by movinglaterally away from the heat source or vertically to below the thermocline.
Mayer (1973) investigated the effects of elevated temperature on survival ofDungeness crab eggs and found significant mortality at the 15 and 20 C treatments.Increased bacterial and protozoan growth occurred in all egg masses at the highertemperatures. Rock crabs should be adapted to slightly warmer temperatures thanDungeness crabs, based on their more southerly distribution, and would be expectedto be more tolerant of such thermal effects in cross-species comparisons.
In culturing the larvae of the Atlantic coast rock crab, Sastry (1976) increased theirsurvival by subjecting them to daily cyclic temperatures, as compared to a constanttemperature which was the average of the fluctuating temperatures. The samephysiological mechanisms which increased viability under cyclic temperatures mayalso operate in Pacific rock crab larvae.
Assessment of Temperature Effects
The main effects observed involved only a decrease in abundance of larger crabsfrom the area of north Diablo Cove. Crabs are capable of avoiding any stressfultemperature regimes by moving into deeper waters below the Diablo Covethermocline (below 15-20 ft). Only at the point of discharge would watertemperatures reach the levels at which laboratory experiments predicted significantmortality in adult crabs (Figure 3.2.3.16-5).
Anticipated Long-Term Changes
Because of the excellent dispersal capabilities of rock crabs, both in the planktoniclarval stages and the mobile benthic adult stages, crabs would be expected tocontinue inhabiting primarily the deeper areas in Diablo Cove and the shallowportions in south Diablo Cove. During cool water upwelling periods, adult crabswould be expected to utilize nearly all areas of the cove.
E8-316.0 3-118
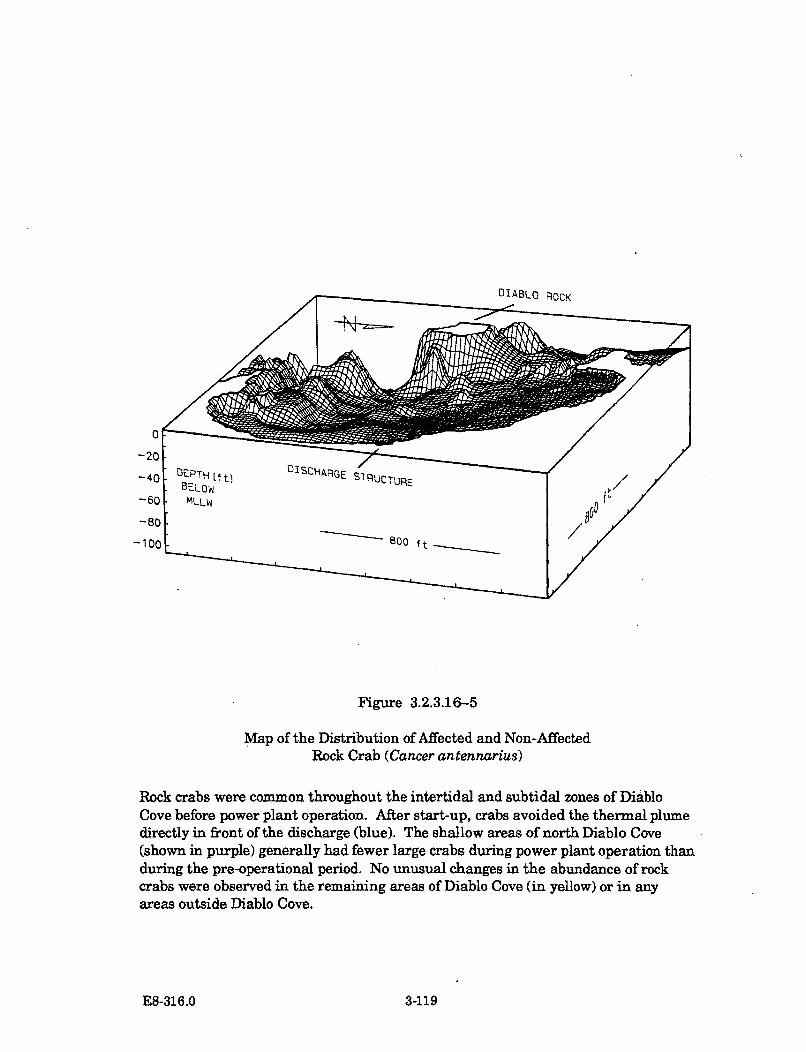
DIABLO ROCK
Figure 3.2.3.16-5
Map of the Distribution of Affected and Non-AffectedRock Crab (Cancer antennarius)
Rock crabs were common throughout the intertidal and subtidal zones of DiabloCove before power plant operation. After start-up, crabs avoided the thermal plumedirectly in front of the discharge (blue). The shallow areas of north Diablo Cove(shown in purple) generally had fewer large crabs during power plant operation thanduring the pre-operational period. No unusual changes in the abundance of rockcrabs were observed in the remaining areas of Diablo Cove (in yellow) or in anyareas outside Diablo Cove.
E8-316.0 3-119
3.2.3.17 Chthamalus fissus(Acorn Barnacle)
Chthamalus fissus, the acorn barnacle, is presentlyfound in large numbers in the rocky intertidalareas in Diablo Cove. The species is a relativelysmall barnacle which commonly occurs in themiddle to high intertidal zone from San Franciscoto Baja California. The barnacles attain a size of 8mm in diameter, and, under optimal conditions,2LLL2A densities of 70,000 individuals per m2 can occur.Prior to 1985, the abundance of acorn barnacleswas generally low at all intertidal TEMP stations.
Beginning in .1985, there was an increase in this species at nearly all of the +1 ftstations in Diablo Cove. These increases were large, occurred rapidly, and havepersisted through 1987. Several stations outside Diablo Cove also had an increase ofacorn barnacles in 1985. However, these increases were smaller in magnitude thanthose seen in Diablo Cove, and by the end of 1987 the abundances had decreased topre-1985 levels. The increases observed outside Diablo Cove suggested that thesettlement of acorn barnacles in Diablo Cove was a natural event. However, thecontinued persistence of the barnacles in Diablo Cove at high abundances may be aresponse to elevated temperatures.
Life History and Ecology
Although acorn barnacles normally cross-fertilize, they are hermaphroditic and canself-fertilize. Nauplius larvae are released into the water column and spend abouttwo weeks in the plankton before settlement, which occurs erratically year-round atall levels in the intertidal. Individuals reach sexual maturity at about two months ofage and can produce up to 16 broods per year. They can live up to three years, withbetter survival in higher than lower intertidal zones. Lower survival in the lowintertidal is related to overgrowth by seaweeds and predation by sea stars andpredaceous gastropods.
They can survive higher in the intertidal than any of the other barnacle species, andspend the major portion of their life out of water.
Distribution and Abundance
Prior to 1982-83, all of the TEMP stations both inside and outside Diablo Cove hadlow numbers of acorn barnacles at both of the station levels (Figures D-38 and D-39in Appendix D). Waves from the severe 1982-83 winter storms disturbed much ofthe coastline and opened substrate for colonization by acorn barnacles and otherspecies. Beginning in 1985, the coverage of acorn barnacles increased in all of theTEMP +1 ft and most of the +3 ft intertidal stations. In Diablo Cove, the increaseswere greater at the lower elevation stations, with the largest changes at Stations
E8-316.0 3-120
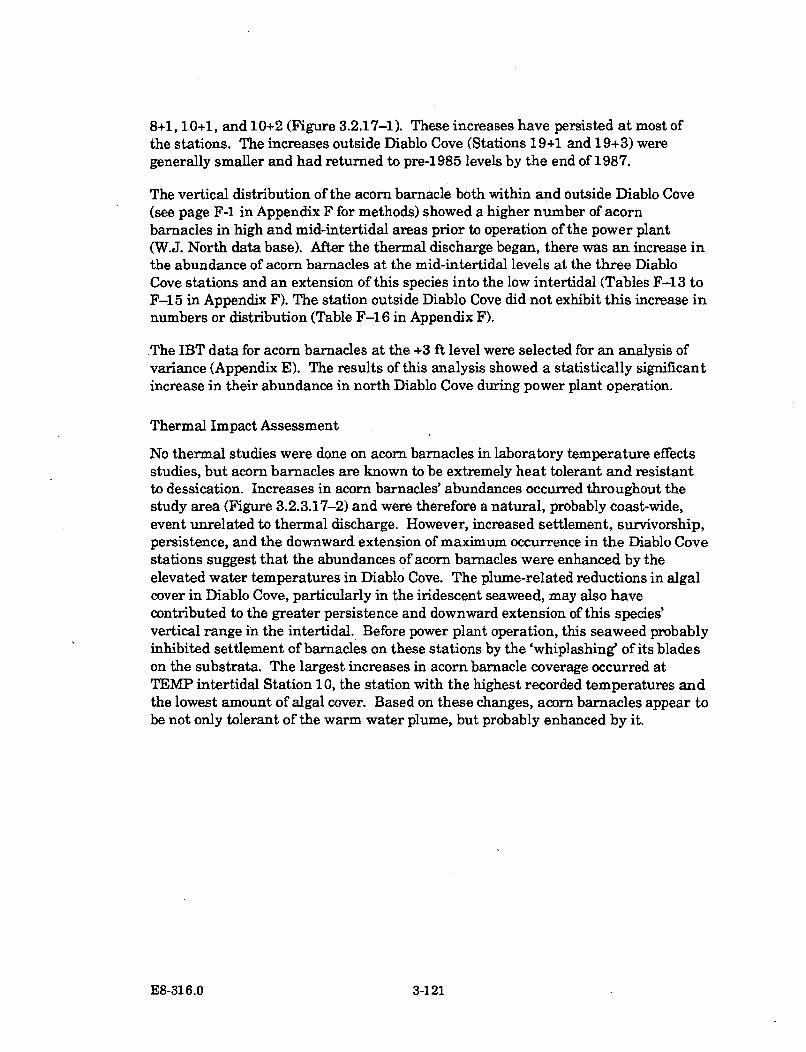
8+1, 10+1, and 10+2 (Figure 3.2.17-1). These increases have persisted at most ofthe stations. The increases outside Diablo Cove (Stations 19+1 and 19+3) weregenerally smaller and had returned to pre-1985 levels by the end of 1987.
The vertical distribution of the acorn barnacle both within and outside Diablo Cove(see page F-1 in Appendix F for methods) showed a higher number of acornbarnacles in high and mid-intertidal areas prior to operation of the power plant(W.J. North data base). After the thermal discharge began, there was an increase inthe abundance of acorn barnacles at the mid-intertidal levels at the three DiabloCove stations and an extension of this species into the low intertidal (Tables F-13 toF-1 5 in Appendix F). The station outside Diablo Cove did not exhibit this increase innumbers or distribution (Table F-1 6 in Appendix F).
The IBT data for acorn barnacles at the +3 ft level were selected for an analysis ofvariance (Appendix E). The results of this analysis showed a statistically significantincrease in their abundance in north Diablo Cove during power plant operation.
Thermal Impact Assessment
No thermal studies were done on acorn barnacles in laboratory temperature effectsstudies, but acorn barnacles are known to be extremely heat tolerant and resistantto dessication. Increases in acorn barnacles' abundances occurred throughout thestudy area (Figure 3.2.3.17-2) and were therefore a natural, probably coast-wide,event unrelated to thermal discharge. However, increased settlement, survivorship,persistence, and the downward extension of maximum occurrence in the Diablo Covestations suggest that the abundances of acorn barnacles were enhanced by theelevated water temperatures in Diablo Cove. The plume-related reductions in algalcover in Diablo Cove, particularly in the iridescent seaweed, may also havecontributed to the greater persistence and downward extension of this species'vertical range in the intertidal. Before power plant operation, this seaweed probablyinhibited settlement of barnacles on these stations by the 'whiplashing' of its bladeson the substrata. The largest increases in acorn barnacle coverage occurred atTEMP intertidal Station 10, the station with the highest recorded temperatures andthe lowest amount of algal cover. Based on these changes, acorn barnacles appear tobe not only tolerant of the warm water plume, but probably enhanced by it.
E8-316.0 3-121
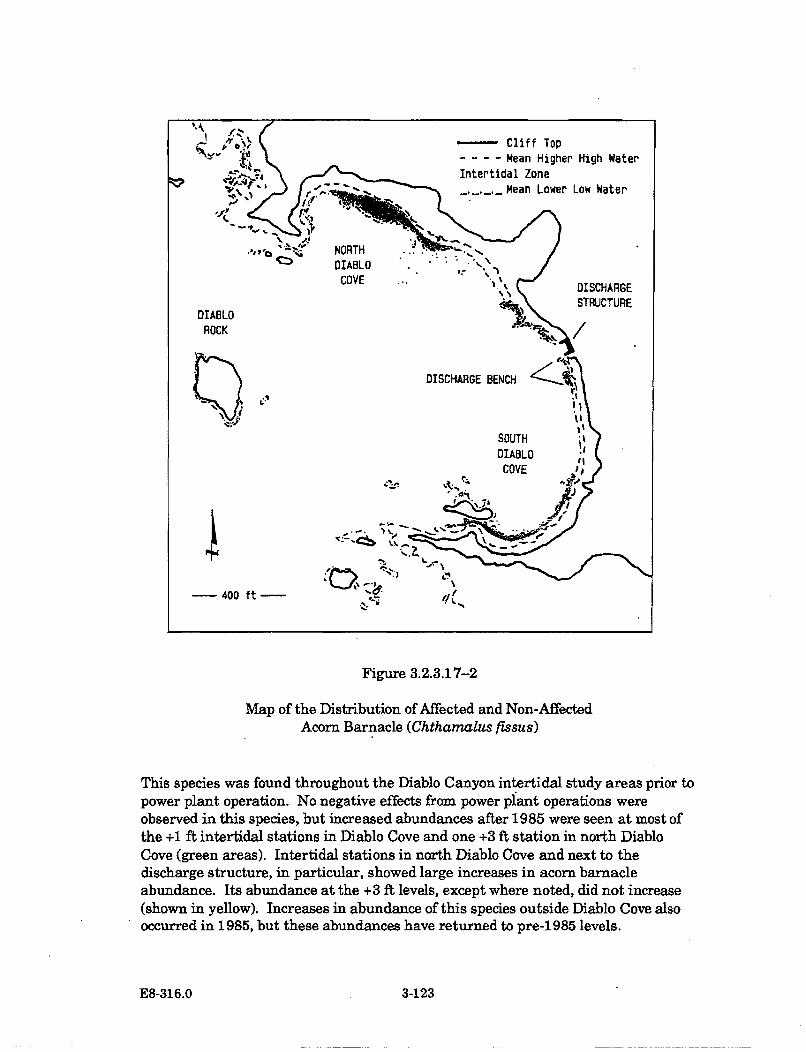
Figure 3.2.3.17-2
Map of the Distribution of Affected and Non-AffectedAcorn Barnacle (Chthamalus fissus)
This species was found throughout the Diablo Canyon intertidal study areas prior topower plant operation. No negative effects from power plant operations wereobserved in this species, but increased abundances after 1985 were seen at most ofthe +1 ft intertidal stations in Diablo Cove and one +3 ft station in north DiabloCove (green areas). Intertidal stations in north Diablo Cove and next to thedischarge structure, in particular, showed large increases in acorn barnacleabundance. Its abundance at the +3 ft levels, except where noted, did not increase(shown in yellow). Increases in abundance of this species outside Diablo Cove alsooccurred in 1985, but these abundances have returned to pre-1985 levels.
E8-316.0 3-123
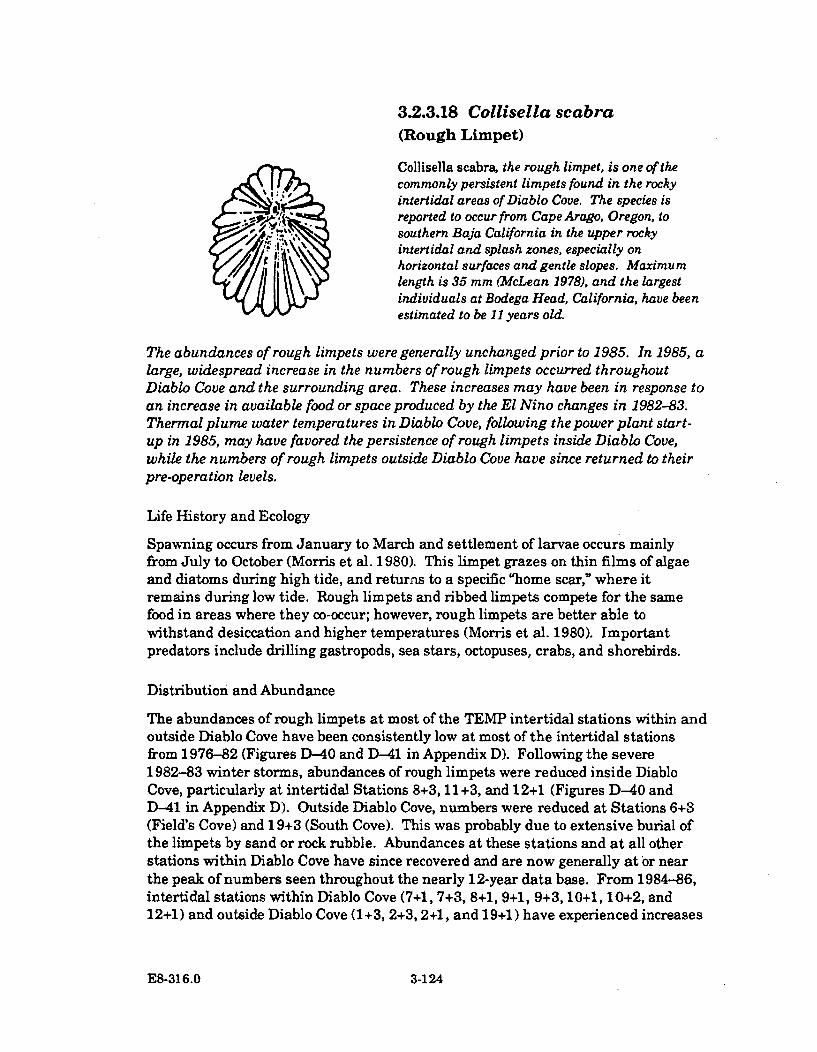
3.2.3.18 Collisella scabra(Rough Limpet)
Collisella scabra, the rough limpet, is one of thecommonly persistent limpets found in the rockyintertidal areas of Diablo Cove. The species isreported to occur from Cape Arago, Oregon, tosouthern Baja California in the upper rockyintertidal and splash zones, especially on/horizontal surfaces and gentle slopes. Maximumlength is 35 mm (McLean 1978), and the largestindividuals at Bodega Head, California, have beenestimated to be 11 years old.
The abundances of rough limpets were generally unchanged prior to 1985. In 1985, alarge, widespread increase in the numbers of rough limpets occurred throughoutDiablo Cove and the surrounding area. These increases may have been in response toan increase in available food or space produced by the El Nino changes in 1982-83.Thermal plume water temperatures in Diablo Cove, following the power plant start-up in 1985, may have favored the persistence of rough limpets inside Diablo Cove,while the numbers of rough limpets outside Diablo Cove have since returned to theirpre-operation levels.
Life History and Ecology
Spawning occurs from January to March and settlement of larvae occurs mainlyfrom July to October (Morris et al. 1980). This limpet grazes on thin films of algaeand diatoms during high tide, and returns to a specific "home scar," where itremains during low tide. Rough limpets and ribbed limpets compete for the samefood in areas where they co-occur; however, rough limpets are better able towithstand desiccation and higher temperatures (Morris et al. 1980). Importantpredators include drilling gastropods, sea stars, octopuses, crabs, and shorebirds.
Distribution and Abundance
The abundances of rough limpets at most of the TEMP intertidal stations within andoutside Diablo Cove have been consistently low at most of the intertidal stationsfrom 1976-82 (Figures D-40 and D-41 in Appendix D). Following the severe1982-83 winter storms, abundances of rough limpets were reduced inside DiabloCove, particularly at intertidal Stations 8+3, 11+3, and 12+1 (Figures D-40 andD-41 in Appendix D). Outside Diablo Cove, numbers were reduced at Stations 6+3(Field's Cove) and 19+3 (South Cove). This was probably due to extensive burial ofthe limpets by sand or rock rubble. Abundances at these stations and at all otherstations within Diablo Cove have since recovered and are now generally at or nearthe peak of numbers seen throughout the nearly 12-year data base. From 1984-86,intertidal stations within Diablo Cove (7+1, 7+3, 8+1, 9+1, 9+3, 10+1, 10+2, and12+1) and outside Diablo Cove (1+3, 2+3, 2+1, and 19+1) have experienced increases
E8-316.0 3-124
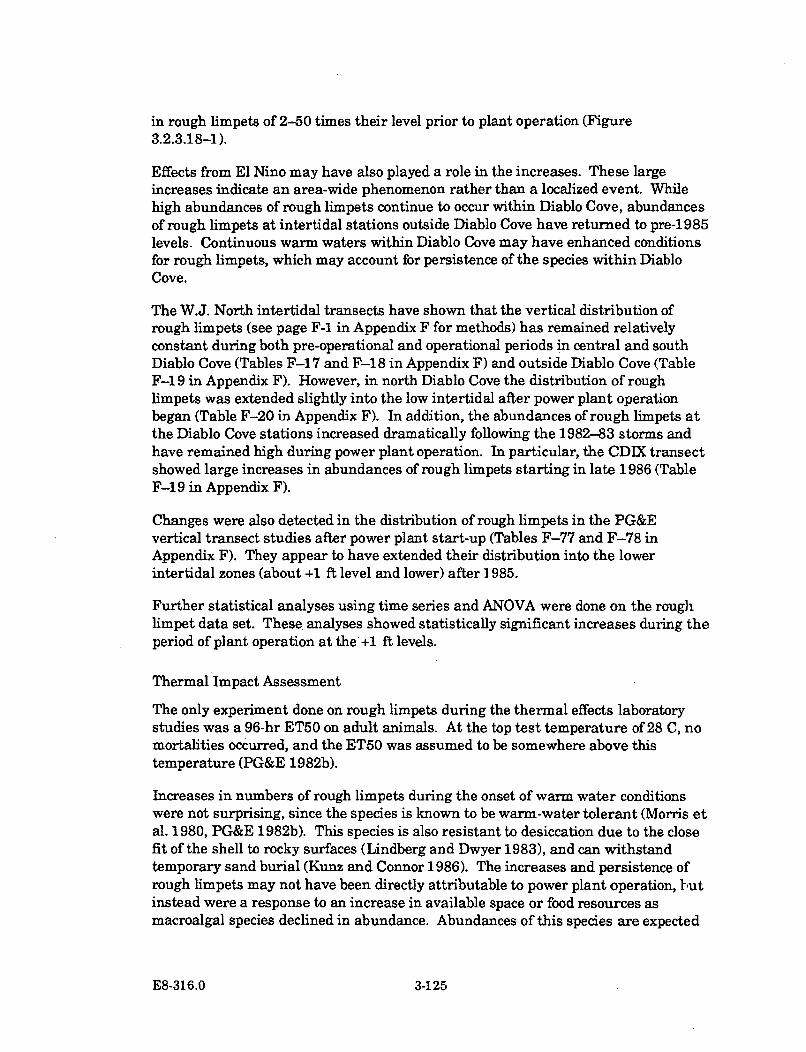
in rough limpets of 2-50 times their level prior to plant operation (Figure3.2.3.18-1).
Effects from El Nino may have also played a role in the increases. These largeincreases indicate an area-wide phenomenon rather than a localized event. Whilehigh abundances of rough limpets continue to occur within Diablo Cove, abundancesof rough limpets at intertidal stations outside Diablo Cove have returned to pre-1985levels. Continuous warm waters within Diablo Cove may have enhanced conditionsfor rough limpets, which may account for persistence of the species within DiabloCove.
The W.J. North intertidal transects have shown that the vertical distribution ofrough limpets (see page F-1 in Appendix F for methods) has remained relativelyconstant during both pre-operational and operational periods in central and southDiablo Cove (Tables F-17 and F-18 in Appendix F) and outside Diablo Cove (TableF-1 9 in Appendix F). However, in north Diablo Cove the distribution of roughlimpets was extended slightly into the low intertidal after power plant operationbegan (Table F-20 in Appendix F). In addition, the abundances of rough limpets atthe Diablo Cove stations increased dramatically following the 1982-83 storms andhave remained high during power plant operation. In particular, the CDIX transectshowed large increases in abundances of rough limpets starting in late 1986 (TableF-19 in Appendix F).
Changes were also detected in the distribution of rough limpets in the PG&Evertical transect studies after power plant start-up (Tables F-77 and F-78 inAppendix F). They appear to have extended their distribution into the lowerintertidal zones (about +1 ft level and lower) after 1985.
Further statistical analyses using time series and ANOVA were done on the roughlimpet data set. These analyses showed statistically significant increases during theperiod of plant operation at the +1 ft levels.
Thermal Impact Assessment
The only experiment done on rough limpets during the thermal effects laboratorystudies was a 96-hr ET50 on adult animals. At the top test temperature of 28 C, nomortalities occurred, and the ET50 was assumed to be somewhere above thistemperature (PG&E 1982b).
Increases in numbers of rough limpets during the onset of warm water conditionswere not surprising, since the species is known to be warm-water tolerant (Morris etal. 1980, PG&E 1982b). This species is also resistant to desiccation due to the closefit of the shell to rocky surfaces (Lindberg and Dwyer 1983), and can withstandtemporary sand burial (Kunz and Connor 1986). The increases and persistence ofrough limpets may not have been directly attributable to power plant operation, 1'utinstead were a response to an increase in available space or food resources asmacroalgal species declined in abundance. Abundances of this species are expected
E8-316.0 3-125
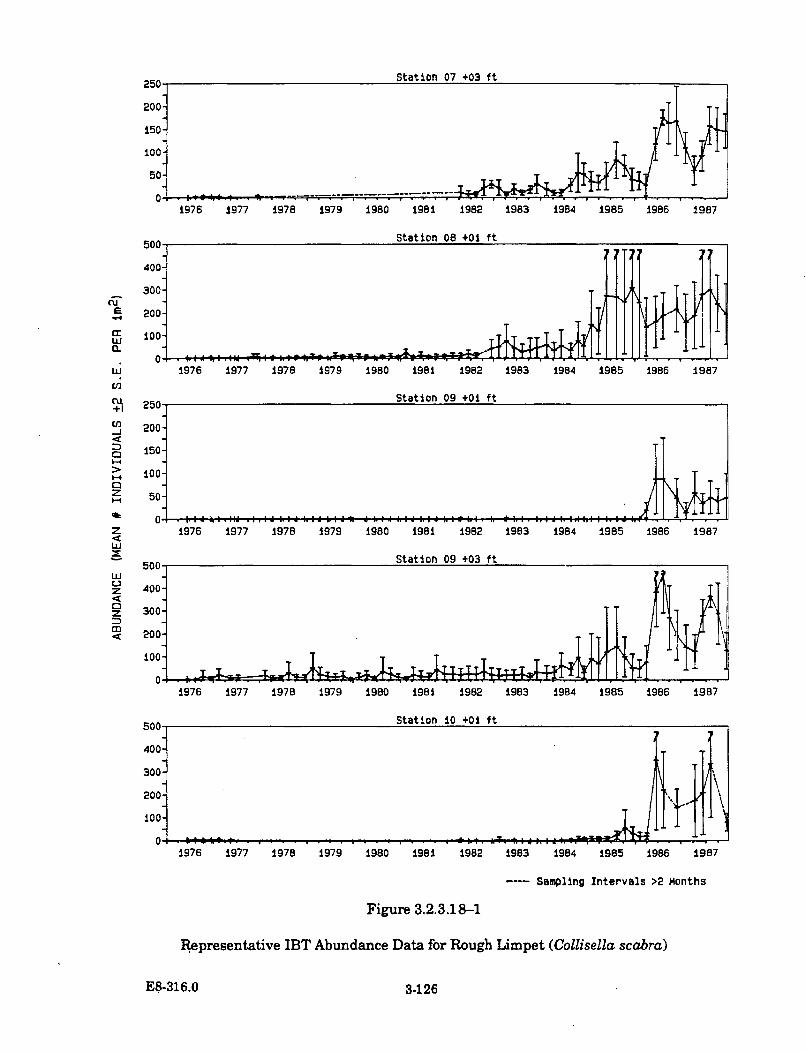
1976 1977 1978 1979 1980 1981 1982 1983 1984 1985 1986 1987
CU
0~
w
LId
0zC3.
z4
200-
100-
0-1976 1977 1978 1979 1980 1981 1982 1983 1984 1985 1986 1987
Station 09 +01 ft
200-
150-
100-
50-
1976 1977 197B 1979 1980 1981 1982 1983 1984 1985 1986 1987
500 Station 09 +03 ft
400-
300-
200
NO-
0oo 4P .f.,
1976 1977 197B 1979 1980 1981 1982 1983 1984 1985 1986 1987
500 Station 10 +01 ft
400-
300-
200-
100-
1976 1977 1978 1979 1980 1981 1982 1983 1984 1985 1986 1987
---- Sampling Intervals >2 Months
Figure 3.2.3.18-1
Representative IBT Abundance Data for Rough Limpet (Collisella scabra)
E8-316.0 3-126

to remain at high levels within Diablo Cove, particularly in north Diablo Cove(Figure 3.2.3.18-2).
E8-316.0 3-127

Figure 3.2.3.18-2
Map of the Distribution of Affected and Non-AffectedRough Limpet (Collisella scabra)
Prior to power plant operation, rough limpets occurred throughout Diablo CoveTEMP intertidal study stations. No power plant-related decreases were seen, butincreases in this species were observed in Diablo Cove after power plant operationbegan (green areas). Areas unaffected by the power plant are shown in yellow.Outside Diablo Cove in 1985 large increases were also seen, but these increases didnot persist as within the cove.
E8-316.0 3-128
3.2.3.19 Haliotis cracherodii(Black Abalone)
Haliotis cracherodii, the black abalone, iscommonly found beneath boulders and in bedrockcrevices in the Diablo Cove intertidal, and isparticularly abundant on the cove headland areas.The species, one of the smallest of the eight speciesof California abalones, has a dark blue to blackshell usually 5-6 in. in length. It ranges fromOregon to Baja California in rocky intertidal ledgesand in crevices down to subtidal depths of 20 ft.The lower market value of the black abalone madeit of marginal commercial importance until, in1973-74, the harvest of black abalone exceeded thatof the red abalone, Haliotis rufescens, (Section3.2.3.20).
Power plant operation did not affect black abalone abundance in most intertidalareas of Diablo Cove. The aggregations at the headlands of Diablo Cove and the areaof large boulders north of Diablo Creek have not been affected by plant operation.The numbers of abalone declined in the areas immediately adjacent to the dischargestructure, possibly the result of elevated temperatures and increased water velocity.
Life History and Ecology
Sexes are separate, and fertilization and initial larval development take place in thewater column. Breeding occurs generally between spring and fall and may becontrolled by photoperiod rather than seasonal temperature changes. In newlysettled individuals, the appearance of the first respiratory notch is the beginning ofthe juvenile stage, and the adult stage is reached at the onset of sexual maturity.Juvenile black abalone from southern California show field growth rates of 26-30mm (about 1 in.) per year for the first two years of life, but growth rates amongindividuals, juveniles and adults, within a population, are extremely variable. Blackabalone can be very motile. Some adult black abalone in the Diablo Canyon studyarea have remained in one spot for up to two years, then moved several meterswithin one week. Juvenile abalone typically move more than adults.
Black abalone are herbivorous and eat a wide variety of algal species, but show apreference for kelps. Drift algae are their primary food source, so they do not exertgrazing pressure on the attached algal community. Predators of juvenile and adultblack abalone include cabezon, sheephead, sea otters, the sea stars Pycnopodiahelianthoides and Pisaster ochraceus, and the rock crab, Cancer antennarius. It islikely that purple urchins, Strongylocentrotus purpuratus, compete for food withblack abalone, since both are drift algal feeders.
E8-316.0 3-129
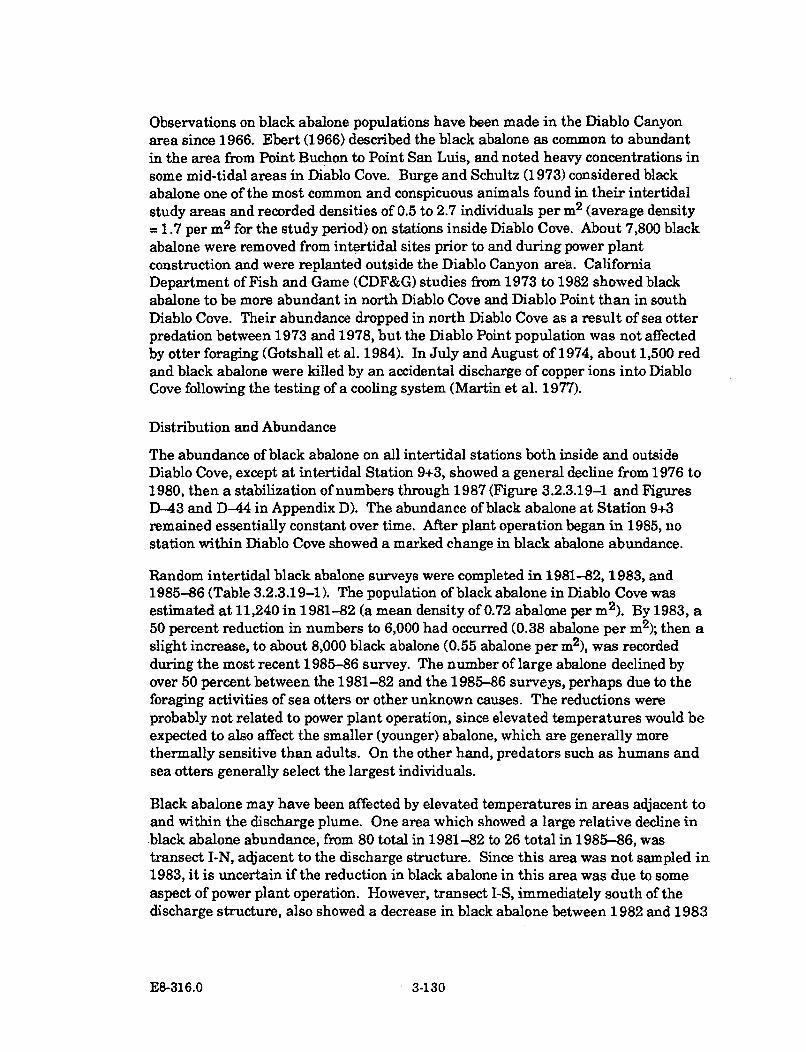
Observations on black abalone populations have been made in the Diablo Canyonarea since 1966. Ebert (1966) described the black abalone as common to abundantin the area from Point Buchon to Point San Luis, and noted heavy concentrations insome mid-tidal areas in Diablo Cove. Burge and Schultz (1973) considered blackabalone one of the most common and conspicuous animals found in their intertidalstudy areas and recorded densities of 0.5 to 2.7 individuals per m2 (average density= 1.7 per m2 for the study period) on stations inside Diablo Cove. About 7,800 blackabalone were removed from intertidal sites prior to and during power plantconstruction and were replanted outside the Diablo Canyon area. CaliforniaDepartment of Fish and Game (CDF&G) studies from 1973 to 1982 showed blackabalone to be more abundant in north Diablo Cove and Diablo Point than in southDiablo Cove. Their abundance dropped in north Diablo Cove as a result of sea otterpredation between 1973 and 1978, but the Diablo Point population was not affectedby otter foraging (Gotshall et al. 1984). In July and August of 1974, about 1,500 redand black abalone were killed by an accidental discharge of copper ions into DiabloCove following the testing of a cooling system (Martin et al. 1977).
Distribution and Abundance
The abundance of black abalone on all intertidal stations both inside and outsideDiablo Cove, except at intertidal Station 9+3, showed a general decline from 1976 to1980, then a stabilization of numbers through 1987 (Figure 3.2.3.19-1 and FiguresD--43 and D-44 in Appendix D). The abundance of black abalone at Station 9+3remained essentially constant over time. After plant operation began in 1985, nostation within Diablo Cove showed a marked change in black abalone abundance.
Random intertidal black abalone surveys were completed in 1981-82, 1983, and1985-86 (Table 3.2.3.19-1). The population of black abalone in Diablo Cove wasestimated at 11,240 in 1981-82 (a mean density of 0.72 abalone per m2 ). By 1983, a50 percent reduction in numbers to 6,000 had occurred (0.38 abalone per m2); then aslight increase, to about 8,000 black abalone (0.55 abalone per m2), was recordedduring the most recent 1985-86 survey. The number of large abalone declined byover 50 percent between the 1981-82 and the 1985-86 surveys, perhaps due to theforaging activities of sea otters or other unknown causes. The reductions wereprobably not related to power plant operation, since elevated temperatures would beexpected to also affect the smaller (younger) abalone, which are generally morethermally sensitive than adults. On the other hand, predators such as humans andsea otters generally select the largest individuals.
Black abalone may have been affected by elevated temperatures in areas adjacent toand within the discharge plume. One area which showed a large relative decline inblack abalone abundance, from 80 total in 1981-82 to 26 total in 1985-86, wastransect I-N, adjacent to the discharge structure. Since this area was not sampled in1983, it is uncertain if the reduction in black abalone in this area was due to someaspect of power plant operation. However, transect I-S, immediately south of thedischarge structure, also showed a decrease in black abalone between 1982 and 1983
E8-316.0 3-i130
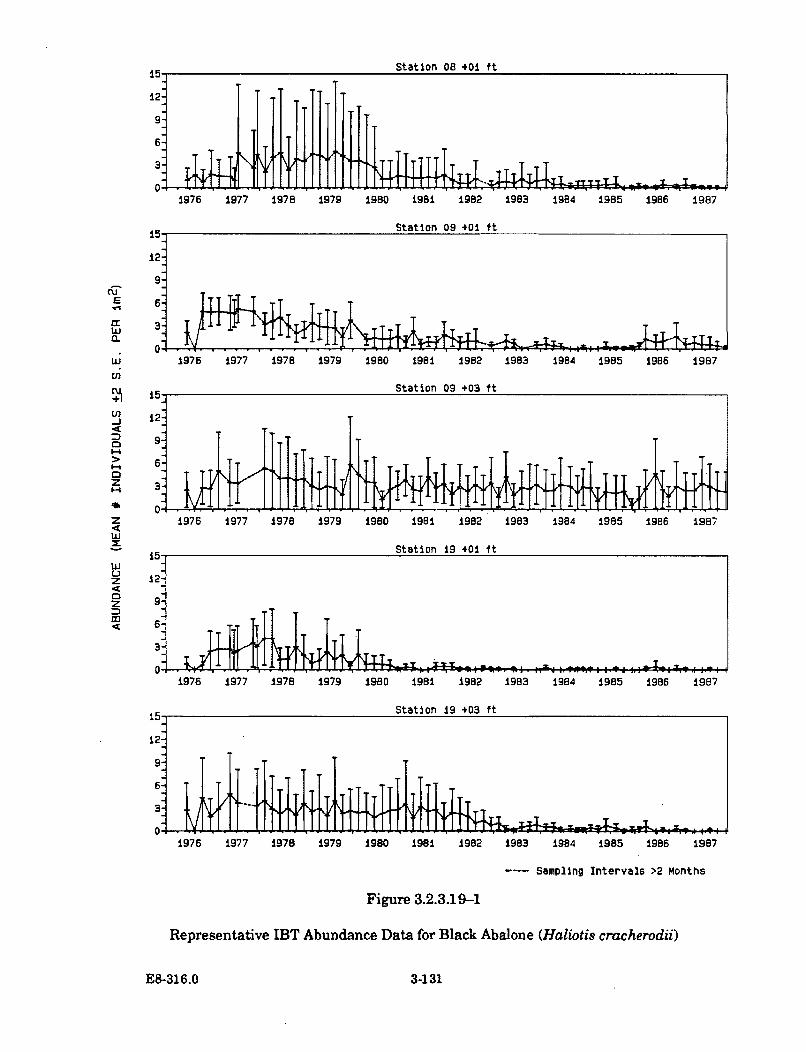
1976 1977 1978 1979 19BO 1981 1982 1983 1984 1985 1986 1987
CuE
1976 1977 1978 1979 1980 1981 1982 1983 1984 1985 1986 1987
J 15 Station 09 +03 ft
U) 12-
0•1-4
Z 0•
Z 1976 1977 1978 1979 19BO 1981 1982 1983 1984 1985 1986 1987LJJx 15 Station 19 +01 ft
5-uJJUz 12-
z 9-
.m 6
3
1976 1977 1978 1979 1980 198I 1982 1983 1984 1985 1986 1987
15 - Stat.ion 19 +03 ft
612
1976 1977 1978 1979 1980 1981 1982 1983 i9B4 1985 1986 1987
---- Sampling Intervals >2 Months
Figure 3.2.3.19-1
Representative IBT Abundance Data for Black Abalone (Haliotis cracherod ii)
E8-316.0 3-131
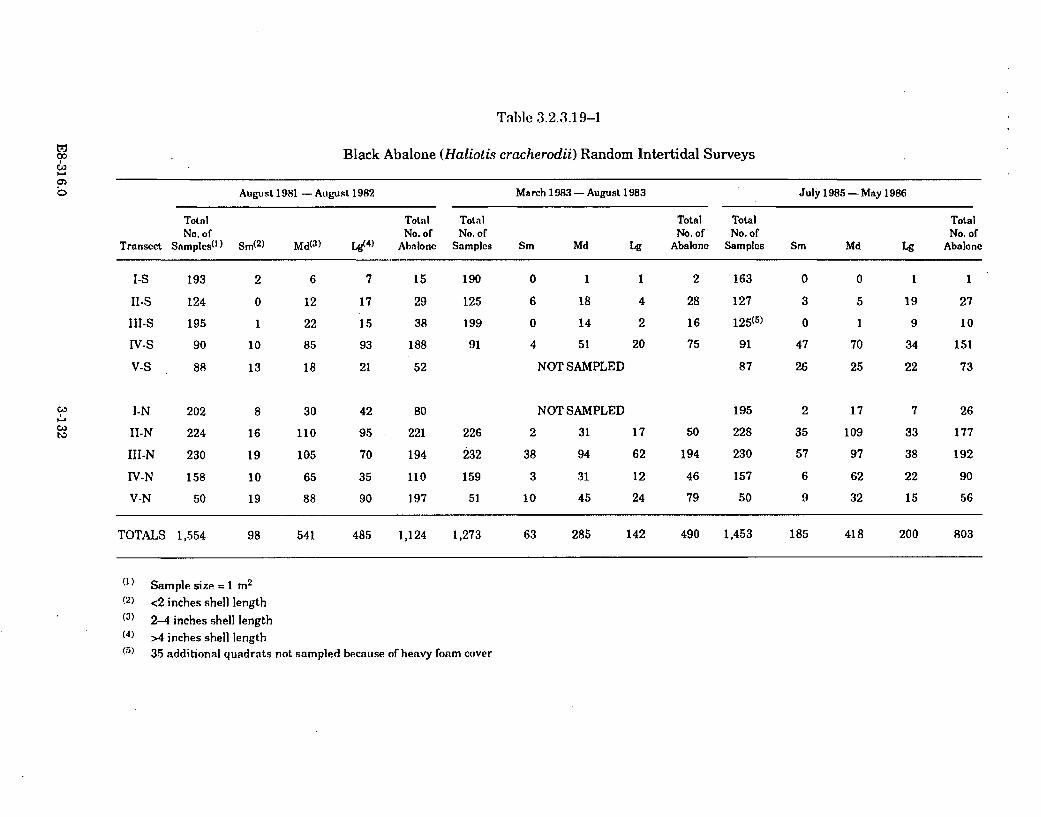
Table 3.2.3.19-1.
til Black Abalone (Haliotis cracherodii) Random Intertidal Surveys
August 1981 - August 1982 March 1983 - August 1983 July 1985 - May 1986
Total Total Total Total Total TotalNo. of No. of No. of No. of No. of No. of
Transect Samples0 ) Sm(2) Md(3) Lg(4) Abalone Samples Sm Md Lg Abalone Samples Sm Md Lg Abalone
I-S 193 2 6 7 15 190 0 1 1 2 163 0 0 1 1
II-S 124 0 12 17 29 125 6 18 4 28 127 3 5 19 27
III-S 195 1 22 15 38 199 0 14 2 16 125(5) 0 1 9 10
NV-S 90 10 85 93 188 91 4 51 20 75 91 47 70 34 151
V-S 88 13 18 21 52 NOT SAMPLED 87 26 25 22 73
I-N 202 8 30 42 80 NOT SAMPLED 195 2 17 7 26
11-N 224 16 110 95 221 226 2 31 17 50 228 35 109 33 177
11-N 230 19 105 70 194 232 38 94 62 194 230 57 97 38 192
IV-N 158 10 65 35 110 159 3 31 12 46 157 6 62 22 90
V-N 50 19 88 90 197 51 10 45 24 79 50 9 32 15 56
TOTALS 1,554 98 541 485 1,124 1,273 63 285 142 490 1,453 185 418 200 803
C,,I-.
(1) Sample size= 1 m2
(2) <2 inches shell length
(3) 2-4 inches shell length(4) >4 inches shell length
) 35 additional quadrats not sampled because of heavy foam cover
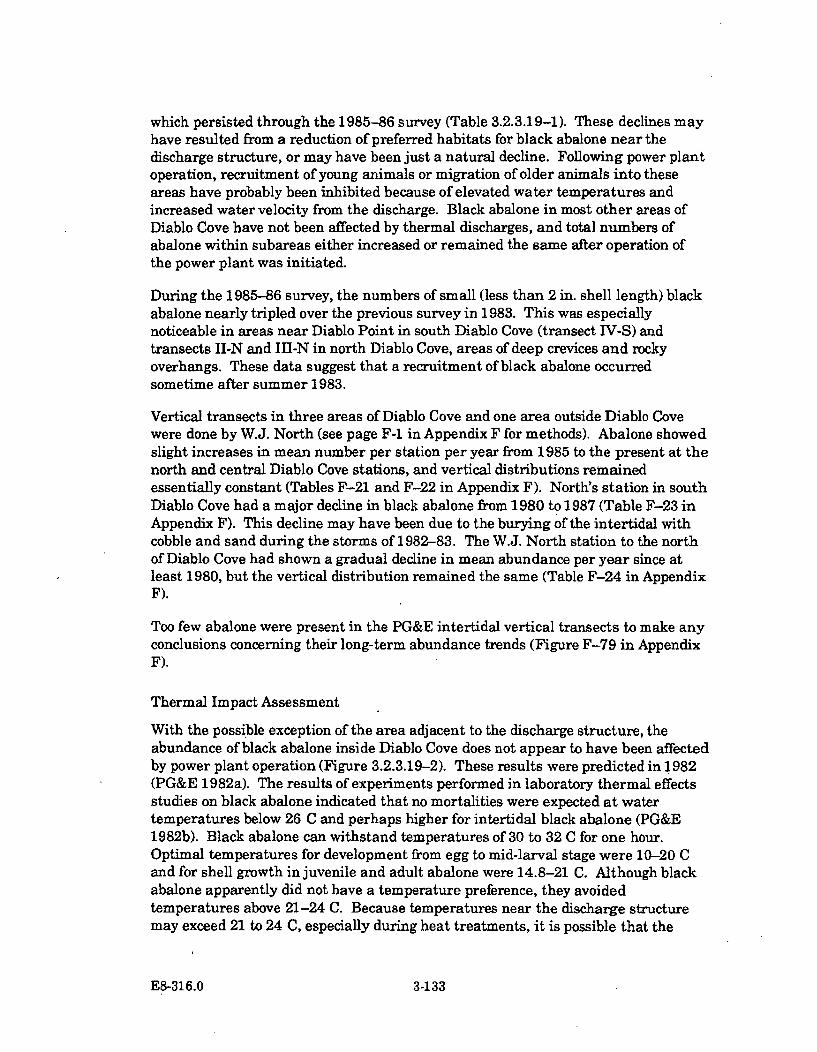
which persisted through the 1985-86 survey (Table 3.2.3.19-1). These declines mayhave resulted from a reduction of preferred habitats for black abalone near thedischarge structure, or may have been just a natural decline. Following power plantoperation, recruitment of young animals or migration of older animals into theseareas have probably been inhibited because of elevated water temperatures andincreased water velocity from the discharge. Black abalone in most other areas ofDiablo Cove have not been affected by thermal discharges, and total numbers ofabalone within subareas either increased or remained the same after operation ofthe power plant was initiated.
During the 1985-86 survey, the numbers of small (less than 2 in. shell length) blackabalone nearly tripled over the previous survey in 1983. This was especiallynoticeable in areas near Diablo Point in south Diablo Cove (transect TV-S) andtransects II-N and III-N in north Diablo Cove, areas of deep crevices and rockyoverhangs. These data suggest that a recruitment of black abalone occurredsometime after summer 1983.
Vertical transects in three areas of Diablo Cove and one area outside Diablo Covewere done by W.J. North (see page F-1 in Appendix F for methods). Abalone showedslight increases in mean number per station per year from 1985 to the present at thenorth and central Diablo Cove stations, and vertical distributions remainedessentially constant (Tables F-21 and F-22 in Appendix F). North's station in southDiablo Cove had a major decline in black abalone from 1980 to 1987 (Table F-23 inAppendix F). This decline may have been due to the burying of the intertidal withcobble and sand during the storms of 1982-83. The W.J. North station to the northof Diablo Cove had shown a gradual decline in mean abundance per year since atleast 1980, but the vertical distribution remained the same (Table F-24 in AppendixF).
Too few abalone were present in the PG&E intertidal vertical transects to make anyconclusions concerning their long-term abundance trends (Figure F-79 in AppendixF).
Thermal Impact Assessment
With the possible exception of the area adjacent to the discharge structure, theabundance of black abalone inside Diablo Cove does not appear to have been affectedby power plant operation (Figure 3.2.3.19-2). These results were predicted in 1982(PG&E 1982a). The results of experiments performed in laboratory thermal effectsstudies on black abalone indicated that no mortalities were expected at watertemperatures below 26 C and perhaps higher for intertidal black abalone (PG&E1982b). Black abalone can withstand temperatures of 30 to 32 C for one hour.Optimal temperatures for development from egg to mid-larval stage were 10-20 Cand for shell growth in juvenile and adult abalone were 14.8-21 C. Although blackabalone apparently did not have a temperature preference, they avoidedtemperatures above 21-24 C. Because temperatures near the discharge structuremay exceed 21 to 24 C, especially during heat treatments, it is possible that the
E8-316.0 3-133
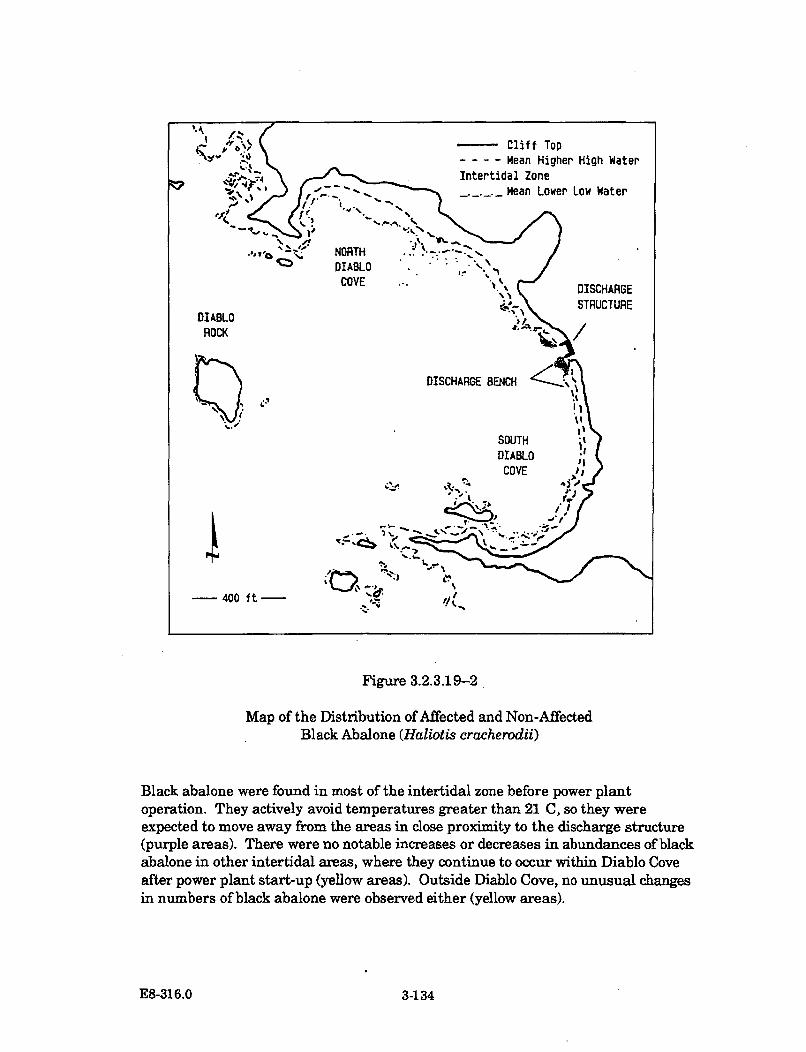
Figure 3.2.3.19-2
Map of the Distribution of Affected and Non-AffectedBlack Abalone (Haliotis cracherodii)
Black abalone were found in most of the intertidal zone before power plantoperation. They actively avoid temperatures greater than 21 C, so they wereexpected to move away from the areas in close proximity to the discharge structure(purple areas). There were no notable increases or decreases in abundances of blackabalone in other intertidal areas, where they continue to occur within Diablo Coveafter power plant start-up (yellow areas). Outside Diablo Cove, no unusual changesin numbers of black abalone were observed either (yellow areas).
E8-316.0 3-134

reduction in black abalone from the areas adjacent to the discharge structurebetween 1983 and 1985-86 was the result of migration out of an area wheretemperatures exceeded 21 C. Except near the discharge structure, elevatedtemperatures do not appear to have affected survival of juvenile abalone; theobserved recruitment of juvenile abalone could have occurred during 1984 when thepower plant was undergoing testing and heated water was being discharged intoDiablo Cove.
E8-316.0 3-135
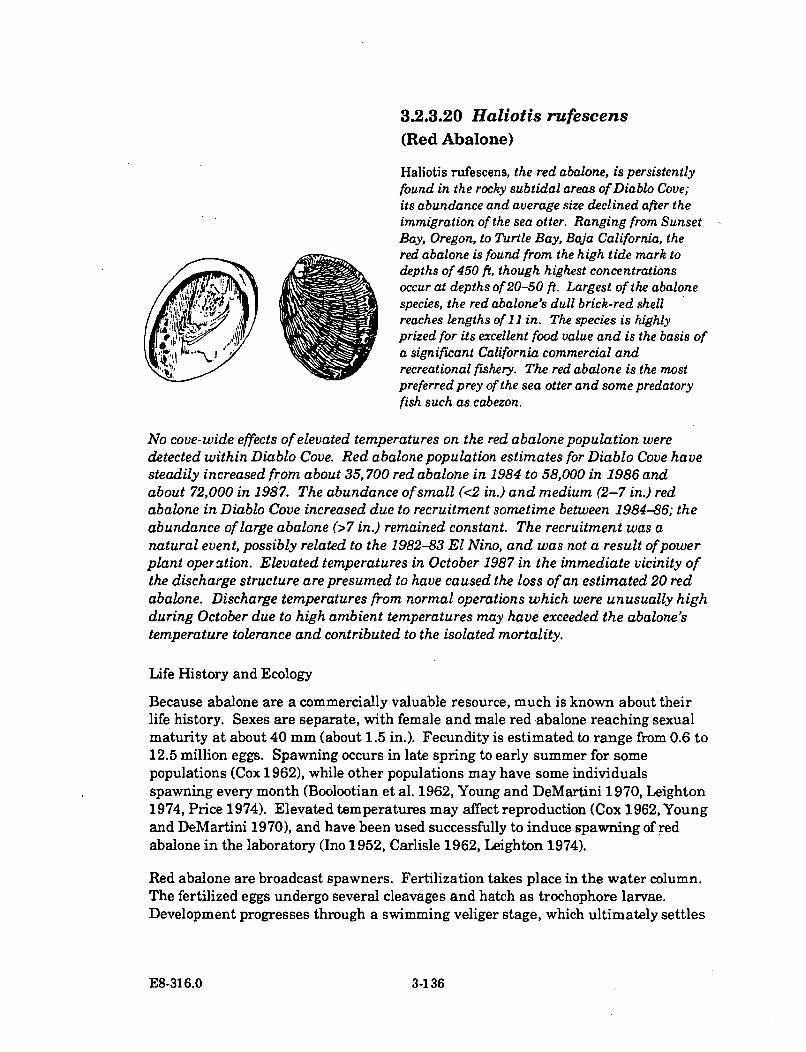
3.2.3.20 Haliotis rufescens(Red Abalone)
Haliotis rufescens, the red abalone, is persistentlyfound in the rocky subtidal areas of Diablo Cove;its abundance and average size declined after theimmigration of the sea otter. Ranging from SunsetBay, Oregon, to Turtle Bay, Baja California, thered abalone is found from the high tide mark todepths of 450 ft, though highest concentrations
IIoccur at depths of 20-50 ft. Largest of the abaloneW species, the red abalone's dull brick-red shell
reaches lengths of 11 in. The species is highlyprized for its excellent food value and is the basis ofa significant California commercial andrecreational fishery. The red abalone is the mostpreferred prey of the sea otter and some predatoryfish such as cabezon.
No cove-wide effects of elevated temperatures on the red abalone population weredetected within Diablo Cove. Red abalone population estimates for Diablo Cove havesteadily increased from about 35,700 red abalone in 1984 to 58,000 in 1986 andabout 72,000 in 1987. The abundance of small (<2 in.) and medium (2-7 in.) redabalone in Diablo Cove increased due to recruitment sometime between 1984-86; theabundance of large abalone (>7 in.) remained constant. The recruitment was anatural event, possibly related to the 1982-83 El Nino, and was not a result of powerplant operation. Elevated temperatures in October 1987 in the immediate vicinity ofthe discharge structure are presumed to have caused the loss of an estimated 20 redabalone. Discharge temperatures from normal operations which were unusually highduring October due to high ambient temperatures may have exceeded the abalone'stemperature tolerance and contributed to the isolated mortality.
Life History and Ecology
Because abalone are a commercially valuable resource, much is known about theirlife history. Sexes are separate, with female and male red abalone reaching sexualmaturity at about 40 mm (about 1.5 in.). Fecundity is estimated to range from 0.6 to12.5 million eggs. Spawning occurs in late spring to early summer for somepopulations (Cox 1962), while other populations may have some individualsspawning every month (Boolootian et al. 1962, Young and DeMartini 1970, Leighton1974, Price 1974). Elevated temperatures may affect reproduction (Cox 1962, Youngand DeMartini 1970), and have been used successfully to induce spawning of redabalone in the laboratory (Ino 1952, Carlisle 1962, Leighton 1974).
Red abalone are broadcast spawners. Fertilization takes place in the water column.The fertilized eggs undergo several cleavages and hatch as trochophore larvae.Development progresses through a swimming veliger stage, which ultimately settles
E8-316.0 3-136
and metamorphoses into crawling postlarvae. Settlement ends the larval(planktonic) stage, and deposition of the peristomal shell begins the postlarval stage.Formation of the first respiratory pore (notch stage) marks the beginning of thejuvenile stage, which culminates in the attainment of sexual maturity (Leighton1974).
In the laboratory, red abalone postlarvae attained the "notch" (first juvenile) stage in30 to 40 days at 16-24 C (Leighton 1974). The mean size of juveniles 3.7 months oldwas 4.4 mm, and the size range was 2.6-6.1 mm. After one year in culture the meansize of juveniles was 15.6 mm, but the size range was 9.9-20.0 mm. McBeth (1972)reported that juvenile red abalone grew from an initial size of 6 mm toapproximately 26 mm in one year. There is little information available on growthrates of natural populations of adult red abalone, but it appears that growth isirregular throughout the year. Due to a high degree of variability of individualgrowth rates, age and size cannot be related meaningfully in populations of redabalone.
Red abalone are grazing herbivores which feed primarily on macroalgae, particularlykelps. Both the red urchin and the purple urchin are potential competitors for food.
The main predator of adult red abalone in central California is the sea otter.Abalone in areas subjected to predation by sea otters are restricted to deep cracksand crevices. Other predators of juveniles and smaller abalone include rock crab,octopus, sea stars, sheephead, and cabezon.
Red abalone have been the mainstay of a commercial fishery in California dating tothe 1850's (Cox 1962). Commercial landings throughout the state have shown ageneral decline since 1957 (Price 1974). Annual landings from Morro Bay to AvilaBeach have declined steadily from 1971 to 1975. Gotshall et al. (1977) attributedthis decline to increased otter predation. In addition to their commercialimportance, red abalone sustain a significant sport fishery in parts of the state.
Observations on red abalone populations in the Diablo Canyon area have been madesince 1966, including two studies made prior to construction of the power plant.Ebert (1966) recorded a "substantial" population of red abalone at several stationswithin Diablo Cove. The stations north and south of Diablo Cove had "substantiallyhigher numbers of red abalone than the Diablo Canyon area."
North (1969) described five zones in Diablo Cove: deep urchin barrens (deeper than50-60 ft); brown forest (50-60 ft to 25 ft); shallow urchin barrens (25 ft to 10 ft);shallow subtidal (10 ft to lower intertidal); and intertidal zone. Ebert and Clark (inNorth 1969) stated that Diablo Cove was considered only marginal fishing territoryby commercial abalone divers, probably due to extensive areas dominated byurchins. North (1969) did not mention seeing any abalone in the deep barren zone.He observed the highest densities of red abalone in the brown forest zone, and thiswas the only area where juvenile red abalone were found by him. Some red abalonewere in the open in shallow barren areas and appeared to be in direct competition
E8-316.0 3-137
with urchins for food. There was no mention of red abalone in the shallow subtidalareas. North (1969) concluded that the main portion of the red abalone populationin Diablo Cove was at depths below 25 ft.
Disruption of the intake cove and Diablo Cove by construction activities started in1970. To avoid or minimize the adverse effects of construction activities, abalonewere collected from construction sites under the auspices of California Departmentof Fish and Game (CDF&G) biologists and wardens during 1969-72. A total of 30transplants were made from the intake and discharge sites. About 15,400 abalonewere removed, including 7,500 red abalone, and were replanted outside the DiabloCanyon area.
Burge and Schultz (1973) studied intertidal and subtidal areas in and around DiabloCanyon from 1970-71. They concluded that intertidal and subtidal depths to 20 ftalong the Diablo Canyon coastline were excellent habitat for the substantialnumbers of red abalone. On their 20 ft transect inside Diablo Cove there was anaverage density of 1.29 red abalone per m2 , with similar densities throughout theshallow water zone of Diablo Cove. As depth increased past 20 ft inside Diablo Cove,abalone habitat generally declined in quality, but localized beds of red abalone wereobserved in some deeper sections of the cove.
In July and August, 1974, accidental discharges of copper ion into Diablo Covefollowing the testing of cooling water pumps resulted in the loss of an estimated1,500 red and black abalone (Martin et al. 1977). The effect of copper on abalonewas most severe in south Diablo Cove.
Sea otters moved into the Diablo Canyon area in 1974. CDF&G biologists monitoreda decline in red abalone from foraging activities of sea otters which began in summer1974 and extended over both permanent and randomly located 30 m 2 stations withinDiablo Cove (Gotshall et al. 1978). By CDF&G estimates, the 40 otters in thevicinity of Diablo Cove ate 50 to 70 abalone per day. At the time that the sea ottermoved into Diablo Cove, the subtidal red abalone population was at a very low level(Gotshall et al. 1984). In 1976 and 1977, CDF&G biologists recorded an increase inabalone densities in Diablo Cove, which was attributed to growth of juvenileabalone. CDF&G data from 1976 to 1982 indicated that red abalone in Diablo Covewere scarce, but were more common in the shallow areas (Gotshall et al. 1984).
Distribution and Abundance
TEMP intertidal and subtidal studies took place from 1976-87. Very few redabalone were found at the TEMP intertidal stations (IBT data); instead SAQ andSFQ surveys, random red abalone surveys from subtidal stations, and qualitativeobservations were utilized for the following analyses.
Large red abalone tended to be permanent residents in a specific crevice, andmovements were generally restricted within the crevice. Differences in theabundance of these large abalone at a station from survey to survey may have been
E8-316.0 3-138
due to real differences, (e.g., immigration, emigration, death, or recruitment) or tosampling error. Changes in abundance due to immigration and emigration were notconsidered to be significant, because these large abalone seldom moved outside theirhome crevice. Recruitment events on a subtidal station are not seen as animmediate sharp rise in abalone abundance, but rather as a general increase innumbers over time as small abalone become established in a permanent location andgrow to a size which can more easily be detected.
Abalone encountered by the SFQ sampling were always small and were not residentin the strict sense because they tended to be highly motile. While some quadrats onsome stations had microhabitat features more attractive to juvenile abalone, thereappeared to be a high probability that an individual present in one survey would notbe the same one present in successive surveys in the same quadrat. Therefore, it isassumed that juvenile abalone surveyed by the SFQ method were not the sameindividuals between surveys for a particular quadrat and station, and that the SFQdata reflect recruitment and immigration of juvenile (mainly red) abalone. Althoughtwo other species of abalone, the flat abalone and the threaded abalone, are presentsubtidally in Diablo Cove, they are not common.
Several trends in abundance were seen: subtidal stations in north Diablo Covegenerally had more abalone than stations in south Diablo Cove (Figure 3.2.3.20-1and Tables 3.2.3.20-1,3.2.3.20-2, and 3.2.3.20-3); all stations in south Diablo Coveand at Diablo Rock have had very few or no abalone present throughout the over 11years of sampling (Figure D-45 in Appendix D and Tables 3.2.3.20-1 and3.2.3.20-2). In north Diablo Cove, subtidal Station 8-10 had the highest abundanceduring both pre-operational and operational periods, with an average abundance of2.3 and 3.0 abalone per m 2 per survey, respectively (Table 3.2.3.20-1). At moststations, juveniles increased in abundance slightly, especially at Stations 8-10 and12-10, from the pre-operational to operational periods (Table 3.2.3.20-2). The othertwo subtidal stations in north Diablo Cove, Stations 9-10 and 9-15, showed slightincreases in juvenile and adult red abalone from the pre-operational to theoperational period (Tables 3.2.3.20-1 and 3.2.3.20-2). At Station 9-15 theabundance of red abalone was low during pre-operation and remained low duringthe operational phase, but the frequency of occurrence of abalone more than doubled,from 12.5 percent to 31 percent. It appears likely that the number of red abalonepresent on Station 9-15 did not increase over time, but rather that the abalonewhich were present in the pre-operational period became more obvious during andafter plant start-up, as macroalgal cover decreased or abalone grew in size.
Subtidal Stations 19-10 and 20-20 lie outside Diablo Cove to the south and outsidethe influences of power plant operation. On Station 19-10 both juvenile and adultred abalone were reduced between 1976 and the operational period, and, through1987, had not recovered. Their abundance at this station was always very low,except during the first two surveys. A plausible explanation is that red abalonewere reduced through mortality, perhaps by otter predation, by summer 1977.During the 1982-83 winter storms, particularly the severe March 1983 storm, the
E8-316.0 3-139
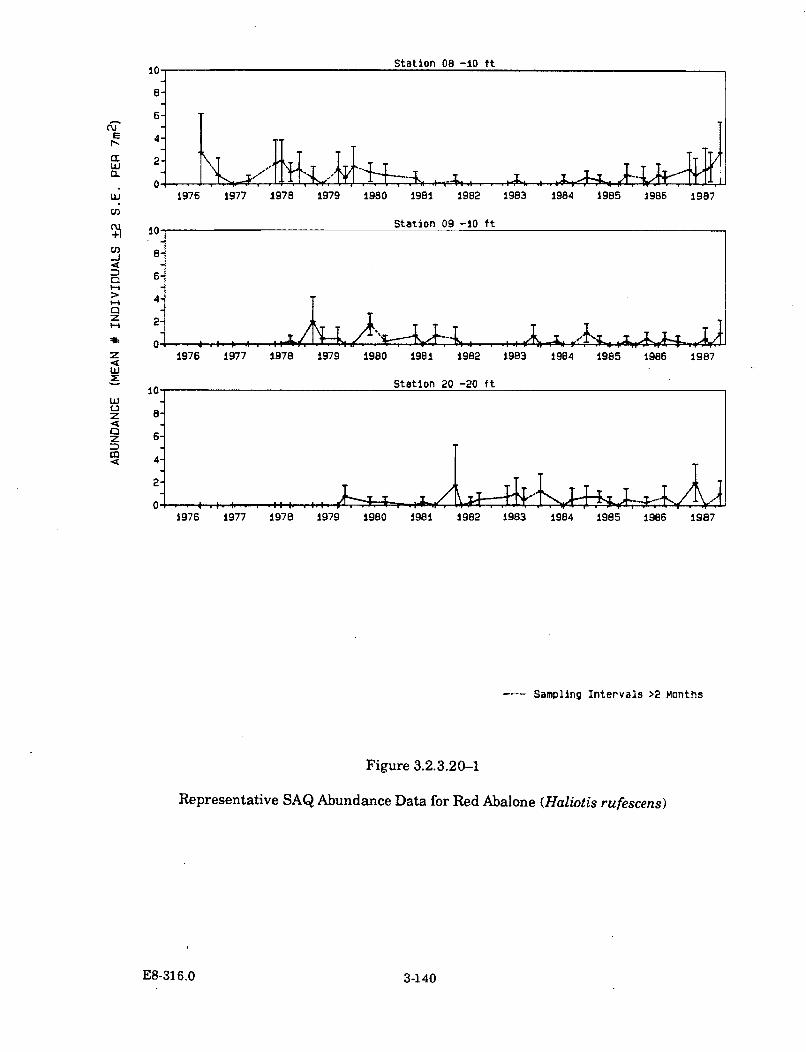
C2
cc
0~
z
nk
z0z
Station 08 -10 ft
6-
4-
2-1976 1977 1978 1979 1980 1981 1982 1983 1984 1985 1986 1987
10 Station 09 -10 ft
8-
6-
4-
2•
0 : . . . . : .I , 0 1
1976 1977 1978 1979 1980 1981 1982 1983 1984 1985 1986 1987
10 Station 20 -20 ft
6-
4-
19,76 '1977" 1'9'78 1979 1980 1981 1982 1983 ±984 1985 1986 1987
Sampling Intervals >2 Months
Figure 3.2.3.20-1
Representative SAQ Abundance Data for Red Abalone (Haliotis rufescens)
E8-316.0 3-140
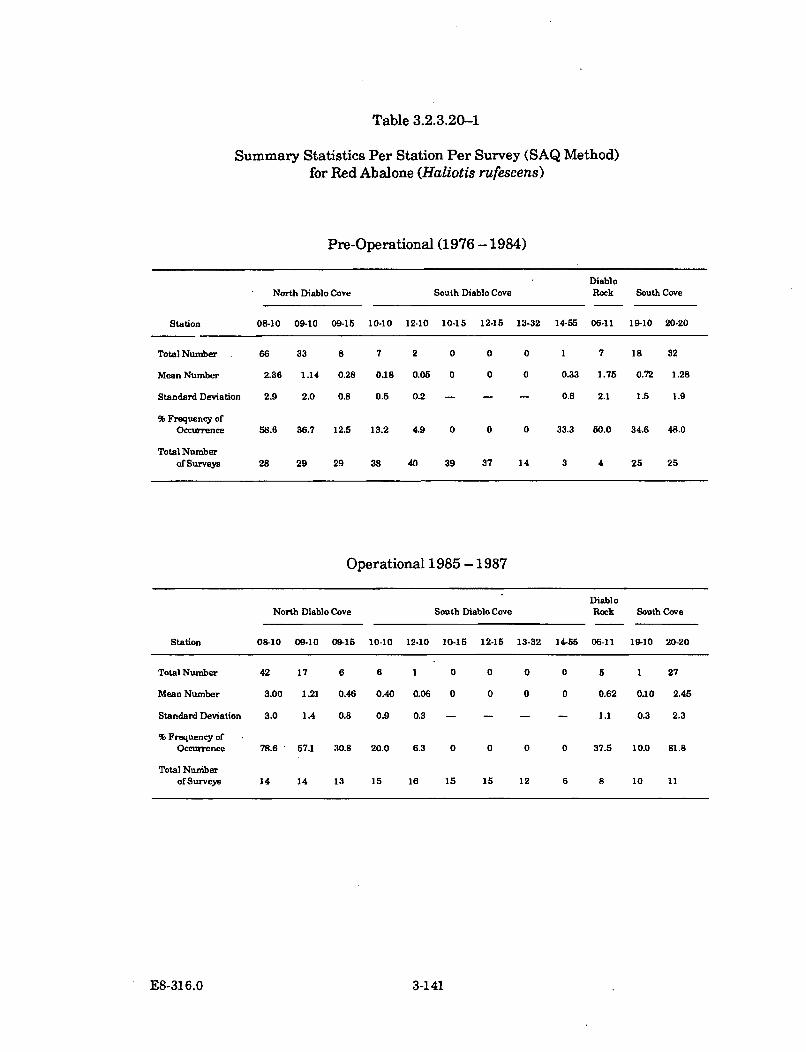
Table 3.2.3.20-1
Summary Statistics Per Station Per Survey (SAQ Method)for Red Abalone (Haliotis rufescens)
Pre-Operational (1976 - 1984)
DiabloNorth Diablo Cove South Diablo Cove Rock South Cove
Station 08-10 09-10 09-15 10-10 12-10 10-15 12-15 13-32 14-55 06-11 19-10 20-20
Total Number 66 33 8 7 2 0 0 0 1 7 18 32
Mean Number 2.36 1.14 0.28 0.18 0.05 0 0 0 0.33 1.75 0.72 1.28
Standard Deviation 2.9 2.0 0.8 0.5 0.2 - - - 0.6 2.1 1.5 1.9
% Frequency ofOccurrence 58.6 36.7 12.5 13.2 4.9 0 0 0 33.3 50.0 34.6 48.0
Total NumberofSurveys 28 29 29 38 40 39 37 14 3 4 25 25
Operational 1985 - 1987
DiabloNorth Diablo Cove South Diablo Cove Rock South Cove
Station 08-10 09-10 09-15" 10-10 12-10 10-15 12-15 13-32 14-.5 06-11 19-10 20-20
Total Number 42 17 6 6 1 0 0 0 0 5 1 27
Mean Number 3.00 1.21 0.46 0.40 0.06 0 0 0 0 0.62 0.10 2.45
Standard Deviation 3.0 1.4 0.8 0.9 0.3 - - - - 1.1 0.3 2.3
% Frequency ofOccurrence 78.6 57.1 30.8 20.0 6.3 0 0 0 0 37.5 10.0 81.8
Total NumberofSurveys 14 14 13 15 16 15 15 12 6 8 10 11
E8-316.0 3-141
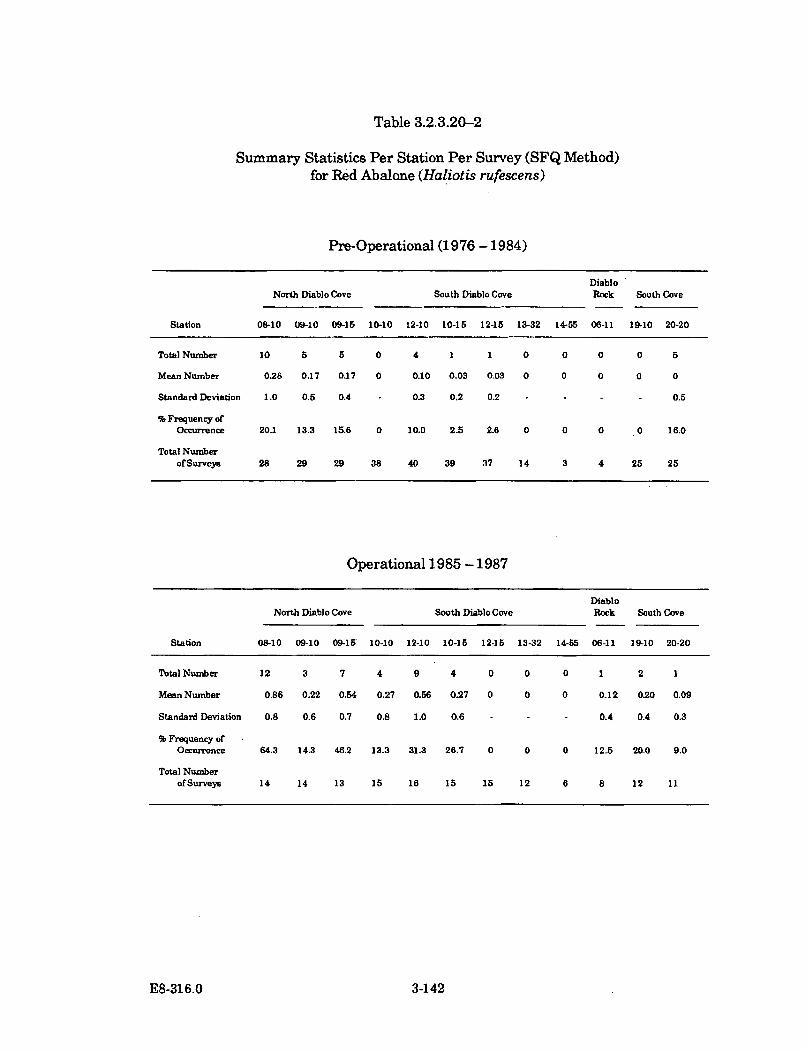
Table 3.2.3.20-2
Summary Statistics Per Station Per Survey (SFQ Method)for Red Abalone (Haliotis rufescens)
Pre-Operational (1976 - 1984)
DiabloNorth Diablo Cove South Diablo Cove Rock South Cove
Station 08-10 09-10 09-15 10-10 12-10 10-15 12-15 13-32 14-55 06-11 19-10 20-20
Total Number 10 5 5 0 4 1 1 0 0 0 0 5
Mean Number 0.28 0.17 0.17 0 0.10 0.03 0.03 0 0 0 0 0
Standard Deviation 1.0 0.5 0.4 - 0.3 0.2 0.2 - - - 0.5
% Frequency ofOccurrence 20.1 13.3 15.6 0 10.0 2.5 2.6 0 0 0 ,0 16.0
Total NumberofSurveys 28 29 29 38 40 39 37 14 3 4 25 25
Operational 1985 -1987
DiabloNorth Diablo Cove South Diablo Cove Rock South Cove
Station 08-10 09-10 09-15 10-10 12-10 10-15 12-15 13-32 14-55 06-11 19-10 20-20
Total Number 12 3 7 4 9 4 0 0 0 1 2 1
Mean Number 0.86 0.22 0.54 0.27 0.56 0.27 0 0 0 0.12 0.20 0.09
Standard Deviation 0.8 0.6 0.7 0.8 1.0 0.6 - - 0.4 0.4 0.3
% Frequency ofOccurrence 64.3 14.3 46.2 13.3 31.3 26.7 0 0 0 12.5 20.0 9.0
Total NumberofSurveys 14 14 13 15 16 15 15 12 6 8 12 11
E8-316.0 3-142
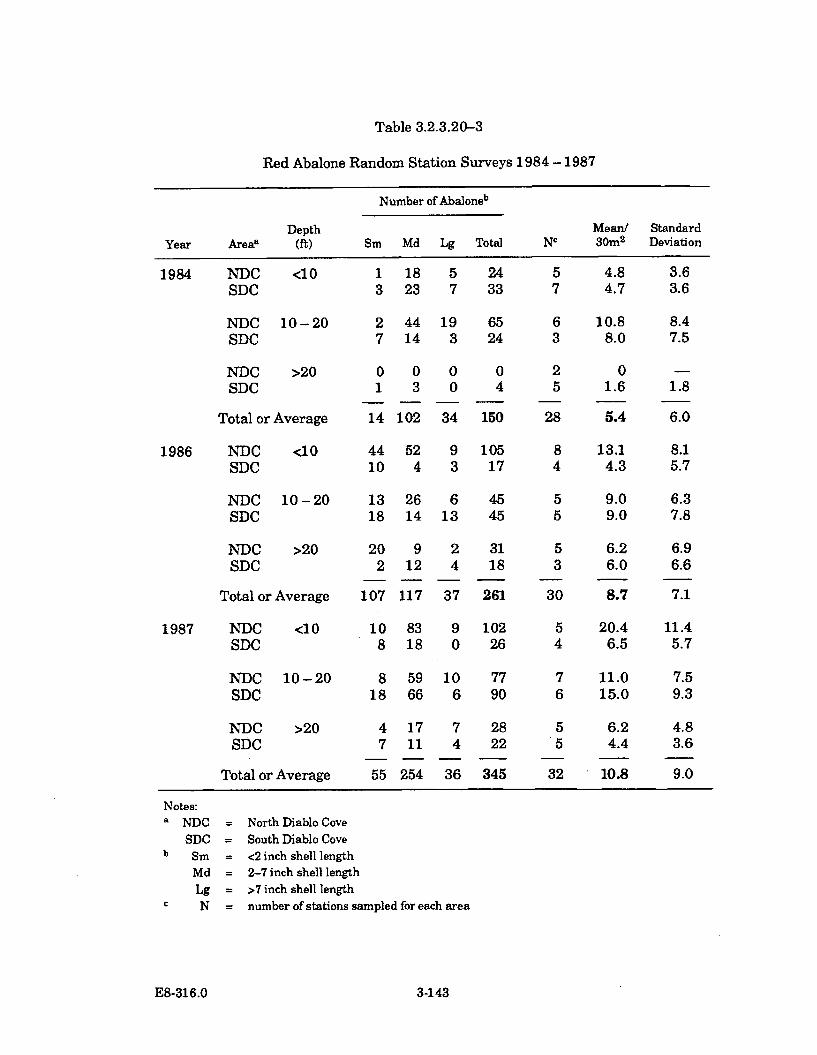
Table 3.2.3.20-3
Red Abalone Random Station Surveys 1984 -1987
Number of Abaloneb
Depth Mean/ StandardYear Areaa (ft) Sm Md Lg Total Nc 30m 2 Deviation
1984 NDC <10SDC
NDC 10-20SDC
NDC >20
SDC
Total or Average
1986 NDC <10SDC
NDC 10-20SDC
NDC >20SDC
Total or Average
1987 NDC <10SDC
NDC 10-20SDC
NDC >20
SDC
Total or Average
1 18 5 243 23 7 33
2 44 19 657 14 3 24
0 0 0 0
1 3 0 4
14 102 34 150
44 52 9 10510 4 3 17
13 26 6 4518 14 13 45
20 9 2 31
2 12 4 18
107 117 37 261
10 83 9 1028 18 0 26
8 59 10 7718 66 6 90
4 17 7 287 11 4 22
55 254 36 345
57
63
2
5
28
84
55
5
3
30
54
76
5
5
32
4.84.7
10.88.0
0
1.6
5.4
13.14.3
9.09.0
6.26.0
8.7
20.46.5
11.015.0
6.24.4
10.8
3.63.6
8.47.5
1.8
6.0
8.15.7
6.37.8
6.9
6.6
7.1
11.45.7
7.59.3
4.8
3.6
9.0
Notes:a NDC = North Diablo Cove
SDC = South Diablo Cove
b Sm = <2 inch shell length
Md = 2-7 inch shell length
Lg = >7 inch shell lengthC N = number of stations sampled for each area
E8-316.0 3-143
predominantly large-boulder substratum at Station 19-10 was thoroughly disrupted.This disruption and movement of boulders evidently contributed to a furtherdecrease in red abalone on the station.
Station 20-20 showed a pattern of increasing numbers of larger red abalone fromthe pre-operational to the operational period (Table 3.2.3.20-1). Their meanabundance per survey increased from 1.3 to 2.5, and the frequency of occurrenceincreased from 48 percent to 82 percent. However, this increase is interpreted as asampling error or artifact associated with substratum with a high degree ofirregularity, i.e., abalone were very difficult to detect on this station due to thepresence of deep crevices in locations awkward for viewing.
As a whole, the SFQ juvenile abalone data show a trend toward an increase in bothmean abundance per survey and percent frequency of occurrence during theoperational period (Table 3.2.3.20-2). This trend is most noticeable on the shallowstations within Diablo Cove, but is at least indicated on one station outside DiabloCove as well. Of the 12 total subtidal stations, five stations within Diablo Coveshowed no marked change in juvenile abalone abundance from 1976 to the present,six stations (five in Diablo Cove and one outside) showed varying degrees of anincrease in abundance from the pre-operational to the operational period, and onestation outside Diablo Cove showed a decrease over time.
The abundance data from fixed subtidal stations utilizing SAQ and SFQ methodsshow general trends of red abalone abundance. However, to obtain wider arealdistributions, size classes, and population estimates of red abalone within DiabloCove, a random red abalone survey was implemented. Three surveys werecompleted: 1983, 1985, and 1987, with 28, 30, and 32 stations sampled each year,respectively. Each station sampled an area of 30 m 2 .
Estimates of the Diablo Cove red abalone population increased from about 35,700red abalone in 1984, with a 62 percent increase to about 57,000 abalone in 1986, andanother increase of 24 percent to an estimated 72,000 abalone in 1987. Threegeneral features are notable: first, most of the increase of abalone from 1984 to 1986occurred in the small size class which increased by 93 animals (a 6-fold increase) in1986 over 1984; second, in 1987, the number of small abalone decreased by one-halfas compared to 1986, and the medium size class more than doubled from 1986 to1987; third, the number of large red abalone remained constant from 1984 to 1987(Table 3.2.3.20-3). Red abalone were more abundant in the northern half of DiabloCove, as in the SAQ and SFQ data, and they were most abundant at depths lessthan 20 ft (Table 3.2.3.20-3).
These data suggest that recruitment occurred between the 1984 and 1986 surveys.This recruitment appears as a sharp increase in the number of juvenile abalone inthe 1986 survey. By the 1987 survey, the 1986 juveniles had grown out of the smallsize class and into the medium size class. The average growth of red abalone duringtheir first 3-4 years is about 17 mm (about 2/3 in.) per year, but may be as much as48 mm per year (Morris et al. 1980). Other evidence suggests that substantial
E8-316.0 3-144
recruitment events, as indicated by these data, are not uncommon occurrences inpopulations of marine invertebrates (Pearse and Hines 1987; also see bat starSection 3.2.3.21). Further, commercial abalone divers in the southern CaliforniaChannel Islands noticed large numbers of small abalone beginning in 1985 (D.Pleschner, pers.comm.). It seems probable that such a widespread phenomenon wasrelated to the 1982-83 El Nino.
Thermal Impact Assessment
No direct, widespread temperature effects on red abalone were seen by the end of1987 in Diablo Cove except in the area adjacent to and immediately in front of thedischarge (Figure 3.2.3.20-2). Although abundances over time at the permanentsubtidal stations have always generally been low, no dramatic decreases in redabalone were seen on the subtidal stations after thermal discharges into Diablo Covewere initiated. Thermal tolerances of eggs, larvae, juvenile, and adult red abalonehave been studied by many researchers. Generally, temperature tolerancesincreased with age. In a southern California population of red abalone, normal eggdevelopment occurred between 10 and 23 C and normal larval development occurredbetween 13.5 and 20.0 C (Leighton 1974). The most rapid larval growth was from 15to 18 C, with survival of larvae and postlarvae being low above this range.
Adams (1974) found that developing embryos (16-32 cell stage) incubated at 15 Cfailed to reach the veliger stage when subjected to a temperature of 25 C, andsuffered 100 percent mortality in 36 hours at 25 C. Embryos at the same stage,when moved from incubation at 15 C to test temperatures of 15-23 C, showed noaberrant development and had no mortality. Red abalone veligers acclimated to20 C showed no mortality after 26 hours at 23 and 25 C. Those in 30 C water had50 percent mortality after 18 hours and 100 percent mortality at 22 hours, and at31 C there was 100 percent mortality after 18 hours.
Adams and Price (1974) performed simulated entrainment experiments with larvalred abalone. Eggs were incubated and larvae held at 16.7 to 17.8 C. Veliger stages40 to 60 hours old were exposed to temperatures that were 6.7, 10.0, and 13.3 Cabove the acclimation temperature for one or ten minutes. They were then quicklybrought down to 2.8 C above the acclimation temperature and allowed to cool to thestarting point. Except in the case of a ten-minute exposure to 13.3 C above ambient,no significant mortality differences were found between the experimental andcontrol groups.
Leighton (cited in Adams 1974) found that adult red abalone had an upper lethaltemperature of 33 C for a one-hour exposure, and that minimum and maximumtemperatures for feeding activity were 10 and 20 C, respectively. Adult red abalone,acclimated to 10 C and placed in 23 C water for 36 hours, experienced a 50 percentmortality, while adults acclimated to 20 C displayed no mortality at the same testtemperature (Adams 1974). Ebert (1974) found that the upper lethal temperature ofadult red abalone could be increased by increasing the acclimation temperature.The upper temperature to which adults could be acclimated was approximately 22 C.
E8-316.0 3-145
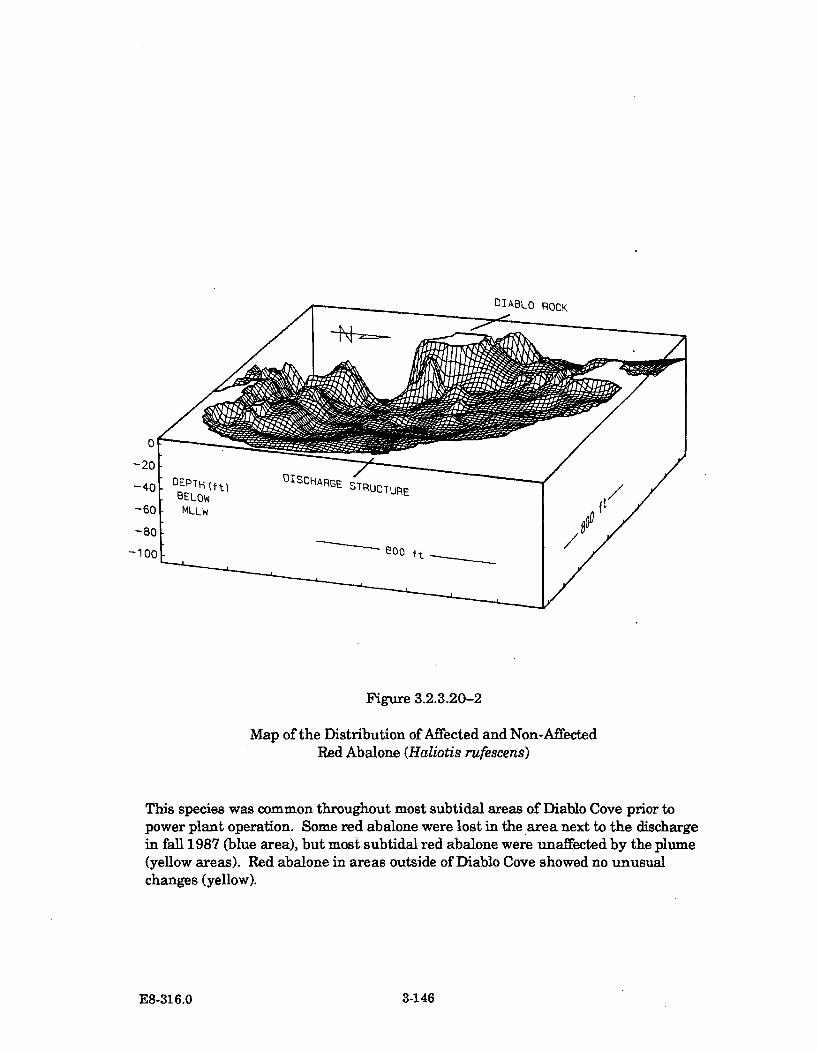
OIABLO ROCK
Figure 3.2.3.20-2
Map of the Distribution of Affected and Non-AffectedRed Abalone (Haliotis rufescens)
This species was common throughout most subtidal areas of Diablo Cove prior topower plant operation. Some red abalone were lost in the area next to the dischargein fall 1987 (blue area), but most subtidal red abalone were unaffected by the plume(yellow areas). Red abalone in areas outside of Diablo Cove showed no unusualchanges (yellow).
E8-316.0 3-146
The 96-hour ET50 temperature for red abalone acclimated to 10 C (computed fromEbert's data) was approximately 24 C. Increasing the acclimation temperature from10 to 20 C raised the 96-hr ET50 temperature approximately 1 C (PG&E 1979).
In the Diablo Canyon Thermal Effects Laboratory studies, six major experimentswere performed on red abalone: 1) 96-hr ET50 heat tolerance; 2) temperature effectson early development and settling of larvae; 3) growth rates as related totemperature and diet; 4) temperature preference/avoidance; 5) predator/preystudies; and 6) effects of thermal dose. The ET50's for red abalone acclimated to 12,15 and 24 C were 23.4, 24.3 and 27.1 C, respectively. Abalone acclimated to ambienttemperatures preferred temperatures below 21 C, while abalone acclimated to 18and 21 C moved into temperatures up to 26 and 28 C, respectively, but would notsurvive extended exposures above 22 and 26 C. Temperature ranges for optimaldevelopment varied with the stage of development: 12-20 C for early development,and 8.6-22.4 C for post-cleavage. Temperatures of 24 C produced mortalities inboth groups. Temperature appeared to have little effect on larval settlement.Optimal shell growth was at 12-17.9 C on a diet of brown algae.
Although no decreases in red abalone were seen at the subtidal stations, there werelocalized areas, especially near the discharge structure, where abalone were lost dueto power plant effects. In October 1987,20 dead red abalone were found at subtidaldepths of ten ft and less in the immediate area of the discharge structure. Theabalone had recently died in place and did not have any physical evidence ofpredation (holes, chipped shell margins, etc.). Approximately 70 live red abalonewere found in the same area as the dead abalone, and, in several instances, live anddead abalone were within inches of each other. Five of the live red abalone were outon top of rocks, outside any protective crevices or shelters. The dead abalone rangedfrom about 4 to 7 in. in size. The unusual combination of high fall ambient watertemperatures, elevated discharge temperatures from two-unit plant operation, andheat treatment presumably stressed the abalone to a point where they could nolonger withstand even relatively brief exposures to aberrant temperatures.
Normal operation temperatures at this time approached and may have exceeded thered abalone's incipient lethal temperature. The abalone that died had been living inan area where they were exposed to discharge temperatures frequently above 25 C;red abalone acclimated at 24 C in laboratory thermal tolerance tests exhibited a 96-hr LT50 at 27.2 C. Recurring exposures to the October normal operations dischargetemperatures may have pre-stressed the abalone, making them more susceptible tothe high October heat treatment discharge temperatures. The recorded dischargetemperatures from the unit undergoing heat treatment during October did exceedthe red abalone's one-hour temperature tolerance of 30 C.
It is expected that the late larval and early post-settlement juvenile stages of redabalone may show high mortality in areas less than ten ft. In deeper areas, thesestages are not expected to be adversely affected by heated discharge waters. Themost critical discharge temperatures for red abalone occur in the fall, when ambientwater temperatures are the highest.
E8-316.0 3-147
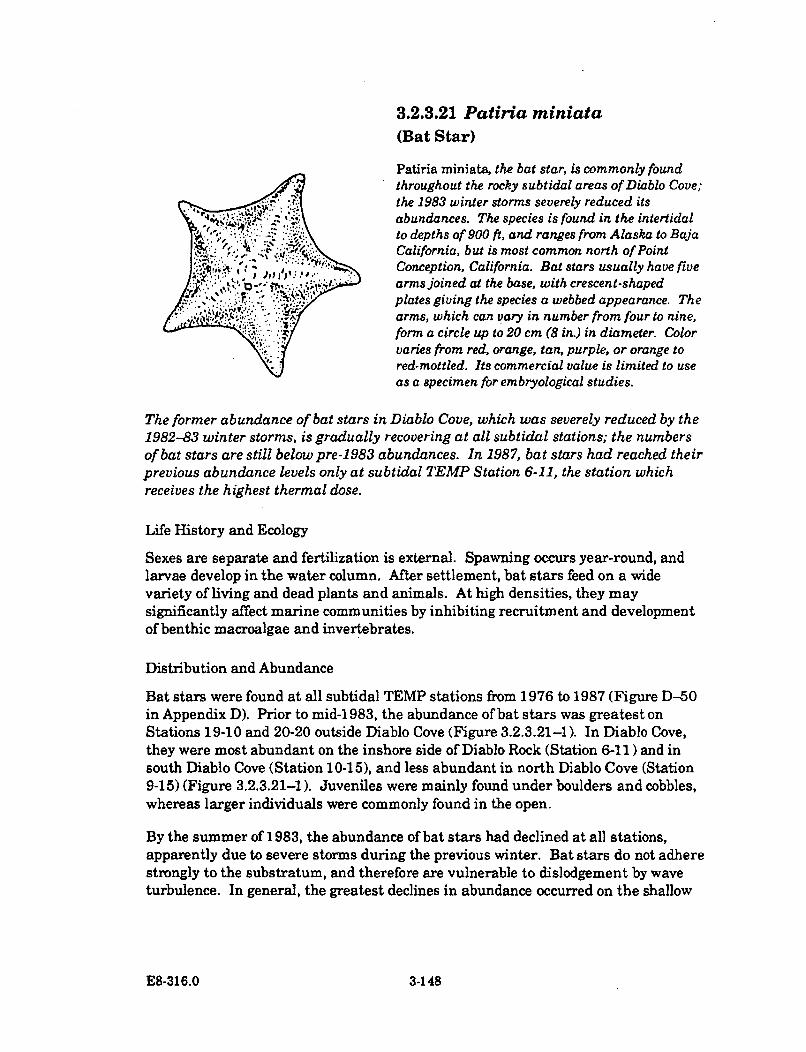
3.2.3.21 Patiria miniata(Bat Star)
Patiria miniata, the bat star, is commonly foundthroughout the rocky subtidal areas of Diablo Cove;the 1983 winter storms severely reduced itsabundances. The species is found in the intertidalto depths of 900 ft, and ranges from Alaska to BajaCalifornia, but is most common north of PointConception, California. Bat stars usually have fivearms joined at the base, with crescent-shapedplates giving the species a webbed appearance. The
I It :.arms, which can vary in number from four to nine,form a circle up to 20 cm (8 in.) in diameter. Colorvaries from red, orange, tan, purple, or orange tored-mottled. Its commercial value is limited to useas a specimen for embryological studies.
The former abundance of bat stars in Diablo Cove, which was severely reduced by the1982-83 winter storms, is gradually recovering at all subtidal stations; the numbersof bat stars are still below pre-1983 abundances. In 1987, bat stars had reached theirprevious abundance levels only at subtidal TEMP Station 6-11, the station whichreceives the highest thermal dose.
Life History and Ecology
Sexes are separate and fertilization is external. Spawning occurs year-round, andlarvae develop in the water column. After settlement, bat stars feed on a widevariety of living and dead plants and animals. At high densities, they maysignificantly affect marine communities by inhibiting recruitment and developmentof benthic macroalgae and invertebrates.
Distribution and Abundance
Bat stars were found at all subtidal TEMP stations from 1976 to 1987 (Figure D-50in Appendix D). Prior to mid-1983, the abundance of bat stars was greatest onStations 19-10 and 20-20 outside Diablo Cove (Figure 3.2.3.21-1). In Diablo Cove,they were most abundant on the inshore side of Diablo Rock (Station 6-11 ) and insouth Diablo Cove (Station 10-15), and less abundant in north Diablo Cove (Station9-15) (Figure 3.2.3.21-1). Juveniles were mainly found under boulders and cobbles,whereas larger individuals were commonly found in the open.
By the summer of 1983, the abundance of bat stars had declined at all stations,apparently due to severe storms during the previous winter. Bat stars do not adherestrongly to the substratum, and therefore are vulnerable to dislodgement by waveturbulence. In general, the greatest declines in abundance occurred on the shallow
E8-316.0 3-148
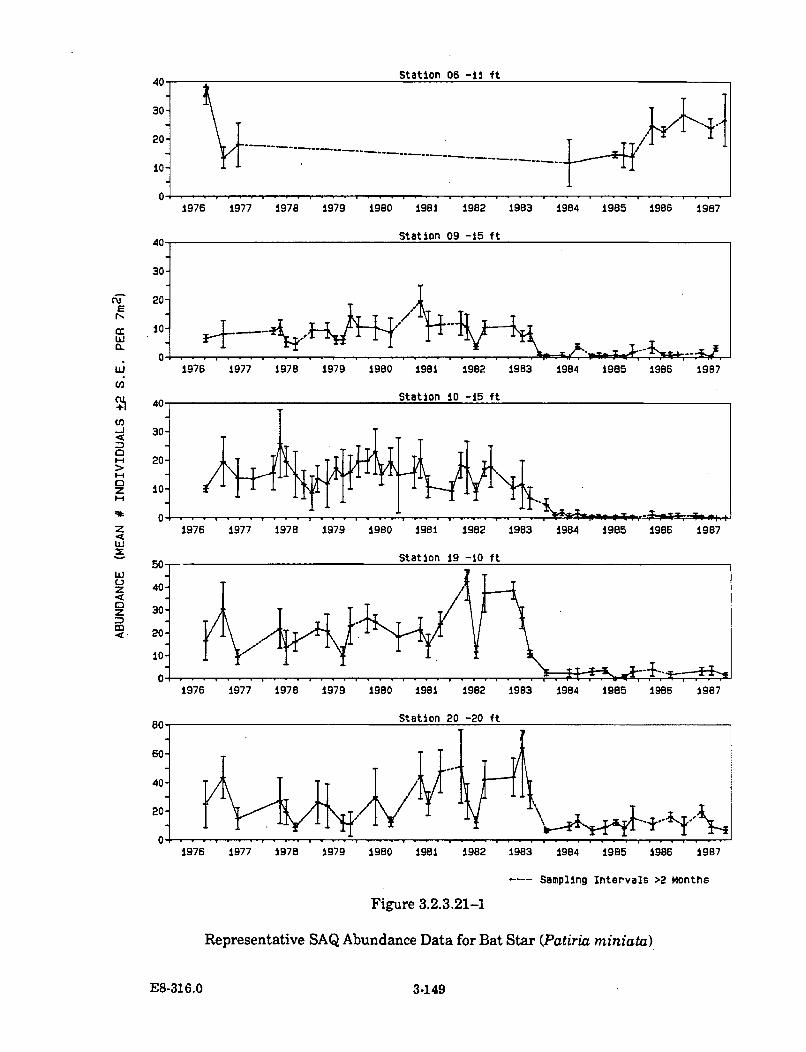
Station 06 -ii ft
30-
20-
10-
1976 1977 1978 1979 1980 1981 1982 1983 1984 1985 1986 1987
EN
ccw0.
W
Cn
z
z
w
w0-z
zM
1976 1977 1978 1979 1980 1981 1982 1983 1984 1985 1986 1987
1982 1983 1984 1985 1986 1987
---- Sampling Intervals >2 months
Figure 3.2.3.21-1
Representative SAQ Abundance Data for Bat Star (Patiria miniata)
E8-316.0 3-149
stations, where water motion was strongest. The abundance of bat stars in DiabloCove has increased slowly after these disturbances but, to the present, has notreached pre-1983 levels, except at Station 6-11.
Analyses of bat star data presented in Appendix E did not show any statisticallysignificant changes in abundance, for the stations examined, that could be attributedto power plant operation.
Thermal Impact Assessment
Laboratory thermal preference experiments showed that bat stars exhibited nopreference for a specific temperature when placed into a tank with a temperaturegradient, although temperatures exceeding 22 C were avoided (PG&E 1982b). Heattreatment experiments (PG&E 1983) demonstrated that short periods oftemperatures up to 32 C were tolerated. Little or no mortality would be expected attemperatures below 25 or 26 C, according to 96-hr ET50 tests (PG&E 1 982b).
The abundances of bat stars have decreased in some areas of Diablo Cove, andincreased in other areas (Figure 3.2.3.21-2). Decreases in the area immediately infront of the discharge plume were mainly from the increased water velocity of theplume. The increase in bat stars at Station 6-11 (on the inshore side of Diablo Rock),an area persistently exposed to the thermal plume, is evidence that this species istolerant of warm water. Sea stars of all sizes were present in this area, whichindicated that recruitment of newly settled juveniles and immigration of adults bothcontributed to the increased numbers. The adults which migrated into the areawere probably not attracted by warm water, but instead by some aspect of thebiological commumity which changed after power plant operation, such as anincrease in the abundance or accessibility of preferred food items.
It is possible that elevated temperatures in the shallow subtidal areas of DiabloCove could inhibit successful spawning of resident bat stars. The fertilized eggs ordeveloping larvae could be subjected to thermal shock by the elevated temperaturesand become more susceptible to predation. However, even if bat stars inside DiabloCove did not spawn, or if survivorship of spawned larvae was low, nearbypopulations from unaffected areas would be expected to supply enough viable larvaeto ensure the continued existence of bat stars in Diablo Cove.
E8-316.0 3-150
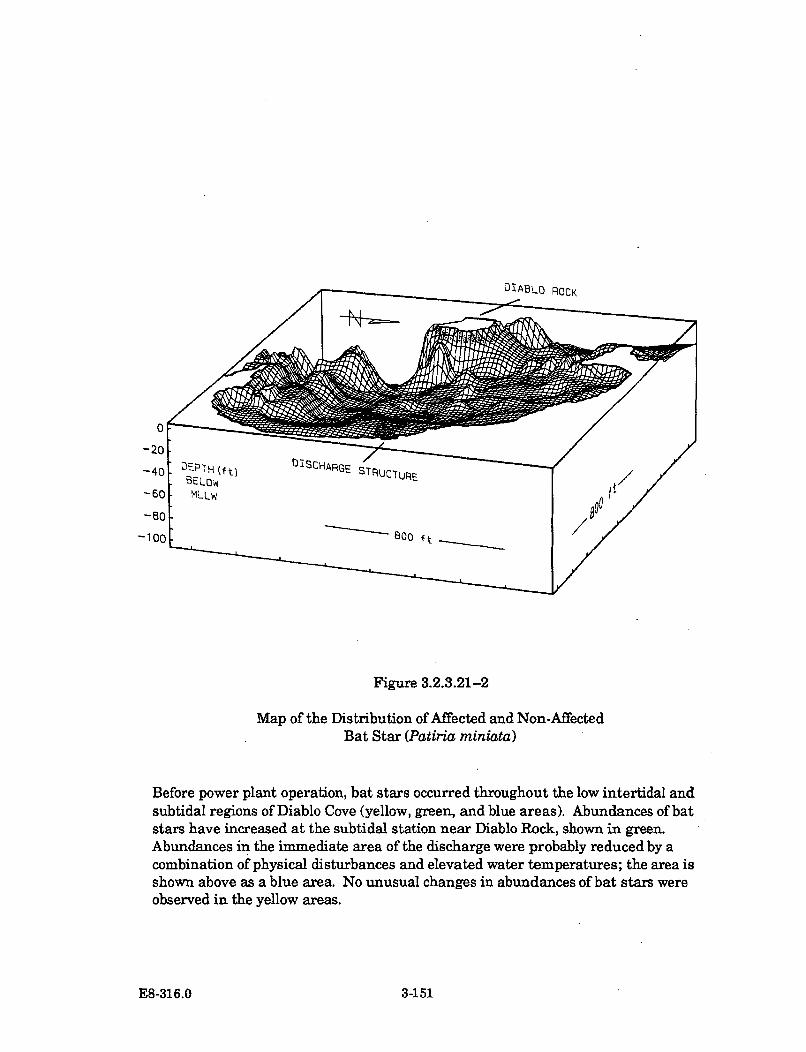
DIABLO ROCK
Figure 3.2.3.21-2
Map of the Distribution of Affected and Non-AffectedBat Star (Patiria miniata)
Before power plant operation, bat stars occurred throughout the low intertidal andsubtidal regions of Diablo Cove (yellow, green, and blue areas). Abundances of batstars have increased at the subtidal station near Diablo Rock, shown in green.Abundances in the immediate area of the discharge were probably reduced by acombination of physical disturbances and elevated water temperatures; the area isshown above as a blue area. No unusual changes in abundances of bat stars wereobserved in the yellow areas.
E8-316.0 3-151
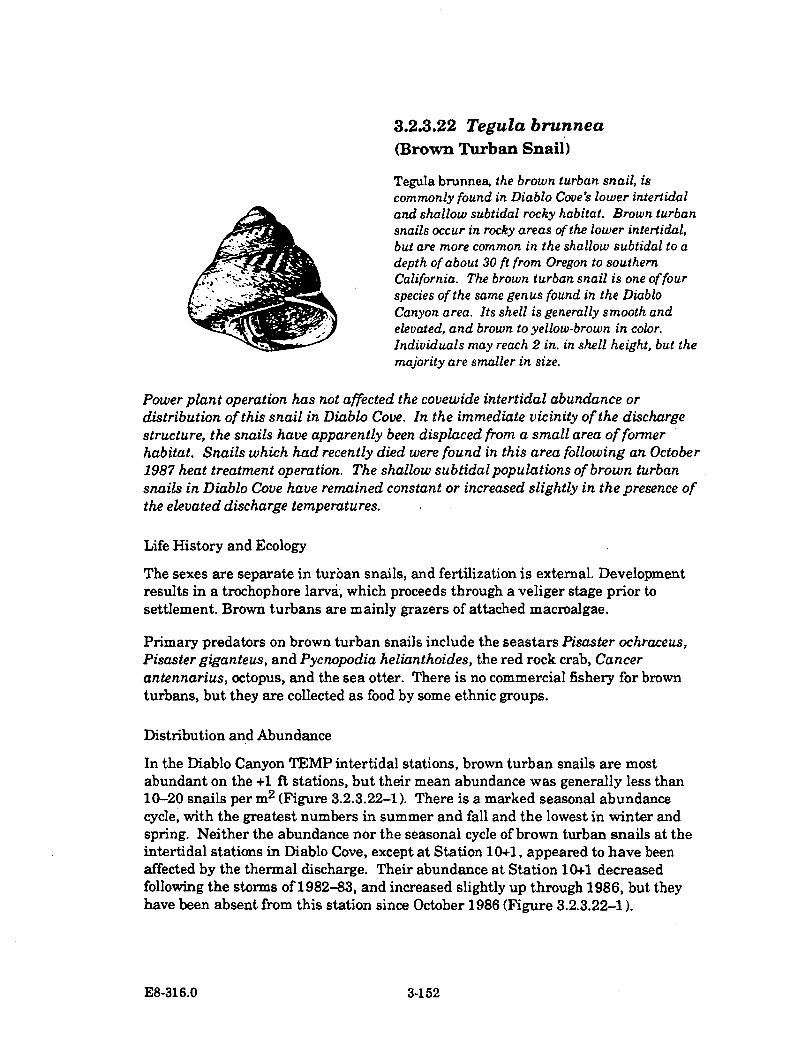
3.2.3.22 Tegula brunnea
(Brown Turban Snail)
Tegula brunnea, the brown turban snail, iscommonly found in Diablo Cove's lower intertidaland shallow subtidal rocky habitat. Brown turbansnails occur in rocky areas of the lower intertidal,but are more common in the shallow subtidal to adepth of about 30 ft from Oregon to southernCalifornia. The brown turban snail is one of fourspecies of the same genus found in the DiabloCanyon area. Its shell is generally smooth andelevated, and brown to yellow-brown in color.Individuals may reach 2 in. in shell height, but themajority are smaller in size.
Power plant operation has not affected the covewide intertidal abundance ordistribution of this snail in Diablo Cove. In the immediate vicinity of the dischargestructure, the snails have apparently been displaced from a small area of formerhabitat. Snails which had recently died were found in this area following an October1987 heat treatment operation. The shallow subtidal populations of brown turbansnails in Diablo Cove have remained constant or increased slightly in the presence ofthe elevated discharge temperatures.
Life History and Ecology
The sexes are separate in turban snails, and fertilization is external. Developmentresults in a trochophore larva; which proceeds through a veliger stage prior tosettlement. Brown turbans are mainly grazers of attached macroalgae.
Primary predators on brown turban snails include the seastars Pisaster ochraceus,Pisaster giganteus, and Pycnopodia helianthoides, the red rock crab, Cancerantennarius, octopus, and the sea otter. There is no commercial fishery for brownturbans, but they are collected as food by some ethnic groups.
Distribution and Abundance
In the Diablo Canyon TEMP intertidal stations, brown turban snails are mostabundant on the +1 ft stations, but their mean abundance was generally less than10-20 snails per m 2 (Figure 3.2.3.22-1). There is a marked seasonal abundancecycle, with the greatest numbers in summer and fall and the lowest in winter andspring. Neither the abundance nor the seasonal cycle of brown turban snails at theintertidal stations in Diablo Cove, except at Station 10+1, appeared to have beenaffected by the thermal discharge. Their abundance at Station 10+1 decreasedfollowing the storms of 1982-83, and increased slightly up through 1986, but theyhave been absent from this station since October 1986 (Figure 3.2.3.22-1).
E8-316.0 3-152
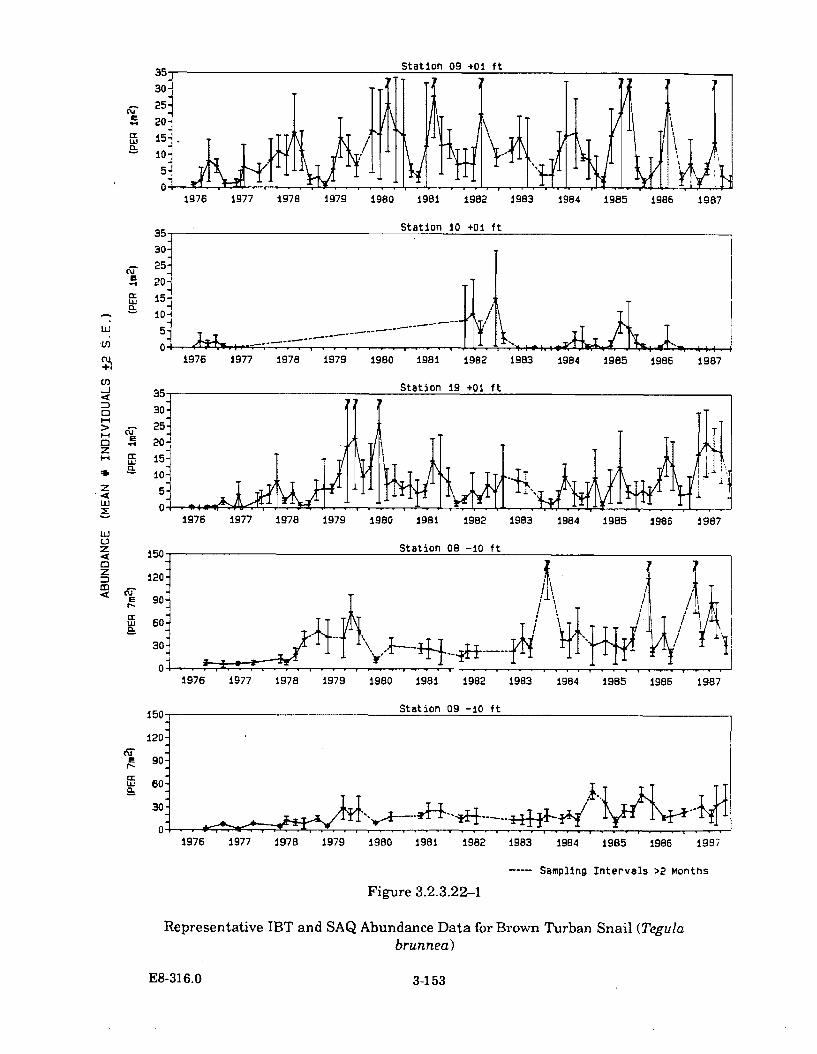
Station 09 +01 ft
30-ý
2520.J
A 4 ,, P.. o ' . . - ' . .. - I . . . . T.-- T . . . . ,• , )I
1976 1977 1978 1979 1980 1981 1982 1983 1984 1985 1986 1987
EWI
U)
-o 30.
> ýU- 25-
c 20-z1-4 15-
lk 10-z 5:
z.- , 0'O
Station 19 +01 ft
1976 1977 1978 1979 1980 198± 1982 1983 1984 1985 1985 1987
W4U
z
FE
t,
0.
1976 1977 1978 1979 1980 i981 1982 1983 1984 1985 1985 1987
Station 09 -10 ft10 .
120-
e90-
Cr,,' 60-
30-7X TI-1-
U,,.....................................
1976 1977 1978 1979 1980 1981 1982 1983 1984 1985 1986 1987
---- Sampling Intervals >2 Months
Figure 3.2.3.22-1
Representative IBT and SAQ Abundance Data for Brown Turban Snail (Tegulabrunnea)
E8-316.0 3-153
The W.J. North vertical intertidal transect (see page F-1 in Appendix F for methods)in central Diablo Cove experienced a similar decrease in numbers of brown turbansnails (Table F-25 in Appendix F). However, since late 1984, North's verticaltransects in north Diablo Cove and south Diablo Cove have experienced largeincreases in the number of brown turbans (Tables F-26 and F-27 in Appendix F).These data show that, in north Diablo Cove, the peak in abundance of brown turbansnails slowly shifted to lower tidal levels with each succeeding survey, while in southDiablo Cove this shift did not occur. No notable changes were seen outside DiabloCove in his vertical LCIX transect at the control station (Table F-28 in Appendix F).
In the PG&E vertical intertidal transects in north and south Diablo Cove (TablesF-86 and F-88 in Appendix F), the abundance of brown turban snails was reducedat levels above +0.5 ft beginning in 1987.
Prior to 1985, brown turban snails were common and abundant in the shallowsubtidal areas of Diablo Cove. They did not show a dear seasonal cycle, but theirabundances were variable. The effect of power plant operation on their subtidalabundance in Diablo Cove is not clear. When both the SAQ and SFQ data (FiguresD-56 and D-57 in Appendix D) are examined, there appears to be a slight increasein brown turban snail abundance at the shallow stations in north Diablo Cove(Stations 8-10 and 9-10) and short-term increases at the remainder of the DiabloCove stations. The stations outside Diablo Cove showed no change in brown turbansnail abundance after 1985.
Brown turban snails were selected for further analyses using time series andanalysis of variance for the +1 ft IBT and SFQ data sets (Appendix E). In theintertidal, these analyses did not reveal any statistically significant changes in theabundance of brown turban snails that could be attributed to power plant operation.In the subtidal, the time series analysis indicated a general increase in theirabundance in the shallow areas of Diablo Cove after power plant operation.
Thermal Impact Assessment
In October 1987, dead brown turban snails were observed in the immediate area ofthe discharge plume. They appeared to have died recently, as soft body tissue wasstill present. Thermal Effects Laboratory experiments on brown turban snails foundthat the 96-hr ET50 value was 25.7 C (PG&E 1982b).
It is thought that high fall ambient temperatures and two-unit discharge had leftthe snails in a weakend condition prior to exposure to higher heat treatmentdischarge temperatures. Brown turban snails will probably remain scarce or absententirely in Diablo Cove intertidal and subtidal areas close to the discharge structure,where water temperatures may exceed their thermal tolerance limits under certainconditions (Figure 3.2.3.22-2). Brown turban snail abundance at the +1 ft level inintertidal areas elsewhere in Diablo Cove will possibly decrease slightly, withmovement lower into the intertidal. This downward movement in the intertidal
E8-316.0 3-154
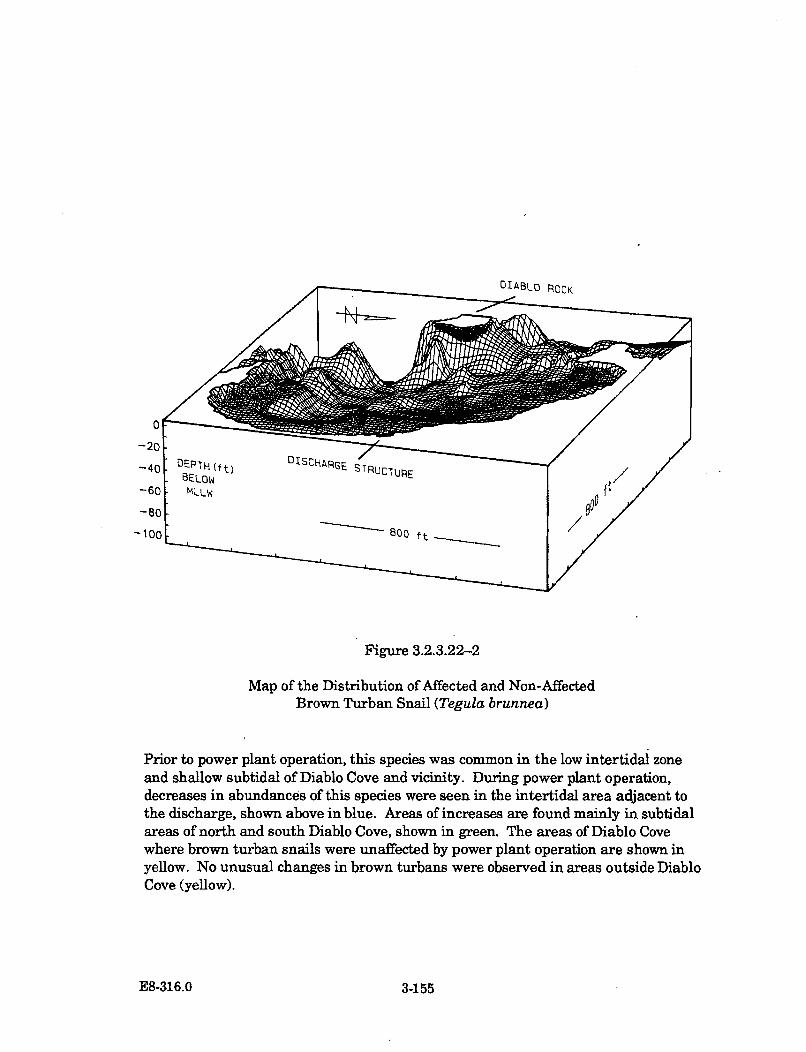
DIABLO ROCK
Figure 3.2.3.22-2
Map of the Distribution of Affected and Non-AffectedBrown Turban Snail (Tegula brunnea)
Prior to power plant operation, this species was common in the low intertidal zoneand shallow subtidal of Diablo Cove and vicinity. During power plant operation,decreases in abundances of this species were seen in the intertidal area adjacent tothe discharge, shown above in blue. Areas of increases are found mainly in subtidalareas of north and south Diablo Cove, shown in green. The areas of Diablo Covewhere brown turban snails were unaffected by power plant operation are shown inyellow. No unusual changes in brown turbans were observed in areas outside DiabloCove (yellow).
E8-316.0 3-155
appears to be an effect of elevated temperatures. It appears that warmer water hasincreased the subtidal abundance of the brown turban snails in north Diablo Cove(Figure 3.2.3.22-2). This increase may be a response to a shift in the availability ofa preferred food. Thermal Effects Laboratory studies on brown turban snailsshowed that optimal shell growth occurred on a mixed diet of kelp and understoryalgal species at a temperature of about 18 C (PG&E 1982b). In the shallow areas ofDiablo Cove, mixed algae, including drift kelp, are abundant, and the annual meanwater temperature is roughly 18 C. This appears to be an optimal environment forbrown turbans. In response to these conditions, brown turban snails appear to begradually moving into the shallow subtidal areas of Diablo Cove. This species' long-term abundance in both the intertidal and subtidal portions of Diablo Cove will bedependent on their thermal preference, availability of food, and interactions betweenbrown turban snails and their competitors and predators.
E8-316.0 3-156
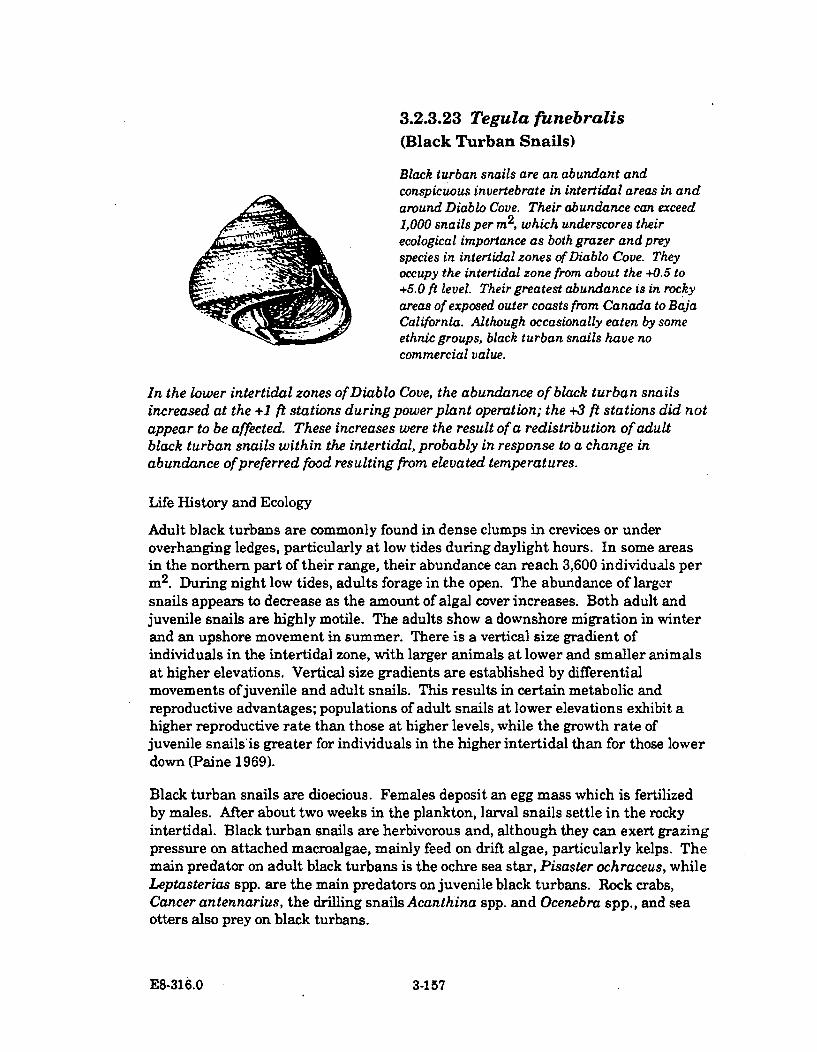
3.2.3.23 Tegula funebralis
(Black Turban Snails)
Black turban snails are an abundant andconspicuous invertebrate in intertidal areas in andaround Diablo Cove. Their abundance can exceed1,000 snails per m2, which underscores theirecological importance as both grazer and preyspecies in intertidal zones of Diablo Cove. Theyoccupy the intertidal zone from about the +0.5 to+5.0 ft level. Their greatest abundance is in rockyareas of exposed outer coasts from Canada to Baja
FCalifornia. Although occasionally eaten by someethnic groups, black turban snails have nocommercial value.
In the lower intertidal zones of Diablo Cove, the abundance of black turban snailsincreased at the +1 ft stations during power plant operation; the +3 ft stations did notappear to be affected. These increases were the result of a redistribution of adultblack turban snails within the intertidal, probably in response to a change inabundance of preferred food resulting from elevated temperatures.
Life History and Ecology
Adult black turbans are commonly found in dense clumps in crevices or underoverhanging ledges, particularly at low tides during daylight hours. In some areasin the northern part of their range, their abundance can reach 3,600 individuals perm2. During night low tides, adults forage in the open. The abundance of largersnails appears to decrease as the amount of algal cover increases. Both adult andjuvenile snails are highly motile. The adults show a downshore migration in winterand an upshore movement in summer. There is a vertical size gradient ofindividuals in the intertidal zone, with larger animals at lower and smaller animalsat higher elevations. Vertical size gradients are established by differentialmovements of juvenile and adult snails. This results in certain metabolic andreproductive advantages; populations of adult snails at lower elevations exhibit ahigher reproductive rate than those at higher levels, while the growth rate ofjuvenile snails is greater for individuals in the higher intertidal than for those lowerdown (Paine 1969).
Black turban snails are dioecious. Females deposit an egg mass which is fertilizedby males. After about two weeks in the plankton, larval snails settle in the rockyintertidal. Black turban snails are herbivorous and, although they can exert grazingpressure on attached macroalgae, mainly feed on drift algae, particularly kelps. Themain predator on adult black turbans is the ochre sea star, Pisaster ochraceus, whileLeptasterias spp. are the main predators on juvenile black turbans. Rock crabs,Cancer antennarius, the drilling snails Acanthina spp. and Ocenebra spp., and seaotters also prey on black turbans.
E8-316.0 3-157
Distribution and Abundance
Prior to 1985, black turban snails were generally more abundant at the +3 ft levelthan at the +1 ft level on the intertidal stations in the Diablo Canyon study areas(Figures D-58 and D-59 in Appendix D). Abundances at the +3 ft level were quitevariable, but generally highest in summer and lowest in winter. In contrast, the+1 ft level showed a seasonal cycle of greater abundance in winter and a decrease insummer. Black turban snails were more abundant in sheltered areas than in wave-exposed areas. In addition, quadrats with crevices contained many times moresnails than quadrats with smooth, flat bench rock.
Beginning in 1985, sharp increases in the abundance of black turban snails at the+1 ft level were seen at most of the stations (Figure 3.2.3.23-1), which havegenerally persisted through 1987. Station 10+1, located near the dischargestructure, showed little increase in black turban snails after power plant operation,but their abundance at Station 10+2 increased sharply in 1986. Some of the +1 ftstations showed a regular pattern of seasonal high and low abundances of turbansnails. Prior to 1985, however, their abundance dropped to nearly zero during thesummer minimum, whereas after 1985 several hundred snails per m2 typicallyremained on the stations year-round. On most stations, black turban snails wereabundant during 1987 in areas where, prior to power plant operation, few if anysnails occurred. Periods of maximum abundance of the black turban snails appearto have generally shifted to summer on some of the stations. Station 8+1 appearedto retain a normal annual abundance cycle. With the exception of Station 9+3, theseincreases were not observed at the +3 ft stations inside Diablo Cove (Figure3.2.3.23-1), although a slight general increase in the abundance of black turban-snails has occurred on the +3 ft stations in Diablo Cove since 1984.
Of the +1 ft stations outside Diablo Cove, only Station 6+1 in Field's Cove (Figure3.2.3.23-1) had a post-1985 pattern of black turban snail abundance similar to theDiablo Cove +1 ft stations. At the +3 ft levels, Stations 1+3, 6+3, and 19+3 showedan increase in black turban snails after 1985 (Figure 3.2.3.23-1 and Figure D-59 inAppendix D). No temporal or numerical shift in the normal seasonal abundancecycle was apparent on the intertidal stations at either level outside Diablo Cove.
The W.J. North vertical transects (see page F-1 in Appendix F for methods) showedhigh numbers of black turban snails at most of the high and mid-tidal levels at allthree of his Diablo Cove stations through 1984 (Tables F-29, F-30, and F-31 inAppendix F). After 1985, an increase in the number of black turbans was seen at allof the Diablo Cove transects, especially at the CDIX and NDIX transects. Incontrast, the station north of Diablo Cove had low numbers of black turban snails,but they remained constant over time and within tidal levels (Table F-32 inAppendix F). Vertical distributions of black turbans remained the same at allstations.
E8-316.0 3-158
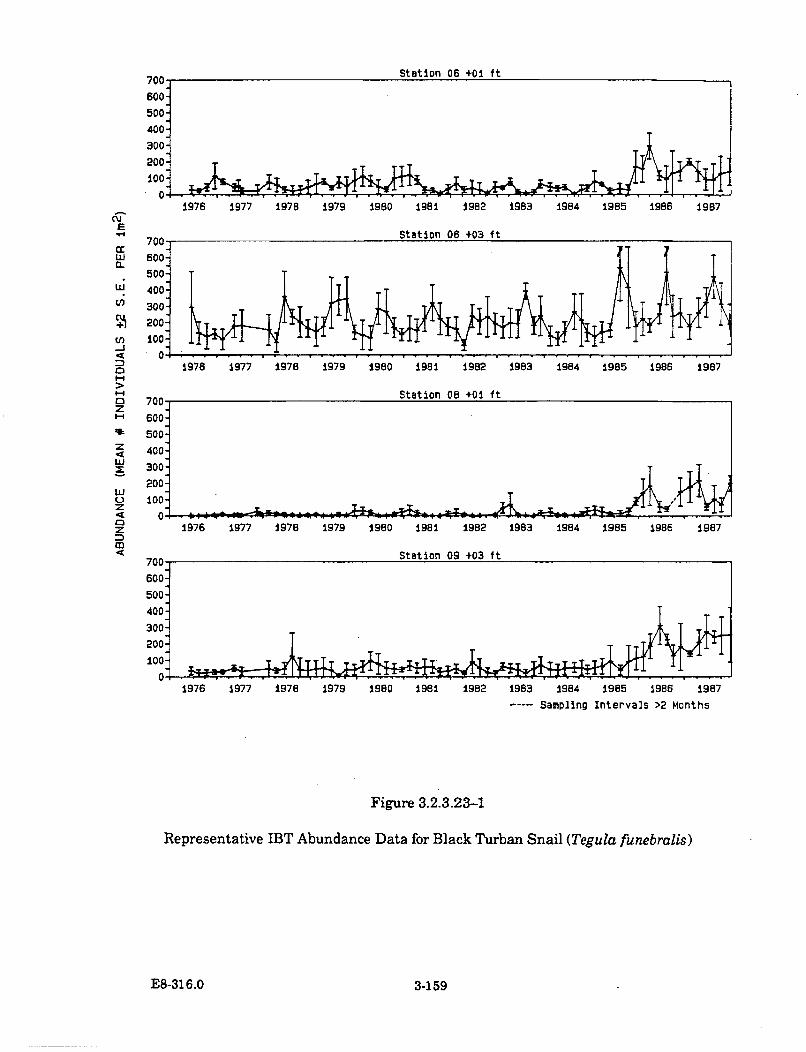
1976 1977 1978 1979 1980 1981 1982 1983 1984 1985 1986 1987
LLI
(-
.40
z
z43LI
700
600-
500-
400:
300-
200-
100-
0:1976 1977 1978 1979 1980 1981 1982 1983 1984 1985 1986 1987
700 Station 08 +01 ft
600-
500:400:300-200-100:T
1976 1977 1978 1979 1980 1981 1982 1983 1984 1985 1986 1987
1976 1977 1978 1979 1980 1981 1982 1983 1984 1985 1986 1987---- Sampling Intervals >2 Months
Figure 3.2.3.23-1
Representative IBT Abundance Data for Black Turban Snail (Tegula funebralis)
E8-316.0 3-159
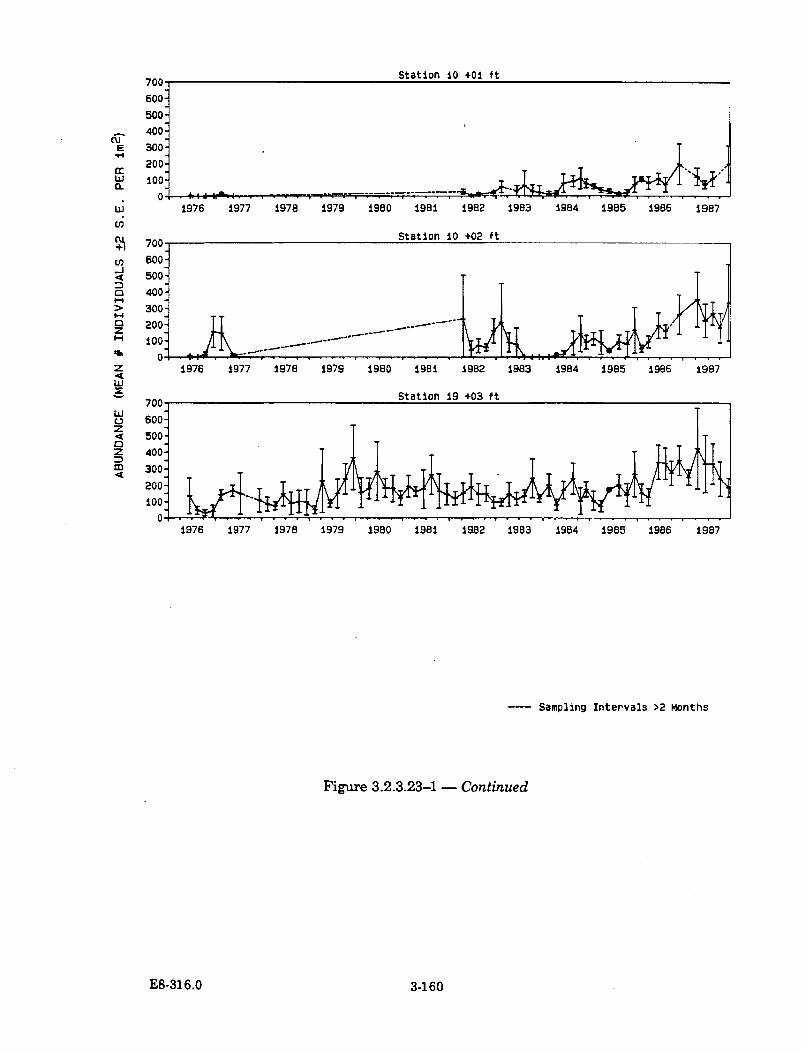
Station 10 401 ft
E
IL
wON~
700
600:500O400:300-200-100-
1976 1977 1978 1979 1980 1981 1982 19B3 1984 1985 1986 1987
700_ Station 10 +02 ft
ED 600-
500-
D 400-
> 300-
200:100.0:
z
700"
600-z4 500-
Z 400-
D 300-4•
q -
83 1984 1985 1986 1987
---- Sampling Intervals >2 Months
Figure 3.2.3.23-1 - Continued
E8-31 6.0 3-160
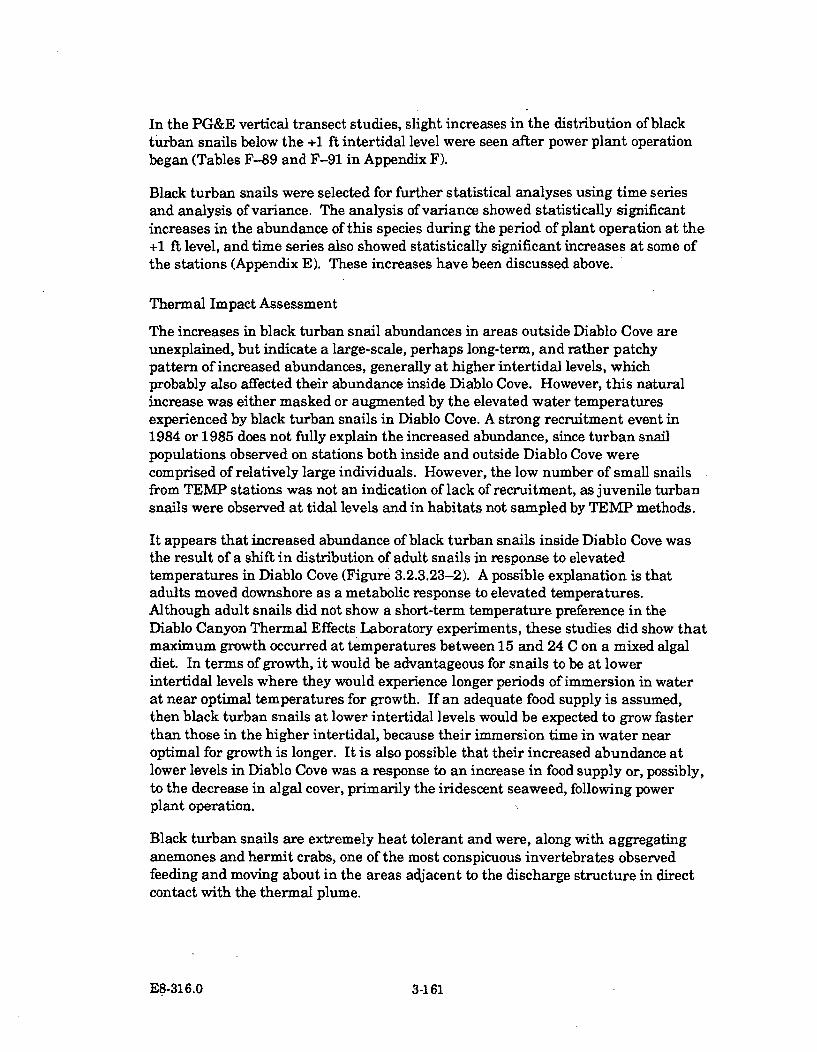
In the PG&E vertical transect studies, slight increases in the distribution of blackturban snails below the +1 ft intertidal level were seen after power plant operationbegan (Tables F-89 and F-91 in Appendix F).
Black turban snails were selected for further statistical analyses using time seriesand analysis of variance. The analysis of variance showed statistically significantincreases in the abundance of this species during the period of plant operation at the+1 ft level, and time series also showed statistically significant increases at some ofthe stations (Appendix E). These increases have been discussed above.
Thermal Impact Assessment
The increases in black turban snail abundances in areas outside Diablo Cove areunexplained, but indicate a large-scale, perhaps long-term, and rather patchypattern of increased abundances, generally at higher intertidal levels, whichprobably also affected their abundance inside Diablo Cove. However, this naturalincrease was either masked or augmented by the elevated water temperaturesexperienced by black turban snails in Diablo Cove. A strong recruitment event in1984 or 1985 does not fully explain the increased abundance, since turban snailpopulations observed on stations both inside and outside Diablo Cove werecomprised of relatively large individuals. However, the low number of small snailsfrom TEMP stations was not an indication of lack of recruitment, as juvenile turbansnails were observed at tidal levels and in habitats not sampled by TEMP methods.
It appears that increased abundance of black turban snails inside Diablo Cove wasthe result of a shift in distribution of adult snails in response to elevatedtemperatures in Diablo Cove (Figure 3.2.3.23-2). A possible explanation is thatadults moved downshore as a metabolic response to elevated temperatures.Although adult snails did not show a short-term temperature preference in theDiablo Canyon Thermal Effects Laboratory experiments, these studies did show thatmaximum growth occurred at temperatures between 15 and 24 C on a mixed algaldiet. In terms of growth, it would be advantageous for snails to be at lowerintertidal levels where they would experience longer periods of immersion in waterat near optimal temperatures for growth. If an adequate food supply is assumed,then black turban snails at lower intertidal levels would be expected to grow fasterthan those in the higher intertidal, because their immersion time in water nearoptimal for growth is longer. It is also possible that their increased abundance atlower levels in Diablo Cove was a response to an increase in food supply or, possibly,to the decrease in algal cover, primarily the iridescent seaweed, following powerplant operation.
Black turban snails are extremely heat tolerant and were, along with aggregatinganemones and hermit crabs, one of the most conspicuous invertebrates observedfeeding and moving about in the areas adjacent to the discharge structure in directcontact with the thermal plume.
E8-316.0 3-161
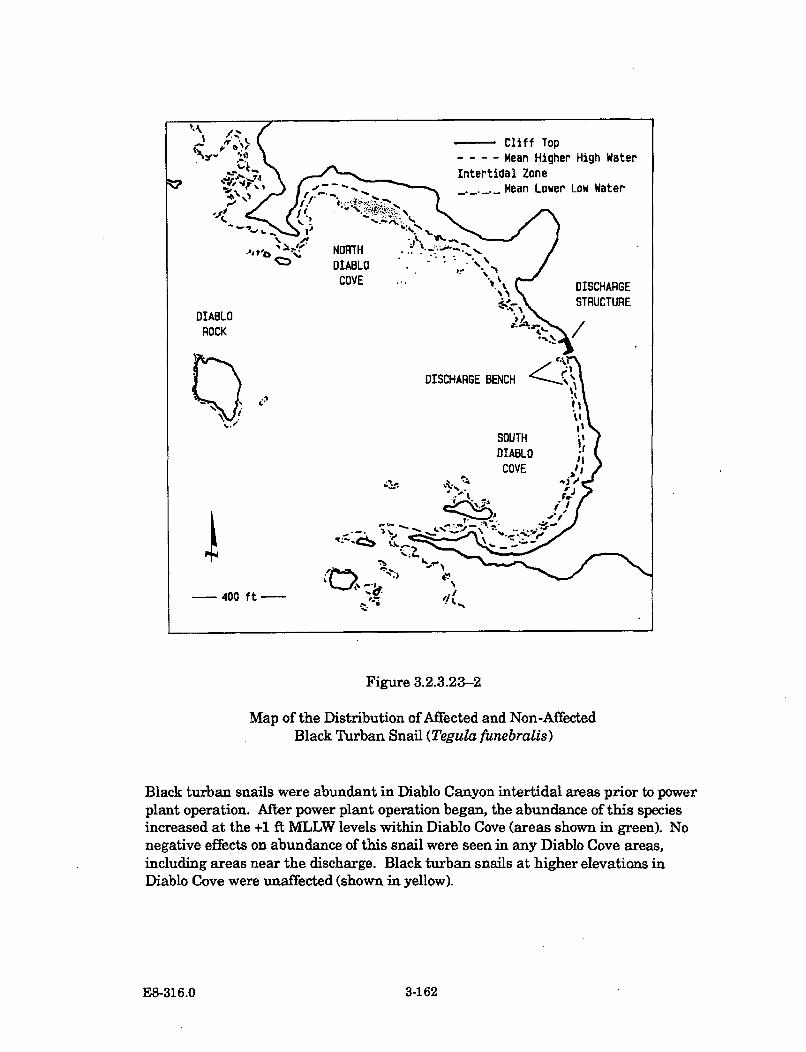
Figure 3.2.3.23-2
Map of the Distribution of Affected and Non-AffectedBlack Turban Snail (Tegula funebralis)
Black turban snails were abundant in Diablo Canyon intertidal areas prior to powerplant operation. After power plant operation began, the abundance of this speciesincreased at the +1 ft MLLW levels within Diablo Cove (areas shown in green). Nonegative effects on abundance of this snail were seen in any Diablo Cove areas,including areas near the discharge. Black turban snails at higher elevations inDiablo Cove were unaffected (shown in yellow).
E8-316.0 3-162
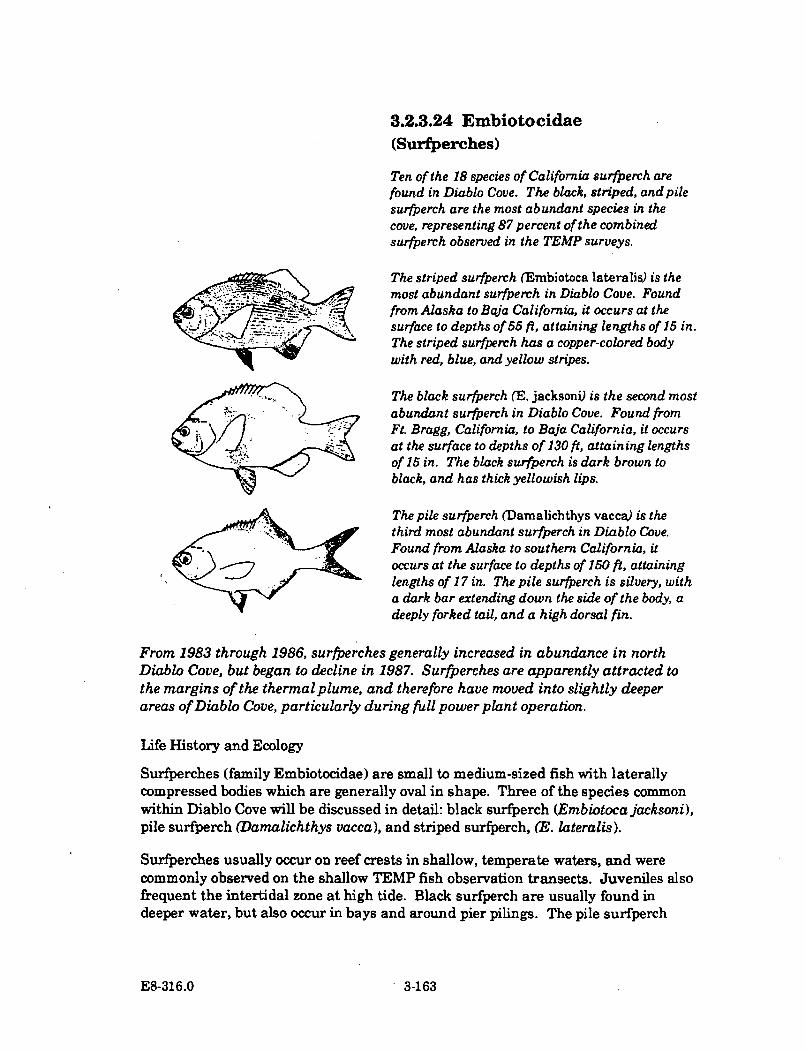
3.2.3.24 Embiotocidae(Surfperches)
Ten of the 18 species of California surfperch arefound in Diablo Cove. The black, striped, and pilesurfperch are the most abundant species in thecove, representing 87 percent of the combinedsurfperch observed in the TEMP surveys.
The striped surfperch (Embiotoca lateralis) is themost abundant surfperch in Diablo Cove. Foundfrom Alaska to Baja California, it occurs at thesurface to depths of 55 ft, attaining lengths of 15 in.The striped surfperch has a copper-colored bodywith red, blue, and yellow stripes.
The black surfperch (E. jacksoni) is the second mostabundant surfperch in Diablo Cove. Found fromFt. Bragg, California, to Baja California, it occurs
at the surface to depths of 130 ft, attaining lengthsof 15 in. The black surfperch is dark brown toblack, and has thick yellowish lips.
The pile surfperch (Damalichthys vacc&) is thethird most abundant surfperch in Diablo Cove.Found from Alaska to southern California, it
S• occurs at the surface to depths of 150 ft, attaininglengths of 17 in. The pile surfperch is silvery, witha dark bar extending down the side of the body, adeeply forked tail, and a high dorsal fin.
From 1983 through 1986, surfperches generally increased in abundance in northDiablo Cove, but began to decline in 1987. Surfperches are apparently attracted to
the margins of the thermal plume, and therefore have moved into slightly deeperareas of Diablo Cove, particularly during full power plant operation.
Life History and Ecology
Surfperches (family Embiotocidae) are small to medium-sized fish with laterallycompressed bodies which are generally oval in shape. Three of the species common
within Diablo Cove will be discussed in detail: black surfperch (Embiotocajacksoni),
pile surfperch (Damalichthys vacca), and striped surfperch, (E. lateralis).
Surfperches usually occur on reef crests in shallow, temperate waters, and werecommonly observed on the shallow TEMP fish observation transects. Juveniles alsofrequent the intertidal zone at high tide. Black surfperch are usually found indeeper water, but also occur in bays and around pier pilings. The pile surfperch
E8-316.0 .3-163
overlaps in vertical distribution with both the striped and black surfperch. Stripedsurfperch are more common in the high surge areas of Diablo Cove than are othersurfperch species.
Surfperches are one of the few families of live-bearing marine fishes. Courtshipgenerally occurs from spring through summer, when males and females assembleinto loosely grouped pairs. Males of many of the species often assume a darkermating coloration and often fertilize more than one female. Spermatozoa are carriedin the female until late fall or winter, when the eggs are ready for fertilization. Thelarval surfperch develop internally within the female and are released as fullydeveloped juveniles. At this stage the juveniles grow rapidly and may reachmaturity during their first year (Isaacson and Isaacson 1966).
Most members of the surfperch family feed in both the intertidal and subtidal zones(Cannon 1962). Generally, they are benthic grazing carnivores, and selectively feedon amphipod crustaceans in the algal turf. The pile surfperch specializes in eatinghard-shelled molluscs, crabs, and barnacles, and the striped surfperch consistentlyeats amphipods and crabs. Although both black surfperch and striped surfperch co-occur throughout the same depth range, striped surfperch are more common inshallow water (Schmitt and Holbrook 1986). Hixon (1981) presented acomprehensive description of the trophic and competitive relationships betweenthese species.
Surfperch are a popular sport fish, although the most desirable species, such as thebarred surfperch, are caught in the surf zone of sandy beaches. Because of the smallsize of the fish and the necessity for using hook-and-line methods, commercialfishing for surfperch is not very profitable, although a small fishery does exist.
Distribution and Abundance
The abundances of the black, pile, and striped surfperch on TEMP fish observationtransects are presented by survey in Figures D-61, D-69, and D-72 in Appendix D.Mean abundances along the benthic transects are shown for adults and juveniles byyear (Figure 3.2.3.24-1), and a summary of total juvenile and adult surfperchabundances is presented in Table 3.2.3.24-1. In north Diablo Cove the numbers ofadult surfperch generally increased from 1983 to 1986, then decreased during 1987for all three species. Juvenile black surfperch, however, increased during 1987.Abundances in south Diablo Cove were relatively constant during the study period,but also declined slightly in 1987. in the South Cove reference area, stripedsurfperch generally declined in abundance from 1976 levels, while black surfperchincreased over time. Pile perch, however, increased substantially in the same areaduring the 1987 surveys, a trend which was not reflected at any of the stationsinside Diablo Cove.
E8-316.0 3-164
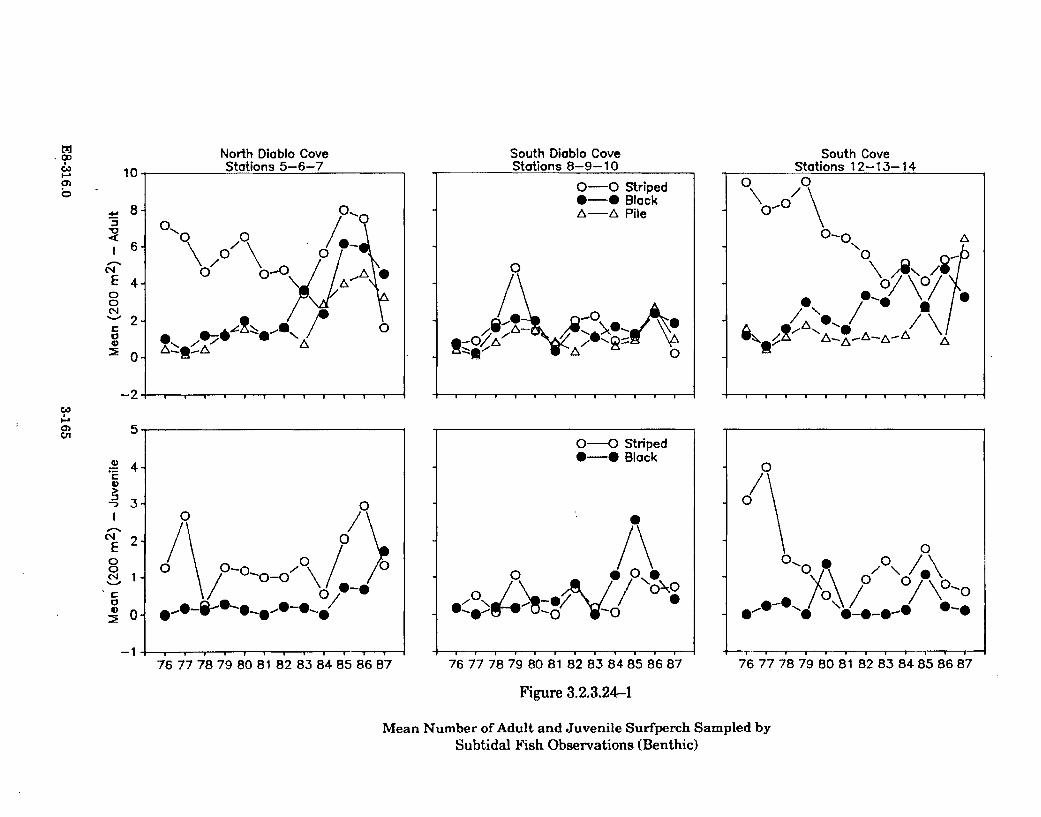
0
North Diablo CoveStations 5-6-7
I-
U'
10
8.
6-
C14E 4.00(N"-2.
~0-
-2
5-
) .
5 3-
C 2.E
0.
-1
South Diablo CoveStations 8-9-10
0-0 Striped0-0 BlackA-A Pile
0 0
0-0
0\ /R\ / I
/ A \ o/ \0/ *
A " A A
. . . . . . . . . ,= . • i . .
South CoveStations 12-13-14
0-0 Striped*-0 Black
767 8 77 87 0 8182 83 84 85 8687 76 77 78 79 8 8812 83 84 85 86 87 76 77 78 79 80 81 82 83 84 85 86 87
Figure 3.2.3.24-1
Mean Number of Adult and Juvenile Surfperch Sampled bySubtidal Fish Observations (Benthic)
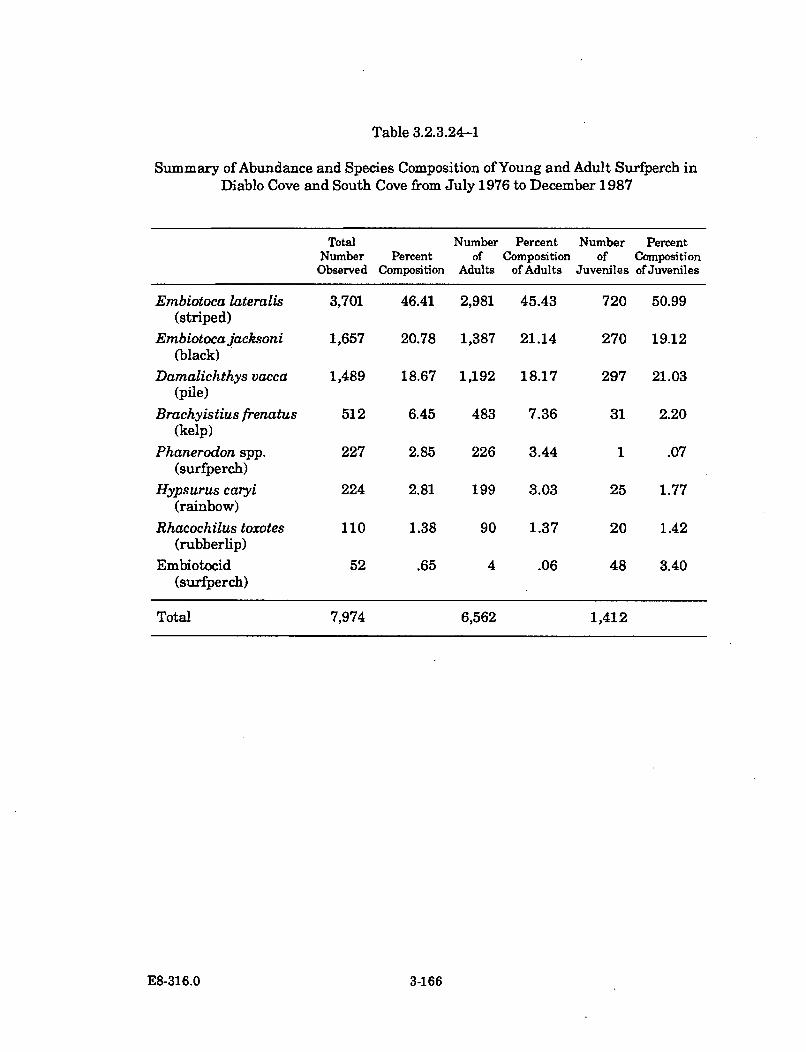
Table 3.2.3.24-1
Summary of Abundance and Species Composition of Young and Adult Surfperch inDiablo Cove and South Cove from July 1976 to December 1987
Embiotoca lateralis(striped)
Embiotocajacksoni(black)
Damalichthys vacca(pile)
Brachyistius frenatus(kelp)
Phanerodon spp.(surfperch)
Hypsurus caryi(rainbow)
Rhacochilus toxotes(rubberlip)
Embiotocid(surfperch)
Total
TotalNumberObserved
3,701
1,657
1,489
512
227
224
110
52
PercentComposition
46.41
20.78
18.67
6.45
2.85
2.81
1.38
.65
Numberof
Adults
2,981
1,387
1,192
483
226
199
90
4
Percent Number PercentComposition of Composition
of Adults Juveniles of Juveniles
45.43 720 50.99
21.14 270 19.12
18.17 297 21.03
7.36 31 2.20
3.44 1 .07
3.03 25 1.77
1.37 20 1.42
.06 48 3.40
7,974 6,562 1,412
E8-316.0 3-166
Thermal Impact Assessment
Laboratory thermal effects studies have shown the optimal temperature for growthof black surfperch to be approximately 18 C (PG&E 1982b). The estimated upperlethal temperature for juvenile black surfperch acclimated at 12.2 C was 24.5 C.The results of the black surfperch temperature gradient experiments established aregion of both upper and lower temperature avoidance, depending on the thermalacclimation of the fish. Fish acclimated to 16 C tolerated warmer temperatures, butindividuals would be expected to avoid stressful temperatures under actual fieldconditions.
Surfperch distributions generally shifted from south Diablo Cove to the deeper partsof north Diablo Cove during the period of power plant operation (Figure 3.2.3.24-2).The deeper ambient temperature water in the north Diablo Cove channel created atemperature gradient which attracted surfperches. The gradient also carriedsuspended material which may have been used as food by some of the fish.
In summary, the number of surfperch in Diablo Cove has generally increased alongthe margins of the thermal plume, especially in deeper portions of the north DiabloCove channel and beneath the thermocline. In shallow areas of north and southDiablo Cove, abundance decreased during 1987, probably as a result of thermalavoidance and the lack of kelp canopy cover.
E8-316.0 3-167
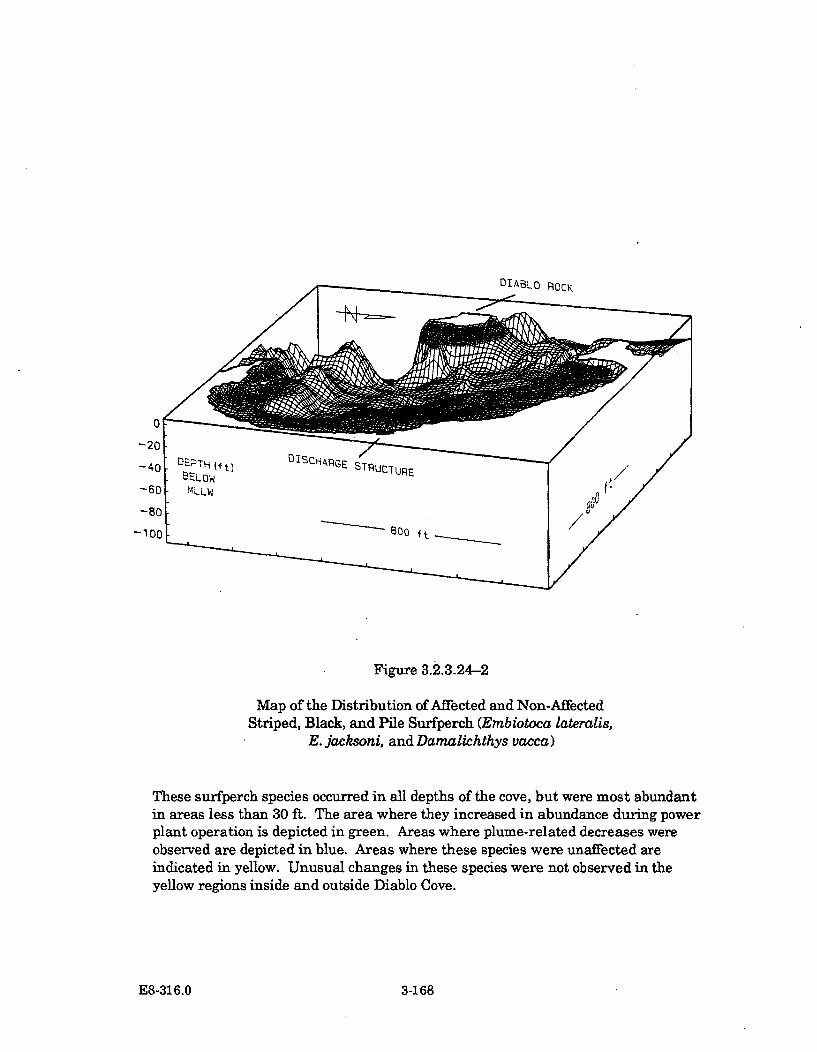
DIABLO ROCK
Figure 3.2.3.24-2
Map of the Distribution of Affected and Non-AffectedStriped, Black, and Pile Surfperch (Embiotoca lateralis,
E. jacksoni, and Damalichthys vacca)
These surfperch species occurred in all depths of the cove, but were most abundantin areas less than 30 ft. The area where they increased in abundance during powerplant operation is depicted in green. Areas where plume-related decreases wereobserved are depicted in blue. Areas where these species were unaffected areindicated in yellow. Unusual changes in these species were not observed in theyellow regions inside and outside Diablo Cove.
E8-316.0 3-168
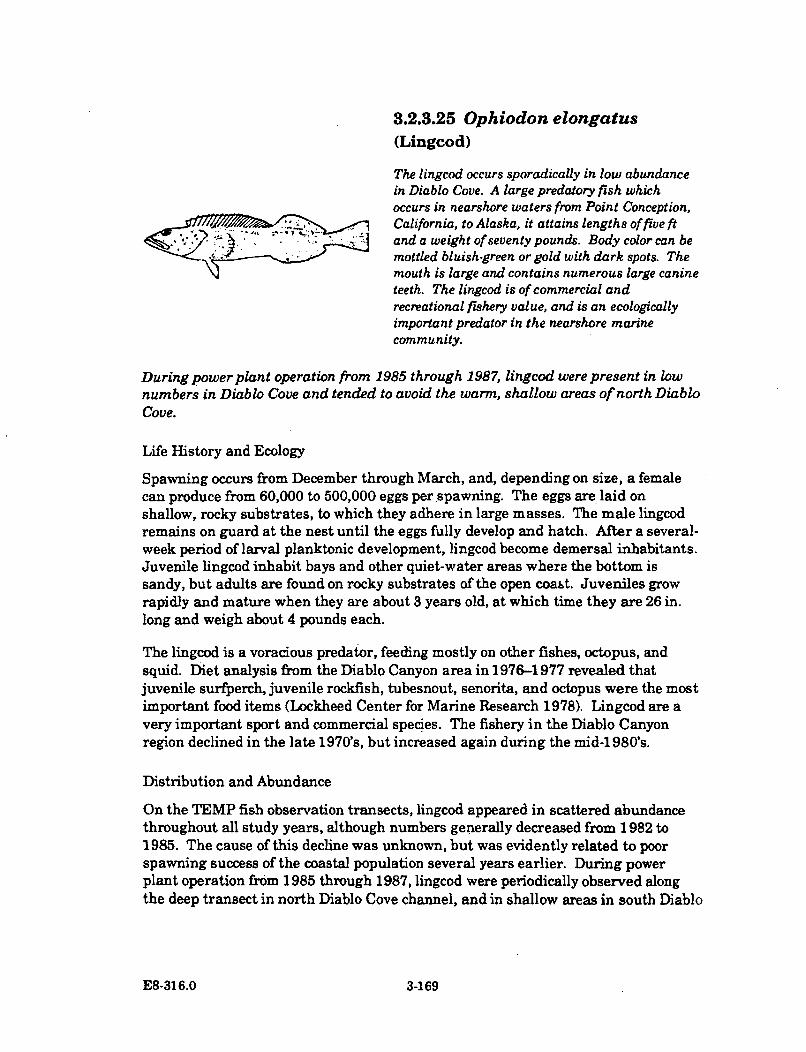
3.2.3.25 Ophiodon elongatus(Lingcod)
The lingcod occurs sporadically in low abundancein Diablo Cove. A large predatory fish whichoccurs in nearshore waters from Point Conception,
SCalifornia, to Alaska, it attains lengths of five ftand a weight of seventy pounds. Body color can bemottled bluish.green or gold with dark spots. Themouth is large and contains numerous large canineteeth. The lingcod is of commercial andrecreational fishery value, and is an ecologicallyimportant predator in the nearshore marinecommunity.
During power plant operation from 1985 through 1987, lingcod were present in lownumbers in Diablo Cove and tended to avoid the warm, shallow areas of north DiabloCove.
Life History and Ecology
Spawning occurs from December through March, and, depending on size, a femalecan produce from 60,000 to 500,000 eggs per spawning. The eggs are laid onshallow, rocky substrates, to which they adhere in large masses. The male lingcodremains on guard at the nest until the eggs fully develop and hatch. After a several-week period of larval planktonic development, lingcod become demersal inhabitants.Juvenile lingcod inhabit bays and other quiet-water areas where the bottom issandy, but adults are found on rocky substrates of the open coast. Juveniles growrapidly and mature when they are about 3 years old, at which time they are 26 in.long and weigh about 4 pounds each.
The lingcod is a voracious predator, feeding mostly on other fishes, octopus, andsquid. Diet analysis from the Diablo Canyon area in 1976-1977 revealed thatjuvenile surfperch, juvenile rockfish, tubesnout, senorita, and octopus were the mostimportant food items (Lockheed Center for Marine Research 1978). Lingcod are avery important sport and commercial species. The fishery in the Diablo Canyonregion declined in the late 1970's, but increased again during the mid-1 980's.
Distribution and Abundance
On the TEMP fish observation transects, lingcod appeared in scattered abundancethroughout all study years, although numbers generally decreased from 1982 to1985. The cause of this decline was unknown, but was evidently related to poorspawning success of the coastal population several years earlier. During powerplant operation from 1985 through 1987, lingcod were periodically observed alongthe deep transect in north Diablo Cove channel, and in shallow areas in south Diablo
E8-316.0 3-169
Cove, but were absent from shallow areas in north Diablo Cove where they hadpreviously been present (Figure 3.2.3.25-1 and Figure D-66 in Appendix D).
Thermal Impact Assessment
Lingcod are primarily adapted to cool temperate water temperatures, as can be seenfrom their geographical distribution. In laboratory experiments, embryos held at8 C survived temperatures of 22 C, but not 24 C. Larvae were sensitive totemperatures as low as 18 C, where torpid behavior was observed. No thermaleffects studies have been done on the adult stage of lingcod, but they would beexpected to avoid stressful temperatures under actual field conditions.
The absence of lingcod in the warmest areas of Diablo Cove during power plantoperation indicated that they were intolerant of the warm temperatures normallyencountered near the thermal discharge (Figure 3.2.3.25-2). Their mobility,however, would preclude any adverse effects on the population as a whole, andrecruitment would still occur outside the affected areas.
E8-316.0 3-170
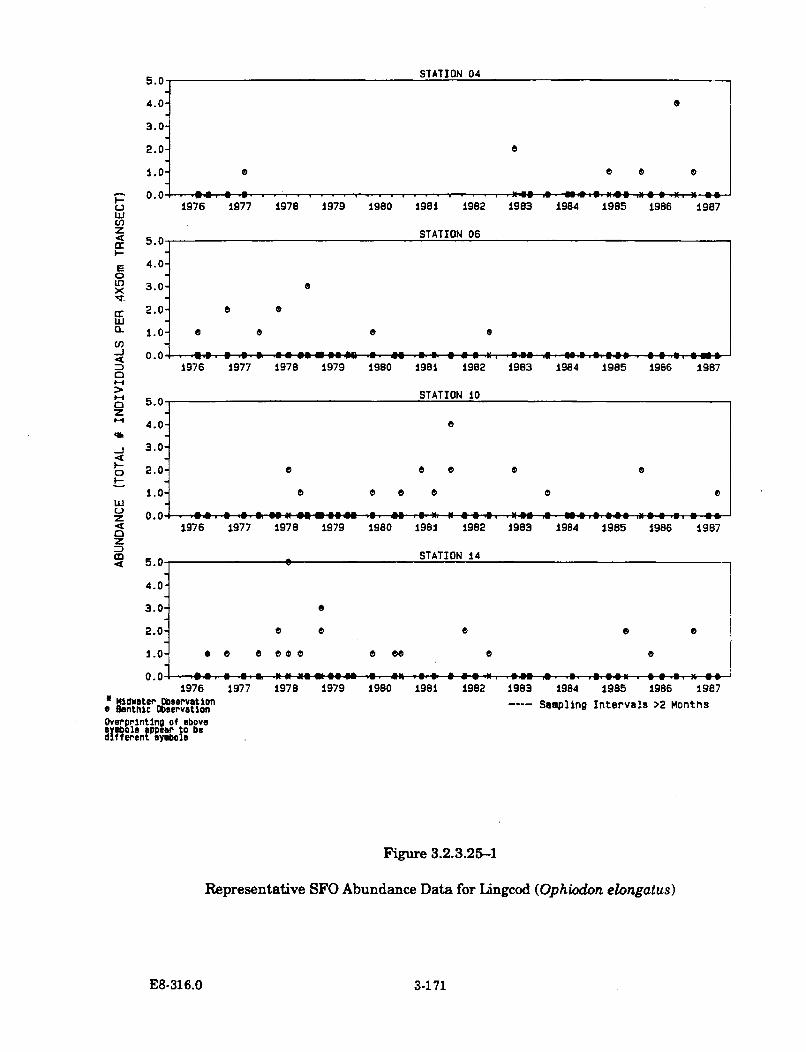
5.0 STATION 04
4.0-
3.0-
2.0-
1.0- 0 0 0
0.0* - a -01 6 A -. Au .: .S. M408 .pA .
L) 1976 1977 1978 1979 1980 1981 1982 1983 1984 1985 1986 1987LIU
zx STATION 06Cc 5.0-
I.-2 4.0-
0 3.0-x
cc 2.0- 0LUJCL 1.0- ®a 0 0En
0 o. 0 i-i 0 O 4 a apps a so - - 46 9.3aa 40 9.5 33.6 -6a 0.3 0 a a4 SO a1976 1977 1978 1979 1980 1981 1982 1983 1984 1985 1986 1987D
STATION 10o 5.0-
k 4.0-
-. 3.0-- 2.0
I.-1.0 .1aAa 0 0- 0 .0 0
1976 1977 1978 1979 1980 1981 1982 1983 1984 1985 1986 1987zM STATION 14<(5.0-
4.0.
3.0-
2.0 0 0 0 0 0
0.0 • 0 0 000 0 00 aA
0.0 0._0 ,= ..- -R-i_ m.o--.e- .--. ,,= ..-..- --e ~.. *.e-- ,,. .. s.u_-.': . i 3.-. 35-=
1976 1977 1978 1979 1980 1981 1982 1983 1984 1985 1986 1987H Ntdwate, 'servmtion ---- Sampling Intervals >2 MonthsBenthic Zaervation
Overprlnting of above
sybool tppear .to bedfferent symbols
Figure 3.2.3.25-1
Representative SFO Abundance Data for Lingcod (Ophiodon elongatus)
E8-316.0 3-171
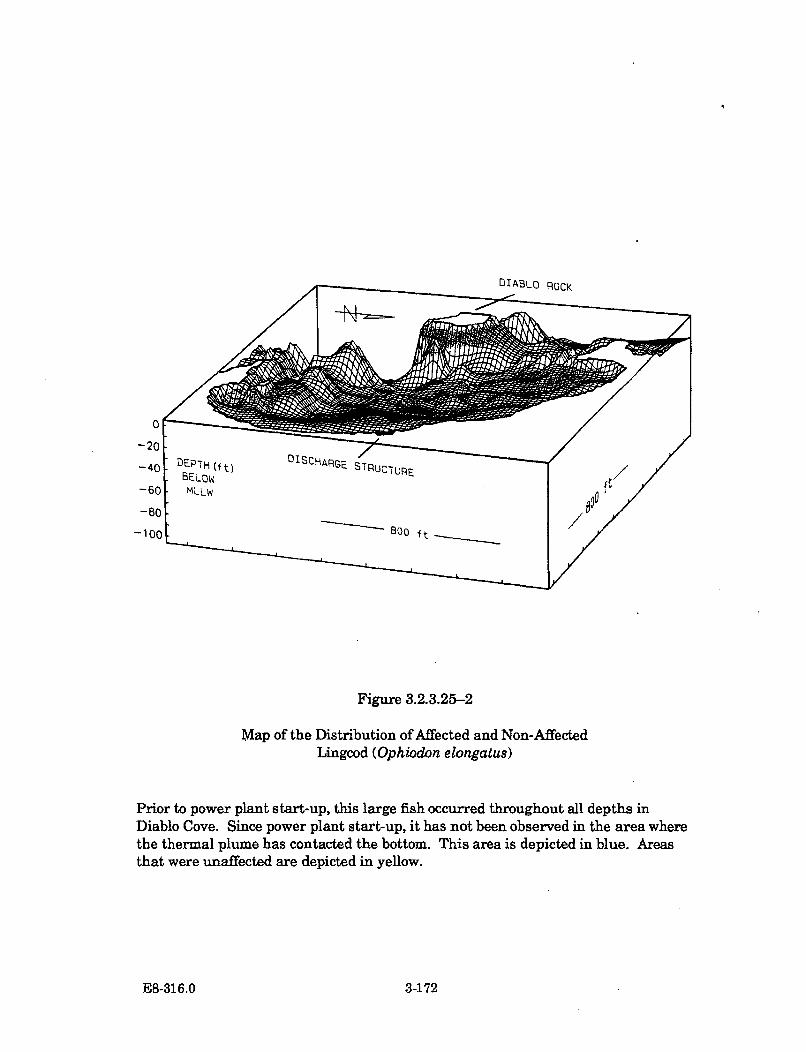
0I1BLO ROCK
Figure 3.2.3.25-2
Map of the Distribution of Affected and Non-AffectedLingcod (Ophiodon elongatus)
Prior to power plant start-up, this large fish occurred throughout all depths inDiablo Cove. Since power plant start-up, it has not been observed in the area wherethe thermal plume has contacted the bottom. This area is depicted in blue. Areasthat were unaffected are depicted in yellow.
E8-316.0 3-172
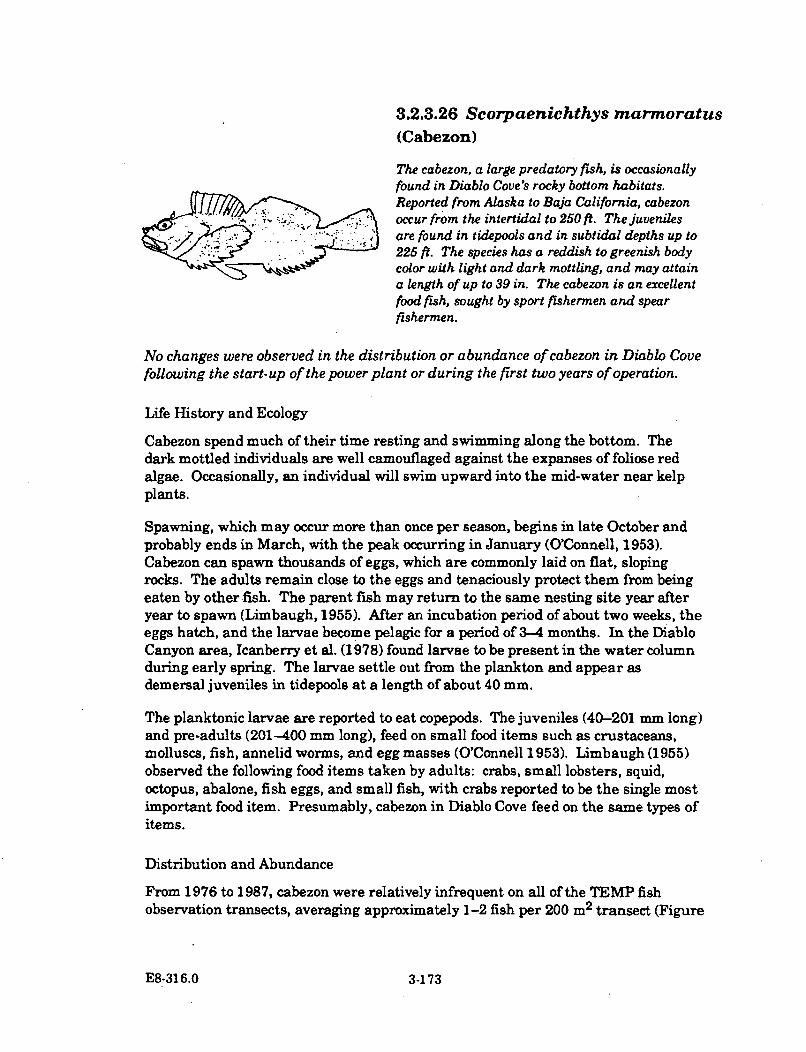
3.2.3.26 Scorpaenichthys marmoratus(Cabezon)
The cabezon, a large predatory fish, is occasionallyfound in Diablo Cove's rocky bottom habitats.Reported from Alaska to Baja California, cabezonoccur from the intertidal to 250ft. The juveniles
. .are found in tidepools and in subtidal depths up to225 ft. The species has a reddish to greenish bodycolor with light and dark mottling, and may attaina length of up to 39 in. The cabezon is an excellentfood fish, sought by sport fishermen and spearfishermen.
No changes were observed in the distribution or abundance of cabezon in Diablo Covefollowing the start-up of the power plant or during the first two years of operation.
Life History and Ecology
Cabezon spend much of their time resting and swimming along the bottom. Thedark mottled individuals are well camouflaged against the expanses of foliose redalgae. Occasionally, an individual will swim upward into the mid-water near kelpplants.
Spawning, which may occur more than once per season, begins in late October andprobably ends in March, with the peak occurring in January (O'Connell, 1953).Cabezon can spawn thousands of eggs, which are commonly laid on flat, slopingrocks. The adults remain close to the eggs and tenaciously protect them from beingeaten by other fish. The parent fish may return to the same nesting site year afteryear to spawn (Limbaugh, 1955). After an incubation period of about two weeks, theeggs hatch, and the larvae become pelagic for a period of 3-4 months. In the DiabloCanyon area, Icanberry et al. (1978) found larvae to be present in the water columnduring early spring. The larvae settle out from the plankton and appear asdemersal juveniles in tidepools at a length of about 40 mm.
The planktonic larvae are reported to eat copepods. The juveniles (40-201 mm long)and pre-adults (201-400 mm long), feed on small food items such as crustaceans,molluscs, fish, annelid worms, and egg masses (O'Connell 1953). Limbaugh (1955)observed the following food items taken by adults: crabs, small lobsters, squid,octopus, abalone, fish eggs, and small fish, with crabs reported to be the single mostimportant food item. Presumably, cabezon in Diablo Cove feed on the same types ofitems.
Distribution and Abundance
From 1976 to 1987, cabezon were relatively infrequent on all of the TEMP fishobservation transects, averaging approximately 1-2 fish per 200 m2 transect (Figure
E8-316.0 3-173
3.2.3.26-1). Because of their generally low abundances, no seasonal or annual cyclescould be discerned. Most cabezon were found in north Diablo Cove (44 percent),followed by the stations outside Diablo Cove (32 percent), and finally south DiabloCove (24 percent). Most of the nesting sites were also found in north Diablo Cove.
Thermal Impact Assessment
The lack of appreciable change in the abundance of cabezon in the Diablo Covesampling sites after power plant start-up indicated that the population in DiabloCove was largely unaffected by the thermal plume (Figure 3.2.3.26-2). In thesesampling sites temperatures have commonly exceeded 18 C during power plantoperation, and in laboratory experiments cabezon avoided this temperature,preferring cooler 16 C water. Thus, it is possible that many individuals in the covemay be moving into deeper, cooler areas, or leaving the cove.
In addition to the possibility of adult cabezon being sensitive to the thermal plume,the eggs that are deposited in the shallow portions of the cove may be at risk of nothatching. In laboratory experiments, hatching success was impaired in eggs exposedto 18 C water for 208 hours (PG&E 1982b). However, if it is true that adults wouldtend to avoid this temperature in the field, their eggs would then not be likely to beexposed to detrimental temperatures. Only when the eggs are laid during atemporary period of cooler water would they later be at risk of not hatching.
E8-316.0 3-174
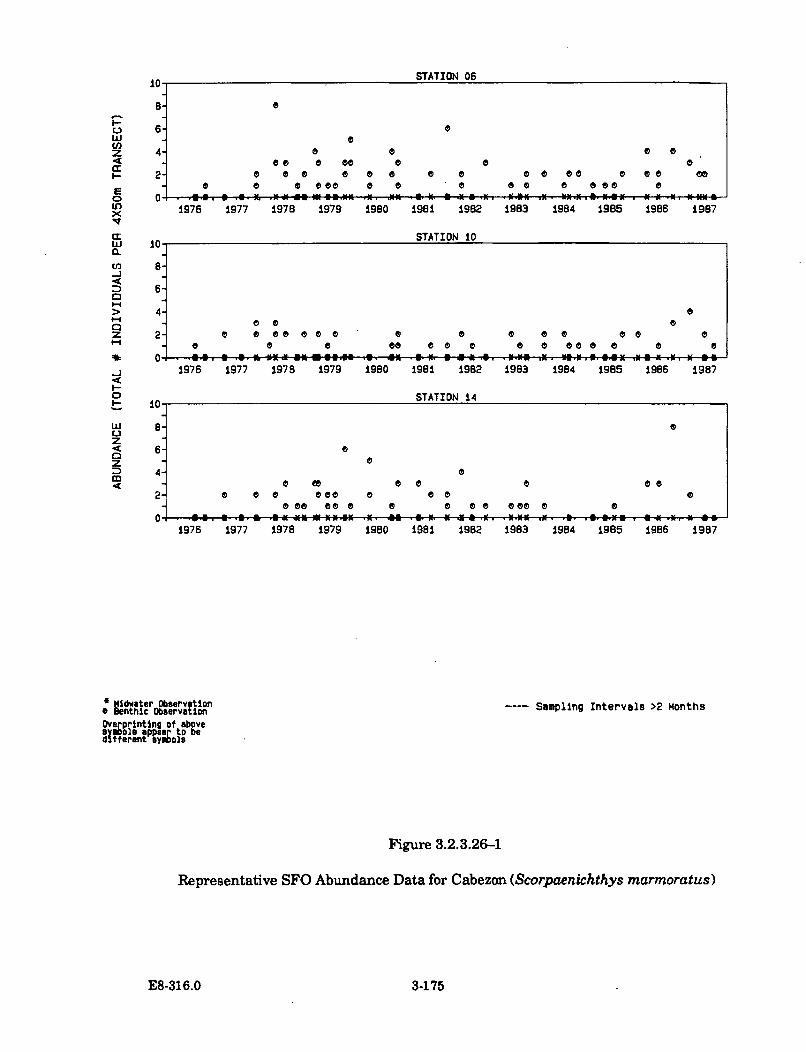
10 STATION 06
80
c. 6,w0 •007- 4-
*- 2 0 00 0 0 0 0 • o cc® 0 *
EE 00 00 0 00 0 0
UO 1976 1977 197B 1979 1980 1981 1982 19B3 1984 1985 1986 1987x,q,
CE STATION 10w 10a.ED 8-J
> 4S 6
9-4 4 0
Z 20 0 0 00 00 0a-'0 00 0 0 0 0 0 000 0 0
nka 1 *N .a~~.z.almuu 816 ix on-@@ aam 4116 mx *.~mO 6 a1976 1977 1978 1979 1980 1981 1982 1983 1984 1985 1986 1987
I.-.O STATION 14
lo-
w 0
z00
L 40-to 0 0 0 00
2- 0 0 0 se0 a 000 00 00 0 0 0 0 0 000 00
0 I- . a 3. N as a a .* . * K a1976 1977 1978 1979 1980 1981 1982 1983 1984 1985 1986 1987
S dtwgater Ob.rv..on ---- Sampling Intervals >2 Months0 n I ObservationBfenithic Observation
Overprinting of aboveSjffols .ofPpea; o bedferen ey ios
Figure 3.2.3.26-1
Representative SFO Abundance Data for Cabezon (Scorpaenichthys marmoratus)
E8-316.0 3-175

DIABLO ROCK
Figure 3.273.26-2
Map of the Distribution of Affected and Non-AffectedCabezon (Scorpaenichthys marmoratus)
Prior to power plant operation, this large cottid was found throughout Diablo Cove.This fish was displaced from the area directly offshore of the discharge structure andthe area immediately inshore of Diablo Rock, depicted in blue, but was commonlyseen in all other areas of the cove. A possibly lost nesting area for this fish in northDiablo Cove is depicted in purple. Areas unaffected by the plume are depicted inyellow.
E8-316.0 3-176
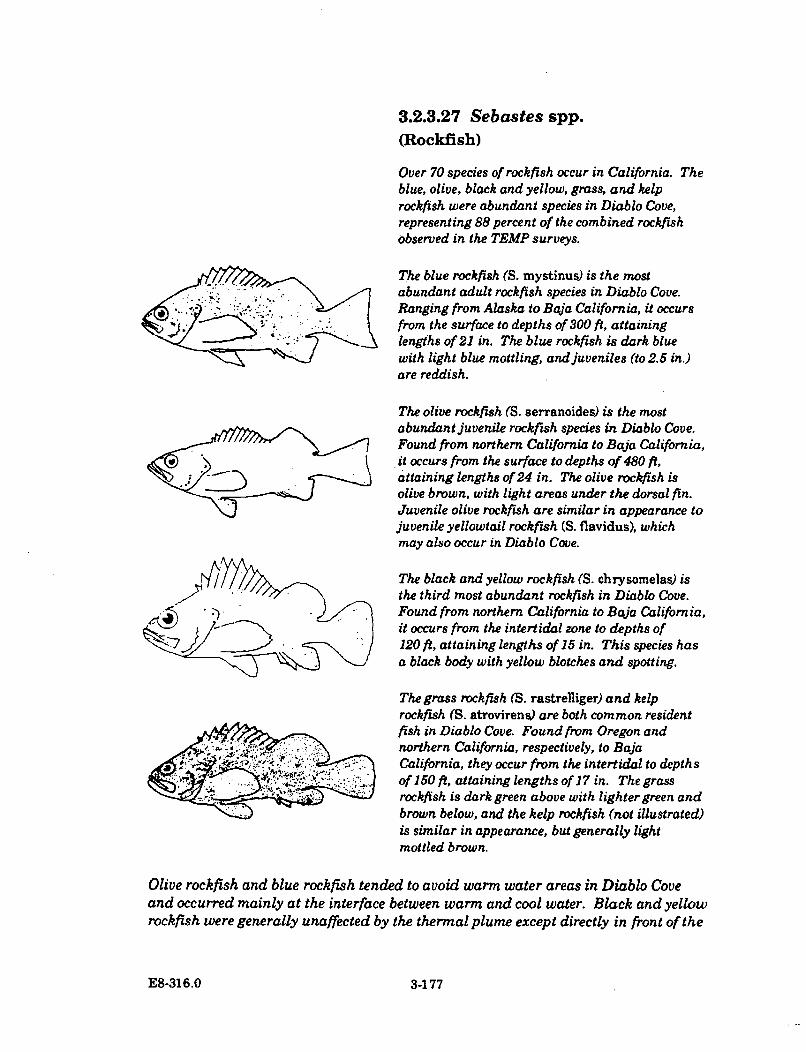
3.2.3.27 Sebastes spp.(Rockfish)
Over 70 species of rockfish occur in California. Theblue, olive, black and yellow, grass, and kelprockfish were abundant species in Diablo Cove,representing 88 percent of the combined rockfishobserved in the TEMP surveys.
The blue rockfish (S. mystinus) is the mostabundant adult rockfish species in Diablo Cove.Ranging from Alaska to Bqaa California, it occursf rom the surface to depths of 300 ft, attaininglengths of 21 in. The blue rockfish is dark bluewith light blue mottling, and juveniles (to 2.5 in.)are reddish.
The olive rockfish (S. serranoides) is the mostabundant juvenile rockfish species in Diablo Cove.Found from northern California to Baja California,it occurs from the surface to depths of 480 ft,J j"attaining lengths of 24 in. The olive rockfish isolive brown, with light areas under the dorsal fin.Juvenile olive rockfish are similar in appearance tojuvenile yellowtail rockfish (S. flavidus), whichmay also occur in Diablo Cove.
The black and yellow rockflsh (S. chrysomelas) isthe third most abundant rockfish in Diablo Cove.
..Found from northern California to Baja California,
it occurs from the intertidal zone to depths of• . " 120 ft, attaining lengths of 15 in. This species has
a black body with yellow blotches and spotting.
The grass rockfish (S. rastrelliger) and kelprockfish (S. atrovirens) are both common residentfish in Diablo Cove. Found from Oregon and
.,.northern California, respectively, to BajaCalifornia, they occur from the intertidal to depthsof 150 ft, attaining lengths of 17 in. The grassrockfish is dark green above with lighter green and
brown below, and the kelp rockfish (not illustrated)is similar in appearance, but generally lightmottled brown.
Olive rockfish and blue rockfish tended to avoid warm water areas in Diablo Coveand occurred mainly at the interface between warm and cool water. Black and yellowrockfish were generally unaffected by the thermal plume except directly in front of the
E8-316.0 3-177
thermal discharge, where, in October 1987, several dead individuals were found. Theobservations suggested that black and yellow rockfish maintained their territorieseven under unfavorable temperature regimes. Grass rockfish showed a long-termabundance increase in north Diablo Cove from 1979 to 1987, and were apparentlyunaffected by the thermal plume. Kelp rockfish and juvenile rockfish of severalspecies were displaced into deeper areas of Diablo Cove, since their preferred habitat,the understory and floating kelp canopy, was affected in shallow areas during plantoperation.
Life History and Ecology
Rockfish are characterized by their laterally compressed bodies, large fins, generallylarge mouths, and well-developed head spines. Body color may sufficientlydifferentiate many of the species, as implied by their descriptive common names. Ataxonomic key to the nearly 70 rockfish species in California was developed byPhillips (1968). Juveniles are often difficult to identify correctly because of colorvariation, and specialized taxonomic keys for juveniles have been prepared by Allen(1976) and Anderson (1983). The various species can occupy almost all nearshoredepth ranges and habitat types, and are widely distributed in temperate waters ofthe Pacific coast.
Blue rockfish and olive rockfish may be distinguished from the other three speciesbeing considered, not only by their body color but also by their behavioral tendencyto aggregate in the midwater near rock pinnacles or kelp canopies. Kelp and grassrockfish typically occupy the near-bottom habitat beneath tree kelp canopies, andblack and yellow rockfish find territorial shelters in rock crevices or betweenboulders. The fishes' preferred habitats dictate their feeding preferences as well,with the three bottom-dwelling species consuming smaller fish and benthicinvertebrates in Diablo Cove (Burge and Schultz 1973). Olive rockfish also feed onother fish and benthic invertebrates, but blue rockfish prefer kelp, small jellyfish, orfree-drifting invertebrates which are abundant in the midwater habitat (Gotshall etal. 1965). Rockfish themselves, especially juveniles, are preyed upon by larger fishsuch as the cabezon (Scorpaenichthys marmoratus) and lingcod (Ophiodonelongatus).
Reproduction is similar among the rockfish species, with fertilization and eggdevelopment occurring internally. Spawning generally occurs in winter, and newlyhatched larvae are released directly into the water column. Larvae then developfurther in the plankton, and after several months finally recruit to their nearshorehabitats as juveniles. In Diablo Cove, juvenile rockfish appeared in the spring andsummer, and were commonly observed in association with tree kelp or bladder chainkelp canopies.
Rockfish are of major importance to both the commercial and sport fisheries inCalifornia (Miller and Geibel 1973, Miller and Hardwick 1973). The commercialspecies include those trawled in deep-water areas, as well as several shallow-waterspecies more common in sport catches. The abundance of rockfish caught by sport
E8-316.0 3-178
fishermen from Morro Bay and Port San Luis in the vicinity of Diablo Cove wasmonitored from 1980-1987 by PG&E, and blue rockfish generally ranked first inabundance.
Distribution and Abundance
Of the 14 species of rockfish observed on the TEMP subtidal fish observationtransects, the olive, blue, black and yellow, and bocaccio species represented99.7 percent of all adults and juveniles recorded, and over 81 percent of theindividual rockfish observed in Diablo Cove were juveniles (Table 3.2.3.27-1). Theabundances of five representative species of rockfish observed from 1976-1987 inDiablo Cove and reference areas are presented in Figure 3.2.3.27-1 and in FiguresD-60, D-62, D-64, D-65, and D-67 in Appendix D.
Blue rockfish abundance in nearshore areas was closely related to the presence of awell-developed bull kelp canopy which provided shelter for both juveniles and adults.The South Cove area generally had more optimal habitat in this respect. WithinDiablo Cove, blue rockfish were most abundant in the deeper high-relief areas of thenorth and south channels, and to a lesser extent on the shallow reefs in the northportion of the cove. Abundances in north Diablo Cove steadily decreased from 1983through 1987. The beginning of this decrease coincided with the coast-wide El Ninowarming trend of 1983, and was mirrored in the sport fishery catches immediatelyoffshore of Diablo Canyon.
Olive rockfish selected habitats similar to those of blue rockfish, but theirabundances in north Diablo Cove increased markedly during 1986 and 1987 over thepre-operptional levels. At the same time, abundances remained relativelyunchanged in both south Diablo Cove and South Cove stations.
Black and yellow rockfish abundances were generally low and quite variable in bothnorth and south Diablo Cove, but increased steadily over time in the South Covearea (Figure 3.2.3.27-1). A slight decrease in abundance occurred in north DiabloCove from 1983-1987, although the numbers were relatively high compared withsouth Diablo Cove, where lack of suitable rocky habitat precluded the establishmentof a large resident population.
Grass rockfishwere present in low abundances in all areas from 1976-1987 andpersisted in thermally affected areas during power plant operation (Figure3.2.3.27-1). Kelp rockfish were even less abundant overall, and were most oftenseen in the mid-water adjacent to giant kelp plants, or among understory tree kelpsin the deeper channel areas of Diablo Cove.
Thermal Impact Assessment
Laboratory studies on heat tolerance and optimal temperature for growth wereconducted on blue rockfish (PG&E 1982b). During four-day heat tolerance tests, fishwhich were acclimated to 12 C and 16 C experienced lethal temperatures of 22.5 C
E8-316.0 3-179
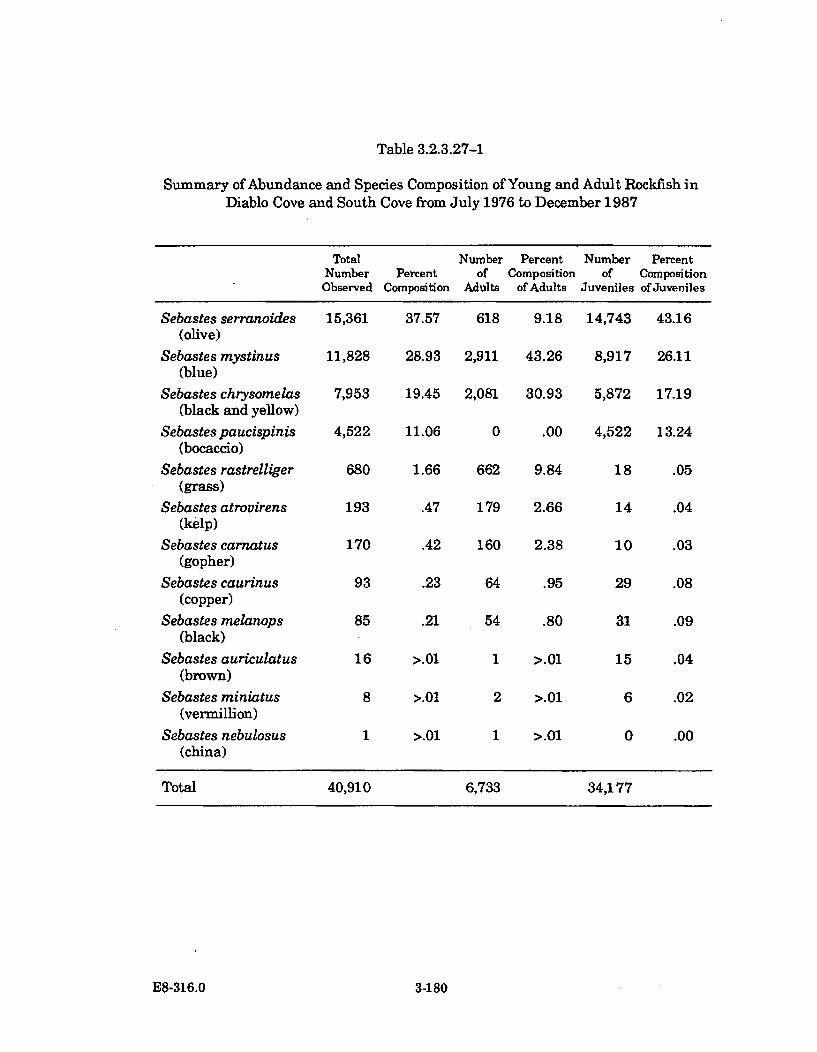
Table 3.2.3.27-1
Summary of Abundance and Species Composition of Young and Adult Rockfish inDiablo Cove and South Cove from July 1976 to December 1987
Total Number Percent Number PercentNumber Percent of Composition of Composition
Observed Composition Adults of Adults Juveniles of Juveniles
Sebastes serranoides(olive)
Sebastes mystinus(blue)
Sebastes chrysomelas(black and yellow)
Sebastes paucispinis(bocaccio)
Sebastes rastrelliger(grass)
Sebastes atrovirens(kelp)
Sebastes carnatus(gopher)
Sebastes caurinus(copper)
Sebastes melanops(black)
Sebastes auriculatus(brown)
Sebastes miniatus(vermillion)
Sebastes nebulosus(china)
Total
15,361
11,828
7,953
4,522
680
193
170
93
85
16
37.57
28.93
19.45
11.06
1.66
.47
.42
.23
.21
61
2,91
2,08
66
17
16
6
5
8 9.18
1 43.26
11 30.93
0 .00
'2 9.84
r9 2.66
;0 2.38
34 .95
i4 .80
1 >.01
2 >.01
1 >.01
14,743
8,917
5,872
4,522
18
14
10
29
31
15
43.16
26.11
17.19
13.24
.05
.04
.03
.08
.09
.04
8
1
>.01
>.01
>.01
6 .02
0 .00
40,910 6,733 34,177
E8-316.0 3-180
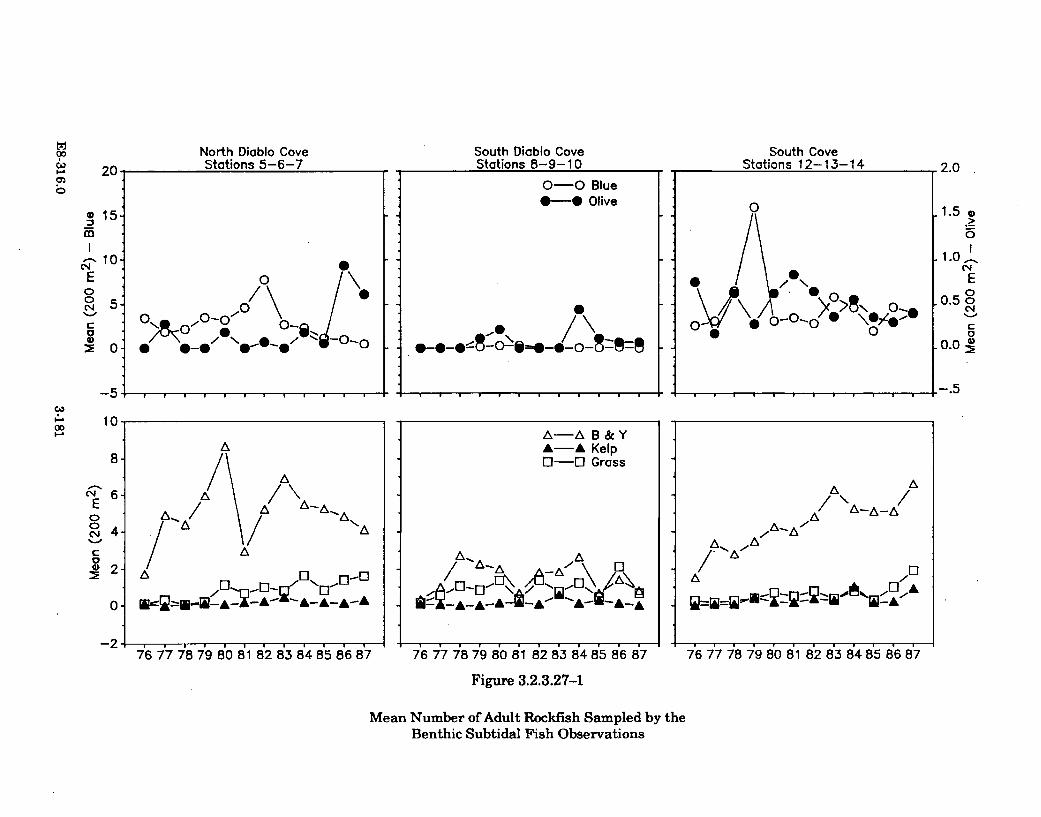
ITJ
90I-A
North Diablo CoveStations 5-6-7
South Diablo CoveStations 8-9-10
South CoveStations 12-13-14
0
CNE
00
04
20
15-
10-
5.
0-
0-0 Blue0-0 Olive
.o\ /0
2.0
.1.5 e5
1.0
E0
0.5 o
C0
.0.0 :
.-. 5C.,
I-.
-5
10
v..........................................
E00N
(DM)
A-,&, A 11_ý A
A-A B&YA-A KelpI3-0l Gross
/A A-A \ / [
II-•-A-A- -I-A, "A- W-A--A
4,
A A
A/A El
-AA-A-A0.
-276 77 78 79 80 81 82 83 848 5 86 87 76 77 78 79 80 81 82 83 84 85 86 87 i6 77 78 79 80 •1 82 83 84 85 86 87
Figure 3.2.3.27-1
Mean Number of Adult Rockfish Sampled by theBenthic Subtidal Fish Observations
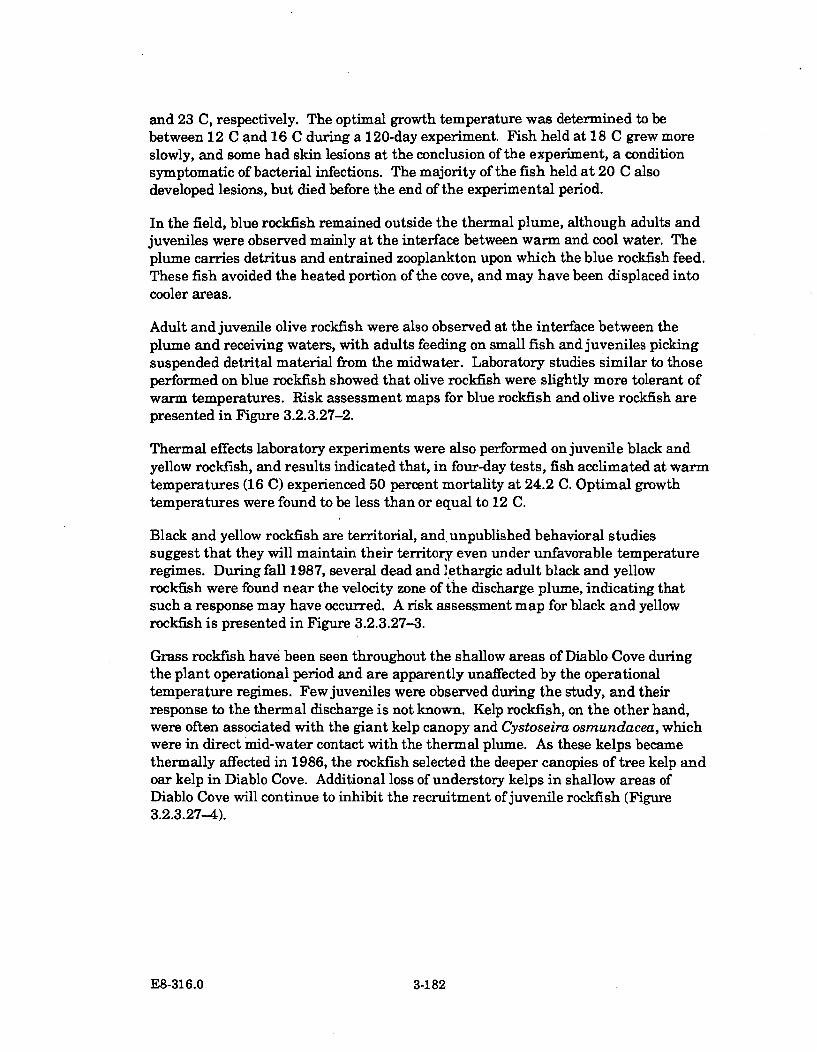
and 23 C, respectively. The optimal growth temperature was determined to bebetween 12 C and 16 C during a 120-day experiment. Fish held at 18 C grew moreslowly, and some had skin lesions at the conclusion of the experiment, a conditionsymptomatic of bacterial infections. The majority of the fish held at 20 C alsodeveloped lesions, but died before the end of the experimental period.
In the field, blue rockfish remained outside the thermal plume, although adults andjuveniles were observed mainly at the interface between warm and cool water. Theplume carries detritus and entrained zooplankton upon which the blue rockfish feed.These fish avoided the heated portion of the cove, and may have been displaced intocooler areas.
Adult and juvenile olive rockfish were also observed at the interface between theplume and receiving waters, with adults feeding on small fish and juveniles pickingsuspended detrital material from the midwater. Laboratory studies similar to thoseperformed on blue rockfish showed that olive rockfish were slightly more tolerant ofwarm temperatures. Risk assessment maps for blue rockfish and olive rockfish arepresented in Figure 3.2.3.27-2.
Thermal effects laboratory experiments were also performed on juvenile black andyellow rockfish, and results indicated that, in four-day tests, fish acclimated at warmtemperatures (16 C) experienced 50 percent mortality at 24.2 C. Optimal growthtemperatures were found to be less than or equal to 12 C.
Black and yellow rockfish are territorial, and, unpublished behavioral studiessuggest that they will maintain their territory even under unfavorable temperatureregimes. During fall 1987, several dead and lethargic adult black and yellowrockfish were found near the velocity zone of the discharge plume, indicating thatsuch a response may have occurred. A risk assessment map for black and yellowrockfish is presented in Figure 3.2.3.27-3.
Grass rockfish have been seen throughout the shallow areas of Diablo Cove duringthe plant operational period and are apparently unaffected by the operationaltemperature regimes. Few juveniles were observed during the study, and theirresponse to the thermal discharge is not known. Kelp rockfish, on the other hand,were often associated with the giant kelp canopy and Cystoseira osmundacea, whichwere in direct mid-water contact with the thermal plume. As these kelps becamethermally affected in 1986, the rockfish selected the deeper canopies of tree kelp andoar kelp in Diablo Cove. Additional loss of understory kelps in shallow areas ofDiablo Cove will continue to inhibit the recruitment of juvenile rockfish (Figure3.2.3.27-4).
E8-316.0 3-182

DIABLO ROCK
Figure 3.2.3.27-2
Map of the Distribution of Affected and Non-AffectedBlue Rockfish (Sebastes mystinus) andOlive Rockfish (Sebastes serranoides)
These two water column dwellers occurred throughout all depths of Diablo Cove.However, they were most abundant at depths greater than 20 ft. The area fromwhich fish were displaced is depicted in blue. The areas where these fish becameconcentrated at the boundary between the cool and warm waters of the plume at alldepths are indicated in green. The unaffected areas are indicated in yellow.
E8-316.0 3-183
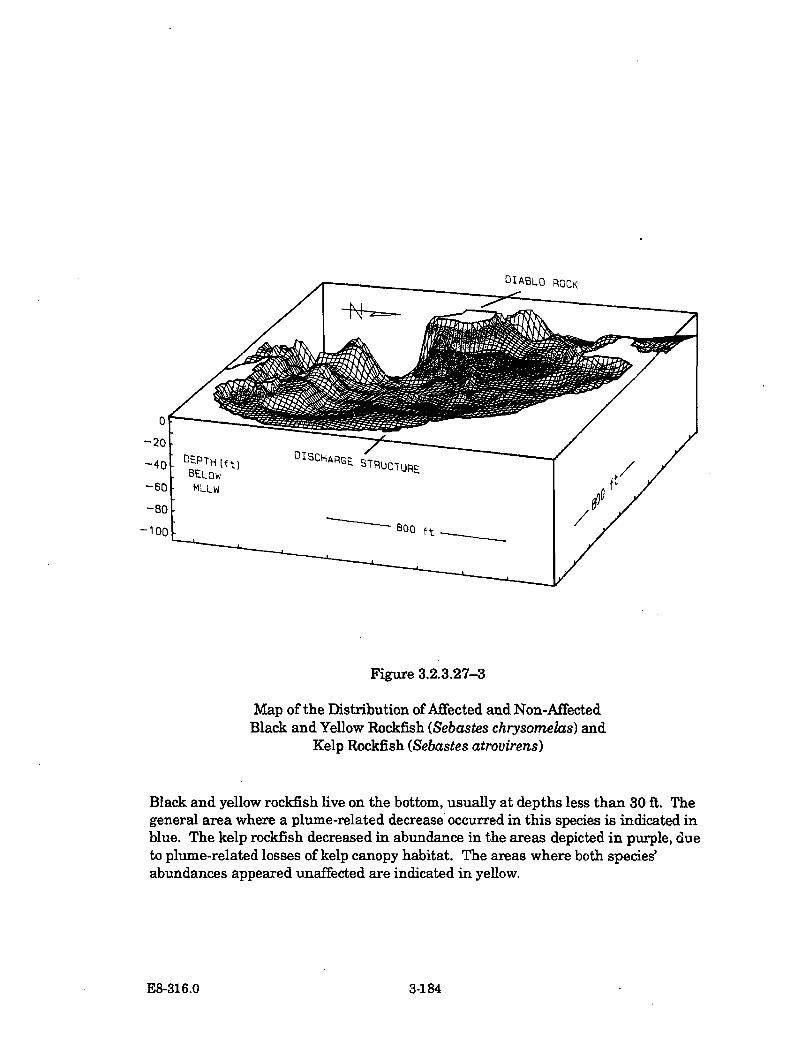
Figure 3.2.3.27-3
Map of the Distribution of Affected and Non-AffectedBlack and Yellow Rockfish (Sebastes chrysomelas) and
Kelp Rockfish (Sebastes atrovirens)
Black and yellow rockfish live on the bottom, usually at depths less than 30 ft. Thegeneral area where a plume-related decrease occurred in this species is indicated inblue. The kelp rockfish decreased in abundance in the areas depicted in purple, dueto plume-related losses of kelp canopy habitat. The areas where both species'abundances appeared unaffected are indicated in yellow.
E8-316.0 3-184
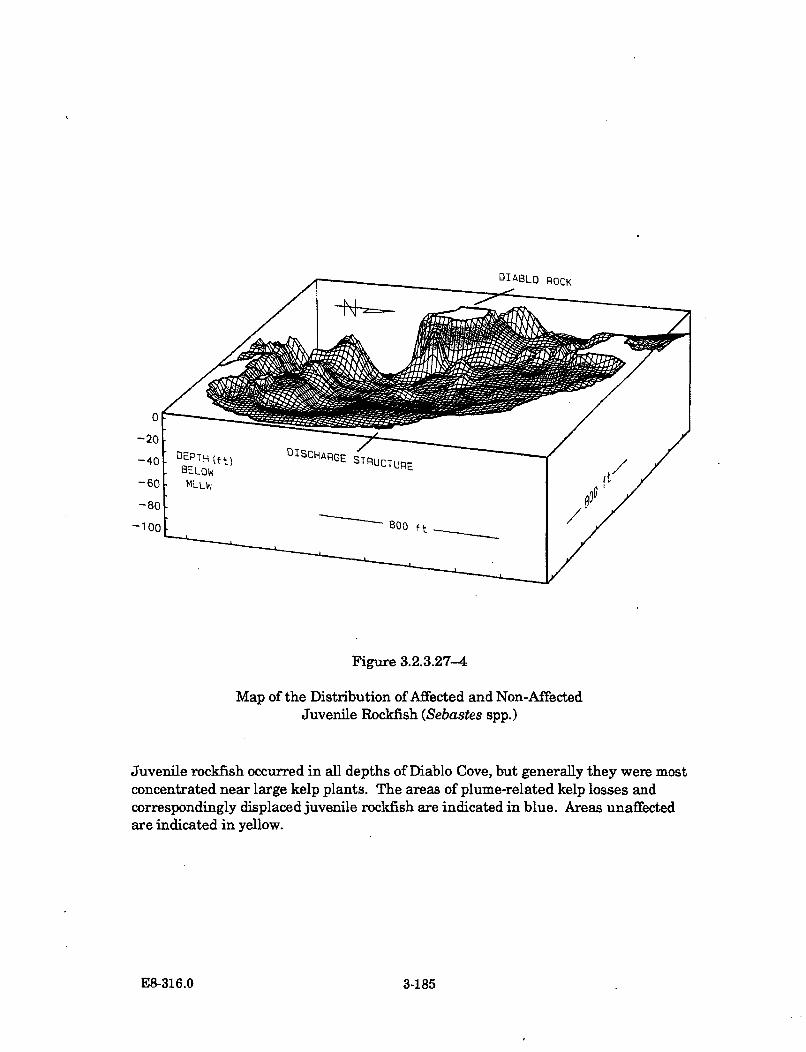
DIABLO ROCK
Figure 3.2.3.27-4
Map of the Distribution of Affected and Non-AffectedJuvenile Rockfish (Sebastes spp.)
Juvenile rockfish occurred in all depths of Diablo Cove, but generally they were mostconcentrated near large kelp plants. The areas of plume-related kelp losses andcorrespondingly displaced juvenile rockfish are indicated in blue. Areas unaffectedare indicated in yellow.
E8-316.0 3-185
0 pzzý4
3.2.3.28 Stichaeidae(Prickleback Fishes)
Four members of the family Stichaeidae(pricklebacks and cockscombs) constitute themajority of the intertidal fish fauna in Diablo Cove:the monkeyface-eel, high cockscomb, rockprickleback, and black prickleback. These specieslive beneath rocks and are adapted to periodicexposure to air during low tides.
The monkeyface-eel (Cebidichthys violaceus) occursfrom Oregon to Baja California. The body isusually dull black to greenish-gray, with twodarker bars below each eye. Adult fish reach alength of 30 in. and may live as long as 17 years.
The high cockscomb (Anoplarchus purpurescens)has a geographic range from the Bering Sea toSanta Rosa Island, California. Its color variesfrom black, gray, and purplish to red. Adult fishare readily distinguished by a prominent, fleshycrest on top of the head. Adult fish are normally nolonger than 8 in.
The rock prickleback (Xiphister mucosus) has ageographic range fron, Alaska to Pt. Arguello,California, and was generally the most commonintertidal fish species along the Diablo Canyoncoastline. The body is greenish-black to gray, withtwo dark bands diverging from each eye. Adult fishcan reach a length of 24 in.
The black prickleback (Xiphister atropurpureus)ranges from Alaska to Baja California. Its colorvaries from reddish-brown to black, with threedark bands diverging from the eyes, and a lightband across the base of the caudal fin. Adults canattain a length of 12 in.
During power plant operation, from 1985-1987, the two prickleback species declinedin abundance in Diablo Cove, whereas the other two species appeared to beunaffected by the thermal discharge.
Life History and Ecology
The stichaeid fishes have long, slender, laterally compressed bodies and an eel-likeappearance. The dorsal and anal fins are also long, extending to the end of the body,
E8-316.0 3-186
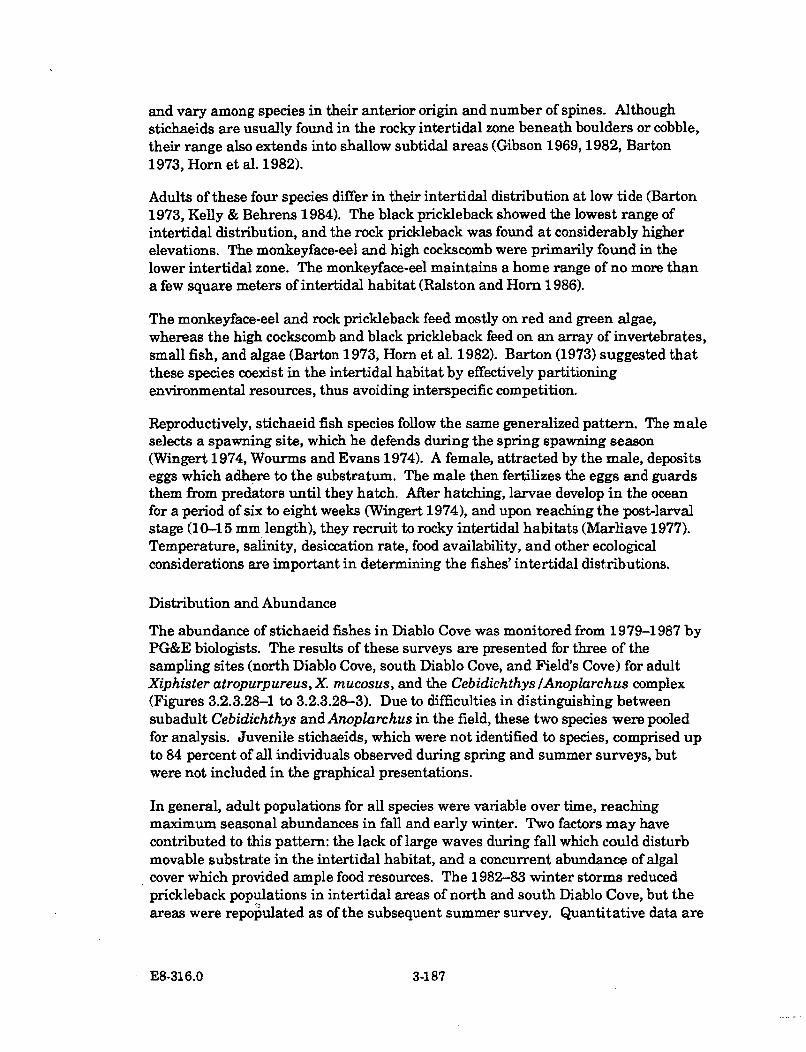
and vary among species in their anterior origin and number of spines. Althoughstichaeids are usually found in the rocky intertidal zone beneath boulders or cobble,their range also extends into shallow subtidal areas (Gibson 1969, 1982, Barton1973, Horn et al. 1982).
Adults of these four species differ in their intertidal distribution at low tide (Barton1973, Kelly & Behrens 1984). The black prickleback showed the lowest range ofintertidal distribution, and the rock prickleback was found at considerably higherelevations. The monkeyface-eel and high cockscomb were primarily found in thelower intertidal zone. The monkeyface-eal maintains a home range of no more thana few square meters of intertidal habitat (Ralston and Horn 1986).
The monkeyface-eel and rock prickleback feed mostly on red and green algae,whereas the high cockscomb and black prickleback feed on an array of invertebrates,small fish, and algae (Barton 1973, Horn et al. 1982). Barton (1973) suggested thatthese species coexist in the intertidal habitat by effectively partitioningenvironmental resources, thus avoiding interspecific competition.
Reproductively, stichaeid fish species follow the same generalized pattern. The maleselects a spawning site, which he defends during the spring spawning season(Wingert 1974, Wourms and Evans 1974). A female, attracted by the male, depositseggs which adhere to the substratum. The male then fertilizes the eggs and guardsthem from predators until they hatch. After hatching, larvae develop in the oceanfor a period of six to eight weeks (Wingert 1974), and upon reaching the post-larvalstage (10-15 mm length), they recruit to rocky intertidal habitats (Marliave 1977).Temperature, salinity, desiccation rate, food availability, and other ecologicalconsiderations are important in determining the fishes' intertidal distributions.
Distribution and Abundance
The abundance of stichaeid fishes in Diablo Cove was monitored from 1979-1987 byPG&E biologists. The results of these surveys are presented for three of thesampling sites (north Diablo Cove, south Diablo Cove, and Field's Cove) for adultXiphister atropurpureus, X. mucosus, and the Cebidichthys lAnoplarchus complex(Figures 3.2.3.28-1 to 3.2.3.28-3). Due to difficulties in distinguishing betweensubadult Cebidichthys and Anoplarchus in the field, these two species were pooledfor analysis. Juvenile stichaeids, which were not identified to species, comprised upto 84 percent of all individuals observed during spring and summer surveys, butwere not included in the graphical presentations.
In general, adult populations for all species were variable over time, reachingmaximum seasonal abundances in fall and early winter. Two factors may havecontributed to this pattern: the lack of large waves during fall which could disturbmovable substrate in the intertidal habitat, and a concurrent abundance of algalcover which provided ample food resources. The 1982-83 winter storms reducedprickleback populations in intertidal areas of north and south Diablo Cove, but theareas were repo ulated as of the subsequent summer survey. Quantitative data are
E8-316.0 3-187
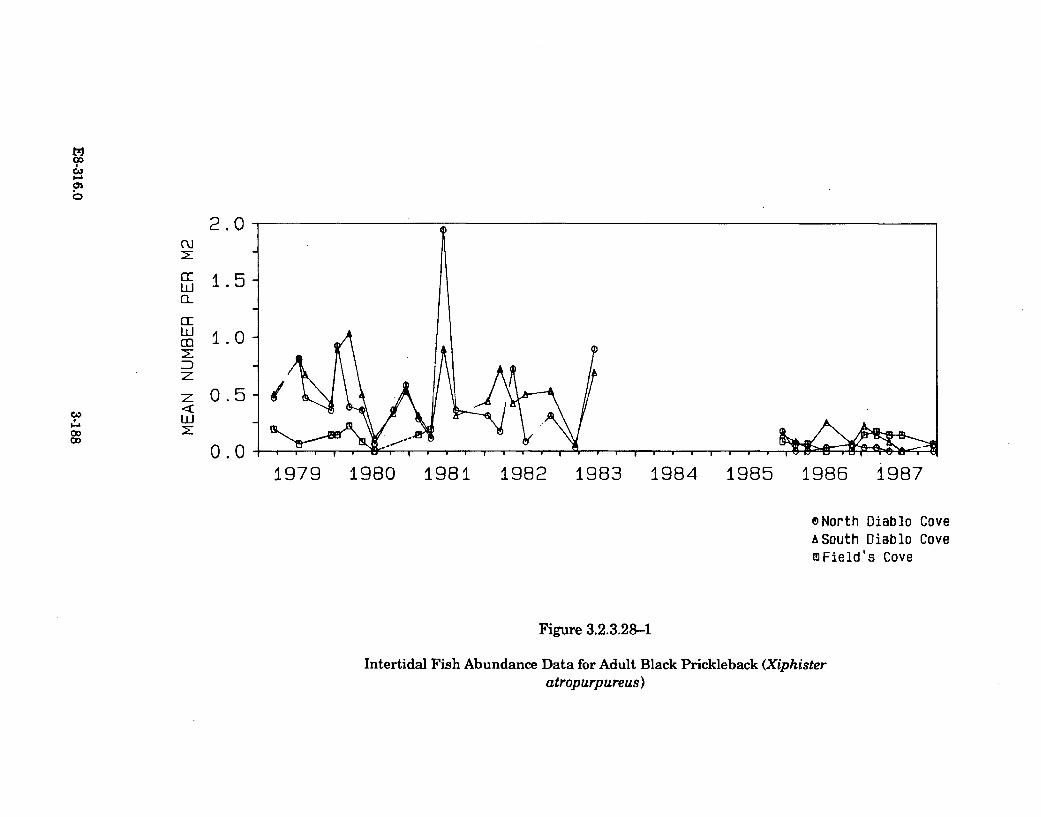
CA)
CU
0-UCmDzO
2.0
1.5
1.0
0.5
0.0
Co
1979 1980 1981 1982 1983 1984 1985 1986 1987
ONorth Diablo CoveASouth Diablo CovemField's Cove
Figure 3.2.3.28-1
Intertidal Fish Abundance Data for Adult Black Prickleback (Xiphisteratropurpureus)
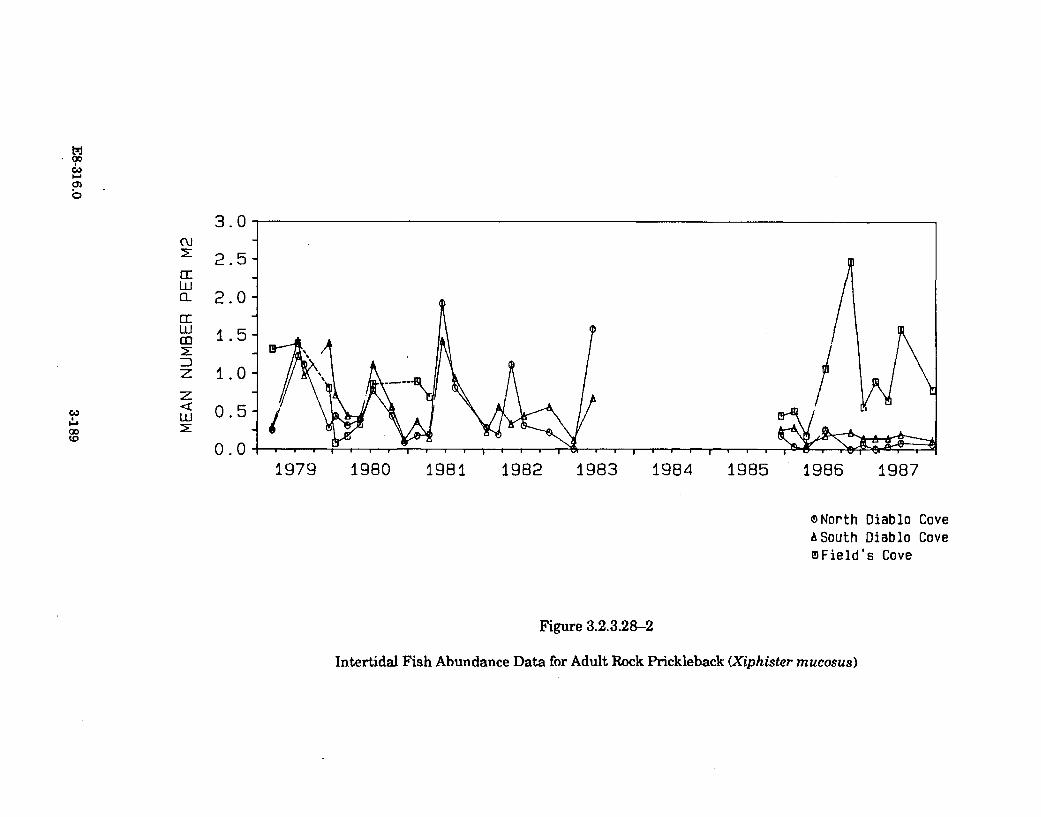
tTj9D
CL
z
zj
3.0
2.5
2.0
1.5
1.0
0.5
0.0
C,,,
1979 1980 1981 1982 1983 1984 1985 1986 1987
oNorth Diablo Cove
A South Diablo CoveeField's Cove
Figure 3.2.3.28-2
Intertidal Fish Abundance Data for Adult Rock Prickleback (Xiphister mucosus)
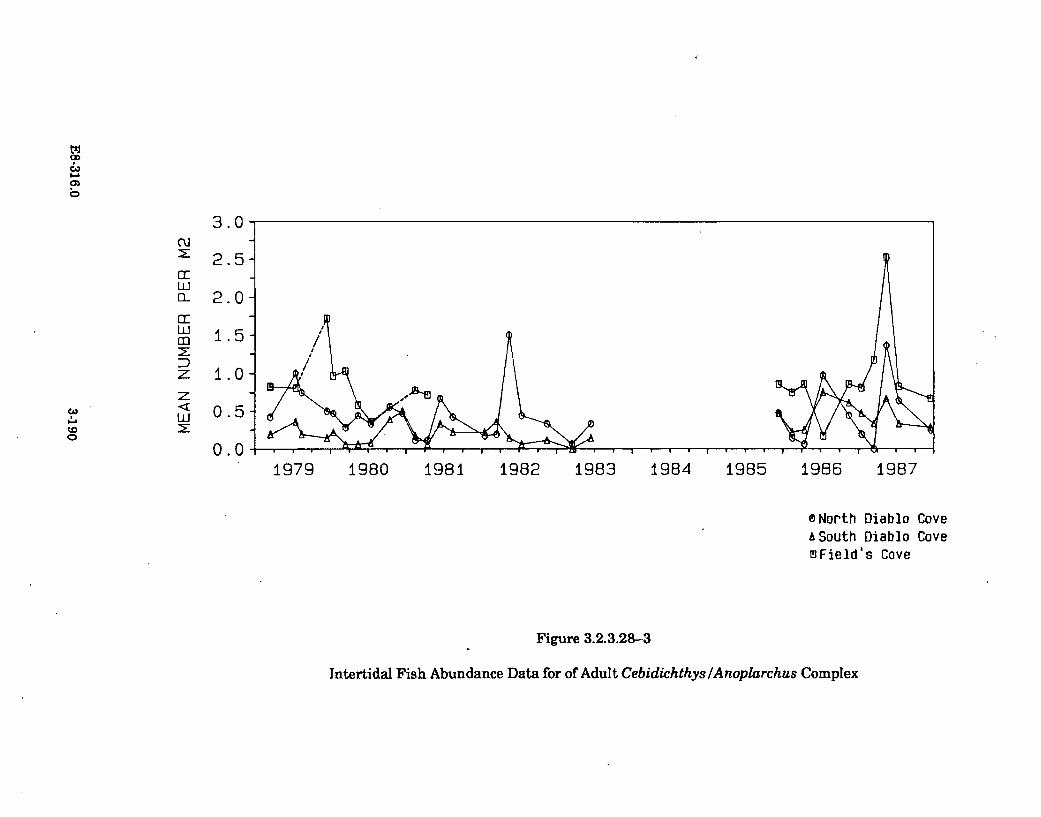
t0
I.-
CU
X
IJ
z
LU
3.0
2.5
2.0
1.5
1.0
0.5
0.0
CO~I-.0o
1979 1980 1981 1982 1983 1984 1985 1986 1987
0North Diablo CoveASouth Diab]o CovemField's Cove
Figure 3.2.3.28-3
Intertidal Fish Abundance Data for of Adult Cebidichthys/Anoplarchus Complex
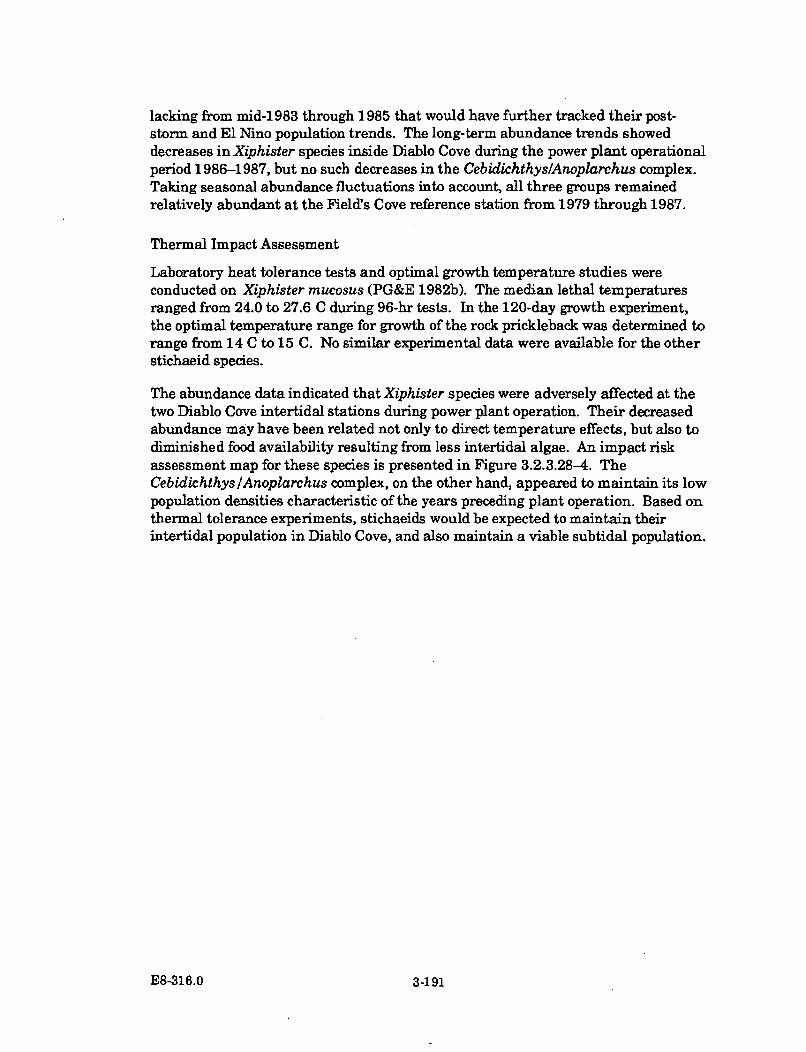
lacking from mid-1983 through 1985 that would have further tracked their post-storm and El Nino population trends. The long-term abundance trends showeddecreases in Xiphister species inside Diablo Cove during the power plant operationalperiod 1986-1987, but no such decreases in the Cebidichthys/Anoplarchus complex.Taking seasonal abundance fluctuations into account, all three groups remainedrelatively abundant at the Field's Cove reference station from 1979 through 1987.
Thermal Impact Assessment
Laboratory heat tolerance tests and optimal growth temperature studies wereconducted on Xiphister mucosus (PG&E 1982b). The median lethal temperaturesranged from 24.0 to 27.6 C during 96-hr tests. In the 120-day growth experiment,the optimal temperature range for growth of the rock prickleback was determined torange from 14 C to 15 C. No similar experimental data were available for the otherstichaeid species.
The abundance data indicated that Xiphister species were adversely affected at thetwo Diablo Cove intertidal stations during power plant operation. Their decreasedabundance may have been related not only to direct temperature effects, but also todiminished food availability resulting from less intertidal algae. An impact riskassessment map for these species is presented in Figure 3.2.3.28-4. TheCebidichthys/Anoplarchus complex, on the other hand, appeared to maintain its lowpopulation densities characteristic of the years preceding plant operation. Based onthermal tolerance experiments, stichaeids would be expected to maintain theirintertidal population in Diablo Cove, and also maintain a viable subtidal population.
E8-316.0 3-191
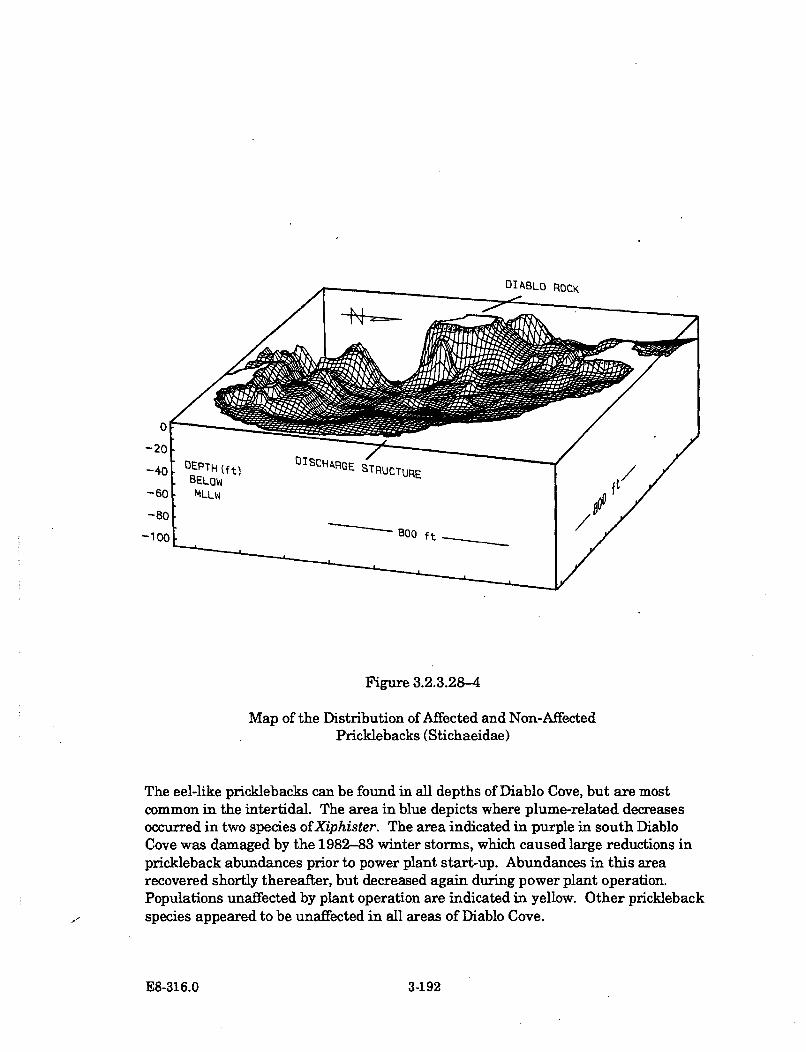
DIABLO ROCK
Figure 3.2.3.28-4
Map of the Distribution of Affected and Non-AffectedPricklebacks (Stichaeidae)
The eel-like pricklebacks can be found in all depths of Diablo Cove, but are mostcommon in the intertidal. The area in blue depicts where plume-related decreasesoccurred in two species of Xiphister. The area indicated in purple in south DiabloCove was damaged by the 1982-83 winter storms, which caused large reductions inprickleback abundances prior to power plant start-up. Abundances in this arearecovered shortly thereafter, but decreased again during power plant operation.Populations unaffected by plant operation are indicated in yellow. Other pricklebackspecies appeared to be unaffected in all areas of Diablo Cove.
E8-316.0 3-192
3.2.3.29 Other Intertidal and Subtidal Algal Species
A number of algal, invertebrate, and fish species are considered important to themaintenance of the condition and structure of Diablo Cove's intertidal and subtidalmarine communities. Some of these species have been discussed in the previousspecies accounts in this report. Many other species, however, are also ubiquitous inthe cove's community, but because of their smaller size or lesser abundance, theyhave received less attention in previous TEMP reports. Presented here aredescriptions of some of these species that are also considered important in the cove'sintertidal and subtidal communities. Many of these species lack common names. Inthese instances only the scientific names are given.
The algal species discussions are presented first, followed by the invertebrate, andthen fish species. The algal species section is divided into the intertidal and thesubtidal forms.
Intertidal Algae
The most prevalent intertidal algal species (taxa) in the TEMP +1 and +3 ft stationareas, and their changes in percent area cover over time are given in Tables3.2.3.29-1 to 3.2.3.29-6. The species' respective abundance values per area and timeperiod represent the average of the appropriately pooled station-quadrat surveydata. Data from Stations 14+3 and 15+3 at Diablo Point were included in the non-Diablo Cove +1 ft data base, since these intertidal stations (in high wave motionareas) supported algal species more common to the lower +1 ft elevation zones of theother non-cove stations.
The tables reveal that, in general, the same algal species (taxa) were initiallypresent in all study areas in generally the same rank order of abundance. The mostabundant species in the areas were Iridaea flaccida, Mastocarpus papillatus,Gigartina canaliculata, Gastroclonium coulteri, Endocladia muricata, and non-coralline crusts. All but the latter species are discussed in the individual speciesaccounts presented earlier in this section of the report.
The tables also reveal that the 1982-83 severe winter storms had a large pre-operational impact on the intertidal algal populations in Diablo Cove, particularly inthe south portion, where algal cover was dramatically reduced during 1983-84.North Diablo Cove was less impacted. Thus, at the onset of power plant operation,species abundances were generally greater in the north portion of Diablo Cove.
The following are descriptions of the changes in some of the less abundant species.
Corallina vancouveriensis
Corallina vancouveriensis is an articulated coralline algal species that mostcommonly stands about an inch tall in mid- to low-intertidal habitats in Diablo Cove.The appearance of this species differs from the articulated coralline species of the
E8-316.0 3-193
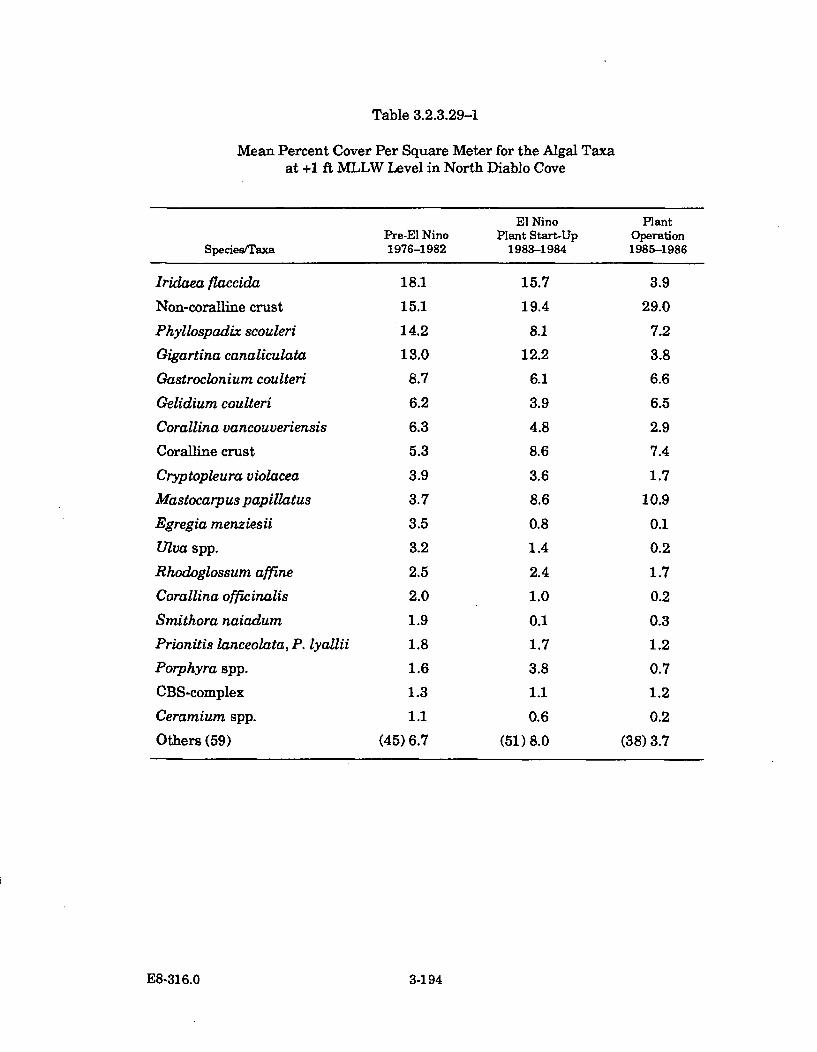
Table 3.2.3.29-1
Mean Percent Cover Per Square Meter for the Algal Taxaat +1 ft MLLW Level in North Diablo Cove
El Nino PlantPre-El Nino Plant Start-Up Operation
Species/Taxa 1976-1982 1983-1984 1985-1986
Iridaea flaccida 18.1 15.7 3.9
Non-coralline crust 15.1 19.4 29.0
Phyllospadix scouleri 14.2 8.1 7.2
Gigartina canaliculata 13.0 12.2 3.8
Gastroclonium coulteri 8.7 6.1 6.6
Gelidium coulteri 6.2 3.9 6.5
Corallina vancouveriensis 6.3 4.8 2.9
Coralline crust 5.3 8.6 7.4
Cryptopleura violacea 3.9 3.6 1.7
Mastocarpus papillatus 3.7 8.6 10.9
Egregia menziesii 3.5 0.8 0.1
Ulva spp. 3.2 1.4 0.2
Rhodoglossum affine 2.5 2.4 1.7
Corallina officinalis 2.0 1.0 0.2
Smithora naiadum 1.9 0.1 0.3
Prionitis lanceolata, P. lyallii 1.8 1.7 1.2
Porphyra spp. 1.6 3.8 0.7
CBS-complex 1.3 1.1 1.2
Ceramium spp. 1.1 0.6 0.2
Others (59) (45) 6.7 (51) 8.0 (38) 3.7
E8-316.0 3-194
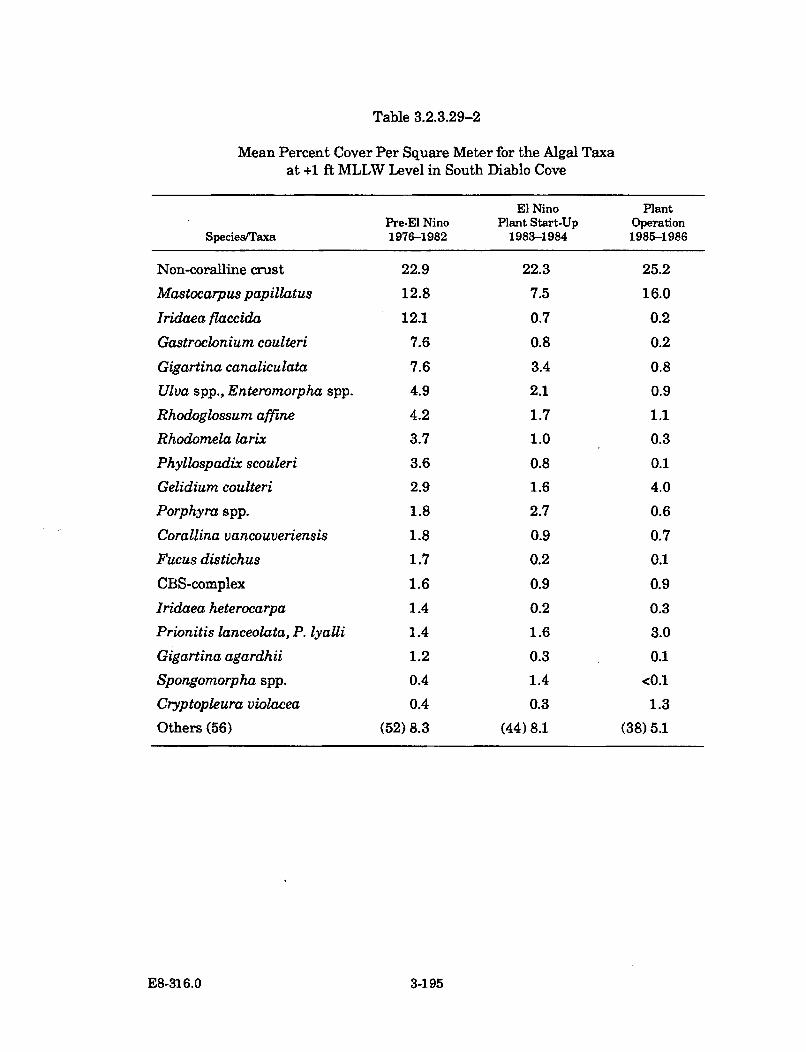
Table 3.2.3.29-2
Mean Percent Cover Per Square Meter for the Algal Taxaat +1 ft MLLW Level in South Diablo Cove
El Nino PlantPre-El Nino Plant Start-Up Operation
Speciest~axa 1976-1982 1983-1984 1985-1986
Non-coralline crust 22.9 22.3 25.2
Mastocarpus papillatus 12.8 7.5 16.0
Iridaea f/accida 12.1 0.7 0.2
Gastroclonium coulteri 7.6 0.8 0.2
Gigartina canaliculata 7.6 3.4 0.8
Ulva spp., Enteromorpha spp. 4.9 2.1 0.9
Rhodoglossum affine 4.2 1.7 1.1
Rhodomela larix 3.7 1.0 0.3
Phyllospadix scouleri 3.6 0.8 0.1
Gelidium coulteri 2.9 1.6 4.0
Porphyra spp. 1.8 2.7 0.6
Corallina vancouveriensis 1.8 0.9 0.7
Fucus distichus 1.7 0.2 0.1
CBS-complex 1.6 0.9 0.9
Iridaea heterocarpa 1.4 0.2 0.3
Prionitis lanceolata, P. lyalli 1.4 1.6 3.0
Gigartina agardhii 1.2 0.3 0.1
Spongomorpha spp. 0.4 1.4 <0.1
Cryptopleura violacea 0.4 0.3 1.3
Others (56) (52) 8.3 (44) 8.1 (38) 5.1
E8-316.0 3-195
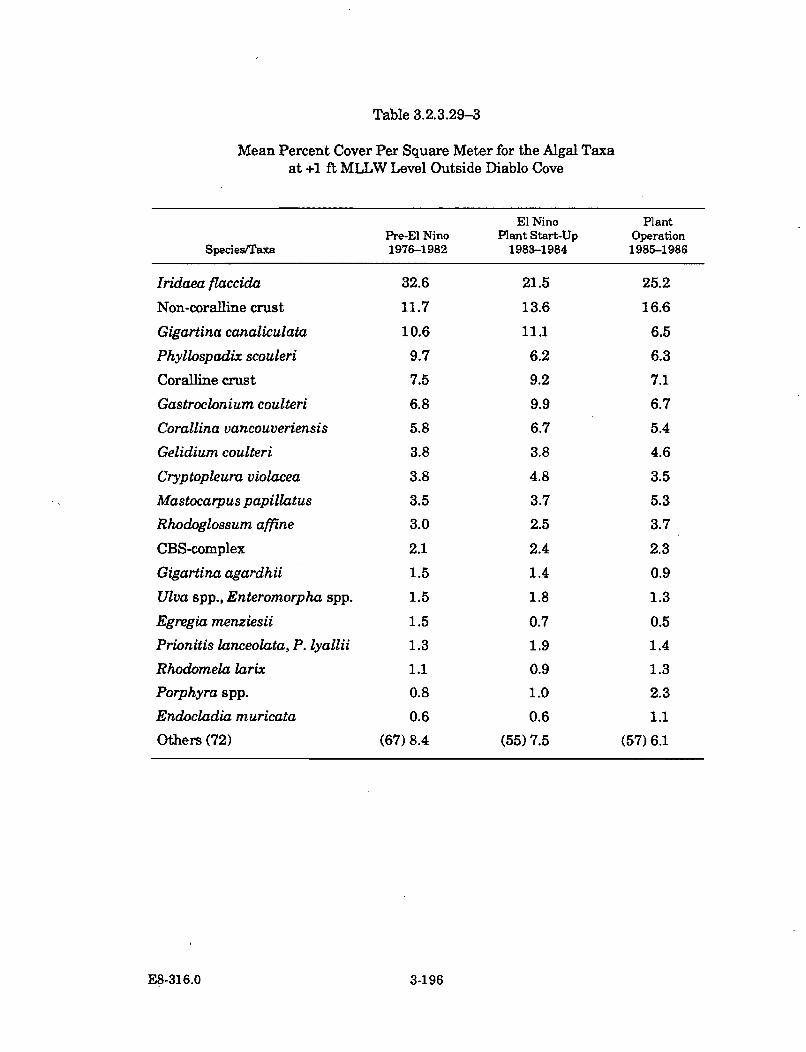
Table 3.2.3.29-3
Mean Percent Cover Per Square Meter for the Algal Taxaat +1 ft MLLW Level Outside Diablo Cove
El Nino PlantPre-El Nino Plant Start-Up Operation
Species/Taxa 1976-1982 1983-1984 1985-1986
Iridaea flaccida 32.6 21.5 25.2
Non-coralline crust 11.7 13.6 16.6
Gigartina canaliculata 10.6 11.1 6.5
Phyllospadix scouleri 9.7 6.2 6.3
Coralline crust 7.5 9.2 7.1
Gastroclonium coulteri 6.8 9.9 6.7
Corallina vancouveriensis 5.8 6.7 5.4
Gelidium coulteri 3.8 3.8 4.6
Cryptopleura violacea 3.8 4.8 3.5
Mastocarpus papillatus 3.5 3.7 5.3
Rhodoglossum affine 3.0 2.5 3.7
CBS-complex 2.1 2.4 2.3
Gigartina agardhii 1.5 1.4 0.9
Ulva spp., Enteromorpha spp. 1.5 1.8 1.3
Egregia menziesii 1.5 0.7 0.5
Prionitis lanceolata, P. lyallii 1.3 1.9 1.4
Rhodomela larix 1.1 0.9 1.3
Porphyra spp. 0.8 1.0 2.3
Endocladia muricata 0.6 0.6 1.1
Others (72) (67) 8.4 (55) 7.5 (57) 6.1
E8-316.0 3-196
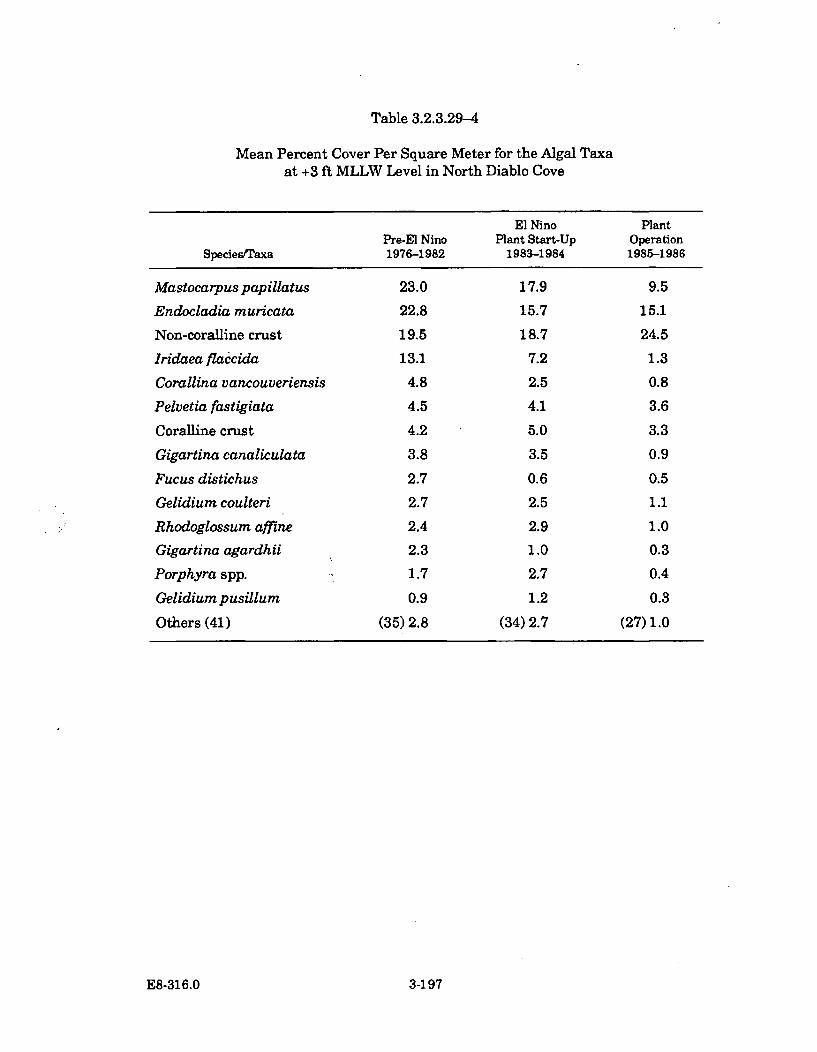
Table 3.2.3.29-4
Mean Percent Cover Per Square Meter for the Algal Taxaat +3 ft MLLW Level in North Diablo Cove
El Nino PlantPre-E1 Nino Plant Start-Up Operation
Species/raxa 1976-1982 1983-1984 1985-1986
Mastocarpus papillatus 23.0 17.9 9.5
Endocladia muricata 22.8 15.7 15.1
Non-coralline crust 19.5 18.7 24.5
Iridaea flaccida 13.1 7.2 1.3
Corallina vancouveriensis 4.8 2.5 0.8
Pelvetia fastigiata 4.5 4.1 3.6
Coralline crust 4.2 5.0 3.3
Gigartina canaliculata 3.8 3.5 0.9
Fucus distichus 2.7 0.6 0.5
Gelidium coulteri 2.7 2.5 1.1
Rhodoglossum affine 2.4 2.9 1.0
Gigartina agardhii 2.3 1.0 0.3
Porphyra spp. 1.7 2.7 0.4
Gelidiumpusillum 0.9 1.2 0.3
Others (41) (35) 2.8 (34) 2.7 (27) 1.0
E8-316.0 3-197
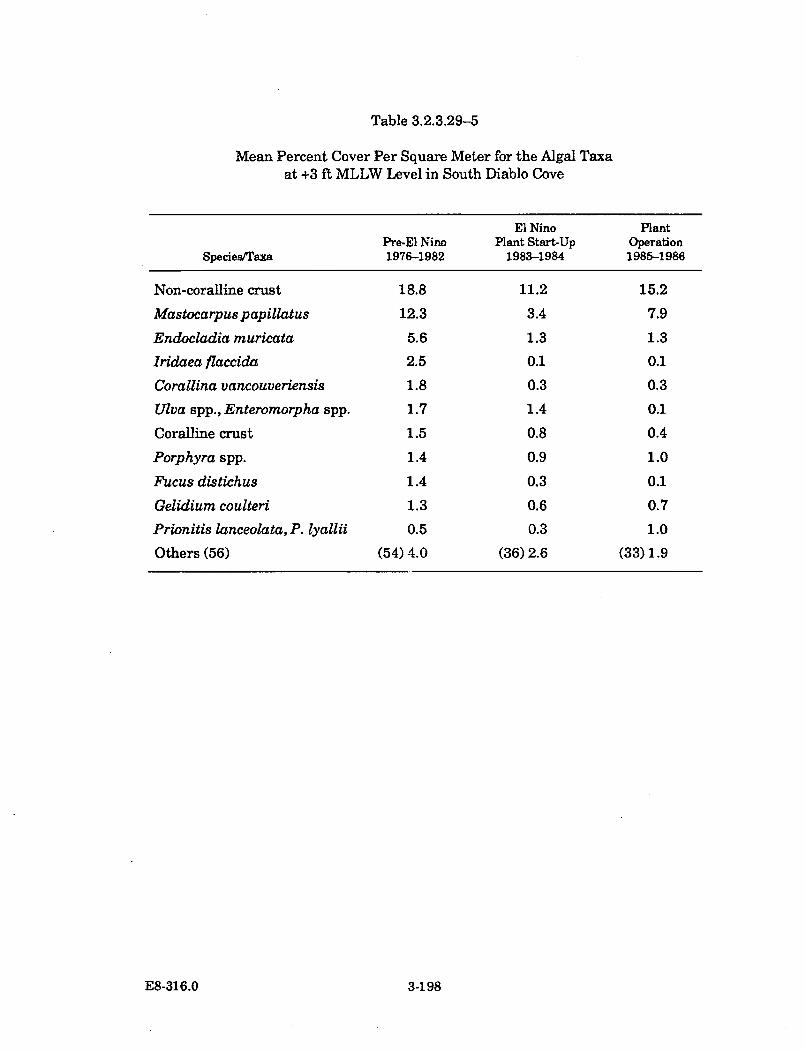
Table 3.2.3.29-5
Mean Percent Cover Per Square Meter for the Algal Taxaat +3 ft MLLW Level in South Diablo Cove
El Nino PlantPre-El Nino Plant Start-Up Operation
Species/Taxa 1976-1982 1983-1984 1985--1986
Non-coralline crust 18.8 11.2 15.2
Mastocarpuspapillatus 12.3 3.4 7.9
Endocladia muricata 5.6 1.3 1.3
Iridaea flaccida 2.5 0.1 0.1
Corallina vancouveriensis 1.8 0.3 0.3
Ulva spp., Enteromorpha spp. 1.7 1.4 0.1
Coralline crust 1.5 0.8 0.4
Porphyra spp. 1.4 0.9 1.0
Fucus distichus 1.4 0.3 0.1
Gelidium coulteri 1.3 0.6 0.7
Prionitis lanceolata, P. lyallii 0.5 0.3 1.0
Others (56) (54) 4.0 (36) 2.6 (33)1.9
E8-316.0 3-198
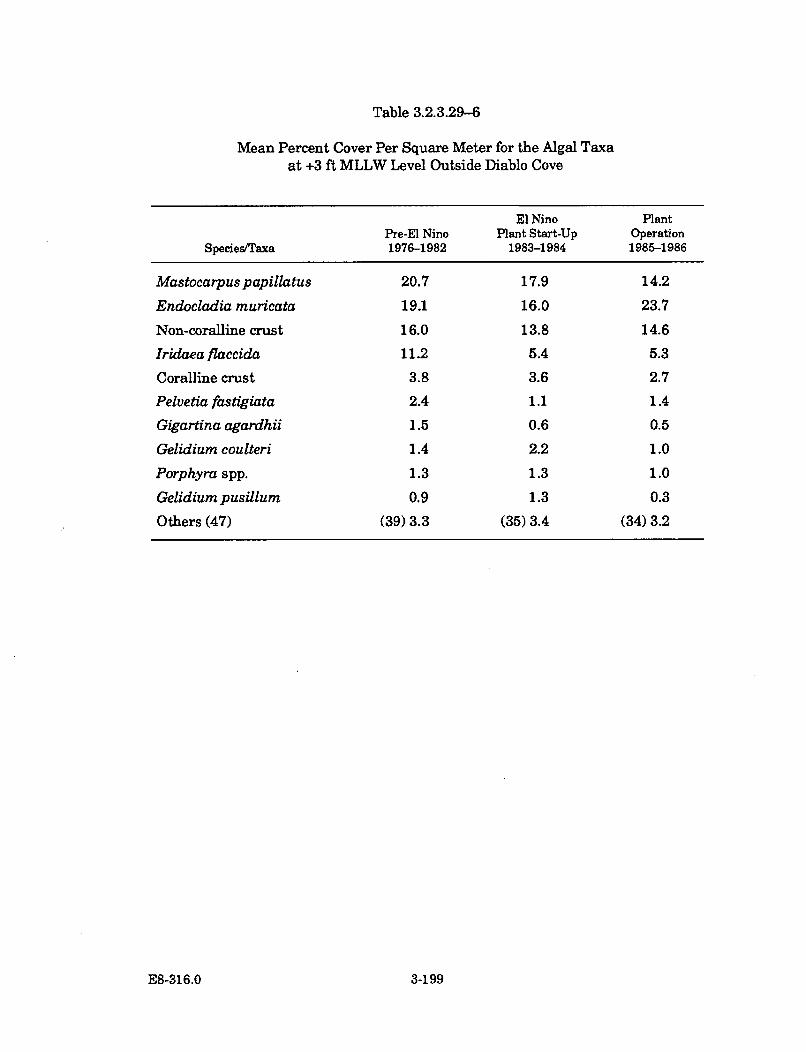
Table 3.2.3.29-6
Mean Percent Cover Per Square Meter for the Algal Taxaat +3 ft MLLW Level Outside Diablo Cove
El Nino PlantPre-El Nino Plant Start-Up Operation
Species/Taxa 1976-1982 1983-1984 1985-1986
Mastocarpus papillatus 20.7 17.9 14.2
Endocladia muricata 19.1 16.0 23.7
Non-coralline crust 16.0 13.8 14.6
Iridaea flaccida 11.2 5.4 5.3
Coralline crust 3.8 3.6 2.7
Pelvetia fastigiata 2.4 1.1 1.4
Gigartina agardhii 1.5 0.6 0.5
Gelidium coulteri 1.4 2.2 1.0
Porphyra spp. 1.3 1.3 1.0
Gelidium pusillum 0.9 1.3 0.3
Others (47) (39) 3.3 (35) 3.4 (34) 3.2
E8-316.0 3-199
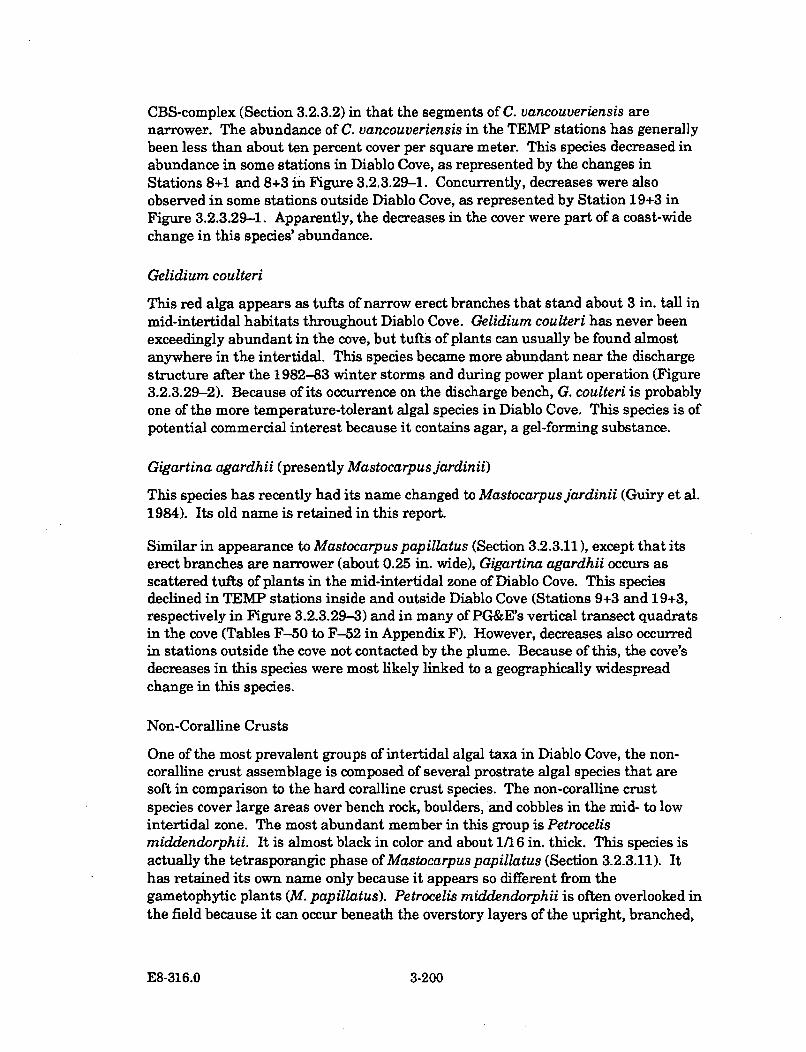
CBS-complex (Section 3.2.3.2) in that the segments of C. vancouveriensis arenarrower. The abundance of C. vancouveriensis in the TEMP stations has generallybeen less than about ten percent cover per square meter. This species decreased inabundance in some stations in Diablo Cove, as represented by the changes inStations 8+1 and 8+3 in Figure 3.2.3.29-1. Concurrently, decreases were alsoobserved in some stations outside Diablo Cove, as represented by Station 19+3 inFigure 3.2.3.29-1. Apparently, the decreases in the cover were part of a coast-widechange in this species' abundance.
Gelidium coulteri
This red alga appears as tufts of narrow erect branches that stand about 3 in. tall inmid-intertidal habitats throughout Diablo Cove. Gelidium coulteri has never beenexceedingly abundant in the cove, but tufts of plants can usually be found almostanywhere in the intertidal. This species became more abundant near the dischargestructure after the 1982-83 winter storms and during power plant operation (Figure3.2.3.29-2). Because of its occurrence on the discharge bench, G. coulteri is probablyone of the more temperature-tolerant algal species in Diablo Cove. This species is ofpotential commercial interest because it contains agar, a gel-forming substance.
Gigartina agardhii (presently Mastocarpus jardinii)
This species has recently had its name changed to Mastocarpusjardinii (Guiry et al.1984). Its old name is retained in this report.
Similar in appearance to Mastocarpus pap illatus (Section 3.2.3.11), except that itserect branches are narrower (about 0.25 in. wide), Gigartina agardhii occurs asscattered tufts of plants in the mid-intertidal zone of Diablo Cove. This speciesdeclined in TEMP stations inside and outside Diablo Cove (Stations 9+3 and 19+3,respectively in Figure 3.2.3.29-3) and in many of PG&E's vertical transect quadratsin the cove (Tables F-50 to F-52 in Appendix F). However, decreases also occurredin stations outside the cove not contacted by the plume. Because of this, the cove'sdecreases in this species were most likely linked to a geographically widespreadchange in this species.
Non-Coralline Crusts
One of the most prevalent groups of intertidal algal taxa in Diablo Cove, the non-coralline crust assemblage is composed of several prostrate algal species that aresoft in comparison to the hard coralline crust species. The non-coralline crustspecies cover large areas over bench rock, boulders, and cobbles in the mid- to lowintertidal zone. The most abundant member in this group is Petrocelismiddendorphii. It is almost black in color and about 1/16 in. thick. This species isactually the tetrasporangic phase of Mastocarpus papillatus (Section 3.2.3.11). Ithas retained its own name only because it appears so different from thegametophytic plants (M. papillatus). Petrocelis middendorphii is often overlooked inthe field because it can occur beneath the overstory layers of the upright, branched,
E8-316.0 3-200
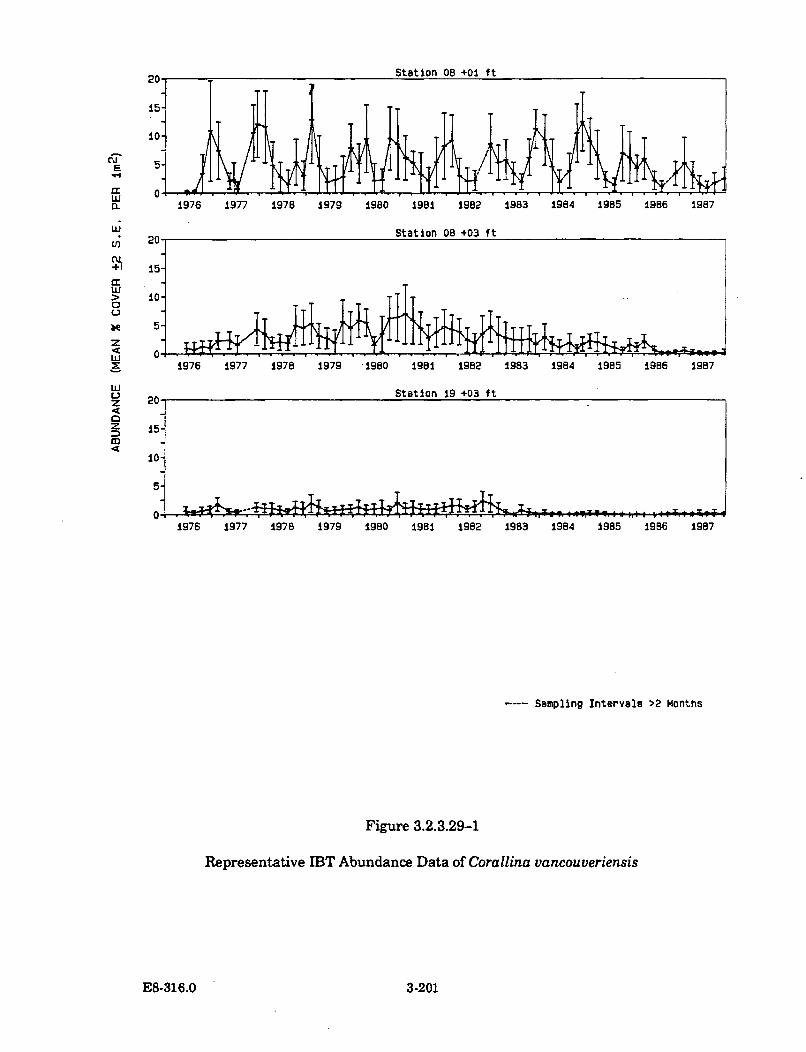
E 5--r
IJJ
:15-
> 10-0
Li
r 5.
CL
LU
w
> 20
0
be 15-
4< 0-
z 205
iO"
5"
1976 1977 1978 1979 1980 1981 1982 1983 1984 1985 19B6 1987
Station 19 +03 ft
1976 1977 1978 1979 1980 19B 1982 1983 1984 1985 1986 1987
--- Sampling Intervals >2 Months
Figure 3.2.3.29-1
Representative IBT Abundance Data of Corallina vancouveriensis
E8-316.0 3-201
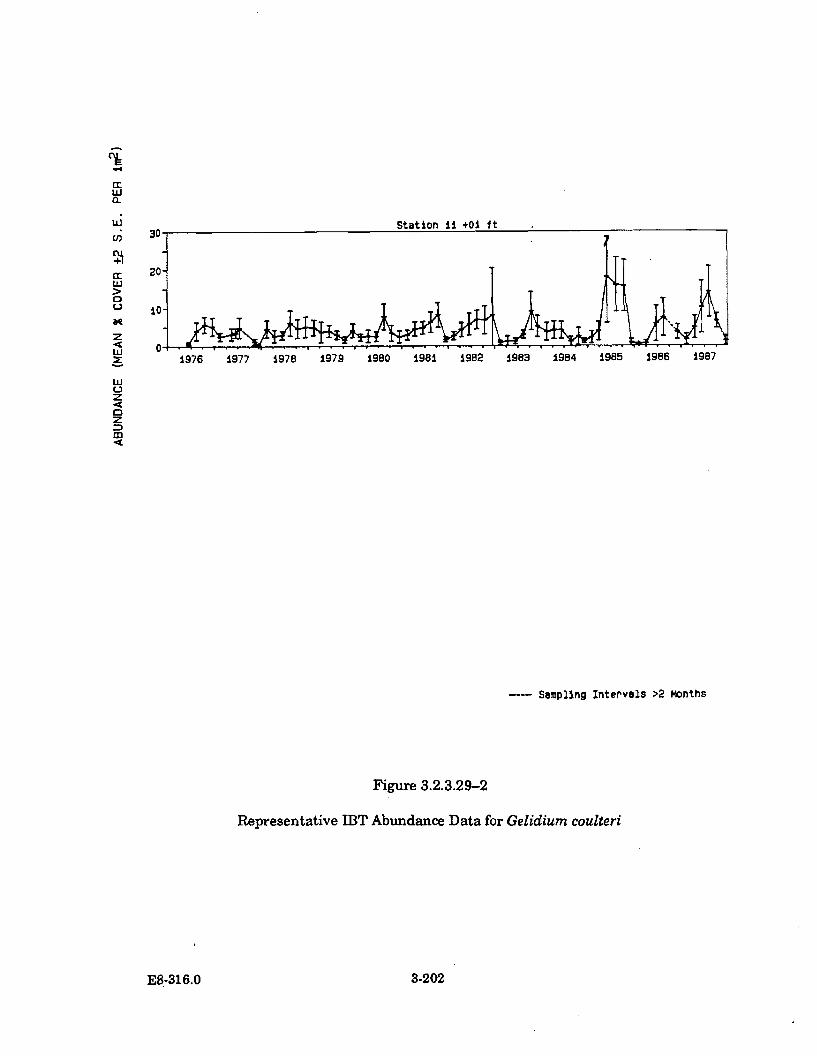
0
z
4z
z.4
0976 1977 1978 1979 1980 1981 1982 1983 1984 1985 1986 1987
---- Sampling Intervals >2 Months
Figure 3.2.3.29-2
Representative IBT Abundance Data for Gelidium coulteri
E8-316.0 3-202
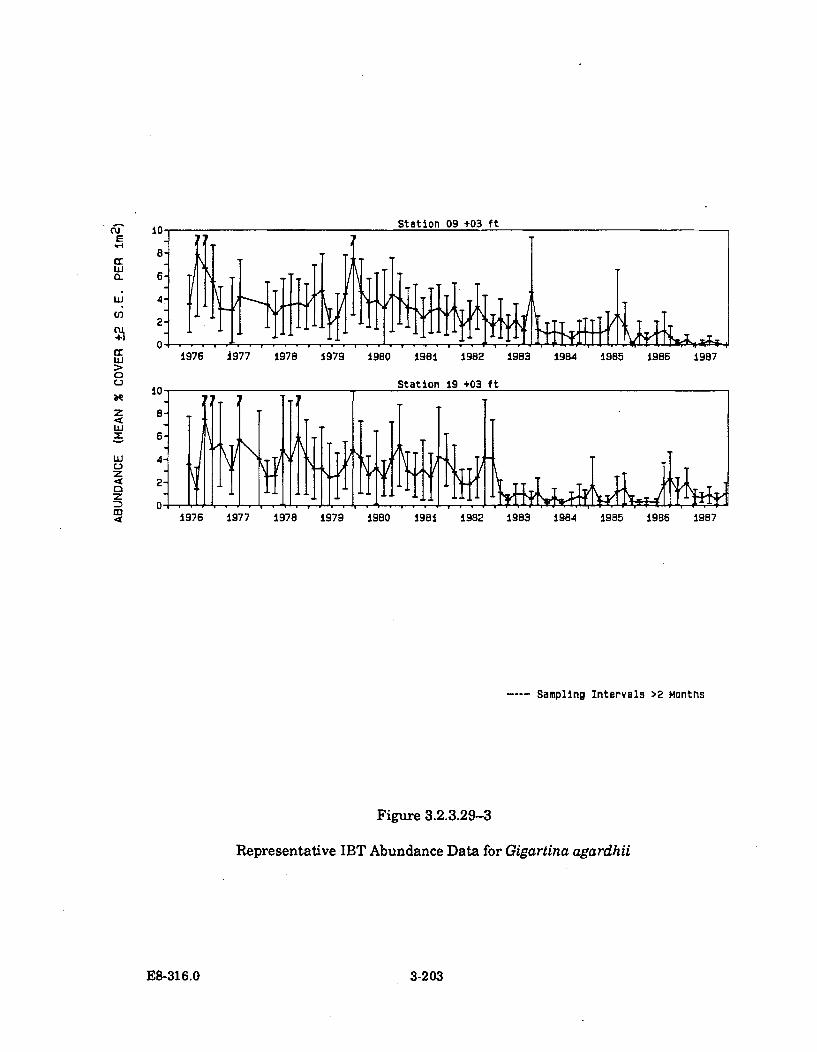
cc'-4CL
0~
w)
z.4iii
z
z
4 1976 1977 1978 1979 1980 1981 1982 1983 1984 1985 19B6 1987
---- Sampling Intervals >2 Months
Figure 3.2.3.29-3
Representative IBT Abundance Data for Gigartina agardhii
EB-316.0 3-203
or foliose algal species. Because the upright species can mask the presence of P.middendorphii, accurately determining this species' abundance (percent cover) inthe field is often difficult.
The intertidal random point contact sampling method (IPC) most accurately samplesthe crustose species because it samples completely beneath the overstory algallayers. Several station graphs representing the changes over time in the abundanceof non-coralline crust in Diablo Cove are presented in Figure 3.2.3.29-4. The datareveal that the coverage of the non-coralline crust assemblage in Diablo Cove can bevariable over time. However, some of this variation is probably an artifact of thedifficulties in sampling this group. In general, no long-term trend occurred amongthe IPC quadrats. After power plant start-up, this assemblage continued to increasein some quadrats in Diablo Cove, while it decreased in others. Abundances in somequadrats in Diablo Cove did not change appreciably. Similar inconsistenciesoccurred in quadrats outside the cove. Quadrat data representing the observedchanges outside Diablo Cove are depicted in Stations 2+1 and 2+3 in Figure3.2.3.29-4. Representative data for the Diablo Cove quadrats are shown by thechanges observed in Stations 8+1 and 8+3 in this same figure.
Rhodoglossum affine (presently Gigartina montereiensis)
This species has recently had its name changed to Gigartina montereiensis(Parkinson 1981). Its old name is retained in this report.
Rhodoglossum affine is a leafy red alga that is olive green and stands about 3 in. tallin mid-intertidal habitats in Diablo Cove. This species generally occurredeverywhere, but usually not in high abundances (less than about 5 percent cover persquare meter). It remained a conspicuous member in the cove's intertidal algalcommunity during power plant operation. Like Gelidium coulteri, this species is ofpotential commercial interest as a source of carageenan, another type of gel-formingagent. In areas in Monterey Bay where it occurs more abundantly, it has beenstudied for potential commercial harvesting and mariculture.
Subtidal Algae
Lists of the prevalent subtidal understory algal species (taxa) observed in the TEMPsubtidal 10-15 ft stations are presented in Table 3.2.3.29-7 to 3.2.3.29-9. (Thecoverage of the overstory kelp canopies is not included in these tables.)Corresponding abundances in the columns are average percentage cover per stationper survey values. These were calculated by pooling SLC data for the appropriatestations per area and surveys per time period. The tables show that, in general,north Diablo Cove, south Diablo Cove, and the non-Diablo Cove station areassupported the same species and in relatively the same hierarchy of abundance overtime, with the exception of unusual increases in the abundance of Cryptopleuraviolacea during the power plant operational period. The majority of the understoryalgal cover was provided by three taxa groups: Botryoglossum farlowianum, theCBS-complex, and the crustose coralline algae. These and the kelp species are
E8-316.0 3-204
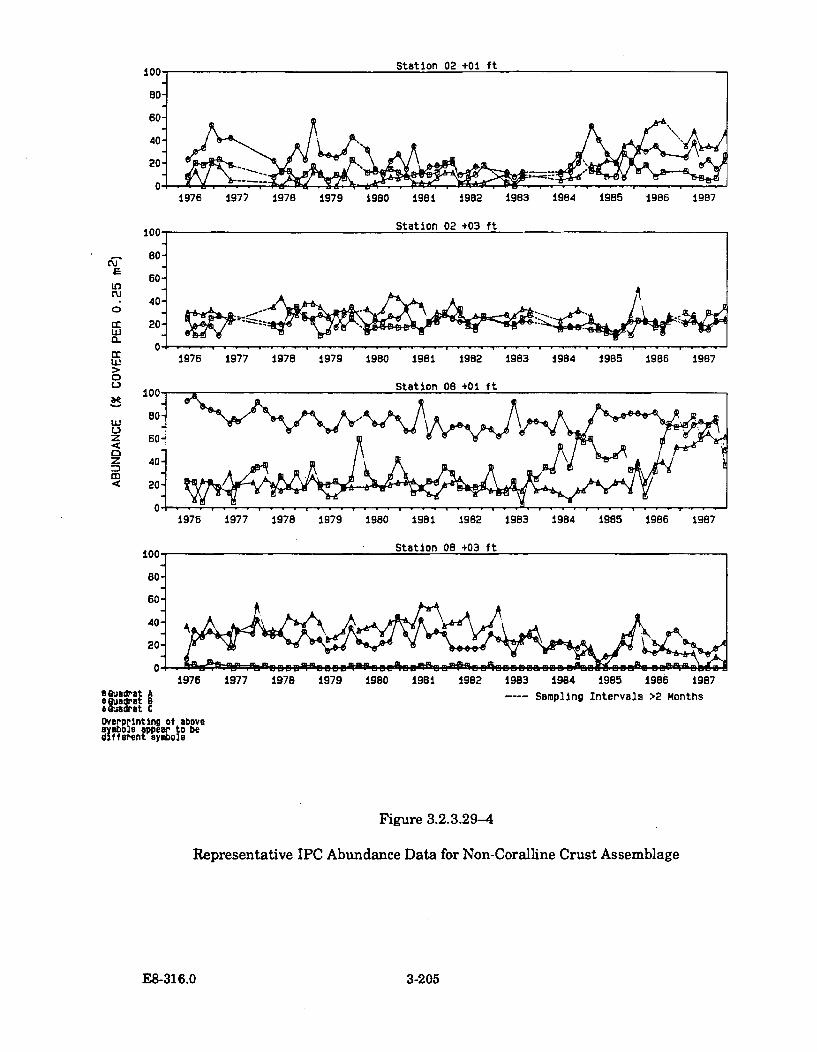
1979 1980 1981 1982 1983 1984 19B5
Station 02 +03 ft
cc
&
UiCJ
0wa-
LIJ
LIJ
w
L)
zDz
80-
60-
40-
20-
1976 1977 1978 1979 1980 1981 1982 1983 1984 1985 1986 1087
1976 1977 1978 1979 1980 1981 1982 1983 1984 1985 1986 1987
---- Sampling Intervals >2 MonthsgQumdrat Aa Quadrot Ba Guadrat COverprinting of aboveasmbols appear to beSff erent symbols
Figure 3.2.3.29-4
Representative IPC Abundance Data for Non-Coralline Crust Assemblage
E8-316.0 3-205
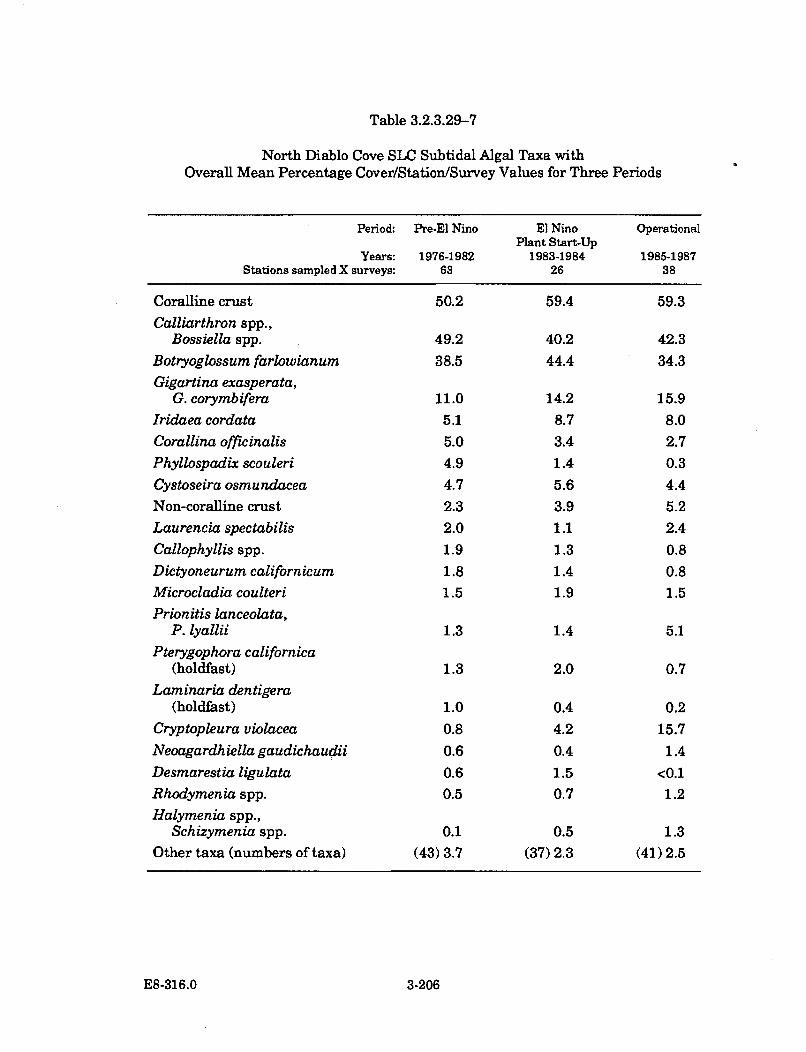
Table 3.2.3.29-7
North Diablo Cove SLC Subtidal Algal Taxa withOverall Mean Percentage Cover/Station/Survey Values for Three Periods
Period: Pre-El Nino El Nino OperationalPlant Start-Up
Years: 1976-1982 1983-1984 1985-1987Stations sampled X surveys: 63 26 38
Coralline crust 50.2 59.4 59.3
Calliarthron spp.,Bossiella spp. 49.2 40.2 42.3
Botryoglossum farlowianum 38.5 44.4 34.3
Gigartina exasperata,G. corymbifera 11.0 14.2 15.9
Iridaea cordata 5.1 8.7 8.0Corallina officinalis 5.0 3.4 2.7
Phyllospadix scouleri 4.9 1.4 0.3
Cystoseira osmundacea 4.7 5.6 4.4Non-coralline crust 2.3 3.9 5.2
Laurencia spectabilis 2.0 1.1 2.4
Callophyllis spp. 1.9 1.3 0.8
Dictyoneurum californicum 1.8 1.4 0.8Microcladia coulteri 1.5 1.9 1.5
Prionitis lanceolata,P. lyallii 1.3 1.4 5.1
Pterygophora californica(holdfast) 1.3 2.0 0.7
Laminaria dentigera(holdfast) 1.0 0.4 0.2
Cryptopleura violacea 0.8 4.2 15.7
Neoagardhiella gaudichaudii 0.6 0.4 1.4
Desmarestia ligulata 0.6 1.5 <0.1
Rhodymenia spp. 0.5 0.7 1.2
Halymenia spp.,Schizymenia spp. 0.1 0.5 1.3
Other taxa (numbers of taxa) (43) 3.7 (37) 2.3 (41) 2.5
E8-316.0 3-206
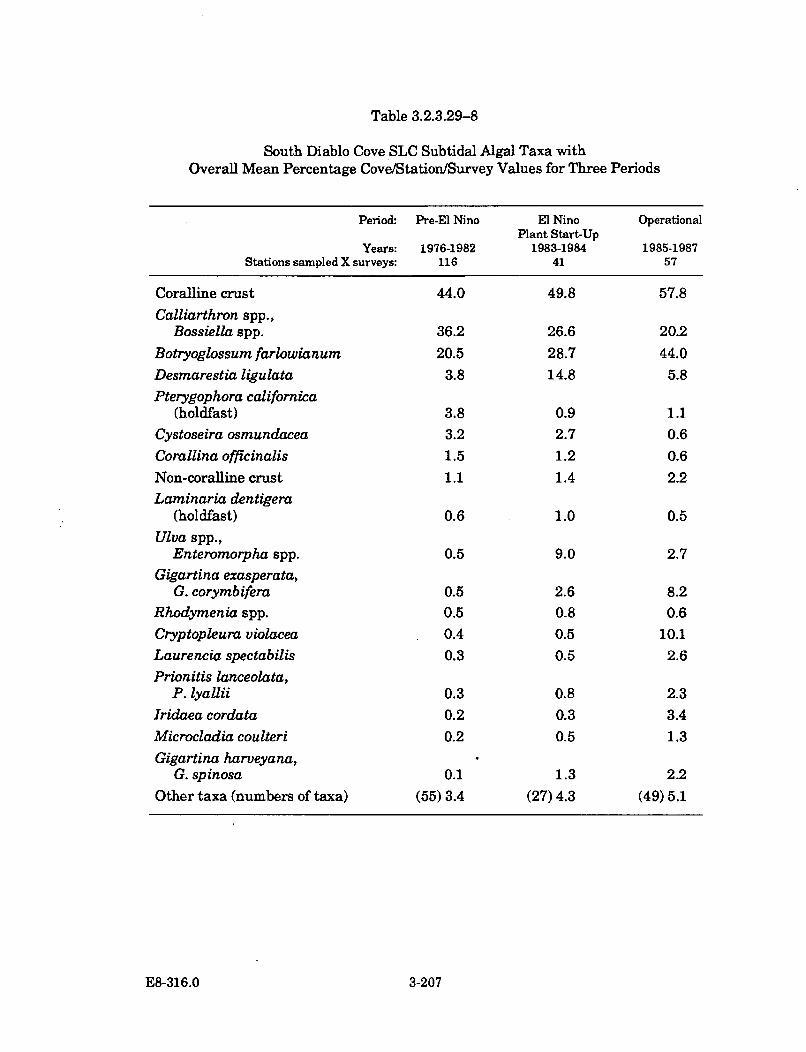
Table 3.2.3.29-8
South Diablo Cove SLC Subtidal Algal Taxa withOverall Mean Percentage Cove/Station/Survey Values for Three Periods
Period: Pre-El Nino El Nino OperationalPlant Start-Up
Years: 1976-1982 1983-1984 1985-1987Stations sampled X surveys: 116 41 57
Coralline crust 44.0 49.8 57.8
Calliarthron spp.,Bossiella spp. 36.2 26.6 20.2
Botryoglossum farlowianum 20.5 28.7 44.0
Desmarestia ligulata 3.8 14.8 5.8
Pterygophora californica(holdfast) 3.8 0.9 1.1
Cystoseira osmundacea 3.2 2.7 0.6
Corallina officinalis 1.5 1.2 0.6
Non-coralline crust 1.1 1.4 2.2
Laminaria dentigera(holdfast) 0.6 1.0 0.5
Ulva spp.,Enteromorpha spp. 0.5 9.0 2.7
Gigartina exasperata,G. corymbifera 0.5 2.6 8.2
Rhodymenia spp. 0.5 0.8 0.6
Cryptopleura violacea 0.4 0.5 10.1
Laurencia spectabilis 0.3 0.5 2.6
Prionitis lanceolata,P. lyallii 0.3 0.8 2.3
Iridaea cordata 0.2 0.3 3.4
Microcladia coulteri 0.2 0.5 1.3
Gigartina harveyana,G. spinosa 0.1 1.3 2.2
Other taxa (numbers of taxa) (55) 3.4 (27) 4.3 (49) 5.1
E8-316.0 3-207
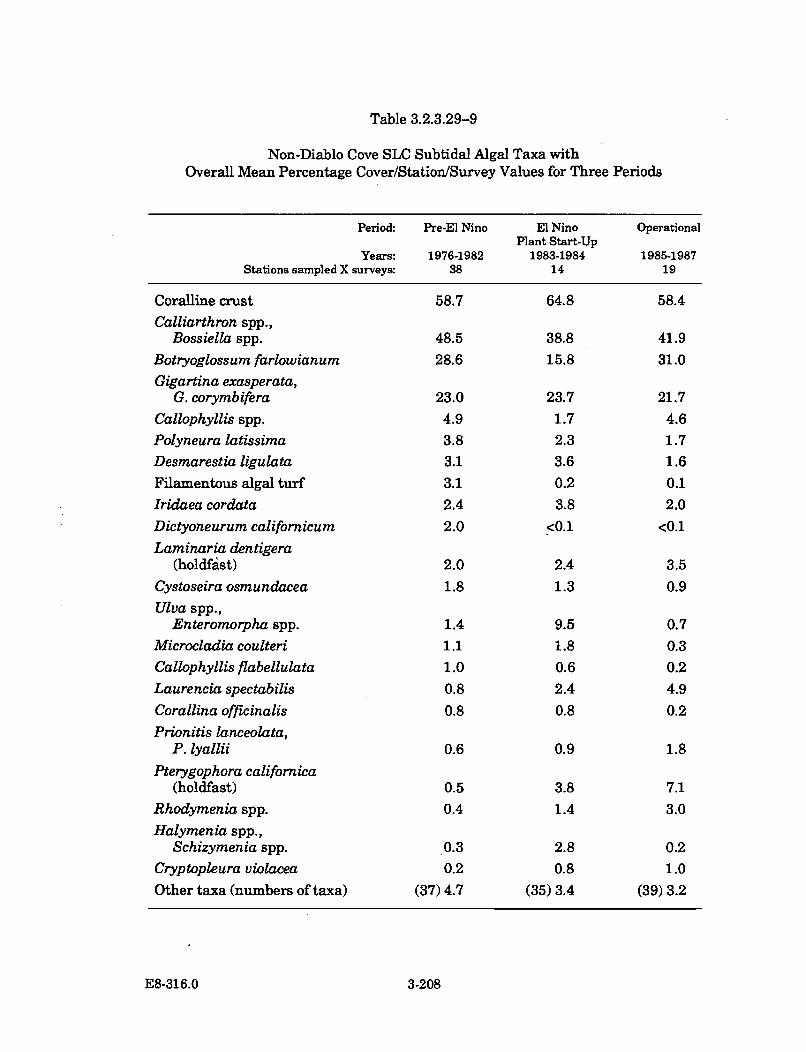
Table 3.2.3.29-9
Non-Diablo Cove SLC Subtidal Algal Taxa withOverall Mean Percentage Cover/Station/Survey Values for Three Periods
Period: Pre-El Nino El Nino OperationalPlant Start-Up
Years: 1976-1982 1983-1984 1985-1987Stations sampled X surveys: 38 14 19
Coralline crust 58.7 64.8 58.4
Calliarthron spp.,Bossiella spp. 48.5 38.8 41.9
Botryoglossum farlowianum 28.6 15.8 31.0
Gigartina exasperata,G. corymbifera 23.0 23.7 21.7
Callophyllis spp. 4.9 1.7 4.6Polyneura latissima 3.8 2.3 1.7
Desmarestia ligulata 3.1 3.6 1.6
Filamentous algal turf 3.1 0.2 0.1
Iridaea cordata 2.4 3.8 2.0
Dictyoneurum californicum 2.0 <0.1 <0.1
Laminaria dentigera(holdfast) 2.0 2.4 3.5
Cystoseira osmundacea 1.8 1.3 0.9
Ulva spp.,Enteromorpha spp. 1.4 9.5 0.7
Microcladia coulteri 1.1 1.8 0.3
Callophyllis flabellulata 1.0 0.6 0.2Laurencia spectabilis 0.8 2.4 4.9
Corallina officinalis 0.8 0.8 0.2
Prionitis lanceolata,P. lyalifi 0.6 0.9 1.8
Pterygophora californica(holdfast) 0.5 3.8 7.1
Rhodymenia spp. 0.4 1.4 3.0
Halymenia spp.,Schizymenia spp. 0.3 2.8 0.2
Cryptopleura violacea 0.2 0.8 1.0
Other taxa (numbers of taxa) (37) 4.7 (35) 3.4 (39) 3.2
E8-316.0 3-208
discussed individually in the previous species accounts in this report. Algal coverwas initially least in south Diablo Cove. This was largely because extensive shadingby the kelp canopies of Pterygophora californica and Laminaria dentigera hadlimited the growth of the smaller understory algae. During power plant operation,many of these understory algal species increased in abundance after the densities ofthe kelps decreased and the canopies thinned.
Following are representative station data and brief descriptions of the changes inthe less abundant understory algal species in the cove's shallows. None appearednegatively affected by the thermal plume. In general, many became more commonin Diablo Cove during power plant operation. The increases may not have been dueto the thermal plume, however, because increases which occurred concurrentlyoutside Diablo Cove in areas not contacted by the plume suggest that many of thecove's increases were natural events.
Desmarestia ligulata var. ligulata
This species is an annually occurring brown, strap-like kelp plant whose blades aretypically about 6 ft in length. Desmarestia ligulata densely colonizes open substratein spring-summer. The amount of plants (coverage) that occurs annually is largelydependent on the severity of the previous winter's storms (i.e., the greater thestorms, the greater the amount of open substrate for colonization). In some yearsthis species has covered large expanses over the bottom, especially in the shallowsouth and deeper central portions of Diablo Cove. This species appears to betolerant of the warm water plume, since annual reoccurrences of this speciescontinued in Diablo Cove throughout the power plant operational study phase(Figure 3.2.3.29-5).
Farlowia compressa
This understory red algal species consists of relatively thick, flat blades with smallprojections along their margins. The plants stand about 7 in. tall. This species wassparse in occurrence prior to power plant operation in both cove and non-covesampling stations. This species became more common in nearly all these stationsduring the operation of the power plant (Figure 3.2.3.29-6).
Gelidium robustum
Gelidium robustum is a coarsely branched red alga that stands about 15 in. tall insubtidal habitats. Prior to power plant operation, this species was sparse in DiabloCove. During power plant operation large increases in this species' abundanceoccurred, but not within the TEMP stations. G. robustum was found growingabundantly on the tops of rocky outcroppings which were within the plume andwithin five to ten ft of the sea surface. This species is typically more common in thewarmer waters south of Point Conception, and it is possible that the warm waterplume from the power plant has enhanced this species' growth in the cove.
E8-316.0 3-209
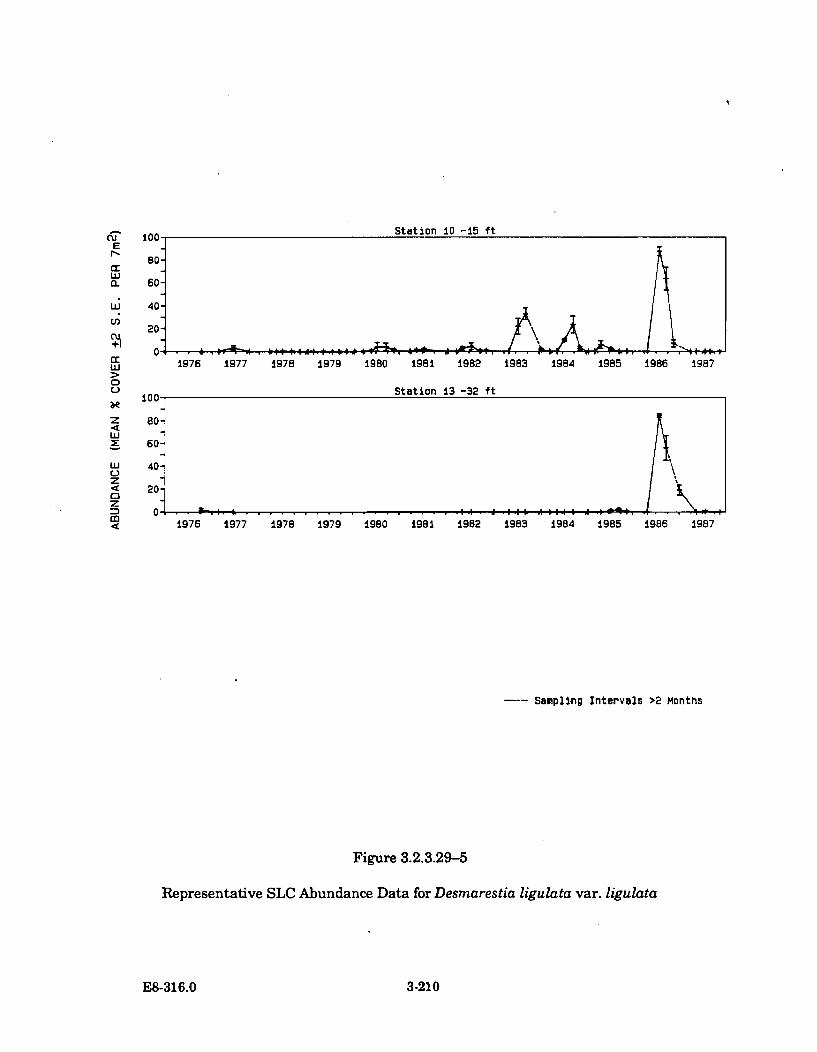
LU
LUJ
EI)
LU
0L)
zLU
LU
z
z
m4
100 Station 10 -15 ft
s0-
60-
40-
20"
01976 1977 1978 1979 1980 1981 1982 1983 1984 1985 1986 1987
100 Station 13 -32 ft
80-
60"
40". \
20181
1976 1977 1978 1979 19B0 19B8 1 982 1983 1984 1985 1986 1987
--- Sampling Intervals >2 Months
Figure 3.2.3.29-5
Representative SLC Abundance Data for Desmarestia ligulata var. ligulata
E8-316.0 3-210
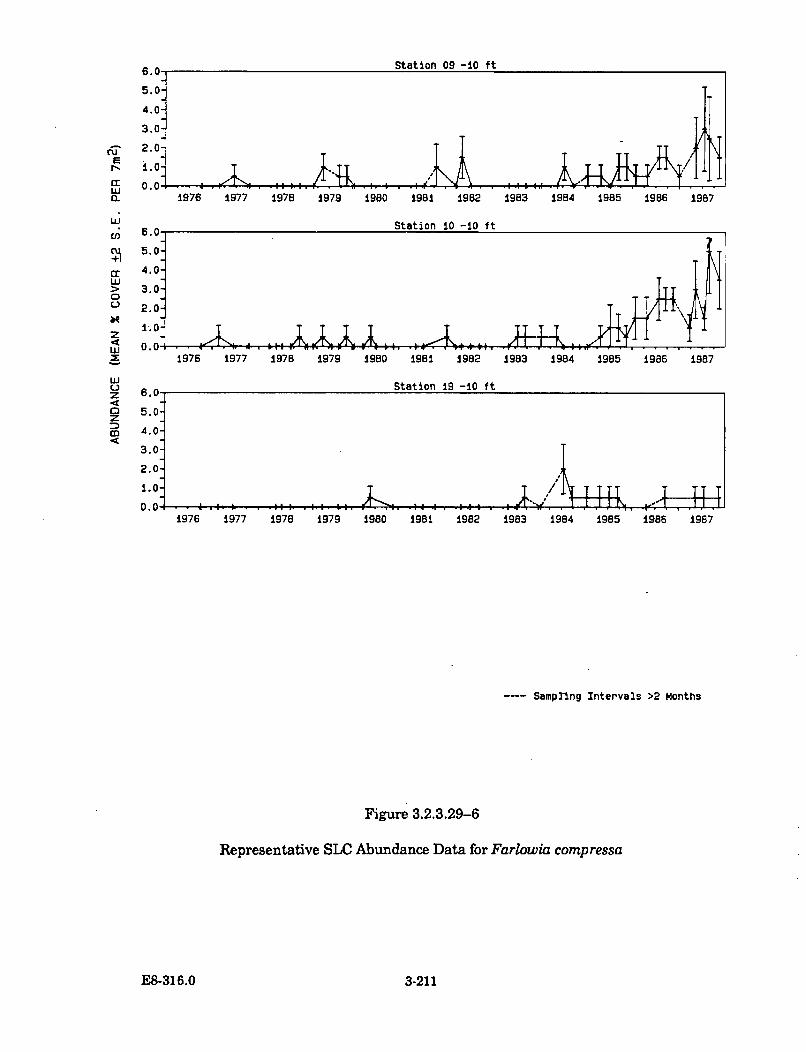
6.0 Station 09 -10 ft
5.0-
4.0:
3.0-
2.0-
0.0-1976 1977 1978 1979 1980 1981 1982 1983 1984 1985 1986 1987
Station 10 -0 ft
UJ
E
IL
Ur
LuJ
0UJ
zLuJ
Luz4
.U-
5.0:
4.0-
3.0-
2.0-
1..0-
0.0
6.0
5.0-
4.0-
3.0-
2.0o
1.0-
0. 0:
~{/~il~iT
1976 1977 1978 1979 1980 1981 1982 1983 1984 1985 1986 1987
Station 19 -10 ft
. ... ... . ..-. 4 if1976 1977 1978 1979 198o 1981 1982 1983 1984 1985 1986 1987
Samprlng Intervals >2 Months
Figure 3.2.3.29-6
Representative SLC Abundance Data for Farlowia compressa
E8-316.0 3-211
Gigartina exasperata plus G. corymbifera
Because they resemble each other closely, two species of Gigartina have beencombined in this study (G. exasperata and G. corymbifera). These red algal plantsconsist of a discoid-shaped holdfast from which develop many red blades that growto about 20 in. in length. The blades are broad, thick, and covered with papillae overthe surfaces, giving the blades a coarse texture. These species are commonly called"Turkish towel seaweed." The two species occur in the low intertidal, but in DiabloCove most are present in the subtidal to depths of about 15 ft. They were notaffected by the thermal plume.
Because of their size, they have been some of the more conspicuous foliose red algalforms in Diablo Cove both before and during power plant operation. In the portionsof Diablo Cove that have frequently been contacted by the thermal plume, thesespecies' abundances either remained relatively unchanged or increased (Figure3.2.3.29-7). Large increases occurred in south Diablo Cove (represented by Station12-10 data in Figure 3.2.3.29-7) after the overstory, shading kelp canopies werethinned. Because of these increases, Gigartina were obviously not negativelyaffected by the thermal plume. The increases in Diablo Cove were detectedstatistically in the time series and analysis of variance tests discussed in AppendixE.
These species were previously affected by the 1983 El Nino, when some loss of colorwas observed. They appeared light yellow-orange rather than orange-red. Althoughthey lost some pigmentation, most of the plants survived. Because color loss did notoccur during power plant operation, the color loss during the El Nino may have beenthe result of poor nutrient availability, rather than a temperature-related effect.
Halymenia spp.iSchizymenia spp.
These smooth, broad-bladed, red foliose algae grow up to 15 in. long at all depths ofDiablo Cove. Because they appear similar to each other, they have been treated asone taxonomic category in the TEMP studies. This group of species has usually beenfound scattered throughout all depths in Diablo Cove, and has never beenexceedingly abundant in any one area. In general, as with Gigartina exasperata/G.corymbifera species (see above), Halymenia spp./Schizymenia spp. became morecommon in the shallow areas (less than about 15 ft deep) in Diablo Cove duringpower plant operation.
Iridaea cordata
Iridaea cordata is similar in appearance to Iridaea flaccida (Section 3.2.3.9). LikeIridaea flaccida, 1. cordata consists of a disc-shaped holdfast from which developmany flat blades up to about 15 in. long. The blades also have an iridescent sheen tothem, although they appear more purple than I. flaccida, which appears more green.Also, I. cordata occurs lower in the intertidal than I. flaccida, and can be found indepths to about 20 ft in Diablo Cove. Iridaea cordata fluctuates in abundance
E8-316.0 3-212
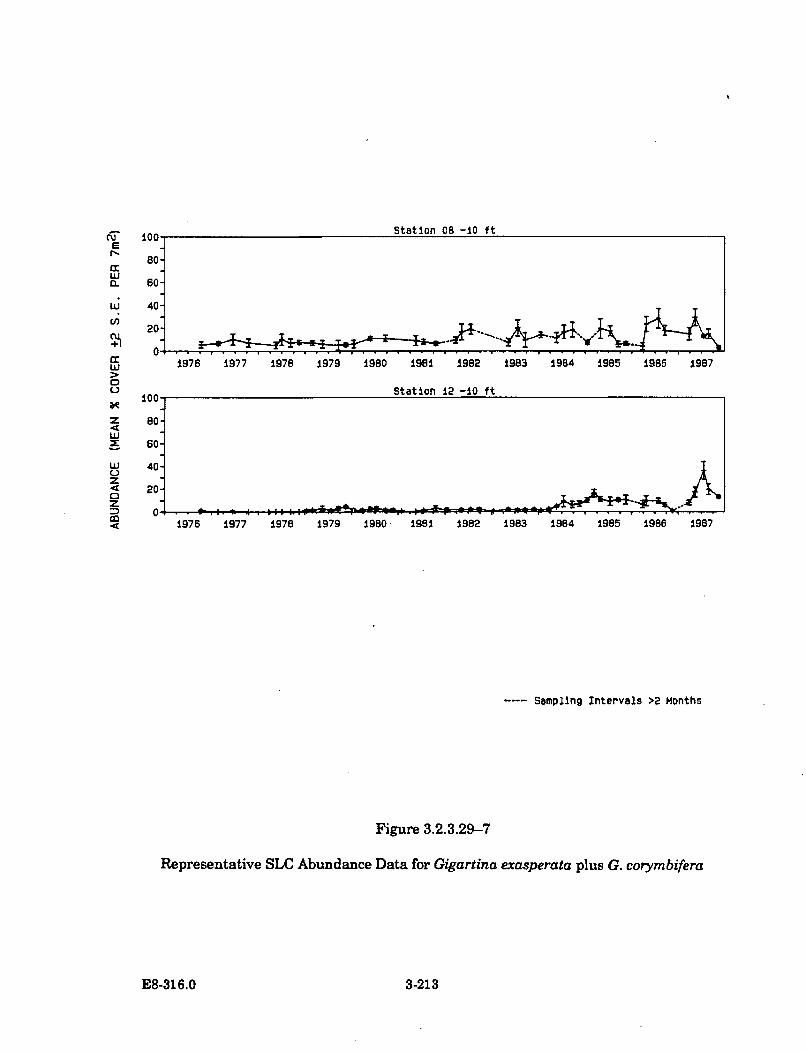
ccE
'ia.
w(n
w0
LU4-,
z4
LUC.)z
z
100 Station 08 -10 ft
80
50
40-
20-
1976 1977 1978 1979 1980 1981 1982 1983 1984 1985 1986 1987
100 Station 12 -10 ft
60-
40-
20 T .X1 .
1975 1977 1978 1979 1980 1981 1982 1983 1984 1985 1986 1987
Sampling Intervals >2 Months
Figure 3.2.3.29-7
Representative SLC Abundance Data for Gigartina exasperata plus G. corymbifera
E8-316.0 3-213
seasonally, being considerably more abundant during summer than in winter. Thisspecies did not exhibit any abnormal changes in its seasonal cycle during powerplant operation. However, like many other understory algal species in south DiabloCove, I. cordata increased in abundance during power plant operation after theshading overstory kelp canopies were thinned (Figure 3.2.3.29-8).
Laurencia spectabilis
This red algal species develops short, blunt, semi-cylindrical branches along its 8 in.axes. It occurs in the low intertidal and in most depths in Diablo Cove. This specieshas not been very abundant in the cove, but it has been conspicuous where it occursbecause its shape generally stands out from the more blade-like shapes of otherspecies. Small increases in this species' coverage occurred in many areas of the coveduring power plant operation (represented by the changes observed in Stations 9-15and 10-15 in Figure 3.2.3.29-9). Increases also occurred outside Diablo Cove inareas not contacted by the thermal plume (Station 19-10 in the same figure).
Prionitis lanceolata plus P. lyalli
These two red algal species consist of thick, stiff branches about 12 in. long.Because of their close resemblance to one another, they have been treated as oneentity. They occur mainly in the low intertidal to depths of about 20 ft in DiabloCove. Occasionally they can be found in high intertidal tidepools which can becomequite warmed by the sun, and because of this, these species are considered naturallytolerant of warm water. During power plant operation this group of species becamemore abundant in several subtidal stations.
Rhodymenia spp.
The rhyzomatous root system of Rhodymenia spp. produces flat blades that arerelatively stiff, about 2 in. long, and grow laterally over the bottom. This specieswas sparse in occurrence in the TEMP stations prior to power plant start-up. Afterpower plant start-up, it increased in abundance in Station 6-11 (Figure 3.2.3.29-10),located inshore at the base of Diablo Rock. This was one of the areas in Diablo Covethat was most persistently contacted by the thermal plume. Like G. robustum(above), Rhodymenia spp. may grow better under warm water conditions.
Invertebrates
Other representative Diablo Canyon invertebrates not previously discussed inSection 3.2.3 are presented in the following, in alphabetical order: Acmaea mitra,Astraea gibberosa, colonial/social (C/S) tunicates, Mitrella (now Alia) carinata,Pagurus spp., Pisaster spp., Pugettia spp., Pycnopodia helianthoides, andStrongylocentrotus spp. These species were chosen because they have beenrepresented in previous TEMP annual reports and are important members in theDiablo Cove marine community.
E8-316.0 3-214
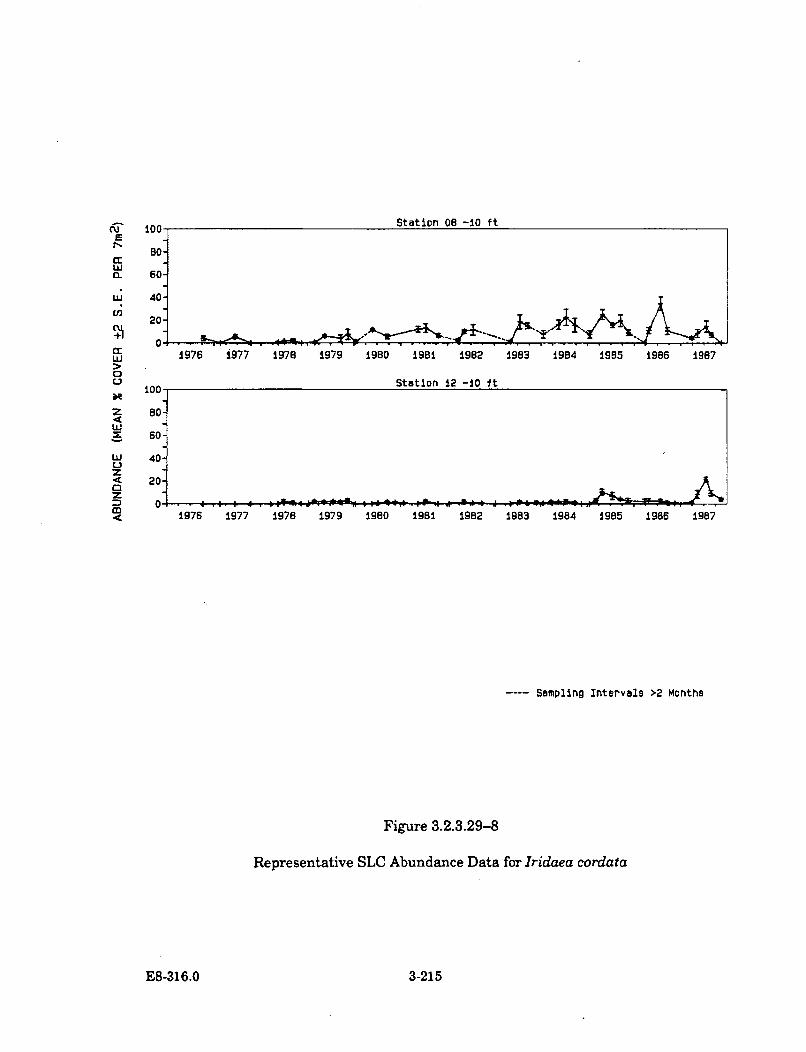
C2
wr
uLJ
0
z4
z
zM
1976 1977 1978 1979 1980 1981 1982 1983 1984 1985 1986 1987
t00 Station 12 -10 ft
so-
so"
40"20-"
1976 1977 1978 1979 1980 1981 1982 1983 1984 1985 1986 1987
---- Sampling Intervals >2 Months
Figure 3.2.3.29-8
Representative SLC Abundance Data for Iridaea cordata
E8-316.0 3-215
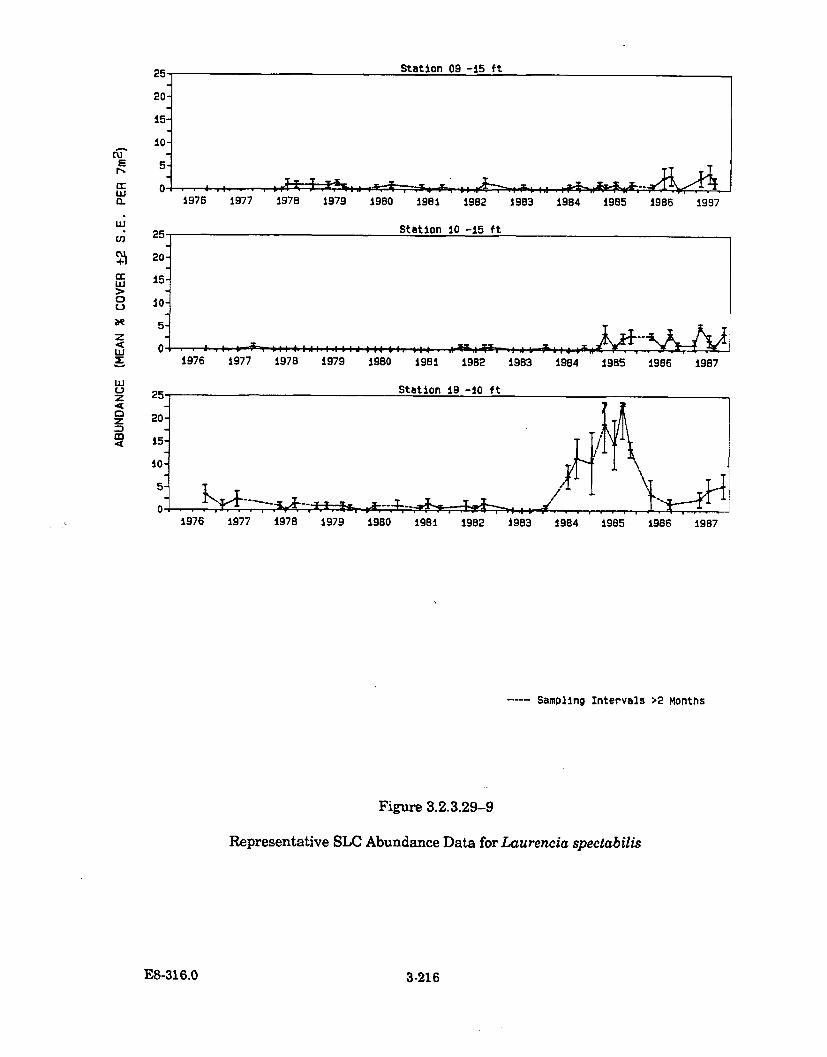
w
w
L)
zw
wC-,z0z
25 Station 09 -15 ft
20"
15-
10-
5
1976 1977 1978 1979 1980 1981 1982 1983 1984 1985 1986 1987
25 Station 10 -15 ft
20o
15-so•
5-
0 --- kji1976 1977 1978 1979 1980 1981 1982 1983 1984 1985 1986 1987
1976 1977 1978 1979 1980 1981 1982 1984 1985 1986 1987
Sampling Intervals >2 Months
Figure 3.2.3.29-9
Representative SLC Abundance Data for Laurencia spectabilis
E8-316.0 3-216
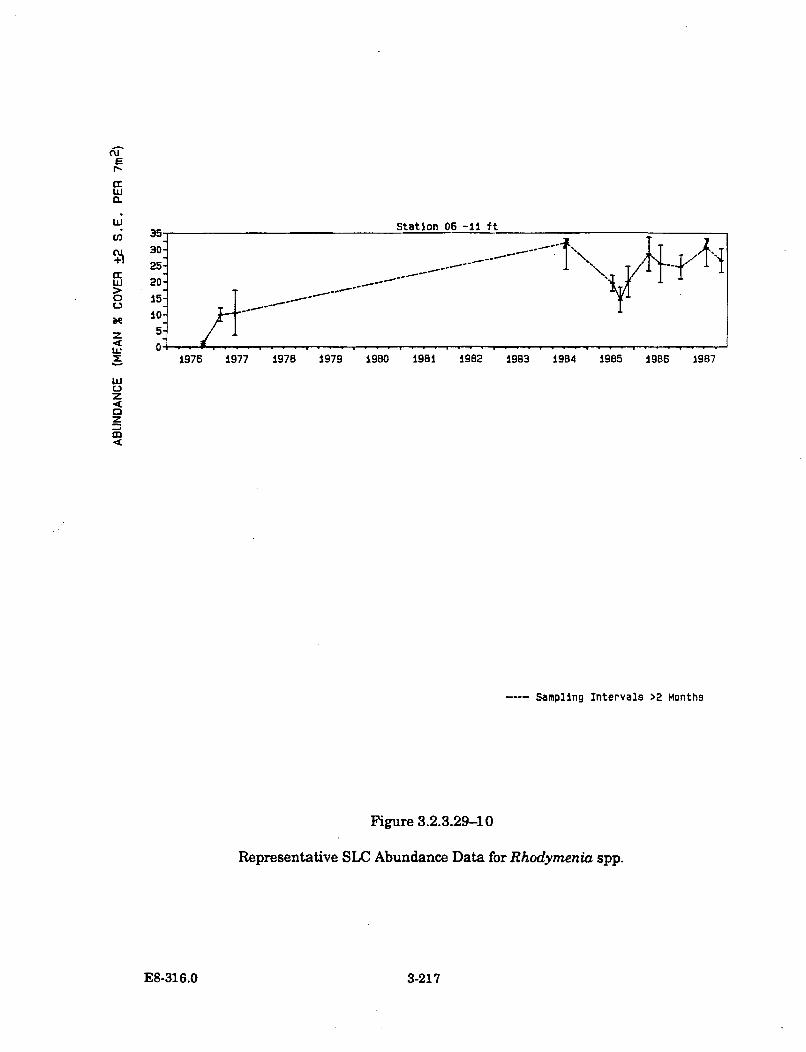
EO
w
0
z
w
z,-C0
1976 1977 1978 1979 1980 0981 1982 1983 1984 1985 1986 1987
---- Sampling Intervals >2 Months
Figure 3.2.3.29-10
Representative SLC Abundance Data for Rhodymenia spp.
E8-316.0 3-217
Acmaea mitra (Dunce Cap Limpet)
Dunce cap limpets are common in the low intertidal and shallow subtidal areas fromAlaska to Mexico. In Diablo Canyon intertidal study areas, they were infrequentlyencountered at the lowest intertidal stations, but were more common in shallowsubtidal areas of Diablo Cove. Stations 9-10,10-10, 10-15, 12-10 and 19-10 allshowed increases in limpet abundance in 1984 and a concomitant decreasebeginning in 1985 (Figure D-31 in Appendix D), neither of which appears to berelated to power plant operation. Station 12-10 in south Diablo Cove showed anincrease in dunce cap limpets in 1987 which was related to increased substratumavailability and not elevated temperatures. No apparent effects from power plantoperation were seen in the distribution of dunce cap limpets from the PG&Eintertidal vertical transect studies (Tables F-73 and F-74 in Appendix F). InThermal Effects Laboratory studies, "ecological death," or loss of ability to hold tosubstratum, occurred at a temperature of 23.1 C for four days. Overall, power plantoperation has not affected the abundance of dunce cap limpets in Diablo Cove.
Astraea gibberosa (Red Top Snail)
Red top snails do not appear to be affected by power plant operation. They occurmostly in shallow subtidal areas from Canada to Mexico. They are herbivores, buttheir dietary composition is unknown. In the study area, red top snails were morecommon in south Diablo Cove than in north Diablo Cove. From field observations,roughly two size (age) groups were distinguished: adults greater than about 2 in.shell diameter, and juveniles with a shell size of 1 in. or less. All subtidal TEMPstations generally showed the greatest abundances between 1979 and 1983, then aperiod of reduced abundance through 1987 (Figure D-36 in Appendix D). The foursubtidal stations in south Diablo Cove all showed an increase in red top snailabundance during the last survey of 1987, but it is not known whether this increasewas related to power plant operation. Two Thermal Effects Laboratory studies wereconducted on red top snails: a 96-hr ET50 study and a preference/avoidanceexperiment. No mortality of adult snails was found at temperatures up to 24.9 C.The 96-hr ET50 value was determined to be 26 C, and an avoidance reaction wasnoted, with animals avoiding water temperatures greater than 24 C.
Colonial/Social Tunicates
The colonial and social tunicates as a group are found worldwide, althoughindividual species usually have a much more restricted distribution. They can befound in the lowest portions of the intertidal down to at least 100 ft, and are usuallyattached to hard substrates. Tunicates are filter feeders and cannot withstand longexposures out of water. Colonial tunicates usually form encrusting sheets less than2 in. in thickness, in which are found genetically identical individuals called zooids.Individual social tunicates differ from colonial ones in that their zooids are notembedded in a common sheet, but are only attached to each other by a thin,vascularized sheet of common material. This group has no known commercial value.
E8-316.0 3-218
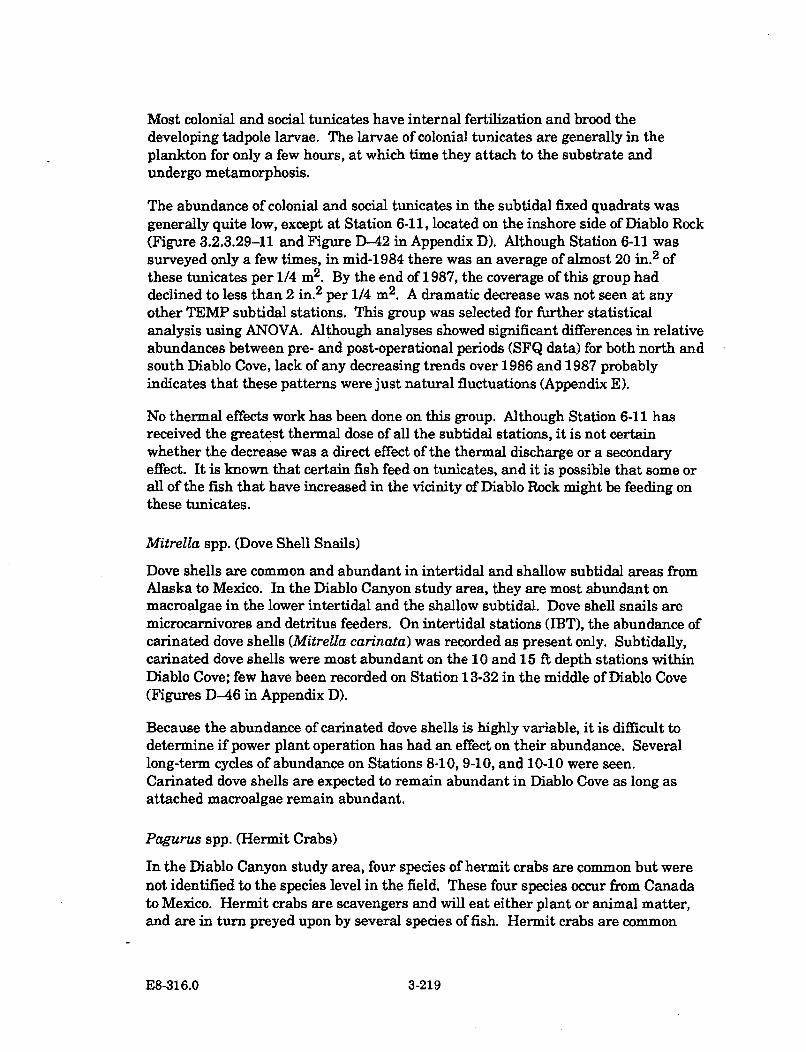
Most colonial and social tunicates have internal fertilization and brood thedeveloping tadpole larvae. The larvae of colonial tunicates are generally in theplankton for only a few hours, at which time they attach to the substrate andundergo metamorphosis.
The abundance of colonial and social tunicates in the subtidal fixed quadrats wasgenerally quite low, except at Station 6-11, located on the inshore side of Diablo Rock(Figure 3.2.3.29-11 and Figure D-42 in Appendix D). Although Station 6-11 wassurveyed only a few times, in mid-1984 there was an average of almost 20 in.2 of
these tunicates per 1/4 m2. By the end of 1987, the coverage of this group haddeclined to less than 2 in.2 per 1/4 m 2. A dramatic decrease was not seen at anyother TEMP subtidal stations. This group was selected for further statisticalanalysis using ANOVA. Although analyses showed significant differences in relativeabundances between pre- and post-operational periods (SFQ data) for both north andsouth Diablo Cove, lack of any decreasing trends over 1986 and 1987 probablyindicates that these patterns were just natural fluctuations (Appendix E).
No thermal effects work has been done on this group. Although Station 6-11 hasreceived the greatest thermal dose of all the subtidal stations, it is not certainwhether the decrease was a direct effect of the thermal discharge or a secondaryeffect. It is known that certain fish feed on tunicates, and it is possible that some orall of the fish that have increased in the vicinity of Diablo Rock might be feeding onthese tunicates.
Mitrella spp. (Dove Shell Snails)
Dove shells are common and abundant in intertidal and shallow subtidal areas fromAlaska to Mexico. In the Diablo Canyon study area, they are most abundant onmacroalgae in the lower intertidal and the shallow subtidal. Dove shell snails aremicrocarnivores and detritus feeders. On intertidal stations (IBT), the abundance ofcarinated dove shells (Mitrella carinata) was recorded as present only. Subtidally,carinated dove shells were most abundant on the 10 and 15 ft depth stations withinDiablo Cove; few have been recorded on Station 13-32 in the middle of Diablo Cove(Figures D-46 in Appendix D).
Because the abundance of carinated dove shells is highly variable, it is difficult todetermine if power plant operation has had an effect on their abundance. Severallong-term cycles of abundance on Stations 8-10, 9-10, and 10-10 were seen.Carinated dove shells are expected to remain abundant in Diablo Cove as long asattached macroalgae remain abundant.
Pagurus spp. (Hermit Crabs)
In the Diablo Canyon study area, four species of hermit crabs are common but werenot identified to the species level in the field. These four species occur from Canadato Mexico. Hermit crabs are scavengers and will eat either plant or animal matter,and are in turn preyed upon by several species of fish. Hermit crabs are common
E8-316.0 3-219
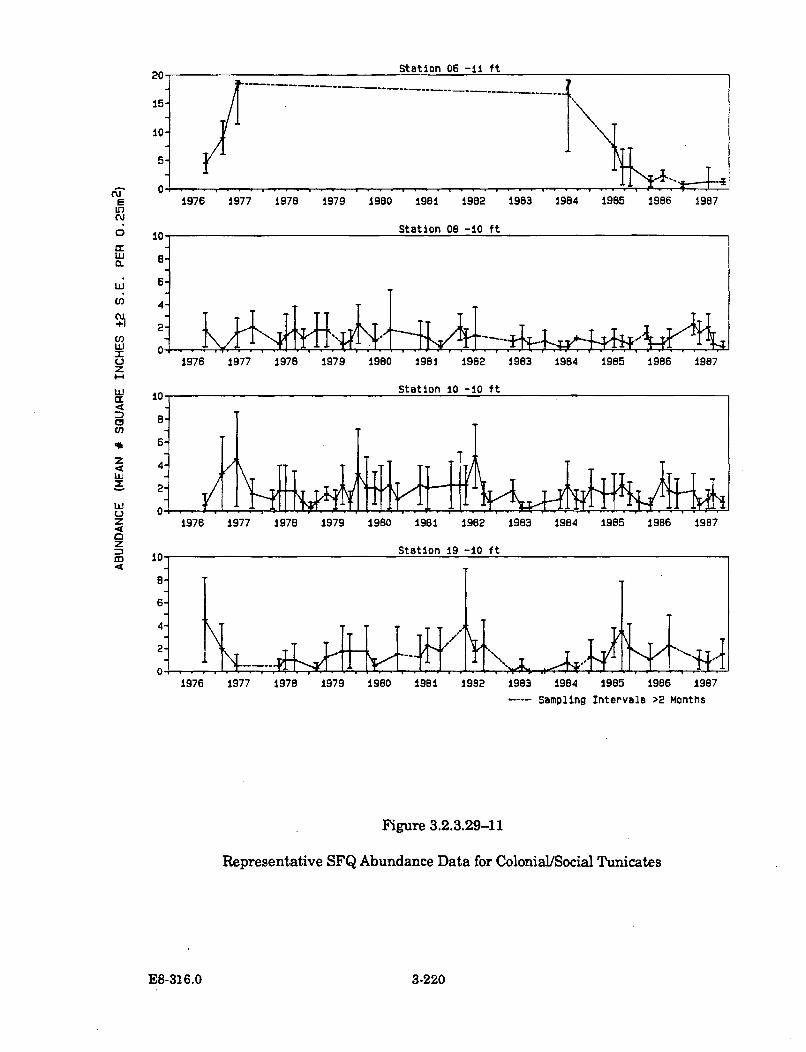
20 Station 06 -11 ft
10"
5 91976 1977 1978 1979 1980 1981 1982 1983 1984 1985 1986 1987
Cu0
IJJ
U;
Ui
z*-I
w4
U,
zzLjM
Station 10 -10 ft10-
8-
6-
4-
2-
0 iE4
10-
1976 1977 1978 1979 1980 1981 1982 1983 1984 1985 1986 1987
1976 1977 1978 1979 1980 1981 1982
--- Sampling Intervals >2 Months
Figure 3.2.3.29-11
Representative SFQ Abundance Data for Colonial/Social Tunicates
E8-316.0 3-220
and abundant in most intertidal and subtidal areas of the Diablo Canyon study area(Figures D-47 to D-49 in Appendix D). Generally, the abundance of hermit crabs inboth intertidal and subtidal areas was unaffected by power plant operation. Alongwith aggregating anemones and black turban snails, hermit crabs were verycommon in shallow subtidal areas near the discharge structure and in contact withthe thermal plume. No changes were detected in the distribution of hermit crabsafter power plant operation from PG&E vertical transect data (Tables F-80 andF-82 in Appendix F). This species was chosen for time series analysis using SFQdata. Although three subtidal stations showed significant increases, the increaseswere not large in comparison to the range of error for the fitted models (Appendix E).Thermal tolerance and preference/avoidance studies on two species of hermit crabsin the Thermal Effects Laboratory studies indicated that Pagurus samuelis had ahigher heat tolerance (96-hr ET50 of 28 C) and avoidance temperature (29 C) thanP. granosimanus (96-hr ET50 of 26-27 C, and avoidance temperature of 20-26 C).The factors which appeared to have the greatest influence on the abundance anddistribution of hermit crabs were characteristics of the substratum; they were mostabundant in tidepools and rocky areas, and least abundant on flat bench rock areasand sand.
Pisaster spp. (Short-Spined, Giant, and Ochre Sea Stars)
Three species of Pisaster are found in the Diablo Canyon area, Pisaster brevispinus,the short-spined sea star; P. giganteus, the giant sea star; and P. ochraceus, theochre sea star. All three species are found from Alaska or British Columbia tosouthern California. They are found in the mid-intertidal to subtidal depths of300 ft. All of these sea stars are predators on bivalves, snails, chitons, barnacles,and many other invertebrates. Abundance over time data for the three subtidalPisaster species have been combined in the figures. The SAQ method showed lownumbers of individuals at most of the subtidal TEMP stations (Figure D-51 inAppendix D). Generally, Pisaster spp. were most abundant at deeper stations.However, the shallow subtidal Station 6-11, located on the inshore side of DiabloRock, showed an increase in abundance after 1985 to levels similar to those of thedeep stations. Most likely the increase was an immigration of larger-sized animalsonto the station, and not recruitment, since the numbers of small sea stars in theSFQ did not show the same increases (Figure 3.2.3.29-12). Thermal EffectsLaboratory studies (96-hr ET50 tests) were done on the adults of the three Pisasterspecies (PG&E 1982b). The 96-hr ET50's were 25.8, 26.0, and 26.0 C for short-spined, giant, and ochre sea stars, respectively. The ochre sea star showed an activeavoidance to temperatures of 25 C and above. These findings do not explain whyPisaster spp. increased in Station 6-11. It is likely that the increases were related tosome other feature in the area, such as food.
In contrast to the adults, the abundance of juvenile Pisaster spp. on the subtidalstations in north Diablo Cove (Stations 8-10 and 9-10 in Figure 3.2.3.29-12) showeda decrease beginning in mid-1 986. Given their high abundance prior to 1985, thisreduction appears to be either a direct avoidance of warm temperatures, a
E8-316.0 3-221
Station 06 -11 ft
B-
wU 4-C0
0'-l
1976 1977 1978 1979 1980 1981 1982 1983 1984 1985 1986 1987
Station 06 -fl ft
LU
E
nr
z
wJ w
x R-
w
LUz
z
w En
w
8
6-
4-
2-
1976 1977 1978 1979 1980 1981 1982 1983 1984 1985 1986 1987
8-
6"
4-
2-
1976 1977 1978 1979 1980 1981 1982 1983 i984 1985 1986 1987
Station 09 -10 ft
8-
U 6Ix 2-
1 1
1976 1977 1978 1979 1980 1981 1982 1983 1984 1985 1986 1987
---- Sampling Intervals >2 Months
Figure 3.2.3.29-12
Representative SAQ and SFQ Abundance Data for Sea Stars (Pisaster spp.)
E8-316.0 3-222
response to a change in the biological community related to food supply, or refugefrom predators.
Pugettia spp. (Kelp Crabs)
On the TEMP stations, the majority of the kelp crabs found were Pugettia richii andP. producta. Both species occur from Alaska to Mexico in the low intertidal and insubtidal areas. Kelp crabs are an important forage item for several species ofrockfish, as well as for rock crabs and octopus. Kelp crabs mainly eat algae,especially kelps. Subtidally, kelp crabs were more abundant at the 10 ft stationsthan at the deeper stations, although their abundances were variable on all stations(Figures D-52 and D-53 in Appendix D). The SFQ data showed a reduction inabundance on the subtidal stations in south Diablo Cove after about 1985, whichmay be an indirect effect of power plant operation (Figure D-53 in Appendix D). Ifthe abundances of kelp crabs were directly affected by temperature, then crabs inthe northern part of Diablo Cove, which was warmer than the southern portion,would have shown a similar reduction in abundance during power plant operation.It is possible that the decreased abundance of kelps in south Diablo Cove affectedthe crab populations. Thermal Effects Laboratory studies showed that P. productaavoided temperatures of 21 C (PG&E 1982b), and the 96-hr ET50 was determined tobe 25-26 C for both species of kelp crab.
Pycnopodia helianthoides (Sunflower Sea Star)
Sunflower sea stars occur from Alaska to southern California in intertidal zones, butthey are more common in subtidal areas. They are large and relatively fast-movingpredatory sea stars which prey on sea urchins, clams, abalone, chitons, numerousspecies of snails, hermit crabs, and other crabs. Sunflower sea stars were notabundant during the pre-operational period in the Diablo Canyon study area, andusually averaged about one sea star per station (Figure D-54 in Appendix D). Sinceno subtidal stations inside Diablo Cove showed a reduction in abundance ofsunflower sea stars after 1985, power plant operation does not appear to haveaffected their abundances. In general, the abundance of these sea stars appears tobe influenced more by the abundance of prey species than by water temperatures.The only Thermal Effects Laboratory study conducted was a preference/avoidanceexperiment. Sunflower sea stars showed a definite avoidance of temperatures above21 C in the tests.
Strongylocentrotus spp. (Sea Urchins)
There were two common species of sea urchins in the Diablo Canyon study area, thesmaller purple urchin (Strongylocentrotuspurpuratus) and the larger red urchin (S.franciscanus). Generally, purple urchins were common and abundant in theintertidal and shallow subtidal, while the red urchin was more common in subtidalareas. In the TEMP study areas, purple urchins were abundant in both the subtidaland intertidal areas, while red urchins were rare. However, before 1974 when seaotters moved into Diablo Cove, red urchins were very abundant. North (1969)
E8-316.0 3 -223
described shallow and deep urchin barren areas in Diablo Cove, which consisted ofhigh densities of red urchins. These urchin zones were eradicated by foraging seaotters, and since that time urchins, especially red urchins, have been uncommon inthe subtidal areas of Diablo Cove.
Purple and red urchin abundances have been combined to show abundances overtime at the TEMP stations. Very low abundances of urchins were found on allstations from 1976 to 1985, except for the early surveys on Station 20-20 locatedoutside Diablo Cove (Figure D-55 in Appendix D). Beginning in 1985, urchinsincreased on most stations, but were still not common. The SFQ data, whichgenerally showed the abundance of small urchins, indicated that a recruitment ofurchins to the study area occurred about 1984 and persisted through 1987 (Figure3.2.3.29-13). This recruitment appeared as part of a coast-wide recruitment whichwas not confined to Diablo Cove and was apparently not affected by power plantoperation. The PG&E intertidal vertical transect studies showed a decrease in thedistribution of S. purpuratus after the 1982-83 storms (Tables F-83 and F-85 inAppendix F). Two Thermal Effects Laboratory studies were conducted on purpleurchins. The 96-hr ET50 on adults occurred in the range of 22-23.5 C. Thermaldose studies indicated that purple urchins could withstand 26 C for one hour.
Fish
Painted greenling
The painted greenling or convict fish (Oxylebiuspictus) was a common species on thedeeper benthic transects in Diablo Cove both before and during power plantoperation. Its small mouth is adapted to picking crustaceans from algal mats, and itprimarily uses boulder and crevice habitat for protection. Painted greenlings haveremained relatively unaffected by the thermal discharge because their preferredhabitat lies beneath the main influence of the plume. Juveniles typically recruit intodeeper nearshore habitats, and eventually migrate inshore as they mature. Theyhave been abundant on the reference stations outside Diablo Cove and should alsocontinue to persist inside the cove during power plant operation.
Senorita
The senorita (Oxyjulis californica) is a smaller member of the wrasse family and hasbeen very common in Diablo Cove since 1976, ranking first in terms of overallnumber of individuals seen on the fish observation transects. They form looseschools and feed on small invertebrates either on the bottom or in the water column.During circulating pump testing and full power plant operation, senoritas becameparticularly abundant in and adjacent to the thermal plume, apparently attracted byan abundance of entrained food items, They may also serve as prey itemsthemselves for other species of predatory fish in the cove. Senoritas should continueto be a prominent fish species in Diablo Cove because of their tolerance of widethermal regimes.
E8-316.0 3-224
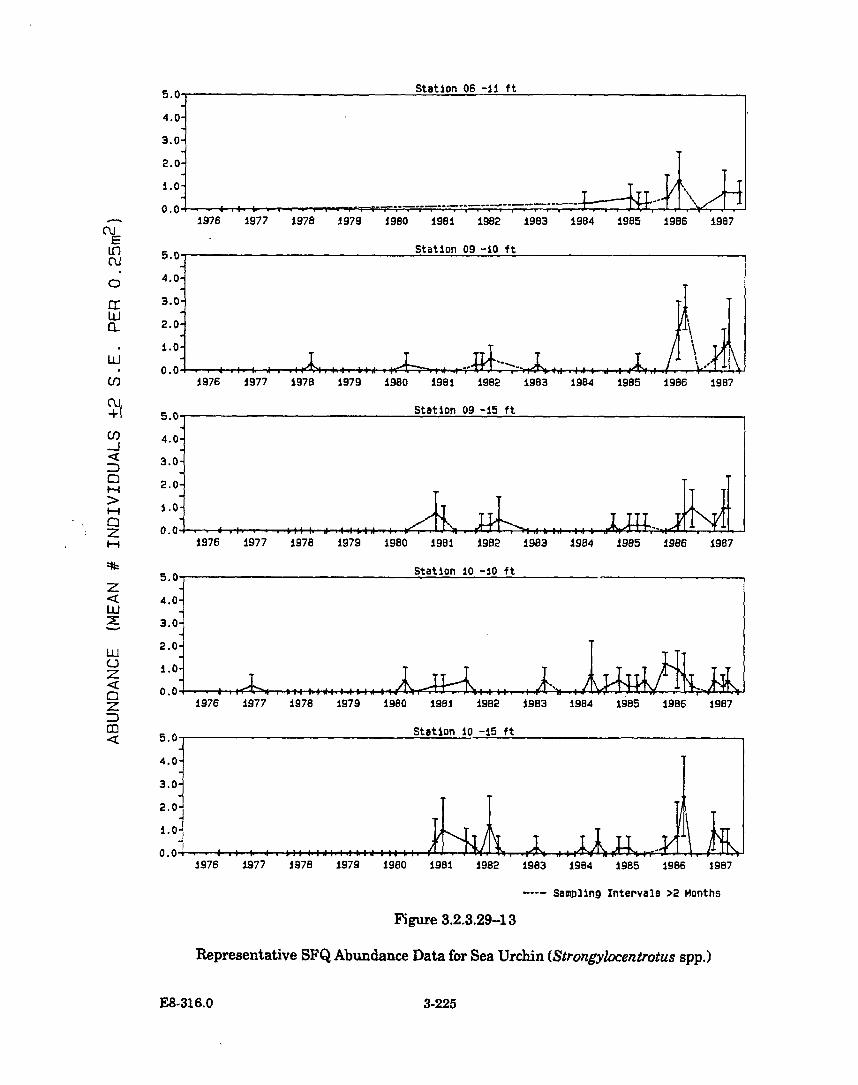
CUELnCuCU
LU0~Lu
LU
-J
CO
Cu
+1-
z
i-I
m
LU
LU
zC
z
1976 1977 1978 1979 1980 1981 1982 1983 1984 1985 1986 1987
Station 09 -15 ftI
4.0-
3.0-
2.0-
0.11976 1977 1978 1979 1980 1981 1982 1983 1984 1985 1986 1987
1976 1977 1978 1979 1980 1981 1982 1983 1984 1985 1986 1987
Station 10 -15 ft5.0
4.0-
3.0]
2.0-
1.0- ~kk1U.'
1976 1977 1978 1979 1980 1981 1982 1983 1984 1985 1986 1987
---- Sampllng Intervals >2 Months
Figure 3.2.3.29-13
Representative SFQ Abundance Data for Sea Urchin (Strongykbcentrotus spp.)
E8-316.0 3 -225
Sheephead
The sheephead (Semicossyphuspulcher) is a large member of the wrasse family,which is most common in the warmer waters south of Point Conception. During theEl Nino conditions which prevailed in 1983, juvenile sheephead became unusuallyabundant in Diablo Cove, although adults were previously not uncommon in deeperwaters outside Diablo Cove. Finding shelter among the shallow kelp canopies,juveniles remained in Diablo Cove after normal oceanographic conditions returnedin 1984. However, when power plant operation began shortly thereafter, sheepheadbecame increasingly common on TEMP-SFO transects in north Diablo Cove andnear Diablo Rock. Moreover, individuals grew considerably during this time, somuch so that mature adults were observed as early as 1986.
Sheephead feed on a wide variety of invertebrates such as sea urchins, mussels,abalones, and hermit crabs, and appear to have found adequate food resources inDiablo Cove to sustain their population of several hundred individuals. Theirpreference for warm temperate water suggests that sheephead will continue toinhabit Diablo Cove during the forthcoming years of power plant operation.
Leopard sharks and bat rays
Leopard sharks (Triakis semifasciata) and bat rays (Myliobatis californica) differfrom the bony fishes in that their skeletons are cartilaginous, but they fulfill similarecological roles as important predators in the nearshore community. Both speciescan grow to several feet in length and were very infrequent on the TEMP-SFOtransects prior to power plant operation. Their typical habitat in central Californiais in the warmer waters of bays and estuaries, where they feed on bottom-dwellingclams, worms, and crustaceans. With the beginning of thermal discharge intoDiablo Cove in 1985, small schools of adult sharks and rays became increasinglycommon, particularly in direct contact with the thermal plume. Individuals of bothspecies were also seen in the shallow areas of north Diablo Cove and near DiabloRock from 1985 to 1987. Presumably they were feeding primarily on small schoolingfish, such as topsmelt, which were attracted to the thermal discharge, or on a varietyof other potential food items present in Diablo Cove. The occurrence of leopardsharks and bat rays during power plant operation suggests that they have beenattracted by the warmer water and adequate food supplies. It is uncertain whetheror not they will find suitable conditions in Diablo Cove for reproduction, but themigratory capabilities of the adults enable them to seek this preferred habitat whichhas been created by the thermal discharge.
E8-316.0 3-226
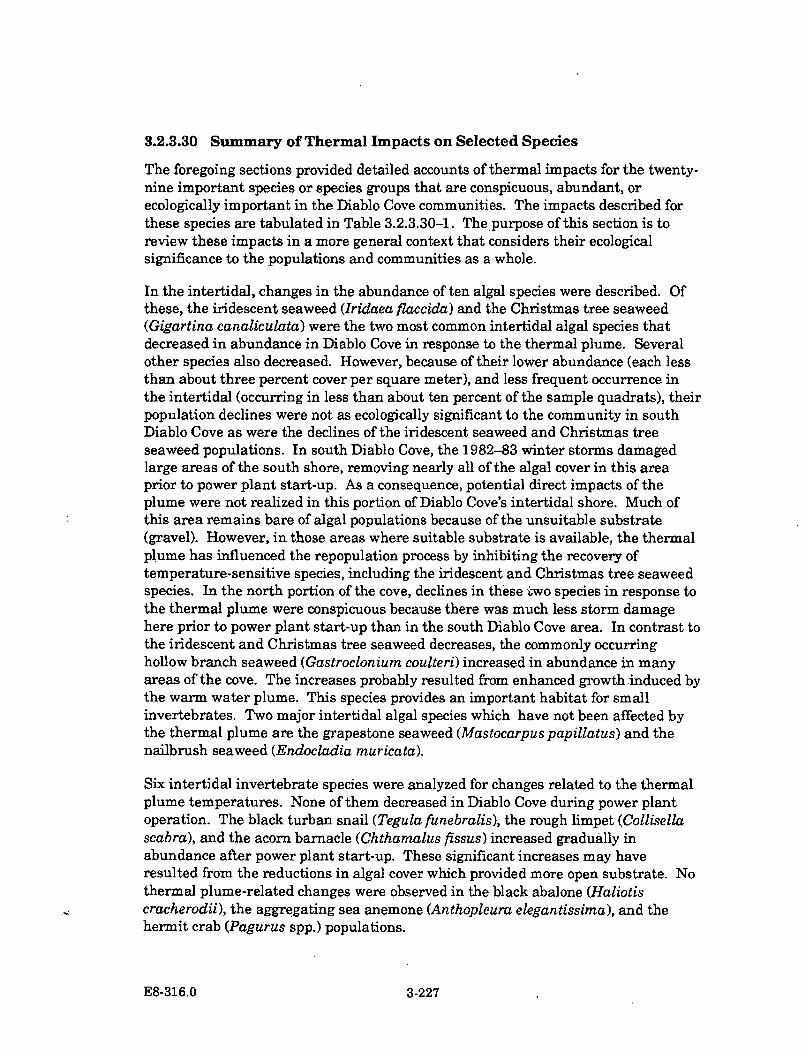
3.2.3.30 Summary of Thermal Impacts on Selected Species
The foregoing sections provided detailed accounts of thermal impacts for the twenty-nine important species or species groups that are conspicuous, abundant, orecologically important in the Diablo Cove communities. The impacts described forthese species are tabulated in Table 3.2.3.30-1. The purpose of this section is toreview these impacts in a more general context that considers their ecologicalsignificance to the populations and communities as a whole.
In the intertidal, changes in the abundance of ten algal species were described. Ofthese, the iridescent seaweed (Iridaea flaccida) and the Christmas tree seaweed(Gigartina canaliculata) were the two most common intertidal algal species thatdecreased in abundance in Diablo Cove in response to the thermal plume. Severalother species also decreased. However, because of their lower abundance (each lessthan about three percent cover per square meter), and less frequent occurrence inthe intertidal (occurring in less than about ten percent of the sample quadrats), theirpopulation declines were not as ecologically significant to the community in southDiablo Cove as were the declines of the iridescent seaweed and Christmas treeseaweed populations. In south Diablo Cove, the 1982-83 winter storms damagedlarge areas of the south shore, removing nearly all of the algal cover in this areaprior to power plant start-up. As a consequence, potential direct impacts of theplume were not realized in this portion of Diablo Cove's intertidal shore. Much ofthis area remains bare of algal populations because of the unsuitable substrate(gravel). However, in those areas where suitable substrate is available, the thermalplume has influenced the repopulation process by inhibiting the recovery oftemperature-sensitive species, including the iridescent and Christmas tree seaweedspecies. In the north portion of the cove, declines in these ýwo species in response tothe thermal plume were conspicuous because there was much less storm damagehere prior to power plant start-up than in the south Diablo Cove area. In contrast tothe iridescent and Christmas tree seaweed decreases, the commonly occurringhollow branch seaweed (Gastroclonium coulteri) increased in abundance in manyareas of the cove. The increases probably resulted from enhanced growth induced bythe warm water plume. This species provides an important habitat for smallinvertebrates. Two major intertidal algal species which have not been affected bythe thermal plume are the grapestone seaweed (Mastocarpus papillatus) and thenailbrush seaweed (Endocladia muricata).
Six intertidal invertebrate species were analyzed for changes related to the thermalplume temperatures. None of them decreased in Diablo Cove during power plantoperation. The black turban snail (Tegula funebralis), the rough limpet (Collisellascabra), and the acorn barnacle (Chthamalus fissus) increased gradually inabundance after power plant start-up. These significant increases may haveresulted from the reductions in algal cover which provided more open substrate. Nothermal plume-related changes were observed in the black abalone (Haliotiscracherodii), the aggregating sea anemone (Anthopleura elegantissima), and thehermit crab (Pagurus spp.) populations.
E8-316.0 3-227
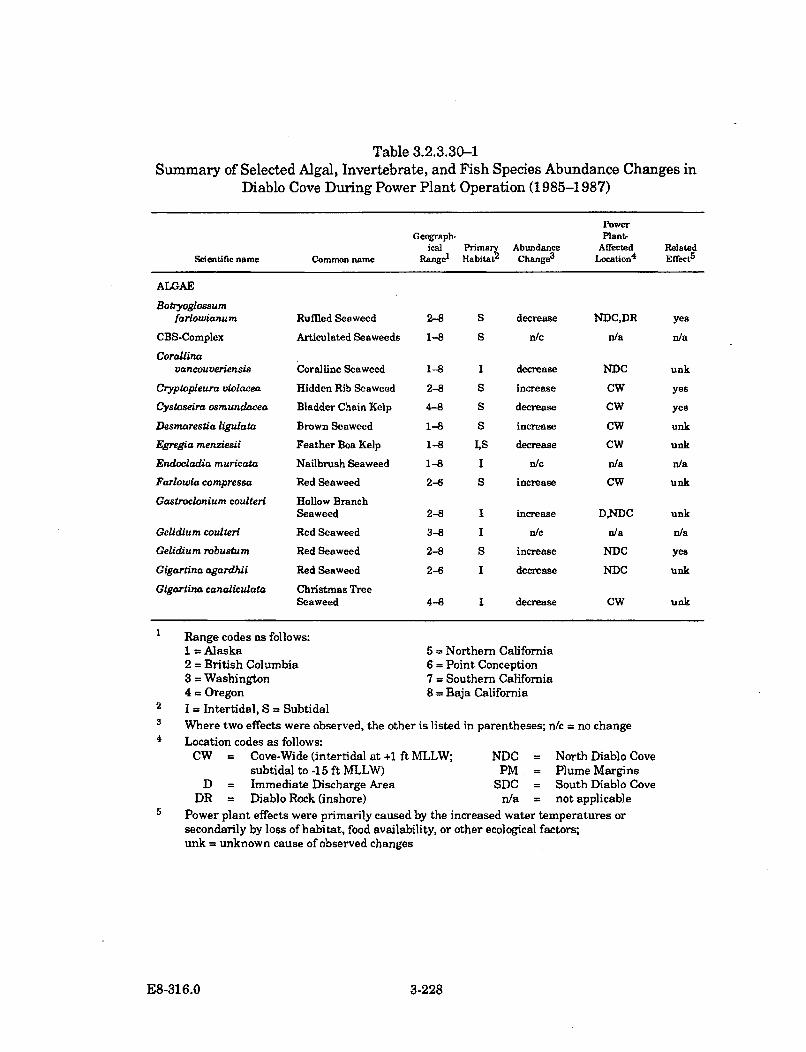
Table 3.2.3.30-1Summary of Selected Algal, Invertebrate, and Fish Species Abundance Changes in
Diablo Cove During Power Plant Operation (1985-1987)
PowerGeograph- Plant-
ical Primary Abundance Affected RelatedScientific name Common name Range' Habitat 2 Change3 Location4 Effect 5
ALGAEBotryoglossum
farlowianum Ruffled Seaweed 2-8 S decrease NDC,DR yes
CBS-Complex Articulated Seaweeds 1-8 S n/c n/a n/a
Corallinavancouveriensis Coralline Seaweed 1-8 I decrease NDC unk
Cryptopleura violacea Hidden Rib Seaweed 2-8 S increase CW yes
Cysloseira osmundacea Bladder Chain Kelp 4-8 S decrease CW yes
Desmarestia ligulata Brown Seaweed 1-8 S increase CW unk
Egregia menziesii Feather Boa Kelp 1-8 IS decrease CW unk
Endocladia muricata Nailbrush Seaweed 1-8 I n/c n/a n/a
Farlowla compressa Red Seaweed 2-6 S increase CW unk
Gastroclonium coulteri Hollow BranchSeaweed 2-8 I increase DNDC unk
Gelidium coulteri Red Seaweed 3-8 I n/c n/a n/a
Gelidium robustum Red Seaweed 2-8 S increase NDC yes
Gigartina agardhii Red Seaweed 2-6 I decrease NDC unk
Gigartina canaliculata Christmas TreeSeaweed 4-8 1 decrease CW unk
Range codes as follows:1 = Alaska2 = British Columbia3 = Washington4 = Oregon
2 1 = Intertidal, S = Subtidal
5 = Northern California6 = Point Conception7 = Southern California8 = Baja California
3 Where two effects were observed, the other is listed in parentheses; n/c = no change4 Location codes as follows:
CW = Cove-Wide (intertidal at +1 ft MLLW; NDC = North Diablo Covesubtidal to -15 ft MLLW) PM = Plume Margins
D = Immediate Discharge Area SDC = South Diablo CoveDR = Diablo Rock (inshore) n/a = not applicable
Power plant effects were primarily caused by the increased water temperatures orsecondarily by loss of habitat, food availability, or other ecological factors;unk = unknown cause of observed changes
E8-316.0 3-228
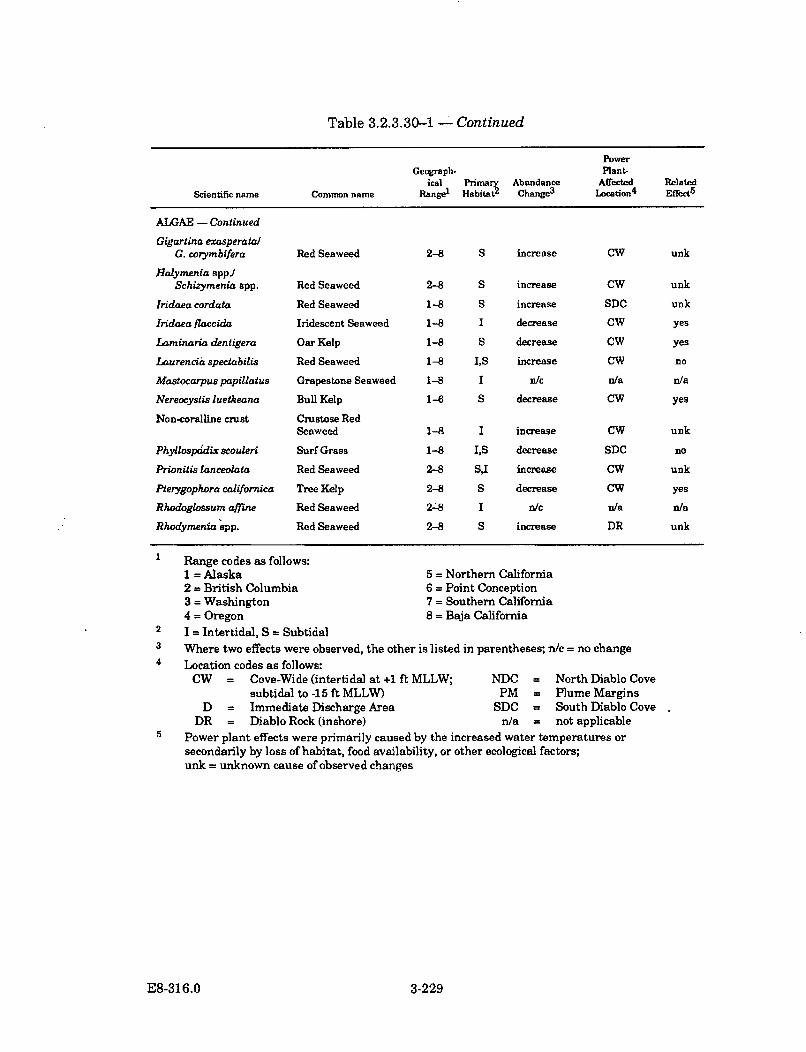
Table 3.2.3.30-1 - Continued
PowerGeograph- Plant-
ical Primary Abundance Affected RelatedScientific name Common name Range1 Habitat 2 Change3 Location 4 Effect 5
ALGAE - Continued
Gigartina exasperatalG. corymbifera Red Seaweed 2-8 S increase CW unk
Halymenia sppJSchizymenia spp. Red Seaweed 2-8 S increase CW unk
Iridaea cordata Red Seaweed 1-8 S increase SDC unk
Iridaea flaccida Iridescent Seaweed 1-8 I decrease CW yes
Laminaria dentigera Oar Kelp 1-8 S decrease CW yes
Laurencia spectabilis Red Seaweed 1-8 IS increase CW no
Mastocarpus papillatus Grapestone Seaweed 1-8 I n/c n/a n/a
Nereocystis luetkeana Bull Kelp 1-6 S decrease CW yes
Non-coralline crust Crustose RedSeaweed 1-8 I increase CW unk
PhyllospSdix scouleri Surf Grass 1-8 IS decrease SDC no
Prionitis lanceolata Red Seaweed 2-S SI increase CW unk
Pterygophora californica Tree Kelp 2-8 S decrease CW yes
Rhodoglossum aftine Red Seaweed 2--8 I n/c n/a n/a
Rhodymenia spp. Red Seaweed 2-8 S increase DR unk
Range codes as follows:
1 = Alaska2 = British Columbia3 = Washington4 = Oregon
2 1 = Intertidal, S = Subtidal
5 = Northern California6 = Point Conception7 = Southern California8 = Baja California
3 Where two effects were observed, the other is listed in parentheses; n/c = no change4 Location codes as follows:
CW = Cove-Wide (intertidal at +1 ft MLLW; NDC = North Diablo Covesubtidal to -15 ft MLLW) PM = Plume Margins
D = Immediate Discharge Area SDC = South Diablo CoveDR = Diablo Rock (inshore) n/a = not applicable
5 Power plant effects were primarily caused by the increased water temperatures orsecondarily by loss of habitat, food availability, or other ecological factors;unk = unknown cause of observed changes
E8-316.0 3-229
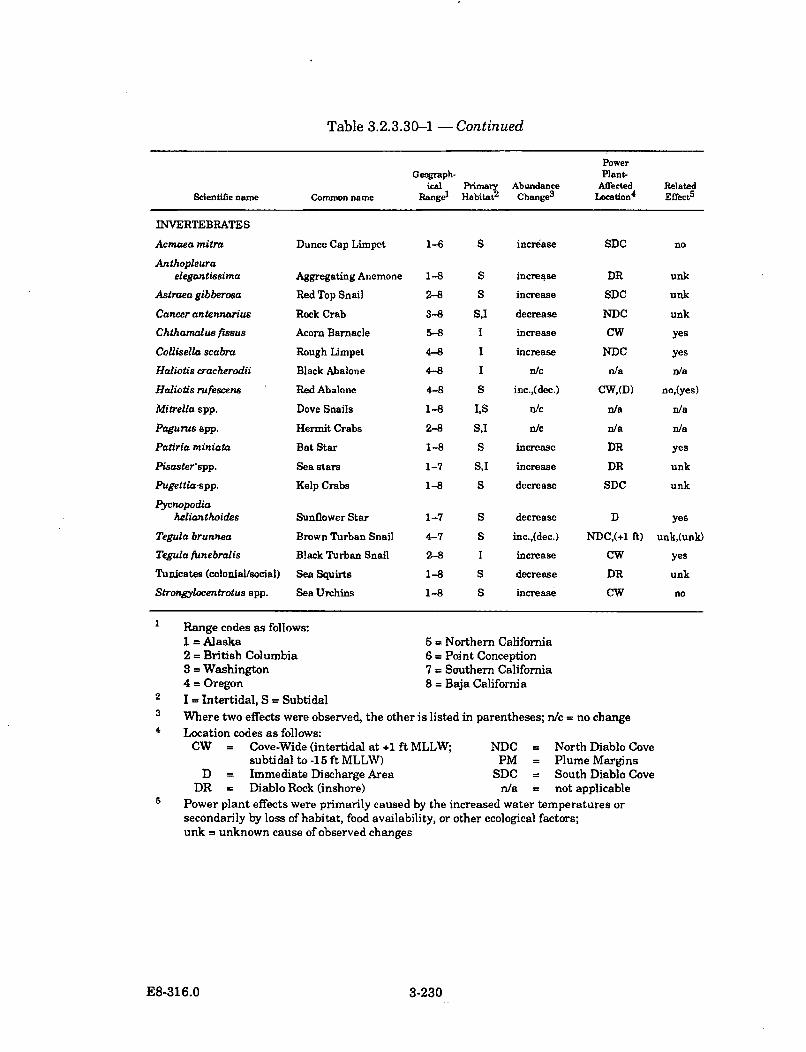
Table 3.2.3.30-1 - Continued
PowerGeograph- Plant-
ical Primary Abundance Affected RelatedScientific name Common name Rangel Habitat 2 Change3 L.cation4 Effects
INVERTEBRATES
Acmaea mitre Dunce Cap Limpet 1-6 S increase SDC no
Anthopleuraelegantissima Aggregating Anemone 1-8 S increase DR unk
Astraea gibberosa Red Top Snail 2-8 S increase SDC unk
Cancer antennarius Rock Crab 3-8 S,1 decrease NDC unk
Chthamalus fissus Acorn Barnacle 5-8 1 increase CW yes
Collisella scabra Rough Limpet 4-8 1 increase NDC yes
Haliotis cracherodii Black Abalone 4-8 I n/c n/a n/a
Haliotis rufescens Red Abalone 4-8 S inc.,(dec.) CW,(D) no,(yes)
Mitrella spp. Dove Snails 1-8 IS n/c n/a n/a
Pagurus app. Hermit Crabs 2-8 S,1 n/c n/a n/a
Patitia miniata Bat Star 1-8 S increase DR yes
Pisaster'spp. Sea stars 1-7 S,I increase DR unk
Pugettia-spp. Kelp Crabs 1-8 S decrease SDC unk
Pycnopodiahelianthoides Sunflower Star 1-7 S decrease D yes
Tegula brunnea Brown Turban Snail 4-7 S inc.,(dec.) NDC,(+1 ft) unk,(unk)
Tegula funebralis Black Turban Snail 2-8 I increase CW yes
Tunicates (colonial/social) Sea Squirts 1-8 S decrease DR unk
Strongylocentrotus spp. Sea Urchins 1-8 S increase CW no
Range codes as follows:
1 = Alaska2 = British Columbia3 = Washington4 = Oregon
2 1 - Intertidal, S = Subtidal
5 = Northern California6 = Point Conception7 = Southern California8 = Baja California
a Where two effects were observed, the other is listed in parentheses; n/c = no change4 Location codes as follows:
CW = Cove-Wide (intertidal at +1 ft MLLW; NDC = North Diablo Covesubtidal to -15 ft MLLW) PM = Plume Margins
D = Immediate Discharge Area SDC = South Diablo CoveDR = Diablo Rock (inshore) n/a = not applicable
Power plant effects were primarily caused by the increased water temperatures orsecondarily by loss of habitat, food availability, or other ecological factors;unk = unknown cause of observed changes
E8-316.0 3-230
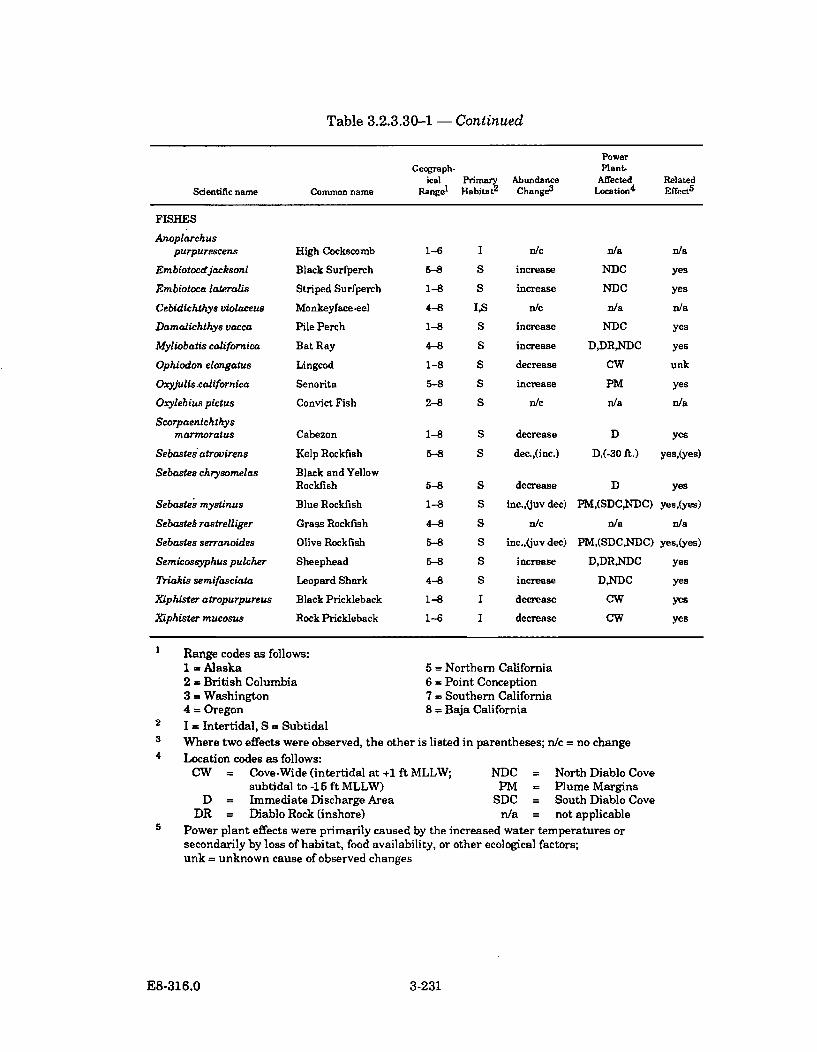
Table 3.2.3.30-1 - Continued
PowerGeograph- Plant-
ical Primary Abundance Affected RelatedScientific name Common name Range1 Habitat 2 Change3 Location4 Effect5
FISHES
Anoplarchuspurpureacens High Cockscomb
Embiotocdjacksoni Black Surfperch
Embiotoca lateralis Striped Surfperch
Cebidichthys violaceus Monkeyface-eel
Damalichthys vacca Pile Perch
Myliobatis cadifornia Bat Ray
Ophiodon elongatus
Oxyjulis.californica
Oxylebius pictus
Scorpaenichthys
Lingcod
Senorita
Convict Fish
marmoratus Cabezon
Sebastes'atrovirens Kelp Rockfish
Sebastes chrysomelas Black and YellowRockfish
Sebastes mystinus Blue Rockfish
Sebastek rastrelliger Grass Rockfish
Sebastes serranoides Olive Rockfish
Semicossyphus pulcher Sheephead
Triakis semifasciata Leopard Shark
Xiphister atropurpureus Black Prickleback
Xiphister mucosus Rock Prickleback
1-6
5-8
1-8
4-8
1-8
4-8
1-8
5-8
2-8
1-8
5-8
5-8
1-8
4-8
5-8
5-8
4-8
1-8
1-6
I n/c n/a n/a
S increase NDC yes
S increase NDC yes
IS n/c n/a n/a
S increase NDC yes
S increase D,DRNDC yes
S decrease CW unk
S increase PM yes
S n/c n/a n/a
S decrease D yes
S dec.,(inc.) D,(-30 ft.) yes,(yes)
S decrease D yes
S inc.,(juv dec) PM,(SDCNDC) yes,(yes)
S n/c n/a n/a
S inc.,(juv dec) PM,(SDC,NDC) yes,(yes)
S increase D,DRNDC yes
S increase DNDC yes
I decrease CW yes
I decrease CW yes
I Range codes as follows:1 = Alaska 5 = Northern California2 = British Columbia 6 = Point Conception3 = Washington 7 = Southern California4 = Oregon 8 = Baja California
2 1 = Intertidal, S = Subtidal3 Where two effects were observed, the other is listed in parentheses; n/c = no change4 Location codes as follows:
CW = Cove-Wide (intertidal at +1 ft MLLW; NDC = North Diablo Covesubtidal to -15 ft MLLW) PM = Plume Margins
D = Immediate Discharge Area SDC = South Diablo CoveDR = Diablo Rock (inshore) n/a = not applicable
5 Power plant effects were primarily caused by the increased water temperatures orsecondarily by loss of habitat, food availability, or other ecological factors;unk = unknown cause of observed changes
E8-316.0 3-231
Intertidal fish species which were analyzed for thermal plume-related changesincluded the black pricideback (Xiphister atropurpureus), rock prickleback (X.mucosus), high cockscomb (Anoplarchus purpurescens), and monkeyface-eel(Cebidichthys violaceus). Both Xiphister species decreased significantly inabundance throughout the cove following power plant start-up. The decreases inthese species may reflect a direct response to either the warmer water or the loss ofintertidal algae (which are a source of habitat and food for the species), or acombination of both.
From Diablo Cove's subtidal community, five kelp species and 12 foliose-typeseaweed species were described. The warm water plume caused significantdecreases in four kelp species: bull kelp (Nereocystis luetkeana), oar kelp (Laminariadentigera), tree kelp (Pterygophora californica), and bladder chain kelp (Cystoseiraosmundacea). The changes occurred primarily in shallow areas (less than 20 ftdepth) in Diablo Cove. All of the thermal plume-related changes were confined toareas in Diablo Cove, except for the bull kelp. Temperature effects (prematuresenescence) in those bull kelp individuals reaching the water surface were observedabout 1,000 yards upcoast from and outside Diablo Cove. This is the only thermalplume impact observed outside Diablo Cove. The warm water plume may havecontributed to preventing the recruitment of feather boa kelp (Egregia menziesii)during power plant operation. This species occurred in the shallow subtidal andintertidal areas of the cove, and was low in abundance prior to power plant start-up.The kelp populations that declined in the shallow cove areas were replaced bysignificant increases in foliose red algal populations (Botryoglossum farlowianum,Cryptopleura violacea) which grew on top of the articulated coralline algae. Otherfoliose red algal species became more abundant during power plant operation.However, these increases were considerably less significant than the increases of B.farlowianum and C. violacea, and were not caused by the thermal plume. Surf grass(Phyllospadix scouleri) was affected by the 1982-83 storms throughout Diablo Cove,except in the north Diablo Cove intertidal. During power plant operation itsabundance did not change any further.
Fourteen subtidal invertebrate species were reviewed from the TEMP quantitativeand qualitative records. Of these, the abundances of two species were negativelyaffected by the thermal plume. Larger individual rock crabs (Cancer antennarius)decreased in abundance in the shallow areas of north Diablo Cove. Presumably theymoved into deeper areas beneath the plume in the north channel area of DiabloCove. The red abalone population in Diablo Cove nearly doubled in number from1984 to 1987. During fall 1987, mortality of a small number of red abalone (Haliotisrufescens) occurred near the discharge structure as a result of the unusually highdischarge temperatures. Bat stars, Patiria miniata, appeared in greater numbers inan area of Diablo Cove persistently contacted by the plume (inshore of Diablo Rock).The cause of this increase is unknown. Most likely, some factor such as an increasein food attracted the bat stars to the area. The California sea hare (Aplysiacalifornica) increased temporarily in the shallows of Diablo Cove. Individuals of thisspecies live for only a year. The increase in this population during power plant
E8-316.0 3-232
operation was likely a natural episodic event, typical of species that have a short lifespan. The nine other invertebrate species selected for review did not appear to bepositively or negatively affected by the thermal plume.
Five species of rockfish (Sebastes spp.), three species of surfperch (Embiotocidae),and two other subtidal fish species in Diablo Cove were described in the previousspecies accounts. Several plume-related changes were observed. There weredecreases in the seasonal abundances of juvenile rockfish in the shallow areas ofDiablo Cove where there were plume-related losses of kelps. The loss of kelp directlyaffects rockfish because the juveniles prefer living near kelp canopies. Somerockfish species remain near kelp canopies throughout their entire life. Thesespecies have been able to move to deeper areas of the cove where the kelps remainedabundant. As some rockfish mature, they move from the kelp canopies to thebottom, and live within rocky crevices and in the open spaces between boulders (e.g.,black and yellow rockfish, S. chrysomelas). Some of the shallow-water individuals ofthese species may be at direct risk from the plume, because their territorial behaviormay override any tendency to move away from potentially harmful thermalconditions.
During power plant operation there were increases in the occurrences of bat rays(Myliobatis californica) and leopard sharks (Triakis semifasciata). These specieswere only infrequently encountered in Diablo Cove during the pre-discharge studyphase. During power plant operation these species increased appreciably inabundance in Diablo Cove, and were mainly concentrated within the turbulence zoneof the discharge.
Just prior to the warm water discharges from the power plant, several fish specieswhich are more commonly found south of Point Conception appeared in greaternumbers in Diablo Cove. This change resulted from adult migration and larvaltransport that occurred when warm water masses moved northward along theCalifornia coast during the 1983 El Nino event. The warm water plume hasmaintained this warm-water fish assemblage in Diablo Cove even though thesurrounding areas have returned to normal. The prevalent warm water species arethe California sheephead (Semicossyphus pulcher), opaleye (Girella nigricans), andhalfmoon (Medialuna californiensis).
The species discussed above were selected because they characterize Diablo Cove'sintertidal and subtidal communities, and because the effects on them attributed toboth natural conditions and the power plant's thermal plume are effectsrepresentative of those on the community as a whole. The large amount of datacollected on the many other algal, invertebrate, and fish species in Diablo Cove andvicinity are presented in the microfiche appendices attached to this report(Appendices G and H). Discussion of these data was not included in this reportbecause many of the species occurred too infrequently in the TEMP sampling sites tomake detailed assessments of the effects of the thermal plume on their populations.
E8-316.0 3-233
The species discussed in this report represent the most important species in DiabloCove. Thus, the effects of the thermal plume on these species characterize the mostsignificant changes to the communities as a whole.
3.2.4 Marine Community Thermal Impact Assessment
The TEMP program has documented the occurrence and distribution of severalhundred algal, invertebrate, and fish species in intertidal and subtidal habitats inand around Diablo Cove. The role and importance of each species in the overallfunctioning of the marine community (e.g., as habitat, food resource, herbivore, orpredator/prey) can be determined by analysis of its abundance, persistence, anddistribution. The multitude of interactions between species and the influence of thephysical environment create a complex web of energetic and behavioralrelationships, of which each link can be variable in its strength of association overtime and space. Because many species overlap in their use of community resources,certain species changes may not necessarily alter the structure, character, and"health" of the community. This property is referred to as "elasticity" and"resilience" in the community.
In Diablo Cove the biological changes from natural causes have reflectedgeographically widespread changes along the California coast, whereas the man-induced changes from power plant activities have been localized within Diablo Cove(with one exception). The most pertinent example of a natural event that affectedDiablo Cove's marine community is the impact that the immigration into DiabloCove of the sea otter in 1974 had on the distribution and abundance of sea urchinsand kelp. The sea otters' consumption of the sea urchins that grazed on the kelpresulted in a shift from a community in which sea urchins played a dominant role instructuring the community to one in which the role of the sea otter has maintained akelp forest-dominated community. This condition will persist in Diablo Cove as longas sea otters are present. A more detailed discussion of this change is presented inthe following section.
No other large-scale population shifts in Diablo Cove have been as directly related tothe influence of a single species as occurred with the sea otter immigration. Theabundances of other species have changed, but their effects on the community havebeen much less dramatic than those of the sea otter. In such cases, the magnitude ofchanges and their persistence have been less, and the roles of the species have beenless critical in structuring the community. Accordingly, the community-wide effectsof these changes have been relatively limited. Algal species periodically exhibitedunusual population increases (blooms), which were reduced to more normal levels byrecurrent winter storm disturbances. Over the 11 years of observations, thesephysical and biological "checks and balances" in Diablo Cove's community haverepeatedly reestablished certain population levels after the blooms and have tendedto maintain a state of dynamic equilibrium in the marine community.
The introduction of thermal effluent into the Diablo Cove biological communitiescreated a state of higher than natural ambient water temperatures. The biological
E8-316.0 3-234
changes that have resulted from the presence of the plume are expected to continueas long as the power plant continues to discharge thermal effluent into Diablo Cove.The data obtained during the eight years prior to thermal discharges revealed thatthe marine communities in Diablo Cove were generally rather stable, despite theearlier changes induced by the sea otter and the long-term changes documented in afew species. Therefore, it is reasonable to conclude that, without the thermaldischarge, most of the area currently affected by the thermal plume would revert tocommunities essentially similar to those observed in these areas before thermaldischarges.
The following chronology is a summary of the natural and power plant-relatedbiological changes that have been observed in Diablo Cove from 1966 through theend of the TEMP studies in 1987. Refer to Section 1.3.3 for descriptions of the pre-discharge ecological setting in Diablo Cove.
3.2.4.1 Changes Prior to Thermal Discharge (1966-1984)
The first reported marine ecological observations in Diablo Cove were made in 1966by Ebert (1966) and later in the same year by North (reported in North 1969). Inaddition to compiling a list of the cove's algal and invertebrate species, Northdescribed subtidal "algal barren grounds" in the center of Diablo Cove. Northpostulated that the absence of algae in this area was a result of concentrated grazingby a dense population of red sea urchins. Kelp and foliose algal species weregenerally observed only in areas without sea urchins. Red abalone were common inDiablo Cove, even though they had been harvested commercially for many yearsprier to Ebert's (1966) and North's (1969) studies.
In 1970, a temporary cofferdam was built to facilitate the construction of the powerplant's discharge structure. About 100 m of the intertidal zone upcoast anddowncoast of the discharge structure site was buried by the construction activities.After the removal of the cofferdam in 1971, the disrupted intertidal areas becamerepopulated with the same species of algae and invertebrates that occurred inadjoining undisturbed habitats. In 1974, seawater was discharged from the powerplant during the initial cooling water pump tests. Shortly following the discharges,an estimated 1,500 red and black abalone were found dead in Diablo Cove; accordingto Martin et al. (1977), their death was attributed to exposures to high levels ofcopper ion. The copper-nickel alloy tubes were replaced with less toxic titaniumtubes. Since that time, the red abalone population has had good recruitment ofjuveniles and shown signs of a strong recovery in the adult stages.
In 1973-74 the southern migratory front of the southern sea otter reached DiabloCove. Since their arrival, sea otters have remained an important ecologicalstructuring force within Diablo Cove and along its outer shores. The red sea urchinpopulation was reduced by the foraging of the sea otters. Shortly thereafter, thealgal barren areas reported by North (1969) became forested with the annual bullkelp and perennial tree kelp and oar kelp species. (Algal increases following areduction in grazing pressure from sea urchins have been observed elsewhere, and
E8-316.0 3-235
are well documented in the scientific literature.) In the previously barren areas, theaccumulating numbers of tree and oar kelp plants were eventually able to excludethe annual bull kelp species by covering more of the substrate and inhibiting bullkelp recruitment. Bull kelp continued to repopulate the cove each year, but itsdistribution was restricted to Diablo Cove's perimeter and the north and southheadlands, where higher wave action periodically created open substrate for itsrecruitment.
The winter storms of 1982-83 were unusually severe and caused widespreaddamage to man-made structures and disturbances to the natural shoreline (scouring,boulder rolling, sand shifting) along the entire California coast. The greatest stormdamage to Diablo Cove occurred in early 1983, when a portion of a large pinnacleisland near the cove's south shore collapsed. Large quantities of cobble-sizefragmented rock were strewn about and eventually covered the TEMP intertidalStation 12 in south Diablo Cove. Large amounts of subtidal sand were transportedby the storm waves across the main intertidal zone and were deposited on the upperelevations of the beach immediately downcoast of the discharge structure. Thescouring effect of the transported sand and cobble nearly eliminated intertidal algaland invertebrate populations along the entire southern shore of Diablo Cove.Damages to the cove's northern shore were not nearly as extensive. In the storm-affected subtidal areas, reductions in oar kelp, tree kelp, and sea star abundanceswere observed at greater depths than had been observed following other winterstorms. These changes were attributed to the unusually large waves that wererecorded during this period.
The 1983 El Nino ocean warming event followed the 1982-83 winter storms. Thiswarming caused abnormally high ambient water temperatures in Diablo Cove. ElNino ocean warming and associated current changes are relatively common in thesouthern hemisphere, but are infrequent in the northern hemisphere. It is onlywhen the event is unusually strong that the oceanographic and associated climaticchanges extend to the northern hemisphere. The previous extension of an El Ninointo the northern hemisphere occurred in 1976, but it was not as strong as the 1983El Nino. Although both events had similar temperature maximums in Diablo Cove,the 1983 El Nino produced longer periods of elevated temperatures (Figure 3.2.2-1).
The 1983 El Nino event caused a number of species changes. The annual bull kelppopulation in Diablo Cove senesced prematurely, due to the warmer water andpossibly lower amount of nutrients. El Nino effects on other algal species were notas detrimental. Minor paling of color occurred in some intertidal and subtidal algalspecies, but the color change did not appear to affect their abundances. Shortlythereafter, the same algal species appeared normal in coloration. Invertebratespecies appeared unaffected by the El Nino, except for some sea star species.However, Diablo Cove's assemblage of fish species was changed substantially by theEl Nino.
Juvenile stages of fish species that are typically common only south of PointConception were transported by northward-flowing currents and appeared in greater
E8-316.0 3-236
than normal numbers in Diablo Cove during the 1983 El Nino. These speciesincluded the opaleye, halfmoon, kelp bass, giant kelpfish, and sheephead. Many ofthese characteristically warm water species had been observed previously in lownumbers in the Diablo Canyon area, possibly as a result of previous El Nino events.The cool-water fish species that were already living in the cove did not appear to beaffected by the introduction of warm-water species. All but the kelp bass and giantkelpfish species still persisted in the cove as of 1987. Many of the changes notedduring the 1983 El Nino did not occur during the previous 1976 El Nino, presumablydue to the weaker nature of the 1976 event.
In early 1984, an unusual amount of bleached algae were observed in the shallowsubtidal portion (depths less than about 15 ft) of south Diablo Cove (PG&E 1985).The condition was characterized by the temporary lack of growth in bladder chainkelp and a loss of color in the articulated coralline algal species. Some of theaffected plants eventually died from these conditions. The changes were consideredunusual because of their localized occurrence within Diablo Cove, and because thesetypes of changes on this scale had not been observed before.
3.2.4.2 Changes During Power Plant Operation (1984-1987)
Power ascension testing of DCPP Unit 1 began in 1984. Since then, heated effluenthas been discharged into Diablo Cove at various rates, depending on the operationsof one or both units and heat treatments for biofouling control. In general, the start-up ascension testing of Unit 1 did not produce any biologically significanttemperature elevations in Diablo Cove. The effects of the previous 1982-83 stormswere still evident in the cove during this transition period, with minor indications ofbiological recovery. The most notable power plant-related effect during the start-uptesting phase was the scouring of the shallow, rocky bottom (0-15 ft depth) directlyin front of the discharge structure. Dense stands of the perennial oar kelp whichoccupied this area (approximately 150 x 300 ft) were removed by the velocity of thedischarge flows. Smaller algae and sessile invertebrates in this area were lessaffected, presumably because of less drag effect or a stronger ability to adhere to thesubstrate.
Unit 1 became fully operational in 1985, and water temperatures in Diablo Covewere raised significantly above normal (up to 10 C above ambient at the surface).Several temperature-related species changes followed, some of which resulted in aloss or gain of individuals, and some of which resulted in a shift in distribution todifferent areas in the cove. The thermal effects observed in Diablo Cove arediscussed in the following sections; detailed changes that occurred in individualspecies populations were presented in Section 3.2.3.
Changes in Abundance and Distribution
Several changes in the abundance and occurrence of several of Diablo Cove's specieswere recorded following start-up of the power plant. Thermal plume-relatedmortalities occurred in bull kelp throughout the cove, and in the shallow areas of the
E8-316.0 3-237
cove the populations of oar kelp, tree kelp, and bladder chain kelp have declinedsignificantly. When the cove's bull kelp plants grew to within ten ft of the seasurface each summer and thus became exposed to the plume, the plants lost theirblades. The plants outside the influence of the thermal plume normally lose theirblades in late summer and fall (about three months later), as growth andreproduction cease. The effect of early blade senescence is expected to occur duringeach year of power plant operation. In 1987, the premature senescence wasobserved in bull kelp populations outside the cove but within the influence of thenorth-flowing surface thermal plume.
A general decline in the health of the oar, tree, and bladder chain kelp plants wasobserved prior to their disappearance from the cove's affected subtidal areas. Thedeepest extent of the thermal plume effects on these kelp species was observed at adepth of 25 ft on the inshore side of Diablo Rock. This effect arises from thedeflection of the plume as it flows toward Diablo Rock. One effect of this deflectionis to cause a downwelling of the plume to greater depths than in other portions ofDiablo Cove. Since power plant start-up there has not been any observedrecruitment of these three kelp species into the affected areas, and their abundancesare expected to remain low or nonexistent as long as the power plant continues toproduce heated effluent. The deeper-living plants in cooler water areas of DiabloCove have not been affected.
In contrast to the losses of kelp, the foliose red alga Cryptopleura violacea exhibiteda marked increased in abundance following start-up of the power plant. Theincreases are not evident in the peak seasonal abundance of this annual species.
In the intertidal zone, the most notable changes during power plant operationoccurred on the 300 x 300 ft rocky bench immediately downcoast from and adjacentto the discharge structure. Nearly all of the algal cover was gradually removed bythe elevated temperatures and/or scouring effects of the turbulent discharge water.Open bare substrata became colonized by mussels and acorn and gooseneckbarnacles in the areas once covered with algae. The only algae (mostly articulatedcorallines) remaining on the bench occurred in the tidepools and depressions. Onthe more protected downsloping portions of the bench were luxuriant mats of hollowbranch and foliose red algae, which are more tolerant of temperature and waveshear.
In Diablo Cove's intertidal areas farther away from the discharge structure, largereductions in the cover of iridescent seaweed (Iridaea flaccida) occurred. Thisspecies was one of the most prevalent algal species in the cove prior to power plantoperation. Reductions in this species were not evident outside Diablo Cove,indicating that the gradual decline in this species was related to the thermal plume.The most noticeable decreases were observed in the north portion of Diablo Cove.On the south side of Diablo Cove, iridescent seaweed coverage was already sparse,having been reduced by earlier 1982-83 winter storms. In this area, the plumeprobably prevented recovery of this species.
E8-316.0 3-238
The ubiquitous black turban snail increased in abundance in many intertidal areasin north and south Diablo Cove. Increases also occurred outside the cove. However,the increases within Diablo Cove were much larger.
Unit 2 was taken off-line from April until July 1987 for refueling. For the remainderof 1987, both units operated at nearly full power. This period was significant in theTEMP studies because the highest temperatures in Diablo Cove were measuredduring this year. The greater volume of elevated temperature water from two-unitoperations, plus the simultaneous operation of both units during fall when ambienttemperatures are greatest, resulted in the occurrence of higher temperatures atgreater depths and farther away from the discharge structure than had previouslybeen seen. (Only single-unit operations had occurred during previous fall periods.)The additional effects noted from this mode of power plant operation were mostobvious in bull kelp populations. During 1987, premature senescence in this speciesextended over a larger area than before outside Diablo Cove (about 2,500 ft upcoastfrom and outside Diablo Cove). Also, oar kelp and tree kelp plants that were livingin deeper portions of the cove (20-25 ft) and had previously been unaffected by thethermal plume began losing blade tissue. However, these plants were still presentat the end of 1987. Cessation of growth of bladder chain kelp was also observedduring the late summer and fall of 1987.
Behavioral Changes
"Behavioral responses" to the thermal plume have been exhibited by fish and motileinvertebrate species.
The fish community in Diablo Cove prior to power plant thermal discharge wasdominated by species that were characteristic of the cooler temperate conditions thattypically prevail along the central California open coast. Many of these fish specieswere at the southern margins of their ranges which extended from Pt. Conception,about 45 miles south of Diablo Cove, as far north as British Columbia or Alaska.Among these were species in the surfperch, rockfish, sculpin, tubesnout, andgreenling families. Although some of these typically northern species have beenobserved in the warmer waters south of Pt. Conception, several species found inDiablo Cove were strictly from cooler temperate regions.
The fish community also included a few species of fish families from warmertemperate waters, notably members of the wrasse, goby, blenny, pomacentrid, andopaleye families. These, however, were present in far lower abundances than thetypically northern species, and were often restricted to specific areas, such as southDiablo Cove or the intake cove, which offered slightly warmer and calmer conditions.With the onset of power plant operation and thermal discharge in 1985, theproportion of these typically warm-temperate species increased. The common fishfauna in the shallow areas of Diablo Cove was then comprised of sheephead, opaleye,halfmoon, blacksmith, rainbow surfperches, topsmelt, leopard sharks, and bat rays,all formerly uncommon species. Still present, however, in the cool transition areaswere the rockfish, lingcod, painted greenlings, and others.
E8-316.0 3-239
A shift in dominance toward the species adapted to warmer water was evidentbefore plant operation when the unusual El Nino warm water conditions prevailedin 1983. The thermal discharge prolonged these favorable conditions for speciestolerant of warm water. Some species which arrived in 1983, however, such as thekelp bass and giant kelpfish, were still not able to successfully adapt to the DiabloCove habitat, which indicates that other factors, such as food supply, suitable kelpcanopy, or the presence of a different suite of predators, were as important astemperature in determining their survival. Because of the mobility of fish, they areable to avoid unfavorable conditions; therefore the cool water fish have mainly beendisplaced from their former shallow habitats in Diablo Cove. Other species have, inturn, taken their place and should continue to dominate the fish faunal compositionduring power plant operation.
Redistributions occurred with several surfperch and rockfish species that exhibitcharacteristic vertical distribution in the water (kelp and/or high bathymetrictopography). The southern portion of Diablo Cove is relatively low in relief. Thekelp losses in this area, combined with possible plume avoidance, resulted in thekelp-associated fish moving and occupying deeper areas of the cove where kelpsremained in cooler water or where there was sufficient high bathymetric relief. Thisredistribution of fish will last as long as there is a lack of kelp in the shallows andthe power plant continues to discharge heated effluent into Diablo Cove.
Adult rock crabs have become less abundant in north Diablo Cove, presumablybecause they have moved into areas outside the influence of the thermal plume, orhave avoided this area in their migrations into the cove. The distribution of threespecies of fish (senoritas, bat rays, and leopard sharks) exhibited. a concentration,primarily near the turbulence zone, at the boundary of the plumc-.
3.2.4.3 Analyses of Changes in the Community
The observations prior to power plant operation indicate that species changes inDiablo Cove can be caused by a number of naturally occurring factors. The elevatedwater temperature in portions of Diablo Cove caused by the power plant has been anew factor to which the community has had to make adjustments. The plume hasreduced the abundances and changed the distributions of some major species. Onthe other hand, other species have increased in abundance during power plantoperation. The following describes the affected portions of Diablo Cove, changes inimportant ecological features of the cove's community, and changes in speciescomposition and abundance of the algal, invertebrate, and fish assemblages.
Thermal Impact Areas
In the intertidal, plume-related decreases occurred in algal species abundances. Thethermal effects changes were most apparent along the north shores, where theaffected species were once highly abundant. Along the south shores, the abundancesof nearly all species had already been reduced by the 1982-83 winter storms, and
E8-316.0 3-240
the plume possibly inhibited the recovery of temperature-sensitive species such asiridescent and Christmas tree seaweeds.
In the subtidal, the vertical range of effects on the benthic organisms was variablethroughout Diablo Cove. In north Diablo Cove it extended from the intertidal todepths of about 15 ft; in south Diablo to about 10 ft. This discrepancy is largely dueto the effect of tide height on the angle of trajectory of the plume passing throughthe cove. A rocky ridge system immediately in front of the discharge structurebecomes nearly emergent at low tide, deflecting the plume toward north DiabloCove. During high tide the ridge is further underwater, and the plume tends to passover the ridges. During these periods the plume exits the discharge structure at anangle more perpendicular to the shoreline. Thus, at low tide the plume generallycontacts deeper areas in north Diablo Cove than in south Diablo Cove. Diablo Rockis situated near the center of the mouth of the cove. Accordingly, areas on theinshore side of Diablo Rock are most persistently exposed to the plume. Diablo Rocktends to block the plume, which causes it to downwell slightly. Biological effectswere observed to 25 ft in this area. Areas where plume-related effects were observedon the benthic species represent about 65 percent of the total bottom area of thecove.
Changes in Ecological Structure
Increases occurred in some intertidal and subtidal species during power plantoperation, but not all of them can be considered ecologically equal replacementspecies for those that decreased. In terms of kelp habitat for fish, there were somelosses of this resource without replacement in shallow areas of Diablo Cove. Low-growing foliose red algae predominated in the areas where the 3 ft tall kelp specieswere once highly abundant. There were also no species that replaced the intertidaliridescent seaweed (Iridaea flaccida) species. This species provides canopy (shading)for some invertebrates. The decreases in Christmas tree seaweed (Gigartinacanaliculata), which forms habitat for intertidal invertebrates, were possibly offsetby the increases in hollow branch seaweed (Gastroclonium coulteri), an alga whichforms similar habitat.
Community Analyses
Graphical analyses were performed on the algal, invertebrate, and fish TEMP datasets to assess the changes in species content over time within these assemblages.Both the total number of species and the Shannon-Weiner diversity index (H' = E pilog pi from Pielou 1975) were used measure the changes. The Shannon-Weiner(S-W) diversity index is sensitive to both the number of species and the abundanceof the species, and represents the probability of encountering a given species.Highest diversity occurs when the various species are present in similarabundances. Lowest diversity occurs when a species is considerably more abundantthan others.
E8-316.0 3-241

The SLC data set (percentage cover abundances of the understory algae) was used tocalculate the subtidal algal S-W diversity indices. The values remained relativelyunchanged in the stations over the course of the TEMP studies. Although thediversity of the understory algal assemblage remained relatively unchanged, therewere large decreases in the densities and coverage of the overstory canopies of oarkelp and tree kelp. These species were counted by the SAQ method, and theirabundances were not included in any subtidal algal diversity analyses.
Representative graphs depicting the changes in the S-W diversity index for thealgae in the intertidal band transect stations (IBT) are presented in Figure 3.2.4-1.Remaining station graphs for the algae are presented in Appendix D in Figure D-73.During power plant operation, S-W diversity indices decreased in the Diablo Covestations (represented by the changes noted in stations 9+1 and 9+3 in Figure3.2.4-1). Concurrently, there were no decreases in this index in the stations outsideDiablo Cove (Stations 6+1 and 6+3), linking the cove changes to the thermal plume.
For the subtidal invertebrates the S-W calculations were applied to the SFQ dataset, and to only those organisms which were counted. Encrusting tunicates,sponges, and bryozoans whose abundances were measured as area coverage wereomitted. For the subtidal invertebrates there were no changes in the S-W index asa result of power plant operation. In general, each station had S-W indices betweenthree and four during the pre-operational and operational study periods, and usuallyover 40 to as many 60 species (taxa) per sampling period. During some samplingperiods, however, the diversity values decreased when the polychaete wormPhragmatopoma californica or the vermetid gastropod Dendropoma lituella wasabundant. In the case of the intertidal invertebrates, only the total number ofspecies (taxa) was analyzed: there were about 40-50 invertebrate taxa present ineach station/level per sampling period, but occasionally over 80 taxa were recorded.No invertebrate species disappeared from any subtidal or intertidal station as aresult of power plant operation.
Fish diversity values, computed from the SFO data set, were generally low and quitevariable between areas and surveys. This variation was due, in part, to the summerrecruitment of numerous juvenile rockfish, which caused the overall diversity valuesto decline seasonally. Topsmelt, Atherinops affinis, and senoritas, Oxyjuliscalifornica, were also abundant schooling fish species which could significantly affectthe S-W diversity calculations. Although overall fish diversity did not changedramatically in Diablo Cove during power plant operation, fish species tolerant ofwarm water became more common in the shallow areas of the cove. Accordingly, thediversity of species tolerant of warm water increased in north Diablo Cove and nearDiablo Rock, while species tolerant of cool water became less diverse in these areas.
The decrease in diversity reflected several species changes. The losses of theiridescent and Christmas tree seaweed species, which were once two of the moreabundant algal species in the stations, accounted for large reductions in algal cover.Adding to the decline in the S-W index were the reductions in the total number ofalgal species present in the TEMP sampling sites. Many of the species which
E8-316.0 3-242
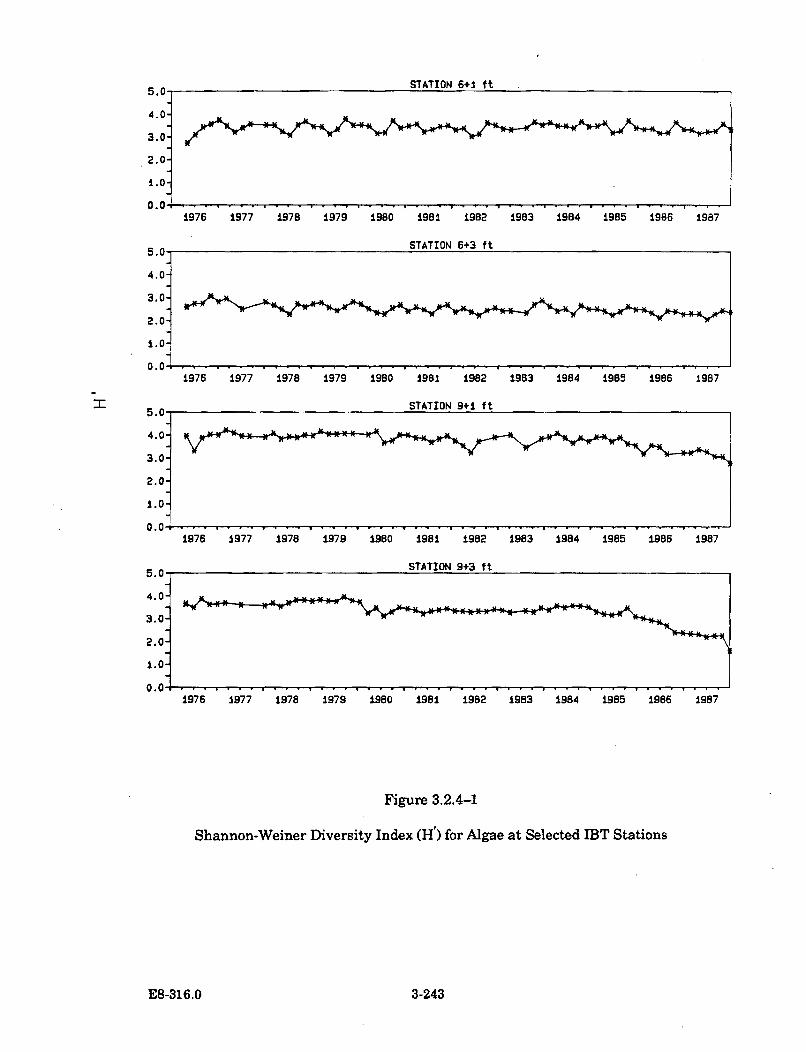
STATION 6+1 ft5.0
4.0-
3.0-
2.0-
0. ,
5.01
4.0-
3.0-
2.0-
1.0-
0.0
1976 1977 1978 1979 1980 1981 1982 1983 1984 1985 1986 1987
STATION 6+3 ft
I
1976 1977 1978 1979 1980 1981 1982 1983 1984 1985 1986 1987
STATION 9+1 ft5.0
4.0-
3.0-
2.0-
1.0-
IJ.
1976 1977 1978 1979 1980 1981 1982 1983 1984 1985 1985 1987
STATION 9+3 ft
4.0-
3.0-
2.0-
1.0-
0.0-
I1976 1977 1978 1979 1980 1981 1982 1983 1984 1985 1986 1987
Figure 3.2.4-1
Shannon-Weiner Diversity Index (H') for Algae at Selected IBT Stations
E8-316.0 3-243
disappeared were the less abundant forms. Representative station graphs of thechanges in the number of algal species (taxa) in Diablo Cove (Stations 9+1 and 9+3)and outside the cove (Stations 6+1 and 6+3) are presented in Figure 3.2.4-2.Remaining station graphs are presented in Appendix D in Figure D-74. Searchstrategies and familiarity with algal taxonomy improved during the beginning of theTEMP studies. Hence, more species were found after the initial surveys. For anumber of subsequent years the number of species encountered were similar fromone survey to the next up to power plant start-up. During power plant operation,many species (common and rare forms) were no longer present in the stations. Thespecies which disappeared from the sampling sites and accounted for much of thedecline in the S-W indices are presented in Table 3.2.4-1. The species listed inthese tables are those whose occurrences became less frequent in north Diablo Cove.The same species changes occurred in south Diablo Cove. Many of the species lostfrom the +1 and +3 ft levels in the TEMP stations (in Table 3.2.4-1) alsodisappeared from other elevations in Diablo Cove, as indicated by results fromPG&E's vertical transect studies (see Appendix F).
Thermal plume effects on an intertidal algal species may not occur for plants at allheights in the intertidal. Vadas et al. (1976) found that the thermal plume from theMaine Yankee Atomic Power Plant only affected certain plants, namely those livingnear their upper and lower vertical ranges in the intertidal. The result was thatindividuals of the affected species occurred within a narrower band than normalalong the intertidal. W.J. North's vertical transect data base, which samples theentire range of intertidal elevations in portions of Diablo Cove, was examined todetermine if the algal species which disappeared from the TEMP +1 and +3 fthorizontal band transects disappeared at other elevations. The iridescent andChristmas tree seaweed species essentially disappeared throughout their verticalranges (Figures F-5 to F-8 in Appendix F, respectively). The less common speciesthat disappeared from the TEMP sites were sparse or sporadic in occurrence inNorth's transects. Thus, no firm conclusions can be reached on whether there wereany thermal effects on plants of these species above and below the TEMP stationelevations. However, because these species were infrequent in occurrence, they wereprobably of minor ecological importance.
Summary
The changes in Diablo Cove's algal, invertebrate, and fish communities described bythe TEMP quantitative data base and the qualitative observations indicate thatdespite the number of biological changes that occurred as a result of power plantoperation, the present marine community in Diablo Cove can be considered equallyas rich in the numbers of species and their abundances as under pre-operationalconditions, and equally as rich as communities outside the influence of the thermalplume. Although some species decreased in abundance in Diablo Cove during powerplant operation, the changes in the subtidal were localized, with much of the cove'spopulation of the temperature-sensitive species being unaffected. In the intertidal,temperature-related algal declines and losses were more widespread along the cove's
E8-316.0 3 -244
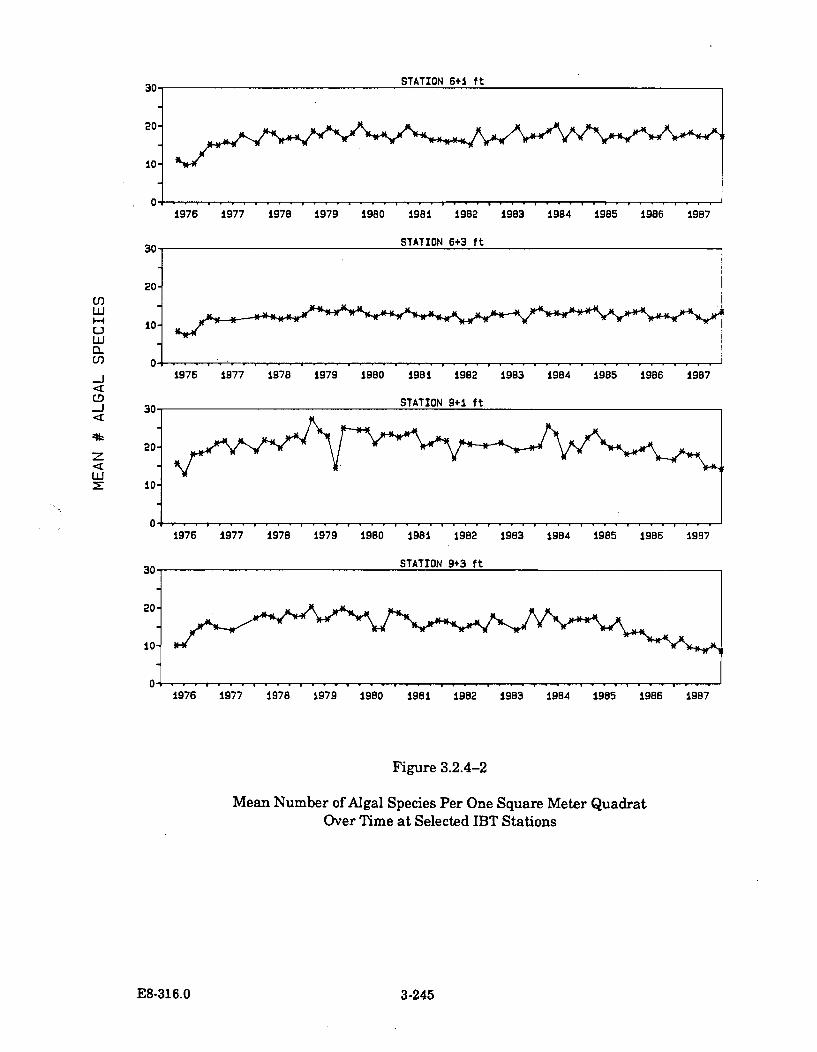
STATION 6+1 ft
1976 1977 197B 1979 1980 1981 1982 1983 1984 1985 1986 1987
STATION 6+3 ft
U)uLJU)
-1k
uLJx
20-
10-
1976 1977 1978 1979 1980 1981 1982 1983 1984 1985 1986 1987
STATION 9+1 ft
20-
10-
fit .................................. . .. ..... . . .. . .. .. ...........................
1976 1977 1978 1979 1980 1981 1982 1983 1984 1985 1986 1987
STATION 9+3 ft
20-
10-
1976 1977 1978 1979 1980 1981 1982 1983 1984 1985 1986 1987
Figure 3.2.4-2
Mean Number of Algal Species Per One Square Meter QuadratOver Time at Selected IBT Stations
E8-316.0 3-245
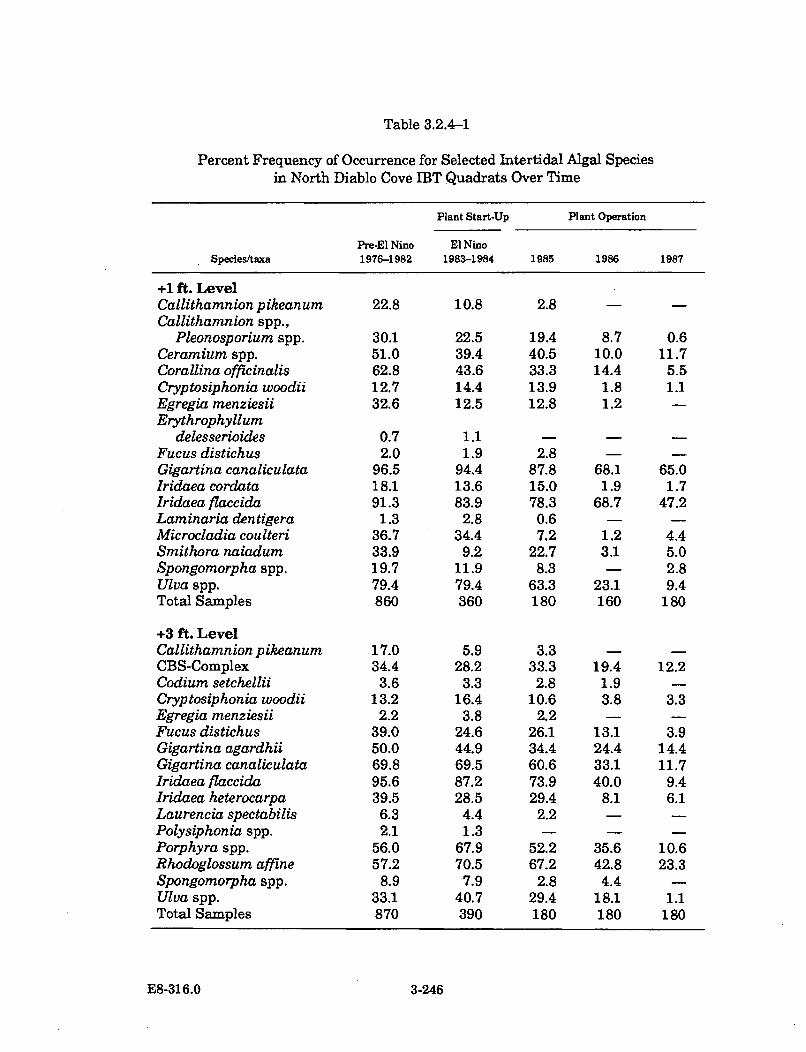
Table 3.2.4-1
Percent Frequency of Occurrence for Selected Intertidal Algal Speciesin North Diablo Cove IBT Quadrats Over Time
Plant Start-Up Plant Operation
Pre-El Nino El NinoSpecies/taxa 1976-1982 1983-1984 1985 1986 1987
+1 ft. LevelCallithamnion pikeanum 22.8 10.8 2.8 - -
Callithamnion spp.,Pleonosporium spp. 30.1 22.5 19.4 8.7 0.6
Ceramium spp. 51.0 39.4 40.5 10.0 11.7Corallina officinalis 62.8 43.6 33.3 14.4 5.5Cryptosiphonia woodii 12.7 14.4 13.9 1.8 1.1Egregia menziesii 32.6 12.5 12.8 1.2 -
Erythrophyllumdelesserioides 0.7 1.1 - -
Fucus distichus 2.0 1.9 2.8 - -
Gigartina canaliculata 96.5 94.4 87.8 68.1 65.0Iridaea cordata 18.1 13.6 15.0 1.9 1.7Iridaea flaccida 91.3 83.9 78.3 68.7 47.2Laminaria dentigera 1.3 2.8 0.6 - -
Microcladia coulteri 36.7 34.4 7.2 1.2 4.4Smithora naiadum 33.9 9.2 22.7 3.1 5.0Spongomorpha spp. 19.7 11.9 8.3 - 2.8Ulva spp. 79.4 79.4 63.3 23.1 9.4Total Samples 860 360 180 160 180
+3 ft. LevelCallithamnion pikeanum 17.0 5.9 3.3 - -CBS-Complex 34.4 28.2 33.3 19.4 12.2Codium setchellii 3.6 3.3 2.8 1.9 -
Cryptosiphonia woodii 13.2 16.4 10.6 3.8 3.3Egregia menziesii 2.2 3.8 2.2 - -
Fucus distichus 39.0 24.6 26.1 13.1 3.9Gigartina agardhii 50.0 44.9 34.4 24.4 14.4Gigartina canaliculata 69.8 69.5 60.6 33.1 11.7Iridaea flaccida 95.6 87.2 73.9 40.0 9.4Iridaea heterocarpa 39.5 28.5 29.4 8.1 6.1Laurencia spectabilis 6.3 4.4 2.2 - -
Polysiphonia spp. 2.1 1.3 - - -
Porphyra spp. 56.0 67.9 52.2 35.6 10.6Rhodoglossum affine 57.2 70.5 67.2 42.8 23.3Spongomorpha spp. 8.9 7.9 2.8 4.4 -
Ulva spp. 33.1 40.7 29.4 18.1 1.1Total Samples 870 390 180 180 180
E8-316.0 3 -246

shoreline. However, there has been no apparent diminution of invertebrate and fishhabitat and food resources corresponding to the changes in algal species' coverages.Studies of Diablo Cove's intertidal animal species have shown that the majority ofspecies are not restricted to any particular algal species for habitat; they can switchto other algal species for food or cover. Some species became more abundant inDiablo Cove during power plant operation, adding to the complexity of the structureand organization of the cove's community.
E8-316.0 3-247
4.0 SUMMARY OF THERMAL EFFECTS
Section 4.1 presents a summary review of the thermal effects of the DCPP discharge,based on the changes measured and observed among the selected species describedin Section 3.2.3 and the ecological changes in the cove's communities discussed inSection 3.2.4. of this report. Section 4.2 contains a summary finding regarding theprotection of the beneficial uses of the receiving waters in Diablo Cove.
4.1 Thermal Changes
In all natural environments, various physical and biological interactions affect theabundances and distributions of species in time and space. These natural forces inthe marine environment which can shape and control the species' abundances anddistributions are constantly changing; this natural state of fluctuation produces acontinual state of dynamic change in populations of both directly and indirectlyaffected species. The ecological significance of any one of these changes dependslargely on the magnitude, extent, and persistence of the change. The focus of thisreport is on ecologically significant changes in the marine communities of DiabloCove and therefore, in this assessment, the emphasis has been to assess cove-widechanges. The following is a synopsis of these cove-wide changes which have resultedfrom the operation of the power plant, discussed and compared with communitychanges that occurred during the eight years of the study prior to power plantoperation.
During the pre-operational baseline period, at least three large-scale natural eventssignificantly altered the cove-wide abundances of the plants and animals. The firstchange was induced by the arrival of the sea otter in Diablo Cove during the mid-1970's. Their foraging on red sea urchins in the cove, which graze on algae, quicklyresulted in an expansion of the cove's kelp forest. The second and third eventsoccurred nearly 10 years later. The extraordinary winter storms of 1982-83collapsed part of a cliff in south Diablo Cove. The fragmented cobble-size rockburied all plant and animal life in the local bench rock intertidal area. Species wereslow to recover on the unstable cobble. The intertidal shores of north Diablo Covewere less impacted by the storms, and species abundances were not as reduced as insouth Diablo Cove. The storms also temporarily reduced the abundance of severalsubtidal benthic species. Later in 1983 the El Nino episode, the third event,temporarily caused short-term reductions in some algal species, but increased thediversity of the cove's fish community. The composition of the intertidal andsubtidal marine communities in Diablo Cove still exhibited the effects of theseevents when power plant start-up occurred in 1984: a kelp forest was present in thesubtidal, the newly adjusted fish community was still present, and the south shoresof Diablo Cove were reduced in benthic species abundances.
Several species of the community as modified by these natural changes haveresponded to the new current and velocity patterns in Diablo Cove which resultedfrom the operation of the power plant. As the discharge enters the cove, the fast-
E8-316.0 4-1

flowing water mixes with the cove's receiving waters immediately in front of thedischarge structure. The resulting turbulence in this area has scoured the bottomand removed all but the most firmly attached animals and smaller plants. On therocky bench adjoining the discharge structure there has been a switch in speciesdominance from algae to attached invertebrates. This area, and the nearby subtidalareas, have been the most changed by the thermal discharge. A hundred yardsoffshore from the discharge structure, the momentum and turbulence of thedischarge decreases, and in some areas it is deflected upward as it contacts theirregular rocky bottom. The upwelling water at these points suspends, in the watercolumn, the algal drift material that normally resides on the bottom. Certain fish(senoritas, bat rays, and leopard sharks) are attracted to this turbulent area andperhaps to the warmer water temperatures.
Further seaward of the discharge point the water depth increases, and the plumespreads over the cove's surface and separates from the bottom. The plants andanimals living in this central region of the cove are apparently unaffected by theoverlying thermal plume. Along the shores of the cove, the thermal plume remainsin contact with the bottom and shoreline (in north Diablo Cove to depths of about 15ft and in south Diablo Cove to depths of about 10 ft). Portions of the thermal plumecome into contact with Diablo Rock as they move seaward, which causes the plumeto turn downward and recontact the bottom at a depth of about 25 ft, immediatelyinshore of Diablo Rock. In all of these plume-contacted regions, significant declinesin the abundance of kelp species occurred (bull kelp, oar kelp, and tree kelp). Foliosered algal species have increased in abundance and reoccupied the open space, but donot replace the unique kelp habitat provided by the taller kelp plants. Rockfishspecies, which had congregated near the shallow-water kelp, moved into the deeperareas of the cove where the kelp plants remained abundant beneath the overlyingthermal plume.
As the plume exits Diablo Cove, it becomes thinner as its buoyancy causes it to riseand spread out on the surface; at the same time, the temperature of the plumecontinues to decay. The only biological change outside the cove attributed to thethermal effects of the residual plume was observed in the surface canopy of theannual bull kelp populations to the north of Diablo Cove; the temperature of thedischarge plume caused the surface blades of the plants in this affected area tosenesce earlier in the year than normal. This premature senescence is a thermaleffect that had been commonly observed inside Diablo Cove during the summerthermal discharge periods in 1985, 1986, and 1987.
The Thermal Discharge Assessment Report (PG&E 1982a) stated that the warmwater introduced into Diablo Cove might eventually cause a switch in the structureand organization of the cove's community. It was anticipated that the attached,warm-water-tolerant species living in the cove and certain warm-water-tolerantspecies found south of Point Conception would appear in greater numbers after thepower plant began operation, replacing some of the species adapted to colder waterand unable to survive in areas contacted by the plume. By the end of 1987, this
E8-316.0 4-2
replacement process had begun, although somewhat differently than had beenpredicted. Thermally affected kelp species from the shallow areas of the cove werenot replaced by other kelp species, but were instead replaced by a cover of foliose redalgae. Motile, temperature-sensitive species had been expected to move away fromthe plume, as did occur in the rockfish and rock crab species, which moved to deeperareas of the cove. Other motile species appeared, in fact, unaffected by the thermaldischarge temperatures. However, some motile, temperature-sensitive species areterritorial (some rockfish species, for example), and have remained in theirterritories despite the risk of lethal temperatures.
In the intertidal, the near-discharge area changed as had been anticipated.Scouring and elevated temperatures reduced algal cover, and the swift-moving waterenhanced the abundance of attached filter-feeding invertebrates (mussels, barnacles,and sea anemones).
Not all the biological changes that occurred during power plant operation had beenanticipated, and some appear to be due to the interaction of natural and powerplant-induced changes. During the 1982/1983 El Nino episode, the abundance ofwarm-water fish species in Diablo Cove increased. Several of these fish populationsappear to be sustained in the cove by the warm-water plume present during powerplant pperation. A community of species adapted to and dynamically changingwithin the fluctuations of the thermal discharge environment will eventually becomeestablished in Diablo Cove.
4.2 Protection of Beneficial Uses
The summary of thermal effects findings from the Diablo Canyon discharge studiesleads finally to a review and assurance that the discharge temperature limitsestablished by the RWQCB in the discharge permit protect, in a balanced way, thebeneficial uses of Diablo Cove's receiving water, particularly the beneficial use of thecove as a marine habitat.
The thermal effects monitoring program has shown that the composition,abundance, and distribution of the cove's receiving water species have changed inresponse to the temperature and flow of the power plant's discharge. The results ofthe cove-wide population studies clearly demonstrate the continued and successfuluse of the cove's marine habitat, except for a small area at the point of initialdischarge. There is no evidence that changes which have occurred in this limiteddischarge area have had any measurable effect on the cove's neighboring marinepopulations. Temperature increases have occurred in many of the intertidal andsubtidal areas of the cove which have discouraged the presence of species sensitiveto warm temperatures and encouraged the success of species which tolerate or preferwarmer water. The established temperature limits of the discharge appear to beprotective of the cove's marine habitat, based on the operating data gathered to dateand the population responses of the habitat's species. A review and discussion of thepower plant's discharge permit temperature limits, plant operations, and discharge
E8-316.0 4-3

temperatures is presented in this volume of the report following Section 5.0. in thesection entitled, "Evaluation of Permit Temperature Limits."
E8-316.0 4-4
5.0 LITERATURE CITED
Abbott, I.A., and W.J. North. 1971. Temperature influences on floral composition inCalifornia coastal waters. Pages 72-79 in K. Nisizawa (ed.), Proc. SeventhIntl. Seaweed Symp.
Abbott, I.A., and G. Hollenberg. 1976. Marine algae of California. Stanford Univ.Press. XII + 827 pp.
Adams, J.R. 1974. Thermal tolerance of adult red abalone. Pages 175-180 inEnvironmental Investigations at Diablo Canyon, 1972-1973; PG&E, Dept.Engr. Res.
Adams, J.R. 1975. The influence of thermal discharges on the distribution ofmacroflora and fauna. Ph.D. Dissert. Univ. of Wash., 364 pp.
Adams, J.R., and D.G. Price. 1974. Thermal shock tolerances of larval red abalone(Haliotis rufescens) from Diablo Canyon, California. Pages 155-174 inEnvironmental Investigations at Diablo Canyon, 1972-1973. PG&E, Dept.Engr. Res.
Aleem, A.A. 1973. Ecology of akelp-bed in southern California. Botanica Marina16:83-95.
Allen, M.J. 1977. Southern California trawl-caught juvenile rockfishes. Presentedat the SCCWRP taxonomic standard. mtg. June 30, 1977.
Anderson, T.W. 1983. Identification and development of nearshore juvenilerockfishes (genus Sebastes) in central California kelp forests. M.A. Thesis,Calif. State Univ., Fresno. 216 pp.
Atomic Energy Commission (AEC). 1973. Final Environmental Statement Relatedto the Nuclear Generating Station Diablo Canyon Units 1 and 2, Pacific Gasand Electric Company. Docket Nos. 50-386 and 50-323.
Barton, M.G. 1973. Studies on the intertidal vertical distribution, food habits, andmovements of five species of eel blennies (Pisces: Stichaeidae and Pholidae)at San Simeon, California. M.A. Thesis, Calif. State Univ., Fullerton. 109PP.
Behrens, D.W. 1978. Effects of intermittent chlorination on selected invertebratespecies indigenous to Diablo Cove - a laboratory study. Chapter V inEnvironmental investigations at Diablo Canyon, 1975-1977, Vol. II. PG&E,Dept. Engr. Res.
Behrens, D.W. 1982. NPDES monitoring program and toxicity studies at DiabloCanyon - 1981. Chapter V in Environmental investigations at DiabloCanyon, 1981. PG&E, Dept. Engr. Res.
E8-316.0 5-1
Behrens, D.W., and J.L. Kelly. 1986. Space and habitat resource creation in fourspecies of intertidal red algae. Chapter IV in Behrens, D.W., and J.L. Kelly(eds.), Environmental investigations at Diablo Canyon. PG&E, Dept. Engr.Res. December 1986.
Behrens, D.W., and K.E. Shaffer. 1986. Observations of the gray whale migrationin the vicinity of Diablo Canyon: 1984-1985 migration. Chapter VIII inEnvironmental investigations at Diablo Canyon, 1985, Vol. I, MarineEcological Studies. PG&E, Dept. Engr. Res.
Benech, S.V., and E.W. Colson. 1976. Size and distribution of the California seaotter population in the vicinity of Diablo Canyon Nuclear Power Plant,October 1973 - December 1975. PG&E, Dept. Engr. Res. Rpt. No. 7846.11-76.
Best, B. 1964. Feeding activities of Tegula funebralis (Mollusca: Gastropoda).Veliger 6 (Suppl.) 42-45.
Bireley, L.E. 1987. Application of intervention analysis to power plant monitoringdata. Pages 340-347 in Smith, P.H. (ed.), SUGI 12, Proc. 12th SAS UsersGroup Intl. Conference, Dallas, Texas.
Black, R. 1974. Some biological interactions affecting intertidal populations of thekelp Egregia laevigata. Mar. Biol. 28:189-198.
Boolootian, R.A., A. Farmanfarmaian, and A.C. Giese. 1962. On the reproductivecycle and breeding habits of two western species of Haliotis. Biol. Bull.122:183-193.
Box, G.E.P., and G.C. Tiao. 1975. Intervention analysis with applicati3ns toeconomic and environmental problems. J. Am. Statist. Assoc. 70:70-79.
Box, G.E.P., and G.M. Jenkins. 1976. Time series analysis, forecasting and control.Holden-Day, Inc., San Francisco.
Breda, V.A. 1982. Composition, abundance and phenology of foliose red algaeassociated with two Macrocystis pyrifera forests in Monterey Bay, California.M.A. Thesis, San Jose State Univ., Calif. 67 pp.
Burge, R.T., and S.A. Schultz. 1973. The marine environment in the vicinity ofDiablo Cove with special reference to abalone and bony fishes. Calif. Dept.Fish Game Mar. Res. Tech. Rpt. No. 19. 433 pp.
Cannon, R. 1967. How to fish the Pacific Coast. Lane Publishing Co., Menlo Park,Calif.
Carlisle, J.G., Jr. 1962. Spawning and early life history of Haliotis rufescensSwainson. Nautilus 76:44-48.
Carroll, J.C. 1982. Seasonal abundance, size composition, and growth of rock crab,Cancer antennarius Stimpson, off central California. J. Crust. Biol. 2(4):549-561.
E8-316.0 5-2
Cox, K.W. 1962. California abalones, family Haliotidae. Calif. Dept. Fish Game,Fish Bull. 118. 133 pp.
Dawson, E.Y. 1966. Marine botany. Holt, Rinehart, and Winston, Inc., New York.371 pp.
Dayton, P.K. 1975. Experimental studies of algal canopy interactions in a sea otterdominated kelp community at Amchitka Island, Alaska. Fish. Bull. (U.S.)73(2):230-237.
Dayton, P.K., V. Currie, T. Gerrodette, B.D. Keller, R. Rosenthal, and D. Ven Tresca.1984. Patch dynamics and stability of some California kelp communities.Ecol. Monogr. 54:253-289.
Dearn, S.L. 1988. Invertebrate assemblages associated with four species ofintertidal algae: faunal composition and dynamics. PG&E, Dept. Engr. Res.52 pp.
Devinny, J.S. 1975. The effects of thermal outfalls on marine benthic algae. Ph.D.Dissert. Calif. Inst. Tech., Pasadena, Calif. 210 pp.
Ebert, E.E. 1966. An evaluation of marine resources in the Diablo Canyon area -May 2-4, 1966. MRO Ref. No. 66-10. Calif. Dept. Fish Game, Special Study.
Ebert, E.E. 1974. Elevated temperature tolerance of the red abalone Haliotisrufescens. Presented at a joint mtg. Am. Fish. Soc. and the Wildl. Soc.,Monterey, Calif.
Edwards, D., and B.C. Coull. 1987. Autoregressive trend analysis: an exampleusing long-term ecological data. Oikos 50:95-102.
Eschmeyer, W.N., E.S. Herald, and H. Hammann. 1983. A field guide to Pacificcoast fishes in North America. Houghton Mifflin Company, Boston. 336 pp.
Fitch, J.E., and R.J. Lavenberg. 1971. Marine food and game fishes of California.Univ. of Calif. Press, Berkeley. 179 pp.
Foreman, R.E. 1970. Physiology, ecology and development of the brown alga,Nereocystis luetkeana (Mertens) Postels & Ruprecht. Ph.D. Dissert. Univ. ofCalif., Berkeley. 114 pp.
Foreman, R.E. 1977. Ecological studies of Nereocystis luetkeana. I. Populationdynamics and life cycle strategy in different environments. J. Phycol. 13(Suppl.):78 (Abstract only).
Foster, M.S. 1982. Factors controlling the intertidal zonation of Iridaea flaccida(Rhodophyta). J. Phycol. 18:285-294.
Garsd, A., and W.E. Howard. 1981. A 19-year study of microtine populationfluctuations using time-series analysis. Ecology 62:930-937.
E8-316.0 5-3
Gibson, R.N. 1969. The biology and behavior of littoral fish. Oceanogr. Mar. Biol.Ann. Rev. 7:307-410.
Gibson, R.N. 1982. Recent studies on the biology of intertidal fishes. Oceanogr.Mar. Biol. Ann. Rev. 20:363-414.
Gotshall, D.W., J.G. Smith, and A. Holbert. 1965. Food of the blue rockfishSebastodes mystinus. Calif. Dept. Fish Game 51(3):147-162.
Gotshall, D.W., L.L. Laurent, and F.E. Wendell. 1977. Diablo Canyon Power Plantsite ecological study annual report, Part I, July 1, 1975 -June 30, 1976, andquarterly report no. 12, April 1, 1976 - June 30, 1976. Calif. Dept. Fish GameMar. Res. Admin. Rpt. No. 77-18. 125 pp.
Gotshall, D.W., L.L. Laurent, and J. Grant. 1978. Diablo Canyon Power Plant siteecological study annual report, July 1, 1976 - June 30, 1977. Calif. Dept. FishGame Res. Agency, Mar. Res. Adm. Rpt. 79-2.
Gotshall, D.W., L.L. Laurent, S.L. Owen, J. Grant, and P. Law. 1984. Aquantitative ecological study of selected nearshore marine plants andanimals at the Diablo Canyon Power Plant site: A pre-operational baseline1973-1978. Calif. Dept. Fish Game Res. Agency, Marine Resources TechnicalReport No. 48.
Gotshall, D.W., J.R.R. Ally, D.L. Vaughn, B.B. Hatfield, and P. Law. 1986. Pre-operational baseline studies of selected nearshore marine biota at the DiabloCanyon Power Plant site: 1979-1982. Calif. Dept. Fish Game Res. Agency,Mar. Res. Tech. Rpt. No. 50.
Green, R.H. 1979. Sampling design and statistical methods for environmentalbiologists. J. Wiley and Sons, New York. 257 pp.
Guiry, M.D., J.A. West, D.-H. Kim, and M. Masuda. 1984. Reinstatement of thegenus Mastocarpus. Kiitzing (Rhodophyta). Taxon, 33 (1):53-63.
Gunnill, F.C. 1986. Demography of Cystoseira osmundacea and Halidrys dioica(Phaeophyta, Cystoseiraceae) at La Jolla, California, U.S.A. Bot. Marina29:137-146.
Hixon, M.A. 1981. An experimental analysis of territoriality in the California reeffish Embiotocajacksoni (Embiotocidae). Copeia 3:653-665.
Hodgson, L.M. 1981. Photosynthesis of the red alga Gastroclonium coulteri(Rhodophyta) in response to changes in temperature, light intensity, anddesiccation J. Phycol. 17(1):37-42.
Horn, M.H., S.N. Murray, and T.W. Edwards. 1982. Dietary selectivity in the fieldand food preferences in the laboratory for two herbivorous fishes from atemperate intertidal zone. Mar. Biol. 67:237-246.
Hurlbert, S.H. 1984. Pseudoreplication and the design of ecological fieldexperiments. Ecol. Monogr. 54:187-211.
E8-316.0 5-4
Icanberry, J.W., J.W. Warrick, and D.W. Rice, Jr. 1978. Seasonal larval fishabundance in waters off Diablo Canyon, California. Trans. Amer. Fish. Soc.107:225-234.
Ino, T. 1952. Biological studies on the propagation of Japanese abalone (genusHaliotis). Bull..Tokai Reg. Fish. Res. Lab. 5:1-102.
Isaacson, P.A., and D.M. Isaacson. 1966. Notes on the life history of the blackperch, Embiotocajacksoni Agassiz. Trans. Amer. Fish Soc. 95:107-109.
Jackson, G.A. 1977. Nutrients and production of the giant kelp Macrocystispyriferaoff southern California. Limnol. Oceanogr. 22:979-995.
Jennison, B.L. 1978. Effects of thermal effluents on reproduction in a sea anemoneAnthopleura elegantissima. In Thorp, J.H., and J.W. Gibbons (eds.), DOESymp. Ser., Vol. 48. Energy and Environmental Stress in Aquatic Systems.Nov. 1977, Augusta Ga. 854 pp.
Jennison, B.L. 1979. Gametogenesis and reproductive cycles in the sea anemoneAnthopleura elegantissima (Brandt 1835). Can. J. Zool. 57:403-411.
Johanson, H.W., and L.F. Austin. 1970. Growth rates in the articulated corallineCalliarthron (Rhodophyta). Can. J. Bot. 48:125-132.
Kelly, J.L., and D.W. Behrens. 1981. Intertidal algal faunal associations study.Chapter XIII in Behrens, D.W. (ed.), Environmental investigations at DiabloCanyon. PG&E, Dept. Engr. Res. Dec. 1981.
Kelly, J.L., and D.W. Behrens. 1984. Intertidal fish community study at DiabloCanyon Power Plant. Pages 1-74 in Environmental investigations at DiabloCanyon, 1984. PG&E, Dept. Engr. Res.
Kenzler, E.M. 1987. Comparison of foam in Diablo Cove: heated versus colddischarge jet. In Environmental investigations at Diablo Canyon PowerPlant, 1986 Annual Report, Vol. II. PG&E, Dept. Engr. Res.
Krenn, S.J., and T.C. Wilson. 1986. Diablo Canyon artificial reef project - 1985studies. Chapter VI in Environmental investigations at Diablo Canyon, 1985,Vol. I, Marine Ecological Studies. PG&E, Dept. Engr. Res.
Kunz, C., and V.M. Connor. 1986. Roles of the home scar of Collisella scabra.(Gould). Veliger 29:25-50.
Larkum, A.W.D. 1972. Frond structure and growth in Laminaria hyperborea. J.Mar. Biol. Ass. U.K. 32:405-418.
Leighton, D.L. 1966. Studies of food preference in algivorous invertebrates of.southern California kelp beds. Pac. Sci. 20:104-113.
Leighton, D.L. 1974. The influence of temperature on larval and juvenile growth inthree species of southern California abalones. Fish. Bull. (U.S.) 72:1137-1145.
E8-316.0 5-5
Leighton, D.L., and R.A. Boolootian. 1963. Diet and growth in the black abaloneHaliotis cracherodii. Ecology 44:227-238.
Leighton, J.P., S.W. Tu, A.A. Petroccitto, and L.K. Eastman. 1986.Characterization of receiving water temperatures during power ascensiontesting of Unit 1 Diablo Canyon Power Plant. Report No. 420-85.748, PG&E,Dept. Engr. Res. 140 pp.
Limbaugh, C. 1955. Fish life in the kelp beds and the effect of kelp harvesting.Univ. California Inst. UC-IMR Ref. 55-9. 158 pp.
Lindberg, D.R., and K.R. Dwyer. 1983. The topography, formation, and role of thehome depression of Collisella scabra (Gould) (Gastropoda: Acmaeidae).Veliger 25:229-234.
Lockheed Center for Marine Research. 1978. PG&E 316(a) demonstration programfield biology preoperational phase database summary, Vols. 1 and 2.Lockheed Ctr. Mar. Res., Carlsbad, Calif.
Luning, K., and M. Neushul. 1978. Light and temperature demands for growth andreproduction of laminarian gametophytes in southern and central California.Mar. Biol. 45:297-309.
Markham, J.W. 1969. Vertical distribution of epiphytes on the stipe of Nereocystisluetkeana (Mertens) Postels and Ruprecht. Syesis 2:227-240.
Martin, M., M. Stephenson, D. Smith, J. Linfield, G. Ichikawa, J. Goetzel, J.Bennett, S. Eastman, and M. Manera. 1985. Diablo Canyon Nuclear PowerPlant outfall monitoring report. State Mussel Watch Progr. Prelimin. DataRpt. 1984-1985. Calif. Dept. Fish Game. 19 pp.
Marliave, J.B. 1977. Substratum preferences of settling larvae of marine fishesreared in the laboratory. J. Exp. Mar. Biol. Ecol. 27:47-60.
Martin, M., M.D. Stephenson, and J.M. Martin. 1977. Copper toxicity experimentsin relation to abalone deaths observed in a power plant's cooling waters.Calif. Dept. Fish Game 63:95-100.
Mayer, D.L. 1973. The ecology and thermal sensitivity of the Dungeness crab,Cancer magister, and related species of its benthic community in Similk Bay,Washington. Ph.D. Dissert. Univ. Wash., Seattle. 188 pp.
McBeth, J.W. 1972. The growth and survival of the California red abalone inJapan. Venus 31:122-126.
McKay, H.H. 1933. Life history of Pterygophora californica Ruprecht. Univ. Calif.Publ. Bot. 17:111-148.
McLean, J.H. 1962. Sublittoral ecology of kelp beds of open coast area near Carmel,California. Biol. Bull. 122:95-114.
E8-316.0 5-6
McLean, J.H. 1978. Marine shells of southern California. L.A. Co. Mus. Nat. Hist.,Sci. Ser. 24, 104 pp.
Meek, R.P. 1983. Diablo Canyon continuous current measurements, June 1979 -April 1982. Chapter V in Environmental investigations at Diablo Canyon,1982. PG&E, Dept. Engr. Res.
Michanek, G. 1975. Seaweed resources of the ocean. FAO Fish. Tech. Paper 138(Pirs/T 38) Rome. 127 pp.
Miller, D.J., and J.E. Hardwick. 1973. The status of the rockfish resource and itsmanagement. Calif. Dept. Fish Game, Res. Agency, Mar. Res. Tech. Rpt. 17.
Miller, D.J., and J.J. Geibel. 1973. Summary of blue rockfish and lingcod lifehistories; a reef ecology study; and giant kelp, Macrocystis pyrifera,experiments in Monterey Bay, California. Calif. Dept. Fish Game, Fish Bull.158. 137 pp.
Morris, R.H, D.P. Abbott, and E.C. Haderlie. 1980. Intertidal invertebrates ofCalifornia. Stanford Univ. Press, Stanford, Calif. 690 pp.
Murray, S.N., and M.M. Littler. 1978. Patterns of algal succession in a perturbatedmarine intertidal community. J. Phycol. 14:506-512.
Nicholson, N.L. 1970. Field studies on the giant kelp Nereocystis. J. Phycol. 6:177-182.
Nicholson, N.I. 1976. Laminariales. Pages 228-257 in I.A. Abbott and G.H.Hollenberg, Marine algae of California. Stanford Univ. Press, Stanford, Calif.
North, W.J. 1969. An evaluation of the marine flora and fauna in the vicinity ofDiablo Cove, California. Marine Advisors, La Jolla, Calif. Pages 1097-1128.
North, W.J., and C.L. Hubbs. 1968. Utilization of kelp-bed resources in southernCalifornia. Calif. Dept. Fish Game, Fish Bull. 160. 264 pp.
North, W.J., E.K. Anderson, and F.A. Chapman. 1974. Summary report on marineecological studies. Pages 51-76 in Environmental investigations at DiabloCanyon, 1972-1973. PG&E, Dept. Engr. Res.
North, W.J., F.A. Chapman, and E.K. Anderson. 1986. W.J. North MarineEcological Investigations: 1985. Chapter I in Environmental investigationsat Diablo Canyon, 1985. PG&E, Dept. Engr. Res.
Northcraft, R.D. 1948. Marine algal colonization of the Monterey Peninsula,California. Amer. J. Bot. 35:396-404.
O'Connell, C.P. 1953. The life history of the cabezon Scorpaenichthys marnoratus(Ayres). Calif. Dept. Fish Game, Fish Bull. 93:1-76.
Parkinson, P.G. 1981. Phycologiae Historiae Analecta Autodidactica. 3rd facicle.Pettifogging Press, Auckland, N.Z. 28 pp.
E8-316.0 5-7
PG&E. 1971. Environmental report, Units 1 and 2, Diablo Canyon Site. AECDockets 50-275, 50-323. July 1971.
PG&E. 1978. Diablo Canyon Power Plant 316(a) demonstration. Nine-monthprogress report. May 1978.
PG&E. 1979. Diablo Canyon Power Plant 316(a) demonstration. Nine-monthprogress report. February 1979.
PG&E. 1982a. Thermal discharge assessment report. Diablo Canyon Power Plant.April 1982.
PG&E. 1982b. Compendium of thermal effects laboratory studies. Diablo CanyonPower Plant. April 1982.
PG&E. 1982c. Assessment of alternatives to the existing cooling water system.Diablo Canyon Power Plant. April 1982.
PG&E. 1983. Compendium of thermal effects laboratory studies. Addendum A.Diablo Canyon Power Plant. Doc. No. B-83-178.
PG&E. 1985. Environmental evaluation of heat treatment thermal discharges.Diablo Canyon Power Plant. July 1985.
PG&E. 1986a. Annual summary report on discharge monitoring at Diablo CanyonPower Plant during 1985. January 1986.
PG&E. 1986b. Thermal effects monitoring program. 1985 annual report. DiabloCanyon Power Plant. May 1986.
PG&E. 1987a. Diablo Canyon Power Plant 316(b) cooling water intake assessment,1986 annual report. April, 1987.
PG&E. 1987b. Thermal effects monitoring program. 1986 annual report. DiabloCanyon Power Plant. May 1987.
Paine, R.T. 1969. The Pisaster-Tegula interaction: prey patches, predator foodpreference and intertidal community structure. Ecology 50:950-961.
Pearse, J.S., and A.H. Hines. 1987. Long-term population dynamics of sea urchinsin a central California kelp forest: rare recruitment and rapid decline. Mar.Ecol. Progr. Ser. 39:275-283.
Phillips, J.B. 1968. Review of rockfish program. Mar. Res. Operat., Dept. FishGame, MRO No. 68-1, 73 pp.
Pielou, E.C. 1975. Mathematical Ecology. Wiley, N.Y.
Pimentel, R.A., and R.C. Bowker. 1984. Diablo Canyon intertidal fish study andcommunity structure analysis report for survey 2 through 15. Chapter XI inEnvironmental investigations at Diablo Canyon, 1983. PG&E, Dept. Engr.Res.
E8-316.0 5-8
Polanshek, A.R., and J.A. West. 1975. Culture and hybridization studies onPetrocelis from Alaska and California. J. Phycol. 11:434-439.
Polanshek, A.R., and J.A. West. 1977. Culture and hybridization studies onGigartinapapillata (Rhodophyta). J. Phycol. 13:141-149.
Price, P.S. 1974. Aspects of the reproductive cycle of red abalone Haliotis rufescens.M.S. Thesis. San Diego State Univ., Calif. 62 pp.
Ralston, S.L., and M.H. Horn. 1986. High tide movements of the temperate-zoneherbivorous fish Cebidichthys violaceus as determined by ultrasonictelemetry. J. Exp. Mar. Biol. Ecol. 98:35-50.
Reed, D.C., and M.S. Foster. 1984. The effects of canopy shading on algalrecruitment and growth in a giant kelp forest. Ecology 65:937-948.
Reimer, N.S., C.L. Wasanobu, K.T. Wasanobu, and J.R. Norton. 1985. Amino-acidsequence of the Anthopleura xanthogrammica heart stimulant anthopleurin.Br. J. Biol. Chem. 260:8690-8693.
Ricketts, E.F., J. Calvin, and J.W. Hedgpeth. 1968. Between Pacific tides, 4th ed.Stanford Univ. Press, Stanford, Calif. 614 pp.
Ricketts, E.F., J. Calvin, and J.W. Hedgpeth. 1985. Between Pacific tides, 5th ed.Stanford Univ. Press, Stanford, Calif. 652 pp.
Ryan, P.J., S.W. Tu, J.P. Leighton, and R.L. Wiegel. 1986. Hydraulic modelverification tests for Unit 1, Diablo Canyon Power Plant. PG&E Report 420-86.557. 342 pp.
Ryan, P.J., N. Ismail, R.C.H. Lou, S.W. Tu, and R.L. Wiegel. 1987a. Hydraulicmodel verification tests for Units 1 and 2, Diablo Canyon Power Plant. Tech.Rpt. BEL 27-17, HEL, UCB. Also PG&E Report 420DC-87.16.
Ryan, P.J., S.W. Tu, N. Ismail, and R.L. Wiegel. 1987b. Verification of physicalmodel of a coastal structure. ASCE Hydraulic Conference, Williamsburg, Va.Aug. 1987.
SAS Institute Inc. 1985. Statistical analysis system users guide: Statistics, Vers. 5.SAS Inst. Inc., Cary, N.C. Pages 433-506.
Sastry, A.N. 1976. Effects of constant and cyclic temperature regimes on thepelagic larval development of a brachyuran crab. Pages 81-87 in Esch, G.W.,and R.W. McFarlane, (eds.). Thermal Ecology II. ERDA Symp. Ser. 40.
Schiel, D.RI 1985. A short-term demographic study of Cystoseira osmundacea(Fucales: Cystoseiraceae) in central California. J. Phycol. 21:99-106.
Schmitt, R.J., and S.J. Holbrook. 1986. Seasonally fluctuating resources andtemporal variability of interspecific competition. Oecologia (Berl.). 69:1-11.
E8-316.0 5-9
Schmitz, K, and C.S. Lobban. 1976. A survey of translocation in Laminariales(Phaeophyceae). Mar. Biol. 36:207-216.
Scholm, H. 1966. Untersuchungen zur Waermeresistenz von Tiefenalgen. Bot.Mar. 9:54-61.
Slocum, C.J. 1980. Differential susceptibility to grazers of an intertidal alga:advantages of heteromorphic generations. Journ. of Exp. Mar. Biol. and Ecol.46:99-110.
Smith, G.M. 1969. Marine algae of Monterey Peninsula, California. 2nd ed.Incorporating the 1966 supplement by G.J. Hollenberg and I.A. Abbott.Stanford Univ. Press, Stanford, Calif. 752 pp.
Smith, R.I., and J.T. Carlton. 1975. Lights manual: intertidal invertebrates of thecentral California coast, 3rd ed. Univ. of Calif. Press, Berkeley. 716 pp.
Snedecor, G.W., and W.G. Cochran. 1980. Statistical methods. Iowa State Univ.Press.
Sommerville, D.C., and S.J. Krenn. 1983. Fisheries investigations at Diablo Canyon1982. Chapter XIV in Environmental investigations at Diablo Canyon, 1982.PG&E, Dept. Engr. Res.
Sparling, S.P. 1977. An annotated list of the marine algae (Chlorophyta,Phaeophyta, Rhodophyta) of San Luis Obispo County, California, with keys togenera and species. Blake Printery, San Luis Obispo, Calif.
SPSS Inc. 1988. SPSS-X Trends. SPSS Inc. Chicago, IL.
Stephan, J.A. 1978. Analysis of aerial photographs to determine the areal extent ofkelp beds near the Diablo Canyon Power Plant. In Environmentalinvestigations at Diablo Canyon 1975-1977, PG&E, Dept. Engr. Res. Vol. I.61 pp.
Stephens, J.S., Jr., and K.E. Zerba. 1981. Factors affecting fish diversity on atemperate reef. Env. Biol. Fish. 6:111-121.
Stephens, J.S., Jr., P.A. Morris, KE. Zerba, and M. Love. 1984. Factors affectingfish diversity on a temperate reef: the fish assemblage off Palos VerdesPoint, 1984-1981. Env. Biol. Fish. 11:259-275.
Stewart, J., E. DeMartini, and B. Myers. 1978. Plants and animals associated withPhyllospadix species in San Diego County. Final Rpt. to L.A. Dist. Corps ofEngineers.
Stewart, J., and B. Myers. 1980. Assemblages of algae and invertebrates insouthern California Phyllospadix-dominated intertidal habitats. Aquatic Bot.9:73-94.
Stewart-Oaten, A., W.W. Murdoch, and K.R. Parker. 1986. Environmental impactassessment: "pseudoreplication" in time. Ecology 67:929-940.
E8-316.0 5-10
Tu, S.W., J.P. Leighton, C.O. White, and C.C. Hsu. 1986. Buoyant jetcharacteristics of Diablo Canyon Power Plant - A field study of powerascension testing of Unit 2 and full load operation of Unit 1. PG&E, Dept.Engr. Res. Report No. 420-86.475.
Vadas, R.L., M. Keser, and P.C. Rusanowski. 1976. Influence of thermal loading onthe ecology of intertidal algae. In Esch, G.W., and R.W. MacFarlane (eds.),Thermal Ecology II. ERDA Symp. Ser. (CONF-750425) Augusta, Ga. Pages202-212.
Warrick, J.W. 1979. Analysis of subtidal water temperatures in the vicinity ofDiablo Cove. Chapter VI in Environmental investigations at Diablo Canyon,1975-1977. PG&E, Dept. Engr. Res.
West, J.A. 1972. The life history of Petrocelis franciscana. Br. Phycol. J. 7:299-308.
White, C.O. 1983. Oceanographic studies, 1982, Diablo Canyon Power Plant.Chapter I in Environmental investigations at Diablo Canyon, 1982. PG&E,Dept. Engr. Res.
White, C.O. 1985. Summarization of wave data measured offshore of DiabloCanyon. Chapter III in Environmental investigations at Diablo Canyon,1984. Vol. II, Oceanographic and environ. engr. studies. PG&E, Dept. Engr.Res.
Widdowson, T.B. 1972. Growth rate inEgregia as a measure of pollution. Pages268-272 in Proc. Seventh Intl. Seaweed Symp., Wiley Interscience, NewYork.
Wilson, T.C. 1978. The effeci, of chlorine residuals on the blue rockfish (Sebastesmystinus), the rock prickleback (Xiphister mucosus), and the copepod(Calanuspacificus). Chapter VI in Environmental investigations at DiabloCanyon, 1975-1977, Vol. II. PG&E, Dept. Engr. Res.
Wingert, R.C. 1974. Comparative reproductive cycles and growth histories of twospecies of Xiphister (Pisces: Stichaeidae), from San Simeon, California. M.A.Thesis, Calif. State Univ., Fullerton. 91 pp.
Wourms, J.P., and D. Evans. 1974. The annual reproductive cycle of the blackprickleback, Xiphister atropurpureus, a Pacific coast blennioid fish. Can. J.Zool. 52:795-802.
Young, J.S., and J.D. DeMartini. 1970. The reproductive cycle, gonadal histology,and gametogenesis of the red abalone, Haliotis rufescens (Swainson). Calif.Dept. Fish Game 56:298-309.
E8-316.0 5-11

THERMAL EFFECTS MONITORING PROGRAMEVALUATION OF NPDES PERMIT TEMPERATURE LIMITS
Summary
This report addresses Provision D.4.a of the Diablo Canyon Power Plant (DCPP)National Pollutant Discharge Elimination System (N-PDES) permit CA0003571Order No. 85-101, which requires PG&E to "Submit the results of thermal studiesevaluating whether the temperature limits in the permit can be made morestringent without interfering with prudent operating practices of the industry." Theexisting NPDES permit, adopted by the State of California, Regional Water QualityControl Board, Central Coast Region (CCRWQCB), on July 12,1985 contains thefollowing temperature effluent limits for Discharge 001:
B.1.f. The daily average discharge temperature shall not exceed the daily averageof the natural temperature of the intake water by more than 22 0F (12.20 C),except during heat treatment for demusseling.
B.1.g. During heat treatment for demusseling the daily average dischargetemperature shall not exceed the daily average of the natural temperature ofthe intake water by more than 25OF (13.90C), and the maximum temperatureincrease (delta T) measured at the point of discharge of the unit being treatedshall be less than 50°F (27.80 C) over that of the intake. The duration of themaximum temperature during heat treatment of any half-condenser shall notexceed one hour during any 24 hour period.
A summary of the daily average delta T values (Figure 1), previously reported to theCCRWQCB on the monthly Q2 forms, shows that the existing limits have not beenexceeded since permit adoption on July 12, 1985, although considerable variabilityin the temperature data is evident. Figure 1 provides an indication of the trend ofthe normal operation daily average delta T over time. It is possible, however, thatthe average delta T may increase slightly in the future, perhaps by a half of adegree, as condenser tube plugging and circulating water system pump wear occur.
Discharge temperatures have remained within permit limits under heat treatmentconditions. To date, there have been a total often heat treatments, seven performedon the Unit 1 condenser and three performed on the Unit 2 condenser. There havealso been two refueling outages, one Unit 1 and one Unit 2 outage. Unit 1 iscurrently in its second refueling outage. The daily average delta T values during the10 heat treatments of record have not exceeded the normal operating condition dailyaverage delta T limit (221F). Although the worst case heat treatment conditionshave not been experienced by the plant, it is anticipated that even under suchconditions the temperature spikes will be transient and the daily average delta Tvalues will not exceed the 250F permit limit.
The results of the Thermal Effects Monitoring Program (TEMP), submitted with thisdocument, show that the beneficial uses of the receiving water have been protected
E8-316.0 I
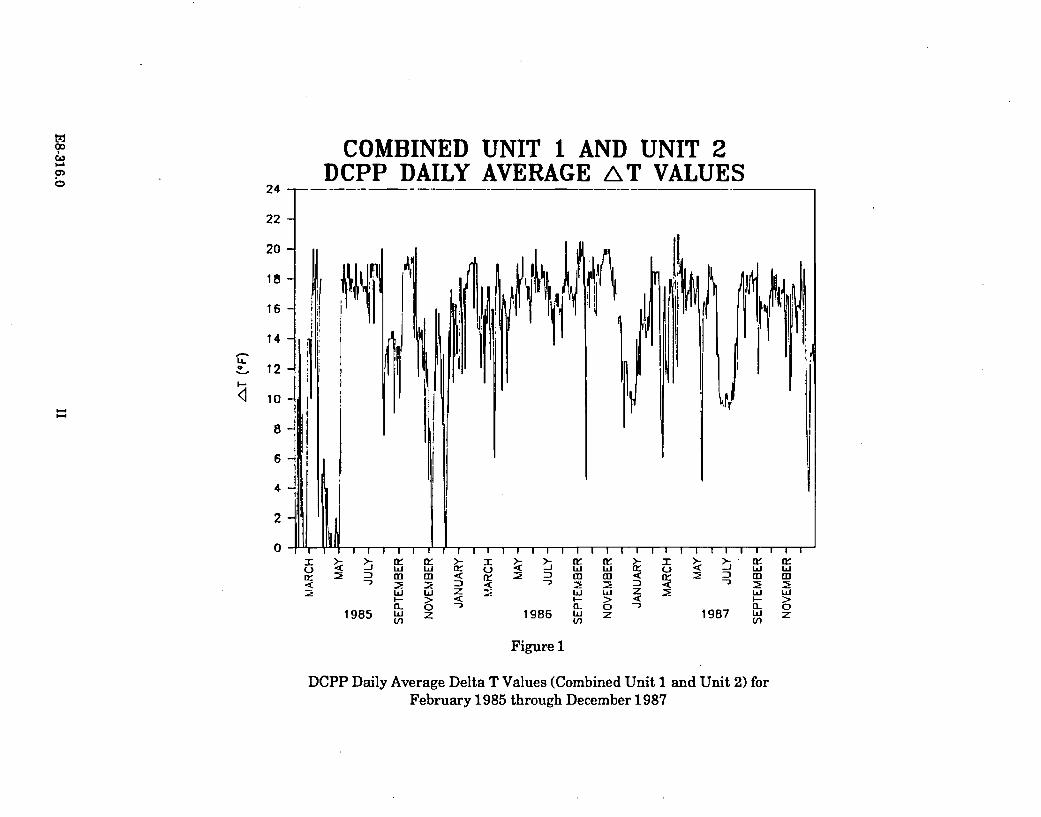
90
I.-
0 24
22
20
18
16
14
LL12
10
8
6
4
2
0
COMBINED UNIT 1 AND UNIT 2DCPP DAILY AVERAGE AT VALUES
[0 M - 4 :2 2
I-> 4 -> 4->n 0o -,0 0 -, n 0
1985 z 1986 I z 1987 w z
Figure 1
DCPP Daily Average Delta T Values (Combined Unit 1 and Unit 2) forFebruary 1985 through December 1987

with the existing discharge. PG&E believes that the existing permit limits arereasonable and necessary, and that the beneficial uses in the vicinity of thedischarge have been and will continue to be protected with these limits in effect.
E8-316.0 III
TABLE OF CONTENTS
SECTION PAGE
SUM M ARY ............................................................................................... I
TABLE OF CONTENTS ........................................................................ IV
LIST OF FIGURES .................................................................................... V
1.0 DIABLO CANYON POWER PLANT OPERATION ............................ VI
1.1 1987 Generation Data ............................................................................. VI
1.2 Temperature ............................................................................................... VII
1.2.1 Normal Operation ...................................................................... X
1.2.2 Heat Treatment ........................................................................... XIII
2.0 SAN ONOFRE 1986 OPERATING DATA ............................................... XX
3.0 SUM MARY AND CONCLUSIONS ....................................................... XIV
E8-316.0 IV
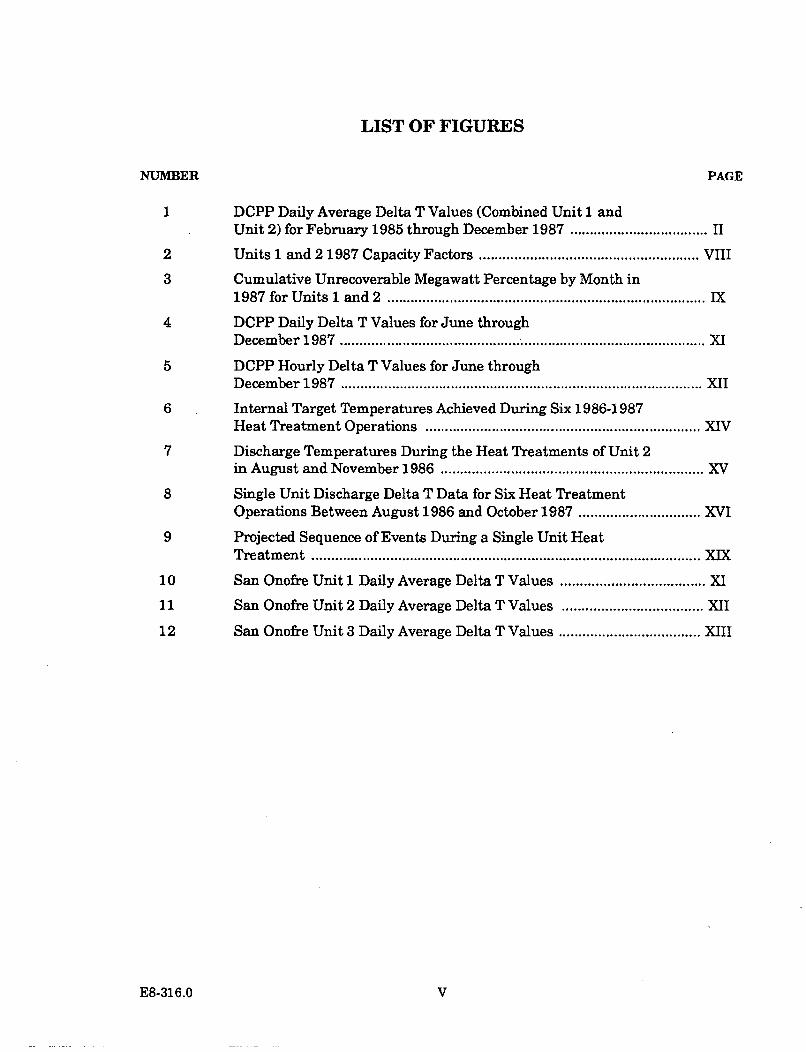
LIST OF FIGURES
NUMBER PAGE
1 DCPP Daily Average Delta T Values (Combined Unit 1 andUnit 2) for February 1985 through December 1987 ............................... II
2 Units 1 and 2 1987 Capacity Factors ........................................................ VIII
3 Cumulative Unrecoverable Megawatt Percentage by Month in1987 for U nits I and 2 ................................................................................. IX
4 DCPP Daily Delta T Values for June throughD ecem ber 1987 ......................................................................................... XI
5 DCPP Hourly Delta T Values for June throughD ecem ber 1987 ............................................................................................ X II
6 Internal Target Temperatures Achieved During Six 1986-1987Heat Treatm ent Operations ...................................................................... XIV
7 Discharge Temperatures During the Heat Treatments of Unit 2in August and November 1986 ............................................................... XV
8 Single Unit Discharge Delta T Data for Six Heat TreatmentOperations Between August 1986 and October 1987 ............................... XVI
9 Projected Sequence of Events During a Single Unit HeatTreatm ent ................................................................................................... X IX
10 San Onofre Unit 1 Daily Average Delta T Values ................................. XI
11 San Onofre Unit 2 Daily Average Delta T Values .................................... XII
12 San Onofre Unit 3 Daily Average Delta T Values .................................... XIII
E8-316.0 V
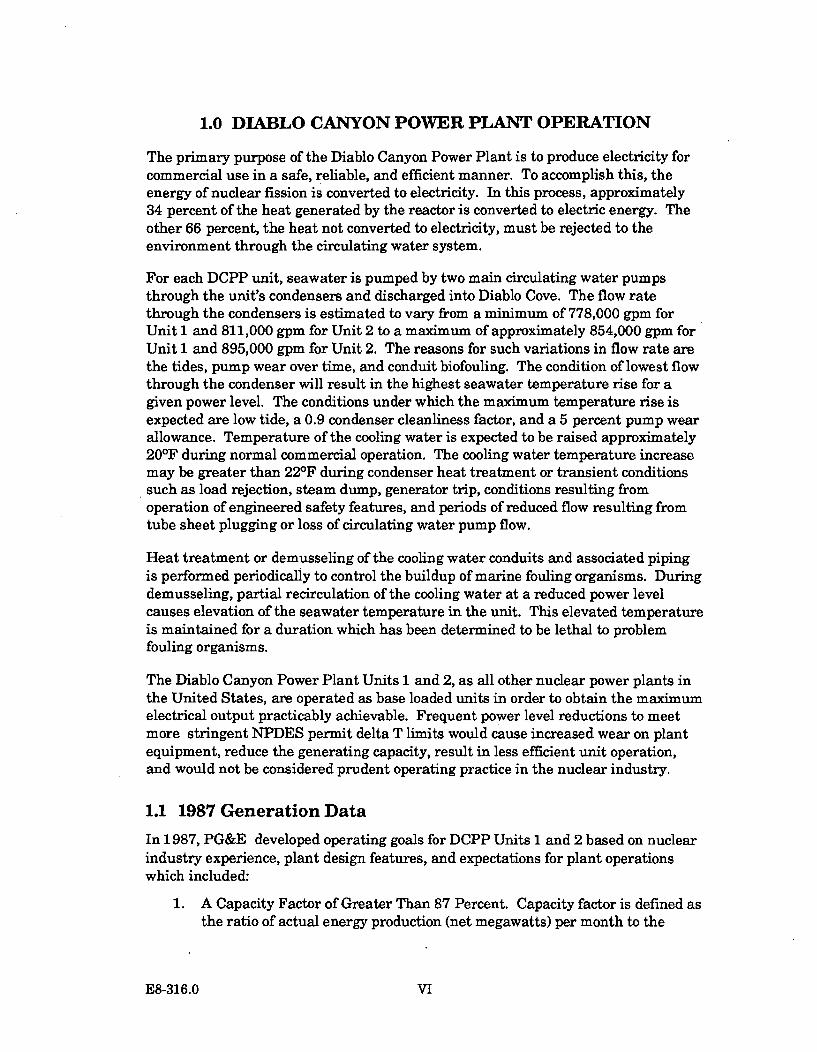
1.0 DIABLO CANYON POWER PLANT OPERATION
The primary purpose of the Diablo Canyon Power Plant is to produce electricity forcommercial use in a safe, reliable, and efficient manner. To accomplish this, theenergy of nuclear fission is converted to electricity. In this process, approximately34 percent of the heat generated by the reactor is converted to electric energy. Theother 66 percent, the heat not converted to electricity, must be rejected to theenvironment through the circulating water system.
For each DCPP unit, seawater is pumped by two main circulating water pumpsthrough the unit's condensers and discharged into Diablo Cove. The flow ratethrough the condensers is estimated to vary from a minimum of 778,000 gpm forUnit 1 and 811,000 gpm for Unit 2 to a maximum of approximately 854,000 gpm forUnit 1 and 895,000 gpm for Unit 2. The reasons for such variations in flow rate arethe tides, pump wear over time, and conduit biofouling. The condition of lowest flowthrough the condenser will result in the highest seawater temperature rise for agiven power level. The conditions under which the maximum temperature rise isexpected are low tide, a 0.9 condenser cleanliness factor, and a 5 percent pump wearallowance. Temperature of the cooling water is expected to be raised approximately20°F during normal commercial operation. The cooling water temperature increasemay be greater than 22 0F during condenser heat treatment or transient conditionssuch as load rejection, steam dump, generator trip, conditions resulting fromoperation of engineered safety features, and periods of reduced flow resulting fromtube sheet plugging or loss of circulating water pump flow.
Heat treatment or demusseling of the cooling water conduits and associated pipingis performed periodically to control the buildup of marine fouling organisms. Duringdemusseling, partial recirculation of the cooling water at a reduced power levelcauses elevation of the seawater temperature in the unit. This elevated temperatureis maintained for a duration which has been determined to be lethal to problemfouling organisms.
The Diablo Canyon Power Plant Units 1 and 2, as all other nuclear power plants inthe United States, are operated as base loaded units in order to obtain the maximumelectrical output practicably achievable. Frequent power level reductions to meetmore stringent NPDES permit delta T limits would cause increased wear on plantequipment, reduce the generating capacity, result in less efficient unit operation,and would not be considered prudent operating practice in the nuclear industry.
1.1 1987 Generation Data
In 1987, PG&E developed operating goals for DCPP Units 1 and 2 based on nuclearindustry experience, plant design features, and expectations for plant operationswhich included:
1. A Capacity Factor of Greater Than 87 Percent. Capacity factor is defined asthe ratio of actual energy production (net megawatts) per month to the
E8-316.0 VI
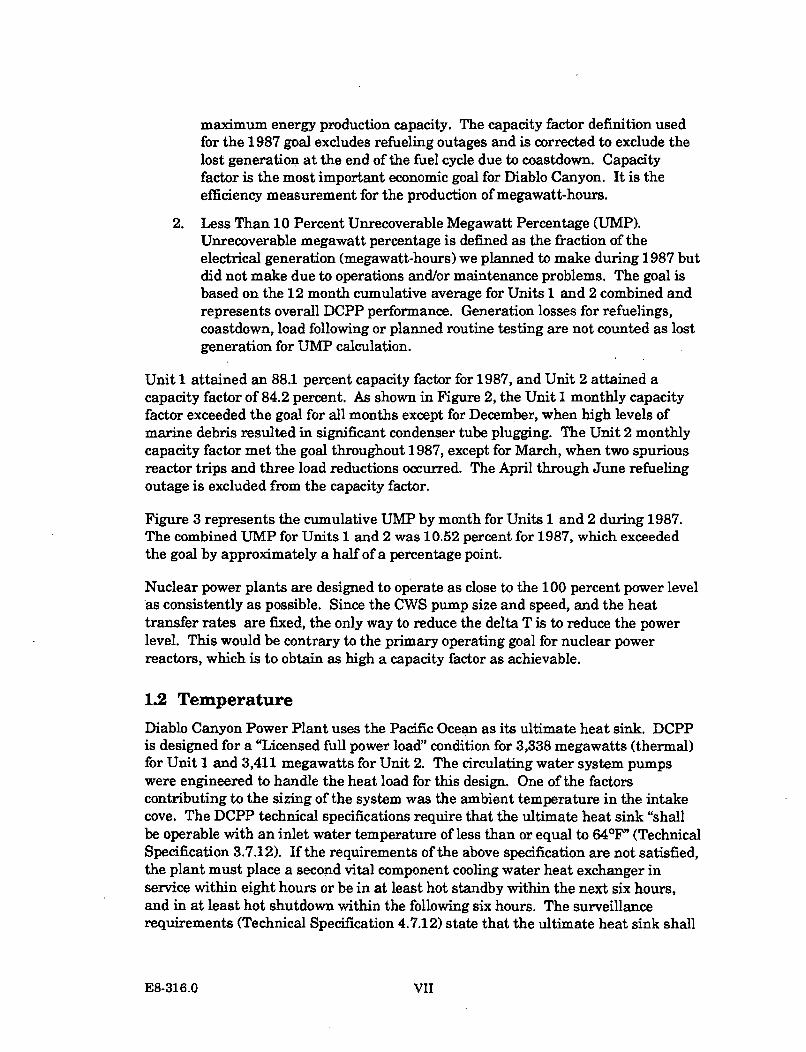
maximum energy production capacity. The capacity factor definition usedfor the 1987 goal excludes refueling outages and is corrected to exclude thelost generation at the end of the fuel cycle due to coastdown. Capacityfactor is the most important economic goal for Diablo Canyon. It is theefficiency measurement for the production of megawatt-hours.
2. Less Than 10 Percent Unrecoverable Megawatt Percentage (UMP).Unrecoverable megawatt percentage is defined as the fraction of theelectrical generation (megawatt-hours) we planned to make during 1987 butdid not make due to operations and/or maintenance problems. The goal isbased on the 12 month cumulative average for Units 1 and 2 combined andrepresents overall DCPP performance. Generation losses for refuelings,coastdown, load following or planned routine testing are not counted as lostgeneration for UMP calculation.
Unit 1 attained an 88.1 percent capacity factor for 1987, and Unit 2 attained acapacity factor of 84.2 percent. As shown in Figure 2, the Unit 1 monthly capacityfactor exceeded the goal for all months except for December, when high levels ofmarine debris resulted in significant condenser tube plugging. The Unit 2 monthlycapacity factor met the goal throughout 1987, except for March, when two spuriousreactor trips and three load reductions occurred. The April through June refuelingoutage is excluded from the capacity factor.
Figure 3 represents the cumulative UMP by month for Units 1 and 2 during 1987.The combined UMP for Units 1 and 2 was 10.52 percent for 1987, which exceededthe goal by approximately a half of a percentage point.
Nuclear power plants are designed to operate as close to the 100 percent power levelas consistently as possible. Since the CWS pump size and speed, and the heattransfer rates are fixed, the only way to reduce the delta T is to reduce the powerlevel. This would be contrary to the primary operating goal for nuclear powerreactors, which is to obtain as high a capacity factor as achievable.
1.2 Temperature
Diablo Canyon Power Plant uses the Pacific Ocean as its ultimate heat sink. DCPPis designed for a "Licensed full power load" condition for 3,338 megawatts (thermal)for Unit 1 and 3,411 megawatts for Unit 2. The circulating water system pumpswere engineered to handle the heat load for this design. One of the factorscontributing to the sizing of the system was the ambient temperature in the intakecove. The DCPP technical specifications require that the ultimate heat sink "shallbe operable with an inlet water temperature of less than or equal to 641F' (TechnicalSpecification 3.7.12). If the requirements of the above specification are not satisfied,the plant must place a second vital component cooling water heat exchanger inservice within eight hours or be in at least hot standby within the next six hours,and in at least hot shutdown within the following six hours. The surveillancerequirements (Technical Specification 4.7.12) state that the ultimate heat sink shall
E8-316.0 VII
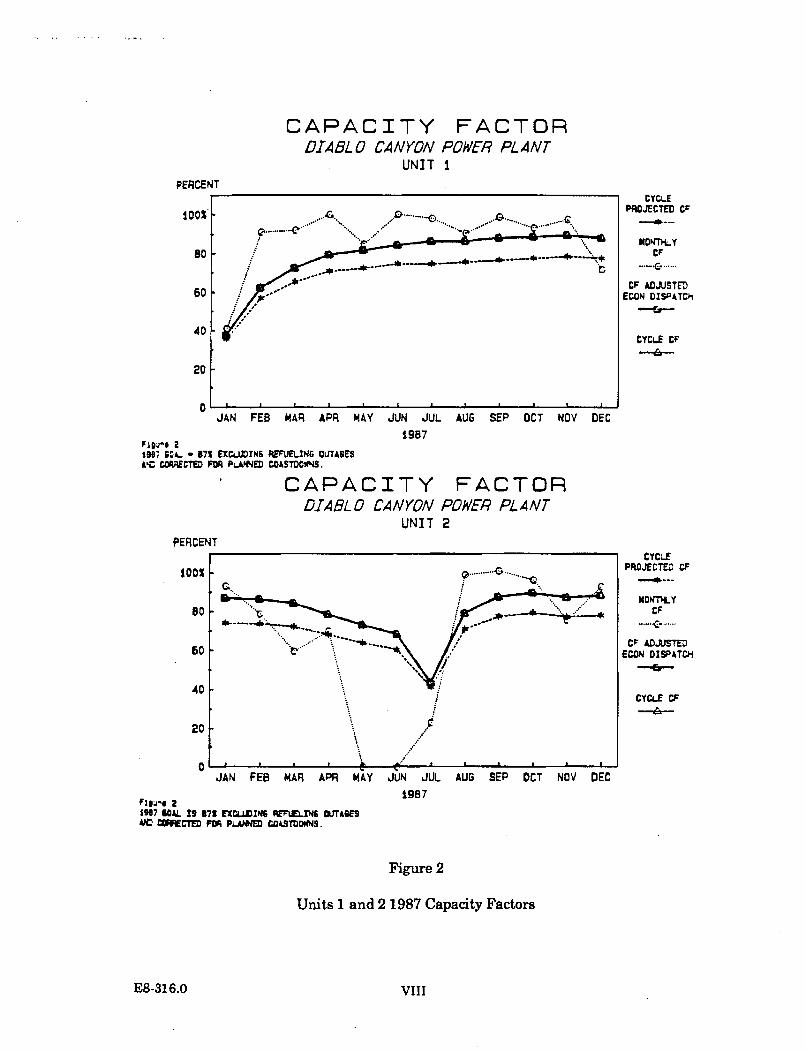
CAPACITY FACTORDIABLO CANYON POWER PLANT
UNIT I
PERCENT
100x%
s0 I
CYCLEPROJECTED CF
CF
CF ADJUSTEDECON DISPATCh
CYCLE CF
60 F
40 -
20 I
0JAN FEB MAR APR MAY JUN JUL
1987
AUG SEP OCT NOV DEC
P194"t 2190;, 6A.4- - 071 EXCLI.VINSAC CVWRCTED FOR Pi..AWMW
REFrUELING OUTAGESCOASTDOWNS.
CAPACITYDIABL 0 CANYON
UNIT
FACTORPOWER PLANT2
PERCENT
100%
s0 F
CYCLEPROJECTED CF
MDWTýLYCF
Cr ADJUSTEDEWN DISPATCH
CYCLE CF
60 1
40 ý
20 -
0JAN FEB MAR APR NAY JUN JUL AUG SEP OCT NOV DEC
1987
19o~~e67A SO9 8 71 EXCLUDIN6 RIEF).EL.NS OffAWSA~C CWNCTE FMR P"MEZD CWATDOWNS.
Figure 2
Units 1 and 2 1987 Capacity Factors
E8-316.0 VIlI
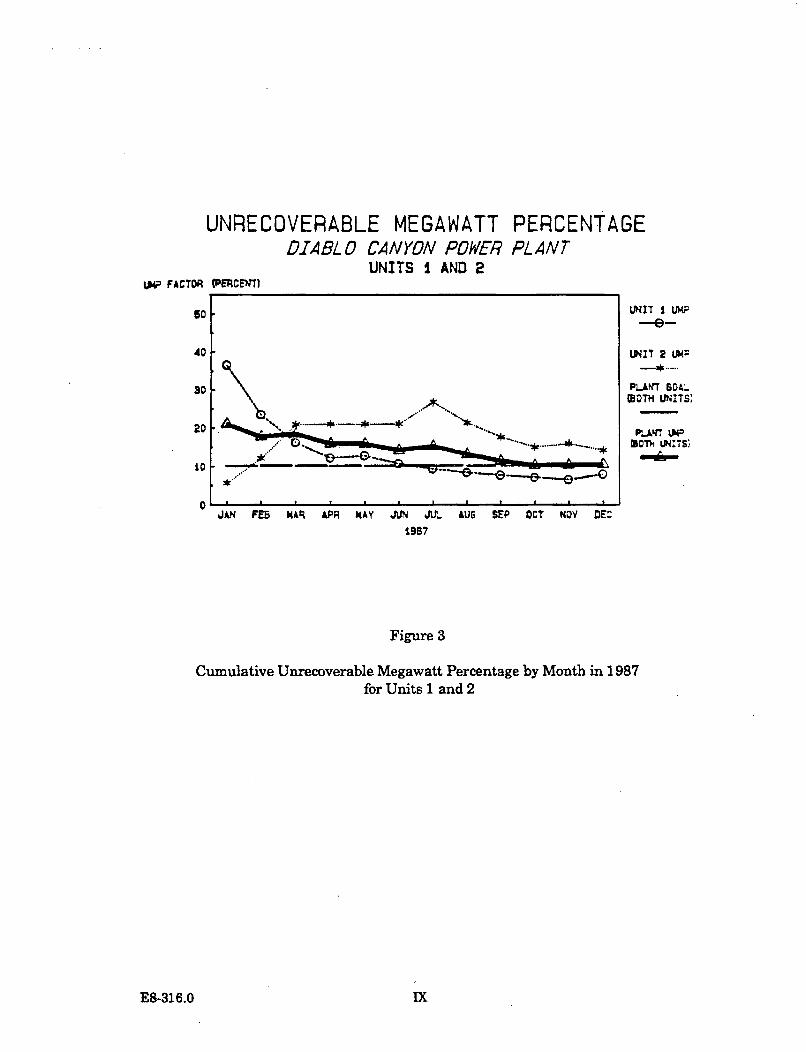
UNRECOVERABLE MEGAWATT PERCENTAGEDIABLO CANYON POWER PLANT
UNITS i AND 2UMP FACTOR (PERCEWT)
50
40 i
UNIrT I VU47
UN~IT 2 LU4-
PLANT GDAL
PWAm LWX5
MMr~ LN:Ts
30
20
to
0JAN FEB MAR APR MAY JON JXL AUG SEP OCT NOV DEC
1957
Figure 3
Cumulative Unrecoverable Megawatt Percentage by Month in 1987for Units 1 and 2
E8-316.0 ix
be determined operable by verifying the inlet water temperature to be within itslimit:
a. At least once per 24 hours when the inlet temperature is equal to or lessthan 600F, or
b. At least once per 12 hours when the inlet water temperature is greater than60"F but less than 62 0F, or
c. At least once per 2 hours when the inlet water temperature is equal to orgreater than 62°F but less than or equal to 640F.
In addition to the technical specifications, which limit operation at certain ambienttemperature conditions, PG&E has taken steps to assure that the permit delta Tlimits are not exceeded. The DCPP control room contains an annunciator window(Circulating Water Hi Delta T Discharge/Intake) which sounds an alarm in thecontrol room if the discharge/intake delta T exceeds the setpoint (currently 201F).The required operator actions are:
1. Verify the validity of the alarm;
2. Reduce load to bring the delta-T to below 20°F; and
3. Log the length of time the alarm is in, and the cause. Report this problemto the Chemistry Department by means of an Action Request.
This procedure is being revised so that the alarm set point will be 220F. Newequipment for monitoring the temperature will allow operations personnel todetermine the average daily cumulative delta T on a real time basis.
L2.1 Normal Operation
During normal operation, defined as all operating conditions except heat treatment,PG&E has not exceeded the existing permit limits as established in the permitadopted on July 12,1985. As can be seen from Figure 1, the combined daily averagetwo unit discharge delta T was generally in the range of 12-20OF for the time periodof February, 1985, through December, 1987. Even during normal operation, largechanges in the daily average delta T values are observed. The daily average delta Tvalues for 1987 (Figure 4) show that this variation occurs in both units, often intandem. The amount of variation is much more evident in the hourly delta T valuesof the two units for the same period (Figure 5). This period was used because itconsists of two unit operation and because it covers the time of the year with thehighest ambient temperatures, and is therefore expected to represent a worst casesituation in terms of delta T data. These figures indicate that dramatic temperaturevariations can occur over short periods of time and that daily average temperaturescould be substantially higher than those seen to date, although these highertemperatures would be transient in nature.
E8-316.0 X
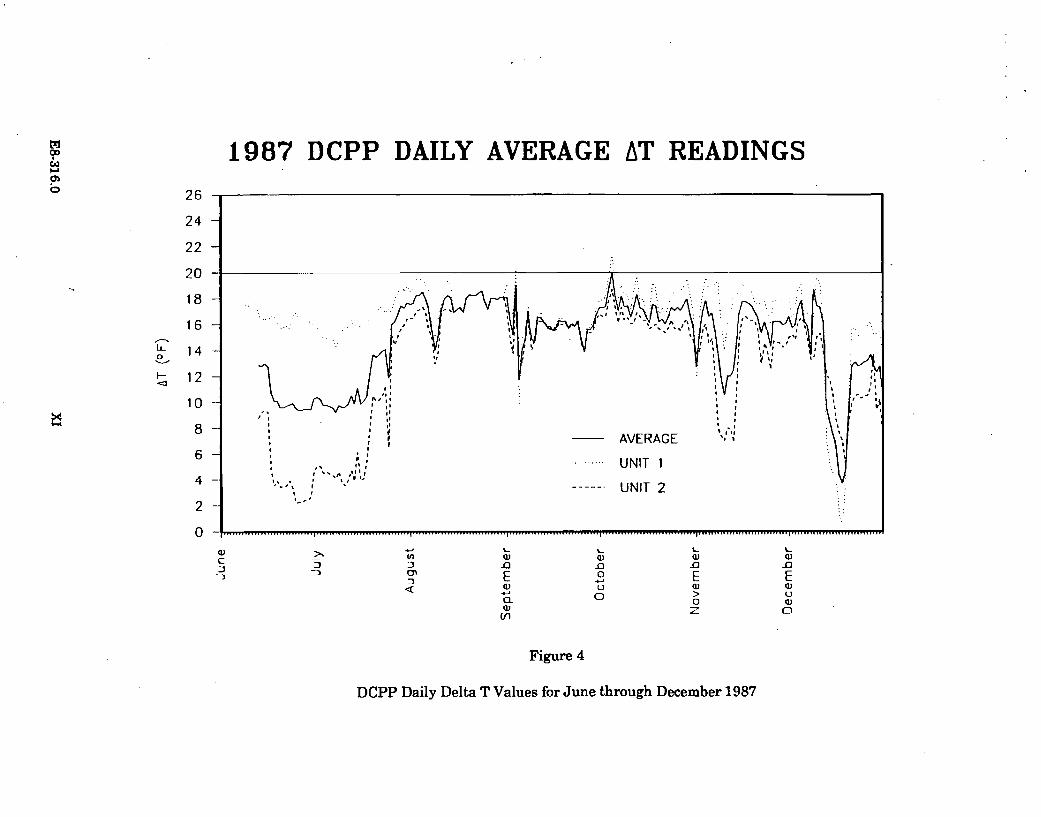
T1987 DCPP DAILY AVERAGE AT READINGSCA3
o 26
24 -
22 -
20 - _ _ _ _
16
, 14
12
10 i
AVERAGEI 9
...... UNIT 14 ------- UNIT 2
00
E E EUa) a)
> UC0 )
Figure 4
DCPP Daily Delta T Values for June through December 1987
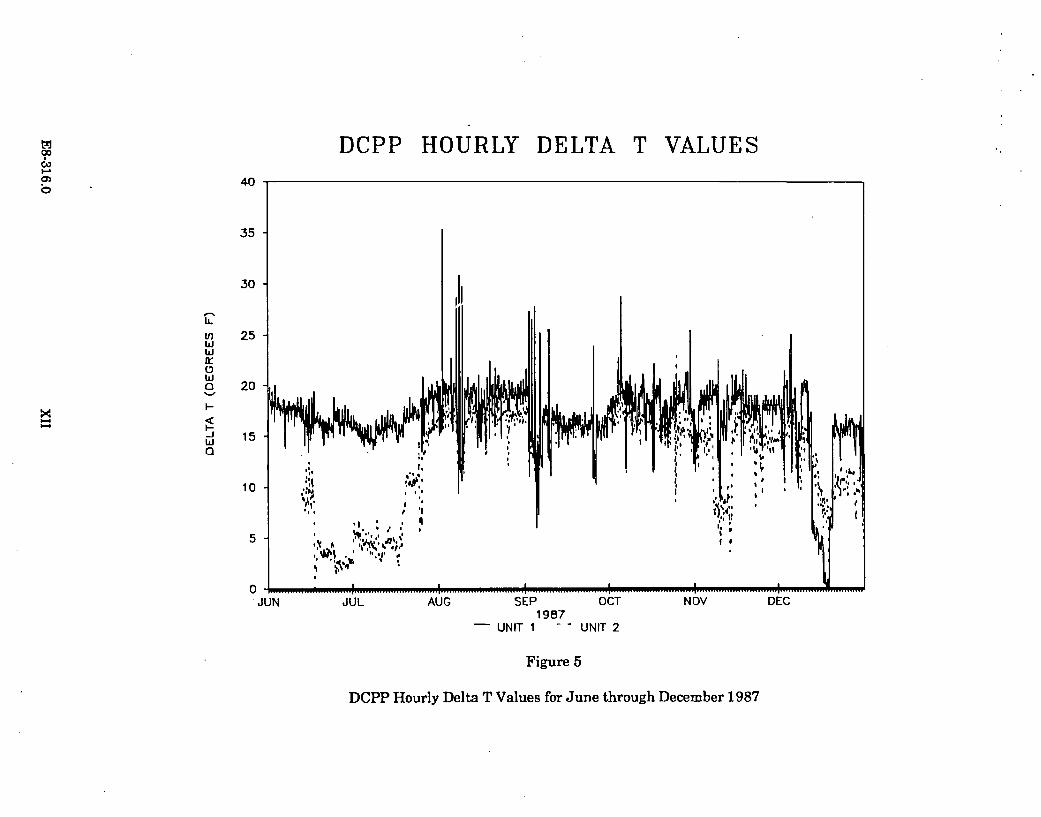
ti
I-
DCPP HOURLY DELTA T VALUES40
35
30
25
20
15
LL
wwL
a:
x-4
10
5
0JUN JUL AUG SEP OCT NOV DEC
1987UNIT 1 -- UNIT 2
Figure 5
DCPP Hourly Delta T Values for June through December 1987
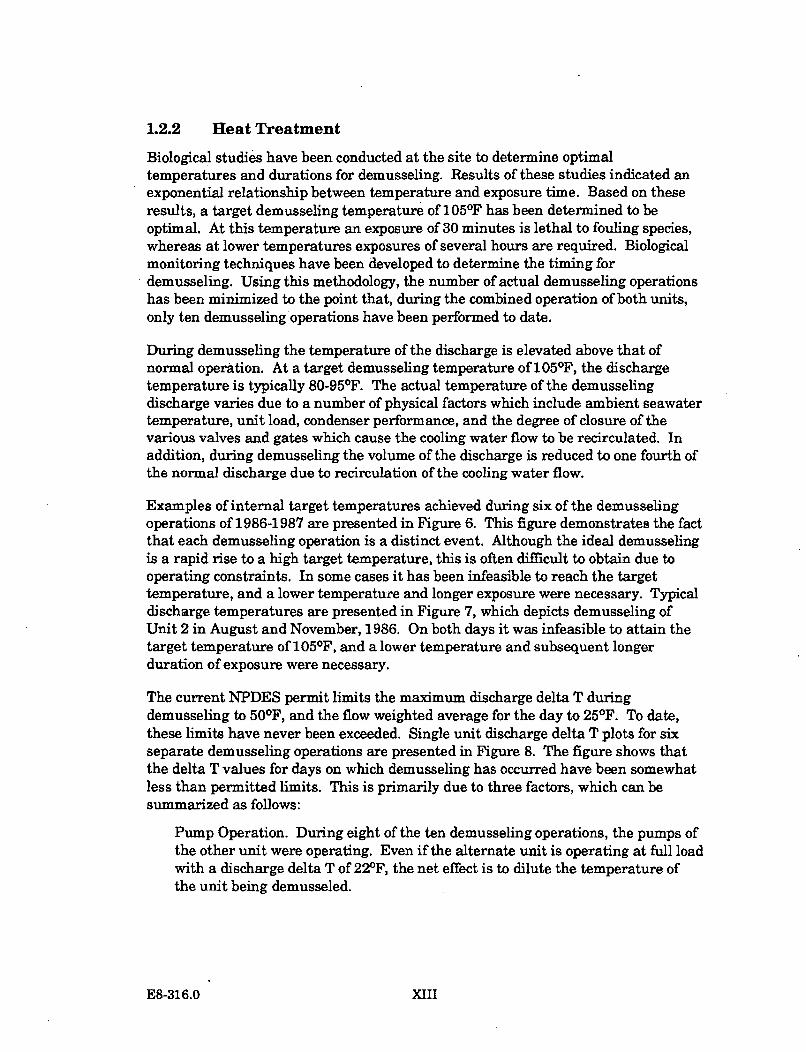
1.2.2 Heat Treatment
Biological studies have been conducted at the site to determine optimaltemperatures and durations for demusseling. Results of these studies indicated anexponential relationship between temperature and exposure time. Based on theseresults, a target demusseling temperature of 105°F has been determined to beoptimal. At this temperature an exposure of 30 minutes is lethal to fouling species,whereas at lower temperatures exposures of several hours are required. Biologicalmonitoring techniques have been developed to determine the timing fordemusseling. Using this methodology, the number of actual demusseling operationshas been minimized to the point that, during the combined operation of both units,only ten demusseling operations have been performed to date.
During demusseling the temperature of the discharge is elevated above that ofnormal operation. At a target demusseling temperature of 1050F, the dischargetemperature is typically 80-95°F. The actual temperature of the demusselingdischarge varies due to a number of physical factors which include ambient seawatertemperature, unit load, condenser performance, and the degree of closure of thevarious valves and gates which cause the cooling water flow to be recirculated. Inaddition, during demusseling the volume of the discharge is reduced to one fourth ofthe normal discharge due to recirculation of the cooling water flow.
Examples of internal target temperatures achieved during six of the demusselingoperations of 1986-1987 are presented in Figure 6. This figure demonstrates the factthat each demusseling operation is a distinct event. Although the ideal demusselingis a rapid rise to a high target temperature, this is often difficult to obtain due tooperating constraints. In some cases it has been infeasible to reach the targettemperature, and a lower temperature and longer exposure were necessary. Typicaldischarge temperatures are presented in Figure 7, which depicts demusseling ofUnit 2 in August and November, 1986. On both days it was infeasible to attain thetarget temperature of 1050F, and a lower temperature and subsequent longerduration of exposure were necessary.
The current NPDES permit limits the maximum discharge delta T duringdemusseling to 50 0F, and the flow weighted average for the day to 250F. To date,these limits have never been exceeded. Single unit discharge delta T plots for sixseparate demusseling operations are presented in Figure 8. The figure shows thatthe delta T values for days on which demusseling has occurred have been somewhatless than permitted limits. This is primarily due to three factors, which can besummarized as follows:
Pump Operation. During eight of the ten demusseling operations, the pumps ofthe other unit were operating. Even if the alternate unit is operating at full loadwith a discharge delta T of 221F, the net effect is to dilute the temperature ofthe unit being demusseled.
E8-316.0 XIII
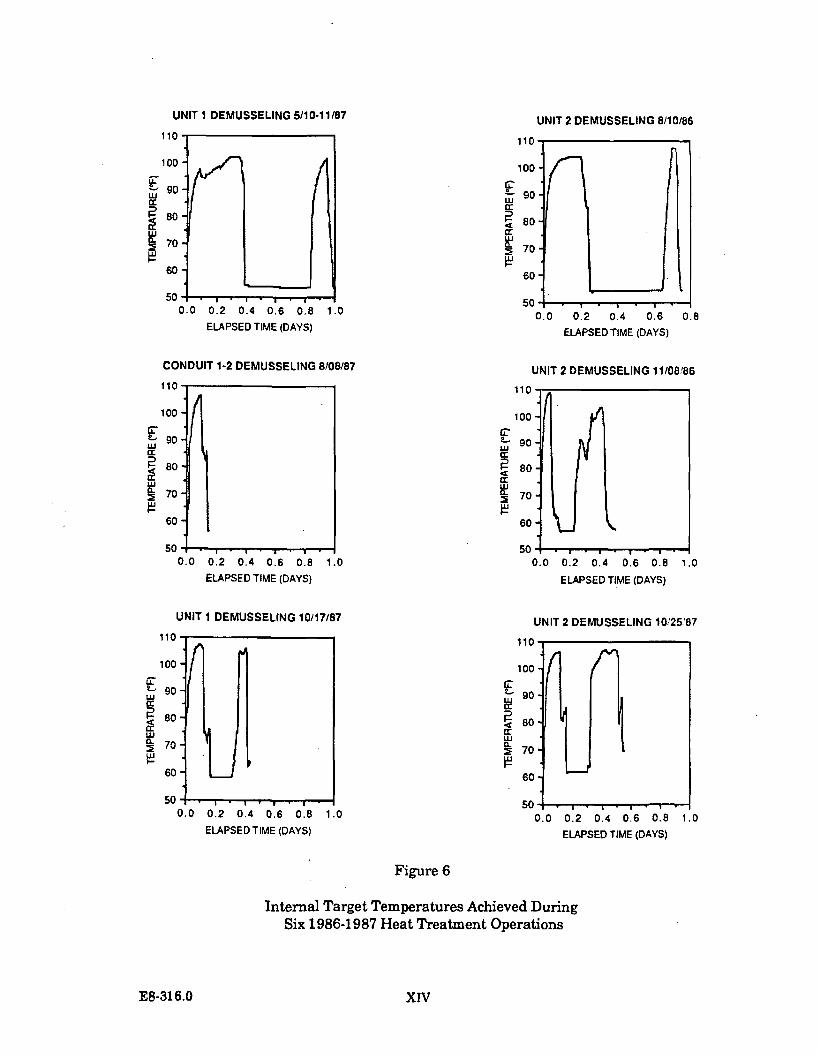
UNIT 1 DEMUSSELING 5/10-11/87
110
100-
90
80-
500.0 0 2 0.4 0.6 0.8 1.0
ELAPSED TIME (DAYS)
CONDUIT 1-2 DEMUSSELING 8/08/87
UNIT 2 DEMUSSELING 8/10/86
110
S90
4• 80a:
• 70
60"
50 ,0.0 0.2 0.4 0.6 0.8
ELAPSED TIME (DAYS)
UNIT 2 DEMUSSELING 11/08/86
110
100
90
80
2 70
110
F
a:Cc
60
50 I V I0.0 0.2 0.4 0.6 0.8 1.0
ELAPSED TIME (DAYS)
UNIT I DEMUSSELING 10/17/87
0.0 0.2 0.4 0.6 0.8 1.0
ELAPSED TIME (DAYS)
UNIT 2 DEMUSSELING 10,25'87
110
100
S90
<R 80
a- 70
60
50
110.
100
g 9o
80
70-
60
so.0.0 0.2 0.4 0.6 0.8 1.0
ELAPSED TIME (DAYS)0.0 0.2 0.4 0.6 0.8 1.0
ELAPSED TIME (DAYS)
Figure 6
Internal Target Temperatures Achieved DuringSix 1986-1987 Heat Treatment Operations
E8-316.0 XIV
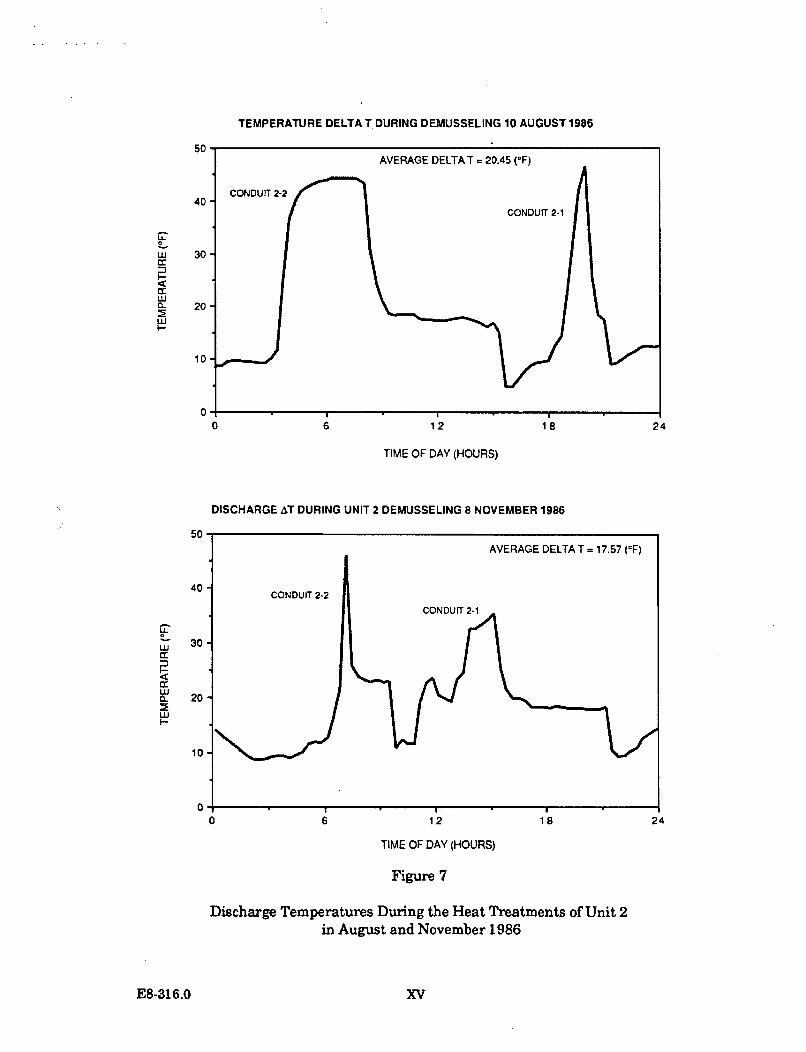
TEMPERATURE DELTA T DURING DEMUSSELING 10 AUGUST 1986
LU
LU
50
40
30
20
10
00 6 12 18 24
TIME OF DAY (HOURS)
DISCHARGE AT DURING UNIT 2 DEMUSSELING 8 NOVEMBER 1986
LU
I-
w0~
LUI-
0 6 12 18
TIME OF DAY (HOURS)
Figure 7
Discharge Temperatures During the Heat Treatments of Unit 2in August and November 1986
24
E8-316.0 xv
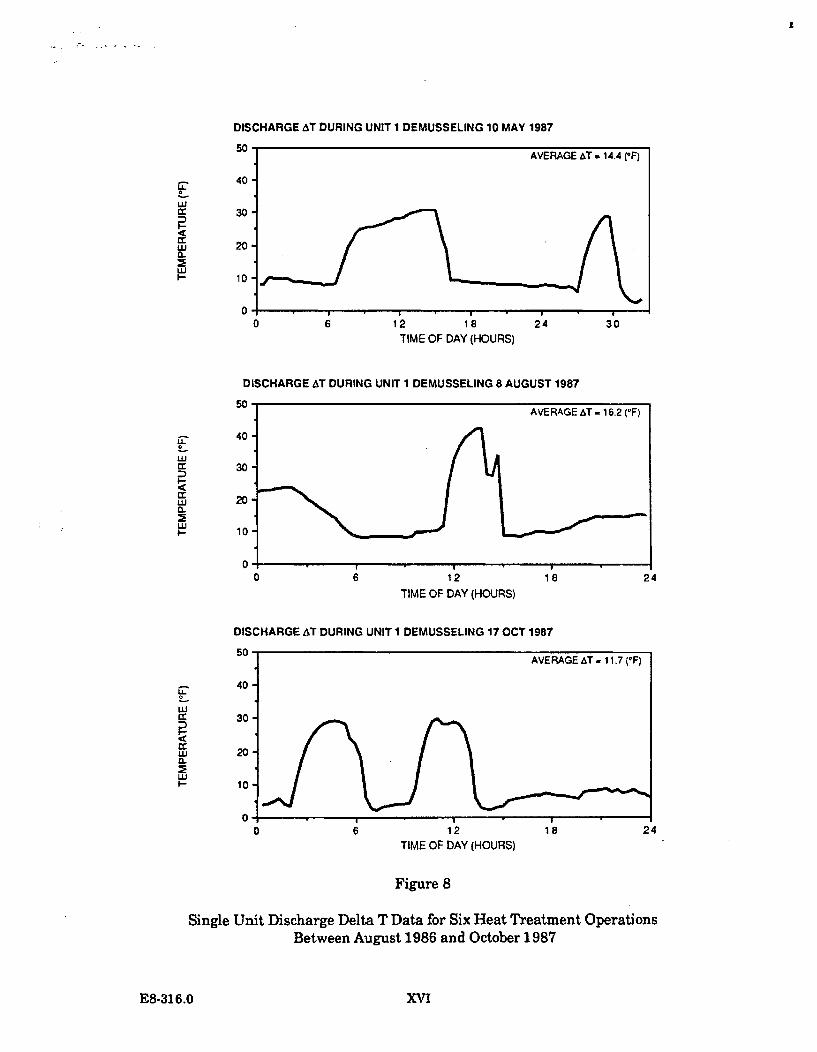
DISCHARGE AT DURING UNIT 1 DEMUSSELING 10 MAY 1987
LU
w
UJa-I-
50
40
30
20
10
AVERAGE AT - 14.4 (-F)
0a 6 12 18 24 30
TIME OF DAY (HOURS)
DISCHARGE AT DURING UNIT 1 DEMUSSELING 8 AUGUST 1987
wj
cc
U-Cw
50
40
30
20
10
0
TIME OF DAY (HOURS)
DISCHARGE AT DURING UNIT I DEMUSSELING 17 OCT 1987
U-a..a-
TIME OF DAY (HOURS)
Figure 8
Single Unit Discharge Delta T Data for Six Heat Treatment OperationsBetween August 1986 and October 1987
E8-316.0 XVI
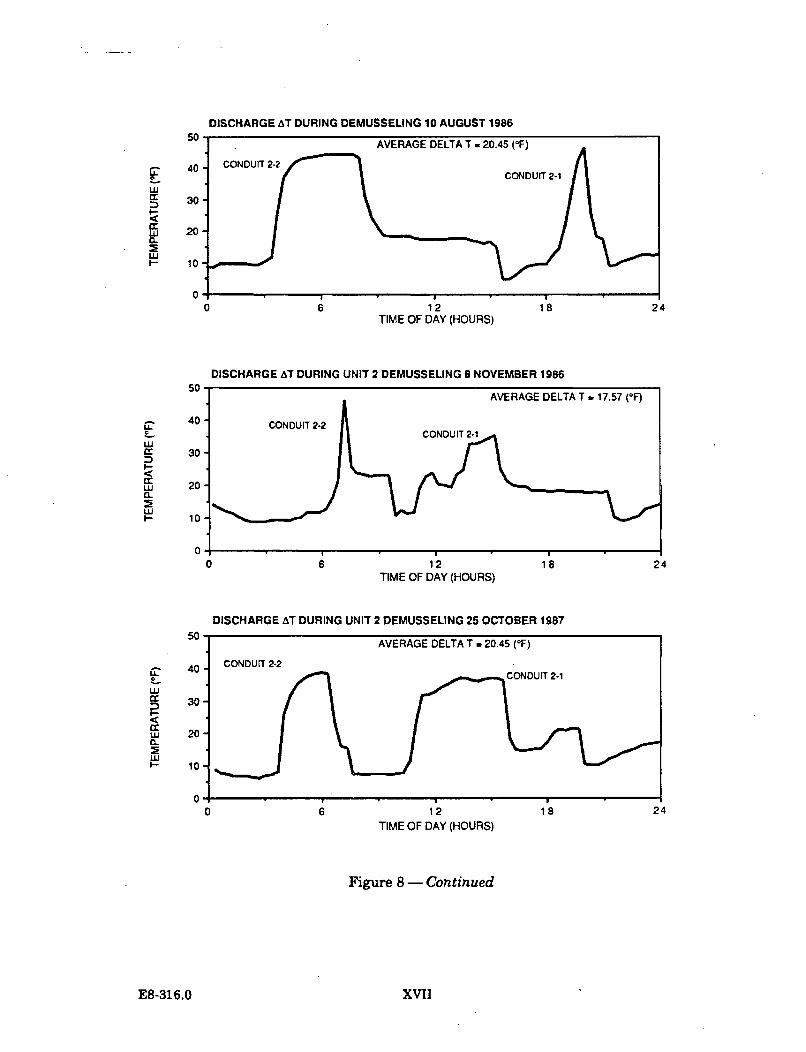
0.wU
I-
wU
9-
wr
0.CL
50
40
30
20
10
0
DISCHARGE AT DURING DEMUSSELING 10 AUGUST 1986
AVERAGE DELTA T - 20.45 (°F)
CONDUIT 2-2CI / r i CONDUIT 2-1
DISCHARGE AT DURING UNIT 2 DEMUSSELING 8 NOVEMBER 1986
0 6 12 18TIME OF DAY (HOURS)
DISCHARGE AT DURING UNIT 2 DEMUSSELING 25 OCTOBER 1987
24
12TIME OF DAY (HOURS)
Figure 8 - Continued
E8-316.0 XVII
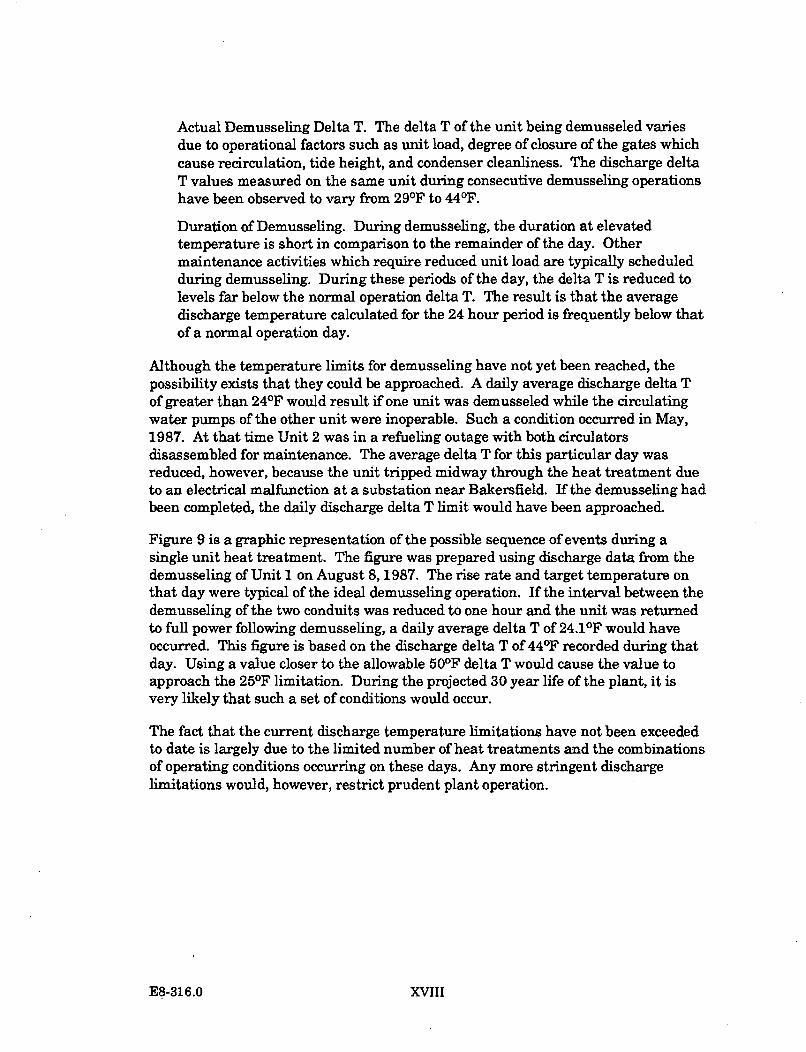
Actual Demusseling Delta T. The delta T of the unit being demusseled variesdue to operational factors such as unit load, degree of closure of the gates whichcause recirculation, tide height, and condenser cleanliness. The discharge deltaT values measured on the same unit during consecutive demusseling operationshave been observed to vary from 29 0F to 440F.
Duration of Demusseling. During demusseling, the duration at elevatedtemperature is short in comparison to the remainder of the day. Othermaintenance activities which require reduced unit load are typically scheduledduring demusseling. During these periods of the day, the delta T is reduced tolevels far below the normal operation delta T. The result is that the averagedischarge temperature calculated for the 24 hour period is frequently below thatof a normal operation day.
Although the temperature limits for demusseling have not yet been reached, thepossibility exists that they could be approached. A daily average discharge delta Tof greater than 24°F would result if one unit was demusseled while the circulatingwater pumps of the other unit were inoperable. Such a condition occurred in May,1987. At that time Unit 2 was in a refueling outage with both circulatorsdisassembled for maintenance. The average delta T for this particular day wasreduced, however, because the unit tripped midway through the heat treatment dueto an electrical malfunction at a substation near Bakersfield. If the demusseling hadbeen completed, the daily discharge delta T limit would have been approached.
Figure 9 is a graphic representation of the possible sequence of events during asingle unit heat treatment. The figure was prepared using discharge data from thedemusseling of Unit 1 on August 8,1987. The rise rate and target temperature onthat day were typical of the ideal demusseling operation. If the interval between thedemusseling of the two conduits was reduced to one hour and the unit was returnedto full power following demusseling, a daily average delta T of 24.10 F would haveoccurred. This figure is based on the discharge delta T of 440F recorded during thatday. Using a value closer to the allowable 50°F delta T would cause the value toapproach the 250F limitation. During the projected 30 year life of the plant, it isvery likely that such a set of conditions would occur.
The fact that the current discharge temperature limitations have not been exceededto date is largely due to the limited number of heat treatments and the combinationsof operating conditions occurring on these days. Any more stringent dischargelimitations would, however, restrict prudent plant operation.
E8-316.0 XVIII
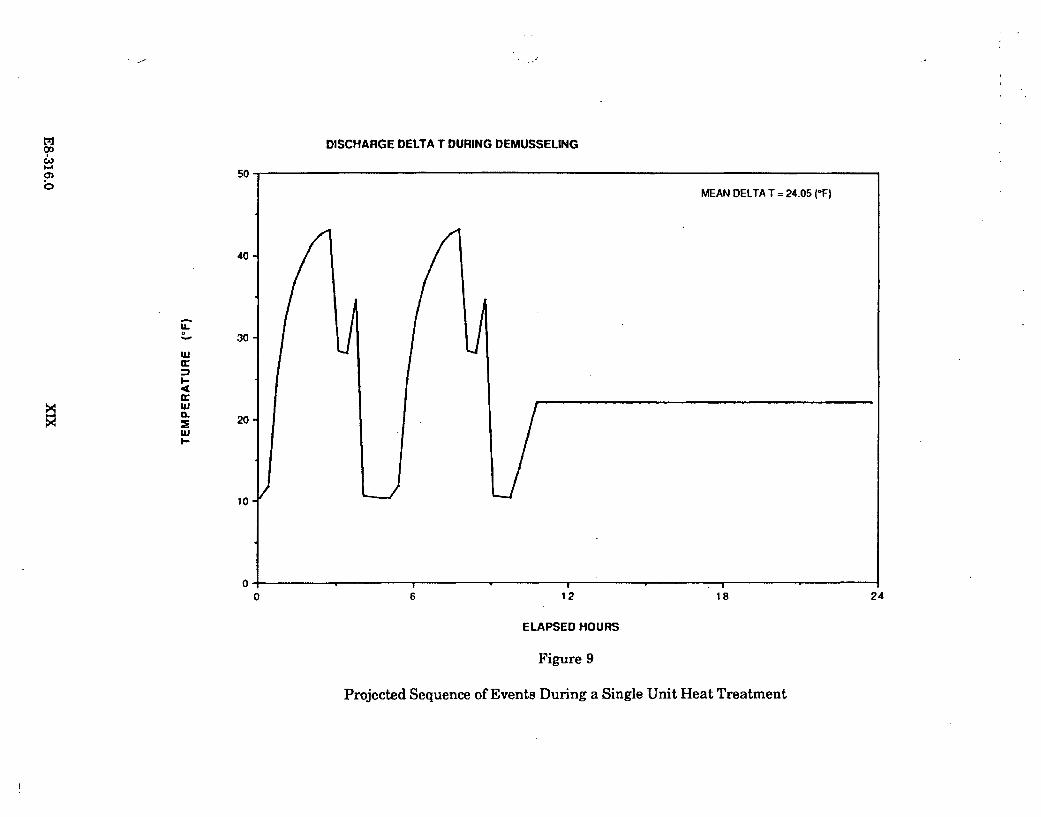
t2-w•
DISCHARGE DELTA T DURING DEMUSSELING
50
40
30
20
tL
w
CL'U0.
x
10
0 6 12 18 24
ELAPSED HOURS
Figure 9
Projected Sequence of Events During a Single Unit Heat Treatment
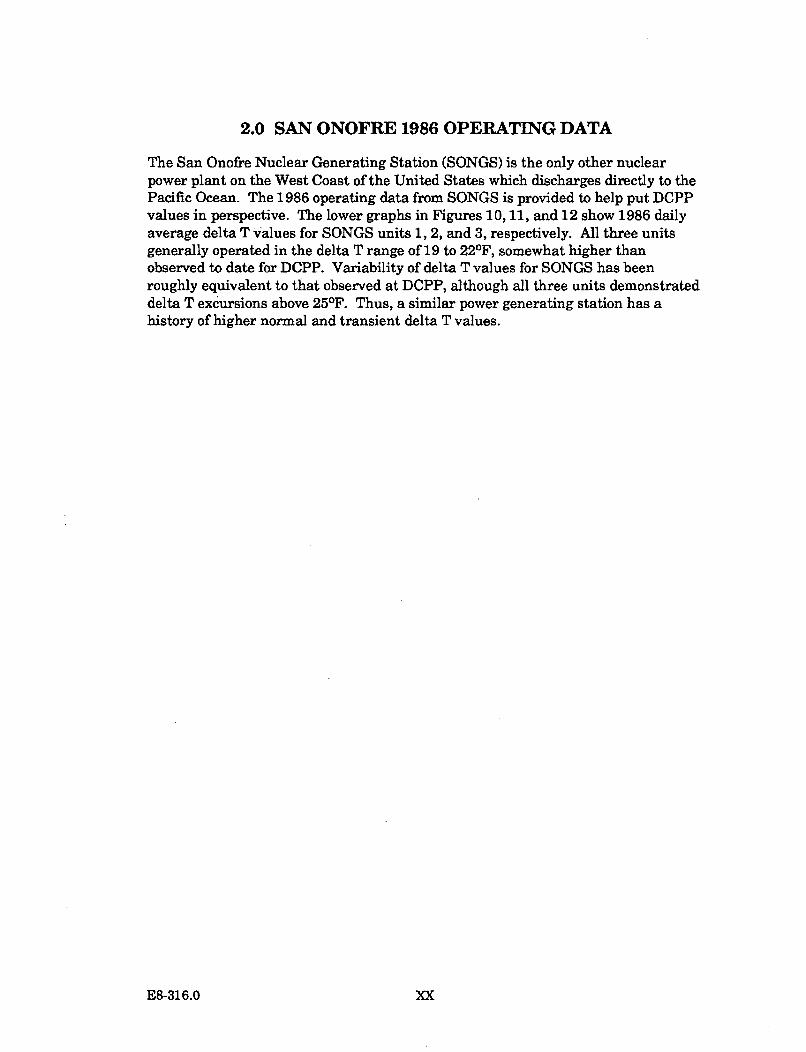
2.0 SAN ONOFRE 1986 OPERATING DATA
The San Onofre Nuclear Generating Station (SONGS) is the only other nuclearpower plant on the West Coast of the United States which discharges directly to thePacific Ocean. The 1986 operating data from SONGS is provided to help put DCPPvalues in perspective. The lower graphs in Figures 10, 11, and 12 show 1986 dailyaverage delta T values for SONGS units 1, 2, and 3, respectively. All three unitsgenerally operated in the delta T range of 19 to 221F, somewhat higher thanobserved to date for DCPP. Variability of delta T values for SONGS has beenroughly equivalent to that observed at DCPP, although all three units demonstrateddelta T excursions above 25 0F. Thus, a similar power generating station has ahistory of higher normal and transient delta T values.
E8-316.0 XX
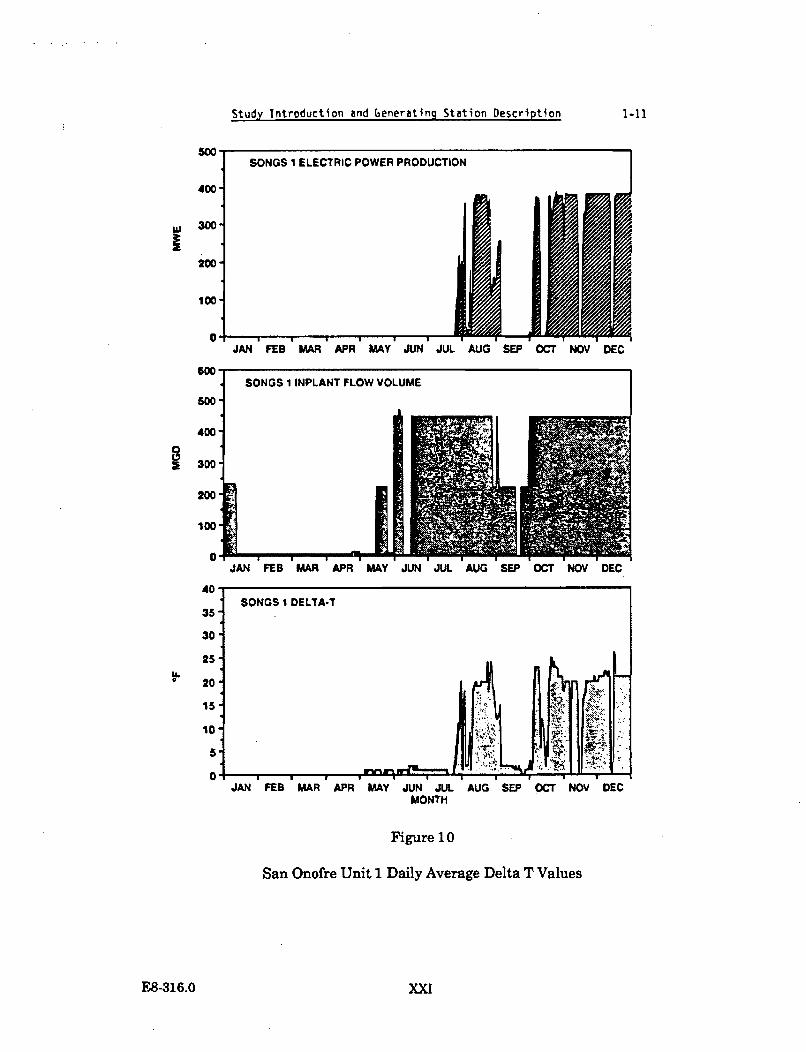
Study Introduction and 6eneratlng Station Description 1-11
wIV-m
SONGS I ELECTRIC POWER PRODUCTION
400-
w 300
200
100.
0
400-
500 -
400
35-
30
25-
o 20"
I
JAN FES MAR APR MAY JUN JUL AUG SEP OCT NOV DEC
JAN FEB MAR APR MAY JUN JUL AUG SEP OCT NOV DECMONTH
Figure 10
San Onofre Unit 1 Daily Average Delta T Values
E8-316.0 XX!
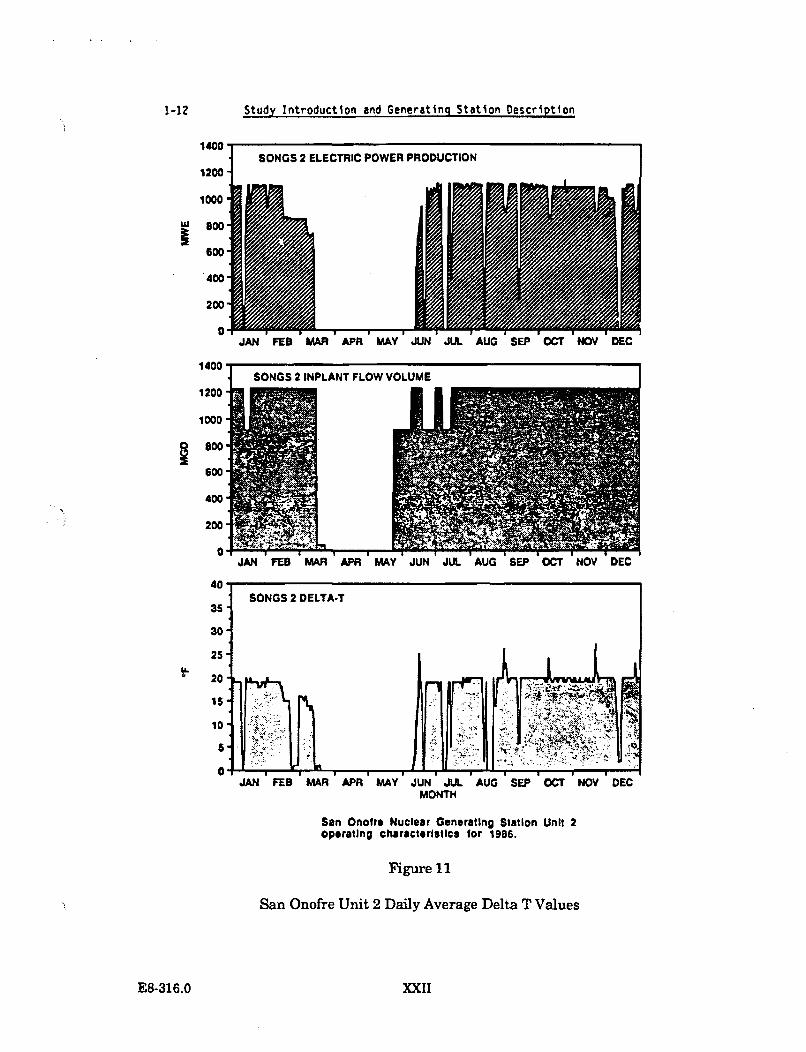
1-12 Study Introduction and Generating Station Description
1400SONGS 2 ELECTRIC POWER PRODUCTION
1200
1000
"' 00"
600
400
200 V
0JAN FEB MAR APR MAY JUN JUL AUG SEP OCT NOV DEC
1400
1200
1000
JAN FEB MAR APR MAY JUN JUL AUG SEP OCT NOV DEC
40SONGS 2 DELTA-T
35.
30"
25-
20"
0JAN FEB MAR APR MAY JUN JUL AUG SEP OCT NOV DEC
MONTH
San Onofre Nuclear Generating Station Unit 2operating characteristics for 1986.
Figure 11
San Onofre Unit 2 Daily Average Delta T Values
E8-316.0 XXII
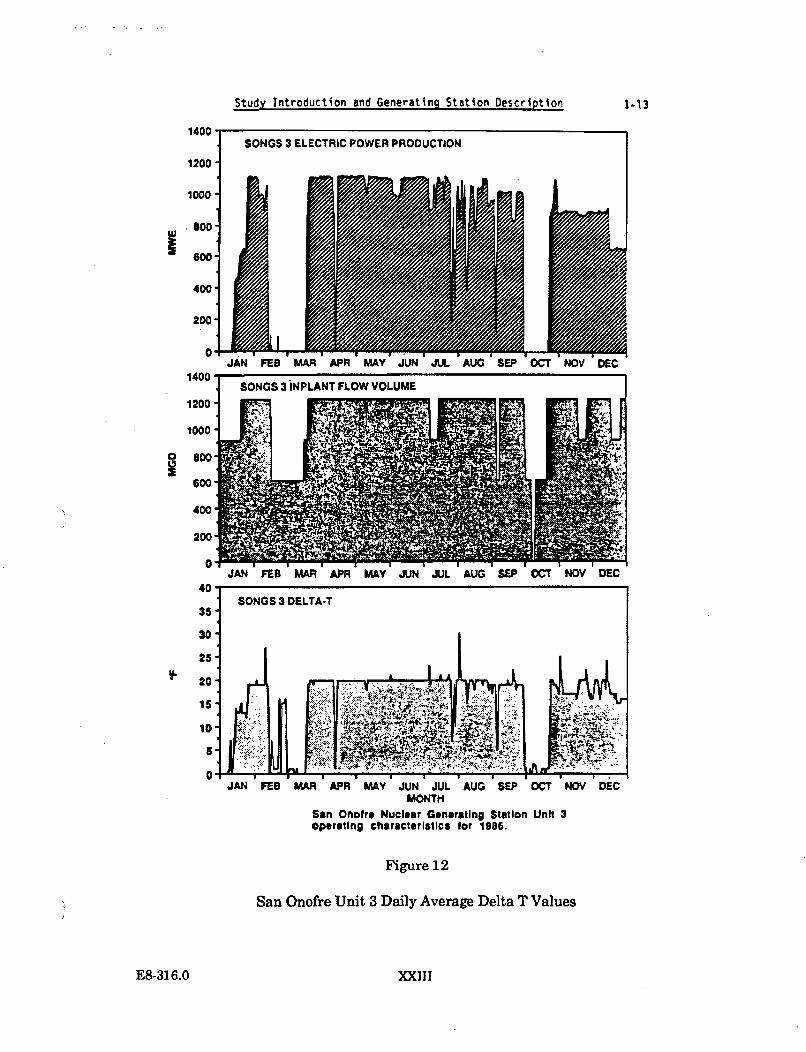
Study Introduction and Generating Station Description 1-13
1400
1200'
1000'
Lu Boo *
600.
400'
200-
0.
1400
1200"
1000"
0• 800-
600'
400
200
0
40
35-
30'
25'
20O
15
10'
5.
SONGS 3 ELECTRIC POWER PRODUCTION
I
JAN FED MAR APR MAY JUN JUL AUG SEP OCT NOV DEC
JAN FEB MAR APR MAY JUN JUL AUG SEP OCT NOV DEC
JAN FEB MAR APR MAY JUN JUL AUG SEP OCT NOV DECMONTH
San Onofre Nuclear Generating Station Unit 3operating characteristics for 19856.
Figure 12
San Onofre Unit 3 Daily Average Delta T Values
E8-316.0 XXIII
3.0 SUMMARY AND CONCLUSIONS
A review of DCPP plant operating data shows that PG&E has been able toconsistently meet the delta T conditions in the current NPDES permit, and that thedaily average delta T expected and observed at DCPP is in line with the delta Tvalues observed at other plants. However, these delta T values demonstrate a largeamount of variability. Furthermore, all conditions which might affect the delta Thave not yet been experienced. Therefore, it is prudent to retain the 22 0F delta Tlimit in the permit as a daily average limit. It has also been shown that each heattreatment is a unique situation, and that all heat treatment scenarios have not beenexperienced. Additionally, the TEMP final report indicates that the beneficial usesare being protected with the existing discharge conditions. In summary, the existingNPDES temperature delta T permit limits are reasonable and allow for operatingflexibility, while protecting the beneficial uses in the vicinity of the discharge.
E8-316.0 XXIV
-I