decadal change in intraseasonal variability over the south china sea
TRANSCRIPT
Decadal change in intraseasonal variability over the South China Sea
Yoshiyuki Kajikawa,1 Tetsuzo Yasunari,2 and Bin Wang1,3
Received 5 January 2008; revised 20 February 2009; accepted 24 February 2009; published 27 March 2009.
[1] Evidence is presented to reveal a decadal change aroundmid-1990s in the behavior of intraseasonal variability (ISV)over the South China Sea (SCS). During 1979–1993, the ISVhas a spectral peak around 64 days, which is longer thanin the recent epoch of 1994–2007 (around 42 days). TheISV event in 1979–1993 involves a merging process ofthe northward and westward propagating convectionanomalies over the western North Pacific. The ISV in1994–2007 has no such a merging process but exhibits atilted band structure extending from the northern IndianOcean to the SCS, which is strongly connected to theequatorial eastward propagating Madden-Julian Oscillation.The merging process during 1979–1993 modified the ISVover the SCS, resulting in the prolonged period, enhancedconvective activity and a weakened relationship with theeastward propagatingMJO. The possible cause of this changeis discussed. Citation: Kajikawa, Y., T. Yasunari, and B. Wang
(2009), Decadal change in intraseasonal variability over the South
China Sea, Geophys. Res. Lett., 36, L06810, doi:10.1029/
2009GL037174.
1. Introduction
[2] The South China Sea summer monsoon (SCSSM) isan important component of the Asian summer monsoon.After the discovery of the eastward propagating Madden-Julian Oscillation (MJO) [Madden and Julian, 1972], theactive/break cycle of the Asian summer monsoon have beenrecognized as a results of northward propagation of the intra-seasonal convection system [Yasunari, 1980, 1981], whichis sometimes but not always linked to the MJO [Wang andRui, 1990]. The SCSSM has strongest intraseasonal vari-ability (ISV) over the entire Asian summer monsoon regions[Kemball-Cook and Wang, 2001]. Furthermore, the ISVoverthe South China Sea (SCS) has relatively large interannualvariability compared with those over the Arabian Sea and theBay of Bengal [Kajikawa and Yasunari, 2005]. Better under-stand the behavior of the SCSSM system is important as itcan affect the weather and climate over the East Asia [Nitta,1987], Indo-China, the western North Pacific and even theIndian Ocean andmaritime continent [Kajikawa et al., 2003].[3] Previous studies have described the mean temporal
evolution of the ISVover the Indian Ocean andwestern NorthPacific. Some differences were found in the composite spatialstructure of the ISV. For instance, using OLR data for the
period 1974–1997, Goswami and Mohan [2001] showedthat the ISV based on convection anomalies over the Bay ofBengal has a zonally elongated structure of convectionanomalies across the northern Indian Ocean and westernNorth Pacific. On the other hand, using OLR data for theperiod 1979–1993, Hsu and Weng [2001] showed a quadra-pole structure of convection anomalies, which are zonally outof phase between the northern Indian Ocean and the westernNorth Pacific. This discrepancy could be due to their datacovering different periods but could also arise from the non-stationary behavior of the ISV.[4] Kwon et al. [2005] found a significant decadal change
in the relationship between the East Asian monsoon and thewestern North Pacific monsoon before and after (inclusive)1994. Kwon et al. [2007] also discussed the climate shift ofsummertime circulation over the East Asia and suggestedthat the increasing the number of typhoon in the westernNorth Pacific may have impacted the precipitation increaseover the southern China since the mid-1990s. This decadalshift also induced the decadal change of the SCSSM [Wanget al., 2009] and potentially the ISV over the SCS.[5] Therefore, this study investigates the possible long-
term change of the ISV properties over the SCS with aspecial focus on periodicity and spatial-temporal evolutionduring the 29 years from 1979 to 2007. The data used hereininclude daily interpolated outgoing longwave radiation (OLR)from the NOAA satellite [Liebmann and Smith, 1996] and thewind data from the NCEP/NCAR reanalysis project [Kalnayet al., 1996].
2. Decadal Change in Temporal Characteristics
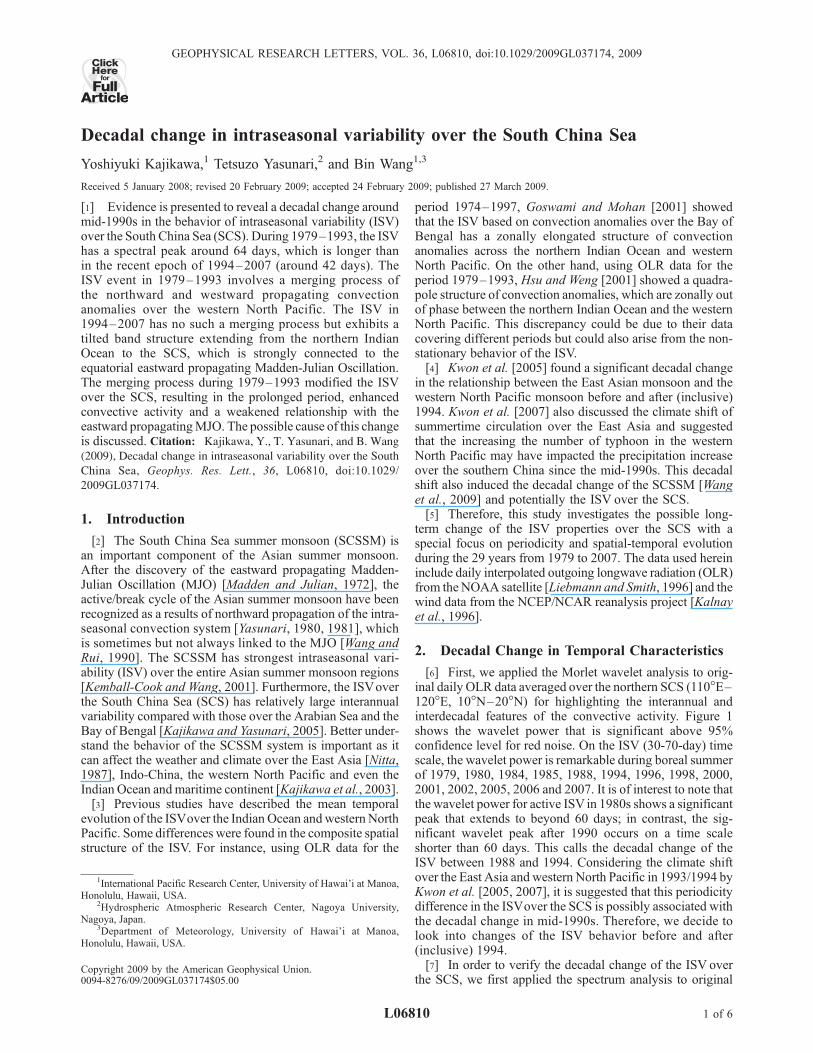
[6] First, we applied the Morlet wavelet analysis to orig-inal daily OLR data averaged over the northern SCS (110�E–120�E, 10�N–20�N) for highlighting the interannual andinterdecadal features of the convective activity. Figure 1shows the wavelet power that is significant above 95%confidence level for red noise. On the ISV (30-70-day) timescale, the wavelet power is remarkable during boreal summerof 1979, 1980, 1984, 1985, 1988, 1994, 1996, 1998, 2000,2001, 2002, 2005, 2006 and 2007. It is of interest to note thatthe wavelet power for active ISV in 1980s shows a significantpeak that extends to beyond 60 days; in contrast, the sig-nificant wavelet peak after 1990 occurs on a time scaleshorter than 60 days. This calls the decadal change of theISV between 1988 and 1994. Considering the climate shiftover the East Asia and western North Pacific in 1993/1994 byKwon et al. [2005, 2007], it is suggested that this periodicitydifference in the ISVover the SCS is possibly associated withthe decadal change in mid-1990s. Therefore, we decide tolook into changes of the ISV behavior before and after(inclusive) 1994.[7] In order to verify the decadal change of the ISV over
the SCS, we first applied the spectrum analysis to original
GEOPHYSICAL RESEARCH LETTERS, VOL. 36, L06810, doi:10.1029/2009GL037174, 2009ClickHere
for
FullArticle
1International Pacific Research Center, University of Hawai’i at Manoa,Honolulu, Hawaii, USA.
2Hydrospheric Atmospheric Research Center, Nagoya University,Nagoya, Japan.
3Department of Meteorology, University of Hawai’i at Manoa,Honolulu, Hawaii, USA.
Copyright 2009 by the American Geophysical Union.0094-8276/09/2009GL037174$05.00
L06810 1 of 6
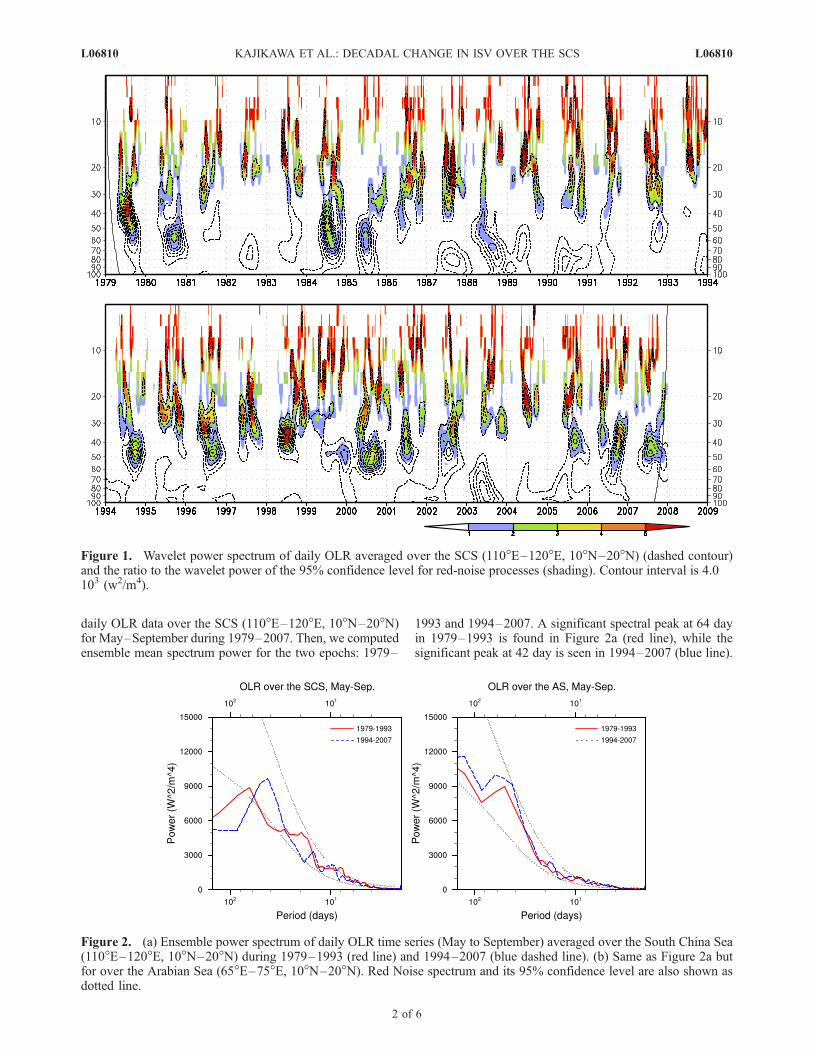
daily OLR data over the SCS (110�E–120�E, 10�N–20�N)for May–September during 1979–2007. Then, we computedensemble mean spectrum power for the two epochs: 1979–
1993 and 1994–2007. A significant spectral peak at 64 dayin 1979–1993 is found in Figure 2a (red line), while thesignificant peak at 42 day is seen in 1994–2007 (blue line).
Figure 1. Wavelet power spectrum of daily OLR averaged over the SCS (110�E–120�E, 10�N–20�N) (dashed contour)and the ratio to the wavelet power of the 95% confidence level for red-noise processes (shading). Contour interval is 4.0 �103 (w2/m4).
Figure 2. (a) Ensemble power spectrum of daily OLR time series (May to September) averaged over the South China Sea(110�E–120�E, 10�N–20�N) during 1979–1993 (red line) and 1994–2007 (blue dashed line). (b) Same as Figure 2a butfor over the Arabian Sea (65�E–75�E, 10�N–20�N). Red Noise spectrum and its 95% confidence level are also shown asdotted line.
L06810 KAJIKAWA ET AL.: DECADAL CHANGE IN ISV OVER THE SCS L06810
2 of 6

Figure 3
L06810 KAJIKAWA ET AL.: DECADAL CHANGE IN ISV OVER THE SCS L06810
3 of 6
This period difference (about 20 days) is statistically sig-nificant between the two epochs. The spectrum differencearound 42days is also significant by the Welch’s two-samplet-test. In contrast, the spectrum power of OLR over theArabian Sea (110�E–120�E, 10�N–20�N; Figure 2b) forMay–September does not show significant differencebetween 1979–1993 and 1994–2007. The periodicity ofthe ISV over the SCS in 1994–2007 is very close to thatover the Arabian Sea in 1994–2007, whereas different in1979–1993. The ensemble mean spectrum over the Bayof Bengal also shows no significant difference between1979–1993 and 1994–2007 (figure not shown). Thus, itis suggested that the decadal change of the ISV in terms ofperiodicity occurs only over the SCS and this also impliesa change in the spatial structure of the ISV between thetwo epochs, especially the phase relationship between theSCS and the Arabian Sea/Bay of Bengal.
3. Epochal Differences in the Spatialand Temporal Evolution
[8] Based on the results of the wavelet and spectrumanalysis, the band-pass filtering of the data was performedfor the entire period by using the 30–80 day Lanczos filter[Duchon, 1979] with 121 weights. In order to identify thedifference in the spatial-temporal evolution of the ISV be-tween the two epochs, we calculated the lagged regressioncoefficient between the filtered OLR time series over theSCS (110�E–120�E, 10�N–20�N) and the OLR and 850 hParelative vorticity anomalies over the entire domain of interest
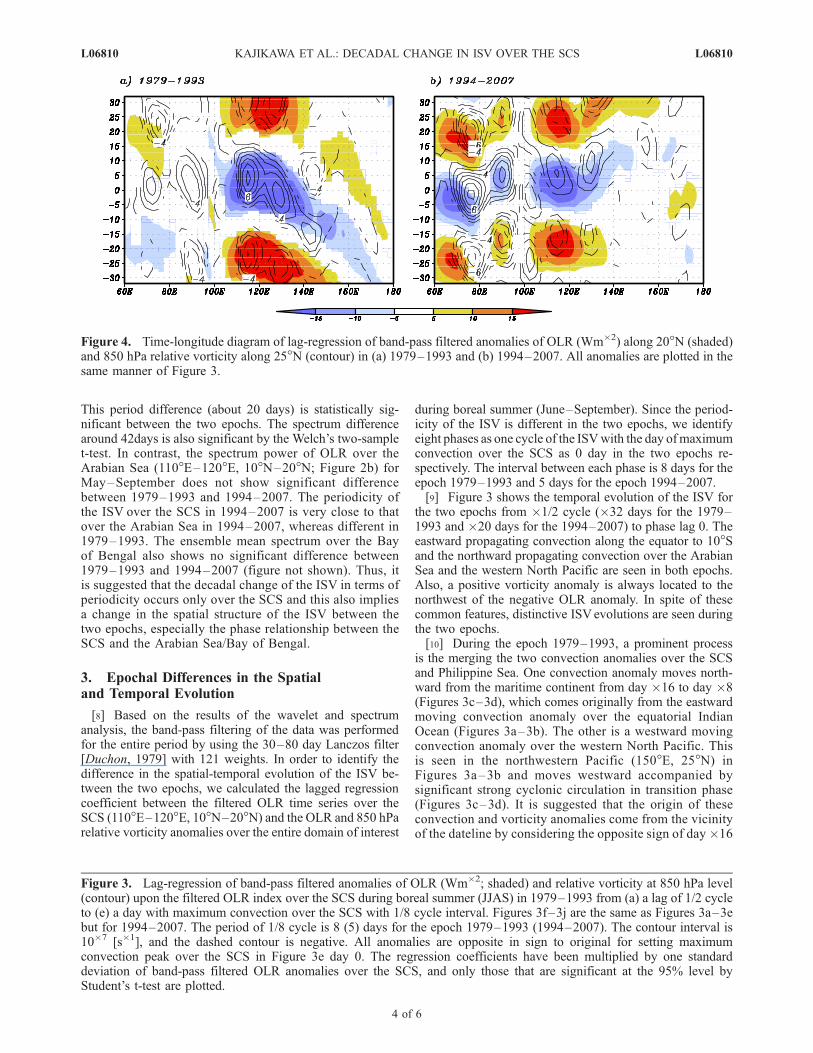
during boreal summer (June–September). Since the period-icity of the ISV is different in the two epochs, we identifyeight phases as one cycle of the ISVwith the day ofmaximumconvection over the SCS as 0 day in the two epochs re-spectively. The interval between each phase is 8 days for theepoch 1979–1993 and 5 days for the epoch 1994–2007.[9] Figure 3 shows the temporal evolution of the ISV for
the two epochs from �1/2 cycle (�32 days for the 1979–1993 and �20 days for the 1994–2007) to phase lag 0. Theeastward propagating convection along the equator to 10�Sand the northward propagating convection over the ArabianSea and the western North Pacific are seen in both epochs.Also, a positive vorticity anomaly is always located to thenorthwest of the negative OLR anomaly. In spite of thesecommon features, distinctive ISVevolutions are seen duringthe two epochs.[10] During the epoch 1979–1993, a prominent process
is the merging the two convection anomalies over the SCSand Philippine Sea. One convection anomaly moves north-ward from the maritime continent from day �16 to day �8(Figures 3c–3d), which comes originally from the eastwardmoving convection anomaly over the equatorial IndianOcean (Figures 3a–3b). The other is a westward movingconvection anomaly over the western North Pacific. Thisis seen in the northwestern Pacific (150�E, 25�N) inFigures 3a–3b and moves westward accompanied bysignificant strong cyclonic circulation in transition phase(Figures 3c–3d). It is suggested that the origin of theseconvection and vorticity anomalies come from the vicinityof the dateline by considering the opposite sign of day�16
Figure 3. Lag-regression of band-pass filtered anomalies of OLR (Wm�2; shaded) and relative vorticity at 850 hPa level(contour) upon the filtered OLR index over the SCS during boreal summer (JJAS) in 1979–1993 from (a) a lag of 1/2 cycleto (e) a day with maximum convection over the SCS with 1/8 cycle interval. Figures 3f–3j are the same as Figures 3a–3ebut for 1994–2007. The period of 1/8 cycle is 8 (5) days for the epoch 1979–1993 (1994–2007). The contour interval is10�7 [s�1], and the dashed contour is negative. All anomalies are opposite in sign to original for setting maximumconvection peak over the SCS in Figure 3e day 0. The regression coefficients have been multiplied by one standarddeviation of band-pass filtered OLR anomalies over the SCS, and only those that are significant at the 95% level byStudent’s t-test are plotted.
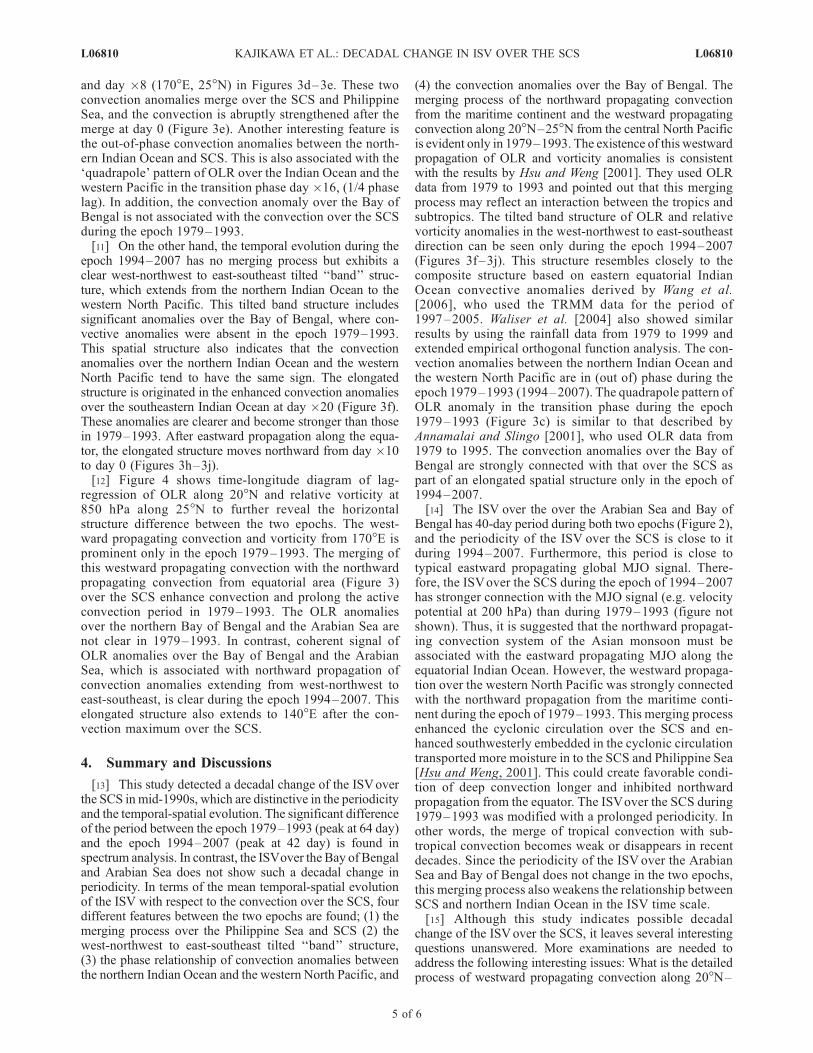
Figure 4. Time-longitude diagram of lag-regression of band-pass filtered anomalies of OLR (Wm�2) along 20�N (shaded)and 850 hPa relative vorticity along 25�N (contour) in (a) 1979–1993 and (b) 1994–2007. All anomalies are plotted in thesame manner of Figure 3.
L06810 KAJIKAWA ET AL.: DECADAL CHANGE IN ISV OVER THE SCS L06810
4 of 6
and day �8 (170�E, 25�N) in Figures 3d–3e. These twoconvection anomalies merge over the SCS and PhilippineSea, and the convection is abruptly strengthened after themerge at day 0 (Figure 3e). Another interesting feature isthe out-of-phase convection anomalies between the north-ern Indian Ocean and SCS. This is also associated with the‘quadrapole’ pattern of OLR over the Indian Ocean and thewestern Pacific in the transition phase day �16, (1/4 phaselag). In addition, the convection anomaly over the Bay ofBengal is not associated with the convection over the SCSduring the epoch 1979–1993.[11] On the other hand, the temporal evolution during the
epoch 1994–2007 has no merging process but exhibits aclear west-northwest to east-southeast tilted ‘‘band’’ struc-ture, which extends from the northern Indian Ocean to thewestern North Pacific. This tilted band structure includessignificant anomalies over the Bay of Bengal, where con-vective anomalies were absent in the epoch 1979–1993.This spatial structure also indicates that the convectionanomalies over the northern Indian Ocean and the westernNorth Pacific tend to have the same sign. The elongatedstructure is originated in the enhanced convection anomaliesover the southeastern Indian Ocean at day �20 (Figure 3f).These anomalies are clearer and become stronger than thosein 1979–1993. After eastward propagation along the equa-tor, the elongated structure moves northward from day �10to day 0 (Figures 3h–3j).[12] Figure 4 shows time-longitude diagram of lag-
regression of OLR along 20�N and relative vorticity at850 hPa along 25�N to further reveal the horizontalstructure difference between the two epochs. The west-ward propagating convection and vorticity from 170�E isprominent only in the epoch 1979–1993. The merging ofthis westward propagating convection with the northwardpropagating convection from equatorial area (Figure 3)over the SCS enhance convection and prolong the activeconvection period in 1979–1993. The OLR anomaliesover the northern Bay of Bengal and the Arabian Sea arenot clear in 1979–1993. In contrast, coherent signal ofOLR anomalies over the Bay of Bengal and the ArabianSea, which is associated with northward propagation ofconvection anomalies extending from west-northwest toeast-southeast, is clear during the epoch 1994–2007. Thiselongated structure also extends to 140�E after the con-vection maximum over the SCS.
4. Summary and Discussions
[13] This study detected a decadal change of the ISVoverthe SCS in mid-1990s, which are distinctive in the periodicityand the temporal-spatial evolution. The significant differenceof the period between the epoch 1979–1993 (peak at 64 day)and the epoch 1994–2007 (peak at 42 day) is found inspectrum analysis. In contrast, the ISVover the Bay of Bengaland Arabian Sea does not show such a decadal change inperiodicity. In terms of the mean temporal-spatial evolutionof the ISV with respect to the convection over the SCS, fourdifferent features between the two epochs are found; (1) themerging process over the Philippine Sea and SCS (2) thewest-northwest to east-southeast tilted ‘‘band’’ structure,(3) the phase relationship of convection anomalies betweenthe northern Indian Ocean and the western North Pacific, and
(4) the convection anomalies over the Bay of Bengal. Themerging process of the northward propagating convectionfrom the maritime continent and the westward propagatingconvection along 20�N–25�N from the central North Pacificis evident only in 1979–1993. The existence of this westwardpropagation of OLR and vorticity anomalies is consistentwith the results by Hsu and Weng [2001]. They used OLRdata from 1979 to 1993 and pointed out that this mergingprocess may reflect an interaction between the tropics andsubtropics. The tilted band structure of OLR and relativevorticity anomalies in the west-northwest to east-southeastdirection can be seen only during the epoch 1994–2007(Figures 3f–3j). This structure resembles closely to thecomposite structure based on eastern equatorial IndianOcean convective anomalies derived by Wang et al.[2006], who used the TRMM data for the period of1997–2005. Waliser et al. [2004] also showed similarresults by using the rainfall data from 1979 to 1999 andextended empirical orthogonal function analysis. The con-vection anomalies between the northern Indian Ocean andthe western North Pacific are in (out of) phase during theepoch 1979–1993 (1994–2007). The quadrapole pattern ofOLR anomaly in the transition phase during the epoch1979–1993 (Figure 3c) is similar to that described byAnnamalai and Slingo [2001], who used OLR data from1979 to 1995. The convection anomalies over the Bay ofBengal are strongly connected with that over the SCS aspart of an elongated spatial structure only in the epoch of1994–2007.[14] The ISV over the over the Arabian Sea and Bay of
Bengal has 40-day period during both two epochs (Figure 2),and the periodicity of the ISV over the SCS is close to itduring 1994–2007. Furthermore, this period is close totypical eastward propagating global MJO signal. There-fore, the ISVover the SCS during the epoch of 1994–2007has stronger connection with the MJO signal (e.g. velocitypotential at 200 hPa) than during 1979–1993 (figure notshown). Thus, it is suggested that the northward propagat-ing convection system of the Asian monsoon must beassociated with the eastward propagating MJO along theequatorial Indian Ocean. However, the westward propaga-tion over the western North Pacific was strongly connectedwith the northward propagation from the maritime conti-nent during the epoch of 1979–1993. This merging processenhanced the cyclonic circulation over the SCS and en-hanced southwesterly embedded in the cyclonic circulationtransported more moisture in to the SCS and Philippine Sea[Hsu and Weng, 2001]. This could create favorable condi-tion of deep convection longer and inhibited northwardpropagation from the equator. The ISVover the SCS during1979–1993 was modified with a prolonged periodicity. Inother words, the merge of tropical convection with sub-tropical convection becomes weak or disappears in recentdecades. Since the periodicity of the ISV over the ArabianSea and Bay of Bengal does not change in the two epochs,this merging process also weakens the relationship betweenSCS and northern Indian Ocean in the ISV time scale.[15] Although this study indicates possible decadal
change of the ISVover the SCS, it leaves several interestingquestions unanswered. More examinations are needed toaddress the following interesting issues: What is the detailedprocess of westward propagating convection along 20�N–
L06810 KAJIKAWA ET AL.: DECADAL CHANGE IN ISV OVER THE SCS L06810
5 of 6
25�N? How is the quadrapole structure in 1979–1993formed? And why is the merging process prominent in1979–1993? The convection anomalies over the southeast-ern Indian Ocean and the Bay of Bengal might be animportant area for the decadal change of the ISV structure.The SST anomalies over the mid-western Pacific could beassociated with the existence of the westward propagatingconvection and worthwhile to research for addressing abovequestions.
[16] Acknowledgments. The authors acknowledge support from theInternational Pacific Research Center (IPRC). Bin Wang acknowledges thesupport by the Climate Dynamics Program of the National ScienceFoundation and the NOAA OGP through CLIVAR Program. This researchwas supported by the JAMSTEC, which sponsors research at the IPRC.IPRC/SOEST publication 598/7659.
ReferencesAnnamalai, H., and J. Slingo (2001), Active/break cycles: Diagnosis of theintraseasonal variability of the Asian summer monsoon, Clim. Dyn., 18,85–102.
Duchon, C. E. (1979), Lanczos filtering in one and two dimensions, J. Appl.Meteorol., 18, 1016–1022.
Goswami, B. N., and R. S. A. Mohan (2001), Intraseasonal oscillations andinterannual variability of the Indian summer monsoon, J. Clim., 14,1180–1198.
Hsu, H.-H., and C.-H. Weng (2001), Northward propagation of the intra-seasonal oscillation in the western North Pacific during the boreal sum-mer: Structure and mechanism, J. Clim., 14, 3834–3850.
Kajikawa, Y., and T. Yasunari (2005), Interannual variability of the 10–25-and 30–60-day variation over the South China Sea during boreal summer,Geophys. Res. Lett., 32, L04710, doi:10.1029/2004GL021836.
Kajikawa, Y., T. Yasunari, and R. Kawamura (2003), The role of the localHadley circulation over the western Pacific on the zonally asymmetricanomalies over the Indian Ocean, J. Meteorol. Soc. Jpn., 81, 259–276.
Kalnay, E., et al. (1996), The NCEP/NCAR 40-year reanalysis project, Bull.Am. Meteorol. Soc., 77, 437–471.
Kemball-Cook, S., and B. Wang (2001), Equatorial waves and air-sea inter-action in the boreal summer intraseasonal oscillation, J. Clim., 14, 2923–2942.
Kwon, M., J.-G. Jhun, B. Wang, S.-I. An, and J.-S. Kug (2005), Decadalchange in relationship between east Asian and WNP summer monsoons,Geophys. Res. Lett., 32, L16709, doi:10.1029/2005GL023026.
Kwon, M., J.-G. Jhun, and K.-J. Ha (2007), Decadal change in east Asiansummer monsoon circulation in the mid-1990s, Geophys. Res. Lett., 34,L21706, doi:10.1029/2007GL031977.
Liebmann, B., and C. A. Smith (1996), Description of a complete (inter-polated) outgoing longwave radiation dataset, Bull. Am. Meteorol. Soc.,77, 1275–1277.
Madden, R. A., and P. R. Julian (1972), Description of global-scale circula-tion cells in the tropics with a 40–50 day periods, J. Atmos. Sci., 29,1109–1123.
Nitta, T. (1987), Convective activities in the tropical western Pacific andtheir impact on the Northern Hemisphere summer circulation, J. Meteorol.Soc. Jpn., 65, 373–390.
Waliser, D., R. Murtugudde, and L. E. Lucas (2004), Indo-Pacific Oceanresponse to atmospheric intraseasonal variability: 2. Boreal summer andintraseasonal oscillation, J. Geophys. Res., 109, C03030, doi:10.1029/2003JC002002.
Wang, B., and H. Rui (1990), Synoptic climatology of transient tropicalintraseasonal convection anomalies, Meteorol. Atmos. Phys., 44, 43–61.
Wang, B., P. Webster, K. Kikuchi, T. Yasunari, and Y. Qi (2006), Borealsummer quasi-monthly oscillation in the global tropics, Clim. Dyn., 27,661–675.
Wang, B., F. Huang, Z. Wu, J. Yang, X. Fu, and K. Kikuchi (2009), Multi-scale climate variability of the South China Sea monsoon: A review, Dyn.Atmos. Ocean, in press.
Yasunari, T. (1980), A quasi-stationary appearance of 30 to 40 day periodin the cloudiness fluctuation during the summer monsoon over India,J. Meteorol. Soc. Jpn., 58, 225–229.
Yasunari, T. (1981), Structure of and Indian summer monsoon system witharound 40-day period, J. Meteorol. Soc. Jpn., 59, 336–354.
�����������������������Y. Kajikawa, International Pacific Research Center, University of Hawai’i
at Manoa, 1680 East West Road, Honolulu, HI 96822, USA. ([email protected])B. Wang, Department of Meteorology, University of Hawai’i at Manoa,
Honolulu, HI 96822, USA.T. Yasunari, Hydrospheric Atmospheric Research Center, Nagoya
University, Nagoya 464-8601, Japan.
L06810 KAJIKAWA ET AL.: DECADAL CHANGE IN ISV OVER THE SCS L06810
6 of 6