intraseasonal variability of global land monsoon precipitation
TRANSCRIPT
ARTICLE OPEN
Intraseasonal variability of global land monsoon precipitationand its recent trendFei Liu1✉, Bin Wang2✉, Yu Ouyang3, Hui Wang1, Shaobo Qiao1, Guosen Chen4 and Wenjie Dong1
Accurate prediction of global land monsoon rainfall on a sub-seasonal (2–8 weeks) time scale has become a worldwide demand.Current forecasts of weekly-mean rainfall in most monsoon regions, however, have limited skills beyond two weeks, calling for amore profound understanding of monsoon intraseasonal variability (ISV). We show that the high-frequency (HF; 8–20 days) ISV,crucial for the Week 2 and Week 3 predictions, accounts for about 53–70% of the total (8–70 days) ISV, generally dominating thesub-seasonal predictability of various land monsoons, while the low-frequency (LF; 20–70 days)’s contribution is comparable to HFonly over Australia (AU; 47%), South Asia (SA; 43%), and South America (SAM; 40%). The leading modes of HFISVs in NorthernHemisphere (NH) monsoons primarily originate from different convectively coupled equatorial waves, while from mid-latitude wavetrains for Southern Hemisphere (SH) monsoons and East Asian (EA) monsoon. The Madden-Julian Oscillation (MJO) directlyregulates LFISVs in Asian-Australian monsoon and affects American and African monsoons by exciting Kelvin waves and mid-latitude teleconnections. During the past four decades, the HF (LF) ISVs have considerably intensified over Asian (Asian-Australian)monsoon but weakened over American (SAM) monsoon. Sub-seasonal to seasonal (S2S) prediction models exhibit higher sub-seasonal prediction skills over AU, SA, and SAM monsoons that have larger LFISV contributions than other monsoons. These resultssuggest an urgent need to improve the simulation of convectively coupled equatorial waves and two-way interactions betweenregional monsoon ISVs and mid-latitude processes and between MJO and regional monsoons, especially under the global warmingscenarios.
npj Climate and Atmospheric Science (2022) 5:30 ; https://doi.org/10.1038/s41612-022-00253-7
INTRODUCTIONHigh-quality social development with effective disaster preven-tion, logistics-planning, agriculture production, and decision-making requires accurate sub-seasonal rainfall prediction overland monsoon regions where about two-thirds of the world’spopulation live1. Tropical intraseasonal variabilities (ISVs) and theassociated teleconnections are dominant sources of sub-seasonalpredictability2–4.Madden-Julian Oscillation (MJO)5,6 is a major mode of tropical
ISV2,7. During boreal summer, MJO’s eastward propagation signifi-cantly weakened, meanwhile pronounced northward and north-eastward propagation prevails in the Northern Hemispheric (NH)monsoon regions8–13. The MJO’s impacts on regional monsoonrainfall have been extensively investigated. These include SouthAsian (SA)14–16, East Asian (EA)17–19, North American (NAM)20–22,northern African (NAF)23–25, Australian (AU)26–28, South American(SAM)29–34, and South African (SAF)35–37 monsoons.Prediction of weekly-mean land monsoon rainfall at a lead of
2–8 weeks has been a major effort yet particularly challenging. Thecurrent evaluation of sub-seasonal prediction skill and predictabilityestimates has primarily focused on the leading modes of the MJO orboreal summer intraseasonal oscillation3,38–41. The state-of-the-artEuropean Centre for Medium-Range Weather Forecast (ECMWF)model can predict the leading modes of the MJO up to 40 days inadvance in terms of the Real-time Multivariate MJO (RMM) index42,43.However, for up to four weeks, the MJO’s rainfall prediction skill isconfined to a narrow equatorial belt, and the rainfall prediction skills
drop rapidly beyond two weeks in vast off-equatorial monsoonregions44,45. User community concerns with weekly rainfall predictionrather than the MJO index. The reason behind the limited sub-seasonal predictability of monsoon rainfall is the forefront challengefaced by the sub-seasonal prediction community.This further raises the question of why the weekly-mean monsoon
rainfall prediction skill declines much faster than the MJO index skillin the prediction models. The MJO index measures the equatorialregion’s low-frequency (LF, ~20–70 day) ISV. In most off-equatorialmonsoon regions, the MJO index only accounts for a fraction of thetotal intraseasonal rainfall variability46. We suspect that the Week 2 toWeek 3 monsoon rainfall is mainly dominated by the high-frequency(HF, ~8–20 day) ISV, not the MJO. We might not have fullyrecognized the importance of HFISV in sub-seasonal prediction andpredictability. The HFISVs may originate from convectively coupledequatorial Rossby waves, named quasi-biweekly oscillation47, andfrom mid-latitude wave trains due to eddy-mean flow interaction,eddy–eddy interaction, and others48–50. The HFISVs in variousmonsoon regions have been documented. Over SA, HFISV wasdominated by the westward-propagating quasi-biweekly oscilla-tion16,47,51–53. The significant HFISV of EA precipitation was linked topreceding mid-latitude wave trains and tropical quasi-biweeklyoscillation18,53–56. HFISVs were also reported over NAM57,NAF23,24,58, AU27, and SAM29,33,59–61. However, the predictabilitysources of HFISV and the processes by which the equatorialdisturbances and mid-latitude processes affect the HFISV of differentmonsoons are not well understood.
1School of Atmospheric Sciences Sun Yat-Sen University, Key Laboratory of Tropical Atmosphere-Ocean System Ministry of Education, and Southern Marine Science andEngineering Guangdong Laboratory, Zhuhai 519082, China. 2Department of Atmospheric Sciences and International Pacific Research Center, University of Hawaii atManoa, Honolulu, HI 96822, USA. 3Shaanxi Meteorological Observatory, Xi’an 710014, China. 4Earth System Modeling Center, Key Laboratory of Meteorological Disaster of Ministryof Education, Collaborative Innovation Center on Forecast and Evaluation of Meteorological Disasters, Nanjing University of Information Science and Technology, Nanjing 210044,China. ✉email: [email protected]; [email protected]
www.nature.com/npjclimatsci
Published in partnership with CECCR at King Abdulaziz University
1234567890():,;
The ISVs have been investigated primarily in individualmonsoon regions, as mentioned above, because each regionalmonsoon has an indigenous land-ocean configuration andinvolves different atmosphere–ocean–land interaction processesand convective and mesoscale systems62. On the other hand, anacross-the-board synthesis of the common and distinct featuresamong the regional monsoons’ ISVs is persuasive for an in-depthunderstanding, simulation, and prediction of the ISVs. Theeastward-propagating planetary-scale MJO circulation systemand mid-latitude disturbances may significantly regulate andcoordinate the regional ISVs by changing monsoon circulations.These coordination and regional influences entail a globalperspective. An overview of the ISVs of the land monsoon rainfallfrom a global perspective is advantageous for a deeper under-standing of MJO–monsoon interaction, different characteristicsand sources of regional ISV, and especially for improving the sub-seasonal prediction of regional land monsoon rainfall.Our particular interests also include examining recent changes
in regional monsoon ISV intensity under global warming. Theseasonal-mean rainfall in the NH monsoon regions has increasedconsiderably since 197963, and the MJO residence time wasobserved to increase over the Indo-Pacific Maritime Continent by5–6 days during the last four decades due to the warm poolexpansion64. These changes of mean state and MJO might haveinfluenced the land monsoon ISV. The regional ISV was found tobe enhanced since 1993 over South China65. The changes in bothHF and LFISV intensities in most land monsoon regions, however,remain unknown.This study reviews and investigates the rainfall ISVs among
individual land monsoons, including different leading modes ofvariability, their origins, tracks of HFISV disturbances, and recentchanges in ISV intensity. We also try to explain the divergent sub-seasonal prediction skills over different land monsoon regions incurrent sub-seasonal to seasonal (S2S) prediction models. Theresults are expected to deepen understanding of the dynamics ofthe monsoon ISV and improve ISV’s simulation and sub-seasonalprediction of land monsoon rainfall.
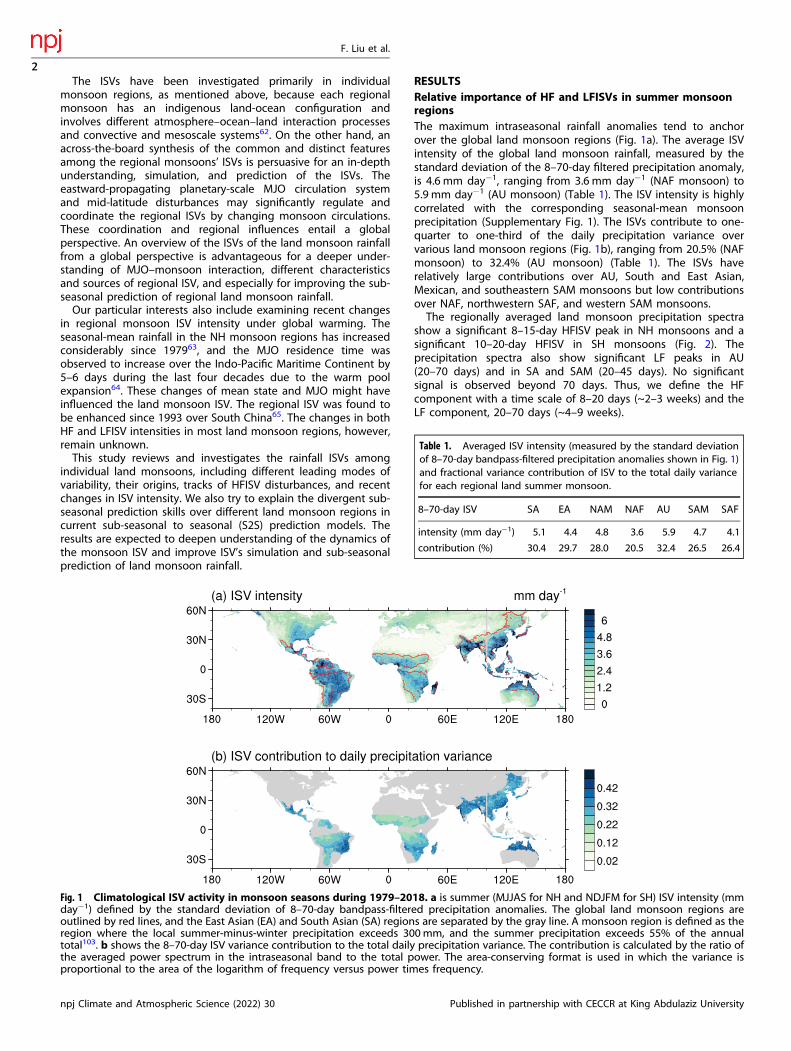
RESULTSRelative importance of HF and LFISVs in summer monsoonregionsThe maximum intraseasonal rainfall anomalies tend to anchorover the global land monsoon regions (Fig. 1a). The average ISVintensity of the global land monsoon rainfall, measured by thestandard deviation of the 8–70-day filtered precipitation anomaly,is 4.6 mm day−1, ranging from 3.6 mm day−1 (NAF monsoon) to5.9 mm day−1 (AU monsoon) (Table 1). The ISV intensity is highlycorrelated with the corresponding seasonal-mean monsoonprecipitation (Supplementary Fig. 1). The ISVs contribute to one-quarter to one-third of the daily precipitation variance overvarious land monsoon regions (Fig. 1b), ranging from 20.5% (NAFmonsoon) to 32.4% (AU monsoon) (Table 1). The ISVs haverelatively large contributions over AU, South and East Asian,Mexican, and southeastern SAM monsoons but low contributionsover NAF, northwestern SAF, and western SAM monsoons.The regionally averaged land monsoon precipitation spectra
show a significant 8–15-day HFISV peak in NH monsoons and asignificant 10–20-day HFISV in SH monsoons (Fig. 2). Theprecipitation spectra also show significant LF peaks in AU(20–70 days) and in SA and SAM (20–45 days). No significantsignal is observed beyond 70 days. Thus, we define the HFcomponent with a time scale of 8–20 days (~2–3 weeks) and theLF component, 20–70 days (~4–9 weeks).
Fig. 1 Climatological ISV activity in monsoon seasons during 1979–2018. a is summer (MJJAS for NH and NDJFM for SH) ISV intensity (mmday−1) defined by the standard deviation of 8–70-day bandpass-filtered precipitation anomalies. The global land monsoon regions areoutlined by red lines, and the East Asian (EA) and South Asian (SA) regions are separated by the gray line. A monsoon region is defined as theregion where the local summer-minus-winter precipitation exceeds 300mm, and the summer precipitation exceeds 55% of the annualtotal103. b shows the 8–70-day ISV variance contribution to the total daily precipitation variance. The contribution is calculated by the ratio ofthe averaged power spectrum in the intraseasonal band to the total power. The area-conserving format is used in which the variance isproportional to the area of the logarithm of frequency versus power times frequency.
Table 1. Averaged ISV intensity (measured by the standard deviationof 8–70-day bandpass-filtered precipitation anomalies shown in Fig. 1)and fractional variance contribution of ISV to the total daily variancefor each regional land summer monsoon.
8–70-day ISV SA EA NAM NAF AU SAM SAF
intensity (mm day−1) 5.1 4.4 4.8 3.6 5.9 4.7 4.1
contribution (%) 30.4 29.7 28.0 20.5 32.4 26.5 26.4
F. Liu et al.
2
npj Climate and Atmospheric Science (2022) 30 Published in partnership with CECCR at King Abdulaziz University
1234567890():,;
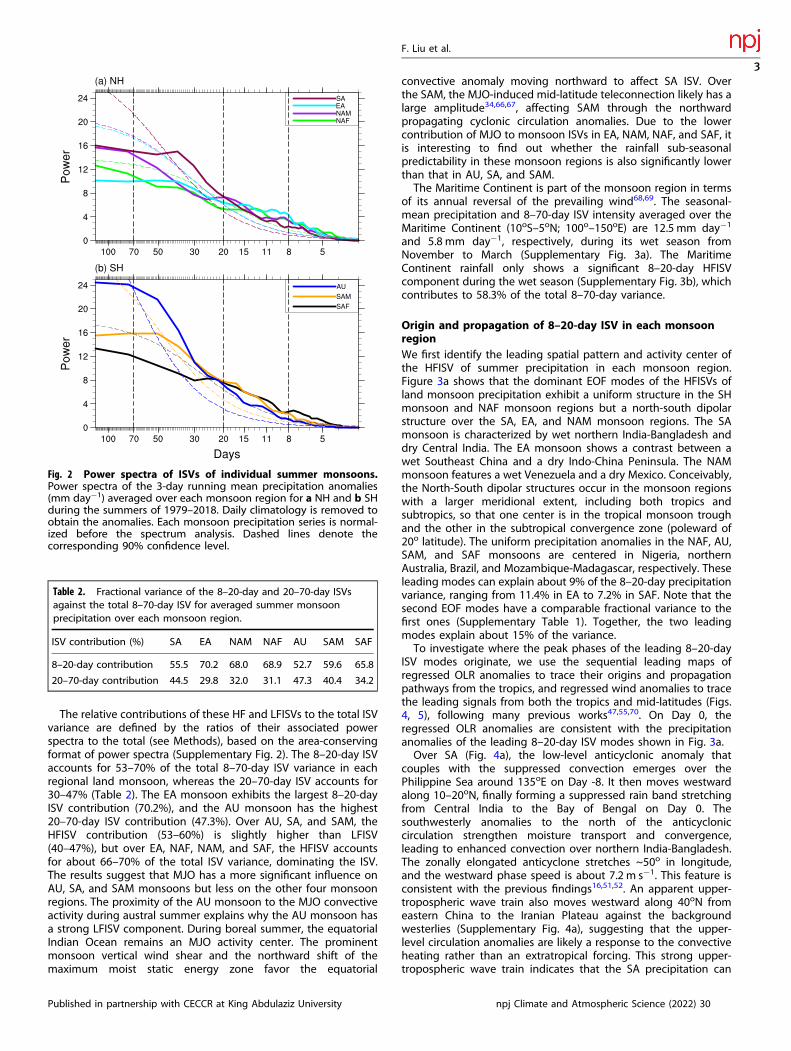
The relative contributions of these HF and LFISVs to the total ISVvariance are defined by the ratios of their associated powerspectra to the total (see Methods), based on the area-conservingformat of power spectra (Supplementary Fig. 2). The 8–20-day ISVaccounts for 53–70% of the total 8–70-day ISV variance in eachregional land monsoon, whereas the 20–70-day ISV accounts for30–47% (Table 2). The EA monsoon exhibits the largest 8–20-dayISV contribution (70.2%), and the AU monsoon has the highest20–70-day ISV contribution (47.3%). Over AU, SA, and SAM, theHFISV contribution (53–60%) is slightly higher than LFISV(40–47%), but over EA, NAF, NAM, and SAF, the HFISV accountsfor about 66–70% of the total ISV variance, dominating the ISV.The results suggest that MJO has a more significant influence onAU, SA, and SAM monsoons but less on the other four monsoonregions. The proximity of the AU monsoon to the MJO convectiveactivity during austral summer explains why the AU monsoon hasa strong LFISV component. During boreal summer, the equatorialIndian Ocean remains an MJO activity center. The prominentmonsoon vertical wind shear and the northward shift of themaximum moist static energy zone favor the equatorial
convective anomaly moving northward to affect SA ISV. Overthe SAM, the MJO-induced mid-latitude teleconnection likely has alarge amplitude34,66,67, affecting SAM through the northwardpropagating cyclonic circulation anomalies. Due to the lowercontribution of MJO to monsoon ISVs in EA, NAM, NAF, and SAF, itis interesting to find out whether the rainfall sub-seasonalpredictability in these monsoon regions is also significantly lowerthan that in AU, SA, and SAM.The Maritime Continent is part of the monsoon region in terms
of its annual reversal of the prevailing wind68,69. The seasonal-mean precipitation and 8–70-day ISV intensity averaged over theMaritime Continent (10oS–5oN; 100o–150oE) are 12.5 mm day−1
and 5.8 mm day−1, respectively, during its wet season fromNovember to March (Supplementary Fig. 3a). The MaritimeContinent rainfall only shows a significant 8–20-day HFISVcomponent during the wet season (Supplementary Fig. 3b), whichcontributes to 58.3% of the total 8–70-day variance.
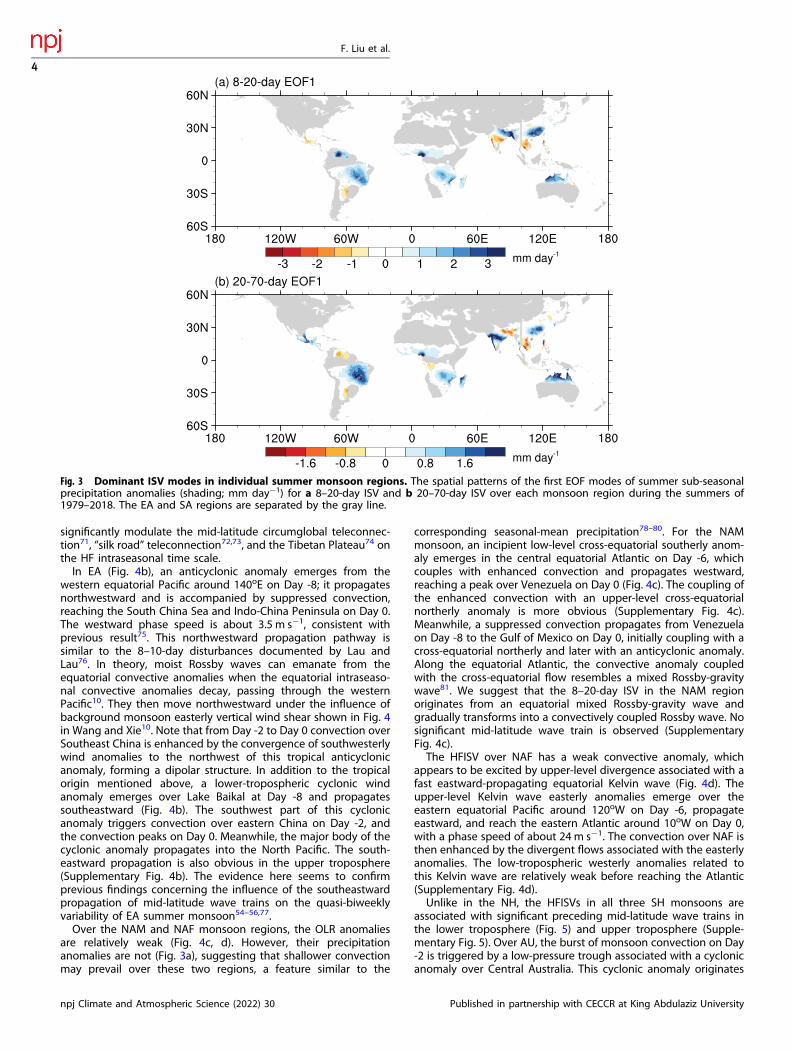
Origin and propagation of 8–20-day ISV in each monsoonregionWe first identify the leading spatial pattern and activity center ofthe HFISV of summer precipitation in each monsoon region.Figure 3a shows that the dominant EOF modes of the HFISVs ofland monsoon precipitation exhibit a uniform structure in the SHmonsoon and NAF monsoon regions but a north-south dipolarstructure over the SA, EA, and NAM monsoon regions. The SAmonsoon is characterized by wet northern India-Bangladesh anddry Central India. The EA monsoon shows a contrast between awet Southeast China and a dry Indo-China Peninsula. The NAMmonsoon features a wet Venezuela and a dry Mexico. Conceivably,the North-South dipolar structures occur in the monsoon regionswith a larger meridional extent, including both tropics andsubtropics, so that one center is in the tropical monsoon troughand the other in the subtropical convergence zone (poleward of20o latitude). The uniform precipitation anomalies in the NAF, AU,SAM, and SAF monsoons are centered in Nigeria, northernAustralia, Brazil, and Mozambique-Madagascar, respectively. Theseleading modes can explain about 9% of the 8–20-day precipitationvariance, ranging from 11.4% in EA to 7.2% in SAF. Note that thesecond EOF modes have a comparable fractional variance to thefirst ones (Supplementary Table 1). Together, the two leadingmodes explain about 15% of the variance.To investigate where the peak phases of the leading 8–20-day
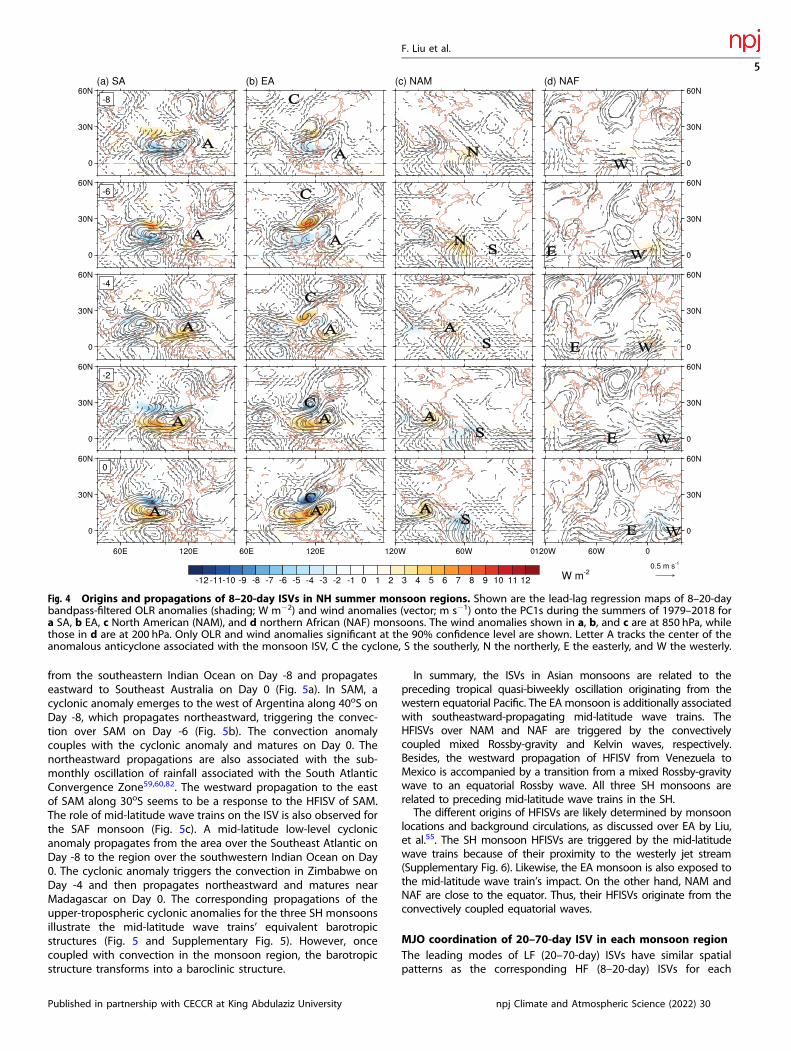
ISV modes originate, we use the sequential leading maps ofregressed OLR anomalies to trace their origins and propagationpathways from the tropics, and regressed wind anomalies to tracethe leading signals from both the tropics and mid-latitudes (Figs.4, 5), following many previous works47,55,70. On Day 0, theregressed OLR anomalies are consistent with the precipitationanomalies of the leading 8–20-day ISV modes shown in Fig. 3a.Over SA (Fig. 4a), the low-level anticyclonic anomaly that
couples with the suppressed convection emerges over thePhilippine Sea around 135oE on Day -8. It then moves westwardalong 10–20oN, finally forming a suppressed rain band stretchingfrom Central India to the Bay of Bengal on Day 0. Thesouthwesterly anomalies to the north of the anticycloniccirculation strengthen moisture transport and convergence,leading to enhanced convection over northern India-Bangladesh.The zonally elongated anticyclone stretches ~50o in longitude,and the westward phase speed is about 7.2 m s−1. This feature isconsistent with the previous findings16,51,52. An apparent upper-tropospheric wave train also moves westward along 40oN fromeastern China to the Iranian Plateau against the backgroundwesterlies (Supplementary Fig. 4a), suggesting that the upper-level circulation anomalies are likely a response to the convectiveheating rather than an extratropical forcing. This strong upper-tropospheric wave train indicates that the SA precipitation can
Fig. 2 Power spectra of ISVs of individual summer monsoons.Power spectra of the 3-day running mean precipitation anomalies(mm day−1) averaged over each monsoon region for a NH and b SHduring the summers of 1979–2018. Daily climatology is removed toobtain the anomalies. Each monsoon precipitation series is normal-ized before the spectrum analysis. Dashed lines denote thecorresponding 90% confidence level.
Table 2. Fractional variance of the 8–20-day and 20–70-day ISVsagainst the total 8–70-day ISV for averaged summer monsoonprecipitation over each monsoon region.
ISV contribution (%) SA EA NAM NAF AU SAM SAF
8–20-day contribution 55.5 70.2 68.0 68.9 52.7 59.6 65.8
20–70-day contribution 44.5 29.8 32.0 31.1 47.3 40.4 34.2
F. Liu et al.
3
Published in partnership with CECCR at King Abdulaziz University npj Climate and Atmospheric Science (2022) 30
significantly modulate the mid-latitude circumglobal teleconnec-tion71, “silk road” teleconnection72,73, and the Tibetan Plateau74 onthe HF intraseasonal time scale.In EA (Fig. 4b), an anticyclonic anomaly emerges from the
western equatorial Pacific around 140oE on Day -8; it propagatesnorthwestward and is accompanied by suppressed convection,reaching the South China Sea and Indo-China Peninsula on Day 0.The westward phase speed is about 3.5 m s−1, consistent withprevious result75. This northwestward propagation pathway issimilar to the 8–10-day disturbances documented by Lau andLau76. In theory, moist Rossby waves can emanate from theequatorial convective anomalies when the equatorial intraseaso-nal convective anomalies decay, passing through the westernPacific10. They then move northwestward under the influence ofbackground monsoon easterly vertical wind shear shown in Fig. 4in Wang and Xie10. Note that from Day -2 to Day 0 convection overSoutheast China is enhanced by the convergence of southwesterlywind anomalies to the northwest of this tropical anticyclonicanomaly, forming a dipolar structure. In addition to the tropicalorigin mentioned above, a lower-tropospheric cyclonic windanomaly emerges over Lake Baikal at Day -8 and propagatessoutheastward (Fig. 4b). The southwest part of this cyclonicanomaly triggers convection over eastern China on Day -2, andthe convection peaks on Day 0. Meanwhile, the major body of thecyclonic anomaly propagates into the North Pacific. The south-eastward propagation is also obvious in the upper troposphere(Supplementary Fig. 4b). The evidence here seems to confirmprevious findings concerning the influence of the southeastwardpropagation of mid-latitude wave trains on the quasi-biweeklyvariability of EA summer monsoon54–56,77.Over the NAM and NAF monsoon regions, the OLR anomalies
are relatively weak (Fig. 4c, d). However, their precipitationanomalies are not (Fig. 3a), suggesting that shallower convectionmay prevail over these two regions, a feature similar to the
corresponding seasonal-mean precipitation78–80. For the NAMmonsoon, an incipient low-level cross-equatorial southerly anom-aly emerges in the central equatorial Atlantic on Day -6, whichcouples with enhanced convection and propagates westward,reaching a peak over Venezuela on Day 0 (Fig. 4c). The coupling ofthe enhanced convection with an upper-level cross-equatorialnortherly anomaly is more obvious (Supplementary Fig. 4c).Meanwhile, a suppressed convection propagates from Venezuelaon Day -8 to the Gulf of Mexico on Day 0, initially coupling with across-equatorial northerly and later with an anticyclonic anomaly.Along the equatorial Atlantic, the convective anomaly coupledwith the cross-equatorial flow resembles a mixed Rossby-gravitywave81. We suggest that the 8–20-day ISV in the NAM regionoriginates from an equatorial mixed Rossby-gravity wave andgradually transforms into a convectively coupled Rossby wave. Nosignificant mid-latitude wave train is observed (SupplementaryFig. 4c).The HFISV over NAF has a weak convective anomaly, which
appears to be excited by upper-level divergence associated with afast eastward-propagating equatorial Kelvin wave (Fig. 4d). Theupper-level Kelvin wave easterly anomalies emerge over theeastern equatorial Pacific around 120oW on Day -6, propagateeastward, and reach the eastern Atlantic around 10oW on Day 0,with a phase speed of about 24 m s−1. The convection over NAF isthen enhanced by the divergent flows associated with the easterlyanomalies. The low-tropospheric westerly anomalies related tothis Kelvin wave are relatively weak before reaching the Atlantic(Supplementary Fig. 4d).Unlike in the NH, the HFISVs in all three SH monsoons are
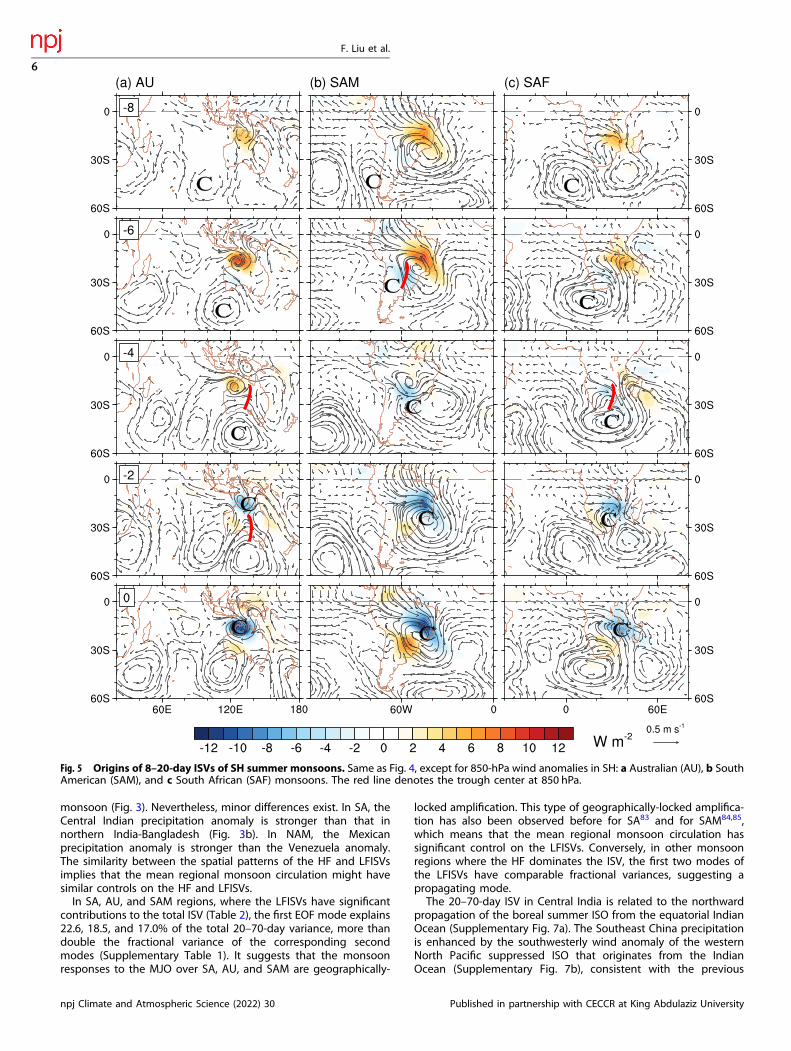
associated with significant preceding mid-latitude wave trains inthe lower troposphere (Fig. 5) and upper troposphere (Supple-mentary Fig. 5). Over AU, the burst of monsoon convection on Day-2 is triggered by a low-pressure trough associated with a cyclonicanomaly over Central Australia. This cyclonic anomaly originates
Fig. 3 Dominant ISV modes in individual summer monsoon regions. The spatial patterns of the first EOF modes of summer sub-seasonalprecipitation anomalies (shading; mm day−1) for a 8–20-day ISV and b 20–70-day ISV over each monsoon region during the summers of1979–2018. The EA and SA regions are separated by the gray line.
F. Liu et al.
4
npj Climate and Atmospheric Science (2022) 30 Published in partnership with CECCR at King Abdulaziz University
from the southeastern Indian Ocean on Day -8 and propagateseastward to Southeast Australia on Day 0 (Fig. 5a). In SAM, acyclonic anomaly emerges to the west of Argentina along 40oS onDay -8, which propagates northeastward, triggering the convec-tion over SAM on Day -6 (Fig. 5b). The convection anomalycouples with the cyclonic anomaly and matures on Day 0. Thenortheastward propagations are also associated with the sub-monthly oscillation of rainfall associated with the South AtlanticConvergence Zone59,60,82. The westward propagation to the eastof SAM along 30oS seems to be a response to the HFISV of SAM.The role of mid-latitude wave trains on the ISV is also observed forthe SAF monsoon (Fig. 5c). A mid-latitude low-level cyclonicanomaly propagates from the area over the Southeast Atlantic onDay -8 to the region over the southwestern Indian Ocean on Day0. The cyclonic anomaly triggers the convection in Zimbabwe onDay -4 and then propagates northeastward and matures nearMadagascar on Day 0. The corresponding propagations of theupper-tropospheric cyclonic anomalies for the three SH monsoonsillustrate the mid-latitude wave trains’ equivalent barotropicstructures (Fig. 5 and Supplementary Fig. 5). However, oncecoupled with convection in the monsoon region, the barotropicstructure transforms into a baroclinic structure.
In summary, the ISVs in Asian monsoons are related to thepreceding tropical quasi-biweekly oscillation originating from thewestern equatorial Pacific. The EA monsoon is additionally associatedwith southeastward-propagating mid-latitude wave trains. TheHFISVs over NAM and NAF are triggered by the convectivelycoupled mixed Rossby-gravity and Kelvin waves, respectively.Besides, the westward propagation of HFISV from Venezuela toMexico is accompanied by a transition from a mixed Rossby-gravitywave to an equatorial Rossby wave. All three SH monsoons arerelated to preceding mid-latitude wave trains in the SH.The different origins of HFISVs are likely determined by monsoon
locations and background circulations, as discussed over EA by Liu,et al.55. The SH monsoon HFISVs are triggered by the mid-latitudewave trains because of their proximity to the westerly jet stream(Supplementary Fig. 6). Likewise, the EA monsoon is also exposed tothe mid-latitude wave train’s impact. On the other hand, NAM andNAF are close to the equator. Thus, their HFISVs originate from theconvectively coupled equatorial waves.
MJO coordination of 20–70-day ISV in each monsoon regionThe leading modes of LF (20–70-day) ISVs have similar spatialpatterns as the corresponding HF (8–20-day) ISVs for each
Fig. 4 Origins and propagations of 8–20-day ISVs in NH summer monsoon regions. Shown are the lead-lag regression maps of 8–20-daybandpass-filtered OLR anomalies (shading; W m−2) and wind anomalies (vector; m s−1) onto the PC1s during the summers of 1979–2018 fora SA, b EA, c North American (NAM), and d northern African (NAF) monsoons. The wind anomalies shown in a, b, and c are at 850 hPa, whilethose in d are at 200 hPa. Only OLR and wind anomalies significant at the 90% confidence level are shown. Letter A tracks the center of theanomalous anticyclone associated with the monsoon ISV, C the cyclone, S the southerly, N the northerly, E the easterly, and W the westerly.
F. Liu et al.
5
Published in partnership with CECCR at King Abdulaziz University npj Climate and Atmospheric Science (2022) 30
monsoon (Fig. 3). Nevertheless, minor differences exist. In SA, theCentral Indian precipitation anomaly is stronger than that innorthern India-Bangladesh (Fig. 3b). In NAM, the Mexicanprecipitation anomaly is stronger than the Venezuela anomaly.The similarity between the spatial patterns of the HF and LFISVsimplies that the mean regional monsoon circulation might havesimilar controls on the HF and LFISVs.In SA, AU, and SAM regions, where the LFISVs have significant
contributions to the total ISV (Table 2), the first EOF mode explains22.6, 18.5, and 17.0% of the total 20–70-day variance, more thandouble the fractional variance of the corresponding secondmodes (Supplementary Table 1). It suggests that the monsoonresponses to the MJO over SA, AU, and SAM are geographically-
locked amplification. This type of geographically-locked amplifica-tion has also been observed before for SA83 and for SAM84,85,which means that the mean regional monsoon circulation hassignificant control on the LFISVs. Conversely, in other monsoonregions where the HF dominates the ISV, the first two modes ofthe LFISVs have comparable fractional variances, suggesting apropagating mode.The 20–70-day ISV in Central India is related to the northward
propagation of the boreal summer ISO from the equatorial IndianOcean (Supplementary Fig. 7a). The Southeast China precipitationis enhanced by the southwesterly wind anomaly of the westernNorth Pacific suppressed ISO that originates from the IndianOcean (Supplementary Fig. 7b), consistent with the previous
C
C
C
C
C
C
C
CCC
C
C
C
CC
Fig. 5 Origins of 8–20-day ISVs of SH summer monsoons. Same as Fig. 4, except for 850-hPa wind anomalies in SH: a Australian (AU), b SouthAmerican (SAM), and c South African (SAF) monsoons. The red line denotes the trough center at 850 hPa.
F. Liu et al.
6
npj Climate and Atmospheric Science (2022) 30 Published in partnership with CECCR at King Abdulaziz University
works8,52,86. In SH, the AU monsoon 20–70-day ISV is dominantlyaffected by the MJO convection over the Arafura Sea (Supple-mentary Fig. 7c), as demonstrated by previous works28,87. The MJOmodulates other monsoon regions primarily by exciting Kelvinwaves. Significant preceding MJO convection anomalies areobserved over the Warm Pool region. The MJO-excited Kelvinwaves, represented by upper-level easterly anomalies, propagateeastward along the equator and enhance the convection over theGulf of Mexico, Nigeria, Brazil, and Zambia-Madagascar (Supple-mentary Fig. 8).Significant preceding mid-latitude wave trains are observed in
SAM. The wave train associated with SAM originates from theocean to the east of Australia and is tied to the MJO convectionanomaly over the tropical western Pacific (Supplementary Fig. 8c).This Indo-Pacific MJO’s impact on SAM through the mid-latitudeteleconnection has also been observed previously34,37,59,60,67,88–90.Since the group speed of the teleconnection is quite fast, and theMJO’s signal can reach America in about 1 week91,92 so that theSAM only lags the Indo-Pacific MJO by 10 days. It would beinteresting to explore how much these mid-latitude LF wave trainsare independent of the tropical MJO forcing in the future, asdiscussed by previous works93,94.In summary, the 20–70-day ISVs of the Asian-Australian
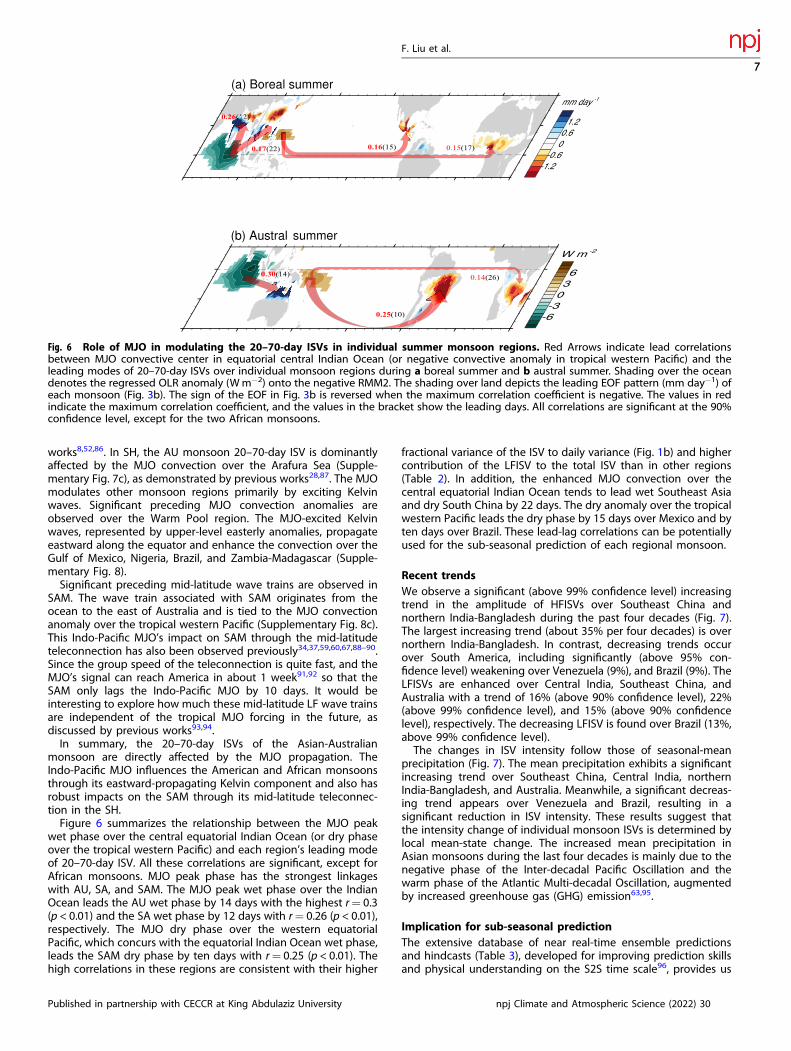
monsoon are directly affected by the MJO propagation. TheIndo-Pacific MJO influences the American and African monsoonsthrough its eastward-propagating Kelvin component and also hasrobust impacts on the SAM through its mid-latitude teleconnec-tion in the SH.Figure 6 summarizes the relationship between the MJO peak
wet phase over the central equatorial Indian Ocean (or dry phaseover the tropical western Pacific) and each region’s leading modeof 20–70-day ISV. All these correlations are significant, except forAfrican monsoons. MJO peak phase has the strongest linkageswith AU, SA, and SAM. The MJO peak wet phase over the IndianOcean leads the AU wet phase by 14 days with the highest r= 0.3(p < 0.01) and the SA wet phase by 12 days with r= 0.26 (p < 0.01),respectively. The MJO dry phase over the western equatorialPacific, which concurs with the equatorial Indian Ocean wet phase,leads the SAM dry phase by ten days with r= 0.25 (p < 0.01). Thehigh correlations in these regions are consistent with their higher
fractional variance of the ISV to daily variance (Fig. 1b) and highercontribution of the LFISV to the total ISV than in other regions(Table 2). In addition, the enhanced MJO convection over thecentral equatorial Indian Ocean tends to lead wet Southeast Asiaand dry South China by 22 days. The dry anomaly over the tropicalwestern Pacific leads the dry phase by 15 days over Mexico and byten days over Brazil. These lead-lag correlations can be potentiallyused for the sub-seasonal prediction of each regional monsoon.
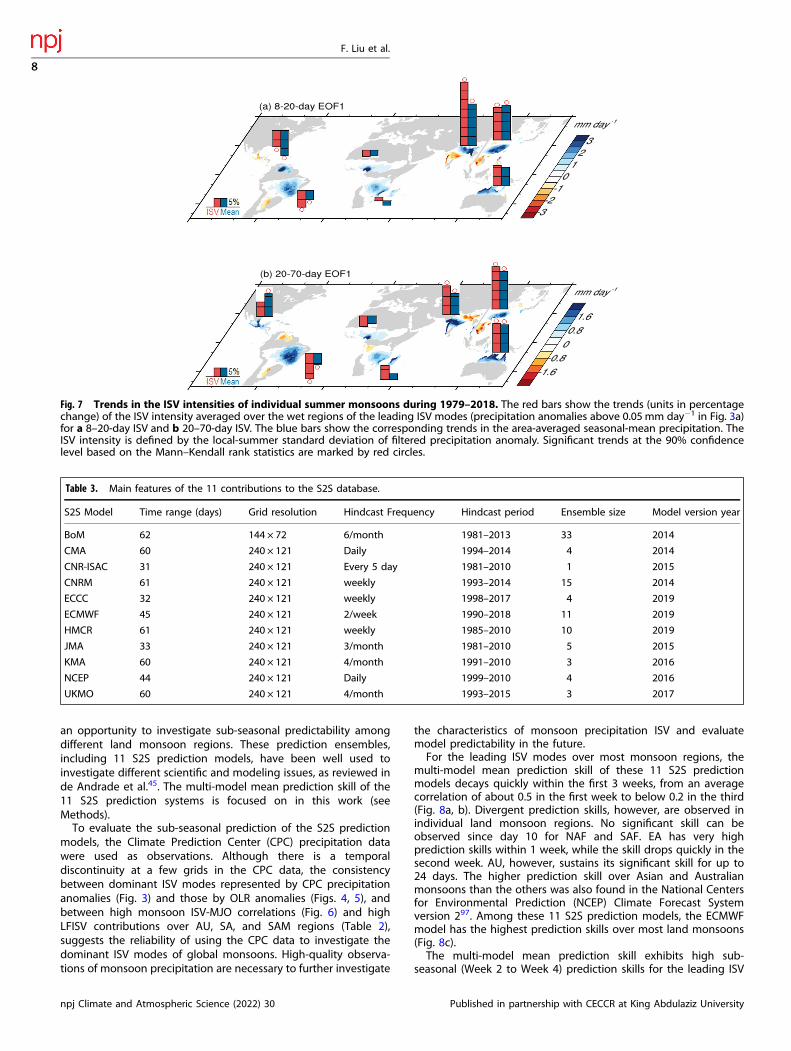
Recent trendsWe observe a significant (above 99% confidence level) increasingtrend in the amplitude of HFISVs over Southeast China andnorthern India-Bangladesh during the past four decades (Fig. 7).The largest increasing trend (about 35% per four decades) is overnorthern India-Bangladesh. In contrast, decreasing trends occurover South America, including significantly (above 95% con-fidence level) weakening over Venezuela (9%), and Brazil (9%). TheLFISVs are enhanced over Central India, Southeast China, andAustralia with a trend of 16% (above 90% confidence level), 22%(above 99% confidence level), and 15% (above 90% confidencelevel), respectively. The decreasing LFISV is found over Brazil (13%,above 99% confidence level).The changes in ISV intensity follow those of seasonal-mean
precipitation (Fig. 7). The mean precipitation exhibits a significantincreasing trend over Southeast China, Central India, northernIndia-Bangladesh, and Australia. Meanwhile, a significant decreas-ing trend appears over Venezuela and Brazil, resulting in asignificant reduction in ISV intensity. These results suggest thatthe intensity change of individual monsoon ISVs is determined bylocal mean-state change. The increased mean precipitation inAsian monsoons during the last four decades is mainly due to thenegative phase of the Inter-decadal Pacific Oscillation and thewarm phase of the Atlantic Multi-decadal Oscillation, augmentedby increased greenhouse gas (GHG) emission63,95.
Implication for sub-seasonal predictionThe extensive database of near real-time ensemble predictionsand hindcasts (Table 3), developed for improving prediction skillsand physical understanding on the S2S time scale96, provides us
0.26(12)
0.17(22) 0.16(15) 0.15(17)
0.30(14)
0.25(10)
0.14(26)
Fig. 6 Role of MJO in modulating the 20–70-day ISVs in individual summer monsoon regions. Red Arrows indicate lead correlationsbetween MJO convective center in equatorial central Indian Ocean (or negative convective anomaly in tropical western Pacific) and theleading modes of 20–70-day ISVs over individual monsoon regions during a boreal summer and b austral summer. Shading over the oceandenotes the regressed OLR anomaly (Wm−2) onto the negative RMM2. The shading over land depicts the leading EOF pattern (mm day−1) ofeach monsoon (Fig. 3b). The sign of the EOF in Fig. 3b is reversed when the maximum correlation coefficient is negative. The values in redindicate the maximum correlation coefficient, and the values in the bracket show the leading days. All correlations are significant at the 90%confidence level, except for the two African monsoons.
F. Liu et al.
7
Published in partnership with CECCR at King Abdulaziz University npj Climate and Atmospheric Science (2022) 30
an opportunity to investigate sub-seasonal predictability amongdifferent land monsoon regions. These prediction ensembles,including 11 S2S prediction models, have been well used toinvestigate different scientific and modeling issues, as reviewed inde Andrade et al.45. The multi-model mean prediction skill of the11 S2S prediction systems is focused on in this work (seeMethods).To evaluate the sub-seasonal prediction of the S2S prediction
models, the Climate Prediction Center (CPC) precipitation datawere used as observations. Although there is a temporaldiscontinuity at a few grids in the CPC data, the consistencybetween dominant ISV modes represented by CPC precipitationanomalies (Fig. 3) and those by OLR anomalies (Figs. 4, 5), andbetween high monsoon ISV-MJO correlations (Fig. 6) and highLFISV contributions over AU, SA, and SAM regions (Table 2),suggests the reliability of using the CPC data to investigate thedominant ISV modes of global monsoons. High-quality observa-tions of monsoon precipitation are necessary to further investigate
the characteristics of monsoon precipitation ISV and evaluatemodel predictability in the future.For the leading ISV modes over most monsoon regions, the
multi-model mean prediction skill of these 11 S2S predictionmodels decays quickly within the first 3 weeks, from an averagecorrelation of about 0.5 in the first week to below 0.2 in the third(Fig. 8a, b). Divergent prediction skills, however, are observed inindividual land monsoon regions. No significant skill can beobserved since day 10 for NAF and SAF. EA has very highprediction skills within 1 week, while the skill drops quickly in thesecond week. AU, however, sustains its significant skill for up to24 days. The higher prediction skill over Asian and Australianmonsoons than the others was also found in the National Centersfor Environmental Prediction (NCEP) Climate Forecast Systemversion 297. Among these 11 S2S prediction models, the ECMWFmodel has the highest prediction skills over most land monsoons(Fig. 8c).The multi-model mean prediction skill exhibits high sub-
seasonal (Week 2 to Week 4) prediction skills for the leading ISV
Fig. 7 Trends in the ISV intensities of individual summer monsoons during 1979–2018. The red bars show the trends (units in percentagechange) of the ISV intensity averaged over the wet regions of the leading ISV modes (precipitation anomalies above 0.05 mm day−1 in Fig. 3a)for a 8–20-day ISV and b 20–70-day ISV. The blue bars show the corresponding trends in the area-averaged seasonal-mean precipitation. TheISV intensity is defined by the local-summer standard deviation of filtered precipitation anomaly. Significant trends at the 90% confidencelevel based on the Mann–Kendall rank statistics are marked by red circles.
Table 3. Main features of the 11 contributions to the S2S database.
S2S Model Time range (days) Grid resolution Hindcast Frequency Hindcast period Ensemble size Model version year
BoM 62 144 × 72 6/month 1981–2013 33 2014
CMA 60 240 × 121 Daily 1994–2014 4 2014
CNR-ISAC 31 240 × 121 Every 5 day 1981–2010 1 2015
CNRM 61 240 × 121 weekly 1993–2014 15 2014
ECCC 32 240 × 121 weekly 1998–2017 4 2019
ECMWF 45 240 × 121 2/week 1990–2018 11 2019
HMCR 61 240 × 121 weekly 1985–2010 10 2019
JMA 33 240 × 121 3/month 1981–2010 5 2015
KMA 60 240 × 121 4/month 1991–2010 3 2016
NCEP 44 240 × 121 Daily 1999–2010 4 2016
UKMO 60 240 × 121 4/month 1993–2015 3 2017
F. Liu et al.
8
npj Climate and Atmospheric Science (2022) 30 Published in partnership with CECCR at King Abdulaziz University
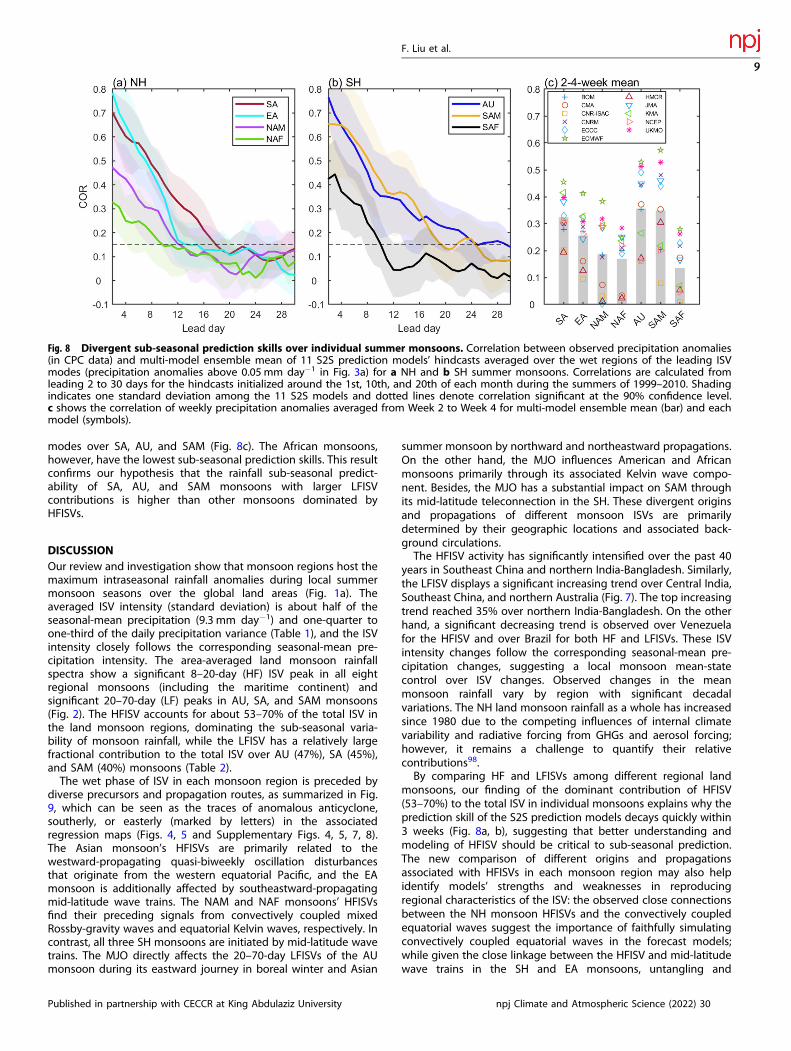
modes over SA, AU, and SAM (Fig. 8c). The African monsoons,however, have the lowest sub-seasonal prediction skills. This resultconfirms our hypothesis that the rainfall sub-seasonal predict-ability of SA, AU, and SAM monsoons with larger LFISVcontributions is higher than other monsoons dominated byHFISVs.
DISCUSSIONOur review and investigation show that monsoon regions host themaximum intraseasonal rainfall anomalies during local summermonsoon seasons over the global land areas (Fig. 1a). Theaveraged ISV intensity (standard deviation) is about half of theseasonal-mean precipitation (9.3 mm day−1) and one-quarter toone-third of the daily precipitation variance (Table 1), and the ISVintensity closely follows the corresponding seasonal-mean pre-cipitation intensity. The area-averaged land monsoon rainfallspectra show a significant 8–20-day (HF) ISV peak in all eightregional monsoons (including the maritime continent) andsignificant 20–70-day (LF) peaks in AU, SA, and SAM monsoons(Fig. 2). The HFISV accounts for about 53–70% of the total ISV inthe land monsoon regions, dominating the sub-seasonal varia-bility of monsoon rainfall, while the LFISV has a relatively largefractional contribution to the total ISV over AU (47%), SA (45%),and SAM (40%) monsoons (Table 2).The wet phase of ISV in each monsoon region is preceded by
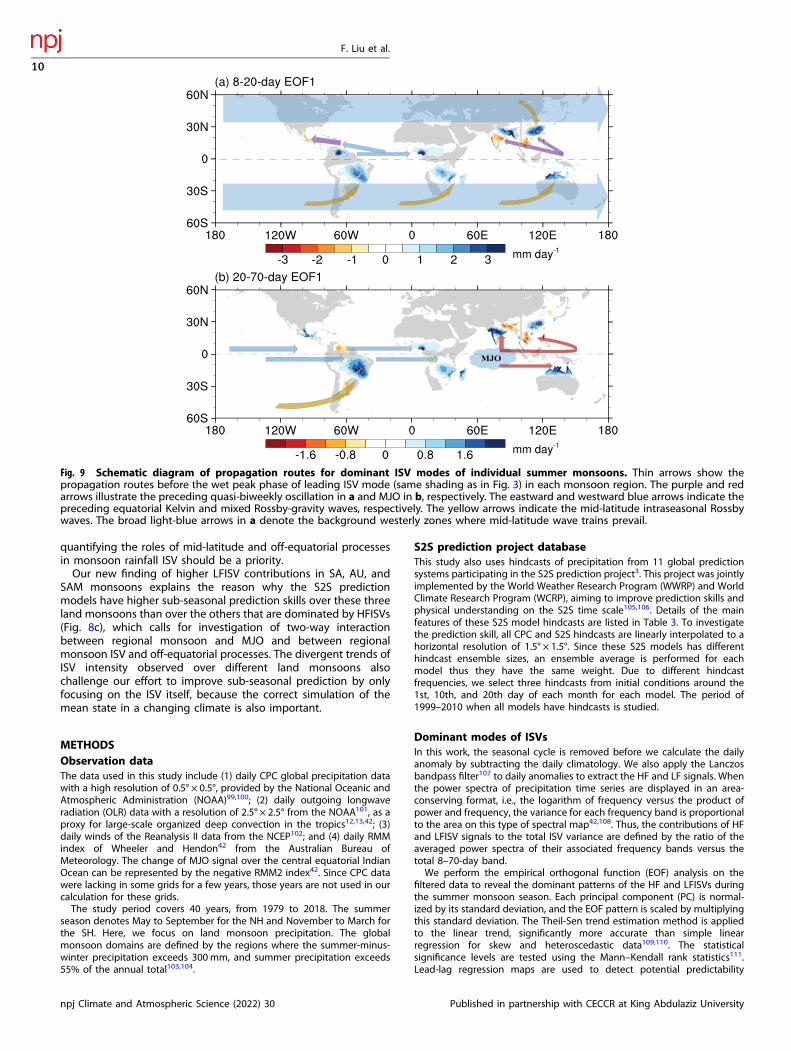
diverse precursors and propagation routes, as summarized in Fig.9, which can be seen as the traces of anomalous anticyclone,southerly, or easterly (marked by letters) in the associatedregression maps (Figs. 4, 5 and Supplementary Figs. 4, 5, 7, 8).The Asian monsoon’s HFISVs are primarily related to thewestward-propagating quasi-biweekly oscillation disturbancesthat originate from the western equatorial Pacific, and the EAmonsoon is additionally affected by southeastward-propagatingmid-latitude wave trains. The NAM and NAF monsoons’ HFISVsfind their preceding signals from convectively coupled mixedRossby-gravity waves and equatorial Kelvin waves, respectively. Incontrast, all three SH monsoons are initiated by mid-latitude wavetrains. The MJO directly affects the 20–70-day LFISVs of the AUmonsoon during its eastward journey in boreal winter and Asian
summer monsoon by northward and northeastward propagations.On the other hand, the MJO influences American and Africanmonsoons primarily through its associated Kelvin wave compo-nent. Besides, the MJO has a substantial impact on SAM throughits mid-latitude teleconnection in the SH. These divergent originsand propagations of different monsoon ISVs are primarilydetermined by their geographic locations and associated back-ground circulations.The HFISV activity has significantly intensified over the past 40
years in Southeast China and northern India-Bangladesh. Similarly,the LFISV displays a significant increasing trend over Central India,Southeast China, and northern Australia (Fig. 7). The top increasingtrend reached 35% over northern India-Bangladesh. On the otherhand, a significant decreasing trend is observed over Venezuelafor the HFISV and over Brazil for both HF and LFISVs. These ISVintensity changes follow the corresponding seasonal-mean pre-cipitation changes, suggesting a local monsoon mean-statecontrol over ISV changes. Observed changes in the meanmonsoon rainfall vary by region with significant decadalvariations. The NH land monsoon rainfall as a whole has increasedsince 1980 due to the competing influences of internal climatevariability and radiative forcing from GHGs and aerosol forcing;however, it remains a challenge to quantify their relativecontributions98.By comparing HF and LFISVs among different regional land
monsoons, our finding of the dominant contribution of HFISV(53–70%) to the total ISV in individual monsoons explains why theprediction skill of the S2S prediction models decays quickly within3 weeks (Fig. 8a, b), suggesting that better understanding andmodeling of HFISV should be critical to sub-seasonal prediction.The new comparison of different origins and propagationsassociated with HFISVs in each monsoon region may also helpidentify models’ strengths and weaknesses in reproducingregional characteristics of the ISV: the observed close connectionsbetween the NH monsoon HFISVs and the convectively coupledequatorial waves suggest the importance of faithfully simulatingconvectively coupled equatorial waves in the forecast models;while given the close linkage between the HFISV and mid-latitudewave trains in the SH and EA monsoons, untangling and
Fig. 8 Divergent sub-seasonal prediction skills over individual summer monsoons. Correlation between observed precipitation anomalies(in CPC data) and multi-model ensemble mean of 11 S2S prediction models’ hindcasts averaged over the wet regions of the leading ISVmodes (precipitation anomalies above 0.05 mm day−1 in Fig. 3a) for a NH and b SH summer monsoons. Correlations are calculated fromleading 2 to 30 days for the hindcasts initialized around the 1st, 10th, and 20th of each month during the summers of 1999–2010. Shadingindicates one standard deviation among the 11 S2S models and dotted lines denote correlation significant at the 90% confidence level.c shows the correlation of weekly precipitation anomalies averaged from Week 2 to Week 4 for multi-model ensemble mean (bar) and eachmodel (symbols).
F. Liu et al.
9
Published in partnership with CECCR at King Abdulaziz University npj Climate and Atmospheric Science (2022) 30
quantifying the roles of mid-latitude and off-equatorial processesin monsoon rainfall ISV should be a priority.Our new finding of higher LFISV contributions in SA, AU, and
SAM monsoons explains the reason why the S2S predictionmodels have higher sub-seasonal prediction skills over these threeland monsoons than over the others that are dominated by HFISVs(Fig. 8c), which calls for investigation of two-way interactionbetween regional monsoon and MJO and between regionalmonsoon ISV and off-equatorial processes. The divergent trends ofISV intensity observed over different land monsoons alsochallenge our effort to improve sub-seasonal prediction by onlyfocusing on the ISV itself, because the correct simulation of themean state in a changing climate is also important.
METHODSObservation dataThe data used in this study include (1) daily CPC global precipitation datawith a high resolution of 0.5° × 0.5°, provided by the National Oceanic andAtmospheric Administration (NOAA)99,100; (2) daily outgoing longwaveradiation (OLR) data with a resolution of 2.5° × 2.5° from the NOAA101, as aproxy for large-scale organized deep convection in the tropics12,13,42; (3)daily winds of the Reanalysis II data from the NCEP102; and (4) daily RMMindex of Wheeler and Hendon42 from the Australian Bureau ofMeteorology. The change of MJO signal over the central equatorial IndianOcean can be represented by the negative RMM2 index42. Since CPC datawere lacking in some grids for a few years, those years are not used in ourcalculation for these grids.The study period covers 40 years, from 1979 to 2018. The summer
season denotes May to September for the NH and November to March forthe SH. Here, we focus on land monsoon precipitation. The globalmonsoon domains are defined by the regions where the summer-minus-winter precipitation exceeds 300mm, and summer precipitation exceeds55% of the annual total103,104.
S2S prediction project databaseThis study also uses hindcasts of precipitation from 11 global predictionsystems participating in the S2S prediction project3. This project was jointlyimplemented by the World Weather Research Program (WWRP) and WorldClimate Research Program (WCRP), aiming to improve prediction skills andphysical understanding on the S2S time scale105,106. Details of the mainfeatures of these S2S model hindcasts are listed in Table 3. To investigatethe prediction skill, all CPC and S2S hindcasts are linearly interpolated to ahorizontal resolution of 1.5° × 1.5°. Since these S2S models has differenthindcast ensemble sizes, an ensemble average is performed for eachmodel thus they have the same weight. Due to different hindcastfrequencies, we select three hindcasts from initial conditions around the1st, 10th, and 20th day of each month for each model. The period of1999–2010 when all models have hindcasts is studied.
Dominant modes of ISVsIn this work, the seasonal cycle is removed before we calculate the dailyanomaly by subtracting the daily climatology. We also apply the Lanczosbandpass filter107 to daily anomalies to extract the HF and LF signals. Whenthe power spectra of precipitation time series are displayed in an area-conserving format, i.e., the logarithm of frequency versus the product ofpower and frequency, the variance for each frequency band is proportionalto the area on this type of spectral map42,108. Thus, the contributions of HFand LFISV signals to the total ISV variance are defined by the ratio of theaveraged power spectra of their associated frequency bands versus thetotal 8–70-day band.We perform the empirical orthogonal function (EOF) analysis on the
filtered data to reveal the dominant patterns of the HF and LFISVs duringthe summer monsoon season. Each principal component (PC) is normal-ized by its standard deviation, and the EOF pattern is scaled by multiplyingthis standard deviation. The Theil-Sen trend estimation method is appliedto the linear trend, significantly more accurate than simple linearregression for skew and heteroscedastic data109,110. The statisticalsignificance levels are tested using the Mann–Kendall rank statistics111.Lead-lag regression maps are used to detect potential predictability
MJO
Fig. 9 Schematic diagram of propagation routes for dominant ISV modes of individual summer monsoons. Thin arrows show thepropagation routes before the wet peak phase of leading ISV mode (same shading as in Fig. 3) in each monsoon region. The purple and redarrows illustrate the preceding quasi-biweekly oscillation in a and MJO in b, respectively. The eastward and westward blue arrows indicate thepreceding equatorial Kelvin and mixed Rossby-gravity waves, respectively. The yellow arrows indicate the mid-latitude intraseasonal Rossbywaves. The broad light-blue arrows in a denote the background westerly zones where mid-latitude wave trains prevail.
F. Liu et al.
10
npj Climate and Atmospheric Science (2022) 30 Published in partnership with CECCR at King Abdulaziz University
sources of the ISV patterns for each monsoon region. We test statisticalsignificance based on the two-tailed Student’s t-test, and the significanceof the results is assessed at a 90% confidence level without especiallymentioned in this study. Since the filtering method is used in this work, theeffective degree of freedom is considered to test the significance112, whichis defined as Ne ¼ Nð1� r1Þ=ð1þ r1Þ, where N is the sample size of totaldays and r1 is the lag-one autocorrelation.
DATA AVAILABILITYThe data that support the findings of this study are openly available and they can befound in the respective references.
CODE AVAILABILITYAll computer codes used to generate results in the paper are available from thecorresponding author upon reasonable request.
Received: 17 August 2021; Accepted: 22 March 2022;
REFERENCES1. Webster, P. J. & Hoyos, C. D. Prediction of monsoon rainfall and river discharge
on 15-30-day time scales. Bull. Am. Meteorol. Soc. 85, 1745–1765 (2004).2. Lau, W. K. M. & Waliser, D. E. Intraseasonal Variability of the
Atmosphere–Ocean–Climate System (Springer, 2011).3. Vitart, F. et al. The subseasonal to seasonal (S2S) prediction project database.
Bull. Am. Meteorol. Soc. 98, 163–173 (2017).4. Stan, C. et al. Review of tropical‐extratropical teleconnections on intraseasonal
time scales. Rev. Geophys. 55, 902–937 (2017).5. Madden, R. A. & Julian, P. R. Detection of a 40-50 day oscillation in the zonal
wind in the tropical Pacific. J. Atmos. Sci. 28, 702–708 (1971).6. Madden, R. A. & Julian, P. R. Description of global-scale circulation cells in the
tropics with a 40-50 day period. J. Atmos. Sci. 29, 1109–1123 (1972).7. Zhang, C. Madden‐Julian oscillation. Rev. Geophys. 43, 453–468 (2005).8. Wang, B. & Rui, H. Synoptic climatology of transient tropical intraseasonal
convection anomalies: 1975–1985. Meteorol. Atmos. Phys. 44, 43–61 (1990).9. Hendon, H. H. & Salby, M. L. The life cycle of the Madden–Julian oscillation. J.
Atmos. Sci. 51, 2225–2237 (1994).10. Wang, B. & Xie, X. A model for the boreal summer intraseasonal oscillation. J.
Atmos. Sci. 54, 72–86 (1997).11. Webster, P. J. et al. Monsoons: processes, predictability, and the prospects for
prediction. J. Geophys. Res. Atmos. 1031, 14451–14510 (1998).12. Kikuchi, K., Wang, B. & Kajikawa, Y. Bimodal representation of the tropical
intraseasonal oscillation. Clim. Dyn. 38, 1989–2000 (2012).13. Lee, J.-Y. et al. Real-time multivariate indices for the boreal summer intrasea-
sonal oscillation over the Asian summer monsoon region. Clim. Dyn. 40,493–509 (2013).
14. Yasunari, T. Structure of an Indian summer monsoon system with around 40-dayperiod. J. Meteor. Soc. Jpn. 59, 336–354 (1981).
15. Hartmann, D. & Michelsen, M. Intraseasonal periodicities in Indian rainfall. J.Atmos. Sci. 46, 2838–2862 (1989).
16. Annamalai, H. & Slingo, J. M. Active /break cycles: diagnosis of the intraseasonalvariability of the Asian summer monsoon. Clim. Dyn. 18, 85–102 (2001).
17. Chen, L. X., Zhu, C. W., Wang, W. & Zhang, P. Q. Analysis of the characteristics of30–60 day low-frequency oscillation over Asia during 1998 SCSMEX. Adv. Atmos.Sci. 18, 623–638 (2001).
18. Liang, P. & Ding, Y. Climatologic characteristics of the intraseasonal oscillation ofEast Asian meiyu (in Chinese). Acta Meteorol. Sin. 70, 418–435 (2012).
19. Hsu, P.-C., Lee, J.-Y. & Ha, K.-J. Influence of boreal summer intraseasonal oscil-lation on rainfall extremes in southern China. Int. J. Climatol. 36, 1403–1412(2016).
20. Higgins, R. W. & Shi, W. Intercomparison of the principal modes of interannualand intraseasonal variability of the North American Monsoon System. J. Clim. 14,403–417 (2001).
21. Barlow, M. & Salstein, D. Summertime influence of the Madden-Julian oscillationon daily rainfall over Mexico and Central America. Geophys. Res. Lett. 33, L21708(2006).
22. Perdigon-Morales, J., Romero-Centeno, R., Barrett, B. S. & Ordonez, P. Intrasea-sonal variability of summer precipitation in Mexico: MJO influence on themidsummer drought. J. Clim. 32, 2313–2327 (2019).
23. Sultan, B., Janicot, S. & Diedhiou, A. The West African monsoon dynamics. Part I:documentation of intraseasonal variability. J. Clim. 16, 3389–3406 (2003).
24. Maloney, E. D. & Shaman, J. Intraseasonal variability of the West African mon-soon and Atlantic ITCZ. J. Clim. 21, 2898–2918 (2008).
25. Janicot, S., Mounier, F., Gervois, S., Sultan, B. & Kiladis, G. N. The dynamics of theWest African monsoon. Part V: the detection and role of the dominant modes ofconvectively coupled equatorial Rossby waves. J. Clim. 23, 4005–4024 (2010).
26. Hendon, H. H. & Liebmann, B. The intraseasonal (30-50 day) oscillation of theAustralian summer monsoon. J. Atmos. Sci. 47, 2909–2923 (1990).
27. Wheeler, M. C. & McBride, J. L. In Intraseasonal Variability in the Atmosphere-Ocean Climate System (eds Lau, W. K. M. & Waliser, D. E.) Ch. 5 (Springer, 2005).
28. Wheeler, M., Hendon, H., Cleland, S., Meinke, H. & Donald, A. Impacts of theMadden–Julian oscillation on Australian rainfall and circulation. J. Clim. 22,1482–1498 (2009).
29. Nogués-Paegle, J., Byerle, L. A. & Mo, K. C. Intraseasonal modulation of SouthAmerican summer precipitation. Mon. Weather Rev. 128, 837–850 (2000).
30. Liebmann, B., Kiladis, G. N., Vera, C. S., Saulo, A. C. & Carvalho, L. M. V. Sub-seasonal variations of rainfall in South America in the vicinity of the low-level jeteast of the Andes and comparison to those in the South Atlantic convergencezone. J. Clim. 17, 3829–3842 (2004).
31. Carvalho, L. M. V., Jones, C. & Liebmann, B. The South Atlantic convergencezone: intensity, form, persistence, and relationships with intraseasonal tointerannual activity and extreme rainfall. J. Clim. 17, 88–108 (2004).
32. Alvarez, M. S., Vera, C. S., Kiladis, G. N. & Liebmann, B. Influence of the MaddenJulian oscillation on precipitation and surface air temperature in South America.Clim. Dyn. 46, 245–262 (2015).
33. Vera, C. S., Alvarez, M. S., Gonzalez, P. L. M., Liebmann, B. & Kiladis, G. N. Seasonalcycle of precipitation variability in South America on intraseasonal timescales.Clim. Dyn. 51, 1991–2001 (2018).
34. Grimm, A. M. Madden-Julian oscillation impacts on South American summermonsoon season: precipitation anomalies, extreme events, teleconnections, androle in the MJO cycle. Clim. Dyn. 53, 907–932 (2019).
35. Pohl, B. & Camberlin, P. Influence of the Madden–Julian oscillation on EastAfrican rainfall. I: intraseasonal variability and regional dependency. Q. J. R.Meteorol. Soc. 132, 2521–2539 (2006).
36. Berhane, F. & Zaitchik, B. Modulation of daily precipitation over east Africa bythe Madden-Julian oscillation. J. Clim. 27, 6016–6034 (2014).
37. Camberlin, P., Gitau, W., Kiladis, G. N., Bosire, E. & Pohl, B. Intraseasonal tointerannual modulation of diurnal precipitation distribution over Eastern Africa.J. Geophys. Res. Atmos. 124, 11863–11886 (2019).
38. Neena, J. M., Lee, J. Y., Waliser, D. & Wang, B. Predictability of the Madden-Julianoscillation in the intraseasonal variability hindcast experiment (ISVHE). J. Clim.27, 4531–4543 (2014).
39. Lee, S. S., Wang, B., Waliser, D. E., Neena, J. M. & Lee, J.-Y. Predictability andprediction skill of the boreal summer intraseasonal oscillation in the intrasea-sonal variability hindcast experiment. Clim. Dyn. 45, 2123–2135 (2015).
40. Martin, Z. et al. The influence of the quasi-biennial oscillation on theMadden–Julian oscillation. Nat. Rev. Earth Environ. 2, 477–489 (2021).
41. Meehl, G. A. et al. Initialized Earth system prediction from subseasonal to dec-adal timescales. Nat. Rev. Earth Environ. 2, 340–357 (2021).
42. Wheeler, M. C. & Hendon, H. H. An all-season real-time multivariate MJO index:development of an index for monitoring and prediction. Mon. Weather Rev. 132,1917–1932 (2004).
43. Lim, Y., Son, S. W. & Kim, D. MJO prediction skill of the subseasonal-to-seasonalprediction models. J. Clim. 31, 4075–4094 (2018).
44. Li, S. & Robertson, A. Evaluation of sub-monthly precipitation forecast skill fromglobal ensemble prediction systems. Mon. Weather Rev. 143, 2871–2889 (2015).
45. de Andrade, F. M., Coelho, C. A. S. & Cavalcanti, I. F. A. Global precipitationhindcast quality assessment of the subseasonal to seasonal (S2S) predictionproject models. Clim. Dyn. 52, 5451–5475 (2019).
46. Lee, S. S. & Wang, B. Regional boreal summer intraseasonal oscillation overIndian Ocean and Western Pacific: comparison and predictability study. Clim.Dyn. 46, 2213–2229 (2016).
47. Kikuchi, K. & Wang, B. Global perspective of the quasi-biweekly oscillation. J.Clim. 22, 1340–1359 (2009).
48. Simmons, A., Wallace, J. & Branstator, G. Barotropic wave propagation andinstability, and atmospheric teleconnection patterns. J. Atmos. Sci. 40,1363–1392 (1983).
49. Blackmon, M. L., Lee, Y. H., Wallace, J. M. & Hsu, H. H. Time variation of 500 mbheight fluctuations with long, intermediate and short time scales as deducedfrom lag-correlation statistics. J. Atmos. Sci. 41, 981–991 (1984).
50. Zhang, Y., Yang, X. Q., Nie, Y. & Chen, G. Annular mode-like variation in amultilayer quasigeostrophic model. J. Atmos. Sci. 69, 2940–2958 (2012).
51. Krishnamurti, T. & Bhalme, H. Oscillations of a monsoon system. Part I. Obser-vational aspects. J. Atmos. Sci. 33, 1937–1954 (1976).
F. Liu et al.
11
Published in partnership with CECCR at King Abdulaziz University npj Climate and Atmospheric Science (2022) 30
52. Yasunari, T. Cloudiness fluctuations associated with the northern hemispheresummer monsoon. J. Meteor. Soc. Jpn. 57, 227–242 (1979).
53. Qian, Y., Hsu, P.-C. & Kazuyoshi, K. New real-time indices for the quasi-biweeklyoscillation over the Asian summer monsoon region. Clim. Dyn. 53, 2603–2624(2019).
54. Yang, J., Wang, B. & Bao, Q. Biweekly and 21–30-day variations of the subtropicalsummer monsoon rainfall over the lower reach of the Yangtze River Basin. J.Clim. 23, 1146–1159 (2010).
55. Liu, F. et al. Seasonal evolution of the intraseasonal variability of China summerprecipitation. Clim. Dyn. 54, 4641–4655 (2020).
56. Ren, Q. et al. Origins of the intraseasonal variability of east Asian summerprecipitation. Geophys. Res. Lett. 49, e2021GL096574 (2022).
57. Mo, K. C. Intraseasonal modulation of summer precipitation over North America.Mon. Weather Rev. 128, 1490–1505 (2000).
58. Mounier, F., Janicot, S. & Kiladis, G. N. The west African monsoon dynamics. PartIII: the quasi-biweekly zonal dipole. J. Clim. 21, 1911–1928 (2008).
59. Nogués-Paegle, J. & Mo, K. C. Alternating wet and dry conditions over SouthAmerica during summer. Mon. Weather Rev. 125, 279–291 (1997).
60. Liebmann, B., Kiladis, G. N., Marengo, J., Ambrizzi, T. & Glick, J. D. Submonthlyconvective variability over South America and the South Atlantic convergencezone. J. Clim. 12, 1877–1891 (1999).
61. Gonzalez, P. L. M. & Vera, C. S. Summer precipitation variability over SouthAmerica on long and short intraseasonal timescales. Clim. Dyn. 43, 1993–2007(2014).
62. Chang, C.-P. et al. The Global Monsoon System: Research and Forecast 2nd edn(World Scientific, 2011).
63. Wang, B. et al. Northern Hemisphere summer monsoon intensified by mega-ElNino/southern oscillation and Atlantic multidecadal oscillation. Proc. Natl Acad.Sci. USA 110, 5347–5352 (2013).
64. Roxy, M. K. et al. Twofold expansion of the Indo-Pacific warm pool warps theMJO life cycle. Nature 575, 647–651 (2019).
65. Cheng, Y., Wang, L. & Li, T. Causes of interdecadal increase in the intraseasonalrainfall variability over Southern China around the early 1990s. J. Clim. 33, 1–47(2020).
66. Mo, K. C. & Paegle, J. N. In Intraseasonal Variability in the Atmosphere-OceanClimate System (eds Lau, W. K. M. & Waliser, D. E.) Ch.4 (Springer, 2005).
67. Roundy, P. E. In Intraseasonal Variability in the Atmosphere-Ocean Climate System(eds Lau, W. K. M. & Waliser, D. E.) Ch. 14 (Springer, 2012).
68. Chang, C. P., Wang, Z., McBride, J. & Liu, C.-H. Annual cycle of Southeast Asia -Maritime continent rainfall and the asymmetric monsoon transition. J. Clim. 18,287–301 (2005).
69. Ramage, C. S. Monsoon Meteorology (Academic, 1971).70. Yang, J. & Wang, B. Anticorrelated intensity change of the quasi-biweekly and
30–50-day oscillations over the South China Sea. Geophys. Res. Lett. 35, L16702(2008).
71. Ding, Q. & Wang, B. Circumglobal teleconnection in the northern hemispheresummer. J. Clim. 18, 3483–3505 (2005).
72. Lu, R., Ryu, C.-S. & Dong, B. Associations between the western North Pacificmonsoon and the South China sea monsoon. Adv. Atmos. Sci. 19, 12–24 (2002).
73. Enomoto, T., Hoskins, B. J. & Matsuda, Y. The formation mechanism of the Boninhigh in August. Q. J. R. Meteorol. Soc. 129, 157–178 (2003).
74. Yang, J. et al. Characterizing two types of transient intraseasonal oscillations inthe Eastern Tibetan Plateau summer rainfall. Clim. Dyn. 48, 1749–1768 (2017).
75. Chen, T.-C. & Chen, J.-M. The intraseasonal oscillation of the lower-tropospericcirculation over the western Pacific during the 1979 northern summer. J. Meteor.Soc. Jpn. 71, 205–220 (1993).
76. Lau, K.-H. & Lau, N.-C. Observed structure and propagation characteristics oftropical summertime synoptic scale disturbances. Mon. Weather Rev. 118,1888–1913 (1990).
77. Gao, M. et al. How are heat waves over Yangtze River valley associated withatmospheric quasi-biweekly oscillation? Clim. Dyn. 51, 4421–4437 (2018).
78. Waliser, D. E., Graham, N. E. & Gautier, C. Comparison of the highly reflectivecloud and outgoing longwave radiation datasets for use in estimating tropicaldeep convection. J. Clim. 6, 331–353 (1993).
79. Zhang, C., Nolan, D. S., Thorncroft, C. D. & Nguyen, H. Shallow meridional cir-culations in the tropical atmosphere. J. Clim. 21, 3453–3470 (2008).
80. Nie, J., Boos, W. R. & Kuang, Z. Observational evaluation of a convective quasi-equilibrium view of monsoons. J. Clim. 23, 4416–4428 (2010).
81. Kiladis, G. N., Wheeler, M. C., Haertel, P. T., Straub, K. H. & Roundy, P. E. Con-vectively coupled equatorial waves. Rev. Geophys. 47 (2009).
82. Kousky, V. E. Frontal influences on northeast Brazil. Mon. Weather Rev. 107,1140–1153 (1979).
83. Goswami, B. N. & Ajaya Mohan, R. S. Intraseasonal oscillations and interannualvariability of the Indian summer monsoon. J. Clim. 14, 1180–1198 (2000).
84. Grimm, A., Pal, J. & Giorgi, F. Connection between Spring conditions and peakSummer monsoon rainfall in South America: role of soil moisture, surfacetemperature, and topography in eastern Brazil. J. Clim. 20, 5929–5945 (2007).
85. Taschetto, A. & Wainer, I. Reproducibility of South American precipitation due tosubtropical South Atlantic SSTs. J. Clim. 21, 2835–2851 (2008).
86. Kemball-cook, S. & Wang, B. Equatorial waves and air-sea interaction in theboreal summer intraseasonal oscillation. J. Clim. 14, 2923–2942 (2001).
87. Moise, A., Smith, I., Brown, J., Colman, R. & Narsey, S. Observed and projectedintra‐seasonal variability of Australian monsoon rainfall. Int. J. Climatol. 40,2310–2327 (2019).
88. Jones, C. & Carvalho, L. Spatial–intensity variations in extreme precipitation inthe contiguous United States and the Madden–Julian oscillation. J. Clim. 25,4898–4913 (2011).
89. Alvarez, M., Vera, C. & Kiladis, G. MJO modulating the activity of the leadingmode of intraseasonal variability in South America. Atmosphere 8, 232 (2017).
90. Dias, J., Sakaeda, N., Kiladis, G. & Kikuchi, K. Influences of the MJO on the space-time organization of tropical convection: MJO & organized tropical convection.J. Geophys. Res. Atmos. 122, 8012–8032 (2017).
91. Cassou, C. Intraseasonal interaction between the Madden-Julian oscillation andthe North Atlantic oscillation. Nature 455, 523–527 (2008).
92. Moon, J. Y., Wang, B. & Ha, K. J. ENSO regulation of MJO teleconnection. Clim.Dyn. 37, 1133–1149 (2011).
93. Wang, L., Li, T., Zhou, T. & Rong, X. Origin of the intraseasonal variability over theNorth Pacific in boreal summer. J. Clim. 26, 1211–1229 (2013).
94. Zhu, T. & Yang, J. Two types of mid-high-latitude low-frequency intraseasonaloscillations near the Ural Mountains during boreal summer. J. Clim. 34, 1–56(2021).
95. Wang, B. et al. Toward predicting changes in the land monsoon rainfall a decadein advance. J. Clim. 31, 2699–2714 (2018).
96. Vitart, F. Madden-Julian oscillation prediction and teleconnections in the S2Sdatabase. Q. J. R. Meteorol. Soc. 143, 2210–2220 (2017).
97. Liu, X. et al. Subseasonal forecast skills and biases of global summer monsoonsin the NCEP climate forecast system version 2. Clim. Dyn. 42, 1487–1508 (2013).
98. Wang, B. et al. Monsoons climate change assessment. Bull. Am. Meteorol. Soc.102, E1–E19 (2021).
99. Xie, P. et al. A gauge-based analysis of daily precipitation over East Asia. J.Hydrometeorol. 8, 607–626 (2007).
100. Chen, M. et al. Assessing objective techniques for gauge-based analyses ofglobal daily precipitation. J. Geophys. Res. Atmos. 113, D04110 (2008).
101. Liebmann, B. & Smith, C. Description of a complete (interpolated) outgoinglongwave radiation dataset. Bull. Am. Meteorol. Soc. 77, 1275–1277 (1996).
102. Kanamitsu, M. et al. NCEP dynamical seasonal forecast system 2000. Bull. Am.Meteorol. Soc. 83, 1019–1038 (2002).
103. Wang, B. & Ding, Q. Global monsoon: dominant mode of annual variation in thetropics. Dyn. Atmos. Oceans 44, 165–183 (2008).
104. Lee, J.-Y. & Wang, B. Future change of global monsoon in the CMIP5. Clim. Dyn.42, 101–119 (2014).
105. Vitart, F., Robertson, A. & Anderson, D. Subseasonal to seasonal predictionproject: bridging the gap between weather and climate. Bull. World Meteorol.Organ 61, 23–28 (2012).
106. Robertson, A. W., Kumar, A., Peña, M. & Vitart, F. Improving and promotingsubseasonal to seasonal prediction. Bull. Am. Meteorol. Soc. 96, ES49–ES53(2015).
107. Duchon, C. Lanczos filtering in one and two dimensions. J. Appl. Meteorol. 18,1016–1022 (1979).
108. Zangvil, A. On the presentation and interpretation of spectra of large-scaledisturbances. Mon. Weather Rev. 105, 1469–1472 (1977).
109. Akritas, M. G., Murphy, S. A. & Lavalley, M. P. The Theil-Sen estimator with doublycensored data and applications to astronomy. J. Am. Stat. Assoc. 90, 170–177(1995).
110. Wilcox, R. R. Simulation results on extensions of the Theil-Sen regression esti-mator. Commun. Stat. -Simul. Comput 27, 1117–1126 (1998).
111. Kendall, M. G. Rank Correlation Methods 2nd ed (Hafner Publishing Co., 1955).112. Zwiers, F. W. & von Storch, H. Taking serial correlation into account in tests of
the mean. J. Clim. 8, 336–351 (1995).
ACKNOWLEDGEMENTSThis work was supported by the Guangdong Major Project of Basic and Applied BasicResearch (2020B0301030004) and the Natural Science Foundation of China(42175061; 41975107; and 42088101). B.W. acknowledges the support from theNational Science Foundation (award #2025057). This paper is ESMC ContributionNo. 375.
F. Liu et al.
12
npj Climate and Atmospheric Science (2022) 30 Published in partnership with CECCR at King Abdulaziz University

AUTHOR CONTRIBUTIONSF.L. and B.W. conceived the idea and proposed this study. Y.O. and H.W. conductedthe data analyses. All the authors discussed the concepts. The manuscript wasdrafted by F.L. and B.W. and edited by all authors.
COMPETING INTERESTSThe authors declare no competing interests.
ADDITIONAL INFORMATIONSupplementary information The online version contains supplementary materialavailable at https://doi.org/10.1038/s41612-022-00253-7.
Correspondence and requests for materials should be addressed to Fei Liu or BinWang.
Reprints and permission information is available at http://www.nature.com/reprints
Publisher’s note Springer Nature remains neutral with regard to jurisdictional claimsin published maps and institutional affiliations.
Open Access This article is licensed under a Creative CommonsAttribution 4.0 International License, which permits use, sharing,
adaptation, distribution and reproduction in anymedium or format, as long as you giveappropriate credit to the original author(s) and the source, provide a link to the CreativeCommons license, and indicate if changes were made. The images or other third partymaterial in this article are included in the article’s Creative Commons license, unlessindicated otherwise in a credit line to the material. If material is not included in thearticle’s Creative Commons license and your intended use is not permitted by statutoryregulation or exceeds the permitted use, you will need to obtain permission directlyfrom the copyright holder. To view a copy of this license, visit http://creativecommons.org/licenses/by/4.0/.
© The Author(s) 2022
F. Liu et al.
13
Published in partnership with CECCR at King Abdulaziz University npj Climate and Atmospheric Science (2022) 30