monsoon report 2020.pdf - imd pune
TRANSCRIPT
IMD Met Monograph:
ESSO/IMD/Synoptic Met/01(2021)/25
Government of India
India Meteorological Department
Edited by
Medha Khole, O. P. Sreejith, D. S. Pai and Sunitha Devi
Office of the Climate Research and Services
India Meteorological Department
PUNE- 411 005
INDIA
2020
Copyright © India Meteorological Department, 2021 The right of publication in print, electronic or any other form reserved by the India Meteorological Department. Short extracts may be reproduced, however the source should be clearly indicated. DISCLAIMER & LIMITATIONS The contents published in this report have been checked and authenticity assured within limitations of human errors. India Meteorological Department is not responsible for any errors and omissions. The geographical boundaries shown in this report do not necessarily correspond to the political boundaries.
Monsoon 2020 A Report
List of Authors
Name of Chapters Name of Office
Regional Characteristics of the Southwest Monsoon2020
Office of the Director General of Meteorology, New Delhi and Office of the Head, Climate and Research Services, Pune.
Global and Regional Circulation Anomalies Office of the Head, Climate and Research Services, Pune
Extreme Weather Events over Western Region (Maharashtra, Gujarat and Goa) During Southwest Monsoon 2020
Regional Meteorological Centre, India Meteorological Department, Mumbai.
Meteorological features associated with floods over eastern India during Southwest Monsoon 2020.
Regional Meteorological Centre, India Meteorological Department, Kolkata.
Disastrous Weather Events Over Central India During SW Monsoon 2020.
Regional Meteorological Centre, India Meteorological Department, Nagpur
Extremely heavy rainfall activity over the Southern peninsular India.
Regional Meteorological Centre, India Meteorological Department, Chennai.
A heavy rainfall episode over northeast region of India during 9-13 July 2020.
Regional Meteorological Centre, India Meteorological Department, Guwahati.
Performance of Southwest Monsoon 2020 over Uttar Pradesh and Rajasthan.
Regional Meteorological Centre, India Meteorological Department, Delhi.
Rainfall Features. Office of the Head, Climate and Research Services,Pune and Office of the Director General of Meteorology, New Delhi.
Agrometeorological Features of the Monsoon and services providing during Southwest Monsoon 2020.
Office of the Head, Climate and Research Services,Pune.
Verification of Quantitative Precipitation (QPF)during Southwest Monsoon 2020 over River Sub-basins of India.
Office of the Director General of Meteorology, New Delhi.
Operational and Experimental Long Range Prediction Forecasts.
Office of the Head, Climate and Research Services, Pune and Office of Indian Tropical Meteorology.
Extended Range Forecast (ERF) during Southwest Monsoon,
Office of the Director General of Meteorology, New Delhi and Office of Indian Tropical Meteorology.
Study of Monsoon features using Satellite Products.
Office of the Director General of Meteorology, New Delhi.
Monitoring of Low-Pressure Systems during the monsoon season – 2020 using Automatic Weather Stations (AWS).
Office of the Head, Climate and Research Services, Pune.
Verification of heavy rainfall warning. Office of the Director General of Meteorology, New Delhi.
Contents Monsoon 2020
A Report
Ch. No.
Name Authors Page No.
Acknowledgements
Preface
Executive Summary
1 1. Regional Characteristics of the Southwest Monsoon 2020
Sunitha Devi S., K Sathi Devi, Rajendra Kumar Jenamani, Soma Senroy, Naresh Kumar, Anupam Kashyapi and S. D. Sanap.
1-18
2 Global and Regional Circulation Anomalies
Aarti Bandgar, O. P. Sreejith and D. S. Pai. 19-38
3 Extreme Weather Events over Western India
K. S. Hosalikar, Bishwombhar Singh, S. A. Bhute, Nitha. T. S.,Jan Mohammad, Shambu Ravindren, Jayanta Sarkar, Manorama Mohanty, Vigin Lal F, Rahul M., Saurabh Mishra and Nisha Kushwaha
39-77
4 Meteorological features associated with floods over eastern India during southwest monsoon 2020
S Bandyopadhyay, H R Biswas, Umashankar Das, D Roy, Sourish Bondyopadhyay, Anand Shankar, G N Raha and G K Das.
78-93
5 Disastrous Weather Events over Central India During SW Monsoon 2020
Bhawna and M L Sahu 94-103
6 Extremely heavy rainfall activity over the Southern peninsular.
B.Geetha, R.V.Deepa , K.S.Rakhil, and S.Balachandran.
104-107
7 A heavy rainfall episode over northeast region of India during 9-13 July 2020
S. O. Shaw, S. Das, K. C. Sarkar and B. P. Mandal.
108-116
8 Performance od South West Monsoon-2020 over Uttar Pradesh and Rajasthan
J. P. Gupta, M. Danish, R. S. Sharma, Himanshu Sharma and Roop Narayan Khumawat
117-139
9 Rainfall Features B. P. Yadav, Pulak Guhathakurta and Rahul Saxena
140-165
10 Agrometeorological Features of the Monsoon and services providing during Southwest Monsoon 2020
Kripan Ghosh, R. Balasubramanian, K.K. Singh, Gracy John, Bhairavi S. Kurtkoti and Vidya Choudhari.
166-182
11 Verification of Quantitative Precipitation (QPF) during Southwest Monsoon 2020 over River Sub-basins of India
B. P. Yadav, Ashok Kumar Das, Jyotsana Dhingra and Charu.
183-201
12 Operational and Experimental Long Range Prediction forecasts
O.P. Sreejith, Divya Surendran, Madhuri Musale, Pai D. S. and Suryachandra Rao
202-220
13 Extended Range Forecast (ERF) during Southwest Monsoon
D. R. Pattanaik, Satendra Kumar, Praveen Kumar, Ashish Alone, Raju Mandal, Avijit Dey, R. Phani, M. Mohapatra and A. K. Sahai.
221-241
14 Study of Monsoon features using Satellite Products.
Suman Goyal and Chinmay Khadke 242-249
15 Monitoring of Low-Pressure Systems during the Monsoon season - 2020 using Automatic Weather Station (AWS)
Manish R. Ranalkar, Anjit Anjan and K.N. Mohan
250-260
16 Verification of heavy rainfall warning
K. Sathi Devi and Naresh Kumar 261-279
17 Summary and Conclusions
Medha Khole, O.P. Sreejith and Sunitha Devi
280-292
ACKNOWLEDGEMENTS
The report was prepared with the valuable inputs from scientists
andoperational forecasters from various offices of India Meteorological
Department(IMD). The editors express their sincere thanks to all the authors and co-
authors of various chapters of this report for their valuable contributions in
completing this report. As in the previous years, this report was prepared at the
Office of Climate Research and Services, India Meteorological Department,
Pune.The sincere efforts and support of the officers and staff of Climate Monitoring
and Prediction Group, IMD, Pune, for providing the technical assistance, are
thankfully acknowledged.
The meticulous contributions of Shri Jayesh Shah, Shri S.Y. Suryawanshi,
Shri B.S. Hirve, Shri S.K. Karande, Shri B.M. Kedari, Shri Jose Samuel and other
officers and staff members of the Printing and Documentation Section for designing,
typesetting and printing of the report are duly acknowledged. We also extend our
sincere thanks to Dr. M. Mohapatra, Director General of Meteorology for his valuable
guidance and support in preparation of this report.
---------------------------------------------------------------------------------------------------------------------------
PREFACE
As about 55% of the total cultivated area in India is under rain fed agriculture, the
Indian National food security largely depends on the performance of Southwest Monsoon.
The Southwest Monsoon is the principal rainy season for India. More than 75 percent of
India’s annual rainfall occurs during southwest monsoon season. About 70 percent of the
Indian population depends on farming for its livelihood. In addition to agriculture and drinking
water, the Southwest monsoon rainfall is also the essential source of water for other sectors
like power and industries which are directly or indirectly influenced by monsoon rainfall.
Thus, the performance of Southwest monsoon holds the key for the Indian Economy.
Since 2005, India Meteorological Department publishes a detailed report on
monsoon every year to document various characteristics of monsoon in order to serve as a
quick reference to both operational and research communities. The present report on
Southwest Monsoon of 2020 has documented salient features of the Southwest monsoon
2020. The report has been divided into 16 Chapters which highlight various features like
onset and withdrawal of monsoon, features of synoptic systems formed over the Indian
Region during the season, large-scale and regional circulation features and description of
meteorological analysis of significant weather events over different parts of the country,
among others. It also covers forecast verification at various time scales like seasonal and
extended range.
During 2020, the seasonal (June-September) rainfall over the country as a whole
was 109% of its Long Period Average (LPA). It was the third highest after 112% of LPA in
1994 and 110% of LPA in 2019. The monthly rainfall over the country as a whole was 118%
of LPA in June, 90% of LPA in July, 127% of LPA in August, and 104% of LPA in
September. The seasonal rainfalls over Northwest India, Central India, South Peninsula and
Northeast (NE) India were 84%, 115%, 130% and 106% of their respective LPA. Out of 36
meteorological subdivisions, 2 subdivisions (5% of the total area of the country) received
large excess rainfall, 13 subdivisions (35% of the total area of the country) received excess
rainfall, 16 subdivisions (45% of the total area of the country) received normal seasonal
rainfall and 5 subdivisions (15% of the total area of the country) received deficient season
rainfall during the season.
The Southwest monsoon current arrived over the south Andaman Sea and Nicobar
Islands on 17th May 2020 (5 days ahead of its normal date). However, the further advance
of the monsoon was sluggish. It set in over Kerala on 1st June coinciding with its normal
date for onset over Kerala; The Monsoon covered the entire country on 26th June 2020; 12
days before its normal date (8th July). The withdrawal of the monsoon from western parts of
northwest India started on 28th September 2020 against the normal date of 17th September
2020 with a delay of around 11 days. The Southwest Monsoon withdrew from the entire
country on 28th October 2020. During the season, one Severe Cyclonic Storm “NISARGA”
formed over the Arabian Sea, during 1st to 4th June. This year also witnessed absence of
monsoon depression during the season.
A coherent Madden Julian Oscillation (MJO) signal was not evident during June and
on most days of July. Only towards the end of July upto mid of August, the signal became

active and slight eastward propagation from Indian Ocean to the maritime continent was
seen. As the MJO moved eastwards over the Indian seas, the Arabian Sea and Bay of
Bengal became convectively active in August. The formation of five low pressure systems
over the North Bay of Bengal in succession out of which four of them became Well marked
(4-10 , 9-11, 13-18 , 19-26 and 24-31 August) and their west-northwestward movement
across central India upto Gujarat and south Rajasthan, active MJO, active Monsoon trough
mostly south of its normal position and stronger winds reaching up to 50-60 kmph in lower
levels over Arabian Sea during a few days in the month led to active monsoon conditions
over most parts of the country and caused significantly higher than normal rainfall over
central and western parts of India during the month of August. A weak MJO re-entered
eastern Indian Ocean in late August and propagated eastwards into maritime continent with
weak amplitude by the end of monsoon season.
The present report spells out challenging aspects of monsoon monitoring, variability
and prediction; and provides useful and authentic information about the 2020 southwest
monsoon season for operational forecasters, researchers and other users. I sincerely
appreciate all the authors and co-authors of the various chapters of the report for their
valuable contribution. I also appreciate the efforts made by the Editors and officers/staff of
the Climate research and Services, IMD, Pune in bringing out this Meteorological
Monograph.
-----
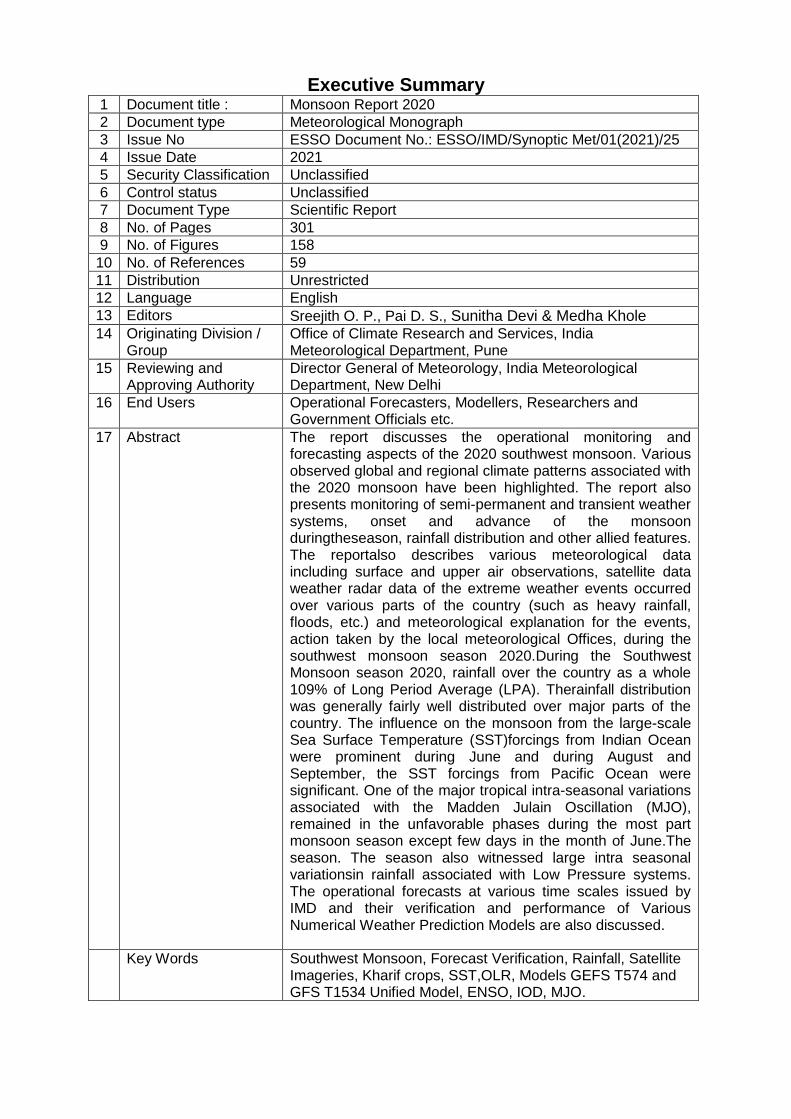
Executive Summary 1 Document title : Monsoon Report 2020
2 Document type Meteorological Monograph
3 Issue No ESSO Document No.: ESSO/IMD/Synoptic Met/01(2021)/25
4 Issue Date 2021
5 Security Classification Unclassified
6 Control status Unclassified
7 Document Type Scientific Report
8 No. of Pages 301
9 No. of Figures 158
10 No. of References 59
11 Distribution Unrestricted
12 Language English
13 Editors Sreejith O. P., Pai D. S., Sunitha Devi & Medha Khole
14 Originating Division / Group
Office of Climate Research and Services, India Meteorological Department, Pune
15 Reviewing and Approving Authority
Director General of Meteorology, India Meteorological Department, New Delhi
16 End Users Operational Forecasters, Modellers, Researchers and Government Officials etc.
17 Abstract The report discusses the operational monitoring and forecasting aspects of the 2020 southwest monsoon. Various observed global and regional climate patterns associated with the 2020 monsoon have been highlighted. The report also presents monitoring of semi-permanent and transient weather systems, onset and advance of the monsoon duringtheseason, rainfall distribution and other allied features. The reportalso describes various meteorological data including surface and upper air observations, satellite data weather radar data of the extreme weather events occurred over various parts of the country (such as heavy rainfall, floods, etc.) and meteorological explanation for the events, action taken by the local meteorological Offices, during the southwest monsoon season 2020.During the Southwest Monsoon season 2020, rainfall over the country as a whole 109% of Long Period Average (LPA). Therainfall distribution was generally fairly well distributed over major parts of the country. The influence on the monsoon from the large-scale Sea Surface Temperature (SST)forcings from Indian Ocean were prominent during June and during August and September, the SST forcings from Pacific Ocean were significant. One of the major tropical intra-seasonal variations associated with the Madden Julain Oscillation (MJO), remained in the unfavorable phases during the most part monsoon season except few days in the month of June.The season. The season also witnessed large intra seasonal variationsin rainfall associated with Low Pressure systems. The operational forecasts at various time scales issued by IMD and their verification and performance of Various Numerical Weather Prediction Models are also discussed.
Key Words Southwest Monsoon, Forecast Verification, Rainfall, Satellite Imageries, Kharif crops, SST,OLR, Models GEFS T574 and GFS T1534 Unified Model, ENSO, IOD, MJO.
1
1
REGIONAL CHARACTERISTICS OF THE
SOUTHWEST MONSOON 2020
Sunitha Devi S., K Sathi Devi, Rajendra Kumar Jenamani, Soma
Senroy, Naresh Kumar, Anupam Kashyapi and S. D. Sanap
This Chapter discusses the observed features of Southwest Monsoon 2020 including
various synoptic scale weather systems during the advance, mature and withdrawal
phases of the monsoon.
1.1 Onset and advance of southwest Monsoon-2020
1.1.1 Arrival of Southwest Monsoon Current over the Andaman Sea
Strengthening of the tropospheric south-westerly wind anomalies and associated
convective activity over the parts of Bay of Bengal (BoB) and Nicobar Islands & Andaman
Sea is observed at the beginning of third week of May. The consequent rainfall activity over
the region indicated the arrival of the southwest monsoon (SWM) over this region on 17th
May. Formation of the low-pressure area over southeast BoB and adjoining south Andaman
Sea and its intensification into a cyclonic storm „Amphan‟ has obstructed the further progress
of the SWM over the region till 26th May. Enhanced cloud cover and deepening of
southwesterly winds with its extension up to mid-tropospheric levels, SWM further advanced
into some more parts of the south BoB, most parts of Andaman Sea and Andaman and
Nicobar Islands on 28th May.Even though onset of the monsoon over south Andaman Sea
was 5 days before its normal date of arrival, it took 6 more days to cover the entire region.
1.1.2 Monsoon onset over Kerala
The SWM arrived over Kerala on its normal date i.e. on 1st June. The depth of the
southwesterlies upto 600 hPa was observed from 19th May onwards. All three criterion for
2
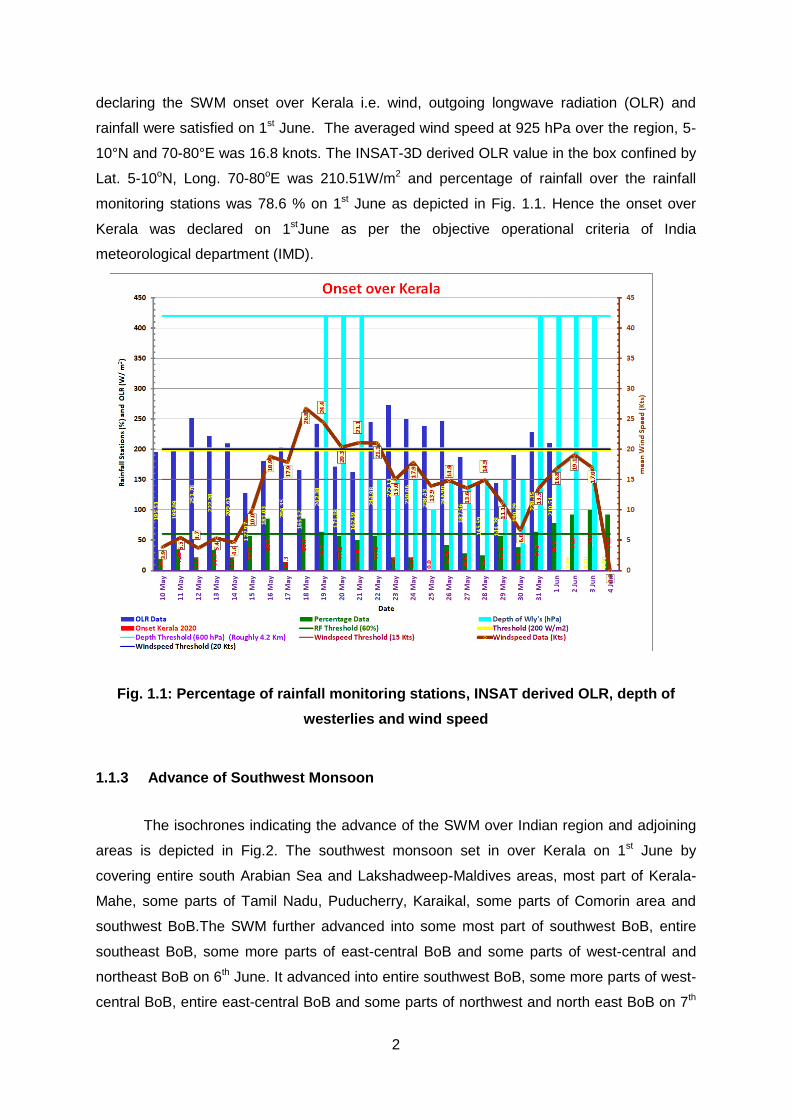
declaring the SWM onset over Kerala i.e. wind, outgoing longwave radiation (OLR) and
rainfall were satisfied on 1st June. The averaged wind speed at 925 hPa over the region, 5-
10°N and 70-80°E was 16.8 knots. The INSAT-3D derived OLR value in the box confined by
Lat. 5-10oN, Long. 70-80oE was 210.51W/m2 and percentage of rainfall over the rainfall
monitoring stations was 78.6 % on 1st June as depicted in Fig. 1.1. Hence the onset over
Kerala was declared on 1stJune as per the objective operational criteria of India
meteorological department (IMD).
Fig. 1.1: Percentage of rainfall monitoring stations, INSAT derived OLR, depth of
westerlies and wind speed
1.1.3 Advance of Southwest Monsoon
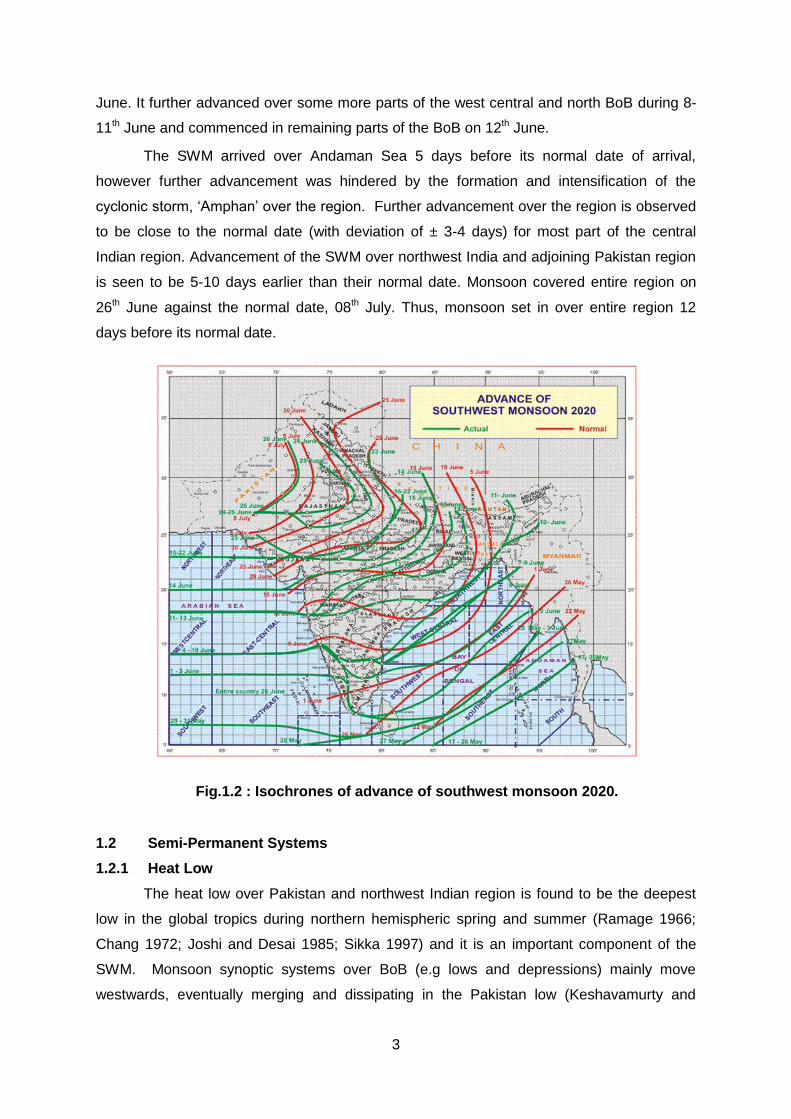
The isochrones indicating the advance of the SWM over Indian region and adjoining
areas is depicted in Fig.2. The southwest monsoon set in over Kerala on 1st June by
covering entire south Arabian Sea and Lakshadweep-Maldives areas, most part of Kerala-
Mahe, some parts of Tamil Nadu, Puducherry, Karaikal, some parts of Comorin area and
southwest BoB.The SWM further advanced into some most part of southwest BoB, entire
southeast BoB, some more parts of east-central BoB and some parts of west-central and
northeast BoB on 6th June. It advanced into entire southwest BoB, some more parts of west-
central BoB, entire east-central BoB and some parts of northwest and north east BoB on 7th
3
June. It further advanced over some more parts of the west central and north BoB during 8-
11th June and commenced in remaining parts of the BoB on 12th June.
The SWM arrived over Andaman Sea 5 days before its normal date of arrival,
however further advancement was hindered by the formation and intensification of the
cyclonic storm, „Amphan‟ over the region. Further advancement over the region is observed
to be close to the normal date (with deviation of ± 3-4 days) for most part of the central
Indian region. Advancement of the SWM over northwest India and adjoining Pakistan region
is seen to be 5-10 days earlier than their normal date. Monsoon covered entire region on
26th June against the normal date, 08th July. Thus, monsoon set in over entire region 12
days before its normal date.
Fig.1.2 : Isochrones of advance of southwest monsoon 2020.
1.2 Semi-Permanent Systems
1.2.1 Heat Low
The heat low over Pakistan and northwest Indian region is found to be the deepest
low in the global tropics during northern hemispheric spring and summer (Ramage 1966;
Chang 1972; Joshi and Desai 1985; Sikka 1997) and it is an important component of the
SWM. Monsoon synoptic systems over BoB (e.g lows and depressions) mainly move
westwards, eventually merging and dissipating in the Pakistan low (Keshavamurty and
4
Awade 1970). Departure of the pressure from normal has influence on the monsoon activity.
Strong pressure gradient between heat low region (below normal pressure) and peninsular
region (above normal pressure) is understood to be favorable for the monsoon activity over
Indian region.
The month wise lowest and the second lowest values of the heat low were:
June: 996hPa (on 16, 18,19& 20,28,29) and 998hPa
(on 6,7,8,12,13,15,21,22,26,27)
July: 994 hPa (on 5,11,12,16,20,21) and 996hPa (on 3,4,6,10,13,14,15,30)
Aug: 992hPa (on 4,5,6) and 994hPa (on 3,13,14,15,17,19)
Sept: 1000hPa (on 11,22,23,26) and 1002hPa (on 1,6,7,17,18,19,20,21,24,25)
1.2.2 Monsoon Trough
With Advance of the SWM the heat low gradually extends eastwards and forms an
elongated low-pressure zone running parallel to the Himalayan Mountains in the west to east
direction. This is referred as the monsoon trough (MT). The trough line runs at surface
roughly parallel to the Himalayan foothills from Ganganagar to Kolkata through Allahabad,
with west to southwest winds to south and easterlies to the north of the trough line. The MT
is not a stationary system. It shows periodic movements to the north and south of its normal
position. Its northward movement intensifies the rainfall activity at the foothills of the
Himalayas in milieu of very less or ceased rainfall activity at central Indian region. This
situation is called as the „break in monsoon‟. The trough sometimes shifts to the central parts
when monsoon depressions from the North Bay move west / west northwest-wards across
the country.
A trough at mean sea level made its first appearance on 15th June. It extended from
Pakistan to the cyclonic circulation associated with the low-pressure area over east central
and adjoining west central Bay of Bengal across north Rajasthan, north Madhya Pradesh,
Chhattisgarh and Odisha at 0.9 km above mean sea level. Upon setting up the monsoon
over entire region, MT got established on 27th June. The western part of it lay over north of
its normal position while eastern part lay close to the foothills of Himalayas on remaining
days in June. It remained south (north, foothills of Himalaya) of its normal position in first
(second) week of July. Western end of the MT is seen at normal and south of its normal
position during third and fourth week of July. However, eastern end of the MT is observed
close to the foothills of the Himalayas during third and fourth week of the July. Western end
of the MT oscillated between normal and north of its normal position while eastern end was
5
seen at foothills of Himalaya during first week of August. During second and third week, the
western end of the MT was at south of its normal position with eastern end at its normal
position. It remained south of its normal position during fourth week of the August. During
last few days of the August and a first week of the September, MT was mainly seen at the
foothills of Himalayas with slight variations for a day or two. Strong north-south fluctuation in
the position of MT was observed during second and third week of September.Up to mid of
the fourth week of the September, the western end of itlay near normal / north of its normal
position whereas the eastern end lay north of its normal position, close to the foot hills of
Himalayas. It became disorganized after 28th of September due to withdrawal of South West
Monsoon.
1.2.3 Tibetan Anticyclone
The High over Tibet from 500 hPa and above centered near Tibet at 500 hPa and
over Tibet at 300 hPa and 200 hPa, is a semi- permanent warm anticyclone. In June the axis
of the anticyclonic belt is at about 25oN, at 300 and 200 hPa, and near 30oN only at 100 hPa,
at the southern periphery of Tibet. August is similar to July, but the anticyclone is a little
more to the north and slightly more intense. In September, the anticyclonic belt is near about
26oN up to 200 hPa and 30oN at 100 hPa. Ramaswamy (1965) pointed out that well
distributed rainfall over India is associated with well–pronounced and east–to–west oriented
anticyclone over Tibet at 500 and 300 hPa levels, and a pronounced high index circulation
over Siberia, Mongolia and north China.
The position of Tibetan anticyclone (TA) is mainly seen at south/southeast of its
normal position for the month of June. It is seen at east- northeast of its normal position on
first week of July while it was at east of its normal position during second and third week of
July. Westward movement of the TA from its normal position is seen in the fourth week of
July. It was seen at its normal position during first week of August. Position of the TA is
mainly seen at west of its normal position during second, third and fourth week of the
August. It was seen at its normal position during first two week of the September with slight
west/north westward movement for a day or two. Towards the end of third week of
September, it moved west/ southwest of its normal position. It was seen consistently
southeast of its normal position during last week of the September.
1.2.4 Tropical Easterly Jet
Tropical Easterly Jet (TEJ) is an important component of the SWM circulation which
can be seen in the upper tropospheric levels (100-150 hPa) centered near about the latitude
of Chennai (Krishnamurti and Bhalme, 1976). The jet stream runs from the east coast of
Vietnam to the west coast of Africa. It exhibits the periodic movements to the north and
6
south of its normal location during SWM season. Normally, the jet is at an accelerating stage
from the South China Sea to south India and decelerates thereafter. Consequent upper level
divergence is regarded as favourable for convection upstream of 70OE and subsidence
downstream. This year, TEJ got established over southern tip of Peninsular India by 8th
June with Thiruvananthapuram reporting easterlies of 81 knots at 123 hPa on 8th June.
Highest wind speed of 144 knots at 131 hPa at Chennai station was recorded on 11th
August.
1.2.5 Mascarene High
The Mascarenes High (MH) is a high-pressure area centered at 30oS/ 50oE off the
coast of Madagascar near the Mascarene Islands in the Southern Indian Ocean (SIO). Short
period variation in the intensity of the MH is dominated by the passage of the extra-tropical
waves in SIO (Sikka and Gray. 1981). The intensification of Mascarene High strengthens the
cross equatorial flow in the form of Low-Level Jet and the corresponding monsoon current
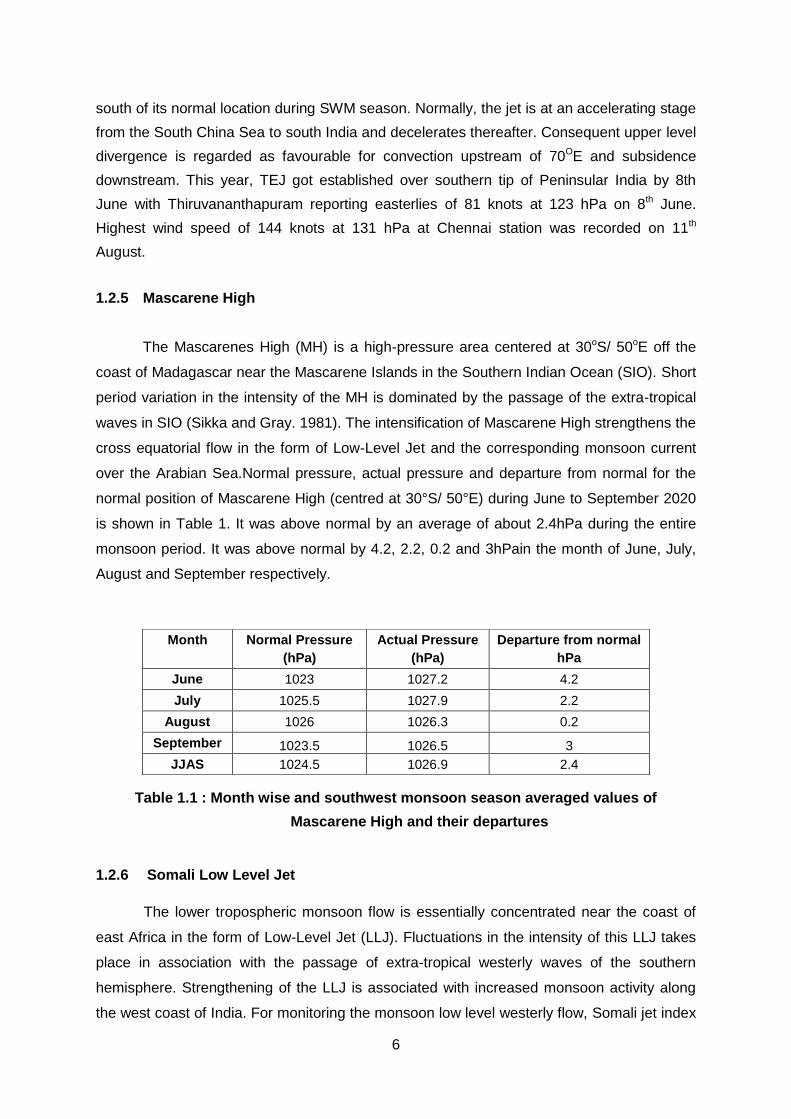
over the Arabian Sea.Normal pressure, actual pressure and departure from normal for the
normal position of Mascarene High (centred at 30°S/ 50°E) during June to September 2020
is shown in Table 1. It was above normal by an average of about 2.4hPa during the entire
monsoon period. It was above normal by 4.2, 2.2, 0.2 and 3hPain the month of June, July,
August and September respectively.
Table 1.1 : Month wise and southwest monsoon season averaged values of
Mascarene High and their departures
1.2.6 Somali Low Level Jet
The lower tropospheric monsoon flow is essentially concentrated near the coast of
east Africa in the form of Low-Level Jet (LLJ). Fluctuations in the intensity of this LLJ takes
place in association with the passage of extra-tropical westerly waves of the southern
hemisphere. Strengthening of the LLJ is associated with increased monsoon activity along
the west coast of India. For monitoring the monsoon low level westerly flow, Somali jet index
Month Normal Pressure
(hPa)
Actual Pressure
(hPa)
Departure from normal
hPa
June 1023 1027.2 4.2
July 1025.5 1027.9 2.2
August 1026 1026.3 0.2
September 1023.5 1026.5 3
JJAS 1024.5 1026.9 2.4
7
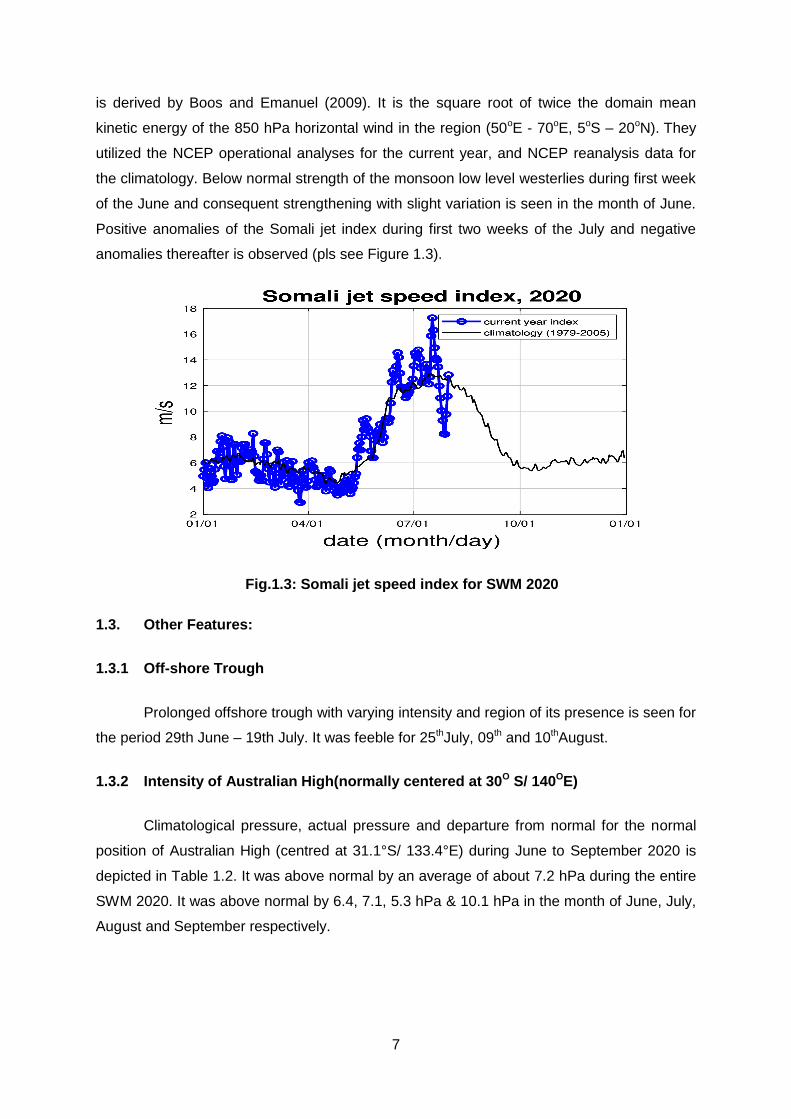
is derived by Boos and Emanuel (2009). It is the square root of twice the domain mean
kinetic energy of the 850 hPa horizontal wind in the region (50oE - 70oE, 5oS – 20oN). They
utilized the NCEP operational analyses for the current year, and NCEP reanalysis data for
the climatology. Below normal strength of the monsoon low level westerlies during first week
of the June and consequent strengthening with slight variation is seen in the month of June.
Positive anomalies of the Somali jet index during first two weeks of the July and negative
anomalies thereafter is observed (pls see Figure 1.3).
Fig.1.3: Somali jet speed index for SWM 2020
1.3. Other Features:
1.3.1 Off-shore Trough
Prolonged offshore trough with varying intensity and region of its presence is seen for
the period 29th June – 19th July. It was feeble for 25thJuly, 09th and 10thAugust.
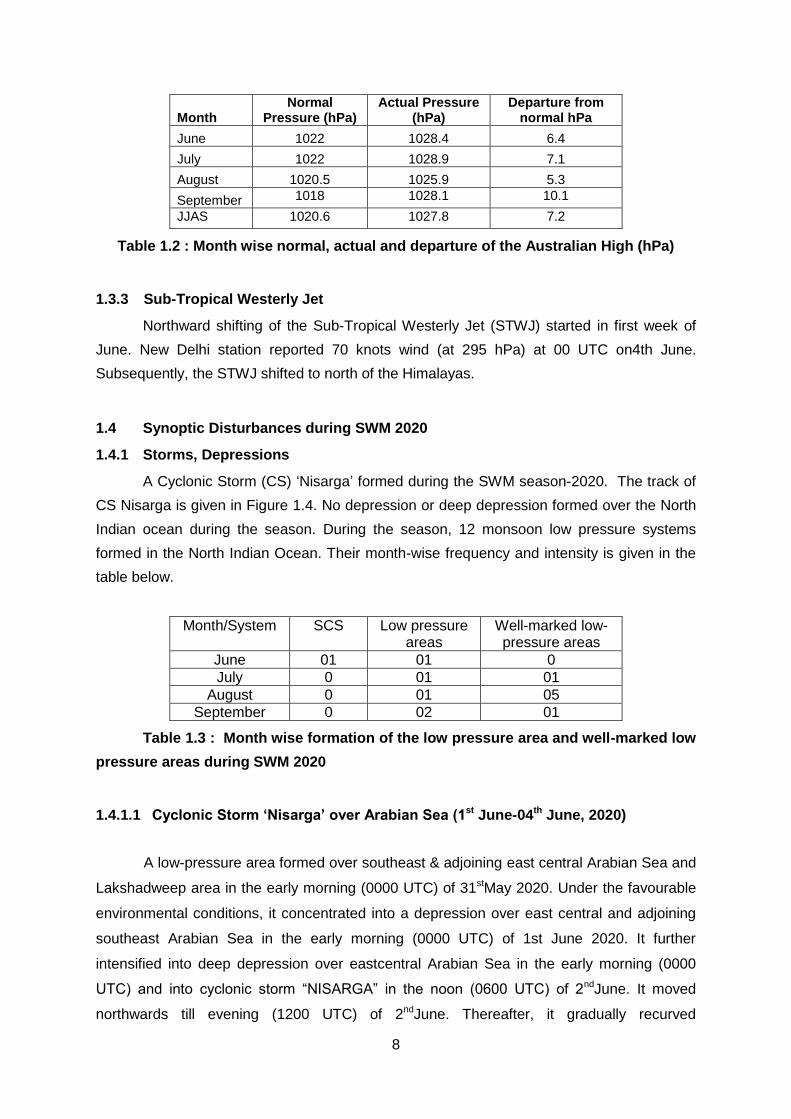
1.3.2 Intensity of Australian High(normally centered at 30O S/ 140OE)
Climatological pressure, actual pressure and departure from normal for the normal
position of Australian High (centred at 31.1°S/ 133.4°E) during June to September 2020 is
depicted in Table 1.2. It was above normal by an average of about 7.2 hPa during the entire
SWM 2020. It was above normal by 6.4, 7.1, 5.3 hPa & 10.1 hPa in the month of June, July,
August and September respectively.
8
Month Normal
Pressure (hPa) Actual Pressure
(hPa) Departure from
normal hPa
June 1022 1028.4 6.4
July 1022 1028.9 7.1
August 1020.5 1025.9 5.3
September 1018 1028.1 10.1
JJAS 1020.6 1027.8 7.2
Table 1.2 : Month wise normal, actual and departure of the Australian High (hPa)
1.3.3 Sub-Tropical Westerly Jet
Northward shifting of the Sub-Tropical Westerly Jet (STWJ) started in first week of
June. New Delhi station reported 70 knots wind (at 295 hPa) at 00 UTC on4th June.
Subsequently, the STWJ shifted to north of the Himalayas.
1.4 Synoptic Disturbances during SWM 2020
1.4.1 Storms, Depressions
A Cyclonic Storm (CS) „Nisarga‟ formed during the SWM season-2020. The track of
CS Nisarga is given in Figure 1.4. No depression or deep depression formed over the North
Indian ocean during the season. During the season, 12 monsoon low pressure systems
formed in the North Indian Ocean. Their month-wise frequency and intensity is given in the
table below.
Month/System SCS Low pressure areas
Well-marked low-pressure areas
June 01 01 0
July 0 01 01
August 0 01 05
September 0 02 01
Table 1.3 : Month wise formation of the low pressure area and well-marked low
pressure areas during SWM 2020
1.4.1.1 Cyclonic Storm ‘Nisarga’ over Arabian Sea (1st June-04th June, 2020)
A low-pressure area formed over southeast & adjoining east central Arabian Sea and
Lakshadweep area in the early morning (0000 UTC) of 31stMay 2020. Under the favourable
environmental conditions, it concentrated into a depression over east central and adjoining
southeast Arabian Sea in the early morning (0000 UTC) of 1st June 2020. It further
intensified into deep depression over eastcentral Arabian Sea in the early morning (0000
UTC) and into cyclonic storm “NISARGA” in the noon (0600 UTC) of 2ndJune. It moved
northwards till evening (1200 UTC) of 2ndJune. Thereafter, it gradually recurved
9
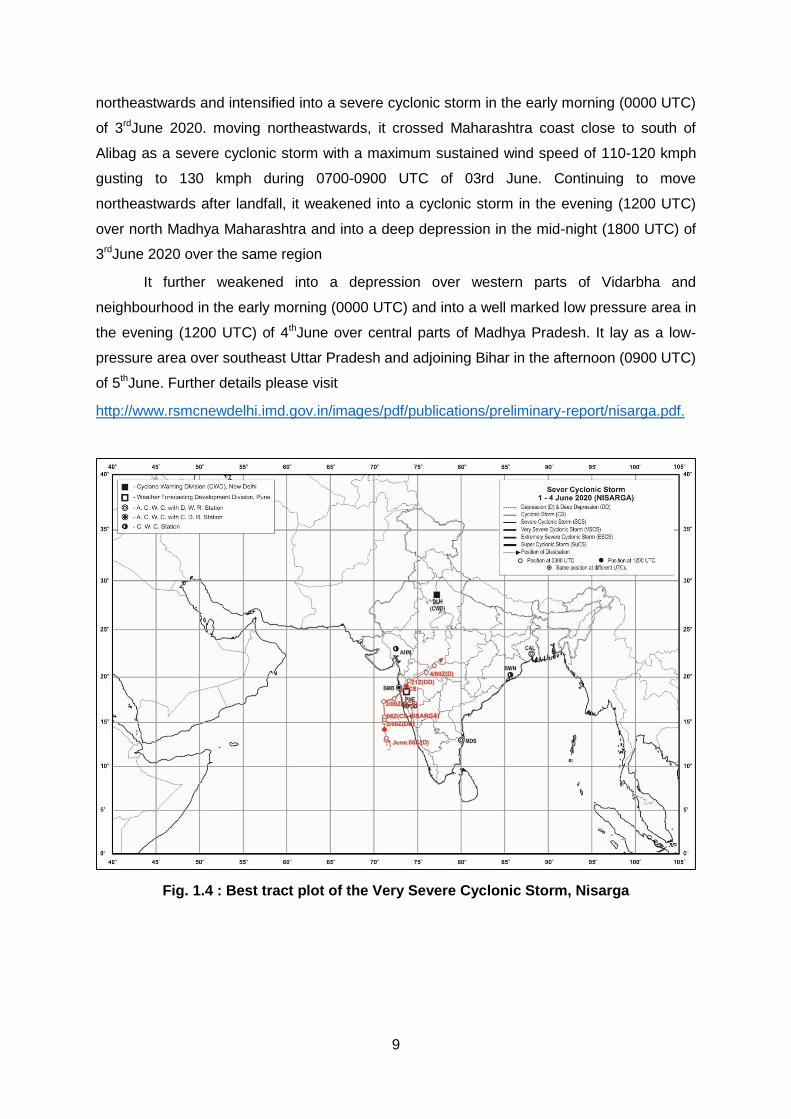
northeastwards and intensified into a severe cyclonic storm in the early morning (0000 UTC)
of 3rdJune 2020. moving northeastwards, it crossed Maharashtra coast close to south of
Alibag as a severe cyclonic storm with a maximum sustained wind speed of 110-120 kmph
gusting to 130 kmph during 0700-0900 UTC of 03rd June. Continuing to move
northeastwards after landfall, it weakened into a cyclonic storm in the evening (1200 UTC)
over north Madhya Maharashtra and into a deep depression in the mid-night (1800 UTC) of
3rdJune 2020 over the same region
It further weakened into a depression over western parts of Vidarbha and
neighbourhood in the early morning (0000 UTC) and into a well marked low pressure area in
the evening (1200 UTC) of 4thJune over central parts of Madhya Pradesh. It lay as a low-
pressure area over southeast Uttar Pradesh and adjoining Bihar in the afternoon (0900 UTC)
of 5thJune. Further details please visit
http://www.rsmcnewdelhi.imd.gov.in/images/pdf/publications/preliminary-report/nisarga.pdf.
Fig. 1.4 : Best tract plot of the Very Severe Cyclonic Storm, Nisarga
10
1.4.2 Low Pressure Areas/Well Marked Low Pressure Areas
Under the influence of cyclonic circulation extending upto mid-tropospheric levels,
first low-pressure area formed over East central BoB on 9thJune. It moved northwestwards
and became less marked on 17th June over east Uttar Pradesh and neighbourhood. Due to
this system monsoon was vigorous over south eastern and central Indian region.
The cyclonic circulation extending upto lower to mid-tropospheric levels over south
Gujarat and neighbourhood persisted for 1st to 4th July, 2020. Under its influence, a low
pressure area formed over coastal Saurashtra and neighbourhood on 5th morning. It lay over
Kutch and neighbourhood with an associated cyclonic circulation extended up to 5.8 km
above m. s. l. tilting southwards with height on the same day. It lay as a well-marked low
pressure area over the same region 6th morning and further lay over Saurashtra and
neighbourhood with the associated cyclonic circulation extended up to 7.6 km above m. s. l.
tilting southwards with height. It moved north westwards and become less marked over
south Pakistan and neighbourhood. Under its influence monsoon was active to vigorous over
Saurashtra Kutch and adjoining region.
Under the influence of upper air cyclonic circulation extending upto mid-tropospheric
levels, the low-pressure area (5th -7th July) formed over northwest Bay of Bengal off
Odisha-Gangetic West Bengal coasts with an associated cyclonic circulation extended up to
7.6 km above m. s. l. tilting south-westwards with height on 5th July. It moved
northwestwards and become less marked over western parts of the Jharkhand and
neighbourhood on the evening of 07th July and the associated cyclonic circulation merged
with the MT on same day. Due to this eastern end of the MT moved north of its normal
position.
Under the influence of the cyclonic circulation lay over northeast Bay of Bengal and
neighbourhood between 3.1 and 4.5 km above m. s. l. a low-pressure area (04th – 07th
August) formed over North Bay of Bengal and neighbourhood on the morning of 04th August
and became well marked low pressure area over northwest BoB off north Odisha-West
Bengal coasts in the evening of same day.It moved westwards and become less marked
over southwest Madhya Pradesh and adjoining Gujarat Region on 07th August.
The cyclonic circulation associated with the above mentioned less marked system
moved further westwards and emerged in northeast Arabian sea. Under its influence a low-
11
pressure area (7th – 10th August) formed over northeast Arabian sea and adjoining coastal
areas of Kutch and south Pakistan on the evening of 7th August. It lay as a well-marked low-
pressure area over central parts of north Arabian Sea and adjoining south Pakistan coast on
8th morning which further lay over northwest, adjoining northeast Arabian Sea and
neighbourhood on same day. It moved westward and become less marked over northwest
Arabian sea off the region of Oman coast on 10th August.
A cyclonic circulation between 3.6 and 5.8 km above m. s. l. lay over northwest Bay
of Bengal and neighbourhood on 8th. Under its influence, a low pressure area formed over
northwest and adjoining westcentral Bay of Bengal off Odisha-north Andhra Pradesh coasts
on 9th August morning. It further lay over northwest Bay of Bengal off north Odisha-Gangetic
West Bengal coasts with an associated cyclonic circulation which extended up to 5.8 km
above m. s. l. tilting southwestward with height on the same day which lay over north
Chhattisgarh and neighbourhood in the evening hours. It then lay over northeast Madhya
Pradesh and neighbourhood on 10th morning which persisted over the same region with the
associated cyclonic circulation extended up to 2.1 km above m. s. l. afterwards. It lay over
northwest Madhya Pradesh and neighbourhood on 11th morning which became less marked
on the same day.
A low-pressure area (13th – 18th August) is formed over northwest Bay of Bengal off
north Odisha and West Bengal coasts on 13th August. It lay It lay as a well-marked low-
pressure area over north coastal Odisha and adjoining areas of northwest Bay of Bengal,
Gangetic west Bengal on the evening of 14th August. By moving northwestwards it less
marked over northeast Madhya Pradesh and adjoining areas of north Chhattisgarh and
southeast Uttar Pradesh in the morning of 18th August.
Under the influence of cyclonic circulation between 5.8 km and 7.6 km above m. s. l.
lay over northeast Bay of Bengal and neighbourhood a low pressure (19th– 26th August) area
formed over north Bay of Bengal and neighbourhood on 19thmorning which further lay as a
well marked low pressure area over northwest Bay of Bengal and neighbourhood with the
associated cyclonic circulation extended up to 7.6 km above m. s. l. tilting south-westward
with height on the same day. It moved west-northwestwards across Madhya Pradesh, South
West Rajashtan and become less marked over south Pakistan and neighbourhood on 26th
August. Under its influence, central and north west Indian region received substantial
amount of rainfall and monsoon activity was mostly vigorous over the region.
12
A cyclonic circulation lay over Bangladesh & neighbourhood between 5.8 km and 7.6
km above m. s. l. on 23rd. Under its influence a low-pressure area (24th August-2nd
September)formed over north Bay of Bengal and neighbourhood on 24th morning which
persisted over the same region with the associated cyclonic circulation extended upto 7.6 km
above m. s. l. tilting southwestward with height on the same day. With the associated
cyclonic circulation extended up to 7.6 km above m. s. l. tilting southwestward with height, it
lay as a well marked low pressure area over the same region on 25th and lay over northwest
Bay of Bengal and adjoining coastal areas of Gangetic West Bengal and north Odisha on
26th August.It moved west north westwards and lay as a low pressure area over west
Madhya Pradesh and adjoining east Rajasthan on 30th morning. Moving further in the same
direction, finally, merged with the heat low on 2nd morning with remnant cyclonic circulation
extended up to 3.1 km above m.s.l. over lay over Punjab and adjoining Pakistan.
Cyclonic circulation extending up to 4.5 km m.s.l lay over southeast and adjoining
eastcentral Arabian sea for 3rd -5thth September. Under its influence a low-pressure area
(6th -8th September) formed over southeast and adjoining eastcentral Arabian Sea with the
associated cyclonic circulation extended up to 4.5 km above m.s.l., on 6th morning which
persisted over the same region. It lay over eastcentral Arabian Sea off Karnataka coast with
the associated cyclonic circulation extended up to 3.1 km above m.s.l. on 7th. It merged with
the off-shore trough from north Maharashtra coast to Lakshadweep area on 8th. However,
the associated cyclonic circulation persisted over eastcentral Arabian Sea off Karnataka
coast and extended between 1.5 and 5.8 km above m.s.l. It persisted over the same region
between the same levels on 9th.
A cyclonic circulation lay over westcentral Bay of Bengal off Andhra Pradesh coast
and extended up to 3.1 km above m.s.l. on 12th September. Under its influence a low
pressure area (13th–16th September) formed over west-central Bay of Bengal off north
Andhra Pradesh coast on 13thmorning. It persisted over the same region with the associated
cyclonic circulation extended up to midtropospheric levels tilting southwestward with height
on the same day. Maintaining associated cyclonic circulation‟s vertical extent and its
southwestward tilt with height, the low lay over west-central Bay of Bengal and adjoining
north Andhra Pradesh coast on 14th morning which became well marked low pressure area
over the same region on the same day; it then weakened and lay as a low-pressure area
over the same region on 15th. It lay over Telangana and adjoining south Chhattisgarh on
16th morning and became less marked subsequently.
13
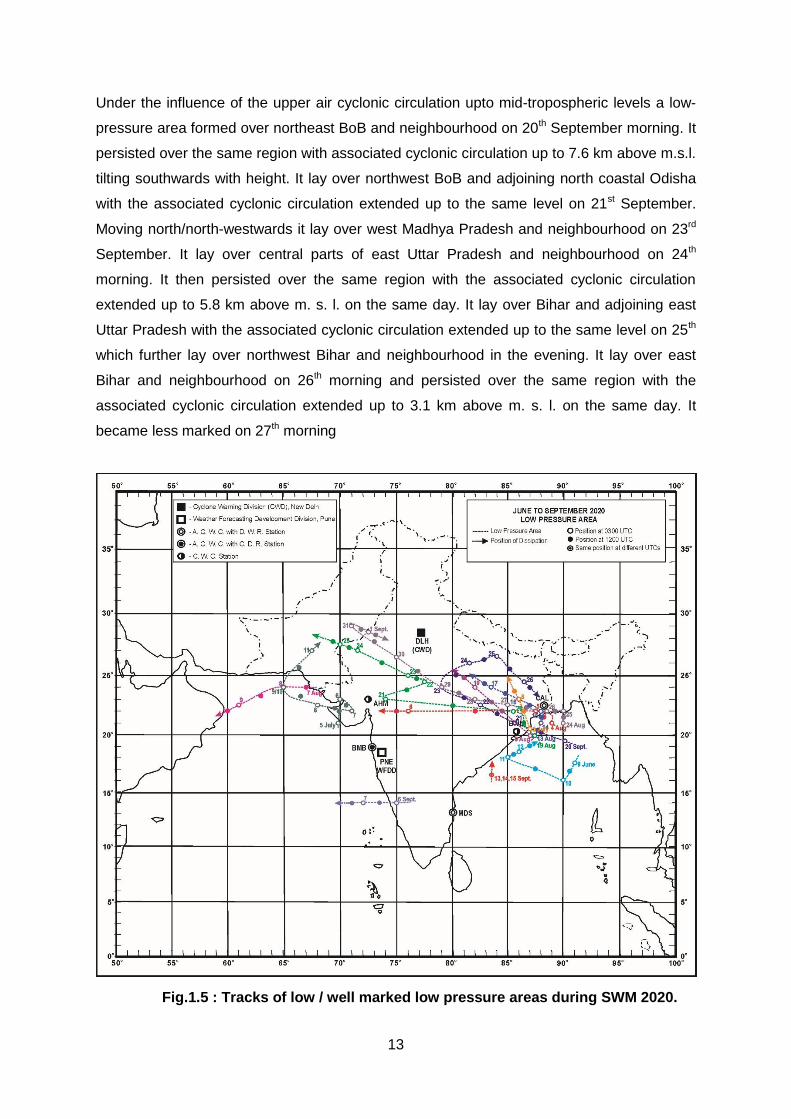
Under the influence of the upper air cyclonic circulation upto mid-tropospheric levels a low-
pressure area formed over northeast BoB and neighbourhood on 20th September morning. It
persisted over the same region with associated cyclonic circulation up to 7.6 km above m.s.l.
tilting southwards with height. It lay over northwest BoB and adjoining north coastal Odisha
with the associated cyclonic circulation extended up to the same level on 21st September.
Moving north/north-westwards it lay over west Madhya Pradesh and neighbourhood on 23rd
September. It lay over central parts of east Uttar Pradesh and neighbourhood on 24th
morning. It then persisted over the same region with the associated cyclonic circulation
extended up to 5.8 km above m. s. l. on the same day. It lay over Bihar and adjoining east
Uttar Pradesh with the associated cyclonic circulation extended up to the same level on 25th
which further lay over northwest Bihar and neighbourhood in the evening. It lay over east
Bihar and neighbourhood on 26th morning and persisted over the same region with the
associated cyclonic circulation extended up to 3.1 km above m. s. l. on the same day. It
became less marked on 27th morning
Fig.1.5 : Tracks of low / well marked low pressure areas during SWM 2020.
14
1.4.3 Upper Air Cyclonic Circulations
There were 127 upper air cyclonic circulations (in lower, mid and Upper tropospheric
levels) which formed during the season.
The month wise distribution of these is: 32, 44, 22 &29during June, July, August and
September respectively.
1.4.4 Eastward Moving Cyclonic Circulations/Western Disturbances
There were 19 eastward moving systems as upper air cyclonic circulations. The
month wise distribution of these is: 4, 5, 1 &9during June, July, August and September
respectively.
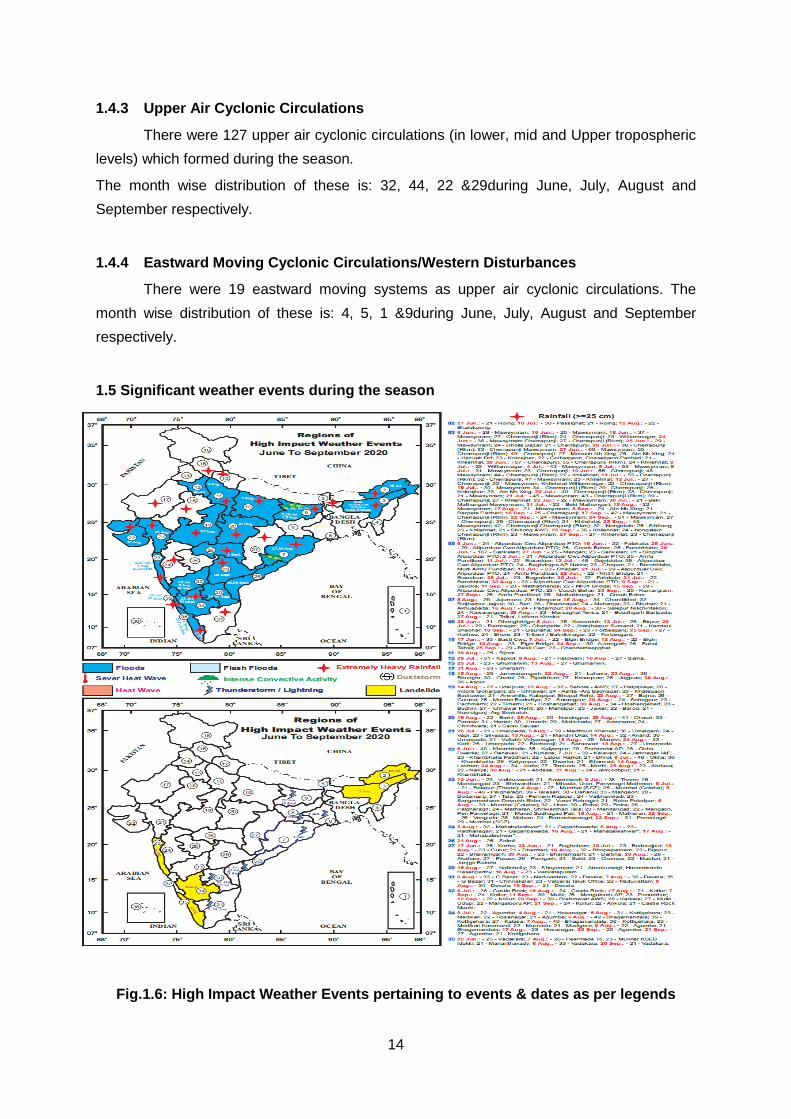
1.5 Significant weather events during the season
Fig.1.6: High Impact Weather Events pertaining to events & dates as per legends
15
The resultant weather which affected normal life and damage to property, excluding
those from the lack of timely rains are depicted in Fig. 1.6. High impact weather manifested
as extremely heavy rainfall (rainfall amount ≥ 25cm during 24 hours) is also marked over the
affected sub-divisions and representative amounts with their location and dates of
occurrence are given in the Table along with the figure. A detailed analysis of some of these
events is made in the subsequent chapters.
1.6 Low Pressure Systems over Other Oceanic Areas during June to September
2020.
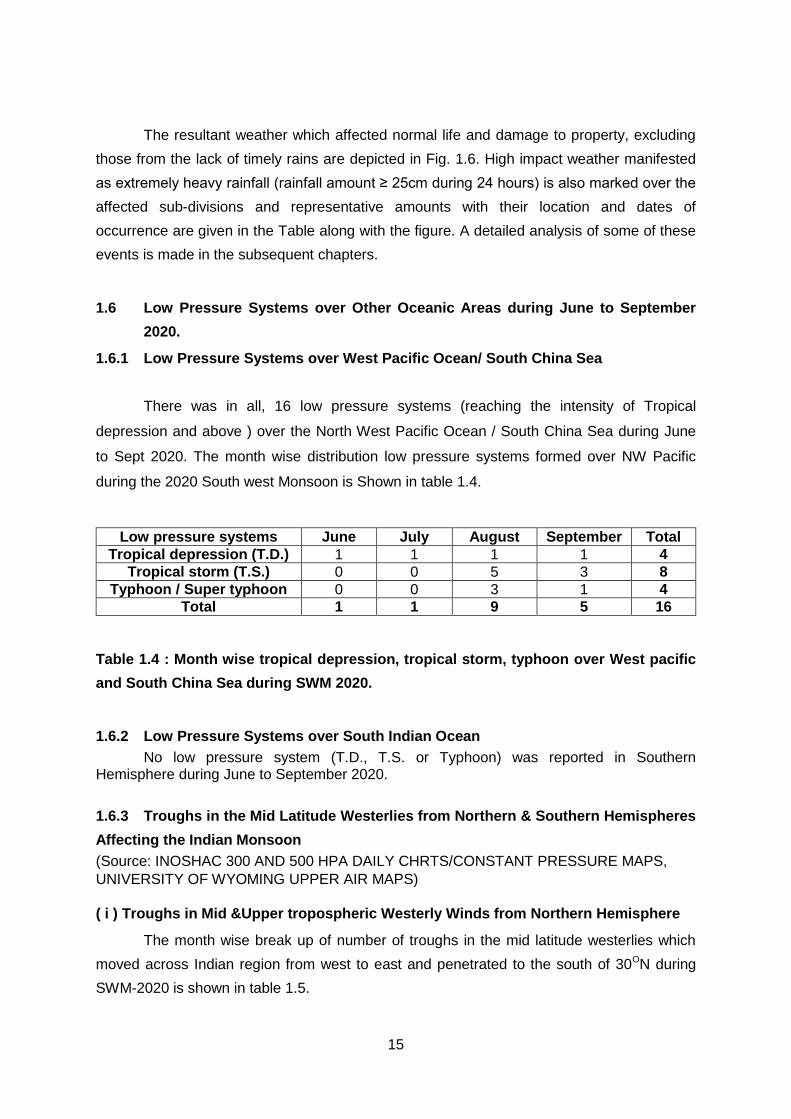
1.6.1 Low Pressure Systems over West Pacific Ocean/ South China Sea
There was in all, 16 low pressure systems (reaching the intensity of Tropical
depression and above ) over the North West Pacific Ocean / South China Sea during June
to Sept 2020. The month wise distribution low pressure systems formed over NW Pacific
during the 2020 South west Monsoon is Shown in table 1.4.
Low pressure systems June July August September Total
Tropical depression (T.D.) 1 1 1 1 4
Tropical storm (T.S.) 0 0 5 3 8
Typhoon / Super typhoon 0 0 3 1 4
Total 1 1 9 5 16
Table 1.4 : Month wise tropical depression, tropical storm, typhoon over West pacific
and South China Sea during SWM 2020.
1.6.2 Low Pressure Systems over South Indian Ocean
No low pressure system (T.D., T.S. or Typhoon) was reported in Southern Hemisphere during June to September 2020.
1.6.3 Troughs in the Mid Latitude Westerlies from Northern & Southern Hemispheres
Affecting the Indian Monsoon
(Source: INOSHAC 300 AND 500 HPA DAILY CHRTS/CONSTANT PRESSURE MAPS,
UNIVERSITY OF WYOMING UPPER AIR MAPS)
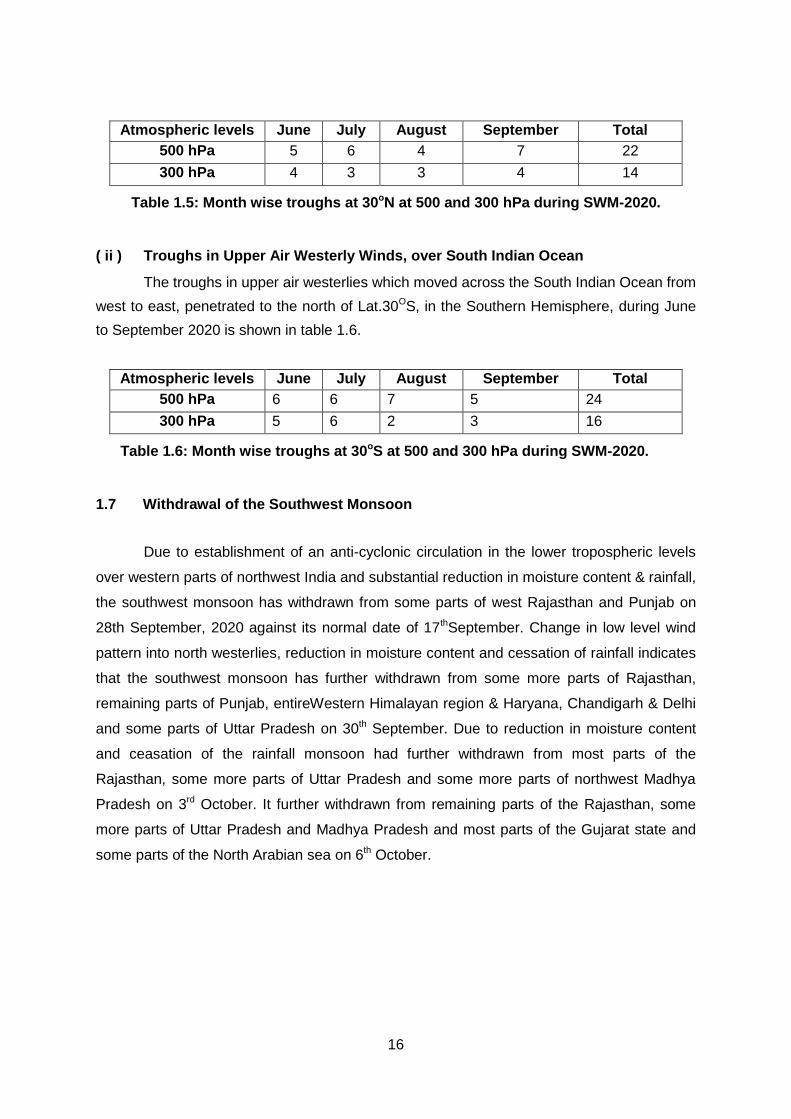
( i ) Troughs in Mid &Upper tropospheric Westerly Winds from Northern Hemisphere
The month wise break up of number of troughs in the mid latitude westerlies which
moved across Indian region from west to east and penetrated to the south of 30ON during
SWM-2020 is shown in table 1.5.
16
Atmospheric levels June July August September Total
500 hPa 5 6 4 7 22
300 hPa 4 3 3 4 14
Table 1.5: Month wise troughs at 30oN at 500 and 300 hPa during SWM-2020.
( ii ) Troughs in Upper Air Westerly Winds, over South Indian Ocean
The troughs in upper air westerlies which moved across the South Indian Ocean from
west to east, penetrated to the north of Lat.30OS, in the Southern Hemisphere, during June
to September 2020 is shown in table 1.6.
Atmospheric levels June July August September Total
500 hPa 6 6 7 5 24
300 hPa 5 6 2 3 16
Table 1.6: Month wise troughs at 30oS at 500 and 300 hPa during SWM-2020.
1.7 Withdrawal of the Southwest Monsoon
Due to establishment of an anti-cyclonic circulation in the lower tropospheric levels
over western parts of northwest India and substantial reduction in moisture content & rainfall,
the southwest monsoon has withdrawn from some parts of west Rajasthan and Punjab on
28th September, 2020 against its normal date of 17thSeptember. Change in low level wind
pattern into north westerlies, reduction in moisture content and cessation of rainfall indicates
that the southwest monsoon has further withdrawn from some more parts of Rajasthan,
remaining parts of Punjab, entireWestern Himalayan region & Haryana, Chandigarh & Delhi
and some parts of Uttar Pradesh on 30th September. Due to reduction in moisture content
and ceasation of the rainfall monsoon had further withdrawn from most parts of the
Rajasthan, some more parts of Uttar Pradesh and some more parts of northwest Madhya
Pradesh on 3rd October. It further withdrawn from remaining parts of the Rajasthan, some
more parts of Uttar Pradesh and Madhya Pradesh and most parts of the Gujarat state and
some parts of the North Arabian sea on 6th October.
17
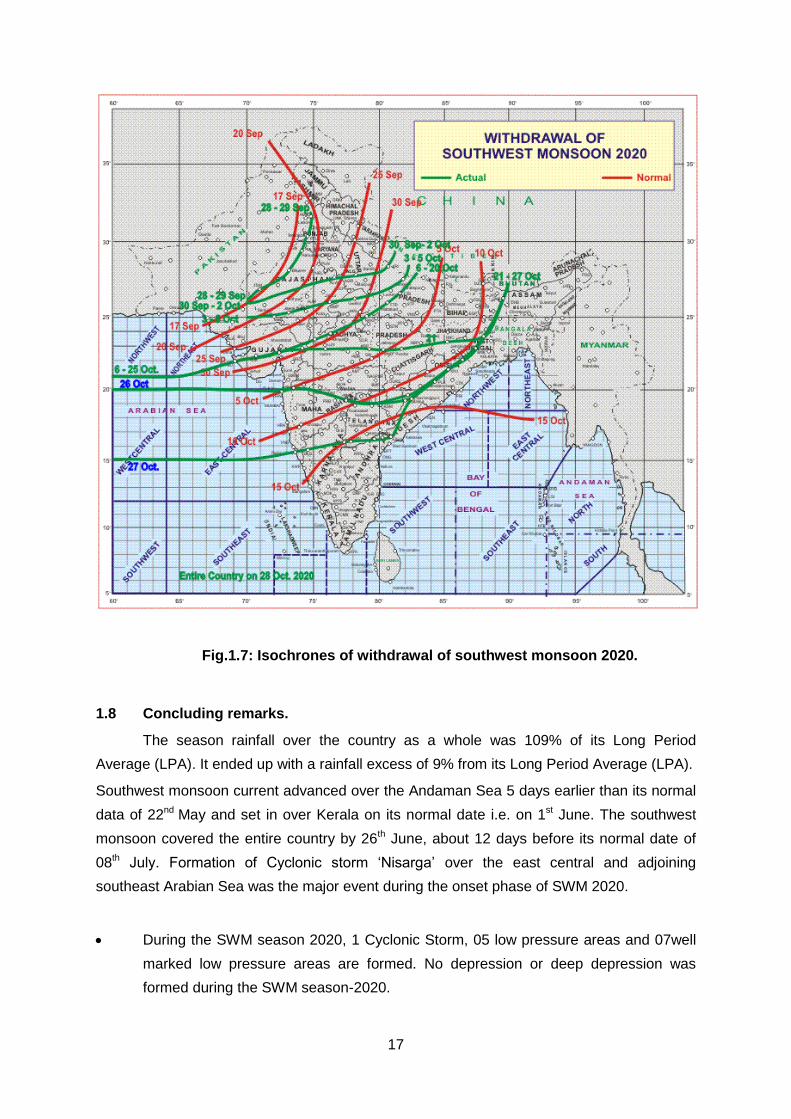
Fig.1.7: Isochrones of withdrawal of southwest monsoon 2020.
1.8 Concluding remarks.
The season rainfall over the country as a whole was 109% of its Long Period
Average (LPA). It ended up with a rainfall excess of 9% from its Long Period Average (LPA).
Southwest monsoon current advanced over the Andaman Sea 5 days earlier than its normal
data of 22nd May and set in over Kerala on its normal date i.e. on 1st June. The southwest
monsoon covered the entire country by 26th June, about 12 days before its normal date of
08th July. Formation of Cyclonic storm „Nisarga‟ over the east central and adjoining
southeast Arabian Sea was the major event during the onset phase of SWM 2020.
During the SWM season 2020, 1 Cyclonic Storm, 05 low pressure areas and 07well
marked low pressure areas are formed. No depression or deep depression was
formed during the SWM season-2020.
18
The withdrawal of monsoon from west Rajasthan commenced on 28thSeptember
delayed by 11 days compared to its normal date of 17thSeptember.
References:
Ananthakrishnan, R., Srinivasan, V., Ramakrishnan, A.R. and Jambunathan, R., 1968: „Synoptic features associated with onset of South-West Monsoon over Kerala‟, Forecasting Manual Unit Report IV – 18.2., India Meteorological Department.
Boos, W.R and Emanuel, K.A., 2009: „Annual intensification of the Somali Jet in a
quasi-equilibrium framework: Observational composites‟, Quart. J.R. Met. Soc, 135, 319-335.
Chang J-H (1972) Atmospheric circulation systems and climates.Oriental Publish
Co., Hawaii, p 328 Joshi PC, Desai PS (1985) The satellite-determined thermal structure of heat low
during Indian south-west monsoon season. Adv Space Res 5:57–60
Keshavamurty, R. N and Awade, S. T., 1970: „On the maintenance of the mean monsoon trough over North India‟, Mon Weather Rev 98:315–320.
Ramage,C.S., 1971: „Monsoon Meteorology‟ Academic Press, New York and
London, 296 pp. Ramaswamy, C., 1965: „On synoptic methods of forecasting the vageries of
southwest monsoon over India and neighbouring countries‟, Proc. Symp. Meteor. Results IIOE, Bombay, pp. 317-349.
Sikka, D.R., and W.M.Gray, 1981: „Cross-hemispheric actions and the onset of
summer monsoon over India‟, International conference on Sci. Results of monsoon experiments, Bali, Indonesia, 26-30 Oct., 1981, pp. 3-74 to 3-78.
Sikka DR (1997) Desert climate and its dynamics. Curr Sci 72:35–46
---------
19
2
GLOBAL AND REGIONAL CIRCULATION ANOMALIES
Arti B. Bandgar, O. P. Sreejith and D. S. Pai
In this Chapter, main features of global climate anomalies like sea surface
temperature, outgoing long wave radiation and circulation features during 2020
southwest monsoon season are discussed and important factors responsible for the
observed rainfall patterns over India during the season are identified.
2.1 Sea Surface Temperature (SST) Anomalies
2.1.1 Equatorial Pacific Ocean
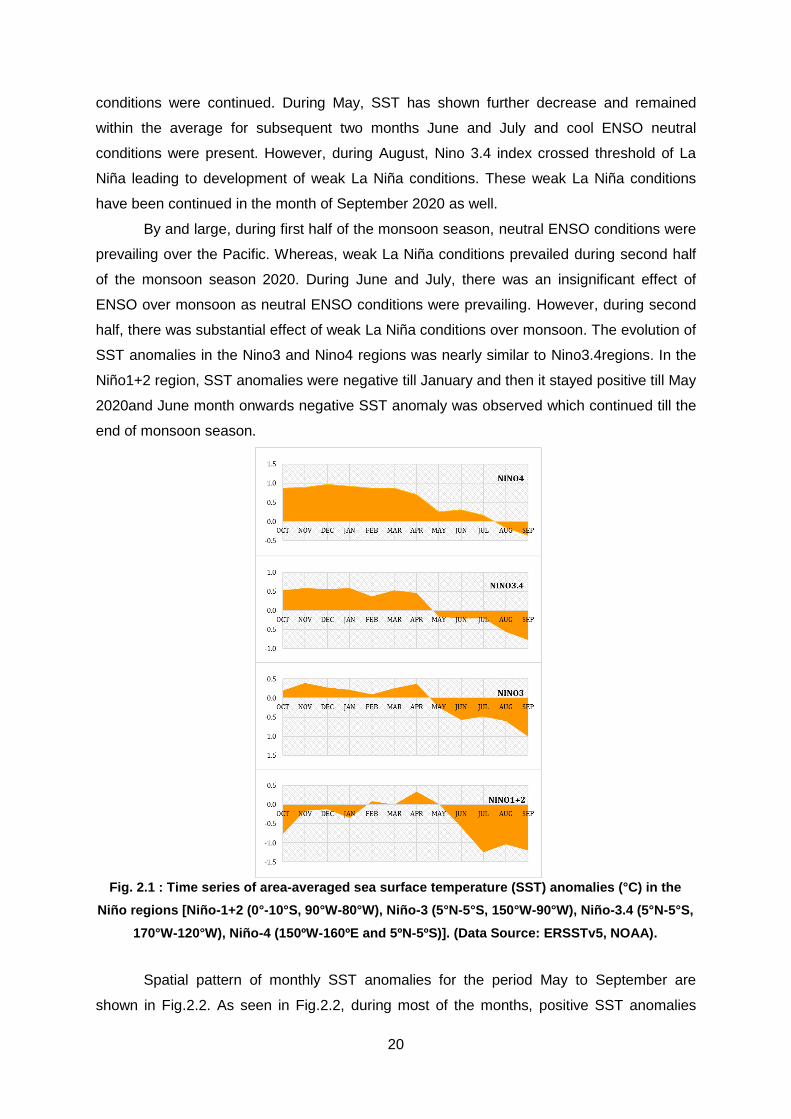
Evolution of SST anomalies in the four Nino regions since October 2019 to
September 2020 is shown in the Fig. 2.1. During later part of 2019, SST anomalies were
observed very close to the El Niño threshold. Therefore, from October 2019 to January
2020, borderline/weak El Niño conditions were prevailing over the equatorial Pacific. During
February, these borderline/weak El Niño conditions have weakened somewhat and Nino 3.4
value has come down just within the average and thus ENSO neutral conditions were
observed during February 2020. Though slightly warmer SSTs observed again in the month
of March 2020, in the subsequent month of April, further weakening of SST anomalies was
observed. The weakening of SST anomalies was continued in the May also, however
Nino3.4 value remained within the neutral range. These cool ENSO neutral SST conditions
were continued in the following months of June and July. The cooling of SSTs was increased
further leading to develop borderline/weak La Niña conditions in the month of August 2020.
During September also weak La Niña conditions were seen persistent.
Nino3.4 average SST anomaly index in October 2019 was 0.53oC and it was 0.59oC
in the end of January 2020. Warmer SSTs over Nino3.4 region shown decrease during
February 2020 with Nino3.4 index value 0.37oC. In the month of March, it has again shown
increase up to 0.53oC. From April, warmer SSTs reduced again and thereafter neutral ENSO
20
conditions were continued. During May, SST has shown further decrease and remained
within the average for subsequent two months June and July and cool ENSO neutral
conditions were present. However, during August, Nino 3.4 index crossed threshold of La
Niña leading to development of weak La Niña conditions. These weak La Niña conditions
have been continued in the month of September 2020 as well.
By and large, during first half of the monsoon season, neutral ENSO conditions were
prevailing over the Pacific. Whereas, weak La Niña conditions prevailed during second half
of the monsoon season 2020. During June and July, there was an insignificant effect of
ENSO over monsoon as neutral ENSO conditions were prevailing. However, during second
half, there was substantial effect of weak La Niña conditions over monsoon. The evolution of
SST anomalies in the Nino3 and Nino4 regions was nearly similar to Nino3.4regions. In the
Niño1+2 region, SST anomalies were negative till January and then it stayed positive till May
2020and June month onwards negative SST anomaly was observed which continued till the
end of monsoon season.
Fig. 2.1 : Time series of area-averaged sea surface temperature (SST) anomalies (°C) in the
Niño regions [Niño-1+2 (0°-10°S, 90°W-80°W), Niño-3 (5°N-5°S, 150°W-90°W), Niño-3.4 (5°N-5°S,
170°W-120°W), Niño-4 (150ºW-160ºE and 5ºN-5ºS)]. (Data Source: ERSSTv5, NOAA).
Spatial pattern of monthly SST anomalies for the period May to September are
shown in Fig.2.2. As seen in Fig.2.2, during most of the months, positive SST anomalies
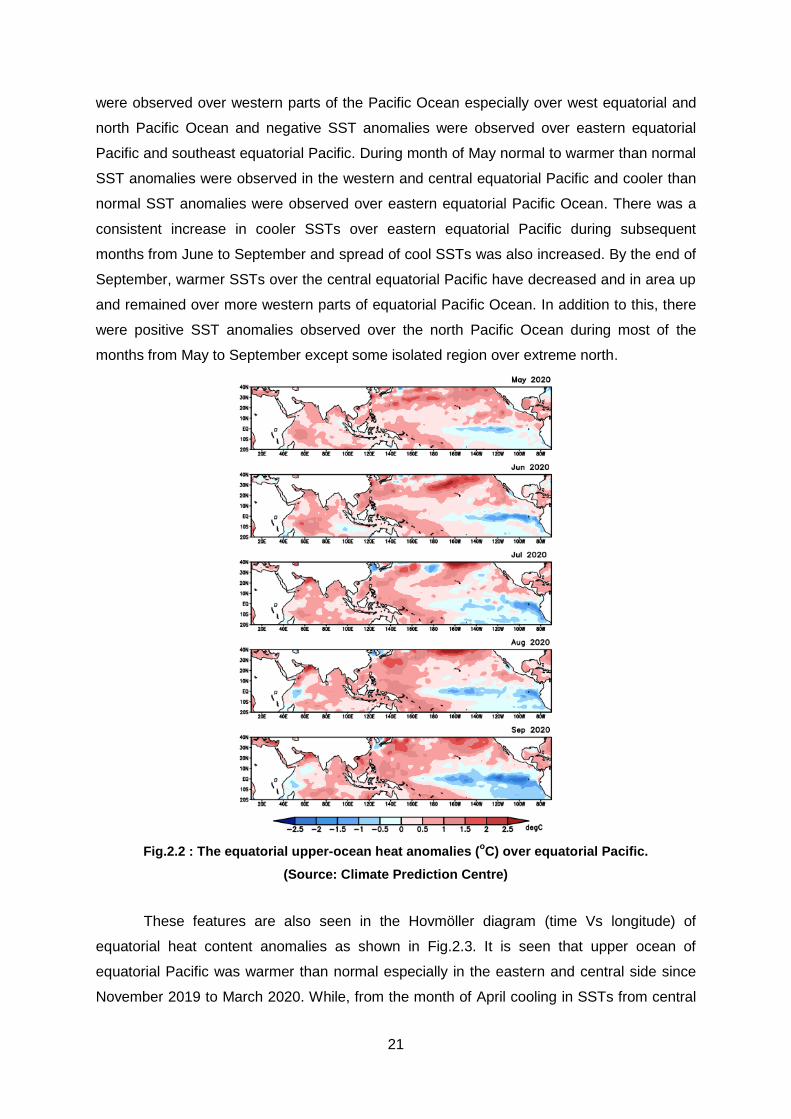
21
were observed over western parts of the Pacific Ocean especially over west equatorial and
north Pacific Ocean and negative SST anomalies were observed over eastern equatorial
Pacific and southeast equatorial Pacific. During month of May normal to warmer than normal
SST anomalies were observed in the western and central equatorial Pacific and cooler than
normal SST anomalies were observed over eastern equatorial Pacific Ocean. There was a
consistent increase in cooler SSTs over eastern equatorial Pacific during subsequent
months from June to September and spread of cool SSTs was also increased. By the end of
September, warmer SSTs over the central equatorial Pacific have decreased and in area up
and remained over more western parts of equatorial Pacific Ocean. In addition to this, there
were positive SST anomalies observed over the north Pacific Ocean during most of the
months from May to September except some isolated region over extreme north.
Fig.2.2 : The equatorial upper-ocean heat anomalies (oC) over equatorial Pacific.
(Source: Climate Prediction Centre)
These features are also seen in the Hovmöller diagram (time Vs longitude) of
equatorial heat content anomalies as shown in Fig.2.3. It is seen that upper ocean of
equatorial Pacific was warmer than normal especially in the eastern and central side since
November 2019 to March 2020. While, from the month of April cooling in SSTs from central
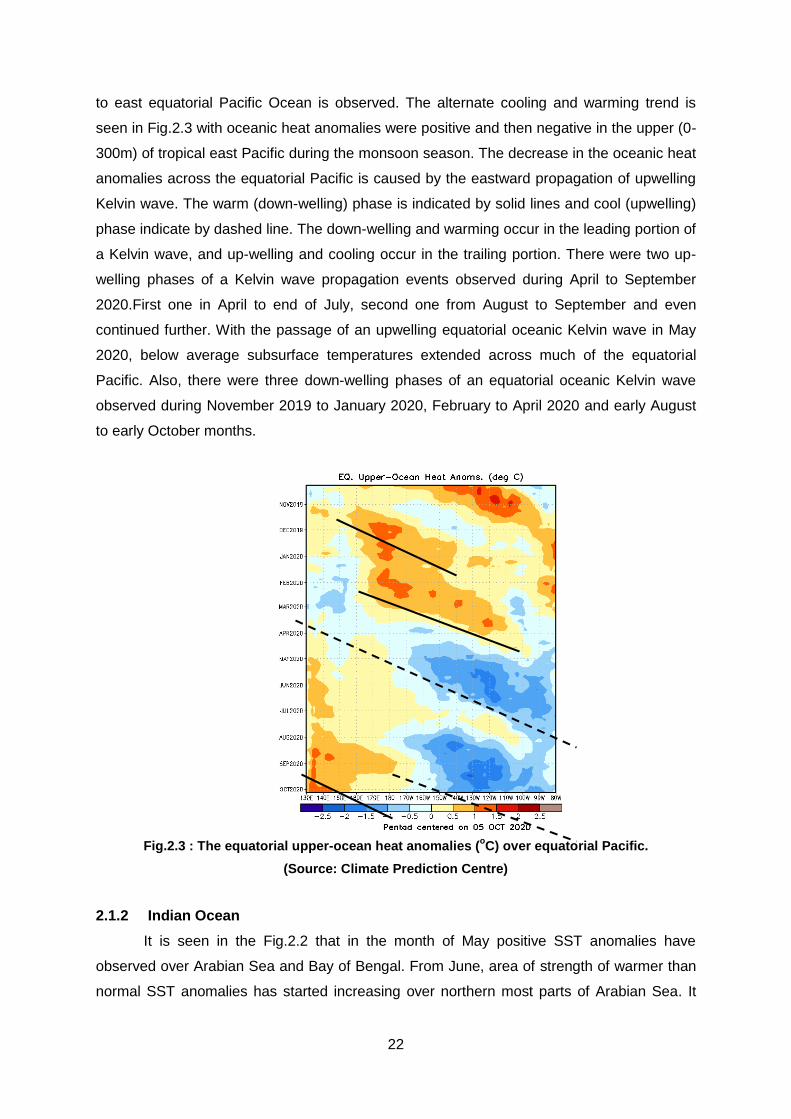
22
to east equatorial Pacific Ocean is observed. The alternate cooling and warming trend is
seen in Fig.2.3 with oceanic heat anomalies were positive and then negative in the upper (0-
300m) of tropical east Pacific during the monsoon season. The decrease in the oceanic heat
anomalies across the equatorial Pacific is caused by the eastward propagation of upwelling
Kelvin wave. The warm (down-welling) phase is indicated by solid lines and cool (upwelling)
phase indicate by dashed line. The down-welling and warming occur in the leading portion of
a Kelvin wave, and up-welling and cooling occur in the trailing portion. There were two up-
welling phases of a Kelvin wave propagation events observed during April to September
2020.First one in April to end of July, second one from August to September and even
continued further. With the passage of an upwelling equatorial oceanic Kelvin wave in May
2020, below average subsurface temperatures extended across much of the equatorial
Pacific. Also, there were three down-welling phases of an equatorial oceanic Kelvin wave
observed during November 2019 to January 2020, February to April 2020 and early August
to early October months.
Fig.2.3 : The equatorial upper-ocean heat anomalies (oC) over equatorial Pacific.
(Source: Climate Prediction Centre)
2.1.2 Indian Ocean
It is seen in the Fig.2.2 that in the month of May positive SST anomalies have
observed over Arabian Sea and Bay of Bengal. From June, area of strength of warmer than
normal SST anomalies has started increasing over northern most parts of Arabian Sea. It
23
kept increasing till end of the monsoon season. In the Bay of Bengal also spread of warmer
than normal SST anomalies has increased by the end of monsoon season. Around mid of
May warmer SST anomalies have observed over most parts of western equatorial Indian
Ocean and cooler SST anomalies have observed over eastern equatorial Indian Ocean with
weak positive Indian Ocean dipole (IOD) conditions during June. However, in the month of
July spatial pattern of IOD has altered with a small patch of negative SST anomalies at the
west Indian Ocean and the negative SST anomaliesvanished at east Indian Ocean. The
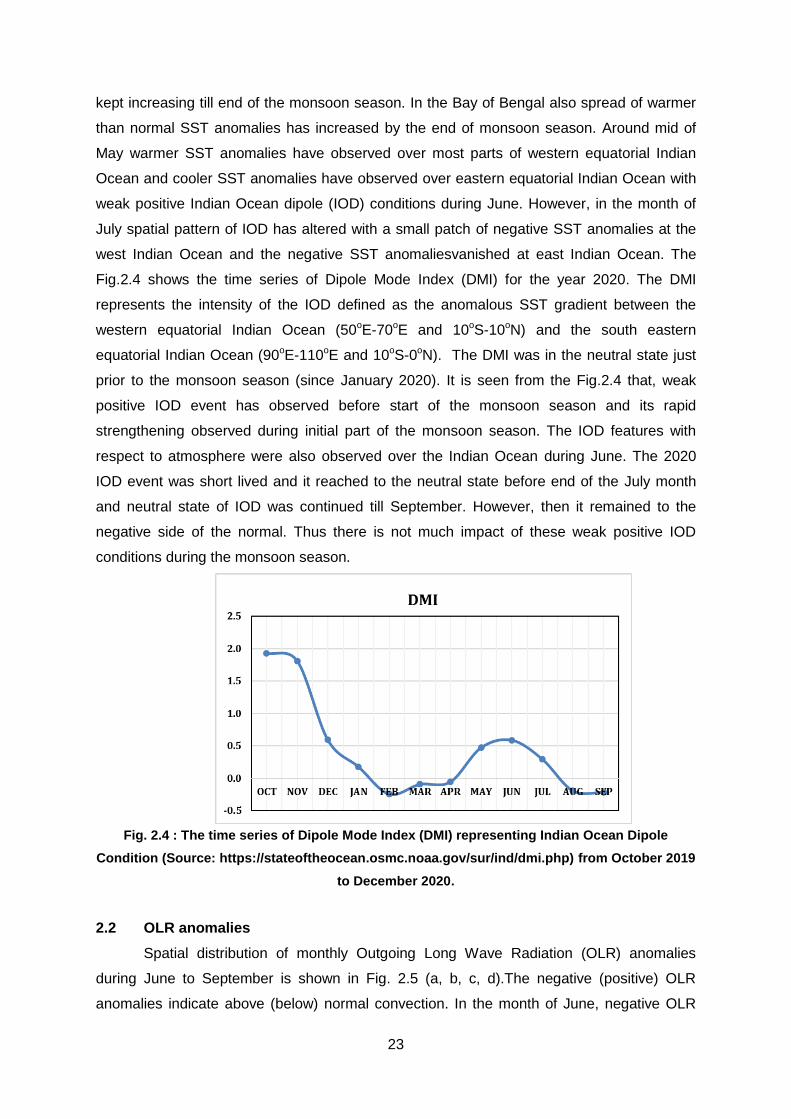
Fig.2.4 shows the time series of Dipole Mode Index (DMI) for the year 2020. The DMI
represents the intensity of the IOD defined as the anomalous SST gradient between the
western equatorial Indian Ocean (50oE-70oE and 10oS-10oN) and the south eastern
equatorial Indian Ocean (90oE-110oE and 10oS-0oN). The DMI was in the neutral state just
prior to the monsoon season (since January 2020). It is seen from the Fig.2.4 that, weak
positive IOD event has observed before start of the monsoon season and its rapid
strengthening observed during initial part of the monsoon season. The IOD features with
respect to atmosphere were also observed over the Indian Ocean during June. The 2020
IOD event was short lived and it reached to the neutral state before end of the July month
and neutral state of IOD was continued till September. However, then it remained to the
negative side of the normal. Thus there is not much impact of these weak positive IOD
conditions during the monsoon season.
Fig. 2.4 : The time series of Dipole Mode Index (DMI) representing Indian Ocean Dipole
Condition (Source: https://stateoftheocean.osmc.noaa.gov/sur/ind/dmi.php) from October 2019
to December 2020.
2.2 OLR anomalies
Spatial distribution of monthly Outgoing Long Wave Radiation (OLR) anomalies
during June to September is shown in Fig. 2.5 (a, b, c, d).The negative (positive) OLR
anomalies indicate above (below) normal convection. In the month of June, negative OLR
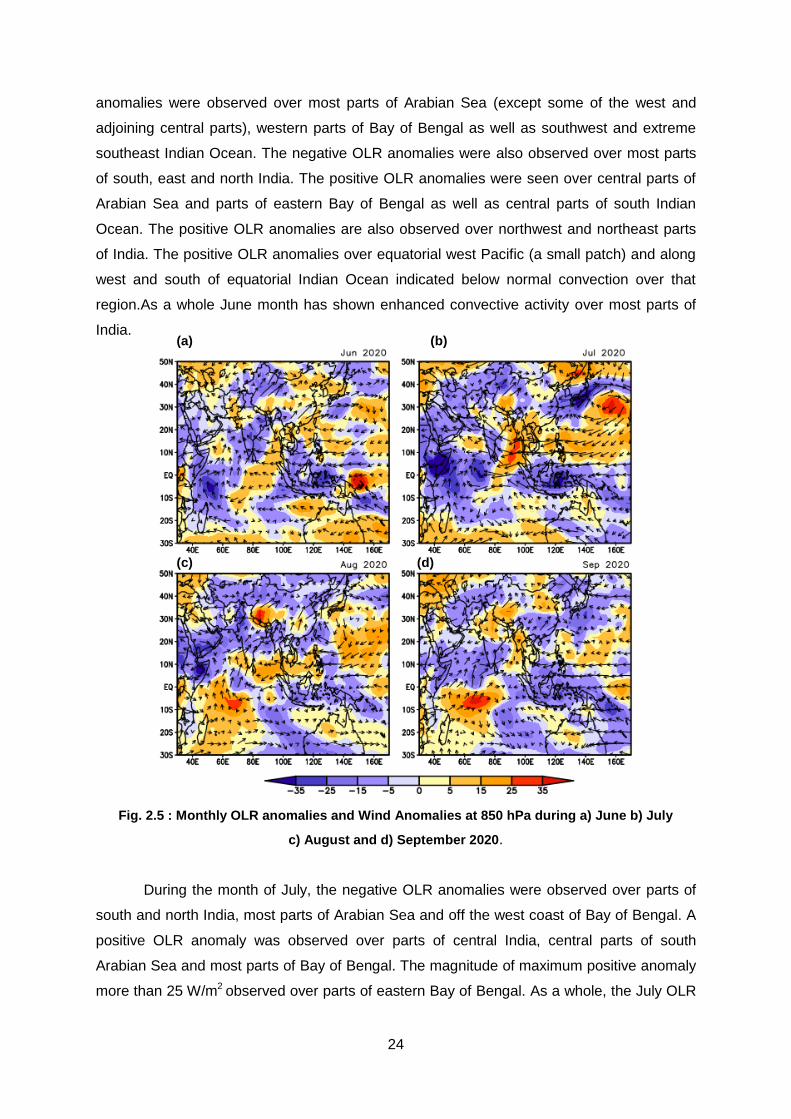
24
anomalies were observed over most parts of Arabian Sea (except some of the west and
adjoining central parts), western parts of Bay of Bengal as well as southwest and extreme
southeast Indian Ocean. The negative OLR anomalies were also observed over most parts
of south, east and north India. The positive OLR anomalies were seen over central parts of
Arabian Sea and parts of eastern Bay of Bengal as well as central parts of south Indian
Ocean. The positive OLR anomalies are also observed over northwest and northeast parts
of India. The positive OLR anomalies over equatorial west Pacific (a small patch) and along
west and south of equatorial Indian Ocean indicated below normal convection over that
region.As a whole June month has shown enhanced convective activity over most parts of
India.
Fig. 2.5 : Monthly OLR anomalies and Wind Anomalies at 850 hPa during a) June b) July
c) August and d) September 2020.
During the month of July, the negative OLR anomalies were observed over parts of
south and north India, most parts of Arabian Sea and off the west coast of Bay of Bengal. A
positive OLR anomaly was observed over parts of central India, central parts of south
Arabian Sea and most parts of Bay of Bengal. The magnitude of maximum positive anomaly
more than 25 W/m2 observed over parts of eastern Bay of Bengal. As a whole, the July OLR
(a) (b)
(c) (d)
25
anomaly pattern over Indian region showed enhanced convective activity over southern
parts of India and some parts from north and east and northeast India. In the month of
August, the negative OLR anomalies observed over entire India except southern peninsula
and foothills of Himalayas. This indicates monsoon trough was active during the most of the
August month. During September, convective activity is seen weakened over some parts of
India especially over northwest, east and northeast region of India and negative OLR
anomalies were observed southern peninsula and small part from northeast India. Negative
OLR anomalies were also observed over most parts of Arabian Ocean and some parts from
east Bay of Bengal.
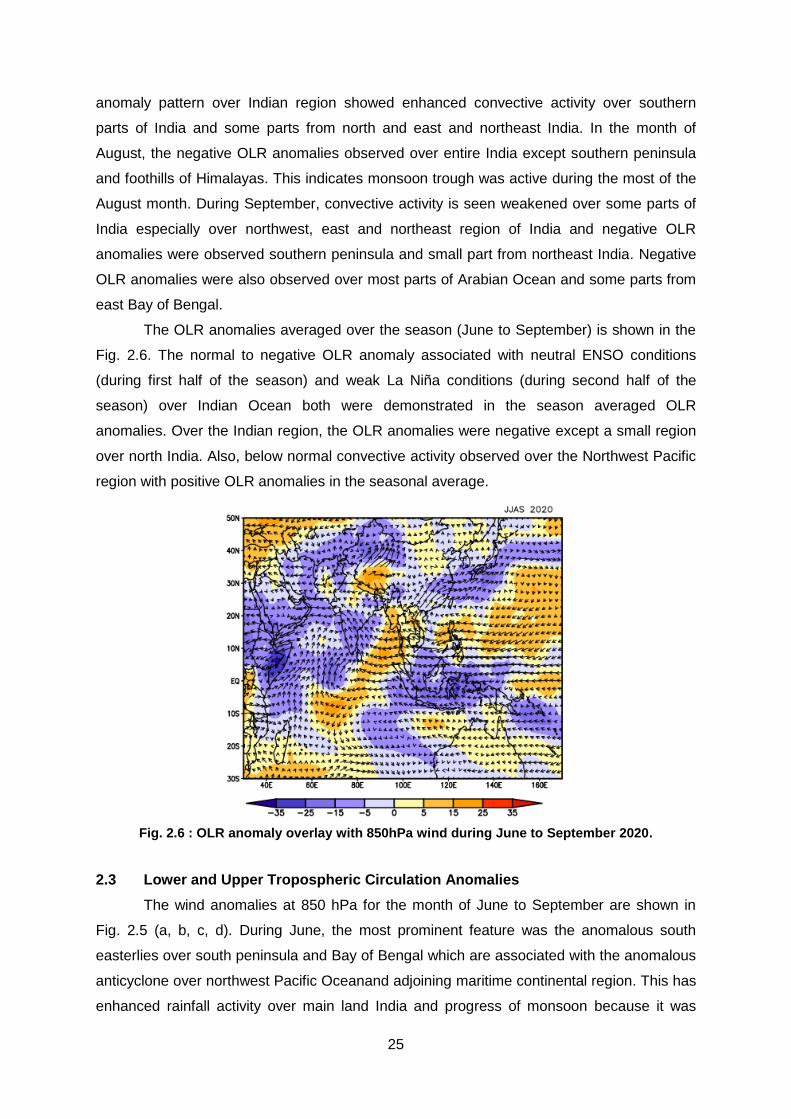
The OLR anomalies averaged over the season (June to September) is shown in the
Fig. 2.6. The normal to negative OLR anomaly associated with neutral ENSO conditions
(during first half of the season) and weak La Niña conditions (during second half of the
season) over Indian Ocean both were demonstrated in the season averaged OLR
anomalies. Over the Indian region, the OLR anomalies were negative except a small region
over north India. Also, below normal convective activity observed over the Northwest Pacific
region with positive OLR anomalies in the seasonal average.
Fig. 2.6 : OLR anomaly overlay with 850hPa wind during June to September 2020.
2.3 Lower and Upper Tropospheric Circulation Anomalies
The wind anomalies at 850 hPa for the month of June to September are shown in
Fig. 2.5 (a, b, c, d). During June, the most prominent feature was the anomalous south
easterlies over south peninsula and Bay of Bengal which are associated with the anomalous
anticyclone over northwest Pacific Oceanand adjoining maritime continental region. This has
enhanced rainfall activity over main land India and progress of monsoon because it was
26
rendering moisture from Bay of Bengal to the main land. South westerlies were not so
organized but these winds also supplied moisture from Arabian Sea to the main land. This
overall wind pattern has caused enhanced rainfall activity over most parts of India during
June. During July, a strong anticyclonic circulation is located over Northwest Pacific Ocean
and easterlies associated with it were prevailing over most parts of India except some parts
from north India. Because of this wind pattern, a disorganized cross equatorial flow was
observed over southern parts of India. However, due to easterlies coming from Bay of
Bengal have carried lot of moisture with them and rainfall received over the region. During
August a strong cross equatorial flow has observed, which lead to above normal rainfall over
most parts of India. The monsoon trough remained active for most part the August which
gave consistent normal to above normal rainfall over entire India except over southern parts
of India and foothills of Himalayas where subdued rainfall activity observed. The anticyclonic
circulation over northwest Pacific has weakened and shifted towards west and induced
southerlies over northeast India with some enhanced rainfall activity. In the month of
September, an organized cross equatorial flow and shifting of monsoon trough over south
India has led to above normal rainfall activity especially over central India and south
peninsula. The anticyclonic circulation over northwest Pacific has further weakened and its
influence has been reduced during September over Indian region. The weak anomalous
cross equatorial flow over northwest Pacific also indicated below normal typhoon activity
over the region and it did not have negative impact on rainfall over Indian region. In the
month of September, southward shift in monsoon trough and strong wind pattern over the
central Indian region indicate above normal rainfall conditions during the month over most
parts of India.
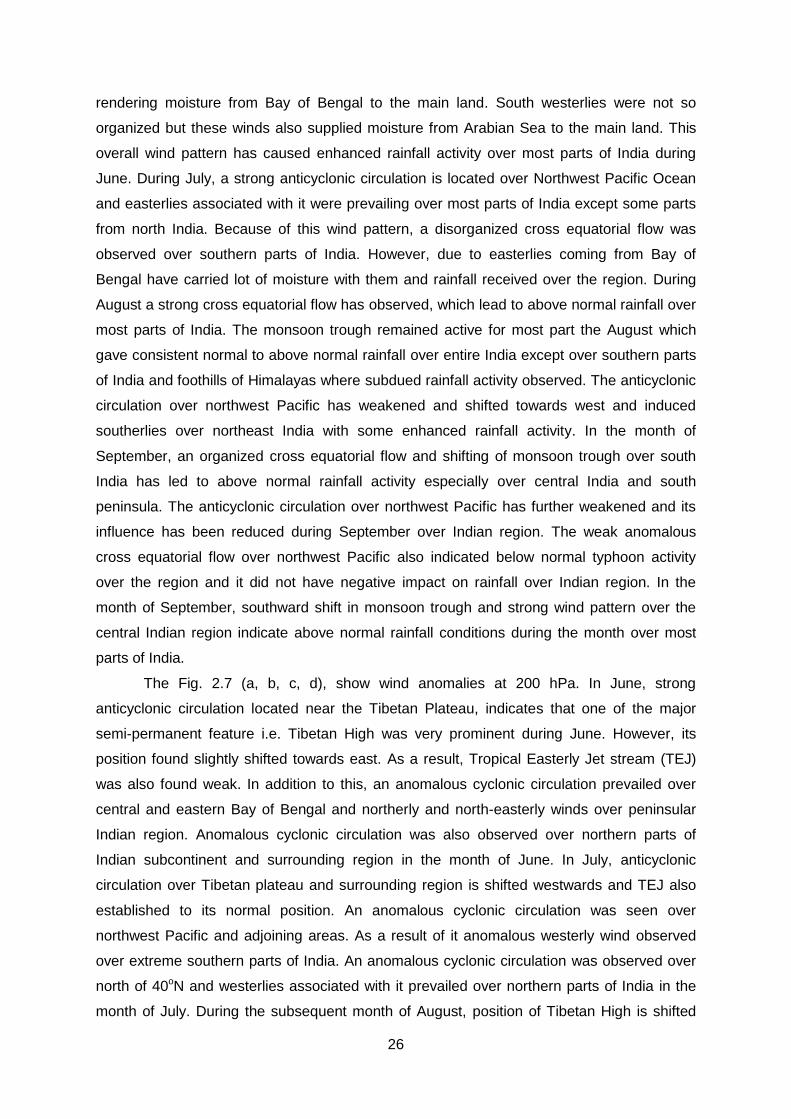
The Fig. 2.7 (a, b, c, d), show wind anomalies at 200 hPa. In June, strong
anticyclonic circulation located near the Tibetan Plateau, indicates that one of the major
semi-permanent feature i.e. Tibetan High was very prominent during June. However, its
position found slightly shifted towards east. As a result, Tropical Easterly Jet stream (TEJ)
was also found weak. In addition to this, an anomalous cyclonic circulation prevailed over
central and eastern Bay of Bengal and northerly and north-easterly winds over peninsular
Indian region. Anomalous cyclonic circulation was also observed over northern parts of
Indian subcontinent and surrounding region in the month of June. In July, anticyclonic
circulation over Tibetan plateau and surrounding region is shifted westwards and TEJ also
established to its normal position. An anomalous cyclonic circulation was seen over
northwest Pacific and adjoining areas. As a result of it anomalous westerly wind observed
over extreme southern parts of India. An anomalous cyclonic circulation was observed over
north of 40oN and westerlies associated with it prevailed over northern parts of India in the
month of July. During the subsequent month of August, position of Tibetan High is shifted
27
towards eastward and an anomalous upper air anticyclonic circulation was observed over
northwest parts of India and neighboring region. Overall upper air wind pattern indicates
weakening observed in TEJ. As a result of these features, northeasterly or northerly wind
has observed over entire India during August. In the month of September, position of Tibetan
high was observed southwestwards of its normal position. Its intensity also was stronger
than all other months during the monsoon season. As a result, strong TEJ was seen over
entire India during September. There were not strong anomalous cyclonic or anticyclonic
circulation observed over the Pacific Ocean.
Fig. 2.7 : Wind Anomalies at 200 hPa during a) June b) July c) August d) September 2020.
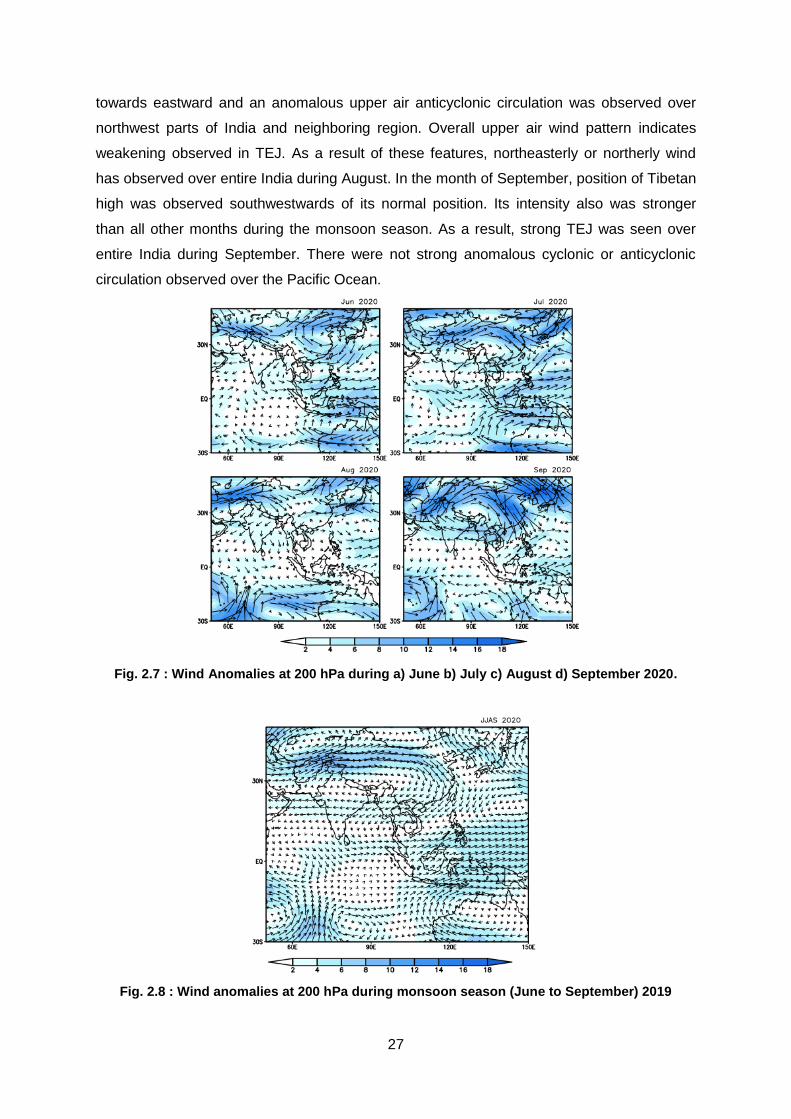
Fig. 2.8 : Wind anomalies at 200 hPa during monsoon season (June to September) 2019
28
The wind anomalies averaged over the season (June to September) is shown in the
Fig. 2.6 (850 hPa) and Fig. 2.8 (200 hPa). In the season averaged (June-September) 850
hPa wind anomaly (Fig. 2.6) it has observed that strong cross equatorial flow from south
Indian Ocean and strong low level Jetstream during the monsoon season over the south
peninsula. It can also be observed that southeasterly or southerly winds coming from Bay of
Bengal and Arabian Sea might have brought lot of moisture in the mainland India during
entire season. In the season average, organized and stronger than normal 200 hPa easterly
wind (Fig. 2.8) were found. Strong TEJ indicate the enhance monsoon circulation during
2020 SW monsoon season.
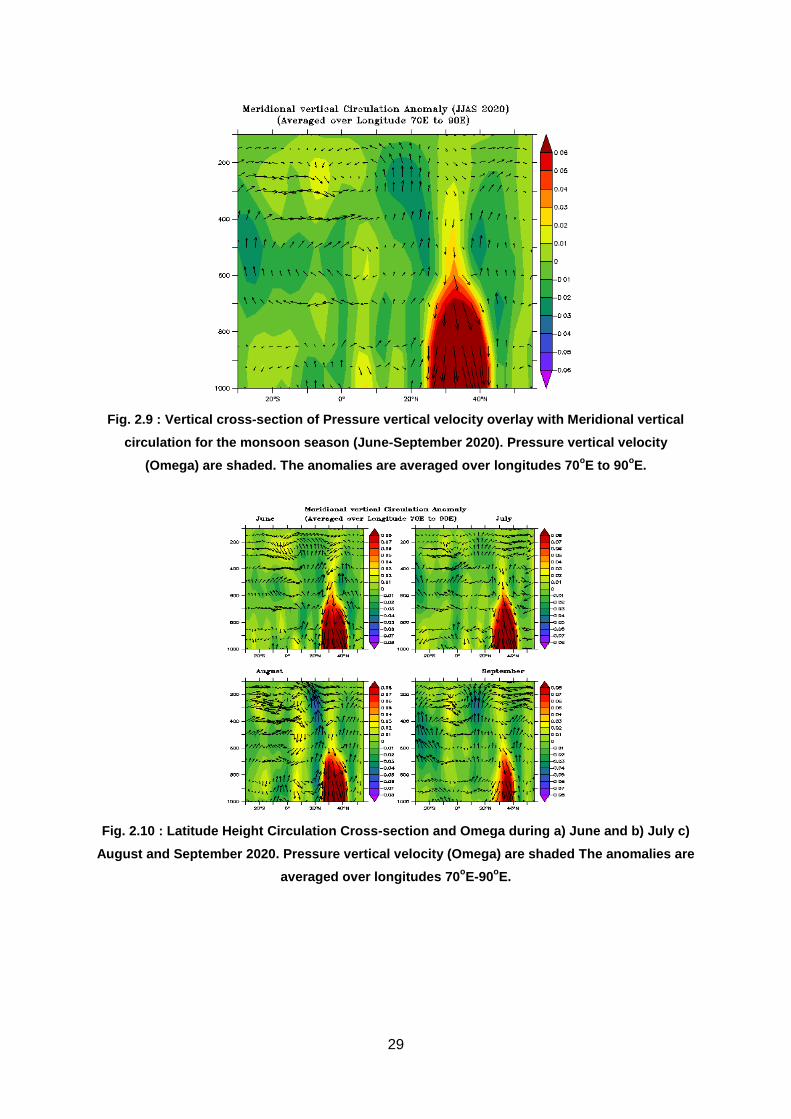
2.4 Meridional and Zonal Circulation Anomalies over Indian Region
To examine the changes in the meridional circulation over Indian region during the
monsoon season, latitude-height cross section of vertical velocity (omega) anomalies
averaged over longitudinal zone of 70oE-90oE was plotted for the monsoon season (Fig.2.9).
It can be seen that there is a one anomalous meridional circulation cell over north Indian
region, having strong descending branch over north of about 25oN. There is also a weak
anomalous meridional circulation having ascending branch over the south of latitude 25oN.
Another strong meridional cell with its ascending branch near 10oS and descending branch
over south of 10oN was also observed. These indicate overall, rising motion prevailed in the
Indian region during the monsoon season and in supporting enhanced rainfall activity during
season, conditions also seen favorable in the large scale circulation pattern over maritime
continent and surrounding region. Fig. 2.10 (a, b, c, d) which depict the monthly meridional
circulation anomaly over Indian monsoon region during June to September. It can be seen
that the strength of the descending motion near latitude 30oN observed during June has
increased in the subsequent months. A strong ascending branch was observed over south of
30oN during July month. It has decreased in subsequent month of August and September.
Though there was anomalous descending motion observed over Indian region during the
August and September months, also magnitude of rising motion (ascending branch) has
been increased anomalously during these months over and around 20oN. This favorable
vertical circulation caused above normal convective activity and resulted in excess rainfall
during the second half of the season.
29
Fig. 2.9 : Vertical cross-section of Pressure vertical velocity overlay with Meridional vertical
circulation for the monsoon season (June-September 2020). Pressure vertical velocity
(Omega) are shaded. The anomalies are averaged over longitudes 70oE to 90
oE.
Fig. 2.10 : Latitude Height Circulation Cross-section and Omega during a) June and b) July c)
August and September 2020. Pressure vertical velocity (Omega) are shaded The anomalies are
averaged over longitudes 70oE-90
oE.
30
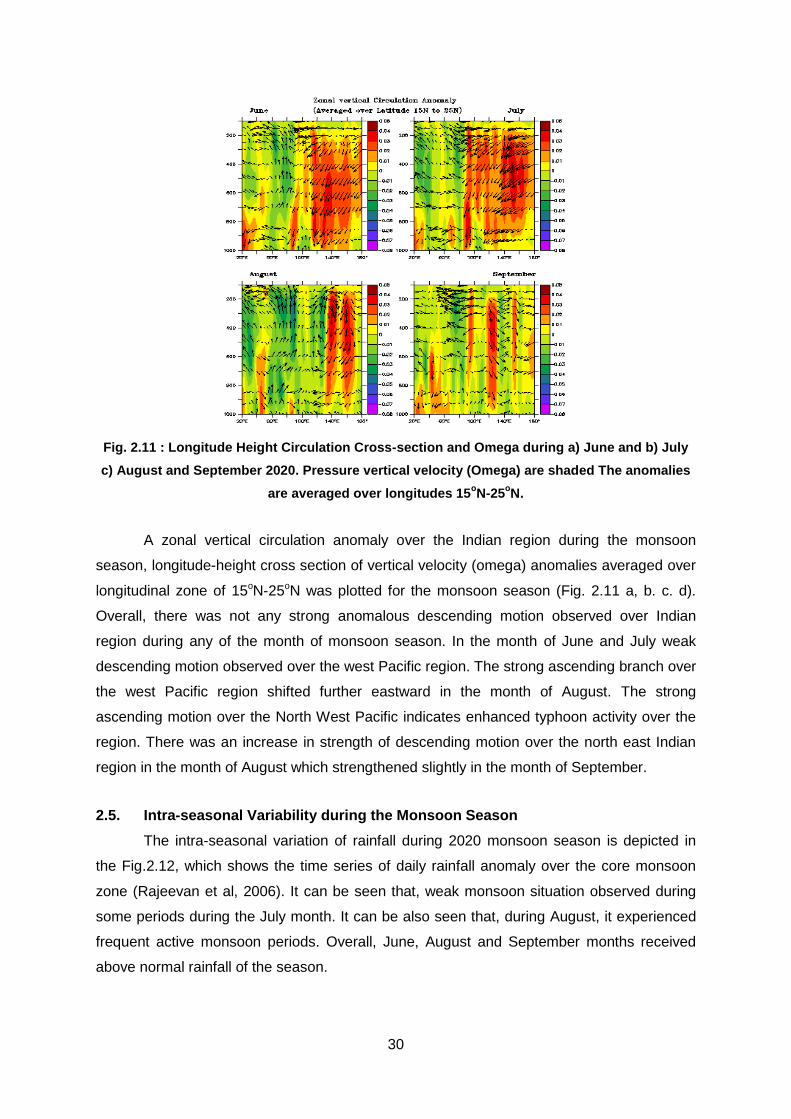
Fig. 2.11 : Longitude Height Circulation Cross-section and Omega during a) June and b) July
c) August and September 2020. Pressure vertical velocity (Omega) are shaded The anomalies
are averaged over longitudes 15oN-25
oN.
A zonal vertical circulation anomaly over the Indian region during the monsoon
season, longitude-height cross section of vertical velocity (omega) anomalies averaged over
longitudinal zone of 15oN-25oN was plotted for the monsoon season (Fig. 2.11 a, b. c. d).
Overall, there was not any strong anomalous descending motion observed over Indian
region during any of the month of monsoon season. In the month of June and July weak
descending motion observed over the west Pacific region. The strong ascending branch over
the west Pacific region shifted further eastward in the month of August. The strong
ascending motion over the North West Pacific indicates enhanced typhoon activity over the
region. There was an increase in strength of descending motion over the north east Indian
region in the month of August which strengthened slightly in the month of September.
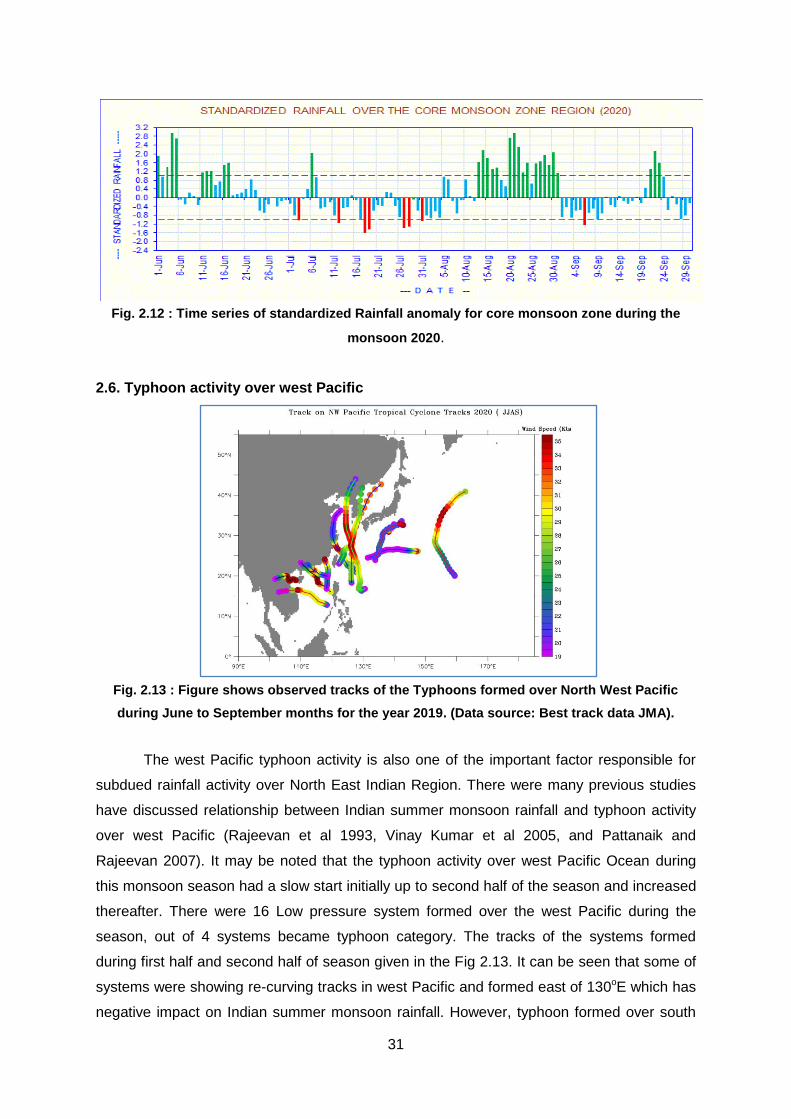
2.5. Intra-seasonal Variability during the Monsoon Season
The intra-seasonal variation of rainfall during 2020 monsoon season is depicted in
the Fig.2.12, which shows the time series of daily rainfall anomaly over the core monsoon
zone (Rajeevan et al, 2006). It can be seen that, weak monsoon situation observed during
some periods during the July month. It can be also seen that, during August, it experienced
frequent active monsoon periods. Overall, June, August and September months received
above normal rainfall of the season.
31
Fig. 2.12 : Time series of standardized Rainfall anomaly for core monsoon zone during the
monsoon 2020.
2.6. Typhoon activity over west Pacific
Fig. 2.13 : Figure shows observed tracks of the Typhoons formed over North West Pacific
during June to September months for the year 2019. (Data source: Best track data JMA).
The west Pacific typhoon activity is also one of the important factor responsible for
subdued rainfall activity over North East Indian Region. There were many previous studies
have discussed relationship between Indian summer monsoon rainfall and typhoon activity
over west Pacific (Rajeevan et al 1993, Vinay Kumar et al 2005, and Pattanaik and
Rajeevan 2007). It may be noted that the typhoon activity over west Pacific Ocean during
this monsoon season had a slow start initially up to second half of the season and increased
thereafter. There were 16 Low pressure system formed over the west Pacific during the
season, out of 4 systems became typhoon category. The tracks of the systems formed
during first half and second half of season given in the Fig 2.13. It can be seen that some of
systems were showing re-curving tracks in west Pacific and formed east of 130oE which has
negative impact on Indian summer monsoon rainfall. However, typhoon formed over south
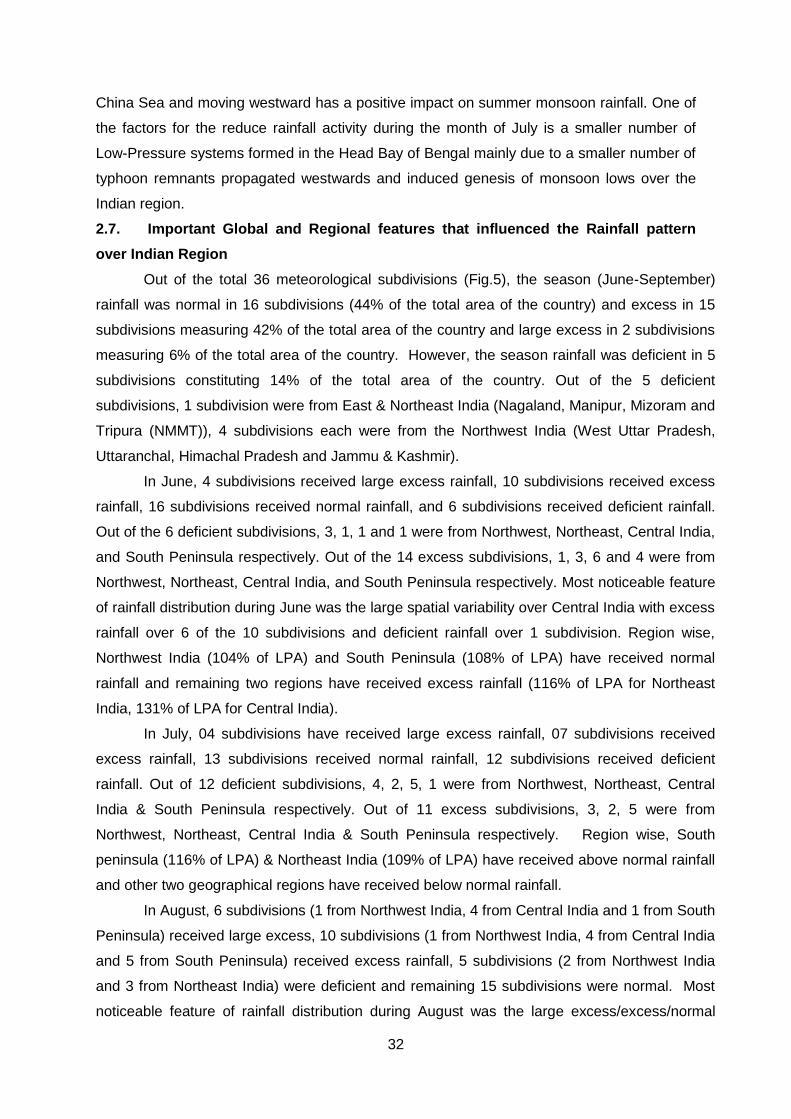
32
China Sea and moving westward has a positive impact on summer monsoon rainfall. One of
the factors for the reduce rainfall activity during the month of July is a smaller number of
Low-Pressure systems formed in the Head Bay of Bengal mainly due to a smaller number of
typhoon remnants propagated westwards and induced genesis of monsoon lows over the
Indian region.
2.7. Important Global and Regional features that influenced the Rainfall pattern
over Indian Region
Out of the total 36 meteorological subdivisions (Fig.5), the season (June-September)
rainfall was normal in 16 subdivisions (44% of the total area of the country) and excess in 15
subdivisions measuring 42% of the total area of the country and large excess in 2 subdivisions
measuring 6% of the total area of the country. However, the season rainfall was deficient in 5
subdivisions constituting 14% of the total area of the country. Out of the 5 deficient
subdivisions, 1 subdivision were from East & Northeast India (Nagaland, Manipur, Mizoram and
Tripura (NMMT)), 4 subdivisions each were from the Northwest India (West Uttar Pradesh,
Uttaranchal, Himachal Pradesh and Jammu & Kashmir).
In June, 4 subdivisions received large excess rainfall, 10 subdivisions received excess
rainfall, 16 subdivisions received normal rainfall, and 6 subdivisions received deficient rainfall.
Out of the 6 deficient subdivisions, 3, 1, 1 and 1 were from Northwest, Northeast, Central India,
and South Peninsula respectively. Out of the 14 excess subdivisions, 1, 3, 6 and 4 were from
Northwest, Northeast, Central India, and South Peninsula respectively. Most noticeable feature
of rainfall distribution during June was the large spatial variability over Central India with excess
rainfall over 6 of the 10 subdivisions and deficient rainfall over 1 subdivision. Region wise,
Northwest India (104% of LPA) and South Peninsula (108% of LPA) have received normal
rainfall and remaining two regions have received excess rainfall (116% of LPA for Northeast
India, 131% of LPA for Central India).
In July, 04 subdivisions have received large excess rainfall, 07 subdivisions received
excess rainfall, 13 subdivisions received normal rainfall, 12 subdivisions received deficient
rainfall. Out of 12 deficient subdivisions, 4, 2, 5, 1 were from Northwest, Northeast, Central
India & South Peninsula respectively. Out of 11 excess subdivisions, 3, 2, 5 were from
Northwest, Northeast, Central India & South Peninsula respectively. Region wise, South
peninsula (116% of LPA) & Northeast India (109% of LPA) have received above normal rainfall
and other two geographical regions have received below normal rainfall.
In August, 6 subdivisions (1 from Northwest India, 4 from Central India and 1 from South
Peninsula) received large excess, 10 subdivisions (1 from Northwest India, 4 from Central India
and 5 from South Peninsula) received excess rainfall, 5 subdivisions (2 from Northwest India
and 3 from Northeast India) were deficient and remaining 15 subdivisions were normal. Most
noticeable feature of rainfall distribution during August was the large excess/excess/normal
33
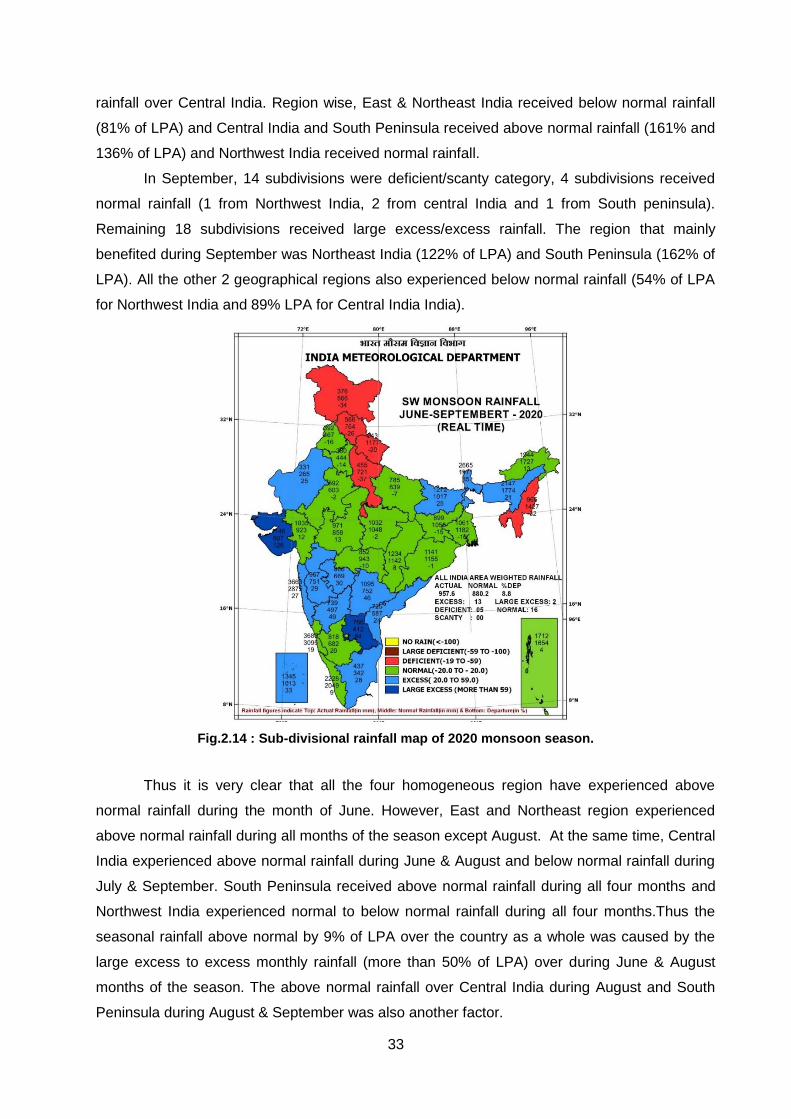
rainfall over Central India. Region wise, East & Northeast India received below normal rainfall
(81% of LPA) and Central India and South Peninsula received above normal rainfall (161% and
136% of LPA) and Northwest India received normal rainfall.
In September, 14 subdivisions were deficient/scanty category, 4 subdivisions received
normal rainfall (1 from Northwest India, 2 from central India and 1 from South peninsula).
Remaining 18 subdivisions received large excess/excess rainfall. The region that mainly
benefited during September was Northeast India (122% of LPA) and South Peninsula (162% of
LPA). All the other 2 geographical regions also experienced below normal rainfall (54% of LPA
for Northwest India and 89% LPA for Central India India).
Fig.2.14 : Sub-divisional rainfall map of 2020 monsoon season.
Thus it is very clear that all the four homogeneous region have experienced above
normal rainfall during the month of June. However, East and Northeast region experienced
above normal rainfall during all months of the season except August. At the same time, Central
India experienced above normal rainfall during June & August and below normal rainfall during
July & September. South Peninsula received above normal rainfall during all four months and
Northwest India experienced normal to below normal rainfall during all four months.Thus the
seasonal rainfall above normal by 9% of LPA over the country as a whole was caused by the
large excess to excess monthly rainfall (more than 50% of LPA) over during June & August
months of the season. The above normal rainfall over Central India during August and South
Peninsula during August & September was also another factor.
34
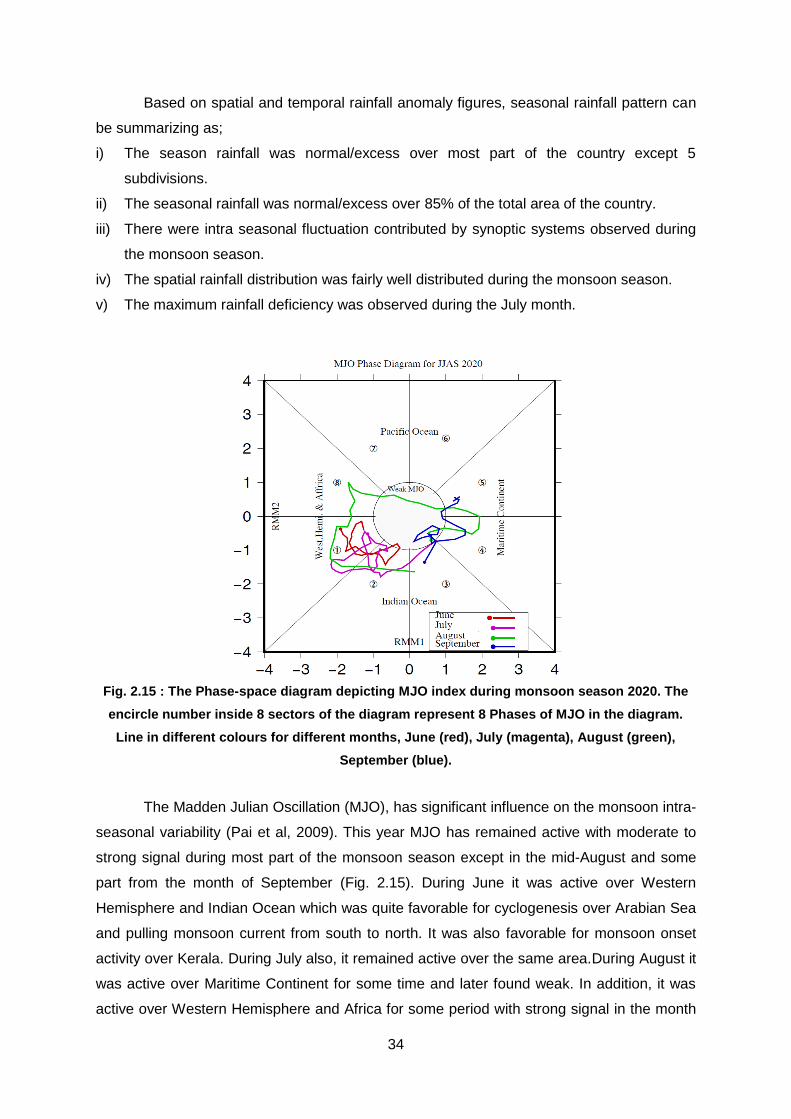
Based on spatial and temporal rainfall anomaly figures, seasonal rainfall pattern can
be summarizing as;
i) The season rainfall was normal/excess over most part of the country except 5
subdivisions.
ii) The seasonal rainfall was normal/excess over 85% of the total area of the country.
iii) There were intra seasonal fluctuation contributed by synoptic systems observed during
the monsoon season.
iv) The spatial rainfall distribution was fairly well distributed during the monsoon season.
v) The maximum rainfall deficiency was observed during the July month.
Fig. 2.15 : The Phase-space diagram depicting MJO index during monsoon season 2020. The
encircle number inside 8 sectors of the diagram represent 8 Phases of MJO in the diagram.
Line in different colours for different months, June (red), July (magenta), August (green),
September (blue).
The Madden Julian Oscillation (MJO), has significant influence on the monsoon intra-
seasonal variability (Pai et al, 2009). This year MJO has remained active with moderate to
strong signal during most part of the monsoon season except in the mid-August and some
part from the month of September (Fig. 2.15). During June it was active over Western
Hemisphere and Indian Ocean which was quite favorable for cyclogenesis over Arabian Sea
and pulling monsoon current from south to north. It was also favorable for monsoon onset
activity over Kerala. During July also, it remained active over the same area.During August it
was active over Maritime Continent for some time and later found weak. In addition, it was
active over Western Hemisphere and Africa for some period with strong signal in the month
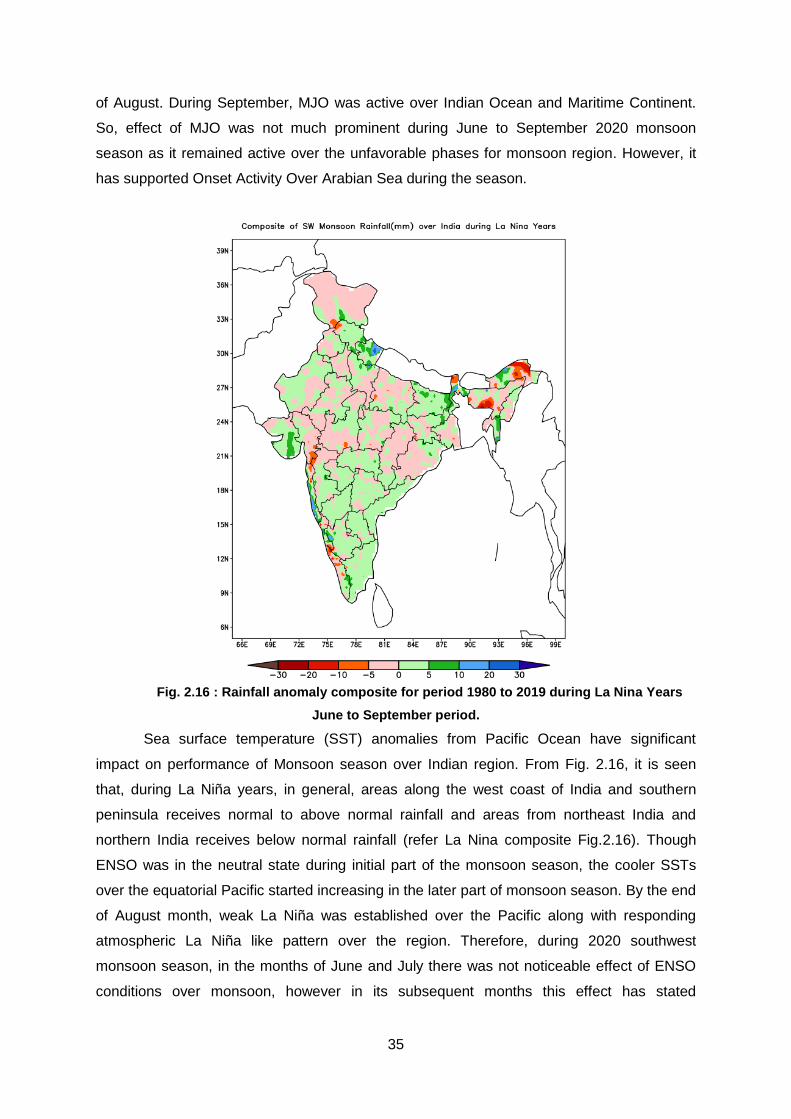
35
of August. During September, MJO was active over Indian Ocean and Maritime Continent.
So, effect of MJO was not much prominent during June to September 2020 monsoon
season as it remained active over the unfavorable phases for monsoon region. However, it
has supported Onset Activity Over Arabian Sea during the season.
Fig. 2.16 : Rainfall anomaly composite for period 1980 to 2019 during La Nina Years
June to September period.
Sea surface temperature (SST) anomalies from Pacific Ocean have significant
impact on performance of Monsoon season over Indian region. From Fig. 2.16, it is seen
that, during La Niña years, in general, areas along the west coast of India and southern
peninsula receives normal to above normal rainfall and areas from northeast India and
northern India receives below normal rainfall (refer La Nina composite Fig.2.16). Though
ENSO was in the neutral state during initial part of the monsoon season, the cooler SSTs
over the equatorial Pacific started increasing in the later part of monsoon season. By the end
of August month, weak La Niña was established over the Pacific along with responding
atmospheric La Niña like pattern over the region. Therefore, during 2020 southwest
monsoon season, in the months of June and July there was not noticeable effect of ENSO
conditions over monsoon, however in its subsequent months this effect has stated
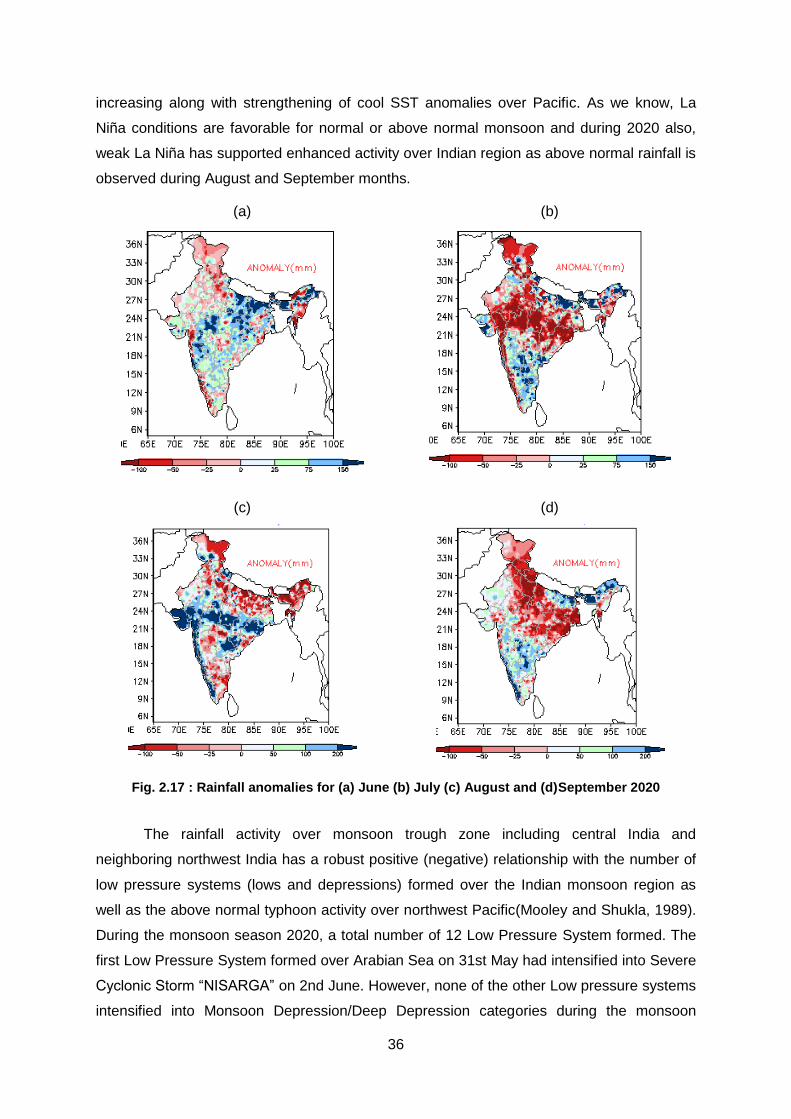
36
increasing along with strengthening of cool SST anomalies over Pacific. As we know, La
Niña conditions are favorable for normal or above normal monsoon and during 2020 also,
weak La Niña has supported enhanced activity over Indian region as above normal rainfall is
observed during August and September months.
(a)
(b)
(c)
(d)
Fig. 2.17 : Rainfall anomalies for (a) June (b) July (c) August and (d)September 2020
The rainfall activity over monsoon trough zone including central India and
neighboring northwest India has a robust positive (negative) relationship with the number of
low pressure systems (lows and depressions) formed over the Indian monsoon region as
well as the above normal typhoon activity over northwest Pacific(Mooley and Shukla, 1989).
During the monsoon season 2020, a total number of 12 Low Pressure System formed. The
first Low Pressure System formed over Arabian Sea on 31st May had intensified into Severe
Cyclonic Storm “NISARGA” on 2nd June. However, none of the other Low pressure systems
intensified into Monsoon Depression/Deep Depression categories during the monsoon
37
season. Thus the rainfall activity over Indian main land during this season (Fig. 2.17) was
significantly linked to the activity of the low pressure systems formed over Indian monsoon
region.
2.8. Summary
Southwest monsoon 2020 season performed very well in terms of monsoon rainfall
during most of the season. Though less number of monsoon disturbances in the Bay of
Bengal this year and insignificant MJO forcing, the monsoon has got impact from large scale
forgings like Indian Ocean and Pacific Ocean SSTs. During the 2020 southwest monsoon
season, in the month of June, weak positive IOD conditions were present over Indian Ocean,
however IOD index turned in to neutral condition during the subsequent months sonot much
impact on monsoon rainfall. However, the large-scale SST forcing from Pacific Ocean were
prominent during August and September months as strengthening of La Niña conditions was
observed in the later part of the monsoon season and its effect was quite significant. As a
result, influence on the monsoon from the large-scale SST forcing from Indian Ocean were
prominent during June and during August and September SST forcing from Pacific Ocean
was significant. However, there are some other synoptic scale factors and intra-seasonal
variations dominated the rainfall during the monsoon season. This year monsoon season
has observed intra-seasonal variations associated with formation of monsoon low pressure
systems and Northwest Pacific typhoon activity. One of the major tropical intra-seasonal
variations associated with the MJO, was remained in the unfavorable phases during the
most part of monsoon season except few days in the month of June, so the influence of MJO
was less during 2020 monsoon season. The rainfall during the second half of the season
was also attributed to the formation of low-pressure system over Indian region. The above
normal rainfall over the central and adjoining parts of the India during the second half of the
season was also attributed to the active monsoon trough which was remained to south of its
normal position most of the times as well as formation of more number of lows. Thus, the
rainfall deficiency was more during the July and in its subsequent months like August and
September, excess rainfall activity was observed. However, the spatial rainfall distribution
was fairly well distributed during the monsoon season.
References :
Ashok K. and N. H. Saji, (2007), On the impacts of ENSO and Indian Ocean dipole events on sub-regional Indian summer monsoon rainfall. Nat. Hazards. 42, pp 273–285. Mooley D. A. and Shukla, J., (1989), Main features of the westward moving low pressure systems which form over Indian region during the summer monsoon season and their relation to monsoon rainfall. Mausam, 40, pp 137–152.

38
Pai D. S., Jyoti Bhate, O. P. Sreejith and H. R. Hatwar, (2009) Impact of MJO on the intraseasonal variation of the summer monsoon rainfall over India, Climate Dynamics, 36, N-12, pp 41-55. Pattanaik D. R and Rajeevan M., (2007), Northwest Pacific tropical cyclone activity and July rainfall over India.Meteorology and Atmospheric Physics, 95, pp 63-72. Rajeevan M., (1993), Inter-relationship between NW Pacific typhoon activity and Indian summer monsoon on inter-annual and intra seasonal time scales. Mausam, 44, pp 109-111. Rajeevan M., S. Gadgil and J. Bhate, (2008), Active and Break spells of Indian Summer monsoon, NCC research report, 7. Vinay Kumar and Krishnan R., (2005), On the association between the Indian summer monsoon and tropical cyclone activity over the Northwest Pacific. Current Science, 88, pp 602-612. Wheeler M. C., Hendon H. H., (2004), An all-season real-time multivariate MJO Index: Development of an index for monitoring and prediction, Mon. Weather. Rev., 132, pp 1917-1932.
39
3
EXTREME WEATHER EVENTS OVER
WESTERN REGION (MAHARASHTRA, GUJARAT AND GOA)
DURING SOUTH WEST MONSOON 2020
K. S. Hosalikar, Bishwombhar Singh, S. A. Bhute, Nitha. T. S.,
Jan Mohammad and Shambu Ravindren, Jayanta Sarkar,
Manorama Mohanty, Vigin Lal F, Rahul M., Saurabh Mishra and
Nisha Kushwaha
3.1. Performance of Southwest Monsoon 2020 over Maharashtra State :
As per the long range forecast (LRF) issued by IMD prior to the season, Maharashtra
received a good quantum of rainfall during monsoon 2020. Monsoon made its presence felt
in Maharashtra on 11th June through Harnai; a coastal station in south Konkan delayed by
one day from its normal onset date of 10th June. It further covered entire parts of
Maharashtra by 15th June 2020. Maharashtra received a normal monsoon this year with a
seasonal total of 1165 mm against its long period average of 1004.2 mm with a positive
departure of 16%. Normal to excess rainfall occurred over most districts of Maharashtra
except 3 districts of Vidarbha subdivision (Akola, Amaravati and Yavatmal).
The seasonal rainfall (June- September) over Maharashtra during monsoon is shown
in Fig. 3.1 Monthly performance of monsoon during June to September is shown in Fig. 3.2
Monthly rainfall figures indicate that the drought prone areas on interior Maharashtra
especially Marathwada continuously received good rainfall during all the four months with
mostly excess to large excess rainfall during most months. Monsoon withdrew from Mumbai
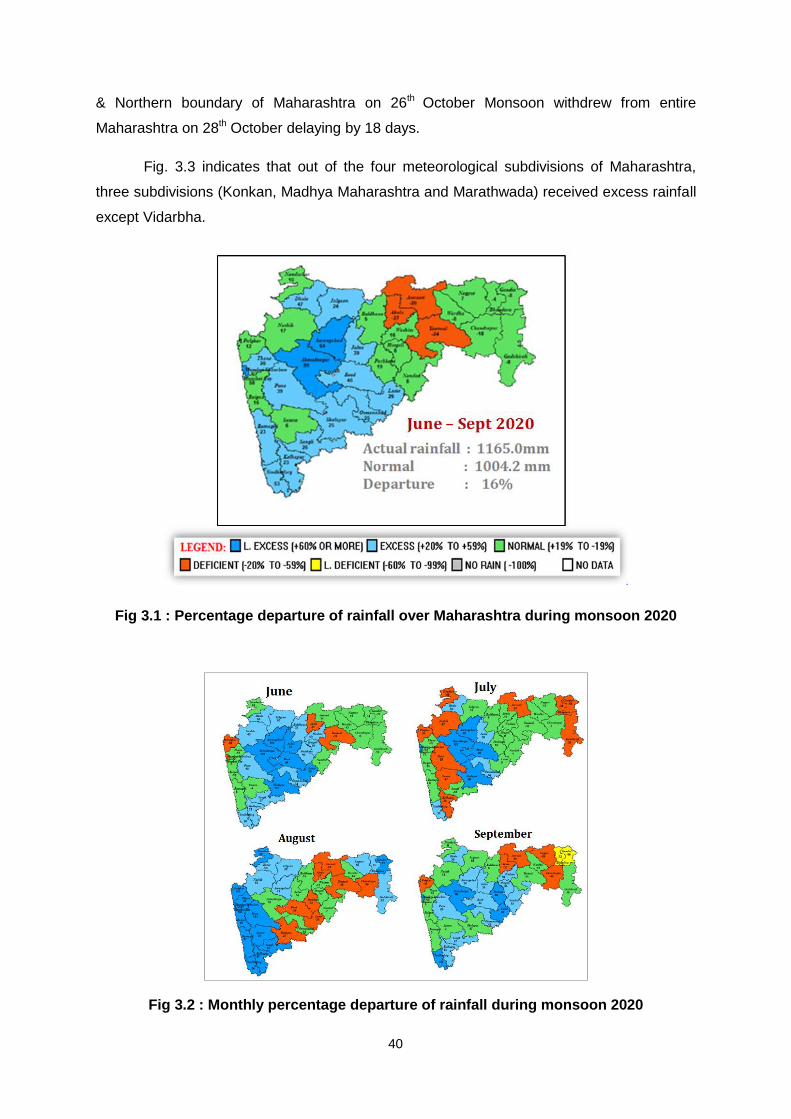
40
& Northern boundary of Maharashtra on 26th October Monsoon withdrew from entire
Maharashtra on 28th October delaying by 18 days.
Fig. 3.3 indicates that out of the four meteorological subdivisions of Maharashtra,
three subdivisions (Konkan, Madhya Maharashtra and Marathwada) received excess rainfall
except Vidarbha.
Fig 3.1 : Percentage departure of rainfall over Maharashtra during monsoon 2020
Fig 3.2 : Monthly percentage departure of rainfall during monsoon 2020
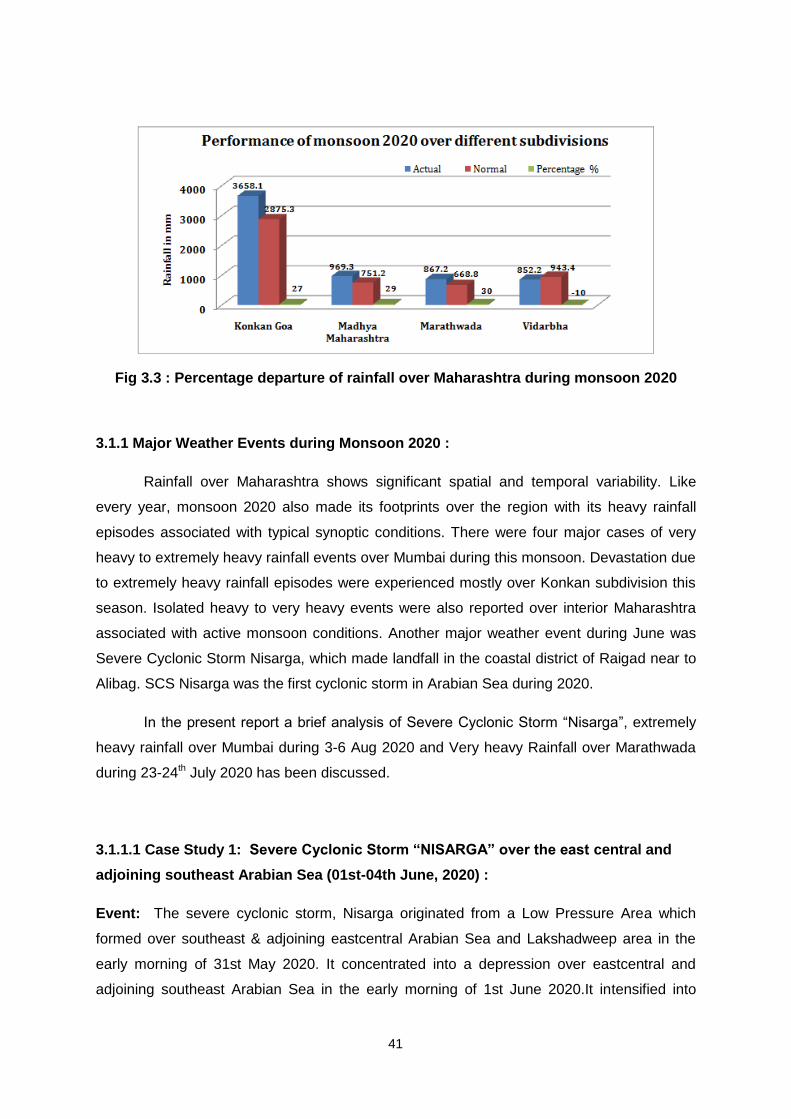
41
Fig 3.3 : Percentage departure of rainfall over Maharashtra during monsoon 2020
3.1.1 Major Weather Events during Monsoon 2020 :
Rainfall over Maharashtra shows significant spatial and temporal variability. Like
every year, monsoon 2020 also made its footprints over the region with its heavy rainfall
episodes associated with typical synoptic conditions. There were four major cases of very
heavy to extremely heavy rainfall events over Mumbai during this monsoon. Devastation due
to extremely heavy rainfall episodes were experienced mostly over Konkan subdivision this
season. Isolated heavy to very heavy events were also reported over interior Maharashtra
associated with active monsoon conditions. Another major weather event during June was
Severe Cyclonic Storm Nisarga, which made landfall in the coastal district of Raigad near to
Alibag. SCS Nisarga was the first cyclonic storm in Arabian Sea during 2020.
In the present report a brief analysis of Severe Cyclonic Storm “Nisarga”, extremely
heavy rainfall over Mumbai during 3-6 Aug 2020 and Very heavy Rainfall over Marathwada
during 23-24th July 2020 has been discussed.
3.1.1.1 Case Study 1: Severe Cyclonic Storm “NISARGA” over the east central and
adjoining southeast Arabian Sea (01st-04th June, 2020) :
Event: The severe cyclonic storm, Nisarga originated from a Low Pressure Area which
formed over southeast & adjoining eastcentral Arabian Sea and Lakshadweep area in the
early morning of 31st May 2020. It concentrated into a depression over eastcentral and
adjoining southeast Arabian Sea in the early morning of 1st June 2020.It intensified into
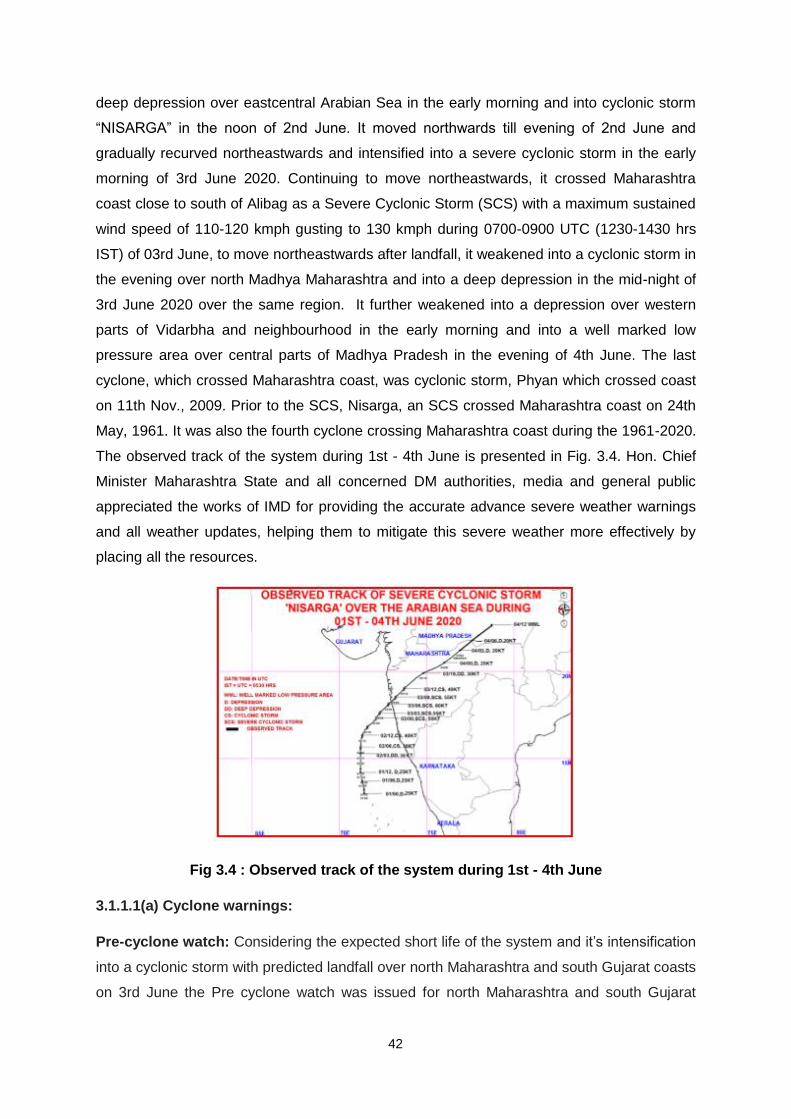
42
deep depression over eastcentral Arabian Sea in the early morning and into cyclonic storm
“NISARGA” in the noon of 2nd June. It moved northwards till evening of 2nd June and
gradually recurved northeastwards and intensified into a severe cyclonic storm in the early
morning of 3rd June 2020. Continuing to move northeastwards, it crossed Maharashtra
coast close to south of Alibag as a Severe Cyclonic Storm (SCS) with a maximum sustained
wind speed of 110-120 kmph gusting to 130 kmph during 0700-0900 UTC (1230-1430 hrs
IST) of 03rd June, to move northeastwards after landfall, it weakened into a cyclonic storm in
the evening over north Madhya Maharashtra and into a deep depression in the mid-night of
3rd June 2020 over the same region. It further weakened into a depression over western
parts of Vidarbha and neighbourhood in the early morning and into a well marked low
pressure area over central parts of Madhya Pradesh in the evening of 4th June. The last
cyclone, which crossed Maharashtra coast, was cyclonic storm, Phyan which crossed coast
on 11th Nov., 2009. Prior to the SCS, Nisarga, an SCS crossed Maharashtra coast on 24th
May, 1961. It was also the fourth cyclone crossing Maharashtra coast during the 1961-2020.
The observed track of the system during 1st - 4th June is presented in Fig. 3.4. Hon. Chief
Minister Maharashtra State and all concerned DM authorities, media and general public
appreciated the works of IMD for providing the accurate advance severe weather warnings
and all weather updates, helping them to mitigate this severe weather more effectively by
placing all the resources.
Fig 3.4 : Observed track of the system during 1st - 4th June
3.1.1.1(a) Cyclone warnings:
Pre-cyclone watch: Considering the expected short life of the system and it’s intensification
into a cyclonic storm with predicted landfall over north Maharashtra and south Gujarat coasts
on 3rd June the Pre cyclone watch was issued for north Maharashtra and south Gujarat
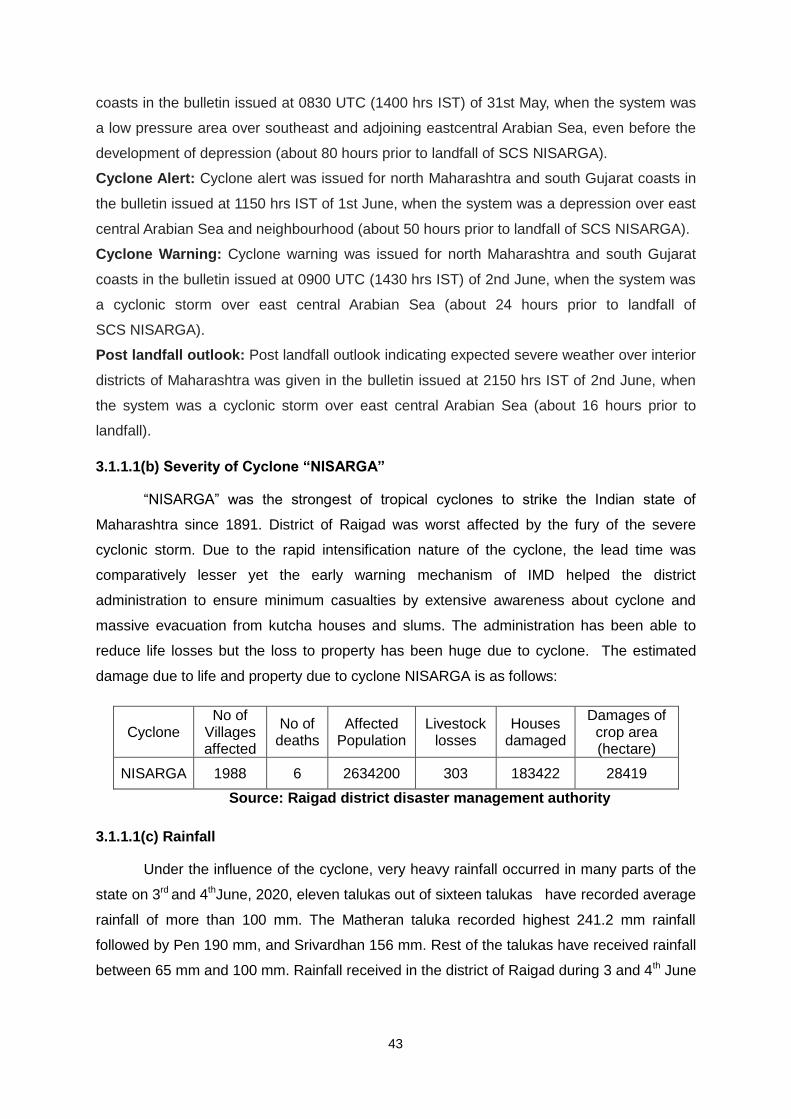
43
coasts in the bulletin issued at 0830 UTC (1400 hrs IST) of 31st May, when the system was
a low pressure area over southeast and adjoining eastcentral Arabian Sea, even before the
development of depression (about 80 hours prior to landfall of SCS NISARGA).
Cyclone Alert: Cyclone alert was issued for north Maharashtra and south Gujarat coasts in
the bulletin issued at 1150 hrs IST of 1st June, when the system was a depression over east
central Arabian Sea and neighbourhood (about 50 hours prior to landfall of SCS NISARGA).
Cyclone Warning: Cyclone warning was issued for north Maharashtra and south Gujarat
coasts in the bulletin issued at 0900 UTC (1430 hrs IST) of 2nd June, when the system was
a cyclonic storm over east central Arabian Sea (about 24 hours prior to landfall of
SCS NISARGA).
Post landfall outlook: Post landfall outlook indicating expected severe weather over interior
districts of Maharashtra was given in the bulletin issued at 2150 hrs IST of 2nd June, when
the system was a cyclonic storm over east central Arabian Sea (about 16 hours prior to
landfall).
3.1.1.1(b) Severity of Cyclone “NISARGA”
“NISARGA” was the strongest of tropical cyclones to strike the Indian state of
Maharashtra since 1891. District of Raigad was worst affected by the fury of the severe
cyclonic storm. Due to the rapid intensification nature of the cyclone, the lead time was
comparatively lesser yet the early warning mechanism of IMD helped the district
administration to ensure minimum casualties by extensive awareness about cyclone and
massive evacuation from kutcha houses and slums. The administration has been able to
reduce life losses but the loss to property has been huge due to cyclone. The estimated
damage due to life and property due to cyclone NISARGA is as follows:
Cyclone No of
Villages affected
No of deaths
Affected Population
Livestock losses
Houses damaged
Damages of crop area (hectare)
NISARGA 1988 6 2634200 303 183422 28419
Source: Raigad district disaster management authority
3.1.1.1(c) Rainfall
Under the influence of the cyclone, very heavy rainfall occurred in many parts of the
state on 3rd and 4thJune, 2020, eleven talukas out of sixteen talukas have recorded average
rainfall of more than 100 mm. The Matheran taluka recorded highest 241.2 mm rainfall
followed by Pen 190 mm, and Srivardhan 156 mm. Rest of the talukas have received rainfall
between 65 mm and 100 mm. Rainfall received in the district of Raigad during 3 and 4th June
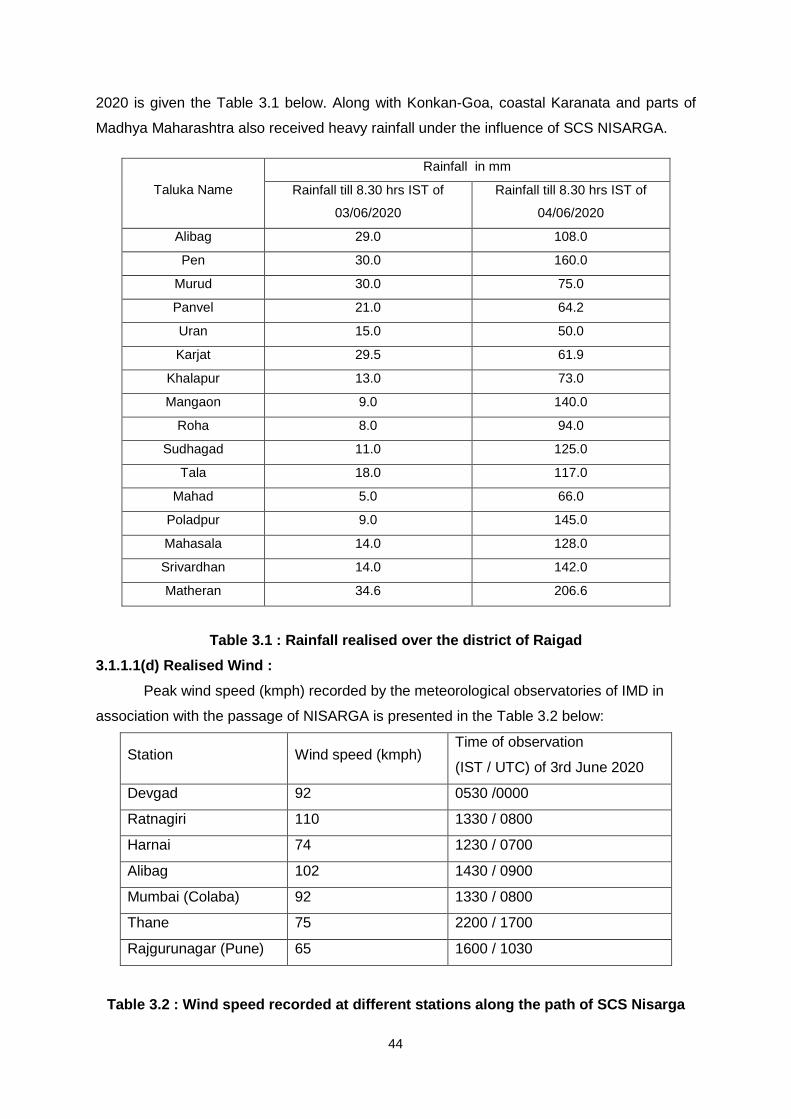
44
2020 is given the Table 3.1 below. Along with Konkan-Goa, coastal Karanata and parts of
Madhya Maharashtra also received heavy rainfall under the influence of SCS NISARGA.
Taluka Name
Rainfall in mm
Rainfall till 8.30 hrs IST of
03/06/2020
Rainfall till 8.30 hrs IST of
04/06/2020
Alibag 29.0 108.0
Pen 30.0 160.0
Murud 30.0 75.0
Panvel 21.0 64.2
Uran 15.0 50.0
Karjat 29.5 61.9
Khalapur 13.0 73.0
Mangaon 9.0 140.0
Roha 8.0 94.0
Sudhagad 11.0 125.0
Tala 18.0 117.0
Mahad 5.0 66.0
Poladpur 9.0 145.0
Mahasala 14.0 128.0
Srivardhan 14.0 142.0
Matheran 34.6 206.6
Table 3.1 : Rainfall realised over the district of Raigad
3.1.1.1(d) Realised Wind :
Peak wind speed (kmph) recorded by the meteorological observatories of IMD in
association with the passage of NISARGA is presented in the Table 3.2 below:
Station Wind speed (kmph) Time of observation
(IST / UTC) of 3rd June 2020
Devgad 92 0530 /0000
Ratnagiri 110 1330 / 0800
Harnai 74 1230 / 0700
Alibag 102 1430 / 0900
Mumbai (Colaba) 92 1330 / 0800
Thane 75 2200 / 1700
Rajgurunagar (Pune) 65 1600 / 1030
Table 3.2 : Wind speed recorded at different stations along the path of SCS Nisarga
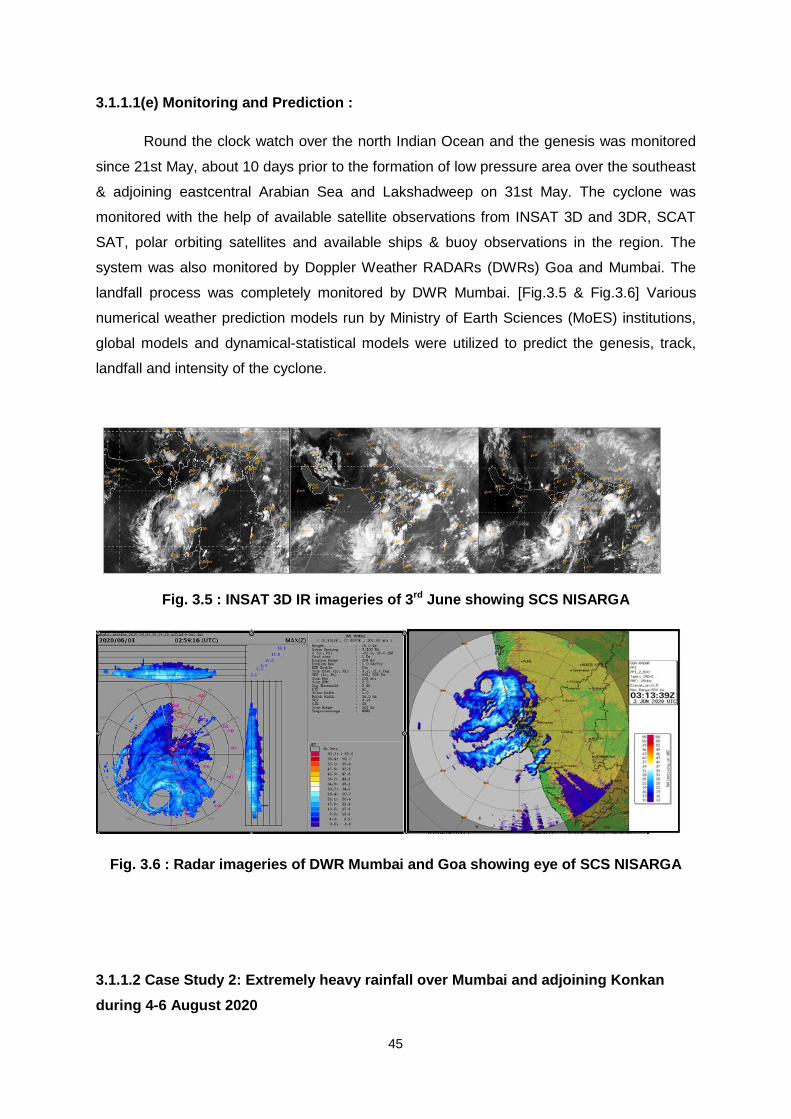
45
3.1.1.1(e) Monitoring and Prediction :
Round the clock watch over the north Indian Ocean and the genesis was monitored
since 21st May, about 10 days prior to the formation of low pressure area over the southeast
& adjoining eastcentral Arabian Sea and Lakshadweep on 31st May. The cyclone was
monitored with the help of available satellite observations from INSAT 3D and 3DR, SCAT
SAT, polar orbiting satellites and available ships & buoy observations in the region. The
system was also monitored by Doppler Weather RADARs (DWRs) Goa and Mumbai. The
landfall process was completely monitored by DWR Mumbai. [Fig.3.5 & Fig.3.6] Various
numerical weather prediction models run by Ministry of Earth Sciences (MoES) institutions,
global models and dynamical-statistical models were utilized to predict the genesis, track,
landfall and intensity of the cyclone.
Fig. 3.5 : INSAT 3D IR imageries of 3rd June showing SCS NISARGA
Fig. 3.6 : Radar imageries of DWR Mumbai and Goa showing eye of SCS NISARGA
3.1.1.2 Case Study 2: Extremely heavy rainfall over Mumbai and adjoining Konkan
during 4-6 August 2020
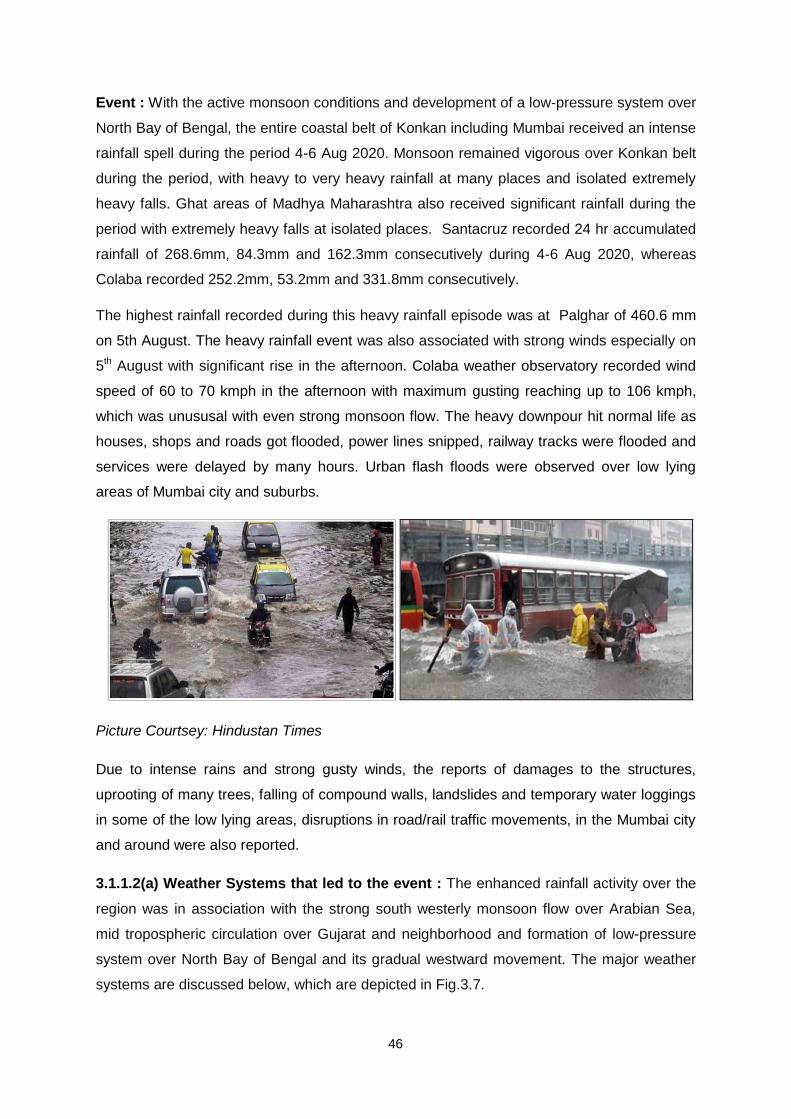
46
Event : With the active monsoon conditions and development of a low-pressure system over
North Bay of Bengal, the entire coastal belt of Konkan including Mumbai received an intense
rainfall spell during the period 4-6 Aug 2020. Monsoon remained vigorous over Konkan belt
during the period, with heavy to very heavy rainfall at many places and isolated extremely
heavy falls. Ghat areas of Madhya Maharashtra also received significant rainfall during the
period with extremely heavy falls at isolated places. Santacruz recorded 24 hr accumulated
rainfall of 268.6mm, 84.3mm and 162.3mm consecutively during 4-6 Aug 2020, whereas
Colaba recorded 252.2mm, 53.2mm and 331.8mm consecutively.
The highest rainfall recorded during this heavy rainfall episode was at Palghar of 460.6 mm
on 5th August. The heavy rainfall event was also associated with strong winds especially on
5th August with significant rise in the afternoon. Colaba weather observatory recorded wind
speed of 60 to 70 kmph in the afternoon with maximum gusting reaching up to 106 kmph,
which was unususal with even strong monsoon flow. The heavy downpour hit normal life as
houses, shops and roads got flooded, power lines snipped, railway tracks were flooded and
services were delayed by many hours. Urban flash floods were observed over low lying
areas of Mumbai city and suburbs.
Picture Courtsey: Hindustan Times
Due to intense rains and strong gusty winds, the reports of damages to the structures,
uprooting of many trees, falling of compound walls, landslides and temporary water loggings
in some of the low lying areas, disruptions in road/rail traffic movements, in the Mumbai city
and around were also reported.
3.1.1.2(a) Weather Systems that led to the event : The enhanced rainfall activity over the
region was in association with the strong south westerly monsoon flow over Arabian Sea,
mid tropospheric circulation over Gujarat and neighborhood and formation of low-pressure
system over North Bay of Bengal and its gradual westward movement. The major weather
systems are discussed below, which are depicted in Fig.3.7.
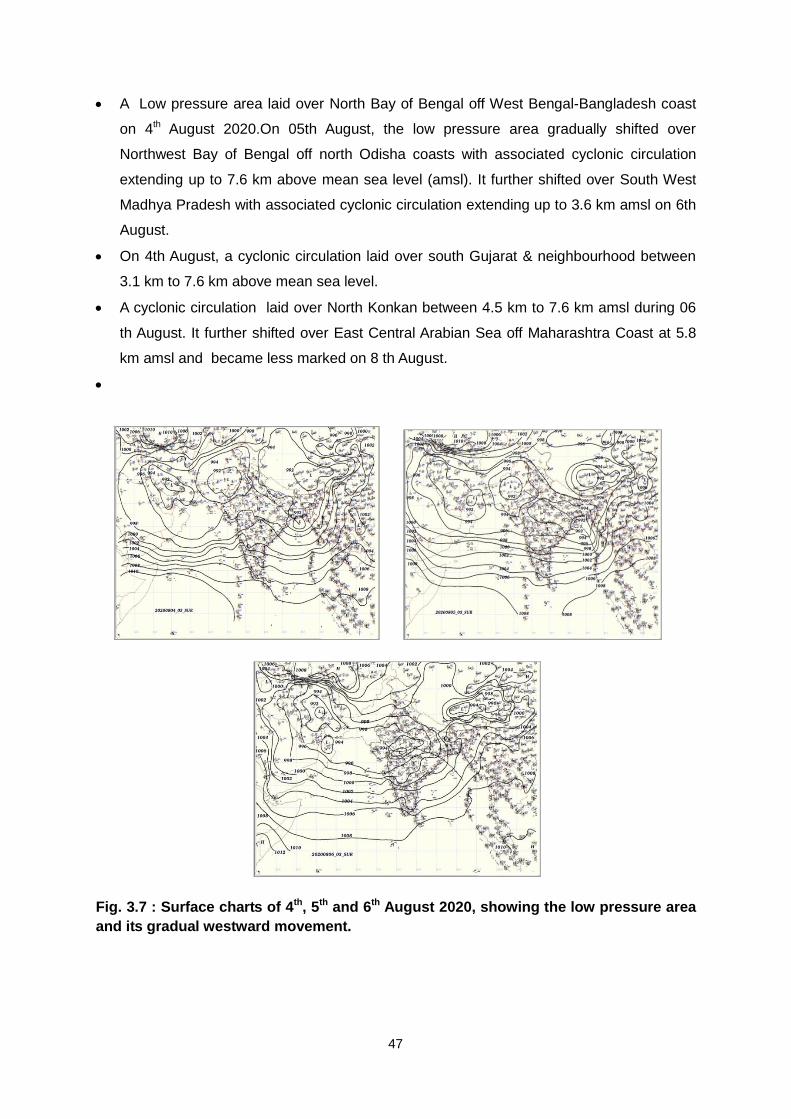
47
A Low pressure area laid over North Bay of Bengal off West Bengal-Bangladesh coast
on 4th August 2020.On 05th August, the low pressure area gradually shifted over
Northwest Bay of Bengal off north Odisha coasts with associated cyclonic circulation
extending up to 7.6 km above mean sea level (amsl). It further shifted over South West
Madhya Pradesh with associated cyclonic circulation extending up to 3.6 km amsl on 6th
August.
On 4th August, a cyclonic circulation laid over south Gujarat & neighbourhood between
3.1 km to 7.6 km above mean sea level.
A cyclonic circulation laid over North Konkan between 4.5 km to 7.6 km amsl during 06
th August. It further shifted over East Central Arabian Sea off Maharashtra Coast at 5.8
km amsl and became less marked on 8 th August.
Fig. 3.7 : Surface charts of 4th, 5th and 6th August 2020, showing the low pressure area
and its gradual westward movement.
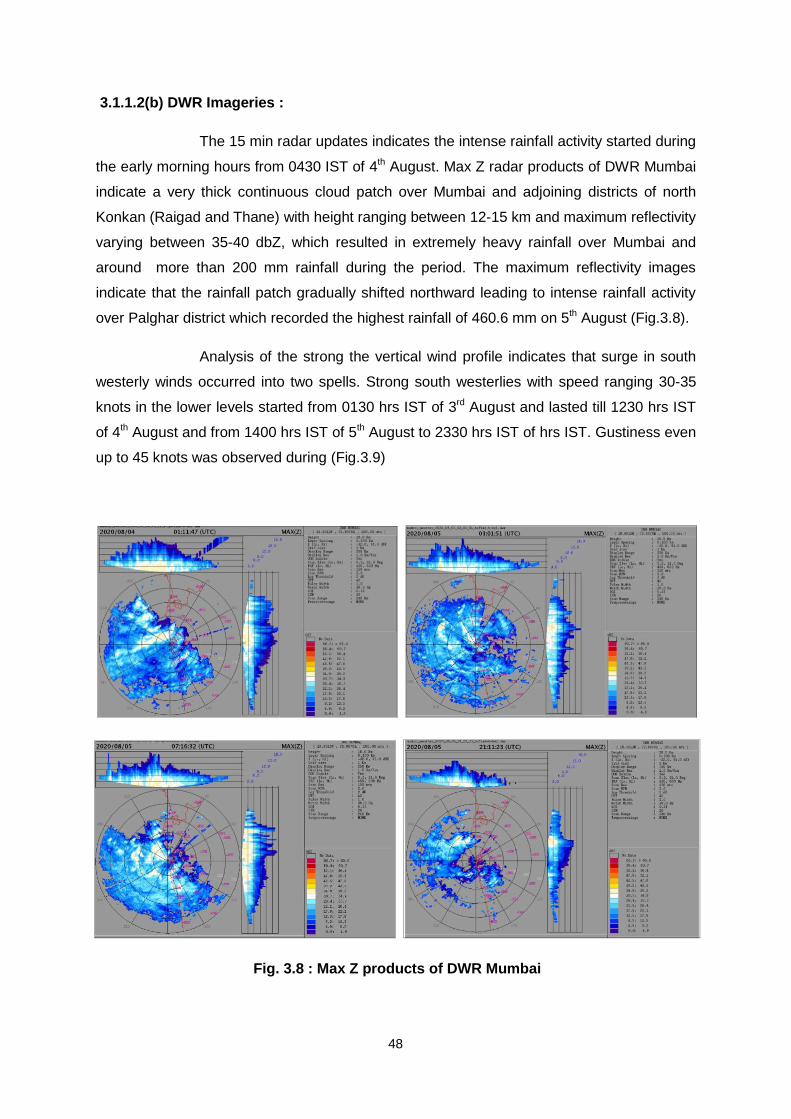
48
3.1.1.2(b) DWR Imageries :
The 15 min radar updates indicates the intense rainfall activity started during
the early morning hours from 0430 IST of 4th August. Max Z radar products of DWR Mumbai
indicate a very thick continuous cloud patch over Mumbai and adjoining districts of north
Konkan (Raigad and Thane) with height ranging between 12-15 km and maximum reflectivity
varying between 35-40 dbZ, which resulted in extremely heavy rainfall over Mumbai and
around more than 200 mm rainfall during the period. The maximum reflectivity images
indicate that the rainfall patch gradually shifted northward leading to intense rainfall activity
over Palghar district which recorded the highest rainfall of 460.6 mm on 5th August (Fig.3.8).
Analysis of the strong the vertical wind profile indicates that surge in south
westerly winds occurred into two spells. Strong south westerlies with speed ranging 30-35
knots in the lower levels started from 0130 hrs IST of 3rd August and lasted till 1230 hrs IST
of 4th August and from 1400 hrs IST of 5th August to 2330 hrs IST of hrs IST. Gustiness even
up to 45 knots was observed during (Fig.3.9)
Fig. 3.8 : Max Z products of DWR Mumbai
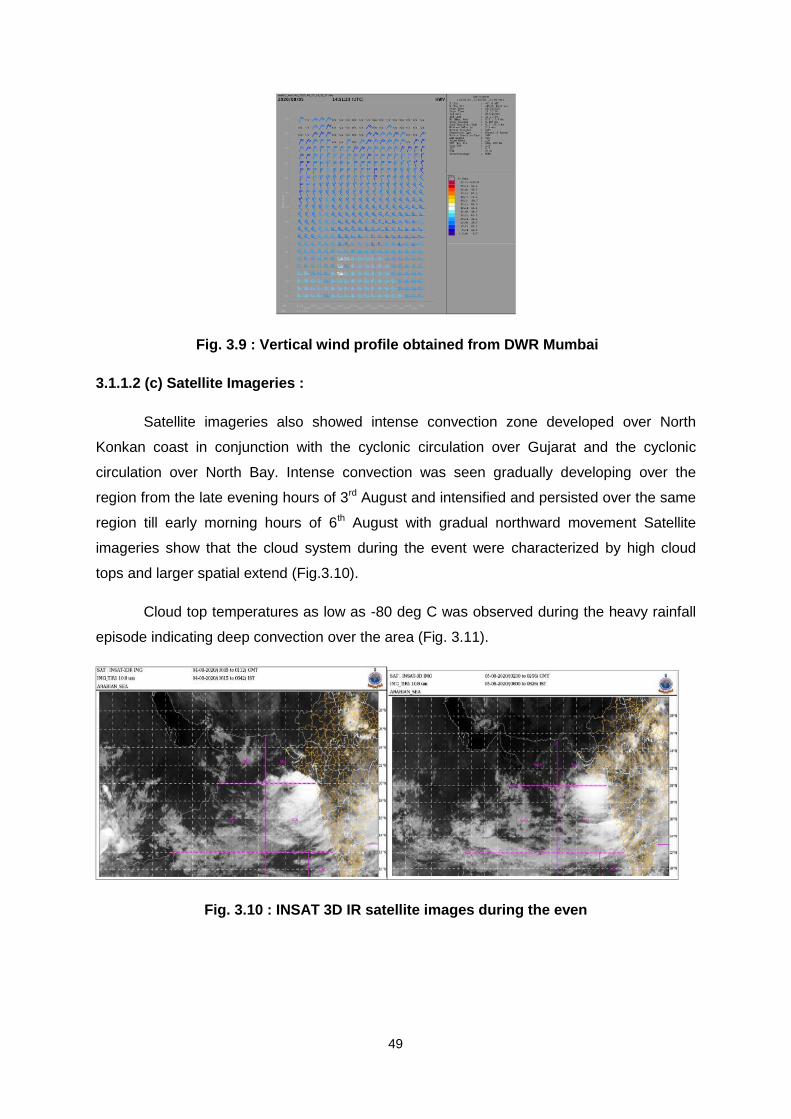
49
Fig. 3.9 : Vertical wind profile obtained from DWR Mumbai
3.1.1.2 (c) Satellite Imageries :
Satellite imageries also showed intense convection zone developed over North
Konkan coast in conjunction with the cyclonic circulation over Gujarat and the cyclonic
circulation over North Bay. Intense convection was seen gradually developing over the
region from the late evening hours of 3rd August and intensified and persisted over the same
region till early morning hours of 6th August with gradual northward movement Satellite
imageries show that the cloud system during the event were characterized by high cloud
tops and larger spatial extend (Fig.3.10).
Cloud top temperatures as low as -80 deg C was observed during the heavy rainfall
episode indicating deep convection over the area (Fig. 3.11).
Fig. 3.10 : INSAT 3D IR satellite images during the even
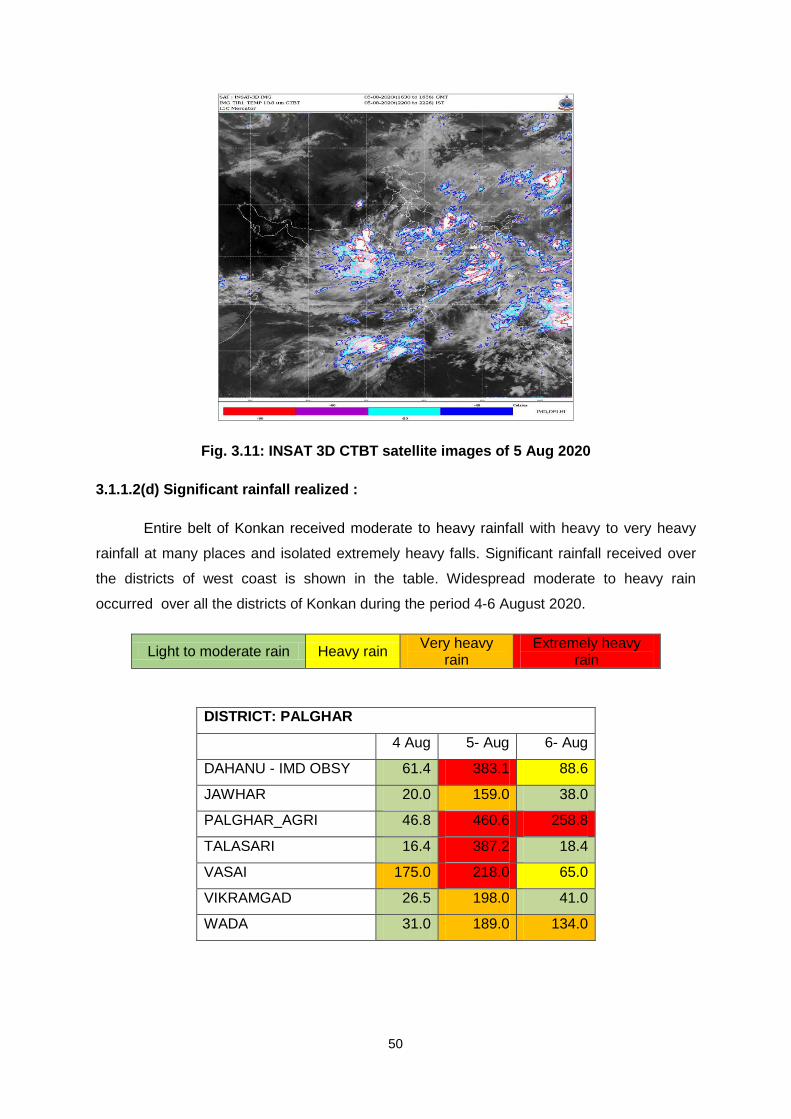
50
Fig. 3.11: INSAT 3D CTBT satellite images of 5 Aug 2020
3.1.1.2(d) Significant rainfall realized :
Entire belt of Konkan received moderate to heavy rainfall with heavy to very heavy
rainfall at many places and isolated extremely heavy falls. Significant rainfall received over
the districts of west coast is shown in the table. Widespread moderate to heavy rain
occurred over all the districts of Konkan during the period 4-6 August 2020.
Light to moderate rain Heavy rain Very heavy
rain Extremely heavy
rain
DISTRICT: PALGHAR
4 Aug 5- Aug 6- Aug
DAHANU - IMD OBSY 61.4 383.1 88.6
JAWHAR 20.0 159.0 38.0
PALGHAR_AGRI 46.8 460.6 258.8
TALASARI 16.4 387.2 18.4
VASAI 175.0 218.0 65.0
VIKRAMGAD 26.5 198.0 41.0
WADA 31.0 189.0 134.0
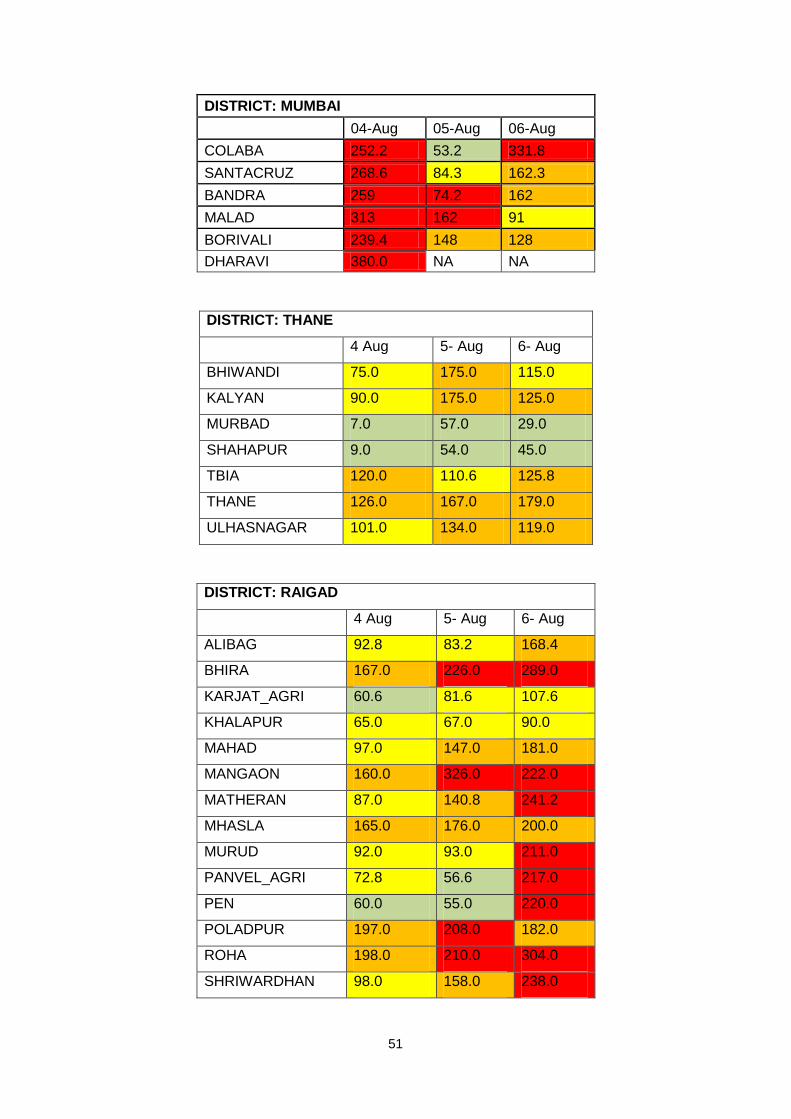
51
DISTRICT: MUMBAI
04-Aug 05-Aug 06-Aug
COLABA 252.2 53.2 331.8
SANTACRUZ 268.6 84.3 162.3
BANDRA 259 74.2 162
MALAD 313 162 91
BORIVALI 239.4 148 128
DHARAVI 380.0 NA NA
DISTRICT: THANE
4 Aug 5- Aug 6- Aug
BHIWANDI 75.0 175.0 115.0
KALYAN 90.0 175.0 125.0
MURBAD 7.0 57.0 29.0
SHAHAPUR 9.0 54.0 45.0
TBIA 120.0 110.6 125.8
THANE 126.0 167.0 179.0
ULHASNAGAR 101.0 134.0 119.0
DISTRICT: RAIGAD
4 Aug 5- Aug 6- Aug
ALIBAG 92.8 83.2 168.4
BHIRA 167.0 226.0 289.0
KARJAT_AGRI 60.6 81.6 107.6
KHALAPUR 65.0 67.0 90.0
MAHAD 97.0 147.0 181.0
MANGAON 160.0 326.0 222.0
MATHERAN 87.0 140.8 241.2
MHASLA 165.0 176.0 200.0
MURUD 92.0 93.0 211.0
PANVEL_AGRI 72.8 56.6 217.0
PEN 60.0 55.0 220.0
POLADPUR 197.0 208.0 182.0
ROHA 198.0 210.0 304.0
SHRIWARDHAN 98.0 158.0 238.0
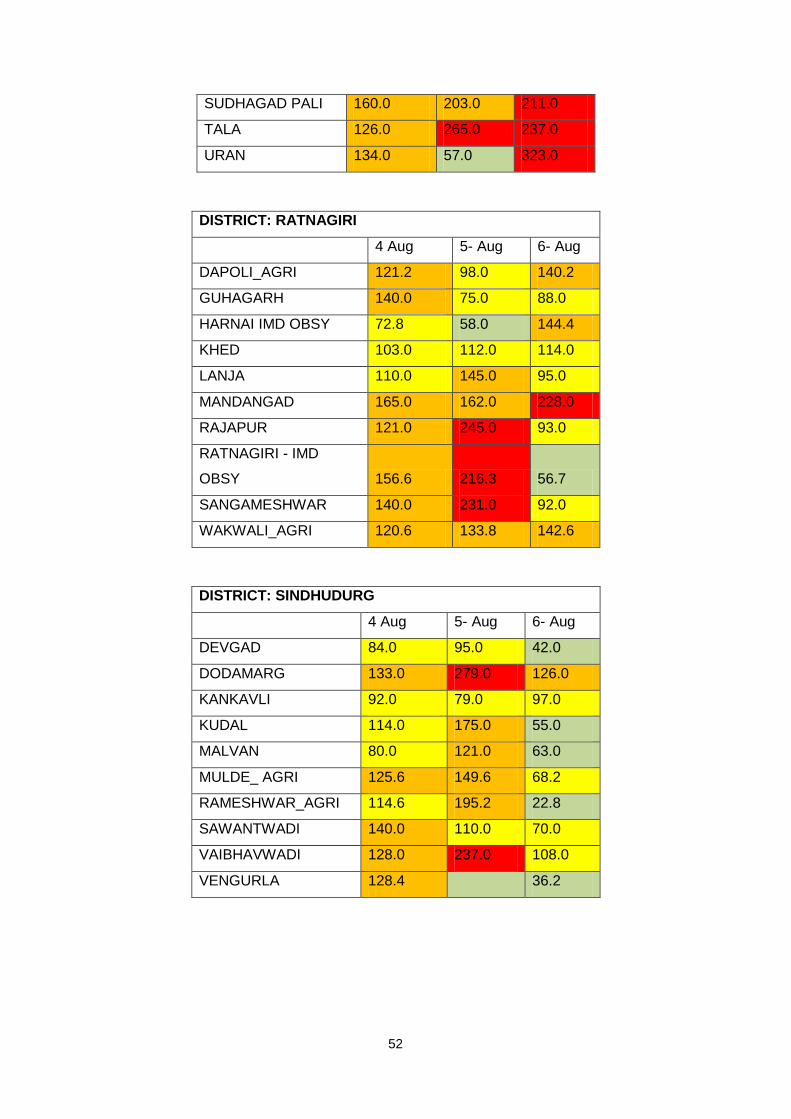
52
SUDHAGAD PALI 160.0 203.0 211.0
TALA 126.0 265.0 237.0
URAN 134.0 57.0 323.0
DISTRICT: RATNAGIRI
4 Aug 5- Aug 6- Aug
DAPOLI_AGRI 121.2 98.0 140.2
GUHAGARH 140.0 75.0 88.0
HARNAI IMD OBSY 72.8 58.0 144.4
KHED 103.0 112.0 114.0
LANJA 110.0 145.0 95.0
MANDANGAD 165.0 162.0 228.0
RAJAPUR 121.0 245.0 93.0
RATNAGIRI - IMD
OBSY 156.6 216.3 56.7
SANGAMESHWAR 140.0 231.0 92.0
WAKWALI_AGRI 120.6 133.8 142.6
DISTRICT: SINDHUDURG
4 Aug 5- Aug 6- Aug
DEVGAD 84.0 95.0 42.0
DODAMARG 133.0 279.0 126.0
KANKAVLI 92.0 79.0 97.0
KUDAL 114.0 175.0 55.0
MALVAN 80.0 121.0 63.0
MULDE_ AGRI 125.6 149.6 68.2
RAMESHWAR_AGRI 114.6 195.2 22.8
SAWANTWADI 140.0 110.0 70.0
VAIBHAVWADI 128.0 237.0 108.0
VENGURLA 128.4
36.2
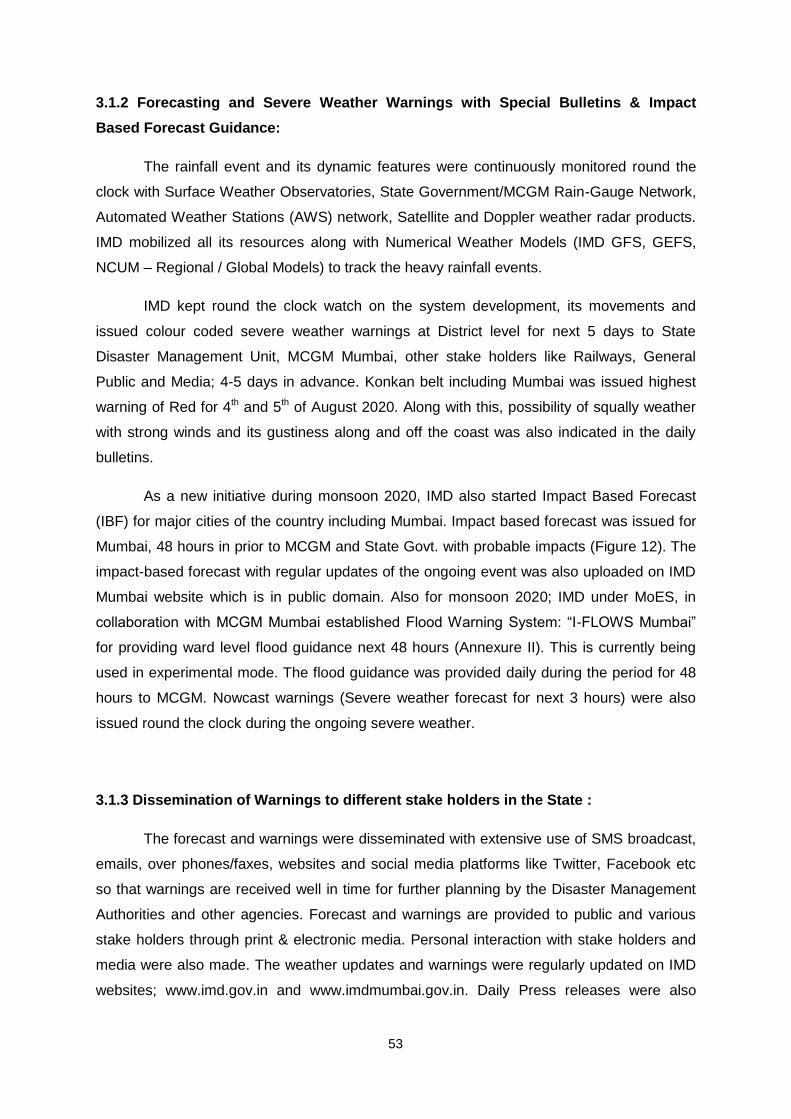
53
3.1.2 Forecasting and Severe Weather Warnings with Special Bulletins & Impact
Based Forecast Guidance:
The rainfall event and its dynamic features were continuously monitored round the
clock with Surface Weather Observatories, State Government/MCGM Rain-Gauge Network,
Automated Weather Stations (AWS) network, Satellite and Doppler weather radar products.
IMD mobilized all its resources along with Numerical Weather Models (IMD GFS, GEFS,
NCUM – Regional / Global Models) to track the heavy rainfall events.
IMD kept round the clock watch on the system development, its movements and
issued colour coded severe weather warnings at District level for next 5 days to State
Disaster Management Unit, MCGM Mumbai, other stake holders like Railways, General
Public and Media; 4-5 days in advance. Konkan belt including Mumbai was issued highest
warning of Red for 4th and 5th of August 2020. Along with this, possibility of squally weather
with strong winds and its gustiness along and off the coast was also indicated in the daily
bulletins.
As a new initiative during monsoon 2020, IMD also started Impact Based Forecast
(IBF) for major cities of the country including Mumbai. Impact based forecast was issued for
Mumbai, 48 hours in prior to MCGM and State Govt. with probable impacts (Figure 12). The
impact-based forecast with regular updates of the ongoing event was also uploaded on IMD
Mumbai website which is in public domain. Also for monsoon 2020; IMD under MoES, in
collaboration with MCGM Mumbai established Flood Warning System: “I-FLOWS Mumbai”
for providing ward level flood guidance next 48 hours (Annexure II). This is currently being
used in experimental mode. The flood guidance was provided daily during the period for 48
hours to MCGM. Nowcast warnings (Severe weather forecast for next 3 hours) were also
issued round the clock during the ongoing severe weather.
3.1.3 Dissemination of Warnings to different stake holders in the State :
The forecast and warnings were disseminated with extensive use of SMS broadcast,
emails, over phones/faxes, websites and social media platforms like Twitter, Facebook etc
so that warnings are received well in time for further planning by the Disaster Management
Authorities and other agencies. Forecast and warnings are provided to public and various
stake holders through print & electronic media. Personal interaction with stake holders and
media were also made. The weather updates and warnings were regularly updated on IMD
websites; www.imd.gov.in and www.imdmumbai.gov.in. Daily Press releases were also
54
issued to the stake holders from 1 Aug 2020, regarding the expectation of severe weather
over the region during 3-6th Aug 2020.
IMD throughout kept round the clock watch on the system development, its
movements issued colour code severe weather warnings; both for; state and district wise to
public, disaster managers, and stake holders on real time. IMD also briefed the Cabinet,
Govt of Maharashtra about the latest updates of situation and its further likely intensity on
7th August 2020, through a presentation at Mumbai. The rainfall event and
its atmospherics features were continuously monitored round the clock by IMD with surface
synoptic observatories, State Government Rain-guage network, Automated Weather
Stations (AWS) network Satellite and DWR Mumbai, Sholapur and Goa products.
3.1.4 Concluding Remarks :
Monsoon 2020 ended with a diverse monsoon activity over the Maharashtra. 2020
happened to be normal monsoon for Maharashtra with large number of high impact events.
Severe cyclonic storm Nisarga was the first cyclonic storm of the season in Arabian Sea.
The extremely heavy rainfall of 4-6 August over Mumbai and adjoining areas of Konkan was
under the combined influence of the westward movement of the low pressure area over
North Bay of Bengal and the mid-tropospheric circulation over Gujarat during the same
period. The study highlights the role of typical monsoon synoptic systems in evoking heavy
rainfall episodes over Maharashtra especially west coast.
RMC Mumbai under the effective guidance of NWFC, New Delhi effectively handled
both severe cyclonic storm NISARGA and the very heavy rainfall event over Mumbai. Very
good feedback was received from the user’s side including general public, media and other
stake holders for timely communication of severe weather warnings in advance. All the entire
available observational network; surface, upper air, DWR and Satellite products weather
charts, NWP guidance were fully utilised and there was no interruption in network during the
period. The daily national VC guidance was also taken during the period. Mesonet network
of rainfall measurements with almost 150 rain guages was very useful and both APP as well
as portal was utilised during the event to understand the spatial and temporal variability of
the rainfall at every 15 minutes. The link for MONSOON ONLINE is also provided on the
IMD Mumbai website. The district level warnings started well in advance and were put on the
IMD Mumbai website and also the messages were sent to all concerned stake holders;
Mumbai city disaster management unit MCGM, Disaster Management Unit, Govt of
Maharashtra, Commissioner of Police, Railways and Media
55
Press Releases were issued from indicating the possibility of high impact event over
the region. Impact based bulletins were also issued as per SOP followed by regular rainfall
updates with possible impacts, till the event was over. Flood guidance provided from I –
flows Mumbai were also provided to the state and Mumbai disaster management authorities.
The events were handled successfully.
Reference: RSMC Preliminary report on SCS Nisarga
3.2 : Southwest Monsoon 2020 over Gujarat State
The seasonal (June-September) rainfall over the state Gujarat as a whole was 158%
of its long period average (LPA). Seasonal rainfall over the subdivisions of Gujarat region
and Saurashtra-Kutch was 112%, 226% of respective LPA. During the season, out of the
total 33 districts, 13 districts received large excess rainfall (departure 60% more than
respective LPA), 5 districts received excess rainfall (20% to 59% more than respective LPA),
13 districts received normal rainfall (-19% to 19% more than respective LPA) and 2 districts
received deficient rainfall(less than -20% to -59%) as shown in Fig. 3.13. Monthly rainfall
over the state as a whole was 8% of LPA in June, -7% of LPA in July, 198% of LPA in
August, and 0% of LPA in September. Monthly rainfall over the subdivision Gujarat region
was -20% of LPA in June, -50% of LPA in July, 115% of LPA in August, and -17% of LPA in
September. Monthly rainfall over the subdivision Saurashtra-Kutch was 42% of LPA in June,
55% of LPA in July, 341% of LPA in August, and 27% of LPA in September.
Southwest monsoon advanced on 14th June (on 14th June, 1 day ahead of its normal
date, 15th June) and further advanced to Gujarat on 15th June covered almost half of
Gujarat. It covered the entire state on 24th June (6 days before the normal date, 30th June
2020). Though the withdrawal commenced from northwest India only on 28th September as
against the normal date of 17th September, it withdrew from part of Gujarat by 6th October
(against the normal date of 30th September). During mid-Jun, monsoon advanced into parts
of South Gujarat on 14th June and further advanced into some more parts of Gujarat on 15th
June and covered all districts of South Gujarat region, Saurashtra, and some districts of
north Gujarat region namely Ahmedabad, Kheda, Anand, Panchamahal, Dahod and part of
Kutch district (up to Kandla) due to the formation of an east-west shear zone which ran
along Lat.22°N across Central India between 3.1 and 4.5 km above mean sea level. It
further advanced into some more parts of Kutch and Gujarat region on 23rd June and
covered the entire state on 24th June due to a trough which ran from northwest Rajasthan to
south Bihar at lower tropospheric levels. Gujarat region reported deficient rain during June
and July due to the absence of any major monsoon disturbance over Bay of Bengal.
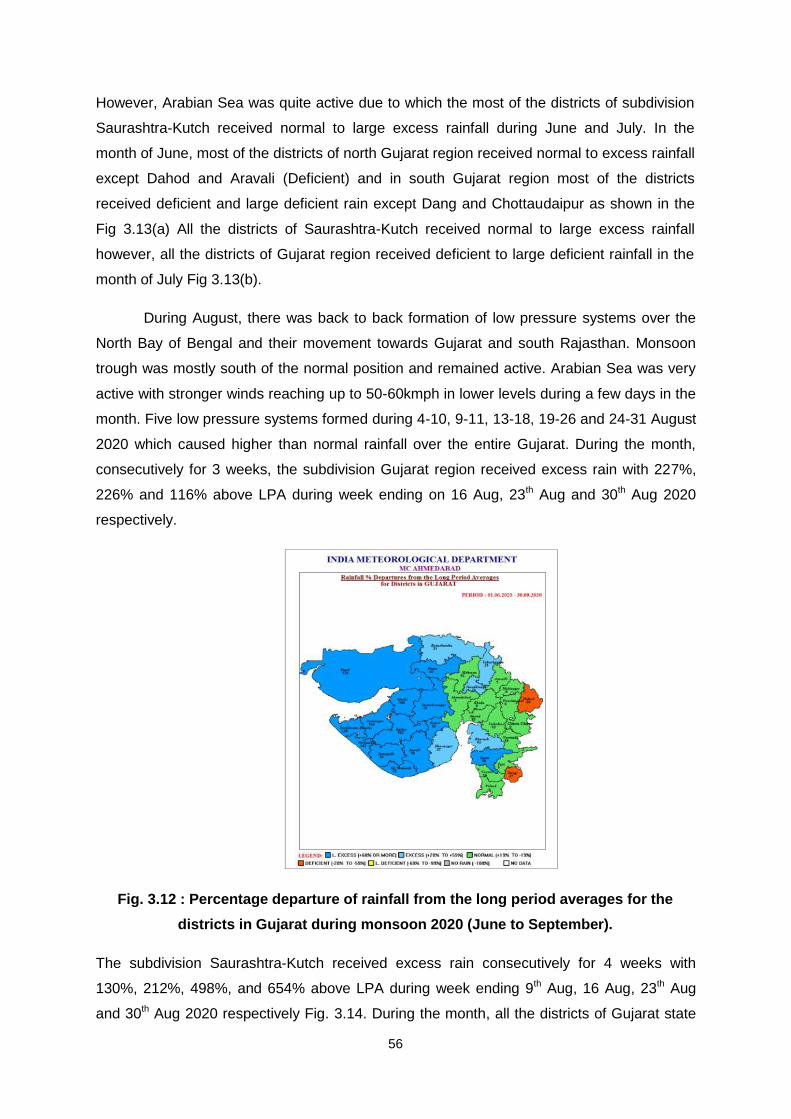
56
However, Arabian Sea was quite active due to which the most of the districts of subdivision
Saurashtra-Kutch received normal to large excess rainfall during June and July. In the
month of June, most of the districts of north Gujarat region received normal to excess rainfall
except Dahod and Aravali (Deficient) and in south Gujarat region most of the districts
received deficient and large deficient rain except Dang and Chottaudaipur as shown in the
Fig 3.13(a) All the districts of Saurashtra-Kutch received normal to large excess rainfall
however, all the districts of Gujarat region received deficient to large deficient rainfall in the
month of July Fig 3.13(b).
During August, there was back to back formation of low pressure systems over the
North Bay of Bengal and their movement towards Gujarat and south Rajasthan. Monsoon
trough was mostly south of the normal position and remained active. Arabian Sea was very
active with stronger winds reaching up to 50-60kmph in lower levels during a few days in the
month. Five low pressure systems formed during 4-10, 9-11, 13-18, 19-26 and 24-31 August
2020 which caused higher than normal rainfall over the entire Gujarat. During the month,
consecutively for 3 weeks, the subdivision Gujarat region received excess rain with 227%,
226% and 116% above LPA during week ending on 16 Aug, 23th Aug and 30th Aug 2020
respectively.
Fig. 3.12 : Percentage departure of rainfall from the long period averages for the
districts in Gujarat during monsoon 2020 (June to September).
The subdivision Saurashtra-Kutch received excess rain consecutively for 4 weeks with
130%, 212%, 498%, and 654% above LPA during week ending 9th Aug, 16 Aug, 23th Aug
and 30th Aug 2020 respectively Fig. 3.14. During the month, all the districts of Gujarat state
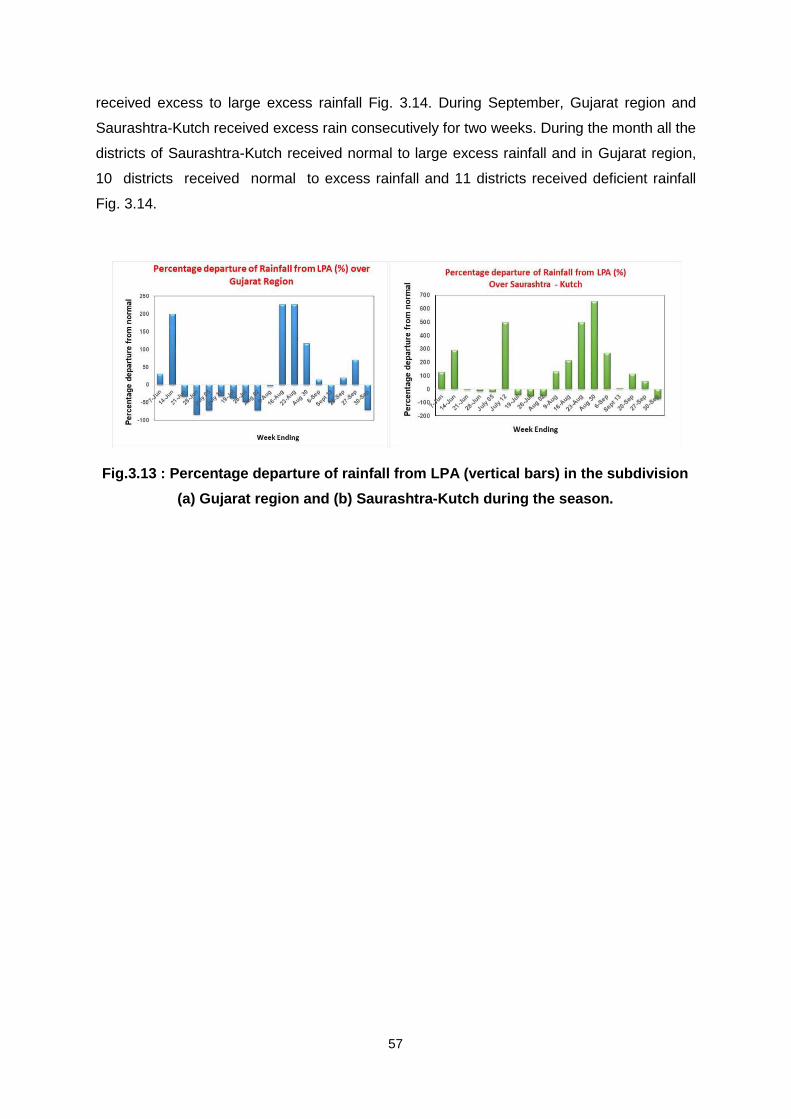
57
received excess to large excess rainfall Fig. 3.14. During September, Gujarat region and
Saurashtra-Kutch received excess rain consecutively for two weeks. During the month all the
districts of Saurashtra-Kutch received normal to large excess rainfall and in Gujarat region,
10 districts received normal to excess rainfall and 11 districts received deficient rainfall
Fig. 3.14.
Fig.3.13 : Percentage departure of rainfall from LPA (vertical bars) in the subdivision
(a) Gujarat region and (b) Saurashtra-Kutch during the season.
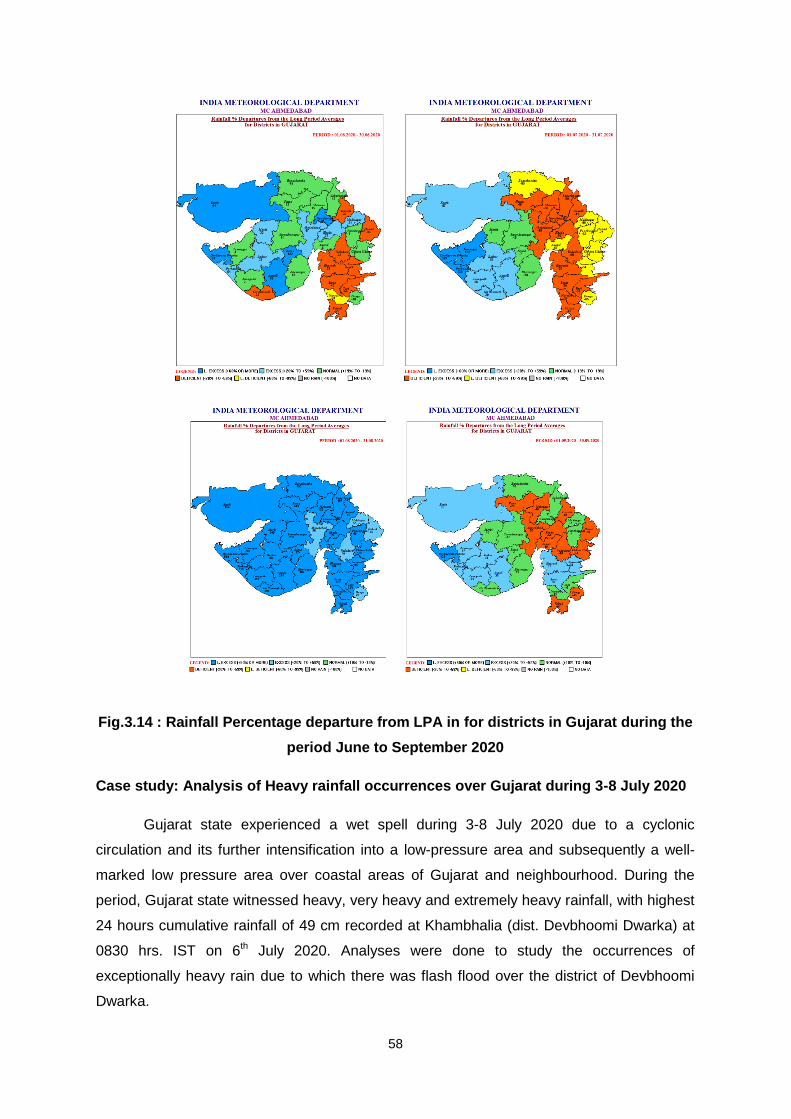
58
Fig.3.14 : Rainfall Percentage departure from LPA in for districts in Gujarat during the
period June to September 2020
Case study: Analysis of Heavy rainfall occurrences over Gujarat during 3-8 July 2020
Gujarat state experienced a wet spell during 3-8 July 2020 due to a cyclonic
circulation and its further intensification into a low-pressure area and subsequently a well-
marked low pressure area over coastal areas of Gujarat and neighbourhood. During the
period, Gujarat state witnessed heavy, very heavy and extremely heavy rainfall, with highest
24 hours cumulative rainfall of 49 cm recorded at Khambhalia (dist. Devbhoomi Dwarka) at
0830 hrs. IST on 6th July 2020. Analyses were done to study the occurrences of
exceptionally heavy rain due to which there was flash flood over the district of Devbhoomi
Dwarka.
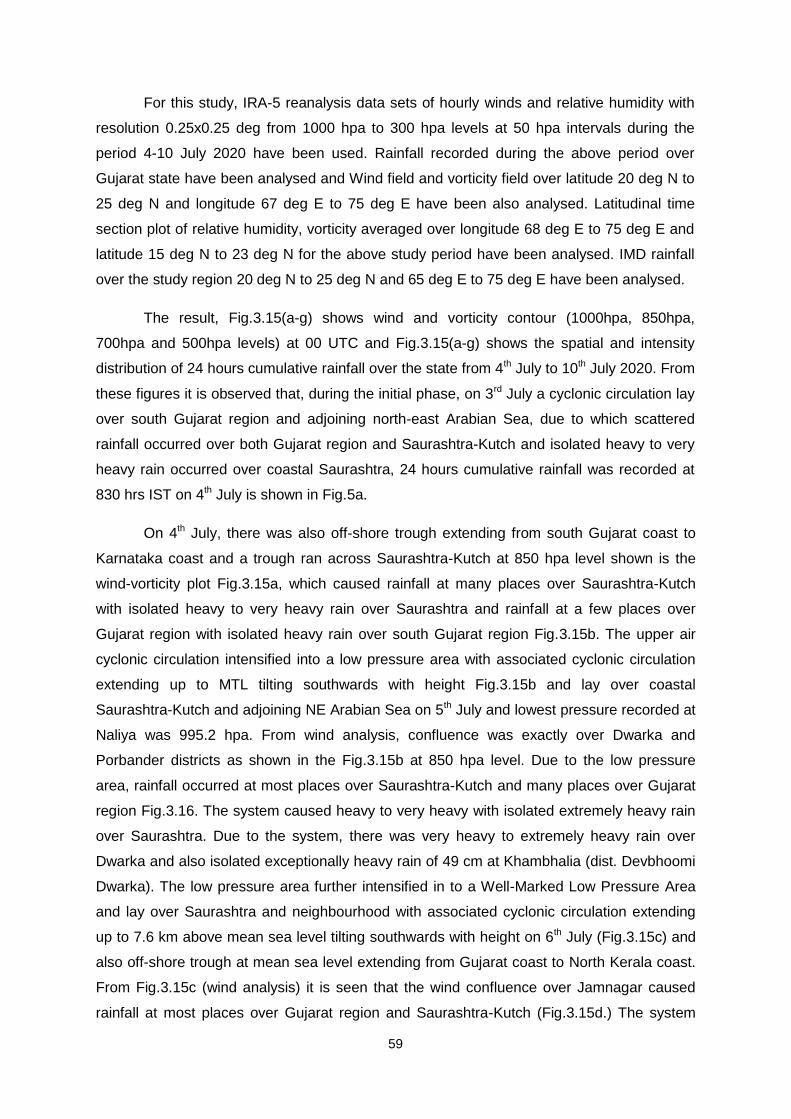
59
For this study, IRA-5 reanalysis data sets of hourly winds and relative humidity with
resolution 0.25x0.25 deg from 1000 hpa to 300 hpa levels at 50 hpa intervals during the
period 4-10 July 2020 have been used. Rainfall recorded during the above period over
Gujarat state have been analysed and Wind field and vorticity field over latitude 20 deg N to
25 deg N and longitude 67 deg E to 75 deg E have been also analysed. Latitudinal time
section plot of relative humidity, vorticity averaged over longitude 68 deg E to 75 deg E and
latitude 15 deg N to 23 deg N for the above study period have been analysed. IMD rainfall
over the study region 20 deg N to 25 deg N and 65 deg E to 75 deg E have been analysed.
The result, Fig.3.15(a-g) shows wind and vorticity contour (1000hpa, 850hpa,
700hpa and 500hpa levels) at 00 UTC and Fig.3.15(a-g) shows the spatial and intensity
distribution of 24 hours cumulative rainfall over the state from 4th July to 10th July 2020. From
these figures it is observed that, during the initial phase, on 3rd July a cyclonic circulation lay
over south Gujarat region and adjoining north-east Arabian Sea, due to which scattered
rainfall occurred over both Gujarat region and Saurashtra-Kutch and isolated heavy to very
heavy rain occurred over coastal Saurashtra, 24 hours cumulative rainfall was recorded at
830 hrs IST on 4th July is shown in Fig.5a.
On 4th July, there was also off-shore trough extending from south Gujarat coast to
Karnataka coast and a trough ran across Saurashtra-Kutch at 850 hpa level shown is the
wind-vorticity plot Fig.3.15a, which caused rainfall at many places over Saurashtra-Kutch
with isolated heavy to very heavy rain over Saurashtra and rainfall at a few places over
Gujarat region with isolated heavy rain over south Gujarat region Fig.3.15b. The upper air
cyclonic circulation intensified into a low pressure area with associated cyclonic circulation
extending up to MTL tilting southwards with height Fig.3.15b and lay over coastal
Saurashtra-Kutch and adjoining NE Arabian Sea on 5th July and lowest pressure recorded at
Naliya was 995.2 hpa. From wind analysis, confluence was exactly over Dwarka and
Porbander districts as shown in the Fig.3.15b at 850 hpa level. Due to the low pressure
area, rainfall occurred at most places over Saurashtra-Kutch and many places over Gujarat
region Fig.3.16. The system caused heavy to very heavy with isolated extremely heavy rain
over Saurashtra. Due to the system, there was very heavy to extremely heavy rain over
Dwarka and also isolated exceptionally heavy rain of 49 cm at Khambhalia (dist. Devbhoomi
Dwarka). The low pressure area further intensified in to a Well-Marked Low Pressure Area
and lay over Saurashtra and neighbourhood with associated cyclonic circulation extending
up to 7.6 km above mean sea level tilting southwards with height on 6th July (Fig.3.15c) and
also off-shore trough at mean sea level extending from Gujarat coast to North Kerala coast.
From Fig.3.15c (wind analysis) it is seen that the wind confluence over Jamnagar caused
rainfall at most places over Gujarat region and Saurashtra-Kutch (Fig.3.15d.) The system

60
caused heavy to very heavy rains at isolated places with isolated extremely heavy falls over
Saurashtra with maximum rainfall of 39 cm at Kalavad (dist. Jamnagar). These systems also
persisted on 7th July and moved north westward (Fig.3.15e) and caused rainfall at many
places over Gujarat region and Saurashtra-Kutch (Fig.3.15c). The system caused heavy to
very heavy rains at isolated places with isolated extremely heavy falls over Saurashtra with
maximum rainfall of 47cm at Okha (dist. Devbhoomi Dwarka). From Fig.3.16f and Fig. 3.16g,
it is seen that, the confluence zone was over north-east Arabian Sea, Saurashtra-Kutch did
not receive much rains as shown in the Fig.3.15 f and 3.15 g. From Fig.3.17a & 3.17b, it is
observed that during 5th, 6th and 7th July 2020, there was relative humidity more than 90
percentages at lower level as well as higher level over the region where very heavy to
extremely heavy rain with exceptionally heavy rain occurred. Vorticity was maximum at both
lower and higher levels (Fig.3.15c and 3.15d) over the region. Thus, the availability of
continuous relative humidity and higher vorticity from lower level to higher level can play a
vital role towards the occurrences of extremely/exceptionally heavy rain when accompanied
with a strong synoptic system.
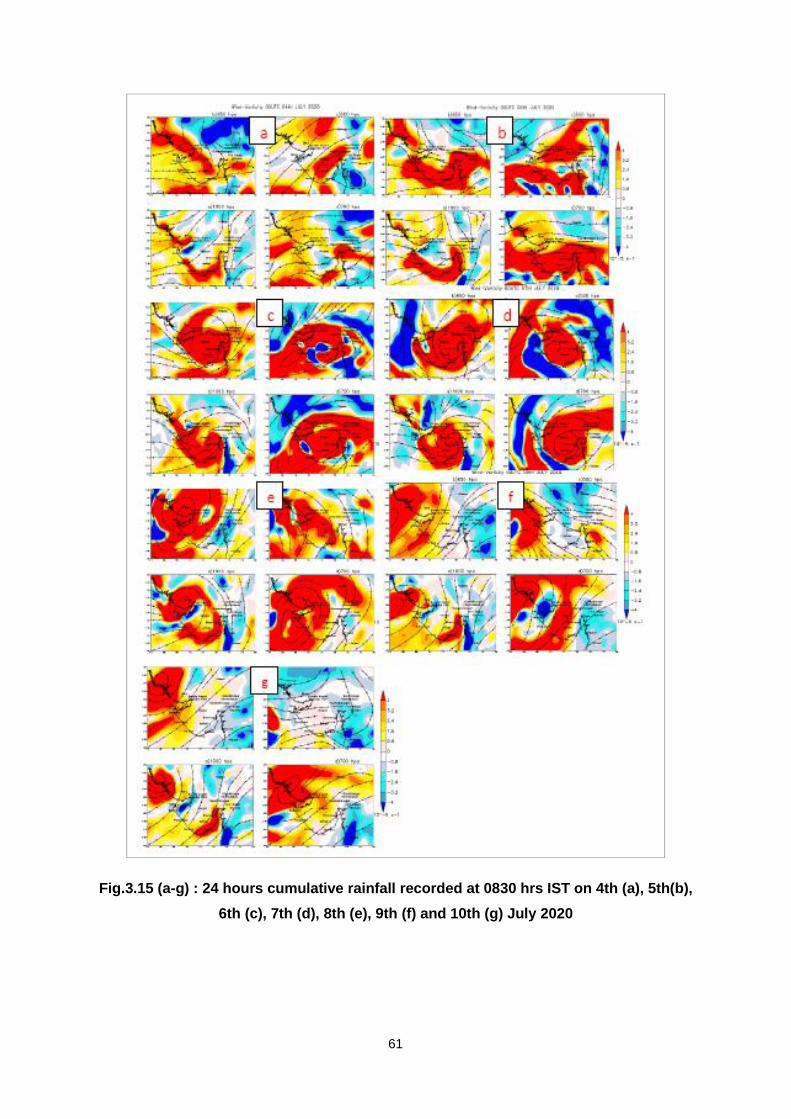
61
Fig.3.15 (a-g) : 24 hours cumulative rainfall recorded at 0830 hrs IST on 4th (a), 5th(b),
6th (c), 7th (d), 8th (e), 9th (f) and 10th (g) July 2020
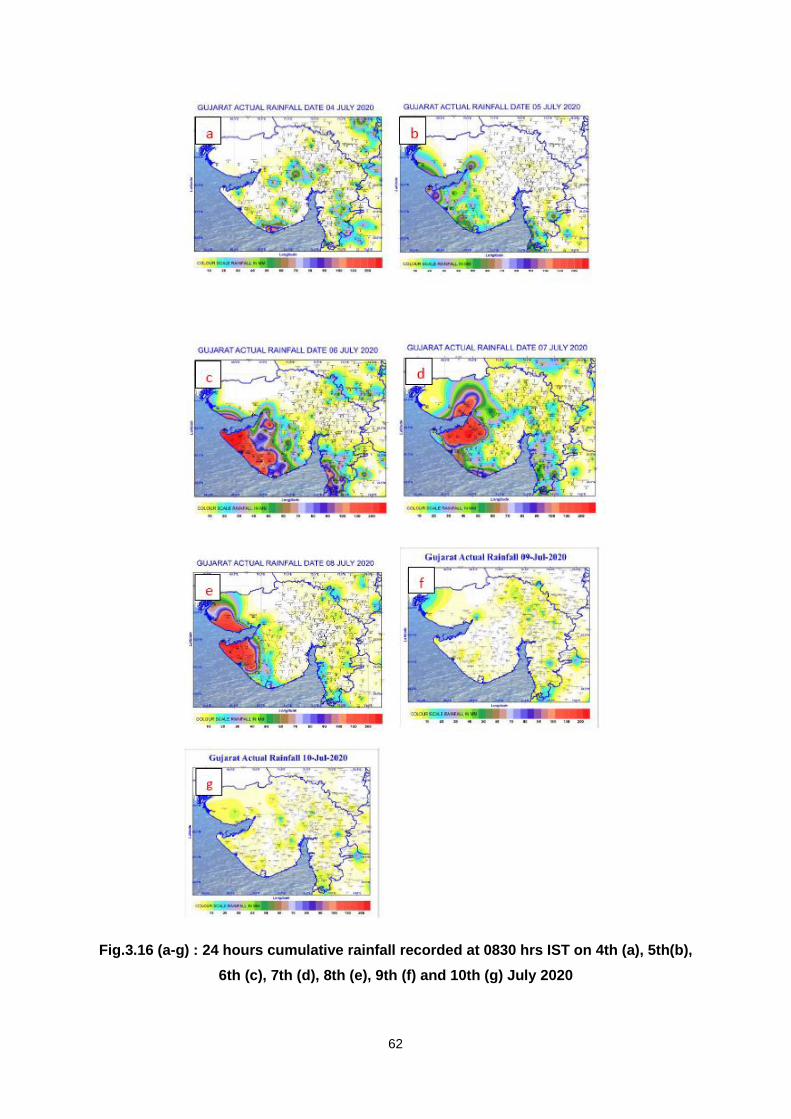
62
Fig.3.16 (a-g) : 24 hours cumulative rainfall recorded at 0830 hrs IST on 4th (a), 5th(b),
6th (c), 7th (d), 8th (e), 9th (f) and 10th (g) July 2020
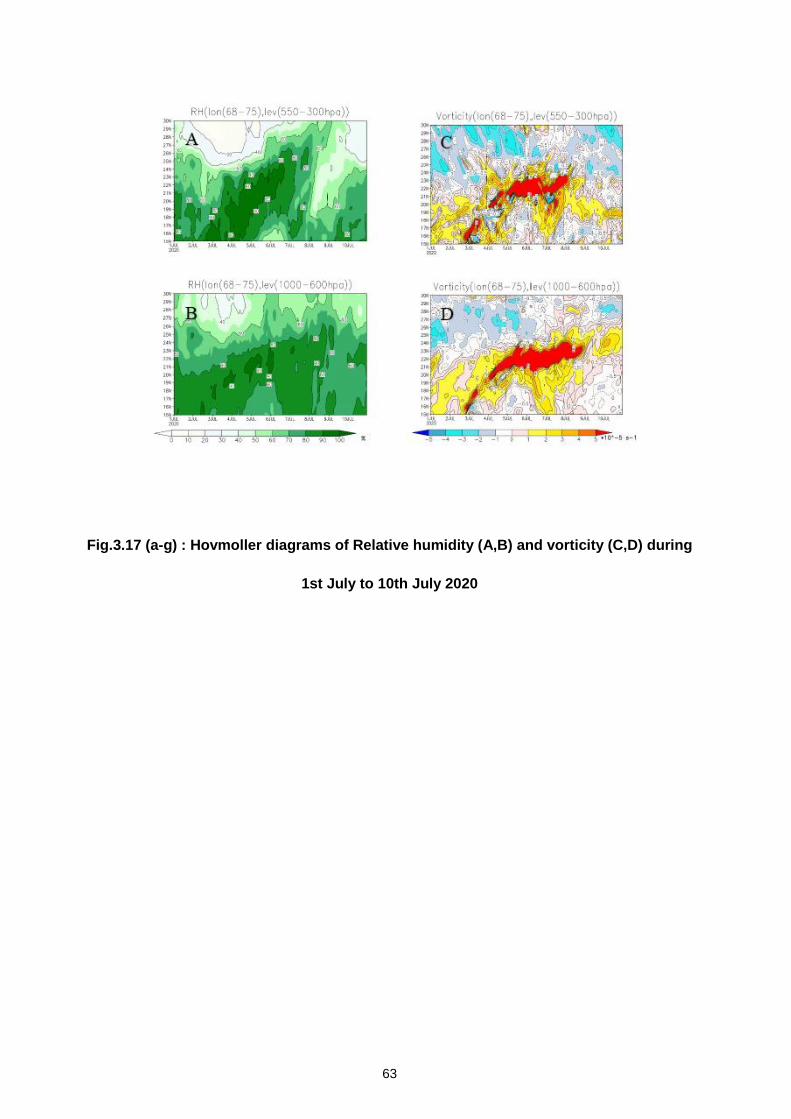
63
Fig.3.17 (a-g) : Hovmoller diagrams of Relative humidity (A,B) and vorticity (C,D) during
1st July to 10th July 2020
64
3.3. : SOUTHWEST MONSOON 2020 OVER GOA STATE
Goa a state, comprising two districts – North Goa and South Goa, which are divided
into 11 Talukas, having a total area of 3702 Sq Km. Goa is situated along Konkan Coast of
India and has a coast line of 131 km. It has a partly hilly terrain with the Western Ghats rising
nearly 1200 meters. There are two main rivers, i.e. Mondovi and Zuari. Goa receives most of
its rainfall during Southwest Monsoon from June to September with an average of 2975.6 mm.
During 2020, though the Southwest monsoon set in over Kerala on 01stJune, 2020,
exactly on its normal date, it advanced over Goa on 11thJune, i.e. 5 days later of its normal
date of arrival over Goa. In the south west monsoon 2020, the state average seasonal total
rainfall was 4204 mm against a normal value of 2976 mm, which was 41% higher and the
highest recorded seasonal total. Before year 2020, the highest seasonal total was recorded in
the year 1961 which was 4098 mm.
Chief Synoptic Features and weather summary
June 2020
A cyclonic circulation lay over North Konkan & neighbourhood between 3.1 KM & 3.6 KM
amsl on 16th June. It persisted on 17th June between 3.1 & 7.6 KM amsl. Also, a shear zone
at 3.1 KM amsl ran from Jharkhand to the cyclonic circulation over North Konkan across
Chhattisgarh, Telangana & NIK on 17th June.
The shear zone became less marked on 18th June. The cyclonic circulation over Konkan &
neighbourhood lay at 3.1 Km amsl on 18th June. It became less marked on 19th June.
Another cyclonic circulation lay over central Arabian Sea & neighborhood between 1.5 &
7.6 KM amsl on 18th June.
Under the influence of these synoptic systems monsoon was Active over Goa state on 12, 14,
16, 17, 18 & 19 June. On 13th June Monsoon activity over Goa was Vigorous.
Heavy rainfall was reported for 09 days, among these very heavy rainfall activity was reported
at most places on 17th June, at isolated places on 12, 13, 14, 15 & 18 June. State received
1030 mm of rain against the long period average value of 899 mm. The rainfall distribution
over Goa was above the normal range of its long period average (15%) (Table 3.2).
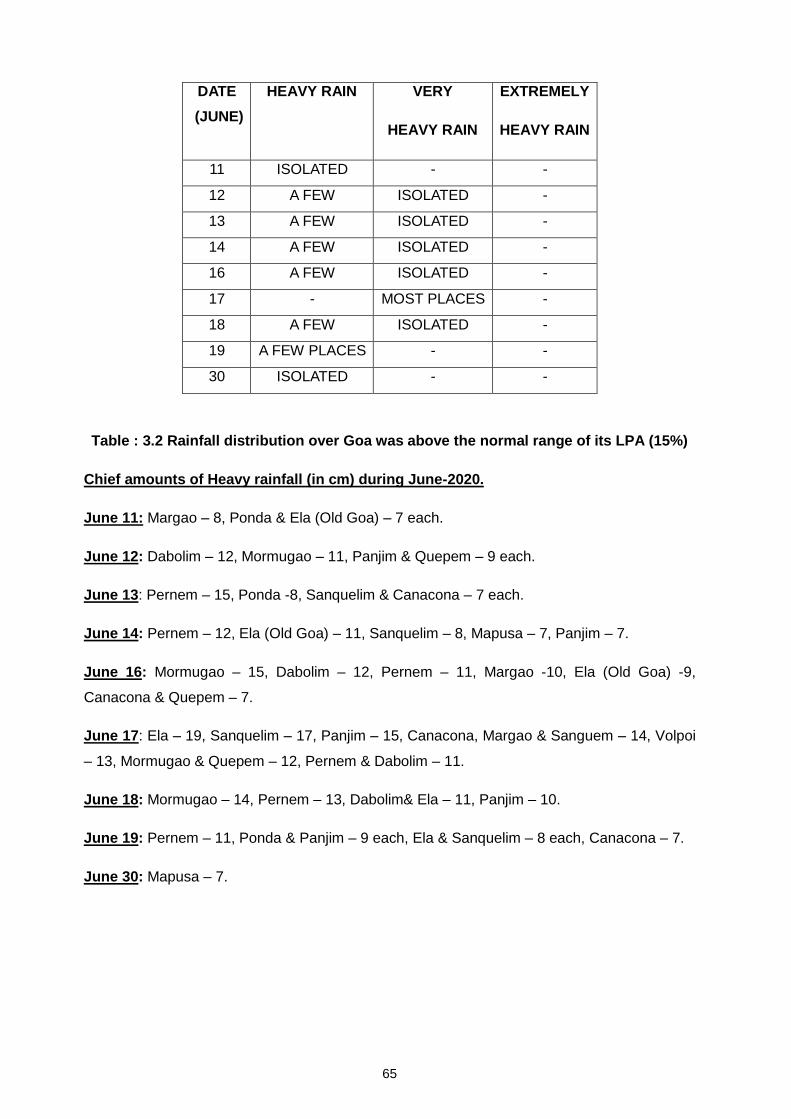
65
DATE
(JUNE)
HEAVY RAIN VERY
HEAVY RAIN
EXTREMELY
HEAVY RAIN
11 ISOLATED - -
12 A FEW ISOLATED -
13 A FEW ISOLATED -
14 A FEW ISOLATED -
16 A FEW ISOLATED -
17 - MOST PLACES -
18 A FEW ISOLATED -
19 A FEW PLACES - -
30 ISOLATED - -
Table : 3.2 Rainfall distribution over Goa was above the normal range of its LPA (15%)
Chief amounts of Heavy rainfall (in cm) during June-2020.
June 11: Margao – 8, Ponda & Ela (Old Goa) – 7 each.
June 12: Dabolim – 12, Mormugao – 11, Panjim & Quepem – 9 each.
June 13: Pernem – 15, Ponda -8, Sanquelim & Canacona – 7 each.
June 14: Pernem – 12, Ela (Old Goa) – 11, Sanquelim – 8, Mapusa – 7, Panjim – 7.
June 16: Mormugao – 15, Dabolim – 12, Pernem – 11, Margao -10, Ela (Old Goa) -9,
Canacona & Quepem – 7.
June 17: Ela – 19, Sanquelim – 17, Panjim – 15, Canacona, Margao & Sanguem – 14, Volpoi
– 13, Mormugao & Quepem – 12, Pernem & Dabolim – 11.
June 18: Mormugao – 14, Pernem – 13, Dabolim& Ela – 11, Panjim – 10.
June 19: Pernem – 11, Ponda & Panjim – 9 each, Ela & Sanquelim – 8 each, Canacona – 7.
June 30: Mapusa – 7.
66
JULY 2020 :
The offshore trough was present from Maharashtra coast to Karnataka coast on 1st
July.
A shear zone ran roughly along Lat 15°N between 4.5 and 5.8 km above mean sea
level on 1st July, and became less marked on 2nd July. The shear zone ran roughly
along 16°N between 3.6 km and 5.8 km above mean sea level tilting southwards on 3rd
July, and became disorganized on 4th July.
A cyclonic circulation lay over west central Bay of Bengal off Andhra Pradesh at 3.1 km
above mean sea level on 3rd July. Under its influence, a low pressure formed over
Northwest Bay of Bengal off Odisha coast on 5th july. Associated cyclonic circulation
extended upto 7.6 km above mean sea level.
A low pressure lay over coastal Kutch and neighbourhood and associated cyclonic
circulation extends upto 5.8 km above mean sea level on 5th July. This well marked low
pressure then lay over Saurashtra on 6th July. It further lay as low pressure over
Northeast Arabian sea and adjoining Pakistan with associated cyclonic circulation
extending upto 5.6km above mean sea level on 9th July. On 11th July it then lay over
south Pakistan and neighborhood, and became unimportant for Goa region.
The off shore trough ran from Goa coast to south Kerela coast on 12th July and later
ran from south Maharastra to Kerela coast on 13th July and became feeble till 15th July.
An east west shear zone ran roughly along latitude 18°N and was seen between 3.1
and 5.8 km above mean sea level on 15th July. It then ran along latitude 19°N between
3.1 and 5.8 km above mean sea level on 16th July and further ran roughly along 20° N
on 17th July. It then became less marked in 18th July.
A cyclonic circulation lay over North interior Karnataka and neighbourhood between 3.6
and 4.5km above mean sea level on 14th July. It merged with the above east west
shear zone on 15th July. The cyclonic circulation over north Konkan then lay over South
Gujarat region and neighbourhood at 1.5 km above mean sea level on 16th July.
The off shore trough ran from East central Arabian sea off Karnataka coast to Kerala
coast on 18th July. It then ran from south Maharashtra coast to Kerala coast on 19th
July and became less marked on 20th July.
A cyclonic circulation lay over South east Bay of Bengal and adjoining Andaman sea
between 1.5 and 5.8 km on 27th July. It moved over to south west and adjoining west
central Bay of Bengal off south Andhra Pradesh and north Tamil Nadu coasts and
extended upto 5.8 km above mean sea level on 29th July. The cyclonic circulation then
lay over south coastal Andhra Pradesh and adjoining north Tamil Nadu between 3.1
and 5.8 km on 30th July.
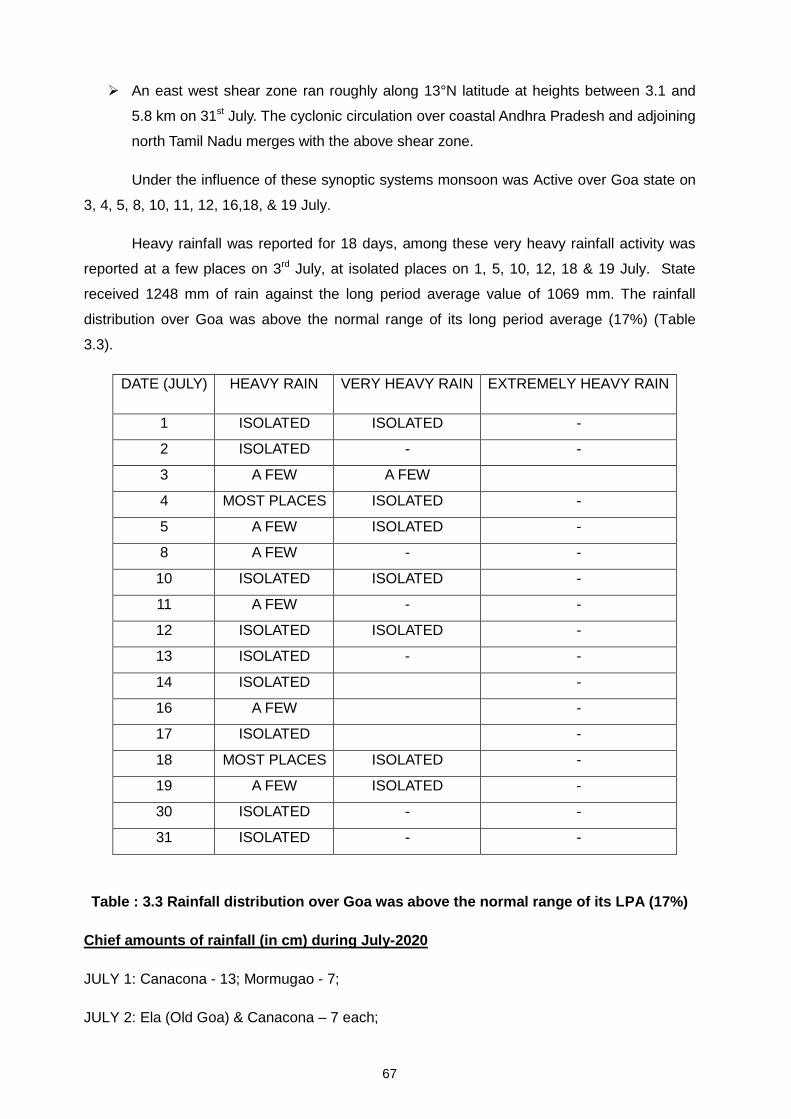
67
An east west shear zone ran roughly along 13°N latitude at heights between 3.1 and
5.8 km on 31st July. The cyclonic circulation over coastal Andhra Pradesh and adjoining
north Tamil Nadu merges with the above shear zone.
Under the influence of these synoptic systems monsoon was Active over Goa state on
3, 4, 5, 8, 10, 11, 12, 16,18, & 19 July.
Heavy rainfall was reported for 18 days, among these very heavy rainfall activity was
reported at a few places on 3rd July, at isolated places on 1, 5, 10, 12, 18 & 19 July. State
received 1248 mm of rain against the long period average value of 1069 mm. The rainfall
distribution over Goa was above the normal range of its long period average (17%) (Table
3.3).
DATE (JULY) HEAVY RAIN VERY HEAVY RAIN EXTREMELY HEAVY RAIN
1 ISOLATED ISOLATED -
2 ISOLATED - -
3 A FEW A FEW
4 MOST PLACES ISOLATED -
5 A FEW ISOLATED -
8 A FEW - -
10 ISOLATED ISOLATED -
11 A FEW - -
12 ISOLATED ISOLATED -
13 ISOLATED - -
14 ISOLATED -
16 A FEW -
17 ISOLATED -
18 MOST PLACES ISOLATED -
19 A FEW ISOLATED -
30 ISOLATED - -
31 ISOLATED - -
Table : 3.3 Rainfall distribution over Goa was above the normal range of its LPA (17%)
Chief amounts of rainfall (in cm) during July-2020
JULY 1: Canacona - 13; Mormugao - 7;
JULY 2: Ela (Old Goa) & Canacona – 7 each;
68
JULY 3: Sanquelim - 20; Margao - 15; Dabolim - 14; Pernem - 13; Quepem - 12; Canacona -
11; Mapusa - 10; Panaji - 9; Ela(Old goa) - 9; Sanguem - 9;
JULY 4: Pernem – 10; Mapusa, Panaji & Dabolim – 9 each; Sanquelim & Quepem – 8 each;
Ela (Old Goa) & Mormugao – 7 each;
JULY 5: Sanguem - 17; Sankhali - 12; Pernem & Quepem – 11 each; Ela (Old Goa) – 8;
Canacona - 7;
JULY 8: Sanguem – 9; Pernem, Sanquelim & Quepem – 8 each; .
JULY 10: Sanquelim – 15; Volpoi – 10; Mapusa – 8; Quepem – 7;.
JULY 11: Sanguem - 10; Pernem, Panaji, Canacona, Quepem - 8each;.
JULY12: Mapusa- 15; Pernem – 12; Canacona Panaji-8each.
JULY 13: Quepem - 9; Pernem - 7;.
JULY 14: Mormugao - 9; Panaji - 7;.
JULY 16: Panjim & Ela (Old Goa) - 9 each; Mormugao – 8; Pernem, Volpoi & Dabolim -7
each;
JULY 17: Sanquelim - 9; Mapusa & Canacona - 8 each;.
JULY 18: Canacona – 12; Panjim & Ela (Old Goa) – 11 each; Quepem – 10; Pernem,
Sanquelim, Volpoi & Margao – 9 each; Mapusa, Dabolim & Sanguem – 8 each; Mormugao - 7.
JULY 19: Canacona – 15; Dabolim - 13; Quepem - 11; Panjim & Mormugao - 10 each;
Sanquelim, Sanguem &Ela (old goa) – 7 each;
JULY 30: Quepem – 9.
JULY 31: Ela(Old Goa) – 10; Sanguem - 7;
AUGUST 2020 :
On 04th August, a cyclonic circulation lay over south Gujarat & neighborhood between 3.1 to
7.6 km amsl. A LOPAR lay over north Bay of Bengal off WB-Bangladesh coast on the same
day.
On 05th August, The LOPAR over North Bay of Bengal shifted over Northwest Bay of Bengal
off north Odisha-WB coasts with associated cyclonic circulation extending up to 7.6 km amsl.
It further shifted over SW MP & associated cyclonic circulation extends up to 3.6 km amsl
during 6th August.
69
A cyclonic circulation lay over North Konkan between 4.5 km to 7.6 km amsl during 06th
August. It further shifted over EC Arabian Sea off MH Coast at 5.8 km amsl. It became less
marked on 8th August.
A LOPAR lay over NE MP & neighborhood on 10th August. Besides that, an off-shore trough
ran from Karnataka coast to Lakshadweep area on the same day.
The LOPAR & off-shore trough became less marked on 11th August.
On 15th August, a WML laid over NC AP & adjoining WB & associated cyclonic circulation
extends up to 9.5 km amsl. An EW shear zone also existed between 5.8 to 7.6 km amsl and
ran roughly along 19°N.
On 16th August, WML lay as a LOPAR over Jharkhand & adjoining GWB with associated
cyclonic circulation up to 7.6 km amsl tilting with height. & the East-west shear zone ran
roughly along Lat. 19 degree North across peninsular India between 4.5 to 7.6 km amsl.
The LOPAR over Jharkhand lay over NE MP & adjoining areas with associated cyclonic
circulation extending up to 5.8 km amsl during 17th August. And the EW shear zone ran
roughly along 20°N between 4.5 to 7.6 km amsl. It persisted till 21stAugust.
The LOPAR over NE MP became less marked on 18th August but associated cyclonic
circulation persisted up to 5.8 km amsl. Another cyclonic circulation also laid over NE Bay of
Bengal & neighborhood between 5.8& 7.6 km amsl on the same day.
Under the influence of cyclonic circulation over NE Bay of Bengal, A LOPAR formed over
North Bay of Bengal which lay as a WML with associated cyclonic circulation extending up to
7.6 km amsl on 19th August. The WML shifted over North interior Odisha & adjoining
Jharkhand with associated cyclonic circulation extending up to 7.6 km amsl on 20th August. It
further shifted over central parts of East MP & neighborhood with associated cyclonic
circulation extending up to 7.6 km amsl on 21st August.
The WML over central parts of MP laid over NW MP & neighborhood on 22nd August.
There existed a WML over SW Jharkhand & Associated cyclonic circulation extending up to
7.6 km amsl on 27th August. It shifted over North Chhattisgarh & adjoining East MP &
associated cyclonic circulation extending up to 7.6 km amsl persists on 28th August. It shifted
to North MP & adjoining south UP on 29th August.
Under the influence of these synoptic systems monsoon was Active over Goa state on 4, 5, 6,
8, 11, 17, 21, 22, 23, 28, 29 & 30th August. On 16th August Monsoon activity over Goa was
Vigorous.
Heavy rainfall was reported for 12 days, among these very heavy rainfall activity was reported
for 06 days & extremely heavy rainfall for 01 day. State received 1172 mm of rain against the
long period average value of 702 mm. The rainfall distribution over Goa was above the normal
range of its long period average (67%) (Table 3.4).
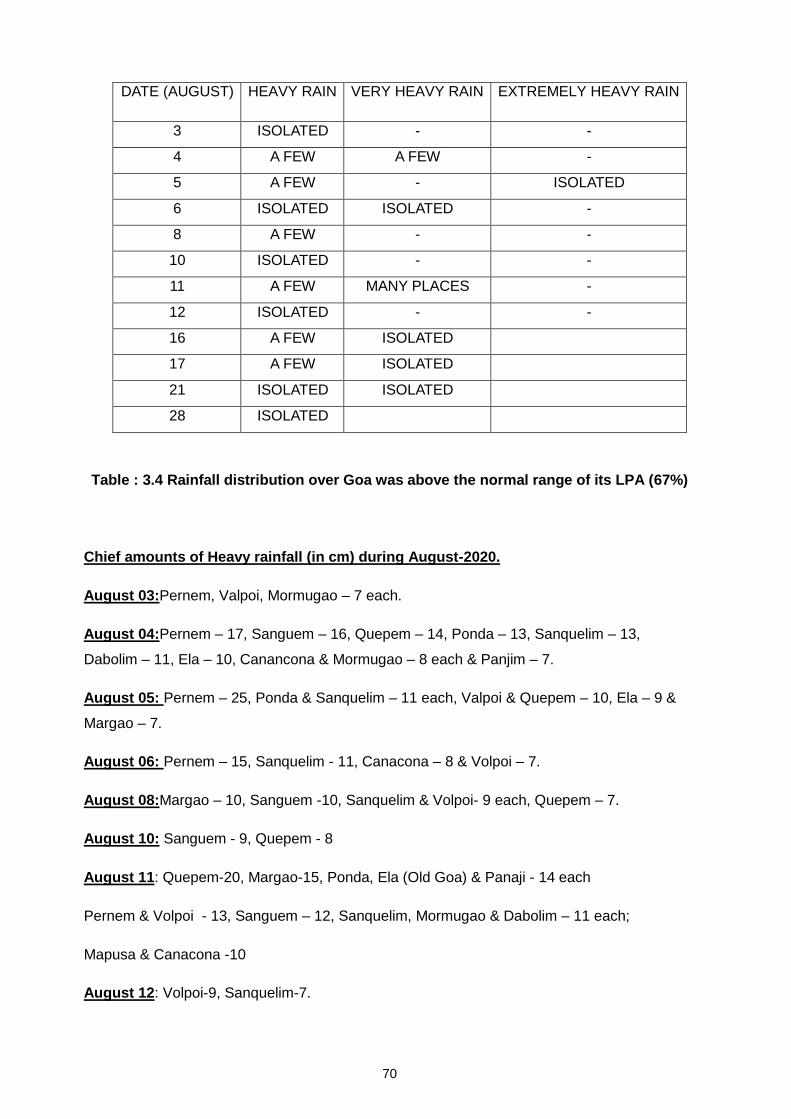
70
DATE (AUGUST) HEAVY RAIN VERY HEAVY RAIN EXTREMELY HEAVY RAIN
3 ISOLATED - -
4 A FEW A FEW -
5 A FEW - ISOLATED
6 ISOLATED ISOLATED -
8 A FEW - -
10 ISOLATED - -
11 A FEW MANY PLACES -
12 ISOLATED - -
16 A FEW ISOLATED
17 A FEW ISOLATED
21 ISOLATED ISOLATED
28 ISOLATED
Table : 3.4 Rainfall distribution over Goa was above the normal range of its LPA (67%)
Chief amounts of Heavy rainfall (in cm) during August-2020.
August 03:Pernem, Valpoi, Mormugao – 7 each.
August 04:Pernem – 17, Sanguem – 16, Quepem – 14, Ponda – 13, Sanquelim – 13,
Dabolim – 11, Ela – 10, Canancona & Mormugao – 8 each & Panjim – 7.
August 05: Pernem – 25, Ponda & Sanquelim – 11 each, Valpoi & Quepem – 10, Ela – 9 &
Margao – 7.
August 06: Pernem – 15, Sanquelim - 11, Canacona – 8 & Volpoi – 7.
August 08:Margao – 10, Sanguem -10, Sanquelim & Volpoi- 9 each, Quepem – 7.
August 10: Sanguem - 9, Quepem - 8
August 11: Quepem-20, Margao-15, Ponda, Ela (Old Goa) & Panaji - 14 each
Pernem & Volpoi - 13, Sanguem – 12, Sanquelim, Mormugao & Dabolim – 11 each;
Mapusa & Canacona -10
August 12: Volpoi-9, Sanquelim-7.
71
August 16: Volpoi-15, Pernem, Ela (Old Goa) & Sanquelim -13 each; Ponda & Panaji - 11
each;
Mormugao – 10, Dabolim & Sanguem – 9, Mapusa & Quepem - 8.
August 17:Volpoi -16, Ponda & Canacona -9, Sanquelim, Quepem & Sanguem – 8 each;
Panaji-7.
August 21: Volpoi-12, Sanquelim-8 & Sanguem-7.
August 28: Quepem-9, Sanguem-7.
August 30: Quepem-8.
SEPTEMBER 2020 :
A cyclonic circulation lay over WC Bay of Bengal & off coastal AP & North Tamilnadu,
extending up to 2.1 km amsl on 2nd September.
A LOPAR lay over EC Arabian Sea off Karnataka coast with associated cyclonic circulation
extending up to 3.1 km amsl on 7th September.
On 11th September, an Off-shore trough at MSL ran from north MH coast to Kerala coast.
On the same day, two more systems, a cyclonic circulation over EC Arabian Sea up to 2.1
km amsl & an EW shear zone roughly along 15°N across peninsular India between 3.1 & 5.8
Km amsl existed.
The off-shore trough from MH coast to Kerala coast persisted on 12thSeptember. On the
same day, Cyclonic circulation over EC Arabian Sea off Karnataka coast shifted over EC
Arabian Sea off MH Coast extending up to 3.1 km amsl. The EW Shear zone also persisted
& a fresh Cyclonic circulation lay over WC Bay of Bengal off AP coast, extending up to 3.1
km amsl on 12thSeptember.
On 13th September, the off-shore trough ran from South Gujarat coast to North Karnataka
coast. The cyclonic circulation over EC Arabian Sea lay over NE Arabian Sea off Gujarat
coast extending up to 4.5 km amsl. The EW Shear zone became less marked. On the same
day, a LOPAR lay over WC Bay of Bengal off AP coast with associated cyclonic circulation
extending up to mid tropospheric level.
During 14th September, the offshore trough persisted. The LOPAR lay as WML area over
WC Bay of Bengal off AP coast & the cyclonic circulation over NE Arabian Sea off Gujarat
coast persisted.
On 15th September, the offshore trough became less marked. The WML became a LOPAR
over the same region with associated cyclonic circulation up to mid-tropospheric level.
Another cyclonic circulation lay over South Gujarat region and neighborhood at 1.5 km amsl.
72
The LOPAR became less marked on 16th September & associated cyclonic circulation laid
over Telangana & neighborhood persisted up to 3.1 km amsl. An EW Shear zone ran roughly
along 15°N between 3.6 & 5.8 km amsl on the same day.
The Cyclonic circulation over Telangana extending up to 2.1 km amsl persisted on 17th
September. The EW shear zone between 4.5 & 5.8 km amsl along 16°N and a cyclonic
circulation over CAP & neighborhood between 3.1 & 3.6 km amsl existed on the same day.
On 18 September, the cyclonic circulation over Telangana shifted over Telangana &
Vidarbha extending up to 0.9 km amsl & The EW shear zone persisted. The cyclonic
circulation over CAP merged with EW shear zone. Another cyclonic circulation laid over WC
Bay of Bengal off north CAP-Odisha coasts at 1.5 km amsl on the same day.
During 19th September, the EW shear zone was seen along16°N between 3.1 & 7.6 km
amsl. The Cyclonic circulation over WC BoB off North AP coast laid over North CAP &
neighborhood extending up to 0.9 km amsl. The cyclonic circulation over Telangana became
less marked.
A LOPAR formed over NE Bay of Bengal & neighborhood with associated cyclonic
circulation extending up to 7.6 km amsl on 20th September. The EW shear zone persisted.
Cyclonic circulation over North CAP became less marked.
On 21st September, LOPAR over NE Bay of Bengal laid over NW Bay of Bengal & adjoining
North Coastal Odisha & associated cyclonic circulation extending up to 7.6 km amsl. The
EW Shear zone ran roughly along 17°N between 3.1 & 7.6 km amsl. A fresh cyclonic
circulation lay over MH Coast & neighborhood extending up to 0.9 km amsl.
During 22nd September, LOPAR over NC Odisha shifted over North Chhattisgarh &
neighborhood with associated cyclonic circulation extending up to 5.8 km amsl. The cyclonic
circulation over North MH coast persisted up to 0.9 km amsl. The EW shear zone became
less marked.
On 23rd September, the LOPAR lay over central parts of west MP & neighborhood with
associated cyclonic circulation up to 5.8 km amsl. The cyclonic circulation over North MH
persisted.
On 24th Septemebr, The LOPAR shifted over East UP & neighborhood with associated
cyclonic circulation extending up to 5.8 km amsl. The cyclonic circulation over North MH
became less marked.
On 25th September, the LOPAR lay over Bihar & adjoining east UP with associated cyclonic
circulation extending up to 5.8 km amsl. A trough ran from Madhya MH to Comorian area
across interior Karnataka & Kerala 0.9 km amsl.
On 26th September, the LOPAR became unimportant for Goa. A trough ran from the LOPAR
to WC Bay of Bengal off AP coast between 3.1 & 5.8 km amsl. A trough at 3.1 km amsl ran
from south Chhattisgarh to south interior Karnataka. The trough from Madhya MH to
Comorin area became less important.
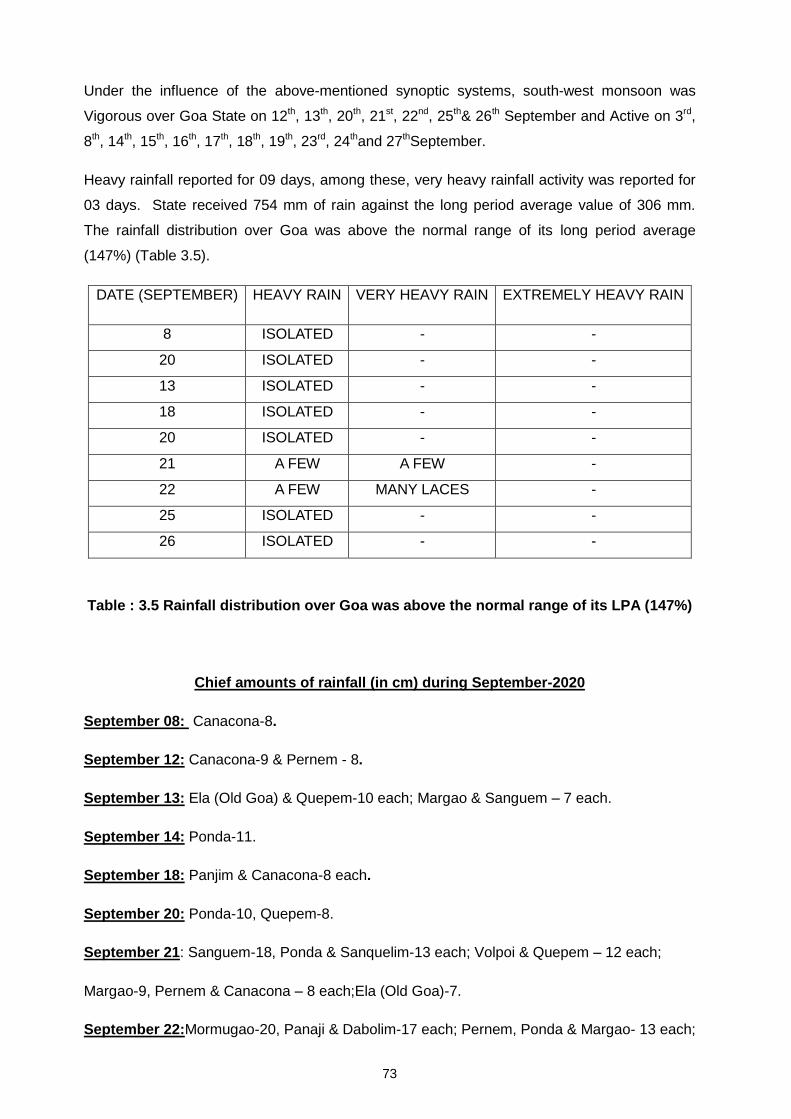
73
Under the influence of the above-mentioned synoptic systems, south-west monsoon was
Vigorous over Goa State on 12th, 13th, 20th, 21st, 22nd, 25th& 26th September and Active on 3rd,
8th, 14th, 15th, 16th, 17th, 18th, 19th, 23rd, 24thand 27thSeptember.
Heavy rainfall reported for 09 days, among these, very heavy rainfall activity was reported for
03 days. State received 754 mm of rain against the long period average value of 306 mm.
The rainfall distribution over Goa was above the normal range of its long period average
(147%) (Table 3.5).
DATE (SEPTEMBER) HEAVY RAIN VERY HEAVY RAIN EXTREMELY HEAVY RAIN
8 ISOLATED - -
20 ISOLATED - -
13 ISOLATED - -
18 ISOLATED - -
20 ISOLATED - -
21 A FEW A FEW -
22 A FEW MANY LACES -
25 ISOLATED - -
26 ISOLATED - -
Table : 3.5 Rainfall distribution over Goa was above the normal range of its LPA (147%)
Chief amounts of rainfall (in cm) during September-2020
September 08: Canacona-8.
September 12: Canacona-9 & Pernem - 8.
September 13: Ela (Old Goa) & Quepem-10 each; Margao & Sanguem – 7 each.
September 14: Ponda-11.
September 18: Panjim & Canacona-8 each.
September 20: Ponda-10, Quepem-8.
September 21: Sanguem-18, Ponda & Sanquelim-13 each; Volpoi & Quepem – 12 each;
Margao-9, Pernem & Canacona – 8 each;Ela (Old Goa)-7.
September 22:Mormugao-20, Panaji & Dabolim-17 each; Pernem, Ponda & Margao- 13 each;
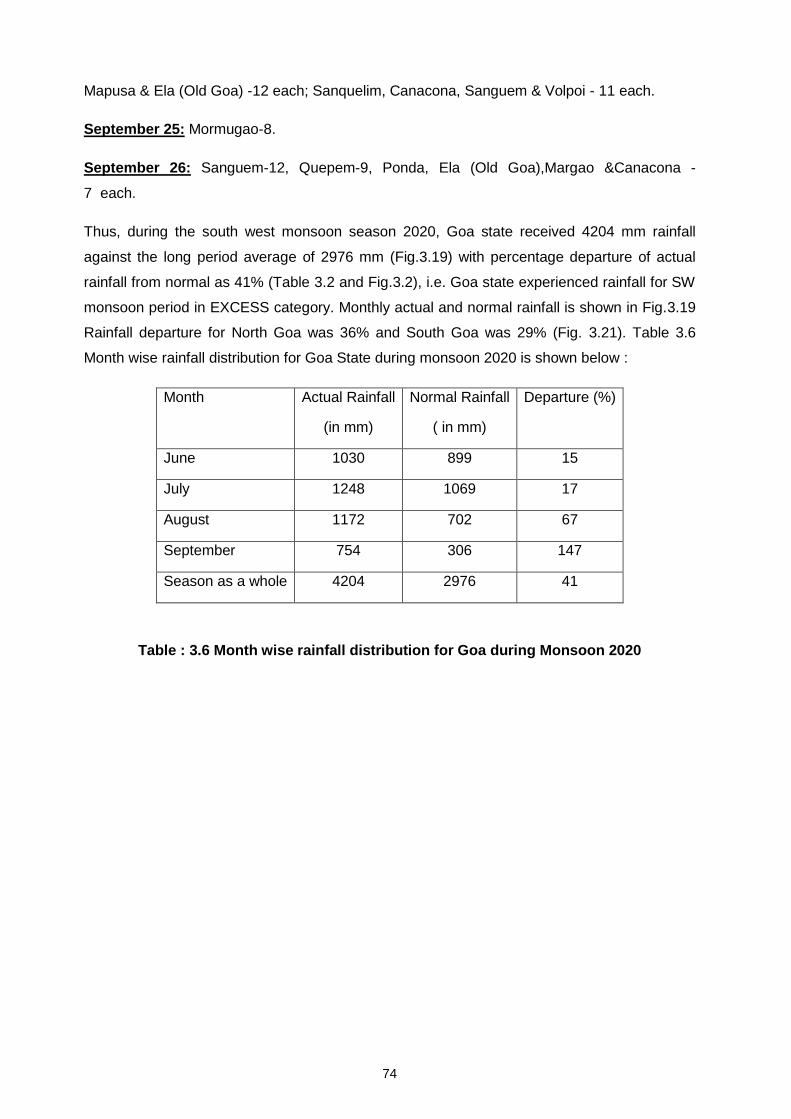
74
Mapusa & Ela (Old Goa) -12 each; Sanquelim, Canacona, Sanguem & Volpoi - 11 each.
September 25: Mormugao-8.
September 26: Sanguem-12, Quepem-9, Ponda, Ela (Old Goa),Margao &Canacona -
7 each.
Thus, during the south west monsoon season 2020, Goa state received 4204 mm rainfall
against the long period average of 2976 mm (Fig.3.19) with percentage departure of actual
rainfall from normal as 41% (Table 3.2 and Fig.3.2), i.e. Goa state experienced rainfall for SW
monsoon period in EXCESS category. Monthly actual and normal rainfall is shown in Fig.3.19
Rainfall departure for North Goa was 36% and South Goa was 29% (Fig. 3.21). Table 3.6
Month wise rainfall distribution for Goa State during monsoon 2020 is shown below :
Month Actual Rainfall
(in mm)
Normal Rainfall
( in mm)
Departure (%)
June 1030 899 15
July 1248 1069 17
August 1172 702 67
September 754 306 147
Season as a whole 4204 2976 41
Table : 3.6 Month wise rainfall distribution for Goa during Monsoon 2020
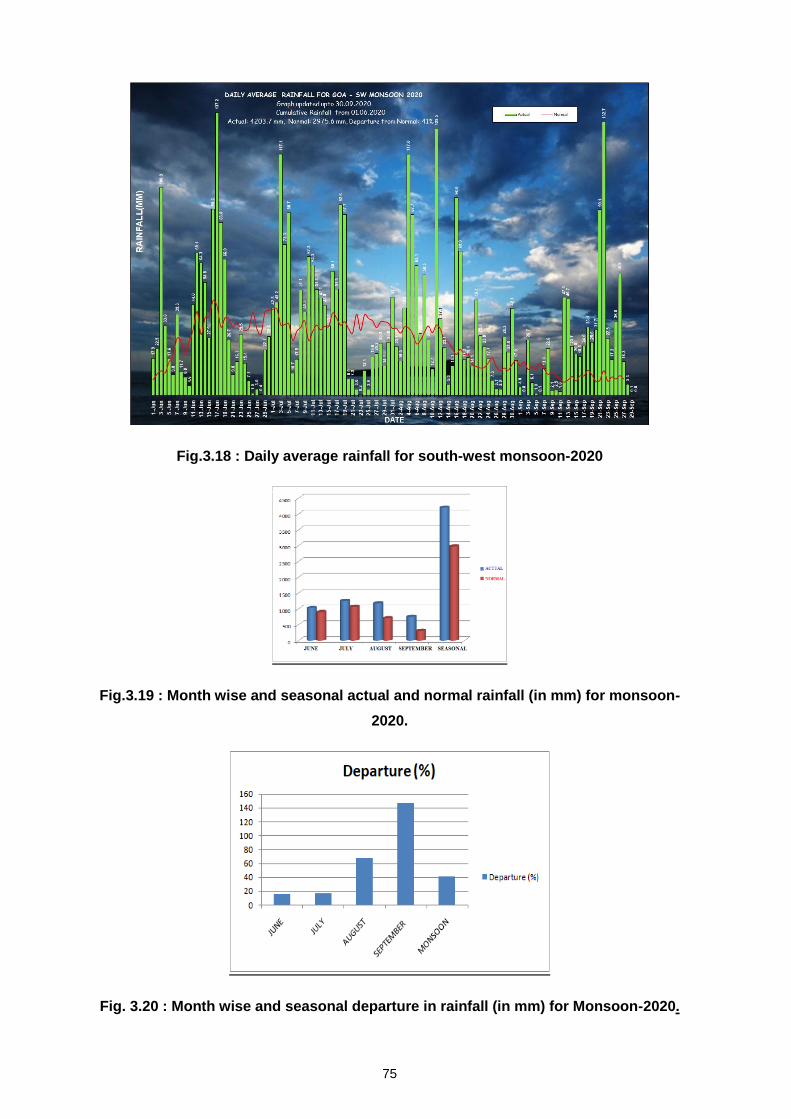
75
Fig.3.18 : Daily average rainfall for south-west monsoon-2020
Fig.3.19 : Month wise and seasonal actual and normal rainfall (in mm) for monsoon-
2020.
Fig. 3.20 : Month wise and seasonal departure in rainfall (in mm) for Monsoon-2020.
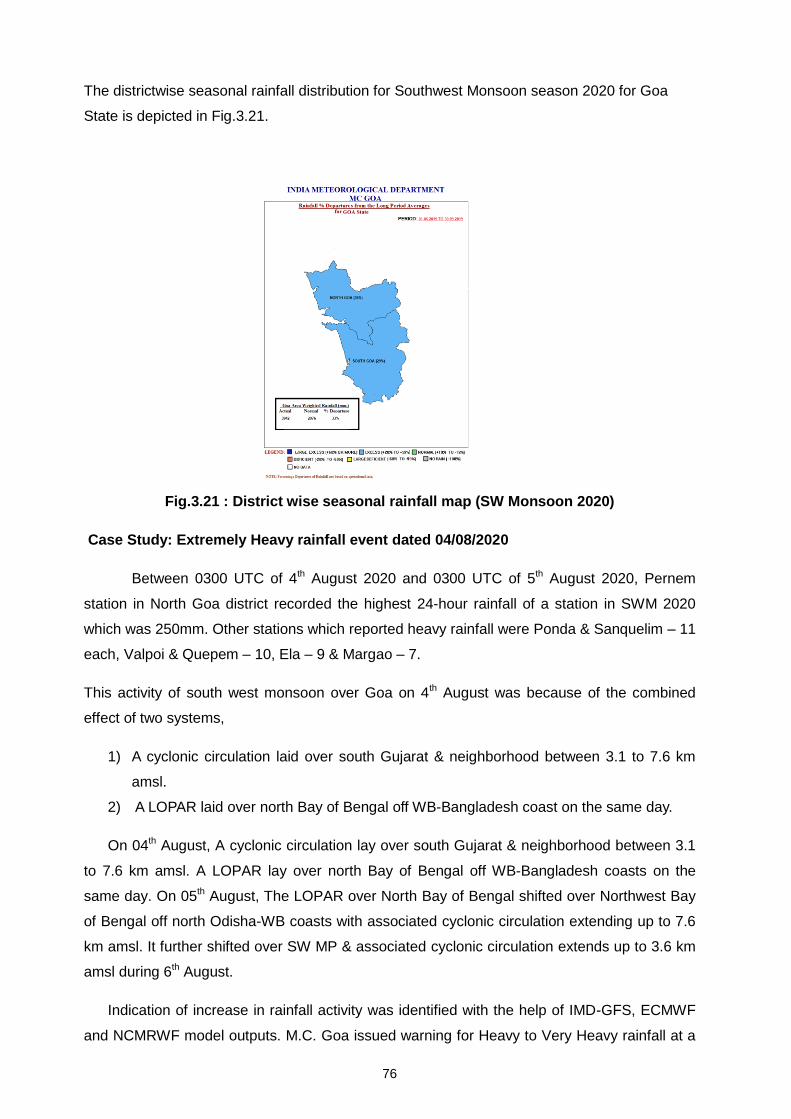
76
The districtwise seasonal rainfall distribution for Southwest Monsoon season 2020 for Goa
State is depicted in Fig.3.21.
Fig.3.21 : District wise seasonal rainfall map (SW Monsoon 2020)
Case Study: Extremely Heavy rainfall event dated 04/08/2020
Between 0300 UTC of 4th August 2020 and 0300 UTC of 5th August 2020, Pernem
station in North Goa district recorded the highest 24-hour rainfall of a station in SWM 2020
which was 250mm. Other stations which reported heavy rainfall were Ponda & Sanquelim – 11
each, Valpoi & Quepem – 10, Ela – 9 & Margao – 7.
This activity of south west monsoon over Goa on 4th August was because of the combined
effect of two systems,
1) A cyclonic circulation laid over south Gujarat & neighborhood between 3.1 to 7.6 km
amsl.
2) A LOPAR laid over north Bay of Bengal off WB-Bangladesh coast on the same day.
On 04th August, A cyclonic circulation lay over south Gujarat & neighborhood between 3.1
to 7.6 km amsl. A LOPAR lay over north Bay of Bengal off WB-Bangladesh coasts on the
same day. On 05th August, The LOPAR over North Bay of Bengal shifted over Northwest Bay
of Bengal off north Odisha-WB coasts with associated cyclonic circulation extending up to 7.6
km amsl. It further shifted over SW MP & associated cyclonic circulation extends up to 3.6 km
amsl during 6th August.
Indication of increase in rainfall activity was identified with the help of IMD-GFS, ECMWF
and NCMRWF model outputs. M.C. Goa issued warning for Heavy to Very Heavy rainfall at a
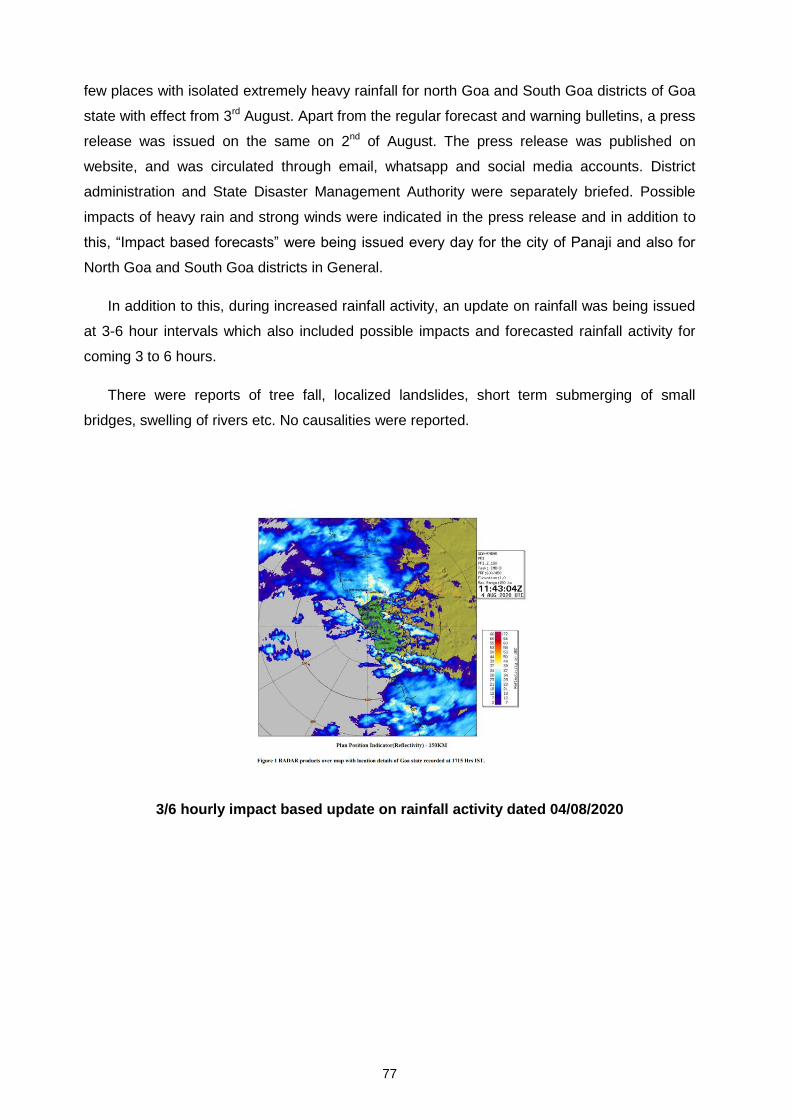
77
few places with isolated extremely heavy rainfall for north Goa and South Goa districts of Goa
state with effect from 3rd August. Apart from the regular forecast and warning bulletins, a press
release was issued on the same on 2nd of August. The press release was published on
website, and was circulated through email, whatsapp and social media accounts. District
administration and State Disaster Management Authority were separately briefed. Possible
impacts of heavy rain and strong winds were indicated in the press release and in addition to
this, “Impact based forecasts” were being issued every day for the city of Panaji and also for
North Goa and South Goa districts in General.
In addition to this, during increased rainfall activity, an update on rainfall was being issued
at 3-6 hour intervals which also included possible impacts and forecasted rainfall activity for
coming 3 to 6 hours.
There were reports of tree fall, localized landslides, short term submerging of small
bridges, swelling of rivers etc. No causalities were reported.
3/6 hourly impact based update on rainfall activity dated 04/08/2020
78
4
METEOROLOGICAL FEATURES ASSOCIATED WITH
FLOODS OVER EASTERN INDIA DURING SOUTHWEST MONSOON 2020
S Bandyopadhyay, H R Biswas, Umashankar Das, D Roy,
Sourish Bondyopadhyay, Anand Shankar, G N Raha and G K Das
This Chapter discusses the analysis of various meteorological features associated
with floods over eastern India during the Southwest Monsoon season 2020.
4.1 : Introduction Floods are very common in eastern India during southwest monsoon season. It
brings a lot of misery to the people of this region. Eastern India particularly Bihar, West
Bengal and Odisha witnessed moderate river line flood during Monson season 2020. Heavy
to very heavy rainfall along with extremely heavy rainfall was observed over the eastern
India (Fig-4.1) during monsoon 2020.
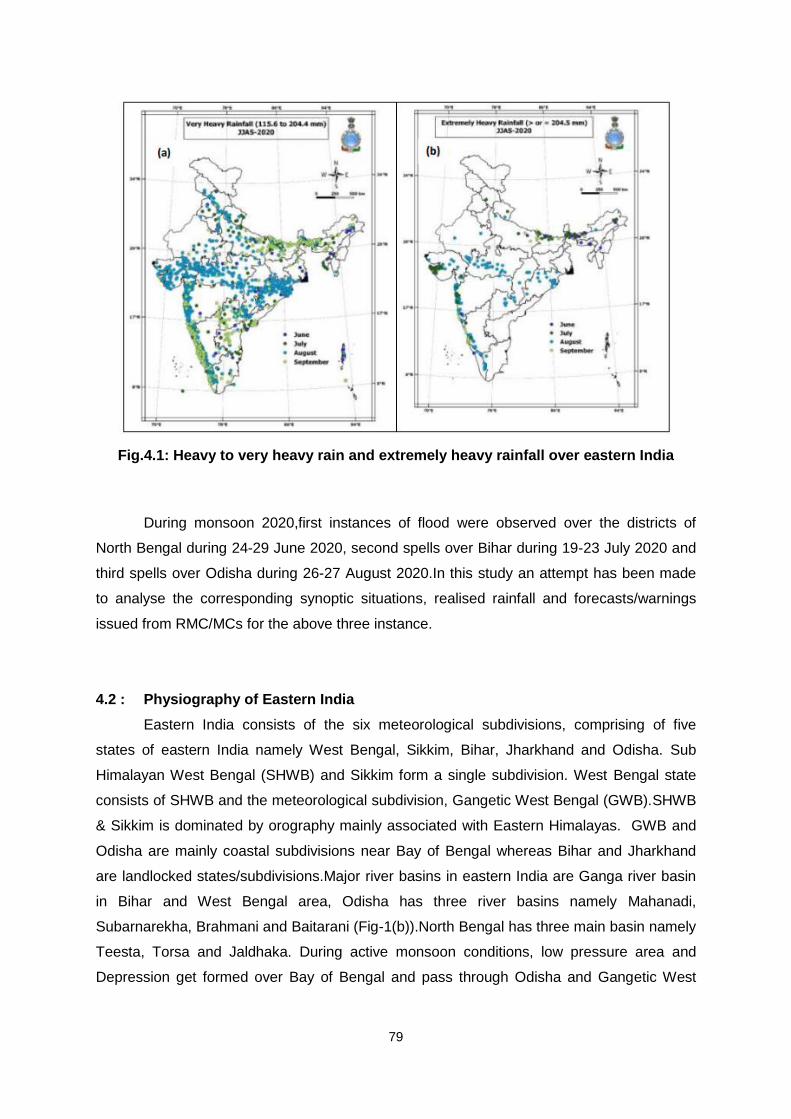
79
Fig.4.1: Heavy to very heavy rain and extremely heavy rainfall over eastern India
During monsoon 2020,first instances of flood were observed over the districts of
North Bengal during 24-29 June 2020, second spells over Bihar during 19-23 July 2020 and
third spells over Odisha during 26-27 August 2020.In this study an attempt has been made
to analyse the corresponding synoptic situations, realised rainfall and forecasts/warnings
issued from RMC/MCs for the above three instance.
4.2 : Physiography of Eastern India
Eastern India consists of the six meteorological subdivisions, comprising of five
states of eastern India namely West Bengal, Sikkim, Bihar, Jharkhand and Odisha. Sub
Himalayan West Bengal (SHWB) and Sikkim form a single subdivision. West Bengal state
consists of SHWB and the meteorological subdivision, Gangetic West Bengal (GWB).SHWB
& Sikkim is dominated by orography mainly associated with Eastern Himalayas. GWB and
Odisha are mainly coastal subdivisions near Bay of Bengal whereas Bihar and Jharkhand
are landlocked states/subdivisions.Major river basins in eastern India are Ganga river basin
in Bihar and West Bengal area, Odisha has three river basins namely Mahanadi,
Subarnarekha, Brahmani and Baitarani (Fig-1(b)).North Bengal has three main basin namely
Teesta, Torsa and Jaldhaka. During active monsoon conditions, low pressure area and
Depression get formed over Bay of Bengal and pass through Odisha and Gangetic West
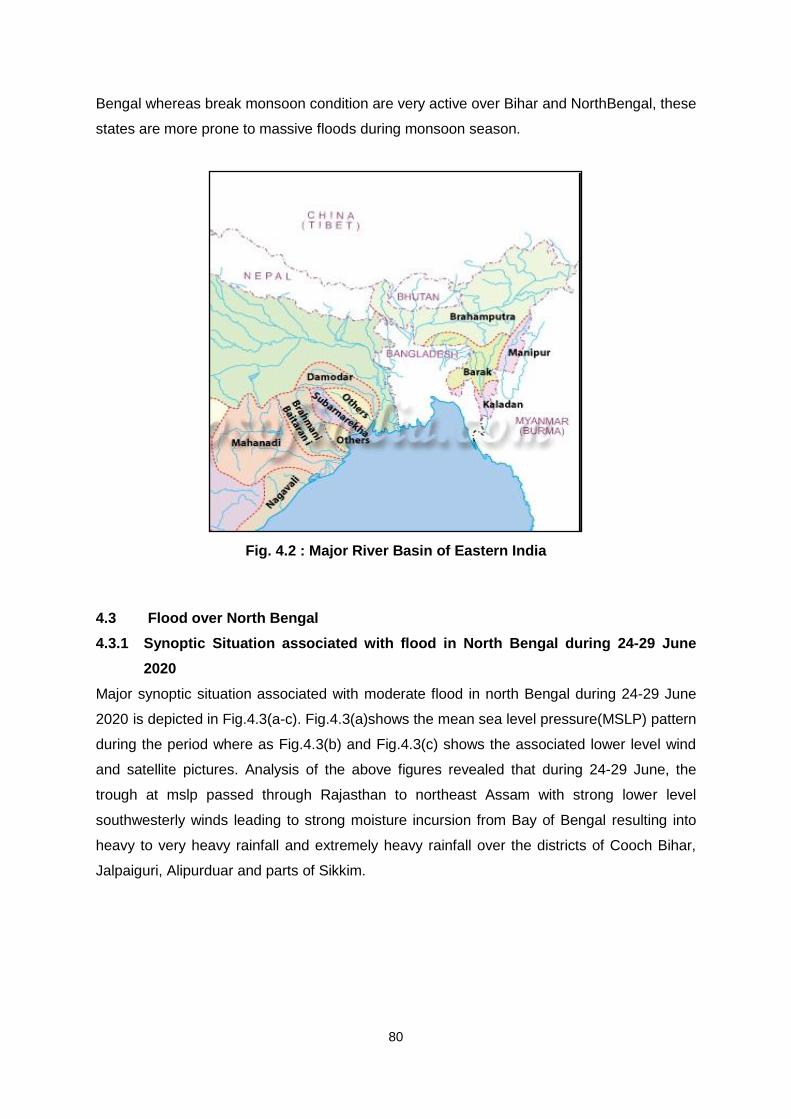
80
Bengal whereas break monsoon condition are very active over Bihar and NorthBengal, these
states are more prone to massive floods during monsoon season.
Fig. 4.2 : Major River Basin of Eastern India
4.3 Flood over North Bengal
4.3.1 Synoptic Situation associated with flood in North Bengal during 24-29 June
2020
Major synoptic situation associated with moderate flood in north Bengal during 24-29 June
2020 is depicted in Fig.4.3(a-c). Fig.4.3(a)shows the mean sea level pressure(MSLP) pattern
during the period where as Fig.4.3(b) and Fig.4.3(c) shows the associated lower level wind
and satellite pictures. Analysis of the above figures revealed that during 24-29 June, the
trough at mslp passed through Rajasthan to northeast Assam with strong lower level
southwesterly winds leading to strong moisture incursion from Bay of Bengal resulting into
heavy to very heavy rainfall and extremely heavy rainfall over the districts of Cooch Bihar,
Jalpaiguri, Alipurduar and parts of Sikkim.
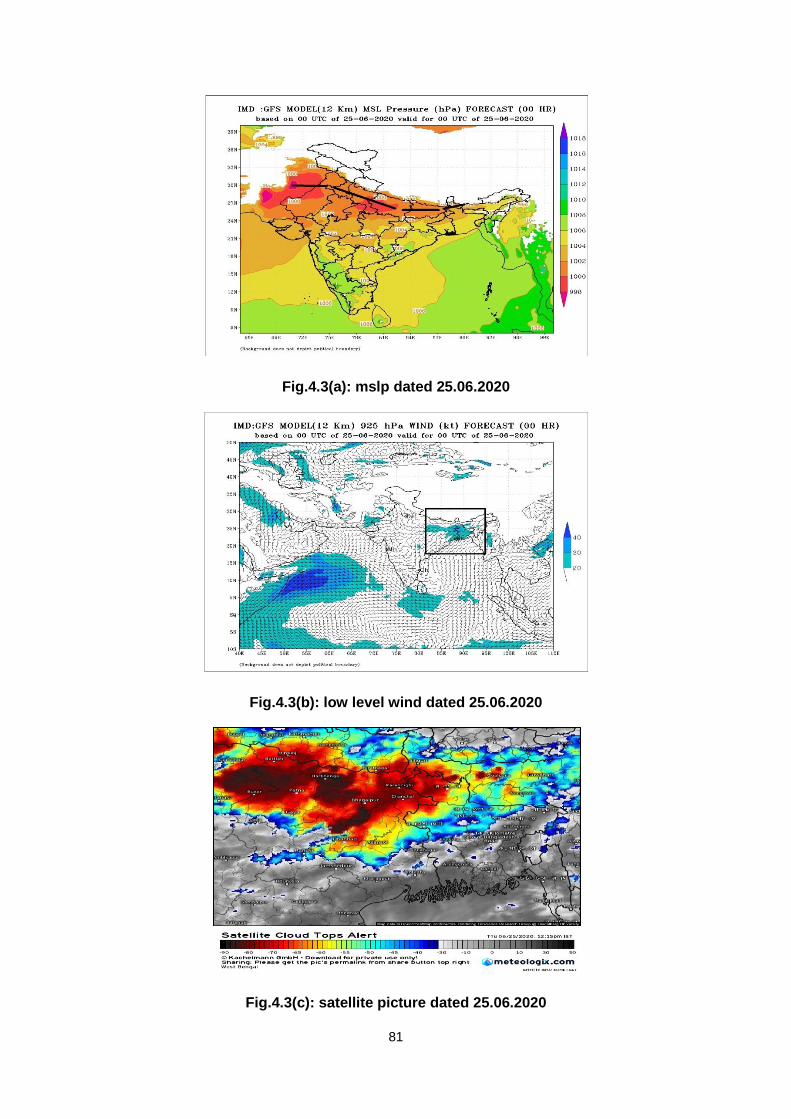
81
Fig.4.3(a): mslp dated 25.06.2020
Fig.4.3(b): low level wind dated 25.06.2020
Fig.4.3(c): satellite picture dated 25.06.2020
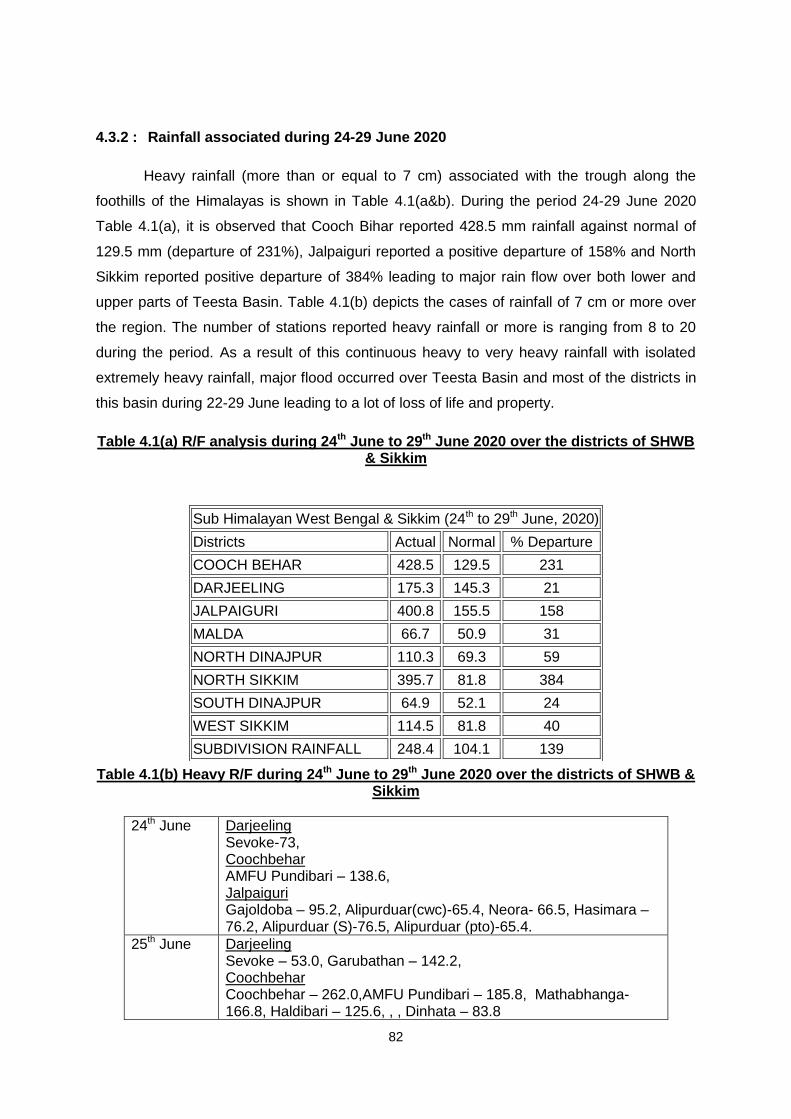
82
4.3.2 : Rainfall associated during 24-29 June 2020
Heavy rainfall (more than or equal to 7 cm) associated with the trough along the
foothills of the Himalayas is shown in Table 4.1(a&b). During the period 24-29 June 2020
Table 4.1(a), it is observed that Cooch Bihar reported 428.5 mm rainfall against normal of
129.5 mm (departure of 231%), Jalpaiguri reported a positive departure of 158% and North
Sikkim reported positive departure of 384% leading to major rain flow over both lower and
upper parts of Teesta Basin. Table 4.1(b) depicts the cases of rainfall of 7 cm or more over
the region. The number of stations reported heavy rainfall or more is ranging from 8 to 20
during the period. As a result of this continuous heavy to very heavy rainfall with isolated
extremely heavy rainfall, major flood occurred over Teesta Basin and most of the districts in
this basin during 22-29 June leading to a lot of loss of life and property.
Table 4.1(a) R/F analysis during 24th June to 29th June 2020 over the districts of SHWB & Sikkim
Table 4.1(b) Heavy R/F during 24th June to 29th June 2020 over the districts of SHWB & Sikkim
24th June Darjeeling Sevoke-73, Coochbehar AMFU Pundibari – 138.6, Jalpaiguri Gajoldoba – 95.2, Alipurduar(cwc)-65.4, Neora- 66.5, Hasimara – 76.2, Alipurduar (S)-76.5, Alipurduar (pto)-65.4.
25th June Darjeeling Sevoke – 53.0, Garubathan – 142.2, Coochbehar Coochbehar – 262.0,AMFU Pundibari – 185.8, Mathabhanga-166.8, Haldibari – 125.6, , , Dinhata – 83.8
Sub Himalayan West Bengal & Sikkim (24th to 29th June, 2020)
Districts Actual Normal % Departure
COOCH BEHAR 428.5 129.5 231
DARJEELING 175.3 145.3 21
JALPAIGURI 400.8 155.5 158
MALDA 66.7 50.9 31
NORTH DINAJPUR 110.3 69.3 59
NORTH SIKKIM 395.7 81.8 384
SOUTH DINAJPUR 64.9 52.1 24
WEST SIKKIM 114.5 81.8 40
SUBDIVISION RAINFALL 248.4 104.1 139
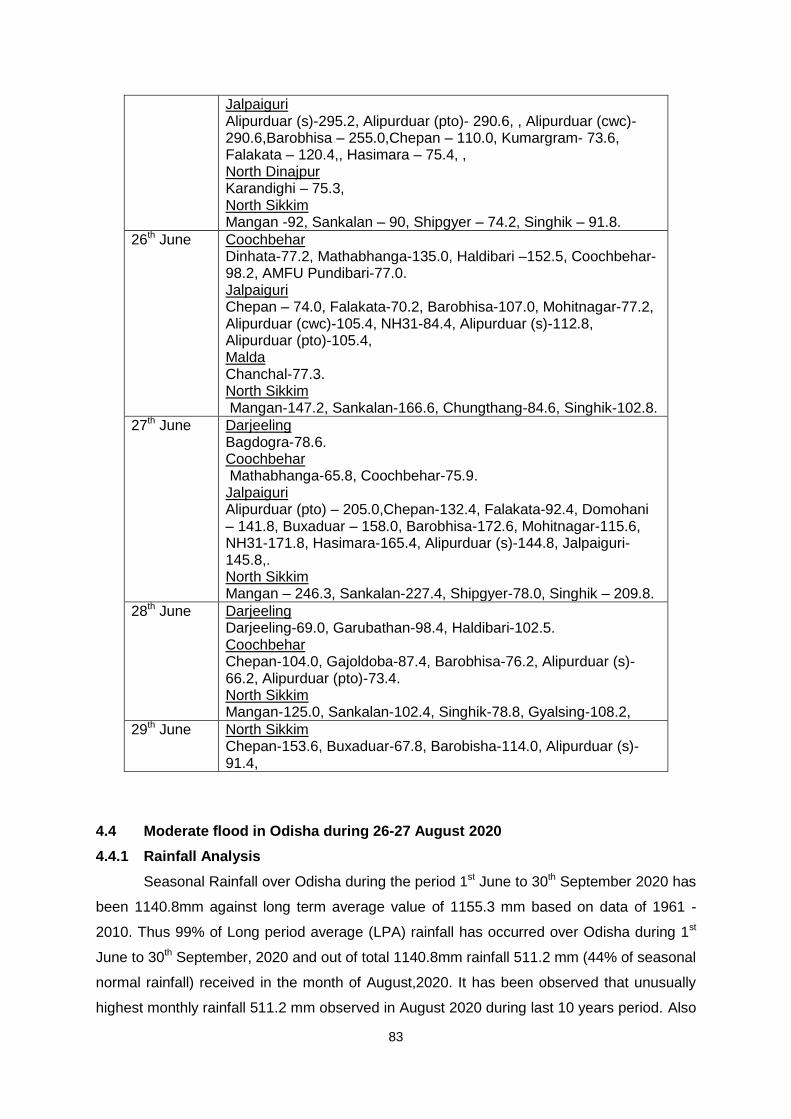
83
Jalpaiguri Alipurduar (s)-295.2, Alipurduar (pto)- 290.6, , Alipurduar (cwc)-290.6,Barobhisa – 255.0,Chepan – 110.0, Kumargram- 73.6, Falakata – 120.4,, Hasimara – 75.4, , North Dinajpur Karandighi – 75.3, North Sikkim Mangan -92, Sankalan – 90, Shipgyer – 74.2, Singhik – 91.8.
26th June Coochbehar Dinhata-77.2, Mathabhanga-135.0, Haldibari –152.5, Coochbehar- 98.2, AMFU Pundibari-77.0. Jalpaiguri Chepan – 74.0, Falakata-70.2, Barobhisa-107.0, Mohitnagar-77.2, Alipurduar (cwc)-105.4, NH31-84.4, Alipurduar (s)-112.8, Alipurduar (pto)-105.4, Malda Chanchal-77.3. North Sikkim Mangan-147.2, Sankalan-166.6, Chungthang-84.6, Singhik-102.8.
27th June Darjeeling Bagdogra-78.6. Coochbehar Mathabhanga-65.8, Coochbehar-75.9. Jalpaiguri Alipurduar (pto) – 205.0,Chepan-132.4, Falakata-92.4, Domohani – 141.8, Buxaduar – 158.0, Barobhisa-172.6, Mohitnagar-115.6, NH31-171.8, Hasimara-165.4, Alipurduar (s)-144.8, Jalpaiguri- 145.8,. North Sikkim Mangan – 246.3, Sankalan-227.4, Shipgyer-78.0, Singhik – 209.8.
28th June Darjeeling Darjeeling-69.0, Garubathan-98.4, Haldibari-102.5. Coochbehar Chepan-104.0, Gajoldoba-87.4, Barobhisa-76.2, Alipurduar (s)-66.2, Alipurduar (pto)-73.4. North Sikkim Mangan-125.0, Sankalan-102.4, Singhik-78.8, Gyalsing-108.2,
29th June North Sikkim Chepan-153.6, Buxaduar-67.8, Barobisha-114.0, Alipurduar (s)-91.4,
4.4 Moderate flood in Odisha during 26-27 August 2020
4.4.1 Rainfall Analysis
Seasonal Rainfall over Odisha during the period 1st June to 30th September 2020 has
been 1140.8mm against long term average value of 1155.3 mm based on data of 1961 -
2010. Thus 99% of Long period average (LPA) rainfall has occurred over Odisha during 1st
June to 30th September, 2020 and out of total 1140.8mm rainfall 511.2 mm (44% of seasonal
normal rainfall) received in the month of August,2020. It has been observed that unusually
highest monthly rainfall 511.2 mm observed in August 2020 during last 10 years period. Also
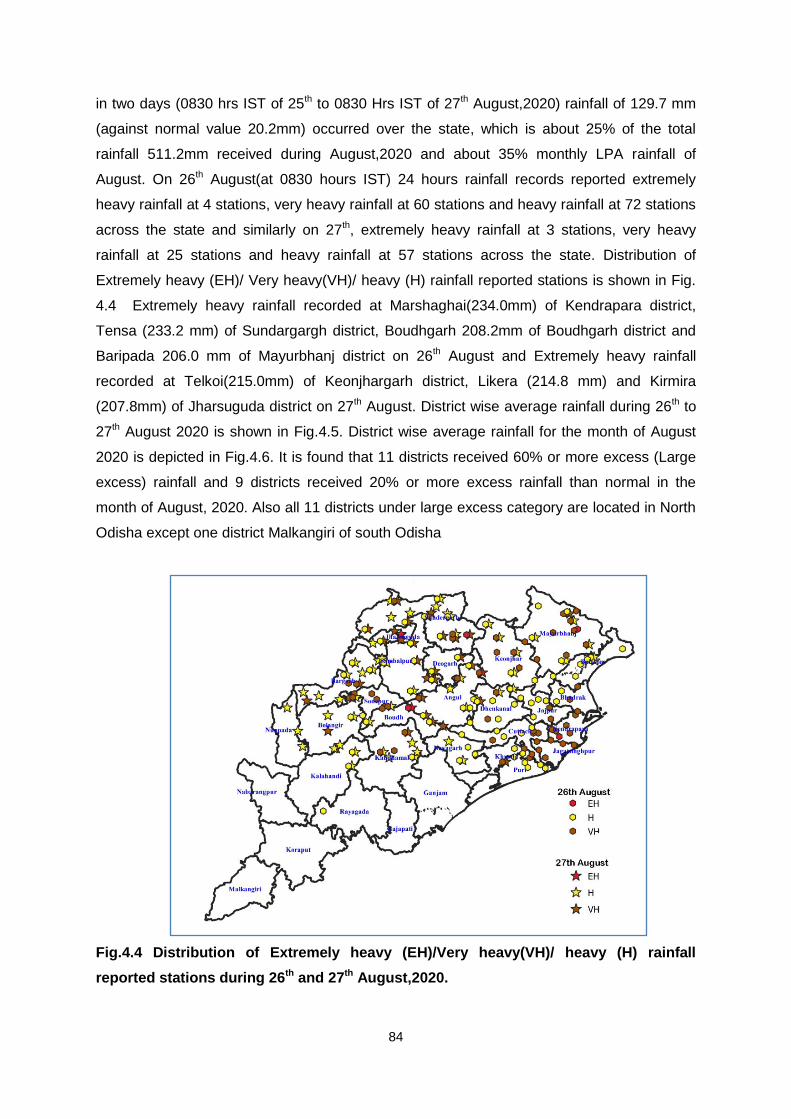
84
in two days (0830 hrs IST of 25th to 0830 Hrs IST of 27th August,2020) rainfall of 129.7 mm
(against normal value 20.2mm) occurred over the state, which is about 25% of the total
rainfall 511.2mm received during August,2020 and about 35% monthly LPA rainfall of
August. On 26th August(at 0830 hours IST) 24 hours rainfall records reported extremely
heavy rainfall at 4 stations, very heavy rainfall at 60 stations and heavy rainfall at 72 stations
across the state and similarly on 27th, extremely heavy rainfall at 3 stations, very heavy
rainfall at 25 stations and heavy rainfall at 57 stations across the state. Distribution of
Extremely heavy (EH)/ Very heavy(VH)/ heavy (H) rainfall reported stations is shown in Fig.
4.4 Extremely heavy rainfall recorded at Marshaghai(234.0mm) of Kendrapara district,
Tensa (233.2 mm) of Sundargargh district, Boudhgarh 208.2mm of Boudhgarh district and
Baripada 206.0 mm of Mayurbhanj district on 26th August and Extremely heavy rainfall
recorded at Telkoi(215.0mm) of Keonjhargarh district, Likera (214.8 mm) and Kirmira
(207.8mm) of Jharsuguda district on 27th August. District wise average rainfall during 26th to
27th August 2020 is shown in Fig.4.5. District wise average rainfall for the month of August
2020 is depicted in Fig.4.6. It is found that 11 districts received 60% or more excess (Large
excess) rainfall and 9 districts received 20% or more excess rainfall than normal in the
month of August, 2020. Also all 11 districts under large excess category are located in North
Odisha except one district Malkangiri of south Odisha
Fig.4.4 Distribution of Extremely heavy (EH)/Very heavy(VH)/ heavy (H) rainfall
reported stations during 26th and 27th August,2020.
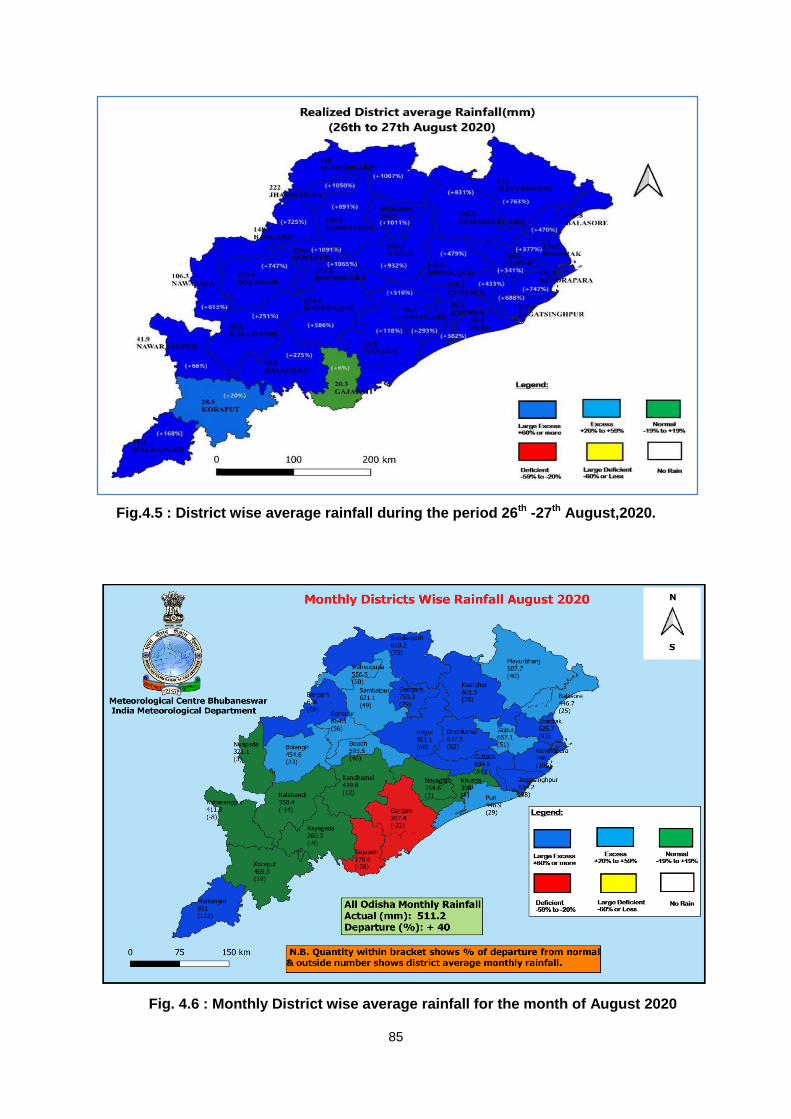
85
Fig.4.5 : District wise average rainfall during the period 26th -27th August,2020.
Fig. 4.6 : Monthly District wise average rainfall for the month of August 2020
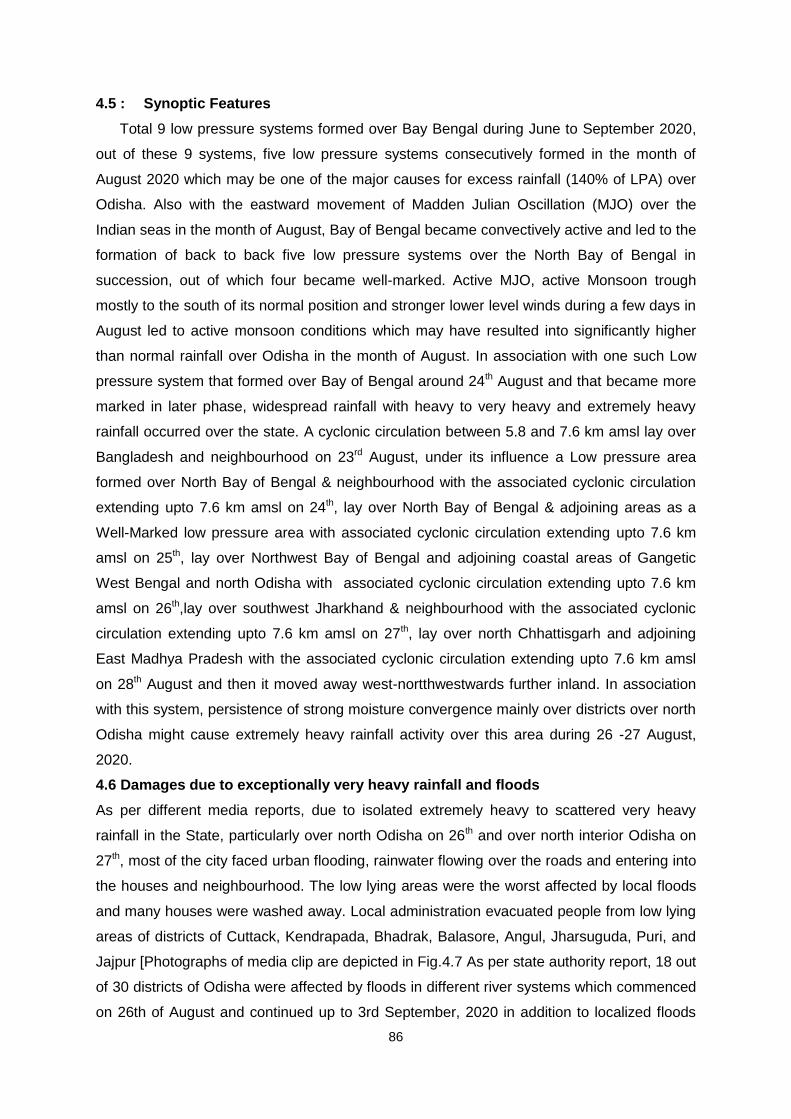
86
4.5 : Synoptic Features
Total 9 low pressure systems formed over Bay Bengal during June to September 2020,
out of these 9 systems, five low pressure systems consecutively formed in the month of
August 2020 which may be one of the major causes for excess rainfall (140% of LPA) over
Odisha. Also with the eastward movement of Madden Julian Oscillation (MJO) over the
Indian seas in the month of August, Bay of Bengal became convectively active and led to the
formation of back to back five low pressure systems over the North Bay of Bengal in
succession, out of which four became well-marked. Active MJO, active Monsoon trough
mostly to the south of its normal position and stronger lower level winds during a few days in
August led to active monsoon conditions which may have resulted into significantly higher
than normal rainfall over Odisha in the month of August. In association with one such Low
pressure system that formed over Bay of Bengal around 24th August and that became more
marked in later phase, widespread rainfall with heavy to very heavy and extremely heavy
rainfall occurred over the state. A cyclonic circulation between 5.8 and 7.6 km amsl lay over
Bangladesh and neighbourhood on 23rd August, under its influence a Low pressure area
formed over North Bay of Bengal & neighbourhood with the associated cyclonic circulation
extending upto 7.6 km amsl on 24th, lay over North Bay of Bengal & adjoining areas as a
Well-Marked low pressure area with associated cyclonic circulation extending upto 7.6 km
amsl on 25th, lay over Northwest Bay of Bengal and adjoining coastal areas of Gangetic
West Bengal and north Odisha with associated cyclonic circulation extending upto 7.6 km
amsl on 26th,lay over southwest Jharkhand & neighbourhood with the associated cyclonic
circulation extending upto 7.6 km amsl on 27th, lay over north Chhattisgarh and adjoining
East Madhya Pradesh with the associated cyclonic circulation extending upto 7.6 km amsl
on 28th August and then it moved away west-nortthwestwards further inland. In association
with this system, persistence of strong moisture convergence mainly over districts over north
Odisha might cause extremely heavy rainfall activity over this area during 26 -27 August,
2020.
4.6 Damages due to exceptionally very heavy rainfall and floods
As per different media reports, due to isolated extremely heavy to scattered very heavy
rainfall in the State, particularly over north Odisha on 26th and over north interior Odisha on
27th, most of the city faced urban flooding, rainwater flowing over the roads and entering into
the houses and neighbourhood. The low lying areas were the worst affected by local floods
and many houses were washed away. Local administration evacuated people from low lying
areas of districts of Cuttack, Kendrapada, Bhadrak, Balasore, Angul, Jharsuguda, Puri, and
Jajpur [Photographs of media clip are depicted in Fig.4.7 As per state authority report, 18 out
of 30 districts of Odisha were affected by floods in different river systems which commenced
on 26th of August and continued up to 3rd September, 2020 in addition to localized floods
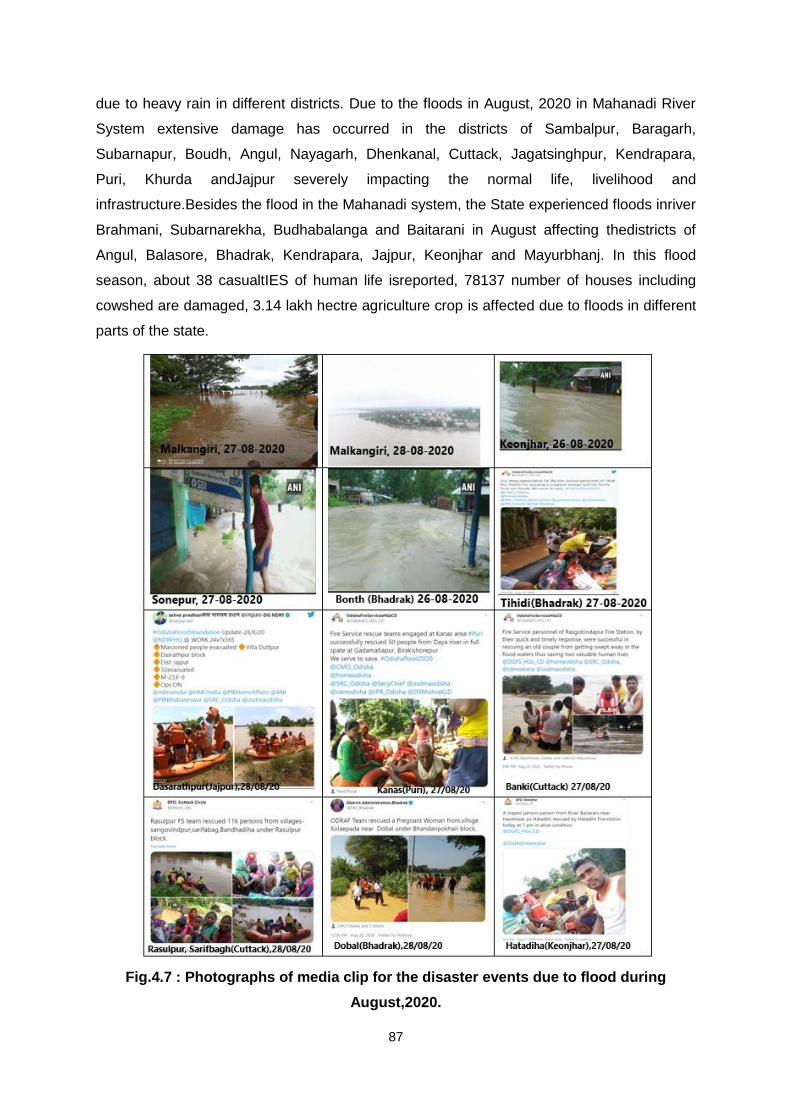
87
due to heavy rain in different districts. Due to the floods in August, 2020 in Mahanadi River
System extensive damage has occurred in the districts of Sambalpur, Baragarh,
Subarnapur, Boudh, Angul, Nayagarh, Dhenkanal, Cuttack, Jagatsinghpur, Kendrapara,
Puri, Khurda andJajpur severely impacting the normal life, livelihood and
infrastructure.Besides the flood in the Mahanadi system, the State experienced floods inriver
Brahmani, Subarnarekha, Budhabalanga and Baitarani in August affecting thedistricts of
Angul, Balasore, Bhadrak, Kendrapara, Jajpur, Keonjhar and Mayurbhanj. In this flood
season, about 38 casualtIES of human life isreported, 78137 number of houses including
cowshed are damaged, 3.14 lakh hectre agriculture crop is affected due to floods in different
parts of the state.
Fig.4.7 : Photographs of media clip for the disaster events due to flood during
August,2020.
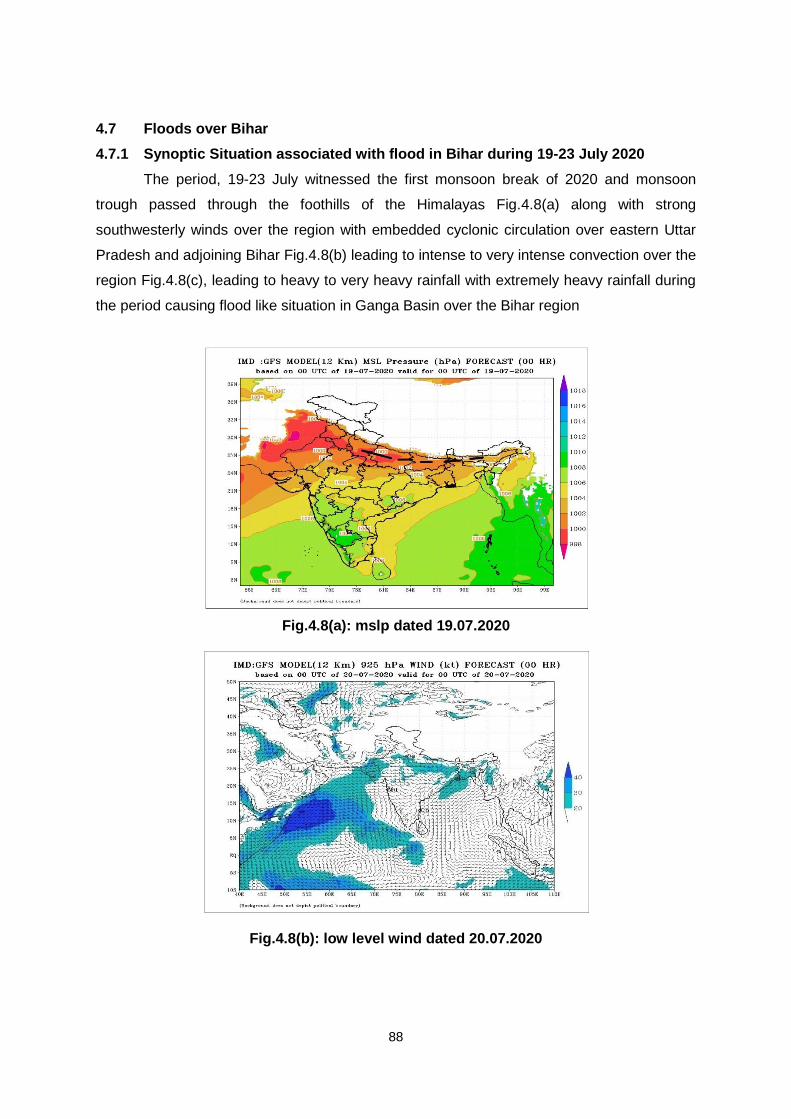
88
4.7 Floods over Bihar
4.7.1 Synoptic Situation associated with flood in Bihar during 19-23 July 2020
The period, 19-23 July witnessed the first monsoon break of 2020 and monsoon
trough passed through the foothills of the Himalayas Fig.4.8(a) along with strong
southwesterly winds over the region with embedded cyclonic circulation over eastern Uttar
Pradesh and adjoining Bihar Fig.4.8(b) leading to intense to very intense convection over the
region Fig.4.8(c), leading to heavy to very heavy rainfall with extremely heavy rainfall during
the period causing flood like situation in Ganga Basin over the Bihar region
Fig.4.8(a): mslp dated 19.07.2020
Fig.4.8(b): low level wind dated 20.07.2020
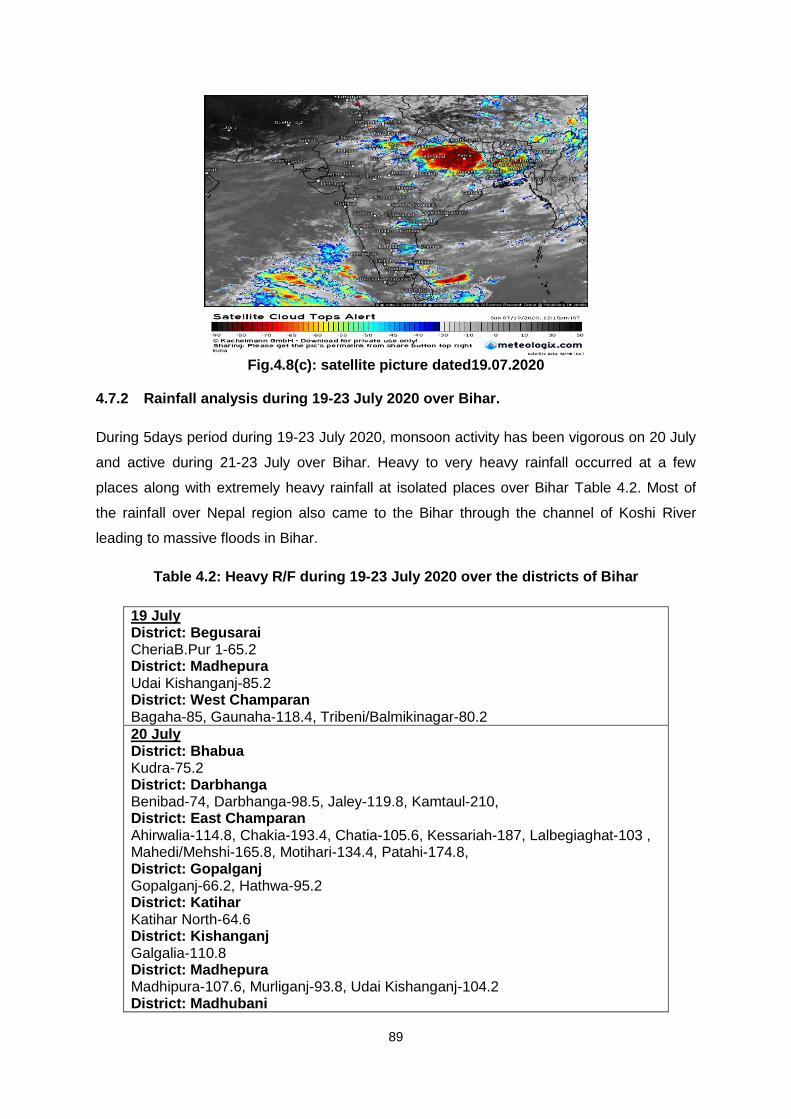
89
Fig.4.8(c): satellite picture dated19.07.2020
4.7.2 Rainfall analysis during 19-23 July 2020 over Bihar.
During 5days period during 19-23 July 2020, monsoon activity has been vigorous on 20 July
and active during 21-23 July over Bihar. Heavy to very heavy rainfall occurred at a few
places along with extremely heavy rainfall at isolated places over Bihar Table 4.2. Most of
the rainfall over Nepal region also came to the Bihar through the channel of Koshi River
leading to massive floods in Bihar.
Table 4.2: Heavy R/F during 19-23 July 2020 over the districts of Bihar
19 July District: Begusarai CheriaB.Pur 1-65.2 District: Madhepura Udai Kishanganj-85.2 District: West Champaran Bagaha-85, Gaunaha-118.4, Tribeni/Balmikinagar-80.2
20 July District: Bhabua Kudra-75.2 District: Darbhanga Benibad-74, Darbhanga-98.5, Jaley-119.8, Kamtaul-210, District: East Champaran Ahirwalia-114.8, Chakia-193.4, Chatia-105.6, Kessariah-187, Lalbegiaghat-103 , Mahedi/Mehshi-165.8, Motihari-134.4, Patahi-174.8, District: Gopalganj Gopalganj-66.2, Hathwa-95.2 District: Katihar Katihar North-64.6 District: Kishanganj Galgalia-110.8 District: Madhepura Madhipura-107.6, Murliganj-93.8, Udai Kishanganj-104.2 District: Madhubani
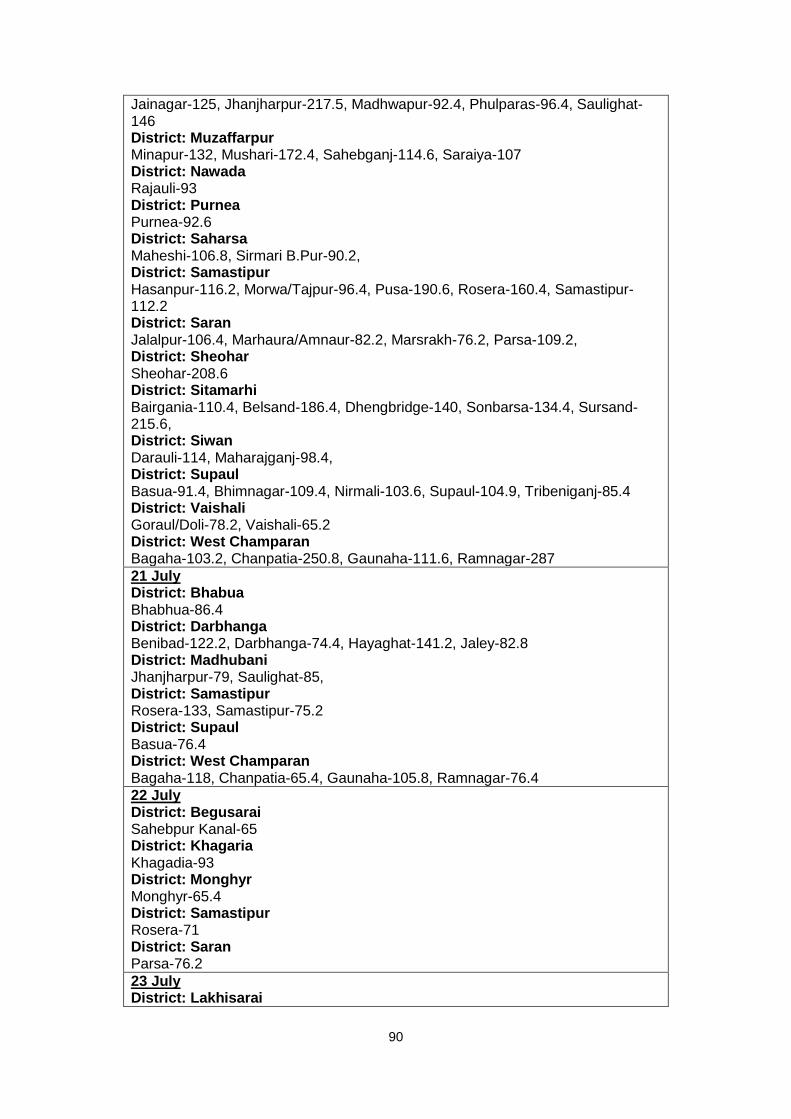
90
Jainagar-125, Jhanjharpur-217.5, Madhwapur-92.4, Phulparas-96.4, Saulighat-146 District: Muzaffarpur Minapur-132, Mushari-172.4, Sahebganj-114.6, Saraiya-107 District: Nawada Rajauli-93 District: Purnea Purnea-92.6 District: Saharsa Maheshi-106.8, Sirmari B.Pur-90.2, District: Samastipur Hasanpur-116.2, Morwa/Tajpur-96.4, Pusa-190.6, Rosera-160.4, Samastipur-112.2 District: Saran Jalalpur-106.4, Marhaura/Amnaur-82.2, Marsrakh-76.2, Parsa-109.2, District: Sheohar Sheohar-208.6 District: Sitamarhi Bairgania-110.4, Belsand-186.4, Dhengbridge-140, Sonbarsa-134.4, Sursand-215.6, District: Siwan Darauli-114, Maharajganj-98.4, District: Supaul Basua-91.4, Bhimnagar-109.4, Nirmali-103.6, Supaul-104.9, Tribeniganj-85.4 District: Vaishali Goraul/Doli-78.2, Vaishali-65.2 District: West Champaran Bagaha-103.2, Chanpatia-250.8, Gaunaha-111.6, Ramnagar-287
21 July District: Bhabua Bhabhua-86.4 District: Darbhanga Benibad-122.2, Darbhanga-74.4, Hayaghat-141.2, Jaley-82.8 District: Madhubani Jhanjharpur-79, Saulighat-85, District: Samastipur Rosera-133, Samastipur-75.2 District: Supaul Basua-76.4 District: West Champaran Bagaha-118, Chanpatia-65.4, Gaunaha-105.8, Ramnagar-76.4
22 July District: Begusarai Sahebpur Kanal-65 District: Khagaria Khagadia-93 District: Monghyr Monghyr-65.4 District: Samastipur Rosera-71 District: Saran Parsa-76.2
23 July District: Lakhisarai
91
Barhiya-69 District: Sitamarhi Bairgania-116.4, Belsand-86.4 District: Vaishali Jandhaha-65, Mahua-110 District: West Champaran Bagaha-65, Gaunaha-75.6
4.8 : Monitoring of Meteorological condition and issue of advisory/warnings by RMC
Kolkata
The above described adverse meteorological phenomenawere continuously
monitored by ACWC Kolkata round the clock during monsoon period with the help of
Satellite pictures, conventional charts, DWR Kolkata and national NWP model products
along with consultation/guidance of NWFC, New Delhi.
Information on Synoptic Situation and heavy rainfall warning and advisories were issued to 1. Chief Secretary, Govt of West Bengal; 2. Secretary, Disaster Management, Govt of West Bengal Heavy rainfall warnings were issued to Chief secretary, Secretary Disaster
Management, Secretary Home Department, Govt. of West Bengal; DMs of all districts of
West Bengal; Principal Chief Engineer (Bridge), Eastern & South Eastern Railway, Coal
India Ltd., GM Eastern Coalfield Ltd
All the modes of communication like telephone, E-mail, Websites, Whatsapp have
been used for dissemination of advisories and warnings. Press releases have been issued &
Electronic and prints media have been briefed regularly.
4.9 : Monitoring of the system and weather Warnings by MC Bhubaneswar
The Well-Marked-Low pressure system was closely monitored by Meteorological
Centre, Bhubaneswar under guidance of RMC Kolkata and NWFC, New Delhi. Information
on Synoptic Situation and heavy rainfall warning and advisories, nowcasts were issued to
various authorities of Govt. of Odisha, Principal Secretary, Revenue & Disaster
Management, Principal Secretary, Dept. of Agriculture, Principal Secretary, Department of
Water Resources, Special Relief Commissioner (SRC), M.D., OSDMA, Govt. of Odisha,
RDC, Central Division/Southern Division/ Northern Division, AIR Cuttack / Doordarshan ,
print andelectronic media etc. Statistics of Bulletins issued by MC Bhubaneswar in addition
to routine general weather bulletins is given below.
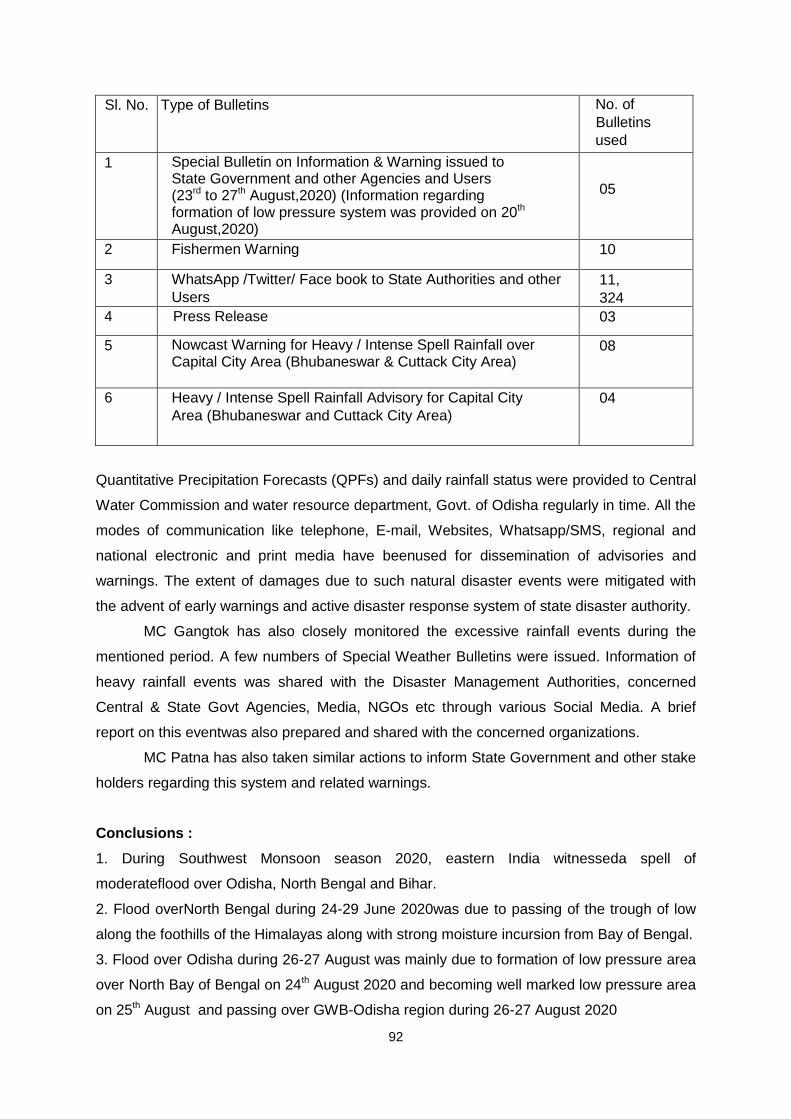
92
Sl. No. Type of Bulletins No. of
Bulletins
used
1 Special Bulletin on Information & Warning issued to State Government and other Agencies and Users (23rd to 27th August,2020) (Information regarding formation of low pressure system was provided on 20th August,2020)
05
2 Fishermen Warning 10
3 WhatsApp /Twitter/ Face book to State Authorities and other
Users
11,
324
4 Press Release 03
5 Nowcast Warning for Heavy / Intense Spell Rainfall over Capital City Area (Bhubaneswar & Cuttack City Area)
08
6 Heavy / Intense Spell Rainfall Advisory for Capital City
Area (Bhubaneswar and Cuttack City Area)
04
Quantitative Precipitation Forecasts (QPFs) and daily rainfall status were provided to Central
Water Commission and water resource department, Govt. of Odisha regularly in time. All the
modes of communication like telephone, E-mail, Websites, Whatsapp/SMS, regional and
national electronic and print media have beenused for dissemination of advisories and
warnings. The extent of damages due to such natural disaster events were mitigated with
the advent of early warnings and active disaster response system of state disaster authority.
MC Gangtok has also closely monitored the excessive rainfall events during the
mentioned period. A few numbers of Special Weather Bulletins were issued. Information of
heavy rainfall events was shared with the Disaster Management Authorities, concerned
Central & State Govt Agencies, Media, NGOs etc through various Social Media. A brief
report on this eventwas also prepared and shared with the concerned organizations.
MC Patna has also taken similar actions to inform State Government and other stake
holders regarding this system and related warnings.
Conclusions :
1. During Southwest Monsoon season 2020, eastern India witnesseda spell of
moderateflood over Odisha, North Bengal and Bihar.
2. Flood overNorth Bengal during 24-29 June 2020was due to passing of the trough of low
along the foothills of the Himalayas along with strong moisture incursion from Bay of Bengal.
3. Flood over Odisha during 26-27 August was mainly due to formation of low pressure area
over North Bay of Bengal on 24th August 2020 and becoming well marked low pressure area
on 25th August and passing over GWB-Odisha region during 26-27 August 2020

93
4. Flood over Bihar was mainly associated with the running of monsoon trough along the
foothills of the Himalayas.
5. Widespread damage to the agricultural crops and some loss of life has been witnessed
due to the floods.
6. Issuance ofaccurate weather forecasts/warnings well in advance and their transmission by
all means of communications like telephone, website, facebook, twitter, instagram, e-mail
and whatsapp to the concerned State Government disaster Managers along with personal
briefings to Senior Officers of Government and media by RMC Kolkata, MC Bhubaneswar,
MC Gangtok and MC Patna were very much effective for management of adverse disaster
situations.
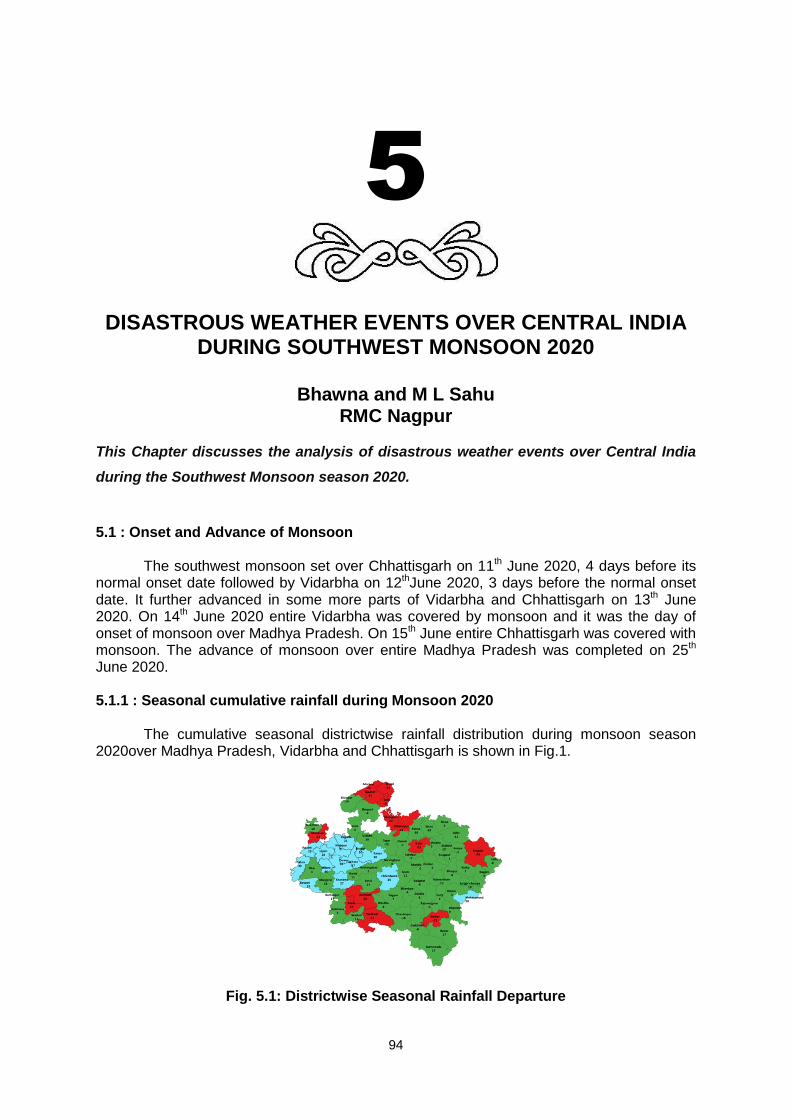
94
5
DISASTROUS WEATHER EVENTS OVER CENTRAL INDIA DURING SOUTHWEST MONSOON 2020
Bhawna and M L Sahu
RMC Nagpur
This Chapter discusses the analysis of disastrous weather events over Central India
during the Southwest Monsoon season 2020.
5.1 : Onset and Advance of Monsoon
The southwest monsoon set over Chhattisgarh on 11th June 2020, 4 days before its normal onset date followed by Vidarbha on 12thJune 2020, 3 days before the normal onset date. It further advanced in some more parts of Vidarbha and Chhattisgarh on 13th June 2020. On 14th June 2020 entire Vidarbha was covered by monsoon and it was the day of onset of monsoon over Madhya Pradesh. On 15th June entire Chhattisgarh was covered with monsoon. The advance of monsoon over entire Madhya Pradesh was completed on 25th June 2020. 5.1.1 : Seasonal cumulative rainfall during Monsoon 2020 The cumulative seasonal districtwise rainfall distribution during monsoon season 2020over Madhya Pradesh, Vidarbha and Chhattisgarh is shown in Fig.1.
Fig. 5.1: Districtwise Seasonal Rainfall Departure
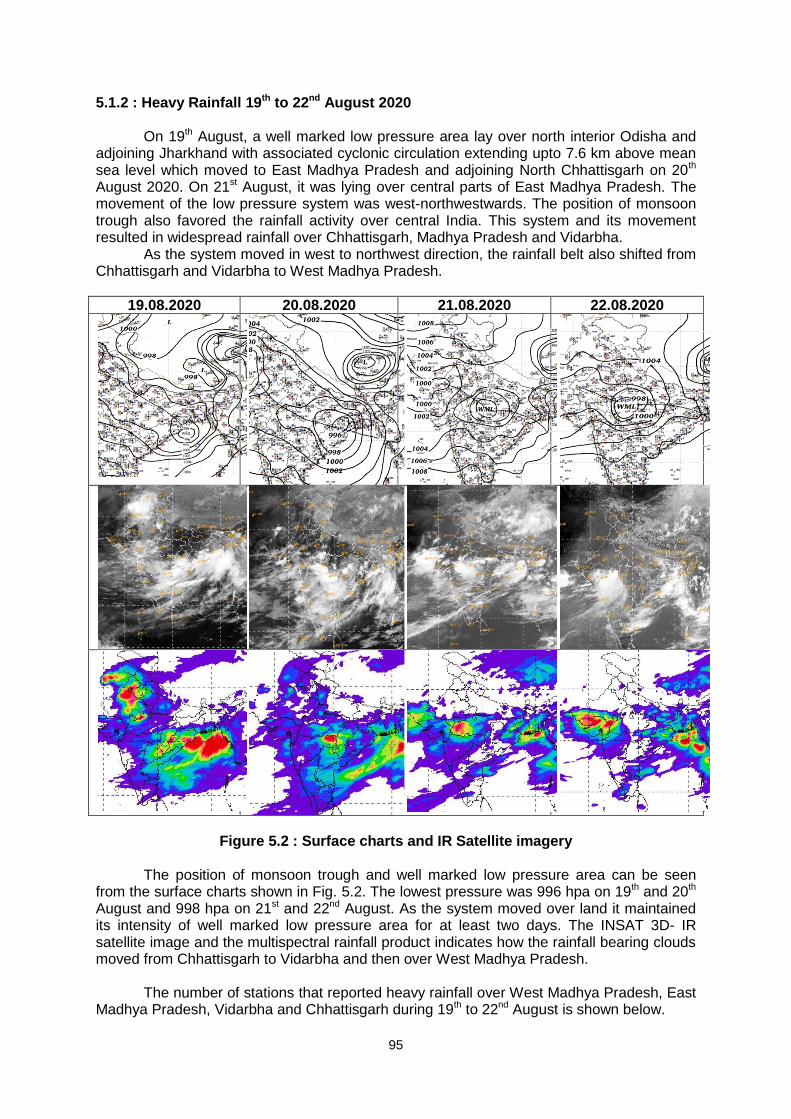
95
5.1.2 : Heavy Rainfall 19th to 22nd August 2020
On 19th August, a well marked low pressure area lay over north interior Odisha and adjoining Jharkhand with associated cyclonic circulation extending upto 7.6 km above mean sea level which moved to East Madhya Pradesh and adjoining North Chhattisgarh on 20th August 2020. On 21st August, it was lying over central parts of East Madhya Pradesh. The movement of the low pressure system was west-northwestwards. The position of monsoon trough also favored the rainfall activity over central India. This system and its movement resulted in widespread rainfall over Chhattisgarh, Madhya Pradesh and Vidarbha.
As the system moved in west to northwest direction, the rainfall belt also shifted from Chhattisgarh and Vidarbha to West Madhya Pradesh.
19.08.2020 20.08.2020 21.08.2020 22.08.2020
Figure 5.2 : Surface charts and IR Satellite imagery
The position of monsoon trough and well marked low pressure area can be seen from the surface charts shown in Fig. 5.2. The lowest pressure was 996 hpa on 19th and 20th August and 998 hpa on 21st and 22nd August. As the system moved over land it maintained its intensity of well marked low pressure area for at least two days. The INSAT 3D- IR satellite image and the multispectral rainfall product indicates how the rainfall bearing clouds moved from Chhattisgarh to Vidarbha and then over West Madhya Pradesh.
The number of stations that reported heavy rainfall over West Madhya Pradesh, East Madhya Pradesh, Vidarbha and Chhattisgarh during 19th to 22nd August is shown below.
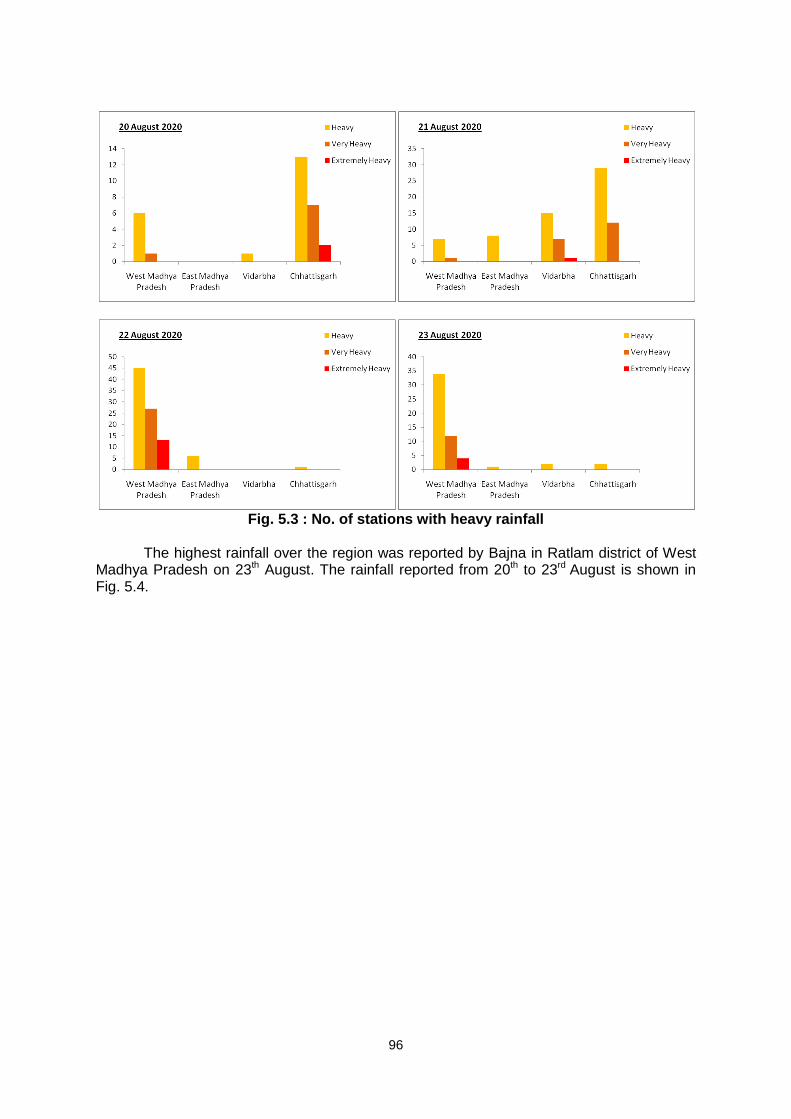
96
Fig. 5.3 : No. of stations with heavy rainfall
The highest rainfall over the region was reported by Bajna in Ratlam district of West
Madhya Pradesh on 23th August. The rainfall reported from 20th to 23rd August is shown in Fig. 5.4.
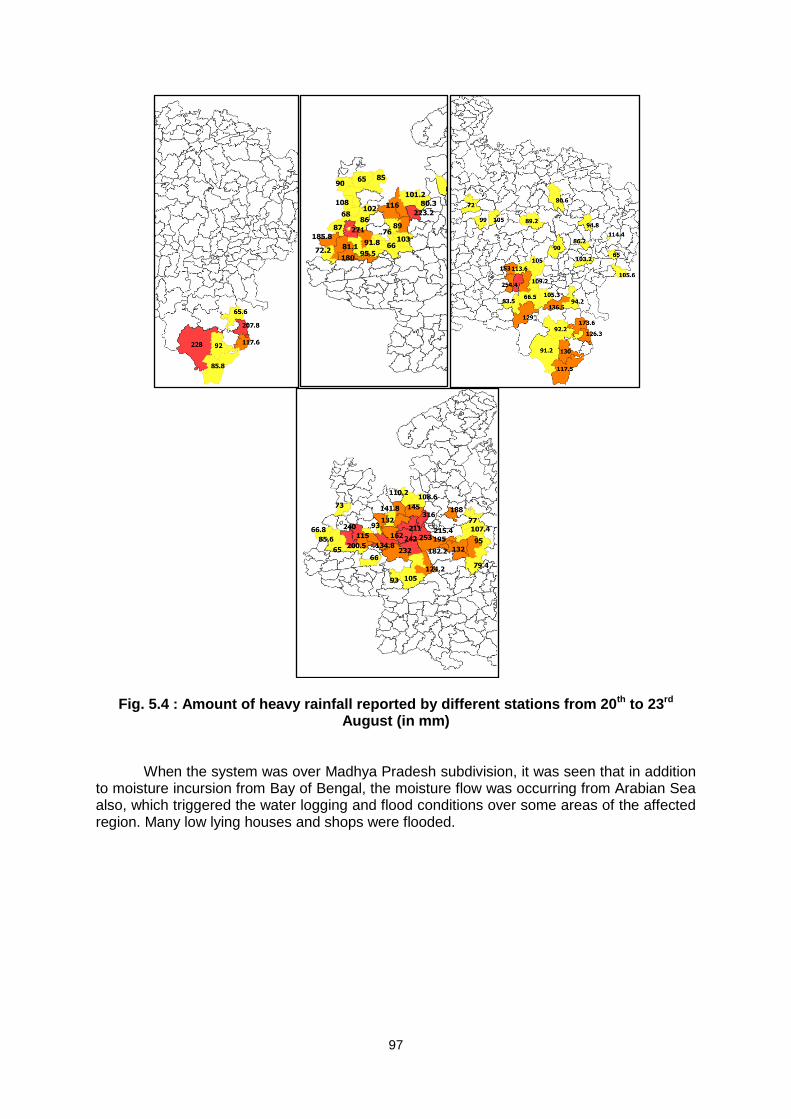
97
Fig. 5.4 : Amount of heavy rainfall reported by different stations from 20th to 23rd August (in mm)
When the system was over Madhya Pradesh subdivision, it was seen that in addition to moisture incursion from Bay of Bengal, the moisture flow was occurring from Arabian Sea also, which triggered the water logging and flood conditions over some areas of the affected region. Many low lying houses and shops were flooded.
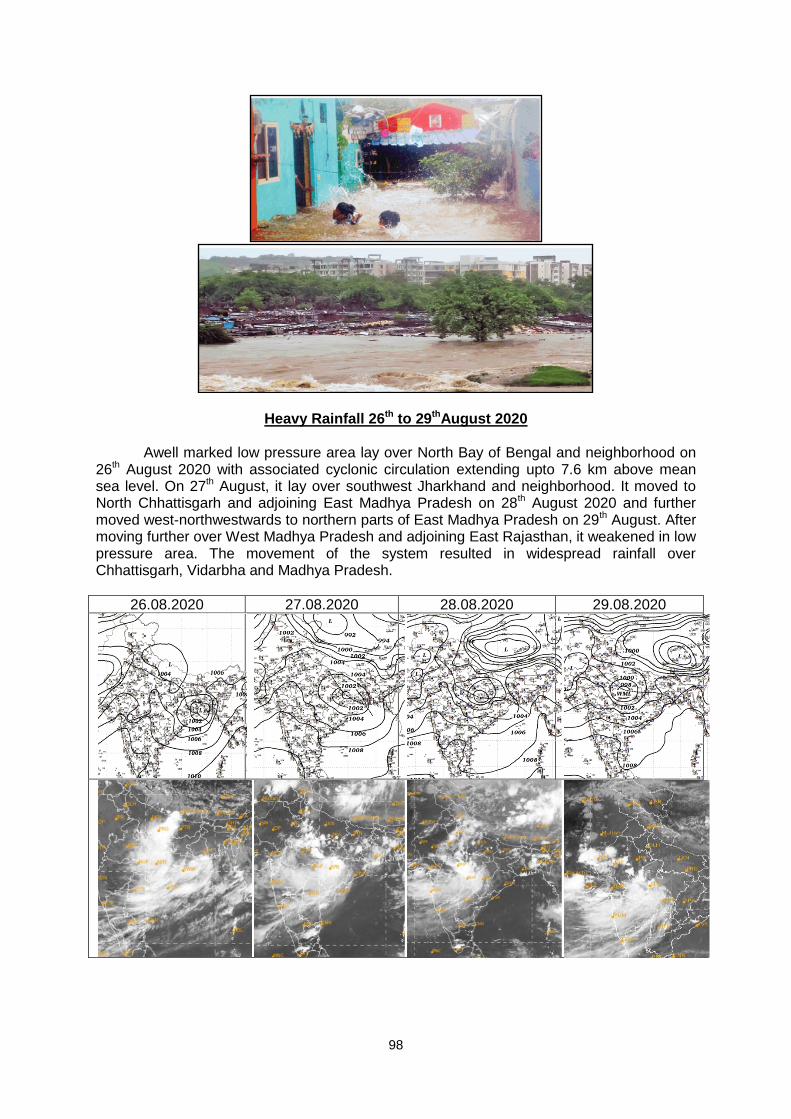
98
Heavy Rainfall 26th to 29thAugust 2020 Awell marked low pressure area lay over North Bay of Bengal and neighborhood on 26th August 2020 with associated cyclonic circulation extending upto 7.6 km above mean sea level. On 27th August, it lay over southwest Jharkhand and neighborhood. It moved to North Chhattisgarh and adjoining East Madhya Pradesh on 28th August 2020 and further moved west-northwestwards to northern parts of East Madhya Pradesh on 29th August. After moving further over West Madhya Pradesh and adjoining East Rajasthan, it weakened in low pressure area. The movement of the system resulted in widespread rainfall over Chhattisgarh, Vidarbha and Madhya Pradesh.
26.08.2020 27.08.2020 28.08.2020 29.08.2020
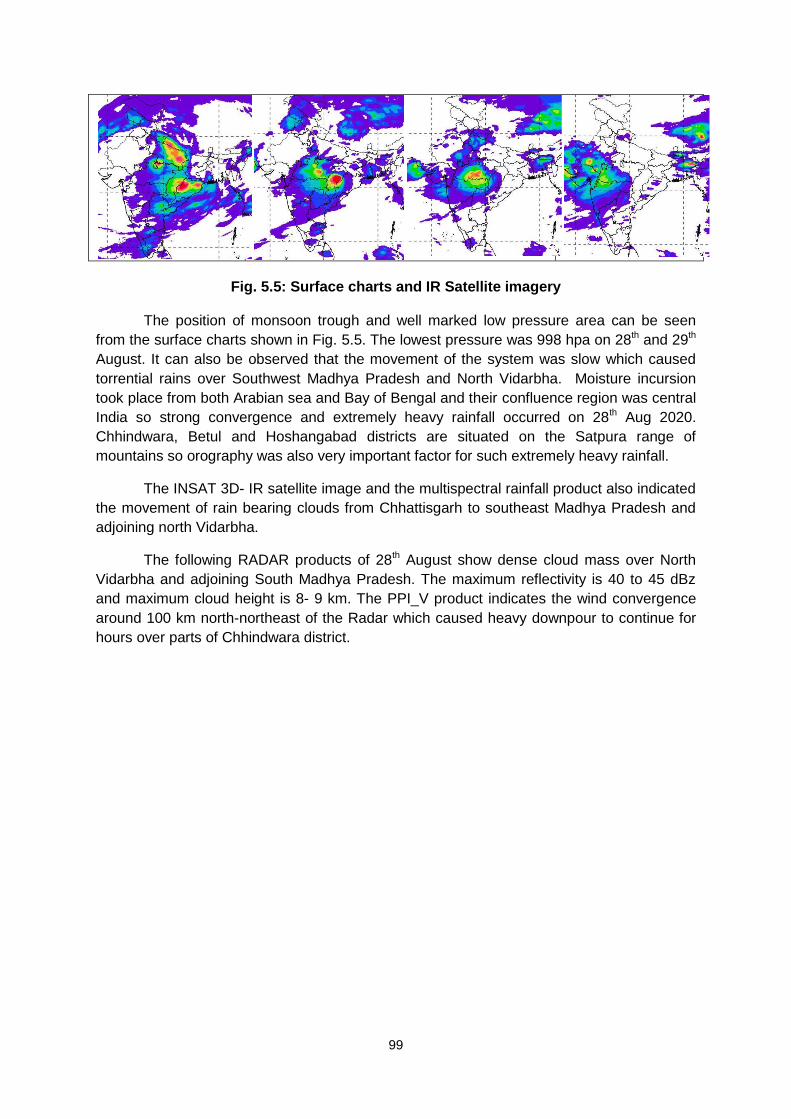
99
Fig. 5.5: Surface charts and IR Satellite imagery
The position of monsoon trough and well marked low pressure area can be seen
from the surface charts shown in Fig. 5.5. The lowest pressure was 998 hpa on 28th and 29th
August. It can also be observed that the movement of the system was slow which caused
torrential rains over Southwest Madhya Pradesh and North Vidarbha. Moisture incursion
took place from both Arabian sea and Bay of Bengal and their confluence region was central
India so strong convergence and extremely heavy rainfall occurred on 28th Aug 2020.
Chhindwara, Betul and Hoshangabad districts are situated on the Satpura range of
mountains so orography was also very important factor for such extremely heavy rainfall.
The INSAT 3D- IR satellite image and the multispectral rainfall product also indicated
the movement of rain bearing clouds from Chhattisgarh to southeast Madhya Pradesh and
adjoining north Vidarbha.
The following RADAR products of 28th August show dense cloud mass over North
Vidarbha and adjoining South Madhya Pradesh. The maximum reflectivity is 40 to 45 dBz
and maximum cloud height is 8- 9 km. The PPI_V product indicates the wind convergence
around 100 km north-northeast of the Radar which caused heavy downpour to continue for
hours over parts of Chhindwara district.
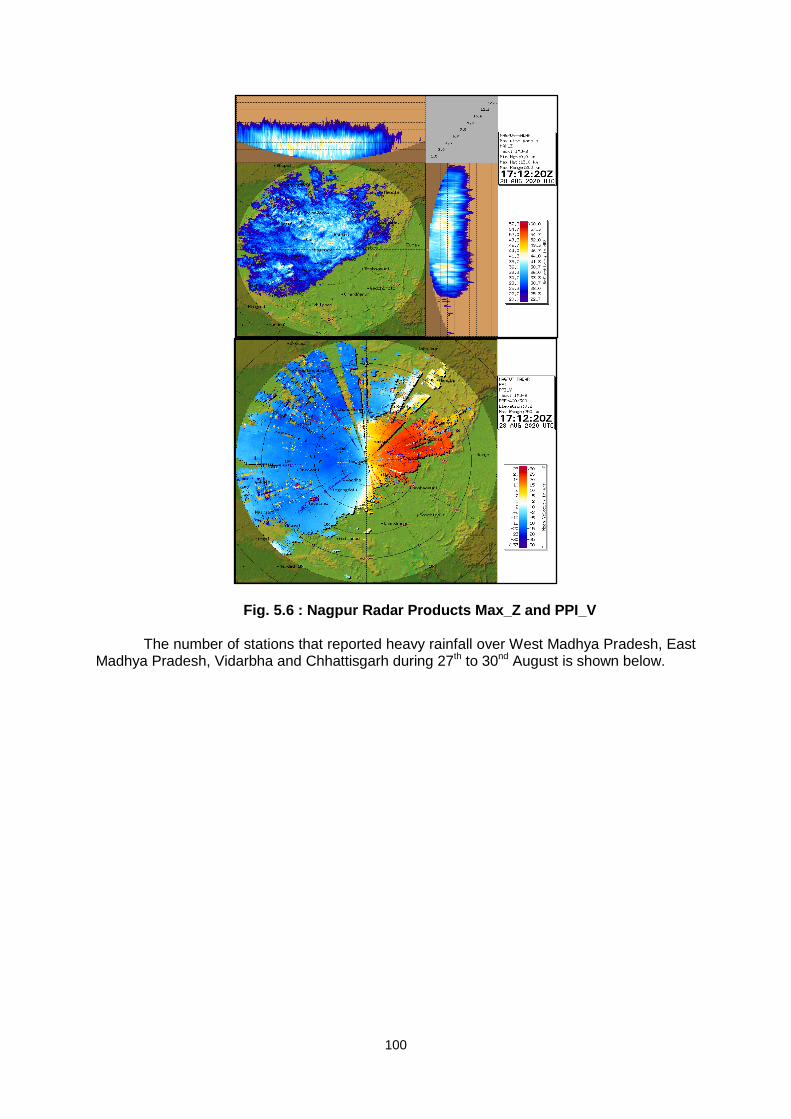
100
Fig. 5.6 : Nagpur Radar Products Max_Z and PPI_V
The number of stations that reported heavy rainfall over West Madhya Pradesh, East Madhya Pradesh, Vidarbha and Chhattisgarh during 27th to 30nd August is shown below.
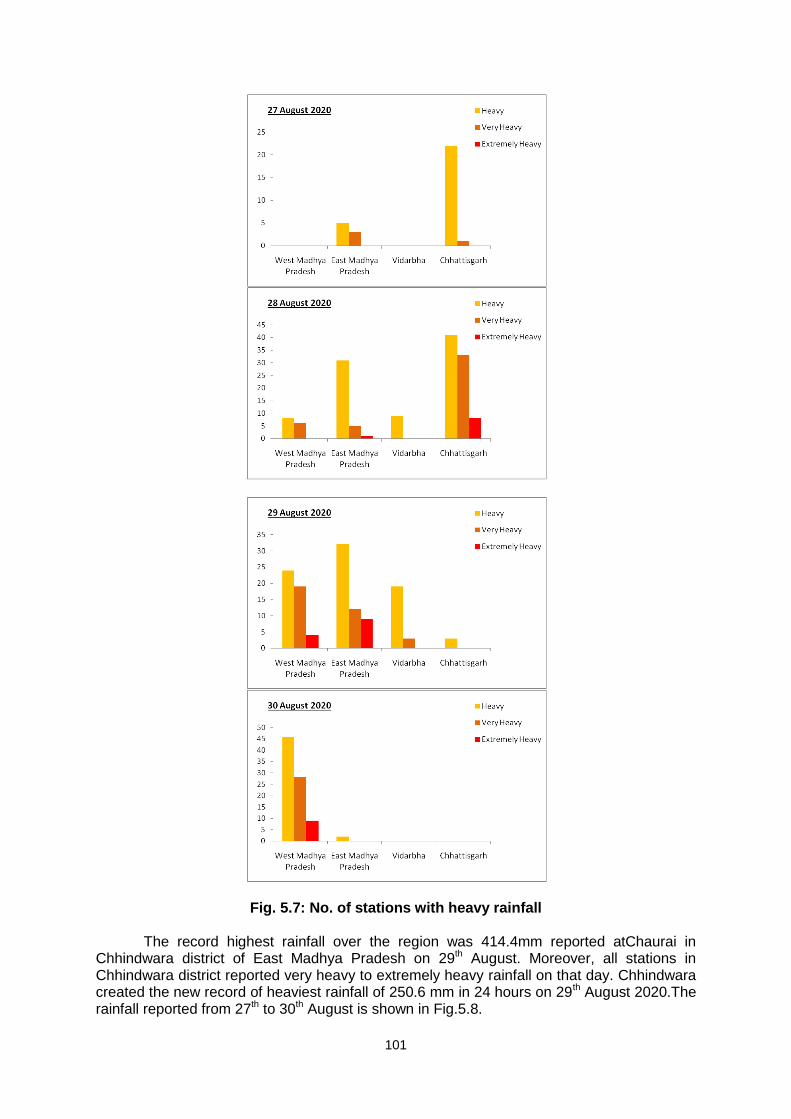
101
Fig. 5.7: No. of stations with heavy rainfall
The record highest rainfall over the region was 414.4mm reported atChaurai in Chhindwara district of East Madhya Pradesh on 29th August. Moreover, all stations in Chhindwara district reported very heavy to extremely heavy rainfall on that day. Chhindwara created the new record of heaviest rainfall of 250.6 mm in 24 hours on 29th August 2020.The rainfall reported from 27th to 30th August is shown in Fig.5.8.
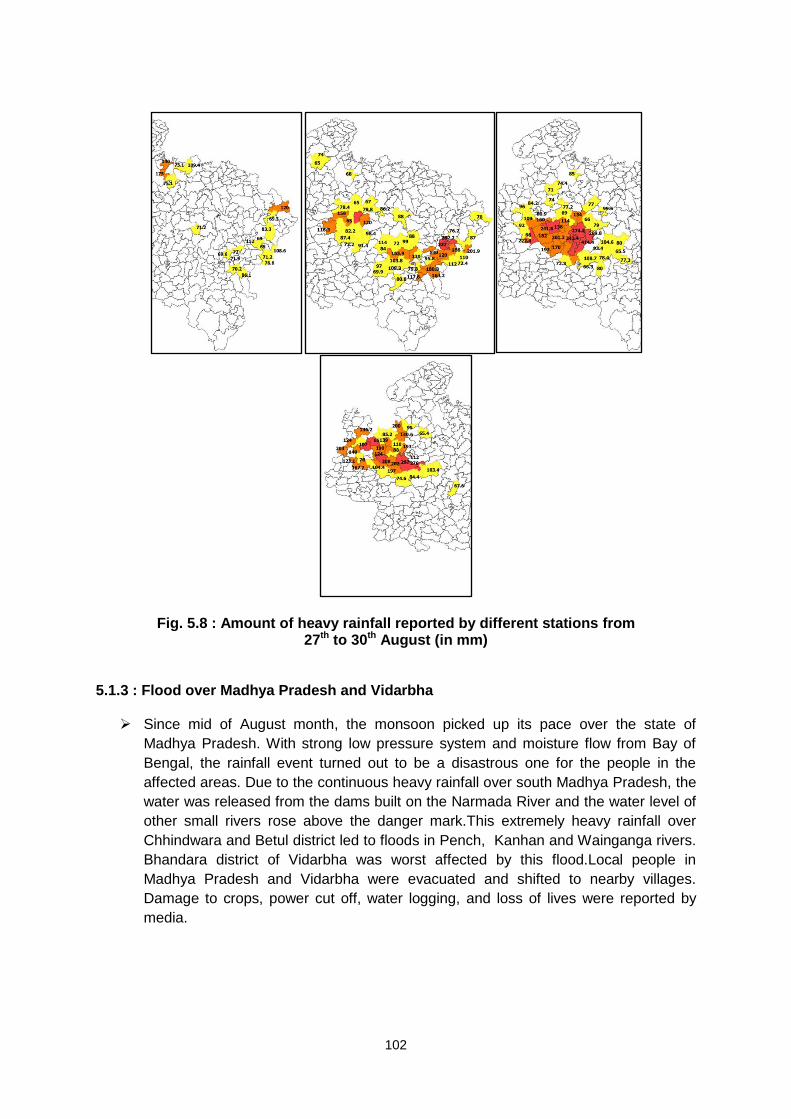
102
Fig. 5.8 : Amount of heavy rainfall reported by different stations from 27th to 30th August (in mm)
5.1.3 : Flood over Madhya Pradesh and Vidarbha Since mid of August month, the monsoon picked up its pace over the state of
Madhya Pradesh. With strong low pressure system and moisture flow from Bay of
Bengal, the rainfall event turned out to be a disastrous one for the people in the
affected areas. Due to the continuous heavy rainfall over south Madhya Pradesh, the
water was released from the dams built on the Narmada River and the water level of
other small rivers rose above the danger mark.This extremely heavy rainfall over
Chhindwara and Betul district led to floods in Pench, Kanhan and Wainganga rivers.
Bhandara district of Vidarbha was worst affected by this flood.Local people in
Madhya Pradesh and Vidarbha were evacuated and shifted to nearby villages.
Damage to crops, power cut off, water logging, and loss of lives were reported by
media.
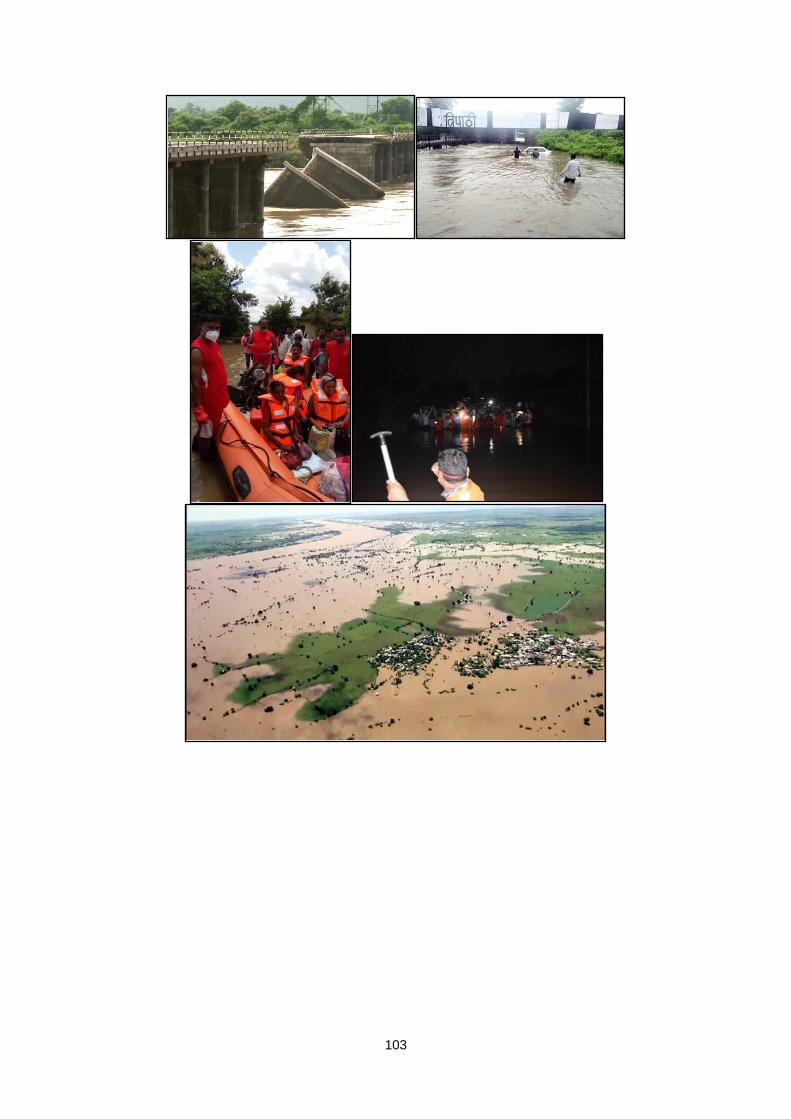
103
104
6
EXTREMELY HEAVY RAINFALL ACTIVITY OVER THE
SOUTHERN PENINSULAR REGION
B. Geetha, R.V. Deepa , K.S. Rakhil, and S. Balachandran
RMC Chennai
This Chapter discusses the analysis of the events of extremely heavy rainfall activity
over southern peninsular India during the Southwest Monsoon season 2020.
6.1 : Introduction
The southern peninsular (SP) region comprising of nine meteorological subdivisions
of Kerala & Mahe (KER), Lakshadweep (LAK), Coastal Karnataka (CK), South Interior
Karnataka (SIK), North Interior Karnataka (NIK), Telangana (TEL), Coastal Andhra Pradesh
& Yanam (CAP), Rayalaseema (RYS) and Tamil Nadu, Puducherry & Karaikal (TN)
experienced some extreme rainfall events during the southwest monsoon season, 2020.
Highest 24-hr accumulated rainfall of 58 cm was recorded in Avalanche in the Nilgiris district
of TN followed by 49 cm in Bagamandala in Kodagu district of SIK as on 08:30 IST of 06th
August 2020.
Heavy rainfall occurrence has been reported on about 50% of the days during the
season at isolated places in four subdivisions (TN, CK, TEL, SIK). No. of days of heavy (≥
7cm/day), very heavy (≥ 12cm/day and extremely heavy (≥ 21cm/day) rainfall occurrences in
the 9 subdivisions in the SP region is given in Table-1. The highest number of heavy rainfall
reports (≥7 cm/day) has come from TN (72 days), followed by CK (70 days). Very heavy
rainfall (≥12cm/day) occurred in TN and CK on 27 days and 30 days respectively. TEL, KER
& SIK also reported very heavy rainfall occurrences on 23-26 days. Extremely heavy rainfall
occurrences were reported on 8 days over SIK followed by 6 days each over CK & TN.
Overall, there were 14 days of extremely heavy rainfall occurrences in the SP region (June
22nd (KER); Aug 4th-8th (SIK & TN: 4th-8th& KER: 7th&8th), 15th-17th (TEL:15th&16th, SIK & CK:
17th); Sep 7th (CK),11th-12th (CK), 20th (KER,CK,SIK & TN) &21st (CK & SIK) . The list of the
extremely heavy rainfall occurrences during June-September, 2020 is presented in Table-2.
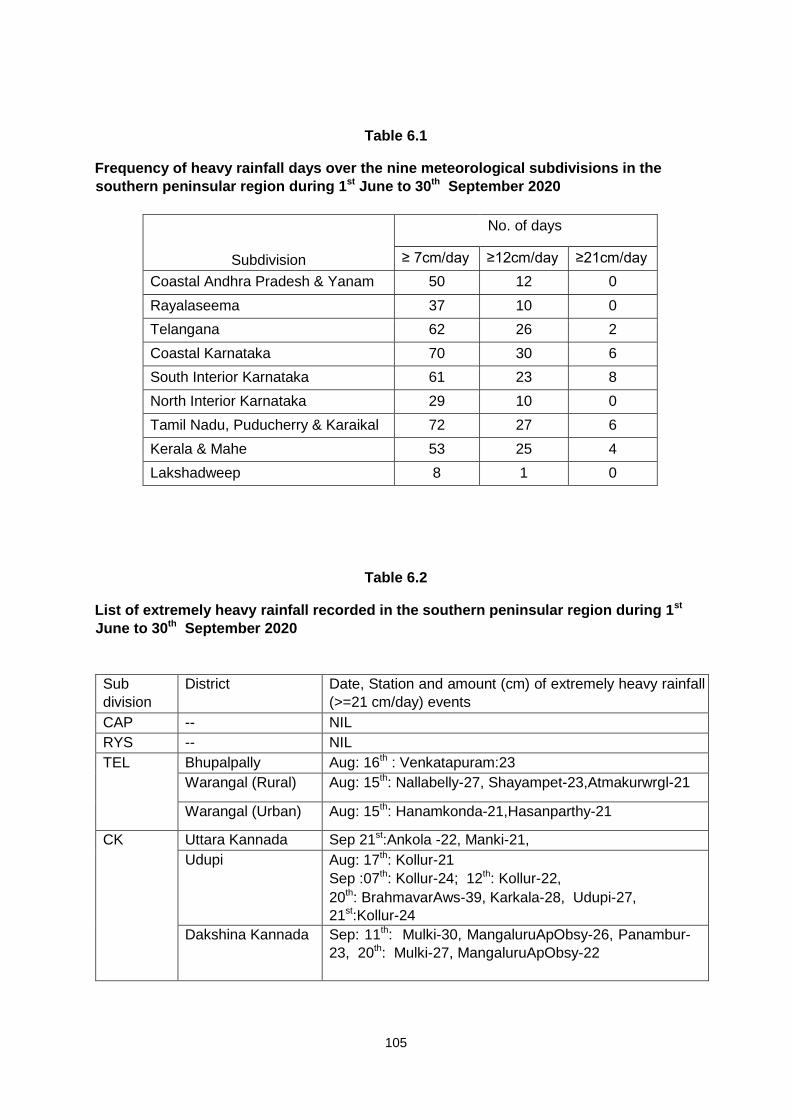
105
Table 6.1
Frequency of heavy rainfall days over the nine meteorological subdivisions in the
southern peninsular region during 1st June to 30th September 2020
Subdivision
No. of days
≥ 7cm/day ≥12cm/day ≥21cm/day
Coastal Andhra Pradesh & Yanam 50 12 0
Rayalaseema 37 10 0
Telangana 62 26 2
Coastal Karnataka 70 30 6
South Interior Karnataka 61 23 8
North Interior Karnataka 29 10 0
Tamil Nadu, Puducherry & Karaikal 72 27 6
Kerala & Mahe 53 25 4
Lakshadweep 8 1 0
Table 6.2
List of extremely heavy rainfall recorded in the southern peninsular region during 1st
June to 30th September 2020
Sub
division
District Date, Station and amount (cm) of extremely heavy rainfall
(>=21 cm/day) events
CAP -- NIL
RYS -- NIL
TEL Bhupalpally Aug: 16th : Venkatapuram:23
Warangal (Rural) Aug: 15th: Nallabelly-27, Shayampet-23,Atmakurwrgl-21
Warangal (Urban) Aug: 15th: Hanamkonda-21,Hasanparthy-21
CK Uttara Kannada Sep 21st:Ankola -22, Manki-21,
Udupi Aug: 17th: Kollur-21
Sep :07th: Kollur-24; 12th: Kollur-22,
20th: BrahmavarAws-39, Karkala-28, Udupi-27,
21st:Kollur-24
Dakshina Kannada Sep: 11th: Mulki-30, MangaluruApObsy-26, Panambur-
23, 20th: Mulki-27, MangaluruApObsy-22
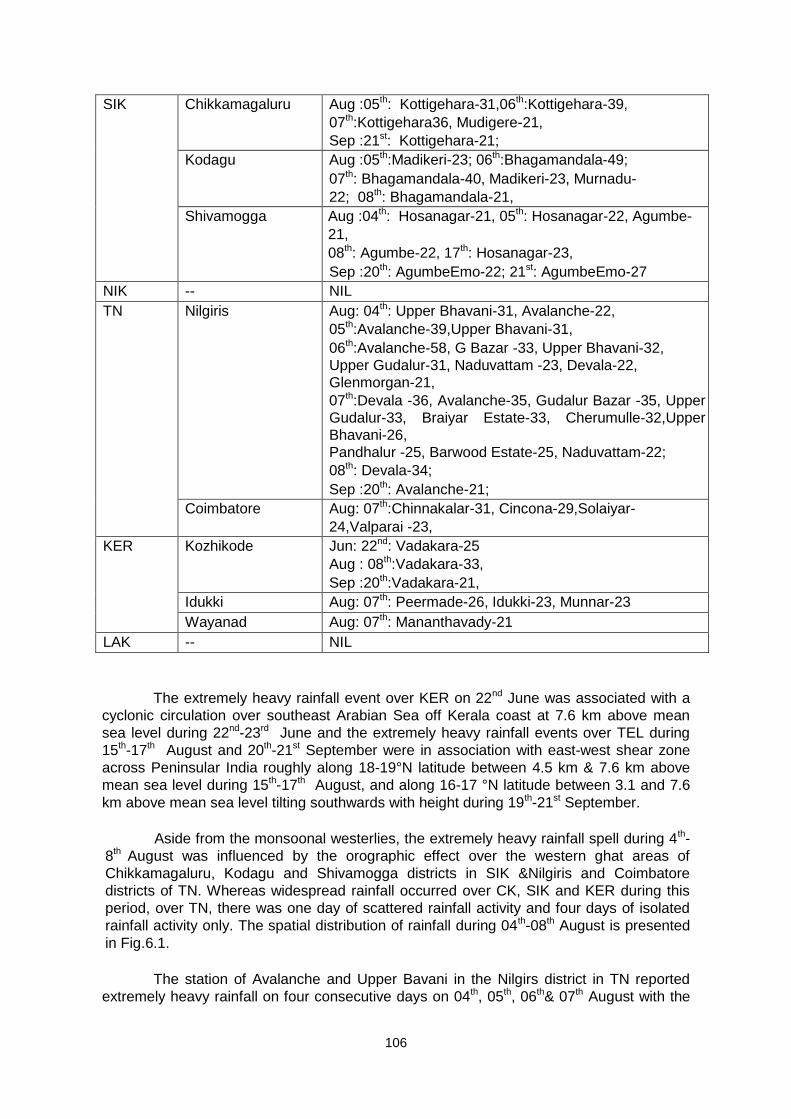
106
SIK Chikkamagaluru Aug :05th: Kottigehara-31,06th:Kottigehara-39,
07th:Kottigehara36, Mudigere-21,
Sep :21st: Kottigehara-21;
Kodagu Aug :05th:Madikeri-23; 06th:Bhagamandala-49;
07th: Bhagamandala-40, Madikeri-23, Murnadu-
22; 08th: Bhagamandala-21,
Shivamogga Aug :04th: Hosanagar-21, 05th: Hosanagar-22, Agumbe-
21,
08th: Agumbe-22, 17th: Hosanagar-23,
Sep :20th: AgumbeEmo-22; 21st: AgumbeEmo-27
NIK -- NIL
TN Nilgiris Aug: 04th: Upper Bhavani-31, Avalanche-22,
05th:Avalanche-39,Upper Bhavani-31,
06th:Avalanche-58, G Bazar -33, Upper Bhavani-32,
Upper Gudalur-31, Naduvattam -23, Devala-22,
Glenmorgan-21,
07th:Devala -36, Avalanche-35, Gudalur Bazar -35, Upper
Gudalur-33, Braiyar Estate-33, Cherumulle-32,Upper
Bhavani-26,
Pandhalur -25, Barwood Estate-25, Naduvattam-22;
08th: Devala-34;
Sep :20th: Avalanche-21;
Coimbatore Aug: 07th:Chinnakalar-31, Cincona-29,Solaiyar-
24,Valparai -23,
KER Kozhikode Jun: 22nd: Vadakara-25
Aug : 08th:Vadakara-33,
Sep :20th:Vadakara-21,
Idukki Aug: 07th: Peermade-26, Idukki-23, Munnar-23
Wayanad Aug: 07th: Mananthavady-21
LAK -- NIL
The extremely heavy rainfall event over KER on 22nd June was associated with a
cyclonic circulation over southeast Arabian Sea off Kerala coast at 7.6 km above mean
sea level during 22nd-23rd June and the extremely heavy rainfall events over TEL during
15th-17th August and 20th-21st September were in association with east-west shear zone
across Peninsular India roughly along 18-19°N latitude between 4.5 km & 7.6 km above
mean sea level during 15th-17th August, and along 16-17 °N latitude between 3.1 and 7.6
km above mean sea level tilting southwards with height during 19th-21st September.
Aside from the monsoonal westerlies, the extremely heavy rainfall spell during 4th-
8th August was influenced by the orographic effect over the western ghat areas of
Chikkamagaluru, Kodagu and Shivamogga districts in SIK &Nilgiris and Coimbatore
districts of TN. Whereas widespread rainfall occurred over CK, SIK and KER during this
period, over TN, there was one day of scattered rainfall activity and four days of isolated
rainfall activity only. The spatial distribution of rainfall during 04th-08th August is presented
in Fig.6.1.
The station of Avalanche and Upper Bavani in the Nilgirs district in TN reported
extremely heavy rainfall on four consecutive days on 04th, 05th, 06th& 07th August with the
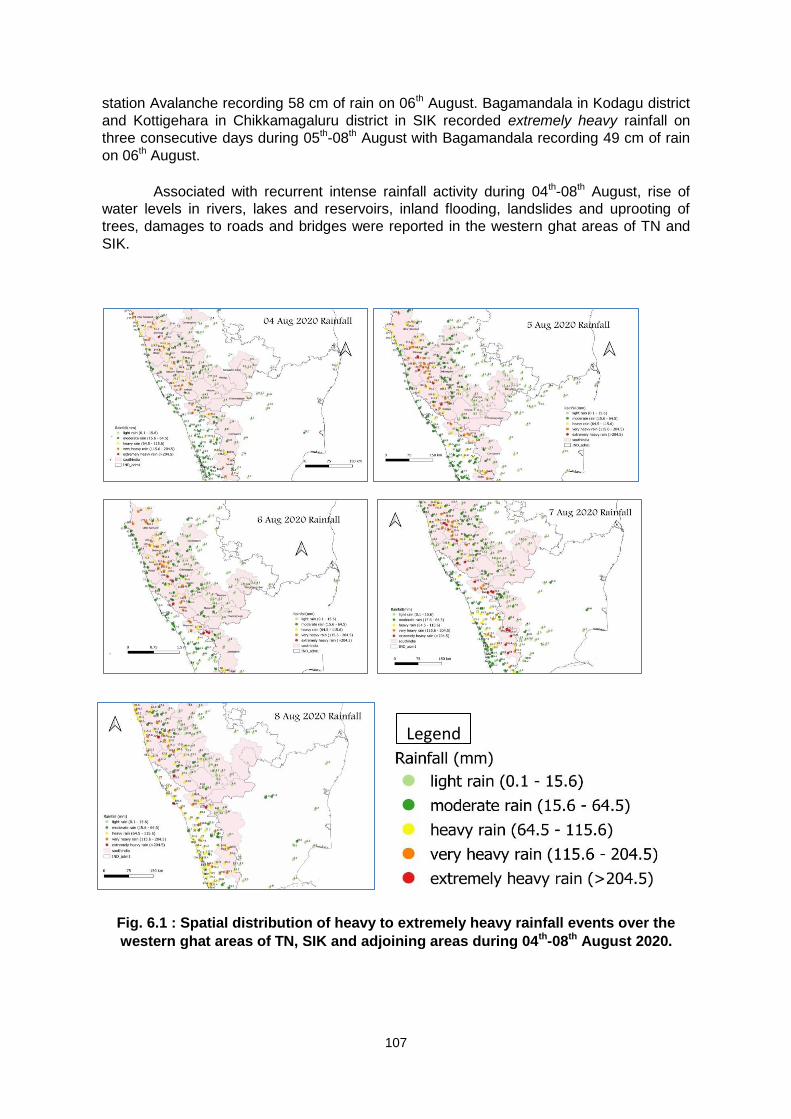
107
station Avalanche recording 58 cm of rain on 06th August. Bagamandala in Kodagu district
and Kottigehara in Chikkamagaluru district in SIK recorded extremely heavy rainfall on
three consecutive days during 05th-08th August with Bagamandala recording 49 cm of rain
on 06th August.
Associated with recurrent intense rainfall activity during 04th-08th August, rise of
water levels in rivers, lakes and reservoirs, inland flooding, landslides and uprooting of
trees, damages to roads and bridges were reported in the western ghat areas of TN and
SIK.
Fig. 6.1 : Spatial distribution of heavy to extremely heavy rainfall events over the
western ghat areas of TN, SIK and adjoining areas during 04th-08th August 2020.
Legend
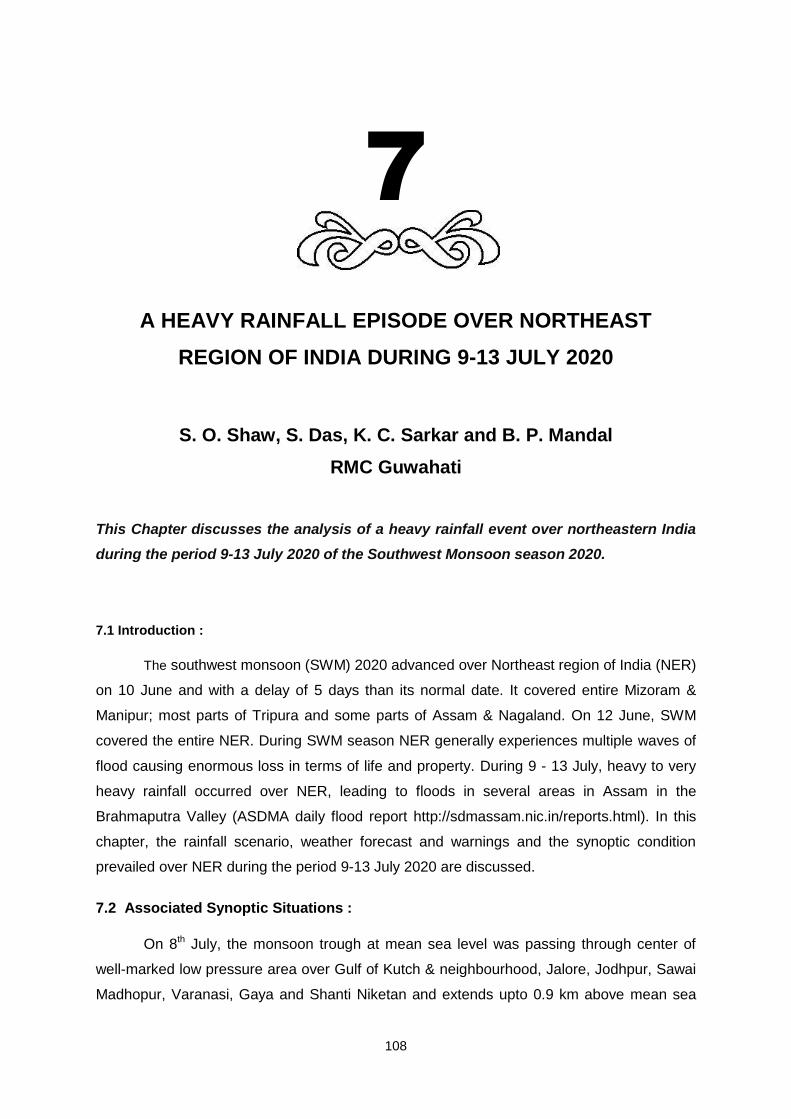
108
7
A HEAVY RAINFALL EPISODE OVER NORTHEAST
REGION OF INDIA DURING 9-13 JULY 2020
S. O. Shaw, S. Das, K. C. Sarkar and B. P. Mandal
RMC Guwahati
This Chapter discusses the analysis of a heavy rainfall event over northeastern India
during the period 9-13 July 2020 of the Southwest Monsoon season 2020.
7.1 Introduction :
The southwest monsoon (SWM) 2020 advanced over Northeast region of India (NER)
on 10 June and with a delay of 5 days than its normal date. It covered entire Mizoram &
Manipur; most parts of Tripura and some parts of Assam & Nagaland. On 12 June, SWM
covered the entire NER. During SWM season NER generally experiences multiple waves of
flood causing enormous loss in terms of life and property. During 9 - 13 July, heavy to very
heavy rainfall occurred over NER, leading to floods in several areas in Assam in the
Brahmaputra Valley (ASDMA daily flood report http://sdmassam.nic.in/reports.html). In this
chapter, the rainfall scenario, weather forecast and warnings and the synoptic condition
prevailed over NER during the period 9-13 July 2020 are discussed.
7.2 Associated Synoptic Situations :
On 8th July, the monsoon trough at mean sea level was passing through center of
well-marked low pressure area over Gulf of Kutch & neighbourhood, Jalore, Jodhpur, Sawai
Madhopur, Varanasi, Gaya and Shanti Niketan and extends upto 0.9 km above mean sea

109
level. On 9th, the eastern end shifted towards the foot hills of Himalayas and at mean sea
level it was passing through Amritsar, Karnal, Bareilly, Ballia, Patna, Bhagalpur and its
eastern part runs close to the foothills of the Himalayas. On 10th, the entire monsoon trough
at msl shifted close to foothills of the Himalayas and the eastern end remained close to the
foot hills of Himalayas upto 12th, however the western end shifted towards the south on 12th
and on 13th the entire monsoon trough shifted towards the south. During the period cyclonic
circulations at the lower levels of the troposphere were also seen in the proximity of NER.
Moisture convergence was also taking place over NER from Bay of Bengal in the lower
trophospheric levels due to strong South-westerly winds. The presence of monsoon trough
over NER and the strong moisture convergence resulted in enhanced rainfall activity over
NER during the period. Moisture flux and winds at lower levels are presented in Fig.7.1 and
Fig. 7.2 respectively.
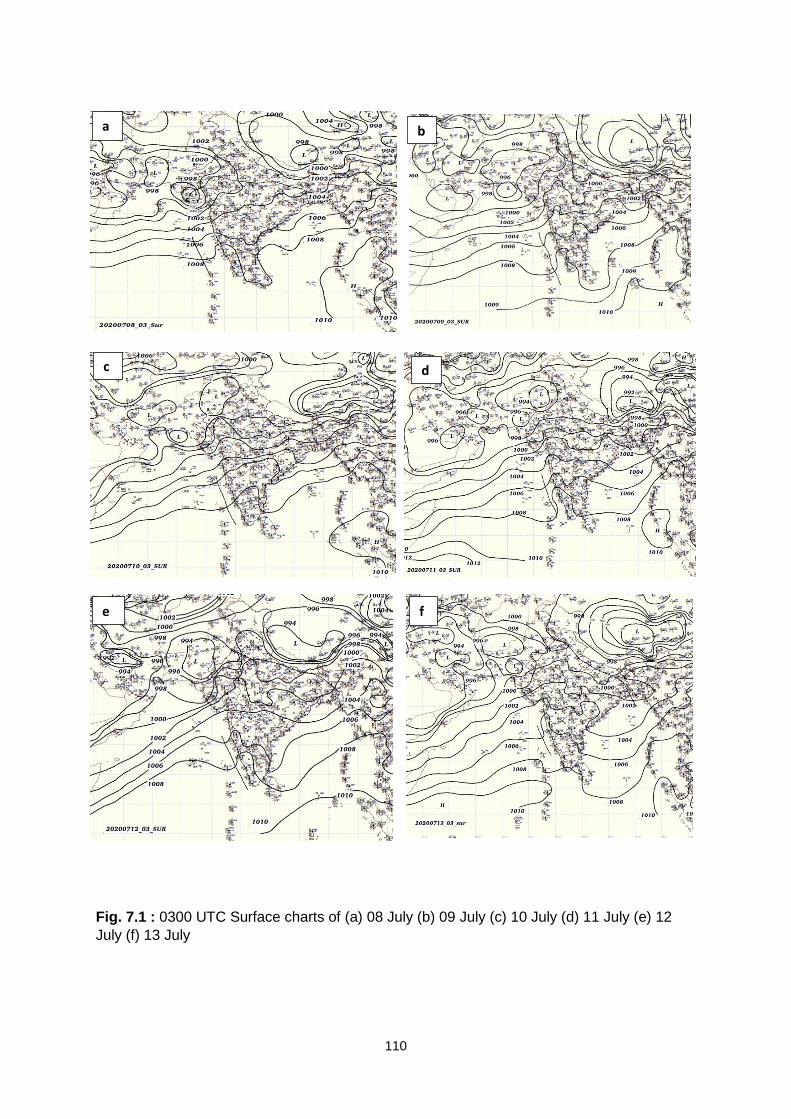
110
Fig. 7.1 : 0300 UTC Surface charts of (a) 08 July (b) 09 July (c) 10 July (d) 11 July (e) 12
July (f) 13 July
a b
c
e
d
f
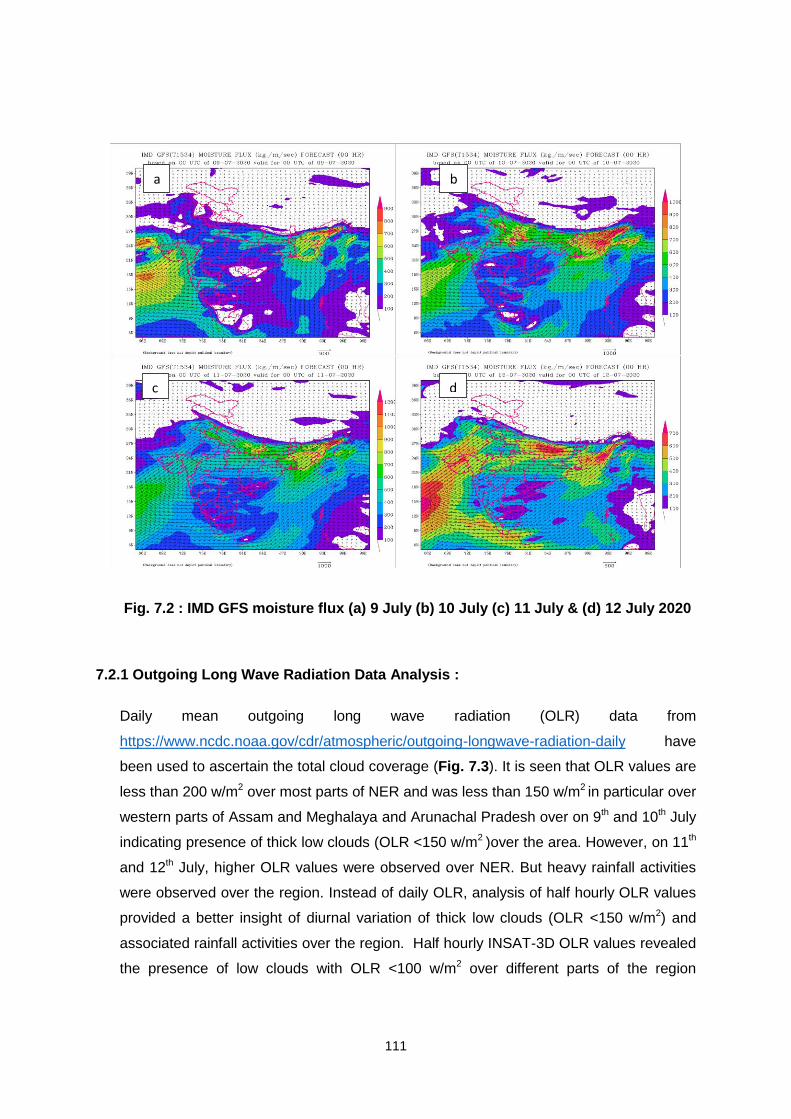
111
Fig. 7.2 : IMD GFS moisture flux (a) 9 July (b) 10 July (c) 11 July & (d) 12 July 2020
7.2.1 Outgoing Long Wave Radiation Data Analysis :
Daily mean outgoing long wave radiation (OLR) data from
https://www.ncdc.noaa.gov/cdr/atmospheric/outgoing-longwave-radiation-daily have
been used to ascertain the total cloud coverage (Fig. 7.3). It is seen that OLR values are
less than 200 w/m2 over most parts of NER and was less than 150 w/m2 in particular over
western parts of Assam and Meghalaya and Arunachal Pradesh over on 9th and 10th July
indicating presence of thick low clouds (OLR <150 w/m2 )over the area. However, on 11th
and 12th July, higher OLR values were observed over NER. But heavy rainfall activities
were observed over the region. Instead of daily OLR, analysis of half hourly OLR values
provided a better insight of diurnal variation of thick low clouds (OLR <150 w/m2) and
associated rainfall activities over the region. Half hourly INSAT-3D OLR values revealed
the presence of low clouds with OLR <100 w/m2 over different parts of the region
a b
c d
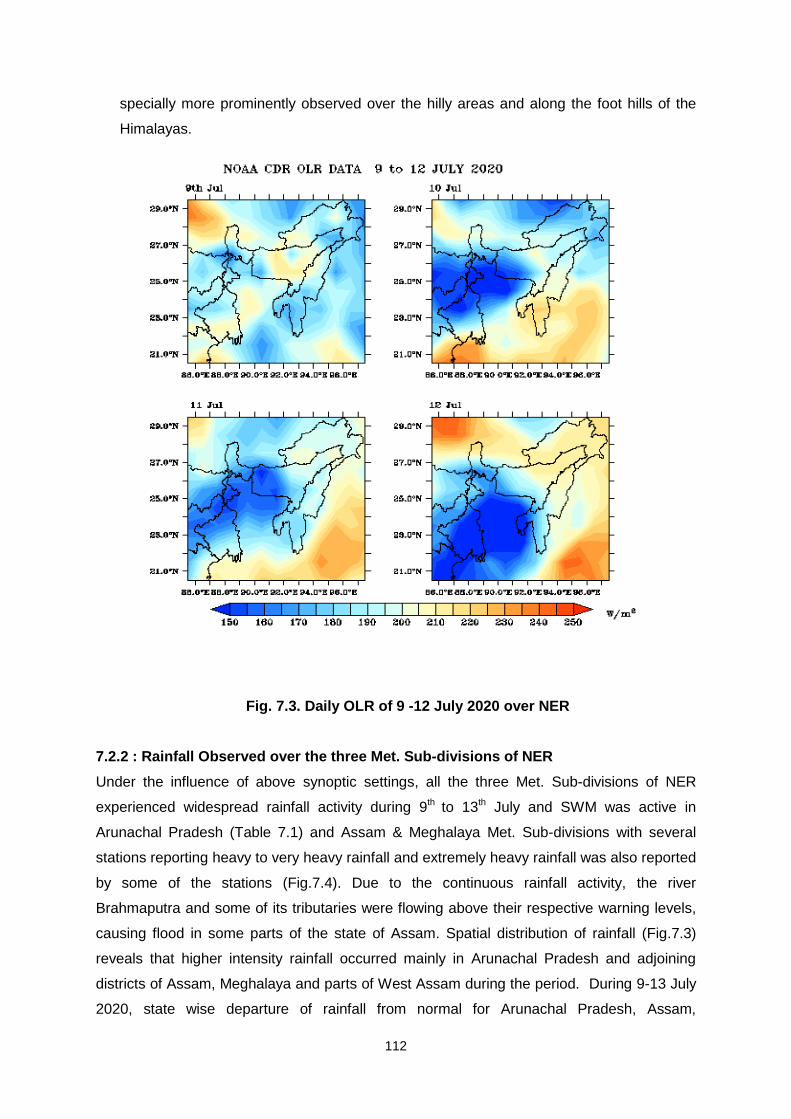
112
specially more prominently observed over the hilly areas and along the foot hills of the
Himalayas.
Fig. 7.3. Daily OLR of 9 -12 July 2020 over NER
7.2.2 : Rainfall Observed over the three Met. Sub-divisions of NER
Under the influence of above synoptic settings, all the three Met. Sub-divisions of NER
experienced widespread rainfall activity during 9th to 13th July and SWM was active in
Arunachal Pradesh (Table 7.1) and Assam & Meghalaya Met. Sub-divisions with several
stations reporting heavy to very heavy rainfall and extremely heavy rainfall was also reported
by some of the stations (Fig.7.4). Due to the continuous rainfall activity, the river
Brahmaputra and some of its tributaries were flowing above their respective warning levels,
causing flood in some parts of the state of Assam. Spatial distribution of rainfall (Fig.7.3)
reveals that higher intensity rainfall occurred mainly in Arunachal Pradesh and adjoining
districts of Assam, Meghalaya and parts of West Assam during the period. During 9-13 July
2020, state wise departure of rainfall from normal for Arunachal Pradesh, Assam,
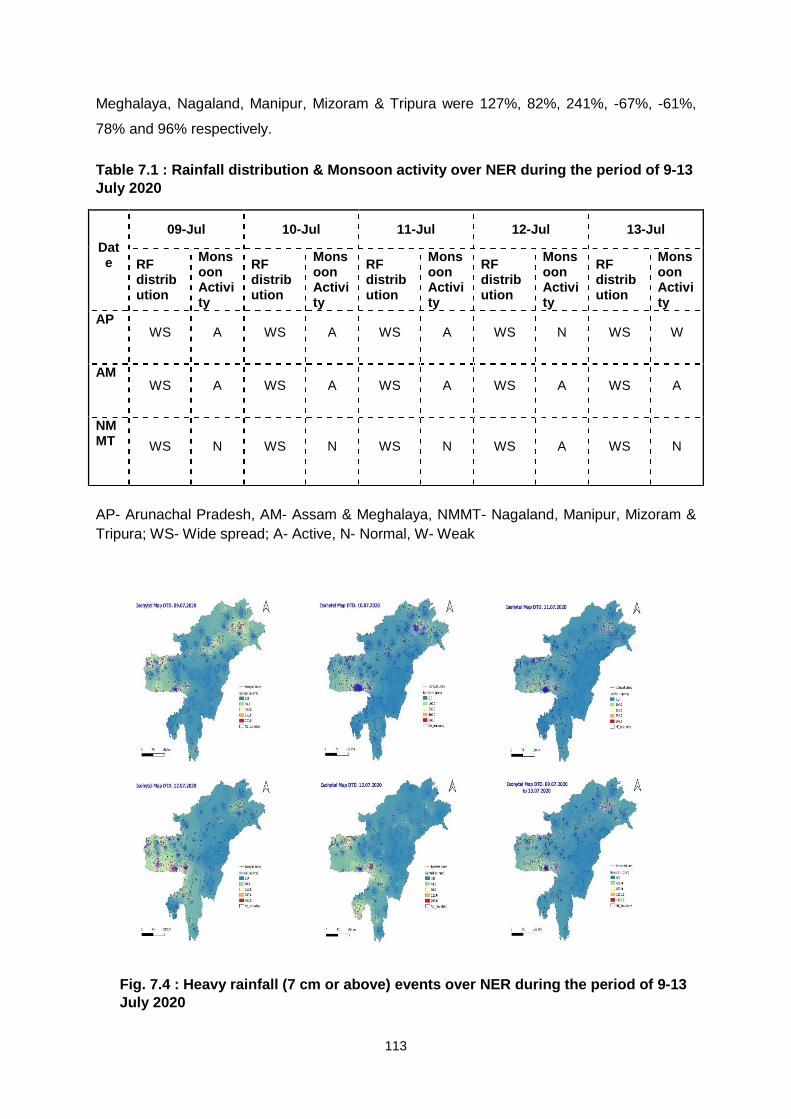
113
Meghalaya, Nagaland, Manipur, Mizoram & Tripura were 127%, 82%, 241%, -67%, -61%,
78% and 96% respectively.
Table 7.1 : Rainfall distribution & Monsoon activity over NER during the period of 9-13
July 2020
AP- Arunachal Pradesh, AM- Assam & Meghalaya, NMMT- Nagaland, Manipur, Mizoram &
Tripura; WS- Wide spread; A- Active, N- Normal, W- Weak
Fig 3: Datewise and cumulative Spatial distribution of rainfall during 9-13 July 2020
Fig. 7.4 : Heavy rainfall (7 cm or above) events over NER during the period of 9-13
July 2020
Date
09-Jul 10-Jul 11-Jul 12-Jul 13-Jul
RF distribution
Monsoon Activity
RF distribution
Monsoon Activity
RF distribution
Monsoon Activity
RF distribution
Monsoon Activity
RF distribution
Monsoon Activity
AP
WS A WS A WS A WS N WS W
AM
WS A WS A WS A WS A WS A
NMMT
WS N WS N WS N WS A WS N
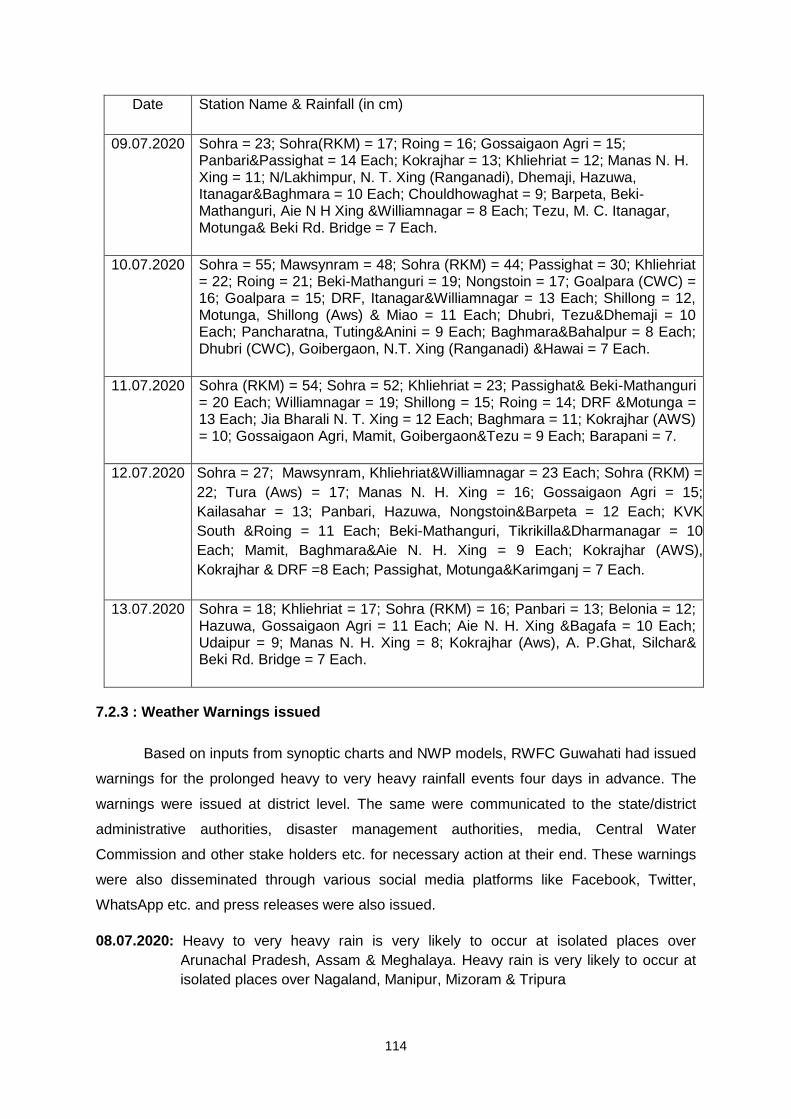
114
Date Station Name & Rainfall (in cm)
09.07.2020 Sohra = 23; Sohra(RKM) = 17; Roing = 16; Gossaigaon Agri = 15; Panbari&Passighat = 14 Each; Kokrajhar = 13; Khliehriat = 12; Manas N. H. Xing = 11; N/Lakhimpur, N. T. Xing (Ranganadi), Dhemaji, Hazuwa, Itanagar&Baghmara = 10 Each; Chouldhowaghat = 9; Barpeta, Beki-Mathanguri, Aie N H Xing &Williamnagar = 8 Each; Tezu, M. C. Itanagar, Motunga& Beki Rd. Bridge = 7 Each.
10.07.2020 Sohra = 55; Mawsynram = 48; Sohra (RKM) = 44; Passighat = 30; Khliehriat = 22; Roing = 21; Beki-Mathanguri = 19; Nongstoin = 17; Goalpara (CWC) = 16; Goalpara = 15; DRF, Itanagar&Williamnagar = 13 Each; Shillong = 12, Motunga, Shillong (Aws) & Miao = 11 Each; Dhubri, Tezu&Dhemaji = 10 Each; Pancharatna, Tuting&Anini = 9 Each; Baghmara&Bahalpur = 8 Each; Dhubri (CWC), Goibergaon, N.T. Xing (Ranganadi) &Hawai = 7 Each.
11.07.2020 Sohra (RKM) = 54; Sohra = 52; Khliehriat = 23; Passighat& Beki-Mathanguri = 20 Each; Williamnagar = 19; Shillong = 15; Roing = 14; DRF &Motunga = 13 Each; Jia Bharali N. T. Xing = 12 Each; Baghmara = 11; Kokrajhar (AWS) = 10; Gossaigaon Agri, Mamit, Goibergaon&Tezu = 9 Each; Barapani = 7.
12.07.2020 Sohra = 27; Mawsynram, Khliehriat&Williamnagar = 23 Each; Sohra (RKM) =
22; Tura (Aws) = 17; Manas N. H. Xing = 16; Gossaigaon Agri = 15;
Kailasahar = 13; Panbari, Hazuwa, Nongstoin&Barpeta = 12 Each; KVK
South &Roing = 11 Each; Beki-Mathanguri, Tikrikilla&Dharmanagar = 10
Each; Mamit, Baghmara&Aie N. H. Xing = 9 Each; Kokrajhar (AWS),
Kokrajhar & DRF =8 Each; Passighat, Motunga&Karimganj = 7 Each.
13.07.2020 Sohra = 18; Khliehriat = 17; Sohra (RKM) = 16; Panbari = 13; Belonia = 12; Hazuwa, Gossaigaon Agri = 11 Each; Aie N. H. Xing &Bagafa = 10 Each; Udaipur = 9; Manas N. H. Xing = 8; Kokrajhar (Aws), A. P.Ghat, Silchar& Beki Rd. Bridge = 7 Each.
7.2.3 : Weather Warnings issued
Based on inputs from synoptic charts and NWP models, RWFC Guwahati had issued
warnings for the prolonged heavy to very heavy rainfall events four days in advance. The
warnings were issued at district level. The same were communicated to the state/district
administrative authorities, disaster management authorities, media, Central Water
Commission and other stake holders etc. for necessary action at their end. These warnings
were also disseminated through various social media platforms like Facebook, Twitter,
WhatsApp etc. and press releases were also issued.
08.07.2020: Heavy to very heavy rain is very likely to occur at isolated places over
Arunachal Pradesh, Assam & Meghalaya. Heavy rain is very likely to occur at
isolated places over Nagaland, Manipur, Mizoram & Tripura
115
09.07.2020: Heavy to very heavy rain with isolated extremely falls is very likely to occur at isolated places over Arunachal Pradesh, Assam & Meghalaya. Heavy rain is very likely to occur at isolated places over Nagaland, Manipur, Mizoram & Tripura.
10.07.2020: Heavy to very heavy rain with isolated extremely falls is very likely to occur at
isolated places over Arunachal Pradesh, Assam & Meghalaya. Heavy to very
heavy rain is very likely to occur at isolated places over Nagaland, Manipur,
Mizoram & Tripura.
11.07.2020: Heavy to very heavy rain with isolated extremely falls is very likely to occur at
isolated places over Arunachal Pradesh, Assam & Meghalaya. Heavy to very
heavy rain is very likely to occur at isolated places over Nagaland, Manipur,
Mizoram & Tripura.
12.07.2020: Heavy to very heavy rain with isolated extremely falls is very likely to occur at
isolated places over Assam & Meghalaya. Heavy to very heavy rain is very
likely to occur at isolated places over Arunachal Pradesh. Heavy rain is very
likely to occur at isolated places over Nagaland, Manipur, Mizoram & Tripura.
13.07.2020: Heavy to very heavy rain is very likely to occur at isolated places over Assam,
Meghalaya, Nagaland, Manipur, Mizoram & Tripura. Heavy rain is very likely to
occur at isolated places over Arunachal Pradesh
7.2.4 : Skill of Quantitative Precipitation Forecast issued
Quantitative Precipitation Forecasts (QPF) were issued for five rainfall categories viz.
0 (No rainfall), 0.1-10 mm, 11-25 mm, 26-50 mm, 51-100 mm and >100 mm for 20 river sub-
catchments of river Brahmaputra and Barak and their tributaries. The PC of ‘0’ rainfall
category was 100% in all the three days, whereas in 0.1-10 mm whereas QPF of the higher
category viz. 51-100 mm and >100 mm was more than 85% irrespective of the day. The
consolidated report on the skill of QPF issued for various river sub-catchments of River
Brahmaputra and Barak is presented in Table 3.
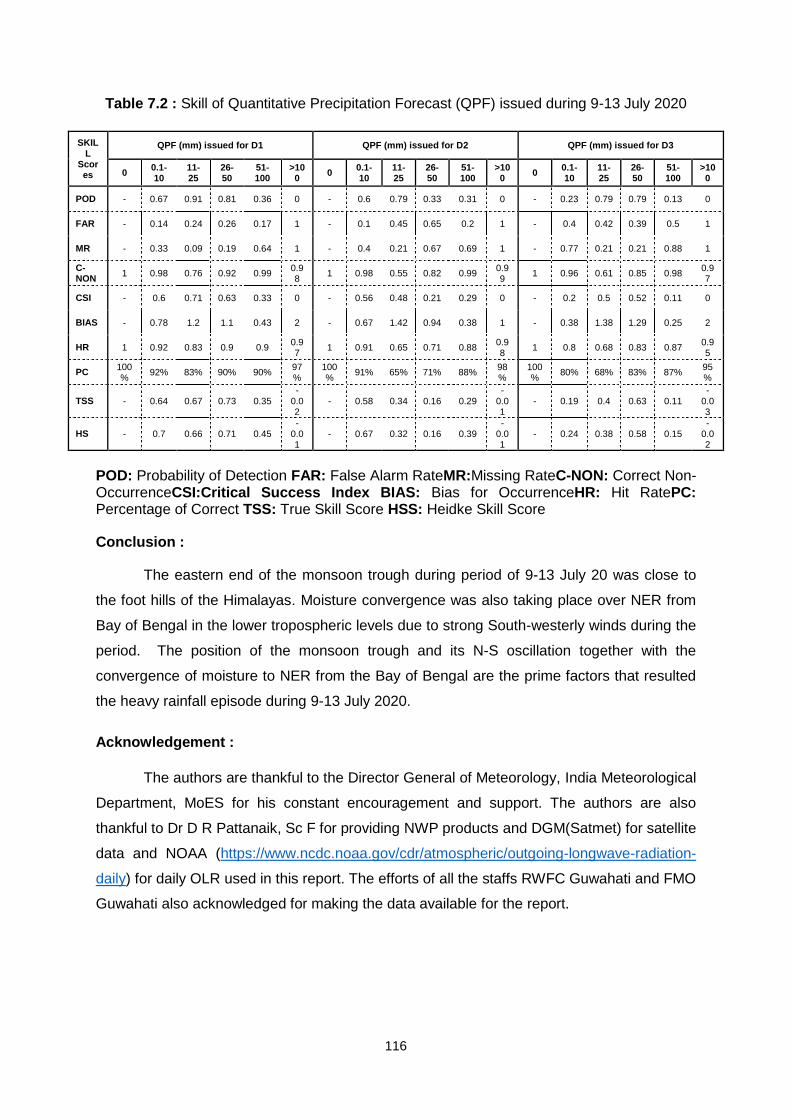
116
Table 7.2 : Skill of Quantitative Precipitation Forecast (QPF) issued during 9-13 July 2020
SKILL
Scores
QPF (mm) issued for D1 QPF (mm) issued for D2 QPF (mm) issued for D3
0 0.1-10
11-25
26-50
51-100
>100
0 0.1-10
11-25
26-50
51-100
>100
0 0.1-10
11-25
26-50
51-100
>100
POD - 0.67 0.91 0.81 0.36 0 - 0.6 0.79 0.33 0.31 0 - 0.23 0.79 0.79 0.13 0
FAR - 0.14 0.24 0.26 0.17 1 - 0.1 0.45 0.65 0.2 1 - 0.4 0.42 0.39 0.5 1
MR - 0.33 0.09 0.19 0.64 1 - 0.4 0.21 0.67 0.69 1 - 0.77 0.21 0.21 0.88 1
C-NON
1 0.98 0.76 0.92 0.99 0.98
1 0.98 0.55 0.82 0.99 0.99
1 0.96 0.61 0.85 0.98 0.97
CSI - 0.6 0.71 0.63 0.33 0 - 0.56 0.48 0.21 0.29 0 - 0.2 0.5 0.52 0.11 0
BIAS - 0.78 1.2 1.1 0.43 2 - 0.67 1.42 0.94 0.38 1 - 0.38 1.38 1.29 0.25 2
HR 1 0.92 0.83 0.9 0.9 0.97
1 0.91 0.65 0.71 0.88 0.98
1 0.8 0.68 0.83 0.87 0.95
PC 100%
92% 83% 90% 90% 97%
100%
91% 65% 71% 88% 98%
100%
80% 68% 83% 87% 95%
TSS - 0.64 0.67 0.73 0.35 -
0.02
- 0.58 0.34 0.16 0.29 -
0.01
- 0.19 0.4 0.63 0.11 -
0.03
HS - 0.7 0.66 0.71 0.45 -
0.01
- 0.67 0.32 0.16 0.39 -
0.01
- 0.24 0.38 0.58 0.15 -
0.02
POD: Probability of Detection FAR: False Alarm RateMR:Missing RateC-NON: Correct Non-OccurrenceCSI:Critical Success Index BIAS: Bias for OccurrenceHR: Hit RatePC: Percentage of Correct TSS: True Skill Score HSS: Heidke Skill Score
Conclusion :
The eastern end of the monsoon trough during period of 9-13 July 20 was close to
the foot hills of the Himalayas. Moisture convergence was also taking place over NER from
Bay of Bengal in the lower tropospheric levels due to strong South-westerly winds during the
period. The position of the monsoon trough and its N-S oscillation together with the
convergence of moisture to NER from the Bay of Bengal are the prime factors that resulted
the heavy rainfall episode during 9-13 July 2020.
Acknowledgement :
The authors are thankful to the Director General of Meteorology, India Meteorological
Department, MoES for his constant encouragement and support. The authors are also
thankful to Dr D R Pattanaik, Sc F for providing NWP products and DGM(Satmet) for satellite
data and NOAA (https://www.ncdc.noaa.gov/cdr/atmospheric/outgoing-longwave-radiation-
daily) for daily OLR used in this report. The efforts of all the staffs RWFC Guwahati and FMO
Guwahati also acknowledged for making the data available for the report.
117
8
PERFORMANCE OF SOUTH WEST MONSOON-2020 OVER UTTAR PRADESH & RAJASTHAN
J. P. Gupta, M. Danish, R.S. Sharma, Himanshu Sharma &
Roop Narayan Kumawat RMC Delhi
In this Chapter, the performance of South West Monsoon 2020 over Uttar Pradesh state is discussed in details along with suitable case studies. The extreme events associated with heavy to very heavy rainfall in the state have also been highlighted. A case study of an extremely heavy rainfall event on 14th August, 2020 leading to flood situations in Jaipur, is also presented in this Chapter. 8.1 : Introduction
During Southwest Monsoon (June-September), Uttar Pradesh state received 83% rainfall of its long period average (LPA). Monthly rainfall over the state as a whole was 148% of LPA in June, 87% of LPA in July, 75% of LPA in August, and 50% of LPA in September. Only in June month above normal rainfall was received.
Total four case studies of heavy to very heavy rainfall have been taken during south-west monsoon season. In that it was found that mostly rainfall occurred during onset of monsoon, Easterly-westerly wind interactions and Low Pressure system formation over Bay of Bengal.
In this monsoon season only 1 Low Pressure system formed against an average of 6 Depressions & 8 low pressure areas. This is the most probable reason for deficient rainfall during the south-west monsoon over the state. Case1: Trough & Cyclonic circulation over East U.P. during 15th – 21th June: During this period a trough ran from northwest Rajasthan to Gangetic West Bengal across East Rajasthan, north Madhya Pradesh and Jharkhand and extended upto 0.9 km above mean sea level on 15thJune (Fig.1); it ran from northwest Rajasthan to the cyclonic circulation over East Uttar Pradesh across south Haryana and West Uttar Pradesh and extended upto 0.9 km above mean sea level on 16th June; it ran from central Pakistan to Bangladesh across north Rajasthan, south Uttar Pradesh, Jharkhand and Gangetic West Bengal and extends upto 0.9 km above mean sea level on 17th June and became less marked on 18th June.
Southwest Monsoon advanced into some parts of north Arabian Sea, Gujarat state, entire Diu, some more parts of Madhya Pradesh, remaining parts of Chhattisgarh, Jharkhand
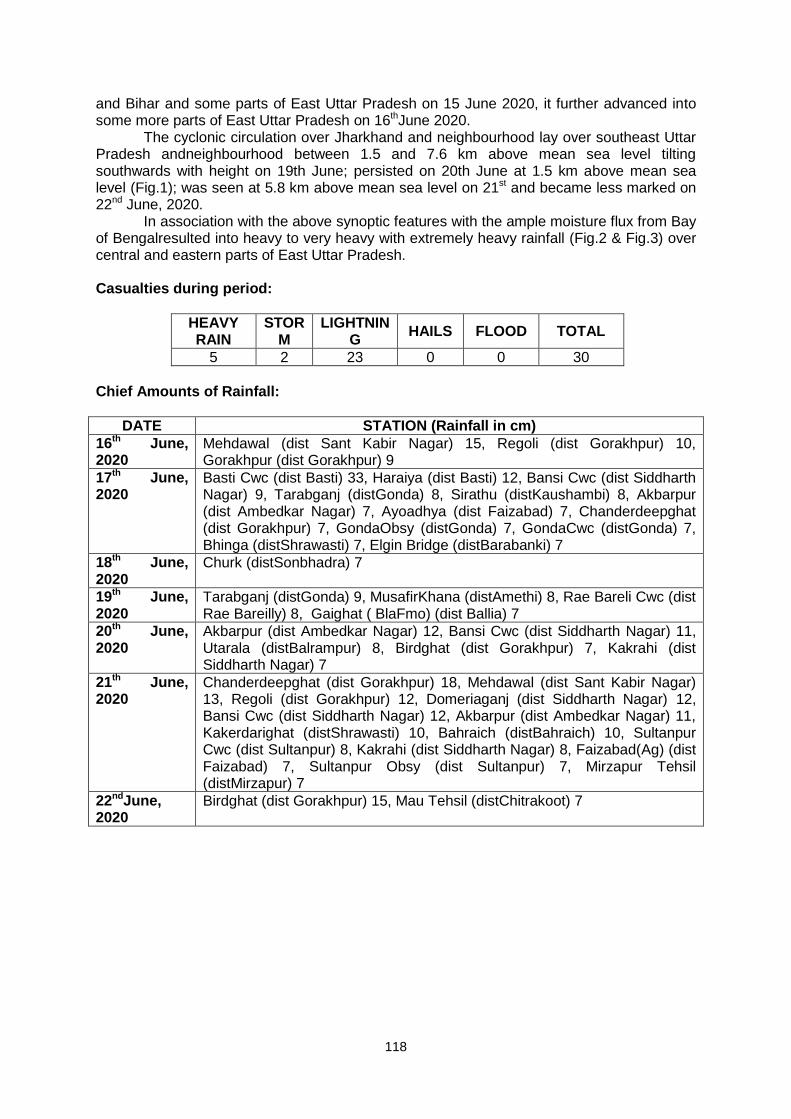
118
and Bihar and some parts of East Uttar Pradesh on 15 June 2020, it further advanced into some more parts of East Uttar Pradesh on 16thJune 2020.
The cyclonic circulation over Jharkhand and neighbourhood lay over southeast Uttar Pradesh andneighbourhood between 1.5 and 7.6 km above mean sea level tilting southwards with height on 19th June; persisted on 20th June at 1.5 km above mean sea level (Fig.1); was seen at 5.8 km above mean sea level on 21st and became less marked on 22nd June, 2020.
In association with the above synoptic features with the ample moisture flux from Bay of Bengalresulted into heavy to very heavy with extremely heavy rainfall (Fig.2 & Fig.3) over central and eastern parts of East Uttar Pradesh.
Casualties during period:
HEAVY RAIN
STORM
LIGHTNING
HAILS FLOOD TOTAL
5 2 23 0 0 30
Chief Amounts of Rainfall:
DATE STATION (Rainfall in cm)
16th June, 2020
Mehdawal (dist Sant Kabir Nagar) 15, Regoli (dist Gorakhpur) 10, Gorakhpur (dist Gorakhpur) 9
17th June, 2020
Basti Cwc (dist Basti) 33, Haraiya (dist Basti) 12, Bansi Cwc (dist Siddharth Nagar) 9, Tarabganj (distGonda) 8, Sirathu (distKaushambi) 8, Akbarpur (dist Ambedkar Nagar) 7, Ayoadhya (dist Faizabad) 7, Chanderdeepghat (dist Gorakhpur) 7, GondaObsy (distGonda) 7, GondaCwc (distGonda) 7, Bhinga (distShrawasti) 7, Elgin Bridge (distBarabanki) 7
18th June, 2020
Churk (distSonbhadra) 7
19th June, 2020
Tarabganj (distGonda) 9, MusafirKhana (distAmethi) 8, Rae Bareli Cwc (dist Rae Bareilly) 8, Gaighat ( BlaFmo) (dist Ballia) 7
20th June, 2020
Akbarpur (dist Ambedkar Nagar) 12, Bansi Cwc (dist Siddharth Nagar) 11, Utarala (distBalrampur) 8, Birdghat (dist Gorakhpur) 7, Kakrahi (dist Siddharth Nagar) 7
21th June, 2020
Chanderdeepghat (dist Gorakhpur) 18, Mehdawal (dist Sant Kabir Nagar) 13, Regoli (dist Gorakhpur) 12, Domeriaganj (dist Siddharth Nagar) 12, Bansi Cwc (dist Siddharth Nagar) 12, Akbarpur (dist Ambedkar Nagar) 11, Kakerdarighat (distShrawasti) 10, Bahraich (distBahraich) 10, Sultanpur Cwc (dist Sultanpur) 8, Kakrahi (dist Siddharth Nagar) 8, Faizabad(Ag) (dist Faizabad) 7, Sultanpur Obsy (dist Sultanpur) 7, Mirzapur Tehsil (distMirzapur) 7
22ndJune, 2020
Birdghat (dist Gorakhpur) 15, Mau Tehsil (distChitrakoot) 7
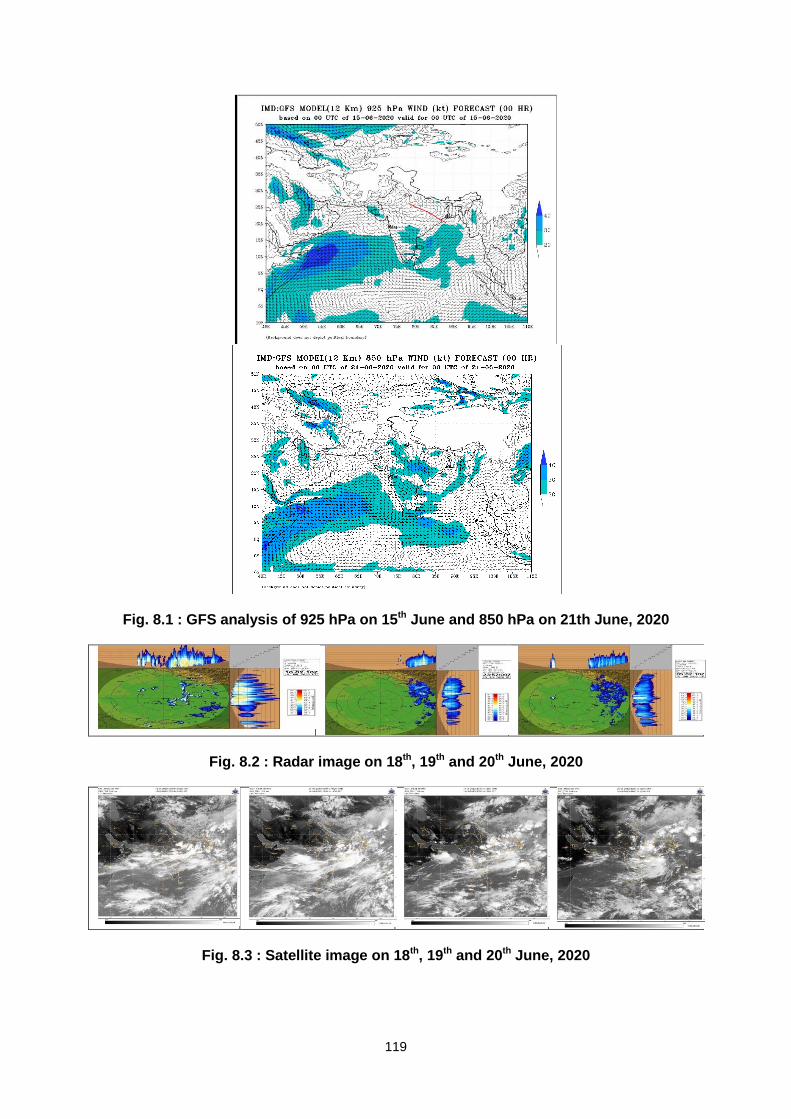
119
Fig. 8.1 : GFS analysis of 925 hPa on 15th June and 850 hPa on 21th June, 2020
Fig. 8.2 : Radar image on 18th, 19th and 20th June, 2020
Fig. 8.3 : Satellite image on 18th, 19th and 20th June, 2020
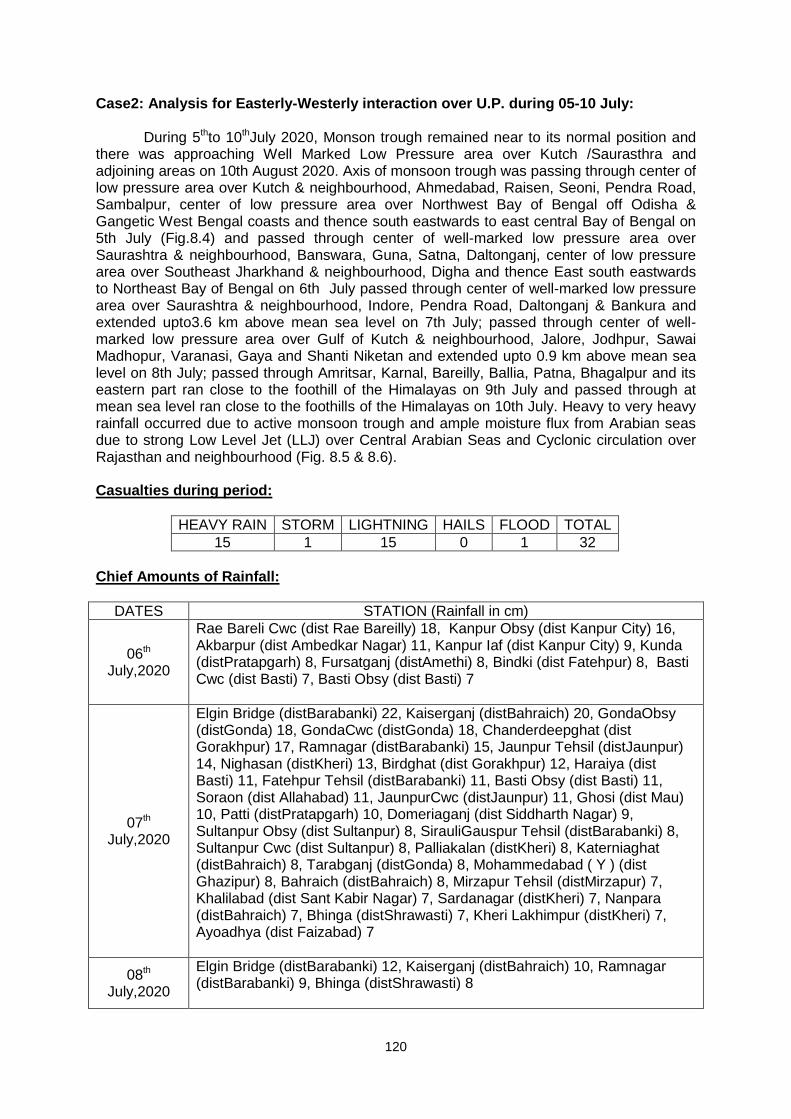
120
Case2: Analysis for Easterly-Westerly interaction over U.P. during 05-10 July:
During 5thto 10thJuly 2020, Monson trough remained near to its normal position and there was approaching Well Marked Low Pressure area over Kutch /Saurasthra and adjoining areas on 10th August 2020. Axis of monsoon trough was passing through center of low pressure area over Kutch & neighbourhood, Ahmedabad, Raisen, Seoni, Pendra Road, Sambalpur, center of low pressure area over Northwest Bay of Bengal off Odisha & Gangetic West Bengal coasts and thence south eastwards to east central Bay of Bengal on 5th July (Fig.8.4) and passed through center of well-marked low pressure area over Saurashtra & neighbourhood, Banswara, Guna, Satna, Daltonganj, center of low pressure area over Southeast Jharkhand & neighbourhood, Digha and thence East south eastwards to Northeast Bay of Bengal on 6th July passed through center of well-marked low pressure area over Saurashtra & neighbourhood, Indore, Pendra Road, Daltonganj & Bankura and extended upto3.6 km above mean sea level on 7th July; passed through center of well-marked low pressure area over Gulf of Kutch & neighbourhood, Jalore, Jodhpur, Sawai Madhopur, Varanasi, Gaya and Shanti Niketan and extended upto 0.9 km above mean sea level on 8th July; passed through Amritsar, Karnal, Bareilly, Ballia, Patna, Bhagalpur and its eastern part ran close to the foothill of the Himalayas on 9th July and passed through at mean sea level ran close to the foothills of the Himalayas on 10th July. Heavy to very heavy rainfall occurred due to active monsoon trough and ample moisture flux from Arabian seas due to strong Low Level Jet (LLJ) over Central Arabian Seas and Cyclonic circulation over Rajasthan and neighbourhood (Fig. 8.5 & 8.6).
Casualties during period:
HEAVY RAIN STORM LIGHTNING HAILS FLOOD TOTAL
15 1 15 0 1 32
Chief Amounts of Rainfall:
DATES STATION (Rainfall in cm)
06th July,2020
Rae Bareli Cwc (dist Rae Bareilly) 18, Kanpur Obsy (dist Kanpur City) 16, Akbarpur (dist Ambedkar Nagar) 11, Kanpur Iaf (dist Kanpur City) 9, Kunda (distPratapgarh) 8, Fursatganj (distAmethi) 8, Bindki (dist Fatehpur) 8, Basti Cwc (dist Basti) 7, Basti Obsy (dist Basti) 7
07th July,2020
Elgin Bridge (distBarabanki) 22, Kaiserganj (distBahraich) 20, GondaObsy (distGonda) 18, GondaCwc (distGonda) 18, Chanderdeepghat (dist Gorakhpur) 17, Ramnagar (distBarabanki) 15, Jaunpur Tehsil (distJaunpur) 14, Nighasan (distKheri) 13, Birdghat (dist Gorakhpur) 12, Haraiya (dist Basti) 11, Fatehpur Tehsil (distBarabanki) 11, Basti Obsy (dist Basti) 11, Soraon (dist Allahabad) 11, JaunpurCwc (distJaunpur) 11, Ghosi (dist Mau) 10, Patti (distPratapgarh) 10, Domeriaganj (dist Siddharth Nagar) 9, Sultanpur Obsy (dist Sultanpur) 8, SirauliGauspur Tehsil (distBarabanki) 8, Sultanpur Cwc (dist Sultanpur) 8, Palliakalan (distKheri) 8, Katerniaghat (distBahraich) 8, Tarabganj (distGonda) 8, Mohammedabad ( Y ) (dist Ghazipur) 8, Bahraich (distBahraich) 8, Mirzapur Tehsil (distMirzapur) 7, Khalilabad (dist Sant Kabir Nagar) 7, Sardanagar (distKheri) 7, Nanpara (distBahraich) 7, Bhinga (distShrawasti) 7, Kheri Lakhimpur (distKheri) 7, Ayoadhya (dist Faizabad) 7
08th July,2020
Elgin Bridge (distBarabanki) 12, Kaiserganj (distBahraich) 10, Ramnagar (distBarabanki) 9, Bhinga (distShrawasti) 8
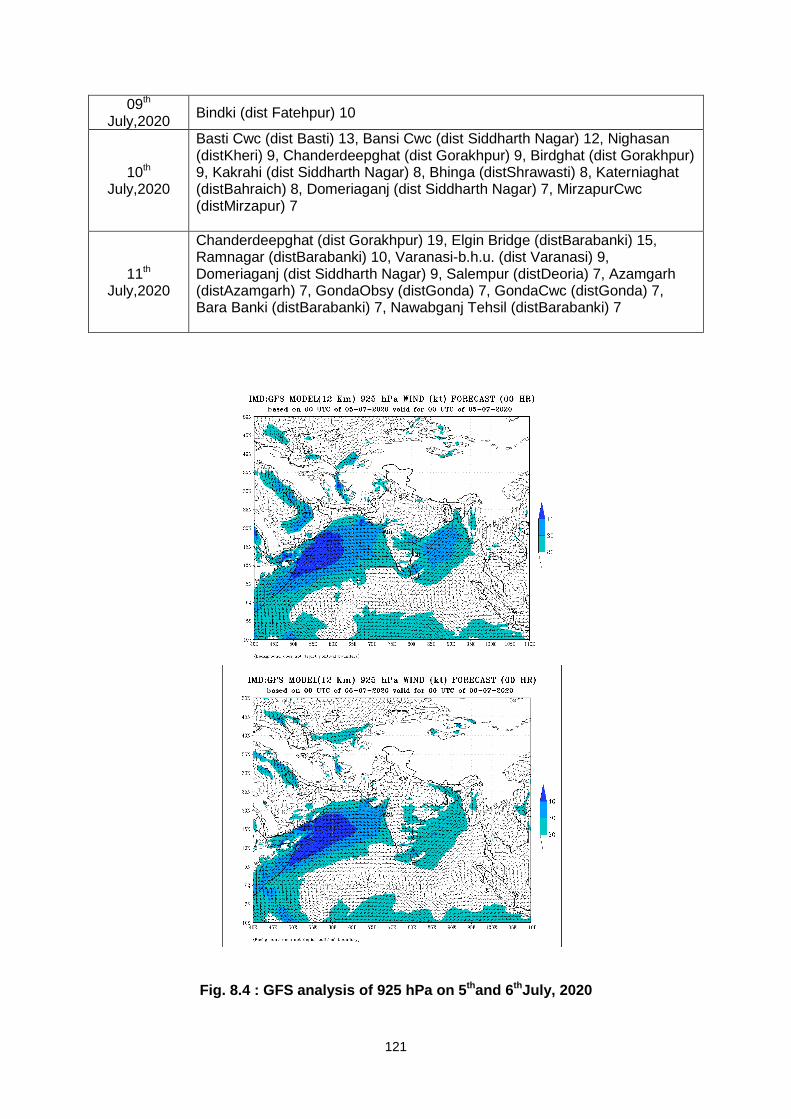
121
09th July,2020
Bindki (dist Fatehpur) 10
10th July,2020
Basti Cwc (dist Basti) 13, Bansi Cwc (dist Siddharth Nagar) 12, Nighasan (distKheri) 9, Chanderdeepghat (dist Gorakhpur) 9, Birdghat (dist Gorakhpur) 9, Kakrahi (dist Siddharth Nagar) 8, Bhinga (distShrawasti) 8, Katerniaghat (distBahraich) 8, Domeriaganj (dist Siddharth Nagar) 7, MirzapurCwc (distMirzapur) 7
11th July,2020
Chanderdeepghat (dist Gorakhpur) 19, Elgin Bridge (distBarabanki) 15, Ramnagar (distBarabanki) 10, Varanasi-b.h.u. (dist Varanasi) 9, Domeriaganj (dist Siddharth Nagar) 9, Salempur (distDeoria) 7, Azamgarh (distAzamgarh) 7, GondaObsy (distGonda) 7, GondaCwc (distGonda) 7, Bara Banki (distBarabanki) 7, Nawabganj Tehsil (distBarabanki) 7
Fig. 8.4 : GFS analysis of 925 hPa on 5thand 6thJuly, 2020
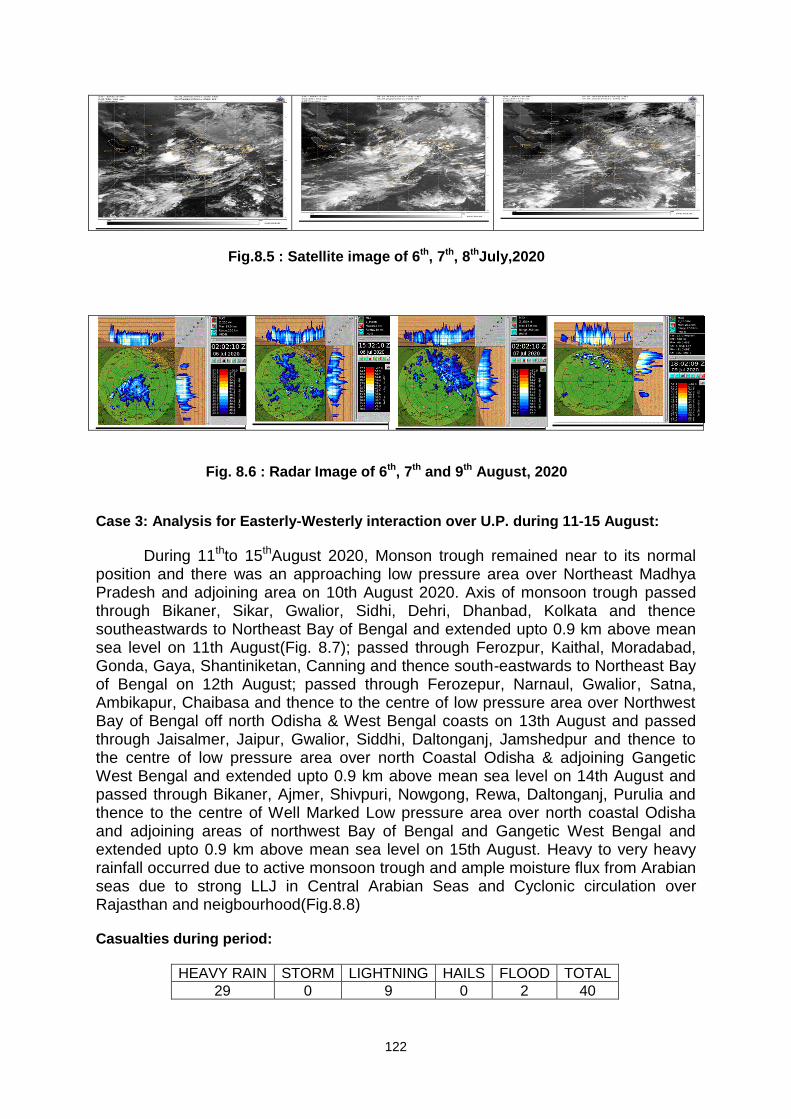
122
Fig.8.5 : Satellite image of 6th, 7th, 8thJuly,2020
Fig. 8.6 : Radar Image of 6th, 7th and 9th August, 2020
Case 3: Analysis for Easterly-Westerly interaction over U.P. during 11-15 August:
During 11thto 15thAugust 2020, Monson trough remained near to its normal position and there was an approaching low pressure area over Northeast Madhya Pradesh and adjoining area on 10th August 2020. Axis of monsoon trough passed through Bikaner, Sikar, Gwalior, Sidhi, Dehri, Dhanbad, Kolkata and thence southeastwards to Northeast Bay of Bengal and extended upto 0.9 km above mean sea level on 11th August(Fig. 8.7); passed through Ferozpur, Kaithal, Moradabad, Gonda, Gaya, Shantiniketan, Canning and thence south-eastwards to Northeast Bay of Bengal on 12th August; passed through Ferozepur, Narnaul, Gwalior, Satna, Ambikapur, Chaibasa and thence to the centre of low pressure area over Northwest Bay of Bengal off north Odisha & West Bengal coasts on 13th August and passed through Jaisalmer, Jaipur, Gwalior, Siddhi, Daltonganj, Jamshedpur and thence to the centre of low pressure area over north Coastal Odisha & adjoining Gangetic West Bengal and extended upto 0.9 km above mean sea level on 14th August and passed through Bikaner, Ajmer, Shivpuri, Nowgong, Rewa, Daltonganj, Purulia and thence to the centre of Well Marked Low pressure area over north coastal Odisha and adjoining areas of northwest Bay of Bengal and Gangetic West Bengal and extended upto 0.9 km above mean sea level on 15th August. Heavy to very heavy rainfall occurred due to active monsoon trough and ample moisture flux from Arabian seas due to strong LLJ in Central Arabian Seas and Cyclonic circulation over Rajasthan and neigbourhood(Fig.8.8)
Casualties during period:
HEAVY RAIN STORM LIGHTNING HAILS FLOOD TOTAL
29 0 9 0 2 40
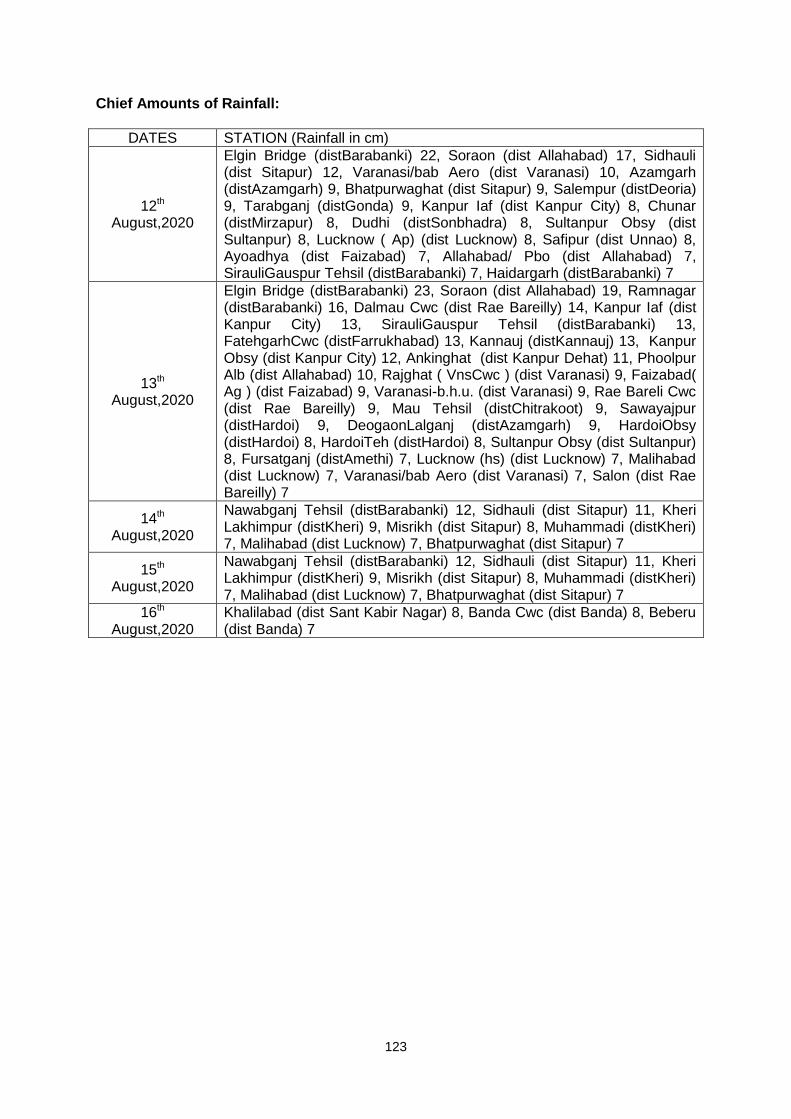
123
Chief Amounts of Rainfall:
DATES STATION (Rainfall in cm)
12th August,2020
Elgin Bridge (distBarabanki) 22, Soraon (dist Allahabad) 17, Sidhauli (dist Sitapur) 12, Varanasi/bab Aero (dist Varanasi) 10, Azamgarh (distAzamgarh) 9, Bhatpurwaghat (dist Sitapur) 9, Salempur (distDeoria) 9, Tarabganj (distGonda) 9, Kanpur Iaf (dist Kanpur City) 8, Chunar (distMirzapur) 8, Dudhi (distSonbhadra) 8, Sultanpur Obsy (dist Sultanpur) 8, Lucknow ( Ap) (dist Lucknow) 8, Safipur (dist Unnao) 8, Ayoadhya (dist Faizabad) 7, Allahabad/ Pbo (dist Allahabad) 7, SirauliGauspur Tehsil (distBarabanki) 7, Haidargarh (distBarabanki) 7
13th August,2020
Elgin Bridge (distBarabanki) 23, Soraon (dist Allahabad) 19, Ramnagar (distBarabanki) 16, Dalmau Cwc (dist Rae Bareilly) 14, Kanpur Iaf (dist Kanpur City) 13, SirauliGauspur Tehsil (distBarabanki) 13, FatehgarhCwc (distFarrukhabad) 13, Kannauj (distKannauj) 13, Kanpur Obsy (dist Kanpur City) 12, Ankinghat (dist Kanpur Dehat) 11, Phoolpur Alb (dist Allahabad) 10, Rajghat ( VnsCwc ) (dist Varanasi) 9, Faizabad( Ag ) (dist Faizabad) 9, Varanasi-b.h.u. (dist Varanasi) 9, Rae Bareli Cwc (dist Rae Bareilly) 9, Mau Tehsil (distChitrakoot) 9, Sawayajpur (distHardoi) 9, DeogaonLalganj (distAzamgarh) 9, HardoiObsy (distHardoi) 8, HardoiTeh (distHardoi) 8, Sultanpur Obsy (dist Sultanpur) 8, Fursatganj (distAmethi) 7, Lucknow (hs) (dist Lucknow) 7, Malihabad (dist Lucknow) 7, Varanasi/bab Aero (dist Varanasi) 7, Salon (dist Rae Bareilly) 7
14th August,2020
Nawabganj Tehsil (distBarabanki) 12, Sidhauli (dist Sitapur) 11, Kheri Lakhimpur (distKheri) 9, Misrikh (dist Sitapur) 8, Muhammadi (distKheri) 7, Malihabad (dist Lucknow) 7, Bhatpurwaghat (dist Sitapur) 7
15th August,2020
Nawabganj Tehsil (distBarabanki) 12, Sidhauli (dist Sitapur) 11, Kheri Lakhimpur (distKheri) 9, Misrikh (dist Sitapur) 8, Muhammadi (distKheri) 7, Malihabad (dist Lucknow) 7, Bhatpurwaghat (dist Sitapur) 7
16th August,2020
Khalilabad (dist Sant Kabir Nagar) 8, Banda Cwc (dist Banda) 8, Beberu (dist Banda) 7
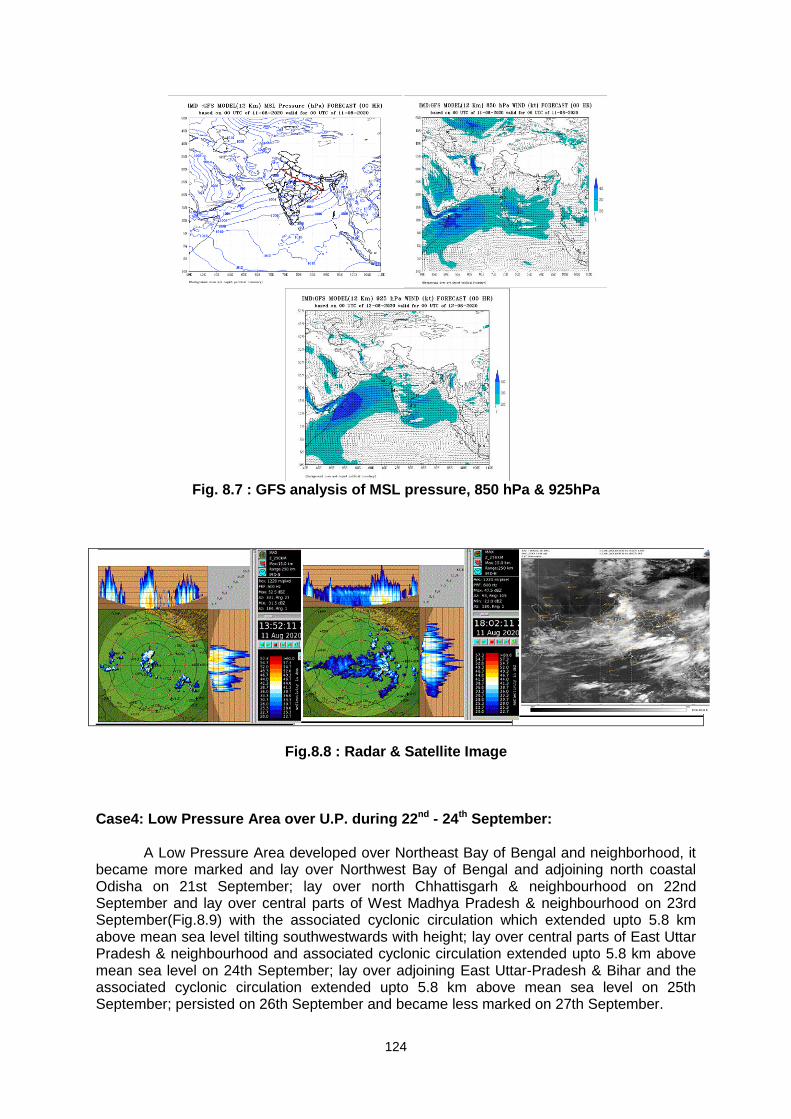
124
Fig. 8.7 : GFS analysis of MSL pressure, 850 hPa & 925hPa
Fig.8.8 : Radar & Satellite Image
Case4: Low Pressure Area over U.P. during 22nd - 24th September: A Low Pressure Area developed over Northeast Bay of Bengal and neighborhood, it became more marked and lay over Northwest Bay of Bengal and adjoining north coastal Odisha on 21st September; lay over north Chhattisgarh & neighbourhood on 22nd September and lay over central parts of West Madhya Pradesh & neighbourhood on 23rd September(Fig.8.9) with the associated cyclonic circulation which extended upto 5.8 km above mean sea level tilting southwestwards with height; lay over central parts of East Uttar Pradesh & neighbourhood and associated cyclonic circulation extended upto 5.8 km above mean sea level on 24th September; lay over adjoining East Uttar-Pradesh & Bihar and the associated cyclonic circulation extended upto 5.8 km above mean sea level on 25th September; persisted on 26th September and became less marked on 27th September.
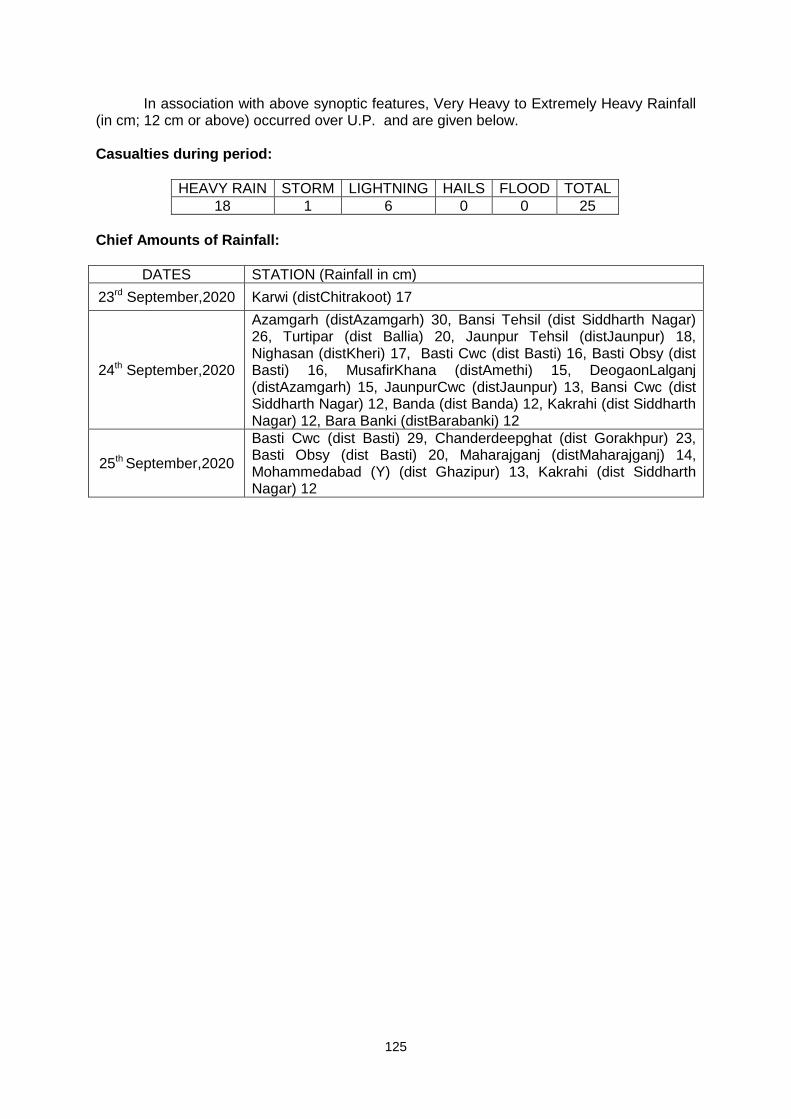
125
In association with above synoptic features, Very Heavy to Extremely Heavy Rainfall (in cm; 12 cm or above) occurred over U.P. and are given below. Casualties during period:
HEAVY RAIN STORM LIGHTNING HAILS FLOOD TOTAL
18 1 6 0 0 25
Chief Amounts of Rainfall:
DATES STATION (Rainfall in cm)
23rd September,2020 Karwi (distChitrakoot) 17
24th September,2020
Azamgarh (distAzamgarh) 30, Bansi Tehsil (dist Siddharth Nagar) 26, Turtipar (dist Ballia) 20, Jaunpur Tehsil (distJaunpur) 18, Nighasan (distKheri) 17, Basti Cwc (dist Basti) 16, Basti Obsy (dist Basti) 16, MusafirKhana (distAmethi) 15, DeogaonLalganj (distAzamgarh) 15, JaunpurCwc (distJaunpur) 13, Bansi Cwc (dist Siddharth Nagar) 12, Banda (dist Banda) 12, Kakrahi (dist Siddharth Nagar) 12, Bara Banki (distBarabanki) 12
25th September,2020
Basti Cwc (dist Basti) 29, Chanderdeepghat (dist Gorakhpur) 23, Basti Obsy (dist Basti) 20, Maharajganj (distMaharajganj) 14, Mohammedabad (Y) (dist Ghazipur) 13, Kakrahi (dist Siddharth Nagar) 12
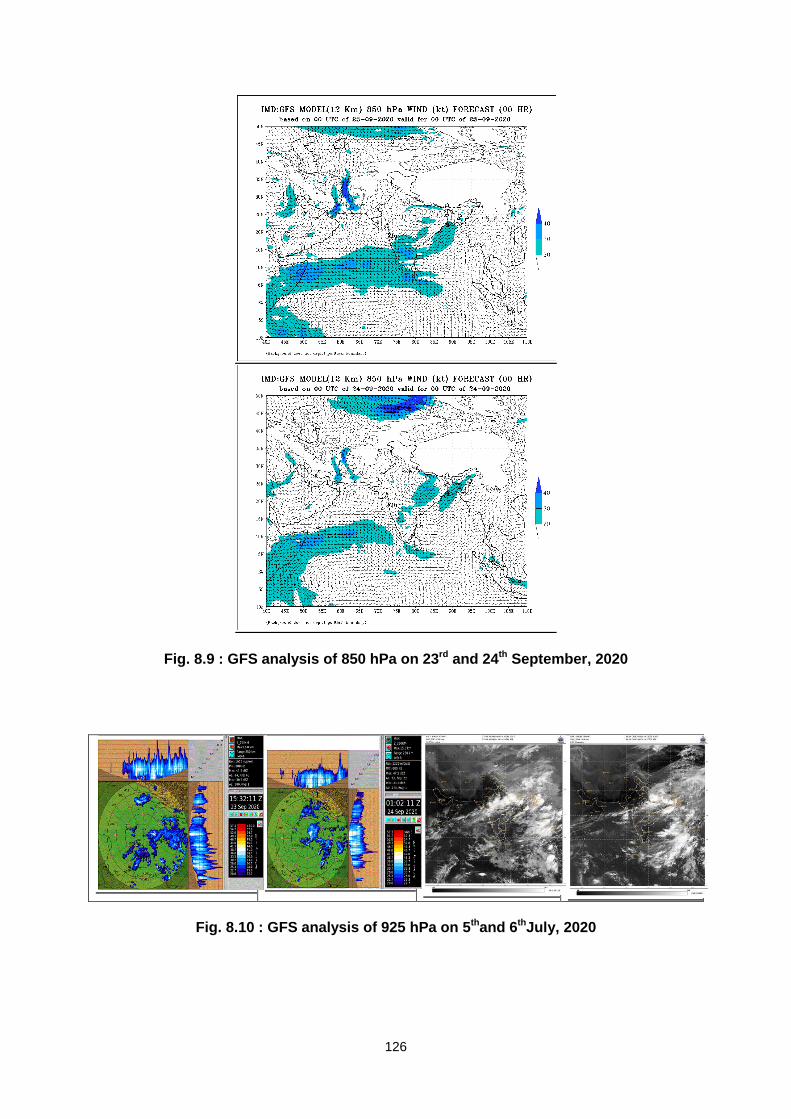
126
Fig. 8.9 : GFS analysis of 850 hPa on 23rd and 24th September, 2020
Fig. 8.10 : GFS analysis of 925 hPa on 5thand 6thJuly, 2020
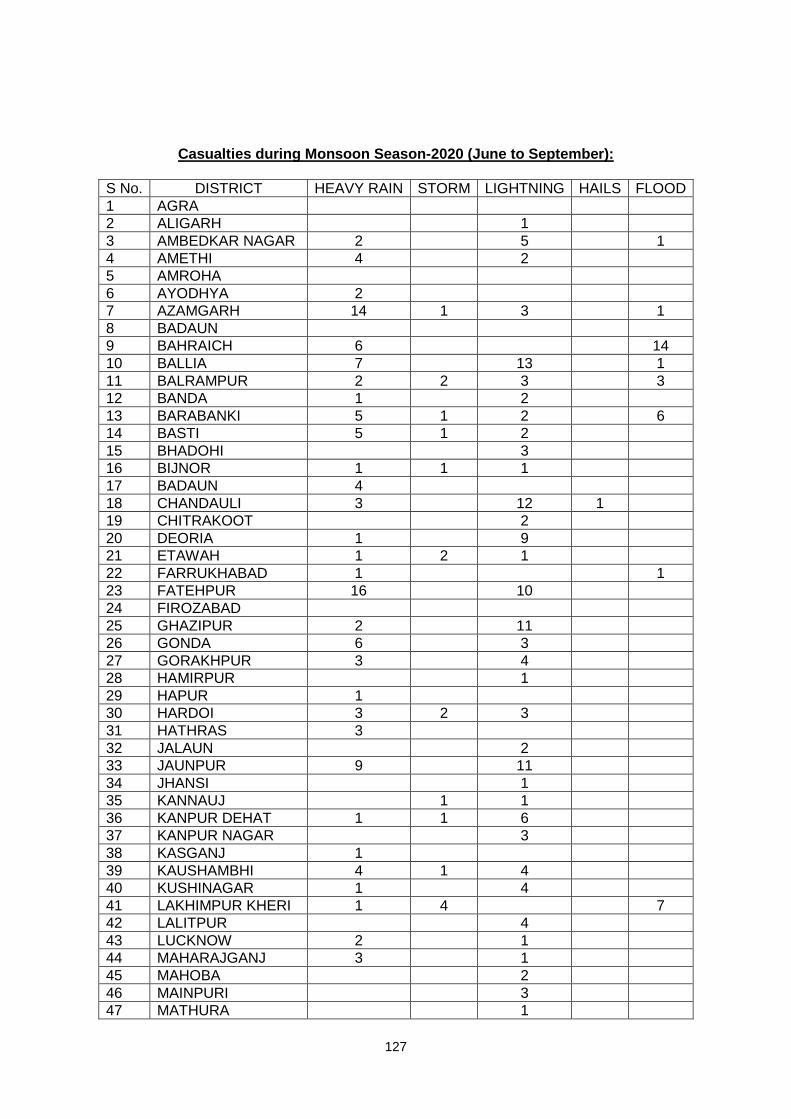
127
Casualties during Monsoon Season-2020 (June to September):
S No. DISTRICT HEAVY RAIN STORM LIGHTNING HAILS FLOOD
1 AGRA
2 ALIGARH 1
3 AMBEDKAR NAGAR 2 5 1
4 AMETHI 4 2
5 AMROHA
6 AYODHYA 2
7 AZAMGARH 14 1 3 1
8 BADAUN
9 BAHRAICH 6 14
10 BALLIA 7 13 1
11 BALRAMPUR 2 2 3 3
12 BANDA 1 2
13 BARABANKI 5 1 2 6
14 BASTI 5 1 2
15 BHADOHI 3
16 BIJNOR 1 1 1
17 BADAUN 4
18 CHANDAULI 3 12 1
19 CHITRAKOOT 2
20 DEORIA 1 9
21 ETAWAH 1 2 1
22 FARRUKHABAD 1 1
23 FATEHPUR 16 10
24 FIROZABAD
25 GHAZIPUR 2 11
26 GONDA 6 3
27 GORAKHPUR 3 4
28 HAMIRPUR 1
29 HAPUR 1
30 HARDOI 3 2 3
31 HATHRAS 3
32 JALAUN 2
33 JAUNPUR 9 11
34 JHANSI 1
35 KANNAUJ 1 1
36 KANPUR DEHAT 1 1 6
37 KANPUR NAGAR 3
38 KASGANJ 1
39 KAUSHAMBHI 4 1 4
40 KUSHINAGAR 1 4
41 LAKHIMPUR KHERI 1 4 7
42 LALITPUR 4
43 LUCKNOW 2 1
44 MAHARAJGANJ 3 1
45 MAHOBA 2
46 MAINPURI 3
47 MATHURA 1
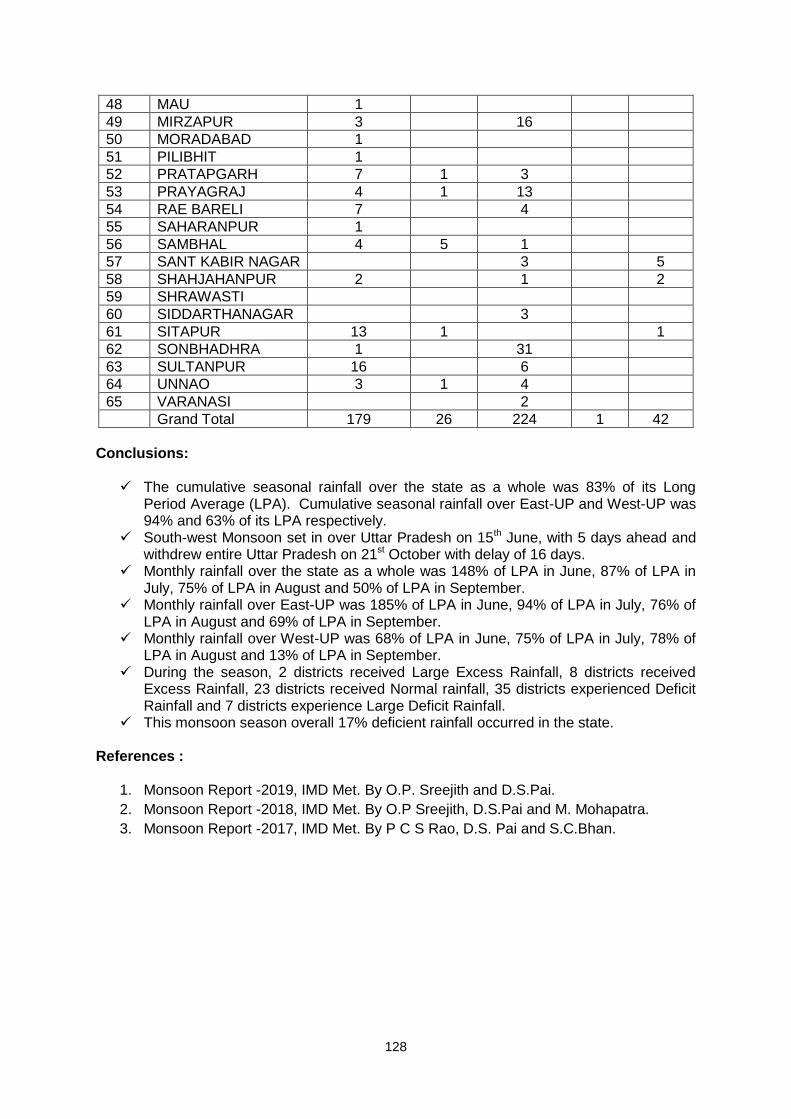
128
48 MAU 1
49 MIRZAPUR 3 16
50 MORADABAD 1
51 PILIBHIT 1
52 PRATAPGARH 7 1 3
53 PRAYAGRAJ 4 1 13
54 RAE BARELI 7 4
55 SAHARANPUR 1
56 SAMBHAL 4 5 1
57 SANT KABIR NAGAR 3 5
58 SHAHJAHANPUR 2 1 2
59 SHRAWASTI
60 SIDDARTHANAGAR 3
61 SITAPUR 13 1 1
62 SONBHADHRA 1 31
63 SULTANPUR 16 6
64 UNNAO 3 1 4
65 VARANASI 2
Grand Total 179 26 224 1 42
Conclusions: The cumulative seasonal rainfall over the state as a whole was 83% of its Long
Period Average (LPA). Cumulative seasonal rainfall over East-UP and West-UP was 94% and 63% of its LPA respectively.
South-west Monsoon set in over Uttar Pradesh on 15th June, with 5 days ahead and withdrew entire Uttar Pradesh on 21st October with delay of 16 days.
Monthly rainfall over the state as a whole was 148% of LPA in June, 87% of LPA in July, 75% of LPA in August and 50% of LPA in September.
Monthly rainfall over East-UP was 185% of LPA in June, 94% of LPA in July, 76% of LPA in August and 69% of LPA in September.
Monthly rainfall over West-UP was 68% of LPA in June, 75% of LPA in July, 78% of LPA in August and 13% of LPA in September.
During the season, 2 districts received Large Excess Rainfall, 8 districts received Excess Rainfall, 23 districts received Normal rainfall, 35 districts experienced Deficit Rainfall and 7 districts experience Large Deficit Rainfall.
This monsoon season overall 17% deficient rainfall occurred in the state. References :
1. Monsoon Report -2019, IMD Met. By O.P. Sreejith and D.S.Pai.
2. Monsoon Report -2018, IMD Met. By O.P Sreejith, D.S.Pai and M. Mohapatra.
3. Monsoon Report -2017, IMD Met. By P C S Rao, D.S. Pai and S.C.Bhan.
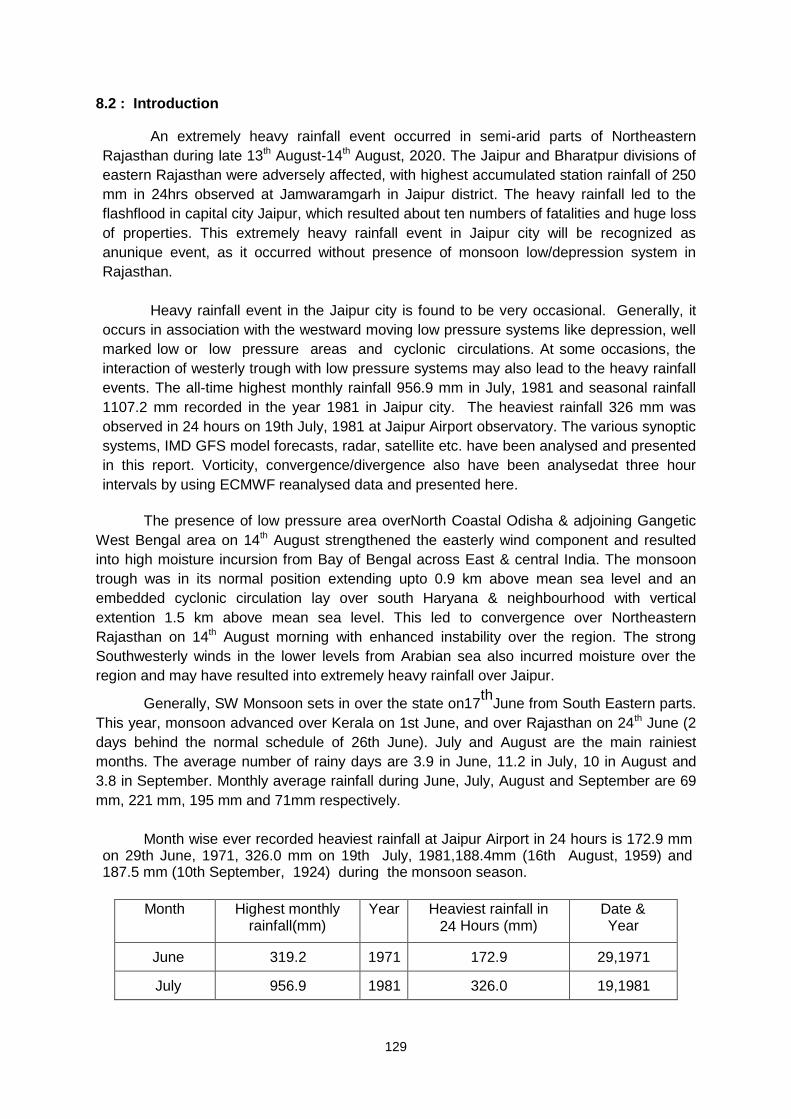
129
8.2 : Introduction
An extremely heavy rainfall event occurred in semi-arid parts of Northeastern
Rajasthan during late 13th August-14th August, 2020. The Jaipur and Bharatpur divisions of
eastern Rajasthan were adversely affected, with highest accumulated station rainfall of 250
mm in 24hrs observed at Jamwaramgarh in Jaipur district. The heavy rainfall led to the
flashflood in capital city Jaipur, which resulted about ten numbers of fatalities and huge loss
of properties. This extremely heavy rainfall event in Jaipur city will be recognized as
anunique event, as it occurred without presence of monsoon low/depression system in
Rajasthan.
Heavy rainfall event in the Jaipur city is found to be very occasional. Generally, it
occurs in association with the westward moving low pressure systems like depression, well
marked low or low pressure areas and cyclonic circulations. At some occasions, the
interaction of westerly trough with low pressure systems may also lead to the heavy rainfall
events. The all-time highest monthly rainfall 956.9 mm in July, 1981 and seasonal rainfall
1107.2 mm recorded in the year 1981 in Jaipur city. The heaviest rainfall 326 mm was
observed in 24 hours on 19th July, 1981 at Jaipur Airport observatory. The various synoptic
systems, IMD GFS model forecasts, radar, satellite etc. have been analysed and presented
in this report. Vorticity, convergence/divergence also have been analysedat three hour
intervals by using ECMWF reanalysed data and presented here.
The presence of low pressure area overNorth Coastal Odisha & adjoining Gangetic
West Bengal area on 14th August strengthened the easterly wind component and resulted
into high moisture incursion from Bay of Bengal across East & central India. The monsoon
trough was in its normal position extending upto 0.9 km above mean sea level and an
embedded cyclonic circulation lay over south Haryana & neighbourhood with vertical
extention 1.5 km above mean sea level. This led to convergence over Northeastern
Rajasthan on 14th August morning with enhanced instability over the region. The strong
Southwesterly winds in the lower levels from Arabian sea also incurred moisture over the
region and may have resulted into extremely heavy rainfall over Jaipur.
Generally, SW Monsoon sets in over the state on17th
June from South Eastern parts.
This year, monsoon advanced over Kerala on 1st June, and over Rajasthan on 24th June (2
days behind the normal schedule of 26th June). July and August are the main rainiest
months. The average number of rainy days are 3.9 in June, 11.2 in July, 10 in August and
3.8 in September. Monthly average rainfall during June, July, August and September are 69
mm, 221 mm, 195 mm and 71mm respectively.
Month wise ever recorded heaviest rainfall at Jaipur Airport in 24 hours is 172.9 mm on 29th June, 1971, 326.0 mm on 19th July, 1981,188.4mm (16th August, 1959) and 187.5 mm (10th September, 1924) during the monsoon season.
Month Highest monthly rainfall(mm)
Year Heaviest rainfall in
24 Hours (mm)
Date & Year
June 319.2 1971 172.9 29,1971
July 956.9 1981 326.0 19,1981
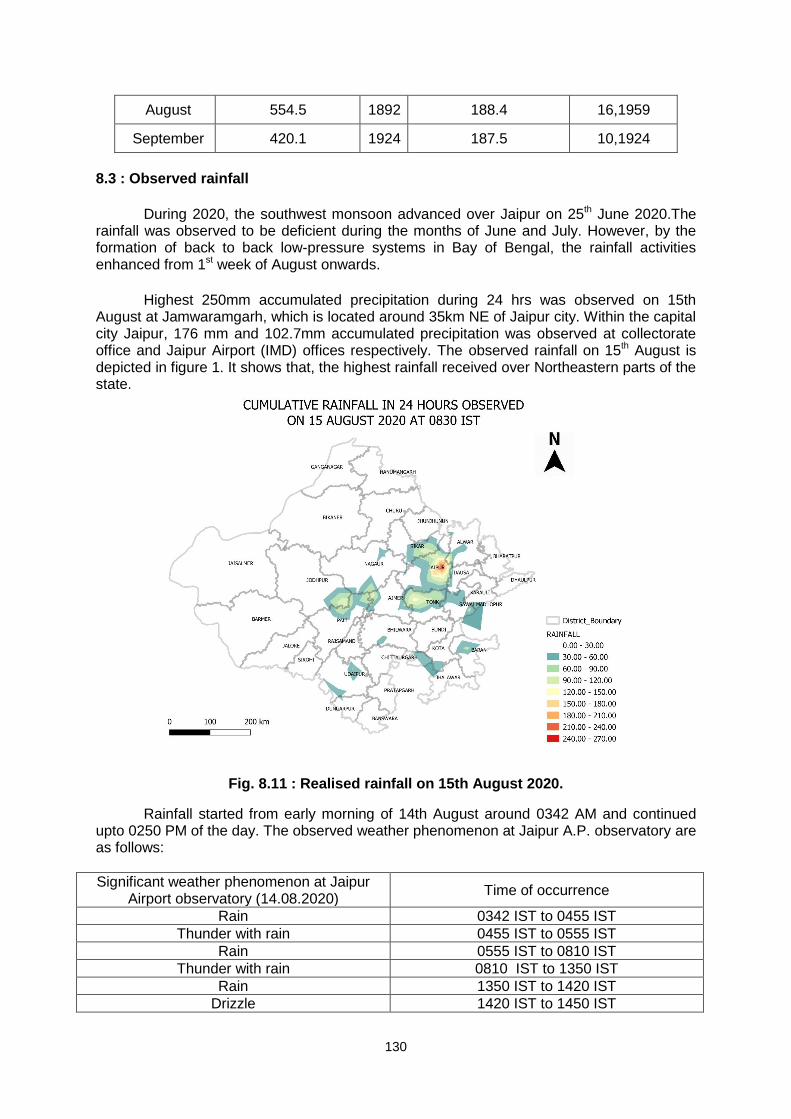
130
August 554.5 1892 188.4 16,1959
September 420.1 1924 187.5 10,1924
8.3 : Observed rainfall
During 2020, the southwest monsoon advanced over Jaipur on 25th June 2020.The rainfall was observed to be deficient during the months of June and July. However, by the formation of back to back low-pressure systems in Bay of Bengal, the rainfall activities enhanced from 1st week of August onwards.
Highest 250mm accumulated precipitation during 24 hrs was observed on 15th August at Jamwaramgarh, which is located around 35km NE of Jaipur city. Within the capital city Jaipur, 176 mm and 102.7mm accumulated precipitation was observed at collectorate office and Jaipur Airport (IMD) offices respectively. The observed rainfall on 15th August is depicted in figure 1. It shows that, the highest rainfall received over Northeastern parts of the state.
Fig. 8.11 : Realised rainfall on 15th August 2020.
Rainfall started from early morning of 14th August around 0342 AM and continued upto 0250 PM of the day. The observed weather phenomenon at Jaipur A.P. observatory are as follows:
Significant weather phenomenon at Jaipur Airport observatory (14.08.2020)
Time of occurrence
Rain 0342 IST to 0455 IST
Thunder with rain 0455 IST to 0555 IST
Rain 0555 IST to 0810 IST
Thunder with rain 0810 IST to 1350 IST
Rain 1350 IST to 1420 IST
Drizzle 1420 IST to 1450 IST
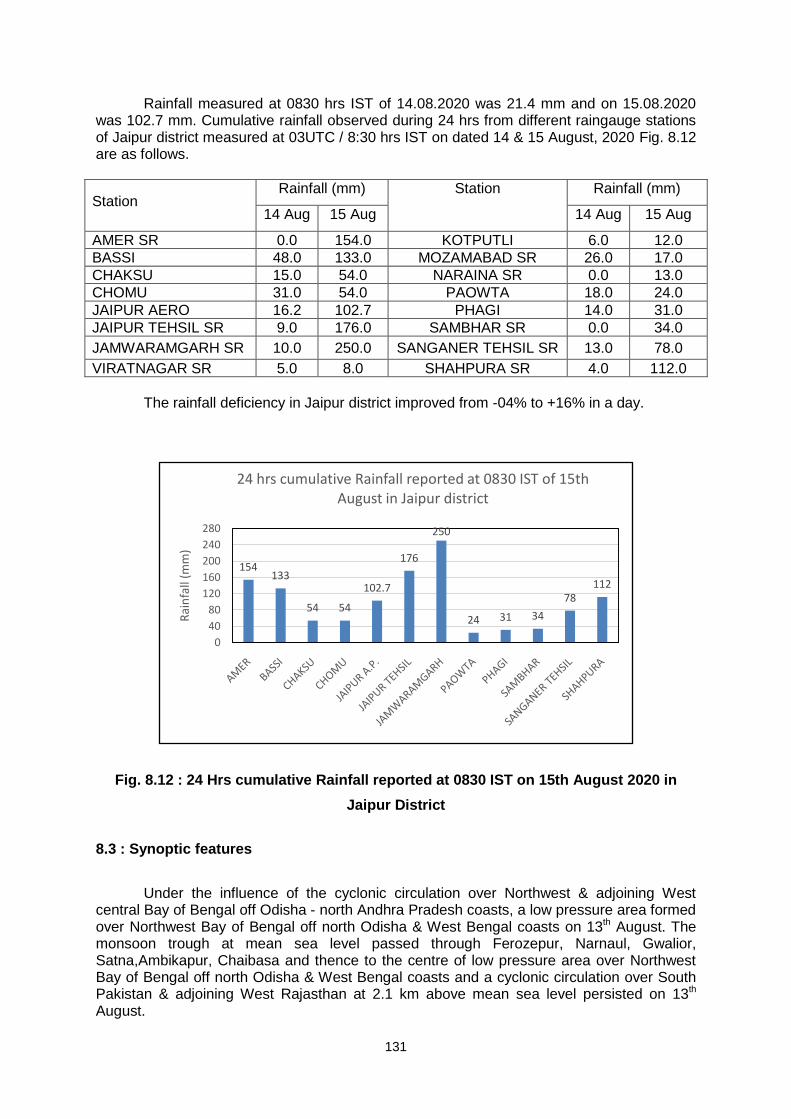
131
Rainfall measured at 0830 hrs IST of 14.08.2020 was 21.4 mm and on 15.08.2020 was 102.7 mm. Cumulative rainfall observed during 24 hrs from different raingauge stations of Jaipur district measured at 03UTC / 8:30 hrs IST on dated 14 & 15 August, 2020 Fig. 8.12 are as follows.
Station Rainfall (mm) Station Rainfall (mm)
14 Aug 15 Aug 14 Aug 15 Aug
AMER SR 0.0 154.0 KOTPUTLI 6.0 12.0
BASSI 48.0 133.0 MOZAMABAD SR 26.0 17.0
CHAKSU 15.0 54.0 NARAINA SR 0.0 13.0
CHOMU 31.0 54.0 PAOWTA 18.0 24.0
JAIPUR AERO 16.2 102.7 PHAGI 14.0 31.0
JAIPUR TEHSIL SR 9.0 176.0 SAMBHAR SR 0.0 34.0
JAMWARAMGARH SR 10.0 250.0 SANGANER TEHSIL SR 13.0 78.0
VIRATNAGAR SR 5.0 8.0 SHAHPURA SR 4.0 112.0
The rainfall deficiency in Jaipur district improved from -04% to +16% in a day.
Fig. 8.12 : 24 Hrs cumulative Rainfall reported at 0830 IST on 15th August 2020 in
Jaipur District
8.3 : Synoptic features
Under the influence of the cyclonic circulation over Northwest & adjoining West central Bay of Bengal off Odisha north Andhra Pradesh coasts, a low pressure area formed over Northwest Bay of Bengal off north Odisha & West Bengal coasts on 13th August. The monsoon trough at mean sea level passed through Ferozepur, Narnaul, Gwalior, Satna,Ambikapur, Chaibasa and thence to the centre of low pressure area over Northwest Bay of Bengal off north Odisha & West Bengal coasts and a cyclonic circulation over South Pakistan & adjoining West Rajasthan at 2.1 km above mean sea level persisted on 13th August.
154133
54 54
102.7
176
250
24 31 34
78112
0
40
80
120
160
200
240
280
Rai
nfa
ll (m
m)
24 hrs cumulative Rainfall reported at 0830 IST of 15th August in Jaipur district
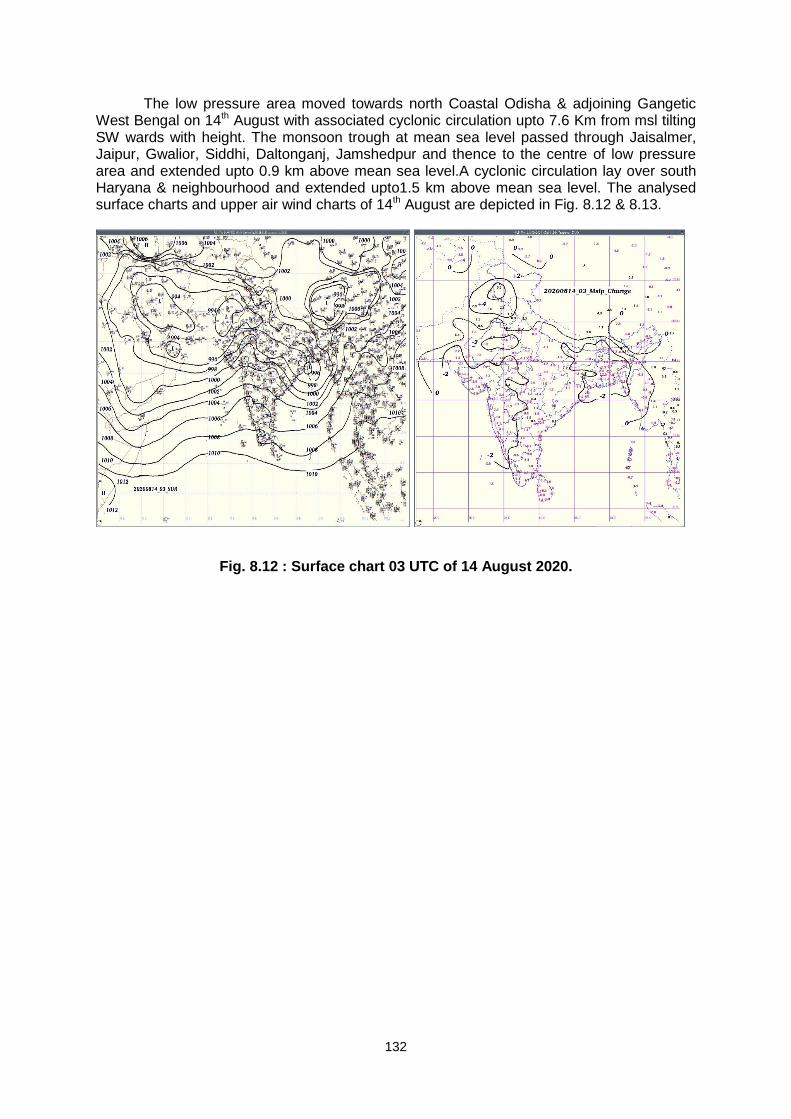
132
The low pressure area moved towards north Coastal Odisha & adjoining Gangetic West Bengal on 14th August with associated cyclonic circulation upto 7.6 Km from msl tilting SW wards with height. The monsoon trough at mean sea level passed through Jaisalmer, Jaipur, Gwalior, Siddhi, Daltonganj, Jamshedpur and thence to the centre of low pressure area and extended upto 0.9 km above mean sea level.A cyclonic circulation lay over south Haryana & neighbourhood and extended upto1.5 km above mean sea level. The analysed surface charts and upper air wind charts of 14th August are depicted in Fig. 8.12 & 8.13.
Fig. 8.12 : Surface chart 03 UTC of 14 August 2020.
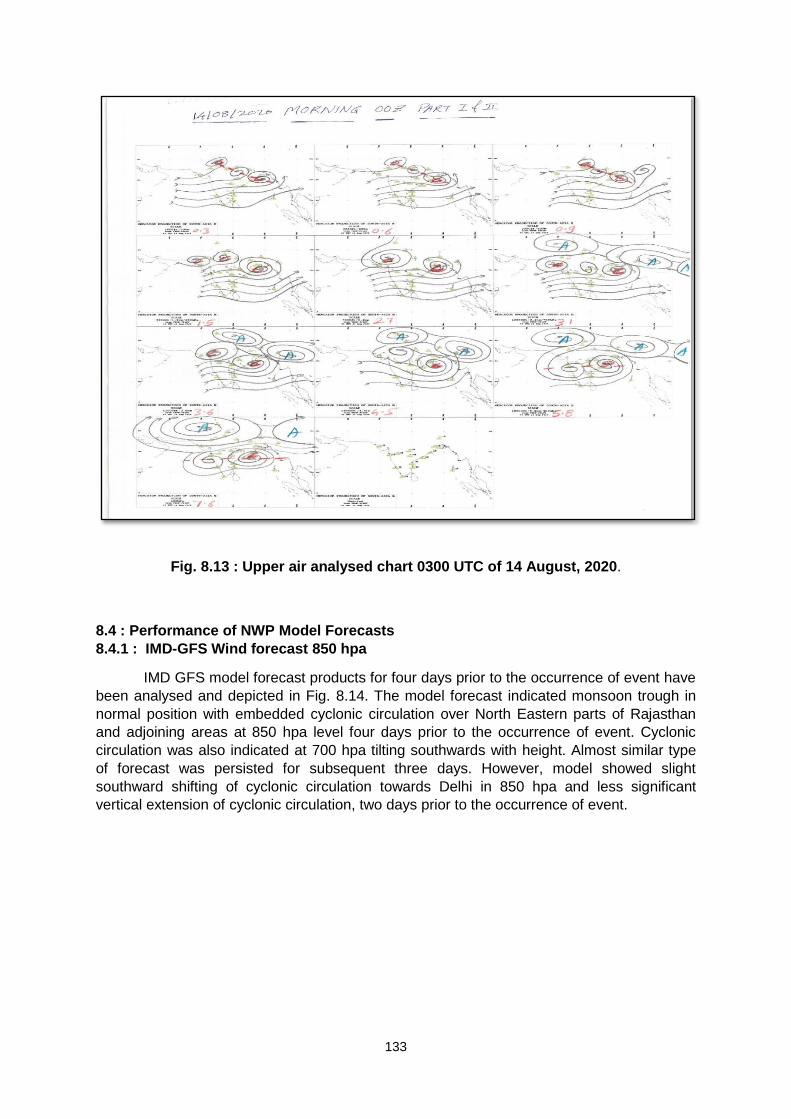
133
Fig. 8.13 : Upper air analysed chart 0300 UTC of 14 August, 2020.
8.4 : Performance of NWP Model Forecasts
8.4.1 : IMD-GFS Wind forecast 850 hpa
IMD GFS model forecast products for four days prior to the occurrence of event have
been analysed and depicted in Fig. 8.14. The model forecast indicated monsoon trough in
normal position with embedded cyclonic circulation over North Eastern parts of Rajasthan
and adjoining areas at 850 hpa level four days prior to the occurrence of event. Cyclonic
circulation was also indicated at 700 hpa tilting southwards with height. Almost similar type
of forecast was persisted for subsequent three days. However, model showed slight
southward shifting of cyclonic circulation towards Delhi in 850 hpa and less significant
vertical extension of cyclonic circulation, two days prior to the occurrence of event.
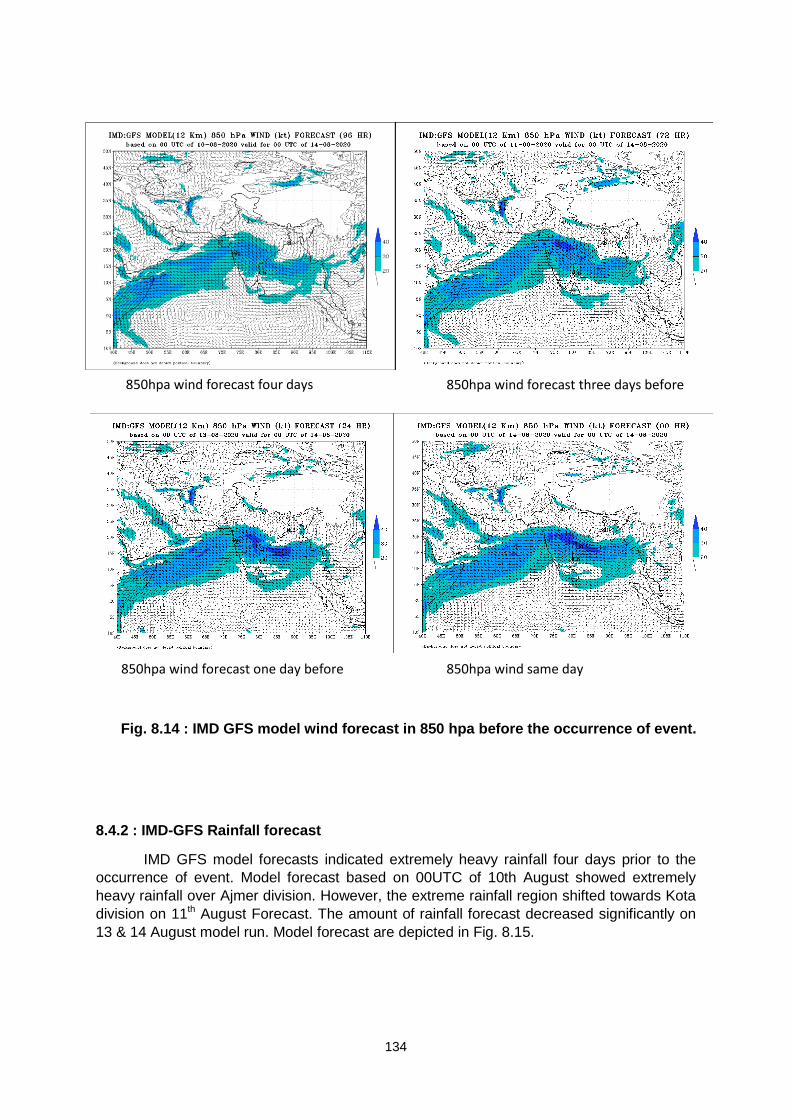
134
8.4.2 : IMD-GFS Rainfall forecast
IMD GFS model forecasts indicated extremely heavy rainfall four days prior to the
occurrence of event. Model forecast based on 00UTC of 10th August showed extremely
heavy rainfall over Ajmer division. However, the extreme rainfall region shifted towards Kota
division on 11th August Forecast. The amount of rainfall forecast decreased significantly on
13 & 14 August model run. Model forecast are depicted in Fig. 8.15.
850hpa wind forecast three days before
850hpa wind forecast one day before 850hpa wind same day
850hpa wind forecast four days
before
Fig. 8.14 : IMD GFS model wind forecast in 850 hpa before the occurrence of event.
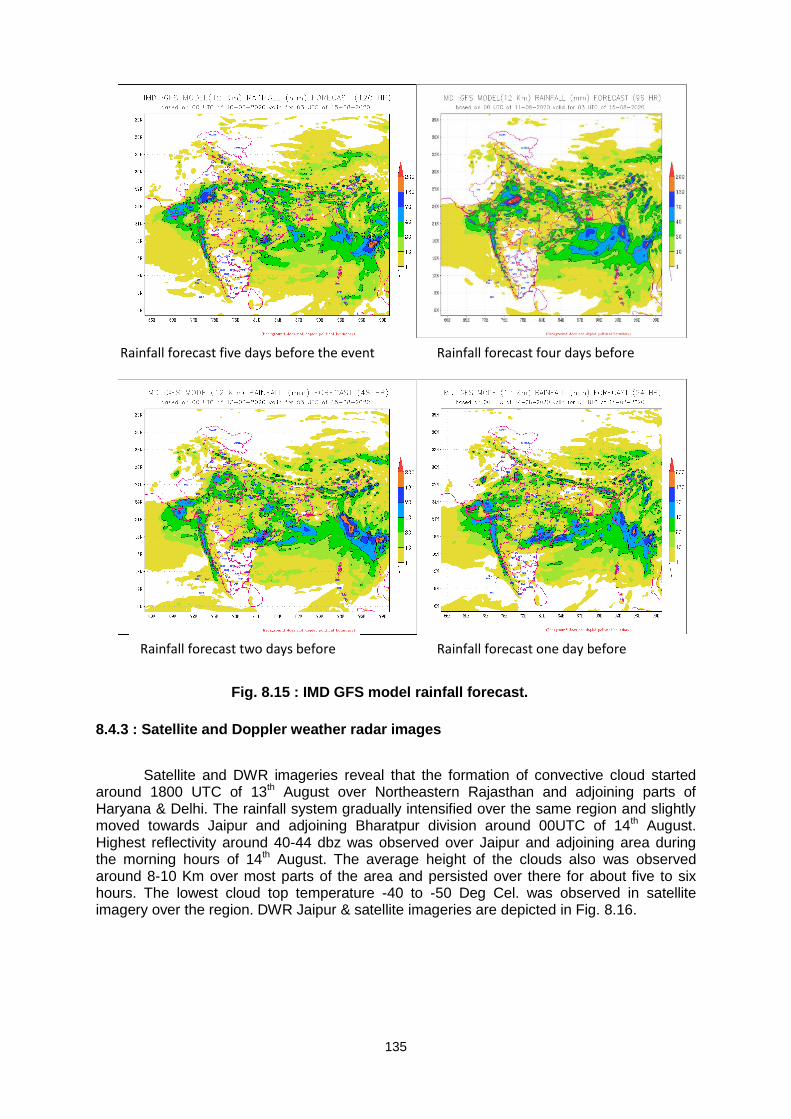
135
8.4.3 : Satellite and Doppler weather radar images
Satellite and DWR imageries reveal that the formation of convective cloud started
around 1800 UTC of 13th August over Northeastern Rajasthan and adjoining parts of Haryana & Delhi. The rainfall system gradually intensified over the same region and slightly moved towards Jaipur and adjoining Bharatpur division around 00UTC of 14th August. Highest reflectivity around 40-44 dbz was observed over Jaipur and adjoining area during the morning hours of 14th August. The average height of the clouds also was observed around 8-10 Km over most parts of the area and persisted over there for about five to six hours. The lowest cloud top temperature -40 to -50 Deg Cel. was observed in satellite imagery over the region. DWR Jaipur & satellite imageries are depicted in Fig. 8.16.
Rainfall forecast five days before the event Rainfall forecast four days before
Rainfall forecast two days before Rainfall forecast one day before
Fig. 8.15 : IMD GFS model rainfall forecast.
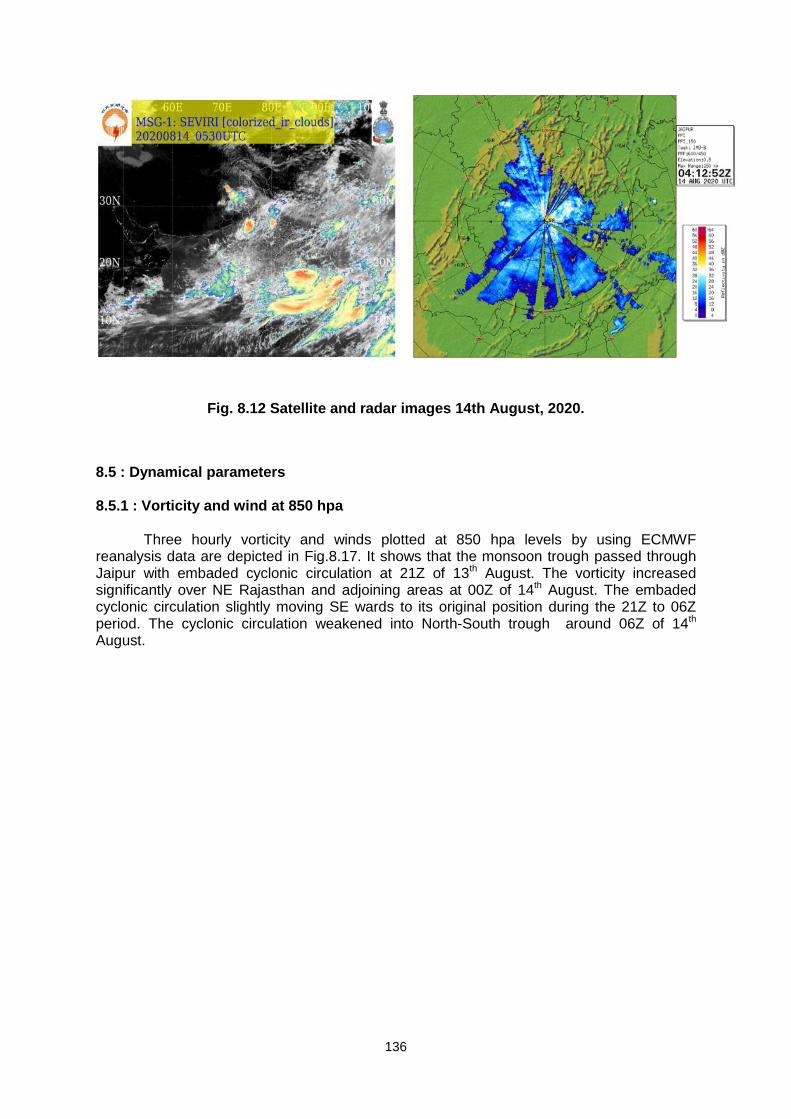
136
Fig. 8.12 Satellite and radar images 14th August, 2020.
8.5 : Dynamical parameters
8.5.1 : Vorticity and wind at 850 hpa
Three hourly vorticity and winds plotted at 850 hpa levels by using ECMWF reanalysis data are depicted in Fig.8.17. It shows that the monsoon trough passed through Jaipur with embaded cyclonic circulation at 21Z of 13th August. The vorticity increased significantly over NE Rajasthan and adjoining areas at 00Z of 14th August. The embaded cyclonic circulation slightly moving SE wards to its original position during the 21Z to 06Z period. The cyclonic circulation weakened into North-South trough around 06Z of 14th August.
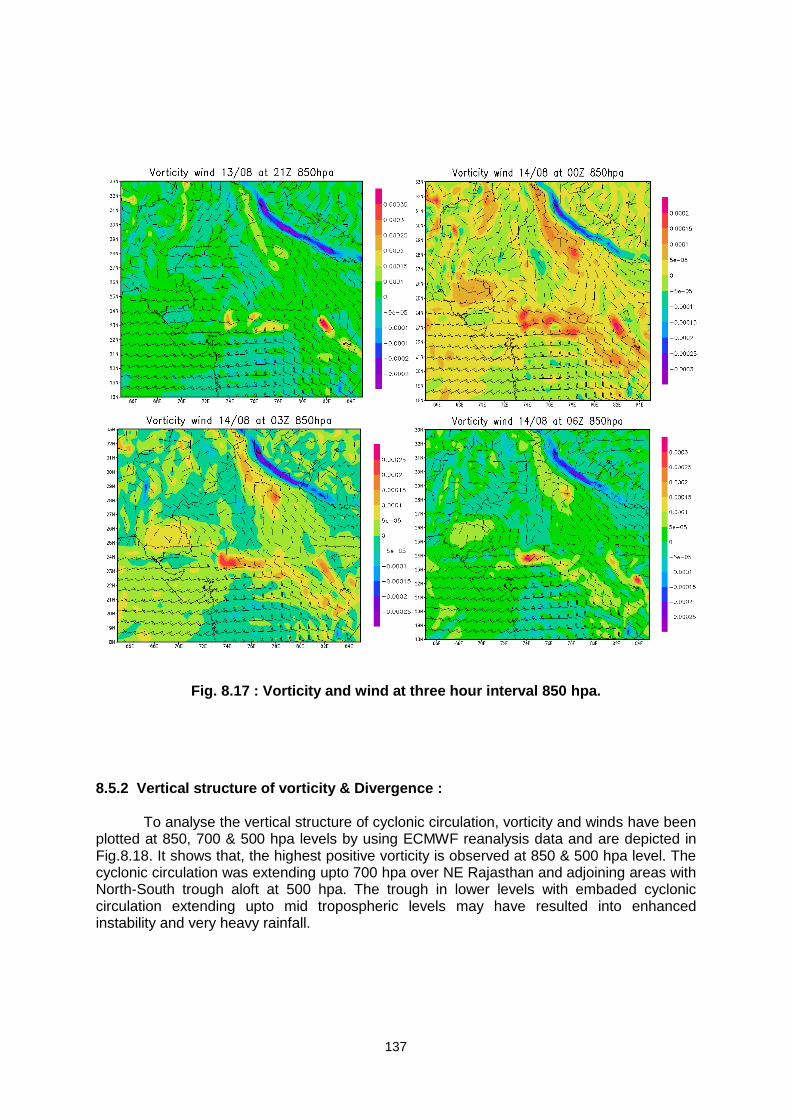
137
Fig. 8.17 : Vorticity and wind at three hour interval 850 hpa.
8.5.2 Vertical structure of vorticity & Divergence :
To analyse the vertical structure of cyclonic circulation, vorticity and winds have been
plotted at 850, 700 & 500 hpa levels by using ECMWF reanalysis data and are depicted in Fig.8.18. It shows that, the highest positive vorticity is observed at 850 & 500 hpa level. The cyclonic circulation was extending upto 700 hpa over NE Rajasthan and adjoining areas with North-South trough aloft at 500 hpa. The trough in lower levels with embaded cyclonic circulation extending upto mid tropospheric levels may have resulted into enhanced instability and very heavy rainfall.
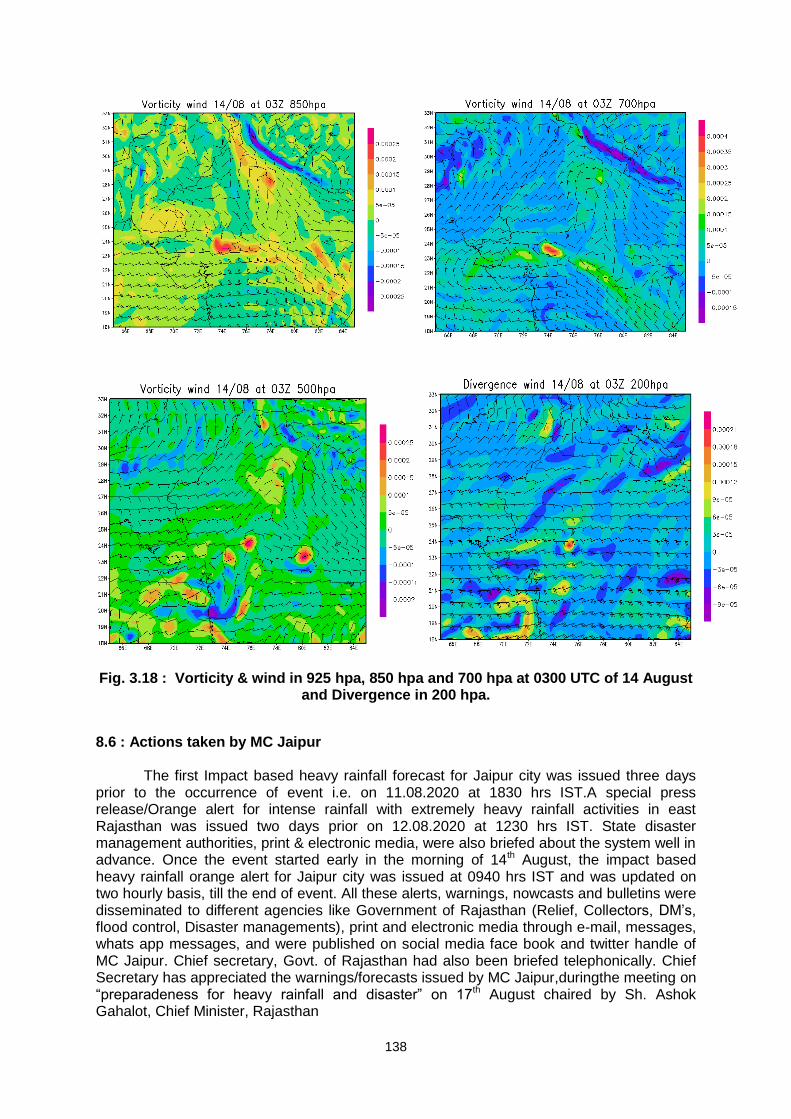
138
Fig. 3.18 : Vorticity & wind in 925 hpa, 850 hpa and 700 hpa at 0300 UTC of 14 August
and Divergence in 200 hpa.
8.6 : Actions taken by MC Jaipur
The first Impact based heavy rainfall forecast for Jaipur city was issued three days
prior to the occurrence of event i.e. on 11.08.2020 at 1830 hrs IST.A special press release/Orange alert for intense rainfall with extremely heavy rainfall activities in east Rajasthan was issued two days prior on 12.08.2020 at 1230 hrs IST. State disaster management authorities, print & electronic media, were also briefed about the system well in advance. Once the event started early in the morning of 14th August, the impact based heavy rainfall orange alert for Jaipur city was issued at 0940 hrs IST and was updated on two hourly basis, till the end of event. All these alerts, warnings, nowcasts and bulletins were disseminated to different agencies like Government of Rajasthan (Relief, Collectors, DM’s, flood control, Disaster managements), print and electronic media through e-mail, messages, whats app messages, and were published on social media face book and twitter handle of MC Jaipur. Chief secretary, Govt. of Rajasthan had also been briefed telephonically. Chief Secretary has appreciated the warnings/forecasts issued by MC Jaipur,duringthe meeting on “preparadeness for heavy rainfall and disaster” on 17th August chaired by Sh. Ashok Gahalot, Chief Minister, Rajasthan
139
8.7 : Media reports
According to local newspapers, due to poor drainage system and non cleaning of sewer system before monsoon season, the rain water logged in many parts of the city. Huge loss of property has been reported, more than 250 vehicleswere flowed out in the water, roads were blockedby landslidesin some areas and about five numbers of casualties were reported by local media. Media has also reported that, it was the largest Rescue operation by 9 teams of disaster management, 200 volunteers of civil defense, along with 5 SDRF teams in the fields in Jaipur city after 1981flood.
Conclusion :
An extremely heavy rainfall event in Jaipur city during this monsoon year will be
recognized as a special phenomenon, as it occurred without presence of monsoon
low/depression system in Rajasthan. The normal position of trough line and an embedded
cyclonic circulation over south Haryana & neighborhood with vertical extension1.5 km above
mean sea level led to wind convergence over Northeastern Rajasthan on 14th August
morning and resulted into enhanced instability over the region. The strong Southwesterly
winds in the lower levels from Arabian sea also incurred moisture over the region. In
association with cyclonic circulation, strong positive vorticity developed over North east
Rajasthan between 03UTC to 06 UTC of 14 August, 2020 implying strong upward motion of
convectively unstable moist air over the region. The slow movement and intensification of
the system led to the extremely heavy rainfall over Jaipur and adjoining area during the
monsoon season in 2020.
140
9
RAINFALL FEATURES
B. P. Yadav, Pulak Guhathakurta and Rahul Saxena
In this chapter, various spatial and temporal features of rainfall during the season and
its statistics have been discussed.
The Southwest Monsoon season rainfall over the country as a whole during 2020
was 109% of Long Period Average (LPA).Rainfall distribution was generally fairly well
distributed over major parts of the countryexcept Nagaland, Manipur, Mizoram and Tripura,
West Uttar Pradesh, Uttarakhand, Himachal Pradesh, and Jammu & Kashmir and Ladakh
sub-division. The season observed significant intra seasonal variationsin rainfall as realized
rainfall in June (117.6117% of LPA)and August (127 % of LPA) being above normal, July (90
% of LPA)& September (104 % of LPA) being normal.
9.1 General Features (Rainfall) :
For the country as a whole, seasonal rainfall at the end of the southwest monsoon
season (June to September) was 109 % of its LPA value. For the country as a whole, the
LPA value of southwest monsoon season rainfall, based on the data for the period 1961-
2010 is 880.6 mm.
The four homogeneous regions received seasonal rainfall as follows:
i. East & Northeast India -106% of LPA
ii. Northwest India - 84 % of LPA
iii. South Peninsula - 129 % of LPA
iv. Central India - 115 % of LPA
The country received monthly rainfall during the season as follows:
i. June- 117 % of its LPA
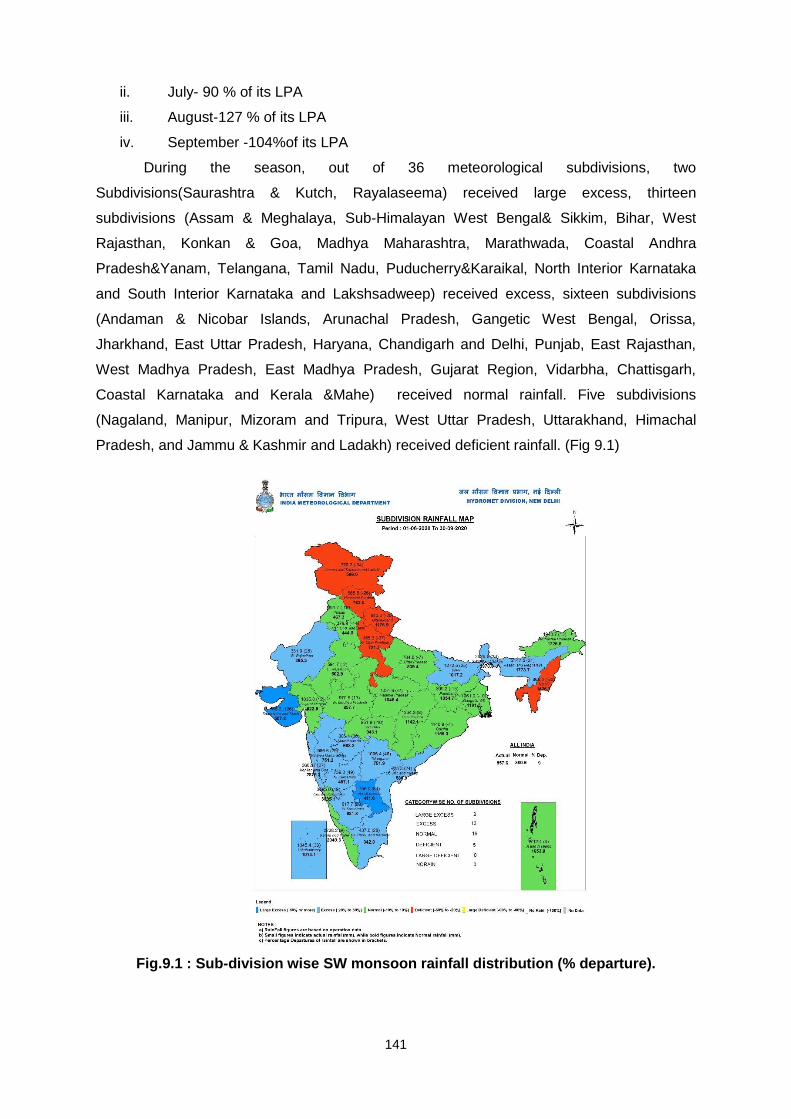
141
ii. July- 90 % of its LPA
iii. August-127 % of its LPA
iv. September -104%of its LPA
During the season, out of 36 meteorological subdivisions, two
Subdivisions(Saurashtra & Kutch, Rayalaseema) received large excess, thirteen
subdivisions (Assam & Meghalaya, Sub-Himalayan West Bengal& Sikkim, Bihar, West
Rajasthan, Konkan & Goa, Madhya Maharashtra, Marathwada, Coastal Andhra
Pradesh&Yanam, Telangana, Tamil Nadu, Puducherry&Karaikal, North Interior Karnataka
and South Interior Karnataka and Lakshsadweep) received excess, sixteen subdivisions
(Andaman & Nicobar Islands, Arunachal Pradesh, Gangetic West Bengal, Orissa,
Jharkhand, East Uttar Pradesh, Haryana, Chandigarh and Delhi, Punjab, East Rajasthan,
West Madhya Pradesh, East Madhya Pradesh, Gujarat Region, Vidarbha, Chattisgarh,
Coastal Karnataka and Kerala &Mahe) received normal rainfall. Five subdivisions
(Nagaland, Manipur, Mizoram and Tripura, West Uttar Pradesh, Uttarakhand, Himachal
Pradesh, and Jammu & Kashmir and Ladakh) received deficient rainfall. (Fig 9.1)
Fig.9.1 : Sub-division wise SW monsoon rainfall distribution (% departure).
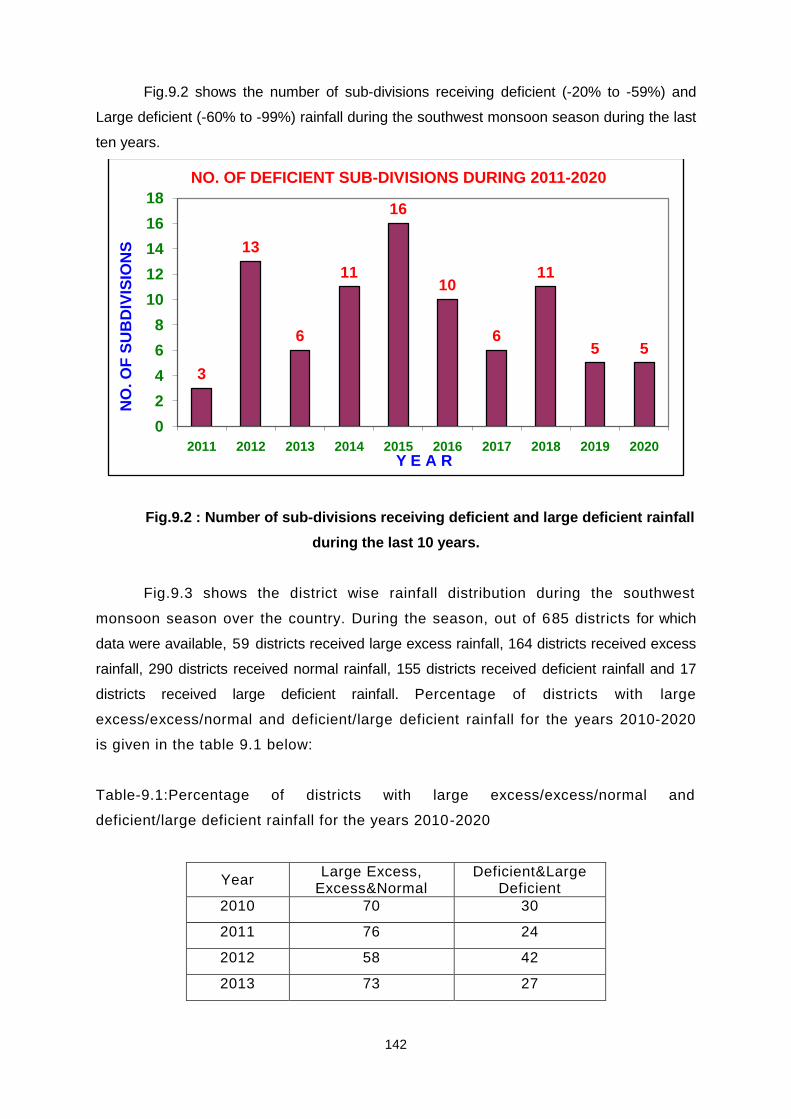
142
Fig.9.2 shows the number of sub-divisions receiving deficient (-20% to -59%) and
Large deficient (-60% to -99%) rainfall during the southwest monsoon season during the last
ten years.
Fig.9.2 : Number of sub-divisions receiving deficient and large deficient rainfall
during the last 10 years.
Fig.9.3 shows the district wise rainfall distribution during the southwest
monsoon season over the country. During the season, out of 685 districts for which
data were available, 59 districts received large excess rainfall, 164 districts received excess
rainfall, 290 districts received normal rainfall, 155 districts received deficient rainfall and 17
districts received large deficient rainfall. Percentage of districts with large
excess/excess/normal and deficient/large deficient rainfall for the years 2010-2020
is given in the table 9.1 below:
Table-9.1:Percentage of districts with large excess/excess/normal and
deficient/large deficient rainfall for the years 2010-2020
Year Large Excess,
Excess&Normal Deficient&Large
Deficient
2010 70 30
2011 76 24
2012 58 42
2013 73 27
3
13
6
11
16
10
6
11
5 5
0
2
4
6
8
10
12
14
16
18
2011 2012 2013 2014 2015 2016 2017 2018 2019 2020
NO
. O
F S
UB
DIV
ISIO
NS
Y E A R
NO. OF DEFICIENT SUB-DIVISIONS DURING 2011-2020
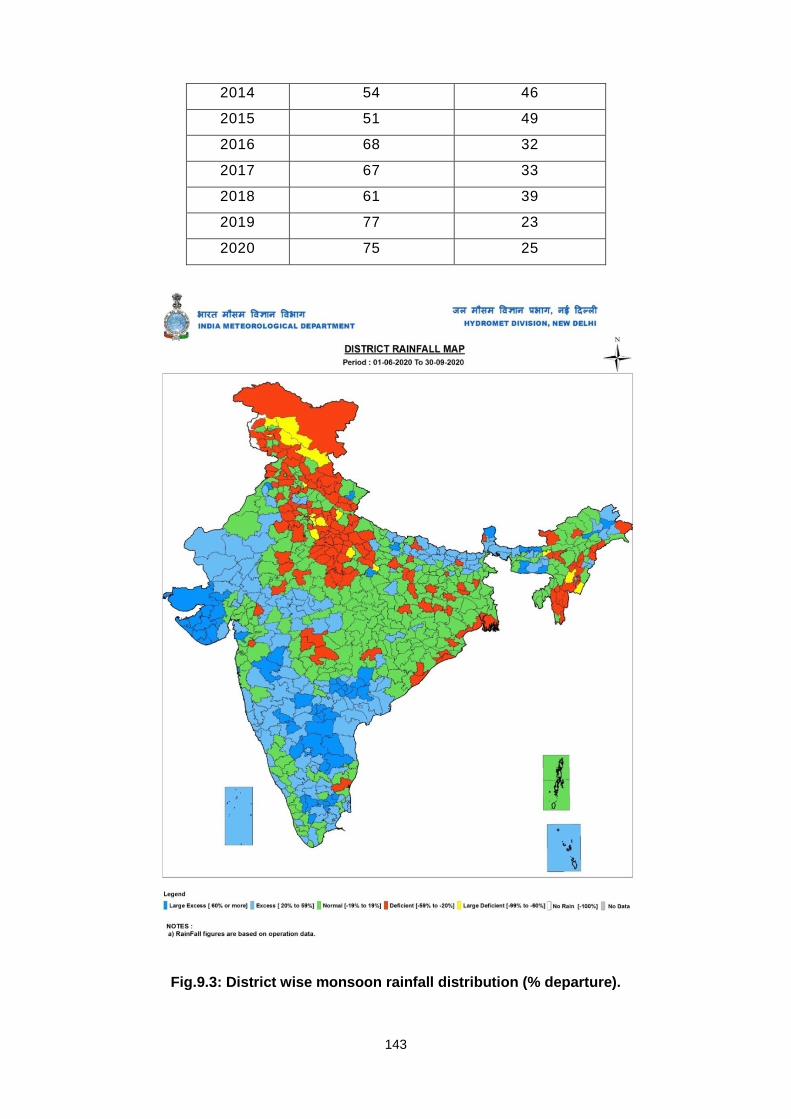
143
2014 54 46
2015 51 49
2016 68 32
2017 67 33
2018 61 39
2019 77 23
2020 75 25
Fig.9.3: District wise monsoon rainfall distribution (% departure).
144
9.2 Monthly rainfall distribution:
9.2.1 Meteorological Sub-division wise monthly distribution of rainfall:
June:
During the month, rainfall activity over the country as a whole was117% of LPA.
During the month, except 6 subdivisions (Nagaland, Manipur, Mizoram & Tripura, West Uttar
Pradesh, Himachal Pradesh, Jammu & Kashmir and Ladakh, Gujarat Region and Lakshadweep)
all other subdivisions received large excess/excess/normal rainfall. Rainfall received over the
subdivisions of Bihar, East and West Uttar Pradesh, East Madhya Pradesh, Marathwada and
Rayalaseema was one and half times of its normal value.Out of 36 meteorological subdivisions,
4 received large excess rainfall, 10 received excess rainfall, 16 subdivisions received normal
rainfall and 6 subdivisions received deficient rainfall(Fig.9.4a).
July:
During the month, rainfall activity over the country as a whole was 90% of LPA. Most
of the sub-divisions in the east and northeast India and south peninsular India received large
excess/excess/normal rainfall, while sub-divisions in the central India and some sub-divisions of
northwest India which comprises the monsoon trough zone received deficient rainfall except
Madhya Maharashtra & Saurashtra & Kutch. Rainfall over Saurashtra & Kutch, Rayalaseema,
Tamil Nadu, Puducherry &Karaikal, North Interior Karnataka and Lakshadweep islands was more
than 1.5 times of its normal value. Rainfall deficiency over Odisha, Jammu & Kashmir and
Ladakh, East Rajasthan, East and West Madhya Pradesh and Gujarat Region was more than
30%. Out of 36 meteorological subdivisions, 4 received large excess rainfall, 7 received excess
rainfall, 13 received normal rainfall, 12 subdivisions received deficient rainfall(Fig.9.4b).
August:
During the month, rainfall activity over the country as a whole was127% of LPA. Most
of meteorological subdivisions received large excess/ excess/normal rainfall except some
subdivisions of northeastern/northern regions. Rainfall over West Rajasthan, West Madhya
Pradesh, Gujarat State, Konkan & Goa, Madhya Maharashtra and Telangana was more than 1.5
times of its normal value.Out of 36 meteorological subdivisions, 6 received large excess rainfall,
10 received excess rainfall, 15 received normal rainfall, 5 subdivisions received deficient rainfall
(Fig 9.4c)
September:
During the month, rainfall activity over the country as a whole was104% of
LPA. Most of the sub-divisions peninsular India and northwest India received large
excess/excess/normal rainfall. Whereas subdivisions from northeast India except Assam &
Meghalaya and Sub-Himalayan West Bengal & Sikkim, north India received deficient/large
deficient rainfall. Sub divisions such as Assam & Meghalaya, Sub-Himalayan West Bengal &
Sikkim, West Rajasthan, Marathwada, Rayalaseema, Coastal Karnataka, North and South
Interior Karnataka, Kerala and Lakshadweep received more than one and half times the normal
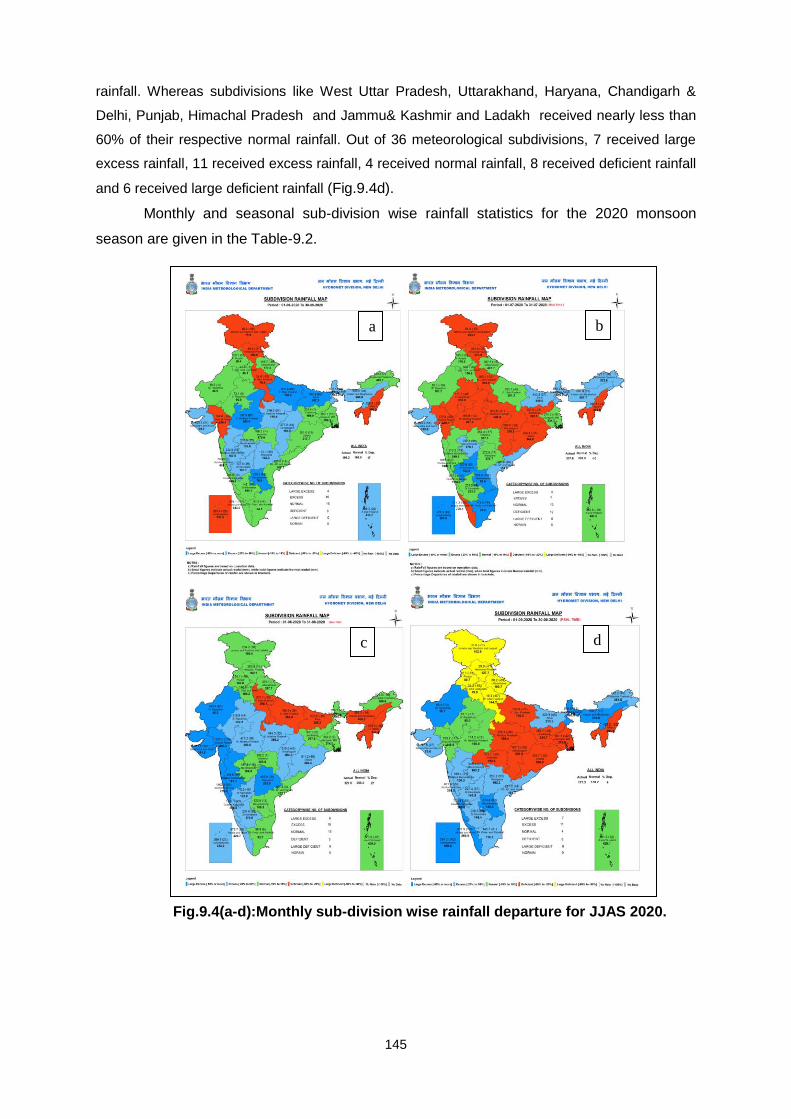
145
rainfall. Whereas subdivisions like West Uttar Pradesh, Uttarakhand, Haryana, Chandigarh &
Delhi, Punjab, Himachal Pradesh and Jammu& Kashmir and Ladakh received nearly less than
60% of their respective normal rainfall. Out of 36 meteorological subdivisions, 7 received large
excess rainfall, 11 received excess rainfall, 4 received normal rainfall, 8 received deficient rainfall
and 6 received large deficient rainfall (Fig.9.4d).
Monthly and seasonal sub-division wise rainfall statistics for the 2020 monsoon
season are given in the Table-9.2.
Fig.9.4(a-d):Monthly sub-division wise rainfall departure for JJAS 2020.
a b
c d
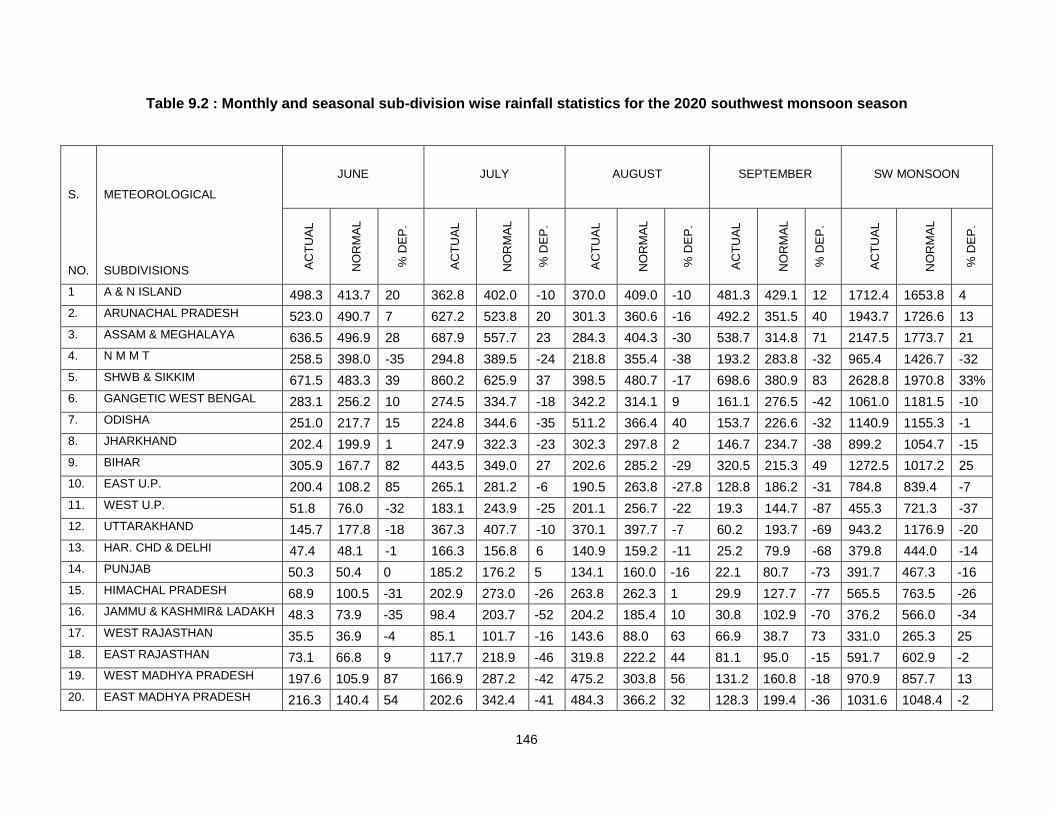
146
Table 9.2 : Monthly and seasonal sub-division wise rainfall statistics for the 2020 southwest monsoon season
S. METEOROLOGICAL
JUNE
JULY
AUGUST
SEPTEMBER
SW MONSOON
NO. SUBDIVISIONS AC
TU
AL
NO
RM
AL
% D
EP
.
AC
TU
AL
NO
RM
AL
% D
EP
.
AC
TU
AL
NO
RM
AL
% D
EP
.
AC
TU
AL
NO
RM
AL
% D
EP
.
AC
TU
AL
NO
RM
AL
% D
EP
.
1 A & N ISLAND 498.3 413.7 20 362.8 402.0 -10 370.0 409.0 -10 481.3 429.1 12 1712.4 1653.8 4
2. ARUNACHAL PRADESH 523.0 490.7 7 627.2 523.8 20 301.3 360.6 -16 492.2 351.5 40 1943.7 1726.6 13
3. ASSAM & MEGHALAYA 636.5 496.9 28 687.9 557.7 23 284.3 404.3 -30 538.7 314.8 71 2147.5 1773.7 21
4. N M M T 258.5 398.0 -35 294.8 389.5 -24 218.8 355.4 -38 193.2 283.8 -32 965.4 1426.7 -32
5. SHWB & SIKKIM 671.5 483.3 39 860.2 625.9 37 398.5 480.7 -17 698.6 380.9 83 2628.8 1970.8 33%
6. GANGETIC WEST BENGAL 283.1 256.2 10 274.5 334.7 -18 342.2 314.1 9 161.1 276.5 -42 1061.0 1181.5 -10
7. ODISHA 251.0 217.7 15 224.8 344.6 -35 511.2 366.4 40 153.7 226.6 -32 1140.9 1155.3 -1
8. JHARKHAND 202.4 199.9 1 247.9 322.3 -23 302.3 297.8 2 146.7 234.7 -38 899.2 1054.7 -15
9. BIHAR 305.9 167.7 82 443.5 349.0 27 202.6 285.2 -29 320.5 215.3 49 1272.5 1017.2 25
10. EAST U.P. 200.4 108.2 85 265.1 281.2 -6 190.5 263.8 -27.8 128.8 186.2 -31 784.8 839.4 -7
11. WEST U.P. 51.8 76.0 -32 183.1 243.9 -25 201.1 256.7 -22 19.3 144.7 -87 455.3 721.3 -37
12. UTTARAKHAND 145.7 177.8 -18 367.3 407.7 -10 370.1 397.7 -7 60.2 193.7 -69 943.2 1176.9 -20
13. HAR. CHD & DELHI 47.4 48.1 -1 166.3 156.8 6 140.9 159.2 -11 25.2 79.9 -68 379.8 444.0 -14
14. PUNJAB 50.3 50.4 0 185.2 176.2 5 134.1 160.0 -16 22.1 80.7 -73 391.7 467.3 -16
15. HIMACHAL PRADESH 68.9 100.5 -31 202.9 273.0 -26 263.8 262.3 1 29.9 127.7 -77 565.5 763.5 -26
16. JAMMU & KASHMIR& LADAKH 48.3 73.9 -35 98.4 203.7 -52 204.2 185.4 10 30.8 102.9 -70 376.2 566.0 -34
17. WEST RAJASTHAN 35.5 36.9 -4 85.1 101.7 -16 143.6 88.0 63 66.9 38.7 73 331.0 265.3 25
18. EAST RAJASTHAN 73.1 66.8 9 117.7 218.9 -46 319.8 222.2 44 81.1 95.0 -15 591.7 602.9 -2
19. WEST MADHYA PRADESH 197.6 105.9 87 166.9 287.2 -42 475.2 303.8 56 131.2 160.8 -18 970.9 857.7 13
20. EAST MADHYA PRADESH 216.3 140.4 54 202.6 342.4 -41 484.3 366.2 32 128.3 199.4 -36 1031.6 1048.4 -2
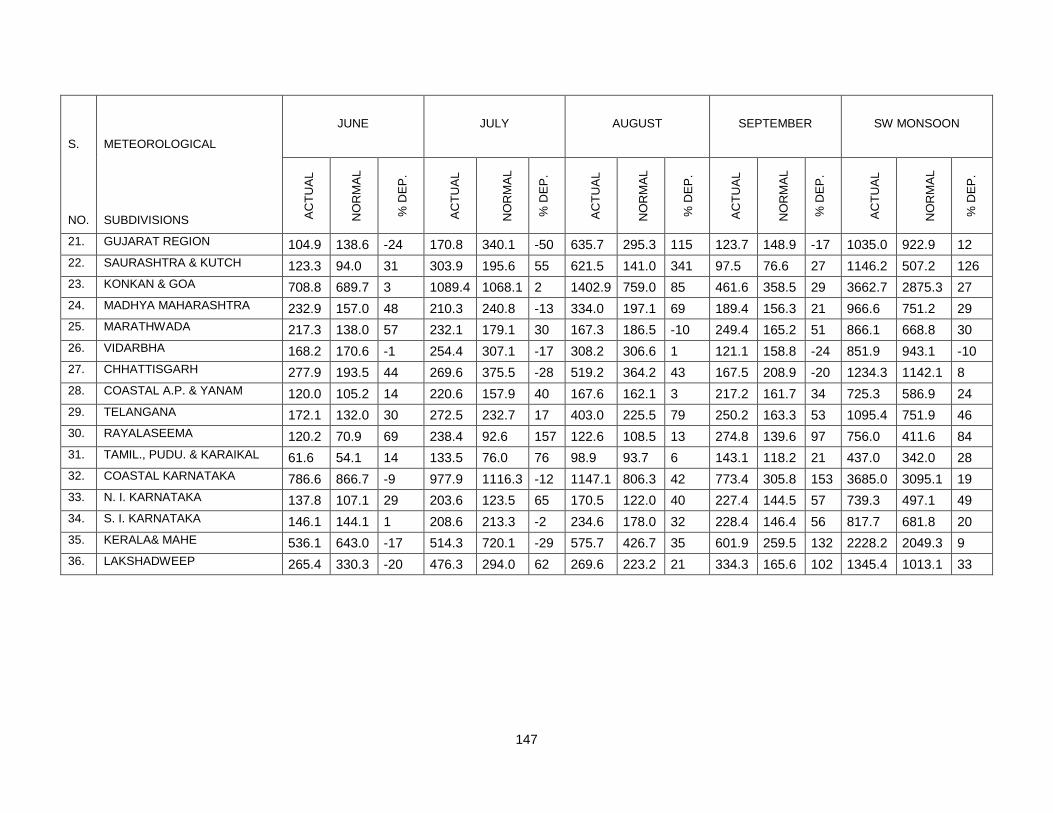
147
S. METEOROLOGICAL
JUNE
JULY
AUGUST
SEPTEMBER
SW MONSOON
NO. SUBDIVISIONS AC
TU
AL
NO
RM
AL
% D
EP
.
AC
TU
AL
NO
RM
AL
% D
EP
.
AC
TU
AL
NO
RM
AL
% D
EP
.
AC
TU
AL
NO
RM
AL
% D
EP
.
AC
TU
AL
NO
RM
AL
% D
EP
.
21. GUJARAT REGION 104.9 138.6 -24 170.8 340.1 -50 635.7 295.3 115 123.7 148.9 -17 1035.0 922.9 12
22. SAURASHTRA & KUTCH 123.3 94.0 31 303.9 195.6 55 621.5 141.0 341 97.5 76.6 27 1146.2 507.2 126
23. KONKAN & GOA 708.8 689.7 3 1089.4 1068.1 2 1402.9 759.0 85 461.6 358.5 29 3662.7 2875.3 27
24. MADHYA MAHARASHTRA 232.9 157.0 48 210.3 240.8 -13 334.0 197.1 69 189.4 156.3 21 966.6 751.2 29
25. MARATHWADA 217.3 138.0 57 232.1 179.1 30 167.3 186.5 -10 249.4 165.2 51 866.1 668.8 30
26. VIDARBHA 168.2 170.6 -1 254.4 307.1 -17 308.2 306.6 1 121.1 158.8 -24 851.9 943.1 -10
27. CHHATTISGARH 277.9 193.5 44 269.6 375.5 -28 519.2 364.2 43 167.5 208.9 -20 1234.3 1142.1 8
28. COASTAL A.P. & YANAM 120.0 105.2 14 220.6 157.9 40 167.6 162.1 3 217.2 161.7 34 725.3 586.9 24
29. TELANGANA 172.1 132.0 30 272.5 232.7 17 403.0 225.5 79 250.2 163.3 53 1095.4 751.9 46
30. RAYALASEEMA 120.2 70.9 69 238.4 92.6 157 122.6 108.5 13 274.8 139.6 97 756.0 411.6 84
31. TAMIL., PUDU. & KARAIKAL 61.6 54.1 14 133.5 76.0 76 98.9 93.7 6 143.1 118.2 21 437.0 342.0 28
32. COASTAL KARNATAKA 786.6 866.7 -9 977.9 1116.3 -12 1147.1 806.3 42 773.4 305.8 153 3685.0 3095.1 19
33. N. I. KARNATAKA 137.8 107.1 29 203.6 123.5 65 170.5 122.0 40 227.4 144.5 57 739.3 497.1 49
34. S. I. KARNATAKA 146.1 144.1 1 208.6 213.3 -2 234.6 178.0 32 228.4 146.4 56 817.7 681.8 20
35. KERALA& MAHE 536.1 643.0 -17 514.3 720.1 -29 575.7 426.7 35 601.9 259.5 132 2228.2 2049.3 9
36. LAKSHADWEEP 265.4 330.3 -20 476.3 294.0 62 269.6 223.2 21 334.3 165.6 102 1345.4 1013.1 33
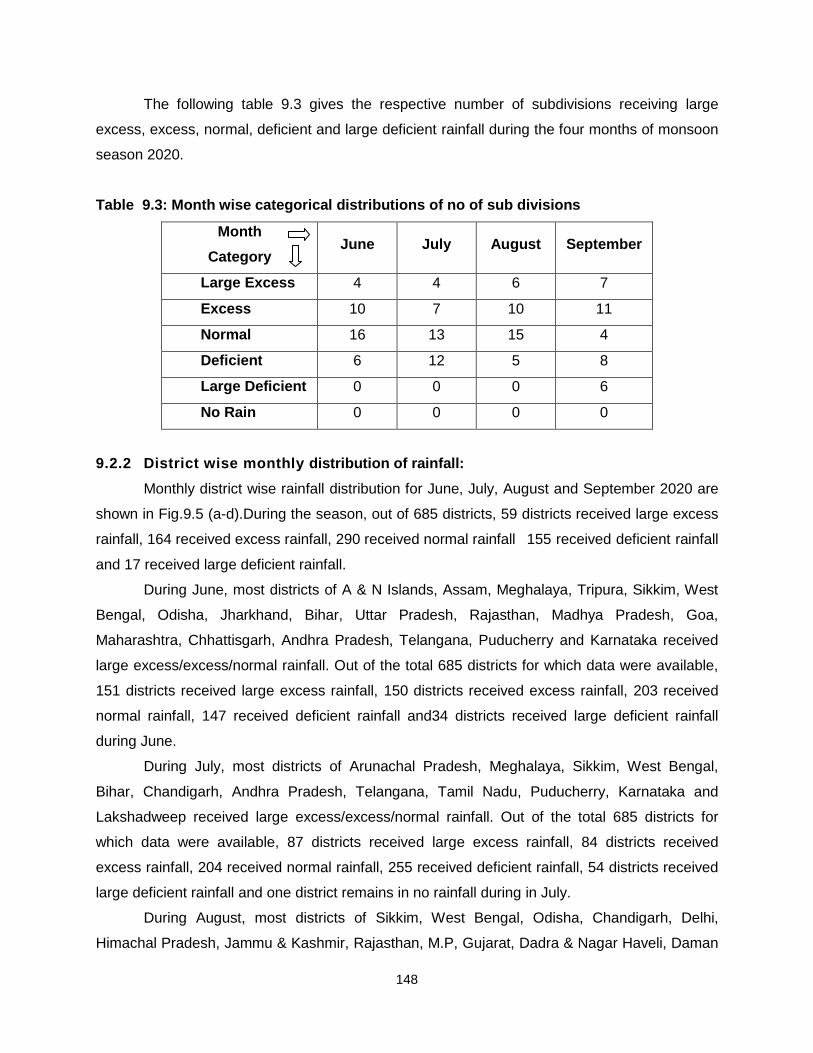
148
The following table 9.3 gives the respective number of subdivisions receiving large
excess, excess, normal, deficient and large deficient rainfall during the four months of monsoon
season 2020.
Table 9.3: Month wise categorical distributions of no of sub divisions
Month
Category June July August September
Large Excess 4 4 6 7
Excess 10 7 10 11
Normal 16 13 15 4
Deficient 6 12 5 8
Large Deficient 0 0 0 6
No Rain 0 0 0 0
9.2.2 District wise monthly distribution of rainfall:
Monthly district wise rainfall distribution for June, July, August and September 2020 are
shown in Fig.9.5 (a-d).During the season, out of 685 districts, 59 districts received large excess
rainfall, 164 received excess rainfall, 290 received normal rainfall 155 received deficient rainfall
and 17 received large deficient rainfall.
During June, most districts of A & N Islands, Assam, Meghalaya, Tripura, Sikkim, West
Bengal, Odisha, Jharkhand, Bihar, Uttar Pradesh, Rajasthan, Madhya Pradesh, Goa,
Maharashtra, Chhattisgarh, Andhra Pradesh, Telangana, Puducherry and Karnataka received
large excess/excess/normal rainfall. Out of the total 685 districts for which data were available,
151 districts received large excess rainfall, 150 districts received excess rainfall, 203 received
normal rainfall, 147 received deficient rainfall and34 districts received large deficient rainfall
during June.
During July, most districts of Arunachal Pradesh, Meghalaya, Sikkim, West Bengal,
Bihar, Chandigarh, Andhra Pradesh, Telangana, Tamil Nadu, Puducherry, Karnataka and
Lakshadweep received large excess/excess/normal rainfall. Out of the total 685 districts for
which data were available, 87 districts received large excess rainfall, 84 districts received
excess rainfall, 204 received normal rainfall, 255 received deficient rainfall, 54 districts received
large deficient rainfall and one district remains in no rainfall during in July.
During August, most districts of Sikkim, West Bengal, Odisha, Chandigarh, Delhi,
Himachal Pradesh, Jammu & Kashmir, Rajasthan, M.P, Gujarat, Dadra & Nagar Haveli, Daman
149
& Diu, Goa, Maharashtra, Chhattisgarh, Andhra Pradesh, Telangana, Karnataka, Kerala and
Lakshadweep. received Large excess/excess/normal rainfall. Out of the total 685 districts for
which data were available, 127 districts received large excess rainfall, 128 districts received
excess rainfall, 209 received normal rainfall, 191 received deficient rainfall, 29 districts received
large deficient rainfall and one district remains in no rainfall during August.
During September, most districts of A & N Island, Arunachal Pradesh,
Assam,Meghalaya, Tripura, Sikkim, Bihar, Andhra Pradesh, Telangana, Tamil Nadu,
Puducherry, Kerala and Lakshadweep received large excess/excess/normal rainfall. Out of the
total 685 districts for which data were available, 108 districts received large excess rainfall, 122
districts received excess rainfall, 139 received normal rainfall, 163 received deficient rainfall,
143 districts received large deficient rainfall and 10 remain in no rain during September.
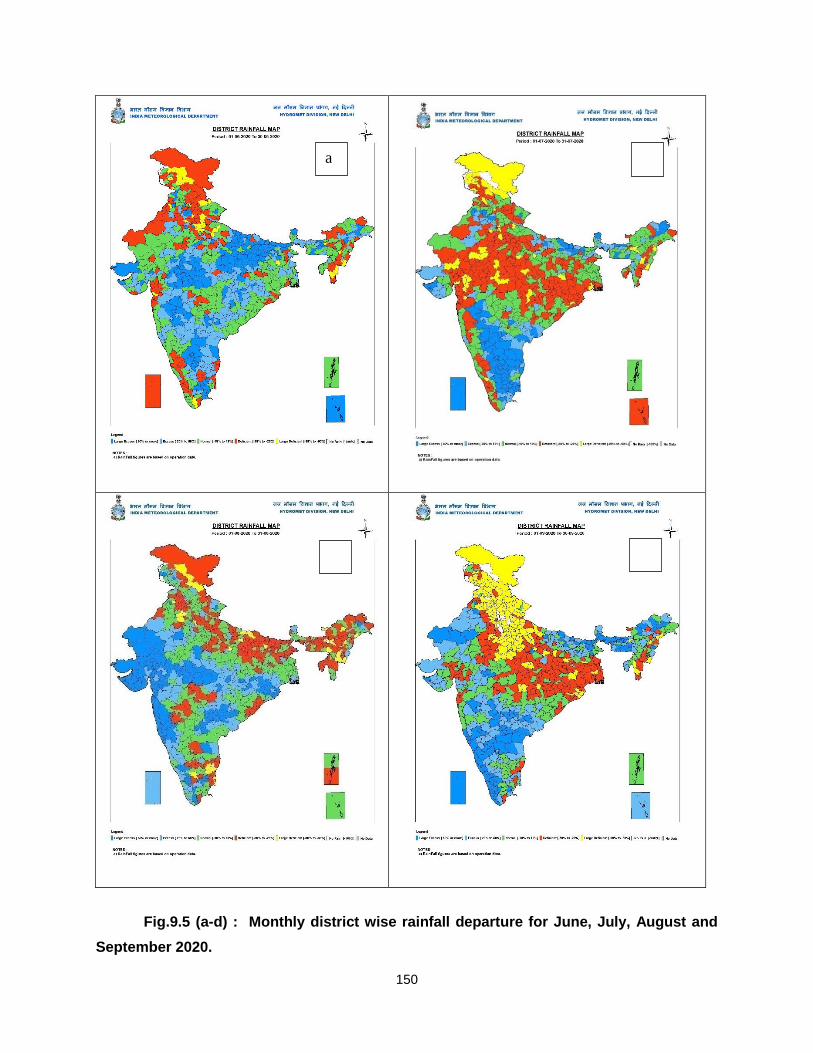
150
Fig.9.5 (a-d) : Monthly district wise rainfall departure for June, July, August and
September 2020.
a b
d c
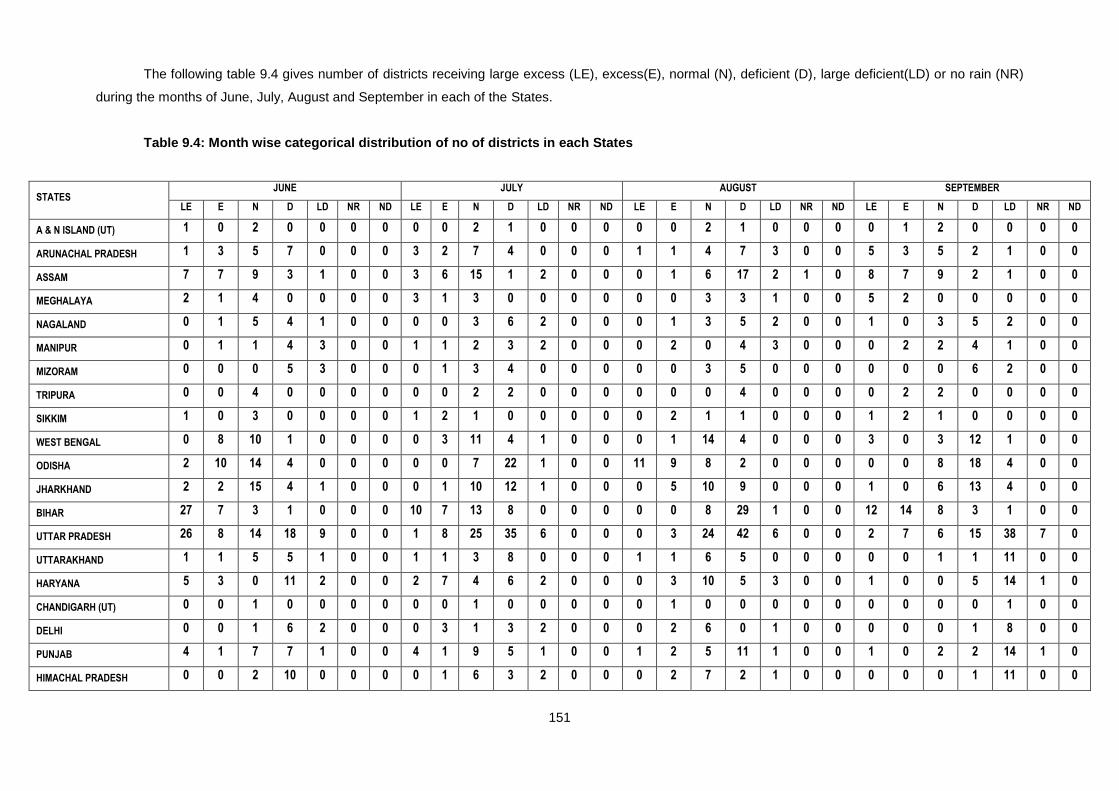
151
The following table 9.4 gives number of districts receiving large excess (LE), excess(E), normal (N), deficient (D), large deficient(LD) or no rain (NR)
during the months of June, July, August and September in each of the States.
Table 9.4: Month wise categorical distribution of no of districts in each States
STATES JUNE JULY AUGUST SEPTEMBER
LE E N D LD NR ND LE E N D LD NR ND LE E N D LD NR ND LE E N D LD NR ND
A & N ISLAND (UT) 1 0 2 0 0 0 0 0 0 2 1 0 0 0 0 0 2 1 0 0 0 0 1 2 0 0 0 0
ARUNACHAL PRADESH 1 3 5 7 0 0 0 3 2 7 4 0 0 0 1 1 4 7 3 0 0 5 3 5 2 1 0 0
ASSAM 7 7 9 3 1 0 0 3 6 15 1 2 0 0 0 1 6 17 2 1 0 8 7 9 2 1 0 0
MEGHALAYA 2 1 4 0 0 0 0 3 1 3 0 0 0 0 0 0 3 3 1 0 0 5 2 0 0 0 0 0
NAGALAND 0 1 5 4 1 0 0 0 0 3 6 2 0 0 0 1 3 5 2 0 0 1 0 3 5 2 0 0
MANIPUR 0 1 1 4 3 0 0 1 1 2 3 2 0 0 0 2 0 4 3 0 0 0 2 2 4 1 0 0
MIZORAM 0 0 0 5 3 0 0 0 1 3 4 0 0 0 0 0 3 5 0 0 0 0 0 0 6 2 0 0
TRIPURA 0 0 4 0 0 0 0 0 0 2 2 0 0 0 0 0 0 4 0 0 0 0 2 2 0 0 0 0
SIKKIM 1 0 3 0 0 0 0 1 2 1 0 0 0 0 0 2 1 1 0 0 0 1 2 1 0 0 0 0
WEST BENGAL 0 8 10 1 0 0 0 0 3 11 4 1 0 0 0 1 14 4 0 0 0 3 0 3 12 1 0 0
ODISHA 2 10 14 4 0 0 0 0 0 7 22 1 0 0 11 9 8 2 0 0 0 0 0 8 18 4 0 0
JHARKHAND 2 2 15 4 1 0 0 0 1 10 12 1 0 0 0 5 10 9 0 0 0 1 0 6 13 4 0 0
BIHAR 27 7 3 1 0 0 0 10 7 13 8 0 0 0 0 0 8 29 1 0 0 12 14 8 3 1 0 0
UTTAR PRADESH 26 8 14 18 9 0 0 1 8 25 35 6 0 0 0 3 24 42 6 0 0 2 7 6 15 38 7 0
UTTARAKHAND 1 1 5 5 1 0 0 1 1 3 8 0 0 0 1 1 6 5 0 0 0 0 0 1 1 11 0 0
HARYANA 5 3 0 11 2 0 0 2 7 4 6 2 0 0 0 3 10 5 3 0 0 1 0 0 5 14 1 0
CHANDIGARH (UT) 0 0 1 0 0 0 0 0 0 1 0 0 0 0 0 1 0 0 0 0 0 0 0 0 0 1 0 0
DELHI 0 0 1 6 2 0 0 0 3 1 3 2 0 0 0 2 6 0 1 0 0 0 0 0 1 8 0 0
PUNJAB 4 1 7 7 1 0 0 4 1 9 5 1 0 0 1 2 5 11 1 0 0 1 0 2 2 14 1 0
HIMACHAL PRADESH 0 0 2 10 0 0 0 0 1 6 3 2 0 0 0 2 7 2 1 0 0 0 0 0 1 11 0 0
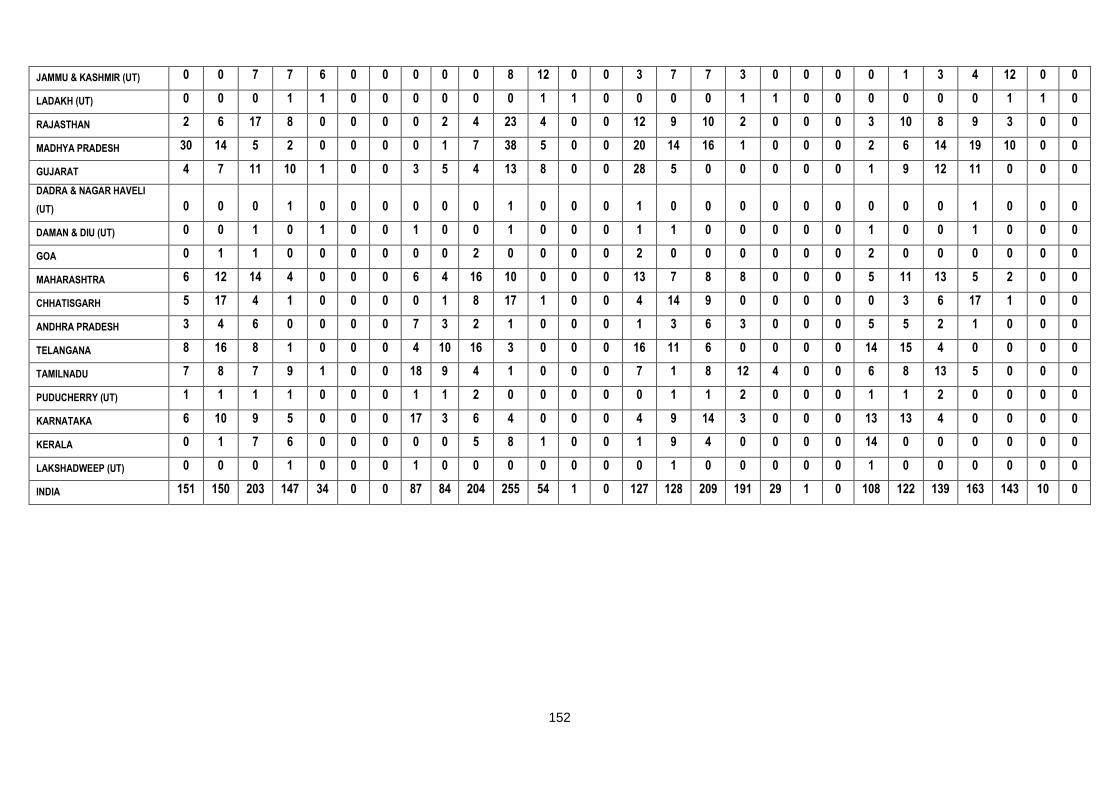
152
JAMMU & KASHMIR (UT) 0 0 7 7 6 0 0 0 0 0 8 12 0 0 3 7 7 3 0 0 0 0 1 3 4 12 0 0
LADAKH (UT) 0 0 0 1 1 0 0 0 0 0 0 1 1 0 0 0 0 1 1 0 0 0 0 0 0 1 1 0
RAJASTHAN 2 6 17 8 0 0 0 0 2 4 23 4 0 0 12 9 10 2 0 0 0 3 10 8 9 3 0 0
MADHYA PRADESH 30 14 5 2 0 0 0 0 1 7 38 5 0 0 20 14 16 1 0 0 0 2 6 14 19 10 0 0
GUJARAT 4 7 11 10 1 0 0 3 5 4 13 8 0 0 28 5 0 0 0 0 0 1 9 12 11 0 0 0
DADRA & NAGAR HAVELI
(UT) 0 0 0 1 0 0 0 0 0 0 1 0 0 0 1 0 0 0 0 0 0 0 0 0 1 0 0 0
DAMAN & DIU (UT) 0 0 1 0 1 0 0 1 0 0 1 0 0 0 1 1 0 0 0 0 0 1 0 0 1 0 0 0
GOA 0 1 1 0 0 0 0 0 0 2 0 0 0 0 2 0 0 0 0 0 0 2 0 0 0 0 0 0
MAHARASHTRA 6 12 14 4 0 0 0 6 4 16 10 0 0 0 13 7 8 8 0 0 0 5 11 13 5 2 0 0
CHHATISGARH 5 17 4 1 0 0 0 0 1 8 17 1 0 0 4 14 9 0 0 0 0 0 3 6 17 1 0 0
ANDHRA PRADESH 3 4 6 0 0 0 0 7 3 2 1 0 0 0 1 3 6 3 0 0 0 5 5 2 1 0 0 0
TELANGANA 8 16 8 1 0 0 0 4 10 16 3 0 0 0 16 11 6 0 0 0 0 14 15 4 0 0 0 0
TAMILNADU 7 8 7 9 1 0 0 18 9 4 1 0 0 0 7 1 8 12 4 0 0 6 8 13 5 0 0 0
PUDUCHERRY (UT) 1 1 1 1 0 0 0 1 1 2 0 0 0 0 0 1 1 2 0 0 0 1 1 2 0 0 0 0
KARNATAKA 6 10 9 5 0 0 0 17 3 6 4 0 0 0 4 9 14 3 0 0 0 13 13 4 0 0 0 0
KERALA 0 1 7 6 0 0 0 0 0 5 8 1 0 0 1 9 4 0 0 0 0 14 0 0 0 0 0 0
LAKSHADWEEP (UT) 0 0 0 1 0 0 0 1 0 0 0 0 0 0 0 1 0 0 0 0 0 1 0 0 0 0 0 0
INDIA 151 150 203 147 34 0 0 87 84 204 255 54 1 0 127 128 209 191 29 1 0 108 122 139 163 143 10 0
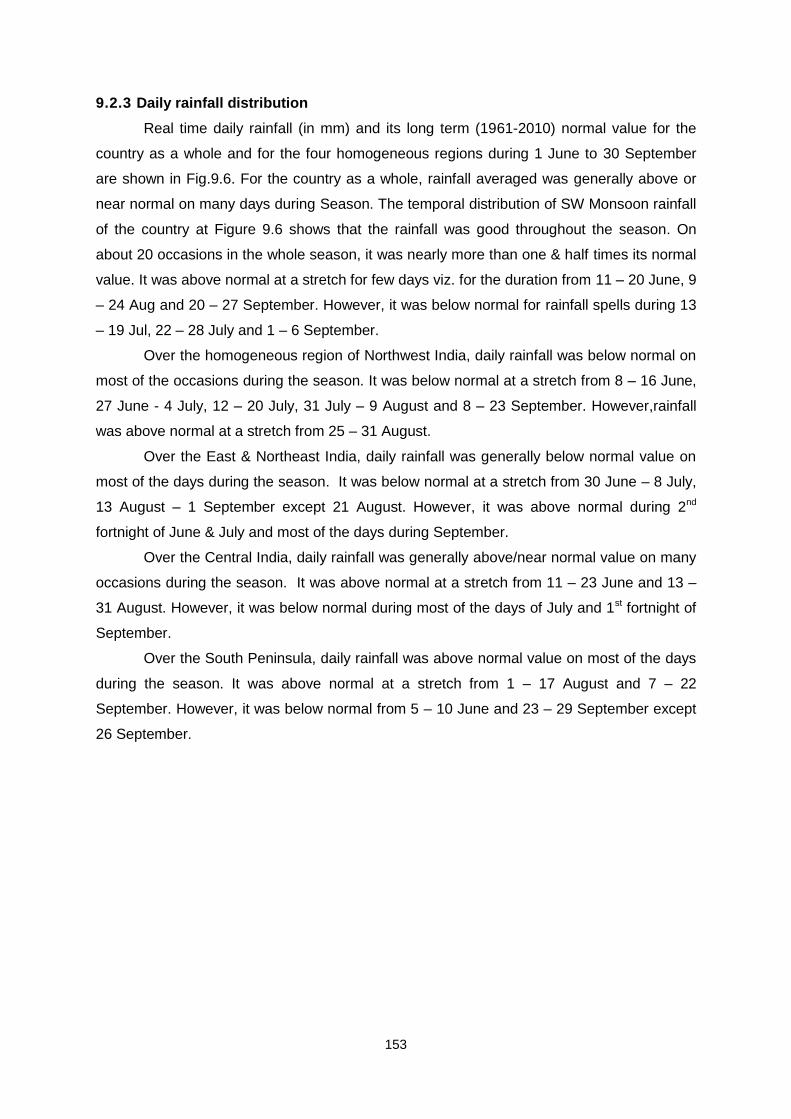
153
9.2.3 Daily rainfall distribution
Real time daily rainfall (in mm) and its long term (1961-2010) normal value for the
country as a whole and for the four homogeneous regions during 1 June to 30 September
are shown in Fig.9.6. For the country as a whole, rainfall averaged was generally above or
near normal on many days during Season. The temporal distribution of SW Monsoon rainfall
of the country at Figure 9.6 shows that the rainfall was good throughout the season. On
about 20 occasions in the whole season, it was nearly more than one & half times its normal
value. It was above normal at a stretch for few days viz. for the duration from 11 – 20 June, 9
– 24 Aug and 20 – 27 September. However, it was below normal for rainfall spells during 13
– 19 Jul, 22 – 28 July and 1 – 6 September.
Over the homogeneous region of Northwest India, daily rainfall was below normal on
most of the occasions during the season. It was below normal at a stretch from 8 – 16 June,
27 June - 4 July, 12 – 20 July, 31 July – 9 August and 8 – 23 September. However,rainfall
was above normal at a stretch from 25 – 31 August.
Over the East & Northeast India, daily rainfall was generally below normal value on
most of the days during the season. It was below normal at a stretch from 30 June – 8 July,
13 August – 1 September except 21 August. However, it was above normal during 2nd
fortnight of June & July and most of the days during September.
Over the Central India, daily rainfall was generally above/near normal value on many
occasions during the season. It was above normal at a stretch from 11 – 23 June and 13 –
31 August. However, it was below normal during most of the days of July and 1st fortnight of
September.
Over the South Peninsula, daily rainfall was above normal value on most of the days
during the season. It was above normal at a stretch from 1 – 17 August and 7 – 22
September. However, it was below normal from 5 – 10 June and 23 – 29 September except
26 September.
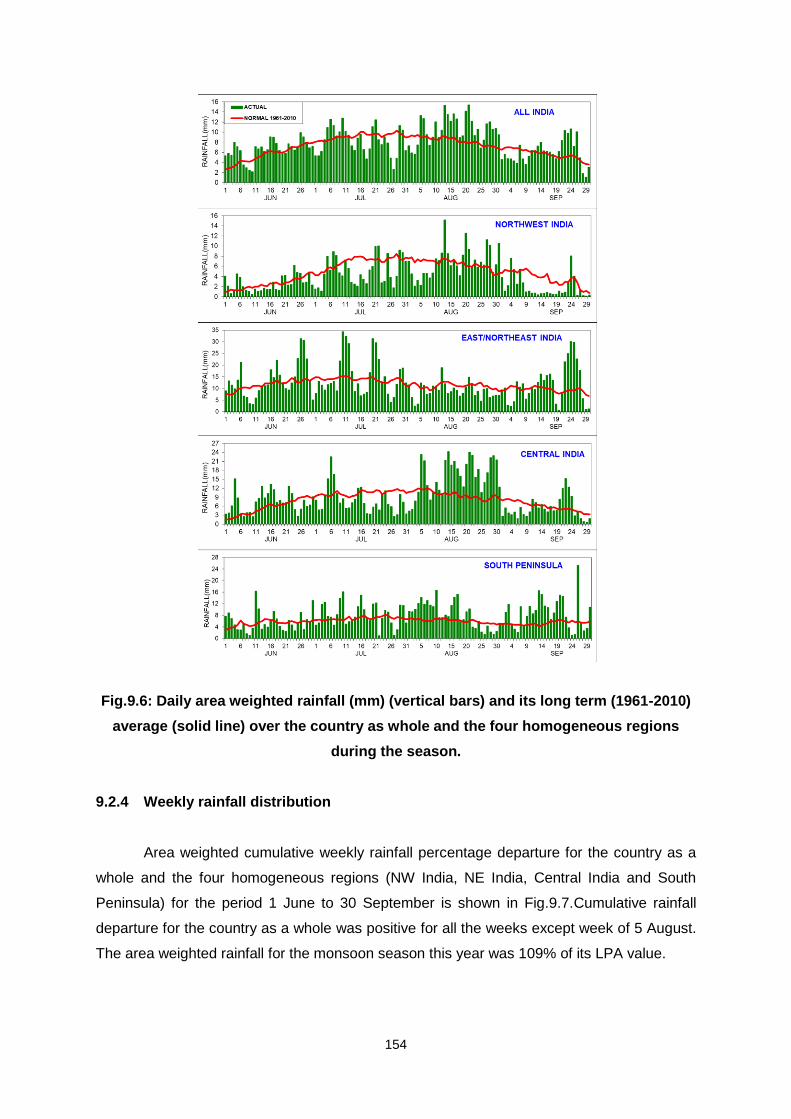
154
Fig.9.6: Daily area weighted rainfall (mm) (vertical bars) and its long term (1961-2010)
average (solid line) over the country as whole and the four homogeneous regions
during the season.
9.2.4 Weekly rainfall distribution
Area weighted cumulative weekly rainfall percentage departure for the country as a
whole and the four homogeneous regions (NW India, NE India, Central India and South
Peninsula) for the period 1 June to 30 September is shown in Fig.9.7.Cumulative rainfall
departure for the country as a whole was positive for all the weeks except week of 5 August.
The area weighted rainfall for the monsoon season this year was 109% of its LPA value.
155
Cumulative weekly rainfall departure for East and northeast region and South
Peninsula region was positive during all the weeks of the season. For northwest region, the
rainfall departure was positive for all the weeks upto8 July, thereafter it was negative till the
end of season.For central region, the rainfall departure was positive for all the weeks except
for 3 weeks of 29 July, 5 August and 12 August.
Week by week and cumulative weekly rainfall percentage departure for each of the
36 meteorological subdivisions from 1 June to 30 Sept. is shown in Fig.9.8 and 9.9
respectively. Weekly rainfall was large excess, excess or normal during most of the weeks
(more than 50% of the weeks) for some subdivisions of east & northeast, central and south
peninsular India viz. Andaman & Nicobar island, Arunachal Pradesh, Assam & Meghalaya,
Sub-Himalayan West Bengal and Sikkim, Gangetic West Bengal, Odisha, Jharkhand, Bihar,
West Rajasthan, East Rajasthan, West Madhya Pradesh, East Madhya Pradesh, Saurashtra
& Kutch, Konkan & Goa, Madhya Maharashtra, Marathwada, Vidarbha, Chattisgarh, Coastal
Andhra Pradesh & Yenam, Telangana, Rayalaseema, Tamil Nadu, Puducherry & Karaikal,
Coastal Karnataka, South Interior Karnataka, North Interior Karnataka and Lakshadweep.
Similarly, cumulative weekly rainfall was also large excess, excess or normal during
most of the weeks (more than 50% of the weeks) for most of the subdivisions viz. Andaman
& Nicobar Islands, Arunachal Pradesh, Assam & Meghalaya, Sub-Himalayan West Bengal
& Sikkim, Gangetic West Bengal, Odisha, Jharkhand, Bihar, East Uttar Pradesh,
Uttarakhand, Harayana, Chandigarh & Delhi, Punjab, West Rajasthan, East Rajasthan, West
Madhya Pradesh, East Madhya Pradesh, Gujarat Region, Saurashtra & Kutch, Konkan &
Goa, Madhya Maharashtra, Marathwada, Vidarbha, Chattisgarh, Coastal Andhra Pradesh &
Yenam, Telangana, Rayalaseema, Tamil Nadu, Puducherry & Karaikal, Coastal Karnataka,
North Interior Karnataka, South Interior Karnataka, Kerala & Mahe and Lakshadweep.
9.2.5 Heavy Rainfall Events
During the 2020 southwest monsoon season, very heavy rainfall (≥ 12 cm in 24
hours)/ extremely heavy rainfall (≥ 21 cm in 24 hours) events were reported at many
stations. The month wise and station wise distribution of extremely heavy rainfall events is
given in Table-9.5.Record rainfall (in 24 hrs.) for the month reported during the season is
given in Table-9.6.
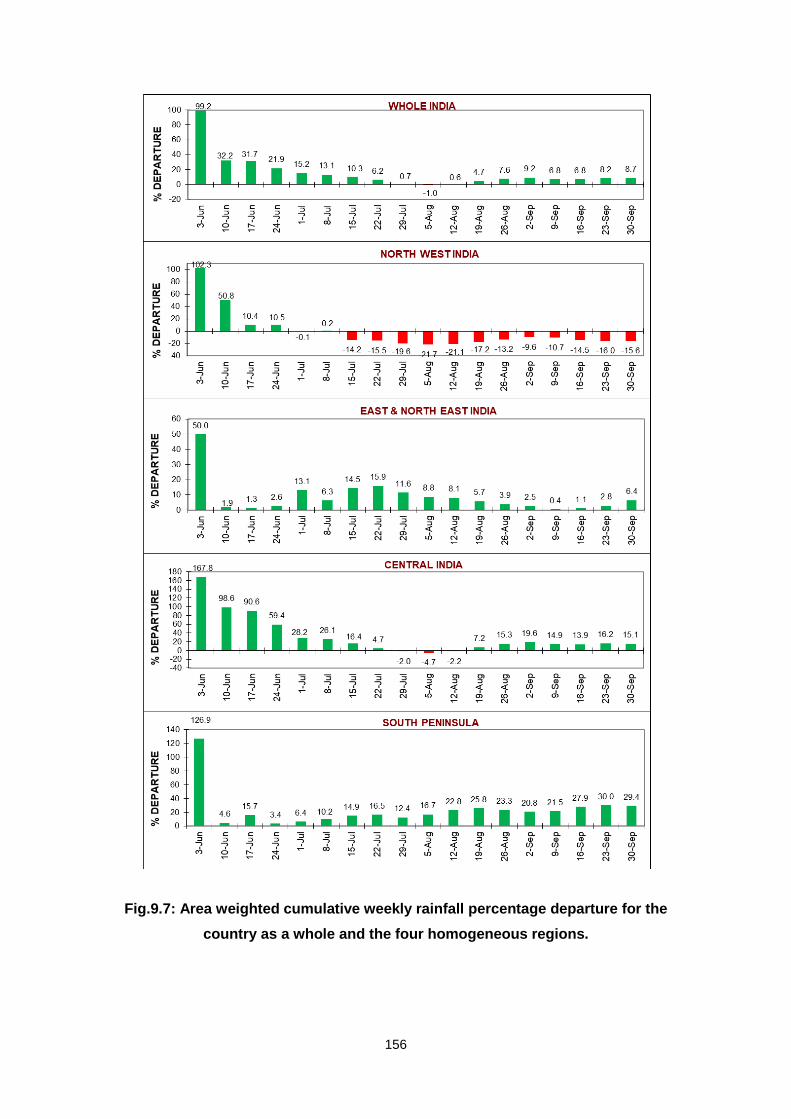
156
Fig.9.7: Area weighted cumulative weekly rainfall percentage departure for the
country as a whole and the four homogeneous regions.
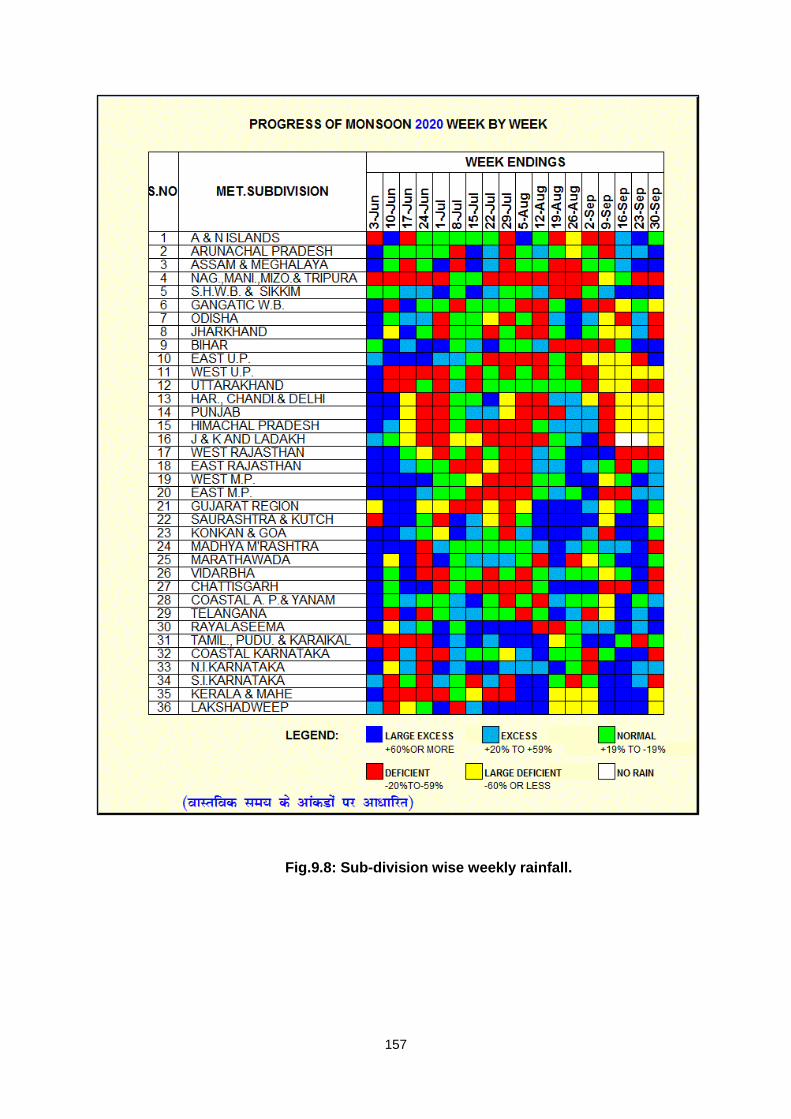
157
Fig.9.8: Sub-division wise weekly rainfall.
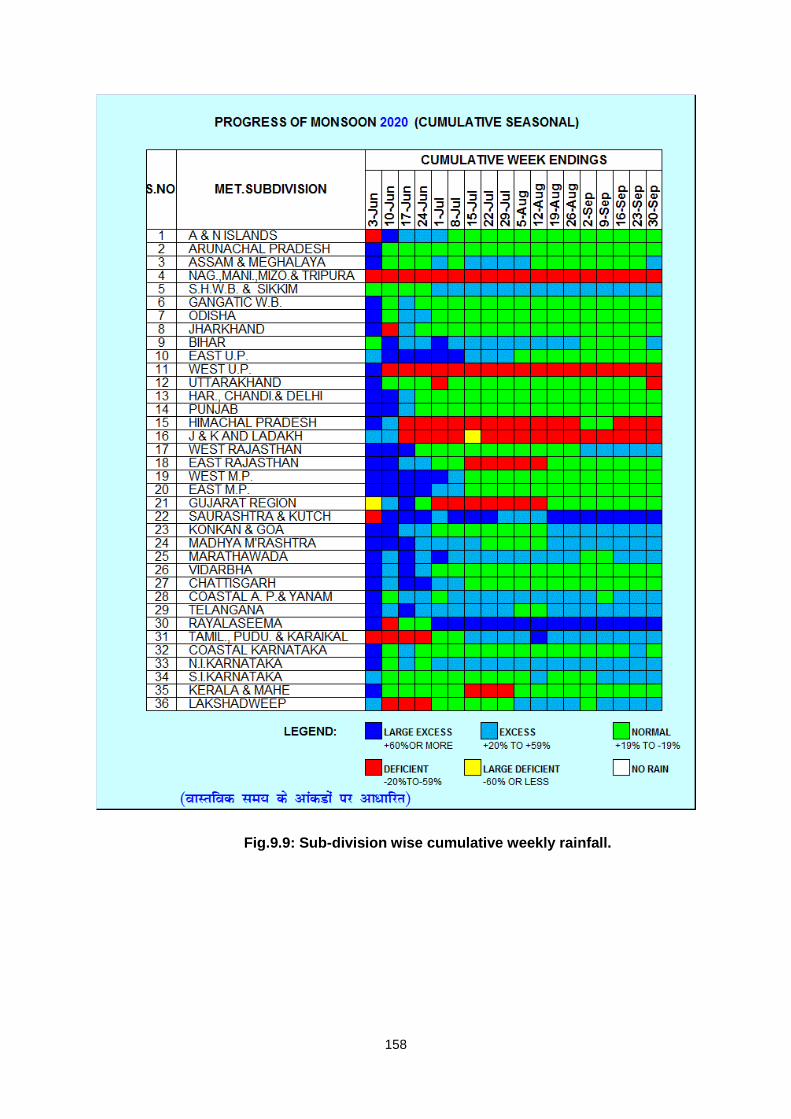
158
Fig.9.9: Sub-division wise cumulative weekly rainfall.
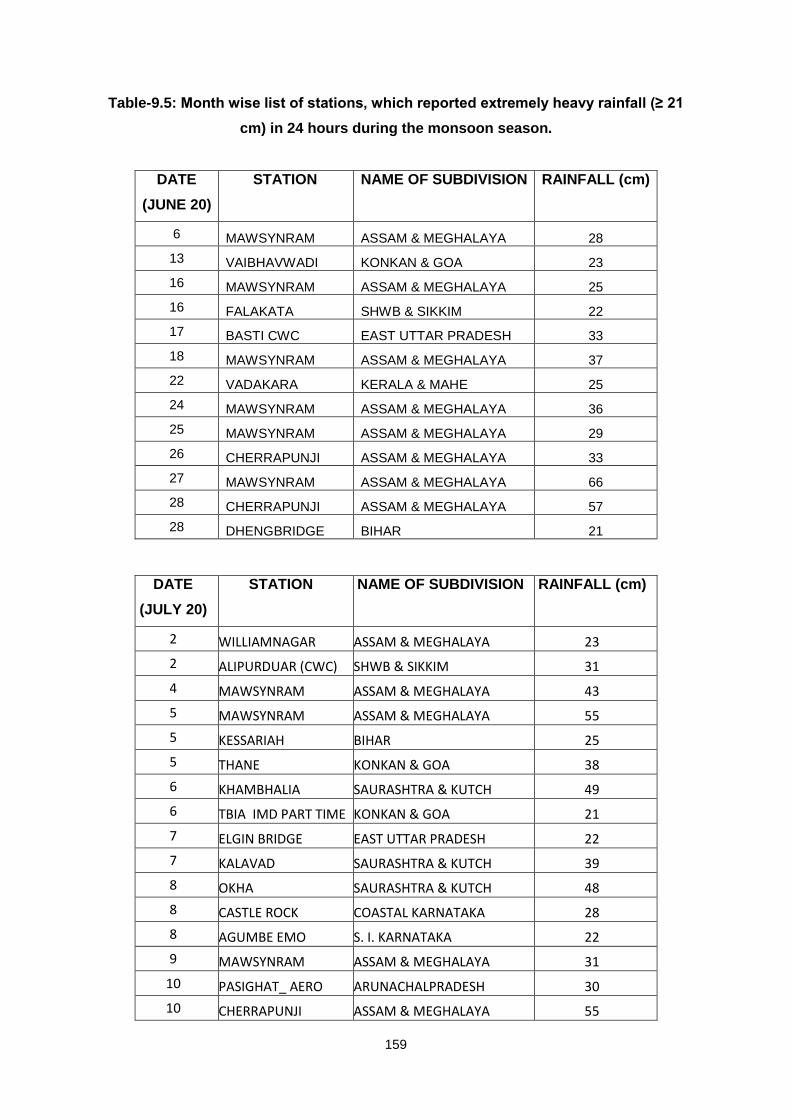
159
Table-9.5: Month wise list of stations, which reported extremely heavy rainfall (≥ 21
cm) in 24 hours during the monsoon season.
DATE
(JUNE 20)
STATION NAME OF SUBDIVISION RAINFALL (cm)
6 MAWSYNRAM ASSAM & MEGHALAYA 28
13 VAIBHAVWADI KONKAN & GOA 23
16 MAWSYNRAM ASSAM & MEGHALAYA 25
16 FALAKATA SHWB & SIKKIM 22
17 BASTI CWC EAST UTTAR PRADESH 33
18 MAWSYNRAM ASSAM & MEGHALAYA 37
22 VADAKARA KERALA & MAHE 25
24 MAWSYNRAM ASSAM & MEGHALAYA 36
25 MAWSYNRAM ASSAM & MEGHALAYA 29
26 CHERRAPUNJI ASSAM & MEGHALAYA 33
27 MAWSYNRAM ASSAM & MEGHALAYA 66
28 CHERRAPUNJI ASSAM & MEGHALAYA 57
28 DHENGBRIDGE BIHAR 21
DATE
(JULY 20)
STATION NAME OF SUBDIVISION RAINFALL (cm)
2 WILLIAMNAGAR ASSAM & MEGHALAYA 23
2 ALIPURDUAR (CWC) SHWB & SIKKIM 31
4 MAWSYNRAM ASSAM & MEGHALAYA 43
5 MAWSYNRAM ASSAM & MEGHALAYA 55
5 KESSARIAH BIHAR 25
5 THANE KONKAN & GOA 38
6 KHAMBHALIA SAURASHTRA & KUTCH 49
6 TBIA IMD PART TIME KONKAN & GOA 21
7 ELGIN BRIDGE EAST UTTAR PRADESH 22
7 KALAVAD SAURASHTRA & KUTCH 39
8 OKHA SAURASHTRA & KUTCH 48
8 CASTLE ROCK COASTAL KARNATAKA 28
8 AGUMBE EMO S. I. KARNATAKA 22
9 MAWSYNRAM ASSAM & MEGHALAYA 31
10 PASIGHAT_ AERO ARUNACHALPRADESH 30
10 CHERRAPUNJI ASSAM & MEGHALAYA 55
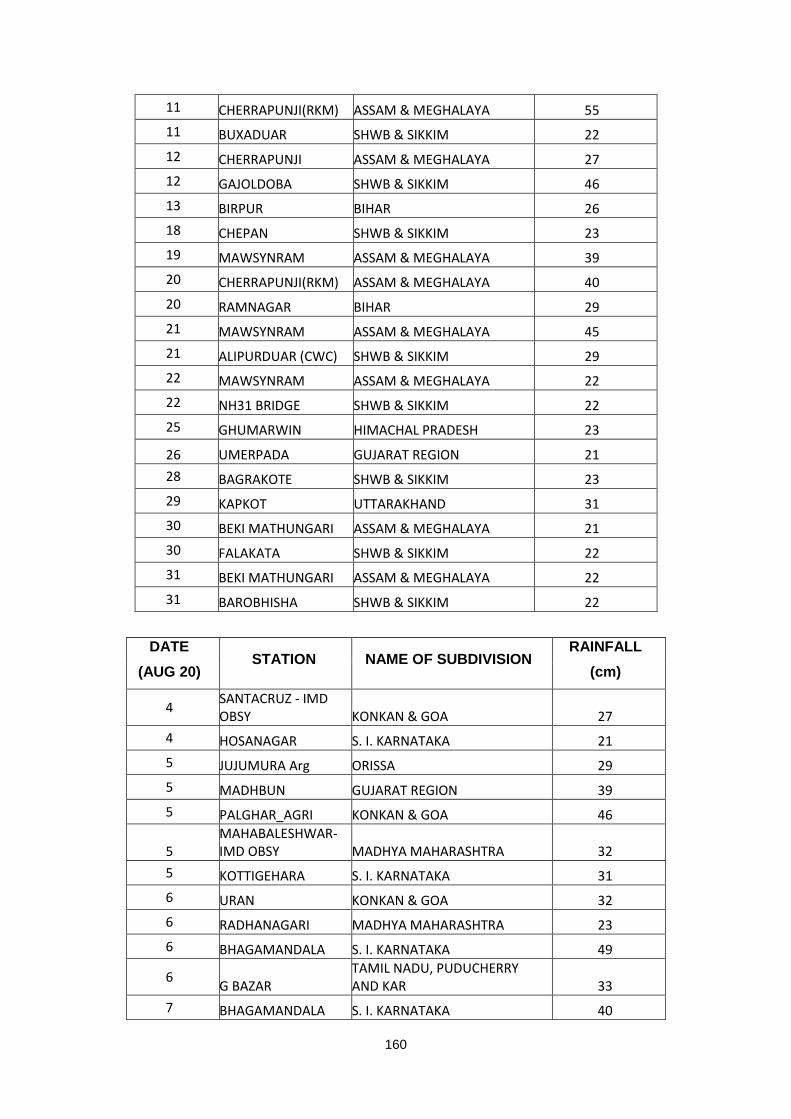
160
11 CHERRAPUNJI(RKM) ASSAM & MEGHALAYA 55
11 BUXADUAR SHWB & SIKKIM 22
12 CHERRAPUNJI ASSAM & MEGHALAYA 27
12 GAJOLDOBA SHWB & SIKKIM 46
13 BIRPUR BIHAR 26
18 CHEPAN SHWB & SIKKIM 23
19 MAWSYNRAM ASSAM & MEGHALAYA 39
20 CHERRAPUNJI(RKM) ASSAM & MEGHALAYA 40
20 RAMNAGAR BIHAR 29
21 MAWSYNRAM ASSAM & MEGHALAYA 45
21 ALIPURDUAR (CWC) SHWB & SIKKIM 29
22 MAWSYNRAM ASSAM & MEGHALAYA 22
22 NH31 BRIDGE SHWB & SIKKIM 22
25 GHUMARWIN HIMACHAL PRADESH 23
26 UMERPADA GUJARAT REGION 21
28 BAGRAKOTE SHWB & SIKKIM 23
29 KAPKOT UTTARAKHAND 31
30 BEKI MATHUNGARI ASSAM & MEGHALAYA 21
30 FALAKATA SHWB & SIKKIM 22
31 BEKI MATHUNGARI ASSAM & MEGHALAYA 22
31 BAROBHISHA SHWB & SIKKIM 22
DATE
(AUG 20) STATION NAME OF SUBDIVISION
RAINFALL
(cm)
4 SANTACRUZ - IMD OBSY KONKAN & GOA 27
4 HOSANAGAR S. I. KARNATAKA 21
5 JUJUMURA Arg ORISSA 29
5 MADHBUN GUJARAT REGION 39
5 PALGHAR_AGRI KONKAN & GOA 46
5 MAHABALESHWAR- IMD OBSY MADHYA MAHARASHTRA 32
5 KOTTIGEHARA S. I. KARNATAKA 31
6 URAN KONKAN & GOA 32
6 RADHANAGARI MADHYA MAHARASHTRA 23
6 BHAGAMANDALA S. I. KARNATAKA 49
6 G BAZAR
TAMIL NADU, PUDUCHERRY AND KAR 33
7 BHAGAMANDALA S. I. KARNATAKA 40
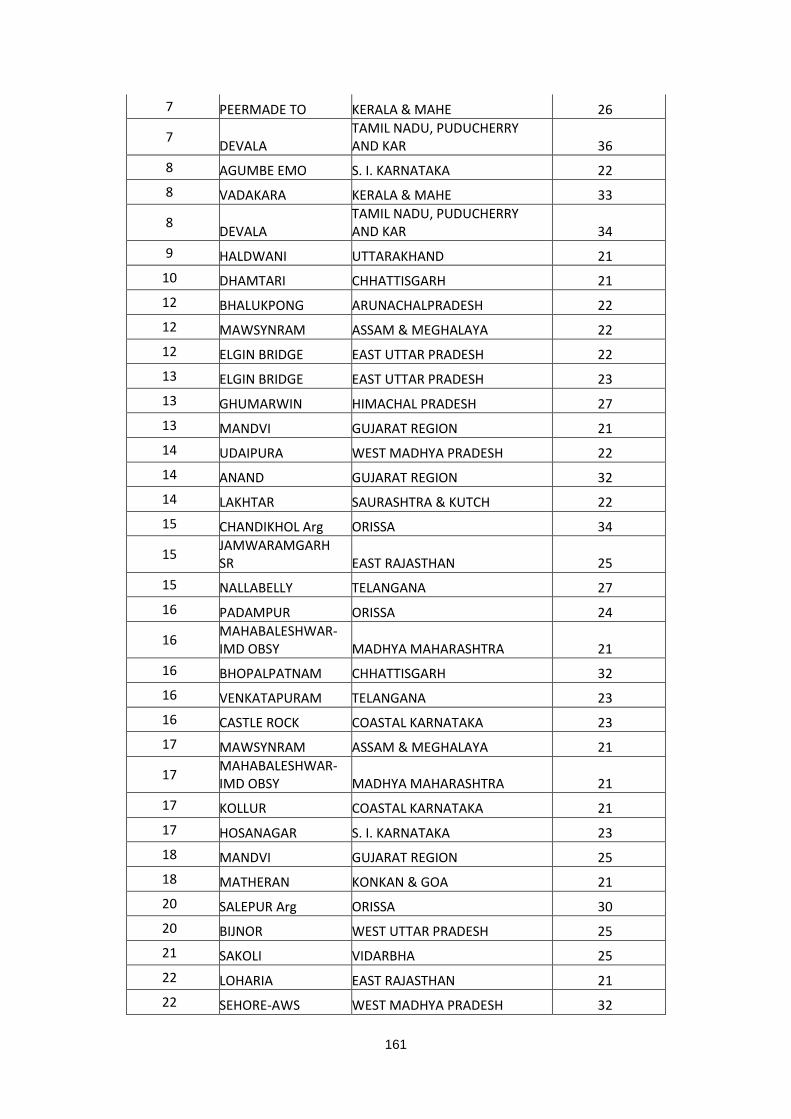
161
7 PEERMADE TO KERALA & MAHE 26
7 DEVALA
TAMIL NADU, PUDUCHERRY AND KAR 36
8 AGUMBE EMO S. I. KARNATAKA 22
8 VADAKARA KERALA & MAHE 33
8 DEVALA
TAMIL NADU, PUDUCHERRY AND KAR 34
9 HALDWANI UTTARAKHAND 21
10 DHAMTARI CHHATTISGARH 21
12 BHALUKPONG ARUNACHALPRADESH 22
12 MAWSYNRAM ASSAM & MEGHALAYA 22
12 ELGIN BRIDGE EAST UTTAR PRADESH 22
13 ELGIN BRIDGE EAST UTTAR PRADESH 23
13 GHUMARWIN HIMACHAL PRADESH 27
13 MANDVI GUJARAT REGION 21
14 UDAIPURA WEST MADHYA PRADESH 22
14 ANAND GUJARAT REGION 32
14 LAKHTAR SAURASHTRA & KUTCH 22
15 CHANDIKHOL Arg ORISSA 34
15 JAMWARAMGARH SR EAST RAJASTHAN 25
15 NALLABELLY TELANGANA 27
16 PADAMPUR ORISSA 24
16 MAHABALESHWAR- IMD OBSY MADHYA MAHARASHTRA 21
16 BHOPALPATNAM CHHATTISGARH 32
16 VENKATAPURAM TELANGANA 23
16 CASTLE ROCK COASTAL KARNATAKA 23
17 MAWSYNRAM ASSAM & MEGHALAYA 21
17 MAHABALESHWAR- IMD OBSY MADHYA MAHARASHTRA 21
17 KOLLUR COASTAL KARNATAKA 21
17 HOSANAGAR S. I. KARNATAKA 23
18 MANDVI GUJARAT REGION 25
18 MATHERAN KONKAN & GOA 21
20 SALEPUR Arg ORISSA 30
20 BIJNOR WEST UTTAR PRADESH 25
21 SAKOLI VIDARBHA 25
22 LOHARIA EAST RAJASTHAN 21
22 SEHORE-AWS WEST MADHYA PRADESH 32
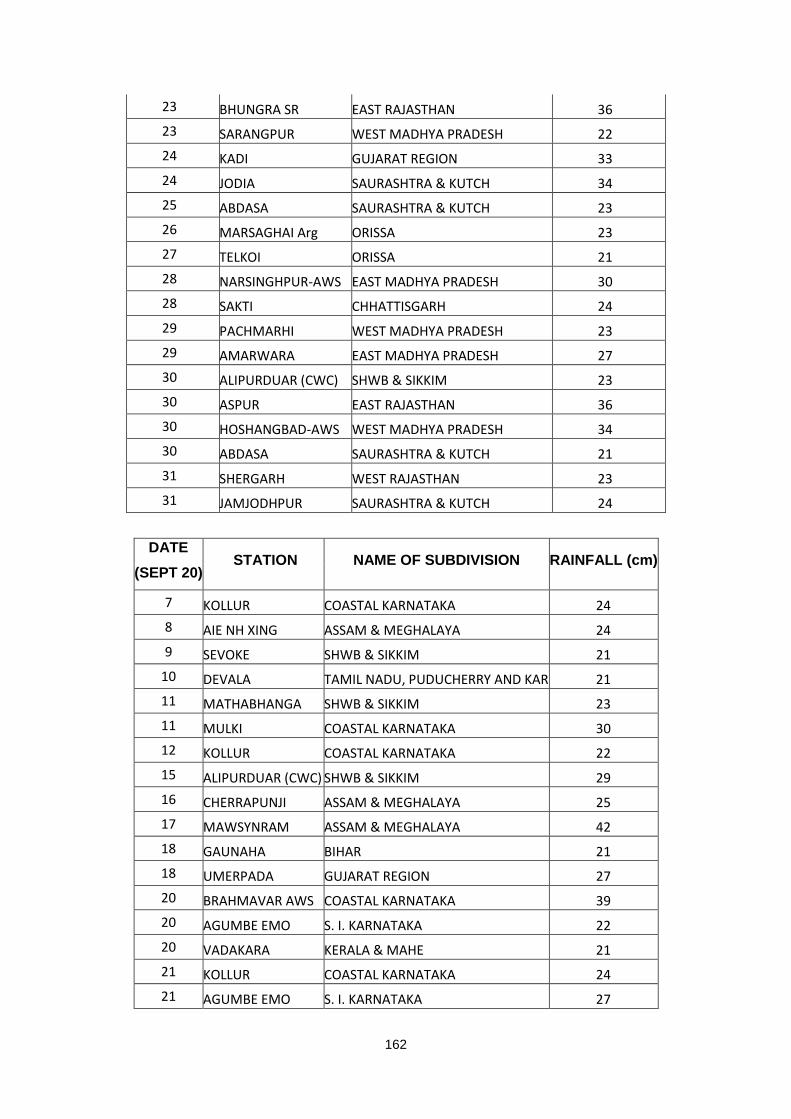
162
23 BHUNGRA SR EAST RAJASTHAN 36
23 SARANGPUR WEST MADHYA PRADESH 22
24 KADI GUJARAT REGION 33
24 JODIA SAURASHTRA & KUTCH 34
25 ABDASA SAURASHTRA & KUTCH 23
26 MARSAGHAI Arg ORISSA 23
27 TELKOI ORISSA 21
28 NARSINGHPUR-AWS EAST MADHYA PRADESH 30
28 SAKTI CHHATTISGARH 24
29 PACHMARHI WEST MADHYA PRADESH 23
29 AMARWARA EAST MADHYA PRADESH 27
30 ALIPURDUAR (CWC) SHWB & SIKKIM 23
30 ASPUR EAST RAJASTHAN 36
30 HOSHANGBAD-AWS WEST MADHYA PRADESH 34
30 ABDASA SAURASHTRA & KUTCH 21
31 SHERGARH WEST RAJASTHAN 23
31 JAMJODHPUR SAURASHTRA & KUTCH 24
DATE
(SEPT 20) STATION NAME OF SUBDIVISION RAINFALL (cm)
7 KOLLUR COASTAL KARNATAKA 24
8 AIE NH XING ASSAM & MEGHALAYA 24
9 SEVOKE SHWB & SIKKIM 21
10 DEVALA TAMIL NADU, PUDUCHERRY AND KAR 21
11 MATHABHANGA SHWB & SIKKIM 23
11 MULKI COASTAL KARNATAKA 30
12 KOLLUR COASTAL KARNATAKA 22
15 ALIPURDUAR (CWC) SHWB & SIKKIM 29
16 CHERRAPUNJI ASSAM & MEGHALAYA 25
17 MAWSYNRAM ASSAM & MEGHALAYA 42
18 GAUNAHA BIHAR 21
18 UMERPADA GUJARAT REGION 27
20 BRAHMAVAR AWS COASTAL KARNATAKA 39
20 AGUMBE EMO S. I. KARNATAKA 22
20 VADAKARA KERALA & MAHE 21
21 KOLLUR COASTAL KARNATAKA 24
21 AGUMBE EMO S. I. KARNATAKA 27
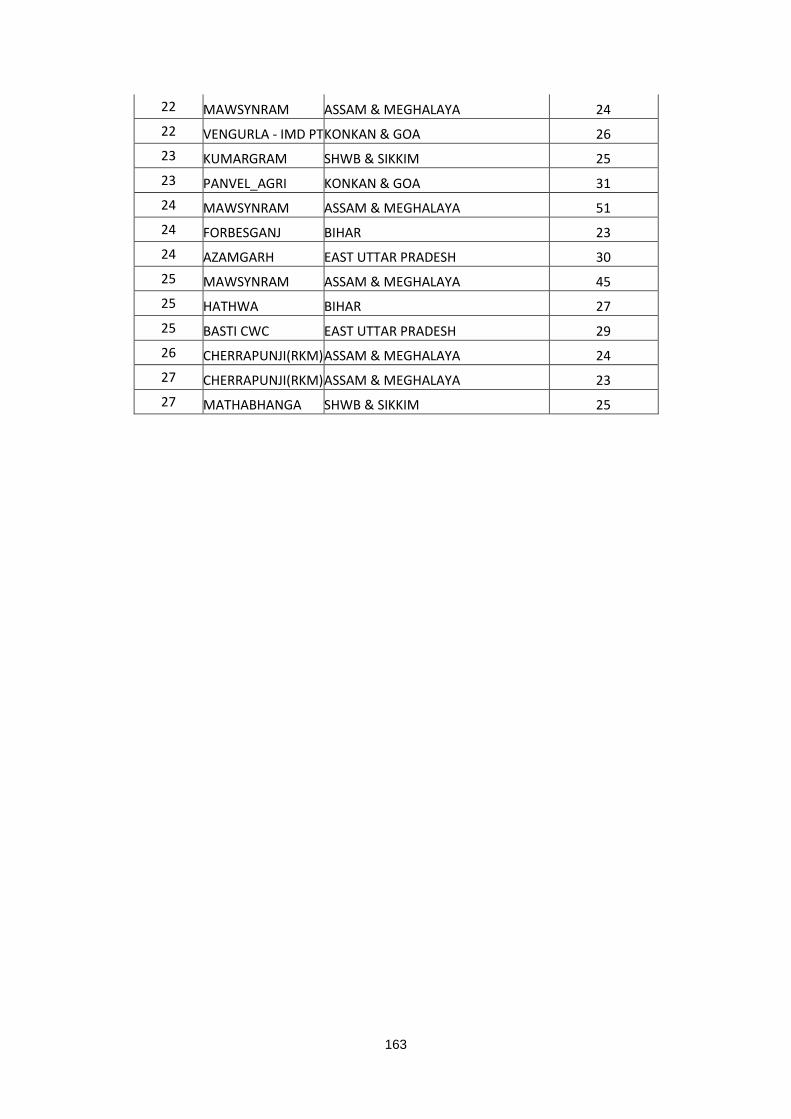
163
22 MAWSYNRAM ASSAM & MEGHALAYA 24
22 VENGURLA - IMD PT KONKAN & GOA 26
23 KUMARGRAM SHWB & SIKKIM 25
23 PANVEL_AGRI KONKAN & GOA 31
24 MAWSYNRAM ASSAM & MEGHALAYA 51
24 FORBESGANJ BIHAR 23
24 AZAMGARH EAST UTTAR PRADESH 30
25 MAWSYNRAM ASSAM & MEGHALAYA 45
25 HATHWA BIHAR 27
25 BASTI CWC EAST UTTAR PRADESH 29
26 CHERRAPUNJI(RKM) ASSAM & MEGHALAYA 24
27 CHERRAPUNJI(RKM) ASSAM & MEGHALAYA 23
27 MATHABHANGA SHWB & SIKKIM 25
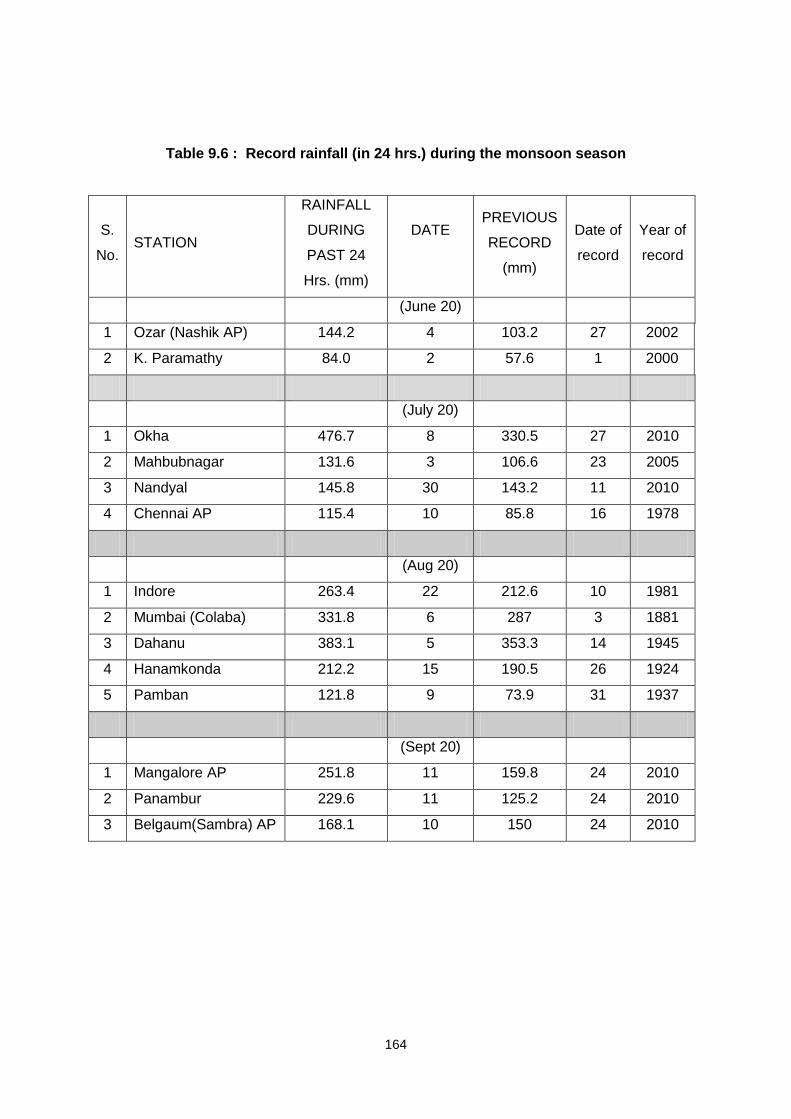
164
Table 9.6 : Record rainfall (in 24 hrs.) during the monsoon season
S.
No. STATION
RAINFALL
DURING
PAST 24
Hrs. (mm)
DATE
PREVIOUS
RECORD
(mm)
Date of
record
Year of
record
(June 20)
1 Ozar (Nashik AP) 144.2 4 103.2 27 2002
2 K. Paramathy 84.0 2 57.6 1 2000
(July 20)
1 Okha 476.7 8 330.5 27 2010
2 Mahbubnagar 131.6 3 106.6 23 2005
3 Nandyal 145.8 30 143.2 11 2010
4 Chennai AP 115.4 10 85.8 16 1978
(Aug 20)
1 Indore 263.4 22 212.6 10 1981
2 Mumbai (Colaba) 331.8 6 287 3 1881
3 Dahanu 383.1 5 353.3 14 1945
4 Hanamkonda 212.2 15 190.5 26 1924
5 Pamban 121.8 9 73.9 31 1937
(Sept 20)
1 Mangalore AP 251.8 11 159.8 24 2010
2 Panambur 229.6 11 125.2 24 2010
3 Belgaum(Sambra) AP 168.1 10 150 24 2010
165
Conclusions :
The Southwest Monsoon season rainfall over the country as a whole during 2020
was 109% of Long Period Average (LPA). Rainfall distribution was generally fairly well
distributed over major parts of the country. The season observed significant intra seasonal
variations in rainfall as realized rainfall in June (117 % of LPA) and August (127 % of LPA)
being above normal, July (90 % of LPA) & September (104 % of LPA) being normal.
The homogeneous regions of South Peninsula (129% of LPA) and Central India
(115% of LPA) received above normal rainfall, East & Northeast India (106% of LPA)
received normal rainfall, while Northwest India (84% of LPA) received below normal rainfall.
During the season, out of 36 meteorological subdivisions, two Subdivisions
(Saurashtra & Kutch, Rayalaseema) received large excess, 13 received excess, 16 received
normal rainfall. Five subdivisions received deficient rainfall. Out of 5 deficient sub-divisions, 1
was from east & northeast India (Nagaland, Manipur, Mizoram & Tripura), 4 were from
northwest India (West Uttar Pradesh, Uttarakhand, Himachal Pradesh, and Jammu &
Kashmir and Ladakh).
During the season, out of 685 districts, 59 districts received large excess rainfall, 164
districts received excess rainfall, 290 districts received normal rainfall, 155 districts received
deficient rainfall and 17 received large deficient rainfall.
For the country as a whole, rainfall averaged was generally above or near normal on
many days during Season. On about 20 occasions in the whole season, it was nearly more
than one & half times its normal value. It was above normal at a stretch for few days viz. for
the duration from 11 – 20 June, 9 – 24 Aug and 20 – 27 September. However, it was below
normal for rainfall spells during 13 – 19 Jul, 22 – 28 July and 1 – 6 September.
166
10
AGROMETEOROLOGICAL FEATURES OF THE MONSOON AND SERVICES PROVIDED DURING
SOUTHWEST MONSOON 2020
Kripan Ghosh, R. Balasubramanian, K.K. Singh, Gracy John, Bhairavi S. Kurtkoti and Vidya Choudhari
This Chapter discusses various agrometeorological features of the Southwest
Monsoon 2020 and the details of agrometeorological services provided by India
Meteorological Department.
10.1 : Introduction
As a large part of India depends on monsoon rainfall for Agricultural activities,
onset and subsequent distribution of rainfall during the season is extremely important
for kharif crop production. During the year 2020, the Southwest Monsoon has set in
over Kerala on 1st June coinciding with its normal date of onset. Advancing further, it
covered the entire country on 26th June 2020 against the normal date of 8th July (Fig.
10.1). The progress of Southwest Monsoon was normal over South & East India,
about a week delay in advance over Northeast India and about 7-12 days early
advance over Central and Northwest India.
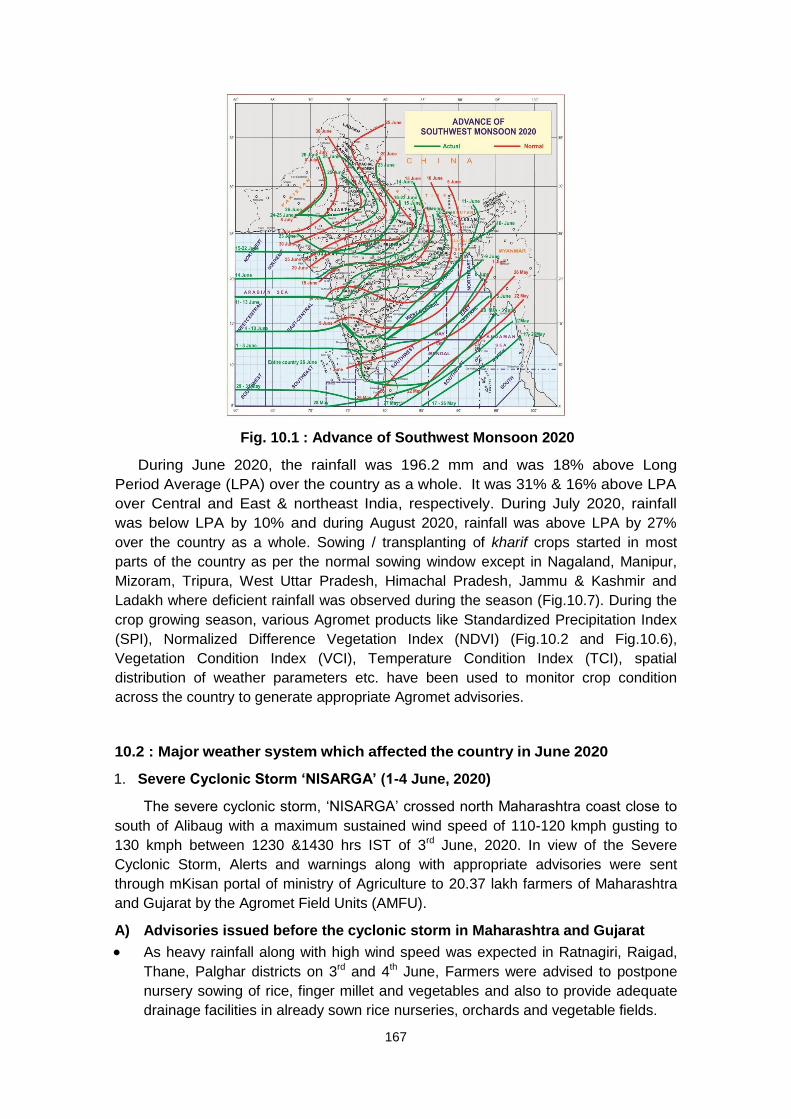
167
Fig. 10.1 : Advance of Southwest Monsoon 2020
During June 2020, the rainfall was 196.2 mm and was 18% above Long
Period Average (LPA) over the country as a whole. It was 31% & 16% above LPA
over Central and East & northeast India, respectively. During July 2020, rainfall
was below LPA by 10% and during August 2020, rainfall was above LPA by 27%
over the country as a whole. Sowing / transplanting of kharif crops started in most
parts of the country as per the normal sowing window except in Nagaland, Manipur,
Mizoram, Tripura, West Uttar Pradesh, Himachal Pradesh, Jammu & Kashmir and
Ladakh where deficient rainfall was observed during the season (Fig.10.7). During the
crop growing season, various Agromet products like Standardized Precipitation Index
(SPI), Normalized Difference Vegetation Index (NDVI) (Fig.10.2 and Fig.10.6),
Vegetation Condition Index (VCI), Temperature Condition Index (TCI), spatial
distribution of weather parameters etc. have been used to monitor crop condition
across the country to generate appropriate Agromet advisories.
10.2 : Major weather system which affected the country in June 2020
1. Severe Cyclonic Storm ‘NISARGA’ (1-4 June, 2020)
The severe cyclonic storm, ‘NISARGA’ crossed north Maharashtra coast close to
south of Alibaug with a maximum sustained wind speed of 110-120 kmph gusting to
130 kmph between 1230 &1430 hrs IST of 3rd June, 2020. In view of the Severe
Cyclonic Storm, Alerts and warnings along with appropriate advisories were sent
through mKisan portal of ministry of Agriculture to 20.37 lakh farmers of Maharashtra
and Gujarat by the Agromet Field Units (AMFU).
A) Advisories issued before the cyclonic storm in Maharashtra and Gujarat
As heavy rainfall along with high wind speed was expected in Ratnagiri, Raigad,
Thane, Palghar districts on 3rd and 4th June, Farmers were advised to postpone
nursery sowing of rice, finger millet and vegetables and also to provide adequate
drainage facilities in already sown rice nurseries, orchards and vegetable fields.
168
In Navsari, Dangs and Valsad districts in Gujarat, postponement of sowing of rice
in nurseries, immediate harvesting of matured crops and subsequent storage in
safe places were advised. Farmers were also advised to arrange for adequate
drainage facilities in already sown vegetable fields and rice nurseries and to
undertake staking in banana, mango, papaya and pomegranate to prevent lodging
due to strong winds.
B) Remedial Measures for Post-Cyclone in Maharashtra
The following Post-Cyclone remedial measures were suggested to the farmers in
Konkan, North Madhya Maharashtra and Gujarat -
Konkan
To make arrangement to drain out excess water from already sown rice nurseries,
orchards, fruit nurseries and vegetable crops nursery.
If nursery sowing of rice not completed, to wait till receding of water to undertake
sowing.
If rice nurseries were washed out due to heavy rainfall, to undertake re-sowing of
rice nursery till receding of water and also to undertake sowing of cucurbitaceous
and other vegetable crops when soil reaches field capacity.
To give slanting cut to the broken branches of fruit trees due to cyclone and then
to apply Bordeaux or black Japan coal tar to cut portion.
To remove all fallen or damaged banana plants and to cut the main stem close to
the ground to allow new growth.
To give proper staking to support the fruit crop plants disturbed by cyclonic wind.
North Madhya Maharashtra
To uproot and destroy the crops damaged by cyclone or heavy rains.
To remove and dispose the uprooted or damaged trees when the weather would
be dry and clear.
South Gujarat
To drain out excess water from standing crops like sugarcane, rice, chilli, okra,
brinjal and cucurbitaceous crops.
Selection of early maturing varieties of cotton, pigeon pea, rice, okra and sorghum
to cope up with the effect of cyclone and heavy rain.
Sowing of HYV and hybrid seeds of rice, maize, pigeon pea, cotton and
vegetables crops like okra, tomato, chilly etc.
Selection of suitable varieties for specific situation and SRI (System of Rice
Intensification) to reduce the adverse effects of water logging due to cyclone.
2. Attack of desert locust and its movement
First attack of desert locust, a tropical grasshopper has been reported on 21st May
from Jaisalmer district in Rajasthan, which borders Pakistan, after a gap of 26 years.

169
These locusts have destroyed crops spread over huge part of lands in Rajasthan. The
districts adversely affected by large scale include Sriganganagar, Jaisalmer, Barmer
and Bikaner. In Gujarat also, Banaskantha and Patan districts in North Gujarat were
affected by locust.
The effect on kharif crops were not very prominent in Gujarat and Rajasthan but
significant effects were noticed in rabi crops like mustard and cumin crops. In Gujarat,
rapeseed and cumin seed crops were mainly damaged by locust. In Rajasthan, cumin
and mustard crops were mostly affected in Jaisalmer and Sriganganagar districts.
Under Gramin Krishi Mausam Sewa Project (GKMS) scheme, AMFUs, especially
at Dantiwada in Gujarat, Bikaner and Sriganganagar in Rajasthan and AMFUs in
Madhya Pradesh, Maharashtra and Chhattisgarh issued alerts and warning along with
agromet advisories for desert locust for the farmers at district levels, whenever
necessary.
Advisories Issued
Rajasthan
Where there was attack of locusts, farmers were advised by AMFUs to apply
Malathion (96%) in standing crops or Chloropyriphos (50%) @ 1 ml/litre or
Chloropyriphos (20%) 2.5 ml/litre of water.
On arrival / attack of locust in area, farmers were advised to intimate immediately
to locust control room, Suratgarh at 09969341927, 09588849282 or to Deputy
Director (Extension), Sriganganagar at 0154-2422345, 09928116968.
Gujarat:
Advisories were issued –
to keep vigil for locusts in the crop fields;
as soon as group of locusts were reported, immediately to alert the villagers to
make loud noises by playing drums, leaf bins or plates in the fields;
if a group of locust stay stationary at night, to burn with kerosene or
flamethrower;
where locusts flock to the farm or in grassland, to spray Malathion 5% /
Quinalphos 1.5% powder.
In some areas of Madhya Pradesh, Chhattisgarh, Maharashtra, Odisha and Bihar
where attack of desert locust was observed, the following advisories were issued:
To Adopt mechanical measures like making loud noise by beating drums, burning
crackers etc.
To chase away the locust swarms during morning hours.
For chemical control, to spray Diflubenzuron 25% WP @ 10 g or Lambda
Cyhalothrin 5% EC @ 400 ml or Cinelothin 10 % WP @ 200 g per ha between 11
pm to 8 am.
In case of severe attack, to apply Chloropyriphos (50%) @ 1 ml/litre or (20%) @
2.5 ml/litre of water in standing crops.
170
3. Agromet Advisory Services (AAS) under various rainfall situations during SW
Monsoon 2020
A) Dry spells / deficient rainfall during the season
During the season, rainfall deficiency was observed in Nagaland, Manipur,
Mizoram, Tripura, West Uttar Pradesh, Himachal Pradesh, Jammu & Kashmir and
Ladakh (Fig.10.2). Farmers were advised to undertake following contingency
measures:
Nagaland:
Due to deficient rainfall in the month of July and August, sowing of normal crops
was delayed in medium and upland conditions. In medium land, sowing of short
duration varieties of soybean, maize and groundnut were advised against normal
varieties. In soybean, mulching with crop residues/green leaves, thinning and gap
filling within 1-2 weeks after sowing and also keeping the soybean fields weed free
were advised.
Manipur:
Due to deficient rainfall situation in June, July and till end of August (-38%), the
conditions were not optimum for rice cultivation. If sowing of rice could not be carried
out, farmers were advised to adopt contingency crops like black gram (urad) / lentil
(masoor)/ green gram (moong)/ Lathyrus.
Mizoram:
Farmers were advised to make bund around the rice fields to conserve soil
moisture in view of deficient rainfall situation. In Mandarin orange orchards, farmers
were advised to conserve the soil moisture through mulching with dry leaves and grass
at the base of the plant. If mulching was not enough to overcome the water stress
problem, applying light and frequent irrigation to the plant was suggested to reduce the
fruit dropping problem.
Tripura:
As rainfall in the month of June was below normal, irrigation had to be arranged in
the seedbed of Aman rice in some places. In the same way, irrigation had also to be
applied in standing Aus rice. Sowing of maize in up and medium land and kharif
vegetables were slightly delayed.
West Uttar Pradesh:
Farmers were advised to keep the standing crop fields weed free by undertaking
intercultural operation with Dora/ Kulpa or manual weeding or use of recommended
herbicides for management of monocot / dicot weeds and to monitor rice nurseries for
water stress conditions and to remove weeds from the seed bed. It was also
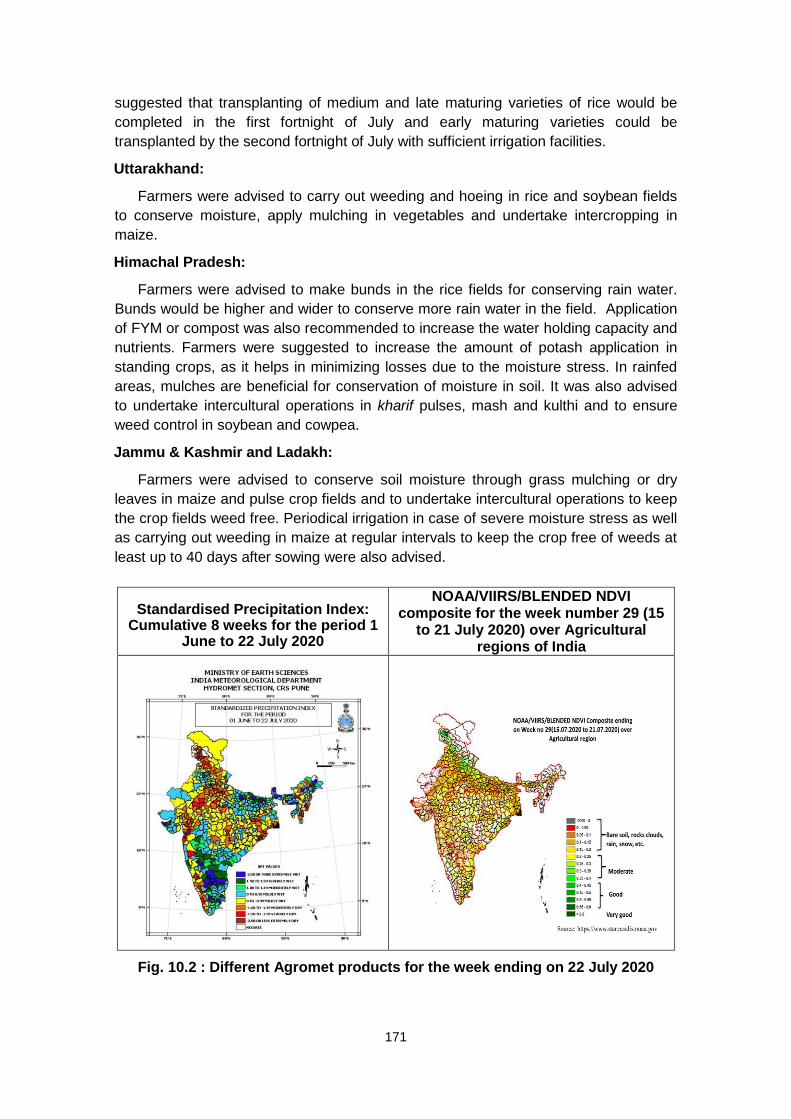
171
suggested that transplanting of medium and late maturing varieties of rice would be
completed in the first fortnight of July and early maturing varieties could be
transplanted by the second fortnight of July with sufficient irrigation facilities.
Uttarakhand:
Farmers were advised to carry out weeding and hoeing in rice and soybean fields
to conserve moisture, apply mulching in vegetables and undertake intercropping in
maize.
Himachal Pradesh:
Farmers were advised to make bunds in the rice fields for conserving rain water.
Bunds would be higher and wider to conserve more rain water in the field. Application
of FYM or compost was also recommended to increase the water holding capacity and
nutrients. Farmers were suggested to increase the amount of potash application in
standing crops, as it helps in minimizing losses due to the moisture stress. In rainfed
areas, mulches are beneficial for conservation of moisture in soil. It was also advised
to undertake intercultural operations in kharif pulses, mash and kulthi and to ensure
weed control in soybean and cowpea.
Jammu & Kashmir and Ladakh:
Farmers were advised to conserve soil moisture through grass mulching or dry
leaves in maize and pulse crop fields and to undertake intercultural operations to keep
the crop fields weed free. Periodical irrigation in case of severe moisture stress as well
as carrying out weeding in maize at regular intervals to keep the crop free of weeds at
least up to 40 days after sowing were also advised.
Standardised Precipitation Index: Cumulative 8 weeks for the period 1
June to 22 July 2020
NOAA/VIIRS/BLENDED NDVI composite for the week number 29 (15
to 21 July 2020) over Agricultural regions of India
Fig. 10.2 : Different Agromet products for the week ending on 22 July 2020
172
B) Heavy rainfall / Flood situations:
Alerts and warnings along with suitable agromet advisories for heavy rainfall had
been issued under GKMS scheme to the farmers in different States by the AMFUs /
DAMUs through AIR, DoorDarshan, DD (Sahyadri), print (newspapers) and electronic
media including SMS using mobile phone through mKisan portal launched by Ministry
of Agriculture, Govt of India and through private companies under Public Private
Partnership (PPP) mode for better crop management.
a) Agromet Advisories issued in view of Heavy Rainfall
During occurrence of heavy rainfall, farmers were advised to undertake following
farm operations -
to provide adequate drainage to avoid water stagnation in the crop fields before
heavy rainfall;
to drain out excess water from the standing crop fields after heavy rainfall and thus,
to avoid water logging in the fields of cotton, maize and pulses by maintaining
adequate drainage facilities.
to harvest the matured crops immediately before occurrence of heavy rain;
to avoid keeping harvested produces in open space and store the harvested
products at safe place;
to provide support to banana, undertake propping up in sugarcane/staking of
vegetables to prevent the crops from lodging;
to avoid intercultural operation and application of plant protection measures and
fertilizers to the standing crops.
b) Impact of Flood on crops and related Agromet advisories
i) Impact of Flood
Assam:
Floods during 20-25 July affected Standing crops such as Sali rice (nursery raising
/ transplanting), jute, vegetables and pulses in Dhemaji, Lakhimpur, Biswanath,
Charaideo, Sonitpur, Udalguri, Darrang, Baksa, Nalbari, Chirang, Bongaigaon,
Kokrajhar, Dhubri, South Salmara, Barpeta, Goalpara, Kamrup, Kamrup (Metro),
Morigaon, Nagaon, Hojai, West Karbi Anglong, Golaghat, Jorhat, Majuli,
Sivasagar,Dibrugarh, Tinsukia, Cachar and Karbi Anglong districts. Total crop area
affected till 29 July 2020 was 82,609,20 hectares. Floods were also reported during
21-24 August 2020 in Dhemaji and Tinsukia districts affecting standing crops. The total
crop area affected due to floods was 2,65,401.60 hectares as per the Assam State
Disaster Management Authority (ASDMA) report.
Kerala:
Heavy rain during August 6-10 caused floods in Thiruvananthapuram, Kollam,
Alappuzha, Thrissur, Palakkad, Kozhikode, Kasaragod, Wayanad, Kannur,
Malappuram and Ernakulam districts and floods and landslides in Idukki, Kottayam
and Pathanamthitta districts in Kerala. Standing crops of Virippu rice, banana, pepper,
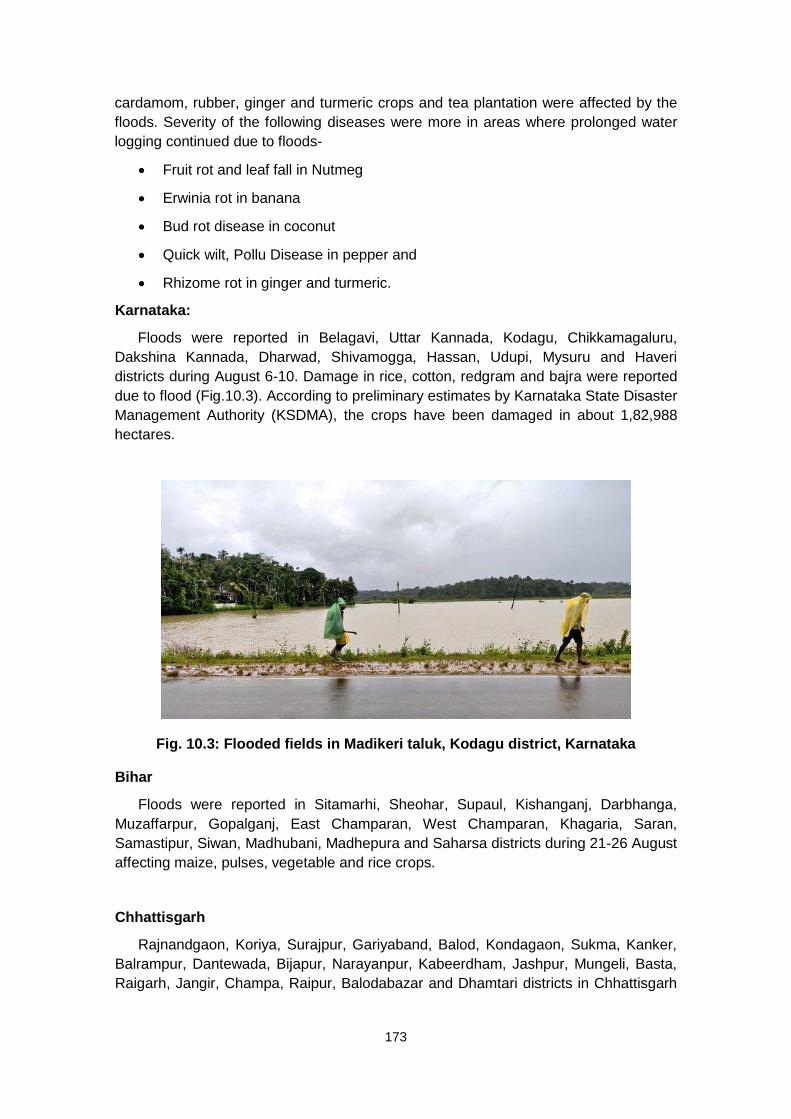
173
cardamom, rubber, ginger and turmeric crops and tea plantation were affected by the
floods. Severity of the following diseases were more in areas where prolonged water
logging continued due to floods-
Fruit rot and leaf fall in Nutmeg
Erwinia rot in banana
Bud rot disease in coconut
Quick wilt, Pollu Disease in pepper and
Rhizome rot in ginger and turmeric.
Karnataka:
Floods were reported in Belagavi, Uttar Kannada, Kodagu, Chikkamagaluru,
Dakshina Kannada, Dharwad, Shivamogga, Hassan, Udupi, Mysuru and Haveri
districts during August 6-10. Damage in rice, cotton, redgram and bajra were reported
due to flood (Fig.10.3). According to preliminary estimates by Karnataka State Disaster
Management Authority (KSDMA), the crops have been damaged in about 1,82,988
hectares.
Fig. 10.3: Flooded fields in Madikeri taluk, Kodagu district, Karnataka
Bihar
Floods were reported in Sitamarhi, Sheohar, Supaul, Kishanganj, Darbhanga,
Muzaffarpur, Gopalganj, East Champaran, West Champaran, Khagaria, Saran,
Samastipur, Siwan, Madhubani, Madhepura and Saharsa districts during 21-26 August
affecting maize, pulses, vegetable and rice crops.
Chhattisgarh
Rajnandgaon, Koriya, Surajpur, Gariyaband, Balod, Kondagaon, Sukma, Kanker,
Balrampur, Dantewada, Bijapur, Narayanpur, Kabeerdham, Jashpur, Mungeli, Basta,
Raigarh, Jangir, Champa, Raipur, Balodabazar and Dhamtari districts in Chhattisgarh
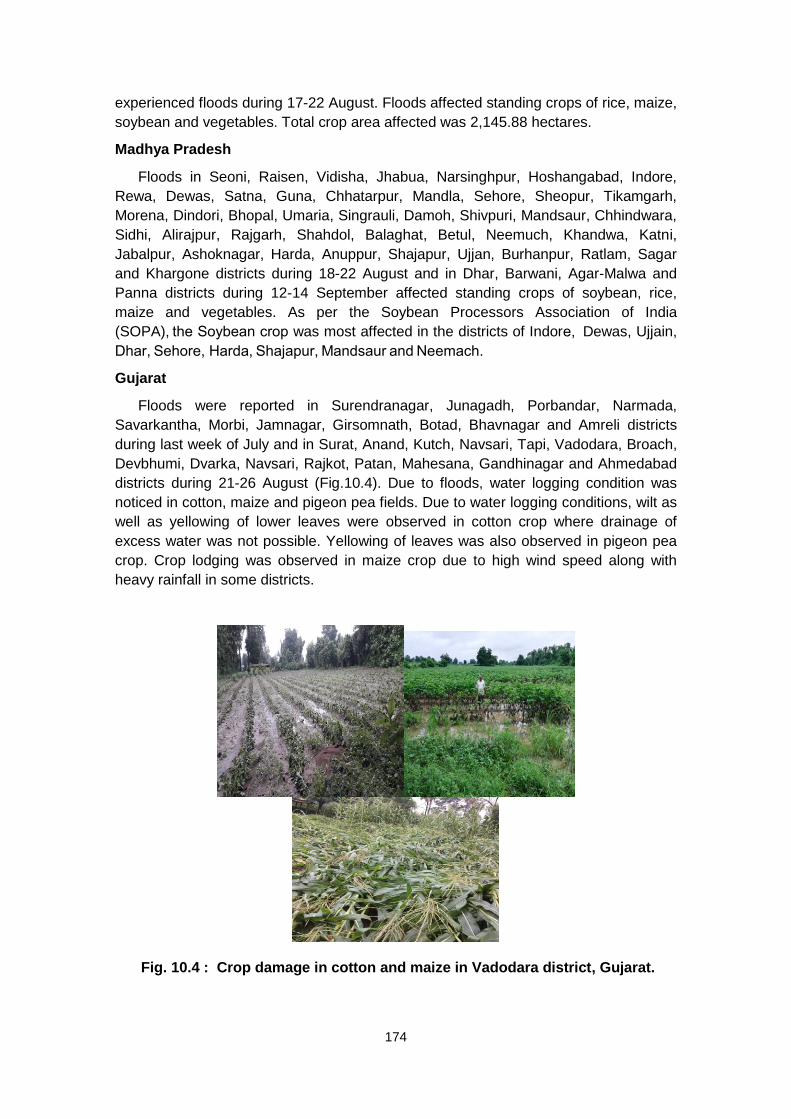
174
experienced floods during 17-22 August. Floods affected standing crops of rice, maize,
soybean and vegetables. Total crop area affected was 2,145.88 hectares.
Madhya Pradesh
Floods in Seoni, Raisen, Vidisha, Jhabua, Narsinghpur, Hoshangabad, Indore,
Rewa, Dewas, Satna, Guna, Chhatarpur, Mandla, Sehore, Sheopur, Tikamgarh,
Morena, Dindori, Bhopal, Umaria, Singrauli, Damoh, Shivpuri, Mandsaur, Chhindwara,
Sidhi, Alirajpur, Rajgarh, Shahdol, Balaghat, Betul, Neemuch, Khandwa, Katni,
Jabalpur, Ashoknagar, Harda, Anuppur, Shajapur, Ujjan, Burhanpur, Ratlam, Sagar
and Khargone districts during 18-22 August and in Dhar, Barwani, Agar-Malwa and
Panna districts during 12-14 September affected standing crops of soybean, rice,
maize and vegetables. As per the Soybean Processors Association of India
(SOPA), the Soybean crop was most affected in the districts of Indore, Dewas, Ujjain,
Dhar, Sehore, Harda, Shajapur, Mandsaur and Neemach.
Gujarat
Floods were reported in Surendranagar, Junagadh, Porbandar, Narmada,
Savarkantha, Morbi, Jamnagar, Girsomnath, Botad, Bhavnagar and Amreli districts
during last week of July and in Surat, Anand, Kutch, Navsari, Tapi, Vadodara, Broach,
Devbhumi, Dvarka, Navsari, Rajkot, Patan, Mahesana, Gandhinagar and Ahmedabad
districts during 21-26 August (Fig.10.4). Due to floods, water logging condition was
noticed in cotton, maize and pigeon pea fields. Due to water logging conditions, wilt as
well as yellowing of lower leaves were observed in cotton crop where drainage of
excess water was not possible. Yellowing of leaves was also observed in pigeon pea
crop. Crop lodging was observed in maize crop due to high wind speed along with
heavy rainfall in some districts.
Fig. 10.4 : Crop damage in cotton and maize in Vadodara district, Gujarat.
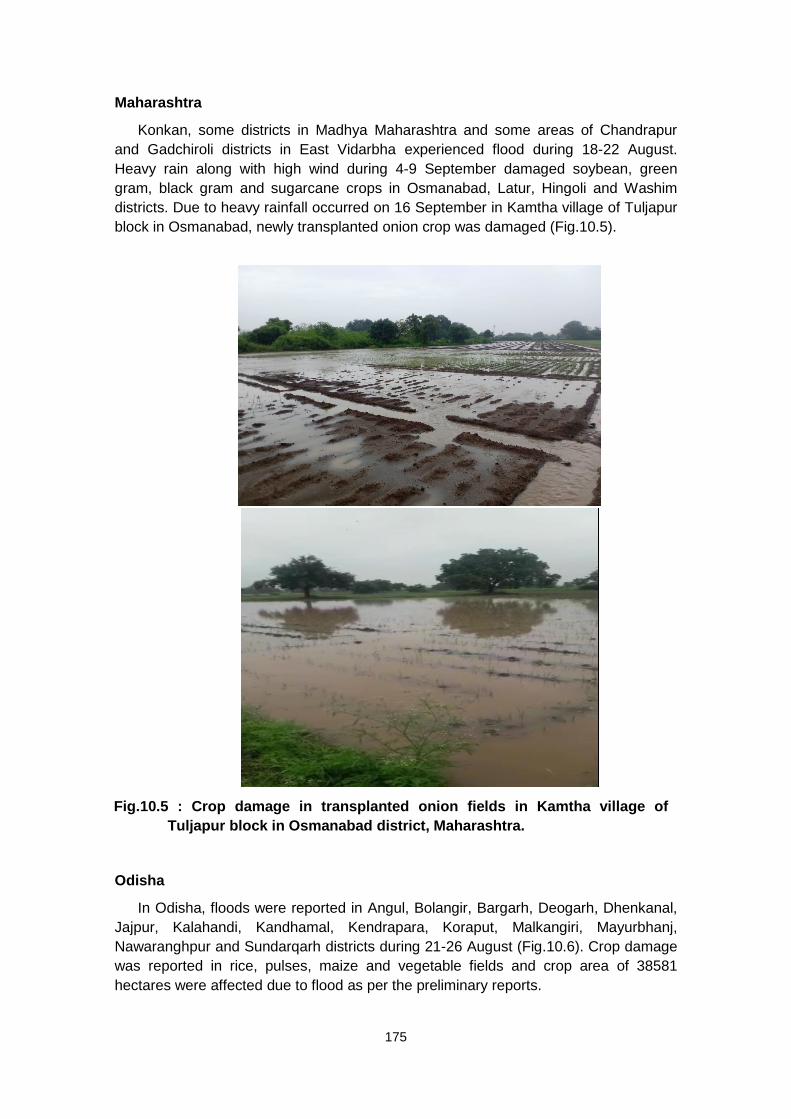
175
Maharashtra
Konkan, some districts in Madhya Maharashtra and some areas of Chandrapur
and Gadchiroli districts in East Vidarbha experienced flood during 18-22 August.
Heavy rain along with high wind during 4-9 September damaged soybean, green
gram, black gram and sugarcane crops in Osmanabad, Latur, Hingoli and Washim
districts. Due to heavy rainfall occurred on 16 September in Kamtha village of Tuljapur
block in Osmanabad, newly transplanted onion crop was damaged (Fig.10.5).
Fig.10.5 : Crop damage in transplanted onion fields in Kamtha village of
Tuljapur block in Osmanabad district, Maharashtra.
Odisha
In Odisha, floods were reported in Angul, Bolangir, Bargarh, Deogarh, Dhenkanal,
Jajpur, Kalahandi, Kandhamal, Kendrapara, Koraput, Malkangiri, Mayurbhanj,
Nawaranghpur and Sundarqarh districts during 21-26 August (Fig.10.6). Crop damage
was reported in rice, pulses, maize and vegetable fields and crop area of 38581
hectares were affected due to flood as per the preliminary reports.
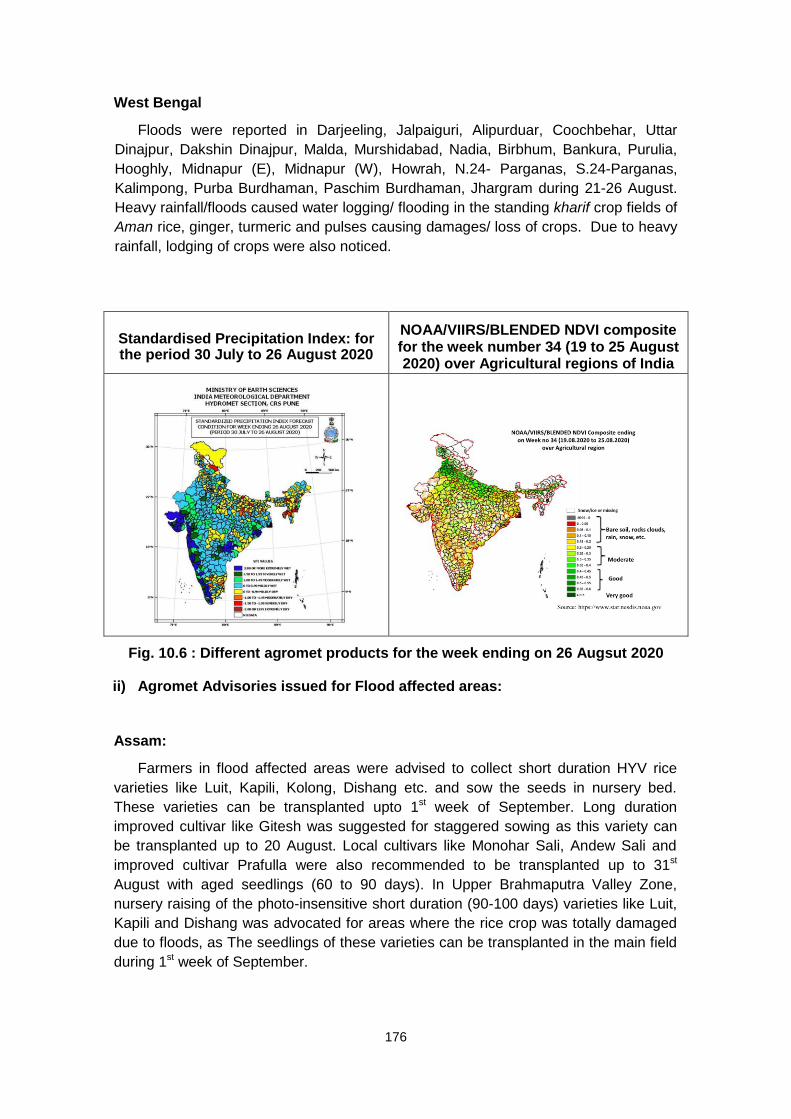
176
West Bengal
Floods were reported in Darjeeling, Jalpaiguri, Alipurduar, Coochbehar, Uttar
Dinajpur, Dakshin Dinajpur, Malda, Murshidabad, Nadia, Birbhum, Bankura, Purulia,
Hooghly, Midnapur (E), Midnapur (W), Howrah, N.24- Parganas, S.24-Parganas,
Kalimpong, Purba Burdhaman, Paschim Burdhaman, Jhargram during 21-26 August.
Heavy rainfall/floods caused water logging/ flooding in the standing kharif crop fields of
Aman rice, ginger, turmeric and pulses causing damages/ loss of crops. Due to heavy
rainfall, lodging of crops were also noticed.
Standardised Precipitation Index: for the period 30 July to 26 August 2020
NOAA/VIIRS/BLENDED NDVI composite for the week number 34 (19 to 25 August 2020) over Agricultural regions of India
Fig. 10.6 : Different agromet products for the week ending on 26 Augsut 2020
ii) Agromet Advisories issued for Flood affected areas:
Assam:
Farmers in flood affected areas were advised to collect short duration HYV rice
varieties like Luit, Kapili, Kolong, Dishang etc. and sow the seeds in nursery bed.
These varieties can be transplanted upto 1st week of September. Long duration
improved cultivar like Gitesh was suggested for staggered sowing as this variety can
be transplanted up to 20 August. Local cultivars like Monohar Sali, Andew Sali and
improved cultivar Prafulla were also recommended to be transplanted up to 31st
August with aged seedlings (60 to 90 days). In Upper Brahmaputra Valley Zone,
nursery raising of the photo-insensitive short duration (90-100 days) varieties like Luit,
Kapili and Dishang was advocated for areas where the rice crop was totally damaged
due to floods, as The seedlings of these varieties can be transplanted in the main field
during 1st week of September.

177
Kerala:
In banana, there was chance of Erwinia rot. Farmers were suggested to ensure
proper drainage in banana field. As a precautionary measure, application of lime in
the banana basin was recommended. To improve disease resistance, drenching
the basin with Pseudomonas @ 20g per litre of water was advised. Affected plants
could be protected by drenching the basin with 3g copper oxychloride or 2g copper
hydroxide per one litre of water. Severely affected plants were advised to be cut
and removed to prevent further spread of disease.
Coconut: As there was possibility of occurrence of Bud rot disease, farmers were
advised to keep three numbers each of perforated Mancozeb sachets (5m per
packet) around spindle leaves as a prophylactic measure against bud rot.
Pepper: There was chance of quick wilt disease in pepper. To control Quick wilt
and pollu disease, drenching the soil with 0.2 % Copper oxychloride and spraying
the aerial part with 1% Bordeaux mixture as a prophylactic measure was
suggested. Application of Trichoderma/ Psuedomonas culture would control the
quick wilt infestation.
Karnataka:
Due to heavy rain / flood, farmers were advised to postpone intercultural operation
and application of plant protection measures and fertilizers to the standing crops and to
arrange for adequate drainage in standing crop fields to avoid water stagnation.
Nursery beds were covered with polythene sheets to protect vegetable seedlings from
rainfall. Farmers were advised to drain out excess water and to maintain water level up
to 5cm in rice fields. Post heavy rain/floods, advisories like draining out for excess
water from maize, groundnut and vegetable fields were issued. If damage was noticed
in transplanted rice due to heavy rain/ flood, farmers were advised to maintain plant
population by transplanting clonal tillers detaching from the old clumps, wherever
possible.
Bihar:
In Flood affected districts, advisories like draining out excess water from maize,
pulse and vegetable fields were issued. In Flood affected areas, wherever crops are
fully damaged, sowing of September pigeon pea in upland areas was recommended.
Chhattisgarh:
In standing rice, after receding of flood water, farmers were advised to undertake
gap filling by using tillers, separated from the existing hills. There was also a chance of
outbreak of diseases like bacterial blight and sheath blight in rice. To control, spraying
of Pseudomonas @ 10 g/litre of water or Tebuconazole (50%) + Trifloxystrobin 25 WG
@ 0.4 g/litre of water was recommended. In maize, farmers were suggested drain out
excess water.
178
Madhya Pradesh:
Farmers were advised to drain out excess water from soybean, maize and turmeric
fields and maintain adequate drainage and also to monitor the standing crops for
outbreak of pest and diseases.
Gujarat:
In South Gujarat, farmers were advised to drain out excess water and maintain 5-
7 cm water level in rice fields and to avoid water logging condition in sweet corn, bajra,
okra, brinjal and other standing crops and mango orchards. wherever the number of
plants in the unit area was affected due to heavy rainfall in the cotton field, it was
recommended to reduce the number of plants. Castor or pigeon pea was suggested to
be planted as a relay crop. In the fields where crops like pearl millet, maize and pulses
have been destroyed by excessive rains, farmers were advised to undertake sowing of
cluster bean, green gram, black gram, pigeon pea, castor, pearl millet and flax and
also fodder crops like sorghum, cowpea. Providing support to newly planted mango
grafts was also recommended. Short term vegetable crops like cluster bean, cowpea,
okra, spinach, fenugreek, coriander, etc. were suggested to be cultivated.
In Saurashtra, in Targhadia district, due to continuous rain and wet condition,
farmers were advised to drain out excess water from low-lying area immediately for
prevention of wilting in all crops and to apply urea, ammonium sulphate and muriate of
potash fertilizers each @ 30 kg/ha in cotton, chilli and other vegetables immediately to
revive growth. In the field where kharif crops were damaged severely, farmers were
suggested to undertake re-sowing, with Ajwain, castor, pigeon pea and sesame and
chick pea for green pod and fodder crops like sorghum and bajra. Spraying of
Mencozeb fungicide @ 27 g/10 litre of water during clear weather was recommended
for prevention of Alternaria and other fungal diseases in cotton and vegetable crops.
Maharashtra:
Continuous heavy rain created waterlogging in cashewnut orchards in Konkan.
As waterlogging along with high relative humidity and less sunshine hours was
favourable for the development of Phytophthora fungal disease resulting in yellowing
of leaves followed by leaf drop and drying of tender leaves and buds and also causing
branch rot in cashewnut, farmers were advised to take appropriate measures. Farmers
were also advised to drain out excess water from the fields of groundnut.
In Madhya Maharashtra, in affected districts, farmers were advised to drain out
excess water from standing crop fields and also to maintain 5 cm water level in rice
fields. After draining out water from sugarcane fields, application of 25% N, P and K
fertilizers and 8 kg Zinc sulphate was recommended for better growth of crops during
clear weather. Frequent rains and high humid condition were favourable for
occurrence of tikka in groundnut; to control, spraying of Mancozeb @ 25 g + Bavistin
@ 25 g in 10 liters of water was suggested.
179
In East Vidarbha, in Bramhapuri, Saoli and Gondpimpari talukas of Chandrapur
district and Gadchiroli wadsa, chamorshi, and Bhamargarh talukas of Gadchiroli
district, where water logging was observed in rice crop, farmers were advised to drain
out excess water and apply 20 kg N / ha to get more tillers after receding of flood
water.
Odisha:
In flood affected districts, farmers were advised to drain out excess water from the
submerged rice fields and also to drain out excess water from sugarcane, jute and
vegetable fields. Accordingly, farmers were also advised to adjust the plant population
by redistribution of hills in rice and top dress with N and K for rejuvenation of growth
after cessation of heavy rainfall. In up and medium land, where there was no scope for
revival of rice crop, sowing of pre-rabi crops like black gram, green gram, horse gram,
sesame etc. after cessation of heavy rainfall was recommended. If mortality in rice
crop was more than 50%, farmers were advised to undertake
re-transplanting with the available aged seedlings with closer spacing @ 4-5 seedlings
per hill; in case of non-availability of seedlings, broadcasting of sprouted seeds of short
and medium durations were recommended after cessation of heavy rainfall.
West Bengal:
In case rice seed bed was damaged due to flood, farmers were advised to
prepare a fresh seed bed on high ground with short duration rice varieties. Farmers
were also advised to maintain optimum water level in transplanted rice fields by
draining out excess water, construct proper drainage system to avoid flooding in maize
and pulse crop fields, provide adequate drainage facilities in turmeric and ginger fields.
There was possibility of occurrence of sheath blight and wilting due to heavy rains in
wet seeded Aman rice. Spraying with Validimethrin @ 1ml / liter of water or
Carbendazin @ 2g / liter of water for sheath blight and Streptocyclene for wilt as well
as application of additional potassium fertilizer to the plants were recommended after
draining out of water.
Incidence of pest and disease during kharif season, 2020
During the season, no major outbreak of pests and diseases had been reported.
White fly attack in cotton was reported in some areas of Haryana. Suitable control
measures had been suggested through agromet advisories by the AMFUs like keeping
vigil on white fly infestation in cotton fields and for infestation above the economical
threshold level (ETL), spraying one liter Nimbecidine mixed with 250 liters water per
acre was recomended. In Madhya Maharashtra, frequent rains and high humid
condition was favourable for occurrence of tikka and rust in groundnut crop; to control
spraying with Mancozeb @ 25 g + Bavistin @ 25 g in 10 liters of water was
recommended. In Vidarbha, to control wilt in cotton due to continuous rainfall and
water logging condition, removing excess water from the fields and drenching with
Copper Oxychloride @ 25 g per 10 liters of water or Carbandazim 50 WP @ 10 g per
10 liters of water were advised. In Assam, for control of stem borer and case warm in
180
Sali rice during tillering stage, spraying of Fipronil 5 SC @ 50 ml per bigha of land or
Thiamethoxam 25 WG @ 13 g per bigha of land was advised. In Bihar, regular
monitoring was advised for infestation of stem borer in rice crop at tillering stage. In the
fields with infestation above ETL, application of Cartap Hydrochloride 4G @ 10 kg/acre
was advised to protect the crop. In Madhya Pradesh, due to favourable weather
conditions, there was possibility of incidence of Girdle beetle in soybean; for
management, spraying the crop with Thicloprid 21.7 SC @ 650 ml/ha or Trizophos 40
EC @ 800 ml/ha was recommended.
10.3 : Impact of Monsoon 2020 on Crop Production
The cumulative rainfall during southwest monsoon season 2020 has been 9 per
cent higher than Long Period Average (LPA). Accordingly, most of the major states
contributing towards National crop production have witnessed normal rainfall. As per
the First Advanced Estimates of production of major kharif crops for 2020-21 released
by the Ministry of Agriculture, Govt. of India, the total food grains output during kharif
season of 2020-21 crop year has been estimated at a record 144.52 MT as against
143.38 MT in the previous year.
India's rice production has been estimated at record 102.36 million tonnes in kharif
season of 2020-21 crop year on the back of good monsoon rains and acreage,
according to Government data.
The output of coarse cereals has been estimated to decline to 32.84 MT as against
33.69 MT in the previous year.
Pulse crops production is pegged higher at 9.31 MT as against 7.72 MT in kharif
season of last year.
In the non-food grains category, oilseeds production in kharif season has been
estimated at 25.73 MT as against 22.31 MT last year.
Cotton production is pegged at 37.12 million bales (of 170 kg each) in kharif
season of 2020-21 from 35.49 million bales in the previous year.
The output of sugarcane is likely to rise to 399.83 MT from 355.7 MT, as per the
data.
The production of most of the crops for the kharif season 2020 has been
estimated higher than their normal. However, kharif crops like soybean and cotton, the
actual production for the current year may be less than the advance estimates. The
soybean crop got damaged or yields may drop in some of the States like Madhya
Pradesh and Maharashtra because of heavy rains. The Soybean Processors
Association of India (SOPA) had estimated crop area loss of 10-12% on account of
heavy rains in Madhya Pradesh based on a survey undertaken by the industry body in
the rain-affected areas of the state. Likewise, the probable yield loss that may occur in
cotton crop as the crop in some of the States like Haryana got affected by heavy rain
in August. Due to waterlogging in Hissar, Fatehabad, Jind and Bhiwani districts of
Haryana, nearly 50000 acres of cotton was adversely affected. Official reports and
assessments from farmers indicate that cotton, in nearly 10,000 acres has been
destroyed completely.

181
IMD issued appropriate alerts and warnings along with Agromet advisories based
on the medium range weather forecast as well as the extended range weather forecast
to the farming community in order to deal with the impact of adverse weather situation.
These agromet advisories helped the farmers to take appropriate farm management
decisions like sowing of crops, supplementary irrigation, management of pests and
diseases, contingent crop planning etc. in time which has resulted in improvement in
agricultural situations under extreme weather conditions.
GKMS: Success Stories collected from the Farmers
1.
Mr. Lal Chand
Mr. Lal Chand, from Village Balaicha, Block Mahendragarah, District Mahendragarh, State Haryana is a farmer with 15 years farming experience. He is getting Agromet advisories. He told that service is very useful for him in case of irrigation, spraying operations etc. By better use of advisories he makes arrangement to drain out excess amount of rain water in cotton field and avoid losses. According to him, crop damage due to rainfall was reduced through a single advisory four days before. With the help of useful advisories, he did harvesting in mustard 2 days in advance and avoided the losses. Overall, he saved ₹5000 to 7500/- per acre.
2.
Shri Prabir Mondal
Shri Prabir Mondal from Block Jayanagar-I, Village Joynagar (P), District South 24 Parganas, State West Bengal is very much benefitted by receiving the SMS on weather, storm and cyclone alert and weather based Agromet advisories. He also got benefitted by advisories about the use of proper fertilizer dose and spraying of pesticide at appropriate weather condition.
3.
Shri Shibu V. R
Shibu from Block Kollam, Village Kottarakka, District Veliyam, State Kerala having banana cultivation in 6.5 acres of land in two different locations which comprise of total 3000 plants. By the timely advice for the chances of Sigatokka incidence in banana during rainy days and by providing suitable organic control measures through AAS bulletin, he could be able to detect the disease and take control measures at the earliest. Advice for postponing fertilizer and pesticide application during first week of August also helped him to reschedule the operations and thus, prevented the loss of product as well as economic loss.

182
4.
Shri. Viveka Nand Mishra
Shri Vivekananda Mishra is a farmer growing rice and sugarcane crop in Ramkola block of Kushinagar district of Uttar Pradesh. He used to regularly follow the AAS. He told that with the help of weather forecast and agromet advisories, he was able to save ₹650/- by withholding irrigation and spraying of insecticide at each time in rice during the kharif season 2020.
183
11
VERIFICATION OF QUANTITATIVE PRECIPITATION
FORECAST (QPF) DURING SW MONSOON 2020 OVER
RIVER SUB-BASINS OF INDIA
B. P. Yadav, Ashok Kumar Das, Jyotsana Dhingra and Charu India Meteorological Department, New Delhi
This Chapter discusses the results of verification of Quantitative Precipitation
Forecasts (QPFs) during Southwest Monsoon season 2020 over various river
Sub-basins of India.
11.1 : Introduction
Flood is a regular feature in India. Every year floods occur in one or another part
of the country which causes huge losses to both life and property. In India, India
Meteorological Department (IMD) and Central Water commission (CWC) carry out the
work of Flood Forecasting jointly. IMD is the nodal agency for issuing Quantitative
Precipitation Forecast (QPF) for river Basins/ sub-Basins where as CWC is the nodal
agency for issuing Flood Forecast. The QPF is the main input in the Flood Forecasting
models for issuing flood forecast by CWC. IMD through its field offices called “Flood
Meteorological Offices (FMOs)” issues QPF on operational basis during flood season.
There are 13 FMOs located at different parts of flood prone areas of the country, which
are located at Agra, Ahmedabad, Asansol, Bhubaneswar, Guwahati, Hyderabad,
Jalpaiguri, Lucknow, New Delhi, Patna, Srinagar, Chennai and Bengaluru that cater to
the river basins mentioned in Table1. IMD also provides similar support to Damodar
Valley Corporation (DVC) for the river Basins of Barakar and Damodar. The location and
area of jurisdiction of 13 FMOs and DVC Kolkata are shown inFig.1.
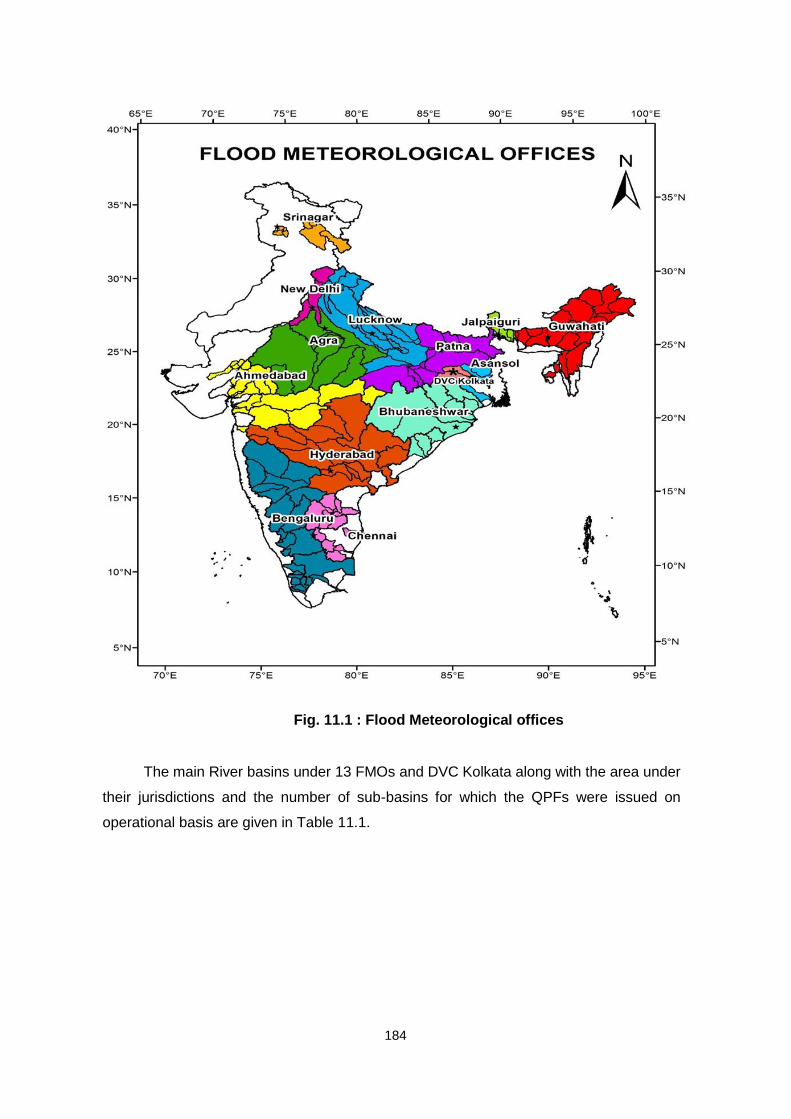
184
Fig. 11.1 : Flood Meteorological offices
The main River basins under 13 FMOs and DVC Kolkata along with the area under
their jurisdictions and the number of sub-basins for which the QPFs were issued on
operational basis are given in Table 11.1.
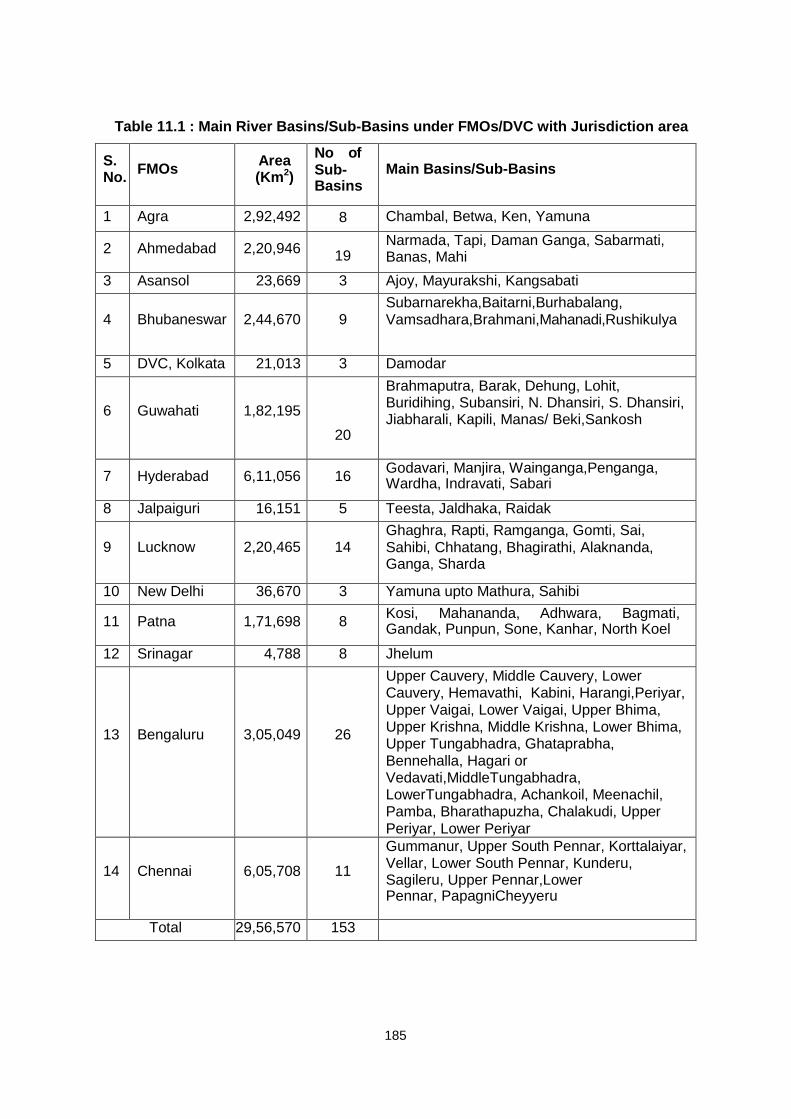
185
Table 11.1 : Main River Basins/Sub-Basins under FMOs/DVC with Jurisdiction area
S. No.
FMOs Area (Km2)
No of Sub- Basins
Main Basins/Sub-Basins
1 Agra 2,92,492 8 Chambal, Betwa, Ken, Yamuna
2 Ahmedabad 2,20,946
19 Narmada, Tapi, Daman Ganga, Sabarmati, Banas, Mahi
3 Asansol 23,669 3 Ajoy, Mayurakshi, Kangsabati
4
Bhubaneswar
2,44,670
9 Subarnarekha,Baitarni,Burhabalang, Vamsadhara,Brahmani,Mahanadi,Rushikulya
5 DVC, Kolkata 21,013 3 Damodar
6
Guwahati
1,82,195
20
Brahmaputra, Barak, Dehung, Lohit, Buridihing, Subansiri, N. Dhansiri, S. Dhansiri, Jiabharali, Kapili, Manas/ Beki,Sankosh
7 Hyderabad 6,11,056 16 Godavari, Manjira, Wainganga,Penganga, Wardha, Indravati, Sabari
8 Jalpaiguri 16,151 5 Teesta, Jaldhaka, Raidak
9
Lucknow
2,20,465
14 Ghaghra, Rapti, Ramganga, Gomti, Sai, Sahibi, Chhatang, Bhagirathi, Alaknanda, Ganga, Sharda
10 New Delhi 36,670 3 Yamuna upto Mathura, Sahibi
11 Patna 1,71,698 8 Kosi, Mahananda, Adhwara, Bagmati, Gandak, Punpun, Sone, Kanhar, North Koel
12 Srinagar 4,788 8 Jhelum
13
Bengaluru
3,05,049
26
Upper Cauvery, Middle Cauvery, Lower Cauvery, Hemavathi, Kabini, Harangi,Periyar, Upper Vaigai, Lower Vaigai, Upper Bhima, Upper Krishna, Middle Krishna, Lower Bhima, Upper Tungabhadra, Ghataprabha, Bennehalla, Hagari or Vedavati,MiddleTungabhadra, LowerTungabhadra, Achankoil, Meenachil, Pamba, Bharathapuzha, Chalakudi, Upper Periyar, Lower Periyar
14
Chennai
6,05,708
11
Gummanur, Upper South Pennar, Korttalaiyar, Vellar, Lower South Pennar, Kunderu, Sagileru, Upper Pennar,Lower Pennar, PapagniCheyyeru
Total 29,56,570 153
186
Flood Meteorological Service of IMD provides through their FMOs/DVC, daily QPF
bulletin and Hydromet Bulletin to Central Water Commission (CWC) for operation flood
forecasting. QPF bulletin is issued at 0930hrs IST and Hydromet Bulletin at 1230 hrs IST.
QPF (fct.) is issued for a lead-time of 7-days (forecast for 3 days and outlook for
subsequent 4 days) daily during flood season. If situation demands, QPF bulletins are
further updated in the evening.
In addition to flood season, QPF Bulletins consist of sub-basin wise QPFs and
heavy rainfall warning is issued by concerned FMOs/DVC during cyclone period or when
there is a chance of heavy rainfall that may lead to flood.
Hydromet Bulletin contains the following information.
Prevailing Synoptic situations,
Spatial and temporal distribution of rainfall,
Categorical Sub-basin wise QPF for Day-1, Day-2, andDay-3.
Probabilistic QPF for each QPF category
Heavy rainfall warnings for Day-1, Day-2, andDay-3.
Sub-basin wise past 24 hour realized rainfall.
Station wise observed significant rainfall (≥ 5cm).
The performance of QPF is verified for the flood season annually. In this chapter we
will discuss the verification results of operational sub-basin wise QPF for the SW
monsoon season 2020.
11.2 : Data Used
QPF is issued as an a real precipitation forecast sub-basin wise by the FMOs/DVC
daily in the flood season in the following categories.
i. 0 (no rain) ii. 0.1 – 10 mm iii. 11 –25 mm iv. 26 – 50 mm v. 51 – 100 mm vi. > 100 mm
The sub-basin wise QPFs are verified with the observed areal rainfall. The sub-basin
observed areal rainfall has been computed by averaging the observed rainfall of stations
in the area. The all India no. of QPFs issued for Day-1, Day-2 and Day-3 by FMOs during
the SW monsoon season 2020 is 18666 for each day for total 153 flood prone river sub-
basins.
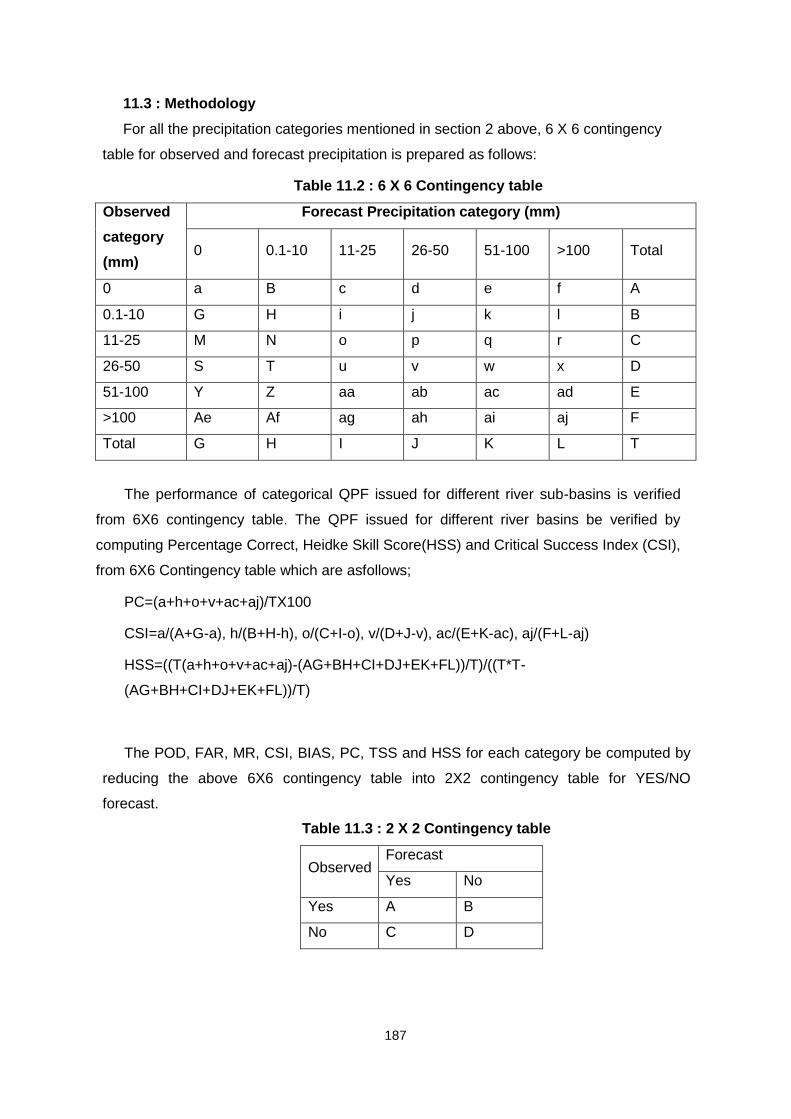
187
11.3 : Methodology
For all the precipitation categories mentioned in section 2 above, 6 X 6 contingency
table for observed and forecast precipitation is prepared as follows:
Table 11.2 : 6 X 6 Contingency table
Observed
category
(mm)
Forecast Precipitation category (mm)
0 0.1-10 11-25 26-50 51-100 >100 Total
0 a B c d e f A
0.1-10 G H i j k l B
11-25 M N o p q r C
26-50 S T u v w x D
51-100 Y Z aa ab ac ad E
>100 Ae Af ag ah ai aj F
Total G H I J K L T
The performance of categorical QPF issued for different river sub-basins is verified
from 6X6 contingency table. The QPF issued for different river basins be verified by
computing Percentage Correct, Heidke Skill Score(HSS) and Critical Success Index (CSI),
from 6X6 Contingency table which are asfollows;
PC=(a+h+o+v+ac+aj)/TX100
CSI=a/(A+G-a), h/(B+H-h), o/(C+I-o), v/(D+J-v), ac/(E+K-ac), aj/(F+L-aj)
HSS=((T(a+h+o+v+ac+aj)-(AG+BH+CI+DJ+EK+FL))/T)/((T*T-
(AG+BH+CI+DJ+EK+FL))/T)
The POD, FAR, MR, CSI, BIAS, PC, TSS and HSS for each category be computed by
reducing the above 6X6 contingency table into 2X2 contingency table for YES/NO
forecast.
Table 11.3 : 2 X 2 Contingency table
Observed Forecast
Yes No
Yes A B
No C D

188
Probability of detection(POD)=(A/(A+B))
False Alarm Rate (FAR)=C/(C+A)
Missing Rate(MR)=B/(B+A)
Correct Non-Occurrence (C-NON)=D/(C+D)
Critical Success Index (CSI)==Threat Score=A/(A+B+C)
Bias for occurrence (BIAS)=(A+C)/(A+B)
Percentage Correct(PC)=(A+D)/(A+B+C+D) X100=Hit Rate X 100
True Skill Score (TSS)=A/(A+B)+D/(C+D)-1
Heidke skill score (HSS)=2{(AD-BC)/(B*B+C*C+2AD+(B+C)(A+D)
)}
FOR BEST/PERFECT FORECAST, POD=1, FAR=0, MR=0
The final skill score is the average of this verification over all forecasting offices. In
addition to percentage of correct, forecast within the same category, the percentages of
QPFs that are within ±1 category and out by two or more categories are computed.
During SW monsoon season 2020, the skill scores for operational sub-basin wise QPFs
are computed for all FMOs/DVC for day-1, day-2 andday-3.
11.4 : Results and Discussions
The QPF verification statistics for different FMOs/DVC for Day-1, Day-2 and Day-3
forecast are computed and given in the subsequent sections.
11.4.1 : Verification of Day-1 QPF
The QPF verification statistics for different FMOs, and DVC for Day-1 are given in
Table - 4. The all India percentage correct QPF within the same category is 61% and
within ±1 category is 95%. The highest percentage correct QPF was for FMO Guwahati
which was 81% and lowest was for FMO Bengaluru at 42% as seen from Fig.-.2. The
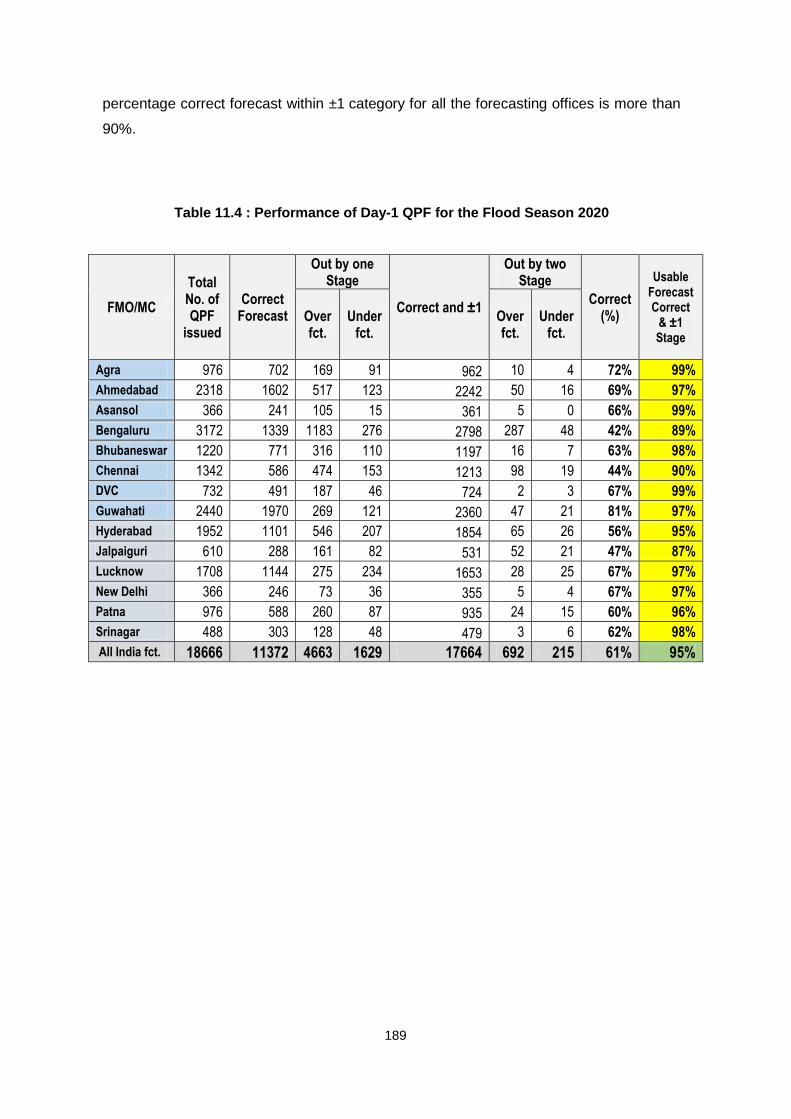
189
percentage correct forecast within ±1 category for all the forecasting offices is more than
90%.
Table 11.4 : Performance of Day-1 QPF for the Flood Season 2020
FMO/MC
Total No. of QPF
issued
Correct Forecast
Out by one Stage
Correct and ±1
Out by two Stage
Correct (%)
Usable Forecast Correct
& ±1 Stage
Over fct.
Under fct.
Over fct.
Under fct.
Agra 976 702 169 91 962 10 4 72% 99%
Ahmedabad 2318 1602 517 123 2242 50 16 69% 97%
Asansol 366 241 105 15 361 5 0 66% 99%
Bengaluru 3172 1339 1183 276 2798 287 48 42% 89%
Bhubaneswar 1220 771 316 110 1197 16 7 63% 98%
Chennai 1342 586 474 153 1213 98 19 44% 90%
DVC 732 491 187 46 724 2 3 67% 99%
Guwahati 2440 1970 269 121 2360 47 21 81% 97%
Hyderabad 1952 1101 546 207 1854 65 26 56% 95%
Jalpaiguri 610 288 161 82 531 52 21 47% 87%
Lucknow 1708 1144 275 234 1653 28 25 67% 97%
New Delhi 366 246 73 36 355 5 4 67% 97%
Patna 976 588 260 87 935 24 15 60% 96%
Srinagar 488 303 128 48 479 3 6 62% 98%
All India fct. 18666 11372 4663 1629 17664 692 215 61% 95%
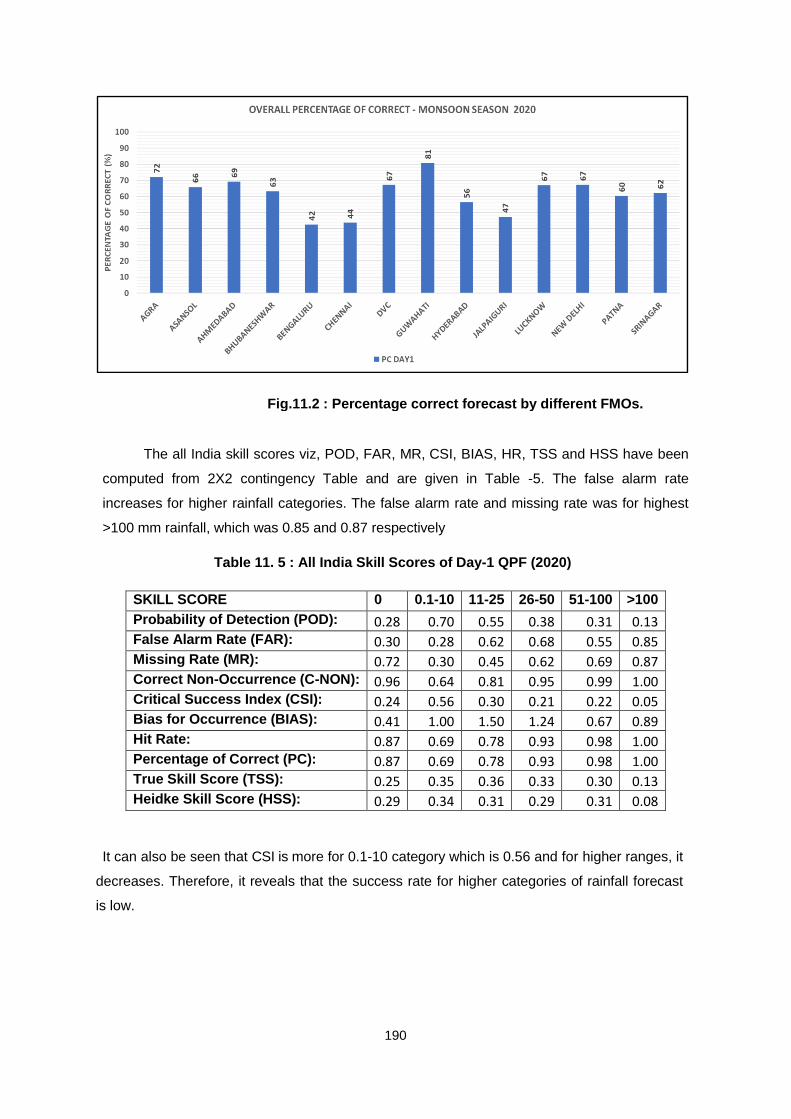
190
Fig.11.2 : Percentage correct forecast by different FMOs.
The all India skill scores viz, POD, FAR, MR, CSI, BIAS, HR, TSS and HSS have been
computed from 2X2 contingency Table and are given in Table -5. The false alarm rate
increases for higher rainfall categories. The false alarm rate and missing rate was for highest
>100 mm rainfall, which was 0.85 and 0.87 respectively
Table 11. 5 : All India Skill Scores of Day-1 QPF (2020)
SKILL SCORE 0 0.1-10 11-25 26-50 51-100 >100
Probability of Detection (POD): 0.28 0.70 0.55 0.38 0.31 0.13 False Alarm Rate (FAR): 0.30 0.28 0.62 0.68 0.55 0.85 Missing Rate (MR): 0.72 0.30 0.45 0.62 0.69 0.87 Correct Non-Occurrence (C-NON): 0.96 0.64 0.81 0.95 0.99 1.00 Critical Success Index (CSI): 0.24 0.56 0.30 0.21 0.22 0.05 Bias for Occurrence (BIAS): 0.41 1.00 1.50 1.24 0.67 0.89 Hit Rate: 0.87 0.69 0.78 0.93 0.98 1.00 Percentage of Correct (PC): 0.87 0.69 0.78 0.93 0.98 1.00 True Skill Score (TSS): 0.25 0.35 0.36 0.33 0.30 0.13 Heidke Skill Score (HSS): 0.29 0.34 0.31 0.29 0.31 0.08
It can also be seen that CSI is more for 0.1-10 category which is 0.56 and for higher ranges, it
decreases. Therefore, it reveals that the success rate for higher categories of rainfall forecast
is low.
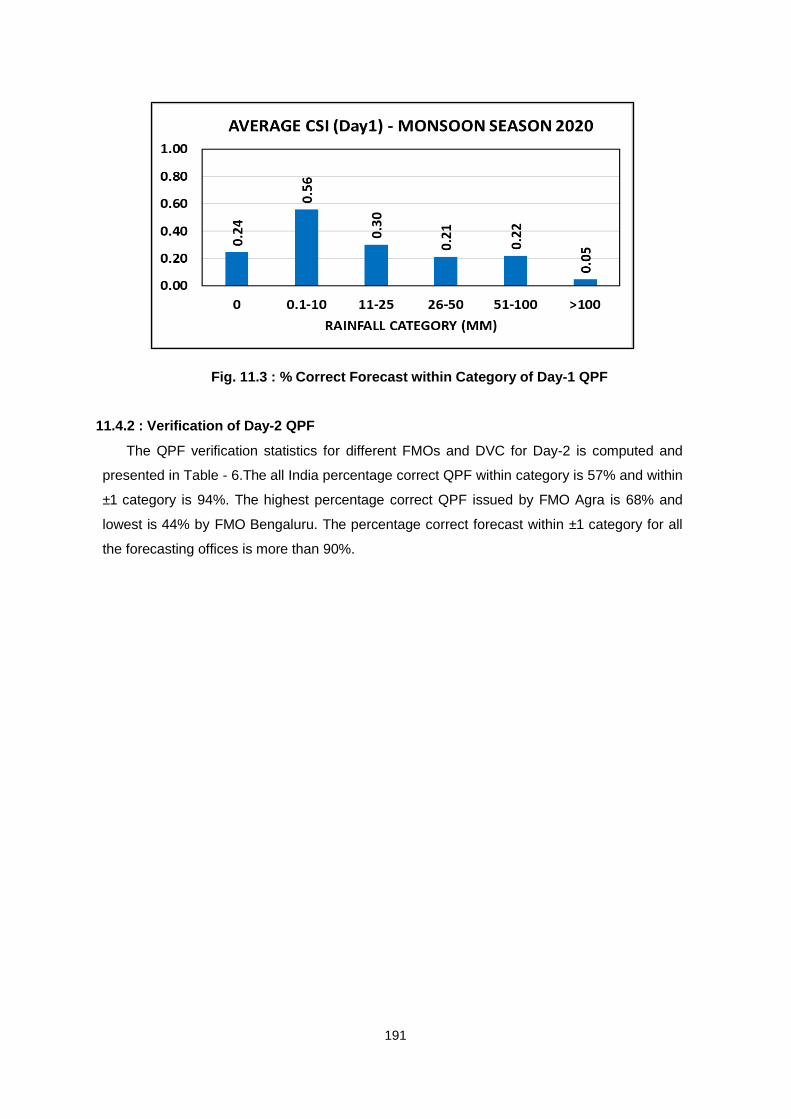
191
Fig. 11.3 : % Correct Forecast within Category of Day-1 QPF
11.4.2 : Verification of Day-2 QPF
The QPF verification statistics for different FMOs and DVC for Day-2 is computed and
presented in Table - 6.The all India percentage correct QPF within category is 57% and within
±1 category is 94%. The highest percentage correct QPF issued by FMO Agra is 68% and
lowest is 44% by FMO Bengaluru. The percentage correct forecast within ±1 category for all
the forecasting offices is more than 90%.

192
Table 11.6 : Performance of QPF (Day-2) updated for the Monsoon Season 2020
FMO/MC
Total No. of QPF
issued
Correct Forecast
Out by one Stage
Correct and ±1
Out by two Stage
Correct (%)
Usable Forecast Correct & ±1 Stage
Over fct.
Under fct.
Over fct.
Under fct.
Agra 976 661 176 95 932 41 2 68% 95%
Ahmedabad 2318 1404 450 361 2215 34 58 61% 96%
Asansol 366 217 107 38 362 4 0 59% 99%
Bengaluru 3172 1404 1089 341 2834 223 66 44% 90%
Bhubaneswar 1220 781 281 128 1190 16 14 64% 98%
Chennai 1342 622 344 232 1198 86 42 46% 89%
DVC 732 463 175 77 715 6 8 63% 98%
Guwahati 2440 1572 387 388 2347 45 37 64% 96%
Hyderabad 1952 1046 521 256 1823 66 52 54% 93%
Jalpaiguri 610 273 144 103 520 54 23 45% 85%
Lucknow 1708 1122 346 182 1650 38 20 66% 97%
New Delhi 366 224 89 37 350 10 4 61% 96%
Patna 976 563 286 73 922 34 15 58% 94%
Srinagar 488 319 108 51 478 1 9 65% 98%
All India fct. 18666 10671 4503 2362 17536 658 350 57% 94%
The all India skill scores viz, POD, FAR, MR, CSI, BIAS, PC, TSS and HSS have been
computed from 2X2 contingency and are given in Table 12.7. The all India false alarm rate is
the lowest as 0.31 (for 0.1-10 mm category) and increases for higher rainfall categories. The
highest false alarm rate is for >100 rainfall category and highest missing rate is also for the
category >100 mm.
Table 11.7 : All India Skill Scores of Day-2 QPF (2020)
SKILL SCORE 0 0.1-10 11-25 26-50 51-100 >100
Probability of Detection (POD): 0.28 0.69 0.46 0.20 0.19 0.09 False Alarm Rate (FAR): 0.40 0.31 0.67 0.82 0.76 0.83 Missing Rate (MR): 0.72 0.31 0.54 0.80 0.81 0.91 Correct Non-Occurrence (C-NON): 0.95 0.59 0.80 0.95 0.99 1.00 Critical Success Index (CSI): 0.23 0.53 0.24 0.10 0.10 0.05 Bias for Occurrence (BIAS): 0.43 1.02 1.40 1.30 0.76 0.43 Hit Rate: 0.87 0.66 0.75 0.92 0.98 1.00 Percentage of Correct (PC): 0.87 0.66 0.75 0.92 0.98 1.00 True Skill Score (TSS): 0.23 0.29 0.26 0.14 0.19 0.09 Heidke Skill Score (HSS): 0.26 0.28 0.22 0.13 0.15 0.08
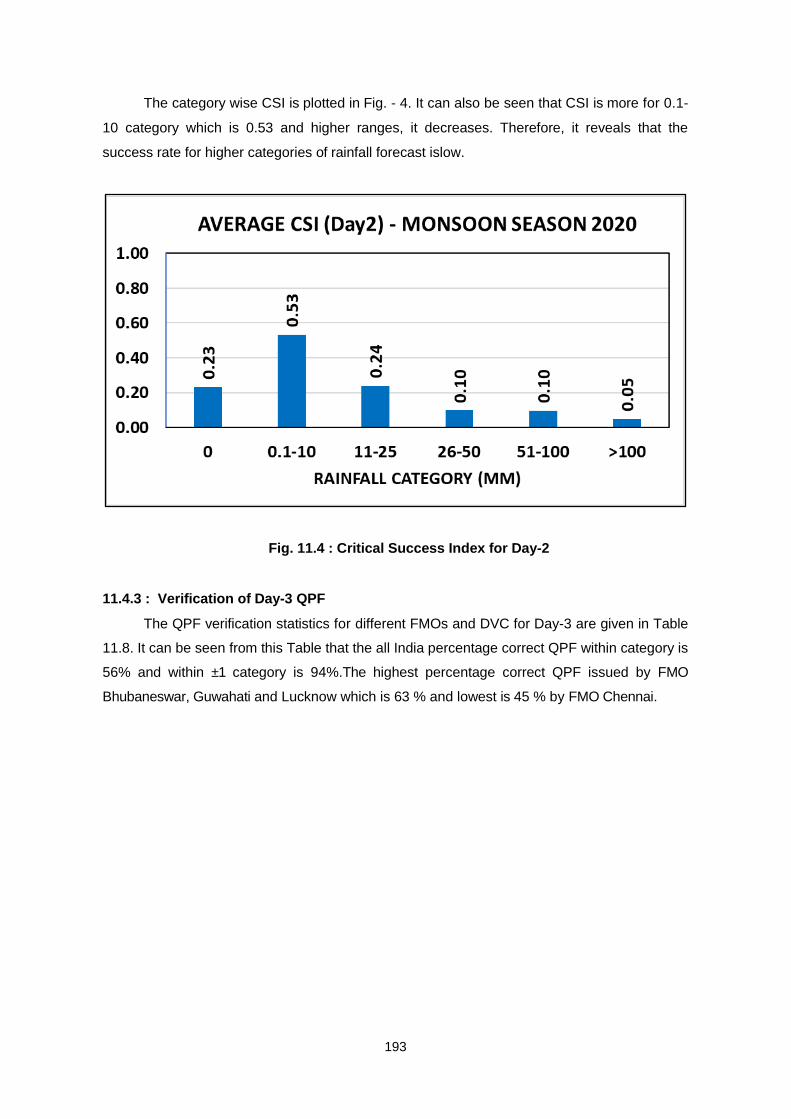
193
The category wise CSI is plotted in Fig. - 4. It can also be seen that CSI is more for 0.1-
10 category which is 0.53 and higher ranges, it decreases. Therefore, it reveals that the
success rate for higher categories of rainfall forecast islow.
Fig. 11.4 : Critical Success Index for Day-2
11.4.3 : Verification of Day-3 QPF
The QPF verification statistics for different FMOs and DVC for Day-3 are given in Table
11.8. It can be seen from this Table that the all India percentage correct QPF within category is
56% and within ±1 category is 94%.The highest percentage correct QPF issued by FMO
Bhubaneswar, Guwahati and Lucknow which is 63 % and lowest is 45 % by FMO Chennai.
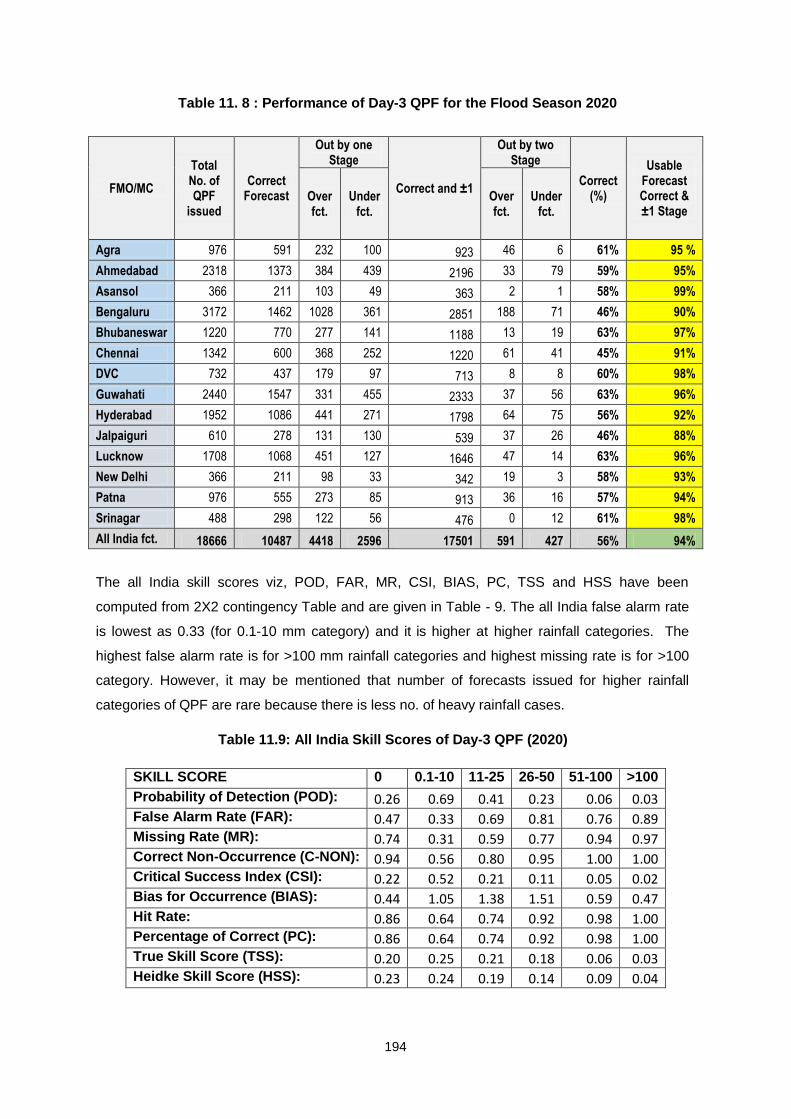
194
Table 11. 8 : Performance of Day-3 QPF for the Flood Season 2020
FMO/MC
Total No. of QPF
issued
Correct Forecast
Out by one Stage
Correct and ±1
Out by two Stage
Correct (%)
Usable Forecast Correct & ±1 Stage
Over fct.
Under fct.
Over fct.
Under fct.
Agra 976 591 232 100 923 46 6 61% 95 %
Ahmedabad 2318 1373 384 439 2196 33 79 59% 95%
Asansol 366 211 103 49 363 2 1 58% 99%
Bengaluru 3172 1462 1028 361 2851 188 71 46% 90%
Bhubaneswar 1220 770 277 141 1188 13 19 63% 97%
Chennai 1342 600 368 252 1220 61 41 45% 91%
DVC 732 437 179 97 713 8 8 60% 98%
Guwahati 2440 1547 331 455 2333 37 56 63% 96%
Hyderabad 1952 1086 441 271 1798 64 75 56% 92%
Jalpaiguri 610 278 131 130 539 37 26 46% 88%
Lucknow 1708 1068 451 127 1646 47 14 63% 96%
New Delhi 366 211 98 33 342 19 3 58% 93%
Patna 976 555 273 85 913 36 16 57% 94%
Srinagar 488 298 122 56 476 0 12 61% 98%
All India fct. 18666 10487 4418 2596 17501 591 427 56% 94%
The all India skill scores viz, POD, FAR, MR, CSI, BIAS, PC, TSS and HSS have been
computed from 2X2 contingency Table and are given in Table - 9. The all India false alarm rate
is lowest as 0.33 (for 0.1-10 mm category) and it is higher at higher rainfall categories. The
highest false alarm rate is for >100 mm rainfall categories and highest missing rate is for >100
category. However, it may be mentioned that number of forecasts issued for higher rainfall
categories of QPF are rare because there is less no. of heavy rainfall cases.
Table 11.9: All India Skill Scores of Day-3 QPF (2020)
SKILL SCORE 0 0.1-10 11-25 26-50 51-100 >100
Probability of Detection (POD): 0.26 0.69 0.41 0.23 0.06 0.03 False Alarm Rate (FAR): 0.47 0.33 0.69 0.81 0.76 0.89 Missing Rate (MR): 0.74 0.31 0.59 0.77 0.94 0.97 Correct Non-Occurrence (C-NON): 0.94 0.56 0.80 0.95 1.00 1.00 Critical Success Index (CSI): 0.22 0.52 0.21 0.11 0.05 0.02 Bias for Occurrence (BIAS): 0.44 1.05 1.38 1.51 0.59 0.47 Hit Rate: 0.86 0.64 0.74 0.92 0.98 1.00 Percentage of Correct (PC): 0.86 0.64 0.74 0.92 0.98 1.00 True Skill Score (TSS): 0.20 0.25 0.21 0.18 0.06 0.03 Heidke Skill Score (HSS): 0.23 0.24 0.19 0.14 0.09 0.04
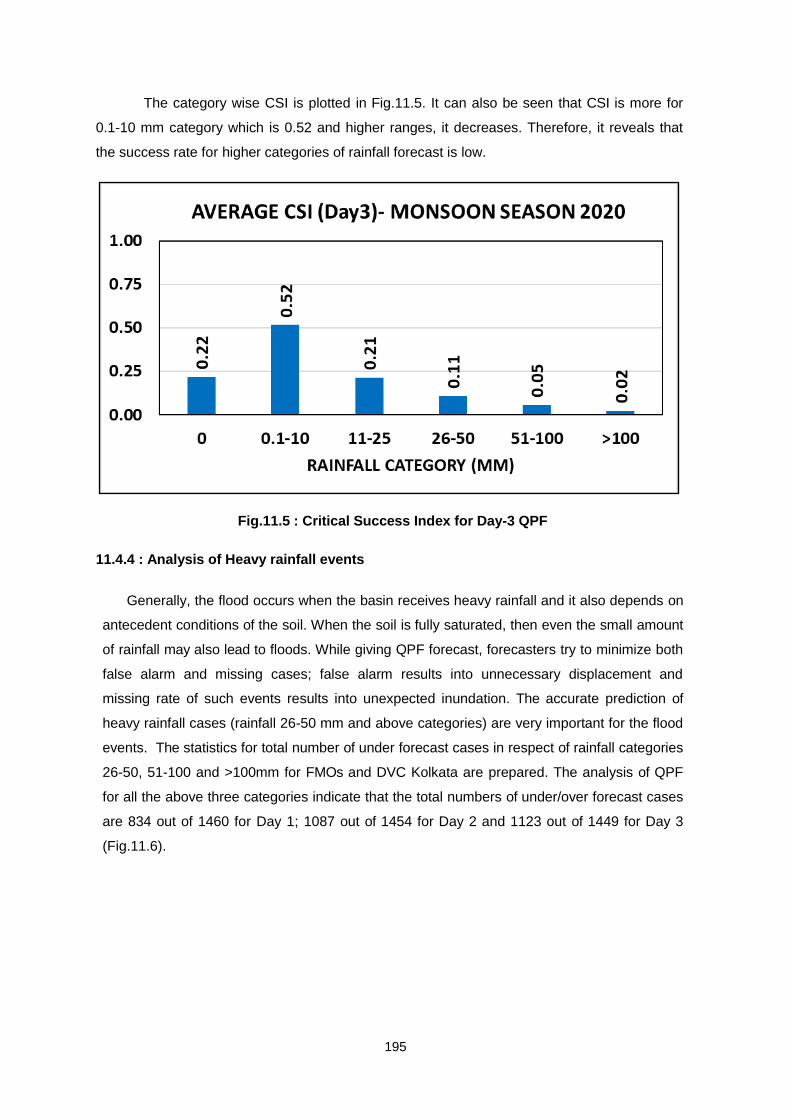
195
The category wise CSI is plotted in Fig.11.5. It can also be seen that CSI is more for
0.1-10 mm category which is 0.52 and higher ranges, it decreases. Therefore, it reveals that
the success rate for higher categories of rainfall forecast is low.
Fig.11.5 : Critical Success Index for Day-3 QPF
11.4.4 : Analysis of Heavy rainfall events
Generally, the flood occurs when the basin receives heavy rainfall and it also depends on
antecedent conditions of the soil. When the soil is fully saturated, then even the small amount
of rainfall may also lead to floods. While giving QPF forecast, forecasters try to minimize both
false alarm and missing cases; false alarm results into unnecessary displacement and
missing rate of such events results into unexpected inundation. The accurate prediction of
heavy rainfall cases (rainfall 26-50 mm and above categories) are very important for the flood
events. The statistics for total number of under forecast cases in respect of rainfall categories
26-50, 51-100 and >100mm for FMOs and DVC Kolkata are prepared. The analysis of QPF
for all the above three categories indicate that the total numbers of under/over forecast cases
are 834 out of 1460 for Day 1; 1087 out of 1454 for Day 2 and 1123 out of 1449 for Day 3
(Fig.11.6).
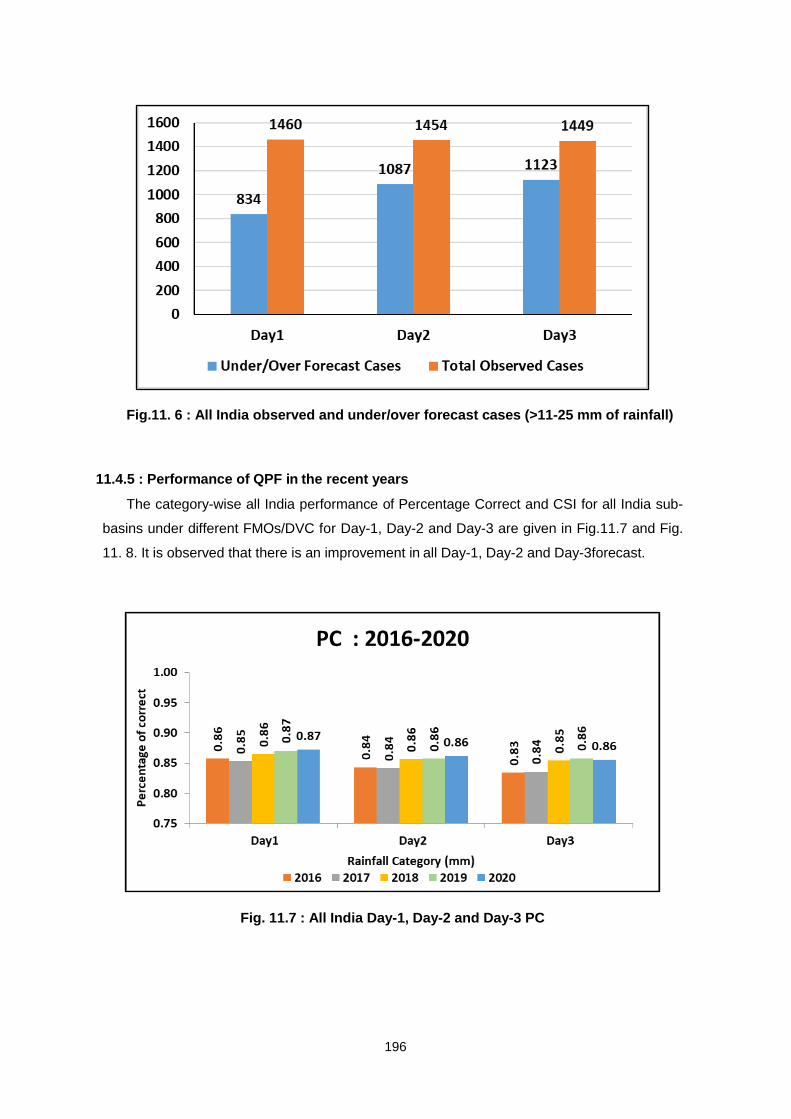
196
Fig.11. 6 : All India observed and under/over forecast cases (>11-25 mm of rainfall)
11.4.5 : Performance of QPF in the recent years
The category-wise all India performance of Percentage Correct and CSI for all India sub-
basins under different FMOs/DVC for Day-1, Day-2 and Day-3 are given in Fig.11.7 and Fig.
11. 8. It is observed that there is an improvement in all Day-1, Day-2 and Day-3forecast.
Fig. 11.7 : All India Day-1, Day-2 and Day-3 PC
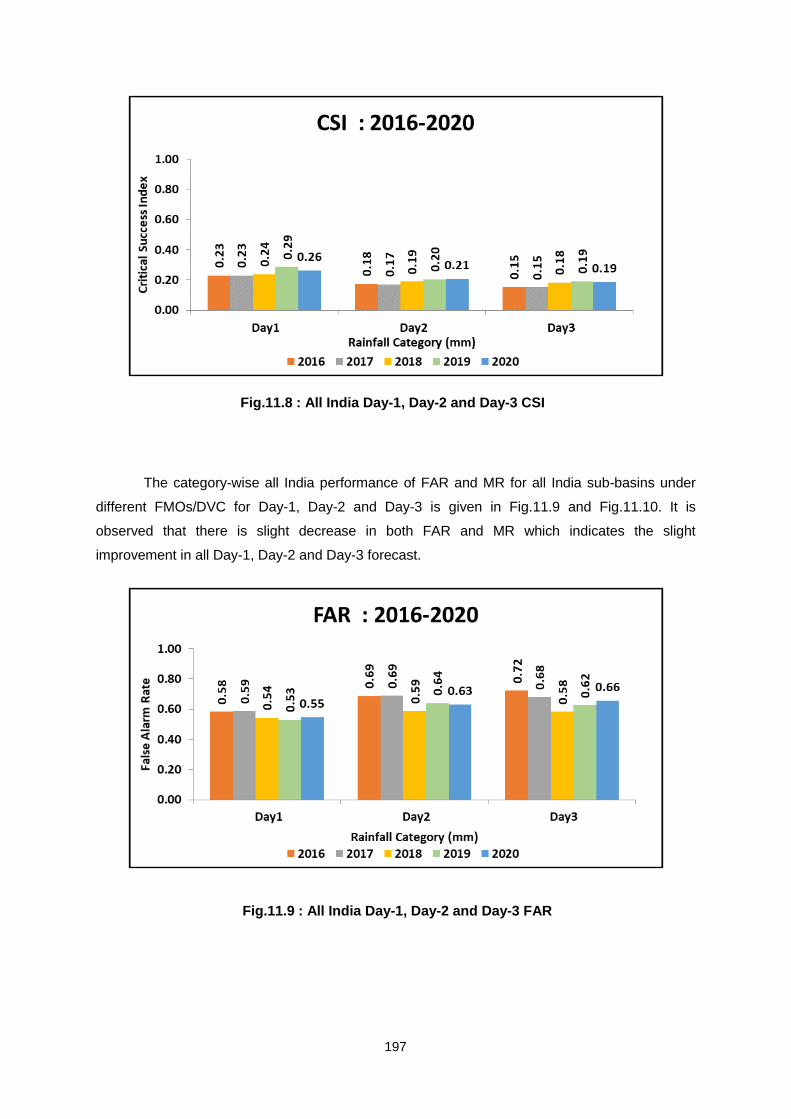
197
Fig.11.8 : All India Day-1, Day-2 and Day-3 CSI
The category-wise all India performance of FAR and MR for all India sub-basins under
different FMOs/DVC for Day-1, Day-2 and Day-3 is given in Fig.11.9 and Fig.11.10. It is
observed that there is slight decrease in both FAR and MR which indicates the slight
improvement in all Day-1, Day-2 and Day-3 forecast.
Fig.11.9 : All India Day-1, Day-2 and Day-3 FAR
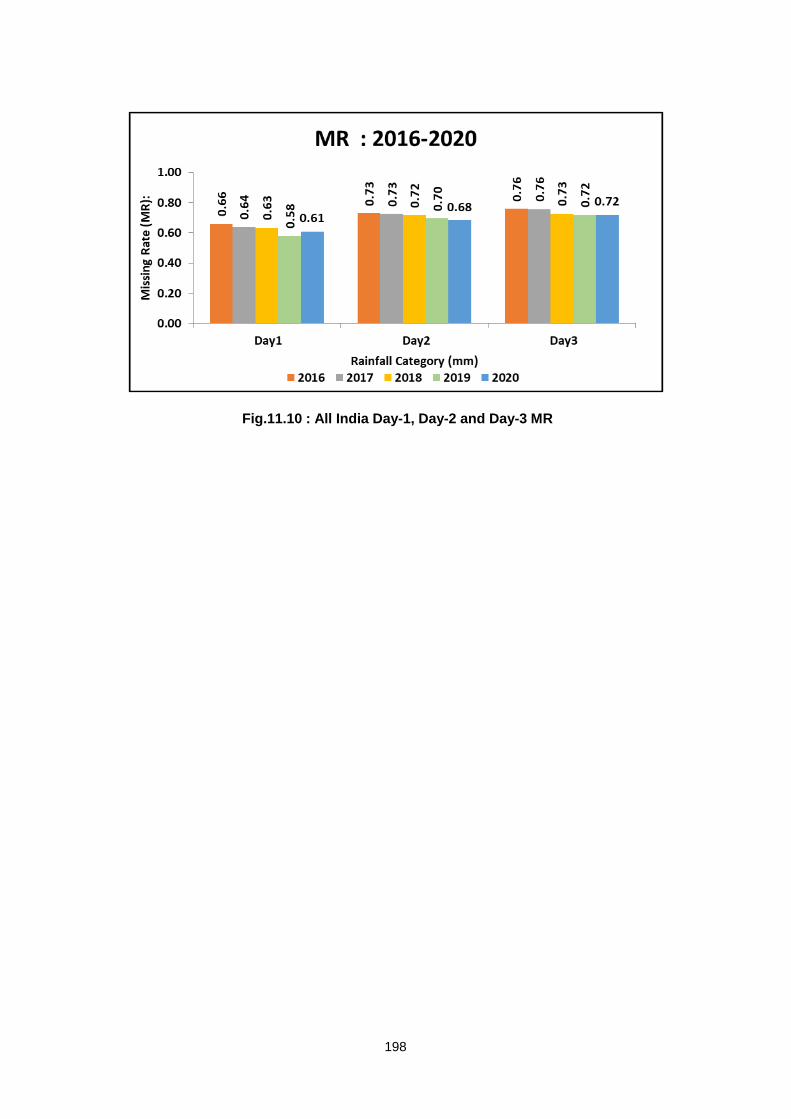
198
Fig.11.10 : All India Day-1, Day-2 and Day-3 MR
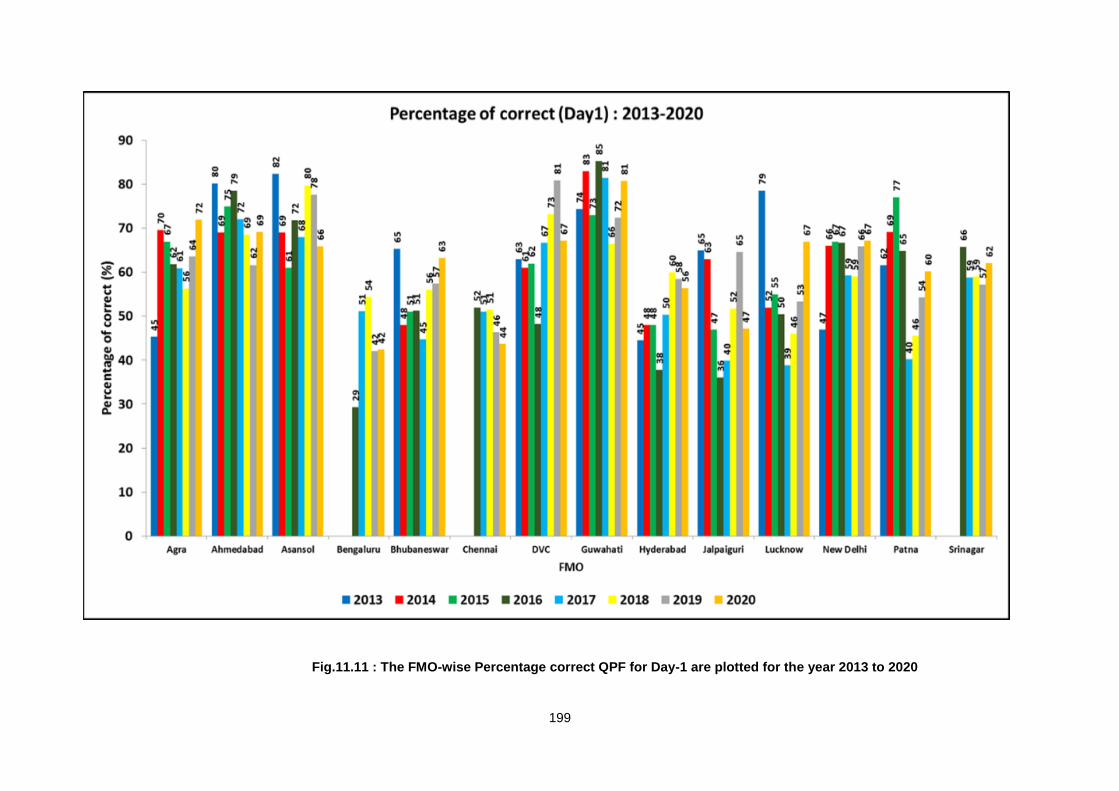
199
Fig.11.11 : The FMO-wise Percentage correct QPF for Day-1 are plotted for the year 2013 to 2020
200
The FMO-wise Percentage correct QPF for Day-1 are plotted for the year 2013 to
2020 (Fig.11.11). The accuracy of Day-1 QPF of FMOs namely, Agra, Ahmedabad,
Bengaluru, Bhubaneshwar, Guwahati, Lucknow, New Delhi, Patna and Srinagar has
improved during the last years while it has deteriorated in respect of FMOs namely, Asansol,
Chennai, DVC, Hyderabad and Jalpaiguri.
Conclusion :
i). All India percentage correct QPF within category for FMOs are 61% for Day-1, 57% for
Day-2, and 56% for Day-3. However, the accuracy of correct QPF within ±1 category is
95% for Day-1, 94% for Day-2, and 94% for Day-3.
ii). The highest percentage correct QPF issued by FMO Guwahati is 81% and lowest by
FMO Bengaluru as 42% for Day-1; it is the highest for FMO Agra as 68%, and lowest
45% by FMO Bengaluru for Day2; it is highest by FMO Guwahati as 63% and lowest
45% by FMO Chennai for Day3.
iii). All India Critical Success Index (CSI) for the rainfall categories 0.1-10, 11-25, 26-50,
51-100 and >100 mm varies from 0.56 to 0.05 for Day-1, 0.53 to 0.05 for Day-2, 0.52
to 0.02 for Day-3. CSI decreases as we move to the higher rainfall categories.
Probability of Detection (POD) also varies in similar manner.
iv). The accuracy of Day-1 QPF of FMOs namely, Agra, Ahmedabad, Bengaluru,
Guwahati, Lucknow, New Delhi, Patna and Srinagar have improved during the last
years while it has deteriorated in respect of FMOs namely, Asansol, Bhubaneshwar,
Chennai, DVC, Hyderabad and Jalpaiguri.
v). All India False Alarm Rate (FAR) for the rainfall categories 0.1-10, 11-25, 26-
50, 51-100 and >100 mm varies from 0.28 to 0.85 for Day-1, 0.31 to 0.83 for
Day-2, 0.33 to 0.89 for Day-3. FAR increases as we move to the higher rainfall
categories.
vi). The category wise overall performance of percentage correct forecast within
category under different FMOs and DVC for Day-1, Day-2 and Day-3, shows
that the performance of Day-1 forecast for the higher rainfall categories 26-50
mm, 51-100 mm and >100 mm has significant improvement.
vii). The accuracy of Day-1 QPF of FMOs namely, Agra, Ahmedabad, Bengaluru,
Bhubaneshwar, Guwahati, Lucknow, New Delhi, Patna and Srinagar have improved
during the last years while it has deteriorated in respect of FMOs namely, Asansol,
Chennai, DVC, Hyderabad and Jalpaiguri.
201
References :
1. „Verification of Quantitative Precipitation Forecast (QPF) 2015 over river basins of
India‟ by S. Kaur, S. K. Diwakar and A. K. Das, Report No. ESSO/IMD/HS/Basin
Hydrology/12/2017(1).
2. „Verification of Quantitative Precipitation Forecast (QPF) 2017 during SW Monsoon
over River Sub-basins of India‟ by B. P. Yadav and Ashok Kumar Das, SW Monsoon
Report 2017, Chapter -21.
3. „Verification of Quantitative Precipitation Forecast (QPF) 2018 during SW Monsoon
over River Sub-basins of India‟ by B. P. Yadav and Ashok Kumar Das, SW Monsoon
Report 2018, Chapter -17.
4. „Skill of operational forecast of heavy rainfall events during southwest monsoon
season over India‟ by B. P. Yadav, Naresh Kumar and L. S. Rathore, 66, 579- 584
5. „Verification of Quantitative Precipitation Forecast (QPF) 2014 over river basins of
India‟, IMD MET. Monograph: Synoptic Meteorology No.: ESSO/IMD/SYNOPTIC
MET/01-2014/15.
6. „Performance of IMD Multi-Model Ensemble (MME) and WRF ARW based sub-basin
wise rainfall forecast for Mahanadi basin during Flood Season 2009, 2010‟ by Ashok
Kumar Das and Surinder Kaur, Mausam, 64, 4(Oct 2013), 625-644.
7. „Performance of IMD Multi-Model Ensemble and WRF (ARW) model for sub-basin
wise rainfall forecast during Monsoon 2012‟ by Ashok Kumar Das and Surinder Kaur
in Mausam 67, 2 (April 2016), 323-332.
202
12
OPERATIONAL AND EXPERIMENTAL LONG RANGE
PREDICTION FORECASTS
O. P. Sreejith1,, Divya Surendran1, Madhuri Musale1, Pai D. S1
& Suryachadra Rao2. 1India Meteorological Department, Pune
2Indian Institute of Tropical Meteorology, Pune
This chapter discusses the various operational forecasts issued by India
Meteorological Department (IMD) for the monthly and seasonal rainfall over India and date
of monsoon onset over Kerala for the 2020southwest monsoon season and its
verification.The chapter also discusses the experimental forecasts generated using IMD’s
dynamical global forecasting system based on coupled forecasting system (CFS) and
experimental obtained from various climate research centers within the country and
abroad.
12.1. Introduction
Every year, India Meteorological Department (IMD) issues operational monthly and
seasonal forecasts for the southwest monsoon rainfall using models based on the latest
statistical techniques with useful skill (Rajeevan et al. 2007, Pai et al. 2011).In 2020, the
long range forecast for the 2020 southwest monsoon rainfall was issued in 3 stages. The
first stage long range forecast issued on 15th April consisted of only forecast for season
(June-September) rainfall over the country as a whole. In the second stage (1stJune),
along with the update for the April forecast, forecast for season rainfall over the four broad
geographical regions (northwest India, central India, south Peninsula and northeast India)
and that for monthly rainfall over the country as a whole for the months of July and August
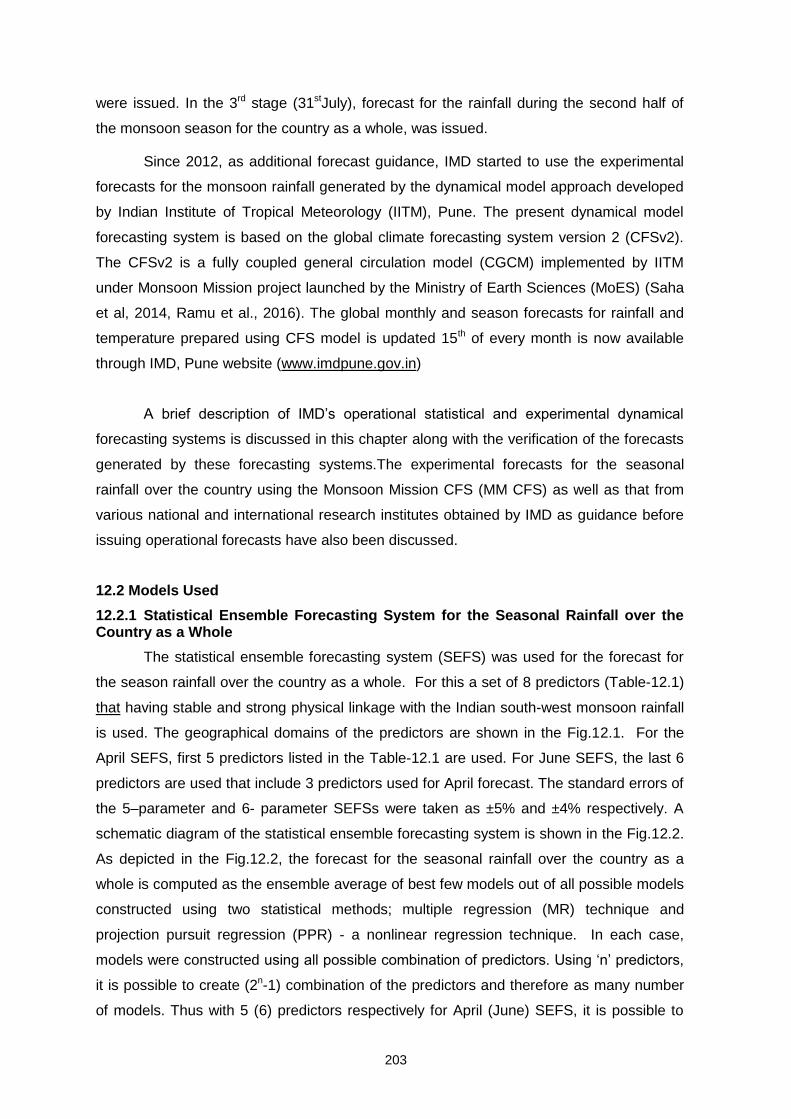
203
were issued. In the 3rd stage (31stJuly), forecast for the rainfall during the second half of
the monsoon season for the country as a whole, was issued.
Since 2012, as additional forecast guidance, IMD started to use the experimental
forecasts for the monsoon rainfall generated by the dynamical model approach developed
by Indian Institute of Tropical Meteorology (IITM), Pune. The present dynamical model
forecasting system is based on the global climate forecasting system version 2 (CFSv2).
The CFSv2 is a fully coupled general circulation model (CGCM) implemented by IITM
under Monsoon Mission project launched by the Ministry of Earth Sciences (MoES) (Saha
et al, 2014, Ramu et al., 2016). The global monthly and season forecasts for rainfall and
temperature prepared using CFS model is updated 15th of every month is now available
through IMD, Pune website (www.imdpune.gov.in)
A brief description of IMD‟s operational statistical and experimental dynamical
forecasting systems is discussed in this chapter along with the verification of the forecasts
generated by these forecasting systems.The experimental forecasts for the seasonal
rainfall over the country using the Monsoon Mission CFS (MM CFS) as well as that from
various national and international research institutes obtained by IMD as guidance before
issuing operational forecasts have also been discussed.
12.2 Models Used
12.2.1 Statistical Ensemble Forecasting System for the Seasonal Rainfall over the Country as a Whole
The statistical ensemble forecasting system (SEFS) was used for the forecast for
the season rainfall over the country as a whole. For this a set of 8 predictors (Table-12.1)
that having stable and strong physical linkage with the Indian south-west monsoon rainfall
is used. The geographical domains of the predictors are shown in the Fig.12.1. For the
April SEFS, first 5 predictors listed in the Table-12.1 are used. For June SEFS, the last 6
predictors are used that include 3 predictors used for April forecast. The standard errors of
the 5–parameter and 6- parameter SEFSs were taken as ±5% and ±4% respectively. A
schematic diagram of the statistical ensemble forecasting system is shown in the Fig.12.2.
As depicted in the Fig.12.2, the forecast for the seasonal rainfall over the country as a
whole is computed as the ensemble average of best few models out of all possible models
constructed using two statistical methods; multiple regression (MR) technique and
projection pursuit regression (PPR) - a nonlinear regression technique. In each case,
models were constructed using all possible combination of predictors. Using „n‟ predictors,
it is possible to create (2n-1) combination of the predictors and therefore as many number
of models. Thus with 5 (6) predictors respectively for April (June) SEFS, it is possible to
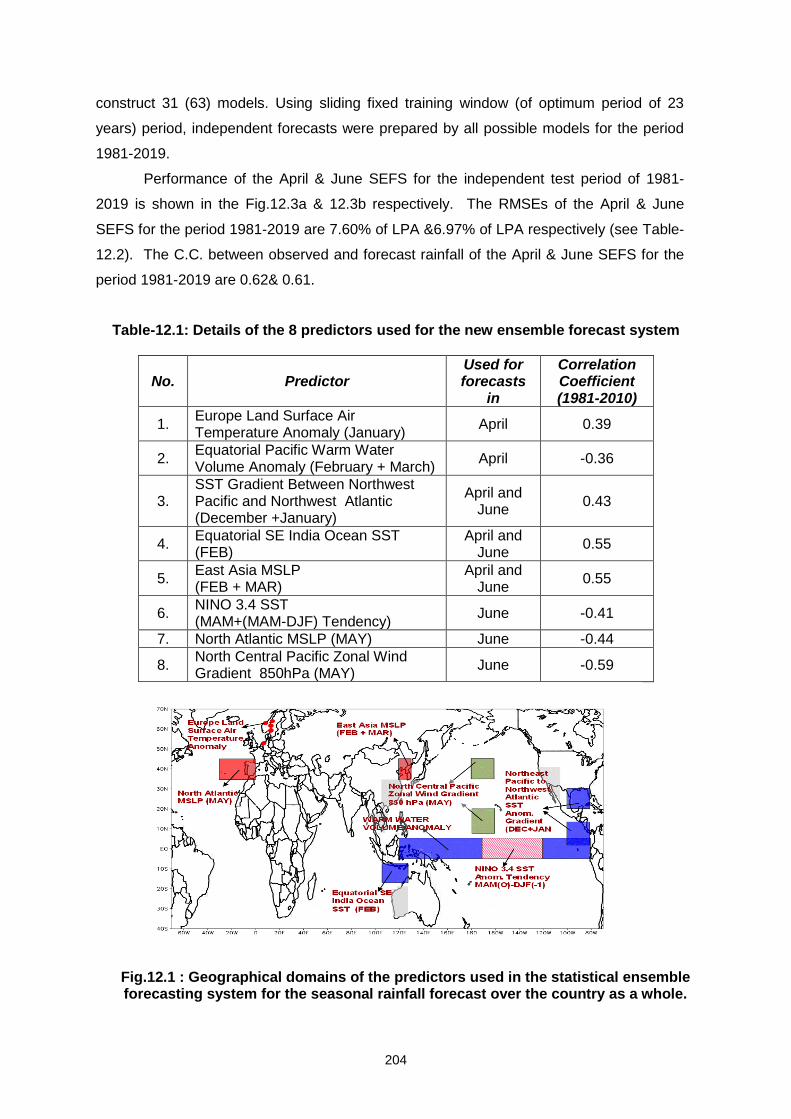
204
construct 31 (63) models. Using sliding fixed training window (of optimum period of 23
years) period, independent forecasts were prepared by all possible models for the period
1981-2019.
Performance of the April & June SEFS for the independent test period of 1981-
2019 is shown in the Fig.12.3a & 12.3b respectively. The RMSEs of the April & June
SEFS for the period 1981-2019 are 7.60% of LPA &6.97% of LPA respectively (see Table-
12.2). The C.C. between observed and forecast rainfall of the April & June SEFS for the
period 1981-2019 are 0.62& 0.61.
Table-12.1: Details of the 8 predictors used for the new ensemble forecast system
No. Predictor Used for forecasts
in
Correlation Coefficient (1981-2010)
1. Europe Land Surface Air Temperature Anomaly (January)
April 0.39
2. Equatorial Pacific Warm Water Volume Anomaly (February + March)
April -0.36
3. SST Gradient Between Northwest Pacific and Northwest Atlantic (December +January)
April and June
0.43
4. Equatorial SE India Ocean SST (FEB)
April and June
0.55
5. East Asia MSLP (FEB + MAR)
April and June
0.55
6. NINO 3.4 SST (MAM+(MAM-DJF) Tendency)
June -0.41
7. North Atlantic MSLP (MAY) June -0.44
8. North Central Pacific Zonal Wind Gradient 850hPa (MAY)
June -0.59
Fig.12.1 : Geographical domains of the predictors used in the statistical ensemble forecasting system for the seasonal rainfall forecast over the country as a whole.
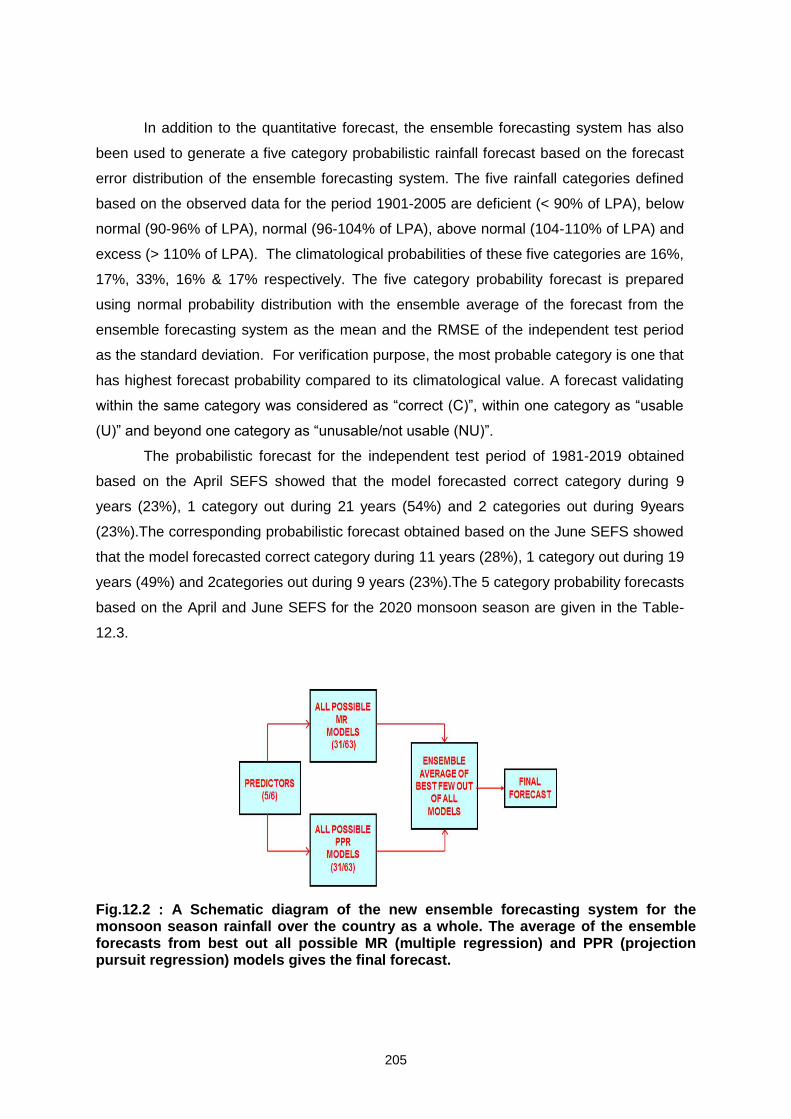
205
In addition to the quantitative forecast, the ensemble forecasting system has also
been used to generate a five category probabilistic rainfall forecast based on the forecast
error distribution of the ensemble forecasting system. The five rainfall categories defined
based on the observed data for the period 1901-2005 are deficient (< 90% of LPA), below
normal (90-96% of LPA), normal (96-104% of LPA), above normal (104-110% of LPA) and
excess (> 110% of LPA). The climatological probabilities of these five categories are 16%,
17%, 33%, 16% & 17% respectively. The five category probability forecast is prepared
using normal probability distribution with the ensemble average of the forecast from the
ensemble forecasting system as the mean and the RMSE of the independent test period
as the standard deviation. For verification purpose, the most probable category is one that
has highest forecast probability compared to its climatological value. A forecast validating
within the same category was considered as “correct (C)”, within one category as “usable
(U)” and beyond one category as “unusable/not usable (NU)”.
The probabilistic forecast for the independent test period of 1981-2019 obtained
based on the April SEFS showed that the model forecasted correct category during 9
years (23%), 1 category out during 21 years (54%) and 2 categories out during 9years
(23%).The corresponding probabilistic forecast obtained based on the June SEFS showed
that the model forecasted correct category during 11 years (28%), 1 category out during 19
years (49%) and 2categories out during 9 years (23%).The 5 category probability forecasts
based on the April and June SEFS for the 2020 monsoon season are given in the Table-
12.3.
Fig.12.2 : A Schematic diagram of the new ensemble forecasting system for the monsoon season rainfall over the country as a whole. The average of the ensemble forecasts from best out all possible MR (multiple regression) and PPR (projection pursuit regression) models gives the final forecast.
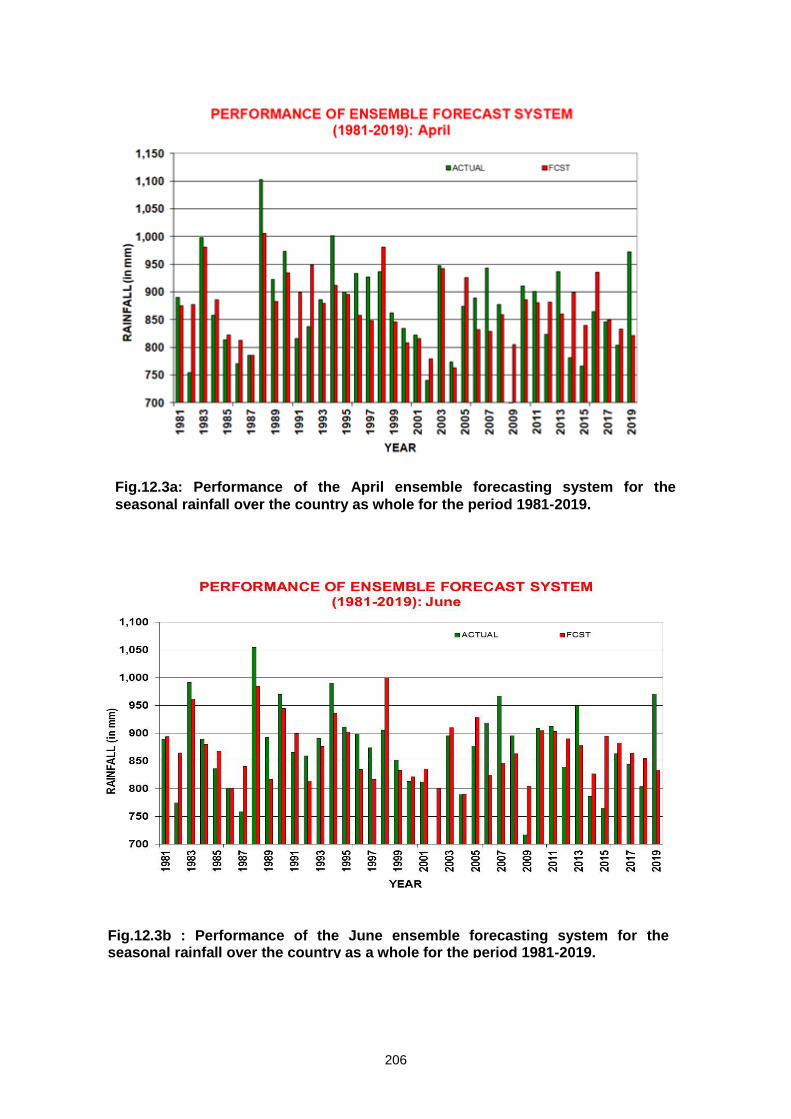
206
Fig.12.3a: Performance of the April ensemble forecasting system for the
seasonal rainfall over the country as whole for the period 1981-2019.
Fig.12.3b : Performance of the June ensemble forecasting system for the seasonal rainfall over the country as a whole for the period 1981-2019.
207
12.2.2 Principal Component Regression (PCR) Models Used for the Other Operational
Forecasts
Separate PCR models were used for generating forecasts for the rainfall over the
country as a whole during the peak rainfall months (July and August) and second half of
the monsoon season (August + September) and for the season (June – September)
rainfall over the four broad geographical regions of the country. The details of the various
PCR models are given in the Table 12.4 in brief.
These models used “moving training period” method for the forecasting of rainfall
for a reference year. In this method, the forecast for a reference year is prepared using
fixed number of years (constant training window period) just prior to the reference year as
the training period. As seen in the Table 12.4, models for forecasting rainfall over country
as whole (monthly, second half of the season & season) used 23 yrs and that for the
season rainfall over the four broad geographical regions used 30 yrs as the constant
training window period. In the PCR method, principal component analysis (PCA) is carried
out on the predictor data of the training period and first few PCs that explain 80% of the
total variability of the predictors during that period were retained. The retained PCs were
than related against the predictor series for the same period using the multiple linear
regression method. Scores of the selected PCs for the reference year were then calculated
using the PC loading matrix and predictor values for the reference year. These score
values along with the coefficients of the trained regression equation were used for
calculating the predictor value for the reference year. In this way, rainfall during the second
half of the southwest monsoon season over the country as a whole was predicted for the
independent test period.
The skills of the models are expressed in terms of correlation coefficient (C.C) and
root mean square error (RMSE) between the model forecast and actual rainfall anomaly
during the independent test period and are shown in the last two columns of the Table
12.2. As seen in the Table 12.2, the skills of the models for the 4 broad regions are
relatively less than that of the models for the country as a whole. Among the monthly
forecast models, model for August rainfall over country as a whole showed least skill.
Among the models for the season rainfall over the broad regions, model for Northwest
India showed highest skill and that for Central India showed lowest skill.
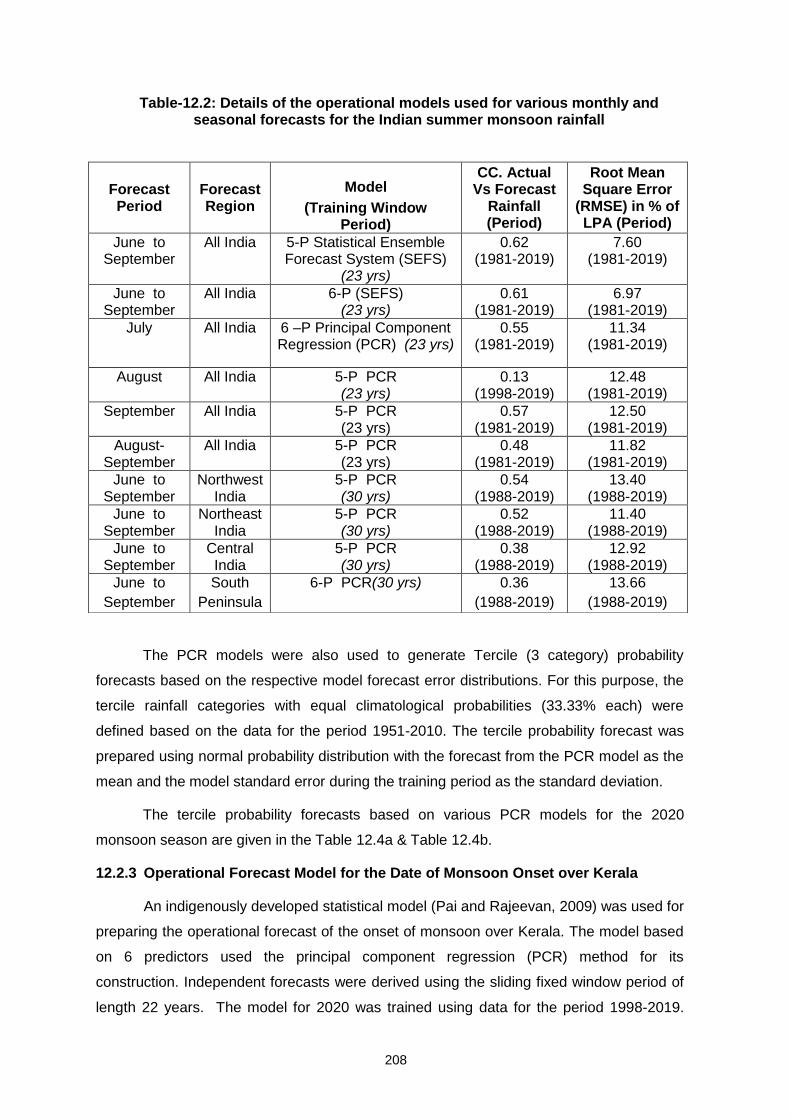
208
Table-12.2: Details of the operational models used for various monthly and seasonal forecasts for the Indian summer monsoon rainfall
The PCR models were also used to generate Tercile (3 category) probability
forecasts based on the respective model forecast error distributions. For this purpose, the
tercile rainfall categories with equal climatological probabilities (33.33% each) were
defined based on the data for the period 1951-2010. The tercile probability forecast was
prepared using normal probability distribution with the forecast from the PCR model as the
mean and the model standard error during the training period as the standard deviation.
The tercile probability forecasts based on various PCR models for the 2020
monsoon season are given in the Table 12.4a & Table 12.4b.
12.2.3 Operational Forecast Model for the Date of Monsoon Onset over Kerala
An indigenously developed statistical model (Pai and Rajeevan, 2009) was used for
preparing the operational forecast of the onset of monsoon over Kerala. The model based
on 6 predictors used the principal component regression (PCR) method for its
construction. Independent forecasts were derived using the sliding fixed window period of
length 22 years. The model for 2020 was trained using data for the period 1998-2019.
Forecast Period
Forecast Region
Model
(Training Window Period)
CC. Actual Vs Forecast
Rainfall (Period)
Root Mean Square Error
(RMSE) in % of LPA (Period)
June to September
All India 5-P Statistical Ensemble Forecast System (SEFS)
(23 yrs)
0.62 (1981-2019)
7.60 (1981-2019)
June to September
All India 6-P (SEFS) (23 yrs)
0.61 (1981-2019)
6.97 (1981-2019)
July All India 6 –P Principal Component Regression (PCR) (23 yrs)
0.55 (1981-2019)
11.34 (1981-2019)
August All India 5-P PCR (23 yrs)
0.13 (1998-2019)
12.48 (1981-2019)
September All India 5-P PCR (23 yrs)
0.57 (1981-2019)
12.50 (1981-2019)
August- September
All India 5-P PCR (23 yrs)
0.48 (1981-2019)
11.82 (1981-2019)
June to September
Northwest India
5-P PCR (30 yrs)
0.54 (1988-2019)
13.40 (1988-2019)
June to September
Northeast India
5-P PCR (30 yrs)
0.52 (1988-2019)
11.40 (1988-2019)
June to September
Central India
5-P PCR (30 yrs)
0.38 (1988-2019)
12.92 (1988-2019)
June to
September
South
Peninsula
6-P PCR(30 yrs) 0.36
(1988-2019)
13.66
(1988-2019)
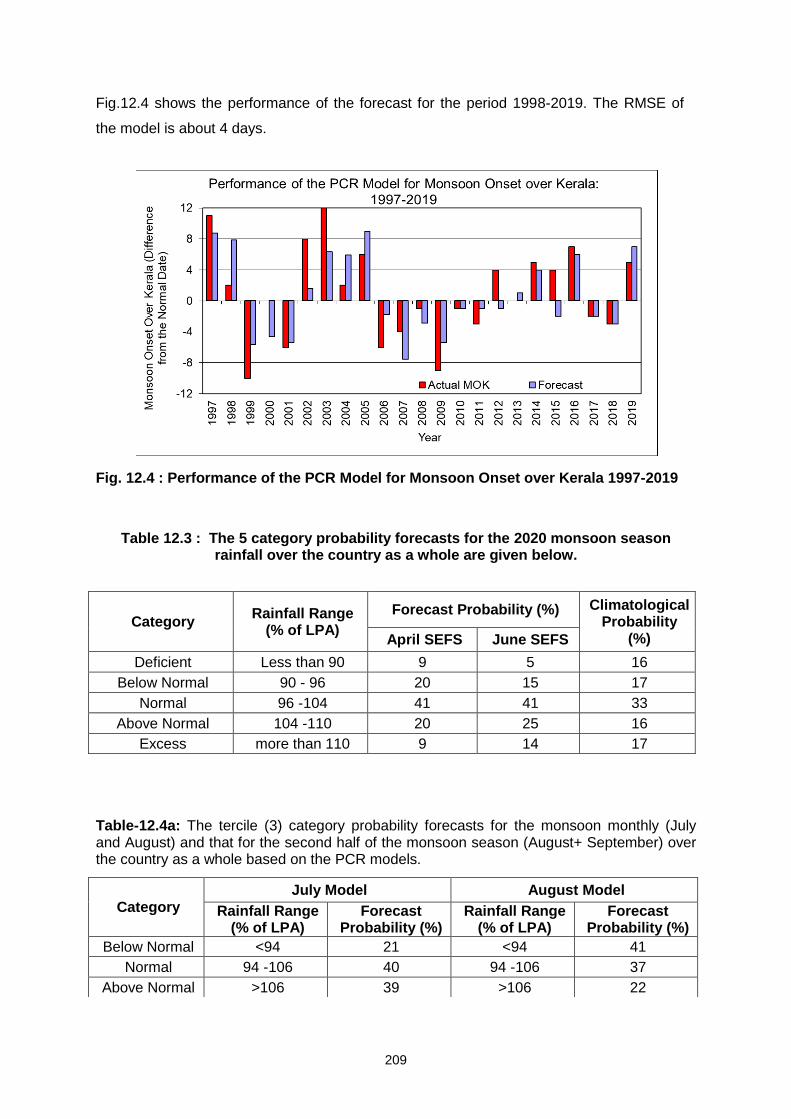
209
Fig.12.4 shows the performance of the forecast for the period 1998-2019. The RMSE of
the model is about 4 days.
Fig. 12.4 : Performance of the PCR Model for Monsoon Onset over Kerala 1997-2019
Table 12.3 : The 5 category probability forecasts for the 2020 monsoon season rainfall over the country as a whole are given below.
Table-12.4a: The tercile (3) category probability forecasts for the monsoon monthly (July and August) and that for the second half of the monsoon season (August+ September) over the country as a whole based on the PCR models.
Category Rainfall Range
(% of LPA)
Forecast Probability (%) Climatological Probability
(%) April SEFS June SEFS
Deficient Less than 90 9 5 16
Below Normal 90 - 96 20 15 17
Normal 96 -104 41 41 33
Above Normal 104 -110 20 25 16
Excess more than 110 9 14 17
Category July Model August Model
Rainfall Range (% of LPA)
Forecast Probability (%)
Rainfall Range (% of LPA)
Forecast Probability (%)
Below Normal <94 21 <94 41
Normal 94 -106 40 94 -106 37
Above Normal >106 39 >106 22
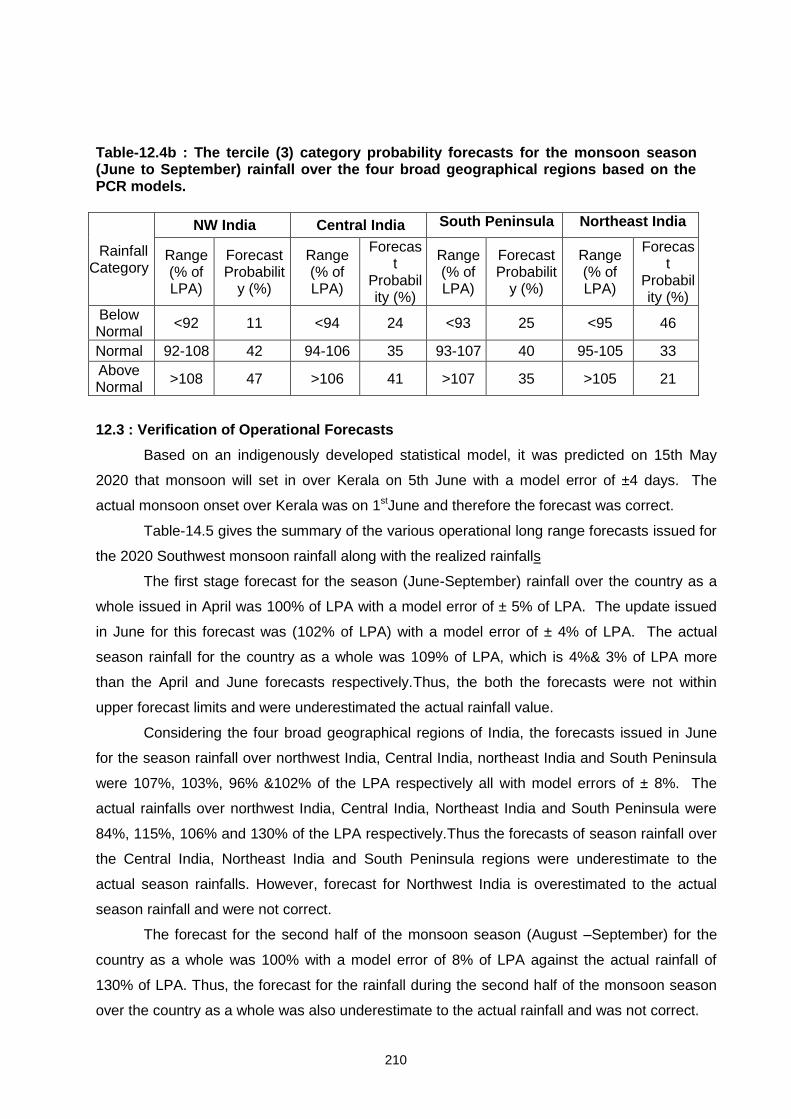
210
Table-12.4b : The tercile (3) category probability forecasts for the monsoon season (June to September) rainfall over the four broad geographical regions based on the PCR models.
12.3 : Verification of Operational Forecasts
Based on an indigenously developed statistical model, it was predicted on 15th May
2020 that monsoon will set in over Kerala on 5th June with a model error of ±4 days. The
actual monsoon onset over Kerala was on 1stJune and therefore the forecast was correct.
Table-14.5 gives the summary of the various operational long range forecasts issued for
the 2020 Southwest monsoon rainfall along with the realized rainfalls
The first stage forecast for the season (June-September) rainfall over the country as a
whole issued in April was 100% of LPA with a model error of ± 5% of LPA. The update issued
in June for this forecast was (102% of LPA) with a model error of ± 4% of LPA. The actual
season rainfall for the country as a whole was 109% of LPA, which is 4%& 3% of LPA more
than the April and June forecasts respectively.Thus, the both the forecasts were not within
upper forecast limits and were underestimated the actual rainfall value.
Considering the four broad geographical regions of India, the forecasts issued in June
for the season rainfall over northwest India, Central India, northeast India and South Peninsula
were 107%, 103%, 96% &102% of the LPA respectively all with model errors of ± 8%. The
actual rainfalls over northwest India, Central India, Northeast India and South Peninsula were
84%, 115%, 106% and 130% of the LPA respectively.Thus the forecasts of season rainfall over
the Central India, Northeast India and South Peninsula regions were underestimate to the
actual season rainfalls. However, forecast for Northwest India is overestimated to the actual
season rainfall and were not correct.
The forecast for the second half of the monsoon season (August –September) for the
country as a whole was 100% with a model error of 8% of LPA against the actual rainfall of
130% of LPA. Thus, the forecast for the rainfall during the second half of the monsoon season
over the country as a whole was also underestimate to the actual rainfall and was not correct.
Rainfall Category
NW India Central India South Peninsula Northeast India
Range (% of LPA)
Forecast Probabilit
y (%)
Range (% of LPA)
Forecast
Probability (%)
Range (% of LPA)
Forecast Probabilit
y (%)
Range (% of LPA)
Forecast
Probability (%)
Below Normal
<92 11 <94 24 <93 25 <95 46
Normal 92-108 42 94-106 35 93-107 40 95-105 33
Above Normal
>108 47 >106 41 >107 35 >105 21
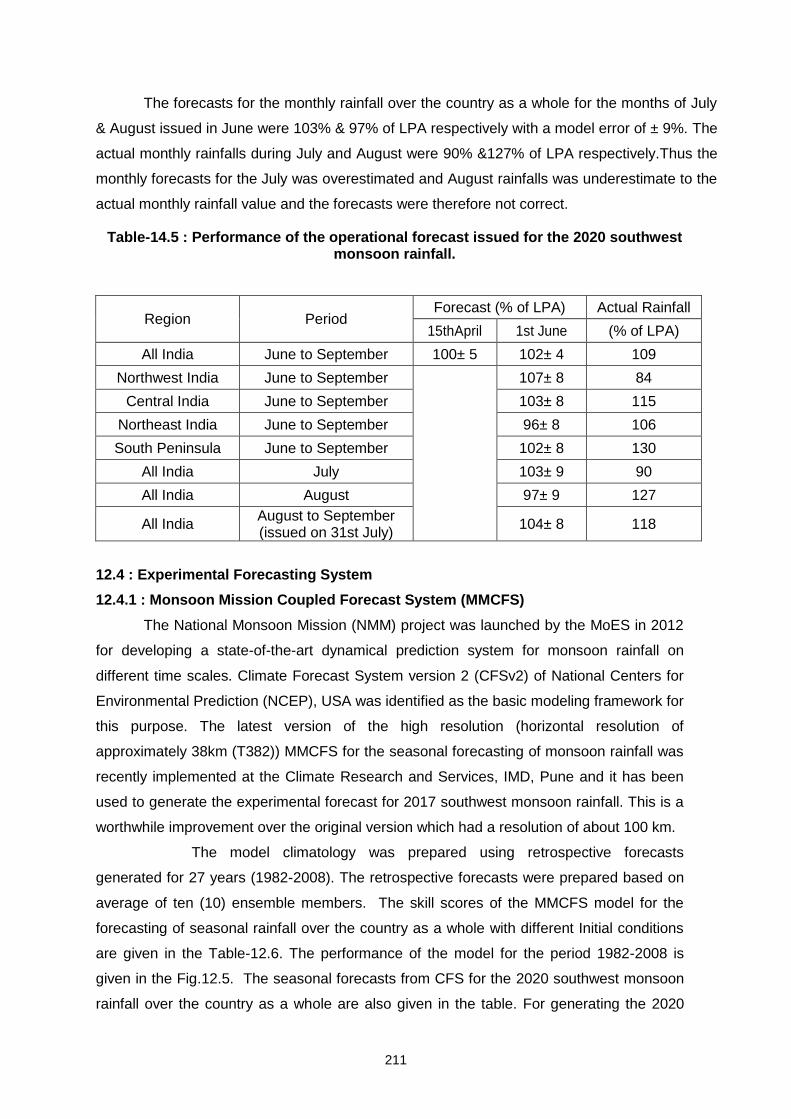
211
The forecasts for the monthly rainfall over the country as a whole for the months of July
& August issued in June were 103% & 97% of LPA respectively with a model error of ± 9%. The
actual monthly rainfalls during July and August were 90% &127% of LPA respectively.Thus the
monthly forecasts for the July was overestimated and August rainfalls was underestimate to the
actual monthly rainfall value and the forecasts were therefore not correct.
Table-14.5 : Performance of the operational forecast issued for the 2020 southwest monsoon rainfall.
Region Period Forecast (% of LPA) Actual Rainfall
15thApril 1st June (% of LPA)
All India June to September 100± 5 102± 4 109
Northwest India June to September 107± 8 84
Central India June to September 103± 8 115
Northeast India June to September 96± 8 106
South Peninsula June to September 102± 8 130
All India July 103± 9 90
All India August 97± 9 127
All India August to September (issued on 31st July)
104± 8 118
12.4 : Experimental Forecasting System
12.4.1 : Monsoon Mission Coupled Forecast System (MMCFS)
The National Monsoon Mission (NMM) project was launched by the MoES in 2012
for developing a state-of-the-art dynamical prediction system for monsoon rainfall on
different time scales. Climate Forecast System version 2 (CFSv2) of National Centers for
Environmental Prediction (NCEP), USA was identified as the basic modeling framework for
this purpose. The latest version of the high resolution (horizontal resolution of
approximately 38km (T382)) MMCFS for the seasonal forecasting of monsoon rainfall was
recently implemented at the Climate Research and Services, IMD, Pune and it has been
used to generate the experimental forecast for 2017 southwest monsoon rainfall. This is a
worthwhile improvement over the original version which had a resolution of about 100 km.
The model climatology was prepared using retrospective forecasts
generated for 27 years (1982-2008). The retrospective forecasts were prepared based on
average of ten (10) ensemble members. The skill scores of the MMCFS model for the
forecasting of seasonal rainfall over the country as a whole with different Initial conditions
are given in the Table-12.6. The performance of the model for the period 1982-2008 is
given in the Fig.12.5. The seasonal forecasts from CFS for the 2020 southwest monsoon
rainfall over the country as a whole are also given in the table. For generating the 2020
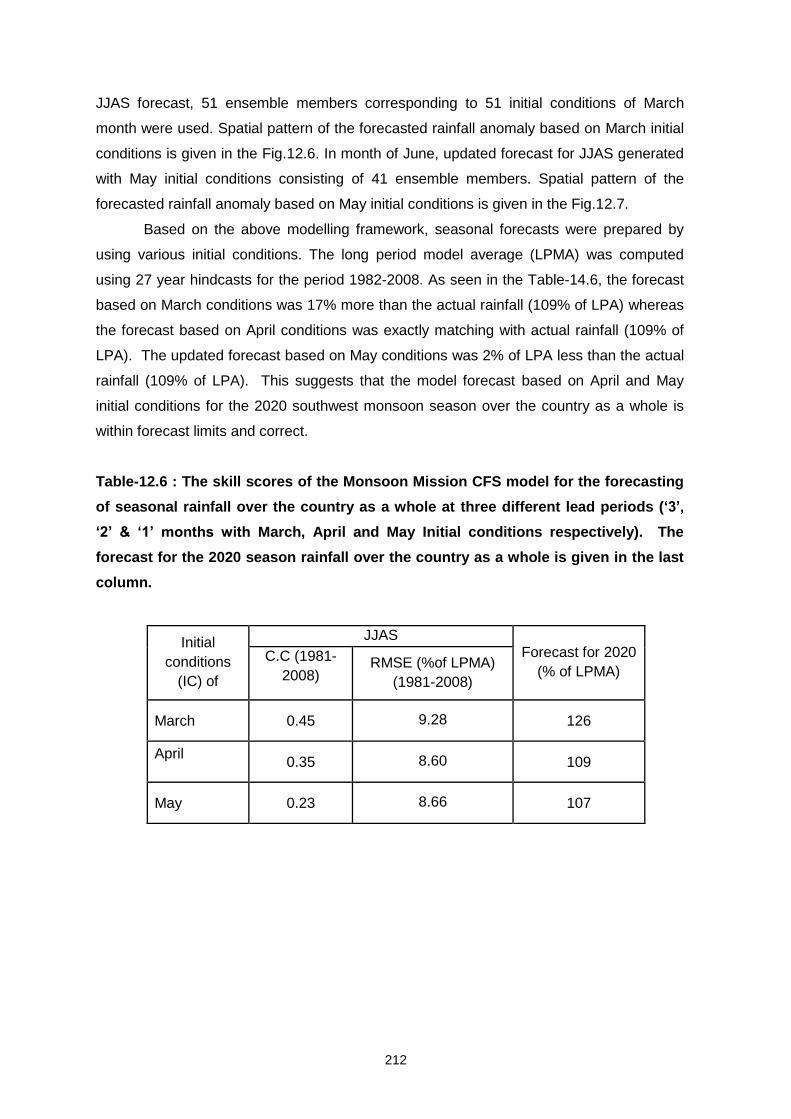
212
JJAS forecast, 51 ensemble members corresponding to 51 initial conditions of March
month were used. Spatial pattern of the forecasted rainfall anomaly based on March initial
conditions is given in the Fig.12.6. In month of June, updated forecast for JJAS generated
with May initial conditions consisting of 41 ensemble members. Spatial pattern of the
forecasted rainfall anomaly based on May initial conditions is given in the Fig.12.7.
Based on the above modelling framework, seasonal forecasts were prepared by
using various initial conditions. The long period model average (LPMA) was computed
using 27 year hindcasts for the period 1982-2008. As seen in the Table-14.6, the forecast
based on March conditions was 17% more than the actual rainfall (109% of LPA) whereas
the forecast based on April conditions was exactly matching with actual rainfall (109% of
LPA). The updated forecast based on May conditions was 2% of LPA less than the actual
rainfall (109% of LPA). This suggests that the model forecast based on April and May
initial conditions for the 2020 southwest monsoon season over the country as a whole is
within forecast limits and correct.
Table-12.6 : The skill scores of the Monsoon Mission CFS model for the forecasting
of seasonal rainfall over the country as a whole at three different lead periods (‘3’,
‘2’ & ‘1’ months with March, April and May Initial conditions respectively). The
forecast for the 2020 season rainfall over the country as a whole is given in the last
column.
Initial
conditions
(IC) of
JJAS Forecast for 2020
(% of LPMA) C.C (1981-
2008) RMSE (%of LPMA)
(1981-2008)
March 0.45 9.28 126
April
0.35 8.60 109
May 0.23 8.66 107
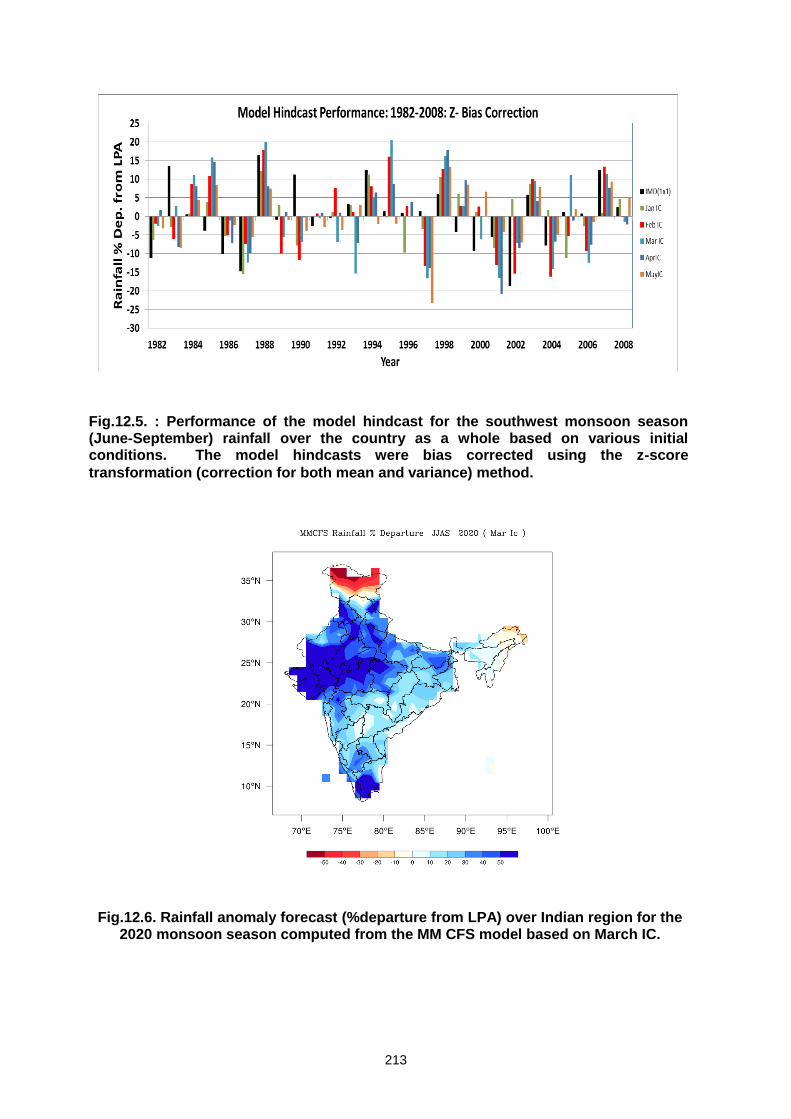
213
Fig.12.6. Rainfall anomaly forecast (%departure from LPA) over Indian region for the
2020 monsoon season computed from the MM CFS model based on March IC.
Fig.12.5. : Performance of the model hindcast for the southwest monsoon season (June-September) rainfall over the country as a whole based on various initial conditions. The model hindcasts were bias corrected using the z-score
transformation (correction for both mean and variance) method.
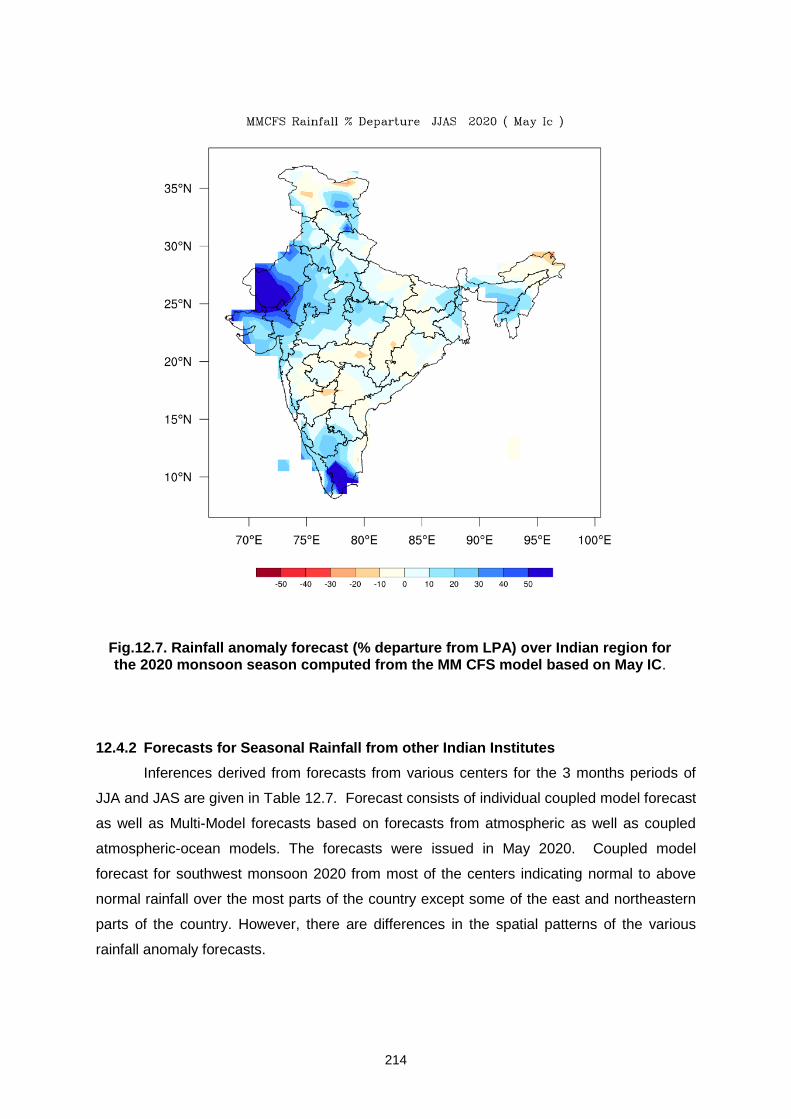
214
Fig.12.7. Rainfall anomaly forecast (% departure from LPA) over Indian region for the 2020 monsoon season computed from the MM CFS model based on May IC.
12.4.2 Forecasts for Seasonal Rainfall from other Indian Institutes
Inferences derived from forecasts from various centers for the 3 months periods of
JJA and JAS are given in Table 12.7. Forecast consists of individual coupled model forecast
as well as Multi-Model forecasts based on forecasts from atmospheric as well as coupled
atmospheric-ocean models. The forecasts were issued in May 2020. Coupled model
forecast for southwest monsoon 2020 from most of the centers indicating normal to above
normal rainfall over the most parts of the country except some of the east and northeastern
parts of the country. However, there are differences in the spatial patterns of the various
rainfall anomaly forecasts.
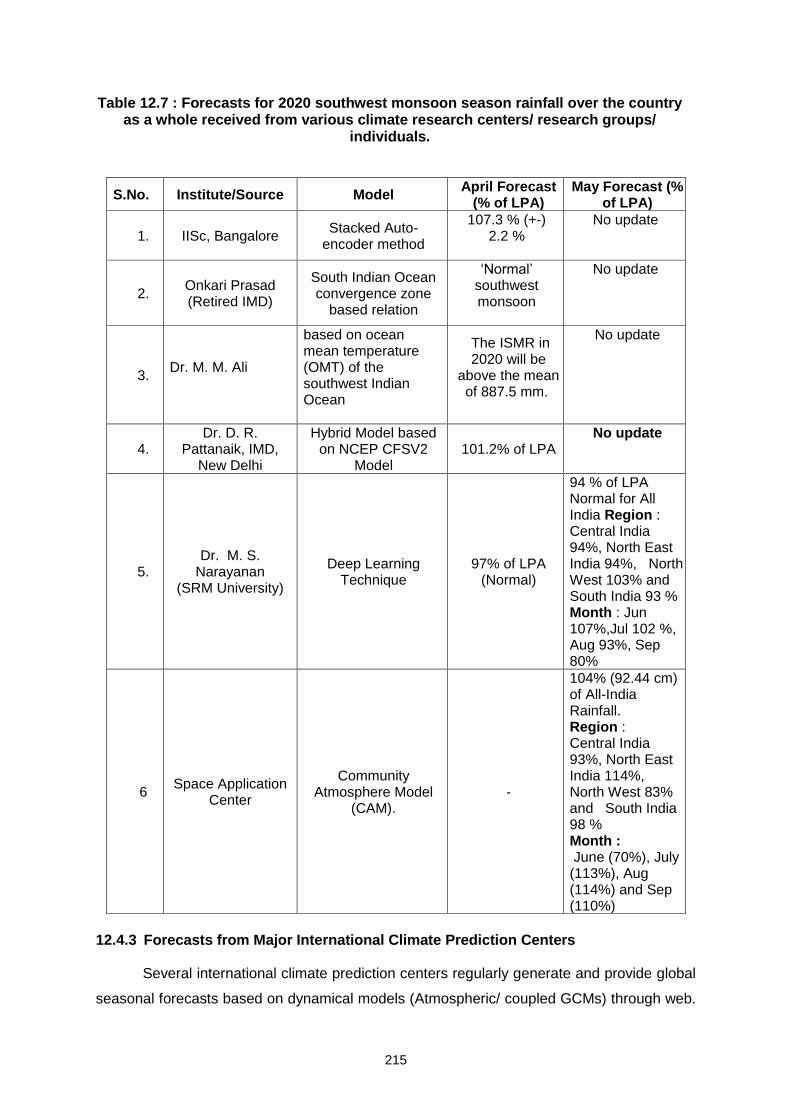
215
Table 12.7 : Forecasts for 2020 southwest monsoon season rainfall over the country as a whole received from various climate research centers/ research groups/
individuals.
12.4.3 Forecasts from Major International Climate Prediction Centers
Several international climate prediction centers regularly generate and provide global
seasonal forecasts based on dynamical models (Atmospheric/ coupled GCMs) through web.
S.No. Institute/Source Model April Forecast
(% of LPA) May Forecast (%
of LPA)
1. IISc, Bangalore Stacked Auto-
encoder method
107.3 % (+-) 2.2 %
No update
2. Onkari Prasad (Retired IMD)
South Indian Ocean convergence zone
based relation
„Normal‟ southwest monsoon
No update
3. Dr. M. M. Ali
based on ocean mean temperature (OMT) of the southwest Indian Ocean
The ISMR in 2020 will be
above the mean of 887.5 mm.
No update
4. Dr. D. R.
Pattanaik, IMD, New Delhi
Hybrid Model based on NCEP CFSV2
Model 101.2% of LPA
No update
5. Dr. M. S.
Narayanan (SRM University)
Deep Learning Technique
97% of LPA (Normal)
94 % of LPA Normal for All India Region : Central India 94%, North East India 94%, North West 103% and South India 93 % Month : Jun 107%,Jul 102 %, Aug 93%, Sep 80%
6 Space Application
Center
Community Atmosphere Model
(CAM). -
104% (92.44 cm) of All-India Rainfall. Region : Central India 93%, North East India 114%, North West 83% and South India 98 % Month : June (70%), July (113%), Aug (114%) and Sep (110%)
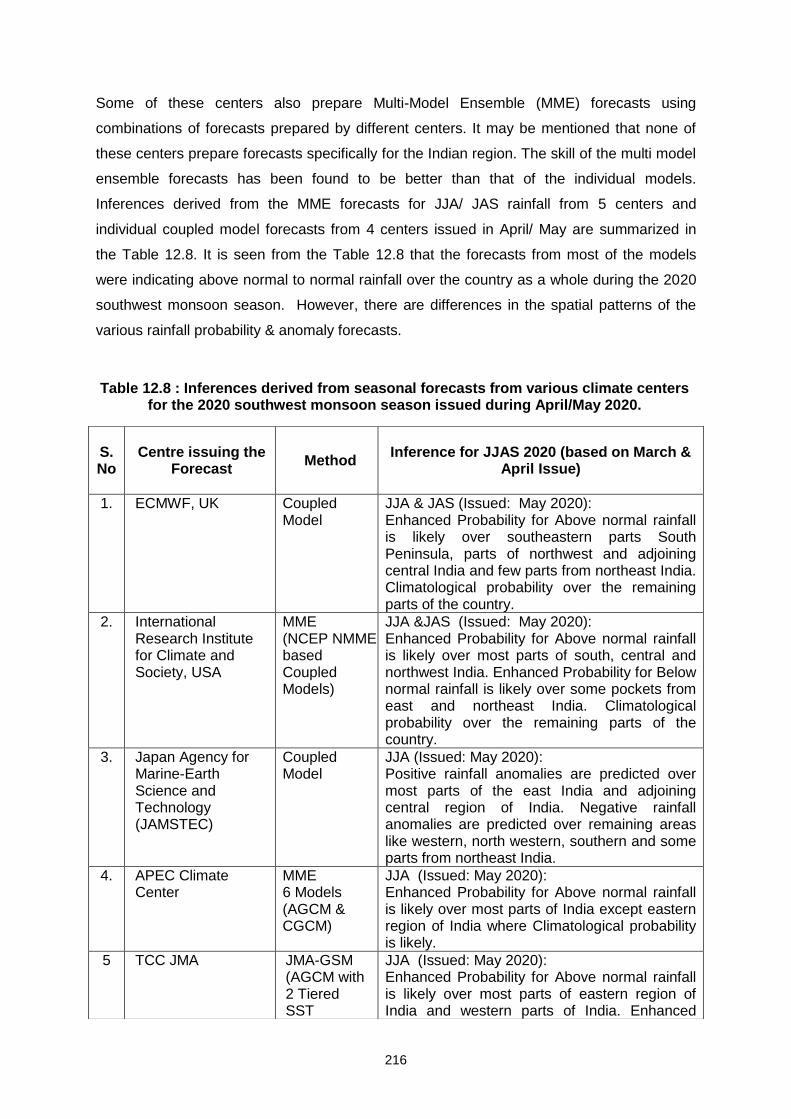
216
Some of these centers also prepare Multi-Model Ensemble (MME) forecasts using
combinations of forecasts prepared by different centers. It may be mentioned that none of
these centers prepare forecasts specifically for the Indian region. The skill of the multi model
ensemble forecasts has been found to be better than that of the individual models.
Inferences derived from the MME forecasts for JJA/ JAS rainfall from 5 centers and
individual coupled model forecasts from 4 centers issued in April/ May are summarized in
the Table 12.8. It is seen from the Table 12.8 that the forecasts from most of the models
were indicating above normal to normal rainfall over the country as a whole during the 2020
southwest monsoon season. However, there are differences in the spatial patterns of the
various rainfall probability & anomaly forecasts.
Table 12.8 : Inferences derived from seasonal forecasts from various climate centers for the 2020 southwest monsoon season issued during April/May 2020.
S. No
Centre issuing the Forecast
Method
Inference for JJAS 2020 (based on March &
April Issue)
1. ECMWF, UK Coupled Model
JJA & JAS (Issued: May 2020): Enhanced Probability for Above normal rainfall is likely over southeastern parts South Peninsula, parts of northwest and adjoining central India and few parts from northeast India. Climatological probability over the remaining parts of the country.
2. International Research Institute for Climate and Society, USA
MME (NCEP NMME based Coupled Models)
JJA &JAS (Issued: May 2020): Enhanced Probability for Above normal rainfall is likely over most parts of south, central and northwest India. Enhanced Probability for Below normal rainfall is likely over some pockets from east and northeast India. Climatological probability over the remaining parts of the country.
3. Japan Agency for Marine-Earth Science and Technology (JAMSTEC)
Coupled Model
JJA (Issued: May 2020): Positive rainfall anomalies are predicted over most parts of the east India and adjoining central region of India. Negative rainfall anomalies are predicted over remaining areas like western, north western, southern and some parts from northeast India.
4. APEC Climate Center
MME 6 Models (AGCM & CGCM)
JJA (Issued: May 2020): Enhanced Probability for Above normal rainfall is likely over most parts of India except eastern region of India where Climatological probability is likely.
5 TCC JMA JMA-GSM (AGCM with 2 Tiered SST
JJA (Issued: May 2020): Enhanced Probability for Above normal rainfall is likely over most parts of eastern region of India and western parts of India. Enhanced
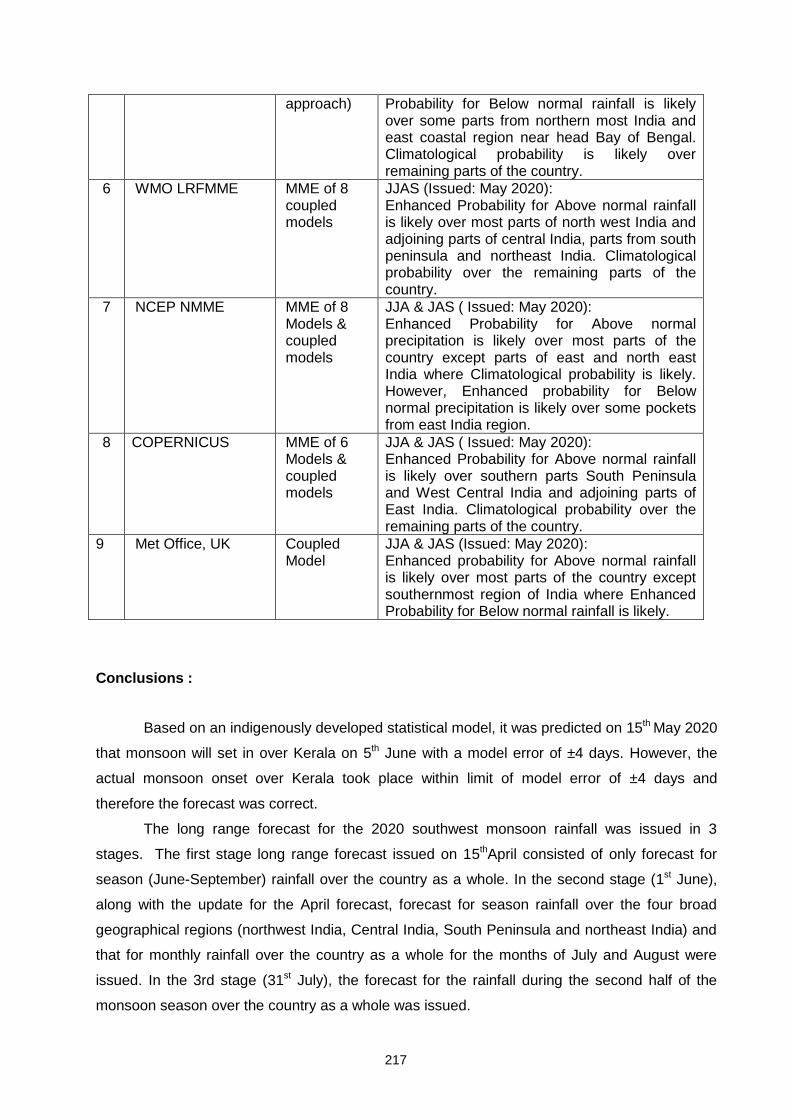
217
Conclusions :
Based on an indigenously developed statistical model, it was predicted on 15th May 2020
that monsoon will set in over Kerala on 5th June with a model error of ±4 days. However, the
actual monsoon onset over Kerala took place within limit of model error of ±4 days and
therefore the forecast was correct.
The long range forecast for the 2020 southwest monsoon rainfall was issued in 3
stages. The first stage long range forecast issued on 15thApril consisted of only forecast for
season (June-September) rainfall over the country as a whole. In the second stage (1st June),
along with the update for the April forecast, forecast for season rainfall over the four broad
geographical regions (northwest India, Central India, South Peninsula and northeast India) and
that for monthly rainfall over the country as a whole for the months of July and August were
issued. In the 3rd stage (31st July), the forecast for the rainfall during the second half of the
monsoon season over the country as a whole was issued.
approach) Probability for Below normal rainfall is likely over some parts from northern most India and east coastal region near head Bay of Bengal. Climatological probability is likely over remaining parts of the country.
6 WMO LRFMME MME of 8 coupled models
JJAS (Issued: May 2020): Enhanced Probability for Above normal rainfall is likely over most parts of north west India and adjoining parts of central India, parts from south peninsula and northeast India. Climatological probability over the remaining parts of the country.
7 NCEP NMME MME of 8 Models & coupled models
JJA & JAS ( Issued: May 2020): Enhanced Probability for Above normal precipitation is likely over most parts of the country except parts of east and north east India where Climatological probability is likely. However, Enhanced probability for Below normal precipitation is likely over some pockets from east India region.
8 COPERNICUS MME of 6 Models & coupled models
JJA & JAS ( Issued: May 2020): Enhanced Probability for Above normal rainfall is likely over southern parts South Peninsula and West Central India and adjoining parts of East India. Climatological probability over the remaining parts of the country.
9 Met Office, UK Coupled Model
JJA & JAS (Issued: May 2020): Enhanced probability for Above normal rainfall is likely over most parts of the country except southernmost region of India where Enhanced Probability for Below normal rainfall is likely.
218
The first stage forecast for the season (June-September) rainfall over the country as a
whole issued in April was 100% of LPA with a model error of ± 5% of LPA. The update issued
in May for this forecast was (102% of LPA) with a model error of ± 4% of LPA. The actual
season rainfall for the country as a whole was 109% of LPA, which is 4% &3% of LPA more
than upper forecast limits of the April and May forecasts. Thus the both the forecasts were not
within forecast limits.
Considering the four broad geographical regions of India, the forecasts issued in May for
the season rainfall over northwest India, Central India, northeast India and South Peninsula
were 107%, 103%, 96% &102% of the LPA respectively all with model errors of ± 8%. The
actual rainfalls over northwest India, Central India, Northeast India and South Peninsula were
84%, 115%, 106% and 130% of the LPA respectively. Thus the forecasts of season rainfall over
the Central India, Northeast India and South Peninsula regions were underestimate to the
actual season rainfalls. However, forecast for Northwest India is overestimated to the actual
season rainfall and were not correct. The actual rainfalls of Central India, Northeast India and
South Peninsula were more than the forecasted values by 12%, 10% and 28% LPA
respectively. Whereas, the actual season rainfall over Northwest India was 23% less than
forecasted value. Thus, the forecasts of the seasonal rainfalls for the all the four geographical
regions were not correct.
The forecast for the second half of the monsoon season (August –September) for the
country as a whole was 104% with a model error of 8% of LPA against the actual rainfall of
118% of LPA, which is 6% more than the upper forecast limit of (104%+8% = 112% of LPA).
Thus, the forecast for the rainfall during the second half of the monsoon season over the
country as a whole was also underestimate to the actual rainfall and was not correct
The forecasts for the monthly rainfall over the country as a whole for the months of July
& August issued in June were 103% & 97% of LPA respectively with a model error of ± 9%.
Thus the monthly forecasts for the July was overestimated and August rainfalls was
underestimate to the actual monthly rainfalls (90% & 127% of LPA respectively). The actual
rainfalls during July is 4% less than the lower forecast limit and that of August is 21% more than
the upper forecast limit and the forecasts were therefore not correct.
While issuing the long range forecast in the month of April, Warm ENSO Neutral
conditions where prevailed over Pacific Ocean. IMD‟s analysis based on Climate model
indicateddevelopment of La Nina condition during the second half of the monsoon season and
development of neutral Indian Ocean Dipole (IOD) during the monsoon season came correct.
The development of the La Nina is one of the factors which helps to get good rainfall activity
during the second half of the season. However, the emergence of negative Indian Ocean Dipole
(IOD) in the middle of the monsoon season did not happen. It may be noted that IMD forecast
219
for monsoon onset over Kerala (5th June with model error of ±4 days) was correct and realized
date of onset of monsoon over Kerala was 1st June in this year.The impact of synoptic scale
systems and intra-seasonal variations dominated the rainfall during the monsoon season. The
rainfall during the month of June was 118% of LPA due to formation of Severe Cyclonic Storm
“NISARGA” and associated rainfall activity. The excess rainfall received in the month of June
and August month were mainly due to synoptic scale Low Pressure Systems. However, in the
month of July rainfall was deficient (90% of LPA) due to the absence of formation of low-
Pressure systems mainly due to absence of remnants from West Pacific typhoon activity and
unfavorable MJO activity. The rainfall during the second half was more than expected by IMD
mainly due to the longer life period of a series of low-pressure systems formed over the region,
which mostly moved along the monsoon trough resulting in above normal season rainfalls over
Central India & South Peninsula and below normal seasonal rainfall over North-East India.
Seasonal rainfall over Northwest India was deficit (84% of LPA) mainly due to the fact that most
of the Low-Pressure Systems dissipated before reaching to northern latitudes. Overall, the
impact of synoptic scales systems and intra seasonal variations on the monsoon performance
was very significant this year resulting in increased uncertainty in the predictability of monsoon
at seasonal scales.
The experimental forecasts from Monsoon Mission CFS for the season rainfall over the
country as a whole based on March initial conditions were overestimated to the actual situation
by about 17%. However, forecasts based on April (109%) and May (107%) initial conditions
were very much within the forecast limits. The experimental forecasts from most of the other
Indian sources as well as from the international climate centers indicated normal to above
normal rainfall.
References :
Pai, D. S., O.P.Sreejith, S. G. Nargund, Madhuri Musale, and Ajit Tyagi, 2011, Present
Operational Long Range Forecasting System for Southwest Monsoon Rainfall over India and its
Performance During 2010, Mausam, 62, N2, pp179-196.
Pai, D. S. and M. Rajeevan, 2009, Summer monsoon onset over Kerala: New Definition
and Prediction, J. Earth Syst. Sci. 118, No. 2, pp123–135.
Rajeevan M, Pai D.S., Anil Kumar R, and Lal B, 2007, New statistical models for long-
range forecasting of southwest monsoon rainfall over India, Climate Dynamics, V28, pp813-828.
Saha, Subodh K., Samir Pokhrel, Hemantkumar S. Chaudhari, Ashish Dhakate, Swati
Shewale, C. T. Sabeerali, Kiran Salunke, Anupam Hazra, Somnath Mahapatra, and A.
Suryachandra Rao. "Improved simulation of Indian summer monsoon in latest NCEP climate
forecast system free run." International Journal of Climatology 34, no. 5 (2014): 1628-1641.

220
Ramu, D. A., C. Sabeerali, R. Chattopadhyay, D. N. Rao, G. George, A. Dhakate, K.
Salunke, A. Srivastava, and S. A. Rao (2016), Indian summer monsoon rainfall simulation and
prediction skill in the CFSv2 coupled model: Impact of atmospheric horizontal resolution, Joural
of Geophysical Research: Atmospheres, pp. 1752–1775, doi:871 10.1002/2015JD023538.
221
13
EXTENDED RANGE FORECAST (ERF) DURING
SOUTHWEST MONSOON 2020
D. R. Pattanaik1*, Satendra Kumar1, Praveen Kumar1, Ashish Alone1, Raju Mandal2, Avijit Dey2, R. Phani2, M. Mohapatra1 and A. K. Sahai2
1*India Meteorological Department, New Delhi, India 2Indian Institute of Tropical Meteorology, Pune, India
Email* : [email protected] or [email protected]
A detailed analysis of the performance of the operational extended range forecast
(ERF) issued by IMD during the southwest monsoon 2020 is presented in this Chapter.
Abstract
The performance of operational extended range forecast (ERF) issued by IMD is
evaluated for the southwest monsoon 2020. The early onset of monsoon over the Bay of
Bengal and the normal onset of monsoon over Kerala with slightly rapid progress northward
are very well captured in the ERF with two to three weeks lead time. The ERF also captured
very well the transitions from normal to weaker phase of monsoon in July. The active phase
of monsoon in entire August was well anticipated in ERF with a lead time of 3 weeks. The
active monsoon condition in second half of September associated with delayed withdrawal
from northwest India was also reasonably well captured in the ERF. Quantitatively, the ERF
shows significant skill up to three weeks on all India level. The met subdivision wise
forecasts show slightly higher than 80% correct (forecast and observed category matching)
to partially correct (when the forecast category is out by one category) forecasts (40%
correct and 40% partially correct) for at least two weeks with wrong category forecast (when
the forecast category in two or more category out) is close to 20%. Thus, skilful forecast at
met-subdivision level for two weeks are being used routinely for agro-advisory services. IMD
is also started preparing the operational ERF at district level experimentally.
222
Key words : Extended range forecast, active-break cycle, CFSv2, Multi-model ensemble.
Met-subdivision level forecast
13.1 Introduction
The 2020 southwest monsoon season is unique in the sense that it is the second
consecutive excess monsoon year after 2019. These two consecutive excess monsoon
years occurred after a gap of 24 years (after 1994) with the seasonal rainfall over India
during June to September (JJAS) ended with above normal rainfall in two consecutive years.
with a departure of 110% of its Long Period Average (LPA) of 88 cm. Associated with
normal onset over Kerala and with monthly rainfall over the country as a whole of 118% of
LPA in June, 90% of LPA in July, 127% of LPA in August, and 104% of LPA in September
the AISMR during 2020 was +110%. The development of the La Nina is one of the factors
which helped to get good rainfall activity during the second half of the season.
The monsoon season 2020 also witnessed intra-seasonal variability. The forecasting of
southwest monsoon rainfall on extended range time scale (prediction of active-break cycle of
monsoon) is vital for the vast agro-economic country like India. The extended range
forecasting of monsoon in 3 to 4 week time scale can help in taking decisions pertaining to
crop planning. In last few decades, many statistical and dynamical models have been
developed for predicting the summer monsoon rainfall both in the extended range and the
seasonal scale. Atmospheric General Circulation Models (AGCM) and Coupled GCMs
(CGCMs) are the main tools for dynamical seasonal scale prediction. The India
Meteorological Department (IMD) has been issuing the operational extended range forecast
since 2009 to various users. Up to the year 2016 the real-time monitoring of intra-seasonal
monsoon rainfall in IMD was carried out by utilizing the real time products available from the
set of coupled models run at different national (Indian Institute of Tropical Meteorology) and
international centres like National Centre for Environmental Prediction‟s (NCEP‟s) Climate
Forecast System version 2 (CFSv2), ECMWF and the JMA‟s ensemble prediction model
(Pattanaik et al., 2013; Pattanaik 2014). A review article on operational extended range
forecast (ERF) activity in IMD since its inception in 2008 and its applications in different
sectors has been discussed in the recent paper by Pattanaik et al., (2019). Since 2017, the
new ERF modelling system of IMD adopted from IITM is running for operational use by IMD.
In the present article the real time forecasting of monsoon activity over India during June to
September on extended range time scale is (3 to 4 weeks) analyzed for recent monsoon
season of 2020.
13.2 A brief discussion on coupled models used
The current operational ERF modeling system is a suite of models at different
resolutions based on the CFSv2 coupled model adopted from NCEP (Saha et al., 2014). The
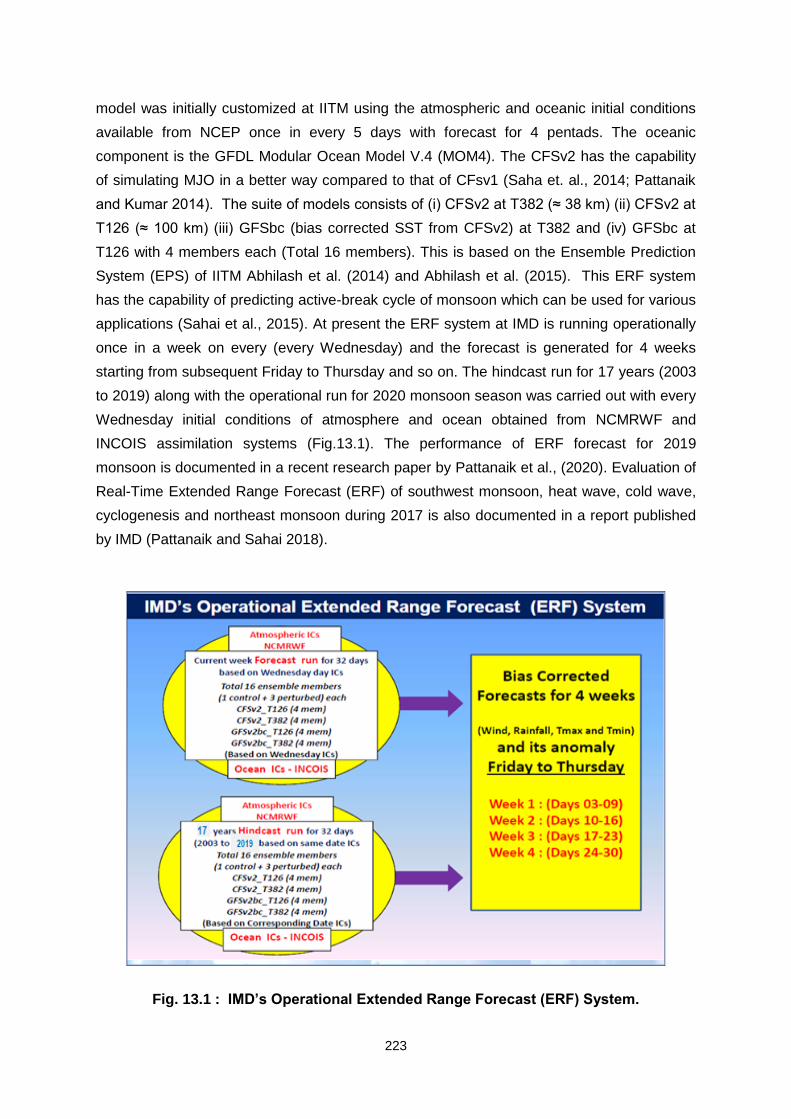
223
model was initially customized at IITM using the atmospheric and oceanic initial conditions
available from NCEP once in every 5 days with forecast for 4 pentads. The oceanic
component is the GFDL Modular Ocean Model V.4 (MOM4). The CFSv2 has the capability
of simulating MJO in a better way compared to that of CFsv1 (Saha et. al., 2014; Pattanaik
and Kumar 2014). The suite of models consists of (i) CFSv2 at T382 (≈ 38 km) (ii) CFSv2 at
T126 (≈ 100 km) (iii) GFSbc (bias corrected SST from CFSv2) at T382 and (iv) GFSbc at
T126 with 4 members each (Total 16 members). This is based on the Ensemble Prediction
System (EPS) of IITM Abhilash et al. (2014) and Abhilash et al. (2015). This ERF system
has the capability of predicting active-break cycle of monsoon which can be used for various
applications (Sahai et al., 2015). At present the ERF system at IMD is running operationally
once in a week on every (every Wednesday) and the forecast is generated for 4 weeks
starting from subsequent Friday to Thursday and so on. The hindcast run for 17 years (2003
to 2019) along with the operational run for 2020 monsoon season was carried out with every
Wednesday initial conditions of atmosphere and ocean obtained from NCMRWF and
INCOIS assimilation systems (Fig.13.1). The performance of ERF forecast for 2019
monsoon is documented in a recent research paper by Pattanaik et al., (2020). Evaluation of
Real-Time Extended Range Forecast (ERF) of southwest monsoon, heat wave, cold wave,
cyclogenesis and northeast monsoon during 2017 is also documented in a report published
by IMD (Pattanaik and Sahai 2018).
Fig. 13.1 : IMD’s Operational Extended Range Forecast (ERF) System.
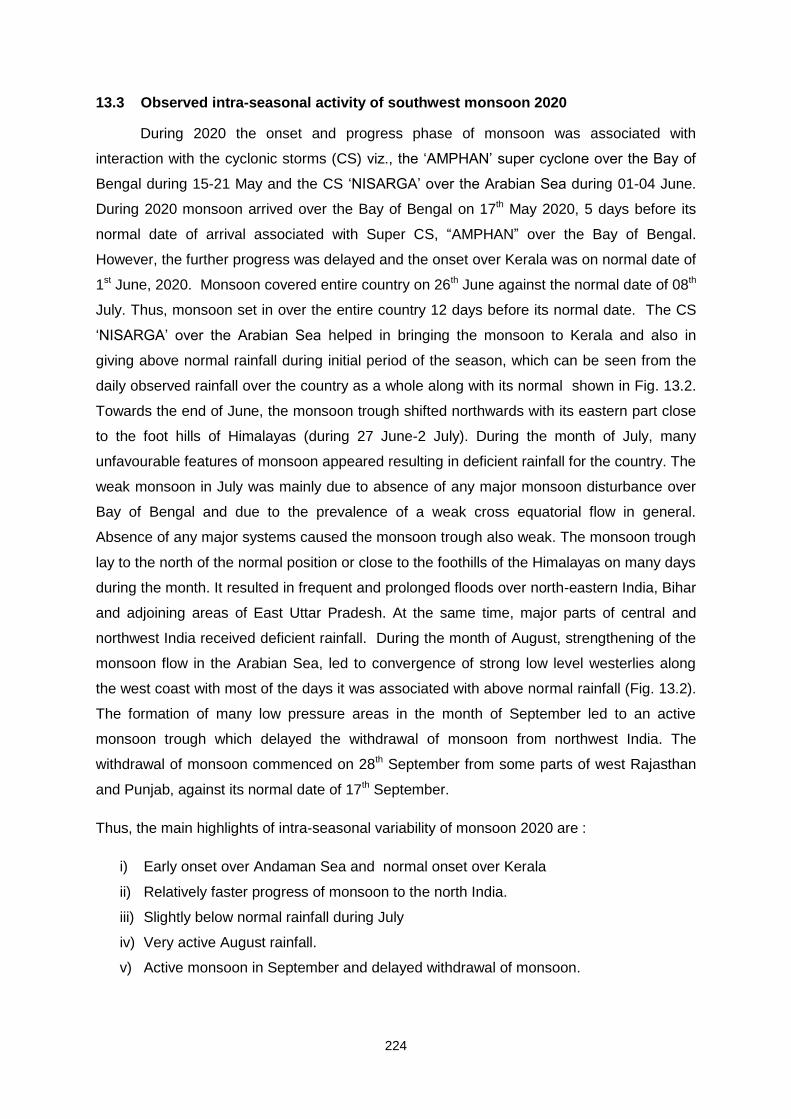
224
13.3 Observed intra-seasonal activity of southwest monsoon 2020
During 2020 the onset and progress phase of monsoon was associated with
interaction with the cyclonic storms (CS) viz., the „AMPHAN‟ super cyclone over the Bay of
Bengal during 15-21 May and the CS „NISARGA‟ over the Arabian Sea during 01-04 June.
During 2020 monsoon arrived over the Bay of Bengal on 17th May 2020, 5 days before its
normal date of arrival associated with Super CS, “AMPHAN” over the Bay of Bengal.
However, the further progress was delayed and the onset over Kerala was on normal date of
1st June, 2020. Monsoon covered entire country on 26th June against the normal date of 08th
July. Thus, monsoon set in over the entire country 12 days before its normal date. The CS
„NISARGA‟ over the Arabian Sea helped in bringing the monsoon to Kerala and also in
giving above normal rainfall during initial period of the season, which can be seen from the
daily observed rainfall over the country as a whole along with its normal shown in Fig. 13.2.
Towards the end of June, the monsoon trough shifted northwards with its eastern part close
to the foot hills of Himalayas (during 27 June-2 July). During the month of July, many
unfavourable features of monsoon appeared resulting in deficient rainfall for the country. The
weak monsoon in July was mainly due to absence of any major monsoon disturbance over
Bay of Bengal and due to the prevalence of a weak cross equatorial flow in general.
Absence of any major systems caused the monsoon trough also weak. The monsoon trough
lay to the north of the normal position or close to the foothills of the Himalayas on many days
during the month. It resulted in frequent and prolonged floods over north-eastern India, Bihar
and adjoining areas of East Uttar Pradesh. At the same time, major parts of central and
northwest India received deficient rainfall. During the month of August, strengthening of the
monsoon flow in the Arabian Sea, led to convergence of strong low level westerlies along
the west coast with most of the days it was associated with above normal rainfall (Fig. 13.2).
The formation of many low pressure areas in the month of September led to an active
monsoon trough which delayed the withdrawal of monsoon from northwest India. The
withdrawal of monsoon commenced on 28th September from some parts of west Rajasthan
and Punjab, against its normal date of 17th September.
Thus, the main highlights of intra-seasonal variability of monsoon 2020 are :
i) Early onset over Andaman Sea and normal onset over Kerala
ii) Relatively faster progress of monsoon to the north India.
iii) Slightly below normal rainfall during July
iv) Very active August rainfall.
v) Active monsoon in September and delayed withdrawal of monsoon.
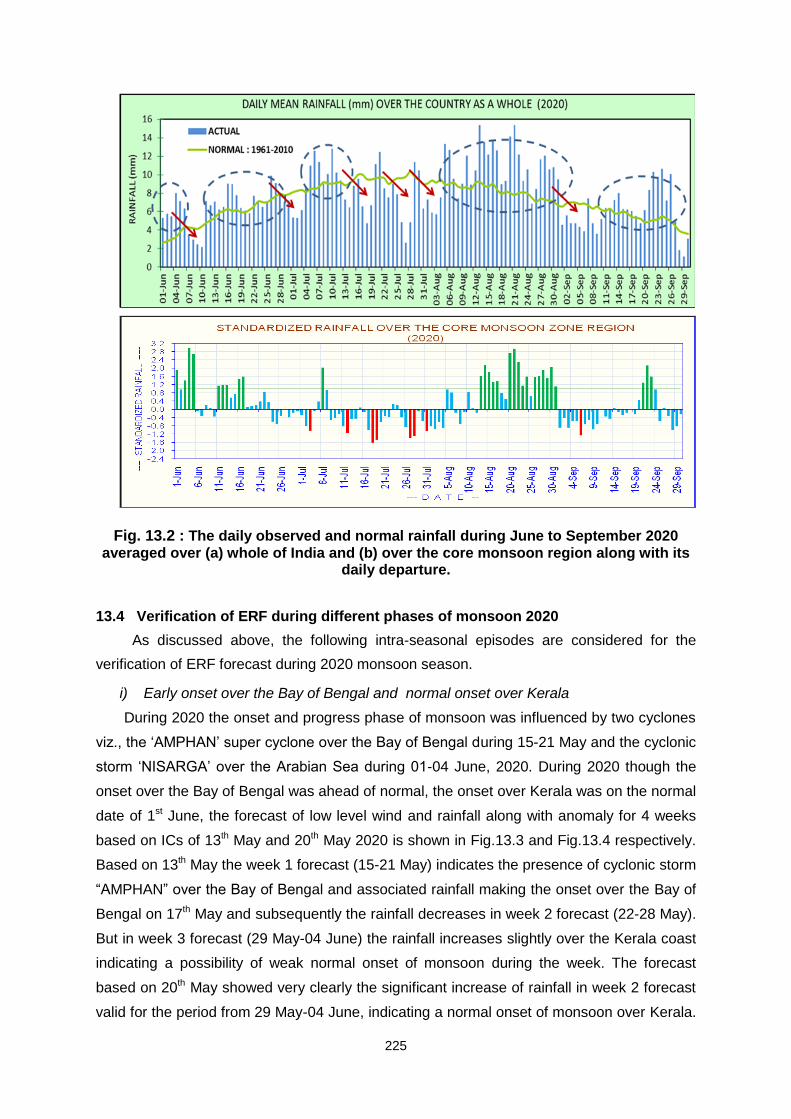
225
Fig. 13.2 : The daily observed and normal rainfall during June to September 2020 averaged over (a) whole of India and (b) over the core monsoon region along with its
daily departure.
13.4 Verification of ERF during different phases of monsoon 2020
As discussed above, the following intra-seasonal episodes are considered for the
verification of ERF forecast during 2020 monsoon season.
i) Early onset over the Bay of Bengal and normal onset over Kerala
During 2020 the onset and progress phase of monsoon was influenced by two cyclones
viz., the „AMPHAN‟ super cyclone over the Bay of Bengal during 15-21 May and the cyclonic
storm „NISARGA‟ over the Arabian Sea during 01-04 June, 2020. During 2020 though the
onset over the Bay of Bengal was ahead of normal, the onset over Kerala was on the normal
date of 1st June, the forecast of low level wind and rainfall along with anomaly for 4 weeks
based on ICs of 13th May and 20th May 2020 is shown in Fig.13.3 and Fig.13.4 respectively.
Based on 13th May the week 1 forecast (15-21 May) indicates the presence of cyclonic storm
“AMPHAN” over the Bay of Bengal and associated rainfall making the onset over the Bay of
Bengal on 17th May and subsequently the rainfall decreases in week 2 forecast (22-28 May).
But in week 3 forecast (29 May-04 June) the rainfall increases slightly over the Kerala coast
indicating a possibility of weak normal onset of monsoon during the week. The forecast
based on 20th May showed very clearly the significant increase of rainfall in week 2 forecast
valid for the period from 29 May-04 June, indicating a normal onset of monsoon over Kerala.
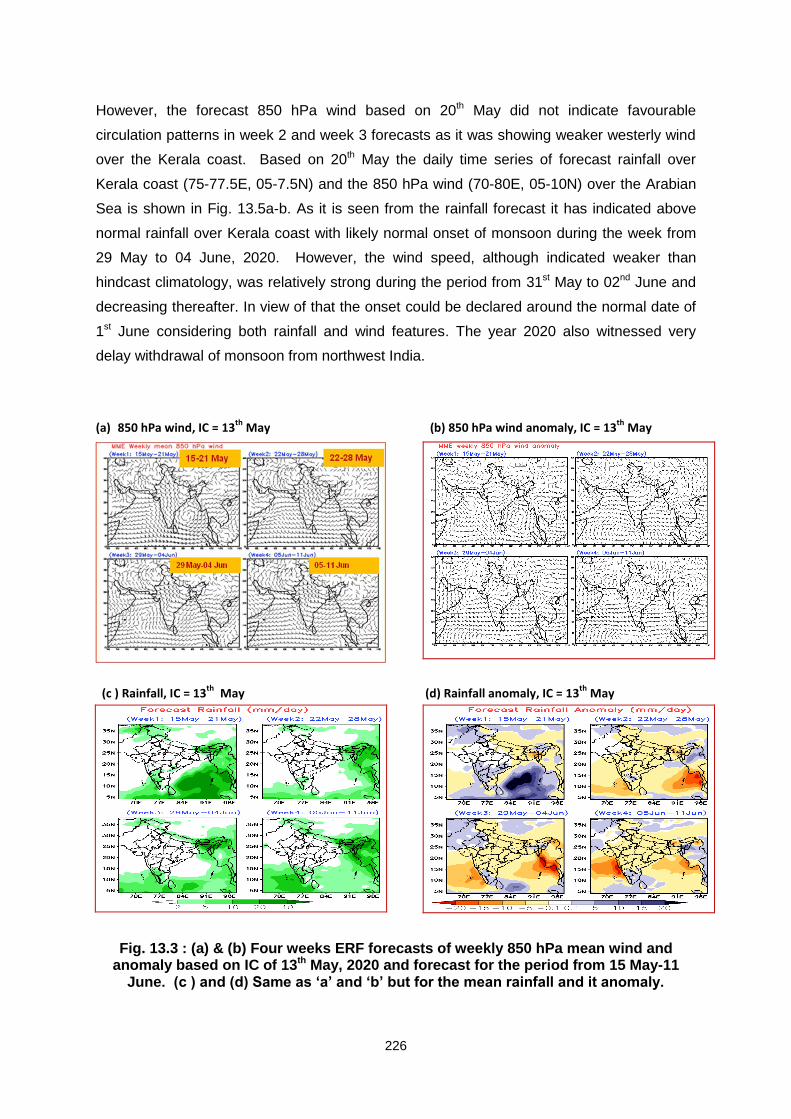
226
However, the forecast 850 hPa wind based on 20th May did not indicate favourable
circulation patterns in week 2 and week 3 forecasts as it was showing weaker westerly wind
over the Kerala coast. Based on 20th May the daily time series of forecast rainfall over
Kerala coast (75-77.5E, 05-7.5N) and the 850 hPa wind (70-80E, 05-10N) over the Arabian
Sea is shown in Fig. 13.5a-b. As it is seen from the rainfall forecast it has indicated above
normal rainfall over Kerala coast with likely normal onset of monsoon during the week from
29 May to 04 June, 2020. However, the wind speed, although indicated weaker than
hindcast climatology, was relatively strong during the period from 31st May to 02nd June and
decreasing thereafter. In view of that the onset could be declared around the normal date of
1st June considering both rainfall and wind features. The year 2020 also witnessed very
delay withdrawal of monsoon from northwest India.
(a) 850 hPa wind, IC = 13th
May (b) 850 hPa wind anomaly, IC = 13th
May
(c ) Rainfall, IC = 13
th May (d) Rainfall anomaly, IC = 13
th May
Fig. 13.3 : (a) & (b) Four weeks ERF forecasts of weekly 850 hPa mean wind and anomaly based on IC of 13th May, 2020 and forecast for the period from 15 May-11
June. (c ) and (d) Same as ‘a’ and ‘b’ but for the mean rainfall and it anomaly.
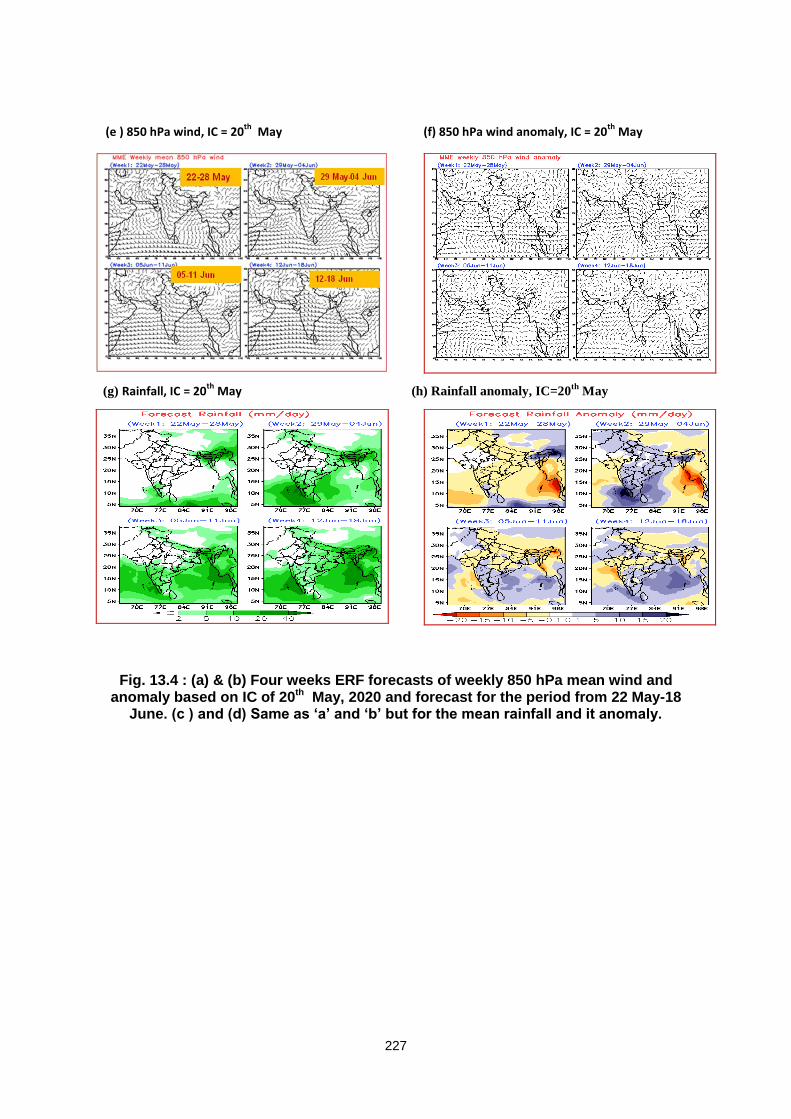
227
(e ) 850 hPa wind, IC = 20th
May (f) 850 hPa wind anomaly, IC = 20th
May
(g) Rainfall, IC = 20th
May (h) Rainfall anomaly, IC=20th
May
Fig. 13.4 : (a) & (b) Four weeks ERF forecasts of weekly 850 hPa mean wind and anomaly based on IC of 20th May, 2020 and forecast for the period from 22 May-18
June. (c ) and (d) Same as ‘a’ and ‘b’ but for the mean rainfall and it anomaly.
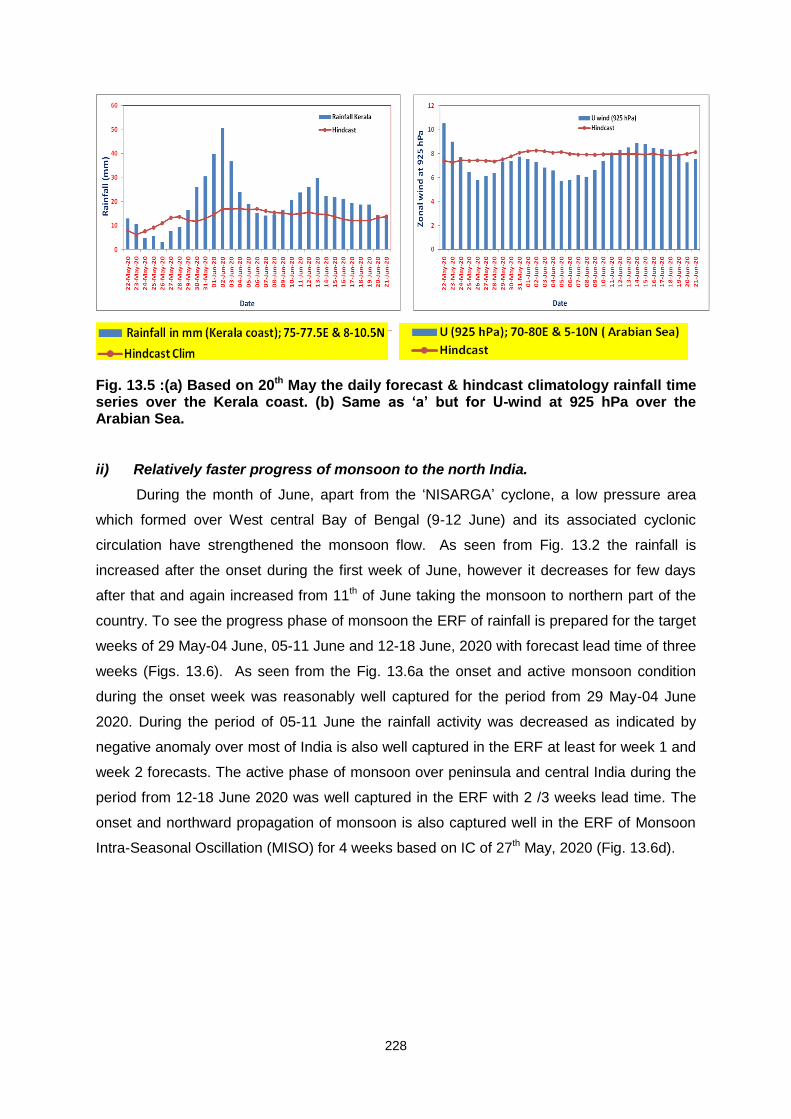
228
Fig. 13.5 :(a) Based on 20th May the daily forecast & hindcast climatology rainfall time series over the Kerala coast. (b) Same as ‘a’ but for U-wind at 925 hPa over the Arabian Sea. ii) Relatively faster progress of monsoon to the north India.
During the month of June, apart from the „NISARGA‟ cyclone, a low pressure area
which formed over West central Bay of Bengal (9-12 June) and its associated cyclonic
circulation have strengthened the monsoon flow. As seen from Fig. 13.2 the rainfall is
increased after the onset during the first week of June, however it decreases for few days
after that and again increased from 11th of June taking the monsoon to northern part of the
country. To see the progress phase of monsoon the ERF of rainfall is prepared for the target
weeks of 29 May-04 June, 05-11 June and 12-18 June, 2020 with forecast lead time of three
weeks (Figs. 13.6). As seen from the Fig. 13.6a the onset and active monsoon condition
during the onset week was reasonably well captured for the period from 29 May-04 June
2020. During the period of 05-11 June the rainfall activity was decreased as indicated by
negative anomaly over most of India is also well captured in the ERF at least for week 1 and
week 2 forecasts. The active phase of monsoon over peninsula and central India during the
period from 12-18 June 2020 was well captured in the ERF with 2 /3 weeks lead time. The
onset and northward propagation of monsoon is also captured well in the ERF of Monsoon
Intra-Seasonal Oscillation (MISO) for 4 weeks based on IC of 27th May, 2020 (Fig. 13.6d).
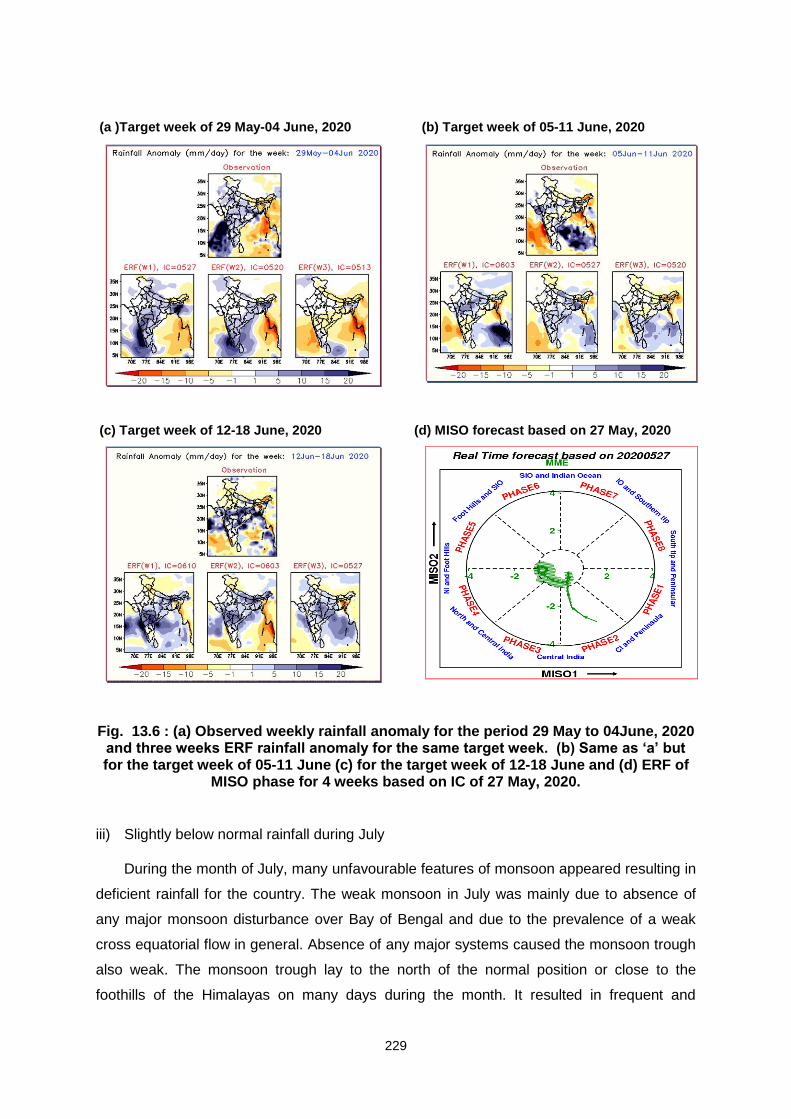
229
(a )Target week of 29 May-04 June, 2020 (b) Target week of 05-11 June, 2020
(c) Target week of 12-18 June, 2020 (d) MISO forecast based on 27 May, 2020
Fig. 13.6 : (a) Observed weekly rainfall anomaly for the period 29 May to 04June, 2020
and three weeks ERF rainfall anomaly for the same target week. (b) Same as ‘a’ but for the target week of 05-11 June (c) for the target week of 12-18 June and (d) ERF of
MISO phase for 4 weeks based on IC of 27 May, 2020. iii) Slightly below normal rainfall during July
During the month of July, many unfavourable features of monsoon appeared resulting in
deficient rainfall for the country. The weak monsoon in July was mainly due to absence of
any major monsoon disturbance over Bay of Bengal and due to the prevalence of a weak
cross equatorial flow in general. Absence of any major systems caused the monsoon trough
also weak. The monsoon trough lay to the north of the normal position or close to the
foothills of the Himalayas on many days during the month. It resulted in frequent and
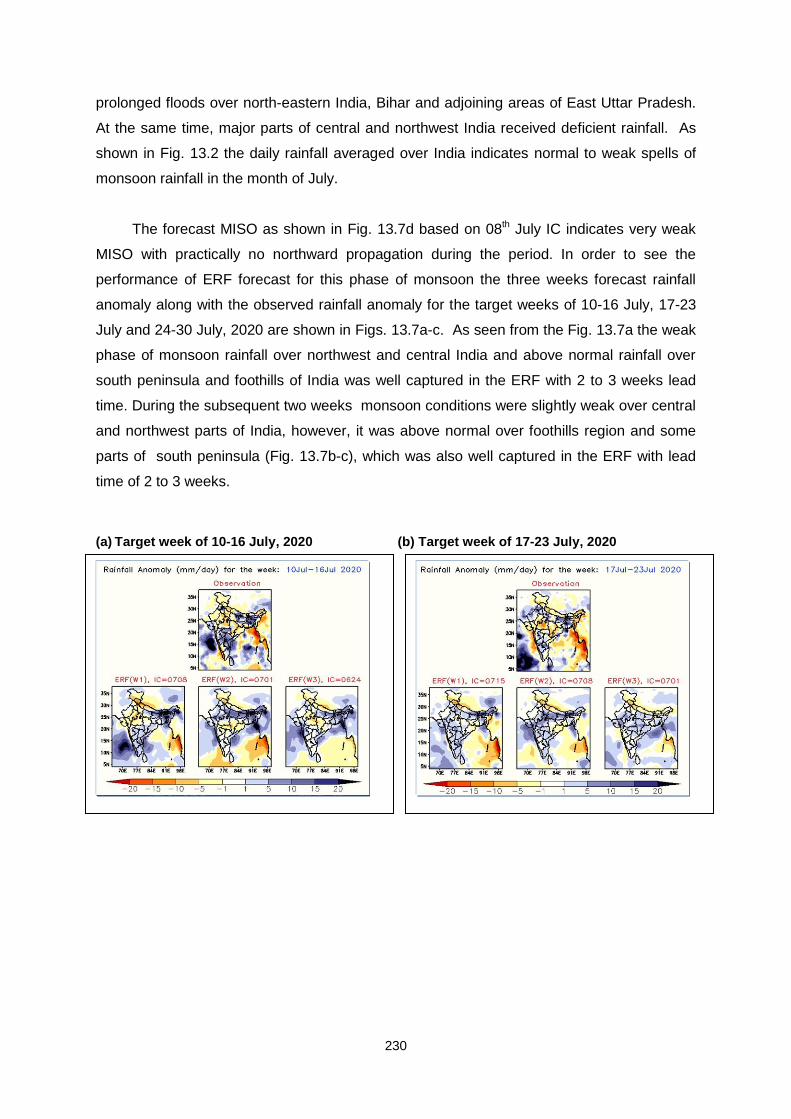
230
prolonged floods over north-eastern India, Bihar and adjoining areas of East Uttar Pradesh.
At the same time, major parts of central and northwest India received deficient rainfall. As
shown in Fig. 13.2 the daily rainfall averaged over India indicates normal to weak spells of
monsoon rainfall in the month of July.
The forecast MISO as shown in Fig. 13.7d based on 08th July IC indicates very weak
MISO with practically no northward propagation during the period. In order to see the
performance of ERF forecast for this phase of monsoon the three weeks forecast rainfall
anomaly along with the observed rainfall anomaly for the target weeks of 10-16 July, 17-23
July and 24-30 July, 2020 are shown in Figs. 13.7a-c. As seen from the Fig. 13.7a the weak
phase of monsoon rainfall over northwest and central India and above normal rainfall over
south peninsula and foothills of India was well captured in the ERF with 2 to 3 weeks lead
time. During the subsequent two weeks monsoon conditions were slightly weak over central
and northwest parts of India, however, it was above normal over foothills region and some
parts of south peninsula (Fig. 13.7b-c), which was also well captured in the ERF with lead
time of 2 to 3 weeks.
(a) Target week of 10-16 July, 2020 (b) Target week of 17-23 July, 2020
and
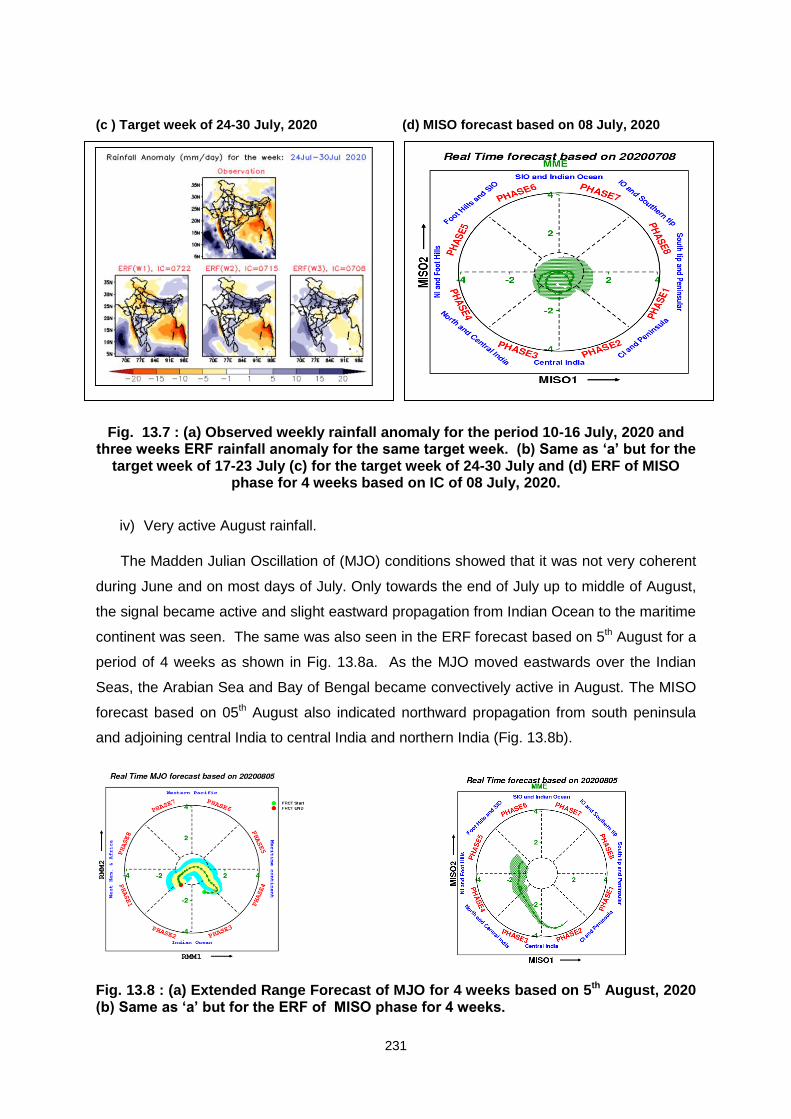
231
(c ) Target week of 24-30 July, 2020 (d) MISO forecast based on 08 July, 2020
Fig. 13.7 : (a) Observed weekly rainfall anomaly for the period 10-16 July, 2020 and
three weeks ERF rainfall anomaly for the same target week. (b) Same as ‘a’ but for the target week of 17-23 July (c) for the target week of 24-30 July and (d) ERF of MISO
phase for 4 weeks based on IC of 08 July, 2020.
iv) Very active August rainfall.
The Madden Julian Oscillation of (MJO) conditions showed that it was not very coherent
during June and on most days of July. Only towards the end of July up to middle of August,
the signal became active and slight eastward propagation from Indian Ocean to the maritime
continent was seen. The same was also seen in the ERF forecast based on 5th August for a
period of 4 weeks as shown in Fig. 13.8a. As the MJO moved eastwards over the Indian
Seas, the Arabian Sea and Bay of Bengal became convectively active in August. The MISO
forecast based on 05th August also indicated northward propagation from south peninsula
and adjoining central India to central India and northern India (Fig. 13.8b).
Fig. 13.8 : (a) Extended Range Forecast of MJO for 4 weeks based on 5th August, 2020 (b) Same as ‘a’ but for the ERF of MISO phase for 4 weeks.
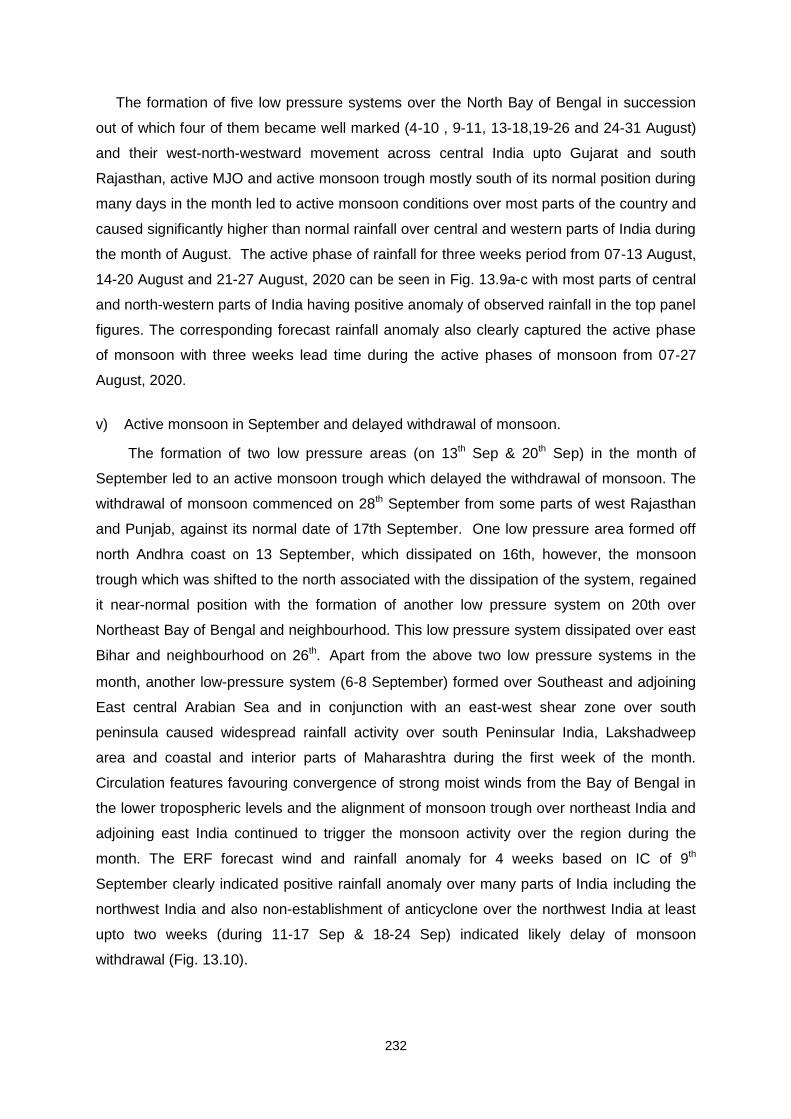
232
The formation of five low pressure systems over the North Bay of Bengal in succession
out of which four of them became well marked (4-10 , 9-11, 13-18,19-26 and 24-31 August)
and their west-north-westward movement across central India upto Gujarat and south
Rajasthan, active MJO and active monsoon trough mostly south of its normal position during
many days in the month led to active monsoon conditions over most parts of the country and
caused significantly higher than normal rainfall over central and western parts of India during
the month of August. The active phase of rainfall for three weeks period from 07-13 August,
14-20 August and 21-27 August, 2020 can be seen in Fig. 13.9a-c with most parts of central
and north-western parts of India having positive anomaly of observed rainfall in the top panel
figures. The corresponding forecast rainfall anomaly also clearly captured the active phase
of monsoon with three weeks lead time during the active phases of monsoon from 07-27
August, 2020.
v) Active monsoon in September and delayed withdrawal of monsoon.
The formation of two low pressure areas (on 13th Sep & 20th Sep) in the month of
September led to an active monsoon trough which delayed the withdrawal of monsoon. The
withdrawal of monsoon commenced on 28th September from some parts of west Rajasthan
and Punjab, against its normal date of 17th September. One low pressure area formed off
north Andhra coast on 13 September, which dissipated on 16th, however, the monsoon
trough which was shifted to the north associated with the dissipation of the system, regained
it near-normal position with the formation of another low pressure system on 20th over
Northeast Bay of Bengal and neighbourhood. This low pressure system dissipated over east
Bihar and neighbourhood on 26th. Apart from the above two low pressure systems in the
month, another low-pressure system (6-8 September) formed over Southeast and adjoining
East central Arabian Sea and in conjunction with an east-west shear zone over south
peninsula caused widespread rainfall activity over south Peninsular India, Lakshadweep
area and coastal and interior parts of Maharashtra during the first week of the month.
Circulation features favouring convergence of strong moist winds from the Bay of Bengal in
the lower tropospheric levels and the alignment of monsoon trough over northeast India and
adjoining east India continued to trigger the monsoon activity over the region during the
month. The ERF forecast wind and rainfall anomaly for 4 weeks based on IC of 9th
September clearly indicated positive rainfall anomaly over many parts of India including the
northwest India and also non-establishment of anticyclone over the northwest India at least
upto two weeks (during 11-17 Sep & 18-24 Sep) indicated likely delay of monsoon
withdrawal (Fig. 13.10).
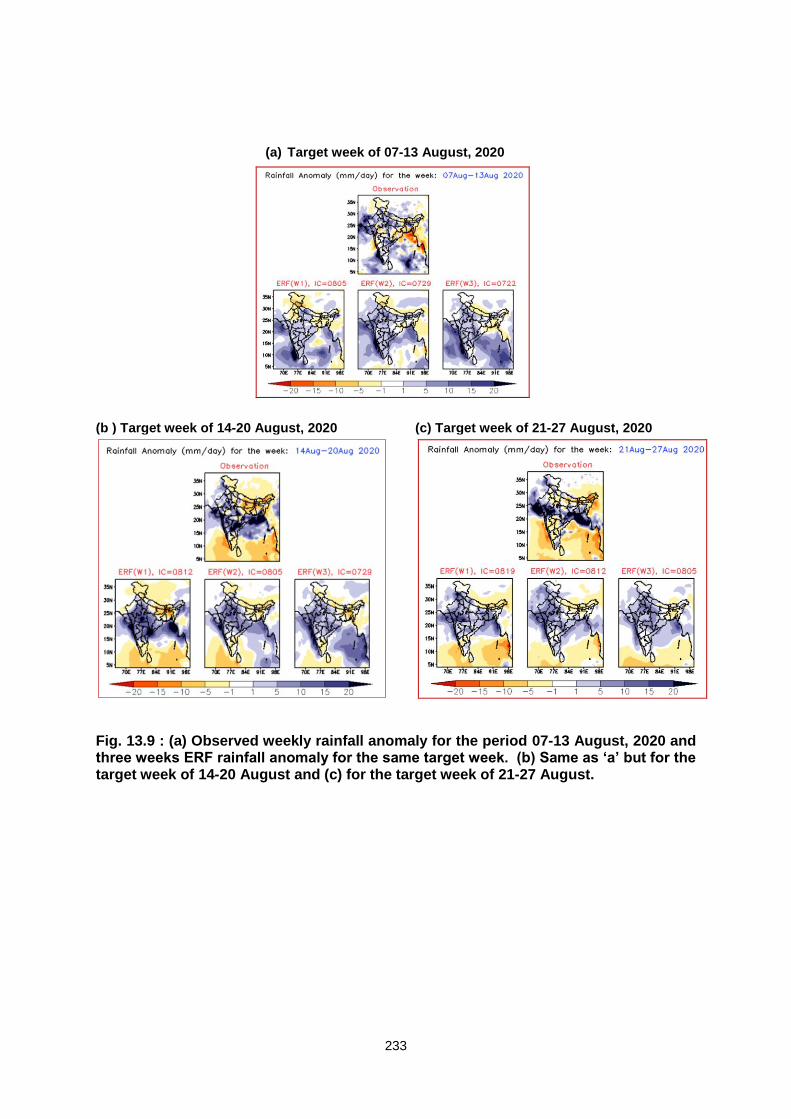
233
(a) Target week of 07-13 August, 2020
(b ) Target week of 14-20 August, 2020 (c) Target week of 21-27 August, 2020
Fig. 13.9 : (a) Observed weekly rainfall anomaly for the period 07-13 August, 2020 and three weeks ERF rainfall anomaly for the same target week. (b) Same as ‘a’ but for the target week of 14-20 August and (c) for the target week of 21-27 August.
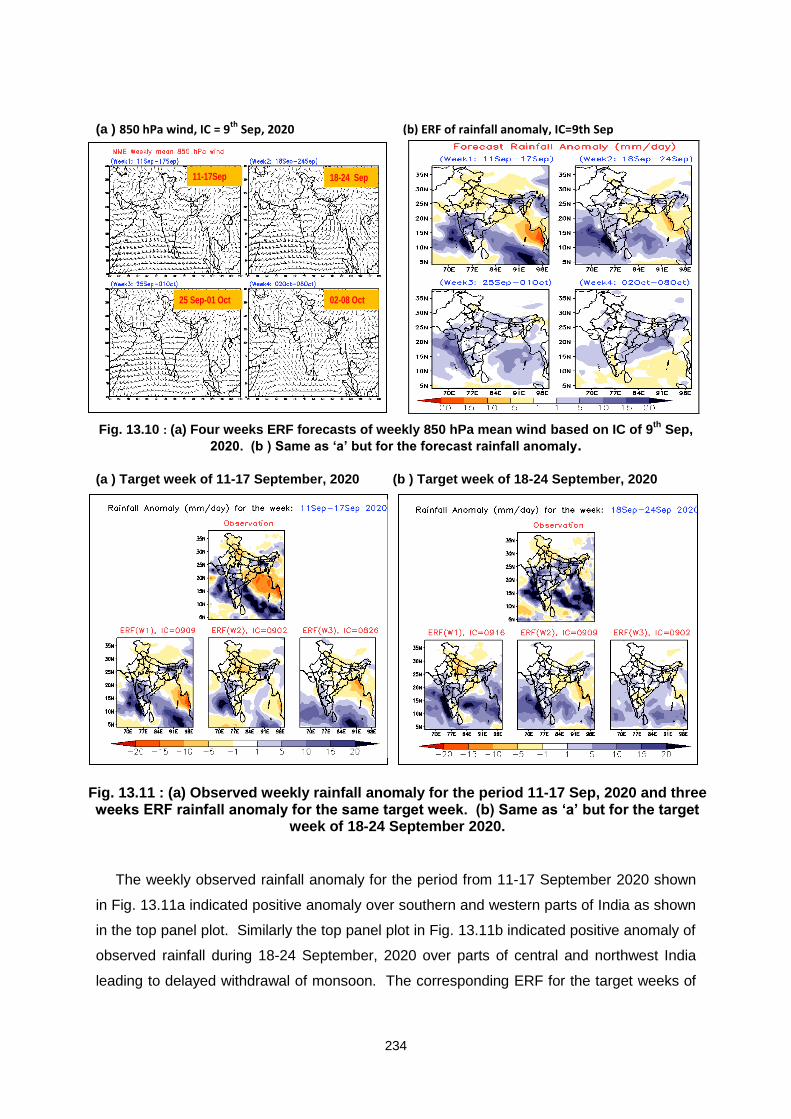
234
(a ) 850 hPa wind, IC = 9th
Sep, 2020 (b) ERF of rainfall anomaly, IC=9th Sep
Fig. 13.10 : (a) Four weeks ERF forecasts of weekly 850 hPa mean wind based on IC of 9
th Sep,
2020. (b ) Same as ‘a’ but for the forecast rainfall anomaly.
(a ) Target week of 11-17 September, 2020 (b ) Target week of 18-24 September, 2020
Fig. 13.11 : (a) Observed weekly rainfall anomaly for the period 11-17 Sep, 2020 and three weeks ERF rainfall anomaly for the same target week. (b) Same as ‘a’ but for the target
week of 18-24 September 2020.
The weekly observed rainfall anomaly for the period from 11-17 September 2020 shown
in Fig. 13.11a indicated positive anomaly over southern and western parts of India as shown
in the top panel plot. Similarly the top panel plot in Fig. 13.11b indicated positive anomaly of
observed rainfall during 18-24 September, 2020 over parts of central and northwest India
leading to delayed withdrawal of monsoon. The corresponding ERF for the target weeks of
11-17Sep 18-24 Sep
25 Sep-01 Oct 02-08 Oct
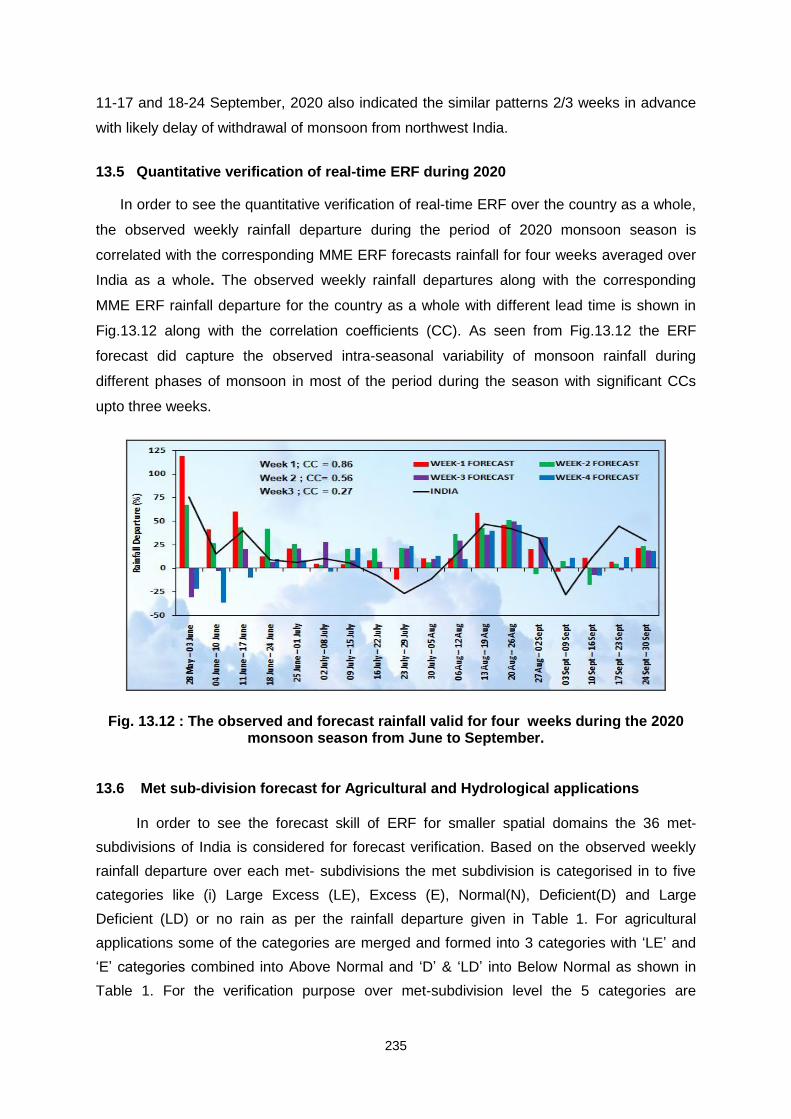
235
11-17 and 18-24 September, 2020 also indicated the similar patterns 2/3 weeks in advance
with likely delay of withdrawal of monsoon from northwest India.
13.5 Quantitative verification of real-time ERF during 2020
In order to see the quantitative verification of real-time ERF over the country as a whole,
the observed weekly rainfall departure during the period of 2020 monsoon season is
correlated with the corresponding MME ERF forecasts rainfall for four weeks averaged over
India as a whole. The observed weekly rainfall departures along with the corresponding
MME ERF rainfall departure for the country as a whole with different lead time is shown in
Fig.13.12 along with the correlation coefficients (CC). As seen from Fig.13.12 the ERF
forecast did capture the observed intra-seasonal variability of monsoon rainfall during
different phases of monsoon in most of the period during the season with significant CCs
upto three weeks.
Fig. 13.12 : The observed and forecast rainfall valid for four weeks during the 2020
monsoon season from June to September.
13.6 Met sub-division forecast for Agricultural and Hydrological applications
In order to see the forecast skill of ERF for smaller spatial domains the 36 met-
subdivisions of India is considered for forecast verification. Based on the observed weekly
rainfall departure over each met- subdivisions the met subdivision is categorised in to five
categories like (i) Large Excess (LE), Excess (E), Normal(N), Deficient(D) and Large
Deficient (LD) or no rain as per the rainfall departure given in Table 1. For agricultural
applications some of the categories are merged and formed into 3 categories with „LE‟ and
„E‟ categories combined into Above Normal and „D‟ & „LD‟ into Below Normal as shown in
Table 1. For the verification purpose over met-subdivision level the 5 categories are

236
considered and the forecast met subdivision is considered to be correct (C) if the category
matches with the forecast category, partially correct (PC) if it is one category out and wrong
if it is two or more categories out as shown in Table 2. Based on this the verification skill
score of met-subdivision level forecast in terms of correct (C), partially correct (PC) and
wrong (W) forecast during the monsoon season 2020 is shown in Fig. 13.13.
Table 13.1 : Categorization of met-subdivision based on observed rainfall departure in a week
Forecast OBS
Large Excess Excess Normal Deficient Scanty (No Rain)
Large Excess
Correct (C)
Partially Correct (PC)
Wrong (W) Wrong (W) Wrong (W)
Excess Partially Correct (PC)
Correct (C)
Partially Correct (PC)
Wrong (W) Wrong (W)
Normal Wrong (W) Partially Correct (PC)
Correct (C)
Partially Correct (PC)
Wrong (W)
Deficient Wrong (W) Wrong (W) Partially Correct (PC)
Correct (C) Partially Correct (PC)
Scanty (No Rain)
Wrong (W) Wrong (W) Wrong (W) Partially Correct (PC)
Correct (C)
Table 13.2 : Contingency table considered for verification of sub-division level
forecast.
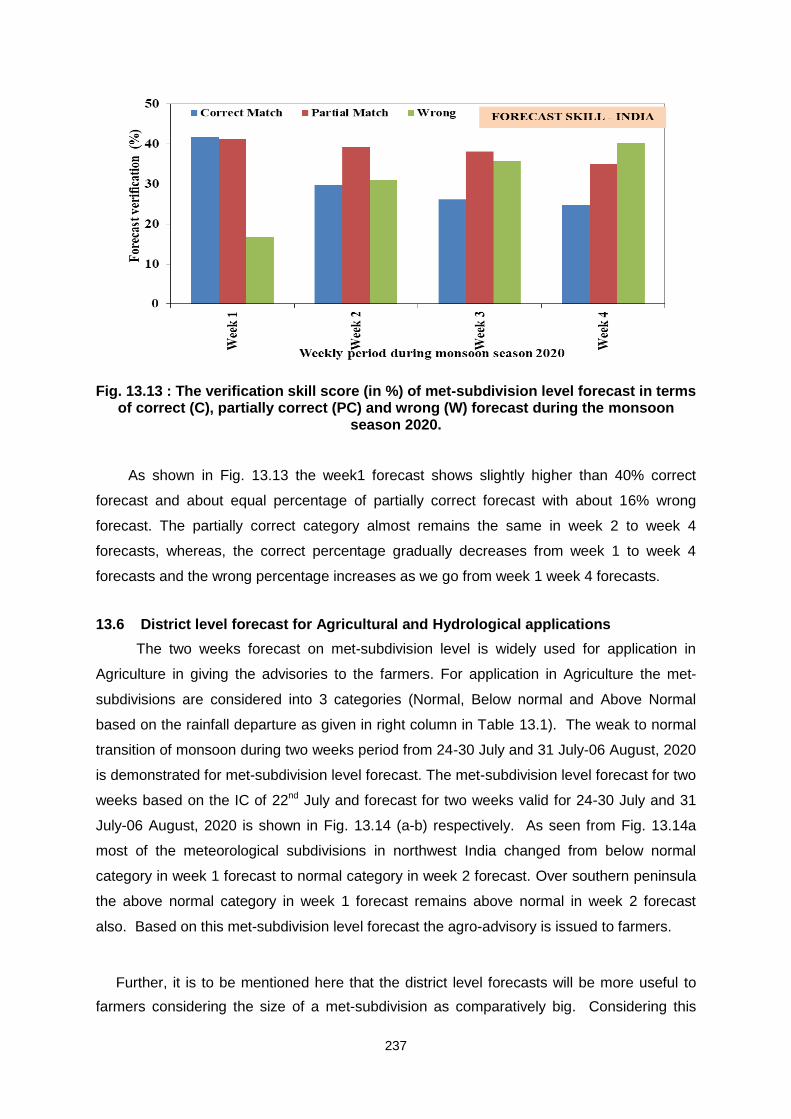
237
Fig. 13.13 : The verification skill score (in %) of met-subdivision level forecast in terms of correct (C), partially correct (PC) and wrong (W) forecast during the monsoon
season 2020. As shown in Fig. 13.13 the week1 forecast shows slightly higher than 40% correct
forecast and about equal percentage of partially correct forecast with about 16% wrong
forecast. The partially correct category almost remains the same in week 2 to week 4
forecasts, whereas, the correct percentage gradually decreases from week 1 to week 4
forecasts and the wrong percentage increases as we go from week 1 week 4 forecasts.
13.6 District level forecast for Agricultural and Hydrological applications
The two weeks forecast on met-subdivision level is widely used for application in
Agriculture in giving the advisories to the farmers. For application in Agriculture the met-
subdivisions are considered into 3 categories (Normal, Below normal and Above Normal
based on the rainfall departure as given in right column in Table 13.1). The weak to normal
transition of monsoon during two weeks period from 24-30 July and 31 July-06 August, 2020
is demonstrated for met-subdivision level forecast. The met-subdivision level forecast for two
weeks based on the IC of 22nd July and forecast for two weeks valid for 24-30 July and 31
July-06 August, 2020 is shown in Fig. 13.14 (a-b) respectively. As seen from Fig. 13.14a
most of the meteorological subdivisions in northwest India changed from below normal
category in week 1 forecast to normal category in week 2 forecast. Over southern peninsula
the above normal category in week 1 forecast remains above normal in week 2 forecast
also. Based on this met-subdivision level forecast the agro-advisory is issued to farmers.
Further, it is to be mentioned here that the district level forecasts will be more useful to
farmers considering the size of a met-subdivision as comparatively big. Considering this
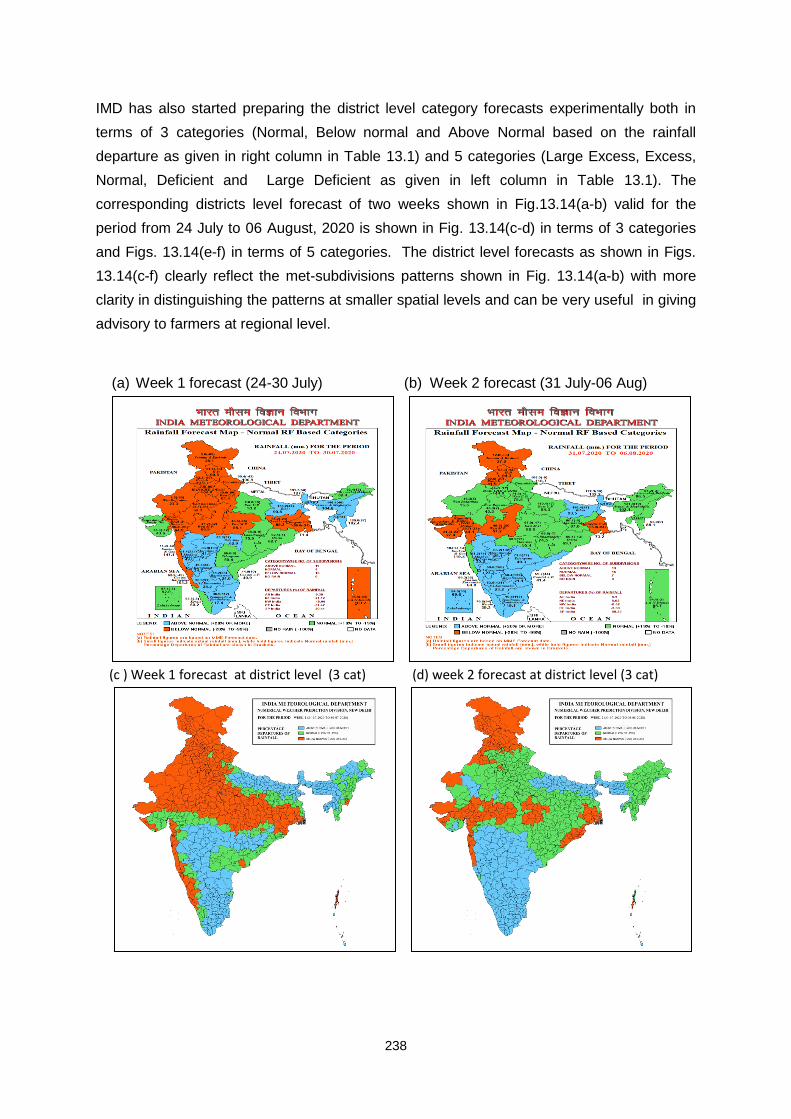
238
IMD has also started preparing the district level category forecasts experimentally both in
terms of 3 categories (Normal, Below normal and Above Normal based on the rainfall
departure as given in right column in Table 13.1) and 5 categories (Large Excess, Excess,
Normal, Deficient and Large Deficient as given in left column in Table 13.1). The
corresponding districts level forecast of two weeks shown in Fig.13.14(a-b) valid for the
period from 24 July to 06 August, 2020 is shown in Fig. 13.14(c-d) in terms of 3 categories
and Figs. 13.14(e-f) in terms of 5 categories. The district level forecasts as shown in Figs.
13.14(c-f) clearly reflect the met-subdivisions patterns shown in Fig. 13.14(a-b) with more
clarity in distinguishing the patterns at smaller spatial levels and can be very useful in giving
advisory to farmers at regional level.
(a) Week 1 forecast (24-30 July) (b) Week 2 forecast (31 July-06 Aug)
(c ) Week 1 forecast at district level (3 cat) (d) week 2 forecast at district level (3 cat)
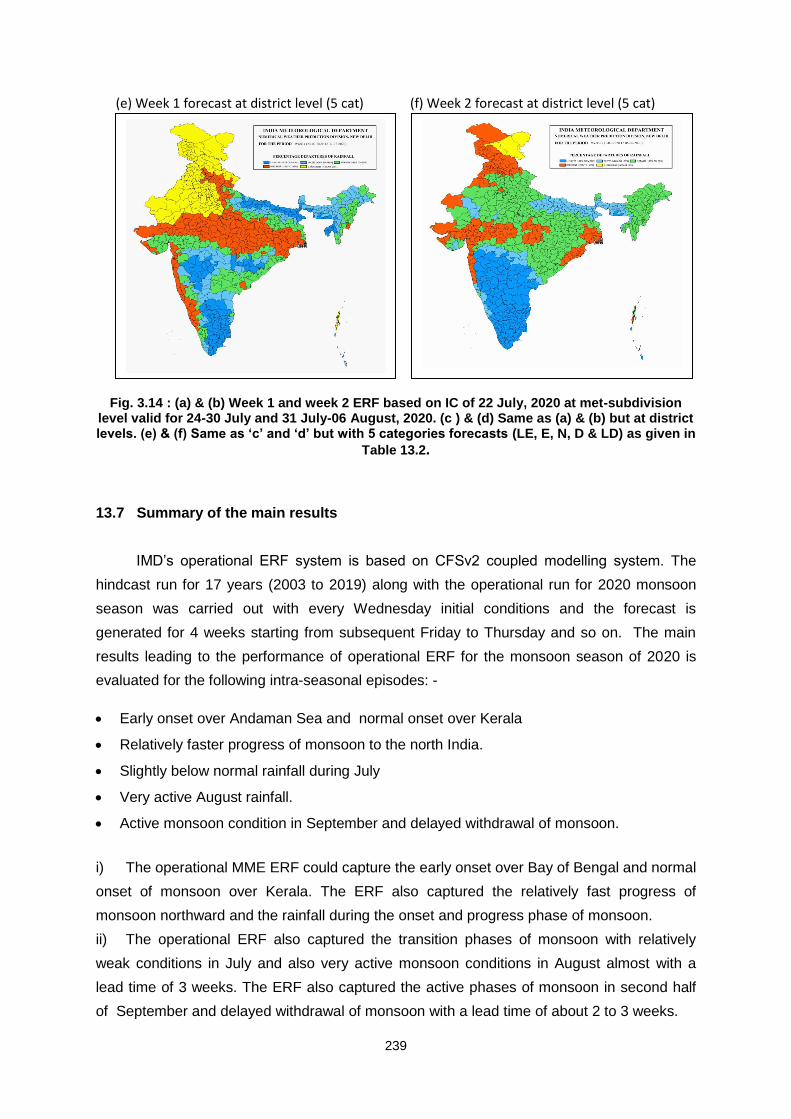
239
(e) Week 1 forecast at district level (5 cat) (f) Week 2 forecast at district level (5 cat)
Fig. 3.14 : (a) & (b) Week 1 and week 2 ERF based on IC of 22 July, 2020 at met-subdivision
level valid for 24-30 July and 31 July-06 August, 2020. (c ) & (d) Same as (a) & (b) but at district levels. (e) & (f) Same as ‘c’ and ‘d’ but with 5 categories forecasts (LE, E, N, D & LD) as given in
Table 13.2.
13.7 Summary of the main results
IMD‟s operational ERF system is based on CFSv2 coupled modelling system. The
hindcast run for 17 years (2003 to 2019) along with the operational run for 2020 monsoon
season was carried out with every Wednesday initial conditions and the forecast is
generated for 4 weeks starting from subsequent Friday to Thursday and so on. The main
results leading to the performance of operational ERF for the monsoon season of 2020 is
evaluated for the following intra-seasonal episodes: -
Early onset over Andaman Sea and normal onset over Kerala
Relatively faster progress of monsoon to the north India.
Slightly below normal rainfall during July
Very active August rainfall.
Active monsoon condition in September and delayed withdrawal of monsoon.
i) The operational MME ERF could capture the early onset over Bay of Bengal and normal
onset of monsoon over Kerala. The ERF also captured the relatively fast progress of
monsoon northward and the rainfall during the onset and progress phase of monsoon.
ii) The operational ERF also captured the transition phases of monsoon with relatively
weak conditions in July and also very active monsoon conditions in August almost with a
lead time of 3 weeks. The ERF also captured the active phases of monsoon in second half
of September and delayed withdrawal of monsoon with a lead time of about 2 to 3 weeks.
240
iii) Quantitatively, over the country as a whole the MME ERF forecast provided useful
guidance with the CC between observed and forecast rainfall departure is found to be
significant till three weeks.
iv) The met subdivision wise forecasts for two weeks are being used for providing Agromet
advisory to farmers. The correct to partially correct category of met-subdivision level forecast
is found to be about 80% till 2 to 3 weeks, which is being used widely for Agromet advisory
purpose.
v) The experimental district level forecast for two weeks shows encouraging results and
could be considered for applications in Agriculture sector.
Acknowledgement :
The real time extended range forecast capability of IMD is being strengthened
through the collaborative efforts of the MoES institutions viz., the IITM, NCMRWF, INCOIS
and NCEP. The CFSv2/GFSbc customised at IITM was implemented in IMD for the
operational run. Thanks are also due to IMD Pune for providing observed rainfall data.
References :
Abhilash, S., A.K. Sahai, N. Borah, S. Joseph, R. Chattopadhyay, S. Sharmila, M. Rajeevan, B.E. Mapes, and A. Kumar, 2015: Improved Spread–Error Relationship and Probabilistic Prediction from the CFS-Based Grand Ensemble Prediction System. J. Appl. Meteor. Climatol., 54, 1569–1578, https://doi.org/10.1175/JAMC-D-14-0200.1.
Abhilash, S., Sahai, A. K., Pattnaik, S., Goswami, B. N. and Kumar, A. 2014:, Extended range prediction of active-break spells of Indian summer monsoon rainfall using an ensemble prediction system in NCEP Climate Forecast System. Int. J. Climatol., 34: 98–113. doi:10.1002/joc.3668.
Pattanaik D. R. and Arun Kumar, 2014 : Comparison of intra-seasonal forecast of Indian summer
monsoon between two versions of NCEP coupled models. Theoretical and Applied Climatology. DOI
10.1007/s00704-013-1071-1.
Pattanaik, D. R. and A. K. Sahai, 2018 : Evaluation of Real-Time Extended Range Forecast (ERF) of southwest monsoon, heat wave, cold wave, cyclogenesis and northeast monsoon during 2017. IMD Technical Report, IMD. No. ESSO/IMD/NWP-Extended Range Forecast (ERF) Report No. 01 (2018)/05. PP 1-142.
Pattanaik, D.R., 2014: Meteorological subdivisional-level extended range forecast over India during southwest monsoon 2012. Meteorolohy and Atmospheric Physics. DOI 10.1007/s00703-014-0308-6.
Pattanaik D.R., A.K. Sahai, Raju Mandal, R. Phani Muralikrishna, Avijit Dey, Rajib Chattopadhyay,
Susmitha Joseph, Amar Deep Tiwari and Vimal Mishra, 2019: Evolution of operational extended
range forecast system of IMD: Prospects of its applications in different sectors, Mausam, Vol. 70,
233-264.
Pattanaik D. R, A. K. Sahai, R. Phani Murali krishna, Raju Mandal and Avijit Dey, 2020 : Active-Break
Transitions of Monsoons Over India as Predicted by Coupled Model Ensembles. Pure Appl. Geophys.
Vol. 177, 4391–4422.
Saha Suranjana, Shrinivas Moorthi, Xingren Wu, Jiande Wang, Sudhir Nadiga, Patrick Tripp, Hua-Lu Pan, David Behringer, Yu-Tai Hou, Hui-ya Chuang, Mark Iredell, Michael Ek, Jesse Meng, Rongqian Yang, Huug van den Dool, Qin Zhang, Wanqiu Wang, Mingyue Chen, 2014 : The NCEP Climate

241
Forecast System Version 2. Journal of Climate J. Climate, 27, 2185–2208. doi: http://dx.doi.org/10.1175/JCLI-D-12-00823.1. Sahai A. K, R. Chattopadhyay, S. Joseph, R. Mandal, A. Dey, S. Abhilash,R. P. M. Krishna and N. Borah, 2015: Real-time performance of a multi-model ensemble-based extended range forecast system in predicting the 2014 monsoon season based on NCEP-CFSv2.Current Science, Vol. 109, No. 10, p1802-1813.
242
14
STUDY OF MONSOON FEATURES USING
SATELLITE PRODUCTS
Suman Goyal and Chinmay Khadke
This Chapter discusses an analysis of various features of Southwest Monsoon 2020
using a variety of satellite imageries and products from INSAT-3D/3DR and
METEOSAT-8 satellites
14.1 : Introduction
A large atmosphere-ocean coupled phenomenon like monsoon requires synoptic
observations spanning the tropics and beyond on the either side of equator. Geostationary
satellites provide the continuous observations on such a scale and hence are a vital tool for
the operational forecasters.
Movement of Inter Tropical Convergence Zone sets the south-west monsoon over
Kerala. The Onset of monsoon over Kerala has been studied extensively (Joseph et al.
2003, Soman et al 1993, Ananthakrishnan et al 1968). An objective criterion is used
currently which uses the satellite data as essential inputs. The advancement of satellite data
and variety of enhanced satellite imagery enables meteorologists to monitor and study the
development of monsoonal disturbances (Mahajan 2003) such as formation of monsoon
depressions. During the course of monsoon there are spells of vigorous convection and
subdued convection causing active and break spells. Sikka et al (1980) studied the daily
variation of the maximum cloud zones exhibiting the alternating spells of rainfall. The
withdrawal process starts from the north-west part of India in the month of September. This
is associated with the establishment of anticyclone and lack of moisture supply in the region.
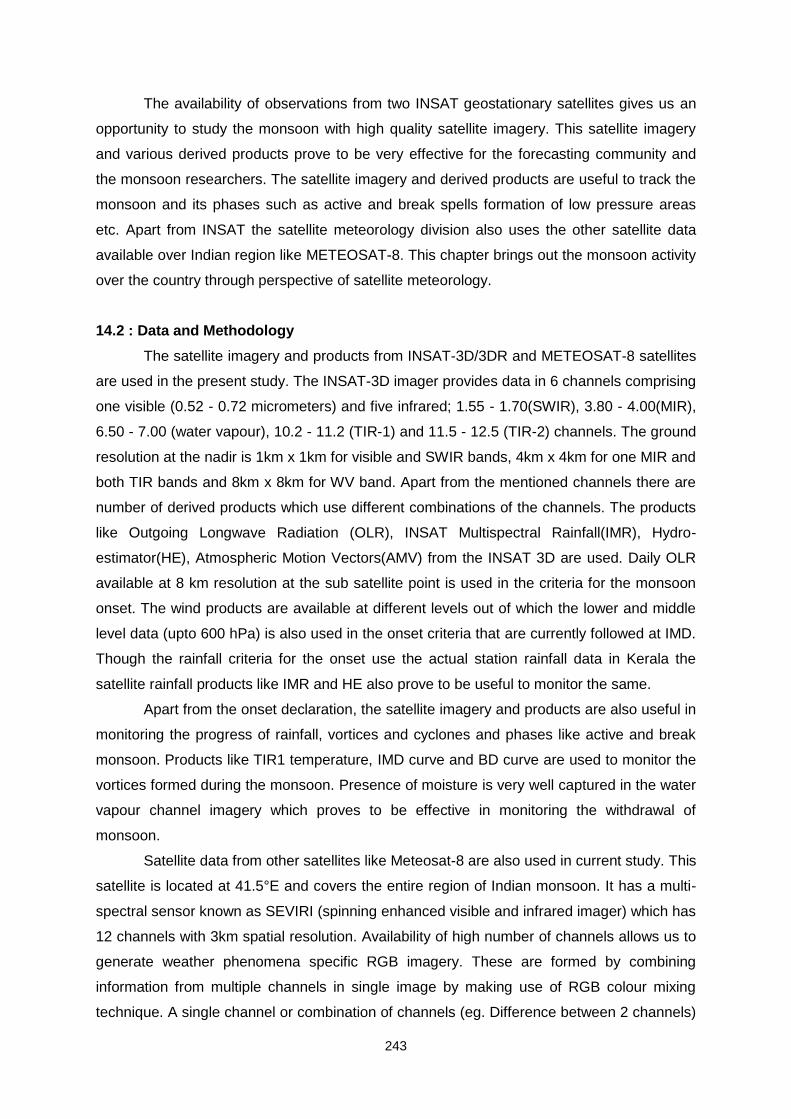
243
The availability of observations from two INSAT geostationary satellites gives us an
opportunity to study the monsoon with high quality satellite imagery. This satellite imagery
and various derived products prove to be very effective for the forecasting community and
the monsoon researchers. The satellite imagery and derived products are useful to track the
monsoon and its phases such as active and break spells formation of low pressure areas
etc. Apart from INSAT the satellite meteorology division also uses the other satellite data
available over Indian region like METEOSAT-8. This chapter brings out the monsoon activity
over the country through perspective of satellite meteorology.
14.2 : Data and Methodology
The satellite imagery and products from INSAT-3D/3DR and METEOSAT-8 satellites
are used in the present study. The INSAT-3D imager provides data in 6 channels comprising
one visible (0.52 - 0.72 micrometers) and five infrared; 1.55 - 1.70(SWIR), 3.80 - 4.00(MIR),
6.50 - 7.00 (water vapour), 10.2 - 11.2 (TIR-1) and 11.5 - 12.5 (TIR-2) channels. The ground
resolution at the nadir is 1km x 1km for visible and SWIR bands, 4km x 4km for one MIR and
both TIR bands and 8km x 8km for WV band. Apart from the mentioned channels there are
number of derived products which use different combinations of the channels. The products
like Outgoing Longwave Radiation (OLR), INSAT Multispectral Rainfall(IMR), Hydro-
estimator(HE), Atmospheric Motion Vectors(AMV) from the INSAT 3D are used. Daily OLR
available at 8 km resolution at the sub satellite point is used in the criteria for the monsoon
onset. The wind products are available at different levels out of which the lower and middle
level data (upto 600 hPa) is also used in the onset criteria that are currently followed at IMD.
Though the rainfall criteria for the onset use the actual station rainfall data in Kerala the
satellite rainfall products like IMR and HE also prove to be useful to monitor the same.
Apart from the onset declaration, the satellite imagery and products are also useful in
monitoring the progress of rainfall, vortices and cyclones and phases like active and break
monsoon. Products like TIR1 temperature, IMD curve and BD curve are used to monitor the
vortices formed during the monsoon. Presence of moisture is very well captured in the water
vapour channel imagery which proves to be effective in monitoring the withdrawal of
monsoon.
Satellite data from other satellites like Meteosat-8 are also used in current study. This
satellite is located at 41.5°E and covers the entire region of Indian monsoon. It has a multi-
spectral sensor known as SEVIRI (spinning enhanced visible and infrared imager) which has
12 channels with 3km spatial resolution. Availability of high number of channels allows us to
generate weather phenomena specific RGB imagery. These are formed by combining
information from multiple channels in single image by making use of RGB colour mixing
technique. A single channel or combination of channels (eg. Difference between 2 channels)
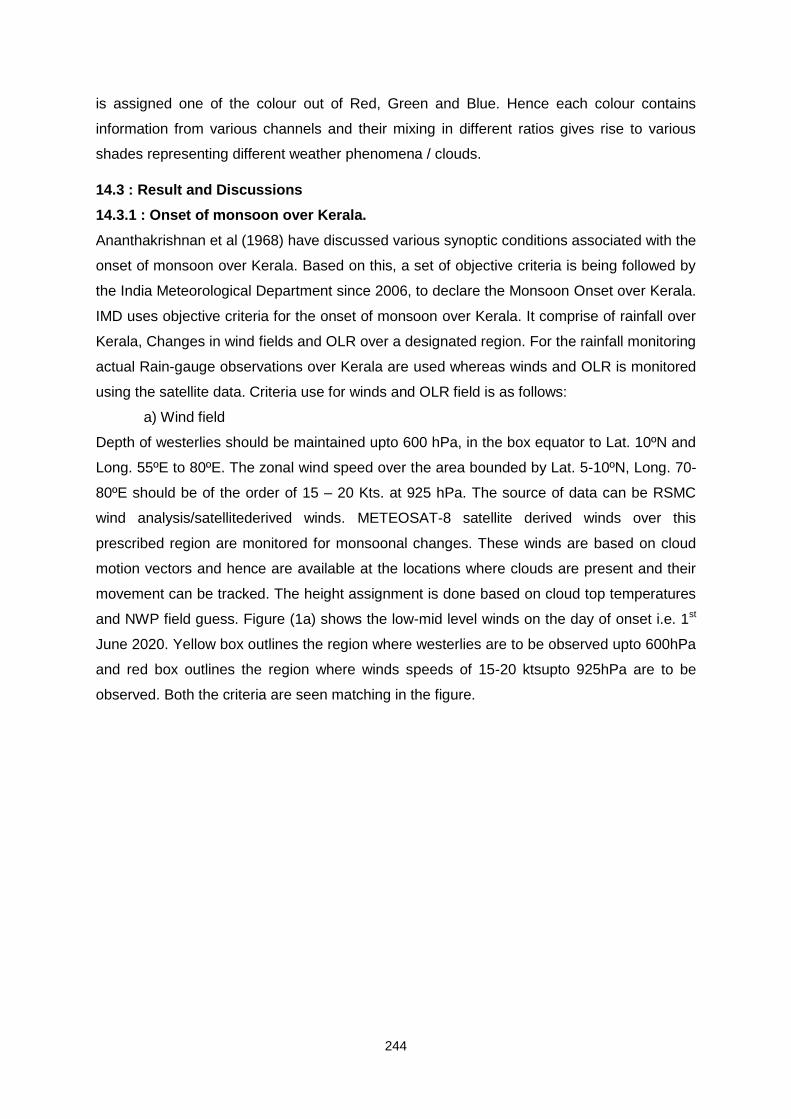
244
is assigned one of the colour out of Red, Green and Blue. Hence each colour contains
information from various channels and their mixing in different ratios gives rise to various
shades representing different weather phenomena / clouds.
14.3 : Result and Discussions
14.3.1 : Onset of monsoon over Kerala.
Ananthakrishnan et al (1968) have discussed various synoptic conditions associated with the
onset of monsoon over Kerala. Based on this, a set of objective criteria is being followed by
the India Meteorological Department since 2006, to declare the Monsoon Onset over Kerala.
IMD uses objective criteria for the onset of monsoon over Kerala. It comprise of rainfall over
Kerala, Changes in wind fields and OLR over a designated region. For the rainfall monitoring
actual Rain-gauge observations over Kerala are used whereas winds and OLR is monitored
using the satellite data. Criteria use for winds and OLR field is as follows:
a) Wind field
Depth of westerlies should be maintained upto 600 hPa, in the box equator to Lat. 10ºN and
Long. 55ºE to 80ºE. The zonal wind speed over the area bounded by Lat. 5-10ºN, Long. 70-
80ºE should be of the order of 15 – 20 Kts. at 925 hPa. The source of data can be RSMC
wind analysis/satellitederived winds. METEOSAT-8 satellite derived winds over this
prescribed region are monitored for monsoonal changes. These winds are based on cloud
motion vectors and hence are available at the locations where clouds are present and their
movement can be tracked. The height assignment is done based on cloud top temperatures
and NWP field guess. Figure (1a) shows the low-mid level winds on the day of onset i.e. 1st
June 2020. Yellow box outlines the region where westerlies are to be observed upto 600hPa
and red box outlines the region where winds speeds of 15-20 ktsupto 925hPa are to be
observed. Both the criteria are seen matching in the figure.
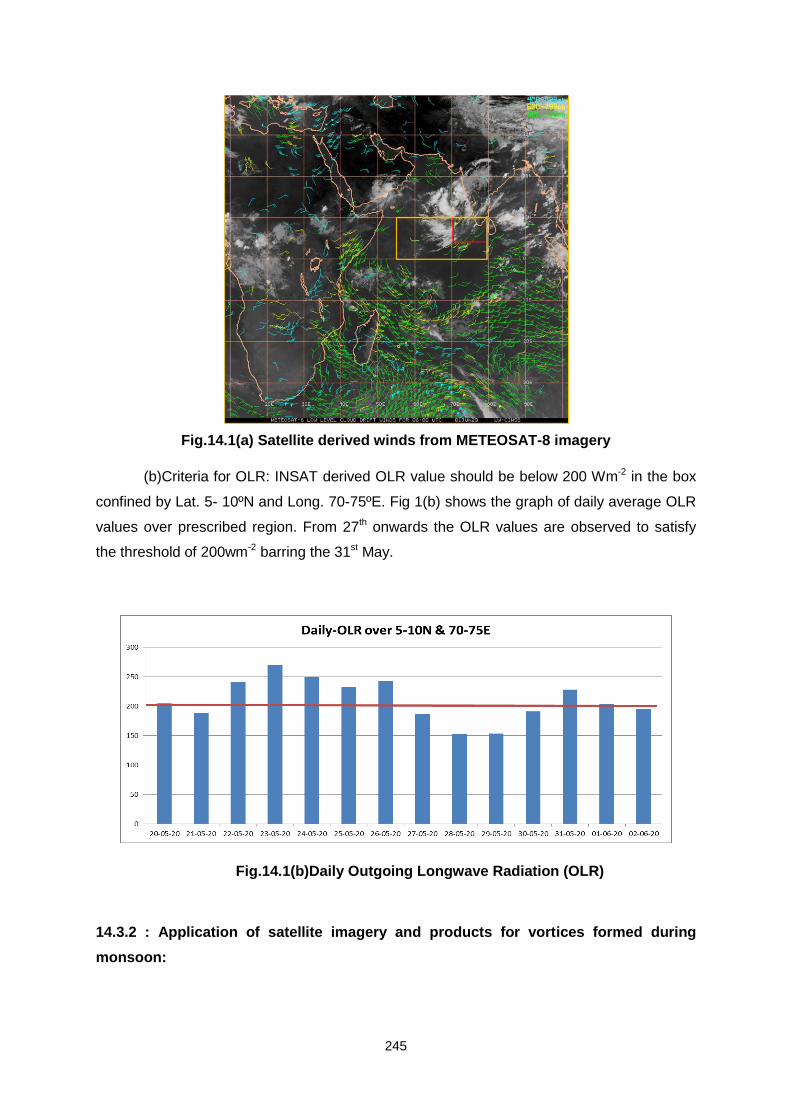
245
Fig.14.1(a) Satellite derived winds from METEOSAT-8 imagery
(b)Criteria for OLR: INSAT derived OLR value should be below 200 Wm-2 in the box
confined by Lat. 5- 10ºN and Long. 70-75ºE. Fig 1(b) shows the graph of daily average OLR
values over prescribed region. From 27th onwards the OLR values are observed to satisfy
the threshold of 200wm-2 barring the 31st May.
Fig.14.1(b)Daily Outgoing Longwave Radiation (OLR)
14.3.2 : Application of satellite imagery and products for vortices formed during
monsoon:
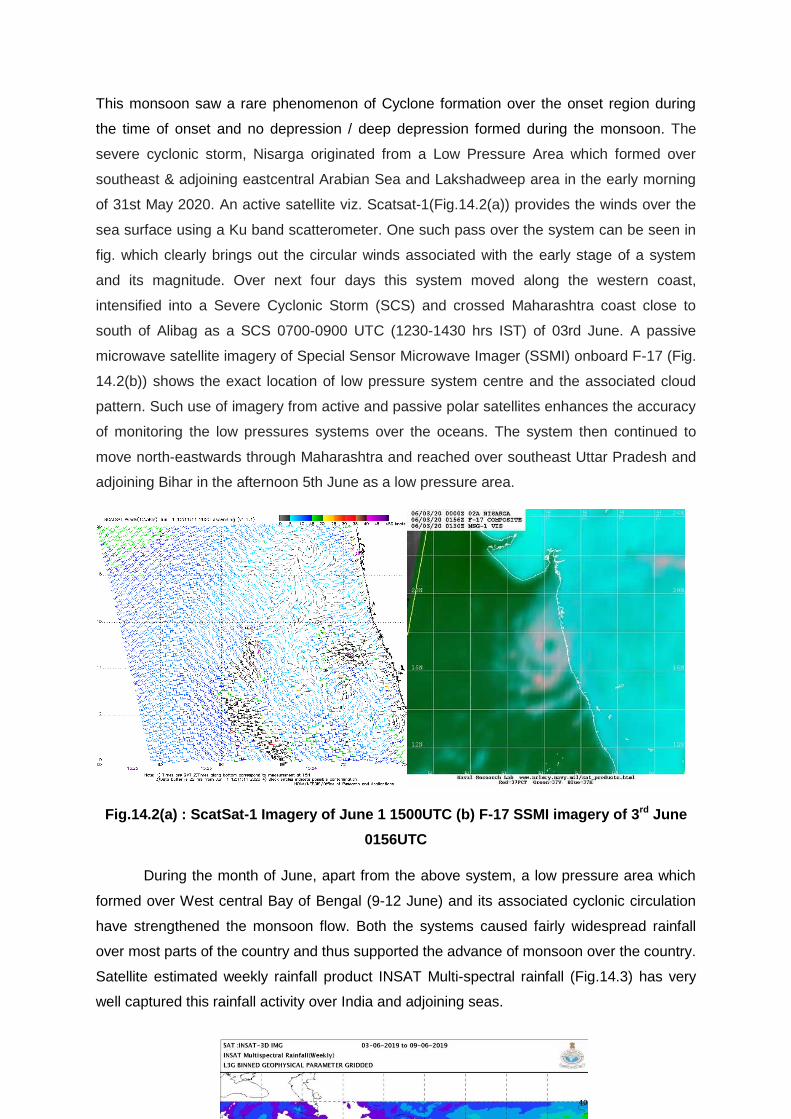
246
This monsoon saw a rare phenomenon of Cyclone formation over the onset region during
the time of onset and no depression / deep depression formed during the monsoon. The
severe cyclonic storm, Nisarga originated from a Low Pressure Area which formed over
southeast & adjoining eastcentral Arabian Sea and Lakshadweep area in the early morning
of 31st May 2020. An active satellite viz. Scatsat-1(Fig.14.2(a)) provides the winds over the
sea surface using a Ku band scatterometer. One such pass over the system can be seen in
fig. which clearly brings out the circular winds associated with the early stage of a system
and its magnitude. Over next four days this system moved along the western coast,
intensified into a Severe Cyclonic Storm (SCS) and crossed Maharashtra coast close to
south of Alibag as a SCS 0700-0900 UTC (1230-1430 hrs IST) of 03rd June. A passive
microwave satellite imagery of Special Sensor Microwave Imager (SSMI) onboard F-17 (Fig.
14.2(b)) shows the exact location of low pressure system centre and the associated cloud
pattern. Such use of imagery from active and passive polar satellites enhances the accuracy
of monitoring the low pressures systems over the oceans. The system then continued to
move north-eastwards through Maharashtra and reached over southeast Uttar Pradesh and
adjoining Bihar in the afternoon 5th June as a low pressure area.
Fig.14.2(a) : ScatSat-1 Imagery of June 1 1500UTC (b) F-17 SSMI imagery of 3rd June
0156UTC
During the month of June, apart from the above system, a low pressure area which
formed over West central Bay of Bengal (9-12 June) and its associated cyclonic circulation
have strengthened the monsoon flow. Both the systems caused fairly widespread rainfall
over most parts of the country and thus supported the advance of monsoon over the country.
Satellite estimated weekly rainfall product INSAT Multi-spectral rainfall (Fig.14.3) has very
well captured this rainfall activity over India and adjoining seas.
247
Fig.14.3 : Satellite derived Weekly rainfall from INSAT3D
14.4 : Withdrawal of southwest Monsoon
The monsoon withdrawal from the north-west parts of the country around 28th September
and continued for a month till about 28th October, when it completely withdraws from the
country. For monsoon withdrawal over the country, reduction in moisture along with its
spatial continuity are observed using the Water vapour imageries from satellites as it
provides a measure of moisture content of the atmosphere at middle levels and helps in
deciding the withdrawal of monsoon. For the present study we have used Meteosat-8 based
RGB product known as Air mass RGB. This product combines the information from two
water vapour channels along with two Infrared channels giving holistic view to monitor the
dry-wet air-masses over the region. Recipe used in the formulation of this RGB product is
given in the following table 14.1.
Table 14.1 Recipes used in the formulation of various RGB products based on
METEOSAT- 8
Product Red Green Blue
Air-mass WV6.2µm -7.3 µm IR 9.7µm -10.8 µm WV 6.2µm
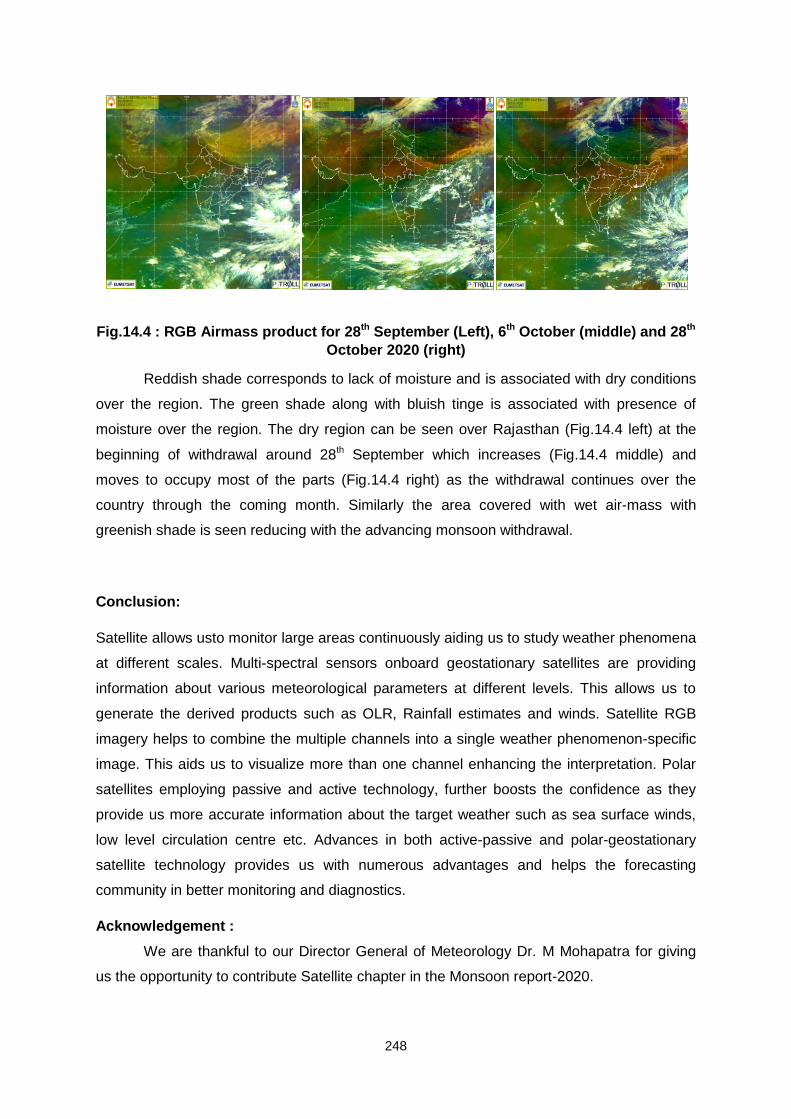
248
Fig.14.4 : RGB Airmass product for 28th September (Left), 6th October (middle) and 28th
October 2020 (right)
Reddish shade corresponds to lack of moisture and is associated with dry conditions
over the region. The green shade along with bluish tinge is associated with presence of
moisture over the region. The dry region can be seen over Rajasthan (Fig.14.4 left) at the
beginning of withdrawal around 28th September which increases (Fig.14.4 middle) and
moves to occupy most of the parts (Fig.14.4 right) as the withdrawal continues over the
country through the coming month. Similarly the area covered with wet air-mass with
greenish shade is seen reducing with the advancing monsoon withdrawal.
Conclusion:
Satellite allows usto monitor large areas continuously aiding us to study weather phenomena
at different scales. Multi-spectral sensors onboard geostationary satellites are providing
information about various meteorological parameters at different levels. This allows us to
generate the derived products such as OLR, Rainfall estimates and winds. Satellite RGB
imagery helps to combine the multiple channels into a single weather phenomenon-specific
image. This aids us to visualize more than one channel enhancing the interpretation. Polar
satellites employing passive and active technology, further boosts the confidence as they
provide us more accurate information about the target weather such as sea surface winds,
low level circulation centre etc. Advances in both active-passive and polar-geostationary
satellite technology provides us with numerous advantages and helps the forecasting
community in better monitoring and diagnostics.
Acknowledgement :
We are thankful to our Director General of Meteorology Dr. M Mohapatra for giving
us the opportunity to contribute Satellite chapter in the Monsoon report-2020.

249
References :
Ananthakrishnan, R., Srinivasan, V., Ramakrishnan, A.R. and Jambunathan, R., 1968:
‘Synoptic features associated with onset of South-West Monsoon over Kerala’, Forecasting
Manual Unit Report IV – 18.2., India Meteorological Department.
Joseph, P.V., K.P. Sooraj and C.K. Rajan 2003. Conditions leading to Monsoon onset over
Kerala and the associated Hadley cell. Mausam, 54(1): 155-164.
Mahajan P.N., 2003 satellite data for diagnostic of Monsoon disturbances, Mausam,54, 165-
172.
Sikka, D.R. and Gadgil, S. 1980. On the maximum cloud zone and the ITCZ over Indian
longitudes during the southwest monsoon. Mon. Wea. Rev., 108: 1840-1853.
Soman, M. K. and Krishna Kumar, K., 1993, Space-time evolution of meteorological features
associated with the onset of the Indian summer monsoon, Mon. Wea. Rev., V121, pp1177-
1194.
250
15
MONITORING OF LOW-PRESSURE SYSTEMS DURING THE
MONSOON SEASON – 2020 USING AUTOMATIC WEATHER
STATIONS (AWS)
Manish R. Ranalkar, Anjit Anjan and K.N. Mohan
CR&S Pune
A network of over 700 Automatic Weather Stations (AWSs) and 1350 Automatic Rain
Gauges (ARGs) has been established by India Meteorological Department. This
Chapter discusses utility of AWS data for monitoring and prediction of low pressure
systems during the Southwest Monsoon 2020.
Since year 2007, surface observational network has been strengthened by India
Meteorological Department by establishing a network of 724 Automatic Weather Stations
and 1352 Automatic Rain Gauge stations across the country to cater to operational
requirements of IMD. The AWS and ARG network in conjunction with manned surface
observational network provides surface observations at high spatial and temporal resolution
to monitor weather systems of different time and spatial scales. Keeping abreast with
technological development in the field of telecommunication, IMD is gradually switching over
to mobile (GPRS) telemetry for transmission of data to central data server. A few selected
stations in mountainous regions with poor mobile network coverage would still be using
satellite telemetry for transmission of data. This Chapter discusses performance of AWS and
ARG stations during Low-Pressure Systems developed during Southwest monsoon season
2020.
15.1 : Introduction
Since 2007, IMD has put in significance efforts to strengthen and augment its surface
observational network. As on date, a fairly dense and well distributed network of 724
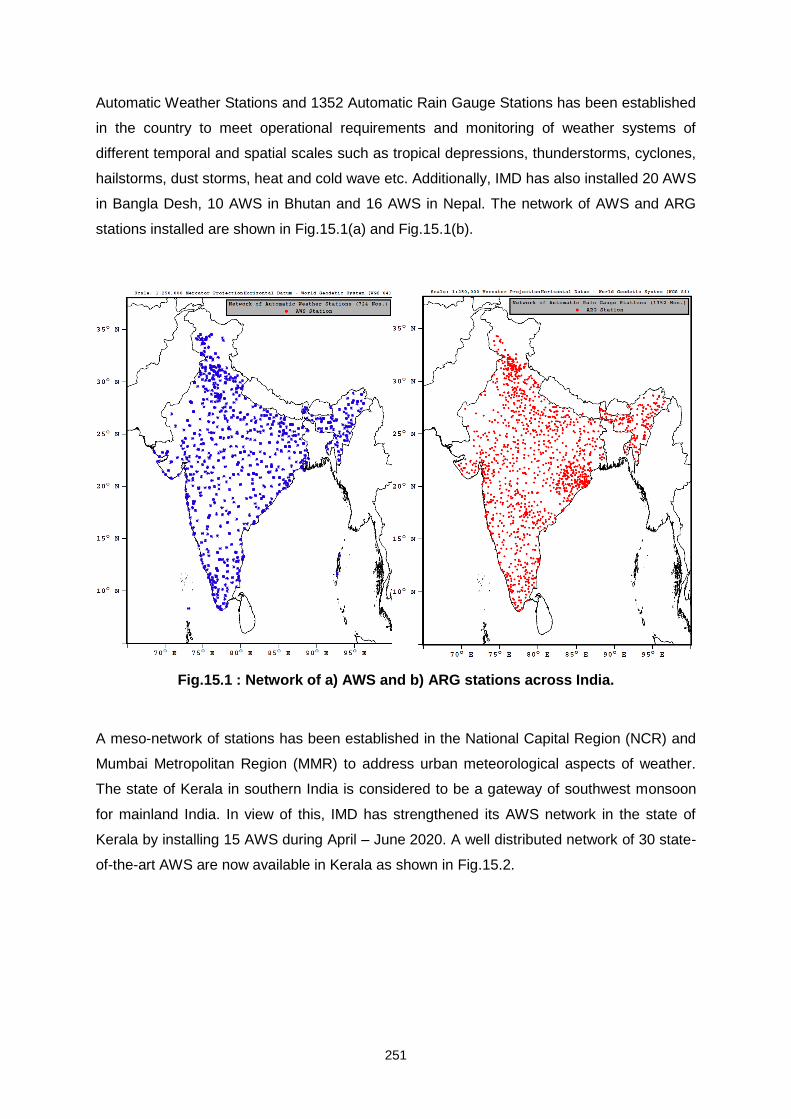
251
Automatic Weather Stations and 1352 Automatic Rain Gauge Stations has been established
in the country to meet operational requirements and monitoring of weather systems of
different temporal and spatial scales such as tropical depressions, thunderstorms, cyclones,
hailstorms, dust storms, heat and cold wave etc. Additionally, IMD has also installed 20 AWS
in Bangla Desh, 10 AWS in Bhutan and 16 AWS in Nepal. The network of AWS and ARG
stations installed are shown in Fig.15.1(a) and Fig.15.1(b).
Fig.15.1 : Network of a) AWS and b) ARG stations across India.
A meso-network of stations has been established in the National Capital Region (NCR) and
Mumbai Metropolitan Region (MMR) to address urban meteorological aspects of weather.
The state of Kerala in southern India is considered to be a gateway of southwest monsoon
for mainland India. In view of this, IMD has strengthened its AWS network in the state of
Kerala by installing 15 AWS during April – June 2020. A well distributed network of 30 state-
of-the-art AWS are now available in Kerala as shown in Fig.15.2.
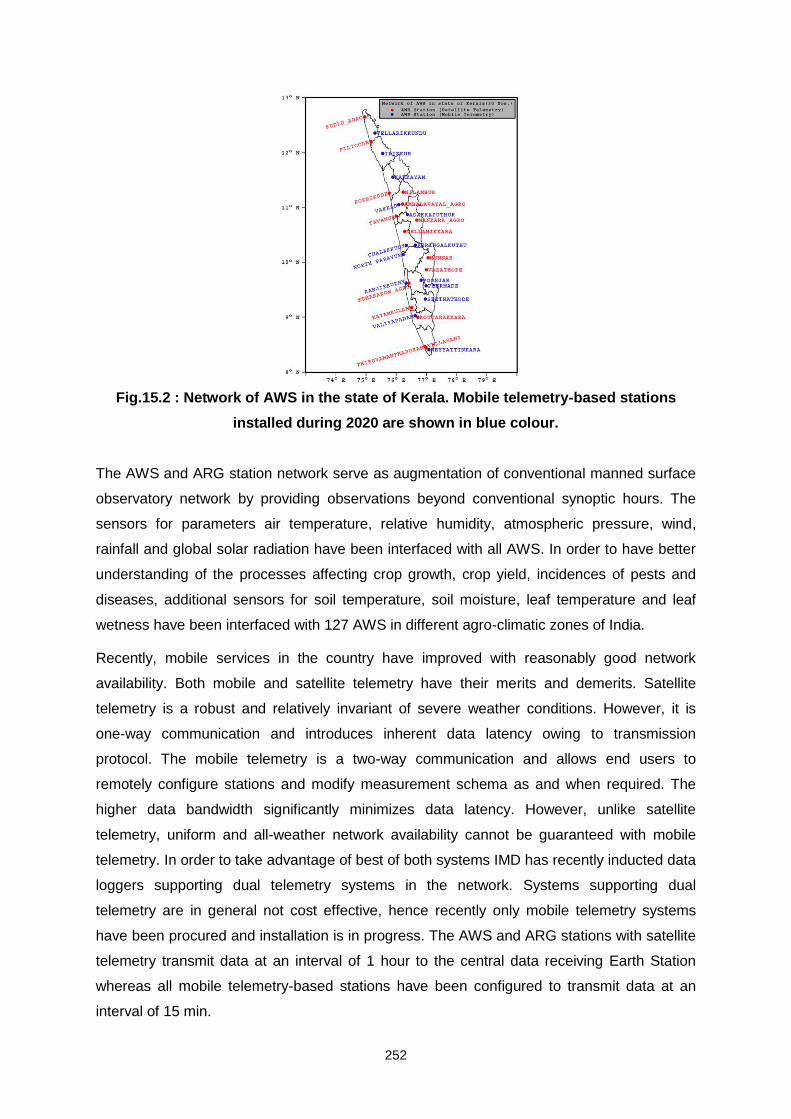
252
Fig.15.2 : Network of AWS in the state of Kerala. Mobile telemetry-based stations
installed during 2020 are shown in blue colour.
The AWS and ARG station network serve as augmentation of conventional manned surface
observatory network by providing observations beyond conventional synoptic hours. The
sensors for parameters air temperature, relative humidity, atmospheric pressure, wind,
rainfall and global solar radiation have been interfaced with all AWS. In order to have better
understanding of the processes affecting crop growth, crop yield, incidences of pests and
diseases, additional sensors for soil temperature, soil moisture, leaf temperature and leaf
wetness have been interfaced with 127 AWS in different agro-climatic zones of India.
Recently, mobile services in the country have improved with reasonably good network
availability. Both mobile and satellite telemetry have their merits and demerits. Satellite
telemetry is a robust and relatively invariant of severe weather conditions. However, it is
one-way communication and introduces inherent data latency owing to transmission
protocol. The mobile telemetry is a two-way communication and allows end users to
remotely configure stations and modify measurement schema as and when required. The
higher data bandwidth significantly minimizes data latency. However, unlike satellite
telemetry, uniform and all-weather network availability cannot be guaranteed with mobile
telemetry. In order to take advantage of best of both systems IMD has recently inducted data
loggers supporting dual telemetry systems in the network. Systems supporting dual
telemetry are in general not cost effective, hence recently only mobile telemetry systems
have been procured and installation is in progress. The AWS and ARG stations with satellite
telemetry transmit data at an interval of 1 hour to the central data receiving Earth Station
whereas all mobile telemetry-based stations have been configured to transmit data at an
interval of 15 min.
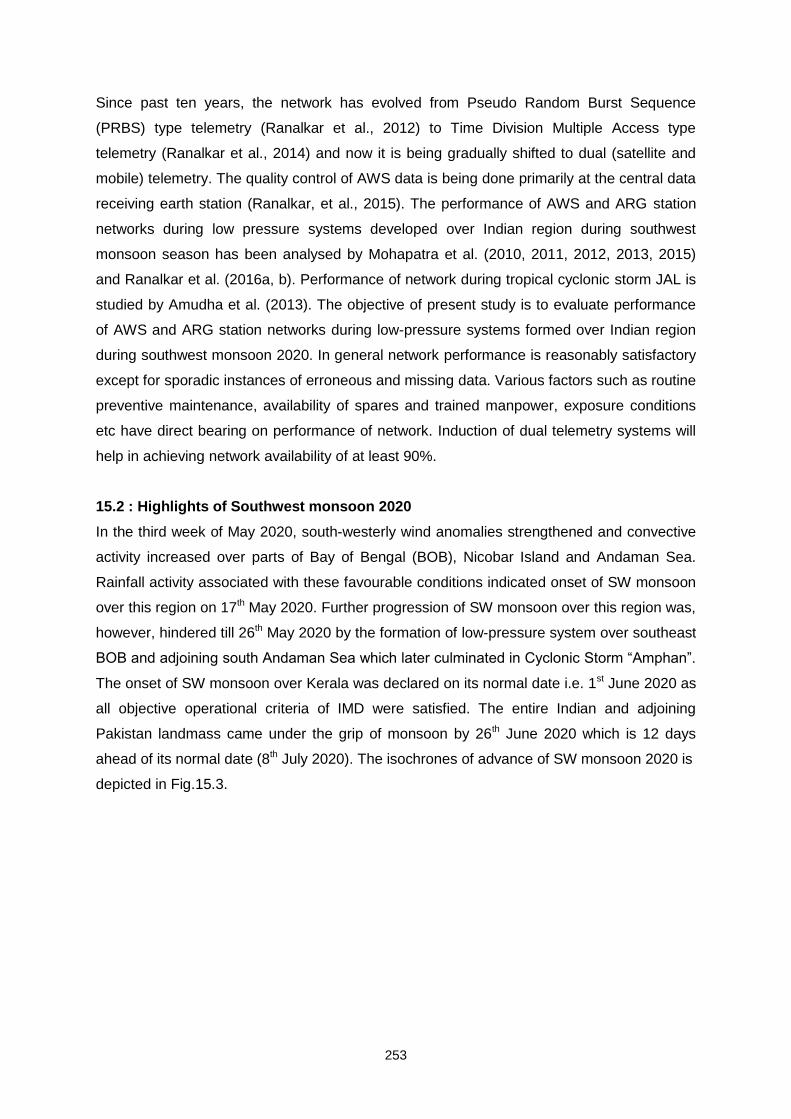
253
Since past ten years, the network has evolved from Pseudo Random Burst Sequence
(PRBS) type telemetry (Ranalkar et al., 2012) to Time Division Multiple Access type
telemetry (Ranalkar et al., 2014) and now it is being gradually shifted to dual (satellite and
mobile) telemetry. The quality control of AWS data is being done primarily at the central data
receiving earth station (Ranalkar, et al., 2015). The performance of AWS and ARG station
networks during low pressure systems developed over Indian region during southwest
monsoon season has been analysed by Mohapatra et al. (2010, 2011, 2012, 2013, 2015)
and Ranalkar et al. (2016a, b). Performance of network during tropical cyclonic storm JAL is
studied by Amudha et al. (2013). The objective of present study is to evaluate performance
of AWS and ARG station networks during low-pressure systems formed over Indian region
during southwest monsoon 2020. In general network performance is reasonably satisfactory
except for sporadic instances of erroneous and missing data. Various factors such as routine
preventive maintenance, availability of spares and trained manpower, exposure conditions
etc have direct bearing on performance of network. Induction of dual telemetry systems will
help in achieving network availability of at least 90%.
15.2 : Highlights of Southwest monsoon 2020
In the third week of May 2020, south-westerly wind anomalies strengthened and convective
activity increased over parts of Bay of Bengal (BOB), Nicobar Island and Andaman Sea.
Rainfall activity associated with these favourable conditions indicated onset of SW monsoon
over this region on 17th May 2020. Further progression of SW monsoon over this region was,
however, hindered till 26th May 2020 by the formation of low-pressure system over southeast
BOB and adjoining south Andaman Sea which later culminated in Cyclonic Storm “Amphan”.
The onset of SW monsoon over Kerala was declared on its normal date i.e. 1st June 2020 as
all objective operational criteria of IMD were satisfied. The entire Indian and adjoining
Pakistan landmass came under the grip of monsoon by 26th June 2020 which is 12 days
ahead of its normal date (8th July 2020). The isochrones of advance of SW monsoon 2020 is
depicted in Fig.15.3.
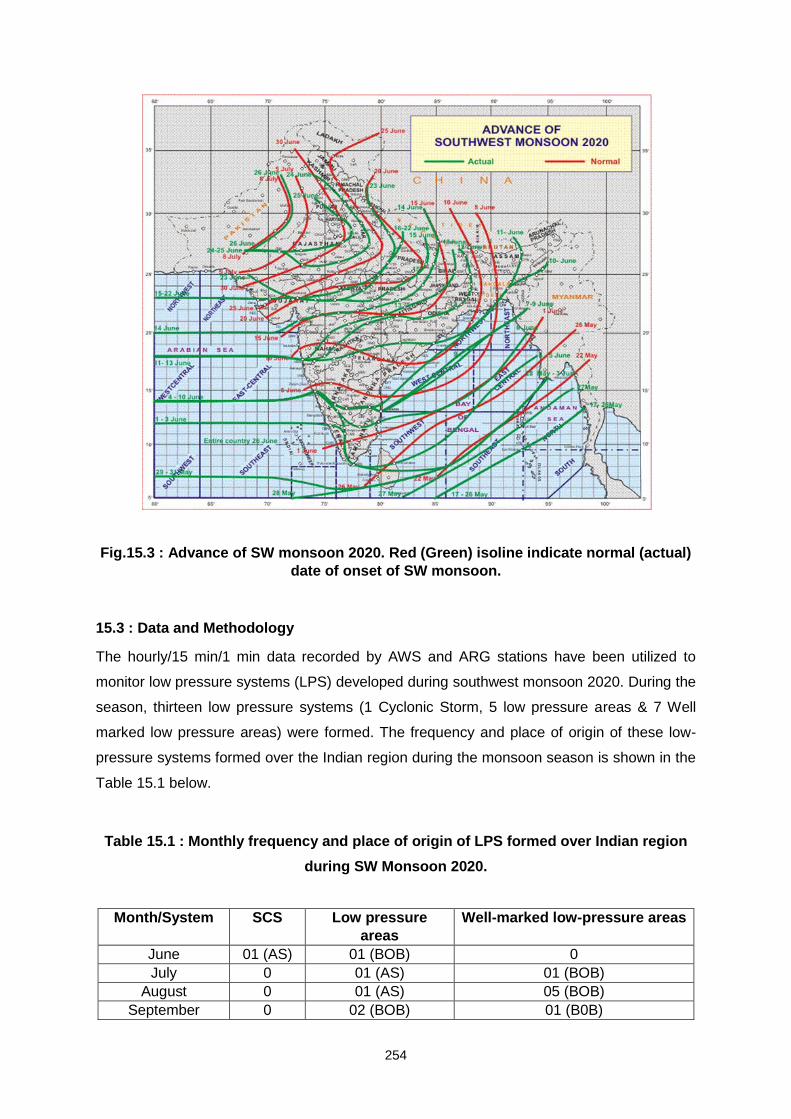
254
Fig.15.3 : Advance of SW monsoon 2020. Red (Green) isoline indicate normal (actual)
date of onset of SW monsoon.
15.3 : Data and Methodology
The hourly/15 min/1 min data recorded by AWS and ARG stations have been utilized to
monitor low pressure systems (LPS) developed during southwest monsoon 2020. During the
season, thirteen low pressure systems (1 Cyclonic Storm, 5 low pressure areas & 7 Well
marked low pressure areas) were formed. The frequency and place of origin of these low-
pressure systems formed over the Indian region during the monsoon season is shown in the
Table 15.1 below.
Table 15.1 : Monthly frequency and place of origin of LPS formed over Indian region
during SW Monsoon 2020.
Month/System SCS Low pressure
areas
Well-marked low-pressure areas
June 01 (AS) 01 (BOB) 0
July 0 01 (AS) 01 (BOB)
August 0 01 (AS) 05 (BOB)
September 0 02 (BOB) 01 (B0B)
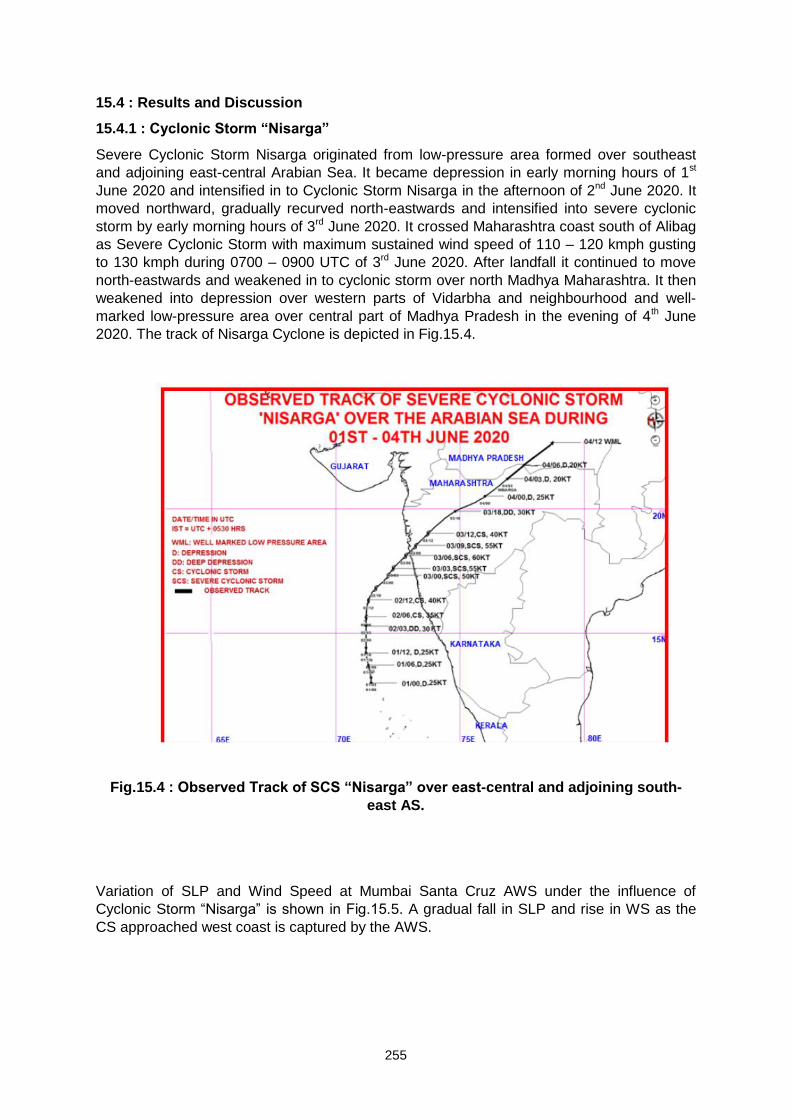
255
15.4 : Results and Discussion
15.4.1 : Cyclonic Storm “Nisarga”
Severe Cyclonic Storm Nisarga originated from low-pressure area formed over southeast
and adjoining east-central Arabian Sea. It became depression in early morning hours of 1st
June 2020 and intensified in to Cyclonic Storm Nisarga in the afternoon of 2nd June 2020. It
moved northward, gradually recurved north-eastwards and intensified into severe cyclonic
storm by early morning hours of 3rd June 2020. It crossed Maharashtra coast south of Alibag
as Severe Cyclonic Storm with maximum sustained wind speed of 110 – 120 kmph gusting
to 130 kmph during 0700 – 0900 UTC of 3rd June 2020. After landfall it continued to move
north-eastwards and weakened in to cyclonic storm over north Madhya Maharashtra. It then
weakened into depression over western parts of Vidarbha and neighbourhood and well-
marked low-pressure area over central part of Madhya Pradesh in the evening of 4th June
2020. The track of Nisarga Cyclone is depicted in Fig.15.4.
Fig.15.4 : Observed Track of SCS “Nisarga” over east-central and adjoining south-
east AS.
Variation of SLP and Wind Speed at Mumbai Santa Cruz AWS under the influence of
Cyclonic Storm “Nisarga” is shown in Fig.15.5. A gradual fall in SLP and rise in WS as the
CS approached west coast is captured by the AWS.
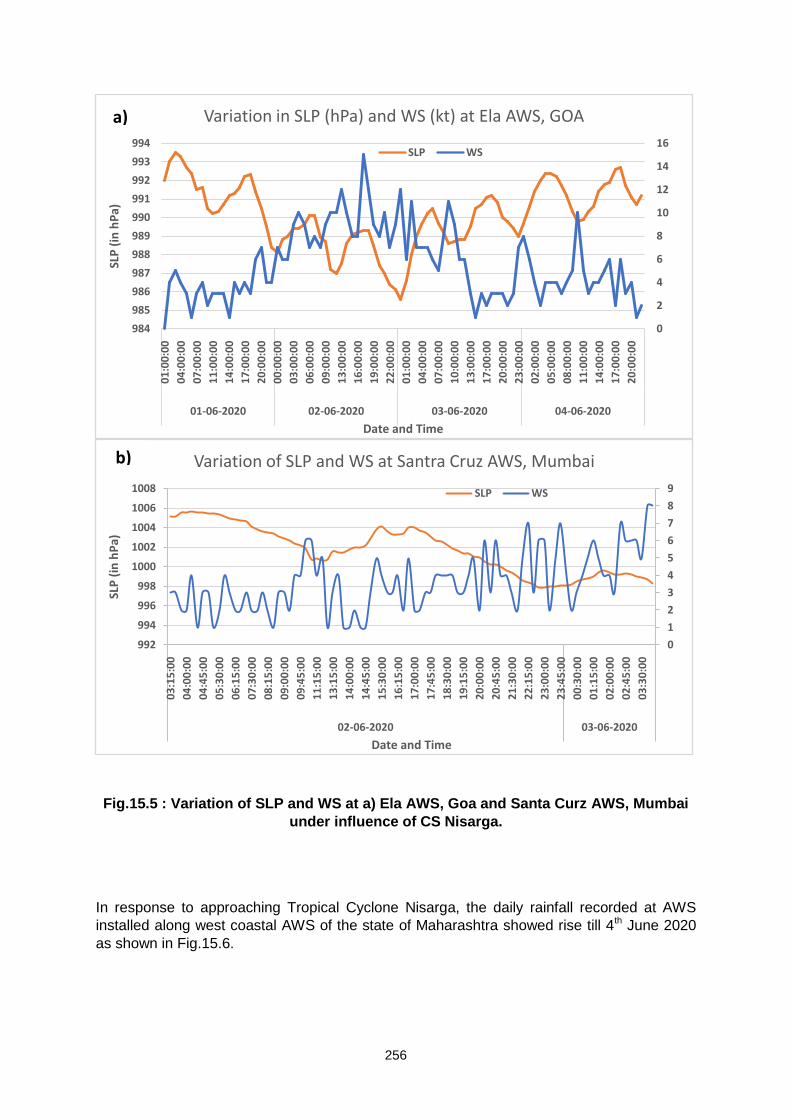
256
Fig.15.5 : Variation of SLP and WS at a) Ela AWS, Goa and Santa Curz AWS, Mumbai
under influence of CS Nisarga.
In response to approaching Tropical Cyclone Nisarga, the daily rainfall recorded at AWS
installed along west coastal AWS of the state of Maharashtra showed rise till 4th June 2020
as shown in Fig.15.6.
0
2
4
6
8
10
12
14
16
984
985
986
987
988
989
990
991
992
993
994
01
:00
:00
04
:00
:00
07
:00
:00
11
:00
:00
14
:00
:00
17
:00
:00
20
:00
:00
00
:00
:00
03
:00
:00
06
:00
:00
09
:00
:00
13
:00
:00
16
:00
:00
19
:00
:00
22
:00
:00
01
:00
:00
04
:00
:00
07
:00
:00
10
:00
:00
13
:00
:00
17
:00
:00
20
:00
:00
23
:00
:00
02
:00
:00
05
:00
:00
08
:00
:00
11
:00
:00
14
:00
:00
17
:00
:00
20
:00
:00
01-06-2020 02-06-2020 03-06-2020 04-06-2020
SLP
(in
hP
a)
Date and Time
Variation in SLP (hPa) and WS (kt) at Ela AWS, GOA
SLP WS
0
1
2
3
4
5
6
7
8
9
992
994
996
998
1000
1002
1004
1006
1008
03
:15
:00
04
:00
:00
04
:45
:00
05
:30
:00
06
:15
:00
07
:30
:00
08
:15
:00
09
:00
:00
09
:45
:00
11
:15
:00
13
:15
:00
14
:00
:00
14
:45
:00
15
:30
:00
16
:15
:00
17
:00
:00
17
:45
:00
18
:30
:00
19
:15
:00
20
:00
:00
20
:45
:00
21
:30
:00
22
:15
:00
23
:00
:00
23
:45
:00
00
:30
:00
01
:15
:00
02
:00
:00
02
:45
:00
03
:30
:00
02-06-2020 03-06-2020
SLP
(in
hP
a)
Date and Time
Variation of SLP and WS at Santra Cruz AWS, Mumbai
SLP WS
a)
b)
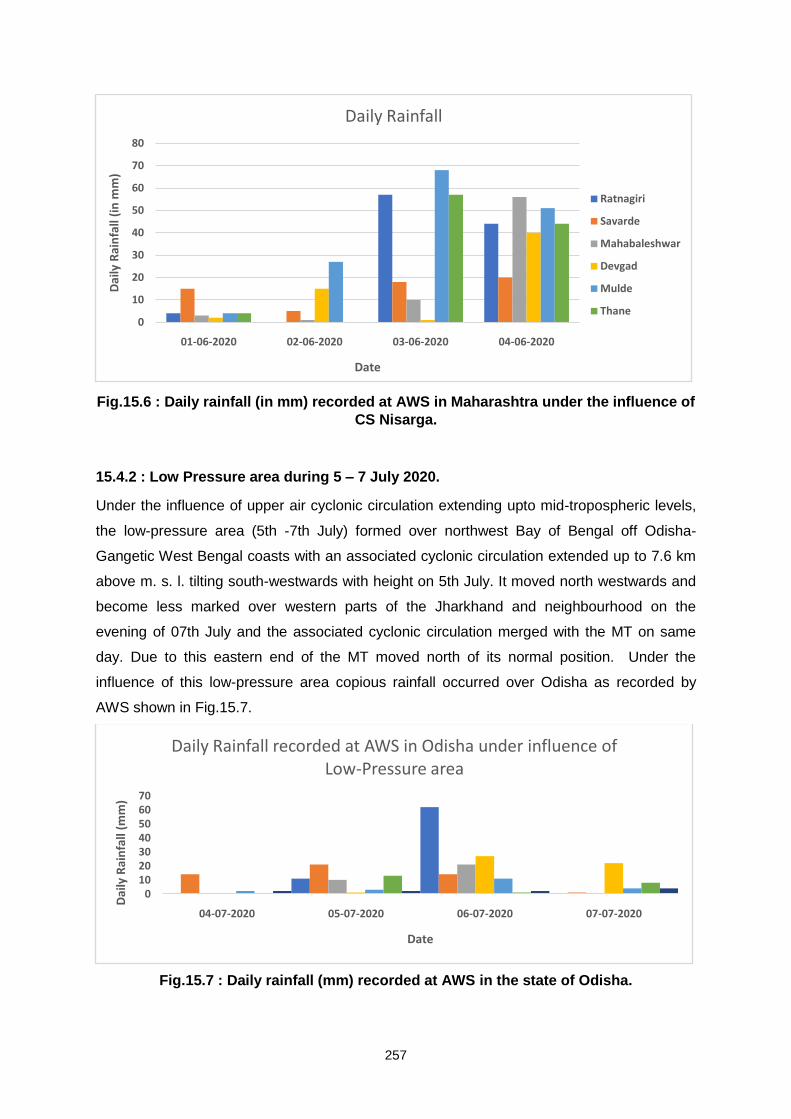
257
Fig.15.6 : Daily rainfall (in mm) recorded at AWS in Maharashtra under the influence of
CS Nisarga.
15.4.2 : Low Pressure area during 5 – 7 July 2020.
Under the influence of upper air cyclonic circulation extending upto mid-tropospheric levels,
the low-pressure area (5th -7th July) formed over northwest Bay of Bengal off Odisha-
Gangetic West Bengal coasts with an associated cyclonic circulation extended up to 7.6 km
above m. s. l. tilting south-westwards with height on 5th July. It moved north westwards and
become less marked over western parts of the Jharkhand and neighbourhood on the
evening of 07th July and the associated cyclonic circulation merged with the MT on same
day. Due to this eastern end of the MT moved north of its normal position. Under the
influence of this low-pressure area copious rainfall occurred over Odisha as recorded by
AWS shown in Fig.15.7.
Fig.15.7 : Daily rainfall (mm) recorded at AWS in the state of Odisha.
0
10
20
30
40
50
60
70
80
01-06-2020 02-06-2020 03-06-2020 04-06-2020
Dai
ly R
ain
fall
(in
mm
)
Date
Daily Rainfall
Ratnagiri
Savarde
Mahabaleshwar
Devgad
Mulde
Thane
010203040506070
04-07-2020 05-07-2020 06-07-2020 07-07-2020
Dai
ly R
ain
fall
(mm
)
Date
Daily Rainfall recorded at AWS in Odisha under influence of Low-Pressure area
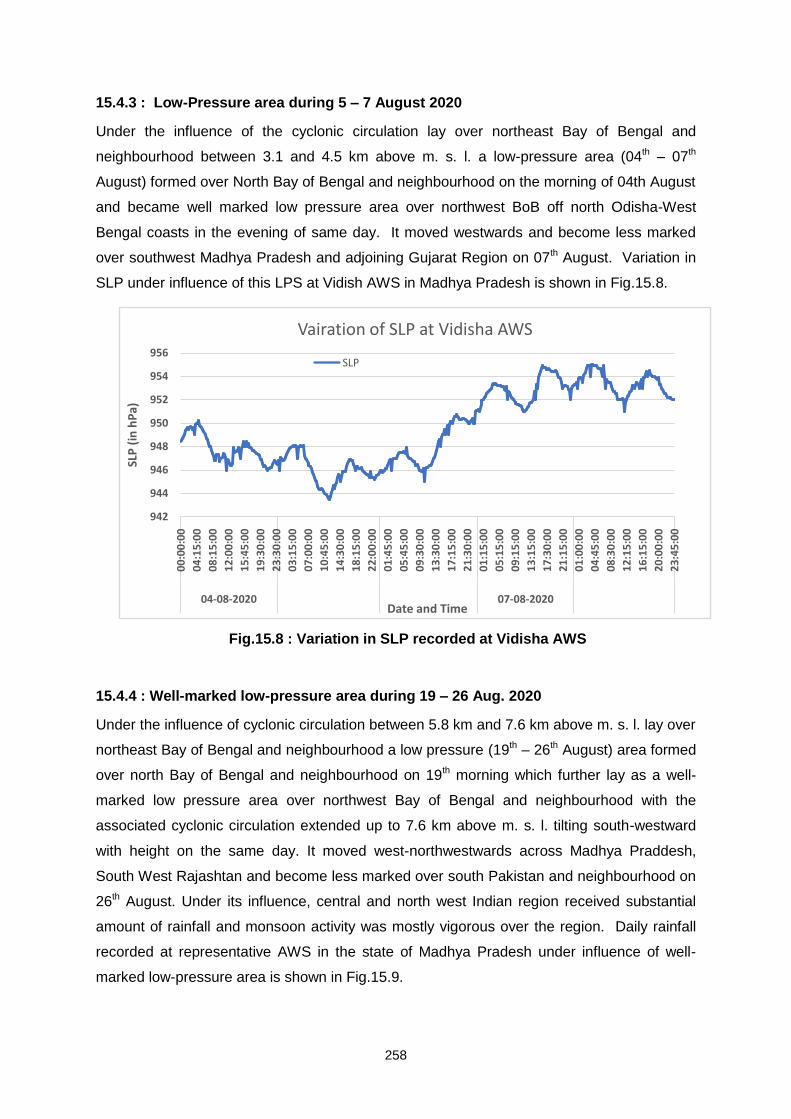
258
15.4.3 : Low-Pressure area during 5 – 7 August 2020
Under the influence of the cyclonic circulation lay over northeast Bay of Bengal and
neighbourhood between 3.1 and 4.5 km above m. s. l. a low-pressure area (04th – 07th
August) formed over North Bay of Bengal and neighbourhood on the morning of 04th August
and became well marked low pressure area over northwest BoB off north Odisha-West
Bengal coasts in the evening of same day. It moved westwards and become less marked
over southwest Madhya Pradesh and adjoining Gujarat Region on 07th August. Variation in
SLP under influence of this LPS at Vidish AWS in Madhya Pradesh is shown in Fig.15.8.
Fig.15.8 : Variation in SLP recorded at Vidisha AWS
15.4.4 : Well-marked low-pressure area during 19 – 26 Aug. 2020
Under the influence of cyclonic circulation between 5.8 km and 7.6 km above m. s. l. lay over
northeast Bay of Bengal and neighbourhood a low pressure (19th – 26th August) area formed
over north Bay of Bengal and neighbourhood on 19th morning which further lay as a well-
marked low pressure area over northwest Bay of Bengal and neighbourhood with the
associated cyclonic circulation extended up to 7.6 km above m. s. l. tilting south-westward
with height on the same day. It moved west-northwestwards across Madhya Praddesh,
South West Rajashtan and become less marked over south Pakistan and neighbourhood on
26th August. Under its influence, central and north west Indian region received substantial
amount of rainfall and monsoon activity was mostly vigorous over the region. Daily rainfall
recorded at representative AWS in the state of Madhya Pradesh under influence of well-
marked low-pressure area is shown in Fig.15.9.
942
944
946
948
950
952
954
956
00
:00
:00
04
:15
:00
08
:15
:00
12
:00
:00
15
:45
:00
19
:30
:00
23
:30
:00
03
:15
:00
07
:00
:00
10
:45
:00
14
:30
:00
18
:15
:00
22
:00
:00
01
:45
:00
05
:45
:00
09
:30
:00
13
:30
:00
17
:15
:00
21
:30
:00
01
:15
:00
05
:15
:00
09
:15
:00
13
:15
:00
17
:30
:00
21
:15
:00
01
:00
:00
04
:45
:00
08
:30
:00
12
:15
:00
16
:15
:00
20
:00
:00
23
:45
:00
04-08-2020 07-08-2020
SLP
(in
hP
a)
Date and Time
Vairation of SLP at Vidisha AWS
SLP
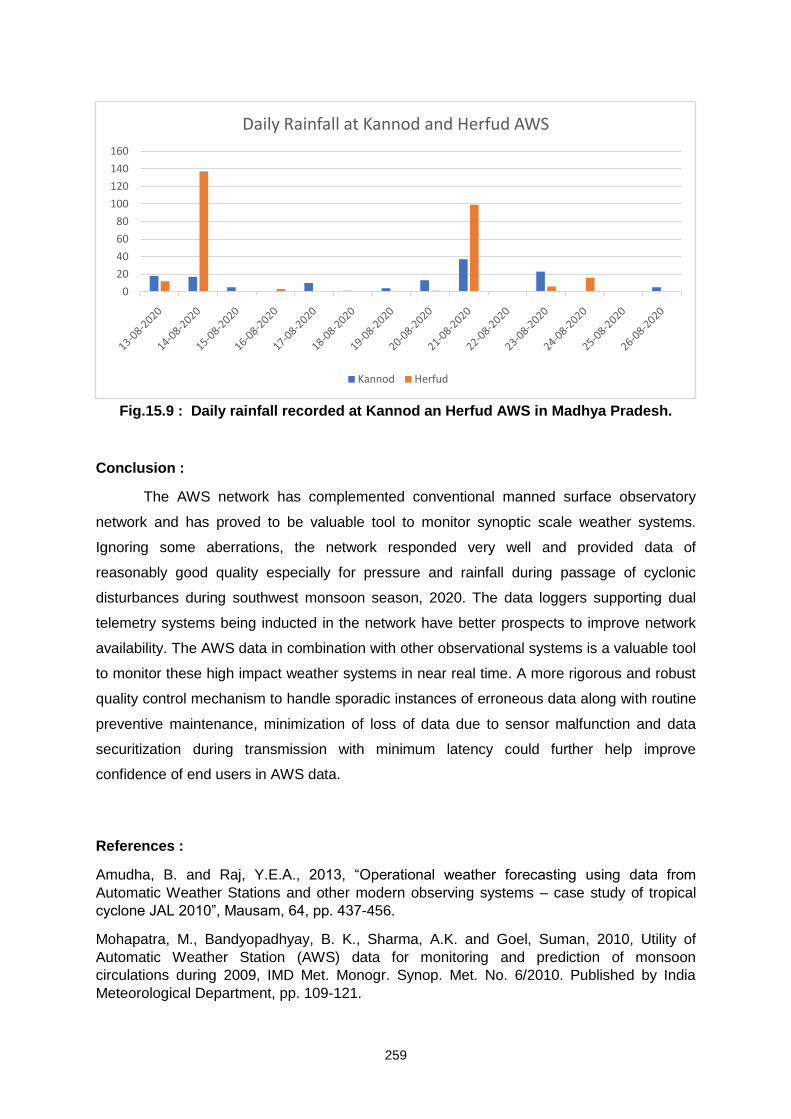
259
Fig.15.9 : Daily rainfall recorded at Kannod an Herfud AWS in Madhya Pradesh.
Conclusion :
The AWS network has complemented conventional manned surface observatory
network and has proved to be valuable tool to monitor synoptic scale weather systems.
Ignoring some aberrations, the network responded very well and provided data of
reasonably good quality especially for pressure and rainfall during passage of cyclonic
disturbances during southwest monsoon season, 2020. The data loggers supporting dual
telemetry systems being inducted in the network have better prospects to improve network
availability. The AWS data in combination with other observational systems is a valuable tool
to monitor these high impact weather systems in near real time. A more rigorous and robust
quality control mechanism to handle sporadic instances of erroneous data along with routine
preventive maintenance, minimization of loss of data due to sensor malfunction and data
securitization during transmission with minimum latency could further help improve
confidence of end users in AWS data.
References :
Amudha, B. and Raj, Y.E.A., 2013, “Operational weather forecasting using data from
Automatic Weather Stations and other modern observing systems – case study of tropical
cyclone JAL 2010”, Mausam, 64, pp. 437-456.
Mohapatra, M., Bandyopadhyay, B. K., Sharma, A.K. and Goel, Suman, 2010, Utility of
Automatic Weather Station (AWS) data for monitoring and prediction of monsoon
circulations during 2009, IMD Met. Monogr. Synop. Met. No. 6/2010. Published by India
Meteorological Department, pp. 109-121.
0
20
40
60
80
100
120
140
160
Daily Rainfall at Kannod and Herfud AWS
Kannod Herfud
260
Mohapatra, M, Naresh Kumar and Manish Ranalkar, 2011, Utility of Automatic Weather
Station (AWS) data for monitoring and prediction of cyclonic disturbances during 2010, IMD
Met. Monogr. Synop. Met. No. 10/2011.Published by India Meteorological Department, pp.
189-203.
Mohapatra, M, Naresh Kumar and Manish Ranalkar, 2012, Utility of Automatic Weather
Station (AWS) data for monitoring and prediction of cyclonic disturbances during 2011, IMD
Met. Monogr. Synop.Met. No. 01/2012. Published by India Meteorological Department, pp.
161-172.
Mohapatra, M, and Manish Ranalkar, 2014, Analysis of automatic weather station data for
monitoring and prediction of cyclonic disturbances, IMD Met. Monograph, Synoptic
Meteorology No.: ESSO/IMD/SYNOPTIC MET/01-2014/15, pp. 170 183.
Mohapatra, M., Ranalkar, M.R. Sunitha Devi, S., 2015, Validation of Automatic Weather
Station (AWS) data for monitoring and prediction of low pressure systems during monsoon
season, IMD Met. Monograph, ESSO Document No.: ESSO/IMD/ Synoptic Met./
01(2015)/17, pp. 171-188.
Ranalkar, M.R., Mali, R.R., Mohapatra, M., 2016a, Validation of Automatic Weather Station
(AWS) data for monitoring and prediction of low pressure systems during monsoon season,
IMD Met. Monograph, ESSO Document No.: ESSO / IMD / SYNOPTIC MET / 01(2016) / 20,
pp. 234-243.
Ranalkar, M.R., Charan Singh, 2017, Validation of Automatic Weather Station (AWS) Data
for Monitoring and prediction ofthe Low-Pressure Systems during the Monsoon Season
2017, IMD Met. Monograph, ESSO Document No.: ESSO / IMD / SYNOPTIC MET.
Ranalkar, M.R., Chaudhari, H.S., Hazra, A., Sawaisarje, G.K. and Pokhrel, S., 2016b,
“Dynamical features of incessant heavy rainfall event of June 2013 over Uttarakhand, India”,
Nat. Hazards, 80, pp. 1579 – 1601, 10.1007/s11069-015-2040-z.
Earth System Science Organization (ESSO), 2015 Southwest Monsoon End of Season
Report.
Ranalkar, M.R., Mishra, R. P., Anjan, A. and Krishnaiah, S., 2012, “Network of Automatic
Weather Stations: Pseudo Random Burst Sequence Type”, Mausam, 63, 4, 587-606.
Ranalkar, M.R., Gupta, M. K., Mishra, R.P., Anjan, A. and Krishnaiah, S., 2014, “Network of
Automatic Weather Stations: Time Division Multiple Access Type”, Mausam, 65, 3, 393 406.
Ranalkar, M.R., Anjan, A., Mishra, R.P., Mali, R.R. and Krishnaiah, S., 2015, “Development
of operational near real time network monitoring and quality control system for
implementation at AWS data receiving Earth Station.
World Meteorological Organisation, 2010, Commission for Instruments and Methods of
Observation (CIMO) Guide No.8, 7th Edition, 2010.
261
16
VERIFICATION OF HEAVY RAINFALL WARNINGS
K.Sathi Devi and Naresh Kumar
IMD, New Delhi
The results of verification of the various Heavy Rainfall warnings issued by IMD, for
various regions of India during South west Monsoon Season 2020, are discussed in the
Chapter.
16.1 : Introduction
Southwest Monsoon season is the major rainfall season for the country. This season
consists of four months from June to September. Even though the normal date of monsoon
onset over Kerala is 1st June, it takes more than one month for the monsoon to cover the
entire country. Monsoon starts withdrawing from northwest India by the middle of September
and it withdraw from the entire country by the middle of October in general. Thus, the
duration monsoon over different parts of the country is different however the rainfall
occurring from 1st June to 30th September is considered as the monsoon seasonal rainfall for
preparation of rainfall statistics and for verification of forecast etc.
During monsoon season, under the influence of synoptic systems, different parts of
the country experience heavy to very heavy and extremely heavy rainfall activities leading to
floods, damage to crops, landslides etc. thus causing severe impacts to public life and
property.
India Meteorological Department issues forecast and warnings with colour code for
the spatial distribution and intensity of rainfall expected for the next five days to the users
including disaster management authorities at the Central and State levels. From National
Weather Forecasting Centre (NWFC), these warnings are issued in the sub divisional scale
whereas from the Regional and State Meteorological Centres the forecasts and warnings are
issued in the district scale.
In order to improve the quality of the forecast and warnings, it is necessary to verify
the warnings issued with the observed weather. India Meteorological Department verifies all
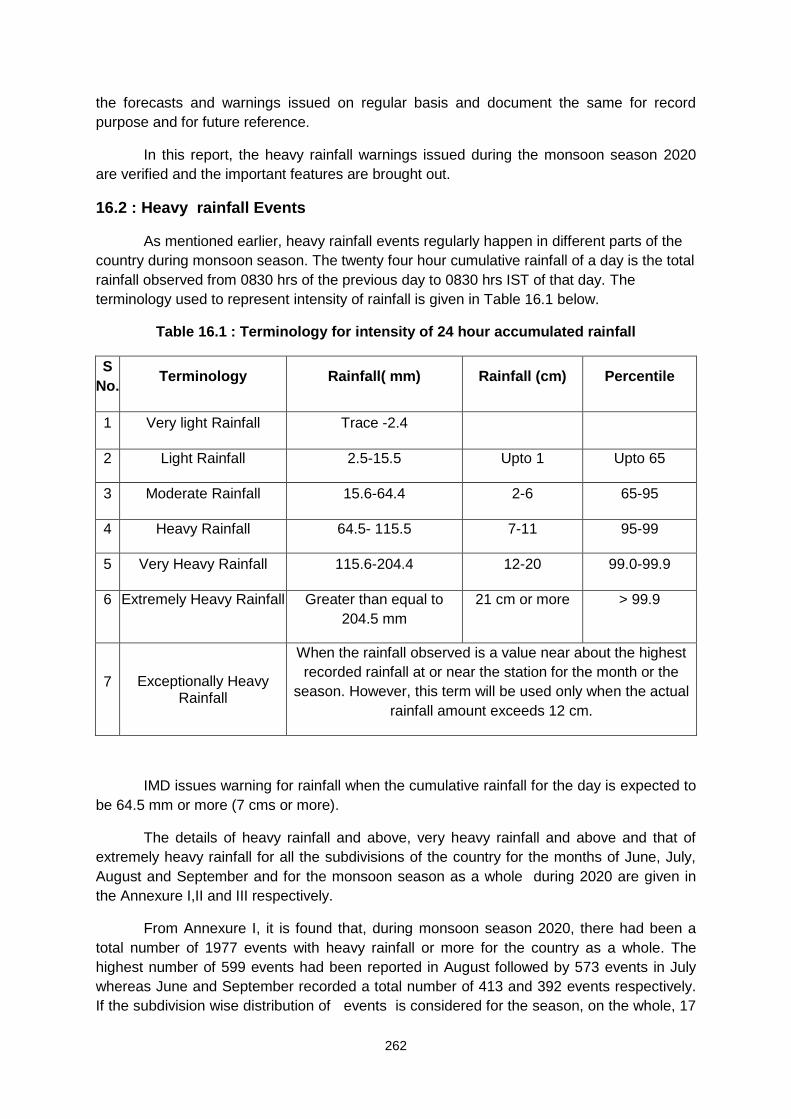
262
the forecasts and warnings issued on regular basis and document the same for record
purpose and for future reference.
In this report, the heavy rainfall warnings issued during the monsoon season 2020
are verified and the important features are brought out.
16.2 : Heavy rainfall Events
As mentioned earlier, heavy rainfall events regularly happen in different parts of the
country during monsoon season. The twenty four hour cumulative rainfall of a day is the total
rainfall observed from 0830 hrs of the previous day to 0830 hrs IST of that day. The
terminology used to represent intensity of rainfall is given in Table 16.1 below.
Table 16.1 : Terminology for intensity of 24 hour accumulated rainfall
S
No. Terminology Rainfall( mm) Rainfall (cm) Percentile
1 Very light Rainfall Trace -2.4
2 Light Rainfall 2.5-15.5 Upto 1 Upto 65
3 Moderate Rainfall 15.6-64.4 2-6 65-95
4 Heavy Rainfall 64.5- 115.5 7-11 95-99
5 Very Heavy Rainfall 115.6-204.4 12-20 99.0-99.9
6 Extremely Heavy Rainfall Greater than equal to
204.5 mm
21 cm or more > 99.9
7 Exceptionally Heavy Rainfall
When the rainfall observed is a value near about the highest
recorded rainfall at or near the station for the month or the
season. However, this term will be used only when the actual
rainfall amount exceeds 12 cm.
IMD issues warning for rainfall when the cumulative rainfall for the day is expected to
be 64.5 mm or more (7 cms or more).
The details of heavy rainfall and above, very heavy rainfall and above and that of
extremely heavy rainfall for all the subdivisions of the country for the months of June, July,
August and September and for the monsoon season as a whole during 2020 are given in
the Annexure I,II and III respectively.
From Annexure I, it is found that, during monsoon season 2020, there had been a
total number of 1977 events with heavy rainfall or more for the country as a whole. The
highest number of 599 events had been reported in August followed by 573 events in July
whereas June and September recorded a total number of 413 and 392 events respectively.
If the subdivision wise distribution of events is considered for the season, on the whole, 17
263
subdivisions recorded 60 or more events of heavy rainfall or more. The highest number of
103 events is reported from Assam & Meghalaya followed by Sub Himalayan West Bengal &
Sikkim with 90 events and Konkan & Goa with 88 events .The lowest number of 8 events
had been reported from Lakshadweep followed by 14 from Jammu Kashmir & Ladakh.
In the month of June, Assam & Meghalaya and Sub Himalayan West Bengal &
Sikkim with 26 events each reported the maximum number of events followed by Odisha
with 23 events whereas Jammu Kashmir & Ladakh reported NIL events and Lakshadweep
recorded only one event.
In the month of July, Assam & Meghalaya recorded a total number of 28 events
followed by Konkan & Goa with 27 events whereas Sub Himalayan West Bengal & Sikkim
and Bihar recorded 26 events each. The lowest number of 2 events had been recorded by
Lakshadweep during the month followed by 4 events reported from Jammu & Kashmir.
In the month of August, the highest number of 27 events is reported from Gujarat
Region followed by Assam & Meghalaya and Coastal Karnataka with 26 events each. In this
month also Lakshadweep recorded the lowest number of 2 events followed by Marathwada
with 3 events.
In the month of September, the maximum number of 23 events had been reported
from Assam & Meghalya followed by 20 events from Sub Himalayan West Bengal & Sikkim
and 19 events reported each from Tamil Nadu, Puducherry & Karaikkal and Bihar.
Details of rainfall events with the intensity of very heavy and above are given in
Annexure II. There had been a total number of 734 such events during the season for the
country as a whole. The maximum number of 264 events was reported in the month of
August followed by 196 events in July and 138 and 136 events respectively in September
and June. It is found that Assam & Meghalaya, Sub Himalayan West Bengal & Sikkim,
Orissa, Bihar, Konkan & Goa and Coastal Karnataka reported 30 or more number of such
events during the season. For the season as a whole, the highest number of 62 events was
reported from Assam & Meghalaya followed by 52 events from Konkan & Goa and 48 events
from Sub Himalayan West Bengal & Sikkim. The lowest number of 1 event was reported
from Lakshadweep followed by 4 events each from Jammu Kashmir and Ladakh and
Marathwada.
In the month of June, maximum number of 16 events was reported from Assam &
Meghalaya followed by 13 from Konkan & Goa and 12 from Sub Himalyan West Bengal &
Sikkim whereas, Haryana, Chandigarh & Delhi, Himachal Pradesh, Jammu Kashmir &
Ladakh, East & West Rajasthan and Lakshadweep reported NIL events.
In the month of July, Assam & Meghalaya recorded the highest number of 21 events
followed by Konkan & Goa with 17 events and Bihar with 16 events. Andaman & Nicobar,
Jharkhand and Marathwada reported NIL events during the month.
In the month of August, Gujarat Region recorded the maximum number of 18 events
followed by Konkan & Goa with 15 and Odisha with 14 events whereas Marathwada and
Lakshadweep reported NIL events.
264
In the month of September, the maximum number of 14 events was reported from
Assam & Meghalaya followed by 13 and 11 events respectively from Sub Himalayan West
Bengal & Sikkim and Bihar whereas West Uttar Pradesh, Haryana, Chandigarh & Delhi,
Punjab, Jammu Kashmir & Ladakh, East Madhaya Pradesh, Vidarbha and Lakshadweep
reported NIL events during the month.
Annexure III gives the details of extremely heavy rainfall events during monsoon
season 2020. There had been a total number of 157 such events during the season. If the
monthly frequency is considered, maximum number of the events occurred in August with 67
events followed by 38 and 32 events in July and September respectively whereas June
recorded a total number of 20 extremely heavy rainfall events. During the season, Assam &
Meghalaya reported the maximum number of 31 events followed by Sub Himalayan West
Bengal & Sikkim with 20 events. Eleven sub divisions viz. Andaman & Nicobar Islands ,
Gangetic West Bengal, Jharkhand, Haryana, Chandigarh & Delhi, Punjab, Jammu Kashmir
& Ladakh, Marathwada, Coastal Andhra Pradesh & Yanam, Rayalaseema, North Interior
Karnataka and Lakshadweep had not reported any extremely heavy rainfall during the
season.
Assam & Meghalaya recorded the maximum number of 13 events in the month of
July followed by 8 events each in June and September. Sub Himalayan West Bengal &
Sikkim recorded a maximum number of 9 events in the month of July followed by 5 events
each in June and Septemeber. Odisha and South interior Karnataka recorded 6 events each
in August. Even though Assam & Meghalaya recorded the maximum number of extremely
heavy rainfall events during the season, it recorded only 2 such events in the month of
August whereas the subdivisions along the central parts of the country and adjoining areas
recorded maximum number of events in August.
16.3 : Verification of Forecast
IMD issues forecast and warnings for five days. From NWFC these forecasts and
warnings are given for the country as a whole for 36 subdivisions. Even though these
forecasts are updated four times a day, verification presented here is for the main forecast
issued in the noon based upon the observations of 00 and 03 UTC.
Forecasts issued for Day 1 (D1) cover the weather expected during 24 hrs period,
Day 2 (D2) for the period between 24 to 48 hours, Day 3 (D3) for the period between 48 to
72 hours, Day 4 (D4) for the period between 72 to 96 hours and Day 5 (D5) for the period
between 96 to 120 hours.
Meteorological day is considered from 0830 hrs IST of any day concerned to 0830
hrs IST of the next day.
Four verification indices viz. Probability of Detection (POD), Critical Success Index
(CSI), False Alarm Rate (FAR) and Missing Rate (MR) are considered for the verification of
the heavy rainfall warnings issued during the monsoon season 2020.
In order to define these indices, four possibilities of the forecasted and observed
weather need to be considered.
If the heavy rainfall warning is issued and it is realised it corresponds to Hits (A)
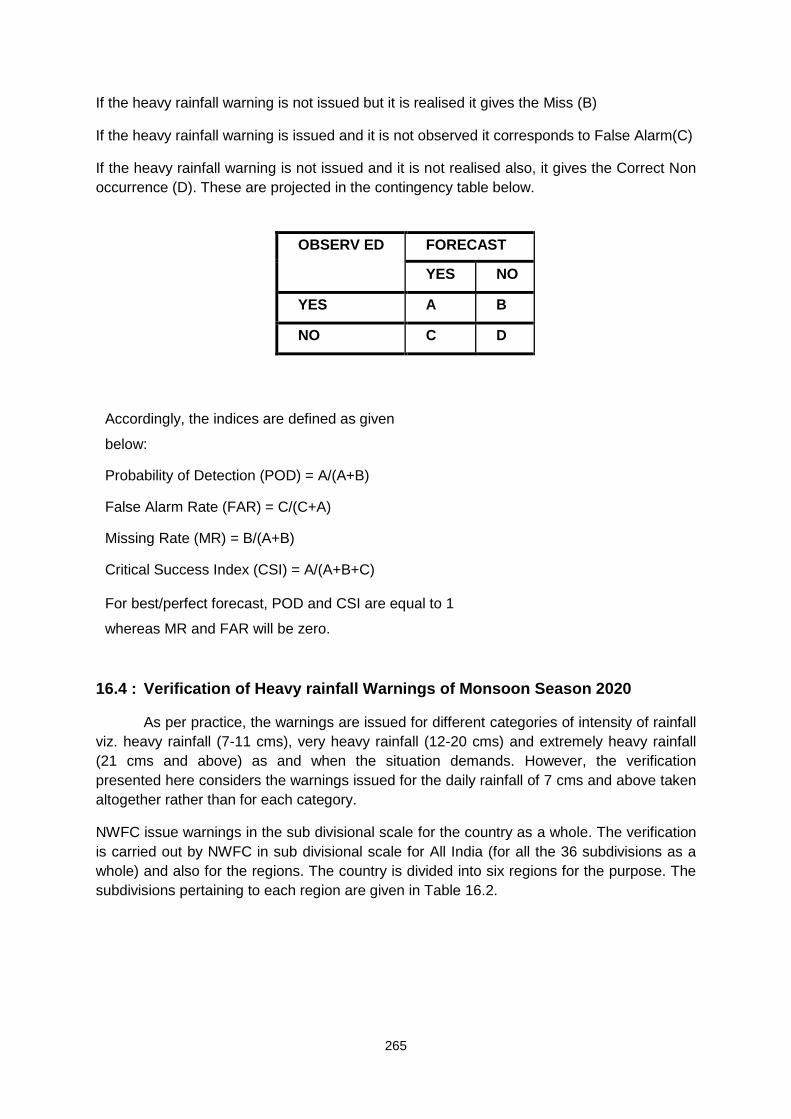
265
If the heavy rainfall warning is not issued but it is realised it gives the Miss (B)
If the heavy rainfall warning is issued and it is not observed it corresponds to False Alarm(C)
If the heavy rainfall warning is not issued and it is not realised also, it gives the Correct Non
occurrence (D). These are projected in the contingency table below.
OBSERV ED FORECAST
YES NO
YES A B
NO C D
Accordingly, the indices are defined as given
below:
Probability of Detection (POD) = A/(A+B)
False Alarm Rate (FAR) = C/(C+A)
Missing Rate (MR) = B/(A+B)
Critical Success Index (CSI) = A/(A+B+C)
For best/perfect forecast, POD and CSI are equal to 1
whereas MR and FAR will be zero.
16.4 : Verification of Heavy rainfall Warnings of Monsoon Season 2020
As per practice, the warnings are issued for different categories of intensity of rainfall
viz. heavy rainfall (7-11 cms), very heavy rainfall (12-20 cms) and extremely heavy rainfall
(21 cms and above) as and when the situation demands. However, the verification
presented here considers the warnings issued for the daily rainfall of 7 cms and above taken
altogether rather than for each category.
NWFC issue warnings in the sub divisional scale for the country as a whole. The verification
is carried out by NWFC in sub divisional scale for All India (for all the 36 subdivisions as a
whole) and also for the regions. The country is divided into six regions for the purpose. The
subdivisions pertaining to each region are given in Table 16.2.
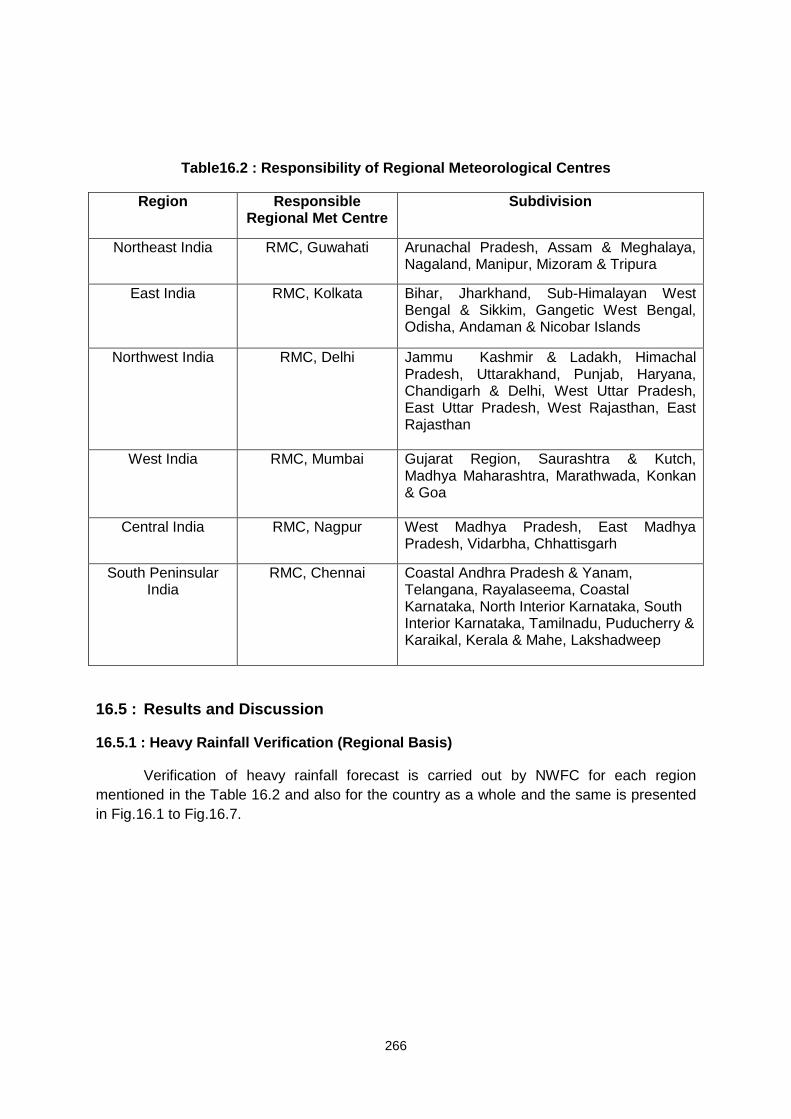
266
Table16.2 : Responsibility of Regional Meteorological Centres
Region Responsible Regional Met Centre
Subdivision
Northeast India RMC, Guwahati Arunachal Pradesh, Assam & Meghalaya, Nagaland, Manipur, Mizoram & Tripura
East India RMC, Kolkata Bihar, Jharkhand, Sub-Himalayan West Bengal & Sikkim, Gangetic West Bengal, Odisha, Andaman & Nicobar Islands
Northwest India RMC, Delhi Jammu Kashmir & Ladakh, Himachal Pradesh, Uttarakhand, Punjab, Haryana, Chandigarh & Delhi, West Uttar Pradesh, East Uttar Pradesh, West Rajasthan, East Rajasthan
West India RMC, Mumbai Gujarat Region, Saurashtra & Kutch, Madhya Maharashtra, Marathwada, Konkan & Goa
Central India RMC, Nagpur West Madhya Pradesh, East Madhya Pradesh, Vidarbha, Chhattisgarh
South Peninsular India
RMC, Chennai Coastal Andhra Pradesh & Yanam, Telangana, Rayalaseema, Coastal Karnataka, North Interior Karnataka, South Interior Karnataka, Tamilnadu, Puducherry & Karaikal, Kerala & Mahe, Lakshadweep
16.5 : Results and Discussion
16.5.1 : Heavy Rainfall Verification (Regional Basis)
Verification of heavy rainfall forecast is carried out by NWFC for each region
mentioned in the Table 16.2 and also for the country as a whole and the same is presented
in Fig.16.1 to Fig.16.7.
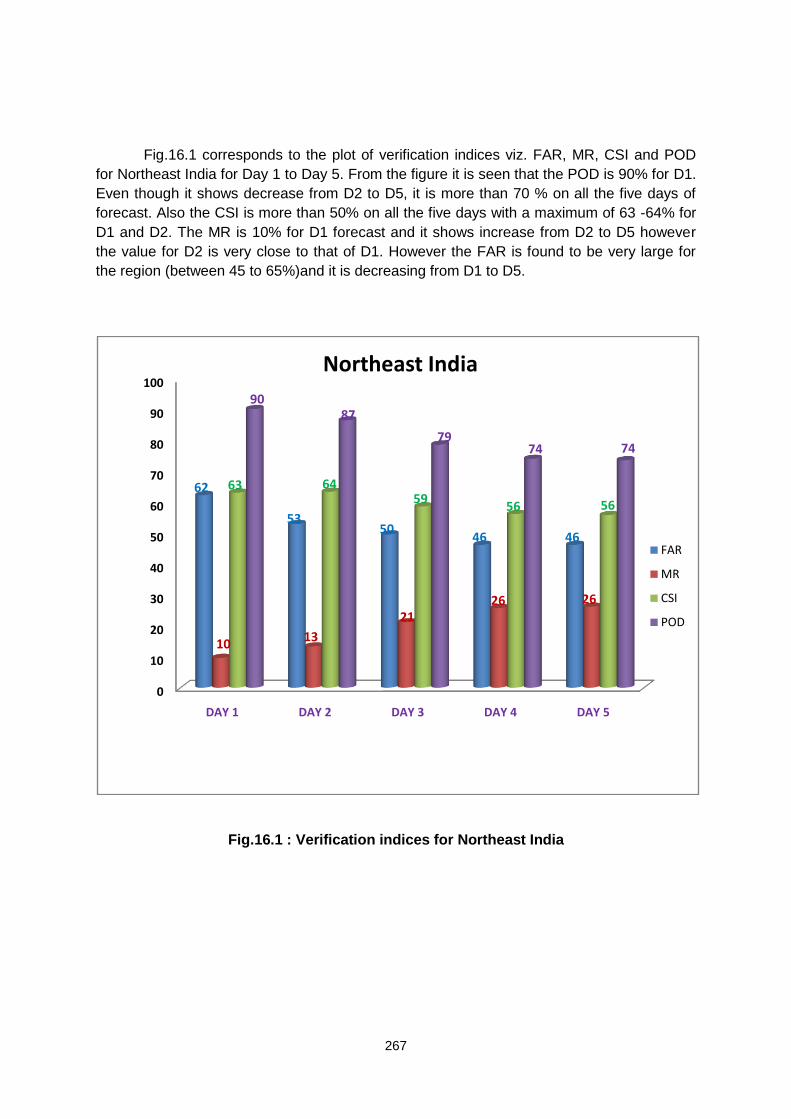
267
Fig.16.1 corresponds to the plot of verification indices viz. FAR, MR, CSI and POD
for Northeast India for Day 1 to Day 5. From the figure it is seen that the POD is 90% for D1.
Even though it shows decrease from D2 to D5, it is more than 70 % on all the five days of
forecast. Also the CSI is more than 50% on all the five days with a maximum of 63 -64% for
D1 and D2. The MR is 10% for D1 forecast and it shows increase from D2 to D5 however
the value for D2 is very close to that of D1. However the FAR is found to be very large for
the region (between 45 to 65%)and it is decreasing from D1 to D5.
Fig.16.1 : Verification indices for Northeast India
0
10
20
30
40
50
60
70
80
90
100
DAY 1 DAY 2 DAY 3 DAY 4 DAY 5
62
5350
46 46
1013
2126 26
63 6459
56 56
9087
7974 74
Northeast India
FAR
MR
CSI
POD
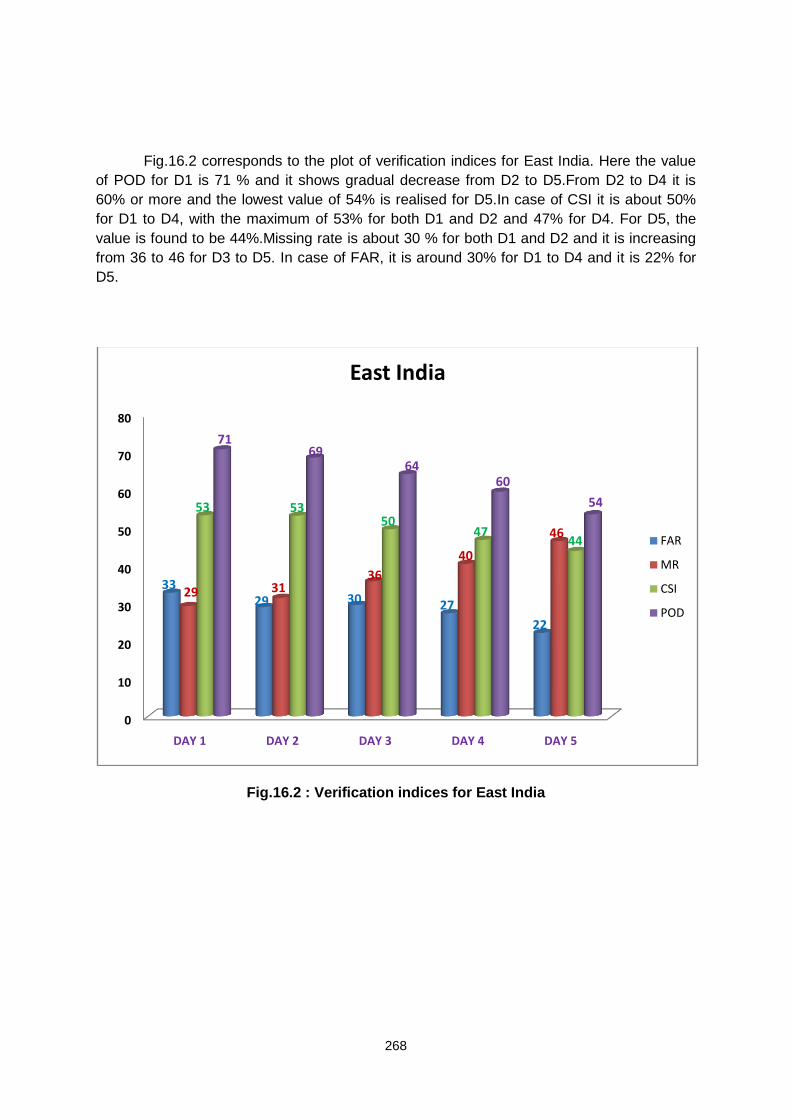
268
Fig.16.2 corresponds to the plot of verification indices for East India. Here the value
of POD for D1 is 71 % and it shows gradual decrease from D2 to D5.From D2 to D4 it is
60% or more and the lowest value of 54% is realised for D5.In case of CSI it is about 50%
for D1 to D4, with the maximum of 53% for both D1 and D2 and 47% for D4. For D5, the
value is found to be 44%.Missing rate is about 30 % for both D1 and D2 and it is increasing
from 36 to 46 for D3 to D5. In case of FAR, it is around 30% for D1 to D4 and it is 22% for
D5.
Fig.16.2 : Verification indices for East India
0
10
20
30
40
50
60
70
80
DAY 1 DAY 2 DAY 3 DAY 4 DAY 5
3329 30 27
22
29 3136
40
46
53 5350
4744
7169
6460
54
East India
FAR
MR
CSI
POD
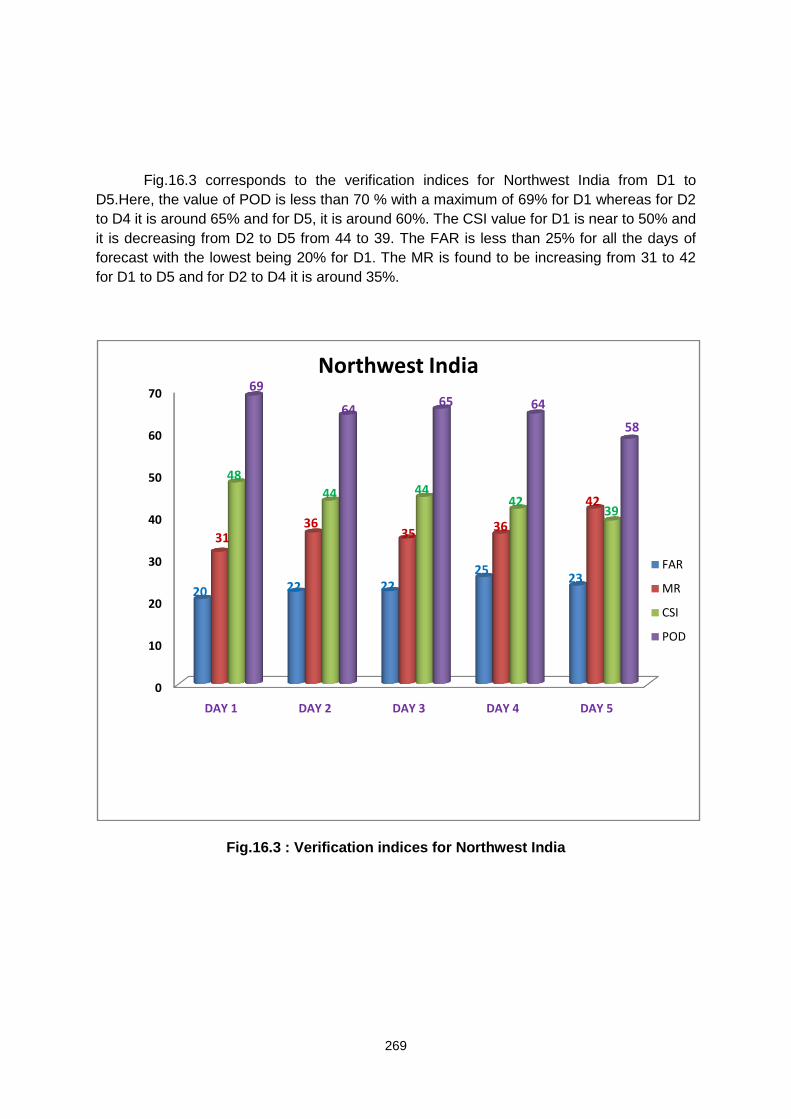
269
Fig.16.3 corresponds to the verification indices for Northwest India from D1 to
D5.Here, the value of POD is less than 70 % with a maximum of 69% for D1 whereas for D2
to D4 it is around 65% and for D5, it is around 60%. The CSI value for D1 is near to 50% and
it is decreasing from D2 to D5 from 44 to 39. The FAR is less than 25% for all the days of
forecast with the lowest being 20% for D1. The MR is found to be increasing from 31 to 42
for D1 to D5 and for D2 to D4 it is around 35%.
Fig.16.3 : Verification indices for Northwest India
0
10
20
30
40
50
60
70
DAY 1 DAY 2 DAY 3 DAY 4 DAY 5
20 22 2225
23
3136
35 36
42
48
44 4442
39
69
6465 64
58
Northwest India
FAR
MR
CSI
POD
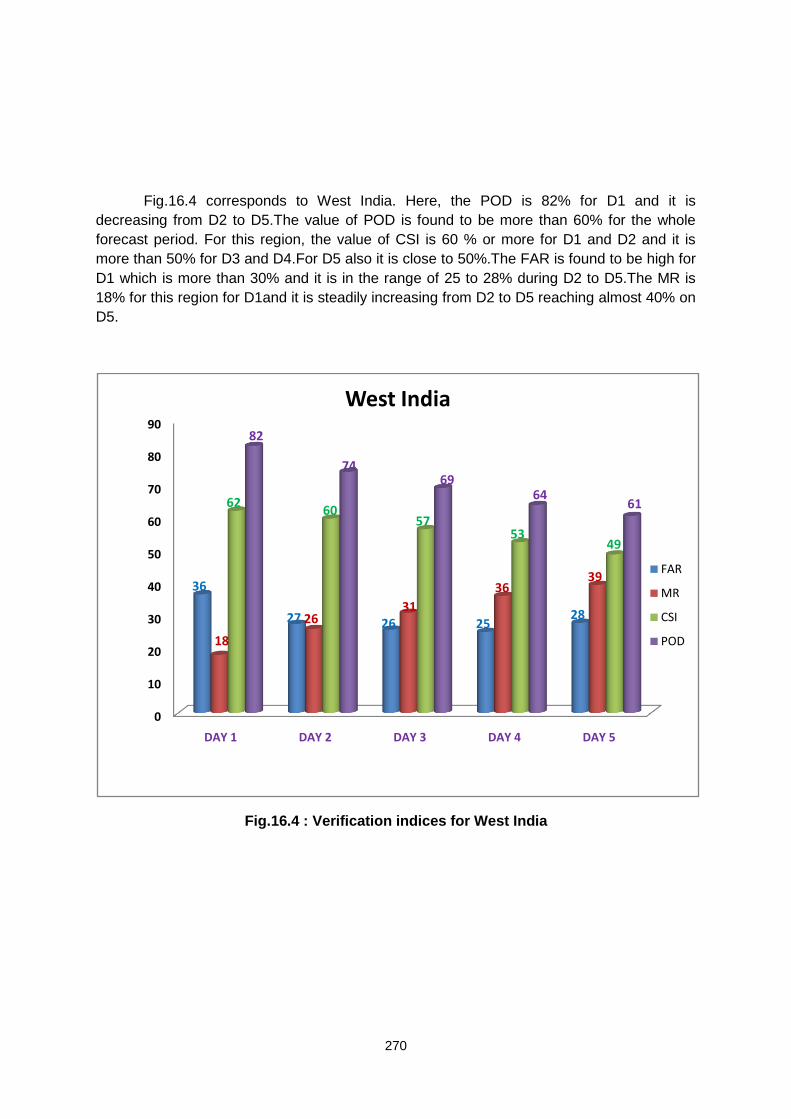
270
Fig.16.4 corresponds to West India. Here, the POD is 82% for D1 and it is
decreasing from D2 to D5.The value of POD is found to be more than 60% for the whole
forecast period. For this region, the value of CSI is 60 % or more for D1 and D2 and it is
more than 50% for D3 and D4.For D5 also it is close to 50%.The FAR is found to be high for
D1 which is more than 30% and it is in the range of 25 to 28% during D2 to D5.The MR is
18% for this region for D1and it is steadily increasing from D2 to D5 reaching almost 40% on
D5.
Fig.16.4 : Verification indices for West India
0
10
20
30
40
50
60
70
80
90
DAY 1 DAY 2 DAY 3 DAY 4 DAY 5
36
27 26 2528
18
2631
3639
6260
5753
49
82
7469
6461
West India
FAR
MR
CSI
POD
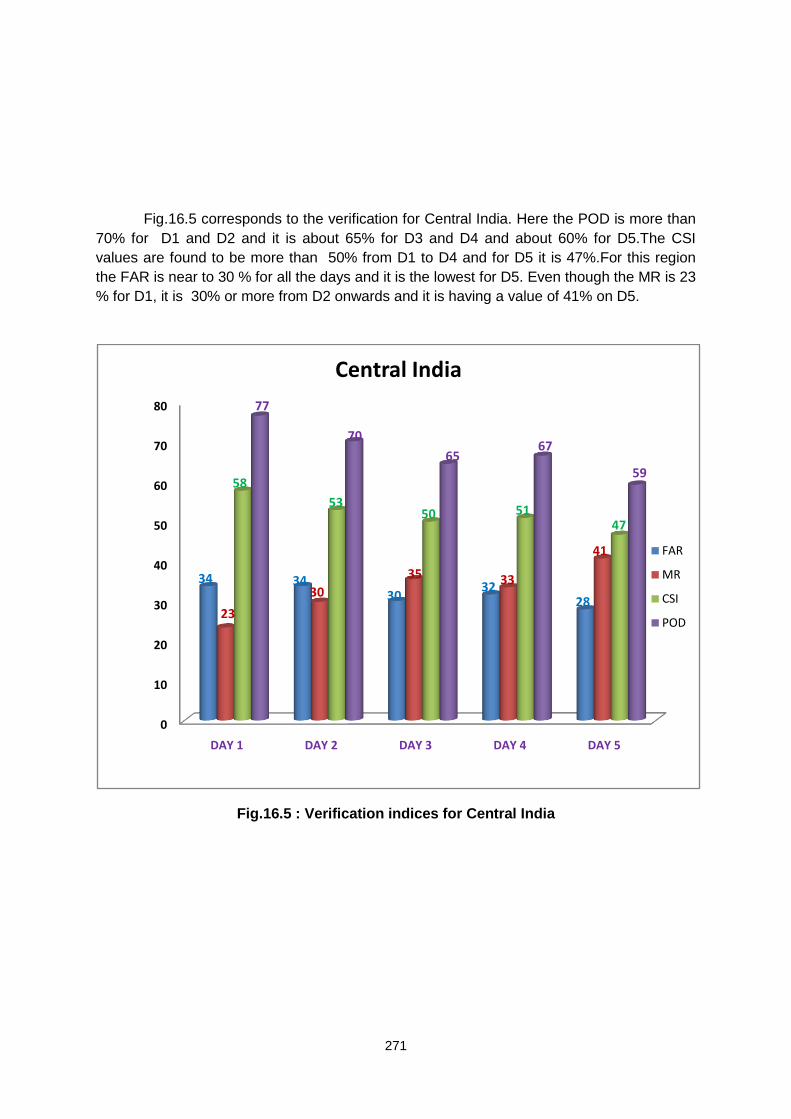
271
Fig.16.5 corresponds to the verification for Central India. Here the POD is more than
70% for D1 and D2 and it is about 65% for D3 and D4 and about 60% for D5.The CSI
values are found to be more than 50% from D1 to D4 and for D5 it is 47%.For this region
the FAR is near to 30 % for all the days and it is the lowest for D5. Even though the MR is 23
% for D1, it is 30% or more from D2 onwards and it is having a value of 41% on D5.
Fig.16.5 : Verification indices for Central India
0
10
20
30
40
50
60
70
80
DAY 1 DAY 2 DAY 3 DAY 4 DAY 5
34 3430
3228
23
30
35 33
41
58
5350 51
47
77
70
6567
59
Central India
FAR
MR
CSI
POD
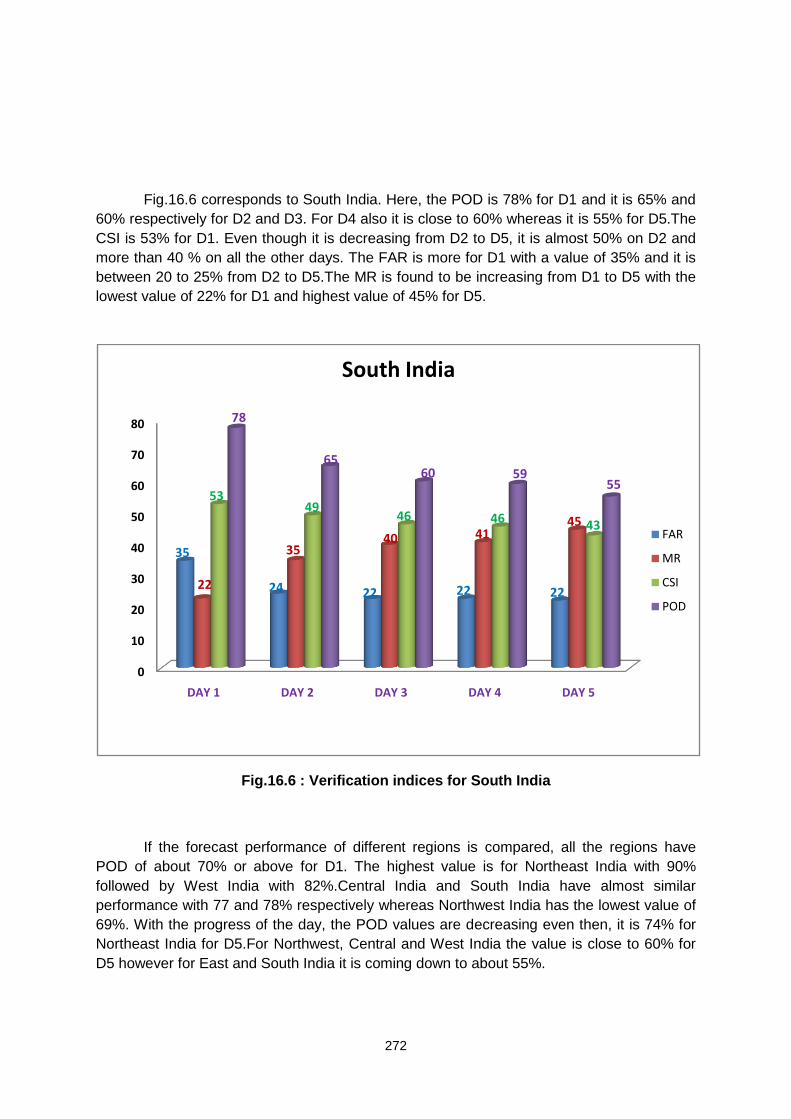
272
Fig.16.6 corresponds to South India. Here, the POD is 78% for D1 and it is 65% and
60% respectively for D2 and D3. For D4 also it is close to 60% whereas it is 55% for D5.The
CSI is 53% for D1. Even though it is decreasing from D2 to D5, it is almost 50% on D2 and
more than 40 % on all the other days. The FAR is more for D1 with a value of 35% and it is
between 20 to 25% from D2 to D5.The MR is found to be increasing from D1 to D5 with the
lowest value of 22% for D1 and highest value of 45% for D5.
Fig.16.6 : Verification indices for South India
If the forecast performance of different regions is compared, all the regions have
POD of about 70% or above for D1. The highest value is for Northeast India with 90%
followed by West India with 82%.Central India and South India have almost similar
performance with 77 and 78% respectively whereas Northwest India has the lowest value of
69%. With the progress of the day, the POD values are decreasing even then, it is 74% for
Northeast India for D5.For Northwest, Central and West India the value is close to 60% for
D5 however for East and South India it is coming down to about 55%.
0
10
20
30
40
50
60
70
80
DAY 1 DAY 2 DAY 3 DAY 4 DAY 5
35
24 22 22 2222
3540 41
45
5349
46 46 43
78
6560 59
55
South India
FAR
MR
CSI
POD
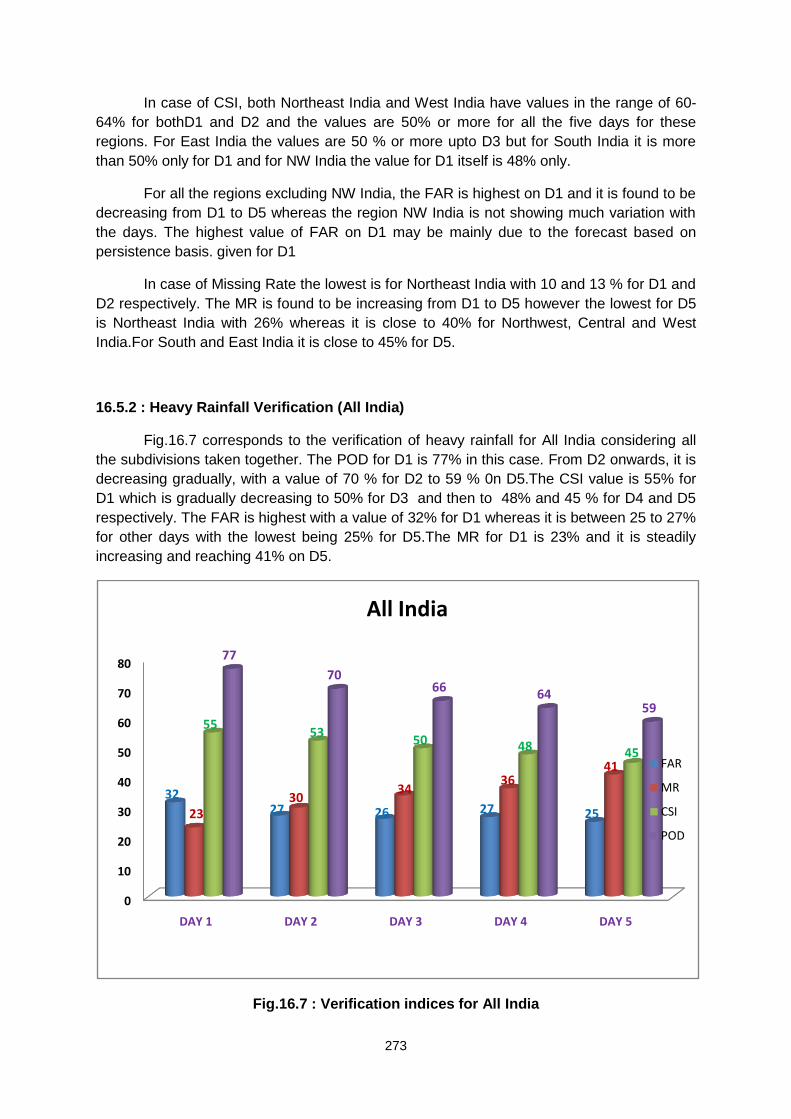
273
In case of CSI, both Northeast India and West India have values in the range of 60-
64% for bothD1 and D2 and the values are 50% or more for all the five days for these
regions. For East India the values are 50 % or more upto D3 but for South India it is more
than 50% only for D1 and for NW India the value for D1 itself is 48% only.
For all the regions excluding NW India, the FAR is highest on D1 and it is found to be
decreasing from D1 to D5 whereas the region NW India is not showing much variation with
the days. The highest value of FAR on D1 may be mainly due to the forecast based on
persistence basis. given for D1
In case of Missing Rate the lowest is for Northeast India with 10 and 13 % for D1 and
D2 respectively. The MR is found to be increasing from D1 to D5 however the lowest for D5
is Northeast India with 26% whereas it is close to 40% for Northwest, Central and West
India.For South and East India it is close to 45% for D5.
16.5.2 : Heavy Rainfall Verification (All India)
Fig.16.7 corresponds to the verification of heavy rainfall for All India considering all
the subdivisions taken together. The POD for D1 is 77% in this case. From D2 onwards, it is
decreasing gradually, with a value of 70 % for D2 to 59 % 0n D5.The CSI value is 55% for
D1 which is gradually decreasing to 50% for D3 and then to 48% and 45 % for D4 and D5
respectively. The FAR is highest with a value of 32% for D1 whereas it is between 25 to 27%
for other days with the lowest being 25% for D5.The MR for D1 is 23% and it is steadily
increasing and reaching 41% on D5.
Fig.16.7 : Verification indices for All India
0
10
20
30
40
50
60
70
80
DAY 1 DAY 2 DAY 3 DAY 4 DAY 5
3227 26 27 2523
3034
3641
5553
50 48 45
77
7066
6459
All India
FAR
MR
CSI
POD
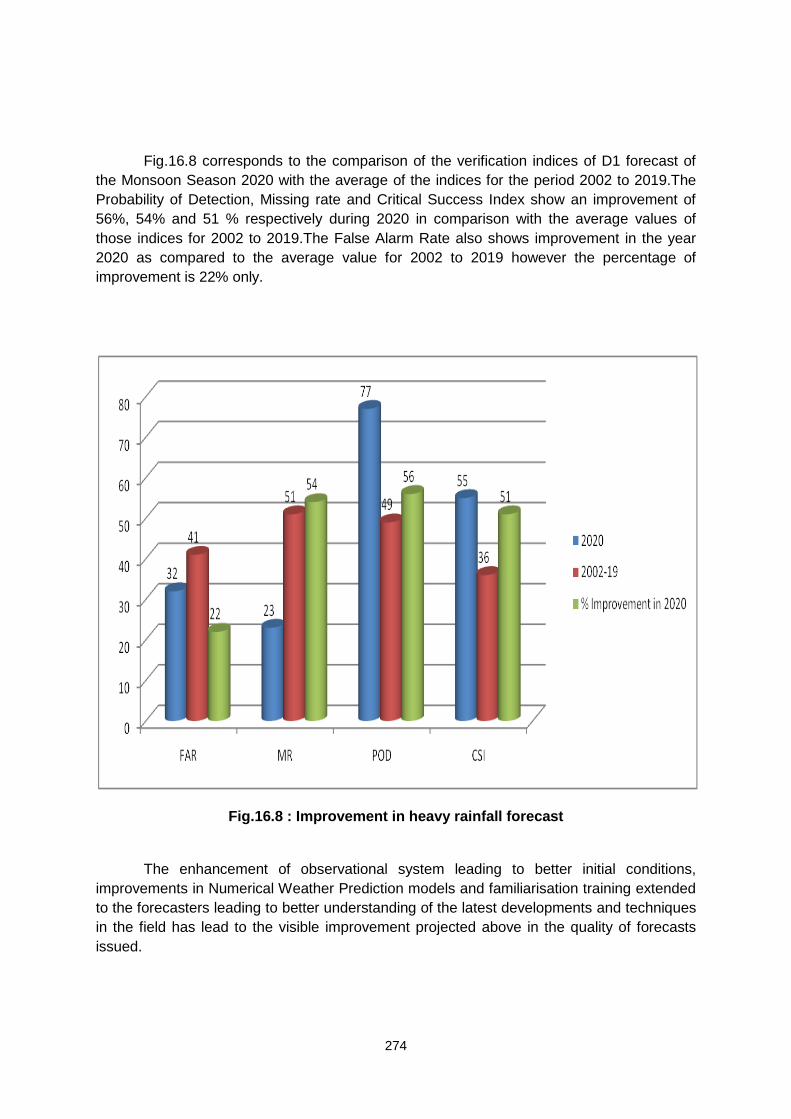
274
Fig.16.8 corresponds to the comparison of the verification indices of D1 forecast of
the Monsoon Season 2020 with the average of the indices for the period 2002 to 2019.The
Probability of Detection, Missing rate and Critical Success Index show an improvement of
56%, 54% and 51 % respectively during 2020 in comparison with the average values of
those indices for 2002 to 2019.The False Alarm Rate also shows improvement in the year
2020 as compared to the average value for 2002 to 2019 however the percentage of
improvement is 22% only.
Fig.16.8 : Improvement in heavy rainfall forecast
The enhancement of observational system leading to better initial conditions,
improvements in Numerical Weather Prediction models and familiarisation training extended
to the forecasters leading to better understanding of the latest developments and techniques
in the field has lead to the visible improvement projected above in the quality of forecasts
issued.
275
Summary and Conclusions :
The heavy rainfall events of Monsoon Season 2020 are analysed and the warnings
issued for heavy rainfall and above for the season are verified and the results are presented
in this document. The Probability of Detection, Critical Success Index, False Alarm Rate and
Missing Rate are computed regional wise as well as All India basis and the results are
compared. Also the verification indices for All India Warning for Day 1 for the year 2020 is
compared with the average of the indices for D1 forecast for the period from 2002 to 2019
and the improvement in forecast is brought forward.
The important points are summarised below:
I. There had been a total number of 1977 events of heavy rainfall and above during
Monsoon season 2020 out of which 734 had been very heavy rainfall and above and
157 had been extremely heavy rainfall. The maximum number of events of heavy
rainfall and above,very heavy rainfall and above and extremely heavy rainfall had
occurred in the month of August.
II. Assam and Meghalaya recorded the highest number of events in all the three
categories with 103 events of heavy rainfall and above, 62 events of very heavy
rainfall and above and 31 extremely heavy rainfall events. Sub Himalayan West
Bengal & Sikkim and Konkan &Goa respectively with 90 and 88 events each of
heavy rainfall & above (among which 20 and 9 events respectively were of extremely
heavy rainfall) came next. Lakshadweep recorded the lowest number of 8 events of
heavy rainfall and above among which one was very heavy rainfall event.It has not
recorded any extremely heavy rainfall event.
III. In addition to Lakshadweep, another ten sub divisions viz. Andaman & Nicobar
Islands, Gangetic West Bengal, Jharkhand, Haryana, Chandigarh & Delhi, Punjab,
Jammu Kashmir & Ladakh, Marathwada, Coastal Andhra Pradesh &Yanam,
Rayalaseema and North Interior Karnataka had not reported any extremely heavy
rainfall during the season.
IV. When the sub divisions along the central parts of the country and adjoining areas
recorded maximum number of extremely heavy rainfall events in August, Assam&
Meghalaya recorded only two such events in August, even though the maximum
number of extremely heavy rainfall events during the season was realised in this
subdivision.
V. If the Probability of Detection for different regions is considered, all the regions have
POD of about 70% or more for Day 1 forecast. The highest value for Day 1 is 90% for
Northeast India followed by 82% for West India. Even though the values are showing
a decrease with the progress of the days of forecast, it is more than 70% for
Northeast India, close to 60% for Northwest, Central and West India and about 55%
for East and South India for Day 5 forecast.
276
VI. The CSI values are 60% or more for NE and West India and it is 50% or more for all
the five days of forecast for these regions.It is 50% or more for Central India up tofour
days, for East India up to three days and South India upto two days.
VII. The False alarm rate is found to be higher for D1 forecast for all the regions whereas
the Missing Rate shows lowest value for D1 forecast after which it increases
gradually.
VIII. The forecast performance is satisfactory for all the regions for Monsoon Season
2020. Northeast India and West India have done better however; the False Alarm
Rate for Northeast India is very high.For all other regions, there is consistency in the
forecast performance during the forecast period as found by the verification indices.
IX. For All India basis, the POD is maximum for Day1 (77%) and it decreasing to D5
however it is close to 60% even on Day 5.The CSI value is 50 to 55% upto Day 3 and
it is between 45% to 48% for D4 and D5 .The FAR is highest for D1 and it is
decreasing and reaching 25% on D5. The MR is less than 30% for D1 and D2 and
there is an increase of 10% afterwards till D5. Thus the All India Forecast
performance is also satisfactory.
X. Probability of Detection, Missing rate and Critical Success Index show significant
improvement of 56%, 54% and 51 % respectively in heavy rainfall warning during
Monsoon season 2020 with respect to the forecast for Day 1, in comparison with the
average values of those indices for the season 2002 to 2019. The False Alarm Rate
also shows improvement in the year 2020 as compared to the average value for
2002 to 2019 with the percentage of improvement is 22%.
XI. The enhancement of observational system leading to better initial conditions,
improvements in Numerical Weather Prediction models and familiarisation training
extended to the forecasters leading to better understanding of the latest
developments and techniques in the forecasting field has led to the visible
improvement projected above in the quality of forecasts issued.
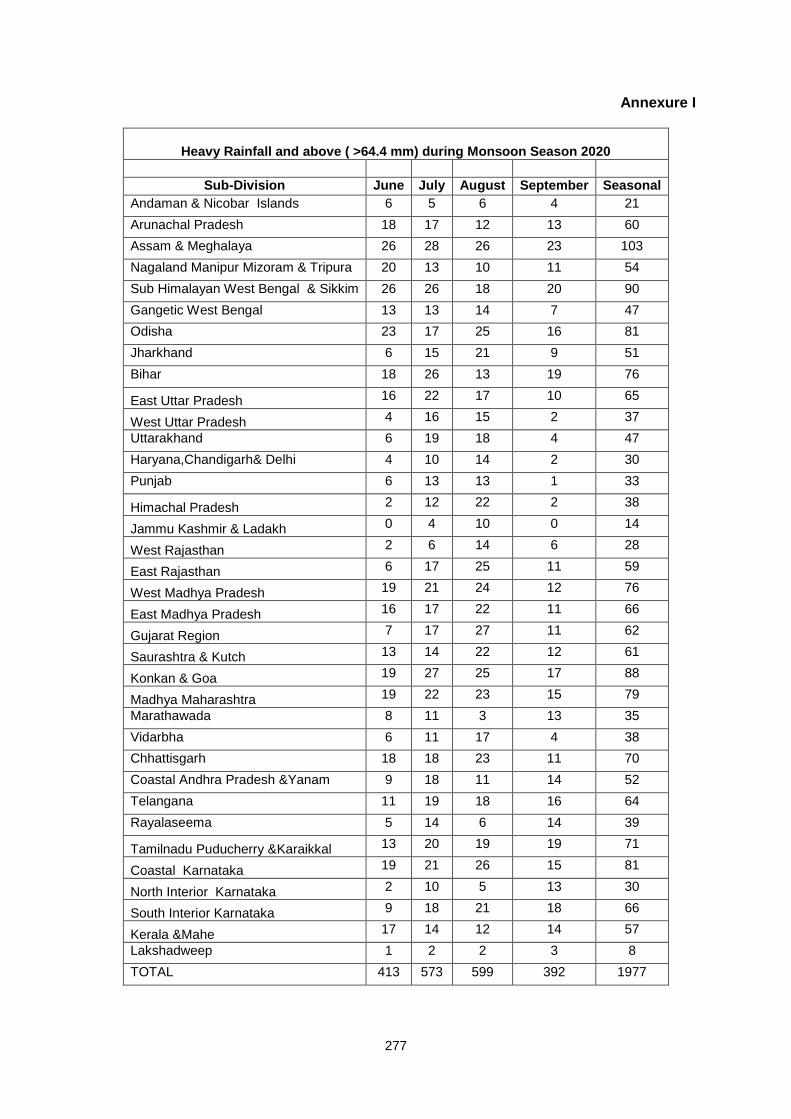
277
Annexure I
Heavy Rainfall and above ( >64.4 mm) during Monsoon Season 2020
Sub-Division June July August September Seasonal
Andaman & Nicobar Islands 6 5 6 4 21
Arunachal Pradesh 18 17 12 13 60
Assam & Meghalaya 26 28 26 23 103
Nagaland Manipur Mizoram & Tripura 20 13 10 11 54
Sub Himalayan West Bengal & Sikkim 26 26 18 20 90
Gangetic West Bengal 13 13 14 7 47
Odisha 23 17 25 16 81
Jharkhand 6 15 21 9 51
Bihar 18 26 13 19 76
East Uttar Pradesh 16 22 17 10 65
West Uttar Pradesh 4 16 15 2 37
Uttarakhand 6 19 18 4 47
Haryana,Chandigarh& Delhi 4 10 14 2 30
Punjab 6 13 13 1 33
Himachal Pradesh 2 12 22 2 38
Jammu Kashmir & Ladakh 0 4 10 0 14
West Rajasthan 2 6 14 6 28
East Rajasthan 6 17 25 11 59
West Madhya Pradesh 19 21 24 12 76
East Madhya Pradesh 16 17 22 11 66
Gujarat Region 7 17 27 11 62
Saurashtra & Kutch 13 14 22 12 61
Konkan & Goa 19 27 25 17 88
Madhya Maharashtra 19 22 23 15 79
Marathawada 8 11 3 13 35
Vidarbha 6 11 17 4 38
Chhattisgarh 18 18 23 11 70
Coastal Andhra Pradesh &Yanam 9 18 11 14 52
Telangana 11 19 18 16 64
Rayalaseema 5 14 6 14 39
Tamilnadu Puducherry &Karaikkal 13 20 19 19 71
Coastal Karnataka 19 21 26 15 81
North Interior Karnataka 2 10 5 13 30
South Interior Karnataka 9 18 21 18 66
Kerala &Mahe 17 14 12 14 57
Lakshadweep 1 2 2 3 8
TOTAL 413 573 599 392 1977
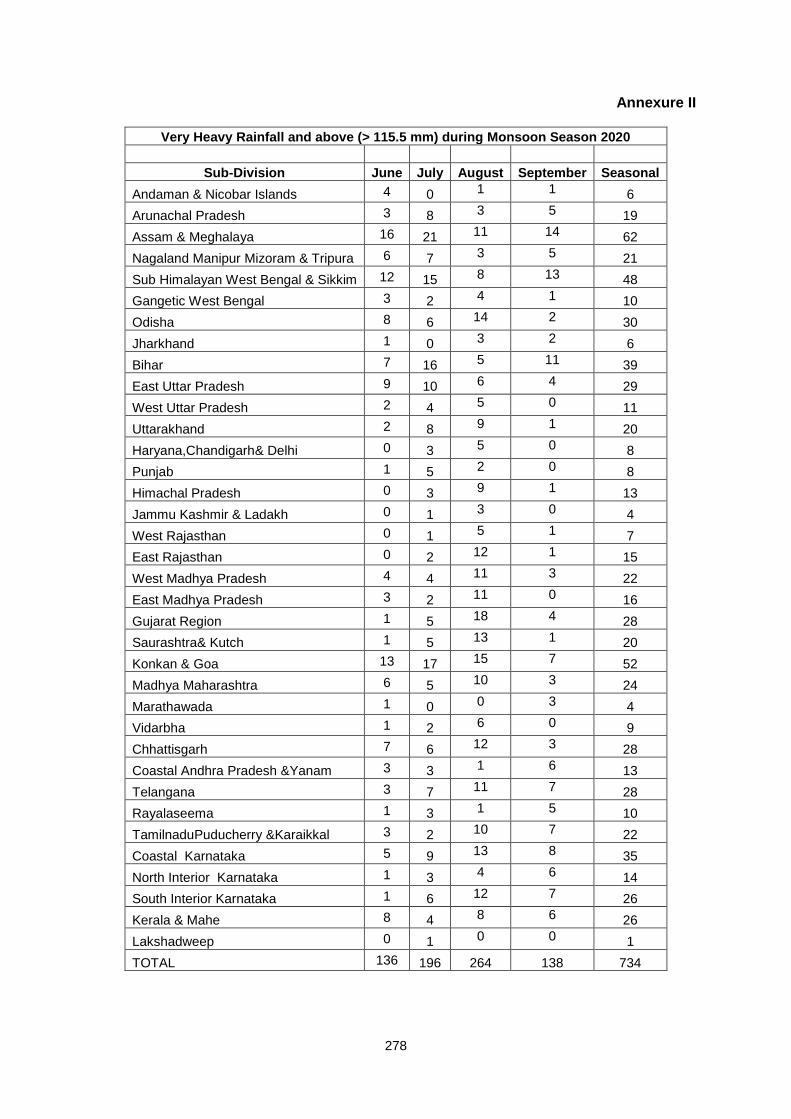
278
Annexure II
Very Heavy Rainfall and above (> 115.5 mm) during Monsoon Season 2020
Sub-Division June July August September Seasonal
Andaman & Nicobar Islands 4 0 1 1 6
Arunachal Pradesh 3 8 3 5 19
Assam & Meghalaya 16 21 11 14 62
Nagaland Manipur Mizoram & Tripura 6 7 3 5 21
Sub Himalayan West Bengal & Sikkim 12 15 8 13 48
Gangetic West Bengal 3 2 4 1 10
Odisha 8 6 14 2 30
Jharkhand 1 0 3 2 6
Bihar 7 16 5 11 39
East Uttar Pradesh 9 10 6 4 29
West Uttar Pradesh 2 4 5 0 11
Uttarakhand 2 8 9 1 20
Haryana,Chandigarh& Delhi 0 3 5 0 8
Punjab 1 5 2 0 8
Himachal Pradesh 0 3 9 1 13
Jammu Kashmir & Ladakh 0 1 3 0 4
West Rajasthan 0 1 5 1 7
East Rajasthan 0 2 12 1 15
West Madhya Pradesh 4 4 11 3 22
East Madhya Pradesh 3 2 11 0 16
Gujarat Region 1 5 18 4 28
Saurashtra& Kutch 1 5 13 1 20
Konkan & Goa 13 17 15 7 52
Madhya Maharashtra 6 5 10 3 24
Marathawada 1 0 0 3 4
Vidarbha 1 2 6 0 9
Chhattisgarh 7 6 12 3 28
Coastal Andhra Pradesh &Yanam 3 3 1 6 13
Telangana 3 7 11 7 28
Rayalaseema 1 3 1 5 10
TamilnaduPuducherry &Karaikkal 3 2 10 7 22
Coastal Karnataka 5 9 13 8 35
North Interior Karnataka 1 3 4 6 14
South Interior Karnataka 1 6 12 7 26
Kerala & Mahe 8 4 8 6 26
Lakshadweep 0 1 0 0 1
TOTAL 136 196 264 138 734
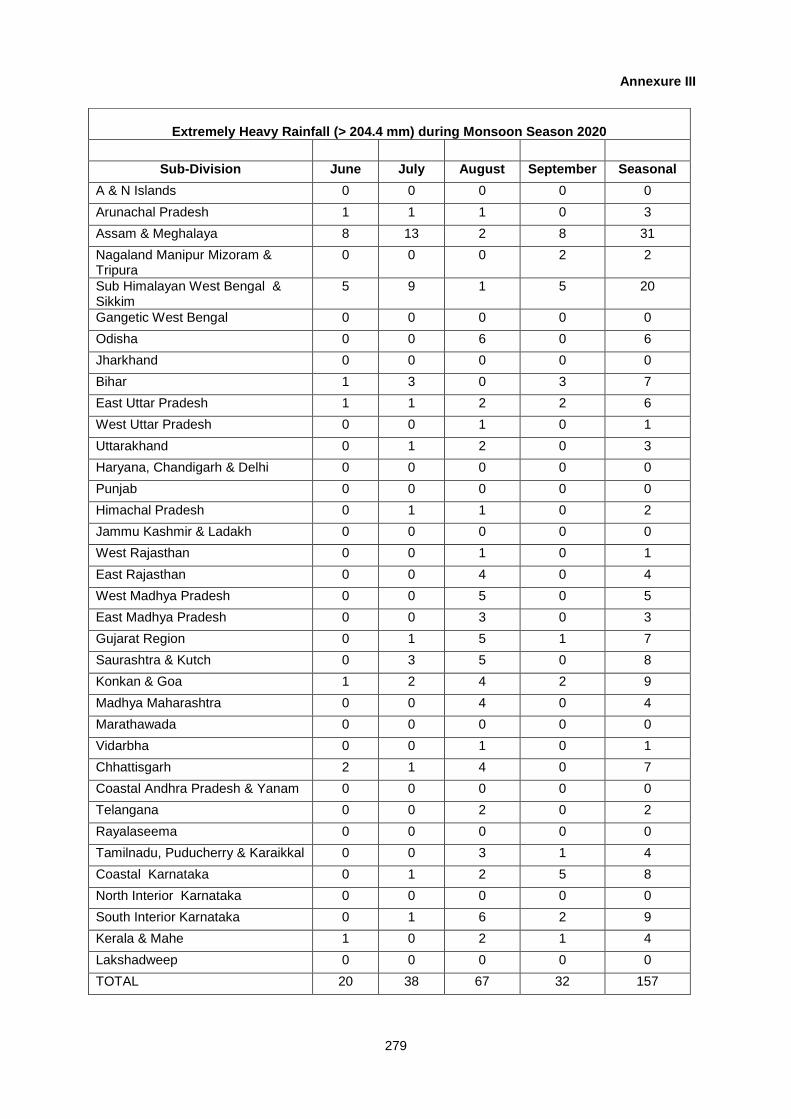
279
Annexure III
Extremely Heavy Rainfall (> 204.4 mm) during Monsoon Season 2020
Sub-Division June July August September Seasonal
A & N Islands 0 0 0 0 0
Arunachal Pradesh 1 1 1 0 3
Assam & Meghalaya 8 13 2 8 31
Nagaland Manipur Mizoram & Tripura
0 0 0 2 2
Sub Himalayan West Bengal & Sikkim
5 9 1 5 20
Gangetic West Bengal 0 0 0 0 0
Odisha 0 0 6 0 6
Jharkhand 0 0 0 0 0
Bihar 1 3 0 3 7
East Uttar Pradesh 1 1 2 2 6
West Uttar Pradesh 0 0 1 0 1
Uttarakhand 0 1 2 0 3
Haryana, Chandigarh & Delhi 0 0 0 0 0
Punjab 0 0 0 0 0
Himachal Pradesh 0 1 1 0 2
Jammu Kashmir & Ladakh 0 0 0 0 0
West Rajasthan 0 0 1 0 1
East Rajasthan 0 0 4 0 4
West Madhya Pradesh 0 0 5 0 5
East Madhya Pradesh 0 0 3 0 3
Gujarat Region 0 1 5 1 7
Saurashtra & Kutch 0 3 5 0 8
Konkan & Goa 1 2 4 2 9
Madhya Maharashtra 0 0 4 0 4
Marathawada 0 0 0 0 0
Vidarbha 0 0 1 0 1
Chhattisgarh 2 1 4 0 7
Coastal Andhra Pradesh & Yanam 0 0 0 0 0
Telangana 0 0 2 0 2
Rayalaseema 0 0 0 0 0
Tamilnadu, Puducherry & Karaikkal 0 0 3 1 4
Coastal Karnataka 0 1 2 5 8
North Interior Karnataka 0 0 0 0 0
South Interior Karnataka 0 1 6 2 9
Kerala & Mahe 1 0 2 1 4
Lakshadweep 0 0 0 0 0
TOTAL 20 38 67 32 157
280
17
SUMMARY AND CONCLUSIONS
Medha Khole, O.P. Sreejith and Sunitha Devi, S.
The present report consists of total 16 Chapters which discuss and describe various
aspects of Southwest Monsoon 2020. The regional characteristics of the Southwest
Monsoon 2020 like its Onset over Kerala, its advance over various regions of India, the
rainfall distribution in relation to various synoptic systems and the withdrawal of the monsoon
are described in Chapter 1. In the year 2020, the Southwest Monsoon current advanced
over the Andaman Sea on 17th May 2020, 5 days before its normal date of arrival. The
further advance of the monsoon was delayed due to the formation and intensification of the
Super Cyclonic Storm, „Amphan‟ over the Bay of Bengal. The monsoon set in over Kerala on
its normal date of on 1st June. Further advancement over the country was observed to be
almost close to the normal date (with deviation of ± 3-4 days) for most parts of the central
India. The advance of the Southwest Monsoon over northwest India occurred about 5-10
days earlier than the respective normal date. Southwest Monsoon covered the entire country
on 26th June against the normal date of 8th July. Thus, monsoon covered over the entire
country 12 days before its normal date. During the Southwest Monsoon season 2020, a total
number of 12 Low Pressure Systems were observed. The first Low Pressure System formed
over Arabian Sea on 31st May which intensified into Severe Cyclonic Storm „NISARGA‟ on
2nd June. However, none of the other Low-pressure systems intensified into Monsoon
Depression/Deep Depression categories during the monsoon season. The first Low
Pressure System of the season; the Severe Cyclonic Storm „NISARGA‟ originated from a
low pressure area which formed over Southeast and adjoining East Central Arabian Sea and
Lakshadweep area in the early morning of 31st May 2020. It concentrated into a Depression
over East Central and adjoining Southeast Arabian Sea in the early morning of 1st June
2020. It intensified further into a Deep Depression over East Central Arabian Sea in the early
morning and into a Cyclonic Storm „NISARGA‟ in the noon of 2nd June. It moved northwards
till evening of 2nd June and gradually recurved north-eastwards and intensified into a Severe
281
Cyclonic Storm in the early morning of 3rd June. Continuing to move north-eastwards, it
crossed Maharashtra coast close to south of Alibaug as a Severe Cyclonic Storm during the
afternoon of 3rd June. Continuing to move north-eastwards after landfall, it weakened into a
Cyclonic Storm in the evening over north Madhya Maharashtra and into a Deep Depression
in the midnight of 3rd June over the same region. It further weakened into a Depression over
western parts of Vidarbha and neighbourhood in the early morning and into a Well Marked
Low pressure over central parts of Madhya Pradesh in the evening of 4th June. It weakened
further into a Low pressure area over southeast Uttar Pradesh and adjoining Bihar in the
afternoon of 5th June. During the month of June, apart from the above system, a low
pressure area which formed over West central Bay of Bengal (9-12 June) and its associated
cyclonic circulation strengthened the monsoon flow. Cyclonic vortices at upper levels off
both, the east and the west coast, over central & north India, east-west shear zone across
Peninsular India, an east-west trough at mean sea level extending upto lower tropospheric
levels with cyclonic circulations embedded in it were also observed. All these systems
caused fairly widespread to widespread rainfall activity over most parts of the country and
thus supported the advance of monsoon over the country. Towards the end of the month,
the monsoon trough shifted northwards with its eastern part close to the foot hills of
Himalayas (during 27 June-2 July). During the month of July, many features unfavourable for
monsoon circulation appeared resulting in deficient rainfall for the country. The weak
monsoon during July was mainly due to absence of any major monsoon disturbance over
Bay of Bengal and due to the prevalence of a weak cross equatorial flow in general.
Absence of any major systems caused the monsoon trough also to be weak. The monsoon
trough lay to the north of its normal position or close to the foothills of the Himalayas on
many days during the month. This resulted in frequent and prolonged floods over
northeastern India, Bihar and adjoining areas of East Uttar Pradesh. At the same time, major
parts of central and northwest India received deficient rainfall. However, during the first week
of July, with the formation of two low pressure areas; one over coastal Saurashtra and
neighbourhood (5 -12 July) and the other over Northwest Bay of Bengal off Odisha-Gangetic
West Bengal coast (5-6 July) and their associated cyclonic circulations tilting southwards
with height, monsoon trough was observed in its normal/south of its normal position during
3-8 July. The low pressure area which formed over coastal Saurashtra and neighbourhood,
became Well marked on 6th July over Kutch and neighbourhood. In addition to this low
pressure area, an offshore trough, a shear zone along 16°N and the monsoon trough to the
south of its normal position resulted in widespread rainfall activity over Gujarat State and
over coastal & interior parts of Maharashtra and the other low pressure area over Bay of
Bengal caused widespread rainfall activity over eastern parts of India. During the
subsequent three weeks of July, an off-shore trough along south Maharashtra and Kerala
282
coasts, cyclonic vortices over north Konkan coast and east-west shear zone across
peninsular India caused widespread / fairly widespread rainfall with heavy to very heavy
rainfall activity along the west coast and adjoining interior parts of peninsular India. During
the same period, the interactions of the eastern end of monsoon trough (which lay north
/close to foot hills of Himalayas) with the cyclonic circulations and convergence of strong
southwesterly to southerly winds from Bay of Bengal over east and northeast India triggered
monsoon activity over northeast and adjoining east India. The interaction of western end of
monsoon trough with the systems in westerlies, circulations in the lower tropospheric levels
and moisture incursions from the Arabian Sea caused widespread / fairly widespread rainfall
with heavy rainfall over Western Himalayan Region, plains of northwest India & adjoining
central & west India during third and fourth week of the month. A coherent Madden Julian
Oscillation (MJO) signal was not evident during June and on most days of July. Only towards
the end of July upto mid of August, the signal became active and slight eastward
propagation from Indian Ocean to the maritime continent was seen. In association with
absence of low pressure systems over the Bay of Bengal, shifting of monsoon trough to the
foothills on many days and unfavourable conditions like MJO, the monsoon rainfall was
deficient during July across central India. At the same time, it caused floods over
northeastern States, Bihar and East Uttar Pradesh on a few occasions. As the MJO moved
eastwards over the Indian seas, the Arabian Sea and Bay of Bengal became convectively
active during August. The formation of five low pressure systems over the North Bay of
Bengal in succession [out of which four of them became Well marked (4-10 , 9-11, 13-18 ,
19-26 and 24-31 August)] and their west-northwestward movement across central India upto
Gujarat a and south Rajasthan, active MJO, active Monsoon trough mostly south of its
normal position and stronger winds reaching up to 50-60 kmph in lower levels over Arabian
Sea during a few days in the month led to active monsoon conditions over most parts of the
country and caused significantly higher than normal rainfall over central and western parts of
India during the month of August. During the month, strengthening of the monsoon flow over
the Arabian Sea led to convergence of strong low level westerlies along the west coast.
Also, the presence of cyclonic vortices, off-shore trough, east-west shear zone over
peninsular India caused widespread rainfall/thundershowers along the west coast, over parts
of Peninsular India, Gujarat state, Konkan & Goa and Madhya Maharashtra. The synoptic
scale circulation system in westerlies and convergence of moist low level winds from Arabian
Sea, cyclonic circulations over northwest India and presence of strong easterlies due to the
presence of low pressure systems caused scattered to fairly widespread
rainfall/thunderstorms over Western Himalayan Region and adjoining parts of northwest
India during the month. Due to active monsoon conditions, riverine floods occurred over
Odisha, Telangana, Madhya Pradesh, Maharashtra, Gujarat and Rajasthan. The active
283
monsoon conditions consecutively for 4 weeks led to excess rainfall activity over the country.
Fairly widespread to widespread rainfall/thunderstorms over parts of Northeast and adjoining
parts of East India with heavy to very heavy rainfall was also observed during the first,
second and the last week of August due to the convergence of moist southwesterlies to
southerlies from the Bay of Bengal and presence of cyclonic vortices in the lower levels. A
weak MJO re-entered eastern Indian Ocean during late August and propagated eastwards
into maritime continent with weak amplitude by the end of monsoon season. From the last
week of August till the formation of a low pressure area off north Andhra coast on 13
September, either the western or the eastern end of monsoon trough remained north of its
normal position or close to foot hills of Himalayas. Heat LOW also started weakening. The
low pressure area which formed on 13th September subsequently became Well Marked Low
and dissipated over Telangana and adjoining south Chhattisgarh. It triggered monsoon
activity over Central and Peninsular India. After the dissipation of the low pressure area on
16th, the monsoon trough lay north of its normal position and regained its near-normal
position with the formation of another low pressure system on 20th over Northeast Bay of
Bengal and neighbourhood. This low pressure system dissipated over east Bihar and
neighbourhood on 26th. East Uttar Pradesh, Bihar and Sub Himalayan West Bengal
experienced widespread rainfall/thunderstorms due to this system. The monsoon trough
became disorganized on 28th September. Apart from the above two low pressure systems
during the month, another low-pressure system (6-8 September) formed over Southeast and
adjoining East central Arabian Sea and in conjunction with an east-west shear zone over
south peninsula caused widespread rainfall activity over south Peninsular India,
Lakshadweep area and coastal and interior parts of Maharashtra during the first week of the
month. Circulation features favouring convergence of strong moist winds from the Bay of
Bengal in the lower tropospheric levels and the alignment of monsoon trough over northeast
India and adjoining east India continued to trigger the monsoon activity over the region
during the month. The formation of two low pressure areas in the month of September led to
an active monsoon trough which delayed the withdrawal of monsoon. The withdrawal of
monsoon commenced on 28th September from some parts of west Rajasthan and Punjab,
against its normal date of 17th September with the establishment of an anticyclonic
circulation in the lower tropospheric levels over western parts of northwest India and
substantial reduction in moisture content & rainfall. A further change in the low level wind
pattern into north westerlies, reduction in moisture content and cessation of rainfall over
northwest India, led to the withdrawal of southwest monsoon from some more parts of
Rajasthan, remaining parts of Punjab, entire Western Himalayan region & Haryana,
Chandigarh & Delhi and some parts of Uttar Pradesh on 30th September. It then withdrew
from most parts of Rajasthan, some more parts of Uttar Pradesh and some parts of
284
northwest Madhya Pradesh on 3rd October 2020 and from remaining parts of Rajasthan,
some more parts of Uttar Pradesh and Madhya Pradesh, most parts of Gujarat state and
some parts of North Arabian Sea on 6th October 2020. The Southwest Monsoon withdrew
from the entire country on 28th October 2020. The details of the semi-permanent systems
and significant weather systems associated with the Southwest Monsoon are also discussed
in this Chapter.
Chapter 2 describes the Global Climate Anomalies observed during the Southwest
Monsoon season 2020.During the 2020 southwest monsoon season, during the month of
June, weak positive Indian Ocean Dipole (IOD) conditions were present over Indian Ocean,
however IOD index turned in to neutral condition during the subsequent months. As such, it
did not have much impact on monsoon rainfall. However, the large-scale Sea Surface
Temperature (SST) forcings from Pacific Ocean were prominent during August and
September months as strengthening of La Niña conditions was observed during the later
part of the monsoon season and its effect was quite significant. As a result, influence on the
monsoon from the large-scale SST forcing over Indian Ocean was prominent during June
and during August and during September, the SST forcing from Pacific Ocean was
significant. However, there are some other synoptic scale factors and intra-seasonal
variations which dominated the rainfall during the monsoon season. This year monsoon
season has observed intra-seasonal variations associated with formation of monsoon low
pressure systems and Northwest Pacific typhoon activity. One of the major tropical intra-
seasonal variations associated with the MJO, remained in the unfavorable phases during the
most part monsoon season except for a few days during the month of June, so the influence
of MJO was less during 2020 monsoon season. The rainfall during the second half of the
season was also attributed to the formation of low-pressure systems over Indian region. The
above normal rainfall over the central and adjoining parts of the India during the second half
of the season was also attributed to the active monsoon trough which remained to the south
of its normal position on most of the days as well as formation of a greater number of lows.
Thus, the rainfall deficiency was more during the July and during the subsequent months of
August and September, excess rainfall activity was observed. However, the spatial rainfall
distribution was fairly well distributed during the monsoon season.
Chapter 3 to Chapter 8 discuss the information from the Regional Meteorological
Centres [Mumbai, Kolkata, New Delhi, Nagpur, Chennai and Gauhati] pertaining to
performance of Southwest Monsoon in the respective regions and various actions initiated
regarding warnings and forecasts, by these regional centres.
Chapter 3 describes various extreme weather event characteristics over
Maharashtra, Goa and Gujarat. There were four major cases of very heavy to extremely
285
heavy rainfall events over Mumbai during Southwest Monsoon 2020. Devastation due to
extremely heavy rainfall episodes was experienced mostly over Konkan subdivision. Isolated
heavy to very heavy rainfall events were also reported over interior Maharashtra associated
with active monsoon conditions. Another major weather event during June was Severe
Cyclonic Storm (SCS)Nisarga, which made landfall over the coastal district of Raigad near to
Alibag. SCS Nisarga was the first cyclonic storm over the Arabian Sea during 2020. The
weather characteristics associated with the extreme events are discussed in details in this
Chapter. As a new initiative during monsoon 2020, IMD started issuing Impact Based
Forecast (IBF) for major cities of the country including Mumbai. The details of these
forecasts issued during the Southwest Monsoon season of 2020 are also summarised in this
Chapter. The seasonal (June-September) rainfall over the state of Gujarat as a whole was
158% of its Long Period Average (LPA). The spatial and temporal distribution of rainfall
during the Southwest Monsoon season 2020, along with the case study on the analysis of
Heavy rainfall occurrences over Gujarat during 3-8 July 2020, are also presented in this
Chapter. Similar analysis for the state of Goa is presented in this Chapter.
The meteorological features associated with the floods over eastern India during
southwest monsoon 2020 are discussed in Chapter 4. During the Southwest monsoon
season of 2020, first instances of floods were observed over the districts of North Bengal
during 24-29 June 2020, second spells over Bihar during 19-23 July 2020 and third spells
over Odisha during 26-27 August 2020. The details of rainfall analysis with occurrences of
heavy to very heavy rainfall and extremely heavy rainfall over various regions of eastern
India and the causative factors, including the analysis of synoptic systems, for the said
events of rainfall leading to floods, are presented in this Chapter. The floods over North
Bengal during 24-29 June 2020 were due to location of the monsoon trough along the
foothills of the Himalayas along with strong moisture incursion from Bay of Bengal. Floods
over Odisha during 26-27 August was mainly due to formation of low pressure area over
North Bay of Bengal on 24th August 2020 and becoming well marked low pressure area on
25th August and passing over GWB-Odisha region during 26-27 August 2020. The flood over
Bihar was mainly associated with the positioning of the monsoon trough at the mean sea
level, along the foothills of the Himalayas. This Chapter also describes the details of various
warnings issued by Meteorological Centres of the regions for these instances of heavy to
very heavy rainfall and extremely heavy rainfall leading to floods.
Chapter 5 describes the Disastrous Weather Events Over Central India During SW
Monsoon 2020. The case studies of heavy rainfall events over Central India during 19-22
August 2020 and 26th to 29th August 2020 in relation to associated synoptic circulation
features are also presented.
286
The details of Extremely heavy rainfall activity over the southern peninsular region
are discussed in Chapter 6. Heavy rainfall occurrence has been reported on about 50% of
the days during the season at isolated places in four subdivisions (Tamilnadu, Coastal
Karnataka, Telangana and South Interior Karnataka). The highest number of heavy rainfall
reports (≥7 cm/day) has been reported from Tamilnadu (72 days), followed by Coastal
Karnataka (70 days). Very heavy rainfall (≥12cm/day) occurred in Tamilnadu and Coastal
Karnataka on 27 days and 30 days respectively. Telangana, Kerala and South Interior
Karnataka also reported very heavy rainfall occurrences on 23-26 days. Extremely heavy
rainfall occurrences were reported on 8 days over South Interior Karnataka followed by 6
days each over Coastal Karnataka and Tamilnadu. Overall, there were 14 days of extremely
heavy rainfall occurrences in the Sothern Peninsular region. An analysis of causative factors
for these incidences is also presented in this Chapter.
Chapter 7 describes an event of heavy rainfall episode over north-eastern region of
India during 9-13 July 2020. The rainfall scenario, weather forecasts and warnings and the
synoptic conditions which prevailed over north-eastern region of India and an analysis of
Outgoing Longwave Radiation (OLR), during the period 9-13 July 2020 are discussed in
details. all the three meteorological Sub-divisions of North East India experienced
widespread rainfall activity during 9th to 13th July and the South West Monsoon was active
over Arunachal Pradesh and Assam & Meghalaya Several stations in the region reported
heavy to very heavy rainfall and extremely heavy rainfall was also reported by some of the
stations. Due to the continuous rainfall activity, the river Brahmaputra and some of its
tributaries were flowing above their respective warning levels, causing floods in some parts
of the state of Assam. The spatial distribution of rainfall reveals that higher intensity rainfall
occurred mainly over Arunachal Pradesh and adjoining districts of Assam, Meghalaya and
parts of West Assam during the period. During 9-13 July 2020, state wise departure of
rainfall from normal for Arunachal Pradesh, Assam, Meghalaya, Nagaland, Manipur,
Mizoram & Tripura were 127%, 82%, 241%, -67%, -61%, 78% and 96% respectively. It was
observed that, the eastern end of the monsoon trough at mean sea level during period of 9-
13 July 20 was close to the foot hills of the Himalayas. Also, moisture convergence took
place over North East India from Bay of Bengal in the lower tropospheric levels due to strong
South-westerly winds during the period. The position of the monsoon trough and its N-S
oscillations, together with the convergence of moisture to North East India from the Bay of
Bengal, are the prime factors that resulted the heavy rainfall episode during 9-13 July 2020.
The performance of the Southwest monsoon 2020 over the state of Uttar Pradesh is
discussed in Chapter 8. An event of extremely heavy rainfall on 14th August, 2020 leading
to flood situations in Jaipur, the capital city of the state of Rajastan, is also described and
287
analysed in this Chapter. During Southwest Monsoon (June-September), season of 2020,
Uttar Pradesh state received 83% rainfall of its Long Period average (LPA). The monthly
rainfall over the state as a whole was 148% of LPA during June, 87% of LPA during July,
75% of LPA during August, and 50% of LPA during September. Total four case studies of
heavy to very heavy rainfall over the state during south-west monsoon season have been
analysed and discussed in this Chapter. It has been observed that mostly rainfall occurred
during onset of monsoon, Easterly-westerly wind interactions and Low Pressure system
formation over Bay of Bengal. An extremely heavy rainfall event occurred over semi-arid
parts of Northeastern Rajasthan during late 13th August-14th August, 2020. The Jaipur and
Bharatpur divisions of eastern Rajasthan were adversely affected, with highest
accumulated station rainfall of 250 mm in 24hrs observed at Jamwaramgarh in Jaipur
district. The heavy rainfall led to the flashflood in capital city Jaipur, which resulted about
ten numbers of fatalities and huge loss of properties. A detailed analysis of this event is
also presented in this Chapter.
The details of rainfall features observed during the Southwest Monsoon season 2020
are discussed in Chapter 9.The Southwest Monsoon season rainfall over the country as a
whole during 2020 was 109% of Long Period Average (LPA). Rainfall distribution was
generally fairly well distributed over major parts of the country except Nagaland, Manipur,
Mizoram and Tripura, West Uttar Pradesh, Uttarakhand, Himachal Pradesh, and Jammu &
Kashmir and Ladakh sub-division. The season observed significant intra seasonal variations
in rainfall as realized rainfall in June (117% of LPA) and August (127 % of LPA) being above
normal, July (90 % of LPA) & September (104 % of LPA) being normal. During the season,
out of 36 meteorological subdivisions, two Subdivisions (Saurashtra & Kutch, Rayalaseema)
received large excess, thirteen subdivisions (Assam & Meghalaya, Sub-Himalayan West
Bengal & Sikkim, Bihar, West Rajasthan, Konkan & Goa, Madhya Maharashtra,
Marathwada, Coastal Andhra Pradesh & Yanam, Telangana, Tamil Nadu, Puducherry &
Karaikal, North Interior Karnataka and South Interior Karnataka and Lakshsadweep)
received excess, sixteen subdivisions (Andaman & Nicobar Islands, Arunachal Pradesh,
Gangetic West Bengal, Orissa, Jharkhand, East Uttar Pradesh, Haryana, Chandigarh and
Delhi, Punjab, East Rajasthan, West Madhya Pradesh, East Madhya Pradesh, Gujarat
Region, Vidarbha, Chattisgarh, Coastal Karnataka and Kerala & Mahe) received normal
rainfall. Five subdivisions (Nagaland, Manipur, Mizoram and Tripura, West Uttar Pradesh,
Uttarakhand, Himachal Pradesh, and Jammu & Kashmir and Ladakh) received deficient
rainfall. The homogeneous regions of South Peninsula (129% of LPA) and Central India
(115% of LPA) received above normal rainfall, East & Northeast India (106% of LPA)
received normal rainfall, while Northwest India (84% of LPA) received below normal rainfall.
During the season, out of 685 districts, 59 districts received large excess rainfall, 164
288
districts received excess rainfall, 290 districts received normal rainfall, 155 districts received
deficient rainfall and 17 received large deficient rainfall. For the country as a whole, rainfall
averaged was generally above or near normal on many days during Season. On about 20
occasions in the whole season, it was nearly more than one & half times its normal value. It
was above normal at a stretch for few days viz. for the duration from 11 – 20 June, 9 – 24
Aug and 20 – 27 September. However, it was below normal for rainfall spells during 13 – 19
Jul, 22 – 28 July and 1 – 6 September.
The details of various agrometeorological services provided by India Meteorological
Department during the Southwest Monsoon season 2020 are described in Chapter 10. India
Meteorological Department issues advisories on appropriate measures to be taken by the
farming community in relation to the ensuing weather, through agrometeorological
advisories. These are based on Medium and Extended Range Weather Forecasts and are
issued to manage the adverse impacts of weather on various types of crops, at different
stages of their growth. Various types of agrometeorological advisories for various crops
which were issued by IMD during Southwest Monsoon season of 2020, in association with
Severe Cyclonic Storm „Nisarg‟ and other heavy rainfall spells, have been described in this
Chapter.
Chapter 11 presents the verification of Quantitative Precipitation Forecasts (QPFs)
during 2020 SW Monsoon over River Sub-basins of India. Every year floods occur in one or
another part of the country which causes huge losses to both life and property. In India, India
Meteorological Department (IMD) and Central Water commission (CWC) carry out the work
of Flood Forecasting jointly. IMD is the nodal agency for issuing Quantitative Precipitation
Forecast (QPF) for river Basins/ sub-Basins where as CWC is the nodal agency for issuing
Flood Forecast. The QPF is the main input in the Flood Forecasting models for issuing flood
forecast by CWC. IMD through its field offices called “Flood Meteorological Offices (FMOs)”
issues QPF on operational basis during flood season. There are 13 FMOs located at
different parts of flood prone areas of the country, which are located at Agra, Ahmedabad,
Asansol, Bhubaneswar, Guwahati, Hyderabad, Jalpaiguri, Lucknow, New Delhi, Patna,
Srinagar, Chennai and Bengaluru that cater to the river basins. It is observed that, the All
India percentage correct QPF within category for FMOs is 61% for Day-1, 57% for Day-2,
and 56% for Day-3. However, the accuracy of correct QPF within ±1 category is 95% for
Day-1, 94% for Day-2, and 94% for Day-3. All India Critical Success Index (CSI) for the
rainfall categories 0.1-10, 11-25, 26-50, 51-100 and >100 mm varies from 0.56 to 0.05 for
Day-1, 0.53 to 0.05 for Day-2, 0.52 to 0.02 for Day-3. CSI decreases as we move to the
higher rainfall categories. All India False Alarm Rate (FAR) for the rainfall categories 0.1-10,
11-25, 26-50, 51-100 and >100 mm varies from 0.28 to 0.85 for Day-1, 0.31 to 0.83 for Day-
289
2, 0.33 to 0.89 for Day-3. FAR increases for the higher rainfall categories.
Chapter 12 discusses the various operational forecasts issued by India
Meteorological Department (IMD) for the monthly and seasonal rainfall over India and date of
monsoon onset over Kerala for the 2020 southwest monsoon season and their verification.
The chapter also discusses the experimental forecasts generated using IMD‟s dynamical
global forecasting system based on coupled forecasting system (CFS) and experimental
obtained from various climate research centers within the country and abroad. Based on an
indigenously developed statistical model, it was predicted on 15th May 2020 that monsoon
will set in over Kerala on 5th June with a model error of ±4 days. The actual monsoon onset
over Kerala took place within limit of model error of ±4 days and therefore the forecast was
correct.The first stage forecast for the seasonal (June-September) rainfall during 2020, over
the country as a whole issued in April was 100% of LPA with a model error of ± 5% of LPA.
The update issued in May for this forecast was (102% of LPA) with a model error of ± 4% of
LPA. The actual season rainfall for the country as a whole was 109% of LPA, which is 4% &
3% of LPA more than upper forecast limits of the April and May forecasts. Thus, the both the
forecasts were not within forecast limits. Considering the four broad geographical regions of
India, the forecasts issued in May for the season rainfall over northwest India, Central India,
northeast India and South Peninsula were 107%, 103%, 96% & 102% of the LPA
respectively all with model errors of ± 8%. The forecast for the second half of the monsoon
season (August –September) for the country as a whole was 104% with a model error of 8%
of LPA against the actual rainfall of 118% of LPA, which is 6% more than the upper forecast
limit of (104%+8% = 112% of LPA). The forecasts for the monthly rainfall over the country as
a whole for the months of July & August issued in June were 103% & 97% of LPA
respectively with a model error of ± 9%. Thus, the monthly forecasts for the July was
overestimated and August rainfalls was underestimate to the actual monthly rainfalls (90% &
127% of LPA respectively). The actual rainfall during July is 4% less than the lower forecast
limit and that of August is 21% more than the upper forecast limit.While issuing the long
range forecast in the month of April, Warm ENSO Neutral conditions where prevailed over
Pacific Ocean. IMD‟s analysis based on Climate model indicated development of La Nina
condition during the second half of the monsoon season and development of neutral Indian
Ocean Dipole (IOD) during the monsoon season came correct. The development of the La
Nina is one of the factors which helps to get good rainfall activity during the second half of
the season. However, the emergence of negative Indian Ocean Dipole (IOD) in the middle of
the monsoon season did not happen. It may be noted that IMD forecast for monsoon onset
over Kerala (5th June with model error of ±4 days) was correct and realized date of onset of
monsoon over Kerala was 1st June in this year. The impact of synoptic scale systems and
290
intra-seasonal variations dominated the rainfall during the monsoon season. The rainfall
during the month of June was 118% of LPA due to formation of Severe Cyclonic Storm
“NISARGA” and associated rainfall activity. The excess rainfall received in the month of June
and August month were mainly due to synoptic scale Low Pressure Systems. However, in
the month of July rainfall was deficient (90% of LPA) due to the absence of formation of low-
Pressure systems mainly due to absence of remnants from West Pacific typhoon activity and
unfavorable MJO activity. The rainfall during the second half was more than expected by IMD
mainly due to the longer life period of a series of low-pressure systems formed over the
region, which mostly moved along the monsoon trough resulting in above normal season
rainfalls over Central India & South Peninsula and below normal seasonal rainfall over North-
East India. Seasonal rainfall over Northwest India was deficit (84% of LPA) mainly due to the
fact that most of the Low-Pressure Systems dissipated before reaching to northern latitudes.
Overall, the impact of synoptic scales systems and intra seasonal variations on the monsoon
performance was very significant this year resulting in increased uncertainty in the
predictability of monsoon at seasonal scales. The experimental forecasts from Monsoon
Mission CFS for the season rainfall over the country as a whole based on March initial
conditions were overestimated to the actual situation by about 17%. However, forecasts
based on April (109%) and May (107%) initial conditions were very much within the forecast
limits. The experimental forecasts from most of the other Indian sources as well as from the
international climate centers indicated normal to above normal rainfall.
Chapter 13 describes the evaluation of the performance of the operational and
experimental Extended Range Forecasts (ERFs) during the Southwest Monsoon season
2020. The operational Multi Model Ensemble (MME) ERF could capture the early onset over
Bay of Bengal and normal onset of monsoon over Kerala. The ERF also captured the
relatively fast progress of monsoon northward and the rainfall during the onset and progress
phase of monsoon. The operational ERF also captured the transition phases of monsoon
with relatively weak conditions in July and also very active monsoon conditions in August
almost with a lead time of 3 weeks. The ERF captured the active phases of monsoon in
second half of September and delayed withdrawal of monsoon with a lead time of about 2 to
3 weeks. Quantitatively, over the country as a whole the MME ERF forecast provided useful
guidance with the CC between observed and forecast rainfall departure is found to be
significant till three weeks.
Chapter 14 describes the utilization of various satellite products for monitoring and
analysis of various aspects of Southwest Monsoon 2020. The Onset of Monsoon over
Kerala, its advance over various regions of India, various synoptic scale systems and
withdrawal of monsoon have been discussed in the light of satellite products. The utility of
291
such derived satellite products as OLR, Rainfall estimates and winds, Satellite RGB imagery,
has also been demonstrated in this Chapter.
Chapter 15 describes the performance of Automatic Weather Station (AWS) data in
monitoring low pressure systems during Southwest Monsoon season 2020. As on date, a
fairly dense and well distributed network of 724 Automatic Weather Stations and 1352
Automatic Rain Gauge Stations has been established in the country to meet operational
requirements and monitoring of weather systems of different temporal and spatial scales
such as tropical depressions, thunderstorms, cyclones, hailstorms, dust storms, heat and
cold wave etc. It has been observed that, the AWS network has complemented the
conventional manned surface observatory network and has proved to be a valuable tool to
monitor synoptic scale weather systems. Ignoring some aberrations, the network responded
very well and provided data of reasonably good quality especially for pressure and rainfall
during passage of cyclonic disturbances during Southwest Monsoon season, 2020.
Chapter 16 discusses the results of verification of the various Heavy Rainfall warnings
issued by IMD during South west Monsoon Season 2020, for various regions of India. There
had been a total number of 1977 of events of heavy rainfall and above during Monsoon
season 2020 out of which 734 had been very heavy rainfall and above and 157 had been
extremely heavy rainfall. The maximum number of events of heavy rainfall and above, very
heavy rainfall and above and extremely heavy rainfall had occurred in the month of August.
Assam and Meghalaya recorded the highest number of events in all the three categories.
Lakshadweep recorded the lowest number of 8 events of heavy rainfall and above among
which one was very heavy rainfall event. It has not recorded any extremely heavy rainfall
event. In addition to Lakshadweep, another ten sub divisions viz. Andaman & Nicobar
Islands, Gangetic West Bengal, Jharkhand, Haryana, Chandigarh & Delhi, Punjab, Jammu
Kashmir & Ladakh, Marathwada, Coastal Andhra Pradesh &Yanam, Rayalaseema and North
Interior Karnataka had not reported any extremely heavy rainfall during the season. The
Probability of Detection for different regions for all the regions is about 70% or more for Day
1 forecast. The highest value for Day 1 is 90% for Northeast India followed by 82% for West
India.The Critical Score Index (CSI) values are 60% or more for NE and West India and 50%
or more for all the five days of forecast for these regions. The CSI is 50% or more for Central
India up to four days, for East India up to three days and South India up to two days.The
False alarm rate is found to be higher for D1 forecast for all the regions whereas the Missing
Rate shows lowest value for D1 forecast after which it increases gradually. Probability of
Detection, Missing rate and Critical Success Index show significant improvement of 56%,
54% and 51 % respectively in heavy rainfall warning during Monsoon season 2020 with

292
respect to the forecast for Day 1, in comparison with the average values of those indices for
the season 2002 to 2019. The False Alarm Rate also shows improvement in the year 2020
as compared to the average value for 2002 to 2019 with the percentage of improvement is
22%.