climate of rajasthan - imd pune
TRANSCRIPT


i
P R E F A C E
The importance of meteorology and its economic and social benefits are
being increasingly realised all over the world. In our country also, various sectors like agriculture, aviation, energy, industry require climatological information pertaining to different regions of the country, for planning and executing projects, with a view to derive maximum advantage from meteorological and/or climatological conditions. Keeping these requirements in view, it was decided by India Meteorological Department to publish a series of “Climatological Summaries” for each state in the country incorporating the district climatological summaries. The sixteenth issue in the series of ‘State Climatological Summaries’ is “Climate of Rajasthan”, which is the revised version of its earlier publication No.6 brought out in the year 1988. The present publication contains an extensive information on rainfall in Rajasthan state and various districts of state based on the available rainfall data for the period 1951-2000. The climatological data in respect of temperature, wind, clouds and other weather parameters for the period from 1961-1990 and information on droughts, excessive rainfall, depressions and cyclonic storms are also included in the publication. The climatological summary and related maps were prepared by Shri S.M.Deshpande, Smt. U.S.Satpute, Smt. P.R.Iyer, Shri. R.S.Wayal, Smt. P.P.Bhagwat and Shri A.B.Dhule from “Climatological Publications Section” of the Office of the Additional Director General of Meteorology (Research), India Meteorological Department, Pune. The contributions of Shri A.K. Jaswal, Director (NDC) , Shri B.V. Potdar, Shri K.K. Raina and Shri V.W.Mhaske have been very vital. The designing and printing has been done by DTP unit, under the supervision of Shri Philipose Abraham. The publication was prepared by Smt. P.G.Gore, Director and reviewed by Dr. A.L. Koppar, DDGM(C). Dr.A.B. Mazumdar, LACD-ADGM(R), provided the overall guidance for this publication. I appreciate their sincere efforts.
NEW DELHI
December, 2010
AJIT TYAGI DIRECTOR GENERAL OF METEOROLOGY

INDIA METEOROLOGICAL DEPARTMENT DOCUMENT AND DATA CONTROL SHEET
1 Document title Climate of Rajasthan
2 Document type
Scientific Publication
3 Issue No. Climatological Summaries of States Series - No. 16 4 Issue date December 2010
5 Security Classification
Unclassified
6 Control Status Uncontrolled 7 No. of Pages 260 8 No. of Figures 28
9 No. of references
Nil
10 Distribution Unrestricted 11 Language English
12 Authors Climatological Publication Section, Office of Additional Director General of Meteorology (Research), Pune.
13 Originating Division/Group
Climatological Publication Section
14
Reviewing and Approving Authority
Director General of Meteorology, India Meteorological Department, New Delhi.
15 End users
State Gazetteers Unit, Central and State Ministries of Agriculture, Science & Technology, Education, Irrigation and Power, Disaster Management Agencies, Research Institutes and Agricultural Universities.
17 Abstract
The publication contains extensive information on the climate of Rajasthan and its districts based on rainfall, temperature, winds, clouds and other weather parameters. The information on droughts, excessive rainfall, depressions and cyclonic storms are also included in the publication.
18 Key words
State Summary, District Summary, Physical Features, Climatic Classification, Heaviest Rainfall, Highest Maximum Temperature, Lowest Minimum Temperature, Rainfall Variability, Seasonal Rainfall, Annual Rainfall, Mean Maximum Temperature, Mean Minimum Temperature.

ii
I N T R O D U C T I O N
The climatology of the state of Rajasthan in terms of various meteorological
parameters is described in the first chapter. It is followed by a detailed description of
the climate of each district in the succeeding chapters. In this publication, the
districts of Rajasthan state which were in existence as on 1st January 2009, have
been considered and the climatology of these districts, arranged in alphabetical
order is presented.
The normals of meteorological parameters used for describing the climate are
generally based on data for the period 1961 to 1990, except in the case of rainfall.
The normals of rainfall are based on the data for the period 1951 to 2000. These
data are obtained from National Data Centre, Pune. The extreme values of
temperature and rainfall presented in the publication are based on the data updated
upto the year 2009 and 2006 respectively.

iii
TABLE OF CONTENTS
Climate of Rajasthan Page No.
State Climatological Summary:
General Description …. 1
Climate 4
Atmospheric Sea Level Pressure & Winds …. 5
Temperature …. 5
Humidity …. 7
Cloudiness …. 7
Rainfall …. 8
Rainfall Variability …. 9
Drought & Excessive Rainfall …. 10
Weather Hazards …. 21
Consolidated Tables (I to VII) …. 23
District Climatological Summaries:
WEST RAJASTHAN
1. Barmer …. 48
2. Bikaner …. 54
3. Churu …. 62
4. Ganganagar …. 69
5. Jaisalmer …. 78
6. Jalore …. 84
7. Jodhpur …. 91
8. Nagaur …. 97
9. Pali …. 103

iv
Climate of Rajasthan (contd) Page No.
District Climatological Summaries:
EAST RAJASTHAN
1. Ajmer …. 110
2. Alwar …. 117
3. Banswara …. 124
4. Baran …. 131
5. Bharatpur …. 136
6. Bhilwara …. 143
7. Bundi …. 151
8. Chittorgarh …. 156
9. Dausa …. 164
10. Dholpur …. 169
11. Dungarpur …. 175
12 Hanumangarh …. 182
13. Jaipur …. 187
14. Jhalawar 195
15. Jhujhunuu 202
16. Karoli 208
17. Kota …. 213
18. Rajsamand …. 222
19. Sawai Madhopur …. 227
20. Sikar …. 233
21. Sirohi …. 239
22. Tonk …. 247
23. Udaipur …. 253

v
LIST OF ILLUSTRATIONS Page
No. Fig. 1 Physical Features VIFig. 1(a) Inset VIIFig. 2 Climatic Classification VIII
Temperature
Fig. 2(a) Mean Maximum Temperature for May …. IXFig. 2(b) Mean Maximum Temperature for July …. XFig. 2(c) Mean Maximum Temperature for October …. XIFig. 2(d) Mean Maximum Temperature for January …. XIIFig. 3(a) Mean Minimum Temperature for January …. XIIIFig. 3(b) Mean Minimum Temperature for April …. XIVFig. 3(c) Mean Minimum Temperature for July …. XVFig. 3(d) Mean Minimum Temperature for October …. XVIFig. 4 Highest Maximum Temperature ever recorded …. XVIIFig. 5 Lowest Minimum Temperature ever recorded …. XVIII
Rainfall
Fig. 6 Annual Normal Rainfall (cm) Seasonal Rainfall (cm)
XIX
Fig. 6(a) Cold Weather Season - January – February …. XXFig. 6(b) Premonsoon (Hot Weather) Season - March – May …. XXIFig. 6(c) Monsoon Season - June – September …. XXIIFig. 6(d) Post Monsoon Season - October – December …. XXIII
Fig. 7 District Normals of Seasonal and Annual Rainfall (mm) (1951-2000) for East Rajasthan
…. XXIV
Fig. 7(a) District Normals of Seasonal and Annual Rainfall (mm) (1951-2000) for West Rajasthan
…. XXV
Fig. 8 Catchment Areas (105, 106, 107, 108, 202, 403, 404, 405, 406, 407, 600) with Annual Rainfall (mm)
…. XXVI
Fig. 9 Coefficient of rainfall variation – Annual …. XXVIIFig. 9(a) Coefficient of rainfall variation – Premonsoon (Mar-May) …. XXVIIIFig. 9(b) Coefficient of rainfall variation – Southwest Monsoon
(Jun-Sep) …. XXIX
Fig. 9(c) Coefficient of rainfall variation – Post-monsoon (Oct-Dec)
…. XXX
Fig. 9(d) Coefficient of rainfall variation – Winter (Jan-Feb) …. XXXIFig. 10 Area affected by Drought (1951-2000) …. XXXIIFig. 11 Area affected by Excessive Rainfall (1951-2000) …. XXXIII


II


1
THE CLIMATE OF RAJASTHAN
General Description
The state of Rajasthan is located in the northwestern part of the Republic of
India. It is the largest state covering an area of 3,42,239 square kilometers, bounded
by 23°30’North and 30°11’North latitude and 69°East and 78°East longitude. The
state shares its west and northwestern boundary with Pakistan which is about 1070
km. Gujarat and part of Madhya Pradesh on its south, rest of Madhya Pradesh and
Uttar Pradesh on its east and Punjab and Haryana on its north and northeast. This
state has a type of rhomboid shape and stretches lengthwise 869 km from west to
east and 826 km from north to south. The tropic of Cancer passes through its
southern tip in the Banswara district. This state is practically free from maritime
influence. Orographic features and absence of maritime influence affect the climate
of the state to a large extent. The physical features of the state are shown in Fig. 1.
The inset Fig. 1(a) indicates its position in the country.
The distinguishing feature of the state is the Aravalli range, the strong barrier
which divides the plains of Marwar (lying between 24°37’ and 27°42’North Latitudes
and 70°05’ and 75°22’ East Longitude) from the high table land of Mewar (lying
between 23°49’ and 25°28’North Latitude and 73°01’ and 74°49’East Longitude).
The range which commences at the ‘Ridge’ at Delhi, comes into prominence near
the town of Ajmer, where it appears in a succession of parallel hills. The highest
point, on which is perched the fort of Taragarh, rises immediately above the city of
Ajmer to a height of about 870 metres above sea level between 395 and 425 metres
above the valley at its base. The ‘Nagpahar’ or serpent hill, 5 km west of Ajmer city,
attains a slightly lower elevation. About 16 km from Ajmer, the hills disappear for a
short distance but in the neighbourhood of Beawar form a compact double range
which approach each other southward and finally meet near Todgarh, from where a

2
succession of hills and valleys extends to the farthest extremity of the Merwara.
Thence the range gradually becomes bolder and more precipitous, till it finally
terminates in the southeast corner of the Sirohi district near Mount Abu.
The plateau on which the town of Ajmer stands, marks the highest point in
plains of India and from the hills, which surround the land slopes away on every side.
The range of hills between Ajmer and Nasirabad marks the dividing watershed of the
Indian sub-continent. The rain which falls on the southern or Nasirabad side, finds its
way by the river Chambal into the Bay of Bengal; that which falls on the other side is
discharged by Luni into the Gulf of Kutch. Further south the water shed is still more
clearly marked and is the high wall of rock which separates Marwar from Mewar.
The entire portion of West Rajasthan formerly known as Marwar (lying 24°37’
and 27°42’ North Latitude and 70°05’ and 70°22’ East Longitude) is sterile, sandy
and inhospitable but improves gradually from a mere desert in the far west and north
to comparatively fertile and habitable lands in the northeast, east and southeast in
the neighbourhood of the Aravalli hills. The ‘great desert’, forming the whole of the
West Rajasthan – Sind frontier, extends from the edge of the Rann of Kutch beyond
the Luni river northward and between it and what has been called the ‘little desert’ on
the east is a zone of absolutely barren country, consisting of a rocky land cut off by
limestone ridges, which to some extent protect it from the desert sands. These
places are covered with sand hills, shaped generally in long straight ridges, which
seldom meet but run in parallel lines. Some of these ridges may be 3 kilometres
long. The only important river in west Rajasthan is the Luni or salt river (the Lonavari
or Lavanavari) which rises in the hills southwest of Ajmer city and was first known as
Sagarmati. After passing Govingarh in the Ajmer district, it is joined by the Sarsuti
(Saraswati) which has its source in the sacred lake of Puskar, and from this point it is
called the Luni. After a course of about 320 km generally west to southwest it is
finally lost in the marshy ground at the head of the Rann of Kutch. It receives the
drainage brought by the mountain torrents down the western slopes of the Aravalli
hills between Ajmer and Abu. It has several tributaries, the chief being the Lilri, the
Raipur Luni, the Guhiya, the Bundi, the Sukri and the Jawai on the left bank and the
Jojri on the right, but none of them is perennial.

3
The other principal rivers are the Chambal and its tributary, the Banas. The
Chambal (the Charmwati) rises in Central India some 14 km southwest of the
cantonment of Mhow and after flowing generally north for 315 km, enters Mewar in
the extreme east near the old fort of Chaurasgarh. From Bahinsrorgarh the Chambal
flows northeast for some 10 km and the rest of its course lies in or along the borders
of the Bundi, Kota, Jaipur, Dholpur and Gwalior districts. It eventually falls into the
Jamuna 40 km southwest of Etawah in Uttar Pradesh.
The Banas (the ‘hope of the forest’) rises in the Aravalli, about 65 kms
northwest of Udaipur and flows southward until it reaches Gogunda plateau, when it
turns to the east and cutting through the outlying ridges of the Aravalli, burst into
open country. Its subsequent course lies in or along the borders of Udaipur, Ajmer,
Jaipur, Bundi, Tonk districts and it eventually falls into the Chambal. Its total length is
about 480 km.
The river Banganga originates from the low hills of Bairath (Jaipur district)
flows eastward entering Sawai Madhopur and Bharatpur districts. The river Gambhiri
which originates from Karoli hills in Sawai Madhopur district passes through the parts
of Bharatpur district and joins the river Jamuna. The river Mahi also originates from
the Mhow ranges at Madhya Pradesh. It enters Rajasthan state near Khandu Village
(Banswara district).
The state is divided into two sub-divisions namely: a) West Rajasthan b)East
Rajasthan. There are 32 districts in the state.
West Rajasthan
East Rajasthan
1 Barmer 1 Ajmer 10 Dholpur 19 Sawai Madhopur2 Bikaner 2 Alwar 11 Dungarpur 20 Sikar 3 Churu 3 Banswara 12 Hanumangarh 21 Sirohi 4 Ganganagar 4 Baran 13 Jaipur 22 Tonk 5 Jaisalmer 5 Bharatpur 14 Jhalawar 23 Udaipur 6 Jalore 6 Bhilwara 15 Jhunjhunu 7 Jodhpur 7 Bundi 16 Karoli 8 Nagaur 8 Chittorgarh 17 Kota 9 Pali. 9 Dausa 18 Rajsamand

4
Climate Areas in Rajasthan state under each climatic pattern based on Koppen’s
classification are shown in Fig. 1. This broad classification is based on the variation
of temperature and rainfall. West Rajasthan has a climate: Tropical desert, Arid; hot
(BWh). The districts adjacent to Madhya Pradesh have a climate type marginally
varying between the types Tropical Savanna – Hot; seasonally dry (Aw) and Interior
Mediterranean, Mild winter; dry and hot summer (Csa) and Sub Tropical Monsoon
with mild and dry winter, hot summer (Cwa).
The districts Jaisalmer, Barmer, Jodhpur, Bikaner, Nagaur, Ganganagar,
Hanumangarh from West Rajasthan have Tropical Desert, Arid and hot climate
(Bwh). Baran, Sirohi, Dungarpur, Sawai Madhopur, Jhalawar districts of East
Rajasthan have interior Mediterranean mild winter, dry and hot summer (Csa). The
Chittorgarh district has a climate type marginally varying between the types Interior
Mediterranean, mild winter, dry and hot summer (Csa) and sub-tropical monsoon,
mild and dry winter, hot summer (Cwa). Banswara district of east Rajasthan has
climate of Tropical Savanna – Hot, seasonally dry winter (Aw). Remaining districts of
east Rajasthan belongs to the climate type: Tropical Steppe, semi arid, hot (Bsh).
The year may be divided into four seasons. The winter season from January
to February is followed by the premonsoon season from March to May. The period
from June to September constitutes the southwest monsoon season and the period
from October to December form the post monsoon season.
The period from November to March is generally very unpleasant due to biting
cold over the entire state, when a series of severe cold waves associated with
western disturbances affect the entire state. In the summer months from April to
June, weather is very dry and uncomfortable. Due to lower temperatures, the plateau
regions are, however, comparatively less uncomfortable in summer. Weather tends
to be oppressive during July due to high humidity and temperature. The rest period
of the monsoon is fairly comfortable due to reduced day temperature, although
humidity continues to be high.

5
Atmospheric Sea Level Pressure and Winds:
The seasonal variation of atmospheric pressure over the state takes place in
a systematic manner with a maximum in the winter (January) and a minimum in the
monsoon season (July). The pressure gradient over the state generally remains
weak except during the late summer and monsoon season. During winter the higher
pressure is to the north. In July, the pressure decreases from south to north in
Rajasthan.
The winds are light and mainly from northwest-north-northeast over the state
in January, turn gradually anticlockwise and are replaced by light northwesterly to
westerly or southwesterly winds in April. With the advance of the summer, the
pressure gradient increases and correspondingly the winds from northwest to
southwest also strengthen reaching their maximum strength in July. In July, the
pressure decreases from west-southwest to east-northeast over the state. October is
the month of transition, with weakest pressure gradient. From October onwards, the
change over of the pressure and wind pattern commences and north-northeasterly
winds appear. Table 1 gives the monthly mean wind speed in kmph, for the
observatory stations in the two sub-divisions.In addition, predominant wind directions
in the morning and evening have been included. For each sub-division, the mean
monthly wind speed is given at the end of the respective sub-divisional table.
Temperature:
Table 2 gives the mean daily maximum and minimum temperatures at the
observatory stations and for each of the two subdivisions. Fig. 2(a, b, c, d) and 3(a,
b, c, d) show the distribution of mean maximum and mean minimum temperatures
respectively for the selected months. Fig. 4 and 5 give the extremes of temperature
ever recorded in respect of observatory stations. These values were obtained based
on data available upto the year 2009.
Day temperatures are more or less uniform over the plains except during the
winter and monsoon season, when temperatures increase southwards and
northwards respectively. In general, the night minimum temperatures are lower in
higher latitudes except during the southwest monsoon when they are more or less

6
uniform. Both day and night temperatures are lower over the plateau and at high
level stations than over the plains.
May is the hottest month with the mean maximum temperature at about 41°C
-42°C in the plains, the plateau regions and elevated places recording 2°C to 4°C
lower.
The highest maximum temperature ever recorded at an individual
station in the plains is 50.6°C at Alwar on 10 May 1956, which is about 10°C higher
than the normal of the warmest month. Mount Abu, a hill station registered the
highest maximum temperature at 39.2°C on 15 May 1985, which was 7°C higher
than the normal for the warmest month.
January is the coldest month in the state when the mean minimum
temperature for the state as a whole is 7.4°C varying from 4°C in the north to 12°C in
the south. During winter, much lower temperature may be experienced in the wake
of western disturbances. On such occasions, minimum temperature 2°C - 5°C below
the freezing point can be registered at few stations in the northern parts of
Rajasthan. The lowest minimum temperature ever recorded at an individual plain
station was -5.9°C at Jaisalmer on 12 January 1967, while the hill station of Abu had
recorded the lowest temperature of -7.4°C on 12 December 1994. These were
12.8°C and 13.1°C below the respective normals for the coldest months.
The maximum temperature rise rapidly from February onwards till May and
minimum temperature from February onwards till June. The increase in maximum in
the period from January to May ranges from 13°C to 20°C at individual stations as
we proceed from south to north of the state. From the beginning of June to the end
of July, the maximum temperature falls by about 3°C to 7°C whereas the minimum
temperature falls only by about 3°C to 5°C from June to September. A slight rise in
the maximum temperature is experienced in the month of September due to
increased insolation. The night temperatures start falling rapidly after September
while day temperatures follow this trend after October and both attain lowest values
by January. The fall in minimum temperature and maximum temperature is about

7
8°C to 15°C and 5°C to 7°C respectively during these periods. In both cases, the fall
increases from southern parts of the state to the northern parts.
July and August have the smallest diurnal range of temperature of about 9°C
in the state. The diurnal range increases rapidly after the withdrawal of the monsoon.
During the period from November to May, the diurnal range is of the order of 15°C to
18°C, being greatest in November.
Humidity
Table 3 gives the mean relative humidity at 0830 and 1730 hours IST for the
individual stations in the two subdivisions. The relative humidity is generally high
during the period from July to September. It is about 45%-47% in June rising to a
little less than 70% during August in West Rajasthan and to about 76%-77% in East
Rajasthan. The diurnal variation in relative humidity is least during monsoon being
higher in West Rajasthan. The relative humidity is least during the summer
afternoons when it becomes about 20 to 30% in major parts of the state making the
summer very dry and hot. The diurnal variation is highest during the period January
and February.
Cloudiness and Sunshine
The period from October to May is cloudless or lightly clouded, the part of the
period from January to March being more clouded. Afternoons are however,
comparatively more clouded than forenoons, in this period. In April and May the sky
remains cloudless or lightly clouded over the state. During monsoon season skies
are heavily clouded especiallly during July and August, when generally sky is
covered with 4 oktas of cloud in West Rajasthan, and with 5 oktas of cloud in East
Rajasthan respectively. On an average in each of these two months, the sky
remains overcast for 5 days and clear on 7 days per month in West Rajasthan and
for more than 8-9 days and clear on 4-5 days per month in East Rajasthan. During
October, clouding decreases to a great extent over the entire state.
Tables 4 and 4(a) give the mean number of days with clear skies, overcast
skies and the mean monthly total cloud amount at 0830 and 1730 hours IST
respectively.

8
For general information, the mean hours of bright sunshine for different
months for some observatory stations in the state are indicated in Table 4(b).
Rainfall
Table 5 gives district wise and sub-divisional normals for monthly and annual
rainfall and the number of rainy days. For the hilly regions, rainfall data of individual
hill station (elevation exceeding 1067m) are given in Table 5(a). Fig 6 and 6(a) to
6(d) show the annual and seasonal distribution of rainfall. Fig. 7 and 7(a) shows the
districtwise seasonal and annual rainfall for each of the two sub-divisions and
provide a measure for comparison of seasonal rainfall with the annual rainfall.
The total annual rainfall in state varies from14 cm over the extreme
northwestern parts to 1000 cm over the southeastern parts. The southwest monsoon
is the principal rainy season when the state receives 91% of its annual rainfall.
Rainfall in the winter season (January-February) is about 2% of the annual total
rainfall in the summer season (March-May) is about 3% and in the post-monsoon
season (October-December) it is about 4%.
Southern/southeastern districts adjacent to Madhya Pradesh constitute the
area of maximum rainfall in the state. Pali and Jalore districts on the west of Aravalli
hills receive maximum amount of rain of 50 cm and 43 cm in West Rajasthan. In the
north/northwest districts Bikaner, Ganganagar, Jaisalmer receive annual rainfall of
26cm, 24cm and 17cm respectively, annual rainfall over Jaisalmer district being the
lowest. These districts and the adjoining areas constitute the driest zone of the state.
The mean annual rainfall in the East and West Rajasthan is about 64.9 cm and 32.7
cm respectively with the districts of East Rajasthan receiving more rainfall than those
of West Rajasthan.
The southwest monsoon sets in over the eastern parts of the state by about
the last week of June and extends over the entire state by the first week of July. July
and August are the rainiest months, each accounting individually to about 34% of the
annual rainfall. In each of these months, there are about 5 rainy days (with daily
rainfall of about atleast 2.5 cm) in West Rajasthan and about 9 -10 rainy days in East
Rajasthan.

9
The withdrawal of the southwest monsoon begins from the northern western
parts of the state around 1st September and by 15th September monsoon withdraws
from the entire state.
During winter (January-February), East and West Rajasthan receive 1 cm and
0.7 cm of rainfall respectively, which is although small in amount is of great
significance for agriculture. This rainfall occurs in association with western
disturbances which move from west to east across the northern parts of the country.
Table 6 gives the monthly and annual rainfall for various river catchments
numbers 105, 106, 107, 108, 202, 403, 404, 405, 406, 407 and 600 in the state. The
annual rainfall of these river catchments is shown in Fig. 8.
Rainfall Variability
Coefficient of variation (cv) which is expressed in percentage is defined as:
C.V. = Standard deviation (σ) x 100
Normal (N)
Where σ = Standard Deviation N = Normal of the annual rainfall
The following discussion gives the picture of rainfall variability, in different
seasons as well as year as a whole. Fig. 9 and Fig. 9(a) to 9(d) indicate the rainfall
variability for the whole year, pre monsoon, southwest monsoon, post monsoon and
winter season respectively.
Co-efficient of variation (cv) of annual rainfall is more than 60% in extreme
western parts of the state. In southeastern and extreme eastern parts of the state, it
is less than 30%. In other parts of the state it ranges between 30% to 60%. In the
months of January and February, the cv is extremely high and it ranges from 100 to
200. It increases from northeast to southwest. During the summer months i.e. March
to May, it is the lowest in the northeastern parts of the state, adjacent to Haryana
state, which is less than 100% and increases to its southwestern and extreme
southern parts of the state which is greater than 200%. During the southwest

10
monsoon season cv is more than 60% in the extreme western parts of the state. In
the extreme southern parts of the state, it is less than 35% and in the other parts of
the state, it ranges from 30 to 60%. During post monsoon season cv is less than 150
in eastern parts of the state while in the extreme northern-northwestern parts of the
state cv is greater than 200. In other regions of the state it varies in between 150 and
200.
Droughts and Excessive Rainfall
A. Droughts: Meteorologically drought over an area or place may be defined as
a situation when annual rainfall over the area or place is less than 75% of the
normal. It is further classified as ‘moderate drought’ if rainfall deficit is between 25 to
50% and ‘severe drought’ when it is more than 50%.
Areas where frequency of drought as defined above is 20% of the years
examined are classified as ‘drought areas’ and areas having drought condition for
more than 40% of the years under consideration represent “chronically drought
affected areas”.
Drought conditions which prevailed over Rajasthan during the 50 year period
from 1951-2000 are described below:
a) West Rajasthan
All districts in this sub-division viz. Barmer (16), Bikaner (12), Churu (12),
Ganganagar (7), Jaisalmer (13), Jalore (15), Jodhpur (18), Nagaur (14) and Pali (16)
became the victims of ‘drought’ for the number of years as indicated within the
brackets against each district. All the districts in the sub-division except Ganganagar
experienced the drought conditions for more than 20% of the years under
consideration and may therefore, be classified as ‘Drought Areas’, while Jodhpur
district very nearly satisfies the criteria for being classified as a ‘chronically drought
affected area’.
The severity of drought not only depends upon the order of rainfall deficiency
in a single year, but also on the continued occurrence of deficient rain in successive
years, even though the deficiency in each such successive year may not be as high

11
as in a single year. Occasions of occurrence of drought conditions in successive
years, were very frequent in the case of this sub-division.
The details of yearwise occurrence of successive drought during the 50 year
period 1951 to 2000 over each district are given in Table (i).
Table (i)
Years of successive droughts and the Affected districts.
Years of Successive Drought
Affected Districts
1951-1952 Bikaner, Churu 1962-1963 Barmer, Pali 1965-1966 Nagaur 1968-1969 Barmer, Bikaner, Churu, Ganganagar, Jaisalmer,
Jalore, Jodhpur, Pali 1971-1972 Pali 1980-1981 Jalore 1980-1981-1982 Pali 1984-1985-1986-1987 Bikaner, Jaisalmer, Jalore, Jodhpur ,Nagaur, Pali1985-1986-1987-1988 Barmer 1996-1997-1998-1999 Jodhpur
The above table clearly brings out the area which was simultaneously affected
by drought conditions. Further, rainfall of less than 50% of the annual normal
representing severe drought conditions occurred in various districts as indicated in
the following table.

12
Table (ii)
Districtwise years of severe drought with lowest percentage of annual rainfall and year
Districts Years of Severe Drought
(Rainfall < 50%) Lowest amount of
rainfall in cms (expressed as % of annual normal) with
year Barmer 1966, 1968, 1969, 1974, 1987 4.5 cm in 1969 (18%) Bikaner 1963, 1968, 1991 7.5 cm in 1968 (29%) Churu 1952 17.1 cm in 1952 (46%) Ganganagar 1968 11.2 cm in 1968 (46%) Jaisalmer 1963, 1968, 1969, 1974, 1987,
1991 2.2 cm in 1969 (13%)
Jalore 1968, 1969, 1974, 1980, 1986, 1987, 1991
9.1 cm in 1968 (21%)
Jodhpur 1968, 1969, 1987, 1996, 1997, 1998, 1999
1.6 cm in 1998 (5%)
Nagaur 1951, 1963, 1987 16.4 cm in 1951 (42%) Pali 1969, 1974, 1981, 1987 16.0 cm in 1969 (32%)
It can be seen that the lowest district rainfall expressed as percentage of the
annual normal was only 5% recorded in Jodhpur district in 1998.
The sub-division had experienced widespread drought in the years 1951,
1963, 1968, 1969, 1972, 1974, 1984, 1985, 1986, 1987 and 1991, when the number
of districts experiencing drought condition was 6, 7, 8, 9, 7, 6, 7, 7, 6, 8 and 7
respectively. In the year 1969 whole sub-division was affected by drought condition.
Moreover, it happens to be successive year of drought in eight districts and five
districts affected by severe drought condition.
b) East Rajasthan
All the districts in this subdivision viz. Ajmer (11), Alwar (7), Banswara (9),
Baran (7), Bharatpur (6), Bhilwara (4), Bundi (11), Chittorgarh (7), Dausa (7),
Dholpur (8), Dungarpur (10), Hanumangarh (9), Jaipur (13), Jhalawar (11),
Jhunjhunu (13), Karoli (12), Kota (10), Rajsamand (8), Sawai Madhopur (10),

13
Sikar (10), Sirohi (10), Tonk (8) and Udaipur (11) experienced drought conditions for
the number of years as indicated within brackets against each district.
14 districts viz. Ajmer (23%), Banswara (20%), Bundi (25%),
Hanumangarh (23%), Dungarpur (21%), Jaipur (27%), Jhalawar (24%),
Jhunjhunu (27%), Karoli (29%), Kota (21%), Sawai Madhopur (21%), Sikar (21%),
Sirohi (23%) and Udaipur (23%) had drought condition for more than 20% of the
years and may therefore, be classified as drought areas.
Occasions of occurrence of drought conditions in successive years were very
frequent in this sub-division also. The following Table (iii) depicts districtwise years of
successive drought during the 50 year period 1951 to 2000.
Table (iii)
Districtwise years of Successive Drought
Districts Years of Successive
Drought Jaipur, Jhunjhunu, Sawai Mahodpur 1951-1952-1953 Karoli 1953-1954 Hanumangarh 1958-1959-1960-1961 Ajmer 1962-1963 Bundi, Baran, Chittorgah,Jaipur, Jhalawar, Karoli, Kota, Sawai Madhopur, Udaipur
1965-1966
Banswara, Dungarpur 1964-1965-1966 Dungarpur 1968-1969 Dholpur 1978-1979 Jhalawar 1979-1980-1981 Rajsamand 1984-1985 Ajmer, Sirohi 1985-1986-1987 Alwar, Bharatpur, Dholpur, Jaipur, Jhunjhunu, Karoli, Udaipur
1986-1987
Dausa 1986-1987-1988 Bundi 1987-1988 -1989 Sawai Madhopur 1989 -1990 Dholpur 1993 -1994 Kota 1998 -1999

14
The above table clearly brings out the area which was simultaneously affected
by drought conditions. Further, rainfall of less than 50% of the annual normal rainfall
representing severe drought conditions occurred in various districts as indicated in
the following Table (iv).
Table (iv)
Districtwise years of severe drought with lowest percentage of annual rainfall and year
District Years of Severe Drought
(Rainfall < 50%)
Lowest amount of rainfall in cm (expressed as % of annual normal) with year
Ajmer 1972, 1987 21.4 cm in 1972 (47%) Alwar 1987 28.5 cm in 1987 (46%) Banswara 1966 38.8 cm in 1966 (44%) Baran 1965 37.8 cm in 1965 (44%) Bharatpur 1979 19.9 cm in 1979 (32%) Bhilwara 1951 27.9 cm in 1951 (47%) Chittorgarh 1951 28.6 cm in 1951 (36%) Dungarpur 1966 31.5 cm in 1966 (45%) Hanumangarh 1951, 1969, 1974 9.9 cm in 1969 (34%) Jhunjhunu 1951, 1968, 1999 19.0 cm in 1951 (40%) Karoli 1989 31.6 cm in 1989 (46%) Sikar 1972 21.6 cm in 1972 (47%) Sirohi 1974, 1987 17.8 cm in 1987 (32%) Tonk 1951 29.9 cm in 1951 (49%)
It can be seen that the lowest district annual rainfall expressed as percentage
of annual normal was only 32% recorded in Bharatpur and Sirohi districts in year
1979 and 1987 respectively. 1951, 1965, 1972 and 1987 were the years of
widespread drought when the number of districts experiencing drought was 21, 16,
16 and 17 respectively out of 23 districts in the sub-division.
During the period 1951 – 2000, there was no drought anywhere in the state in
the 9 years, viz. 1955, 1956, 1967, 1973, 1975, 1976, 1977, 1983 and 1992. In the 9
years period viz. 1959, 1961, 1970, 1978, 1990, 1994, 1995, 1996 and 1997, only
one district experienced the drought condition. 1951, 1965, 1972 and 1987 were the
year of widespread drought in the state when the number of districts experiencing

15
drought was 27, 21, 23 and 25 respectively out of 32 districts of the state. During the
above 50 years period, Sikar and Tonk districts had never fallen in the grip of
drought in any two consecutive years.
B. Excessive rainfall
Rainfall sufficiently in excess of the normal is a predominant factor for
occurrence of floods, particularly in high rainfall regions. For the purpose of the
present description, annual rainfall of 125% or more of the normal is considered as
excessive rain.
Fig.11 shows the percentage frequency of excessive rainfall and successive
years of excessive rainfall during the period 1951-2000.
West Rajasthan
The following Table (v) gives the district-wise excessive rainfall years and
highest annual rainfall (expressed as percentage of normal) with the year of
occurrence.

16
Table (v) Districtwise years of excessive rainfall with highest percentage
of annual rainfall and year
District Years of Excessive Rainfall (Rainfall > 125%)
Highest amount of rainfall (expressed as % of annual normal) with year
Barmer 1955, 1959, 1961, 1967, 1973, 1975, 1976, 1990, 1992, 1993, 1994, 1995, 1997, 1998
75.3 cm in 1990 (299%)
Bikaner 1959, 1964, 1975, 1976, 1978, 1982, 1983, 1992, 1995, 1997, 1998.
53. 8 cm in 1997 (208%)
Churu 1964, 1970, 1975, 1976, 1978, 1983, 1988, 1995, 1997, 1998
79.4 cm in 1978 (214%)
Ganganagar 1956, 1966, 1967, 1976, 1978, 1983, 1990, 1992, 1995, 1997
55.7 cm in 1997 (229%)
Jalore 1952, 1955, 1956, 1959, 1961, 1973, 1975, 1976, 1983, 1992, 1994, 1997
95.0 cm in 1956 (219%)
Jodhpur 1956, 1967, 1970, 1973, 1975, 1976, 1983, 1990, 1992
66.4 cm in 1975 (207%)
Jaisalmer 1953, 1955, 1956, 1961, 1973, 1975, 1976, 1983, 1992, 1993, 1994, 1995, 1998, 1999
48.4 cm in 1973 (280%)
Nagaur 1955, 1964, 1970, 1971, 1975, 1976, 1983, 1995
113.1 cm in 1975 (289%)
Pali 1955, 1959, 1961, 1967, 1970, 1973, 1975, 1979, 1983, 1990, 1992, 1994, 1997
109.3 cm in 1973 (219%)
From the above table it is seen that during the 50 year period from 1951-
2000, there were 27 years in which some districts or other in the sub-division
recorded excessive rainfall, the maximum and minimum amount being 299% and
207% of the normal annual rainfall in the year 1990 and 1975 for the district Barmer
and Jodhpur respectively.
The districts Barmer and Jaisalmer have got maximum number (14) years
with excessive rainfall while Nagaur has got minimum number (8) years with such

17
rainfall. In the year 1975, 1976 and 1983 eight district out of nine districts of the
subdivision received excessive rainfall. Successive years of excessive rainfall are
shown against each district in Table (vi).
Table (vi)
Districtwise Successive years of Excessive Rainfall
District Successive Years of Excessive Rainfall Barmer 1975-1976, 1992-1993-1994-1995, 1997-1998 Bikaner 1975-1976, 1982-1983, 1997-1998 Churu 1975-1976, 1997-1998 Ganganagar 1966-1967 Jaisalmer 1955-1956, 1975-1976, 1992-1993-1994-1995,
1998-1999 Jalore 1955-1956, 1975-1976 Jodhpur 1975-1976 Nagaur 1970-1971, 1975-1976
All the districts of the subdivision except Ganganagar and Pali experienced
excessive rainfall in successive year 1975-1976. Districts Barmer and Jaisalmer
experienced excessive rainfall in four consecutive years 1992-1995. Only Pali district
had no occasion when district experienced such rainfall in two consecutive years.
The heaviest rainfall recorded at any station for one day in the subdivision
was 780.3 mm at Parbatsar station in Nagaur district on 16 September 1900.
East Rajasthan
The following Table (vii) gives the district wise excessive rainfall years and
highest annual rainfall (expressed as percentage of normal) with the year of
occurrence.

18
Table (vii) Districtwise years of excessive rainfall with highest percentage
of annual rainfall and year
District Years of Excessive Rainfall Highest amount of rainfall (expressed as % of annual normal) with year
Ajmer 1955, 1956, 1973, 1975, 1976, 1979, 1983, 1994, 1997, 1998
90.5 cm in 1975 (199%)
Alwar 1955, 1958, 1967, 1976, 1983, 1985, 1995
108.3 cm in 1995 (175%)
Baran 1956, 1961, 1971, 1975, 1982, 1994
131.4 cm in 1975 (153%)
Banswara 1952, 1954, 1959, 1961, 1973, 1976, 1978, 1981, 1984, 1990, 1994, 1997
163.2 cm in 1973 (185%)
Bharatpur 1955, 1958, 1961, 1967, 1976, 1977, 1982, 1983, 1995, 1996, 1998, 1999
105.2 cm in 1958 (169%)
Bhilwara 1952, 1955, 1956, 1958, 1961, 1970, 1973, 1976, 1982, 1983, 1990, 1994
96.6 cm in 1994 (163%)
Bundi 1955, 1956, 1958, 1959, 1961, 1969, 1971, 1973, 1974, 1975, 1976, 1979
117.4 cm in 1956 (168%)
Chittorgarh 1952, 1955, 1956, 1959, 1961, 1973, 1976, 1994
141.3 cm in 1973 (178%)
Dausa 1955, 1958, 1959, 1961, 1975, 1978, 1981, 1995
115.6 cm in 1995 (170%)
Dholpur 1955, 1957, 1958, 1961, 1967, 1977, 1992
119.8 cm in 1977 (177%)
Dungarpur 1959, 1973, 1976, 1977, 1984, 1990, 1994, 1996, 1998
130.1 cm in 1977 (186%)
Hanumangarh 1966, 1970, 1971, 1975, 1976, 1978, 1982, 1983, 1992, 1994, 1995
60.0 cm in 1978 (205%)
Jaipur 1956, 1957, 1959, 1971, 1975, 1977, 1981, 1983, 1990, 1995, 1997
125.9 cm in 1977 (211%)
Jhalawar 1952, 1961, 1969, 1971, 1973, 1985, 1986
144,6 cm in 1961 (157%)

19
Table (vii) (contd…)
Districtwise years of excessive rainfall with highest percentage of annual rainfall and year
District Years of Excessive Rainfall Highest amount of rainfall (expressed as % of annual normal) with year
Jhunjhunu 1955, 1956, 1964, 1967, 1975, 1976, 1977, 1978, 1988, 1993, 1995, 1997
84.3 cm in 1978 (177%)
Karoli 1956, 1961, 1971, 1975, 1983, 1992, 1995
116.0 cm in 1961 (169%)
Rajsamand 1959, 1967, 1973, 1975, 1976, 1983, 1990, 1992, 1994
111.3 cm in 1973 (200%)
Kota 1955, 1956, 1961, 1971, 1974, 1975, 1977, 1986
127.5 cm in 1971 (168%)
Sawai Madhopur
1956, 1958, 1959, 1961, 1971, 1975, 1981, 1983, 1994, 1995, 1996, 1997, 1998, 1999
112. 2 cm in 1956 (154%)
Sikar 1955, 1956, 1964, 1967, 1970, 1975, 1977, 1978, 1983, 1995
103.4 cm in 1977 (225%)
Sirohi 1952, 1956, 1959, 1961, 1967, 1970, 1973, 1975, 1976, 1983, 1990, 1992, 1994
152.5 cm in 1973 (274%)
Tonk 1956, 1961, 1971, 1973, 1975, 1976, 1977, 1983
94.5 cm in 1971 (155%)
Udaipur 1954, 1959, 1973, 1975, 1976, 1994
143.6 cm in 1973 (206%)
From the above table it may be seen that during the period under
consideration, there were 37 years in which some districts or the other in the sub-
division recorded excessive rainfall, the maximum and the minimum amount being
274% and 153% of the normal annual rainfall in the year 1973 and 1975 for the
Sirohi and Baran districts respectively. Excessive rain occurred in the each and
every districts of the sub-division viz. Ajmer (10), Alwar (7), Banswara (12), Baran
(6), Bharatpur (12), Bhilwara (12), Bundi (12), Chittorgarh (8), Dausa (8), Dholpur
(7), Dungarpur (9), Hanumangarh (11), Jaipur (11), Jhalawar (7), Jhunjhunu (12),
Karoli (7), Kota (8), Rajsamand (9), Sawai Madhopur (14), Sikar (10), Sirohi (13),
Tonk (8), and Udaipur (6), in 6 to 14 years as shown within the brackets against

20
each district. In the year 1975 and 1976, 15 and 14 districts out of 23 districts of sub-
division received excessive rainfall.
Table (viii)
Districtwise Successive years of Excessive Rainfall
District Successive Years of Excessive Rainfall Ajmer 1955-1956, 1975-1976, 1997-1998 Bharatpur 1976-1977, 1982-1983, 1995-1996, 1998-1999 Bhilwara 1955-1956, 1982-1983 Bundi 1955-1956, 1958-1959, 1973-1974-1975-1976 Hanumangarh 1970-9171, 1975-1976, 1982-1983, 1994-1995 Chittorgarh 1955-1956 Dausa 1958-1959 Dungarpur 1976-1977 Jaipur 1956-1957 Jhalawar 1985-1986 Jhunjhunu 1955-1956, 1975-1976-1977-1978 Rajsamand 1975-1976 Kota 1955-1956, 1974-1975 Sawai Madhopur 1958-1959, 1994-1995-1996-1997-1998-1999 Sikar 1955-1956, 1977-1978 Sirohi 1975-1976 Tonk 1975-1976-1977 Udaipur 1975-1976 Dholpur 1957-1958
Districts Sawai Madhopur (1994-1999), Bundi (1973-1976), Jhunjhunu (1975-
1978) and Tonk (1975-1977) had experienced excessive rainfall in 6, 4, 4 and 3
successive years respectively in the years mentioned in brackets against each
district. Four districts in the sub-division viz. Alwar, Banswara, Baran and Karoli had
no consecutive years of excessive rainfall in the period under consideration. Eight
districts of sub-division registered excessive rainfall in the consecutive years 1975-
1976. The heaviest rainfall in 24 hours recorded at any station in the sub-division
was 802.9 mm at Chittor in Chittorgarh district on 14 July 1982.

21
Cyclonic Storms and Depressions
Cyclonic storms and depressions which mostly affect India originate and or
intensify over the Bay of Bengal, mostly during May to November or December.
Some of them originating over the Arabian Sea also affect Konkan, Gujarat,
Saurasthra and Kutch and northwest India during the above period. They usually
travel west to northwest and cross the coast. In general, storms and depressions
weaken on entering land. Hence Rajasthan situated far inland, does not experience
the full fury of the severe storms/depressions like the coastal regions. During the
course of their movement, the disturbances sometimes turn or recurve towards north
or northeast. This point of turning progressively shifts westwards till September. For
example, the disturbances in May recurve, while still out in the Bay of Bengal. As
such, the few of them which cross the coast and travel inland weaken far away from
the state and cannot affect it. The disturbances during the period June to September
form over the head Bay of Bengal and traveling westwards pass across the state of
Madhya Pradesh. During this period sometimes they move west/northwestwards as
far as Rajasthan. With the advance of the above period, the tracks of the bay storms
and depressions progressively shift south. In association with these systems, heavy
to very heavy rain occurs over the area affected by them.
The track of the bay cyclones is even more southerly in October and
November and these have no influence on Rajasthan weather. The bay cyclonic
storms/depressions which reach the state generally become considerably weak due
to long land travel. Maximum number of storms/depressions from the Bay of Bengal
affect the state in the month of August/September.
Table VII gives the total number of storms/depressions which affected each of
the two sub-divisions during the 110 years period ending 2000. For this purpose,
depressions affecting more than one sub-division have been counted separately for
each sub-division. The last column gives the total number of depressions/storms
which affected the state as a whole during this period. For this purpose, each
depression is counted as one even though it may have affected more than one sub-
division. During the period 1891-2000, 197 storms/depressions influenced the
weather of Rajasthan state.
22
Other Weather Phenomena
Thunderstorms and Duststorms
Convective activity is essential for the occurrence of thunderstorms and dust
storms. With the advance of the summer, thunder activity becomes pronounced due
to ground heating. When the moisture is insufficient in the atmosphere, dry
thunderstorms or dust storms occur. Maximum numbers of thunderstorms occur,
with the approach of the monsoon current, while dust storms are mainly confined to
the summer months March-June. Premonsoon and monsoon thunderstorms are
sometimes severe and accompanied by hail. Squall is uncommon in the state. The
average number of days of thunderstorms during the monsoon season is about 11 in
West Rajasthan and 10 in East Rajasthan, the maximum being in July in both the
subdivisions. The average annual number of thunderstorms in the West and East
Rajasthan are 17.0 and 15.0. In the winter months, the state experiences
thunderstorms sometimes accompanied by hail in association with western
disturbances. Thunder activity is minimum in the months from November to January
in both the sub-divisions.
Fog
Hill fog occurs during the monsoon season at few places, when air is almost
saturated and is easily cooled below the dew point while rising over high elevations.
Conditions like light to calm winds, clear skies etc., which favour occurrence of
radiation fog exist after the withdrawal of the monsoon till February. But due to lack
of sufficient moisture, fog occurs only occasionally, the maximum frequency of
occurrence being 0.8 in December and January in both West and East Rajasthan.


TABLE – I MEAN WIND SPEED (kmph) AND PREDOMINANT WIND DIRECTION
STATION JAN FEB MAR APR MAY JUN JUL AUG SEP OCT NOV DEC ANNUAL
EAST RAJASTHAN
Ajmer a 3.5 4.3 5.8 7.3 10.3 12.1 10.2 8.9 7.2 4.1 3.3 3.2 6.7 m C/NE C/NE C/SW C/SW SW SW/W SW/W SW/W SW/W C/SW C/NE C/NE e C/NE/SW SW/NW SW/NW SW SW/W SW/W SW/W SW/W SW/W C/SW C/NE C/NE Alwar a 2.1 2.8 3.4 4.2 6.1 6.3 4.6 3.4 3.2 2.0 1.8 1.6 3.5 m C C C/SW C/NW C/NW C/NW C/NW C/NW C/NW C/NE C C e C/NW/NE C/NW NW NW NW NW/C C/SW C/SW C/NW C/NW C C/NW Banswara a 4.7 5.6 6.0 6.2 9.4 9.8 7.7 6.4 4.3 4.0 4.5 4.9 6.1 m SE/E SE SE SW SW SW SW SW SW SE SE SE c NW NW NW/W W/SW W/SW SW SW SW SW NW C/NW NW Bharatpur a 3.0 3.6 4.2 4.6 5.2 6.3 4.8 3.7 3.7 3.0 2.1 2.3 3.9 m C/W C/W C/W C/W W/C/SW W/C/SW C/W/SW C/W C/W/SW C/W C/W C/W e C/N/NW C/N C/N/NW W/NW NW/W C/N C/SW C/SW C/N C/N C/NW/N C/N Bhilwara a 3.9 4.8 5.3 6.4 8.8 11.4 9.9 7.8 6.0 4.4 3.3 3.5 6.3 m C/NE C/NE C/NE/SW SW SW SW SW SW SW/NW C/SW C/NE C/NE
e NE/C NE SW/NW/NE SWNW SW/NW SW SW SW SW/NW NE/NW C/NE NE/C Chambal a 3.1 3.7 4.3 5.1 6.8 9.1 7.3 5.5 4.2 2.8 2.6 2.7 4.8 (Rawat Bhata Dam) m C C C C C/SW/NW C/SW C/SW C/SW C/SW/NW C C C
e C/NE C/NW C/NW C/NW C/SW/NW C/SW C/SW C/SW C/SW C/NE C/NE C/NE Chittorgarh a 3.9 4.2 4.7 5.4 7.0 9.3 7.8 6.3 4.5 3.2 3.2 3.4 5.2
m C/NE/N C/NE/N C/S/NE C/S SW/S SW SW SW C/SW/S C/S C/NE C/NE/N e NE/C/N NE/NW NW/SW/W SW/W SW SW SW SW SW C/NE C/NE C/NE
Dholpur a 3.4 4.3 5.2 5.9 7.3 8.6 7.0 5.4 4.6 3.0 2.5 2.7 5.0 m C/W C/W C/W C/W C/W C/W C/W C/W C/W C C C e C/W C/N C/W C/W C/W C/W C/W C/W C C C C
Dungarpur a 1.7 2.5 3.3 4.2 7.3 9.4 7.6 5.4 3.6 1.7 1.5 1.5 4.1 m C C C/NE C/SW SW/W SW/W SW C/SW/W C/SW/W C C C e C/NE C/SW C/SW SW SW SW SW SW/C C/SW C C C

TABLE – I (Contd…) MEAN WIND SPEED (kmph) AND PREDOMINANT WIND DIRECTION
STATION JAN FEB MAR APR MAY JUN JUL AUG SEP OCT NOV DEC ANNUAL
EAST RAJASTHAN Jaipur a 4.0 4.6 6.0 7.3 9.8 9.4 8.1 7.7 6.7 5.1 3.6 3.5 6.3 (Sanganer) m C/E C/E C/E C/NW NW/C W/NW W/NW NW/W NW/C C/E/NW C/E C/E e C/NW NW/C NW NW NW/W NW/W W W/C/NW W/NW C/NW C/NW C/NW Jhalawar a 3.6 4.4 5.3 6.4 9.8 13.0 10.5 7.5 5.4 3.2 2.5 3.0 6.2 m C/NE/N C/N/NE C/N/NE C/W/N W W W/SW W/SW W/SW C/NE/N C/N/NE C/N/NE e NE/N N/NE N/W NW/W W W W W/SW W/NW C/N/NE C/N/NE NE/C Kota a 3.0 3.7 5.1 5.5 9.3 13.5 10.9 9.3 7.6 4.1 2.9 2.8 6.5 m C/NW C/NW C/W C/NW NW/C/W W/NW W W W/C/NW C/NW C C/NW e C/NE C/NW C/NW C/NW NW/C NW/W SW/NW C/W C/NW C C C/NE Kota (A) a 5.5 6.4 7.7 9.9 13.1 15.8 13.6 11.7 10.3 6.5 4.5 4.5 9.1 m C/W C/W W/C/NW W/NW W W W W W W/C/NW C/W C/W e NE/E NE/N NE/N NW/N NW/W W/SW W/SW W W/NW/N NE/E/N NE NE/E Kota PBO a 4.5 5.1 6.1 7.2 9.6 12.5 12.6 9.9 8.1 5.2 4.0 4.1 7.4 m C/NW C/NW C/NW NW W/NW W W/SW W NW/W C/NW/W C/NW C/NW/E e NE NE NE NW NW SW/W/NW SW/W W/NW NW NE NE NE Pilani a 5.4 6.3 7.0 7.6 9.6 12.0 9.4 7.8 7.1 5.3 4.6 4.6 7.2 m SW/C SW/SE SW SW/W SW/W W/SW SW/W SW/W SW/W SW/W SW/C SW e NW/N NW/N/W NW/W NW/W NW/W W W W W/NW NW/W NW NW/N Sawai Madhopur a 3.2 3.0 3.1 4.3 5.4 5.7 5.7 4.4 4.3 2.6 2.6 1.9 3.8 m C/NE C/N/SW C/SW C/SW C/W NW/W W/C/SW C/W C/SW C/SW C/SW C/SW/N e C/N C/N NW/N NW/N NW NW C/W/SW C/W C/NW C/N C/N C/N Sikar a 4.0 4.4 4.5 4.8 5.5 6.7 6.6 4.3 4.4 4.6 3.2 3.1 4.7 m C C C C C/W C/W C/W C C C C C e C/W C/W C/W C/W C/W C/W C/W C/W C/W C C C/W

TABLE – I (Contd…) MEAN WIND SPEED (kmph) AND PREDOMINANT WIND DIRECTION
STATION JAN FEB MAR APR MAY JUN JUL AUG SEP OCT NOV DEC ANNUAL
EAST RAJASTHAN Tonk a 4.5 5.6 6.4 7.5 9.9 11.7 10.1 8.5 7.5 4.8 3.9 4.4 7.1 m NW/W NW/W W W W W W W W W W/NW NW/W e W/NW NW/W W/NW W W W W W W NW/W C/W/NW W/NW Udaipur/Dabok(A) a 5.6 6.4 7.3 8.2 10.7 12.9 11.0 9.0 6.8 5.2 4.5 4.7 7.7 m C/NW C/NW C/NW C/NW SW SW SW SW/C C/SW C/NW C/NW C/NW e C/E/NE C/E/W W W W SW/W SW SW SW/W C/NE/W C/NE/E C/NE/E Udaipur (City) a 1.6 2.2 2.9 3.8 5.0 6.4 5.0 3.9 2.9 1.5 1.1 1.3 3.1 m C/W C/W C/W C/W C/W SW SW/C/W C/W/SW C/W C C C e C/W C/W/SW W/C/SW W/SW SW/W SW SW/W SW/W SW/W C/W C/W C/W/NE/E Sub Div. Mean a 3.7 4.4 5.2 6.1 8.3 10.1 8.5 6.8 5.6 3.8 3.1 3.2 5.7
HILL STATION Mount Abu a 3.6 5.0 5.6 7.0 8.0 9.1 8.8 7.5 5.4 3.9 3.5 3.2 5.9 m C/SW C/SW C/SW C/SW SW/C SW SW C/SW C/SW C/SW C C e C/SW C/SW SW/C SW/C SW SW SW SW/C C/SW C/SW C/SW C/SW
a: Mean Wind Speed in km per hour. m: Predominant wind direction in the morning. e: Predominant wind direction in the evening. Var Variable. C: Calm. * Hill stations not considered for sub-divisional mean.

TABLE II
MEAN DAILY MAXIMUM AND MEAN DAILY MINIMUM TEMPERATURE (°C)
WEST RAJASTHAN STATIONS JAN FEB MAR APR MAY JUN JUL AUG SEP OCT NOV DEC ANNUAL Barmer Max 25.6 28.6 34.2 39.2 41.8 40.2 36.7 35.0 36.2 37.0 32.2 27.2 34.5 Min 10.6 13.1 18.7 24.4 26.5 27.2 26.3 25.5 24.6 22.3 16.5 11.7 20.6 Bikaner (P.B.O.) Max 22.8 25.8 31.2 37.8 41.3 42.1 38.7 37.0 37.3 36.1 30.2 24.1 33.7 Min 5.1 9.1 14.9 21.5 26.0 29.0 28.1 26.9 24.8 18.8 11.7 6.8 18.6 Bikaner Max 23.2 26.0 32.2 38.2 41.8 41.6 38.0 36.9 37.0 36.3 30.9 25.1 33.9 Min 5.7 9.0 15.3 22.0 26.6 28.9 27.9 27.0 25.1 19.1 11.9 6.4 18.7 Churu Max 22.7 25.6 31.7 37.7 41.2 41.3 37.4 35.8 36.1 35.3 30.1 24.5 33.3 Min 4.4 7.8 13.7 19.9 24.8 27.9 27.0 25.6 23.4 17.3 10.3 5.1 17.3 Erinpura/Jawaibandh Max 26.3 28.8 33.9 38.2 40.3 38.2 33.6 31.6 33.7 35.2 31.8 27.8 33.3 Min 8.0 10.8 16.7 22.6 26.0 26.5 25.4 24.2 23.7 20.3 14.2 9.7 19.0 Jailsalmer Max 23.8 26.9 32.7 38.2 41.6 40.6 37.5 35.9 36.3 36.1 31.1 25.2 33.8 Min 6.9 10.3 15.9 21.9 25.2 26.8 26.3 25.3 23.9 19.9 13.2 8.2 18.6 Jalore Max 25.6 27.8 34.0 39.1 41.1 39.7 35.4 33.2 35.2 36.6 31.8 26.4 33.8 Min 10.5 13.7 19.4 25.4 28.3 28.8 27.0 25.8 25.9 23.0 16.5 11.2 21.3 Jodhpur Max 25.4 28.1 33.8 38.9 41.5 40.2 36.1 34.2 35.5 36.4 31.8 26.9 34.1 Min 8.9 11.4 17.1 22.7 26.6 28.0 26.7 25.4 24.2 19.8 14.5 10.3 19.6 Nagaur Max 23.8 26.6 32.7 38.0 41.2 40.5 36.4 34.8 35.5 36.2 30.6 25.3 33.5 Min 6.0 9.6 15.2 20.9 25.1 27.3 25.9 24.8 23.3 18.4 12.1 7.2 18.0

TABLE II (Contd…)
MEAN DAILY MAXIMUM AND MEAN DAILY MINIMUM TEMPERATURE (°C)
WEST RAJASTHAN
STATIONS JAN FEB MAR APR MAY JUN JUL AUG SEP OCT NOV DEC ANNUAL Phalodi Max 24.2 27.3 33.2 38.7 41.9 41.3 37.8 36.2 37.0 36.8 31.4 25.7 34.3 Min 6.5 9.8 15.8 21.8 25.4 26.6 26.1 25.2 23.6 19.5 13.2 7.5 18.4 Sriganganagar Max 21.4 23.8 29.4 36.4 40.6 41.7 38.2 37.0 36.7 35.0 29.2 23.0 32.7 Min 5.4 8.1 13.4 19.2 23.9 28.0 27.3 26.4 23.7 17.6 11.0 6.1 17.5 Sub Div. Mean Max 24.1 26.8 32.6 38.2 41.3 40.7 36.9 35.2 36.0 36.1 31.0 25.6 33.7 Min 7.1 10.2 16.0 22.0 25.9 27.7 26.7 25.6 24.2 19.6 13.2 8.2 18.9

TABLE-II MEAN DAILY MAXIMUM AND MEAN DAILY MINIMUM TEMPERATURE(oC)
EAST RAJASTHAN
STATION JAN FEB MAR APR MAY JUN JUL AUG SEP OCT NOV DEC ANNUAL Max 23.8 26.5 32.0 37.5 40.4 39.1 34.3 32.0 33.6 34.6 29.8 25.2 32.4 Ajmer Min 7.2 10.2 15.7 21.9 26.4 26.9 25.3 24.3 23.6 18.8 12.8 8.2 18.4 Max 21.8 24.8 31.6 37.3 40.6 40.6 35.3 33.1 33.9 33.7 28.9 23.3 32.1 Alwar Min 7.6 10.6 16.4 22.8 27.0 29.3 27.0 25.8 24.5 19.2 13.2 8.9 19.4 Max 27.9 30.4 35.0 39.5 40.8 37.4 32.2 30.2 32.8 34.9 32.6 28.7 33.5 Banswara Min 12.3 14.6 18.9 23.8 26.4 25.7 24.1 23.2 22.7 20.3 16.8 13.1 20.2 Max 22.4 25.5 32.4 38.7 42.1 41.7 34.9 33.7 35.0 34.4 29.6 24.5 32.9 Bharatpur Min 7.2 9.2 14.3 20.6 25.7 28.0 26.4 25.6 23.9 19.0 12.7 8.1 18.4 Max 23.9 27.0 32.7 37.8 40.9 39.1 33.5 31.4 33.1 34.0 30.0 25.4 32.4 Bhilwara Min 7.5 10.2 15.5 21.6 25.7 26.3 24.6 23.4 22.2 18.1 12.9 8.8 18.1 Max 24.7 27.5 33.2 38.1 41.0 38.7 33.2 31.0 32.8 34.0 29.9 25.7 32.5 Chambal
(Rawat Bhata Dam) Min 9.6 12.1 17.4 22.8 26.8 27.0 24.8 23.7 22.7 18.9 14.2 10.6 19.2
Max 24.5 26.7 33.0 38.2 40.7 38.5 32.5 30.6 32.9 33.9 29.7 25.8 32.3 Chittorgarh Min 6.7 8.6 14.3 20.4 24.6 25.3 23.6 22.5 21.2 16.8 11.6 7.5 16.9 Max 23.3 26.7 32.9 39.5 42.4 41.7 35.5 33.5 34.4 34.9 30.3 24.7 33.3 Dholpur Min 6.3 9.4 14.2 21.2 26.1 28.6 26.5 25.2 23.7 18.3 12.0 7.0 18.2 Max 26.2 28.9 34.4 38.6 40.0 37.6 32.0 30.1 32.5 34.4 31.1 27.6 32.8 Dungarpur Min 8.7 11.1 15.8 21.5 25.3 25.7 24.1 23.4 22.5 18.9 14.8 10.3 18.5 Max 22.6 25.2 31.2 37.0 40.1 39.3 34.2 32.3 33.7 33.9 29.1 24.2 31.9 Jaipur
(Sangner) Min 7.9 10.6 15.7 21.4 25.3 27.2 25.7 24.5 23.0 18.9 13.5 8.9 18.5 Max 25.4 28.1 34.0 39.0 42.0 39.3 33.5 31.3 32.9 34.3 30.7 26.5 33.1 Jhalawar Min 8.7 11.4 16.7 22.3 26.4 26.8 24.4 23.6 22.7 18.7 13.9 9.6 18.8

TABLE-II (contd…) MEAN DAILY MAXIMUM AND MEAN DAILY MINIMUM TEMPERATURE(oC)
EAST RAJASTHAN
STATION JAN FEB MAR APR MAY JUN JUL AUG SEP OCT NOV DEC ANNUAL Max 24.5 27.8 33.8 38.9 41.8 40.2 34.6 32.0 33.4 34.7 31.0 26.0 33.2 Kota Min 9.3 12.4 18.0 24.3 28.1 28.1 25.3 24.4 23.9 20.6 14.9 10.7 20.0 Max 23.7 27.0 33.0 38.8 42.0 39.9 34.1 32.0 33.9 34.5 30.0 25.2 32.8 Kota (A) Min 10.6 13.5 18.9 25.0 29.1 29.0 26.4 25.2 24.9 21.6 16.1 11.8 21.0 Max 23.6 26.2 32.5 39.0 42.4 40.3 34.3 32.0 34.3 34.6 29.8 25.1 32.8 Kota (PBO) Min 9.8 11.9 17.1 23.6 28.3 28.5 25.9 24.8 24.6 20.8 15.2 10.9 20.1 Max 22.4 25.2 31.3 36.9 40.2 40.6 36.3 34.8 35.5 35.0 29.9 24.2 32.7 Pilani Min 4.5 7.7 13.6 19.2 23.9 27.3 26.2 25.1 23.0 17.5 11.1 5.4 17.0 Max 24.3 26.5 32.8 38.8 42.3 41.2 34.3 32.3 34.3 34.7 30.6 25.5 33.1 Sawai
Madhopur Min 6.2 8.2 13.8 20.4 25.1 26.5 24.1 22.9 21.9 17.2 12.4 7.9 17.2 Max 22.7 25.5 31.3 36.8 39.7 39.6 35.3 33.6 34.2 34.2 29.3 23.8 32.2 Sikar Min 4.3 7.1 12.6 18.5 22.9 25.7 24.9 24.1 22.2 16.7 10.0 5.1 16.2 Max 23.6 26.5 32.8 38.3 41.4 40.4 35.2 32.9 34.2 34.9 30.0 25.1 32.9 Tonk Min 6.9 9.7 15.5 22.3 26.5 28.5 26.5 25.4 24.1 19.3 13.0 8.0 18.8 Max 24.2 26.9 32.3 37.2 39.5 37.1 31.9 30.0 32.3 33.6 29.4 25.3 31.6 Udaipur/
Dabok (A) Min 7.1 9.3 14.3 20.3 25.0 26.0 24.5 23.1 21.4 16.9 11.8 7.9 17.3 Max 24.2 27.1 32.2 36.4 38.4 36.1 31.1 29.5 31.5 33.1 29.6 25.9 31.3 Udaipur
(City) Min 7.1 9.6 15.0 20.4 23.9 24.6 23.0 22.1 20.6 16.4 11.7 8.1 16.9 Max 24.0 26.8 32.7 38.1 40.9 39.4 33.9 31.9 33.6 34.3 30.1 25.4 32.6 Sub Div.
Mean Min 7.8 10.4 15.7 21.7 25.9 27.1 25.2 24.1 23.0 18.6 13.2 8.8 18.5
HILL STATION Max 20.0 21.7 25.9 30.0 31.9 29.3 24.8 23.1 25.4 27.5 24.4 21.6 25.5 Mount Abu Min 5.7 8.0 12.8 17.4 19.8 19.0 18.3 17.6 16.9 14.4 10.2 6.6 13.9
*Hill stations not considered for sub-divisional mean.

32
TABLE III MEAN RELATIVE HUMIDITY(%)
RAJASTHAN WEST STATION JAN FEB MAR APR MAY JUN JUL AUG SEP OCT NOV DEC ANNUAL
Barmer M 51 49 44 42 54 68 77 79 72 54 50 51 58 E 28 26 22 22 23 34 49 53 42 29 31 30 32 Bikaner (P.B.O) M 67 53 48 34 36 60 66 70 63 49 51 64 54 E 31 22 21 15 16 25 44 48 37 26 32 37 30 Bikaner M 63 56 47 36 36 52 68 72 65 47 48 59 54 E 30 28 22 17 15 25 45 49 38 24 30 34 30 Churu M 72 65 56 46 44 54 71 77 70 57 60 69 62 E 38 33 28 25 24 32 54 58 48 32 34 39 37 Erinpura/ M 75 66 53 49 54 66 78 83 76 62 68 77 67 Jawaibandh E 44 46 33 33 33 44 64 71 59 47 49 51 47 Jaisalmer M 57 52 45 43 55 65 73 75 70 53 52 57 58 E 30 26 22 21 21 29 44 48 38 27 29 32 31 Jalore M 55 52 44 42 55 65 75 79 69 54 52 56 58 E 33 32 27 26 29 39 56 61 48 34 36 37 38 Jodhpur M 54 49 38 35 45 60 73 80 72 52 48 54 55 E 26 24 17 15 18 31 50 58 45 26 27 30 31 Nagaur M 54 49 42 39 42 57 72 75 65 48 48 52 54 E 43 36 32 28 23 36 55 60 47 36 44 43 40 Phalodi M 59 55 48 44 51 64 73 76 70 53 50 55 58 E 32 29 27 26 25 32 46 50 39 28 31 32 33 Sriganganagar M 81 75 65 48 39 48 68 72 68 62 71 81 65 E 43 37 33 23 21 27 49 53 45 37 43 48 38 Sub Div.Mean M 60 54 46 40 45 57 70 74 67 52 53 59 56 E 37 32 28 24 24 35 53 57 47 34 37 40 37
M: MORNING E: EVENING

33
TABLE III MEAN RELATIVE HUMIDITY(%)
RAJASTHAN EAST STATION JAN FEB MAR APR MAY JUN JUL AUG SEP OCT NOV DEC ANNUAL
Ajmer M 65 56 41 35 38 57 75 80 69 54 56 64 58 E 34 28 21 22 22 36 58 67 53 34 37 40 38 Alwar M 80 71 58 47 44 53 73 79 71 66 68 78 66 E 49 43 38 32 32 40 64 71 61 48 48 53 48 Banswara M 48 44 38 38 53 68 80 83 76 56 51 54 57 E 31 27 23 21 24 42 64 70 55 35 34 36 39 Bharatpur M 80 73 62 47 43 53 79 82 76 65 68 77 67 E 52 43 35 31 26 39 68 70 58 43 48 56 47 Bhilwara M 61 52 40 32 35 55 77 82 74 54 55 62 57 E 29 23 17 15 18 35 61 71 55 32 33 34 35 Chambal (Rawat Bhata Dam) M 67 57 43 35 39 60 79 86 78 63 65 70 62 E 37 29 24 22 23 41 68 77 61 37 37 40 41 Chittorgarh M 73 61 46 36 44 62 81 86 78 62 64 72 64 E 38 30 23 19 21 39 65 72 55 35 37 41 40 Dholpur M 64 56 45 33 33 47 74 79 72 54 52 60 56 E 45 38 27 22 23 35 65 72 62 44 43 47 44 Dungarpur M 67 57 43 46 62 75 88 90 82 68 65 69 68 E 37 31 25 26 30 46 70 78 65 45 41 41 45 Jaipur (Sangner) M 63 56 43 30 33 51 74 81 69 48 50 60 55 E 33 27 18 14 17 31 60 68 50 28 31 37 34 Jhalawar M 63 52 35 29 34 58 78 85 78 59 58 65 58 E 33 27 19 16 17 36 62 74 59 34 32 35 37 Kota M 63 51 37 29 31 52 72 80 72 56 56 63 55 E 38 30 22 18 20 38 62 74 60 37 36 42 40 Kota (A) M 57 47 33 23 28 51 73 80 67 47 48 58 51 E 32 26 17 12 14 32 59 68 50 28 30 34 34 Kota P.B.O M 67 58 44 30 33 52 75 80 66 51 54 64 56 E 43 36 25 16 18 34 61 70 50 34 36 42 39 Pilani M 69 63 54 43 43 56 75 82 75 58 58 66 62 E 35 29 23 20 22 33 57 64 51 33 31 34 36 Sawai Madhopur M 75 63 47 34 34 50 76 83 73 57 62 73 61 E 41 32 23 20 19 34 62 71 54 37 41 44 40 Sikar M 61 53 47 41 47 56 73 77 68 54 53 58 57 E 37 34 30 26 31 37 59 63 51 34 35 38 40 Tonk M 73 66 54 45 47 60 77 84 77 64 66 74 66 E 51 43 38 34 32 43 66 74 61 48 52 56 50 Udaipur/Dabok (a) M 65 55 41 34 41 64 79 84 76 59 60 67 60 E 33 28 20 19 24 44 68 75 58 34 35 37 40 Udaipur (City) M 66 59 46 41 45 66 79 82 74 62 62 67 62 E 41 34 28 29 33 51 70 75 63 43 45 45 46 Sub Div.Mean M 66 58 45 36 40 57 77 82 74 58 59 66 60 E 39 32 25 22 23 38 63 71 57 37 38 42 41 HILL STATION Mount Abu M 54 47 40 33 35 74 93 95 81 56 57 61 61
E 38 31 27 22 28 52 80 87 71 42 41 44 47 Hill stations not considered for sub-divisional mean
M: MORNING E: EVENING

34
TABLE – IV MEAN CLOUND AMOUNT **(OKTA OF THE SKY) AND MEAN NUMBER OF DAYS OF
CLEAR AND OVERCAST SKIES AT 0830 HOURS IST STATION JAN FEB MAR APR MAY JUN JUL AUG SEP OCT NOV DEC ANNUAL
WEST RAJASTHAN
Barmer a 18 16 15 18 21 8 1 2 11 24 21 18 173 b 0 1 1 1 0 2 6 6 1 0 0 0 18 c 1.6 1.7 1.9 1.6 1.0 3.2 5.4 5.2 2.6 0.8 0.9 1.5 2.3 Bikaner P.B.O a 16 13 13 17 22 20 7 7 17 25 23 16 196 b 1 1 1 0 1 1 2 3 1 0 0 1 12 c 2.2 2.2 2.5 1.7 1.1 1.3 3.7 3.6 1.4 0.7 0.9 2.3 2.0 Bikaner a 17 14 14 16 22 20 7 6 16 26 22 17 197 b 1 1 1 0 0 1 2 2 1 0 0 1 10 c 2.0 2.0 2.0 1.6 0.9 1.3 3.3 3.3 1.4 0.5 0.8 1.7 1.7 Churu a 17 15 15 17 22 19 8 6 15 25 22 17 198 b 1 1 1 0 1 1 3 3 1 0 0 1 13 c 1.9 2.0 1.8 1.6 1.2 1.6 3.6 3.7 1.7 0.6 1.0 1.6 1.9 Erinpura a 19 16 18 19 23 8 1 1 6 22 21 17 171 (Jawaibandh) b 2 2 2 1 1 6 18 18 5 1 1 1 58
c 1.9 2.2 2.0 1.7 1.0 3.9 6.4 6.5 3.9 1.1 1.4 1.9 2.8 Jaisalmer a 20 17 18 20 27 18 10 9 17 25 22 19 222 b 1 1 1 1 0 1 3 3 1 0 1 1 14
c 1.5 1.8 1.6 1.5 0.5 1.7 3.4 3.4 1.5 0.5 0.8 1.5 1.6 Jalore a 24 19 23 23 26 12 4 4 14 25 24 25 223
b 0 1 0 0 0 2 10 8 2 0 1 0 24 c 0.9 1.3 0.8 0.7 0.5 2.6 5.2 5.1 2.4 0.6 0.7 0.8 1.8
Nagaur a 21 19 22 23 26 21 4 4 19 28 24 23 234 b 1 1 0 0 0 1 5 5 1 0 0 1 15 c 1.6 1.7 1.4 1.3 0.7 2.0 4.8 4.3 1.9 0.5 0.9 1.3 1.9
Phalodi a 18 16 15 18 24 20 6 5 15 25 23 17 202 b 0 1 1 0 0 1 2 2 1 0 0 1 9 c 1.5 1.7 1.6 1.2 0.6 1.4 3.1 3.4 1.6 0.5 0.8 1.4 1.6 Sriganganagar a 19 14 17 16 22 22 12 11 21 28 25 19 226 b 2 2 1 1 1 1 3 2 1 0 0 1 15 c 2.0 2.2 2.0 1.6 1.0 1.1 2.9 2.6 1.0 0.3 0.7 1.8 1.6 Sub Div. a 19 16 17 19 24 17 6 6 15 25 23 19 206 Mean b 1 1 1 0 0 2 5 5 2 0 0 1 18 c 1.7 1.9 1.8 1.5 0.9 2.0 4.2 4.1 1.9 0.6 0.9 1.6 1.9 a: Days with clear sky. b: Days with sky overcast. c: Mean cloud amount.
** Okta = Unit, equal to area of one eighth of the sky used in specifying cloud amount.
For example: 1 Okta means 1/8th of the sky covered.

35
TABLE – IV MEAN CLOUD AMOUNT **(OKTA OF THE SKY) AND MEAN NUMBER OF DAYS OF
CLEAR AND OVERCAST SKIES AT 0830 HOURS IST
STATION JAN FEB MAR APR MAY JUN JUL AUG SEP OCT NOV DEC ANNUAL
EAST RAJASTHAN
Ajmer a 19 17 18 18 23 14 4 3 11 25 21 19 192 b 1 1 1 1 1 2 7 8 3 0 1 1 27 c 1.6 1,7 1,6 1,6 0.9 2.5 5.0 5.4 2.8 0.8 1.1 1.5 2.2 Alwar a 19 18 20 19 22 18 5 3 12 24 24 20 204 b 2 1 1 1 1 2 6 7 4 1 1 1 28 c 1.9 2.1 1.7 1.5 1.2 2.1 4.7 5.1 2.8 0.9 1.0 1.6 2.2 Banswara a 24 21 25 25 23 8 4 2 12 23 23 24 214 b 2 2 2 2 1 4 7 7 4 2 2 2 37 c 1.0 1.0 0.8 0.8 0.9 3.3 4.7 5.3 3.3 1.4 1.0 1.0 2.0 Bharatpur a 20 21 19 21 22 24 18 7 7 20 25 23 230 b 1 1 1 1 1 2 10 7 3 1 1 1 30 c 1.6 1.6 1.3 1.1 0.9 2.0 4.6 4.4 2.3 0.6 0.8 1.2 1.9 Bhilwara a 19 16 17 20 22 13 1 1 6 23 21 18 177 b 2 2 1 1 1 4 16 18 6 1 2 2 56
c 2.0 2.1 2.0 1.9 1.2 3.4 6.3 6.5 3.7 1.1 1.7 2.0 2.8 Chambal a 21 19 23 23 24 14 3 2 13 24 21 21 208 (Rawat Bhata b 1 1 0 0 0 3 12 17 5 1 1 1 42 Dam) c 1.1 1.1 0.8 0.6 0.6 2.3 5.2 5.7 2.7 0.8 1.0 1.0 1.9 Chittorgarh a 21 21 25 22 26 17 10 7 18 24 25 23 239
b 2 1 0 0 1 3 10 15 3 1 1 1 38 c 1.6 1.2 0.8 0.9 0.6 2.3 4.2 5.1 2.0 0.9 0.8 1.1 1.8
Dholpur a 21 19 22 23 23 17 6 6 13 26 22 24 222 b 3 2 1 1 1 4 13 13 5 1 2 2 48 c 1.8 1.5 1.3 1.0 0.9 2.5 5.1 5.2 3.0 0.7 1.2 1.4 2.1
Dungarpur a 20 18 20 20 20 4 0 0 5 18 21 18 164 b 1 0 0 1 1 3 13 14 3 1 1 1 39 c 1.5 1.6 1.4 1.5 1.4 4.4 6.5 6.4 3.9 1.6 1.4 1.6 2.8

36
TABLE – IV (Contd…)
MEAN CLOUD AMOUNT **(OKTA OF THE SKY) AND MEAN NUMBER OF DAYS OF CLEAR AND OVERCAST SKIES AT 0830 HOURS IST
STATION JAN FEB MAR APR MAY JUN JUL AUG SEP OCT NOV DEC ANNUAL
EAST RAJASTHAN
Jaipur a 15 13 15 16 19 13 3 2 9 20 20 15 160 (Sanganer) b 1 1 1 0 1 2 8 8 2 1 0 1 26 c 1.9 2.1 2.0 1.8 1.3 2.6 5.3 5.6 3.0 1.0 1.3 1.7 2.5 Jhalawar a 24 24 25 26 24 17 14 8 15 27 25 25 254 b 1 0 0 0 2 3 5 6 2 0 0 0 19 c 0.9 0.7 0.7 0.8 1.0 2.3 3.8 4.8 2.7 0.5 0.8 0.8 1.7 Kota a 23 21 22 21 24 16 2 1 13 25 23 24 215 b 1 1 0 1 1 2 12 16 4 1 1 1 41 c 1.4 1.3 1.5 1.5 0.8 2.6 5.7 6.1 3.4 0.9 1.3 1.6 2.3 Kota (A) a 17 16 18 18 23 11 3 2 8 20 20 18 174 b 1 1 0 0 0 2 8 8 3 1 1 1 26 c 1.5 1.5 1.4 1.2 0.8 2.8 5.3 5.6 3.1 1.1 1.2 1.5 2.3 Kota PBO a 19 15 17 20 21 12 2 1 7 21 21 17 173 b 1 1 0 0 0 2 7 9 2 1 1 1 25 c 1.5 1.6 1.4 1.1 0.9 2.8 5.4 5.7 2.8 1.1 1.2 1.5 2.3 Pilani a 21 18 19 21 23 20 10 9 18 27 25 22 233 b 1 1 1 0 1 1 3 4 1 0 0 1 14 c 1.8 1.8 1.8 1.4 1.0 1.7 3.6 3.6 1.7 0.5 0.9 1.4 1.8 Sawaii a 25 23 27 26 29 23 10 10 22 27 25 27 274 Madhopur b 2 1 1 1 0 2 13 13 2 1 2 1 39 c 0.9 1.0 0.7 0.5 0.5 1.4 4.5 4.5 1.6 0.5 0.9 0.8 1.5 Sikar a 22 19 21 23 20 15 6 7 16 27 26 24 226 b 0 0 0 0 0 0 2 2 1 0 0 0 5 c 0.9 0.8 0.7 0.6 0.8 1.2 2.5 2.4 1.3 0.3 0.4 0.7 1.1

37
TABLE – IV (Contd…) MEAN CLOUD AMOUNT **(OKTA OF THE SKY) AND MEAN NUMBER OF DAYS OF
CLEAR AND OVERCAST SKIES AT 0830 HOURS IST
STATION JAN FEB MAR APR MAY JUN JUL AUG SEP OCT NOV DEC ANNUAL
EAST RAJASTHAN Tonk a 20 17 19 19 23 14 5 2 12 24 22 22 199 b 0 0 0 0 0 1 3 4 1 0 1 0 10 c 1.6 1.6 1.6 1.3 1.0 2.4 4.7 5.0 2.7 0.8 1.2 1.4 2.1 Udaipur/Dabok a 18 16 18 18 24 10 3 2 9 20 21 18 177 (A) b 1 1 0 0 0 2 9 11 3 1 1 0 29 c 1.4 1.4 1.4 1.3 0.6 3.2 5.8 5.9 3.1 1.0 1.1 1.4 2.3 Udaipur (City) a 24 23 24 24 27 15 6 5 13 26 24 24 235 b 1 0 0 1 0 2 8 9 3 0 0 0 24 c 1.0 1.0 1.0 1.0 0.5 2.7 5.4 5.6 2.8 0.7 1.0 1.0 2.0 Sub Div. Mean a 21 19 21 21 23 14 5 4 12 24 23 21 208 b 1 1 1 1 1 2 9 10 3 1 1 1 32 c 1.4 1.4 1.3 1.2 0.9 2.5 4.9 5.2 2.7 0.9 1.1 1.3 2.1
HILL STATION
Mount Abu a 25 22 22 22 25 13 1 1 14 26 24 23 218 b 1 1 1 0 1 6 23 23 4 1 1 1 63 c 0.8 1.0 1.1 0.9 0.8 4.1 6.7 6.9 3.1 0.6 0.7 0.9 2.3
a: Days with clear sky. b: Days with sky overcast. c: Mean cloud amount. ** Okta = Unit, equal to area of one eighth of the sky used in specifying cloud amount. For Example: 1 Okta means 1/8th of the sky covered. * Hill stations not considered for sub-divisional mean.

38
TABLE – IV (a) MEAN CLOUND AMOUNT **(OKTA OF THE SKY) AND MEAN NUMBER OF DAYS OF
CLEAR AND OVERCAST SKIES AT 1730 HOURS IST STATION JAN FEB MAR APR MAY JUN JUL AUG SEP OCT NOV DEC ANNUAL
WEST RAJASTHAN
Barmer a 18 14 14 14 19 15 3 1 6 18 20 17 159 b 0 1 1 1 0 1 4 4 1 0 0 0 13 c 1.8 2.0 2.4 2.3 1.3 2.4 4.7 5.0 3.3 1.4 1.3 1.8 2.5 Bikaner a 14 13 10 12 14 14 5 2 9 18 20 12 143 (P.B.O) b 1 1 1 0 1 1 4 3 1 0 0 1 14 c 2.4 2.6 3.1 2.6 2.2 2.3 4.6 5.1 2.6 1.4 1.0 2.3 2.7 Bikaner a 15 12 12 10 16 13 4 3 9 19 19 16 148 b 1 1 1 1 0 1 2 2 1 0 0 0 10 c 2.0 2.2 2.6 2.4 1.6 2.1 4.2 4.3 2.4 1.0 1.0 1.9 2.3 Churu a 16 14 12 12 14 12 4 3 7 21 20 16 151 b 1 1 1 1 1 1 3 3 1 0 0 0 13 c 1.9 2.2 2.4 2.4 2.0 2.4 4.6 4.8 2.7 1.0 1.1 1.8 2.4 Erinpura a 17 16 16 14 19 8 0 0 3 17 19 17 146 (Jawaibandh) b 1 2 2 2 1 6 15 16 5 1 1 1 53
c 2.0 2.2 2.5 2.4 1.6 3.8 6.5 6.4 4.6 1.9 1.8 2.1 3.1 Jaisalmer a 18 15 15 15 19 17 11 9 13 24 22 18 196 b 1 1 1 1 1 1 3 3 1 0 0 1 14
c 1.6 1.8 2.2 2.0 1.2 1.7 3.4 3.4 1.9 0.8 0.9 1.5 1.9 Jalore a 22 18 21 22 25 16 6 5 13 19 22 22 211
b 0 1 1 0 0 1 4 4 1 0 1 0 13 c 1.1 1.3 1.2 1.0 0.5 2.1 4.3 4.1 2.1 1.1 0.8 0.9 1.7
Nagaur a 21 18 21 18 20 18 3 3 14 23 25 23 207 b 1 1 0 1 1 1 5 5 2 0 0 0 17 c 1.7 1.9 1.8 2.2 1.6 2.5 5.1 4.7 2.5 0.9 1.0 1.3 2.3
Phalodi a 16 14 12 12 16 16 8 4 9 20 22 17 166 b 0 1 1 1 0 1 2 2 0 0 0 0 8 c 1.5 1.8 2.0 2.0 1.5 1.6 3.2 3.6 2.2 0.9 1.0 1.4 1.9 Sriganganagar a 16 12 14 15 19 19 7 4 14 26 23 15 184 b 1 2 1 1 1 1 3 3 1 0 0 2 16 c 2.0 2.3 2.5 2.1 1.4 1.5 3.8 4.0 1.8 0.5 0.9 1.9 2.1 Sub Div. a 17 15 15 14 18 15 5 3 10 21 21 17 171 Mean b 1 1 1 1 1 1 5 5 1 0 0 1 18 c 1.8 2.0 2.3 2.1 1.5 2.2 4.4 4.5 2.6 1.1 1.1 1.7 2.3 a: Days with clear sky. b: Days with sky overcast. c: Mean cloud amount. ** Okta = Unit, equal to area of one eighth of the sky used in specifying cloud
amount. For example: 1 Okta means 1/8th of the sky covered.

39
TABLE – IV (a) MEAN CLOUD AMOUNT **(OKTA OF THE SKY) AND MEAN NUMBER OF DAYS OF
CLEAR AND OVERCAST SKIES AT 1730 HOURS IST
STATION JAN FEB MAR APR MAY JUN JUL AUG SEP OCT NOV DEC ANNUAL
EAST RAJASTHAN
Ajmer a 18 14 17 16 17 12 3 3 8 20 20 17 165 b 0 1 1 1 1 2 7 7 2 1 1 1 25 c 1.6 2.0 1.9 2.1 1.7 2.7 5.1 5.3 3.3 1.3 1.3 1.7 2.5 Alwar a 18 13 16 15 16 5 2 1 5 20 22 20 153 b 1 1 1 1 1 2 6 5 2 1 0 0 21 c 2.0 2.5 2.5 2.6 2.6 3.8 5.7 5.5 3.8 1.4 1.4 1.8 3.0 Banswara a 23 20 25 24 24 10 4 2 10 23 23 23 211 b 2 2 2 2 1 3 5 5 4 2 2 2 32 c 1.0 1.0 0.9 0.9 0.7 2.7 4.2 4.7 3.2 1.1 1.3 1.1 1.9 Bharatpur a 20 17 19 18 20 14 5 5 10 24 23 21 196 b 1 1 1 1 1 2 9 6 2 1 1 1 27 c 1.5 1.7 1.5 1.5 1.6 2.7 4.9 4.6 2.8 0.8 0.9 1.3 2.1 Bhilwara a 19 16 17 16 16 3 1 0 3 17 18 19 145 b 2 2 1 3 2 6 18 19 7 2 3 1 66
c 1.9 2.4 2.3 2.6 2.3 4.7 5.9 6.7 4.8 2.0 2.0 2.1 3.3 Chambal a 21 20 21 18 13 6 1 0 6 20 21 21 168 (Rawat Bhata b 1 1 1 1 2 5 15 18 6 1 1 1 53 Dam) c 1.1 1.1 1.1 1.4 1.9 3.5 5.9 6.3 3.5 1.1 1.2 1.1 2.4 Chittorgarh a 22 20 24 18 18 15 9 5 18 21 24 21 215
b 1 1 0 1 1 3 12 15 2 1 1 1 39 c 1.3 1.4 1.0 1.7 1.8 3.0 4.3 5.4 2.3 1.2 1.0 1.4 2.2
Dholpur a 21 19 21 19 19 14 5 5 12 24 24 23 206 b 2 2 2 1 2 5 14 13 6 1 1 1 50 c 1.6 1.6 1.6 1.7 1.6 3.0 5.5 5.3 3.3 0.9 1.2 1.3 2.4
Dungarpur a 21 18 19 20 23 6 0 0 4 17 22 21 171 b 0 0 0 0 0 2 7 9 2 1 1 0 22 c 1.3 1.6 1.7 1.8 1.2 3.3 5.5 5.8 3.6 1.7 1.3 1.2 2.5
Jaipur a 13 11 11 10 12 6 1 1 3 14 17 13 112 (Sanganer) b 1 1 1 1 1 3 8 8 2 1 1 0 28 c 2.0 2.4 2.6 2.7 2.2 3.4 6.0 6.1 3.7 1.5 1.5 1.9 3.0 Jhalawar a 25 23 24 24 21 15 14 8 13 26 25 25 243 b 0 0 0 0 2 3 5 6 3 0 0 0 19 c 0.9 0.7 0.9 1.2 1.6 2.7 3.9 4.8 3.3 0.8 0.7 0.8 1.9 Kota a 20 19 18 17 18 4 1 0 4 20 21 22 164 b 1 1 1 1 1 4 12 15 5 1 1 1 44 c 1.4 1.5 2.0 2.4 1.9 3.9 6.0 6.4 4.1 1.4 1.3 1.5 2.8 Kota (PBO) a 18 13 14 13 11 4 0 0 1 14 19 16 123 b 0 1 0 0 0 3 9 9 2 1 1 0 26 c 1.4 1.9 1.9 2.0 2.1 4.0 6.1 6.2 3.9 1.5 1.3 1.6 2.8 Kota (A) a 16 13 14 11 11 5 2 1 3 13 17 15 121 b 0 1 0 1 0 3 8 9 2 1 1 0 26 c 1.6 1.8 1.9 2.3 2.2 3.9 6.0 6.2 4.0 1.6 1.5 1.7 2.9 Pilani a 19 15 16 17 17 13 4 4 12 23 23 20 183 b 1 1 1 0 1 1 3 4 1 0 1 1 15 c 1.9 2.2 2.4 2.2 1.9 2.4 4.6 4.4 2.7 1.0 1.0 1.5 2.4 Sawai a 27 23 26 25 25 22 9 9 20 27 25 27 265 Madhopur b 1 1 1 1 1 2 13 12 2 1 2 0 37 c 0.7 0.9 0.9 0.8 0.8 1.8 4.6 4.5 1.8 0.5 0.9 0.6 1.6

40
TABLE – IV (a) (Contd…) MEAN CLOUD AMOUNT **(OKTA OF THE SKY) AND MEAN NUMBER OF DAYS OF
CLEAR AND OVERCAST SKIES AT 1730 HOURS IST
STATION JAN FEB MAR APR MAY JUN JUL AUG SEP OCT NOV DEC ANNUAL
EAST RAJASTHAN
Sikar a 18 16 15 15 13 9 3 2 10 21 22 19 163 b 0 0 0 0 0 0 2 2 0 0 0 0 4 c 1.0 1.1 1.1 1.1 1.3 1.6 2.9 2.8 1.7 0.6 0.6 0.8 1.4 Tonk a 18 16 16 14 17 6 1 1 5 18 20 19 151 b 0 0 0 0 0 1 4 4 1 1 1 0 12 c 1.5 1.9 2.1 2.1 2.0 3.4 5.4 5.3 3.2 1.4 1.4 1.6 2.6 Udaipur (City) a 22 21 21 20 21 12 5 5 9 18 22 22 198 b 1 0 0 1 0 3 9 10 4 1 0 0 29 c 1.1 1.2 1.6 1.6 1.2 2.9 5.8 6.0 3.8 1.8 1.4 1.3 2.5 Udaipur/Dabok(A) a 16 16 15 11 14 6 1 1 2 12 18 17 129 b 1 0 1 1 1 3 10 13 3 1 1 0 35 c 1.6 1.7 2.1 2.1 1.9 3.8 6.1 6.4 4.5 2.1 1.5 1.6 2.9 Sub Div. Mean a 20 17 18 17 17 9 4 3 8 20 21 20 174 b 1 1 1 1 1 3 9 9 3 1 1 1 32 c 1.4 1.6 1.7 1.8 1.7 3.2 5.2 5.4 3.4 1.3 1.2 1.4 2.4
HILL STATION Mount Abu a 24 21 23 20 22 12 1 1 5 22 24 23 198 b 1 1 0 1 1 3 18 19 5 1 1 0 51 c 0.9 1.0 1.2 1.3 0.9 3.0 6.1 6.4 3.8 1.1 0.8 1.0 2.3 a: Days with clear sky. b: Days with sky overcast. c: Mean cloud amount. ** Okta = Unit, equal to area of one eighth of the sky used in specifying cloud amount. For Example: 1 Okta means 1/8th of the sky covered. * Hill stations not considered for sub-divisional mean.

41
TABLE IV (b) MEAN NUMBER OF HOURS OF BRIGHT SUNSHINE PER DAY
RAJASTHAN
STATION JAN FEB MAR APR MAY JUN JUL AUG SEP OCT NOV DEC ANNUAL
Barmer 9.3 9.1 8.9 9.9 10.4 9.2 6.7 7.0 9.1 9.7 9.4 8.9 107.5
Jaipur (Sangner)
8.6 8.9 8.8 9.0 8.1 5.9 4.4 4.8 7.5 9.2 9.1 8.7 93.0
Sriganganagar 7.1 7.1 8.4 8.8 9.5 8.0 6.8 8.6 8.6 8.7 8.5 6.8 96.8

42
TABLE – V MEAN RAINFALL (mm) AND NUMBER OF RAINY DAYS
WEST RAJASTHAN
DISTRICT JAN FEB MAR APR MAY JUN JUL AUG SEP OCT NOV DEC ANNUAL Barmer a 1.2 1.4 2.2 2.3 6.9 20.6 88.9 80.5 41.1 3.4 2.8 0.4 251.7 b 0.1 0.2 0.1 0.2 0.5 1.2 4.1 4.0 2.1 0.3 0.2 0.0 13.0 Bikaner a 4.3 6.9 5.9 4.8 14.4 27.3 80.2 68.4 35.9 5.9 2.6 1.9 258.5 b 0.5 0.6 0.6 0.5 1.1 1.8 4.4 4.1 2.2 0.4 0.2 0.2 16.6 Churu a 6.0 7.3 6.1 4.4 16.0 36.6 129.1 104.7 47.7 7.9 2.7 2.5 371.0 b 0.5 0.7 0.7 0.5 1.4 2.5 6.0 5.7 2.5 0.5 0.2 0.3 21.5 Ganganagar a 4.3 5.9 5.1 5.5 8.0 23.5 79.7 76.7 29.1 1.6 1.6 2.4 243.4 b 0.4 0.6 0.5 0.5 0.7 1.4 4.0 3.6 1.5 0.1 0.1 0.2 13.6 Jaisalmer a 1.6 2.8 1.9 3.0 6.6 18.6 59.6 50.1 23.4 2.3 1.9 1.1 172.9 b 0.2 0.4 0.2 0.3 0.5 1.1 3.2 2.4 1.4 0.2 0.1 0.1 10.1 Jalore a 2.1 1.4 2.9 1.7 8.9 32.7 164.7 136.4 66.5 8.1 7.5 1.0 433.9 b 0.2 0.2 0.1 0.2 0.6 1.9 6.1 6.0 3.0 0.4 0.4 0.1 19.2 Jodhpur a 2.7 2.9 2.6 4.8 10.0 29.3 110.7 101.4 47.1 5.4 2.4 1.4 320.7 b 0.3 0.3 0.3 0.3 0.8 2.0 5.3 5.2 2.5 0.3 0.2 0.1 17.6 Nagaur a 4.4 5.8 2.8 4.2 14.7 37.9 143.9 115.4 50.3 6.2 2.7 2.9 391.2 b 0.4 0.5 0.3 0.4 1.2 2.4 6.5 6.5 3.0 0.4 0.2 0.3 22.1 Pali a 2.4 1.7 2.0 1.8 6.6 5.0 177.7 162.3 82.9 7.1 3.3 1.1 498.9 b 0.3 0.2 0.1 0.2 0.5 2.5 6.7 7.3 3.6 0.5 0.2 0.1 22.2 Sub.Div. a 3.2 4.0 3.5 3.6 10.2 30.7 114.9 99.5 47.1 5.3 3.1 1.6 326.7 Mean. b 0.3 0.4 0.3 0.3 0.8 1.9 5.1 5.0 2.4 0.3 0.2 0.1 17.1

43
TABLE – V
MEAN RAINFALL (mm) AND NUMBER OF RAINY DAYS EAST RAJASTHAN
DISTRICT JAN FEB MAR APR MAY JUN JUL AUG SEP OCT NOV DEC ANNUAL Ajmer a 4.2 2.4 2.3 2.2 8.9 42.3 169.0 153.4 58.1 8.0 2.3 1.8 454.9 b 0.3 0.2 0.2 0.2 0.6 2.2 7.1 7.1 2.9 0.4 0.2 0.1 21.5 Alwar a 9.7 10.0 5.8 5.4 15.9 42.3 191.3 211.9 99.1 18.7 3.8 4.7 618.6 b 0.8 1.0 0.6 0.6 1.2 2.6 8.9 9.4 4.3 0.9 0.3 0.4 31.0 Banswara a 2.6 0.4 1.9 1.0 4.3 96.2 283.9 297.1 154.5 24.8 12.1 3.4 882.2 b 0.2 0.0 0.1 0.1 0.2 4.1 11.5 12.4 6.0 0.9 0.5 0.2 36.2 Baran a 7.2 3.2 2.9 1.6 6.3 73.5 292.3 311.2 122.6 25.3 9.0 3.9 859.0 b 0.6 0.3 0.3 0.2 0.5 4.2 11.4 13.3 5.9 1.0 0.5 0.4 38.6 Bharatpur a 8.8 8.2 5.2 3.8 11.0 44.8 193.7 226.0 97.9 16.1 3.3 3.6 622.4 b 0.7 0.8 0.6 0.4 0.9 2.7 9.5 10.2 4.7 0.8 0.3 0.3 31.9 Bhilwara a 4.1 3.1 2.9 2.2 9.0 64.8 194.9 207.1 83.3 10.5 7.3 3.6 592.8 b 0.3 0.3 0.2 0.2 0.7 3.7 9.0 9.5 4.2 0.6 0.4 0.2 29.3 Bundi a 4.7 3.1 3.1 2.0 7.7 60.5 261.3 232.9 98.5 15.0 7.5 2.6 698.9 b 0.4 0.3 0.3 0.2 0.7 3.4 10.6 10.8 4.7 0.6 0.3 0.2 32.5 Chittorgarh a 3.8 1.6 2.2 2.5 8.0 75.6 254.2 290.0 120.0 18.7 14.8 2.5 793.9 b 0.3 0.2 0.2 0.2 0.7 3.9 9.8 11.4 5.4 0.9 0.6 0.2 33.8 Dausa a 9.2 6.9 3.8 3.5 13.3 53.8 234.9 236.6 93.3 16.3 4.5 3.7 679.8 b 0.7 0.7 0.5 0.3 1.1 3.2 10.6 10.8 5.0 0.8 0.4 0.3 34.4 Dholpur a 7.7 8.5 6.0 2.0 6.4 46.2 200.4 260.8 109.6 22.1 3.5 3.9 677.1 b 0.7 0.7 0.5 0.3 0.6 2.4 9.7 10.9 4.9 1.1 0.3 0.3 32.4 Dungarpur a 1.8 0.7 1.6 1.2 5.3 81.5 228.2 237.3 109.5 15.1 15.0 2.4 699.6 b 0.2 0.1 0.1 0.1 0.2 3.5 9.8 9.7 4.5 0.7 0.5 0.1 29.5 Hanumangarh a 7.4 8.6 6.3 4.3 10.5 26.9 103.0 83.2 30.9 5.0 3.1 3.4 292.6 b 0.6 0.7 0.6 0.4 0.8 1.7 4.4 3.9 1.7 0.3 0.2 0.3 15.6 Jaipur a 7.1 7.9 3.1 5.2 16.4 56.6 217.3 193.6 71.1 12.6 2.9 3.0 596.8 b 0.6 0.7 0.4 0.4 1.2 3.0 9.5 9.4 4.1 0.7 0.3 0.3 30.6 Jhalawar a 7.3 2.3 3.8 1.6 6.6 84.9 279.2 341.7 149.9 26.8 12.2 4.9 921.2 b 0.7 0.2 0.4 0.2 0.6 4.4 11.2 12.7 6.3 1.1 0.7 0.4 38.9 Jhunjhunu a 8.2 9.5 6.2 4.9 20.1 45.6 155.2 145.6 60.3 11.6 3.4 5.6 476.2 b 0.8 0.9 0.7 0.6 1.5 2.9 7.6 7.4 3.4 0.8 0.3 0.4 27.3 Karoli a 8.7 6.7 3.6 2.4 10.1 48.9 217.9 265.7 97.3 16.8 4.8 3.7 686.6 b 0.7 0.6 0.4 0.2 0.7 2.7 10.1 11.1 4.8 0.8 0.3 0.3 32.7 Kota a 6.1 2.2 2.9 1.9 6.9 58.7 261.6 261.4 125.5 21.4 7.1 3.0 758.7 b 0.6 0.2 0.4 0.2 0.6 3.6 10.4 11.4 5.7 0.9 0.4 0.3 34.7 Rajsamand a 3.9 2.3 4.1 2.7 11.3 67.9 179.3 178.4 83.9 12.8 6.9 3.0 556.5 b 0.3 0.2 0.2 0.2 0.8 3.7 8.4 8.6 4.2 0.8 0.5 0.2 28.1 Sawaimadhopur a 7.8 7.2 3.6 3.7 10.3 54.9 249.6 263.8 98.1 20.5 5.2 4.0 728.7 b 0.6 0.6 0.4 0.3 0.8 3.2 10.3 11.4 4.8 1.0 0.3 0.3 34.0 Sikar a 7.4 8.2 3.9 4.1 18.7 45.4 168.3 135.4 53.2 8.3 3.8 2.9 459.6 b 0.7 0.7 0.5 0.5 1.2 2.8 7.6 6.9 3.1 0.5 0.3 0.3 25.1

44
TABLE – V (Contd…) MEAN RAINFALL (mm) AND NUMBER OF RAINY DAYS
EAST RAJASTHAN
DISTRICT JAN FEB MAR APR MAY JUN JUL AUG SEP OCT NOV DEC ANNUAL Sirohi a 1.2 0.7 1.1 0.8 3.1 59.2 177.6 188.1 112.7 9.3 2.3 0.6 556.7 b 0.1 0.1 0.1 0.1 0.2 2.9 7.5 8.0 3.9 0.5 0.2 0.1 23.7 Tonk a 4.1 5.1 2.1 2.2 8.4 63.1 219.0 210.8 76.1 12.6 4.1 2.3 609.9 b 0.4 0.4 0.2 0.2 0.7 3.2 9.6 9.9 4.0 0.6 0.3 0.2 29.7 Udaipur a 2.9 1.8 3.6 2.3 7.5 77.3 231.3 226.4 117.0 16.0 9.2 1.9 697.2 b 0.3 0.2 0.2 0.2 0.6 3.9 10.3 10.5 5.4 1.0 0.5 0.1 33.2 Sub.Div. a 5.9 4.8 3.6 2.8 9.8 59.6 215.8 224.3 96.6 15.8 6.4 3.2 648.6 Mean. b 0.5 0.4 0.3 0.3 0.7 3.2 9.3 9.9 4.5 0.8 0.4 0.3 30.6
a : Normal Rainfall (mm) b : Average number of rainy days (i.e. days with rainfall of 2.5 mm or more)
TABLE – V(a) MEAN RAINFALL (mm) AND NUMBER OF RAINY DAYS
HILL STATIONS
STATIONS JAN FEB MAR APR MAY JUN JUL AUG SEP OCT NOV DEC ANNUAL Abu a 5.4 1.9 4.2 4.0 9.9 88.7 621.9 574.8 244.0 16.9 16.3 2.4 1590.3 (Obsy) b 0.3 0.2 0.2 0.2 0.6 4.6 16.0 17.3 6.9 1.0 0.7 0.3 48.3 Mount Abu a 6.7 3.2 3.7 4.4 15.0 116.0 593.5 659.2 242.7 15.5 14.1 3.0 1677.0 b 0.4 0.4 0.1 0.2 1.0 5.7 16.8 18.8 7.2 0.9 0.8 0.3 52.6 a : Normal Rainfall (mm)
b : Average number of rainy days (i.e. days with rainfall of 2.5 mm or more)
Hill stations not considered for subdivisional mean.

45
TABLE – VI MEAN RAINFALL (mm) OVER DIFFERENT RIVER CATCHMENTS OF RAJASTHAN
Jan Feb Mar Apr May Jun Jul Aug Sep Oct Nov Dec Annual 1. River Mahi (Catchment No. 105)
Districts/parts of districts within this Catchment: East Rajasthan : Banswara, Dungapur, Chittorgarh, Udaipur
2.5 0.7 2.0 1.2 5.2 90.1 255.6 271.1 137.0 20.8 13.8 2.7 802.7 2. River Sabarmati (Catchment No. 106)
Districts/parts of districts within this Catchment: East Rajasthan : Udaipur, Dungarpur
2.7 1.6 3.6 1.5 6.4 76.2 267.5 240.5 124.2 14.8 5.4 1.7 746.1 3. Streams of Kathiwar (Catchment No. 107)
Districts/parts of districts within this Catchment: East Rajasthan : Sirohi
3.2 2.0 2.8 2.1 8.5 58.2 223.3 203.0 112.8 8.7 6.2 1.5 632.3 4. River Luni (Catchment No. 108)
Districts/parts of districts within this Catchment: East Rajasthan
West Rajasthan : :
Ajmer, Sirohi, Udaipur, Rajasmand Barmer, Jalore, Jodhpur, Nagaur, Pali
3.1 2.6 3.7 3.5 14.2 71.4 191.1 175.4 79.5 10.4 4.7 2.6 562.2 5. River Sutlej between Bhakra Dam Site and the Beas, excluding the Beas
(Catchment No. 202) Districts/parts of districts within this Catchment:
West Rajasthan : Ganganagar
4.1 5.7 5.0 5.5 7.6 22.2 76.9 75.3 12.5 1.4 1.4 2.6 220.2 6. River Yamuna upto its confluence with river Chambal (excluding Chambal)
(Catchment No. 403) Districts/parts of districts within this Catchment:
East Rajasthan : Alwar, Bharatpur, Dholpur, Jaipur, Jhunjhunu, Sawai Madhopur, Sikar
7.9 8.6 5.9 2.3 7.5 45.9 198.8 253.4 107.3 21.3 3.5 4.0 666.2

46
TABLE – VI (Contd) MEAN RAINFALL (mm) OVER DIFFERENT RIVER CATCHMENTS OF RAJATHAN
Jan Feb Mar Apr May Jun Jul Aug Sep Oct Nov Dec Annual 7. River Chambal upto Kota Dam Site (Catchment No. 404)
Districts/parts of districts within this Catchment: East Rajasthan : Chittorgarh, Jhalawar
5.5 2.0 3.2 2.6 7.8 72.7 269.8 295.2 142.3 19.0 14.6 3.6 838.4 8. River Chambal from Kota Dam Site to its confluene with River Banas (excluding river
Banas) (Catchment No. 405) Districts/parts of districts within this Catchment:
East Rajasthan : Baran, Bundi, Jhalawar, Kota, Sawai Madhopur, Jaipur
6.4 3.2 3.0 1.4 6.6 72.3 290.5 300.1 116.8 24.3 9.4 3.4 837.3 9. River Banas (Catchment No. 406)
Districts/parts of districts within this Catchment: East Rajasthan : Ajmer, Bhilwara, Chittorgarh, Dausa, Jaipur, Sawai Madhopur, Rajasmand,
Tonk, Udaipur
4.0 2.6 3.3 2.6 9.6 59.5 184.4 182.5 76.5 12.4 6.3 2.8 546.6 10. River Chambal from its confluence with River Banas to its confluence with river Yamuna
(Catchment No. 407) Districts/parts of districts within this Catchment:
East Rajasthan
:
Chittorgarh, Jhalawar
10.2 3.4 3.1 3.3 5.2 78.9 314.5 295.2 135.7 23.0 7.4 5.2 885.1 11. Thar Parkar Desert (Catchment No. 600)
Districts/parts of districts within this Catchment: West Rajasthan : Bikaner, Churu, Ganganagar, Jodhpur, Barmer, Nagaur, Jaisalmer
4.7 5.9 4.1 4.2 14.1 34.2 118.3 97.7 41.8 6.0 2.7 2.2 335.9

47
TABLE – VII STORMS AND DEPRESSIONS AFFECTING RAJASTHAN
DURING 1891 – 2000
MONTH NO. OF STORMS/DEPRESSIONS RAJASTHAN
STATE AS A WHOLE
EAST WEST
January NIL 1 1
February NIL NIL NIL
March NIL NIL NIL
April 1 1 1
May 1 1 2
June 11 9 15
July 42 20 47
August 64 34 65
September 55 18 56
October 9 3 9
November 1 NIL 1
December NIL NIL NIL
Total 194 87 197


48
BARMER DISTRICT
The characteristic feature of the climate of this district in common with the
adjoining districts of Rajasthan is its dryness, large diurnal range of temperature and
the fitful and erratic nature of the rainfall. The year may be divided into four seasons,
the winter from November to March, the summer from April to June, the southwest
monsoon season from July to mid September and the post monsoon season from
mid September to the end of October.
RAINFALL
Records of rainfall in the district are available for eight raingauge stations, for
period ranging from 11 to 50 years. Tables 1 and 2 give the details of rainfall at these
stations and for the district as a whole. The average annual rainfall in the district as a
whole is 251.7 mm. In general, the rainfall over the district decreases towards the
west. About 84% of the annual rainfall occurs during the months June to September,
mostly in association with depression of Bay origin which reaches the district. The
variation in the rainfall from year to year is not very large. During the fifty year period
1951 to 2000, the highest annual rainfall in the district amounting to 299% of the
annual normal was recorded in 1990 whereas the lowest annual rainfall which was
only 18% of the normal was recorded in 1969. In the same fifty year period there
were 19 years when the annual rainfall was less than 80% of the normal. There were
four occasions when such a low rainfall occurred in two consecutive years and one
occasion of four consecutive years. The erratic nature of the rainfall in the district will
be evident from Table 1. For example Balotra had 250% of the normal rainfall in
1995 while in 1969 there was 4% of the normal rainfall in this station. Rainless years
or years with extremely scanty rainfall are not unknown particularly in the western

49
parts of the district. In 36 years out of 48, rainfall in the district was between 101 mm
and 400 mm.
The average number of rainy days (i.e. days with rainfall of 2.5 mm or more)
in a year in the district is only 13. This number varies from 08 at Jasol to17 at
Siwana.
The heaviest rainfall in 24 hours recorded at any station in the district was
370.0 mm at Pachpadra on 12 August 1992.
TEMPERATURE
There is a meteorological observatory in the district at Barmer. The data of
this station can be taken as representative of the meteorological condition over the
district as a whole. The hot season commences by beginning of March when the
temperature begins to rise rapidly and attains its highest value in May or June. May
is the hottest month with the mean daily maximum temperature at 41.8oC and the
mean daily minimum temperature at 26.5oC. Throughout the summer, heat is intense
and scorching wind prevails. In the hot season the district is affected by heat waves
and maximum temperature may rise to about 48oC-50oC. With the onset of the
monsoon in the first week of July there is decrease in temperature. After the
withdrawal of the monsoon by about the first week of September there is increase in
day temperature and a secondary maximum is recorded in the month of October.
However, night temperatures decrease steadily. In the month of November when the
winter season sets in, both day and night temperatures decrease rapidly till January
which is the coldest month with the mean daily maximum temperature at about
25.6oC and the mean daily minimum temperature at about 10.6oC. The diurnal range
of temperature is large in all the months. On some days the minimum temperature
often falls one to two degrees below the freezing point of water in January and frost
occurs. The drop in night temperature, especially in winter is rather sudden and very
trying.

50
HUMIDITY
As mentioned earlier, the climate is very dry. Even during the brief monsoon
period the air is dry in between the fitful rains. The humidity in monsoon is about
70% in the mornings.
CLOUDINESS
In July and August skies are heavily clouded and occasionally overcast.
During the rest of the year skies are clear or lightly clouded.
WINDS
Winds are generally light in the post monsoon and winter months. In later part
of summer and southwest monsoon months winds are moderate. In post monsoon
and winter months winds blow from directions between northwest and northeast. In
the month of March, southwesterly winds appear and strengthen in later months. In
later part of summer and southwest monsoon season southwesterly winds are
predominant.
SPECIAL WEATHER PHENOMENA
Some of the monsoon depressions during July and August, originating in the
Bay of Bengal move west or west-northwest and reach the district or its
neighbourhood towards the later stages of their travel, causing gusty winds and
heavy rain. Thunderstorms practically occur throughout the year. Its frequency is
more in later part of summer and southwest monsoon season. Dust storms occur in
summer and southwest monsoon season. In the winter months occasional fog
occurs.
Tables 3, 4 and 5 give the temperature and relative humidity, mean wind
speed and special weather phenomena respectively for Barmer observatory.


52
TABLE - 2
Frequency of Annual Rainfall in the District (Data 1951 - 2000)
(BARMER) Range in mm No. of years Range in mm No. of years 001 – 100 4 401 – 500 4 101 – 200 15 501 – 600 3 201 – 300 12 601 – 700 0 301 – 400 9 701 – 800 1
(Data available for 48years only)
TABLE – 3
Normals of Temperature and Relative Humidity (BARMER)
MONTH
Mean Daily Maximum
Temperature
Mean Daily Minimum
Temperature
Highest Maximum
ever recorded
Lowest Minimum
ever recorded
Relative
Humidity (%) 0C 0C 0C Date 0C Date 0830
IST 1730 IST
January 25.6 10.6 36.6 1990 Jan 17 -1.7 1935 Jan 15 51 28
February 28.6 13.1 39.4 1943 Feb 27 3.8 1984 Feb 21 49 26
March 34.2 18.7 43.3 1946 Mar 30 2004 Mar 21
4.5 1979 Mar 09 44 22
April 39.2 24.4 48.3 1958 Apr 25 12.2 1945 Apr 02 42 22
May 41.8 26.5 49.9 1995 May 10 16.7 1931 May 31 54 23
June 40.2 27.2 48.7 1994 Jun 07 16.2 1964 Jun 14 68 34
July 36.7 26.3 45.5 2006 Jul 05 19.4 1936 Jul 07 77 49
August 35.0 25.5 43.7 1987 Aug 21
20.0 1941 Aug 25 2006 Aug 20
79 53
September 36.2 24.6 45.9 2001 Sep 25 16.7 1935 Sep 30 72 42
October 37.0 22.3 43.1 2002 Oct 11 13.9 1933 Oct 30 54 29
November 32.2 16.5 39.4 2001 Nov 01 6.7 1946 Nov 29 50 31
December 27.2 11.7 35.2 2003 Dec 09 2.3 1959 Dec 17 51 30
Annual 34.5 20.6 58 32

53
TABLE - 4
Mean Wind Speed in km/hr. (BARMER)
Jan Feb Mar Apr May Jun Jul Aug Sep Oct Nov Dec Annual 5.1 6.0 7.2 9.2 11.4 12.2 10.2 8.9 7.4 5.7 4.6 5.1 7.7
TABLE - 5 Special Weather Phenomena
(BARMER)
Mean No. of Days With
Jan Feb Mar Apr May Jun Jul Aug Sep Oct Nov Dec Annual
Thunder 0.1 0.4 0.6 0.8 1.6 2.0 3.9 2.9 1.6 0.7 0.1 0.1 14.8 Hail 0.0 0.0 0.0 0.0 0.0 0.0 0.0 0.0 0.0 0.0 0.0 0.0 0.0 Dust storm 0.1 0.2 0.3 0.8 1.1 1.1 0.7 0.2 0.0 0.1 0.0 0.0 4.6 Fog 0.1 0.1 0.0 0.0 0.0 0.0 0.0 0.0 0.0 0.0 0.0 0.1 0.3

54
BIKANER DISTRICT
The district has a desert climate, with large variations of temperature and
scanty rainfall. The winter period from November to March is followed by the summer
from April to June. The period from July to mid September is the period of rains. Mid
September to October is the transitional period.
RAINFALL
The records of rainfall in the district are available for seven raingauge station
for the period ranging from 23 to 45 years. Tables 1 and 2 give the details of rainfall
at these stations and for the district as a whole. The average annual rainfall in the
district as a whole is 258.5 mm. The rainfall in general increases from the northeast
towards the southeast. In the northwestern portions of the district for which no rainfall
are available, the rainfall is likely to be much less than in the southeastern half of the
district. About 82% of the annual rainfall is received from the southwest monsoon
season. July is the rainiest month. The variation in the annual rainfall from year to
year is not large. In the fifty year period from 1951 to 2000 the highest annual
rainfall in the district amounting to 208% of the normal occurred in 1997. 1968 was
the year with the lowest rainfall which was 29% of the normal. The variation in the
annual rainfall from year to year may be much larger in the northwestern portions of
the district. In the same fifty year period, rainfall less than 80% of the normal
occurred in 16 years. In the district as a whole, there were four occasions when two
consecutive years had less than 80% of the normal rainfall. It will be seen from Table
2 that in 41 years out of 47, the rainfall in the district was between 101mm and
400 mm.

55
On an average there are 17 rainy days (i.e. days with rainfall of 2.5 mm or
more) in a year in the district. This number varies from 08 at Palana to 21 at Bikaner
(PBO) observatory.
The heaviest rainfall in 24 hours recorded at any station in the district was
265.9 mm at Palana on 07 August 1933.
TEMPERATURE
There are two meteorological observatories in the district at Bikaner and
Bikaner (PBO). The records of these stations may be taken as representative of the
meteorological conditions in the district as a whole. The temperature rises rapidly
after March. May and June are generally the hottest months with the mean daily
maximum temperature at about 41.7oC and mean daily minimum temperature at
about 27.6oC. The summer months are intensely hot with scorching dust laden
winds, the day temperatures sometimes go upto 49oC. With the advance of the
southwest monsoon by about the middle of July temperatures decrease a little, but
the oppressiveness of weather continues due to the increased humidity.
After the later half of September when the monsoon withdraws the day
temperatures increase a little but the night temperatures begin to drop. From
November the drop in both day and night temperatures is more rapid. The diurnal
range of temperature is very large particularly in the winter months. The drop in
temperatures after nightfall is rather sudden and trying. January is the coldest month
with the mean daily maximum temperature at about 23.0oC and mean daily minimum
temperature at about 5.4oC. During the winter season cold waves affect the district in
the wake of passing western disturbances and the minimum temperatures
sometimes drop down to about three to four degrees below the freezing point of
water and frost occurs.
The highest maximum temperature ever recorded at Bikaner and Bikaner
(PBO) was 49.4oC on 28 May 1914and 47.6oC on 10 June 1979 and 20 June 1980
respectively and the lowest minimum temperature was –4.0oC on 26 January 1964
and -3.8oC on 12 June 1967 respectively.

56
HUMIDITY
Except during the short rainy period humidity is low and even during the rainy
period air is drier in between rains. The summer months are the driest, especially in
the afternoons in April and May when relative humidity is of the order of 15% to 20%.
CLOUDINESS
Even during the rainy parts of the year, skies are only moderately clouded on
many days. Overcast or heavily clouded skies prevail only on few days. In the rest of
the year skies are lightly clouded, except in the winter season when in association
with western disturbances, cloudy skies prevail for short spells of a day or two.
WINDS
Except for moderate winds during the period May to September winds are
generally light. In the summer and southwest monsoon season, southwesterly winds
prevail. In the post monsoon and winter season, light southeasterly wind blows in the
morning and light northerly winds blow in the afternoon. March is the transitional
month from which southwesterly winds start blowing and it continues.
SPECIAL WEATHER PHENOMENA
Some of the monsoon depressions in July and August which form at the head
of the Bay of Bengal and move in a westerly northwesterly direction reach Rajasthan
towards the later stages of their travel causing strong gusty winds and widespread
heavy rains. Thunderstorms occur throughout the year with more frequency in
summer and southwest monsoon season. Dust storms occur in hot season. Dust
storms and thunderstorms are occasionally accompanied with squalls and
sometimes with hail. Sand storms are more frequent in hot season in west
Rajasthan.

57
Tables 3, 4 and 5 and 3(a), 4(a) and 5(a) give the temperature and relative
humidity, mean wind speed and special weather phenomena respectively for Bikaner
and Bikaner PBO observatories.


59
TABLE - 2 Frequency of Annual Rainfall in the District
(Data 1951 - 2000) (BIKANER)
Range in mm No. of years Range in mm No. of years 001 – 100 1 301 – 400 11 101 – 200 13 401 – 500 3 201 – 300 17 501 – 600 2
(Data available for 47 years only)
TABLE - 3 Normals of Temperature and Relative Humidity
(BIKANER)
MONTH
Mean Daily Maximum
Temperature
Mean Daily Minimum
Temperature
Highest Maximum
ever recorded
Lowest Minimum
ever recorded
Relative
Humidity (%) 0C 0C 0C Date 0C Date 0830
IST 1730 IST
January 23.2 5.7 32.9 1991 Jan 28 -4.0 1964 Jan 26 63 30
February 26.0 9.0 37.2 1953 Feb 28 -2.5 1974 Feb 07 56 28
March 32.2 15.3 42.8 1924 Mar 25 -0.6 1898 Mar 04 47 22
April 38.2 22.0 47.2 1925 Apr 24 8.3 1953 Apr 01 36 17
May 41.8 26.6 49.4 1914 May 28 13.7 1960 May 08 36 15
June 41.6 28.9 48.9 1897 Jun 10 17.8 1888 Jun 04 52 25
July 38.0 27.9 47.8 1963 Jul 07 20.5 1974 Jul 04 68 45
August 36.9 27.0 43.4 1987 Aug 25 20.6 1983 Aug 29 72 49
September 37.0 25.1 43.9 1915 Sep 11 16.5 1972 Sep 24 65 38
October 36.3 19.1 42.2 1951 Oct 05 7.6 1964 Oct 30 47 24
November 30.9 11.9 38.5 2001 Nov 02 0.6 1937 Nov 30 48 30
December 25.1 6.4 33.5 2003 Dec 09 -2.8 1950 Dec 59 34
2008 Dec 05
Annual 33.9 18.7 54 30

60
TABLE - 4
Mean Wind Speed in km/hr. (BIKANER)
Jan Feb Mar Apr May Jun Jul Aug Sep Oct Nov Dec Annual 2.8 3.8 5.1 6.3 8.5 10.9 9.1 8.2 6.8 4.0 2.7 2.4 5.9
TABLE - 5 Special Weather Phenomena
(BIKANER)
Mean No. of Days With
Jan Feb Mar Apr May Jun Jul Aug Sep Oct Nov Dec Annual
Thunder 0.8 0.9 1.9 2.1 5.4 5.0 6.0 5.9 3.0 0.9 0.2 0.2 32.3 Hail 0.1 0.1 0.1 0.1 0.1 0.0 0.0 0.0 0.0 0.0 0.0 0.0 0.5 Dust storm 0.0 0.3 0.7 1.5 2.7 2.6 1.8 0.7 0.1 0.1 0.0 0.0 10.5 Fog 1.5 0.6 0.1 0.0 0.0 0.1 0.0 0.0 0.0 0.0 0.3 0.9 3.5

61
TABLE – 3(a) Normals of Temperature and Relative Humidity
(BIKANER PBO)
MONTH
Mean Daily Maximum
Temperature
Mean Daily Minimum
Temperature
Highest Maximum
ever recorded
Lowest Minimum
ever recorded
Relative
Humidity (%) 0C 0C 0C Date 0C Date 0830
IST 1730 IST
January 22.8 5.1 28.8 1974 Jan 18 -3.8 1967 Jan 12 67 31 February 25.8 9.1 35.1 1980 Feb 27 -2.5 1974 Feb 07 53 22 March 31.2 14.9 41.4 1984 Mar 31 5.3 1979 Mar 10 48 21 April 37.8 21.5 45.6 1979 Apr 27 10.6 1967 Apr 06 34 15 May 41.3 26.0 47.5 1984 May 28 15.2 1979 May 03 36 16
June 42.1 29.0 47.6 1979 Jun 10 1980 Jun 20 21.4 1983 Jun 11 50 25
July 38.7 28.1 45.3 1968 Jul 03 1979 Jul 09 20.5 1974 Jul 04 66 44
August 37.0 26.9 43.0 1979 Aug 01 23.5 1979 Aug 20 70 48 September 37.3 24.8 42.5 1974 Sep 21 16.5 1972 Sep 24 63 37 October 36.1 18.8 41.1 1968 Oct 05 10.7 1983 Oct 29 49 26 November 30.2 11.7 36.5 1979 Nov 04 3.3 1966 Nov 30 51 32 December 24.1 6.8 30.7 1968 Dec 11 -0.7 1973 Dec 28 64 37 Annual 33.7 18.6 54 30
TABLE – 4(a) Mean Wind Speed in km/hr.
(BIKANER PBO)
Jan Feb Mar Apr May Jun Jul Aug Sep Oct Nov Dec Annual 4.3 5.4 6.8 7.5 9.9 12.6 10.8 9.9 8.4 5.3 4.0 4.0 7.4
TABLE – 5(a) Special Weather Phenomena
(BIKANER PBO)
Mean No. of Days With Jan Feb Mar Apr May Jun Jul Aug Sep Oct Nov Dec Annual Thunder 0.8 0.5 1.8 2.2 6.2 4.2 6.3 4.3 3.4 1.4 0.8 0.8 32.7 Hail 0.3 0.0 0.3 0.1 0.4 0.0 0.0 0.1 0.2 0.1 0.1 0.0 1.6 Dust storm 0.0 0.3 1.3 1.6 1.9 2.0 2.3 0.9 0.3 0.3 0.0 0.0 10.9 Fog 0.8 0.6 0.2 0.0 0.0 0.0 0.0 0.0 0.0 0.0 0.4 0.8 2.8

62
CHURU DISTRICT
The district has a dry desert climate, with large variations of temperature and
scanty rainfall. The winter period from November to March is followed by the summer
season from April to June. The period from July to mid September is the southwest
monsoon season. Mid September to October is the period of transition from
monsoon to the cold season.
RAINFALL
Records of rainfall in the district are available for eight raingauge stations, for
period ranging from 43 to 44 years. Tables1 and 2 give the details of rainfall at these
stations and for the district as a whole. The average annual rainfall in the district as a
whole is 371.0 mm. The rainfall in general increases from the northwest towards the
southeast and varies from 308.4 mm at Dungargarh and 344.8 mm at Sardarshahar
to 419.8 mm at Sujangarh. About 86% of the annual rainfall is received during the
southwest monsoon period. July is the rainiest month. The variation in the rainfall
from year to year is not very large. During the fifty year period 1951 to 2000, the
highest annual rainfall in the district occurred in 1978, when it amounted to 214% of
the normal. 1952 was the year with the lowest annual rainfall when it amounted to
46% of the normal. During this fifty year period, the rainfall was less than 80% of the
normal in 18 years. Four consecutive years of such a low rainfall occurred once and
two consecutive years occurred twice during this period, in the district. It will be seen
from Table 2 that the rainfall in the district was between 201 mm and 500 mm in 35
years out of 47.

63
On an average there are 21 rainy days (i.e. days with rainfall of 2.5 mm or
more) in a year in the district. This number varies from 19 at Dungargarh to 25 at
Churu Observatory.
The heaviest rainfall in 24 hours recorded at any station in the district was
319.0 mm at Taranagar/Reni on 22July 1978.
TEMPERATURE
The only meteorological observatory in the district is at Churu and the
temperature and other meteorological records of this station may be taken as
representative of the climatic conditions over the district in general. Temperature
rises rapidly after March. May and June are the hottest months with the mean daily
maximum temperature at about 41.2oC and 41.3oC and the mean daily minimum
temperature at about 24.8oC and 27.9oC respectively. In summer months, the
weather is intensely hot with scorching dust laden winds and the day temperatures
sometimes go upto about 49oC. With the advance of the southwest monsoon season
early in July, temperature decreases a little. But the oppressiveness of the weather
continues, due to increased humidity. After the middle of September when the
monsoon withdraws, the temperatures begin to decrease gradually and after about
the middle of November rapidly. The diurnal range of temperature is very large
particularly in the winter months. The drop in temperature after October is rather
sudden and trying. January is the coldest month with the mean daily minimum
temperature at 4.4oC and the mean daily maximum temperature at 22.7oC. During
winter season, cold waves in association with passing western disturbances, affect
the district and the minimum temperatures sometimes drop to four to five degrees
below the freezing point of water and frost occurs.
The highest maximum temperature ever recorded at Churu was 49.9 oC on
26 May 1998 and the lowest minimum temperature was –4.6oC on 28 December
1973, 16 January 1974 and 07 February 1974 respectively.

64
HUMIDITY
Except during the brief southwest monsoon period when the relative humidity
is above 60% the air is generally dry. Even during the rainy period, the air is drier in
between the rains. The summer is the driest period of the year when the relative
humidity, particularly in the afternoons is below 30%.
CLOUDINESS
Even during the monsoon period, the skies are only moderately clouded on
many days and overcast or heavily clouded skies prevail only on a few days. In the
rest of the year, skies are lightly clouded or clear except during the winter season,
when in association with passing western disturbances cloudy skies prevail for short
spells of a day or two.
WINDS
Winds are generally light with some strengthening in force during the later part
of the summer season and the southwest monsoon season. In the period from May
to October winds blow mainly from directions between southwest and west. During
post monsoon and winter season, winds are generally light. The winds from south in
morning are more common and in the afternoon they increase in strength and are
mainly from north. In April, the morning winds are mostly from directions between
south and southwest while in the afternoons, they are predominantly from directions
between west and northwest.
SPECIAL WEATHER PHENOMENA
Some of the depressions which originate in the Bay of Bengal in the
southwest monsoon season move across the central parts of the country and reach
the district during the last stages of activity and cause widespread rain before
dissipating. An occasional post monsoon storm and depression also affects the
district. Thunderstorms occur throughout the year with higher frequency during

65
southwest monsoon season. Dust storms occur in the hot season. In the wake of
western disturbances, occasional fog occurs in the cold season.
Tables 3, 4 and 5 give the temperature and relative humidity, mean wind
speed and special weather phenomena respectively for Churu observatory.


67
TABLE - 2 Frequency of Annual Rainfall in the District
(Data 1951 - 2000) (CHURU)
Range in mm No. of years Range in mm No. of years 101 – 200 3 501 – 600 4 201 – 300 15 601 – 700 4 301 – 400 14 701 – 800 1 401 – 500 6
(Data available for 47 years only)
TABLE – 3
Normals of Temperature and Relative Humidity (CHURU)
MONTH
Mean Daily Maximum
Temperature
Mean Daily Minimum
Temperature
Highest Maximum
ever recorded
Lowest Minimum
ever recorded
Relative
Humidity (%) 0C 0C 0C Date 0C Date 0830
IST 1730 IST
January 22.7 4.4 33.4 2006 Jan 30 -4.6 1974 Jan 16 72 39
February 25.6 7.8 37.4 2006 Feb 20 -4.6 1974 Feb 07 65 33
March 31.7 13.7 42.5 1999 Mar 30 1.8 1979 Mar 10 56 28
April 37.7 19.9 46.2 2009 Apr 30 8.8 1974 Apr 01 46 25
May 41.2 24.8 49.9 1998 May 26 11.8 1969 May 02 44 24
June 41.3 27.9 49.0 2003 Jun 05 17.7 1974 Jun 10 54 32
July 37.4 27.0 46.0 2009 Jul 07 19.1 2003 Jul 11 71 54
August 35.8 25.6 43.1 2002 Aug 03 19.6 1976 Aug 17 77 58
September 36.1 23.4 44.1 2005 Sep 05 14.0 1972 Sep 23 70 48
October 35.3 17.3 42.3 1987 Oct 03 8.1 1964 Oct 09 57 32
November 30.1 10.3 38.4 2001 Nov 02 -1.0 1978 Nov 29 60 34
December 24.5 5.1 33.5 2003 Dec 09 -4.6 1973 Dec 28 69 39
Annual 33.3 17.3 62 37

68
TABLE - 4
Mean Wind Speed in km/hr. (CHURU)
Jan Feb Mar Apr May Jun Jul Aug Sep Oct Nov Dec Annual 3.3 4.8 6.0 6.4 8.2 10.7 9.4 7.6 6.1 4.1 2.9 2.9 6.0
TABLE - 5 Special Weather Phenomena
(CHURU)
Mean No. of Days With Jan Feb Mar Apr May Jun Jul Aug Sep Oct Nov Dec Annual Thunder 0.6 1.4 1.8 2.8 4.8 4.2 6.1 5.3 2.9 1.0 0.5 0.3 31.7 Hail 0.0 0.2 0.1 0.1 0.1 0.1 0.0 0.0 0.0 0.0 0.0 0.0 0.6 Dust storm 0.0 0.2 0.5 1.1 1.9 2.1 1.1 0.5 0.3 0.1 0.0 0.0 7.8 Fog 1.6 0.7 0.1 0.0 0.1 0.0 0.0 0.0 0.1 0.0 0.0 1.0 3.6

69
GANGANAGAR DISTRICT
The district has a desert kind of climate with large variations of temperature,
extreme dryness and scanty rainfall which are characteristics of a desert climate.
The cold season from November to March is followed by the summer from April to
June. July to mid September constitutes the southwest monsoon season. Mid
September to October is the transitional post monsoon period.
RAINFALL
Records of rainfall in the district are available for twenty six raingauge
stations, for period ranging from 10 to 49 years. Tables 1 and 2 give the details of
rainfall at these stations and for the district as a whole. The average annual rainfall in
the district as a whole is 243.4 mm. In general, the rainfall decreases from the north
to south. The annual rainfall varies from 266.9 mm at Ganganagar in the northern
border to 219.9 mm at Anupgarh towards south of the district. About 86% of the
annual rainfall in the district is received during the period June to September. July
and August are the rainiest months. The variation in the annual rainfall from year is
year is not large. In the 50 year period from 1951 to 2000, the highest annual rainfall
in the district amounting to 229% of the normal occurred in 1997, while the lowest
rainfall which was only 46% of the normal in 1968. During the fifty year period, the
rainfall less than 80% of the normal occurred in 10 years. There were two occasions,
when the rainfall was less than 80% of the normal for two consecutive years. It will
be seen from Table 2 that annual rainfall in the district was between 101 mm and
400 mm in 43 years out of 47.

70
On an average there are 14 rainy days (i.e. days with rainfall of 2.5 mm or
more) in a year in the district. This number varies from 08 at Karnisar to 20 at
Sriganganagar observatory.
The heaviest rainfall in 24 hours recorded at any station in the district was
251.7 mm at Ganganagar on 31 August 1928.
TEMPERATURE
There are two meteorological observatories in the district, one at Anupgarh
and the other at Sriganganagar. The data for Anupgarh observatory is not available
for sufficient period. The record of Sriganganagar is available for a longer period and
may be taken as representative of the climatological conditions prevailing in the
district as a whole. Temperatures rise rapidly after March. May and June are the
hottest months with the mean daily maximum temperature at 40.6oC and 41.7oC.
The heat in the summer season with frequent scorching dust laden winds is intense
and the day temperatures sometimes may go upto 49oC -50oC. Sriganganagar is
one of the hottest parts in India in summer. With the advance of the southwest
monsoon by about the middle of July temperatures decrease a little. The weather
continues to be oppressive due to increased moisture in the air. With the withdrawal
of the monsoon by about the latter half of September both day and night
temperatures begin to decrease, the drop in night temperatures being more rapid.
The diurnal range of temperature is very large, particularly in the winter months and
drop in temperature after nightfall is rather sudden and trying. January is the coldest
month with the mean daily minimum temperature at 5.4oC and the mean daily
maximum temperature at 21.4oC. In the wake of western disturbances moving
across north India during the winter season, cold waves affect the district and the
minimum temperature sometimes drops to two or three degrees below the freezing
point of water and frost occurs.
The highest maximum temperature recorded at Sriganganagar was 50oC on
14 June 1934 and the lowest minimum temperature was –2.8oC on 11 February
1950.

71
HUMIDITY
Except during the short rainy season, humidity is low and even during the
rainy period the air is drier in between the rains. The summer months are the driest,
especially in the afternoons during April and May when the relative humidity is of the
order of 20% to 25%.
CLOUDINESS
Even during the southwest monsoon season skies are only moderately
clouded on many days and overcast or heavily clouded skies prevailing only on a
few days. In the rest of the year the skies are lightly clouded or clear except during
the winter months, when in association with passing western disturbances, cloudy
skies prevail for short spells of a day or two.
WINDS
Winds are generally light except in the early part of southwest monsoon
months. During southwest monsoon season, winds blow from southwest direction.
During post monsoon, winter and summer season, winds blow mostly from northwest
direction in the afternoon. During March to May, northwesterly winds prevail in the
morning also, whereas in the post monsoon and winter season, winds are light and
variable in direction in the morning.
SPECIAL WEATHER PHENOMENA
Some of the depressions which originate in the Bay of Bengal in the
southwest monsoon season and move in a westerly direction reach the district or its
neighbourhood during the last stages of activity and cause widespread rain. An
occasional post monsoon storm and depression may also affect the district. Frequent
sand and dust storms occur in the hot season. Thunderstorms occur throughout the
year with more frequency during the hot season and southwest monsoon season.
During the cold season, occasional fog occurs in the wake of western disturbances.

72
Tables 3, 4 and 5 give the temperature and relative humidity, mean wind
speed and special weather phenomena respectively for Sriganganagar observatory.
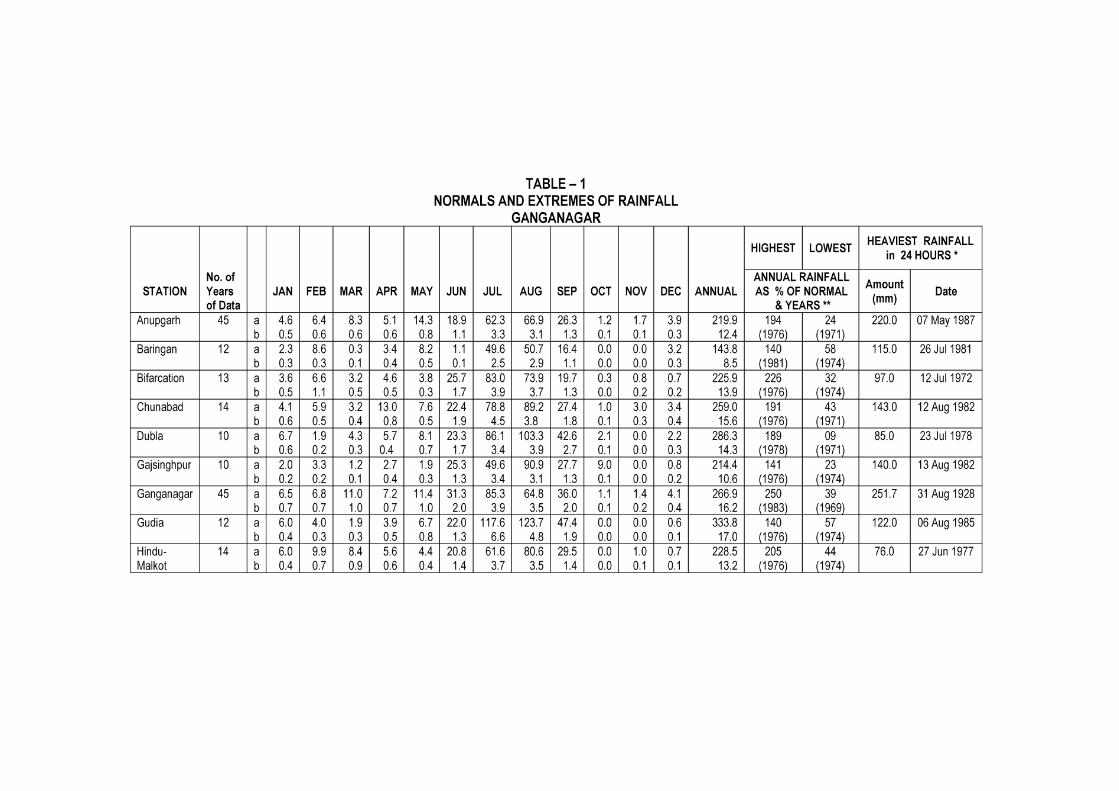


76
TABLE - 2 Frequency of Annual Rainfall in the District
(Data 1951 - 2000) (GANGANAGAR)
Range in mm No. of years Range in mm No. of years 101 – 200 10 401 – 500 3 201 – 300 25 501 – 600 1 301 – 400 8
(Data available for 47 years only)
TABLE – 3
Normals of Temperature and Relative Humidity (SRIGANGANAGAR)
MONTH Mean Daily Maximum
Temperature
Mean Daily Minimum
Temperature
Highest Maximum
ever recorded
Lowest Minimum
ever recorded
Relative
Humidity (%) 0C 0C 0C Date 0C Date 0830
IST 1730 IST
January 21.4 5.4 36.1 1948 Jan 30 -2.2 1945 Jan 12 81 43
February 23.8 8.1 35.0 1953 Feb 28 -2.8 1950 Feb 11 75 37
March 29.4 13.4 41.1 1942 Mar 26 0.6 1945 Mar 26 65 33
April 36.4 19.2 46.6 1958 Apr 25 6.9 1994 Apr 07 48 23
May 40.6 23.9 49.4 1944 May 30 11.7 1945 May 04 39 21
June 41.7 28.0 50.0 1934 Jun 14 13.8 1970 Jun 06 48 27
July 38.2 27.3 46.8 1968 Jul 04 14.5 1970 Jul 21 68 49
August 37.0 26.4 44.4 1991 Aug 03 16.2 1970 Aug 16 72 53
September 36.7 23.7 43.8 2005 Sep 03 14.0 2001 Sep 18 68 45
October 35.0 17.6 41.1 1941 Oct 10 1952 Oct 04 2006 Oct 03 2008 Oct 05
1.9 2007 Oct 04 62 37
November 29.2 11.0 39.0 1975 Nov 01 1.7 1938 Nov 30 71 43
December 23.0 6.1 31.5 1998 Dec 07 -1.7 1950 Dec 28 81 48
Annual 32.7 17.5 65 38

77
TABLE - 4 Mean Wind Speed in km/hr.
(SRIGANGANAGAR)
Jan Feb Mar Apr May Jun Jul Aug Sep Oct Nov Dec Annual 2.3 3.0 4.0 4.6 4.9 6.4 5.9 4.7 3.5 2.6 1.8 1.6 3.8
TABLE - 5 Special Weather Phenomena
(SRIGANGANAGAR)
Mean No. of Days With Jan Feb Mar Apr May Jun Jul Aug Sep Oct Nov Dec Annual Thunder 0.4 0.8 1.5 1.9 3.5 2.9 4.5 4.9 2.4 0.5 0.3 0.6 24.2 Hail 0.0 0.0 0.0 0.0 0.1 0.2 0.0 0.0 0.0 0.0 0.0 0.0 0.3 Dust storm 0.1 0.0 0.4 0.5 1.9 2.4 1.4 1.0 0.7 0.1 0.1 0.0 8.6 Fog 3.6 1.5 0.4 0.1 0.0 0.0 0.0 0.0 0.0 0.2 0.9 4.5 11.2

78
JAISALMER DISTRICT
The district has a desert climate characterized by the extreme dryness of the
air, large extremes of temperature and the fitful and erratic nature of rainfall. The
winter season from November to about the middle of March is followed by the hot
season which extends upto the end of June. The southwest monsoon season is from
July to the middle of September. The latter half of September and October constitute
the post monsoon season.
RAINFALL
Records of rainfall in the district are available for eight raingauge stations, for
period ranging from 15 to 49 years. Tables 1 and 2 give the details of rainfall at these
stations and for the district as a whole. The average annual rainfall in the district as a
whole is 172.9 mm. The rainfall is largely confined to the southwest monsoon season
when 88% of the annual rainfall is received. July is generally the month with the
maximum rainfall. The variation in the rainfall from year to year is not large. In the
fifty year period 1951 to 2000, the highest annual rainfall in the district amounting to
280% of the normal occurred in 1973 whereas 1969 was the year with the least
amount of rainfall, when the annual total was only 13% of the normal. Considering
the district as a whole there were as many as 15 years in the fifty year period when
the rainfall was less than 80% of the normal. Three and four consecutive years of
such a low rainfall have occurred twice and once respectively. It will be seen from
Table 2 that the annual rainfall in the district was between 001 mm and 300 mm in
41 years out of 48.

79
On an average there are 10 rainy days (i.e. days with rainfall of 2.5 mm or
more) in a year in the district. This number varies from 08 at Fatehgarh to 12 at
Pokaran.
The heaviest rainfall in 24 hours recorded at any station in the district was
540.0 mm at Sam on 17 August 1973.
TEMPERATURE
There is only one meteorological observatory in the district and it is located at
Jaisalmer. The records of this station may be taken as representative of the
climatological conditions in the district as a whole. From about the middle of March
temperatures begin to rise rapidly and attain the highest values in May or June. The
mean daily maximum temperature is 41.6 oC and the mean daily minimum
temperature is 25.2oC in May. Day temperatures sometimes go upto about 49oC.
Throughout the summer the heat is intense and scorching winds prevail. With the
advance of the southwest monsoon air over the district, the temperature decreases
appreciably in July. By about the middle of September when the monsoon withdraws
from the district, the day temperatures increase slightly. After September the day
temperatures decrease gradually and from the next month onwards rather rapidly.
The drop in night temperatures is more rapid. January is the coldest month when the
mean daily maximum temperature is 23.8oC and the mean daily minimum
temperature is 6.9oC. In association with western disturbances passing across north
India in the cold season the district experiences cold waves when the minimum
temperatures often go down to four to six degrees below the freezing point of water
and frost occurs damaging vegetation. The diurnal variation of temperature is large
in all the months. The drop in temperature after dusk especially in winter is very rapid
and trying.
The highest maximum temperature recorded at Jaisalmer was 49.2oC on 04
June1991 and the lowest minimum temperature recorded at Jaisalmer was –5.9oC
on 12 January 1967.

80
HUMIDITY
The air is generally very dry. Even during the brief monsoon season the air is
dry in between the fitful rains. However, humidity is about 70% in the mornings in
monsoon season.
CLOUDINESS
Skies are generally clear or lightly clouded except in the southwest monsoon
season, when the cloudiness is moderate. Heavily clouded to overcast skies prevail
only on a few days.
WINDS
In the summer and southwest monsoon season, southwesterly winds prevail.
In the post monsoon and winter season, wind blows in the directions north,
northeast. In the early summer season, northwesterly winds blow in the afternoon
and afterwards, southwesterly winds start blowing.
SPECIAL WEATHER PHENOMENA
A few of the depressions in July and August which originate in the Bay of
Bengal and move in a westerly direction, reach the district and its neighbourhood
during their last stages causing gusty winds and heavy rain. Dust storms and
thunderstorms occasionally accompanied by squalls occur in the winter, summer and
even in the early monsoon period. In the cold season western disturbances affect the
district causing cloudy skies. Fog occurs in winter occasionally.
Tables 3, 4 and 5 give the temperature and relative humidity, mean wind
speed and special weather phenomena respectively for Jaisalmer observatory.


82
Frequency of Annual Rainfall in the District
(Data 1951 - 2000) (JAISALMER)
Range in mm No. of years Range in mm No. of years 001 – 100 10 301 – 400 6 101 – 200 23 401 – 500 1 201 – 300 08
(Data available for 48 years only)
TABLE – 3
Normals of Temperature and Relative Humidity (JAISALMER)
MONTH
Mean Daily Maximum
Temperature
Mean Daily Minimum
Temperature
Highest Maximum
ever recorded
Lowest Minimum
Ever recorded
Relative
Humidity (%) 0C 0C 0C Date 0C Date 0830
IST 1730 IST
January 23.8 6.9 35.8 1990 Jan 14 -5.9 1967 Jan 12 57 30
February 26.9 10.3 37.8 1953 Feb 27 -4.4 1972 Feb 08 52 26
March 32.7 15.9 42.0 2004 Mar 22 3.4 1979 Mar 09 45 22
April 38.2 21.9 45.8 2009 Apr 29 10.6 1953 Apr 01 43 21
May 41.6 25.2 47.8 1956 May 29 15.1 1967 May 14 55 21
June 40.6 26.8 49.2 1991 Jun 04 17.2 1974 Jun 30 65 29
July 37.5 26.3 47.1 1991 Jul 11 20.1 1999 Jul 11 73 44
August 35.9 25.3 43.3 1957 Aug 05 1958 Aug 20
19.1 1965 Aug 31 75 48
September 36.3 23.9 43.3 1949 Sep 10 12.9 1966 Sep 16 70 38
October 36.1 19.9 42.2 1951 Oct 04 8.3 1949 Oct 31 53 27
November 31.1 13.2 38.8 1990 Nov 12 2.0 1988 Nov 06 52 29
December 25.2 8.2 34.4 2003 Dec 09 -0.6 1950 Dec 27 57 32
Annual 33.8 18.6 58 31

83
TABLE - 4
Mean Wind Speed in km/hr. (JAISALMER)
Jan Feb Mar Apr May Jun Jul Aug Sep Oct Nov Dec Annual 6.3 7.1 8.4 10.2 14.7 20.5 18.4 15.8 12.2 6.8 5.5 5.7 11.0
TABLE - 5 Special Weather Phenomena
(JAISALMER)
Mean No. of Days With
Jan Feb Mar Apr May Jun Jul Aug Sep Oct Nov Dec Annual
Thunder 0.4 0.4 0.6 0.5 0.8 1.2 1.9 1.9 1.0 0.2 0.0 0.1 9.0 Hail 0.0 0.0 0.0 0.0 0.0 0.0 0.0 0.0 0.0 0.0 0.0 0.0 0.0 Dust storm 0.1 0.2 0.2 0.4 0.3 1.0 0.5 0.5 0.2 0.1 0.0 0.0 3.5 Fog 0.4 0.2 0.0 0.0 0.1 0.0 0.0 0.0 0.0 0.0 0.1 0.2 1.0

84
JALORE DISTRICT
In common with the adjoining districts of Rajasthan, the district is
characterized by a dry climate with large extremes of temperature and low rainfall.
The year may be divided into four seasons, the winter from November to March, the
summer from April to June, the monsoon season from July to mid September and
the post monsoon season from mid September to the end of October.
RAINFALL
Records of rainfall in the district are available for six raingauge stations, for
period ranging from 31 to 45 years. Tables 1 and 2 give the details of rainfall at these
stations and for the district as a whole. The average annual rainfall in the district as a
whole is 433.9 mm. The rainfall over the district decreases from the southeast
towards the northwest and varies from 502.7 mm at Jaswantpura to 403.7 mm at
Bhinmal. About 92% of the annual rainfall occurs during the period June to
September. July and August are the rainiest months. The variation in the rainfall from
year to year is very large. During the fifty year period 1951 to 2000, the highest
annual rainfall in the district amounting to 219% of the normal occurred in 1956 while
the lowest annual rainfall which was only 21% of the normal was recorded in 1968.
During the same fifty year period rainfall less than 80% of the normal occurred in 20
years. Out of these, there were five occasions when such a low rainfall occurred in
two consecutive years. It will be seen from Table 2 that the annual rainfall in the
district was between 201 mm and 600 mm in 29 years out of 44.

85
The average number of rainy days (i.e. days with rainfall of 2.5 mm or more)
in a year in the district is only 19 and this number varies from 17 at Sachor to 21 at
Jalore and Jalore observatory.
The heaviest rainfall in 24 hours recorded at any station in the district was
511.8 mm at Sachor on 16 September 1893.
TEMPERATURE
There is a meteorological observatory in the district at Jalore. The description
of the climate that follows is based upon the records of Jalore observatory. The
diurnal range of temperature is large in all the months. The cold season starts in
November when temperatures begin to decrease. January is the coldest month with
the mean daily maximum temperature at about 25.6oC and the mean daily minimum
at about 10.5oC. The rapid drop in temperatures after sunset is very trying. In
association with passing western disturbances during the cold season, the district
experiences cold waves when the minimum temperature sometimes goes down
below one degree. Temperatures rise rapidly after mid February and reach the
highest values in May. May is the hottest month with the mean daily maximum
temperature at 41.1oC and the mean daily minimum temperature at 28.3oC.
Throughout the summer the heat is intense and scorching winds prevail. The
temperatures may go above 48oC on some days. With the onset of the southwest
monsoon by about the first week of July day temperatures decrease appreciably.
After the withdrawal of the monsoon by about the second week of September day
temperatures again increase and a secondary maximum in day temperatures is
reached in October. But night temperatures decrease progressively.
The highest maximum temperature ever recorded at Jalore was 48.8oC on 20
May 1998. The lowest minimum temperature ever recorded at Jalore was 0.4oC on
13 December 1994.

86
HUMIDITY
Except during the southwest monsoon season, the relative humidity is low
throughout the year. Even during the rainy period, in between the rains the humidity
is comparatively lower. Morning humidity is about75% during southwest monsoon
season.
CLOUDINESS
The skies are heavily clouded and occasionally overcast during the southwest
monsoon season. During the rest of the year, the skies are mostly clear or lightly
clouded.
WINDS
Winds are generally light to moderate, with strengthening in force during April
to September. In the monsoon season, wind blows from direction west-southwest. In
the post monsoon and winter season, winds blow in the directions between
northwest and northeast. In the summer season, northwesterly winds prevail and
west-southwesterly winds start blowing in the afternoons.
SPECIAL WEATHER PHENOMENA
Some of the depressions during July and August, originating in the Bay of
Bengal move in west or west-northwest direction and reach the district or its
neighbourhood during the last stages of their travel. These affect the district and its
neighbourhood causing widespread heavy rain and gusty winds. Dust storms occur
in summer and its frequency of occurrence is more in later half of summer season.
Dust storms are often preceded by thunderstorms. Thunderstorms occur in summer.
Sometimes in the southwest monsoon season, the rainfall is also associated with
thunder.
Tables 3, 4 and 5 give the temperature and relative humidity, mean wind
speed and special weather phenomena respectively for Jalore observatory.


88
TABLE 2 Frequency of Annual Rainfall in the District
(Data 1951 - 2000) (JALORE)
Range in mm No. of years Range in mm No. of years 001 – 100 3 501 – 600 6 101 – 200 3 601 – 700 4 201 – 300 6 701 – 800 2 301 – 400 12 801 – 900 2 401 – 500 5 901 – 1000 1
(Data available for 44 years only)
TABLE – 3
Normals of Temperature and Relative Humidity (JALORE)
MONTH
Mean Daily Maximum
Temperature
Mean Daily Minimum
Temperature
Highest Maximum
ever recorded
Lowest Minimum
ever recorded
Relative
Humidity (%) 0C 0C 0C Date 0C Date 0830
IST 1730 IST
January 25.6 10.5 35.4 2008 Jan 18 1.2 1973 Jan 28 55 33
February 27.8 13.7 41.8 2001 Feb 15 2.4 1993 Feb 21 52 32
March 34.0 19.4 42.4 1977 Mar 30 1984 Mar 31 2004 Mar 17
4.4 1984 Mar 30 44 27
April 39.1 25.4 45.7 1979 Apr 27 11.8 1993 Apr 02 42 26
May 41.1 28.3 48.8 1998 May 20 18.4 1985 May 19 55 29
June 39.7 28.8 47.4 1991 Jun 05 17.8 2009 Jun 05 65 39
July 35.4 27.0 45.4 2000 Jul 01 16.6 2000 Jul 22 75 56
August 33.2 25.8 42.2 1987 Aug 17 15.4 2000 Aug 14 79 61
September 35.2 25.9 43.4 2000 Sep 23 14.4 1994 Sep 30 69 48
October 36.6 23.0 44.0 2000 Oct 03 9.8 1994 Oct 21 54 34
November 31.8 16.5 40.0 1987 Nov 04 0.6 1995 Nov 26 52 36
December 26.4 11.2 35.0 2000 Dec 08 0.4 1994 Dec 13 56 37
Annual 33.8 21.3 58 38

89
TABLE - 4
Mean Wind Speed in km/hr. (JALORE)
Jan Feb Mar Apr May Jun Jul Aug Sep Oct Nov Dec Annual 3.5 4.6 6.6 9.0 13.1 12.7 11.2 10.0 8.2 4.8 2.7 2.8 7.4
TABLE - 5 Special Weather Phenomena
(JALORE)
Mean No. of Days With
Jan Feb Mar Apr May Jun Jul Aug Sep Oct Nov Dec Annual
Thunder 0.0 0.1 0.1 0.2 0.3 0.9 1.3 1.2 0.9 0.1 0.0 0.1 5.2 Hail 0.0 0.0 0.0 0.0 0.0 0.0 0.0 0.0 0.0 0.0 0.0 0.0 0.0 Dust storm 0.0 0.4 0.5 0.5 1.3 1.8 0.6 0.3 0.3 0.5 0.0 0.4 6.6 Fog 0.0 0.0 0.0 0.0 0.0 0.0 0.0 0.0 0.0 0.0 0.0 0.0 0.0

90
JODHPUR DISTRICT
The climate of this district, in common with the adjoining districts of Rajasthan,
is characterized by extreme dryness, wide range and extremes of temperature and
the fitful and uncertain rainfall. The winter season is from November to March and is
followed by the summer from April to June. The period from July to mid September
forms the southwest monsoon season and mid September to October is the post
monsoon season.
RAINFALL
Records of rainfall in the district are available for eight raingauge stations, for
period ranging from 12 to 50 years. Tables 1 and 2 give the statement of rainfall at
these stations and for the district as a whole. The average annual rainfall in the
district as a whole is 320.7 mm. The rainfall generally increases from the northwest
to the southeast. The annual rainfall varies from about 20 cm in the extreme
northwest to about 40 cm in the extreme southeast of the district. About 80% of the
rainfall is received during the southwest monsoon season. The variation in the
annual rainfall from year to year is not very large. In the fifty year period 1951 to
2000, the highest annual rainfall in the district amounting to 207% of the normal
occurred in 1975 whereas 1998 is the year of lowest annual rainfall amounting to
05% of the normal. In the same fifty year period rainfall less than 80% of the normal
occurred in 21 years. In the district as a whole there were three occasions when
such a low rainfall occurred in two consecutive years and on two occasions it
occurred in four consecutive years. It will be seen from Table 2 that the annual
rainfall in the district was between 101 mm and 500 mm in 43 years out of 49.

91
On an average there are 18 rainy days (i.e. days with rainfall of 2.5 mm or
more) in a year in the district. This number varies from 22 at Bilara to 12 at Phalodi
(Obsy).
The heaviest rainfall in 24 hours recorded at any station in the district was
300.0 mm at Bilara on 31 July 1999.
TEMPERATURE
There are two meteorological observatories in the district, one at Jodhpur and
another at Phalodi. The data of the Phalodi observatory may be taken to represent
the weather conditions in the northwestern half of the district while data of Jodhpur
as representative of the conditions in the southeastern half. At Phalodi, temperature
is generally lower in the winter and higher in the summer than at Jodhpur.
Temperature rises rapidly after March. May is the hottest month with the mean daily
maximum temperature at 41.5oC at Jodhpur and 41.9oC at Phalodi. In June the day
temperatures are slightly lower but the night temperatures are higher than in May.
The summer months are intensely hot with scorching winds. The maximum
temperature may occasionally exceed 47oC. With the advance of the monsoon air
into the district after mid July temperature drops appreciably. A secondary maximum
in day temperature is attained after mid September or October after the withdrawal of
the southwest monsoon. Thereafter both day and night temperatures decrease
rapidly. January is the coldest month when the mean daily minimum temperature at
Jodhpur is 8.9oC while at Phalodi it is 6.5oC. During the winter season, cold waves
affect the district in the wake of passing western disturbances and the minimum
temperature sometimes drops to two or three degrees below the freezing point of
water. The diurnal variation of temperature is very large and the drop in temperature
after the sunset is very rapid, during the winter months.
The highest maximum temperature recorded at Jodhpur was 48.9oC on 25
May 1932 and 49.0oC on 07 June 1991 at Phalodi. The lowest minimum temperature
recorded at Jodhpur was –2.2oC on 31 January 1905 and –3.3oC on 12 January
1942 at Phalodi.

92
HUMIDITY
Except during the short southwest monsoon season, humidity is very low.
Even in that season low humidity prevails in between the fifful rains.
CLOUDINESS
In the monsoon season skies are heavily clouded to overcast on many days.
In the rest of the year clear or lightly clouded skies are common.
WINDS
Except for moderate to strong winds during the period May to August, winds
are generally light during the rest of the year. During the winter season, winds blow
from northeasterly direction. By April, southwesterly winds begin and these become
predominant in the summer and monsoon months. In October, winds are
southwesterly and northeasterly winds begin to appear.
SPECIAL WEATHER PHENOMENA
Occasionally some of the depressions which originate in the Bay of Bengal
during the southwest monsoon season move across the country in a westerly to
northwesterly direction reach the district and its neighbourhood and cause strong
gusty winds and widespread rain before dissipating. Dust storms and thunderstorms
occur in the hot season and are sometimes accompanied by squalls. Thunderstorms
occur in the southwest monsoon season also. Fog occurs in the winter season.
Tables 3, 4 and 5 and 3(a), 4(a) and 5(a) give the temperature and relative
humidity, mean wind speed and special weather phenomena respectively for
Jodhpur and Phalodi observatories.

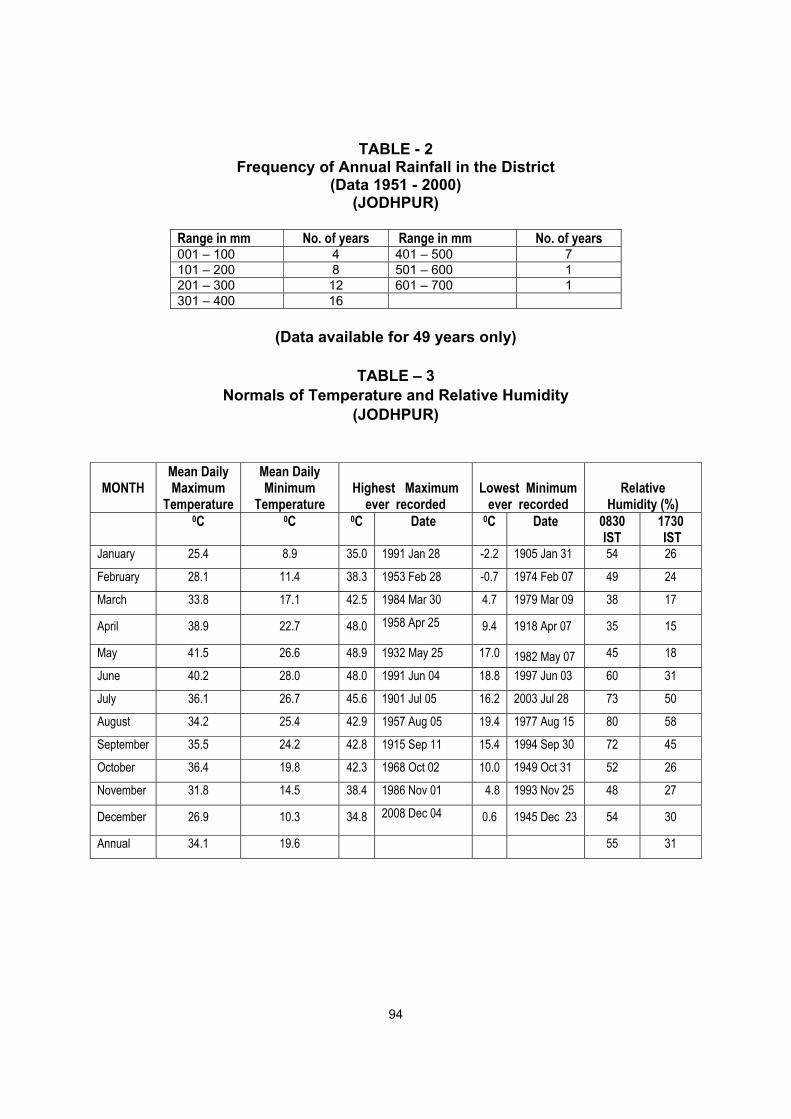
94
TABLE - 2 Frequency of Annual Rainfall in the District
(Data 1951 - 2000) (JODHPUR)
Range in mm No. of years Range in mm No. of years 001 – 100 4 401 – 500 7 101 – 200 8 501 – 600 1 201 – 300 12 601 – 700 1 301 – 400 16
(Data available for 49 years only)
TABLE – 3
Normals of Temperature and Relative Humidity (JODHPUR)
MONTH
Mean Daily Maximum
Temperature
Mean Daily Minimum
Temperature
Highest Maximum
ever recorded
Lowest Minimum
ever recorded
Relative
Humidity (%) 0C 0C 0C Date 0C Date 0830
IST 1730 IST
January 25.4 8.9 35.0 1991 Jan 28 -2.2 1905 Jan 31 54 26
February 28.1 11.4 38.3 1953 Feb 28 -0.7 1974 Feb 07 49 24
March 33.8 17.1 42.5 1984 Mar 30 4.7 1979 Mar 09 38 17
April 38.9 22.7 48.0 1958 Apr 25
9.4 1918 Apr 07 35 15
May 41.5 26.6 48.9 1932 May 25 17.0 1982 May 07 45 18
June 40.2 28.0 48.0 1991 Jun 04 18.8 1997 Jun 03 60 31
July 36.1 26.7 45.6 1901 Jul 05 16.2 2003 Jul 28 73 50
August 34.2 25.4 42.9 1957 Aug 05 19.4 1977 Aug 15 80 58
September 35.5 24.2 42.8 1915 Sep 11 15.4 1994 Sep 30 72 45
October 36.4 19.8 42.3 1968 Oct 02 10.0 1949 Oct 31 52 26
November 31.8 14.5 38.4 1986 Nov 01 4.8 1993 Nov 25 48 27
December 26.9 10.3 34.8 2008 Dec 04
0.6 1945 Dec 23 54 30
Annual 34.1 19.6 55 31

95
TABLE - 4
Mean Wind Speed in km/hr. (JODHPUR)
Jan Feb Mar Apr May Jun Jul Aug Sep Oct Nov Dec Annual 6.3 7.3 7.9 8.3 12.0 18.1 13.0 10.6 8.3 5.4 5.7 6.1 9.1
TABLE - 5 Special Weather Phenomena
(JODHPUR)
Mean No. of Days With Jan Feb Mar Apr May Jun Jul Aug Sep Oct Nov Dec Annual Thunder 0.4 0.9 0.9 2.0 3.8 5.0 6.8 5.7 3.0 0.8 0.1 0.2 29.6 Hail 0.0 0.1 0.1 0.1 0.1 0.0 0.2 0.0 0.0 0.0 0.0 0.0 0.6 Dust storm 0.0 0.2 0.5 1.0 2.9 3.1 1.5 0.3 0.2 0.1 0.0 0.0 9.8 Squall 0.0 0.0 0.1 0.2 0.5 1.1 0.7 0.4 0.4 0.1 0.0 0.0 3.5 Fog 0.3 0.3 0.0 0.0 0.1 0.0 0.3 0.1 0.2 0.1 0.1 0.4 1.9
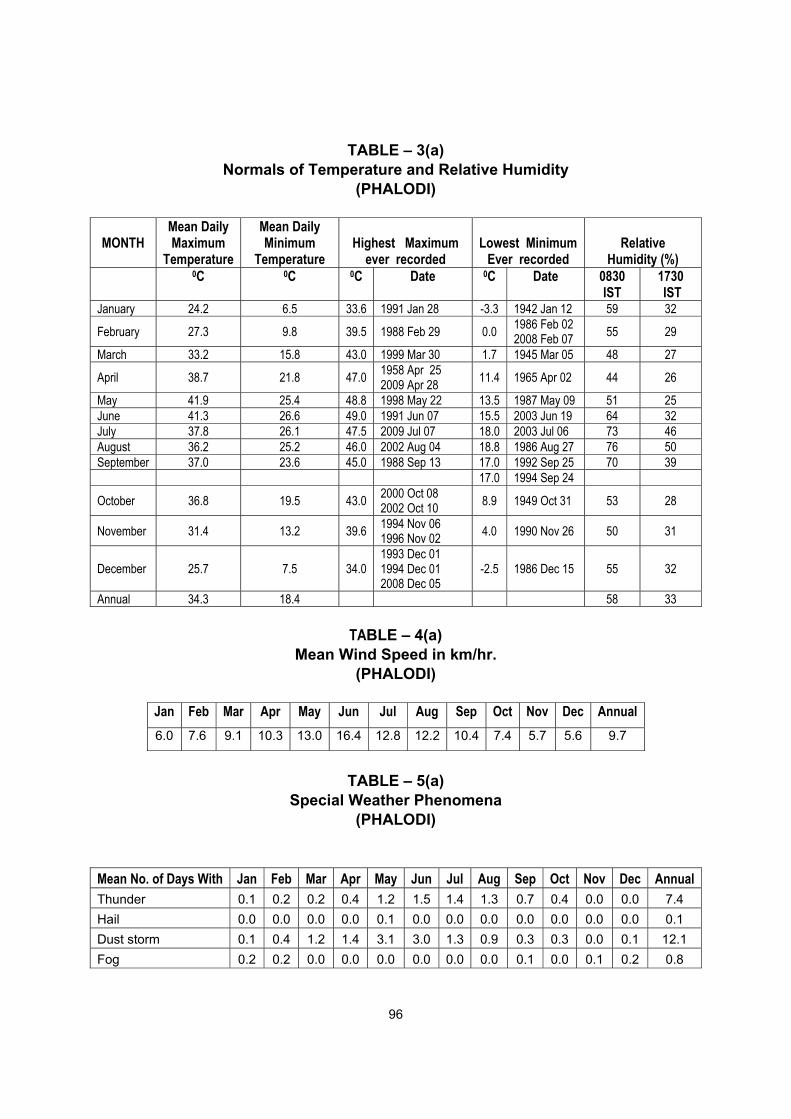
96
TABLE – 3(a) Normals of Temperature and Relative Humidity
(PHALODI)
MONTH
Mean Daily Maximum
Temperature
Mean Daily Minimum
Temperature
Highest Maximum
ever recorded
Lowest Minimum
Ever recorded
Relative
Humidity (%) 0C 0C 0C Date 0C Date 0830
IST 1730 IST
January 24.2 6.5 33.6 1991 Jan 28 -3.3 1942 Jan 12 59 32
February 27.3 9.8 39.5 1988 Feb 29 0.0 1986 Feb 02 2008 Feb 07 55 29
March 33.2 15.8 43.0 1999 Mar 30 1.7 1945 Mar 05 48 27
April 38.7 21.8 47.0 1958 Apr 25 2009 Apr 28 11.4 1965 Apr 02 44 26
May 41.9 25.4 48.8 1998 May 22 13.5 1987 May 09 51 25 June 41.3 26.6 49.0 1991 Jun 07 15.5 2003 Jun 19 64 32 July 37.8 26.1 47.5 2009 Jul 07 18.0 2003 Jul 06 73 46 August 36.2 25.2 46.0 2002 Aug 04 18.8 1986 Aug 27 76 50 September 37.0 23.6 45.0 1988 Sep 13 17.0 1992 Sep 25 70 39 17.0 1994 Sep 24
October 36.8 19.5 43.0 2000 Oct 08 2002 Oct 10 8.9 1949 Oct 31 53 28
November 31.4 13.2 39.6 1994 Nov 06 1996 Nov 02 4.0 1990 Nov 26 50 31
December 25.7 7.5 34.0 1993 Dec 01 1994 Dec 01 2008 Dec 05
-2.5 1986 Dec 15 55 32
Annual 34.3 18.4 58 33
TABLE – 4(a) Mean Wind Speed in km/hr.
(PHALODI)
Jan Feb Mar Apr May Jun Jul Aug Sep Oct Nov Dec Annual 6.0 7.6 9.1 10.3 13.0 16.4 12.8 12.2 10.4 7.4 5.7 5.6 9.7
TABLE – 5(a)
Special Weather Phenomena (PHALODI)
Mean No. of Days With Jan Feb Mar Apr May Jun Jul Aug Sep Oct Nov Dec Annual Thunder 0.1 0.2 0.2 0.4 1.2 1.5 1.4 1.3 0.7 0.4 0.0 0.0 7.4 Hail 0.0 0.0 0.0 0.0 0.1 0.0 0.0 0.0 0.0 0.0 0.0 0.0 0.1 Dust storm 0.1 0.4 1.2 1.4 3.1 3.0 1.3 0.9 0.3 0.3 0.0 0.1 12.1 Fog 0.2 0.2 0.0 0.0 0.0 0.0 0.0 0.0 0.1 0.0 0.1 0.2 0.8

97
NAGAUR DISTRICT
The climate of this district, in common with adjoining districts of Rajasthan is
characterized by highly variable rainfall, extreme dryness and large variations of
temperature. The winter season from November to March is followed by the summer
from April to June. The period from about the beginning of July to the middle of
September constitutes the main rainy season. The latter half of September and
October forms the transition period.
RAINFALL
Records of rainfall in the district are available for nine raingauge stations, for
period ranging from 38 to 45 years. Table 1 and 2 give the details of rainfall at these
stations and for the district as a whole. The average annual rainfall in the district as a
whole is 391.2 mm. The rainfall generally increases from northwest towards the
southeast in the district. The period from June to September is the rainy season. July
and August are the rainiest months. The rainfall during the period June to September
constitutes about 89% of the annual rainfall. The variation in the rainfall from year to
year is not large. In the fifty year period 1951 to 2000, the highest annual rainfall
which amounted to 289% of the normal occurred in 1975. 1951 was the year with the
lowest annual rainfall which amounted to only 42% of the normal. In the same fifty
year period the annual rainfall was less than 80% of the normal in 15 years. In the
district as a whole, during this fifty year period, two and four consecutive years of
rainfall less than 80% of the normal occurred once. It will be seen from Table 2 that
the annual rainfall in the district was between 201 mm and 500 mm in 31 years out of
42.

98
On an average there are 22 rainy days (i.e. days with rainfall of 2.5 mm or
more) in a year in the district. The number of rainy days is more or less uniform over
the district and is about 20 to 23 days.
The heaviest rainfall in 24 hours recorded at any station in the district was
780.3 mm at Parbatsar on 16 September1900.
TEMPERATURE
There is meteorological observatory in the district at Nagaur. The description
of the climate that follows is based on the records of this observatory. Temperatures
rise rapidly from March. May is the hottest month with the daily maximum
temperature at 41.2oC and the mean daily minimum temperature at 25.1oC. Night
temperatures continue to rise upto June when the mean minimum temperature
reaches 27.3oC. The summer months are intensely hot and dust laden winds blow.
The maximum temperature may sometimes go upto 48oC. With the advance of the
southwest monsoon into the district by about the beginning of July, day temperatures
drop appreciably but with the withdrawal of the monsoon after the first week of
September, while the night temperatures continue to fall, the day temperatures show
a rise and the secondary maximum in day temperatures is attained in October.
Thereafter both day and night temperatures decrease rapidly. January is the coldest
month with the mean daily maximum temperature at 23.8oC and the mean daily
minimum temperature at 6.0oC. During the winter season, in the wake of passing
western disturbances spells of colder weather are experienced in the district. The
minimum temperature on such occasion may drop down to two to three degrees
below the freezing point of water and frost may occur. The diurnal variation of
temperature during winter months is of the order of 18oC and the drop in temperature
after sunset is appreciable.
The highest maximum temperature recorded at Nagaur was 48.4oC on 31
May 1965 and the lowest minimum temperature was –2.9oC on 13 January 1967.

99
HUMIDITY
Except during the short southwest monsoon season, the relative humidity is
very low. Even during the monsoon low humidity prevails in between the fitful rains.
The summer months are the driest, when relative humidity is on an average between
20% and 30% in the afternoons.
CLOUDINESS
During the monsoon season skies are heavily clouded or overcast on some
days. In the rest of the year the skies are clear or lightly clouded. In the winter
season, in association with passing western disturbances, cloudy skies prevail for
short spells of a day or two.
WINDS
Winds are generally light to moderate with some strengthening in force during
April to September. During the later part of summer and southwest monsoon season,
wind blows from directions between southwest and south. October is the transitional
month and after October, in the post monsoon season wind blows in the direction
north/northeasterly. Whereas in the winter season wind blows in the direction
between northeast to northwest. During early summer, southwesterly winds start
blowing in the morning and northwesterly winds prevail in the afternoon.
SPECIAL WEATHER PHENOMENA
Some of the depressions which originate in the Bay of Bengal during the
southwest monsoon season move in a westerly to northwesterly direction and
occasionally reach the district or its neighbourhood causing widespread rain and
strong winds before dissipating. Dust storms and thunderstorms occur in the hot
season and are sometimes accompanied by squalls. Thunderstorms occur in the
monsoon season also. Occasional fog occurs in winter.
Tables 3, 4 and 5 give the temperature and relative humidity, mean wind
speed and special weather phenomena respectively for Nagaur observatory.


101
TABLE – 2 Frequency of Annual Rainfall in the District
(Data 1951 - 2000) (NAGAUR)
Range in mm No. of years Range in mm No. of years 101 – 200 4 701 – 800 0 201 – 300 10 801 – 900 0 301 – 400 9 901 – 1000 0 401 – 500 12 1001 – 1100 0 501 – 600 4 1101 – 1200 1 601 – 700 2
(Data available for 42 years only)
TABLE – 3 Normals of Temperature and Relative Humidity
(NAGAUR)
MONTH
Mean Daily Maximum
Temperature
Mean Daily Minimum
Temperature
Highest Maximum
ever recorded
Lowest Minimum
ever recorded
Relative
Humidity (%) 0C 0C 0C Date 0C Date 0830
IST 1730 IST
January 23.8 6.0 31.9 1965 Jan 15 -2.9 1967 Jan 13 54 43
February 26.6 9.6 36.5 1993 Feb 11 -1.9 1974 Feb 07 49 36
March 32.7 15.2 41.4 1972 Mar 27 4.5 1972 Mar 01 42 32
April 38.0 20.9 45.4 1979 Apr 27 10.4 1993 Apr 02 39 28
May 41.2 25.1 48.4 1965 May 31 15.4 1969 May 02 42 23
June 40.5 27.3 48.0 1994 Jun 06 15.6 1997 Jun 03 57 36
July 36.4 25.9 45.0 1968 Jul 03 18.5 1996 Jul 01 72 55
August 34.8 24.8 42.4 1972 Aug 06 19.4 1995 Aug 05 75 60
September 35.5 23.3 42.2 1974 Sep 21 15.3 1972 Sep 24 65 47
October 36.2 18.4 41.6 1986 Oct 09 8.9 1995 Oct 30 48 36
November 30.6 12.1 38.2 1978 Nov 03 3.8 1978 Nov 27 48 44
December 25.3 7.2 34.1 1986 Dec 04 -0.8 1986 Dec 19 52 43
Annual 33.5 18.0 54 40

102
TABLE - 4
Mean Wind Speed in km/hr. (NAGAUR)
Jan Feb Mar Apr May Jun Jul Aug Sep Oct Nov Dec Annual 5.2 6.3 7.7 8.4 11.0 14.4 12.0 9.8 8.3 5.3 4.4 4.9 8.1
TABLE - 5 Special Weather Phenomena
(NAGAUR)
Mean No. of Days With
Jan Feb Mar Apr May Jun Jul Aug Sep Oct Nov Dec Annual
Thunder 0.1 0.2 0.2 0.3 1.2 0.8 0.5 0.3 0.4 0.1 0.1 0.0 4.2 Hail 0.0 0.0 0.0 0.1 0.1 0.0 0.0 0.0 0.0 0.0 0.0 0.0 0.2 Dust storm 0.0 0.0 0.5 1.0 2.3 1.4 0.5 0.0 0.0 0.1 0.0 0.0 5.8 Fog 0.4 0.0 0.1 0.0 0.0 0.0 0.0 0.0 0.0 0.0 0.0 0.4 0.9

103
PALI DISTRICT
The climate of this district is on the whole dry with a hot season comparatively
milder than in the adjoining districts to the north and northwest. The cold season
from December to February is followed by the hot season which lasts till about the
middle of June. The period from mid June to mid September is the southwest
monsoon season. The period from mid September to end of November is the post
monsoon season.
RAINFALL
Records of rainfall in the district are available for twelve raingauge stations,
for period ranging from 10 to 46 years. Tables 1 and 2 give the details of rainfall at
these stations and for the district as a whole. The average annual rainfall in the
district as a whole is 498.9 mm. The rainfall generally decreases from the southeast
to the northwest in the district. But the region around Jatiram gets lesser rain than
even the northwestern parts of the district. The rainfall during the period June to
September constitutes about 95% of the annual rainfall. July and August are the
rainiest months. The variation in the rainfall from year to year is not very large. In the
fifty year period 1951 to 2000, the highest annual rainfall amounting to 219% of the
normal occurred in 1973 while the lowest annual rainfall which was only 32% of the
normal occurred in 1969. During this fifty year period, the rainfall was less than 80%
of the normal in 17 years. There were three occasions when such a low rainfall
occurred in two consecutive years and one occasion each when it occurred for three
and four consecutive years. It will be seen from Table 2 that the annual rainfall in the
district was between 201 mm and 800 mm in 39 years out of 46.

104
On an average there are 22 rainy days (i.e. days with rainfall of 2.5 mm or
more) in a year in the district. This number varies from 16 at Bogol, Hemwas and
Kharda to 27 at Desuri and Erinpura/Jawai Observatory.
The heaviest rainfall in 24 hours recorded at any station in the district was
381.0 mm at Desuri on 31 July 1952.
TEMPERATURE
The only meteorological observatory in the district is at Erinpura and records
of this observatory are available for few years only. The description which follows is
based on the records of this observatory and of the observatories in the
neighbouring districts. From about November both day and night temperatures drop
rapidly till January which is the coldest month. The drop in the temperature after
nightfall is very rapid and trying during the cold season. During the coldest month of
January the mean daily minimum temperature is 8oC to 9oC and the mean daily
maximum is about 25oC-26oC. In the wake of western disturbances moving across
north India during the cold season, cold waves affect the district and on such
occasions the minimum temperature may go down to a degree or two below the
freezing point of water and frost may occur. Temperatures rise rapidly after
February. May is the hottest month of the year with the mean daily maximum
temperature at about 40oC-41oC and the mean daily minimum at about 26oC-27oC.
The summer months are intensely hot with scorching winds. The maximum
temperatures may sometimes reach to about 48oC in May. With the onset of the
southwest monsoon by about mid June the day temperatures drop appreciably. With
the withdrawal of the southwest monsoon by about mid September the day
temperatures increase slightly and a secondary maximum in the day temperature is
reached in October. But night temperatures continue to decrease. Later
temperatures begin to drop steadily.
The highest maximum temperature ever recorded at Erinpura was 48.1oC on
06 May 1966 and the lowest minimum was –3.1oC on 13 January 1994 and 17
January 2000.

105
HUMIDITY
During the brief southwest monsoon season the relative humidity is generally
high. In the rest of the year, the air is dry. The summer months are the driest when
humidity particularly in the afternoons is about 25% to 35% generally.
CLOUDINESS
Skies are generally heavily clouded to overcast during the southwest
monsoon season. During the rest of the year the skies are mostly clear or lightly
clouded. In the winter season which is generally marked by clear bright weather,
brief spells of cloudy weather occur in association with the passage of western
disturbances across north India.
WINDS
Winds are generally light with some strengthening in force during the southwest
monsoon season. From May to September, the winds are predominantly from
southwest. In the post monsoon, winter and summer months winds are mainly from
directions between south and southwest. In northwestern parts adjacent to Jodhpur
observatory, winds are northeasterly during the post and winter season.
SPECIAL WEATHER PHENOMENA
Some of the monsoon depressions which originate in the Bay of Bengal and
move in a westerly direction, reach the district or its neighbourhood and cause gusty
winds and widespread rain before dissipating. Sand, dust storms and thunderstorms
occur occasionally during the summer season. Thunderstorms also occur during the
southwest monsoon season. Occasional fog occurs during monsoon, post monsoon
and winter season.
Tables 3, 4 and 5 give the temperature and relative humidity, mean wind
speed and special weather phenomena respectively for Erinpura observatory.

.


108
TABLE - 2 Frequency of Annual Rainfall in the District
(Data 1951 - 2000) (PALI)
Range in mm No. of years Range in mm No. of years 101 – 200 2 601 – 700 5 201 – 300 5 701 – 800 5 301 – 400 10 801 – 900 3 401 – 500 8 901 – 1000 1 501 – 600 6 1001 – 1100 1
(Data available for 46 years only)
TABLE – 3
Normals of Temperature and Relative Humidity (ERINPURA)
MONTH Mean Daily Maximum
Temperature
Mean Daily Minimum
Temperature
Highest Maximum
ever recorded
Lowest Minimum
ever recorded
Relative
Humidity (%) 0C 0C 0C Date 0C Date 0830
IST 1730 IST
January 26.3 8.0 33.5 2006 Jan 22 -3.1 1994 Jan 13 2000 Jan 17
75 44
February 28.8 10.8 38.1 1993 Feb 14 -0.5 2005 Feb 20 65 36
March 33.9 16.7 42.0 2004 Mar 23 1991 Mar 30
4.4 1975 Mar 12 1979 Mar 10
53 33
April 38.2 22.6 45.6 1958 Apr 27 8.0 2005 Apr 11 49 32
May 40.3 26.0 48.1 1966 May 06 12.6 2008 May 07 54 33
June 38.2 26.5 46.9 1980 Jun 12 7.6 2004 Jun 06 66 44
July 33.6 25.4 43.0 2009 Jul 07 15.0 2006 Jul 29 78 64
August 31.6 24.2 38.6 1965 Aug 20 1998 Aug 26
14.0 2006 Aug 07 83 71
September 33.7 23.7 41.0 2005 Sep 06 13.7 1996 Sep 13 76 60
October 35.2 20.3 40.6 1969 Oct 09 1985 Oct 04
8.2 2004 Oct 30 62 47
November 31.8 14.2 38.0 2004 Nov 05 2.1 1975 Nov 27 68 49
December 27.8 9.7 37.6 1999 Dec 05
0.0 2005 Dec 20 77 50
Annual 33.3 19.0 67 47

109
TABLE - 4
Mean Wind Speed in km/hr. (ERINPURA)
Jan Feb Mar Apr May Jun Jul Aug Sep Oct Nov Dec Annual 2.8 3.8 5.0 5.5 7.3 8.8 7.2 6.1 5.0 3.9 2.8 2.4 5.1
TABLE - 5 Special Weather Phenomena
(ERINPURA)
Mean No. of Days With
Jan Feb Mar Apr May Jun Jul Aug Sep Oct Nov Dec Annual
Thunder 0.1 0.1 0.1 0.4 0.6 1.6 2.0 1.6 1.3 0.4 0.0 0.0 8.2 Hail 0.0 0.0 0.0 0.0 0.0 0.1 0.0 0.0 0.0 0.0 0.0 0.0 0.1 Dust storm 0.0 0.1 0.0 0.2 1.0 0.3 0.0 0.1 0.0 0.0 0.0 0.0 1.7 Fog 0.2 0.2 0.0 0.2 0.1 0.0 0.1 0.5 0.0 0.0 0.2 0.1 1.6

110
AJMER DISTRICT
The district has a hot dry summer and a cold bracing winter. December to
February is the cold season after which the hot season commences and continues
till about the last week of June when the southwest monsoon sets in. The southwest
monsoon season is comparatively short in this region and lasts only till mid
September. The period from the second half of September to the end of November is
the post monsoon season.
RAINFALL
Records of rainfall in the district are available for twenty raingauge stations,
for period ranging from 32 to 49 years. Tables 1 and 2 give the data of rainfall at
these stations and for the district as a whole. The average annual rainfall in the
district as a whole is 454.9 mm. About 93% of the annual rainfall is received during
the period from June to September. July and August are the rainiest months. The
variation in the annual rainfall from year to year is not large. In the fifty year period
from 1951 to 2000 the highest annual rainfall which amounted to 199% of the annual
normal occurred in 1975 whereas 1972 was the year of lowest annual rainfall
amounting to only 47% of the normal. During this fifty year period, there were 13
years when annual rainfall was less than 80% of the normal rainfall. There is one
occasion each when such a low rainfall occurred in two and three consecutive years,
viz. 1962-63 and 1985-86-87 respectively. It is seen from Table 2 that in 33 years out
of 47 years the annual rainfall in the district was between 301 mm and 600 mm.
On an average there are 21 rainy days (i.e. days with rainfall of 2.5 mm or
more) in a year in the district. This number varies from 14 at Mangliawas to 31 at
Ajmer observatory.

111
The heaviest rainfall in 24 hours recorded at any station in the district was
500.0 mm at Nasirabad on 05 October 1989.
TEMPERATURE
The meteorological data of only observatory in the district at Ajmer may be
taken as representative of the weather conditions in the district as a whole. The
period from March to June is one of continuous rise in temperature, May and first
half of June being the hottest part of the year. The mean daily maximum temperature
in May is 40.4oC and the mean daily minimum temperature is 26.4oC. The night
temperatures in June are a little higher than in May. In May maximum temperature
may go upto about 47oC. After the setting of southwest monsoon in second half of
June, temperature decreases somewhat but the relief from the heat is not marked
because of the added discomfort from the increase in humidity, brought in by
southwest monsoon air. After the withdrawal of the monsoon by mid September,
days become hotter in October and a secondary maximum in day temperatures is
reached. However, nights become progressively cooler. After mid November, both
day and night temperatures drop rapidly till January which is the coldest month with
the mean daily maximum temperature at 23.8oC and the mean daily minimum
temperature at 7.2oC. In association with cold waves which affects the district in the
wake of western disturbances which pass across north India during the cold season,
minimum temperature, particularly in January and February go down to a degree or
two below the freezing point of water and frost may occur.
The highest maximum temperature ever recorded at Ajmer was 47.4oC on 19
May 1977 and the lowest minimum temperature ever recorded was -2.8oC on 16
January 1935.
HUMIDITY
The air is generally dry throughout the year except for the brief period of
southwest monsoon season when the humidity is generally more than 70%. In the

112
summer season which is the driest part of the year. Afternoon values of humidity are
as low as 20% to25%.
CLOUDINESS
During the southwest monsoon season skies are moderately to heavily
clouded, generally overcast on some days. In the rest of the year clear or lightly
clouded skies prevail. But on a few days in winter season skies become cloudy when
district is affected by passing western disturbances.
WINDS
Except for moderate winds during summer and southwest monsoon season,
winds are generally light. In the summer and southwest monsoon season, wind
blows mainly from directions west/southwest. In the post monsoon season, wind
blows from northeast direction, whereas in winter season, wind blows from northeast
direction in the morning and in between northwest to southwest directions in the
afternoon. March is the transitional month, after which the wind blows from
southwesterly direction.
SPECIAL WEATHER PHENOMENA
Depressions which originate in the Bay of Bengal and move across the central
parts of the country in the southwest monsoon season affect the district during the
last stage causing widespread heavy rainfall. Thunderstorms occur practically in all
the months of the year, but its frequency is more during May to September. In the
hot season dust storms also occur. Occasional fog occurs in winter months.
Tables 3, 4 and 5 give the temperature and relative humidity, mean wind
speed and special weather phenomena respectively for Ajmer observatory.
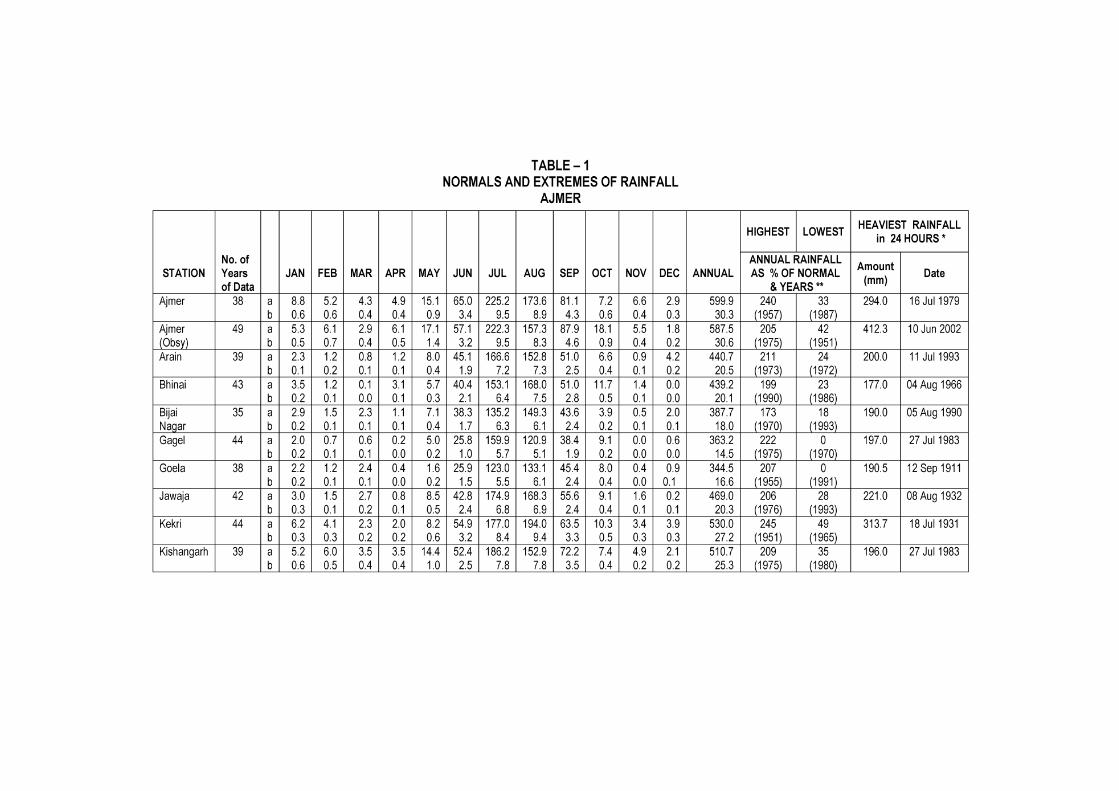


115
TABLE - 2 Frequency of Annual Rainfall in the District
(Data 1951 - 2000) (AJMER)
Range in mm No. of years Range in mm No. of years 201 – 300 5 601 – 700 4 301 – 400 11 701 – 800 1 401 – 500 13 801 – 900 3 501 – 600 9 901 – 1000 1
(Data available for 47 years only)
TABLE - 3 Normals of Temperature and Relative Humidity
(AJMER)
MONTH
Mean Daily Maximum
Temperature
Mean Daily Minimum
Temperature
Highest Maximum
ever recorded
Lowest Minimum
Ever recorded
Relative
Humidity (%) 0C 0C 0C Date 0C Date 0830
IST 1730 IST
January 23.8 7.2 32.6 1979 Jan 04 -2.8 1935 Jan 16 65 34
February 26.5 10.2 36.8 1985 Feb 28 -1.1 1905 Feb 01 56 28
March 32.0 15.7 42.3 1984 Mar 31 2.2 1898 Mar 04 41 21
April 37.5 21.9 44.6 1958 Apr 26 9.4 1970 Apr 01 35 22
May 40.4 26.4 47.4 1977 May 19 14.3 1974 May 27 38 22
June 39.1 26.9 46.4 1987 Jun 07 14.7 1972 Jun 28 57 36
July 34.3 25.3 44.4 1901 Jul 05 14.4 1972 Jul 11 75 58
August 32.0 24.3 42.3 1987 Aug 19 18.9 1973 Aug 19 80 67
September 33.6 23.6 42.0 1987 Sep 26 14.6 1972 Sep 27 69 53
October 34.6 18.8 42.0 1987 Oct 03 7.8 1889 Oct 25 54 34
November 29.8 12.8 37.5 1994 Nov 10 2.8 1926 Nov 18 56 37
December 25.2 8.2 39.0 2002 Dec 09 -0.6 1945 Dec 24 64 40
Annual 32.4 18.4 58 38

116
TABLE - 4 Mean Wind Speed in km/hr.
(AJMER)
Jan Feb Mar Apr May Jun Jul Aug Sep Oct Nov Dec Annual 3.5 4.3 5.8 7.3 10.3 12.1 10.2 8.9 7.2 4.1 3.3 3.2 6.7
TABLE - 5 Special Weather Phenomena
(AJMER)
Mean No. of Days With
Jan Feb Mar Apr May Jun Jul Aug Sep Oct Nov Dec Annual
Thunder 0.2 0.4 0.5 0.6 1.9 2.4 3.1 3.1 1.2 0.5 0.2 0.4 14.5 Hail 0.0 0.0 0.1 0.0 0.0 0.0 0.0 0.0 0.0 0.0 0.0 0.0 0.1 Dust storm 0.0 0.2 0.3 0.7 1.3 1.3 0.2 0.2 0.1 0.0 0.0 0.0 4.3 Fog 0.2 0.2 0.0 0.3 0.0 0.0 0.0 0.0 0.0 0.0 0.0 0.3 1.0

117
ALWAR DISTRICT
The district has a dry climate with a hot summer, a cold winter and a short
monsoon season. The cold season starts by about the middle of November and
continues to about the beginning of March. The hot season follows thereafter and
extends to the end of June. The southwest monsoon season is from July to mid
September. The period from mid September to mid November may be termed as the
post monsoon season.
RAINFALL
Records of rainfall in the district are available for eighteen raingauge stations,
for periods ranging from 16 to 45 years. Tables 1 and 2 give the details of rainfall at
these stations and for the district as a whole. The average annual rainfall in the
district as a whole is 618.6 mm. The rainfall during the southwest monsoon season
constitutes nearly 88% of the annual rainfall. The variation in the rainfall from year to
year is not very large. In the fifty year period 1951 to 2000, the highest annual which
amounted to 175% of the normal occurred in 1995 while the lowest annual rainfall in
the same period which was only 46% of the normal occurred in 1987. The rainfall
was less than 80% of the normal in 10 years out of which two consecutive years of
rainfall less than 80% of the normal occurred once in the district. It will be seen from
Table 2 that the annual rainfall in the district was between 401 mm and 800 mm in
34 years out of 44.
On an average there are 31 rainy days (i.e. days with rainfall of 2.5 mm or
more) in a year in the district. This number varies from 26 at Nimarana to 39 at Alwar
observatory.

118
The heaviest rainfall in 24 hours recorded at any station in the district was
350.5 mm at Mandawar 03 October 1891.
TEMPERATURE
The only meteorological observatory in the district is at Alwar. The description
which follows is based on the records of this observatory. The period from March to
June is one of continuous increase in temperatures, May and June being the hottest
part of the year. The mean daily maximum temperature in May and June is 40.6oC
and the mean daily minimum temperature is 27.0oC and 29.3oC respectively for May
and June. In May and June, the maximum temperatures sometimes go upto 49 or
50oC. The setting in of the southwest monsoon after the middle of June lowers the
temperature somewhat, but the relief from the heat is not marked because of the
added discomfort from the increase in humidity, which is a characteristic of monsoon
air. After the withdrawal of the monsoon by mid September, days become hotter and
in October day temperatures are somewhat same as in the previous month. The
nights become progressively cooler. After mid November both day and night
temperatures drop rapidly till January, which is the coldest month. The mean daily
maximum temperature in this month is 21.8oC and the mean daily minimum is 7.6oC.
In association with cold waves which sometimes affect the district in the wake of
western disturbances which move across north India during the cold season,
minimum temperatures particularly in December to February may go down to a
degree below the freezing point of water occasionally.
HUMIDITY
During the brief southwest monsoon season the relative humidity is generally
over 70%. In the rest of the year, the air is generally dry. In the summer season
which is the driest part of the year, afternoon relative humidity may be as low as 30%
to 40%.

119
CLOUDINESS
During the southwest monsoon season skies are moderately to heavily
clouded and overcast on some days. In the rest of the year the skies are mostly clear
or lightly clouded. But on a few days in the winter season, the skies become cloudy,
when the district is affected by passing western disturbances.
WINDS
Winds are generally light to moderate. But in summer and early southwest
monsoon season, winds strengthen slightly on some days and blows from northwest.
Northwesterly to southwesterly winds prevail during the southwest monsoon season.
In the post monsoon and winter months winds are mostly from directions between
northwest to northeast.
SPECIAL WEATHER PHENOMENA
Depressions originating in the Bay of Bengal in the southwest monsoon
season move across the central parts of the country and during their last stages,
sometimes affect the district causing heavy rain. In the hot season, dust or
thunderstorms occur frequently, some of them accompanied by squalls and
occasionally by hail. Thunderstorms occur mostly in the monsoon season.
Tables 3, 4 and 5 give the temperature and relative humidity, mean wind
speed and special weather phenomena respectively for Alwar observatory.


122
TABLE - 2 Frequency of Annual Rainfall in the District
(Data 1951 - 2000) (ALWAR)
Range in mm No. of years Range in mm No. of years 201 – 300 1 701 – 800 9 301 – 400 4 801 – 900 3 401 – 500 5 901 – 1000 1 501 – 600 11 1001 – 1100 1 601 – 700 9
(Data available for 44 years only)
TABLE – 3
Normals of Temperature and Relative Humidity (ALWAR)
MONTH Mean Daily Maximum
Temperature
Mean Daily Minimum
Temperature
Highest Maximum
ever recorded
Lowest Minimum
ever recorded
Relative
Humidity (%) 0C 0C 0C Date 0C Date 0830
IST 1730 IST
January 21.8 7.6 29.1 1977 Jan 12 -0.8 1967 Jan 12 80 49
February 24.8 10.6 35.0 1985 Feb 28 2.4 1974 Feb 07 71 43
March 31.6 16.4 39.9 1984 Mar 30 7.3 1979 Mar 09 58 38
April 37.3 22.8 46.4 1958 Apr 26 11.2 1965 Apr 02 47 32
May 40.6 27.0 50.6 1956 May 10 15.7 1969 May 02 44 32
June 40.6 29.3 48.8 1957 Jun 18 20.0 1976 Jun 19 53 40
July 35.3 27.0 43.8 1968 Jul 04 20.6 1983 Jul 10 73 63
August 33.1 25.8 41.2 1972 Aug 03 20.1 1985 Aug 23 79 71
September 33.9 24.5 40.1 1974 Sep 16 16.8 1972 Sep 26 71 61
October 33.7 19.2 40.6 1957 Oct 08 12.0 1960 Oct 26 66 48
November 28.9 13.2 36.0 1977 Nov 05 6.1 1970 Nov 29
68
48
December 23.3 8.9 29.7 1982 Dec 08 1.4 1961 Dec 24 78 53
Annual 32.1 19.4 66 48

123
TABLE - 4
Mean Wind Speed in km/hr. (ALWAR)
Feb Mar Apr May Jun Jul Aug Sep Oct Nov Dec Annual
2.1 2.8 3.4 4.2 6.1 6.3 4.6 3.4 3.2 2.0 1.8 1.6 3.5
TABLE - 5 Special Weather Phenomena
(ALWAR)
Mean No. of Days With
Jan Feb Mar Apr May Jun Jul Aug Sep Oct Nov Dec Annual
Thunder 0.5 0.8 0.7 1.0 3.3 2.9 3.5 2.6 2.0 1.0 0.1 0.3 18.7 Hail 0.0 0.0 0.0 0.0 0.2 0.0 0.0 0.1 0.0 0.0 0.0 0.0 0.3 Dust storm 0.0 0.0 0.2 0.3 1.0 0.5 0.1 0.0 0.0 0.0 0.0 0.0 2.1 Fog 0.1 0.2 0.0 0.1 0.0 0.0 0.0 0.0 0.0 0.0 0.0 0.3 0.7

124
BANSWARA DISTRICT
This district which is on the southern border of Rajasthan has a climate which
is very much milder than that in the desert regions further north and northwest. The
cold season is from December to February and is followed by the hot season which
lasts till about the middle of June. Thereafter the southwest monsoon season starts
and continues till the middle of September. The period from mid September to
November constitutes the post monsoon season.
RAINFALL
Records of rainfall in the district are available for eighteen raingauge stations,
for period ranging from 11 to 45 years. The details of rainfall at these stations and for
the district as a whole are given in Tables 1 and 2. The average annual rainfall in the
district as a whole is 882.2 mm. The rainfall during the southwest monsoon period
from June to September is nearly 94% of the annual total of rainfall. The variations in
the annual rainfall from year to year are large. In the fifty year period 1951 to 2000,
the highest annual rainfall amounting to 185% of the normal occurred in 1973 while
in 1966 the rainfall was the lowest and was only 44% of the normal. In the same fifty
years period the rainfall was less than 80% of the normal in 10 years. Three
consecutive years of rainfall less than 80% of the normal occurred on one occasion.
It will be evident from Table 2 that in 30 years out of 44 the annual rainfall was
between 701 mm and 1200 mm.

125
On an average there are 36 rainy days (i.e. days with rainfall of 2.5 mm or
more) in a year in the district. This number varies from 31 at Loharia to 42 at
Banswara, Danpura and Kushalgarh.
The heaviest rainfall in 24 hours recorded at any station in the district was
558.8 mm at Banswara on 23 July 1959.
TEMPERATURE
There is a meteorological observatory in the district at Banswara. The hot
season commences by March and the temperatures rise with the advance of the
season. May is generally the hottest month with the mean daily maximum
temperature at 40.8oC and the mean daily minimum temperature at 26.4oC. In
Banswara district the maximum temperature may sometimes go beyond 46oC-47oC.
The weather becomes cool when the southwest monsoon sets in the district by the
middle of June. After the withdrawal of the southwest monsoon by about the middle
of September the day temperatures show a slight increase. From about the middle of
November, both the day and night temperatures drop and January is generally the
coldest month with the mean daily maximum temperature at 27.9oC and the mean
daily minimum temperature at 12.3oC. In these months in the wake of some of the
western disturbances passing across north India, cold waves affect the district and
the night temperatures may go down upto 2-3 oC.
The highest maximum temperature ever recorded at Banswara was 47.5oC on
03 June 1991 and the lowest minimum temperature ever recorded was 2.8oC on 29
January 1973.
HUMIDITY
Relative humidity is high, more than 70% during the southwest monsoon
season. But in summer and winter months, the air is dry.

126
CLOUDINESS
Skies are heavily clouded to overcast in the southwest monsoon season. In
the rest of the year skies are generally clear or lightly clouded.
WINDS
Winds are generally light in the post monsoon and winter months. Winds are
moderate and sometimes strong during the period May to August. In summer and
southwest monsoon season, winds are predominantly from the southwest. Light
southeasterly winds in the mornings and northwesterly in the afternoons begin to
blow from October and these continue in the post monsoon and winter season.
SPECIAL WEATHER PHENOMENA
In October and to a lesser extent in the monsoon months, the district and its
neighbourhood are affected by depressions and cyclonic storms, causing
widespread rain. Thunderstorms occur in the summer months and the rain in the
southwest monsoon months is sometimes associated with thunder.
Tables 3, 4 and 5 give the temperature and relative humidity, mean wind
speed and special weather phenomena respectively for Banswara observatory.


129
TABLE - 2 Frequency of Annual Rainfall in the District
(Data 1951 - 2000) (BANSWARA)
Range in mm No. of years Range in mm No. of years 301 – 400 1 1001 – 1100 3 401 – 500 4 1101 – 1200 7 501 – 600 2 1201 – 1300 2 601 – 700 3 1301 – 1400 0 701 – 800 5 1401 – 1500 1 801 – 900 12 1501 – 1600 0 901 – 1000 3 1601 – 1700 1
(Data available for 44 years only)
TABLE - 3
Normals of Temperature and Relative Humidity (BANSWARA)
MONTH Mean Daily Maximum
Temperature
Mean Daily Minimum
Temperature
Highest Maximum
ever recorded
Lowest Minimum
Ever recorded
Relative
Humidity (%) 0C 0C 0C Date 0C Date 0830
IST 1730 IST
January 27.9 12.3 34.2 2000 Jan 12 2.8 1973 Jan 29 48 31
February 30.4 14.6 39.6 1967 Feb 04 5.4 1972 Feb 14 44 27
March 35.0 18.9 44.1 1966 Mar 18 7.4 1965 Mar 20 38 23
April 39.5 23.8 45.5 1970 Apr 25 15.9 1997 Apr 03 38 21
May 40.8 26.4 46.4 1970 May 11 2002 May 05 1998 May 17
16.4 1973 May 31 53 24
June 37.4 25.7 47.5 1991 Jun 03 18.1 1972 Jun 10 68 42
July 32.2 24.1 42.0 2009 Jul 05 17.9 1973 Jul 16 80 64
August 30.2 23.2 39.8 1987 Aug 08 18.4 1972 Aug 25 83 70
September 32.8 22.7 40.0 1989 Sep 28 14.3 1972 Sep 24 76 55
October 34.9 20.3 40.0 2000 Oct 21 12.7 1973 Oct 05 56 35
November 32.6 16.8 37.5 2001 Nov 03 8.9 1972 Oct 30 51 34
December 28.7 13.1 35.0 1995 Dec 11 4.5 1990 Dec 31 54 36
Annual 33.5 20.2 57 39

130
TABLE - 4 Mean Wind Speed in km/hr.
(BANSWARA)
Jan Feb Mar Apr May Jun Jul Aug Sep Oct Nov Dec Annual 4.7 5.6 6.0 6.2 9.4 9.8 7.7 6.4 4.3 4.0 4.5 4.9 6.1
TABLE - 5 Special Weather Phenomena
(BANSWARA)
Mean No. of Days With
Jan Feb Mar Apr May Jun Jul Aug Sep Oct Nov Dec Annual
Thunder 0.0 0.1 0.0 0.0 0.1 0.3 0.4 0.8 0.2 0.0 0.2 0.0 2.2 Hail 0.0 0.0 0.0 0.0 0.0 0.0 0.0 0.0 0.0 0.0 0.0 0.0 0.0 Dust storm 0.0 0.0 0.1 0.0 0.0 0.1 0.0 0.0 0.0 0.0 0.0 0.0 0.2 Fog 0.0 0.0 0.0 0.0 0.0 0.0 0.0 0.0 0.0 0.0 0.1 0,O O,1

131
BARAN DISTRICT
The district enjoys a dry climate except in the monsoon season. The year may
broadly be divided into four seasons. The cold season from mid-November to
February is followed by the hot season which extends to about the middle of June.
The period from about the middle of June to September is the southwest monsoon
season and the two months October and November constitute the post monsoon
season.
RAINFALL
Records of rainfall are available for eight stations in the district for period
ranging from 44 to 45 years. Tables 1 and 2 give the details of the rainfall at these
stations and for the district as a whole. The average annual rainfall in the district is
859.0 mm. The rainfall increases from the northwest region of the district to the
southeast. About 93% of the annual rainfall is received during the southwest
monsoon season. More than 50% of the frequencies are grouped in the range 701
mm to 1000 mm. During the fifty year period from 1951 to 2000, the rainfall in the
district as a whole was highest in 1975 and amounted to 153% of the normal. The
lowest annual rainfall of 44% of the normal was received in 1965.
During the fifty year period, the rainfall less than 80% of the normal occurred
in 10 years. Consecutive years of rainfall less than 80% of the normal occurred on
two occasions in the years 1953-54 and 1965-66. It will be seen from Table 2 that in
33 years out of 44 years, the rainfall in the district ranged between 501 mm and 1000
mm.

132
On an average there are 39 rainy days (i.e. days with rainfall of 2.5 mm or
more) in a year in the district. The number of rainy days increases from the west to
the east. This number varies from 37 at Antah to 41 at Shahabad.
The heaviest rainfall in 24 hours recorded at any station in the district was
413.2 at Baran on 13 August 1967.
TEMPERATURE
This district has been formed from earlier Kota district. Since there is no
meteorological observatory in this district, data of nearby Kota observatory has been
considered for describing the weather conditions of the district. The cold season
starts from about the middle of November and continues till the end of February.
January is the coldest month with the mean daily maximum temperature at about
24.0oC and the mean daily minimum temperature at about 10oC. In association with
the cold waves in the wake of western disturbances passing across north India, the
minimum temperature sometimes drop to one or two degrees above the freezing
point of water. Both day and night temperatures increase rapidly from March to May
which is the hottest month, with the mean daily maximum temperature at about
42.0oC while the mean daily minimum temperature is at about 28.0oC. In May
temperature may sometimes exceed 48oC. There is an appreciable drop in
temperature with the advance of the southwest monsoon into the district. After the
withdrawal of the southwest monsoon by the end of September, day temperatures
increase slightly with a secondary maximum in October.
HUMIDITY
The air is generally dry except in the southwest monsoon season. In the
summer months, the relative humidity is very low, often being less than 20% in the
afternoons.

133
CLOUDINESS
The cold season witnesses generally clear bright weather with brief spells of
cloudy weather caused by occasional western disturbances which pass across north
India. In the summer and the post monsoon months, skies are clear or lightly
clouded. Moderate to heavily clouded skies are common in the southwest monsoon
season.
WINDS
Generally light to moderate winds prevail throughout the year with a slight
strengthening in the early monsoon period. In the post monsoon and winter season,
winds blow from directions between northwest to northeast. During summer and
southwest monsoon season, winds blow from directions between west-northwest.
SPECIAL WEATHER PHENOMENA
Some of the depressions which originate in the Bay of Bengal during the
monsoon season and move across central parts of the country in a westerly or west-
northwesterly direction affect the district and its neighbourhood and cause
widespread heavy rain and strong winds. Dust storms occur in the summer months.
Thunderstorms occur throughout the year, more frequently in southwest monsoon
season . Occasional fog occurs during winter.


135
TABLE - 2 Frequency of Annual Rainfall in the District
(Data 1951 – 2000) (BARAN)
Range in mm No. of years Range in mm No. of years 301 – 400 1 901 – 1000 9 401 – 500 2 1001 – 1100 3 501 – 600 4 1101 – 1200 2 601 – 700 4 1201 – 1300 2 701 – 800 5 1301 – 1400 1 801 – 900 11
(Data available for 44 years only)

136
BHARATPUR DISTRICT
The district has a dry climate with a hot summer, a cold winter and a short
monsoon season. The cold season starts by about the middle of November and
continues to about the beginning of March. The hot season follows thereafter and
extends to the end of June. The southwest monsoon season is from July to mid
September. The period from mid September to mid November may be termed as the
post monsoon season.
RAINFALL
Records of rainfall in the district are available for thirteen raingauge stations,
for period ranging from 11 to 45 years. Table 1 and 2 give the details of rainfall at
these stations and for the district as a whole. The average annual rainfall in the
district as a whole is 622.4 mm. The annual rainfall in the district decreases from the
south towards the north. The annual rainfall at Bayana in south is 691.8 mm and that
at Kamen in north is 638.5 mm. The rainfall during the southwest monsoon season
constitutes about 83% of the annual rainfall. The variation in the rainfall from year to
year is not very large. In the fifty year period 1951 to 2000, the highest annual rainfall
which amounted to 169% of the normal occurred in 1958 while the lowest annual
rainfall in the same period which was only 32% of the normal occurred in 1979. In 7
years out of 50 years, the rainfall was less than 80% of the normal, and of these, two
years were consecutive years of such a low rainfall. It will be seen from Table 2 that
the annual rainfall in the district was between 501 mm and 900 mm in 38 out of 49
years.

137
On an average there are 32 rainy days (i.e. days with rainfall of 2.5 mm or
more) in a year in the district. This number varies from 26 at Angai to 38 at Bharatpur
(observatory).
The heaviest rainfall in 24 hours recorded at any station in the district was
630.0 mm at Bharatpur on 25 August 1996.
TEMPERATURE
The only meteorological observatory in the district is at Bharatpur and the
records for this observatory may be taken as representative of the climatological
conditions in the district. The period from March to June is one of continuous
increase in temperatures, May and June being the hottest part of the year. The mean
daily maximum temperature in May is at about 42.1oC and the mean daily minimum
is at about 25.7oC. In the summer season, the heat is intense and the scorching dust
laden winds add to the discomfort. The maximum temperatures sometimes reach
48oC and above in this season. The setting in of the southwest monsoon by about
the end of June lowers the temperature appreciably, but the relief from the heat is
not marked due to the increased dampness of the monsoon air. After the withdrawal
of the monsoon by mid September, days become a little hotter, but the nights
become progressively cooler. From November both day and night temperatures
decrease rapidly till January, the coldest month, with the mean daily maximum
temperature at about 22.4oC and the mean daily minimum temperature at about
7.2oC. In association with cold waves which affect the district in the wake of western
disturbances which move across north India during the cold season, minimum
temperature may at times fall to one or two degree above the freezing point of water.
The highest maximum temperature ever recorded at Bharatpur was 48.5oC on
26 May 1998 and the lowest minimum temperature was 1.7oC on 03 February 1975.
HUMIDITY
During the brief southwest monsoon season the relative humidity is generally
over 70%. In the rest of the year, the air is generally dry. In the summer season

138
which is the driest part of the year, afternoon relative humidity goes down to 30% or
less.
CLOUDINESS
Skies are moderately to heavily clouded and overcast on some days during
the southwest monsoon season. In the rest of the year the skies are mostly clear or
lightly clouded. On a few days in the cold season, the skies become cloudy, when
the district is affected by passing western disturbances.
WINDS
Winds are generally light to moderate, but in summer and early part of the
southwest monsoon season, winds strengthen slightly on some days. During the
later part of summer and early southwest monsoon season, westerly/southwesterly
winds prevail in the morning and blow from northwesterly direction in the afternoon.
In the later part of southwest monsoon season, wind blows from west and southwest
direction. In the post monsoon, winter season and early part of summer season,
westerly wind blows in the morning and north/northwesterly wind blows in the
afternoon.
SPECIAL WEATHER PHENOMENA
Depressions originating in the Bay of Bengal in the southwest monsoon
season move across the central parts of the country and during their last stages,
sometimes affect the district causing heavy rain. In the hot season, dust storms
occur frequently. Thunderstorms occur mostly throughout the year. Fog occurs in
winter.
Tables 3, 4 and 5 give the temperature and relative humidity, mean wind
speed and special weather phenomena respectively for Bharatpur observatory.


141
TABLE - 2 Frequency of Annual Rainfall in the District
(Data 1951-2000) (BHARATPUR)
Range in mm No. of years Range in mm No. of years 101 – 200 1 601 – 700 10 201 – 300 0 701 – 800 8 301 – 400 2 801 – 900 6 401 – 500 4 901 – 1000 3 501 – 600 14 1001 – 1100 1
(Data available for 49 years only)
TABLE – 3
Normals of Temperature and Relative Humidity (BHARATPUR)
MONTH
Mean Daily Maximum
Temperature
Mean Daily Minimum
Temperature
Highest Maximum
ever recorded
Lowest Minimum
ever recorded
Relative
Humidity (%) 0C 0C 0C Date 0C Date 0830
IST 1730 IST
January 22.4 7.2 31.6 1994 Jan 24 1.9 1978 Jan 19 80 52
February 25.5 9.2 38.6 1991 Feb 26 1.7 1975 Feb 03 73 43
March 32.4 14.3 41.9 1984 Mar 31 6.8 1979 Mar 10 62 35
April 38.7 20.6 47.0 1979 Apr 29 11.4 1976 Apr 01 47 31
May 42.1 25.7 48.5 1998 May 26 17.8 1982 May 14 43 26
June 41.7 28.0 47.8 1981 Jun 17 18.0 1983 Jun 29 53 39
July 34.9 26.4 46.7 1982 Jul 07 19.2 1978 Jul 20 79 68
August 33.7 25.6 40.9 2002 Aug 02 22.2 1981 Aug 31 82 70
September 35.0 23.9 41.6 1981 Sep 15 19.0 1982 Sep 26 76 58
October 34.4 19.0 40.5 2002 Oct 05 12.2 1974 Oct 28 65 43
November 29.6 12.7 39.6 1977 Nov 18 5.2 1974 Nov 24 68 48
December 24.5 8.1 36.4 1993 Dec 02 2.8 1974 Dec 24 1986 Dec 16 77 56
Annual 32.9 18.4 67 47

142
TABLE - 4
Mean Wind Speed in km/hr. (BHARATPUR)
Jan Feb Mar Apr May Jun Jul Aug Sep Oct Nov Dec Annual 3.0 3.6 4.2 4.6 5.2 6.3 4.8 3.7 3.7 3.0 2.1 2.3 3.9
TABLE - 5 Special Weather Phenomena
(BHARATPUR)
Mean No. of Days With
Jan Feb Mar Apr May Jun Jul Aug Sep Oct Nov Dec Annual
Thunder 0.8 0.5 0.8 1.1 2.4 3.1 3.9 3.2 1.9 0.2 0.0 0.5 18.4 Hail 0.0 0.0 0.0 0.0 0.0 0.0 0.0 0.0 0.0 0.0 0.0 0.0 0.0 Dust storm 0.0 0.0 0.0 0.8 1.9 1.0 0.0 0.0 0.1 0.1 0.0 0.1 4.0 Fog 3.5 1.0 0.2 0.0 0.0 0.0 0.0 0.0 0.0 0.0 0.5 4.9 10.1

143
BHILWARA DISTRICT
The district has a hot dry summer, a bracing cold season. The cold season is
from December to February and is followed by the hot season from March to about
the last week of June. The southwest monsoon season which follows, lasts till about
mid September. The period from mid September to about the end of November
constitutes the post monsoon season.
RAINFALL
Records of rainfall in the district are available for twenty raingauge stations,
for period ranging from 10 to 45 years. Tables 1 and 2 give the details of rainfall at
these stations and for the district as a whole. The average annual rainfall in the
district as a whole is 592.8 mm. About 82% of the annual rainfall is received during
the southwest monsoon season. July and August are the rainiest months. The
variation in the rainfall from year to year is not very large. In the fifty year period 1951
to 2000, the highest annual rainfall which amounted to 163% of the normal occurred
in 1994. The lowest annual rainfall which was only 47% of the normal occurred in
1951. The rainfall in the district as a whole was less than 80% of the normal in 6
years. Such a low rainfall occurred in the district for two consecutive years on one
occasion in the fifty year period. It will be seen from Table 2 that the annual rainfall in
the district was between 401 mm and 800 mm in 35 years out of 44.
On an average there are 29 rainy days (i.e. days with rainfall of 2.5 mm or
more) in a year in the district. This number varies from 19 at Khari Dam to 34 at
Mandalgarh and Arwar (Dam).

144
The heaviest rainfall in 24 hours recorded at any station in the district was
440.0 mm at Sahara on 08 July 1984.
TEMPERATURE
There is a meteorological observatory in the district at Bhilwara. The
description of the climate which follows is based on the records of this observatory.
The period from March to May is one of continuous rise in temperatures. May is the
hottest month of the year. The mean daily maximum temperature in this month is at
about 40.9oC and the mean daily minimum temperature is at about 25.7oC. The
maximum temperature on some days may go above 47oC. The southwest monsoon
sets in by about the last week of June and lowers the temperature somewhat but the
relief from the heat is not marked because of the added discomfort from the increase
in humidity brought in by the monsoon air. After the withdrawal of the monsoon by
about mid-September days become hotter and a secondary maximum is reached in
October. But night temperatures continue to decrease steadily after the withdrawal of
the monsoon. After mid November both day and night temperatures drop rapidly till
January which is the coldest month with the mean daily maximum temperature at
about 23.9oC and the mean daily minimum temperature at about 7.5oC. In
association with cold waves which sometimes affect the district in the wake of
western disturbances which move across north India during the cold season, the
minimum temperatures, particularly in January and February may go down slightly
below the freezing point of water and frost may occur.
The highest maximum temperature ever recorded at Bhilwara was 47.8oC on
16 May 1976 and the lowest minimum temperature was –0.3oC on 11 January 1967.
HUMIDITY
The relative humidity is generally over 60% in the brief southwest monsoon
season. In the rest of the year the air is dry. In the summer season which is the
driest part of the year, the afternoon humidity may be as low as below 20%.

145
CLOUDINESS
The skies are moderately to heavily clouded and overcast on some days
during the southwest monsoon season. In the rest of the year the skies are mostly
clear or lightly clouded. On a few days in the cold season, the skies become cloudy,
when the district is affected by passing western disturbances.
WINDS
Winds are generally light to moderate with some strengthening in force in the
later half of summer and the early southwest monsoon season. Southwesterly winds
prevail during summer and southwest monsoon months. In the post monsoon and
winter season the winds are mainly from northeast.
SPECIAL WEATHER PHENOMENA
During the southwest monsoon season, depressions which originate in the
Bay of Bengal and move across the country in a westerly to northwesterly direction
affect the district and its neighbourhood during the last stages and cause widespread
heavy rain and gusty winds. Thunderstorms occur practically in all the months of the
year but they are comparatively more frequent in the period May to September. Dust
storms occur during the hot season and early part of the southwest monsoon
season. Occasional fog occurs during the winter.
Tables 3, 4 and 5 give the temperature and relative humidity, mean wind
speed and special weather phenomena respectively for Bhilwara observatory.
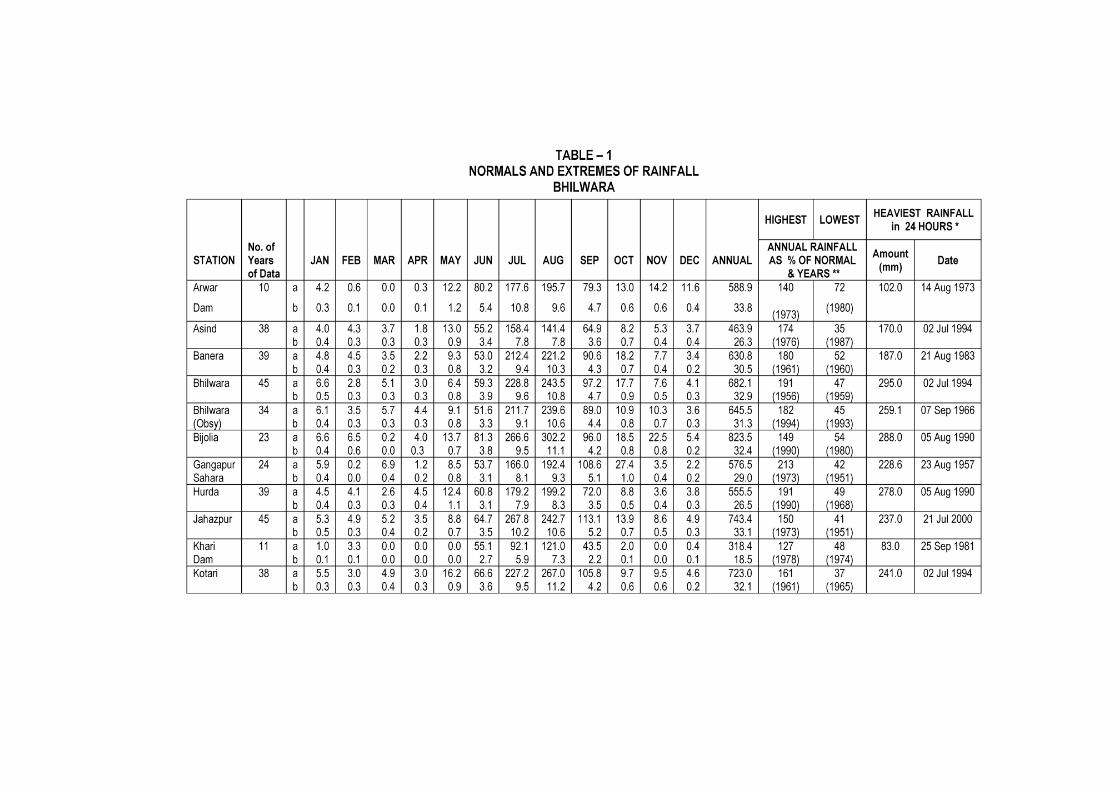


149
TABLE - 2 Frequency of Annual Rainfall in the District
(Data 1951 - 2000) (BHILWARA`)
Range in mm No. of years Range in mm No. of years 201 – 300 1 601 – 700 6 301 – 400 1 701 – 800 8 401 – 500 9 801 – 900 5 501 – 600 12 901 – 1000 2
(Data available for 44 years only)
TABLE – 3
Normals of Temperature and Relative Humidity (BHILWARA)
MONTH
Mean Daily Maximum
Temperature
Mean Daily Minimum
Temperature
Highest Maximum
ever recorded
Lowest Minimum
ever recorded
Relative
Humidity (%) 0C 0C 0C Date 0C Date 0830
IST 1730 IST
January 23.9 7.5 32.0 1994 Jan 28 -0.3 1967 Jan 11 61 29
February 27.0 10.2 36.7 1985 Feb 28 1.7 1984 Feb 22 52 23
March 32.7 15.5 41.2 1984 Mar 31 6.3 1972 Mar 01 40 17
April 37.8 21.6 44.8 1996 Apr 28 11.8 1965 Apr 02 32 15
May 40.9 25.7 47.8 1976 May 16 16.9 1964 May 28 35 18
June 39.1 26.3 47.0 2003 Jun 04 16.5 1997 Jun 03 55 35
July 33.5 24.6 42.5 1968 Jul 03 15.0 2003 Jul 07 77 61
August 31.4 23.4 39.2 1965 Aug 20 16.0 2003 Aug 02 82 71
September 33.1 22.2 40.5 2002 Sep 30 15.5 1967 Sep 28 74 55
October 34.0 18.1 41.5 2002 Oct 03 10.0 1983 Oct 30 54 32
November 30.0 12.9 36.0 1996 Nov 01 5.0 1975 Nov 30 55 33
December 25.4 8.8 33.3 1963 Dec 12 0.9 1966 Dec 11 62 34
Annual 32.4 18.1 57 35

150
TABLE - 4
Mean Wind Speed in km/hr. (BHILWARA)
Jan Feb Mar Apr May Jun Jul Aug Sep Oct Nov Dec Annual 3.9 4.8 5.3 6.4 8.8 11.4 9.9 7.8 6.0 4.4 3.3 3.5 6.3
TABLE - 5 Special Weather Phenomena
(BHILWARA)
Mean No. of Days With
Jan Feb Mar Apr May Jun Jul Aug Sep Oct Nov Dec Annual
Thunder 0.1 0.3 0.6 0.4 0.7 1.8 2.2 1.4 1.2 0.4 0.1 0.2 9.4 Hail 0.0 0.0 0.0 0.0 0.0 0.0 0.0 0.0 0.0 0.0 0.0 0.0 0.0 Dust storm 0.0 0.1 0.1 0.4 0.8 0.3 0.2 0.0 0.0 0.0 0.0 0.0 1.9 Fog 0.4 0.1 0.0 0.0 0.0 0.0 0.0 0.0 0.0 0.0 0.2 0.6 1.3

151
BUNDI DISTRICT
The climate of this district is generally dry except in the southwest monsoon
season. The year may broadly be divided into four seasons. The period from
December to February is the cold season and is followed by the hot season which
extends to about the third week of June when the southwest monsoon season starts.
This season continues till the middle of September. The period from mid September
to November is the post monsoon season.
RAINFALL
Records of rainfall are available for seven stations in the district for period
ranging from 12 to 45 years. Tables 1 and 2 give the details of the rainfall at these
stations and for the district as a whole. The average annual rainfall in the district is
698.9 mm. The rainfall generally decreases from the southeast to northwest. About
93% of the annual rainfall is received during the period June to September. There is
not much variation in the rainfall from year to year. In the fifty year period 1951 to
2000, the rainfall in the district was the highest in 1956 when it was 168% of the
normal. 1972 was the year with the lowest annual rainfall which amounted to only
54% of the normal. In 13 years out of 50, the rainfall was less than 80% of the
normal. On two occasions two consecutive years and on one occasion three
consecutive years had rainfall less than 80% of the normal. It will be seen from Table
2, that in 38 years out of 50, the annual rainfall was between 401 mm and 1000 mm.
On an average there are 33 rainy days (i.e. days with rainfall of 2.5 mm or
more) in a year in the district. This number is nearly the same throughout the district.

152
The heaviest rainfall in 24 hours recorded at any station in the district was
413.3 mm at Hindoli on 22 August 1942.
TEMPERATURE
There is a meteorological observatory in the district at Bundi. But it has
started very recently. However, the meteorological data recorded at Kota
observatory in the neighbouring district gives a fair idea of temperature and other
weather phenomena in this district. After about the middle of November both day and
night temperatures begin to drop steadily till Janruary which is generally the coldest
month of the year. The mean daily maximum temperature in that month may be
about 24oC while the mean daily minimum temperature may be of the order of 9oC.
In association with cold waves in the wake of western disturbances passing across
north India, the minimum temperatures may sometimes be as low as two or three
degrees above the freezing point of water. In February the temperatures are slightly
higher than in January, but from March temperature rises rapidly. May is usually the
hottest month when the maximum temperature may sometimes be as high as 47oC
to 48oC. With the advance of the southwest monsoon over the district the
temperatures drop appreciably. After about the middle of September, day
temperatures increase slightly and usually there is a secondary maximum of
temperature in October.
HUMIDITY
Dry air prevails over the district except in the southwest monsoon season. In
the summer months, particularly in the afternoons the relative humidity is very low.
CLOUDINESS
Except for brief spells of cloudy weather caused by occasional western
disturbances passing across north India, clear bright weather prevails during the cold
season. In the summer and post monsoon season skies are clear or lightly clouded
while moderately to heavily clouded skies are common in the southwest monsoon
months.

153
WINDS
Generally light to moderate winds prevail throughout the year with a slight
strengthening in the early monsoon period. In the post monsoon and winter season,
winds blow from directions between northwest and northeast. During summer and
southwest monsoon season, winds blow from directions west-northwest.
SPECIAL WEATHER PHENOMENA
Some of the depressions which originate in the Bay of Bengal during the
monsoon season and move across the central parts of the country in a westerly or
west-northwesterly direction affect the district and its neighbourhood and cause
widespread heavy rain and strong winds. Dust storms occur in the summer months.
Thunderstorms occur throughout the year, more frequently in southwest monsoon
season. Occasional fog occurs during winter.


155
TABLE - 2 Frequency of Annual Rainfall in the District
(Data 1951 - 2000) (BUNDI)
Range in mm No. of years Range in mm No. of years 301 – 400 1 801 – 900 8 401 – 500 8 901 – 1000 5 501 – 600 7 1001 – 1100 2 601 – 700 6 1101 – 1200 3 701 – 800 4
(Data available for 44 years only)

156
CHITTORGARH DISTRICT
The climate of this district is generally dry except during the southwest
monsoon season. The period from December to February is the cold season. The
hot season is from March to about the third week of June. The southwest monsoon
season, which follows, thereafter lasts till about the middle of September. The period
from mid September to November constitutes the post monsoon season.
RAINFALL
Records of rainfall in the district are available for twenty raingauge stations,
for period ranging from 11 to 45 years. Tables1 and 2 give the details of rainfall at
these stations and for the district as a whole. The average annual rainfall in the
district as a whole is 793.9 mm. The rainfall in the district generally decreases from
the southeast towards the northwest. The region around Chittor gets more rainfall
than in the rest of the district. The annual rainfall varies from 591.0 mm at Badgaon
to 1033.6 mm at Chittor. About 93% of the annual rainfall is received during the
period June to September. August is the rainiest month. The variation in the rainfall
from year to year is not large. In the fifty year period 1951 to 2000, the annual rainfall
was the highest in 1973, when it amounted to 178% of the normal. The lowest
annual rainfall which occurred in 1951 was only 36% of the normal. During the same
fifty year period the annual rainfall in the district was less than 80% of the normal in 8
years and there is one occasion of such a low rainfall occurred in two consecutive
years. It will be seen from Table 2 that the annual rainfall in the district was between
501 mm and 1100 mm in 43 years out of 48 years.

157
On an average there are 34 rainy days (i.e. days with rainfall of 2.5 mm or
more) in a year in the district. This number varies from 27 at Bhopal Sagar to 41 at
Partabgarh.
The heaviest rainfall in 24 hours recorded at any station in the district was
802.9 mm at Chittor on 14 July 1982.
TEMPERATURE
There are two meteorological observatories in the district, one is at Rawat
Bhata Dam and another at Chittorgarh. The records of Rawat Bhata Dam and
Chittorgarh observatories may be taken as representative of the conditions in the
eastern and western part of the district. After the middle of November both day and
night temperatures begin to drop steadily till January which is the coldest month. The
mean daily maximum temperature during this month is 24.5oC at Chittorgarh and
24.7oC at Rawat Bhata Dam site and the mean daily minimum temperature is 6.7oC
and 9.6oC at Chittorgarh and Rawat Bhata Dam respectively. In association with
western disturbances which move across north India during the cold season, cold
waves affect the district and the minimum temperature may go below the freezing
point of water and frost may occur. From March temperatures rise rapidly. May is
usually the hottest month with the mean daily maximum temperature at 40.7oC and
41.0oC at Chittorgarh and Rawat Bhata Dam respectively and the mean daily
minimum temperature is 24.6oC and 26.8oC at Chittorgarh and Rawat Bhata Dam
respectively. The heat in the summer season is intense and the dry hot winds which
are usual in this season make the weather unpleasant. The day temperatures may
go up above 46oC-47oC on some occasions. With the advance of the southwest
monsoon over the district by about the third week of June, there is an appreciable
drop in temperature. After the withdrawal of the monsoon by about mid September,
day temperatures increase slightly and secondary maximum is reached in October.
But the nights become progressively cooler. After October both day and night
temperatures begin to drop steadily. The highest maximum temperature ever
recorded at Rawat Bhata Dam was 47.6oC on 16 May 1985 and that at Chittorgarh
was 46.0oC on 06 May 2002. The lowest minimum temperature was –0.1oC on 15

158
January 2003 and –1.1oC on 25 December 1955 at Chittorgarh and Rawat Bhata
Dam respectively. HUMIDITY
Except during the southwest monsoon season when the humidity is about
80% or more, the air is generally dry. The driest part of the year is the hot season,
when the humidity is about 20% only in the afternoons. CLOUDINESS
Skies are moderately to heavily clouded and overcast on some days during
the southwest monsoon season. In the rest of the year the skies are mostly clear or
lightly clouded. But on a few days in the cold season, when the district is affected by
passing western disturbances, spells of cloudy weather occur on a day or two.
WINDS
Winds are generally moderate with some strengthening in force in the
summer and the early southwest monsoon season. Southwesterly winds prevail
during the monsoon months and from October to February northeasterly winds
appear. From March to June wind blows from west-southwest.
SPECIAL WEATHER PHENOMENA
Some of the depressions which originate in the Bay of Bengal during the
southwest monsoon season move across the country in a westerly to northwesterly
direction. These affect the district and its neighbourhood during the last stages
before dissipating, causing widespread heavy rain. Thunderstorms occur practically
in all the months of the year but they are comparatively more frequent in the period
May to September. Dust storms occur occasionally during the hot season. Fog
occurs in winter and early summer months.
Tables 3, 4 and 5 and 3(a), 4(a) and 5(a) give the temperature and relative
humidity, mean wind speed and special weather phenomena respectively for
Chittorgarh and Rawat Bhata Dam observatories.


161
TABLE - 2 Frequency of Annual Rainfall in the District
(Data 1951 - 2000) (CHITTORGARH)
Range in mm No. of years Range in mm No. of years 201 – 300 1 901 – 1000 3 301 – 400 0 1001 – 1100 5 401 – 500 1 1101 – 1200 1 501 – 600 5 1201 – 1300 1 601 - 700 6 1301 – 1400 0 701 – 800 17 1401 – 1500 1 801 – 900 7
(Data available for 48 years only)
TABLE – 3
Normals of Temperature and Relative Humidity (CHITTORGARH)
MONTH
Mean Daily Maximum
Temperature
Mean Daily Minimum
Temperature
Highest Maximum
ever recorded
Lowest Minimum
Ever recorded
Relative
Humidity (%) 0C 0C 0C Date 0C Date 0830
IST 1730 IST
January 24.5 6.7 32.7 1991 Jan 27 -0.1 2003 Jan 15 73 38
February 26.7 8.6 37.4 2006 Feb 23 0.3 1981 Feb 02 61 30
March 33.0 14.3 41.4 1999 Mar 31 3.8 1979 Mar 09 46 23
April 38.2 20.4 45.1 2009 Apr 29 12.1 1975 Apr 09 36 19
May 40.7 24.6 46.0 2002 May 06 16.2 1983 May 22 44 21
June 38.5 25.3 45.6 1994 Jun 06 17.2 1997 Jun 03 62 39
July 32.5 23.6 41.5 2009 Jul 07 18.5 1974 Jul 14 81 65
August 30.6 22.5 36.9 1979 Aug 31 18.8 1986 Aug 27 86 72
September 32.9 21.2 39.9 2009 Sep 23 12.4 2002 Sep 17 78 55
October 33.9 16.8 40.0 2002 Oct 08 6.4 1983 Oct 29 62 35
November 29.7 11.6 38.0 2002 Nov 20 3.5 1983 Nov 30 64 37
December 25.8 7.5 34.5 2002 Dec 14 0.2 1980 Dec 08 72 41
Annual 32.3 16.9 64 40

162
TABLE - 4
Mean Wind Speed in km/hr. (CHITTORGARH)
Jan Feb Mar Apr May Jun Jul Aug Sep Oct Nov Dec Annual 3.9 4.2 4.7 5.4 7.0 9.3 7.8 6.3 4.5 3.2 3.2 3.4 5.2
TABLE - 5 Special Weather Phenomena
(CHITTORGARH)
Mean No. of Days With
Jan Feb Mar Apr May Jun Jul Aug Sep Oct Nov Dec Annual
Thunder 0.0 0.6 0.4 0.3 1.9 2.1 2.6 3.9 0.7 0.5 0.1 0.1 13.2 Hail 0.0 0.0 0.0 0.0 0.1 0.1 0.0 0.0 0.0 0.0 0.0 0.0 0.2 Dust storm 0.1 0.1 0.2 0.2 0.8 0.5 0.1 0.1 0.0 0.0 0.0 0.0 2.1 Fog 1.7 1.8 1.5 1.9 1.8 0.3 0.1 0.1 0.7 2.5 0.4 3.1 15.9

163
TABLE – 3(a) Normals of Temperature and Relative Humidity
CHAMBAL (RAWAT BHATA DAM)
MONTH Mean Daily Maximum
Temperature
Mean Daily Minimum
Temperature
Highest Maximum
ever recorded
Lowest Minimum
Ever recorded
Relative
Humidity (%) 0C 0C 0C Date 0C Date 0830
IST 1730 IST
January 24.7 9.6 34.6 2006 Jan 17 0.0 1956 Jan 22 67 37 February 27.5 12.1 38.2 2005 Feb 12 0.5 1957 Feb 11 57 29 March 33.2 17.4 41.3 2004 Mar 19 5.5 1956 Mar 01 43 24 April 38.1 22.8 46.0 1958 Apr 27 12.9 1987 Apr 02 35 22 May 41.0 26.8 47.6 1985 May 16 15.6 1957 May 09 39 23
June 38.7 27.0 46.1 1995 Jun 05 1979 Jun 10 16.3 1957 Jun 06 60 41
July 33.2 24.8 46.1 1962 Jul 02 17.4 2006 Jul 21 79 68 August 31.0 23.7 41.3 1987 Aug 06 15.6 1957 Aug 13 86 77 September 32.8 22.7 40.6 1979 Sep 28 14.4 1957 Sep 30 78 61 October 34.0 18.9 40.6 1984 Oct 04 8.3 1955 Oct 31 63 37
November 29.9 14.2 37.2 1957 Nov 06 3.3 1958 Nov 23 1956 Nov 29 65 37
December 25.7 10.6 32.6 1968 Dec 12 1963 Dec 12 -1.1 1955 Dec 25 70 40
Annual 32.5 19.2 62 41
TABLE – 4(a)
Mean Wind Speed in km/hr. CHAMBAL (RAWAT BHATA DAM)
Jan Feb Mar Apr May Jun Jul Aug Sep Oct Nov Dec Annual 3.1 3.7 4.3 5.1 6.8 9.1 7.3 5.5 4.2 2.8 2.6 2.7 4.8
TABLE – 5(a) Special Weather Phenomena
CHAMBAL (RAWAT BHATA DAM)
Mean No. of Days With
Jan Feb Mar Apr May Jun Jul Aug Sep Oct Nov Dec Annual
Thunder 0.3 0.3 0.8 0.9 3.3 5.4 5.1 2.4 1.8 0.8 0.6 0.3 22.0 Hail 0.0 0.0 0.0 0.0 0.0 0.0 0.0 0.0 0.0 0.0 0.0 0.0 0.0 Dust storm 0.0 0.0 0.2 0.4 1.2 1.4 0.1 0.0 0.0 0.0 0.0 0.0 3.3 Fog 0.3 0.1 0.1 0.0 0.0 0.0 0.0 0.0 0.0 0.0 0.1 0.4 1.0

164
DAUSA DISTRICT
The district has a dry climate except during the southwest monsoon season.
December to February is the cold season after which the hot season commences
and continues till about the third week of June when the southwest monsoon sets in.
The southwest monsoon season is comparatively short in this region and lasts only
till mid September. The period from about the second half of September to the end of
November constitutes the post monsoon or the retreating monsoon season.
RAINFALL
Records of rainfall in the district are available for four raingauge stations, for
period ranging from 36 to 43 years. Tables1 and 2 give the details of the rainfall at
these stations and for the district as a whole. The average annual rainfall in the
district is 679.8 mm. Rainfall in general is uniform throughout the district. The rainfall
during the period June to September constitutes nearly 91% of the annual normal
rainfall. The variation of the annual rainfall from year to year is not very large. In the
fifty year period from 1951 to 2000 the highest annual rainfall amounting to 170% of
the normal occurred in 1995, while the lowest annual rainfall which was only 53% of
the normal occurred in 1951. During this period, there were 11 years when the
annual rainfall was less than 80% of the annual normal rainfall. There is only one
occasion when such a low rainfall occurred in three consecutive years in the district.
It will be seen from Table 2 that the annual rainfall was between 501mm to 800 mm
in 22 years out of 39.

165
On an average there are 34 rainy days (with rain of 2.5 mm or more) in a year
in the district. This number varies from 32 at Lalsot to 36 at Sikrai.
The heaviest rainfall in 24 hours recorded at any station in the district was
550.0 mm at Dausa on 19 July 1981.
TEMPERATURE
There is no meteorological observatory in the district. So the description which
follows is based on data of observatory in the neighbouring Jaipur district, where
similar climatic conditions prevail. The period from March to June is of continuous
rise of temperature, May and first half of June being the hottest part of the year with
the mean daily maximum temperature at about 40°C and the mean daily minimum
temperature at about 26°C. On individual days, during May and June, maximum
temperature may go upto about 49°C. With the arrival of the southwest monsoon
season by about the third week of June, the day temperatures decrease, but the
nights in June are little hotter than May and the relief from heat is not marked
because of the added discomfort from the increase in humidity brought in by the
southwest monsoon. After the withdrawal of the moonsoon by about the third week
of September, though night temperatures drop a little, the day temperatures increase
and a secondary maxima in day temperature is recorded in October. Both day and
night temperatures drop rapidly after mid November till January which is the coldest
month, with the mean daily maximum temperature at about 22°C-23°C and the mean
daily minimum temperature at about 7°C-8°C. In association with cold waves which
sometimes affect the district in the wake of western disturbances which pass across
north India during the cold season, minimum temperature particularly in January and
February may go down to a degree or two below the freezing point of water.
HUMIDITY
The values of relative humidity are generally about 60% in southwest
monsoon season. In the rest of the year, the air is generally dry. In the summer

166
season which is also the driest part of the year, the afternoon values of relative
humidity may be as low as 15%-20%.
.
CLOUDINESS
During the southwest monsoon season, the skies are moderately to heavily
clouded and generally overcast on some days. In the rest of the year clear or lightly
clouded skies prevail except in winter season. On a few days in winter, the skies
become cloudy when the district is affected by western disturbances.
WINDS
Winds are generally light to moderate, but in summer and the early southwest
monsoon season, winds may strengthen on some days. Westerly to northwesterly
winds prevail in the southwest monsoon season. In the period from October to March
winds are mostly from direction east in morning, while in the afternoon, they are
mainly from northwest. Northwesterly winds prevail during the summer season.
SPECIAL WEATHER PHENOMENA
During the southwest monsoon season the district is sometimes affected by
the depressions which originate in the Bay of Bengal and move across the central
parts of the country and reach the districts or its neighbourhood causing widespread
heavy rainfall. Thunderstorms occur practically in all the months of the year, but their
frequency is more during the later part of summer and southwest monsoon season
and are sometimes associated with squall. Alongwith thunderstorms, hail may also
occur occasionally. In the hot season dust storms also occur. In winter months fog
occurs occasionally.


168
TABLE - 2
Frequency of Annual Rainfall in the District (Data 1951 - 2000)
(DAUSA)
Range in mm No. of years Range in mm No. of years 301 – 400 2 801 – 900 5 401 – 500 4 901 – 1000 5 501 – 600 9 1001 – 1100 0 601 – 700 6 1101 – 1200 1 701 – 800 7
(Data available for 39 years only)

169
DHOLPUR DISTRICT
The district has a dry climate with a hot summer, a cold winter and a short
monsoon season. The cold season starts by about the middle of November and
continues to about the beginning of March. The hot season follows thereafter and
extends to about the end of June. The southwest monsoon season is from July to
mid-September. The period from mid-September to mid-November may be termed
as the post monsoon season.
RAINFALL
Records of rainfall in the district are available for seven raingauge stations for
period ranging from 38 to 45 years. Tables 1 and 2 give the details of the rainfall at
these stations and for the district as a whole. The average annual rainfall in the
district is 677.1 mm. The rainfall during the southwest monsoon season constitutes
about 91% of the annual rainfall. The variation in the annual rainfall from year to year
is not very large. In the fifty years period 1951-2000, the highest annual rainfall which
amounted to 177% of the normal, occurred in 1977, while the lowest annual rainfall
in the same period was only 55% of the normal, which occurred the very next year in
1978. In 11 years out the 44 years, the rainfall was less than 80% of the normal, and
2 consecutive years of such a low rainfall occurred thrice during the same period. It
will be seen from Table 2, that in 28 years out of 44, the annual rainfall in the district
was between 501 mm and 800 mm.

170
On an average there are 32 rainy days (i.e. days with rainfall of 2.5 mm or
more) in a year in the district. This number varies from 26 at Sepao to 39 at Dholpur
observatory.
The heaviest rainfall in 24 hours recorded at any station in the district was
400.0 mm at Rajakhera on 21 July 1972.
TEMPERATURE
There is only one meteorological observatory in the district at Dholpur and
records for this observatory may be taken as representative of climatic conditions
prevailing in the district. The period from March to May is one of continuous increase
in temperatures, May and June being the hottest part of the year. The mean daily
maximum temperature in May is 42.4oC and the mean daily minimum temperature is
26.1oC. In the summer season, the heat is intense and the scorching dust laden
winds add to the discomfort. The maximum temperature sometimes reaches 50oC in
this season. The setting in of the southwest monsoon by about the end of June
lowers the temperature appreciably, but the relief from the heat is not marked due to
the increased dampness of the monsoon air. After the withdrawal of the monsoon by
mid-September, days become a little hotter, but the night becomes progressively
cooler. From November both day and night temperatures decrease rapidly till
January the coldest month, with the mean daily maximum temperature at 23.3oC and
the mean daily minimum temperature at 6.3oC. In association with cold waves which
affect the district in the wake of western disturbances which pass across north India
during the cold season, minimum temperature may at times fall to about 3 oC-4oC
below the freezing point of water.
The highest maximum temperature ever recorded at Dholpur was 50.0oC on
03 June 1995 and the lowest minimum temperature ever recorded was –4.3oC on 03
January 1990.

171
HUMIDITY
During the southwest monsoon season the values of relative humidity are
generally about 70%. In the rest of the year, the air is generally dry. In the summer
monsoon season, which is the driest part of the year, the afternoon relative humidity
goes down to below 30%.
CLOUDINESS
During the southwest monsoon season, skies are moderately to heavily
clouded generally and overcast on some days. In the rest of the year, clear or lightly
clouded skies prevail. But on few days, in the winter season, skies become cloudy
when the district is affected by passing western disturbances.
WINDS
Winds are generally light to moderate, but in summer and the early part of the
southwest monsoon season winds strengthen slightly on some days. In summer,
winds generally blow from west direction. Westerly winds prevail during the monsoon
months. In the post monsoon and winter months, winds are westerly but more
frequently calm wind prevails.
SPECIAL WEATHER PHENOMENA
Depressions originating in the Bay of Bengal in the southwest monsoon
season move across the central parts of the country and during their last stages,
sometimes affect the district causing heavy rain. In the hot season, dust storms
occur frequently, some of them are accompanied occasionally by hail.
Thunderstorms occur throughout the year. Occasional fog occurs during the winter
season.
Tables 3, 4 and 5 give the temperature and relative humidity, mean wind
speed and special weather phenomena respectively for Dholpur observatory.


173
TABLE - 2 Frequency of Annual Rainfall in the District
(Data 1951 - 2000) (DHOLPUR)
Range in mm No. of years Range in mm No. of years 301 – 400 4 801 – 900 2 401 – 500 4 901 – 1000 2 501 – 600 12 1001 – 1100 2 601 – 700 5 1101 – 1200 2 701 – 800 11
(Data available for 44 years only)
TABLE - 3
Normals of Temperature and Relative Humidity (DHOLPUR)
MONTH Mean Daily Maximum
Temperature
Mean Daily Minimum
Temperature
Highest Maximum
ever recorded
Lowest Minimum
ever recorded
Relative
Humidity (%) 0C 0C 0C Date 0C Date 0830
IST 1730 IST
January 23.3 6.3 32.6 1990 Jan 29 1991 Jan 29
-4.3 1990 Jan 03 64 45
February 26.7 9.4 36.8 1966 Feb 27 0.2 1974 Feb 08 56 38
March 32.9 14.2 42.8 1994 Mar 31 4.0 1990 Mar 02 45 27
April 39.5 21.2 47.3 1999 Apr 30 11.0 1989 Apr 04 33 22
May 42.4 26.1 49.8 1998 May 28 16.7 1969 May 02 33 23
June 41.7 28.6 50.0 1995 Jun 03 18.4 1999 Jun 25 47 35
July 35.5 26.5 46.0 1995 Jul 08 16.4 1996 Jul 10 74 65
August 33.5 25.2 43.5 1993 Aug 02 17.4 1989 Aug 14 79 72
September 34.4 23.7 41.7 1979 Sep 01 14.9 1989 Sep 28 72 62
October 34.9 18.3 41.8 1980 Oct 07 8.9 1989 Oct 22 54 44
November 30.3 12.0 37.7 1987 Nov 01 3.1 1989 Nov 30 52 43
December 24.7 7.0 32.7 1994 Dec 07 -3.3 1989 Dec 28 60 47
Annual 33.3 18.2 56 44

174
TABLE - 4 Mean Wind Speed in km/hr.
(DHOLPUR)
Jan Feb Mar Apr May Jun Jul Aug Sep Oct Nov Dec Annual 3.4 4.3 5.2 5.9 7.3 8.6 7.0 5.4 4.6 3.0 2.5 2.7 5.0
TABLE - 5 Special Weather Phenomena
(DHOLPUR)
Mean No. of Days With
Jan Feb Mar Apr May Jun Jul Aug Sep Oct Nov Dec Annual
Thunder 0.5 0.8 0.8 1.0 2.4 2.8 4.3 3.8 1.9 0.6 0.1 0.3 19.3 Hail 0.0 0.2 0.1 0.0 0.0 0.0 0.0 0.0 0.0 0.0 0.0 0.0 0.3 Dust storm 0.0 0.1 0.4 0.4 1.6 1.4 0.4 0.0 0.1 0.3 0.0 0.0 4.7 Fog 0.6 0.2 0.0 0.0 0.0 0.0 0.0 0.0 0.0 0.1 0.0 0.5 1.4

175
DUNGARPUR DISTRICT
The district has on the whole a dry climate with the hot season milder than in
the desert regions of Rajasthan. The cold season is from December to February
followed by the hot season which lasts till about the middle of June. Thereafter, the
southwest monsoon commences and continues till about the middle of September.
The post monsoon season is from mid-September to November.
RAINFALL
Records of rainfall in the district are available for fourteen raingauge stations,
for period ranging from 19 to 44 years. The details of rainfall at these stations and for
the district as a whole are given in Tables 1 and 2. The average annual rainfall in the
district is 699.6 mm. The southwest monsoon period is the main rainy season, July
and August being the rainiest months. The rainfall during this period constitutes
about 94% of the annual rainfall. The annual rainfall varies from 537.6 mm at Dewal
to 851.5 mm at Dungarpur observatory. The variation in the rainfall from year to year
is not large. In the fifty year period 1951 to 2000, the highest annual rainfall
amounting to 186% of the normal, occurred in 1977, while 1966 was the year with
the lowest annual rainfall which was only 45% of the normal. In the same fifty years
period the annual rainfall was less than 80% of the normal in 14 years. Three
consecutive years of rainfall less than 80% of the normal occurred once during 1964
to 1966 and two consecutive years of such a low rainfall occurred thrice during the
same fifty year period in the district. It will be seen from Table 2 that the annual
rainfall in the district was between 501mm and 900 mm in 32 years out of 48.

176
On an average there are 29 rainy days (i.e. days with rainfall of 2.5 mm or
more) in a year in the district. This number varies from 25 at Dewal, Ganeshpur,
Nithawa and Sahla to 37 at Dungarpur observatory.
The heaviest rainfall in 24 hours recorded at any station in the district was
512.0 mm at Poeroi (Hydro) on 26 August 1987.
TEMPERATURE
There is a meteorological observatory in the district at Dungarpur. The
description that follows is mainly based on the records of this observatory. The hot
season commences by March and the temperatures rise rapidly with the advance of
the season. May is generally the hottest month. The mean daily maximum
temperature in May is about 40oC and the mean daily minimum temperature is about
25oC.On some days in May and the early part of June the day temperatures may
reach upto 45oC. With the onset of the monsoon by about the middle of June the day
temperatures drop appreciably. After the withdrawal of the monsoon by about the
middle of September the day temperatures increase slightly and a secondary
maximum in day temperatures is reached in October. Thereafter, the day
temperatures steadily decrease. But the night temperatures decrease progressively
after the withdrawal of the southwest monsoon. From November onwards the day
temperatures also decrease. The decrease in night temperatures from November is
more rapid. January is the coldest month with the mean daily maximum temperature
at 26.2oC and the mean daily minimum at about 8.7oC. During the cold season, in
association with passing western disturbances spells of cold weather affect the
district. The minimum temperature on such occasions may sometimes go down to
about the freezing point of water and frost may occur.
The highest maximum temperature ever recorded at Dungarpur was 45.4oC
on 12 May 1970 and the lowest minimum temperature ever recorded was 0.0oC on
15 January 1967 and 06 February 1984.

177
HUMIDITY
Except during the brief southwest monsoon season when the values of
relative humidity are generally high, the air is generally dry. The summer season is
the driest part of the year when the afternoon relative humidity may be as low as
25% to 30%.
CLOUDINESS
Except during the southwest monsoon season when the skies are heavily
clouded or overcast the skies are generally clear or lightly clouded during the year.
But in the cold season which is generally marked by clear bright weather, brief spells
of cloudy weather may occur for a day or two in association with passing western
disturbances.
WINDS
Winds are generally light to moderate with slight strengthening in force during
May to July. Winds blow mainly from directions west and southwest during the period
from May to September. During the post monsoon and winter months winds blow
from direction between southwest to northeast. By the beginning of summer,
southwesterly wind appears and become predominant as the season advances.
SPECIAL WEATHER PHENOMENA
Depressions and cyclonic storms originating in the Bay of Bengal in July and
August affect the district or its neighbourhood towards the later stages of their
movement causing widespread heavy rain and gusty winds. Thunderstorms occur
during the period May to October. Dust storms occur occasionally during the hot
season. Fog generally occurs during winter.
Tables 3, 4 and 5 give the temperature and relative humidity, mean wind
speed and special weather phenomena respectively for Dungarpur observatory.


180
TABLE - 2 Frequency of Annual Rainfall in the District
(Data 1951 - 2000) (DUNGARPUR)
Range in mm No. of years Range in mm No. of years 301 – 400 4 901 – 1000 1 401 – 500 5 1001 – 1100 3 501 – 600 8 1101 – 1200 1 601 – 700 9 1201 – 1300 1 701 – 800 6 1301 – 1400 1 801 – 900 9
(Data available for 48 years only)
TABLE - 3 Normals of Temperature and Relative Humidity
(DUNGARPUR)
MONTH
Mean Daily Maximum
Temperature
Mean Daily Minimum
Temperature
Highest Maximum
ever recorded
Lowest Minimum
ever recorded
Relative
Humidity (%) 0C 0C 0C Date 0C Date 0830
IST 1730 IST
January 26.2 8.7 35.0 1967 Jan 12 0.0 1967 Jan 15 67 37
February 28.9 11.1 36.0 1981 Feb 24 0.0 1984 Feb 06 57 31
March 34.4 15.8 42.1 1984 Mar 31 7.5 1971 Mar 01 43 25
April 38.6 21.5 44.6 1970 Apr 26 12.0 1967 Apr 07 46 26
May 40.0 25.3 45.4 1980 May 03
17.4 1967 May 05 62 30
June 37.6 25.7 44.2 1979 Jun 18 1973 Jun 04 1983 Jun 16
19.2 1972 Jun 09 75 46
July 32.0 24.1 41.0 1969 Jul 07 20.0 1972 Jul 09 88 70
August 30.1 23.4 38.2 1974 Aug 18 20.5 1970 Aug 31 90 78
September 32.5 22.5 38.6 1974 Sep 18 14.8 1972 Sep 26 82 65
October 34.4 18.9 38.6 1935 Oct 01 12.4 1975 Oct 28 68 45
November 31.1 14.8 35.6 1976 Nov 13 5.8 1975 Nov 28 65 41
December 27.6 10.3 32.8 1984 Dec 11 4.0 1971 Dec 19 69 41
Annual 32.8 18.5 68 45

181
TABLE - 4 Mean Wind Speed in km/hr.
(DUNGARPUR)
Jan Feb Mar Apr May Jun Jul Aug Sep Oct Nov Dec Annual 1.7 2.5 3.3 4.2 7.3 9.4 7.6 5.4 3.6 1.7 1.5 1.5 4.1
TABLE - 5 Special Weather Phenomena
(DUNGARPUR)
Mean No. of Days With
Jan Feb Mar Apr May Jun Jul Aug Sep Oct Nov Dec Annual
Thunder 0.0 0.1 0.1 0.0 0.1 0.3 0.1 0.2 0.1 0.1 0.0 0.0 1.1 Hail 0.0 0.0 0.0 0.0 0.0 0.0 0.0 0.0 0.0 0.0 0.0 0.0 0.0 Dust storm 0.0 0.0 0.0 0.0 0.1 0.0 0.0 0.0 0.0 0.0 0.0 0.0 0.1 Fog 2.6 1.4 0.0 0.1 0.1 0.0 0.0 0.0 0.0 0.0 0.1 1.6 5.9

182
HANUMANGARH DISTRICT
The district has a desert kind of climate with large variations of temperature,
extreme dryness and scanty rainfall which are characteristic of a desert climate. The
cold season from November to March is followed by the summer from April to June.
July to mid September constitutes the southwest monsoon season. Mid September
to October is the transitional post monsoon season.
RAINFALL
Records of rainfall in the district are available for two raingauge stations, for
45 years. Tables 1 and 2 give the details of the rainfall at these stations and for the
district as a whole. The average annual rainfall in the plains of the district is 292.6
mm. About 83% of the annual rainfall in the district is received during the period June
to September. July is the rainiest month. The variation in the annual rainfall from
year to year is not very large. In the fifty year period from 1951 to 2000, the highest
annual rainfall in the district amounting to 205% of the normal occurred in 1978 while
1969 was the year with the lowest annual rainfall amounting to only 34% of the
normal. During the same fifty year period rainfall less than 80% of the normal
occurred in 11 years. In the district as a whole there is one occasion of two
consecutive years and one occasion of four consecutive years when the rainfall was
less than 80% of the normal. It will be seen from Table 2 that the annual rainfall was
between 101 mm to 500 mm in 36 years out of 39.
On an average there are 16 rainy days (with rain of 2.5 mm or more) in a year
in the district. This number varies from 13 at Hanumangarh to 17 at Bhadra.

183
The heaviest rainfall in 24 hours recorded at any station in the district was
160.0 mm at Hanumangarah on 10 July 1968.
TEMPERATURE
There is no meterological observatory in the district. So description which
follows is based on data of observatories in the neighbouring district Ganganagar.
Temperatures rise rapidly after March. May and June are the hottest months with the
mean daily maximum temperature at about 40.6oC and 41.7°C. The heat in the
summer season with the frequent, scorching dust laden winds is intense and the day
temperatures sometimes may go upto about 49°C - 50°C. Neighbouring district of
Hanumangarh is Sri Ganganagar which is one of the hottest parts in India in
summer. With the advance of the southwest monsoon by about the middle of July
temperatures decrease a little. The weather continues to be oppressive due to the
increased moisture in the air. With the withdrawal of the monsoon by about the latter
half of September both day and night temperatures begin to decrease, the drop in
night temperatures being more rapid. The diurnal range of temperature is very large,
particularly in the winter months and drop in temperature after nightfall is rather
sudden and trying. January is the coldest month with the mean daily minimum
temperature at about 5.4°C and the mean daily maximum temperature is at about
21.4°C. In the wake of western disturbances moving across north India during the
winter season, cold waves affect the district and minimum temperature sometimes
drops to two or three degrees below the freezing point of water and frost occurs.
HUMIDITY
Except during the short rainy season humidity is low and even during the rainy
period the air is drier in between the rains. The summer months are the driest,
especially in the afternoons during April and May when the relative humidity is of the
order or 20% to 25%,

184
CLOUDINESS
Even during the southwest monsoon season, the skies are only moderately
clouded on many days, overcast or heavily clouded skies prevailing only on a few
days. In the rest of the year skies are lightly clouded or clear except during the winter
months when, in association with passing western disturbances, cloudy skies prevail
for short spells of a day or two.
WINDS
Winds are generally light except in the early part of southwest monsoon
months. During southwest monsoon season, winds blow from southwest direction.
During post monsoon, winter and summer season, winds blow mostly from northwest
direction in the afternoon. During March to May, northwesterly winds prevail in the
morning also, whereas in the post monsoon and winter season, winds are light and
variable in direction in the morning.
SPECIAL WEATHER PHENOMENA
Some of the depressions which originate in the Bay of Bengal in the
southwest monsoon season and move in a westerly direction reach the district or its
neighbourhood during the last stages of activity and cause widespread rain. An
occasional post monsoon storm and depression may also affect the district. Frequent
sand and dust storms occur in the hot season. Thunderstorms occur throughout the
year with more frequency during the hot season and southwest monsoon season.
During the cold season, occasional fog occurs in the wake of western disturbances.


186
TABLE - 2
Frequency of Annual Rainfall in the District (Data 1951 - 2000) (HANUMANGARH)
Range in mm No. of years Range in mm No. of years 001 – 100 1 401 – 500 5 101 – 200 6 501 – 600 1 201 – 300 16 601 – 700 1 301 – 400 9
(Data available for 39 years only)

187
JAIPUR DISTRICT
The district has a dry climate except during the southwest monsoon season.
December to February is the cold season after which the hot season commences
and continues till about the third week of June when the southwest monsoon sets in.
The southwest monsoon season is comparatively short in this region and lasts only
till mid September. The period from the second half of September to the end of
November is the post monsoon season or retreating monsoon season.
RAINFALL
Records of rainfall in the district are available for twentyone raingauge
stations, for period ranging from 11 to 50 years. Tables 1 and 2 give the details of
rainfall at these stations and for the district as a whole. The average annual rainfall in
the district as a whole is 596.8 mm. The rainfall generally increases from northwest
to southeast. The rainfall during the period June to September constitutes nearly
90% of the annual rainfall. The variation in the rainfall from year to year is not very
large. In the fifty year period 1951 to 2000, the highest annual rainfall in the district
which amounted to 211% of the normal occurred in 1977 while the lowest annual
rainfall in the same period which was only 52% of the normal occurred in 1987. The
rainfall was less than 80% of the normal in 16 years out of which three years 1951-
1953 were consecutive and there were four occasions of two consecutive years
having such a low rainfall. It will be seen from Table 2 that the annual rainfall in the
district was between 301 mm and 800 mm in 41 years out of 48.

188
On an average there are 31 rainy days (i.e. days with rainfall of 2.5 mm or
more) in a year in the district. This number varies from 23 at Phulera to 36 at
Vairath/Bairath Hydro.
The heaviest rainfall in 24 hours recorded at any station in the district was
589.2 mm at Kanota on 19 July 1981.
TEMPERATURE
The only meteorological observatory in the district is located at Jaipur city.
The data of this station may be taken as representative of the weather conditions in
the district as a whole. The period from March to June is one of continuous increase
in temperatures, May and the first half of June being the hottest part of the year. The
mean daily maximum temperature in May is 40.1oC and the mean daily minimum
temperature is 25.3oC. The night temperatures in June are a little higher than in May.
In May, the maximum temperature sometimes goes upto 49oC. The setting in of the
southwest monsoon after the middle of June, lowers the temperature somewhat, but
the relief from the heat is not marked because of the added discomfort from the
increase in humidity, brought in by the southwest monsoon air. After the withdrawal
of the monsoon by mid September, days become hotter and in October a secondary
maximum in day temperature is reached. The nights become progressively cooler.
After mid November both day and night temperatures drop rapidly till January, which
is the coldest month with the mean daily maximum temperature at 22.6oC and the
mean daily minimum temperature at 7.9oC. In association with cold waves which
sometimes affect the district in the wake of passing western disturbances across
north India during the cold season, minimum temperatures particularly in January
and February may go down to a degree or two below the freezing point of water.
The highest maximum temperature recorded at Jaipur was 49.0oC on 23 May
1994 and the lowest minimum temperature was –2.2oC on two consecutive days on
31 January and 01 February 1905.

189
HUMIDITY
During the brief southwest monsoon season the relative humidity is generally
over 60%. In the rest of the year, the air is dry. In the summer season which is also
the driest part of the year, afternoon relative humidity may be as low as 15% to 20%.
CLOUDINESS
During the southwest monsoon season skies are moderately to heavily
clouded generally and overcast on some days. In the rest of the year clear or lightly
clouded skies prevail. But on a few days in the winter season, the skies become
cloudy, when the district is affected by passing western disturbances.
WINDS
Winds are generally light to moderate, but in summer and early southwest
monsoon season, winds may strengthen slightly on some days. Westerly to
northwesterly winds prevail in the southwest monsoon season. In the period from
October to March winds are mostly from direction east in the morning, while in the
afternoon, they are mainly from northwest. Northwesterly winds prevail during
summer season.
SPECIAL WEATHER PHENOMENA
During the southwest monsoon season the district is sometimes affected by
depressions which originate in the Bay of Bengal and move across the central parts of
the country and during their last stages, sometimes affect the district causing heavy
rainfall. Thunderstorms occur practically in all the months of the year, but they are
more frequent during the period May to September and are sometimes associated
with squall. Along with thunderstorms, hail may also occur occasionally. In the hot
season dust storms also occur. Occasional fog occurs during winter season.
Tables 3, 4 and 5 give the temperature and relative humidity, mean wind speed
and special weather phenomena respectively for Jaipur observatory.


193
TABLE - 2 Frequency of Annual Rainfall in the District
(Data 1951 -2000) (JAIPUR)
Range in mm No. of years Range in mm No. of years 301 – 400 7 801 – 900 4 401 – 500 12 901 – 1000 2 501 – 600 8 1001 – 1100 0 601 – 700 7 1101 – 1200 0 701 – 800 7 1201 – 1300 1
(Data available for 48 years only)
TABLE – 3
Normals of Temperature and Relative Humidity (JAIPUR )
MONTH Mean Daily Maximum
Temperature
Mean Daily Minimum
Temperature
Highest Maximum
ever recorded
Lowest Minimum
ever recorded
Relative
Humidity (%) 0C 0C 0C Date 0C Date 0830
IST 1730 IST
January 22.6 7.9 31.7 1932 Jan 31 -2.2 1905 Jan 31 63 33
February 25.2 10.6 36.7 1953 Feb 28 -2.2 1905 Feb 01 56 27
March 31.2 15.7 42.8 1892 Mar 27 3.3 1898 Mar 04 43 18
April 37.0 21.4 44.9 1958 Apr 27 9.4 1905 Apr 01 30 14
May 40.1 25.3 49.0 1994 May 23 15.6 1920 May 17 33 17
June 39.3 27.2 47.2 1897 Jun 10 19.7 1976 Jun 18 51 31
July 34.2 25.7 46.7 1901 Jul 05 20.6 1931 Jul 05 2005 Jul 06
74 60
August 32.3 24.5 41.7 1911 Aug 01 18.9 1953 Aug 23 81 68
September 33.7 23.0 41.7 1899 Sep 11 15.0 1972 Sep 23 69 50
October 33.9 18.9 40.0 1899 Oct 04 11.1 1934 Oct 30 48 28
November 29.1 13.5 36.4 2001 Nov 03 1999 Nov 01
3.3 1938 Nov 30 50 31
December 24.2 8.9 34.6 2007 Dec 03 0.0 1964 Dec 13 60 37
Annual 31.9 18.5 55 35

194
TABLE - 4
Mean Wind Speed in km/hr. (JAIPUR )
Jan Feb Mar Apr May Jun Jul Aug Sep Oct Nov Dec Annual 4.0 4.6 6.0 7.3 9.8 9.4 8.1 7.7 6.7 5.1 3.6 3.5 6.3
TABLE - 5 Special Weather Phenomena
(JAIPUR )
Mean No. of Days With
Jan Feb Mar Apr May Jun Jul Aug Sep Oct Nov Dec Annual
Thunder 0.5 1.6 1.7 2.2 4.5 6.1 9.2 8.0 4.0 1.3 0.5 0.6 40.2 Hail 0.0 0.1 0.1 0.0 0.1 0.1 0.0 0.0 0.0 0.0 0.0 0.0 0.4 Dust storm 0.0 0.2 0.6 1.2 3.5 2.6 0.8 0.0 0.1 0.0 0.1 0.0 9.1 Squall 0.0 0.0 0.2 0.2 0.6 0.4 0.4 0.2 0.1 0.0 0.0 0.0 2.1 Fog 0.6 0.6 0.0 0.0 0.0 0.0 0.0 0.0 0.0 0.1 0.1 0.8 2.2

195
JHALAWAR DISTRICT
The climate is on the whole fairly dry (though not by Rajasthan’s standards)
and healthy. The year may be divided into four seasons, the cold season from
December to February, the hot season from March to the middle of June, the
monsoon from mid-June to September and the post monsoon from October and
November.
RAINFALL
Records of rainfall in the district are available for twelve raingauge stations,
for period ranging from 32 to 45 years. Statements relating to rainfall at these
stations and for the district as a whole are given in Tables 1 and 2. The average
annual rainfall for the district is 921.2 mm. The southwest monsoon advances into
the district in the latter half of June and as much as 93% of the annual rainfall is
received during this season. The variation in the rainfall from year to year is
appreciable which is evident from Table 2. During the fifty year period 1951 to 2000,
1951 was the year with the lowest rainfall, amounting to 51% of the normal, while
1961 was the year with the maximum rain, amounting to 157% of the normal. During
the same period there were 13 years when the rainfall was less than 80% of the
normal. Three consecutive years of such a low rainfall occurred twice during this
period. The three consecutive years of low rainfall are 1964-66 and 1979-81. The
annual rainfall in the district ranges between 501 mm and 1100 mm in 37 years out
of 46.

196
On an average on 39 days in a year the district gets rain of 2.5 mm or more.
This number varies from 36 days at Pachaahar to 42 days at Iklera/Aklera.
The heaviest rainfall in 24 hours recorded at any station in the district was
410.7 mm at Jhalara Patan on 17 August 1969.
TEMPERATURE
Meteorological data are available for the observatory at Jhalawar and may be
taken as representative of the conditions in the district. The cold season starts by
middle of November and lasts upto February, January being the coldest month with
the mean daily minimum temperature at 8.7°C. In association with cold waves in the
wake of passing western disturbances, the minimum temperature sometimes drops
down considerably. On rare occasions, the minimum temperature can drop to about
a degree below the freezing point of water. Both the day and night temperatures
begin to rise rapidly from February onwards, reaching their highest values in late
May or early June. The mean daily maximum temperature in May is 42.0°C and the
mean daily minimum temperature is 26.4°C. During the summer months the
maximum temperature sometimes goes above 48°C. With the onset of the monsoon
there is an appreciable drop in temperature. After the withdrawal of the monsoon day
temperatures register slight increase with a secondary maximum in October. The
highest maximum temperature recorded at Jhalawar was 49.3°C on 29 May 1994
and the lowest minimum was –0.6°C on 16 January 1935.
HUMIDITY
The atmosphere is generally dry except in the monsoon period when the
relative humidity is of the order of 70%-80%. In the summer months, the relative
humidity is low, often going down to 15% to 20% percent in the afternoons.

197
CLOUDINESS
The winter season is one of clear bright weather interspersed with brief spells
of cloudy weather caused by the occasional western disturbances which traverse
north India. In the summer and post monsoon months the skies are generally clear
or lightly clouded. During the monsoon months, the skies are moderately to heavily
clouded.
WINDS
Winds are generally light to moderate with some strengthening in force during
the summer season and southwest monsoon season. In the period from May to
September, winds blow from directions between west and southwest in the morning,
while in the afternoons they are predominantly from northwest. During the post
monsoon, winter and early summer months, winds are mainly from north or
northeast.
SPECIAL WEATHER PHENOMENA
Some of the monsoon depressions which originate in the Bay of Bengal and
move in west-northwesterly direction, pass through the district or its neighbourhood,
causing widespread heavy rain and strong winds. Dust storms and thunderstorms
occur in the summer months. Even during the monsoon season rainfall is often
associated with thunder. Occasional fog occurs during winter.
Tables 3, 4 and 5 give the temperature and relative humidity, mean wind
speed and special weather phenomena respectively for Jhalawar observatory.


200
TABLE - 2 Frequency of Annual Rainfall in the District
(Data 1951 - 2000) (JHALAWAR)
Range in mm No. of years Range in mm No. of years 401 – 500 1 1001 – 1100 9 501 – 600 5 1101 – 1200 2 601 – 700 5 1201 – 1300 1 701 – 800 4 1301 – 1400 4 801 – 900 8 1401 – 1500 1 901 – 1000 6
(Data available for 46 years only)
TABLE - 3
Normals of Temperature and Relative Humidity (JHALAWAR)
MONTH Mean Daily Maximum
Temperature
Mean Daily Minimum
Temperature
Highest Maximum
ever recorded
Lowest Minimum
ever recorded
Relative
Humidity (%) 0C 0C 0C Date 0C Date 0830
IST 1730 IST
January 25.4 8.7 33.7 1991 Jan 26 -0.6 1935 Jan 16 63 33
February 28.1 11.4 38.6 1976 Feb 22 2006 Feb 21
1.7 1934 Feb 02 52 27
March 34.0 16.7 43.2 2004 Mar 23 5.0 1943 Mar 05 35 19
April 39.0 22.3 46.3 1958 Apr 27 12.6 1996 Apr 04 29 16
May 42.0 26.4 49.3 1994 May 29 18.4 1960 May 09 34 17
June 39.3 26.8 49.1 1995 Jun 05 17.5 1965 Jun 05 58 36
July 33.5 24.4 43.9 1966 Jul 12 18.6 1986 Jul 28 78 62
August 31.3 23.6 40.2 1972 Aug 03 17.0 1984 Aug 06 85 74
September 32.9 22.7 39.4 1974 Sep 18 1968 Sep 23
14.2 1968 Sep 18 78 59
October 34.3 18.7 40.0 1951 Oct 05 10.0 1984 Oct 28 59 34
November 30.7 13.9 38.0 1976 Nov 16 5.4 1995 Nov 27 58 32
December 26.5 9.6 33.6 2002 Dec 17 1.2 1994 Dec 12 65 35
Annual 33.1 18.8 58 37

201
TABLE - 4 Mean Wind Speed in km/hr.
(JHALAWAR)
Jan Feb Mar Apr May Jun Jul Aug Sep Oct Nov Dec Annual 3.6 4.4 5.3 6.4 9.8 13.0 10.5 7.5 5.4 3.2 2.5 3.0 6.2
TABLE - 5 Special Weather Phenomena
(JHALAWAR)
Mean No. of Days With
Jan Feb Mar Apr May Jun Jul Aug Sep Oct Nov Dec Annual
Thunder 0.3 0.0 0.2 0.3 0.6 0.8 1.3 1.2 0.7 0.3 0.1 0.1 5.9 Hail 0.0 0.0 0.0 0.0 0.0 0.0 0.0 0.0 0.0 0.0 0.0 0.0 0.0 Dust storm 0.0 0.0 0.0 0.0 0.0 0.0 0.0 0.0 0.0 0.0 0.0 0.0 0.0 Fog 0.0 0.0 0.0 0.0 0.0 0.0 0.0 0.0 0.0 0.0 0.0 0.3 0.3

202
JHUNJHUNU DISTRICT
The district has a dry climate with a hot summer, a cold winter and a short
monsoon season. The cold season starts by about the middle of November and
continues to about the beginning of March. The hot season follows thereafter and
extends o about the end of June. The southwest monsoon season is from July to
mid-September. The period from mid-September to mid-November constitutes the
post monsoon season.
RAINFALL
Records of rainfall in the district are available for five raingauge stations, for
sufficiently long periods. Tables 1 and 2 give the details of the rainfall at these
stations and for the district as a whole. The average annual rainfall in the district is
476.2 mm. The rainfall increases from the northwest towards the southeast. The
rainfall varies from 427.0 mm at Jhunjhunu and Chirawa to 545.5 mm at Khetri.
During the southwest monsoon season the total rainfall constitutes about 76% of the
annual rainfall. July and August are the rainiest months. The variation in the annual
rainfall from year to year is not large. In the fifty years period 1951-2000, the highest
annual rainfall which amounted to 177% of the normal, occurred in 1978, while the
lowest annual rainfall in the same period which was only 40% of the normal,
occurred in 1951. In 15 years out the 50 years, the rainfall was less than 80% of the
normal. Two and three consecutive years of such a low rainfall occurred once during
the period in the district. It will be seen from Table 2, that in 37 years out of 48, the
annual rainfall in the district was between 301 mm and 700 mm.

203
On an average there are 27 rainy days (i.e. days with rainfall of 2.5 mm or
more) in a year in the district. This number varies from 23 at Chirawa to 32 at Khetri.
The heaviest rainfall in 24 hours recorded at any station in the district was
281.4 mm at Khetri on 13 July 1908.
TEMPERATURE
The only meteorological observatory in the district is at Pilani. The account of
the climate, which follows, is therefore based on the records of this observatory. The
period from March to June is one of continuous increase in temperatures, June being
the hottest month of the year. The mean daily maximum temperature in the month is
40.6oC and the mean daily minimum temperature is 27.3oC. In May and June, the
heat is intense, and on some days the maximum temperatures may rise upto about
48oC. The arrival of the southwest monsoon in the district by about the beginning of
July, lowers the temperature appreciably, but relief from the oppressive heat is not
marked because of the added discomfort from the increase in humidity. After the
withdrawal of the southwest monsoon by mid-September, the day temperatures
increase slightly. Nights however become progressively cooler. After mid-November
both day and night temperatures decrease rapidly till January, which is the coldest
month with the mean daily maximum temperature at 22.4oC and the mean daily
minimum temperature at 4.5oC. In association with cold waves which sometimes
affect the district in the wake of western disturbances which pass across north India
during the cold season, the minimum temperatures sometimes drop to 3oC to 4oC
below the freezing point of water.
The highest maximum temperature ever recorded at Pilani was 48.6oC on 02
May 1999 and the lowest minimum temperature ever recorded was –4.0oC on 09
February 1974.
HUMIDITY
Except during the brief southwest monsoon season when the values of
relative humidity are generally high, the air is generally dry. In the summer season,

204
which is the driest part of the year, afternoon relative humidity may be as low as 20%
to 25%.
CLOUDINESS
During the southwest monsoon season, skies are moderately to heavily
clouded and overcast on few days. In the rest of the year, the skies are mainly clear
or lightly clouded. In the winter season, the skies become cloudy when the district is
affected by passing western disturbances.
WINDS
Winds are generally light to moderate, but in summer and the early part of the
southwest monsoon season, winds strengthen slightly on some days. During
summer and southwest monsoon season, wind blows from west to southwest in the
morning and northwest to west in the afternoon. In the post monsoon and winter
season, southwesterly winds predominate in the morning and northwest-westerly
winds prevail in the afternoon.
SPECIAL WEATHER PHENOMENA
Depressions originating in the Bay of Bengal in the southwest monsoon
season move across the central parts of the country and some of them during their
last stages affect the district causing heavy rain. In the hot season dust storms or
thunderstorms occur frequently. They also occur in the monsoon season. Fog occurs
in winter season.
Tables 3, 4 and 5 give the temperature and relative humidity, mean wind
speed and special weather phenomena respectively for Pilani observatory.
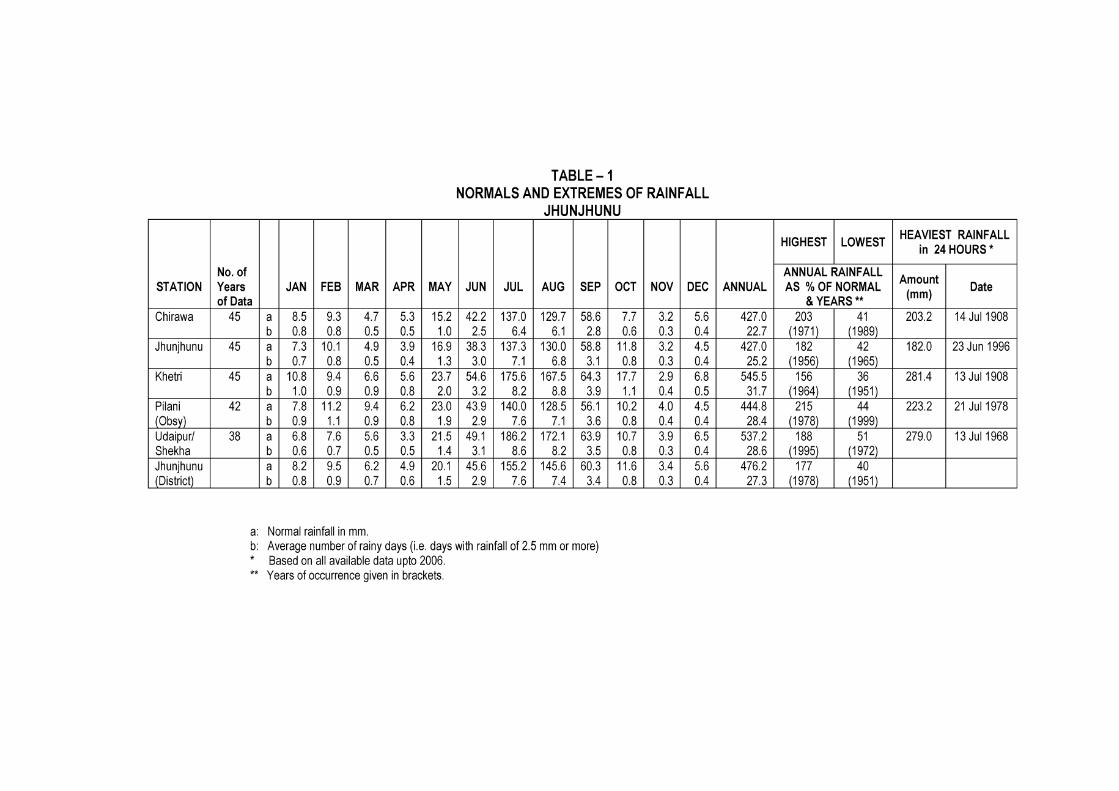

206
TABLE - 2 Frequency of Annual Rainfall in the District
(Data 1951 - 2000) (JHUNJHUNU)
Range in mm No. of years Range in mm No. of years 101 – 200 2 501 – 600 9 201 – 300 6 601 – 700 8 301 – 400 11 701 – 800 2 401 – 500 9 801 – 900 1
(Data available for 48 years only)
TABLE - 3 Normals of Temperature and Relative Humidity
(PILANI)
MONTH
Mean Daily Maximum
Temperature
Mean Daily Minimum
Temperature
Highest Maximum
ever recorded
Lowest Minimum
ever recorded
Relative
Humidity (%) 0C 0C 0C Date 0C Date 0830
IST 1730 IST
January 22.4 4.5 31.8 1991 Jan 29 -3.9 1964 Jan 25 69 35
February 25.2 7.7 35.1 2008 Feb 29 -4.0 1974 Feb 09 63 29
March 31.3 13.6 44.8 25 Mar 1985 3.8 1979 Mar 09 54 23
April 36.9 19.2 47.1 2009 Apr 30 8.5 1967 Apr 06 43 20
May 40.2 23.9 48.6 1999 May 02 13,5 1969 May 02 43 22
June 40.6 27.3 46.9 1963 Jun 20 17.4 1996 Jun 06 56 33
July 36.6 26.2 44.5 1968 Jul 03 18.3 1959 Jul 14 75 57
August 34.8 25.1 42.6 1991 Aug 08 19.0 1967 Aug 28 82 64
September 35.5 23.0 41.5 2005 Sep 06 13.7 1972 Sep 23 75 51
October 35.0 17.5 40.4 2005 Oct 27 9.0 1967 Oct 30 58 33
2006 Oct 04
November 29.9 11.1 37.8 1977 Nov 02 1.8 1996 Nov 29 58 31
December 24.2 5.4 31.9 2001 Dec 10 2.7 1973 Dec 30 66 34
Annual 32.7 17.0 62 36

207
TABLE - 4 Mean Wind Speed in km/hr.
(PILANI)
Jan Feb Mar Apr May Jun Jul Aug Sep Oct Nov Dec Annual 5.4 6.3 7.0 7.6 9.6 12.0 9.4 7.8 7.1 5.3 4.6 4.6 7.2
TABLE - 5 Special Weather Phenomena
(PILANI)
Mean No. of Days With Jan Feb Mar Apr May Jun Jul Aug Sep Oct Nov Dec Annual Thunder 0.3 0.3 0.4- 0.7 1.5 1.1 0.4 0.5 0.2 0.2 0.0 0.0 5.6 Hail 0.0 0.0 0.1 0.1 0.2 0.0 0.0 0.0 0.0 0.0 0.0 0.0 0.4 Dust storm 0.0 0.1 0.6 1.2 2.0 3.2 0.5 0.1 0.1 0.0 0.0 0.0 7.8 Fog 1.6 0.6 0.1 0.0 0.1 0.0 0.0 0.0 0.0 0.0 0.1 1.1 3.6

208
KAROLI DISTRICT
The district has a dry climate with a hot summer, cold winter and short rainy
season. December to February is the cold season. The hot season is from March to
about the third week of June. The rainy season which follows, lasts till about the third
week of September. The period from about the third week of September to the end
of November constitutes the post monsoon or the transition season.
RAINFALL
Records of rainfall in the district are available for five raingauge stations, for
period ranging from 37 to 43 years. Tables 1 and 2 give the details of the rainfall at
these stations and for the district as a whole. The average annual rainfall in the
district is 686.6 mm. Rainfall in general increases from the northeast towards the
southwest in the district, and varies from 611.2 mm at Nadoti to 789.5 mm at
Sapotra. The rainfall during the period June to September constitutes about 92% of
the annual normal rainfall. The variation of the annual rainfall from year to year is
large. In the fifty year period from 1951 to 2000, the highest annual rainfall
amounting to 169% of the normal occurred in 1961, while the lowest annual rainfall
which was only 46% of the normal occurred in 1989. During the same period there
are 12 years when the annual rainfall was less than 80% of the annual normal
rainfall. There are three occasions when such a low rainfall occurred in two
consecutive years in the district. It will be seen from Table 2 that the annual rainfall
was between 401 to 900 mm in 34 years out of 42.

209
On an average there are 33 rainy days (i.e. days with rainfall of 2.5 mm or
more) in a year in the district. This number varies from 30 at Nadoti to 36 at Sapotra.
The heaviest rainfall in 24 hours recorded at any station in the district was
360.0 mm at Karoli on 11 August 1972.
TEMPERATURE
There is no meteorological observatory in the district. So the description which
follows is based on data of observatories in the neighbouring districts Sawai
Madhopur and Dholpur, where similar climatic conditions prevail. March to June is
period of continuous rise in temperature, May and first half of June being the hottest
part of the year with the mean daily maximum temperature at about 42°C and the
mean daily minimum temperature at about 25.5°C. The nights in June are a little
hotter than in May. During May and June, on individual days, maximum temperature
may go upto about 48°C-49°C. With the arrival of the southwest monsoon season by
about the third week of June, the day temperatures lowers somewhat, but the relief
from the heat is not marked because of the added discomfort from the increase in
humidity brought in by the southwest monsoon air. After the withdrawal of the
monsoon by about the third week of September, though night temperatures drop
appreciably, the day temperatures increase and a secondary maxima in day
temperature is recorded in October. Both day and night temperatures drop rapidly
after mid November till January which is the coldest month, with the mean daily
maximum temperature at about 23°-24°C and the mean daily minimum temperature
at about 6.3°C. In association with cold waves which sometimes affect the district in
the wake of western disturbances which pass across north India during the cold
season, minimum temperature particularly in January and February may go down to
a degree or two below the freezing point of water.
HUMIDITY
The values of relative humidity are generally about 60%-70% in southwest
monsoon season. In the rest of the year, the air is generally dry except during

210
January and December, when values of relative humidity are about 60%-70% in
mornings. The driest part of the year is summer season, when the afternoon values
of relative humidity may be as low as 20%.
CLOUDINESS
During the southwest monsoon season, the skies are moderately to heavily
clouded, being overcast on some days. In the rest of the year skies are generally
clear. During the cold season however, on a few days, the skies become cloudy
when district is affected by passing western disturbances.
WINDS
Winds are generally light to moderate with some strengthening in force in the
summer and southwest monsoon season. Westerly to southwesterly wind prevails in
southwest monsoon season. In the post monsoon, winter and summer months,
winds are light on some days. Winds blow mostly from directions southwest in the
morning and from north-northwest in the afternoons. In the summer season the
winds blow from directions between southwest and northwest.
SPECIAL WEATHER PHENOMENA
Some of the depressions originate in the Bay of Bengal in the southwest
monsoon season and move across the central parts of the country and reach the
district or its neighbourhood causing widespread heavy rain and gusty winds.
Thunderstorms occur practically in all the months of the year, but its frequency is
more during the later part of summer and southwest monsoon season.
Thunderstorms are sometimes accompanied with hail during early summer season.
In hot season, dust storms occur occasionally. In winter low pressure waves moving
from the west affect the weather over the district. Fog occurs in the winter months.

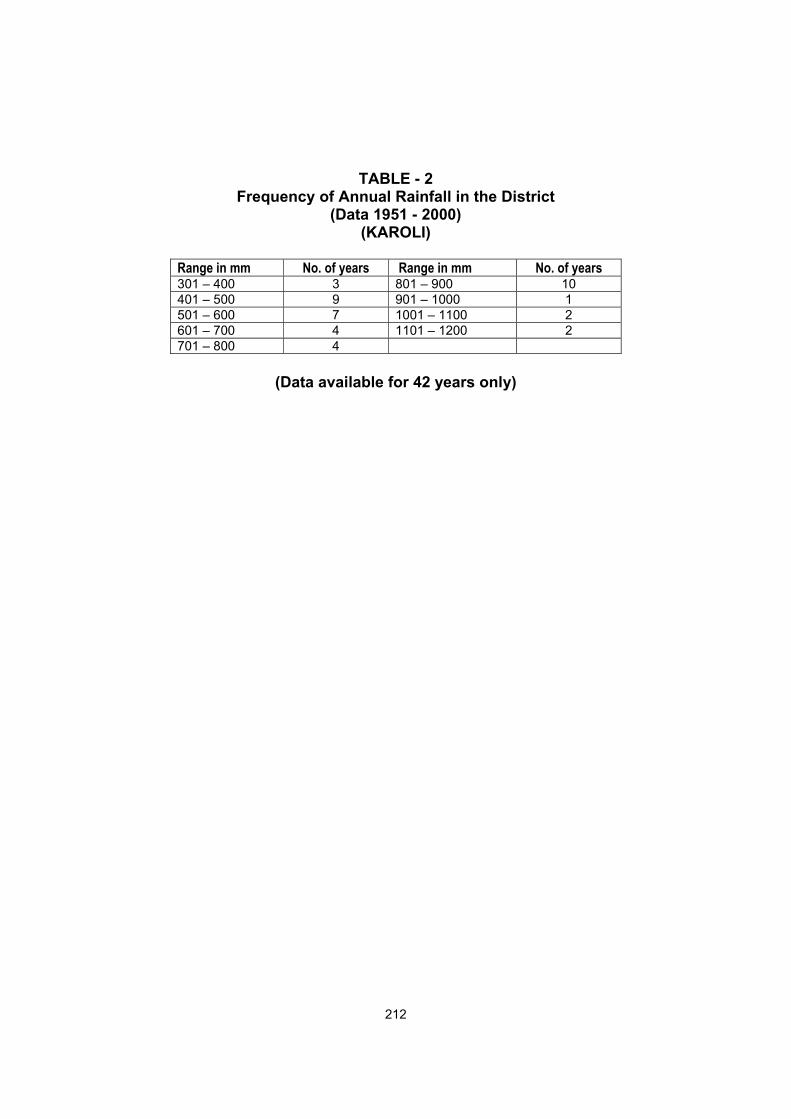
212
TABLE - 2 Frequency of Annual Rainfall in the District
(Data 1951 - 2000) (KAROLI)
Range in mm No. of years Range in mm No. of years 301 – 400 3 801 – 900 10 401 – 500 9 901 – 1000 1 501 – 600 7 1001 – 1100 2 601 – 700 4 1101 – 1200 2 701 – 800 4
(Data available for 42 years only)

213
KOTA DISTRICT
The district enjoys a dry climate except in the monsoon season. The year may
broadly be divided into four seasons. The cold season from mid-November to
February is followed by the hot season which extends to about the middle of June.
The period from about the middle of June to September is the southwest monsoon
season and the two months October and November constitute the post monsoon or
the retreating monsoon season.
RAINFALL
Records of rainfall are available for thirteen raingauge stations in the district
for the period ranging from 10 to 45 years. Tables 1 and 2 give the data of rainfall at
these stations and for the district as a whole. The average annual rainfall in the
district is 758.7 mm. The rainfall increases from northwest to the southeast. About
93% of the annual rainfall is received during the southwest monsoon season. The
frequencies of rainfall are more concentrated in the range 701 mm to 900 mm.
During the fifty year period from 1951 to 2000, the rainfall in the district as a whole
was the highest in 1971 and amounted to 168% of the normal. 1965 was the year
with the lowest annual rainfall which was as low as 51% of the normal. In the same
fifty year period rainfall less than 80% of the normal occurred in 11 years.
Consecutive years of rainfall less than 80% of the normal occurred in 1965-1966 and
1998 -1999. It will be seen from Table 2 that in 37 years out of 48, the annual rainfall
in the district was between 501 mm and 1000 mm.
214
On an average there are 35 rainy days (i.e. days with rainfall of 2.5 mm or
more) in a year in the district. As in case of the amount of rainfall, the number of
rainy days increases from northwest to the southeast. This number varies from 35 at
Kota observatory to 37 at Sangod.
The heaviest rainfall in 24 hours recorded at any station in the district was
383.3 mm at Chechat on 29 June 1945.
TEMPERATURE
There are three meteorological observatories in the district, at Kota, Kota
(PBO) and Kota (A) and the data of these stations may be taken to represent the
weather conditions in the district. The cold season starts from about the middle of
November and continues till the end of February. January is the coldest month with
the mean daily maximum temperature at about 23.9oC and the mean daily minimum
temperature at about 9.9oC. In association with the cold waves in the wake of
western disturbances passing across north India, the minimum temperature
sometimes drops to one or two degrees above the freezing point of water. Both day
and night temperatures increase rapidly from March to May which is the hottest
month with the mean daily maximum temperature at about 42.0oC while the mean
daily minimum at about 28.5oC. In May temperature may sometimes exceed 48oC.
There is an appreciable drop in temperature with the advance of the southwest
monsoon into the district. After the withdrawal of the southwest monsoon by the end
of September, day temperatures increase slightly with a secondary maximum in
October.
The highest maximum temperatures recorded at Kota, Kota (PBO) and Kota
(A) were 48.5oC in May 1962, 47.4oC on 27 May 1998 and 48.5oC on 28 April 1984
respectively. The lowest minimum temperatures were 1.7oC on 31 January 1929,
2.1oC on 25 January 1997 and 1.8oC on 11 January 1967 respectively.
215
HUMIDITY
The air is generally dry except in the southwest monsoon season. In the
summer months, the relative humidity is very low, often being less than 20% in the
afternoons.
CLOUDINESS
The cold season is one of generally clear bright weather with brief spells of
cloudy weather caused by occasional western disturbances which pass across north
India. In the summer and the post monsoon months, skies are clear or lightly
clouded. Moderate to heavily clouded skies are common in the southwest monsoon
season.
WINDS
Generally light to moderate winds prevail throughout the year with a light
strengthening in the early monsoon period. In the post monsoon and winter season,
winds blow from directions between northwest and northeast. During summer and
southwest monsoon season, winds blow from directions west-northwest.
SPECIAL WEATHER PHENOMENA
Some of the depressions which originate in the Bay of Bengal during the
monsoon season and move across the central parts of the country in a westerly or
west-northwesterly direction affect the district and its neighbourhood and cause
widespread heavy rain and strong winds. Dust storms occur in the summer months.
Thunderstorms occur throughout the year, more frequently in southwest monsoon
season. Occasional fog occurs during winter.
Tables 3, 4, 5 and 3(a), 4(a), 5(a) and 3(b), 4(b), 5(b) give the temperature
and relative humidity, mean wind speed and special weather phenomena
respectively for Kota, Kota (PBO) and Kota (A) observatories.


218
Frequency of Annual Rainfall in the District
(Data 1951 - 2000) (KOTA)
Range in mm No. of years Range in mm No. of years 301 – 400 2 801 – 900 11 401 – 500 3 901 – 1000 5 501 – 600 6 1001 – 1100 3 601 – 700 4 1101 – 1200 1 701 – 800 11 1201 – 1300 2
(Data available for 48 years only)
TABLE - 3 Normals of Temperature and Relative Humidity
(KOTA)
MONTH
Mean Daily Maximum
Temperature
Mean Daily Minimum
Temperature
Highest Maximum
ever recorded
Lowest Minimum
ever recorded
Relative
Humidity (%) 0C 0C 0C Date 0C Date 0830
IST 1730 IST
January 24.5 9.3 33.9 1912 Jan 30 1.7 1929 Jan 31 63 38
February 27.8 12.4 38.3 1943 Feb 28 2.2 1929 Feb 01 51 30
March 33.8 18.0 42.8 1945 Mar 31 8.9 1945 Mar 07 37 22
April 38.9 24.3 47.5 1958 Apr 27 14.0 1976 Apr 01 29 18
May 41.8 28.1 48.5 1962 May − 17.5 1977 May 02 31 20
June 40.2 28.1 47.8 1945 Jun 13 21.0 1974 Jun 09 52 38
July 34.6 25.3 47.2 1923 Jul 02 16.4 1965 Jul 31 72 62
August 32.0 24.4 42.0 1975 Aug 17 18.0 1965 Aug 01 80 74
September 33.4 23.9 40.6 1951 Sep 28 18.2 1967 Sep 03 72 60
October 34.7 20.6 41.1 1930 Oct 30 13.0 1961 Oct 30 1962 Oct 29
56 37
November 31.0 14.9 37.5 1977 Nov 05 7.2 1970 Nov 29 56 36
December 26.0 10.7 33.9 1941 Dec 10 2.6 1961 Dec 27 63 42
Annual 33.2 20.0 55 40

219
TABLE - 4
Mean Wind Speed in km/hr. (KOTA)
Jan Feb Mar Apr May Jun Jul Aug Sep Oct Nov Dec Annual 3.0 3.7 5.1 5.5 9.3 13.5 10.9 9.3 7.6 4.1 2.9 2.8 6.5
TABLE - 5 Special Weather Phenomena
(KOTA)
Mean No. of Days With
Jan Feb Mar Apr May Jun Jul Aug Sep Oct Nov Dec Annual
Thunder 0.5 0.7 1.0 1.5 4.2 6.0 6.8 6.9 3.9 0.8 0.3 0.4 33.0 Hail 0.0 0.1 0.1 0.0 0.0 0.1 0.0 0.0 0.0 0.0 0.0 0.0 0.3 Dust storm 0.0 0.1 0.6 1.0 3.9 2.2 0.4 0.1 0.1 0.0 0.0 0.0 8.4 Fog 0.4 0.1 0.0 0.2 1.1 0.2 0.0 0.0 0.0 0.0 0.0 0.4 2.4 Squall 0.0 0.1 0.0 0.0 0.0 0.0 0.0 0.0 0.0 0.0 0.0 0.0 0.1

220
TABLE – 3(a) Normals of Temperature and Relative Humidity
(KOTA PBO)
MONTH
Mean Daily Maximum
Temperature
Mean Daily Minimum
Temperature
Highest Maximum
ever recorded
Lowest Minimum
ever recorded
Relative
Humidity (%) 0C 0C 0C Date 0C Date 0830
IST 1730 IST
January 23.6 9.8 32.3 2004 Jan 18 2.1 1997 Jan 25 67 43 February 26.2 11.9 37.2 1985 Feb 28 3.0 1984 Feb 25 58 36 March 32.5 17.1 41.9 2004 Mar 22 8.1 1982 Mar 02 44 25 April 39.0 23.6 45.5 2000 Apr 28 13.7 1981 Apr 06 30 16 May 42.4 28.3 47.4 1998 May 27 19.4 2001 May 19 33 18 June 40.3 28.5 47.1 2003 Jun 05 20.0 2005 Jun 02 52 34 July 34.3 25.9 42.2 1984 Jul 01 20.0 1986 Jul 28 75 61
August 32.0 24.8 41.1 1987 Aug 02 21.4 1981 Aug 28 1983 Aug 01 80 70
September 34.3 24.6 40.1 1987 Sep 27 20.5 1990 Sep 17 66 50 October 34.6 20.8 39.8 1986 Oct 16 13.7 1978 Oct 16 51 34 November 29.8 15.2 38.0 2001 Nov 02 6.1 1978 Nov 28 54 36 December 25.1 10.9 33.4 2002 Dec 17 3.5 1978 Dec 30 64 42 Annual 32.8 20.1 56 39
TABLE – 4(a)
Mean Wind Speed in km/hr. (KOTA PBO)
Jan Feb Mar Apr May Jun Jul Aug Sep Oct Nov Dec Annual 4.5 5.1 6.1 7.2 9.6 12.5 12.6 9.9 8.1 5.2 4.0 4.1 7.4
TABLE – 5(a) Special Weather Phenomena
(KOTA PBO)
Mean No. of Days With
Jan Feb Mar Apr May Jun Jul Aug Sep Oct Nov Dec Annual
Thunder 0.2 0.5 0.4 0.4 2.0 2.5 2.3 3.8 1.3 0.1 0.1 0.2 13.8 Hail 0.0 0.0 0.0 0.0 0.3 0.0 0.0 0.0 0.0 0.0 0.0 0.0 0.3 Dust storm 0.0 0.0 0.4 0.3 1.9 1.5 0.2 0.2 0.1 0.0 0.0 0.1 4.7 Fog 0.8 0.2 0.0 0.0 0.0 0.0 0.0 0.0 0.0 0.0 0.1 0.7 1.8

221
TABLE – 3(b) Normals of Temperature and Relative Humidity
(KOTA (A) )
MONTH Mean Daily Maximum
Temperature
Mean Daily Minimum
Temperature
Highest Maximum
ever recorded
Lowest Minimum
ever recorded
Relative
Humidity (%) 0C 0C 0C Date 0C Date 0830
IST 1730 IST
January 23.7 10.6 33.4 1966 Jan 14 1.8 1967 Jan 11 57 32 February 27.0 13.5 37.0 1973 Feb 26 4.5 1971 Feb 02 47 26 March 33.0 18.9 42.7 2003 Mar 30 8.6 1979 Mar 01 33 17 April 38.8 25.0 48.5 1984 Apr 28 14.0 1976 Apr 01 23 12 May 42.0 29.1 47.7 1998 May 23 20.0 1971 May 17 28 14 June 39.9 29.0 47.3 1979 Jun 10 18.8 1979 Jun 21 51 32 July 34.1 26.4 44.9 1995 Jul 02 17.1 2004 Jul 08 73 59 August 32.0 25.2 41.0 1987 Aug 03 18.4 2006 Aug 15
80 68
September 33.9 24.9 41.0 2009 Sep 22 16.4 1966 Sep 08 67 50 October 34.5 21.6 46.8 2003 Oct 12 14.3 1964 Oct 26 47 28 November 30.0 16.1 38.0 2001 Nov 02 7.1 1970 Nov 29 48 30 December 25.2 11.8 33.2 1963 Dec 13 3.8 1964 Dec 14 58 34 Annual 32.8 21.0 51 34
TABLE – 4(b)
Mean Wind Speed in km/hr. (KOTA (A))
Jan Feb Mar Apr May Jun Jul Aug Sep Oct Nov Dec Annual 5.5 6.4 7.7 9.9 13.1 15.8 13.6 11.7 10.3 6.5 4.5 4.5 9.1
TABLE – 5(b) Special Weather Phenomena
(KOTA (A))
Mean No. of Days With
Jan Feb Mar Apr May Jun Jul Aug Sep Oct Nov Dec Annual
Thunder 0.3 0.1 0.6 0.4 1.4 1.8 2.9 2.7 1.4 0.2 0.4 0.1 12.3 Hail 0.0 0.1 0.0 0.0 0.0 0.0 0.0 0.0 0.0 0.1 0.0 0.0 0.2 Dust storm 0.0 0.0 0.1 0.1 0.4 0.2 0.0 0.1 0.0 0.1 0.0 0. 1.0 Fog 0.0 0.0 0.0 0.0 0.0 0.0 0.0 0.0 0.0 0.0 0.0 0.2 0.2

222
RAJSAMAND DISTRICT
The district has on the whole a dry climate with hot season milder than in the
Rajasthan desert areas to the northwest of the district. The cold season is from
December to February and is followed by the hot season which lasts till about the
middle of June. Mid June to mid September constitutes the southwest monsoon
season. The post monsoon season from the middle of September to the end of
November is one of transition from monsoon to winter conditions.
RAINFALL
Records of rainfall in the district are available for seven raingauge stations
and details of rainfall at these stations and for the district as a whole, are given in
Tables 1 and 2. The average annual rainfall in the district is 556.5 mm. The rainfall
during the months June to September constitutes to about 92% of the annual
rainfall. July and August are the rainiest months with the maximum rains. The
variation in the annual rainfall from year to year is not very large. In the fifty year
period from 1951 to 2000, the highest annual rainfall amounting to 200% of the
normal occurred in 1973 in the district. 1987 was the year with the lowest annual
rainfall which was only 56% of the normal. In the same fifty year period the rainfall
was less than 80% of the normal in 13 years. Two consecutive years of such a low
rainfall less than 80% of the normal occurred thrice in fifty year period. It will be seen
from Table 2 that in 41 years out of 42, the annual rainfall in the district was between
301 mm and 800 mm.

223
On an average there are 28 rainy days (i.e. days with rainfall of 2.5 mm or
more) in a year in the district. As in case of the amount of rainfall, the number of
rainy days increases from the north to the south. This number varies from 25 at
Bhim/Dawer to 33 at Khumbalgarh.
The heaviest rainfall in 24 hours recorded at any station in the district was
261.6 at Bhim/Dawer on 22August 1944.
TEMPERATURE
There is no meteorological observatory in the district. So the description which
follows is based on data of meteorological observatory in the neighbouring district
Udaipur from which this district has been formed. The winter season sets in after the
middle of November, when both the day and night temperatures begin to drop
steadily. January is generally the coldest month with the mean daily maximum
temperature at about 24oC and the mean daily minimum temperature at about 7oC.
The minimum temperature sometimes reaches the freezing point of water and frost
may occur occasionally. The diurnal range of temperature is large particularly in the
winter and summer months. Both the day and night temperatures rise rather rapidly
after the end of February till May which is generally the hottest month of the year
Nights are warmer in June also. The mean daily maximum temperature in that month
is at about 39oC and the mean daily minimum temperature is at about 25oC. The
summer is milder than in the desert regions of Rajasthan. By the third or fourth week
of June when the southwest monsoon reaches the district, temperatures drop
appreciably. After the withdrawal of the southwest monsoon by about the middle of
September, there is a slight increase in day temperatures although the night
temperatures begin to drop. From November onwards the day temperatures also
decrease.
HUMIDITY
Except in the brief southwest monsoon season when the relative humidity is
generally about 70% or more, the air is very dry. The summer months are the driest

224
part of the year when the relative humidity goes down to 20% to 25% particularly in
the afternoons.
CLOUDINESS
In the southwest monsoon season especially in July and August skies are
often heavily clouded to overcast. During the rest of the year skies are generally
clear or lightly clouded. But in the winter season which is generally marked by clear
bright weather, brief spells of cloudy weather, occur in association with the passage
of western disturbances across north India.
WINDS
Winds are generally light to moderate with some strengthening in force in the
latter half of summer and the southwest monsoon season. In the period from May to
September winds blow from directions southwest and west. In the post monsoon
season and winter season the winds are predominantly from directions northwest
and northeast. Thereafter northwesterly and westerly predominate in late winter and
early summer.
SPECIAL WEATHER PHENOMENA
Some of the monsoon depressions in July and August which form at the head
of the Bay of Bengal and move in a westerly or west northwesterly direction, reach
the district and its neighbourhood towards the later stages of their movement and
cause gusty winds and widespread heavy rainfall. Thunderstorms occur throughout
the year, mainly during southwest monsoon season. Duststorms occur early summer
season. Fog occurs during post monsoon and winter months.
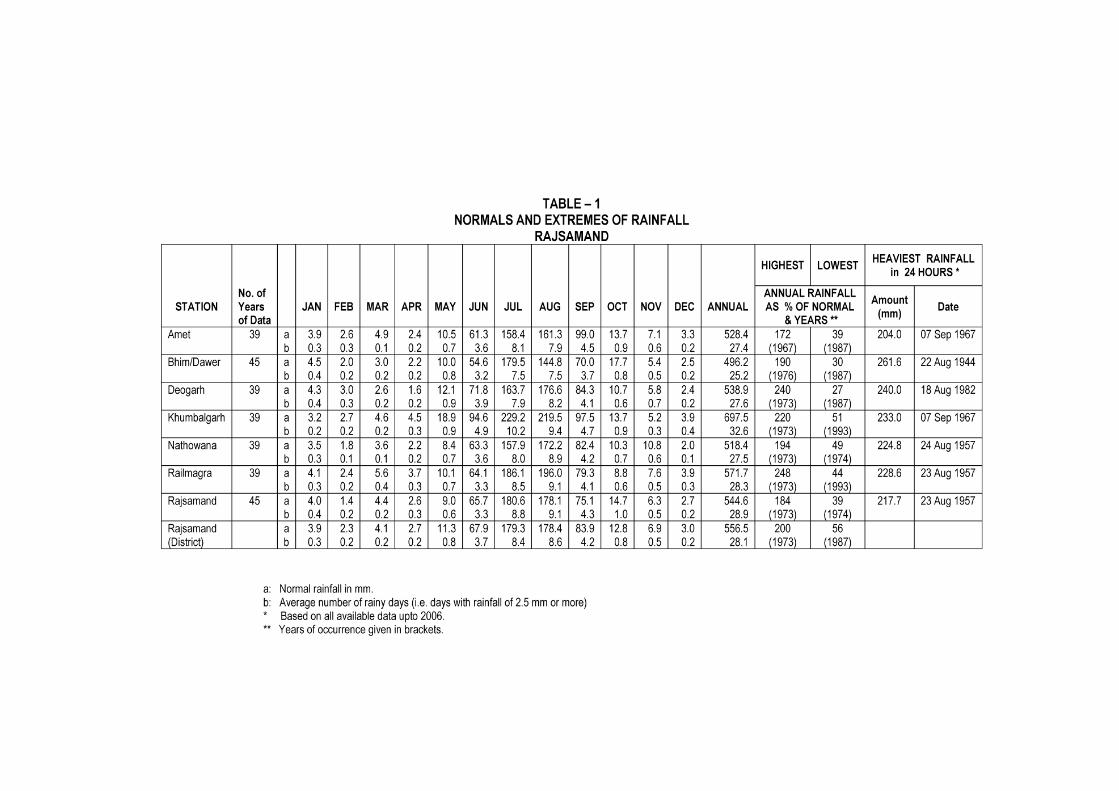

226
TABLE - 2 Frequency of Annual Rainfall in the District
(Data 1951 - 2000) (RAJSAMAND)
Range in mm No. of years Range in mm No. of years 301 – 400 7 801 – 900 0 401 – 500 10 901 – 1000 0 501 – 600 10 1001 – 1100 0 601 – 700 9 1101 – 1200 1 701 – 800 5
(Data available for 42 years only)

227
SAWAI MADHOPUR DISTRICT
The district has a dry climate except during the short rainy season. December
to February is the cold season. The hot season is from March to about the third week
of June. The rainy season which follows, lasts till about the third week of September.
The period from about the third week of September to the end of November
constitute the transition period.
RAINFALL
Records of rainfall in the district are available for seven raingauge stations for
period ranging from 24 to 44 years. Tables 1 and 2 give the details of the rainfall at
these stations and for the district as a whole. The average annual rainfall in the
district is 728.7 mm. The rainfall during the southwest monsoon season constitutes
about 91% of the annual rainfall. The variation in the annual rainfall from year to year
is large. It varies from 598.9 mm at Mahwa/Mahawar to 872.6 mm at Sawai
Madhopur (Obsy). In the 50 year period 1951-2000, the highest annual rainfall which
amounted to 154% of the normal, occurred in 1956, while the lowest annual rainfall
in the same period which was only 53% of the normal, which occurred in the year in
1987. In the fifty years period the annual rainfall of the district was less than 80% of
the normal during 13 years. There was one occasion each of two, three and four
consecutive years of such low rainfall in the district as a whole. It will be seen from
Table 2 that the annual rainfall in the district was between 501 mm and 1100 mm in
41 years out of 48.

228
On an average there are 34 rainy days (i.e. days with rainfall of 2.5 mm or
more) in a year in the district. This number varies from 29 at Bonli to 41 at Sawai
Madhopur observatory.
The heaviest rainfall in 24 hours recorded at any station in the district was
505.0 mm at Bamanwas on 19 July 1981.
TEMPERATURE
There is only one meteorological observatory in the district at Sawai
Madhopur. Hence, in the following description, the meteorological records of this
observatory may be taken as representative of the climatic conditions in the district.
The period from March to June is one of continuous rise in temperature, May and
first half of June being the hottest part of the year. The mean daily maximum
temperature in May is about 42oC and the mean daily minimum temperature is about
25oC. The night temperatures in June are litlle higher than in May. The maximum
temperature in May and June may go on individual days go upto about 48oC. The
setting in of the southwest monsoon by about the third week of June lowers the
temperature somewhat but the relief from the heat is not marked because of the
added discomfort from the increase in humidity brought in by the southwest
monsoon air. After the withdrawal of the monsoon by about the third week of
September days become hotter and in October a secondary maximum in day
temperature is recorded. The nights become progressively cooler. Both day and
night temperatures drop rapidly after mid-November till January which is the coldest
month with the mean daily maximum temperature at about 24oC and the mean daily
minimum temperature at about 6oC. In association with cold waves which sometimes
affect the district in the wake of western disturbances which pass across north India
during the cold season, minimum temperatures particularly in January and February
may go down to a degree below the freezing point of water.
The highest maximum temperature ever recorded at Sawai Madhopur
observatory was 48.0oC on 29 May 1994 and 04 June 1995 and the lowest minimum
temperature ever recorded was –1.2oC on 03 February 1983.

229
HUMIDITY
The relative humidity is generally over 60% during the southwest monsoon
season. During the rest of the year, the air is dry. The driest part of the year is the
summer season, when the afternoon relative humidity may be as low as about 20%.
CLOUDINESS
During the southwest monsoon season, skies are moderately to heavily
clouded being overcast on some days. In the rest of the year, skies are generally
clear. During the cold season however, on a few days, the skies become cloudy
when the district is affected by passing western disturbances.
WINDS
Winds are mostly light with some strengthening in the force during summer
and early southwest monsoon season. Winds blow mainly from westerly and
southwesterly directions during the southwest monsoon season. In the post
monsoon, winter and early summer months, winds blow from direction southwesterly
in morning and northerly to northwesterly in the afternoon.
SPECIAL WEATHER PHENOMENA
Some of the depressions originating in the Bay of Bengal during the
southwest monsoon season (particularly during the month of July and August) move
across the central parts of the country and reach the district or its neighbourhood
causing widespread heavy rain and gusty winds. Thunderstorms occur during the
period from February to August. In association with the thunderstorms hail may
sometimes occur during the months February and March. Dust storms occur
occasionally during the hot season. During the period January to March low pressure
waves moving across from the west affect the weather over the district. Fog
sometimes, occur in winter months.
Tables 3, 4 and 5 give temperature and relative humidity, mean wind speed
and special weather phenomena respectively for Sawai Madhopur observatory.


231
TABLE - 2 Frequency of Annual Rainfall in the District
(Data 1951 - 2000) (SAWAI MADHOPUR)
Range in mm No. of years Range in mm No. of years 301 – 400 3 801 – 900 5 401 – 500 3 901 – 1000 9 501 – 600 9 1001 – 1100 5 601 – 700 8 1101 – 1200 1 701 – 800 5
(Data available for 48 years only)
TABLE - 3 Normals of Temperature and Relative Humidity
(SAWAI MADHOPUR)
MONTH
Mean Daily Maximum
Temperature
Mean Daily Minimum
Temperature
Highest Maximum
ever recorded
Lowest Minimum
ever recorded
Relative
Humidity (%) 0C 0C 0C Date 0C Date 0830
IST 1730 IST
January 24.3 6.2 32.9 1991 Jan 28 -1.0 1983 Jan 20 75 41
February 26.5 8.2 36.0 1985 Feb 28 2006 Feb 24
-1.2 1983 Feb 03 63 32
March 32.8 13.8 42.0 2004 Mar 23 3.5 1983 Mar 06 47 23
April 38.8 20.4 46.3 2009 Apr 29 9.3 1983 Apr 01 34 20
May 42.3 25.1 48.0 1994 May 29 14.6 1983 Mar 24 34 19
June 41.2 26.5 48.0 1995 Jun 04 14.3 1994 Jun 13 50 34
July 34.3 24.1 46.3 1982 Jul 04 11.5 2005 Jul 29 76 62
August 32.3 22.9 40.0 2002 Aug 04 16.4 1983 Aug 02 83 71
September 34.3 21.9 40.9 2009 Sep 22 14.0 1982 Sep 27 73 54
October 34.7 17.2 41.0 2002 Oct 07 6.8 1983 Oct 30 57 37
November 30.6 12.4 39.9 1991 Nov 04 2.5 1982 Nov 28 62 41
December 25.5 7.9 32.0 1994 Dec 14 1.0 1982 Dec 30 73 44
Annual 33.1 17.2 61 40

232
TABLE - 4 Mean Wind Speed in km/hr.
(SAWAI MADHOPUR)
Jan Feb Mar Apr May Jun Jul Aug Sep Oct Nov Dec Annual 3.2 3.0 3.1 4.3 5.4 5.7 5.7 4.4 4.3 2.6 2.6 1.9 3.8
TABLE - 5 Special Weather Phenomena
(SAWAI MADHOPUR)
Mean No. of Days With
Jan Feb Mar Apr May Jun Jul Aug Sep Oct Nov Dec Annual
Thunder 0.0 0.4 0.6 0.7 0.7 1.7 1.8 1.3 0.0 0.0 0.0 0.0 7.2 Hail 0.0 0.2 0.4 0.0 0.0 0.0 0.1 0.0 0.0 0.0 0.0 0.0 0.7 Dust storm 0.0 0.0 0.2 0.2 1.8 0.8 0.3 0.0 0.0 0.1 0.0 0.0 3.4 Fog 0.4 0.3 0.0 0.0 0.0 0.0 0.0 0.1 0.0 0.0 0.0 0.3 1.1

233
SIKAR DISTRICT
The climate of this district is characterized by a hot summer, scanty rainfall, a
cool winter season and general dryness of air except in the brief monsoon season.
The period from about the middle of November to the end of February is the cold
season, after which the hot season commences and lasts till about the end of June.
The southwest monsoon season which follows, continues till about the middle of
September. The next one and half month may be termed as the post monsoon or
retreating monsoon season.
RAINFALL
Records of rainfall in the district are available for eight raingauge stations for
period ranging from 34 to 49 years. . Tables 1 and 2 give the details of the rainfall at
these stations and for the district as a whole. The average annual rainfall in the
district is 459.6 mm. The rainfall in general is uniform in the district. The rainfall
during the southwest monsoon season constitutes about 87% of the annual rainfall.
The variation in the annual rainfall from year to year is not very large. In the fifty year
period from 1951 to 2000, the highest annual rainfall which amounted to 225% of the
normal occurred in 1977, while the lowest annual rainfall which amounted to 47% of
the normal, occurred in 1972. The annual rainfall was less than 80% of the annual
normal rainfall occurred in 11 years out of 48 years. During the same period, there is
only one occasion when such a low rainfall occurred in two consecutive years in the
district. It is seen from Table 2 that in 45 years out of 48, the annual rainfall in the
district was between 201 mm to 700 mm.
234
On an average there are 25 rainy days (i.e. days with rainfall of 2.5 mm or
more) in a year in the district. This number varies from 20 at Ramgarh to 29 at
Neemkathana..
The heaviest rainfall in 24 hours recorded at any station in the district was
388.6 mm at Srimadhopur on 24 August 1894.
TEMPERATURE
There is only one meteorological observatory in the district at Sikar. The data
of this station may be taken as brief representative of the climatic condition in the
district as a whole. The period from March to June is one of continuous increase in
temperature. May and June constitutes the hottest part of the year. The mean daily
maximum temperature in May is 39.7oC and the mean daily minimum temperature is
22.9oC. The night temperatures in June are higher than in May. In the summer
season heat is intense and scorching dust rising winds add to the discomfort. During
May and June on some days, maximum temperature may go upto 49oC. The arrival
of the southwest monsoon by about the end of June lowers the temperature
somewhat but the relief from heat is not marked because of the added discomfort
from the increase in humidity. After the withdrawal of the southwest monsoon by
about mid September, days become hotter and secondary maximum is reached in
October but the nights become progressively cooler. After the mid November both
day and night temperatures drop rapidly till January which is the coldest month, with
the mean daily maximum temperature at about 22.7oC and the mean daily minimum
temperature at about 4.3oC. In association with cold waves which affect the district in
the wake of western disturbances which pass across north India during the cold
season, minimum temperature may go down to three to four degrees below the
freezing point of water.
The highest maximum temperature and lowest minimum temperature ever
recorded at Sikar observatory was 49.7oC on 12 June 1993 and –4.9oC on 19
December 1986 respectively.

235
HUMIDITY
During the brief southwest monsoon season the value of relative humidity are
generally high. In the rest of the year the air is dry. In summer season, which is the
driest part of the year, the afternoon values of humidity are below 30%.
CLOUDINESS
During the southwest monsoon season, skies are moderately to heavily
clouded generally and overcast on some days. In the rest of the year, skies are clear
or lightly clouded, but on a few days in the winter season, skies become cloudy when
the district is affected by passing western disturbances.
WINDS
Winds are generally light to moderate with little strengthening in force in latter
half of summer and early southwest monsoon season. Westerly and southwesterly
winds prevail in the southwest monsoon season. In post monsoon months, winds are
generally calm or light and mostly from direction between west and northwest. In
winter months winds are light and mostly from direction between east and southeast
in the morning and west and northwest in the evening. In summer season, winds
blow mostly from west direction.
SPECIAL WEATHER PHENOMENA
During the southwest monsoon season, the district is affected by depressions
which originate in the Bay of Bengal and move across the central parts of the
country, causing widespread heavy rainfall. Thunderstorms occur in later half of
summer and early part of southwest monsoon season. In hot season dust storms
and dust raising winds occur occasionally.
Tables 3, 4 and 5 give the temperature and relative humidity, mean wind
speed and special weather phenomena respectively for Sikar observatory.


237
TABLE - 2 Frequency of Annual Rainfall in the District
(Data 1951 - 2000) (SIKAR)
Range in mm No. of years Range in mm No. of years 201 – 300 9 701 – 800 2 301 – 400 10 801 – 900 0 401 – 500 11 901 – 1000 0 501 – 600 8 1001 – 1100 1 601 – 700 7
(Data available for 48 years only)
TABLE - 3 Normals of Temperature and Relative Humidity
(SIKAR)
MONTH
Mean Daily Maximum
Temperature
Mean Daily Minimum
Temperature
Highest Maximum
ever recorded
Lowest Minimum
ever recorded
Relative
Humidity (%) 0C 0C 0C Date 0C Date 0830
IST 1730 IST
January 22.7 4.3 31.4 1991 Jan 30 -0.9 1991 Jan 01 61 37
February 25.5 7.1 37.4 1973 Feb 27 -4.2 1974 Feb 07 53 34
March 31.3 12.6 40.4 1996 Mar 29 1.3 1982 Mar 02 47 30
April 36.8 18.5 45.5 1993 Apr 29 7.0 1982 Apr 01 41 26
May 39.7 22.9 49.0 1994 May 26 10.1 1982 May 20 47 31
June 39.6 25.7 49.7 1993 Jun 12 15.6 1999 Jun 05 56 37
July 35.3 24.9 44.4 1947 Jul 15 15.1 1982 Jul 12 73 59
August 33.6 24.1 41.1 1965 Aug 20 16.9 1992 Aug 20 77 63
September 34.2 22.2 39.4 1954 Sep 02 1981 Sep 17
13.1 1963 Sep 28 68 51
October 34.2 16.7 41.0 1995 Oct 21 5.4 1964 Oct 31 54 34
November 29.3 10.0 37.8 1972 Nov 17 0.0 1962 Nov 30 53 35
December 23.8 5.1 32.5 1993 Dec 02 -4.9 1986 Dec 19 56 38
Annual 32.2 16.2 57 40

238
TABLE - 4 Mean Wind Speed in km/hr.
(SIKAR)
Jan Feb Mar Apr May Jun Jul Aug Sep Oct Nov Dec Annual 4.0 4.4 4.5 4.8 5.5 6.7 6.6 4.3 4.4 4.6 3.2 3.1 4.7
TABLE - 5 Special Weather Phenomena
(SIKAR)
Mean No. of Days With
Jan Feb Mar Apr May Jun Jul Aug Sep Oct Nov Dec Annual
Thunder 0.0 0.0 0.1 0.0 0.0 0.1 0.1 0.0 0.0 0.0 0.0 0.0 0.3 Hail 0.0 0.0 0.0 0.0 0.0 0.0 0.0 0.0 0.0 0.0 0.0 0.0 0.0 Dust storm 0.0 0.0 0.1 0.0 0.1 0.0 0.0 0.0 0.0 0.0 0.0 0.0 0.2 Fog 0.0 0.0 0.0 0.0 0.0 0.0 0.0 0.0 0.0 0.0 0.0 0.0 0.0

239
SIROHI DISTRICT
The district on the whole has a dry climate with the hot season somewhat
milder than in the adjoining districts to the north and northwest. The cold season is
from October to February. This is followed by the hot season which lasts till about
the middle of June. The period from mid June to mid September is the southwest
monsoon season. Mid September to the end of November constitute the post
monsoon season.
RAINFALL
Records of rainfall in the district are available for eighteen raingauge stations,
for period ranging from 10 to 47 years. Tables 1 and 2 give the details of the rainfall
at these stations and for the district as a whole. The rainfall at Mount Abu which is a
hill station is much higher than at stations in the plains. The average annual rainfall
in the plains of the district is 556.7 mm. The average annual rainfall at Mount Abu is
1677.0 mm. The rainfall during the period from June to September constitutes 97%
of the annual rainfall. July and August are the rainiest months when 66% of the
annual rainfall is received. The variations in the annual rainfall from year to year are
large. During the 49 year period 1951 to 1999 the highest annual rainfall which
amounted to 274% of the normal was received in 1973 while the lowest rainfall which
was only 32% of the normal occurred in 1987. In the same 49 year period the rainfall
was less than 80% of the normal in 15 years. Three consecutive years of rainfall less
than 80% of the normal occurred once during 1985 to 1987and two consecutive
240
years of such a low rainfall occurred on four occasions. It will be seen from Table 2
that the annual rainfall was between 301 to 700 mm in 29 years out of 44.
On an average the number of rainy days (i.e. days with rainfall of 2.5 mm or
more) in the plains of the district is 24 in a year out of which 22 are in the period
June to September. At Mount Abu the number of rainy days in a year is 53.
The heaviest rainfall in 24 hours recorded at any station in the plains of the
district was 635.0 mm at Pindwara on 01 September 1973.The heaviest rainfall in 24
hours at Mount Abu was 700.0 mm on 08 September 1992.
TEMPERATURE
There is only one meteorological observatory in the district at Mount Abu.
Being a hill station the data of temperature and other meteorological elements at this
station will not be representative of the conditions in the district as a whole. However,
the meteorological data are available for Erinpura observatory outside the northern
border of the district. The condition of this station may be taken to be fairly
representative of those in the plains of the district. The following account is therefore,
based on the meteorological records of Erinpura.
From about November both day and night temperatures drop rapidly till
January which is generally the coldest month. The drop in temperature after nightfall
is very rapid and trying during the cold season. The mean daily maximum
temperature in this month in the plains is of the order of 26°C and the mean daily
minimum about 0.8°C. At Mount Abu the mean daily maximum temperature in
January is 20.0°C and the mean daily minimum is 5.7°C. In the wake of western
disturbances which move across north India in the winter months, cold waves affect
the district and the temperatures may go down to a degree or two below the freezing
point of water and frost may occur. Both the day and night temperatures rise rapidly
after February till May which is usually the hottest month of the year. The mean daily
maximum temperature in May is 31.9°C at Mount Abu and is of the order of 40°C in
the plains. The mean daily minimum temperature in May is 19.8°C at Mount Abu and

241
that about 26°C in the plains. With the onset of the southwest monsoon in the
second half of June, the temperatures drop appreciably and weather becomes more
pleasant. With the withdrawal of the southwest monsoon by mid September the day
temperatures increase slightly and there is a secondary maximum temperature in
October. Afterwards, day temperatures start decreasing till January. However, nights
are progressively cooler. At Mount Abu the highest maximum temperature recorded
was 39.2°C on 15 May 1985. The lowest minimum temperature recorded was –7.4°C
on 12 December 1994. At Erinpura Road Observatory which is just outside the
northern border of the district, the highest maximum temperature was 48.1°C on 06
May 1966. The lowest minimum temperature was –3.1°C on 13 January 1994.
HUMIDITY
Humidity is generally high in the brief southwest monsoon season. During the
rest of the year the air is dry. The summer months form the driest part of the year
when humidity is low particularly in the afternoons about 25%.
CLOUDINESS
During the southwest monsoon season, skies are generally heavily clouded to
overcast. During the rest of the year, skies are mostly clear or lightly clouded. In the
winter season, which is generally marked by clear or bright weather, brief spells of
cloudy weather occur in association with the passage of western disturbances
across north India.
WINDS
Winds are generally light with some strengthening in force during the
southwest monsoon season. From May to September, the winds are predominantly
from southwest. In the post monsoon, winter and summer months, winds are mainly
from directions betwe
en south and southwest.

242
SPECIAL WEATHER PHENOMENA
A few of the monsoon depressions particularly in July and August which form
at the head of the Bay of Bengal and move across the country in a westerly or west-
northwesterly direction reach the district and the neighbourhood towards the later
stage and cause gusty winds and widespread rainfall. Occasional dust storms and
thunderstorms occur in the summer months, while rainfall in the monsoon months is
also associated often with thunder. Fog occurs during monsoon and winter months.
Tables 3, 4 and 5 give the temperature and relative humidity, mean wind
speed and special weather phenomena respectively for Mount Abu observatory.


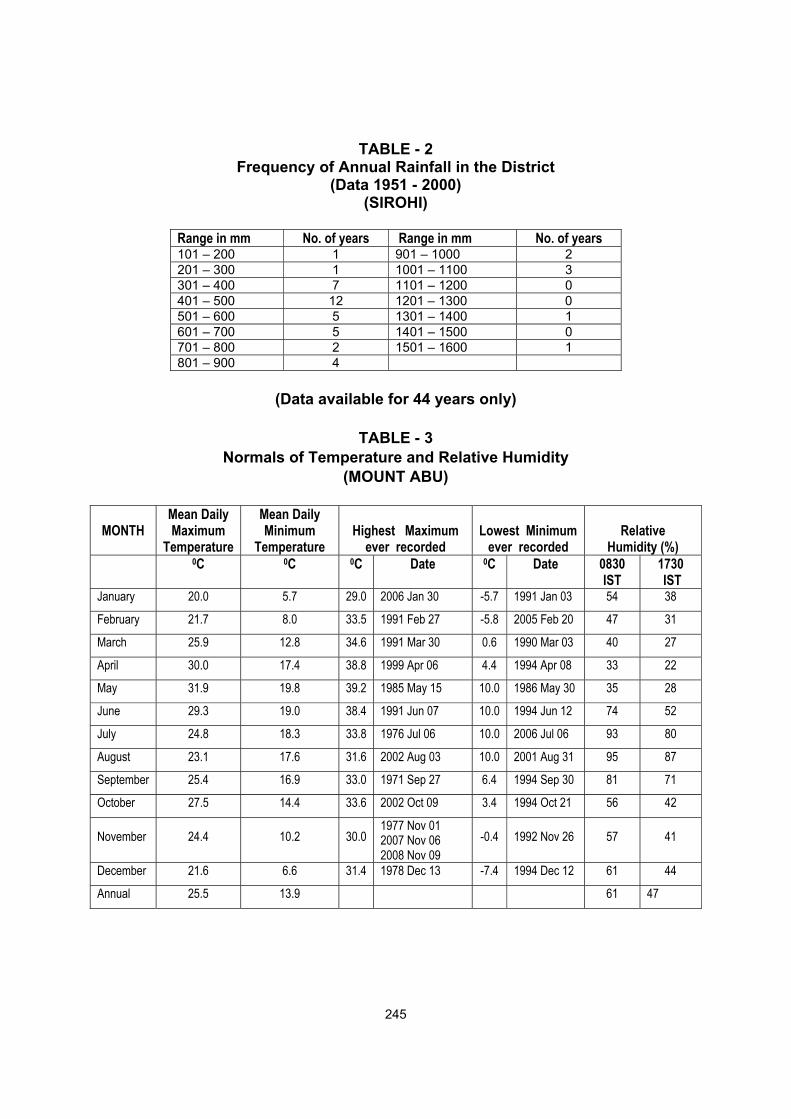
245
TABLE - 2 Frequency of Annual Rainfall in the District
(Data 1951 - 2000) (SIROHI)
Range in mm No. of years Range in mm No. of years 101 – 200 1 901 – 1000 2 201 – 300 1 1001 – 1100 3 301 – 400 7 1101 – 1200 0 401 – 500 12 1201 – 1300 0 501 – 600 5 1301 – 1400 1 601 – 700 5 1401 – 1500 0 701 – 800 2 1501 – 1600 1 801 – 900 4
(Data available for 44 years only)
TABLE - 3
Normals of Temperature and Relative Humidity (MOUNT ABU)
MONTH Mean Daily Maximum
Temperature
Mean Daily Minimum
Temperature
Highest Maximum
ever recorded
Lowest Minimum
ever recorded
Relative
Humidity (%) 0C 0C 0C Date 0C Date 0830
IST 1730 IST
January 20.0 5.7 29.0 2006 Jan 30 -5.7 1991 Jan 03 54 38
February 21.7 8.0 33.5 1991 Feb 27 -5.8 2005 Feb 20 47 31
March 25.9 12.8 34.6 1991 Mar 30 0.6 1990 Mar 03 40 27
April 30.0 17.4 38.8 1999 Apr 06 4.4 1994 Apr 08 33 22
May 31.9 19.8 39.2 1985 May 15 10.0 1986 May 30 35 28
June 29.3 19.0 38.4 1991 Jun 07 10.0 1994 Jun 12 74 52
July 24.8 18.3 33.8 1976 Jul 06 10.0 2006 Jul 06 93 80
August 23.1 17.6 31.6 2002 Aug 03 10.0 2001 Aug 31 95 87
September 25.4 16.9 33.0 1971 Sep 27 6.4 1994 Sep 30 81 71
October 27.5 14.4 33.6 2002 Oct 09 3.4 1994 Oct 21 56 42
November 24.4 10.2 30.0 1977 Nov 01 2007 Nov 06 2008 Nov 09
-0.4 1992 Nov 26 57 41
December 21.6 6.6 31.4 1978 Dec 13 -7.4 1994 Dec 12 61 44
Annual 25.5 13.9 61 47

246
TABLE - 4 Mean Wind Speed in km/hr.
(MOUNT ABU)
Jan Feb Mar Apr May Jun Jul Aug Sep Oct Nov Dec Annual 3.6 5.0 5.6 7.0 8.0 9.1 8.8 7.5 5.4 3.9 3.5 3.2 5.9
TABLE - 5 Special Weather Phenomena
(MOUNT ABU)
Mean No. of Days With
Jan Feb Mar Apr May Jun Jul Aug Sep Oct Nov Dec Annual
Thunder 0.0 0.1 0.2 0.2 0.9 1.2 1.3 1.2 0.6 0.2 0.0 0.1 6.0 Hail 0.0 0.0 0.0 0.0 0.0 0.0 0.0 0.0 0.0 0.0 0.0 0.0 0.0 Dust storm 0.1 0.0 0.1 0.1 0.6 0.3 0.0 0.0 0.0 0.0 0.0 0.0 1.2 Fog 0.3 0.3 0.2 0.0 0.3 3.5 5.5 6.0 2.3 0.2 0.0 0.1 18.7

247
TONK DISTRICT
The climate of this district is generally dry except in the short southwest
monsoon season. The year may be divided into four seasons. The period from
December to February is the cold season. The hot season which commences in
March extends to about the third week of June, when the southwest monsoon starts.
This season continues till the middle of September. The period from mid-September
to November is the post monsoon season.
RAINFALL
Records of rainfall in the district are available for nine raingauge stations, for
period ranging from 15 to 45 years. The details of rainfall at these stations and for
the district as a whole are given in Tables 1 and 2. The average annual rainfall for
the district is 609.9 mm. The rainfall is generally uniform throughout the district.
About 93% of the annual rainfall is received during the period June to September,
July and August being the rainiest months. There is not large variation in the rainfall
from year to year. In the fifty year period from 1951 to 2000 the annual rainfall in the
district was the highest in 1971 when it amounted to 155% of the normal, whereas
1951 was the year with the lowest rainfall which amounted to only 49% of the
normal. Considering the district as a whole, there were 12 years out of the fifty, for
which the rainfall was less than 80% of the normal wherein two consecutive years of
such a low rainfall occurred on two occasions. It will be seen from Table 2 that in 38
years out of 45, the annual rainfall was between 301 mm and 800 mm.

248
On an average there are 30 rainy days (i.e. days with rainfall of 2,5 mm or
more) in a year the district. There is not much variation in the number of rainy days in
the district.
The heaviest rainfall in 24 hours recorded at any station in the district was
312.0 mm at Mashi Tank on 29 June 1971.
TEMPERATURE
There is one meteorological observatory at Tonk in the district. The
meteorological data of this station may be taken as quite representative of the
climatic condition in the district as a whole. The description of climate which follows
is based on the data of this observatory. The period from March to May is one of
steady increase in temperature. The months May and June constitute the hottest
part of the year, when the mean daily maximum temperature is at about 41°C and
the mean daily minimum is at about 27°C. With the advance of the southwest
monsoon over the district after the middle of June, the temperatures decrease but
the relief from the heat is not marked because of the added discomfort from increase
in humidity brought in by southwest monsoon air. After the withdrawal of the
monsoon by mid September, day temperature increases and in October a secondary
maxima is reached. However the nights become progressively cooler. After October
there is an appreciable fall in both day and night temperatures till January, which is
the coldest month of the year with the mean daily maximum temperature at about
23.6°C and the mean daily minimum temperature at about 6.9°C. In association with
cold waves in the wake of western disturbances, temperatures may sometimes go
down to a degree below the freezing point of water, especially in January and
February and frost may occur.
The highest maximum temperature ever recorded at Tonk was 49.7°C on 31
May 1969. The lowest minimum temperature ever recorded at Tonk was –0.8°C on
14 January 1967.

249
HUMIDITY
Dry air prevails over the district except in the southwest monsoon months July
and August when it is about 75%. In summer months, particularly in the afternoons
the relative humiditiy is very low about 35%.
CLOUDINESS
During the southwest monsoon season skies are moderately to heavily
clouded generally and overcast on some days. In the rest of the year clear or lightly
clouded skies prevail. But on a few days in the winter season skies become cloudy
when the district is affected by passing western disturbances.
WINDS
Winds are generally light to moderate with some strengthening in force in the
later part of summer and early monsoon period. Westerly winds prevail in the
summer and southwest monsoon season. In the post monsoon and winter months
winds are mostly from direction between west and northwest.
SPECIAL WEATHER PHENOMENA
Some of the depressions which originate in the Bay of Bengal during the
southwest monsoon season and move across the central parts of the country reach
the district during their later stages and cause heavy rain and strong winds.
Thunderstorms occur throughout the year, but they are more frequent during the
summer and monsoon months. Dust storms occur in the summer months.
Occasional fog occurs in winter months.
Tables 3, 4 and 5 give the temperature and relative humidity, mean wind
speed and special weather phenomena respectively for Tonk observatory.


251
TABLE - 2 Frequency of Annual Rainfall in the District
(Data 1951 - 2000) (TONK)
Range in mm No. of years Range in mm No. of years 301 – 400 6 701 – 800 8 401 – 500 7 801 – 900 3 501 – 600 4 901 – 1000 4 601 – 700 13
(Data available for 45 years only)
TABLE - 3
Normals of Temperature and Relative Humidity (TONK)
MONTH Mean Daily Maximum
Temperature
Mean Daily Minimum
Temperature
Highest Maximum
ever recorded
Lowest Minimum
ever recorded
Relative
Humidity (%) 0C 0C 0C Date 0C Date 0830
IST 1730 IST
January 23.6 6.9 32.0 1995 Jan 28 -0.8 1967 Jan 14 73 51
February 26.5 9.7 35.8 2003 Feb 28 -0.7 1974 Feb 07 66 43
March 32.8 15.5 43.6 1999 Mar 30 5.2 1972 Mar 01 54 38
April 38.3 22.3 45.1 1973 Apr 28 10.2 1997 Apr 03 45 34
May 41.4 26.5 49.7 1969 May 31 16.3 1979 May 04 47 32
June 40.4 28.5 46.1 1966 Jun 08 18.0 1996 Jun 04 60 43
July 35.2 26.5 44.4 1995 Jul 03 15.2 2001 Jul 06 77 66
August 32.9 25.4 42.1 1972 Aug 04 17.0 1996 Aug 04 84 74
September 34.2 24.1 40.9 1974 Sep 17 14.4 1972 Sep 24 77 61
October 34.9 19.3 40.7 1972 Oct 14 9.8 1964 Oct 26 64 48
November 30.0 13.0 38.4 2003 Nov 17 3.3 1970 Nov 29 66 52
December 25.1 8.0 32.0 2000 Dec 05 0.3 1968 Dec 27 74 56
Annual 32.9 18.8 66 50

252
TABLE - 4 Mean Wind Speed in km/hr.
(TONK)
Jan Feb Mar Apr May Jun Jul Aug Sep Oct Nov Dec Annual 4.5 5.6 6.4 7.5 9.9 11.7 10.1 8.5 7.5 4.8 3.9 4.4 7.1
TABLE - 5 Special Weather Phenomena
(TONK)
Mean No. of Days With
Jan Feb Mar Apr May Jun Jul Aug Sep Oct Nov Dec Annual
Thunder 0.2 0.9 0.6 0.4 1.8 3.2 4.5 4.4 2.9 0.4 0.0 0.1 19.4 Hail 0.0 0.0 0.0 0.0 0.2 0.1 0.0 0.0 0.0 0.0 0.0 0.0 0.3 Dust storm 0.0 0.0 0.0 0.0 0.5 0.3 0.0 0.0 0.0 0.0 0.0 0.0 0.8 Fog 0.1 0.1 0.0 0.0 0.0 0.0 0.0 0.0 0.0 0.0 0.0 0.1 0.3

253
UDAIPUR DISTRICT
The district has on the whole a dry climate, with the hot season milder than in
the Rajasthan desert areas to the northwest of the district. The cold season is from
December to February and is followed by the hot season which lasts till about the
middle of June. Mid June to mid September constitutes the southwest monsoon
season. The post monsoon season from the middle of September to the end of
November is one of transition from monsoon to winter conditions.
RAINFALL
The district has a network of twenty raingauge stations, for period ranging
from 10 to 45 years. Tables 1 and 2 give the details of rainfall at these stations and
for the district as a whole. The average annual rainfall in the district as a whole is
697.2 mm. Naglia gets annual rainfall of 929.6 mm, while the annual rainfall at
Sarara/Salara is only 550.6 mm. The rainfall during the months June to September
constitutes about 93% of the annual rainfall. July and August are the months with the
maximum rainfall which is about one third of the annual rainfall. The variation in the
annual rainfall from year to year is not large. In the fifty year period 1951 to 2000, the
highest annual rainfall amounting to 206% of the normal occurred in 1973 in the
district. 1987 was the year with the lowest rainfall which was only 50% of the normal.
In the same fifty year period the rainfall was less than 80% of the normal in 14 years.
Occasions of two consecutive years of rainfall less than 80% of the normal occurred
twice in the fifty year period. It will be seen from Table 2 that in 35 years out of 49,
the annual rainfall in the district was between 501 mm and 900 mm.

254
On an average there are 33 rainy days (i.e. days with rainfall of 2.5 mm or
more) in a year in the district. This number varies from 27 at Sarara/Salara to 43 at
Bikrani Hydro.
The heaviest rainfall in 24 hours recorded at any station in the district was
322.6 mm at Bikrani Hydro on 01 September 1973.
TEMPERATURE
There are two meteorological observatories in the district, one at Udaipur and
other at Udaipur City. The data of these stations can be taken as representative of
the conditions in the district as a whole. The winter season sets in after the middle of
November, when both day and night temperatures begin to drop steadily. January is
generally the coldest month with the mean daily maximum temperature at about
24.2oC and the mean daily minimum temperature at about 7.1oC. The minimum
temperature sometimes reaches the freezing point of water and frost may occur
occasionally. The diurnal range of temperature is large particularly in winter and
summer months. Both day and night temperatures rise rather rapidly after the end of
February till May which is the hottest month of the year. Night temperatures are
warmer in June also. The mean daily maximum temperature in that month is at about
39oC and the mean daily minimum temperature is at about 25oC. The summer is
milder than in the desert regions of Rajasthan. By the third or fourth week of June
when the southwest monsoon reaches the district, temperatures drop appreciably.
After the withdrawal of the southwest monsoon by about middle of September, there
is a slight increase in day temperatures although the night temperatures begin to
drop. From November onwards the day temperatures also decrease. The highest
maximum temperature ever recorded at Udaipur Dabok (A) and Udaipur City was
46.4oC on 31 May 1983 and 44.6oC on 27 May 1973 respectively and the lowest
minimum was –1.3oC on 01 January 1991 and 22 February 1984 and 0.4oC on 07
February 1974 at Udaipur Dabok (A) and Udaipur City respectively.
.
255
HUMIDITY
Except in the brief southwest monsoon season when the relative humidity is
about 70% or more, the air is very dry. The summer months are the driest part of the
year when the relative humidity goes down to 20%-25% particularly in the afternoons
at Udaipur Dabok (A) and upto 25%-35% at Udaipur City. CLOUDINESS
In the southwest monsoon season especially in July and August skies are
often heavily clouded to overcast. During the rest of the year skies are generally
clear or lightly clouded. But in the winter season which is generally marked by clear
bright weather, brief spells of cloudy weather, occur in association with the passage
of western disturbances across north India.
WINDS
Winds are generally light to moderate with some strengthening in force in the
latter half of summer and the southwest monsoon season. In the period from May to
September winds blow from directions southwest and west. In the post monsoon
season and winter season the winds are predominantly from directions northwest
and northeast. Thereafter northwesterly and westerly predominate in late winter and
early summer.
SPECIAL WEATHER PHENOMENA
Some of the monsoon depressions in July and August which form at the head
of the Bay of Bengal and move in a westerly or west northwesterly direction, reach
the district and its neighbourhood towards the later stages of their movement and
cause gusty winds and widespread heavy rainfall. Thunderstorms occur throughout
the year, mainly during southwest monsoon season. Duststorms occur early summer
season. Fog occurs during post monsoon and winter months.
Tables 3, 4, 5 and 3(a), 4(a) and 5(a) give the temperature and relative
humidity, mean wind speed and special weather phenomena respectively for
Udaipur Dabok (A) and Udaipur City observatories.


258
TABLE - 2 Frequency of Annual Rainfall in the District
(Data 1951 - 2000) (UDAIPUR)
Range in mm No. of years Range in mm No. of years 301 – 400 4 901 – 1000 3 401 – 500 5 1001 – 1100 1 501 – 600 10 1101 – 1200 0 601 – 700 10 1201 – 1300 0 701 – 800 8 1301 – 1400 0 801 – 900 7 1401 – 1500 1
(Data available for 49 years only)
TABLE - 3 Normals of Temperature and Relative Humidity
(UDAIPUR/DABOK (A))
MONTH
Mean Daily Maximum
Temperature
Mean Daily Minimum
Temperature
Highest Maximum
ever recorded
Lowest Minimum
ever recorded
Relative
Humidity (%) 0C 0C 0C Date 0C Date 0830
IST 1730 IST
January 24.2 7.1 33.3 1991 Jan 29 -1.3 1991 Jan 01 65 33
February 26.9 9.3 39.2 1993 Feb 15 -1.3 1984 Feb 22 55 28
March 32.3 14.3 42.0 1996 Mar 28 5.1 1982 Mar 02 41 20
April 37.2 20.3 44.0 1996 Apr 29 10.0 1989 Apr 05 34 19
May 39.5 25.0 46.4 1983 May 31 15.2 1979 May 03 41 24
June 37.1 26.0 46.2 1995 Jun 01 19.0 1997 Jun 04 2009 Jun 16
64 44
July 31.9 24.5 41.4 2009 Jul 07 20.0 2009 Jul 10 79 68
August 30.0 23.1 38.4 1987 Aug 18 19.0 1968 Aug 29 84 75
September 32.3 21.4 38.8 1987 Sep 26 13.4 1972 Sep 26 76 58
October 33.6 16.9 39.4 2000 Oct 21 9.4 1983 Oct 30 59 34
November 29.4 11.8 36.6 2001 Nov 02 3.4 1988 Nov 30 60 35
December 25.3 7.9 34.0 2003 Dec 09 -0.9 1990 Dec 31 67 37
Annual 31.6 17.3 60 40

259
TABLE - 4
Mean Wind Speed in km/hr. (UDAIPUR/DABOK (A))
Jan Feb Mar Apr May Jun Jul Aug Sep Oct Nov Dec Annual 5.6 6.4 7.3 8.2 10.7 12.9 11.0 9.0 6.8 5.2 4.5 4.7 7.7
TABLE - 5 Special Weather Phenomena
(UDAIPUR/DABOK (A))
Mean No. of Days With
Jan Feb Mar Apr May Jun Jul Aug Sep Oct Nov Dec Annual
Thunder 0.1 0.5 0.7 0.7 2.7 4.9 5.1 5.2 3.2 1.3 0.3 0.1 24.8 Hail 0.0 0.1 0.0 0.0 0.1 0.0 0.1 0.0 0.0 0.0 0.0 0.0 0.3 Dust storm 0.0 0.0 0.0 0.1 0.5 0.6 0.4 0.0 0.0 0.1 0.0 0.0 1.7 Fog 0.1 0.0 0.0 0.0 0.0 0.0 0.0 0.1 0.1 0.1 0.1 0.2 0.7

260
TABLE – 3(a) Normals of Temperature and Relative Humidity
(UDAIPUR CITY)
MONTH
Mean Daily Maximum
Temperature
Mean Daily Minimum
Temperature
Highest Maximum
ever recorded
Lowest Minimum
ever recorded
Relative
Humidity (%) 0C 0C 0C Date 0C Date 0830
IST 1730 IST
January 24.2 7.1 30.8 1965 Jan 13 0.9 1962 Jan 22 66 41 February 27.1 9.6 36.7 1953,Feb 28 0.4 1974 Feb 07 59 34 March 32.2 15.0 39.1 1984 Mar 31 5.2 1983 Mar 02 46 28 April 36.4 20.4 44.4 1958 Apr 27 10.6 1955 Apr 15 41 29 May 38.4 23.9 44.6 1973 May 27 16.3 1960 May 09 45 33 June 36.1 24.6 43.4 1973 Jun 05 16.7 1974 Jun 09 66 51 July 31.1 23.0 40.0 1968 Jul 03 18.6 1983 Jul 28 79 70 August 29.5 22.1 35.6 1970 Aug 05 15.2 1978 Aug 05 82 75 September 31.5 20.6 37.8 1974 Sep 21 11.8 1976 Sep 21 74 63
October 33.1 16.4 37.7 1980 Oct 29 1982 Oct 13 8.6 1983 Oct 29 62 43
November 29.6 11.7 36.0 2006 Nov 18 3.8 1974 Nov 29 62 45 December 25.9 8.1 33.8 1980 Dec 03 0.6 1950 Dec 29 67 45 Annual 31.3 16.9 62 46
TABLE – 4(a)
Mean Wind Speed in km/hr. (UDAIPUR CITY)
Jan Feb Mar Apr May Jun Jul Aug Sep Oct Nov Dec Annual 1.6 2.2 2.9 3.8 5.0 6.4 5.0 3.9 2.9 1.5 1.1 1.3 3.1
TABLE – 5(a) Special Weather Phenomena
(UDAIPUR CITY)
Mean No. of Days With
Jan Feb Mar Apr May Jun Jul Aug Sep Oct Nov Dec Annual
Thunder 0.0 0.2 0.8 0.5 2.2 3.8 4.6 3.0 3.0 0.6 0.1 0.2 19.0 Hail 0.0 0.0 0.0 0.0 0.0 0.0 0.0 0.0 0.0 0.0 0.0 0.0 0.0 Dust storm 0.0 0.0 0.1 0.0 0.3 0.0 0.0 0.0 0.0 0.0 0.0 0.0 0.4 Fog 0.0 0.2 0..0 0.0 0.0 0.0 0.0 0.0 0.0 0.0 0.0 1.3 1.5