intraseasonal variability associated with wet monsoons in southeast arizona
TRANSCRIPT
1 SEPTEMBER 2002 2477C A V A Z O S E T A L .
q 2002 American Meteorological Society
Intraseasonal Variability Associated with Wet Monsoons in Southeast Arizona
TEREZA CAVAZOS, ANDREW C. COMRIE, AND DIANA M. LIVERMAN
Department of Geography and Regional Development, The University of Arizona, Tucson, Arizona
(Manuscript received 3 April 2001, in final form 6 March 2002)
ABSTRACT
The intraseasonal evolution of the North American monsoon in southeast Arizona during the 1980–93 periodis investigated using a neural network–based nonlinear classification technique known as the self-organizingmap (SOM). The goal of the SOM algorithm is to discover meaningful low-dimensional structures hidden inthe high-dimensional observations. Various daily lagged atmospheric fields (850-hPa meridional winds, 700-hPaspecific humidity, 500-hPa geopotential heights, and 850–500-hPa thickness) for the summer season (June–July–August–September) of the 1980–93 period are used in the nonlinear classification of monsoon modes. Specialemphasis is given to the wettest monsoon modes. The neural network classification successfully captures themultidimensional interaction of the atmospheric variables during the monsoon evolution, and shows monsoon‘‘bursts’’ and ‘‘breaks’’ in a given year. Spectral analysis of daily summer rainfall in the study area reveals asignificant peak in the 12–18-day band; a secondary and significant peak is also found near 40 days. Thus,monsoon bursts and breaks seem to be modulated by low-frequency variability.
The SOM nonlinear classification shows that the mature phase of the monsoon is associated with two distinctintraseasonal (.10 days) wet monsoon modes. The signature of the wettest monsoon mode is a zonal three-cellanomalous midtropospheric height pattern over the North Pacific–North American sector, suggesting a large-scale dynamical mechanism, possibly linked to sea surface temperature (SST) anomalies in the North Pacific.This zonal mode, which is most frequent in July and August, is characterized by an enhanced and northeastward-displaced monsoon ridge, large amounts of midtropospheric moisture over the study area, and an out of phaserelationship between precipitation in the southwest United States and precipitation in the Great Plains. The zonalmode has been recognized in longer datasets and it is the most typical mode that characterizes the mature phaseof the monsoon in the southwest United States. In contrast, the second wettest intraseasonal monsoon modedoes not show a monsoon ridge, but a meridional three-cell anomalous midtropospheric height pattern alongthe west coast of North America, weak height anomalies over the rest of North America, and large amounts ofmoisture over the study area. Importantly, this meridional mode, which is most frequent in August and September,does not show out of phase links to Great Plains precipitation. The meridional wet mode also shows an anomalouslow-level cyclonic circulation off the west coast of central-south Mexico suggesting that convective activity offthe southern Mexican coast—possibly associated with the intertropical convergence zone—may cross over theIsthmus of Tehuantepec toward the Gulf of Mexico and the southern United States. This would explain the weaklink between precipitation in the Southwest and precipitation in the Great Plains during August and Septemberof the 1980–93 period.
At more regional scales, the zonal wet mode is also characterized by a latitudinal gradient of SST anomaliesbetween Baja California and southern Mexico and reversed low-level flow over the Gulf of California. Lookingat extreme wet monsoons outside of the study period (e.g., 1955, 1959, 1999) it is shown that the positive SSTanomaly pattern along the Pacific coast of Baja California, which characterized wet events during 1980–93, canbe completely reversed during other extreme wet events. These contrasting results suggest that interaction betweenlocal and remote forcing mechanisms over the study area are complex during extreme events and needs furtherinvestigation.
1. Introduction
In the past decade there has been an upsurge in theamount of research undertaken to investigate the vari-ability of the so called ‘‘Arizona monsoon’’ and the‘‘Mexican monsoon.’’ Much of the research has shownthat what used to be thought of as an essentially re-
Corresponding author address: Dr. Tereza Cavazos, Departamentode Oceanografıa Fısica, CICESE, P.O. Box 434844, San Diego, CA92143.E-mail: [email protected]
gional-scale phenomenon (e.g., Bryson and Lowry1955; Tang and Reiter 1984; Carleton 1986; Moore etal. 1989; Douglas et al. 1993) is actually an integralpart of the large-scale North American monsoon system(NAMS), which encompasses most of Mexico and partsof the United States (e.g., Adams and Comrie 1997;Higgins et al. 1997; Barlow et al. 1998; Yu and Wallace2000; Higgins and Shi 2001). The mean evolution ofthe monsoon from Mexico to the United States is char-acterized by the regular northward progression of heavyprecipitation from southern Mexico by early June,
2478 VOLUME 15J O U R N A L O F C L I M A T E
which quickly spreads northward along the westernslopes of the Sierra Madre Occidental (Douglas et al.1993; Stensrud et al. 1997) into the southwestern UnitedStates by early July (Higgins et al. 1999). The onset ofthe monsoon in Arizona is frequently abrupt; in a matterof a day, the dry, desert air may be replaced by a humid,thunderstorm-spawning air mass (Moore et al. 1989).The change in air mass is due to a shift of the axis ofthe surface subtropical ridge (Bryson and Lowry 1955)and a northward displacement of the high pressure cen-ters over the eastern Pacific and the western AtlanticOceans (Carleton 1986). Increases in precipitation alsocoincides with the development of a pronounced anti-cyclone at the jet stream level (e.g., Okabe 1995) andthe development of a thermally induced trough in thedesert of the Southwest (Tang and Reiter 1984; Rowsonand Colucci 1992). Diabatic heating (due possibly tosolar and latent heating) over the northern Mexican pla-teau and the southwest United States appear responsiblefor the establishment of the upper-level anticyclone(Higgins et al. 1998; Barlow et al. 1998) comparable,though in a much lesser degree, to that of the TibetanPlateau (e.g., Webster et al. 1998).
Wet (dry) summers in the southwestern United Statesare thus linked to an intensification and northward dis-placement (weakening and southward displacement) ofthe monsoon anticyclone (e.g., Carleton et al. 1990;Douglas et al. 1993; Higgins et al. 1998; Higgins et al.1999; Castro et al. 2001). As the ridge shifts to the north,the prevailing winds change from westerly to south-easterly across much of the southwestern United States.The northward movement of the subtropical ridge andconcomitant southeasterly midtropospheric flow duringwet events prompts moisture advection aloft from theregion of persistent convection over western Mexico(Mullen et al. 1998). Wet summers in Arizona have beenalso linked to an enhanced longitudinal gradient (2, 1)of sea surface temperatures (SST) between the Pacificcoast of Baja California and the Gulf of California(Carleton et al. 1990) and reversal of the winds in thenorthern Gulf of California (Tang and Reiter 1984; Bad-an-Dangon et al. 1991). Observational and modelingstudies (Stensrud et al. 1997; Mitchell et al. 2002) sug-gest that high SSTs in the northern Gulf of California(.29.58C) favor evaporation and low-level moistureand, thus, are conducive to wet conditions in the south-western United States. In a much larger scale, outflowrelated to strong monsoon activity causes atmosphericdescent and drying over the Great Plains (e.g., Mo etal. 1997; Higgins et al. 1997; Higgins et al. 1998; Bar-low et al. 1998). Higgins and Shi (2001) indicate thatthe onset date of the monsoon in the southwest UnitedStates seems to be modulated by remote forcings (i.e.,antecedent conditions in the SSTs), but the intensity(i.e., total seasonal precipitation) could be more directlylinked to local forcings and intraseasonal variations.Mitchell et al. (2002) argue that both onset date andintensity of the monsoon in Arizona are related to local
boundary conditions of the SSTs in the Gulf of Cali-fornia, but they do not discard other possible factors.Independently of the relative contributions of local ver-sus remote forcings to monsoon precipitation variabilityin Arizona, several studies suggest that a large portionof this variability is linked to intraseasonal phenomenasuch as easterly waves (e.g., Zehnder 1991; Adams andComrie 1997); Gulf of California surge events (e.g.,Hales 1972; Brenner 1974; Stensrud 1997); tropical cy-clones (e.g., Higgins and Shi 2001); and the Madden–Julian oscillation (MJO; e.g., Higgins and Shi 2001).Monsoon ‘‘bursts’’ (active periods) and ‘‘breaks’’ (dryperiods), as termed by Carleton (1986), are rather dis-tinct over the southwest United States and are supportedby Mullen et al. (1998) who document a significant 12–18-day quasiperiodicity in monsoon precipitation insoutheastern Arizona. Mo (2000) suggests a 22-day in-traseasonal mode in monsoon precipitation in Arizonaand New Mexico that is linked to tropical convection,and Higgins and Shi (2001) indicate that wet and drymonsoon periods in western Mexico and the southwestUnited States are linked to 30–60-day variations as-sociated with the MJO (e.g., Madden and Julian 1994).Modulation at 40 days (e.g., Lau and Chan 1986) and10–20 days also occurs in the Asian monsoon (e.g.,Krishnamurti and Ardanuy 1980). Thus, local and re-mote forcings, as well as large-scale, intraseasonal dy-namics seem to play an important role in modulatingwidespread convection, bursts, and breaks, and the over-all intensity of monsoon precipitation over the southwestUnited States.
The main goal of this paper is to investigate the in-traseasonal variability (.10 days) of the monsoon and,in particular, its mature phase in southeast Arizona (Fig.1) during the 1980–93 period using a relatively novelneural network classification technique known as theself-organizing map (SOM). The objective of the SOMalgorithm is to discover meaningful low-dimensionalclimate patterns hidden in the multidimensional dailyobservations, and it can be thought of as a nonlinearform of cluster analysis. Daily lagged atmosphericfields, such as midtropospheric specific humidity, geo-potential heights, low-level winds, and thickness, areused in the SOM analysis to generate intraseasonal mon-soon climate modes. Previous studies have examinedaspects of the variability of some of these variablesindividually and have derived monsoon modes typicalof wet and dry intraseasonal events (e.g., Carleton 1986;Mullen et al. 1998) or the climate modes characteristicof the monsoon evolution in the southwestern UnitedStates (e.g., Higgins et al. 1997). However, the presentanalysis differs from past studies in that the classifi-cation of monsoon modes is derived from a set of high-dimensional daily atmospheric variables keyed oversoutheastern Arizona. We expect to determine relevantfeatures of the monsoon evolution based on similar dailyand low-passed (.10 days) atmospheric conditions.Some of the questions that we want to answer in this
1 SEPTEMBER 2002 2479C A V A Z O S E T A L .
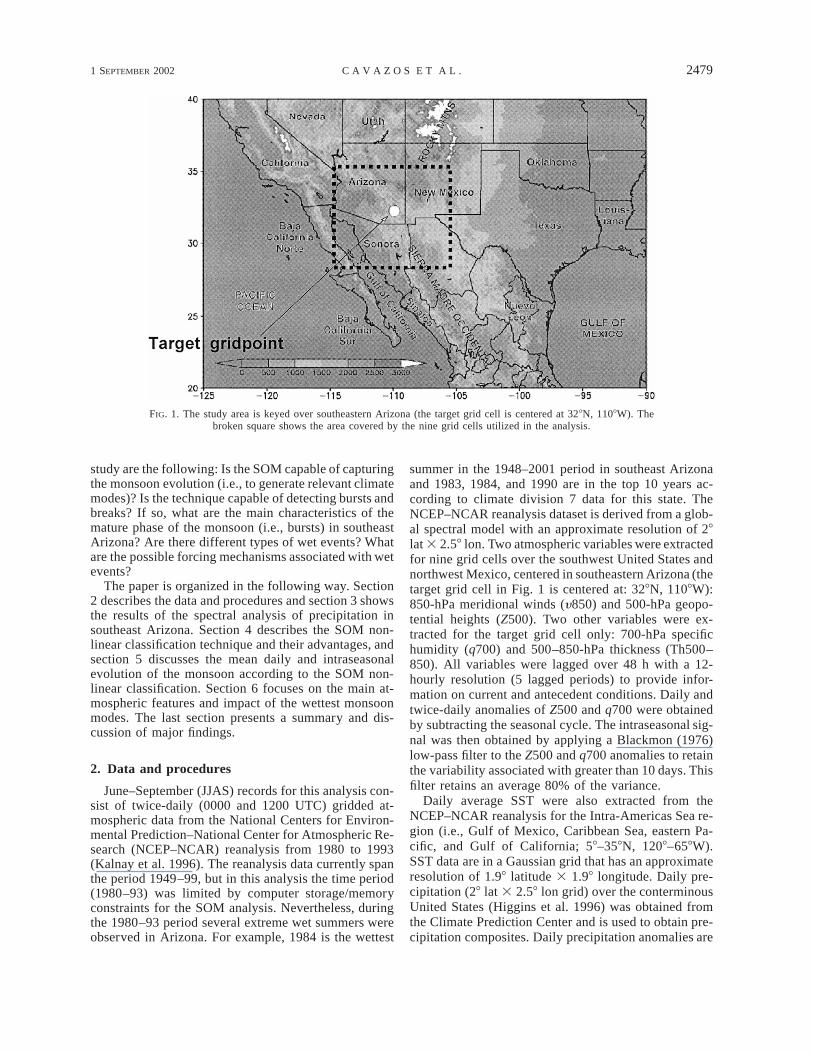
FIG. 1. The study area is keyed over southeastern Arizona (the target grid cell is centered at 328N, 1108W). Thebroken square shows the area covered by the nine grid cells utilized in the analysis.
study are the following: Is the SOM capable of capturingthe monsoon evolution (i.e., to generate relevant climatemodes)? Is the technique capable of detecting bursts andbreaks? If so, what are the main characteristics of themature phase of the monsoon (i.e., bursts) in southeastArizona? Are there different types of wet events? Whatare the possible forcing mechanisms associated with wetevents?
The paper is organized in the following way. Section2 describes the data and procedures and section 3 showsthe results of the spectral analysis of precipitation insoutheast Arizona. Section 4 describes the SOM non-linear classification technique and their advantages, andsection 5 discusses the mean daily and intraseasonalevolution of the monsoon according to the SOM non-linear classification. Section 6 focuses on the main at-mospheric features and impact of the wettest monsoonmodes. The last section presents a summary and dis-cussion of major findings.
2. Data and procedures
June–September (JJAS) records for this analysis con-sist of twice-daily (0000 and 1200 UTC) gridded at-mospheric data from the National Centers for Environ-mental Prediction–National Center for Atmospheric Re-search (NCEP–NCAR) reanalysis from 1980 to 1993(Kalnay et al. 1996). The reanalysis data currently spanthe period 1949–99, but in this analysis the time period(1980–93) was limited by computer storage/memoryconstraints for the SOM analysis. Nevertheless, duringthe 1980–93 period several extreme wet summers wereobserved in Arizona. For example, 1984 is the wettest
summer in the 1948–2001 period in southeast Arizonaand 1983, 1984, and 1990 are in the top 10 years ac-cording to climate division 7 data for this state. TheNCEP–NCAR reanalysis dataset is derived from a glob-al spectral model with an approximate resolution of 28lat 3 2.58 lon. Two atmospheric variables were extractedfor nine grid cells over the southwest United States andnorthwest Mexico, centered in southeastern Arizona (thetarget grid cell in Fig. 1 is centered at: 328N, 1108W):850-hPa meridional winds (y850) and 500-hPa geopo-tential heights (Z500). Two other variables were ex-tracted for the target grid cell only: 700-hPa specifichumidity (q700) and 500–850-hPa thickness (Th500–850). All variables were lagged over 48 h with a 12-hourly resolution (5 lagged periods) to provide infor-mation on current and antecedent conditions. Daily andtwice-daily anomalies of Z500 and q700 were obtainedby subtracting the seasonal cycle. The intraseasonal sig-nal was then obtained by applying a Blackmon (1976)low-pass filter to the Z500 and q700 anomalies to retainthe variability associated with greater than 10 days. Thisfilter retains an average 80% of the variance.
Daily average SST were also extracted from theNCEP–NCAR reanalysis for the Intra-Americas Sea re-gion (i.e., Gulf of Mexico, Caribbean Sea, eastern Pa-cific, and Gulf of California; 58–358N, 1208–658W).SST data are in a Gaussian grid that has an approximateresolution of 1.98 latitude 3 1.98 longitude. Daily pre-cipitation (28 lat 3 2.58 lon grid) over the conterminousUnited States (Higgins et al. 1996) was obtained fromthe Climate Prediction Center and is used to obtain pre-cipitation composites. Daily precipitation anomalies are
2480 VOLUME 15J O U R N A L O F C L I M A T E
defined as departures from the mean daily values forthe 1980–93 period.
3. Spectral analysis of precipitation insoutheastern Arizona
A spectral analysis was applied to the precipitationanomalies for mean wet, mean dry, and intermediateyears to determine the dominant intraseasonal periodsof variation in southeastern Arizona (the target grid cellin Fig. 1). Wet (1982, 1983, 1984, 1990); dry (1987,1989, 1993); and intermediate (1980, 1981, 1985, 1986,1988, 1991, 1992) years were obtained based on a 1standard deviation criterion (e.g., wet summer . 1 stddev season21).
A Blackman–Tukey method with a lag window of1/20 , M/N , 1/3 was chosen to compromise the effectsof bias (size of bandwidth) and variance (size of con-fidence bands) (Chatfield 1975, p. 141). Here M is thetruncation point of the lag window and N is 122 daysseason21 (JJAS).1 A white noise spectrum and 95% con-fidence intervals were also computed to determine thesignificant periods of variation. Spectral analysis of dai-ly summer rainfall for mean wet, mean dry, and inter-mediate years in the study area reveal a significant peakin the 12–18-day band; a secondary and significant peakis also found near 40–60 days. On average, more than60% of the temporal variance of monsoon precipitationis contained in fluctuations between 10 and 90 days.These results corroborate that monsoon bursts andbreaks in Arizona seem to be modulated by low-fre-quency intraseasonal variability as suggested by otherauthors (Mullen et al. 1998; Mo 2000; Higgins and Shi2001). We also calculated a 7-day running mean pre-cipitation anomaly at each grid cell to illustrate the spa-tial distribution of precipitation associated with the in-traseasonal climate modes (see section 5) derived fromthe SOM analysis.
4. The self-organizing map (SOM)
The Kohonen SOM (Kohonen 1995) is a neural net-work classification technique that is particularly wellsuited for recognizing relevant structures in complex,high-dimensional data. Recently, the SOM has beenused to extract the fundamental patterns of human geneexpression inherent in massive datasets (e.g., Tamayoet al. 1999) suggesting new hypotheses about gene dif-ferentiation. In climate research it has been applied toclimate change (Hewitson 1998), climate diagnosticsand downscaling (Cavazos 1999, 2000), and satelliteremote sensing (e.g., Ambroise et al. 2000; Wan andFraser 2000). Results of a comparison of the SOM neu-ral network and linear clustering methods by Mangia-meli et al. (1996) showed the SOM to be significantly
1 Larger M leads to more detail in spectrum, but greater varianceof estimates and vice versa.
superior in both accuracy and robustness. Cavazos(2000) used a SOM to investigate circulation and hu-midity patterns associated with extreme precipitationevents in the Balkans and found the results to be con-sistent with past studies based on empirical orthogonalfunctions (EOF) and canonical correlation analysis(CCA; e.g., Corte-Real et al. 1995; Busuioc and vonStorch 1996). However, many natural phenomena arecharacterized by essential nonlinear structures that canbe invisible to linear reduction techniques (e.g., EOF).For example, the interactive, highly nonlinear soil–at-mosphere system has been found to display robust self-organized features with global characteristics that mayarise mainly as the product of local dynamics (Rodri-guez-Iturbe et al. 1998).
The mathematical framework of the SOM is foundin Kohonen (1995) and the algorithm is available online(Kohonen et al. 1995, see reference for the Web site).A brief description of the SOM is also found in Cavazos(1999, 2000). Software implementations of the SOMare available for several computing platforms; they arereasonably fast, and they are scalable to large datasets.The SOM algorithm seeks to discover low-dimensionalcomplex patterns hidden in the high-dimensional inputvariables through an unsupervised learning and self-adaptation process. The SOM consists of a regular, usu-ally two-dimensional, map of nodes onto which a dis-tribution of multidimensional input vectors is projectednonlinearly (Somervuo and Kohonen 1999). Thesenodes are analogous to the classes in linear cluster anal-ysis. The SOM mapping tends to preserve the topo-logic–metric relations between input vectors. The pro-jection is done by a matching process, which representsmost faithfully those dimensions of the input variablesalong which the variance is most pronounced. In thisstudy, the nodes in the SOM map are expected to rep-resent significant climate modes (e.g., clusters of dailysynoptic or intraseasonal patterns) that characterize theevolution of the monsoon in southeastern Arizona. It isthus a diagnostic tool related to linear synoptic clima-tological techniques (e.g., Yarnal 1993; Yarnal et al.2001). In the first stage, every node in the map has anassociated reference weight vector, which is initializedto a small random number. Self-organization and learn-ing proceed by repeatedly exposing the nodes in theKohonen map to the entire set of input vectors (i.e.,daily atmospheric variables). Most SOM applicationsuse the smallest of the Euclidian distances or the max-imum dot product in defining the best match betweenthe input vector and the reference weight vectors in themap. In each iteration the best matching node (winningnode) and its closest neighbors are rewarded, whilethose farther away are inhibited. The result of the it-eration is that the weights of the nodes surrounding thewinner move toward the input vector. The referenceweights are updated accordingly and self-organizationcontinues until convergence is reached. The central re-sult in self-organization is a nonlinear projection of the
1 SEPTEMBER 2002 2481C A V A Z O S E T A L .
probability density function of the input vectors ontothe two-dimensional array using a vector quantization(VQ) approximation. The best map is expected to yieldthe smallest vector quantization error; thus, an appre-ciable number of random initializations (.10) ought tobe tried to avoid falling into a local minimum. The SOMalgorithm has an adaptive VQ procedure to calculatethe error. For more details about the optimal class sep-aration using the VQ procedure see Kohonen (1995)and Somervuo and Kohonen (1999).
There is no rule to determine the ‘‘significant’’ num-ber of nodes in an SOM. After several tests a 5 3 3map (i.e., 15 climate modes) was selected for their phys-ical soundness, though a larger number of modes mayprovide more in-depth synoptic information on the evo-lution of the monsoon and on extreme events. Two ran-dom subsets with 70% of the data were also used to testthe reproducibility of the classification. The differencebetween modes was small suggesting a good repeat-ability. Mangiameli et al. (1996) conducted a sensitivityanalysis of the SOM using empirical data with structuralimperfections (i.e., outliers, irrelevant variables) andfound that the variability between different SOM runswas minimal.
A daily monsoon classification for southeastern Ar-izona (over the target grid cell in Fig. 1) centered at1200 UTC was derived from a time series of atmo-spheric controls mXn composed of m 5 1708 daily(JJAS) vectors from 1980 to 1993 with n 5 100 time-lagged atmospheric variables:
SOM modes 5 f ( X )5 3 m n
f ( X ) 5 f ( y850 , Z500 , q700 ,m n m 45 m 45 m 5
Th500–850 ).m 5
The subscript 45 indicates that each daily vector con-tains information on low-level meridional winds (y850)and midtropospheric geopotential heights (Z500) fromthe target grid cell and its 8 neighbors in Fig. 1 (9 gridcells) for current and antecedent conditions (5 lagtimes). Each daily vector also contains information onmidtropospheric humidity (q700) and thickness(Th500–850) from the target grid cell for current andantecedent conditions (5 lag times). The variables andthe lag time used in this analysis were selected to ac-count for the combined effect of low- and midtropo-spheric circulation, midtropospheric moisture, and heat-ing of the midtropospheric layer during the monsoonseason due to absorption of solar radiation and the ther-mal contrast between continents and oceans (e.g., Krish-namurti 1971). In essence, the SOM analysis enabled anonlinear classification of these multivariate daily datainto 15 categories (modes).
After the SOM analysis, daily time series of severalatmospheric variables were composited into the 5 3 3climate modes, and mean daily and intraseasonal (.10days) anomaly fields were computed, as described in
section 2. Intraseasonal mean anomaly composites ofthe SOM climate modes characteristic of the maturephase of the monsoon (i.e., wettest monsoon modes)were tested in pairs for differences of mean and varianceusing a two-sample t test.2 It is assumed that the dis-tributions of the two-sample means being tested areGaussian (Z) or that the sample sizes are sufficientlylarge that the central limit theorem can be invoked(Wilks 1995, 122–124). In this analysis, all SOM cli-mate modes described in the following sections havemore than 100 observations.
5. SOM results
a. Mean daily monsoon evolution in southeastArizona
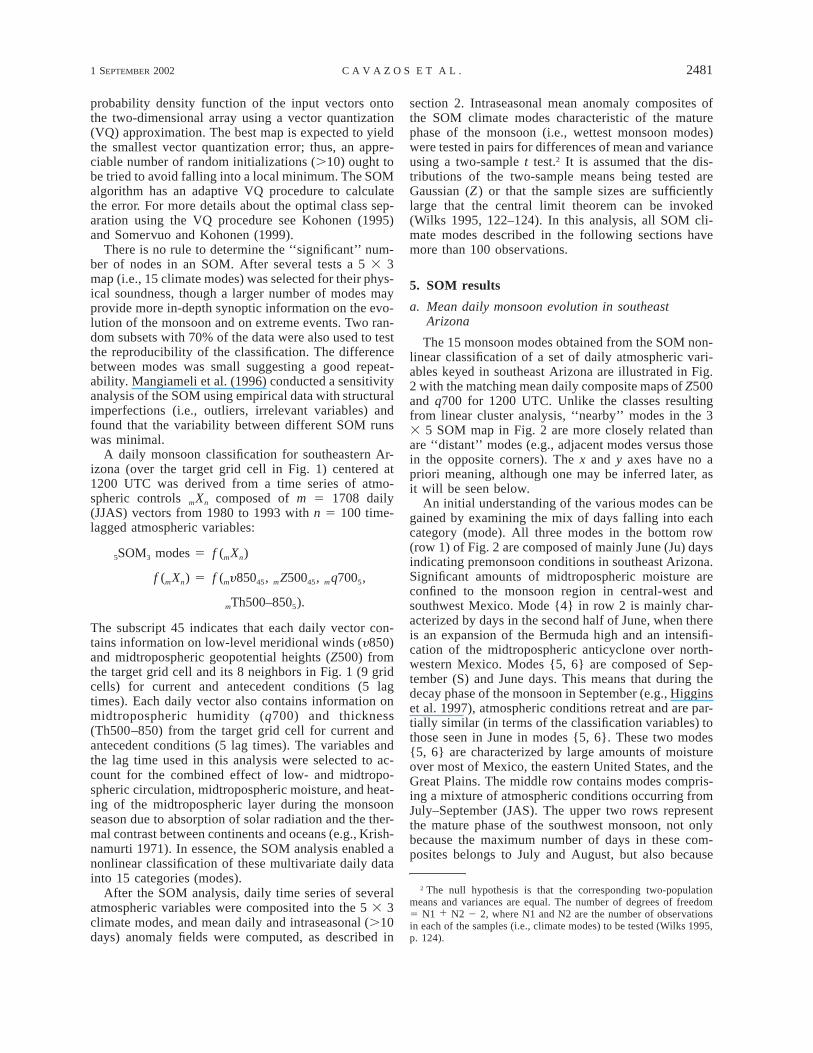
The 15 monsoon modes obtained from the SOM non-linear classification of a set of daily atmospheric vari-ables keyed in southeast Arizona are illustrated in Fig.2 with the matching mean daily composite maps of Z500and q700 for 1200 UTC. Unlike the classes resultingfrom linear cluster analysis, ‘‘nearby’’ modes in the 33 5 SOM map in Fig. 2 are more closely related thanare ‘‘distant’’ modes (e.g., adjacent modes versus thosein the opposite corners). The x and y axes have no apriori meaning, although one may be inferred later, asit will be seen below.
An initial understanding of the various modes can begained by examining the mix of days falling into eachcategory (mode). All three modes in the bottom row(row 1) of Fig. 2 are composed of mainly June (Ju) daysindicating premonsoon conditions in southeast Arizona.Significant amounts of midtropospheric moisture areconfined to the monsoon region in central-west andsouthwest Mexico. Mode {4} in row 2 is mainly char-acterized by days in the second half of June, when thereis an expansion of the Bermuda high and an intensifi-cation of the midtropospheric anticyclone over north-western Mexico. Modes {5, 6} are composed of Sep-tember (S) and June days. This means that during thedecay phase of the monsoon in September (e.g., Higginset al. 1997), atmospheric conditions retreat and are par-tially similar (in terms of the classification variables) tothose seen in June in modes {5, 6}. These two modes{5, 6} are characterized by large amounts of moistureover most of Mexico, the eastern United States, and theGreat Plains. The middle row contains modes compris-ing a mixture of atmospheric conditions occurring fromJuly–September (JAS). The upper two rows representthe mature phase of the southwest monsoon, not onlybecause the maximum number of days in these com-posites belongs to July and August, but also because
2 The null hypothesis is that the corresponding two-populationmeans and variances are equal. The number of degrees of freedom5 N1 1 N2 2 2, where N1 and N2 are the number of observationsin each of the samples (i.e., climate modes) to be tested (Wilks 1995,p. 124).
2482 VOLUME 15J O U R N A L O F C L I M A T E
FIG. 2. Mean daily composites of 500-hPa geopotential heights (dam) and 700-hPa specific humidity (.5 g kg21;shading) derived from the SOM nonlinear classification for southeast Arizona. The label above each composite indicates:the climate mode number (1–15), the number of days in each composite in parentheses, and significant months accordingto the highest frequency of days (Ju 5 Jun, J 5 Jul, A 5 Aug, S 5 Sep). Geopotential heights (Z ) are contouredevery 6 dam, except for Z . 584 dam, which are contoured every 2 dam. Base period: JJAS 1980–93.
the typical monsoon ridge (e.g., Bryson and Lowry1955; Carleton 1986) is fully developed at its northern-most position over the ‘‘Four Corners’’ region (mode{13}) and large amounts of moisture have been advectedinto the southwest United States. During the maturephase in July and August, there is also a considerablereduction of midtropospheric moisture over easternMexico and Texas, which could be linked to the mid-summer drought, the canicula, in those regions (e.g.,Mosino and Garcıa 1974; Magana et al. 1999; Vazquez2000).
There are many possible sequences of these dailymodes that the monsoon can follow in a given year; atintraseasonal, synoptic, and daily timescales the atmo-sphere switches back and forth between different burstand break monsoon modes. The monsoon is a dynamicphenomenon; thus, it is possible to introduce an artificialtime coordinate in Fig. 2 to explain its evolution. Forexample, a common and simplified sequence of mon-soon evolution from premonsoon conditions (i.e., June)to the mature phase (July–August) might be composedfrom the modes in Fig. 2 in the following sequence: {3,

1 SEPTEMBER 2002 2483C A V A Z O S E T A L .
2, 1; 4, 7, 10; 13, 14, 15}. It must be noted that theatmosphere tends to persist for several days in each ofthese modes, and in reality it may transition betweenmany combinations of modes. The westerly circulationcharacteristic of the spring season over the southwestUnited States {3, 2} retreats northward at the end ofJune {1, 4, 7} as the Bermuda high migrates north-westward; the monsoon ridge over northwestern Mexicomoves northward (up the left column of Fig. 2). Then,during the mature phase (top row), the impact of themonsoon in the Southwest will depend on the intensityand latitudinal location of the ridge, as documented inpast studies (e.g., Carleton 1986; Adams and Comrie1997; Higgins et al. 1997; Comrie and Glenn 1998;Castro et al. 2001), as well as on the amount of moistureavailable (e.g., Higgins et al. 1997; Barlow et al. 1998).Large amounts of moisture are advected toward Arizonaand New Mexico when the anticyclone is displaced east-ward (modes {14, 15}) of the Four Corners region(modes {13}). This particular sequence of events {7,10, 13, 14, 15} is consistent with the mean evolutionof the monsoon documented by Higgins et al. (1997)for the 1979–94 period (their Fig. 25). They did 3-daycomposites of Z500 and q500 separately, centered in asequence of 13 days before and 13 days after the mon-soon onset. This consistency shows the reliability of theSOM analysis and confirms that one of the most com-mon features of the onset of the monsoon in the south-west United States is the enhancement of the monsoonridge over the region and the presence of large amountsof moisture, as documented by many authors. As theridge intensifies and migrates to the north, troughs inboth sides of the continent develop as a result of thestrongest thermal contrast between oceans and continentat the height of the boreal summer (e.g., Krishnamurti1971). As indicated in the introduction, this feature isanalogous to that of the Asian monsoon, but in a muchlesser degree.
b. Intraseasonal monsoon evolution in southeastArizona
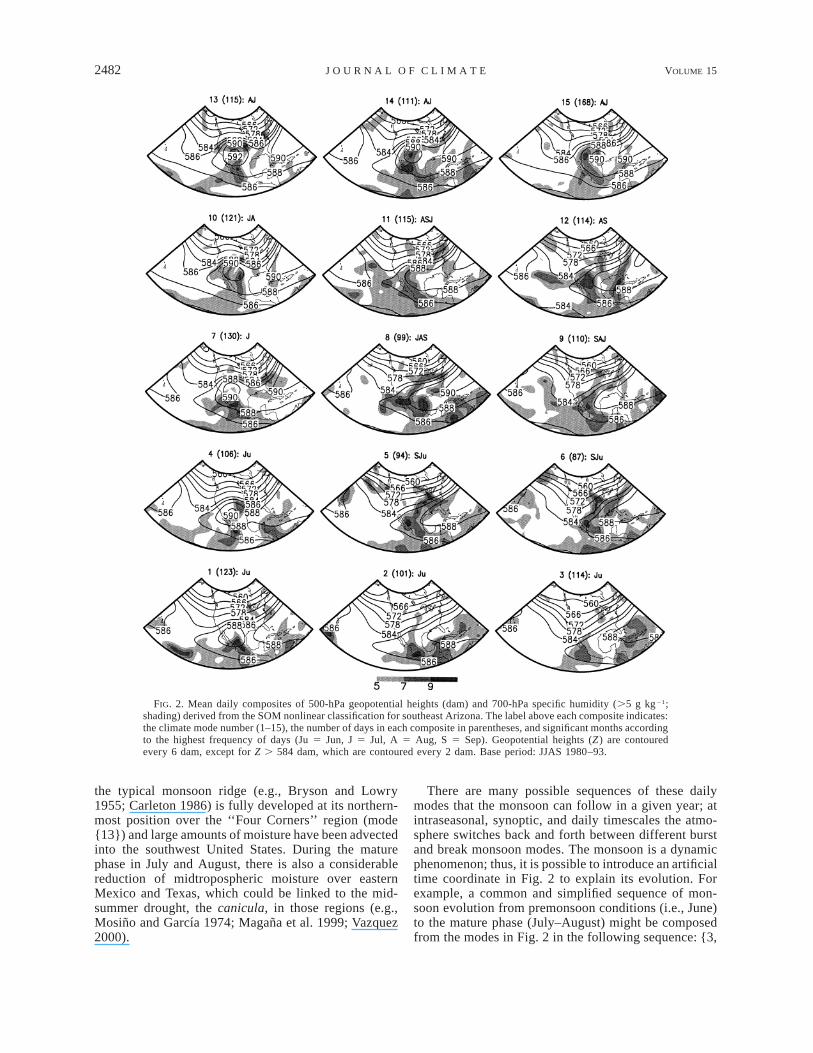
As shown in section 3, the principal mode of vari-ability of monsoon precipitation in southeast Arizonaoccurs at intraseasonal (.10 days) timescales; thus, Fig.3 illustrates the monsoon composites according to thedaily 10-day low-pass Z500 and q700 anomalies. Usinga similar example mode sequence as in the last section,the midtropospheric negative anomalies (i.e., westerlycirculation) in the first half of June {3, 2} weaken asan anomalous anticyclone starts developing in north-western Mexico {1, 4}. At the beginning of June {1, 2,3} northwestern Mexico is characterized by negativemidtropospheric moisture anomalies as seen in Fig. 3,while southwest Mexico experiences large amounts ofmoisture at daily timescales (Fig. 2); nevertheless, themoisture anomalies in southwest Mexico are close tozero at both daily and intraseasonal timescales sug-
gesting a low variability. The premonsoon positiveheight anomalies seen in modes {1, 4} propagate north-westward (up the left column of Fig. 3) leading to anintensification of the monsoon anticyclone over thewestern United States in July and August. During themature phase of the monsoon (top row) the anomalousridge propagates to the east and the anomalous troughover the eastern North Pacific displaces toward thesouthwest United States {13, 14, 15}. As the monsoonanticyclone is displaced eastward, larger positive mois-ture anomalies are seen over the southwest UnitedStates. The geopotential height (Fig. 4) and midtropo-spheric moisture (not shown) anomaly patterns thatcharacterize the mature phase are statistically significantat the 99% level over the NAM region. As illustratedin Fig. 3 and Fig. 4, small, but significant, geopotentialheight anomalies over the region suggest that subtlechanges in the geopotential height field may be suffi-cient to destabilize the atmosphere if significant mois-ture is available. This is supported by large positiveprecipitation anomalies (7-day running means) duringthe mature phase (top two rows) in Fig. 5. Maximumintraseasonal moisture and precipitation anomalies overArizona are observed when the monsoon ridge is shiftedabout 108 eastward (mode {15}) of the typical FourCorners location (mode {13}). These results indicatethat the northward transport of midtropospheric tropicalmoisture (and convective activity) over the southwestUnited States is strongly linked not only to the latitu-dinal location of the monsoon ridge, but also to its lon-gitudinal location.
c. Evolution of the monsoon during the wettest anddriest years of the 1983–93 period
Figure 6 shows daily precipitation and the evolutionof the monsoon modes according to the SOM resultsduring the wettest (1984) and driest (1989) years of the1980–93 period. For ease of illustration the SOM mon-soon modes {1–15} are given negative values in thisfigure. Bursts (active periods) and breaks (dry periods)of the monsoon are clearly evident in the SOM-derivedmodes in Fig. 6. The onset of the monsoon and monsoonbursts over southeast Arizona occur when atmosphericconditions typical of modes {9} or greater are well es-tablished. Monsoon breaks, on the other hand, occurwhen the atmosphere retreats to modes {4, 5, 7} whenthere is a temporal southward displacement of the mon-soon ridge (e.g., Carleton 1986; Carleton et al. 1990)and lack of moisture or even to modes {1, 2, 3} whenthere is a polarity reversal of the midlatitude heightanomaly and a lack of tropical moisture over the studyarea. Figure 6 shows an early (25 June) and late (9 July)start of the monsoon onset for the wet and dry years,respectively, consistent with the mean onset date of themonsoon over the study area (Higgins et al. 1998). Thefrequency of days in each climate mode is further il-lustrated in Table 1, which shows that 1984, the wettest
2484 VOLUME 15J O U R N A L O F C L I M A T E
FIG. 3. Same as Fig. 2 but for the mean composite anomalies of the 10-day low-pass 500-hPa geopotential heightsand 700-hPa specific humidity. Contour interval is 8 m for the geopotential height anomalies. Specific humidityanomalies (g kg21) are shaded.
FIG. 4. Two-sample t test of the difference of means and variances of Z500 modes characteristicof the mature phase of the monsoon: (a) Two wettest monsoon modes {12, 15} and (b) transitiontoward a wet monsoon mode {13, 15}. All shaded areas are statistically significant at the 99%level. Each mode has more than 100 observations.
1 SEPTEMBER 2002 2485C A V A Z O S E T A L .
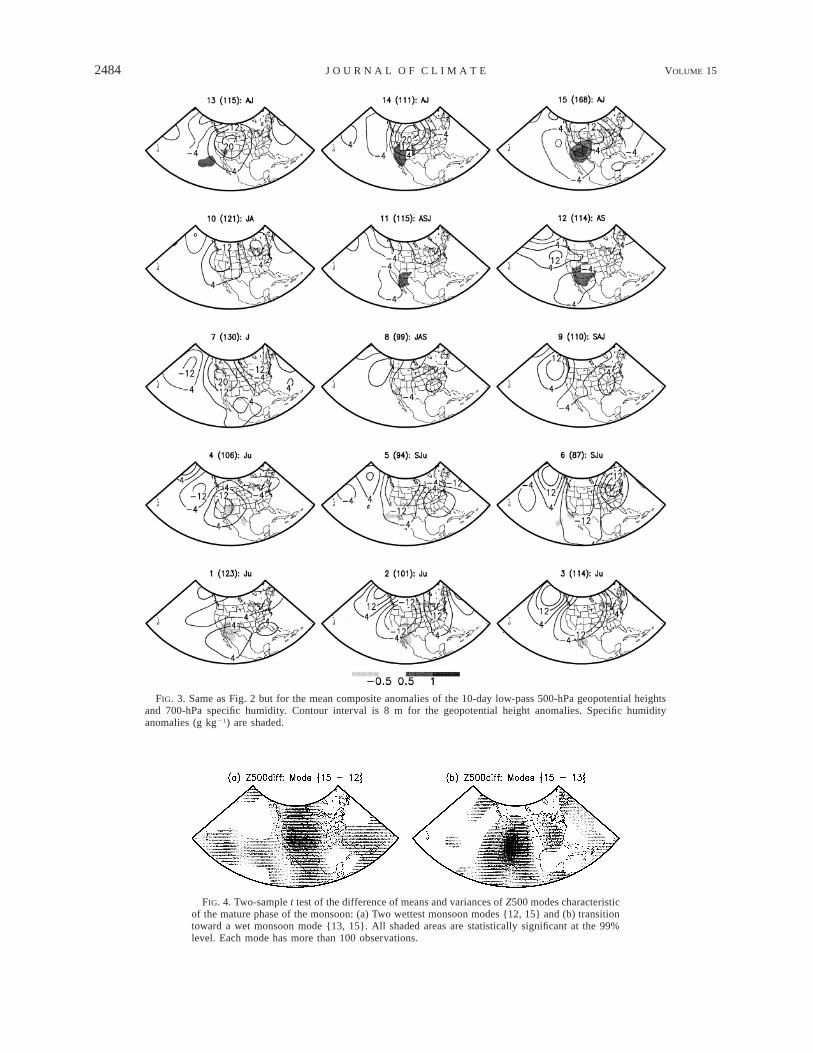
FIG. 5. Composites of 7-day running mean precipitation anomalies. Contour interval is 0.3 mm day 21, except formode {6}, which is 0.5 mm day21. Study period: 1980–93.
year not only in the study period, but also in the 1948–2001 period, has a larger frequency of days (62%) inthe upper five SOM modes, while the driest year of thestudy period, 1989, has a larger number of days (52%)in the lower five modes.
6. Signatures of the wettest monsoon modes
Results indicate that the upper 20th percentile of wetevents in southeast Arizona is associated with four mon-soon modes {11, 12, 14, 15}. The most frequent wetmode {15} explains 28% of this extreme precipitationvariance. The two wettest monsoon modes {12, 15} areboth characterized by the largest amounts of intrasea-sonal moisture over the Southwest (Fig. 3), but their
circulation anomalies as reflected by the midtropo-spheric geopotential heights and precipitation responseaway from this region are different (Fig. 5). Wet modes{14, 15}, which are most frequent during July and Au-gust, show a clear northward-displaced monsoon ridgeand an out of phase relationship between precipitationin the Southwest and precipitation in the Great Plainsconsistent with earlier findings (e.g., Higgins et al. 1997,Higgins et al. 1998). In contrast wet mode {12}, whichis most frequent in August and September, shows weakcirculation anomalies over most of the United States(Fig. 3) and a much weaker relationship between pre-cipitation in the Southwest and precipitation in the GreatPlains (Fig. 5) than modes {14, 15}. This differencecould be linked to responses in the outflow and upper-

2486 VOLUME 15J O U R N A L O F C L I M A T E
FIG. 6. Daily precipitation during the wettest and driest years ofthe study period and evolution of the monsoon according to the SOMclimate modes {1–15}. For ease of plotting, the SOM values areshown as negative.
TABLE 1. SOM frequency of days (JJAS) of each of the 15 monsoonmodes for the wettest (1984) and driest (1989) years of the 1980–93 period in southeast Arizona (see Fig. 6).
Year/mode 1 2 3 4 5 6 7 8 9 10 11 12 13 14 15
19841989
17
217
1011
418
910
62
27
34
46
47
86
123
53
147
3710
level divergence during these distinct types of anoma-lous wet conditions. The zonal wet mode {14, 15}shows a northeastward displacement of the monsoonridge over North America, which could lead to descend-ing motion and drying over the Great Plains. The me-ridional wet mode {12}, on the other hand, shows asignificant north–south three-cell height anomaly pat-tern over western North America, but zero height anom-alies over the rest of the region (Fig. 3), possibly ex-plaining the close to zero precipitation anomalies ob-served over the Great Plains (Fig. 5).
At synoptic and daily timescales (Fig. 2) wet mode{12} generates a midlatitude/tropical confluence overthe Southwest bringing in moisture from the easternPacific tongue and from the Gulf of California. Thetrough produces widespread destabilization and withlarge amounts of moisture at daily and intraseasonaltimescales, mode {12} generates large precipitation to-tals over the southwest United States as shown in Fig.5. This is consistent with one of Carleton’s (1986) syn-optic patterns associated with monsoon bursts in Ari-zona. Other studies also document the importance of amidlatitude trough over the western United States as akey element in the development of surges in the Gulfof California (Stensrud et al. 1997; Adams and Comrie1997). Stensrud et al. (1997) document that if a mid-latitude trough passes the western United States a coupleof days before a tropical easterly wave passes by theGulf of California from the Gulf of Mexico, a strongsurge is a likely outcome. The Gulf of California surge
advects large amounts of moisture northward and pro-motes increased convective activity in Arizona (Stens-rud et al. 1997).
Mo (2000) argues that in the 10–90-day spectral band,the most important intraseasonal mode associated withwet and dry monsoon events of an index of all Arizona–New Mexico precipitation is a 22-day oscillatory mode.Our study area is much smaller than that of Mo’s andalso southeast Arizona is located in the region of largestmonsoon variability (e.g., Douglas et al. 1993). Nev-ertheless, the anomaly patterns associated with our twowettest monsoon modes {12 and 15} in Fig. 3 are anal-ogous to Mo’s (2000) outgoing longwave radiation(OLR) and streamfunction anomalies for day 22 andday 12 of her 22-day mode (her Fig. 20). This similarityindicates that at intraseasonal timescales (.10) thesetwo wet monsoon modes are significant features of themature phase of the monsoon in the southwest UnitedStates.
7. Summary and discussion
Self-organization into statistically stable states thatdisplay well-defined global structures is common in nat-ural phenomena (e.g., Drossel and Schwabl 1992; Soleand Manrubia 1995; Rodrıguez-Iturbe et al. 1998;D’Odorico and Rodrıguez-Iturbe 2000). We employeda neural network classification technique, the self-or-ganizing map (SOM), to explore the organization ofclimate states that characterize the evolution of the mon-soon in southeast Arizona at daily and intraseasonaltimescales (.10 days) during the 1980–93 period. Thecurrent analysis differs from past studies in that thecomposites that characterize the monsoon evolutionwere derived from a SOM unsupervised learning al-gorithm whose objective is to discover the principalmodes of variance of the underlying dimensions of aset of daily atmospheric variables. Each daily vectorcontained information on current and antecedent con-ditions (up to 48 h) of the following variables: y850,q700, Z500, and Th850–500 over the southwesternUnited States and northwestern Mexico (Fig. 1). Webelieve that one of the major advantages of the SOMis the self-organization and nonlinear projection of acomplex set of atmospheric variables associated with aparticular climate phenomenon, such as the monsoon,into a low-dimensional climate space. In this analysis,the monsoon climate modes derived from the SOMproved to be reliable and coherent in their physical in-
1 SEPTEMBER 2002 2487C A V A Z O S E T A L .
terpretation. Two distinct climate modes of the maturephase of the monsoon emerged and were confirmed bycomparison with past studies of the monsoon at daily(e.g., Higgins et al. 1997) and intraseasonal (e.g., Mo2000) timescales. New features that characterized theintraseasonal wet monsoon modes during the 1980–93period are reported here.
The results indicate that during the mature phase ofthe monsoon there are three intraseasonal modes {13,14, 15} (Figs. 2 and 3) in southeast Arizona that arelinked to large amounts of midtropospheric moistureover the southwest United States and to a northward-displaced and intensified monsoon ridge, which leadsto descending motion over the Great Plains. Thesemodes, which have a maximum frequency in July andAugust, are embedded in a zonal three-cell midtropo-spheric height anomaly pattern in the North Pacific-North American sector, suggesting a large-scale forcingmechanism possibly linked to SST anomalies in the Pa-cific Ocean (e.g., Higgins and Shi 2000; Barlow et al.2001; Castro et al. 2001). There are also two other wetmodes {11, 12}, which are more frequent in August andSeptember, that do not present the typical monsoon ridgeand are characterized by a meridional three-cell mid-tropospheric height anomaly over western North Amer-ica. When there is considerable midtropospheric mois-ture over the study area, the zonal and meridional wetmodes generate heavy rainfall in the southwest UnitedStates {i.e., modes 11, 12, 14, 15}. Outflow related tothe zonal wet mode produces drying conditions over theGreat Plains, while the impact of the meridional wetmode is mainly confined to the Southwest region. Thezonal wet mode (i.e., enhanced monsoon ridge) has beenrecognized in longer datasets and in many studies as themost typical mode that characterizes the mature phaseof the monsoon in the southwest United States. As men-tioned in the introduction, wet (dry) summers in thesouthwestern United States are linked to an intensifi-cation and northward displacement (weakening andsouthward displacement) of the monsoon anticyclone(e.g., Carleton et al. 1990; Douglas et al. 1993; Higginset al. 1998; Higgins et al. 1999; Castro et al. 2001). Ourresults indicate that it is not only the northward locationof the ridge, but also its eastward location that is as-sociated with wet conditions in the Southwest. The me-ridional wet mode reported here is analogous to a patterndocumented by Mo (2000) as part of the mature phaseof the monsoon in Arizona/New Mexico.
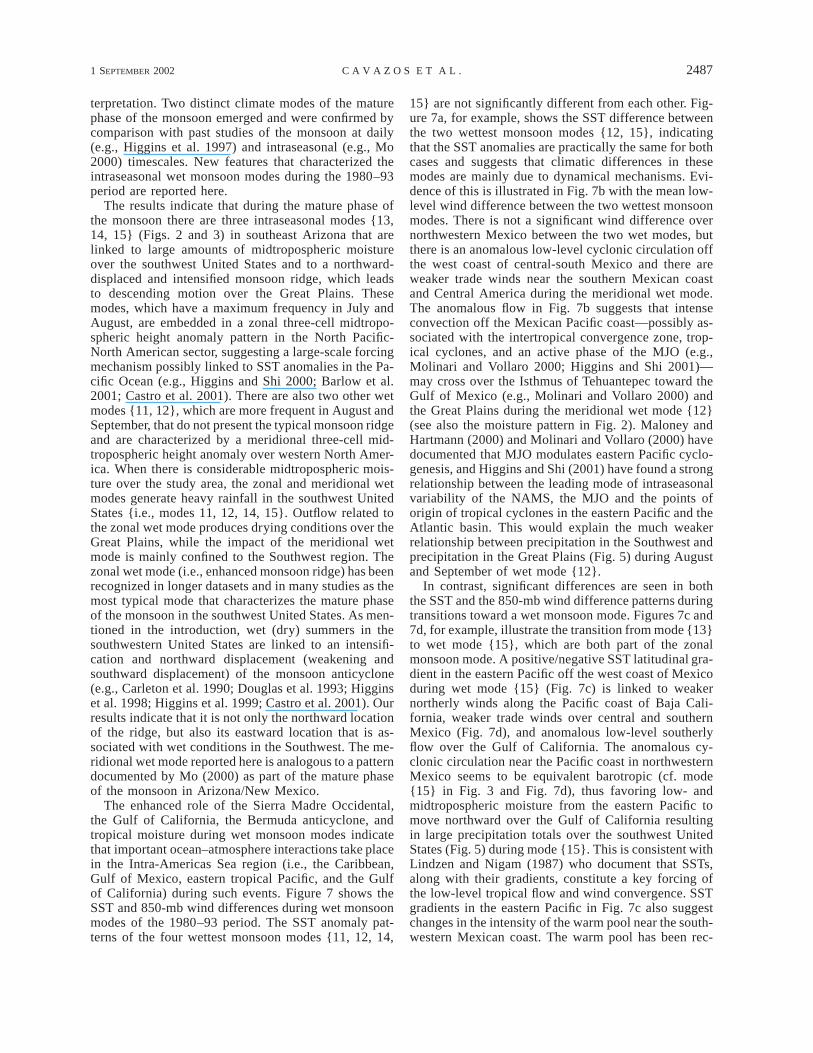
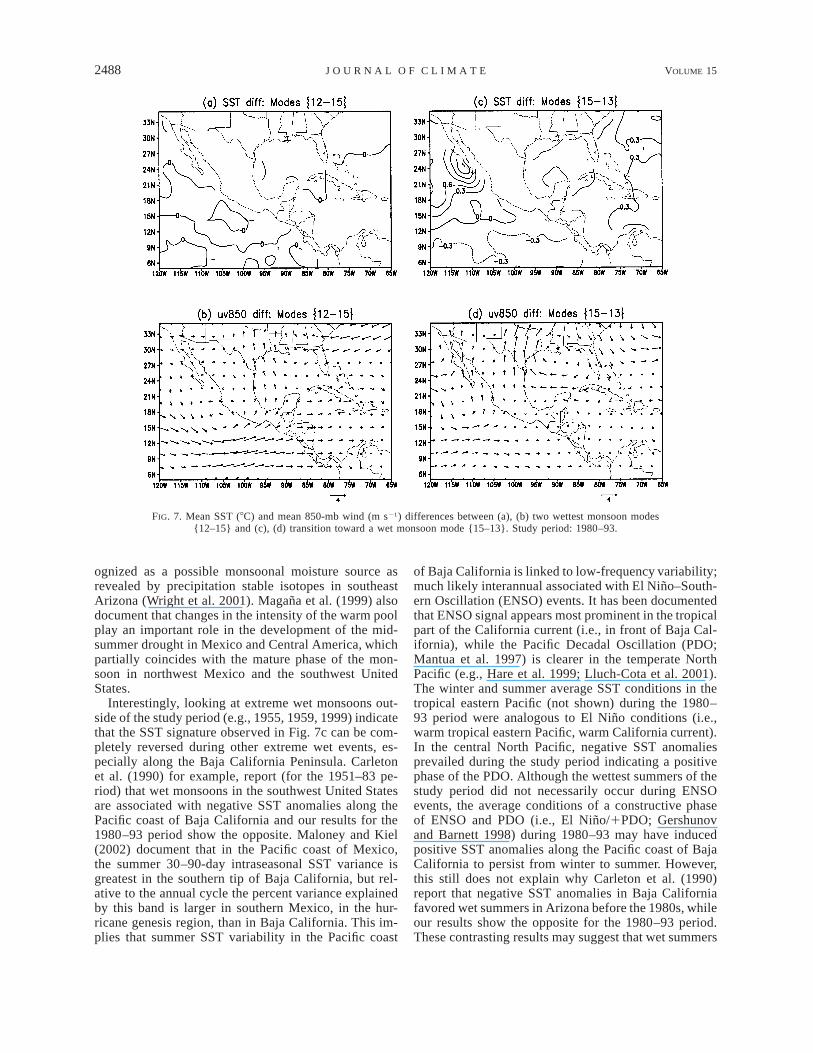
The enhanced role of the Sierra Madre Occidental,the Gulf of California, the Bermuda anticyclone, andtropical moisture during wet monsoon modes indicatethat important ocean–atmosphere interactions take placein the Intra-Americas Sea region (i.e., the Caribbean,Gulf of Mexico, eastern tropical Pacific, and the Gulfof California) during such events. Figure 7 shows theSST and 850-mb wind differences during wet monsoonmodes of the 1980–93 period. The SST anomaly pat-terns of the four wettest monsoon modes {11, 12, 14,
15} are not significantly different from each other. Fig-ure 7a, for example, shows the SST difference betweenthe two wettest monsoon modes {12, 15}, indicatingthat the SST anomalies are practically the same for bothcases and suggests that climatic differences in thesemodes are mainly due to dynamical mechanisms. Evi-dence of this is illustrated in Fig. 7b with the mean low-level wind difference between the two wettest monsoonmodes. There is not a significant wind difference overnorthwestern Mexico between the two wet modes, butthere is an anomalous low-level cyclonic circulation offthe west coast of central-south Mexico and there areweaker trade winds near the southern Mexican coastand Central America during the meridional wet mode.The anomalous flow in Fig. 7b suggests that intenseconvection off the Mexican Pacific coast—possibly as-sociated with the intertropical convergence zone, trop-ical cyclones, and an active phase of the MJO (e.g.,Molinari and Vollaro 2000; Higgins and Shi 2001)—may cross over the Isthmus of Tehuantepec toward theGulf of Mexico (e.g., Molinari and Vollaro 2000) andthe Great Plains during the meridional wet mode {12}(see also the moisture pattern in Fig. 2). Maloney andHartmann (2000) and Molinari and Vollaro (2000) havedocumented that MJO modulates eastern Pacific cyclo-genesis, and Higgins and Shi (2001) have found a strongrelationship between the leading mode of intraseasonalvariability of the NAMS, the MJO and the points oforigin of tropical cyclones in the eastern Pacific and theAtlantic basin. This would explain the much weakerrelationship between precipitation in the Southwest andprecipitation in the Great Plains (Fig. 5) during Augustand September of wet mode {12}.
In contrast, significant differences are seen in boththe SST and the 850-mb wind difference patterns duringtransitions toward a wet monsoon mode. Figures 7c and7d, for example, illustrate the transition from mode {13}to wet mode {15}, which are both part of the zonalmonsoon mode. A positive/negative SST latitudinal gra-dient in the eastern Pacific off the west coast of Mexicoduring wet mode {15} (Fig. 7c) is linked to weakernortherly winds along the Pacific coast of Baja Cali-fornia, weaker trade winds over central and southernMexico (Fig. 7d), and anomalous low-level southerlyflow over the Gulf of California. The anomalous cy-clonic circulation near the Pacific coast in northwesternMexico seems to be equivalent barotropic (cf. mode{15} in Fig. 3 and Fig. 7d), thus favoring low- andmidtropospheric moisture from the eastern Pacific tomove northward over the Gulf of California resultingin large precipitation totals over the southwest UnitedStates (Fig. 5) during mode {15}. This is consistent withLindzen and Nigam (1987) who document that SSTs,along with their gradients, constitute a key forcing ofthe low-level tropical flow and wind convergence. SSTgradients in the eastern Pacific in Fig. 7c also suggestchanges in the intensity of the warm pool near the south-western Mexican coast. The warm pool has been rec-
2488 VOLUME 15J O U R N A L O F C L I M A T E
FIG. 7. Mean SST (8C) and mean 850-mb wind (m s21) differences between (a), (b) two wettest monsoon modes{12–15} and (c), (d) transition toward a wet monsoon mode {15–13}. Study period: 1980–93.
ognized as a possible monsoonal moisture source asrevealed by precipitation stable isotopes in southeastArizona (Wright et al. 2001). Magana et al. (1999) alsodocument that changes in the intensity of the warm poolplay an important role in the development of the mid-summer drought in Mexico and Central America, whichpartially coincides with the mature phase of the mon-soon in northwest Mexico and the southwest UnitedStates.
Interestingly, looking at extreme wet monsoons out-side of the study period (e.g., 1955, 1959, 1999) indicatethat the SST signature observed in Fig. 7c can be com-pletely reversed during other extreme wet events, es-pecially along the Baja California Peninsula. Carletonet al. (1990) for example, report (for the 1951–83 pe-riod) that wet monsoons in the southwest United Statesare associated with negative SST anomalies along thePacific coast of Baja California and our results for the1980–93 period show the opposite. Maloney and Kiel(2002) document that in the Pacific coast of Mexico,the summer 30–90-day intraseasonal SST variance isgreatest in the southern tip of Baja California, but rel-ative to the annual cycle the percent variance explainedby this band is larger in southern Mexico, in the hur-ricane genesis region, than in Baja California. This im-plies that summer SST variability in the Pacific coast
of Baja California is linked to low-frequency variability;much likely interannual associated with El Nino–South-ern Oscillation (ENSO) events. It has been documentedthat ENSO signal appears most prominent in the tropicalpart of the California current (i.e., in front of Baja Cal-ifornia), while the Pacific Decadal Oscillation (PDO;Mantua et al. 1997) is clearer in the temperate NorthPacific (e.g., Hare et al. 1999; Lluch-Cota et al. 2001).The winter and summer average SST conditions in thetropical eastern Pacific (not shown) during the 1980–93 period were analogous to El Nino conditions (i.e.,warm tropical eastern Pacific, warm California current).In the central North Pacific, negative SST anomaliesprevailed during the study period indicating a positivephase of the PDO. Although the wettest summers of thestudy period did not necessarily occur during ENSOevents, the average conditions of a constructive phaseof ENSO and PDO (i.e., El Nino/1PDO; Gershunovand Barnett 1998) during 1980–93 may have inducedpositive SST anomalies along the Pacific coast of BajaCalifornia to persist from winter to summer. However,this still does not explain why Carleton et al. (1990)report that negative SST anomalies in Baja Californiafavored wet summers in Arizona before the 1980s, whileour results show the opposite for the 1980–93 period.These contrasting results may suggest that wet summers
1 SEPTEMBER 2002 2489C A V A Z O S E T A L .
in Arizona are insensitive to SST anomalies along thePacific coast of Baja California, or that the problem ismore complicated than that: the combined interactionof ENSO–PDO may have different signatures and cli-matic impacts over the region depending on their phasesas some authors have started to suggest (e.g., Gershunovand Barnett 1998; Barlow et al. 2001; Castro et al.2001). Thus, in order to better understand intraseasonalmonsoon variability we plan to extend the period ofanalysis and to investigate the relative contribution andinteraction of regional versus remote forcings in a futurestudy.
Acknowledgments. This research was supported bythe NOAA Office of Global Programs, Climate As-sessment for the Southwest (CLIMAS). The final ver-sion of this paper was completed at CICESE, Mexico,with support from CONACyT (I38853-T). We thankBob Maddox, Wayne Higgins, and two anonymous re-viewers who made many insightful comments and sug-gestions on earlier versions of this manuscript.
REFERENCES
Adams, D. K., and A. C. Comrie, 1997: The North American mon-soon. Bull. Amer. Meteor. Soc., 78, 2197–2213.
Ambroise, C., G. Seze, F. Badran, and S. Thiria, 2000: Hierarchicalclustering of self-organizing maps for cloud classification. Neu-rocomputing, 30, 47–52.
Badan-Dangon, A., C. E. Dorman, M. A. Merrifield, and C. D. Win-ant, 1991: The lower atmosphere over the Gulf of California. J.Geophys. Res., 96, 16 877–16 896.
Barlow, M., S. Nigam, and E. H. Berbery, 1998: Evolution of theNorth American monsoon system. J. Climate, 11, 2238–2257.
——, ——, and ——, 2001: ENSO, Pacific decadal variability, andU. S. summertime precipitation, drought, and streamflow. J. Cli-mate, 14, 2105–2128.
Blackmon, M. L., 1976: A climatological spectral study of the 500mb geopotential height of the Northern Hemisphere. J. Atmos.Sci., 33, 1607–1623.
Brenner, I. S., 1974: A surge of maritime tropical air—Gulf of Cal-ifornia to the southwestern United States. Mon. Wea. Rev., 102,375–389.
Bryson, R. A., and W. P. Lowry, 1955: Synoptic climatology of theArizona summer precipitation singularity. Bull. Amer. Meteor.Soc., 36, 329–339.
Busuioc, A., and H. von Storch, 1996: Changes in the winter pre-cipitation in Romania and its relation to large-scale circulation.Tellus, 48A, 538–552.
Carleton, A. M., 1986: Synoptic-dynamic character of ‘‘bursts’’ and‘‘breaks’’ in the southwest U.S. summer precipitation singularity.J. Climatol., 6, 605–623.
——, D. A. Carpenter, and P. J. Desser, 1990: Mechanisms of inter-annual variability of the southwest United States summer rainfallmaximum. J. Climate, 3, 999–1015.
Castro, C. L., T. B. McKee, and R. A. Pielke Sr., 2001: The rela-tionship of the North American monsoon to tropical and NorthPacific sea surface temperatures as revealed by observationalanalysis. J. Climate, 14, 4449–4473.
Cavazos, T., 1999: Large-scale circulation anomalies conducive toextreme events and simulation of daily rainfall in northeasternMexico and southeastern Texas. J. Climate, 12, 1506–1523.
——, 2000: Using self-organizing maps to investigate extreme cli-mate events: An application to wintertime precipitation in theBalkans. J. Climate, 13, 1718–1732.
Chatfield, C., 1975: The Analysis of Time Series: Theory and Practice.Chapman Hill, 263 pp.
Comrie, A. C., and E. C. Glenn, 1998: Principal components-basedregionalization of precipitation regimes across the southwestUnited States and northern Mexico, with an application to mon-soon precipitation variability. Climate Res., 10, 201–215.
Corte-Real, J., X. Zhang, and X. Wang, 1995: Large-scale regimesand surface climatic anomalies over the Mediterranean. Int. J.Climatol., 15, 1135–1150.
D’Odorico, P., and I. Rodrıguez-Iturbe, 2000: Space–time self-or-ganization of mesoscale rainfall and soil moisture. Adv. WaterResour., 23, 349–357.
Douglas, M. W., R. A. Maddox, and K. Howard, 1993: The Mexicanmonsoon. J. Climate, 6, 1665–1677.
Drossel, B., and F. Schwabl, 1992: Self-organized criticality in aforest-fire model. Phys. Rev Lett., 6, 1629–1632.
Gershunov, A., and T. B. Barnett, 1998: Interdecadal modulation ofENSO teleconnections. Bull. Amer. Meteor. Soc., 79, 2715–2725.
Hales, J. E., Jr., 1972: Surges of maritime tropical air northward overthe Gulf of California. Mon. Wea. Rev., 100, 298–306.
Hare, S. R., N. J. Mantua, and R. C. Francis, 1999: Inverse productionregimes: Alaska and west coast Pacific salmon. Fisheries, 24,6–14.
Hewitson, B. C., 1998: Deriving regional climate change scenariosfrom GCMs. Water Research Commission Rep. K5/751, Pretoria,South Africa, 19 pp. [Available online at http://www.wrc.org.za.]
Higgins, R. W., and W. Shi, 2000: Dominant factors responsible forinterannual variability of the summer monsoon in the south-western United States. J. Climate, 13, 759–776.
——, and ——, 2001: Intercomparison of the principal modes ofinterannual and intraseasonal variability of the North Americanmonsoon system. J. Climate, 14, 403–417.
——, J. E. Janowiak, and Y. Yao, 1996: A Gridded Hourly Precip-itation Database for the United States (1963–1993). NCEP/Cli-mate Prediction Center Atlas No. 1, 47 pp.
——, Y. Yao, and X. L. Wang, 1997: Influence of the North Americanmonsoon system on the summer precipitation regime. J. Climate,10, 2600–2622.
——, K. C. Mo, and Y. Yao, 1998: Interannual variability of the U.S.summer precipitation regime with emphasis on the southwesternmonsoon. J. Climate, 11, 2582–2606.
——, Y. Chen, and A. Douglas, 1999: Interannual variability of theNorth American warm season precipitation regime. J. Climate,12, 653–680.
Kalnay, E., and Coauthors, 1996: The NCEP/NCAR 40-Year Re-analysis Project. Bull. Amer. Meteor. Soc., 77, 437–471.
Kohonen, T., 1995: Self-Organizing Maps. Springer Series in Infor-mation Sciences, Vol. 30, Springer-Verlag, 362 pp.
——, J. Hynninen, J. Kangas, and J. Laaksonen, 1995: SOMpPAK,the self-organizing map program, version 3.1. Helsinki Univer-sity of Technology, Laboratory of Computer and InformationScience, Finland, 27 pp. [Available online at http://www.cis.hut.fi/nnrc.]
Krishnamurti, T. N., 1971: Tropical east–west circulation duringnorthern summer. J. Atmos. Sci., 28, 1342–1347.
——, and P. Ardanuy, 1980: The 10–20 day westward propagatingmode and breaks in the monsoon. Tellus, 32, 15–26.
Lau, K.-M., and P. H. Chan, 1986: Aspects of the 40–50 day oscil-lation during the northern summer as inferred from outgoinglong wave radiation. Mon. Wea. Rev., 114, 1354–1367.
Lindzen, R. S., and S. Nigam, 1987: On the role of sea surfacetemperature gradients in forcing low-level winds and conver-gence in the tropics. J. Atmos. Sci., 44, 2418–2436.
Lluch-Cota, D. B., W. S. Wooster, and S. R. Hare, 2001: Sea surfacetemperature variability in coastal areas of the northeastern Pacificrelated to El Nino–Southern Oscillation and the Pacific decadaloscillation. Geophys. Res. Lett., 28, 2029–2032.
Magana, V., J. A. Amador, and S. Medina, 1999: The midsummer
2490 VOLUME 15J O U R N A L O F C L I M A T E
drought over Mexico and Central America. J. Climate, 12, 1577–1588.
Maloney, E. D., and D. L. Hartmann, 2000: Modulation of easternPacific hurricanes by the Madden–Julian oscillation. J. Climate,13, 1451–1460.
——, and J. T. Kiehl, 2002: MJO-related SST variations over thetropical eastern Pacific during Northern Hemisphere summer. J.Climate, 15, 675–689.
Mangiameli, P., S. K. Chen, and D. West, 1996: A comparison ofSOM neural network and hierarchical clustering methods. Eur.J. Operat. Res., 93, 402–417.
Mantua, N. J., S. R. Hare, Y. Zhang, J. M. Wallace, and R. C. Francis,1997: A Pacific interdecadal climate oscillation with impacts onsalmon production. Bull. Amer. Meteor. Soc., 78, 1069–1079.
Mitchell, D. L., D. Ivanova, R. Rabin, K. Redmond, T. J. Brown, andT. Hooker, 2002: Gulf of California sea surface temperatures andthe North American monsoon: Mechanistic implications fromobservations. J. Climate, 15, 2261–2281.
Mo, K., 2000: Intraseasonal modulation of summer precipitation overNorth America. Mon. Wea. Rev., 128, 1490–1505.
——, J. N. Paegle, and R. W. Higgins, 1997: Atmospheric processesassociated with summer floods and droughts in the central UnitedStates. J. Climate, 10, 3028–3046.
Molinari, J., and D. Vollaro, 2000: Planetary- and synoptic-scaleinfluences on eastern Pacific tropical cyclgenesis. Mon. Wea.Rev., 128, 3296–3307.
Moore, T. J., R. L. Gall, and T. C. Adang, 1989: Disturbances alongthe Arizona monsoon boundary. Mon. Wea. Rev., 117, 932–941.
Mosino, P., and E. Garcıa, 1974: The climate of Mexico. Climate ofNorth America, R. A. Bryson and F. K. Hare, Eds., Vol. 2, WorldSurvey of Climatology, Elsevier, 373–404.
Mullen, S. L., J. T. Schmitz, and N. O. Renno, 1998: Intraseasonalvariability of the summer monsoon over southeast Arizona. Mon.Wea. Rev., 126, 3016–3034.
Okabe, I. T., 1995: The North American monsoon. Ph.D. dissertation,Department of Geography, University of British Columbia, 146pp.
Rodriguez-Iturbe, I., P. D’Odorico, and A. Rinaldo, 1998: Possibleself-organizing dynamics for land–atmosphere interaction. J.Geophys. Res., 103D, 23 071–23 077.
Rowson, D. R., and S. J. Colucci, 1992: Synoptic climatology ofthermal low-pressure systems over south-western North Amer-ica. J. Climatol., 12, 529–545.
Sole, R. V., and S. Manrubia, 1995: Self-similarity in rain forests:Evidence for a critical state. Phys. Rev., 51E, 6250–6253.
Somervuo, P., and T. Kohonen, 1999: Self-organizing maps and learn-ing vector quantization for feature sequences. Neural Process.,10, 151–159.
Stensrud, D. J., R. L. Gall, and M. K. Nordquist, 1997: Surges overthe Gulf of California during the Mexican monsoon. Mon. Wea.Rev., 125, 417–437.
Tamayo, P., D. Slonim, J. Mesirov, Q. Zhu, S. Kitareewan, E. Dmi-trovsky, E. S. Lander, and T. R. Golub, 1999: Interpreting pat-terns of gene expression with self-organizing maps: Methodsand application to hematopoietic differentiation. Proc. Natl.Acad. Sci., 96, 2907–2912.
Tang, M., and E. R. Reiter, 1984: Plateau monsoons of the NorthernHemisphere: A comparison between North America and Tibet.Mon. Wea. Rev., 112, 617–637.
Ting, M., and H. Wang, 1997: Summertime U.S. precipitation vari-ability and its relation to Pacific sea surface temperature. J. Cli-mate, 10, 1853–1873.
Vazquez, M. C., 2000: Intraseasonal variation of convective activityin Mexico and Central America. Atmosfera, 13, 95–108.
Wan, W. J., and D. Fraser, 2000: A multiple self-organizing mapscheme for remote sensing classification. Mult. Classifier Syst.,1857, 300–309.
Webster, P. J., V. O. Magana, T. N. Palmer, J. Shukla, R. A. Tomas,M. Yanai, and T. Yasunari, 1998: Monsoons: Processes, pre-dictability, and the prospects of prediction. J. Geophys. Res., 103(C7), 14 451–14 510.
Wilks, D. S., 1995: Statistical Methods in the Atmospheric Sciences.Academic Press, 467 pp.
Wright, W. E., A. Long, A. C. Comrie, S. W. Leavitt, T. Cavazos,and C. Eastoe, 2001: Monsoonal moisture sources revealed usingtemperature, precipitation, and precipitation stable isotope time-series. Geophys. Res. Lett., 28, 787–790.
Yarnal, B., 1993: Synoptic Climatology in Environmental Analysis.Belhaven Press, 195 pp.
——, A. C. Comrie, B. Frakes, and D. P. Brown, 2001: Synopticclimatology 2001: Development and prospects in synoptic cli-matology. Int. J. Climatol., 21, 1923–1950.
Yu, B., and J. M. Wallace, 2000: The principal mode of interannualvariability of the North American monsoon system. J. Climate,13, 2794–2880.
Zehnder, J. A., 1991: The interaction of planetary-scale tropical east-erly waves with topography: A mechanism for the initiation oftropical cyclones. J. Atmos. Sci., 48, 1217–1230.