arizona springs restoration handbook
TRANSCRIPT

Restoration Handbook
ARIZONASPRINGS

ArizonA SpringS reStorAtion HAndbook
Sky iSlAnd AlliAnce And tHe SpringS StewArdSHip inStitute

Edited by
Lawrence E. Stevens, Jeri Ledbetter, Gloria Hardwick, and Molly A. JoyceMuseum of Northern Arizona - Springs Stewardship Institute
3101 N. Fort Valley Rd.Flagstaff, AZ 86001
(928) 774-5211 ext. 231www.SpringStewardshipInstitute.org
and
Louise Misztal and Carianne CampbellSky Island Alliance
PO Box 41165Tucson, AZ 85717
(520) 624-7080www.SkyIslandAlliance.org
Copyright © 2016
Cover Photo by Molly Joyce © 2015.
5
e warmly thank the Nina Mason Pulliam Charitable Trust and the Desert Landscape Conservation Cooperative for supporting con-cept development and preparation of this springs restoration workbook. Through that sup-port, Sky Island Alliance was able to convene meetings with many participants from many walks of life, including private citizens, and representatives of Tribal, city, county, state, and federal government agencies, whose advisement about this undertaking was invaluable. This workbook was written as a collaborative ef-fort by SIA and the Springs Stewardship Institute. SSI’s primary author, Larry Stevens, was assisted by Jeri D. Ledbetter (Program Manager), Jeffrey Jenness (GIS Analyst), Gloria Hardwick (Research Associate), Abraham E. Springer (Department of Earth Sciences, Northern Arizona University).
AcknowledgementS
Suggested CitationStevens, L.E., J.D. Ledbetter, A.E. Springer C. Campbell, L. Misztal, M. Joyce, and G. Hardwick.
2016. Arizona Springs Restoration Handbook. Spring Stewardship Institute, Museum of Northern Arizona, Flagstaff, Arizona and Sky Island Alliance, Tucson, Arizona.
Much-appreciated insight for this book arose from discussions about Nevada springs restoration in 2012 with R.J. Andress (Gradient LLC), S. Carman and B. Poff (U.S. Bureau of Land Management), J. Gurrieri and C.T. Tait (U.S. Forest Service), D. Kreamer (University of Nevada Las Vegas), D.R. Sada (Desert Research Institute), A.E. Springer (Northern Arizona University), and A. Fayfer (U.S. Geological Survey), and see http://docs.springstewardship.org/PDF/NevadaSpringsResto-rationGuide.pdf. The document was designed by Jeri Ledbetter and Molly Joyce. Sky Islands staff members contributed a great deal to this docu-ment, including Louise Misztal, Carianne Camp-bell (authors), and Samantha Hammer (mapping). We deeply appreciate the contributions of images and other materials by our other partners, who are identified in the captions.
W

7
tAble of contentS
In t r o d u c t I o n. . . . . . . . . . . . . . . . . . . . . . . . . . . . . . . . .ch a p t e r 1: ar I z o n a Sp r I n g S ec o S y S t e m S . . . . . . . . . . .ch a p t e r 2: In v e n to r y a n d aS S e S S m e n t . . . . . . . . . . . . ch a p t e r 3: Sp r I n g S-de p e n d e n t Sp e c I e S . . . . . . . . . . . .ch a p t e r 4: r e S to r at I o n p l a n n I n g . . . . . . . . . . . . . . ch a p t e r 5: Sp r I n g S re S to r at I o n. . . . . . . . . . . . . . . ch a p t e r 6: Sp r I n g S mo n I to r I n g. . . . . . . . . . . . . . . . .ap p e n d I x a: F I e l d Fo r m S a n d Seap cr I t e r I a . . . . . . . ap p e n d I x B: h y d r o lo g y v a r I a B l e S . . . . . . . . . . . . . . .ap p e n d I x c: W o r k S h e e t a n d e q u I p m e n t l I S t . . . . . . . . . ap p e n d I x d: S p r I n g S r e S to r at I o n p l a n t S p e c I e S . . . . .B I B l I o g r a p h y . . . . . . . . . . . . . . . . . . . . . . . . . . . . . . .In d e x . . . . . . . . . . . . . . . . . . . . . . . . . . . . . . . . . . . .
81026445056748099
107112117122
8
introduction
n arid landscapes, springs are biologically irreplaceable ecosystems. Emerging in many forms from aquifers, they serve as unique ecological indicators and windows into the Earth. Despite their relatively small geographical footprint, springs support more than 10% of the endangered species in the United States, as well as an enormous number of rare and/or endemic springs-dependent species. Springs are culturally significant to many indigenous cultures in the Southwest who view them as portals and places for training, rituals and the harvest of ethnoecological resources. Thus, springs play a vital role in the health and longevity of the region.
As land managers begin to recognize springs as important biological and cultural resources, they require systematic and comprehensive inventory, assessment and restoration protocols. This handbook is meant to advance the understanding of springs by land managers in the state of Arizona,
Springs Stewardship InstituteThe Springs Stewardship Institute (SSI) was established in 2013 as an initiative of the non-profit 501(c)(3) Museum of Northern Arizona (MNA) to advance the understanding and stewardship of springs ecosystems. SSI works towards this goal through research, stewardship, and collaboration to provide and share information related to these endangered ecosystems. SSI staff publish research papers, books, and guides to assist land managers with stewardship of their springs; much is available at http://springstewardshipinstitute.org/. SSI has developed inventory, assessment, and stewardship tools, and a secure online database of springs ecosystems that is available at http://springsdata.org/.
I as well as promote communication, stewardship, and collaboration, and to provide guidance to land managers embarking on springs stewardship programs. This handbook is intended to provide resource managers with background information regarding the nature of springs ecosystems, inventory and assessment protocols, and the tools necessary for effective restoration and monitoring. Our springs inventory, assessment, and stewardship protocols incorporates much previous research and practical, hands-on recommendations.
Together, with the support of the Sky Island Alliance (SIA), the Desert Landscape Conservation Cooperative (DLCC), and the Springs Stewardship Institute (SSI), land managers across Arizona can use this handbook to set measurable goals in their springs stewardship plans, and implement effective actions towards those goals.
In
tr
od
uc
tIo
n
9
Sky Island AllianceThe Sky Island Alliance (SIA) is a non-profit 501(c)(3) in Tucson, Arizona that works to protect and restore the land, water, and biodiversity of the Sky Islands. Their scope spans the southwestern United States and northwestern Mexico, building partnerships and alliances, creating opportunities for hands-on conservation work, protecting open space, restoring healthy landscapes, connecting wildlife pathways, and inspiring wonder and understanding of the Sky Islands ecoregion. SIA has become a leading organization in connecting citizen science and conservation policy to achieve effective results. To learn more visit their website at: http://www.skyislandalliance.org/.
Chapter 1 - Arizona Springs EcosystemsSprings are biologically, culturally, and economically important in Arizona, the nation’s second
driest state. This chapter offers a detailed description of Arizona springs ecosystems, as well as how and why they are important to the overall environment.
Chapter 2 - Inventory and AssessmentDeveloping a springs restoration plan can be logistically and financially complicated. This chapter
describes the steps necessary to conduct springs inventory and assessment in preparation for stewardship and monitoring restoration planning. This will assist land managers in prioritizing projects to make the most of restoration dollars, as well as providing comprehensive baseline inventory and assessment.
Chapter 3 - Springs-Dependent SpeciesSprings support a diverse array of life. From plants to invertebrates and vertebrates, springs are
biological hotspots in arid landscapes, supporting many endemic, rare, or endangered species. This chapter provides background information on Arizona’s many springs-dependent species.
Chapter 4 - Restoration PlanningInformed stewardship planning is based on a sound understanding of the site—its biota, ecological
integrity, threats, and importance. This chapter, along with the supplemental worksheets, outlines restoration planning and gives an overview of the ongoing restoration and monitoring process.
Chapter 5 - Springs RestorationImplementation methods vary depending on the springs type. This chapter provides case studies
of four most common springs types in Arizona, and successful implementation and monitoring methods.
Chapter 6 - MonitoringMonitoring and information management are essential for longterm site stewardship and
rehabilitation; this process must be iterative. This chapter details the necessary elements of monitoring planning and implementation, and information management.
10
ArizonA SpringS ecoSyStemS
prings are ecosystems where groundwater is exposed at, and typically flows from the Earth’s surface. Hydrologists, wetland technicians, and agency staff often describe “groundwater-dependent headwater wetland ecosystems”, but here we will just call them springs.
Springs are fed by groundwater aquifers, and occur in many settings, both underwater as well as in terrestrial environments. Springs vary greatly in flow, water chemistry, geomorphic form, ecological significance, and cultural and economic importance (Springer et al. 2008). Seeps are simply small springs, usually with immeasurably diffuse or small seepage or flow.
English suffers from having at least three meanings for the word “spring” (i.e., season, mechanical device, and water sources), and languages with unique words for springs may have better appreciation of them (i.e., “source” in French, or “manantial” in Spanish). Also, in our experience, sources are usually multiple; therefore, we prefer to describe these features in the plural form as “springs” or “springs ecosystems”.
While more obviously important in arid regions, springs in all landscapes are among the most productive and influential ecosystems. Springs provide many Arizona homes, ranches, farms, towns, and even some of its cities with domestic, commercial, and livestock water. Springs support a high proportion of the state’s rare and unique wetland plants, invertebrates, fish, and animals, as well as a host of rare, poorly known species and many upland species. In addition, springs
Chapter 1
S are paleontologically, culturally, historically, and socioeconomically important.
As many Arizona ranches, farms, towns, and some cities were founded on springs, many have been intensively used for human purposes. Although most springs in Arizona are ecologically impaired, if the aquifers that support them are intact (often the case in mountainous areas), springs are remarkably resilient and can be readily managed for sustainable human and natural functions. We hope this handbook will encourage more sustainable stewardship of these remarkable ecosystems.
ar I z o n a ge o lo g yArizona straddles the boundary between two
vast geologic provinces (Fig. 1.01), and thus has characteristic features of both. Northern Arizona lies on the Colorado Plateau, which occupies 373,000 km2 (144,000 mi2) of the Four Corners states and Wyoming. It extends south to the Mogollon Rim and includes the White Mountains. The Plateau contains several dozen horizontally bedded strata, consisting of impermeable clay, shale, and mudstone beds (aquitards that restrict groundwater flow), as well as thick sandstones and limestone beds that serve as aquifers. Igneous strata are abundant on top of the Plateau and also occur as buried strata; those on the surface function as shallow aquifers. The deepest strata on the Colorado Plateau are crystalline basement metamorphic rocks—the schists, granites, and gneisses exposed in the Inner Gorge of Grand Canyon. Some of these deep strata bear what may be the oldest groundwater in the Southwest, waters that are warm and enriched with minerals.
Ar
izo
nA S
pr
ing
S Ec
oS
yS
tE
mS
11
western Utah, southern Arizona and New Mexico, and southeastward into Texas and northern Mexico. This province is dominated by fault-block, horst and graben mountain ranges with intervening valleys. As a result, it is characterized by many mountain ranges that in Arizona are mostly aligned to the northwest.
ar I z o n a aq u I F e r SArizona springs waters emerge from aquifers—
bodies of rock with interstitial space and/or fractures that hold water (Fig. 1.02). The water in aquifers is nearly all derived from precipitation, particularly from upland snowmelt in the winter and intense summer rains that saturate the soil, and allow water to infiltrate down to the aquifers. A tiny percent of groundwater is derived from degassing of the Earth’s crust: connate water that discharges upward into the aquifer (Crossey et al. 2012).
The size, structure, and water quality of Arizona aquifers vary in relation to the bedrock geology, depth, and the distance and duration of groundwater’s flowpath between the state’s two geologic provinces (Fig. 1.01). The Colorado Plateau contains stacked and perched aquifers, some of which are the largest in the state (i.e.,
In contrast, central and southern Arizona lie in the Basin and Range geologic province. This 20+ million year-old mountain building event is the result of the Earth’s crust being pulled apart, a tectonic process geologists call extension. The vast Basin and Range province extends from southeastern Oregon, eastern California, Nevada,
Fig. 1.02: Map of principal shallow aquifers of the Arizona. Data published by the U.S. Geological Survey (2003).
Fig. 1.01. (Above) Map of geological provinces in Arizona and the Great Basin © Samantha Hammer, SIA. (Below) Colorado Plateau and Great Basin Provinces in Arizona, SSI.

Ar
izo
nA
Sp
rin
gS E
co
Sy
St
Em
S
12
the Little Colorado River basin and the Kaibab Plateau). In contrast, the Basin and Range portion of the state contains many small aquifers on the mountain ranges, and larger valley fill aquifers in the basins that support our major cities. Flowpaths in both provinces can be very brief (a few days), but may range up to 13,300 years (Monroe et al. 2005; Johnson et al. 2012). Generally, spring water derived from longer and deeper flowpaths is warmer and higher in mineral content and lower in potability (Fig. 1.03).
ar I z o n a Sp r I n g S dI S t r I B u t I o n
Springs are abundant features of the landscape. Using density of springs from the United States, SSI estimates that 500,000 to one million springs occur in the contiguous United States, and perhaps 50 million springs may exist across the world; however, springs are unevenly distributed.
Springs in the United States are most abundant in complex terrain, where the edges of aquifers are exposed. They are rarest in plains and flatland landscapes, such as the Great Plains and the Central Valley of California. They tend to be less common in valleys and on the floodplains of large rivers. In all landscapes, springs are poorly and incompletely mapped: improved mapping of springs is usually the first order of business.
Arizona, the nation’s second driest state, has the highest known density of springs, with more than 10,000 in SSI’s online database, and nearly 0.02 springs/km2 (Fig. 1.04). Arizona springs are most abundant in montane and canyon-bound areas, such as the Sky Islands, the Mogollon Rim, and Grand Canyon regions, and springs are less common in flatlands, such as the southwestern quarter of the state.
Fig. 1.04: Known springs of Arizona currently available at Springs Online (http://springsdata.org/). Data are compiled from multiple sources, including the USGS NHD and Geonames databases, the Arizona State Land Office, federal and state land managing agencies, NGO organizations, independent researchers, topographic maps, and publications.
Fig. 1.03: Aquifer flowpaths, springs emergence, and general water quality characteristics of springs on the Colorado Plateau (modified from Grand Canyon Wildlands Council 2002).
Ar
izo
nA S
pr
ing
S Ec
oS
yS
tE
mS
13
Arizona Geological
Province
Mean Flow (L/sec)(Median; 95%Cl; N)
Mean Temp (°C)(95%CI; N)
Mean pH (95%CI; N)
Mean SC (µS/cm)
(95%CI; N)
North (Colorado Plateau)
27.9 (0.12;
13.97; 744)
18.2 (6.37; 426)
7.6 (0.07; 426)
635 (97.1; 426)
South (Basin and Range)
9.7 (0.19;
5.79; 598)
17.6 (0.8; 280)
7.5(0.9; 280)
607 (117.1; 280)
All Arizona19.8
(0.14; 8.18;1342)
18 (3.84; 706)
7.6 (0.5; 706)
624 (74.6; 706)
Table 1.01: Summary of Arizona springs flow, temperature, pH, and specific conductance by geological province. Data were exported from Springs Online ( http://springsdata.org/ ) on 1/2/2016. No hot springs are included in this analysis. CI = confidence interval, N = sample size, SC = specific conductance.
Pristine springs in Grand Canyon, Arizona. Photo courtesy of Rich Rudow © 2015.
Sp r I n g S Flo W a n d Wat e r qua l I t yWater quality of Arizona springs varies widely in relation to
flowpath (Fig. 1.03). Springs emerging from basalt aquifers at high elevations with relatively short flowpaths typically produce cold, low mineral content water. In contrast, springs with long flowpaths often produce warmer or rarely hot, highly mineralized, travertine-depositing water that emerges at low elevations (e.g. along the lower Little Colorado River, in Fossil Creek in the Verde Valley). Arizona has only a few hot springs (e.g., Arizona, Castle, and Verde Hot Springs; Waring 1965), most with long histories of modification as resorts. While naturally arising, such highly mineralized waters generally are neither palatable nor safely potable. The biota occurring in highly mineralized springs water often are closely adapted to it. As a result, tightly restricted (endemic) species are unique to springs with long flowpaths.
Flow, but not water chemistry varies widely between the state’s two geologic provinces (Table 1.01). Summing the total discharge from 1,342 Arizona springs that have been measured, and adding 5,221 liters per second (L/sec) of springs-contributed baseflow from major Colorado River tributaries, the state’s springs contribute at least 17,176 L/sec of flow (4,537 gallons/sec). This equals 542 billion L/year (439,500 acre-feet/year), representing roughly 6% of Arizona’s 2012 water usage, and 16% of Arizona’s Colorado River annual allotment. Springs in the Colorado Plateau portion of Arizona contribute 84% of the springs discharge for the state; however, overall water quality is similar between Arizona’s two geologic provinces.
Aquifer pollution that affects springs is still relatively rare in Arizona, although contaminant-laced surface waters, such as mining wastes and urban reclaimed water are finding their way into some of the state’s aquifers.
14
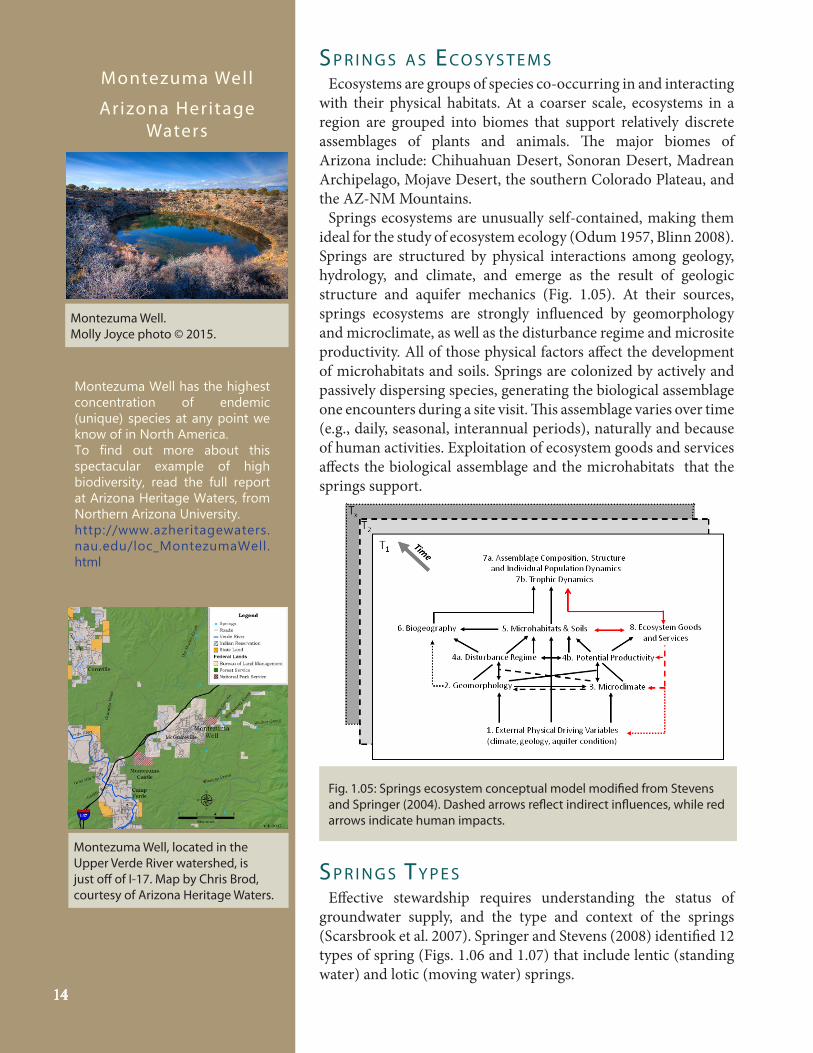
Fig. 1.05: Springs ecosystem conceptual model modified from Stevens and Springer (2004). Dashed arrows reflect indirect influences, while red arrows indicate human impacts.
Montezuma Well, located in the Upper Verde River watershed, is just off of I-17. Map by Chris Brod, courtesy of Arizona Heritage Waters.
Montezuma Well. Molly Joyce photo © 2015.
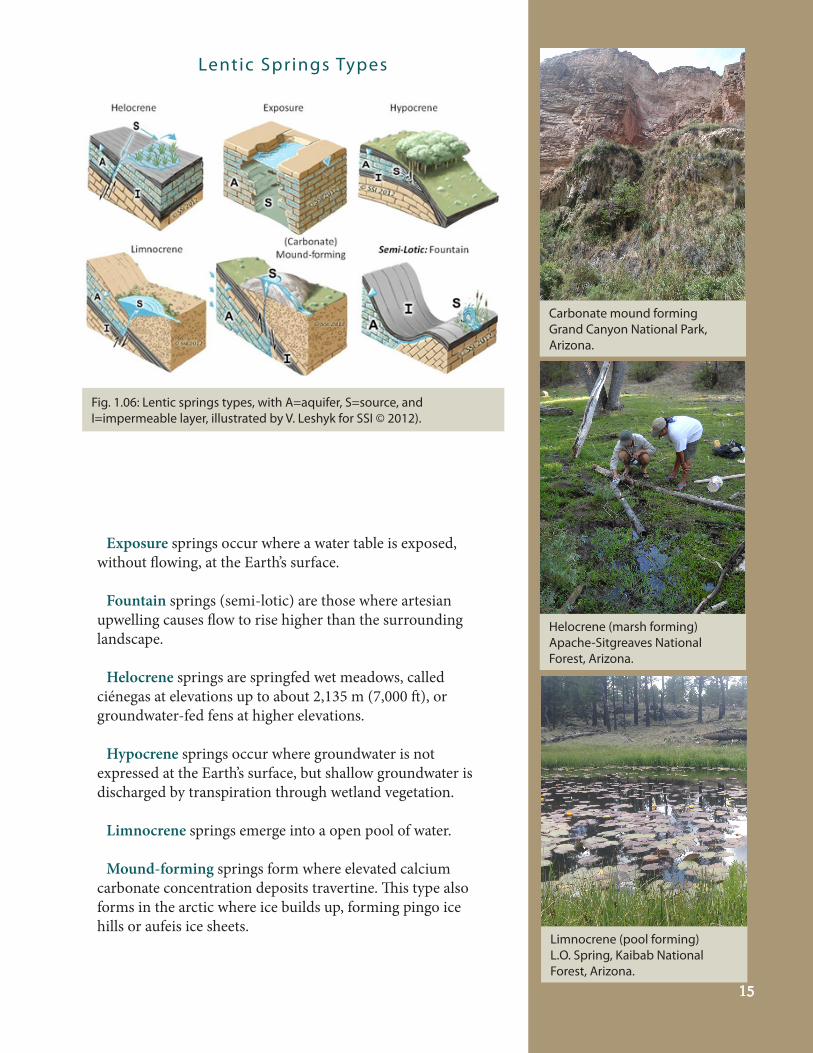
Sp r I n g S ty p e SEffective stewardship requires understanding the status of
groundwater supply, and the type and context of the springs (Scarsbrook et al. 2007). Springer and Stevens (2008) identified 12 types of spring (Figs. 1.06 and 1.07) that include lentic (standing water) and lotic (moving water) springs.
Montezuma Well
Ar izona Heritage Waters
Montezuma Well has the highest concentration of endemic (unique) species at any point we know of in North America.To find out more about this spectacular example of high biodiversity, read the full report at Arizona Heritage Waters, from Northern Arizona University.http://www.azheritagewaters.nau.edu/loc_MontezumaWell.html
Sp r I n g S a S ec o S y S t e m SEcosystems are groups of species co-occurring in and interacting
with their physical habitats. At a coarser scale, ecosystems in a region are grouped into biomes that support relatively discrete assemblages of plants and animals. The major biomes of Arizona include: Chihuahuan Desert, Sonoran Desert, Madrean Archipelago, Mojave Desert, the southern Colorado Plateau, and the AZ-NM Mountains.
Springs ecosystems are unusually self-contained, making them ideal for the study of ecosystem ecology (Odum 1957, Blinn 2008). Springs are structured by physical interactions among geology, hydrology, and climate, and emerge as the result of geologic structure and aquifer mechanics (Fig. 1.05). At their sources, springs ecosystems are strongly influenced by geomorphology and microclimate, as well as the disturbance regime and microsite productivity. All of those physical factors affect the development of microhabitats and soils. Springs are colonized by actively and passively dispersing species, generating the biological assemblage one encounters during a site visit. This assemblage varies over time (e.g., daily, seasonal, interannual periods), naturally and because of human activities. Exploitation of ecosystem goods and services affects the biological assemblage and the microhabitats that the springs support.
15
Exposure springs occur where a water table is exposed, without flowing, at the Earth’s surface.
Fountain springs (semi-lotic) are those where artesian upwelling causes flow to rise higher than the surrounding landscape.
Helocrene springs are springfed wet meadows, called ciénegas at elevations up to about 2,135 m (7,000 ft), or groundwater-fed fens at higher elevations.
Hypocrene springs occur where groundwater is not expressed at the Earth’s surface, but shallow groundwater is discharged by transpiration through wetland vegetation.
Limnocrene springs emerge into a open pool of water.
Mound-forming springs form where elevated calcium carbonate concentration deposits travertine. This type also forms in the arctic where ice builds up, forming pingo ice hills or aufeis ice sheets.
Fig. 1.06: Lentic springs types, with A=aquifer, S=source, and I=impermeable layer, illustrated by V. Leshyk for SSI © 2012).
Lentic Springs Types
Carbonate mound formingGrand Canyon National Park, Arizona.
Helocrene (marsh forming)Apache-Sitgreaves National Forest, Arizona.
Limnocrene (pool forming)L.O. Spring, Kaibab National Forest, Arizona.
16
GushetVaseys Paradise, Grand Canyon National Park, Arizona.
RheocreneBear Spring, Kaibab National Forest, Arizona.
HillslopeTwo Tree Springs, Grand Canyon National Park, Arizona.
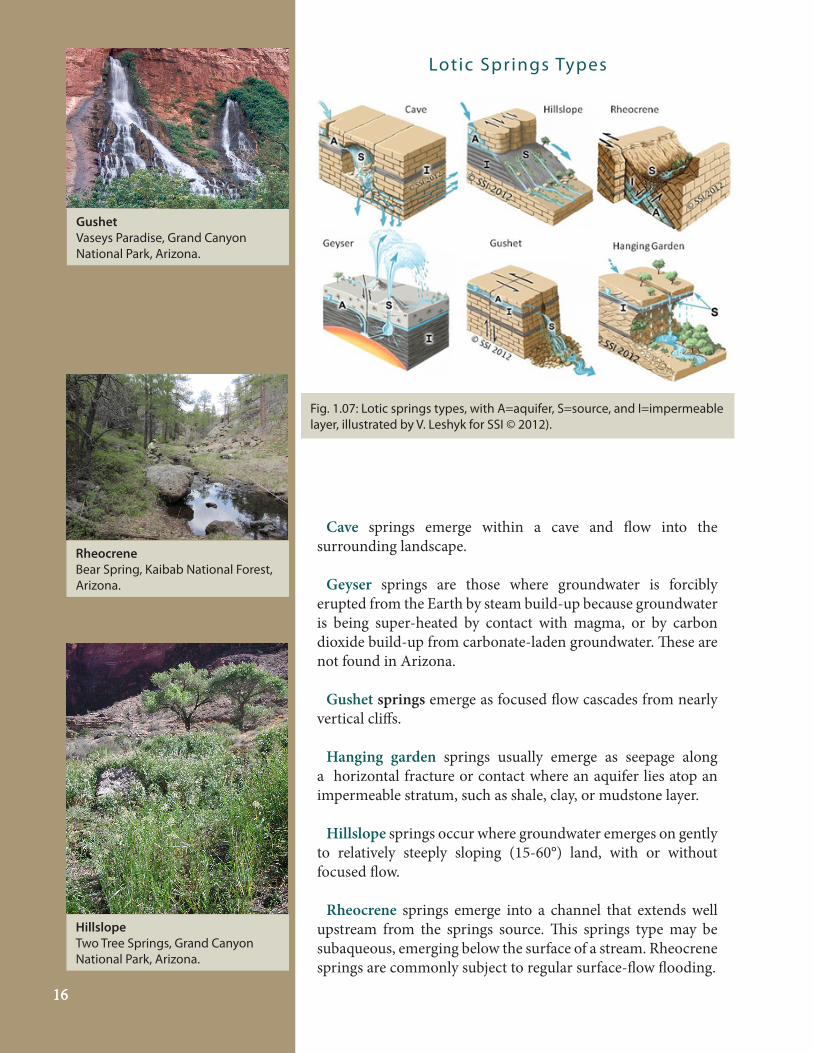
Cave springs emerge within a cave and flow into the surrounding landscape.
Geyser springs are those where groundwater is forcibly erupted from the Earth by steam build-up because groundwater is being super-heated by contact with magma, or by carbon dioxide build-up from carbonate-laden groundwater. These are not found in Arizona.
Gushet springs emerge as focused flow cascades from nearly vertical cliffs.
Hanging garden springs usually emerge as seepage along a horizontal fracture or contact where an aquifer lies atop an impermeable stratum, such as shale, clay, or mudstone layer.
Hillslope springs occur where groundwater emerges on gently to relatively steeply sloping (15-60°) land, with or without focused flow.
Rheocrene springs emerge into a channel that extends well upstream from the springs source. This springs type may be subaqueous, emerging below the surface of a stream. Rheocrene springs are commonly subject to regular surface-flow flooding.
Fig. 1.07: Lotic springs types, with A=aquifer, S=source, and I=impermeable layer, illustrated by V. Leshyk for SSI © 2012).
Lotic Springs Types

Ar
izo
nA S
pr
ing
S Ec
oS
yS
tE
mS
17
Fig. 1.08: Hidden Spring, Grand Canyon. This is an example of a combination of two spring types—a rheocrenic hanging garden. The spring emerges from the contact between geological layers as a hanging garden, but the emergence is within a channel. Photo courtesy of Rich Rudow © 2015.
Not included in this list are paleosprings that flowed in the recent geologic past (e.g., the Pleistocene or early Holocene) but no longer do so. Paleosprings usually occur as travertine mounds (e.g., along Highway 180 south of St. Johns, along the Little Colorado River), or exposures of fossilized peat.
Many springs exhibit characteristics of two or more springs types (Fig. 1.08). The array of springs types in Arizona varies between the two geologic provinces of the state (Fig. 1.01). Hillslope springs are most common across the state, but southern Arizona spring types are co-dominated by rheocrene springs, while northern Arizona on
the Colorado Plateau is co-dominated by hanging gardens. Limnocrene springs are rare in the state, but some support many endemic species (e.g., Montezuma Well, Quitobaquito, and Medicine Springs). Helocrene springs (wet meadows springs) were once abundant throughout the state, with low elevation springs called ciénegas and higher elevation sites called groundwater-dependent fens. Due to extensive draining and management for livestock and agriculture, helocrenes are now among the most critically endangered ecosystem types in the Southwest (Henderson and Minckley 1984).

Ar
izo
nA
Sp
rin
gS E
co
Sy
St
Em
S
18
In the Basin and Range geologic province in the southern half of Arizona, the array of springs types is
whereas on the southern Colorado Plateau in northern Arizona the array of springs types is
among 724 springs for which data were available (Fig. 1.09). The proportion of hillslope, helocrene and hanging gardens springs is much higher on the Colorado Plateau than in the Basin and Range province in Arizona, reflecting the different geologic and tectonic structure of the two provinces. Also, the proportion of limnocrene springs is relatively small in both provinces (4.6-6.4%). Geysers are the only springs type that is not found in Arizona.
Colorado Plateau Basin and Range
Fig 1.09: Springs vary by type across the a) Colorado Plateau (N-549) and b) Basin and Range (N = 175) geologic provinces in Arizona. The proportion of anthropogenic springs, those with geomorphology entirely altered by humans, is about equal in the two provinces (5.1-7.4%).
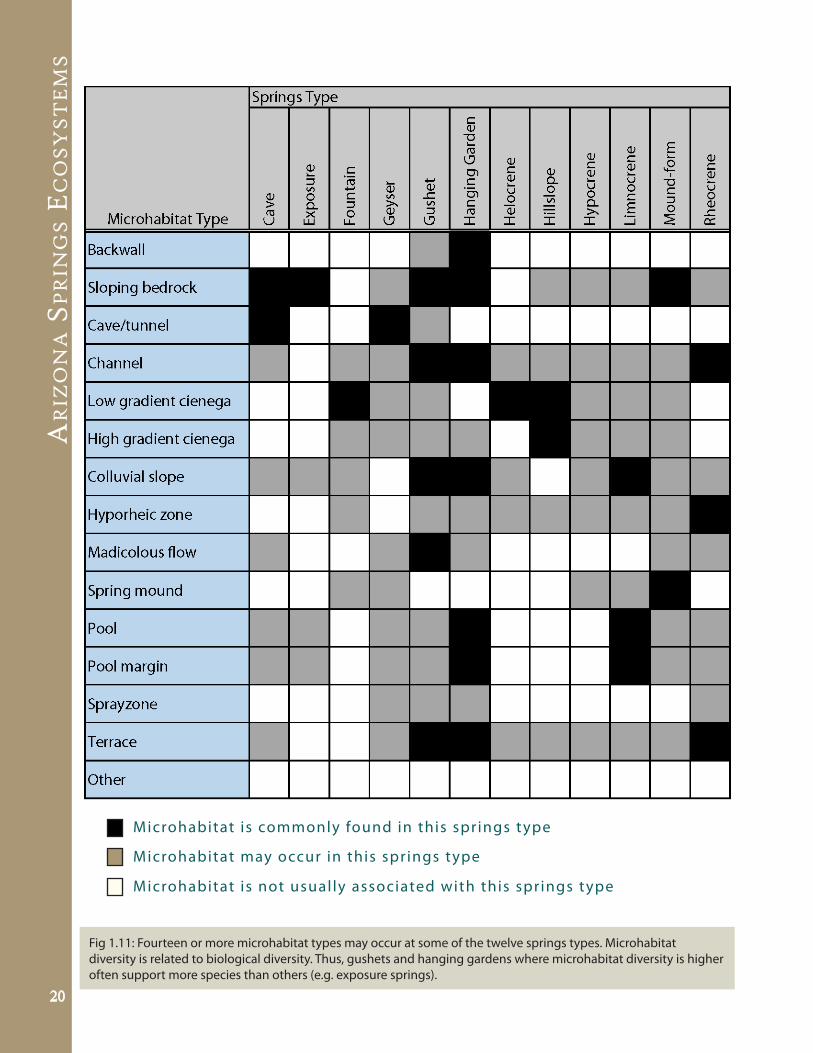
Sp r I n g S mI c r o h a B I tat SSprings are complex ecosystems not only because
of the large array of types, but also because each springs ecosystem may include several to many microhabitats, with each microhabitat supporting its own array of landforms, soils, and plant and animal species (Figs. 1.10 and 1.11).
A dozen microhabitat types are associated with large springs: caves, dry and wet wall surfaces, colluvial slopes, madicolous cascading flow, spray zones, wet meadows, pools, flowing channels and terraces, and hyporheic zones (Table 1.2; Fig. 1.8). Springs microhabitat diversity is positively related
Rheocrene = Hil ls lope > Hanging Garden = Helocrene > O thers
Rheocrene >> Hil ls lope > Helocrene > O thers
to the number of plant species (Sparks 2014; Springer et al. 2014), and likely to invertebrate diversity. Thunder River, a large gushet springs ecosystem in Grand Canyon (Fig. 1.10) supports 10 microhabitats and the highest density of landsnail species known in the Southwest (Spamer and Bogan 1993). Thus, biological diversity of a springs ecosystem is related to the mosaic of microhabitats that occur there. The success of springs ecosystem rehabilitation depends on clearly defining the desired microhabitat array, including the area of each microhabitat desired.

Ar
izo
nA S
pr
ing
S Ec
oS
yS
tE
mS
19
Cave
Terrace
Sloping Bedrock
Madicolous
Sprayzone
Backwall
Fig 1.10: Thunder River Springs microhabitats, Grand Canyon National Park, Arizona.
Channel
Pool
Hyporheic Flow
Ar
izo
nA
Sp
rin
gS E
co
Sy
St
Em
S
20
Microhabitat is commonly found in this spr ings type
Microhabitat may occur in this spr ings type
Fig 1.11: Fourteen or more microhabitat types may occur at some of the twelve springs types. Microhabitat diversity is related to biological diversity. Thus, gushets and hanging gardens where microhabitat diversity is higher often support more species than others (e.g. exposure springs).
Microhabitat is not usual ly associated with this spr ings type
Ar
izo
nA S
pr
ing
S Ec
oS
yS
tE
mS
21
hu m a n Im pa c t S o n Sp r I n g SHumans evolved at springs (Cuthburt and
Ashley 2014), and in the Southwest humans have intensively used springs for millennia to ambush prey, for harvesting plants and minerals, and for agriculture (Haynes 2008). However, modern human uses of springs have become far more complex and the scale of impacts has expanded, including groundwater pumping, flow diversion and irrigation, mining, livestock husbandry, forestry, air and light pollution, recreation, nonnative species introduction, and other direct and indirect uses. Many of these impacts are ubiquitous, occurring across broad regions and at most springs types.
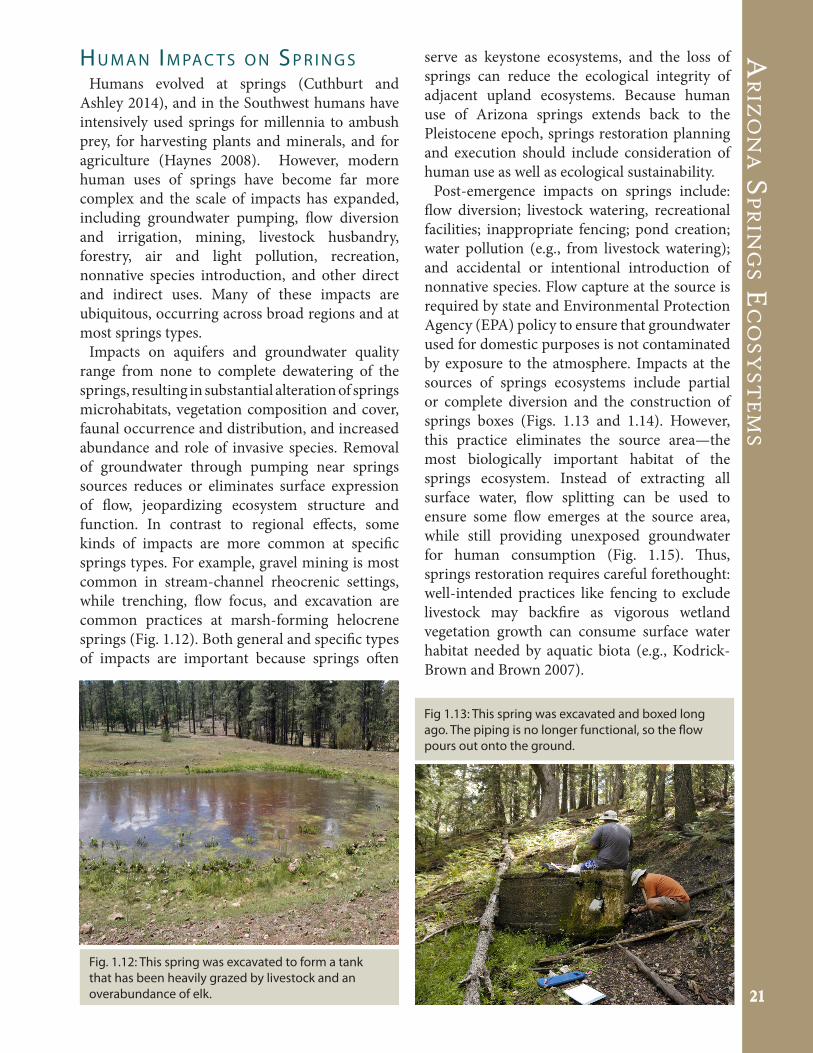
Impacts on aquifers and groundwater quality range from none to complete dewatering of the springs, resulting in substantial alteration of springs microhabitats, vegetation composition and cover, faunal occurrence and distribution, and increased abundance and role of invasive species. Removal of groundwater through pumping near springs sources reduces or eliminates surface expression of flow, jeopardizing ecosystem structure and function. In contrast to regional effects, some kinds of impacts are more common at specific springs types. For example, gravel mining is most common in stream-channel rheocrenic settings, while trenching, flow focus, and excavation are common practices at marsh-forming helocrene springs (Fig. 1.12). Both general and specific types of impacts are important because springs often
serve as keystone ecosystems, and the loss of springs can reduce the ecological integrity of adjacent upland ecosystems. Because human use of Arizona springs extends back to the Pleistocene epoch, springs restoration planning and execution should include consideration of human use as well as ecological sustainability.
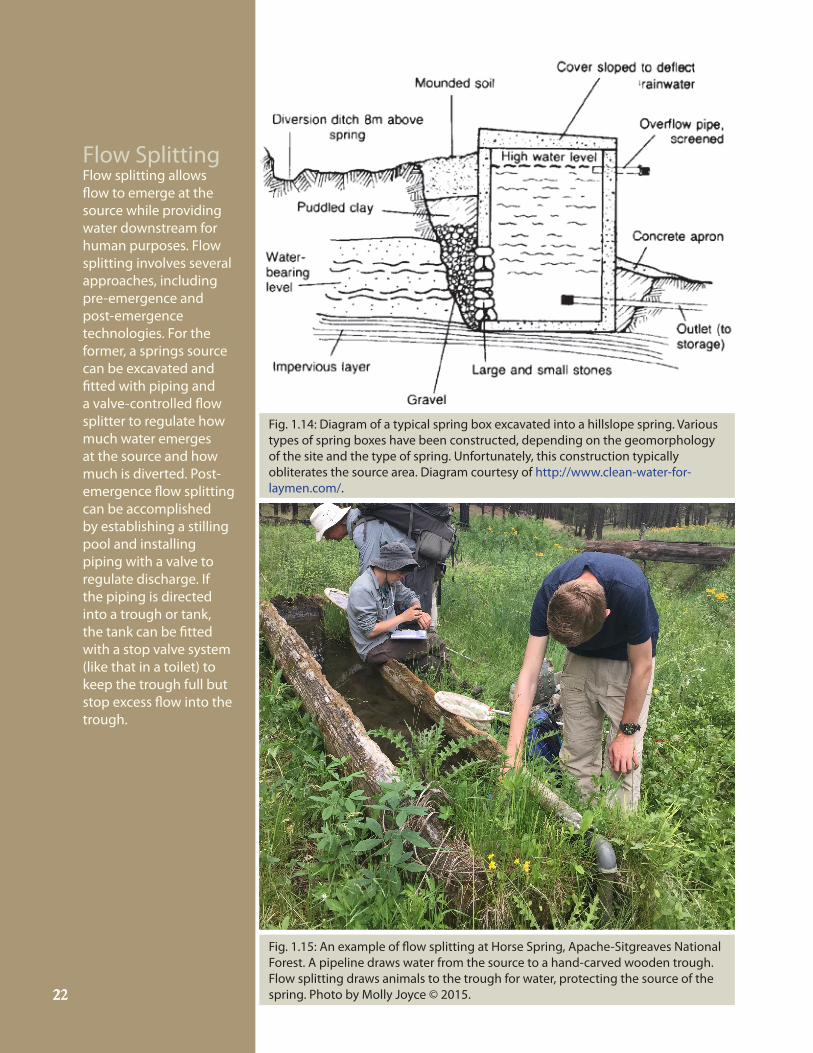
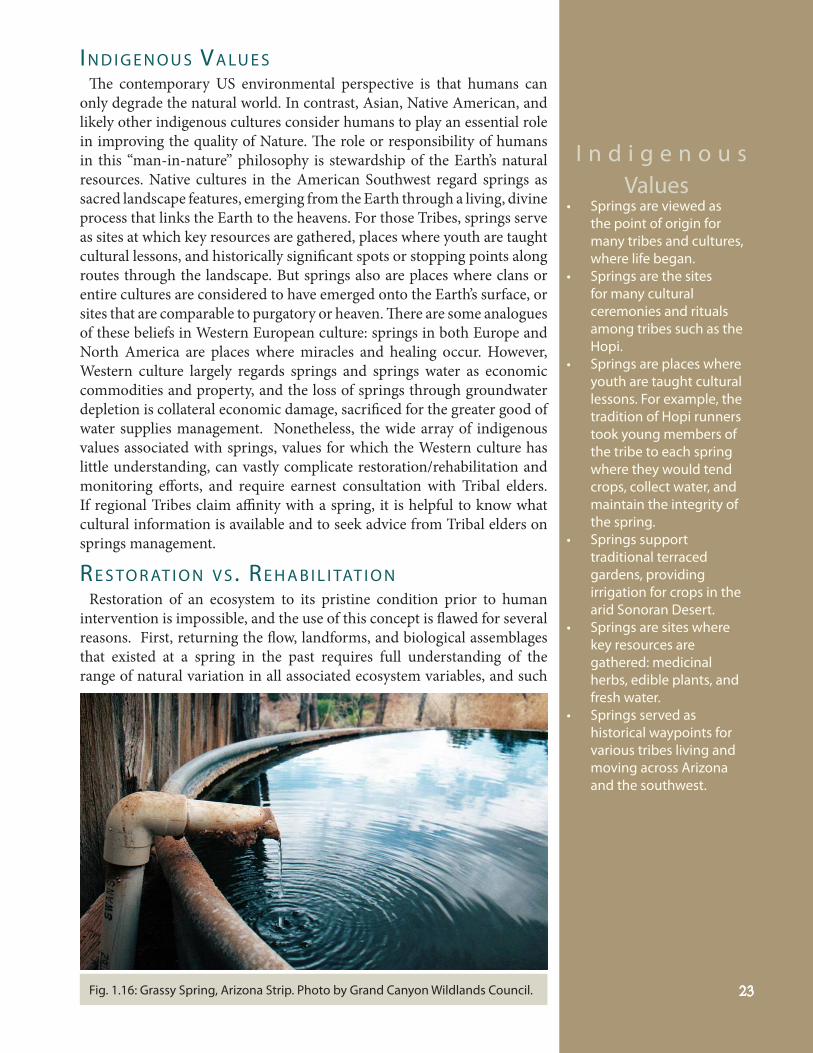
Post-emergence impacts on springs include: flow diversion; livestock watering, recreational facilities; inappropriate fencing; pond creation; water pollution (e.g., from livestock watering); and accidental or intentional introduction of nonnative species. Flow capture at the source is required by state and Environmental Protection Agency (EPA) policy to ensure that groundwater used for domestic purposes is not contaminated by exposure to the atmosphere. Impacts at the sources of springs ecosystems include partial or complete diversion and the construction of springs boxes (Figs. 1.13 and 1.14). However, this practice eliminates the source area—the most biologically important habitat of the springs ecosystem. Instead of extracting all surface water, flow splitting can be used to ensure some flow emerges at the source area, while still providing unexposed groundwater for human consumption (Fig. 1.15). Thus, springs restoration requires careful forethought: well-intended practices like fencing to exclude livestock may backfire as vigorous wetland vegetation growth can consume surface water habitat needed by aquatic biota (e.g., Kodrick-Brown and Brown 2007).
Fig. 1.12: This spring was excavated to form a tank that has been heavily grazed by livestock and an overabundance of elk.
Fig 1.13: This spring was excavated and boxed long ago. The piping is no longer functional, so the flow pours out onto the ground.
22
Fig. 1.14: Diagram of a typical spring box excavated into a hillslope spring. Various types of spring boxes have been constructed, depending on the geomorphology of the site and the type of spring. Unfortunately, this construction typically obliterates the source area. Diagram courtesy of http://www.clean-water-for-laymen.com/.
Fig. 1.15: An example of flow splitting at Horse Spring, Apache-Sitgreaves National Forest. A pipeline draws water from the source to a hand-carved wooden trough. Flow splitting draws animals to the trough for water, protecting the source of the spring. Photo by Molly Joyce © 2015.
Flow SplittingFlow splitting allows flow to emerge at the source while providing water downstream for human purposes. Flow splitting involves several approaches, including pre-emergence and post-emergence technologies. For the former, a springs source can be excavated and fitted with piping and a valve-controlled flow splitter to regulate how much water emerges at the source and how much is diverted. Post-emergence flow splitting can be accomplished by establishing a stilling pool and installing piping with a valve to regulate discharge. If the piping is directed into a trough or tank, the tank can be fitted with a stop valve system (like that in a toilet) to keep the trough full but stop excess flow into the trough.
23
In d I g e n o u S va lu e SThe contemporary US environmental perspective is that humans can
only degrade the natural world. In contrast, Asian, Native American, and likely other indigenous cultures consider humans to play an essential role in improving the quality of Nature. The role or responsibility of humans in this “man-in-nature” philosophy is stewardship of the Earth’s natural resources. Native cultures in the American Southwest regard springs as sacred landscape features, emerging from the Earth through a living, divine process that links the Earth to the heavens. For those Tribes, springs serve as sites at which key resources are gathered, places where youth are taught cultural lessons, and historically significant spots or stopping points along routes through the landscape. But springs also are places where clans or entire cultures are considered to have emerged onto the Earth’s surface, or sites that are comparable to purgatory or heaven. There are some analogues of these beliefs in Western European culture: springs in both Europe and North America are places where miracles and healing occur. However, Western culture largely regards springs and springs water as economic commodities and property, and the loss of springs through groundwater depletion is collateral economic damage, sacrificed for the greater good of water supplies management. Nonetheless, the wide array of indigenous values associated with springs, values for which the Western culture has little understanding, can vastly complicate restoration/rehabilitation and monitoring efforts, and require earnest consultation with Tribal elders. If regional Tribes claim affinity with a spring, it is helpful to know what cultural information is available and to seek advice from Tribal elders on springs management.
re S to r at I o n v S . re h a B I l I tat I o n Restoration of an ecosystem to its pristine condition prior to human
intervention is impossible, and the use of this concept is flawed for several reasons. First, returning the flow, landforms, and biological assemblages that existed at a spring in the past requires full understanding of the range of natural variation in all associated ecosystem variables, and such
I n d i g e n o u s Values
• Springsareviewedasthe point of origin for many tribes and cultures, where life began.
• Springsarethesitesfor many cultural ceremonies and rituals among tribes such as the Hopi.
• Springsareplaceswhereyouth are taught cultural lessons. For example, the tradition of Hopi runners took young members of the tribe to each spring where they would tend crops, collect water, and maintain the integrity of the spring.
• Springssupporttraditional terraced gardens, providing irrigation for crops in the arid Sonoran Desert.
• Springsaresiteswherekey resources are gathered: medicinal herbs, edible plants, and fresh water.
• Springsservedashistorical waypoints for various tribes living and moving across Arizona and the southwest.
Fig. 1.16: Grassy Spring, Arizona Strip. Photo by Grand Canyon Wildlands Council.
Ar
izo
nA
Sp
rin
gS E
co
Sy
St
Em
S
24
monitoring data do not exist. Second, even if those data did exist, using them to recreate past conditions is simply not feasible. Third, humans have used all large springs ecosystems since the Pleistocene here in Arizona: there is no such entity as a springs ecosystem that has not sustained significant anthropogenic impacts, and no such thing as a pristine springs ecosystem.
Nonetheless, ecological rehabilitation and environmental reconciliation of springs can be achieved, as long as the aquifer supplying flow is minimally altered. While this is a significant issue around large urban areas or regions with intensive groundwater extraction, many of the state’s aquifers are small and relatively unaffected by pumping. Springs in those settings can be rehabilitated successfully and provide benefits for wildlife, recreation, and keystone ecosystem functionality.
cl I m at e ch a n g e a n d ad a p tat I o n
Climate changes stand to alter precipitation and groundwater infiltration in the Southwest, and strategies for adaptation to climate change are receiving much consideration by water managing agencies, such as the Bureau of Reclamation (e.g., U.S. Bureau of Reclamation 2012). For those springs with intact aquifers, improved stewardship that includes rehabilitation of ecological and refugial
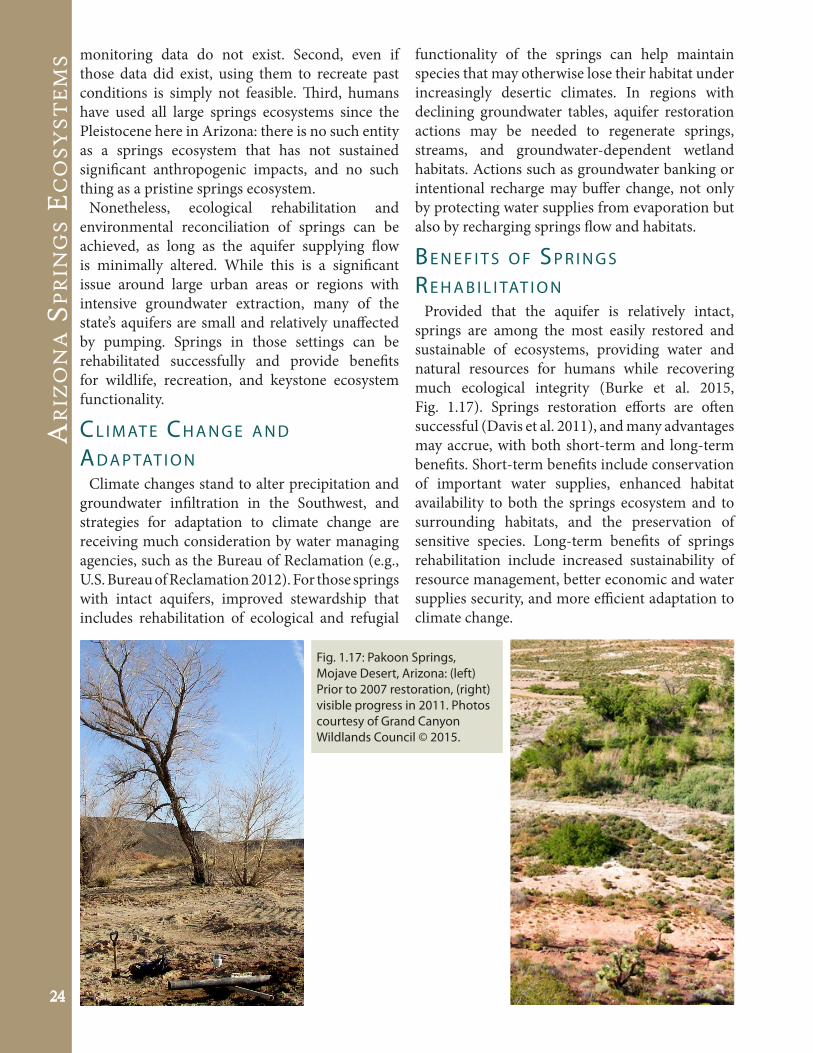
Fig. 1.17: Pakoon Springs, Mojave Desert, Arizona: (left) Prior to 2007 restoration, (right) visible progress in 2011. Photos courtesy of Grand Canyon Wildlands Council © 2015.
functionality of the springs can help maintain species that may otherwise lose their habitat under increasingly desertic climates. In regions with declining groundwater tables, aquifer restoration actions may be needed to regenerate springs, streams, and groundwater-dependent wetland habitats. Actions such as groundwater banking or intentional recharge may buffer change, not only by protecting water supplies from evaporation but also by recharging springs flow and habitats.
Be n e F I t S o F Sp r I n g S re h a B I l I tat I o n
Provided that the aquifer is relatively intact, springs are among the most easily restored and sustainable of ecosystems, providing water and natural resources for humans while recovering much ecological integrity (Burke et al. 2015, Fig. 1.17). Springs restoration efforts are often successful (Davis et al. 2011), and many advantages may accrue, with both short-term and long-term benefits. Short-term benefits include conservation of important water supplies, enhanced habitat availability to both the springs ecosystem and to surrounding habitats, and the preservation of sensitive species. Long-term benefits of springs rehabilitation include increased sustainability of resource management, better economic and water supplies security, and more efficient adaptation to climate change.
Ar
izo
nA S
pr
ing
S Ec
oS
yS
tE
mS
25

26
inventory And ASSeSSment
efore beginning the rehabilitation of a springs ecosystem it is important to understand its eco-logical condition and its relation to other springs and management issues in the land unit of con-cern. Inventory is a fundamental element of eco-system stewardship, providing essential data on the distribution and status of resources, processes, values, and aquatic, wetland, riparian, and upland linkages (Busch and Trexler 2002). Systematic in-ventory precedes assessment, planning, action implementation, and monitoring in a structured resource management strategy. In this chapter we offer an efficient, comprehensive inventory and as-sessment approach for springs, and a secure, user-friendly information management system for data archival, restoration planning, implementation, monitoring, and reporting.SSI synthesized inventory and assessment infor-
mation needs and perspectives from the literature and discussions with many private, Tribal, and agency staff over the past 15 years to refine sampling pro-tocols for the many resource vari-ables of potential interest to springs stewards. These references included methods developed by the Depart-ment of Defense, the U.S. Forest Service (2012), the U.S. National Park Service (Springer et al. 2006), the U.S. Bureau of Land Manage-ment (1991, 1998; Sada and Pohl-mann 2006), several southwestern USA Native American Tribes, U.S. academic institutions (e.g., Paffett et al. 2014), and the Australian govern-
Chapter 2
of Springs Ecosystems
B ment (Eamus et al. 2014). These sources revealed a suite of variables of primary interest to springs stewards: geomorphology; aquifer mechanics and sustainability; flow and water quality; aquatic and wetland vegetation; aquatic and wetland faunae; fish; other vertebrates; cultural elements, includ-ing ecosystem goods and services; and the admin-istrative context of springs stewardship, including water rights and other regulatory issues. Informa-tion collected through systematic inventory was needed not only for the project at hand, but also for comparing site change over time, comparing and prioritizing management at other springs in the region, and providing a relevant monitoring baseline. SSI developed, tested, and refined its protocols
and the Springs Online database by inventorying more than 1,000 springs across North America, from Alberta (Canada) to Mexico.
in
ve
nt
or
y An
d A
SS
eS
Sm
en
t
27
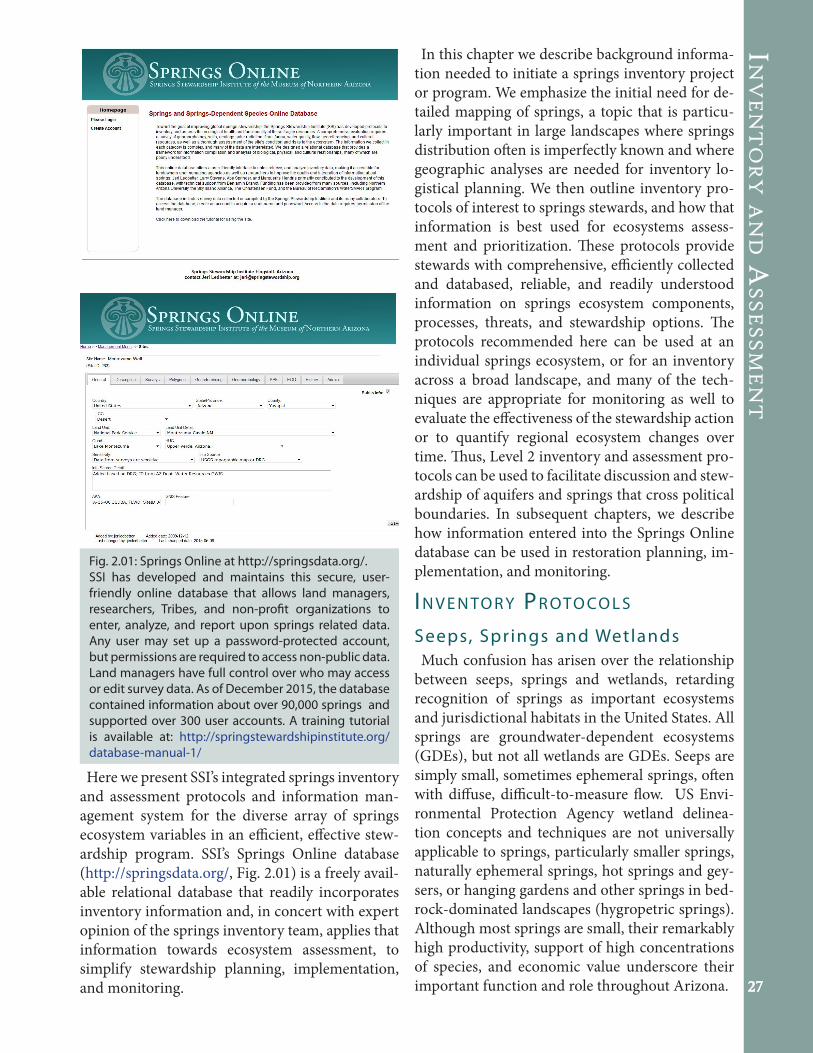
Here we present SSI’s integrated springs inventory and assessment protocols and information man-agement system for the diverse array of springs ecosystem variables in an efficient, effective stew-ardship program. SSI’s Springs Online database (http://springsdata.org/, Fig. 2.01) is a freely avail-able relational database that readily incorporates inventory information and, in concert with expert opinion of the springs inventory team, applies that information towards ecosystem assessment, to simplify stewardship planning, implementation, and monitoring.
In this chapter we describe background informa-tion needed to initiate a springs inventory project or program. We emphasize the initial need for de-tailed mapping of springs, a topic that is particu-larly important in large landscapes where springs distribution often is imperfectly known and where geographic analyses are needed for inventory lo-gistical planning. We then outline inventory pro-tocols of interest to springs stewards, and how that information is best used for ecosystems assess-ment and prioritization. These protocols provide stewards with comprehensive, efficiently collected and databased, reliable, and readily understood information on springs ecosystem components, processes, threats, and stewardship options. The protocols recommended here can be used at an individual springs ecosystem, or for an inventory across a broad landscape, and many of the tech-niques are appropriate for monitoring as well to evaluate the effectiveness of the stewardship action or to quantify regional ecosystem changes over time. Thus, Level 2 inventory and assessment pro-tocols can be used to facilitate discussion and stew-ardship of aquifers and springs that cross political boundaries. In subsequent chapters, we describe how information entered into the Springs Online database can be used in restoration planning, im-plementation, and monitoring.
In v e n to r y pr oto c o l S
Seeps, Springs and WetlandsMuch confusion has arisen over the relationship
between seeps, springs and wetlands, retarding recognition of springs as important ecosystems and jurisdictional habitats in the United States. All springs are groundwater-dependent ecosystems (GDEs), but not all wetlands are GDEs. Seeps are simply small, sometimes ephemeral springs, often with diffuse, difficult-to-measure flow. US Envi-ronmental Protection Agency wetland delinea-tion concepts and techniques are not universally applicable to springs, particularly smaller springs, naturally ephemeral springs, hot springs and gey-sers, or hanging gardens and other springs in bed-rock-dominated landscapes (hygropetric springs). Although most springs are small, their remarkably high productivity, support of high concentrations of species, and economic value underscore their important function and role throughout Arizona.
Fig. 2.01: Springs Online at http://springsdata.org/.SSI has developed and maintains this secure, user-friendly online database that allows land managers, researchers, Tribes, and non-profit organizations to enter, analyze, and report upon springs related data. Any user may set up a password-protected account, but permissions are required to access non-public data. Land managers have full control over who may access or edit survey data. As of December 2015, the database contained information about over 90,000 springs and supported over 300 user accounts. A training tutorial is available at: http://springstewardshipinstitute.org/database-manual-1/

Inv
en
to
ry
an
d a
ss
es
sm
en
t
28
As mentioned above, Level 2 inventory data gathered from laboratory (mapping) and field site visits are compiled into the Springs Online data-base (Fig. 2.01) and used to inform assessment of the ecological integrity of the springs ecosystem through SSI’s springs ecosystem assessment pro-tocol (SEAP). A SEAP report provides springs stewards with clear interpretation of springs eco-logical conditions and risks from the manager’s perspective. Further clarification of the relation-ship between this prioritization and specific man-agement needs requires additional discussion with the stewards (e.g., Paffett 2014).The measurements and estimates, data entry,
quality control, data archives, and interpretation of the above inventory variables are described on the SSI website (springstewardshipinstitute.org). SSI and SIA offer springs inventory and assessment guidance and trainings through in-person, online and webinar sessions.
Three Levels of Inventor yIn this section we describe springs inventory pro-
tocols for cost-effective, comprehensive springs ecosystem inventory and monitoring. We define three levels of inventory (Table 2.01):Level 1 inventory involves a rapid reconnaissance
survey of springs within a landscape or land man-agement unit, including brief (10-20 minutes per site) visits by 1-2 staff for the purpose of georef-erencing, clarifying access, and determining sam-pling equipment needs. Level 2 inventory is a detailed survey of a springs
ecosystem by an expert team that typically spends one to three hours at a springs, describing baseline physical, biological, human impact, and adminis-trative context variables (Table 2.01, field forms in Appendix C). Level 3 inventory involves monitoring of springs
selected for long-term research or restoration, and includes variables measured in the Level 2 inven-tory, as well as other specific variables relevant to the restoration project goals (Chapter 6).
Springs Inventor y and AssessmentLevel 1 General Reconaissance - A rapid survey of springs within a
landscape by 1-2 staff for the purpose of georeferencing, clarifying access, and determining equipment needs.
Level 2 SIP and SEAP - A detailed survey of a springs ecosystem to describe baseline physical and biological data, human impacts, and administrative context variables. (Table 2.02)
Level 3 Monitoring and Research - monitoring of springs selected for long-term research or restoration. Includes variables measured in multiple Level II inventories, as well as other specific variables relevant to restoration project goals. (Chapter 6)
Table 2.01: Three levels of inventory from protocols developed by Stevens et al. (2011).
Nogales Spring, Arizona—a limnocrene (pool forming) spring. SIA photo.

in
ve
nt
or
y An
d A
SS
eS
Sm
en
t
29
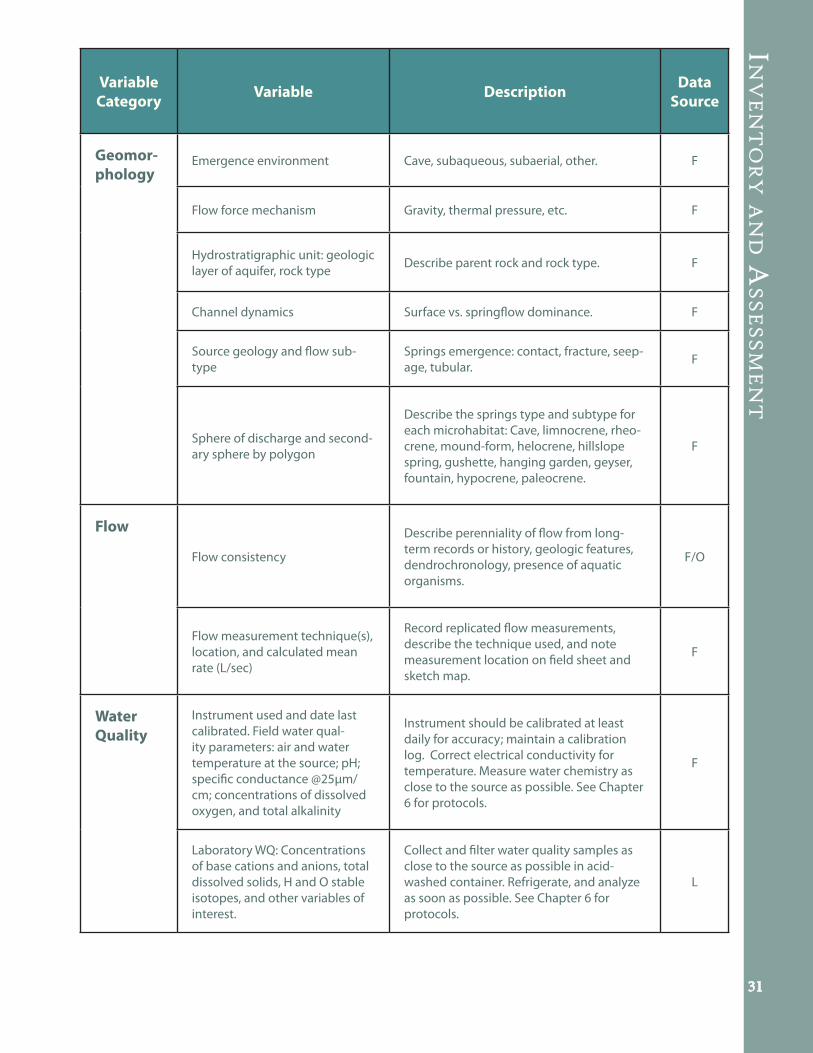
Table 2.02: List and description of primary variables measured or observed during a Level 2 springs ecosystem inventory, and information sources: F – field site visit, L – laboratory analyses, O – office. See key in Level 2 field forms. (Continued on following pages).
Variable Category Variables Description Data
Source
Site Data
Spring Name, country, state or province, county or municipality, 8-digit Hydrologic Unit Code (HUC), Landscape Conservation Coopera-tive (LCC), Other names, Information source, Public (Y/N), Sensitivity.
General Information about the site and the location. Many of these fields are most eas-ily populated through GIS during the Level 1 process, and/or refined after the initial survey. The information source, public checkbox, and sensitivity level indicates the source of location data, and what users should have access to it.
O
Site IDThe Springs Online database automatically populates this value. Additional fields are pro-vided for the individual land unit’s site ID.
O
Land Unit and Land Unit DetailLand owner (NPS, USFS, private, etc.), and unit (eg. Saguaro National Park, North Kaibab Ranger District, etc.)
O
Georeferencing: Information Source, Coordinates, Device, Latitude & Lon-gitude, Elevation (m), Accuracy (EPE, (m), GPS/GIS Comments
Information Source (map, GPS, etc), Datum (should be converted to WGS84 for Springs Online database). Coordinates may be UTMs or Latitude/Longitude, preferably in Decimal Degrees.
F
Access Directions
This information is most important for sites that are difficult to reach, such as those requir-ing a long hike or a climb, crossing private posted land, etc. Any crew safety concerns should be recorded here, as well as notes about culturally sensitive sites.
F
Site Description
This free text field should describe the long-term characteristics and setting of the spring, including the extent and forms of human alteration. It should not include temporal infor-mation about its condition.
F
Solar Radiation BudgetSunrise and sunset using a solar pathfinder to calculate total % seasonal and annual solar flux.
F
Springs Type Springs type(s) F
Polygon code and description Identify discrete geomorphic microhabitats with codes A, B, C, D... F

Inv
en
to
ry
an
d a
ss
es
sm
en
t
30
Variable Category Variables Descrption Data
Source
Survey Data
Date, Start Time, End Time, Sur-veyor’s Names, Project Name, and Survey Protocol.
The date is a required field. The surveyors names, beginning and ending times indicate the thoroughness of the survey. The Project Name is required, allowing a set of surveys to be ana-lyzed. The protocol is also required, identifying what protocols were used (eg. USFS GDE Level I, PFC, etc.).
F
Polygon area (m2); Surface Type and Subtype; Slope Variability (low, medium, high); Aspect (MN or TN); Soil Moisture; Water Depth; % Open Water; % composition by surface substrate particle size (1 to 8) plus Organic Soils and Other (typically anthropogenic); % cover of Pre-cipitate, Litter, Wood; Average Litter Depth (cm).
Describe the characteristics of each microhabi-tat (polygon). Area may be calculated from the sketchmap for small sites, or by aerial imagery in GIS or walking the perimeter with a GPS for large, flat sites. Microhabitats are assigned to a site during the first survey, but may be adjusted as necessary for subsequent surveys should the geomorphology change.
F
Site Condition
This is a free text field to describe the condition of the site at the time of the survey. For example, this should include human impacts, indications of fire or flooding, extent of grazing or brows-ing damage, abundance of wildlife, condition of vegetation, etc.
F
PhotographsInclude the photo number and description of photographs taken, as well as which camera was used. Indicate photo sites on the sketchmap.
F
Sketchmap
Hand drawn map, aerial photograph, or digitized map with scale, orientation, date, observers, landmarks, georeferencing points, photo points. Indicate location of the sketchmap (attached, computer, etc).
F
Biotic Inventory
Aquatic, wetland, and terrestrial plant species inventory
List of species detected, noting endemic and nonnative taxa; visual estimation of % cover in each polygon by stratum:
ground (0-2 m graminoid/herb/non-woody deciduous) shrub (0-4 m woody perennial) mid-canopy (4-10 m woody perennial) tall canopy (>10 m woody perennial) non-vascular basal aquatic
F/L
Aquatic, wetland, and terrestrial invertebrate species inventory
List of species detected, noting endemic and nonnative taxa, data collection type (spot or quantitative), species enumeration, substrate, depth, velocity notes for benthic sampling.
F/L
Aquatic, wetland, and terrestrial vertebrate species inventory
List of species detected, noting endemic and nonnative taxa, and detection method (sign, observation, call, etc)
F/L
in
ve
nt
or
y An
d A
SS
eS
Sm
en
t
31
Variable Category Variable Description Data
Source
Geomor-phology
Emergence environment Cave, subaqueous, subaerial, other. F
Flow force mechanism Gravity, thermal pressure, etc. F
Hydrostratigraphic unit: geologic layer of aquifer, rock type Describe parent rock and rock type. F
Channel dynamics Surface vs. springflow dominance. F
Source geology and flow sub-type
Springs emergence: contact, fracture, seep-age, tubular. F
Sphere of discharge and second-ary sphere by polygon
Describe the springs type and subtype for each microhabitat: Cave, limnocrene, rheo-crene, mound-form, helocrene, hillslope spring, gushette, hanging garden, geyser, fountain, hypocrene, paleocrene.
F
Flow
Flow consistency
Describe perenniality of flow from long-term records or history, geologic features, dendrochronology, presence of aquatic organisms.
F/O
Flow measurement technique(s), location, and calculated mean rate (L/sec)
Record replicated flow measurements, describe the technique used, and note measurement location on field sheet and sketch map.
F
Water Quality
Instrument used and date last calibrated. Field water qual-ity parameters: air and water temperature at the source; pH; specific conductance @25µm/cm; concentrations of dissolved oxygen, and total alkalinity
Instrument should be calibrated at least daily for accuracy; maintain a calibration log. Correct electrical conductivity for temperature. Measure water chemistry as close to the source as possible. See Chapter 6 for protocols.
F
Laboratory WQ: Concentrations of base cations and anions, total dissolved solids, H and O stable isotopes, and other variables of interest.
Collect and filter water quality samples as close to the source as possible in acid-washed container. Refrigerate, and analyze as soon as possible. See Chapter 6 for protocols.
L
Inv
en
to
ry
an
d a
ss
es
sm
en
t
32
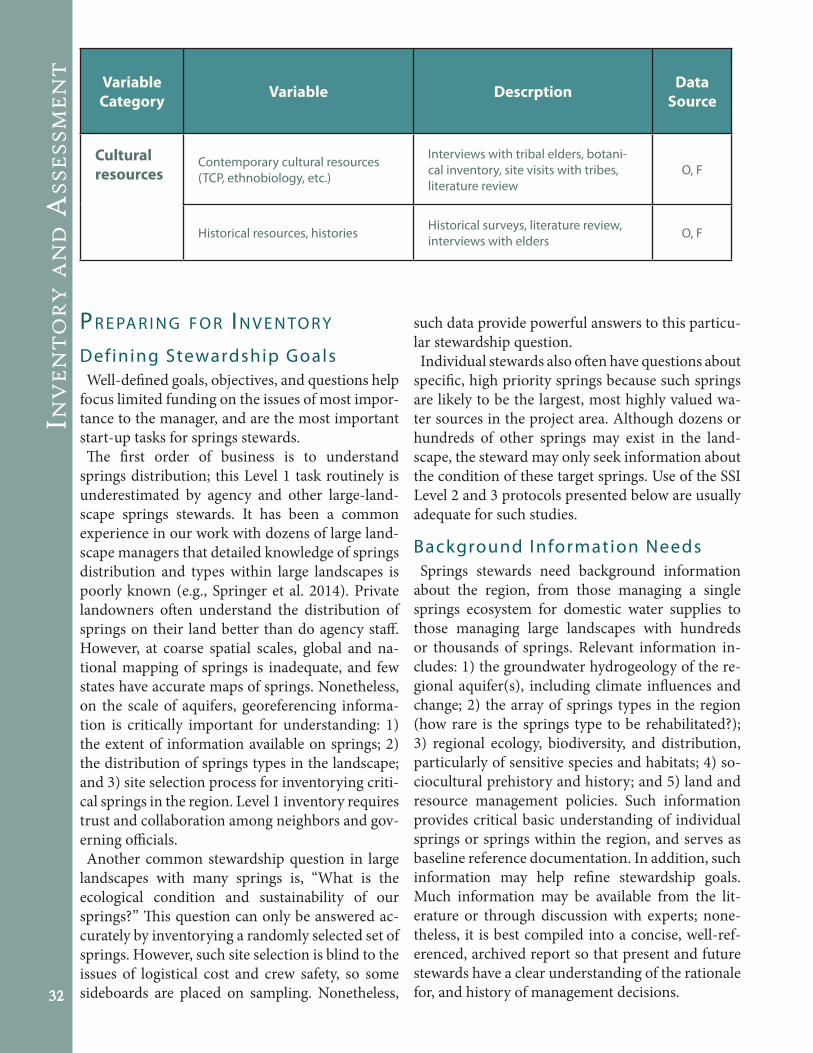
Variable Category Variable Descrption Data
Source
Cultural resources
Contemporary cultural resources (TCP, ethnobiology, etc.)
Interviews with tribal elders, botani-cal inventory, site visits with tribes, literature review
O, F
Historical resources, histories Historical surveys, literature review, interviews with elders O, F
pr e pa r I n g F o r In v e n to r y
Defining Stewardship GoalsWell-defined goals, objectives, and questions help
focus limited funding on the issues of most impor-tance to the manager, and are the most important start-up tasks for springs stewards. The first order of business is to understand
springs distribution; this Level 1 task routinely is underestimated by agency and other large-land-scape springs stewards. It has been a common experience in our work with dozens of large land-scape managers that detailed knowledge of springs distribution and types within large landscapes is poorly known (e.g., Springer et al. 2014). Private landowners often understand the distribution of springs on their land better than do agency staff. However, at coarse spatial scales, global and na-tional mapping of springs is inadequate, and few states have accurate maps of springs. Nonetheless, on the scale of aquifers, georeferencing informa-tion is critically important for understanding: 1) the extent of information available on springs; 2) the distribution of springs types in the landscape; and 3) site selection process for inventorying criti-cal springs in the region. Level 1 inventory requires trust and collaboration among neighbors and gov-erning officials.Another common stewardship question in large
landscapes with many springs is, “What is the ecological condition and sustainability of our springs?” This question can only be answered ac-curately by inventorying a randomly selected set of springs. However, such site selection is blind to the issues of logistical cost and crew safety, so some sideboards are placed on sampling. Nonetheless,
such data provide powerful answers to this particu-lar stewardship question.Individual stewards also often have questions about
specific, high priority springs because such springs are likely to be the largest, most highly valued wa-ter sources in the project area. Although dozens or hundreds of other springs may exist in the land-scape, the steward may only seek information about the condition of these target springs. Use of the SSI Level 2 and 3 protocols presented below are usually adequate for such studies.
Background Information NeedsSprings stewards need background information
about the region, from those managing a single springs ecosystem for domestic water supplies to those managing large landscapes with hundreds or thousands of springs. Relevant information in-cludes: 1) the groundwater hydrogeology of the re-gional aquifer(s), including climate influences and change; 2) the array of springs types in the region (how rare is the springs type to be rehabilitated?); 3) regional ecology, biodiversity, and distribution, particularly of sensitive species and habitats; 4) so-ciocultural prehistory and history; and 5) land and resource management policies. Such information provides critical basic understanding of individual springs or springs within the region, and serves as baseline reference documentation. In addition, such information may help refine stewardship goals. Much information may be available from the lit-erature or through discussion with experts; none-theless, it is best compiled into a concise, well-ref-erenced, archived report so that present and future stewards have a clear understanding of the rationale for, and history of management decisions.
in
ve
nt
or
y An
d A
SS
eS
Sm
en
t
33
Groundwater ModelingAmong the most informative studies available for
planning springs restoration is groundwater mod-eling, which summarizes existing data and pro-vides an essential tool for planning and successful accomplishing springs rehabilitation. High quality models address the risk of dewatering, changes in water quality, the influences on the springs from the surrounding landscape, and climate change risks. Groundwater modeling is available for active management areas in Arizona and in some large regions of the state (e.g., USGS 2012). But often no groundwater model may be available for specific rural aquifers and the long-term sustainability of many aquifers are left in question. If at all possible, securing or developing a groundwater model for the aquifer from which the springs emerge is use-ful for understanding springs distribution, flow-path duration, and water quality prior to under-taking springs rehabilitation.
cu lt u r a l va lu e SAlthough much emphasis has been placed on the
biological values of springs, few regional invento-ries of the indigenous cultural attributes of springs exist, despite widespread regard for springs as cul-turally and spiritually important landforms (e.g., Nabhan 2008; Rea 2008; Phillips et al. 2009). Nei-ther have the socio-economics of Arizona springs been explored.
pr e pa r I n g F o r F I e l d Wo r k
Site SelectionSprings inventory of large or complex landscapes
requires several levels of logistics planning, and that planning should be designed to address the questions of primary interest to the steward(s). In large landscapes, the questions “What is the distri-bution of springs types?” and “What is the condi-tion of our springs?” require statistically rigorous sampling that is not biased by undue attention to individual springs or springs types. Springs often occur in clusters that are typologi-
cally and geochemically similar, and often are sub-ject to similar stewardship strategies. Therefore, we find it most useful to use the Level 1 inventory to conduct a statistical cluster analysis based on latitude, longitude, and elevation. We then ran-domly select clusters, and randomly select one to
several springs per cluster. This stratified random sampling approach allows us to select an unbiased suite of springs for Level 2 inventory. The sample size should be sufficiently large (30-50 springs at least) to allow for detection of rare springs types, although there is no guarantee that such an effort will detect the rarest types of springs. However, if springs types are known in the Level 1 survey, it is also feasible to further randomly stratify the sam-ple by springs type to ensure inventory of all types within the landscape.
Timing Site Vis itsIn Arizona, springs base flow and water quality are
most unambiguously measured during mid-winter, when plant transpiration losses are low. However, the middle of the temperate growing season is likely to be most revealing for biological variables. While a single site visit is highly informative, Grand Can-yon Wildlands Council (2004) reported that three site visits in different seasons were needed to detect >95 percent of plant species at a large site, while six or more site visits (including nocturnal sampling) were needed to detect most of the aquatic and wet-land invertebrate taxa at large springs. Inventories for fish and amphibians also require several visits, while detection of other wetland, riparian, and ter-restrial vertebrates may require numerous visits in a longer-term monitoring context. Springs ecosystems change seasonally in relation
to climate and at random, and every site visit or
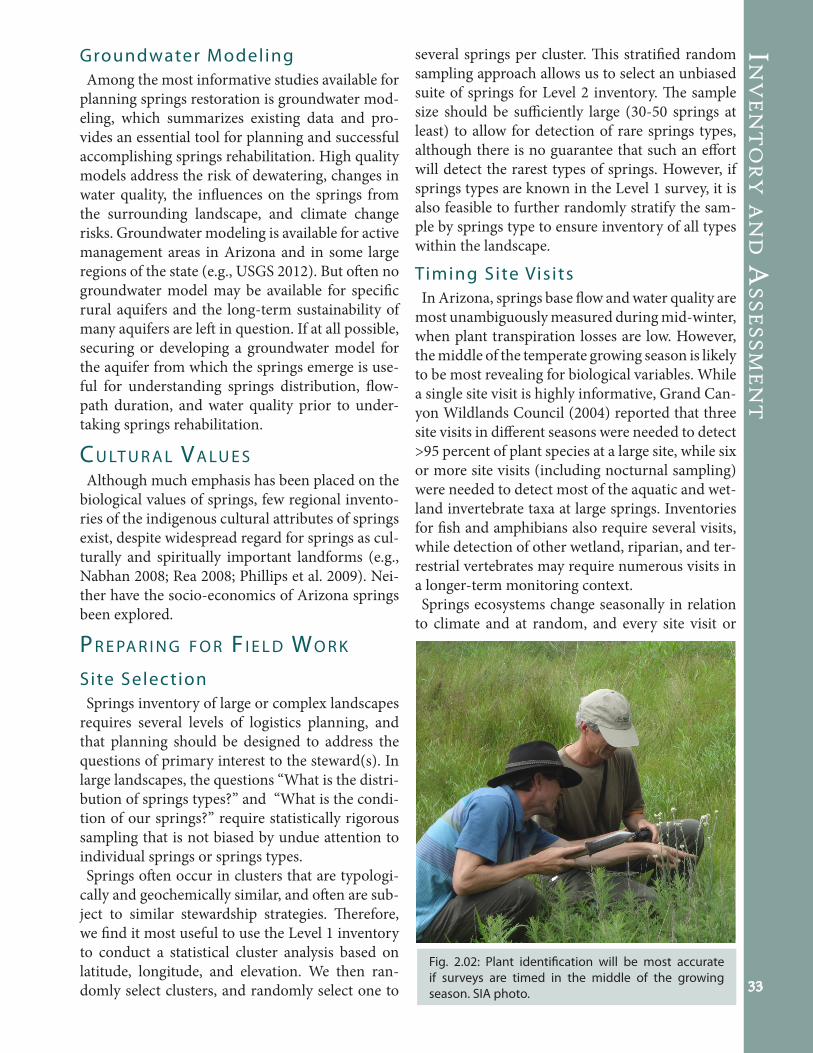
Fig. 2.02: Plant identification will be most accurate if surveys are timed in the middle of the growing season. SIA photo.
Inv
en
to
ry
an
d a
ss
es
sm
en
t
34
inventory is a snapshot in time (Fig. 1.05). Under-standing the range of natural variation at springs is key to improving stewardship, and therefore con-sistent, thorough inventory techniques expand our appreciation of the dynamism of these ecosystems.
Trip Logist ics PlanningFollowing site selection, it is important to develop
a route for the inventory team to access groups of springs that minimizes travel distance and time, and also indicates natural barriers that may de-lay or prevent access (e.g., river crossings, escarp-ments, etc.). For larger projects, it may be helpful to complete a route analysis in GIS.
PermitsPrior to data collection, state, federal, or Tribal
permits often are required from the entity respon-sible for land stewardship. Permits may be required for each land unit visited if a project extends across political jurisdictions. Such individual land unit permitting may substantially delay inventory, as-sessment, and rehabilitation work. If specimens are to be collected during inventory, appropriate repositories should be used or established, and voucher specimens should be collected, prepared, and stored in professionally curated collections for
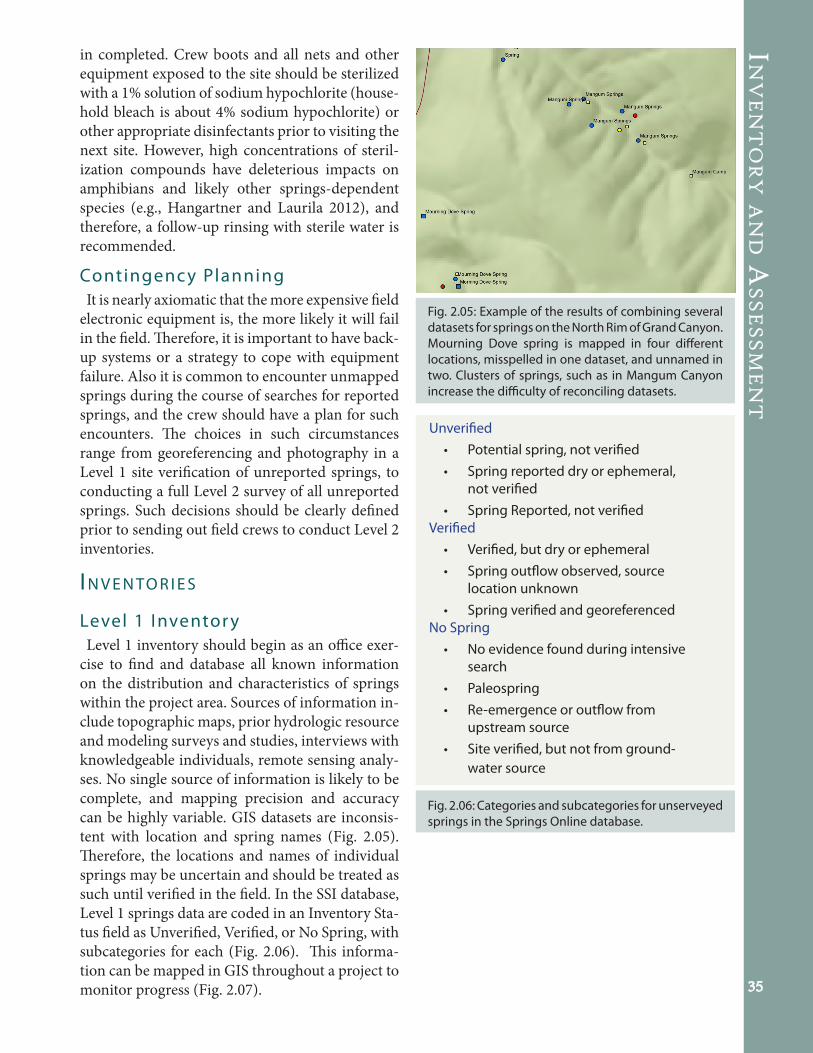
Fig. 2.04: Some springs are particularly challenging to access. Snowslide Spring on the San Francisco Peaks, Arizona. Photo courtesy of Don Keller.
further research, monitoring, or potential litiga-tion.
Equipment ListThe equipment we have found most useful for
Level 2 surveys are listed in Appendix C. Given that some potentially useful equipment, such as a cutthroat flume are heavy devices to transport, in-formation from the Level 1 survey on which flow measurement devices are needed is useful.
SafetySafety is first in importance for the field team,
and is the primary responsibility of the crew lead-er. Vehicular safety, communications, first aid, in-struction in the use and care of special equipment, and final command over the safety of access are concerns for each member of the crew. The crew leader is ultimately responsible for compilation and security of the information collected, and the safe return of the crew and the equipment. In re-mote areas, the crew should always carry sufficient supplies of water, food, flashlights, shovels, extra spare tires, and first aid and emergency supplies to deal with accidents and unexpected circumstanc-es, such as rapid changes in weather. We GPS our vehicles prior to starting on remote field invento-ries, to ensure ease of relocating them, particularly at night. Ensuring the safety of the springs under study
is also the responsibility of the inventory team. The crew should make sure that no weed propa-gules are transported onto the site (e.g., on nets or clothing), and that the site is left in as close to its original condition as possible after the inventory
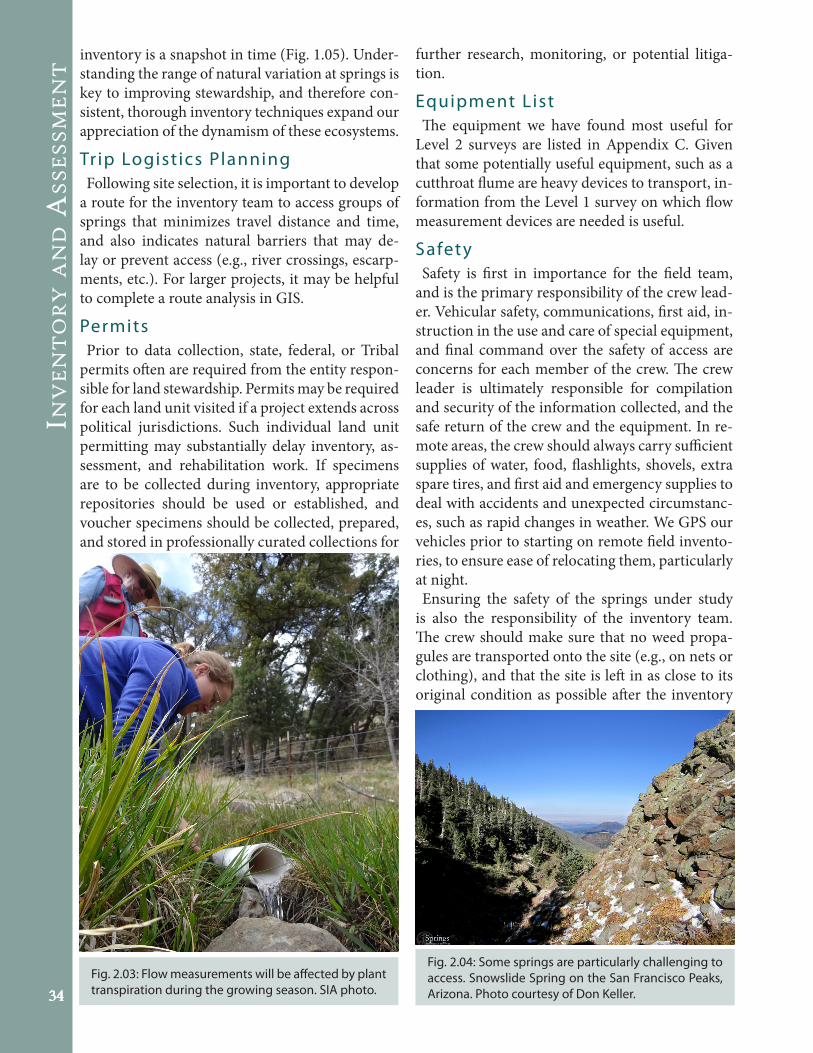
Fig. 2.03: Flow measurements will be affected by plant transpiration during the growing season. SIA photo.
in
ve
nt
or
y An
d A
SS
eS
Sm
en
t
35
in completed. Crew boots and all nets and other equipment exposed to the site should be sterilized with a 1% solution of sodium hypochlorite (house-hold bleach is about 4% sodium hypochlorite) or other appropriate disinfectants prior to visiting the next site. However, high concentrations of steril-ization compounds have deleterious impacts on amphibians and likely other springs-dependent species (e.g., Hangartner and Laurila 2012), and therefore, a follow-up rinsing with sterile water is recommended.
Contingenc y PlanningIt is nearly axiomatic that the more expensive field
electronic equipment is, the more likely it will fail in the field. Therefore, it is important to have back-up systems or a strategy to cope with equipment failure. Also it is common to encounter unmapped springs during the course of searches for reported springs, and the crew should have a plan for such encounters. The choices in such circumstances range from georeferencing and photography in a Level 1 site verification of unreported springs, to conducting a full Level 2 survey of all unreported springs. Such decisions should be clearly defined prior to sending out field crews to conduct Level 2 inventories.
In v e n to r I e S
Level 1 Inventor yLevel 1 inventory should begin as an office exer-
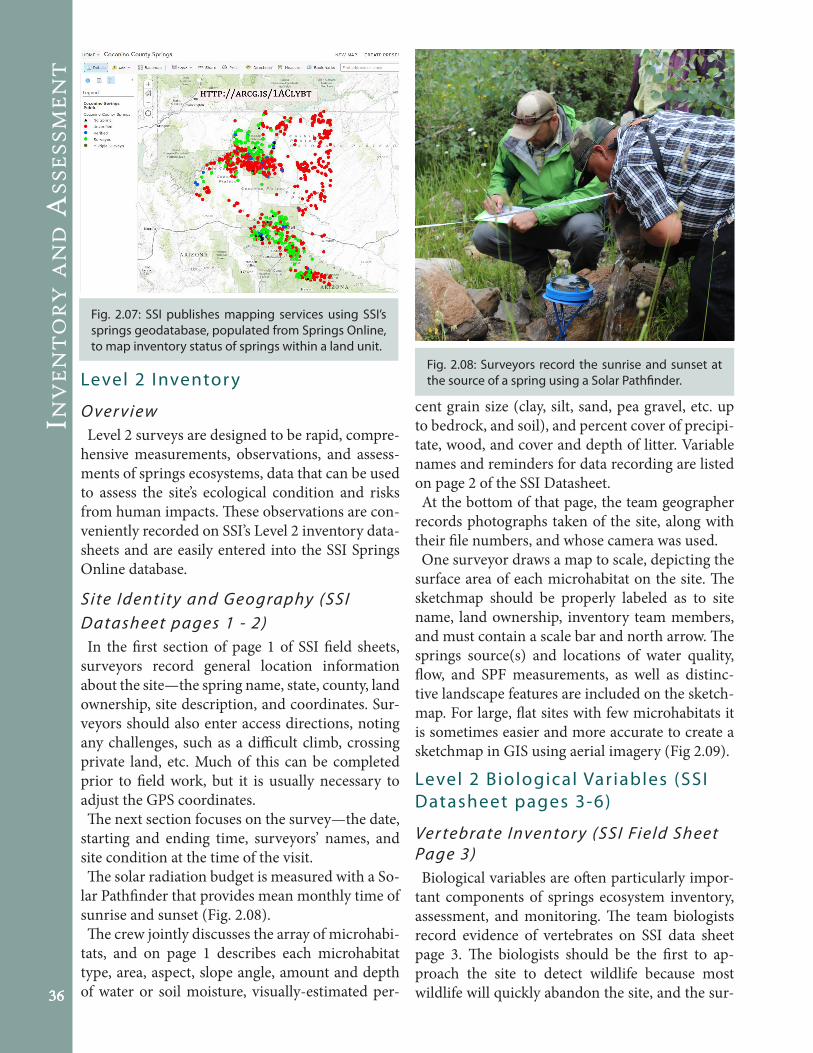
cise to find and database all known information on the distribution and characteristics of springs within the project area. Sources of information in-clude topographic maps, prior hydrologic resource and modeling surveys and studies, interviews with knowledgeable individuals, remote sensing analy-ses. No single source of information is likely to be complete, and mapping precision and accuracy can be highly variable. GIS datasets are inconsis-tent with location and spring names (Fig. 2.05). Therefore, the locations and names of individual springs may be uncertain and should be treated as such until verified in the field. In the SSI database, Level 1 springs data are coded in an Inventory Sta-tus field as Unverified, Verified, or No Spring, with subcategories for each (Fig. 2.06). This informa-tion can be mapped in GIS throughout a project to monitor progress (Fig. 2.07).
Fig. 2.05: Example of the results of combining several datasets for springs on the North Rim of Grand Canyon. Mourning Dove spring is mapped in four different locations, misspelled in one dataset, and unnamed in two. Clusters of springs, such as in Mangum Canyon increase the difficulty of reconciling datasets.
Unverified• Potential spring, not verified• Spring reported dry or ephemeral,
not verified• Spring Reported, not verified
Verified• Verified, but dry or ephemeral• Spring outflow observed, source
location unknown• Spring verified and georeferenced
No Spring• No evidence found during intensive
search• Paleospring• Re-emergence or outflow from
upstream source• Site verified, but not from ground-
water source
Fig. 2.06: Categories and subcategories for unserveyed springs in the Springs Online database.
Inv
en
to
ry
an
d a
ss
es
sm
en
t
36
Level 2 Inventor y
O ver viewLevel 2 surveys are designed to be rapid, compre-
hensive measurements, observations, and assess-ments of springs ecosystems, data that can be used to assess the site’s ecological condition and risks from human impacts. These observations are con-veniently recorded on SSI’s Level 2 inventory data-sheets and are easily entered into the SSI Springs Online database.
Site Identit y and G eo graphy (SSI D atasheet pages 1 - 2)In the first section of page 1 of SSI field sheets,
surveyors record general location information about the site—the spring name, state, county, land ownership, site description, and coordinates. Sur-veyors should also enter access directions, noting any challenges, such as a difficult climb, crossing private land, etc. Much of this can be completed prior to field work, but it is usually necessary to adjust the GPS coordinates. The next section focuses on the survey—the date,
starting and ending time, surveyors’ names, and site condition at the time of the visit.The solar radiation budget is measured with a So-
lar Pathfinder that provides mean monthly time of sunrise and sunset (Fig. 2.08). The crew jointly discusses the array of microhabi-
tats, and on page 1 describes each microhabitat type, area, aspect, slope angle, amount and depth of water or soil moisture, visually-estimated per-
Fig. 2.07: SSI publishes mapping services using SSI’s springs geodatabase, populated from Springs Online, to map inventory status of springs within a land unit.
cent grain size (clay, silt, sand, pea gravel, etc. up to bedrock, and soil), and percent cover of precipi-tate, wood, and cover and depth of litter. Variable names and reminders for data recording are listed on page 2 of the SSI Datasheet.At the bottom of that page, the team geographer
records photographs taken of the site, along with their file numbers, and whose camera was used. One surveyor draws a map to scale, depicting the
surface area of each microhabitat on the site. The sketchmap should be properly labeled as to site name, land ownership, inventory team members, and must contain a scale bar and north arrow. The springs source(s) and locations of water quality, flow, and SPF measurements, as well as distinc-tive landscape features are included on the sketch-map. For large, flat sites with few microhabitats it is sometimes easier and more accurate to create a sketchmap in GIS using aerial imagery (Fig 2.09).
Level 2 Biological Var iables (SSI Datasheet pages 3-6)
Ver tebrate Inventor y (SSI Field Sheet Page 3)Biological variables are often particularly impor-
tant components of springs ecosystem inventory, assessment, and monitoring. The team biologists record evidence of vertebrates on SSI data sheet page 3. The biologists should be the first to ap-proach the site to detect wildlife because most wildlife will quickly abandon the site, and the sur-
Fig. 2.08: Surveyors record the sunrise and sunset at the source of a spring using a Solar Pathfinder.

in
ve
nt
or
y An
d A
SS
eS
Sm
en
t
37
veyors are likely to obliterate sign and tracks. (Fig. 2.10). The crew should take note of birds and wild-life that approach the site during the survey. How-ever, there is no expectation that a Level 2 survey will provide a complete list of the vertebrates us-ing the site. Developing such a list requires a Level 3 long-term monitoring effort, the installation of motion detecting cameras, systematic bird and small mammal surveys, and other longer-term data collection.
Inver tebrate Inventor y (Field Sheet Page 4) Invertebrates are often excellent indicators of
springs ecological integrity. The biologist should intensively explore the site for aquatic and wet-land macroinvertebrates. This opportunistic (spot) sampling may reveal rare species that can-not be practically sampled quantitatively. Where
Fig. 2.09: This sketchmap was created by walking the perimeter of a site with a GPS, importing it into GIS, and using aerial imagery.
sufficient flow exists, at least 3 quantitative benthic samples should be collected. In such settings, a fine-mesh Surber or Hess (basket) sampler, kick-net, or D-net can be randomly placed with the cur-rent running through the net. A uniform area of stream floor immediately upstream from the net should be vigorously disturbed for 1 minute to sweep aquatic invertebrates into the net. The bio-logical sample can be crudely counted in the field, or returned to the laboratory in 70% or stronger EtOH for detailed enumeration, depending on the project needs. The depth, velocity, and visually es-timated substrate particle distribution should be recorded for each replication, and sampling should take place in an upstream direction. At low flow springs, only simple presence/absence detection of aquatic and wetland invertebrates may be pos-sible. Specimens should be prepared and curated according to standard museum protocols.
Fig. 2.10: 2 inch diameter bobcat print found at a spring in Northern Arizona.
Fig. 2.11: SSI staff sampling for aquatic invertebrates at Deer Lake, Kaibab National Forest. Photo by Molly Joyce.
Inv
en
to
ry
an
d a
ss
es
sm
en
t
38
H ydrolo gical Variables (SSI Field Sheet Page 7-8)Categories of geohydrological field variables of
interest at springs include a physical description, flow, and water chemistry. A physical description of the site includes the
source geomorphology, spring type, bedrock and structural geology, flow forcing mechanism, and perenniality. Flow is of primary interest to stewards, and its
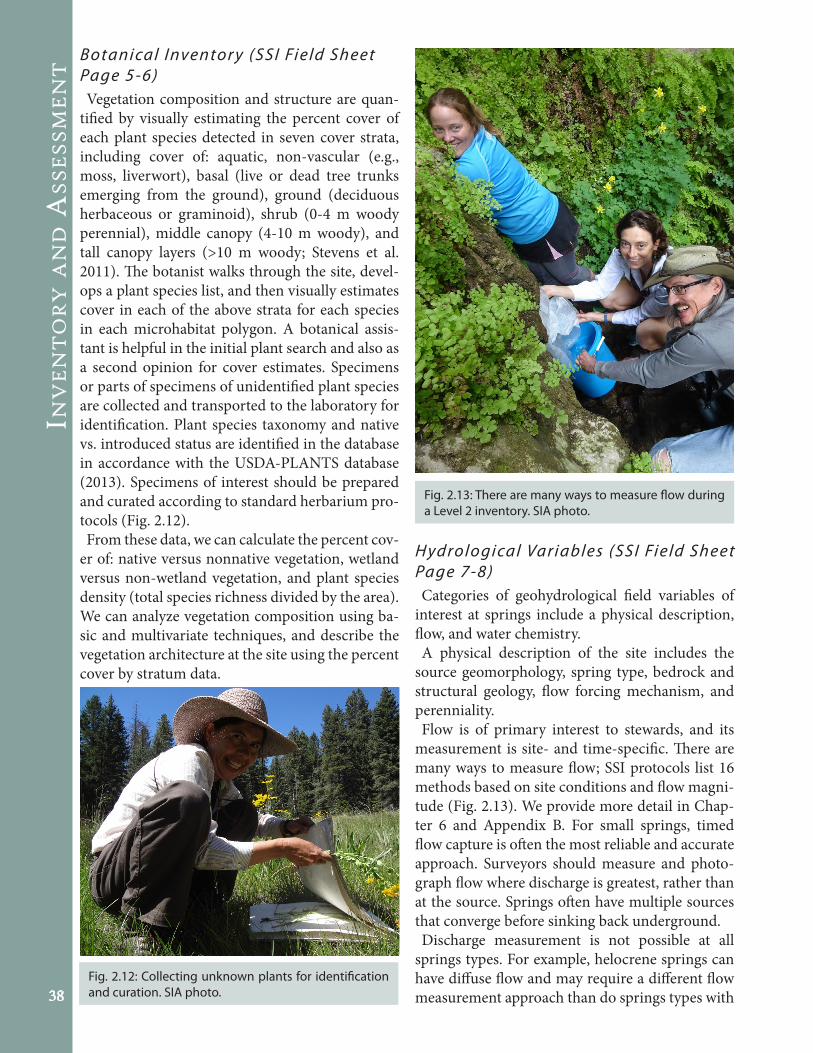
measurement is site- and time-specific. There are many ways to measure flow; SSI protocols list 16 methods based on site conditions and flow magni-tude (Fig. 2.13). We provide more detail in Chap-ter 6 and Appendix B. For small springs, timed flow capture is often the most reliable and accurate approach. Surveyors should measure and photo-graph flow where discharge is greatest, rather than at the source. Springs often have multiple sources that converge before sinking back underground.Discharge measurement is not possible at all
springs types. For example, helocrene springs can have diffuse flow and may require a different flow measurement approach than do springs types with
B otanical Inventor y (SSI Field Sheet Page 5-6)Vegetation composition and structure are quan-
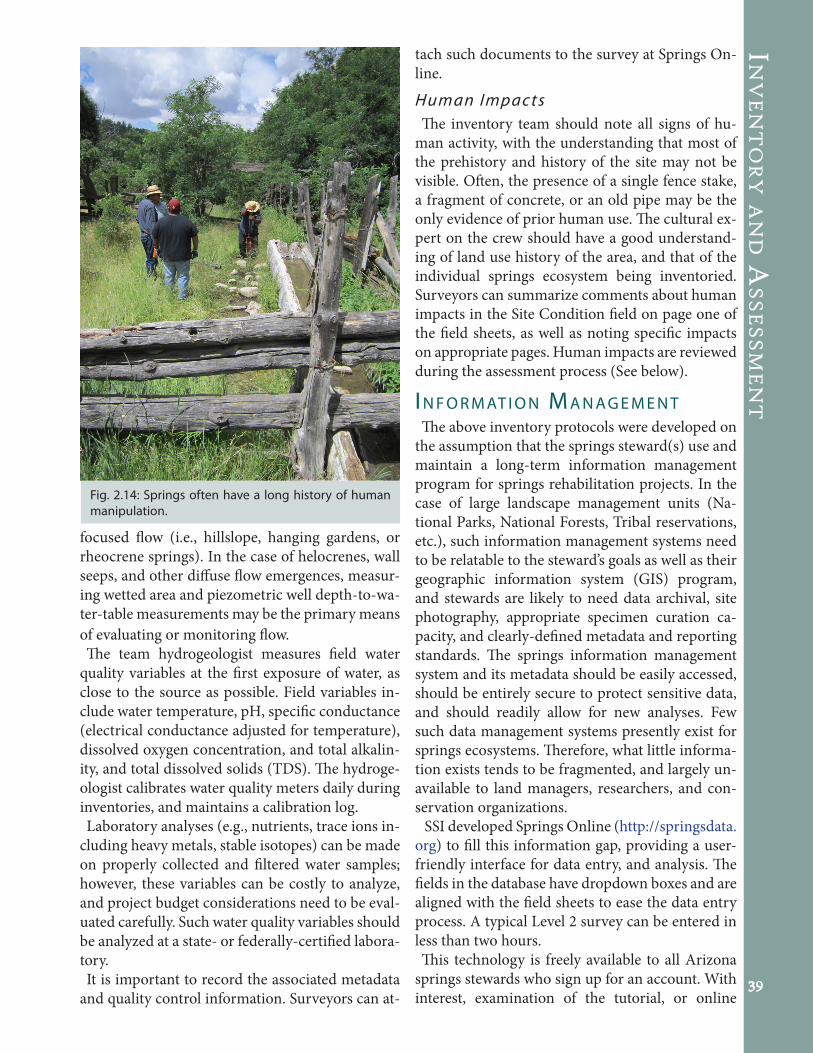
tified by visually estimating the percent cover of each plant species detected in seven cover strata, including cover of: aquatic, non-vascular (e.g., moss, liverwort), basal (live or dead tree trunks emerging from the ground), ground (deciduous herbaceous or graminoid), shrub (0-4 m woody perennial), middle canopy (4-10 m woody), and tall canopy layers (>10 m woody; Stevens et al. 2011). The botanist walks through the site, devel-ops a plant species list, and then visually estimates cover in each of the above strata for each species in each microhabitat polygon. A botanical assis-tant is helpful in the initial plant search and also as a second opinion for cover estimates. Specimens or parts of specimens of unidentified plant species are collected and transported to the laboratory for identification. Plant species taxonomy and native vs. introduced status are identified in the database in accordance with the USDA-PLANTS database (2013). Specimens of interest should be prepared and curated according to standard herbarium pro-tocols (Fig. 2.12). From these data, we can calculate the percent cov-
er of: native versus nonnative vegetation, wetland versus non-wetland vegetation, and plant species density (total species richness divided by the area). We can analyze vegetation composition using ba-sic and multivariate techniques, and describe the vegetation architecture at the site using the percent cover by stratum data.
Fig. 2.13: There are many ways to measure flow during a Level 2 inventory. SIA photo.
Fig. 2.12: Collecting unknown plants for identification and curation. SIA photo.
in
ve
nt
or
y An
d A
SS
eS
Sm
en
t
39
focused flow (i.e., hillslope, hanging gardens, or rheocrene springs). In the case of helocrenes, wall seeps, and other diffuse flow emergences, measur-ing wetted area and piezometric well depth-to-wa-ter-table measurements may be the primary means of evaluating or monitoring flow.The team hydrogeologist measures field water
quality variables at the first exposure of water, as close to the source as possible. Field variables in-clude water temperature, pH, specific conductance (electrical conductance adjusted for temperature), dissolved oxygen concentration, and total alkalin-ity, and total dissolved solids (TDS). The hydroge-ologist calibrates water quality meters daily during inventories, and maintains a calibration log.Laboratory analyses (e.g., nutrients, trace ions in-
cluding heavy metals, stable isotopes) can be made on properly collected and filtered water samples; however, these variables can be costly to analyze, and project budget considerations need to be eval-uated carefully. Such water quality variables should be analyzed at a state- or federally-certified labora-tory. It is important to record the associated metadata
and quality control information. Surveyors can at-
tach such documents to the survey at Springs On-line.
Human Impac tsThe inventory team should note all signs of hu-
man activity, with the understanding that most of the prehistory and history of the site may not be visible. Often, the presence of a single fence stake, a fragment of concrete, or an old pipe may be the only evidence of prior human use. The cultural ex-pert on the crew should have a good understand-ing of land use history of the area, and that of the individual springs ecosystem being inventoried. Surveyors can summarize comments about human impacts in the Site Condition field on page one of the field sheets, as well as noting specific impacts on appropriate pages. Human impacts are reviewed during the assessment process (See below).
In F o r m at I o n ma n a g e m e n tThe above inventory protocols were developed on
the assumption that the springs steward(s) use and maintain a long-term information management program for springs rehabilitation projects. In the case of large landscape management units (Na-tional Parks, National Forests, Tribal reservations, etc.), such information management systems need to be relatable to the steward’s goals as well as their geographic information system (GIS) program, and stewards are likely to need data archival, site photography, appropriate specimen curation ca-pacity, and clearly-defined metadata and reporting standards. The springs information management system and its metadata should be easily accessed, should be entirely secure to protect sensitive data, and should readily allow for new analyses. Few such data management systems presently exist for springs ecosystems. Therefore, what little informa-tion exists tends to be fragmented, and largely un-available to land managers, researchers, and con-servation organizations. SSI developed Springs Online (http://springsdata.
org) to fill this information gap, providing a user-friendly interface for data entry, and analysis. The fields in the database have dropdown boxes and are aligned with the field sheets to ease the data entry process. A typical Level 2 survey can be entered in less than two hours. This technology is freely available to all Arizona
springs stewards who sign up for an account. With interest, examination of the tutorial, or online
Fig. 2.14: Springs often have a long history of human manipulation.
Inv
en
to
ry
an
d a
ss
es
sm
en
t
40
training, virtually any English-speaking individual can use this electronic portal to compile, archive, monitor, and report upon the condition of springs. Easy retrieval of information from the SSI database provides long-term evaluation of change and re-sponse to management activities. The user manual is available at http://springstewardshipinstitute.org/database-manual-1.
Sp r I n g S ec o S y S t e m aS S e S S m e n t (Seap)
Over viewThe U.S. Environmental Protection Agency, Army
Corps of Engineers, and state water quality offices protect ground and surface water quality, wetland ecosystem health, and relevant ecosystem, socio-cultural resources and impacts, and other natural and social aquatic and wetland ecosystem func-tions as needed (e.g., Cowardin et al. 1979; National Research Council 1992, 1994; Federal Geographic Data Committee 2013). Springs ecosystem inven-tory and assessment protocols and recommenda-tions should be consistent with those and other federal land and resource management legislation (e.g., the Antiquities Act of 1906, the National Park Service Organic Act of 1916; the multiple use man-dates of the U.S. National Forest Service and the
Bureau of Land Management, the Clean Water Act of 1973, and the Endangered Species Act of 1973, as amended, as well as state and local policies).Wetlands delineation and management fall under
the jurisdiction of the United States (U.S. Army Corps of Engineers 1987), and consume much technical and regulatory attention. However, dis-cussion of springs is ambiguously included in fed-eral wetlands policy, as defined by the U.S. Fish and Wildlife Service (Cowardin et al. 1979) and the Federal Geographic Data Committee (FGDC 2013). Recent attention to isolated waters of the United States places springs on a list of aquatic re-
Fig. 2.15: Meeting with landowners to discuss springs administrative context, values, and cultural history. SIA photo.
Fig. 2.14: Interface of Springs Online, a relational database available to land managers, researchers, and conservation organizations.
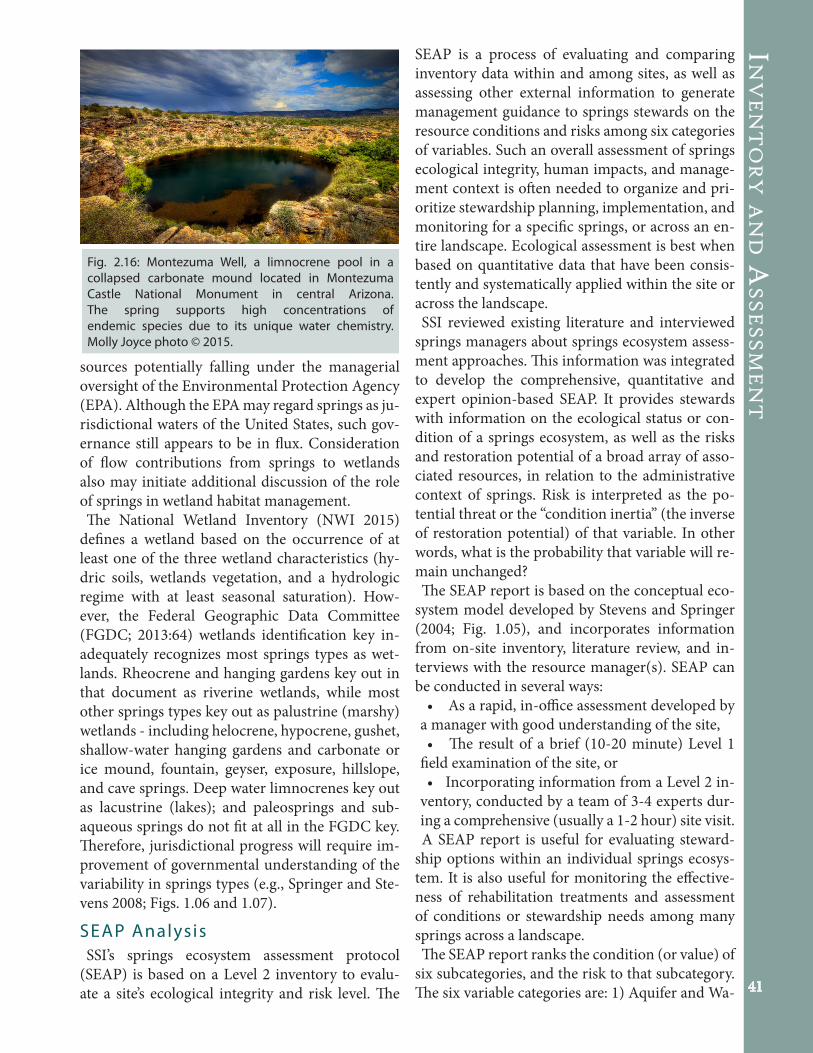
in
ve
nt
or
y An
d A
SS
eS
Sm
en
t
41
sources potentially falling under the managerial oversight of the Environmental Protection Agency (EPA). Although the EPA may regard springs as ju-risdictional waters of the United States, such gov-ernance still appears to be in flux. Consideration of flow contributions from springs to wetlands also may initiate additional discussion of the role of springs in wetland habitat management.The National Wetland Inventory (NWI 2015)
defines a wetland based on the occurrence of at least one of the three wetland characteristics (hy-dric soils, wetlands vegetation, and a hydrologic regime with at least seasonal saturation). How-ever, the Federal Geographic Data Committee (FGDC; 2013:64) wetlands identification key in-adequately recognizes most springs types as wet-lands. Rheocrene and hanging gardens key out in that document as riverine wetlands, while most other springs types key out as palustrine (marshy) wetlands - including helocrene, hypocrene, gushet, shallow-water hanging gardens and carbonate or ice mound, fountain, geyser, exposure, hillslope, and cave springs. Deep water limnocrenes key out as lacustrine (lakes); and paleosprings and sub-aqueous springs do not fit at all in the FGDC key. Therefore, jurisdictional progress will require im-provement of governmental understanding of the variability in springs types (e.g., Springer and Ste-vens 2008; Figs. 1.06 and 1.07).
SEAP AnalysisSSI’s springs ecosystem assessment protocol
(SEAP) is based on a Level 2 inventory to evalu-ate a site’s ecological integrity and risk level. The
SEAP is a process of evaluating and comparing inventory data within and among sites, as well as assessing other external information to generate management guidance to springs stewards on the resource conditions and risks among six categories of variables. Such an overall assessment of springs ecological integrity, human impacts, and manage-ment context is often needed to organize and pri-oritize stewardship planning, implementation, and monitoring for a specific springs, or across an en-tire landscape. Ecological assessment is best when based on quantitative data that have been consis-tently and systematically applied within the site or across the landscape. SSI reviewed existing literature and interviewed
springs managers about springs ecosystem assess-ment approaches. This information was integrated to develop the comprehensive, quantitative and expert opinion-based SEAP. It provides stewards with information on the ecological status or con-dition of a springs ecosystem, as well as the risks and restoration potential of a broad array of asso-ciated resources, in relation to the administrative context of springs. Risk is interpreted as the po-tential threat or the “condition inertia” (the inverse of restoration potential) of that variable. In other words, what is the probability that variable will re-main unchanged?The SEAP report is based on the conceptual eco-
system model developed by Stevens and Springer (2004; Fig. 1.05), and incorporates information from on-site inventory, literature review, and in-terviews with the resource manager(s). SEAP can be conducted in several ways:
• As a rapid, in-office assessment developed by a manager with good understanding of the site,• The result of a brief (10-20 minute) Level 1
field examination of the site, or• Incorporating information from a Level 2 in-
ventory, conducted by a team of 3-4 experts dur-ing a comprehensive (usually a 1-2 hour) site visit.A SEAP report is useful for evaluating steward-
ship options within an individual springs ecosys-tem. It is also useful for monitoring the effective-ness of rehabilitation treatments and assessment of conditions or stewardship needs among many springs across a landscape. The SEAP report ranks the condition (or value) of
six subcategories, and the risk to that subcategory. The six variable categories are: 1) Aquifer and Wa-
Fig. 2.16: Montezuma Well, a limnocrene pool in a collapsed carbonate mound located in Montezuma Castle National Monument in central Arizona. The spring supports high concentrations of endemic species due to its unique water chemistry. Molly Joyce photo © 2015.

Inv
en
to
ry
an
d a
ss
es
sm
en
t
42
ter Quality, 2) Site Geomorphology, 3) Habitat and Microhabitat Array, 4) Site Biota, 5) Human Uses and Influences, and 6) the Administrative Context under which the spring is managed in relation to desired conditions.Each category is scored on the basis of 5-8 subcat-
egory variables, which are ranked on a 0-6 scoring scale. Categories 1-5 are evaluated by the inven-tory team, while Category 6 (Administrative Con-text) is evaluated through a discussion with the land or resource manager that focuses on the stew-ard’s expectations, desires, and level of satisfaction with the current status or “performance” of the springs ecosystem. Categories 1-4 are natural re-source categories, scored through expert opinion. Subcategory scores within categories 1-4 are aver-aged and plotted against the total Category 5 Hu-man Risks scores to produce the overall Category scores. The ecological health score is evaluated in relation to human influences, which then can be compared with the stewardship plan for the site. The field forms and the SEAP criteria are available in Appendix A and on the Springs Stewardship In-stitute website (http://springstewardshipinstitute.org/downloadsandpdfs/).
Using the SEAP SSI has applied the SEAP on individual springs
as well as in regional landscapes (southern Al-berta, southern Nevada, northern Arizona, and elsewhere; e.g. Springer et al. 2014; Ledbetter et
al. in press). SIA conducted a Level 2 inventory and a SEAP analysis of Montezuma Well, a large limnocrene (pool-forming spring) in Montezuma Castle National Monument in central Arizona (Fig. 2.16). The SEAP indicated that the site was in fairly good ecological condition, and intensive recreational visitation are desired by the springs steward (the National Park Service). However, the Well is threatened by regional groundwater pump-ing, and is visited by many thousands of tourists each year, which likely interrupt use of the springs by some wildlife.In large landscapes, comparison of the natural
resources condition scores with the human risk scores provides an initial list of which springs are likely to warrant management attention (Fig. 2.17). For example, SSI inventoried springs on Kaibab
National Forest in northern Arizona. A SEAP anal-ysis revealed a suite of springs that had relatively high ecological condition or value but had mod-erate levels of risk due to anthropogenic impacts (Fig. 2.16). SSI recommended this group of springs to be considered for management attention. Subse-quently, the National Forest Service proposed and conducted restoration actions at the highest prior-ity springs.Thus, the SEAP is broadly and multi-culturally
effective, efficient, comprehensive, and specifi-cally informative for virtually all spring ecosys-tems. Analysis of large suites of springs in several studies have indicated strong responses of springs
Natural Resources Condit ion Score
Fig 2.17: SEAP analysis of anthropogenic ecosystem risk in relation to natural resource conditions for springs within a land unit. Springs in or near the upper right quadrant are in good ecological condition with elevated risk, therefore may warrant stewardship attention (Ledbetter et al. in press).
Eco
syst
em R
isk
Sco
re
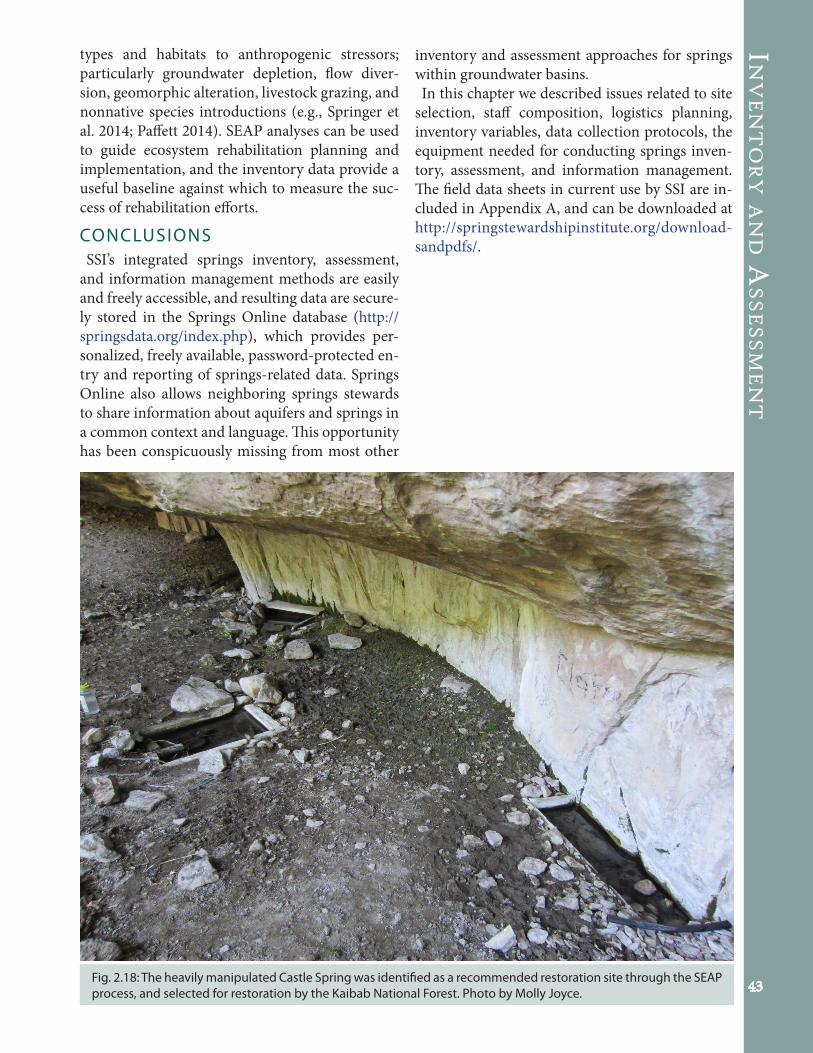
in
ve
nt
or
y An
d A
SS
eS
Sm
en
t
43
types and habitats to anthropogenic stressors; particularly groundwater depletion, flow diver-sion, geomorphic alteration, livestock grazing, and nonnative species introductions (e.g., Springer et al. 2014; Paffett 2014). SEAP analyses can be used to guide ecosystem rehabilitation planning and implementation, and the inventory data provide a useful baseline against which to measure the suc-cess of rehabilitation efforts.
CONCLUSIONSSSI’s integrated springs inventory, assessment,
and information management methods are easily and freely accessible, and resulting data are secure-ly stored in the Springs Online database (http://springsdata.org/index.php), which provides per-sonalized, freely available, password-protected en-try and reporting of springs-related data. Springs Online also allows neighboring springs stewards to share information about aquifers and springs in a common context and language. This opportunity has been conspicuously missing from most other
Fig. 2.18: The heavily manipulated Castle Spring was identified as a recommended restoration site through the SEAP process, and selected for restoration by the Kaibab National Forest. Photo by Molly Joyce.
inventory and assessment approaches for springs within groundwater basins. In this chapter we described issues related to site
selection, staff composition, logistics planning, inventory variables, data collection protocols, the equipment needed for conducting springs inven-tory, assessment, and information management. The field data sheets in current use by SSI are in-cluded in Appendix A, and can be downloaded at http://springstewardshipinstitute.org/download-sandpdfs/.
44
SpringS-dependent SpecieS
ridland springs are renown as hotspots of biological diversity (Williams and Danks, 1991; Shepard, 1993; Botsaneau 1998; Minck-ley and Unmack, 2008; Hershler 2014). Some springs have the highest levels of biological productivity and species density recorded, with productivity exceeding 6 kg/m2/yr (Odum 1957). This stands in marked contrast to the low level of productivity of most arid regions, which may only be a few grams/m2/yr. Springs often are tightly packed with plant, invertebrate, and some vertebrate species, commonly supporting several plant species/m2, again much in contrast to the surrounding uplands (e.g., Ledbetter in press). The abundance of individual springs-depen-
dent species (SDS), such as hydrobiid spring-snails, may exceed 100/m2 (Hershler 2014). In part, the reason that some springs support such high species density and abundance is related to habitat heterogeneity: large gushets, hanging gardens, and other types support up to a dozen different microhabitats, each with its own suite of SDS and facultative species (Stevens and Springer 2004; Springer and Stevens 2008). Sev-eral evolutionarily stable types of springs exist, including some hillslope springs, pool-forming limnocrenes, springfed wet meadow fens or ciénegas, and hanging gardens. Such sites are known for high levels of endemic biodiversity and, in some cases, top-down trophic cascades (e.g., Montezuma Well in central Arizona - Blinn 2008). In addition to the species diversity attributes, springs often function as keystone ecosystems, ecologically highly influential habi-
Chapter 3
Photo by Erik Gaugher
tat patches that play a disproportionately impor-tant role on adjacent uplands (Perla and Stevens 2008). SDS are species that require springs for one or
more critical life history phases, and such species often are closely adapted to the microhabitats in which they occur. More than 80% of the more than 120 springsnail species in North America are local-ized endemics, habitat specialists that cannot exist outside of their individual springs (Hershler 2014). Adaptation and single-site endemism also occurs among some SDS plants in Arizona (Arizona Rare Plant Committee 2006), many aquatic true bugs (Hemiptera) in the Grand Canyon ecoregion (Ste-vens and Polhemus 2008), cyprinodontid pupfish (Brown and Feldmeth 1971, Echelle et al. 2005), the invertebrate and fish fauna of the Great Aus-tralian Basin in Australia (Knott 1998), and sea-floor vent springs. We estimate that more than 10 percent of the federally listed species in the United States are SDS, and SDS include a large number of rare species, including some that are new to sci-ence (e.g., Stevens and Bailowitz 2009; Hershler et al. in press). Unfortunately, springs-dependence is not typically noted on specimen collection labels or in conservation status reviews, making develop-ment of regional SDS lists difficult, and hindering understanding of the role of springs biodiversity at coarse spatial scales.Given the extraordinary biodiversity and abun-
dance of highly adapted and often rare biota at springs, improved understanding of the richness of SDS in Arizona is warranted. Here we provide an overview of the assemblages of species that may be of interest in springs stewardship efforts and
A

Sp
rin
gS-d
ep
en
de
nt S
pe
cie
S
45
we describe how, at some springs, species interac-tions intimately shape those assemblages. We have compiled a list of all plants, invertebrates, and ver-tebrates encountered at Arizona springs in rela-tion to the habitats and regions they occupy, water chemistry, and elevation range at Springs Online. This dataset is increasing in value as more part-ners contribute to it. Such information is useful for planning species recovery or translocation into restored springs and can inspire springs stewards to provide better protection of their springs. In addition, SSI provides an easy-to-use, online SDS database into which those who are interested in springs-dependence among biota can contribute, and access a more complete list of SDS and associ-ated springs information.
pl a n t SBehind California and Texas, and with more than
3,512 species, Arizona has the third highest num-ber of native plants of any US state (Stein 2002). Approximately 10% of the state’s flora is faculta-tively restricted to riparian habitats that make up less than 1% of the land area (e.g., Stevens and Ayers 2002). That SDS plants make up nearly half of those species is surprising because springs habi-tats make up less than 0.01% (one ten thousandth) of the state’s landscape. This means that, on aver-age across the state, springs support significantly greater species densities than do Arizona uplands (Ledbetter et al. in press). Such tight species pack-ing at springs also has been reported in southern Nevada (Abele 2011, Ledbetter et al. 2012) and in Alberta (Springer et al. 2014). Unfortunately, an estimated 15% of Arizona’s plant species are at risk of extinction, including SDS plants (Stein 2002).Springs are places where many upland and SDS
plants co-occur, with facultative upland species occurring around the periphery, contributing fur-ther to the high levels of species packing at springs. Some species, such as wetland monkeyflowers in the genera Mimulus and Erythranthe are common-ly encountered at springs throughout the West, but occur more broadly in wetlands and along slow-moving streams. In contrast, some SDS plants, such as helleborine orchid (Epipactis gigantea) that are widely distributed across the West, occur vir-tually exclusively at springs. Lastly, a few Arizona SDS plants are locally endemic, tightly restricted to just one or a few springs (e.g., McDougall’s fla-
veria, Flaveria mcdougallii, Fig. 3.01; Spence 2008). This same biogeographic pattern holds for springs dependent faunae as well, as discussed below.Including the above-mentioned McDougall’s fla-
veria at a few dozen alkali springs in central Grand Canyon, Arizona hosts a number of unique or rare SDS. These include Navajo sedge (Carex specuic-ola) at hanging gardens in the Four Corners area, and a group of ciénega species, such as Bidens laevis (an aquatic aster at Del Rio and a few other
Fig. 3.01: McDougall’s Flavaria (Flaveria mcdougallii) is endemic to Grand Canyon, found only in alkaline, Mississippian-Cambrian aquifer springs along the Colorado River between miles 137 and 178 below Glen Canyon Dam. Although abundant within its limited habitat, it is considered imperiled.
Fig. 3.02: A yellow form of Cardinal Monkey Flower (Mimulus cardinalis) is found at Vasey’s Paradise spring in Grand Canyon.
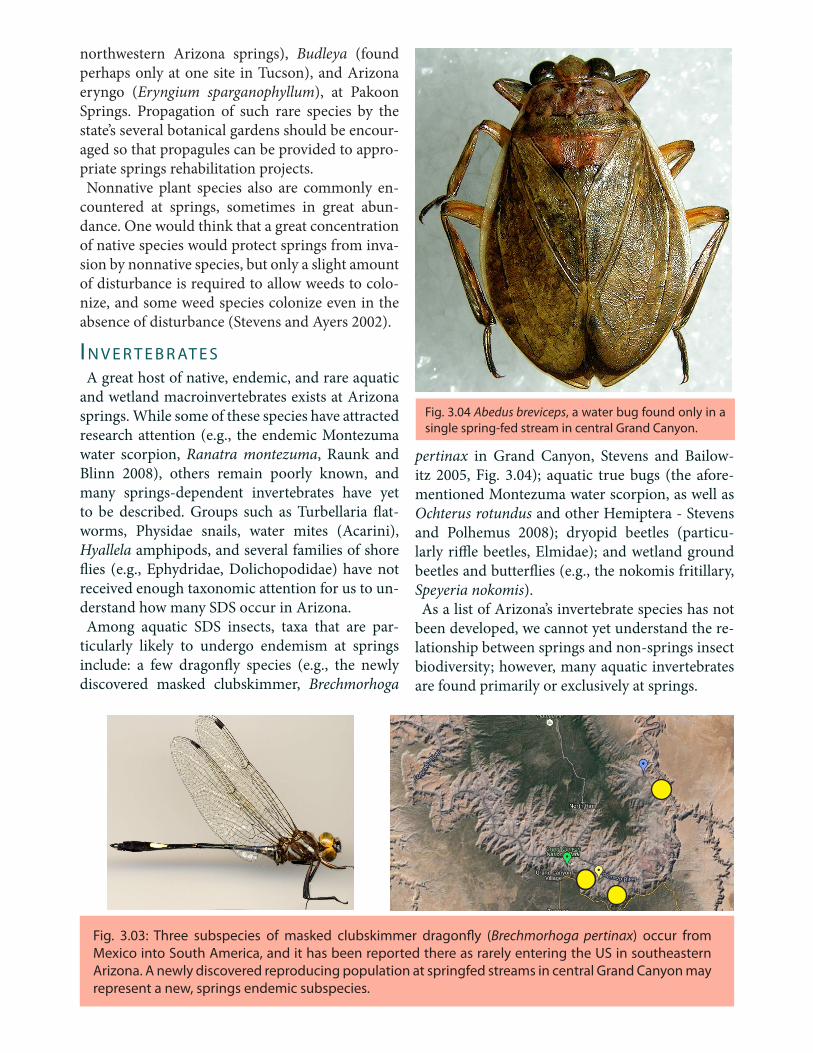
4646
pertinax in Grand Canyon, Stevens and Bailow-itz 2005, Fig. 3.04); aquatic true bugs (the afore-mentioned Montezuma water scorpion, as well as Ochterus rotundus and other Hemiptera - Stevens and Polhemus 2008); dryopid beetles (particu-larly riffle beetles, Elmidae); and wetland ground beetles and butterflies (e.g., the nokomis fritillary, Speyeria nokomis). As a list of Arizona’s invertebrate species has not
been developed, we cannot yet understand the re-lationship between springs and non-springs insect biodiversity; however, many aquatic invertebrates are found primarily or exclusively at springs.
Fig. 3.04 Abedus breviceps, a water bug found only in a single spring-fed stream in central Grand Canyon.
northwestern Arizona springs), Budleya (found perhaps only at one site in Tucson), and Arizona eryngo (Eryngium sparganophyllum), at Pakoon Springs. Propagation of such rare species by the state’s several botanical gardens should be encour-aged so that propagules can be provided to appro-priate springs rehabilitation projects. Nonnative plant species also are commonly en-
countered at springs, sometimes in great abun-dance. One would think that a great concentration of native species would protect springs from inva-sion by nonnative species, but only a slight amount of disturbance is required to allow weeds to colo-nize, and some weed species colonize even in the absence of disturbance (Stevens and Ayers 2002).
In v e r t e B r at e SA great host of native, endemic, and rare aquatic
and wetland macroinvertebrates exists at Arizona springs. While some of these species have attracted research attention (e.g., the endemic Montezuma water scorpion, Ranatra montezuma, Raunk and Blinn 2008), others remain poorly known, and many springs-dependent invertebrates have yet to be described. Groups such as Turbellaria flat-worms, Physidae snails, water mites (Acarini), Hyallela amphipods, and several families of shore flies (e.g., Ephydridae, Dolichopodidae) have not received enough taxonomic attention for us to un-derstand how many SDS occur in Arizona. Among aquatic SDS insects, taxa that are par-
ticularly likely to undergo endemism at springs include: a few dragonfly species (e.g., the newly discovered masked clubskimmer, Brechmorhoga
Fig. 3.03: Three subspecies of masked clubskimmer dragonfly (Brechmorhoga pertinax) occur from Mexico into South America, and it has been reported there as rarely entering the US in southeastern Arizona. A newly discovered reproducing population at springfed streams in central Grand Canyon may represent a new, springs endemic subspecies.
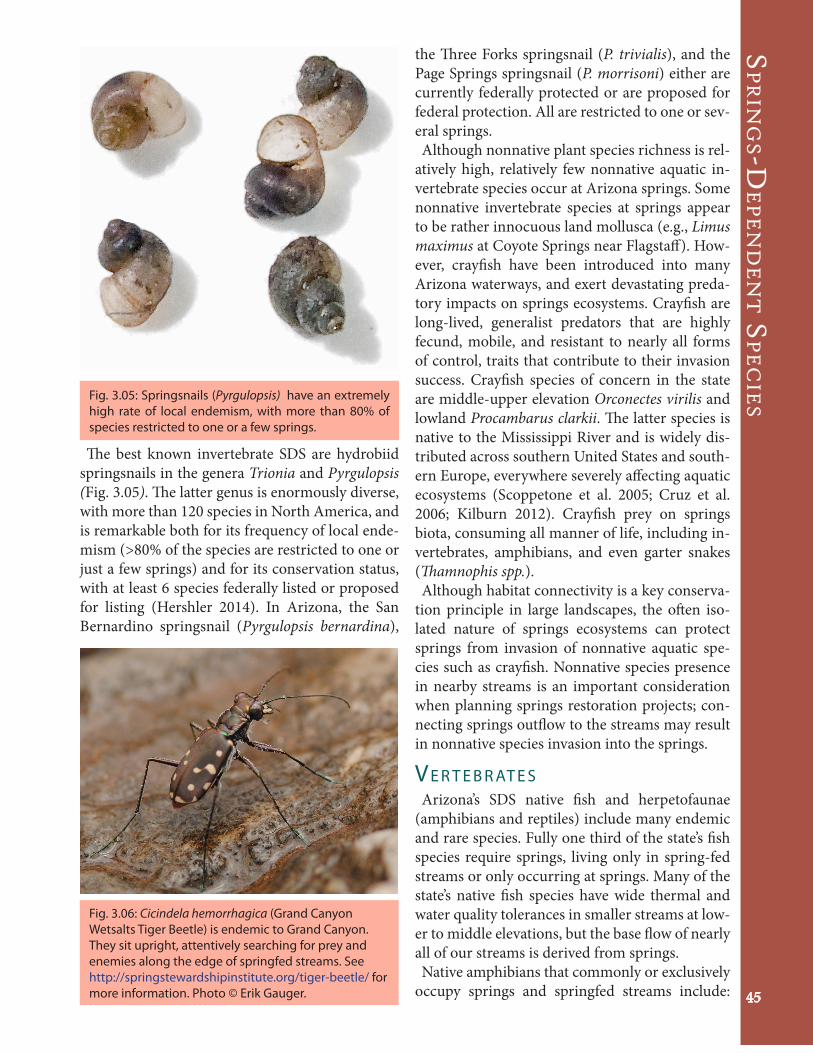
Sp
rin
gS-d
ep
en
de
nt S
pe
cie
S
45
Fig. 3.06: Cicindela hemorrhagica (Grand Canyon Wetsalts Tiger Beetle) is endemic to Grand Canyon. They sit upright, attentively searching for prey and enemies along the edge of springfed streams. See http://springstewardshipinstitute.org/tiger-beetle/ for more information. Photo © Erik Gauger.
The best known invertebrate SDS are hydrobiid springsnails in the genera Trionia and Pyrgulopsis (Fig. 3.05). The latter genus is enormously diverse, with more than 120 species in North America, and is remarkable both for its frequency of local ende-mism (>80% of the species are restricted to one or just a few springs) and for its conservation status, with at least 6 species federally listed or proposed for listing (Hershler 2014). In Arizona, the San Bernardino springsnail (Pyrgulopsis bernardina),
the Three Forks springsnail (P. trivialis), and the Page Springs springsnail (P. morrisoni) either are currently federally protected or are proposed for federal protection. All are restricted to one or sev-eral springs. Although nonnative plant species richness is rel-
atively high, relatively few nonnative aquatic in-vertebrate species occur at Arizona springs. Some nonnative invertebrate species at springs appear to be rather innocuous land mollusca (e.g., Limus maximus at Coyote Springs near Flagstaff). How-ever, crayfish have been introduced into many Arizona waterways, and exert devastating preda-tory impacts on springs ecosystems. Crayfish are long-lived, generalist predators that are highly fecund, mobile, and resistant to nearly all forms of control, traits that contribute to their invasion success. Crayfish species of concern in the state are middle-upper elevation Orconectes virilis and lowland Procambarus clarkii. The latter species is native to the Mississippi River and is widely dis-tributed across southern United States and south-ern Europe, everywhere severely affecting aquatic ecosystems (Scoppetone et al. 2005; Cruz et al. 2006; Kilburn 2012). Crayfish prey on springs biota, consuming all manner of life, including in-vertebrates, amphibians, and even garter snakes (Thamnophis spp.). Although habitat connectivity is a key conserva-
tion principle in large landscapes, the often iso-lated nature of springs ecosystems can protect springs from invasion of nonnative aquatic spe-cies such as crayfish. Nonnative species presence in nearby streams is an important consideration when planning springs restoration projects; con-necting springs outflow to the streams may result in nonnative species invasion into the springs.
ve r t e B r at e SArizona’s SDS native fish and herpetofaunae
(amphibians and reptiles) include many endemic and rare species. Fully one third of the state’s fish species require springs, living only in spring-fed streams or only occurring at springs. Many of the state’s native fish species have wide thermal and water quality tolerances in smaller streams at low-er to middle elevations, but the base flow of nearly all of our streams is derived from springs. Native amphibians that commonly or exclusively
occupy springs and springfed streams include:
Fig. 3.05: Springsnails (Pyrgulopsis) have an extremely high rate of local endemism, with more than 80% of species restricted to one or a few springs.
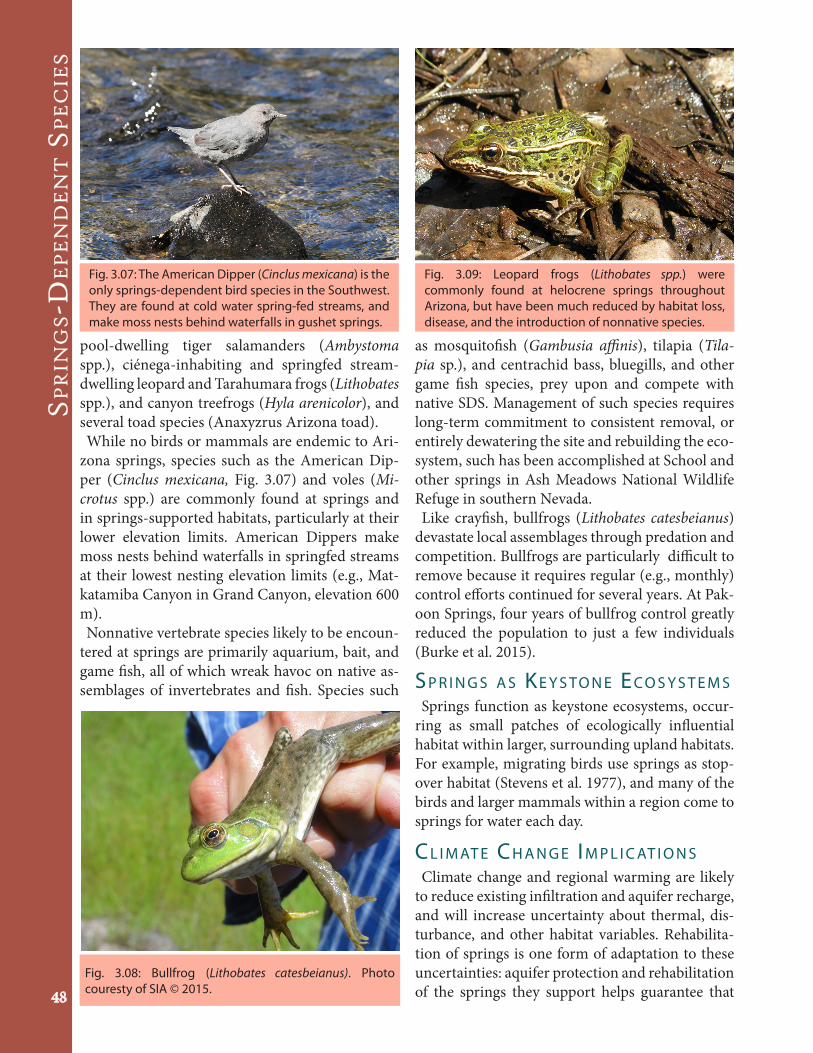
Sp
rin
gS-D
ep
en
De
nt
Sp
ec
ieS
48
pool-dwelling tiger salamanders (Ambystoma spp.), ciénega-inhabiting and springfed stream-dwelling leopard and Tarahumara frogs (Lithobates spp.), and canyon treefrogs (Hyla arenicolor), and several toad species (Anaxyzrus Arizona toad).While no birds or mammals are endemic to Ari-
zona springs, species such as the American Dip-per (Cinclus mexicana, Fig. 3.07) and voles (Mi-crotus spp.) are commonly found at springs and in springs-supported habitats, particularly at their lower elevation limits. American Dippers make moss nests behind waterfalls in springfed streams at their lowest nesting elevation limits (e.g., Mat-katamiba Canyon in Grand Canyon, elevation 600 m). Nonnative vertebrate species likely to be encoun-
tered at springs are primarily aquarium, bait, and game fish, all of which wreak havoc on native as-semblages of invertebrates and fish. Species such
as mosquitofish (Gambusia affinis), tilapia (Tila-pia sp.), and centrachid bass, bluegills, and other game fish species, prey upon and compete with native SDS. Management of such species requires long-term commitment to consistent removal, or entirely dewatering the site and rebuilding the eco-system, such has been accomplished at School and other springs in Ash Meadows National Wildlife Refuge in southern Nevada.Like crayfish, bullfrogs (Lithobates catesbeianus)
devastate local assemblages through predation and competition. Bullfrogs are particularly difficult to remove because it requires regular (e.g., monthly) control efforts continued for several years. At Pak-oon Springs, four years of bullfrog control greatly reduced the population to just a few individuals (Burke et al. 2015).
Sp r I n g S a S ke y S to n e ec o S y S t e m SSprings function as keystone ecosystems, occur-
ring as small patches of ecologically influential habitat within larger, surrounding upland habitats. For example, migrating birds use springs as stop-over habitat (Stevens et al. 1977), and many of the birds and larger mammals within a region come to springs for water each day.
cl I m at e ch a n g e Im p l I c at I o n S Climate change and regional warming are likely
to reduce existing infiltration and aquifer recharge, and will increase uncertainty about thermal, dis-turbance, and other habitat variables. Rehabilita-tion of springs is one form of adaptation to these uncertainties: aquifer protection and rehabilitation of the springs they support helps guarantee that
Fig. 3.08: Bullfrog (Lithobates catesbeianus). Photo couresty of SIA © 2015.
Fig. 3.07: The American Dipper (Cinclus mexicana) is the only springs-dependent bird species in the Southwest. They are found at cold water spring-fed streams, and make moss nests behind waterfalls in gushet springs.
Fig. 3.09: Leopard frogs (Lithobates spp.) were commonly found at helocrene springs throughout Arizona, but have been much reduced by habitat loss, disease, and the introduction of nonnative species.
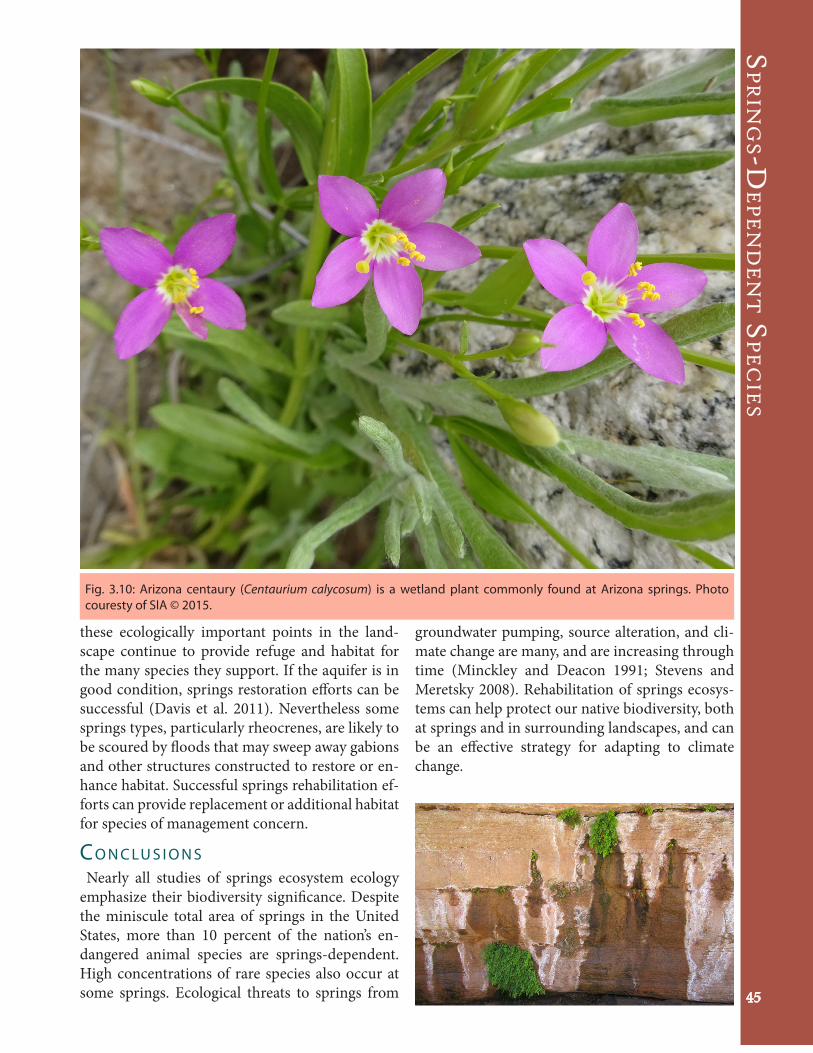
Sp
rin
gS-d
ep
en
de
nt S
pe
cie
S
45
groundwater pumping, source alteration, and cli-mate change are many, and are increasing through time (Minckley and Deacon 1991; Stevens and Meretsky 2008). Rehabilitation of springs ecosys-tems can help protect our native biodiversity, both at springs and in surrounding landscapes, and can be an effective strategy for adapting to climate change.
these ecologically important points in the land-scape continue to provide refuge and habitat for the many species they support. If the aquifer is in good condition, springs restoration efforts can be successful (Davis et al. 2011). Nevertheless some springs types, particularly rheocrenes, are likely to be scoured by floods that may sweep away gabions and other structures constructed to restore or en-hance habitat. Successful springs rehabilitation ef-forts can provide replacement or additional habitat for species of management concern.
co n c lu S I o n SNearly all studies of springs ecosystem ecology
emphasize their biodiversity significance. Despite the miniscule total area of springs in the United States, more than 10 percent of the nation’s en-dangered animal species are springs-dependent. High concentrations of rare species also occur at some springs. Ecological threats to springs from
Fig. 3.10: Arizona centaury (Centaurium calycosum) is a wetland plant commonly found at Arizona springs. Photo couresty of SIA © 2015.
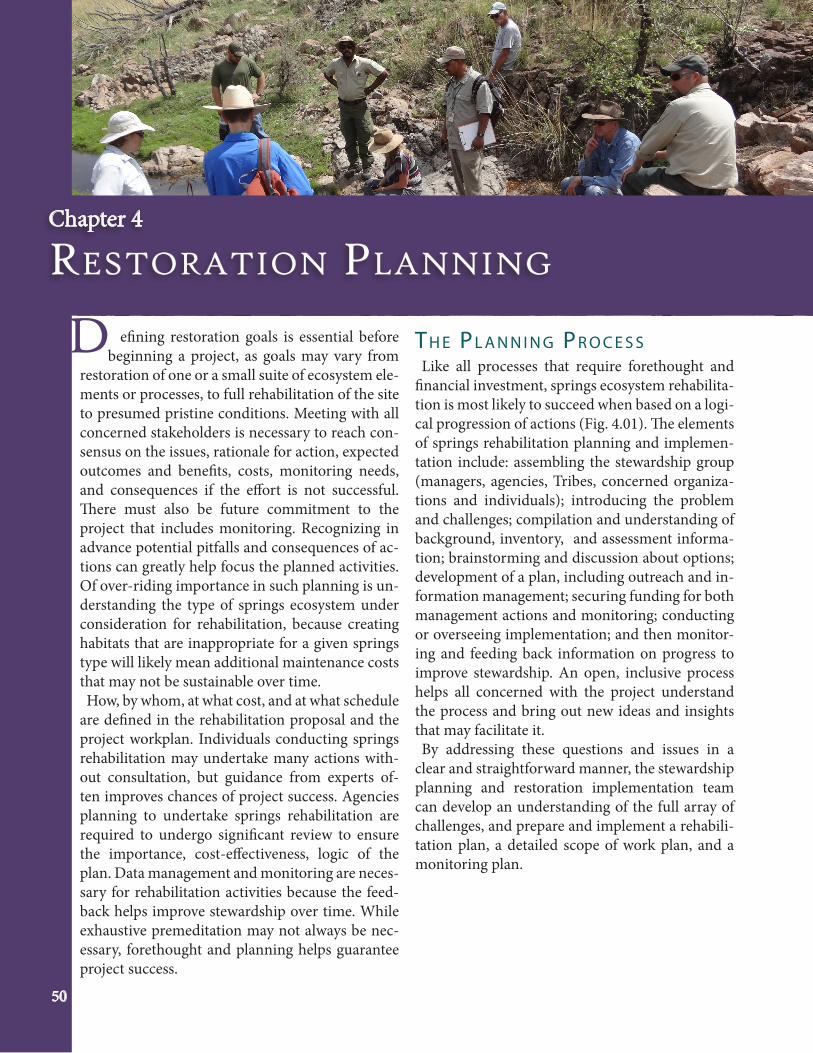
reStorAtion plAnning
efining restoration goals is essential before beginning a project, as goals may vary from restoration of one or a small suite of ecosystem ele-ments or processes, to full rehabilitation of the site to presumed pristine conditions. Meeting with all concerned stakeholders is necessary to reach con-sensus on the issues, rationale for action, expected outcomes and benefits, costs, monitoring needs, and consequences if the effort is not successful. There must also be future commitment to the project that includes monitoring. Recognizing in advance potential pitfalls and consequences of ac-tions can greatly help focus the planned activities. Of over-riding importance in such planning is un-derstanding the type of springs ecosystem under consideration for rehabilitation, because creating habitats that are inappropriate for a given springs type will likely mean additional maintenance costs that may not be sustainable over time. How, by whom, at what cost, and at what schedule
are defined in the rehabilitation proposal and the project workplan. Individuals conducting springs rehabilitation may undertake many actions with-out consultation, but guidance from experts of-ten improves chances of project success. Agencies planning to undertake springs rehabilitation are required to undergo significant review to ensure the importance, cost-effectiveness, logic of the plan. Data management and monitoring are neces-sary for rehabilitation activities because the feed-back helps improve stewardship over time. While exhaustive premeditation may not always be nec-essary, forethought and planning helps guarantee project success.
Chapter 4
D th e pl a n n I n g pr o c e S SLike all processes that require forethought and
financial investment, springs ecosystem rehabilita-tion is most likely to succeed when based on a logi-cal progression of actions (Fig. 4.01). The elements of springs rehabilitation planning and implemen-tation include: assembling the stewardship group (managers, agencies, Tribes, concerned organiza-tions and individuals); introducing the problem and challenges; compilation and understanding of background, inventory, and assessment informa-tion; brainstorming and discussion about options; development of a plan, including outreach and in-formation management; securing funding for both management actions and monitoring; conducting or overseeing implementation; and then monitor-ing and feeding back information on progress to improve stewardship. An open, inclusive process helps all concerned with the project understand the process and bring out new ideas and insights that may facilitate it. By addressing these questions and issues in a
clear and straightforward manner, the stewardship planning and restoration implementation team can develop an understanding of the full array of challenges, and prepare and implement a rehabili-tation plan, a detailed scope of work plan, and a monitoring plan.
50

re
St
or
At
ion
pl
An
nin
g
51
pl a n n I n g qu e S t I o n S (Se e ap p e n d I x B F o r W o r k S h e e t . )After fully reviewing administrative issues, literature, inventory and assessment information, the
springs stewardship group should address the following 18 questions and issues:
1. What is the problem?
2. Can the problem be fixed? • What is the administrative context?
3. Who cares and why?• What is the membership of the stewardship planning and implementation team?• Which other individuals and groups are involved or should collaborate?
4. How will the rehabilitation project be funded in both the short term and long-term?
5. What is the urgency of this project?
6. What are the desired future conditions?• Distinguish among flowing (lotic) versus non- or slow-flowing (lentic) springs types
7. What are the rehabilitation goals (broad future vision for the ecosystem)?• This will vary in relation to the type of springs ecosystem• Further refine understanding of desired microhabitats
8. What are the rehabilitation objectives and options?• What are the specific management goals (e.g., single species or habitat enhancement,
versus whole-ecosystem rehabilitation)
9. If multiple uses are desired, what balance of uses is best and how can those uses best be accommodated?
10. What is likely to be the cost and what are the sources of funding?
11. What is the time line?• Including pre-treatment monitoring • Implementation at 10, 30, 60, 90 and 100% completion• Include long-term, post-treatment monitoring
12. What are the regulatory and compliance issues and how are they to be resolved?
13. Who is responsible for implementation and oversight, and on what schedule?
14. How will information management and reporting be achieved?
15. How will monitoring feedback be used to improve stewardship?
16. What contingency planning is needed?• What if……happens?
17. What additional outreach, partnerships, and funding are needed?
18. What long-term stewardship issues need to be resolved and how will that resolution take place?
• How will the long-term effectiveness of the project be guaranteed?
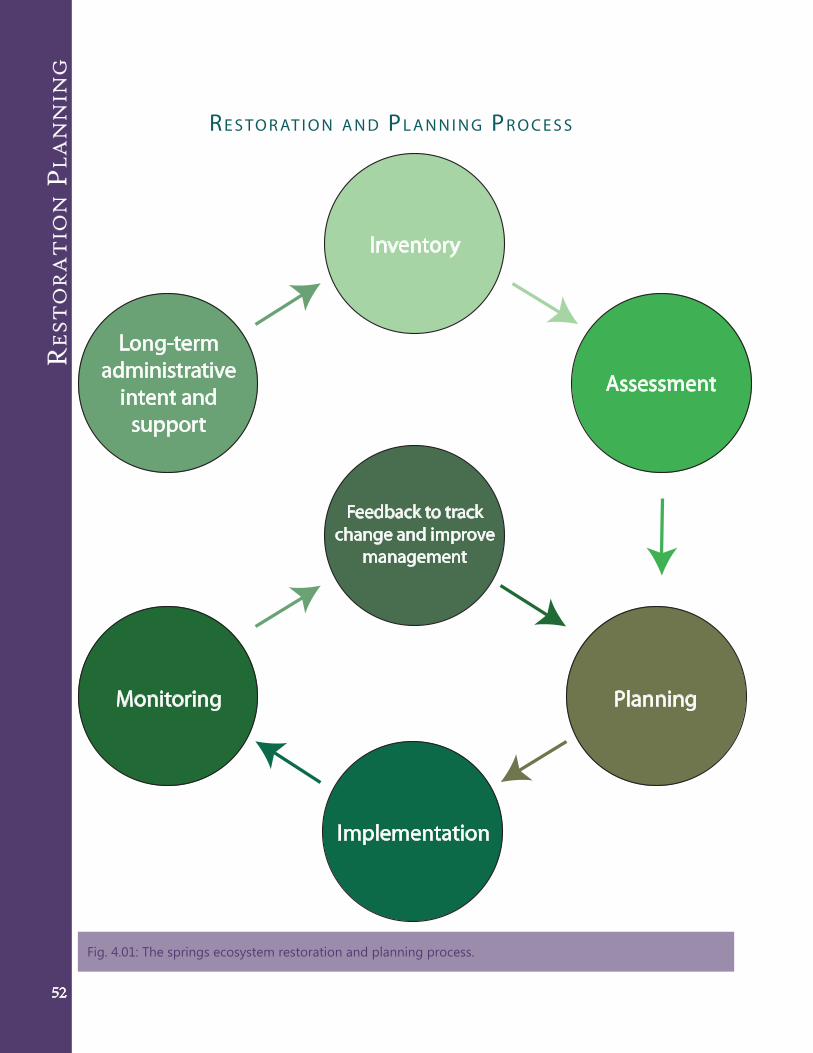
Re
st
oR
at
ion
Pl
an
nin
g
52
Long-term administrative
intent and support
Inventory
Assessment
Planning
Implementation
Monitoring
Feedback to track change and improve
management
re S to r at I o n a n d pl a n n I n g pr o c e S S
Fig. 4.01: The springs ecosystem restoration and planning process.
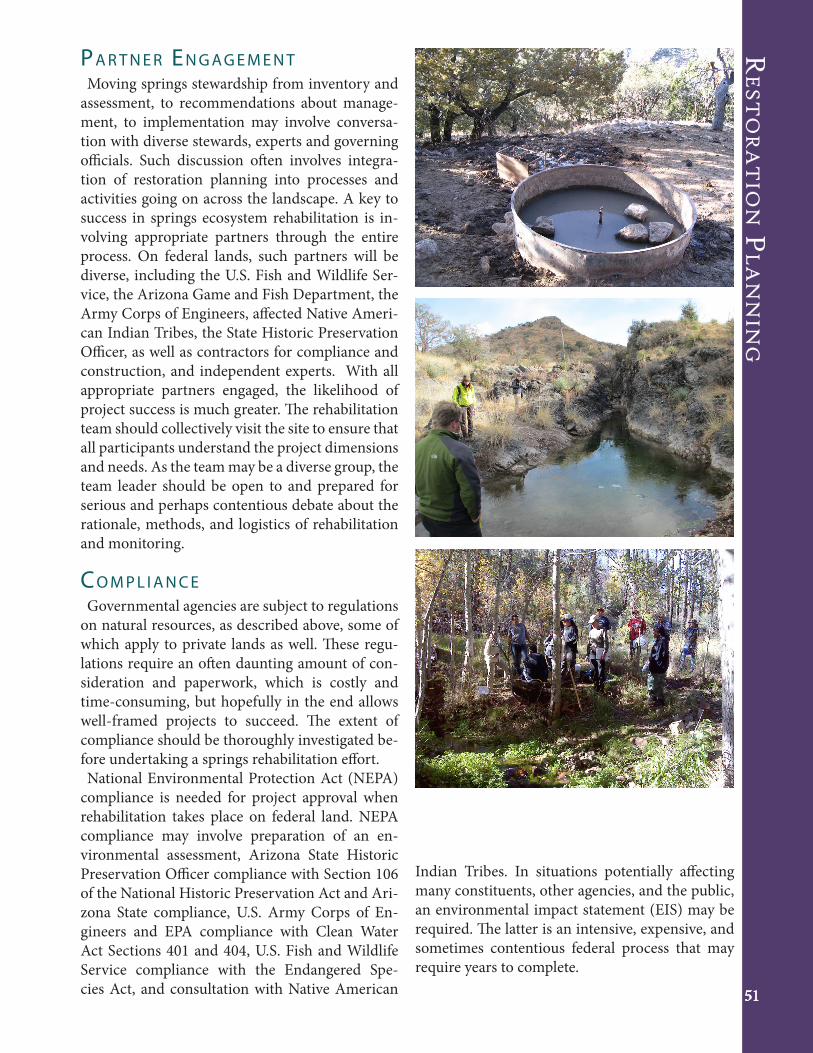
re
St
or
At
ion
pl
An
nin
g
51
pa r t n e r en g a g e m e n tMoving springs stewardship from inventory and
assessment, to recommendations about manage-ment, to implementation may involve conversa-tion with diverse stewards, experts and governing officials. Such discussion often involves integra-tion of restoration planning into processes and activities going on across the landscape. A key to success in springs ecosystem rehabilitation is in-volving appropriate partners through the entire process. On federal lands, such partners will be diverse, including the U.S. Fish and Wildlife Ser-vice, the Arizona Game and Fish Department, the Army Corps of Engineers, affected Native Ameri-can Indian Tribes, the State Historic Preservation Officer, as well as contractors for compliance and construction, and independent experts. With all appropriate partners engaged, the likelihood of project success is much greater. The rehabilitation team should collectively visit the site to ensure that all participants understand the project dimensions and needs. As the team may be a diverse group, the team leader should be open to and prepared for serious and perhaps contentious debate about the rationale, methods, and logistics of rehabilitation and monitoring.
co m p l I a n c eGovernmental agencies are subject to regulations
on natural resources, as described above, some of which apply to private lands as well. These regu-lations require an often daunting amount of con-sideration and paperwork, which is costly and time-consuming, but hopefully in the end allows well-framed projects to succeed. The extent of compliance should be thoroughly investigated be-fore undertaking a springs rehabilitation effort.National Environmental Protection Act (NEPA)
compliance is needed for project approval when rehabilitation takes place on federal land. NEPA compliance may involve preparation of an en-vironmental assessment, Arizona State Historic Preservation Officer compliance with Section 106 of the National Historic Preservation Act and Ari-zona State compliance, U.S. Army Corps of En-gineers and EPA compliance with Clean Water Act Sections 401 and 404, U.S. Fish and Wildlife Service compliance with the Endangered Spe-cies Act, and consultation with Native American
Indian Tribes. In situations potentially affecting many constituents, other agencies, and the public, an environmental impact statement (EIS) may be required. The latter is an intensive, expensive, and sometimes contentious federal process that may require years to complete.
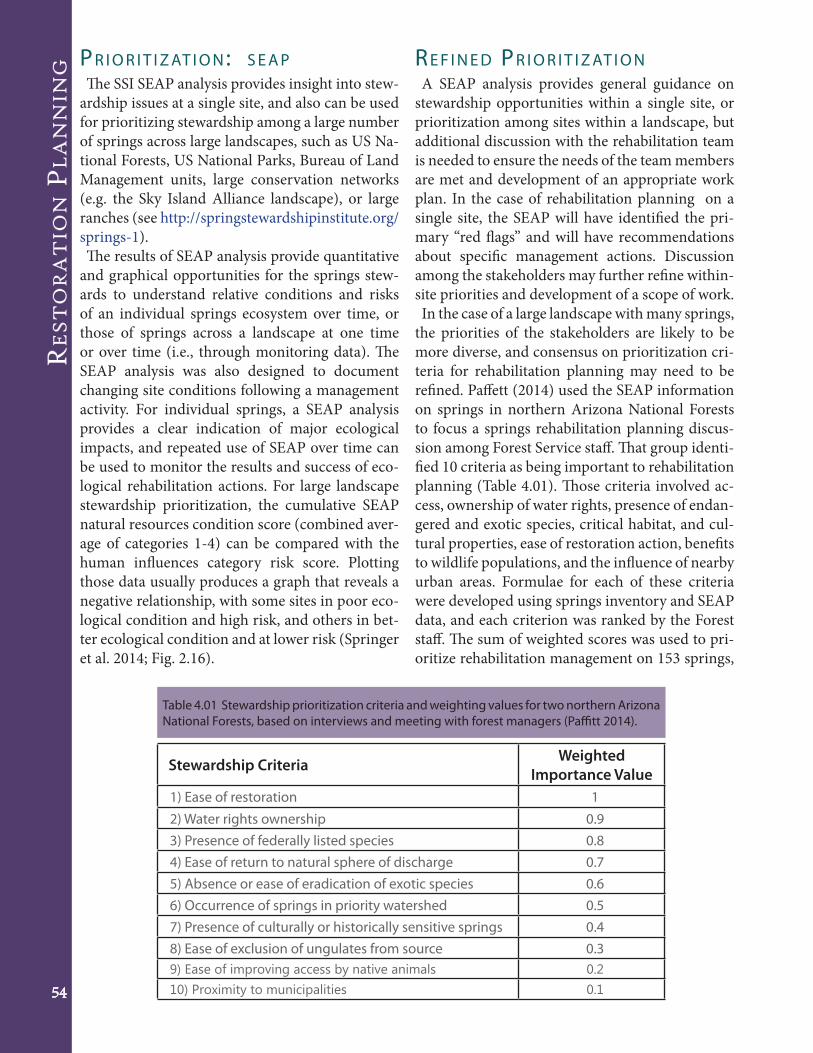
Re
st
oR
at
ion
Pl
an
nin
g
54
re F I n e d pr I o r I t I z at I o n A SEAP analysis provides general guidance on
stewardship opportunities within a single site, or prioritization among sites within a landscape, but additional discussion with the rehabilitation team is needed to ensure the needs of the team members are met and development of an appropriate work plan. In the case of rehabilitation planning on a single site, the SEAP will have identified the pri-mary “red flags” and will have recommendations about specific management actions. Discussion among the stakeholders may further refine within-site priorities and development of a scope of work. In the case of a large landscape with many springs,
the priorities of the stakeholders are likely to be more diverse, and consensus on prioritization cri-teria for rehabilitation planning may need to be refined. Paffett (2014) used the SEAP information on springs in northern Arizona National Forests to focus a springs rehabilitation planning discus-sion among Forest Service staff. That group identi-fied 10 criteria as being important to rehabilitation planning (Table 4.01). Those criteria involved ac-cess, ownership of water rights, presence of endan-gered and exotic species, critical habitat, and cul-tural properties, ease of restoration action, benefits to wildlife populations, and the influence of nearby urban areas. Formulae for each of these criteria were developed using springs inventory and SEAP data, and each criterion was ranked by the Forest staff. The sum of weighted scores was used to pri-oritize rehabilitation management on 153 springs,
Stewardship Criteria Weighted Importance Value
1) Ease of restoration 12) Water rights ownership 0.93) Presence of federally listed species 0.84) Ease of return to natural sphere of discharge 0.75) Absence or ease of eradication of exotic species 0.66) Occurrence of springs in priority watershed 0.57) Presence of culturally or historically sensitive springs 0.48) Ease of exclusion of ungulates from source 0.39) Ease of improving access by native animals 0.210) Proximity to municipalities 0.1
Table 4.01 Stewardship prioritization criteria and weighting values for two northern Arizona National Forests, based on interviews and meeting with forest managers (Paffitt 2014).
pr I o r I t I z at I o n: S e a p The SSI SEAP analysis provides insight into stew-
ardship issues at a single site, and also can be used for prioritizing stewardship among a large number of springs across large landscapes, such as US Na-tional Forests, US National Parks, Bureau of Land Management units, large conservation networks (e.g. the Sky Island Alliance landscape), or large ranches (see http://springstewardshipinstitute.org/springs-1). The results of SEAP analysis provide quantitative
and graphical opportunities for the springs stew-ards to understand relative conditions and risks of an individual springs ecosystem over time, or those of springs across a landscape at one time or over time (i.e., through monitoring data). The SEAP analysis was also designed to document changing site conditions following a management activity. For individual springs, a SEAP analysis provides a clear indication of major ecological impacts, and repeated use of SEAP over time can be used to monitor the results and success of eco-logical rehabilitation actions. For large landscape stewardship prioritization, the cumulative SEAP natural resources condition score (combined aver-age of categories 1-4) can be compared with the human influences category risk score. Plotting those data usually produces a graph that reveals a negative relationship, with some sites in poor eco-logical condition and high risk, and others in bet-ter ecological condition and at lower risk (Springer et al. 2014; Fig. 2.16).

re
St
or
At
ion
pl
An
nin
g
51
and high priority springs were identified for po-tential management attention. Preliminary results were shared with the Forest Service staff, and the final list was developed for Forest planners.This prioritization refinement process may be
improved by recognizing and discussing inher-ent conflicts among criteria. For example, the ease of restoration was interpreted by the managers as proximity to roadways because remote springs re-quire more costly staff and equipment transport. However, springs near roads may be inherently more difficult to rehabilitate because of continued impacts on geomorphology, water quality, wildlife, fugitive dust, and other factors. Also, while springs near municipalities may serve as indicators of ur-banization impacts on aquifer and groundwater quality, springs that are closer to towns are more likely to sustain recreation or water resource ex-ploitation impacts. Nonetheless, the approach of identifying stewardship criteria and ranking them provides a clear prioritization process for manage-ment planning.
co n t I n g e n c y pl a n n I n gSome kinds of events can be predicted based on
the landscape setting of the springs under consid-eration for rehabilitation. For example, flooding is
expected at rheocrene springs, and rockfall is like-ly to occur at hanging gardens. Based on the type of springs ecosystem, the status of the aquifer, the proximity of springs to ranches, recreational use intensity, nonnative species distribution, the im-pacts of and solutions to dewatering, fire, trespass cattle grazing, vandalism, and exotic invasions can be anticipated and potentially mitigated. Consid-eration of expected impacts should be discussed in developing the overall site plan. However, unan-ticipated impacts are likely, and therefore having the team continue to meet and discuss monitoring results is important to maintain the site over a lon-ger time period.
co n c lu S I o n SDevelopment of a springs ecosystem rehabili-
tation plan is important to encourage dialogue among collaborating parties, and to clarify rela-tionships, the administrative context, and consider as much as is possible or reasonable the project scope, needs, timing, costs, information manage-ment, and monitoring contingencies. An open, in-clusive, flexible, and well thought out approach all help to ensure success.
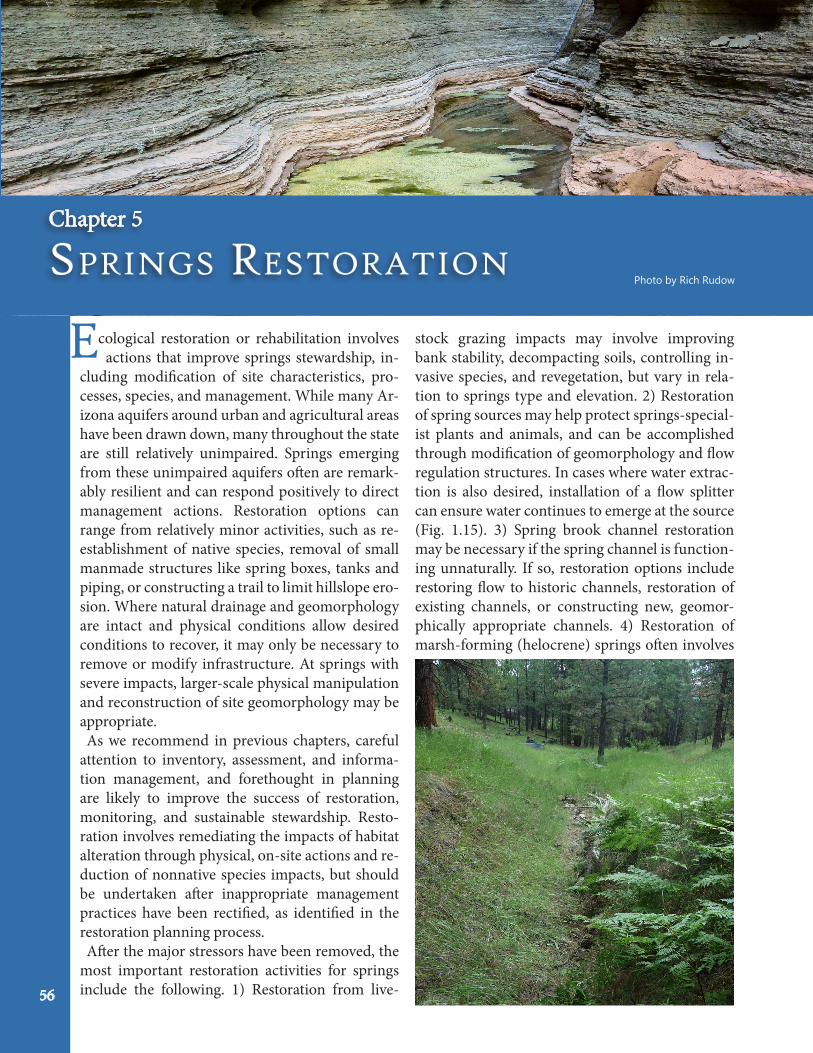
SpringS reStorAtionChapter 5
Photo by Rich Rudow
56
cological restoration or rehabilitation involves actions that improve springs stewardship, in-cluding modification of site characteristics, pro-cesses, species, and management. While many Ar-izona aquifers around urban and agricultural areas have been drawn down, many throughout the state are still relatively unimpaired. Springs emerging from these unimpaired aquifers often are remark-ably resilient and can respond positively to direct management actions. Restoration options can range from relatively minor activities, such as re-establishment of native species, removal of small manmade structures like spring boxes, tanks and piping, or constructing a trail to limit hillslope ero-sion. Where natural drainage and geomorphology are intact and physical conditions allow desired conditions to recover, it may only be necessary to remove or modify infrastructure. At springs with severe impacts, larger-scale physical manipulation and reconstruction of site geomorphology may be appropriate. As we recommend in previous chapters, careful
attention to inventory, assessment, and informa-tion management, and forethought in planning are likely to improve the success of restoration, monitoring, and sustainable stewardship. Resto-ration involves remediating the impacts of habitat alteration through physical, on-site actions and re-duction of nonnative species impacts, but should be undertaken after inappropriate management practices have been rectified, as identified in the restoration planning process.After the major stressors have been removed, the
most important restoration activities for springs include the following. 1) Restoration from live-
stock grazing impacts may involve improving bank stability, decompacting soils, controlling in-vasive species, and revegetation, but vary in rela-tion to springs type and elevation. 2) Restoration of spring sources may help protect springs-special-ist plants and animals, and can be accomplished through modification of geomorphology and flow regulation structures. In cases where water extrac-tion is also desired, installation of a flow splitter can ensure water continues to emerge at the source (Fig. 1.15). 3) Spring brook channel restoration may be necessary if the spring channel is function-ing unnaturally. If so, restoration options include restoring flow to historic channels, restoration of existing channels, or constructing new, geomor-phically appropriate channels. 4) Restoration of marsh-forming (helocrene) springs often involves
E
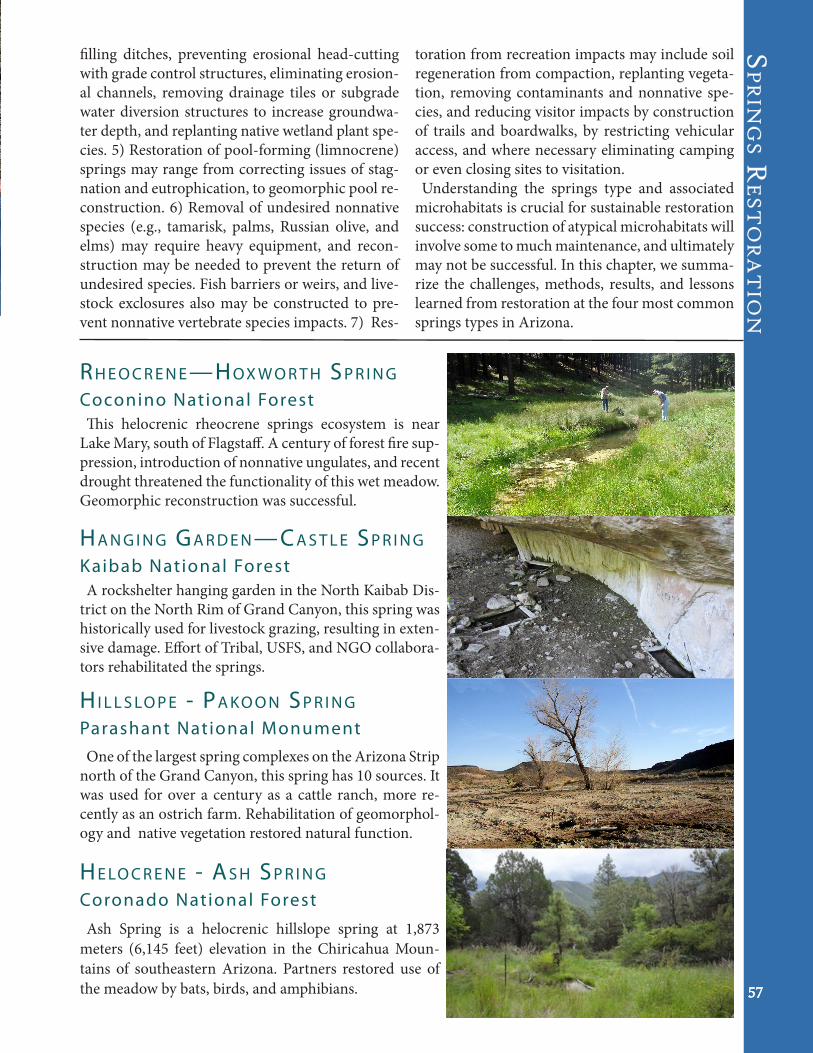
Sp
rin
gS r
eS
to
ra
tio
n
57
filling ditches, preventing erosional head-cutting with grade control structures, eliminating erosion-al channels, removing drainage tiles or subgrade water diversion structures to increase groundwa-ter depth, and replanting native wetland plant spe-cies. 5) Restoration of pool-forming (limnocrene) springs may range from correcting issues of stag-nation and eutrophication, to geomorphic pool re-construction. 6) Removal of undesired nonnative species (e.g., tamarisk, palms, Russian olive, and elms) may require heavy equipment, and recon-struction may be needed to prevent the return of undesired species. Fish barriers or weirs, and live-stock exclosures also may be constructed to pre-vent nonnative vertebrate species impacts. 7) Res-
rh e o c r e n e—hox W o r t h Sp r I n g Coconino National ForestThis helocrenic rheocrene springs ecosystem is near
Lake Mary, south of Flagstaff. A century of forest fire sup-pression, introduction of nonnative ungulates, and recent drought threatened the functionality of this wet meadow. Geomorphic reconstruction was successful.
hI l l S lo p e - pa k o o n Sp r I n g
Parashant National MonumentOne of the largest spring complexes on the Arizona Strip
north of the Grand Canyon, this spring has 10 sources. It was used for over a century as a cattle ranch, more re-cently as an ostrich farm. Rehabilitation of geomorphol-ogy and native vegetation restored natural function.
ha n g I n g ga r d e n —ca S t l e Sp r I n g
Kaibab National ForestA rockshelter hanging garden in the North Kaibab Dis-
trict on the North Rim of Grand Canyon, this spring was historically used for livestock grazing, resulting in exten-sive damage. Effort of Tribal, USFS, and NGO collabora-tors rehabilitated the springs.
he lo c r e n e - aS h Sp r I n g
Coronado National ForestAsh Spring is a helocrenic hillslope spring at 1,873
meters (6,145 feet) elevation in the Chiricahua Moun-tains of southeastern Arizona. Partners restored use of the meadow by bats, birds, and amphibians.
toration from recreation impacts may include soil regeneration from compaction, replanting vegeta-tion, removing contaminants and nonnative spe-cies, and reducing visitor impacts by construction of trails and boardwalks, by restricting vehicular access, and where necessary eliminating camping or even closing sites to visitation. Understanding the springs type and associated
microhabitats is crucial for sustainable restoration success: construction of atypical microhabitats will involve some to much maintenance, and ultimately may not be successful. In this chapter, we summa-rize the challenges, methods, results, and lessons learned from restoration at the four most common springs types in Arizona.
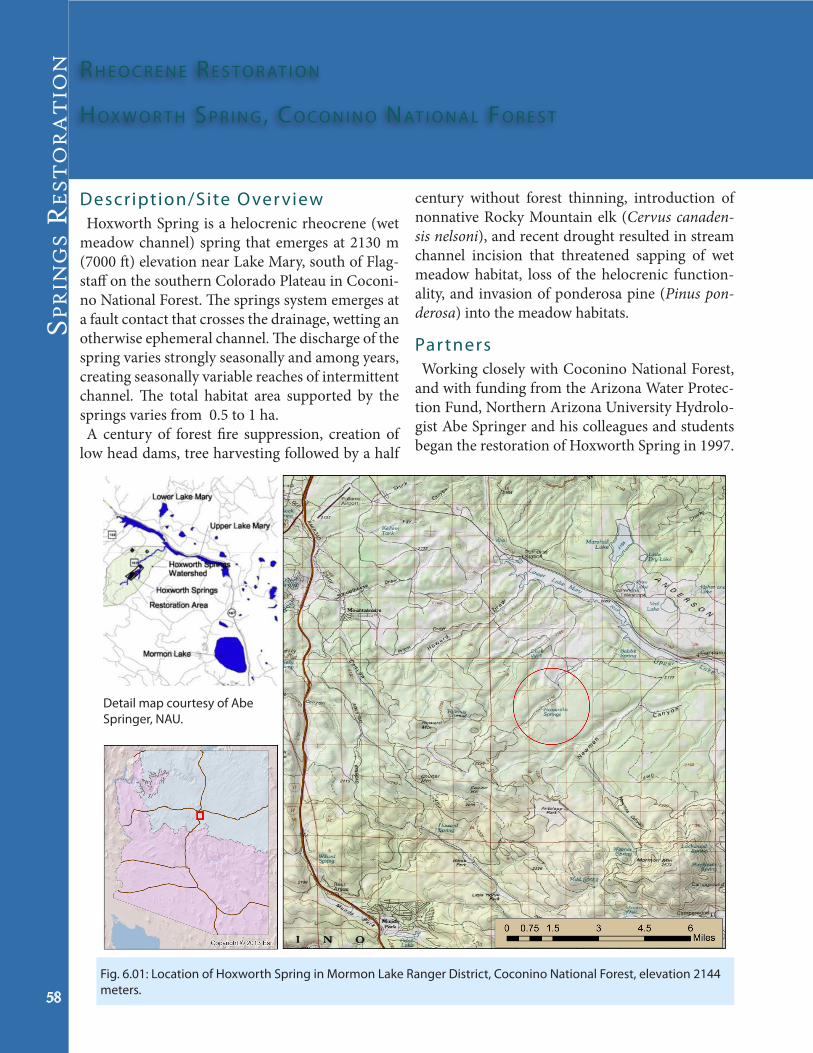
Sp
rin
gS r
eS
to
ra
tio
n
58
Description/Site Over viewHoxworth Spring is a helocrenic rheocrene (wet
meadow channel) spring that emerges at 2130 m (7000 ft) elevation near Lake Mary, south of Flag-staff on the southern Colorado Plateau in Coconi-no National Forest. The springs system emerges at a fault contact that crosses the drainage, wetting an otherwise ephemeral channel. The discharge of the spring varies strongly seasonally and among years, creating seasonally variable reaches of intermittent channel. The total habitat area supported by the springs varies from 0.5 to 1 ha. A century of forest fire suppression, creation of
low head dams, tree harvesting followed by a half
rh e o c r e n e re S to r at I o n
hox W o r t h Sp r I n g , co c o n I n o nat I o n a l Fo r e S t
century without forest thinning, introduction of nonnative Rocky Mountain elk (Cervus canaden-sis nelsoni), and recent drought resulted in stream channel incision that threatened sapping of wet meadow habitat, loss of the helocrenic function-ality, and invasion of ponderosa pine (Pinus pon-derosa) into the meadow habitats.
Par tnersWorking closely with Coconino National Forest,
and with funding from the Arizona Water Protec-tion Fund, Northern Arizona University Hydrolo-gist Abe Springer and his colleagues and students began the restoration of Hoxworth Spring in 1997.
Fig. 6.01: Location of Hoxworth Spring in Mormon Lake Ranger District, Coconino National Forest, elevation 2144 meters.
Detail map courtesy of Abe Springer, NAU.
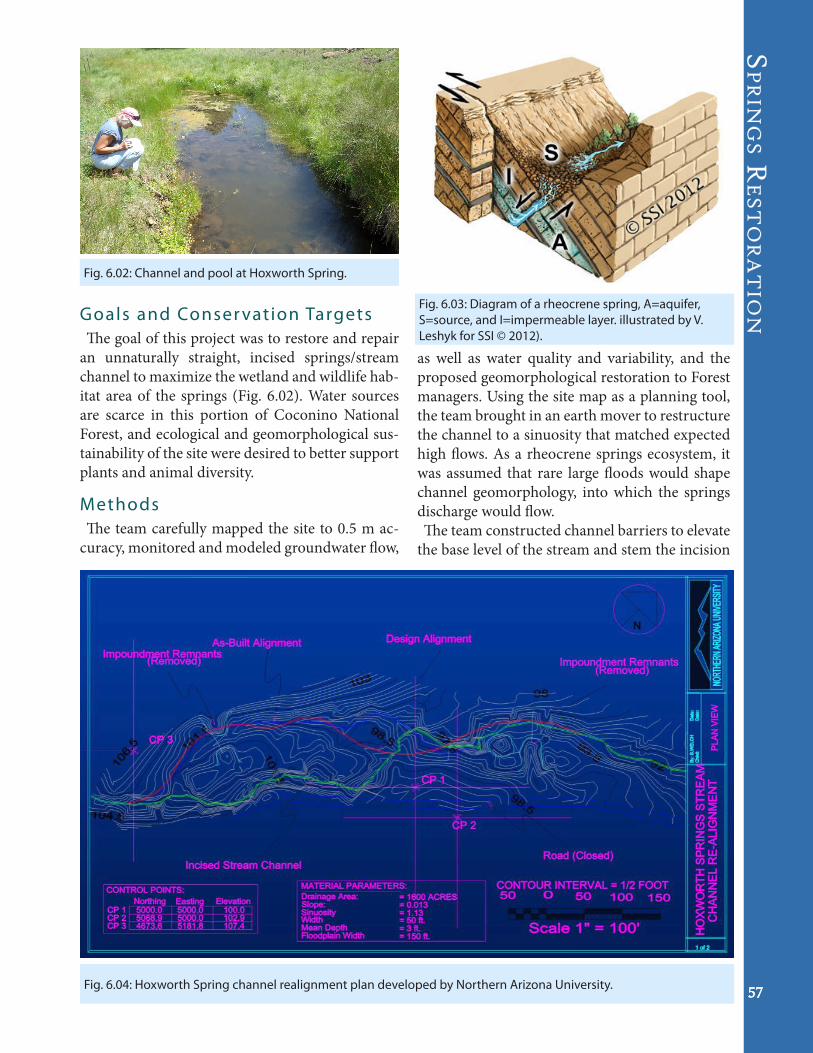
Sp
rin
gS r
eS
to
ra
tio
n
57
Goals and Conser vation TargetsThe goal of this project was to restore and repair
an unnaturally straight, incised springs/stream channel to maximize the wetland and wildlife hab-itat area of the springs (Fig. 6.02). Water sources are scarce in this portion of Coconino National Forest, and ecological and geomorphological sus-tainability of the site were desired to better support plants and animal diversity.
MethodsThe team carefully mapped the site to 0.5 m ac-
curacy, monitored and modeled groundwater flow,
Fig. 6.02: Channel and pool at Hoxworth Spring.
as well as water quality and variability, and the proposed geomorphological restoration to Forest managers. Using the site map as a planning tool, the team brought in an earth mover to restructure the channel to a sinuosity that matched expected high flows. As a rheocrene springs ecosystem, it was assumed that rare large floods would shape channel geomorphology, into which the springs discharge would flow. The team constructed channel barriers to elevate
the base level of the stream and stem the incision
Fig. 6.03: Diagram of a rheocrene spring, A=aquifer, S=source, and I=impermeable layer. illustrated by V. Leshyk for SSI © 2012).
Fig. 6.04: Hoxworth Spring channel realignment plan developed by Northern Arizona University.

Sp
rin
gS r
eS
to
ra
tio
n
60
process, and followed up on that construction with planting of native wetland sedges and other veg-etation to function as bank stabilization. Dr. Springer and his students subsequently con-
ducted long-term monitoring of channel responses and springs flow, and followed up with improved groundwater modeling.
Results and Lessons LearnedOne of the essential lessons learned from this
project is that long-term monitoring data are needed prior to construction to clarify the scope of the restoration activities. Due to an extended dry phase of long-term climate fluctuations, discharge from the spring has been considerably less than expected. The drier climate has caused the length of intermittent flow in the reconstructed channel geomorphology to be less than planned. Also, in-tensive impacts from nonnative elk browsing com-bine to affect channel vegetation and bank erosion.
Nonetheless, Hoxworth Spring now provides open water for wildlife and is functioning well as a ripar-ian wetland. This springs restoration project is successfully
meeting the project objectives. In addition, it was a highly successful collaboration between federal and non-federal partners. It is an important test case for Coconino National Forest, which has ex-pressed interest in improving springs stewardship. Long-term flow monitoring and groundwater modeling has served as an educational opportu-nity for a generation of NAU hydrology students, and has clarified responsiveness of this springs ecosystem to climate change. This site has become a classic case for improving understanding of how improved forest management by forest thinning may help improve springs discharge and enhance Forest wildlife habitat quality. Other excellent ex-amples of rheocrene springs restoration include Anderson et al. (2003) and Marks et al. (2009).
Fig. 6.05: Pre- and post stabilization of Hoxworth Spring, photos courtesy of Abe Springer.
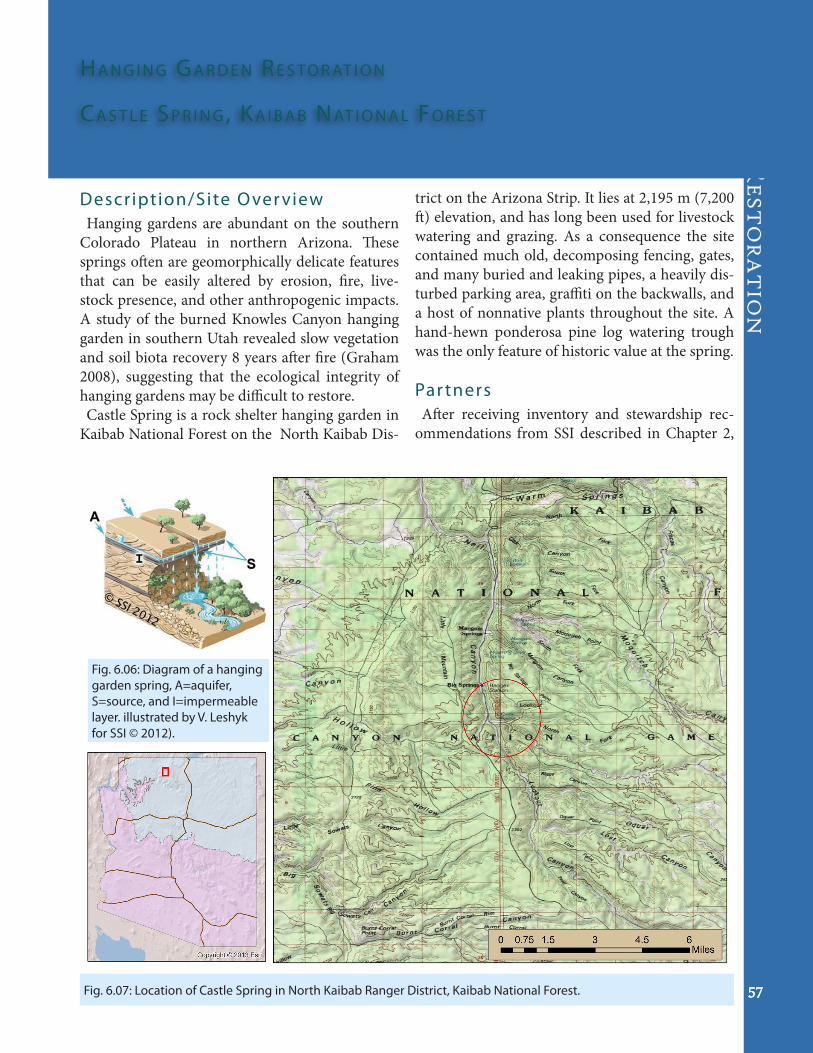
Sp
rin
gS r
eS
to
ra
tio
n
57
trict on the Arizona Strip. It lies at 2,195 m (7,200 ft) elevation, and has long been used for livestock watering and grazing. As a consequence the site contained much old, decomposing fencing, gates, and many buried and leaking pipes, a heavily dis-turbed parking area, graffiti on the backwalls, and a host of nonnative plants throughout the site. A hand-hewn ponderosa pine log watering trough was the only feature of historic value at the spring.
Par tnersAfter receiving inventory and stewardship rec-
ommendations from SSI described in Chapter 2,
Description/Site Over viewHanging gardens are abundant on the southern
Colorado Plateau in northern Arizona. These springs often are geomorphically delicate features that can be easily altered by erosion, fire, live-stock presence, and other anthropogenic impacts. A study of the burned Knowles Canyon hanging garden in southern Utah revealed slow vegetation and soil biota recovery 8 years after fire (Graham 2008), suggesting that the ecological integrity of hanging gardens may be difficult to restore. Castle Spring is a rock shelter hanging garden in
Kaibab National Forest on the North Kaibab Dis-
ha n g I n g ga r d e n re S to r at I o n
ca S t l e Sp r I n g , ka I B a B nat I o n a l Fo r e S t
Fig. 6.06: Diagram of a hanging garden spring, A=aquifer, S=source, and I=impermeable layer. illustrated by V. Leshyk for SSI © 2012).
Fig. 6.07: Location of Castle Spring in North Kaibab Ranger District, Kaibab National Forest.
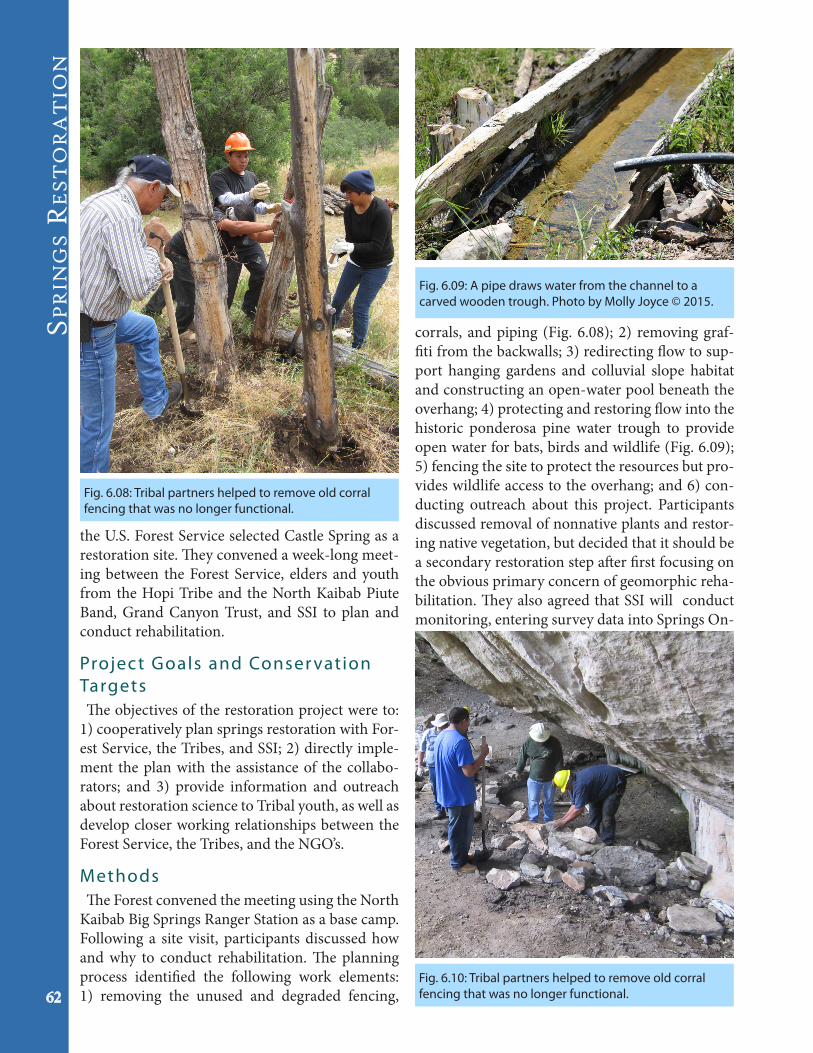
Sp
rin
gS r
eS
to
ra
tio
n
62
corrals, and piping (Fig. 6.08); 2) removing graf-fiti from the backwalls; 3) redirecting flow to sup-port hanging gardens and colluvial slope habitat and constructing an open-water pool beneath the overhang; 4) protecting and restoring flow into the historic ponderosa pine water trough to provide open water for bats, birds and wildlife (Fig. 6.09); 5) fencing the site to protect the resources but pro-vides wildlife access to the overhang; and 6) con-ducting outreach about this project. Participants discussed removal of nonnative plants and restor-ing native vegetation, but decided that it should be a secondary restoration step after first focusing on the obvious primary concern of geomorphic reha-bilitation. They also agreed that SSI will conduct monitoring, entering survey data into Springs On-
the U.S. Forest Service selected Castle Spring as a restoration site. They convened a week-long meet-ing between the Forest Service, elders and youth from the Hopi Tribe and the North Kaibab Piute Band, Grand Canyon Trust, and SSI to plan and conduct rehabilitation.
Project Goals and Conser vation TargetsThe objectives of the restoration project were to:
1) cooperatively plan springs restoration with For-est Service, the Tribes, and SSI; 2) directly imple-ment the plan with the assistance of the collabo-rators; and 3) provide information and outreach about restoration science to Tribal youth, as well as develop closer working relationships between the Forest Service, the Tribes, and the NGO’s.
MethodsThe Forest convened the meeting using the North
Kaibab Big Springs Ranger Station as a base camp. Following a site visit, participants discussed how and why to conduct rehabilitation. The planning process identified the following work elements: 1) removing the unused and degraded fencing,
Fig. 6.09: A pipe draws water from the channel to a carved wooden trough. Photo by Molly Joyce © 2015.
Fig. 6.08: Tribal partners helped to remove old corral fencing that was no longer functional.
Fig. 6.10: Tribal partners helped to remove old corral fencing that was no longer functional.
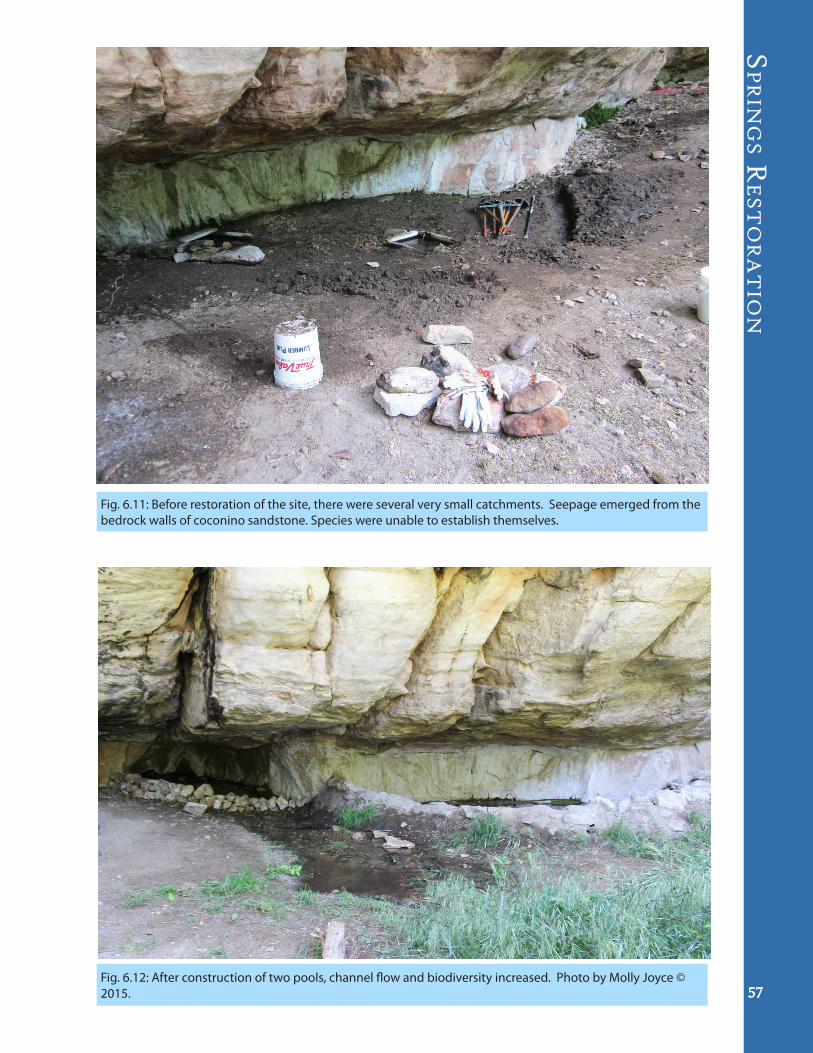
Sp
rin
gS r
eS
to
ra
tio
n
57
Fig. 6.11: Before restoration of the site, there were several very small catchments. Seepage emerged from the bedrock walls of coconino sandstone. Species were unable to establish themselves.
Fig. 6.12: After construction of two pools, channel flow and biodiversity increased. Photo by Molly Joyce © 2015.
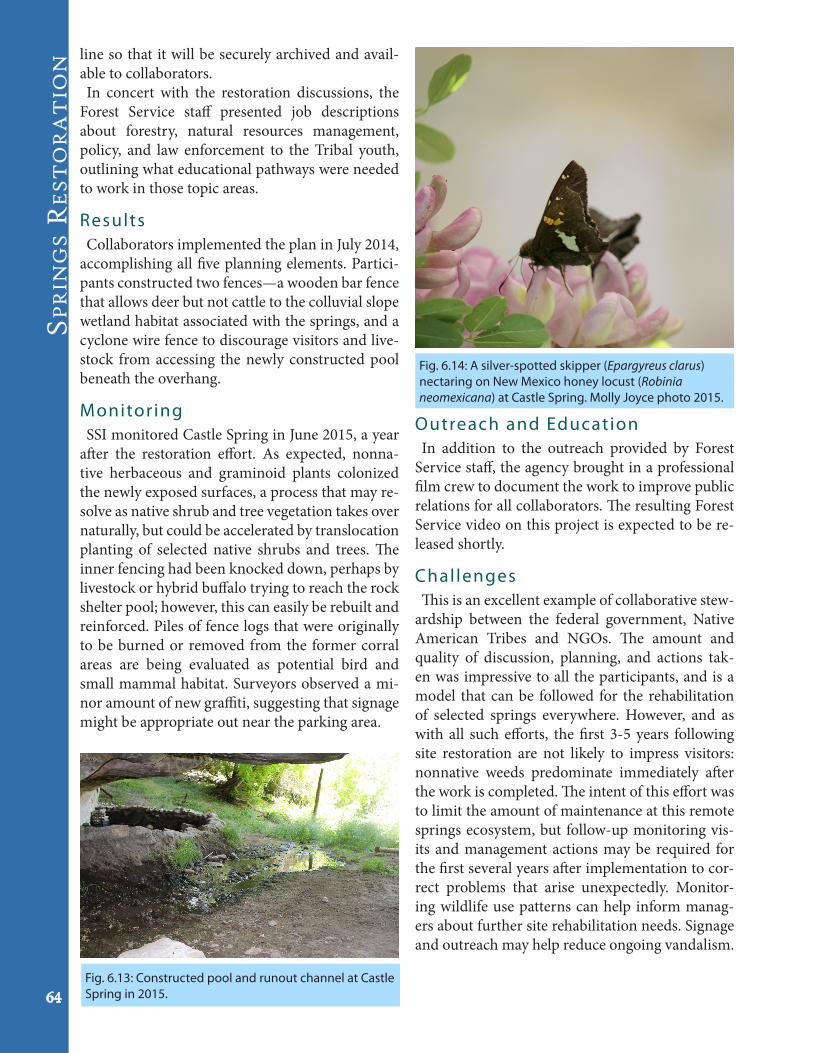
Sp
rin
gS r
eS
to
ra
tio
n
64
line so that it will be securely archived and avail-able to collaborators.In concert with the restoration discussions, the
Forest Service staff presented job descriptions about forestry, natural resources management, policy, and law enforcement to the Tribal youth, outlining what educational pathways were needed to work in those topic areas.
ResultsCollaborators implemented the plan in July 2014,
accomplishing all five planning elements. Partici-pants constructed two fences—a wooden bar fence that allows deer but not cattle to the colluvial slope wetland habitat associated with the springs, and a cyclone wire fence to discourage visitors and live-stock from accessing the newly constructed pool beneath the overhang.
MonitoringSSI monitored Castle Spring in June 2015, a year
after the restoration effort. As expected, nonna-tive herbaceous and graminoid plants colonized the newly exposed surfaces, a process that may re-solve as native shrub and tree vegetation takes over naturally, but could be accelerated by translocation planting of selected native shrubs and trees. The inner fencing had been knocked down, perhaps by livestock or hybrid buffalo trying to reach the rock shelter pool; however, this can easily be rebuilt and reinforced. Piles of fence logs that were originally to be burned or removed from the former corral areas are being evaluated as potential bird and small mammal habitat. Surveyors observed a mi-nor amount of new graffiti, suggesting that signage might be appropriate out near the parking area.
Outreach and EducationIn addition to the outreach provided by Forest
Service staff, the agency brought in a professional film crew to document the work to improve public relations for all collaborators. The resulting Forest Service video on this project is expected to be re-leased shortly.
ChallengesThis is an excellent example of collaborative stew-
ardship between the federal government, Native American Tribes and NGOs. The amount and quality of discussion, planning, and actions tak-en was impressive to all the participants, and is a model that can be followed for the rehabilitation of selected springs everywhere. However, and as with all such efforts, the first 3-5 years following site restoration are not likely to impress visitors: nonnative weeds predominate immediately after the work is completed. The intent of this effort was to limit the amount of maintenance at this remote springs ecosystem, but follow-up monitoring vis-its and management actions may be required for the first several years after implementation to cor-rect problems that arise unexpectedly. Monitor-ing wildlife use patterns can help inform manag-ers about further site rehabilitation needs. Signage and outreach may help reduce ongoing vandalism.
Fig. 6.13: Constructed pool and runout channel at Castle Spring in 2015.
Fig. 6.14: A silver-spotted skipper (Epargyreus clarus) nectaring on New Mexico honey locust (Robinia neomexicana) at Castle Spring. Molly Joyce photo 2015.
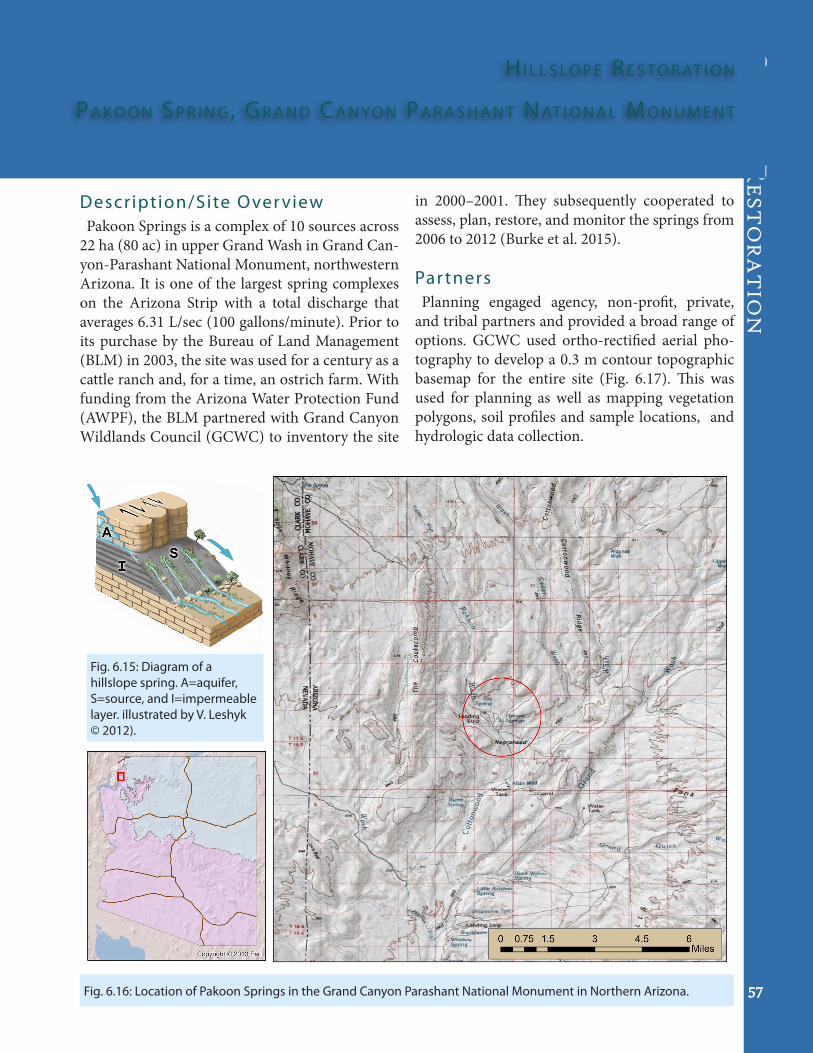
Sp
rin
gS r
eS
to
ra
tio
n
57
Description/Site Over viewPakoon Springs is a complex of 10 sources across
22 ha (80 ac) in upper Grand Wash in Grand Can-yon-Parashant National Monument, northwestern Arizona. It is one of the largest spring complexes on the Arizona Strip with a total discharge that averages 6.31 L/sec (100 gallons/minute). Prior to its purchase by the Bureau of Land Management (BLM) in 2003, the site was used for a century as a cattle ranch and, for a time, an ostrich farm. With funding from the Arizona Water Protection Fund (AWPF), the BLM partnered with Grand Canyon Wildlands Council (GCWC) to inventory the site
hI l l S lo p e re S to r at I o n
pa k o o n Sp r I n g , gr a n d ca n yo n pa r a S h a n t nat I o n a l mo n u m e n t
in 2000–2001. They subsequently cooperated to assess, plan, restore, and monitor the springs from 2006 to 2012 (Burke et al. 2015).
Par tnersPlanning engaged agency, non-profit, private,
and tribal partners and provided a broad range of options. GCWC used ortho-rectified aerial pho-tography to develop a 0.3 m contour topographic basemap for the entire site (Fig. 6.17). This was used for planning as well as mapping vegetation polygons, soil profiles and sample locations, and hydrologic data collection.
Fig. 6.16: Location of Pakoon Springs in the Grand Canyon Parashant National Monument in Northern Arizona.
Fig. 6.15: Diagram of a hillslope spring. A=aquifer, S=source, and I=impermeable layer. illustrated by V. Leshyk © 2012).

Sp
rin
gS r
eS
to
ra
tio
n
66
Fig. 6.17: GCWCdeveloped this digitally rectified orthophoto contour map of Pakoon Springs prior to rehabilitation efforts. This provided 1-foot contours with a 90% accuracy, generated from a land survey. The GIS products provided the basis for developing hydrologic, vegetation, and planning maps. Map and analysis completed by Chris Brod.
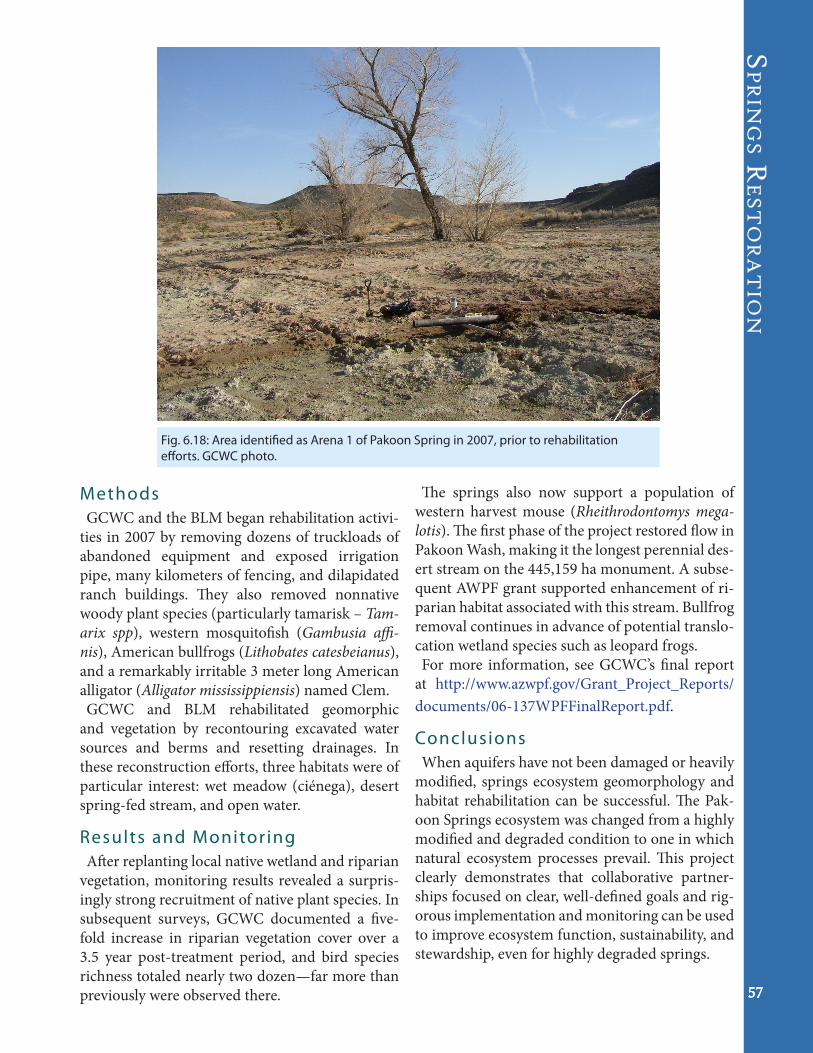
Sp
rin
gS r
eS
to
ra
tio
n
57
MethodsGCWC and the BLM began rehabilitation activi-
ties in 2007 by removing dozens of truckloads of abandoned equipment and exposed irrigation pipe, many kilometers of fencing, and dilapidated ranch buildings. They also removed nonnative woody plant species (particularly tamarisk – Tam-arix spp), western mosquitofish (Gambusia affi-nis), American bullfrogs (Lithobates catesbeianus), and a remarkably irritable 3 meter long American alligator (Alligator mississippiensis) named Clem. GCWC and BLM rehabilitated geomorphic
and vegetation by recontouring excavated water sources and berms and resetting drainages. In these reconstruction efforts, three habitats were of particular interest: wet meadow (ciénega), desert spring-fed stream, and open water.
Results and Monitor ingAfter replanting local native wetland and riparian
vegetation, monitoring results revealed a surpris-ingly strong recruitment of native plant species. In subsequent surveys, GCWC documented a five-fold increase in riparian vegetation cover over a 3.5 year post-treatment period, and bird species richness totaled nearly two dozen—far more than previously were observed there.
The springs also now support a population of western harvest mouse (Rheithrodontomys mega-lotis). The first phase of the project restored flow in Pakoon Wash, making it the longest perennial des-ert stream on the 445,159 ha monument. A subse-quent AWPF grant supported enhancement of ri-parian habitat associated with this stream. Bullfrog removal continues in advance of potential translo-cation wetland species such as leopard frogs. For more information, see GCWC’s final report
at http://www.azwpf.gov/Grant_Project_Reports/documents/06-137WPFFinalReport.pdf.
ConclusionsWhen aquifers have not been damaged or heavily
modified, springs ecosystem geomorphology and habitat rehabilitation can be successful. The Pak-oon Springs ecosystem was changed from a highly modified and degraded condition to one in which natural ecosystem processes prevail. This project clearly demonstrates that collaborative partner-ships focused on clear, well-defined goals and rig-orous implementation and monitoring can be used to improve ecosystem function, sustainability, and stewardship, even for highly degraded springs.
Fig. 6.18: Area identified as Arena 1 of Pakoon Spring in 2007, prior to rehabilitation efforts. GCWC photo.
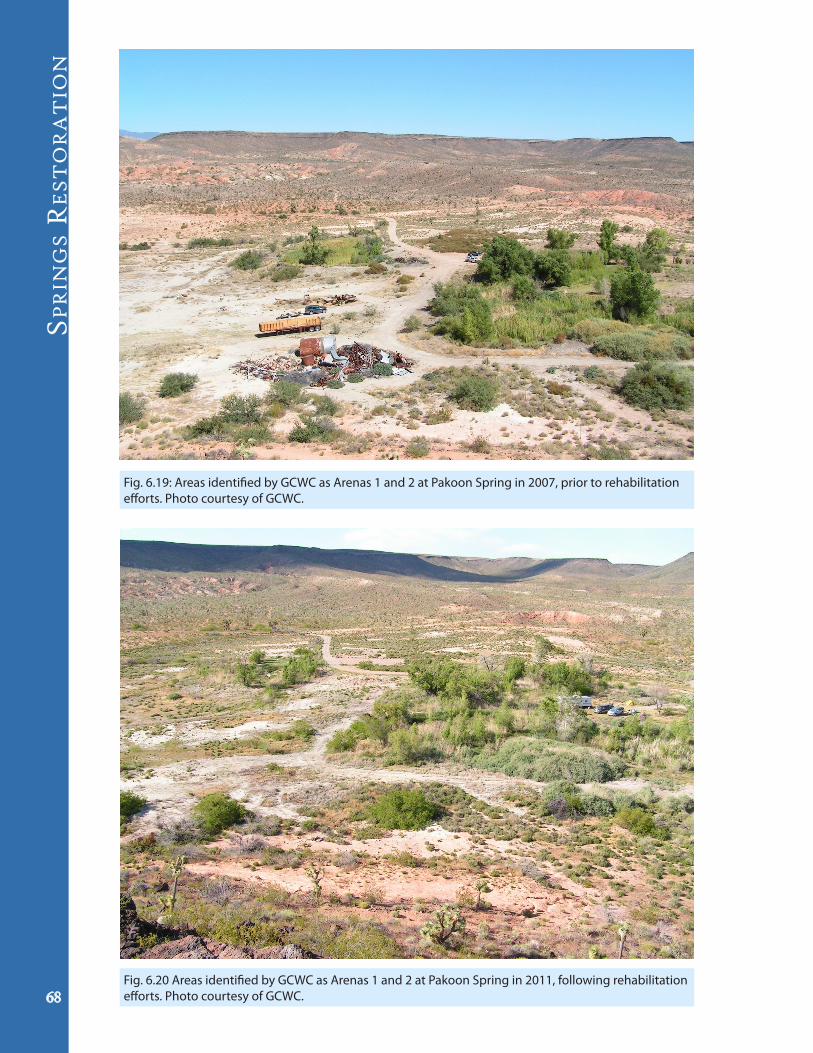
Sp
rin
gS r
eS
to
ra
tio
n
68
Fig. 6.19: Areas identified by GCWC as Arenas 1 and 2 at Pakoon Spring in 2007, prior to rehabilitation efforts. Photo courtesy of GCWC.
Fig. 6.20 Areas identified by GCWC as Arenas 1 and 2 at Pakoon Spring in 2011, following rehabilitation efforts. Photo courtesy of GCWC.
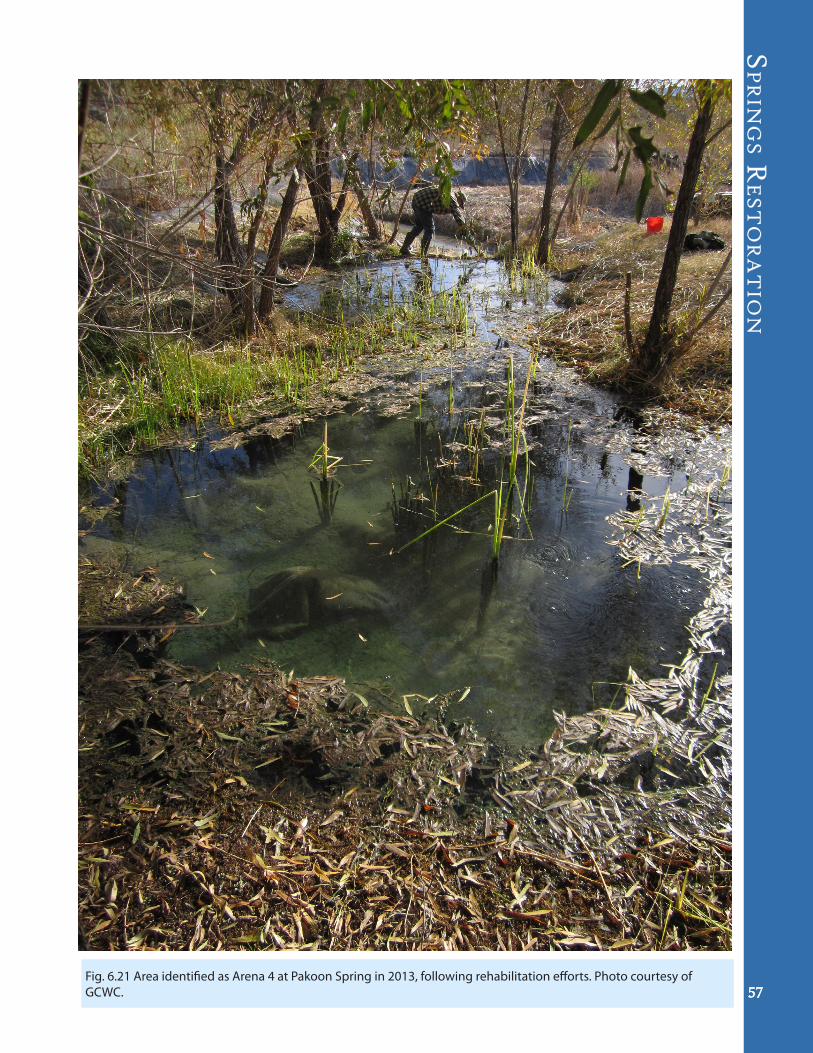
Sp
rin
gS r
eS
to
ra
tio
n
57Fig. 6.21 Area identified as Arena 4 at Pakoon Spring in 2013, following rehabilitation efforts. Photo courtesy of GCWC.
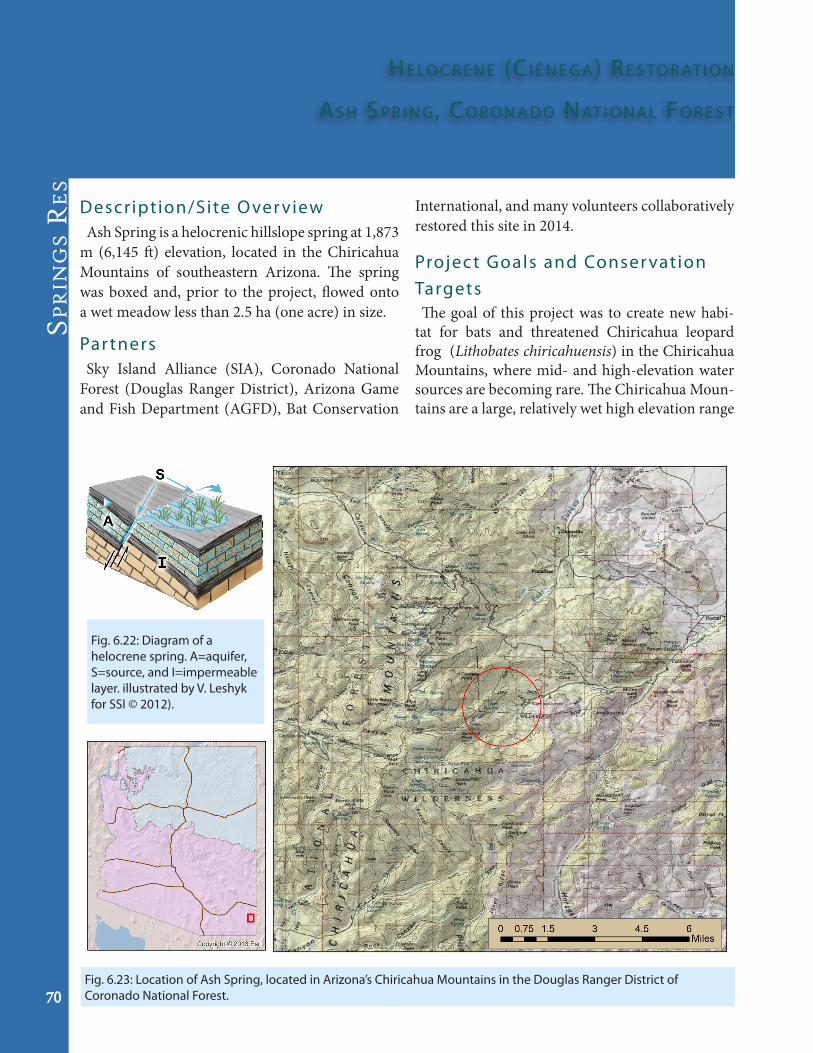
Sp
rin
gS r
eS
to
ra
tio
n
70
he lo c r e n e (cI é n e g a) re S to r at I o n
aS h Sp r I n g , co r o n a d o nat I o n a l Fo r e S t
Description/Site Over viewAsh Spring is a helocrenic hillslope spring at 1,873
m (6,145 ft) elevation, located in the Chiricahua Mountains of southeastern Arizona. The spring was boxed and, prior to the project, flowed onto a wet meadow less than 2.5 ha (one acre) in size.
Par tnersSky Island Alliance (SIA), Coronado National
Forest (Douglas Ranger District), Arizona Game and Fish Department (AGFD), Bat Conservation
International, and many volunteers collaboratively restored this site in 2014.
Project Goals and Conser vation TargetsThe goal of this project was to create new habi-
tat for bats and threatened Chiricahua leopard frog (Lithobates chiricahuensis) in the Chiricahua Mountains, where mid- and high-elevation water sources are becoming rare. The Chiricahua Moun-tains are a large, relatively wet high elevation range
Fig. 6.23: Location of Ash Spring, located in Arizona’s Chiricahua Mountains in the Douglas Ranger District of Coronado National Forest.
Fig. 6.22: Diagram of a helocrene spring. A=aquifer, S=source, and I=impermeable layer. illustrated by V. Leshyk for SSI © 2012).
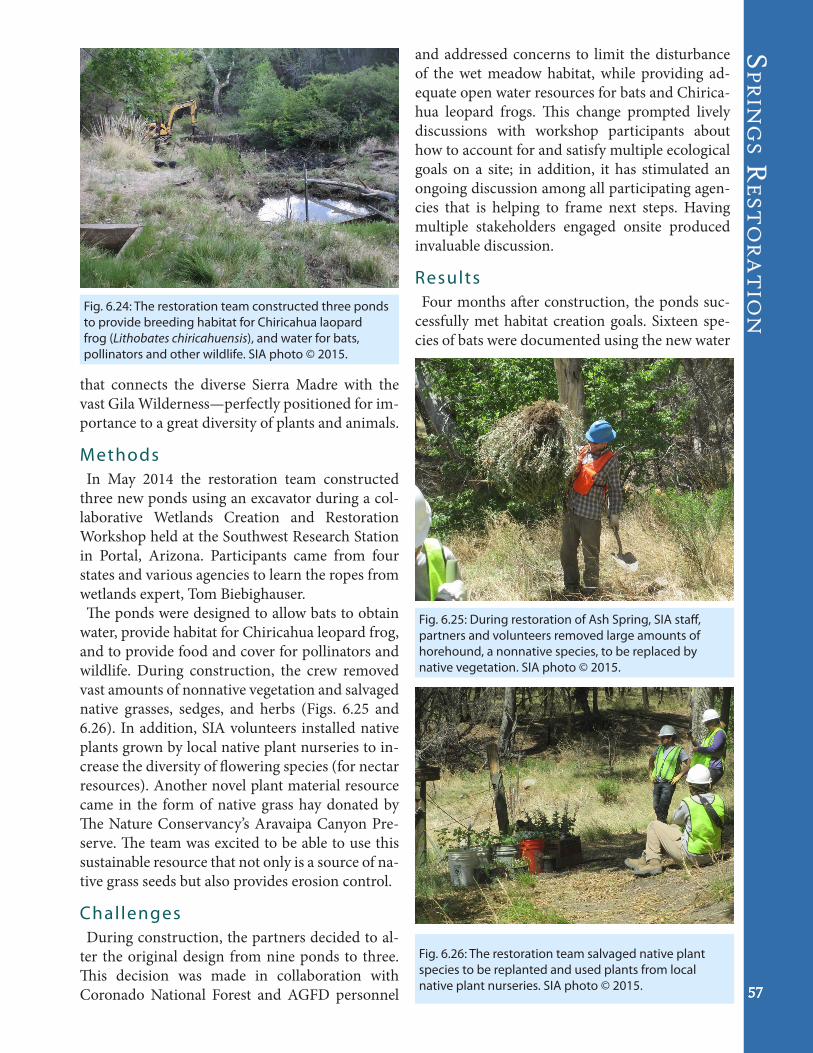
Sp
rin
gS r
eS
to
ra
tio
n
57
that connects the diverse Sierra Madre with the vast Gila Wilderness—perfectly positioned for im-portance to a great diversity of plants and animals.
MethodsIn May 2014 the restoration team constructed
three new ponds using an excavator during a col-laborative Wetlands Creation and Restoration Workshop held at the Southwest Research Station in Portal, Arizona. Participants came from four states and various agencies to learn the ropes from wetlands expert, Tom Biebighauser. The ponds were designed to allow bats to obtain
water, provide habitat for Chiricahua leopard frog, and to provide food and cover for pollinators and wildlife. During construction, the crew removed vast amounts of nonnative vegetation and salvaged native grasses, sedges, and herbs (Figs. 6.25 and 6.26). In addition, SIA volunteers installed native plants grown by local native plant nurseries to in-crease the diversity of flowering species (for nectar resources). Another novel plant material resource came in the form of native grass hay donated by The Nature Conservancy’s Aravaipa Canyon Pre-serve. The team was excited to be able to use this sustainable resource that not only is a source of na-tive grass seeds but also provides erosion control.
ChallengesDuring construction, the partners decided to al-
ter the original design from nine ponds to three. This decision was made in collaboration with Coronado National Forest and AGFD personnel
Fig. 6.25: During restoration of Ash Spring, SIA staff, partners and volunteers removed large amounts of horehound, a nonnative species, to be replaced by native vegetation. SIA photo © 2015.
Fig. 6.26: The restoration team salvaged native plant species to be replanted and used plants from local native plant nurseries. SIA photo © 2015.
Fig. 6.24: The restoration team constructed three ponds to provide breeding habitat for Chiricahua laopard frog (Lithobates chiricahuensis), and water for bats, pollinators and other wildlife. SIA photo © 2015.
and addressed concerns to limit the disturbance of the wet meadow habitat, while providing ad-equate open water resources for bats and Chirica-hua leopard frogs. This change prompted lively discussions with workshop participants about how to account for and satisfy multiple ecological goals on a site; in addition, it has stimulated an ongoing discussion among all participating agen-cies that is helping to frame next steps. Having multiple stakeholders engaged onsite produced invaluable discussion.
Results Four months after construction, the ponds suc-
cessfully met habitat creation goals. Sixteen spe-cies of bats were documented using the new water
Sp
rin
gS r
eS
to
ra
tio
n
72
source during acoustic and mist-net surveys at the end of July, and suspected Chiricahua leopard frog tadpoles were confirmed in early September. SIA also noted that the third and deepest pond was not holding water as expected, presumably because there was not enough clay in the soil to effectively seal the bottom. Working with the Coronado Na-tional Forest, SIA is developing a plan to seal the pond so that it is effective winter habitat for leop-ard frogs, and also to enhance water infiltration in the wet meadow downslope from the pond. The team is seeking grant funding for continuing this
project as well as Phase 2 of Ash Spring to reduc-eerosion in the large gully adjacent to the project.
MonitoringSIA’s Adopt-A-Spring citizen scientist volunteers
are monitoring seasonal changes at Ash Spring five times per year, providing a way to keep Coronado National Forest apprised of stewardship needs, and to help maintain this important new water source for wildlife in a sustainable and ecologically func-tional condition.
Fig. 6.27: Following restoration efforts, constructed fences help protect the wet meadow and ponds from being trampled by livestock. SIA photo © 2015.
Sp
rin
gS r
eS
to
ra
tio
n
57
Fig. 6.28: (Top) Prior to restoration, Ash Spring was a ciénega (wet meadow) that had been boxed, and had no collection pools. (Bottom) After restoration efforts, the site exhibits improved flow and native vegetation has rebounded. SIA photo © 2015.
74
SpringS monitoring
onitoring is the scientific acquisition and analysis of data to inform stewards about system changes or responses to treatments over time. and is best conducted in relation to clearly defined goals, objectives, and scientific questions. A monitoring plan is a good way to frame the con-cepts, rationale, and protocols for a Level 3 springs program. Monitoring is one of several potential Level 3 springs stewardship activities that also may include research, rehabilitation planning and im-plementation, or development. Monitoring should be regarded as a process that will be conducted in perpetuity, so land managers should clearly define and agree upon the commitment, cost, organiza-tion, conduct, and information management of the program prior to initiation.Prior to beginning springs ecosystem monitor-
ing, it also is important to develop and refine the statistical framework for answering the manage-ment questions. This will help with development of the monitoring plan by identifying the variables to be measured and frequency of sampling. If a large monitoring program is proposed, we recommend consultation with a trained statistician to ensure the cost-efficiency of the project and the scientific credibility of the results.
Wh at to mo n I to r Monitoring should focus on a suite of variables
and/or sites that are important to the steward(s), keeping in mind the importance of understanding variation among springs types (sensu Springer and Stevens 2008), cultural and economic values, and ecological integrity. Springs that are being rehabil-itated particularly warrant pre-treatment baseline and post-treatment monitoring (Davis et al. 2011).
Chapter 6
Photo by Rich Rudow
M The Springs Stewardship Institute’s Level 2 sam-pling methods and the SEAP process are appropri-ate for monitoring habitat area, flow, water quality, site geomorphology, vegetation cover and compo-sition, invertebrate and vertebrate presence, an-thropogenic impacts, and administrative context. These methods are generally useful for quantifi-cation of springs physical and biological integrity and function, and the extent of human impacts. However, variables like the dynamics of rare popu-lations may be of specific interest in Level 3 proj-ects.
Wh e n to mo n I to rNo single season is best for characterization of
all springs variables of interest, and among-season and among-year variation in springs characteris-tics is likely to be both substantial and necessary for understanding springs ecosystem function (Stevens et al. 2011). Site visits at the height of the growing season (June to September) are needed to characterize vegetation composition and structure and faunal presence, and to minimize variation in seasonal anthropogenic use intensity. However, mid-summer is likely to be the period with the lowest discharge due to seasonally declining water tables and maximum evapotranspiration, creating trade-offs between monitoring flow and biological variables.
mo n I to r I n g pl a n el e m e n t S
Physical Site Monitor ingThe initial Level 2 inventory can provide baseline
information about geography, hydrogeology, solar
75
Sp
rin
gS M
on
ito
rin
gradiation budget, and biological characteristics, as well as human impacts and administrative context and uses. However, expansion of detail about these or other variables may be desired for long-term monitoring.
Site MapIt is necessary to develop a close-resolution
springs ecosystem map for both rehabilitation and post-treatment monitoring. A high quality map of the study site allows documention of changes in geomorphology and vegetation cover, as well as where sampling measurements are made. Such a map can be developed from aerial photography at 0.3 m or finer scale for determining geomorphic change, planting success, and other such activities.Microhabitats are relocated during each site visit,
and the area of each is measured and re-drawn on the site map. The percent area contribution of each geomorphic habitat type can change between vis-its, and such changes provide a useful indication of trend in Shannon-Weiner geomorphic habitat diversity. Changes in these variables can identify trends in physical and biological characteristics through time at the springs ecosystem.
Flow MeasurementSystematic hydrological measurements are need-
ed for classifying, understanding, and monitoring spring ecosystems, but flow measurement can be difficult or imprecise. Flow and geochemistry add insight into understanding aquifer mechanics and subterranean flowpath duration. Modeling flow variability requires long-term data: collecting flow data during each site visit is important. Springs flow may be measured with one or more
of the protocols listed in Appendix B. That appen-dix describes methods to measure springs flow, ranging from the measurement of wetted patch area when flow is unmeasureable, to standard flow capture methods for small springs, the use of portable flumes or weirs for larger springs, and streamflow cross-section velocity measurement. Such data should be evaluated for quality before
being integrated with other physical and bio-cul-tural information to assess the condition and risks of hydrological alteration to the springs ecosystem (e.g., Wilde 2008). Flow measurement requires planning, both for
the logistics of sampling and the equipment to be
used. At the site, flow should be measured at the point of maximum expression, which is not likely to be the source, but rather some distance down-stream. The point of flow measurement should be recorded on the site map (above). Understanding flow variability is important and
flow can be expected to vary seasonally in most shallow aquifer or low residence-time aquifers. The most conservative flow measurements are made when, or in settings where transpiration losses and precipitation contributions are mini-mal (e.g., winter, in bedrock emergence settings). However, it is equally important to understand the impacts of riparian vegetation on water uptake, so mid-summer measurements also are relevant. As stated above, tradeoffs between seasonality and vegetation mean that there is no single time of year that is best for flow measurement. Replicated flow measurements will provide a trustworthy average value and clarify uncertainty within the measure-ments; we recommend measuring flow at least three times. If the discharge of the spring is low (zero, unmea-
surable, or first magnitude; Appendix B), discharge measurement may take some time and should be started early in the site visit. Second to fifth magni-tude discharges are quicker and easier to measure. Measurement of sixth or higher magnitude dis-charges (non-wadable channels) may require most of the day. Important observations may include the markers of any recent high discharges, such as high water marks, oriented vegetation or debris on or above the channel or floodplain. A novel way to document high flow events is the use of automated oblique photography.
Wat e r qua l I t y mo n I to r I n g
Over viewField and laboratory water geochemistry meth-
ods are described by the U.S. Geological Survey (reviewed in Wilde 2008; Appendix B) and recom-mended by the Environmental Protection Agency. In general, field air and water temperature, pH, specific conductance, total alkalinity, and dis-solved oxygen concentration are measured using daily-calibrated field instrumentation. Water qual-ity samples and measurements are made as close to the springs source as possible to capture character-istics of emerging groundwater.
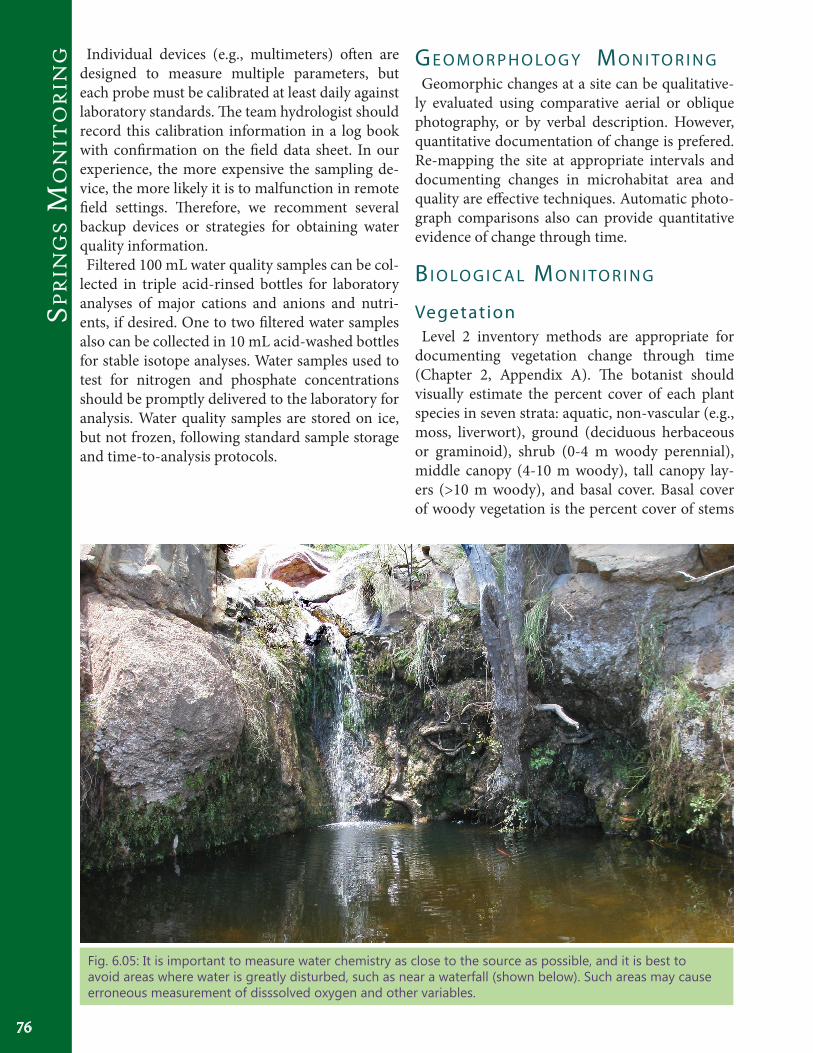
Sp
rin
gS M
on
ito
rin
g
76
Individual devices (e.g., multimeters) often are designed to measure multiple parameters, but each probe must be calibrated at least daily against laboratory standards. The team hydrologist should record this calibration information in a log book with confirmation on the field data sheet. In our experience, the more expensive the sampling de-vice, the more likely it is to malfunction in remote field settings. Therefore, we recomment several backup devices or strategies for obtaining water quality information. Filtered 100 mL water quality samples can be col-
lected in triple acid-rinsed bottles for laboratory analyses of major cations and anions and nutri-ents, if desired. One to two filtered water samples also can be collected in 10 mL acid-washed bottles for stable isotope analyses. Water samples used to test for nitrogen and phosphate concentrations should be promptly delivered to the laboratory for analysis. Water quality samples are stored on ice, but not frozen, following standard sample storage and time-to-analysis protocols.
Fig. 6.05: It is important to measure water chemistry as close to the source as possible, and it is best to avoid areas where water is greatly disturbed, such as near a waterfall (shown below). Such areas may cause erroneous measurement of disssolved oxygen and other variables.
ge o m o r p h o lo g y mo n I to r I n gGeomorphic changes at a site can be qualitative-
ly evaluated using comparative aerial or oblique photography, or by verbal description. However, quantitative documentation of change is prefered. Re-mapping the site at appropriate intervals and documenting changes in microhabitat area and quality are effective techniques. Automatic photo-graph comparisons also can provide quantitative evidence of change through time.
BI o lo g I c a l mo n I to r I n g
Vegetation Level 2 inventory methods are appropriate for
documenting vegetation change through time (Chapter 2, Appendix A). The botanist should visually estimate the percent cover of each plant species in seven strata: aquatic, non-vascular (e.g., moss, liverwort), ground (deciduous herbaceous or graminoid), shrub (0-4 m woody perennial), middle canopy (4-10 m woody), tall canopy lay-ers (>10 m woody), and basal cover. Basal cover of woody vegetation is the percent cover of stems
77
Sp
rin
gS M
on
ito
rin
g(either living or dead) of each dominant woody species emerging on the site. Individual plants may play a role in several canopy layers. For ex-ample, tree seedlings (without woody stems) are included in ground cover, whereas saplings fall in shrub cover, and mature trees may contribute to shrub, middle, and tall canopy strata, as well as basal cover. Several metrics can be calculated from the above
data and used for trend assessment. Using the above data, the SSI database auto-calculates plant species density by dividing the number of plant species by the area of the geomorphic microhabi-tats and that of the entire site. In addition, the database calculates the percent cover and species density of native wetland plant species and non-native plant species in accordance with the USDA-PLANTS database (2013).
Macroinver tebratesInvertebrates should be collected at each site us-
ing spot sampling for a period of at least 30 min-utes during the site visit. Spot collection techniques include general collecting, dip-netting, and aerial netting on the site’s various microhabitats. Noctur-nal site visits often are useful for detecting species that may not otherwise be observed. Nocturnal ul-tra-violet light trapping also can be used to collect adults of some groups (e.g., caddisflies) that may not otherwise be detected. Seasonal nocturnal and ultraviolet sampling should be considered for the first several years of monitoring to establish the range of natural variation and, if warranted, at 3-5 year intervals thereafter to check on macroinverte-brate species composition. Quantitative benthic macroinvertebate sampling
can be used for monitoring if flows are sufficient to provide either deep pool habitats, or channels have flow more than 1.5 cm deep. Benthic inver-tebrates can be quantitatively sampled using stan-dardized time- and area-based methods. A Surber or mini-Surber sampler, kicknet (either 1.0 m or 0.25 m wide net), Hess or mini-Hess sampler, or aquarium or D-net can be used to sample benthic invertebrates by placing the device at a randomly selected position in the stream, vigorously disturb-ing a known area (usually 0.09 m2) for one minute, and allowing the water with invertebrates to flow into the net. The net meshing should be sufficiently fine to capture macroinvertebrates (0.2 to 0.5 mm
diameter). Percent cover of substrata, depth, and velocity should be noted at each site, as well as the site’s field water quality variations (temperature, pH, specific conductance, and dissolved oxygen concentration). Three or more benthic sample rep-licates should be collected in 70% EtOH, each in a separate 0.5 L sample bottle, and returned to the laboratory for enumeration and taxonomic anal-ysis. If funding is insufficient for such laboratory enumeration and identification costs, rapid enu-meration and identification can be accomplished in the field. Specimens of unrecognized species should be collected for taxonomic analysis. Many useful indices have been developed for as-
sessing relationships between water quality and macroinvertebrates (Merritt et al. 2008). Among those most often used is the EPT index, calculated by summing the number of mayflies (Ephemerop-tera), stoneflies (Plecoptera), and caddisflies (Tri-choptera) in standardized benthic samples (Bar-bour et al. 1999, Merritt et al. 2008). Most species in those orders require high quality water, and thus are good indicators of impairment. However, ion-rich waters are often natural in Arizona and such waters do not support high levels of EPT. In such cases, other (particularly rare or endemic) inver-tebrates may be better indicators of water quality impairment.
Ver tebratesThe survey crew should record presence, signs,
or sounds of vertebrate species detectected during monitoring. Long-term monitoring will eventu-ally contribute to a list of vertebrate use of the site. However, if more detailed information is needed, motion-activated cameras, trapping, and a more intensive site visit schedule can be employed.
Sp e c I a l mo n I to r I n g el e m e n t SOnce a complete inventory of the springs types,
species, and conditions at the springs in a land-scape have been conducted, decisions can be made about more detailed monitoring of special features (e.g., particular landforms, hydrological variables, species, or ecological processes). The population dynamics of various taxa can be monitored more closely, and are best studied in relation to specific population- or habitat-based questions. For aquat-ic vegetation and water quality, thin slice analy-sis of travertine may provide insight into diatom
Sp
rin
gS M
on
ito
rin
g
76
composition in relation to water quality over time. For wetland and terrestrial vegetation, long-term transects may provide more detailed information that can be more accurately compared over time, and studies of the number, condition, and growth of individual sensitive plant species can be planned and undertaken. For trees, dendrochronological analyses may provide retrospective trend data on growth and perhaps flow and water quality (e.g., http://web.utk.edu/~grissino/index.htm). The size and/or condition of sensitive inverte-
brate populations is often monitored using the standardized benthic sampling methods (above), or quantification of numbers of individuals/unit area/sampling duration over the life cycle of the target species (Merritt et al. 2008). For example, Martinez and Thome (2006) used quantitative monitoring to determine population dynamics and the life history of the endemic Page spring-snail (Pyrgulopsis morrisoni) in central Arizona.Monitoring of vertebrates at springs should be
conducted systematically, and trends over time can be determined. Fish monitoring usually in-volves indirect sampling intensity-based capture per unit effort (CPUE) methods or direct density estimation using seining, backpack-electroshock-ing, snorkeling, or SCUBA. Amphibian and other herpetofaunal surveys and monitoring are most ef-ficiently conducted using non-lethal “light-touch” visual surveys, in which surveyors gently explore suitable habitats, turning over and replacing logs, rocks, or artificially-installed habitats (e.g., ply-wood boards). In addition, they may use tempo-rary pit-fall traps to locate or capture herpetofau-nae (O’Donnell et al. 2007). Point-count methods are standard for avian monitoring (US Fish and Wildlife Service 1999: http://www.fws.gov/moun-tain-prairie/migbirds/avian_monitoring.pdf ). Live trap sampling population assessment, and disease vector monitoring methods have been de-veloped for small mammals (e.g., https://clu-in.org/download/ert/2029-R00.pdf). Genetics sam-pling methods also are sometimes used to evaluate population viability of vertebrates, using samples of blood or tissue from animals that are collected, or from hair or feces collected randomly or along transects (https://en.wikipedia.org/wiki/Genetic_monitoring#Estimating_abundance_and_life_his-tory_parameters_.E2.80.93_Category_Ia.).
eq u I p m e n t St e r I l I z at I o nOn leaving the monitoring site, surveyors should
sterilize shoes, nets and other items to prevent spread of chitrid fungus, other disease microor-ganisms, and nonnative species. Appropriate ster-ilization methods for clothing, equipment, and vehicles are found at: http://www.issg.org/data-base/species/reference_files/batden/man.pdf. That website reported that “the most effective products for [sterilizing field equipment and clothing to prevent chitrid fungus dispersal] were Path-XTM and the quaternary ammonium Compound 128, which can be used at dilutions containing low lev-els of the active compound didecyl dimethyl am-monium chloride. Bleach, containing the active ingredient sodium hypochlorite, was effective at concentrations of 1% sodium hypochlorite and above. Didecyl dimethyl ammonium chloride at a concentration greater than 0.0012% for 2 min, or sodium hypochlorite at a concentration greater than 1% for 1 min are effective treatment proce-dures.” However, high concentrations of steriliza-tion fluids also pose a threat to springs biota, so we also recommend post-sterilization rinsing with clean water (see Chapter 2).
In F o r m at I o n ma n a g e m e n tAll data, photographs, the sketchmap, and other
information about the biology of each variable and the overall springs ecosystem monitored should be entered into a relational database. SSI’s Springs On-line database at http://springsdata.org/ provides a free, online, secure, easy-to-use, and comprehen-sive springs information management system). Quality control analyses of data entered into
such a system should be conducted using stan-dard methods (Ledbetter et al. 2012, described at: http://springstewardshipinstitute.org/). A well-designed database, such as Springs Online, must be designed not only to archive monitoring data, but also to produce automated reports on the con-dition and trends through time of focal variables. Such database capacity vastly simplifies regular re-porting and conserves staff time. Physical and biological specimens require prepa-
ration, identification, databasing, and curatio, and should be archived in professional museum collec-tions.

79
Sp
rin
gS M
on
ito
rin
gIm p r o v I n g St e Wa r d S h I pThe purpose of a monitoring program is to assess
and improve resource stewardship (Fig. 4.01). De-pending on the scope of the management plan, the monitoring data will contribute to stewardship of individual resources, individual springs, or mul-tiple springs across a landscape. Regular and con-sistent review of monitoring results will help the stewardship team understand project success and challenges. This feedback will help clarify devel-oping changes in resource dynamics and the nec-essary next steps towards improving stewardship.

fie
ld
fo
rm
S A
nd
Se
Ap
cr
ite
riA
Appe
ndix
A
he f
ollo
win
g pa
ges
cont
ain
field
for
ms
a
nd S
EAP
crite
ria in
use
by
SSI
and
SIA
as
of J
anua
ry 2
016.
Thes
e m
atch
the
Sprin
gs
Onl
ine
data
base
, m
akin
g da
ta e
ntry
ver
y st
raig
htfo
rwar
d. A
s th
e pr
otoc
ols
and
field
sh
eets
are
refi
ned
base
d on
pee
r re
view
, fe
edba
ck f
rom
par
tner
s, an
d fie
ld t
estin
g,
they
are o
ccas
iona
lly m
odifi
ed. Th
e mos
t up-
to-d
ate
form
s, SE
AP
crite
ria, a
nd in
vent
ory
prot
ocol
s are
avai
labl
e for
dow
nloa
d as
PD
Fs
at:
http
://sp
rings
tew
ards
hipi
nstit
ute.o
rg/
dow
nloa
dsan
dpdf
s/.
The
Sprin
gs O
nlin
e da
taba
se is
ava
ilabl
e at
ht
tp://
sprin
gsda
ta.o
rg/,
and
the m
anua
l, w
ith
imag
es a
nd in
stru
ctio
nal v
ideo
s are
onl
ine
at
http
://sp
rings
tew
ards
hipi
nstit
ute.o
rg/
data
base
-man
ual-1
. A
use
rnam
e an
d pa
ssw
ord
are
requ
ired
to a
cces
s in
form
atio
n; s
impl
y se
t up
an
acco
unt.
This
will
allo
w a
cces
s to
publ
icly
-av
aila
ble l
ocat
ion
data
for a
ny o
f the
sprin
gs
in th
e da
taba
se. H
owev
er, p
erm
issio
ns a
re
requ
ired
to a
cces
s su
rvey
dat
a. C
onta
ct
an
adm
inist
rato
r of
th
e la
nd
unit
for
perm
issio
n to
ac
cess
in
form
atio
n.
For
mor
e in
form
atio
n, o
r if y
ou a
re a
land
uni
t ad
min
istra
tor,
plea
se co
ntac
t spr
ings
data
@m
usna
z.org
.
T

Spring Name________________________________________ 1Spring Type __________________________
Country____ State_______ County____________________________ 2Sensitivity _________
3Land Unit______________ Land Unit Detail_______________________________________
Quad________________________ HUC_______________________________
4Georef Source___________ Device____________________________ Datum_________
UTM Zone_______ UTM East____________________ UTM North___________________
Lat______________________Long_____________________ Elev__________ ft or m
EPE______ ft or m Declination _____ Comment ________________________________
Gen
eral
Geo
ref
Sur
vey
5SurfType
6Sub-Type
7Slope Var
Mic
roha
bita
ts
ABCDEFG
DescriptionArea(m2)
Water 8Soil moist dpth(cm)
Slope Deg
Aspect T/M____ 1
9Substrate %765432 Org
Prec%
Litter %
Wood %
Litter(cm)
Page ______ of _________ OBS____________
Camera Used_______________________________________ Sketch Map Location__________________________________Im
ages
Photo # Description
SP
F Sunrise: D_______ J_______ N_______ F_______ O_______ M_______ S_______ A_______ A_______ M_______ J_______ J_______
Sunset: D_______ J_______ N_______ F_______ O_______ M_______ S_______ A_______ A_______ M_______ J_______ J_______Site Condition
©Springs Stewardship Institute rev Jan 2016 Entered by ____________________________________ Date_____________ Checked by ______________________________ Date ________________
8 Oth%
Date__________________ Begin Time_______________ End Time________________
Surveyors_______________________________________________________________
______________________________________________Project___________________
Access Directions
Site Description
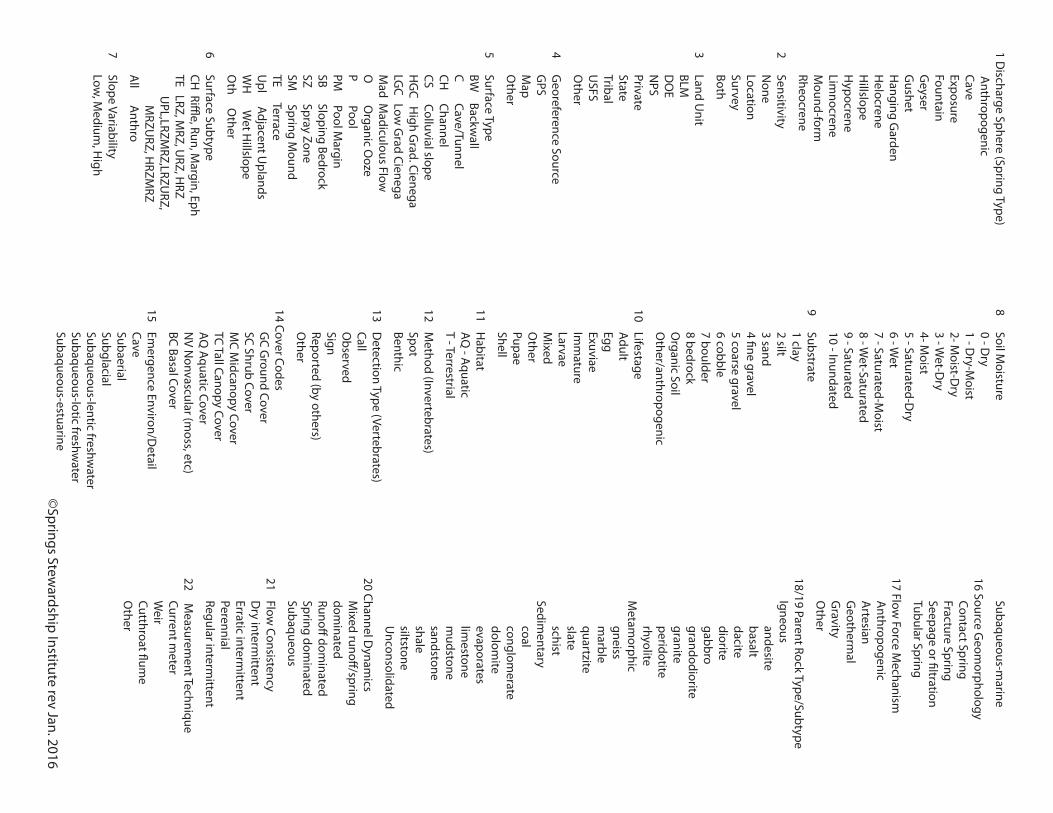
1 Discharge Sphere (Spring Type)
Anthropogenic
CaveExposure FountainG
eyserG
ushetH
anging Garden
Helocrene
Hillslope
Hypocrene
Limnocrene
Mound-form
Rheocrene
2 Sensitivity
N
one
Location
Survey
Both
3 Land U
nitBLMD
OE
NPS
PrivateStateTribalU
SFSO
ther
4 G
eoreference SourceG
PSM
apO
ther
5 Surface TypeBW
Backwall
C Cave/TunnelCH
ChannelCS Colluvial slopeH
GC H
igh Grad. Cienega
LGC Low
Grad Cienega
Mad M
adiculous FlowO
O
rganic Ooze
P PoolPM
Pool Margin
SB Sloping BedrockSZ Spray ZoneSM
Spring Mound
TE TerraceU
pl Adjacent Uplands
WH
Wet H
illslopeO
th Other
6 Surface SubtypeCH
Riffle, Run, M
argin, EphTE LRZ, M
RZ, URZ, H
RZ U
PL,LRZMRZ,LRZU
RZ,
MRZU
RZ, HRZM
RZA
ll A
nthro
7 Slope VariabilityLow
, Medium
, High
8 Soil M
oisture0 - D
ry1 - D
ry-Moist
2- Moist-D
ry3 - W
et-Dry
4- Moist
5 - Saturated-Dry
6 - Wet
7 - Saturated-Moist
8 - Wet-Saturated
9 - Saturated10 - Inundated
9 Substrate1 clay2 silt3 sand4 fine gravel5 coarse gravel6 cobble7 boulder8 bedrockO
rganic SoilO
ther/anthropogenic
10 Lifestage
Adult
Egg
Exuviae
Im
mature
Larvae
M
ixed
Other
Pupae
Shell
11 H
abitat
AQ - Aquatic
T - Terrestrial
12 M
ethod (Invertebrates)
Spot
Benthic
13 D
etection Type (Vertebrates)
Call
Observed
Sign
Reported (by others)
O
ther
14 Cover CodesG
C Ground Cover
SC Shrub CoverM
C Midcanopy Cover
TC Tall Canopy CoverAQ
Aquatic CoverN
V Nonvascular (m
oss, etc)
BC Basal Cover
15 Em
ergence Environ/Detail
CaveSubaerial SubglacialSubaqueous-lentic freshw
aterSubaqueous-lotic freshw
aterSubaqueous-estuarine
Subaqueous-marine
16 Source Geom
orphologyContact SpringFracture SpringSeepage or filtrationTubular Spring
17 Flow Force M
echanismA
nthropogenicA
rtesianG
eothermal
Gravity
Other
18/19 Parent Rock Type/SubtypeIgneous
andesitebasaltdacitedioritegabbrograndodioritegraniteperidotiterhyolite
Metam
orphicgneissm
arblequartziteslateschist
Sedimentary
coalconglom
eratedolom
iteevaporateslim
estonem
udstonesandstoneshalesiltstoneU
nconsolidated
20 Channel Dynam
icsM
ixed runoff/spring dom
inatedRunoff dom
inatedSpring dom
inatedSubaqueous
21 Flow
Consistency
Dry interm
ittent
Erratic intermittent
Perennial
Regular interm
ittent
22 M
easurement Technique
Current meter
Weir
Cutthroat flume
Other
©Springs Stew
ardship Institute rev Jan. 2016

Inverebrates
Spe
cies
Nam
e
Rep
#
10S
tage
Qty
11H
ab-
itat
Com
men
ts12
Met
h-od
Spr
ing
Nam
e___
____
____
____
____
____
___
Pag
e __
____
of _
____
____
OB
S__
____
____
__
Ent
ered
by
____
____
____
____
____
_ D
ate_
____
____
_ C
heck
ed b
y __
____
____
____
____
____
Dat
e __
____
____
©S
prin
gs S
tew
ards
hip
Inst
itute
rev
Jan
2016
Benthic Rep
Loca
tion
Are
a S
q M
Velo
city
m
/sec
Rep
#S
ubst
rate
Tim
e S
ecD
epth
cm
Com
men
ts

Vertebrates
Spe
cies
Nam
e13
Det
ectio
n Ty
peN
o.
Ind
Com
men
ts
Spr
ing
Nam
e___
____
____
____
____
____
___
Pag
e __
____
of _
____
____
OB
S__
____
____
__
Ent
ered
by
____
____
____
____
____
_ D
ate_
____
____
_ C
heck
ed b
y __
____
____
____
____
____
Dat
e __
____
____
©S
prin
gs S
tew
ards
hip
Inst
itute
rev
Jan
2016

Flor
aSpecies Name No.
CollA14Str No. IndComments
Spring Name__________________________ Page ______ of _________ OBS____________
B C D E F G H
Entered by __________________________ Date___________ Checked by ___________________________ Date ______________©Springs Stewardship Institute rev Jan 2016

Flor
aSpecies Name No.
CollA14Str No. IndComments
Spring Name__________________________ Page ______ of _________ OBS____________
B C D E F G H
Entered by __________________________ Date___________ Checked by ___________________________ Date ______________©Springs Stewardship Institute rev Jan 2016
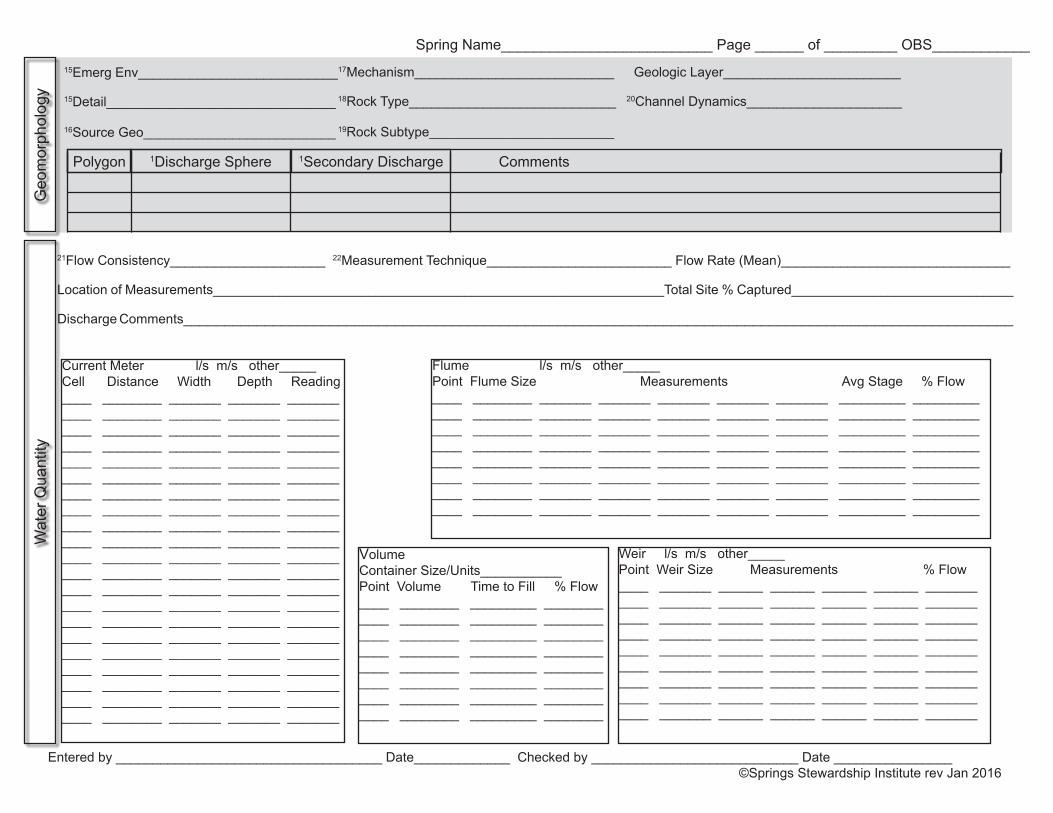
Geo
mor
phol
ogy
15Emerg Env___________________________
15Detail_______________________________
16Source Geo__________________________
17Mechanism___________________________ 18Rock Type____________________________ 19Rock Subtype_________________________
Geologic Layer________________________
20Channel Dynamics_____________________
Polygon 1Discharge Sphere 1Secondary Discharge Comments
21Flow Consistency_____________________ 22Measurement Technique_________________________ Flow Rate (Mean)_______________________________
Location of Measurements_____________________________________________________________Total Site % Captured______________________________
Discharge Comments______________________________________________________________________________________________________
Wat
er Q
uant
itySpring Name__________________________ Page ______ of _________ OBS____________
Weir l/s m/s other_____Point Weir Size Measurements % Flow ____ _______ ______ ______ ______ ______ _______ ____ _______ ______ ______ ______ ______ _______ ____ _______ ______ ______ ______ ______ _______ ____ _______ ______ ______ ______ ______ _______ ____ _______ ______ ______ ______ ______ _______ ____ _______ ______ ______ ______ ______ ___________ _______ ______ ______ ______ ______ ___________ _______ ______ ______ ______ ______ ___________ _______ ______ ______ ______ ______ _______
Flume l/s m/s other_____Point Flume Size Measurements Avg Stage % Flow____ ________ _______ _______ _______ _______ _______ _________ _____________ ________ _______ _______ _______ _______ _______ _________ _____________ ________ _______ _______ _______ _______ _______ _________ _____________ ________ _______ _______ _______ _______ _______ _________ _____________ ________ _______ _______ _______ _______ _______ _________ _____________ ________ _______ _______ _______ _______ _______ _________ _____________ ________ _______ _______ _______ _______ _______ _________ _____________ ________ _______ _______ _______ _______ _______ _________ _________
Current Meter l/s m/s other_____Cell Distance Width Depth Reading ____ ________ _______ _______ ___________ ________ _______ _______ _______ ____ ________ _______ _______ _______ ____ ________ _______ _______ ___________ ________ _______ _______ ___________ ________ _______ _______ ___________ ________ _______ _______ _______ ____ ________ _______ _______ _______ ____ ________ _______ _______ ___________ ________ _______ _______ ___________ ________ _______ _______ ___________ ________ _______ _______ _______ ____ ________ _______ _______ _______ ____ ________ _______ _______ ___________ ________ _______ _______ ___________ ________ _______ _______ ___________ ________ _______ _______ _______ ____ ________ _______ _______ _______ ____ ________ _______ _______ ___________ ________ _______ _______ ___________ ________ _______ _______ _______
Volume Container Size/Units___________Point Volume Time to Fill % Flow ____ ________ _________ ____________ ________ _________ ____________ ________ _________ ____________ ________ _________ ____________ ________ _________ ____________ ________ _________ ____________ ________ _________ ____________ ________ _________ ________
Entered by ____________________________________ Date_____________ Checked by ____________________________ Date ________________©Springs Stewardship Institute rev Jan 2016

Measurement Device(s)________________________________________________ Date Last Calibrated________________ Air Temp ____________
Collection Location/Comments_______________________________________________________________________________________ _____________________________________________________________________________________________________________
Wat
er Q
ualit
ySpring Name__________________________ Page ______ of _________ OBS____________
Depth (cm) pH Conductivity Dissolved O2 Water Temp. (oC)
Average
Field Measurements
Collected for Analysis
Sample Type Sample Taken? Container
Anions
DuplicateTaken?
CationsNutrients2H and 18O Isotopes
Turbidity DeviceAlkalinity
Filtered (Y/N) Treatment
Other
Entered by ____________________________________ Date_____________ Checked by ______________________________ Date ________________
©Springs Stewardship Institute rev Jan 2016
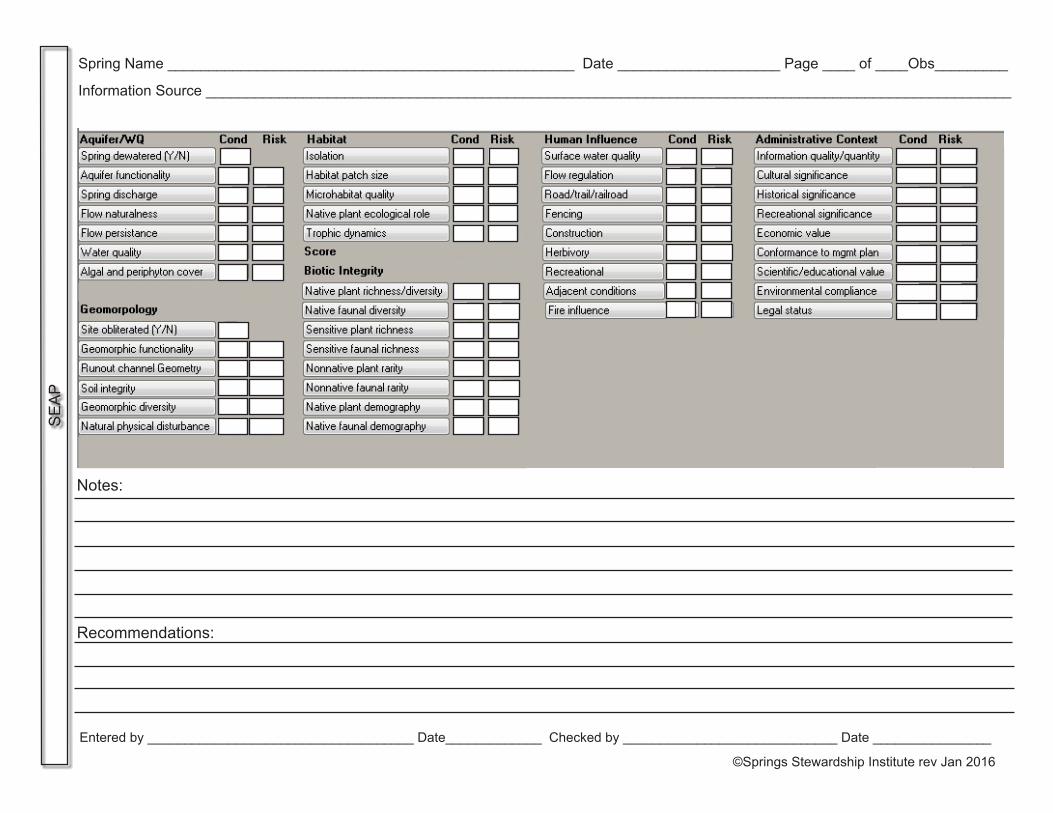
Spring Name __________________________________________________ Date ____________________ Page ____ of ____Obs_________
Information Source ___________________________________________________________________________________________________
Notes:
Entered by ____________________________________ Date_____________ Checked by _____________________________ Date ________________
SE
AP
©Springs Stewardship Institute rev Jan 2016
Recommendations:

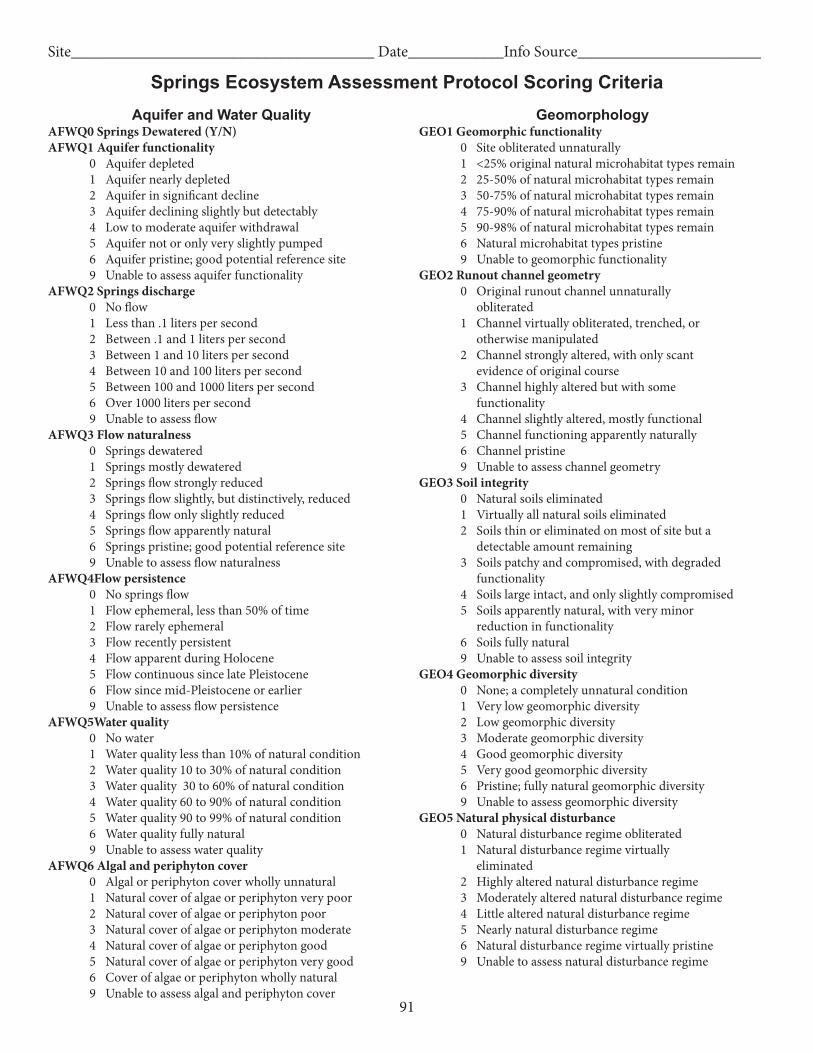
91
Aquifer and Water QualityAFWQ0 Springs Dewatered (Y/N)AFWQ1 Aquifer functionality 0 Aquifer depleted 1 Aquifer nearly depleted 2 Aquifer in significant decline 3 Aquifer declining slightly but detectably 4 Low to moderate aquifer withdrawal 5 Aquifer not or only very slightly pumped 6 Aquifer pristine; good potential reference site 9 Unable to assess aquifer functionalityAFWQ2 Springs discharge 0 No flow 1 Less than .1 liters per second 2 Between .1 and 1 liters per second 3 Between 1 and 10 liters per second 4 Between 10 and 100 liters per second 5 Between 100 and 1000 liters per second 6 Over 1000 liters per second 9 Unable to assess flowAFWQ3 Flow naturalness 0 Springs dewatered 1 Springs mostly dewatered 2 Springs flow strongly reduced 3 Springs flow slightly, but distinctively, reduced 4 Springs flow only slightly reduced 5 Springs flow apparently natural 6 Springs pristine; good potential reference site 9 Unable to assess flow naturalnessAFWQ4 Flow persistence 0 No springs flow 1 Flow ephemeral, less than 50% of time 2 Flow rarely ephemeral 3 Flow recently persistent 4 Flow apparent during Holocene 5 Flow continuous since late Pleistocene 6 Flow since mid-Pleistocene or earlier 9 Unable to assess flow persistenceAFWQ5 Water quality 0 No water 1 Water quality less than 10% of natural condition 2 Water quality 10 to 30% of natural condition 3 Water quality 30 to 60% of natural condition 4 Water quality 60 to 90% of natural condition 5 Water quality 90 to 99% of natural condition 6 Water quality fully natural 9 Unable to assess water qualityAFWQ6 Algal and periphyton cover 0 Algal or periphyton cover wholly unnatural 1 Natural cover of algae or periphyton very poor 2 Natural cover of algae or periphyton poor 3 Natural cover of algae or periphyton moderate 4 Natural cover of algae or periphyton good 5 Natural cover of algae or periphyton very good 6 Cover of algae or periphyton wholly natural 9 Unable to assess algal and periphyton cover
GeomorphologyGEO1 Geomorphic functionality 0 Site obliterated unnaturally 1 <25% original natural microhabitat types remain 2 25-50% of natural microhabitat types remain 3 50-75% of natural microhabitat types remain 4 75-90% of natural microhabitat types remain 5 90-98% of natural microhabitat types remain 6 Natural microhabitat types pristine 9 Unable to geomorphic functionalityGEO2 Runout channel geometry 0 Original runout channel unnaturally obliterated 1 Channel virtually obliterated, trenched, or otherwise manipulated 2 Channel strongly altered, with only scant evidence of original course 3 Channel highly altered but with some functionality 4 Channel slightly altered, mostly functional 5 Channel functioning apparently naturally 6 Channel pristine 9 Unable to assess channel geometryGEO3 Soil integrity 0 Natural soils eliminated 1 Virtually all natural soils eliminated 2 Soils thin or eliminated on most of site but a detectable amount remaining 3 Soils patchy and compromised, with degraded functionality 4 Soils large intact, and only slightly compromised 5 Soils apparently natural, with very minor reduction in functionality 6 Soils fully natural 9 Unable to assess soil integrityGEO4 Geomorphic diversity 0 None; a completely unnatural condition 1 Very low geomorphic diversity 2 Low geomorphic diversity 3 Moderate geomorphic diversity 4 Good geomorphic diversity 5 Very good geomorphic diversity 6 Pristine; fully natural geomorphic diversity 9 Unable to assess geomorphic diversityGEO5 Natural physical disturbance 0 Natural disturbance regime obliterated 1 Natural disturbance regime virtually eliminated 2 Highly altered natural disturbance regime 3 Moderately altered natural disturbance regime 4 Little altered natural disturbance regime 5 Nearly natural disturbance regime 6 Natural disturbance regime virtually pristine 9 Unable to assess natural disturbance regime
Site______________________________________ Date____________Info Source_______________________
Springs Ecosystem Assessment Protocol Scoring Criteria
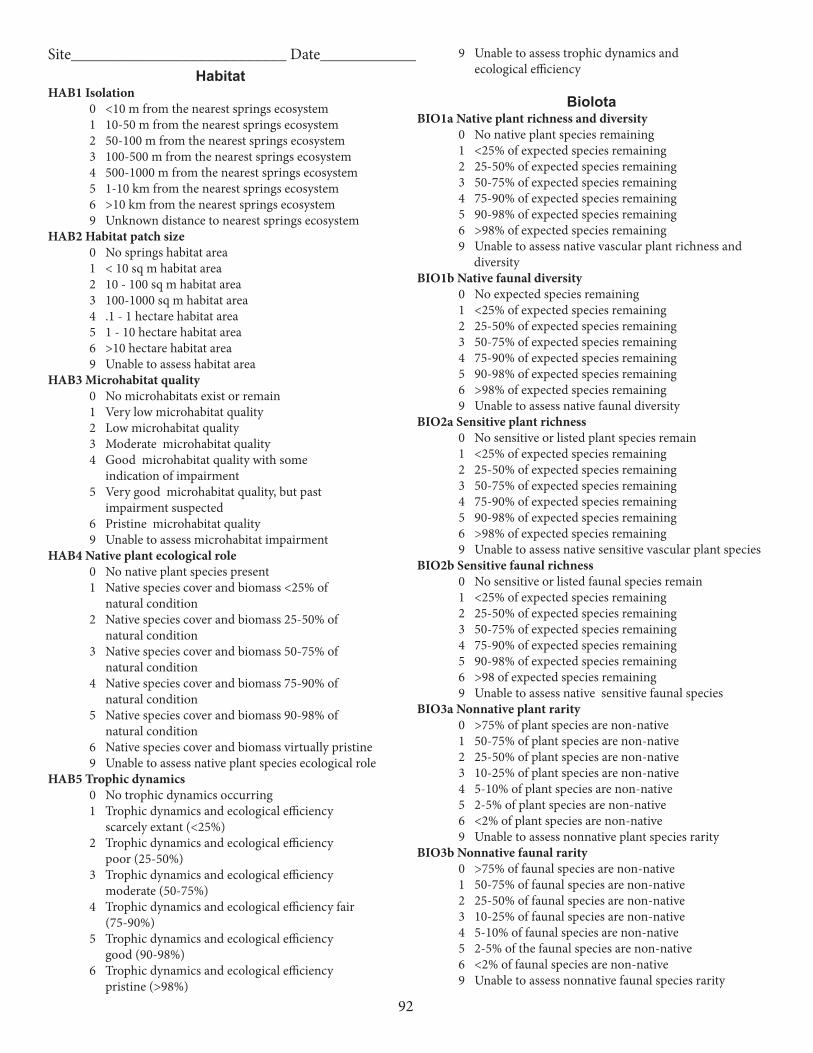
92
HabitatHAB1 Isolation 0 <10 m from the nearest springs ecosystem 1 10-50 m from the nearest springs ecosystem 2 50-100 m from the nearest springs ecosystem 3 100-500 m from the nearest springs ecosystem 4 500-1000 m from the nearest springs ecosystem 5 1-10 km from the nearest springs ecosystem 6 >10 km from the nearest springs ecosystem 9 Unknown distance to nearest springs ecosystemHAB2 Habitat patch size 0 No springs habitat area 1 < 10 sq m habitat area 2 10 - 100 sq m habitat area 3 100-1000 sq m habitat area 4 .1 - 1 hectare habitat area 5 1 - 10 hectare habitat area 6 >10 hectare habitat area 9 Unable to assess habitat areaHAB3 Microhabitat quality 0 No microhabitats exist or remain 1 Very low microhabitat quality 2 Low microhabitat quality 3 Moderate microhabitat quality 4 Good microhabitat quality with some indication of impairment 5 Very good microhabitat quality, but past impairment suspected 6 Pristine microhabitat quality 9 Unable to assess microhabitat impairmentHAB4 Native plant ecological role 0 No native plant species present 1 Native species cover and biomass <25% of natural condition 2 Native species cover and biomass 25-50% of natural condition 3 Native species cover and biomass 50-75% of natural condition 4 Native species cover and biomass 75-90% of natural condition 5 Native species cover and biomass 90-98% of natural condition 6 Native species cover and biomass virtually pristine 9 Unable to assess native plant species ecological roleHAB5 Trophic dynamics 0 No trophic dynamics occurring 1 Trophic dynamics and ecological efficiency scarcely extant (<25%) 2 Trophic dynamics and ecological efficiency poor (25-50%) 3 Trophic dynamics and ecological efficiency moderate (50-75%) 4 Trophic dynamics and ecological efficiency fair (75-90%) 5 Trophic dynamics and ecological efficiency good (90-98%) 6 Trophic dynamics and ecological efficiency pristine (>98%)
9 Unable to assess trophic dynamics and ecological efficiency
Biolota
BIO1a Native plant richness and diversity 0 No native plant species remaining 1 <25% of expected species remaining 2 25-50% of expected species remaining 3 50-75% of expected species remaining 4 75-90% of expected species remaining 5 90-98% of expected species remaining 6 >98% of expected species remaining 9 Unable to assess native vascular plant richness and diversityBIO1b Native faunal diversity 0 No expected species remaining 1 <25% of expected species remaining 2 25-50% of expected species remaining 3 50-75% of expected species remaining 4 75-90% of expected species remaining 5 90-98% of expected species remaining 6 >98% of expected species remaining 9 Unable to assess native faunal diversityBIO2a Sensitive plant richness 0 No sensitive or listed plant species remain 1 <25% of expected species remaining 2 25-50% of expected species remaining 3 50-75% of expected species remaining 4 75-90% of expected species remaining 5 90-98% of expected species remaining 6 >98% of expected species remaining 9 Unable to assess native sensitive vascular plant speciesBIO2b Sensitive faunal richness 0 No sensitive or listed faunal species remain 1 <25% of expected species remaining 2 25-50% of expected species remaining 3 50-75% of expected species remaining 4 75-90% of expected species remaining 5 90-98% of expected species remaining 6 >98 of expected species remaining 9 Unable to assess native sensitive faunal species BIO3a Nonnative plant rarity 0 >75% of plant species are non-native 1 50-75% of plant species are non-native 2 25-50% of plant species are non-native 3 10-25% of plant species are non-native 4 5-10% of plant species are non-native 5 2-5% of plant species are non-native 6 <2% of plant species are non-native 9 Unable to assess nonnative plant species rarityBIO3b Nonnative faunal rarity 0 >75% of faunal species are non-native 1 50-75% of faunal species are non-native 2 25-50% of faunal species are non-native 3 10-25% of faunal species are non-native 4 5-10% of faunal species are non-native 5 2-5% of the faunal species are non-native 6 <2% of faunal species are non-native 9 Unable to assess nonnative faunal species rarity
Site___________________________ Date____________
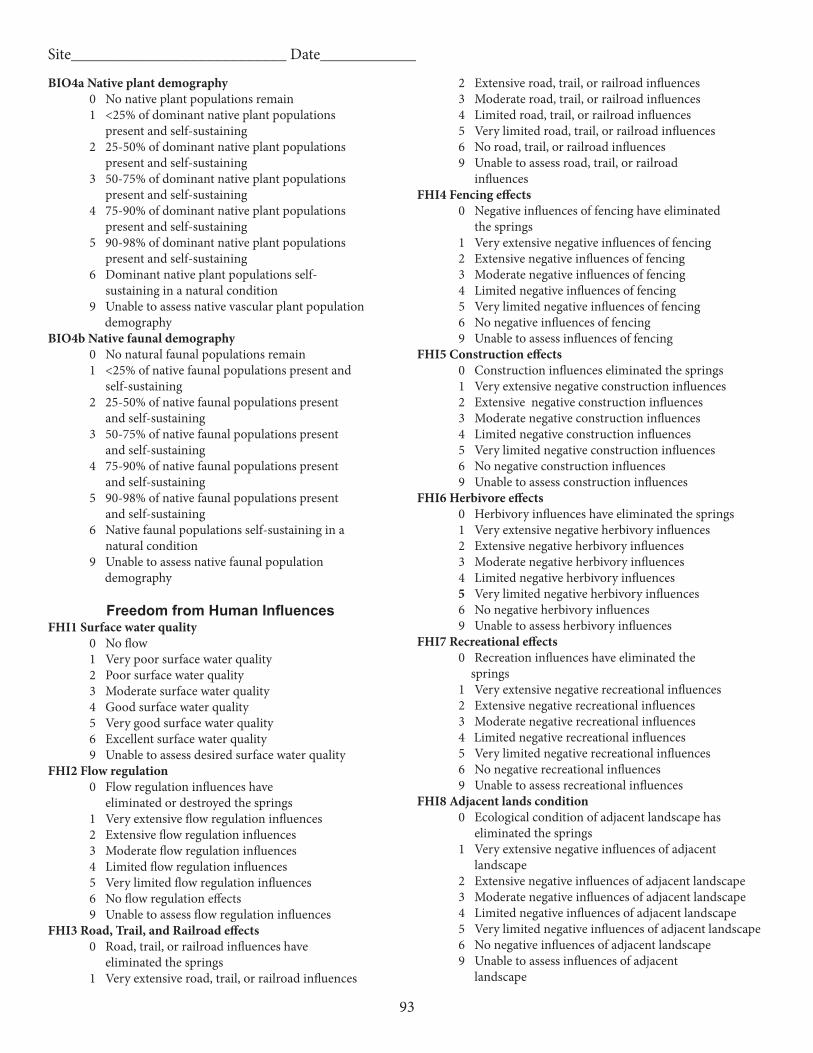
93
BIO4a Native plant demography 0 No native plant populations remain 1 <25% of dominant native plant populations present and self-sustaining 2 25-50% of dominant native plant populations present and self-sustaining 3 50-75% of dominant native plant populations present and self-sustaining 4 75-90% of dominant native plant populations present and self-sustaining 5 90-98% of dominant native plant populations present and self-sustaining 6 Dominant native plant populations self- sustaining in a natural condition 9 Unable to assess native vascular plant population demographyBIO4b Native faunal demography 0 No natural faunal populations remain 1 <25% of native faunal populations present and self-sustaining 2 25-50% of native faunal populations present and self-sustaining 3 50-75% of native faunal populations present and self-sustaining 4 75-90% of native faunal populations present and self-sustaining 5 90-98% of native faunal populations present and self-sustaining 6 Native faunal populations self-sustaining in a natural condition 9 Unable to assess native faunal population demography
Freedom from Human InfluencesFHI1 Surface water quality 0 No flow 1 Very poor surface water quality 2 Poor surface water quality 3 Moderate surface water quality 4 Good surface water quality 5 Very good surface water quality 6 Excellent surface water quality 9 Unable to assess desired surface water qualityFHI2 Flow regulation 0 Flow regulation influences have eliminated or destroyed the springs 1 Very extensive flow regulation influences 2 Extensive flow regulation influences 3 Moderate flow regulation influences 4 Limited flow regulation influences 5 Very limited flow regulation influences 6 No flow regulation effects 9 Unable to assess flow regulation influences FHI3 Road, Trail, and Railroad effects 0 Road, trail, or railroad influences have eliminated the springs 1 Very extensive road, trail, or railroad influences
2 Extensive road, trail, or railroad influences 3 Moderate road, trail, or railroad influences 4 Limited road, trail, or railroad influences 5 Very limited road, trail, or railroad influences 6 No road, trail, or railroad influences 9 Unable to assess road, trail, or railroad influencesFHI4 Fencing effects 0 Negative influences of fencing have eliminated the springs 1 Very extensive negative influences of fencing 2 Extensive negative influences of fencing 3 Moderate negative influences of fencing 4 Limited negative influences of fencing 5 Very limited negative influences of fencing 6 No negative influences of fencing 9 Unable to assess influences of fencingFHI5 Construction effects 0 Construction influences eliminated the springs 1 Very extensive negative construction influences 2 Extensive negative construction influences 3 Moderate negative construction influences 4 Limited negative construction influences 5 Very limited negative construction influences 6 No negative construction influences 9 Unable to assess construction influences FHI6 Herbivore effects 0 Herbivory influences have eliminated the springs 1 Very extensive negative herbivory influences 2 Extensive negative herbivory influences 3 Moderate negative herbivory influences 4 Limited negative herbivory influences 5 Very limited negative herbivory influences 6 No negative herbivory influences 9 Unable to assess herbivory influences FHI7 Recreational effects 0 Recreation influences have eliminated the springs 1 Very extensive negative recreational influences 2 Extensive negative recreational influences 3 Moderate negative recreational influences 4 Limited negative recreational influences 5 Very limited negative recreational influences 6 No negative recreational influences 9 Unable to assess recreational influencesFHI8 Adjacent lands condition 0 Ecological condition of adjacent landscape has eliminated the springs 1 Very extensive negative influences of adjacent landscape 2 Extensive negative influences of adjacent landscape 3 Moderate negative influences of adjacent landscape 4 Limited negative influences of adjacent landscape 5 Very limited negative influences of adjacent landscape 6 No negative influences of adjacent landscape 9 Unable to assess influences of adjacent landscape
Site___________________________ Date____________

94
FHI9 Fire Influence 0 Fire influences have eliminated the springs 1 Very extensive negative influences of fire 2 Extensive negative influences of fire 3 Moderate negative influences of fire 4 Limited negative influences of fire 5 Very limited negative influences of fire 6 No undesired negative influences of fire 9 Unable to assess influences of fire
Administrative ContextAC1 Information quality/quantity 0 No information or map exists 1 Very limited mapping or other information 2 Limited mapping or other information exists 3 A modest amount of credible mapping and other information exists 4 Credible mapping and other scientific infor- mation exists 5 A great deal of high quality mapping and other information has been gathered and compiled 6 The springs is used as a research site, with much high quality information available 9 Unable to assess information quantity and qualityAC2 Indigenous significance 0 No significance as an indigenous cultural site 1 Virtually no evidence of indigenous cultural features or resources 2 One culturally significant feature or resource 3 Two or more culturally significant features or resources 4 Several culturally significant features or resources 5 Numerous indigenous culturally significant features or resources 6 Cultural significance essential for the well- being of one or more indigenous cultures 9 Unable to assess indigenous cultural significanceAC3 Historical significance 0 No historical significance 1 Very little evidence of historically significant elements 2 One historically significant element 3 Two or more historically significant elements 4 Several historically significant elements 5 Numerous historically significant elements 6 Historical significance essential for the well- being of the culture 9 Unable to assess historical significanceAC4 Recreational significance 0 Desired effects of recreational use not achieved 1 Very extensive deviation from desired effects of recreational use 2 Extensive deviation from desired effects of recreational use
3 Moderate deviation from desired effects of recreational use 4 Limited deviation from desired effects of recreational use 5 Very limited deviation from desired effects of recreational use 6 No deviation from desired effects of recreational use 9 Unable to assess deviation from desired effects of recreational useAC5 Economic value 0 The springs has no economic value 1 Very limited economic value 2 Limited economic value 3 Modest economic value 4 Considerable economic value 5 High economic value 6 Very high economic value 9 Unable to assess economic valueAC6 Conformance to mgmt plan 0 No management plan 1 Minimal management planning 2 Very preliminary management plan 3 Management plan exists, but receives little management attention 4 Management plan given moderate attention 5 Management plan given substantial management & legal consideration 6 Management plan fully implemented and followed 9 Unable to assess conformance to management planAC7 Scientific/educational value 0 No features of scientific or educational interest 1 One scientifically or educationally important feature 2 Two features of scientific or educational interest 3 Several features of scientific or educational interest 4 4-9 features of scientific or educational interest 5 At least 10 features of scientific or educational interest 6 Numerous features of scientific or educational interest 9 Unable to assess scientific or educational significanceAC8 Environmental compliance 0 No socioenvironmental compliance conducted or considered 1 Very little socioenvironmental compliance conducted or considered 2 Little socioenvironmental compliance conducted or considered 3 Preliminary socioenvironmental compliance conducted 4 Socioenvironmental compliance undertaken, not yet completed 5 Socioenvironmental compliance completed, not enacted 6 Environmental compliance, and designation of critical habitat, is complete 9 Unable to assess environmental complianceAC9 Legal status 0 No land, water, or ecosystem legal rights exist or are recognized
Site___________________________ Date____________

95
1 Rights may exist but have not been adjudicated or enforced 2 Rights exist but application for those rights/ uses are pending; no enforcement 3 Rights exist and applications have been made; limited enforcement 4 Rights applications have been completed; moderately robust enforcement 5 Rights have been established; robust enforcement 6 Rights established and defended; legislative protection; robust enforcement 9 Unable to assess legal status
Risk 0 No risk to site 1 Negligible risk to site 2 Low risk to site 3 Moderate risk to site 4 Serious risk to site 5 Very great risk to site 6 Extreme risk to site 9 Unable to assess risk to site
Site___________________________ Date____________

96
Cultural ValuesArchaeological Value
0 No archaeological evidence present at or near spring1 Almost no evidence of archeological remains near the spring2 Minor evidence of archaeological artifacts near the spring
(i.e., ceramics)3 Moderate evidence of archaeological remains near the
springs; hunting camp remains, potentially including hearth(s) but no dwellings evident
4 Artifacts, petroglyphs, minor ruins, and/or irrigation works are present, demonstrating fairly extensive prehistoric use of the site
5 Artifacts, petroglyphs, ruins, and/or water works, and dwell-ing sites are present, demonstrating extensive prehistoric use
6 Artifacts, petroglyphs, remains, and extensive ruins nearby, protected by the tribe due to great archaeological significance
9 Unable to assess archaeological value
PetroglyphsShrinesWallsJewelryCeramicsFlakesHearthsRuinsIrrigationMiddensAgricultureHuman RemainsHistorical ArchaeologyOther archaeology
Education/Knowledge Value0 No knowledge of the site recorded in tribal history or aca-
demic records, and no information reasonably expected to exist
1 Knowledge of site expected to exist, but not available, no longer taught
2 Knowledge of site is documented but is minimal and not used in education or research
3 Moderate knowledge of site exists; is used to a moderate extent in education and/or as a research site
4 Fairly significant education and/or research significance
5 Very good educational and/or research significance, provid-ing trans-generational knowledge
6 Outstanding educational and/or research significance; trans-generation knowledge; great concern about protecting site for educational purposes
9 Unable to assess educational or research significance
Youth educationElder knowledgeTrans-generationalCulturally-specificAcademic researchAcademic educationNon-academic educationOther knowledge
Ethnoecology0 No record or presence of plant and/or animal species used for
food, utilitarian, food, medicinal, ceremonial, or other purposes
1 Former presence of ethnobiological resources, but no longer present, or very few ethnobiological resources
2 Only 1 ethnobiologically important species present, or only a few species that can readily be obtained elsewhere
3 Several ethnobiologically important species present, although they can be found elsewhere
4 Several ethnobiologically important species present, of which at least one is difficult to acquire elsewhere
5 Numerous ethnobiologically important species present, with one or more being unique to the site
6 Many ethnobiologically important species present, including many that cannot be found elsewhere
9 Unable to assess ethnobiologically important species
PlantsUsed for foodFirewood, constr, etc.Medicinal purposesCeremonial purposesExtirpated speciesEndangered speciesRestoration potentialMultiple use/other
Ethnoecological processes
Ethnogeological processesDyesPaintsCeramics
Tribal/Band Historical Significance0 History of the site has been lost and is not taught in neither
academic nor non-academic settings
AnimalsUsed for foodUtility animalsMedicinal purposesCeremonial purposesExtirpated speciesEndangered speciesRestoration potentialMultiple use/other
Site__________________________________________________ Date_____________________________
Information Source_____________________________________ Cultural Radius (meters)______________

97
1 History of the site is very limited and poorly available2 History of the site is limited, primarily available in unpub-
lished reports (i.e., water resources, cultural preservation office, etc.)
3 History of the site is moderately available and not well known4 Site history information availability is good and
relatively widely known5 Site history information availability is very good and quite
widely known in both academic and non-academic settings6 Site history information is excellent, and is taught by the
elders to other tribal members in both academic and non-academic settings
9 Unable to assess tribal history of the site
Spring on Historic Route
Site Sacredness0 No record of historical or contemporary site sacredness; no
possibility of the site being sacred1 Site sacredness is very minor; sacredness possible but not
specifically recognized2 Site sacredness is recognized, but has no specific sacred role
or function3 Site sacredness is moderate, related to one specific role or
function4 Site sacredness is fairly high, related to two specific roles or
functions5 Site is highly sacred, related to several specific roles or func-
tions6 Site is very highly sacred, related to many specific roles or
functions9 Unable to assess sacredness of site
Sacredness of waterSacredness of traditional foodsSacredness of materialsSacredness of medicinesSacredness of ceremonial substancesSacredness of archaeological remainsSacredness of storiesSpirits or divine beingsPassage point to/from other worldsSignificance in afterlifeSite is sacredSite is sacred for its pristine characterSite important as route or waypoint
National Registry of Historic Places NRHP Condition
0 Site has no potential for listing with the Tribe(s) or non-tribal agencies
1 Site has not been recognized by Tribe(s) as having potential
for NRHP status, or has been recognized as having very little potential
2 Site has been recognized by the Tribe(s) and/or non-Tribal agencies as having low potential for NRHP status
3 Site has been recognized by the Tribe(s) and/or non-Tribal agencies as having moderate potential for NRHP status, but not formally proposed
4 Site is recognized and listed with the Tribe(s), and NRHP status has been proposed
5 Site is recognized and listed with the Tribe(s), and NRHP status is anticipated and pending
6 NRHP status has been fully completed with both the Tribe(s) and the federal government
9 Unable to assess NRHP potential
Application Status0 No culturally significant properties exist1 NRHP status application completed2 NRHP application submitted3 NRHP status pending acceptance of application4 NRHP status approved, but process not complete5 NRHP status approved6 NRHP status established9 Unable to assess NRHP process
Recognized by Tribe as worthy of listing Recognized by agencies as worthy of listingApplication submitted and refused
Economic Value0 No economic use or sale of springs resources1 Very little economic value OR formerly of very limited eco-
nomic value, but no longer used for agriculture, recreation, or ethnobiological economics
2 Low economic value; use or sale of springs resources depends on erratic availability of resources, weather conditions, etc
3 Moderate economic use(s) or value of springs resources, pri-marily for single family subsistence; limited financial benefits to larger community
4 Good economic uses and sale of springs agricultural, recre-ation, and/or ethnobiological resources to the Tribe and/or external communities
5 Very good economic uses and sale of springs’ agricultural, recreation, and/or ethnobiological resources to the Tribe and/or external communities
6 Tribe receives excellent financial benefits from the use(s) and sale of springs agricultural, recreation, non-use, and/or ethnobiological resources
9 Unable to assess economic value to the Tribe and/or external communities
Single family use/salesCommunal use/salesTribal use/salesLivestock supportPotable waterIrrigation water
Site____________________________________________________________ Date_____________________

98
Mineral extractionMining permitsElectrical powerRecreational visitationNon-agricultural plantsNon-agricultural animalsAquatic agric. plantsWetland agric. plantsNonhunted ethnofaunalNative fishFarmed fishFishing permitsWildlifeHunting licensesReal estateNon-use valuesOther economic values
Tribal Legal Significance0 No legal interest or consideration of the site’s
resources1 Little to no legal status; very little outside interest2 Very low legal status; little outside interest3 Moderate legal significance – some outside interest4 Legal status is fairly well established, and the site is fairly well
protected5 Site legal status is clearly established, and may apply to more
than one Tribe6 Site legal status very clearly established; legal
standing is an important precedent9 Unable to assess legal status
Tribal—individual Tribal-clan Tribal Tribal—multicultural State Federal Agency Other
Tribal Contemporary Useo Tribal use or non-use value1 No direct use but may have potential or non-use value2 One minor use and may have potential non-use value3 Slight use—2 uses plus some non-use value4 Moderate use—3-5 uses plus some non-use value5 Much use—5-7 uses plus some non-use value
6 Extensive use—8 or more uses and non-use value9 Unable to assess tribal use or non-use value
Tribal water useExternal water useIrrigation useAgricultural useCeremonial useFishing useHunting useGathering useEducational useMineral extractionFuel useEnergy useAesthetic useRecreational useGuiding visitation useRoute in use
Site____________________________________________________________ Date_____________________

99
Hydrology vAriAbleS
ystematic hydrological measurements are needed for classifying, understanding, and monitoring spring ecosystems; however, flow mea-surement at springs can be difficult or imprecise. Flow and geochemistry add great insight into un-derstanding aquifer mechanics and subterranean flow path duration. Modeling of flow variabil-ity requires multi-decadal monitoring, so collect-ing flow data during each site visit is important. Springs flow may be measured with one or more of the protocols listed below. Such data should be evaluated for quality before being integrated with other physical and bio-cultural information to as-sess the condition and risks of hydrological altera-tion to the springs ecosystem (e.g., Wilde 2008). Meinzer (1923) developed a ranking scheme for
springs discharge rate, a scale that is widely used (e.g., Jay and Blair 2005); however, Meinzer’s scale is both incomplete and illogical, as it inversely re-lates rank to discharge and does not capture the range of springs discharges. We prefer the scale presented in Springer et al. (2008), augmented slightly below, which uses a logarithmic SI scale to rank springs discharge rates (Table B.01).
Wh e r e a n d Wh e n to me a S u r eFlow measurement requires planning, both for
the logistics of sampling and the equipment to be used. Surveyors should measure flow at the point of maximum expression, which is not likely to be the source but rather some distance downstream. The point of flow measurement should be record-ed on the site map and on the hydrology sheet. Understanding flow variability is important in
many situations, and flow can be expected to
Appendix B
S vary seasonally at most shallow aquifer or low residence-time aquifers. The most conservative flow measurements are made when transpiration losses, seepage into porous substrates, and precipi-tation contributions are minimal. However, it is equally important to understand the impacts of ri-parian vegetation, so mid-summer measurements also are relevant. In short, there is no single time of year that is best for flow measurement.
ho W to me a S u r e Flo WFlow measurement techniques vary in relation to
the site (Table B.01), and the Level 2 SSI springs inventory field sheet provides space for document-ing the method(s) used to measure springs flow. Measure the quantity of water discharging from
the spring. Replicated flow measurements are needed to develop a trustworthy mean value. We recommend taking at least 3-6 measurements. If the discharge of the spring is very low, (first
magnitude), the discharge measurement may take several minutes and should be initiated early in the site visit. Second to fifth magnitude discharges are relatively faster and easier to measure. Mea-surement of sixth or higher magnitude discharges (non-wadeable channels) may take as long or lon-ger than first magnitude measurements, but can be done anytime during the visit. The name, serial number (if available), and accu-
racy of the instrument used to measure discharge should be recorded as well as any other important observations. Important observations may include signs of any recent high flow events, such as high water marks or oriented vegetation or debris on or above the channel or floodplain.
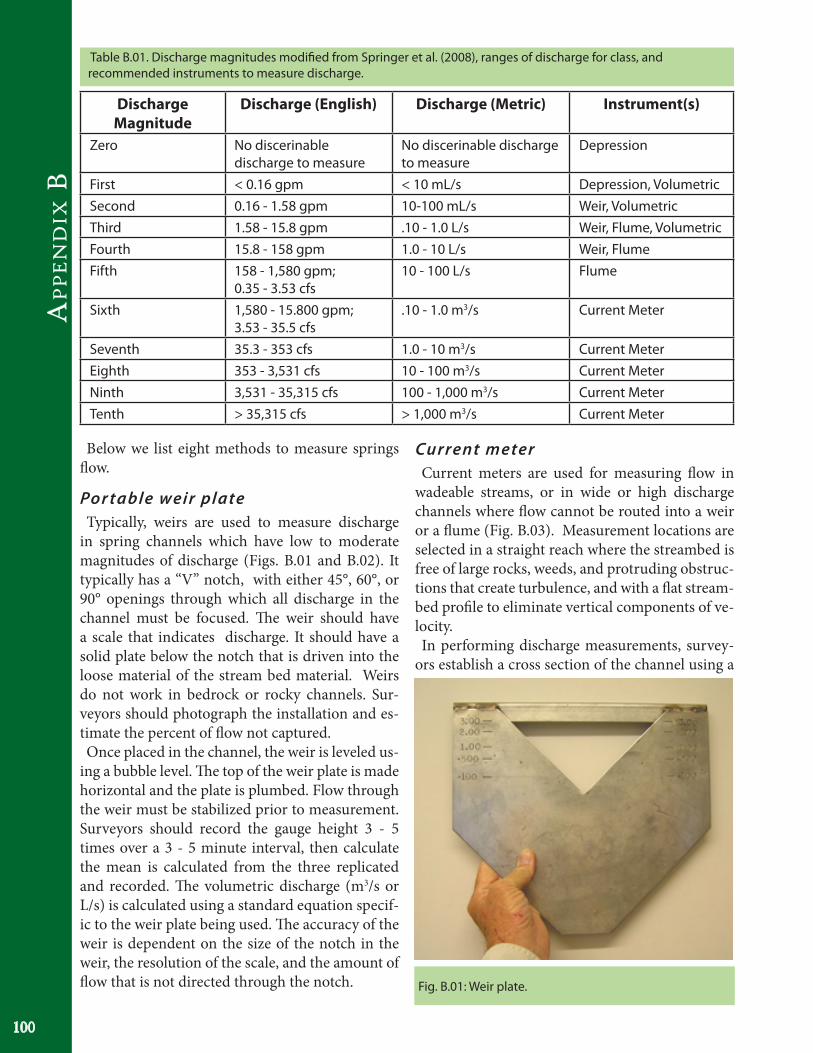
Ap
pe
nd
ix B
100
Below we list eight methods to measure springs flow.
Por table weir plateTypically, weirs are used to measure discharge
in spring channels which have low to moderate magnitudes of discharge (Figs. B.01 and B.02). It typically has a “V” notch, with either 45°, 60°, or 90° openings through which all discharge in the channel must be focused. The weir should have a scale that indicates discharge. It should have a solid plate below the notch that is driven into the loose material of the stream bed material. Weirs do not work in bedrock or rocky channels. Sur-veyors should photograph the installation and es-timate the percent of flow not captured. Once placed in the channel, the weir is leveled us-
ing a bubble level. The top of the weir plate is made horizontal and the plate is plumbed. Flow through the weir must be stabilized prior to measurement. Surveyors should record the gauge height 3 - 5 times over a 3 - 5 minute interval, then calculate the mean is calculated from the three replicated and recorded. The volumetric discharge (m3/s or L/s) is calculated using a standard equation specif-ic to the weir plate being used. The accuracy of the weir is dependent on the size of the notch in the weir, the resolution of the scale, and the amount of flow that is not directed through the notch.
Current meter Current meters are used for measuring flow in
wadeable streams, or in wide or high discharge channels where flow cannot be routed into a weir or a flume (Fig. B.03). Measurement locations are selected in a straight reach where the streambed is free of large rocks, weeds, and protruding obstruc-tions that create turbulence, and with a flat stream-bed profile to eliminate vertical components of ve-locity.In performing discharge measurements, survey-
ors establish a cross section of the channel using a
Table B.01. Discharge magnitudes modified from Springer et al. (2008), ranges of discharge for class, and recommended instruments to measure discharge.
Discharge Magnitude
Discharge (English) Discharge (Metric) Instrument(s)
Zero No discerinable discharge to measure
No discerinable discharge to measure
Depression
First < 0.16 gpm < 10 mL/s Depression, VolumetricSecond 0.16 - 1.58 gpm 10-100 mL/s Weir, VolumetricThird 1.58 - 15.8 gpm .10 - 1.0 L/s Weir, Flume, VolumetricFourth 15.8 - 158 gpm 1.0 - 10 L/s Weir, FlumeFifth 158 - 1,580 gpm;
0.35 - 3.53 cfs10 - 100 L/s Flume
Sixth 1,580 - 15.800 gpm; 3.53 - 35.5 cfs
.10 - 1.0 m3/s Current Meter
Seventh 35.3 - 353 cfs 1.0 - 10 m3/s Current MeterEighth 353 - 3,531 cfs 10 - 100 m3/s Current MeterNinth 3,531 - 35,315 cfs 100 - 1,000 m3/s Current MeterTenth > 35,315 cfs > 1,000 m3/s Current Meter
Fig. B.01: Weir plate.
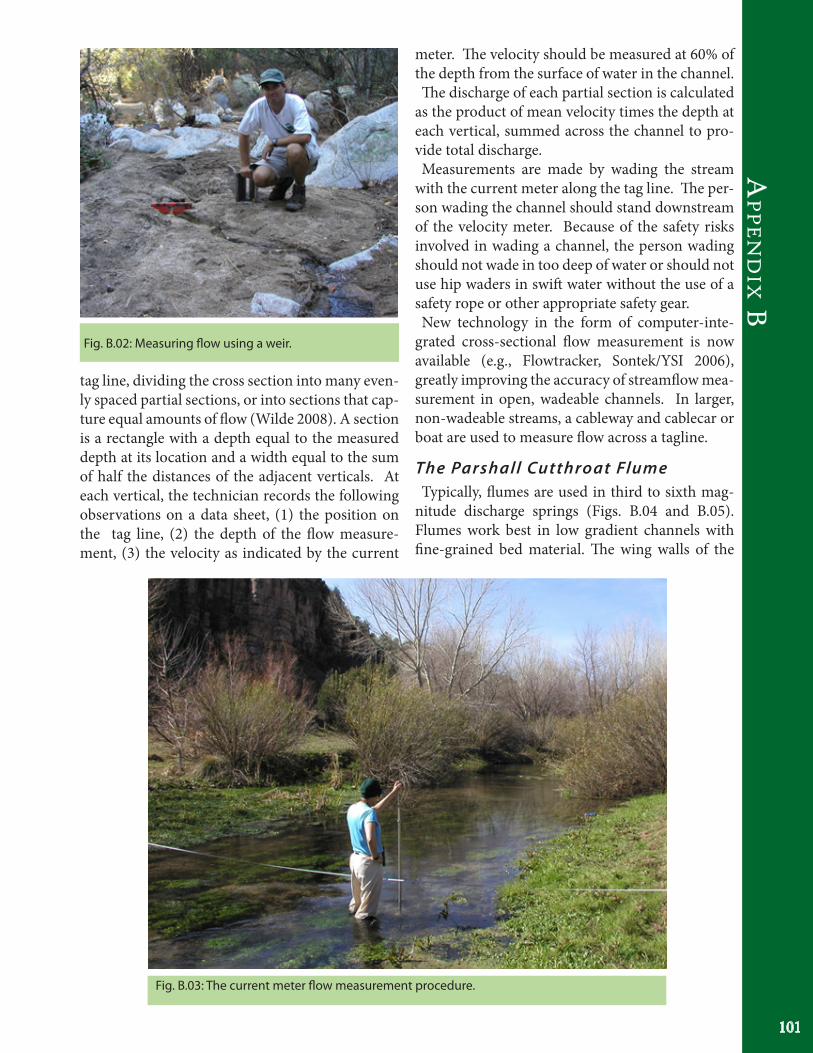
101
Ap
pe
nd
ix Bmeter. The velocity should be measured at 60% of the depth from the surface of water in the channel. The discharge of each partial section is calculated
as the product of mean velocity times the depth at each vertical, summed across the channel to pro-vide total discharge. Measurements are made by wading the stream
with the current meter along the tag line. The per-son wading the channel should stand downstream of the velocity meter. Because of the safety risks involved in wading a channel, the person wading should not wade in too deep of water or should not use hip waders in swift water without the use of a safety rope or other appropriate safety gear. New technology in the form of computer-inte-
grated cross-sectional flow measurement is now available (e.g., Flowtracker, Sontek/YSI 2006), greatly improving the accuracy of streamflow mea-surement in open, wadeable channels. In larger, non-wadeable streams, a cableway and cablecar or boat are used to measure flow across a tagline.
The Pa rshall Cutthroat FlumeTypically, flumes are used in third to sixth mag-
nitude discharge springs (Figs. B.04 and B.05). Flumes work best in low gradient channels with fine-grained bed material. The wing walls of the
Fig. B.03: The current meter flow measurement procedure.
Fig. B.02: Measuring flow using a weir.
tag line, dividing the cross section into many even-ly spaced partial sections, or into sections that cap-ture equal amounts of flow (Wilde 2008). A section is a rectangle with a depth equal to the measured depth at its location and a width equal to the sum of half the distances of the adjacent verticals. At each vertical, the technician records the following observations on a data sheet, (1) the position on the tag line, (2) the depth of the flow measure-ment, (3) the velocity as indicated by the current
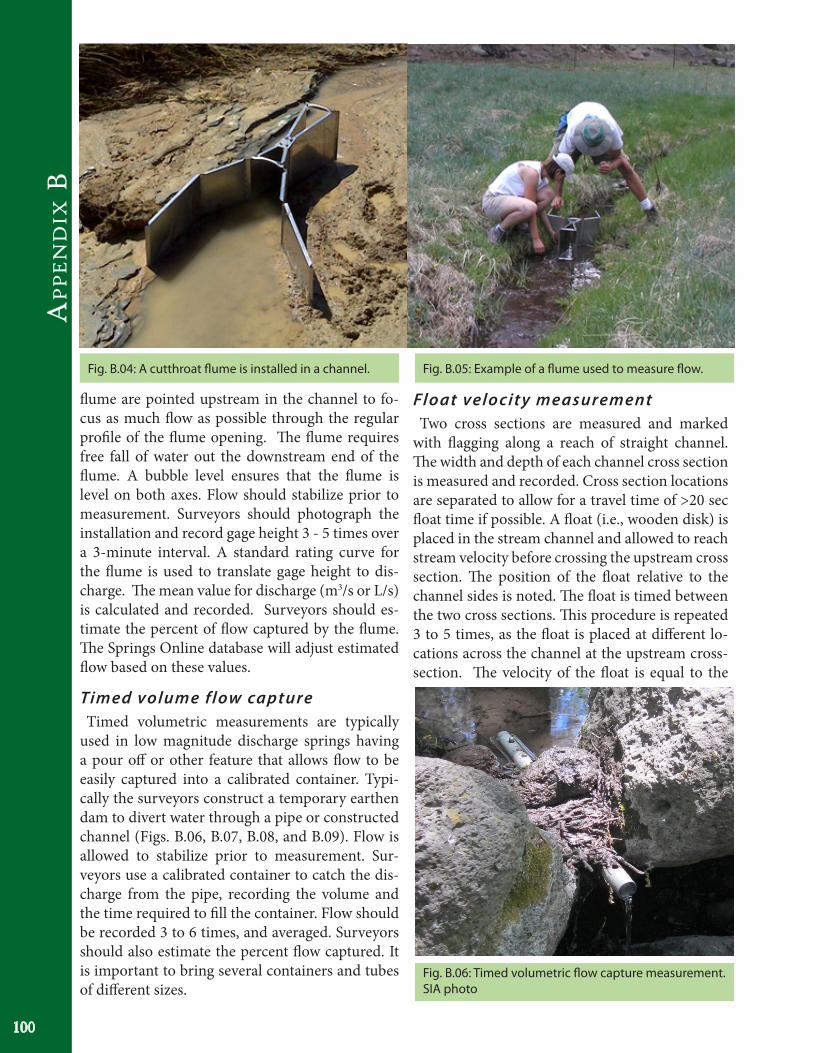
Ap
pe
nd
ix B
100
flume are pointed upstream in the channel to fo-cus as much flow as possible through the regular profile of the flume opening. The flume requires free fall of water out the downstream end of the flume. A bubble level ensures that the flume is level on both axes. Flow should stabilize prior to measurement. Surveyors should photograph the installation and record gage height 3 - 5 times over a 3-minute interval. A standard rating curve for the flume is used to translate gage height to dis-charge. The mean value for discharge (m3/s or L/s) is calculated and recorded. Surveyors should es-timate the percent of flow captured by the flume. The Springs Online database will adjust estimated flow based on these values.
Time d volume f low ca pture Timed volumetric measurements are typically
used in low magnitude discharge springs having a pour off or other feature that allows flow to be easily captured into a calibrated container. Typi-cally the surveyors construct a temporary earthen dam to divert water through a pipe or constructed channel (Figs. B.06, B.07, B.08, and B.09). Flow is allowed to stabilize prior to measurement. Sur-veyors use a calibrated container to catch the dis-charge from the pipe, recording the volume and the time required to fill the container. Flow should be recorded 3 to 6 times, and averaged. Surveyors should also estimate the percent flow captured. It is important to bring several containers and tubes of different sizes.
Float velo cit y measurementTwo cross sections are measured and marked
with flagging along a reach of straight channel. The width and depth of each channel cross section is measured and recorded. Cross section locations are separated to allow for a travel time of >20 sec float time if possible. A float (i.e., wooden disk) is placed in the stream channel and allowed to reach stream velocity before crossing the upstream cross section. The position of the float relative to the channel sides is noted. The float is timed between the two cross sections. This procedure is repeated 3 to 5 times, as the float is placed at different lo-cations across the channel at the upstream cross-section. The velocity of the float is equal to the
Fig. B.04: A cutthroat flume is installed in a channel.
Fig. B.06: Timed volumetric flow capture measurement. SIA photo
Fig. B.05: Example of a flume used to measure flow.
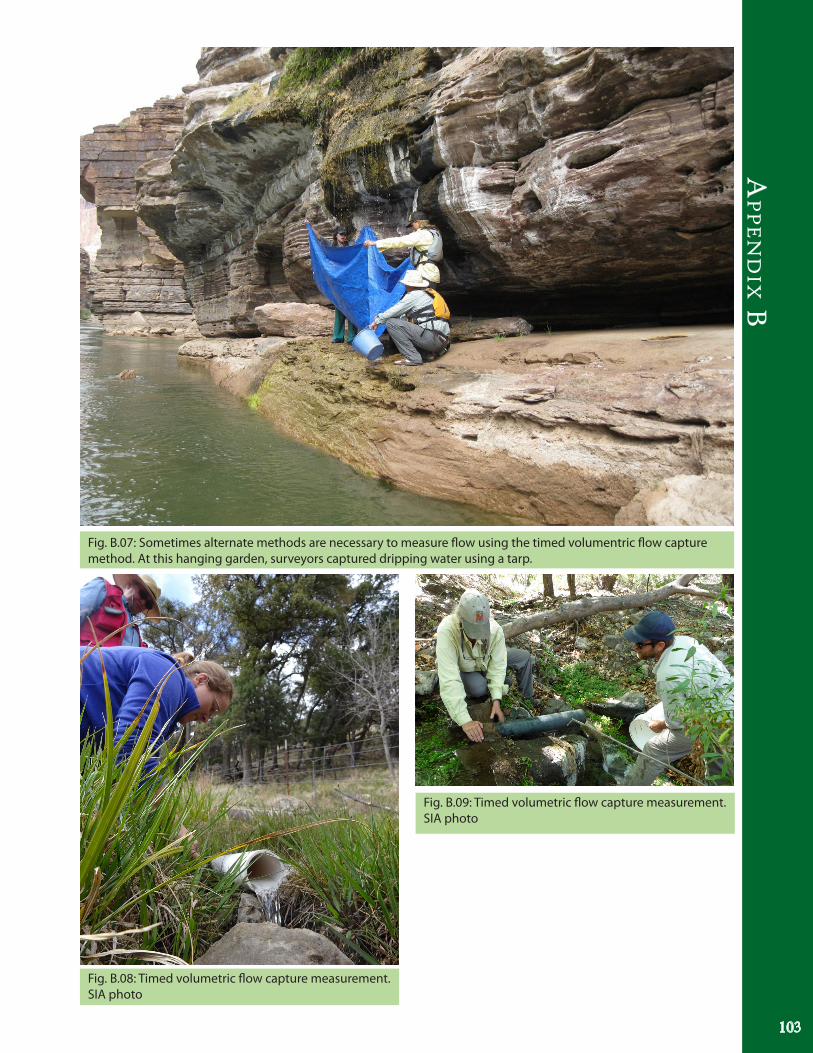
103
Ap
pe
nd
ix B
Fig. B.08: Timed volumetric flow capture measurement. SIA photo
Fig. B.07: Sometimes alternate methods are necessary to measure flow using the timed volumentric flow capture method. At this hanging garden, surveyors captured dripping water using a tarp.
Fig. B.09: Timed volumetric flow capture measurement. SIA photo

Ap
pe
nd
ix B
100
tion is imprecise, it may be the only method pos-sible for some springs, and should be regarded as a last resort. Measurements and photographs should be taken to record the surface area wetted or cov-ered by water and observations recorded on the datasheet.
O ther Flow Measurement CommentsSubaqueous springs emerge from the floors of
streams, lakes, or the ocean floor. Difference meth-ods can be used to estimate flow of larger springs in stream channels. However, measurement in sub-aqueous lentic settings, such as lake floors or ma-rine settings, may involve measurement of the area and velocity of discharging flow using SCUBA, thermal modeling, or other techniques that cannot be accomplished during a rapid assessment.
Wat e r qua l I t y me a S u r e m e n t
Over viewField and laboratory water geochemistry meth-
ods are described by the U.S. Geological Survey (reviewed in Wilde 2008) and endorsed by the En-vironmental Protection Agency. In general, air and water temperature, pH, specific conductance, total alkalinity, and dissolved oxygen concentration are measured using daily-calibrated field instrumen-tation. Water quality samples and measurements are made at the springs source, rather than down-stream from the source, to capture to the greatest extent possible characteristics of the groundwater.
Field MeasurementMany devices are available to measure multiple
parameters (i.e. multimeters), but each probe needs to be calibrated against laboratory standards each day. In our experience, the more expensive the sampling device, the more likely it is to mal-function in remote field settings. Therefore, con-tingency planning is recommended, with several backup devices or strategies for obtaining water quality information. Field water quality measurements of specific con-
ductance (mS/cm), pH, temperature (ºC), and dis-solved oxygen concentration (mg/L) should follow established U.S. Geological Survey and EPA pro-tocols. In addition to these variables, other probes can be used to measure oxygen reduction poten-tial, salinity, depth, barometric pressure, nitrate,
distance between the cross sections divided by the travel time. The mean value of surface horizontal velocity (m/s) is calculated. To convert mean sur-face velocity to mean vertical velocity a coefficient of 0.85 is multiplied by the mean surface veloc-ity. Discharge (m3/s) is calculated by multiplying the value of mean velocity by the average area of the section of the stream channel measured. This method is inferior to the velocity measurement techniques listed above.
D epression/sumpThis method is typically used for small pool-
forming (limnocrene) springs with no outflow. Surveyors measure the depth of the pool, then quickly bail water from the depression. Either they measure the volume of water bailed out, or calcu-late the volume of the drained portion of the pool. They then time the refilling of the pool, repeating this procedure 3 to 5 times. The mean value is re-corded as the measurement.
Wette d a rea measurementIn situations where wetted area can be observed
but flow cannot be measured (e.g., seepage from walls, helocrene springs with no outflow) survey-ors should measure and describe the area of the wetted surface. This can be used as a monitoring metric; some hydrologists use repeat photography as well to document changes in the wetted area of hanging gardens.
Static head cha ngeThis method may be used for a relative com-
parison value for change in the stage elevation of a water body. A metric staff gage is placed in the water body and relative gage elevation is recorded, or efforts are made to locate and record an exist-ing fixed point in or near standing pool and record vertical distance to pool surface. At a later date, the changes in the static head on the staff gage or fixed point are recorded. This measurement technique provides a relative measure of change, but should only be used when no other options exist.
Visual f low estimationSite conditions, such as dense vegetation cover,
steep or flat slope, diffuse discharge into a marshy area, and dangerous access sometimes may not allow for direct measurement of discharge by the techniques listed above. Although visual estima-
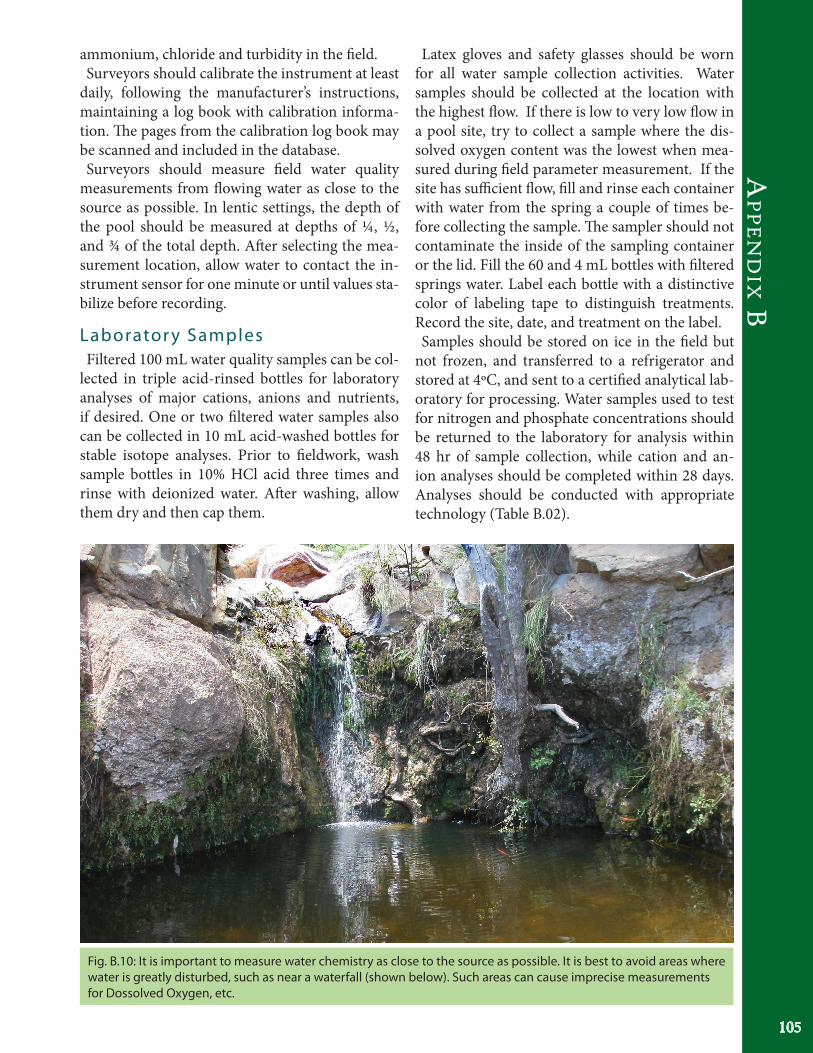
105
Ap
pe
nd
ix Bammonium, chloride and turbidity in the field. Surveyors should calibrate the instrument at least
daily, following the manufacturer’s instructions, maintaining a log book with calibration informa-tion. The pages from the calibration log book may be scanned and included in the database. Surveyors should measure field water quality
measurements from flowing water as close to the source as possible. In lentic settings, the depth of the pool should be measured at depths of ¼, ½, and ¾ of the total depth. After selecting the mea-surement location, allow water to contact the in-strument sensor for one minute or until values sta-bilize before recording.
Laborator y SamplesFiltered 100 mL water quality samples can be col-
lected in triple acid-rinsed bottles for laboratory analyses of major cations, anions and nutrients, if desired. One or two filtered water samples also can be collected in 10 mL acid-washed bottles for stable isotope analyses. Prior to fieldwork, wash sample bottles in 10% HCl acid three times and rinse with deionized water. After washing, allow them dry and then cap them.
Latex gloves and safety glasses should be worn for all water sample collection activities. Water samples should be collected at the location with the highest flow. If there is low to very low flow in a pool site, try to collect a sample where the dis-solved oxygen content was the lowest when mea-sured during field parameter measurement. If the site has sufficient flow, fill and rinse each container with water from the spring a couple of times be-fore collecting the sample. The sampler should not contaminate the inside of the sampling container or the lid. Fill the 60 and 4 mL bottles with filtered springs water. Label each bottle with a distinctive color of labeling tape to distinguish treatments. Record the site, date, and treatment on the label.Samples should be stored on ice in the field but
not frozen, and transferred to a refrigerator and stored at 4ºC, and sent to a certified analytical lab-oratory for processing. Water samples used to test for nitrogen and phosphate concentrations should be returned to the laboratory for analysis within 48 hr of sample collection, while cation and an-ion analyses should be completed within 28 days. Analyses should be conducted with appropriate technology (Table B.02).
Fig. B.10: It is important to measure water chemistry as close to the source as possible. It is best to avoid areas where water is greatly disturbed, such as near a waterfall (shown below). Such areas can cause imprecise measurements for Dossolved Oxygen, etc.
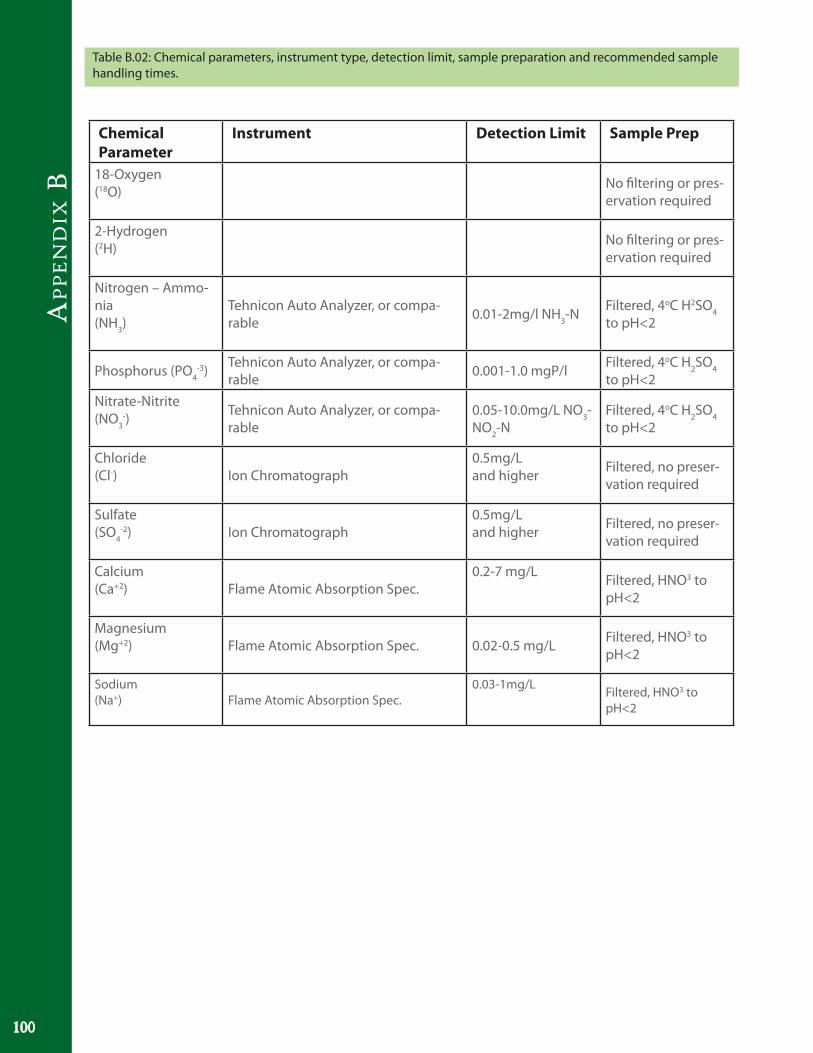
Ap
pe
nd
ix B
100
Chemical Parameter
Instrument Detection Limit Sample Prep
18-Oxygen(18O) No filtering or pres-
ervation required
2-Hydrogen(2H) No filtering or pres-
ervation required
Nitrogen – Ammo-nia(NH3)
Tehnicon Auto Analyzer, or compa-rable 0.01-2mg/l NH3-N Filtered, 4oC H2SO4
to pH<2
Phosphorus (PO4-3) Tehnicon Auto Analyzer, or compa-
rable 0.001-1.0 mgP/l Filtered, 4oC H2SO4 to pH<2
Nitrate-Nitrite(NO3
-) Tehnicon Auto Analyzer, or compa-rable
0.05-10.0mg/L NO3-NO2-N
Filtered, 4oC H2SO4 to pH<2
Chloride(Cl-) Ion Chromatograph
0.5mg/Land higher Filtered, no preser-
vation required
Sulfate(SO4
-2) Ion Chromatograph0.5mg/Land higher Filtered, no preser-
vation required
Calcium(Ca+2) Flame Atomic Absorption Spec.
0.2-7 mg/L Filtered, HNO3 to pH<2
Magnesium(Mg+2) Flame Atomic Absorption Spec. 0.02-0.5 mg/L Filtered, HNO3 to
pH<2
Sodium(Na+) Flame Atomic Absorption Spec.
0.03-1mg/L Filtered, HNO3 to pH<2
Table B.02: Chemical parameters, instrument type, detection limit, sample preparation and recommended sample handling times.

107
Ap
pe
nd
ix Cp
lA
nt A
pp
en
dix
his section contains worksheets and checklists to assist in the Inventory, Assessment, Plan-ning, and Monitoring process.
re S to r at I o n pl a n n I n g
Defining Rehabil itat ion GoalsThis stage is essential before beginning a project.
Goals can vary from restoration of one spring or a small suite of ecosystem elements or processes, to full rehabilitation of the site. Meet with all con-cerned stakeholders to discuss the issues, rationale for action, expected outcomes and benefits, costs, and consequences if the effort is not successful, as well as future commitment to the project, includ-ing monitoring. Defining these parameters in advance can iden-
tify potential pitfalls and consequences of actions, which will help focus the planned activities. Before beginning any other planning, it is important to understand the type of springs ecosystem under consideration for rehabilitation, because creating habitats that are inappropriate for a given springs type will likely mean additional maintenance, costs which may not be sustainable over time. How, by whom, at what cost, and at what sched-
ule are elements of the rehabilitation proposal and the project workplan. Consulting with experts sig-nificantly improves chances of project success. Agencies planning to pursue springs rehabilita-
tion are required to undergo significant review to ensure the importance, cost-effectiveness, and logic of the plan. They should also be involved in framing the monitoring plan. Monitoring is neces-sary for rehabilitation activities. It provides feed-
T back that helps improve stewardship planning over time (Fig. 4.1). While exhaustive premedita-tion may not always be necessary, forethought and planning can help lead to project success.
The Planning ProcessLike all processes that require forethought and
financial investment, springs ecosystem rehabili-tation is most likely to succeed when based on a logical progression of actions (Fig. 4.1). The elements of springs rehabilitation planning
and implementation include: assembling the stew-ardship group (managers, agencies, Tribes, con-cerned organizations and individuals); introduc-ing the problem and challenges; compilation and understanding of background, inventory, and assessment information; brainstorming and dis-cussion about options; development of a plan, in-cluding outreach and information management; securing funding for both management actions and monitoring; conducting or overseeing imple-mentation; and then monitoring and feeding back that information to improve stewardship. An open, inclusive process helps all concerned
with the project understand the process and bring out new ideas and insights that may facilitate the process. The following worksheet provides an easy to follow framework within which to begin the planning process. These are questions that should be considered and answered before, during, and after the restoration process.
workSHeet And equipment liStAppendix C

Ap
pe
nd
ix C
108
1. What is the problem?
2. Can the problem be fixed? • What is the administrative context?
3. Who cares and why?• What is the membership of the stewardship planning and implementation team?• Which other individuals and groups are or should collaborate?
4. How will the rehabilitation project be funded in both the short term and long-term?
5. What is the urgency of this project?
6. What are the desired future conditions?• Distinguish among flowing (lotic) versus non- or slow-flowing (lentic) springs types
7. What are the rehabilitation goals (broad future vision for the ecosystem)?• This will vary in relation the type of springs ecosystem• Further refine understanding of desired microhabitats
8. What are the rehabilitation objectives and options?• What are the specific management goals (e.g., single species or habitat enhancement, versus
whole-ecosystem rehabilitation)
Restoration Planning Worksheet SSI © 2015

109
Ap
pe
nd
ix C9. If multiple uses are desired, what balance of uses is best and how can those uses best be accom-modated?
10. What is likely to be the cost and what are the sources of funding?
11. What is the timeline?• Including pre-treatment monitoring • Implementation at 0, 30, 60, 90 and 100% completion• Include long-term, post-treatment monitoring
12. What are the regulatory and compliance issues and how are they to be resolved?
13. Who is responsible for implementation and oversight, and on what schedule?
14. How will information management and reporting be achieved?
15. How will monitoring feedback be used to improve stewardship?
16. What contingency planning is needed?• What if……happens?
17. What outreach and partnerships are needed?

Ap
pe
nd
ix C
110
18. What long-term stewardship issues need to be resolved and how will that resolution take place?
• How will the long-term effectiveness of the project be guaranteed

111
Ap
pe
nd
ix CSp r I n g S In v e n to r y eq u I p m e n t l I S t
Suggested field equipment:
Science Equipment- Day pack or backpack- Background data including maps and directions to site- GPS unit – set to WGS84 Horizontal Datum, extra GPS batteries- Laptop with GIS or similar mapping software (optional)- Field data sheets, extra sets- Pencils, indelible markers (Sharpies)- Clipboards- Handheld dry erase board and markers (level one surveys)- Graph paper for sketchmap- Data pouch with waterproof field notebook- SEAP scoring criteria- 5 m measuring tape, two 30-100 m measuring tapes or a range finder- Solar Pathfinder and templates for latitude- Sighting compass or Brunton compass- Clinometer- Trowel or shovel- Binoculars- Flash light and extra batteries- Hand lens- Munsell soil color chart (optional)- Water quality kit (EC or SC, pH, temperature, dissolved oxygen)- Calibration fluids and associated log book- Handheld thermometer (backup)- Plant press and newspaper- Flow measurement equipment- Natural history field guides- Camera (memory cards, spare batteries)- Spray bottle and disinfectant- Invertebrate collecting gear (optional: 70-100% EtOH, soft forceps, vials, dip and kick nets, aerial net,
killing jar and fluid such as ethyl acetate)
Personal Safety Equipment- Sun protection (hat, bandana, long sleeve shirt, and sunscreen)- Appropriate clothing (warm layers, rain gear, and synthetic breathable layers for hot weather, closed-
toed shoes)- Clothing accessories (knee pads, work gloves, sun glasses)- Cell or satellite telephone- First aid kit and current training- Drinking water filter (Aquamira, Ketadyne, MSR, etc.)- Hard hat (if applicable)
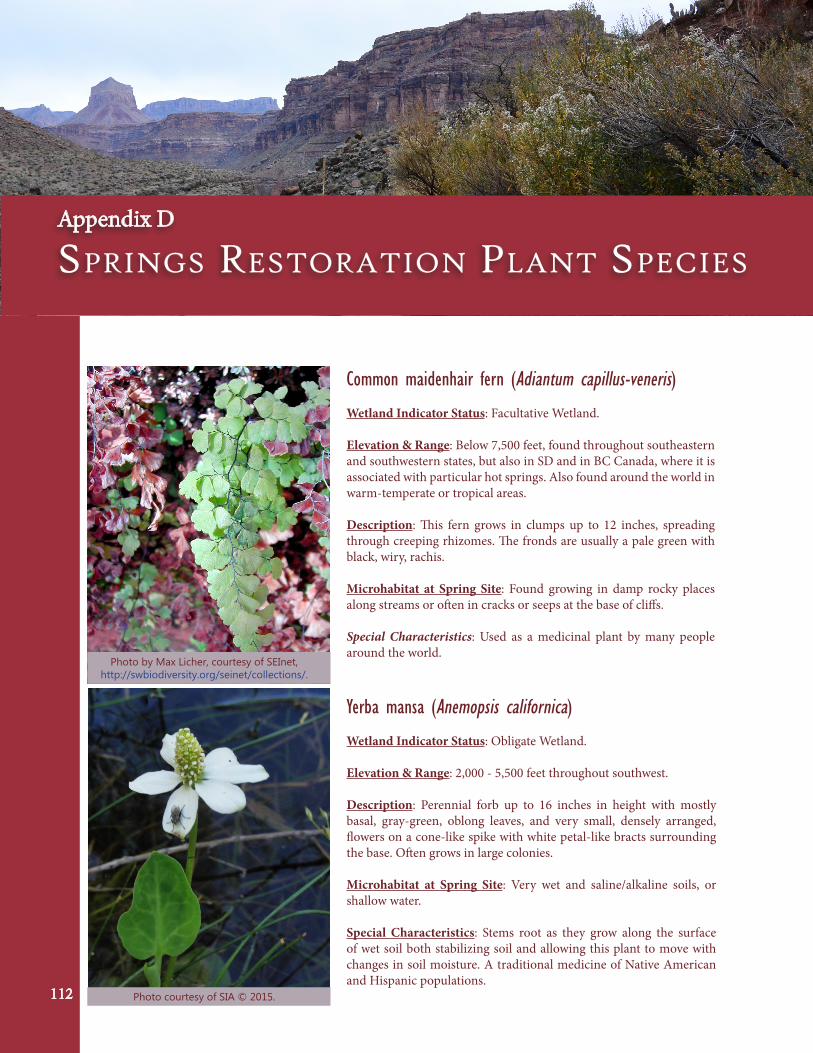
112
pl
An
t Ap
pe
nd
ix
Yerba mansa (Anemopsis californica)Wetland Indicator Status: Obligate Wetland.
Elevation & Range: 2,000 - 5,500 feet throughout southwest.
Description: Perennial forb up to 16 inches in height with mostly basal, gray-green, oblong leaves, and very small, densely arranged, flowers on a cone-like spike with white petal-like bracts surrounding the base. Often grows in large colonies.
Microhabitat at Spring Site: Very wet and saline/alkaline soils, or shallow water.
Special Characteristics: Stems root as they grow along the surface of wet soil both stabilizing soil and allowing this plant to move with changes in soil moisture. A traditional medicine of Native American and Hispanic populations.
Photo courtesy of SIA © 2015.
Common maidenhair fern (Adiantum capillus-veneris)Wetland Indicator Status: Facultative Wetland.
Elevation & Range: Below 7,500 feet, found throughout southeastern and southwestern states, but also in SD and in BC Canada, where it is associated with particular hot springs. Also found around the world in warm-temperate or tropical areas.
Description: This fern grows in clumps up to 12 inches, spreading through creeping rhizomes. The fronds are usually a pale green with black, wiry, rachis. Microhabitat at Spring Site: Found growing in damp rocky places along streams or often in cracks or seeps at the base of cliffs.
Special Characteristics: Used as a medicinal plant by many people around the world.
Photo by Max Licher, courtesy of SEInet, http://swbiodiversity.org/seinet/collections/.
SpringS reStorAtion plAnt SpecieS
Appendix D

113
Ap
pe
nd
ix d
Seep willow (Baccharis salicifolia)Wetland Indicator Status: Facultative Wetland.
Elevation & Range: 2,000 - 5,500 feet throughout southwest.
Description: Shrub up to 12 feet tall with willow-like growth and leaves. Leaves are dark green, shiny, waxy and sticky, with small teeth along margins. Microhabitat at Spring Site: Disturbed sites such as stream sides, and the bottom of dry washes.
Special Characteristics: Dense growth helps to control erosion, also acts as a nurse-plant for riparian tree species. This is an important nectar plant for many species of butterflies.
Photo by Max Licher, courtesy of SEInet, http://swbiodiversity.org/seinet/collections/.
Saltbush (Atriplex spp.)Four-wing saltbush (Atriplex canescens) | Quail bush (Atriplex lentiformis)
Wetland Indicator Status: Atriplex lentiformis - Facultative.
Elevation & Range: Atriplex canescens 2,000 - 8,000 feet throughout west. Atriplex lentiformis below 7,000 feet in AZ, CA, UT, NV.
Description: Shrubs up to 11 feet though usually less, and broader than tall. Gray-green leaves are smooth margined and narrow on Atriplex canescens, typically toothed or rippled and broader and triangular on Atriplex lentiformis. Separate male and female plants.
Microhabitat at Spring Site: Atriplex canescens: sandy and/or saline soils. Atriplex lentiformis grows along riverbanks or in the salty soils of salt flats, dry lakes, and desert scrub habitats.
Special Characteristics: Saltbush has deep roots, provides browse, grows quickly and is easily established with container plants or seed. Spread can be controlled through installation of male container plants.
Sedges (Carex spp.)Wetland Indicator Status: Obligate Wetland
Elevation & Range: Most species in AZ grow between 3,500 - 9,500 feet though there are species that grow at both higher and lower elevations. Sedges grow throughout the United States, several species are native to the southwest.
Description: Perennial, grass-like, plants with angular stems (usually triangular), as the saying goes “sedges have edges.” Plants spread through rhizomes, some grow in tufts. Microhabitat at Spring Site: Many species found in wet areas such as along streams, and in marshy areas or seeps. Some species can tolerate drier soils and can be found far from open water sources.
Special Characteristics: Sedges can be easily salvaged and transplanted and provide excellent erosion control.
Photo by Max Licher, courtesy of SEInet, http://swbiodiversity.org/seinet/collections/.
Photo courtesy of SIA © 2015.
SpringS reStorAtion plAnt SpecieS
Appendix D
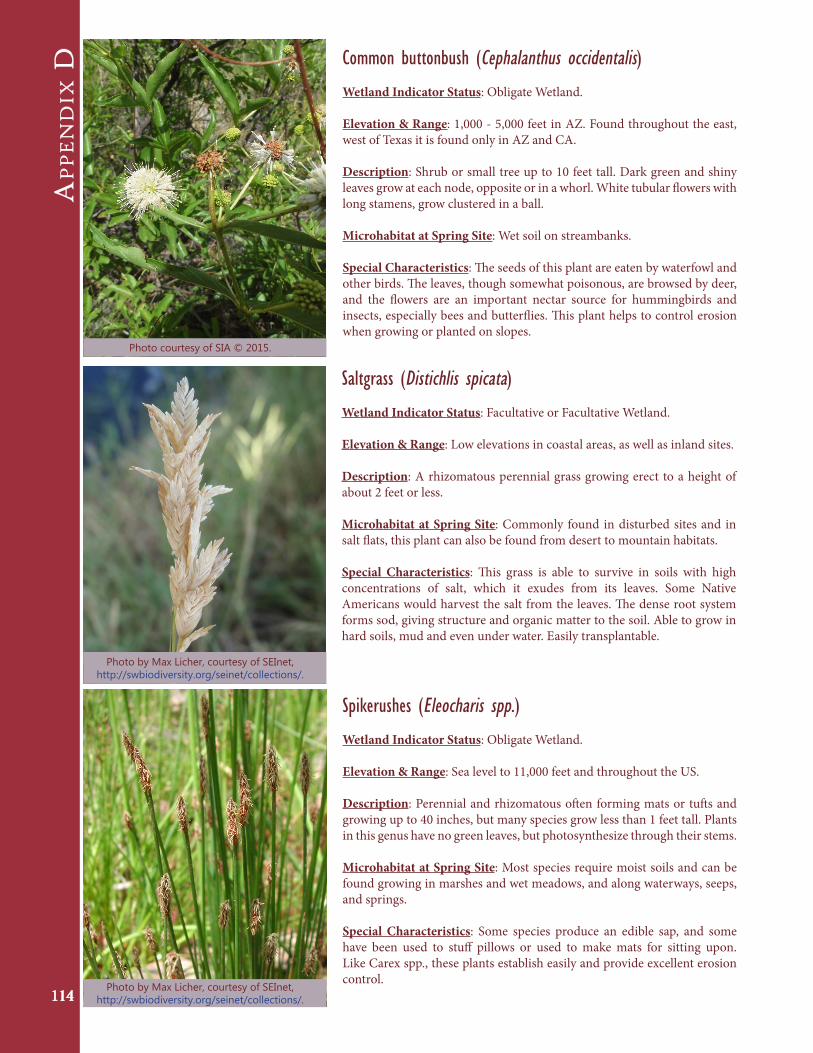
Ap
pe
nd
ix d
114
Common buttonbush (Cephalanthus occidentalis)Wetland Indicator Status: Obligate Wetland.
Elevation & Range: 1,000 - 5,000 feet in AZ. Found throughout the east, west of Texas it is found only in AZ and CA.
Description: Shrub or small tree up to 10 feet tall. Dark green and shiny leaves grow at each node, opposite or in a whorl. White tubular flowers with long stamens, grow clustered in a ball. Microhabitat at Spring Site: Wet soil on streambanks.
Special Characteristics: The seeds of this plant are eaten by waterfowl and other birds. The leaves, though somewhat poisonous, are browsed by deer, and the flowers are an important nectar source for hummingbirds and insects, especially bees and butterflies. This plant helps to control erosion when growing or planted on slopes.
Saltgrass (Distichlis spicata)Wetland Indicator Status: Facultative or Facultative Wetland.
Elevation & Range: Low elevations in coastal areas, as well as inland sites.
Description: A rhizomatous perennial grass growing erect to a height of about 2 feet or less.
Microhabitat at Spring Site: Commonly found in disturbed sites and in salt flats, this plant can also be found from desert to mountain habitats.
Special Characteristics: This grass is able to survive in soils with high concentrations of salt, which it exudes from its leaves. Some Native Americans would harvest the salt from the leaves. The dense root system forms sod, giving structure and organic matter to the soil. Able to grow in hard soils, mud and even under water. Easily transplantable.
Photo courtesy of SIA © 2015.
Photo by Max Licher, courtesy of SEInet, http://swbiodiversity.org/seinet/collections/.
Spikerushes (Eleocharis spp.)Wetland Indicator Status: Obligate Wetland.
Elevation & Range: Sea level to 11,000 feet and throughout the US.
Description: Perennial and rhizomatous often forming mats or tufts and growing up to 40 inches, but many species grow less than 1 feet tall. Plants in this genus have no green leaves, but photosynthesize through their stems. Microhabitat at Spring Site: Most species require moist soils and can be found growing in marshes and wet meadows, and along waterways, seeps, and springs.
Special Characteristics: Some species produce an edible sap, and some have been used to stuff pillows or used to make mats for sitting upon. Like Carex spp., these plants establish easily and provide excellent erosion control.Photo by Max Licher, courtesy of SEInet,
http://swbiodiversity.org/seinet/collections/.
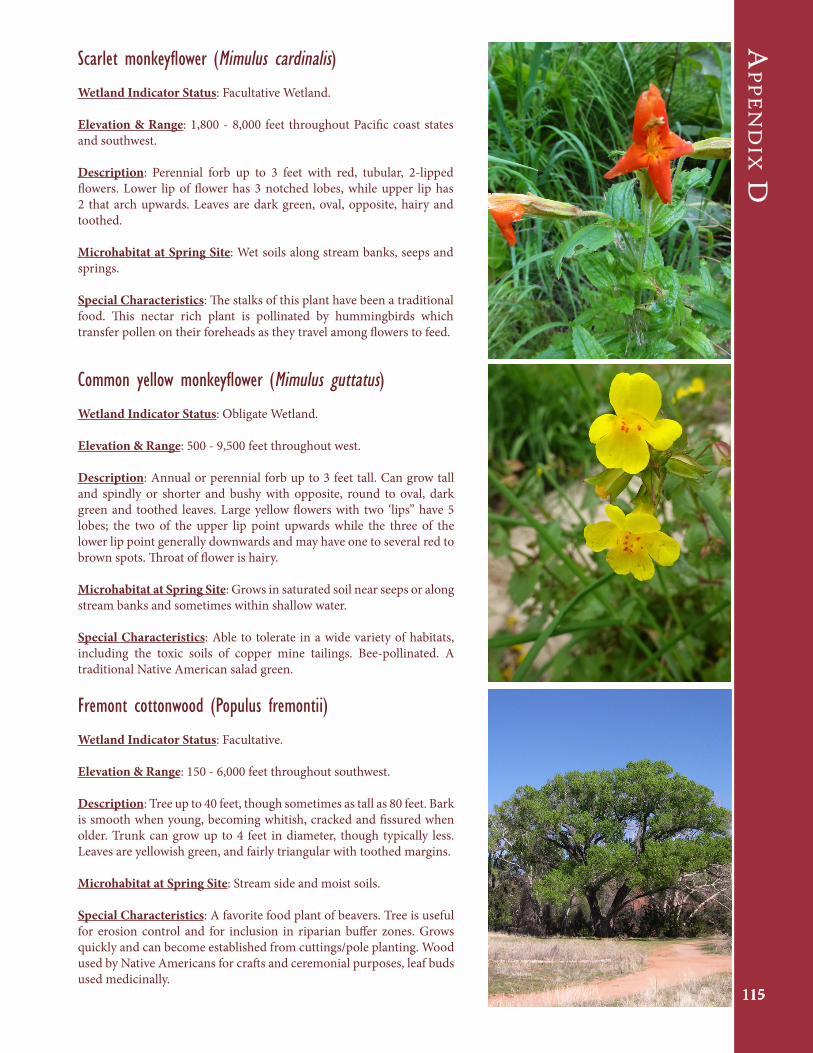
115
Ap
pe
nd
ix dScarlet monkeyflower (Mimulus cardinalis) Wetland Indicator Status: Facultative Wetland.
Elevation & Range: 1,800 - 8,000 feet throughout Pacific coast states and southwest.
Description: Perennial forb up to 3 feet with red, tubular, 2-lipped flowers. Lower lip of flower has 3 notched lobes, while upper lip has 2 that arch upwards. Leaves are dark green, oval, opposite, hairy and toothed. Microhabitat at Spring Site: Wet soils along stream banks, seeps and springs.
Special Characteristics: The stalks of this plant have been a traditional food. This nectar rich plant is pollinated by hummingbirds which transfer pollen on their foreheads as they travel among flowers to feed.
Common yellow monkeyflower (Mimulus guttatus)Wetland Indicator Status: Obligate Wetland.
Elevation & Range: 500 - 9,500 feet throughout west.
Description: Annual or perennial forb up to 3 feet tall. Can grow tall and spindly or shorter and bushy with opposite, round to oval, dark green and toothed leaves. Large yellow flowers with two ‘lips” have 5 lobes; the two of the upper lip point upwards while the three of the lower lip point generally downwards and may have one to several red to brown spots. Throat of flower is hairy.
Microhabitat at Spring Site: Grows in saturated soil near seeps or along stream banks and sometimes within shallow water.
Special Characteristics: Able to tolerate in a wide variety of habitats, including the toxic soils of copper mine tailings. Bee-pollinated. A traditional Native American salad green.
Fremont cottonwood (Populus fremontii)
Wetland Indicator Status: Facultative.
Elevation & Range: 150 - 6,000 feet throughout southwest.
Description: Tree up to 40 feet, though sometimes as tall as 80 feet. Bark is smooth when young, becoming whitish, cracked and fissured when older. Trunk can grow up to 4 feet in diameter, though typically less. Leaves are yellowish green, and fairly triangular with toothed margins. Microhabitat at Spring Site: Stream side and moist soils.
Special Characteristics: A favorite food plant of beavers. Tree is useful for erosion control and for inclusion in riparian buffer zones. Grows quickly and can become established from cuttings/pole planting. Wood used by Native Americans for crafts and ceremonial purposes, leaf buds used medicinally.
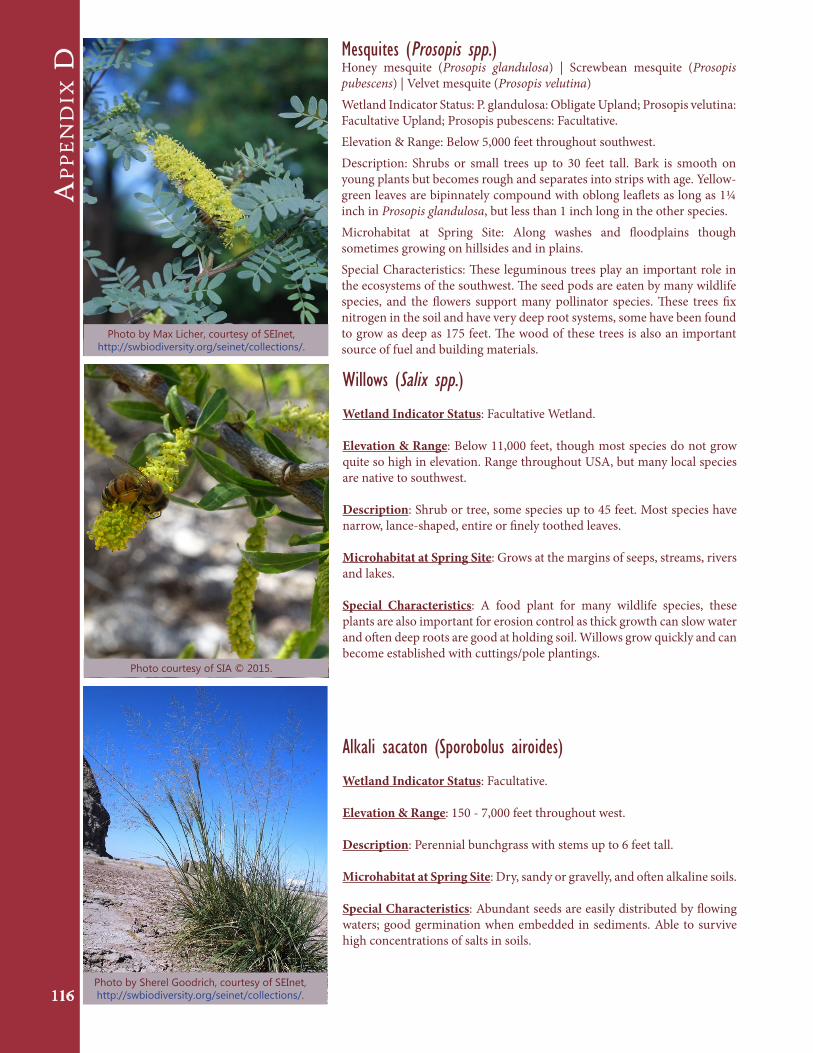
Ap
pe
nd
ix d
116
Mesquites (Prosopis spp.)Honey mesquite (Prosopis glandulosa) | Screwbean mesquite (Prosopis pubescens) | Velvet mesquite (Prosopis velutina)Wetland Indicator Status: P. glandulosa: Obligate Upland; Prosopis velutina: Facultative Upland; Prosopis pubescens: Facultative.Elevation & Range: Below 5,000 feet throughout southwest.Description: Shrubs or small trees up to 30 feet tall. Bark is smooth on young plants but becomes rough and separates into strips with age. Yellow-green leaves are bipinnately compound with oblong leaflets as long as 1¼ inch in Prosopis glandulosa, but less than 1 inch long in the other species.Microhabitat at Spring Site: Along washes and floodplains though sometimes growing on hillsides and in plains.Special Characteristics: These leguminous trees play an important role in the ecosystems of the southwest. The seed pods are eaten by many wildlife species, and the flowers support many pollinator species. These trees fix nitrogen in the soil and have very deep root systems, some have been found to grow as deep as 175 feet. The wood of these trees is also an important source of fuel and building materials.
Willows (Salix spp.)Wetland Indicator Status: Facultative Wetland.
Elevation & Range: Below 11,000 feet, though most species do not grow quite so high in elevation. Range throughout USA, but many local species are native to southwest.
Description: Shrub or tree, some species up to 45 feet. Most species have narrow, lance-shaped, entire or finely toothed leaves. Microhabitat at Spring Site: Grows at the margins of seeps, streams, rivers and lakes.
Special Characteristics: A food plant for many wildlife species, these plants are also important for erosion control as thick growth can slow water and often deep roots are good at holding soil. Willows grow quickly and can become established with cuttings/pole plantings.
Photo by Max Licher, courtesy of SEInet, http://swbiodiversity.org/seinet/collections/.
Photo courtesy of SIA © 2015.
Alkali sacaton (Sporobolus airoides)
Wetland Indicator Status: Facultative.
Elevation & Range: 150 - 7,000 feet throughout west.
Description: Perennial bunchgrass with stems up to 6 feet tall. Microhabitat at Spring Site: Dry, sandy or gravelly, and often alkaline soils.
Special Characteristics: Abundant seeds are easily distributed by flowing waters; good germination when embedded in sediments. Able to survive high concentrations of salts in soils.
Photo by Sherel Goodrich, courtesy of SEInet, http://swbiodiversity.org/seinet/collections/.

117
BiB
lio
gr
ap
hy
bibliogrApHy
Abele, S.L., editor. 2011. Nevada Springs Conservation Plan. Springs Conservation Plan Working Group. The Nature Conservancy, Reno.
Anderson, D., A. Springer, J. Kennedy, W. Odem, and L. DeWald. 2003. Verde River Headwaters Res-toration Demonstration Project: Final Report, Arizona Department of Water Resources Water Protection Fund, Grant No. 98-059.
Arizona Rare Plant Committee. 2006. Arizona Rare Plant Field Guide. Arizona Rare Plant Committee. Barbour M.T., J. Gerritsen, B.D. Snyder, and J.B. Stribling. 1999. Rapid bioassessment protocols for use
in streams and rivers: periphyton, benthic macroinvertebrates and fish. 2nd edition. EPA 841-B-99-002. Office of Water, Washington, DC.
Blinn, D.W. 2008. The extreme environment, trophic structure, and ecosystem dynamicxs of a large, fishless desert spring: Montezuma Well, Arizona. Pp. 98-126 in Stevens, L.E. and V.J. Meretsky, editors. 2008. Aridland Springs of North America: Ecology and Conservation. University of Ari-zona Press, Tucson.
Botosaneanu, L., Editor. 1998. Studies in Crenobiology: The Biology of Springs and Springbrooks. Back-huys Publishers, Leiden.
Brown, J.H. and C.R. Feldmeth. 1971. Evolution in constant and fluctuating environments: thermal tol-erances of desert pupfish (Cyprinodon). Evolution 25:390-398.
Burke, K.J., K.A. Harcksen, L.E. Stevens, R.J. Andress, and R.J. Johnson. 2015. Collaborative rehabilita-tion of Pakoon Springs in Grand Canyon-Parashant National Monument, Arizona. Pp. 312-330 in Huenneke, L.F., C. van Riper III, and K.A. Hayes-Gilpin, editors. The Colorado Plateau VI: Science and Management at the Landscape Scale. University of Arizona Press, Tucson.
Busch, D. and J. Trexler, editors. 2002. Interdisciplinary Approaches for Evaluating Ecoregional Initia-tives. Island Press, Washington.
Cowardin, L.M., F.C. Golet, and E.T. LaRoe. 1970. Classification of wetlands and deepwater habitats of the United States. U.S. Fish and Wildlife Service, Washington, D.C.
Crossey, L.J. and K.E. Karlstrom. 2012. Travertines and travertine springs in eastern Grand Canyon : what they tell us about groundwater, paleoclimate, and incision of Grand Canyon. In Timmons, M.J. and K.E. Karlstrom, editors. Grand Canyon Geology: Two Billion Years of Earth’s History. Geological Society of America.
Maria J. Cruz, M.J., R. Rebelo, and E.G. Crespo. 2006. Effects of an introduced crayfish, Procambarus clarkii, on the distribution of south-western Iberian amphibians in their breeding habitats. Ecog-raphy 29:329-338.
Shepard, W.D. 1993. Desert sprigns – both rare and endangered. Aquatic Conservation: Marine and Freshwater Ecosystems 3:352-359.
Cuthbert, M.O. and G.M. Ashley. 2014. A spring forward for hominin evolution in East Africa. PLoS ONE 9:e107358. doi:10.1371/journal.pone.0107358.
Davis, C.J., A.E. Springer, L.E. Stevens. 2011. Have arid land springs restoration projects been effective in restoring hydrology, geomorphology, and invertebrate and plant species composition compa-rable to natural springs with minimal anthropogenic disturbance?, Collaboration for Environ-mental Evidence, Systematic Review CEE 10-002.
Eamus, D., S. Zolfaghar, R. Villalobos-Vega, J. Cleverly, and A. Huete. 2015. Groundwater-dependent ecosystems: Recent insights from satellite and field-based studies. Hydrology and Earth System Sciences 19:4229-4256.
Echelle, A.A., E.W. Carson, A.F. Echelle, R.A. Van Den Bussche, T. Dowling, and A. Meyer. 2005. His-torical biogeography of the New World pupfish genus Cyprinodon (Teleostei: Cyprinodontidae). Copeia 2005:320–339.

BiB
lio
gr
ap
hy
118
Federal Geographic Data Committee. 2013. Classification of wetlands and deepwater habitats of the United States. Federal Geographic Data Committee Wetlands Subcommittee, Washington, D.C. Available on-line at: https://www.fgdc.gov/standards/projects/FGDC-standards-projects/wet-lands/nvcs-2013.
Graham, T.B. 2008. The Knowles Canyon Hanging Gardens, Glen Canyon National Recreation Area, eight years after burning: Changes in vegetation and soil biota. Pp. 290-317 in Stevens, L.E. and V.J. Meretsky, editors. 2008. Aridland Springs of North America: Ecology and Conservation. University of Arizona Press, Tucson.
Grand Canyon Wildlands Council, Inc. 2002. A hydrological and biological inventory of springs, seeps and ponds of the Arizona Strip: Final report. Arizona Department of Water Resources, Arizona Water Protection Fund, Phoenix.
Grand Canyon Wildlands Council, Inc. 2004. Biological inventory and assessment of ten South Rim springs in Grand Canyon National Park: final report. National Park Service Report, Grand Can-yon.
Hangartner, S.B. and A. Laurila. 2012. Effects of the disinfectant Virkon S on early life-stages of the moor frog (Rana arvalis). Amphibia – Reptilia 33:349-353. DOI: 10.1163/15685381-00002837
Haynes, C.V. Jr. 2008. Quaternary caldron springs as paleoecological archives. Pp. 76-97 in Stevens, L.E. and V.J. Meretsky, editors. 2008. Aridland Springs of North America: Ecology and Conservation. University of Arizona Press, Tucson.
Hendrickson, D.A. and W.L. Minckley. 1985. Ciénegas – Vanishing climax communities of the Ameri-can Southwest. Desert Plants 6:103-175.
Hershler, R., H-P. Liu, and J. Howard. 2014. Springsnails: A new conservation focus in western North America. Bioscience 64:693-700. doi:10.1093/biosci/biu100.
Hershler, R., H-P Liu, and L.E. Stevens. A new springsnail (Hydrobiidae: Pyrgulopsis) from the lower Colorado River basin, northwestern Arizona. Western North American Naturalist. Western North American Naturalist, in press.
Johnson, R.H., E. DeWitt, L. Wirt, A.H. Manning, and A.G. Hunt. 2012. Using geochemistry to identify the source of groundwater to Montezuma Well, a natural spring in central Arizona, USA: part 2. Environmental Earth Sciences 67:1837-1853.
Kilburn, S. 2012. Impacts of introduced crayfish on Ash Meadows aquatic communities: Ash Meadows National Wildlife Refuge, Nevada. University of Illinois at Urbana-Champaign Masters Thesis, Urbana-Champaign.
Knott, B. and E.J. Jasinska. 1998. Mound springs of Australia. Pages 23-38 in Botosaneanu, L, editor. Studies in Crenobiology: The Biology of Springs and Springbrooks. Backhuys, Leiden.
Kodric-Brown, A. and J.H. Brown. 2007. Native fishes, exotic mammals, and the conservation of desert springs. Frontiers in Ecology and the Environment 5:549-553.
Ledbetter, J.D., L.E. Stevens, A.E. Springer, and B. Brandt. 2016. Springs Inventory Database. Online Database. Springs and Springs-Dependent Species Database. Vers. 1.0. Springs Stewardship In-stitute, January 2014. Available online at: www.springsdata.org (accessed 7 Jan 2016).
Ledbetter, J.D., L.E. Stevens, M. Hendrie, and A. Leonard. Ecological inventory and assessment of springs ecosystems on Kaibab National Forest, northern Arizona, USA. U.S. Geological Survey Colorado Plateau Research Symposium, Flagstaff, in press.
Marks, J.C., G.A. Haden, and P.C. O’Neill. 2009. Effects of flow restoration and exotic species removal on recovery of native fish: Lessons from a dam decommissioning. Restoration Ecology; doi: 10:1111/j.1526-100x.2009.00574.x.
Martinez, M.A. and D.M. Thome. 2006. Habitat usage by the Page springsnail, Pyrgulopsis morrisoni (Gastropoda: Hydrobiidae), from Central Arizona. The Veliger 48:8–16.
Merritt, R.W., K.W. Cummins, and M.B. Berg. 2008. An Introduction to the Aquatic Insects of North America, 4th Edition. Kendall/Hunt Publishing Company, Dubuque.

119
BiB
lio
gr
ap
hy
Minckley, W.L. and J. E. Deacon, editors. 1991. Battle Against Extinction: Native Fish Management in the American West. University of Arizona Press, Tucson.
Minckley, W.L. and P.J. Unmack. 2008. The demise of desert springs. Pp. 11-34 in Stevens, L.E. and V.J. Meretsky, editors. 2008. Aridland Springs of North America: Ecology and Conservation. Univer-sity of Arizona Press, Tucson.
Monroe, S.A., R.C. Antweiler, R.J. Hart, H.E. Taylor, M. Truini, J.R. Rihs, and T.J. Felger. 2005. Chemical characteristics of ground-water discharge along the South Rim of Grand Canyon in Grand Can-yon National Park, Arizona, 2000--2001. U.S. Geological Survey Scientific Investigations Report 2004-5146.
Nabhan, G.H. 2008. Plant diversity indluenced by indigenous management of freshwater springs: Flora of Quitovac, Sonora, Mexico. Pp. 244-267 in Stevens, L.E. and V.J. Meretsky, editors. 2008. Arid-land Springs of North America: Ecology and Conservation. University of Arizona Press, Tuc-son.
Nash, C., A. Tecle, and A. Craig. 2015. Restoration Benefits to Natural Springs in the Lake Mary Water-shed. Journal of the Arizona-Nevada Academy of Science 46:30-36.
National Research Council 1992. Restoration of Aquatic Ecosystems: Science, Technology, and Public Policy. National Academy Press, Washington, DC.
National Research Council 1994. Science and Judgment in Risk Assessment. National Academy Press, Washington, DC.
National Wetlands Inventory 2015. National Wetlands Inventory. Available online at: http://www.fws.gov/wetlands/.
O’Donnell R.P., T. Quinn, M.P. Hayes, and K.E. Ryding. 2007. Comparison of three methods for survey-ing amphibians in forested seep habitats in Washington. A report submitted to the Cooperative Monitoring, Evaluation, and Research Committee, Olympia.
Odum, H.T., 1957. Trophic structure and productivity of Silver Springs, Florida, Ecological Monographs 27, 55-112.
Paffett, K. 2014. Springs ecosystem restoration planning through ecological assessment and prioritiza-tion. Northern Arizona University MS Thesis, Flagstaff.
Perla, B.S. and L.E. Stevens. 2008. Biodiversity and productivity at an undisturbed spring in comparison with adjacent grazed riparian and upland habitats. Pp. 230-243 in Stevens, L.E. and V.J. Meretsky, editors. Aridland Springs of North America: Ecology and Conservation. University of Arizona Press, Tucson.
Phillips, D.A. Jr., C.S. VanPool and T.L. VanPool. 2009. The horned serpent tradition in the North Amer-ican Southwest. Pp. 17-30 in VanPool, C., T.L. VanPool, and D.A. Phillips, Jr., editors. Religion in the Prehispanic Southwest. Altamira Press, Lanham.
Ramstead, K.M., J.A. Allen, and A.E. Springer. 2012. Have wet meadow restoration projects in the Southwestern U.S. been effective in restoring geomorphology, hydrology, soils, and plant species composition? Environmental Evidence. 10.1186/2047-2382-1-11. Available online at: http://link.springer.com/article/10.1186/2047-2382-1-11/fulltext.html.
Rea, A.M. 2008. Historic and prehistoric ethnobiology of desert springs. Pp. 268-277 in Stevens, L.E. and V.J. Meretsky, editors. 2008. Aridland Springs of North America: Ecology and Conservation. University of Arizona Press, Tucson.
Sada, D.W and K.F. Pohlmann. 2006. U.S. National Park Service Mojave inventory and monitoring net-work spring survey protocols: Level I and level II. Desert Research Institute, Reno and Las Ve-gas.
Scarsbrook, M., J. Barquín, and D. Gray. 2007. New Zealand coldwater springs and their biodiversity. Science for conservation 278. New Zealand Department of Conservation, Wellington.
Scoppetone, G.G., P.H. Rissler, C. Gourley, and C. Martinez. 2005. Habitat restoration as a means of controlling non-native fish in a Mojave Desert oasis. Restoration Ecology 13:247-256.

BiB
lio
gr
ap
hy
118
Spamer, E.E. and A. Bogan. 1994. Mollusca of the Grand Canyon and vicinity, Arizona: New and revised data on diversity and distributions, with notes on Pleistocene-Holocene mollusks of the Grand Canyon. Proceedings of the Academy of Natural Sciences of Philadelphia 144:21-68.
Sparks, K. 2014. The role of geomorphic diversity on floral diversity in North American springs. North-ern Arizona University Masters Thesis, Flagstaff.
Spence, J.R. 2008. Spring-supported vegetation along the Colorado River on the Colorado Plateau: Flo-ristics, vegetation structure, and environment. Pp. 185-210 in Stevens, L.E. and V.J. Meretsky, editors. Aridland Springs of North America: Ecology and Conservation. University of Arizona Press, Tucson.
Springer, A.E. and L.E. Stevens. 2008. Spheres of discharge of springs. Hydrogeology Journal DOI 10.1007/s10040-008-0341-y.
Springer, A.E., L.E. Stevens, and R. Harms. 2006. Inventory and classification of selected National Park Service springs on the Colorado Plateau: NPS Cooperative Agreement Number CA 1200-99-009. National Park Service, Flagstaff.
Springer, A.E., L.E. Stevens, D. Anderson, R.A. Parnell, D. Kreamer, and S. Flora. 2008. A comprehensive springs classification system: integrating geomorphic, hydrogeochemical, and ecological criteria. Pp. 49-75 in Stevens, L.E. and V. J. Meretsky, editors. Aridland Springs in North America: Ecol-ogy and Conservation. University of Arizona Press, Tucson.
Springer, A.E., L.E. Stevens, J.D. Ledbetter, E.M. Schaller, K.M. Gill, and S.B. Rood. 2014. Ecohydrology and stewardship of Alberta springs ecosystems. Ecohydrology DOI: 10.1002/eco.1596.
Stein, B. 2002. States of the Union: Ranking America’s biodiversity. NatureServe, Arlington.Stevens, L.E. and T.J. Ayers. 2002. The biodiversity and distribution of alien vascular plant and animals
in the Grand Canyon region. Pp. 241-265 in Tellman, B., editor. Invasive exotic species in the Sonoran Region. University of Arizona Press, Tucson.
Stevens, L.E. and R.A. Bailowitz. 2005. Distribution of Brechmorhoga clubskimmers (Odonata: Libel-lulidae) in the Grand Canyon region. Western North American Naturalist 65:170-174.
Stevens, L.E. and R.A. Bailowitz. 2009. Odonata biogeography in the Grand Canyon ecoregion, south-western U.S.A. Annals of the Entomological Society of America 102(2):261-274. Abstract avail-able at: http://www.bioone.org/doi/abs/10.1603/008.102.0208.
Stevens, L.E. and J.T. Polhemus. 2008. Biogeography of aquatic and semi-aquatic Heteroptera in the Grand Canyon ecoregion, southwestern USA. Monographs of the Western North American Nat-uralist 4:38-76.
Stevens, L.E. and V.J. Meretsky, editors. 2008. Aridland Springs of North America: Ecology and Conser-vation. University of Arizona Press, Tucson.
Stevens, L.E. and A.E. Springer. 2004. A conceptual model of springs ecosystem ecology: Task 1B Fi-nal Report, NPS Cooperative Agreement Number CA 1200-99-009. National Park Service, Flag-staff.
Stevens, L.E., B.T. Brown, J.M. Simpson, and R.R. Johnson. 1977. The importance of riparian habitats to migrating birds. Pp. 156-164 in Johnson, R.R. and D. Jones, editors. Proceedings of a Symposium on the Importance, Preservation and Management of Riparian Habitats. U.S. Department of Ag-riculture National Forest Service General Technical Report RM-43. Ft. Collins.
Stevens L.E., A.E. Springer, and J.D. Ledbetter. 2011. Inventory and monitoring protocols for springs ecosystems. Available on-line at: http://www.springstewardship.org/PDF/Springs_Inventory_Protocols_110602.pdf.
U.S. Army Corps of Engineers 1987. Corps of Engineers wetlands delineation manual. Wetlands Re-search Program Technical Report Y-87-1. Available online at: http://el.erdc.usace.army.mil/el-pubs/pdf/wlman87.pdf.
U.S. Bureau of Reclamation. 2012. Colorado River Basin Water Supply and Demand Study. U.S. Depart-ment of the Interior Bureau of Reclamation, Washington, DC. Available online at: http://www.azwater.gov/azdwr/PublicInformationOfficer/ColoradoRiverBasinStudy.htm

121
BiB
lio
gr
ap
hy
U.S. Bureau of Land Management. 1991. Riparian area management: Process for assessing proper func-tioning condition for lentic riparian-wetland areas. U.S. Department of the Interior, Bureau of Land Management Technical Reference 1737-11.
U.S. Bureau of Land Management, U.S. Forest Service, and National Resources Conservation Service. 1998. Riparian area management: A user guide to assessing proper functioning condition and the supporting science for lotic areas. U.S. Department of the Interior, Bureau of Land Management Technical Reference 1737-15.
U.S. Department of Agriculture. 2013. PLANTS Database. U.S. Department of Agriculture. Available online at: http://plants.usda.gov/java/ (accessed 14 September 2013).
US Fish and Wildlife Service. 1999. Statistical guide to data analysis of avian monitoring programs. U.S. Fish and Wildlife Service Biological Technical Publication BTP-R6001-1999, Washington, DC.
U.S. Forest Service. 2012. Groundwater-dependent Ecosystems: Level II Inventory Field Guide: Inven-tory Methods for Project Design and Analysis. U.S. Department of Agriculture National Forest Service General Technical Report WO-86b. Washington, D.C.
U.S. Geological Survey. 2003. Principal Aquifers of the 48 Conterminous United States, Hawaii, Puerto Rico, and the U.S. Virgin Islands. Version 1.0. U.S. Geological Survey, Madison.
U.S. Geological Survey (Pool, D.R., K.W. Blasch, J.B. Callegary, S.A. Leake, and L.F. Graser, co-authors). 2011, Regional groundwater-flow model of the Redwall-Muav, Coconino, and alluvial basin aqui-fer systems of northern and central Arizona: U.S. Geological Survey Scientific Investigations Re-port 2010-5180, v. 1.1, Washington, DC. Available online at: http://pubs.usgs.gov/sir/2010/5180/sir2010-5180.pdf.
Waring, G. 1965. Thermal springs of the United States and other countries of the world, a summary. U.S. Geological Survey Professional Paper 492.
Wilde, F.D. 2008. Guidelines for field-measured water-quality properties. Chapter 6.0, U.S. Geological Survey Field Manual, Washington, DC. Available online at: http://water.usgs.gov/owq/FieldMa-nual/Chapter6/Chapter6.0v2.pdf.
Williams, D. D., and H. V. Danks. 1991. Arthropods of springs: Introduction. Memoirs of the Entomo-logical Society of Canada 155:3-4.

Ind
ex
122
IndexAAbedus breviceps 46Acarini 46Adiantum capillus-veneris 112administrative context 26, 28, 40, 41,
51, 55, 74, 75aerial imagery 65, 66Alligator mississippiensis 67Ambystoma spp. 48American Dipper. See Cinclus mexi-
canaAnaxyzrus Arizona toad 48Anemopsis californica 112Apache-Sitgreaves National Forest 15,
22aquifer 8, 10, 11, 12, 13, 14, 15, 16, 21,
24, 26, 27, 31, 32, 33, 45, 48, 49, 55, 56, 59, 61, 65, 67, 70, 75, 99
perched 11pollution 13stacked 11
aquifer restoration 24Arizona Game and Fish Department
(AGFD) 70, 71Arizona Hot Springs 13. See also hot
springsArizona Strip 23, 57, 61, 65Arizona Water Protection Fund 58, 65Army Corps of Engineers 40, 53Ash Meadows National Wildlife Ref-
uge 48Ash Spring 57, 70, 71, 72, 73Atriplex spp. 113
BBaccharis salicifolia 113Basin and Range 11, 12, 13, 18Bat Conservation International 70bats 57, 62, 70, 71benthic sampling 30, 37, 77, 78Bidens laevis 45biological diversity 18, 20, 44biomes 14biotic inventory 30, 36bird surveys 37, 48, 62, 78, 114, 121Brechmorhoga pertinax 46Budleya 46bullfrog. See Lithobates catesbeianusBureau of Land Management (BLM)
65
Bureau of Reclamation 24
Ccalibration log 31, 39, 105canyon treefrogs. See Hyla arenicolorCarex specuicola 45Carex spp. 45, 113, 114Castle Hot Spring 13. See also hot
springsCastle Spring 43, 57, 61, 62, 63, 64cattle grazing 55cave spring 16. See also springs typesCephalanthus occidentalis 114Cervus canadensis nelsoni 58Chihuahuan Desert 14Cicindela hemorrhagica 47ciénega. See helocrene springCinclus mexicana 48Clean Water Act 40, 53Clem the alligator 67. See also Pakoon
Springsclimate change 24, 32, 33, 48, 49, 60cluster analysis 33Coconino National Forest 57, 58, 59,
60Colorado Plateau 10, 11, 12, 13, 14, 17,
18, 58, 61Colorado River 12, 13, 17, 45, 57
allocation 13compliance 53. See National Environ-
mental Protection Act (NEPA)conceptual model 14contingency planning 35, 55Coronado National Forest 57, 70, 71,
72Coyote Springs 47crayfish 47, 48
Orconectes virilis 47Procambarus clarkii 47
cultural values 33
DDatum 29Del Rio Spring 45density of springs 12Desert Landscape Conservation Coop-
erative (DLCC) 8dissolved oxygen 31, 39, 75, 77, 104,
105. See also water chemistryDistichlis spicata 114distribution. See springs distributionDLCC. See Desert Landscape Conser-
vation Cooperative (DLCC)
E
ecosystems definition 14Eleocharis spp. 114Elmidae 46endangered species 8, 9endemic species 8, 9, 13, 14, 17, 30, 41,
44, 45, 46, 47, 48, 77, 78Abedus breviceps 46Brechmorhoga pertinax 46Cicindela hemorrhagica 47Ochterus rotundus 46Pyrgulopsis bernardina 47Pyrgulopsis morrisoni 47Pyrgulopsis spp. 47, 78Pyrgulopsis trivialis 47Ranatra montezuma 46
environmental impact statement (EIS) 53
Environmental Protection Agency (EPA) 27, 40, 41, 53, 75, 104
EPA. See Environmental Protection Agency (EPA)
Epipactis gigantea 45EPT index 77equipment list, surveys 34, 111equipment sterilization 78Eryngium sparganophyllum 46Erythranthe spp. 45evapotranspiration 74exposure spring 15. See also springs
types
Ffacultative wetland plants 112, 113,
114, 115, 116fauna 26, 45Federal Geographic Data Committee
(FGDC) 40, 41fencing 64, 72fens. See helocrene springfish 10, 26, 33, 44, 47, 48Flaveria mcdougallii 45flow 10, 13, 15, 16, 18, 21, 22, 23, 24,
26, 27, 31, 33, 34, 36, 37, 38, 39, 41, 43, 47, 56, 59, 60, 62, 63, 67, 73, 74, 75, 77, 78, 99, 100, 101, 102, 103, 104, 105
plant transpiration 33, 34flow diversion 21, 43. See also human
impactsflow measurement 27, 31, 38, 75, 99,
101, 102, 103flowpath 11, 13, 33
diagram 12flow rates 13, 19, 21, 22, 31, 34, 38, 75flow splitting 21, 22

In
de
x
123
flume 30, 38, 76, 100, 102. See also flow measurement
forest fire suppression 57, 58Fossil Creek 13fountain spring 15. See also springs
types
GGambusia affinis 48, 67GDE. See groundwater-dependent eco-
system (GDE)GDE protocol 30genetics sampling 78geologic provinces 10, 11, 13, 17, 18
map 11geology, Arizona 10geomorphology 14, 18, 22, 26, 30, 31,
38, 42, 55, 56, 59, 60, 67, 74, 75, 76
geyser spring 16, 31, 41. See also springs types
GIS 5, 29, 30, 34, 35, 36, 37, 39, 66GPS 29, 30, 34, 36, 37Grand Canyon 10, 12, 13, 15, 16, 17,
18, 19, 23, 24, 33, 35, 44, 45, 46, 47, 48, 57, 62, 65
Grand Canyon-Parashant National Monument 65
Grand Canyon Wildlands Council 12, 23, 24, 33, 65, 67, 68, 69
Great Basin 11groundwater-dependent ecosystem
(GDE) 27, 30groundwater extraction. See ground-
water pumpinggroundwater modeling 33groundwater pumping 21, 24, 42, 49.
See also human impactsgushet spring 16, 18, 41, 48. See
also springs types
Hhanging garden spring 16, 17, 18, 20,
27, 31, 39, 41, 44, 45, 55, 57, 61, 62. See also springs types
helocrene 18, 21, 31, 38, 41, 48, 56, 70helocrene spring 15, 17, 44, 45, 48,
57, 58, 67, 70, 71, 72, 73. See also springs types
Hemiptera 44, 46hillslope spring 16, 18, 22, 31, 39,
41, 44, 56, 57, 65, 70. See also springs types
hot springs 13, 27Hoxworth Spring 57, 58, 59, 60
human impacts 21, 24, 39, 42, 57, 61, 74
dewatering 21, 33, 48, 55excavation 21fire 61fire suppression 57, 58flow diversion 21, 43groundwater pumping 21, 42, 49invasive species 21, 56livestock grazing 10, 17, 21, 43, 56,
57, 61, 64, 72mining 13, 21nonnative species introduction 21,
43pollution 13, 21recreation 21, 24, 55, 57
human use 21, 39Hyallela amphipods 46hydrobiid springsnails 44, 47Hydrologic Unit Code (HUC) 29hygropetric springs 27Hyla arenicolor 48hypocrene spring 15. See also springs
types
Iindigenous cultures 8, 23indigenous values 23information management 9, 26, 27,
39, 43, 50, 51, 55, 56, 74, 78. See also Springs Online database
invasive species 21, 56. See also non-native species
Tamarix spp 57, 67inventory 9, 26, 27, 28, 30, 32, 35, 36,
37, 38, 41, 52inventory and assessment protocols 8,
26, 27, 28, 39, 40Level 1 28, 29, 32, 33, 34, 35, 41Level 2 27, 28, 29, 30, 31, 32, 33, 34,
35, 36, 37, 38, 39, 41, 42, 74, 76, 99
Level 3 28, 37, 74invertebrate sampling 26, 28, 30, 32,
33, 37, 74, 75, 76, 77, 78, 99, 104, 105
benthic sampling 30, 37, 77, 78
KKaibab National Forest 15, 16, 37, 42,
43, 57, 61Kaibab Plateau 12keystone ecosystems 21, 24, 44, 48
Llentic springs 14, 51. See also springs
typesleopard frog 48, 67, 70, 71, 72
Lithobates chiricahuensis 70Level 2 27, 28, 29, 29–31, 32, 33, 34,
35, 36, 37, 38, 39, 41, 42, 74, 76, 99. See inventory and assess-ment protocols
Level 3 28, 37, 74limnocrene spring 15, 18, 28, 31, 41,
42, 57. See also springs typesLimus maximus 47Lithobates catesbeianus 48, 67Lithobates chiricahuensis 70Little Colorado River 12, 13, 17Little Colorado River basin 12livestock grazing 43, 56, 57logistics, survey 33, 34, 43, 53, 75, 99lotic 14. See also springs types
MMadrean Archipelago 14maidenhair fern. See Adiantum
capillus-venerismanagement questions 74mapping of springs 12, 27, 28, 32,
35, 36, 65, 76. See also springs distribution
Max Licher 112, 113, 114, 116Medicine Springs 17Mesquite. See Prosopis spp.microhabitat 30, 31, 36, 38, 76microhabitat diversity 18, 19, 20microhabitat type 18, 19, 20, 30, 36,
42, 75Mimulus cardinalis 45, 115Mimulus guttatus 115Mimulus spp. 45, 115mineral content 12, 13mining 13, 21. See also human im-
pactsMogollon Rim 10, 12Mojave Desert 14, 24monitoring 8, 9, 23, 24, 26, 27, 28, 33,
34, 36, 37, 39, 41, 50, 51, 53, 54, 55, 56, 60, 62, 64, 67, 72, 74, 75, 77, 78, 79, 99
monkeyflower 115. See also Mimulus spp.
Montezuma Well 14, 17, 41, 42, 44mosquitofish. See Gambusia affinismound-forming spring 15. See
also springs typesmuseum curation 37, 78

Ind
ex
124
NNational Environmental Protection
Act (NEPA) 53National Forest Service 40, 42National Historic Preservation Act 53National Wetland Inventory 41Nogales Spring 28nonnative
Alligator mississippiensis 67nonnative species 21, 46, 47, 48, 55,
56, 57, 71, 78. See also human impacts
Cervus canadensis nelsoni 58crayfish 47, 48Gambusia affinis 48, 67Lithobates catesbeianus 67Orconectes virilis 47Procambarus clarkii 47Rana catesbeiana 48Tamarix spp 57, 67
Northern Arizona University 5, 14, 58, 59
Oobligate wetland plants 112, 113, 114,
115Orconectes virilis 47
PPage springsnail. See Pyrgulopsis mor-
risoniPakoon Springs 24, 46, 48, 65, 66, 67paleospring 17partner engagement 53permits 34pH 13, 31, 39, 75, 77. See also water
chemistryphotography 30, 38, 76, 100, 102. See
also aerial imageryPhysidae snails 46Pinus ponderosa 58plant transpiration 33, 34pollution. See human impactsPopulus fremontii 115potability 12prioritization 27, 28, 54, 55prioritization criteria, USFS 54Procambarus clarkii 47productivity 14, 27, 44Prosopis spp. 116pupfish 44Pyrgulopsis morrisoni 78, 118Pyrgulopsis spp. 47, 78
Pyrgulopsis bernardina 47
Pyrgulopsis morrisoni 47, 78, 118Pyrgulopsis trivialis 47
QQuitobaquito spring 17
RRanatra montezuma 46recreation 21, 24, 55, 57. See also hu-
man impactsrehabilitation 9, 18, 23, 24, 26, 33, 34,
39, 43, 46, 48, 49, 50, 51, 53, 54, 55, 56, 62, 64, 66, 67, 68, 69, 74, 75
remote sensing 35restoration 8, 9, 21, 23, 24, 26, 27, 28,
33, 41, 42, 43, 47, 49, 50, 52, 53, 54, 55, 56, 57, 58, 59, 60, 62, 63, 64, 71, 72, 73
restoration implementation 9, 26, 27, 43, 50, 51, 53, 64, 67, 74
restoration planning 9, 21, 26, 27, 50, 52, 53, 107
restoration plant species 112restoration vs. rehabilitation 23Rheithrodontomys megalotis 67rheocrene spring 16, 17, 18, 21,
31, 39, 41, 55, 57, 58, 59. See also springs types
riparian habitat 67Rocky Mountain elk. See Cervus ca-
nadensis nelsoni
Ssafety 34Salix spp. 116San Francisco Peaks 34School Spring 48SDS (springs-dependent species) 8, 9,
35, 44, 44–49Abedus breviceps 46Acarini water mites 46Bidens laevis 45Brechmorhoga pertinax 46Budleya 46Carex specuicola 45Cinclus mexicana 48Epipactis gigantea 45Eryngium sparganophyllum 46Flaveria mcdougallii 45Physidae snails 46Pyrgulopsis bernardina 47Pyrgulopsis spp. 47, 78Pyrgulopsis trivialis 47Ranatra montezuma 46
springsnails 44Turbellaria flatworms 46
seeps definition 10, 27seep willow. See Baccharis salicifoliaSEInet 112, 113, 114, 116sensitive species 32, 78site selection 33
cluster analysis 33stratified random sampling 33
sketchmap 30, 36, 37, 78Snowslide Spring 34Solar Pathfinder 36solar radiation budget 36, 74. See
also Solar PathfinderSonoran Desert 14, 23species density 18, 27, 38, 44, 45, 77species diversity 18specific conductance 13, 31, 39, 75, 77.
See also water chemistryspecimens, curation 34, 38, 78Speyeria nokomis 46Sporobolus airoides 116springs box 21, 22. See also human
impactssprings definition 10springs density 12springs-dependent species. See SDS
(springs-dependent species)Cicindela hemorrhagica 47
springs diagrams 15, 16, 59, 61, 65, 70springs distribution 12, 21, 26, 27, 32,
33, 35, 37, 55map 12
springs ecosystem assessment protocol (SEAP) 28, 40, 41, 42, 43, 54, 74. See groundwater-dependent ecosystem (GDE)
springs ecosystems 14springsnails 44Springs Online database 12, 13, 26, 27,
28, 29, 35, 36, 39, 40, 43, 45, 62, 78, 102
springs types 14, 15, 16, 17, 39cave spring 16distribution 18exposure spring 15fountain spring 15geyser springs 16gushet springs 16, 18, 41, 48hanging garden spring 16, 17, 18,
20, 27, 31, 39, 41, 44, 45, 55, 57, 61, 62
helocrene spring 15, 44, 45, 48, 57, 58, 67, 70, 71, 72, 73
hillslope spring 16, 18, 22, 31, 39, 41, 44, 56, 57, 65, 70

In
de
x
125
hypocrene spring 15limnocrene spring 15, 17, 18, 28, 31,
41, 42, 57mound-forming spring 15rheocrene spring 16, 17, 31, 39, 55,
57, 58, 59stewardship 8, 9, 10, 14, 23, 24, 26, 27,
32, 33, 34, 41, 42, 44, 50, 51, 53, 54, 55, 56, 60, 61, 64, 67, 74, 79
substrate 30, 36, 37survey protocol 30
TTamarix spp 57, 67temperature, water 12, 13, 31, 38, 39,
75, 104. See also hot springs; See also water chemistry
Thunder River 18, 19tiger salamanders 48. See also Ambys-
toma spp.timing of surveys 33, 74Tom Biebighauser 71total alkalinity 31, 39, 75, 104. See
also water chemistrytotal dissolved solids (TDS) 31, 39. See
also water chemistrytravertine 13, 15, 17, 77Tribal partners 62Trionia spp. 47Turbellaria flatworms 46
Uuse of springs 10
Vvalue of springs 10, 27vandalism 55, 64Vasey’s Paradise 45vegetation 15, 21, 26, 30, 38, 41, 57,
60, 61, 62, 64, 65, 66, 67, 71, 73, 74, 75, 76, 77, 78, 99, 104. See also facultative wetland plants; See also obligate wetland plants; See also restoration plant spe-cies
vegetation strata 38aquatic 38basal 38ground 38middle canopy 38non-vascular 38shrub 38tall canopy 38
vegetation survey 38
Verde Hot Springs 13. See also hot springs
Verde Valley 13vertebrate 30, 44, 48, 74, 77
Wwater chemistry 10, 13, 31, 41, 45, 75,
76, 104laboratory analysis 39, 105water temperature 31, 38, 39, 75, 104
water quality 11, 12, 13, 21, 26, 31, 33, 36, 39, 40, 41, 47, 55, 59, 74, 75, 76, 77, 78, 88, 91, 104. See also calibration log
water rights 26, 54weir 100, 101. See also flow measure-
mentwestern harvest mouse. See Rheithro-
dontomys megalotiswetland delineation 27wetlands 10, 15, 24, 26, 27, 30, 33, 37,
38, 40, 41, 45, 46, 49, 57, 59, 60, 64, 67, 77, 78
wet meadows spring. See helocrene spring
wetsalts tiger beetle. See Cicindela hemorrhagica
White Mountains 10Willow. See Salix spp.
YYerba mansa. See Anemopsis califor-
nica

ind
ex