glenwood springs, colorado
TRANSCRIPT
Glenwood Springs, ColoradoParks and Recreation Master Plan UpdateNovember 2016


Parks and Recreation Master Plan Update i
Acknowledgements
Mayor and City Council Mayor: Mike Gamba
Mayor Pro‐Term: Todd Leahy Stephen Bershenyi
Kathryn Trauger
Steve Davis Matt Steckler Leo McKinney
Administration City Manager: Debra Figueroa
Interim City Manager: Andrew Gorgey Finance Director: Charles Kelty
Parks and Recreation Commission Lawrence Heinrichs
Andrew Mueller Bill Coleman
Sheldon Emery Chelsea Parkison Harrison Coley
River Commission Ryan Davis
Jeremy Heiman Tommy Hilleke Andrea Holland
Brendon Langenhuizen
Ashley Moffatt Patrick Murphy Richard Neiley Bob Noone
Parks and Recreation Staff Parks & Recreation Director: Tom Barnes
James Main Jessica Hawkins
Yvette Baker Lew Grant
Matt Kraemer Nate Mohrmann
Al Laurrette
Staci Andrassy Kiev Andrassy Karstin Moser Barb Park Mike Cain Lisa Moreau Cristi Newton
Consultant Team GreenPlay, LLC DHM Design
For more information about this document, contact GreenPlay, LLC
At: 1021 E. South Boulder Road, Suite N, Louisville, Colorado 80027, Telephone: 303‐439‐8369 Email: [email protected] www.greenplayllc.com

ii Glenwood Springs, Colorado
Table of Contents I. Executive Summary .................................................................................................................. 1 Introduction ..................................................................................................................................... 1 City of Glenwood Springs Overview ................................................................................................ 1 Planning Process Summary .............................................................................................................. 1 Key Issues and Recurring Themes ................................................................................................... 2 Maintenance Assessment ................................................................................................................ 2 Recommendations ........................................................................................................................... 2
II. The Master Planning Context .................................................................................................. 3 Introduction ..................................................................................................................................... 3 Glenwood Springs ............................................................................................................................ 3 Project Understanding ..................................................................................................................... 3
III. Demographic Profile and Trend Report .................................................................................. 5 Glenwood Springs Population and Demographic Trends ................................................................ 6 Current Trends ............................................................................................................................... 15 National Demographic Trends in Recreation ................................................................................ 17
IV. What We Want: Community Involvement ........................................................................... 21 Community Survey ........................................................................................................................ 22
V. What We Have Now – Facilities and Services ........................................................................ 25 Facility Condition Assessment ....................................................................................................... 25 Program Development .................................................................................................................. 26 Funding Resources ......................................................................................................................... 28
VI. Strategic Business Plan ........................................................................................................ 33 Purpose of this Plan ....................................................................................................................... 33 Business Concept ........................................................................................................................... 33 Market Analysis ............................................................................................................................. 35 Benchmarking ................................................................................................................................ 35 Cost Recovery ................................................................................................................................ 35 Performance Measures ................................................................................................................. 39 Areas for Improvement ................................................................................................................. 43 Strategic Focus Areas ..................................................................................................................... 43 Strategic Business Plan Recommendations ................................................................................... 43 Alternative Revenue Source and Other Financial Opportunities .................................................. 46
VII. Master Plan Recommendations .......................................................................................... 49

Parks and Recreation Master Plan Update iii
List of Tables Table 1: 2016 Glenwood Springs General Demographic Profile ......................................................... 5 Table 2: Glenwood Springs Housing Statistics ................................................................................... 11 Table 3: 2016 Estimated Household Income Comparison ................................................................ 12 Table 4: Estimated Household Spending on Recreation, Leisure and Fitness Activities – ................ 17 Table 5: Benchmarking Facilities ....................................................................................................... 39 Table 6: Glenwood Springs Membership Sales and Revenue 2013‐2015 ......................................... 39 Table 7: Glenwood Springs Registration/Participation 2014‐2015 ................................................... 40 Table 8: Glenwood Springs Community Room Usage 2014‐2015 ..................................................... 41
List of Figures Figure 1: Glenwood Springs, Colorado Population Growth Trend ...................................................... 6 Figure 2: Population Age Distribution: 2010 to 2021 .......................................................................... 7 Figure 3: Glenwood Springs Racial and Ethnic Character 2010 to 2021 ............................................. 7 Figure 4: Racial/Ethnic Character Comparison – City to State ............................................................ 8 Figure 5: 2016 Estimated Educational Attainment of Glenwood Springs Adult Residents Ages 25+ . 9 Figure 6: 2014 Educational Attainment of Young Adults Ages 18 – 24 ............................................. 10 Figure 7: 2014 Educational Attainment & Annual Income of Residents Age 25+ ............................. 11 Figure 8: Distribution of Average Annual City Household Income by Category ................................ 12 Figure 9: Employment by Industry in Glenwood Springs – 2016 ...................................................... 13 Figure 10: Employment by Occupation of Glenwood Springs Residents – 2016 .............................. 14 Figure 11: Household Participation in Outdoor Recreation Activities .............................................. 16 Figure 12: Presence of the Three Largest National Generational Groups in Glenwood Springs ...... 18 Figure 13: Sports Participation Rates by Generation 2014 ............................................................... 18 Figure 14: Glenwood Springs Cost Recovery Pyramid ....................................................................... 36 Figure 15: Glenwood Springs Cost Recovery Percentage Compared to National Average ............... 37 Figure 16: Per Capita Comparison ..................................................................................................... 38 Figure 17: Glenwood Springs Rental Revenues ................................................................................. 41 Figure 18: Glenwood Springs Cost Recovery by Facility 2013‐2015 .................................................. 42

THIS PAGE INTENTIONALLY LEFT BLANK
Parks and Recreation Master Plan Update 1
I. Executive Summary
Introduction The City of Glenwood Springs provides a comprehensive Parks and Recreation system that greatly contributes to the quality of life in the City and the surrounding areas of Garfield County. The Parks and Recreation Department is currently guided by the 2006 Parks and Recreation Master Plan. In order to strategize for the future of this valuable Parks and Recreation system, the Department began a planning process to develop this Parks and Recreation Master Plan Update. Development of the plan took place from March 2015 to November 2016, and included a public input process, services inventory and analysis, park inventory and level of service analysis, needs assessment, operational and maintenance analysis, and financial analysis, all in support of the Department’s Vision Statement. The Master Plan provides the framework to respond to the evolving needs of this unique community.
City of Glenwood Springs Overview Glenwood Springs is a dynamic and growing community of 10,229 residents located 180 miles west of Denver on Colorado’s western slope of the Rocky Mountains. Incorporated in 1885 and consisting of 4.8 square miles, the city sits at the confluence of the Roaring Fork and Colorado Rivers at an elevation of 5,763 feet, and is immediately surrounded by steep‐sided mountains that rise to an elevation of over 8,400 feet.
Planning Process Summary A project team, which included City staff and commission members, has guided this project, providing input to the consultant team throughout the planning process. This collaborative effort creates a plan that fully utilizes the consultants’ expertise and incorporates the local knowledge and institutional history that only community members can provide. Document Review included:
City of Glenwood Springs Comprehensive Plan.
2006 Parks, Recreation, Open Space, and Trails Master Plan.
Transportation Plan as it relates to active transportation (bike, pedestrian, trail) and connectivity for the park and open space system.
Recent community surveys conducted by the City (responses relative to parks, recreation, open space, and trails).
Budget information, fund descriptions, and calculation formulas.
Other adopted plans, concepts, data, and documents necessary to complete the Evaluation, Research, and Analysis portion of the Plan and provide consistency.
“The Glenwood Springs Parks and Recreation Department strives to be a visionary organization—one that becomes a benchmark for other organizations, one that impresses its customers the first time and every time with customer service, and one that empowers its employees so they embrace responsibility, ownership, and accountability...We Take Fun...Seriously!”

2 Glenwood Springs, Colorado
Tasks included:
Community/stakeholder engagement and community survey.
Facility condition assessment.
Trends and demographic analysis.
Strategic business plan analysis and development.
Recommendations: goals, objectives, and action plan.
Key Issues and Recurring Themes During the initial stages of the project and review of the 2006 Parks and Recreation Master Plan recommendations, some key issues were identified for focus around the following aspects of service provision:
Maintenance of facilities and amenities.
Organizational management.
Programs and service delivery.
Cost recovery and funding.
Maintenance Assessment General maintenance program protocols should focus on:
Areas where the irrigation was spotty and in need of adjustment as exhibited in many of the parks.
Standardization of trash receptacles, as there is a mismatch with some bear proof receptacles and some not at all locations.
Improved signage to help with wayfinding.
Continued maintenance to repair broken or overgrown paths.
Addition of dog stations and bike racks, particularly at Sayre Park.
The restroom facility at the athletic fields in Sopris Park.
General weed maintenance and selection of mulch materials to reduce ongoing upkeep.
Recommendations After reviewing the 2006 Parks and Recreation Master Plan recommendations and analyzing the findings of the public engagement process, facility inventory, and level of service analysis, a variety of recommendations are still relevant or have emerged to guide improvements to parks, recreation, and cultural amenities in the City of Glenwood Springs. Recommendations have been suggested to enhance the quality of service through maintenance and improvements to facilities and amenities, financial opportunities, and improved programming and service delivery, as well as organizational efficiencies. Details are provided in Section VII.

Parks and Recreation Master Plan Update 3
II. The Master Planning Context
Introduction Many of the issues confronting the Parks and Recreation Department are not new. Many have been around, identified in previous planning processes, and considered for years, some for decades. Many have been successfully addressed and resolved, while others remain, waiting for solutions that can find the balance between opportunity and financial feasibility, and community support. This Parks and Recreation Master Plan is truly an update. It builds on the foundation established by the 2006 plans. The vision, and many of the recommendations proposed, can be found in the previous plans. Some aspects of this update are new and reflect recommendations and actions that have not previously been identified or adopted. Of particular interest with this master plan update is an analysis of the existing and future Parks and Recreation Department budget needs for parks, trails, recreation programs, community center operations, and other recreation facilities. All of the components of the Parks and Recreation Master Plan update have been developed with a variety of public input techniques and have been confirmed, and in some cases re‐confirmed, by the public and city leadership.
Glenwood Springs Throughout its history, Glenwood Springs has been known for its medicinal hot sulfur springs that continue even today to draw tourists from around the world. In addition, Glenwood Springs is a commercial center for the region. Its location at the intersection of Interstate 70 and State Highway 82, makes it a convenient location for larger businesses that cater to the communities of the Colorado River Valley (Parachute, Rifle, Silt, New Castle) as well as the resorts (Aspen, Snowmass) and resort‐related communities of the Roaring Fork Valley (Carbondale, Basalt, El Jebel). It is also the seat of Garfield County, home to a regional medical center, and supports a campus of Colorado Mountain College. Finally, Glenwood Springs is a long‐standing community in its own right, with a rich historical legacy and a population of year‐round residents. Because tourists and residents alike value Glenwood Springs for its scenic beauty and quality of life, the community and its elected officials are presented with the challenge of how to preserve and maintain these cherished attributes in the face of increasing commercial and residential development pressures.
Project Understanding The City of Glenwood Springs desired a facilitated process to update its 2006 Parks, Recreation, Open Space, and Trails Master Plan, providing a new guiding document and allowing a big‐picture look with short and long‐term recommendations. The recommendations in this plan are based on the community’s vision and values and help ensure sustainable provision of parks, open space, trails, and recreation far into the future within the city and school district boundaries. The current Plan has served the City very well for the past 10 years, and many of the important goals and objectives have been accomplished. However, due to the recession, many improvement projects were put on hold, and additional funds are needed for existing operations and future parks, recreation, and trails acquisition and development. The policies, goals, and implementation strategies of the 2006 Master Plan needed to be updated to reflect the current vision of the community and future demographic make‐up.

4 Glenwood Springs, Colorado
The City of Glenwood Springs is anticipating substantial growth and infill over the next decade. This updated plan will act as a roadmap to enable the Parks and Recreation Department to continue its mission to: “…provide enriching recreational activities, beautiful parks, and open space for our community. We Take Fun Seriously!” Of particular interest with this master plan update is an analysis of the existing and future Parks and Recreation Department budget needs for parks, trails, recreation programs, community center operations, and other recreation facilities. In addition to present and future capital improvement construction needs, this plan includes a Strategic Business Plan section that addresses annual operating budget needs to maintain existing and future service levels. A cost recovery analysis is included to address present and future operations and maintenance needs, and provide recommendations for cost recovery targets and staffing adjustments, and outline a funding plan including the potential for voter approval of the Acquisition and Improvement Fund to implement Master Plan recommendations.
“The Glenwood Springs Parks and Recreation Department strives to be a visionary organization—one that becomes a benchmark for other organizations, one that impresses its customers the first time and every time with customer service, and one that empowers its employees so they embrace responsibility, ownership, and accountability...We Take Fun...Seriously!”

Parks and Recreation Master Plan Update 5
III. Demographic Profile and Trend Report Gaining a clear understanding of the existing and projected demographic character of the city is an important component of the master planning process. By analyzing population data, trends emerge that can inform decision making and resource allocation. For example, if the population of young children were steadily on the rise and existing public recreation facilities for young children, such as playgrounds or tot lots, were barely meeting existing user demand, then the City may want to consider targeting investments to meet the increasing needs of this growing segment of the population. Key areas were analyzed to identify current demographic statistics and trends that can impact the planning and provision of public parks and recreation services in Glenwood Springs. Community characteristics analyzed and discussed below consist of:
Existing and projected total population
Age distribution
Ethnic/Racial diversity
Household information
Educational attainment
Employment
State and County Health Ranking Data used in this demographic profile was sourced from the U.S. Census Bureau, U.S. Census Bureau American Community Survey (ACS), and Esri Business Analyst. A summary of existing demographic highlights is noted in Table 1 below, followed by more detailed demographic analysis. Table 1: 2016 Glenwood Springs General Demographic Profile
Population 10,229
Median Age 35.5
Households 3,966
Average Household Size 2.5
Median Household Income $57,415 Source: Esri Business Analyst and American Community Survey
Key general demographic comparisons – Local, State, and National:
The median age of Glenwood Springs’ residents was 35.5 years, lower than the median age for Colorado (36.9) and the United States (38).
The median household income for Glenwood Springs’ residents in 2016 was estimated to be $57,415. This is lower than the median statewide household income of ($60,903), but higher than the national median household income of $54,149.
Glenwood Springs’s 2016 population was almost evenly split between male (51%) and female (49%) residents. The populations of Colorado, and the United States, are also roughly evenly divided between the sexes.
6 Glenwood Springs, Colorado
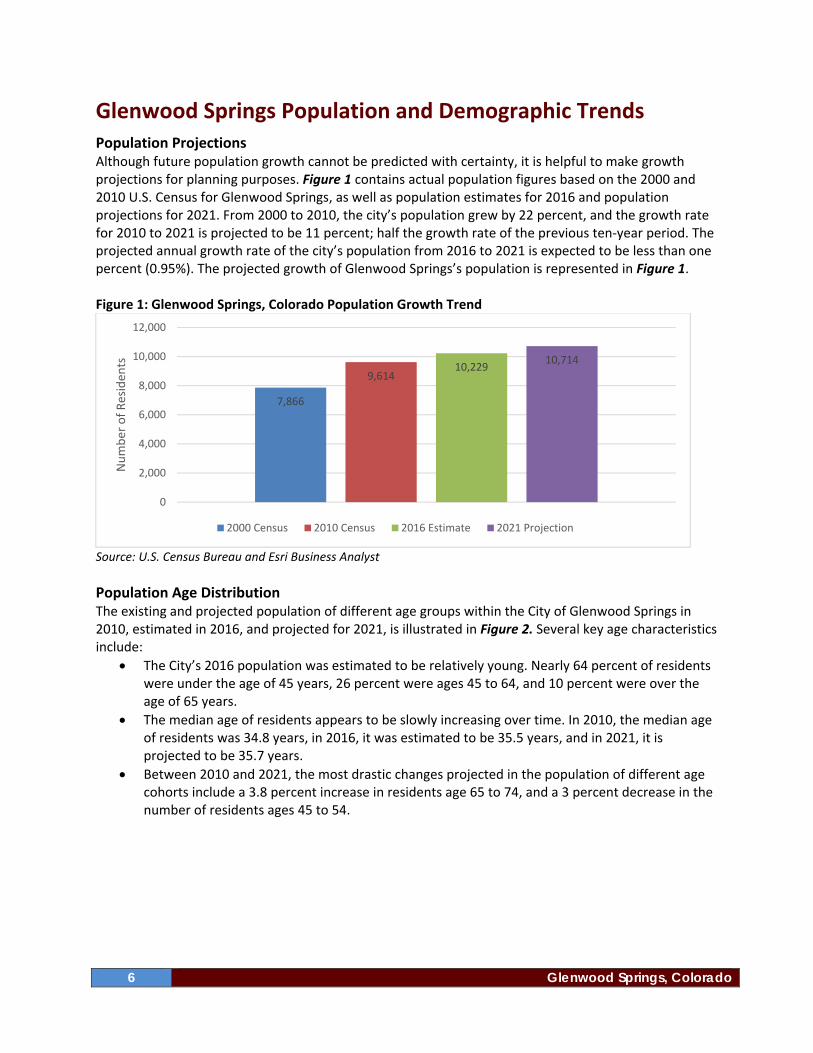
Glenwood Springs Population and Demographic Trends Population Projections Although future population growth cannot be predicted with certainty, it is helpful to make growth projections for planning purposes. Figure 1 contains actual population figures based on the 2000 and 2010 U.S. Census for Glenwood Springs, as well as population estimates for 2016 and population projections for 2021. From 2000 to 2010, the city’s population grew by 22 percent, and the growth rate for 2010 to 2021 is projected to be 11 percent; half the growth rate of the previous ten‐year period. The projected annual growth rate of the city’s population from 2016 to 2021 is expected to be less than one percent (0.95%). The projected growth of Glenwood Springs’s population is represented in Figure 1. Figure 1: Glenwood Springs, Colorado Population Growth Trend
Source: U.S. Census Bureau and Esri Business Analyst
Population Age Distribution The existing and projected population of different age groups within the City of Glenwood Springs in 2010, estimated in 2016, and projected for 2021, is illustrated in Figure 2. Several key age characteristics include:
The City’s 2016 population was estimated to be relatively young. Nearly 64 percent of residents were under the age of 45 years, 26 percent were ages 45 to 64, and 10 percent were over the age of 65 years.
The median age of residents appears to be slowly increasing over time. In 2010, the median age of residents was 34.8 years, in 2016, it was estimated to be 35.5 years, and in 2021, it is projected to be 35.7 years.
Between 2010 and 2021, the most drastic changes projected in the population of different age cohorts include a 3.8 percent increase in residents age 65 to 74, and a 3 percent decrease in the number of residents ages 45 to 54.
7,866
9,61410,229
10,714
0
2,000
4,000
6,000
8,000
10,000
12,000
Number of Residen
ts
2000 Census 2010 Census 2016 Estimate 2021 Projection

Parks and Recreation Master Plan Update 7
Figure 2: Population Age Distribution: 2010 to 2021
Source: U.S. Census Bureau and Esri Business Analyst
Race/Ethnicity Prior to reviewing demographic data pertaining to a population’s racial and ethnic character, it is important to note how the U.S. Census classifies and counts individuals who identify as of Hispanic. The Census notes that Hispanic origin can be viewed as the heritage, nationality, lineage, or country of birth of the person or the person’s parents or ancestors before arrival in the United States. In the U.S. Census, people who identify as Hispanic, Latino, or Spanish may be any race and are included in all of the race categories. All race categories add up to 100 percent of the population; the indication of Hispanic origin is a different view of the population and is not considered a race. Figure 3 reflects the approximate racial/ethnic population distribution for Glenwood Springs, Colorado, from 2010, estimated in 2016, and projected for 2021. Figure 3: Glenwood Springs Racial and Ethnic Character 2010 to 2021
Source: U.S. Census Bureau and Esri Business Analyst
0.0
5.0
10.0
15.0
20.0
0 ‐ 9 10 ‐ 14 15 ‐ 24 25 ‐ 34 35 ‐ 44 45 ‐ 54 55 ‐ 64 65 ‐ 74 75+
% Population
Age Cohorts
2010 2016 2021
CaucasianAfricanAmerican
NativeAmerican
AsianPacificIslander
SomeOther Race
Two orMoreRaces
HispanicOrigin
2010 81.4 1.2 1.0 0.8 0.1 13.2 2.3 31.5
2016 79.9 1.7 1.0 1.0 0.1 13.7 2.6 32.6
2021 78.1 2.2 0.9 1.2 0.2 14.6 2.8 34.2
0.0
10.0
20.0
30.0
40.0
50.0
60.0
70.0
80.0
90.0
% Population
% Population
8 Glenwood Springs, Colorado
Although the ethnic and racial composition of the city is not predicted to change drastically by 2021, the following trends are of note:
The overall racial and ethnic diversity of the community is on the rise. Between 2010 and 2021, the populations of nearly all minority groups is projected to increase, while the majority Caucasian population is anticipated to decline by 3.3 percent. However, the Caucasian population is projected to remain the largest racial or ethnic group in the city by a wide margin in 2021.
The Hispanic population (irrespective of race) is projected to increase by 2.7 percent between 2010 and 2021.
The number of residents identifying with Some Other Race is anticipated to increase by 1.4 percent between 2010 and 2021.
The African American population is projected to increase by one percent between 2010 and 2021.
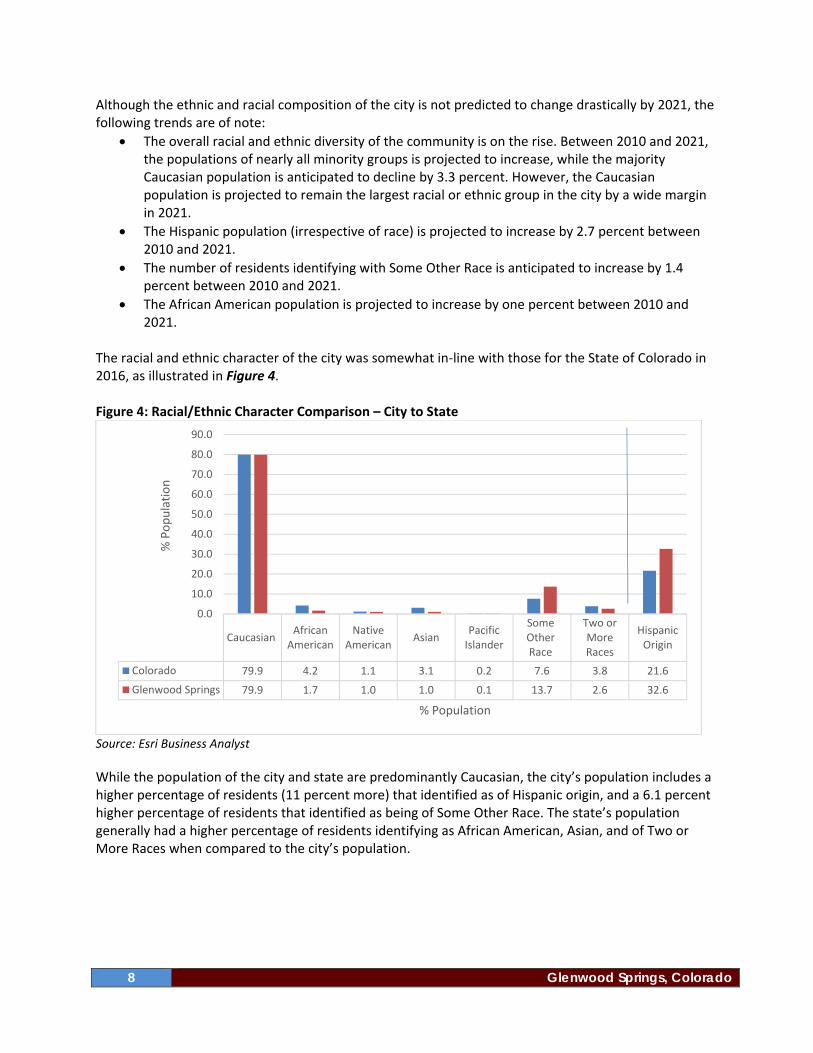
The racial and ethnic character of the city was somewhat in‐line with those for the State of Colorado in 2016, as illustrated in Figure 4. Figure 4: Racial/Ethnic Character Comparison – City to State
Source: Esri Business Analyst
While the population of the city and state are predominantly Caucasian, the city’s population includes a higher percentage of residents (11 percent more) that identified as of Hispanic origin, and a 6.1 percent higher percentage of residents that identified as being of Some Other Race. The state’s population generally had a higher percentage of residents identifying as African American, Asian, and of Two or More Races when compared to the city’s population.
CaucasianAfricanAmerican
NativeAmerican
AsianPacificIslander
SomeOtherRace
Two orMoreRaces
HispanicOrigin
Colorado 79.9 4.2 1.1 3.1 0.2 7.6 3.8 21.6
Glenwood Springs 79.9 1.7 1.0 1.0 0.1 13.7 2.6 32.6
0.0
10.0
20.0
30.0
40.0
50.0
60.0
70.0
80.0
90.0
% Population
% Population
Parks and Recreation Master Plan Update 9
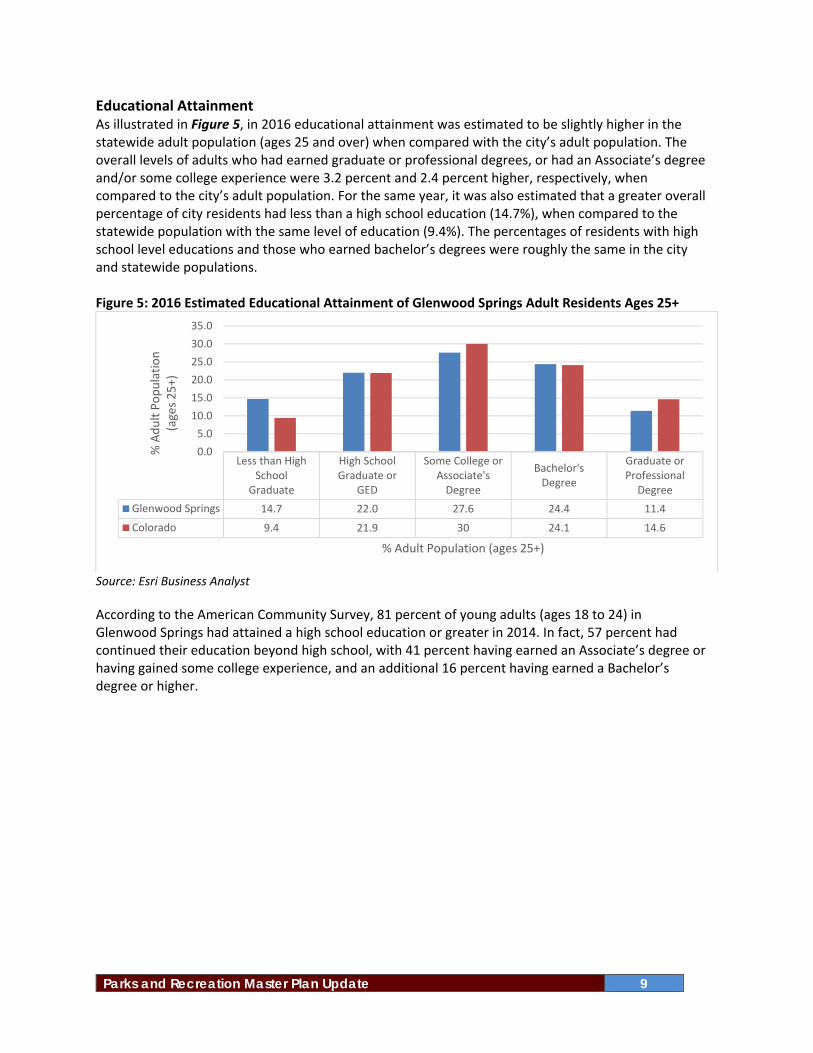
Educational Attainment As illustrated in Figure 5, in 2016 educational attainment was estimated to be slightly higher in the statewide adult population (ages 25 and over) when compared with the city’s adult population. The overall levels of adults who had earned graduate or professional degrees, or had an Associate’s degree and/or some college experience were 3.2 percent and 2.4 percent higher, respectively, when compared to the city’s adult population. For the same year, it was also estimated that a greater overall percentage of city residents had less than a high school education (14.7%), when compared to the statewide population with the same level of education (9.4%). The percentages of residents with high school level educations and those who earned bachelor’s degrees were roughly the same in the city and statewide populations. Figure 5: 2016 Estimated Educational Attainment of Glenwood Springs Adult Residents Ages 25+
Source: Esri Business Analyst
According to the American Community Survey, 81 percent of young adults (ages 18 to 24) in Glenwood Springs had attained a high school education or greater in 2014. In fact, 57 percent had continued their education beyond high school, with 41 percent having earned an Associate’s degree or having gained some college experience, and an additional 16 percent having earned a Bachelor’s degree or higher.
Less than HighSchool
Graduate
High SchoolGraduate or
GED
Some College orAssociate'sDegree
Bachelor'sDegree
Graduate orProfessional
Degree
Glenwood Springs 14.7 22.0 27.6 24.4 11.4
Colorado 9.4 21.9 30 24.1 14.6
0.0
5.0
10.0
15.0
20.0
25.0
30.0
35.0
% Adult Population
(ages 25+)
% Adult Population (ages 25+)

10 Glenwood Springs, Colorado
Figure 6: 2014 Educational Attainment of Young Adults Ages 18 – 24
Source: American Community Survey
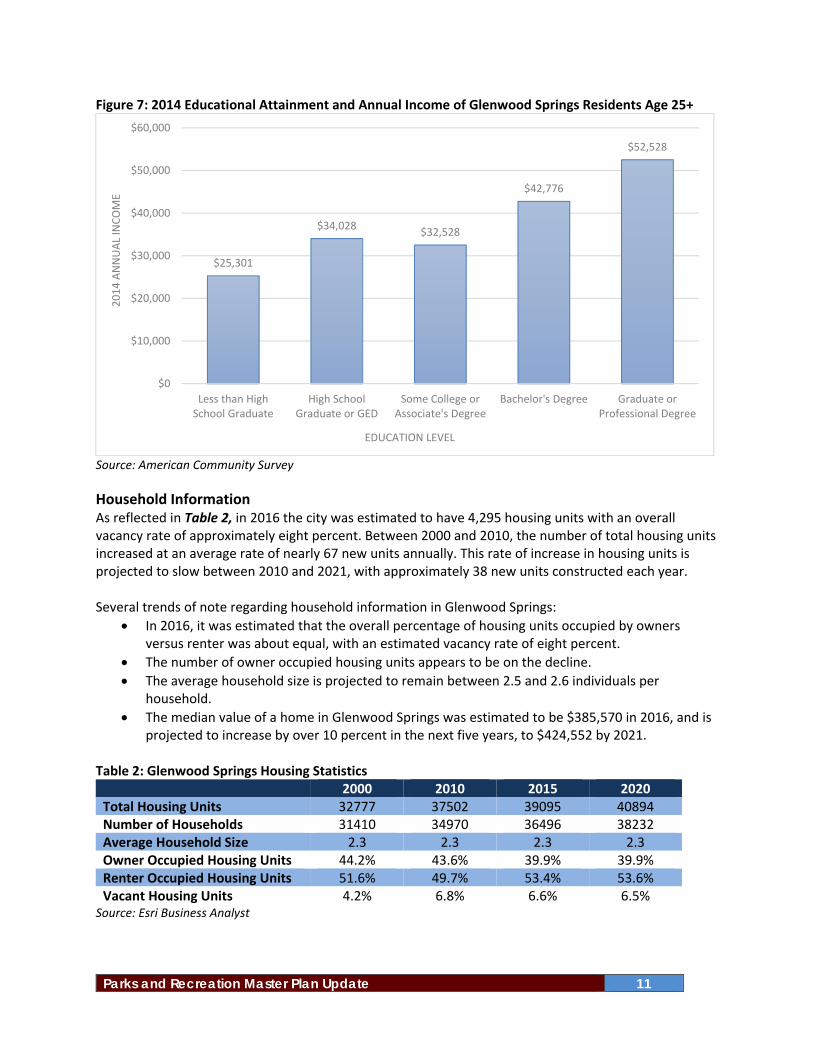
According to a Census study, education levels had more effect on earnings over a 40‐year span in the workforce than any other demographic factor, such as gender, race, and ethnic origin.1 Figure 7 illustrates that Glenwood Springs residents (age 25+) with higher levels of education tend to have higher annual incomes than those with lower levels of education. In 2014, residents with graduate or professional degree were likely to have earned over twice the salary of residents with less than a high school education.
1 Tiffany Julian and Robert Kominski, “Education and Synthetic Work‐Life Earnings Estimates” American Community Survey Reports, US Census Bureau, http://www.Census.gov/prod/2011pubs/acs‐14.pdf, September 2011.
Less than High School Graduate
19%
High School Graduate or GED24%
Some College or Associate's Degree
41%
Bachelor's Degree or higher16%
Parks and Recreation Master Plan Update 11
Figure 7: 2014 Educational Attainment and Annual Income of Glenwood Springs Residents Age 25+
Source: American Community Survey
Household Information As reflected in Table 2, in 2016 the city was estimated to have 4,295 housing units with an overall vacancy rate of approximately eight percent. Between 2000 and 2010, the number of total housing units increased at an average rate of nearly 67 new units annually. This rate of increase in housing units is projected to slow between 2010 and 2021, with approximately 38 new units constructed each year. Several trends of note regarding household information in Glenwood Springs:
In 2016, it was estimated that the overall percentage of housing units occupied by owners versus renter was about equal, with an estimated vacancy rate of eight percent.
The number of owner occupied housing units appears to be on the decline.
The average household size is projected to remain between 2.5 and 2.6 individuals per household.
The median value of a home in Glenwood Springs was estimated to be $385,570 in 2016, and is projected to increase by over 10 percent in the next five years, to $424,552 by 2021.
Table 2: Glenwood Springs Housing Statistics
2000 2010 2015 2020 Total Housing Units 32777 37502 39095 40894 Number of Households 31410 34970 36496 38232 Average Household Size 2.3 2.3 2.3 2.3 Owner Occupied Housing Units 44.2% 43.6% 39.9% 39.9% Renter Occupied Housing Units 51.6% 49.7% 53.4% 53.6% Vacant Housing Units 4.2% 6.8% 6.6% 6.5%
Source: Esri Business Analyst
$25,301
$34,028$32,528
$42,776
$52,528
$0
$10,000
$20,000
$30,000
$40,000
$50,000
$60,000
Less than HighSchool Graduate
High SchoolGraduate or GED
Some College orAssociate's Degree
Bachelor's Degree Graduate orProfessional Degree
2014 ANNUAL INCOME
EDUCATION LEVEL

12 Glenwood Springs, Colorado
Household Income The estimated 2016 median household income of residents of Glenwood Springs was $57,415. This is lower than the median household income of residents in the State of Colorado, but higher than the median level of household income in the United States, as illustrated in Table 3. However, the 2016 average annual household income in Glenwood Springs was lower than the average annual household income in Colorado and nationwide. Table 3: 2016 Estimated Household Income Comparison
Location Median Average
Glenwood Springs $57,415 $75,207
Colorado $60,903 $83,920
United States $54,149 $77,008 Source: Esri Business Analyst and American Community Survey Most households in the city were estimated to have annual incomes in 2016 between $50,000 and $149,999, with the average 2016 household income estimated to be approximately $75,000. By 2021, average annual household income in the city is projected to rise by approximately $6,400, to over $81,000. Figure 8 illustrates the estimated and projected distribution of household income for these time periods. Figure 8: Distribution of Average Annual City Household Income by Category – Estimated 2016 and Projected 2021
Source: Esri Business Analyst and American Community Survey
0.0
5.0
10.0
15.0
20.0
25.0
<$15,000 $15,000 ‐$24,999
$25,000 ‐$34,999
$35,000 ‐$49,999
$50,000 ‐$74,999
$75,000 ‐$99,999
$100,000 ‐$149,999
$150,000 ‐$199,999
$200,000+
% Households
Average Household Income Level
2016 2021
Parks and Recreation Master Plan Update 13
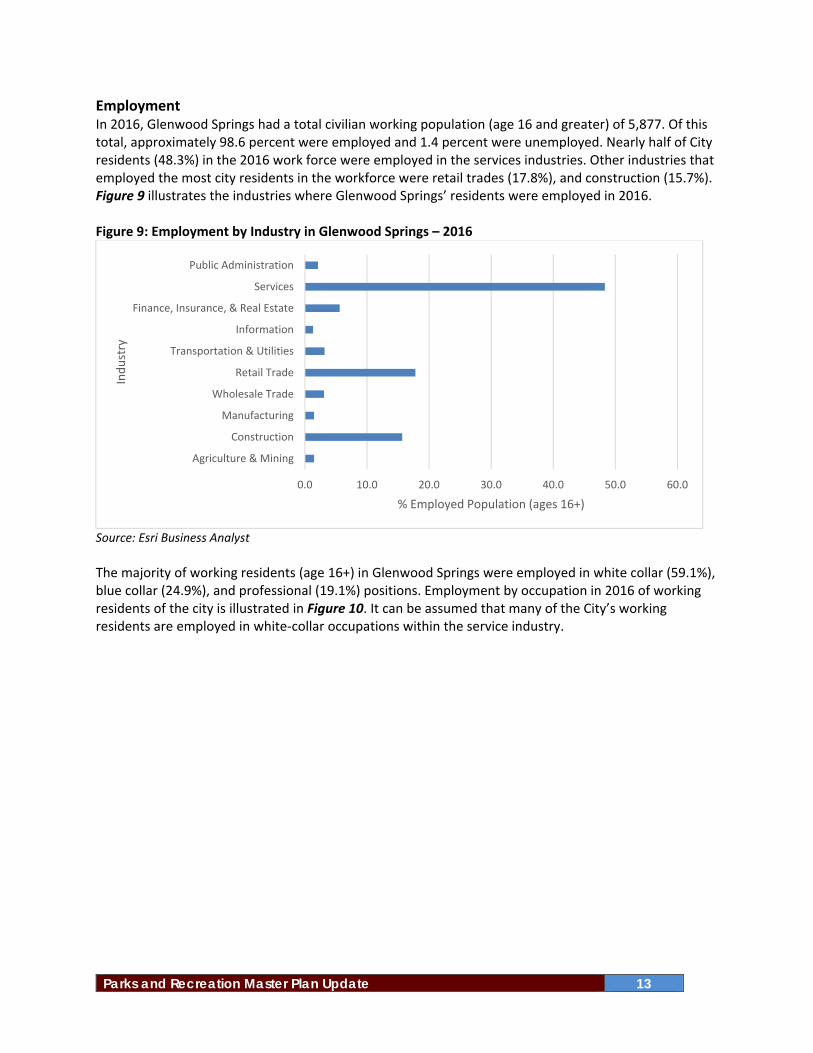
Employment In 2016, Glenwood Springs had a total civilian working population (age 16 and greater) of 5,877. Of this total, approximately 98.6 percent were employed and 1.4 percent were unemployed. Nearly half of City residents (48.3%) in the 2016 work force were employed in the services industries. Other industries that employed the most city residents in the workforce were retail trades (17.8%), and construction (15.7%). Figure 9 illustrates the industries where Glenwood Springs’ residents were employed in 2016. Figure 9: Employment by Industry in Glenwood Springs – 2016
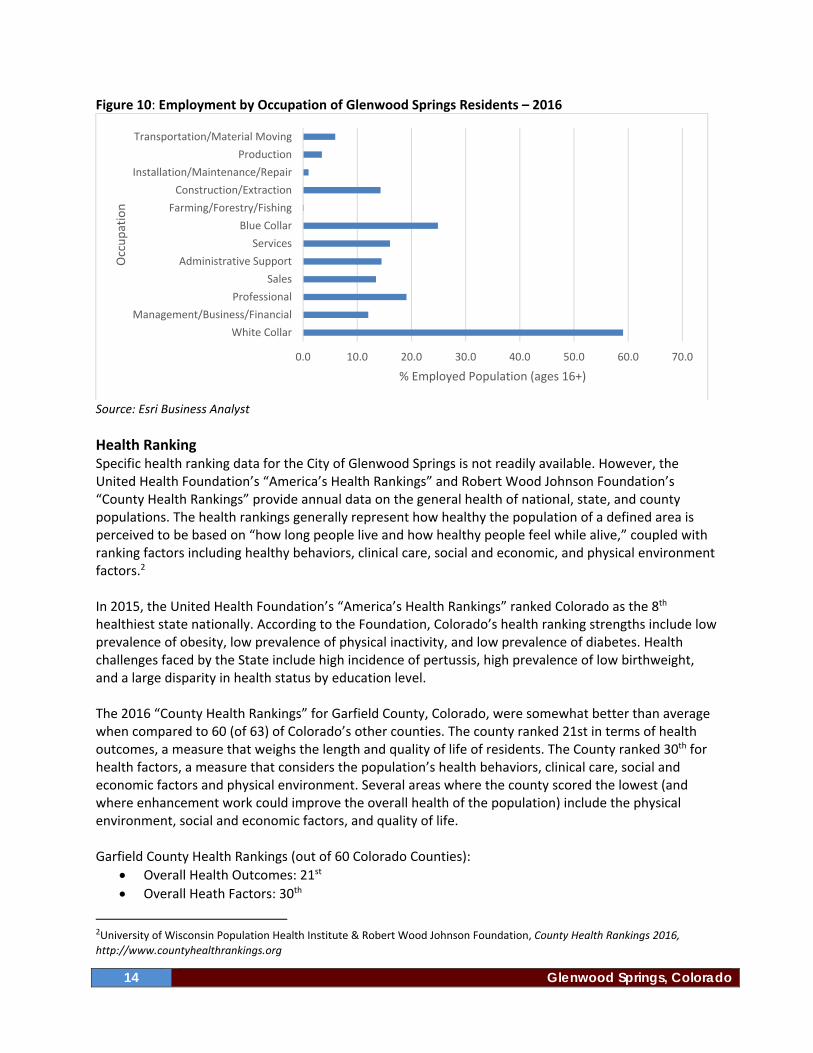
Source: Esri Business Analyst The majority of working residents (age 16+) in Glenwood Springs were employed in white collar (59.1%), blue collar (24.9%), and professional (19.1%) positions. Employment by occupation in 2016 of working residents of the city is illustrated in Figure 10. It can be assumed that many of the City’s working residents are employed in white‐collar occupations within the service industry.
0.0 10.0 20.0 30.0 40.0 50.0 60.0
Agriculture & Mining
Construction
Manufacturing
Wholesale Trade
Retail Trade
Transportation & Utilities
Information
Finance, Insurance, & Real Estate
Services
Public Administration
% Employed Population (ages 16+)
Industry
14 Glenwood Springs, Colorado
Figure 10: Employment by Occupation of Glenwood Springs Residents – 2016
Source: Esri Business Analyst
Health Ranking Specific health ranking data for the City of Glenwood Springs is not readily available. However, the United Health Foundation’s “America’s Health Rankings” and Robert Wood Johnson Foundation’s “County Health Rankings” provide annual data on the general health of national, state, and county populations. The health rankings generally represent how healthy the population of a defined area is perceived to be based on “how long people live and how healthy people feel while alive,” coupled with ranking factors including healthy behaviors, clinical care, social and economic, and physical environment factors.2 In 2015, the United Health Foundation’s “America’s Health Rankings” ranked Colorado as the 8th healthiest state nationally. According to the Foundation, Colorado’s health ranking strengths include low prevalence of obesity, low prevalence of physical inactivity, and low prevalence of diabetes. Health challenges faced by the State include high incidence of pertussis, high prevalence of low birthweight, and a large disparity in health status by education level.
The 2016 “County Health Rankings” for Garfield County, Colorado, were somewhat better than average when compared to 60 (of 63) of Colorado’s other counties. The county ranked 21st in terms of health outcomes, a measure that weighs the length and quality of life of residents. The County ranked 30th for health factors, a measure that considers the population’s health behaviors, clinical care, social and economic factors and physical environment. Several areas where the county scored the lowest (and where enhancement work could improve the overall health of the population) include the physical environment, social and economic factors, and quality of life. Garfield County Health Rankings (out of 60 Colorado Counties):
Overall Health Outcomes: 21st
Overall Heath Factors: 30th
2University of Wisconsin Population Health Institute & Robert Wood Johnson Foundation, County Health Rankings 2016,
http://www.countyhealthrankings.org
0.0 10.0 20.0 30.0 40.0 50.0 60.0 70.0
White Collar
Management/Business/Financial
Professional
Sales
Administrative Support
Services
Blue Collar
Farming/Forestry/Fishing
Construction/Extraction
Installation/Maintenance/Repair
Production
Transportation/Material Moving
% Employed Population (ages 16+)
Occupation

Parks and Recreation Master Plan Update 15
Ranking of select influencing health issues: Length of Life: 21st Quality of Life: 24th Health Behaviors: 36th Clinical Care: 29th Social and Economic Factors: 27th Physical Environment: 43rd
Current Trends The provision of public parks and recreation services can be influenced by local and national social and demographic preferences and market trends in fitness, recreation, and leisure activities. This section of the Plan reviews both local and national trends that may influence the City’s provision of parks and recreation services. Local trends reviewed are based on analysis of 2016 Esri models of citywide household participation in recreation, fitness, and leisure activities, and the associated economic impacts of local participation these types of activities. National trends reviewed draw upon information from a variety of relevant and recent industry reports, studies, and publications. Topics discussed provide insight on current trends influencing the provision of public parks and recreation services nationwide, but are applicable in the provision of these public services locally. The full trends report relevant to Glenwood Springs has been provided as a staff resource document.
Local Participation in Recreation and Fitness Activities According to Esri Business Analyst, the residents of Glenwood Springs participated in a diversity of fitness activities, team and individual sports, outdoor recreation activities, and other leisure activities. Data presented regarding current (2016) estimated local participation in recreation, fitness, and leisure activities is derived from Esri’s model, which measures national propensities to use a product or service applied to local demographic composition. The economic impacts of city residents spending on parks, recreation, and leisure activities is derived from 2016 consumer spending data from Consumer Expenditure Surveys prepared by the Bureau of Labor Statistics and applied to local demographic data. Nearly 1/3 of households within the study area walked, and over 18 percent jogged and ran for fitness over the past year. Participation in fitness activities is known to have positive impacts on individual well‐being and on local public health generally. Walking, the top fitness activity among the Glenwood Springs households, is generally a highly popular activity nationally because it has few barriers to participation and has positive individual health benefits.

16 Glenwood Springs, Colorado
Figure 11: Household Participation in Outdoor Recreation Activities
Source: Esri Business Analyst, Sports, and Leisure Market Potential In addition to the significant number of study area households that participated in walking, jogging, and running for fitness, significant numbers of households also participated in trail‐based activities, including mountain bicycling and hiking. Participation in outdoor activities in a natural environment helps people connect with nature and is known to have positive effects on individual well‐being. Roughly five percent or fewer city households participated in team sports in the past year; however, nearly 11 percent of households golfed. Significant numbers of study area households were estimated to have participated in various leisure activities. Over half of the households dined out, over 40 percent read books, and over 63 percent watched sports on television. The overall estimated participation levels in recreation, fitness, and leisure activities of study area households is tied directly to the local economy.
Local Economic Significance of Recreation, Fitness, and Leisure Recreation, fitness, and leisure activities generate a considerable amount of economic activity in Glenwood Springs. In fact, over the past year, the average household in the city spent an estimated $847 on the recreation, fitness, and leisure activities detailed in Table 4. Over a one‐year period, this spending had an estimated local economic impact of over $3.3 million. As illustrated in Table 4, over two‐thirds of this spending was on fees for attending or participating in recreation and leisure activities.
2.2
4.95.7
4.6
13.7
5.9
14.9
6.0
4.15.4
0.0
2.0
4.0
6.0
8.0
10.0
12.0
14.0
16.0% HOUSEHOLD
PARTICIPATION
ACTIVITIES

Parks and Recreation Master Plan Update 17
Table 4: Estimated Household Spending on Recreation, Leisure and Fitness Activities – July 2015 to July 2016
Cost Category Average
Amount Spent Per Household
Total Annual Household Spending
Entertainment/Recreation Fees and Admissions $584 $2,316,254
Concert/Theater Tickets $52 $207,901
Tickets to Movies/Museums/Parks $71 $280,973
Admission to Sporting Events $55 $216,711
Fees for Participant Sports $92 $366,776
Fees for Recreational Lessons $124 $492,440
Membership Fees for Social/Recreation/Civic Clubs $189 $751,453
Recreational Vehicles and Fees $99 $392,421
Docking and Landing Fees for Boats and Planes $7 $29,299
Camp Fees $32 $126,598
Payments on Boats/Trailers/Campers/RVs $44 $172,527
Rental of RVs or Boats $16 $63,997
Sports, Recreation and Exercise Equipment $164 $650,746
Exercise Equipment and Gear $50 $197,565
Bicycles $29 $116,848
Camping Equipment $16 $63,871
Hunting and Fishing Equipment $46 $183,206
Winter Sports Equipment $5 $20,136
Water Sports Equipment $6 $22,302
Other Sports Equipment $9 $34,648
Rental/Repair of Equipment $3 $12,170
Overall Totals: $847 $3,359,421 Source: Esri Business Analyst, Recreation Expenditures
National Demographic Trends in Recreation Generational Participation and Preferences Three major age groups, the Baby Boomers, Millennial Generation, and Generation Z, are having significant impacts in the planning and provision of parks and recreation services nationwide.
In 2016, nearly 83 percent of the residents of Glenwood Springs were members of the largest three generation groups in the county. As illustrated in Figure 12, 19.1 percent were Baby Boomers, 31.3 percent Millennials, and 32.4 percent were members of Generation Z.

18 Glenwood Springs, Colorado
Figure 12: Presence of the Three Largest National Generational Groups in Glenwood Springs
Source: American Community Survey, and Esri Business Analyst
Although there are some similarities in the recreational preferences of these generational groups, they each tend to have their own unique tastes as illustrated in Figure 13. Figure 13: Sports Participation Rates by Generation 2014
Source: 2015 Participation Report, Physical Activity Council
0.0
5.0
10.0
15.0
20.0
25.0
30.0
35.0
Baby Boomers Millennials Generation Z
% Population
Generational Groups
0.0%
10.0%
20.0%
30.0%
40.0%
50.0%
60.0%
70.0%
IndividualSports
Racquet Sports Team Sports Outdoor Sports Water Sports Fitness Sports
Boomers (1945‐‐1964) Gen X (1965‐‐1979) Millennials (1980‐‐1999) Gen Z (2000+)

Parks and Recreation Master Plan Update 19
Funding Trends The 2016 NRPA Field Report: Parks and Recreation Agency Performance Benchmarks reports
that the typical parks and recreation agency: Has annual operating expenses of $76.44 on a per capita basis/$6,476 per acre of park
and non‐park sites managed by the agency. Has $96,055 in annual operations expenditures for each employee. Personnel services represent 55 percent of the operations budget. Derives three‐fifths of its operating expenditures from general fund tax support. Generates $795,500 in non‐tax revenues on an annual basis. Recovers 29.0 percent of its operating expenditures from non‐tax revenue. Have $2.981 million in capital expenditures budgeted over the next five years. On average, just over half of the capital budget is designated for renovations, while 30
percent is geared toward new development.
According to Recreation Management magazine’s 2015 “State of the Industry Report,” survey respondents from parks and recreation departments/districts reporting about their revenues from 2012 through 2014 indicated a continued recovery from the impact of the recession of 2008. From 2013 to 2014, 44.1 percent of respondents reported that their revenues had increased, and another 44.1 percent reported revenues staying steady. About 48.7 percent of respondents said they expected revenues to continue to increase in 2015, while 44 percent expected no change.
Parks and recreation operating and capital development funding typically comes from conventional sources such as sales, use, and property tax referenda voted upon by the community, along with developer exactions.
Alternative funding sources include a variety of different or non‐conventional public sector strategies for diversifying the funding base beyond traditional tax‐based support.
Creating synergy based on expanded program offerings and collaborative efforts can be beneficial to all providers as interest grows and people gravitate to the type of facility and programs that best suit their recreational needs and schedules. Strategic alliance partnerships where missions run parallel and mutually beneficial relationships can be fostered.
Taxing districts established to provide funds for certain types of improvements that benefit a specific group of affected properties. Special districts (or local improvement districts) are the beneficiaries of pass‐through funding from cities or counties, which have responsibility for their interests.
Marketing Trends The San Jose Group, a consortium of marketing communications companies specializing in
reaching Hispanic and non‐Hispanic markets of the United States, suggests that today’s multicultural population of the United States, or the “new majority,” is 107.6 million, which translates to about 35.1 percent of the country’s total population.
Parks and recreation trends in marketing leisure services continue to emerge and should be taken into consideration in all planning efforts, as different cultures respond differently to marketing techniques.

20 Glenwood Springs, Colorado
Mobile marketing is a growing trend. Social websites and apps are among the most used features on mobile phones. Popular social marketing electronic tools include Facebook, Twitter, YouTube, Instagram, and LinkedIn. Private messaging apps such as Snapchat and WhatsApp are being used more and more for live media coverage.3
Relevance for the City of Glenwood Springs is:
Millennials often look for local and relatively inexpensive ways to experience the outdoors close to home; on trails, bike paths, and in community parks.
Millennials and Baby Boomers both place a high priority on having sidewalks, hiking trails, bike paths, and fitness choices available to them in their community. In fact, these community features are viewed as higher preferences than a great school system, vibrant centers of entertainment and culture, and affordable and convenient transportation choices by both.
Adult sports teams of all sorts, from competitive volleyball to local flag football teams to casual kickball, are becoming more and more popular around the country, especially among Millennials (young adults from around 18 to early 30s). Adult team sports are attractive as ways to be social, get exercise, or just for something to do after work. Sports teams in the work place are also a growing trend in the United States as companies look for new ways to keep their employees healthy and happy.
Youth and young adults (ages 6‐24) who identify as Hispanic prefer to participate in outdoor sports.
Additionally, young adults in general, engage in mobile data applications at much higher rates than adults. It is also a fact that minority Americans lead the way when it comes to mobile internet access.
It will be important for the City of Glenwood Springs to continue to invest in connectivity and walkability, preserving open space, increasing opportunities for outdoor fitness, and investing in mobile applications for programming and wayfinding.
3Jacqueline Woerner, “The 7 Social Media Trends Dominating 2015,” Emarsys Blog,
http://www.emarsys.com/en/resources/blog/the‐7‐social‐media‐trends‐dominating‐2015/, accessed February 26, 2015.

Parks and Recreation Master Plan Update 21
IV. What We Want: Community Involvement Public input was held in August of 2016 through focus groups, staff meetings, meetings with commissioners, and an open public forum. Focus groups were by invitation extended through the parks and recreation staff with the goal of mixing area residents and stakeholders with differing points of view to solicit broad based perspectives. Each meeting lasted approximately 90 minutes. All meetings were facilitated by GreenPlay staff and a series of questions was used to ensure that adequate input opportunity was afforded all attendees. There were a total of six focus groups with public, staff, the River Commission, the Parks and Recreation Commission, and City Council. A total of 41 individuals participated.
Strengths and Opportunities for Improvement The residents of Glenwood Springs benefit from their proximity to the Roaring Fork and Colorado Rivers, and participants rated river access, outdoor recreation opportunities, and river front parks as strengths of the Parks and Recreation system. The community center, swimming pool, variety of parks, and ice rink were also identified as strengths. The staff is well respected and dedicated to providing quality programs and serving the community to meet the demand of the residents. A regional focus, customer orientation, and affordable fees contributed to increased memberships and participation. Focus group participants addressed the need to maintain current facilities and amenities along with adding athletic fields and courts. A general focus on the current parks infrastructure was evident. Use conflict between the established tennis community and the up and coming Pickleball community was acknowledged to be addressed. Finally, finding an appropriate use of the ice rink during the off‐season was identified.
Programming and Activities, and Locations Glenwood Springs residents appreciate their programs and love the outdoors. Although residents are satisfied with the programs that are offered, they desire more program offerings, with a particular interest in outdoor recreation programs and outdoor adventure events and races. They identified more programming for special events, arts and crafts, Pickleball, and additional adult sports and non‐traditional and adventure sports opportunities. Social gatherings and fitness classes were also mentioned to increase use of facility and park space.
Improvements to Existing and New Facilities When asked how satisfied residents are with current facilities, they received lower scores based on the current condition of facilities and many amenities operated by the Department. When asked what improvements are needed, the following suggestions were made for renovations:
Soft surface trails
Restroom upgrade
Boat ramps to accommodate private and commercial users
Addition of lights to athletic fields
Year‐round use of the ice rink
ADA Compliance for all facilities and amenities
Branding/wayfinding signage for parks

22 Glenwood Springs, Colorado
When asked what additional parks and recreation facilities are needed for the community, the following suggestions were made:
More fields and amenities
Additional soft surface trails
Additional public river access
Additional bike paths/trails
Parking at trailheads
Outdoor fitness equipment
Dedicated Pickleball courts
Top Priorities When asked to prioritize what the City should concentrate on in the next 10 years, focus group participants indicated that taking care of we have and improving the current infrastructure should be the top priorities. Following that, participants expressed interest in repurposing existing under used spaces, preserving the environment and habitat, and finding a dedicated revenue source for operations and maintenance. Participants also prioritized additional facilities and amenities including soft surface trails for biking and hiking, a dedicated Pickleball facility, additional fields for youth sports in town, and acquiring property for additional facilities and amenities. There was also concern about continuing to provide affordable memberships and programs, staffing appropriately to maintain the current quality of service, and focus on adventure tourism as a means of new revenue and growth.
Values Glenwood Springs residents value the role the Parks and Recreation Department plays in the community. They believe that staff provides a very good service to residents and visitors and that availability of outdoor programs and activities is essential to maintaining recreation economy of the City. Connectivity must be addressed concerning wayfinding, branding, marketing, and communication. Residents live an active lifestyle, interact with the environment, and enjoy the outdoors daily.
Community Survey A survey research effort and subsequent analysis were designed and conducted to reach out further to the public regarding existing and potential future facilities and services. The survey was conducted using SurveyMonkey and was open from July 14, 2016 through July 24, 2016. A total of 437 completed responses were received, with 59 percent identifying as residents living in 81601 (37%) and 81647 (27%) zip codes. The only other zip code with a double‐digit response was 81623 (11%).
This section provides a summary of the survey results. The complete survey results including open‐ended comments exists as a separate staff resource document due to the large number of pages.
Parks and Recreation Master Plan Update 23
Summary of Selected Findings A brief overview of key findings of the survey include:
The majority feel it is very important to their household that parks, recreation, and trails are available. Eighty‐eight percent (88%) rated the importance of availability to parks, recreation, and trails in Glenwood Springs as very important.
Most important facilities included trails, the community center, public water access, water front parks, and the swimming pool. The most important facility is trails, with a strong majority of respondents identifying it as very important (76%), followed by community center (gym) (61%), public water access (52%), and water front parks (46%). These four amenities are consistently identified throughout the survey as top parks and recreation offerings in Glenwood Springs.
Maintenance of parks and facilities are highest priorities for the future. Sixty percent (60%) of respondents rated maintenance of parks and facilities as the top issue to be addressed by the Parks and Recreation Department. This was followed very closely by connectivity between trails and facilities (59%), affordability of programs and services (52%) and land preservation/acquisition (51%). Land preservation/acquisition received the largest number of top priority responses.
Community events are highly valued. Community events was identified as the most important parks and recreation program, with approximately two‐thirds of respondents identifying it as important (34%) or very important (48%). It is also currently meeting the needs of the community best, with 79% percent indicating that community needs are currently being met. In addition, wellness/fitness/health, and outdoor recreation were important to respondents.
Additional facilities/amenities would increase utilization. Fifty‐eight percent (58%) of respondents stated they would likely utilize Glenwood Springs facilities, services, and programs more often if additional facilities/amenities were provided. This was followed by “programs I want,” (56%) and addressing condition/maintenance of parks or facilities (49%).

THIS PAGE INTENTIONALLY LEFT BLANK

Parks and Recreation Master Plan Update 25
V. What We Have Now – Facilities and Services
Facility Condition Assessment During the summer of 2016, DHM Design, in collaboration with GreenPlay, conducted an inventory and assessment of six parks identified by the Parks and Recreation Department. Focus on only those six parks occurred to avoid duplicating previous work with the 2016 update, as much of the 2006 Master Plan is still valid. The six parks included:
Glenwood Community Center
Glenwood Park (soccer fields across from Sopris Park)
Sayre Park
Sopris Park (athletic fields adjacent to elementary school)
Two Rivers Park
Whitewater Activity Area
The general findings from the site review echo sentiments from the focus group meetings and survey – take care of what we have and maintain and improve the infrastructure. The six parks assessed contribute greatly to the overall recreational experiences for Glenwood residents at a neighborhood, community, and regional level. The overall condition of each of those facilities is good, but a dedicated maintenance program is important for the future health of each of the parks. General maintenance program protocols should focus on:
Areas where the irrigation was spotty and in need of adjustment as exhibited in many of the parks.
Standardization of trash receptacles should be considered, as there is a mismatch with some bear proof receptacles and some not, at all locations.
Improved signage to help with wayfinding.
Continued maintenance to repair broken or overgrown paths.
Addition of dog stations and bike racks, particularly at Sayre Park.
The restroom facility at the athletic fields in Sopris Park.
General weed maintenance and selection of mulch materials to reduce on‐going upkeep. In terms of specific observations, the following upgrades are recommended. Glenwood Community Center
Playground is under‐utilized and could be improved, upgraded or repurposed
Signage
Irrigation adjustments Glenwood Park (soccer fields across from Sopris Park)
The irrigation needs attention to address dry areas
Signage
The fence needs to be repaired

26 Glenwood Springs, Colorado
Sayre Park
The existing playground should be evaluated for ADA compliance with appropriate transfer stations and surfacing material. This should be a top and immediate priority for the City.
Security night lighting for the tennis and ball fields was not working at the time of the visit.
The park needs more dog stations and bike racks given its location and use.
General park maintenance of paths, striping for parking lots, and mulch beds.
Sopris Park (athletic fields adjacent to elementary school)
Irrigation needs more immediate attention
Bleachers are in substandard condition
Restroom is closed (due to vandalism) with a porta‐potty placed in front. City should determine future of restroom facility and either re‐open or repurpose, finding a better more permanent location for the porta‐potty.
Two Rivers Park
Parking lot lines need to be repainted
Path maintenance in front of bathroom needs to be addressed Whitewater Park
Gravel path on north side is in poor condition
General weed maintenance
Irrigation adjustments on north side
In terms of system‐wide recommendations, it is apparent that the community has a strong desire for Pickleball courts and that there are some conflicts between tennis court and Pickleball use. New courts at the Community Center dedicated to Pickleball might be a possibility or perhaps repurposing of underutilized courts in other park locations.
Program Development Understanding core services in the delivery of parks and recreation services will allow the Department to improve upon those areas while developing strategies to assist in the delivery of other services. The basis of determining core services should come from the vision and mission developed by the City and what brings the greatest community benefit in balance with the competencies of the Department, current trends, and the market.

Parks and Recreation Master Plan Update 27
The Department should pursue program development around the priorities identified by customer feedback, program evaluation, and research. Those following criteria should be examined when developing new programs.
Need: outgrowth of a current popular program, or enough demonstrated demand to successfully support a minimal start (one class for instance)
Budget: accounting for all costs and anticipated (conservative) revenues should meet cost recovery target established by the Department
Location: appropriate, available, and within budget
Instructor: qualified, available, and within budget
Materials and supplies: available and within budget
Marketing effort: adequate and timely opportunity to reach intended market, within budget (either existing marketing budget or as part of new program budget)
Further research into what types of programming would be successful needs to be done. Successful programs utilize continuous creative assessments, research, and planning. The Department has a process that evaluates the success of current program offerings and criteria to determine if new program ideas should be instituted or if changes should be made to current programs. Moreover, new leisure and recreation trends may drive different needs. It is very easy to focus on programs that have worked for a number of years, especially if they are still drawing enough interested participants to justify the programs continuation. Starting new programs, based on community demand and/or trends, can be risky due to the inability to predict their success. If program interest seems great, as with those identified in the citizen survey, then the programs should be expanded. Available space may hinder new or expanded opportunities in some cases. Using historical participation levels to determine program popularity and participant feedback can be helpful in deciding if programs should be continued. In addition, utilizing citizen surveys and participant feedback, and researching trends in park and recreational programming, are useful tools in determining future programming needs and desires. Sources for trends information include:
State parks and recreation associations and conferences
National Recreation and Parks Association
Parks and recreation trade publications
Outdoor recreation publications
Program Evaluation All current programs should be evaluated annually to determine if they should be continued, changed (market segment focus, time/day offered, etc.), or discontinued. A few simple questions should be asked about each program that includes:
Is participation increasing or decreasing? If participation is increasing, then it could clearly mean that the program should be continued. If participation is decreasing, are there any steps to take to increase interest through marketing efforts, change the time/day of the program is offered and change the format or instructor? If not, it may be time to discontinue the program.
Is there information contained in the participation feedback that can be used to improve the program?
Are cost recovery goals being met? If not, can fees be realistically increased?
28 Glenwood Springs, Colorado
Is there another provider of the program that is more suitable to offer it? If yes, the Department could provide referrals for its customers for the program it does not or is not willing or able to offer.
Is this program taking up facility space that could be used for expansion of more popular programs or new programs in demand by the community?
Funding Resources There are a variety of mechanisms that local governments can employ to provide services and to make public improvements. Parks and recreation operating and capital development funding typically comes from conventional sources such as sales, use, and property tax referenda voted upon by the community, along with developer exactions. Operating funds are typically capped by legislation; may fluctuate based on the economy, public spending, or assessed valuation; and may not always keep up with inflationary factors. In the case of capital development, “borrowed funds” sunset with the completion of loan repayment and are not available to carry‐over or re‐invest without voter approval. Explained below are the salient points of traditional funding sources. Many of these strategies may be currently in use to some extent by your agency.
General or Operating Fund Parks and recreation services are typically funded by an agency’s General or Operating Fund, which can be comprised of property tax, sales tax, and other compulsory charges levied by a government for the purpose of financing services performed for the common benefit of a community. These funds may also come from resources such as inter‐governmental agreements, reimbursements, and interest and may include such revenue sources as franchise taxes, licenses and permits, fees, transfers in, reserves, interest income, and miscellaneous other incomes.
Property Tax Property tax revenue often funds park and recreation special districts and may be used as a dedicated source for capital development. When used for operation funding, it often makes the argument for charging resident and non‐resident fee differentials.
General Obligation Bonds Bonded indebtedness issued with the approval of the electorate for capital improvements and general public improvements.
Revenue Bonds Bonds used for capital projects that will generate revenue for debt service where fees can be set aside to support repayment of the bond. These are typically issued for water, sewer or drainage charges, and other enterprise type activities.
Inter‐local Agreements Contractual relationships could be established between two or more local units of government and/or between a local unit of government and a non‐profit organization for the joint usage/development of sports fields, regional parks, or other facilities.
Parks and Recreation Master Plan Update 29
Pricing Philosophy Parks & Recreation facilities, programs, and services are very important to the community and are in high demand. However, not all facilities, programs, and services are equal. In general, the more a facility, program, or service provides a community benefit to citizens of Glenwood Springs as a whole, the more that element should be paid for by all citizens as part of the City’s general fund. The more a facility, program, or service provides individual benefits, the more that element should paid for by user fees. This funding and cost recovery philosophy continuum acknowledges the tremendous public benefits of parks and recreation to the community, not only in the obvious ways it provides recreational opportunities to the citizens, but for the sometimes unrecognized benefits of promoting economic development, crime prevention, and community health. In all cases, the City should seek to leverage partnerships wherever possible, and in the best interest of the citizens, to help fund the facilities, programs, and services they provide to the community. Following are some specific examples of how various Parks & Recreation facilities, programs, and services fall on that continuum and how they are paid for: Park Construction New park construction relies on Acquisition and Improvement Funds (A&I) whenever possible for funding. When A&I funds are not available or when developing parks to increase the level of service, general funds are used. Grants are also sought, such as those from the State of Colorado GOCO grants, the Community Development Block Grant (CDBG), and other sources. Whenever possible and in the best interest of the City, partnerships are also used to help develop new parks and/or specific amenities within them.
Park Maintenance Park maintenance benefits the entire community and is funded from the City’s General Fund. Volunteers can be leveraged wherever possible to help save labor and costs.
Trails When developed by the City, trails are paid for by A&I funds, the City’s General Fund or grants, not impact fees. Programs Programs are funded with user fee for registration. These fees are established to pay for direct costs and 10 percent of administrative costs associated with the program. The percentage of cost recovery is determined by the Cost Recovery Policy adopted in 2008.
Marketing Focus group participants indicated not being aware of programs or facility as the main reasons for not using Glenwood Springs program or amenities. It is important that the Department improve communications with residents about program/event offerings and Department information through such strategies as:
Increasing the use of social media
Incorporating smart phone apps which can help: Build a stronger, healthier community through activities and programs. Cultivate an interactive link between agencies and participating individuals. Optimize programs with powerful analytics to reduce costs and generate revenue.

30 Glenwood Springs, Colorado
Organizational Analysis GreenPlay broadly assessed the organizational and management structure of the Parks and Recreation Department and staffing to determine effectiveness and efficiency in meeting current and future departmental responsibilities as related to the community’s needs. The needs assessment – including input from staff interviews, community and key stakeholder engagement, and level of service analysis, along with the consultant’s expertise – has identified areas for operational enhancement:
Improve marketing and communication of activities.
Enhance and improve internal and external communication.
Improve the website so it is current and usable for patrons.
Increase the utilization of technology to improve customer service and efficiencies.
Improve and update park and wayfinding signage and maps.
Increase appropriate partnerships within the community.
Staffing Analysis GreenPlay broadly assessed the management structure and staffing levels of the Parks and Recreation Department to determine effectiveness and efficiency in meeting current and future departmental responsibilities as related to the community’s needs. Many observations were taken into account to determine if the Department had the right mix of staffing in the right places within the department. The staffing analysis process included the observations and assessments of:
Community input.
Community satisfaction rates.
Staff focus group.
Individual staff interviews.
Facility tours.
Observations of quality of maintenance.
Professional knowledge in Parks and Recreation organizations.
SWOT Analysis.
Organizational chart. Staffing Considerations After considering all of the organizational observations and staffing assessment, the consultant team has determined that the Parks and Recreation Department has an adequate number of staff to operate its current system with adjustments needed to assign staff in the right places within the department. To operate more effectively in the future and to implement the Master Plan, the following should be considered:
Developing a standard for recreation staffing that considers: Number of service areas managed per FTE. Number of rentals or Temporary Use Permits issued and managed per FTE. Number of programs and participation rates managed per FTE.
Ensuring staffing resource levels can maintain existing and new facilities at or above acceptable standards as the Master Plan is implemented.
Staffing appropriately to maintain a current FTE for park maintenance based on acres of park land maintained per FTE.

Parks and Recreation Master Plan Update 31
Services Evaluation The Parks and Recreation Department develops and implements leisure time activities that promote positive opportunities to enhance the quality of life for youth, teens, adults, and seniors; encourages physical, creative, and imaginative participation that serves and expands the interest and opportunities for participants beyond school, work, or home. The Department is responsible for the following.
Community Center
Aquatic Center
Ice Rink
Room rentals
Sports programs
Community recreation
Parks
Trails
Cemeteries
Forestry
Special projects
Special events The addition of the ice rink support facility in 2014 provides modern, energy efficient locker rooms and restrooms to the facility, which is entering its 14th season of use. The Whitewater Activity Area is gaining national and international attention as a premiere water feature for a variety of water sports. As professionals, there are now five members of the Department who have achieved the national CPRP (Certified Park and Recreation Professional) status, and on a statewide basis receive recognition for programs and facility management.

THIS PAGE INTENTIONALLY LEFT BLANK

Parks and Recreation Master Plan Update 33
VI. Strategic Business Plan
Purpose of this Plan This Strategic Business Plan was drafted with the intent to provide the Parks and Recreation Department with an overall program management philosophy and approach for the next five to ten years. The plan is a management guide that provides a history of past operations and recommendations to manage the program to maximize service to the community in the most affordable means. The Strategic Business Plan addresses a number of separate components of the program and includes recommendations that can be made over the next five‐year period. These elements can be viewed individually and as a total product. From this plan, a budget outlining necessary revenues to sustain the program can be developed. This budget must be incorporated into the City and Department funding strategy. In addition, an Annual Work Plan should be created each year. This Annual Work Plan is created on a yearly basis by staff and incorporates the key recommendations for the program. The Strategic Business Plan is reviewed and updated on a yearly basis to make adjustments as economic and market conditions change.
Business Concept This project has been guided by a Glenwood Springs Parks and Recreation project team made up of City staff with input from the Parks and Recreation Commission, River Commission, and City Council, which provided input to the GreenPlay consulting team throughout the planning process. This collaborative effort created a plan that fully utilizes the consultant’s expertise and incorporates the local knowledge and institutional history that only staff and community members can provide. The project consisted of the following tasks.
Business Overview
Review of previous planning efforts, City historical information.
Community involvement effort including focus groups, meetings with key stakeholders, and community‐wide public meetings.
Community needs assessment, interest, and opinion survey.
Services Offered Review of three years of operational data from RecTrac, the registration software currently
being used by the Department and budget data reported from the City Finance Department. This review included:
I. Participation 1) Memberships and daily admission passes 2) Program registration and participation 3) Percentage of programs filled and cancelled 4) Retention and repeat users
II. Rentals

34 Glenwood Springs, Colorado
III. Cost Recovery: Revenue/Expenses 1) Revenue or expense by service area 2) Subsidy versus cost recovery 3) Fees and charges
Opportunity/Value
Interviews with staff to provide information about City facilities and services, along with insight regarding the current practices and experiences of the City in serving its residents and visitors.
Identification of alternative providers of recreation services to provide insight regarding the market opportunities in the area for potential new facilities and services.
Analysis addressing recreation, parks, and related services.
Revenue Sources
Review and assessment of relevant data.
Current revenue sources: I. Community Center
1) Memberships 2) Daily Admission Fees
II. Program Registrations 1) Classes 2) Camps 3) Youth Athletics 4) Adult Athletics 5) Adult Fitness
III. Rentals 1) Community Center Meeting Rooms 2) Gymnasium 3) Shelters 4) Athletic Fields 5) Ice Rink 6) Swimming Pool
IV. Ice Rink 1) Leases 2) Leagues 3) Lessons
V. Swimming Pool 1) Lessons 2) Classes
Measurement of the current delivery of service for City facilities allowing for a target level of service to be determined that is both feasible and aligned with the desires of citizens as expressed through the citizen survey.
Exploration of finance and funding mechanisms to support development and sustainability within the system.

Parks and Recreation Master Plan Update 35
Market Analysis Consideration of the profile of the community and demographics, including population growth.
Research of trends related to Glenwood Springs and American lifestyles to help guide the efforts of the Parks and Recreation Department over the next several years.
Target Customers Analyze parks and recreation programming and service delivery.
Conduct an organizational Strengths, Weaknesses, Opportunities, and Threats (SWOT) Analysis.
Develop an assessment of the overall parks and recreation operations.
Market Characteristics and Trends Identification and categorization of recommendations into themes with goals, objectives, and an
action plan for implementation.
Development of an action plan for capital improvements including cost, funding source potentials, and timeframe to support the implementation of the plan.
Benchmarking To get a better picture of how Glenwood Springs compares to other communities of similar size, GreenPlay used the 2016 “NRPA Field Report: Parks and Recreation Agency Performance Benchmarks,” published by the National Recreation and Parks Association. The report compared communities with populations less than 20,000.
Cost Recovery In 2008, Glenwood Springs adopted a Pricing and Cost Recovery Policy using the Pyramid Methodology developed by GreenPlay. As a result of the community process, an overall cost recovery goal was established for the Department of 60 percent of direct cost plus 10 percent of full time personnel expenses related to the program or service. Figure 14 illustrates the overall pyramid and the distribution of programs and services on tiers, each with its own cost recovery goal.

36 Glenwood Springs, Colorado
Figure 14: Glenwood Springs Cost Recovery Pyramid
The results of the 2016 “NRPA Field Report” show that the typical parks and recreation agency recovers 29 percent of its operating expenses from non‐tax revenues. For the fiscal year 2015, the City of Glenwood Springs Parks and Recreation Department recovered 55 percent, 26 percent higher than the national average but five percent lower than the adopted cost recovery goal for the City. Figure 15 compares the national average to Glenwood Springs.
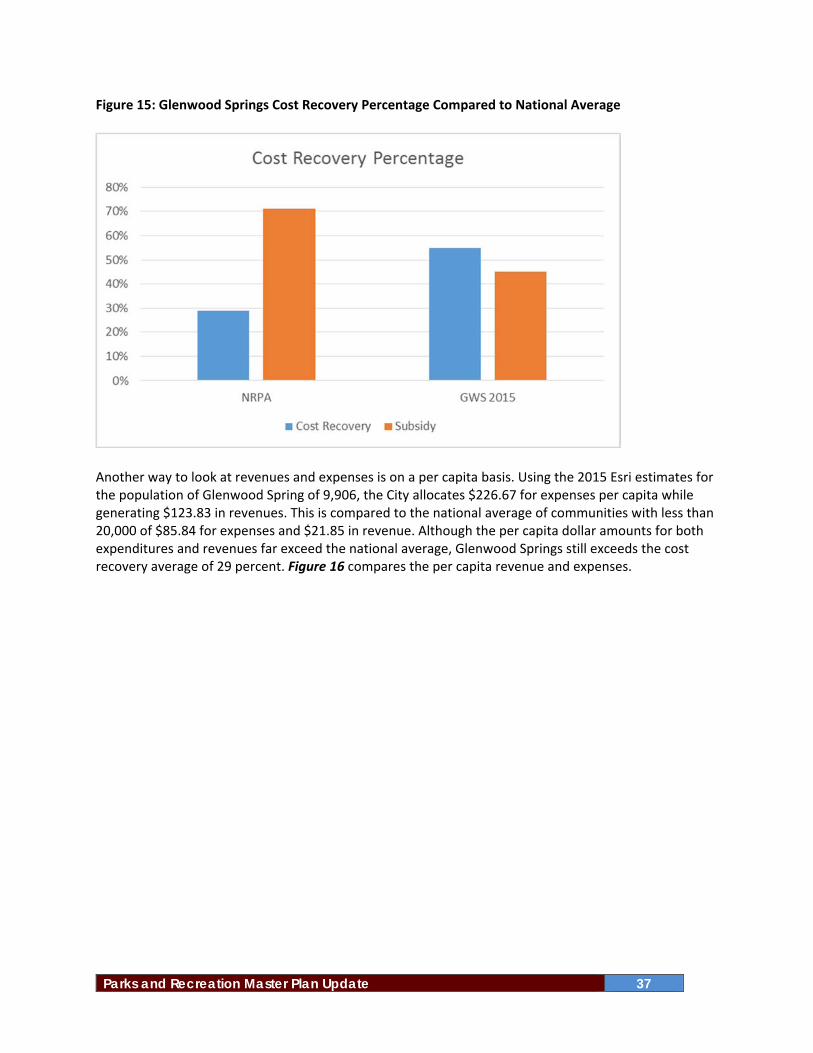
Parks and Recreation Master Plan Update 37
Figure 15: Glenwood Springs Cost Recovery Percentage Compared to National Average
Another way to look at revenues and expenses is on a per capita basis. Using the 2015 Esri estimates for the population of Glenwood Spring of 9,906, the City allocates $226.67 for expenses per capita while generating $123.83 in revenues. This is compared to the national average of communities with less than 20,000 of $85.84 for expenses and $21.85 in revenue. Although the per capita dollar amounts for both expenditures and revenues far exceed the national average, Glenwood Springs still exceeds the cost recovery average of 29 percent. Figure 16 compares the per capita revenue and expenses.

38 Glenwood Springs, Colorado
Figure 16: Per Capita Comparison
In addition to comparing revenues and expenses, GreenPlay benchmarked the level of service for both parks and recreation facilities. Communities of less than 20,000 on average provide 10.6 acres of active park land per 1,000 residents, this compares to 7.57 acres per 1,000 residents in Glenwood Springs. When comparing facilities, the NRPA “Field Report” compares both community centers and recreation centers, which for some facilities includes fitness centers as parts of the recreation center. The community center in Glenwood Springs operates like a recreation center based on amenities offered in the facility. Based on the report, 69 percent of agencies offered recreation centers. The median number of residents per facility is 26,650, greater than twice the number of residents in Glenwood Springs. Fitness centers are offered by 40 percent of agencies and indoor and outdoor ice rinks are offered by 15 and 21 percent of agencies, respectively. Table 5 shows other facilities offered by Glenwood Springs and the national benchmarking data.

Parks and Recreation Master Plan Update 39
Table 5: Benchmarking Facilities
Indoor Facilities Agencies Offering
Median # Residents per Facility
Community Center 45% 30,000
Recreation Center 69% 26,650
Fitness Center 40% 39,765
Ice Rink (Indoor) 15% 28,500
Ice Rink (Outdoor) 21% 16,572
Performance Measures To evaluate the operational effectiveness of the Parks and Recreation Department, GreenPlay looked at several performance measures over a three (3) year period for fiscal years 2013, 2014, and 2015. The consultants reviewed data provided by the City from RecTrac and City budget reports. The performance measures evaluated were:
Community Center memberships
Program registration and participation
Rentals
Cost Recovery Pyramid analysis
Community Center Memberships Community Center memberships and daily pass sales account for 60 percent of the revenue generated by the Parks and Recreation Department, with memberships accounting for 46 percent. In April 2014, the Department restructured the community center memberships to align with member usage, and as a result, sales and revenue dropped. However, a review of the fiscal year‐to‐date revenues for 2016 show a return to previous levels. Also of importance is the percentage of non‐residents purchasing membership to the community center. Through the first three quarters of fiscal year 2016, 27 percent of memberships had been sold to non‐residents, a five percent growth over 2015. Table 6 compares number of sales, visits, and revenue for the three (3) fiscal years. Table 6: Glenwood Springs Membership Sales and Revenue 2013‐2015
Fiscal Year 2013 2014 2015
Total Memberships 2,592 2,516 2,231
Total Daily Passes 993 1,343 1,124
Member Visits 65,732 70,596 71,462
Daily Pass Visits 7,211 9,221 8,390
Revenue Memberships $455,211 $480,032 $430,219
Revenue Daily Passes $59,996 $83,995 $75,330

40 Glenwood Springs, Colorado
Program Registration and Participation Using data from RecTrac, GreenPlay analyzed the number of classes offered and the number of classes with zero enrollment to determine the percentage of classes canceled for 2014 and 2015. For those same years, the number of registration slots (opportunities) offered and filled were also analyzed. In 2014, a total of 370 classes were offered with 152 having zero enrollment or a cancelation rate of 41 percent. In that same year, there were 5,137 maximum opportunities for participation with 1,306 slots being filled (25%). Those numbers increased in 2015 to 447 classes with 228 having zero enrollment (51%) a 10 percent increase from the previous year. However, participation increased to 29 percent. Table 7 outlines the two years of registration and participation. Table 7: Glenwood Springs Registration/Participation 2014‐2015
Registration/Participation 2014 2015
Total Classes 370 447
Zero Enrollment 152 228
Percentage of Classes Cancelled 41% 51%
Maximum Slots 5,137 5,977
Filled Slots 1,306 1,743
Percentage Filled 25% 29%
It should be noted that to best meet the interests of the community and inspire creative programming, excess capacity is normal in the effort and does not necessarily indicate wasted effort. This can occur, for example, from exploring when and where services will be popular by offering three options and only actually holding one of them. However, over time it should be a goal to reduce the number of classes with zero enrollment. Increased participation numbers and rates are the critical indicators of success.
Rentals Facility rentals are the second largest revenue source for the Parks and Recreation Department accounting for nearly $200,000 in fiscal year 2015, an 11 percent increase over 2014. Community Room rentals generate 42 percent of the revenue ($83,446 in 2015) followed by the Ice Rink (36%) and shelters (11%). The major contributor to the Ice Rink is the lease with Glenwood Springs Youth Hockey. In addition to revenue, the demand for Community Room rentals increased 18.5 percent from 2014 to 2015. Figure 17 compares facility rentals from 2014 to 2015 and Table 8 shows Community Room rentals.

Parks and Recreation Master Plan Update 41
Figure 17: Glenwood Springs Rental Revenues
Table 8: Glenwood Springs Community Room Usage 2014‐2015
Community Room Rentals 2014 2015
Reservations 579 710
Total Hours 2,889 3,395
Attendance 21,899 21,341
Revenue $70,780 $83,446
Cost Recovery Pyramid Analysis Since the Pricing and Cost Recovery Policy was adopted in 2008, it has evolved from a cost recovery model for programs and services to a cost recovery model for the Recreation Division as a whole. Initially, the adopted cost recovery goal was 60 percent of direct cost plus 10 percent of related administration for programs. Today the cost recovery goal or expectation is 60 percent of the programs AND operations for the Recreation Division. As discussed earlier in the Benchmarking section, the current cost recovery is 55 percent. For the purposes of performance measures, the consultants analyzed the outcomes of programs and services identified on the tiers of the pyramid, and cost recovery of the facilities: Community Center, Ice Rink, and Pool. GreenPlay used data from RecTrac for the analysis. There were 31 program areas offered that were distributed over three tiers of the pyramid. The review showed:
Program Areas – 31 total Tier 4 – 7 program areas/110% minimum cost recovery goal Tier 3 – 5 program areas/80% minimum cost recovery goal Tier 2 – 19 program areas/50% minimum cost recovery goal
Overall Cost Recovery across all program areas 146%
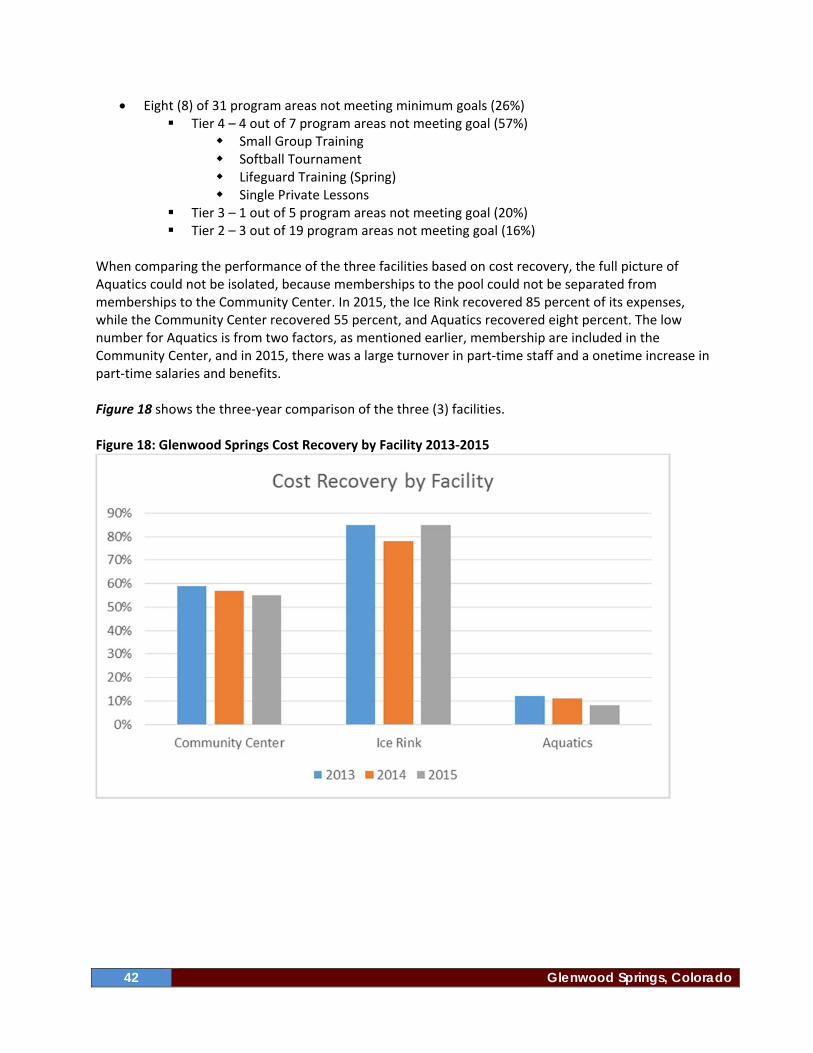
42 Glenwood Springs, Colorado
Eight (8) of 31 program areas not meeting minimum goals (26%) Tier 4 – 4 out of 7 program areas not meeting goal (57%)
Small Group Training Softball Tournament Lifeguard Training (Spring) Single Private Lessons
Tier 3 – 1 out of 5 program areas not meeting goal (20%) Tier 2 – 3 out of 19 program areas not meeting goal (16%)
When comparing the performance of the three facilities based on cost recovery, the full picture of Aquatics could not be isolated, because memberships to the pool could not be separated from memberships to the Community Center. In 2015, the Ice Rink recovered 85 percent of its expenses, while the Community Center recovered 55 percent, and Aquatics recovered eight percent. The low number for Aquatics is from two factors, as mentioned earlier, membership are included in the Community Center, and in 2015, there was a large turnover in part‐time staff and a onetime increase in part‐time salaries and benefits. Figure 18 shows the three‐year comparison of the three (3) facilities. Figure 18: Glenwood Springs Cost Recovery by Facility 2013‐2015

Parks and Recreation Master Plan Update 43
Areas for Improvement Following the analysis of the performance measures, the following Key Issues were identified areas for improvement:
Membership structure established in 2014.
Marketing and communication of activities and facilities.
Program registration and participation.
Cost Recovery Pyramid Tiers alignments.
Rental rates.
Off‐season usage of the Ice Rink.
Aquatic facility usage.
Strategic Focus Areas Analysis of available data resulted in the identification of strategic focus areas used to develop the recommendations that follow.
Awareness.
Operational restructuring.
Staffing.
Capital Improvements.
Alternative revenue sources and other financial opportunities.
Strategic Business Plan Recommendations Analyzing of findings, research, benchmarking, and performance measures; qualitative and quantitative data; and public input assembled for this study has allowed a variety of recommendations to emerge to provide guidance in improving parks and recreation opportunities for the residents and visitors to Glenwood Springs. These goals and objectives describe ways to enhance the level of service and the quality of life with improvement addressing the strategic focus areas.
Goal 1: Awareness Objective 1.1 – Create a brand and marketing plan for the Department. Marketing and branding are essential to the Parks and Recreation Department’s success. Focus group participants and survey respondents indicated that communication and marketing are areas that need improvement. Over a quarter of the members at the Community Center are non‐residents, so it is important to market outside of Glenwood Springs. The local hotels represent an avenue for promotion with guest pass sales to people staying on the property. Objective 1.2 – Focus on membership services for the Community Center. Membership sales at the Community Center is the single largest revenue source for the Department. Since reorganizing the membership structure in 2014, membership sales, daily pass sales, and visits have declined. The Department needs to put a focus on membership services to bring memberships back up to pre‐2014 numbers. Hiring a Membership Services position or creating one within the current structure to create membership drives, social media campaigns, and member appreciation events should be considered.

44 Glenwood Springs, Colorado
Objective 1.3 – Engage the community to use the swimming pool. The swimming pool and amenities are an area that can benefit from additional community usage and support. Currently, competitive swimming and lessons are a focus. Creating opportunities for daytime usage of the slides, zero entry pool, and other amenities for young families and visitors can create activity to attract other users and generate additional revenue. Rentals, birthday parties, and events are additional opportunities.
Goal 2: Operational Restructuring Objective 2.1 – Review and evaluate the membership structure, pricing, and benefits. The new membership structure needs to be monitored and reviewed annually to ensure that revenues and memberships are back to pre‐2014 numbers by the end of fiscal year 2017. By creating a membership services focus, evaluations of the current pricing and benefits can be determined and expectations identified. Objective 2.2 – Evaluate resident and non‐resident policy (rates). Non‐resident memberships account for greater than 25% of current membership sales. Currently, there is a 21% fee differential in resident and non‐resident memberships. Differences vary widely in the region and nationally, based on the percentage of non‐resident members. Raising the non‐resident fee is highly recommended. Objective 2.3 – Create strategies for year‐round Ice Rink usage. The Ice Rink is a semi‐enclosed structure that operates ice from October to April dependent on weather. During the offseason, limited use is scheduled and available for non‐ice use. Currently, Kids Camps uses the space for indoor activities during the summer. The Department should commit to a strategy to use the facility year‐round. Possible opportunities include indoor soccer, Pickleball, or skateboarding. All of these options will require capital investment to upgrade the air handling and ventilation, insulate the roof, and create a playable surface for the identified activity. Another option to committing to year‐round usage would be to contract operations or create public‐private partnership for operations during the ice season. This would reduce personnel and operational expenses. Objective 2.4 – Evaluate and audit existing contracts and lease agreements with vendors using City facilities. Through the Department, the City has contracts and leases with vendors to use City facilities. These contracts and lease agreements should be reviewed to ensure that the current scope meets the needs of the City and audited to ensure compliance with scope. The Department should also look for other opportunities to encourage local vendors to use existing and future facilities and amenities. Some areas of consideration are the per head fee to use the boat ramps, and the use of the swimming pool and the Ice Rink. Objective 2.5 – Consider new programs, program times, member needs. As demand for recreational opportunities increases, it will be important to keep current on member interests and citizen’s needs. The inventory of programs should be evaluated and adjustments made to increase participation and registration to greater than 50 percent. Based on national trends and input from focus group participants and survey respondents, some areas to consider are adult social sports, outdoor adventure recreation, Pickleball, rugby, and outdoor adventure races and events.

Parks and Recreation Master Plan Update 45
Goal 3: Staffing Objective 3.1 – Reorganization of staffing for more efficiency in management. A review of the current organizational structure of the Parks and Recreation Department showed some areas for consolidation of positions and reorganization for better efficiency and customer service. A recommended restructure has been provided as a staff document. Objective 3.2 – Consider using Building Maintenance Foreman to oversee other City facilities. Using the current Building Maintenance Foreman position to oversee the maintenance of all park and recreation buildings and the other non‐emergency buildings in the City’s inventory. This can save on personal expenses, operational expenses and create better efficiency in work order processing, purchasing and customer service. Objective 3.3 –Hire a marketing position. When reorganizing the Department, consider hiring a Membership Services position to create membership drives, social media campaigns, and member appreciation events. This position can also concentrate on promoting the Department, programs and services, front desk operations, and customer relations, as well as the City as a whole. Objective 3.4 – Evaluate contracting services. There are opportunities within the current organizational structure to create savings, and increase efficiency in operations and customer service. The Department currently employs sports officials, ice rink operations, and janitorial services. These functions in many agencies are contracted to outside vendors. By contracting these services, the Department will reduce personnel expenses, reduce the volume of part time employees, save time in the hiring process, and have a single point of contact for each service.
Goal 4: Capital Improvements Objective 4.1 – Continue to maintain, upgrade, and improve existing facilities and amenities. The top factor identified by survey respondents that would increase their use of facilities was condition and maintenance of parks and amenities. The Department has done an excellent job of keeping up with routine maintenance; however, asset replacement of components and upgrades to amenities need to be addressed. The Department should continue to implement existing plans and the Capital Improvement Plan. Objective 4.2 – Repurpose Community Center space for greater participation. Based on user trends and member demands, the Department should consider evaluating space in the Community Center for possible reuse. By repurposing space, additional activities areas can be created. One possible area to repurpose is the lounge area behind front desk for additional cardio space. Objective 4.3 – Enclose Ice Rink for year round usage. To realize the full potential of the Ice Rink, enclosing it for year‐round usage should be considered. Based on the availability of funding this could be accomplished in phases, initially upgrading the air handling and ventilation, and insulating roof to allow for offseason usage. The second phase would be to enclose the facility. By phasing the improvements, the Department can increase usage, generate additional revenue, and gage the need and interest in activities.
46 Glenwood Springs, Colorado
Objective 4.4 – Continue conversion to more energy efficiency lighting and HVAC to reduce utilities cost. The Department has already begun conversion to more energy efficient lighting and HVAC and has experienced a decrease in utility costs. This should be continued throughout the system.
Alternative Revenue Source and Other Financial Opportunities Goal 5: Consider alternative financial strategies Feedback from the public engagement as well as consultant observations and knowledge have identified additional strategies to consider that can create added revenue and potential growth for the Department. Objective 5.1 – Continue the growth of outdoor adventure recreation programs and events. Glenwood Springs is a recreation economy community. Opportunities abound for citizens and visitors to participate in the outdoors. The Department should continue to expand on the region’s outdoor adventure offerings. Some areas identified by the focus group participants are to provide introduction and instruction to outdoor recreation activities like fly fishing, standup paddle boarding, mountain biking, and kayaking. Additionally, Glenwood Springs should consider hosting adventure races and events; these events attract visiting athletes and their families to come and stay in hotels, eat in local restaurants, and purchase goods. Adventure races do not require large capital investments, ongoing maintenance, or permanent facilities to be successful. Objective 5.2 – Consider dedicated Pickleball complex. Glenwood Springs is fortunate to have a passionate and dedicated Pickleball community. The sport is growing nationally in popularity and participation among all ages. There is an opportunity to capitalize on the sport. The United States Pickleball Association offers grants for developing programs in communities. The Department should consider developing a dedicated Pickleball facility for lessons, leagues, and tournaments. During the focus group meeting, it was apparent that a conflict exists between the tennis community and the Pickleball community. A dedicated facility can serve to eliminate the conflict, grow the sport, and provide an additional opportunity to attract visitors. Objective 5.3 – Evaluate potential growth areas. Vacant and developable land is limited in Glenwood Springs; however, focus group participants and consultant review of inventory and potential growth areas identified some potential properties. Those areas included the rodeo grounds, the airport, the open space at Sopris Elementary School, the parcel behind the high school (5 acres), and Sarah Park (remove softball and convert to turf). Objective 5.4 – Explore the opportunity and feasibility of a Special District or Attraction Tax. The State of Colorado allows for the establishment of a special recreation district with voter approval. With Glenwood Springs being a regional attraction, in the future it could become appropriate to conduct a feasibility study to determine if this is the direction the City should pursue. Another funding opportunity for the Department would be the establishment of an Attraction Tax that would be dedicated to Parks and Recreation, allowing the Department to develop and maintain offerings over time.

Parks and Recreation Master Plan Update 47
Objective 5.5 – Develop and contract services for seasonal recreational opportunities. The geography and weather around Glenwood Springs provides opportunities to develop additional outdoor recreation activities. These facilities and amenities could be developed by the City and contracted for operations. Unless they are year‐round operations, it may not make fiscal sense to self‐operate. Some opportunities identified are a tubing hill, cross‐country skiing and a bike park. Objective 5.6 – Explore of funding opportunities. The use of social media as a fundraising mechanism has grown over the past few years and local government has also taken advantage of the popularity. Many communities have used of social media for fundraising specific projects. Sites like Go Fund Me have been used to raise money for playgrounds, outdoor fitness stations, and adventure park features/amenities.

THIS PAGE INTENTIONALLY LEFT BLANK

Parks and Recreation Master Plan Update 49
VII. Master Plan Recommendations GreenPlay reviewed the 2006 Parks and Recreation Master Plan recommendations and analyzed the findings that resulted from the master plan update process. This section describes recommendations to enhance the level of service and the quality of life through continued maintenance and improvement of facilities and amenities, improved organizational efficiencies, improved programs and services and improved financial opportunities.
Goal 1: Continue to Maintain and Improve Facilities and Amenities Objective 1.1 – Continue to maintain and improve existing facilities. The top factor identified by survey respondents that would increase their use of facilities is condition and maintenance of parks and amenities. The Department has done an excellent job of keeping up with routine maintenance; however, asset replacement of components and upgrades to amenities need to be addressed. The Department should continue to implement existing plans and the Capital Improvement Plan. Additionally, the inventory from this master plan should be used to address the deferred maintenance backlog and asset replacement identified as low scoring components. These plans should be reviewed annually and updated as needed. The Department should maintain a GIS database for parks and trails assets using the current inventory from the master plan. As new parks, trails, and amenities are added, or existing assets are upgraded, replaced, or repurposed, the GIS database should be updated to reflect those changes. Objective 1.2 – Develop new amenities at existing parks based on level of service analysis. Demand for usage of facilities, parks, trails, and athletic facilities in Glenwood Springs continues to grow, and the Department should look for opportunities to add new amenities to enhance the experience for users. The Department should look for opportunities to add parks and greenways, bike paths, and trails in those limited new growth areas. A high priority for citizens participating in public engagement process was the addition of soft surface trails, a dedicated Pickleball facility, additional public river access, and additional athletic fields in town. Most importantly, as the City looks to develop new or upgrade existing amenities, it most consider the impacts to the environment and wildlife habitat as well as safety and security concerns. Enforcement of rules and regulations must remain a priority.
Goal 2: Continue to Improve Organizational Efficiencies Objective 2.1 – Look for opportunities to increase appropriate partnerships within the community. The Glenwood Springs Parks and Recreation Department currently partners with a number of agencies and businesses to provide programs and activities to the community. The Department should explore additional opportunities as well as build on its existing partnerships. Where not already in place, the Department should ensure that all existing and future partnerships are accurately portrayed in a detailed and signed partnership agreement.
50 Glenwood Springs, Colorado
Objective 2.2 – Continue to enhance and improve internal and external communication regarding Department activities and services. The Parks and Recreation Department currently does a good job of promoting its programs and activities through the Glenwood Springs Parks and Recreation Activities Guide. To continue to be successful, it should develop a Marketing Plan that will guide efforts in communicating and promoting activities and facilities. This will continue to create greater awareness and should include branding for the Department, use of social media, and development of the Department’s website and partnership opportunities. As part of the Marketing Plan, the Department should also evaluate directional and wayfinding signage to facilities on roadway, pathways, and within parks contributing to a greater sense of connectivity to parks, facilities, and trails. Objective 2.3 – Continue marketing and branding awareness The Department’s marketing and branding efforts should continue to use a variety of methods to engage the community in current and future parks, recreation, trails, and open space planning efforts. Glenwood Springs is a recreation‐based community, and the Department must continue its current efforts to promote and create awareness of the positive impact and the public health benefits these amenities have on the community.
Goal 3: Continue to Improve Programs and Service Delivery Objective 3.1 – Work with other service providers to develop programs and services to meet demand and respond to trends. As popularity in program offerings and activities increases, continue to look for opportunities to expand programs by working in partnerships with the other service providers within the community, and formalizing these agreements in writing. Objective 3.2 – Explore opportunities to develop additional recreational programs and services. Continue to look for opportunities to expand recreational programs and activities based on community demand and trends. The community would like to see outdoor adventure recreation, Pickleball, nature/environmental, and fitness and wellness programs expanded as well as adventure events and races. As new programs and services are developed and implemented, continue to monitor recreational trends while creating a balance between passive and active recreation.
Goal 4: Increase Financial Opportunities Objective 4.1 – Implement the recommendations in the Strategic Business Plan. As part of this master planning process, a Strategic Business Plan was developed with the intent to provide the Glenwood Springs Parks and Recreation Department with an overall program management philosophy and approach for the next five to ten years. The plan is a management guide that provides a history of past operations and recommendations to manage the program to maximize the service to the community in the most effective and affordable means.

Parks and Recreation Master Plan Update 51
Objective 4.2 – Pursue grant and philanthropic opportunities. The Department currently takes advantage of grant opportunities available for programming and facility improvements, and it should continue to pursue any and all grant opportunities at the federal, state, regional, and local levels. To accomplish this, the Department should continue contracting with a dedicated grant writer to research, submit, and track such grants. Objective 4.3 –Continue to evaluate and implement adopted Cost Recovery and Pricing Philosophy and Practice. The Department is guided by a Cost Recovery and Pricing Philosophy and Policy that was adopted in 2008. The cost recovery philosophy, model, and policy is grounded in the values, vision, and mission of the City of Glenwood Springs. The Department should continue and annually review this pricing methodology that reflects the community’s values, while generating revenues to help sustain facilities, parks, trails, programs, and services. Objective 4.4 – Explore opportunities to increase sponsorships. The Department currently has sponsorship arrangements for special events, programs and activities, and it should continue to explore additional and build on existing sponsorships. All existing and future sponsorships should be evaluated to ensure that they are accurately portrayed in a detailed and signed sponsorship agreement.