arizona - state rail plan update - adot
TRANSCRIPT
DRAFT PLAN
FEBRUARY 2021
A R I Z O N ASTATE RAIL PLAN UPDATE
Arizona State Rail Plan
Draft Executive Summary
February 2021
ES-1
Executive Summary
INTRODUCTION The purpose of the Arizona State Rail Plan (SRP) is to guide the advancement of the state’s rail system.
The SRP provides a current assessment of the rail system and serves as a practical roadmap for future
rail investment and policies in Arizona. The SRP is structured as follows.
Chapter/Title Description of Content
Executive Summary
1. The Role of Rail in Statewide Transportation
Describes the role of rail within the State’s transportation system and how Arizona state and local government entities are organized to support rail development.
2. The State’s Existing Rail System
Describes the Arizona rail system, its current condition, and environmental and economic impacts on the State. Identifies past and future trends that have impacted or will impact the Arizona rail system.
3. Proposed Passenger Rail Improvements and Investments
Identifies passenger rail service needs and opportunities. Describes improvements and investments that have been put forward to address passenger rail service needs and opportunities.
4. Proposed Freight Rail Improvements and Investments
Identifies freight rail service needs and opportunities. Describes improvements and investments that have been put forward to address freight rail service needs and opportunities.
5. The State’s Rail Service and Investment Program
Presents ADOT’s vision for railroad transportation, projects and strategies to meet that vision, summary of impacts that would result from the projects and strategies, and a discussion of probable financing scenarios.
6. Coordination and Review
Descriptions of outreach and coordination efforts in developing the SRP.
Technical Appendices
ARIZONA RAILROADS The U.S. Surface Transportation Board (STB) defines three categories of railroad based on revenues:
ES-2
◼ Class I: line haul railroads with more than $457.9 million in annual operating revenue
◼ Class II: line haul railroads with less than $457.9 million in annual operating revenue but more
than $36.6 million in annual operating revenue—also known as regional railroads
◼ Class III: local railroads with less than $36.6 million—also known as short line or switching
railroads
The different types of railroads serve different roles in the rail system. Class I railroads provide long-haul
services. Class II railroads provide regional services that Class I railroads avoid because of cost. The
Association of American railroads defines regional railroads as operating at least 350 route miles. Class
III provide service to smaller markets that cannot be cost-effectively served by the larger railroads.
Access to national markets by customers located on short lines is through connections with the Class I
railroads. Figure 1 maps the Arizona rail system.
ES-3
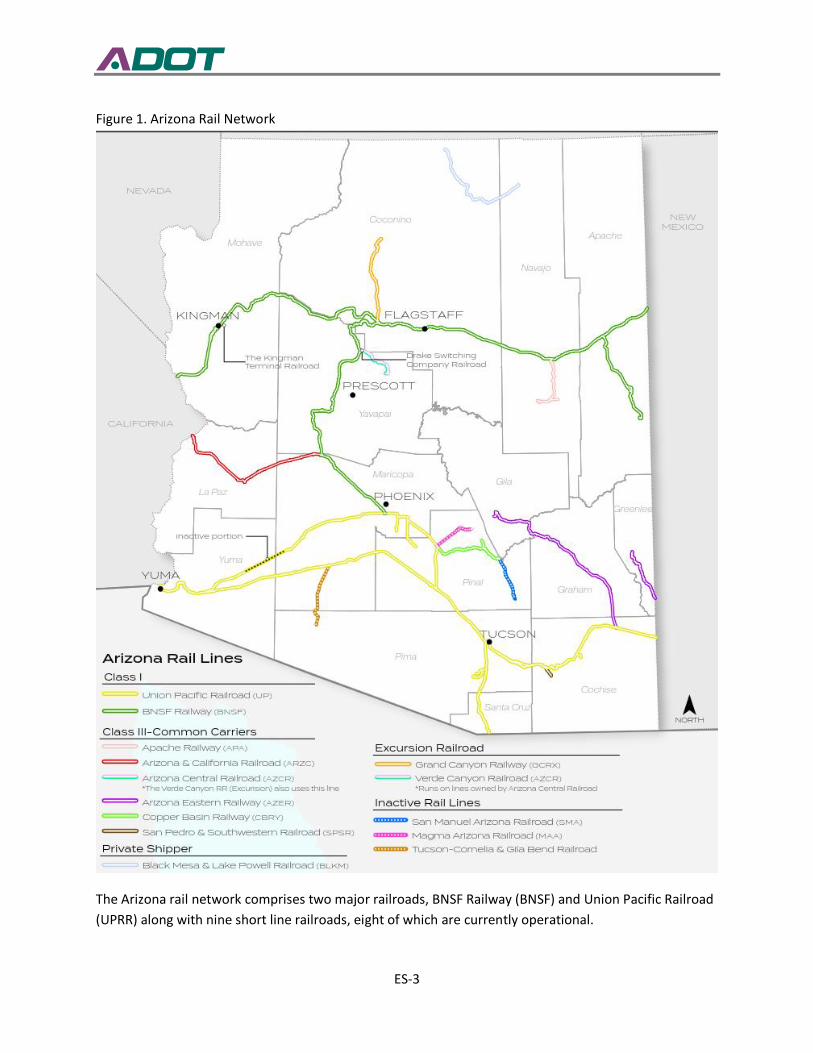
Figure 1. Arizona Rail Network
The Arizona rail network comprises two major railroads, BNSF Railway (BNSF) and Union Pacific Railroad
(UPRR) along with nine short line railroads, eight of which are currently operational.
ES-4
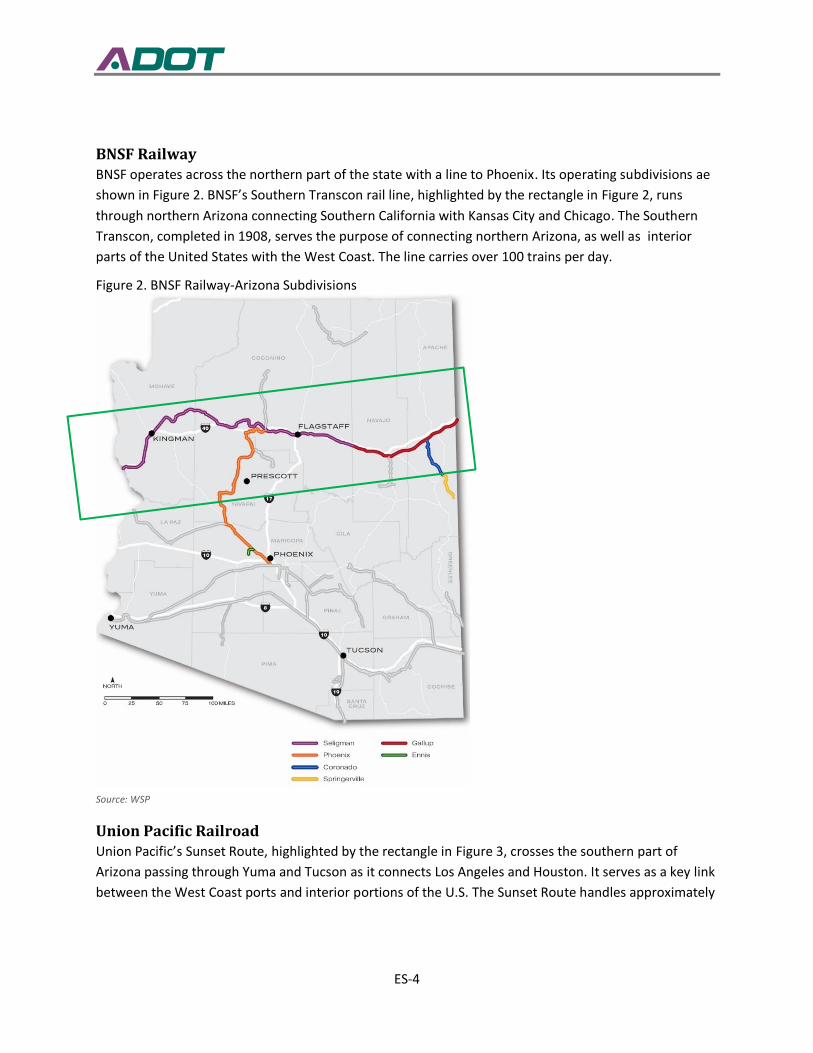
BNSF Railway BNSF operates across the northern part of the state with a line to Phoenix. Its operating subdivisions ae
shown in Figure 2. BNSF’s Southern Transcon rail line, highlighted by the rectangle in Figure 2, runs
through northern Arizona connecting Southern California with Kansas City and Chicago. The Southern
Transcon, completed in 1908, serves the purpose of connecting northern Arizona, as well as interior
parts of the United States with the West Coast. The line carries over 100 trains per day.
Figure 2. BNSF Railway-Arizona Subdivisions
Source: WSP
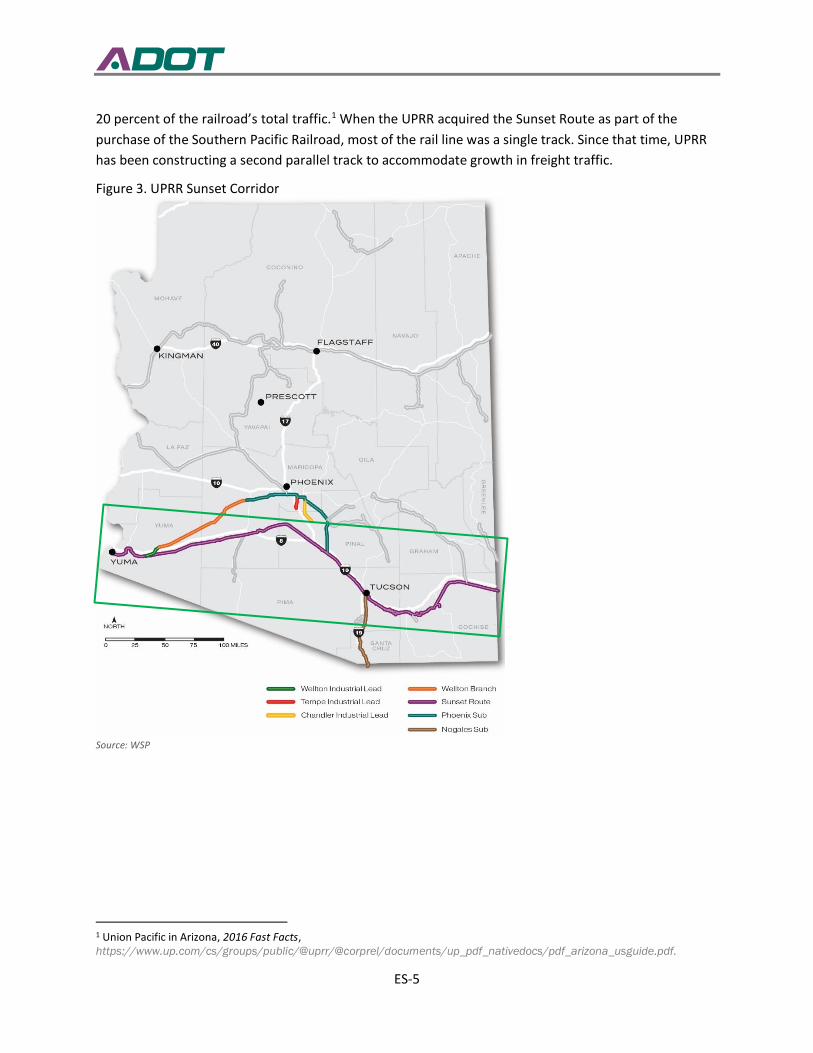
Union Pacific Railroad Union Pacific’s Sunset Route, highlighted by the rectangle in Figure 3, crosses the southern part of
Arizona passing through Yuma and Tucson as it connects Los Angeles and Houston. It serves as a key link
between the West Coast ports and interior portions of the U.S. The Sunset Route handles approximately
ES-5
20 percent of the railroad’s total traffic.1 When the UPRR acquired the Sunset Route as part of the
purchase of the Southern Pacific Railroad, most of the rail line was a single track. Since that time, UPRR
has been constructing a second parallel track to accommodate growth in freight traffic.
Figure 3. UPRR Sunset Corridor
Source: WSP
1 Union Pacific in Arizona, 2016 Fast Facts, https://www.up.com/cs/groups/public/@uprr/@corprel/documents/up_pdf_nativedocs/pdf_arizona_usguide.pdf.
ES-6
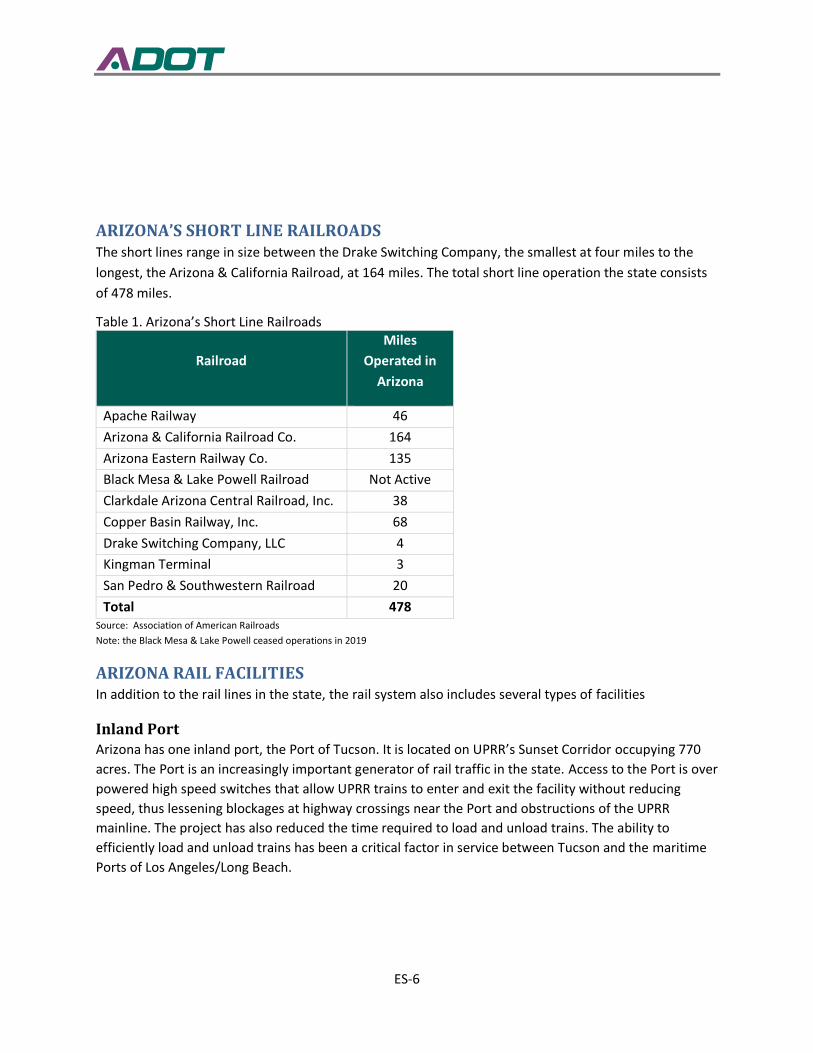
ARIZONA’S SHORT LINE RAILROADS The short lines range in size between the Drake Switching Company, the smallest at four miles to the
longest, the Arizona & California Railroad, at 164 miles. The total short line operation the state consists
of 478 miles.
Table 1. Arizona’s Short Line Railroads
Railroad
Miles
Operated in
Arizona
Apache Railway 46
Arizona & California Railroad Co. 164
Arizona Eastern Railway Co. 135
Black Mesa & Lake Powell Railroad Not Active
Clarkdale Arizona Central Railroad, Inc. 38
Copper Basin Railway, Inc. 68
Drake Switching Company, LLC 4
Kingman Terminal 3
San Pedro & Southwestern Railroad 20
Total 478 Source: Association of American Railroads
Note: the Black Mesa & Lake Powell ceased operations in 2019
ARIZONA RAIL FACILITIES In addition to the rail lines in the state, the rail system also includes several types of facilities
Inland Port Arizona has one inland port, the Port of Tucson. It is located on UPRR’s Sunset Corridor occupying 770
acres. The Port is an increasingly important generator of rail traffic in the state. Access to the Port is over
powered high speed switches that allow UPRR trains to enter and exit the facility without reducing
speed, thus lessening blockages at highway crossings near the Port and obstructions of the UPRR
mainline. The project has also reduced the time required to load and unload trains. The ability to
efficiently load and unload trains has been a critical factor in service between Tucson and the maritime
Ports of Los Angeles/Long Beach.
ES-7
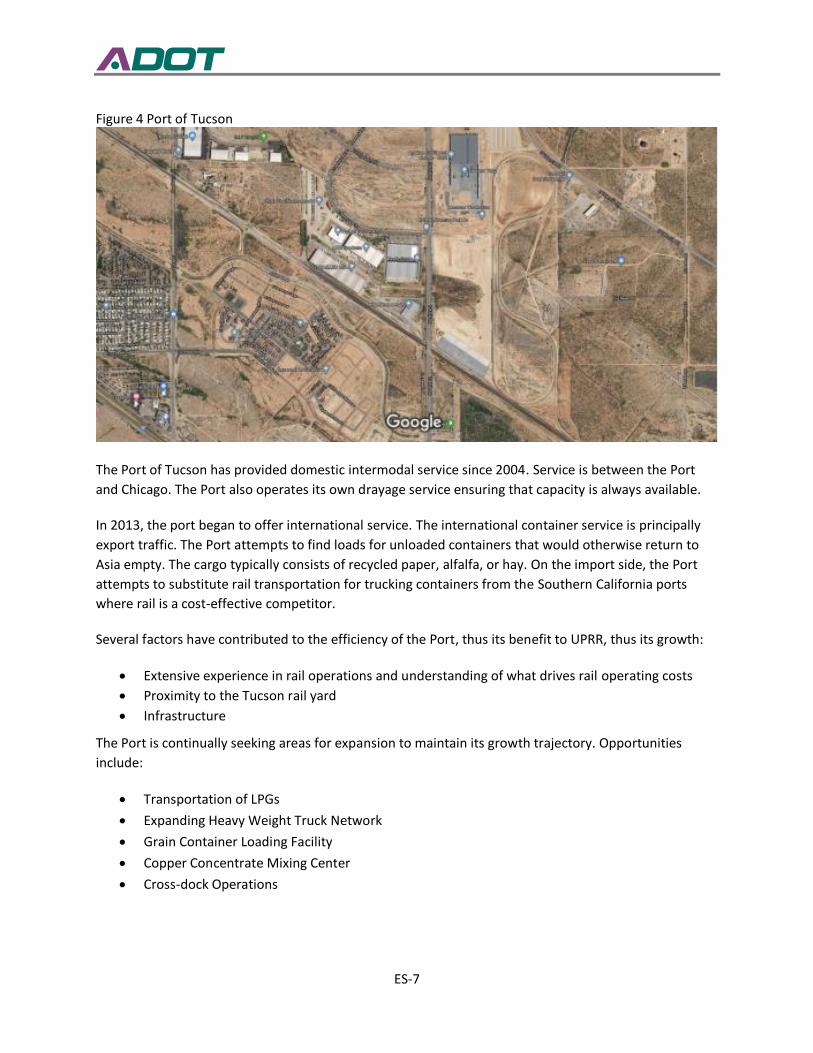
Figure 4 Port of Tucson
The Port of Tucson has provided domestic intermodal service since 2004. Service is between the Port
and Chicago. The Port also operates its own drayage service ensuring that capacity is always available.
In 2013, the port began to offer international service. The international container service is principally
export traffic. The Port attempts to find loads for unloaded containers that would otherwise return to
Asia empty. The cargo typically consists of recycled paper, alfalfa, or hay. On the import side, the Port
attempts to substitute rail transportation for trucking containers from the Southern California ports
where rail is a cost-effective competitor.
Several factors have contributed to the efficiency of the Port, thus its benefit to UPRR, thus its growth:
• Extensive experience in rail operations and understanding of what drives rail operating costs
• Proximity to the Tucson rail yard
• Infrastructure
The Port is continually seeking areas for expansion to maintain its growth trajectory. Opportunities
include:
• Transportation of LPGs
• Expanding Heavy Weight Truck Network
• Grain Container Loading Facility
• Copper Concentrate Mixing Center
• Cross-dock Operations
ES-8
The Port is playing an increasingly important role in economic development in Tucson. Amazon recently
opened a new fulfillment center adjacent to the Port. The Port was a principal attractor for the new
facility.
Transload Terminals Transloading is a form of multi-modal transportation in which non-containerized traffic is transferred
between trucks and rail cars. In addition to the transfer of products, transload facilities also provide
value added services such as storage and repackaging.
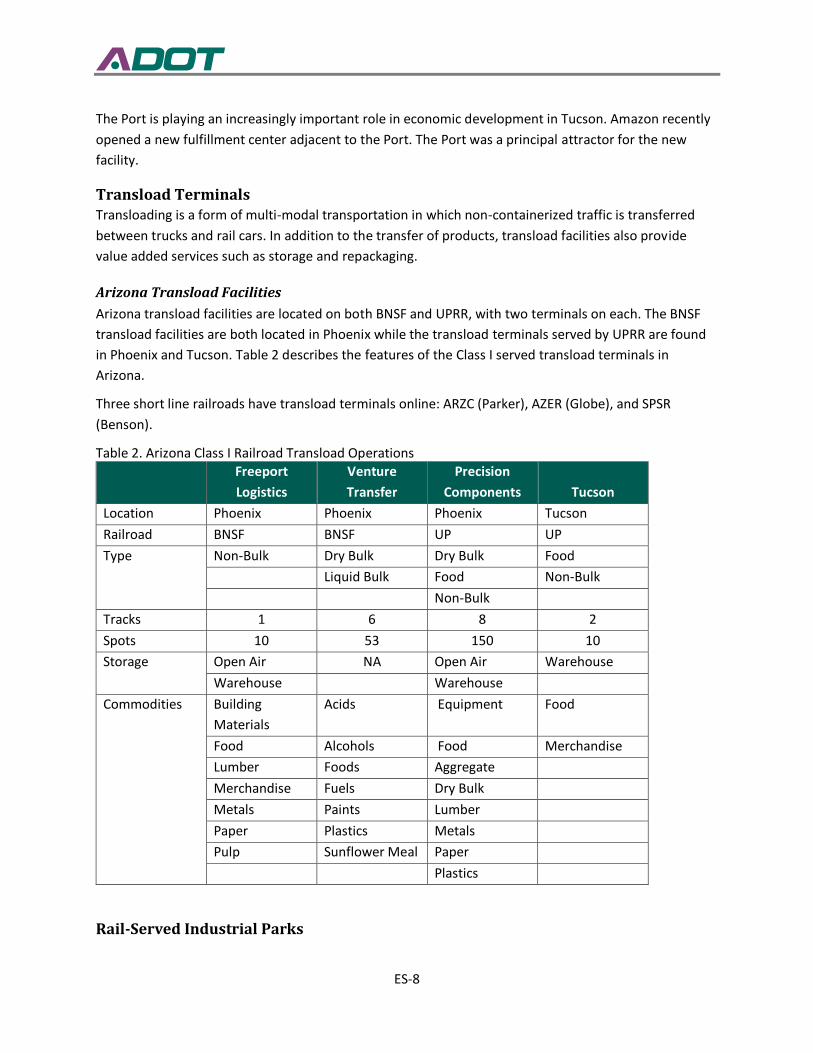
Arizona Transload Facilities
Arizona transload facilities are located on both BNSF and UPRR, with two terminals on each. The BNSF
transload facilities are both located in Phoenix while the transload terminals served by UPRR are found
in Phoenix and Tucson. Table 2 describes the features of the Class I served transload terminals in
Arizona.
Three short line railroads have transload terminals online: ARZC (Parker), AZER (Globe), and SPSR
(Benson).
Table 2. Arizona Class I Railroad Transload Operations
Freeport
Logistics
Venture
Transfer
Precision
Components Tucson
Location Phoenix Phoenix Phoenix Tucson
Railroad BNSF BNSF UP UP
Type
Non-Bulk Dry Bulk Dry Bulk Food
Liquid Bulk Food Non-Bulk
Non-Bulk
Tracks 1 6 8 2
Spots 10 53 150 10
Storage
Open Air NA Open Air Warehouse
Warehouse Warehouse
Commodities
Building
Materials
Acids Equipment Food
Food Alcohols Food Merchandise
Lumber Foods Aggregate
Merchandise Fuels Dry Bulk
Metals Paints Lumber
Paper Plastics Metals
Pulp Sunflower Meal Paper
Plastics
Rail-Served Industrial Parks
ES-9
Another type of facility is the multiple industry, multimodal industrial park with on-site rail operations. A
number of rail served industrial parks are found in Arizona. Most are located on the UPRR Sunset
Corridor with access to the Phoenix and Tucson population and commercial centers. BNSF serves the
only industrial park that operates its own railroad, Kingman Airport and Industrial Park. The industrial
park, located in Kingman on US 66, covers 1,225 acres of which 1,125 acres are currently developed.
Seventy businesses occupy the facility. The main line of the BNSF is adjacent the facility; over three miles
of lead track are within the facility with switching operations provided by Kingman Terminal Railroad.
CROSSING INVENTORY
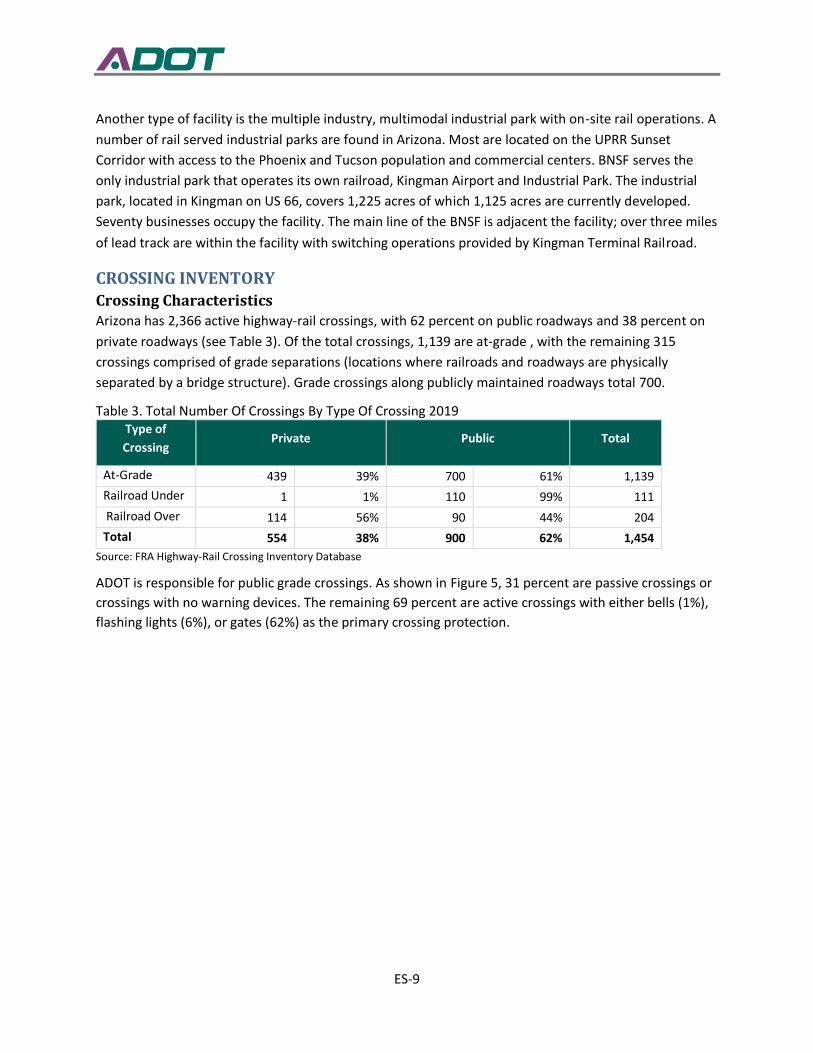
Crossing Characteristics Arizona has 2,366 active highway-rail crossings, with 62 percent on public roadways and 38 percent on
private roadways (see Table 3). Of the total crossings, 1,139 are at-grade , with the remaining 315
crossings comprised of grade separations (locations where railroads and roadways are physically
separated by a bridge structure). Grade crossings along publicly maintained roadways total 700.
Table 3. Total Number Of Crossings By Type Of Crossing 2019 Type of
Crossing Private Public Total
At-Grade 439 39% 700 61% 1,139
Railroad Under 1 1% 110 99% 111
Railroad Over 114 56% 90 44% 204
Total 554 38% 900 62% 1,454
Source: FRA Highway-Rail Crossing Inventory Database
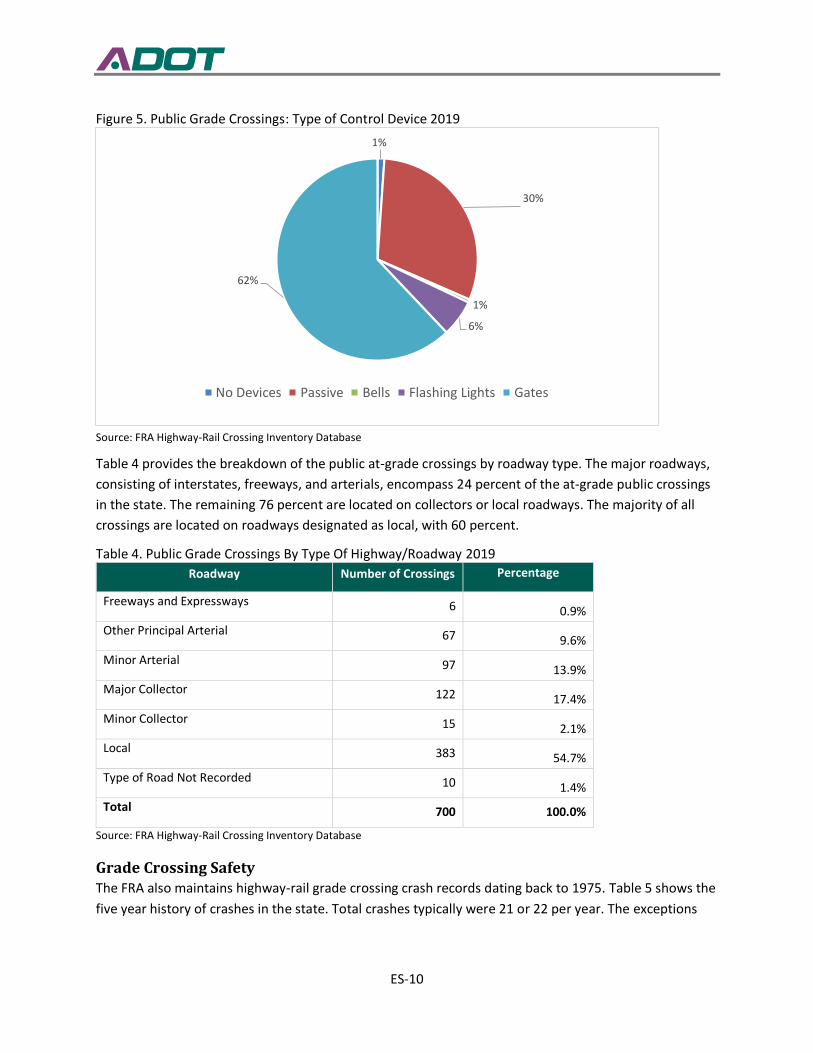
ADOT is responsible for public grade crossings. As shown in Figure 5, 31 percent are passive crossings or
crossings with no warning devices. The remaining 69 percent are active crossings with either bells (1%),
flashing lights (6%), or gates (62%) as the primary crossing protection.
ES-10
Figure 5. Public Grade Crossings: Type of Control Device 2019
Source: FRA Highway-Rail Crossing Inventory Database
Table 4 provides the breakdown of the public at-grade crossings by roadway type. The major roadways,
consisting of interstates, freeways, and arterials, encompass 24 percent of the at-grade public crossings
in the state. The remaining 76 percent are located on collectors or local roadways. The majority of all
crossings are located on roadways designated as local, with 60 percent.
Table 4. Public Grade Crossings By Type Of Highway/Roadway 2019
Roadway Number of Crossings Percentage
Freeways and Expressways 6 0.9%
Other Principal Arterial 67 9.6%
Minor Arterial 97 13.9%
Major Collector 122 17.4%
Minor Collector 15 2.1%
Local 383 54.7%
Type of Road Not Recorded 10 1.4%
Total 700 100.0%
Source: FRA Highway-Rail Crossing Inventory Database
Grade Crossing Safety The FRA also maintains highway-rail grade crossing crash records dating back to 1975. Table 5 shows the
five year history of crashes in the state. Total crashes typically were 21 or 22 per year. The exceptions
1%
30%
1%
6%
62%
No Devices Passive Bells Flashing Lights Gates
ES-11
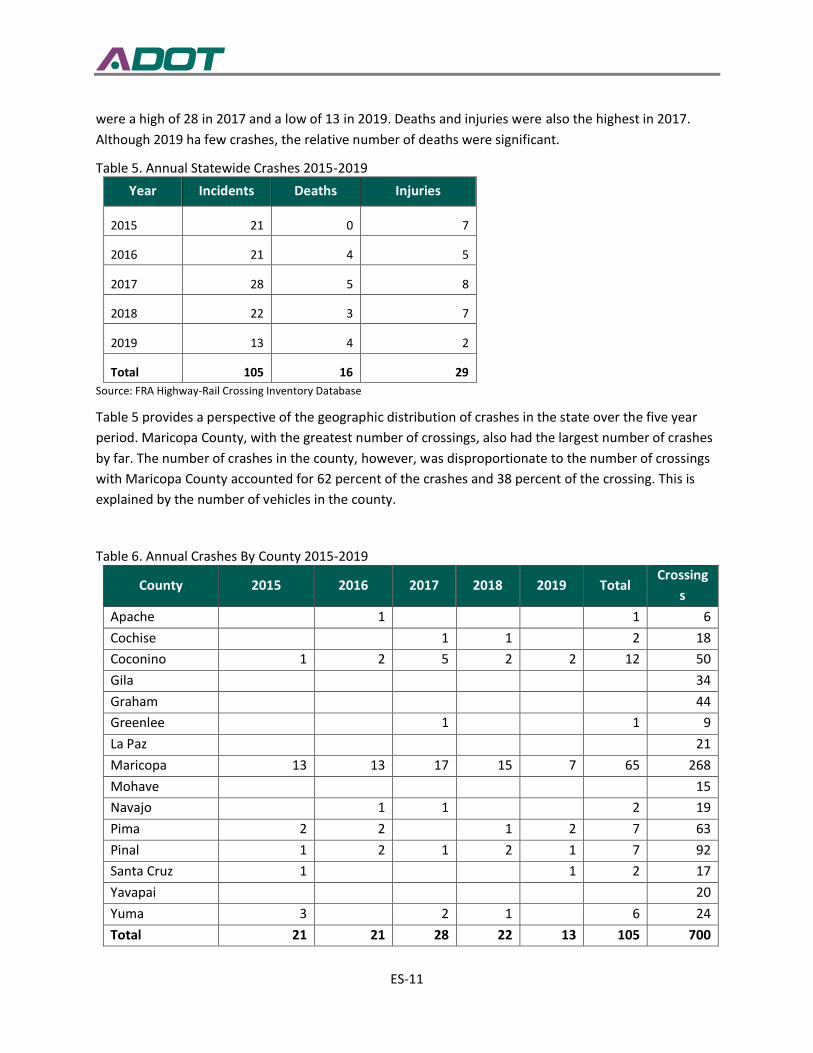
were a high of 28 in 2017 and a low of 13 in 2019. Deaths and injuries were also the highest in 2017.
Although 2019 ha few crashes, the relative number of deaths were significant.
Table 5. Annual Statewide Crashes 2015-2019
Year Incidents Deaths Injuries
2015 21 0 7
2016 21 4 5
2017 28 5 8
2018 22 3 7
2019 13 4 2
Total 105 16 29
Source: FRA Highway-Rail Crossing Inventory Database
Table 5 provides a perspective of the geographic distribution of crashes in the state over the five year
period. Maricopa County, with the greatest number of crossings, also had the largest number of crashes
by far. The number of crashes in the county, however, was disproportionate to the number of crossings
with Maricopa County accounted for 62 percent of the crashes and 38 percent of the crossing. This is
explained by the number of vehicles in the county.
Table 6. Annual Crashes By County 2015-2019
County 2015 2016 2017 2018 2019 Total Crossing
s
Apache 1 1 6
Cochise 1 1 2 18
Coconino 1 2 5 2 2 12 50
Gila 34
Graham 44
Greenlee 1 1 9
La Paz 21
Maricopa 13 13 17 15 7 65 268
Mohave 15
Navajo 1 1 2 19
Pima 2 2 1 2 7 63
Pinal 1 2 1 2 1 7 92
Santa Cruz 1 1 2 17
Yavapai 20
Yuma 3 2 1 6 24
Total 21 21 28 22 13 105 700
ES-12
Source: FRA Highway-Rail Crossing Inventory Database
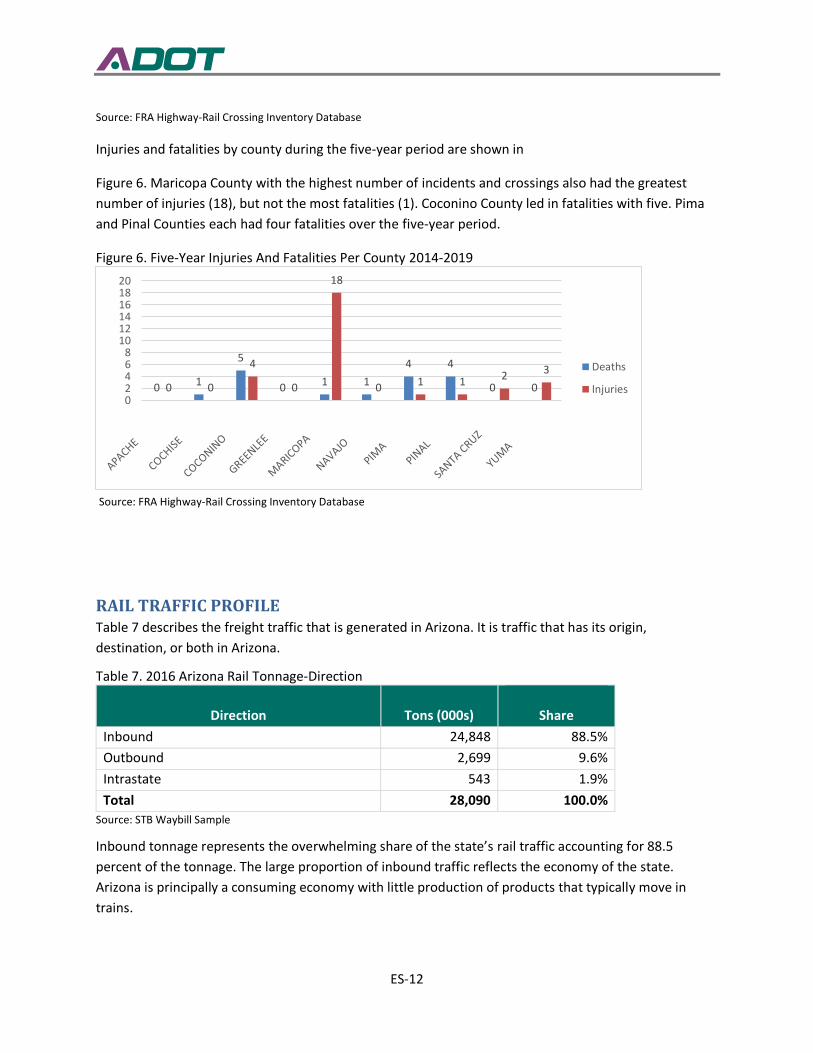
Injuries and fatalities by county during the five-year period are shown in
Figure 6. Maricopa County with the highest number of incidents and crossings also had the greatest
number of injuries (18), but not the most fatalities (1). Coconino County led in fatalities with five. Pima
and Pinal Counties each had four fatalities over the five-year period.
Figure 6. Five-Year Injuries And Fatalities Per County 2014-2019
Source: FRA Highway-Rail Crossing Inventory Database
RAIL TRAFFIC PROFILE Table 7 describes the freight traffic that is generated in Arizona. It is traffic that has its origin,
destination, or both in Arizona.
Table 7. 2016 Arizona Rail Tonnage-Direction
Direction Tons (000s)
Share
Inbound 24,848 88.5%
Outbound 2,699 9.6%
Intrastate 543 1.9%
Total 28,090 100.0%
Source: STB Waybill Sample
Inbound tonnage represents the overwhelming share of the state’s rail traffic accounting for 88.5
percent of the tonnage. The large proportion of inbound traffic reflects the economy of the state.
Arizona is principally a consuming economy with little production of products that typically move in
trains.
0 1
5
0 1 1
4 4
0 00 0
4
0
18
0 1 1 2 3
02468
101214161820
Deaths
Injuries
ES-13
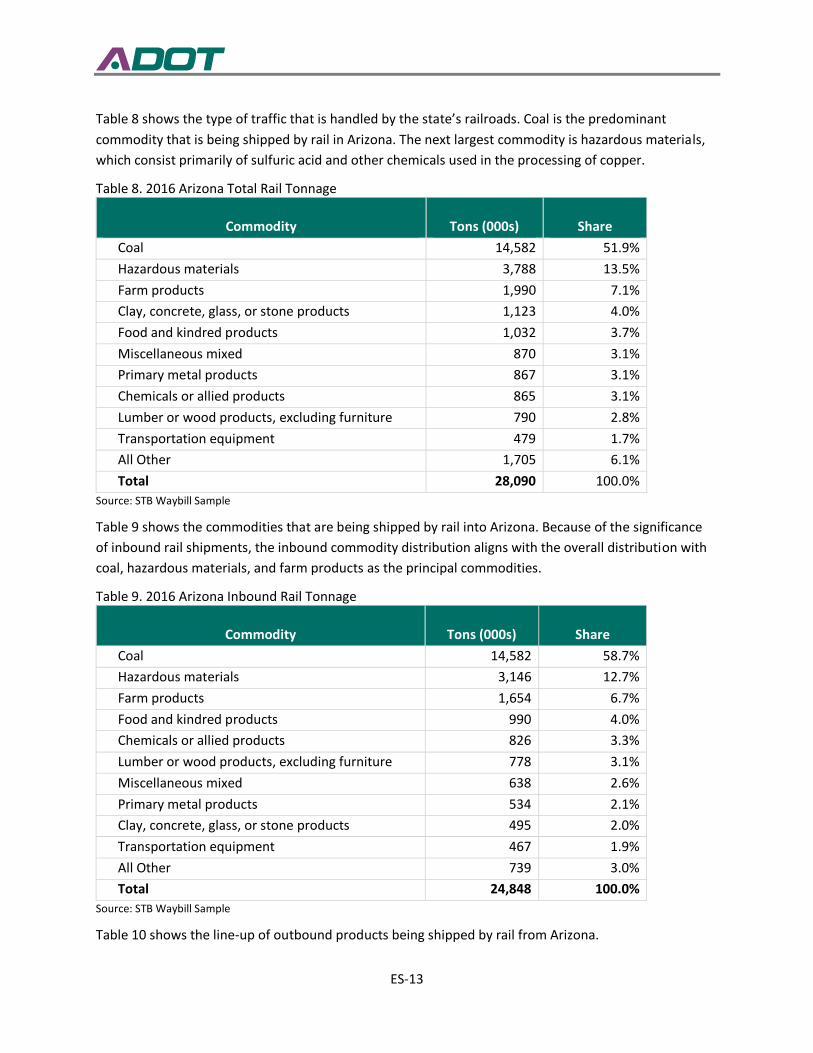
Table 8 shows the type of traffic that is handled by the state’s railroads. Coal is the predominant
commodity that is being shipped by rail in Arizona. The next largest commodity is hazardous materials,
which consist primarily of sulfuric acid and other chemicals used in the processing of copper.
Table 8. 2016 Arizona Total Rail Tonnage
Commodity Tons (000s) Share
Coal 14,582 51.9%
Hazardous materials 3,788 13.5%
Farm products 1,990 7.1%
Clay, concrete, glass, or stone products 1,123 4.0%
Food and kindred products 1,032 3.7%
Miscellaneous mixed 870 3.1%
Primary metal products 867 3.1%
Chemicals or allied products 865 3.1%
Lumber or wood products, excluding furniture 790 2.8%
Transportation equipment 479 1.7%
All Other 1,705 6.1%
Total 28,090 100.0%
Source: STB Waybill Sample
Table 9 shows the commodities that are being shipped by rail into Arizona. Because of the significance
of inbound rail shipments, the inbound commodity distribution aligns with the overall distribution with
coal, hazardous materials, and farm products as the principal commodities.
Table 9. 2016 Arizona Inbound Rail Tonnage
Commodity Tons (000s) Share
Coal 14,582 58.7%
Hazardous materials 3,146 12.7%
Farm products 1,654 6.7%
Food and kindred products 990 4.0%
Chemicals or allied products 826 3.3%
Lumber or wood products, excluding furniture 778 3.1%
Miscellaneous mixed 638 2.6%
Primary metal products 534 2.1%
Clay, concrete, glass, or stone products 495 2.0%
Transportation equipment 467 1.9%
All Other 739 3.0%
Total 24,848 100.0%
Source: STB Waybill Sample
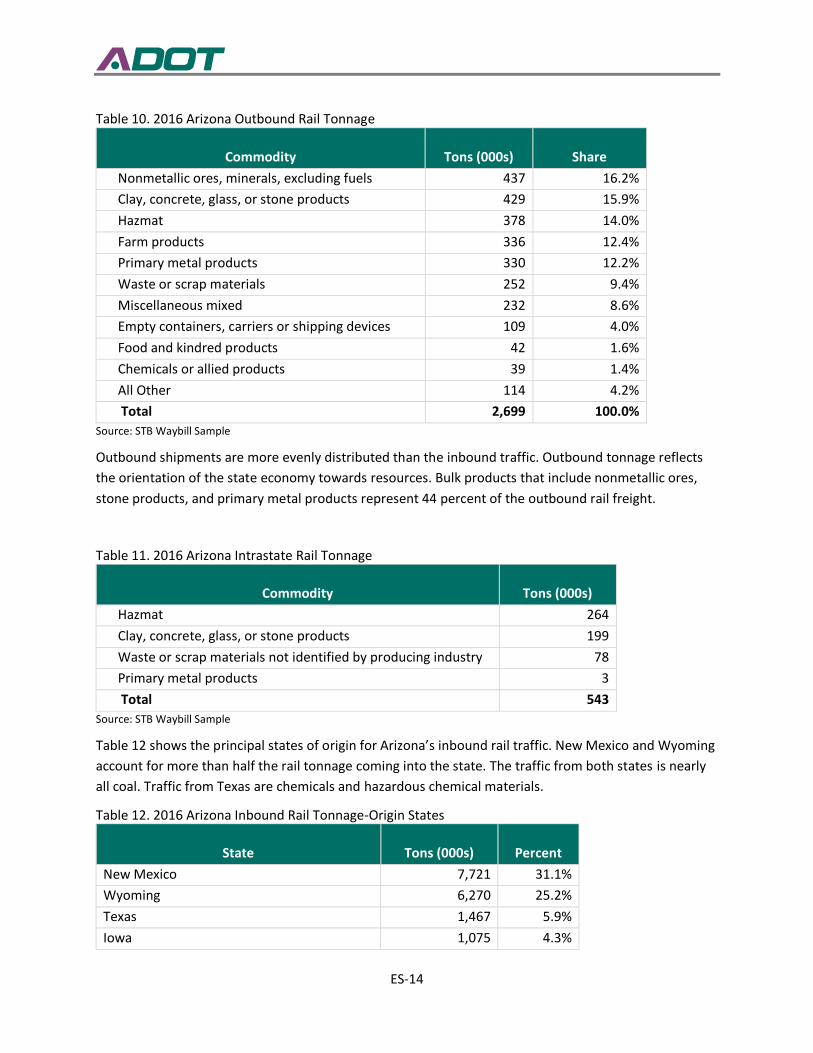
Table 10 shows the line-up of outbound products being shipped by rail from Arizona.
ES-14
Table 10. 2016 Arizona Outbound Rail Tonnage
Commodity Tons (000s) Share
Nonmetallic ores, minerals, excluding fuels 437 16.2%
Clay, concrete, glass, or stone products 429 15.9%
Hazmat 378 14.0%
Farm products 336 12.4%
Primary metal products 330 12.2%
Waste or scrap materials 252 9.4%
Miscellaneous mixed 232 8.6%
Empty containers, carriers or shipping devices 109 4.0%
Food and kindred products 42 1.6%
Chemicals or allied products 39 1.4%
All Other 114 4.2%
Total 2,699 100.0%
Source: STB Waybill Sample
Outbound shipments are more evenly distributed than the inbound traffic. Outbound tonnage reflects
the orientation of the state economy towards resources. Bulk products that include nonmetallic ores,
stone products, and primary metal products represent 44 percent of the outbound rail freight.
Table 11. 2016 Arizona Intrastate Rail Tonnage
Commodity Tons (000s)
Hazmat 264
Clay, concrete, glass, or stone products 199
Waste or scrap materials not identified by producing industry 78
Primary metal products 3
Total 543
Source: STB Waybill Sample
Table 12 shows the principal states of origin for Arizona’s inbound rail traffic. New Mexico and Wyoming
account for more than half the rail tonnage coming into the state. The traffic from both states is nearly
all coal. Traffic from Texas are chemicals and hazardous chemical materials.
Table 12. 2016 Arizona Inbound Rail Tonnage-Origin States
State Tons (000s) Percent
New Mexico 7,721 31.1%
Wyoming 6,270 25.2%
Texas 1,467 5.9%
Iowa 1,075 4.3%
ES-15
Illinois 1,024 4.1%
California 998 4.0%
Nebraska 920 3.7%
Montana 664 2.7%
Louisiana 634 2.6%
Missouri 562 2.3%
Other 3,511 14.1%
Total 24,848 100.0%
Source: STB Waybill Sample
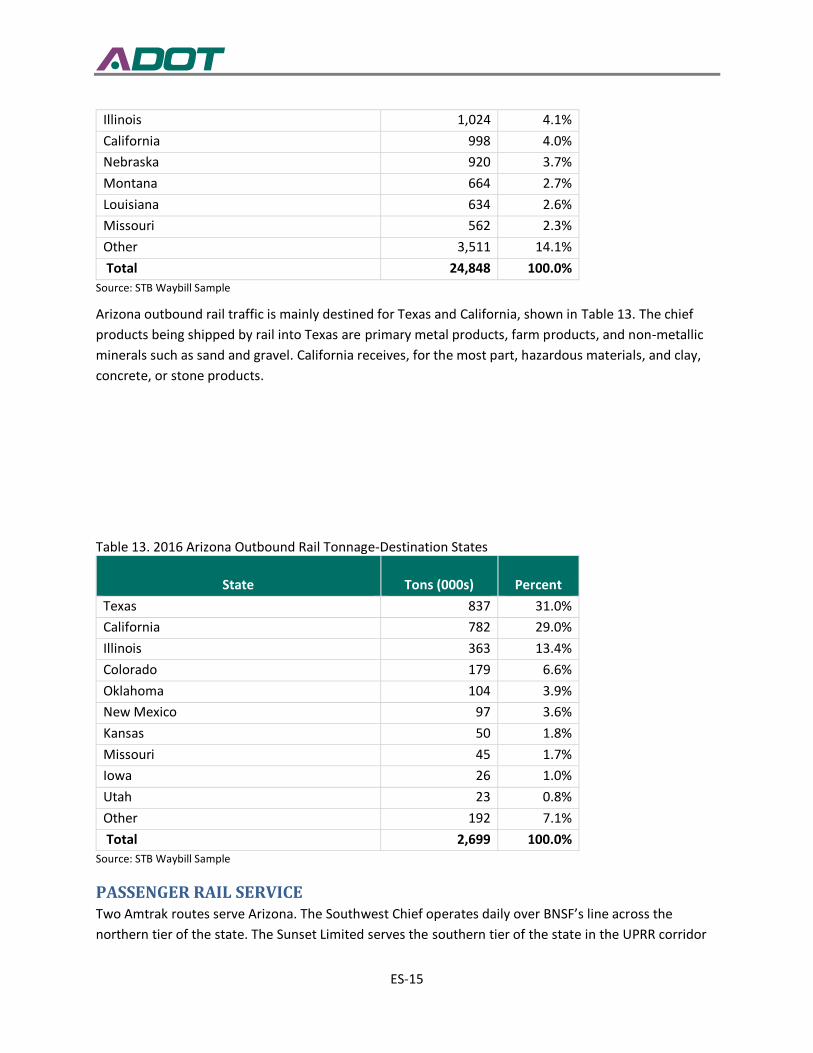
Arizona outbound rail traffic is mainly destined for Texas and California, shown in Table 13. The chief
products being shipped by rail into Texas are primary metal products, farm products, and non-metallic
minerals such as sand and gravel. California receives, for the most part, hazardous materials, and clay,
concrete, or stone products.
Table 13. 2016 Arizona Outbound Rail Tonnage-Destination States
State Tons (000s) Percent
Texas 837 31.0%
California 782 29.0%
Illinois 363 13.4%
Colorado 179 6.6%
Oklahoma 104 3.9%
New Mexico 97 3.6%
Kansas 50 1.8%
Missouri 45 1.7%
Iowa 26 1.0%
Utah 23 0.8%
Other 192 7.1%
Total 2,699 100.0%
Source: STB Waybill Sample
PASSENGER RAIL SERVICE Two Amtrak routes serve Arizona. The Southwest Chief operates daily over BNSF’s line across the
northern tier of the state. The Sunset Limited serves the southern tier of the state in the UPRR corridor
ES-16
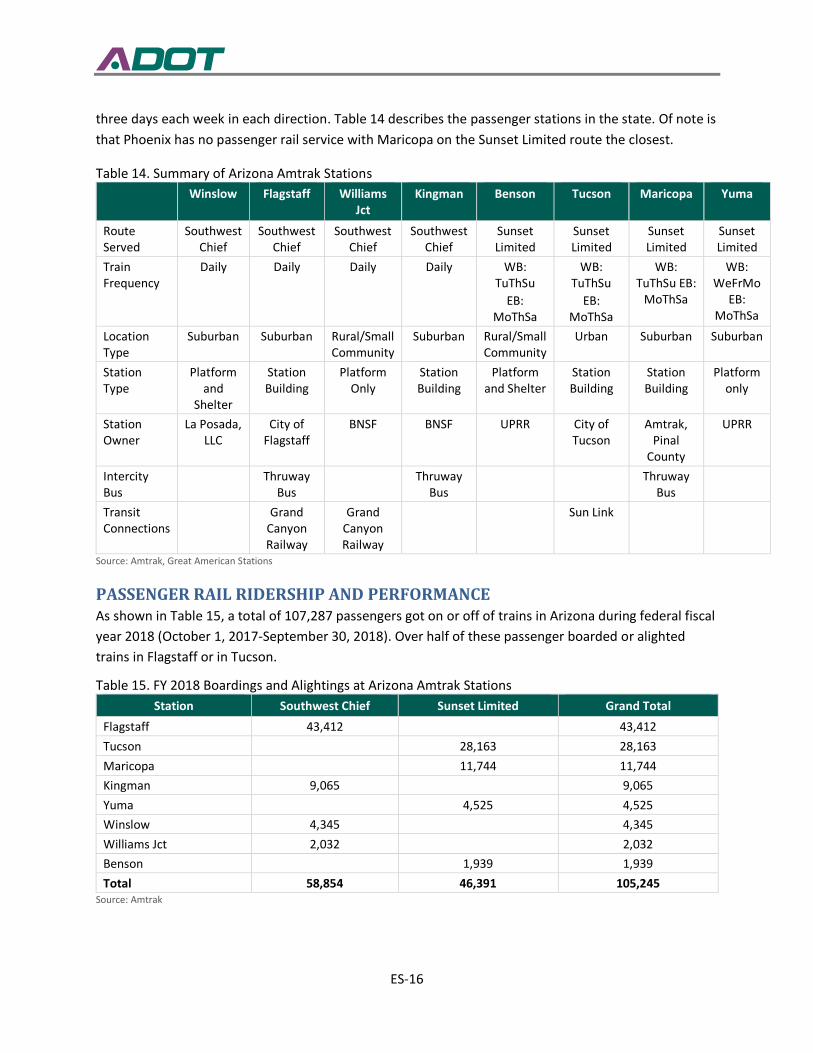
three days each week in each direction. Table 14 describes the passenger stations in the state. Of note is
that Phoenix has no passenger rail service with Maricopa on the Sunset Limited route the closest.
Table 14. Summary of Arizona Amtrak Stations
Winslow Flagstaff Williams Jct
Kingman Benson Tucson Maricopa Yuma
Route Served
Southwest Chief
Southwest Chief
Southwest Chief
Southwest Chief
Sunset Limited
Sunset Limited
Sunset Limited
Sunset Limited
Train Frequency
Daily Daily Daily Daily WB: TuThSu
EB: MoThSa
WB: TuThSu
EB: MoThSa
WB: TuThSu EB:
MoThSa
WB: WeFrMo
EB: MoThSa
Location Type
Suburban Suburban Rural/Small Community
Suburban Rural/Small Community
Urban Suburban Suburban
Station Type
Platform and
Shelter
Station Building
Platform Only
Station Building
Platform and Shelter
Station Building
Station Building
Platform only
Station Owner
La Posada, LLC
City of Flagstaff
BNSF BNSF UPRR City of Tucson
Amtrak, Pinal
County
UPRR
Intercity Bus
Thruway Bus
Thruway Bus
Thruway Bus
Transit Connections
Grand Canyon Railway
Grand Canyon Railway
Sun Link
Source: Amtrak, Great American Stations
PASSENGER RAIL RIDERSHIP AND PERFORMANCE As shown in Table 15, a total of 107,287 passengers got on or off of trains in Arizona during federal fiscal
year 2018 (October 1, 2017-September 30, 2018). Over half of these passenger boarded or alighted
trains in Flagstaff or in Tucson.
Table 15. FY 2018 Boardings and Alightings at Arizona Amtrak Stations
Station Southwest Chief Sunset Limited Grand Total
Flagstaff 43,412 43,412
Tucson 28,163 28,163
Maricopa 11,744 11,744
Kingman 9,065 9,065
Yuma 4,525 4,525
Winslow 4,345 4,345
Williams Jct 2,032 2,032
Benson 1,939 1,939
Total 58,854 46,391 105,245 Source: Amtrak
ES-17
Arizona Amtrak ridership decreased between 2016 and 2018, falling from 107,300 passengers to
105,245. Ridership decrease in 2018 appears to be a single year anomaly as ridership in Arizona had
been on an upward trend since 2012.
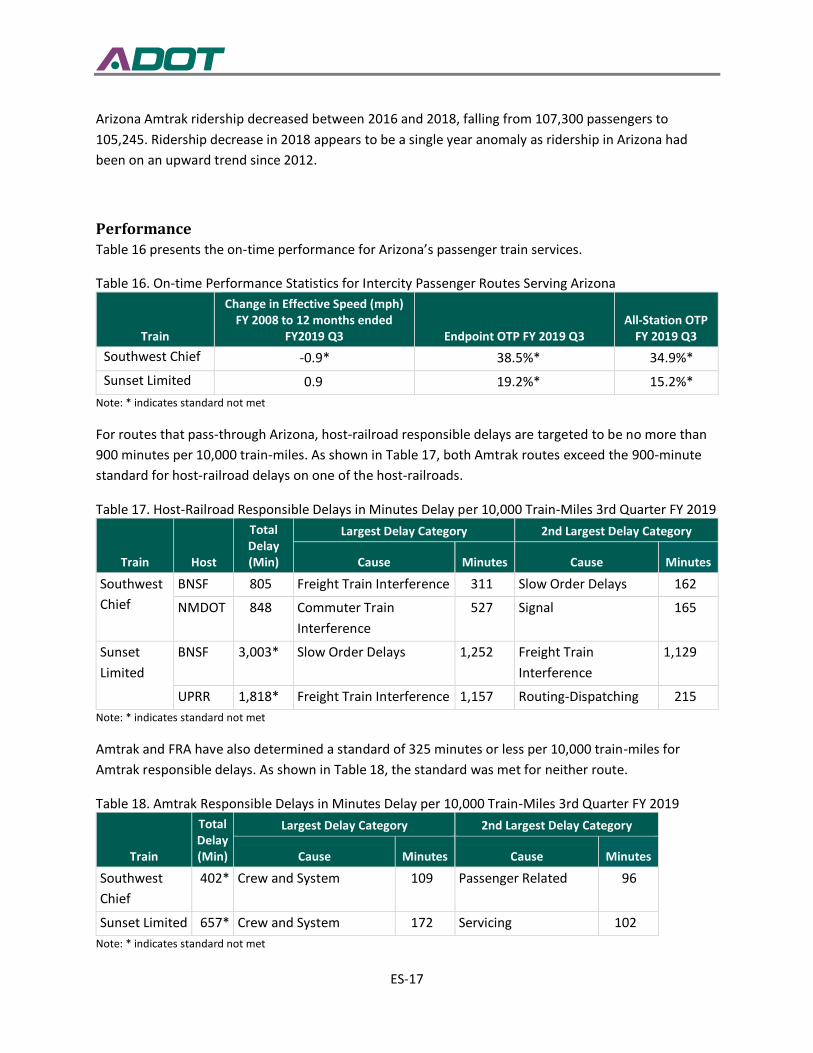
Performance Table 16 presents the on-time performance for Arizona’s passenger train services.
Table 16. On-time Performance Statistics for Intercity Passenger Routes Serving Arizona
Train
Change in Effective Speed (mph) FY 2008 to 12 months ended
FY2019 Q3 Endpoint OTP FY 2019 Q3 All-Station OTP
FY 2019 Q3
Southwest Chief -0.9* 38.5%* 34.9%*
Sunset Limited 0.9 19.2%* 15.2%*
Note: * indicates standard not met
For routes that pass-through Arizona, host-railroad responsible delays are targeted to be no more than
900 minutes per 10,000 train-miles. As shown in Table 17, both Amtrak routes exceed the 900-minute
standard for host-railroad delays on one of the host-railroads.
Table 17. Host-Railroad Responsible Delays in Minutes Delay per 10,000 Train-Miles 3rd Quarter FY 2019
Train Host
Total Delay (Min)
Largest Delay Category 2nd Largest Delay Category
Cause Minutes Cause Minutes
Southwest
Chief
BNSF 805 Freight Train Interference 311 Slow Order Delays 162
NMDOT 848 Commuter Train
Interference
527 Signal 165
Sunset
Limited
BNSF 3,003* Slow Order Delays 1,252 Freight Train
Interference
1,129
UPRR 1,818* Freight Train Interference 1,157 Routing-Dispatching 215
Note: * indicates standard not met
Amtrak and FRA have also determined a standard of 325 minutes or less per 10,000 train-miles for
Amtrak responsible delays. As shown in Table 18, the standard was met for neither route.
Table 18. Amtrak Responsible Delays in Minutes Delay per 10,000 Train-Miles 3rd Quarter FY 2019
Train
Total Delay (Min)
Largest Delay Category 2nd Largest Delay Category
Cause Minutes Cause Minutes
Southwest
Chief
402* Crew and System 109 Passenger Related 96
Sunset Limited 657* Crew and System 172 Servicing 102
Note: * indicates standard not met
ES-18
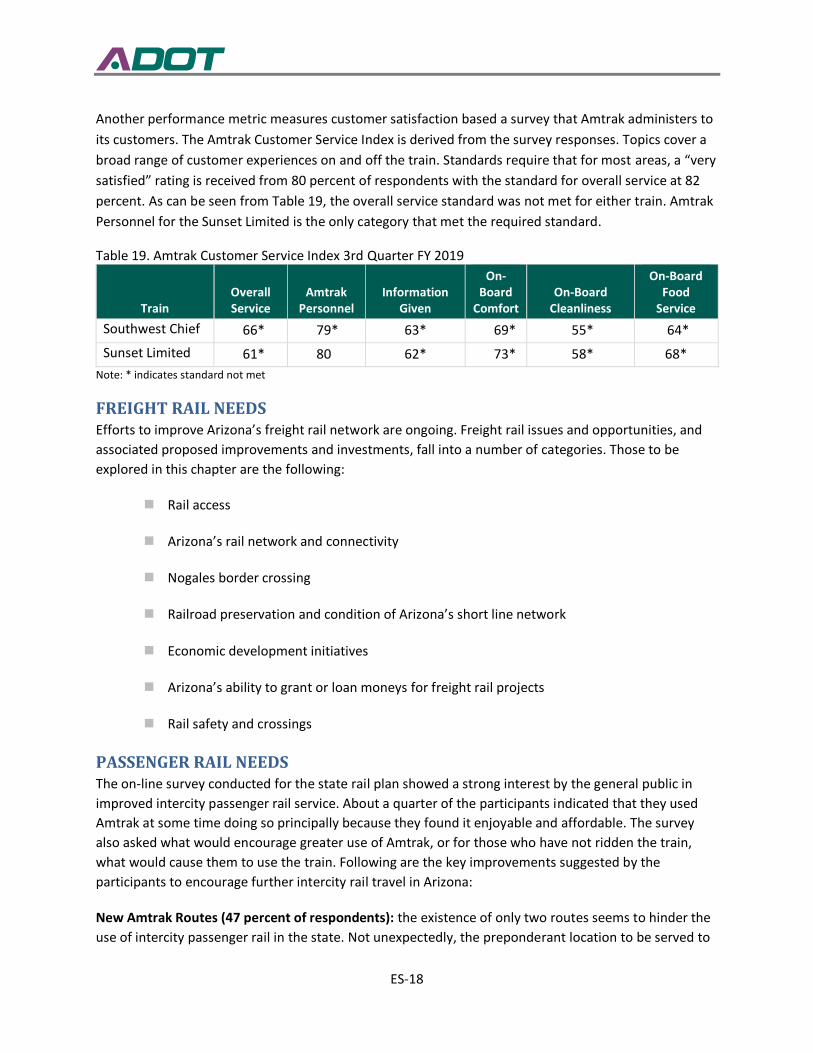
Another performance metric measures customer satisfaction based a survey that Amtrak administers to
its customers. The Amtrak Customer Service Index is derived from the survey responses. Topics cover a
broad range of customer experiences on and off the train. Standards require that for most areas, a “very
satisfied” rating is received from 80 percent of respondents with the standard for overall service at 82
percent. As can be seen from Table 19, the overall service standard was not met for either train. Amtrak
Personnel for the Sunset Limited is the only category that met the required standard.
Table 19. Amtrak Customer Service Index 3rd Quarter FY 2019
Train Overall Service
Amtrak Personnel
Information Given
On-Board
Comfort On-Board
Cleanliness
On-Board Food
Service
Southwest Chief 66* 79* 63* 69* 55* 64*
Sunset Limited 61* 80 62* 73* 58* 68*
Note: * indicates standard not met
FREIGHT RAIL NEEDS Efforts to improve Arizona’s freight rail network are ongoing. Freight rail issues and opportunities, and
associated proposed improvements and investments, fall into a number of categories. Those to be
explored in this chapter are the following:
◼ Rail access
◼ Arizona’s rail network and connectivity
◼ Nogales border crossing
◼ Railroad preservation and condition of Arizona’s short line network
◼ Economic development initiatives
◼ Arizona’s ability to grant or loan moneys for freight rail projects
◼ Rail safety and crossings
PASSENGER RAIL NEEDS The on-line survey conducted for the state rail plan showed a strong interest by the general public in
improved intercity passenger rail service. About a quarter of the participants indicated that they used
Amtrak at some time doing so principally because they found it enjoyable and affordable. The survey
also asked what would encourage greater use of Amtrak, or for those who have not ridden the train,
what would cause them to use the train. Following are the key improvements suggested by the
participants to encourage further intercity rail travel in Arizona:
New Amtrak Routes (47 percent of respondents): the existence of only two routes seems to hinder the
use of intercity passenger rail in the state. Not unexpectedly, the preponderant location to be served to
ES-19
be served by any new routes was identified as Phoenix with high interest in a route to Tucson and a
route to Flagstaff.
New Station Locations on Existing Routes (30 percent): additional stations on existing routes was
identified as the second most important factor attracting additional ridership on intercity trains.
Suggestions on locations were minimal, however, Casa Grande was mentioned by a few respondents.
Improving Speeds of Existing Services (26 percent): using Tucson to Los Angeles and Flagstaff to Los
Angeles as examples, the scheduled average train speed for the former is 46.7 mph and 49.2 mph for
the latter.
Improved Schedules (25 percent): the eastbound services of the two Amtrak routes in Arizona travel at
night making their use inconvenient for many travelers
More Frequent Trains (25 percent): the current single train per day for the Southwest Chief and the
thrice weekly Sunset Limited service proves to be a barrier to expanded use.
Regarding individual comments, the lack of service at Phoenix was a noticeable perceived barrier.
Factors such as station condition and amenities, safety, and interestingly, on-time performance were
not indicated as needing improvement to attract travelers to using intercity passenger rail in Arizona.
Several passenger rail studies have been conducted identifying passenger rail needs in Arizona and the
region. Summaries of the three key studies follow.
Objectives have been defined for the state to meet its rail transportation goals (in bold). Following are
the objectives for each goal. Objectives not in the last plan are designated as “New.”
◼ Improve mobility and accessibility
▪ Develop safe, reliable and affordable transportation choices that strive to reduce highway
congestion, and leverage additional capacity on the State’s transportation system.
▪ Become a catalyst for smart growth community planning that includes multimodal connections
and choices, transit oriented development, and economic growth opportunities.
▪ Improve the efficiency of passenger and freight movements within the State, in partnership
with private carriers.
▪ Initiate efforts to preserve the existing rail network. (New)
▪ Support efforts to ensure passenger stations provide sufficient accessibility and connectivity for
all population groups. (New)
▪ Encourage efforts to upgrade rail lines to industry weight standards permitting use of efficient,
high capacity freight cars. (New)
▪ Explore opportunities for diversified, stable, and sufficient future funding for rail in the state.
(New)
◼ Support economic growth
ES-20
▪ Support regional, tribal and local economic development plans, priorities, goals, and objectives.
▪ Support growth of traditional and non-traditional rail-related and rail-supported industries to
increase global competitiveness.
▪ Improve economic competitiveness through reliable and timely access to passenger rail
connections between economic and employment centers.
▪ Support rail projects to increase freight capacity and capabilities for growth industries and
regions within Arizona. (New)
▪ Investigate additional opportunities for rail service to benefit commerce. (New)
▪ Support rail freight access to smaller communities. (New)
▪ Promote the expansion of rail industrial access to improve connections to industrial or
commercial sites. (New)
◼ Promote sustainable transportation and land use coordination:
▪ Improve Arizona’s sustainability through coordination of rail transportation, land use, and
economic development planning activities.
▪ Encourage land use patterns connected by multiple modes of travel that support rail and
transit access and encourage pedestrian mobility, reduce energy consumption and greenhouse
gas emissions, improve air quality and promote public health.
▪ Foster collaboration between federal, State, regional and local public agencies to plan seamless
multimodal transportation system.
▪ Planning efforts related to new rail corridors or improvements to existing corridors should be
coordinated with local land use plans and the State Land Department conceptual plans to help
promote rail as a community asset.
▪ Encourage proactive smart growth land use planning for land adjacent to rail infrastructure
that does not conflict with freight rail operations. (New)
◼ Preserve the environment, natural and cultural resources
▪ Provide seamless and energy-efficient intermodal rail connections from origin to destination.
▪ Avoid degradation of existing environmental resources, wildlife habitat blocks and movement
corridors, and equitably mitigate impacts.
▪ Protect and maintain wildlife movement corridors.
▪ Promote rail as an environmentally friendly and sustainable alternative to other modes of
travel.
◼ Provide safety and security
▪ Enhance the safety of passenger movements and connections between major activity hubs
within the State and to the national passenger rail system.
▪ Strengthen the security of freight movements.
ES-21
▪ Provide parallel or alternative transportation routes and services to facilitate emergency
access, including evacuation.
▪ • Promote energy security by reducing the state’s reliance on petroleum products, particularly
from foreign sources.
Arizona State Rail Plan
Draft Plan
February 2021
A r i z o n a S t a t e R a i l P l a n
P a g e | i
Contents
The Role of Rail in Statewide Transportation .............................................................................1-1 PURPOSE AND CONTENT ........................................................................................................................ 1-1 MULTIMODAL TRANSPORTATION SYSTEM GOALS.................................................................................. 1-2 ROLE OF RAIL IN THE ARIZONA TRANSPORTATION NETWORK ................................................................ 1-3
1.3.1 Rail’s Past in Arizona ..................................................................................................................................................... 1-3 1.3.2 Rail’s Role in Arizona’s Freight Network ...................................................................................................................... 1-6 FREIGHT RAIL SERVICES, INITIATIVES, AND PLANS .................................................................................. 1-7
1.4.1 BNSF Southern Transcon............................................................................................................................................... 1-7 1.4.2 Sunset Route ................................................................................................................................................................. 1-8 1.4.3 Service to Phoenix ....................................................................................................................................................... 1-10 1.4.4 Rail Corridor Development ......................................................................................................................................... 1-10 1.4.5 Trade with Mexico ...................................................................................................................................................... 1-10 ROLE OF PASSENGER RAIL IN THE ARIZONA TRANSPORTATION NETWORK .......................................... 1-11 PASSENGER RAIL INITIATIVES AND PLANS ............................................................................................ 1-14
1.6.1 Intercity Passenger Rail Initiatives and Plans ............................................................................................................ 1-14 1.6.2 Commuter Rail Initiatives and Plans .......................................................................................................................... 1-14 INSTITUTIONAL GOVERNANCE STRUCTURE OF RAIL IN ARIZONA ......................................................... 1-15
1.7.1 ADOT’s Legislative Rail Authority and Organization ................................................................................................. 1-15 PUBLIC FUNDING AND FINANCING OF RAIL PROJECTS.......................................................................... 1-21
1.8.1 State and Local Funding of Rail Projects in Arizona .................................................................................................. 1-21 1.8.2 Federal Funding Sources ............................................................................................................................................. 1-21 1.8.3 Federal Financing Programs ....................................................................................................................................... 1-25
The State’s Existing Rail System ................................................................................................2-1 ARIZONA RAILROADS ............................................................................................................................. 2-1
2.1.1 Railroad Companies in Arizona .................................................................................................................................... 2-1 2.1.2 Arizona Class I Railroads ............................................................................................................................................... 2-3 2.1.3 Arizona Short Line Railroads ....................................................................................................................................... 2-12 ARIZONA RAIL NETWORK DESCRIPTION ............................................................................................... 2-21
2.2.1 Arizona Railroad Car Height Restrictions ................................................................................................................... 2-21 2.2.2 Arizona Railroad Car Weight Restrictions .................................................................................................................. 2-22 2.2.3 Arizona Rail Line Capacity .......................................................................................................................................... 2-23 CROSSING INVENTORY ......................................................................................................................... 2-26
2.3.1 Crossing Characteristics .............................................................................................................................................. 2-26 2.3.2 Grade Crossing Safety ................................................................................................................................................. 2-30 2.3.3 Federal Highway Administration (FHWA) Section 130 Program Activities .............................................................. 2-33 FREIGHT MULTIMODAL CONNECTIONS ................................................................................................ 2-34
2.4.1 Intermodal Terminals.................................................................................................................................................. 2-34 2.4.2 Inland Ports ................................................................................................................................................................. 2-35 2.4.3 Transload Terminals ................................................................................................................................................... 2-37 2.4.4 Other Rail-Served Multimodal Industrial Parks ......................................................................................................... 2-38 GENERAL IMPACT OF FREIGHT RAIL IN ARIZONA .................................................................................. 2-38
2.5.1 Congestion Mitigation ................................................................................................................................................ 2-38 2.5.2 Safety ........................................................................................................................................................................... 2-39 2.5.3 Trade and Economic Development............................................................................................................................. 2-39 2.5.4 Environmental: Energy Use and Air Quality ............................................................................................................... 2-40 2.5.5 Land Use and Community Impacts ............................................................................................................................. 2-40 PASSENGER RAIL SERVICES IN ARIZONA ............................................................................................... 2-41
2.6.1 Intercity Passenger Rail .............................................................................................................................................. 2-41 2.6.2 Commuter Rail ............................................................................................................................................................ 2-42 2.6.3 Excursion/Tourist Railroads ........................................................................................................................................ 2-42 PASSENGER RAIL STATIONS .................................................................................................................. 2-43 PASSENGER RAIL RIDERSHIP AND PERFORMANCE ................................................................................ 2-43
A r i z o n a S t a t e R a i l P l a n
ii | P a g e 1—The Role of Rail in Statewide Transportation
IMPACT OF PASSENGER RAIL IN ARIZONA ............................................................................................ 2-48 2.9.1 Economic ..................................................................................................................................................................... 2-48 2.9.2 Roadway Congestion .................................................................................................................................................. 2-48 2.9.3 Fuel Consumption ....................................................................................................................................................... 2-48 2.9.4 Safety ........................................................................................................................................................................... 2-48 2.9.5 Land Use ...................................................................................................................................................................... 2-49
DEMOGRAPHIC AND ECONOMIC GROWTH FACTORS AND TRENDS...................................................... 2-49 2.10.1 Gross State Product ................................................................................................................................................ 2-50 2.10.2 Income .................................................................................................................................................................... 2-52 2.10.3 Population............................................................................................................................................................... 2-54 2.10.4 Employment ............................................................................................................................................................ 2-55
FREIGHT RAIL TRAFFIC PROFILES .......................................................................................................... 2-57 2.11.1 Commodity Profile .................................................................................................................................................. 2-57 2.11.2 Rail Trading Partner Profile .................................................................................................................................... 2-59 2.11.3 Arizona Rail Commodity Outlook ........................................................................................................................... 2-60
PASSENGER TRAVEL DEMAND AND GROWTH ...................................................................................... 2-61 FUEL COST TRENDS .............................................................................................................................. 2-62 RAIL CONGESTION TRENDS .................................................................................................................. 2-63 AIRPORT CONGESTION TRENDS ........................................................................................................... 2-64 MARITIME TRENDS............................................................................................................................... 2-64 RESHORING TRENDS ............................................................................................................................ 2-65 TRUCKING TRENDS AND ISSUES ........................................................................................................... 2-66
2.18.1 Driver and Employee Shortage .............................................................................................................................. 2-66 2.18.2 Hours of Service ...................................................................................................................................................... 2-67 2.18.3 Longer and Heavier Trucks ..................................................................................................................................... 2-67
MEXICO TRENDS AND ISSUES ............................................................................................................... 2-67 2.19.1 Rail Traffic Trends ................................................................................................................................................... 2-67 2.19.2 Nearshoring to Mexico ........................................................................................................................................... 2-72 2.19.3 Key Cross Border Supply Chains ............................................................................................................................. 2-72 2.19.4 Mexico Intermodal Services ................................................................................................................................... 2-75
MEXICO TRUCKING INDUSTRY CHANGES .............................................................................................. 2-76
Passenger Rail Transportation Needs, Opportunities, and Investments ......................................3-1 PASSENGER NEEDS-STATE RAIL PLAN SURVEY ........................................................................................ 3-1 INTERCITY RAIL SERVICE: SOUTHWEST MULTI-STATE RAIL PLANNING STUDY ......................................... 3-1
3.2.1 Multi-State Rail Plans ................................................................................................................................................... 3-1 3.2.2 Southwest MSRP ........................................................................................................................................................... 3-3 3.2.3 Background ................................................................................................................................................................... 3-3 3.2.4 Arizona Corridors .......................................................................................................................................................... 3-5 3.2.5 Identification of Corridor Type/Service Tier ............................................................................................................... 3-10 TUCSON-PHOENIX CORRIDOR PASSENGER RAIL SERVICE: INTERCITY/REGIONAL RAIL SERVICE PATTERNS 3-
12 3.3.1 Tucson-Phoenix Corridor Alternatives ........................................................................................................................ 3-12 3.3.2 Yellow Corridor Alternative: Intercity and Local Passenger Rail Service Patterns.................................................... 3-15 3.3.3 Yellow Corridor Alternative Ridership Estimates ....................................................................................................... 3-16 3.3.4 Yellow Corridor Alternative Capital Costs .................................................................................................................. 3-17 COMMUTER RAIL: PHOENIX REGIONAL COMMUTER RAIL SYSTEM ...................................................... 3-18
3.4.1 Potential Benefits and Goals of Commuter Rail ........................................................................................................ 3-18 3.4.2 Potential Commuter Corridor Operations .................................................................................................................. 3-19 3.4.3 Travel Times ................................................................................................................................................................ 3-20 3.4.4 Phoenix Regional Rail Ridership ................................................................................................................................. 3-20 3.4.5 Phoenix Regional Rail Investment Costs .................................................................................................................... 3-22 3.4.6 Relationship with Tucson-Phoenix Corridor ............................................................................................................... 3-22 SUMMARY OF PASSENGER RAIL NEEDS ................................................................................................ 3-23
Freight Rail Transportation Needs, Opportunities, and Investments ..........................................4-1 INTRODUCTION ...................................................................................................................................... 4-1
A r i z o n a S t a t e R a i l P l a n
1—The Role of Rail in Statewide Transportation P a g e | iii
RAIL ACCESS ........................................................................................................................................... 4-1 ARIZONA’S RAIL NETWORK AND CONNECTIVITY .................................................................................... 4-3
4.3.1 Phoenix Area Rail Network Phoenix ............................................................................................................................. 4-3 4.3.2 Yuma Area Rail Network ............................................................................................................................................... 4-4 4.3.3 Tucson Area Rail Network ............................................................................................................................................ 4-5 4.3.4 I-11 and Intermountain West Corridor......................................................................................................................... 4-6 NOGALES BORDER CROSSING ................................................................................................................. 4-7 RAILROAD PRESERVATION AND CONDITION OF ARIZONA’S SHORT LINE NETWORK ............................... 4-8
4.5.1 Arizona & California Railroad ....................................................................................................................................... 4-9 4.5.2 Arizona Eastern Railroad .............................................................................................................................................. 4-9 4.5.3 Black Mesa and Lake Powell Railroad ........................................................................................................................ 4-10 4.5.4 Copper Basin Railway ................................................................................................................................................. 4-10 4.5.5 Kingman Terminal Railroad ........................................................................................................................................ 4-10 ECONOMIC DEVELOPMENT INITIATIVES ............................................................................................... 4-10 ARIZONA’S ABILITY TO GRANT OR LOAN MONEY FOR FREIGHT RAIL PROJECTS .................................... 4-11 RAIL SAFETY AND CROSSINGS ............................................................................................................... 4-11
Rail Service and Investment Program ........................................................................................5-1 VISION, GOALS, AND OBJECTIVES ........................................................................................................... 5-1
5.1.1 Arizona’s Rail Vision ...................................................................................................................................................... 5-1 5.1.2 Arizona’s Rail Transportation System Goals ................................................................................................................ 5-1 5.1.3 Arizona’s Rail Transportation System Objectives ........................................................................................................ 5-2 STATEWIDE RAIL PERFORMANCE MEASURES ......................................................................................... 5-4
5.2.1 Representative Performance Measures ....................................................................................................................... 5-4 RAIL INVESTMENT PROJECTS OF INTEREST ............................................................................................. 5-6 STATE RAIL PLAN IMPACTS ..................................................................................................................... 5-1
A r i z o n a S t a t e R a i l P l a n
iv | P a g e 1—The Role of Rail in Statewide Transportation
Tables Table 1-1. Content of the 2017 Arizona State Rail Plan .......................................................................................... 1-1
Table 1-2. Rail’s Percent Modal Share of Freight Originating and Terminating in Arizona by Commodity and Mileage Range (2017) .................................................................................................................. 1-7
Table 1-3. Summary of Amtrak Routes in Arizona .............................................................................................. 1-11
Table 1-4. Arizona Population Served by Intercity Passenger Rail ........................................................................ 1-12
Table 2-1. Arizona’s Short Line Railroads ............................................................................................................... 2-1
Table 2-2 BNSF Arizona Operating Territories ........................................................................................................ 2-4
Table 2-3. BNSF Arizona Activity ............................................................................................................................ 2-6
Table 2-4. UPRR Arizona Operating Territories ...................................................................................................... 2-8
Table 2-5. UPRR Arizona Activity .......................................................................................................................... 2-11
Table 2-6. Arizona 286,000 Pound Rail Car Trackage ............................................................................................ 2-23
Table 2-7. Rail Line Capacity based on “Rule of Thumb” Parameters ................................................................... 2-24
Table 2-8. BNSF Arizona Line Capacities ............................................................................................................... 2-25
Table 2-9. UPRR Arizona Line Capacities .............................................................................................................. 2-26
Table 2-10. Total Number Of Crossings By Type Of Crossing 2019 ....................................................................... 2-27
Table 2-11. Grade Crossings Per County 2019 ...................................................................................................... 2-27
Table 2-12. Public Grade Crossings By Type Of Highway/Roadway 2019 .............................................................. 2-29
Table 2-13. Annual Statewide Crashes 2015-2019 ............................................................................................... 2-30
Table 2-14. Annual Crashes By County 2015-2019 ............................................................................................... 2-30
Table 2-15. Crossings With Multiple Incidents, 2015-2019 ................................................................................... 2-32
Table 2-16. FAST Act Railway-Highway Crossing Program Funding Allocation to Arizona ..................................... 2-34
Table 2-17. Arizona Class I Railroad Transload Operations ................................................................................... 2-38
Table 2-18. Truck Crash and Rail Accident Rates per 10 Billion Ton-Miles, 2014 National Figures ........................ 2-39
Table 2-19. Comparison of Truck and Rail Emission Rates Over Time ................................................................... 2-40
Table 2-20. Summary of Amtrak Routes in Arizona .............................................................................................. 2-41
Table 2-21. Summary of Thruway Bus Connections in Arizona ............................................................................. 2-42
Table 2-22 Summary of Arizona Amtrak Stations ................................................................................................. 2-43
Table 2-23. FY 2018 Boardings and Alightings at Arizona Amtrak Stations ........................................................... 2-44
Table 2-24. Top Arizona Amtrak Markets 2018 .................................................................................................... 2-45
Table 2-25. PRIIA Section 207 Amtrak Performance Metrics ................................................................................ 2-45
Table 2-26. Percentage of Fully Allocated Operating Cost Covered by Passenger Revenue .................................. 2-46
Table 2-27. Passenger-Miles per Train-Mile ......................................................................................................... 2-46
Table 2-28. On-time Performance Statistics for Intercity Passenger Routes Serving Arizona ................................ 2-46
Table 2-29. Host-Railroad Responsible Delays in Minutes Delay per 10,000 Train-Miles 3rd Quarter FY 2019 ................................................................................................................................................. 2-47
Table 2-30. Amtrak Responsible Delays in Minutes Delay per 10,000 Train-Miles 3rd Quarter FY 2019 ............... 2-47
Table 2-31. Amtrak Customer Service Index 3rd Quarter FY 2019 ........................................................................ 2-48
Table 2-32. County Median Household Income 2018 ........................................................................................... 2-53
Table 2-33. County Population Growth 2010-2018 .............................................................................................. 2-54
Table 2-34, Projected County Population Growth by County (2018-2055) ........................................................... 2-55
A r i z o n a S t a t e R a i l P l a n
1—The Role of Rail in Statewide Transportation P a g e | v
Table 2-35. Arizona vs. United States Sector Location Quotient (December 2019) ............................................... 2-56
Table 2-36. 2016 Arizona Rail Tonnage-Direction ................................................................................................. 2-57
Table 2-37. 2016 Arizona Total Rail Tonnage ....................................................................................................... 2-57
Table 2-38. 2016 Arizona Inbound Rail Tonnage .................................................................................................. 2-58
Table 2-39. 2016 Arizona Outbound Rail Tonnage ............................................................................................... 2-58
Table 2-40. 2016 Arizona Intrastate Rail Tonnage ................................................................................................ 2-59
Table 2-41. 2016 Arizona Inbound Rail Tonnage-Origin States ............................................................................. 2-59
Table 2-42. 2016 Arizona Outbound Rail Tonnage-Destination States.................................................................. 2-60
Table 2-43. Network Velocity (Freight Train-Miles per Train-Hour) ...................................................................... 2-63
Table 2-44. Percent of Arrivals On-Time .............................................................................................................. 2-64
Table 2-45. Percent of Departures On-Time ......................................................................................................... 2-64
Table 3-1. Definitions Of High-Performance Rail (HPR) Service Tiers ...................................................................... 3-2
Table 3-2. Yellow Corridor Alternative Service Patterns ....................................................................................... 3-15
Table 3-3. Yellow Corridor Train Headways .......................................................................................................... 3-16
Table 3-4. Yellow Corridor Service Levels ............................................................................................................. 3-16
Table 3-5. Year 2035 Tucson-Phoenix Commuter and Intercity Trip Demand ....................................................... 3-16
Table 3-6. Yellow Corridor Alternative Investment Costs ..................................................................................... 3-17
Table 3-7. Proposed Phoenix Regional Rail Services ............................................................................................. 3-19
Table 3-8. Proposed Phoenix Regional Rail Capital Cost ....................................................................................... 3-22
Table 5-1. Arizona Rail Performance Measures ...................................................................................................... 5-5
Table 5-2. Proposed Railroad Company Projects .................................................................................................... 5-7
A r i z o n a S t a t e R a i l P l a n
vi | P a g e 1—The Role of Rail in Statewide Transportation
Figures Figure 1-1. BNSF Railway System Map ................................................................................................................... 1-5
Figure 1-2. Union Pacific Railroad System Map ...................................................................................................... 1-6
Figure 1-3. BNSF Southern Transcon Corridor ........................................................................................................ 1-8
Figure 1-4. UPRR Sunset Corridor .......................................................................................................................... 1-9
Figure 1-5. CANAMEX Corridor ............................................................................................................................ 1-11
Figure 1-6. Amtrak Routes and Stations Serving Arizona ...................................................................................... 1-13
Figure 1-7. ADOT Organization Chart ................................................................................................................... 1-16
Figure 1-8. Arizona COGs and MPOs .................................................................................................................... 1-19
Figure 2-1. Arizona Rail System .............................................................................................................................. 2-2
Figure 2-2. BNSF Arizona Network ......................................................................................................................... 2-3
Figure 2-3. BNSF Mobest Yard - Phoenix ................................................................................................................ 2-5
Figure 2-4. UPRR Arizona Network......................................................................................................................... 2-7
Figure 2-5. UPRR Phoenix Yard .............................................................................................................................. 2-9
Figure 2-6. UPRR Tucson Yard .............................................................................................................................. 2-10
Figure 2-7. Examples of High Clearance Freight Cars ............................................................................................ 2-21
Figure 2-8. Public Grade Crossings: Type of Control Device 2019 ......................................................................... 2-28
Figure 2-9. Daily Trains Over Public At-Grade Crossings ....................................................................................... 2-29
Figure 2-10. Five-Year Injuries And Fatalities Per County 2014-2019 .................................................................... 2-31
Figure 2-11. Grade Crossing Crashes By Control Device ....................................................................................... 2-32
Figure 2-12 Port of Tucson ................................................................................................................................... 2-35
Figure 2-13. Ridership by Station, 2016-2018 ...................................................................................................... 2-44
Figure 2-14. Arizona Versus United States Year-Over-Year Real GDP Growth, 2000-2018 .................................... 2-50
Figure 2-15. Arizona vs. United States Sectors by Share of Real GSP (2018) ......................................................... 2-51
Figure 2-16. Arizona vs. United States Real GSP Growth by Sector (2000-2018) ................................................... 2-52
Figure 2-17. Arizona versus United States Per Capita Personal Income ................................................................ 2-53
Figure 2-18. United States v. Arizona YOY Employment Growth .......................................................................... 2-56
Figure 2-19. Vehicle-miles traveled (VMT) year-over-year change in Arizona ....................................................... 2-62
Figure 2-20. Motor Gasoline and Diesel Fuel Price Forecast ................................................................................. 2-63
Figure 2-21. Number of Trains Crossing at Nogales .............................................................................................. 2-68
Figure 2-22. Nogales Import and Export Rail Trade by Value ................................................................................ 2-68
Figure 2-23. Nogales Export Value by Commodity (Million dollars) ...................................................................... 2-69
Figure 2-24. Nogales Import Value by Commodity ............................................................................................... 2-70
Figure 2-25. Geographic Distribution Mexico Copper Production. ....................................................................... 2-71
Figure 2-26. Finished Vehicles Imports at Nogales Rail Crossing ........................................................................... 2-74
Figure 2-27. Ores; Slag, and Ash Rail Exports by Rail ............................................................................................ 2-74
Figure 2-28. Union Pacific Mexico Intermodal Services ........................................................................................ 2-76
Figure 3-1. Greater Los Angeles–Phoenix Existing Mode Share And Travel Times .................................................. 3-5
Figure 3-2. San Diego–Phoenix Existing Mode Share And Travel Times .................................................................. 3-6
Figure 3-3. Las Vegas–Tucson via Phoenix Existing Mode Share And Travel Times ................................................. 3-7
Figure 3-4. Phoenix–Tucson Existing Mode Share And Travel Times ...................................................................... 3-8
A r i z o n a S t a t e R a i l P l a n
1—The Role of Rail in Statewide Transportation P a g e | vii
Figure 3-5. Phoenix–Albuquerque Existing Mode Share And Travel Times ............................................................. 3-9
Figure 3-6. Candidate corridors for potential Southwest HPR network* .............................................................. 3-10
Figure 3-7. Tucson-Phoenix Yellow Alternative .................................................................................................... 3-14
Figure 3-8. Proposed Commuter Rail Lines-Station Activity .................................................................................. 3-21
Figure 3-9. Comparative Commuter Rail System Boardings.................................................................................. 3-21
Figure 4-1. Hassayampa Valley Rail Corridor Cost Analysis Update Study Area ...................................................... 4-4
Figure 4-2. Yuma Rail Corridor Connection to Mexico Area of Potential Alignment................................................ 4-5
Figure 4-3. Area of the Sonoran Corridor ............................................................................................................... 4-6
Figure 4-4. I-11 and Intermountain West Corridor ................................................................................................. 4-7
A r i z o n a S t a t e R a i l P l a n
1—The Role of Rail in Statewide Transportation P a g e | 1-1
The Role of Rail in Statewide Transportation
PURPOSE AND CONTENT
The purpose of the Arizona State Rail Plan (SRP) is to guide the advancement of the rail system used by
the state’s freight shippers and rail passengers. The State Rail Plan provides an updated assessment of
the rail system along with recommendations for policies, programs, processes, and projects to improve
rail-related safety and service, and serves as a practical roadmap for future rail investment and policies
in Arizona. The document will be used to provide an understanding of existing and future issues and
trends influencing the state’s rail system from the present year to the year 2040. It will further serve to
provide guidance and recommendations to enhance Arizona’s rail system and service.
The SRP has been prepared by the Arizona Department of Transportation (ADOT) to meet the
requirements of the federal Passenger Rail Investment and Improvement Act (PRIIA) of 2008, as well as
the subsequent State Rail Plan Guidance issued by the Federal Railroad Administration (FRA) in 2013.
While the primary purpose of PRIIA was to provide for improved passenger rail service in the United
States, the Act requires each state to have an approved rail plan as a condition for receiving future rail
funding for either passenger or freight improvements.
The prior SRP was completed in 2011 and was prepared in support of the transportation framework
studies prepared for Building a Quality Arizona (BqAZ), an association bringing together municipalities,
MPOs, ADOT, the State Legislature, the Governor’s Office, and business leaders to discuss state
infrastructure needs. The current plan is one of several modal plans prepared by ADOT which
complements the vision and goals of the State Long-Range Transportation Plan (LRTP) and the State
Freight Plan.
The State Rail Plan reflects the input of a large number of stakeholders including the railroads, key
freight shippers, government officials, regional planning entities, rail interest groups, economic
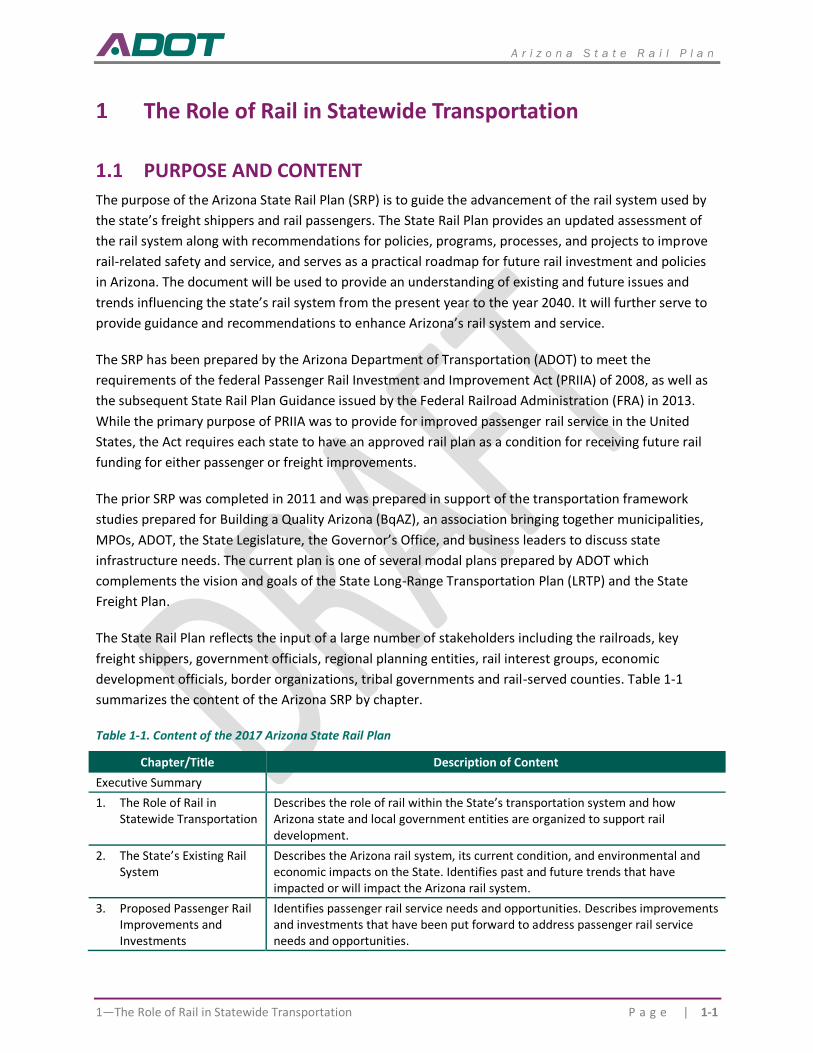
development officials, border organizations, tribal governments and rail-served counties. Table 1-1
summarizes the content of the Arizona SRP by chapter.
Table 1-1. Content of the 2017 Arizona State Rail Plan
Chapter/Title Description of Content
Executive Summary
1. The Role of Rail in Statewide Transportation
Describes the role of rail within the State’s transportation system and how Arizona state and local government entities are organized to support rail development.
2. The State’s Existing Rail System
Describes the Arizona rail system, its current condition, and environmental and economic impacts on the State. Identifies past and future trends that have impacted or will impact the Arizona rail system.
3. Proposed Passenger Rail Improvements and Investments
Identifies passenger rail service needs and opportunities. Describes improvements and investments that have been put forward to address passenger rail service needs and opportunities.
A r i z o n a S t a t e R a i l P l a n
1-2 | P a g e 1. The Role of Rail in Statewide Transportation
Chapter/Title Description of Content
4. Proposed Freight Rail Improvements and Investments
Identifies freight rail service needs and opportunities. Describes improvements and investments that have been put forward to address freight rail service needs and opportunities.
5. The State’s Rail Service and Investment Program
Presents ADOT’s vision for railroad transportation, projects and strategies to meet that vision, summary of impacts that would result from the projects and strategies, and a discussion of probable financing scenarios.
6. Coordination and Review Descriptions of outreach and coordination efforts in developing the SRP.
MULTIMODAL TRANSPORTATION SYSTEM GOALS
The SRP is part of Arizona’s multimodal “family of plans.” In that context, the SRP is an outgrowth of
Arizona’s Long-Range Transportation Plan (LRTP), based on similar goals and objectives. Arizona’s new
LRTP, entitled What Moves You Arizona 2040 (WMYA 2040), was approved and published in Spring
2018. The following are its rail relevant goals and objectives.
1. Improve Mobility, Reliability, and Accessibility – Implement critical, cost-effective investments to
improve access to multimodal transportation and optimize mobility and reliability for passengers
and freight
– Address freight bottlenecks identified by the Statewide Freight Study
– Support and facilitate better accessibility to the statewide multimodal transportation system
and connectivity between modes
– Emphasize the deployment of technology to optimize existing system capacity and performance
2. Preserve and Maintain the System – Maintain, preserve, and extend the service life of existing and
future State Transportation System infrastructure
3. Enhance Safety – Continue to improve and advocate for transportation system safety for all modes
– Reduce the number and rate of serious injuries
– Reduce the number of non-motorized fatalities and serious injuries
4. Strengthen Partnerships – Develop and nurture partnerships that support coordination, integration,
and preservation of ADOT’s investment
– Strengthen the effectiveness of ADOT’s project and program coordination with MPOs, COGs,
local agencies, and tribes
– Improve coordination with state and federal agencies and NGOs
– Explore the use of public-private partnerships to accelerate or improve program and project
delivery
– Reduce institutional and administrative hurdles to public-private partnerships
A r i z o n a S t a t e R a i l P l a n
1—The Role of Rail in Statewide Transportation P a g e | 1-3
5. Improve Program Delivery and Foster Environmental Stewardship – Continually enhance the ability
of ADOT to efficiently, effectively, and transparently deliver programs and projects, and do so in a
way that preserves and protects the natural environment
– Increase the percent of projects delivered on time and on budget
– Communicate investment needs and articulate the benefit of improvements
– Make more effective use of data to improve analysis and inform decisions
– Minimize and mitigate the environmental impact of transportation projects and system
operations
6. Make Cost-Effective Investment Decisions and Support Economic Vitality – Better link planning and
programming through performance-based decision-making that integrates the project evaluation
criteria and weighting established by the LRTP. Ensure responsible management of public resources,
and implement funding strategies to ensure long-term balanced investment in the State
Transportation System.
– Seek to optimize the return on investment (ROI) on all projects and programs
– Implement the most cost effective transportation solutions
– Act as stewards for the state’s natural, cultural, and environmental resource
– Maximize the leveraging of ADOT funds
These multimodal goals and objectives have been considered in developing the rail vision, goals, and
objectives that will appear later in this document.
ROLE OF RAIL IN THE ARIZONA TRANSPORTATION NETWORK
1.3.1 Rail’s Past in Arizona
The origins of rail in Arizona began in May 1877 in Yuma, when a Southern Pacific Railroad engine
crossed the Colorado River from California into Arizona. By 1879, Southern Pacific’s operations extended
from Yuma to Maricopa Wells, and soon after that, reached Tucson. Within another three years, the line
fully extended through southern Arizona to the New Mexico border. The Atlantic and Pacific Railroad,
completed between 1880 and 1883, crossed northern Arizona, linking Albuquerque to California.
The late 1800s and early 1900s was the Golden Age of railroads. After the two cross-state lines were
built, a number of auxiliary routes were constructed. Atchison, Topeka, and Santa Fe Railway (ATSF), of
which Atlantic and Pacific Railroad was a subsidiary, built the 209-mile “Peavine” route in 1893-1895,
connecting Williams Junction to Phoenix. Southern Pacific added segments to Nogales, Douglas, Globe,
Hayden, and other areas in southern Arizona.
The construction of Arizona’s rail network had a major impact on the state’s growth and development,
allowing key commodities in Arizona – including cattle, coal, copper, and cotton – to be shipped to
A r i z o n a S t a t e R a i l P l a n
1-4 | P a g e 1. The Role of Rail in Statewide Transportation
markets outside the state. The advent of railroads also allowed Arizona to receive supplies more quickly
and at a lower cost. Before the railroads were in operation, goods were shipped by steamer from San
Francisco around Baja California and up the Sea of Cortez before being moved to light draft stern-wheel
boats, which would carry goods up the Colorado River into Arizona.
Little rail development occurred until late 20th century due to the increasing competitiveness of
automobile travel. The construction of the interstate highway system, greater regulation of railroads,
and lower vehicle prices made the automobile the preferred mode for personal travel and boosted the
trucking industry’s share of freight movement.
Following a wave of bankruptcies and mergers reducing the number of major railroads in the country
from over 125 in the mid-1950s to 35 in 1980, Congress passed the Staggers Rail Act of 1980, which
largely deregulated the railroad industry and improved railroad companies’ finances.
As a result of rationalization permitted by the Staggers Act, today, two large railroads operate in
Arizona—BNSF Railway Company (BNSF) and Union Pacific Railroad (UPRR).Boththe products of
numerous mergers, the last of which were mid-1990s mergers between the Burlington Northern
Railroad and Atchison, Topeka & Santa Fe Railway (commonly known as the Santa Fe), and between
Southern Pacific (SP) and the UPRR. BNSF operates 33,500 route miles in 28 U.S. states and 2 Canadian
provinces, while UPRR operates 36,000 miles in 23 states. Through connections with eastern railroads,
these railroads facilitate coast-to-coast movement of various commodities, and provide a key link
between California and Midwestern industrial and distribution areas.
A number of smaller railroads also operate in Arizona, which mostly serve the mining and natural
resource industries.
Responsibility for passenger rail operations shifted to Amtrak in the early 1970s following a decades-
long decline in ridership on services previously operated by combined freight and passenger railroads.
Congress created Amtrak in 1970 to relieve the freight railroads of the financial burden of operating
passenger trains, while still preserving passenger rail service. Services provided in Arizona are part of
Amtrak’s long-distance, cross-country operations, operating over the BNSF line in northern Arizona and
the UPRR line in southern Arizona.
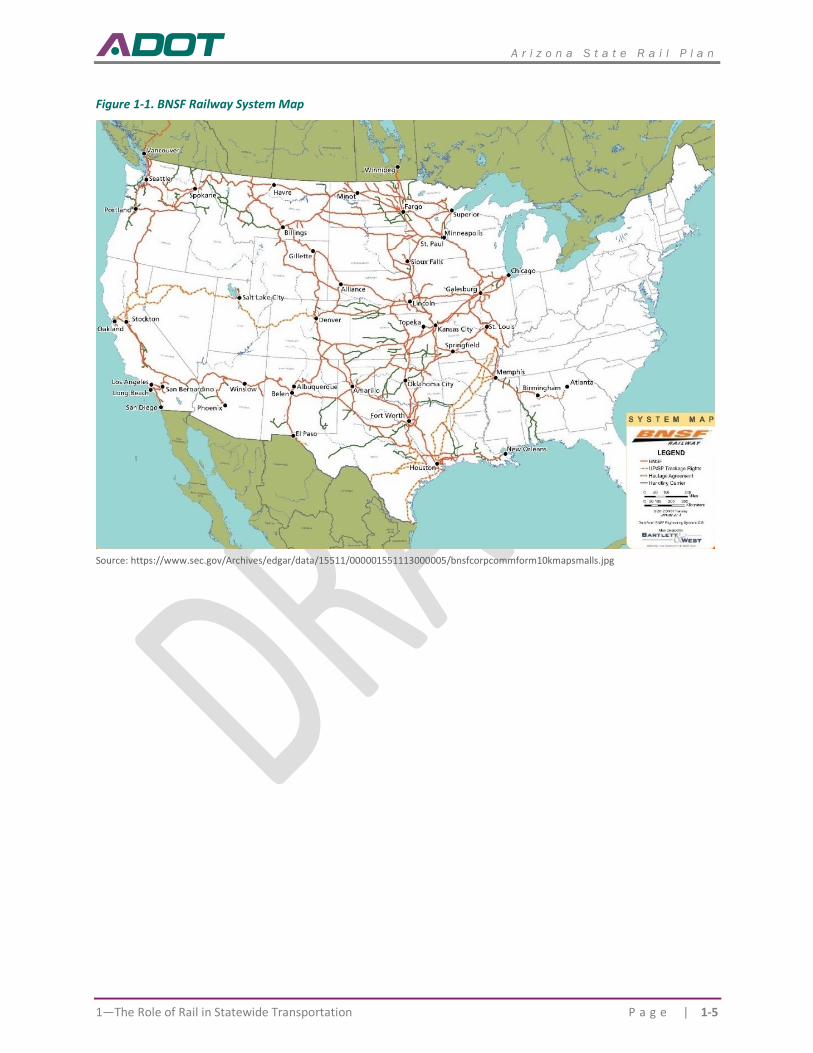
A r i z o n a S t a t e R a i l P l a n
1—The Role of Rail in Statewide Transportation P a g e | 1-5
Figure 1-1. BNSF Railway System Map
Source: https://www.sec.gov/Archives/edgar/data/15511/000001551113000005/bnsfcorpcommform10kmapsmalls.jpg
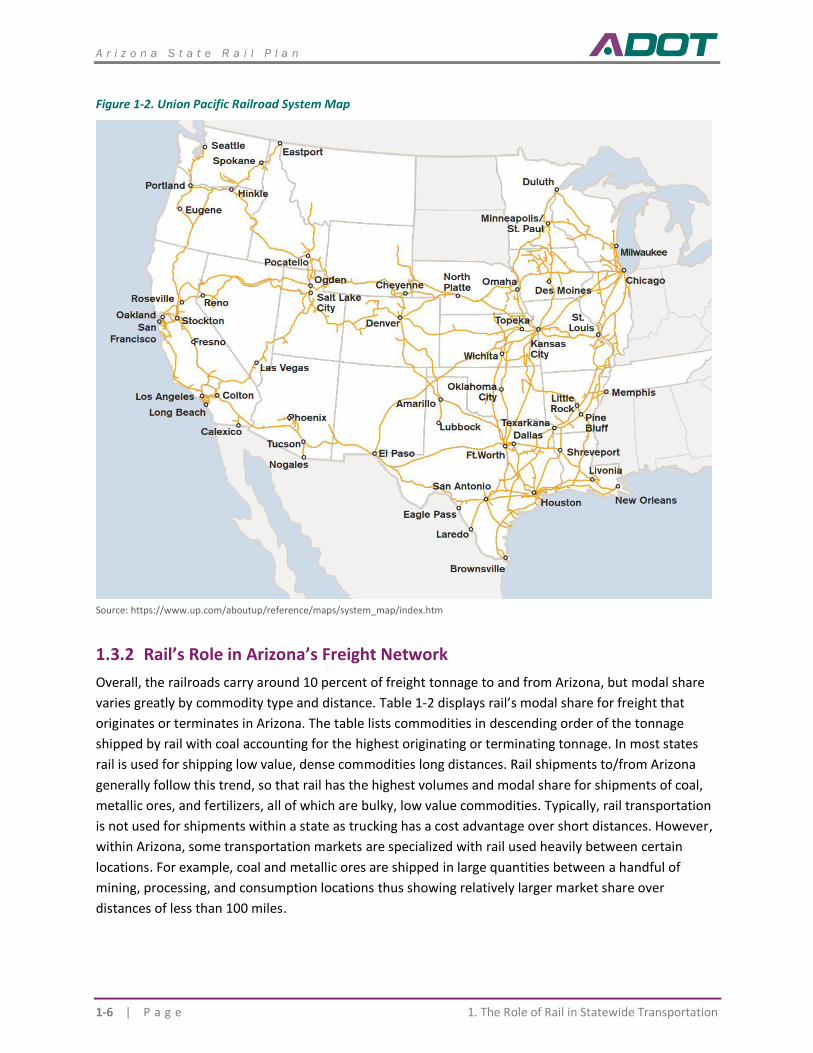
A r i z o n a S t a t e R a i l P l a n
1-6 | P a g e 1. The Role of Rail in Statewide Transportation
Figure 1-2. Union Pacific Railroad System Map
Source: https://www.up.com/aboutup/reference/maps/system_map/index.htm
1.3.2 Rail’s Role in Arizona’s Freight Network
Overall, the railroads carry around 10 percent of freight tonnage to and from Arizona, but modal share
varies greatly by commodity type and distance. Table 1-2 displays rail’s modal share for freight that
originates or terminates in Arizona. The table lists commodities in descending order of the tonnage
shipped by rail with coal accounting for the highest originating or terminating tonnage. In most states
rail is used for shipping low value, dense commodities long distances. Rail shipments to/from Arizona
generally follow this trend, so that rail has the highest volumes and modal share for shipments of coal,
metallic ores, and fertilizers, all of which are bulky, low value commodities. Typically, rail transportation
is not used for shipments within a state as trucking has a cost advantage over short distances. However,
within Arizona, some transportation markets are specialized with rail used heavily between certain
locations. For example, coal and metallic ores are shipped in large quantities between a handful of
mining, processing, and consumption locations thus showing relatively larger market share over
distances of less than 100 miles.
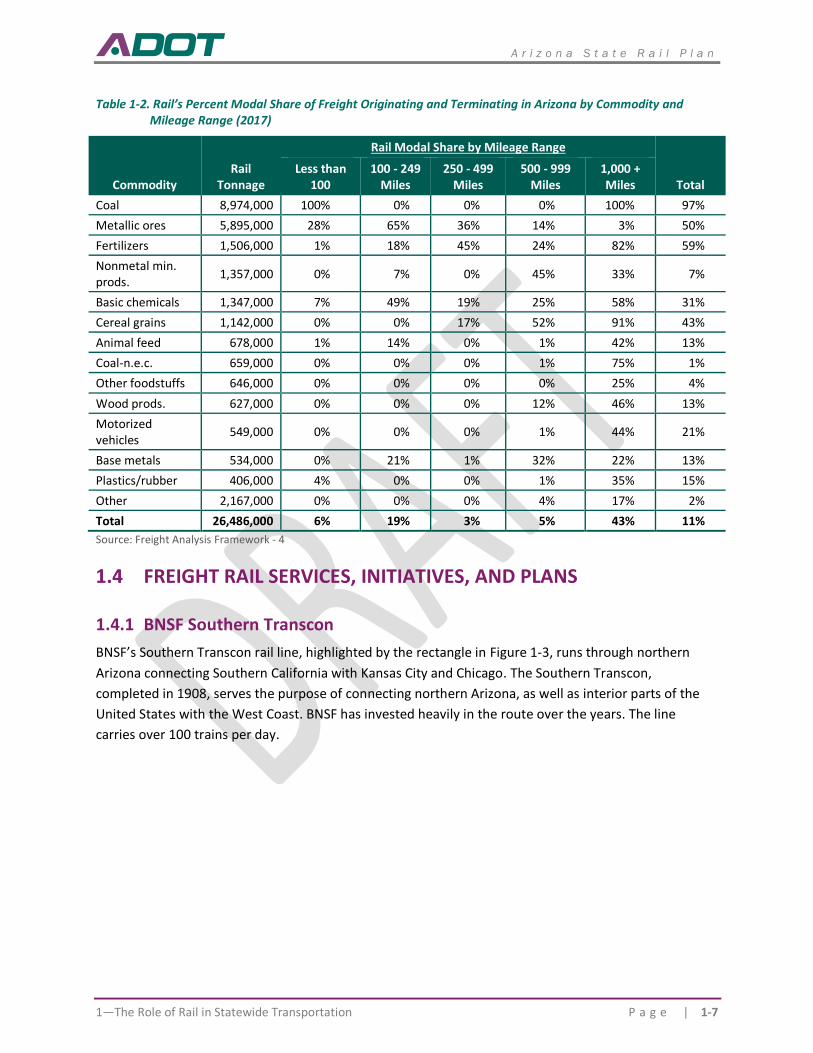
A r i z o n a S t a t e R a i l P l a n
1—The Role of Rail in Statewide Transportation P a g e | 1-7
Table 1-2. Rail’s Percent Modal Share of Freight Originating and Terminating in Arizona by Commodity and Mileage Range (2017)
Commodity Rail
Tonnage
Rail Modal Share by Mileage Range
Total Less than
100 100 - 249
Miles 250 - 499
Miles 500 - 999
Miles 1,000 + Miles
Coal 8,974,000 100% 0% 0% 0% 100% 97%
Metallic ores 5,895,000 28% 65% 36% 14% 3% 50%
Fertilizers 1,506,000 1% 18% 45% 24% 82% 59%
Nonmetal min. prods.
1,357,000 0% 7% 0% 45% 33% 7%
Basic chemicals 1,347,000 7% 49% 19% 25% 58% 31%
Cereal grains 1,142,000 0% 0% 17% 52% 91% 43%
Animal feed 678,000 1% 14% 0% 1% 42% 13%
Coal-n.e.c. 659,000 0% 0% 0% 1% 75% 1%
Other foodstuffs 646,000 0% 0% 0% 0% 25% 4%
Wood prods. 627,000 0% 0% 0% 12% 46% 13%
Motorized vehicles
549,000 0% 0% 0% 1% 44% 21%
Base metals 534,000 0% 21% 1% 32% 22% 13%
Plastics/rubber 406,000 4% 0% 0% 1% 35% 15%
Other 2,167,000 0% 0% 0% 4% 17% 2%
Total 26,486,000 6% 19% 3% 5% 43% 11%
Source: Freight Analysis Framework - 4
FREIGHT RAIL SERVICES, INITIATIVES, AND PLANS
1.4.1 BNSF Southern Transcon
BNSF’s Southern Transcon rail line, highlighted by the rectangle in Figure 1-3, runs through northern
Arizona connecting Southern California with Kansas City and Chicago. The Southern Transcon,
completed in 1908, serves the purpose of connecting northern Arizona, as well as interior parts of the
United States with the West Coast. BNSF has invested heavily in the route over the years. The line
carries over 100 trains per day.
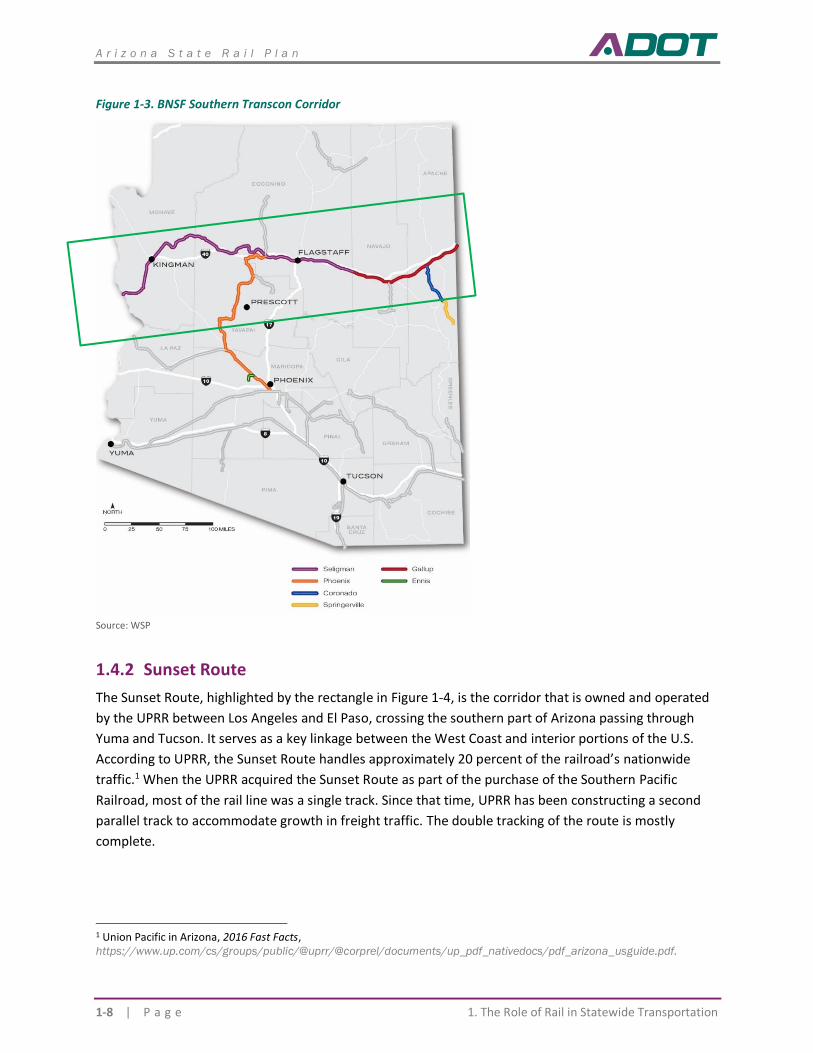
A r i z o n a S t a t e R a i l P l a n
1-8 | P a g e 1. The Role of Rail in Statewide Transportation
Figure 1-3. BNSF Southern Transcon Corridor
Source: WSP
1.4.2 Sunset Route
The Sunset Route, highlighted by the rectangle in Figure 1-4, is the corridor that is owned and operated
by the UPRR between Los Angeles and El Paso, crossing the southern part of Arizona passing through
Yuma and Tucson. It serves as a key linkage between the West Coast and interior portions of the U.S.
According to UPRR, the Sunset Route handles approximately 20 percent of the railroad’s nationwide
traffic.1 When the UPRR acquired the Sunset Route as part of the purchase of the Southern Pacific
Railroad, most of the rail line was a single track. Since that time, UPRR has been constructing a second
parallel track to accommodate growth in freight traffic. The double tracking of the route is mostly
complete.
1 Union Pacific in Arizona, 2016 Fast Facts, https://www.up.com/cs/groups/public/@uprr/@corprel/documents/up_pdf_nativedocs/pdf_arizona_usguide.pdf.
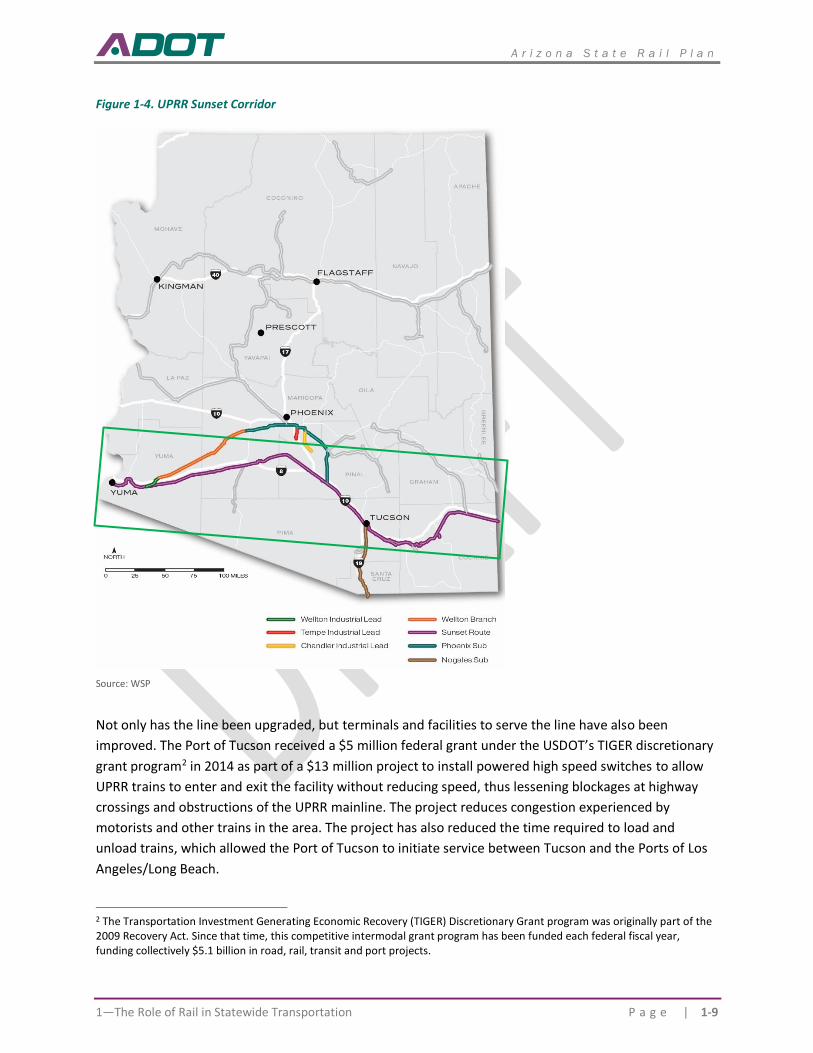
A r i z o n a S t a t e R a i l P l a n
1—The Role of Rail in Statewide Transportation P a g e | 1-9
Figure 1-4. UPRR Sunset Corridor
Source: WSP
Not only has the line been upgraded, but terminals and facilities to serve the line have also been
improved. The Port of Tucson received a $5 million federal grant under the USDOT’s TIGER discretionary
grant program2 in 2014 as part of a $13 million project to install powered high speed switches to allow
UPRR trains to enter and exit the facility without reducing speed, thus lessening blockages at highway
crossings and obstructions of the UPRR mainline. The project reduces congestion experienced by
motorists and other trains in the area. The project has also reduced the time required to load and
unload trains, which allowed the Port of Tucson to initiate service between Tucson and the Ports of Los
Angeles/Long Beach.
2 The Transportation Investment Generating Economic Recovery (TIGER) Discretionary Grant program was originally part of the 2009 Recovery Act. Since that time, this competitive intermodal grant program has been funded each federal fiscal year, funding collectively $5.1 billion in road, rail, transit and port projects.
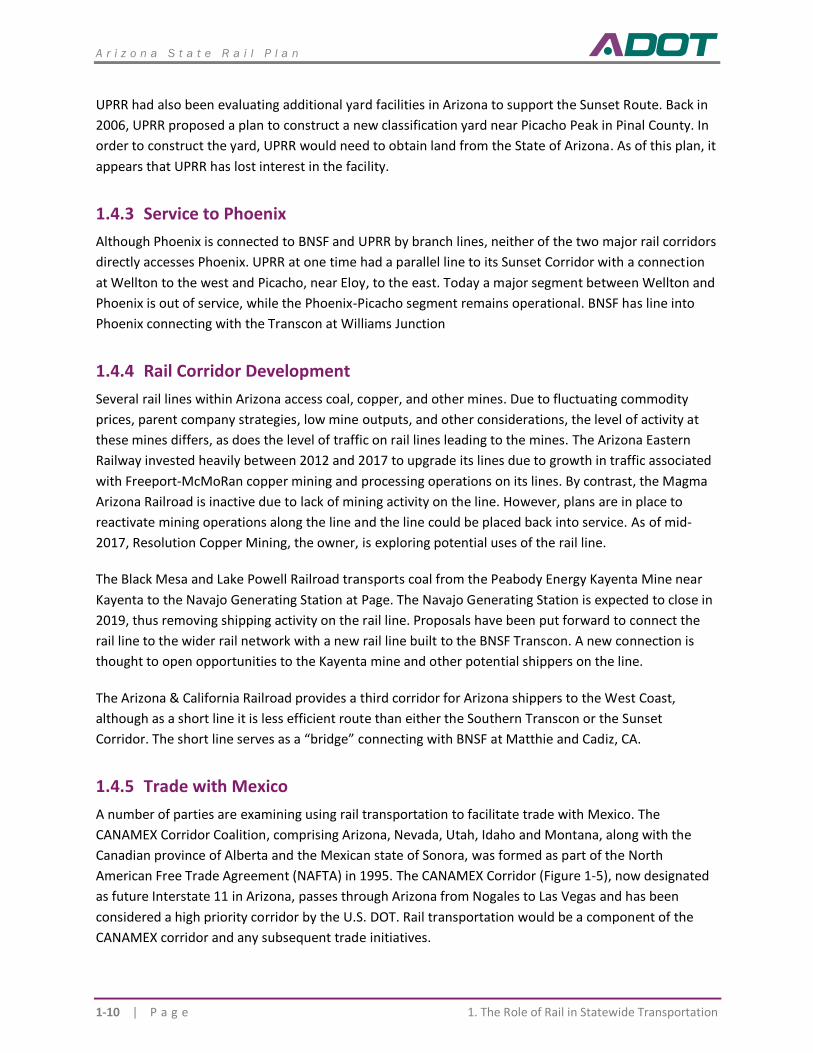
A r i z o n a S t a t e R a i l P l a n
1-10 | P a g e 1. The Role of Rail in Statewide Transportation
UPRR had also been evaluating additional yard facilities in Arizona to support the Sunset Route. Back in
2006, UPRR proposed a plan to construct a new classification yard near Picacho Peak in Pinal County. In
order to construct the yard, UPRR would need to obtain land from the State of Arizona. As of this plan, it
appears that UPRR has lost interest in the facility.
1.4.3 Service to Phoenix
Although Phoenix is connected to BNSF and UPRR by branch lines, neither of the two major rail corridors
directly accesses Phoenix. UPRR at one time had a parallel line to its Sunset Corridor with a connection
at Wellton to the west and Picacho, near Eloy, to the east. Today a major segment between Wellton and
Phoenix is out of service, while the Phoenix-Picacho segment remains operational. BNSF has line into
Phoenix connecting with the Transcon at Williams Junction
1.4.4 Rail Corridor Development
Several rail lines within Arizona access coal, copper, and other mines. Due to fluctuating commodity
prices, parent company strategies, low mine outputs, and other considerations, the level of activity at
these mines differs, as does the level of traffic on rail lines leading to the mines. The Arizona Eastern
Railway invested heavily between 2012 and 2017 to upgrade its lines due to growth in traffic associated
with Freeport-McMoRan copper mining and processing operations on its lines. By contrast, the Magma
Arizona Railroad is inactive due to lack of mining activity on the line. However, plans are in place to
reactivate mining operations along the line and the line could be placed back into service. As of mid-
2017, Resolution Copper Mining, the owner, is exploring potential uses of the rail line.
The Black Mesa and Lake Powell Railroad transports coal from the Peabody Energy Kayenta Mine near
Kayenta to the Navajo Generating Station at Page. The Navajo Generating Station is expected to close in
2019, thus removing shipping activity on the rail line. Proposals have been put forward to connect the
rail line to the wider rail network with a new rail line built to the BNSF Transcon. A new connection is
thought to open opportunities to the Kayenta mine and other potential shippers on the line.
The Arizona & California Railroad provides a third corridor for Arizona shippers to the West Coast,
although as a short line it is less efficient route than either the Southern Transcon or the Sunset
Corridor. The short line serves as a “bridge” connecting with BNSF at Matthie and Cadiz, CA.
1.4.5 Trade with Mexico
A number of parties are examining using rail transportation to facilitate trade with Mexico. The
CANAMEX Corridor Coalition, comprising Arizona, Nevada, Utah, Idaho and Montana, along with the
Canadian province of Alberta and the Mexican state of Sonora, was formed as part of the North
American Free Trade Agreement (NAFTA) in 1995. The CANAMEX Corridor (Figure 1-5), now designated
as future Interstate 11 in Arizona, passes through Arizona from Nogales to Las Vegas and has been
considered a high priority corridor by the U.S. DOT. Rail transportation would be a component of the
CANAMEX corridor and any subsequent trade initiatives.
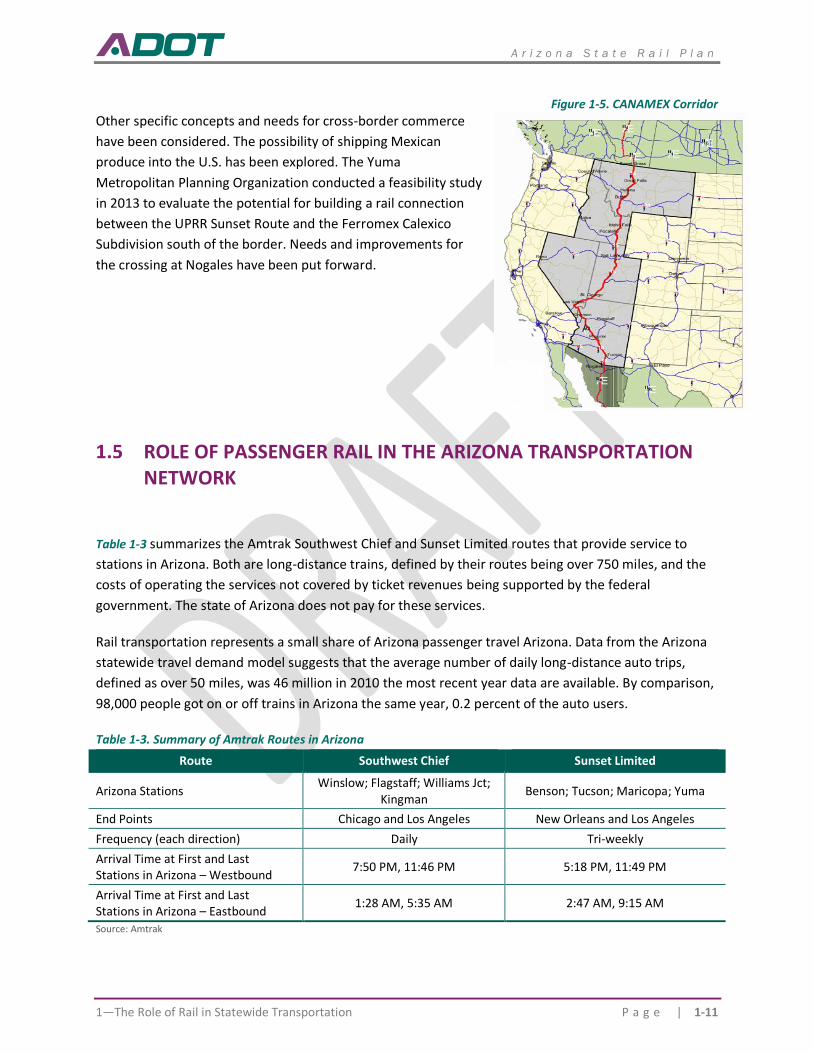
A r i z o n a S t a t e R a i l P l a n
1—The Role of Rail in Statewide Transportation P a g e | 1-11
Figure 1-5. CANAMEX Corridor
Other specific concepts and needs for cross-border commerce
have been considered. The possibility of shipping Mexican
produce into the U.S. has been explored. The Yuma
Metropolitan Planning Organization conducted a feasibility study
in 2013 to evaluate the potential for building a rail connection
between the UPRR Sunset Route and the Ferromex Calexico
Subdivision south of the border. Needs and improvements for
the crossing at Nogales have been put forward.
ROLE OF PASSENGER RAIL IN THE ARIZONA TRANSPORTATION NETWORK
Table 1-3 summarizes the Amtrak Southwest Chief and Sunset Limited routes that provide service to
stations in Arizona. Both are long-distance trains, defined by their routes being over 750 miles, and the
costs of operating the services not covered by ticket revenues being supported by the federal
government. The state of Arizona does not pay for these services.
Rail transportation represents a small share of Arizona passenger travel Arizona. Data from the Arizona
statewide travel demand model suggests that the average number of daily long-distance auto trips,
defined as over 50 miles, was 46 million in 2010 the most recent year data are available. By comparison,
98,000 people got on or off trains in Arizona the same year, 0.2 percent of the auto users.
Table 1-3. Summary of Amtrak Routes in Arizona
Route Southwest Chief Sunset Limited
Arizona Stations Winslow; Flagstaff; Williams Jct;
Kingman Benson; Tucson; Maricopa; Yuma
End Points Chicago and Los Angeles New Orleans and Los Angeles
Frequency (each direction) Daily Tri-weekly
Arrival Time at First and Last Stations in Arizona – Westbound
7:50 PM, 11:46 PM 5:18 PM, 11:49 PM
Arrival Time at First and Last Stations in Arizona – Eastbound
1:28 AM, 5:35 AM 2:47 AM, 9:15 AM
Source: Amtrak
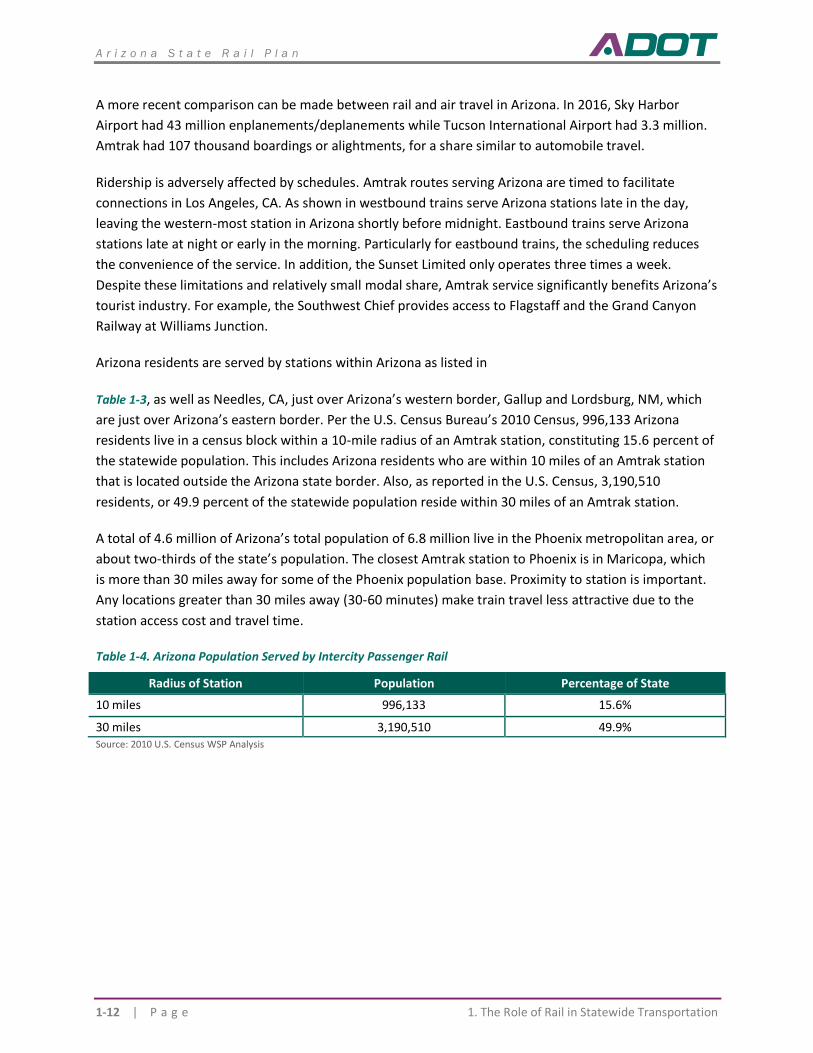
A r i z o n a S t a t e R a i l P l a n
1-12 | P a g e 1. The Role of Rail in Statewide Transportation
A more recent comparison can be made between rail and air travel in Arizona. In 2016, Sky Harbor
Airport had 43 million enplanements/deplanements while Tucson International Airport had 3.3 million.
Amtrak had 107 thousand boardings or alightments, for a share similar to automobile travel.
Ridership is adversely affected by schedules. Amtrak routes serving Arizona are timed to facilitate
connections in Los Angeles, CA. As shown in westbound trains serve Arizona stations late in the day,
leaving the western-most station in Arizona shortly before midnight. Eastbound trains serve Arizona
stations late at night or early in the morning. Particularly for eastbound trains, the scheduling reduces
the convenience of the service. In addition, the Sunset Limited only operates three times a week.
Despite these limitations and relatively small modal share, Amtrak service significantly benefits Arizona’s
tourist industry. For example, the Southwest Chief provides access to Flagstaff and the Grand Canyon
Railway at Williams Junction.
Arizona residents are served by stations within Arizona as listed in
Table 1-3, as well as Needles, CA, just over Arizona’s western border, Gallup and Lordsburg, NM, which
are just over Arizona’s eastern border. Per the U.S. Census Bureau’s 2010 Census, 996,133 Arizona
residents live in a census block within a 10-mile radius of an Amtrak station, constituting 15.6 percent of
the statewide population. This includes Arizona residents who are within 10 miles of an Amtrak station
that is located outside the Arizona state border. Also, as reported in the U.S. Census, 3,190,510
residents, or 49.9 percent of the statewide population reside within 30 miles of an Amtrak station.
A total of 4.6 million of Arizona’s total population of 6.8 million live in the Phoenix metropolitan area, or
about two-thirds of the state’s population. The closest Amtrak station to Phoenix is in Maricopa, which
is more than 30 miles away for some of the Phoenix population base. Proximity to station is important.
Any locations greater than 30 miles away (30-60 minutes) make train travel less attractive due to the
station access cost and travel time.
Table 1-4. Arizona Population Served by Intercity Passenger Rail
Radius of Station Population Percentage of State
10 miles 996,133 15.6%
30 miles 3,190,510 49.9% Source: 2010 U.S. Census WSP Analysis
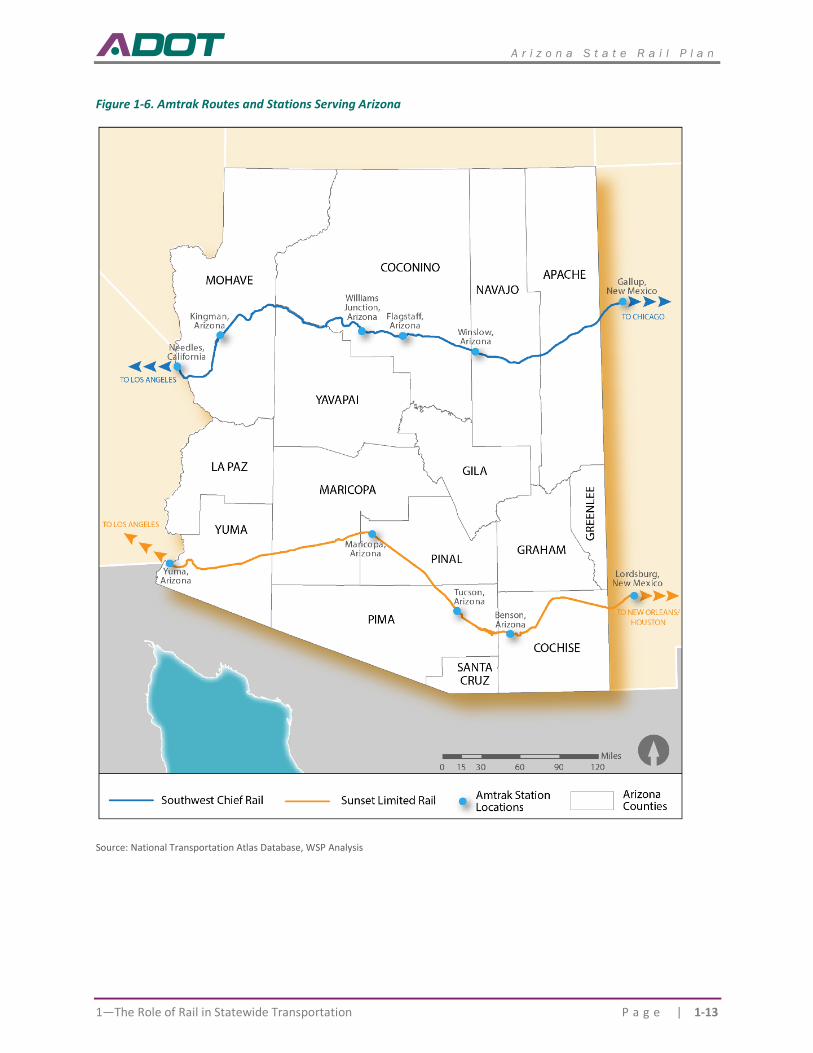
A r i z o n a S t a t e R a i l P l a n
1—The Role of Rail in Statewide Transportation P a g e | 1-13
Figure 1-6. Amtrak Routes and Stations Serving Arizona
Source: National Transportation Atlas Database, WSP Analysis
A r i z o n a S t a t e R a i l P l a n
1-14 | P a g e 1. The Role of Rail in Statewide Transportation
PASSENGER RAIL INITIATIVES AND PLANS
1.6.1 Intercity Passenger Rail Initiatives and Plans
The Arizona Passenger Rail Corridor Study began in 2011 and assessed the feasibility of a passenger rail
service operating between Tucson and Phoenix. A Tier 1 Draft Environmental Impact Statement (DEIS)
was published in September 2015, which documented the environmental considerations related to two
“build” alternatives and a “no-build” alternative. The decision to pursue the alternatives in the DEIS
resulted less from technical analyses and more from public and agency input, including surveys received
from over 10,000 people across Arizona. ADOT, in coordination with the FRA, has completed a Tier 1
Final Environmental Impact Statement, and the FRA has signed a Record of Decision. One of the
alternatives has been selected and routing options will be further reviewed during a Tier 2
environmental review. As of 2019, no funding or construction schedule has been established for the
project, and funding will need to be identified for the project to move forward.
ADOT participated in the Southwest Multi-State Rail Planning Study (SW Study)3, which included
California, Nevada, and Arizona. This study was the first of a series of regional studies to be conducted
by the FRA and represents one part of FRA’s action plan to complete requirements associated with PRIIA
(Passenger Rail Investment and Improvement Act of 2008). In this study, FRA sought to test a series of
tools that FRA hopes will aid with regional rail planning nationwide. The SW Study content:
◼ Inventoried long-distance travel studies in the area;
◼ Identified potential future travel and economic activity;
◼ Applied a network tool to provide sketch-plan evaluation of a range of intercity travel options;
◼ Facilitated workshops and working sessions with a stakeholder group.
The SW Study developed a vision for a future intercity passenger rail network in the Southwest.
1.6.2 Commuter Rail Initiatives and Plans
In 2004, voters in Maricopa County approved Proposition 400, which among other provisions included
funding for a study to assess the feasibility of establishing commuter rail service in the region. The
Commuter Rail Strategic Plan was published in 2009, and based upon this plan the Maricopa Association
of Governments (MAG) commissioned three additional planning studies: The Systems Study, Grand
Avenue Corridor Study, and the Yuma West Corridor Study. They were completed in the Spring of 2010.
In 2017 MAG managed the Regional Commuter Rail System Study Update, the purpose of which was to
revise data from the original Commuter Rail System Study, and to investigate governance and
indemnity/liability issues related to passenger rail implementation.
3 https://cms8.fra.dot.gov/elibrary/sw-study-technical-background-report
A r i z o n a S t a t e R a i l P l a n
1—The Role of Rail in Statewide Transportation P a g e | 1-15
INSTITUTIONAL GOVERNANCE STRUCTURE OF RAIL IN ARIZONA
1.7.1 ADOT’s Legislative Rail Authority and Organization
The Arizona Revised Statutes list, among ADOT’s many duties, “Do multimodal state transportation
planning, cooperate and coordinate transportation planning with local governments.”4 These duties
include rail planning. ADOT serves as the State Rail Transportation Authority responsible for preparing,
maintaining, coordinating, and administering the SRP as well as the State Rail Plan Approval Authority,
which will be responsible for reviewing and approving the SRP.
Figure 1-7 provides a general overview of ADOT’s organization. Organizations that support rail include:
◼ Multimodal Planning Division is responsible for a variety of planning functions including the
preparation of this SRP. Within the Multimodal Planning Division, Planning and Programming
develops the Statewide Transportation Improvement Plan (STIP), the Multimodal Long-Range Plan,
performs freight planning, coordinates bicycle and pedestrian programs, works with tribes and local
planning agencies. With the exception of the STIP, components of each of these activities are
relevant to rail. The Major Projects Group coordinates planning associated with specific projects,
including rail projects.
◼ P3/International has dual responsibilities. The office coordinates public-private partnership (P3)
initiatives, where the private sector assumes some or all of a project’s risks and responsibilities that
would traditionally be borne by ADOT. If a passenger rail service were to be initiated in Arizona in
the future, these P3 functions could be relevant to rail. A private company could assume
construction, operation, and financing activities to support passenger rail that would traditionally be
the responsibility of the public sector. The office also represents ADOT as a party to international
initiatives. ADOT investigates ways that transportation infrastructure, including rail, can support
cross-border commerce and economic development. ADOT is a lead agency in the Transportation
and Trade Corridor Alliance (TTCA) which serves as the state’s freight advisory committee as
federally mandated under the FAST Act. Through the TTCA, ADOT is tasked by the Governor of
Arizona, to work collaboratively with the Arizona-Mexico Commission (AMC), Arizona Commerce
Authority (ACA) and Arizona Office of Tourism and other stakeholders to assess the viability of
opportunities in trade, transportation, logistics, and supply chain management.
◼ Utility and Railroad Engineering Section within the Infrastructure Delivery and Operations Division
coordinates ADOT activities with railroads. The Utility and Railroad Engineering section develops
agreements with railroads if ADOT projects impact or require access to railroad property. This group
is also responsible for maintaining the Statewide Railroad Crossing Inventory and administering the
Federal Highway-Railroad Grade Crossing Safety Program (Section 130).
4 Arizona Revised Statutes, §28-332.
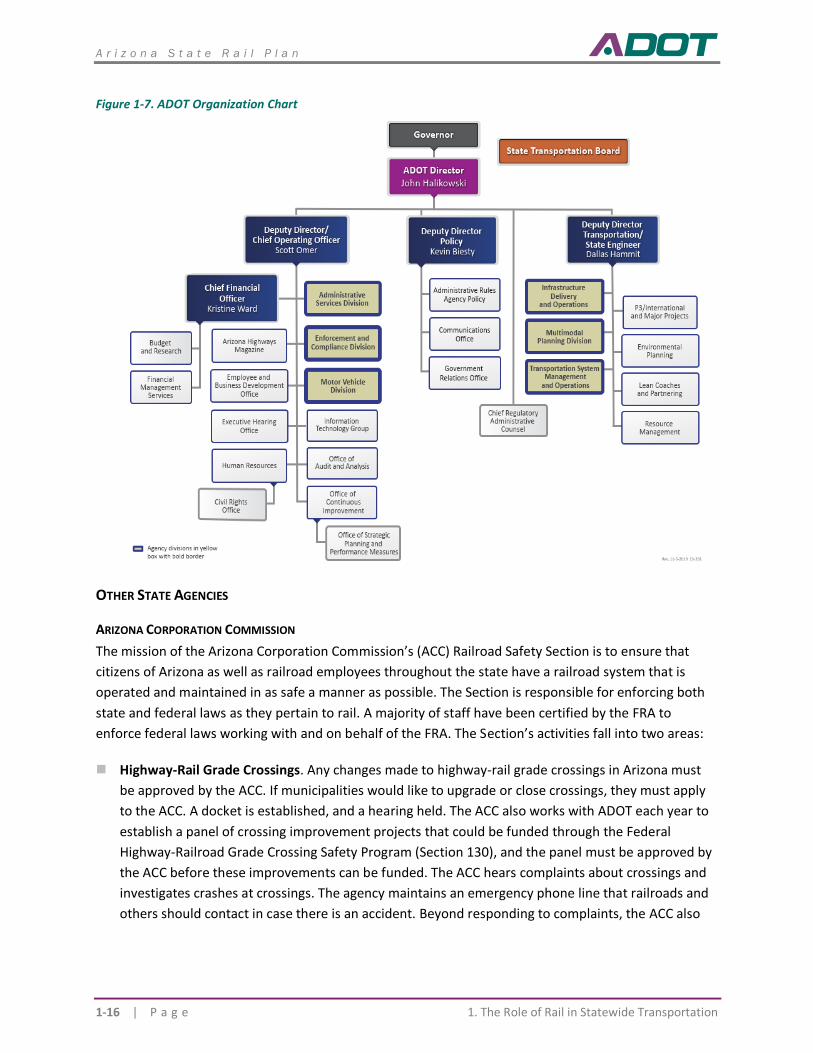
A r i z o n a S t a t e R a i l P l a n
1-16 | P a g e 1. The Role of Rail in Statewide Transportation
Figure 1-7. ADOT Organization Chart
OTHER STATE AGENCIES
ARIZONA CORPORATION COMMISSION
The mission of the Arizona Corporation Commission’s (ACC) Railroad Safety Section is to ensure that
citizens of Arizona as well as railroad employees throughout the state have a railroad system that is
operated and maintained in as safe a manner as possible. The Section is responsible for enforcing both
state and federal laws as they pertain to rail. A majority of staff have been certified by the FRA to
enforce federal laws working with and on behalf of the FRA. The Section’s activities fall into two areas:
◼ Highway-Rail Grade Crossings. Any changes made to highway-rail grade crossings in Arizona must
be approved by the ACC. If municipalities would like to upgrade or close crossings, they must apply
to the ACC. A docket is established, and a hearing held. The ACC also works with ADOT each year to
establish a panel of crossing improvement projects that could be funded through the Federal
Highway-Railroad Grade Crossing Safety Program (Section 130), and the panel must be approved by
the ACC before these improvements can be funded. The ACC hears complaints about crossings and
investigates crashes at crossings. The agency maintains an emergency phone line that railroads and
others should contact in case there is an accident. Beyond responding to complaints, the ACC also
A r i z o n a S t a t e R a i l P l a n
1—The Role of Rail in Statewide Transportation P a g e | 1-17
conducts routine inspections of crossings, crossing warning signals, train control signals and devices
to ensure that they meet federal and state requirements.
◼ Other Railroad Infrastructure and Practices. The ACC investigates accidents, receives complaints,
and conducts inspections beyond highway-rail grade crossings. ACC staff inspect track, locomotives,
shipments of hazardous materials, and railroad operating practices to ensure compliance with
applicable federal and state laws.
ARIZONA COMMERCE AUTHORITY
The Arizona Commerce Authority (ACA) is the state’s lead agency to promote economic development in
Arizona. The ACA takes part in corridor and multinational studies that analyze how infrastructure could
be leveraged to drive economic development, including rail infrastructure. It also seeks to inform
potential companies moving to Arizona of rail assets.
INTERNATIONAL ORGANIZATIONS
ADOT, the ACA and other organizations support rail transportation through membership in cross-border
organizations.
◼ Arizona-Mexico Commission’s mission is to improve the economic prosperity and quality life for
Arizonans through collaborations in advocacy, trade, networking, and information. The ADOT
Director is a co-chair of the Transportation, Infrastructure & Ports Committee. The Arizona
committee is partnered with a counterpart committee in Mexico, through the Arizona-Mexico
Commission’s partner organization, the Comisión Sonora-Arizona. The Transportation, Infrastructure
& Ports committee has developed action items, plans and sponsored summits to explore
improvements to support cross-border commerce.
◼ U.S.-Mexico Joint Working Committee on Transportation Planning is a binational group whose
primary focus is to cooperate on land transportation planning and the facilitation of efficient, safe,
and economical cross-border transportation movements. It is headed by the U.S. Federal Highway
Administration and the Mexican Secretaría de Comunicaciones y Transportes, but also includes the
U.S. Department of State, its counterpart in Mexico, and departments of transportation from
bordering states in the U.S. and Mexico, including Arizona. The group seeks to establish methods
and procedures to analyze infrastructure needs, evaluate transportation demand and resulting
transportation impacts. While the committee’s focus is primarily on roadway transportation,
activities could also be relevant to rail.
LOCAL AND REGIONAL AGENCIES
A range of local and regional government entities can support rail in Arizona through planning and other
activities. As an example, Pima County partnered with the Port of Tucson to support a successful TIGER
grant application to improve intermodal service into and out of the Port of Tucson.
A r i z o n a S t a t e R a i l P l a n
1-18 | P a g e 1. The Role of Rail in Statewide Transportation
COUNCILS OF GOVERNMENT
Within Arizona are six Councils of Governments (COGs). COGS are associations of municipal tribal and
county, and tribal governments that provide communication, policymaking, coordination, advocacy and
technical assistance across jurisdictions. In rural areas of Arizona, the COGs perform planning services
and direct service functions such as operating the Area Agency on Aging, the Head Start programs and
employment programs. The boundaries of Arizona’s COGs were established through Executive Order by
the Arizona governor in 1970. Planning activities can pertain to rail, and COGs can apply for federal
funding relevant to rail. The COG are:
◼ Central Arizona Governments (CAG)
◼ Maricopa Association of Governments (MAG)
◼ Northern Arizona Council of Governments (NACOG)
◼ Pima Association of Governments (PAG)
◼ Southeastern Arizona Governments Organization (SEAGO)
◼ Western Arizona Council of Governments (WACOG)
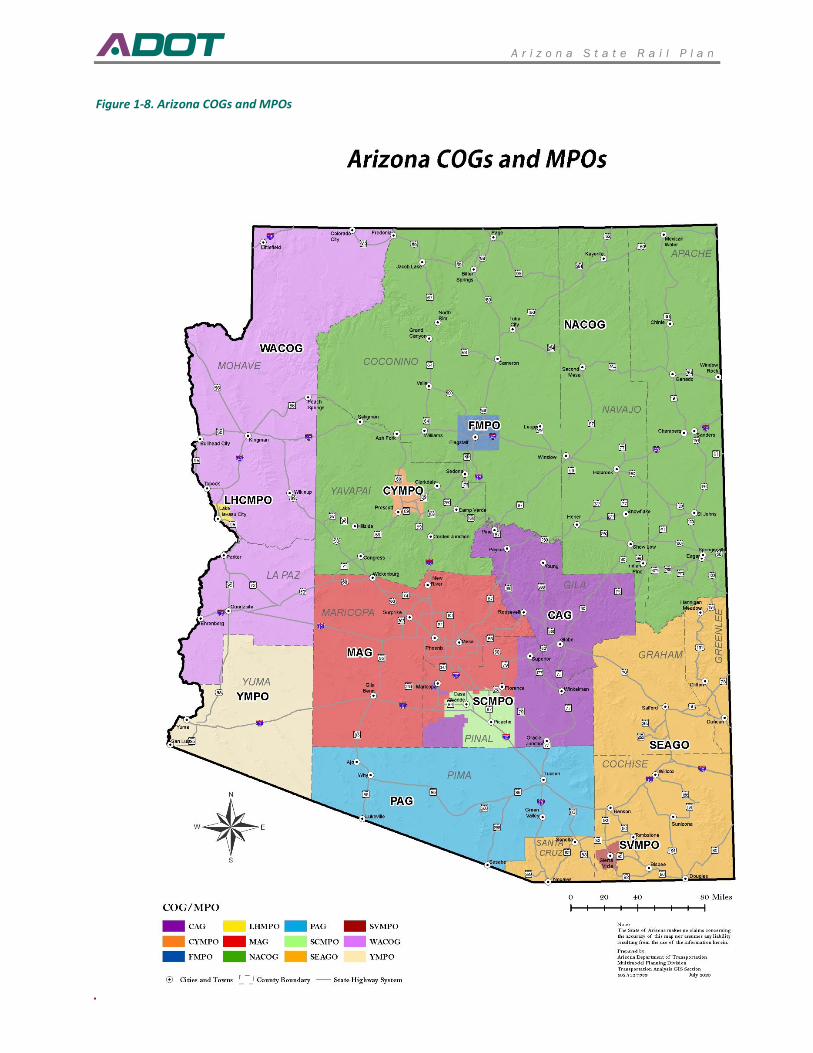
A r i z o n a S t a t e R a i l P l a n
1—The Role of Rail in Statewide Transportation P a g e | 1-19
Figure 1-8. Arizona COGs and MPOs
A r i z o n a S t a t e R a i l P l a n
1-20 | P a g e 1. The Role of Rail in Statewide Transportation
METROPOLITAN PLANNING ORGANIZATIONS
Eight Metropolitan Planning Organizations (MPOs) are located in Arizona. MPOs are required by federal
law for urbanized areas with 50,000 or more population. MPOs are required to evaluate transportation
alternatives, develop a Metropolitan Transportation Plan and a Transportation Improvement Plan, and
involve the stakeholders and the public in the planning process. In the case of MAG and PAG, the COG
and the MPO are the same organization. Similar to COGs, MPOs can include rail within their planning
activities and can sponsor funding applications for rail projects. The MPOs are:
◼ Maricopa Association of Governments (MAG)
◼ Pima Association of Governments (PAG)
◼ Yuma Metropolitan Planning Organization (YMPO)
◼ Flagstaff Metropolitan Planning Organization (FMPO)
◼ Central Yavapai Metropolitan Planning Organization (CYMPO)
◼ Lake Havasu Metropolitan Planning Organization (LHMPO)
◼ Sun Corridor Metropolitan Planning Organization (SCMPO)
◼ Sierra Vista Metropolitan Planning Organization (SVMPO)
Arizona’s COGs and MPOs are shown in Figure 1-8
TRIBAL NATIONS
Arizona is also home to twenty-two sovereign American Indian communities. Total reservation land
covers over a quarter of the state. Most of this land is owned by the U.S. government and held in trust
for usage by the tribes. Native American communities have an interest in the rail lines that cross through
tribal lands in terms of potential economic development, safety, and other issues.
OTHER
Other organizations support rail transportation as well. One example is the Kingman Airport Authority,
which owns a rail-served industrial park outside of Kingman, Arizona. Over 1,500 carloads originate or
terminate in the park per year. Kingman Airport Authority, Inc. is a not-for-profit corporation that leases
the airport and industrial park from the City of Kingman for management purposes. The Kingman Airport
Authority was originally created by Mojave County but now operates independently, leasing property
from the City of Kingman. The Authority’s Board of Directors is made up of local business leaders. Rail
improvements at the industrial park have been funded by selling land parcels in the park. The Airport
Authority facilitates the sale of the property for the City of Kingman by completing all paperwork for
public auctions that the City Council conducts. Patriot Rail Company’s subsidiary, Kingman Terminal
Railroad, provides rail switching service in the park.
A r i z o n a S t a t e R a i l P l a n
1—The Role of Rail in Statewide Transportation P a g e | 1-21
PUBLIC FUNDING AND FINANCING OF RAIL PROJECTS
1.8.1 State and Local Funding of Rail Projects in Arizona
Arizona does not fund rail services. No commuter rail services operate in the state, and existing intercity
passenger rail services in Arizona are funded by ticket revenues and federal subsidies. The Arizona
constitution states that:
Neither the state, nor any county, city, town, municipality, or other subdivision of the
state shall ever give or loan its credit in the aid of, or make any donation or grant, by
subsidy or otherwise, to any individual, association, or corporation.
Because freight railroads are private companies, the “gifting clause” of the Arizona state constitution
severely limits the state’s ability to fund freight rail projects. The practical implication of Arizona’s gifting
clause is that government payments to private companies can only be considered constitutional if the
resulting value to the state can be proven to exceed the amount that was paid to the private entity.
Projects will also be more likely to violate the gifting clause if they benefit a specific company, rather
than members of the general public that happened to take advantage of the project. In general, ADOT
would not invest in infrastructure projects unless the benefits outweigh the costs, but for freight rail
projects, the nature of the benefits (economic competitiveness, safety, environmental savings, reduced
need for highway capacity and damage) make it difficult to prove and guarantee value to the state.
Often the benefits that accrue to freight rail projects are not direct financial benefits to state and local
governments (e.g. increased tax revenues), but a more generalized set of benefits associated with
reduced truck traffic and improvements to freight capacity and fluidity, improved economic
competitiveness. In recent years, a number of economic development initiatives have been challenged
for their adherence to the gifting clause, including a loan to maintain operations on a short line railroad.5
1.8.2 Federal Funding Sources
HIGHWAY-RAIL CROSSINGS PROGRAM (SECTION 130)
ADOT’s Utility and Railroad Section administers the federal aid Highway Rail Crossing Program, which is
authorized by United States Code Title 23, Section 130. The goal of this fund, commonly referred to as
Section 130, is to reduce the crash risk at public highway-rail grade crossings. Nationwide, safety at
highway-rail grade crossings has been improved by projects funded with Section 130 assistance. The
number of crashes at public crossings is less than half what it was in 1980.6
Typical highway rail crossing upgrades using Section 130 funds fall into two categories:
5 Nick Worth, The Tribune-News Silver Creek Herald, “Goldwater Institute Takes Aim at Loan for Apache Railway,” April 2,
2014. 6 Source: Bureau of Transportation Statistics,
https://www.rita.dot.gov/bts/sites/rita.dot.gov.bts/files/publications/national_transportation_statistics/html/table_02_0
3.html
A r i z o n a S t a t e R a i l P l a n
1-22 | P a g e 1. The Role of Rail in Statewide Transportation
◼ At crossings with passive protection (such as crossbucks and/or stop signs), projects to install train-
activated warning devices. Usually, warning bells, flashing lights, overhead cantilevers with flashing
lights, and gates are installed.
◼ At crossings with existing train-activated protection (such as flashing lights and/or gates), projects to
upgrade the existing protections or add a median barrier (to prevent motorists from driving around
lowered gates) or other enhancements to reduce crash risk.
Section 130 improvements require 10 percent matching funds by local government authorities. Arizona
receives on average $2.3 million in Section 130 funds per year.
TIGER GRANT PROGRAM
Beyond highway-rail safety improvement funds, over the past seven years, the most frequently used
source of federal funding source for rail projects has been the TIGER (Transportation Investment
Generating Economic Recovery) program.
TIGER is a highly-competitive grant program that provides funding for road, rail, transit, bike/pedestrian,
and port projects that support economic development, state of good repair, quality of life, sustainability,
and safety. The fiscal year 2017 TIGER solicitation is funded at $500 million. Since the program started,
approximately 21 percent of TIGER funding has gone to freight rail projects, and approximately
28 percent of TIGER funding has gone to transit projects.
Past projects have ranged in size and scope from under $10 million for rural freight rail rehabilitation
projects to up to a $98 million grant to create double-stack capacity along the MD-WV-PA-OH National
Gateway rail corridor, and $100 million to address freight rail congestion in the Chicago area. In Arizona,
two rail-related projects have been funded by a TIGER grant since the program began in 2009:
◼ $5 million awarded to Pima County in 2013 to extend the Wilmot siding and install high-powered
switches to eliminate the need to slow and stop arriving trains at the Port of Tucson Container
Export Rail Facility.
◼ $15 million awarded to ADOT in 2015 for a grade-separation project of the four-lane SR347 over a
double track rail line. This project also relocated an existing Amtrak station.
Demand for TIGER funding exceeds available funds, with only seven percent of applications being
awarded each year.
FAST ACT
The most recent transportation authorization bill, the 2015 Fixing America’s Surface Transportation Act
(FAST Act), included several new rail programs.
A r i z o n a S t a t e R a i l P l a n
1—The Role of Rail in Statewide Transportation P a g e | 1-23
NATIONAL HIGHWAY FREIGHT PROGRAM (FAST ACT SECTION 1116; 23 USC 167)
Funded at $1.1 to $1.5 billion annually for federal FY2016 through FY2020, the new National Highway
Freight Program (NHFP) is intended to improve the efficient movement of freight on the National
Highway Freight Network (NHFN), and support investment in infrastructure and operational
improvements that strengthen economic competitiveness, reduce congestion, reduce the cost of freight
transportation, and improve safety.7 While the program is focused on highway projects, up to
10 percent of a state’s apportionment can be spent on rail, port, and intermodal projects.
Eligible projects include a wide range of activities, including but not limited to planning, environmental
review, environmental mitigation, acquisition of real property, acquisition of equipment,
implementation of intelligent transportation systems, border security technology, resiliency projects,
and construction of highway, rail, port, and intermodal projects, including highway-rail grade
separations.
INFRA GRANT PROGRAM
◼ Infrastructure for Rebuilding America (INFRA) is a grant program established by the FAST Act to
provide funding for the Nationally Significant Freight and Highway Projects (NSFHP). INFRA is a
competitive grant program similar to TIGER, but is focused specifically on freight: highway, rail and
intermodal projects of regional or national significance. Its four goals are:
◼ Support economic vitality on a national or regional level (including improving safety, mobility, and
state-of-good repair on transportation facilities)
◼ Innovation in project design or delivery
◼ Utilization of non-federal funds for infrastructure
◼ Promoting accountability for performance outcomes for federal grant recipients
Funding for the current round (applications due February 25, 2020) is $906 million.
As with TIGER, grants INFRA (formerly FASTLANE) is oversubscribed, with 212 applications requesting a
total of $9.8 billion in the first year of the program (FY2016), during which 18 grantees received $768
7 The FAST Act requires the establishment of a National Highway Freight Network, which will consist of the following components:
• The Primary Highway Freight System (PHFS)
• Critical Rural Freight Corridors
• Critical Urban Freight Corridors
• Those portions of the Interstate System that are not part of the PHFS The FAST Act designates the PHFS and requires FHWA to redesignate it every five years. It also provides for designation of Critical Rural Freight Corridors and Critical Urban Freight Corridors. [23 USC 167(d)-(f)]
A r i z o n a S t a t e R a i l P l a n
1-24 | P a g e 1. The Role of Rail in Statewide Transportation
million in awards.8 About $306 million were for rail-related projects. Arizona won one of the 18 awards,
$54 million for a highway project improving sections of I-10.
FAST ACT FRA PROGRAMS
The FAST Act authorized $2.2 billion over five years (FY2016-FY2020) for three new FRA competitive
grant programs.
◼ Consolidated Rail Infrastructure and Safety Improvements (CRISI) (Sec. 11301): Goals are to improve
the safety, efficiency, and reliability of passenger and freight rail systems. Eligible activities include a
wide range of capital, regional, and corridor planning, environmental analyses, research, workforce
development, and training projects. Over $1.1 billion was authorized over FY2016-FY2020.
◼ Federal-State Partnership for State of Good Repair (Sec. 11302): Intended to reduce the state of
good repair backlog on publicly-owned or Amtrak-owned infrastructure, equipment, and facilities.
Eligible activities include capital projects to (1) replace existing assets in-kind or with assets that
increase capacity or service levels, (2) ensure that service can be maintained while existing assets
are brought into a state of good repair, and (3) bring existing assets to a state of good repair.
Approximately $1.0 billion authorized over FY2016-FY2020.
◼ Restoration and Enhancement Grants (Sec. 11303): Created to provide operating assistance to
initiate, restore or enhance intercity passenger rail transportation. Grants are limited to three years
of operating assistance per route and may not be renewed. Authorized at $20 million annually
through FY2020. Positive Train Control Implementation Grant Program
Section 3028 of the FAST Act authorized funding for implementation of Positive Train Control (PTC).
Selection criteria for this competitive grant program include safety as well as promoting economic
competitiveness and enhancing quality of life and economic opportunity. A 20 percent local match is
required. In August 2016, FRA awarded $25 million in competitive grants for the program in FY2016. For
FY2017, $197 million in grants were given to 17 projects in 13 states. None were in Arizona.
RAILROAD SAFETY INFRASTRUCTURE IMPROVEMENT GRANT
In Federal FY2016 Congress appropriated $25 million for the Rail Safety Infrastructure Improvements
Grant program to improve the safety of rail infrastructure. A total of 23 projects in 14 states and the
District of Columbia received awards. None were in Arizona.
EDA GRANTS
The U.S. Economic Development Administration (EDA) offers a number of grant and loan assistance
programs to support local organizations with economic development.9 EDA assistance is targeted to
distressed communities. Two EDA grant programs are the Public Works program and the Economic
Adjustment Assistance (EAA) Program.
8 This is based on the “Proposed FY2016 FASTLANE Project Awards” (http://transportation.house.gov/uploadedfiles/fastlane_project_awards_7.1.pdf) and is subject to revision. 9 For additional detail, see the EDA website: https://www.eda.gov/programs/eda-programs/
A r i z o n a S t a t e R a i l P l a n
1—The Role of Rail in Statewide Transportation P a g e | 1-25
◼ The Public Works program seeks to help distressed communities revitalize, expand, and upgrade
their physical infrastructure to attract new industry or diversify the economy. It can also be used to
purchase land to support establishment or expansion of industrial or commercial enterprises.
◼ The EAA program provides a wide range of technical, planning, and infrastructure assistance to
regions experiencing adverse economic changes resulting from a steep decline in manufacturing
employment, changes in trade patterns, major natural disasters, military base closures, or
environmental changes and regulations.
Both programs fund rail projects.
CMAQ
The Federal Highway Administration’s Congestion Mitigation and Air Quality (CMAQ) program provides
a flexible funding source to State and local governments for transportation projects and programs to
help meet the requirements of the Clean Air Act. Funding is available to reduce congestion and improve
air quality for areas that do not meet the National Ambient Air Quality Standards (NAAQS) for ozone,
carbon monoxide or particulate matter (nonattainment areas), and for former nonattainment areas that
are now in compliance (so-called “maintenance” areas).
Eight Arizona counties10 are in non-compliance or maintenance for ozone and/or particulate matter, and
are thus eligible to receive CMAQ funding for projects that reduce vehicular emissions.
The FAST Act apportioned $2.3–$2.5 billion per year for this program from FY2016 through FY2020.
Funds may be used for both passenger and freight rail capital expenditures as long as the projects have
an air quality benefit. Examples of CMAQ-funded freight rail projects include intermodal facilities, diesel
engine retrofits, idle-reduction projects in rail yards, and rail track rehabilitation.
FTA FUNDING
Arizona’s transit programs receive federal funding from the Federal Transit Administration (FTA) through
the Section 5307 (urbanized area) formula grants, Section 5337 (State of Good Repair) and Section 5309
(fixed guideway modernization) federal programs. The scope of this Rail Plan covers commuter rail, but
not light rail/streetcars, such as are in place in Tucson and Phoenix. Currently, a commuter rail plan is in
the planning stage for Phoenix. If the system progresses, it will likely seek funding to establish the
service through the FTA 5309 Fixed Guideway Capital Investment Grants program. Once the service is
established, ongoing federal subsidies would be provided by the Section 5307 and Section 5337 formula
grant programs.
1.8.3 Federal Financing Programs
In addition to grant funding, credit assistance can help bridge the gap between project costs and
project-related revenues for freight rail improvement projects. Credit assistance can be in the form of
10 Table of counties and pollutants: https://www3.epa.gov/airquality/greenbook/anayo_az.html
A r i z o n a S t a t e R a i l P l a n
1-26 | P a g e 1. The Role of Rail in Statewide Transportation
loan guarantees, or could be direct loans with favorable terms, including low-interest rates, long
payback periods, and/or payment schedules that do not begin until after construction is completed.
RAILROAD REHABILITATION AND IMPROVEMENT FINANCING
The FRA’s Railroad Rehabilitation and Improvement Financing (RRIF) program provides direct loans and
loan guarantees to finance development of railroad infrastructure. The program is funded up to $35.0
billion, with $7.0 billion reserved for projects benefiting non-Class I railroads. Currently this program is
undersubscribed, with only $2.7 billion in outstanding loans, most to Class II and III railroads. Most
sources indicate that an excessively long approval period (averaging 13 months11) is a reason for the
program’s underutilization.
RRIF was re-authorized under the FAST Act in December 2015, which expanded RRIF to allow financing
of transit oriented development (TOD) elements of passenger rail projects, and to shorten review times
and provide more transparency in the process. The FAST Act also included provisions to speed up
environmental reviews, which may also help increase the program’s utilization.
While new program guidance is being developed, RRIF is proceeding under the existing guidance.
RRIF can be used for projects that:
◼ Acquire, improve, or rehabilitate intermodal or rail equipment or facilities, including track,
components of track, bridges, yards buildings and shops
◼ Refinance outstanding debt incurred for the purposes listed above
◼ Develop or establish new intermodal or railroad facilities
Direct loans may be used to fund up to 100 percent of a railroad project with repayment periods of up
to 35 years, and at favorable interest rates (possibly as low as the U.S. Treasury rate). Eligible borrowers
include railroads, state and local governments, government-sponsored authorities and corporations,
joint ventures that include at least one railroad, and limited option freight shippers who intend to
construct a new rail connection.
The FRA will give priority to projects that provide public benefits, including benefits to public safety, the
environment and economic development. Additional criteria for approving the loans include the
creditworthiness of the applicant and project service/capacity impacts.
The RRIF Express program is particularly designed for Class II and Class III railroads as the only eligible
applicants (including joint ventures that include one Class II and Class III railroad entity as eligible
applicant). RRIF Express aims to reduce the time and costs associated with securing loans to modernize
aging freight rail infrastructure. Introduced in December 2019, the USDOT plans to solicit applications
11 Two examples: https://www.narprail.org/news/blog/section-by-section-analysis-of-fast-act/ http://usa.streetsblog.org/2011/02/18/in-age-of-s%C2%ADpending-cuts-why-are-billions-of-federal-rail-dollars-going-unused/ http://cs.trains.com/trn/b/observation-tower/archive/2015/07/28/to-extend-or-not-to-extend-the-ptc-deadline-the-question-dividing-the-industry.aspx
A r i z o n a S t a t e R a i l P l a n
1—The Role of Rail in Statewide Transportation P a g e | 1-27
for loans from January 2020 to April 2020. Due to low cost of financing (2.25%) and expedited
processing times, the program encourages borrowers that have a well-documented financial history to
finance projects with easily identified revenue streams for loan repayment. Eligible project elements
include track improvement, bridge rehabilitation, rolling stock acquisition, planning and design, and
refinancing nonfederal debt.
TIFIA
The federal Transportation Infrastructure Finance and Innovation Act (TIFIA) is a broad-based credit
program, providing federal credit assistance to a wide range of surface transportation projects, including
highway, transit, intercity passenger rail, some types of freight rail, intermodal freight transfer facilities,
and port terminals. The FAST Act also added TOD to the list of eligible projects under TIFIA.
TIFIA leverages federal dollars by facilitating private participation in transportation projects and
encouraging innovative financing mechanisms that help advance projects more quickly. The FAST Act
continues this program, with funding of $275 to $300 million per year through 2020. While the FAST Act
decreases annual funding to the TIFIA program, it also reduces the minimum project size for TIFIA,
expands eligibility to include infrastructure for TOD development near transit stations, provides funding
to cover the loan evaluation costs typically borne by the borrower, and provides flexibility to States to
use Federal formula dollars to cover credit subsidy costs. Eligible recipients include states,
municipalities, public authorities, and private entities undertaking projects sponsored by public
authorities.
TIFIA provides three types of financial assistance:
◼ Secured loans offering flexible repayment terms (e.g., loan payments delayed for a set number of
months or years during the construction phase)
◼ Loan guarantees, which lend the full-faith-and-credit of the U.S. Government to loans provided by
institutional investors such as pension funds.
◼ Lines of credit, which are contingent sources of funding in the form of Federal loans that may be
drawn upon to supplement project revenues, if needed, during the first ten years of project
operations.
TIFIA cannot provide lines of credit or loans of more than 33 percent and 49 percent of a project,
respectively. In addition, projects must be no more than 80 percent federally funded overall.

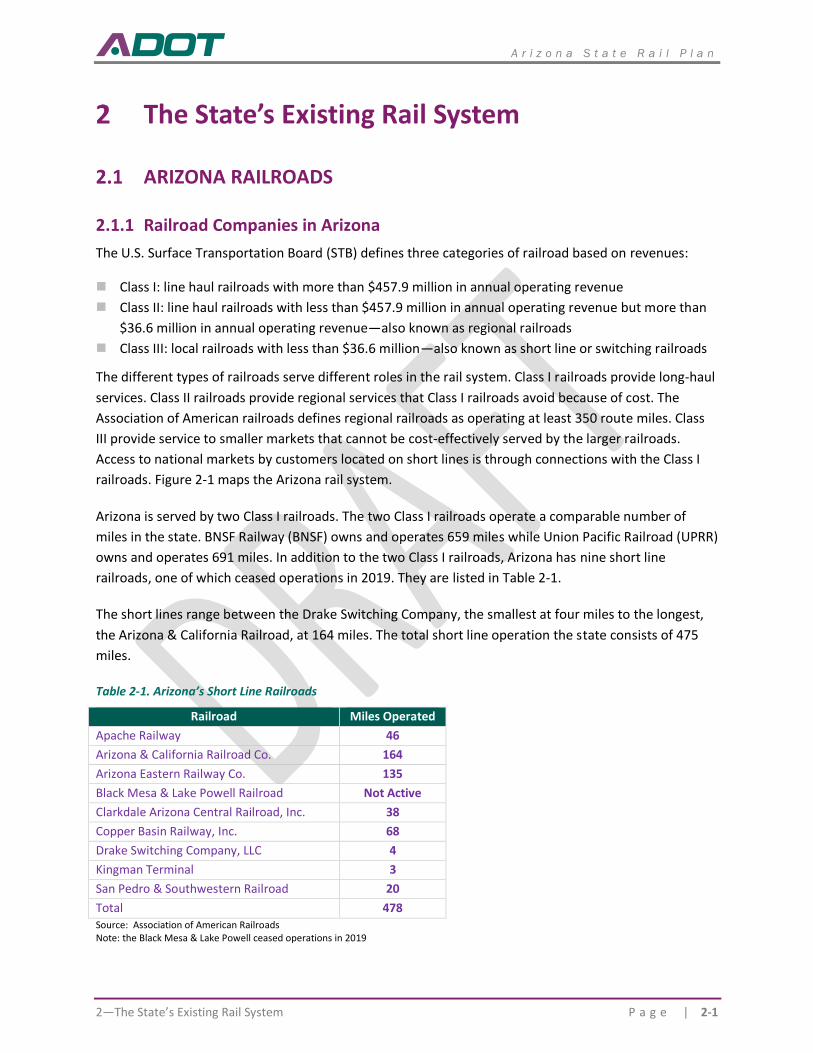
A r i z o n a S t a t e R a i l P l a n
2—The State’s Existing Rail System P a g e | 2-1
The State’s Existing Rail System
ARIZONA RAILROADS
2.1.1 Railroad Companies in Arizona
The U.S. Surface Transportation Board (STB) defines three categories of railroad based on revenues:
◼ Class I: line haul railroads with more than $457.9 million in annual operating revenue
◼ Class II: line haul railroads with less than $457.9 million in annual operating revenue but more than
$36.6 million in annual operating revenue—also known as regional railroads
◼ Class III: local railroads with less than $36.6 million—also known as short line or switching railroads
The different types of railroads serve different roles in the rail system. Class I railroads provide long-haul
services. Class II railroads provide regional services that Class I railroads avoid because of cost. The
Association of American railroads defines regional railroads as operating at least 350 route miles. Class
III provide service to smaller markets that cannot be cost-effectively served by the larger railroads.
Access to national markets by customers located on short lines is through connections with the Class I
railroads. Figure 2-1 maps the Arizona rail system.
Arizona is served by two Class I railroads. The two Class I railroads operate a comparable number of
miles in the state. BNSF Railway (BNSF) owns and operates 659 miles while Union Pacific Railroad (UPRR)
owns and operates 691 miles. In addition to the two Class I railroads, Arizona has nine short line
railroads, one of which ceased operations in 2019. They are listed in Table 2-1.
The short lines range between the Drake Switching Company, the smallest at four miles to the longest,
the Arizona & California Railroad, at 164 miles. The total short line operation the state consists of 475
miles.
Table 2-1. Arizona’s Short Line Railroads
Railroad Miles Operated in Arizona Apache Railway 46
Arizona & California Railroad Co. 164
Arizona Eastern Railway Co. 135
Black Mesa & Lake Powell Railroad Not Active
Clarkdale Arizona Central Railroad, Inc. 38
Copper Basin Railway, Inc. 68
Drake Switching Company, LLC 4
Kingman Terminal 3
San Pedro & Southwestern Railroad 20
Total 478 Source: Association of American Railroads Note: the Black Mesa & Lake Powell ceased operations in 2019
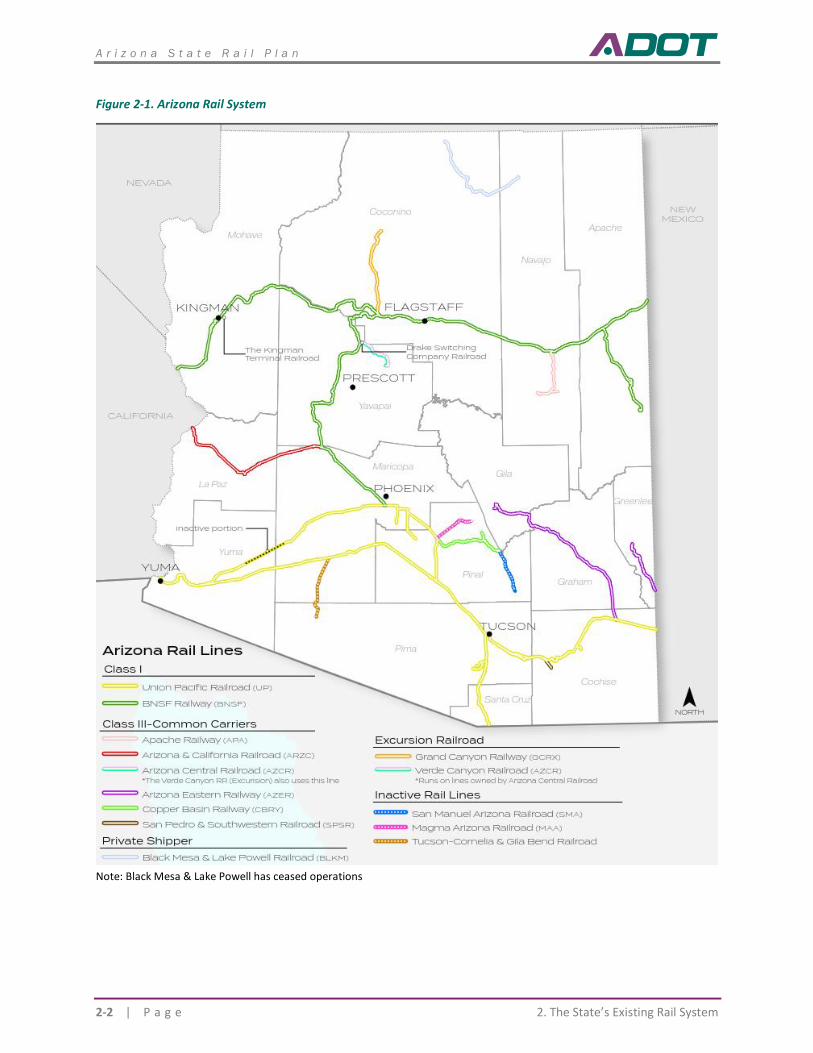
A r i z o n a S t a t e R a i l P l a n
2-2 | P a g e 2. The State’s Existing Rail System
Figure 2-1. Arizona Rail System
Note: Black Mesa & Lake Powell has ceased operations
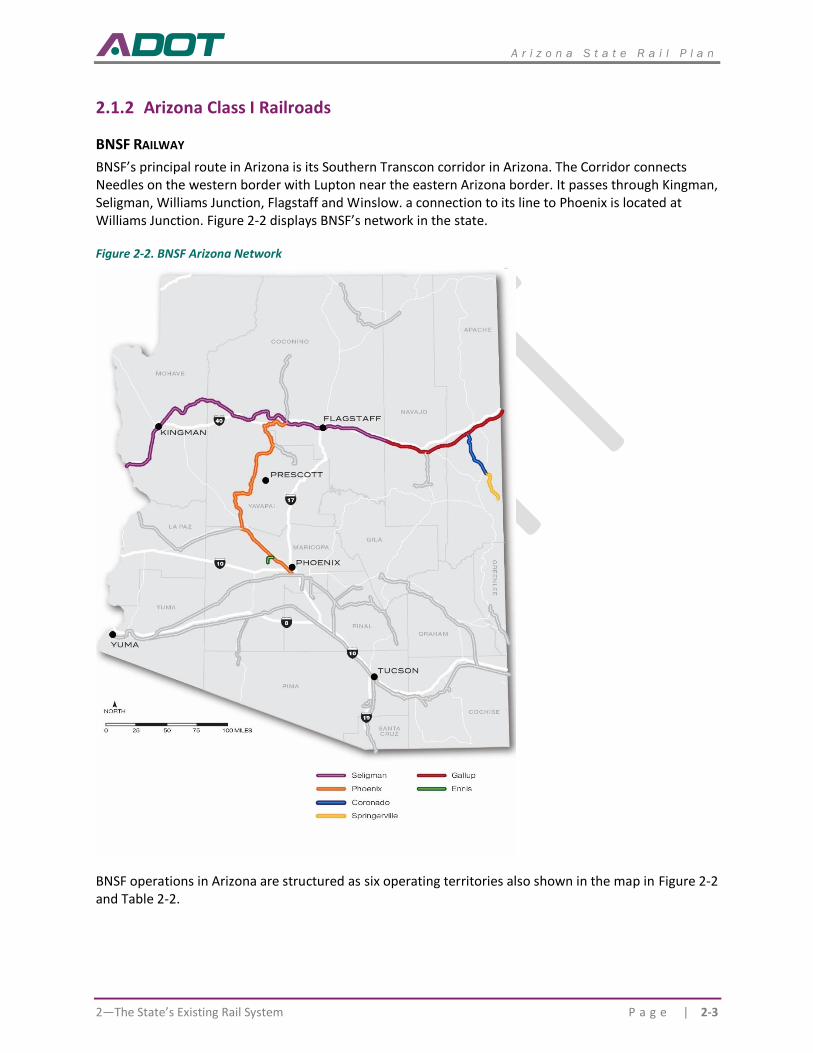
A r i z o n a S t a t e R a i l P l a n
2—The State’s Existing Rail System P a g e | 2-3
2.1.2 Arizona Class I Railroads
BNSF RAILWAY
BNSF’s principal route in Arizona is its Southern Transcon corridor in Arizona. The Corridor connects Needles on the western border with Lupton near the eastern Arizona border. It passes through Kingman, Seligman, Williams Junction, Flagstaff and Winslow. a connection to its line to Phoenix is located at Williams Junction. Figure 2-2 displays BNSF’s network in the state.
Figure 2-2. BNSF Arizona Network
BNSF operations in Arizona are structured as six operating territories also shown in the map in Figure 2-2 and Table 2-2.
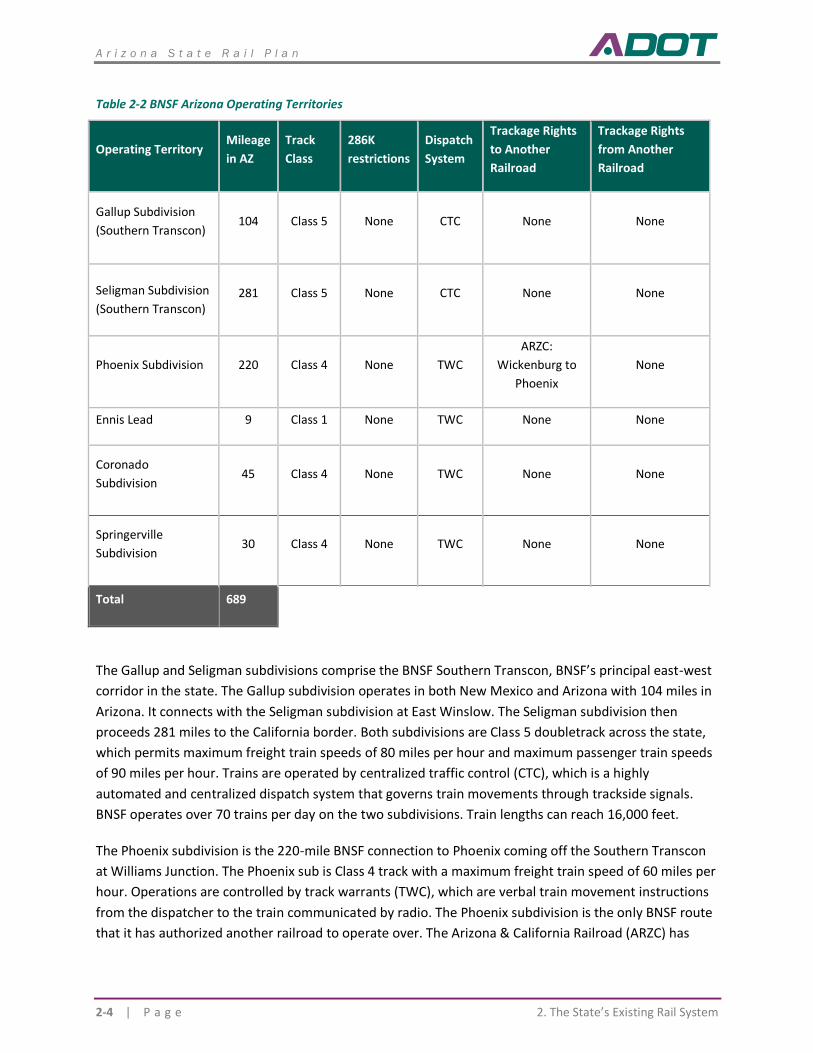
A r i z o n a S t a t e R a i l P l a n
2-4 | P a g e 2. The State’s Existing Rail System
Table 2-2 BNSF Arizona Operating Territories
Operating Territory Mileage
in AZ
Track
Class
286K
restrictions
Dispatch
System
Trackage Rights
to Another
Railroad
Trackage Rights
from Another
Railroad
Gallup Subdivision
(Southern Transcon) 104 Class 5 None CTC None None
Seligman Subdivision
(Southern Transcon) 281 Class 5 None CTC None None
Phoenix Subdivision 220 Class 4 None TWC
ARZC:
Wickenburg to
Phoenix
None
Ennis Lead 9 Class 1 None TWC None None
Coronado
Subdivision 45 Class 4 None TWC None None
Springerville
Subdivision 30 Class 4 None TWC None None
Total 689
The Gallup and Seligman subdivisions comprise the BNSF Southern Transcon, BNSF’s principal east-west
corridor in the state. The Gallup subdivision operates in both New Mexico and Arizona with 104 miles in
Arizona. It connects with the Seligman subdivision at East Winslow. The Seligman subdivision then
proceeds 281 miles to the California border. Both subdivisions are Class 5 doubletrack across the state,
which permits maximum freight train speeds of 80 miles per hour and maximum passenger train speeds
of 90 miles per hour. Trains are operated by centralized traffic control (CTC), which is a highly
automated and centralized dispatch system that governs train movements through trackside signals.
BNSF operates over 70 trains per day on the two subdivisions. Train lengths can reach 16,000 feet.
The Phoenix subdivision is the 220-mile BNSF connection to Phoenix coming off the Southern Transcon
at Williams Junction. The Phoenix sub is Class 4 track with a maximum freight train speed of 60 miles per
hour. Operations are controlled by track warrants (TWC), which are verbal train movement instructions
from the dispatcher to the train communicated by radio. The Phoenix subdivision is the only BNSF route
that it has authorized another railroad to operate over. The Arizona & California Railroad (ARZC) has
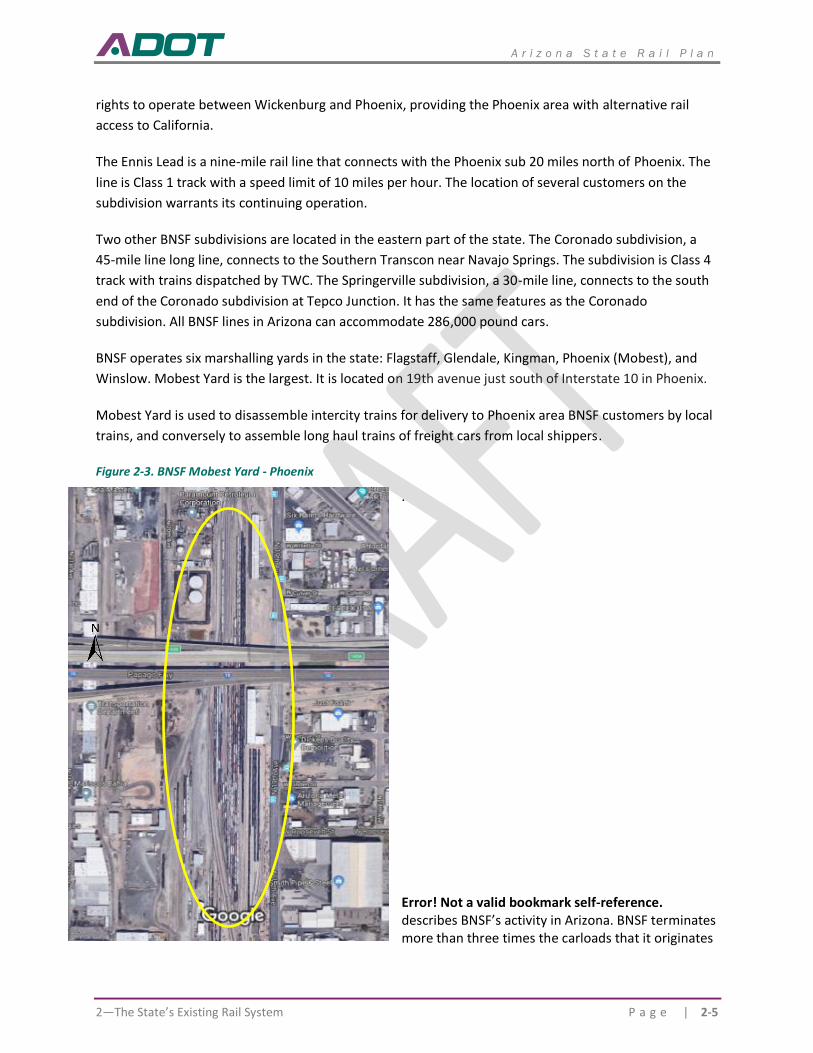
A r i z o n a S t a t e R a i l P l a n
2—The State’s Existing Rail System P a g e | 2-5
rights to operate between Wickenburg and Phoenix, providing the Phoenix area with alternative rail
access to California.
The Ennis Lead is a nine-mile rail line that connects with the Phoenix sub 20 miles north of Phoenix. The
line is Class 1 track with a speed limit of 10 miles per hour. The location of several customers on the
subdivision warrants its continuing operation.
Two other BNSF subdivisions are located in the eastern part of the state. The Coronado subdivision, a
45-mile line long line, connects to the Southern Transcon near Navajo Springs. The subdivision is Class 4
track with trains dispatched by TWC. The Springerville subdivision, a 30-mile line, connects to the south
end of the Coronado subdivision at Tepco Junction. It has the same features as the Coronado
subdivision. All BNSF lines in Arizona can accommodate 286,000 pound cars.
BNSF operates six marshalling yards in the state: Flagstaff, Glendale, Kingman, Phoenix (Mobest), and
Winslow. Mobest Yard is the largest. It is located on 19th avenue just south of Interstate 10 in Phoenix.
Mobest Yard is used to disassemble intercity trains for delivery to Phoenix area BNSF customers by local
trains, and conversely to assemble long haul trains of freight cars from local shippers.
Figure 2-3. BNSF Mobest Yard - Phoenix
.
Error! Not a valid bookmark self-reference. describes BNSF’s activity in Arizona. BNSF terminates more than three times the carloads that it originates
Mobest Yard
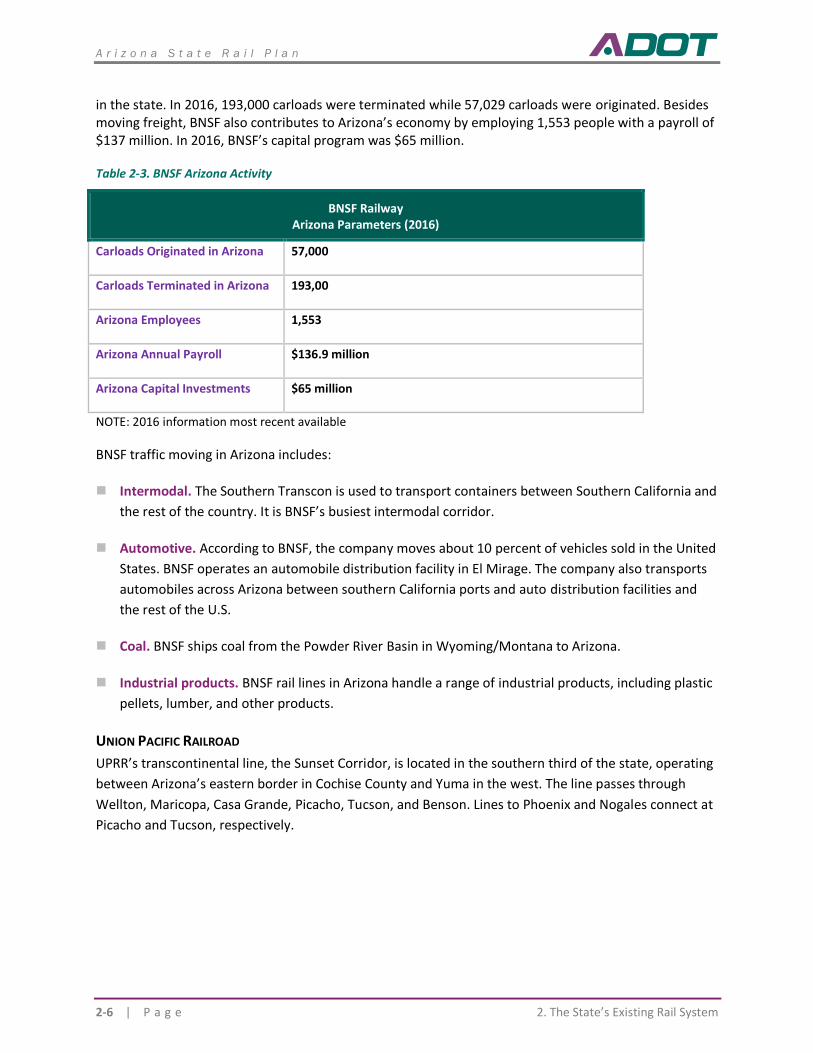
A r i z o n a S t a t e R a i l P l a n
2-6 | P a g e 2. The State’s Existing Rail System
in the state. In 2016, 193,000 carloads were terminated while 57,029 carloads were originated. Besides moving freight, BNSF also contributes to Arizona’s economy by employing 1,553 people with a payroll of $137 million. In 2016, BNSF’s capital program was $65 million.
Table 2-3. BNSF Arizona Activity
BNSF Railway Arizona Parameters (2016)
Carloads Originated in Arizona 57,000
Carloads Terminated in Arizona 193,00
Arizona Employees 1,553
Arizona Annual Payroll $136.9 million
Arizona Capital Investments $65 million
NOTE: 2016 information most recent available
BNSF traffic moving in Arizona includes:
◼ Intermodal. The Southern Transcon is used to transport containers between Southern California and
the rest of the country. It is BNSF’s busiest intermodal corridor.
◼ Automotive. According to BNSF, the company moves about 10 percent of vehicles sold in the United
States. BNSF operates an automobile distribution facility in El Mirage. The company also transports
automobiles across Arizona between southern California ports and auto distribution facilities and
the rest of the U.S.
◼ Coal. BNSF ships coal from the Powder River Basin in Wyoming/Montana to Arizona.
◼ Industrial products. BNSF rail lines in Arizona handle a range of industrial products, including plastic
pellets, lumber, and other products.
UNION PACIFIC RAILROAD
UPRR’s transcontinental line, the Sunset Corridor, is located in the southern third of the state, operating
between Arizona’s eastern border in Cochise County and Yuma in the west. The line passes through
Wellton, Maricopa, Casa Grande, Picacho, Tucson, and Benson. Lines to Phoenix and Nogales connect at
Picacho and Tucson, respectively.
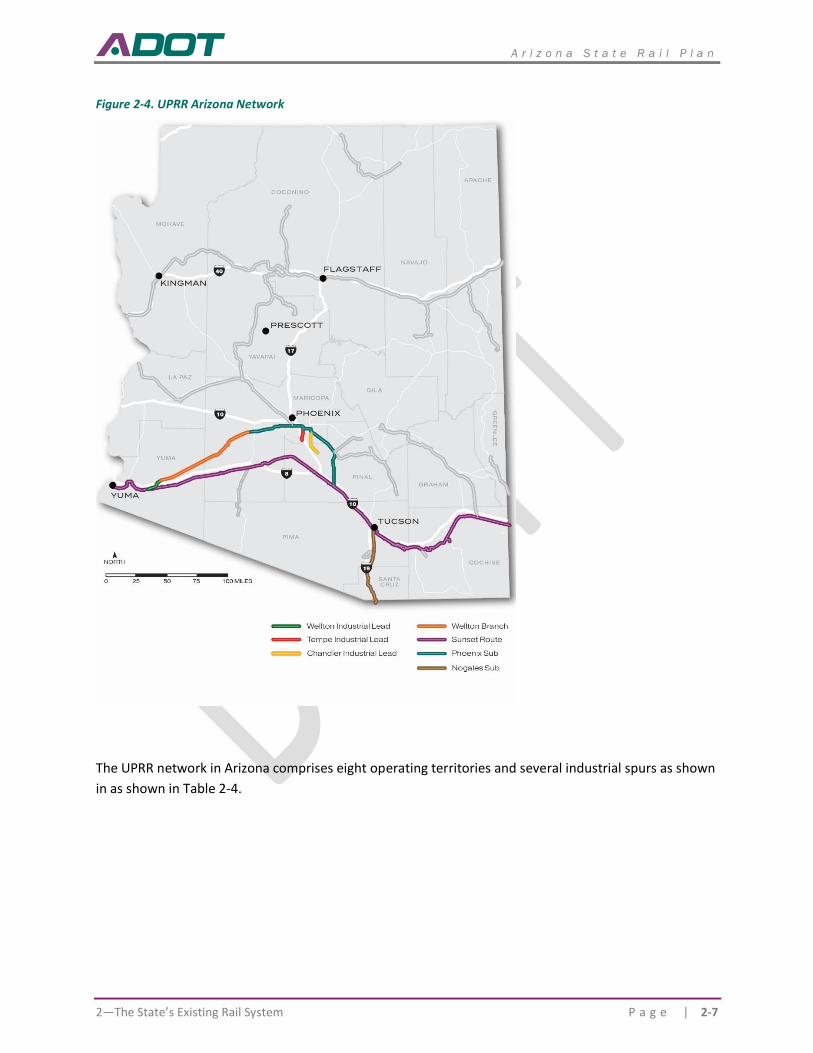
A r i z o n a S t a t e R a i l P l a n
2—The State’s Existing Rail System P a g e | 2-7
Figure 2-4. UPRR Arizona Network
The UPRR network in Arizona comprises eight operating territories and several industrial spurs as shown
in as shown in Table 2-4.
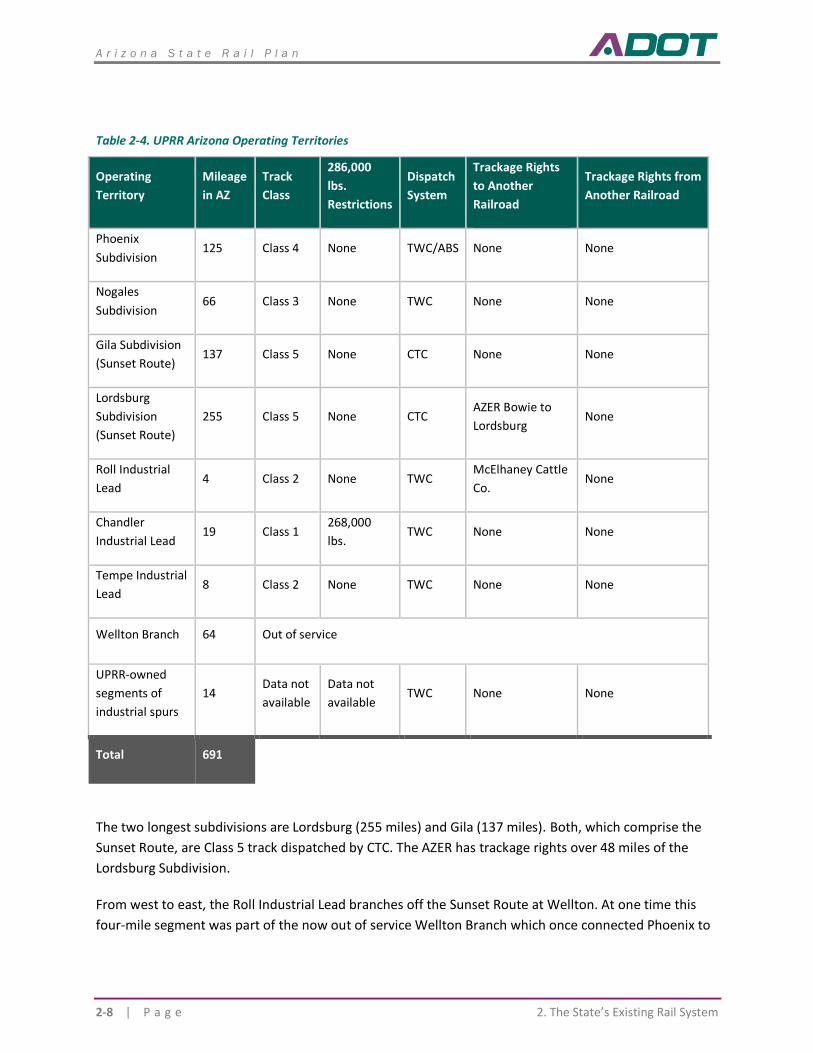
A r i z o n a S t a t e R a i l P l a n
2-8 | P a g e 2. The State’s Existing Rail System
Table 2-4. UPRR Arizona Operating Territories
Operating
Territory
Mileage
in AZ
Track
Class
286,000
lbs.
Restrictions
Dispatch
System
Trackage Rights
to Another
Railroad
Trackage Rights from
Another Railroad
Phoenix
Subdivision 125 Class 4 None TWC/ABS None None
Nogales
Subdivision 66 Class 3 None TWC None None
Gila Subdivision
(Sunset Route) 137 Class 5 None CTC None None
Lordsburg
Subdivision
(Sunset Route)
255 Class 5 None CTC AZER Bowie to
Lordsburg None
Roll Industrial
Lead 4 Class 2 None TWC
McElhaney Cattle
Co. None
Chandler
Industrial Lead 19 Class 1
268,000
lbs. TWC None None
Tempe Industrial
Lead 8 Class 2 None TWC None None
Wellton Branch 64 Out of service
UPRR-owned
segments of
industrial spurs
14 Data not
available
Data not
available TWC None None
Total 691
The two longest subdivisions are Lordsburg (255 miles) and Gila (137 miles). Both, which comprise the
Sunset Route, are Class 5 track dispatched by CTC. The AZER has trackage rights over 48 miles of the
Lordsburg Subdivision.
From west to east, the Roll Industrial Lead branches off the Sunset Route at Wellton. At one time this
four-mile segment was part of the now out of service Wellton Branch which once connected Phoenix to
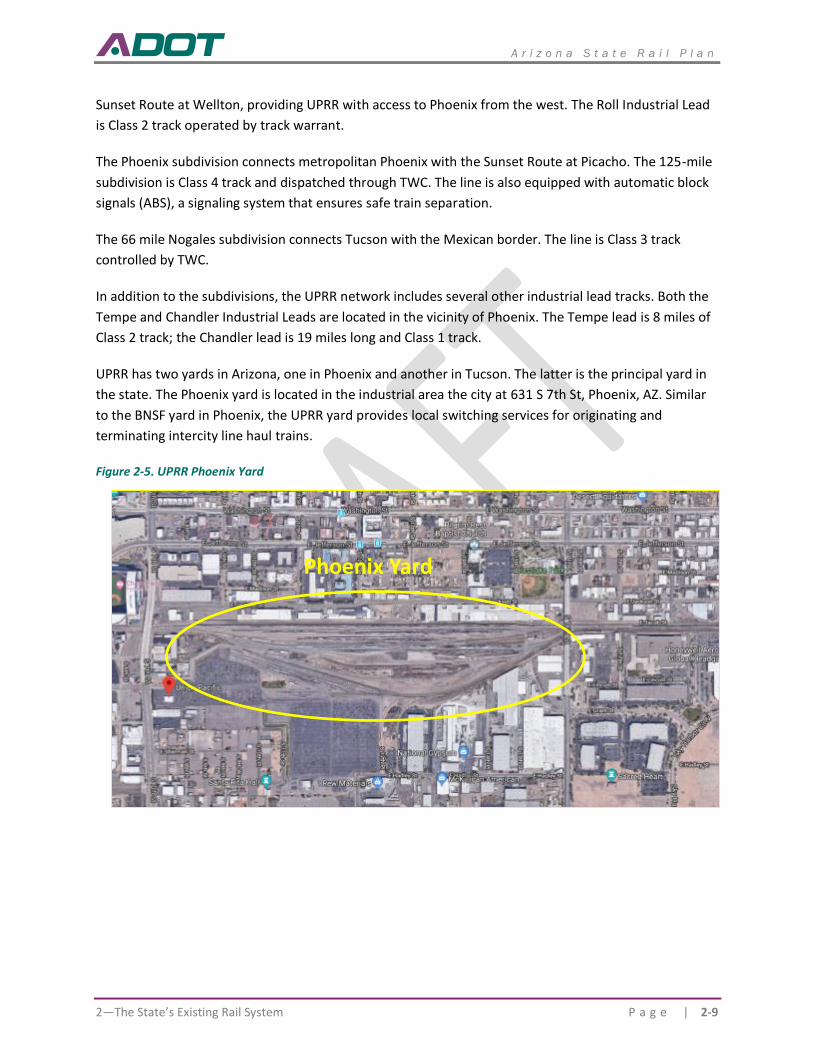
A r i z o n a S t a t e R a i l P l a n
2—The State’s Existing Rail System P a g e | 2-9
Sunset Route at Wellton, providing UPRR with access to Phoenix from the west. The Roll Industrial Lead
is Class 2 track operated by track warrant.
The Phoenix subdivision connects metropolitan Phoenix with the Sunset Route at Picacho. The 125-mile
subdivision is Class 4 track and dispatched through TWC. The line is also equipped with automatic block
signals (ABS), a signaling system that ensures safe train separation.
The 66 mile Nogales subdivision connects Tucson with the Mexican border. The line is Class 3 track
controlled by TWC.
In addition to the subdivisions, the UPRR network includes several other industrial lead tracks. Both the
Tempe and Chandler Industrial Leads are located in the vicinity of Phoenix. The Tempe lead is 8 miles of
Class 2 track; the Chandler lead is 19 miles long and Class 1 track.
UPRR has two yards in Arizona, one in Phoenix and another in Tucson. The latter is the principal yard in
the state. The Phoenix yard is located in the industrial area the city at 631 S 7th St, Phoenix, AZ. Similar
to the BNSF yard in Phoenix, the UPRR yard provides local switching services for originating and
terminating intercity line haul trains.
Figure 2-5. UPRR Phoenix Yard
Phoenix Yard
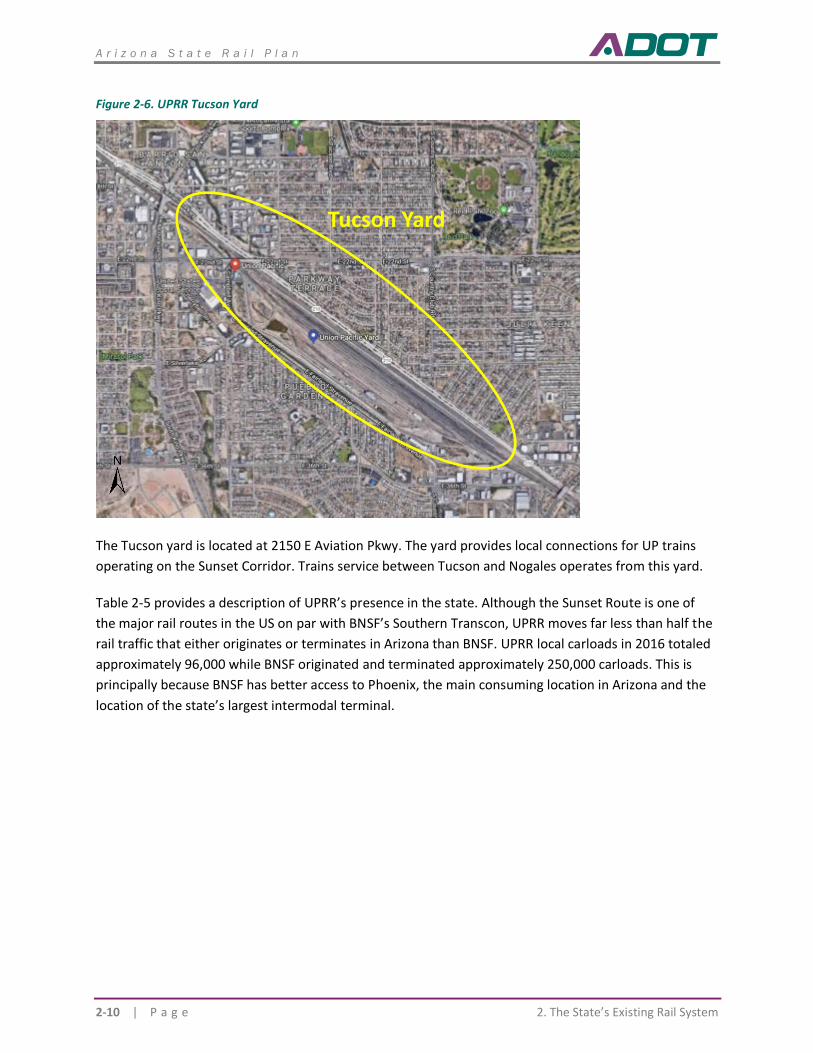
A r i z o n a S t a t e R a i l P l a n
2-10 | P a g e 2. The State’s Existing Rail System
Figure 2-6. UPRR Tucson Yard
The Tucson yard is located at 2150 E Aviation Pkwy. The yard provides local connections for UP trains
operating on the Sunset Corridor. Trains service between Tucson and Nogales operates from this yard.
Table 2-5 provides a description of UPRR’s presence in the state. Although the Sunset Route is one of
the major rail routes in the US on par with BNSF’s Southern Transcon, UPRR moves far less than half the
rail traffic that either originates or terminates in Arizona than BNSF. UPRR local carloads in 2016 totaled
approximately 96,000 while BNSF originated and terminated approximately 250,000 carloads. This is
principally because BNSF has better access to Phoenix, the main consuming location in Arizona and the
location of the state’s largest intermodal terminal.
Tucson Yard
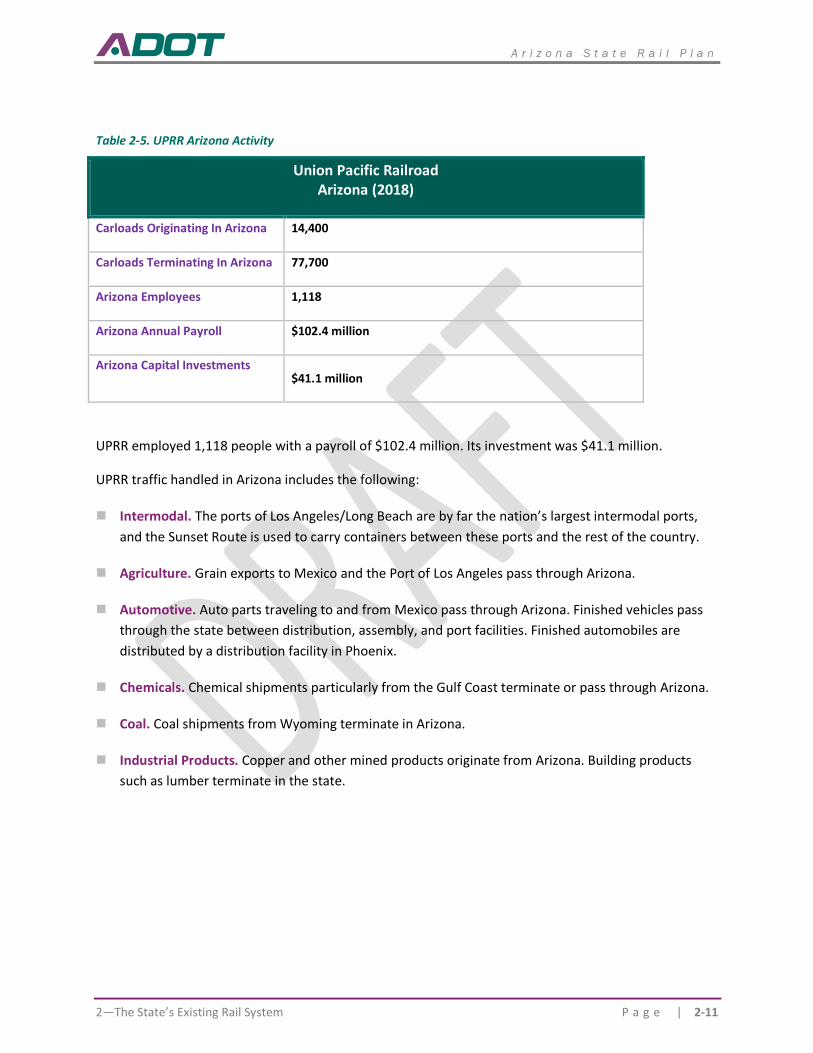
A r i z o n a S t a t e R a i l P l a n
2—The State’s Existing Rail System P a g e | 2-11
Table 2-5. UPRR Arizona Activity
Union Pacific Railroad Arizona (2018)
Carloads Originating In Arizona 14,400
Carloads Terminating In Arizona 77,700
Arizona Employees 1,118
Arizona Annual Payroll $102.4 million
Arizona Capital Investments $41.1 million
UPRR employed 1,118 people with a payroll of $102.4 million. Its investment was $41.1 million.
UPRR traffic handled in Arizona includes the following:
◼ Intermodal. The ports of Los Angeles/Long Beach are by far the nation’s largest intermodal ports,
and the Sunset Route is used to carry containers between these ports and the rest of the country.
◼ Agriculture. Grain exports to Mexico and the Port of Los Angeles pass through Arizona.
◼ Automotive. Auto parts traveling to and from Mexico pass through Arizona. Finished vehicles pass
through the state between distribution, assembly, and port facilities. Finished automobiles are
distributed by a distribution facility in Phoenix.
◼ Chemicals. Chemical shipments particularly from the Gulf Coast terminate or pass through Arizona.
◼ Coal. Coal shipments from Wyoming terminate in Arizona.
◼ Industrial Products. Copper and other mined products originate from Arizona. Building products
such as lumber terminate in the state.
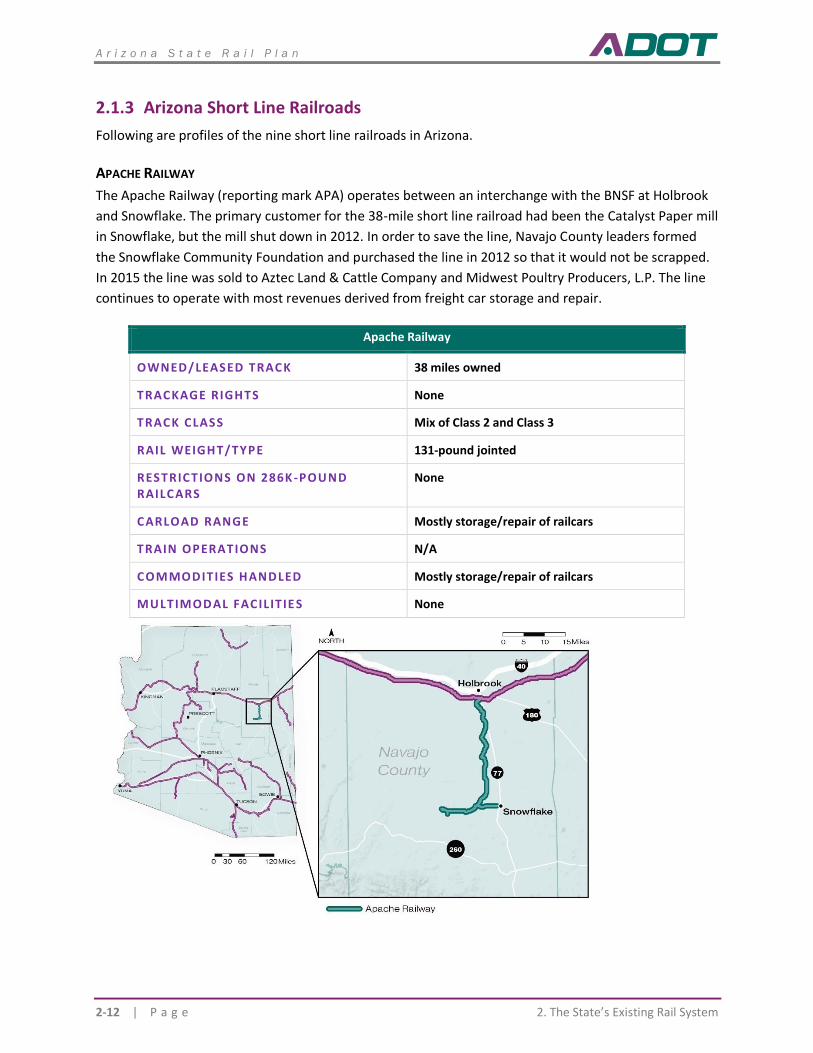
A r i z o n a S t a t e R a i l P l a n
2-12 | P a g e 2. The State’s Existing Rail System
2.1.3 Arizona Short Line Railroads
Following are profiles of the nine short line railroads in Arizona.
APACHE RAILWAY
The Apache Railway (reporting mark APA) operates between an interchange with the BNSF at Holbrook
and Snowflake. The primary customer for the 38-mile short line railroad had been the Catalyst Paper mill
in Snowflake, but the mill shut down in 2012. In order to save the line, Navajo County leaders formed
the Snowflake Community Foundation and purchased the line in 2012 so that it would not be scrapped.
In 2015 the line was sold to Aztec Land & Cattle Company and Midwest Poultry Producers, L.P. The line
continues to operate with most revenues derived from freight car storage and repair.
Apache Railway
OWNED/LEASED TRACK 38 miles owned
TRACKAGE RIGHTS None
TRACK CLASS Mix of Class 2 and Class 3
RAIL WEIGHT/TYPE 131-pound jointed
RESTRICTIONS ON 286K -POUND RAILCARS
None
CARLOAD RANGE Mostly storage/repair of railcars
TRAIN OPERATIONS N/A
COMMODITIES HANDLED Mostly storage/repair of railcars
MULTIMODAL FACILIT IE S None
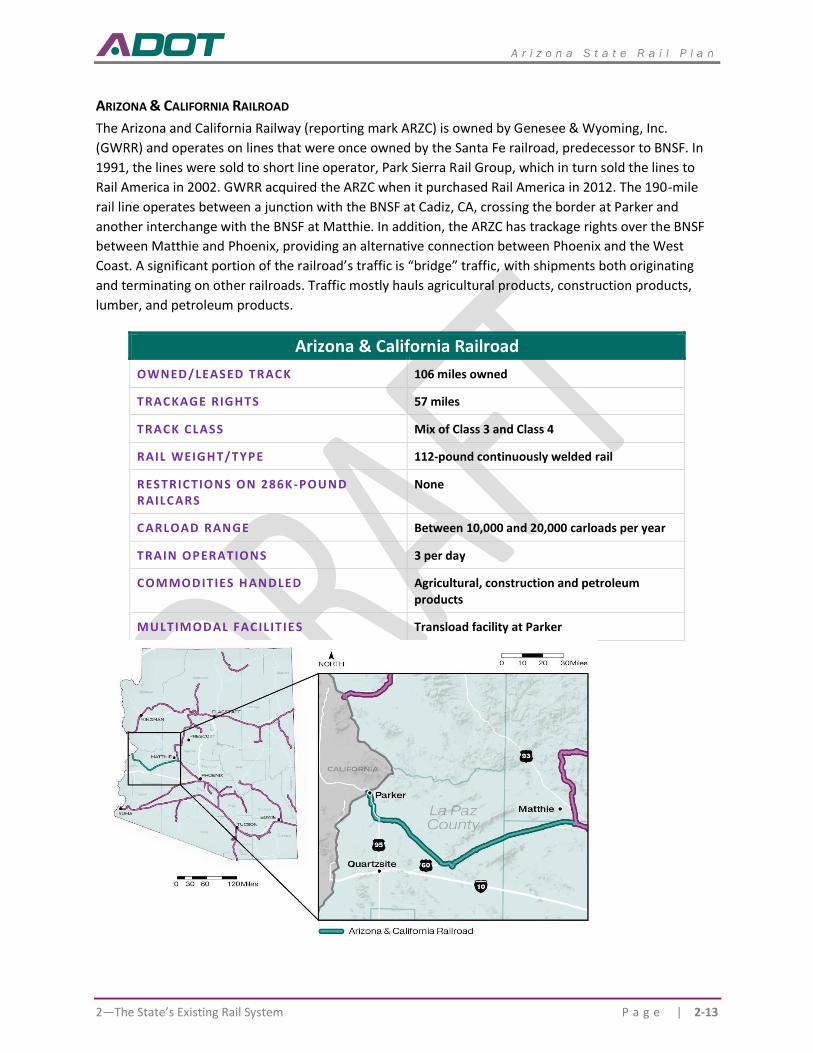
A r i z o n a S t a t e R a i l P l a n
2—The State’s Existing Rail System P a g e | 2-13
ARIZONA & CALIFORNIA RAILROAD
The Arizona and California Railway (reporting mark ARZC) is owned by Genesee & Wyoming, Inc.
(GWRR) and operates on lines that were once owned by the Santa Fe railroad, predecessor to BNSF. In
1991, the lines were sold to short line operator, Park Sierra Rail Group, which in turn sold the lines to
Rail America in 2002. GWRR acquired the ARZC when it purchased Rail America in 2012. The 190-mile
rail line operates between a junction with the BNSF at Cadiz, CA, crossing the border at Parker and
another interchange with the BNSF at Matthie. In addition, the ARZC has trackage rights over the BNSF
between Matthie and Phoenix, providing an alternative connection between Phoenix and the West
Coast. A significant portion of the railroad’s traffic is “bridge” traffic, with shipments both originating
and terminating on other railroads. Traffic mostly hauls agricultural products, construction products,
lumber, and petroleum products.
Arizona & California Railroad
OWNED/LEASED TRACK 106 miles owned
TRACKAGE RIGHTS 57 miles
TRACK CLASS Mix of Class 3 and Class 4
RAIL WEIGHT/TYPE 112-pound continuously welded rail
RESTRICTIONS ON 286K -POUND RAILCARS
None
CARLOAD RANGE Between 10,000 and 20,000 carloads per year
TRAIN OPERATIONS 3 per day
COMMODITIES HANDLED Agricultural, construction and petroleum products
MULTIMODAL FACILIT IE S Transload facility at Parker
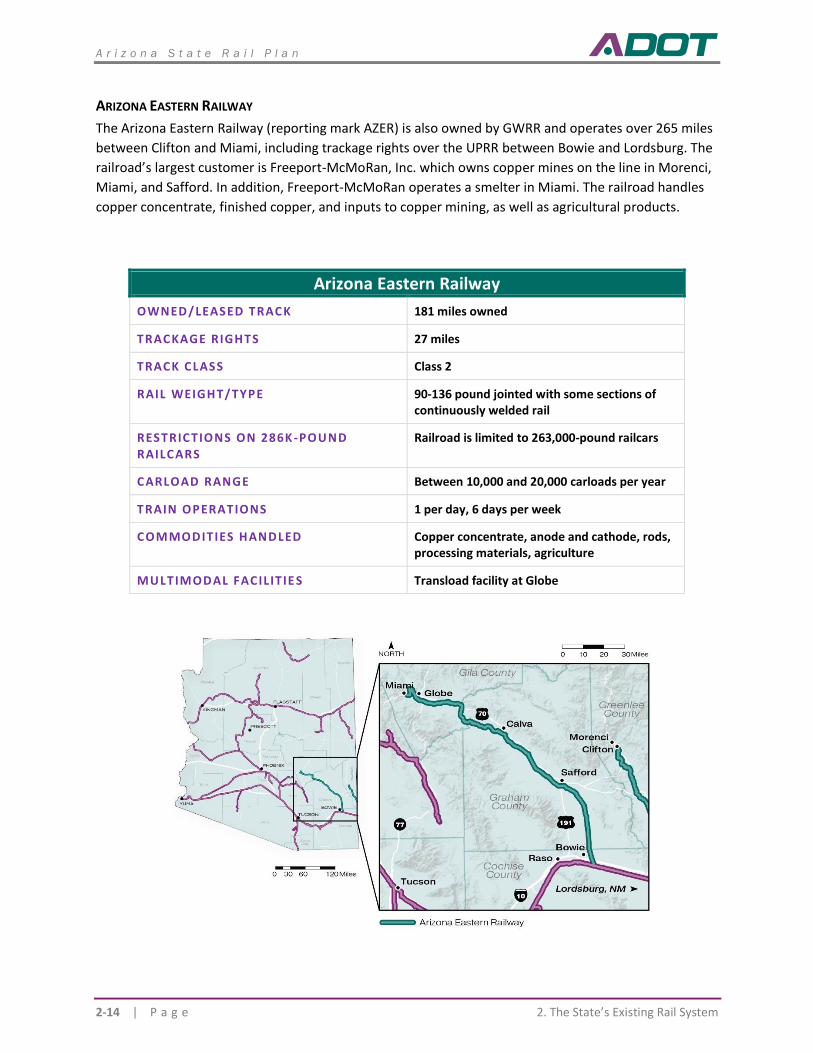
A r i z o n a S t a t e R a i l P l a n
2-14 | P a g e 2. The State’s Existing Rail System
ARIZONA EASTERN RAILWAY
The Arizona Eastern Railway (reporting mark AZER) is also owned by GWRR and operates over 265 miles
between Clifton and Miami, including trackage rights over the UPRR between Bowie and Lordsburg. The
railroad’s largest customer is Freeport-McMoRan, Inc. which owns copper mines on the line in Morenci,
Miami, and Safford. In addition, Freeport-McMoRan operates a smelter in Miami. The railroad handles
copper concentrate, finished copper, and inputs to copper mining, as well as agricultural products.
Arizona Eastern Railway
OWNED/LEASED TRACK 181 miles owned
TRACKAGE RIGHTS 27 miles
TRACK CLASS Class 2
RAIL WEIGHT/TYPE 90-136 pound jointed with some sections of continuously welded rail
RESTRICTIONS ON 286K -POUND RAILCARS
Railroad is limited to 263,000-pound railcars
CARLOAD RANGE Between 10,000 and 20,000 carloads per year
TRAIN OPERATIONS 1 per day, 6 days per week
COMMODITIES HANDLED Copper concentrate, anode and cathode, rods, processing materials, agriculture
MULTIMODAL FACILIT IE S Transload facility at Globe
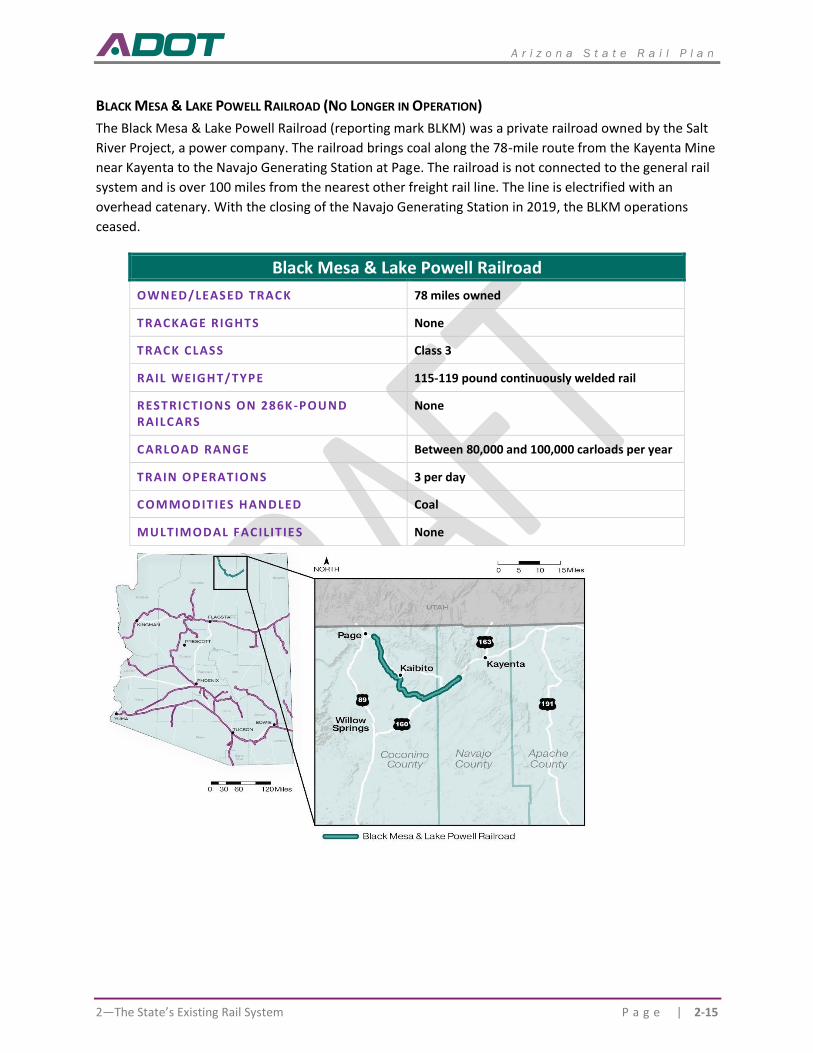
A r i z o n a S t a t e R a i l P l a n
2—The State’s Existing Rail System P a g e | 2-15
BLACK MESA & LAKE POWELL RAILROAD (NO LONGER IN OPERATION)
The Black Mesa & Lake Powell Railroad (reporting mark BLKM) was a private railroad owned by the Salt
River Project, a power company. The railroad brings coal along the 78-mile route from the Kayenta Mine
near Kayenta to the Navajo Generating Station at Page. The railroad is not connected to the general rail
system and is over 100 miles from the nearest other freight rail line. The line is electrified with an
overhead catenary. With the closing of the Navajo Generating Station in 2019, the BLKM operations
ceased.
Black Mesa & Lake Powell Railroad
OWNED/LEASED TRACK 78 miles owned
TRACKAGE RIGHTS None
TRACK CLASS Class 3
RAIL WEIGHT/TYPE 115-119 pound continuously welded rail
RESTRICTIONS ON 286K -POUND RAILCARS
None
CARLOAD RANGE Between 80,000 and 100,000 carloads per year
TRAIN OPERATIONS 3 per day
COMMODITIES HANDLED Coal
MULTIMODAL FACILIT IE S None
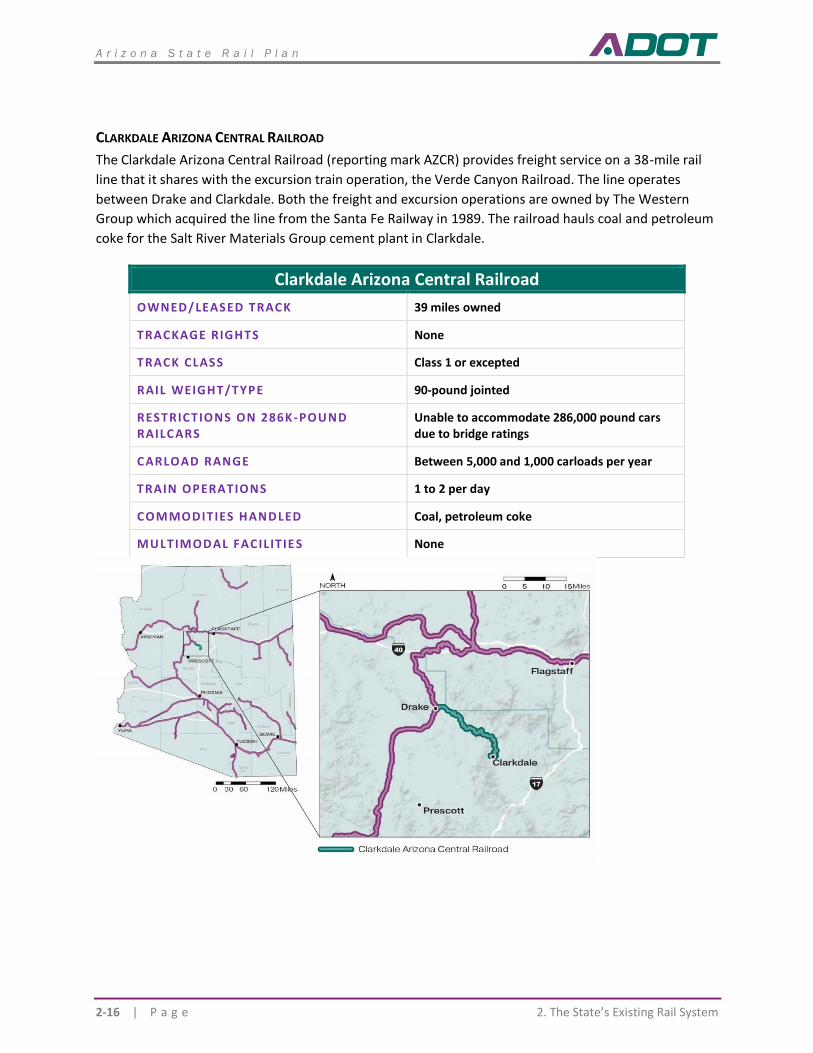
A r i z o n a S t a t e R a i l P l a n
2-16 | P a g e 2. The State’s Existing Rail System
CLARKDALE ARIZONA CENTRAL RAILROAD
The Clarkdale Arizona Central Railroad (reporting mark AZCR) provides freight service on a 38-mile rail
line that it shares with the excursion train operation, the Verde Canyon Railroad. The line operates
between Drake and Clarkdale. Both the freight and excursion operations are owned by The Western
Group which acquired the line from the Santa Fe Railway in 1989. The railroad hauls coal and petroleum
coke for the Salt River Materials Group cement plant in Clarkdale.
Clarkdale Arizona Central Railroad
OWNED/LEASED TRACK 39 miles owned
TRACKAGE RIGHTS None
TRACK CLASS Class 1 or excepted
RAIL WEIGHT/TYPE 90-pound jointed
RESTRICTIONS ON 286K -POUND RAILCARS
Unable to accommodate 286,000 pound cars due to bridge ratings
CARLOAD RANGE Between 5,000 and 1,000 carloads per year
TRAIN OPERATIONS 1 to 2 per day
COMMODITIES HANDLED Coal, petroleum coke
MULTIMODAL FACILIT IE S None
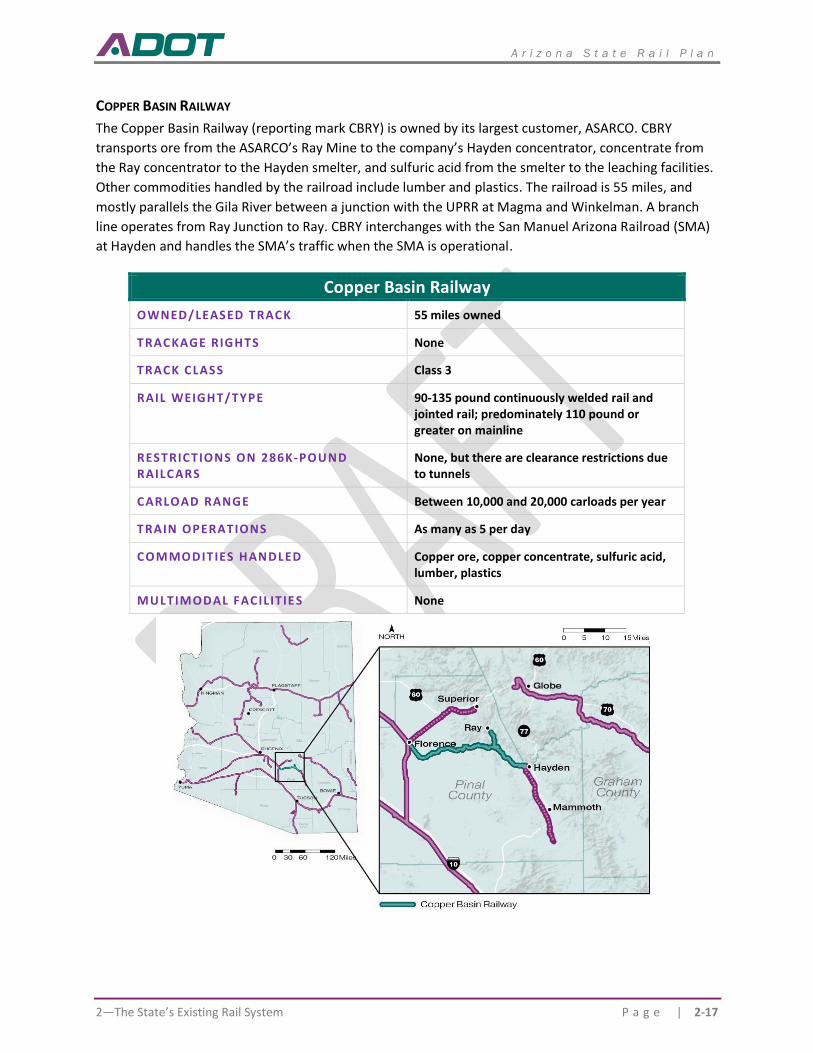
A r i z o n a S t a t e R a i l P l a n
2—The State’s Existing Rail System P a g e | 2-17
COPPER BASIN RAILWAY
The Copper Basin Railway (reporting mark CBRY) is owned by its largest customer, ASARCO. CBRY
transports ore from the ASARCO’s Ray Mine to the company’s Hayden concentrator, concentrate from
the Ray concentrator to the Hayden smelter, and sulfuric acid from the smelter to the leaching facilities.
Other commodities handled by the railroad include lumber and plastics. The railroad is 55 miles, and
mostly parallels the Gila River between a junction with the UPRR at Magma and Winkelman. A branch
line operates from Ray Junction to Ray. CBRY interchanges with the San Manuel Arizona Railroad (SMA)
at Hayden and handles the SMA’s traffic when the SMA is operational.
Copper Basin Railway
OWNED/LEASED TRACK 55 miles owned
TRACKAGE RIGHTS None
TRACK CLASS Class 3
RAIL WEIGHT/TYPE 90-135 pound continuously welded rail and jointed rail; predominately 110 pound or greater on mainline
RESTRICTIONS ON 286K-POUND RAILCARS
None, but there are clearance restrictions due to tunnels
CARLOAD RANGE Between 10,000 and 20,000 carloads per year
TRAIN OPERATIONS As many as 5 per day
COMMODITIES HANDLED Copper ore, copper concentrate, sulfuric acid, lumber, plastics
MULTIMODAL FACILIT IE S None
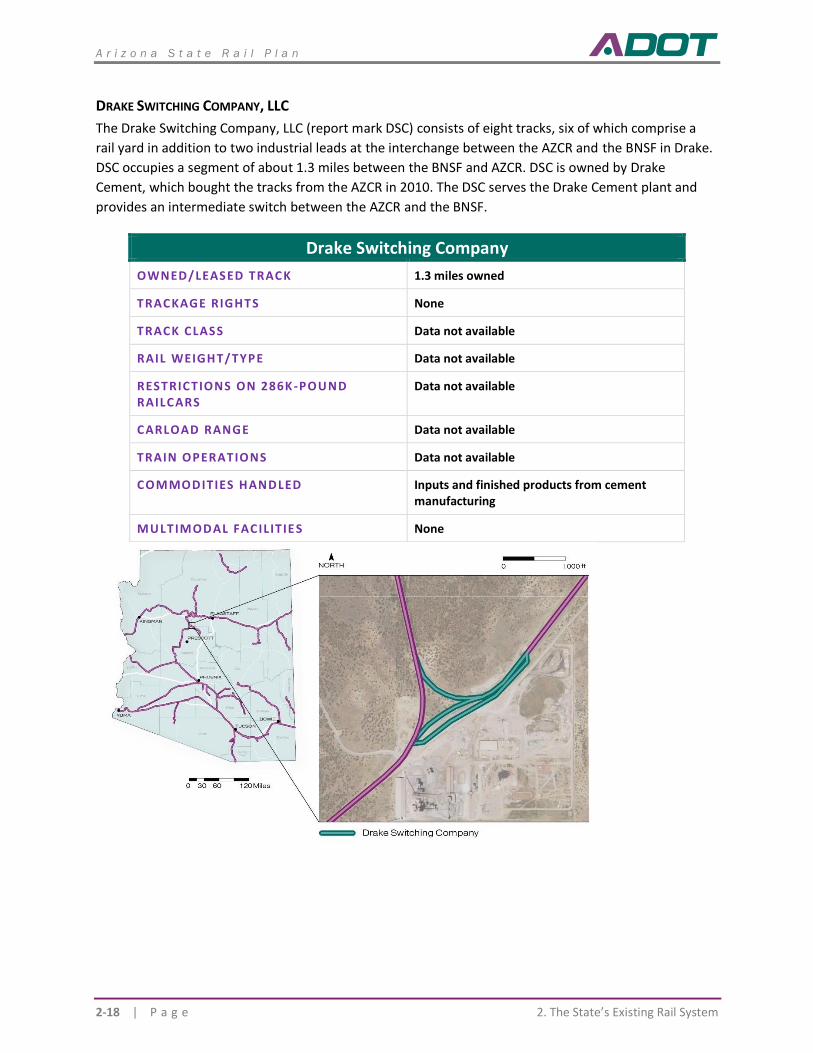
A r i z o n a S t a t e R a i l P l a n
2-18 | P a g e 2. The State’s Existing Rail System
DRAKE SWITCHING COMPANY, LLC
The Drake Switching Company, LLC (report mark DSC) consists of eight tracks, six of which comprise a
rail yard in addition to two industrial leads at the interchange between the AZCR and the BNSF in Drake.
DSC occupies a segment of about 1.3 miles between the BNSF and AZCR. DSC is owned by Drake
Cement, which bought the tracks from the AZCR in 2010. The DSC serves the Drake Cement plant and
provides an intermediate switch between the AZCR and the BNSF.
Drake Switching Company
OWNED/LEASED TRACK 1.3 miles owned
TRACKAGE RIGHTS None
TRACK CLASS Data not available
RAIL WEIGHT/TYPE Data not available
RESTRICTIONS ON 286K -POUND RAILCARS
Data not available
CARLOAD RANGE Data not available
TRAIN OPERATIONS Data not available
COMMODITIES HANDLED Inputs and finished products from cement manufacturing
MULTIMODAL FACILIT IE S None
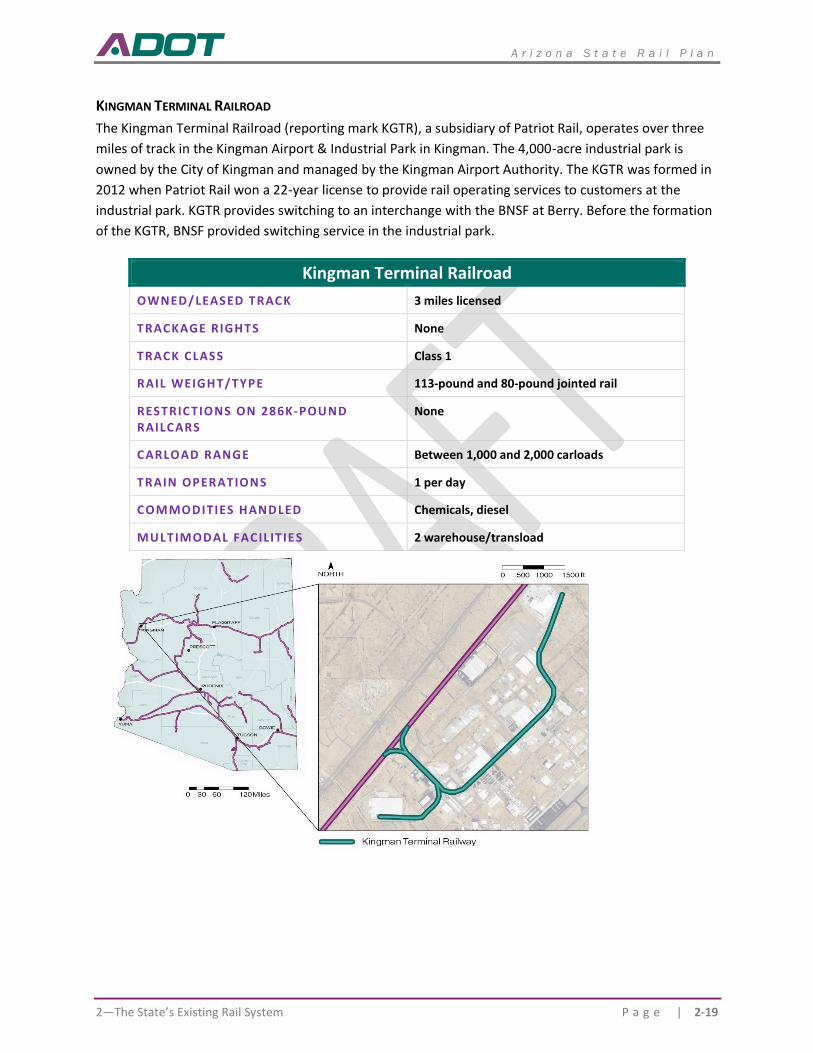
A r i z o n a S t a t e R a i l P l a n
2—The State’s Existing Rail System P a g e | 2-19
KINGMAN TERMINAL RAILROAD
The Kingman Terminal Railroad (reporting mark KGTR), a subsidiary of Patriot Rail, operates over three
miles of track in the Kingman Airport & Industrial Park in Kingman. The 4,000-acre industrial park is
owned by the City of Kingman and managed by the Kingman Airport Authority. The KGTR was formed in
2012 when Patriot Rail won a 22-year license to provide rail operating services to customers at the
industrial park. KGTR provides switching to an interchange with the BNSF at Berry. Before the formation
of the KGTR, BNSF provided switching service in the industrial park.
Kingman Terminal Railroad
OWNED/LEASED TRACK 3 miles licensed
TRACKAGE RIGHTS None
TRACK CLASS Class 1
RAIL WEIGHT/TYPE 113-pound and 80-pound jointed rail
RESTRICTIONS ON 286K-POUND RAILCARS
None
CARLOAD RANGE Between 1,000 and 2,000 carloads
TRAIN OPERATIONS 1 per day
COMMODITIES HANDLED Chemicals, diesel
MULTIMODAL FACILIT IE S 2 warehouse/transload
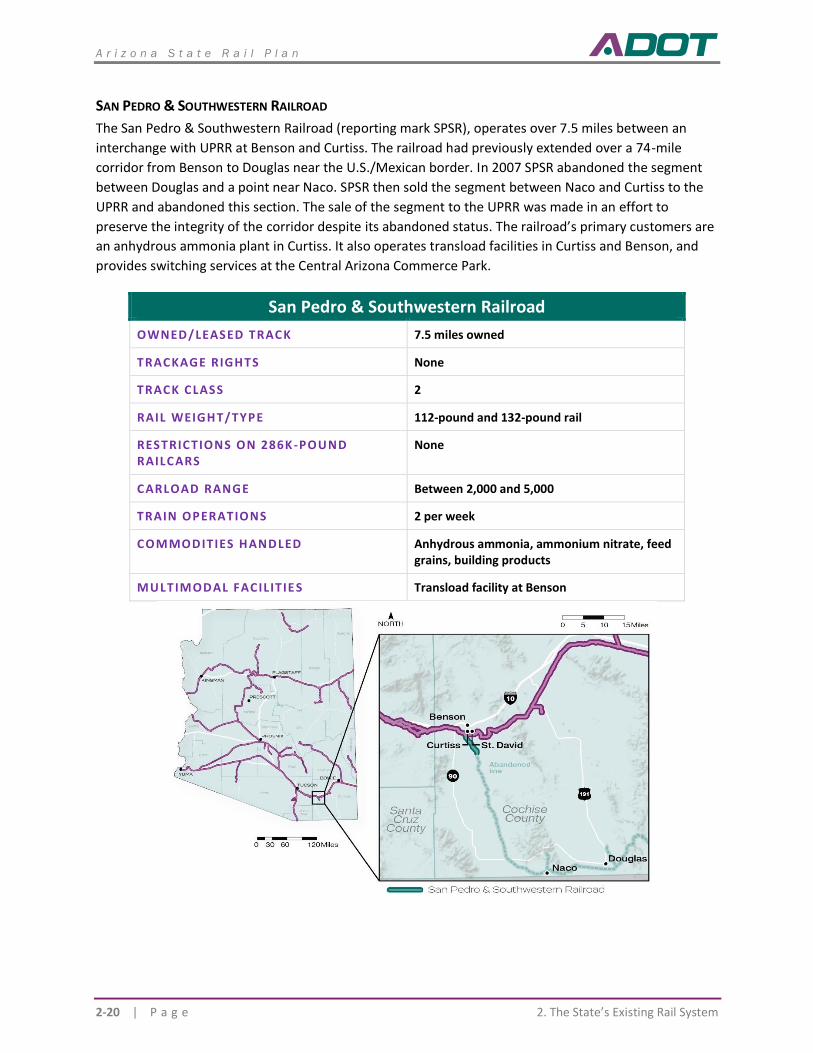
A r i z o n a S t a t e R a i l P l a n
2-20 | P a g e 2. The State’s Existing Rail System
SAN PEDRO & SOUTHWESTERN RAILROAD
The San Pedro & Southwestern Railroad (reporting mark SPSR), operates over 7.5 miles between an
interchange with UPRR at Benson and Curtiss. The railroad had previously extended over a 74-mile
corridor from Benson to Douglas near the U.S./Mexican border. In 2007 SPSR abandoned the segment
between Douglas and a point near Naco. SPSR then sold the segment between Naco and Curtiss to the
UPRR and abandoned this section. The sale of the segment to the UPRR was made in an effort to
preserve the integrity of the corridor despite its abandoned status. The railroad’s primary customers are
an anhydrous ammonia plant in Curtiss. It also operates transload facilities in Curtiss and Benson, and
provides switching services at the Central Arizona Commerce Park.
San Pedro & Southwestern Railroad
OWNED/LEASED TRACK 7.5 miles owned
TRACKAGE RIGHTS None
TRACK CLASS 2
RAIL WEIGHT/TYPE 112-pound and 132-pound rail
RESTRICTIONS ON 286K -POUND RAILCARS
None
CARLOAD RANGE Between 2,000 and 5,000
TRAIN OPERATIONS 2 per week
COMMODITIES HANDLED Anhydrous ammonia, ammonium nitrate, feed grains, building products
MULTIMODAL FACILIT IE S Transload facility at Benson
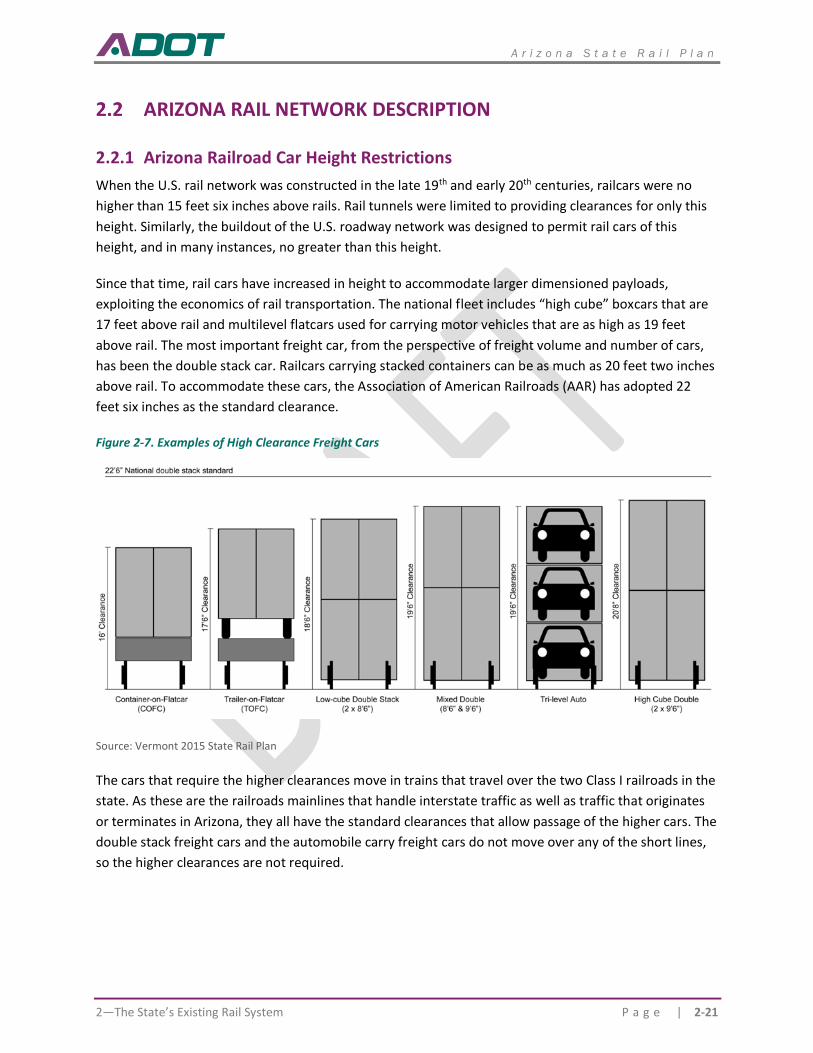
A r i z o n a S t a t e R a i l P l a n
2—The State’s Existing Rail System P a g e | 2-21
ARIZONA RAIL NETWORK DESCRIPTION
2.2.1 Arizona Railroad Car Height Restrictions
When the U.S. rail network was constructed in the late 19th and early 20th centuries, railcars were no
higher than 15 feet six inches above rails. Rail tunnels were limited to providing clearances for only this
height. Similarly, the buildout of the U.S. roadway network was designed to permit rail cars of this
height, and in many instances, no greater than this height.
Since that time, rail cars have increased in height to accommodate larger dimensioned payloads,
exploiting the economics of rail transportation. The national fleet includes “high cube” boxcars that are
17 feet above rail and multilevel flatcars used for carrying motor vehicles that are as high as 19 feet
above rail. The most important freight car, from the perspective of freight volume and number of cars,
has been the double stack car. Railcars carrying stacked containers can be as much as 20 feet two inches
above rail. To accommodate these cars, the Association of American Railroads (AAR) has adopted 22
feet six inches as the standard clearance.
Figure 2-7. Examples of High Clearance Freight Cars
Source: Vermont 2015 State Rail Plan
The cars that require the higher clearances move in trains that travel over the two Class I railroads in the
state. As these are the railroads mainlines that handle interstate traffic as well as traffic that originates
or terminates in Arizona, they all have the standard clearances that allow passage of the higher cars. The
double stack freight cars and the automobile carry freight cars do not move over any of the short lines,
so the higher clearances are not required.
A r i z o n a S t a t e R a i l P l a n
2-22 | P a g e 2. The State’s Existing Rail System
2.2.2 Arizona Railroad Car Weight Restrictions
In the early 1990s, the railroad industry began to shift from a standard maximum freight car gross
weight (weight of freight car and contents) of 263,000 pounds to 286,000 pounds. With the change in
standard weight, the rail tracks had to be strong enough to accommodate the additional weight. With
national rail car fleet composed principally of the heavier cars, track that can support these cars has also
become standard particularly on the Class I railroads.
For the railroads and their customers, larger cars offer a cost savings. The cars had ten percent higher
capacity than the smaller cars. AAR studies of the impact of these railcars estimated that operating
savings excluding maintenance of way would be 8.8 percent.12 Conversely, the 286,000-pound railcar
can increase the cost of maintaining rail lines and bridges. Research conducted for the AAR found that
the net impact of the shift to 286,000 pound railcars, accounting for increased maintenance of way
expenditures, is about 6 percent.13
With the exception of the UPRR Chandler industrial lead, all the lines of the Class I railroads can
accommodate the 286,000-pound car. With respect to the short line railroads, all, other than the
Arizona Eastern and the Clarkdale Arizona Central can handle the heavier cars.
12 Michael J. Babcock, James Sanderson for the Kansas Department of Transportation, The Impact of Jumbo Covered Hopper Cars on Kansas Shortline Railroads, September 2004; Ken Casavant and Denver Tolliver for the Washington Department of Transportation, Impacts of Heavy Axle Loads on Light Density Lines in the State of Washington, February 2001. 13 M.B. Hargrove, Thomas S. Guins, and Carl D. Martland, “Economics of Increased Axle Loads: FAST/HAL Phase II Results,” Report No. LA-007, Association of American Railroads, October 1996.
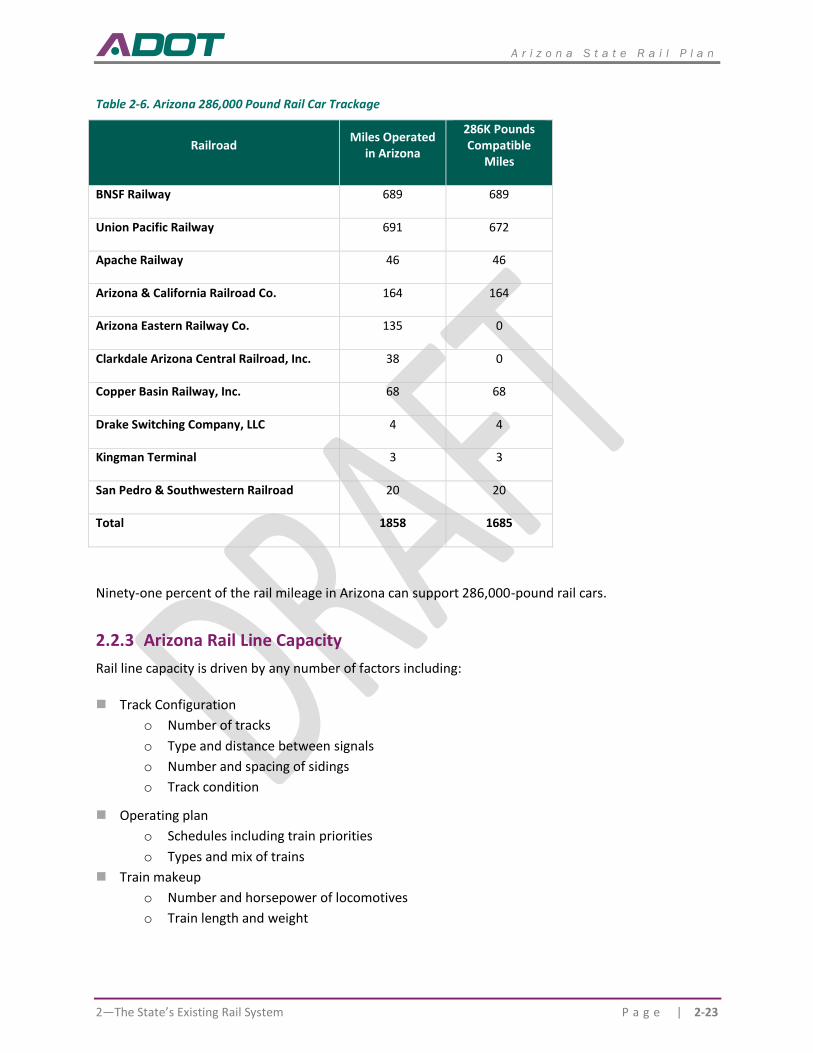
A r i z o n a S t a t e R a i l P l a n
2—The State’s Existing Rail System P a g e | 2-23
Table 2-6. Arizona 286,000 Pound Rail Car Trackage
Railroad Miles Operated
in Arizona
286K Pounds Compatible
Miles
BNSF Railway 689 689
Union Pacific Railway 691 672
Apache Railway 46 46
Arizona & California Railroad Co. 164 164
Arizona Eastern Railway Co. 135 0
Clarkdale Arizona Central Railroad, Inc. 38 0
Copper Basin Railway, Inc. 68 68
Drake Switching Company, LLC 4 4
Kingman Terminal 3 3
San Pedro & Southwestern Railroad 20 20
Total 1858 1685
Ninety-one percent of the rail mileage in Arizona can support 286,000-pound rail cars.
2.2.3 Arizona Rail Line Capacity
Rail line capacity is driven by any number of factors including:
◼ Track Configuration
o Number of tracks
o Type and distance between signals
o Number and spacing of sidings
o Track condition
◼ Operating plan
o Schedules including train priorities
o Types and mix of trains
◼ Train makeup
o Number and horsepower of locomotives
o Train length and weight
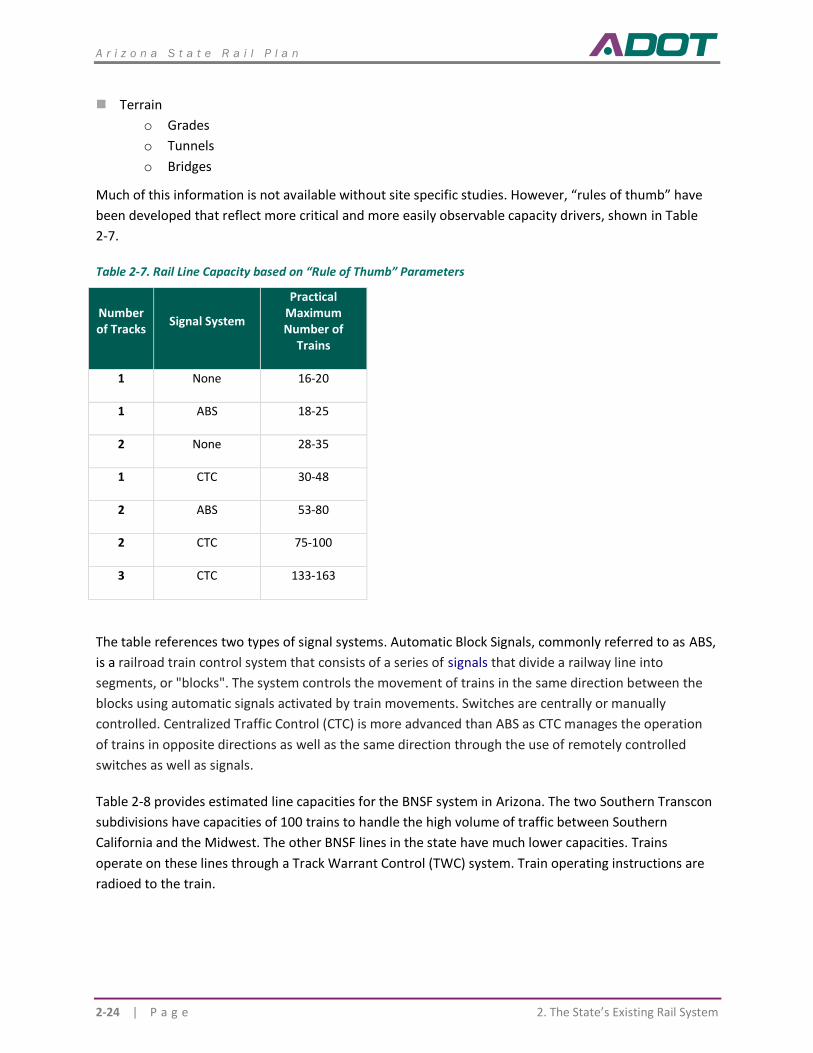
A r i z o n a S t a t e R a i l P l a n
2-24 | P a g e 2. The State’s Existing Rail System
◼ Terrain
o Grades
o Tunnels
o Bridges
Much of this information is not available without site specific studies. However, “rules of thumb” have
been developed that reflect more critical and more easily observable capacity drivers, shown in Table
2-7.
Table 2-7. Rail Line Capacity based on “Rule of Thumb” Parameters
Number of Tracks
Signal System
Practical Maximum Number of
Trains
1 None 16-20
1 ABS 18-25
2 None 28-35
1 CTC 30-48
2 ABS 53-80
2 CTC 75-100
3 CTC 133-163
The table references two types of signal systems. Automatic Block Signals, commonly referred to as ABS,
is a railroad train control system that consists of a series of signals that divide a railway line into
segments, or "blocks". The system controls the movement of trains in the same direction between the
blocks using automatic signals activated by train movements. Switches are centrally or manually
controlled. Centralized Traffic Control (CTC) is more advanced than ABS as CTC manages the operation
of trains in opposite directions as well as the same direction through the use of remotely controlled
switches as well as signals.
Table 2-8 provides estimated line capacities for the BNSF system in Arizona. The two Southern Transcon
subdivisions have capacities of 100 trains to handle the high volume of traffic between Southern
California and the Midwest. The other BNSF lines in the state have much lower capacities. Trains
operate on these lines through a Track Warrant Control (TWC) system. Train operating instructions are
radioed to the train.
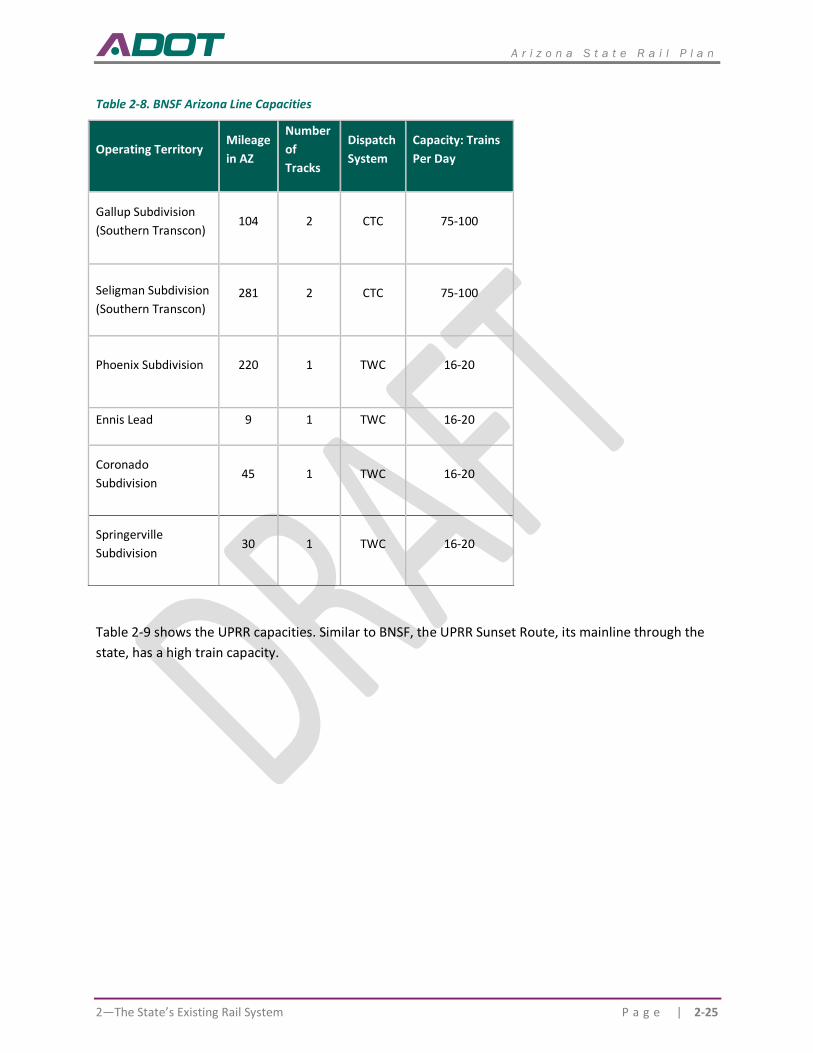
A r i z o n a S t a t e R a i l P l a n
2—The State’s Existing Rail System P a g e | 2-25
Table 2-8. BNSF Arizona Line Capacities
Operating Territory Mileage
in AZ
Number
of
Tracks
Dispatch
System
Capacity: Trains
Per Day
Gallup Subdivision
(Southern Transcon) 104 2 CTC 75-100
Seligman Subdivision
(Southern Transcon) 281 2 CTC 75-100
Phoenix Subdivision 220 1 TWC 16-20
Ennis Lead 9 1 TWC 16-20
Coronado
Subdivision 45 1 TWC 16-20
Springerville
Subdivision 30 1 TWC 16-20
Table 2-9 shows the UPRR capacities. Similar to BNSF, the UPRR Sunset Route, its mainline through the
state, has a high train capacity.
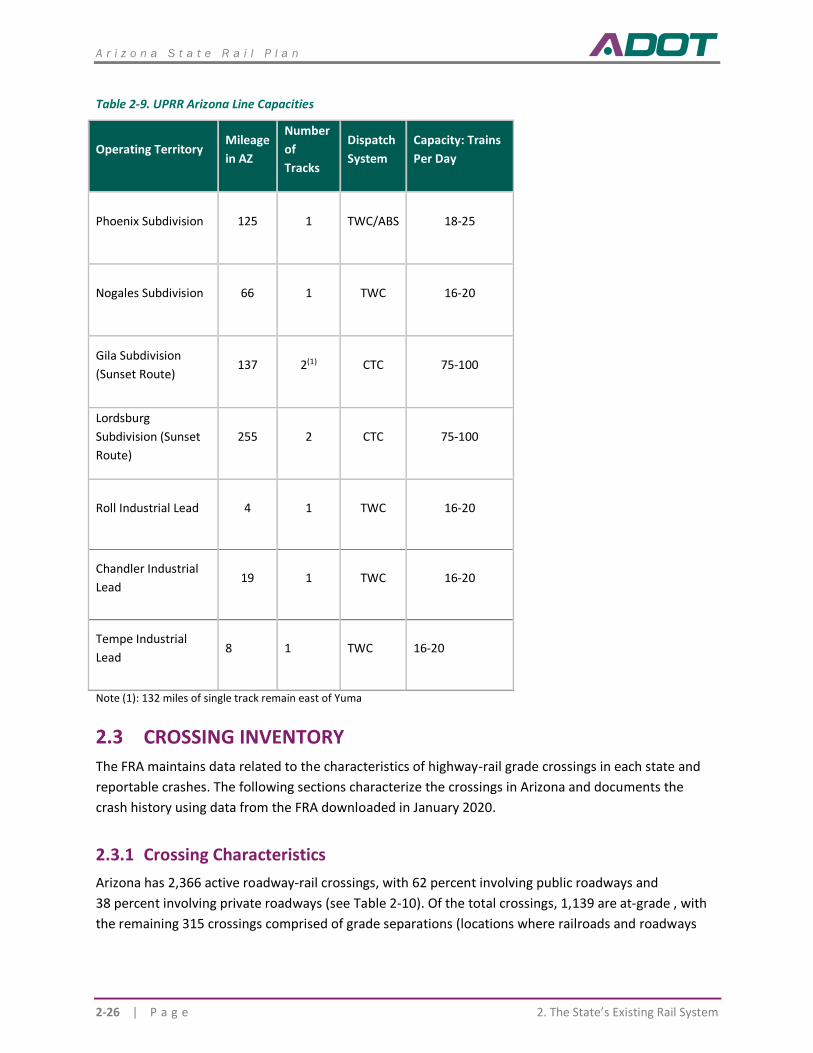
A r i z o n a S t a t e R a i l P l a n
2-26 | P a g e 2. The State’s Existing Rail System
Table 2-9. UPRR Arizona Line Capacities
Operating Territory Mileage
in AZ
Number
of
Tracks
Dispatch
System
Capacity: Trains
Per Day
Phoenix Subdivision 125 1 TWC/ABS 18-25
Nogales Subdivision 66 1 TWC 16-20
Gila Subdivision
(Sunset Route) 137 2(1) CTC 75-100
Lordsburg
Subdivision (Sunset
Route)
255 2 CTC 75-100
Roll Industrial Lead 4 1 TWC 16-20
Chandler Industrial
Lead 19 1 TWC 16-20
Tempe Industrial
Lead 8 1 TWC 16-20
Note (1): 132 miles of single track remain east of Yuma
CROSSING INVENTORY
The FRA maintains data related to the characteristics of highway-rail grade crossings in each state and
reportable crashes. The following sections characterize the crossings in Arizona and documents the
crash history using data from the FRA downloaded in January 2020.
2.3.1 Crossing Characteristics
Arizona has 2,366 active roadway-rail crossings, with 62 percent involving public roadways and
38 percent involving private roadways (see Table 2-10). Of the total crossings, 1,139 are at-grade , with
the remaining 315 crossings comprised of grade separations (locations where railroads and roadways
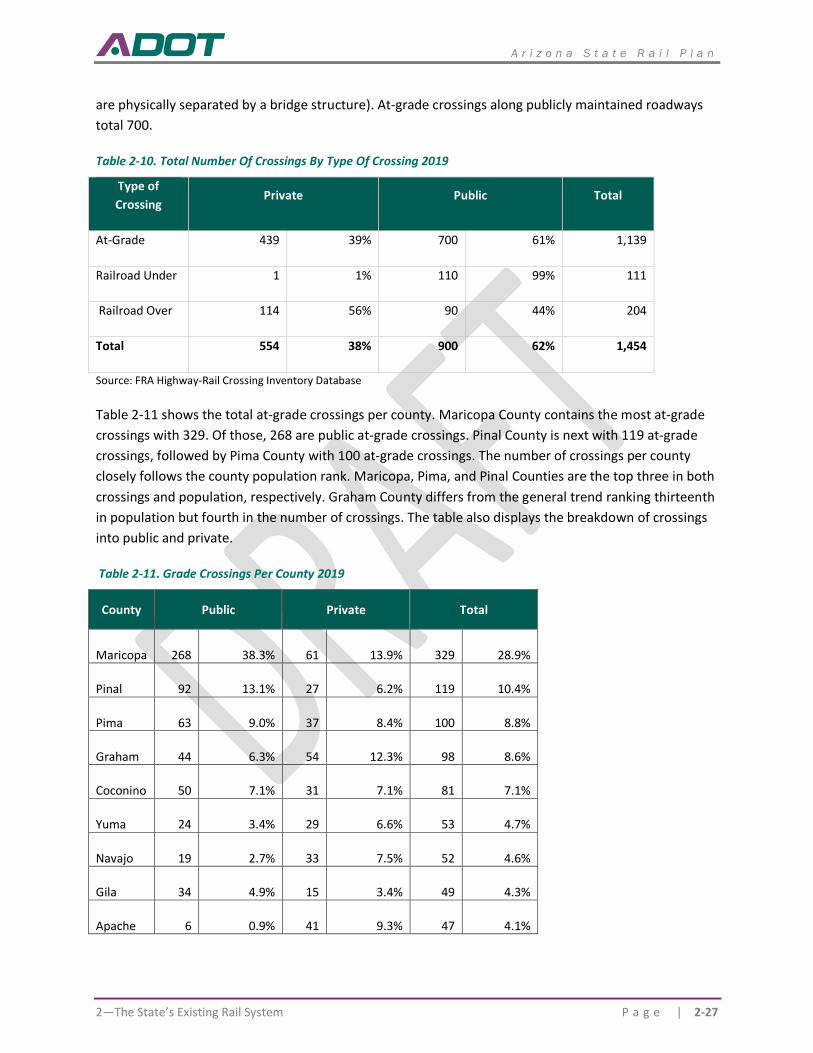
A r i z o n a S t a t e R a i l P l a n
2—The State’s Existing Rail System P a g e | 2-27
are physically separated by a bridge structure). At-grade crossings along publicly maintained roadways
total 700.
Table 2-10. Total Number Of Crossings By Type Of Crossing 2019
Type of
Crossing Private Public Total
At-Grade 439 39% 700 61% 1,139
Railroad Under 1 1% 110 99% 111
Railroad Over 114 56% 90 44% 204
Total 554 38% 900 62% 1,454
Source: FRA Highway-Rail Crossing Inventory Database
Table 2-11 shows the total at-grade crossings per county. Maricopa County contains the most at-grade
crossings with 329. Of those, 268 are public at-grade crossings. Pinal County is next with 119 at-grade
crossings, followed by Pima County with 100 at-grade crossings. The number of crossings per county
closely follows the county population rank. Maricopa, Pima, and Pinal Counties are the top three in both
crossings and population, respectively. Graham County differs from the general trend ranking thirteenth
in population but fourth in the number of crossings. The table also displays the breakdown of crossings
into public and private.
Table 2-11. Grade Crossings Per County 2019
County Public Private Total
Maricopa 268 38.3% 61 13.9% 329 28.9%
Pinal 92 13.1% 27 6.2% 119 10.4%
Pima 63 9.0% 37 8.4% 100 8.8%
Graham 44 6.3% 54 12.3% 98 8.6%
Coconino 50 7.1% 31 7.1% 81 7.1%
Yuma 24 3.4% 29 6.6% 53 4.7%
Navajo 19 2.7% 33 7.5% 52 4.6%
Gila 34 4.9% 15 3.4% 49 4.3%
Apache 6 0.9% 41 9.3% 47 4.1%
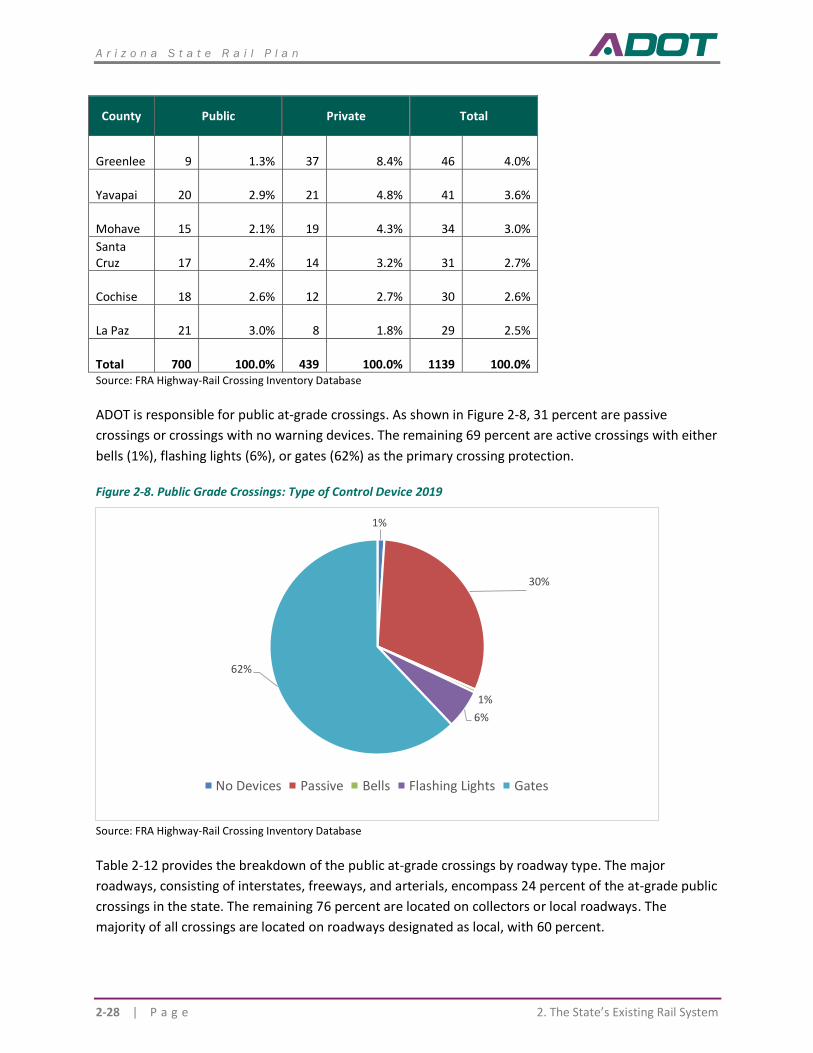
A r i z o n a S t a t e R a i l P l a n
2-28 | P a g e 2. The State’s Existing Rail System
County Public Private Total
Greenlee 9 1.3% 37 8.4% 46 4.0%
Yavapai 20 2.9% 21 4.8% 41 3.6%
Mohave 15 2.1% 19 4.3% 34 3.0%
Santa Cruz 17 2.4% 14 3.2% 31 2.7%
Cochise 18 2.6% 12 2.7% 30 2.6%
La Paz 21 3.0% 8 1.8% 29 2.5%
Total 700 100.0% 439 100.0% 1139 100.0% Source: FRA Highway-Rail Crossing Inventory Database
ADOT is responsible for public at-grade crossings. As shown in Figure 2-8, 31 percent are passive
crossings or crossings with no warning devices. The remaining 69 percent are active crossings with either
bells (1%), flashing lights (6%), or gates (62%) as the primary crossing protection.
Figure 2-8. Public Grade Crossings: Type of Control Device 2019
Source: FRA Highway-Rail Crossing Inventory Database
Table 2-12 provides the breakdown of the public at-grade crossings by roadway type. The major
roadways, consisting of interstates, freeways, and arterials, encompass 24 percent of the at-grade public
crossings in the state. The remaining 76 percent are located on collectors or local roadways. The
majority of all crossings are located on roadways designated as local, with 60 percent.
1%
30%
1%
6%
62%
No Devices Passive Bells Flashing Lights Gates
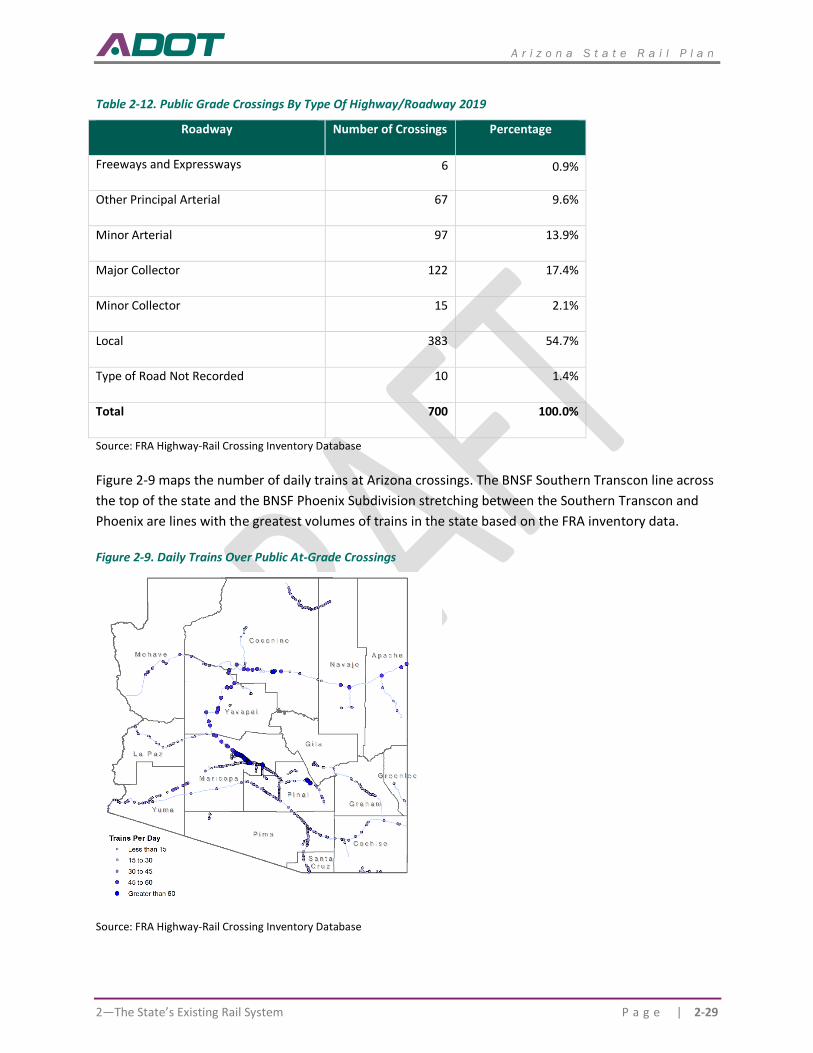
A r i z o n a S t a t e R a i l P l a n
2—The State’s Existing Rail System P a g e | 2-29
Table 2-12. Public Grade Crossings By Type Of Highway/Roadway 2019
Roadway Number of Crossings Percentage
Freeways and Expressways 6 0.9%
Other Principal Arterial 67 9.6%
Minor Arterial 97 13.9%
Major Collector 122 17.4%
Minor Collector 15 2.1%
Local 383 54.7%
Type of Road Not Recorded 10 1.4%
Total 700 100.0%
Source: FRA Highway-Rail Crossing Inventory Database
Figure 2-9 maps the number of daily trains at Arizona crossings. The BNSF Southern Transcon line across
the top of the state and the BNSF Phoenix Subdivision stretching between the Southern Transcon and
Phoenix are lines with the greatest volumes of trains in the state based on the FRA inventory data.
Figure 2-9. Daily Trains Over Public At-Grade Crossings
Source: FRA Highway-Rail Crossing Inventory Database
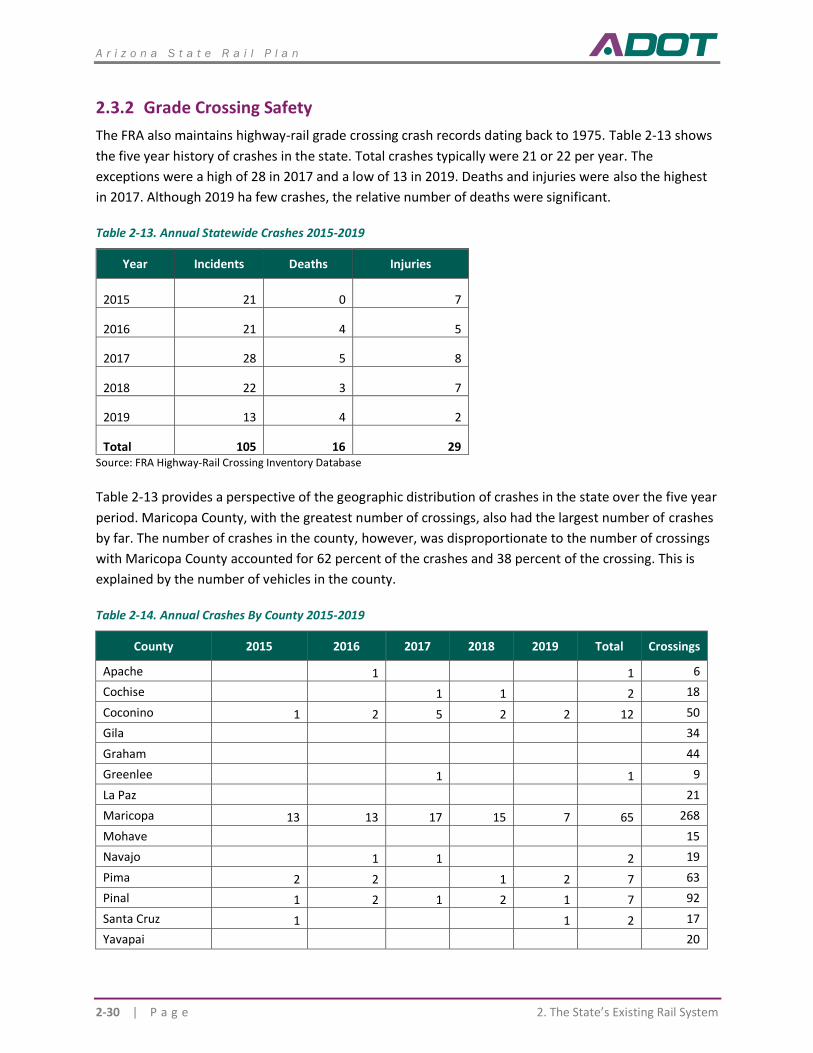
A r i z o n a S t a t e R a i l P l a n
2-30 | P a g e 2. The State’s Existing Rail System
2.3.2 Grade Crossing Safety
The FRA also maintains highway-rail grade crossing crash records dating back to 1975. Table 2-13 shows
the five year history of crashes in the state. Total crashes typically were 21 or 22 per year. The
exceptions were a high of 28 in 2017 and a low of 13 in 2019. Deaths and injuries were also the highest
in 2017. Although 2019 ha few crashes, the relative number of deaths were significant.
Table 2-13. Annual Statewide Crashes 2015-2019
Year Incidents Deaths Injuries
2015 21 0 7
2016 21 4 5
2017 28 5 8
2018 22 3 7
2019 13 4 2
Total 105 16 29 Source: FRA Highway-Rail Crossing Inventory Database
Table 2-13 provides a perspective of the geographic distribution of crashes in the state over the five year
period. Maricopa County, with the greatest number of crossings, also had the largest number of crashes
by far. The number of crashes in the county, however, was disproportionate to the number of crossings
with Maricopa County accounted for 62 percent of the crashes and 38 percent of the crossing. This is
explained by the number of vehicles in the county.
Table 2-14. Annual Crashes By County 2015-2019
County 2015 2016 2017 2018 2019 Total Crossings
Apache 1 1 6
Cochise 1 1 2 18
Coconino 1 2 5 2 2 12 50
Gila 34
Graham 44
Greenlee 1 1 9
La Paz 21
Maricopa 13 13 17 15 7 65 268
Mohave 15
Navajo 1 1 2 19
Pima 2 2 1 2 7 63
Pinal 1 2 1 2 1 7 92
Santa Cruz 1 1 2 17
Yavapai 20
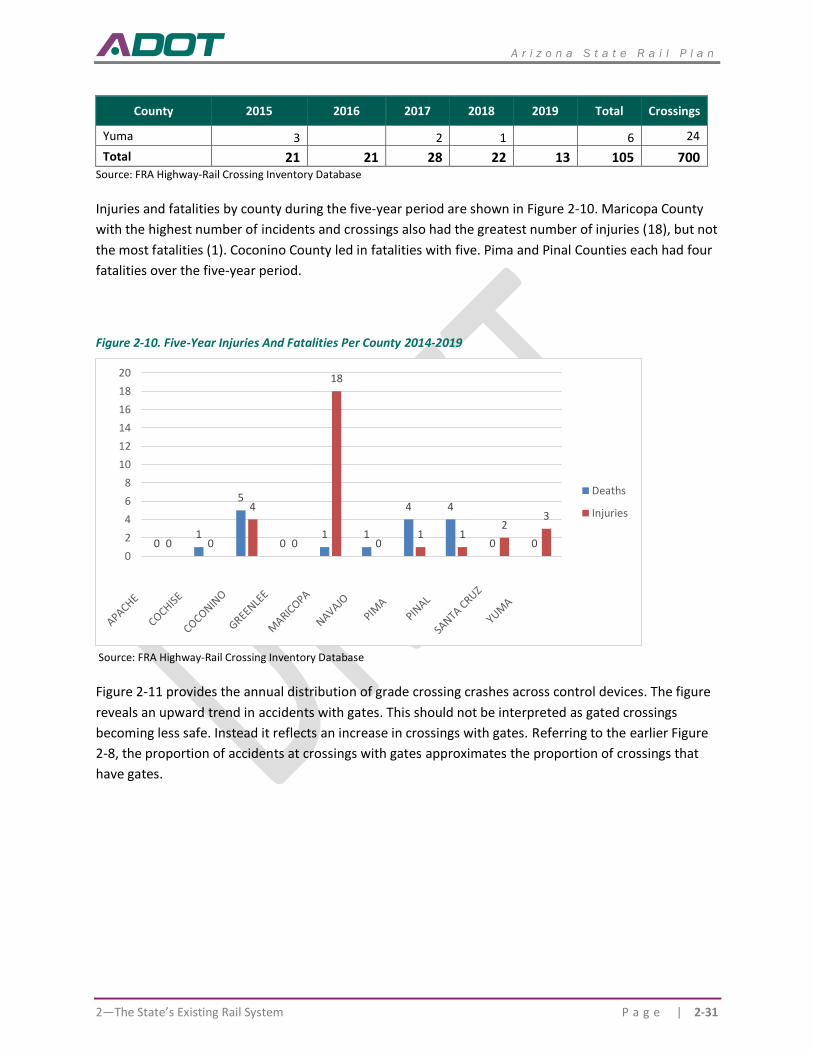
A r i z o n a S t a t e R a i l P l a n
2—The State’s Existing Rail System P a g e | 2-31
County 2015 2016 2017 2018 2019 Total Crossings
Yuma 3 2 1 6 24
Total 21 21 28 22 13 105 700 Source: FRA Highway-Rail Crossing Inventory Database
Injuries and fatalities by county during the five-year period are shown in Figure 2-10. Maricopa County
with the highest number of incidents and crossings also had the greatest number of injuries (18), but not
the most fatalities (1). Coconino County led in fatalities with five. Pima and Pinal Counties each had four
fatalities over the five-year period.
Figure 2-10. Five-Year Injuries And Fatalities Per County 2014-2019
Source: FRA Highway-Rail Crossing Inventory Database
Figure 2-11 provides the annual distribution of grade crossing crashes across control devices. The figure
reveals an upward trend in accidents with gates. This should not be interpreted as gated crossings
becoming less safe. Instead it reflects an increase in crossings with gates. Referring to the earlier Figure
2-8, the proportion of accidents at crossings with gates approximates the proportion of crossings that
have gates.
01
5
01 1
4 4
0 00 0
4
0
18
01 1
23
0
2
4
6
8
10
12
14
16
18
20
Deaths
Injuries
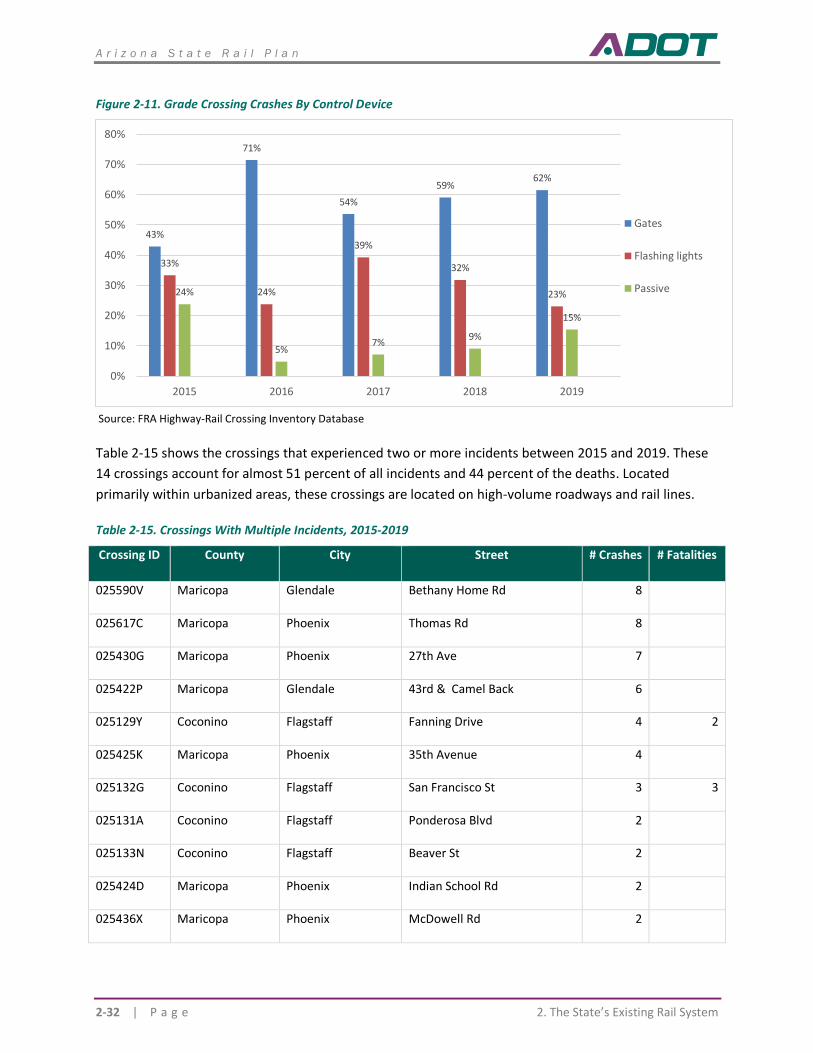
A r i z o n a S t a t e R a i l P l a n
2-32 | P a g e 2. The State’s Existing Rail System
Figure 2-11. Grade Crossing Crashes By Control Device
Source: FRA Highway-Rail Crossing Inventory Database
Table 2-15 shows the crossings that experienced two or more incidents between 2015 and 2019. These
14 crossings account for almost 51 percent of all incidents and 44 percent of the deaths. Located
primarily within urbanized areas, these crossings are located on high-volume roadways and rail lines.
Table 2-15. Crossings With Multiple Incidents, 2015-2019
Crossing ID County City Street # Crashes # Fatalities
025590V Maricopa Glendale Bethany Home Rd 8
025617C Maricopa Phoenix Thomas Rd 8
025430G Maricopa Phoenix 27th Ave 7
025422P Maricopa Glendale 43rd & Camel Back 6
025129Y Coconino Flagstaff Fanning Drive 4 2
025425K Maricopa Phoenix 35th Avenue 4
025132G Coconino Flagstaff San Francisco St 3 3
025131A Coconino Flagstaff Ponderosa Blvd 2
025133N Coconino Flagstaff Beaver St 2
025424D Maricopa Phoenix Indian School Rd 2
025436X Maricopa Phoenix McDowell Rd 2
43%
71%
54%
59%62%
33%
24%
39%
32%
23%24%
5%7%
9%
15%
0%
10%
20%
30%
40%
50%
60%
70%
80%
2015 2016 2017 2018 2019
Gates
Flashing lights
Passive
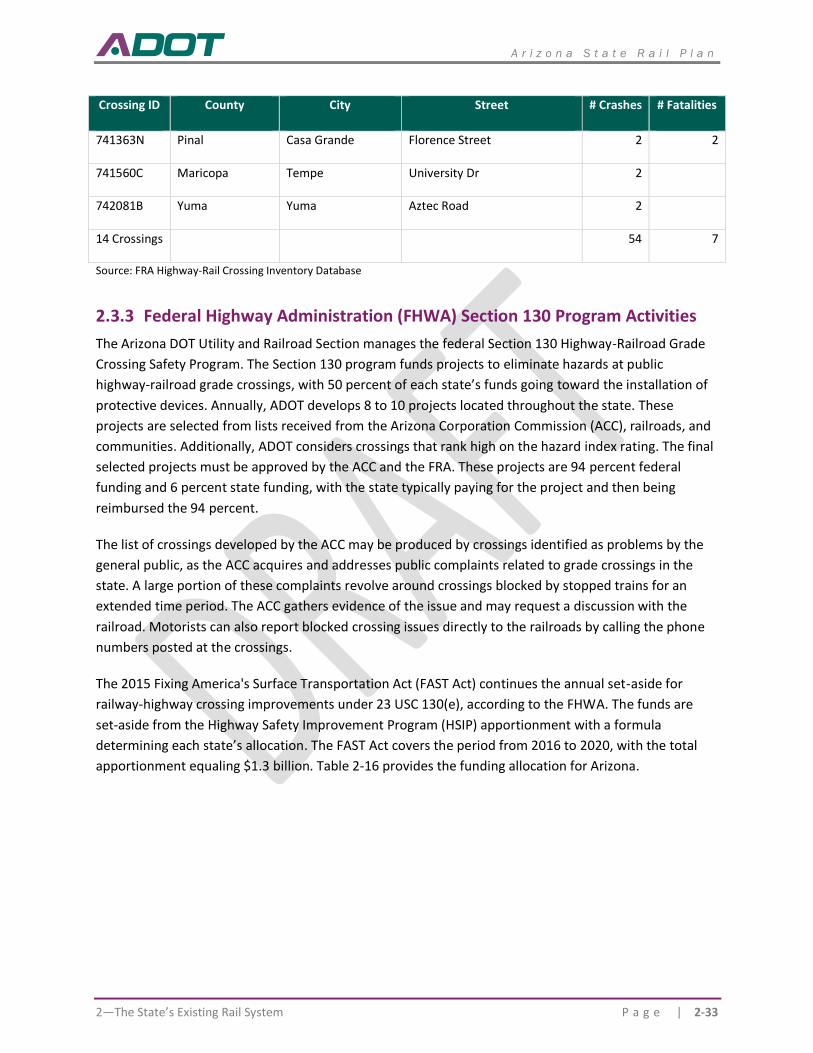
A r i z o n a S t a t e R a i l P l a n
2—The State’s Existing Rail System P a g e | 2-33
Crossing ID County City Street # Crashes # Fatalities
741363N Pinal Casa Grande Florence Street 2 2
741560C Maricopa Tempe University Dr 2
742081B Yuma Yuma Aztec Road 2
14 Crossings
54 7
Source: FRA Highway-Rail Crossing Inventory Database
2.3.3 Federal Highway Administration (FHWA) Section 130 Program Activities
The Arizona DOT Utility and Railroad Section manages the federal Section 130 Highway-Railroad Grade
Crossing Safety Program. The Section 130 program funds projects to eliminate hazards at public
highway-railroad grade crossings, with 50 percent of each state’s funds going toward the installation of
protective devices. Annually, ADOT develops 8 to 10 projects located throughout the state. These
projects are selected from lists received from the Arizona Corporation Commission (ACC), railroads, and
communities. Additionally, ADOT considers crossings that rank high on the hazard index rating. The final
selected projects must be approved by the ACC and the FRA. These projects are 94 percent federal
funding and 6 percent state funding, with the state typically paying for the project and then being
reimbursed the 94 percent.
The list of crossings developed by the ACC may be produced by crossings identified as problems by the
general public, as the ACC acquires and addresses public complaints related to grade crossings in the
state. A large portion of these complaints revolve around crossings blocked by stopped trains for an
extended time period. The ACC gathers evidence of the issue and may request a discussion with the
railroad. Motorists can also report blocked crossing issues directly to the railroads by calling the phone
numbers posted at the crossings.
The 2015 Fixing America's Surface Transportation Act (FAST Act) continues the annual set-aside for
railway-highway crossing improvements under 23 USC 130(e), according to the FHWA. The funds are
set-aside from the Highway Safety Improvement Program (HSIP) apportionment with a formula
determining each state’s allocation. The FAST Act covers the period from 2016 to 2020, with the total
apportionment equaling $1.3 billion. Table 2-16 provides the funding allocation for Arizona.
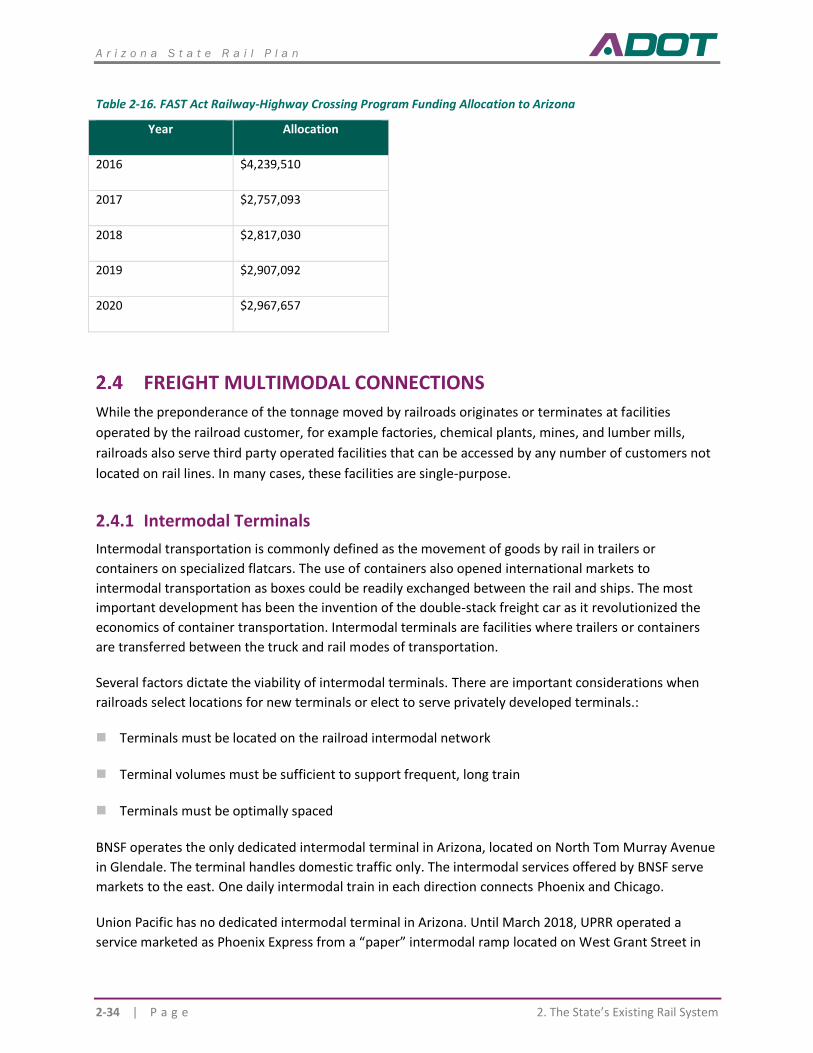
A r i z o n a S t a t e R a i l P l a n
2-34 | P a g e 2. The State’s Existing Rail System
Table 2-16. FAST Act Railway-Highway Crossing Program Funding Allocation to Arizona
Year Allocation
2016 $4,239,510
2017 $2,757,093
2018 $2,817,030
2019 $2,907,092
2020 $2,967,657
FREIGHT MULTIMODAL CONNECTIONS
While the preponderance of the tonnage moved by railroads originates or terminates at facilities
operated by the railroad customer, for example factories, chemical plants, mines, and lumber mills,
railroads also serve third party operated facilities that can be accessed by any number of customers not
located on rail lines. In many cases, these facilities are single-purpose.
2.4.1 Intermodal Terminals
Intermodal transportation is commonly defined as the movement of goods by rail in trailers or
containers on specialized flatcars. The use of containers also opened international markets to
intermodal transportation as boxes could be readily exchanged between the rail and ships. The most
important development has been the invention of the double-stack freight car as it revolutionized the
economics of container transportation. Intermodal terminals are facilities where trailers or containers
are transferred between the truck and rail modes of transportation.
Several factors dictate the viability of intermodal terminals. There are important considerations when
railroads select locations for new terminals or elect to serve privately developed terminals.:
◼ Terminals must be located on the railroad intermodal network
◼ Terminal volumes must be sufficient to support frequent, long train
◼ Terminals must be optimally spaced
BNSF operates the only dedicated intermodal terminal in Arizona, located on North Tom Murray Avenue
in Glendale. The terminal handles domestic traffic only. The intermodal services offered by BNSF serve
markets to the east. One daily intermodal train in each direction connects Phoenix and Chicago.
Union Pacific has no dedicated intermodal terminal in Arizona. Until March 2018, UPRR operated a
service marketed as Phoenix Express from a “paper” intermodal ramp located on West Grant Street in
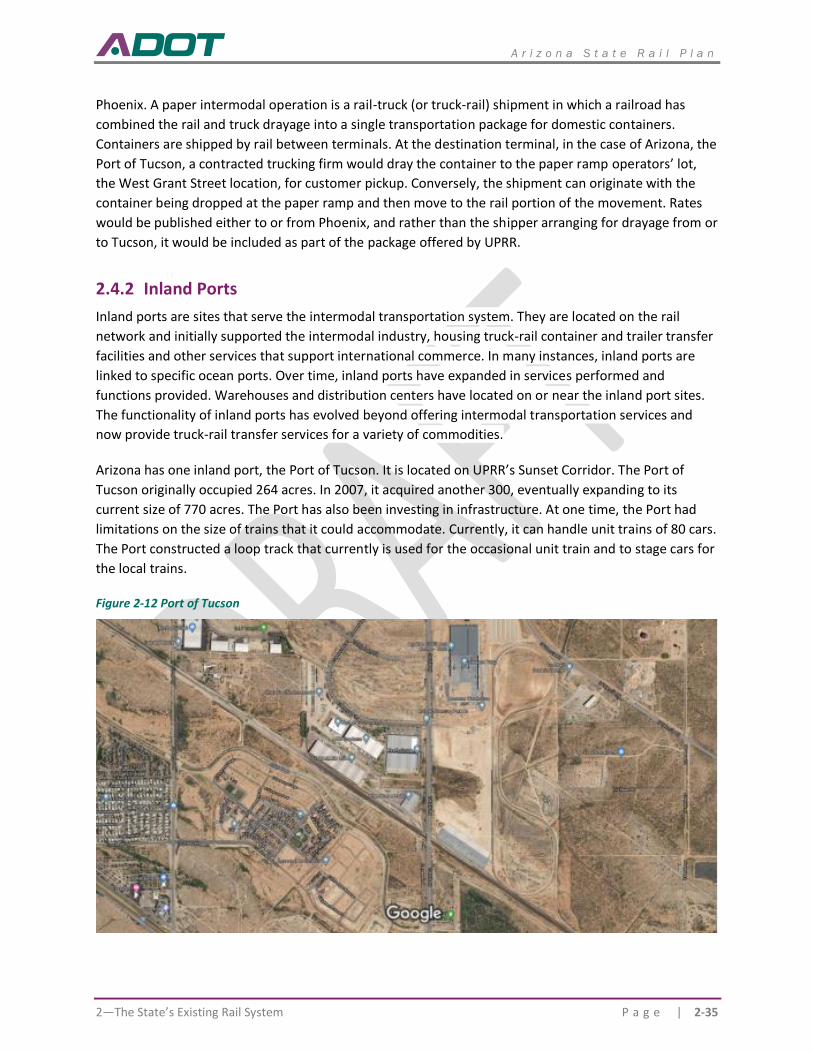
A r i z o n a S t a t e R a i l P l a n
2—The State’s Existing Rail System P a g e | 2-35
Phoenix. A paper intermodal operation is a rail-truck (or truck-rail) shipment in which a railroad has
combined the rail and truck drayage into a single transportation package for domestic containers.
Containers are shipped by rail between terminals. At the destination terminal, in the case of Arizona, the
Port of Tucson, a contracted trucking firm would dray the container to the paper ramp operators’ lot,
the West Grant Street location, for customer pickup. Conversely, the shipment can originate with the
container being dropped at the paper ramp and then move to the rail portion of the movement. Rates
would be published either to or from Phoenix, and rather than the shipper arranging for drayage from or
to Tucson, it would be included as part of the package offered by UPRR.
2.4.2 Inland Ports
Inland ports are sites that serve the intermodal transportation system. They are located on the rail
network and initially supported the intermodal industry, housing truck-rail container and trailer transfer
facilities and other services that support international commerce. In many instances, inland ports are
linked to specific ocean ports. Over time, inland ports have expanded in services performed and
functions provided. Warehouses and distribution centers have located on or near the inland port sites.
The functionality of inland ports has evolved beyond offering intermodal transportation services and
now provide truck-rail transfer services for a variety of commodities.
Arizona has one inland port, the Port of Tucson. It is located on UPRR’s Sunset Corridor. The Port of
Tucson originally occupied 264 acres. In 2007, it acquired another 300, eventually expanding to its
current size of 770 acres. The Port has also been investing in infrastructure. At one time, the Port had
limitations on the size of trains that it could accommodate. Currently, it can handle unit trains of 80 cars.
The Port constructed a loop track that currently is used for the occasional unit train and to stage cars for
the local trains.
Figure 2-12 Port of Tucson
A r i z o n a S t a t e R a i l P l a n
2-36 | P a g e 2. The State’s Existing Rail System
Benefitting from the service on the Sunset Corridor, the Port of Tucson has provided domestic
intermodal service since 2004. In 2013, the port began to offer international service. The domestic
service is between the Port and Chicago. It is also trying to establish a Houston service. The Port also
operates its own drayage service ensuring that capacity is always available.
The international container service is principally export traffic. The Port attempts to find loads for
unloaded containers that would otherwise return to Asia empty. The cargo typically consists of recycled
paper, alfalfa, or hay. On the import side, the Port attempts to substitute rail transportation for trucking
containers from the Southern California ports where rail is a cost-effective competitor.
Although the Port handles containers, no dedicated intermodal trains serve the Port. Containers arrive
and depart in the same manner as other freight cars-on local trains from the UPRR Tucson yard. The Port
receives intermodal cars along with other manifest cars.
Several factors have contributed to the efficiency of the Port and its benefit to UPRR, thus its growth:
◼ Extensive experience in rail operations and understanding of what drives rail operating costs. The
Port strives to lower UPRR’s operating costs. As an example, the Port provides its own switching
within the facility. UPRR only has to pick up or drop off cars - a “hook and haul” operation for UPRR.
This type of operation also results in no incremental effort for UPRR to bring another customer
online.
◼ Proximity to the Tucson rail yard. Tucson Yard is a crew change point with trains having stop. Cars
can easily be switched in or out of trains and put on a local train to the Port of Tucson.
◼ Infrastructure. The Port of Tucson has a two-mile siding, and due to a recent TIGER grant, the siding
is equipped with high speed switches. UPRR trains can enter and exit the siding without having to
reduce speed resulting in negligible disruption to the UPRR mainline.
The Port is continually seeking areas for expansion to maintain its growth trajectory. Opportunities
include:
◼ Transportation of LPG. The Port handled unit trains of liquid petroleum gas (LPG) on an interim
basis while a customer built a facility in Hermosillo. The customer intended to export and then
distribute LPG to Mexico. The location in Hermosillo has had difficulty, so the shipper continues to
use the Port of Tucson.
◼ Expanding Heavy Weight Truck Network. Port would like the expansion of heavy weight truck lanes
as it often receives overweight trucks.
◼ Grain Container Loading Facility. Covered hoppers would bring grain to the Port for transfer to
containers to be exported. UPRR tried a distiller's dried grains with solubles (DDGS), a by-product of
ethanol production used in animal feeds, stuffing facility but failed. Port believes that a more
efficient operation would be successful.
A r i z o n a S t a t e R a i l P l a n
2—The State’s Existing Rail System P a g e | 2-37
◼ Copper Concentrate Mixing Center. Mixing high grade copper concentrate with low grade
concentrate produces a mid-grade concentrate that has a value exceeding the combined value of
the two grades if sold separately.
◼ Cross-dock Operations. Potential boxcar and refrigerated boxcar operation
UPRR and Ferromex tried a produce service, however, it failed because of problems in Nogales. An alternative might be to dray containers across the border to the Port of Tucson. The Port of Tucson could then consolidate shipments for shipping to other parts of the country.
The Port is playing an increasingly important role in economic development in Tucson. Amazon recently opened a new fulfillment center adjacent to the Port. The Port was a principal attractor for the new facility.
2.4.3 Transload Terminals
FUNCTIONALITY
Transloading is a form of multi-modal transportation in which non-containerized traffic is transferred
between trucks and rail cars. Transloading can take place at the origin location, destination location, or
both. Transloading is performed using one of several conveyances
• Forklift. For products like lumber, paper and palletized goods
• Conveyor. For bulk products like sand, soda ash, grains, flour and sugar
• Pump/Pneumatic Transfer. For products like plastic pellets and liquids
• Crane. For large, heavy products like steel beams, rebar, pipe and wind components
• Front-end Loader. For products like rock, salt and other minerals and aggregates
In addition to the transfer of products, transload facilities also provide value added services such as
storage and repackaging.
ARIZONA TRANSLOAD FACILITIES
Arizona transload facilities are located on both BNSF and UPRR, with two terminals on each. The BNSF
transload facilities are both located in Phoenix while the transload terminals served by UPRR are found
in Phoenix and Tucson. Table 2-17 describes the features of the Class I served transload terminals in
Arizona.
Three short line railroads have transload terminals online: ARZC (Parker), AZER (Globe), and SPSR
(Benson).
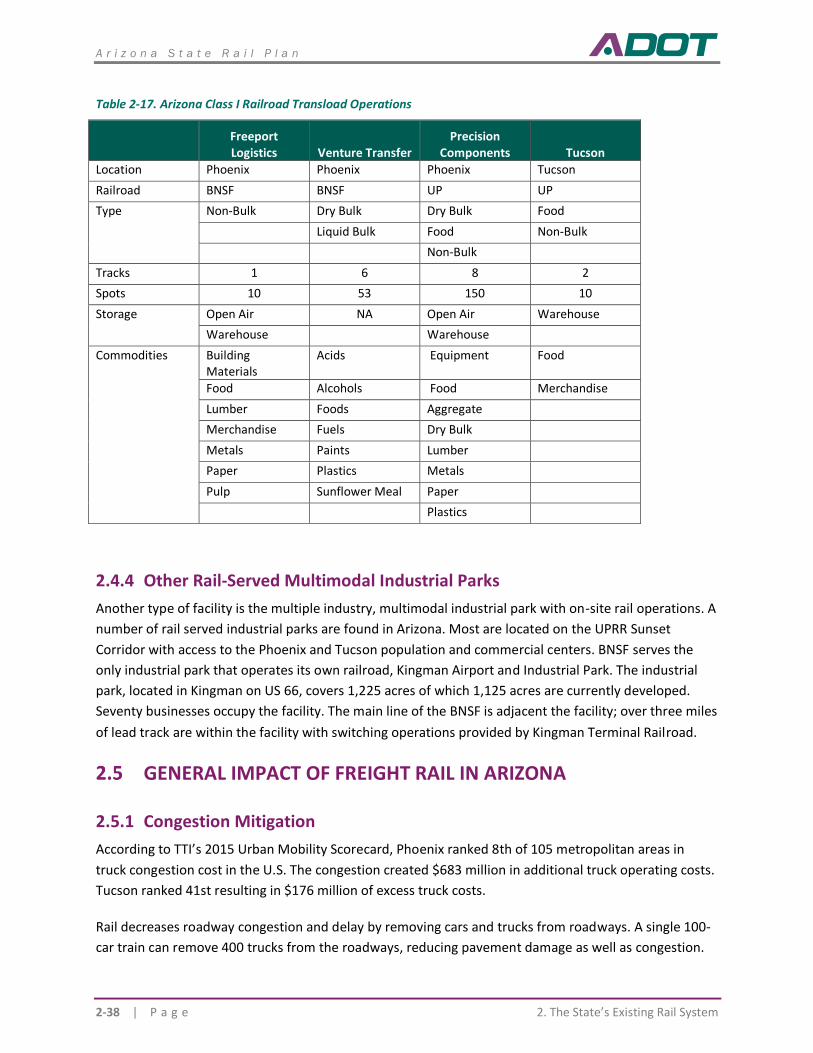
A r i z o n a S t a t e R a i l P l a n
2-38 | P a g e 2. The State’s Existing Rail System
Table 2-17. Arizona Class I Railroad Transload Operations
Freeport Logistics Venture Transfer
Precision Components Tucson
Location Phoenix Phoenix Phoenix Tucson
Railroad BNSF BNSF UP UP
Type
Non-Bulk Dry Bulk Dry Bulk Food
Liquid Bulk Food Non-Bulk
Non-Bulk
Tracks 1 6 8 2
Spots 10 53 150 10
Storage
Open Air NA Open Air Warehouse
Warehouse Warehouse
Commodities
Building Materials
Acids Equipment Food
Food Alcohols Food Merchandise
Lumber Foods Aggregate
Merchandise Fuels Dry Bulk
Metals Paints Lumber
Paper Plastics Metals
Pulp Sunflower Meal Paper
Plastics
2.4.4 Other Rail-Served Multimodal Industrial Parks
Another type of facility is the multiple industry, multimodal industrial park with on-site rail operations. A
number of rail served industrial parks are found in Arizona. Most are located on the UPRR Sunset
Corridor with access to the Phoenix and Tucson population and commercial centers. BNSF serves the
only industrial park that operates its own railroad, Kingman Airport and Industrial Park. The industrial
park, located in Kingman on US 66, covers 1,225 acres of which 1,125 acres are currently developed.
Seventy businesses occupy the facility. The main line of the BNSF is adjacent the facility; over three miles
of lead track are within the facility with switching operations provided by Kingman Terminal Railroad.
GENERAL IMPACT OF FREIGHT RAIL IN ARIZONA
2.5.1 Congestion Mitigation
According to TTI’s 2015 Urban Mobility Scorecard, Phoenix ranked 8th of 105 metropolitan areas in
truck congestion cost in the U.S. The congestion created $683 million in additional truck operating costs.
Tucson ranked 41st resulting in $176 million of excess truck costs.
Rail decreases roadway congestion and delay by removing cars and trucks from roadways. A single 100-
car train can remove 400 trucks from the roadways, reducing pavement damage as well as congestion.
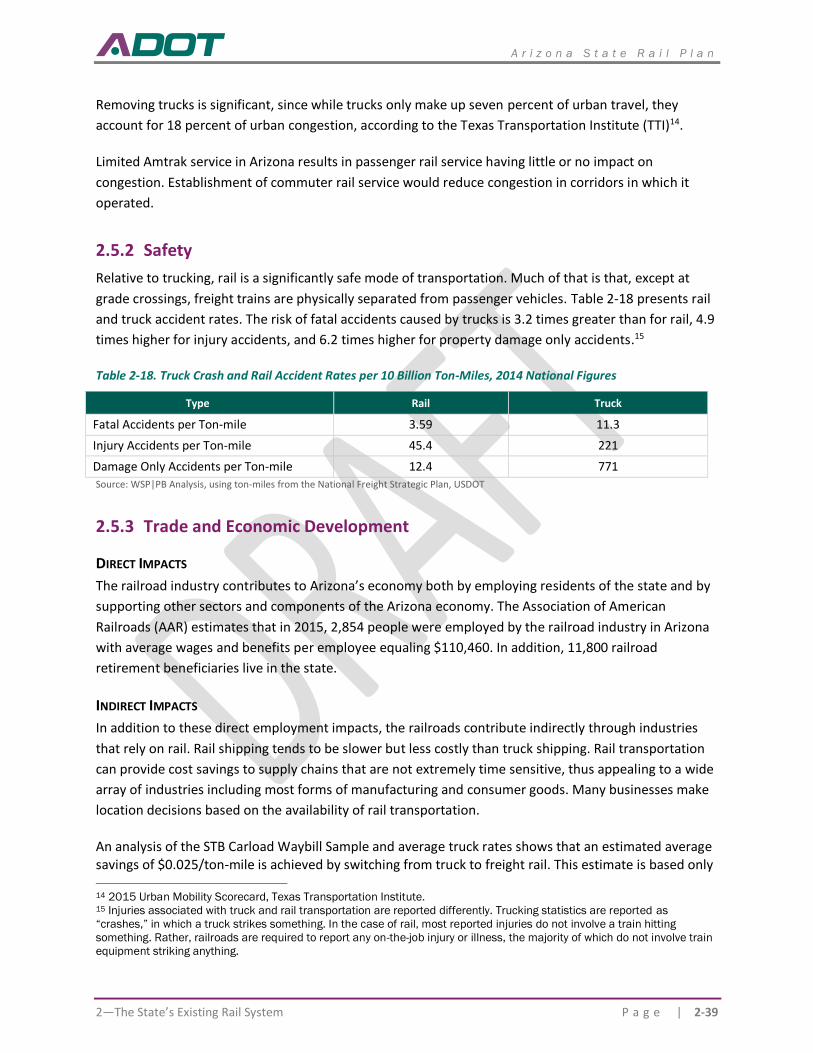
A r i z o n a S t a t e R a i l P l a n
2—The State’s Existing Rail System P a g e | 2-39
Removing trucks is significant, since while trucks only make up seven percent of urban travel, they
account for 18 percent of urban congestion, according to the Texas Transportation Institute (TTI)14.
Limited Amtrak service in Arizona results in passenger rail service having little or no impact on
congestion. Establishment of commuter rail service would reduce congestion in corridors in which it
operated.
2.5.2 Safety
Relative to trucking, rail is a significantly safe mode of transportation. Much of that is that, except at
grade crossings, freight trains are physically separated from passenger vehicles. Table 2-18 presents rail
and truck accident rates. The risk of fatal accidents caused by trucks is 3.2 times greater than for rail, 4.9
times higher for injury accidents, and 6.2 times higher for property damage only accidents.15
Table 2-18. Truck Crash and Rail Accident Rates per 10 Billion Ton-Miles, 2014 National Figures
Type Rail Truck
Fatal Accidents per Ton-mile 3.59 11.3
Injury Accidents per Ton-mile 45.4 221
Damage Only Accidents per Ton-mile 12.4 771
Source: WSP|PB Analysis, using ton-miles from the National Freight Strategic Plan, USDOT
2.5.3 Trade and Economic Development
DIRECT IMPACTS
The railroad industry contributes to Arizona’s economy both by employing residents of the state and by
supporting other sectors and components of the Arizona economy. The Association of American
Railroads (AAR) estimates that in 2015, 2,854 people were employed by the railroad industry in Arizona
with average wages and benefits per employee equaling $110,460. In addition, 11,800 railroad
retirement beneficiaries live in the state.
INDIRECT IMPACTS
In addition to these direct employment impacts, the railroads contribute indirectly through industries
that rely on rail. Rail shipping tends to be slower but less costly than truck shipping. Rail transportation
can provide cost savings to supply chains that are not extremely time sensitive, thus appealing to a wide
array of industries including most forms of manufacturing and consumer goods. Many businesses make
location decisions based on the availability of rail transportation.
An analysis of the STB Carload Waybill Sample and average truck rates shows that an estimated average savings of $0.025/ton-mile is achieved by switching from truck to freight rail. This estimate is based only
14 2015 Urban Mobility Scorecard, Texas Transportation Institute. 15 Injuries associated with truck and rail transportation are reported differently. Trucking statistics are reported as
“crashes,” in which a truck strikes something. In the case of rail, most reported injuries do not involve a train hitting
something. Rather, railroads are required to report any on-the-job injury or illness, the majority of which do not involve train
equipment striking anything.
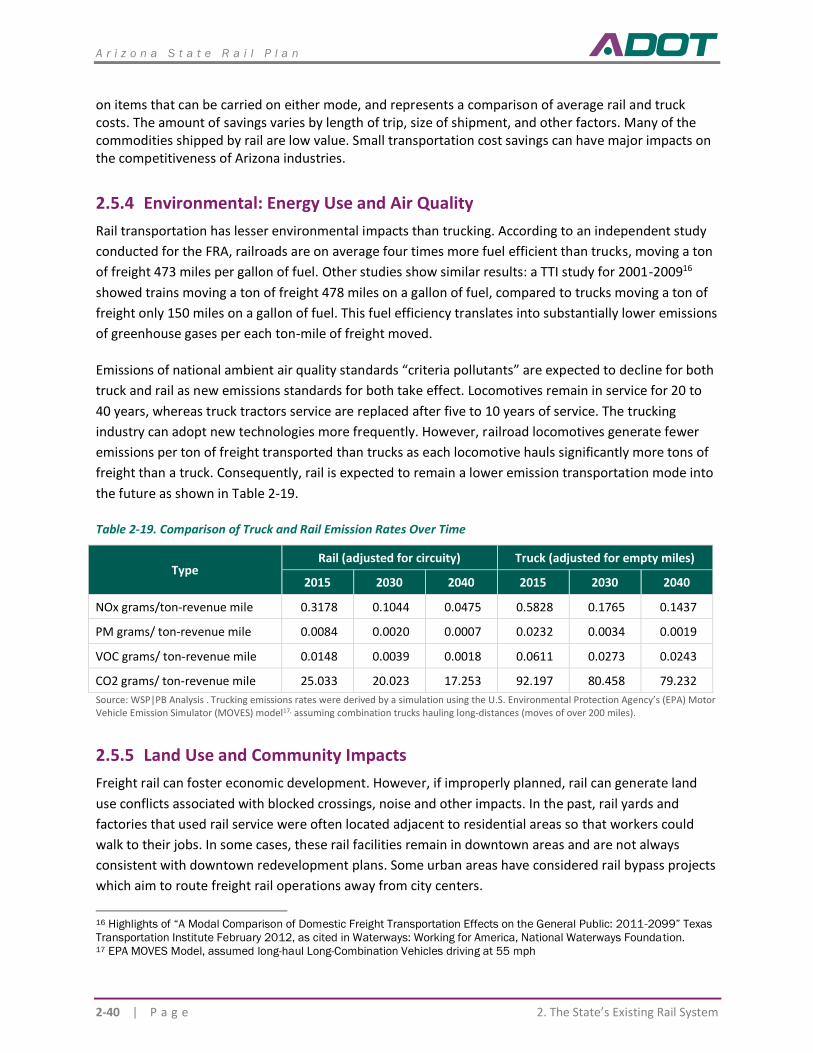
A r i z o n a S t a t e R a i l P l a n
2-40 | P a g e 2. The State’s Existing Rail System
on items that can be carried on either mode, and represents a comparison of average rail and truck costs. The amount of savings varies by length of trip, size of shipment, and other factors. Many of the commodities shipped by rail are low value. Small transportation cost savings can have major impacts on the competitiveness of Arizona industries.
2.5.4 Environmental: Energy Use and Air Quality
Rail transportation has lesser environmental impacts than trucking. According to an independent study
conducted for the FRA, railroads are on average four times more fuel efficient than trucks, moving a ton
of freight 473 miles per gallon of fuel. Other studies show similar results: a TTI study for 2001-200916
showed trains moving a ton of freight 478 miles on a gallon of fuel, compared to trucks moving a ton of
freight only 150 miles on a gallon of fuel. This fuel efficiency translates into substantially lower emissions
of greenhouse gases per each ton-mile of freight moved.
Emissions of national ambient air quality standards “criteria pollutants” are expected to decline for both
truck and rail as new emissions standards for both take effect. Locomotives remain in service for 20 to
40 years, whereas truck tractors service are replaced after five to 10 years of service. The trucking
industry can adopt new technologies more frequently. However, railroad locomotives generate fewer
emissions per ton of freight transported than trucks as each locomotive hauls significantly more tons of
freight than a truck. Consequently, rail is expected to remain a lower emission transportation mode into
the future as shown in Table 2-19.
Table 2-19. Comparison of Truck and Rail Emission Rates Over Time
Type Rail (adjusted for circuity) Truck (adjusted for empty miles)
2015 2030 2040 2015 2030 2040
NOx grams/ton-revenue mile 0.3178 0.1044 0.0475 0.5828 0.1765 0.1437
PM grams/ ton-revenue mile 0.0084 0.0020 0.0007 0.0232 0.0034 0.0019
VOC grams/ ton-revenue mile 0.0148 0.0039 0.0018 0.0611 0.0273 0.0243
CO2 grams/ ton-revenue mile 25.033 20.023 17.253 92.197 80.458 79.232
Source: WSP|PB Analysis . Trucking emissions rates were derived by a simulation using the U.S. Environmental Protection Agency’s (EPA) Motor Vehicle Emission Simulator (MOVES) model17, assuming combination trucks hauling long-distances (moves of over 200 miles).
2.5.5 Land Use and Community Impacts
Freight rail can foster economic development. However, if improperly planned, rail can generate land
use conflicts associated with blocked crossings, noise and other impacts. In the past, rail yards and
factories that used rail service were often located adjacent to residential areas so that workers could
walk to their jobs. In some cases, these rail facilities remain in downtown areas and are not always
consistent with downtown redevelopment plans. Some urban areas have considered rail bypass projects
which aim to route freight rail operations away from city centers.
16 Highlights of “A Modal Comparison of Domestic Freight Transportation Effects on the General Public: 2011 -2099” Texas
Transportation Institute February 2012, as cited in Waterways: Working for America, National Waterways Foundation. 17 EPA MOVES Model, assumed long-haul Long-Combination Vehicles driving at 55 mph
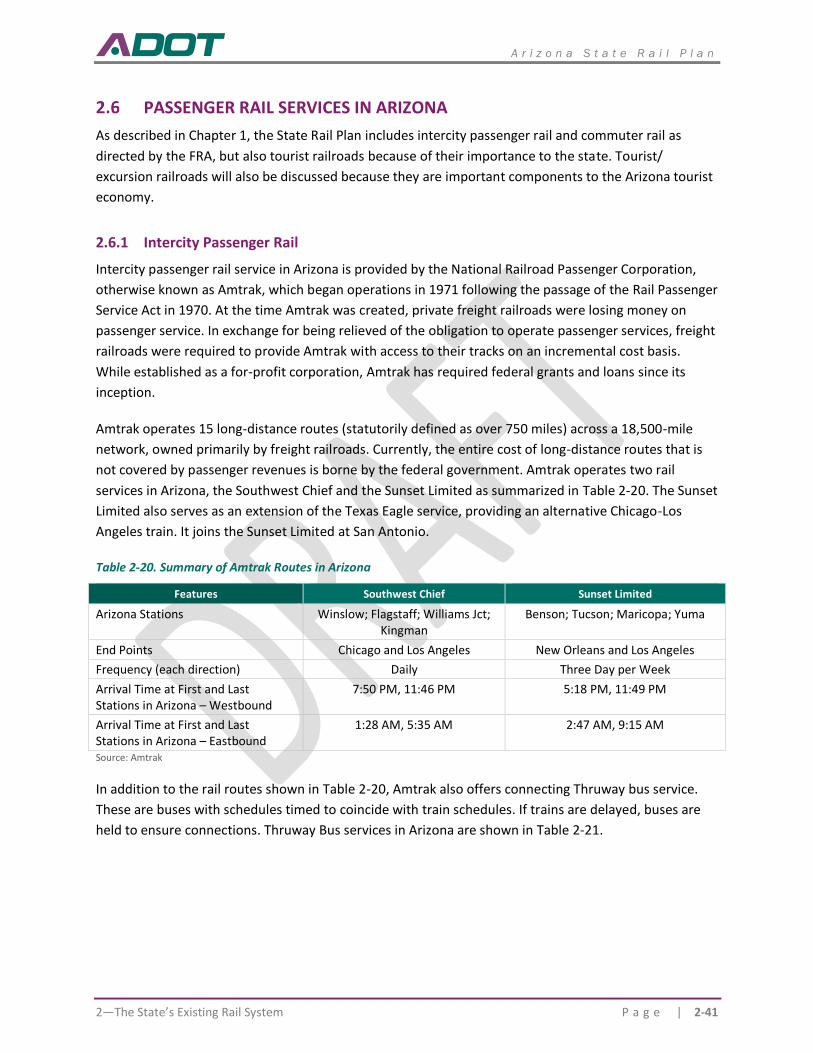
A r i z o n a S t a t e R a i l P l a n
2—The State’s Existing Rail System P a g e | 2-41
PASSENGER RAIL SERVICES IN ARIZONA
As described in Chapter 1, the State Rail Plan includes intercity passenger rail and commuter rail as
directed by the FRA, but also tourist railroads because of their importance to the state. Tourist/
excursion railroads will also be discussed because they are important components to the Arizona tourist
economy.
2.6.1 Intercity Passenger Rail
Intercity passenger rail service in Arizona is provided by the National Railroad Passenger Corporation,
otherwise known as Amtrak, which began operations in 1971 following the passage of the Rail Passenger
Service Act in 1970. At the time Amtrak was created, private freight railroads were losing money on
passenger service. In exchange for being relieved of the obligation to operate passenger services, freight
railroads were required to provide Amtrak with access to their tracks on an incremental cost basis.
While established as a for-profit corporation, Amtrak has required federal grants and loans since its
inception.
Amtrak operates 15 long-distance routes (statutorily defined as over 750 miles) across a 18,500-mile
network, owned primarily by freight railroads. Currently, the entire cost of long-distance routes that is
not covered by passenger revenues is borne by the federal government. Amtrak operates two rail
services in Arizona, the Southwest Chief and the Sunset Limited as summarized in Table 2-20. The Sunset
Limited also serves as an extension of the Texas Eagle service, providing an alternative Chicago-Los
Angeles train. It joins the Sunset Limited at San Antonio.
Table 2-20. Summary of Amtrak Routes in Arizona
Features Southwest Chief Sunset Limited
Arizona Stations Winslow; Flagstaff; Williams Jct; Kingman
Benson; Tucson; Maricopa; Yuma
End Points Chicago and Los Angeles New Orleans and Los Angeles
Frequency (each direction) Daily Three Day per Week
Arrival Time at First and Last Stations in Arizona – Westbound
7:50 PM, 11:46 PM 5:18 PM, 11:49 PM
Arrival Time at First and Last Stations in Arizona – Eastbound
1:28 AM, 5:35 AM 2:47 AM, 9:15 AM
Source: Amtrak
In addition to the rail routes shown in Table 2-20, Amtrak also offers connecting Thruway bus service.
These are buses with schedules timed to coincide with train schedules. If trains are delayed, buses are
held to ensure connections. Thruway Bus services in Arizona are shown in Table 2-21.
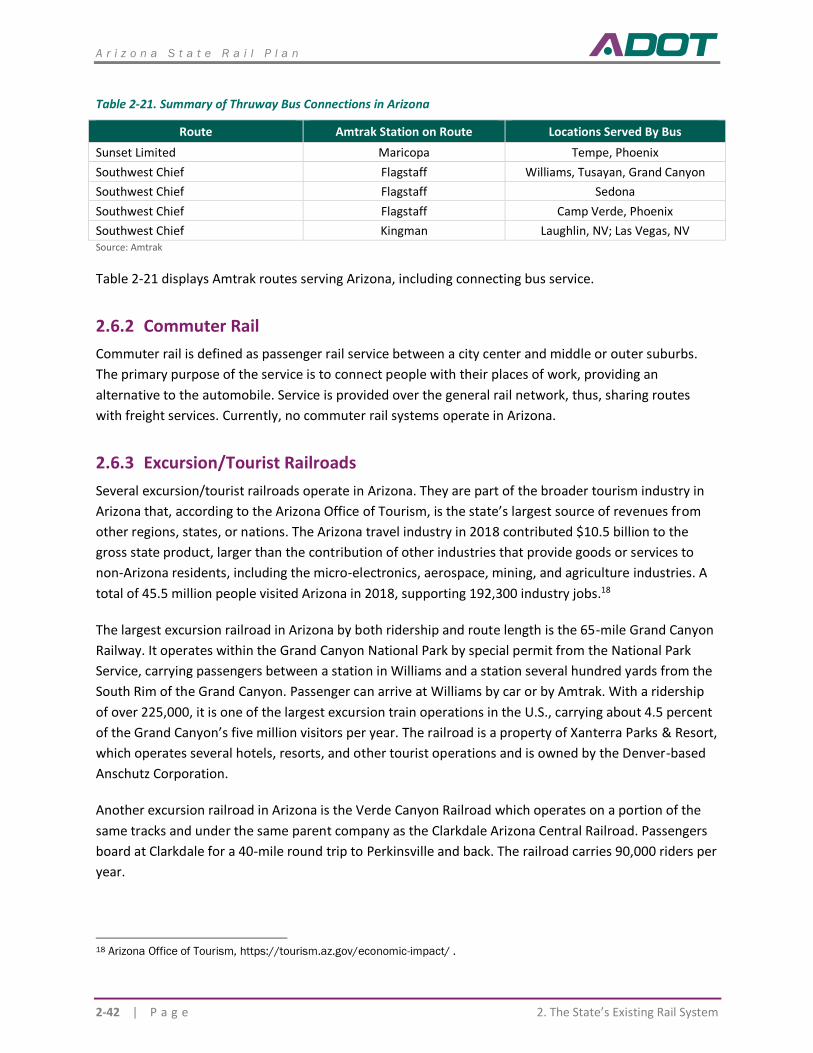
A r i z o n a S t a t e R a i l P l a n
2-42 | P a g e 2. The State’s Existing Rail System
Table 2-21. Summary of Thruway Bus Connections in Arizona
Route Amtrak Station on Route Locations Served By Bus
Sunset Limited Maricopa Tempe, Phoenix
Southwest Chief Flagstaff Williams, Tusayan, Grand Canyon
Southwest Chief Flagstaff Sedona
Southwest Chief Flagstaff Camp Verde, Phoenix
Southwest Chief Kingman Laughlin, NV; Las Vegas, NV Source: Amtrak
Table 2-21 displays Amtrak routes serving Arizona, including connecting bus service.
2.6.2 Commuter Rail
Commuter rail is defined as passenger rail service between a city center and middle or outer suburbs.
The primary purpose of the service is to connect people with their places of work, providing an
alternative to the automobile. Service is provided over the general rail network, thus, sharing routes
with freight services. Currently, no commuter rail systems operate in Arizona.
2.6.3 Excursion/Tourist Railroads
Several excursion/tourist railroads operate in Arizona. They are part of the broader tourism industry in
Arizona that, according to the Arizona Office of Tourism, is the state’s largest source of revenues from
other regions, states, or nations. The Arizona travel industry in 2018 contributed $10.5 billion to the
gross state product, larger than the contribution of other industries that provide goods or services to
non-Arizona residents, including the micro-electronics, aerospace, mining, and agriculture industries. A
total of 45.5 million people visited Arizona in 2018, supporting 192,300 industry jobs.18
The largest excursion railroad in Arizona by both ridership and route length is the 65-mile Grand Canyon
Railway. It operates within the Grand Canyon National Park by special permit from the National Park
Service, carrying passengers between a station in Williams and a station several hundred yards from the
South Rim of the Grand Canyon. Passenger can arrive at Williams by car or by Amtrak. With a ridership
of over 225,000, it is one of the largest excursion train operations in the U.S., carrying about 4.5 percent
of the Grand Canyon’s five million visitors per year. The railroad is a property of Xanterra Parks & Resort,
which operates several hotels, resorts, and other tourist operations and is owned by the Denver-based
Anschutz Corporation.
Another excursion railroad in Arizona is the Verde Canyon Railroad which operates on a portion of the
same tracks and under the same parent company as the Clarkdale Arizona Central Railroad. Passengers
board at Clarkdale for a 40-mile round trip to Perkinsville and back. The railroad carries 90,000 riders per
year.
18 Arizona Office of Tourism, https://tourism.az.gov/economic-impact/ .
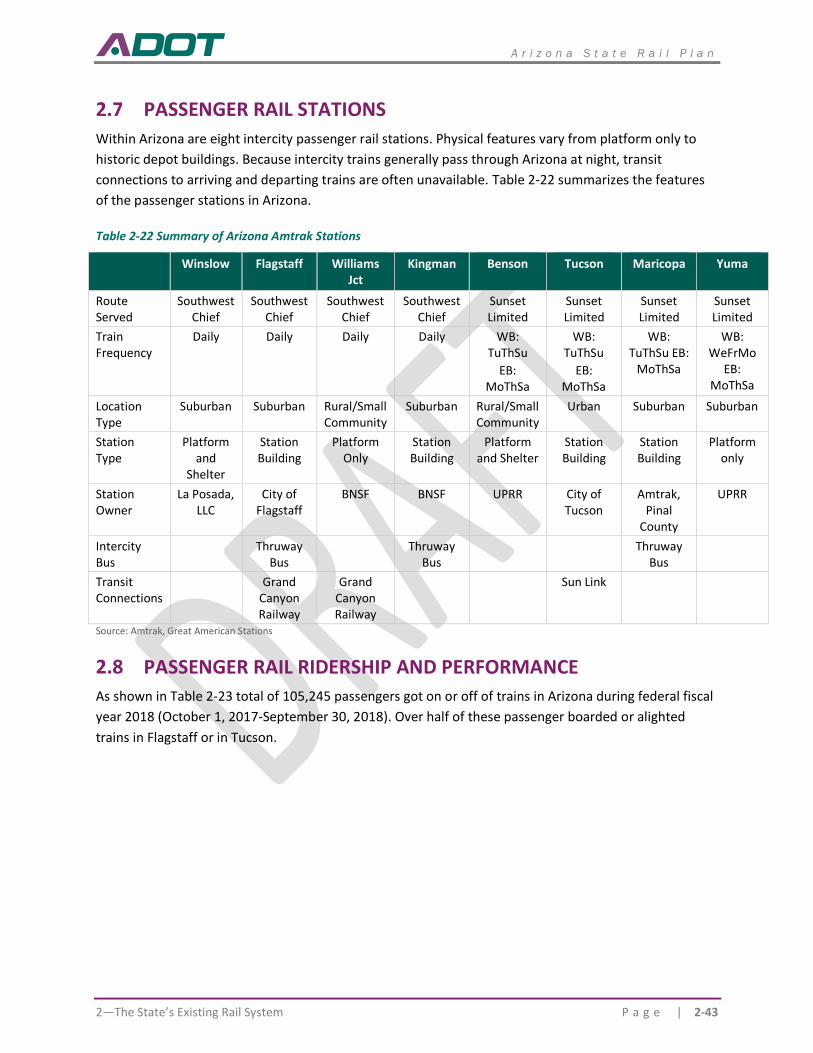
A r i z o n a S t a t e R a i l P l a n
2—The State’s Existing Rail System P a g e | 2-43
PASSENGER RAIL STATIONS
Within Arizona are eight intercity passenger rail stations. Physical features vary from platform only to
historic depot buildings. Because intercity trains generally pass through Arizona at night, transit
connections to arriving and departing trains are often unavailable. Table 2-22 summarizes the features
of the passenger stations in Arizona.
Table 2-22 Summary of Arizona Amtrak Stations
Winslow Flagstaff Williams Jct
Kingman Benson Tucson Maricopa Yuma
Route Served
Southwest Chief
Southwest Chief
Southwest Chief
Southwest Chief
Sunset Limited
Sunset Limited
Sunset Limited
Sunset Limited
Train Frequency
Daily Daily Daily Daily WB: TuThSu
EB: MoThSa
WB: TuThSu
EB: MoThSa
WB: TuThSu EB:
MoThSa
WB: WeFrMo
EB: MoThSa
Location Type
Suburban Suburban Rural/Small Community
Suburban Rural/Small Community
Urban Suburban Suburban
Station Type
Platform and
Shelter
Station Building
Platform Only
Station Building
Platform and Shelter
Station Building
Station Building
Platform only
Station Owner
La Posada, LLC
City of Flagstaff
BNSF BNSF UPRR City of Tucson
Amtrak, Pinal
County
UPRR
Intercity Bus
Thruway Bus
Thruway Bus
Thruway Bus
Transit Connections
Grand Canyon Railway
Grand Canyon Railway
Sun Link
Source: Amtrak, Great American Stations
PASSENGER RAIL RIDERSHIP AND PERFORMANCE
As shown in Table 2-23 total of 105,245 passengers got on or off of trains in Arizona during federal fiscal
year 2018 (October 1, 2017-September 30, 2018). Over half of these passenger boarded or alighted
trains in Flagstaff or in Tucson.
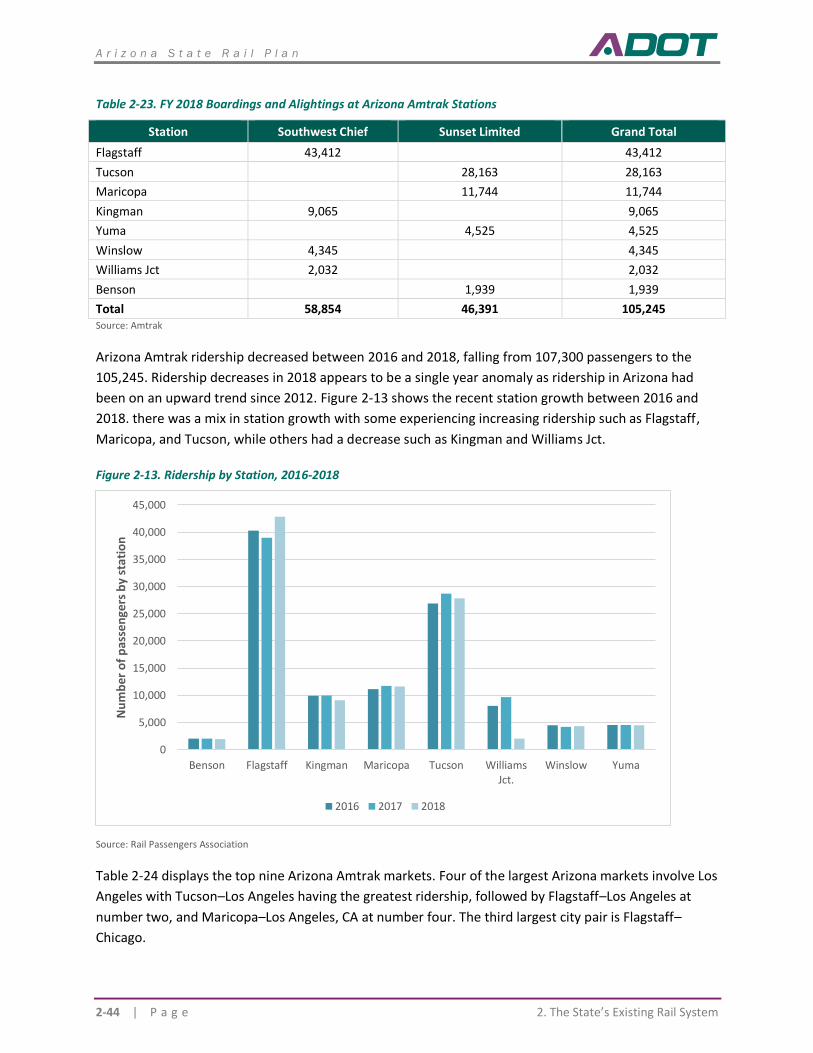
A r i z o n a S t a t e R a i l P l a n
2-44 | P a g e 2. The State’s Existing Rail System
Table 2-23. FY 2018 Boardings and Alightings at Arizona Amtrak Stations
Station Southwest Chief Sunset Limited Grand Total
Flagstaff 43,412 43,412
Tucson 28,163 28,163
Maricopa 11,744 11,744
Kingman 9,065 9,065
Yuma 4,525 4,525
Winslow 4,345 4,345
Williams Jct 2,032 2,032
Benson 1,939 1,939
Total 58,854 46,391 105,245 Source: Amtrak
Arizona Amtrak ridership decreased between 2016 and 2018, falling from 107,300 passengers to the
105,245. Ridership decreases in 2018 appears to be a single year anomaly as ridership in Arizona had
been on an upward trend since 2012. Figure 2-13 shows the recent station growth between 2016 and
2018. there was a mix in station growth with some experiencing increasing ridership such as Flagstaff,
Maricopa, and Tucson, while others had a decrease such as Kingman and Williams Jct.
Figure 2-13. Ridership by Station, 2016-2018
Source: Rail Passengers Association
Table 2-24 displays the top nine Arizona Amtrak markets. Four of the largest Arizona markets involve Los
Angeles with Tucson–Los Angeles having the greatest ridership, followed by Flagstaff–Los Angeles at
number two, and Maricopa–Los Angeles, CA at number four. The third largest city pair is Flagstaff–
Chicago.
0
5,000
10,000
15,000
20,000
25,000
30,000
35,000
40,000
45,000
Benson Flagstaff Kingman Maricopa Tucson WilliamsJct.
Winslow Yuma
Nu
mb
er o
f p
asse
nge
rs b
y st
atio
n
2016 2017 2018
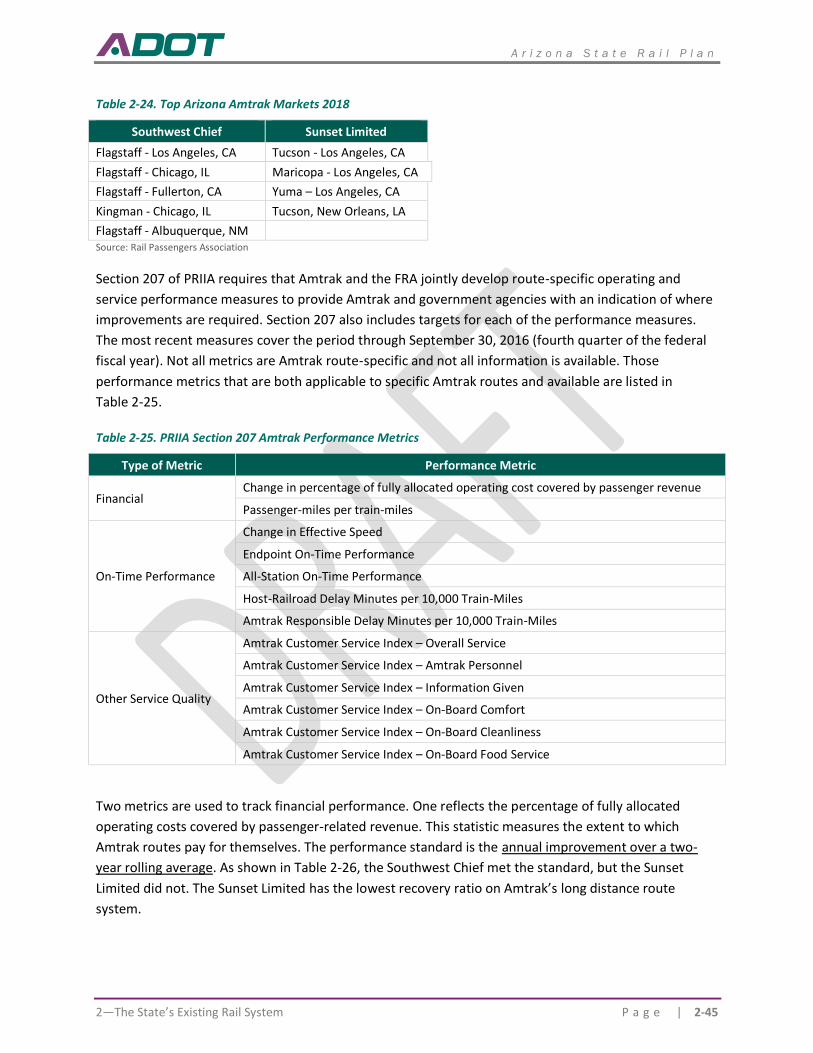
A r i z o n a S t a t e R a i l P l a n
2—The State’s Existing Rail System P a g e | 2-45
Table 2-24. Top Arizona Amtrak Markets 2018
Southwest Chief Sunset Limited
Flagstaff - Los Angeles, CA Tucson - Los Angeles, CA
Flagstaff - Chicago, IL Maricopa - Los Angeles, CA
Flagstaff - Fullerton, CA Yuma – Los Angeles, CA
Kingman - Chicago, IL Tucson, New Orleans, LA
Flagstaff - Albuquerque, NM Source: Rail Passengers Association
Section 207 of PRIIA requires that Amtrak and the FRA jointly develop route-specific operating and
service performance measures to provide Amtrak and government agencies with an indication of where
improvements are required. Section 207 also includes targets for each of the performance measures.
The most recent measures cover the period through September 30, 2016 (fourth quarter of the federal
fiscal year). Not all metrics are Amtrak route-specific and not all information is available. Those
performance metrics that are both applicable to specific Amtrak routes and available are listed in
Table 2-25.
Table 2-25. PRIIA Section 207 Amtrak Performance Metrics
Type of Metric Performance Metric
Financial Change in percentage of fully allocated operating cost covered by passenger revenue
Passenger-miles per train-miles
On-Time Performance
Change in Effective Speed
Endpoint On-Time Performance
All-Station On-Time Performance
Host-Railroad Delay Minutes per 10,000 Train-Miles
Amtrak Responsible Delay Minutes per 10,000 Train-Miles
Other Service Quality
Amtrak Customer Service Index – Overall Service
Amtrak Customer Service Index – Amtrak Personnel
Amtrak Customer Service Index – Information Given
Amtrak Customer Service Index – On-Board Comfort
Amtrak Customer Service Index – On-Board Cleanliness
Amtrak Customer Service Index – On-Board Food Service
Two metrics are used to track financial performance. One reflects the percentage of fully allocated
operating costs covered by passenger-related revenue. This statistic measures the extent to which
Amtrak routes pay for themselves. The performance standard is the annual improvement over a two-
year rolling average. As shown in Table 2-26, the Southwest Chief met the standard, but the Sunset
Limited did not. The Sunset Limited has the lowest recovery ratio on Amtrak’s long distance route
system.
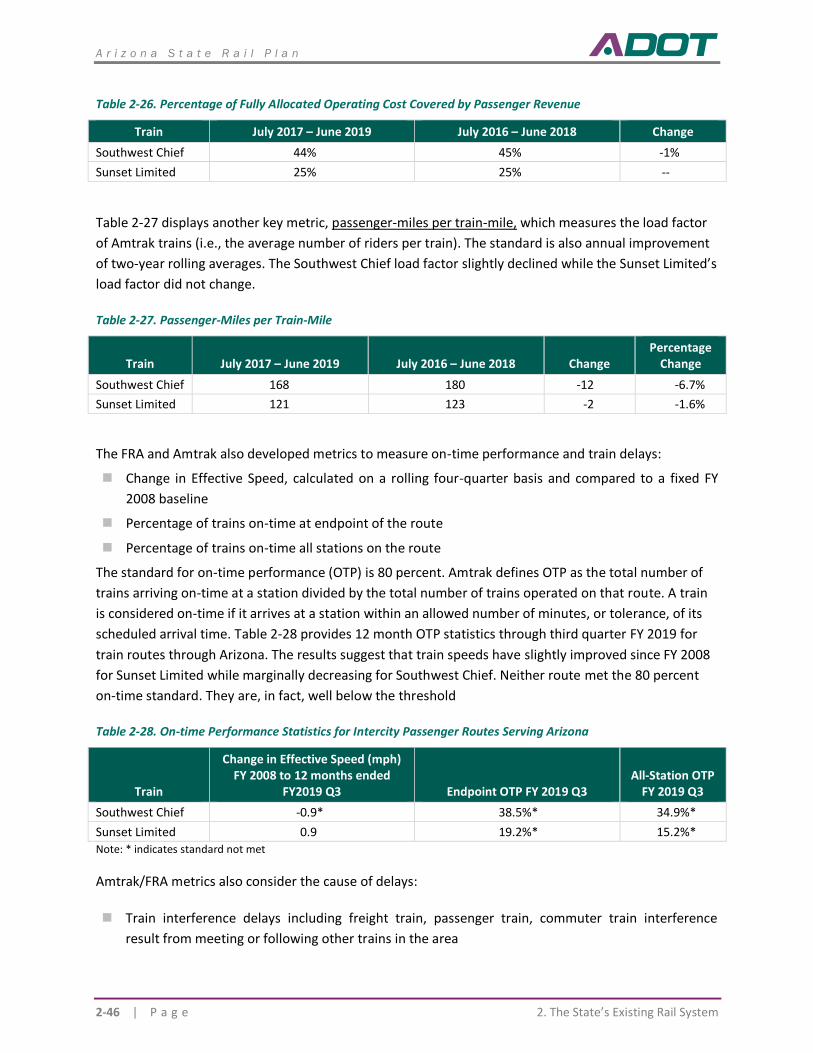
A r i z o n a S t a t e R a i l P l a n
2-46 | P a g e 2. The State’s Existing Rail System
Table 2-26. Percentage of Fully Allocated Operating Cost Covered by Passenger Revenue
Train July 2017 – June 2019 July 2016 – June 2018 Change
Southwest Chief 44% 45% -1%
Sunset Limited 25% 25% --
Table 2-27 displays another key metric, passenger-miles per train-mile, which measures the load factor
of Amtrak trains (i.e., the average number of riders per train). The standard is also annual improvement
of two-year rolling averages. The Southwest Chief load factor slightly declined while the Sunset Limited’s
load factor did not change.
Table 2-27. Passenger-Miles per Train-Mile
Train July 2017 – June 2019 July 2016 – June 2018 Change Percentage
Change
Southwest Chief 168 180 -12 -6.7%
Sunset Limited 121 123 -2 -1.6%
The FRA and Amtrak also developed metrics to measure on-time performance and train delays:
◼ Change in Effective Speed, calculated on a rolling four-quarter basis and compared to a fixed FY
2008 baseline
◼ Percentage of trains on-time at endpoint of the route
◼ Percentage of trains on-time all stations on the route
The standard for on-time performance (OTP) is 80 percent. Amtrak defines OTP as the total number of
trains arriving on-time at a station divided by the total number of trains operated on that route. A train
is considered on-time if it arrives at a station within an allowed number of minutes, or tolerance, of its
scheduled arrival time. Table 2-28 provides 12 month OTP statistics through third quarter FY 2019 for
train routes through Arizona. The results suggest that train speeds have slightly improved since FY 2008
for Sunset Limited while marginally decreasing for Southwest Chief. Neither route met the 80 percent
on-time standard. They are, in fact, well below the threshold
Table 2-28. On-time Performance Statistics for Intercity Passenger Routes Serving Arizona
Train
Change in Effective Speed (mph) FY 2008 to 12 months ended
FY2019 Q3 Endpoint OTP FY 2019 Q3 All-Station OTP
FY 2019 Q3
Southwest Chief -0.9* 38.5%* 34.9%*
Sunset Limited 0.9 19.2%* 15.2%*
Note: * indicates standard not met
Amtrak/FRA metrics also consider the cause of delays:
◼ Train interference delays including freight train, passenger train, commuter train interference
result from meeting or following other trains in the area
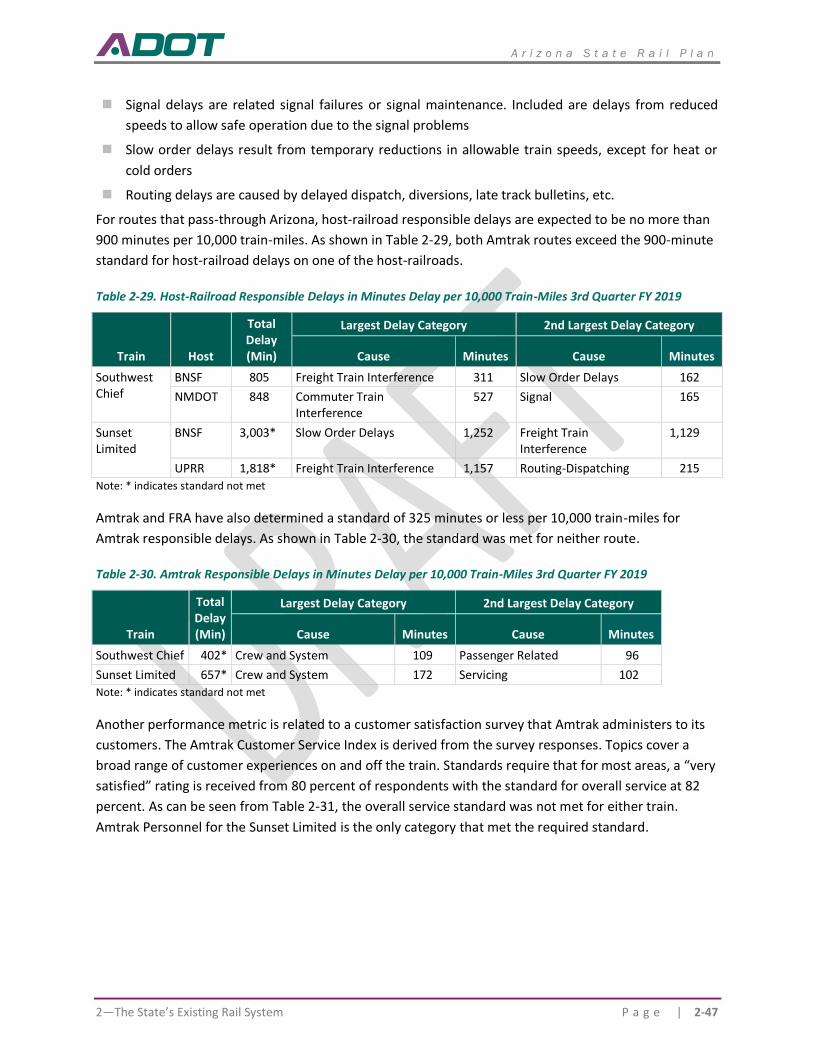
A r i z o n a S t a t e R a i l P l a n
2—The State’s Existing Rail System P a g e | 2-47
◼ Signal delays are related signal failures or signal maintenance. Included are delays from reduced
speeds to allow safe operation due to the signal problems
◼ Slow order delays result from temporary reductions in allowable train speeds, except for heat or
cold orders
◼ Routing delays are caused by delayed dispatch, diversions, late track bulletins, etc.
For routes that pass-through Arizona, host-railroad responsible delays are expected to be no more than
900 minutes per 10,000 train-miles. As shown in Table 2-29, both Amtrak routes exceed the 900-minute
standard for host-railroad delays on one of the host-railroads.
Table 2-29. Host-Railroad Responsible Delays in Minutes Delay per 10,000 Train-Miles 3rd Quarter FY 2019
Train Host
Total Delay (Min)
Largest Delay Category 2nd Largest Delay Category
Cause Minutes Cause Minutes
Southwest Chief
BNSF 805 Freight Train Interference 311 Slow Order Delays 162
NMDOT 848 Commuter Train Interference
527 Signal 165
Sunset Limited
BNSF 3,003* Slow Order Delays 1,252 Freight Train Interference
1,129
UPRR 1,818* Freight Train Interference 1,157 Routing-Dispatching 215
Note: * indicates standard not met
Amtrak and FRA have also determined a standard of 325 minutes or less per 10,000 train-miles for
Amtrak responsible delays. As shown in Table 2-30, the standard was met for neither route.
Table 2-30. Amtrak Responsible Delays in Minutes Delay per 10,000 Train-Miles 3rd Quarter FY 2019
Train
Total Delay (Min)
Largest Delay Category 2nd Largest Delay Category
Cause Minutes Cause Minutes
Southwest Chief 402* Crew and System 109 Passenger Related 96
Sunset Limited 657* Crew and System 172 Servicing 102
Note: * indicates standard not met
Another performance metric is related to a customer satisfaction survey that Amtrak administers to its
customers. The Amtrak Customer Service Index is derived from the survey responses. Topics cover a
broad range of customer experiences on and off the train. Standards require that for most areas, a “very
satisfied” rating is received from 80 percent of respondents with the standard for overall service at 82
percent. As can be seen from Table 2-31, the overall service standard was not met for either train.
Amtrak Personnel for the Sunset Limited is the only category that met the required standard.
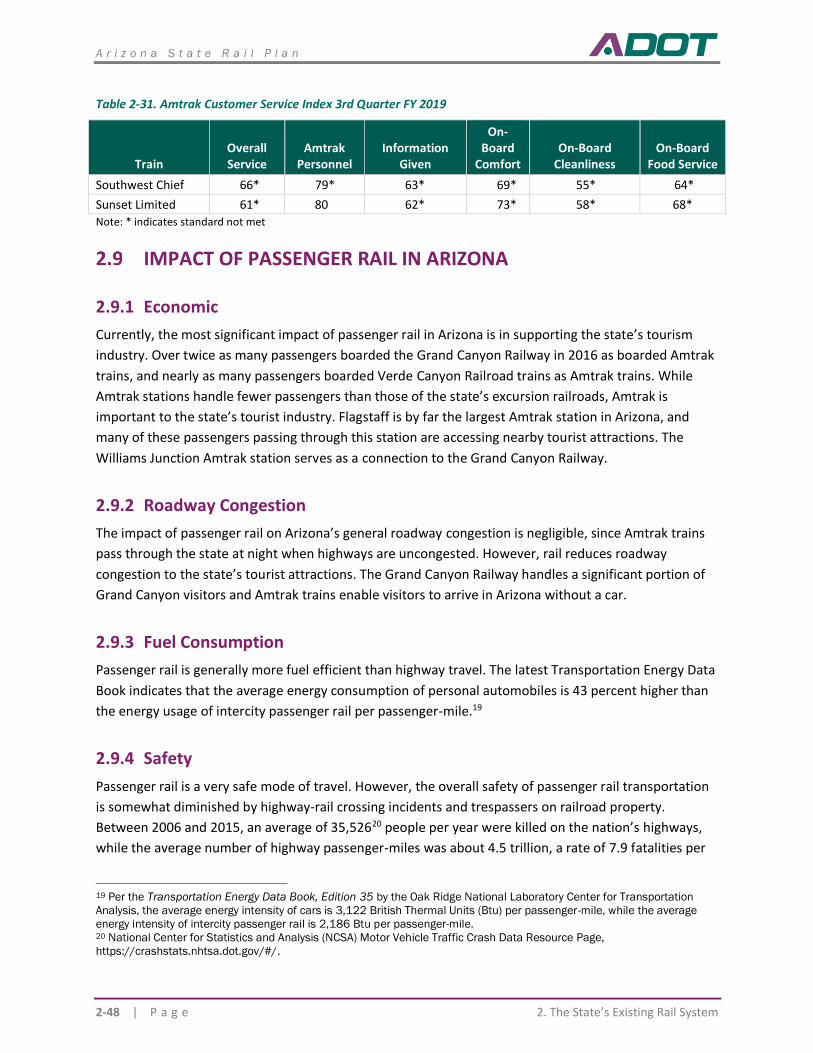
A r i z o n a S t a t e R a i l P l a n
2-48 | P a g e 2. The State’s Existing Rail System
Table 2-31. Amtrak Customer Service Index 3rd Quarter FY 2019
Train Overall Service
Amtrak Personnel
Information Given
On-Board
Comfort On-Board
Cleanliness On-Board
Food Service
Southwest Chief 66* 79* 63* 69* 55* 64*
Sunset Limited 61* 80 62* 73* 58* 68*
Note: * indicates standard not met
IMPACT OF PASSENGER RAIL IN ARIZONA
2.9.1 Economic
Currently, the most significant impact of passenger rail in Arizona is in supporting the state’s tourism
industry. Over twice as many passengers boarded the Grand Canyon Railway in 2016 as boarded Amtrak
trains, and nearly as many passengers boarded Verde Canyon Railroad trains as Amtrak trains. While
Amtrak stations handle fewer passengers than those of the state’s excursion railroads, Amtrak is
important to the state’s tourist industry. Flagstaff is by far the largest Amtrak station in Arizona, and
many of these passengers passing through this station are accessing nearby tourist attractions. The
Williams Junction Amtrak station serves as a connection to the Grand Canyon Railway.
2.9.2 Roadway Congestion
The impact of passenger rail on Arizona’s general roadway congestion is negligible, since Amtrak trains
pass through the state at night when highways are uncongested. However, rail reduces roadway
congestion to the state’s tourist attractions. The Grand Canyon Railway handles a significant portion of
Grand Canyon visitors and Amtrak trains enable visitors to arrive in Arizona without a car.
2.9.3 Fuel Consumption
Passenger rail is generally more fuel efficient than highway travel. The latest Transportation Energy Data
Book indicates that the average energy consumption of personal automobiles is 43 percent higher than
the energy usage of intercity passenger rail per passenger-mile.19
2.9.4 Safety
Passenger rail is a very safe mode of travel. However, the overall safety of passenger rail transportation
is somewhat diminished by highway-rail crossing incidents and trespassers on railroad property.
Between 2006 and 2015, an average of 35,52620 people per year were killed on the nation’s highways,
while the average number of highway passenger-miles was about 4.5 trillion, a rate of 7.9 fatalities per
19 Per the Transportation Energy Data Book, Edition 35 by the Oak Ridge National Laboratory Center for Transportation
Analysis, the average energy intensity of cars is 3,122 British Thermal Units (Btu) per passenger-mile, while the average
energy intensity of intercity passenger rail is 2,186 Btu per passenger-mile. 20 National Center for Statistics and Analysis (NCSA) Motor Vehicle Traffic Crash Data Resource Page,
https://crashstats.nhtsa.dot.gov/#/.
A r i z o n a S t a t e R a i l P l a n
2—The State’s Existing Rail System P a g e | 2-49
billion passenger miles.21 During the same time period, an average of 121 fatalities per year were
associated with Amtrak trains.22 On average, Amtrak trains generated 6.3 billion passenger-miles,
yielding a fatality rate of 19.0 per billion passenger-miles.23 .
While the rate of fatalities associated with intercity passenger rail is higher than that associated with
highway travel, the risk profile is very different. In 2015, 82 percent of deaths were vehicle occupants.
By contrast, two percent of the Amtrak fatalities between 2006 and 2015 were passengers on Amtrak
trains. One percent of the fatalities involved a crash, either of railroad equipment crashing or crashing
into a vehicle at a highway-rail crossing. Fifty-nine percent of Amtrak-related fatalities were trespassers
on rail property, and 37 percent resulted from crashes at highway-rail grade crossings. The risks of
passenger rail are less associated with passengers and more associated with the behavior of non-
passengers around passenger trains.
2.9.5 Land Use
Passenger rail may have some impacts on land use in that some Arizona passenger rail stations have
recently been renovated and are mixed use facilities. As an example, the Kingman Amtrak station also
serves as a railroad museum and was recently renovated. This historic building can serve as an attraction
to the area.
DEMOGRAPHIC AND ECONOMIC GROWTH FACTORS AND TRENDS
The growth of freight and passenger rail in Arizona will be driven by the economy and demographics
that can be described by factors such as gross state product, personal income, population, employment,
and industry composition. Continued growth in population, employment, and personal income will
shape demand for intercity and commuter passenger rail services, while growth in freight-reliant
industries and the overall economy, including the demand for consumer goods will influence the further
development of freight rail. A well-performing rail transportation system in Arizona can improve the
competitiveness of key industries in the state and increase the state’s attractiveness to both businesses
and residents, driving future economic and population growth.
This section will discuss historical trends and forecasts for key economic and demographic factors to
provide some insight into future growth of the rail transportation system in Arizona.
21 U.S. Bureau of Transportation Statistics, National Transportation Statistics, Table 1-40,
https://www.rita.dot.gov/bts/sites/rita.dot.gov.bts/files/publications/national_transportation_statistics/html/table_01_40
.html. 22 FRA Office of Safety Analysis, https://safetydata.fra.dot.gov/OfficeofSafety/default.aspx. 23 U.S. Bureau of Transportation Statistics, National Transportation Statistics, Table 1-40,
https://www.rita.dot.gov/bts/sites/rita.dot.gov.bts/files/publications/national_transportation_statistics/html/table_01_40
.html.
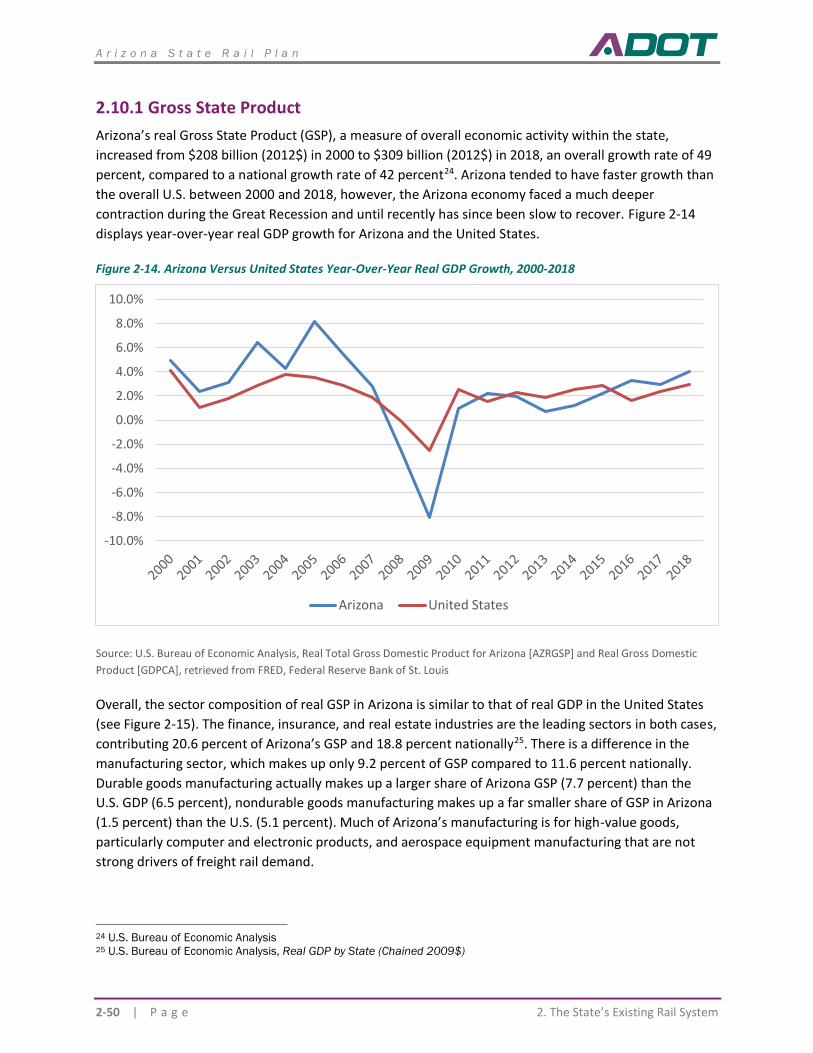
A r i z o n a S t a t e R a i l P l a n
2-50 | P a g e 2. The State’s Existing Rail System
2.10.1 Gross State Product
Arizona’s real Gross State Product (GSP), a measure of overall economic activity within the state,
increased from $208 billion (2012$) in 2000 to $309 billion (2012$) in 2018, an overall growth rate of 49
percent, compared to a national growth rate of 42 percent24. Arizona tended to have faster growth than
the overall U.S. between 2000 and 2018, however, the Arizona economy faced a much deeper
contraction during the Great Recession and until recently has since been slow to recover. Figure 2-14
displays year-over-year real GDP growth for Arizona and the United States.
Figure 2-14. Arizona Versus United States Year-Over-Year Real GDP Growth, 2000-2018
Source: U.S. Bureau of Economic Analysis, Real Total Gross Domestic Product for Arizona [AZRGSP] and Real Gross Domestic
Product [GDPCA], retrieved from FRED, Federal Reserve Bank of St. Louis
Overall, the sector composition of real GSP in Arizona is similar to that of real GDP in the United States
(see Figure 2-15). The finance, insurance, and real estate industries are the leading sectors in both cases,
contributing 20.6 percent of Arizona’s GSP and 18.8 percent nationally25. There is a difference in the
manufacturing sector, which makes up only 9.2 percent of GSP compared to 11.6 percent nationally.
Durable goods manufacturing actually makes up a larger share of Arizona GSP (7.7 percent) than the
U.S. GDP (6.5 percent), nondurable goods manufacturing makes up a far smaller share of GSP in Arizona
(1.5 percent) than the U.S. (5.1 percent). Much of Arizona’s manufacturing is for high-value goods,
particularly computer and electronic products, and aerospace equipment manufacturing that are not
strong drivers of freight rail demand.
24 U.S. Bureau of Economic Analysis 25 U.S. Bureau of Economic Analysis, Real GDP by State (Chained 2009$)
-10.0%
-8.0%
-6.0%
-4.0%
-2.0%
0.0%
2.0%
4.0%
6.0%
8.0%
10.0%
Arizona United States
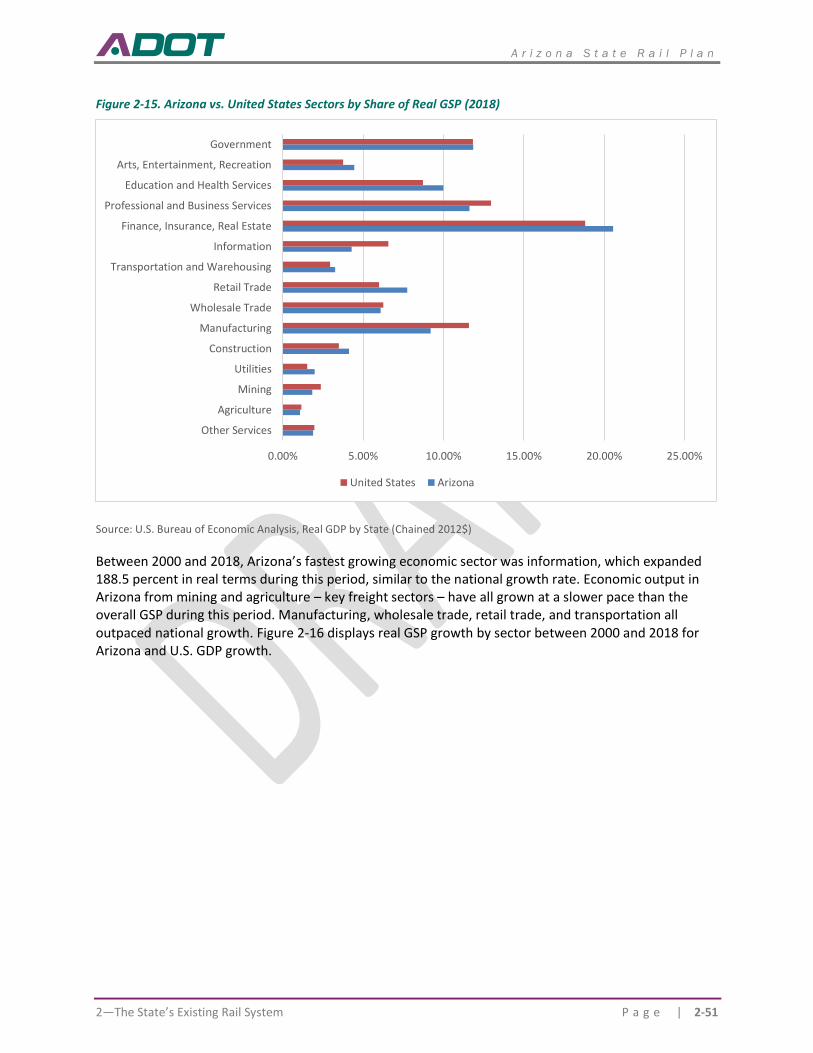
A r i z o n a S t a t e R a i l P l a n
2—The State’s Existing Rail System P a g e | 2-51
Figure 2-15. Arizona vs. United States Sectors by Share of Real GSP (2018)
Source: U.S. Bureau of Economic Analysis, Real GDP by State (Chained 2012$)
Between 2000 and 2018, Arizona’s fastest growing economic sector was information, which expanded 188.5 percent in real terms during this period, similar to the national growth rate. Economic output in Arizona from mining and agriculture – key freight sectors – have all grown at a slower pace than the overall GSP during this period. Manufacturing, wholesale trade, retail trade, and transportation all outpaced national growth. Figure 2-16 displays real GSP growth by sector between 2000 and 2018 for Arizona and U.S. GDP growth.
0.00% 5.00% 10.00% 15.00% 20.00% 25.00%
Other Services
Agriculture
Mining
Utilities
Construction
Manufacturing
Wholesale Trade
Retail Trade
Transportation and Warehousing
Information
Finance, Insurance, Real Estate
Professional and Business Services
Education and Health Services
Arts, Entertainment, Recreation
Government
United States Arizona
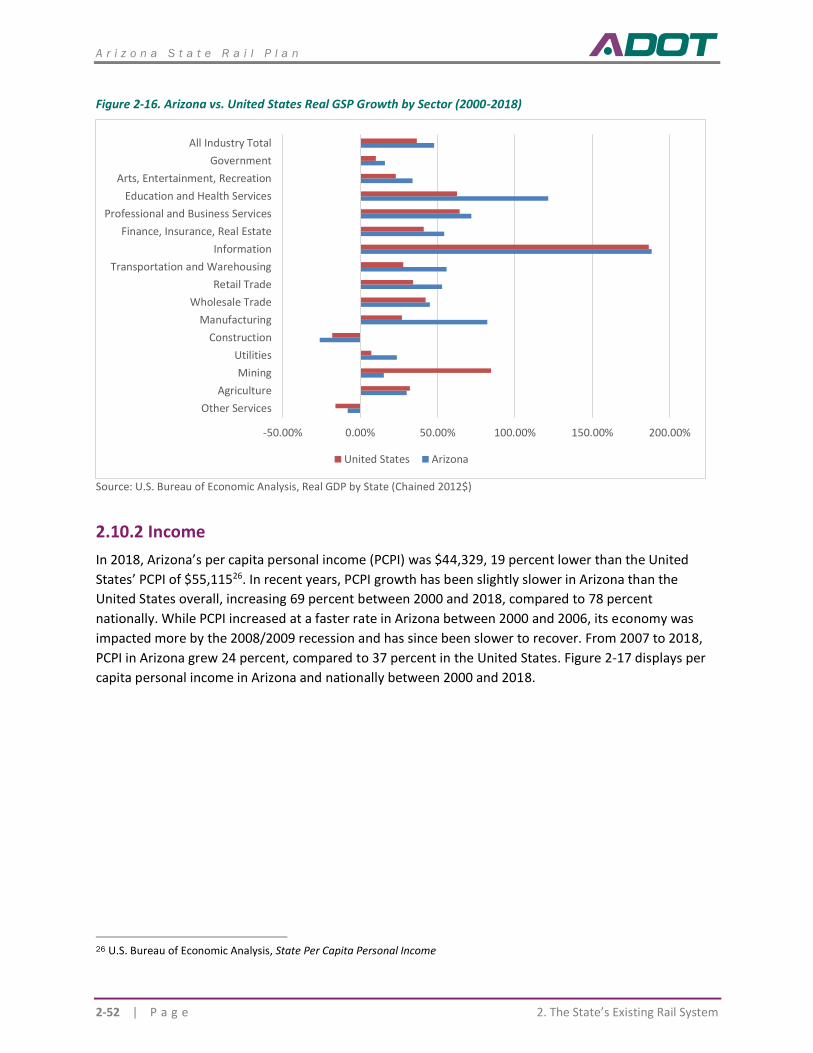
A r i z o n a S t a t e R a i l P l a n
2-52 | P a g e 2. The State’s Existing Rail System
Figure 2-16. Arizona vs. United States Real GSP Growth by Sector (2000-2018)
Source: U.S. Bureau of Economic Analysis, Real GDP by State (Chained 2012$)
2.10.2 Income
In 2018, Arizona’s per capita personal income (PCPI) was $44,329, 19 percent lower than the United
States’ PCPI of $55,11526. In recent years, PCPI growth has been slightly slower in Arizona than the
United States overall, increasing 69 percent between 2000 and 2018, compared to 78 percent
nationally. While PCPI increased at a faster rate in Arizona between 2000 and 2006, its economy was
impacted more by the 2008/2009 recession and has since been slower to recover. From 2007 to 2018,
PCPI in Arizona grew 24 percent, compared to 37 percent in the United States. Figure 2-17 displays per
capita personal income in Arizona and nationally between 2000 and 2018.
26 U.S. Bureau of Economic Analysis, State Per Capita Personal Income
-50.00% 0.00% 50.00% 100.00% 150.00% 200.00%
Other Services
Agriculture
Mining
Utilities
Construction
Manufacturing
Wholesale Trade
Retail Trade
Transportation and Warehousing
Information
Finance, Insurance, Real Estate
Professional and Business Services
Education and Health Services
Arts, Entertainment, Recreation
Government
All Industry Total
United States Arizona
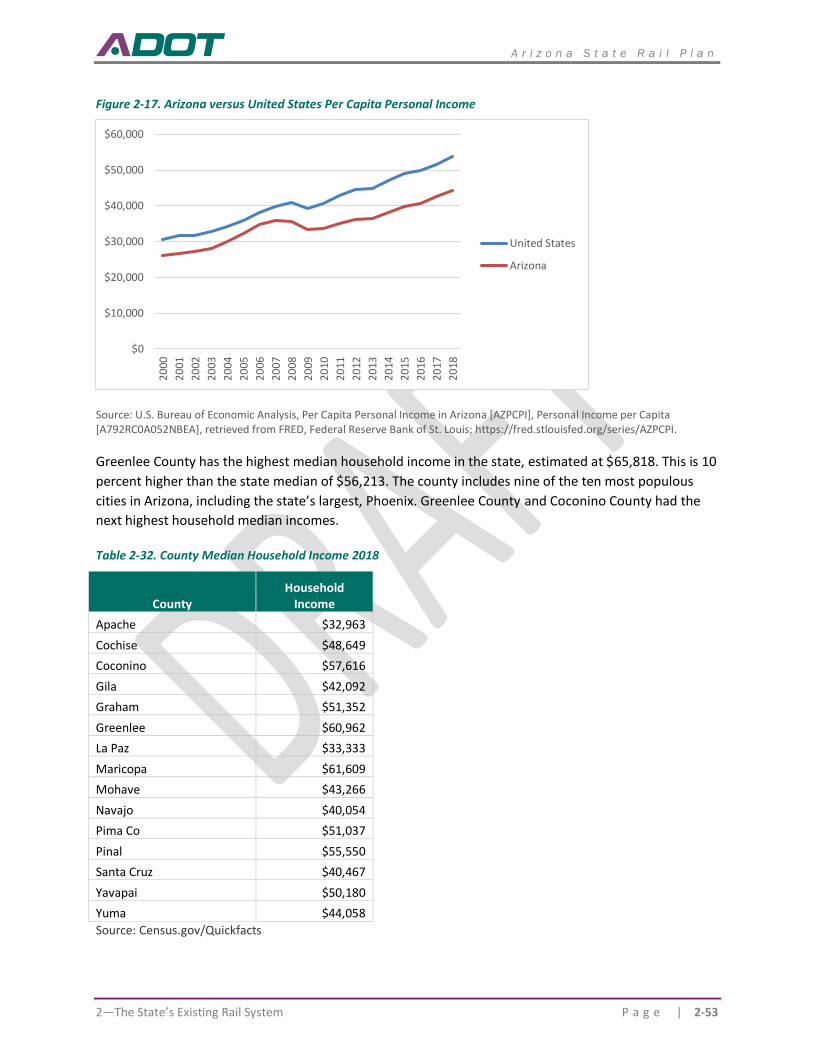
A r i z o n a S t a t e R a i l P l a n
2—The State’s Existing Rail System P a g e | 2-53
Figure 2-17. Arizona versus United States Per Capita Personal Income
Source: U.S. Bureau of Economic Analysis, Per Capita Personal Income in Arizona [AZPCPI], Personal Income per Capita [A792RC0A052NBEA], retrieved from FRED, Federal Reserve Bank of St. Louis; https://fred.stlouisfed.org/series/AZPCPI.
Greenlee County has the highest median household income in the state, estimated at $65,818. This is 10
percent higher than the state median of $56,213. The county includes nine of the ten most populous
cities in Arizona, including the state’s largest, Phoenix. Greenlee County and Coconino County had the
next highest household median incomes.
Table 2-32. County Median Household Income 2018
County Household
Income
Apache $32,963
Cochise $48,649
Coconino $57,616
Gila $42,092
Graham $51,352
Greenlee $60,962
La Paz $33,333
Maricopa $61,609
Mohave $43,266
Navajo $40,054
Pima Co $51,037
Pinal $55,550
Santa Cruz $40,467
Yavapai $50,180
Yuma $44,058
Source: Census.gov/Quickfacts
$0
$10,000
$20,000
$30,000
$40,000
$50,000
$60,000
20
00
20
01
20
02
20
03
20
04
20
05
20
06
20
07
20
08
20
09
20
10
20
11
20
12
20
13
20
14
20
15
20
16
20
17
20
18
United States
Arizona
A r i z o n a S t a t e R a i l P l a n
2-54 | P a g e 2. The State’s Existing Rail System
2.10.3 Population
According to estimates from Arizona’s Office of Economic Opportunity, Arizona’s population stands at
7.1 million, 11 percent higher than the 2010 Census estimate of 6.39 million27. According to U.S. Census
Data, Arizona’s state population grew 24.6 percent between 2000 and 2010, the second fastest among
all states (after Nevada) and well above the national average of 9.7 percent28. Population growth in
Arizona, while still strong, has been slower since 2010. The average compound annual growth rate of
Arizona’s population stands at 1.3 percent between 2010 and 2018, compared to 2.2 percent between
2000 and 2010.
Arizona’s explosive population growth has been spread throughout a number of counties, with Pinal
County having grown by far the fastest among Arizona’s counties. Between 2000 and 2018, its
population increased 141 percent from 180,000 to 413,00029. The next highest growth rate was
Maricopa county at 38.8 percent. By contrast the state’s population increased 36.7 percent.
Table 2-33. County Population Growth 2010-2018
County Population
Growth Rate
Apache 5.6%
Cochise 10.4%
Coconino 24.0%
Gila 6.7%
Graham 12.1%
Greenlee 22.4%
La Paz 10.0%
Maricopa 38.8%
Mohave 31.9%
Navajo 15.3%
Pima Co 21.9%
Pinal 141.5%
Santa Cruz 33.3%
Yavapai 35.1%
Yuma 36.5%
Arizona’s Office of Economic Opportunity forecasts continued moderately strong population growth in
the state. The Office’s 2018 medium-growth scenario population projection release forecasts population
growth of 48 percent between 2018 and 2055, amounting to an average compound annual growth rate
27 Arizona Office of Economic Opportunity, Population Estimates 28 U.S. Census Bureau, Population Distribution and Change: 2000-2010 29 Arizona Office of Economic Opportunity, Population Estimates
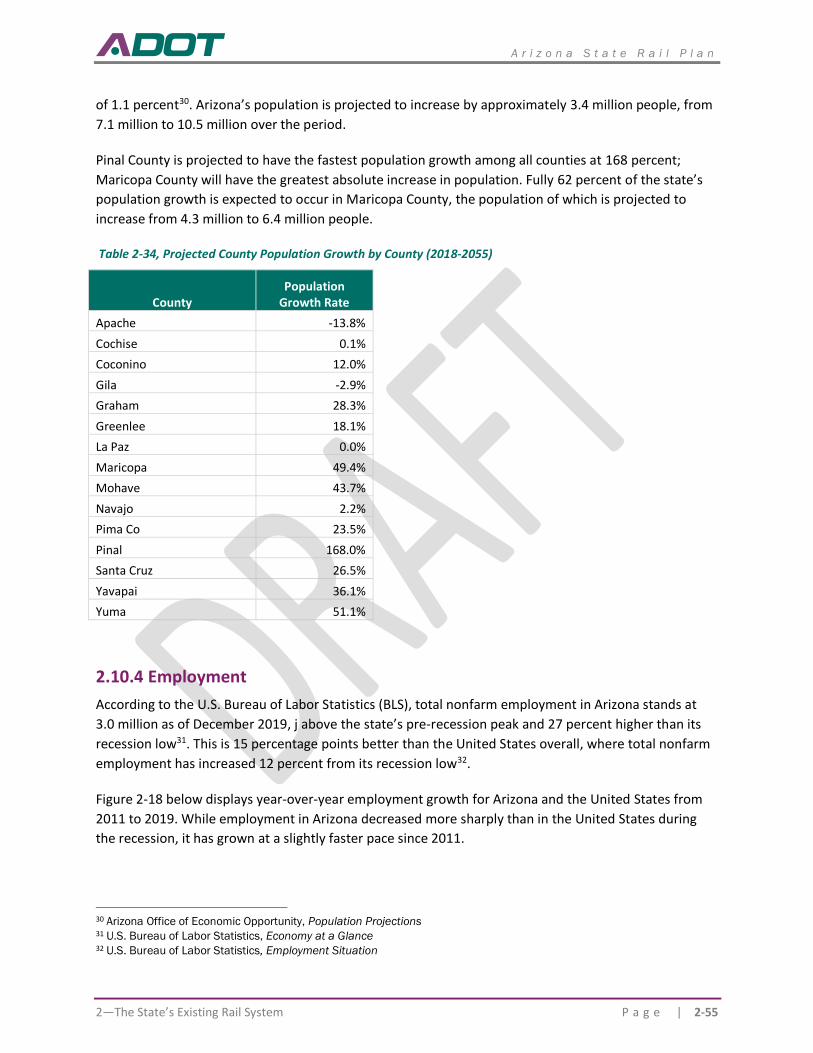
A r i z o n a S t a t e R a i l P l a n
2—The State’s Existing Rail System P a g e | 2-55
of 1.1 percent30. Arizona’s population is projected to increase by approximately 3.4 million people, from
7.1 million to 10.5 million over the period.
Pinal County is projected to have the fastest population growth among all counties at 168 percent;
Maricopa County will have the greatest absolute increase in population. Fully 62 percent of the state’s
population growth is expected to occur in Maricopa County, the population of which is projected to
increase from 4.3 million to 6.4 million people.
Table 2-34, Projected County Population Growth by County (2018-2055)
County Population
Growth Rate
Apache -13.8%
Cochise 0.1%
Coconino 12.0%
Gila -2.9%
Graham 28.3%
Greenlee 18.1%
La Paz 0.0%
Maricopa 49.4%
Mohave 43.7%
Navajo 2.2%
Pima Co 23.5%
Pinal 168.0%
Santa Cruz 26.5%
Yavapai 36.1%
Yuma 51.1%
2.10.4 Employment
According to the U.S. Bureau of Labor Statistics (BLS), total nonfarm employment in Arizona stands at
3.0 million as of December 2019, j above the state’s pre-recession peak and 27 percent higher than its
recession low31. This is 15 percentage points better than the United States overall, where total nonfarm
employment has increased 12 percent from its recession low32.
Figure 2-18 below displays year-over-year employment growth for Arizona and the United States from
2011 to 2019. While employment in Arizona decreased more sharply than in the United States during
the recession, it has grown at a slightly faster pace since 2011.
30 Arizona Office of Economic Opportunity, Population Projections 31 U.S. Bureau of Labor Statistics, Economy at a Glance 32 U.S. Bureau of Labor Statistics, Employment Situation
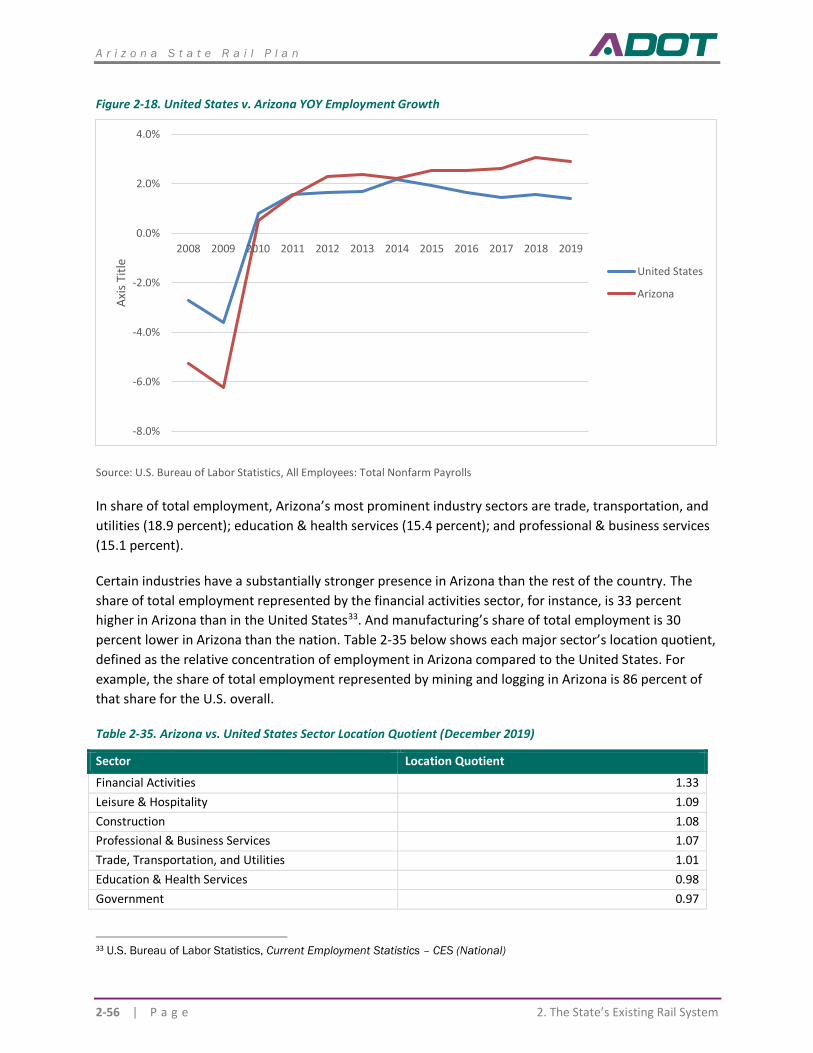
A r i z o n a S t a t e R a i l P l a n
2-56 | P a g e 2. The State’s Existing Rail System
Figure 2-18. United States v. Arizona YOY Employment Growth
Source: U.S. Bureau of Labor Statistics, All Employees: Total Nonfarm Payrolls
In share of total employment, Arizona’s most prominent industry sectors are trade, transportation, and
utilities (18.9 percent); education & health services (15.4 percent); and professional & business services
(15.1 percent).
Certain industries have a substantially stronger presence in Arizona than the rest of the country. The
share of total employment represented by the financial activities sector, for instance, is 33 percent
higher in Arizona than in the United States33. And manufacturing’s share of total employment is 30
percent lower in Arizona than the nation. Table 2-35 below shows each major sector’s location quotient,
defined as the relative concentration of employment in Arizona compared to the United States. For
example, the share of total employment represented by mining and logging in Arizona is 86 percent of
that share for the U.S. overall.
Table 2-35. Arizona vs. United States Sector Location Quotient (December 2019)
Sector Location Quotient
Financial Activities 1.33
Leisure & Hospitality 1.09
Construction 1.08
Professional & Business Services 1.07
Trade, Transportation, and Utilities 1.01
Education & Health Services 0.98
Government 0.97
33 U.S. Bureau of Labor Statistics, Current Employment Statistics – CES (National)
-8.0%
-6.0%
-4.0%
-2.0%
0.0%
2.0%
4.0%
2008 2009 2010 2011 2012 2013 2014 2015 2016 2017 2018 2019
Axi
s Ti
tle
United States
Arizona
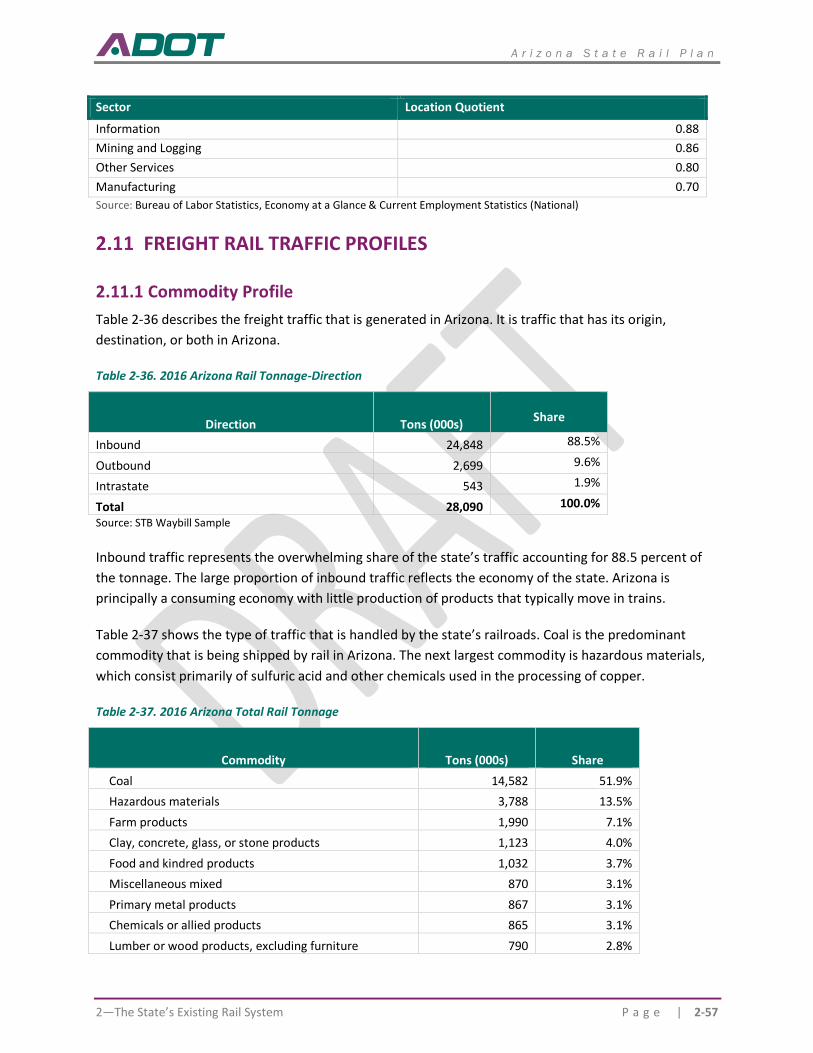
A r i z o n a S t a t e R a i l P l a n
2—The State’s Existing Rail System P a g e | 2-57
Sector Location Quotient
Information 0.88
Mining and Logging 0.86
Other Services 0.80
Manufacturing 0.70
Source: Bureau of Labor Statistics, Economy at a Glance & Current Employment Statistics (National)
FREIGHT RAIL TRAFFIC PROFILES
2.11.1 Commodity Profile
Table 2-36 describes the freight traffic that is generated in Arizona. It is traffic that has its origin,
destination, or both in Arizona.
Table 2-36. 2016 Arizona Rail Tonnage-Direction
Direction Tons (000s)
Share
Inbound 24,848 88.5%
Outbound 2,699 9.6%
Intrastate 543 1.9%
Total 28,090 100.0%
Source: STB Waybill Sample
Inbound traffic represents the overwhelming share of the state’s traffic accounting for 88.5 percent of
the tonnage. The large proportion of inbound traffic reflects the economy of the state. Arizona is
principally a consuming economy with little production of products that typically move in trains.
Table 2-37 shows the type of traffic that is handled by the state’s railroads. Coal is the predominant
commodity that is being shipped by rail in Arizona. The next largest commodity is hazardous materials,
which consist primarily of sulfuric acid and other chemicals used in the processing of copper.
Table 2-37. 2016 Arizona Total Rail Tonnage
Commodity Tons (000s) Share
Coal 14,582 51.9%
Hazardous materials 3,788 13.5%
Farm products 1,990 7.1%
Clay, concrete, glass, or stone products 1,123 4.0%
Food and kindred products 1,032 3.7%
Miscellaneous mixed 870 3.1%
Primary metal products 867 3.1%
Chemicals or allied products 865 3.1%
Lumber or wood products, excluding furniture 790 2.8%
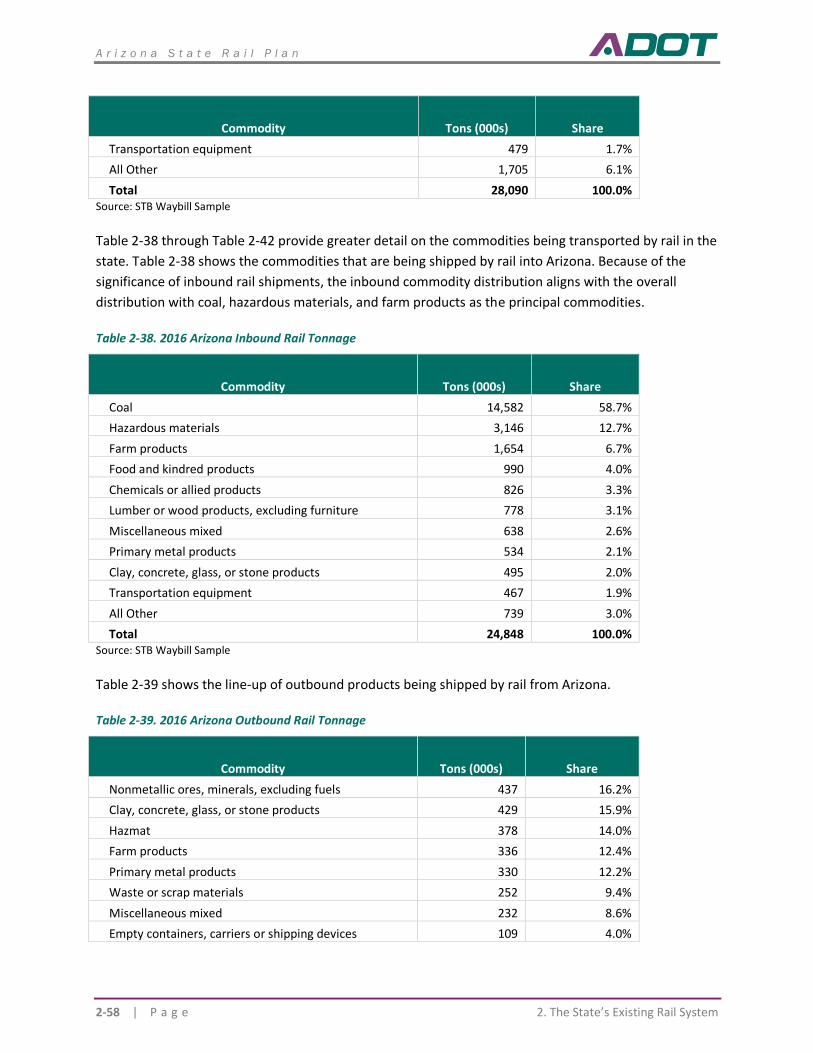
A r i z o n a S t a t e R a i l P l a n
2-58 | P a g e 2. The State’s Existing Rail System
Commodity Tons (000s) Share
Transportation equipment 479 1.7%
All Other 1,705 6.1%
Total 28,090 100.0% Source: STB Waybill Sample
Table 2-38 through Table 2-42 provide greater detail on the commodities being transported by rail in the
state. Table 2-38 shows the commodities that are being shipped by rail into Arizona. Because of the
significance of inbound rail shipments, the inbound commodity distribution aligns with the overall
distribution with coal, hazardous materials, and farm products as the principal commodities.
Table 2-38. 2016 Arizona Inbound Rail Tonnage
Commodity Tons (000s) Share
Coal 14,582 58.7%
Hazardous materials 3,146 12.7%
Farm products 1,654 6.7%
Food and kindred products 990 4.0%
Chemicals or allied products 826 3.3%
Lumber or wood products, excluding furniture 778 3.1%
Miscellaneous mixed 638 2.6%
Primary metal products 534 2.1%
Clay, concrete, glass, or stone products 495 2.0%
Transportation equipment 467 1.9%
All Other 739 3.0%
Total 24,848 100.0% Source: STB Waybill Sample
Table 2-39 shows the line-up of outbound products being shipped by rail from Arizona.
Table 2-39. 2016 Arizona Outbound Rail Tonnage
Commodity Tons (000s) Share
Nonmetallic ores, minerals, excluding fuels 437 16.2%
Clay, concrete, glass, or stone products 429 15.9%
Hazmat 378 14.0%
Farm products 336 12.4%
Primary metal products 330 12.2%
Waste or scrap materials 252 9.4%
Miscellaneous mixed 232 8.6%
Empty containers, carriers or shipping devices 109 4.0%
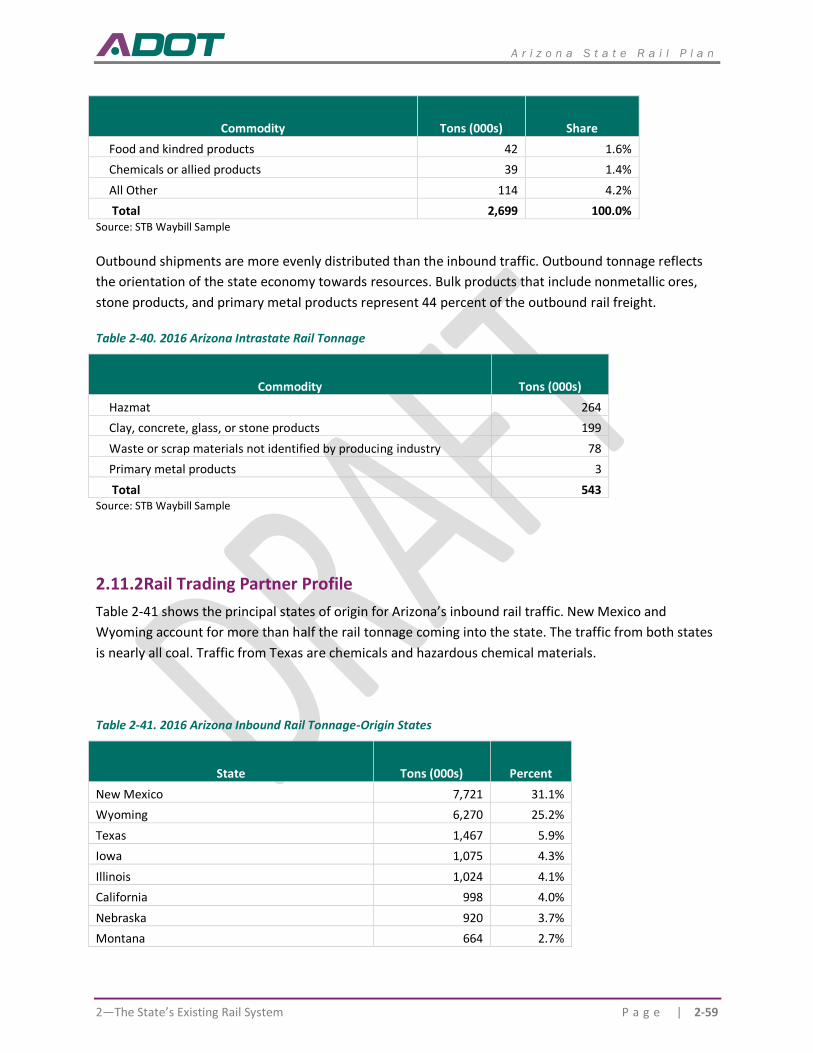
A r i z o n a S t a t e R a i l P l a n
2—The State’s Existing Rail System P a g e | 2-59
Commodity Tons (000s) Share
Food and kindred products 42 1.6%
Chemicals or allied products 39 1.4%
All Other 114 4.2%
Total 2,699 100.0% Source: STB Waybill Sample
Outbound shipments are more evenly distributed than the inbound traffic. Outbound tonnage reflects
the orientation of the state economy towards resources. Bulk products that include nonmetallic ores,
stone products, and primary metal products represent 44 percent of the outbound rail freight.
Table 2-40. 2016 Arizona Intrastate Rail Tonnage
Commodity Tons (000s)
Hazmat 264
Clay, concrete, glass, or stone products 199
Waste or scrap materials not identified by producing industry 78
Primary metal products 3
Total 543 Source: STB Waybill Sample
2.11.2 Rail Trading Partner Profile
Table 2-41 shows the principal states of origin for Arizona’s inbound rail traffic. New Mexico and
Wyoming account for more than half the rail tonnage coming into the state. The traffic from both states
is nearly all coal. Traffic from Texas are chemicals and hazardous chemical materials.
Table 2-41. 2016 Arizona Inbound Rail Tonnage-Origin States
State Tons (000s) Percent
New Mexico 7,721 31.1%
Wyoming 6,270 25.2%
Texas 1,467 5.9%
Iowa 1,075 4.3%
Illinois 1,024 4.1%
California 998 4.0%
Nebraska 920 3.7%
Montana 664 2.7%
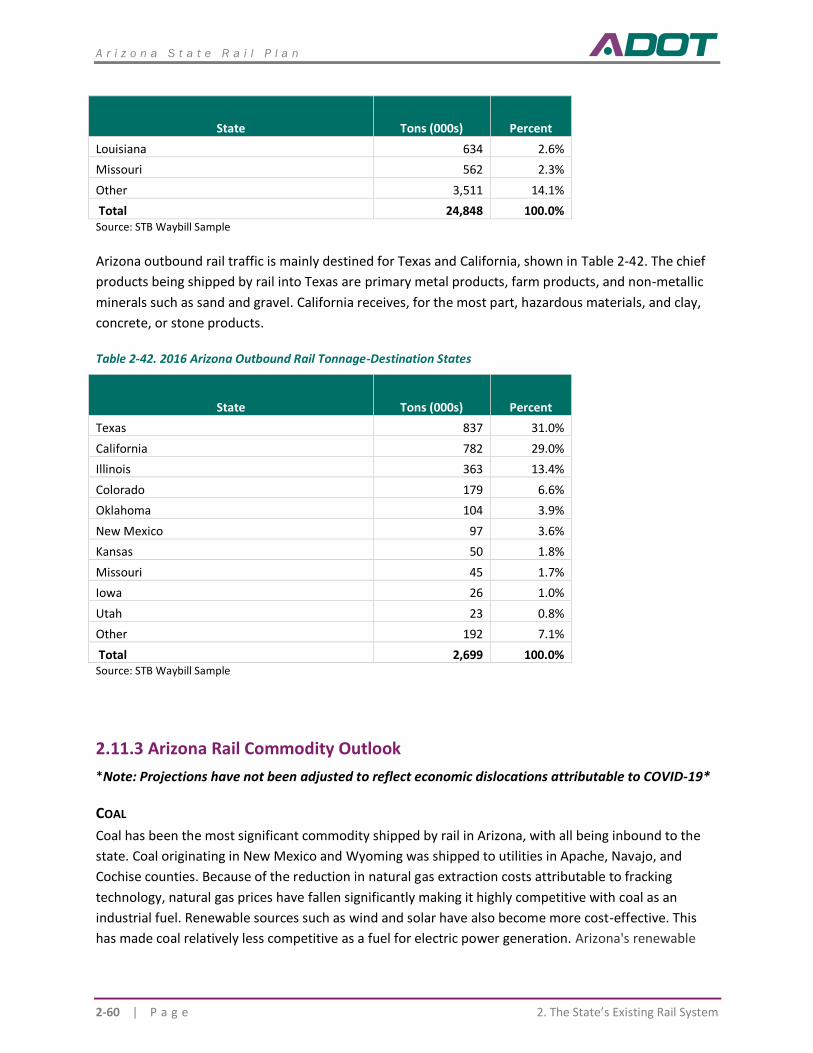
A r i z o n a S t a t e R a i l P l a n
2-60 | P a g e 2. The State’s Existing Rail System
State Tons (000s) Percent
Louisiana 634 2.6%
Missouri 562 2.3%
Other 3,511 14.1%
Total 24,848 100.0% Source: STB Waybill Sample
Arizona outbound rail traffic is mainly destined for Texas and California, shown in Table 2-42. The chief
products being shipped by rail into Texas are primary metal products, farm products, and non-metallic
minerals such as sand and gravel. California receives, for the most part, hazardous materials, and clay,
concrete, or stone products.
Table 2-42. 2016 Arizona Outbound Rail Tonnage-Destination States
State Tons (000s) Percent
Texas 837 31.0%
California 782 29.0%
Illinois 363 13.4%
Colorado 179 6.6%
Oklahoma 104 3.9%
New Mexico 97 3.6%
Kansas 50 1.8%
Missouri 45 1.7%
Iowa 26 1.0%
Utah 23 0.8%
Other 192 7.1%
Total 2,699 100.0% Source: STB Waybill Sample
2.11.3 Arizona Rail Commodity Outlook
*Note: Projections have not been adjusted to reflect economic dislocations attributable to COVID-19*
COAL
Coal has been the most significant commodity shipped by rail in Arizona, with all being inbound to the
state. Coal originating in New Mexico and Wyoming was shipped to utilities in Apache, Navajo, and
Cochise counties. Because of the reduction in natural gas extraction costs attributable to fracking
technology, natural gas prices have fallen significantly making it highly competitive with coal as an
industrial fuel. Renewable sources such as wind and solar have also become more cost-effective. This
has made coal relatively less competitive as a fuel for electric power generation. Arizona's renewable
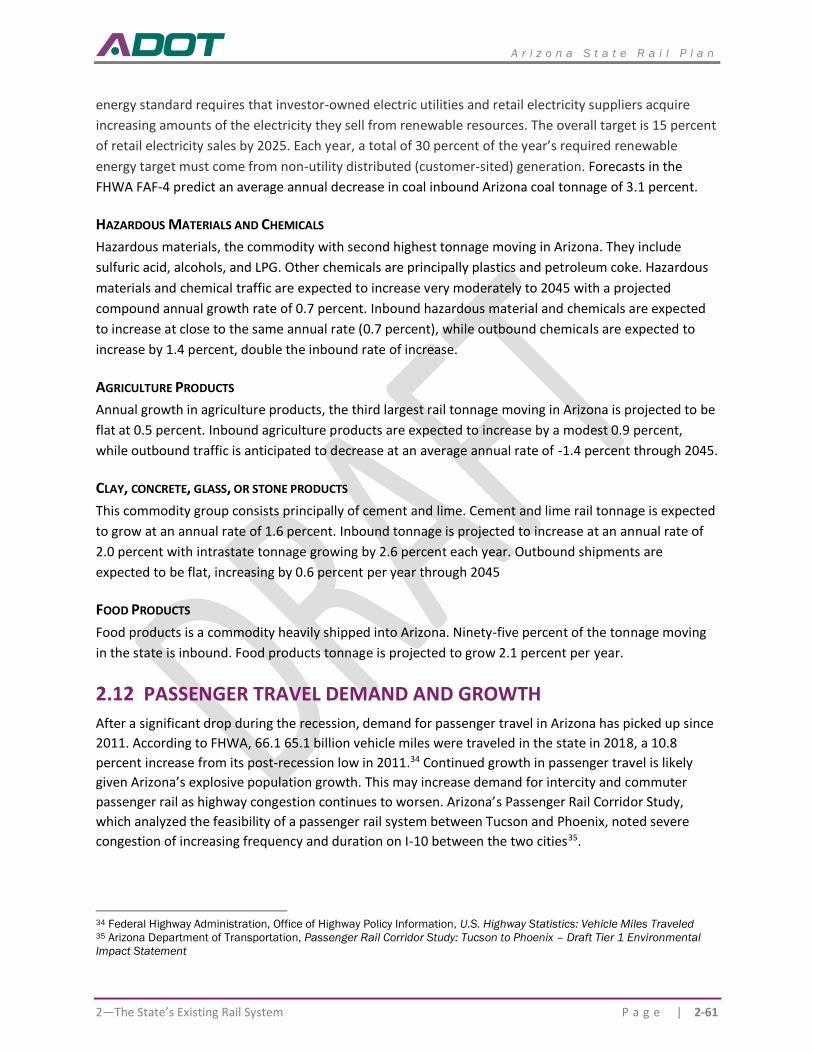
A r i z o n a S t a t e R a i l P l a n
2—The State’s Existing Rail System P a g e | 2-61
energy standard requires that investor-owned electric utilities and retail electricity suppliers acquire
increasing amounts of the electricity they sell from renewable resources. The overall target is 15 percent
of retail electricity sales by 2025. Each year, a total of 30 percent of the year’s required renewable
energy target must come from non-utility distributed (customer-sited) generation. Forecasts in the
FHWA FAF-4 predict an average annual decrease in coal inbound Arizona coal tonnage of 3.1 percent.
HAZARDOUS MATERIALS AND CHEMICALS
Hazardous materials, the commodity with second highest tonnage moving in Arizona. They include
sulfuric acid, alcohols, and LPG. Other chemicals are principally plastics and petroleum coke. Hazardous
materials and chemical traffic are expected to increase very moderately to 2045 with a projected
compound annual growth rate of 0.7 percent. Inbound hazardous material and chemicals are expected
to increase at close to the same annual rate (0.7 percent), while outbound chemicals are expected to
increase by 1.4 percent, double the inbound rate of increase.
AGRICULTURE PRODUCTS
Annual growth in agriculture products, the third largest rail tonnage moving in Arizona is projected to be
flat at 0.5 percent. Inbound agriculture products are expected to increase by a modest 0.9 percent,
while outbound traffic is anticipated to decrease at an average annual rate of -1.4 percent through 2045.
CLAY, CONCRETE, GLASS, OR STONE PRODUCTS
This commodity group consists principally of cement and lime. Cement and lime rail tonnage is expected
to grow at an annual rate of 1.6 percent. Inbound tonnage is projected to increase at an annual rate of
2.0 percent with intrastate tonnage growing by 2.6 percent each year. Outbound shipments are
expected to be flat, increasing by 0.6 percent per year through 2045
FOOD PRODUCTS
Food products is a commodity heavily shipped into Arizona. Ninety-five percent of the tonnage moving
in the state is inbound. Food products tonnage is projected to grow 2.1 percent per year.
PASSENGER TRAVEL DEMAND AND GROWTH
After a significant drop during the recession, demand for passenger travel in Arizona has picked up since
2011. According to FHWA, 66.1 65.1 billion vehicle miles were traveled in the state in 2018, a 10.8
percent increase from its post-recession low in 2011.34 Continued growth in passenger travel is likely
given Arizona’s explosive population growth. This may increase demand for intercity and commuter
passenger rail as highway congestion continues to worsen. Arizona’s Passenger Rail Corridor Study,
which analyzed the feasibility of a passenger rail system between Tucson and Phoenix, noted severe
congestion of increasing frequency and duration on I-10 between the two cities35.
34 Federal Highway Administration, Office of Highway Policy Information, U.S. Highway Statistics: Vehicle Miles Traveled 35 Arizona Department of Transportation, Passenger Rail Corridor Study: Tucson to Phoenix – Draft Tier 1 Environmental
Impact Statement
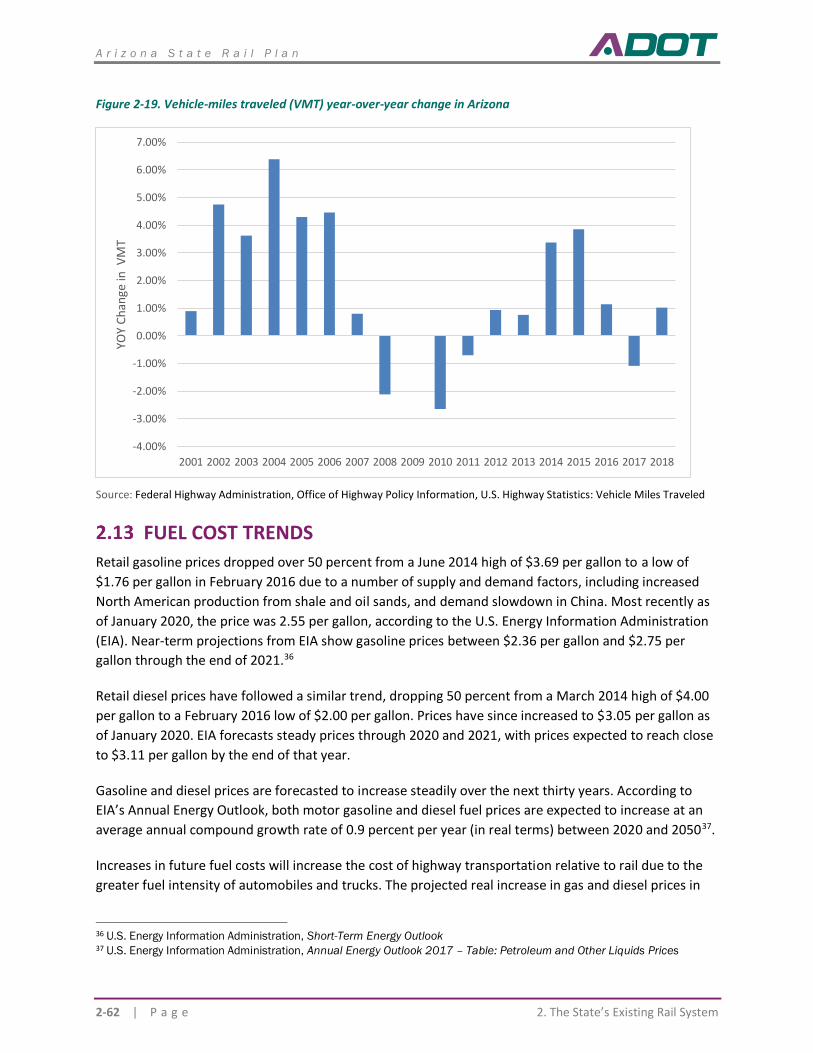
A r i z o n a S t a t e R a i l P l a n
2-62 | P a g e 2. The State’s Existing Rail System
Figure 2-19. Vehicle-miles traveled (VMT) year-over-year change in Arizona
Source: Federal Highway Administration, Office of Highway Policy Information, U.S. Highway Statistics: Vehicle Miles Traveled
FUEL COST TRENDS
Retail gasoline prices dropped over 50 percent from a June 2014 high of $3.69 per gallon to a low of
$1.76 per gallon in February 2016 due to a number of supply and demand factors, including increased
North American production from shale and oil sands, and demand slowdown in China. Most recently as
of January 2020, the price was 2.55 per gallon, according to the U.S. Energy Information Administration
(EIA). Near-term projections from EIA show gasoline prices between $2.36 per gallon and $2.75 per
gallon through the end of 2021.36
Retail diesel prices have followed a similar trend, dropping 50 percent from a March 2014 high of $4.00
per gallon to a February 2016 low of $2.00 per gallon. Prices have since increased to $3.05 per gallon as
of January 2020. EIA forecasts steady prices through 2020 and 2021, with prices expected to reach close
to $3.11 per gallon by the end of that year.
Gasoline and diesel prices are forecasted to increase steadily over the next thirty years. According to
EIA’s Annual Energy Outlook, both motor gasoline and diesel fuel prices are expected to increase at an
average annual compound growth rate of 0.9 percent per year (in real terms) between 2020 and 205037.
Increases in future fuel costs will increase the cost of highway transportation relative to rail due to the
greater fuel intensity of automobiles and trucks. The projected real increase in gas and diesel prices in
36 U.S. Energy Information Administration, Short-Term Energy Outlook 37 U.S. Energy Information Administration, Annual Energy Outlook 2017 – Table: Petroleum and Other Liquids Prices
-4.00%
-3.00%
-2.00%
-1.00%
0.00%
1.00%
2.00%
3.00%
4.00%
5.00%
6.00%
7.00%
2001 2002 2003 2004 2005 2006 2007 2008 2009 2010 2011 2012 2013 2014 2015 2016 2017 2018
YOY
Ch
ange
in V
MT
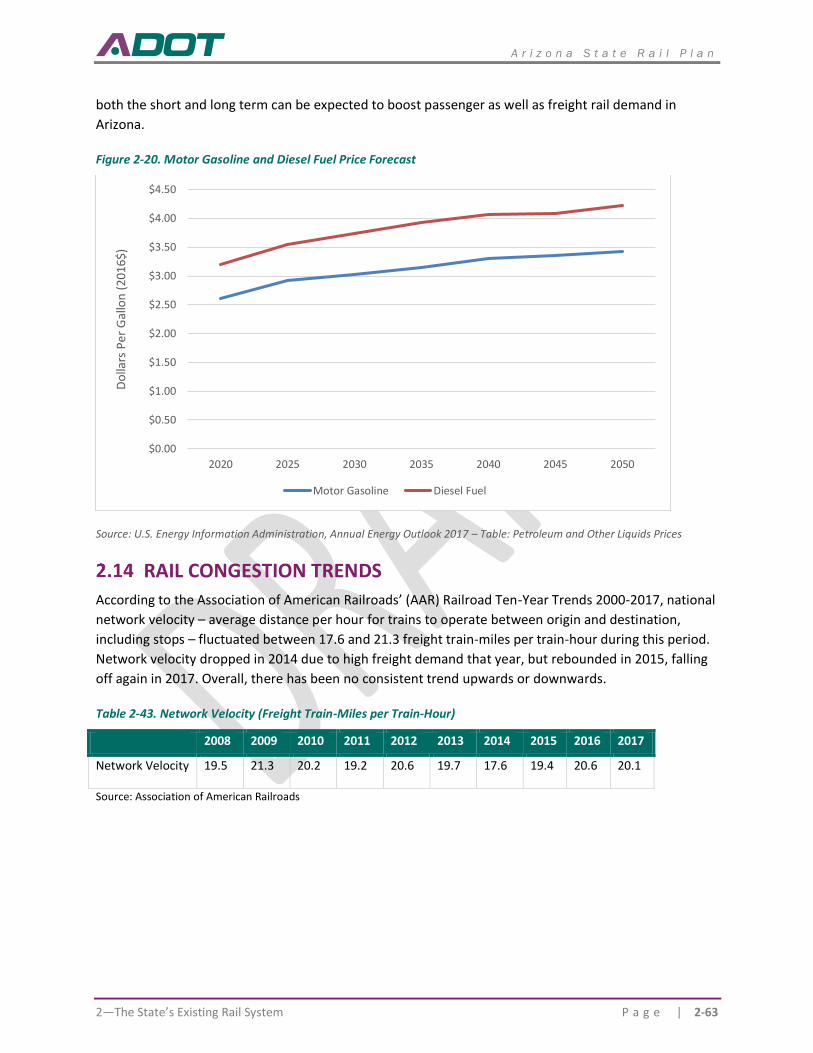
A r i z o n a S t a t e R a i l P l a n
2—The State’s Existing Rail System P a g e | 2-63
both the short and long term can be expected to boost passenger as well as freight rail demand in
Arizona.
Figure 2-20. Motor Gasoline and Diesel Fuel Price Forecast
Source: U.S. Energy Information Administration, Annual Energy Outlook 2017 – Table: Petroleum and Other Liquids Prices
RAIL CONGESTION TRENDS
According to the Association of American Railroads’ (AAR) Railroad Ten-Year Trends 2000-2017, national
network velocity – average distance per hour for trains to operate between origin and destination,
including stops – fluctuated between 17.6 and 21.3 freight train-miles per train-hour during this period.
Network velocity dropped in 2014 due to high freight demand that year, but rebounded in 2015, falling
off again in 2017. Overall, there has been no consistent trend upwards or downwards.
Table 2-43. Network Velocity (Freight Train-Miles per Train-Hour)
2008 2009 2010 2011 2012 2013 2014 2015 2016 2017
Network Velocity 19.5 21.3 20.2 19.2 20.6 19.7 17.6 19.4 20.6 20.1
Source: Association of American Railroads
$0.00
$0.50
$1.00
$1.50
$2.00
$2.50
$3.00
$3.50
$4.00
$4.50
2020 2025 2030 2035 2040 2045 2050
Do
llars
Per
Gal
lon
(20
16$)
Motor Gasoline Diesel Fuel
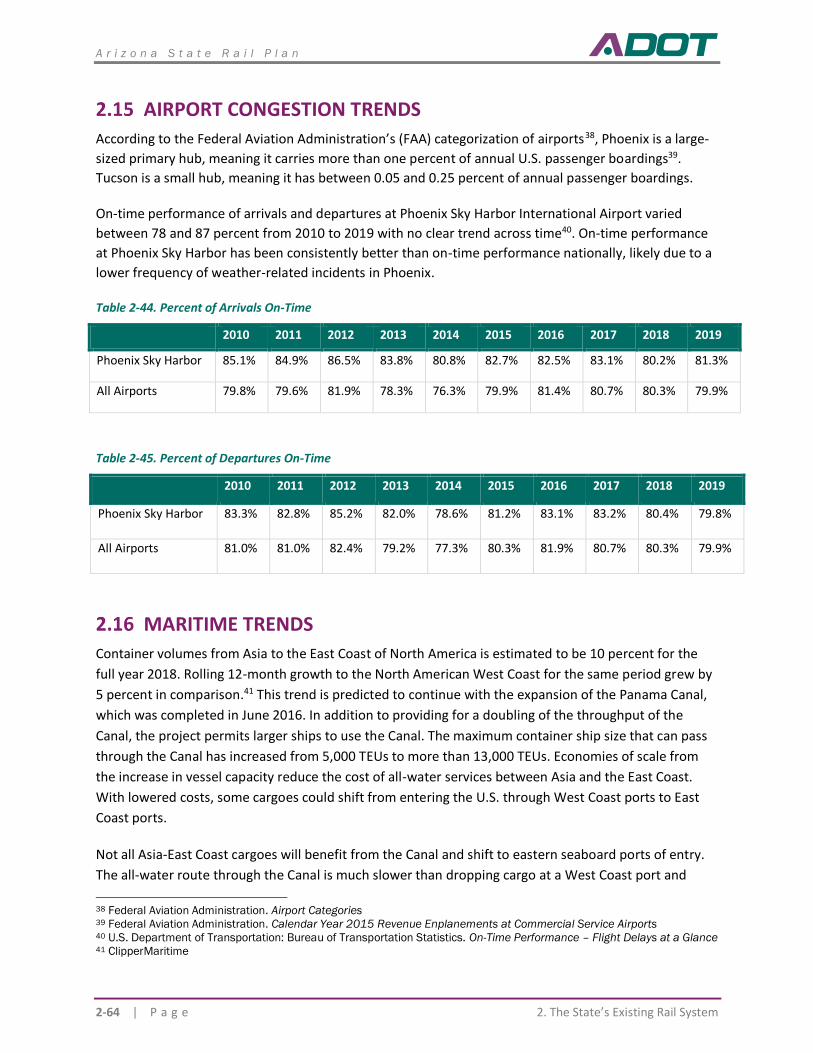
A r i z o n a S t a t e R a i l P l a n
2-64 | P a g e 2. The State’s Existing Rail System
AIRPORT CONGESTION TRENDS
According to the Federal Aviation Administration’s (FAA) categorization of airports38, Phoenix is a large-
sized primary hub, meaning it carries more than one percent of annual U.S. passenger boardings39.
Tucson is a small hub, meaning it has between 0.05 and 0.25 percent of annual passenger boardings.
On-time performance of arrivals and departures at Phoenix Sky Harbor International Airport varied
between 78 and 87 percent from 2010 to 2019 with no clear trend across time40. On-time performance
at Phoenix Sky Harbor has been consistently better than on-time performance nationally, likely due to a
lower frequency of weather-related incidents in Phoenix.
Table 2-44. Percent of Arrivals On-Time
2010 2011 2012 2013 2014 2015 2016 2017 2018 2019
Phoenix Sky Harbor 85.1% 84.9% 86.5% 83.8% 80.8% 82.7% 82.5% 83.1% 80.2% 81.3%
All Airports 79.8% 79.6% 81.9% 78.3% 76.3% 79.9% 81.4% 80.7% 80.3% 79.9%
Table 2-45. Percent of Departures On-Time
2010 2011 2012 2013 2014 2015 2016 2017 2018 2019
Phoenix Sky Harbor 83.3% 82.8% 85.2% 82.0% 78.6% 81.2% 83.1% 83.2% 80.4% 79.8%
All Airports 81.0% 81.0% 82.4% 79.2% 77.3% 80.3% 81.9% 80.7% 80.3% 79.9%
MARITIME TRENDS
Container volumes from Asia to the East Coast of North America is estimated to be 10 percent for the
full year 2018. Rolling 12-month growth to the North American West Coast for the same period grew by
5 percent in comparison.41 This trend is predicted to continue with the expansion of the Panama Canal,
which was completed in June 2016. In addition to providing for a doubling of the throughput of the
Canal, the project permits larger ships to use the Canal. The maximum container ship size that can pass
through the Canal has increased from 5,000 TEUs to more than 13,000 TEUs. Economies of scale from
the increase in vessel capacity reduce the cost of all-water services between Asia and the East Coast.
With lowered costs, some cargoes could shift from entering the U.S. through West Coast ports to East
Coast ports.
Not all Asia-East Coast cargoes will benefit from the Canal and shift to eastern seaboard ports of entry.
The all-water route through the Canal is much slower than dropping cargo at a West Coast port and
38 Federal Aviation Administration. Airport Categories 39 Federal Aviation Administration. Calendar Year 2015 Revenue Enplanements at Commercial Service Airports 40 U.S. Department of Transportation: Bureau of Transportation Statistics. On-Time Performance – Flight Delays at a Glance 41 ClipperMaritime
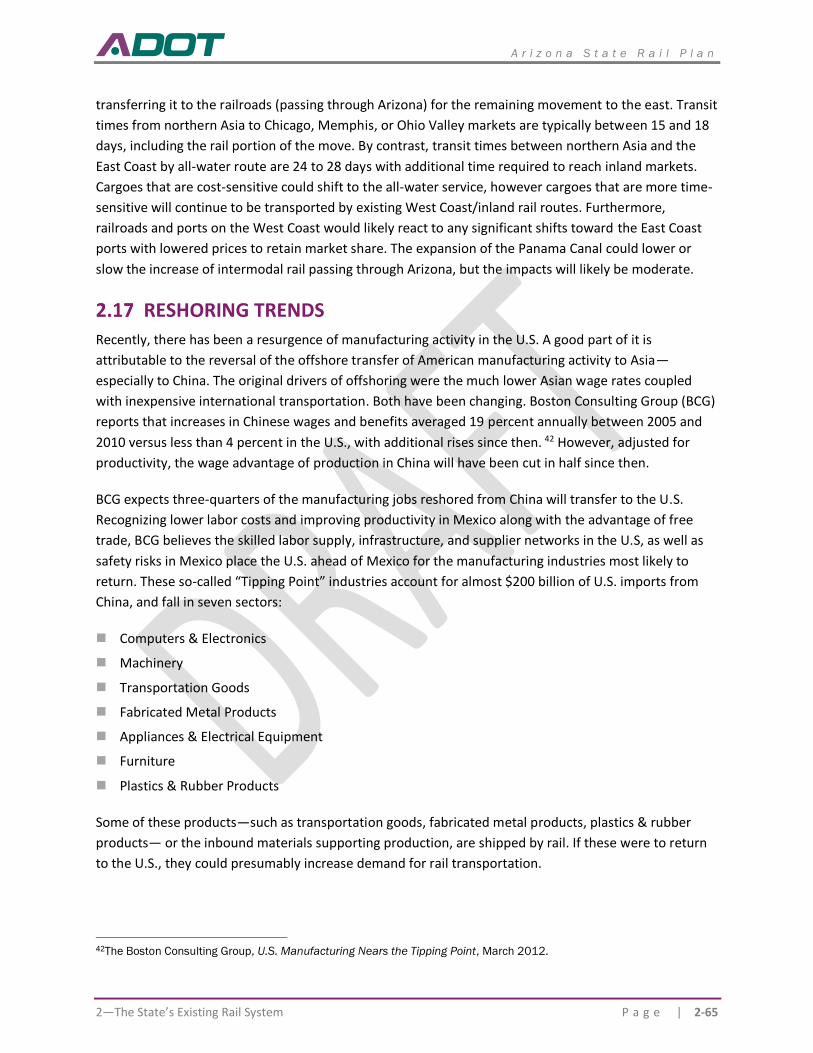
A r i z o n a S t a t e R a i l P l a n
2—The State’s Existing Rail System P a g e | 2-65
transferring it to the railroads (passing through Arizona) for the remaining movement to the east. Transit
times from northern Asia to Chicago, Memphis, or Ohio Valley markets are typically between 15 and 18
days, including the rail portion of the move. By contrast, transit times between northern Asia and the
East Coast by all-water route are 24 to 28 days with additional time required to reach inland markets.
Cargoes that are cost-sensitive could shift to the all-water service, however cargoes that are more time-
sensitive will continue to be transported by existing West Coast/inland rail routes. Furthermore,
railroads and ports on the West Coast would likely react to any significant shifts toward the East Coast
ports with lowered prices to retain market share. The expansion of the Panama Canal could lower or
slow the increase of intermodal rail passing through Arizona, but the impacts will likely be moderate.
RESHORING TRENDS
Recently, there has been a resurgence of manufacturing activity in the U.S. A good part of it is
attributable to the reversal of the offshore transfer of American manufacturing activity to Asia—
especially to China. The original drivers of offshoring were the much lower Asian wage rates coupled
with inexpensive international transportation. Both have been changing. Boston Consulting Group (BCG)
reports that increases in Chinese wages and benefits averaged 19 percent annually between 2005 and
2010 versus less than 4 percent in the U.S., with additional rises since then. 42 However, adjusted for
productivity, the wage advantage of production in China will have been cut in half since then.
BCG expects three-quarters of the manufacturing jobs reshored from China will transfer to the U.S.
Recognizing lower labor costs and improving productivity in Mexico along with the advantage of free
trade, BCG believes the skilled labor supply, infrastructure, and supplier networks in the U.S, as well as
safety risks in Mexico place the U.S. ahead of Mexico for the manufacturing industries most likely to
return. These so-called “Tipping Point” industries account for almost $200 billion of U.S. imports from
China, and fall in seven sectors:
◼ Computers & Electronics
◼ Machinery
◼ Transportation Goods
◼ Fabricated Metal Products
◼ Appliances & Electrical Equipment
◼ Furniture
◼ Plastics & Rubber Products
Some of these products—such as transportation goods, fabricated metal products, plastics & rubber
products— or the inbound materials supporting production, are shipped by rail. If these were to return
to the U.S., they could presumably increase demand for rail transportation.
42The Boston Consulting Group, U.S. Manufacturing Nears the Tipping Point, March 2012.
A r i z o n a S t a t e R a i l P l a n
2-66 | P a g e 2. The State’s Existing Rail System
However, since the original “Tipping Point” report, there has been disagreement over whether reshoring
has actually taken place. BCG conducts annual surveys of senior manufacturing executives at companies
with at least $1 billion in annual revenues. In the latest survey, 31 percent of executives said that they
would likely add production capacity in the U.S. within five years for goods sold in the U.S., while
20 percent said they would add production capacity in China.43 Nine percent said they were actively
reshoring production. BCG contends that the reshoring trend is accelerating and that more recent
surveys are showing a greater instance of reshoring than earlier surveys.
Current trade policies are also driving increased manufacturing in the U.S. The Wall Street Journal
recently reported a growing interest by automotive manufacturers in shifting parts production to the
U.S. The cost of tariffs is causing manufacturers to re-think their supply chains. The proposed United
States-Mexico-Canada Agreement (USMCA), which replaces NAFTA, requires auto makers to build 70 to
75 percent of a car’s value in North America to remain duty-free within the region, up from 62.5 percent
stipulated by NAFTA. In addition, 70 percent of a vehicle’s steel and aluminum must originate in North
America. Car companies also have to ensure 40 percent to 45 percent of the vehicle is made by workers
earning at least $16.00 per hour, a provision aimed at steering more work to the U.S. to generate
manufacturing jobs. Parts manufactured in the U.S. will also be used in cars manufactured in Canada and
Mexico.44
TRUCKING TRENDS AND ISSUES
Trucking availability fluctuates with economic conditions and demand from industry and consumers. The
long-term trend is for the availability of trucking to shrink.
2.18.1 Driver and Employee Shortage
The American Trucking Associations estimate that the nationwide driver shortage in 2018 was 60,800
and expected to exceed 160,000 in 2027.45 The shortage stems from an aging driver population and a
lack of young people willing to enter the profession coupled with low nationwide unemployment rates.
A contributing factor is also that many carriers have strict hiring criteria based on driving history,
experience, and other factors. Consequently, motor carriers are finding few eligible candidates, which is
a quality issue. According to the recent ATA Benchmarking Guide for Driver Recruitment & Retention, 88
percent of fleets reported enough applicants, but many were simply not qualified. Over the next decade,
the trucking industry will need to hire roughly 898,000 new drivers, or an average of nearly 90,000 per
year. Replacing retiring truck drivers will be by far the largest factor, accounting for nearly half of new
driver hires (49 percent). The second largest factor will be industry growth, accounting for 28 percent of
new driver hires. 46
43 Boston Consulting Group, Made in America, Again – Fourth Annual Survey of U.S.-Based Manufacturing Executives,
December 2015. 44 https: Congressional Research Service, USMCA: Motor Vehicle Provisions and Issues, December 19, 2019 45 Truck Driver Shortage Analysis, American Trucking Associations, 2017. 46 Truck Driver Shortage Analysis, American Trucking Associations, 2017.
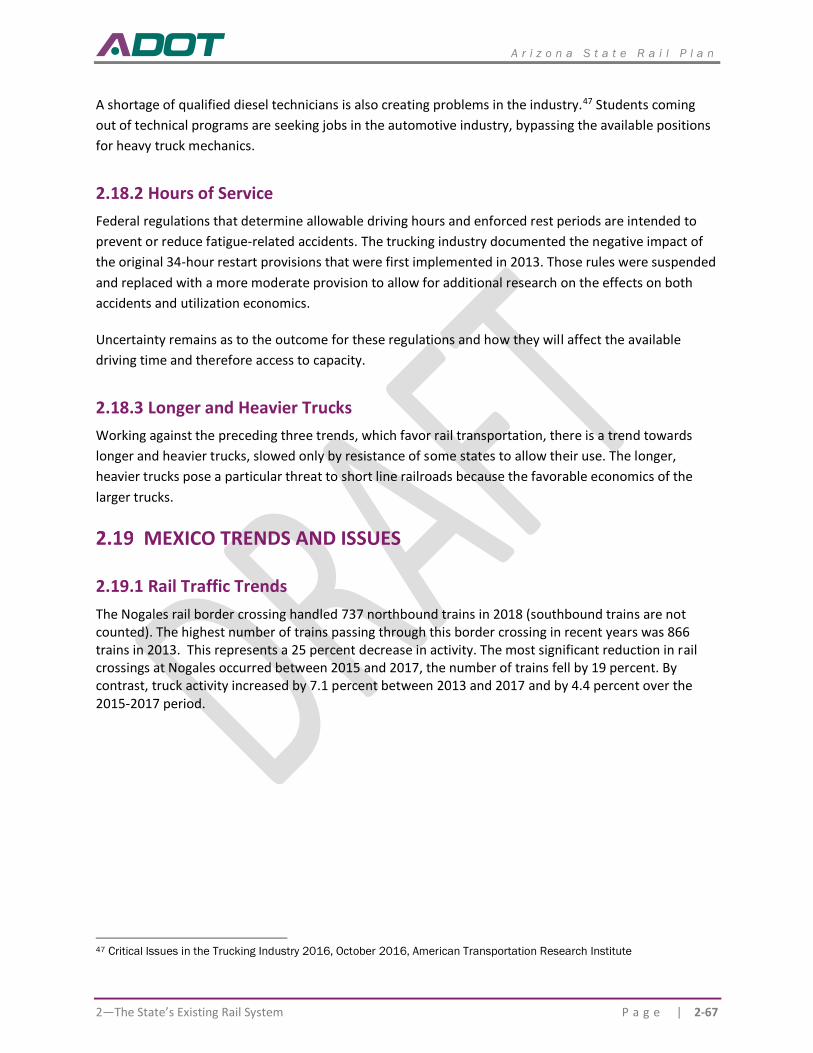
A r i z o n a S t a t e R a i l P l a n
2—The State’s Existing Rail System P a g e | 2-67
A shortage of qualified diesel technicians is also creating problems in the industry.47 Students coming
out of technical programs are seeking jobs in the automotive industry, bypassing the available positions
for heavy truck mechanics.
2.18.2 Hours of Service
Federal regulations that determine allowable driving hours and enforced rest periods are intended to
prevent or reduce fatigue-related accidents. The trucking industry documented the negative impact of
the original 34-hour restart provisions that were first implemented in 2013. Those rules were suspended
and replaced with a more moderate provision to allow for additional research on the effects on both
accidents and utilization economics.
Uncertainty remains as to the outcome for these regulations and how they will affect the available
driving time and therefore access to capacity.
2.18.3 Longer and Heavier Trucks
Working against the preceding three trends, which favor rail transportation, there is a trend towards
longer and heavier trucks, slowed only by resistance of some states to allow their use. The longer,
heavier trucks pose a particular threat to short line railroads because the favorable economics of the
larger trucks.
MEXICO TRENDS AND ISSUES
2.19.1 Rail Traffic Trends
The Nogales rail border crossing handled 737 northbound trains in 2018 (southbound trains are not counted). The highest number of trains passing through this border crossing in recent years was 866 trains in 2013. This represents a 25 percent decrease in activity. The most significant reduction in rail crossings at Nogales occurred between 2015 and 2017, the number of trains fell by 19 percent. By contrast, truck activity increased by 7.1 percent between 2013 and 2017 and by 4.4 percent over the 2015-2017 period.
47 Critical Issues in the Trucking Industry 2016, October 2016, American Transportation Research Institute
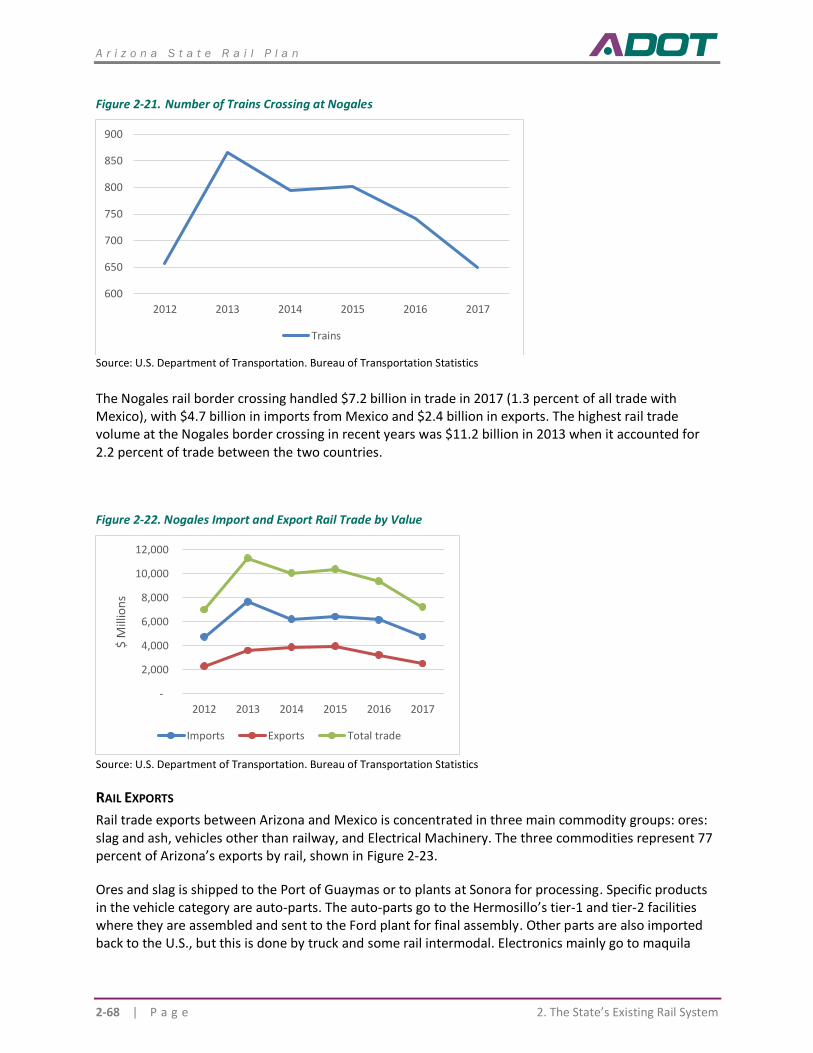
A r i z o n a S t a t e R a i l P l a n
2-68 | P a g e 2. The State’s Existing Rail System
Figure 2-21. Number of Trains Crossing at Nogales
Source: U.S. Department of Transportation. Bureau of Transportation Statistics
The Nogales rail border crossing handled $7.2 billion in trade in 2017 (1.3 percent of all trade with Mexico), with $4.7 billion in imports from Mexico and $2.4 billion in exports. The highest rail trade volume at the Nogales border crossing in recent years was $11.2 billion in 2013 when it accounted for 2.2 percent of trade between the two countries.
Figure 2-22. Nogales Import and Export Rail Trade by Value
Source: U.S. Department of Transportation. Bureau of Transportation Statistics
RAIL EXPORTS
Rail trade exports between Arizona and Mexico is concentrated in three main commodity groups: ores: slag and ash, vehicles other than railway, and Electrical Machinery. The three commodities represent 77 percent of Arizona’s exports by rail, shown in Figure 2-23.
Ores and slag is shipped to the Port of Guaymas or to plants at Sonora for processing. Specific products in the vehicle category are auto-parts. The auto-parts go to the Hermosillo’s tier-1 and tier-2 facilities where they are assembled and sent to the Ford plant for final assembly. Other parts are also imported back to the U.S., but this is done by truck and some rail intermodal. Electronics mainly go to maquila
600
650
700
750
800
850
900
2012 2013 2014 2015 2016 2017
Trains
-
2,000
4,000
6,000
8,000
10,000
12,000
2012 2013 2014 2015 2016 2017
$ M
illio
ns
Imports Exports Total trade
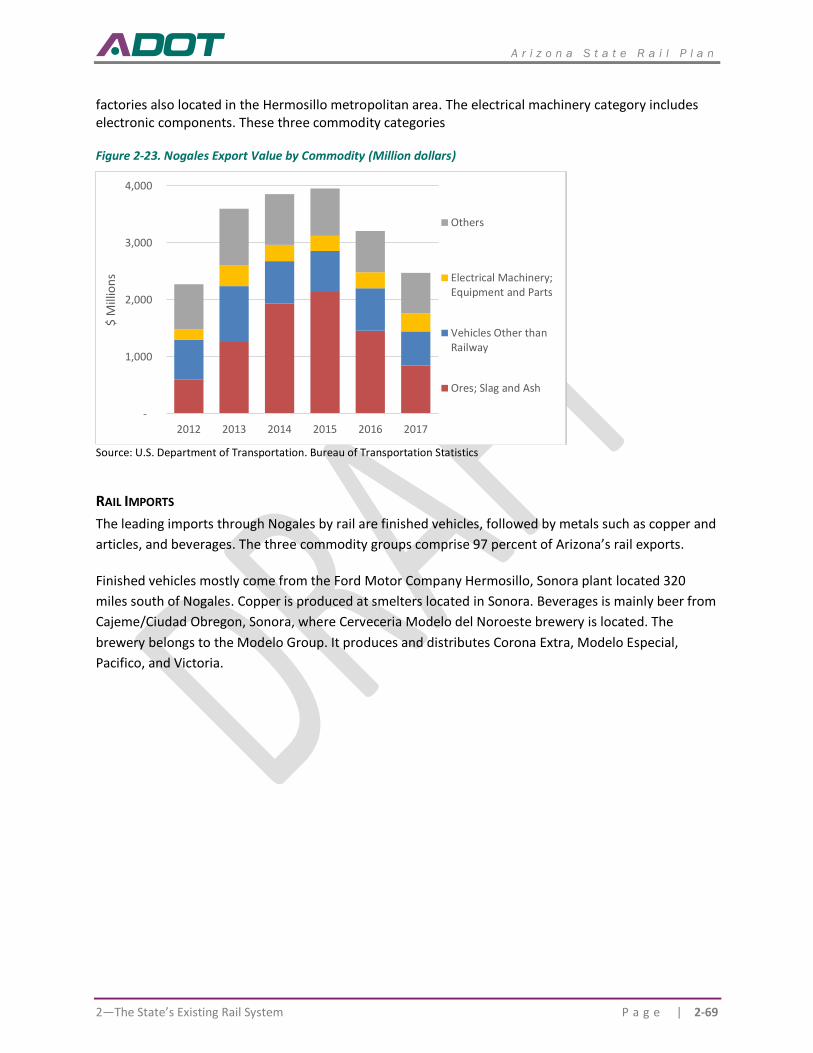
A r i z o n a S t a t e R a i l P l a n
2—The State’s Existing Rail System P a g e | 2-69
factories also located in the Hermosillo metropolitan area. The electrical machinery category includes electronic components. These three commodity categories
Figure 2-23. Nogales Export Value by Commodity (Million dollars)
Source: U.S. Department of Transportation. Bureau of Transportation Statistics
RAIL IMPORTS
The leading imports through Nogales by rail are finished vehicles, followed by metals such as copper and
articles, and beverages. The three commodity groups comprise 97 percent of Arizona’s rail exports.
Finished vehicles mostly come from the Ford Motor Company Hermosillo, Sonora plant located 320
miles south of Nogales. Copper is produced at smelters located in Sonora. Beverages is mainly beer from
Cajeme/Ciudad Obregon, Sonora, where Cerveceria Modelo del Noroeste brewery is located. The
brewery belongs to the Modelo Group. It produces and distributes Corona Extra, Modelo Especial,
Pacifico, and Victoria.
-
1,000
2,000
3,000
4,000
2012 2013 2014 2015 2016 2017
$ M
illio
ns
Others
Electrical Machinery;Equipment and Parts
Vehicles Other thanRailway
Ores; Slag and Ash
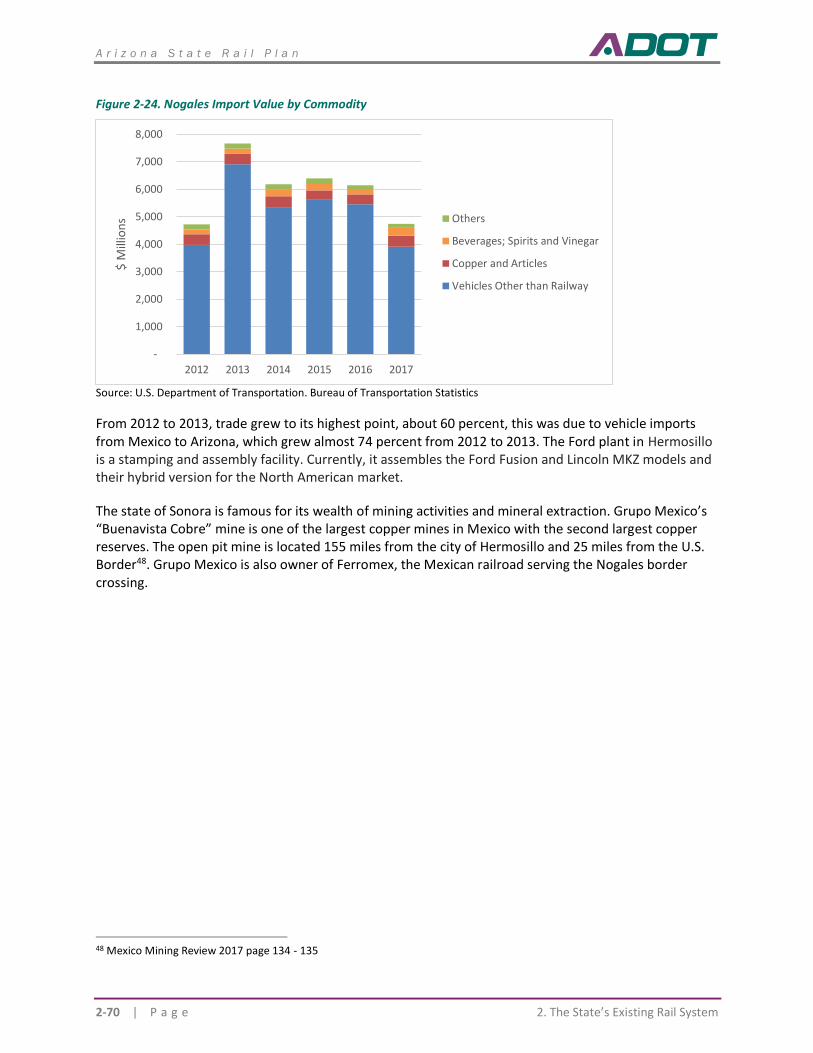
A r i z o n a S t a t e R a i l P l a n
2-70 | P a g e 2. The State’s Existing Rail System
Figure 2-24. Nogales Import Value by Commodity
Source: U.S. Department of Transportation. Bureau of Transportation Statistics
From 2012 to 2013, trade grew to its highest point, about 60 percent, this was due to vehicle imports from Mexico to Arizona, which grew almost 74 percent from 2012 to 2013. The Ford plant in Hermosillo is a stamping and assembly facility. Currently, it assembles the Ford Fusion and Lincoln MKZ models and their hybrid version for the North American market.
The state of Sonora is famous for its wealth of mining activities and mineral extraction. Grupo Mexico’s “Buenavista Cobre” mine is one of the largest copper mines in Mexico with the second largest copper reserves. The open pit mine is located 155 miles from the city of Hermosillo and 25 miles from the U.S. Border48. Grupo Mexico is also owner of Ferromex, the Mexican railroad serving the Nogales border crossing.
48 Mexico Mining Review 2017 page 134 - 135
-
1,000
2,000
3,000
4,000
5,000
6,000
7,000
8,000
2012 2013 2014 2015 2016 2017
$ M
illio
ns Others
Beverages; Spirits and Vinegar
Copper and Articles
Vehicles Other than Railway
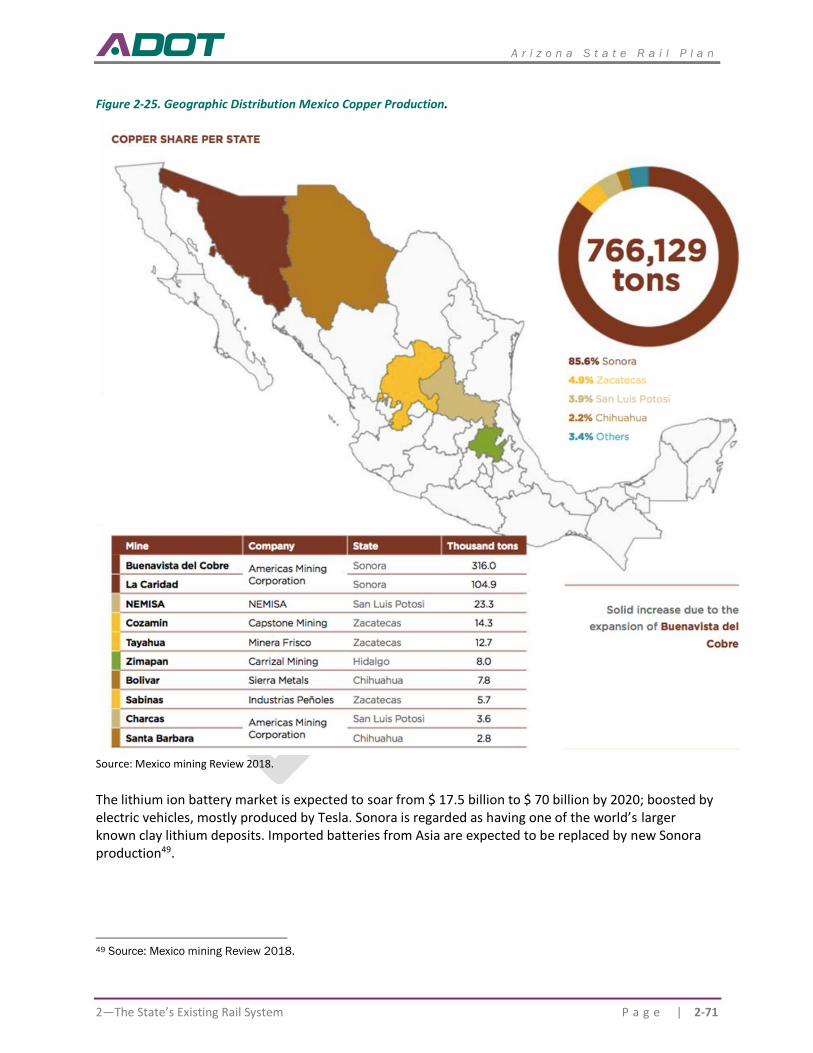
A r i z o n a S t a t e R a i l P l a n
2—The State’s Existing Rail System P a g e | 2-71
Figure 2-25. Geographic Distribution Mexico Copper Production.
Source: Mexico mining Review 2018.
The lithium ion battery market is expected to soar from $ 17.5 billion to $ 70 billion by 2020; boosted by electric vehicles, mostly produced by Tesla. Sonora is regarded as having one of the world’s larger known clay lithium deposits. Imported batteries from Asia are expected to be replaced by new Sonora production49.
49 Source: Mexico mining Review 2018.
A r i z o n a S t a t e R a i l P l a n
2-72 | P a g e 2. The State’s Existing Rail System
Ford announced that it would be moving its small car production from Michigan to Mexico. While the outsourcing of manufacturing from the U.S. is nothing new, North American supply chains are changing and the Ford plant at Hermosillo main production is light vehicles, and their hybrid versions.
2.19.2 Nearshoring to Mexico
Nearshoring (outsourcing of manufacturing and other forms of production to a nearby country) of U.S. production to Mexico has been on the rise for several years and shows no signs of slowing down. The manufacturing operations that are nearshored to Mexico, however, are not necessarily coming exclusively from the United States. In fact, a large segment of this movement is coming from other countries, such as China, that have been a major source of imports for U.S. companies in recent decades as a result of their lower production costs.
Nearshoring in Mexico benefits U.S. companies in many ways:
Proximity. Truck transit times are lower than ocean, taking 48 hours or less to reach destination in the US. By contrast, shipping a container from Asia to the U.S. could take up to six weeks to reach final destination. In addition, the shorter supply chain implies lower required inventory due both to fewer items in transit and improved reliability inherent in shorter distances.
Trucking and Rail Intermodal Service. More than 6 million trucks crossed into the U.S. from Mexico in 2017. In addition, shippers now have more reliable and seamless intermodal service options between Mexico and the U.S., which can offer a 15 to 20 percent cost advantage over trucking.
Labor. Unlike a decade ago when Mexican labor costs were reportedly 60 percent higher than those in China, today they are on par or lower. Mexican companies have also transitioned from simple assemblers of products to exceedingly sophisticated manufacturers.
The increased growth of production in Mexico does has its challenges. The border crossing process is complicated, and trains move fairly slow as they pass through densely populated areas. Together with the strong demand for rail capacity, shippers are facing frequent delays, however, at the moment, acceptable delays.50
2.19.3 Key Cross Border Supply Chains
AUTO-INDUSTRY
The North America car industry comprises parts made and assembled in Mexico, U.S. and Canada. As described earlier, auto industry-related rail traffic is the largest volume moving over the Nogales border crossing. The renegotiation of NAFTA into the USMCA may have an effect on the number of cars shipped to the U.S. The new agreement is expected to push production costs higher on Mexican products, parts and vehicles because of the wage rate provisions in the agreement. Unrelated to trade barriers, auto related rail traffic has decreased in recent years from a 2013 peak due to decreasing demand. In November of 2017, Ford announced plans to lay off 850 workers out of the 2,750 it employs at its
50 AVERITT. Nearshoring to Mexico changing the supply-chain road map https://knowledgecenter.averittexpress.com/nearshoring-to-mexico-changing-the-supply-chain-road-map
A r i z o n a S t a t e R a i l P l a n
2—The State’s Existing Rail System P a g e | 2-73
assembly plant in Hermosillo, due to low demand for the vehicles it manufactures at the Mexican facility.51
Sonora is known for its mining and manufacturing, which includes large automobile factories and recently joined the aerospace industry. The capital of the state, Hermosillo, is the main economic center of the state, thanks to its industry and manufacturing, revolve around the automotive sector.
The automotive industry represents 25 percent of Mexican exports to the United States. Sonora represents the largest automotive cluster in North America. More than 80 companies are located in the state. Sonora is the fourth largest vehicle production state in Mexico with 14.3 percent of the total vehicles produced, with only Coahuila, Aguascalientes and Puebla, each producing more according to data from the Ministry of Economy.52
The near-term outlook for the automotive industry in Sonora is uncertain. On the one hand, the behavior of the automobile market in the United States suggests that the Ford Hermosillo plant could continue to reduce its production of sedan cars in the remainder of 2018.
On the other hand, Ford indicated in April 2018 that plans are in place to assemble a new electric car at its plant in Hermosillo beginning in 2020. Ford would enter a transition period in 2019 to make the necessary adjustments to start production the following year. This could be the beginning of recovering the productive capacity of the company.53
Notwithstanding Ford’s plans, it is expected that by 2020, the Mexican automotive industry will produce about 5 million light vehicles from 13 different brands, in more than 30 manufacturing plants. In recent years, the country has evolved from its initial maquila focus to become a power in the global automotive industry, creating new opportunities for domestic and international suppliers of components and services to contribute to the rapid development of this sector.
51 Mexico Now, November 22, 2017. http://www.mexico-now.com/index.php/article/3325-ford-to-layoff-850-workers-at-hermosillo-plant 52 Foro Estrategia Banorte. Sonora, el pequeño gigante automotriz: https://forobanorte.com/sonora-el-pequeno-gigante-
automotriz/ 53 Circulo Sonora. http://www.circulosonora.com/2018/08/24/industria-automotriz-sonora-retos-ante-nuevo-contexto-
global/
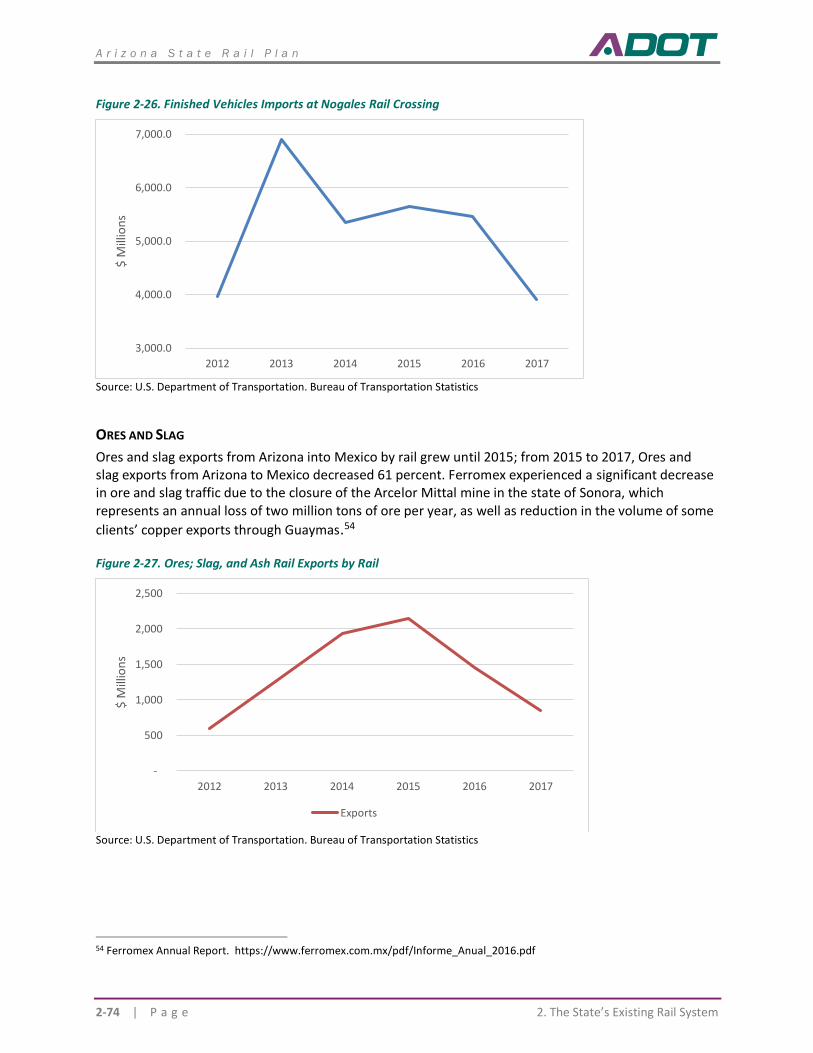
A r i z o n a S t a t e R a i l P l a n
2-74 | P a g e 2. The State’s Existing Rail System
Figure 2-26. Finished Vehicles Imports at Nogales Rail Crossing
Source: U.S. Department of Transportation. Bureau of Transportation Statistics
ORES AND SLAG
Ores and slag exports from Arizona into Mexico by rail grew until 2015; from 2015 to 2017, Ores and slag exports from Arizona to Mexico decreased 61 percent. Ferromex experienced a significant decrease in ore and slag traffic due to the closure of the Arcelor Mittal mine in the state of Sonora, which represents an annual loss of two million tons of ore per year, as well as reduction in the volume of some
clients’ copper exports through Guaymas.54
Figure 2-27. Ores; Slag, and Ash Rail Exports by Rail
Source: U.S. Department of Transportation. Bureau of Transportation Statistics
54 Ferromex Annual Report. https://www.ferromex.com.mx/pdf/Informe_Anual_2016.pdf
3,000.0
4,000.0
5,000.0
6,000.0
7,000.0
2012 2013 2014 2015 2016 2017
$ M
illio
ns
-
500
1,000
1,500
2,000
2,500
2012 2013 2014 2015 2016 2017
$ M
illio
ns
Exports
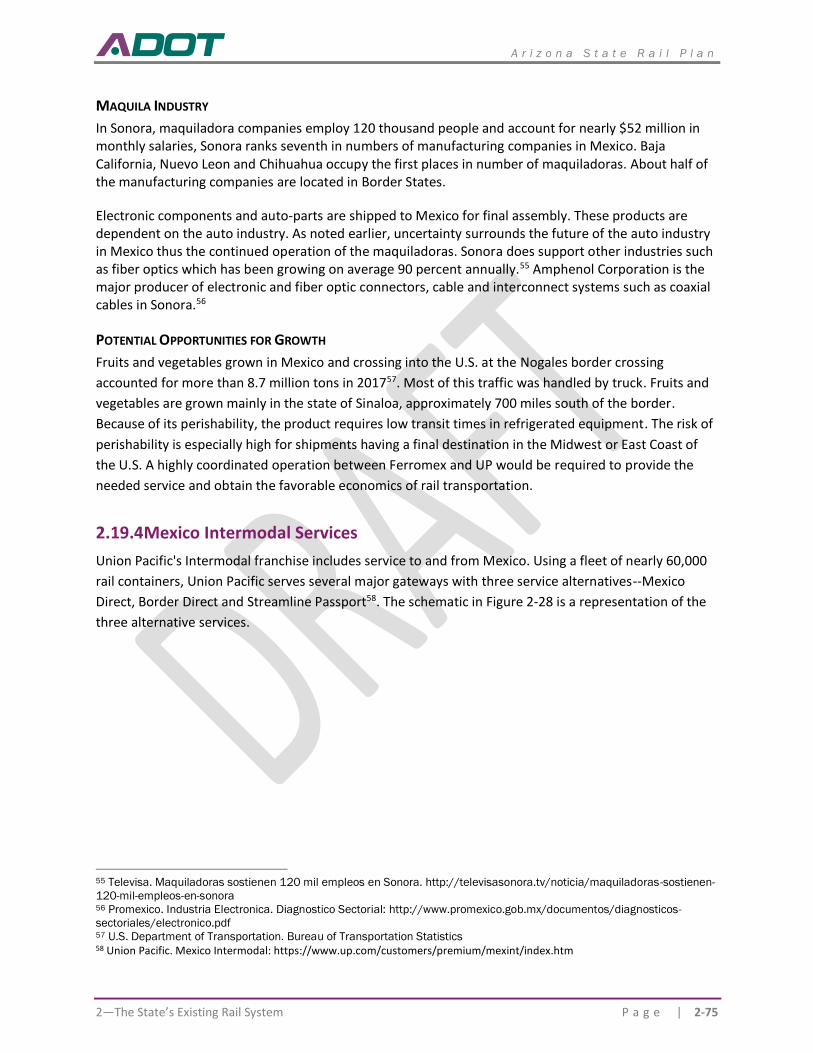
A r i z o n a S t a t e R a i l P l a n
2—The State’s Existing Rail System P a g e | 2-75
MAQUILA INDUSTRY
In Sonora, maquiladora companies employ 120 thousand people and account for nearly $52 million in monthly salaries, Sonora ranks seventh in numbers of manufacturing companies in Mexico. Baja California, Nuevo Leon and Chihuahua occupy the first places in number of maquiladoras. About half of the manufacturing companies are located in Border States.
Electronic components and auto-parts are shipped to Mexico for final assembly. These products are dependent on the auto industry. As noted earlier, uncertainty surrounds the future of the auto industry in Mexico thus the continued operation of the maquiladoras. Sonora does support other industries such as fiber optics which has been growing on average 90 percent annually.55 Amphenol Corporation is the major producer of electronic and fiber optic connectors, cable and interconnect systems such as coaxial cables in Sonora.56
POTENTIAL OPPORTUNITIES FOR GROWTH
Fruits and vegetables grown in Mexico and crossing into the U.S. at the Nogales border crossing
accounted for more than 8.7 million tons in 201757. Most of this traffic was handled by truck. Fruits and
vegetables are grown mainly in the state of Sinaloa, approximately 700 miles south of the border.
Because of its perishability, the product requires low transit times in refrigerated equipment. The risk of
perishability is especially high for shipments having a final destination in the Midwest or East Coast of
the U.S. A highly coordinated operation between Ferromex and UP would be required to provide the
needed service and obtain the favorable economics of rail transportation.
2.19.4 Mexico Intermodal Services
Union Pacific's Intermodal franchise includes service to and from Mexico. Using a fleet of nearly 60,000
rail containers, Union Pacific serves several major gateways with three service alternatives--Mexico
Direct, Border Direct and Streamline Passport58. The schematic in Figure 2-28 is a representation of the
three alternative services.
55 Televisa. Maquiladoras sostienen 120 mil empleos en Sonora. http://televisasonora.tv/noticia/maquiladoras-sostienen-
120-mil-empleos-en-sonora 56 Promexico. Industria Electronica. Diagnostico Sectorial: http://www.promexico.gob.mx/documentos/diagnosticos-
sectoriales/electronico.pdf 57 U.S. Department of Transportation. Bureau of Transportation Statistics 58 Union Pacific. Mexico Intermodal: https://www.up.com/customers/premium/mexint/index.htm
A r i z o n a S t a t e R a i l P l a n
2-76 | P a g e 2. The State’s Existing Rail System
Figure 2-28. Union Pacific Mexico Intermodal Services
Source: Union Pacific: https://www.up.com/customers/premium/mexint/index.htm
MEXICO TRUCKING INDUSTRY CHANGES
Double trailers are commonly used in Mexican main roadway network. As of June 26, 2018, double-trailer vehicles must circulate with a permit from the Secretario de Comunicaciones y Transportes (SCT); otherwise, they will be fined and put out of service. This mandate is intended to reduce accidents and will reduce available truck capacity and may spur some shippers to move more cargo by more expensive single-trailer trucks or convert cargo to intermodal rail. 59/60
Under the new regulations, truck owners must submit paperwork to the government to demonstrate that the tractor-trailers used in a double-trailer are fitted with certain features, including anti-lock brakes, a global positioning satellite system, a regulator that restricts the vehicles to 80 kilometers an hour (about 50 mph) and low emission levels. 61
Another new regulation for trucks is NOM-087 which is the regulation covering driver qualifications will make certain operators of these units have additional and special training. New Hours of Service Rules which require, among other things, a 30 minute break after 5 hours of driving and 8 hours rest after 10 hours behind the wheel if it is a solo operation are part of the new regulation.62
59 The Journal of Commerce. Mexican truck capacity concern ticks up over tractor trailer rule.
https://www.joc.com/trucking-logistics/truckload-freight/mexican-truck-capacity-concern-ticks-over-tractor-trailer-
rule_20180719.html 60 El Economista. https://www.eleconomista.com.mx/estados/Vehiculos-de-doble-remolque-deberan-circular-con-permiso-de-SCT-20180523-0112.html 61 The Journal of Commerce. Mexican truck capacity concern ticks up over tractor trailer rule.
https://www.joc.com/trucking-logistics/truckload-freight/mexican-truck-capacity-concern-ticks-over-tractor-trailer-
rule_20180719.html 62 Mexico Trucker. Mexico Announces New Rules for Double Trailers http://www.mexicotrucker.com/mexico-announces-
new-rules-double-trailers/
A r i z o n a S t a t e R a i l P l a n
3—Passenger Rail Transportation Needs, Opportunities, and Investments P a g e | 3-1
Passenger Rail Transportation Needs, Opportunities, and Investments
PASSENGER NEEDS-STATE RAIL PLAN SURVEY
The on-line survey conducted for the state rail plan showed a strong interest by the general public in
improved intercity passenger rail service. About a quarter of the participants indicated that they used
Amtrak at some time doing so principally because they found it enjoyable and affordable. The survey
also asked what would encourage greater use of Amtrak, or for those who have not ridden the train,
what would cause them to use the train. Following are the key improvements suggested by the
participants to encourage further intercity rail travel in Arizona:
New Amtrak Routes (47 percent of respondents): the existence of only two routes seems to hinder the
use of intercity passenger rail in the state. Not unexpectedly, the preponderant location to be served to
be served by any new routes was identified as Phoenix with high interest in a route to Tucson and a
route to Flagstaff.
New Station Locations on Existing Routes (30 percent): additional stations on existing routes was
identified as the second most important factor attracting additional ridership on intercity trains.
Suggestions on locations were minimal, however, Casa Grande was mentioned by a few respondents.
Improving Speeds of Existing Services (26 percent): using Tucson to Los Angeles and Flagstaff to Los
Angeles as examples, the scheduled average train speed for the former is 46.7 mph and 49.2 mph for
the latter.
Improved Schedules (25 percent): the eastbound services of the two Amtrak routes in Arizona travel at
night making their use inconvenient for many travelers
More Frequent Trains (25 percent): the current single train per day for the Southwest Chief and the
thrice weekly Sunset Limited service proves to be a barrier to expanded use.
Regarding individual comments, the lack of service at Phoenix was a noticeable perceived barrier.
Factors such as station condition and amenities, safety, and interestingly, on-time performance were
not indicated as needing improvement to attract travelers to using intercity passenger rail in Arizona.
Several passenger rail studies have been conducted identifying passenger rail needs in Arizona and the
region. Summaries of the three key studies follow.
INTERCITY RAIL SERVICE: SOUTHWEST MULTI-STATE RAIL PLANNING STUDY
3.2.1 Multi-State Rail Plans
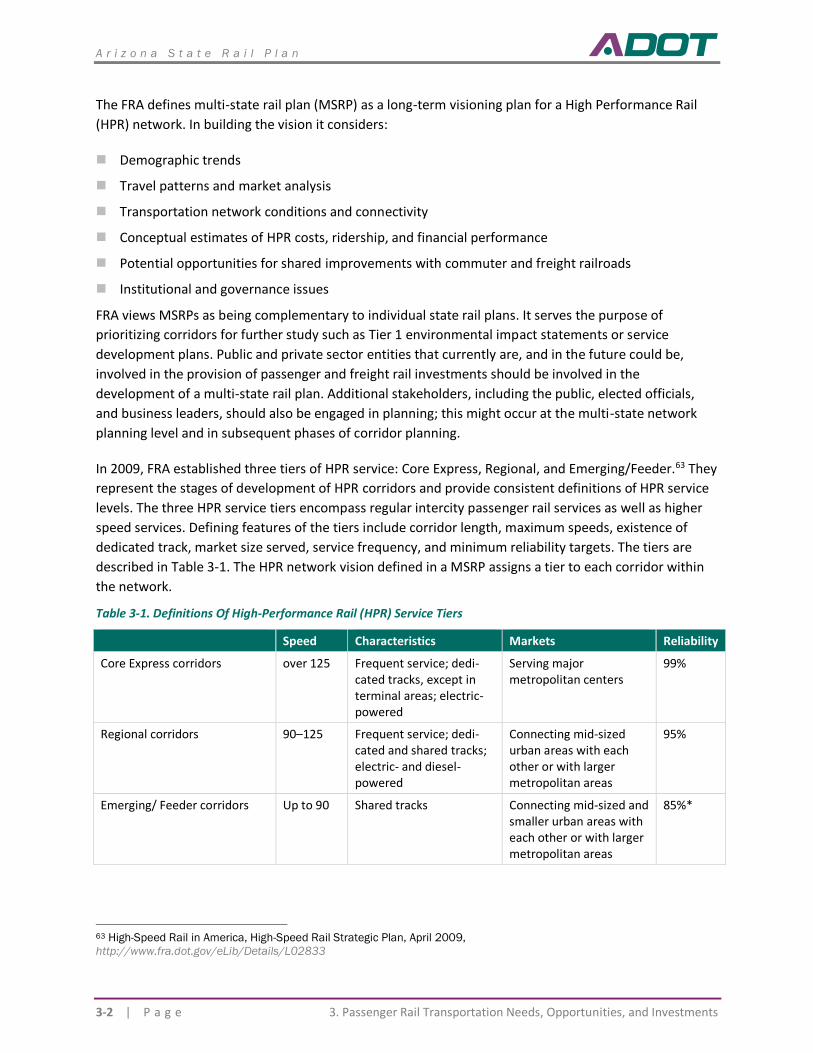
A r i z o n a S t a t e R a i l P l a n
3-2 | P a g e 3. Passenger Rail Transportation Needs, Opportunities, and Investments
The FRA defines multi-state rail plan (MSRP) as a long-term visioning plan for a High Performance Rail
(HPR) network. In building the vision it considers:
◼ Demographic trends
◼ Travel patterns and market analysis
◼ Transportation network conditions and connectivity
◼ Conceptual estimates of HPR costs, ridership, and financial performance
◼ Potential opportunities for shared improvements with commuter and freight railroads
◼ Institutional and governance issues
FRA views MSRPs as being complementary to individual state rail plans. It serves the purpose of
prioritizing corridors for further study such as Tier 1 environmental impact statements or service
development plans. Public and private sector entities that currently are, and in the future could be,
involved in the provision of passenger and freight rail investments should be involved in the
development of a multi-state rail plan. Additional stakeholders, including the public, elected officials,
and business leaders, should also be engaged in planning; this might occur at the multi-state network
planning level and in subsequent phases of corridor planning.
In 2009, FRA established three tiers of HPR service: Core Express, Regional, and Emerging/Feeder.63 They
represent the stages of development of HPR corridors and provide consistent definitions of HPR service
levels. The three HPR service tiers encompass regular intercity passenger rail services as well as higher
speed services. Defining features of the tiers include corridor length, maximum speeds, existence of
dedicated track, market size served, service frequency, and minimum reliability targets. The tiers are
described in Table 3-1. The HPR network vision defined in a MSRP assigns a tier to each corridor within
the network.
Table 3-1. Definitions Of High-Performance Rail (HPR) Service Tiers
Speed Characteristics Markets Reliability
Core Express corridors over 125 Frequent service; dedi-cated tracks, except in terminal areas; electric-powered
Serving major metropolitan centers
99%
Regional corridors 90–125 Frequent service; dedi-cated and shared tracks; electric- and diesel-powered
Connecting mid-sized urban areas with each other or with larger metropolitan areas
95%
Emerging/ Feeder corridors Up to 90 Shared tracks Connecting mid-sized and smaller urban areas with each other or with larger metropolitan areas
85%*
63 High-Speed Rail in America, High-Speed Rail Strategic Plan, April 2009,
http://www.fra.dot.gov/eLib/Details/L02833
A r i z o n a S t a t e R a i l P l a n
3—Passenger Rail Transportation Needs, Opportunities, and Investments P a g e | 3-3
3.2.2 Southwest MSRP
In September 2014, the FRA in collaboration with 19 stakeholders published the Southwest Multi-State
Rail Planning Study.64 The Southwest Study was the first of several MSRPs. Others focused on the
Midwest and Southeast. It had two primary purposes:
◼ Identify potential multi-state network of “candidate corridors” for further evaluation and planning,
utilizing a new sketch-planning network planning tool
◼ Identify institutional challenges and opportunities related to multi-state rail development and
delivery
3.2.3 Background
The study area comprises the states of Arizona, California, and Nevada. The study area encompassed
three of the nation’s 11 megaregions—northern California, Southern California, and the Arizona Sun
Corridor. With multiple metropolitan areas located in corridors of 100 to 600 miles, ideal for passenger
rail service.
The area also contains some of the regions of highest population growth in the US, with Nevada and
Arizona the two fastest-growing states in the country between 2000 and 2010. In addition, California
continues to be the most populous state in the country. The area’s population is highly concentrated
with roughly 94 percent of the area’s population located in urbanized areas representing only three
percent of the total land area in the three states.
With a combined gross domestic product of $2.3 trillion, the three states account for 15.7 percent of the
total us economy. If the three states were a country, they would be the sixth largest economy in the
world, similar to the United Kingdom and 40 percent larger than Canada. The study area is the largest
economy in the world without adequate passenger rail service.
With the expected significant population growth in the three-state region, particularly in the
metropolitan areas, there is a high potential for significant demand for intercity travel between 2010
and 2050. The growth is expected to be as large as 70 percent within the study area with considerable
concentration of travel among major metropolitan areas. Trips between just six urban areas account for
44 percent of all intercity travel between 50 and 800 miles. Given expected economic development, this
pattern is expected to continue into the future.
Motor vehicle is the main mode for intercity travel in the Southwest, accounting for 82 percent of
passenger trips in the region followed by air at 16 percent, and rail at 2 percent. Due to faster growth
expected for air, air travel is expected to gain a larger share of the intercity market in the absence of
new rail investments. Intercity travel within the region is forecast to increase nearly 70 percent between
2010 and 2050, from 162 million to 273 million trips per year. Annual airline trips are expected to
increase more than 300 percent from 27 million in 2010 to 84 million by 2050. Motor vehicle trips are
64 Arizona stakeholders: ADOT, Flagstaff Metropolitan Planning Organization, Maricopa Association of Governments
A r i z o n a S t a t e R a i l P l a n
3-4 | P a g e 3. Passenger Rail Transportation Needs, Opportunities, and Investments
projected to grow 42 percent.65 Absent any new investment, annual trips by rail are anticipated to
continue to comprise a relatively small share of intercity travel overall.
Following are Arizona corridor profiles excerpted from the study.
65 All travel demand figures presented in this report are for intercity trips between 50 and 800 miles. Trips less than
50 miles generally are not considered intercity travel and rail is typically not time-competitive with air on distances greater
than 800 miles.
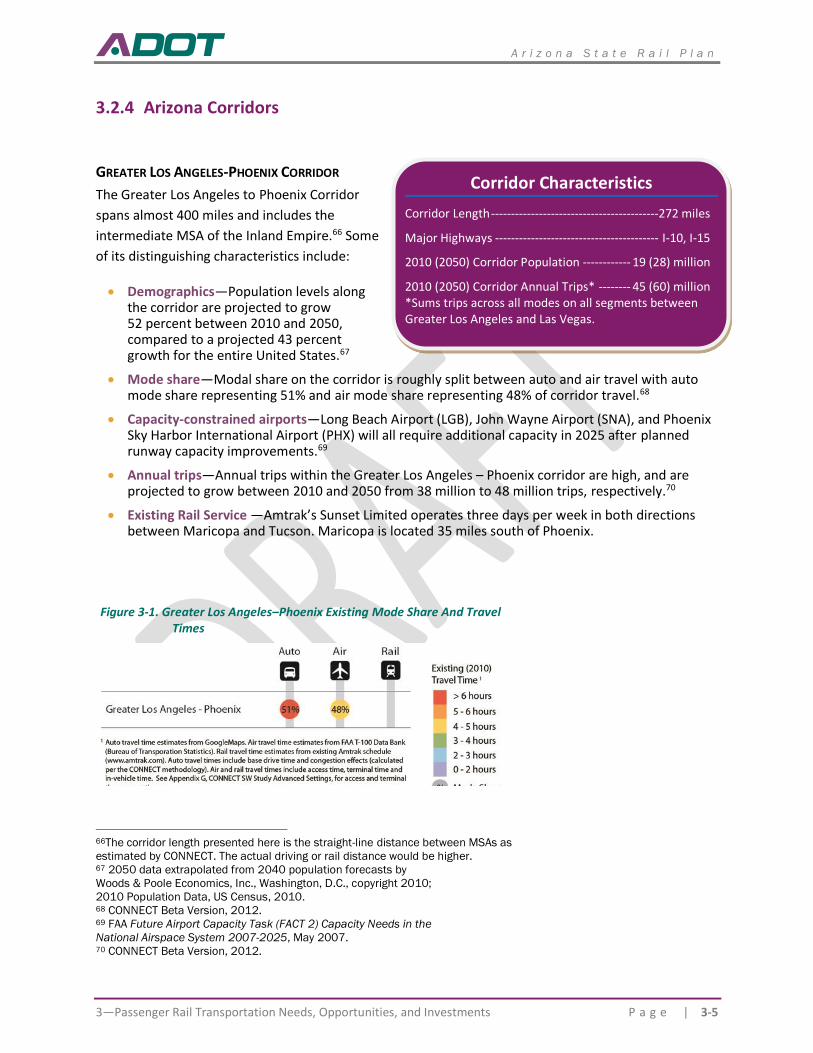
A r i z o n a S t a t e R a i l P l a n
3—Passenger Rail Transportation Needs, Opportunities, and Investments P a g e | 3-5
3.2.4 Arizona Corridors
GREATER LOS ANGELES-PHOENIX CORRIDOR
The Greater Los Angeles to Phoenix Corridor
spans almost 400 miles and includes the
intermediate MSA of the Inland Empire.66 Some
of its distinguishing characteristics include:
• Demographics—Population levels along the corridor are projected to grow 52 percent between 2010 and 2050, compared to a projected 43 percent growth for the entire United States.67
• Mode share—Modal share on the corridor is roughly split between auto and air travel with auto mode share representing 51% and air mode share representing 48% of corridor travel.68
• Capacity-constrained airports—Long Beach Airport (LGB), John Wayne Airport (SNA), and Phoenix Sky Harbor International Airport (PHX) will all require additional capacity in 2025 after planned runway capacity improvements.69
• Annual trips—Annual trips within the Greater Los Angeles – Phoenix corridor are high, and are projected to grow between 2010 and 2050 from 38 million to 48 million trips, respectively.70
• Existing Rail Service —Amtrak’s Sunset Limited operates three days per week in both directions between Maricopa and Tucson. Maricopa is located 35 miles south of Phoenix.
66The corridor length presented here is the straight-line distance between MSAs as
estimated by CONNECT. The actual driving or rail distance would be higher. 67 2050 data extrapolated from 2040 population forecasts by
Woods & Poole Economics, Inc., Washington, D.C., copyright 2010;
2010 Population Data, US Census, 2010. 68 CONNECT Beta Version, 2012. 69 FAA Future Airport Capacity Task (FACT 2) Capacity Needs in the
National Airspace System 2007-2025, May 2007. 70 CONNECT Beta Version, 2012.
Figure 3-1. Greater Los Angeles–Phoenix Existing Mode Share And Travel Times
Corridor Characteristics
Corridor Length ------------------------------------------272 miles
Major Highways ----------------------------------------- I-10, I-15
2010 (2050) Corridor Population ------------ 19 (28) million
2010 (2050) Corridor Annual Trips* -------- 45 (60) million *Sums trips across all modes on all segments between Greater Los Angeles and Las Vegas.
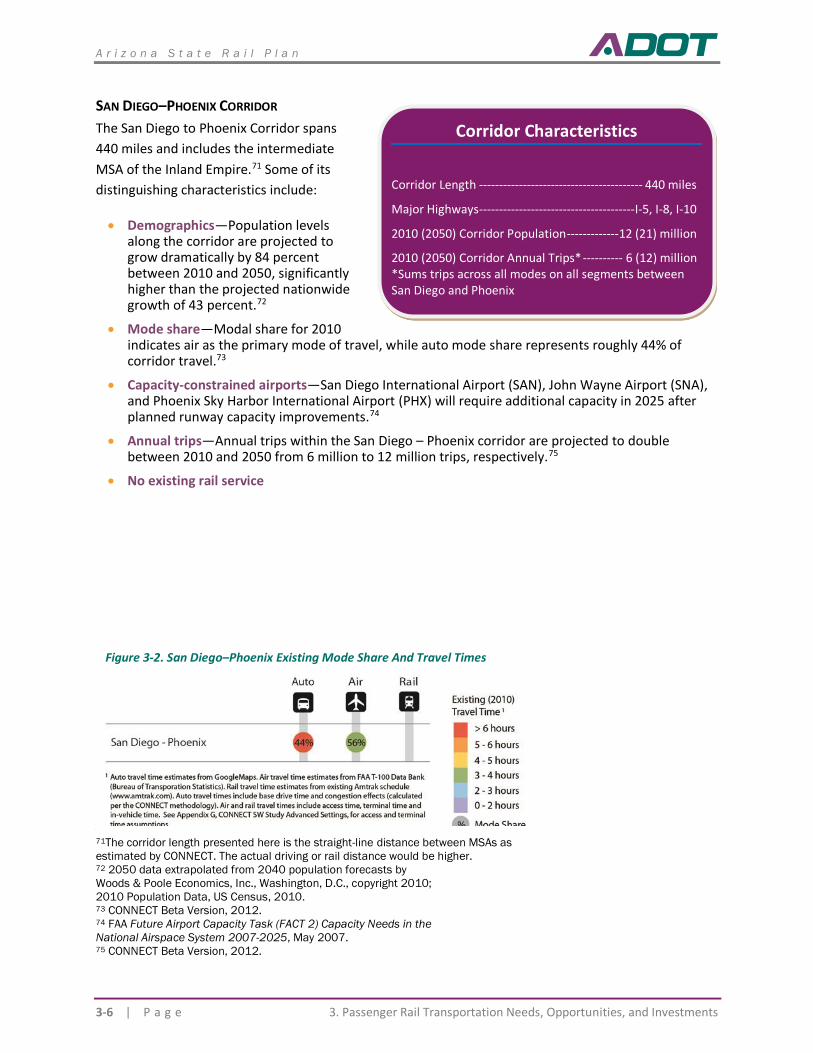
A r i z o n a S t a t e R a i l P l a n
3-6 | P a g e 3. Passenger Rail Transportation Needs, Opportunities, and Investments
SAN DIEGO–PHOENIX CORRIDOR
The San Diego to Phoenix Corridor spans
440 miles and includes the intermediate
MSA of the Inland Empire.71 Some of its
distinguishing characteristics include:
• Demographics—Population levels along the corridor are projected to grow dramatically by 84 percent between 2010 and 2050, significantly higher than the projected nationwide growth of 43 percent.72
• Mode share—Modal share for 2010 indicates air as the primary mode of travel, while auto mode share represents roughly 44% of corridor travel.73
• Capacity-constrained airports—San Diego International Airport (SAN), John Wayne Airport (SNA), and Phoenix Sky Harbor International Airport (PHX) will require additional capacity in 2025 after planned runway capacity improvements.74
• Annual trips—Annual trips within the San Diego – Phoenix corridor are projected to double between 2010 and 2050 from 6 million to 12 million trips, respectively.75
• No existing rail service
71The corridor length presented here is the straight-line distance between MSAs as
estimated by CONNECT. The actual driving or rail distance would be higher. 72 2050 data extrapolated from 2040 population forecasts by
Woods & Poole Economics, Inc., Washington, D.C., copyright 2010;
2010 Population Data, US Census, 2010. 73 CONNECT Beta Version, 2012. 74 FAA Future Airport Capacity Task (FACT 2) Capacity Needs in the
National Airspace System 2007-2025, May 2007. 75 CONNECT Beta Version, 2012.
Corridor Characteristics
Corridor Length ----------------------------------------- 440 miles
Major Highways --------------------------------------- I-5, I-8, I-10
2010 (2050) Corridor Population ------------- 12 (21) million
2010 (2050) Corridor Annual Trips* ---------- 6 (12) million *Sums trips across all modes on all segments between San Diego and Phoenix
Figure 3-2. San Diego–Phoenix Existing Mode Share And Travel Times
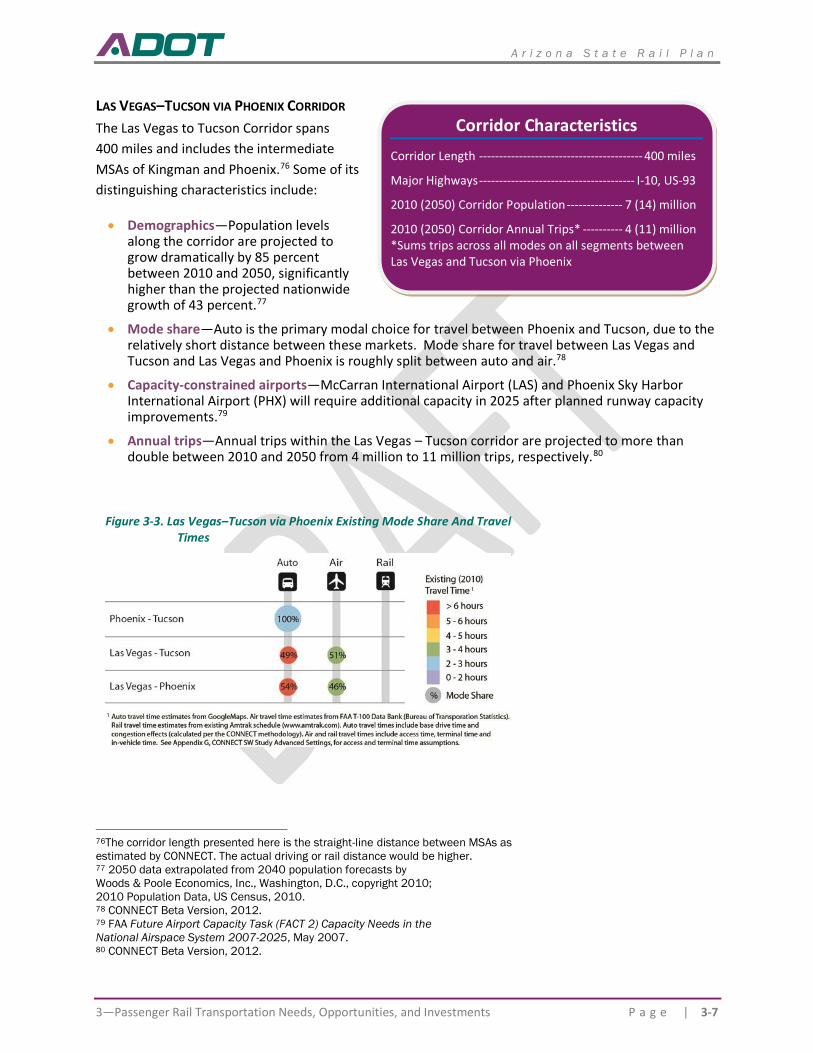
A r i z o n a S t a t e R a i l P l a n
3—Passenger Rail Transportation Needs, Opportunities, and Investments P a g e | 3-7
LAS VEGAS–TUCSON VIA PHOENIX CORRIDOR
The Las Vegas to Tucson Corridor spans
400 miles and includes the intermediate
MSAs of Kingman and Phoenix.76 Some of its
distinguishing characteristics include:
• Demographics—Population levels along the corridor are projected to grow dramatically by 85 percent between 2010 and 2050, significantly higher than the projected nationwide growth of 43 percent.77
• Mode share—Auto is the primary modal choice for travel between Phoenix and Tucson, due to the relatively short distance between these markets. Mode share for travel between Las Vegas and Tucson and Las Vegas and Phoenix is roughly split between auto and air.78
• Capacity-constrained airports—McCarran International Airport (LAS) and Phoenix Sky Harbor International Airport (PHX) will require additional capacity in 2025 after planned runway capacity improvements.79
• Annual trips—Annual trips within the Las Vegas – Tucson corridor are projected to more than double between 2010 and 2050 from 4 million to 11 million trips, respectively.80
76The corridor length presented here is the straight-line distance between MSAs as
estimated by CONNECT. The actual driving or rail distance would be higher. 77 2050 data extrapolated from 2040 population forecasts by
Woods & Poole Economics, Inc., Washington, D.C., copyright 2010;
2010 Population Data, US Census, 2010. 78 CONNECT Beta Version, 2012. 79 FAA Future Airport Capacity Task (FACT 2) Capacity Needs in the
National Airspace System 2007-2025, May 2007. 80 CONNECT Beta Version, 2012.
Corridor Characteristics
Corridor Length ----------------------------------------- 400 miles
Major Highways --------------------------------------- I-10, US-93
2010 (2050) Corridor Population -------------- 7 (14) million
2010 (2050) Corridor Annual Trips* ---------- 4 (11) million *Sums trips across all modes on all segments between Las Vegas and Tucson via Phoenix
Figure 3-3. Las Vegas–Tucson via Phoenix Existing Mode Share And Travel Times
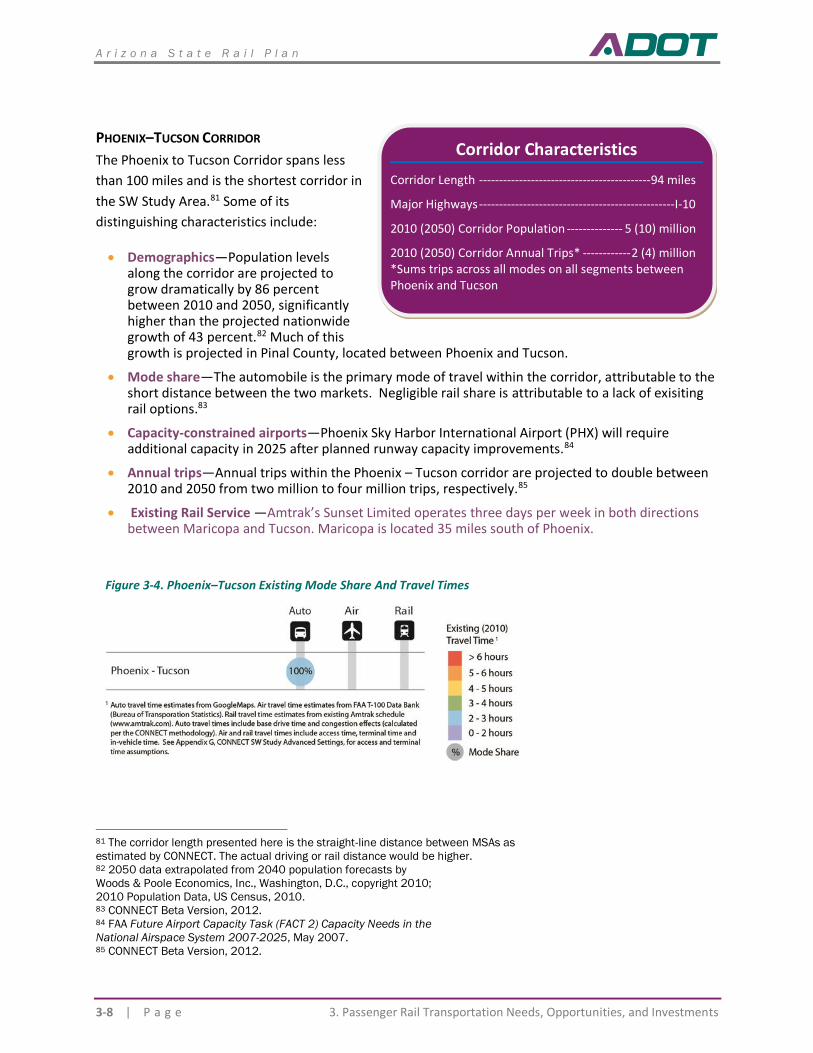
A r i z o n a S t a t e R a i l P l a n
3-8 | P a g e 3. Passenger Rail Transportation Needs, Opportunities, and Investments
PHOENIX–TUCSON CORRIDOR
The Phoenix to Tucson Corridor spans less
than 100 miles and is the shortest corridor in
the SW Study Area.81 Some of its
distinguishing characteristics include:
• Demographics—Population levels along the corridor are projected to grow dramatically by 86 percent between 2010 and 2050, significantly higher than the projected nationwide growth of 43 percent.82 Much of this growth is projected in Pinal County, located between Phoenix and Tucson.
• Mode share—The automobile is the primary mode of travel within the corridor, attributable to the short distance between the two markets. Negligible rail share is attributable to a lack of exisiting rail options.83
• Capacity-constrained airports—Phoenix Sky Harbor International Airport (PHX) will require additional capacity in 2025 after planned runway capacity improvements.84
• Annual trips—Annual trips within the Phoenix – Tucson corridor are projected to double between 2010 and 2050 from two million to four million trips, respectively.85
• Existing Rail Service —Amtrak’s Sunset Limited operates three days per week in both directions between Maricopa and Tucson. Maricopa is located 35 miles south of Phoenix.
81 The corridor length presented here is the straight-line distance between MSAs as
estimated by CONNECT. The actual driving or rail distance would be higher. 82 2050 data extrapolated from 2040 population forecasts by
Woods & Poole Economics, Inc., Washington, D.C., copyright 2010;
2010 Population Data, US Census, 2010. 83 CONNECT Beta Version, 2012. 84 FAA Future Airport Capacity Task (FACT 2) Capacity Needs in the
National Airspace System 2007-2025, May 2007. 85 CONNECT Beta Version, 2012.
Corridor Characteristics
Corridor Length ------------------------------------------- 94 miles
Major Highways ------------------------------------------------- I-10
2010 (2050) Corridor Population -------------- 5 (10) million
2010 (2050) Corridor Annual Trips* ------------ 2 (4) million *Sums trips across all modes on all segments between Phoenix and Tucson
Figure 3-4. Phoenix–Tucson Existing Mode Share And Travel Times
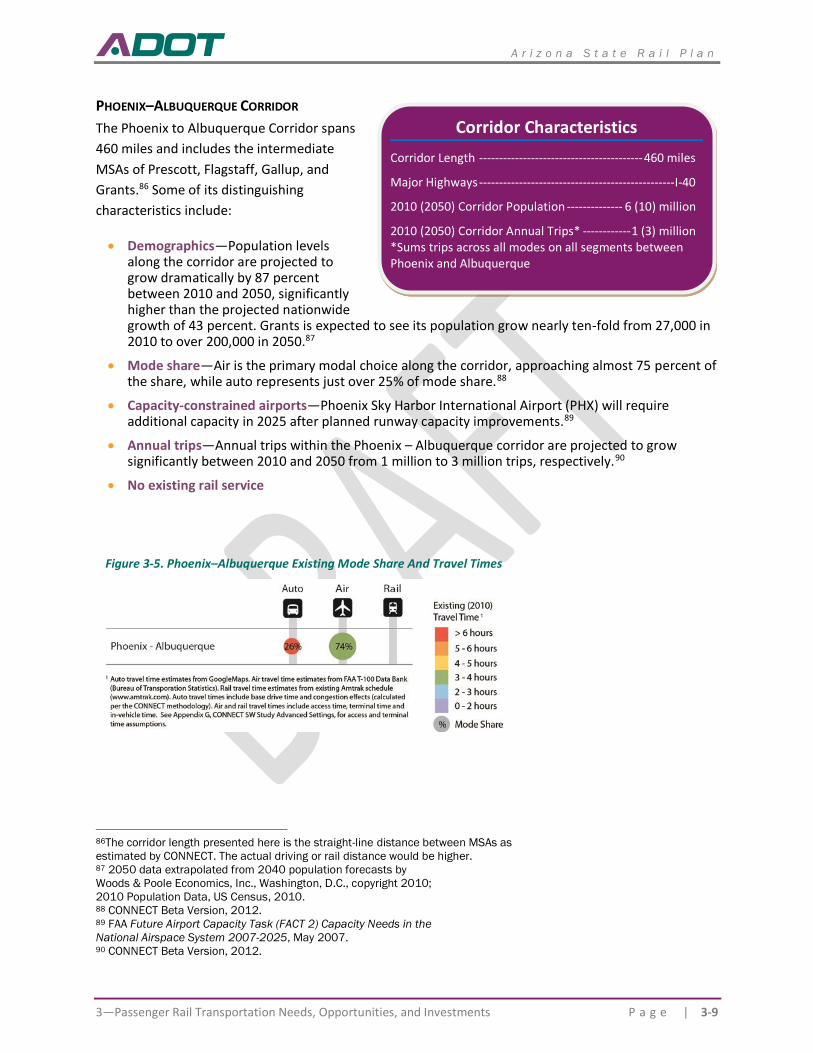
A r i z o n a S t a t e R a i l P l a n
3—Passenger Rail Transportation Needs, Opportunities, and Investments P a g e | 3-9
Corridor Characteristics
Corridor Length ----------------------------------------- 460 miles
Major Highways ------------------------------------------------- I-40
2010 (2050) Corridor Population -------------- 6 (10) million
2010 (2050) Corridor Annual Trips* ------------ 1 (3) million *Sums trips across all modes on all segments between Phoenix and Albuquerque
PHOENIX–ALBUQUERQUE CORRIDOR
The Phoenix to Albuquerque Corridor spans
460 miles and includes the intermediate
MSAs of Prescott, Flagstaff, Gallup, and
Grants.86 Some of its distinguishing
characteristics include:
• Demographics—Population levels along the corridor are projected to grow dramatically by 87 percent between 2010 and 2050, significantly higher than the projected nationwide growth of 43 percent. Grants is expected to see its population grow nearly ten-fold from 27,000 in 2010 to over 200,000 in 2050.87
• Mode share—Air is the primary modal choice along the corridor, approaching almost 75 percent of the share, while auto represents just over 25% of mode share.88
• Capacity-constrained airports—Phoenix Sky Harbor International Airport (PHX) will require additional capacity in 2025 after planned runway capacity improvements.89
• Annual trips—Annual trips within the Phoenix – Albuquerque corridor are projected to grow significantly between 2010 and 2050 from 1 million to 3 million trips, respectively.90
• No existing rail service
86The corridor length presented here is the straight-line distance between MSAs as
estimated by CONNECT. The actual driving or rail distance would be higher. 87 2050 data extrapolated from 2040 population forecasts by
Woods & Poole Economics, Inc., Washington, D.C., copyright 2010;
2010 Population Data, US Census, 2010. 88 CONNECT Beta Version, 2012. 89 FAA Future Airport Capacity Task (FACT 2) Capacity Needs in the
National Airspace System 2007-2025, May 2007. 90 CONNECT Beta Version, 2012.
Figure 3-5. Phoenix–Albuquerque Existing Mode Share And Travel Times
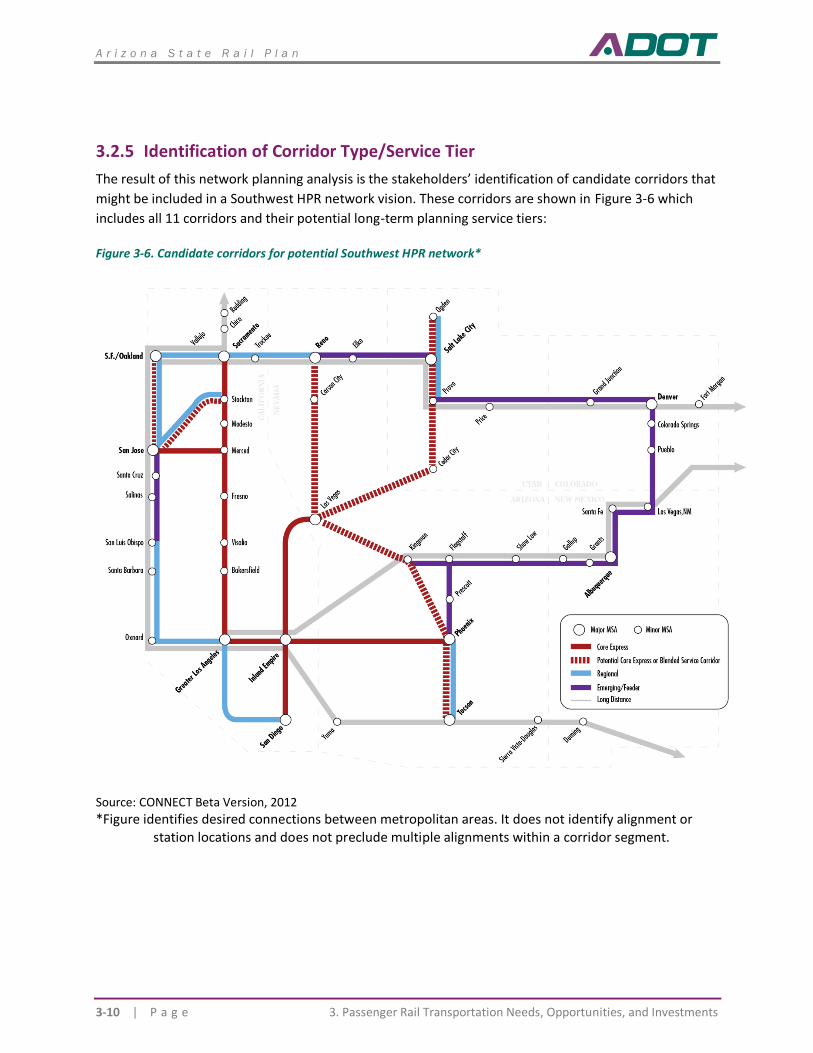
A r i z o n a S t a t e R a i l P l a n
3-10 | P a g e 3. Passenger Rail Transportation Needs, Opportunities, and Investments
3.2.5 Identification of Corridor Type/Service Tier
The result of this network planning analysis is the stakeholders’ identification of candidate corridors that
might be included in a Southwest HPR network vision. These corridors are shown in Figure 3-6 which
includes all 11 corridors and their potential long-term planning service tiers:
Figure 3-6. Candidate corridors for potential Southwest HPR network*
Source: CONNECT Beta Version, 2012
*Figure identifies desired connections between metropolitan areas. It does not identify alignment or station locations and does not preclude multiple alignments within a corridor segment.
A r i z o n a S t a t e R a i l P l a n
3—Passenger Rail Transportation Needs, Opportunities, and Investments P a g e | 3-11
Arizona’s corridors in the study fall into each of the service tiers. The Greater Los Angeles-Phoenix
Corridor and the Las Vegas-Tucson-Phoenix Corridor are considered candidates for Core Express service
while the Tucson-Phoenix Corridor itself is considered a potential regional candidate corridor. The
Emerging/Feeder category includes the Phoenix Albuquerque corridor.
KEY FINDINGS
Key findings of the study are as follows:91
Finding #1—The Southwest network would provide rail access92 to more than 92 percent of all
Californians, Nevadans, and Arizonans. Existing long-distance trains provide service to additional
markets.
Finding #2—Connections to Los Angeles enable significantly improved performance for many corridors.
The Southwest network would allow more than 85 percent of Californians, Nevadans, and Arizonans to
reach Los Angeles in less than four hours on rail.
Finding #3—More than 60 percent of the travel markets within 800 miles would use CHSR or Los
Angeles–Las Vegas infrastructure.
Finding #4—The performance of every corridor included in the Southwest network improves in the
network context.93
Finding #5—The Southwest network is far greater than the sum of its parts. Connections open up new
markets, resulting in up to 50 percent higher network ridership. Efficiencies also lead to capital and
O&M cost savings.
Finding #6—The Inland Empire is potentially a large interstate rail hub, connecting the major markets of
Phoenix, Las Vegas, San Diego, Los Angeles, the Central Valley, and Northern California.
Finding #7—There is a strong case to connect Phoenix with Los Angeles and San Diego via the Inland
Empire. There are economies of scale to be gained by a unified connection between Phoenix and these
two major markets in Southern California.
Finding #8—The case for the San Diego–Inland Empire segment is considerably strengthened in the
context of the multi-state network. Planning for this segment should account for future service to Las
Vegas and Phoenix in addition to California destinations. Connections to Las Vegas may also provide the
opportunity for direct service to Las Vegas and Northern California without the added distance of
traveling through downtown Los Angeles.
Finding #9—Most of the Phoenix–Las Vegas market could be captured with air competitive travel time
(3 ½ hours on Core Express) and more frequent service on a route through the Inland Empire.
91 The role of long-distance Amtrak service has not been considered in this analysis. 92 Rail access is defined as people living within an MSA with at least one station stop. 93 This statement does not imply every potential corridor would always improve in the network context, but rather that the
performance improved for each of the Southwest corridors tested.
A r i z o n a S t a t e R a i l P l a n
3-12 | P a g e 3. Passenger Rail Transportation Needs, Opportunities, and Investments
Finding #10—Las Vegas–Reno and Las Vegas–Salt Lake City have potential to develop into Core Express
corridors after other key parts of the Southwest network are in place. A direct Core Express link between
Las Vegas–Phoenix might also be considered in the future if there is a compelling capacity or market
justification in the context of the full Southwest network.
Finding #11—The Southwest network could alleviate future demand for the air system by 2050,
equivalent to the amount of traffic currently served by two LAX airports, 10 John Wayne airports, or 20
Ontario airports.94
TUCSON-PHOENIX CORRIDOR PASSENGER RAIL SERVICE: INTERCITY/REGIONAL RAIL SERVICE PATTERNS
3.3.1 Tucson-Phoenix Corridor Alternatives
Travel demand in the Tucson-Phoenix corridor is expected to continue expanding in the future. Expected
growth in population and economic development will contribute to the need for increased commuter
and intercity mobility within the corridor, while the ability to increase the capacity of the region’s
roadway network is limited. With the continuing development of western Pinal County, an unacceptable
congestion-related increase in travel times is anticipated to occur. Travel between Tucson and Phoenix
along I-10 is affected by increasing congestion. Adding lanes to I-10 (which cannot be done in some
sections) will not solve the congestion problem in the long run. Passenger rail service in the corridor
would provide both high capacity intercity and commuter transit service. ADOT identified several
purposes that a passenger rail service would serve in the corridor:
◼ Provide transportation alternatives to the automobile and reduce the congestion growth rate
◼ Increase access to existing and planned employment and activity centers
◼ Support reliable travel times and safe travel in an increasingly congested region that currently
affords few transportation alternatives to the automobile
◼ Connect the suburban and rural areas between Tucson and Phoenix
◼ Facilitate continued development of a comprehensive, multimodal, and interconnected regional and
multi-regional transportation network that provides mobility choices for existing and future needs
and allows connectivity to systems beyond the Tucson-Phoenix corridor
To address the need for improved mobility in the corridor, ADOT identified seven conceptual
alternatives that proved to be most effective in meeting the Tucson-Phoenix region’s transportation
needs based on service, travel times, generalized costs based on distance, accessibility, and potential
environmental effects. All conceptual alternatives followed existing or planned transportation routes, so
construction would occur on already developed or planned to be developed land, thus eliminating
environmental disruptions. The alternatives, along with their ADOT designated color codes, were:
◼ Blue – BRT alternative along I-10 in dedicated lanes
94 Based on CONNECT Beta estimate that 38 to 48 million passengers per year would choose rail instead of air in 2050 if
the rail network were implemented, equating to approximately 1,200 flights/day assuming 100 passengers/fight.
A r i z o n a S t a t e R a i l P l a n
3—Passenger Rail Transportation Needs, Opportunities, and Investments P a g e | 3-13
◼ Green – Rail alternative connecting Tucson and Phoenix along I-10 and the UPRR Tempe Branch
◼ Orange – Rail alternative along I-10, the planned North-South Corridor, a designated transit corridor
in the proposed Superstition Vistas master-planned community, and the US 60 Superstition Freeway
◼ Teal – Rail alternative along I-10, the planned North-South Corridor, the UPRR Phoenix Subdivision’s
Southeast Branch, and Rittenhouse Road
◼ Yellow – Rail alternative entirely along UPRR right of way or track, including the Phoenix
Subdivision’s Southeast Branch
◼ Purple – Rail alternative along I-10 from Tucson, turning north through the Gila River Indian
Community north of Casa Grande to join the UPRR Chandler Branch into Phoenix
◼ Red – Rail alternative along I-10 from Tucson continuing along the Maricopa-Casagrande Highway
into the City of Maricopa, then following State Route (SR) 347 to the UPRR Tempe Branch into
Phoenix
A Tier 1 Environmental Impact Statement was developed to determine potential environmental impacts
of service in the corridor. Each of the alternatives were screened for “fatal flaws” with two of the
alternatives, Orange and Yellow, selected for further evaluation. The subsequent analysis determined
the Yellow Alternative to be preferred.
The Yellow Corridor Alternative is shown in Figure 3-7. This alternative is a one-mile-wide corridor that
would follow the I-10 ROW between Tucson and Eloy and then follow the UPRR rail line between the
City of Eloy and downtown Phoenix. Optional routes occur in Tempe and Pinal County.
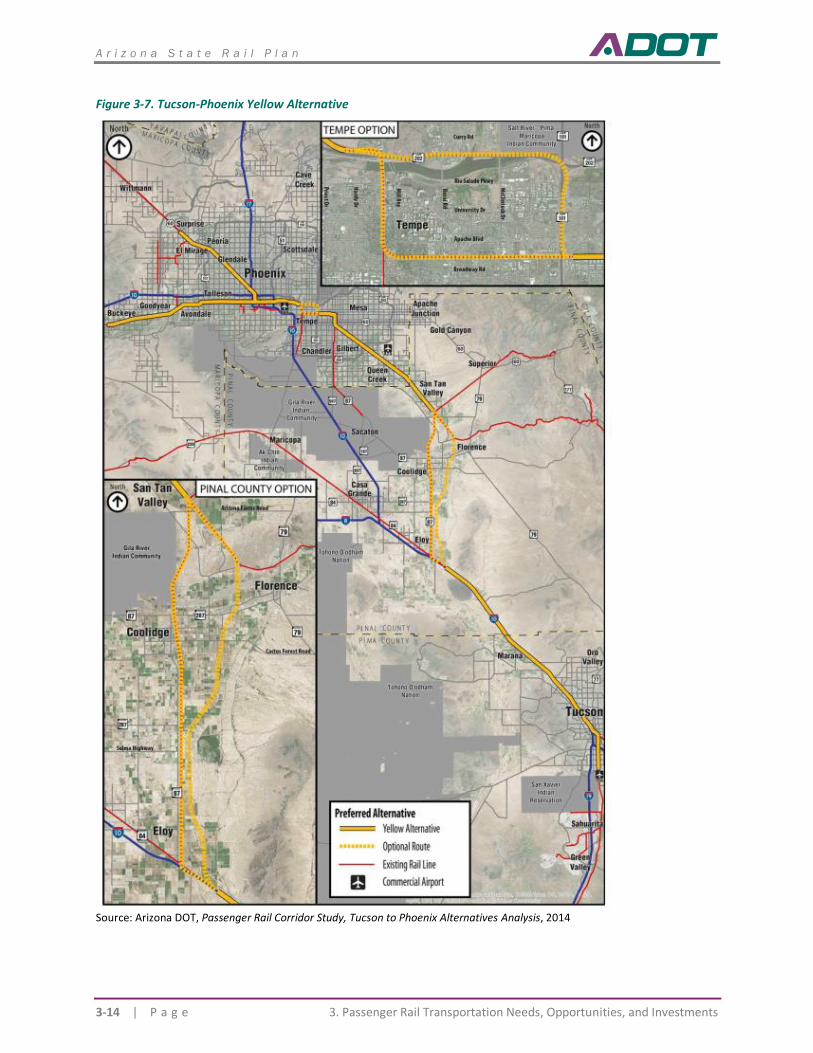
A r i z o n a S t a t e R a i l P l a n
3-14 | P a g e 3. Passenger Rail Transportation Needs, Opportunities, and Investments
Figure 3-7. Tucson-Phoenix Yellow Alternative
Source: Arizona DOT, Passenger Rail Corridor Study, Tucson to Phoenix Alternatives Analysis, 2014
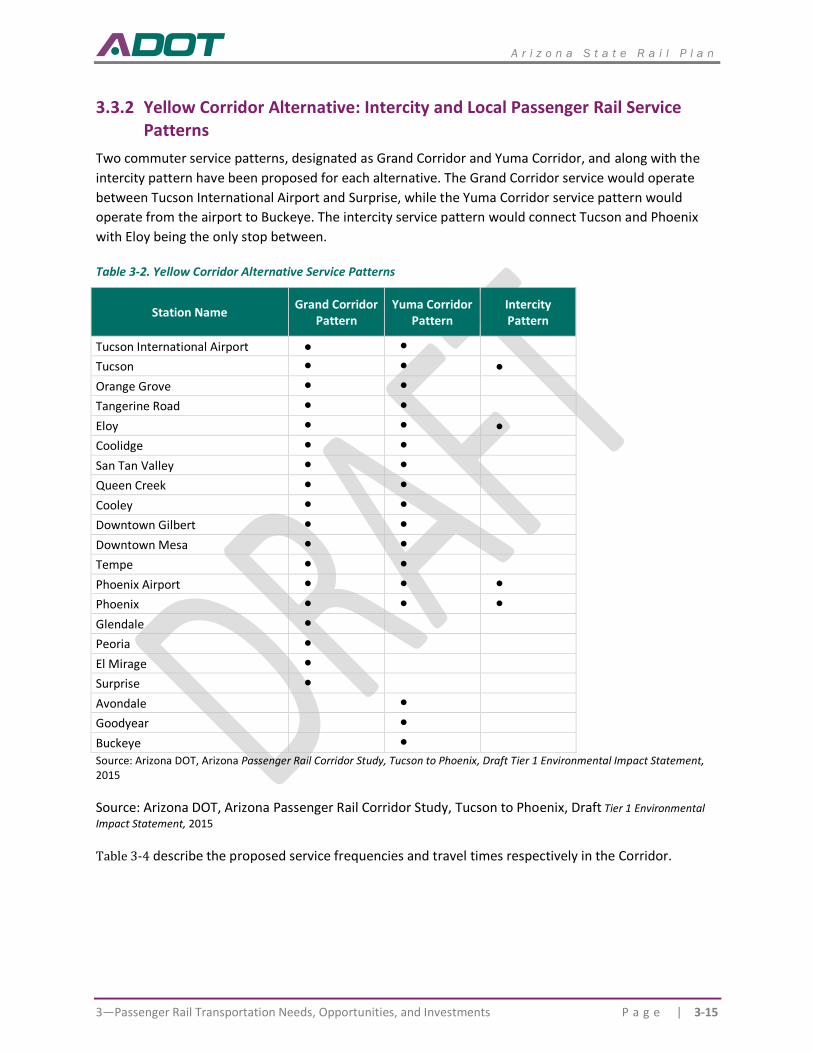
A r i z o n a S t a t e R a i l P l a n
3—Passenger Rail Transportation Needs, Opportunities, and Investments P a g e | 3-15
3.3.2 Yellow Corridor Alternative: Intercity and Local Passenger Rail Service Patterns
Two commuter service patterns, designated as Grand Corridor and Yuma Corridor, and along with the
intercity pattern have been proposed for each alternative. The Grand Corridor service would operate
between Tucson International Airport and Surprise, while the Yuma Corridor service pattern would
operate from the airport to Buckeye. The intercity service pattern would connect Tucson and Phoenix
with Eloy being the only stop between.
Table 3-2. Yellow Corridor Alternative Service Patterns
Station Name Grand Corridor
Pattern Yuma Corridor
Pattern Intercity Pattern
Tucson International Airport ● ●
Tucson ● ● ●
Orange Grove ● ●
Tangerine Road ● ●
Eloy ● ● ●
Coolidge ● ●
San Tan Valley ● ●
Queen Creek ● ●
Cooley ● ●
Downtown Gilbert ● ●
Downtown Mesa ● ●
Tempe ● ●
Phoenix Airport ● ● ●
Phoenix ● ● ●
Glendale ●
Peoria ●
El Mirage ●
Surprise ●
Avondale ●
Goodyear ●
Buckeye ●
Source: Arizona DOT, Arizona Passenger Rail Corridor Study, Tucson to Phoenix, Draft Tier 1 Environmental Impact Statement, 2015
Source: Arizona DOT, Arizona Passenger Rail Corridor Study, Tucson to Phoenix, Draft Tier 1 Environmental
Impact Statement, 2015
Table 3-4 describe the proposed service frequencies and travel times respectively in the Corridor.
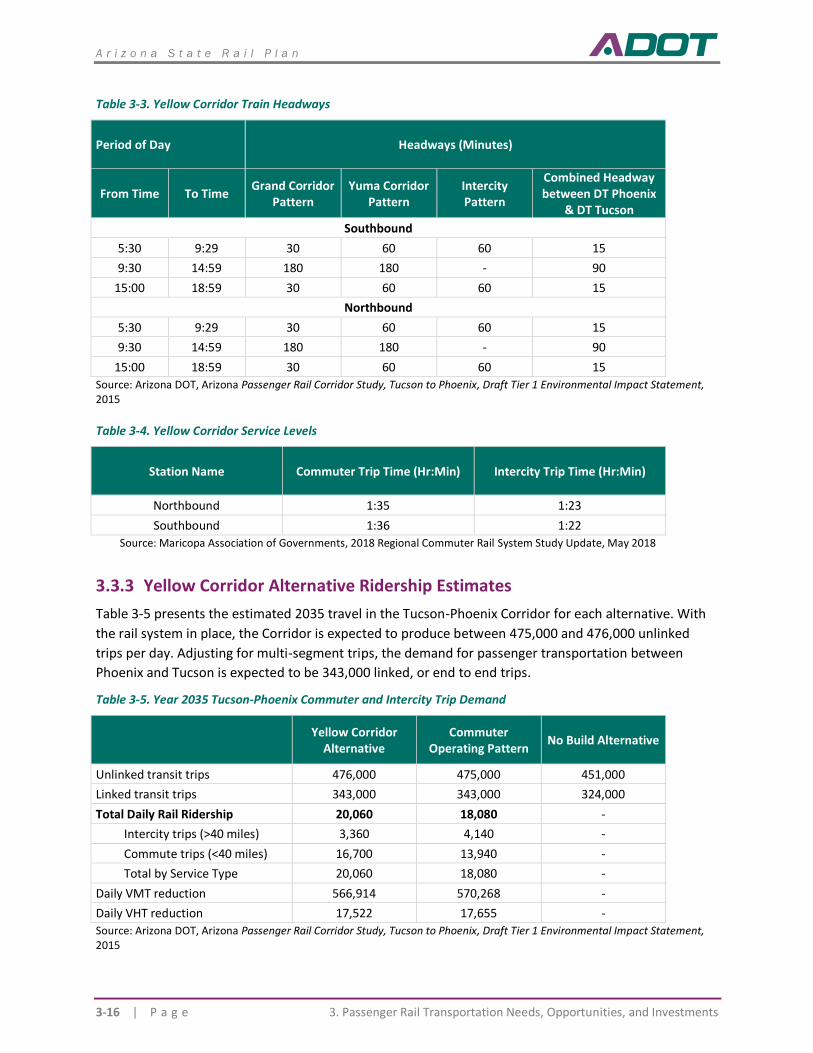
A r i z o n a S t a t e R a i l P l a n
3-16 | P a g e 3. Passenger Rail Transportation Needs, Opportunities, and Investments
Table 3-3. Yellow Corridor Train Headways
Period of Day Headways (Minutes)
From Time To Time Grand Corridor
Pattern Yuma Corridor
Pattern Intercity Pattern
Combined Headway between DT Phoenix
& DT Tucson
Southbound
5:30 9:29 30 60 60 15
9:30 14:59 180 180 - 90
15:00 18:59 30 60 60 15
Northbound
5:30 9:29 30 60 60 15
9:30 14:59 180 180 - 90
15:00 18:59 30 60 60 15
Source: Arizona DOT, Arizona Passenger Rail Corridor Study, Tucson to Phoenix, Draft Tier 1 Environmental Impact Statement, 2015
Table 3-4. Yellow Corridor Service Levels
Station Name Commuter Trip Time (Hr:Min) Intercity Trip Time (Hr:Min)
Northbound 1:35 1:23
Southbound 1:36 1:22
Source: Maricopa Association of Governments, 2018 Regional Commuter Rail System Study Update, May 2018
3.3.3 Yellow Corridor Alternative Ridership Estimates
Table 3-5 presents the estimated 2035 travel in the Tucson-Phoenix Corridor for each alternative. With
the rail system in place, the Corridor is expected to produce between 475,000 and 476,000 unlinked
trips per day. Adjusting for multi-segment trips, the demand for passenger transportation between
Phoenix and Tucson is expected to be 343,000 linked, or end to end trips.
Table 3-5. Year 2035 Tucson-Phoenix Commuter and Intercity Trip Demand
Yellow Corridor
Alternative Commuter
Operating Pattern No Build Alternative
Unlinked transit trips 476,000 475,000 451,000
Linked transit trips 343,000 343,000 324,000
Total Daily Rail Ridership 20,060 18,080 -
Intercity trips (>40 miles) 3,360 4,140 -
Commute trips (<40 miles) 16,700 13,940 -
Total by Service Type 20,060 18,080 -
Daily VMT reduction 566,914 570,268 -
Daily VHT reduction 17,522 17,655 -
Source: Arizona DOT, Arizona Passenger Rail Corridor Study, Tucson to Phoenix, Draft Tier 1 Environmental Impact Statement, 2015
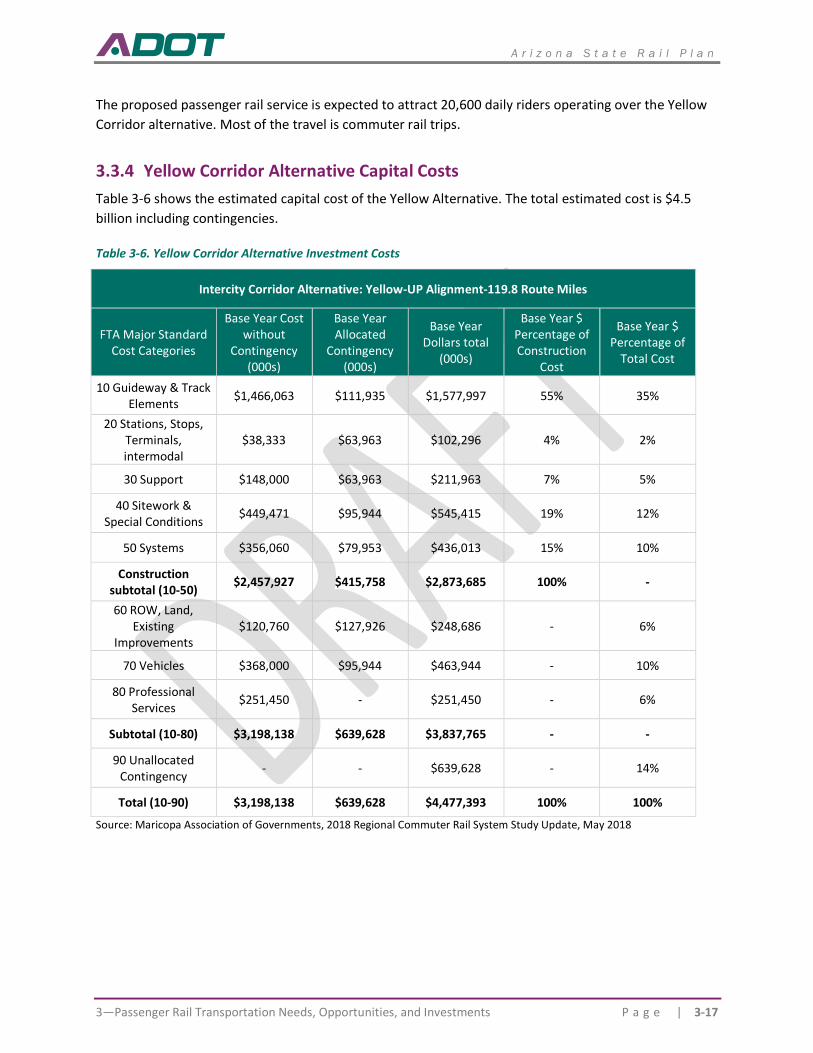
A r i z o n a S t a t e R a i l P l a n
3—Passenger Rail Transportation Needs, Opportunities, and Investments P a g e | 3-17
The proposed passenger rail service is expected to attract 20,600 daily riders operating over the Yellow
Corridor alternative. Most of the travel is commuter rail trips.
3.3.4 Yellow Corridor Alternative Capital Costs
Table 3-6 shows the estimated capital cost of the Yellow Alternative. The total estimated cost is $4.5
billion including contingencies.
Table 3-6. Yellow Corridor Alternative Investment Costs
Intercity Corridor Alternative: Yellow-UP Alignment-119.8 Route Miles
FTA Major Standard Cost Categories
Base Year Cost without
Contingency (000s)
Base Year Allocated
Contingency (000s)
Base Year Dollars total
(000s)
Base Year $ Percentage of Construction
Cost
Base Year $ Percentage of
Total Cost
10 Guideway & Track Elements
$1,466,063 $111,935 $1,577,997 55% 35%
20 Stations, Stops, Terminals, intermodal
$38,333 $63,963 $102,296 4% 2%
30 Support $148,000 $63,963 $211,963 7% 5%
40 Sitework & Special Conditions
$449,471 $95,944 $545,415 19% 12%
50 Systems $356,060 $79,953 $436,013 15% 10%
Construction subtotal (10-50)
$2,457,927 $415,758 $2,873,685 100% -
60 ROW, Land, Existing
Improvements $120,760 $127,926 $248,686 - 6%
70 Vehicles $368,000 $95,944 $463,944 - 10%
80 Professional Services
$251,450 - $251,450 - 6%
Subtotal (10-80) $3,198,138 $639,628 $3,837,765 - -
90 Unallocated Contingency
- - $639,628 - 14%
Total (10-90) $3,198,138 $639,628 $4,477,393 100% 100%
Source: Maricopa Association of Governments, 2018 Regional Commuter Rail System Study Update, May 2018
A r i z o n a S t a t e R a i l P l a n
3-18 | P a g e 3. Passenger Rail Transportation Needs, Opportunities, and Investments
COMMUTER RAIL: PHOENIX REGIONAL COMMUTER RAIL SYSTEM
The recognition that the Phoenix metropolitan region needs commuter rail service goes back to before
2003. After several studies, MAG authored the MAG Regional Commuter Rail System Study in 2010. The
study evaluated the feasibility of commuter rail service in five corridors identified in earlier studies:
◼ Grand Line (formerly Grand Avenue) Corridor (BNSF)
◼ Estrella Line (formerly Yuma West) Corridor (UPRR)
◼ San Tan Line (formerly Southeast or SE) Corridor (UPRR)
◼ Kyrene Line (formerly Tempe) Corridor (UPRR)
◼ Chandler Corridor (UPRR) (Subsequently removed from consideration)
The five corridors were evaluated in the MAG Regional Commuter Rail System Study completed in 2010.
In August of this year (2018), an updated study was published reflecting changes in land use and
demographic patterns since publication of the earlier report. In addition, the Phoenix light rail transit
system expanded since the 2010 study.
3.4.1 Potential Benefits and Goals of Commuter Rail
As described by MAG, commuter rail service would offer the region significant benefits:
Improved mobility, particularly reduced travel time for the commuters. The ability of a commuter rail
system to improve mobility throughout the region, especially during peak hours of congestion, would
result in shorter trip times for commuters. Commuter rail service would enhance connectivity between
suburban growth areas and downtown locations by providing a faster travel option. Improved travel
options would also provide residents greater flexibility in housing location choice knowing that they can
more easily commute to work, attend special events, or access other destinations. Proximity to
commuter rail or other transit options can be a significant amenity for many residents and employers
who would benefit from improved mobility and connectivity.
Higher quality commuter experience. Shorter trip times and a comfortable environment offered by
commuter trains can improve the commute experience. Commuter rail service and stations can be
designed to meet passenger needs, reduce individual carbon footprints, and provide a pleasant
environment for travel during what is normally a time of peak congestion and delays.
Better connections to employment or activity centers for everyday life. Commuter rail service can
more efficiently connect passengers to employment or activity centers such as medical facilities,
educational institutions, shopping, or special events. Connectivity with other modes expands the
benefits. These links may include connectivity to other commuter rail service lines, park-and-ride
facilities, and other transit modes such as local or regional bus service and LRT.
Opportunities to support local development in station areas. A well-designed approach to station
development can assure that commuter rail is a neighborhood asset and supports local businesses
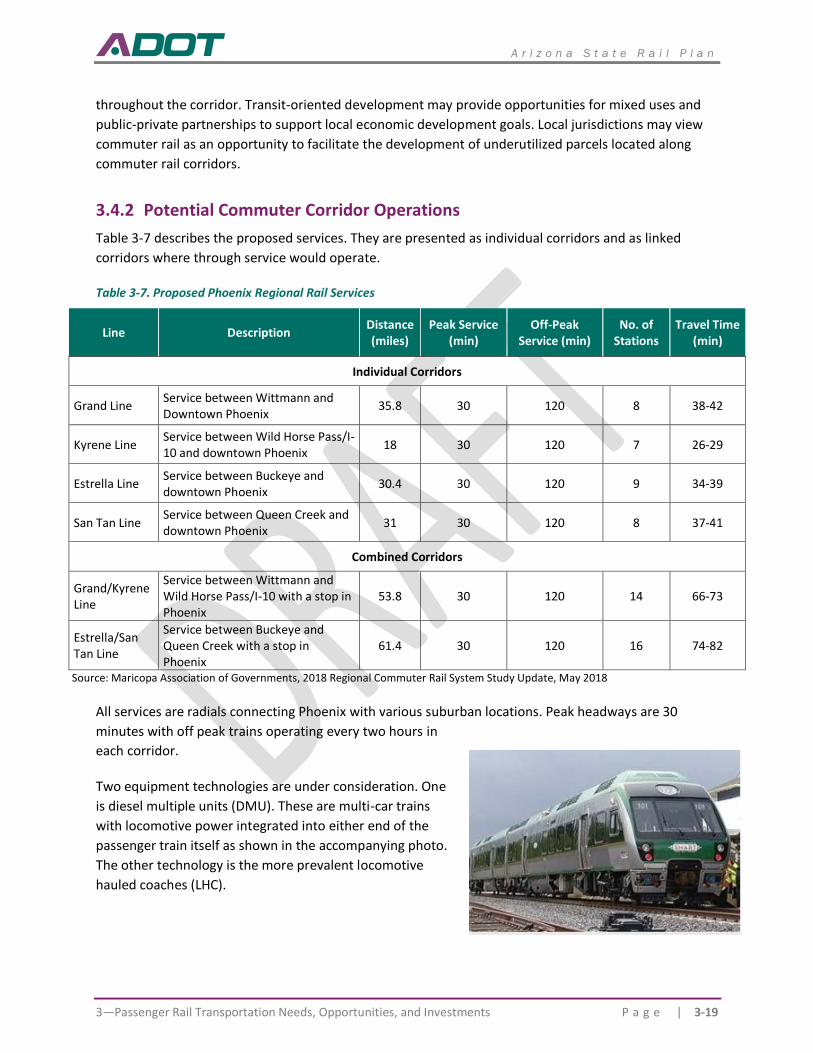
A r i z o n a S t a t e R a i l P l a n
3—Passenger Rail Transportation Needs, Opportunities, and Investments P a g e | 3-19
throughout the corridor. Transit-oriented development may provide opportunities for mixed uses and
public-private partnerships to support local economic development goals. Local jurisdictions may view
commuter rail as an opportunity to facilitate the development of underutilized parcels located along
commuter rail corridors.
3.4.2 Potential Commuter Corridor Operations
Table 3-7 describes the proposed services. They are presented as individual corridors and as linked
corridors where through service would operate.
Table 3-7. Proposed Phoenix Regional Rail Services
Line Description Distance (miles)
Peak Service (min)
Off-Peak Service (min)
No. of Stations
Travel Time (min)
Individual Corridors
Grand Line Service between Wittmann and Downtown Phoenix
35.8 30 120 8 38-42
Kyrene Line Service between Wild Horse Pass/I-10 and downtown Phoenix
18 30 120 7 26-29
Estrella Line Service between Buckeye and downtown Phoenix
30.4 30 120 9 34-39
San Tan Line Service between Queen Creek and downtown Phoenix
31 30 120 8 37-41
Combined Corridors
Grand/Kyrene Line
Service between Wittmann and Wild Horse Pass/I-10 with a stop in Phoenix
53.8 30 120 14 66-73
Estrella/San Tan Line
Service between Buckeye and Queen Creek with a stop in Phoenix
61.4 30 120 16 74-82
Source: Maricopa Association of Governments, 2018 Regional Commuter Rail System Study Update, May 2018
All services are radials connecting Phoenix with various suburban locations. Peak headways are 30
minutes with off peak trains operating every two hours in
each corridor.
Two equipment technologies are under consideration. One
is diesel multiple units (DMU). These are multi-car trains
with locomotive power integrated into either end of the
passenger train itself as shown in the accompanying photo.
The other technology is the more prevalent locomotive
hauled coaches (LHC).
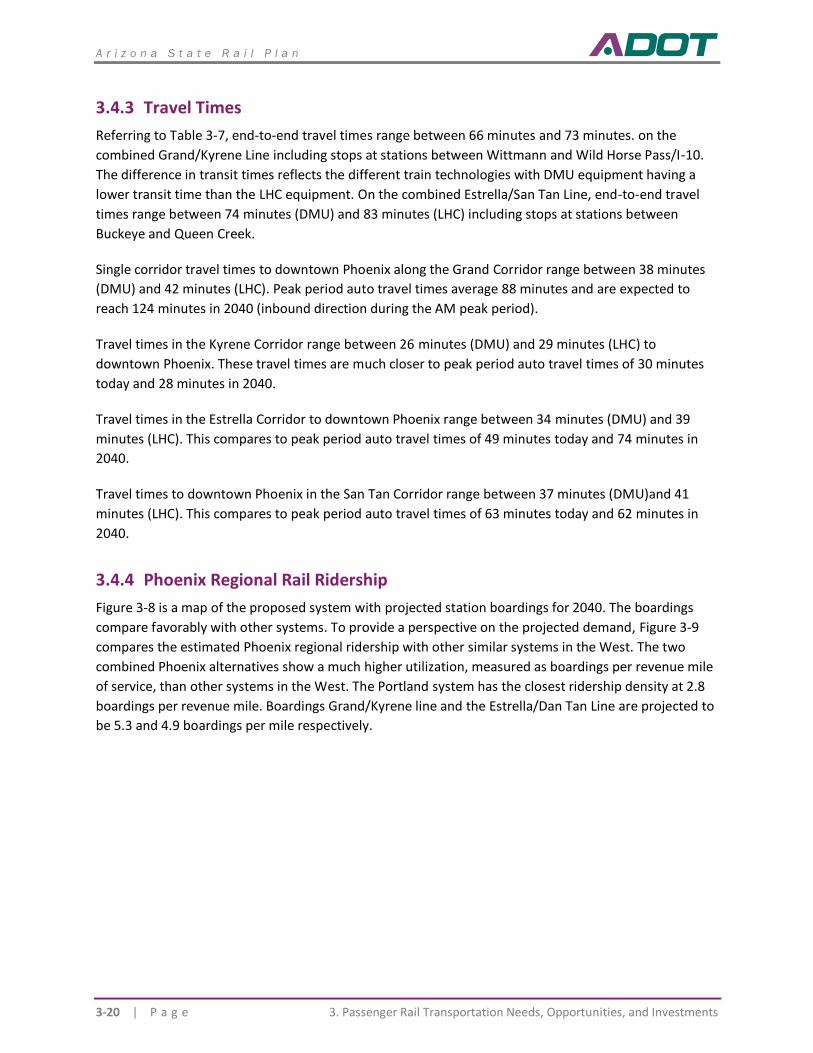
A r i z o n a S t a t e R a i l P l a n
3-20 | P a g e 3. Passenger Rail Transportation Needs, Opportunities, and Investments
3.4.3 Travel Times
Referring to Table 3-7, end-to-end travel times range between 66 minutes and 73 minutes. on the
combined Grand/Kyrene Line including stops at stations between Wittmann and Wild Horse Pass/I-10.
The difference in transit times reflects the different train technologies with DMU equipment having a
lower transit time than the LHC equipment. On the combined Estrella/San Tan Line, end-to-end travel
times range between 74 minutes (DMU) and 83 minutes (LHC) including stops at stations between
Buckeye and Queen Creek.
Single corridor travel times to downtown Phoenix along the Grand Corridor range between 38 minutes
(DMU) and 42 minutes (LHC). Peak period auto travel times average 88 minutes and are expected to
reach 124 minutes in 2040 (inbound direction during the AM peak period).
Travel times in the Kyrene Corridor range between 26 minutes (DMU) and 29 minutes (LHC) to
downtown Phoenix. These travel times are much closer to peak period auto travel times of 30 minutes
today and 28 minutes in 2040.
Travel times in the Estrella Corridor to downtown Phoenix range between 34 minutes (DMU) and 39
minutes (LHC). This compares to peak period auto travel times of 49 minutes today and 74 minutes in
2040.
Travel times to downtown Phoenix in the San Tan Corridor range between 37 minutes (DMU)and 41
minutes (LHC). This compares to peak period auto travel times of 63 minutes today and 62 minutes in
2040.
3.4.4 Phoenix Regional Rail Ridership
Figure 3-8 is a map of the proposed system with projected station boardings for 2040. The boardings
compare favorably with other systems. To provide a perspective on the projected demand, Figure 3-9
compares the estimated Phoenix regional ridership with other similar systems in the West. The two
combined Phoenix alternatives show a much higher utilization, measured as boardings per revenue mile
of service, than other systems in the West. The Portland system has the closest ridership density at 2.8
boardings per revenue mile. Boardings Grand/Kyrene line and the Estrella/Dan Tan Line are projected to
be 5.3 and 4.9 boardings per mile respectively.
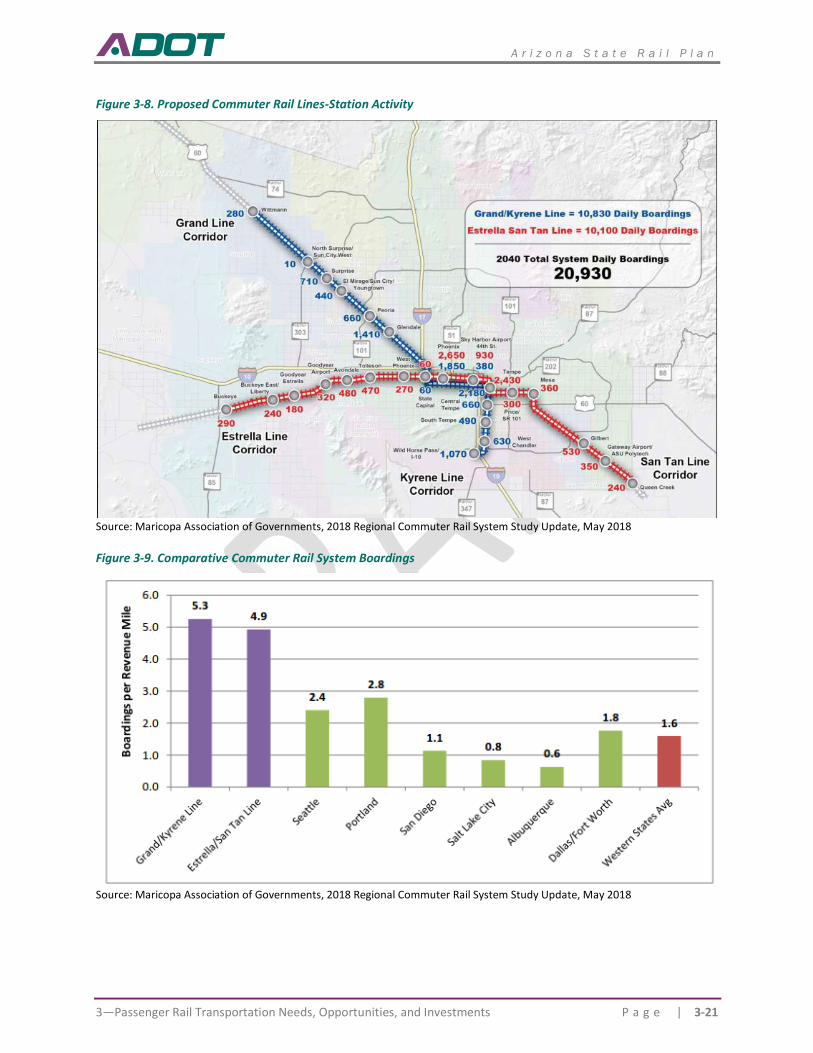
A r i z o n a S t a t e R a i l P l a n
3—Passenger Rail Transportation Needs, Opportunities, and Investments P a g e | 3-21
Figure 3-8. Proposed Commuter Rail Lines-Station Activity
Source: Maricopa Association of Governments, 2018 Regional Commuter Rail System Study Update, May 2018
Figure 3-9. Comparative Commuter Rail System Boardings
Source: Maricopa Association of Governments, 2018 Regional Commuter Rail System Study Update, May 2018
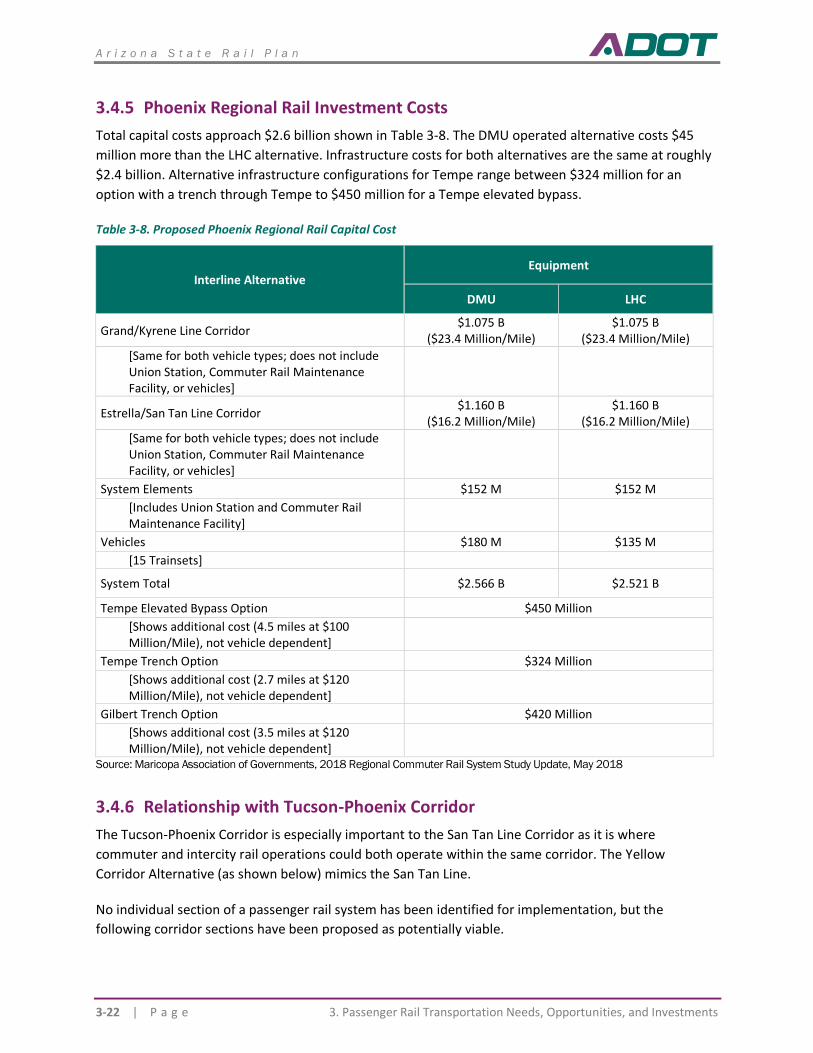
A r i z o n a S t a t e R a i l P l a n
3-22 | P a g e 3. Passenger Rail Transportation Needs, Opportunities, and Investments
3.4.5 Phoenix Regional Rail Investment Costs
Total capital costs approach $2.6 billion shown in Table 3-8. The DMU operated alternative costs $45
million more than the LHC alternative. Infrastructure costs for both alternatives are the same at roughly
$2.4 billion. Alternative infrastructure configurations for Tempe range between $324 million for an
option with a trench through Tempe to $450 million for a Tempe elevated bypass.
Table 3-8. Proposed Phoenix Regional Rail Capital Cost
Interline Alternative Equipment
DMU LHC
Grand/Kyrene Line Corridor $1.075 B
($23.4 Million/Mile) $1.075 B
($23.4 Million/Mile)
[Same for both vehicle types; does not include Union Station, Commuter Rail Maintenance Facility, or vehicles]
Estrella/San Tan Line Corridor $1.160 B
($16.2 Million/Mile) $1.160 B
($16.2 Million/Mile)
[Same for both vehicle types; does not include Union Station, Commuter Rail Maintenance Facility, or vehicles]
System Elements $152 M $152 M
[Includes Union Station and Commuter Rail Maintenance Facility]
Vehicles $180 M $135 M
[15 Trainsets]
System Total $2.566 B $2.521 B
Tempe Elevated Bypass Option $450 Million
[Shows additional cost (4.5 miles at $100 Million/Mile), not vehicle dependent]
Tempe Trench Option $324 Million
[Shows additional cost (2.7 miles at $120 Million/Mile), not vehicle dependent]
Gilbert Trench Option $420 Million
[Shows additional cost (3.5 miles at $120 Million/Mile), not vehicle dependent]
Source: Maricopa Association of Governments, 2018 Regional Commuter Rail System Study Update, May 2018
3.4.6 Relationship with Tucson-Phoenix Corridor
The Tucson-Phoenix Corridor is especially important to the San Tan Line Corridor as it is where
commuter and intercity rail operations could both operate within the same corridor. The Yellow
Corridor Alternative (as shown below) mimics the San Tan Line.
No individual section of a passenger rail system has been identified for implementation, but the
following corridor sections have been proposed as potentially viable.
A r i z o n a S t a t e R a i l P l a n
3—Passenger Rail Transportation Needs, Opportunities, and Investments P a g e | 3-23
◼ Amtrak Connection – Potential service can be initiated by Amtrak, using existing freight track.
◼ Tucson to Marana – Commuter service within the Tucson metro area.
◼ Queen Creek/San Tan Valley to Phoenix – Commuter service within the Phoenix metro area (making
up the San Tan Line Corridor evaluated in this document).
◼ Coolidge to Phoenix – Regional commuter service between Pinal County and Maricopa County
(some of which would be on the San Tan Line Corridor evaluated in this document).
◼ Coolidge to Tucson – Regional commuter service between Pinal County and Pima County.
◼ Tucson to Phoenix – Intercity service.
MAG suggests that the highest potential opportunity in the short term is commuter service from San
Tan Valley to Phoenix, connecting the major East Valley communities. This phase could be divided into
additional subsections to reduce capital and operating commitments in the short term or to provide
additional time to develop solutions to constraints within the corridor
SUMMARY OF PASSENGER RAIL NEEDS
With growing motor vehicle traffic and limitations on roadway expansion contributing to increasing congestion, efficient passenger rail service has become and will continue to be a significant need for Arizona’s travelers. Specific areas are:
◼ Intercity travel in the Southwest
◼ Intercity and commuter travel in the Tucson-Phoenix Corridor
◼ Commuter travel in the Phoenix region
ADOT supports the development of passenger rail service in the state. Funding from state sources,
however, is not available. Taxes will not be increased. Any investment in passenger rail transportation
would need to be made by local communities or MPOs, and/or from federal sources.

A r i z o n a S t a t e R a i l P l a n
4—Freight Rail Transportation Needs, Opportunities, and Investments P a g e | 4-1
Freight Rail Transportation Needs, Opportunities, and Investments
INTRODUCTION
Efforts to improve Arizona’s freight rail network are ongoing. Freight rail issues and opportunities, and
associated proposed improvements and investments, fall into a number of categories. Those to be
explored in this chapter are the following:
◼ Rail access
◼ Arizona’s rail network and connectivity
◼ Nogales border crossing
◼ Railroad preservation and condition of Arizona’s short line network
◼ Economic development initiatives
◼ Arizona’s ability to grant or loan moneys for freight rail projects
◼ Rail safety and crossings
RAIL ACCESS
The state is crossed east-west by two of the nation’s busiest rail lines, the UPRR Sunset Route and the
BNSF Southern Transcon. These two rail lines carry freight between southern California and the rest of
the nation. The Ports of Los Angeles and Long Beach are by far the highest volume container ports in
North American and the largest gateway by which Asia products arrive in the United States. These ports
rely on the Sunset Route and Southern Transcon to transport goods to the rest of the country.
The Sunset Route and the Southern Transcon are the railroad equivalent of major limited access
interstate highways. In the interest of operating efficiency, the railroads have created barriers to access
along these corridors. Due to the volume and speed of freight traffic on the corridors, a shipper
interested in service on these corridors is required to invest in long running track and high-speed
switches that enable trains to enter and leave the corridors at high speeds, thus not interfering with
current traffic moving on the main lines. This infrastructure is costly, and land must be available for the
running tracks, which can extend for miles. The volume of traffic generated by the customers must
justify its investment in the rail sidings and spurs.
In addition to the railroads’ requirements that infrastructure be in place to support access to the
mainlines without impeding other traffic, the railroads also encourage prospective railroad customers
have sufficient business volume to make it cost-effective for the railroad to serve its facility. Ideally, the
prospective shipper can provide the railroad with multiple cars at once, or even better, entire train-size
shipments. Most shippers, however, do not have the available land to assemble cars into a long train.
A r i z o n a S t a t e R a i l P l a n
4-2 | P a g e 4. Freight Rail Transportation Needs, Opportunities, and Investments
When a representative from BNSF was consulted for this rail plan the company noted that the state
lacks rail-served properties, specifically in northern Arizona along its Southern Transcon. BNSF
considered the lack of rail served locations to be a lost opportunity.
These service limitations preclude many shippers from accessing the Southern Transcon, A
representative of the City of Flagstaff mentioned that several shippers including a plastics company, a
paper company, a chemical company, and several food manufacturing companies would like to have rail
service but have not been able to reach agreement with BNSF to serve their locations. It may be
beneficial to develop a cooperative effort whereby multiple shippers can use common infrastructure
that meets these criteria.
The Flagstaff Metropolitan Planning Organization (FMPO) has investigated the possibility of a Regional
Freight Facility in the Flagstaff Regional Freight Strategy., one feature of such a facility could be an
adequate rail siding and switches to allow BNSF to easily serve the locations. Other opportunities could
exist in Winslow.
Access is a key issue for the Kingman Airport Authority as well. The organization is served by the BNSF
on the Southern Transcon. Raw materials are brought into the Kingman Industrial Park by rail.
Manufacturers then convert these raw materials to finished goods and ship them out by rail to markets
in southern California, Las Vegas, or other locations in Arizona. If the park is to expand as planned, rail
volumes will grow as well, and access will need to be improved with a new switch yard. The Kingman
Airport Authority has identified a possible $9.5 million project to improve access to BNSF through a new
switching yard.
Access was identified as an issue on the UPRR Sunset Route as well. One shipper offered that UPRR has
become increasingly less interested in providing service because the customer ships in smaller carload
volumes. UPRR has expressed a preference for unit train service over handling manifest freight, but this
particular shipper can only ship in carload quantities resulting in higher costs to UPRR.
The Port of Tucson is an example of a way around the access issue. The Port requires relatively little
work by UPRR and is low cost to serve. The Port is served by a two-mile siding that was upgraded by a
recent TIGER grant that funded high speed switches for the siding permitting trains to enter or exit the
facility at up to 45 miles per hour. The Port of Tucson also benefits from its proximity to the Tucson rail
yard. Because trains stop at the Tucson Yard anyway, less incremental effort is required by UPRR to
serve the location. The Port of Tucson provides its own switching on its property, so UPRR can focus on
line haul transportation.
Several approaches can reduce the cost of rail access for shippers, including industrial parks and
transload facilities. By industrial parks, companies within a planned industrial development can share
the cost of rail infrastructure and services. The Kingman Industrial Park is an example of such a location
as is the Central Arizona Commerce Park in Casa Grande. In both cases, a short line railroad within the
park provides movement of railcars into and out of shipper facilities, including the Kingman Terminal
Railroad in the Kingman Industrial Park and the San Pedro Southwestern & Southwestern Railroad in the
A r i z o n a S t a t e R a i l P l a n
4—Freight Rail Transportation Needs, Opportunities, and Investments P a g e | 4-3
Central Arizona Commerce Park. Class I railroads sometimes prefer to serve industrial parks such as
these, since they concentrate demand whether the railroad can handle more traffic with lower effort. If
possible, it can be preferable for a short line to provide switching (moving, sorting railcars into and out
of industrial sidings) within the park, since switching by Class I railroads is often more expensive. Class I
railroads often prefer to focus on long-distance transportation and not moving railcars into and out of
industrial locations.
Transload facilities, where cargo is transferred between truck and rail, provide shippers with rail access
even if not physically located on a rail line. The Port of Tucson provides this type of service to customers,
as do other facilities within the state. The Wickenburg Regional Economic Development Partnership has
applied for a $55 million loan under the federal Railroad Rehabilitation and Improvement Financing
(RRIF) Program to develop the Forepaugh Industrial Development and Logistics Park. This facility will
serve as both an industrial park and a transload facility. The City of Flagstaff is considering a transload
facility at the site of a former military installation outside of town.
ARIZONA’S RAIL NETWORK AND CONNECTIVITY
4.3.1 Phoenix Area Rail Network Phoenix
In a sense, Arizona’s rail network is out of “sync” with the state’s population. With over 4.7 million
inhabitants, the Phoenix metropolitan area comprises 60 percent of Arizona’s population and is the 11th
largest metropolitan area in the nation. The UPRR Sunset Route was completed in 1883, and the
Southern Transcon was first built in the 1880s when the population of Maricopa County was less than
10,000. Because Phoenix at the time was not a significant population center, these two rail corridors
bypassed the city, and to this day Phoenix is not served by a rail mainline. The UPRR and BNSF lines that
serve Phoenix are branch lines that terminate in the area, so Phoenix does not benefit from being on a
rail corridor but rather is on the railroad equivalent of two cul-de-sacs. This has created challenges. For
example, Phoenix is not located on an intermodal route, which adds cost and complexity to intermodal
service to/from the city. Unless shippers in Phoenix can fill an entire unit train, blocks of containers
to/from Phoenix must be moved to/from yards on the Sunset Route or Southern Transcon.
MAG and ADOT have studied various options to improve rail access to Phoenix. One option considered
has been the reactivation of the Wellton Branch, of which 80 miles are inactive. This is the most direct
route between Phoenix and southern California. The segment between Roll and Arlington was closed in
1996. Estimated cost to restore the line are between $100 million and $400 million. UPRR has not
expressed interest in restoring the line. One possibility could be incremental restoration if customers are
found to justify reactivation of segments of the Wellton Branch. The Wellton Branch is shown in yellow
in Figure 4-1.
MAG also investigated the possibility of a new rail line that could connect the UPRR Sunset Route near
Gila Bend to the BNSF rail line near Morristown.95 Over much of the alignment, the rail line would
95 Maricopa Association of Governments, Hassayampa Valley Rail Corridors Cost Analysis Update, October 28, 2013.
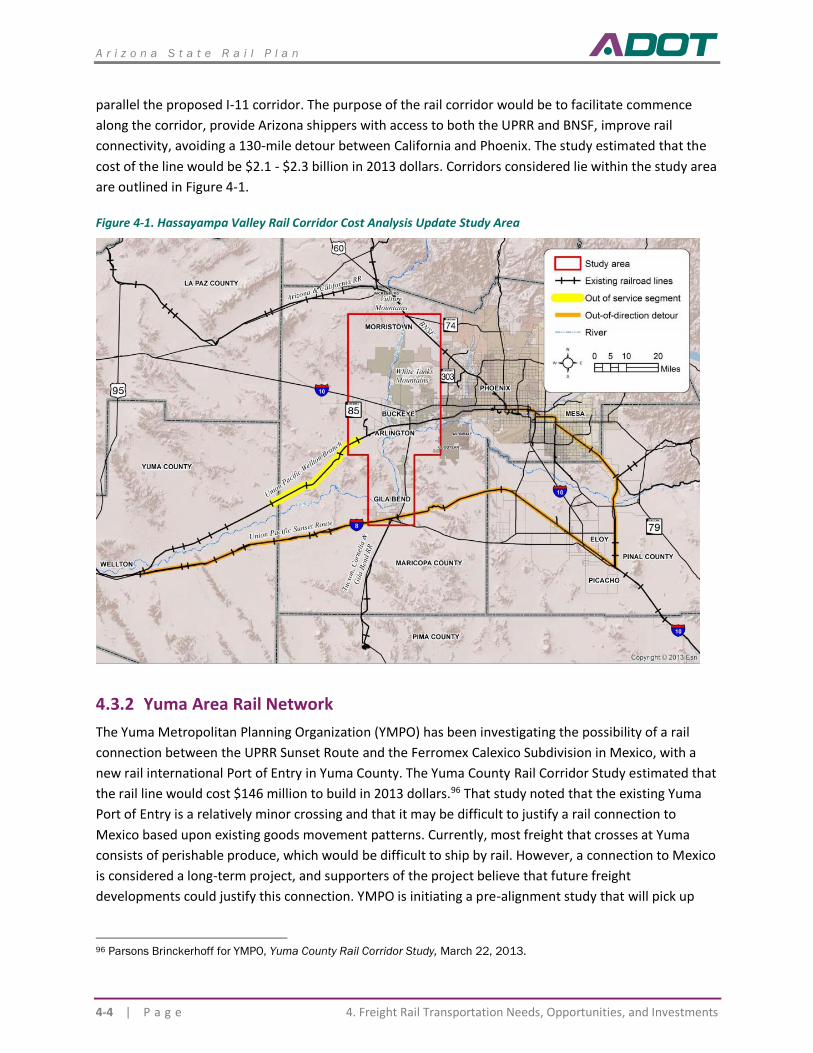
A r i z o n a S t a t e R a i l P l a n
4-4 | P a g e 4. Freight Rail Transportation Needs, Opportunities, and Investments
parallel the proposed I-11 corridor. The purpose of the rail corridor would be to facilitate commence
along the corridor, provide Arizona shippers with access to both the UPRR and BNSF, improve rail
connectivity, avoiding a 130-mile detour between California and Phoenix. The study estimated that the
cost of the line would be $2.1 - $2.3 billion in 2013 dollars. Corridors considered lie within the study area
are outlined in Figure 4-1.
Figure 4-1. Hassayampa Valley Rail Corridor Cost Analysis Update Study Area
4.3.2 Yuma Area Rail Network
The Yuma Metropolitan Planning Organization (YMPO) has been investigating the possibility of a rail
connection between the UPRR Sunset Route and the Ferromex Calexico Subdivision in Mexico, with a
new rail international Port of Entry in Yuma County. The Yuma County Rail Corridor Study estimated that
the rail line would cost $146 million to build in 2013 dollars.96 That study noted that the existing Yuma
Port of Entry is a relatively minor crossing and that it may be difficult to justify a rail connection to
Mexico based upon existing goods movement patterns. Currently, most freight that crosses at Yuma
consists of perishable produce, which would be difficult to ship by rail. However, a connection to Mexico
is considered a long-term project, and supporters of the project believe that future freight
developments could justify this connection. YMPO is initiating a pre-alignment study that will pick up
96 Parsons Brinckerhoff for YMPO, Yuma County Rail Corridor Study, March 22, 2013.
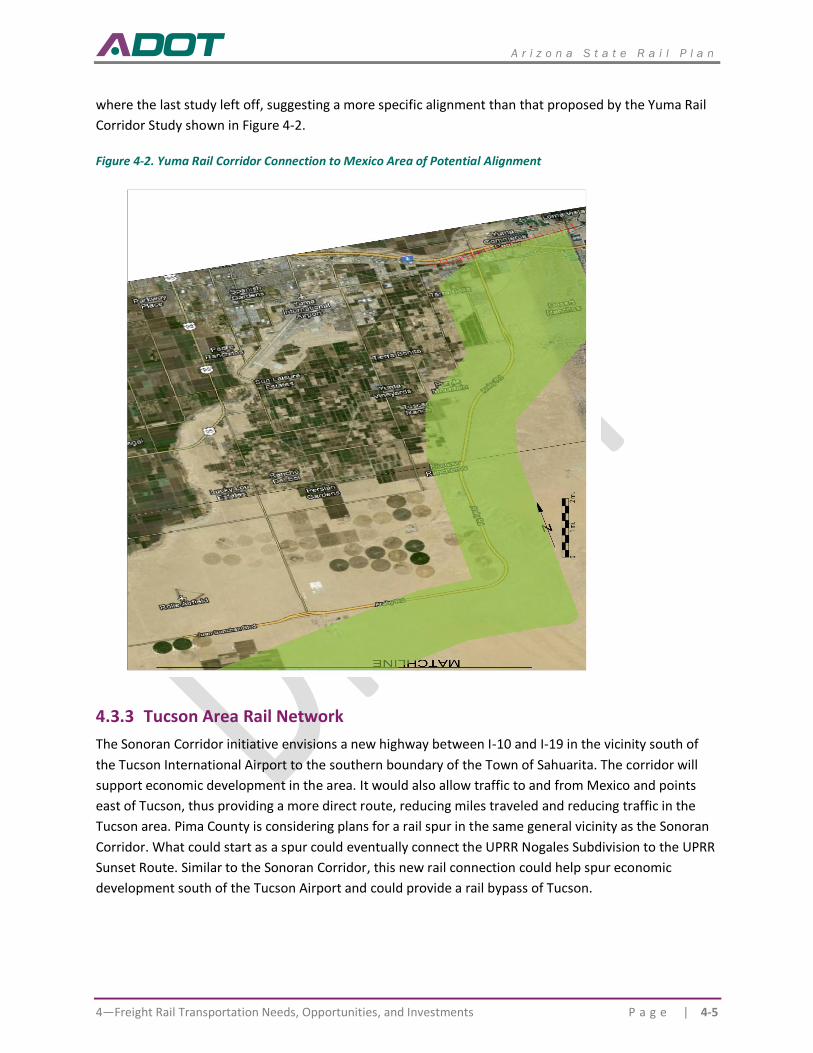
A r i z o n a S t a t e R a i l P l a n
4—Freight Rail Transportation Needs, Opportunities, and Investments P a g e | 4-5
where the last study left off, suggesting a more specific alignment than that proposed by the Yuma Rail
Corridor Study shown in Figure 4-2.
Figure 4-2. Yuma Rail Corridor Connection to Mexico Area of Potential Alignment
4.3.3 Tucson Area Rail Network
The Sonoran Corridor initiative envisions a new highway between I-10 and I-19 in the vicinity south of
the Tucson International Airport to the southern boundary of the Town of Sahuarita. The corridor will
support economic development in the area. It would also allow traffic to and from Mexico and points
east of Tucson, thus providing a more direct route, reducing miles traveled and reducing traffic in the
Tucson area. Pima County is considering plans for a rail spur in the same general vicinity as the Sonoran
Corridor. What could start as a spur could eventually connect the UPRR Nogales Subdivision to the UPRR
Sunset Route. Similar to the Sonoran Corridor, this new rail connection could help spur economic
development south of the Tucson Airport and could provide a rail bypass of Tucson.
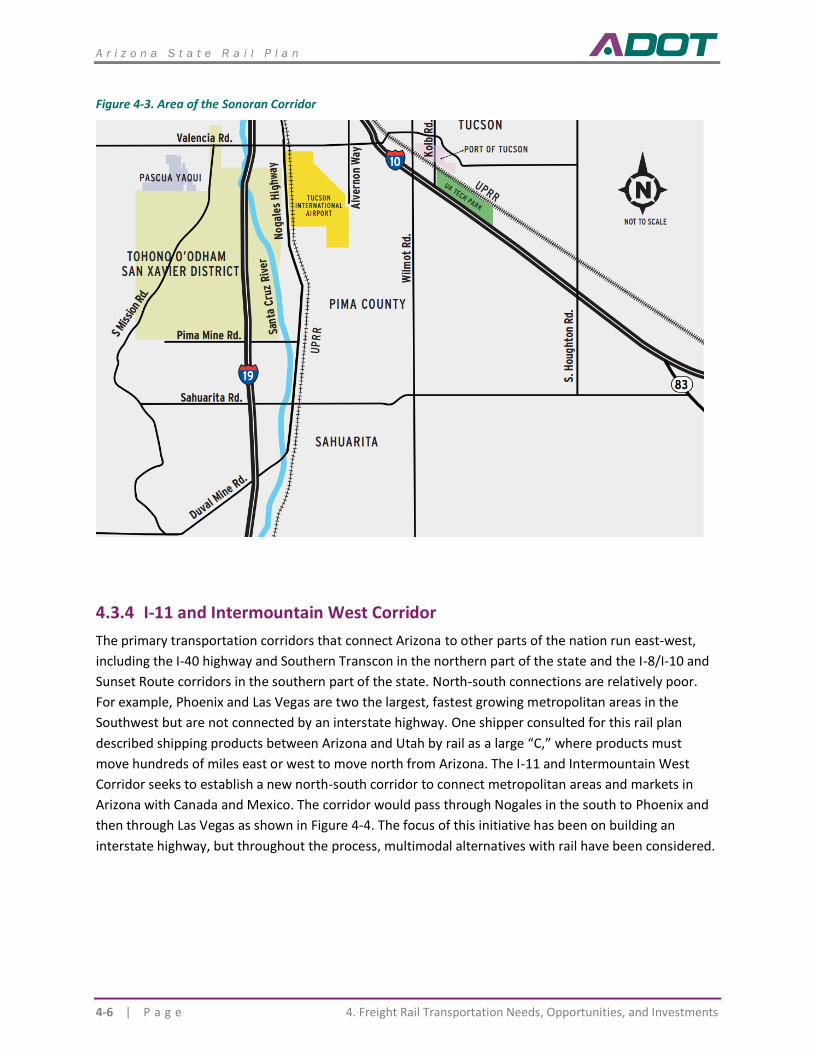
A r i z o n a S t a t e R a i l P l a n
4-6 | P a g e 4. Freight Rail Transportation Needs, Opportunities, and Investments
Figure 4-3. Area of the Sonoran Corridor
4.3.4 I-11 and Intermountain West Corridor
The primary transportation corridors that connect Arizona to other parts of the nation run east-west,
including the I-40 highway and Southern Transcon in the northern part of the state and the I-8/I-10 and
Sunset Route corridors in the southern part of the state. North-south connections are relatively poor.
For example, Phoenix and Las Vegas are two the largest, fastest growing metropolitan areas in the
Southwest but are not connected by an interstate highway. One shipper consulted for this rail plan
described shipping products between Arizona and Utah by rail as a large “C,” where products must
move hundreds of miles east or west to move north from Arizona. The I-11 and Intermountain West
Corridor seeks to establish a new north-south corridor to connect metropolitan areas and markets in
Arizona with Canada and Mexico. The corridor would pass through Nogales in the south to Phoenix and
then through Las Vegas as shown in Figure 4-4. The focus of this initiative has been on building an
interstate highway, but throughout the process, multimodal alternatives with rail have been considered.
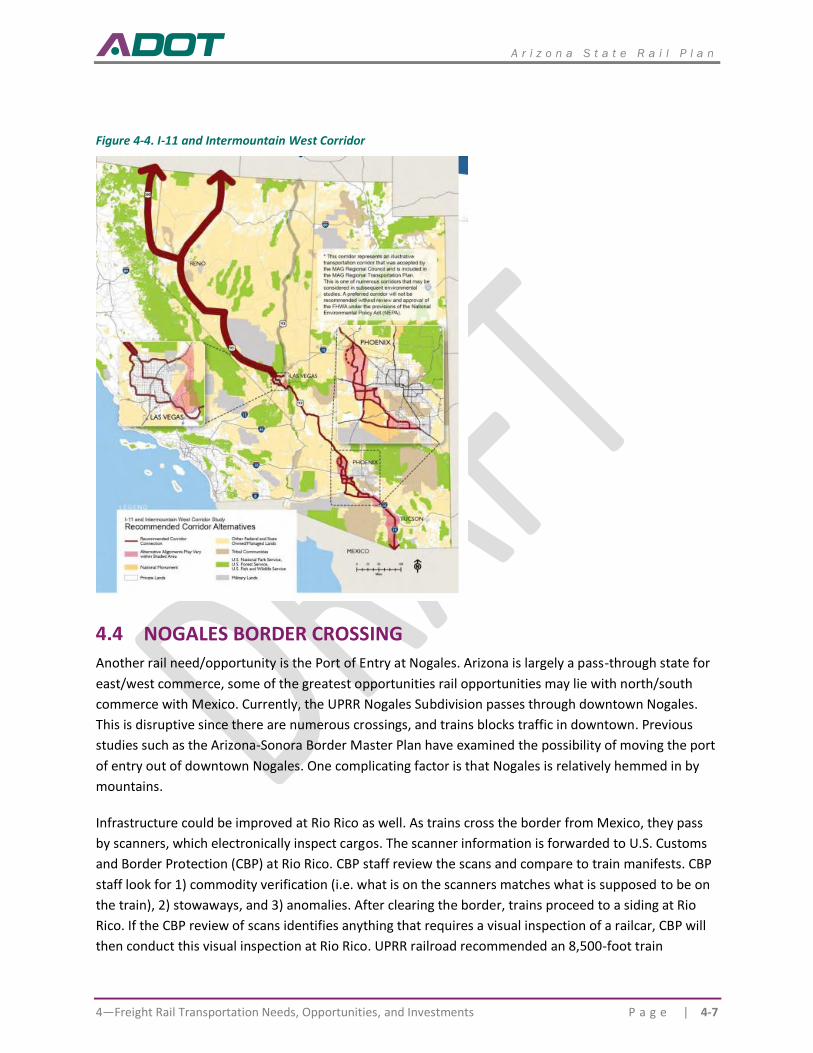
A r i z o n a S t a t e R a i l P l a n
4—Freight Rail Transportation Needs, Opportunities, and Investments P a g e | 4-7
Figure 4-4. I-11 and Intermountain West Corridor
NOGALES BORDER CROSSING
Another rail need/opportunity is the Port of Entry at Nogales. Arizona is largely a pass-through state for
east/west commerce, some of the greatest opportunities rail opportunities may lie with north/south
commerce with Mexico. Currently, the UPRR Nogales Subdivision passes through downtown Nogales.
This is disruptive since there are numerous crossings, and trains blocks traffic in downtown. Previous
studies such as the Arizona-Sonora Border Master Plan have examined the possibility of moving the port
of entry out of downtown Nogales. One complicating factor is that Nogales is relatively hemmed in by
mountains.
Infrastructure could be improved at Rio Rico as well. As trains cross the border from Mexico, they pass
by scanners, which electronically inspect cargos. The scanner information is forwarded to U.S. Customs
and Border Protection (CBP) at Rio Rico. CBP staff review the scans and compare to train manifests. CBP
staff look for 1) commodity verification (i.e. what is on the scanners matches what is supposed to be on
the train), 2) stowaways, and 3) anomalies. After clearing the border, trains proceed to a siding at Rio
Rico. If the CBP review of scans identifies anything that requires a visual inspection of a railcar, CBP will
then conduct this visual inspection at Rio Rico. UPRR railroad recommended an 8,500-foot train
A r i z o n a S t a t e R a i l P l a n
4-8 | P a g e 4. Freight Rail Transportation Needs, Opportunities, and Investments
inspection slot at Rio Rico to improve the efficiency of cross border movements. A representative from a
mining company also mentioned a lack of rail yard capacity for unit trains on the U.S. side of the border.
There is also a need to improve CBP equipment at Rio Rico. CBP staff are able to inspect top containers
on double stack railcars, but are not able to open bottom containers because container wells block the
doors. Similarly, CBP lacks the equipment to inspect certain types of bulk railcars. Currently, railcars that
CBP is unable to access are removed from their trains and then moved to the Port of Tucson on a
different train for inspection at the Port of Tucson. Efficiency could be improved if CBP staff had the
equipment to unload containers from railcars and access bulk cars at Rio Rico.
The Fresh Produce Association of the Americas is exploring ways to ship produce from Sinaloa, Mexico
across the border, potentially using rail. Because produce is perishable, service would need to be fast.
Rail service would only be fast enough for shipping produce if it is point-to-point. Manifest service, by
which railcars are sorted into and out of multiple trains between origin and destination would be too
slow. One possibility could be to truck produce from Sinaloa across the border in refrigerated
containers, which would then be loaded onto trains in Tucson. This could take advantage of the
relatively fast speed of trucking from Mexico and across the border but benefit from the economies of
rail for shipping over long distances.
RAILROAD PRESERVATION AND CONDITION OF ARIZONA’S SHORT LINE NETWORK
Similar to other states, Arizona’s rail network is smaller than it once was. Rail lines in Arizona have been
abandoned over the years or are inactive. As in other states, Class III railroads help to maintain service
on rail lines that would otherwise be abandoned by Class I railroads. However, several factors make the
issue of rail line preservation in Arizona unique.
◼ Some short line railroads in Arizona have a narrow customer base. In some cases, they are owned by
mining companies and are specifically intended to serve a mine or set of mines. In the eastern part
of the US, short line railroads usually operate within populated areas where any number of
customers can locate along the line. In Arizona, just 18.2 percent of the land is privately owned.
Branch lines pass through uninhabited areas to reach specific facilities, such as mines. If the facility
closes, the rail line becomes dormant. Numerous examples of this situation exist in Arizona. For
example, the Tucson, Cornelia & Gila Bend railroad ceased operations when it was no longer needed
to serve Freeport-McMoRan’s mines near Ajo. Magma Arizona Railroad suspended operations in
1996 when the mine it served closed. The San Manuel Arizona Railroad ceased operations in 2006.
The line was briefly brought back into service in 2014 but has since ceased operations again.
◼ Due to the arid climate and land usage, rail lines can remain dormant and then be placed back into
service. As the above bullet illustrates, examples exist of rail lines being dormant for years but then
reopening years later. Mining companies may choose to keep rail lines in place rather than fully
abandoning them. While ties degrade and must be replaced, the process is slower than it is east of
the Mississippi River, and managing vegetation is not as much of a factor. Furthermore, since many
A r i z o n a S t a t e R a i l P l a n
4—Freight Rail Transportation Needs, Opportunities, and Investments P a g e | 4-9
of these lines pass through uninhabited areas, fewer crossing must be maintained. If the lines
operate by easements on public lands, property taxes are less of an issue.
Arizona recently experienced an example of rail line preservation when Navajo County leaders formed
the Snowflake Community Foundation and purchased the Apache Railway line in 2012 so that it would
not be scrapped. Financing was provided by a joint loan from the Arizona Commerce Authority’s Arizona
Innovation Accelerator fund ($1.75 million) and the Arizona MultiBank ($750,000). In 2015 the line was
sold to Aztec Land & Cattle Company and Midwest Poultry Producers, L.P.
Another rail line preservation program put forward by Resolution Copper would restore the Magma
Arizona Railroad. According to a company representative, other mines and shippers have expressed
interest in using the line. Numerous trucks pass through Superior that could potentially be diverted to
rail. The town is interested the rail line supporting economic development. One possibility is some sort
of an excursion train, particularly since the line passes through a scenic area. The line will be costly to
prepare for usage. Some areas have light, 70-pound rail and rotted ties. While the amount of money and
effort to bring the line to FRA Track Class 1 standard would not be that much, significantly more would
be required to bring the line to a state of good repair, i.e. FRA Track Class 2 or 3. While the line may go
back into service anyway, the mine it would serve could be years from being built.
Short line railroads currently in service in Arizona are in varying conditions. As in other states, not all
railroads in Arizona can accommodate industry standard 286,000-pound railcars. The Arizona Eastern
Railway and the Clarkdale Arizona Central railroad can only accommodate 263,000-pound railcars. This
places shippers on these rail lines at a competitive disadvantage since they must either use smaller
railcars or “short load” larger industry standard sized railcars. Rail rates per car are often the same
regardless of size, so shippers on these lines pay the same rate but ship 10 to 15 percent less product
per car. These rail lines represent bottlenecks, since rail shipments may move hundreds of additional
miles off the short lines but are constrained by short lines’ inability to accommodate 286,000-pound
cars.
4.5.1 Arizona & California Railroad
The principal need of the ARZC in Arizona is a better interchange with the BNSF. Because there currently is no interchange track, the ARZC is required to make live meetings with the BNSF at Castle Hot Springs.
4.5.2 Arizona Eastern Railroad
The AZER is limited with light rail incapable of hauling the desired 286,000-pound railcar. The rail in some cases is 80 to 90 years old and suffers from years of deferred maintenance from prior owners.
AZER bridges are also in need of repairs. Approximately 40 percent of the bridges on the line are not able to safely accommodate 286,000-pound rail cars.
The AZER currently does not have any meeting points, sidings, or storage capabilities on the railroad limiting its ability to efficiently move bi-directional traffic to and from our yards/interchange.
A r i z o n a S t a t e R a i l P l a n
4-10 | P a g e 4. Freight Rail Transportation Needs, Opportunities, and Investments
4.5.3 Black Mesa and Lake Powell Railroad
The Black Mesa and Lake Powell Railroad is a 78-mile electrified private railroad that transports coal
from the Peabody Kayenta Mine near Kayenta and the Navajo Generating Station at Page. The Navajo
Generating Station is expected to close in 2019, which would remove the Kayenta mine’s sole customer,
as well as the freight need for the railroad. Because the Black Mesa and Lake Powell Railroad is isolated
from the general rail network, it is not able to help the Kayenta Mine transport coal to other customers,
nor support commerce with the rest of the U.S.
The area around the railroad is economically distressed, and the closing of the mine, generating plant,
and railroad will make matters worse. Stakeholders have requested that alternatives be investigated for
the rail line, so that it could hopefully continue to be a source of employment for the area.
4.5.4 Copper Basin Railway
The Copper Basin is affected by poor service and uncompetitive freight rates of its connecting railroad.
4.5.5 Kingman Terminal Railroad
The Kingman Terminal Railroad has several needs:
◼ An improved interchange with BNSF to accommodate future traffic growth is needed. A larger more efficient track layout will be required.
◼ Expansion of storage capacity could help attract new business. ◼ Development of team track to facilitate operations and attract new business.
ECONOMIC DEVELOPMENT INITIATIVES
Several economic development initiatives involving rail were mentioned by stakeholders during the
development of this rail plan.
◼ Pima County has been examining opportunities south of the Tucson Airport where large parcels of
available land represent an economic development opportunity. The county owns a 500-acre
industrial park south of the airport, while the airport authority and state own larger parcels. The
amount of land is large enough for major developments such as auto manufacturing plant. The
county has received inquiries from manufacturers and logistics companies. The area would be
supported by the airport, rail, interstate. A rail spur could be built to support the area.
◼ Economic development opportunities may be available along the BNSF Ennis Subdivision in the
Phoenix area. Some of this land will never be used for residential development because it is in the
flight path of the Luke Air Force Base. But land could be made available for logistics and
manufacturing. Access to the Ennis Subdivision would need to be improved, since it only has one
side of a “Y”. There is a possibility of a transload facility on the branch, as well as potential industrial
uses.
A r i z o n a S t a t e R a i l P l a n
4—Freight Rail Transportation Needs, Opportunities, and Investments P a g e | 4-11
◼ The Kingman Industrial Park covers 1,100 acres. The Kingman Airport Authority hopes to establish
another 1,200-acre site south of the existing industrial park. It took 30 years for the industrial park
to absorb the original 1,100 acres. Now, the entire park is filled except for 100 acres. The expansion
to the south would provide land for the next 30 years. Fourteen percent of the 70 tenants in the
park use rail. Expansion will requirement improvement of the park’s interchange with the BNSF
Transcon.
◼ Both BNSF and representatives from Flagstaff mentioned rail-related opportunities in northern
Arizona along the BNSF Southern Transcon.
ARIZONA’S ABILITY TO GRANT OR LOAN MONEY FOR FREIGHT RAIL PROJECTS
As mentioned previously, the “gifting clause” of the Arizona state constitution severely limits the state’s
ability to fund freight rail projects. Because the freight rail network is owned by private companies,
investments in freight infrastructure necessarily benefits specific companies. While the State of Arizona
would only invest in projects where the public benefit outweighs the public investment, in reality it is
difficult to absolutely prove that the value the state receives exceeds the public expenditure. The
implications of this situation are several:
1) Private entities assume the roles that public entities fill in other states. For example, port
authorities in other states are often owned by local governments. Facilities owned are not just
maritime ports, but also inland ports where freight can be transferred between rail and truck. In
the case of Arizona, the Port of Tucson, for example, is a private company.
2) Public entities can fund rail improvements, but these cannot be classified as “gifts.” The
Kingman Airport Authority (recently taken over by the City of Kingman) funds rail improvements
through the sale of land. For example, if a property is sold for a certain amount per square foot,
a portion of that may go to building a rail lead to that property. The cost of rail infrastructure
into the park was never gifted but rather part of the sale price of land.
3) For federal multimodal and rail grants, it is important to find private sector partners. Federal
funding of rail mostly is provided through these discretionary grants. These grants typically
require a sizeable non-federal match. Because matching funds cannot be provided by public
entities, it is important that shippers and railroads be made partners in any grant applications of
other public entities in the state sponsored by ADOT.
RAIL SAFETY AND CROSSINGS
While rail transportation is a relatively safe mode of transportation, it still has risks. Most rail fatalities in
Arizona are either caused by trains striking trespassers on railroad right-of ways or collisions at highway-
rail grade crossings. ADOT and the Arizona Corporation Commission (ACC) are responsible for improving
safety of Arizona’s rail network. ADOT administers the federal Railway-Highway Crossings (Section 130)
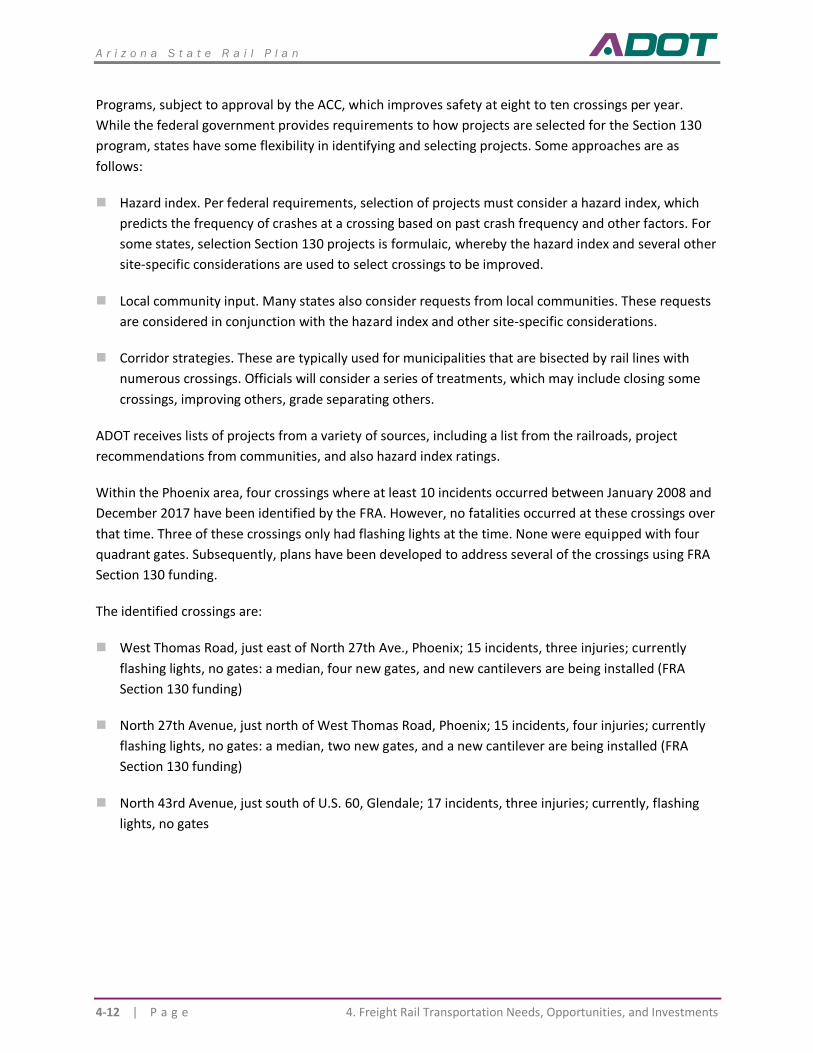
A r i z o n a S t a t e R a i l P l a n
4-12 | P a g e 4. Freight Rail Transportation Needs, Opportunities, and Investments
Programs, subject to approval by the ACC, which improves safety at eight to ten crossings per year.
While the federal government provides requirements to how projects are selected for the Section 130
program, states have some flexibility in identifying and selecting projects. Some approaches are as
follows:
◼ Hazard index. Per federal requirements, selection of projects must consider a hazard index, which
predicts the frequency of crashes at a crossing based on past crash frequency and other factors. For
some states, selection Section 130 projects is formulaic, whereby the hazard index and several other
site-specific considerations are used to select crossings to be improved.
◼ Local community input. Many states also consider requests from local communities. These requests
are considered in conjunction with the hazard index and other site-specific considerations.
◼ Corridor strategies. These are typically used for municipalities that are bisected by rail lines with
numerous crossings. Officials will consider a series of treatments, which may include closing some
crossings, improving others, grade separating others.
ADOT receives lists of projects from a variety of sources, including a list from the railroads, project
recommendations from communities, and also hazard index ratings.
Within the Phoenix area, four crossings where at least 10 incidents occurred between January 2008 and
December 2017 have been identified by the FRA. However, no fatalities occurred at these crossings over
that time. Three of these crossings only had flashing lights at the time. None were equipped with four
quadrant gates. Subsequently, plans have been developed to address several of the crossings using FRA
Section 130 funding.
The identified crossings are:
◼ West Thomas Road, just east of North 27th Ave., Phoenix; 15 incidents, three injuries; currently
flashing lights, no gates: a median, four new gates, and new cantilevers are being installed (FRA
Section 130 funding)
◼ North 27th Avenue, just north of West Thomas Road, Phoenix; 15 incidents, four injuries; currently
flashing lights, no gates: a median, two new gates, and a new cantilever are being installed (FRA
Section 130 funding)
◼ North 43rd Avenue, just south of U.S. 60, Glendale; 17 incidents, three injuries; currently, flashing
lights, no gates
A r i z o n a S t a t e R a i l P l a n
4—Freight Rail Transportation Needs, Opportunities, and Investments P a g e | 4-13
◼ 5100 block of West Bethany Home Road, Glendale; 13 incidents, one injury; currently flashing lights
and gates: pending FHWA funding approval, a raised median, new gates, road widening, a new
sidewalk, new crossing surface, and advanced preemption system will be installed.97
Arizona’s crossings with the highest frequency of fatalities between January 2008 and December 2017
are different and are as follows:
◼ Navajo Boulevard crossing of BNSF Transcon in Holbrook: four incidents, four fatalities; currently
gates and lights: BNSF is planning work on this crossing
◼ San Francisco Street crossing the BNSF Transcon in Flagstaff: five incidents, three fatalities, one
injury; currently four quad gates and lights: FHWA has authorized funding for safety upgrades
consisting of installing an advance preemption system for four crossings along I-40B in Flagstaff. The
four crossings receiving this upgrade are: Beaver St, Ponderosa Pkwy, and Steve's Blvd in addition to
San Francisco St. Construction will begin within the month.
◼ 7th Avenue crossing the UPRR Sunset Route in Tucson: two incidents, two fatalities; gates and lights.
97 The advance preemption system is the communication between the ADOT traffic signal and the BNSF railroad control as
the train approaches the crossing. It signals one to the other up the line prior to a crossing.

A r i z o n a S t a t e R a i l P l a n
5—Rail Service and Investment Program P a g e | 5-1
Rail Service and Investment Program
This chapter describes Arizona’s Rail Service and Investment Program (RSIP). It includes the state’s (1)
rail vision, goals, and objectives and (2) potential rail projects.
VISION, GOALS, AND OBJECTIVES
ADOT has the position that Arizona’s existing vision, goals, and objectives continue to be operative with
additional objectives reflecting the plan outreach. Thus, the existing vision, goals, and objectives have
been re-adopted with the addition of several new objectives.
5.1.1 Arizona’s Rail Vision
Following is ADOT’s vision for the state’s rail system in 2035.
A safe, secure, efficient, and cost-effective passenger and freight rail network forms an integral part of Arizona’s multimodal transportation system. Arizona railroads promote economic opportunities and environmental sustainability that reflect the high value residents of Arizona place on their unique southwestern lifestyle. InterCity passenger rail, a new and reliable mode for Arizona residents, is well connected to commuter rail and local transit systems. Through coordinated land use decisions and wise investments in multimodal facilities, the state is now a showpiece of compact sustainable growth patterns served by an efficient and seamless transit system. Passenger rail has competitive travel times and is the preferred option for many trips both locally and regionally.
The state has a freight rail system that carries long-distance cargo in an energy-efficient manner, with intermodal connections that permit seamless distribution of local deliveries. A robust economy including a greater proportion of manufacturing and entrepreneurship industries is served by a freight system comprised of both Class I railroads and short line operations. The Sun Corridor has become a model megapolitan within the United States; the focused growth patterns have preserved much of the desert environment and promoted a lifestyle emulated by the rest of the country.
The multi-modal transportation system supporting the state has proven to be a key cornerstone of achieving an economy which supports all walks of life and has attracted employers to the state in new and exciting industries.
5.1.2 Arizona’s Rail Transportation System Goals
Drawing from the vision, the rail system has five goals:
◼ Improve mobility and accessibility: create a multi-modal transportation system where the existing
roadway network is complemented by efficient passenger and freight rail service.
A r i z o n a S t a t e R a i l P l a n
5-2 | P a g e 5. Rail Service and Investment Program
◼ Support economic growth: create a passenger rail network which fosters more livable communities
that attract new employers to the State, and help enhance the State’s global competitive position
through strategic freight rail initiatives.
◼ Promote sustainable transportation and land use coordination: develop a multi-modal
transportation system that enables a compact mixed use development pattern which becomes a
sustainable method for accommodating a growing population.
◼ Preserve the environment, natural and cultural resources: move people and freight in a socially and
environmentally responsible manner which will promote preservation of the State’s natural
environment.
◼ Provide safety and security: protect people, cargo, and infrastructure.
5.1.3 Arizona’s Rail Transportation System Objectives
Objectives have been defined for the state to meet its rail transportation goals (in bold). Following are
the objectives for each goal. Objectives not in the last plan are designated as “New.”
◼ Improve mobility and accessibility
▪ Develop safe, reliable and affordable transportation choices that strive to reduce highway
congestion, and leverage additional capacity on the State’s transportation system.
▪ Become a catalyst for smart growth community planning that includes multimodal connections
and choices, transit oriented development, and economic growth opportunities.
▪ Improve the efficiency of passenger and freight movements within the State, in partnership
with private carriers.
▪ Initiate efforts to preserve the existing rail network. (New)
▪ Support efforts to ensure passenger stations provide sufficient accessibility and connectivity for
all population groups. (New)
▪ Encourage efforts to upgrade rail lines to industry weight standards permitting use of efficient,
high capacity freight cars. (New)
▪ Explore opportunities for diversified, stable, and sufficient future funding for rail in the state.
(New)
◼ Support economic growth
▪ Support regional, tribal and local economic development plans, priorities, goals, and objectives.
▪ Support growth of traditional and non-traditional rail-related and rail-supported industries to
increase global competitiveness.
▪ Improve economic competitiveness through reliable and timely access to passenger rail
connections between economic and employment centers.
▪ Support rail projects to increase freight capacity and capabilities for growth industries and
regions within Arizona. (New)
▪ Investigate additional opportunities for rail service to benefit commerce. (New)
A r i z o n a S t a t e R a i l P l a n
5—Rail Service and Investment Program P a g e | 5-3
▪ Support rail freight access to smaller communities. (New)
▪ Promote the expansion of rail industrial access to improve connections to industrial or
commercial sites. (New)
◼ Promote sustainable transportation and land use coordination:
▪ Improve Arizona’s sustainability through coordination of rail transportation, land use, and
economic development planning activities.
▪ Encourage land use patterns connected by multiple modes of travel that support rail and
transit access and encourage pedestrian mobility, reduce energy consumption and greenhouse
gas emissions, improve air quality and promote public health.
▪ Foster collaboration between federal, State, regional and local public agencies to plan seamless
multimodal transportation system.
▪ Planning efforts related to new rail corridors or improvements to existing corridors should be
coordinated with local land use plans and the State Land Department conceptual plans to help
promote rail as a community asset.
▪ Encourage proactive smart growth land use planning for land adjacent to rail infrastructure
that does not conflict with freight rail operations. (New)
◼ Preserve the environment, natural and cultural resources
▪ Provide seamless and energy-efficient intermodal rail connections from origin to destination.
▪ Avoid degradation of existing environmental resources, wildlife habitat blocks and movement
corridors, and equitably mitigate impacts.
▪ Protect and maintain wildlife movement corridors.
▪ Promote rail as an environmentally friendly and sustainable alternative to other modes of
travel.
◼ Provide safety and security
▪ Enhance the safety of passenger movements and connections between major activity hubs
within the State and to the national passenger rail system.
▪ Strengthen the security of freight movements.
▪ Provide parallel or alternative transportation routes and services to facilitate emergency
access, including evacuation.
▪ • Promote energy security by reducing the state’s reliance on petroleum products, particularly
from foreign sources.
A r i z o n a S t a t e R a i l P l a n
5-4 | P a g e 5. Rail Service and Investment Program
STATEWIDE RAIL PERFORMANCE MEASURES
Performance metrics can serve as indicators to guide improvements to a rail system. The measures
point to needs or deficiencies of the rail network, gauge the success of improvement initiatives, or be
used to prioritize projects or initiatives. Generally, performance measures are linked to goals and
provide a means to evaluate whether these goals and objectives are being met.
As important in determining performance measures that are meaningful, is the availability and
timeliness of the performance data. Assembling information to support performance measures has a
cost reflecting the frequency of data collection and the difficulty in obtaining such data. Difficulty is
related to availability. Selected rail-related performance data are publicly available and, in many
instances, can be accessed over the Internet. However, other data are proprietary and are available only
with the agreement of private railroad companies. Some agencies require annual reports by railroads
operating in their states to obtain information systematically about their respective systems.
5.2.1 Representative Performance Measures
Table 5-1 presents several potential statewide performance measures that could measure progress
toward Arizona rail transportation system goals. Some of these could be developed using publicly
available information sources, while others would require periodic questionnaires to railroads.
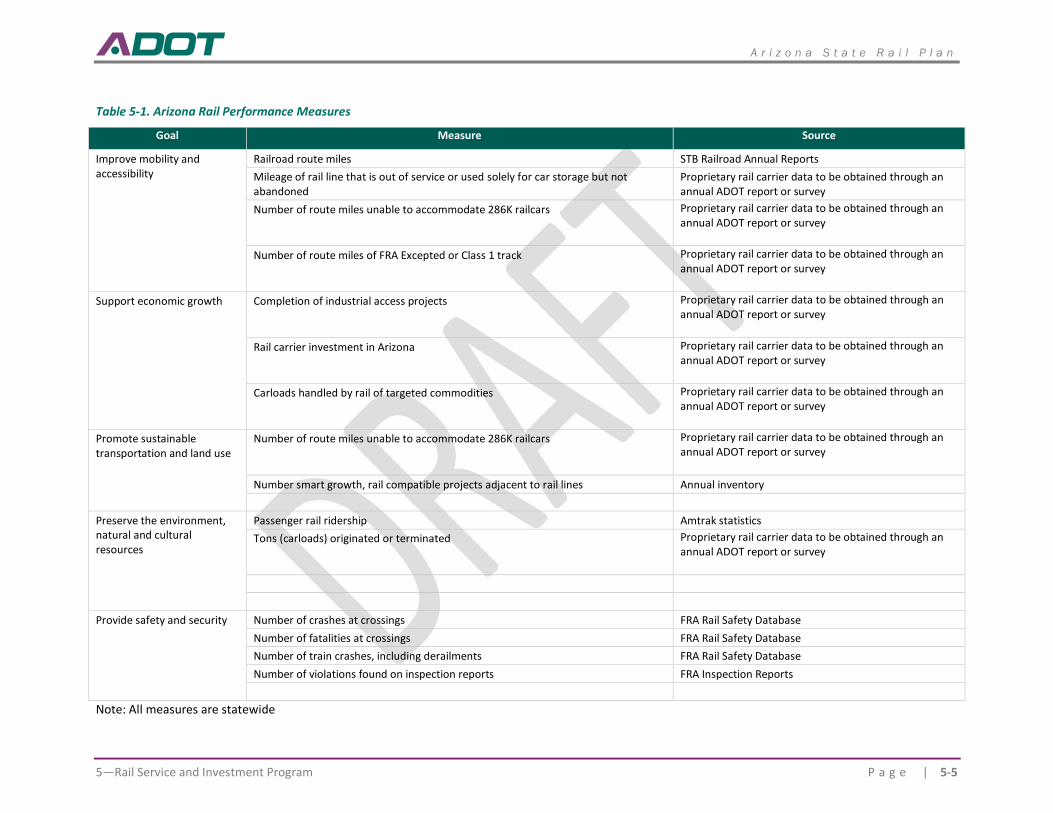
A r i z o n a S t a t e R a i l P l a n
5—Rail Service and Investment Program P a g e | 5-5
Table 5-1. Arizona Rail Performance Measures
Goal Measure Source
Improve mobility and accessibility
Railroad route miles STB Railroad Annual Reports
Mileage of rail line that is out of service or used solely for car storage but not abandoned
Proprietary rail carrier data to be obtained through an annual ADOT report or survey
Number of route miles unable to accommodate 286K railcars Proprietary rail carrier data to be obtained through an annual ADOT report or survey
Number of route miles of FRA Excepted or Class 1 track Proprietary rail carrier data to be obtained through an annual ADOT report or survey
Support economic growth Completion of industrial access projects Proprietary rail carrier data to be obtained through an annual ADOT report or survey
Rail carrier investment in Arizona Proprietary rail carrier data to be obtained through an annual ADOT report or survey
Carloads handled by rail of targeted commodities Proprietary rail carrier data to be obtained through an annual ADOT report or survey
Promote sustainable transportation and land use
Number of route miles unable to accommodate 286K railcars Proprietary rail carrier data to be obtained through an annual ADOT report or survey
Number smart growth, rail compatible projects adjacent to rail lines Annual inventory
Preserve the environment, natural and cultural resources
Passenger rail ridership Amtrak statistics
Tons (carloads) originated or terminated Proprietary rail carrier data to be obtained through an annual ADOT report or survey
Provide safety and security Number of crashes at crossings FRA Rail Safety Database
Number of fatalities at crossings FRA Rail Safety Database
Number of train crashes, including derailments FRA Rail Safety Database
Number of violations found on inspection reports FRA Inspection Reports
Note: All measures are statewide
A r i z o n a S t a t e R a i l P l a n
5-6 | P a g e 5. Rail Service and Investment Program
RAIL INVESTMENT PROJECTS OF INTEREST
Arizona’s rail investment program comprises a handful of projects. Other than the Class I railroads,
which have historically The proscription on the state investing in privately owned assets has somewhat
constrained rail investment in the state. While the two major railroads, BNSF and UPRR, have invested in
their transcontinental lines, the short line railroads have less so, a trend that is likely to continue.
Arizona’s RSIP projects follow in Table 5-2.
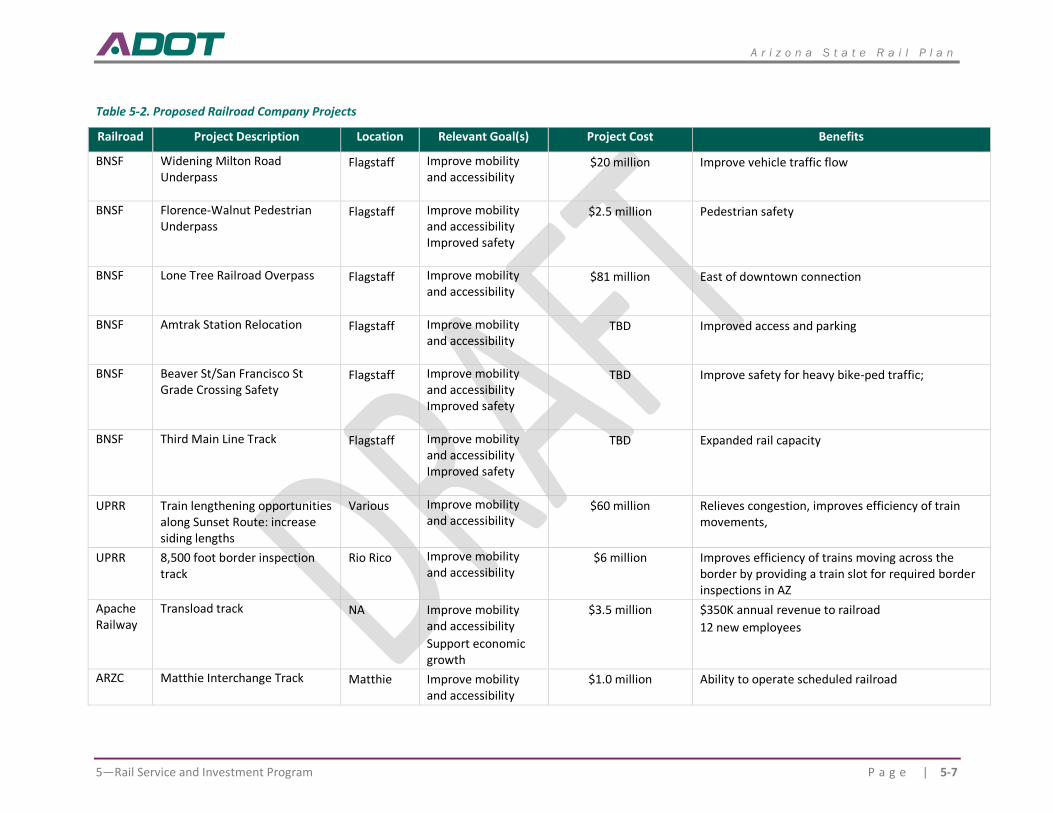
A r i z o n a S t a t e R a i l P l a n
5—Rail Service and Investment Program P a g e | 5-7
Table 5-2. Proposed Railroad Company Projects
Railroad Project Description Location Relevant Goal(s) Project Cost Benefits
BNSF Widening Milton Road Underpass
Flagstaff Improve mobility and accessibility
$20 million Improve vehicle traffic flow
BNSF Florence-Walnut Pedestrian Underpass
Flagstaff Improve mobility and accessibility Improved safety
$2.5 million Pedestrian safety
BNSF Lone Tree Railroad Overpass Flagstaff Improve mobility and accessibility
$81 million East of downtown connection
BNSF Amtrak Station Relocation Flagstaff Improve mobility and accessibility
TBD Improved access and parking
BNSF Beaver St/San Francisco St Grade Crossing Safety
Flagstaff Improve mobility and accessibility Improved safety
TBD Improve safety for heavy bike-ped traffic;
BNSF Third Main Line Track Flagstaff Improve mobility and accessibility Improved safety
TBD Expanded rail capacity
UPRR Train lengthening opportunities along Sunset Route: increase siding lengths
Various Improve mobility and accessibility
$60 million Relieves congestion, improves efficiency of train movements,
UPRR 8,500 foot border inspection track
Rio Rico Improve mobility and accessibility
$6 million Improves efficiency of trains moving across the border by providing a train slot for required border inspections in AZ
Apache Railway
Transload track NA Improve mobility and accessibility
Support economic growth
$3.5 million $350K annual revenue to railroad
12 new employees
ARZC Matthie Interchange Track Matthie Improve mobility and accessibility
$1.0 million Ability to operate scheduled railroad
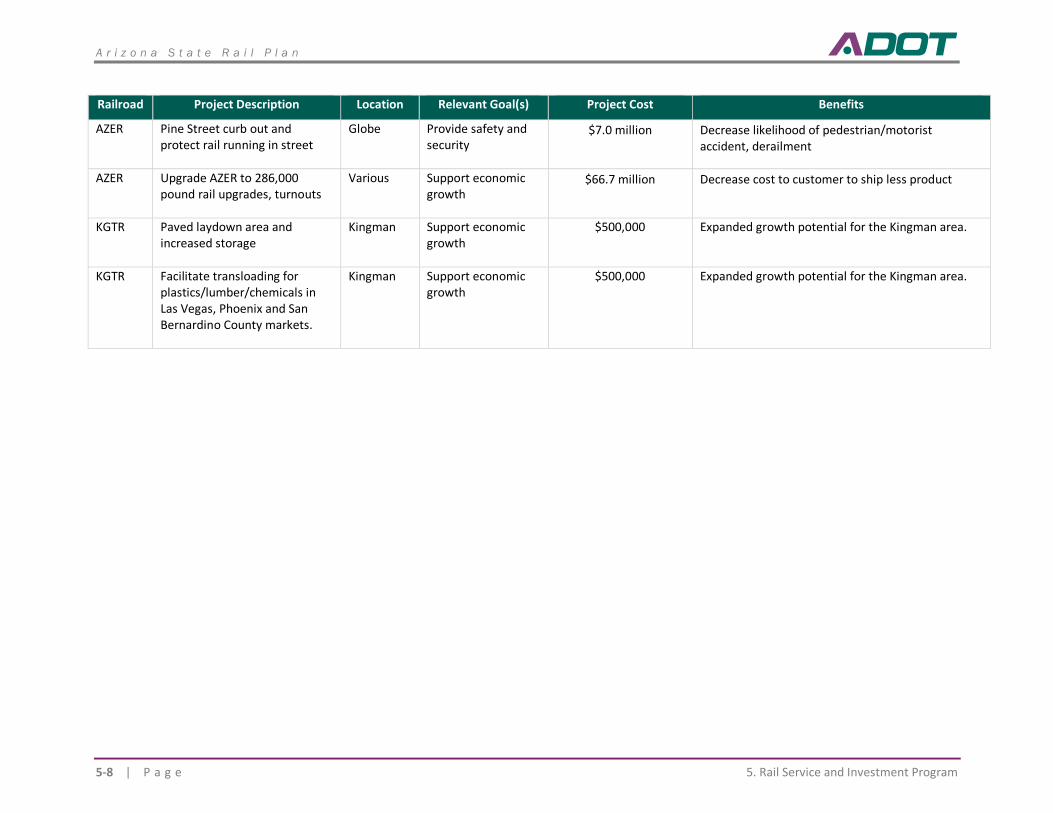
A r i z o n a S t a t e R a i l P l a n
5-8 | P a g e 5. Rail Service and Investment Program
Railroad Project Description Location Relevant Goal(s) Project Cost Benefits
AZER Pine Street curb out and protect rail running in street
Globe Provide safety and security
$7.0 million Decrease likelihood of pedestrian/motorist accident, derailment
AZER Upgrade AZER to 286,000 pound rail upgrades, turnouts
Various Support economic growth
$66.7 million Decrease cost to customer to ship less product
KGTR Paved laydown area and increased storage
Kingman Support economic growth
$500,000 Expanded growth potential for the Kingman area.
KGTR Facilitate transloading for plastics/lumber/chemicals in Las Vegas, Phoenix and San Bernardino County markets.
Kingman Support economic growth
$500,000 Expanded growth potential for the Kingman area.
A r i z o n a S t a t e R a i l P l a n
5—Rail Service and Investment Program P a g e | 5-10
STATE RAIL PLAN IMPACTS
The completion of these projects will have several positive impacts:
◼ Rail Capacity: Capacity will be increased by both permitting the operation of larger freight cars and
allowing higher train speeds.
◼ Transportation System Capacity: Most of the projects could divert freight or passengers to rail,
which could increase available capacity of other modes, particularly highway.
◼ Transportation System Congestion Relief: Because the projects will remove freight from highways,
available highway capacity will increase.
◼ Transportation System Safety: Grade-separation projects will eliminate vehicle-train crashes as well
as fatalities from pedestrians being struck by trains while crossing tracks. Grade separations also
eliminate blocked crossings that interfere with emergency vehicles.
◼ Environmental: Rail transportation is a relatively fuel and environmentally efficient mode of
transportation, so diverting to freight will reduce emissions and fuel consumption.
◼ Economic Efficiency: The proposed projects will reduce rail operating costs to the potential benefit
of rail shippers.
◼ Employment: Rail can attract and/or retain existing employers and thereby boost employment
within Arizona. Many of the initiatives and projects of this SRP will boost job creation.