arizona/new mexico mountains ecoregion
TRANSCRIPT

Chapter 10
Arizona/New Mexico Mountains Ecoregion
Chihuahuan Deserts Ecoregions; to the north, the ecoregion is both bounded and surrounded by the Arizona/New Mexico Plateau Ecoregion (fig. 1). The ecoregion encompasses the largest contiguous ponderosa pine (Pinus ponderosa) forest in the United States (Strom and Fulé, 2007), which stretches from Williams, Arizona, along the Mogollon Rim, Arizona, into southwestern New Mexico, north and west of Silver City, New Mexico.
By Jana Ruhlman, Leila Gass, and Barry Middleton
Ecoregion Description
As the name suggests, the Arizona/New Mexico Moun-tains Ecoregion includes much of the mountainous regions of these two states, plus a very small part in the Guadalupe Mountains of northwestern Texas. Several isolated areas of higher terrain in Arizona and New Mexico are also included in the ecoregion, which occupies approximately 108,432 km2 (41,866 mi2) (Omernik, 1987; U.S. Environmental Protec-tion Agency, 1997). The ecoregion is bounded on the south by the Sonoran Basin and Range, Madrean Archipelago, and
Status and Trends of Land Change in the Western United States—1973 to 2000 Edited by Benjamin M. Sleeter, Tamara S. Wilson, and William Acevedo U.S. Geological Survey Professional Paper 1794–A, 2012
Figure 1. Map of Arizona/New Mexico Mountains Ecoregion and surrounding ecoregions, showing land-use/land-cover classes from 1992 National Land Cover Dataset (Vogelmann and others, 2001); note that not all land-use/land-cover classes shown in explanation may be depicted on map; note also that, for this “Status and Trends of Land Change” study, transitional land-cover class was subdivided into mechanically disturbed and nonmechanically disturbed classes. Squares indicate locations of 10 x 10 km sample blocks analyzed in study. Index map shows locations of geographic features mentioned in text. Abbreviations for Western United States ecoregions are listed in appendix 2. Also shown on map is part of one Great Plains Ecoregion, Southwestern Tablelands (SWT). See appendix 3 for definitions of land-use/land-cover classifications.
Arizona/New Mexico
Plateau
ChihuahuanDesert
SouthernRockies
SouthernRockies
Colorado Plateaus
MadreanArchipelago
Sonoran Basin and Range
SWT
MBR
M E X I C O
106°108°110°112°
36°
34°
32°
0 50 100 150 MILES
0 50 100 150 KILOMETERS
A R I Z O N A
TEXAS
UTAHC O L O R A D O
N E W M E X I C O
Coconino Co.
WilliamsFlagstaff
Sedona
PaysonPrescott
Prescott Valley
Silver City
Mule CreekMorenci
Tyrone
Salt River
Rio
Gra
n de
GRAND CANYON NP
GUADALUPEMTNS
San Francisco Mtn
MO
GO
L L ON
RI M
Gila Riv er
L ittle C olora do River
Mimbres R.
Verde River
Ecoregion boundary
Sample block (10 x 10 km)
Forest
Grassland/Shrubland
Agriculture
Wetland
Ice/Snow
Land-use/land-cover class
Water
Developed
Transitional
Mining
Barren
EXPLANATION

114 Status and Trends of Land Change in the Western United States—1973 to 2000
The mountains of the Arizona/New Mexico Mountains Ecoregion are lower in elevation than neighboring mountain-ous ecoregions and have vegetation indicative of drier, warmer climates (U.S. Environmental Protection Agency, 2002). Semi-arid grassland, chaparral, and pinyon-juniper (Pinus spp. and Juniperus spp.) and oak woodlands (Quercus spp.) grow in the lower elevations. Ponderosa pines dominate the higher eleva-tions, along with Douglas-fir (Pseudotsuga menziesii), Engel-mann spruce (Picea engelmannii), and even alpine tundra atop the highest mountain peaks (fig. 2). San Francisco Mountain (known locally as the “San Francisco Peaks”), Arizona, is the most prominent (and highest) point of the ecoregion, at
3,851 m (12,633 ft). The wide variety of topography results in annual precipitation averages that range from 182 mm (7 in) to 1,293 mm (51 in), in the form of both rain and snow (Daly and others, 2002). Melting snow and summer monsoonal rains feed the headwaters of several river systems within the ecoregion, including the Verde, Salt, Gila, and Little Colorado Rivers in Arizona and the Mimbres River in New Mexico. Average temperatures vary greatly by season and along eleva-tion gradients but range from −18°C during the winter months in the highest elevations to more than 38°C during the summer months in the lowest elevations.
Flagstaff, Arizona, is the largest urban area, with a 2000 population of 52,894. Numerous smaller communities exist throughout the ecoregion: Prescott, Prescott Valley, Payson, and Sedona, Arizona, are the only communities that have greater than 10,000 residents (U.S. Census Bureau, 2000). A large part of the conifer forests are on federal (mainly U.S. Forest Service) or tribal lands, and they provide a valuable resource for timber harvesting and livestock grazing, as well as tourism and outdoor recreation. Almost all public land in the ecoregion other than forest is leased for grazing (Arizona Game and Fish Department, 2006), and all eight national forests in the ecoregion sell saw timber and other tree prod-ucts. Mining is an important contributor to the economy of towns along the southern border of the ecoregion, with major operating copper mines in Morenci, Arizona, and Tyrone, New Mexico. Two sizeable copper mines are also located just outside the ecoregion boundary (Freeport-McMoRan Copper and Gold, 2009). The popularity of the cool mountain coun-try with easy access to the hotter deserts brings millions of visitors to the region to enjoy hiking, camping, skiing, fishing, and hunting, and many towns in the ecoregion rely on tourism for their local economy. Grand Canyon National Park, located in Coconino County, Arizona, in the northwestern part of the ecoregion, receives approximately 3.3 million visitors each year (U.S. Forest Service, 2008).
Contemporary Land-Cover Change (1973 to 2000)
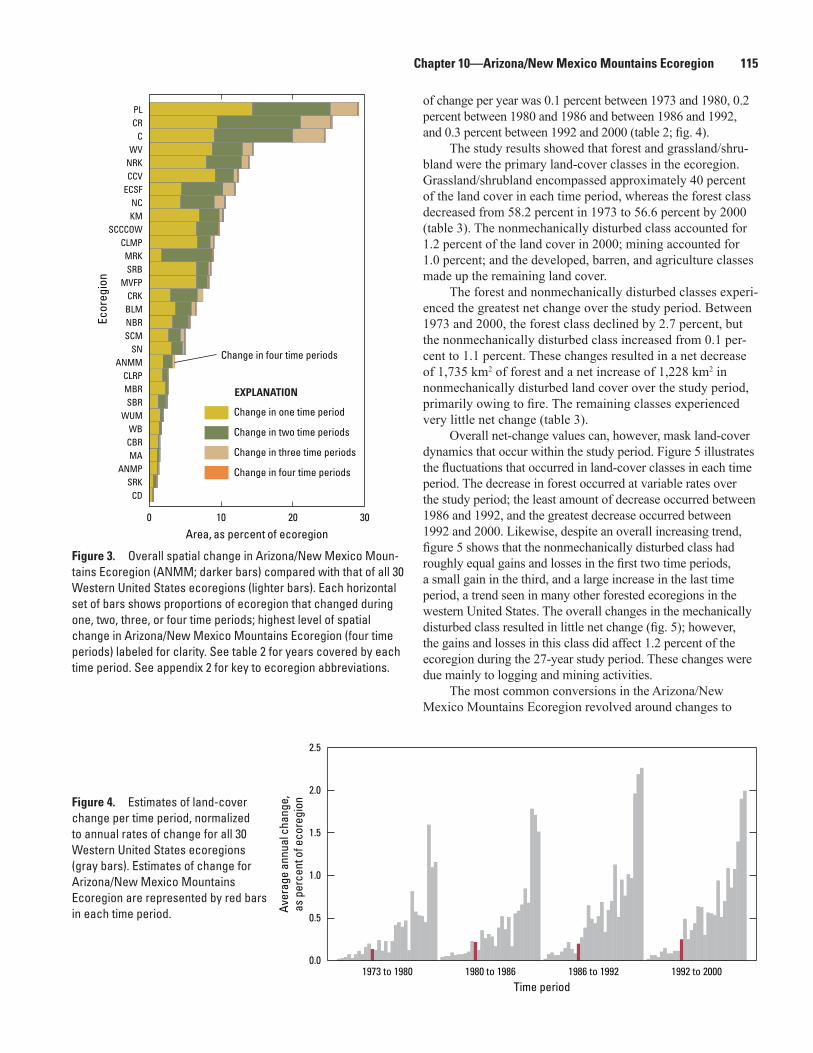
As measured by the project methodology, the Arizona/New Mexico Mountains Ecoregion experienced little land-cover change during the study period (fig. 3). An estimated 3.5 percent of the ecoregion (3,806 km2) changed land cover during the study period: 2.0 percent of the ecoregion changed only once, 1.3 percent changed twice, and 0.2 percent changed three times (table 1). Compared to other western United States ecoregions, change in the Arizona/New Mexico Mountains Ecoregion was low but not as low as the more arid ecoregions of the Southwest (figs. 3,4).
Estimated change in land cover per time period varied from 0.9 percent (1973–1980) to 2.0 percent (1992–2000). When the change estimates were normalized to account for the varying lengths of time between satellite imagery dates, the average rate
Figure 2. Various vegetation zones of Arizona/New Mexico Mountains Ecoregion. A, Ponderosa pine forest in Tonto National Forest, central Arizona. B, Pinyon-juniper woodland on Fort Apache Reservation, eastern Arizona. C, Grassland near Mule Creek, New Mexico.
AA
B
C
A
Chapter 10—Arizona/New Mexico Mountains Ecoregion 115
of change per year was 0.1 percent between 1973 and 1980, 0.2 percent between 1980 and 1986 and between 1986 and 1992, and 0.3 percent between 1992 and 2000 (table 2; fig. 4).
The study results showed that forest and grassland/shru-bland were the primary land-cover classes in the ecoregion. Grassland/shrubland encompassed approximately 40 percent of the land cover in each time period, whereas the forest class decreased from 58.2 percent in 1973 to 56.6 percent by 2000 (table 3). The nonmechanically disturbed class accounted for 1.2 percent of the land cover in 2000; mining accounted for 1.0 percent; and the developed, barren, and agriculture classes made up the remaining land cover.
The forest and nonmechanically disturbed classes experi-enced the greatest net change over the study period. Between 1973 and 2000, the forest class declined by 2.7 percent, but the nonmechanically disturbed class increased from 0.1 per-cent to 1.1 percent. These changes resulted in a net decrease of 1,735 km2 of forest and a net increase of 1,228 km2 in nonmechanically disturbed land cover over the study period, primarily owing to fire. The remaining classes experienced very little net change (table 3).
Overall net-change values can, however, mask land-cover dynamics that occur within the study period. Figure 5 illustrates the fluctuations that occurred in land-cover classes in each time period. The decrease in forest occurred at variable rates over the study period; the least amount of decrease occurred between 1986 and 1992, and the greatest decrease occurred between 1992 and 2000. Likewise, despite an overall increasing trend, figure 5 shows that the nonmechanically disturbed class had roughly equal gains and losses in the first two time periods, a small gain in the third, and a large increase in the last time period, a trend seen in many other forested ecoregions in the western United States. The overall changes in the mechanically disturbed class resulted in little net change (fig. 5); however, the gains and losses in this class did affect 1.2 percent of the ecoregion during the 27-year study period. These changes were due mainly to logging and mining activities.
The most common conversions in the Arizona/New Mexico Mountains Ecoregion revolved around changes to
Figure 3. Overall spatial change in Arizona/New Mexico Moun-tains Ecoregion (ANMM; darker bars) compared with that of all 30 Western United States ecoregions (lighter bars). Each horizontal set of bars shows proportions of ecoregion that changed during one, two, three, or four time periods; highest level of spatial change in Arizona/New Mexico Mountains Ecoregion (four time periods) labeled for clarity. See table 2 for years covered by each time period. See appendix 2 for key to ecoregion abbreviations.
Figure 4. Estimates of land-cover change per time period, normalized to annual rates of change for all 30 Western United States ecoregions (gray bars). Estimates of change for Arizona/New Mexico Mountains Ecoregion are represented by red bars in each time period.
0 10 20 30
Area, as percent of ecoregion
CDSRK
ANMPMA
CBRWB
WUMSBR
MBRCLRP
ANMMSN
SCMNBRBLMCRK
MVFPSRBMRK
CLMPSCCCOW
KMNC
ECSFCCVNRKWV
CCRPL
Ecor
egio
n
EXPLANATION
Change in one time period
Change in two time periods
Change in three time periods
Change in four time periods
Change in four time periods
0.5
0.0
1.0
1.5
2.0
2.5
1973 to 1980 1980 to 1986 1986 to 1992 1992 to 2000
Aver
age
annu
al c
hang
e,as
per
cent
of e
core
gion
Time period

116 Status and Trends of Land Change in the Western United States—1973 to 2000
the forest resulting from both mechanical and nonmechani-cal disturbances (table 4). These conversions, which were the result of both timber harvesting and wildland fires, occasion-ally involved grassland/shrubland as an intermediary land cover between the disturbance and the reforestation. Regenera-tion after disturbance was captured in one of two ways. If the disturbance was due to thinning, or to a moderate fire that did not destroy the majority of trees, then, in the next classifica-tion year, the land might revert directly to forest. However, if clearcutting or severe fire had eliminated the forest, then the next mapped class would usually be grassland/shrubland. More time would be needed for the grassland/shrubland to eventually revert to forest.
The main story of land-cover change in the Arizona/New Mexico Mountains Ecoregion involves its forests and the changes that occurred from both natural and human-caused disturbances. Changes in the nonmechanically disturbed land-cover class were the result of frequent fire (both lightning- and human-caused), which historically has been a major driver of change in this ecoregion (fig. 6). As of 2005, Coconino National Forest had averaged 501 wildfires per year (U.S. For-est Service, 2005). Dry summer thunderstorms in the forests of Arizona and New Mexico result in a high incidence of
lightning strikes, causing the highest average annual number of lightning-caused fires in the nation (Stephens, 2005).
Frequent, low-intensity fires that moved along the ground were part of the evolutionary history of ponderosa pine forests until the early 1900s, but the effects of heavy grazing in the forests, coupled with aggressive fire suppression, have resulted in the unnaturally high tree densities and heavy loads of accumulated fuels that have led to the high-risk fire conditions that exist today (Great Flagstaff Forests Partnership, 2009). These factors may have contributed to the increasing trend in the nonmechanically disturbed class observed in this study. Currently, concerns over insect infestation and catastrophic wildfire events have resulted in ongoing hazardous-fuel–reduction projects (thinning and prescribed burning) through-out the national forests in the ecoregion, which will reduce fuel loads and promote forest health. Success of these methods may eventually reduce the growing number of acres lost to catastrophic wildland fires each year within the ecoregion.
Timber harvesting, either through clearcutting or thin-ning, accounted for the majority of change in the mechanically disturbed land-cover class. Since 1908, the U.S. Forest Service has been tracking the sale of timber from forests in Arizona and New Mexico. The U.S. Forest Service data correlate with the results of this study, which show that harvests increased between 1973 and 1980 and between 1980 and 1986, and they decreased between 1982 and 1992 and between 1992 and 2000 (Paul Fink, U.S. Forest Service, written commun., 2009; see also, fig. 5). Harvests began to decline in 1990 owing to changes in timber-management practices, environ-mental concerns, and the lack of large, profitable trees to cut (Kelley, 1998). In 1986, the U.S. Forest Service sold the rights to nearly 447 million board feet of timber in Arizona and New Mexico forests, which corresponded to the logging peak within the study period. In 2000, this number dropped to below 69 million board feet of timber (Paul Fink, U.S. Forest Service, written commun., 2009). The small towns within the
Figure 5. Normalized average net change in Arizona/New Mexico Mountains Ecoregion by time period for each land-cover class. Bars above zero axis represent net gain, whereas bars below zero represent net loss. Note that not all land-cover classes shown in explanation may be represented in figure. See appendix 3 for definitions of land-use/land-cover classifications.
−2
−1
0
1
2
1973–1980 1980–1986 Time period
1986–1992 1992–2000
Are
a ch
ange
d, a
s pe
rcen
t of e
core
gion
Water
Developed
Mechanically disturbed
Mining
Barren
Forest
Grassland/Shrubland
Agriculture
Wetland
Nonmechanically disturbed
Ice/Snow
EXPLANATION
LAND-USE/LAND-COVER CLASS
Figure 6. Aftermath of fire in Coconino National Forest, north of Flagstaff, Arizona, which occurred between 1992 and 2000. Photograph taken in June 2007.

Chapter 10—Arizona/New Mexico Mountains Ecoregion 117
ecoregion that relied on timber were severely impacted by these decreases, increasing the importance of tourism to their economies (Kelley, 1998).
Historically, logging and frequent forest fires have been major drivers of land-cover change within this ecoregion, and they will both likely continue to impact the cycle of change within the forests. Although the populations of the main cities and towns in the ecoregion continue to increase, many of these population centers are bounded by public lands unavailable to urbanization. Coupled with the fact that nearly 80 percent of the ecoregion is managed public and tribal lands, land-cover change in the Arizona/New Mexico Mountain Ecoregion is likely to remain low.
Table 1. Percentage of Arizona/New Mexico Mountains Ecoregion land cover that changed at least one time during study period (1973–2000) and associated statistical error.
[Most sample pixels remained unchanged (96.5 percent), whereas 3.5 percent changed at least once throughout study period]
Numberof
changes
Percentof
ecoregion
Marginof error(+/− %)
Lowerbound
(%)
Upperbound
(%)
Standarderror(%)
Relativeerror(%)
1 2.0 0.9 1.1 2.8 0.6 29.82 1.3 0.7 0.6 2.0 0.5 34.93 0.2 0.2 0.0 0.4 0.1 72.64 0.0 0.0 0.0 0.1 0.0 73.0
Overall spatial change
3.5 1.5 2.0 5.0 1.0 28.3
Table 2. Raw estimates of change in Arizona/New Mexico Mountains Ecoregion land cover, computed for each of four time periods between 1973 and 2000, and associated error at 85-percent confidence level.
[Estimates of change per period normalized to annual rate of change for each period]
Period Total change(% of ecoregion)
Margin of error
(+/− %)
Lower bound
(%)
Upper bound
(%)
Standard error(%)
Relative error(%)
Average rate
(% per year)Estimate of change, in percent stratum
1973–1980 0.9 0.6 0.3 1.5 0.4 46.1 0.11980–1986 1.3 0.7 0.5 2.0 0.5 39.2 0.21986–1992 1.1 0.6 0.6 1.7 0.4 34.1 0.21992–2000 2.0 0.9 1.1 2.9 0.6 31.1 0.3
Estimate of change, in square kilometers1973–1980 995 676 319 1,671 459 46.1 1421980–1986 1,373 793 581 2,166 538 39.2 2291986–1992 1,237 622 616 1,859 422 34.1 2061992–2000 2,171 995 1,177 3,166 676 31.1 271

118 Status and Trends of Land Change in the Western United States—1973 to 2000
Table 3. Estimated area (and margin of error) of each land-cover class in Arizona/New Mexico Mountains Ecoregion, calculated five times between 1973 and 2000. See appendix 3 for definitions of land-cover classifications.
Water Developed Mechanically disturbed Mining Barren Forest Grassland/
Shrubland Agriculture WetlandNon-
mechanically disturbed
% +/− % +/− % +/− % +/− % +/− % +/− % +/− % +/− % +/− % +/−
Area, in percent stratum1973 0.0 0.0 0.4 0.3 0.0 0.0 0.8 1.1 0.1 0.1 58.2 8.5 39.9 8.3 0.4 0.3 0.0 0.0 0.1 0.11980 0.1 0.1 0.4 0.3 0.1 0.1 0.8 1.2 0.1 0.1 57.7 8.5 39.7 8.3 0.5 0.4 0.0 0.0 0.5 0.61986 0.0 0.0 0.4 0.3 0.4 0.4 0.9 1.3 0.1 0.1 57.5 8.4 40.1 8.3 0.5 0.3 0.0 0.0 0.0 0.01992 0.1 0.1 0.4 0.3 0.2 0.3 0.9 1.3 0.1 0.1 57.5 8.4 40.0 8.3 0.4 0.3 0.0 0.0 0.2 0.22000 0.0 0.0 0.4 0.3 0.0 0.0 1.0 1.4 0.1 0.1 56.6 8.3 40.1 8.2 0.4 0.2 0.0 0.0 1.2 0.8
Netchange 0.0 0.0 0.1 0.0 0.0 0.0 0.2 0.3 0.0 0.0 − 1.6 1.0 0.2 0.6 − 0.1 0.1 0.0 0.0 1.1 0.8
Grosschange 0.2 0.3 0.1 0.0 1.2 1.0 0.2 0.3 0.0 0.0 3.0 1.5 1.8 0.9 0.3 0.3 0.0 0.0 2.6 1.7
Area, in square kilometers1973 25 16 391 313 2 3 855 1,227 146 152 63,129 9,265 43,260 9,033 476 315 39 47 109 1481980 112 107 418 314 123 124 898 1,287 149 152 62,609 9,170 43,042 9,033 557 392 34 46 490 6201986 52 41 426 314 398 396 978 1,402 149 152 62,386 9,151 43,450 8,949 545 377 35 45 13 141992 79 62 448 317 268 309 1,022 1,463 156 152 62,334 9,119 43,383 8,957 482 306 49 49 211 2042000 36 29 475 323 25 36 1,078 1,532 152 152 61,395 8,972 43,502 8,932 384 250 48 52 1,337 879
Netchange 11 17 84 50 23 36 223 306 6 7 − 1,735 1,092 242 634 − 92 135 9 7 1,228 896
Grosschange 231 280 84 50 1,346 1,076 223 306 33 25 3,208 1,651 1,981 1,012 277 354 29 31 2,801 1,879

Chapter 10—Arizona/New Mexico Mountains Ecoregion 119
Table 4. Principal land-cover conversions in Arizona/New Mexico Mountains Ecoregion, showing amount of area changed (and margin of error, calculated at 85-percent confidence level) for each conversion during each of four time periods and also during overall study period. See appendix 3 for definitions of land-cover classifications.
[Values given for “other” class are combined totals of values for other land-cover classes not listed in that time period. Abbreviations: n/a, not applicable]
Period From class To classArea
changedMargin of
errorStandard
error Percent of ecoregion
Percent of all changes
(km2) (+/− km2) (km2)
1973–1980 Forest Nonmechanically disturbed 445 563 382 0.4 44.7Forest Mechanically disturbed 121 122 83 0.1 12.1Grassland/Shrubland Water 83 101 68 0.1 8.4Grassland/Shrubland Agriculture 83 110 75 0.1 8.3Nonmechanically disturbed Grassland/Shrubland 55 71 48 0.1 5.5Other Other 209 n/a n/a 0.2 21.0
Totals 995 0.9 100.01980–1986 Nonmechanically disturbed Grassland/Shrubland 485 620 421 0.4 35.3
Forest Mechanically disturbed 398 396 269 0.4 29.0Grassland/Shrubland Forest 162 203 138 0.1 11.8Mechanically disturbed Grassland/Shrubland 91 93 63 0.1 6.6Grassland/Shrubland Mining 69 100 68 0.1 5.0Other Other 169 n/a n/a 0.2 12.3
Totals 1,373 1.3 100.01986–1992 Mechanically disturbed Forest 306 368 250 0.3 24.7
Forest Mechanically disturbed 265 306 208 0.2 21.4Forest Nonmechanically disturbed 207 204 138 0.2 16.7Grassland/Shrubland Forest 120 125 85 0.1 9.7Mechanically disturbed Grassland/Shrubland 91 117 79 0.1 7.3Other Other 249 n/a n/a 0.2 20.1
Totals 1,237 1.1 100.01992–2000 Forest Nonmechanically disturbed 1,295 844 573 1.2 59.7
Mechanically disturbed Forest 262 305 207 0.2 12.1Nonmechanically disturbed Grassland/Shrubland 168 190 129 0.2 7.7Agriculture Grassland/Shrubland 97 123 84 0.1 4.5Grassland/Shrubland Forest 82 105 71 0.1 3.8Other Other 268 n/a n/a 0.2 12.3
Totals 2,171 2.0 100.0
1973–2000(overall)
Forest Nonmechanically disturbed 1,955 1,262 857 1.8 33.8Forest Mechanically disturbed 808 624 424 0.7 14.0Nonmechanically disturbed Grassland/Shrubland 714 662 450 0.7 12.4Mechanically disturbed Forest 600 548 372 0.6 10.4Grassland/Shrubland Forest 382 336 228 0.4 6.6Other Other 1,317 n/a n/a 1.2 22.8
Totals 5,777 5.3 100.0

120 Status and Trends of Land Change in the Western United States—1973 to 2000
References Cited
Arizona Game and Fish Department, 2006, Arizona-New Mex-ico Mountains—Arizona’s Comprehensive Wildlife Conser-vation Strategy; 2005-2015: Arizona Game and Fish Depart-ment, accessed February 16, 2007, at http://www.azgfd.gov/pdfs/w_c/cwcs/downloads/Section7Arizona-NewMexico.pdf.
Daly, C., Gibson, W., and Taylor, G., 2002, 103-year high-resolution precipitation climate data set for the contermi-nous United States: Corvallis, Oregon State University, The PRISM Climate Group database, accessed May 12, 2009, at http://www.prism.oregonstate.edu.
Freeport-McMoRan Copper and Gold, 2009, Worldwide operations—North America: Freeport-McMoRan Copper and Gold database, accessed April 29, 2009, at http://www.fcx.com/operations/northamerica.htm.
Greater Flagstaff Forests Partnership, 2009, History of deg-radation of southwestern ponderosa pine forests: Greater Flagstaff Forests Partnership database, accessed April 17, 2009, at http://www.gffp.org/pine/history.htm.
Kelley, Matt, 1998, Environmental challenges, economics cut state logging: Tucson, Arizona, The Associated Press, in The Arizona Daily Star, July 5, 1998.
Omernik, J.M., 1987, Ecoregions of the conterminous United States: Annals of the Association of American Geographers, v. 77, no. 1, p. 118–125.
Stephens, Scott L., 2005, Forest fire causes and extent on United States Forest Service lands: International Journal of Wildland Fire, v. 14, p. 213–222, accessed May 12, 2009, at http://www.cnr.berkeley.edu/stephens-lab/Publications/Stephens%20USFS%20fire%20stats%20IJWF%2005.pdf.
Strom, B., and Fulé, P., 2007, Pre-wildfire fuel treatments affect long-term ponderosa pine forest dynamics: Interna-tional Journal of Wildland Fire, v. 16, no. 1, p. 128–138.
U.S. Census Bureau, 2000, U.S. Census 2000: U.S. Depart-ment of Commerce database, accessed April 29, 2009, at http://factfinder.census.gov.
U.S. Environmental Protection Agency, 1997, Descrip-tions of level III ecological regions for the CEC report on ecological regions of North America: U.S. Environmental Protection Agency database, accessed April 12, 2006, at http://www.epa.gov/wed/pages/ecoregions/na_eco.htm#Downloads.
U.S. Forest Service, Coconino National Forest, 2005, Coconino National Forest Fire Management Plan 2005: U.S. Forest Service, accessed April 17, 2009, at http://www.fs.usda.gov/detail/coconino/landmanagement/planning/?cid=stelprdb5334653.
U.S. Forest Service, Coconino National Forest, 2008, 2008 Stakeholders Report: U.S. Forest Service, Coconino National Forest, accessed June 19, 2009, at http://www.fs.usda.gov/Internet/FSE_DOCUMENTS/stelprdb5340530.pdf.
Vogelmann, J.E., Howard, S.M., Yang, L., Larson, C.R., Wylie, B.K., and van Driel, N., 2001, Completion of the 1990s National Land Cover Data Set for the conterminous United States from Landsat Thematic Mapper data and ancillary data sources: Photogrammetric Engineering & Remote Sensing, v. 67, p. 650–662.