contents - who | world health organization
TRANSCRIPT


La Revue de Santé dela Méditerranée orientale
Eastern MediterraneanHealth Journal
ContentsLetter from the Editor .........................................................................................................................................................................................................................................................................................................................S3Message from the WHO Regional Director for the Eastern Mediterranean .............................................................................................................................................................S4
N. Abid, O. U. Islam, A. Bosan, T. Iqbal,A. Darwish and K. M. Bile ..................................................................................................................................................................................................................S5
H. Qureshi, K.M. Bile, R . Jooma, S.E. Alam and H.U.R . Afridi ..............................................................................................................................................................................................................................
K.M. Bile, J.A. Shaikh, H.U.R . Afridi and Y. Khan .........................................................................................................................................................................................................................................................
Q. Hasan, A.H. Bosan and K.M. Bile ......................................................................................................................................................................................................................................................................................
A.F. Shadoul, F. Akhtar and K.M. Bile ....................................................................................................................................................................................................................................................................................S39
P. Metzger, N.A. Baloch, G.N. Kazi and K.M. Bile .........................................................................................................................................................................................................................................................S47
Q. Kakar, M. A. Khan and K. M. Bile ...................................................................................................................................................................................................................................................................................S54
A.A. Khan, N. Khan, K.M. Bile and H. Awan ..................................................................................................................................................................................................................................................................
M.Z.A. Khan, B.M. Kazi, K.M. Bile, M. Magan and J.A. Nasir ..........................................................................................................................................................................................................................
H.R . Rathor, A. Mnzava, K.M. Bile, A. Hafeez and S. Zaman ..............................................................................................................................................................................................................................
K .M. Bile, A .F. Shadoul, H. Raaijmakers, S. Altaf and K . Shabib ....................................................................................................................................................................................
earthquake in PakistanM. Magan, M.K. Bile and Z. Gardezi .....................................................................................................................................................................................................................................................................................
M. Mallick, J.K. Aurakzai, K.M. Bile and N. Ahmed ...................................................................................................................................................................................................................................................S98
S.K.S. Bukhari, J.A.R .H. Qureshi, R . Jooma, K.M. Bile, G.N. Kazi, W.A. Zaibi and A. Zafar ..........................................................................................................................................................
M. Rahim, B.M. Kazi, K.M. Bile, M. Munir and A.R . Khan ..................................................................................................................................................................................................................................
K.M. Bile, K.A. Lashari and A.F. Shadoul ...........................................................................................................................................................................................................................................................................
F. Sabih, K. M. Bile, W. Buehler, A. Hafeez, S. Nishtar and S. Siddiqi .................................................................................................................................................................................................................
A. Hafeez, Z. Khan, K.M. Bile, R . Jooma and M. Sheikh ...........................................................................................................................................................................................................................................
A.Y. Alam, S. Nishtar, S. Amjad and K.M. Bile .................................................................................................................................................................................................................................................................
K.M. Bile, J.A.R .H. Qureshi, S.A.H. Rizvi, S.A.A. Naqvi, A.Q. Usmani and K.A. Lashari ................................................................................................................................................................
M. Haytham Khayat MD, FRSH, Editor-in-chief Muhammad Afzal MSc, MPhil, PhD, Executive Editor
Editorial Board
MPH
Jaouad Mahjour
International Advisory Panel
Editors
Graphics
Administration
S3
Letter from the Editor
2005

EMHJ
S4
Message from the WHO Regional Director for the Eastern Mediterranean
Launched in the early 1950s, the joint technical collaboration between Pakistan and the World Health Organization (WHO) has substantially matured during the ensuing decades into a vibrant partnership exclusively focused on improving the health status of the country’s population. Pakistan has consistently endorsed the primary health care (PHC) principles and developed an elaborate health system infrastructure. The country has also established a large number of health training institutions in the medical, dental, pharmacy, nursing and midwifery fields and a range of allied health sciences, including postgraduate degree-awarding institutions and health professionals’ regulating bodies of international repute. Despite these rich assets, the country is progressing slowly towards achieving its health Millennium Development Goals (MDGs). The predominant challenges range from an overwhelmed health system that finds it difficult to generate the required support for the implementation of key PHC interventions to a rapid population growth that decelerates the reproductive health parameters. The enduring inequities affecting the rural and peri-urban underprivileged populations is another major contributing factor restricting their access to essential health services.
WHO has been working with the Government of Pakistan on a wide range of strategic health policies, operational strate-gies, programmatic interventions, and on establishing normative standards to guide the nation towards the attainment of health MDGs. Pakistan has mobilized its inherent institutional and human resources capacities and endorsed a service delivery approach pursued in the framework of PHC. This commitment has been reiterated in the current National Health Policy which affirms its solemn pledge to universal coverage and access to essential PHC services by incorporating an Essential Health Services Package as well as by the creation of a robust workforce and skills mix at the peripheral levels.
The focus on: maternal, neonatal and child health care, including reproductive health and family planning; control of key communicable diseases; universal access to vaccination, with poliomyelitis eradication as a high priority; ongoing health system strengthening efforts; design of social protection mechanisms; building institutional capacities for health emergency preparedness and response; and establishing a nexus between health and its social determinants are vital elements for translat-ing the established policy into actual practice.
WHO has also remained in the forefront of the United Nations initiative to ‘Deliver as One’, which has been piloted in Pakistan over the past few years. This initiative presents an opportunity for enhanced partnerships for health development and increased aid-effectiveness for this resource-constrained sector.
Against this backdrop, the publication of this EMHJ supplement dedicated to Pakistan’s key health areas is a remarkable achievement, which will document and provide impetus and focus to the Government of Pakistan’s efforts to attain better health outcomes. The twenty evidence-based papers included in this supplement on important policy and programmatic areas, prepared in association with senior national health managers, will provide policy-makers with key support to spearhead diverse interventions in this sector, which is so critical to building the nation. Furthermore, coinciding with the golden jubilee of the establishment of the WHO permanent office in Pakistan in 1960, this publication constitutes a significant milestone in an unwavering and mutually beneficial partnership.
Many of these articles reflect valuable lessons from the disasters that have hit Pakistan in the recent past. Unfortunately, while this special issue was being finalized, Pakistan was confronted with another unprecedented major disaster, where much of the country was submerged in the monsoon floods. Although deeply saddened and grieved over the massive loss of life, national assets and property we strongly believe that the lessons learnt and capacities developed over the years will assist the nation, WHO and the humanitarian partners to respond effectively to this grave national emergency.
Hussein A. Gezairy, M.D., F.R.C.S. Regional Director
S5
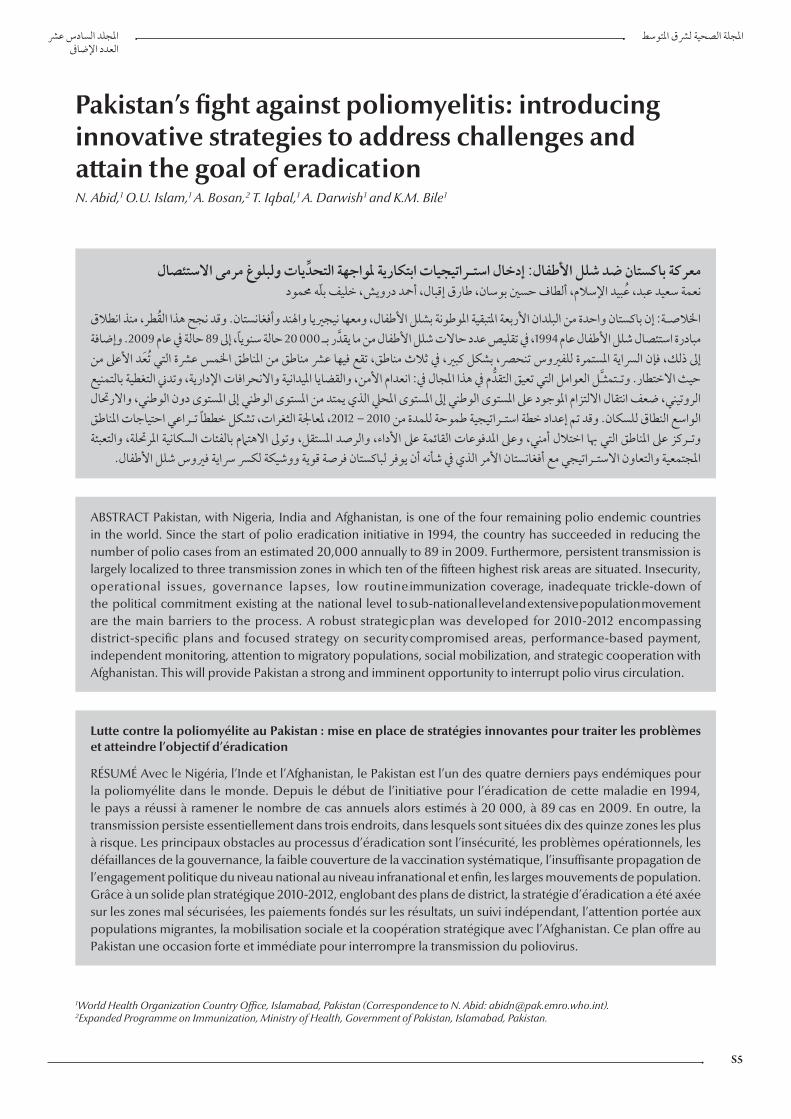
Pakistan’s fight against poliomyelitis: introducing innovative strategies to address challenges and attain the goal of eradicationN. Abid,1 O.U. Islam,1 A. Bosan,2 T. Iqbal,1 A. Darwish 1 and K.M. Bile 1
ABSTRACT Pakistan, with Nigeria, India and Afghanistan, is one of the four remaining polio endemic countries in the world. Since the start of polio eradication initiative in 1994, the country has succeeded in reducing the number of polio cases from an estimated 20,000 annually to 89 in 2009. Furthermore, persistent transmission is largely localized to three transmission zones in which ten of the fifteen highest risk areas are situated. Insecurity, operational issues, governance lapses, low routine immunization coverage, inadequate trickle-down of the political commitment existing at the national level to sub-national level and extensive population movement are the main barriers to the process. A robust strategic plan was developed for 2010-2012 encompassing district-specific plans and focused strategy on security compromised areas, performance-based payment, independent monitoring, attention to migratory populations, social mobilization, and strategic cooperation with Afghanistan. This will provide Pakistan a strong and imminent opportunity to interrupt polio virus circulation.
1World Health Organization Country Office, Islamabad, Pakistan (Correspondence to N. Abid: [email protected]).2Expanded Programme on Immunization, Ministry of Health, Government of Pakistan, Islamabad, Pakistan.
2009 89 20 000 1994
2012 – 2010
Lutte contre la poliomyélite au Pakistan : mise en place de stratégies innovantes pour traiter les problèmes et atteindre l’objectif d’éradication
RÉSUMÉ Avec le Nigéria, l’Inde et l’Afghanistan, le Pakistan est l’un des quatre derniers pays endémiques pour la poliomyélite dans le monde. Depuis le début de l’initiative pour l’éradication de cette maladie en 1994, le pays a réussi à ramener le nombre de cas annuels alors estimés à 20 000, à 89 cas en 2009. En outre, la transmission persiste essentiellement dans trois endroits, dans lesquels sont situées dix des quinze zones les plus à risque. Les principaux obstacles au processus d’éradication sont l’insécurité, les problèmes opérationnels, les défaillances de la gouvernance, la faible couverture de la vaccination systématique, l’insuffisante propagation de l’engagement politique du niveau national au niveau infranational et enfin, les larges mouvements de population. Grâce à un solide plan stratégique 2010-2012, englobant des plans de district, la stratégie d’éradication a été axée sur les zones mal sécurisées, les paiements fondés sur les résultats, un suivi indépendant, l’attention portée aux populations migrantes, la mobilisation sociale et la coopération stratégique avec l’Afghanistan. Ce plan offre au Pakistan une occasion forte et immédiate pour interrompre la transmission du poliovirus.
EMHJ
S6
Introduction
The World Health Assembly (WHA) through resolution WHA.41.28 adopted in 1988 called for the global eradication of poliomyelitis. The sub-sequent implementation of the Polio Eradication Initiative (PEI) strategies has resulted in over 99% reduction in the global annual incidence of poliomyelitis, from an estimated total of over 350 000 cases prior to 1988 to only 1604 cases in 2009; and en-demic circulation has been localized in 4 countries since 2006: Pakistan, Afghanistan, India and Nigeria [1].
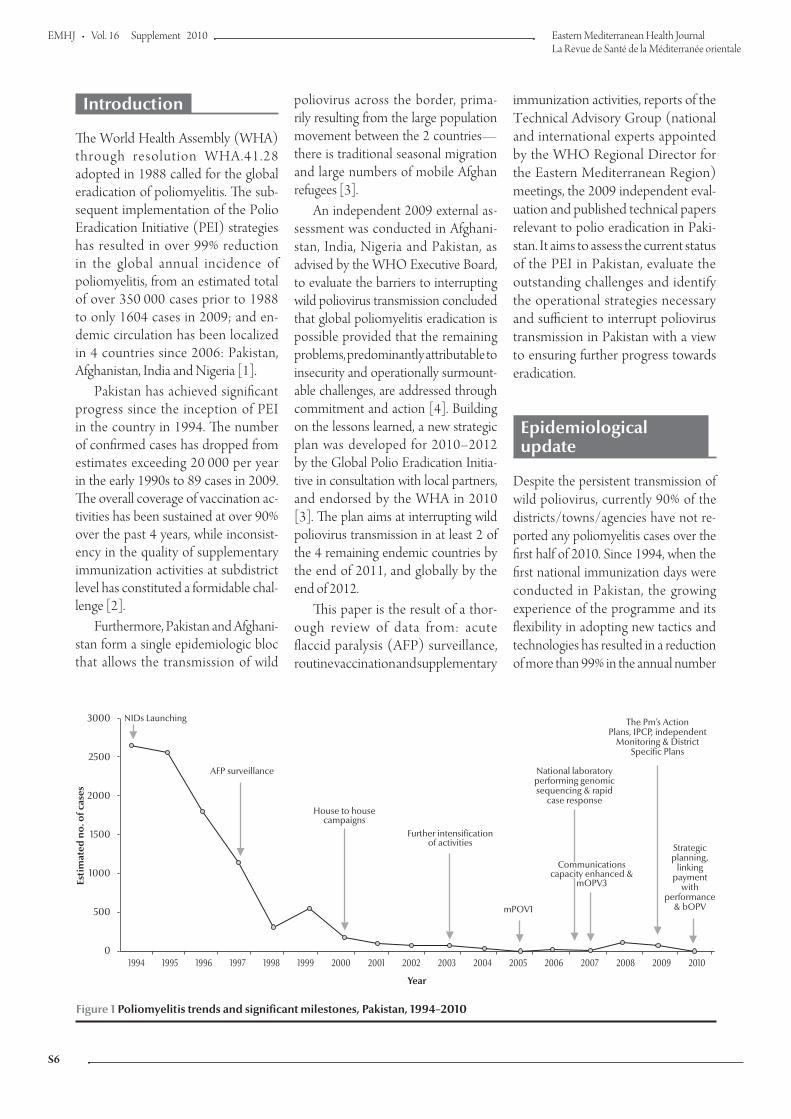
Pakistan has achieved significant progress since the inception of PEI in the country in 1994. The number of confirmed cases has dropped from estimates exceeding 20 000 per year in the early 1990s to 89 cases in 2009. The overall coverage of vaccination ac-tivities has been sustained at over 90% over the past 4 years, while inconsist-ency in the quality of supplementary immunization activities at subdistrict level has constituted a formidable chal-lenge [2].
Furthermore, Pakistan and Afghani-stan form a single epidemiologic bloc that allows the transmission of wild
Figure 1 Poliomyelitis trends and significant milestones, Pakistan, 1994–2010
poliovirus across the border, prima-rily resulting from the large population movement between the 2 countries—there is traditional seasonal migration and large numbers of mobile Afghan refugees [3].
An independent 2009 external as-sessment was conducted in Afghani-stan, India, Nigeria and Pakistan, as advised by the WHO Executive Board, to evaluate the barriers to interrupting wild poliovirus transmission concluded that global poliomyelitis eradication is possible provided that the remaining problems, predominantly attributable to insecurity and operationally surmount-able challenges, are addressed through commitment and action [4]. Building on the lessons learned, a new strategic plan was developed for 2010–2012 by the Global Polio Eradication Initia-tive in consultation with local partners, and endorsed by the WHA in 2010 [3]. The plan aims at interrupting wild poliovirus transmission in at least 2 of the 4 remaining endemic countries by the end of 2011, and globally by the end of 2012.
This paper is the result of a thor-ough review of data from: acute flaccid paralysis (AFP) surveillance, routine vaccination and supplementary
immunization activities, reports of the Technical Advisory Group (national and international experts appointed by the WHO Regional Director for the Eastern Mediterranean Region) meetings, the 2009 independent eval-uation and published technical papers relevant to polio eradication in Paki-stan. It aims to assess the current status of the PEI in Pakistan, evaluate the outstanding challenges and identify the operational strategies necessary and sufficient to interrupt poliovirus transmission in Pakistan with a view to ensuring further progress towards eradication.
Epidemiological update
Despite the persistent transmission of wild poliovirus, currently 90% of the districts/towns/agencies have not re-ported any poliomyelitis cases over the first half of 2010. Since 1994, when the first national immunization days were conducted in Pakistan, the growing experience of the programme and its flexibility in adopting new tactics and technologies has resulted in a reduction of more than 99% in the annual number
3000
2500
2000
1500
1000
500
01994 1995 1996 1997 1998 1999 2000 2001 2002 2003 2004 2005 2006 2007 2008 2009 2010
Year
Estim
ate
d n
o.
of
ca
se
s
AFP surveillance
NIDs Launching
House to housecampaigns
The Pm’s ActionPlans, IPCP, independent
Monitoring & DistrictSpecific Plans
National laboratoryperforming genomicsequencing & rapid
case response
Further intensificationof activities
mPOV1
Strategicplanning,
linkingpayment
withperformance
& bOPV
Communicationscapacity enhanced &
mOPV3
S7
of poliomyelitis cases in the span of 16 years (Figure 1).
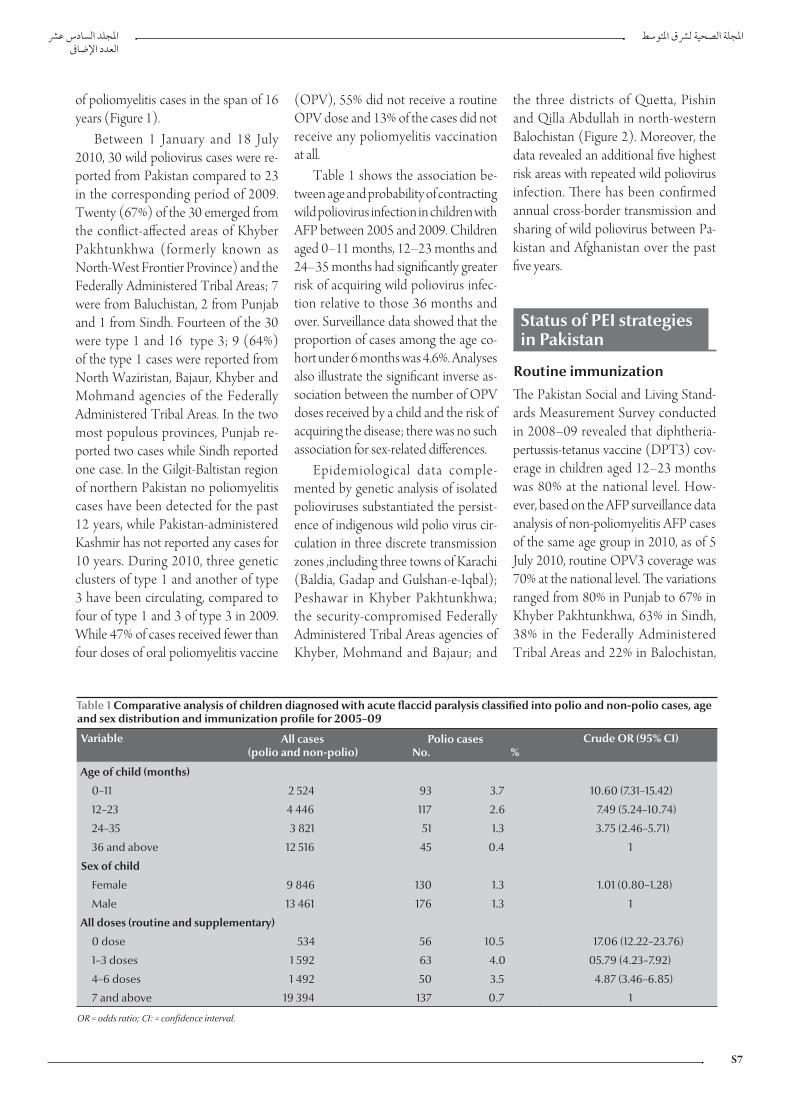
Between 1 January and 18 July 2010, 30 wild poliovirus cases were re-ported from Pakistan compared to 23 in the corresponding period of 2009. Twenty (67%) of the 30 emerged from the conflict-affected areas of Khyber Pakhtunkhwa (formerly known as North-West Frontier Province) and the Federally Administered Tribal Areas; 7 were from Baluchistan, 2 from Punjab and 1 from Sindh. Fourteen of the 30 were type 1 and 16 type 3; 9 (64%) of the type 1 cases were reported from North Waziristan, Bajaur, Khyber and Mohmand agencies of the Federally Administered Tribal Areas. In the two most populous provinces, Punjab re-ported two cases while Sindh reported one case. In the Gilgit-Baltistan region of northern Pakistan no poliomyelitis cases have been detected for the past 12 years, while Pakistan-administered Kashmir has not reported any cases for 10 years. During 2010, three genetic clusters of type 1 and another of type 3 have been circulating, compared to four of type 1 and 3 of type 3 in 2009. While 47% of cases received fewer than four doses of oral poliomyelitis vaccine
Table 1 Comparative analysis of children diagnosed with acute flaccid paralysis classified into polio and non-polio cases, age and sex distribution and immunization profile for 2005–09
Variable All cases(polio and non-polio)
Polio cases No. %
Crude OR (95% CI)
Age of child (months)
0–11 2 524 93 3.7 10.60 (7.31–15.42)
12–23 4 446 117 2.6 7.49 (5.24–10.74)
24–35 3 821 51 1.3 3.75 (2.46–5.71)
36 and above 12 516 45 0.4 1
Sex of child
Female 9 846 130 1.3 1.01 (0.80–1.28)
Male 13 461 176 1.3 1
All doses (routine and supplementary)
0 dose 534 56 10.5 17.06 (12.22–23.76)
1–3 doses 1 592 63 4.0 05.79 (4.23–7.92)
4–6 doses 1 492 50 3.5 4.87 (3.46–6.85)
7 and above 19 394 137 0.7 1
OR = odds ratio; CI: = confidence interval.
(OPV), 55% did not receive a routine OPV dose and 13% of the cases did not receive any poliomyelitis vaccination at all.
Table 1 shows the association be-tween age and probability of contracting wild poliovirus infection in children with AFP between 2005 and 2009. Children aged 0–11 months, 12–23 months and 24–35 months had significantly greater risk of acquiring wild poliovirus infec-tion relative to those 36 months and over. Surveillance data showed that the proportion of cases among the age co-hort under 6 months was 4.6%. Analyses also illustrate the significant inverse as-sociation between the number of OPV doses received by a child and the risk of acquiring the disease; there was no such association for sex-related differences.
Epidemiological data comple-mented by genetic analysis of isolated polioviruses substantiated the persist-ence of indigenous wild polio virus cir-culation in three discrete transmission zones ,including three towns of Karachi (Baldia, Gadap and Gulshan-e-Iqbal); Peshawar in Khyber Pakhtunkhwa; the security-compromised Federally Administered Tribal Areas agencies of Khyber, Moh mand and Bajaur; and
the three districts of Quetta, Pishin and Qilla Abdullah in north-western Balochistan (Figure 2). Moreover, the data revealed an additional five highest risk areas with repeated wild poliovirus infection. There has been confirmed annual cross-border transmission and sharing of wild poliovirus between Pa-kistan and Afghanistan over the past five years.
Status of PEI strategiesin Pakistan
Routine immunizationThe Pakistan Social and Living Stand-ards Measurement Survey conducted in 2008–09 revealed that diphtheria-pertussis-tetanus vaccine (DPT3) cov-erage in children aged 12–23 months was 80% at the national level. How-ever, based on the AFP surveillance data analysis of non-poliomyelitis AFP cases of the same age group in 2010, as of 5 July 2010, routine OPV3 coverage was 70% at the national level. The variations ranged from 80% in Punjab to 67% in Khyber Pakhtunkhwa, 63% in Sindh, 38% in the Federally Administered Tribal Areas and 22% in Balochistan,

EMHJ
S8
illustrating the inequity in routine im-munization coverage in the country.
Supplementary immunization activities
Supplementary immunization strate-gies have been modified over the years in order to reach the maximum number of children. The provision of OPV through fixed points during national immunization days, pursued from 1994 to 1999 (Figure 1) was replaced by a house-to-house strategy from 2000 onwards. With the localization of wild poliovirus circulation, subnational immunization days were introduced
Figure 2 Poliomyelitis cases in Pakistan and Afghanistan in 2009 and 2010 as of 5 July 2010 illustrating shared transmission of zones
in 2001 to specifically target children in high risk areas. For risk assessment purposes, districts, towns and agencies were categorized into low, medium, high or highest risk areas, relative to surveillance data analysis including poliomyelitis epidemiology and the performance quality of district health teams during the supplementary immu-nization activities. High risk and highest risk districts were targeted with more supplementary immunization activi-ties, intensified technical assistance and closer oversight (Table 2). The sup-plementary immunization activities’ microplans (operational plans prepared
before each campaign at the sub-union council level) are regularly reviewed and updated. In 2009, a decision was taken to regard finger-marking of the distal part and the nail of the left little finger using an indelible marker as the sole proof for child vaccination validated by a standardized process of independ-ent monitoring. A total of 38 million doses of OPV are provided during each national immunization day round, and their timely dispatch and distribution is an essential prerequisite for ensuring coverage to more than 30 million under five-year-old children.
AFP surveillance systemThe AFP surveillance system was launched in 1997, and the non polio-myelitis AFP rate per 100 000 children below 15 years of age increased gradu-ally from 0.8 per 100 000 in 1997 to 2.0 per 100 000 in 2001. It was 6.13 in 2009 (the target is more than 2 per 100 000 children under 15 years). Similarly, AFP cases with adequate stool specimens increased from 31% in 1997 to 80% in 2001, while over the past three years the rate has remained at 90% or more. The supplemental surveillance activi-ties being implemented included the collection of samples from at least three contacts if adequate specimens could not be obtained from an AFP case. This strategy was initiated in 2004 and has reached a completeness rate of 92% in 2010, contributing to the detection of 31 of 354 reported poliomyelitis cases. Another supplemental surveillance activity introduced in 2009 is environ-mental monitoring. Samples are col-lected from Karachi and Lahore, and recently also from Peshawar, Quetta and Rawalpindi, demonstrating results consistent with AFP surveillance, ex-cept for two genetically distinct chains of type 1 poliovirus, 1 each in Karachi and Lahore, that were detected through environmental sampling. The National Institute of Health in Islamabad, which houses the regional reference laboratory for Pakistan and Afghanistan (which

S9
performs genomic sequencing), tested stool samples for polioviruses and re-ported diagnostic confirmation within 14 days of receipt for 98% of specimens in 2009 (target ≥ 80%).
Operational strategies
Strategic plan for 2010–12 The national Inter-Provincial Commit-tee on Polio (IPCP), chaired by the Federal Minister for Health and includ-ing all provincial ministers for health, approved a three-year plan to intensify operations with a major emphasis on en-hancing ownership and accountability. The committee approved the globally endorsed process indicators that set specific benchmarks for Pakistan, where successful PEI implementation in Kara-chi in 2010 would require that less than 10% of the target children in each town are missed during every round in at least four supplemental immunizations. For the persistent transmission areas in Balochistan, Khyber Pakhtunkhwa and the Federally Administered Tribal Areas, the proportion of missed target children was required to be lower than 15% in at least eight supplemental im-munizations carried out during 2010.
District-specific plans All districts in Pakistan have PEI- specific plans; however, a more targeted approach is being adopted for the 15
Table 2 Intensified operations plan based on risk categorization for 2010
Risk categorization of districts/ towns/ agencies
Selection criteria No. of districts/ towns/agencies
in each group
No. of NIDs
No. of SNIDs
Additional technical and
oversight support
Low risk Very low probability of importation 59 4 – +
Medium risk High probability of importation from high risk districts
49 4 2 ++
High risk Part of endemic transmission zones or geographically close to the highest risk districts or high population density and frequent population movement with active transmission zones
13 4 4 +++
Highest risk Persistent transmission districts/ towns/ agencies (10) and repeatedly infected (5)
15 4 4 ++++
NIDs = national immunization days; SNIDs = supplementary national immunization days.
highest risk areas, representing districts, agencies and towns promoting specific operations relevant to routine immu-nization, supplemental immunization activities, surveillance and communi-cations. The plans were designed to address the challenges encountered in each highest risk area through targeted and specific locally appropriate interven-tions. The impeded access to the target population has been primarily related to governance lapses or security-related challenges in the programme catchment areas. To improve the PEI performance in these areas, plans include additional supplemental immunization rounds to boost immunity; enhancing techni-cal oversight to improve the quality of operations; ensuring that monitoring activities cover all the union councils (the lowest administrative units in a district) to achieve uniform quality; and convening monthly review meetings at provincial level and quarterly meetings at federal level to assess the progress in the fight against poliomyelitis.
The strategy for the Federally Ad-ministered Tribal Areas focuses on improving access of children to vac-cination, considering the complex security situation due to active conflict. This situation meant that children were deprived of access to vaccination and this has resulted in a higher number of wild poliovirus type 1 cases than other provinces of Pakistan and all other endemic countries collectively
during 2010. The number of inacces-sible target children in the Federally Administered Tribal Areas has conse-quently increased, from about 200 000 (18% of the operational target) during most supplementary immunization activities in 2009 to more than 300 000 (27% of the target children) in 2010. To address this growing inaccessibility and guide the advocacy, negotiation and intervention tactics that ensure the safety of vaccination teams and facili-tate access to the target child popula-tion, the region was categorized into three zones.
Army-held zones where access is per-mitted with security being volatile: all efforts are to be made to achieve the best possible coverage through improved governance and tightened supervision.
Army-held areas where access is de-nied owing to safety concerns: flexible plans are being prepared, including advocacy with army leaders, secured logistics and funds that allow swift vaccination drives including short-interval additional dose strategy campaigns during windows of op-portunity created through formal and informal negotiations. These efforts are coordinated with the government and local community and jirga (tribal assembly) leaders.
Areas where the government control is particularly weak and access highly

EMHJ
S10
problematic: local community leaders were negotiated with and organized to carry out short-interval additional dose strategy immunization in liaison with local authorities and advocating PEI neutrality to gain access and pro-tection for vaccinators. The short-interval additional dose
strategy was successful in Swat, where a poliomyelitis outbreak at the end of two years of continuous inaccessibility was effectively controlled with five rounds of immunization rapidly conducted over four months.
In Karachi’s highest risk towns, the strategy focused on: enhancing the active engagement of the health de-partment leadership, with political par-ties’ commitment to directly interact and influence town health manage-ment and catalyse community social mobilization among the highest risk and under served populations; ensur-ing that all the vaccination teams were selected from the local community in order to address prevailing cultural sensitivities; building operational partnership with nongovernmental or-ganizations and the private sector to supplement the overstretched public sector services. The strategy allows local partners to participate in the
Figure 3 Finger-marking coverage through independent monitoring in children under 5 years, Pakistan, January–May 2010 [adjusted coverage = assessed coverage × (1 – Po); Po = proportion of children inaccessible due to insecurity]. KPK = Khyber Pakhtunkhwa; FATA = Federally Ddministered Tribal Areas; AJK = Azad Jammu and Kashmir
%
100
90
80
70
60
50
40
30
20
10
0
Punjab Sindh KPK (NWFP) FATA Islamabad Balochistan AJK Gilgit-Baltistan Pakistan
Jan Feb Mar Apr May
Province
delivery of immunization services and facilitate social mobilization to im-prove performance of supplementary immunization activities.
The district level plan for the highest risk areas of Balochistan demands direct oversight by the deputy commissioners (the chief executives at district level), with special emphasis on engaging the leadership of the paramedical staff asso-ciation, which has constituted the major challenge to PEI operations’ govern-ance in this province. Focused advocacy is being targeted to communities and the religious leadership to overcome the few existing pockets of chronic refusals to vaccinate against poliomyelitis result-ing from baseless rumours concerning vaccine safety.
Th e s e p l a n s a r e m o n i t o r e d throughprovincial reviews on a monthly basis and federally every quarter to ensure progress in the im-plementation quality (consistently over 90%), particularly in Karachi and Balochistan. Modest progress was also attained in Khyber Pakhtunkhwa, but the situation in the Federally Administered Tribal Areas worsened in 2010 due to the deteriorating security situation.
Independent performance monitoring The outcome of the supplementary im-munization activities is assessed regu-larly by independent monitors verifying the vaccination status of children through finger-marking. Monitors, preferably females and familiar with the local language(s), are recruited from universities, colleges, nongovernmental organizations and the education depart-ment. All the Union Councils from high and highest risk areas are assessed, while 50%–70% of medium and 25% of low risk districts are monitored, with special attention to areas having higher likeli-hood of underperformance. Monitoring results showed finger-marking coverage rates of at least 90% in all provinces and regions except the Federally Admin-istered Tribal Areas where access was seriously compromised (Figure 3).
Performance based payment The IPCP decided to release the final payment of the operational budget conditional on monitors’ verification of at least 90% finger-marking coverage in a district. The proportion of districts achieving at least 90% finger-marking confirmed coverage, increased from 61% in January 2010 to 82% in May
S11
2010, demonstrating the positive im-pact of this managerial decision.
Migratory populationsMigratory groups, including nomads, agriculture, construction and other seasonal workers, internally displaced persons (IDPs) and Afghan refugees, often pose the risk of sustaining polio-virus transmission between regions and districts owing to their high mobility and settlement in underserved geographi-cal areas. The eradication initiative has recently revamped a strategy to effec-tively cover these populations through specific microplans and mechanisms to track their movement and enhance their access to vaccination services. Special vaccination teams are raised to target these groups along known transit routes or while residing in temporary stay locations both during and outside scheduled supplementary immuniza-tion activities with close monitoring of performance. Consequent to this strategy, the June 2010 special vaccina-tion campaign reached approximately 250 000 children in 16 Union Councils of Sindh and Balochistan having a high concentration of migratory popula-tions.
Enhancing communication and social mobilization As integral components of the PEI, communication and social mobiliza-tion were intensified in 53 interven-tion areas including the 15 highest risk areas. To promote these initiatives, in-novative partnerships were developed through the Prime Minister’s Action Plan launced in early 2009 to enhance intersectoral collaboration between the public and private sectors and with the involvement of the civil society.
A major component of the com-munication strategy included the engagement of religious leaders. Key religious scholars belonging to differ-ent schools of thought have reiterated their support for PEI by delivering 17 religious edicts or fatwas in support of poliomyelitis eradication and routine
immunization, leading to a consider-able reduction in refusals to vaccinate against poliomyelitis to less than 0.5%. An interreligious council on health with representation from Islamic, Christian, Sikh, Parsi and Hindu groups supports the immunization programme with a stipulated plan for enhancing public awareness through activities at the district level.
Knowledge, attitudes and practice studies have shown that parents’ aware-ness of poliomyelitis as an important health issue increased from 83.9% in 2008 to 91.7% in 2010 [5]. Moreover, there were significantly more media events that were supportive of the PEI (2500 of 2552) than those raising con-cern, e.g by questioning the efficacy or safety of the vaccine.
Government ownershipPoliomyelitis eradication has always been at the top of the health agenda of successive Pakistani governments. To promote programme ownership and commitment, advocacy efforts were launched with elected representatives resulting in the formation of a caucus of parliamentarians to support poliomy-elitis eradication. The President and the Prime Minister of Pakistan launched the national immunization days in 2009 and 2010, while the IPCP has met three times since its inception in 2009 and provided impetus to the government’s resolve on PEI at the sub-national as well as the national level. At the district level, the district commissioner chairs the dis-trict polio eradication committee before each supplementary immunization to mobilize support from government line departments and other partners in the district. In the supplementary immuni-zation activities conducted during May 2010, district polio eradication commit-tee meetings were held before the cam-paign chaired by high level managers in 98% of the districts, compared to 76% in the January round of the same year.
Cross-border collaboration with Afghanistan The first cross-border immunization post was established in 2002 at Khyber Pass (Torkham) and subsequently extended to 10 other crossing points along the 2430 kilometre border with Afghanistan. The fact that all genetic lineages of wild poliovirus circulating in both countries in 2010 are related to each other, reflecting a shared transmis-sion between the two countries due to extensive population movement, rein-forces the need for closer cross-border coordination and collaboration. During 2008 and 2009, two intercountry meet-ings were held with senior health of-ficials of the two countries for PEI joint planning and coordination, leading to the synchronization of three of the five scheduled supplementary immuniza-tion activities in 2010. In 2009, approxi-mately two million border-crossing eligible children were vaccinated by the permanent cross-border vaccination teams of the two countries.
Discussion
The 22-year old PEI has remained at the top of the global public health agenda with a remarkable restriction of wild poliovirus circulation to localized ar-eas of the four remaining poliomyelitis- endemic countries compared with 125 in 1988 [3]. The plausibility of poliomy-elitis eradication was further reinforced by the 2009 independent evaluation report, asserting the attainability of this goal [4]. Pakistan has reported the highest number of poliomyelitis cases in 2010 relative to other endemic countries. Although there are major operational challenges, the country pos-sesses several opportunities to make a major breakthrough in interrupting wild poliovirus circulation. This is cor-roborated by the fact that persistent transmission is restricted to three zones of central Khyber Pakhtunkhwa and the Federally Administered Tribal Areas;

EMHJ
S12
Quetta, Pishin and Qilla Abdullah of Balochistan; and the Karachi zone. Ac-cordingly, the majority (20/30) of the cases detected up to 18 July 2010 were from these transmission zones, while most of the viruses detected elsewhere were genetically related to the same. It is also important to note that 10 of the 15 highest risk areas fall in the wild poliovirus transmission zones. Like-wise, most of the security-compromised areas are in or adjacent to the Khyber Pakhtunkhwa–Federally Administered Tribal Areas transmission zone.
Quite significantly, the law-and-order challenges are not restricted to the areas affected by the crisis in the Federally Administered Tribal Areas, as they occasionally hamper programme operations in Balochistan, Karachi and northern Sindh. These realities under-line the magnitude of the prevailing challenge, while at the same time ac-centuate the imperative to develop dynamic specific plans and adjust the PEI programme implementation, authenticating the validity of the risk categorization approach. However, the predominant challenge facing the high-est risk areas of Karachi and Balochistan are the inadequate management and weak accountability observed, espe-cially at district level, though recently introduced efforts and strategies for enforcing accountability and closer oversight led by the health departments have produced tangible improvements in the programme implementation [6].
Genetic sequencing data showed that the wild poliovirus had spread from these transmission zones to many for-merly poliomyelitis-free areas such as central Punjab, which suffered an out-break in 2008 in which complacency, reduced frequency of supplementary immunization activities, deterioration of routine immunization, high population movement and an influx of internally dis-placed populations from poliomyelitis- endemic, insecure areas played a major role in re-establishing wild poliovirus circulation [7,8].
Epidemiological data have revealed a significant statistical association between the age of the child and the probability of contracting poliomyelitis: the younger the child, the higher the risk of contracting the disease, with the exception of the low incidence in infants under six months of age, attributed to low exposure to the risk of infection and/or to passive immunity from maternal antibodies [9]. It is, however, critical to reach out to this youngest age cohort during supplementary immuni-zation activities in order to reduce the pool of susceptibles and overcome the habit observed predominantly in rural areas, where access to newborn infants is impeded as they are concealed from outsiders.
Moreover, the study corroborated that children receiving seven doses or more were at significantly lower risk of acquiring the disease compared to those receiving six or fewer doses. The latter finding is supported by other stud-ies revealing that the immunogenicity of OPV is lower in infants in developing countries because of a higher prevalence of competing enteroviruses, recent diar-rhoeal episodes and malnutrition rela-tive to infants in industrialized countries [9–11]. This substantiates the need to ensure access of every eligible child to all opportunities for routine and sup-plementary vaccinations.
Improving routine immunization is one of the cornerstones of poliomyelitis eradication: combined efforts exerted at the district, provincial and federal tiers of government should address current programmatic weaknesses—correcting the health workforce maldistribution and ineffective managerial and logistic arrangements that impede access to vaccination against poliomyelitis and other vaccine-preventable diseases. Concerted efforts are therefore required by the district health management team to improve district immunization op-erational plans, and the equitable dis-tribution of vaccinators with the active involvement of Lady Health Workers
in immunization service delivery, while benefiting from the strong commu-nication and social mobilization skills developed over the years during sup-plementary immunization activities. Given the current low level of routine immunization coverage, Pakistan has to conduct at least 4 national immuni-zation days a year, although the latter would not be able to offset or substitute the significant role of routine immuniza-tion in poliomyelitis eradication [12].
A uniformly high performance in supplementary immunization activi-ties throughout the country at all levels of government is central to the efforts aimed at interrupting wild poliovirus circulation, complemented by further intensification of programme opera-tions in the transmission zones. Despite the observed overall high coverage rates, there are still supplementary immuni-zation–related governance lapses such as inefficiency or misuse of resources in some districts and subdistricts be-cause of deficient vaccination teams, poor training quality, misreporting and delayed or denied payments to vaccina-tion teams in addition to the significant number of unreached children in secu-rity-compromised areas [4]. To over-come these challenges, district health teams operating in high risk zones have to effectively pursue the area-specific plans, the latter being crucial to the suc-cess of poliomyelitis eradication. The recent government resolve of validating the coverage data through finger-mark-ing, reliably generated by independent monitors, and the linking of payment of campaign remunerations with this performance, has proved operationally effective. The regular appraisal meetings held by the provincial chief secretaries and deputy commissioners are power-ful forums for tracking progress, rectify-ing governance faults and providing oversight to the entire implementation process [13,14]. Considering the proc-ess indicators of the global strategic plan, the course of implementation in Pakistan is confidently on track, though

S13
the security-compromised areas fall significantly short of expectations and merit stronger interventions.
Since 2001, AFP surveillance indi-cators in Pakistan have been meeting the WHO targets, and the strategy has successfully guided the PEI operations that have led to a dramatic decrease in poliomyelitis incidence, providing the opportunity in future to spearhead the establishment of an integrated disease surveillance system in Pakistan [15]. However, an AFP surveillance weakness was recently identified in the system when some “long-chain” (“orphan”) polioviruses were detected through ge-netic mapping of wild polioviruses [16]. This suggests the need for enhanced surveillance capacity as well as improv-ing vaccination coverage among migra-tory and underserved populations.
The decision to set specific plans for the 15 highest risk areas was an effective strategic operation as these areas produced 60% of the confirmed poliomyelitis cases in 2010, while the wild poliovirus circulation elsewhere was also closely linked with the ongoing circulation in these highest risk areas. The recent improvement in programme performance in these areas validates the efficacy of this approach with the exception of the crisis-affected Federally Administered Tribal Areas [17].
The first building blocks of the Federally Administered Tribal Ar-eas strategy emphasize programme neutrality and focus on child survival, regardless of which group or conflict rivals the children come from. This substantiates the legitimate prioriti-zation of PEI and its neutrality, and hence the validity of the protection demanded for vaccination teams: in areas of active conflict it is important to ask the government authority and the army as well as the local commu-nity leaders to provide protection and safe passage to the teams. The strategy engages local opinion leaders as focal persons; mobilizes support and ac-ceptance from the tribal assemblies
or jirga with a constant search for windows of opportunity to conduct short-interval additional dose strategy campaigns. Poliomyelitis vaccinations need also to be considered as “add on” strategies to ongoing health and other community interventions to secure better access to vaccination. Moreover, the establishment of vac-cination posts on the exit and entry routes of the crisis-affected areas and efforts to maintain high coverage in all accessible areas within the Federally Administered Tribal Areas and the ad-jacent areas of Khyber Pakhtunkhwa are critical components of the strategy, aiming to create a barrier that buffers virus transmission. This vision could be further consolidated by expanding the social health assets by promoting a comprehensive primary health care package in the area. Interventions that were operationally consistent with the current Federally Administered Tribal Areas strategy have led to the interrup-tion of wild poliovirus transmission in other conflict-affected areas such as in Cambodia, Colombia, Somalia, Sri Lanka and southern Sudan [2,18].
Evidence-based and innovative communication strategies will remain critical to the final push of poliomy-elitis eradication [19]. The establish-ment of the National Polio Control Cell (which provides information to parents of children who have missed vaccination via a toll-free number) through a coalition of public and pri-vate television channels, community-based approaches in the Federally Administered Tribal Areas, and advo-cacy briefing endeavours for political leaders, religious scholars and parlia-mentarians have broadened the scope of the communication strategy and raised awareness among the public, attracting a greater number of stake-holders in support of the programme. Although numerically insignificant, the potential impact of negative me-dia could be substantial, mandating the proactive design of preventive
communication strategies to diffuse the effect of misinformation.
The extensive cross-border popula-tion movement between Afghanistan and Pakistan necessitates the coordina-tion of PEI interventions and the mo-bilization of the required international support for interrupting wild poliovirus circulation in this region.
The strategic plan for 2010–12 has laid down an operational course of action to which the national and health sector political leader-ship has subscribed, mandating the convening of regular IPCP meetings to steer poliomyelitis eradication efforts; enhancing ownership and accountability; improving quality of implementation; reinforcing specific plans for the highest risk areas; re-cruiting vaccination teams familiar with local languages; applying ap-propriate communication strategies; and rationalizing resource use. In the Federally Administered Tribal Ar-eas the strategic package needs to be pursued by closely liaising with gov-ernment institutions and influential community partners, while flagging and maintaining programme neu-trality and prioritization. Targeting the high risk, underserved, migrant populations while travelling and at temporary stay locations has also proved to be a sound strategy.
Given the coherent political com-mitment currently evolving in all tiers of government, the localization of wild poliovirus circulation, the availability of potent vaccines, improving leadership commitment at all levels, the imperative of effective and high quality supplemen-tary immunization activities, impec-cable and highly sensitive surveillance, the extended support of development partners and the district- and regional-specific operational plans, Pakistan has every opportunity to interrupt endemic wild poliovirus circulation, attain the globally set milestones and lead the nation to the goal of poliomyelitis eradi-cation in the near future.

EMHJ
S14
References
1. Progress toward interruption of wild poliovirus transmission—worldwide, 2009. Morbidity and Mortality Weekly Record, 2010, 59(18):545–550.
2. Poliomyelitis eradication in the Eastern Mediterranean Region: progress report 2007–2008. Cairo, World Health Organization Regional Office for the Eastern Mediterranean, 2009 (WHO-EM/POL/380/E; at http://www.emro.who.int/polio/pdf/progressreport_07_08en.pdf, accessed 27 July 2010).
3. Global Polio Eradication Initiative: strategic plan 2010–2012. Geneva, World Health Organization, 2010 (at http://www.polioeradica-tion.org/content/publications/GPEI.StrategicPlan.2010-2012.ENG.May.2010.pdf, accessed 27 July 2010).
4. Global Polio Eradication Initiative. Independent evaluation of major barriers to interrupting poliovirus transmission. Geneva, World Health organization, 2009 [Website] (http://www.polioeradication.org/content/general/Polio_Evaluation_ Report.asp, accessed 5 July 2010).
5. Household polio KAP tracking study, Phase-VI, December 2009. Islamabad, SoSEC consulting Services, 2009.
6. Report on the meeting of the Technical Advisory Group on po-liomyelitis eradication in Afghanistan and Pakistan, Islamabad, Pakistan, 11–12 May 2010. Cairo, World Health Organization Regional Office for the Eastern Mediterranean, 2010 (WHO-EM/POL/386/E).
7. Report on the meeting of the Technical Advisory Group on po-liomyelitis eradication in Afghanistan and Pakistan, Cairo, Egypt, 3–4 February 2008. Cairo, World Health Organization Re-gional Office for the Eastern Mediterranean, 2008 (WHO-EM/POL/366/E).
8. Conclusions and recommendations of the advisory committee on poliomyelitis eradication, November 2009.Weekly Epide-miological Record, 2010, 85(1–2):1–7.
9. Patriarca PA, Wright PF, John TJ. Factors affecting the immuno-genicity of oral polio vaccine in developing countries: review. Review of Infectious Diseases, 1991, 13:926–939.
10. Posey DL et al. The effect of diarrhea on oral polio vaccine failure in Brazil. Journal of Infectious Diseases, 1997, 175(Suppl. 1):S258–263.
11. Swartz TA et al. Routine administration of oral polio vaccine in a subtropical area: factors possibly affecting sero-conversion rates. Journal of Hygiene,1972,70:719–726.
12. Pakistan demographic and health survey 2006–2007. Is-lamabad, Pakistan, National Institute of Population Studies, 2008.
13. Report on an emergency technical consultation on polio eradica-tion in Pakistan. Karachi, Pakistan, June, 2008. Cairo, Eastern Mediterranean Regional Office, World Health Organization, 2008 (WHO-EM/POL/371/E).
14. Lowther SA et al. Characteristics of districts in Pakistan with persistent transmission of wild poliovirus 2000–2001. Eastern Mediterranean Health Journal, 2004, 10(4–5):582–590.
15. Pakistan’s public health surveillance system: a call to action. Washington DC, World Bank, 2005 (Report No.329363-PK).
16. Progress toward poliomyelitis eradication—Afghanistan and Pakistan, 2009. Morbidity and Mortality Weekly Report, 2010, 59(9):268–273.
17. Global Polio Eradication Initiative. Monthly situation report, May 2010. Geneva, World Health Organization, 2010 [Website] (http://www.polioeradication.org/content/general/poliosi-trepMay2010.asp, accessed 10 July 2010).
18. Tangermann RH. Eradication of poliomyelitis in countries af-fected by conflict. Bulletin of the World Health Organization, 2000, 78(3):330–338.
19. Obergon R et al. Achieving polio eradication: a review of health communication evidence and lessons learned in India and Pakistan. Bulletin of the World Health Organization, 2009, 87:624–630.

S15
ABSTRACT A prevalence survey on hepatitis B and C infections was carried out to obtain national estimates and assess epidemiological dynamics and underlying risk factors. Overall prevalence of hepatitis B surface antigen (HBsAg) and anti-hepatitis C virus (HCV) of 2.5% and 4.8%, respectively, reflected a combined infection rate of 7.6% in the general population, consistent with an ongoing high burden of chronic liver disease (CLD). There was significant association of these viral infections with a range of risk factors led by reuse of syringes. These findings validate currently implemented strategies by the national programme for the control of hepatitis viral infections, including universal vaccination of newborns and high-risk groups, support of auto-disable syringes, promotion of infection control and patient safety, public health education, and management of needy CLD patients as a poverty-reduction health intervention.
1Pakistan Medical Research Council, Islamabad, Pakistan.2World Health Organization, Country Office, Islamabad, Pakistan (Correspondence to K.M. Bile: [email protected]).3Ministry of Health, Islamabad, Pakistan.4Jinnah Postgraduate Medical Centre, Karachi, Pakistan.
4.8 2.5
7.6
Prevalence of hepatitis B and C viral infections in Pakistan: findings of a national survey appealing for effective prevention and control measuresH. Qureshi,1 K.M. Bile,2 R. Jooma,3 S.E. Alam 4 and H.U.R. Afridi 2
Prévalence des infections virales de l’hépatite B et de l’hépatite C au Pakistan : résultats d’une enquête nationale appelant à des mesures de lutte efficaces
RÉSUMÉ Une enquête de prévalence sur les infections par les virus de l’hépatite B et de l’hépatite C a été réalisée afin d’obtenir des estimations nationales et d’évaluer la dynamique épidémiologique et les facteurs de risque sous-jacents. La prévalence globale de l’antigène de surface du virus de l’hépatite B et celle des anticorps antivirus de l’hépatite C étaient de 2,5 % et 4,8 % respectivement, reflétant un taux global d’infection de 7,6 % dans la population générale, ce qui est cohérent avec la charge actuelle élevée d’affections hépatiques chroniques. Une association importante de ces infections virales avec de nombreux facteurs de risque liés à la réutilisation des seringues a été observée. Ces résultats attestent du bien-fondé des stratégies du programme national de lutte contre les infections par le virus de l’hépatite, à savoir : vaccination universelle des nouveau-nés et des groupes à haut risque, soutien à l’utilisation de seringues autobloquantes, promotion de la lutte contre les infections et de la sécurité des patients, éducation à la santé publique et prise en charge des patients nécessiteux atteints d’affections hépatiques chroniques en tant qu’intervention sanitaire visant à réduire la pauvreté.

EMHJ
S16
Introduction
Hepatitis B virus (HBV) and hepatitis C virus (HCV) infections contribute to the global public health threats con-fronting most developing countries, where health care systems lack the safety measures necessary to avert the risks of infection and public awareness about the modes of transmission is insuf-ficient [1–3]. A large number of HBV and HCV studies have been carried out in Pakistan over the past two decades, restricted to clinical and hospital-based settings, blood bank institutions and small communities that could not val-idly demonstrate the distribution of HBV and HCV in the general popula-tion, though corroborating the exist-ence of a high burden of chronic liver disease (CLD) in the country [4–7].
Since 1994, the World Health Or-ganization (WHO) has worked with the Federal Ministry of Health substan-tiating the urgency of adding hepatitis B vaccine to the roster of the national Ex-panded Programme on Immunization (EPI) and of its provision to all newborn children in order to build a nationwide lifelong immunity against HBV and eliminate the burden of HBV-related CLD, including primary hepatocellular carcinoma. This recommendation was outlined in 1992 by WHO, with the goal of integrating hepatitis B vaccine into routine EPI by 1997 [8,9].
This aspiration was realized in 2002, through the financial support of the Global Alliance for Vaccines and Im-munization (GAVI Alliance) and with WHO technical support, leading to the procurement of HBV vaccines for over 4 million newborns annually. This arrangement was sustained until 2008, when the pentavalent diphtheria–teta-nus–pertussis–hepatitis B–Haemophil-us influenzae type b (DTP–HepB–Hib) vaccine cofinancing mechanism was introduced.
However, in a populous nation like Pakistan, the need for additional preven-tive interventions and the management
of a large pool of vulnerable patients with HBV- and HCV-related CLD re-quired a national hepatitis B and C con-trol programme with a preventive and curative scope of implementation. The high prevalence of HCV detected by multiple cross-sectional studies added to the alarm, as it is known that over 80% of HCV-infected individuals progress into CLD [1,10]. In 2004, the Ministry of Health developed the first project document of a national hepatitis control programme with federal funding, tech-nically supported by WHO. This land-mark was substantiated in 2005 when the national exchequer earmarked a 5-year budgetary allocation of Rs 2.594 billion, then equivalent to US$ 43 mil-lion. The launching of the programme was facilitated by the strong political support, the growing public concern and the call for action resonated by profes-sional groups, civil society organizations and the media, to contain an impending public health disaster. The programme scope included: vaccination of high-risk groups; safety of blood and blood products; safe injections and invasive devices; hospital waste management; behavioural change communication and hospital-based surveillance.
To substantiate the high burden of HBV and HCV infections and in-fluence the government planning and financing institutions to offer a tangible, long-term budgetary outlay, there was a need to undertake a nationwide HBV and HCV survey that would guide the planning and implementation of hepa-titis prevention and control interven-tions. This paper reports the findings of this survey, which generated credible and representative national data about the high prevalence of HBV and HCV infections, and established the basis for future national control interventions and outcome evaluations.
Methods
The survey was conducted in urban and rural areas of all four provinces and
territories of Pakistan, excluding the Federally Administered Tribal Areas and a few other security-compromised areas, cumulatively accounting for about 3% of the total population. The applied sampling frame was designed by the Federal Bureau of Statistics and clas-sified cities and towns into well-defined enumeration blocks with 200–250 households each, based on the 1998 census population update carried out in 2004 for urban settings; for rural areas the 1998 census data were applied as no similar update was available.
These enumeration blocks and vil-lages constituted the primary sampling units (PSUs), representing urban and rural areas, respectively. The PSUs were further specified for a group of 14 large mega-cities, each forming a separate structure that was further subdivided into low-, middle- and high-income groups, based on earlier data collected from these enumeration blocks. The remaining urban areas constituted one structure labelled “the other urban ar-eas”, while the rural area of each district of the four provinces was considered as a separate structure, except in the sparsely populated province of Balo-chistan, where the provincial adminis-trative divisions each aggregating several districts were considered as the unit for the stratum.
Considering the characteristics of the variables to be estimated, the population distribution and available re-sources, 7000 sample households were considered necessary to attain reliable estimates of HBV and HCV prevalence for national and provincial levels and indicative data about districts. Sample households were drawn from 350 PSUs, 138 urban and 212 rural. Relatively more PSUs were drawn from urban ar-eas to account for their socioeconomic diversity. In the sample selection, urban enumeration blocks and villages were selected as PSUs, based on the “prob-ability proportional to size” sampling method. Subsequently, households within PSUs were selected with equal

S17
probability using a systematic sampling technique with random start. Thus 3500 households were selected from Pun-jab province; 1560 from Sindh; 1100 from Khyber Pakhtunkhwa, formerly the North Western Frontier Province; and 840 from Balochistan. An average family size was 6.5 persons. For sam-ple testing for hepatitis B and hepatitis C, rapid tests were used which were enzyme-linked immunosorbent assay (ELISA) compared, before being pro-cured [Abbott Determine™ for hepatitis B surface antigen (HBsAg), Advanced Quality™ One Step HCV Test (Bionike Inc.) for anti-HCV).
A consent form to be completed by each family head, a family form, an individual form and a report form for feedback of results were prepared. An information brochure was produced to brief families about the objectives of the study. A referral form was also prepared for those needing further medical inves-tigations. All forms were translated into the national language Urdu for easy field application and were field tested prior to survey implementation for validation and fine tuning. All testing surveyors were laboratory technicians who were further trained on how to share the information brochure with the fam-ily head, explain the survey objectives and obtain consent for sampling family members, either by signing a consent form or through a thumb impression, in the presence of at least two fam-ily members. The laboratory technician surveyors were trained on how to run HBV and HCV rapid tests using whole blood, and on how to mark names on the devices and on storage gel tubes where the PSU code, house number and person’s number and name were to be recorded. The tested blood kit devices, once checked, were pasted on the individual report forms to keep a record, while the reports were written on the back of individual forms to en-sure that, if devices were lost, the written report remained. Blood was collected in
gel tubes and serum was separated and stored for further testing.
Hepatitis B e antigen (HBeAg) was tested on all HBsAg-positive sera that were stored for future use using the chemiluminescence method, carbonyl-metalloimmunoassay.
To access targeted PSUs and households to be tested, survey teams contacted local health authorities and Federal Bureau of Statistics staff, who provided names of the households, eas-ing identification of the correct houses. At the household level, blood tests were run in a row on all individuals, rapid tests carried out and results provided before leaving the house within 15–20 minutes.
The house was marked after com-pleting the survey. The teams were to visit all 20 houses of a PSU and seek the help of the local statistical office for replacement in the case of refusal or absence of family members. The Paki-stan Medical Research Council closely monitored the work of the survey teams, assessing the accuracy of their access to the selected PSUs and contact with the identified households, and confirming that tests had been carried out. Any operational inconsistencies observed were then rectified to sustain the validity of the survey implementation.
The survey commenced in July 2007 and was completed in May 2008. The testing results were recorded using SPSS, version 13.0 and subsequently analysed. Statistical differences were estimated using the chi-square test, the odds ratio (OR) and 95% confidence interval (CI) measures. The data were disaggregated by province and district, although the district data were not ro-bust, thus allowing conservative infer-ences at that level.
Results
This nationwide community survey was concluded in 11 months and was successful in reaching out to 96% of
families and individuals selected from the 350 PSUs outlined in the study sample size. The non-tested 4% were due to migration, non-availability of the household members at the time of the visit, or refusals.
Of the families in the sample, 87.6% owned their residential homes. Of the 7000 houses visited, 32.0% were made of mud, 45.4% were made of bricks and plastered walls, 19.3% were of semi-solid material, while 3.3% of the houses were well-furnished modern constructions, indicating the wide socioeconomic di-versity of the tested population.
Piped drinking water was available in 52.7% of the houses; 21.8% of the families obtained water from nearby public taps; 9.7% used well water; 5% fetched water from a spring, pond or river; and 10.8% received water through tankers, or mule or donkey carts.
Sanitation conditions varied: 26.5% did not have any toilet facilities at home; 18.5% used pit latrines; and 55% had flush toilets.
Excluding preschool children, 44.4% of screened individuals were illiterate, while 17% had education below the pri-mary level; of the remaining individuals who had completed primary education, 2% had completed 10 years of schooling and only 1% had graduate education.
Of the tested adult populations 41.4% were housewives or home-based self-employed, 25.5% were students, 15.5% were employed at private or pub-lic sector institutions, while the rest were unskilled workers.
A history of jaundice was recalled by 3% of screened individuals, while 3% reported having one family member who suffered from liver disease. The screened families also reported 496 family members who had died from liver disease. In the study population, the overall prevalence of HBsAg was 2.5%, while anti-HCV prevalence was 4.8%.
Table 1 illustrates HBsAg and anti-HCV prevalence in the study

EMHJ
S18
population, disaggregated by gender. Prevalence of anti-HCV did not show any gender difference, while HBsAg prevalence was significantly higher in males (OR = 1.48; 95% CI: 1.31–1.67).
Table 1 Prevalence of hepatitis B surface antigen (HBsAg) and antibody to the hepatitis C virus (anti-HCV) by sex
Sex No. of subjects HBsAg positive Anti-HCV positive
No. (%) OR (95% CI) No. (%) OR (95% CI)
Female 22 599 447 (2.0) 1 1 090 (4.8) 1
Male 24 444 709 (2.9) 1.48 (1.31–1.67) 1 204 (4.9) 1.02 (0.94–1.11)
Total 47 043 1 156 (2.5) 2 294 (4.8)
CI = confidence interval; OR = odds ratio.
Table 2 Prevalence and factors associated with hepatitis B surface antigen (HBsAg) in Pakistan by age, marital status and history of injection use
Variable Males Females Total
No. (%) OR (95%CI) No. (%) OR (95% CI) No.(%) OR (95% CI)
Age (years)
< 5 33 (1.6) 1 20 (1.0) 1 53 (1.3) 1
5–19 198 (2.1) 1.33 (0.90–1.96) 131 (1.5) 1.56 (0.95–2.57) 329 (1.8) 1.42 (1.05–1.92)
20–29 104 (2.4) 1.55 (1.03–2.35) 88 (2.1) 2.17 (1.30–3.64) 192 (2.2) 1.79 (1.30–2.46)
30–39 106 (3.7) 2.45 (1.63–3.72) 81 (2.8) 2.91 (1.74–4.91) 187 (3.2) 2.61 (1.90–3.60)
40–49 104 (4.5) 2.97 (1.97–4.50) 63 (3.0) 3.11 (1.83–5.34) 167 (3.8) 3.04 (2.20–4.20)
50–59 82 (5.5) 3.70 (2.41–5.68) 34 (2.6) 2.72 (1.51–4.92) 116 (4.1) 3.37 (2.40–4.75)
≥ 60 82 (5.0) 3.32 (2.16–5.10) 30 (2.7) 2.79 (1.53–5.13) 112 (4.0) 3.28 (2.33–4.62)
Total 709 (3.0) 447 (2.0) 1 156 (2.5)
Marital status (20–49 years)
Never married 67 (1.9) 1 36 (1.7) 1 103 (1.8) 1
Married 245 (4.2) 2.32 (1.75–3.09) 193 (2.8) 1.70 (1.70–2.47) 438 (3.4) 1.96 (1.57–2.45)Divorced/separated/widowed 2 (2.7) 1.49 (0.0–6.3) 3 (1.5) 0.88 (0.27–2.84) 5 (1.8) 1.01 (0.36–2.59)Total 314 (3.3) 232 (2.5) 546 (2.9)
No. of intramuscular injections
None 111 (1.9) 1 87 (1.7) 1 198 (1.8) 1
< 5 359 (3.1) 1.68 (1.35–2.09) 215 (2.0) 1.13 (0.87–1.47) 574 (2.5) 1.42 (1.20–1.68)
5–10 177 (3.3) 1.83 (1.43–2.34) 114 (2.2) 1.87 (1.54–2.26) 291 (2.8) 1.55 (1.29–1.81)
> 10 62 (4.4) 2.43 (1.75–3.37) 31 (2.0) 1.17 (0.76–1.80) 93 (3.2) 1.78 (1.38–2.30)
Total 709 (2.9) 447 (2.0) 1 156 (2.5)
Types of syringes
None 115 (1.9) 1 83 (1.7) 1 198 (1.8) 1
New disposable 201 (2.5) 1.35 (1.06–1.71) 124 (1.6) 0.96 (0.72–1.29) 325 (2.1) 1.16 (0.97–1.39)
Re-used syringes 332 (3.7) 1.99 (1.60–2.49) 206 (2.4) 1.40 (1.08–1.83) 538 (3.0) 1.71 (1.44–2.02)
Don’t know 65 (4.6) 2.48 (1.80–3.42) 30 (2.2) 1.30 (0.83–2.02) 95 (3.4) 1.92 (1.48–2.47)
Total 706 (2.9) 450 (2.0) 1 156 (2.5)
CI = confidence interval; OR = odds ratio.
Table 2 shows HBsAg prevalence disaggregated by age, gender, marital status and history of injection use. The data illustrate age- and gender-related differences with a linear trend in the
20 years and above age and gender strata until the 40–49 years age group (P < 0.01). No difference in HBsAg was found between the two youngest age categories or between the 40–49 years age group and higher age categories. Currently married individuals had signif-icantly higher HBsAg positivity relative to those having no history of marriage (OR = 1.96; 95% CI: 1.57–2.45).
Males with a history of injection use had significantly higher HBsAg preva-lence relative to those not reporting injection use; this was true for females only when comparing those with 5–10

S19
injections with non-users. Males using disposable syringes had significantly higher HBsAg prevalence relative to non-injection users, while this was not found among females. Likewise, no significant difference was found in HB-sAg prevalence between females with lesser numbers of injections relative to those with higher numbers, while such a difference was significant for males with 10 or more injections relative to those with less than five. Table 3 illus-trates prevalence of anti-HCV, disag-gregated by age, gender, marital status and injection use. A significant increase in anti-HCV prevalence was observed
distinctly in both genders of all age cat-egories relative to the two youngest age groups. The most prominent increase in HCV infection rate was found among those aged between 20 and 49 years of age (P < 0.01). However, no anti-HCV gender-based differences were found. Individuals with history of mar-riage had significantly higher anti-HCV prevalence compared with those with no history of marriage (OR = 2.01; 95% CI: 1.72–2.34).
With regard to injection use, anti-HCV prevalence was significantly higher among users of any number of injections in both genders relative to
non-users, while a similar difference was found in both genders between the different gradients of injection users. Anti-HCV was also significantly higher among persons exposed to reused sy-ringes relative to those with no history of injection use, while no difference was found between non-users and those using new disposable syringes.
Overall HBeAg positivity in the HBsAg-positive cohort was 14.5%. When HBeAg positivity in the study population was disaggregated by prov-ince, Khyber Pakhtunkhwa had a lower HBeAg prevalence (8.5%); however,
Table 3 Prevalence and factors associated with antibody to the hepatitis C virus (anti-HCV) in Pakistan by age, marital status and history of injection use
Variable Males Females Total
No. (%) OR (95 %CI) No. (%) OR (95% CI) No. (%) OR (95% CI)
Age (years)
< 5 35 (1.7) 1 44 (2.1)1 1 79 (1.6) 1
5–19 192 (2.0) 1.21 (0.83–1.77) 187 (2.1) 1.00 (0.71–1.42) 379 (2.1) 1.09 (0.85–1.41)
20–29 170 (3.9) 2.43 (1.66–3.57) 205 (4.8) 2.33 (1.66–3.29) 375 (4.4) 2.38 (1.85–3.06)
30–39 204 (7.2) 4.62 (3.17–6.75) 247 (8.4) 4.23 (3.02–5.94) 451 (7.8) 4.41 (3.44–5.66)
40–49 261 (11.3) 7.56 (5.22–11.0) 182 (8.5) 4.29 (3.03–6.08) 443 (9.9) 5.75 (4.48–7.39)
50–59 162 (10.9) 7.29 (4.96–10.77) 128 (9.7) 4.96 (3.45–7.15) 290 (10.4 6.01 (4.63–7.81)
≥ 60 180 (10.9) 7.31 (4.99–10.76) 97 (8.6) 4.32 (2.96–6.32) 277 (10.0) 5.76 (4.43–7.50)
Total 1 204 (4.9) 1 090 (4.8) 2 294 (4.9)
Marital status (20–49 years)
Never married 139 (3.9) 1 80 (3.7) 1 219 (3.8) 1
Married 403 (6.9) 1.86 (1.52–2.28) 532 (7.7) 2.17 (1.70–2.78) 935 (7.3) 2.01 (1.72–2.34)
Divorced/separated/widowed 5 (3.6) 0.93 (0.33–2.40) 20 (9.8) 2.82 (1.63–4.83) 25 (7.2) 1.99 (1.26–3.11)
Total 547 (5.7) 632 (6.7) 1 179 (6.2)
No. of intramuscular injections
None 227 (3.8) 1 175 (3.5) 1 402 (3.7) 1
< 5 550 (4.7) 1.25 (1.07–1.47) 457 (4.2) 1.20 (1.0–1.44) 1 007 (4.5) 1.23 (1.09–1.38)
5–10 312 (5.9) 1.58 (1.33–1.89) 329 (6.4) 1.87 (1.54–2.26) 641 (6.1) 1.71 (1.50–1.95)
> 10 115 (8.1) 2.25 (1.77–2.86) 129 (8.4) 2.54 (1.99–3.23) 244 (8.3) 2.38 (2.01–2.82)
Total 1 204 (4.9) 1 090 (4.8) 2 294 (4.9)
Types of syringes
None 227 (3.8) 1 175 (3.5) 1 402 (3.7) 1
New disposable 300 (3.7) 0.99 (0.83–1.18) 252 (3.3) 0.95 (0.78–1.16) 552 (3.5) 0.97 (0.85–1.11)
Re-used syringe 615 (6.8) 1.87 (1.59–2.19) 583 (6.7) 1.98 (1.66–2.36) 1 198 (6.8) 1.91 (1.70–2.15)
Don’t know 62 (4.3) 1.15 (0.85–1.55) 80 (5.9) 1.71 (1.29–2.27) 142 (5.1) 1.41(1.15–1.72)
Total 1 204 (4.9) 1 090 (4.8) 2 305 (4.9)
CI = confidence interval; OR = odds ratio.

EMHJ
S20
the detected interprovincial differences were not significant.
Table 4 illustrates prevalence of HB-sAg and anti-HCV in the study popu-lation by housing structure, drinking water, sanitation, level of education and employment status. HBsAg was signifi-cantly higher among pacca dwellers, and those using pit latrines or the open field, as well as in those with education less than the primary level, relative to those living in kacha houses, or using flush toilets or having higher education than the primary level respectively. HBsAg was also significantly higher among persons working in the government/private sector and among daily wage-earners, relative to those working from home. Contrary results were found for anti-HCV with regard to housing and sanitary facilities with a higher preva-lence among those with relatively better facilities, while having a lower education level and working in the public/pri-
Table 4 Prevalence of hepatitis B surface antigen (HBsAg) and antibody to the hepatitis C virus (anti-HCV) by key social characteristics of the tested population
Variable HBsAg positive Anti-HCV positive
No. (%) OR (95% CI) No. (%) OR (95% CI)
Housing
Kacha home 696 (2.2) 1 1 726 (5.4) 1
Pacca home 460 (3.1) 1.42 (1.25–1.60) 568 (3.8) 0.69 (0.62–0.76)
Drinking water
Piped water at home 604 (2.4) 1 1 425 (5.7) 1
Fetched water from outside 552 (2.4) 0.98 (0.87–1.10) 869 (3.7) 0.64 (0.58–0.70)
Sanitation
Flush toilet available 555 (2.1) 1 1 318 (5.1) 1
Pit latrine at home or going to field 601 (2.8) 1.33 (1.18–1.50) 976 (4.6) 0.90 (0.83–0.98)
Education
Primary and above 411 (2.3) 1 729 (4.0) 1
Below primary 745 (2.6) 1.15 (1.01–1.30) 1 565 (5.4) 1.38 (1.26–1.51)
Employment
Self-employed working from home 418 (2.1) 1 970 (5.0) 1
Working in government private sector 230 (3.0) 1.43 (1.21–1.69) 485 (6.4) 1.31 (1.17–1.46)
Casual worker 51 (3.1) 1.47 (1.08–1.99) 99 (6.1) 1.23 (0.99–1.53)
CI = confidence interval; OR = odds ratio.
Table 5 Prevalence of hepatitis B surface antigen (HBsAg) and antibody to the hepatitis C virus (anti-HCV) by culture-related risk factors
Risk factor No. of subjects
HBsAg positive Anti-HCV positive
No. (%) OR (95% CI) No. (%) OR (95% CI)
Shaving (male ≥ 20 years)
None 5 288 180 (3.4) 1 295 (5.6) 1
Home 1 983 73 (3.7) 1.1 (0.8–1.4) 149 (7.5) 1.4 (1.1–1.7)
Barber 5 419 244 (4.1) 1.5 (1.2–1.9) 532 (9.8) 1.8 (1.5–2.1)Sharing tooth brush/miswak (≥ 5 years)
No 2 364 1 083 (2.6) 1 2 173 (5.1) 1
Yes 476 20 (4.2) 1.6 (1.0–2.7) 41 (8.4) 1.6 (1.2–2.4)
Sharing cigarettes/hookah/bidi (adults ≥ 20 years)
No 23 027 698 (3.0) 1 1 676 (7.3) 1
Yes 1 373 75 (5.5) 1.8 (1.4–2.4) 158 (11.5) 1.7 (1.4–2.0)
Tattooing/acupuncture (≥ 5 years)
No 42 606 1 095 (2.6) 1 2 195 (5.2) 1
Yes 229 8 (3.5) 1.4 (0.6–2.8) 19 (8.3) 1.6 (1.0–2.7)
Ear/nose piercing (female ≥ 5 years)
No 5 257 76 (1.5) 1 161 (3.1) 1
Yes 15 141 351 (2.3) 1.6 (1.2–2.1) 886 (5.8) 2.0 (1.7–2.4)
History of surgery
No 44 697 1 083 (2.4) 1 2 058 (4.6) 1
Yes 2 346 73 (3.1) 1.3 (1.0–1.2) 236 (10.1) 2.3 (2.0–2.7)
CI = confidence interval; OR = odds ratio.

S21
vate sector was associated with a higher exposure to HCV infection.
Table 5 illustrates prevalence of HB-sAg and anti-HCV by exposure to several risk factors. In males aged 20 years and over, HBsAg prevalence was significantly higher among those who were shaved at a barber shop, relative to those who shaved at home or who did not shave at all, while no difference was found be-tween those who shaved at home, relative to those who did not shave at all. Anti-HCV prevalence was significantly higher among those shaving either at barber
shops or at home compared with those who did not shave at all. Both HBsAg and HCV were more prevalent among those who shared tooth brush/miswak or ciga-rettes/hookah and bidi, or had pierced ears or nose, or had a history of surgery. Anti-HCV was also significantly more prevalent among those with a history of tattooing and acupuncture, relative to those who did not.
Figure 1 illustrates the differences in prevalence among the provinces and districts. While overall prevalence of HCV was 4.8%, the Punjab province
had significantly higher prevalence (6.7%) relative to Sindh (5.0%), which in turn had significantly higher anti-HCV prevalence when compared to Balochistan (1.5%) or Khyber Pa-khtunkhwa (1.1%).
Overall prevalence of HBsAg was 2.5%, and Balochistan had the high-est prevalence (4.3%) relative to Sindh (2.5%) and Punjab (2.4%), which in turn had significantly higher prevalence in comparison with Khyber Pakhtunkhwa (1.3%).
Discussion
The HBV and HCV epidemiological studies carried out in Pakistan during past decades had limited geographical scope, different time frames, applied diverse methodologies, and predomi-nantly focused on hospital and high-risk population groups [4–7,11]. Despite these considerable diversities and limitations, the studies supported the presence of high HBV and HCV en-demicity in Pakistan, promulgating the high burden these viral infections pose to populations’ health. These studies determined HBsAg prevalence to range from 2.6% to 3.5%, while anti-HCV prevalence ranged from 3.3% to 5.3%, although lower HBV prevalence was reported from blood donors [12–14]. Among CLD patients, 10%–46% had HBV infections and 40%–86% had anti-HCV [15–18].
The current study has corroborated the above reported high endemicity of HBV and HCV infections in the country, where the overall HBsAg and anti-HCV cumulative prevalence was 7.6%, reflect-ing a population pool of about 13 million being HBV and HCV chronic carriers. These findings are consistent with a cur-rent or imminent high burden of liver disease where 25% of the HBsAg and 80%–85% of the anti-HCV positive indi-viduals may later progress to CLD [1,8].
The association of HBV infection with increased age, marital status and
Figure 1 Maps illustrating the geographical burden of hepatitis B and C viral infections in Pakistan. FANA = Federal Administered Northern Areas; FATA = Federally Administered Tribal Areas; NWFP = North West Frontier Area
Hepatitis B virus
% of hepatitis B
Legend
Province boundary
<= 2.5 %
> 2.5 % to 5 %
> 5 %
Hepatitis C virus
% of hepatitis C
Legend
Province boundary
< 5 %
5 % to 7 %
> 7 %
EMHJ
S22
1. Lavanchy D. The global burden of hepatitis C. Liver Interna-tional, 2009, 29(s1):74–81.
2. Shepard CW, Finelli L, Alter MJ. Global epidemiology of hepa-titis C virus infection. Lancet, 2005, 5:558–567.
3. Rantala M, Van de Laar M JW. Surveillance and epidemiology of hepatitis B and C in Europe – a review. Eurosurveillance, 2008, 13(4–6):1–8.
4. Ali SA et al. Hepatitis B and hepatitis C in Pakistan: prevalence and risk factors. International Journal of Infectious Diseases, 2009, 13:9–19.
5. Khan TS, Rizvi F. Hepatitis B seropositivity among chronic liver disease patients in Hazara division Pakistan. Journal of Ayub Medical College Abottabad, 2003, 15(3):54–55.
6. Raja NS, Janjua KA. Epidemiology of hepatitis C virus infection in Pakistan. Journal of Microbiology, Immunology and Infection, 2008, 41:4–8.
7. Khan ZA, Aslam MI, Ali S. The frequency of hepatitis B and C among volunteer blood donors in Balochistan. Hepatitis Monthly, 2007, 7(2):73–76.
References
exposure to a series of risk factors in-cluding lesser education, outdoor employment, poor sanitation, shaving at the barber, ear/nose piercing and his-tory of surgery corroborates the diverse complementary sources of infection and the need for universal hepatitis B vaccination of all newborn infants and high-risk groups and other hepatitis control preventive interventions. How-ever, the lower level of HBV infection in teenage groups in both sexes may reflect a lesser exposure at that age.
In 2000, Pakistan introduced the monovalent hepatitis B vaccine in the national EPI and replaced it in 2008 with the pentavalent vaccine where hepatitis B vaccine is jointly administered with diphtheria, tetanus, pertussis and Hae-mophilus influenzae B vaccines, reducing the number of child vaccination con-tacts to improve vaccine acceptability and wastage control. Unfortunately, the current performance of the EPI shows that a large number of newborns miss the opportunity of accessing these regu-larly procured vaccines, reflecting the unnecessary avoidable harm to which many children are exposed.
However, the study could not ex-clude the importance of vertical trans-mission, a matter requiring a focused study to evaluate the need for corre-sponding preventive interventions. The higher prevalence of HBV among mar-ried individuals may reflect the potential of sexual transmission, this being an epidemiologically recognized mode of infection, mandating public education
about this risk of infection transition [19].
The higher association of HBV infec-tion with lower socioeconomic condi-tions and exposure to related risk factors categorizes hepatitis B as a disease of poverty, where the aforementioned lower immunization coverage in chil-dren residing in underprivileged areas raises concerns of inequity. Moreover, these finding give directions for ensur-ing the vaccination of high-risk groups, especially the health workforce, and promotion of infection-control safety measures when undertaking traditional practices entailing the use of invasive devices.
The incremental age-related preva-lence of HCV infection reflects increased exposure to high-risk practices such as the widespread reuse of syringes and a range of high risky traditional practices. These behaviours need to be controlled, both among health providers and in the community at large, as out of 95% of the globally used injections administered for therapeutic purposes, 50% were unsafe while 80% were unnecessary [20,21]. This observation is strongly substantiated by the evident correlation between anti-HCV prevalence and the reuse of syringes and frequency of injec-tion use. High community exposure to unsafe injections may also account for the observed lack of gender variation in HCV prevalence. These findings call for the promotion of a nationwide injection safety programme in all health facilities where related guidelines become an
integral part of a patient safety inter-vention with adherence to the funda-mentals of quality of care. The common use of multidose vials also needs to be discouraged and practice by quacks pre-vented through the promotion of public awareness against these risky though traditional practices.
The corroborated greater HBV and HCV risk of infection associated with the history of surgery substantiates the need for improving the safety of surgical care. While transmission of HBV can be tangibly controlled in a few decades through an effective universal vaccina-tion of the identified target population groups coupled with public education and behaviour change communica-tion, for HCV, where vaccination is not an option, public education and advocacy control interventions must be supplemented by the universal use of auto-disable syringes that should replace reusable disposable syringes in the country. Health authorities may also expedite the introduction of injection and patient safety measures in all health facilities and the setting of strategic policies that curtail the use of multidose vials, including those obtained from vet-erinary sources and misused by quacks.
Moreover, the currently pursued nationwide free treatment for under-privileged CLD patients needs to be sustained, as this constitutes a health intervention mitigating poverty, gener-ating public support for the programme and impacting on the quality of life of these patients.

S23
8. Van Damme P, Kane M, Andre M. Integration of hepatitis B vaccination into national immunization programmes. British Medical Journal, 1997, 314(7086):1033.
9. Global progress towards universal childhood hepatitis B vacci-nation. Weekly Epidemiological Record, 2003, 78(42):366–370.
10. Hepatitis C. Weekly Epidemiological Record, 1997, 72(10):65–69.
11. Farooqi JI, Farooqi RJ. Relative frequency of hepatitis “B” virus and hepatitis “C” virus infections in patients of cirrhosis in NWFP. Journal of the College of Physicians and Surgeons–Paki-stan, 2000, 10(6):217–219.
12. Khokhar N, Gill ML, Malik G J. General seroprevalence of hepatitis C and hepatitis B virus infections in population. Jour-nal of the College of Physicians and Surgeons–Pakistan, 2004, 14(9):534–536.
13. Ali N et al. Prevalence of hepatitis B surface antigen and hepa-titis C antibodies in young healthy adults. Pakistan Journal of Pathology, 2002, 13(2):3–6.
14. Kakepoto GN et al. Epidemiology of blood borne viruses: a study of healthy blood donors in Southern Pakistan. Southeast Asian Journal of Tropical Medicine and Public Health, 1996, 27(4):703–706.
15. Masud I, Khan H, Khatak AM. Relative frequency of hepatitis B and C viruses in patients with hepatic cirrhosis at DHQ teaching hospital D. I. Khan. Journal of Ayub Medical College Abottabad, 2004, 16(1):32–34.
16. Khokhar N. Spectrum of chronic liver disease in a tertiary care hospital. Journal of Pakistan Medical Association, 2002, 52(2):56–58.
17. Khan AA et al. Seromarkers of hepatitis B and C in patients with cirrhosis. Journal of the College of Physicians and Surgeons–Pakistan, 2002, 12(2):105–107.
18. Khan TS, Rizvi F, Rashid A. Hepatitis C seropositivity among chronic liver disease patients in Hazara, Pakistan. Journal of Ayub Medical College Abottabad, 2003, 15(2): 53–55.
19. Bile K et al. Late seroconversion to hepatitis B in a Somali village indicates the important role of venereal transmission. Journal of Tropical Medicine and Hygiene, 1991, 94:367–373.
20. Simonsen L et al. Unsafe injections in the developing world and transmission of bloodborne pathogens: A review. Bulletin of the World Health Organization, 1999, 77(10):789–800.
21. Kermode M. Unsafe injections in low-income country health settings: need for injection safety promotion to prevent the spread of blood-borne viruses. Health Promotion International, 2004, 19(1):95–103.

EMHJ
S24
Smokeless tobacco use in Pakistan and its association with oropharyngeal cancerK.M. Bile,1 J.A. Shaikh,1 H.U.R. Afridi1 and Y. Khan2
ABSTRACT Smokeless tobacco (ST), widely used in Pakistan, poses a high risk for oral cancer. Our hospital-based data illustrate that oropharyngeal cancer (9.9%) is the second leading malignancy after breast cancer (16.1%), and is significantly higher than in other Member States of the World Health Organization’s Eastern Mediterranean Region. Urdu-speaking communities had a proportionately higher rate of oropharyngeal cancer (20.4%), followed by Balochis (19.9%), Sindhis (16.8%), Punjabis (11.7%) and Pashtuns (9.6%). Association of oropharyngeal cancer with ST use was four times higher relative to no history of tobacco use after adjusting for age, ethnicity and gender. Our findings also show a predominance of this cancer among males relative to females and one-third of the reported cases occurred among individuals under 40 years. These findings have significant social impact, indicating the need for urgent intervention against the use of ST.
1World Health Organization, Country Office, Islamabad, Pakistan (Correspondence to K.M. Bile: [email protected]). 2National Tobacco Control Programme, Islamabad, Pakistan.
16.1 9.9
9.6 11.7 16.8 19.9 20.4
40
Consommation de tabac sans fumée au Pakistan et association avec le cancer oropharyngé
RÉSUMÉ Le tabac sans fumée, dont la consommation est largement répandue au Pakistan, induit un risque élevé de cancer de la cavité buccale. Les données obtenues auprès des hôpitaux montrent que le cancer oropharyngé est le deuxième cancer majeur (9,9 %) après le cancer du sein (16,1 %), avec un pourcentage nettement plus élevé que dans tout autre État Membre de la Région OMS de la Méditerranée orientale. Proportionnellement, les communautés parlant l’ourdou présentaient le taux de cancer oropharyngé le plus élevé (20,4 %), suivies par celles parlant le baloutchi (19,9 %), le sindhi (16,8 %), le pendjabi (11,7 %) et le pashto (9,6 %). Après ajustement des données en fonction de l’âge, de l’origine ethnique et du sexe, il a été constaté que les cancers oropharyngés étaient quatre fois plus fréquents chez les personnes qui consommaient du tabac sans fumée que chez celles qui n’avaient aucun antécédent de consommation de tabac. Nos résultats montrent également une prédominance de ce cancer chez les hommes. De plus, un tiers des cas signalés concernait des personnes de moins de 40 ans. Ces constats ont des répercussions sociales importantes et indiquent le besoin d’une intervention urgente contre la consommation de tabac sans fumée.

S25
Introduction
According to the World Health Or-ganization (WHO), tobacco is the single most preventable cause of death in the world today [1]. It is estimated that 5.4 million deaths currently occur every year due to tobacco use [2] and projected figures show that by 2030 there will be more than 8 million deaths every year, of which 80% will take place in middle- and low-income developing countries [1,2].
Tobacco can be used in different ways, ranging from cigarette, cigar and pipe smoking to smokeless products, available in various forms and mixtures. The most common forms of smoke-less tobacco (ST) available and used in Pakistan include:
Pan/betel with tobacco – a chewed mixture of areca nut (Areca catechu), tobacco, catechu (Acacia catechu) and slaked lime (calcium oxide and calcium hydroxide), wrapped in a betel leaf (Piper betel) with sweeten-ing agents.
Naswar – a mixture of sun-dried, sometimes only partially cured, pow-dered local tobacco (Nicotiana rus-tica), ash, oil, flavouring agents (e.g. cardamom, menthol), colouring agents (indigo) and lime.
Chalia/supari – areca nut (used plain, flavoured with essences or coated with tobacco).
Gutka – sun-dried roasted, finely chopped tobacco, areca nut, slaked lime and catechu mixed with flavours and sweeteners [3–6]. Most people place these forms of
ST in the mandibular or labial groove or simply apply them to their teeth and gums and suck on them slowly for 10–15 minutes [7].
ST is highly addictive and is a high-risk factor for oropharyngeal cancers as well as cancers of the head and neck, oesophagus and pancreas [1]. The er-roneous belief that chewing tobacco is a safe alternative to smoking may have
led to this growing epidemic, despite the fact that it has multiple ill effects on human health [7].
Pakistan is one of the countries where the use of ST is a culturally ac-ceptable habit. Various studies have re-ported the prevalence of chewing habits in different communities and locations. Studies from Karachi have shown that 21% of men and 12% of women use be-tel [7], for both men and women 7.3% use pan, 6.7% chalia, 7.5% gutka, 14.6% naswar [3] and use of betel and chewed tobacco is 20% and 17%, respectively [8,9]. In medical students, the rate of ST use was reported as 6.4% [7], while among primary-school children, the use of areca and betel was 74% and 35%, respectively [10].
Several studies have shown a clear independent link between the use of betel, areca and ST and oral submu-cous fibrosis, oral cancers, leukoplakia and other head and neck malignancies [4,11]. Among the Indian population, studies have estimated that 49% of oral cancers among males and 90% among females are attributable to chewing habits [11]. A report from Pakistan has also shown that people using pan with-out tobacco and those using pan with tobacco were 9.9 and 8.4 times, respec-tively, more likely to develop oral can-cer, after adjusting for covariates such as smoking, oral submucous fibrosis, use of alcohol and naswar [12]. Incidence rates of cancer of the oral cavity in both males and females were found to be among the highest in all urban cancer registries of south Asia relative to global data [4]. Similarly, cancers of the oral cavity and pharynx are highly common malignancies among males and females in Pakistan [13]. The age standardized incidence rate per 100 000 population of oral cavity cancer in Karachi city from 1 January 1998 to 31 December 2002 was reported as 21.3 in males and 19.3 in females, considered to be among the highest in the world [14].
The objective of this retrospective hospital-based review was to assess the
burden of oropharyngeal cancer among cancer patients admitted in key teaching and cancer hospitals in Pakistan, and evaluate the frequency and association of oropharyngeal cancer with the use of ST.
Methods
Data were obtained from five major lead-ing institutions for cancer diagnostics and management in Pakistan, namely Shau-kat Khanum Memorial Cancer Hospital & Research Centre (SKMCH&RC) in Lahore 2004–2007, Civil Hospital Ka-rachi (CHK) 2004–2008, Jinnah Post Graduate Medical Centre (JPMC) in Karachi 2004–2008, Institute of Radiotherapy and Nuclear Medicine (IRNUM) in Peshawar 2005–2007, and Nuclear Medicine, Oncology and Radiotherapy Institute (NORI) in Islamabad 2006–2008. Only sum-marized data of 21 245 cancer patients were obtained from SKMCH&RC and NORI, showing ranking of the most frequently diagnosed cancers. Data of 29 307 cancer patients, including infor-mation on use of ST and demographic details, were obtained from the Karachi hospitals CHK and JPMC and from IRNUM in Peshawar.
The assessed hospitals used different nomenclature to identify sites of differ-ent cancers. SKMCH&RC classified malignancies based on the International Classification of Diseases for Oncology, 3rd Edition (ICD-O-3) code. NORI re-ported the most frequent cancers based on site-based categories, i.e. cancers of the breast, larynx, liver, oesophagus, lung, gastrointestinal tract (stomach, intestine, colon), blood cancers, cer-vix, oropharynx and others. Data from the Karachi and Peshawar hospitals outlined 50 different categories/sites of cancer, classifying malignancies as cancers of the breast, liver, oesophagus, pancreas, lung (lung, pleura, trachea, bronchi), gastrointestinal tract (stom-ach, small intestine, large intestine,

EMHJ
S26
colon), lymphoma (all types), leukae-mia and multiple myeloma (all types), oropharynx (oral cavity and pharynx), larynx and others (all other organs, e.g. skin, genitourinary, soft tissue, bone, etc.). Oral cavity included the buccal mucosa, upper and lower alveolar ridges, floor of the mouth, retromolar trigone, hard palate, tongue and lips. Pharynx included oropharynx, nasopharynx and hypopharynx.
With regard to habits, patients were classified as: having a history of no ad-diction; using ST (i.e. pan, naswar, gutka, chalia/areca nut); smoking tobacco; using both ST and smoked tobacco; and those addicted to other substances, i.e. alcohol, bhang, opium, etc.
Permission was obtained from the hospitals, and a matrix was designed to generate retrospectively the cancer data available from these hospitals. Data were entered and analysed using SPSS, version 13.0.
Descriptive statistics of sociode-mographic characteristics and use of ST were carried out using frequencies, while univariate and multivariate odds ratios (OR) with 95% confidence in-tervals (CI) were obtained using the chi-squared test and logistic regression analysis.
Results
Data from 50 552 registered cancer pa-tients were collected from five leading hospitals that manage cancer patients admitted for diagnosis and care during a period from 2004 to 2008. Table 1 shows the sociodemographic charac-teristics of registered cancer patients in these five hospitals. Of these, 29 307 patient records had demographic data, while only 7292 had data on tobacco use. The mean age of the cancer patients was 45 years at the time of diagnosis, ranging from 1 to 100 years.
Of the 29 307 cancer patients with demographic data, 53% were males; ethnically, Pashtuns had more
representation (55.5%), while Baluchis and Punjabis were least represented in the study population (Table 1). The group categorized as “Other” included Bengalis, Uzbeks, Afghans, Marwaris and Gujaratis. Overall, there were sig-nificantly more users of ST (37.4%) than tobacco smokers (23.6%).
Aggregated data from 2004–2008 from the five sources showed that among the 50 552 registered cases, breast cancer was the most common cancer (16.1%), followed by oropha-ryngeal cancer (9.9%), which was sig-nificantly higher than all other cancers (P < 0.001) (Table 2). When data were disaggregated by reporting hospital, oropharyngeal cancer was the most frequent cancer in JPMC and IRNUM, and was ranked second in CHK, third in SKMCH&RC and fifth in NORI.
Oropharyngeal cancer was signifi-cantly more frequent in Pakistan com-pared with the other countries from WHO’s Eastern Mediterranean Region (P < 0.001) (Table 3).
In the univariate analysis, there was a significant linear trend of incremental rise in the prevalence of oropharyngeal cancer in the first 4 age groups (χ2 test for linear trend, P < 0.01) (Table 4). In the multivariate analysis, the associa-tion of oropharyngeal cancer with ST was also significantly more prominent among males than females (adjusted OR = 1.59; 95% CI: 1.438–1.82).
When controlling for ethnicity, age and sex, multivariate analysis showed that patients who used ST, smoked tobacco, or practised both habits, had a 4.7 (95% CI: 3.92–5.54), 1.6 (95% CI: 1.31–2.01) and 3.8 (95% CI: (1.31–2.01) times higher likelihood, respectively, of having oropharyngeal cancer, when independently compared with patients not practising any of these habits and these were all statistically significant (Table 4).
Oropharyngeal cancer was sig-nificantly higher among native Urdu-speaking and Balochi communities,
relative to other ethnic groups while no such difference was found between these 2 groups (data not shown in tables). Moreover, Sindhis had a sig-nificantly higher oropharyngeal cancer rate relative to Punjabis, who in turn had a significantly higher oropharyngeal cancer rate compared to Pashtuns.
Discussion
The link between oropharyngeal cancer and consumption of betel, areca nut and tobacco chewing is well established,
Table 1 Social and demographic characteristics of registered cancer patients in five leading hospitals in Pakistan
Variable No. %
Age at time of diagnosis (years)
< 25 4 374 14.9
25–34 2 849 9.7
35–44 4 813 16.4
45–54 6 249 21.3
≥ 55 10 986 37.5
Total 29 271a
Sex
Male 15 529 53.0
Female 13 758 47.0
Total 29 287 a
Ethnicity
Pashtun 16 256 55.5
Punjabi 1 035 3.5
Sindhi 3 019 10.3
Baluchi 895 3.1
Urdu 3 606 12.3
Other 4 496 15.3
Total 29 307
Habit
No addiction 2 514 34.5
Smokeless tobacco 2 730 37.4
Smoking tobacco 1 718 23.6
Both (smoking and smokeless) 306 4.2Other 24 0.3
Total 7 292a
aData for 36 cases on age, 20 cases on sex and 22 015 cases on habit were not available.

S27
and the habit is a commonly accepted cultural practice in south Asia [3,4]. The demographic profile of the diagnosed cancer patients in this study represents a multi-ethnic group of Pakistan as it includes five major leading institutions for cancer diagnostics and management from different parts of the country.
Since the ratification of the WHO Framework Convention on Tobacco Control (WHO FCTC) in 2005, the
Table 2 Cancers most frequently reported from five leading cancer diagnostic and management centres in Pakistana
CancerJPMC CHK IRNUM SKMCH & RC NORI Total
No. (%) No. (%) No. (%) No. (%) No. (%) No. (%)
Oropharynx 1 922 (17.7) 487 (14.8) 1 444 (9.5) 796 (6.3)b 395 (4.60) 5 044 (9.9)
Breast 1 508 (13.9) 613 (18.6) 1 392 (9.2) 2 856 (22.6) 1 790 (20.9) 8 159 (16.1)
Liver 361 (3.3) 110 (3.3) 176 (1.2) 725 (5.7) 142 (1.65) 1 514 (3.0)
Larynx 343 (3.2) 46 (1.4) 188 (1.2) – 189 (2.2) 766 (1.5)
Abdomen and anal canal 698 (6.4) 320 (9.7) 898 (5.9) 540 (4.3)c 1 017 (11.9) d 3 473 (6.9)
Oesophagus 496 (4.6) 117 (3.5) 1 171 (7.7) – 166 (1.93) 1 950 (3.9)
Non-Hodgkin’s lymphoma 502 (4.6) 37 (1.1) 1 312 (8.7) 908 (7.2) – 2 759 (5.5)
Hodgkin disease – – – 462 (3.6) – 462 (0.9)
Lung 798 (7.3) 183 (5.5) 479 (3.2) 399 (3.2) 422 (4.92) 2 281 (4.5)
Brain 265 (2.4) 21 (0.6) 851 (5.6) 257 (2.0) – 1 394 (2.7)
Skin 180 (1.7) 26 (0.8) 830 (5.5) – – 1 036 (2.1)
Uterus/ cervix 366 (3.4) 96 (2.9) 529 (3.5) – 197 (2.3)e 1 188 (2.4)
Acute lymphocytic leukaemia 125 (1.1) 2 (0.1) 748 (4.9) 281 (2.2) – 1 156 (2.3)
Leukaemia – – – 401 (3.2) 730 (8.5)f 1 131 (2.2)
Others 3 322 (30.5) 1 241 (37.6) 5 104 (33.8) 5 039 (39.8) 3 533 (41.2) 18 239 (36.1)
Total 10 886 3 299 15 122 12 664 8 581 50 552aNomenclature variance is related to the use of different classification by the different centres. bOral cavity. cColorectal. dGastrointestinal (all other). eCervix. f Blood cancers. CHK = Civil Hospital Karachi; IRNUM = Institute of Radiotherapy and Nuclear Medicine; JPMC = Jinnah Post Graduate Medical Centre; NORI = Nuclear Medicine, Oncology and Radiotherapy Institute; SKMCH &RC = Shaukat Khanum Memorial Cancer Hospital & Research Centre.
fight against tobacco use and cigarette smoking in particular has become an area of major public health debate in Pa-kistan, where the government, civil soci-ety organizations and media attempt to control tobacco use in the country. On the other hand, tobacco manufactur-ers have reignited fierce opposition to these national efforts. Pakistan, the sixth most populous nation in the world, has a high tobacco consumption rate;
however, tobacco cultivation is a prima-ry cash crop in one province (Khyber Pakhtunkhwa) and this has brought political sensitivity to this important debate. Moreover, the Government interpretation of the WHO FCTC and the proposed control interventions were almost exclusively directed to-wards the control of cigarette smoking, while the control of ST was ignored. As in most south Asian countries, the use
Table 3 Comparison of oropharyngeal and other cancers with selected countries in the Eastern Mediterranean Region
Country Total Oropharynx Stomach, colon, rectum
Liver Pancreas Larynx Lungs Oesophagus
No. (%) No. (%) No. (%) No. (%) No. (%) No. (%) No. (%)
Lebanon [19] 7 888 111 (1.41) 839 (10.64) 67 (0.85) 120 (1.52) 135 (1.71) 875 (11.09) –
Jordan [21] 3 142 75 (2.39) 385 (12.25) 74 (2.36) 27 (0.86) 50 (1.59) 211 (6.72) 27 (0.86)
Kuwait [22] 584 15 (2.57) 69 (11.82) 13 (2.23) 12 (2.05) 5 (0.86) 44 (7.53) 4 (0.68)
Islamic Republic of Iran [20] 47 217 1 206 (2.55) 8 616 (18.25) 283 (0.6) 211 (0.45) 785 (1.66) 1 506 (3.19) 2 584 (5.47)
Pakistan 50 552 5 044 (9.90) 3 473 (6.90) 1 514 (3.0) 218 (0.43) 766 (1.50) 2 281 (4.50) 1 950 (3.90)

EMHJ
S28
of ST products is a common practice in Pakistan, although predominantly limited to the lower socioeconomic strata of the population, except for the occasional traditional use of these prod-ucts, particularly pan, in local groups, especially in Sindh province [3,7]. The evident lack of regulatory attention may be attributed to the strong traditional base of the habit, the low social status of its prime consumers, the limited use of these substances in more prominent public places, the lack of taxation inter-est by the Government, and insufficient awareness and knowledge about the health hazards and risks associated with these products [3,6].
Our analysis illustrates that oropha-ryngeal cancer was the second most prevalent malignancy in Pakistan, re-flecting the high burden collectively experienced by most provincial cancer diagnostic and management centres [14–16]. When data from these sourc-es were disaggregated, this cancer was the most frequent in 2 of the source centres, was ranked second and third in 2 other source centres and was fifth in the remaining source, indicating the robustness of these findings. However, it is important to note that an earlier study of the 10 most frequent cancers globally ranked mouth and pharynx cancer as the sixth most frequent cancer
in the world [17], while a later study did not include oropharyngeal cancer in the 10 most frequent cancers in both developed and developing countries [18]. Oropharyngeal cancer was also significantly more frequent in Pakistan relative to several other countries in the Region with available data [19–22]. Our findings therefore reveal a distinct regional public health problem, requir-ing urgent action by the Pakistan Gov-ernment.
Among the patients whose expo-sure to tobacco risk was recorded, there was a significant association between oropharyngeal cancer and ST use; in fact twice as strong as that between
Table 4 Univariate and multivariate analysis showing association between age, sex, ethnicity and habit of addiction with oropharyngeal cancer
Variable All cases Oropharyngeal cancer Crude OR (95% CI) Adjusted OR (95% CI)a
No. (%)
Age at time of diagnosis (years)
< 25 4 374 395 9.0 1 1
25–34 2 849 349 12.2 1.40 (1.2–1.63) 2.6 (1.7–4.05)
35–44 4 813 689 14.3 1.68 (1.47–1.91) 3.5 (2.4–5.2)
45–54 6 249 943 15.1 1.79 (1.58–2.02) 3.4 (2.3–5.0)
≥ 55 10 986 1 470 13.4 1.55 (1.38–1.74) 2.6 (1.8–3.8)
Total 29 271 3 846 13.1
Sex
Female 13 758 1 466 10.7 1 1
Male 15 529 2 384 15.4 1.52 (1.42–1.63) 1.59 (1.38–1.82)
Total 29 287 3 850 13.1
Habit of patient
No addiction 2 514 207 8.2 1 1
Smokeless tobacco 2 730 867 31.8 5.1 (4.4–6.1) 4.66 (3.92–5.54)
Smoke tobacco 1 718 281 16.4 2.1 (1.8–2.6) 1.62 (1.31–2.01)
Both 306 92 30.1 4.7 (3.6–6.3) 3.77 (2.80–5.08)
Others 24 3 12.5 1.5 (0.4–5.3) 1.04 (0.30–3.56)
Total 7 292 1 450 19.9
Ethnicity
Pashtun 16 256 1 553 9.6 1 1
Punjabi 1 035 121 11.7 1.25 (1.03–1.53) 2.19 (1.58–3.04)
Sindhi 3 019 508 16.8 1.92 (1.72–2.13) 3.05 (2.37–3.92)
Balochi 895 178 19.9 2.35 (1.98–2.79) 3.03 (2.23–4.13)
Urdu speaking 3 606 734 20.4 2.42 (2.20–2.67) 3.12 (2.47–3.93)
Others 4 496 759 16.9 1.92 (1.75–2.11) 2.61 (2.05–3.32)
Total 29 307 3 853 13.1aAdjusted for the other variables shown in the table. CI = confidence interval; OR = odds ratio.

S29
oropharyngeal cancer and cigarette smoking, reflecting the burden that this habit inflicts on the population’s health. This association is explained by WHO’s recent confirmation of the presence of at least 28 carcinogens in ST, including non-volatile alkaloid-derived tobacco, specific nitrosamines, N-nitrosamines, inorganic compounds such as arsenic and nickel, plus radio-elements such as polonium, uranium, beryllium and others [5].
Although in both males and females, ST use was significantly associated with oropharyngeal cancer, male patients had almost a 60% higher risk of devel-oping the disease than females. The significant incremental linear trend in the prevalence of oropharyngeal cancer in the first 4 age group categories of the study population illustrates the poten-tial cumulative impact of the use of ST, an epidemiological observation cor-roborated by previous studies [5,14]. The association of oropharyngeal can-cer with ST was significantly higher for both males and females relative to non-ST users, although this relationship was more prominent among males. With the mean age of the patients being 45 years, a profound socioeconomic burden may be attached to the prema-ture mortality likely to result from such early age diagnosis, indicating the need for control interventions linking the prevention of ST use to the ongoing national action against tobacco use.
The observed greater occurrence of oropharyngeal cancer among native Urdu-speaking and Balochi patients relative to other ethnic groups in the country may be explained by the differ-ent sociocultural traditions related to ST use [13,23]. In Pakistan, the chewed forms of ST, pan and gutka, are pre-sumed to be more common among the Urdu-speaking and Balochi commu-nities, especially those living in Sindh province, while the relatively lower oc-currence of the disease in individuals from other groups may be attributed to a relatively lower consumption of these chewable ST products [23]. However, this assumption is not conclusive, con-sidering the limitations of the study, as the 2 hospitals in Lahore and Islama-bad did not have demographic data on ethnicity or records on the habitués of tobacco. Moreover, the 7292 cases for which information on tobacco use was available had no account of the duration of exposure that could have an impact on the disease occurrence. According to the Pakistan Tobacco Board, the total production of tobacco for 2006–2007 was 103 000 tons, of which about 50% was used for cigarette manufacturing, while the remaining quantity may have been used in ST forms. In addition, exported and imported quantities were comparable, each being estimated at 5% of the yearly production [24].
Pakistan has to reinforce its politi-cal and public health efforts to control
this preventable killer and build an al-liance between the ministries of health, education, commerce, agriculture, the Central Board of Revenue and the pro-vincial governments to ban all forms of tobacco advertisement, sponsorship and marketing, ban all forms of tobacco consumption in all public places and increase the excise taxes on all forms of tobacco. A national cancer registry should also be established to generate an account of the incidence trends, the patterns and burden in the country, the population at risk, and the risk factors engaged, especially smokeless tobacco use. Such a knowledge base will facilitate the introduction of control interventions that consider the underly-ing social, economic and cultural fac-tors and render the prevention of oral cancer an integral part of the national cancer control programme.
Acknowledgement
The authors thank the management of the 5 hospitals: Civil Hospital Karachi; Institute of Radiotherapy and Nuclear Medicine; Jinnah Post Graduate Medi-cal Centre; Nuclear Medicine, Oncol-ogy and Radiotherapy Institute and Shaukat Khanum Memorial Cancer Hospital & Research Centre, who made their cancer data available for this study.
1. WHO report on the global tobacco epidemic, 2008; the MPOWER package. Geneva, World Health Organization, 2008.
2. Mathers CD, Loncar D. Project of global mortality and burden of disease from 2002 to 2030. PLoS Medicine, 2006, 3(11):e442.
3. Khawaja MRH et al. Chewing of betel, areca and tobacco: perceptions and knowledge regarding their role in head and neck cancers in an urban squatter settlement in Pakistan. Asian Pacific Journal of Cancer Prevention, 2006, 7:95–99.
4. Nair U, Bartsch H, Nair J. Alert for an epidemic of oral cancer due to use of the betel quid substitutes gutkha and pan ma-sala: a review of agents and causative mechanism. Mutagenesis, 2004, 19(4):251–261.
5. IARC monographs on the evaluation of carcinogenic risks to hu-mans. Volume 89: Smokeless tobacco and some tobacco-specific N-nitrosamines. Lyon, World Health Organization, Internation-al Agency for Research on Cancer, 2007.
6. Gupta PC, Ray C S. Smokeless tobacco and health in India and South Asia. Respirology, 2003 8:419–431.
7. Imam S Z et al.Use of smokeless tobacco among groups of Pa-kistani medical students – a cross sectional study. BMC Public Health, 2007, 7:231.
8. Mahmood Z. Smoking and chewing habits of people in Karachi 1981. Journal of Pakistan Medical Association, 1982, 32:34–37.
References
EMHJ
S30
9. Qidwai W et al. Are our people health conscious? Results of a patient survey in Karachi, Pakistan. Journal of Ayub Medical Col-lege Abottabad, 2003, 15(1):10–13.
10. Shah SM et al. Addicted school children: prevalence and char-acteristics of areca nut chewers among primary school children in Karachi, Pakistan. Journal of Paediatric and Child Health, 2002, 38:507–510.
11. Balaram P et al. Oral cancer in Southern India: the influence of smoking, drinking paan-chewing and oral hygiene. Interna-tional Journal of Cancer, 2002, 98:440–445.
12. Marchant A et al. Paan without tobacco: an independent risk factor for oral cancer. International Journal of Cancer, 2000, 86:128–131.
13. Bhurgri Y et al. Cancer of the oral cavity and pharynx in Karachi – identification of potential risk factors. Asian Pacific Journal of Cancer Prevention, 2003, 4:125–130.
14. Bhurgri Y. Cancer and the oral cavity – trends in Karachi South (1995–2002). Asian Pacific Journal of Cancer Prevention, 2005, 6:22–26.
15. Bhurgri Y et al. Cancer profile of Hyderabad, Pakistan (1998–2002). Asian Pacific Journal of Cancer Prevention, 2005, 6:474–480.
16. Bhurgri Y et al. Cancer profile of Larkana, Pakistan (2000–2002). Asian Pacific Journal of Cancer Prevention, 2006, 7:518–521.
17. Parkin DM, Pisani P, Ferlay J. Estimates of the worldwide inci-dence of eighteen major cancers in 1985. International Journal of Cancer, 1993, 54:594–606.
18. Mackay J et al., eds. The cancer atlas. Brighton, American Cancer Society, 2006.
19. Salim M, Adib MD, Daniel J, eds. National cancer registry: cancer in Lebanon 2003. Beirut, Ministry of Public Health, 2003.
20. Mousavi SM, ed. Report of national cancer registration in Iran 2004–2005. Tehran, Ministry of Health and Medical Education, 2006.
21. Al-Kayed S, Hijawi B, eds. National cancer registry: incidence of cancer in Jordan. Amman, Ministry of Health, 1999.
22. Al-Hattab O, ed. Kuwait cancer registry: annual report 2003. Kuwait, Ministry of Health, 2003.
23. Mazahir S et al. Socio demographic correlates of betel, areca and smokeless tobacco use as a high risk behavior for head and neck cancers in a squatter settlement of Karachi, Paki-stan. Substance Abuse, Treatment, Prevention, and Policy, 2006, 1:10).
24. Tobacco statistical bulletin 2007. Peshawar, Pakistan Tobacco Board, Ministry of Commerce, 2007.

S31
Review
A review of EPI progress in Pakistan towards achieving coverage targets: present situation and the way forwardQ. Hasan,1 A.H. Bosan 2 and K.M. Bile1
ABSTRACT Pakistan’s Expanded Programme on Immunization (EPI) performance has a significant impact on global and regional immunization indicators such as poliomyelitis eradication, maternal and neonatal tetanus and measles elimination. Despite significant efforts by the Government and partners, Pakistan’s immunization indicators have not met the expected benchmarks. Barriers to achieving immunization goals are related to limited access to immunization services, lack of parent awareness and weak management. With sustained Government commitment, predictable partner support and by adopting effective strategies, Pakistan can achieve the immunization targets set at the regional and global level and make strong progress towards achieving Millennium Development Goal 4. This paper reviews EPI coverage targets, constraints, costs and resource allocation, and financial impact of suboptimal performance, and indicates the way forward to overcome these challenges.
1World Health Organization, Country Office, Islamabad, Pakistan (Correspondence to Q. Hasan: [email protected]).2Expanded Programme on Immunization, Ministry of Health, Islamabad, Pakistan.
Examen des progrès du Programme élargi de vaccination au Pakistan vers la réalisation des cibles de couverture : situation actuelle et voie à suivreRÉSUMÉ Les résultats du Programme élargi de vaccination au Pakistan ont des répercussions importantes sur les indicateurs de vaccination mondiaux et régionaux, ainsi que sur l’éradication de la poliomyélite et l’élimination du tétanos maternel et néonatal et de la rougeole. Malgré les efforts importants du gouvernement et de ses partenaires, les indicateurs de vaccination du Pakistan n’ont pas atteint les niveaux escomptés. Les obstacles à la réalisation des objectifs de vaccination sont l’accès limité aux services de vaccination, le manque de sensibilisation des parents et la faible capacité de gestion. Avec un engagement gouvernemental durable, l’appui prévisible de partenaires et l’adoption de stratégies efficaces, le Pakistan peut atteindre les cibles de vaccination définies aux niveaux mondial et régional et progresser fortement vers la réalisation de l’objectif 4 du Millénaire pour le développement. Cet article examine les cibles de la couverture par le Programme élargi de vaccination, les contraintes, les coûts et l’allocation des ressources, ainsi que les conséquences financières de résultats perfectibles. Il indique la voie à suivre pour surmonter ces obstacles.

EMHJ
S32
Introduction
The Expanded Programme on Im-munization (EPI) in Pakistan annu-ally targets around 5.8 million children aged below 1 year to protect against 8 vaccine-preventable diseases and 5.9 million pregnant women to protect them and their newborns from tetanus through routine immunization services. The overall objective of EPI is to reduce mortality and morbidity resulting from the 8 EPI target diseases.
EPI is almost the exclusive provider of immunization service in Pakistan, where the private sector provides ap-proximately 3% of immunization in-jections [1]. It delivers immunization services through more than 6000 fixed centres and over a million outreach and mobile vaccination sessions annually, involving more than 10 000 vaccina-tors including paramedics trained in EPI, 6000 lady health visitors (LHVs) and other paramedics. Approximately 100 000 lady health workers (LHWs) also assist in routine and supplementary immunization activities by social mobi-lization, defaulter tracing and occasion-ally providing vaccination. The current routine immunization schedules for children and pregnant women are de-scribed in Tables 1 and 2.
EPI began in Pakistan in 1976 on a pilot scale and was expanded country-wide by 1978. Annually, the programme procures vaccines for approximately 5.8 million children and 5.9 million preg-nant women [2]. In addition, a large
number of children and women are also targeted to receive immunization through different supplemental immu-nization activities. Initially started with 6 antigens, the programme added 2 new antigens, hepatitis B and Haemophilus influenzae type b (Hib), during the last decade. Over 30 million children are targeted for every round of polio supple-mental immunization activities. Over 3.4 million women of childbearing age were vaccinated with 3 doses of TT vac-cine during 2009.
At present, interruption of polio transmission, elimination of measles and neonatal tetanus along with reach-ing high routine immunization coverage are the main priorities for EPI Pakistan. In the recent past, the programme intro-duced new vaccines and technologies, which created more interest and pa-rental awareness of immunization. This was reflected in a slow but steady rise in different coverage indicators assessed by independent organizations (Figure 1) [3]. However, these achievements were inadequate to reach the country’s goal for polio eradication, measles and neonatal tetanus elimination and did
not match the efforts and resources al-located for the purpose by the Govern-ment and partners.
The objective of this review is to explore the progress of EPI Pakistan in terms of coverage of different antigens, current knowledge about the con-straints to achieving the desired level of coverage, cost and resource allocation, financial impact of suboptimal perform-ance and the way forward to overcome the challenges in attainment of its goals.
Sources
Several Government documents, survey reports and unpublished programme documents were reviewed and online searches were made to find literature on EPI Pakistan in websites of the World Health Organization (WHO), United Nations Children’s Fund (UNICEF) and other sources. The EPI programme’s official database along with Govern-ment financial documents were also analysed to estimate costs and impact of suboptimal performance.
Results
WHO and UNICEF had been estimat-ing the country’s immunization cover-age every year using the country’s official reports and the available independent survey data (Figure 1) [3]. In the mid-1980s, EPI coverage with 3 doses of diphtheria–pertussis–tetanus (DPT3) vaccine had been around 30% and with 1 dose of measles vaccine (measles1) had been around 40%. Coverage with both
Table 1 Routine immunization schedule for children, Expanded Programme on Immunization (EPI), Pakistan
Name of vaccine Number of doses Age at which administered
BCG 1 At birth
Trivalent OPV 4 At birth and then at 6, 10 and 14 weeks
Pentavalent (DPT–hepatitis B–Hib) 3 At 6, 10 and 14 weeks
Measles 2 At 9 months and in second year of life
BCG= Bacille Calmette-Guérin; OPV = oral poliomyelitis vaccine; DPT = diphtheria–pertussis–tetanus; Hib = Haemophilus influenzae type b.
Table 2 Routine tetanus toxoid (TT) vaccination schedule for pregnant women, Expanded Programme on Immunization (EPI), Pakistan
Vaccination Schedule
TT–1 During the first pregnancy
TT–2 1 month after the first dose
TT–3 6 months after the second dose
TT–4 1 year after the third dose
TT–5 1 year after the fourth dose
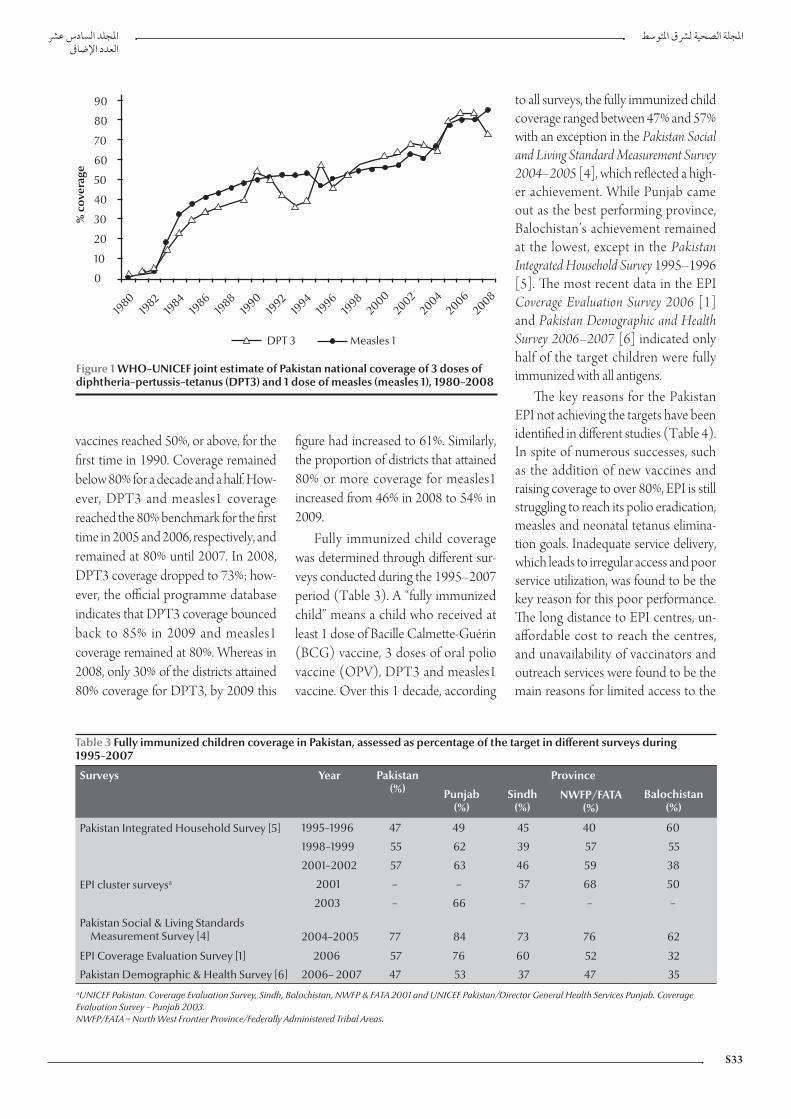
S33
vaccines reached 50%, or above, for the first time in 1990. Coverage remained below 80% for a decade and a half. How-ever, DPT3 and measles1 coverage reached the 80% benchmark for the first time in 2005 and 2006, respectively, and remained at 80% until 2007. In 2008, DPT3 coverage dropped to 73%; how-ever, the official programme database indicates that DPT3 coverage bounced back to 85% in 2009 and measles1 coverage remained at 80%. Whereas in 2008, only 30% of the districts attained 80% coverage for DPT3, by 2009 this
figure had increased to 61%. Similarly, the proportion of districts that attained 80% or more coverage for measles1 increased from 46% in 2008 to 54% in 2009.
Fully immunized child coverage was determined through different sur-veys conducted during the 1995–2007 period (Table 3). A “fully immunized child” means a child who received at least 1 dose of Bacille Calmette-Guérin (BCG) vaccine, 3 doses of oral polio vaccine (OPV), DPT3 and measles1 vaccine. Over this 1 decade, according
to all surveys, the fully immunized child coverage ranged between 47% and 57% with an exception in the Pakistan Social and Living Standard Measurement Survey 2004–2005 [4], which reflected a high-er achievement. While Punjab came out as the best performing province, Balochistan’s achievement remained at the lowest, except in the Pakistan Integrated Household Survey 1995–1996 [5]. The most recent data in the EPI Coverage Evaluation Survey 2006 [1] and Pakistan Demographic and Health Survey 2006–2007 [6] indicated only half of the target children were fully immunized with all antigens.
The key reasons for the Pakistan EPI not achieving the targets have been identified in different studies (Table 4). In spite of numerous successes, such as the addition of new vaccines and raising coverage to over 80%, EPI is still struggling to reach its polio eradication, measles and neonatal tetanus elimina-tion goals. Inadequate service delivery, which leads to irregular access and poor service utilization, was found to be the key reason for this poor performance. The long distance to EPI centres, un-affordable cost to reach the centres, and unavailability of vaccinators and outreach services were found to be the main reasons for limited access to the
Figure 1 WHO–UNICEF joint estimate of Pakistan national coverage of 3 doses of diphtheria–pertussis–tetanus (DPT3) and 1 dose of measles (measles 1), 1980–2008
Table 3 Fully immunized children coverage in Pakistan, assessed as percentage of the target in different surveys during 1995–2007
Surveys Year Pakistan(%)
Province
Punjab (%)
Sindh (%)
NWFP/FATA (%)
Balochistan (%)
Pakistan Integrated Household Survey [5] 1995–1996 47 49 45 40 60
1998–1999 55 62 39 57 55
2001–2002 57 63 46 59 38
EPI cluster surveysa 2001 – – 57 68 50
2003 – 66 – – –
Pakistan Social & Living Standards Measurement Survey [4] 2004–2005 77 84 73 76 62
EPI Coverage Evaluation Survey [1] 2006 57 76 60 52 32
Pakistan Demographic & Health Survey [6] 2006– 2007 47 53 37 47 35aUNICEF Pakistan. Coverage Evaluation Survey, Sindh, Balochistan, NWFP & FATA 2001 and UNICEF Pakistan/Director General Health Services Punjab. Coverage Evaluation Survey – Punjab 2003. NWFP/FATA = North West Frontier Province/Federally Administered Tribal Areas.

EMHJ
S34
service. The EPI Coverage Evaluation Survey 2006 [1] indicated that 12.6% of mothers’ reasons for failing to immu-nize their children was “the vaccination centre is too far or the vaccinator was absent”. Distance to the health centre was again highlighted in a recent study undertaken by EPI with the assistance of UNICEF in 2009, as 30% of mothers reported that it was difficult or very dif-ficult to reach the nearest health facility from their place of residence [7].
Approximately 6000 EPI fixed cen-tres in the country (1 centre for about 27 000 population) provide immuniza-tion services to the people. However, these are not uniformly distributed. One in every 10 union councils (UCs) in Punjab province, the most populous province and recognized as having the most developed infrastructure, is with-out any EPI fixed centre. While at least 2 vaccinators are required in each UC according to the national EPI policy, the real number is lower (1.3 per UC). Except in Sindh (115%), all provinces had a much lower number of vaccina-tors than required according to the na-tional policy. Proportions of vaccinators available against the standard were 52%, 70% and 72%, in Punjab, Khyber Pa-khtunkhwa and Balochistan provinces, respectively. Though some paramedic cadres such as LHVs are engaged in vac-cination in some areas, other potential resources, especially trained LHWs, are restrained from providing vaccination independently.
Lack of recipient awareness about the immunization service and its ben-efits was found to be the second most common contributing factor for low coverage. The Coverage Evaluation Sur-vey – Punjab 2003 [8] highlighted that parental lack of awareness about the need for vaccination was one of the most important reason for low coverage in Punjab. The EPI Coverage Evaluation Survey 2006 [1] supported this finding; lack of awareness about the need for im-munization and the need for subsequent doses were the most commonly given
reasons (18% and 10.2%, respectively) by mothers for failing to immunize their children.
The total routine immunization cost in 2008 was more than US$ 104 million. Over half of that total was used to procure vaccines (Table 5). Per child vaccination cost up to DPT3 was com-pared at actual coverage achieved in the same year against different levels with a gradual increment up to 100% coverage. According to the WHO–UNICEF Joint Reporting Form 2008, Pakistan [9], only 73% target children received all antigens up to DPT3 out of total 5 830 739 surviving infants. If all intended target children had received at least 3 doses of DPT vaccine, per child expenditure in that year would have been US$ 17.89. But according to the baseline year (2008) data of the EPI Comprehensive Multiyear Plan 2011–2015 , this expenditure was US$ 24.51, which is 37% higher [10]. This accounted for a total loss of value of routine immunization investment in 2008 equivalent to US$ 28 164 774.
The Government of Pakistan and other international partners [e.g. Ca-nadian International development Agency (CIDA), Department for International Development [DFID], Global Alliance for Vaccine and Immu-nization (GAVI), Japan International Cooperation Agency (JICA), Rotary International, UNICEF, United States Agency for International Development (USAID), WHO and World Bank] showed their interest and commitment for the immunization programme by investing sizeable resources over the past years. The Government of Pakistan procures all necessary vaccines and in-jection equipment for the programme with its own resources except for a share of the pentavalent vaccine, which is sup-ported by GAVI under a cofinancing agreement. The total cost of the current five-year plan (PC-1) for 2009–1010 to 2013–1014 is PKR 26.422 billion (approximately US$ 322 million) [2], which is almost 2 times larger than the Ta
ble
4 K
ey re
ason
s fo
r fai
lure
in im
mun
izat
ion
achi
evem
ents
in P
akis
tan
indi
cate
d in
diff
eren
t stu
dies
, 199
3–20
09
Reas
onA
hmed
et a
l.,
1999
[14]
Man
suri
&
Baig
, 20
03
[15]
Cov
erag
e Ev
alua
tion
Su
rvey
Pun
jub,
20
03
[8]
UN
ICEF
, Bar
rier
s in
im
mun
izat
ion,
2
00
4 [1
9]
EPI C
over
age
Eval
uati
on S
urve
y,
200
6 [1
]
Sidd
iqi e
t al.,
20
07
[18]
Man
grio
et a
l.,
200
8 [2
0]
Usm
an H
R et
al.,
20
09
[16]
Fa
isal
et a
l.,
200
9 [7
]
Lim
ited
acce
ss to
serv
ices
++
++
++
Lack
of a
war
enes
s of t
he
be
nefit
s of i
mm
uniz
atio
n+
++
+
Low
soci
oeco
nom
ic
st
atus
and
par
enta
l
educ
atio
n+
++
Man
agem
ent p
robl
em+
++
+

S35
last PC-1 of 2004–2005 to 2008–2009 [11]; 80% of the planned cost of the current PC-1 will be from the Gov-ernment’s own exchequer. The rise in contribution towards EPI by provin-cial governments has also been noted. Sindh provincial government budget for EPI increased up to 400% and 155% during the last 2 fiscal years, respectively. Being one of the largest international immunization partners, the total GAVI commitment to EPI Pakistan during 2001–2012 was worth US$ 313 mil-lion (Table 6).
Discussion
After long slow progress in the initial two decades, DPT3 coverage has started to show a slow but steady rise since the late 1990s [3]. The addition of hepatitis B vaccine to the immunization pro-gramme at the beginning of the new millennium failed to boost the coverage as expected. Parents were less compliant to accept 2 injections simultaneously for their infants [1]. Compliance was increased with the introduction of the tetravalent vaccine (DPT–hepatitis B)
in 2006, which required only 1 shot for 4 antigens.
The programme faced another set-back in 2008 during the addition of another new vaccine, a combination pentavalent form (Hib–hepatitis B–DPT), which replaced the then existing tetravalent (DPT–hepatitis B) vaccine. Unfortunately, due to delay in registra-tion and supply of the new product, the introduction could not be timely initi-ated with the result that a total stock out of vaccine occurred for some months and this was the most likely cause of
Table 5 Routine immunization expenditure of the Expanded Programme on Immunization (EPI) Pakistan in 2008 and comparison of per child vaccination cost and loss of value of annual expenditure at actual coverage versus different coverage levels if achieved
Expenditure categories Total expenditure in
2008 (US$)
Cost per child (US$)
At actual coverage
(73%)
If 80% coverage achieved
If 85% coverage achieved
If 90% coverage achieved
If 100% coverage achieved
Vaccines 57 714 408 13.56 12.37 11.64 11.00 9.90
Injection equipment 3 894 360 0.92 0.83 0.79 0.74 0.67
Operations 42 705 209 10.03 9.16 8.62 8.14 7.32
Total 104 313 977 24.51 22.36 21.05 19.88 17.89
Loss of value of annual expenditure due to low coverage (US$ million) 28.16 20.86 15.65 10.43 Nil
Table 6 Approved Global Alliance for Vaccine and Immunization (GAVI) support for Pakistan 2003–2012
GAVI support windows
Total value of support (US$)
2000 2001 2002 2003 2004 2005 2006 2007 2008 2009 2010 2011 2012
New and underused vaccine support (Hep. B vaccine) 25 504 000
New and underused vaccine support (DPT + Hep. B) 47 085 000
New and underused vaccine support (DPT + Hep. B + Hib) 159 266 000
Vaccine introduction grant 1 911 000
Immunization services support 45 769 740
Injection safety support 9 075 500
Health system strengthening 23 525 000
Civil society organization, type A 1 200 000
Total 313 336 240
Hep. B = hepatitis B; DPT = diphtheria–tetanus–pertussis; Hib = Haemophilus influenzae type b.

EMHJ
S36
the fall in DPT3 coverage to 73% in that year. The vaccine stock out was indicated as the key reason for this drop in DPT3 coverage as a similar drop in coverage was not observed for other antigens, such as BCG and measles1, in the same year [3]. By early 2009, the new vaccine introduction was complete throughout the country and DPT3 coverage returned to a level above 80% [12,13].
However, the fully immunized child coverage is still far behind the optimum. In spite of the high coverage claimed in the administrative reports, all surveys ex-cept the Pakistan Social and Living Stand-ard Measurement Survey 2004–2005 conducted during 1995 to 2007 to as-sess immunization coverage in Pakistan indicated that only around half of the targeted children were fully immunized [1,4–6,8]. The discrepancy between the reported data and independent assess-ments raised concerns about the data quality of administrative reports among different stakeholders. Discrepancy in provincial performance was also evi-dent in these surveys. Keen monitoring of the data quality at different level on a regular basis using the standard WHO Data Quality Self-assessment tool may help improve this area.
The most common cause for the poor performance of EPI Pakistan, re-vealed through a series of studies, was the limited access to the immunization service [1,7,8,14–16]. Contrary to the national policy [17], about one-third of UCs did not have fixed centres and the same proportion of government health facilities did not provide EPI services as revealed in different national and subna-tional programme reviews. Moreover, many fixed centres provided immu-nization service only once or twice a week. With limited services through fixed centres, the only alternative to ac-cess the intended target population was through outreach vaccination sessions, which were again irregular and not well implemented because of limited hu-man resources, inadequate operational
support and weak monitoring and supervision. Daily provision of immu-nization services from all Government health facilities would significantly raise access.
An inadequate number of vaccina-tors was one of the main reasons for limited access to service [7,15]. In an average-sized UC with a population of 25 000, a vaccinator working for 16 days every month would require to make only 18–26 contacts each day. However, due to the wide geographical dispersion of this target population the task is more challenging. Moreover, the unequal distribution of vaccinators has left a significant proportion of the UCs uncovered. This inadequacy could be overcome by using EPI-trained LHWs for delivering vaccination services. As LHWs are embedded in, and well ac-cepted by, the community, they have substantial potential for enhancing EPI coverage in their catchment area. Around 20 000 LHWs are ready to provide vaccination after completion of a 6-month training course on rou-tine immunization, assisted by WHO with GAVI health system strengthen-ing (HSS) support. Redistribution of vaccinators in UCs along with use of trained LHWs in immunization service provision could be proven a very effec-tive and immediate measure and would not incur additional cost.
Lack of information about immu-nization was another key reason for not utilizing the available service [1,8,14–17]. Earlier studies indicated that lack of awareness among mothers about the benefits of vaccination was one of the most important reasons for failing to vaccinate a child; however, a recent study revealed evidence of improvement in this area [18]. About 84% of mothers agreed that vaccination helps keep their child healthier, while about two-thirds considered it a problem when a child misses 1 or 2 doses (63.6%) and one-third stated that delaying vaccination was not harmful to their children [7]. Continuous effort of Government and
nongovernment organizations to raise community awareness about immu-nization over the past years undoubt-edly has yielded some results. However, more assertive steps are now required to convert this community awareness into a proactive demand for immunization. Community-based service provision through LHWs can help raise awareness about the importance of completing the schedule and improve compliance by mitigating perceived difficulties in ac-cessing the service.
Insufficient management skills, lack of motivation of health workers, inad-equate resources and poor monitoring and supervision were also reasons for setback in immunization performance [7,14,19,20]. Frequent turnover of dis-trict management due to political and other reasons resulted in inexperienced managers with little immunization background. In the absence of continu-ity of service, organizational experience was lost and managers and vaccinators were not accountable for their perform-ance as supervision and monitoring was not a regular practice. Retaining trained officers at management level for a pe-riod long enough to provide managerial experience, creating career pathways to motivate senior field workers and estab-lishing accountability are all required.
Federal resources for EPI include donor support, which is first deposited in the Federal Government account and is then distributed among prov-inces according to population propor-tion [2,9,21]. This does not help to get critical resources in areas where the programme is most vulnerable. Effec-tive utilization of available resources is another challenge. Moreover, low performance is reducing a significant portion of the investment. Taking 2008 as a baseline, the earmarked budgetary outlay was invested in the programme, although the vaccine utilization was not optimized. If all targeted children were vaccinated, the programme expenditure for each child vaccinated with DPT3 would be US$ 17.89 [9,10]. However,

S37
due to failure to reach about 27% of the targeted children, the actual cost for every vaccinated child was US$ 24.51 [10]. In other words, the programme lost benefits of more than US$ 28 mil-lion of its annual investment in 1 year only. Beside this direct loss, the cost for treatment of diseases incurred by un-vaccinated children also added to public expenditure. Half of this direct value loss could be averted if only 10% more target children could have been vaccinated. In terms of resources, the value lost would have been reduced to US$ 20.86 mil-lion, US$ 15.65 million and US$ 10.43 million by reaching 80%, 85% and 90% coverage rates, respectively. Just by reaching more children, the programme can not only reach its goal but can also add effectiveness and value to its own investment, which is worth millions of dollars.
With GAVI support, EPI Pakistan added 2 important vaccines to its childhood immunization schedule, introduced new technology and ex-panded its cold chain capacity and other infrastructure significantly. In terms of
volume, the new and underused vac-cine support was the largest and most cost intensive. However, direct support to the programme was most critical in building capacity to yield maximum benefits from these new additions. Such direct support needs to be continued by investing HSS support in a way that directly benefits the EPI service delivery capacity and aligns with its indicators, which in turn will enable the programme to increase uptake of new vaccines and thus render more benefits to children. At the same time, reducing the global vaccine price to-wards an affordable level and a gradual incremental increase in allocation of public resources needs to be ensured for sustaining the new costly additions when GAVI support ends.
EPI Pakistan enjoys the highest level of political and administrative support from the Federal Government as well as from provincial governments. The chal-lenge is to reflect these commitments from the highest level into real achieve-ment by increasing vaccination cover-age and thus reducing child mortality.
Some specific actions can be taken to scale-up EPI services in Pakistan: pro-viding regular EPI service through all existing health facilities, establishing an EPI centre in all UCs, redistributing available vaccinators and engaging all skilled manpower, including LHWs, for vaccination could raise community ac-cess and compliance to the service and thus raise coverage significantly within a very short time. Along with better access, creating strong public demand for im-munization through effective social mo-bilization and communication strategy, raising motivation of field workers with proper logistics support, incentives and effective supervision and monitoring, coupled with competent management, could definitely enable the programme to reach more children which would in turn add value to the investment for the programme and accentuate further im-provement in performance. Being one of the most cost-effective public health interventions, immunization improve-ment can make significant contribution in Pakistan’s achievement of MDG 4 for reduction in child mortality.
References
1. Coverage evaluation survey 2006. Islamabad, Ministry of Health, Expanded Programme on Immunization, 2007.
2. Planning commission form – 1 (PC-1) 2009–2010 to 2013–2014. Islamabad, Ministry of Health, Expanded Programme on Im-munization, 2009.
3. WHO/UNICEF estimate of national immunization coverage 1980–2008, Pakistan. Geneva, World Health Organization, 2009 (http://www.who.int/immunization_monitoring/en/globalsummary/timeseries/tswucoveragebycountry.cfm?country=PAK, accessed 24 April 2010).
4. Pakistan social & living standards measurement survey 2004–2005. Islamabad, Federal Bureau of Statistics, 2005.
5. Pakistan integrated household survey: round 1: 1995–1969. Is-lamabad, Federal Bureau of Statistics, 1997.
6. Pakistan demographic and health survey 2006–2007. Islamabad, National Institute of Population Studies, 2008.
7. Faisal A et al. Understanding barriers to immunization in Paki-stan. Islamabad, Ministry of Health, Expanded Programme on Immunization, 2009.
8. Coverage evaluation survey – Punjab 2003. Lahore, Director General Health Services of Punjab, 2003.
9. WHO/UNICEF joint reporting form 2008, Pakistan. Islamabad, Ministry of Health, Expanded Programme on Immunization, 2009.
10. Comprehensive multi-year plan 2011–2015. Islamabad, Min-istry of Health, Expanded Programme on Immunization, 2009.
11. Planning Commission form 1 (PC-1) 2004-05 to 2008-09.. Is-lamabad, Pakistan, Ministry of Health, Expanded Programme on Immunization, 2004.
12. Immunization coverage data. Islamabad, Ministry of Health, Official Database of the Expanded Programme on Immuniza-tion, 2008.
13. Immunization coverage data. Islamabad, Ministry of Health, Official Database of the Expanded Programme on Immuniza-tion, 2009.
14. Ahmad N et al. Immunization coverage in 3 districts of North West Frontier Province (NWFP). Journal of Pakistan Medical As-sociation, 1999, 49(12):301–305.
15. Mansuri FA, Baig LA. Assessment of immunization service in the perspective of both the recipients and the providers: a re-flection from focus group discussions. Journal of Ayub Medical College Abbottabad, 2003, 15(1):14–18.
16. Usman HR et al. Determinants of third dose of diphtheria–tetanus–pertussis (DTP) completion among children who
EMHJ
S38
received DTP1 at rural immunization centres in Pakistan: a cohort study. Tropical Medicine & International Health, 2009, 15(1):140–147.
17. National EPI policy and strategic guidelines. Islamabad, Ministry of Health, Expanded Programme on Immunization, 2005.
18. Siddiqi N et al. Assessment of EPI (expanded programme of immunization) vaccine coverage in a peri-urban area. Journal of Pakistan Medical Association, 2007, 57(8):391–395.
19. Report on assessment of barriers in immunization services in Paki-stan. Pakistan, United Nations Children’s Fund, 2004.
20. Mangrio NK, Alam MM, Shaikh BT. Is expanded programme on immunization doing enough? Viewpoint of health workers and managers in Sindh, Pakistan. Journal of Pakistan Medical Association, 2008, 58(2):64–67.
21. Country information fact sheet, Pakistan. GAVI Alliance (http://www.gavialliance.org/performance/country_results/index.php?countID=52, accessed 10 April 2010).

S39
Review
Maternal, neonatal and child health in Pakistan: towards the MDGs by moving from desire to realityA.F. Shadoul,1 F. Akhtar 2 and K.M. Bile1
ABSTRACT Of the 10 million annual deaths of children below five years of age, four million are neonates. Pakistan’s neonatal mortality rate of 54/1000 live births, which accounts for 57% of the under-five mortality, the contraceptive prevalence rate stagnating at 30%, the meagre number of deliveries assisted by skilled birth attendants (39%) and the low coverage of cost-effective child survival interventions hamper the achievement of Millennium Development Goals (MDGs) 4 and 5. The Government launched the national maternal, neonatal and child health programme in 2007 to promote access to evidence-based cost-effective interventions; strengthen district health system capacities; empower communities; expand the community midwives’ cadre; and promote utilization of essential services. This paper reviews the implementation of the programme and the likelihood of attaining the MDG4 and 5 targets by 2015, and provides strategic directions for scaling-up programme implementation.
1World Health Organization, Country Office, Islamabad, Pakistan (Correspondence to A.F. Shadoul: [email protected]).2Maternal, Neonatal and Child Health Programme, Ministry of Health, Islamabad, Pakistan.
57 5439 30
2007
2015
Santé de la mère, du nouveau-né et de l’enfant au Pakistan : atteindre les objectifs du Millénaire pour le développement en passant du rêve à la réalité
RÉSUMÉ Parmi les dix millions de décès d’enfants de moins de cinq ans, quatre millions concernent des nouveau-nés. Avec un taux de mortalité néonatale de 54 pour 1000 naissances vivantes (ce qui représente 57 % de la mortalité des moins de cinq ans), un pourcentage de prévalence de la contraception qui stagne à 30 %, un nombre très faible d’accouchements assistés par des professionnelles qualifiées (39 %) et une couverture insuffisante en interventions rentables de survie infantile, il est difficile d’atteindre les objectifs 4 et 5 du Millénaire pour le développement au Pakistan. En 2007, le gouvernement a lancé le programme pour la santé de la mère, du nouveau-né et de l’enfant, afin de favoriser l’accès à des interventions d’un bon rapport coût-efficacité et fondées sur des données factuelles, de renforcer les capacités des systèmes de santé de district, d’autonomiser les communautés, de former davantage de sages-femmes communautaires qualifiées et d’encourager le recours aux services essentiels. Cet article étudie la mise en œuvre du programme et la probabilité de réaliser les objectifs 4 et 5 du Millénaire pour le développement d’ici à 2015. Il propose aussi des orientations stratégiques en vue de l’extension de la mise en œuvre du programme.

EMHJ
S40
Introduction
More than 10 million children younger than five years die globally every year [1,2]. About 41% of child deaths oc-cur in sub-Saharan Africa and 34% in south Asia [3]. Half of the worldwide deaths in children under five years occur in six countries alone, which include Pakistan, and 90% occur in 42 countries [4]. These deaths are attributed largely to diarrhoea (22%), pneumonia (21%), malaria (9%), AIDS (3%), measles (1%) and neonatal causes (33%), while being underweight confers an additional risk of mortality from infectious diseases [5]. Almost 4 million newborns suffer from moderate to severe birth asphyxia, with at least 800 000 dying and a higher number developing sequelae every year [6].
W o r l d H e a l t h O r g a n i z a t i o n (WHO) and United Nations Chil-dren’s Fund (UNICEF) have estimated that one in every 38 women dies from pregnancy-related causes [7]. Recent estimates showed that 342 900 mater-nal deaths occurred worldwide in 2008, down from 526 300 in 1980, showing a 1.5% yearly rate of decline [8].
One-tenth of global maternal deaths (around 53 000) occur annually in WHO’s Eastern Mediterranean Re-gion. Pakistan is responsible for almost 20% (11 000) of the regional maternal mortality, while more than 95% of this burden is shared by seven countries, namely Afghanistan, Iraq, Morocco, Pakistan, Somalia, Sudan and Yemen, which also suffer from high neonatal mortality rates (NNMRs) [9]. Ten countries harbour 67% of the burden of neonatal deaths, with Pakistan being the fourth country on the list, accounting for 7% of the global neonatal deaths [10].
The maternal mortal ity ratio (MMR) of 276/100 000 live births, under-five mortality rate (U5MR), in-fant mortality rate (IMR) and NNMR of 94/1000, 78/1000 and 54/1000 live births, respectively, are unacceptably
high [11]. The contraceptive prevalence rate of 30%, the unmet need for contra-ceptive services of 25% and total fertility rate of 4.1 would constrain the attain-ment of Millennium Development Goal (MDG) 5. The Pakistan demographic and health survey (PDHS) 2006–2007 indicates that 39% of births were as-sisted by skilled birth attendants , 34% were facility based and 66% were home based, while 68% occurred in periph-eral rural settings. Approximately 7.3% of births were delivered by caesarean section with wide disparities between urban and rural areas [12].
The IMR of 78/1000 live births is higher than the averages of low-income countries and south Asia by 10% and 16%, respectively [13]. High levels of child and maternal mortality and mor-bidity in Pakistan result from the inter-play of a variety of factors, including the low status of women in society, poor nutrition, poor access to health services, particularly emergency obstetric and neonatal care (EmONC), rural–urban disparity, and poverty and illiteracy [14–16]. One-fifth of newborns are low birth weight, and 38% of under-five chil-dren are underweight, while anaemia re-mains highly prevalent among women (40%) and under-five children (62%) [15,17]. Over the past four decades, there has been a slow reduction in infant mortality, while neonatal mortality has remained virtually static at 54/1000 live births (PDHS 2006–2007) with most deaths occurring during the early neonatal period or first week of life. Moreover, high levels of perinatal mortality (159/1000 pregnancies) are associated with events occurring during late gestation, delivery, postpartum and the first week of life [11].
Health care provision in Pakistan involves the private and public sectors. The public sector is comprised of a large network exceeding 10 000 health facilities, in addition to around 3000 family welfare centres run by the Min-istry of Population Welfare with limited functional integration [18,19]. Pakistan
also has a flourishing network of private health care providers with a larger utili-zation base. Most people initially seek curative care from the private sector; for instance 49% of diarrhoea cases initially seek care from private practitioners, and about 70% of private sector services are urban based [17]. Several nongovern-mental organizations possessing varying capacities focus on provision of family planning (FP) services, mainly in urban areas. Traditional birth attendants and relatives are the major providers of de-livery care in rural areas [11].
The health system’s ability to re-spond and provide adequate and com-prehensive quality services continues to remain limited, as is access to and utili-zation of preventive and curative health services. Availability of lady health work-ers and lady health visitors has increased substantially; however, the availability of women medical officers and commu-nity midwives (CMWs) remains very low. Similarly, basic and comprehensive EmONC is provided at various levels of the health system, though the coverage, access and utilization levels are unsatis-factory.
This paper aims to review the progress attained on maternal neonatal and child health (MNCH) and evalu-ate the likelihood of Pakistan achieving its MDG 4 and 5 targets by 2015.
Methods
More than 25 published documents and national surveys relating to MNCH in Pakistan were thoroughly reviewed, the major ones being PDHS 2006–2007; MNCH PC-1, National Health Policy 2001 and the draft policy 2010; Paki-stan MDG reports and Pakistan Social and Living Standards Measurement Survey 2005–2006. Documents ad-dressing MNCH policies, strategies and related estimates, developed by WHO/UNICEF/United Nations Population Fund (UNFPA) and the World Bank
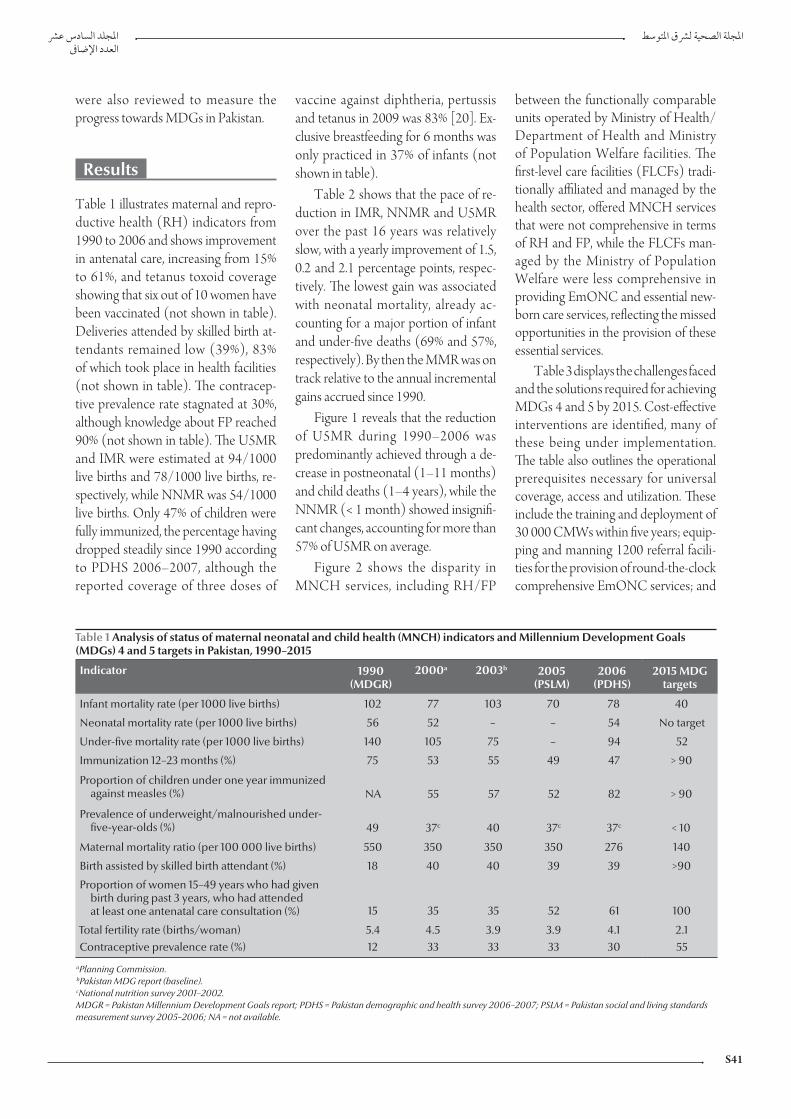
S41
were also reviewed to measure the progress towards MDGs in Pakistan.
Results
Table 1 illustrates maternal and repro-ductive health (RH) indicators from 1990 to 2006 and shows improvement in antenatal care, increasing from 15% to 61%, and tetanus toxoid coverage showing that six out of 10 women have been vaccinated (not shown in table). Deliveries attended by skilled birth at-tendants remained low (39%), 83% of which took place in health facilities (not shown in table). The contracep-tive prevalence rate stagnated at 30%, although knowledge about FP reached 90% (not shown in table). The U5MR and IMR were estimated at 94/1000 live births and 78/1000 live births, re-spectively, while NNMR was 54/1000 live births. Only 47% of children were fully immunized, the percentage having dropped steadily since 1990 according to PDHS 2006–2007, although the reported coverage of three doses of
vaccine against diphtheria, pertussis and tetanus in 2009 was 83% [20]. Ex-clusive breastfeeding for 6 months was only practiced in 37% of infants (not shown in table).
Table 2 shows that the pace of re-duction in IMR, NNMR and U5MR over the past 16 years was relatively slow, with a yearly improvement of 1.5, 0.2 and 2.1 percentage points, respec-tively. The lowest gain was associated with neonatal mortality, already ac-counting for a major portion of infant and under-five deaths (69% and 57%, respectively). By then the MMR was on track relative to the annual incremental gains accrued since 1990.
Figure 1 reveals that the reduction of U5MR during 1990–2006 was predominantly achieved through a de-crease in postneonatal (1–11 months) and child deaths (1–4 years), while the NNMR (< 1 month) showed insignifi-cant changes, accounting for more than 57% of U5MR on average.
Figure 2 shows the disparity in MNCH services, including RH/FP
between the functionally comparable units operated by Ministry of Health/Department of Health and Ministry of Population Welfare facilities. The first-level care facilities (FLCFs) tradi-tionally affiliated and managed by the health sector, offered MNCH services that were not comprehensive in terms of RH and FP, while the FLCFs man-aged by the Ministry of Population Welfare were less comprehensive in providing EmONC and essential new-born care services, reflecting the missed opportunities in the provision of these essential services.
Table 3 displays the challenges faced and the solutions required for achieving MDGs 4 and 5 by 2015. Cost-effective interventions are identified, many of these being under implementation. The table also outlines the operational prerequisites necessary for universal coverage, access and utilization. These include the training and deployment of 30 000 CMWs within five years; equip-ping and manning 1200 referral facili-ties for the provision of round-the-clock comprehensive EmONC services; and
Table 1 Analysis of status of maternal neonatal and child health (MNCH) indicators and Millennium Development Goals (MDGs) 4 and 5 targets in Pakistan, 1990–2015
Indicator 1990 (MDGR)
2000a 2003b 2005 (PSLM)
2006 (PDHS)
2015 MDG targets
Infant mortality rate (per 1000 live births) 102 77 103 70 78 40
Neonatal mortality rate (per 1000 live births) 56 52 – – 54 No target
Under-five mortality rate (per 1000 live births) 140 105 75 – 94 52
Immunization 12–23 months (%) 75 53 55 49 47 > 90
Proportion of children under one year immunized against measles (%) NA 55 57 52 82 > 90
Prevalence of underweight/malnourished under- five-year-olds (%) 49 37c 40 37c 37c < 10
Maternal mortality ratio (per 100 000 live births) 550 350 350 350 276 140
Birth assisted by skilled birth attendant (%) 18 40 40 39 39 >90
Proportion of women 15–49 years who had given birth during past 3 years, who had attended at least one antenatal care consultation (%) 15 35 35 52 61 100
Total fertility rate (births/woman) 5.4 4.5 3.9 3.9 4.1 2.1Contraceptive prevalence rate (%) 12 33 33 33 30 55
aPlanning Commission. bPakistan MDG report (baseline). cNational nutrition survey 2001–2002. MDGR = Pakistan Millennium Development Goals report; PDHS = Pakistan demographic and health survey 2006–2007; PSLM = Pakistan social and living standards measurement survey 2005–2006; NA = not available.

EMHJ
S42
the scaling-up of integrated manage-ment of newborn and child illness/essential newborn care/prenatal care coverage, by ensuring their effective delivery in 90% of FLCFs from the cur-rent level of 54%.
Discussion
During the past two decades, Pakistan has accomplished reasonable gains in reducing maternal, infant and under-five mortalities: from 1990 to 2006 the MMR, U5MR and IMR have dropped by 50%, 24% and 33%, respectively. Despite this tangible progress, Pakistan may not advance sufficiently to reach the set MDG targets by 2015, and hence is lagging behind other coun-tries of comparable socioeconomic
development. The relatively lower reduction in the IMR and U5MR can primarily be attributed to the nearly stagnant NNMR, which progressed only 4% over the same period.
Pakistan’s national MDG report of 2004 charted a road map for enhancing maternal and child survival by placing greater emphasis on reducing maternal and neonatal mortality through:
training and deployment of commu-nity-based skilled birth attendants;
ensuring access to quality basic and comprehensive EmONC referral services in the rural and urban mar-ginalized areas;
introducing a unified policy on ma-ternal and child health through holis-tic interventions;
Table 2 Reduction in mortality in 16 years, attained gains and required improvement to achieve Millennium Development Goals (MDGs) 4 and 5 by 2015
Indicator 1990 baseline (MDGR)
2006 performance
(PDHS)
Points gained per
yeara
2015 expected mortality rates
with the current pacea
MDG target 2015
(MDGR)
Yearly reduction pace to achieve MDG targets by
2015a
Maternal mortality ratiob 550 276 3.1 139 140 3.1
Infant mortality ratec 102 78 1.5 66 40 4.7
Neonatal mortality ratec 56 54 0.2 53 18 7.8Under-five mortality ratec 140 94 2.1 71 52 3.8
aCalculated from baseline (1990) and 2006 mortality rates; bper 100 000 live births; cper 1000 live births. MDGR = Pakistan MDG report; PDHS = Pakistan demographic and health survey 2006–2007.
Figure 1 Neonatal, infant and child mortalities: comparison between 1990 baseline and 2006 under-five mortality rate (U5MR) (per 1000 live births) by age group
38
16
64
24
56
54
1-4 years
1-11 months
< 1 month
0 10 20 30 40 50 60 70
U5MR 1990 baseline U5MR 2006
integrating and promoting maternal and child nutrition;
encompassing social safety nets and health insurance schemes;
fostering behaviour change targeting both men and women.Pakistan can timely achieve MDG5
if the reported pace of reduction in MMR is sustained and accelerated; however, with a contraceptive preva-lence rate stagnating at 30%, a low rate of deliveries assisted by a skilled birth attendant (39%) and the lack of acces-sible and quality EmONC services, this task is most challenging. The prevention of unplanned pregnancies alone could avert around one-quarter of maternal deaths, including those resulting from unsafe abortions, by addressing the large unmet need for child spacing [11]. Although a range of socioeconomic factors may influence maternal survival, the major focus needs to be directed to health system strengthening, enabling universal delivery of essential MNCH services that are effective and affordable to the underprivileged strata of society. The U5MR and IMR will only make a real breakthrough when the stagnating NNMR is addressed effectively.
The observed fragmentation in the delivery of MNCH services, including RH and FP, by the Ministry of Health and Ministry of Population Welfare constitutes a major challenge, as close to 10 000 FLCFs run by the health sector need to strengthen their RH and FP service delivery capacities to avert the
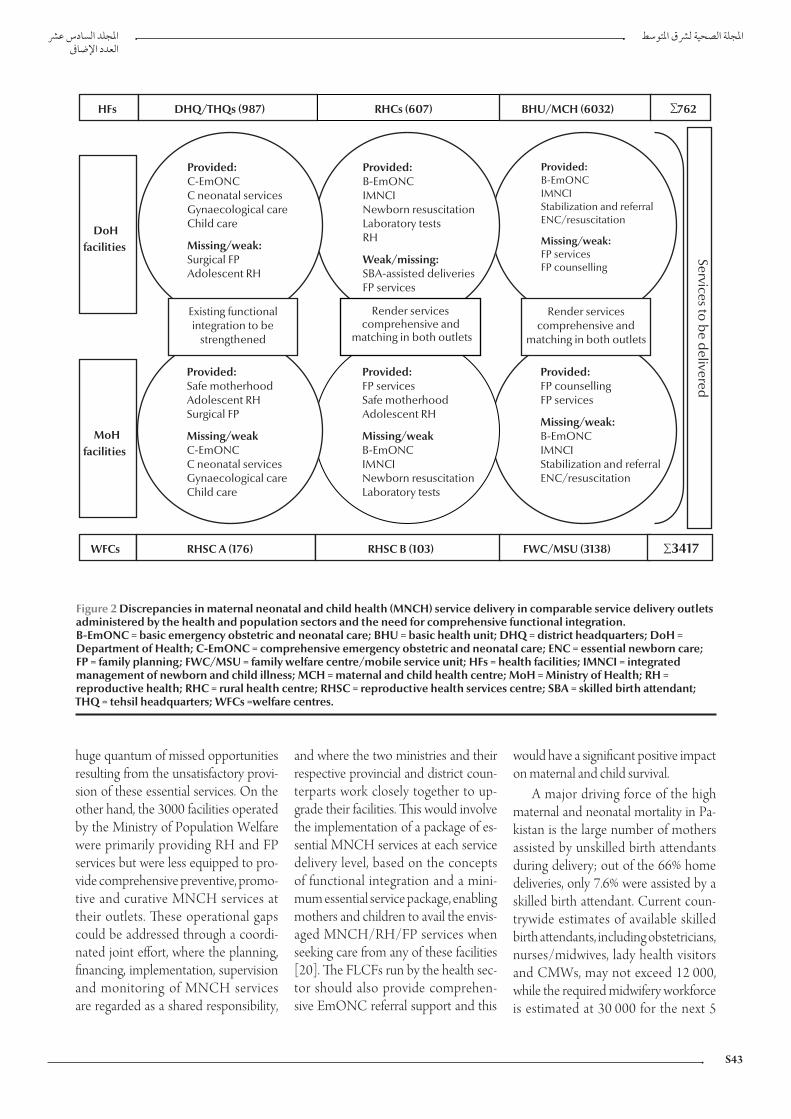
S43
huge quantum of missed opportunities resulting from the unsatisfactory provi-sion of these essential services. On the other hand, the 3000 facilities operated by the Ministry of Population Welfare were primarily providing RH and FP services but were less equipped to pro-vide comprehensive preventive, promo-tive and curative MNCH services at their outlets. These operational gaps could be addressed through a coordi-nated joint effort, where the planning, financing, implementation, supervision and monitoring of MNCH services are regarded as a shared responsibility,
and where the two ministries and their respective provincial and district coun-terparts work closely together to up-grade their facilities. This would involve the implementation of a package of es-sential MNCH services at each service delivery level, based on the concepts of functional integration and a mini-mum essential service package, enabling mothers and children to avail the envis-aged MNCH/RH/FP services when seeking care from any of these facilities [20]. The FLCFs run by the health sec-tor should also provide comprehen-sive EmONC referral support and this
would have a significant positive impact on maternal and child survival.
A major driving force of the high maternal and neonatal mortality in Pa-kistan is the large number of mothers assisted by unskilled birth attendants during delivery; out of the 66% home deliveries, only 7.6% were assisted by a skilled birth attendant. Current coun-trywide estimates of available skilled birth attendants, including obstetricians, nurses/midwives, lady health visitors and CMWs, may not exceed 12 000, while the required midwifery workforce is estimated at 30 000 for the next 5
Figure 2 Discrepancies in maternal neonatal and child health (MNCH) service delivery in comparable service delivery outlets administered by the health and population sectors and the need for comprehensive functional integration. B-EmONC = basic emergency obstetric and neonatal care; BHU = basic health unit; DHQ = district headquarters; DoH = Department of Health; C-EmONC = comprehensive emergency obstetric and neonatal care; ENC = essential newborn care; FP = family planning; FWC/MSU = family welfare centre/mobile service unit; HFs = health facilities; IMNCI = integrated management of newborn and child illness; MCH = maternal and child health centre; MoH = Ministry of Health; RH = reproductive health; RHC = rural health centre; RHSC = reproductive health services centre; SBA = skilled birth attendant; THQ = tehsil headquarters; WFCs =welfare centres.

EMHJ
S44
Table 3 Challenges, solutions and operational implications to attain Millennium Development Goals (MDGs) 4 and 5 by 2015
Challenges Solutions Implications
MDG 4
Vaccination coverage of > 90% for 12–23 month children
Improving EPI coverage (pentavalent) Providing daily routine immunization, including measles, through more than 15 000 health facility fixed sites (7000 currently)
Achieving > 90% coverage of measles vaccination
Outreach services to 20 communities per union councils per month
Orientation and involvement of 100 000 LHWs and private sector
Scaling-up and implementing IMNCI, essential newborn care and postnatal care coverage to > 90% of FLCFs
Focusing on unreached and underserved populations in urban slums and rural areas
Mass training of > 15 000 FLCF staff on IMNCI, ENC and PNC
Training of 100 000 LHWs on management of severe pneumonia, low osmolar ORS and zinc
Involving the private sector and NGOsSustaining availability of essential drugs and equipment in all FLCFs
Introducing IMNCI and child survival projects in preservice training
Accelerating the pace of reduction in neonatal mortality
Ensuring ANC, PNC, skilled attendance at birth, and timely referral
More coordination between EPI, LHWs, nutrition and MNCH
Training and deploying a critical mass of more than 30 000 CMWs
Training LHVs/LHWs on ENC and PNC
Training all SBAs, paediatricians and WMOs on neonatal resuscitation
MDG 5
Increasing number of deliveries assisted by SBAs and encouraging facility-based deliveries
Producing and deploying critical mass of CMWs/SBAs
Raising public awareness regarding SBA and facility-based deliveries
Training and deployment of more than 30 000 CMWs in the next 5 years in rural areas and slums
Making SBAs available for assisted normal deliveries in 987 THQ/DHQ, 607 RHCs, 279 RHCA&B and 3138 FWCs
Availability of round-the-clock C-EmONC services in 987 THQ/DHQ and 279 RHCA&B
Tangible improvement in FP services
Functional integration of FP services between MoPW/MoH outlets
Providing FP services in more than 10 000 MoH health facilities and 3417 MoPW WFCs
Addressing unmet needs Training and involvement of all CMWs/LHVs and LHWs in FP servicesRaising public awareness Training staff and involving all private sector facilities
Cross-cutting issues
Increasing access to quality MNCH/FP services
Providing FP services in all health outlets
Equipping more than 10 000 MoH health facilities and 3000 MoPW facilities to provide integrated MNCH/FP services, including neonatal resuscitationStrengthening health system especially
human resources (WMOs) Providing ORS, zinc, amoxicillin, FP commodities and clean delivery kits to all LHWs, LHVs and CMWsProviding supplies, equipment and
timely referral
Allocating more resources
Addressing all forms of maternal and child malnutrition
Bridging deficiencies of both macro- and micronutrients (especially iron and iodine)
Iron/folate supplementation for all pregnant women, vitamin A supplementation for all under-five children by more than 100 000 LHWs
Managing severe malnutrition and establishing therapeutic feeding centres in more than 987 DHQ/THQ hospitals
Improving care-seeking behaviours and demand creation
Focusing on awareness, health education and behavioural changes
Increasing emphasis on the poor, slums and vulnerable groups
Utilizing innovative ideas, e.g. vouchers schemes, cash transfer and in-kind incentives (food rations, oil)
Developing prepayment mechanisms through revamped public sector or through social, private and community-based health insurance
ANC = antenatal care; C-EmONC = comprehensive emergency obstetrics and neonatal care; CMWs = community midwives; THQ/DHQ = tehsil headquarters/district headquarters; ENC = essential newborn care; EPI = Expanded Programme on Immunization; FP = family planning; FLCFs = first-level care facilities; FWCs = family welfare centres; IMNCI, integrated management of newborn and child illness; LHVs = lady health visitors; LHWs = lady health workers; MNCH = maternal neonatal and child health; MoH = Ministry of Health; MoPW = Ministry of Population Welfare; MNCH = maternal neonatal and child health; NGOs = nongovernmental organizations; ORS = oral rehydration salts; PNC = prenatal care; RHCs = rural health centres; RHCA&B = reproductive health centre type A & B; SBAs = skilled birth attendants; WFCs = welfare centres; WMOs = women medical officers.
S45
years. This estimate is determined by envisaging one CMW for every 5000 catchment area population, with the CMW performing on average at least 150 deliveries per year, in addition to over 1000 antenatal and postnatal visits. The proposed coverage is lower than that indicated by the Safe Mother-hood Initiative, where one skilled birth attendant is required for every 2000 population, but still challenging both in operational and financing terms, un-derscoring the need for international partnerships to successfully embark on this major undertaking [21].
Pakistan may repeat its globally acknowledged success in the training and deployment of over 100 000 lady health workers by assuming a similar political commitment and declaring a crash programme for the training and deployment of CMWs. To accomplish this mission within the set time frame, CMW training needs to be conducted in all tertiary, district headquarter and tehsil headquarter hospitals, securing the necessary equipment and quali-fied human resources. The initiative will concurrently ensure the delivery of comprehensive EmONC referral serv-ices and allow assisted home deliveries through community-based outreach services. The placement of third-year postgraduate students registered at the College of Physicians and Surgeons of Pakistan in district and tehsil head-quarter hospitals for 6–12 months as part of their residence training and em-ploying 2–3 nurses/midwives in each participating hospital unit would largely mitigate the human resource gap and render the process feasible.
This gigantic task should entail mobilizing support from the 64 medi-cal universities/colleges of Pakistan, College of Physicians and Surgeons of Pakistan, Midwifery Association of Pakistan, Pakistan Nursing Council, Society of Obstetrics and Gynaecology of Pakistan and the 110 currently opera-tional nursing and midwifery schools in the country, generating a nationwide
movement to attain this critical social goal. A series of national meetings with active interprovincial and district par-ticipation should be organized to build a nationwide consensus for this flag-ship health reform intervention. Once trained, the CMWs could maintain a contractual employment relationship with the national health system, similar to the approach pursued for lady health workers. The latter will substantiate their close affiliation with the health system in terms of supervision and monitoring, recording and reporting, continuing education and the provision of basic supplies and equipment.
In view of the obvious preference of most rural mothers to give birth at home, it would be unrealistic to en-vision a CMW clinic for conducting deliveries, as opposed to the culturally preferred mode of attending births at home. Organizing transport facilities to promptly access comprehensive EmONC services is another major un-dertaking, requiring active coordination of households and local community or-ganizations. As an intermediate strategy and based on recent evidence showing that traditional birth attendants can im-pact on reducing perinatal and neonatal mortality and stillbirths [22], their skill training on clean deliveries, combined with improved linkages with the health system, could be considered for rural areas where access to CMW services is remote. However, the ultimate ob-jective should be the deployment of skilled birth attendants in all rural areas to ensure access to quality services.
From 1990 to 2006, the decline in U5MR was mostly from reductions in postneonatal (1–11 months) and child (1–4 years) mortalities, while the NNMR has remained almost stagnant, indicating the need for enhancing ef-forts to attain MDG 4 targets by 2015 with an unyielding focus on reducing the NNMR. More than 62% of deaths in under-five children can be averted by ensuring universal coverage with the 16 WHO-supported interventions
identified by the Bellagio Study Group on Child Survival, which were selected by the national MNCH programme as evidence-based child health inter-ventions [23]. Three-quarters of peri-natal deaths and at least 30%–40% of infant deaths can be averted through improved maternal health, adequate nutrition during pregnancy, effective antenatal services and deliveries assisted by a skilled birth attendant with neo-natal resuscitation and postnatal visits [24]. In addition, household and com-munity newborn care, correct breast-feeding practices, keeping the baby warm, recognizing when to seek care and timely referral to RH centres and hospital emergency neonatal care units can contribute significantly to newborn survival [23,25].
Other critical interventions include maintaining full immunization cover-age of children aged 12–23 months at more than 90% and scaling-up and implementing integrated management of newborn and child illness, essential newborn care and prenatal care in more than 90% of FLCFs.
The private sector role in MNCH and RH service delivery is crucial to improving access to these vital serv-ices, hence the need to engage a large number of practicing family physicians. A platform of advocacy and public edu-cation on MNCH, RH and FP relevant to maternal and child survival has to be generated. Demand creation, uti-lization of available services, support through voucher schemes, conditional cash transfers, the possible link with the Benazir Income Support Programme, and development of prepayment mechanisms through revamped public sector or through social, private and community-based health insurance schemes for the poor, are critical ele-ments that would improve access to these vital services.
The Federal Government approved the national MNCH programme in 2007 at a cost of PKR 20 billion (about US$ 333.3 million) to adopt

EMHJ
S46
References
and implement proven cost-effective interventions and attain MDG 4 and 5 targets. The programme has devel-oped strong partnerships reflected in the technical and financial support provided by UN agencies, especially WHO, UNICEF, UNFPA and the “Delivering as One” joint programme; health development partners including AusAID, Department for International Development (DFID), Japan Inter-national Cooperation Agency (JICA), United States Agency for International
Development (USAID) and World Bank; GAVI Health System Strengthen-ing Support (GAVI HSS); and bilateral initiatives such as the Norway–Pakistan Partnership Initiative. The government has to reinforce its commitment to MNCH through an incremental budg-etary outlay and international resource mobilization, while ensuring the effec-tive and nationwide implementation of the programme.
Over the past two decades, Pakistan has accomplished reasonable gains in
reducing maternal, infant and under-five mortality rates, as from 1990 to 2006. Despite this tangible progress, achieving MDGs 4 and 5 may be de-layed unless the prospected range of maternal and child survival interven-tions are scaled-up, with a strong focus on the production and deployment of a critical mass of CMWs linked to the health system, and by a major improve-ment of RH and FP services, supported by a strong partnership and active com-munity participation.
1. Ahmad OB, Lopez AD, Inoue M. The decline in child mortality: a reappraisal. Bulletin of the World Health Organization, 2000, 78:1175–1191.
2. The world health report 2002: reducing risks, promoting healthy life. Geneva, World Health Organization, 2002.
3. Child mortality statistics. New York, United Nations Children’s Fund (http://www.childinfo. org/cmr/revis/db2.htm, ac-cessed 21 January 2010).
4. Hill K et al., eds. Trends in child mortality in the developing world, 1960–1996. New York, United Nations Children’s Fund, 1998.
5. Ezzati M et al., eds. Comparative quantification of death risks: glo-bal and regional burden of disease attributable to selected major factors. Geneva, World Health Organization, 2006.
6. Costello AM. Prenatal health in developing countries. Transac-tions of the Royal Society of Tropical Medicine and Hygiene, 1993, 87:1–2.
7. Maternal mortality in 2005: estimates developed by WHO, UNICEF, UNFPA and the World Bank. Geneva, World Health Organization, 2007.
8. Hogan MC et al. Maternal mortality for 181 countries, 1980–2008: a systematic analysis of progress towards millennium development Goal 5. Lancet, 2010, 375(9726):1609–1623.
9. Neonatal mortality in EMR, determinants and strategies for achiev-ing MDG 4. Cairo, World Health Organization, Regional Office for the Eastern Mediterranean, 2007.
10. Lawn JE et al. 4 million neonatal deaths: when, where and why? Lancet, 2005, 365(9462):891–900.
11. Pakistan demographic and health survey (PDHS) 2006–2007. Islamabad, National Institute of Population Studies, 2007.
12. Pakistan country profile: analysis of demographic health surveys. Geneva, World Health Organization, Department of Making Pregnancy Safer, 2009.
13. Siddiqi S et al. A critique of maternal and child health policy in Pakistan. Oxford, Oxford University Press, 2004.
14. Pakistan integrated household survey 2001–2. Islamabad, Federal Bureau of Statistics, 2002.
15. Pakistan Medical Research Council, health survey of Pakistan. Islamabad, Medical Research Council, Ministry of Health, 1998.
16. Pakistan demographic and health survey 2006–2007. Islamabad, National Institute of Population Studies, 2007.
17. Pakistan integrated household survey 2001–2002. Islamabad, Federal Bureau of Statistics, 2002.
18. Nishtar S, Amjad S. Synergizing health and population in Paki-stan. Journal of Pakistan Medical Association, 2009 (Suppl.3):S3–S20.
19. Bile K. The imperative of functional integration for achievement of MDGs. Journal of Pakistan Medical Association, 2009, 59(9 Suppl. 3):S34–38:
20. National EPI report. Islamabad, Ministry of Health, 2009.
21. The world health report 2005: make every mother and child count. Geneva, World Health Organization, 2005.
22. Sibley LM et al. Traditional birth attendant training for improv-ing health behaviours and pregnancy outcomes. Cochrane Database of Systematic Review, 2007, 3 (No.CD005460).
23. Jones G et al. How many child deaths can we prevent this year? Lancet, 2003, 362:65–71.
24. Bhutta ZA. Maternal and child malnutrition in Pakistan: chal-lenges and opportunities. Oxford, Oxford University Press, 2004.
25. Bhutta ZA. Shaping policy for maternal and newborn health: a compendium of studies. Baltimore, MD, Bill and Melinda Gates Foundation, 2003:5–12.
S47
Review
Tuberculosis control in Pakistan: reviewing a decade of success and challenges P. Metzger,1 N.A. Baloch,2 G.N. Kazi1 and K.M. Bile1
ABSTRACT Pakistan has shown drastic expansion of tuberculosis (TB) care during the past 10 years, increasing case notifications from 11 050 in 2000 to 248 115 in 2008. Over 1 million TB patients have been cared for since 2000, with a treatment success rate of 91% in 2007. This paper examines the strategic decisions and infrastructure improvements underlying this achievement, such as the implementation of universal DOTS coverage, expansion of the laboratory network, effective drug management systems, improved communication strategies, and inclusion of private practitioners, laboratories and hospitals in the TB control programme through the public–private mix strategy. The paper also outlines challenges faced in further expanding TB control within the private sector and parastatal health care institutions; strengthening the laboratory network for diagnosis of drug-resistant TB; and ensuring uninterrupted supply of quality anti-TB drugs, all requiring continued and coordinated technical and donor support.
1World Health Organization, Country Office, Islamabad, Pakistan (Correspondence to P. Metzger: [email protected]).2National Tuberculosis Control Programme, Islamabad, Pakistan.
2000 11 050
2007 91 2000 2008 248 115
Lutte contre la tuberculose au Pakistan : analyse d’une décennie de succès et de difficultés
RÉSUMÉ Au cours des dix dernières années, les soins concernant la tuberculose se sont considérablement développés au Pakistan. Ainsi, les cas signalés sont passés de 11 050 en 2000 à 248 115 en 2008. Plus d’un million de patients atteints de tuberculose ont été soignés depuis 2000, avec un taux de réussite thérapeutique de 91 % en 2007. Cet article étudie les décisions stratégiques et les améliorations des infrastructures à l’origine de cette réussite, comme la mise en œuvre d’une couverture universelle pour le traitement de brève durée sous surveillance directe, le développement du réseau de laboratoires, des systèmes efficaces pour la gestion des médicaments, l’amélioration des stratégies de communication et l‘intégration de praticiens, de laboratoires et d’hôpitaux privés dans le programme de lutte antituberculeuse, dans le cadre d’une stratégie associant secteurs public et privé. L’article met également l’accent sur les difficultés rencontrées dans l’extension de la lutte antituberculeuse au sein du secteur privé et des établissements de soins semi-publics, le renforcement du réseau de laboratoires pour le diagnostic de la tuberculose pharmacorésistante et la garantie d’une fourniture continue en médicaments antituberculeux de qualité. Ces trois points requièrent un soutien technique et un appui des bailleurs de fonds continus et coordonnés.

EMHJ
S48
Introduction
Tuberculosis (TB) is globally the second most common cause of death from infectious diseases, killing almost 2 million people annually. An estimated 8 million new TB cases occur every year, of which 80% are among people in the most economically productive age groups [1], representing a major economic burden for individuals and countries [2]. Twenty-2 high-burden countries account for about 80% of the total TB disease burden worldwide. Although sub-Saharan Africa has the highest incidence rate, Bangladesh, China, India, Indonesia and Pakistan together account for half of the global TB burden [3].
The 2008 estimated incidence in Pakistan of 181 cases of TB per 100 000 population, or 297 000 cases, and of 81 new sputum smear positive (SS+) cases per 100 000 population, or 133 000 cases, is likely an underestimate of the true burden of disease [3]. The 2008 estimates have recently been revised through a consultative process with the country, applying a new methodol-ogy that takes into account the “missed” cases and, in the absence of a prevalence survey, uncertainties in estimates re-flected in large confidence intervals.
According to previous estimates, the case detection rate for all TB cases gradually improved from 19% in 2002 to 84% in 2008; for new SS+ cases the case detection rate increased from 13% to 74%. However, with the recent higher estimates of TB incidence, the case de-tection rate for all TB cases is about 60% and for new SS+ cases is about 58% [4].
Nevertheless, the Pakistan National Tuberculosis Programme (NTP) has achieved a remarkable and steady im-provement in numbers of TB cases de-tected, from 11 050 in 2000 to 248 115 in 2008, and treatment success rates reached 91% in 2007. This has been achieved through extraordinary com-mitment and financial inputs by the
Government and health development partners, providing support for strategic and infrastructure improvements by the NTP.
The World Health Organization (WHO) Directly Observed Treatment Short-course (DOTS) strategy for TB was adopted and piloted in Pakistan from 1995 onwards, but major progress in TB control was only achieved after the revival of the NTP in 2001 when TB had been declared a national public health emergency through the “Islama-bad Declaration”. The NTP functions under the Ministry of Health and is responsible for overall coordination, policy direction and technical guidance for TB control, while actual implemen-tation is the responsibility of the Pro-vincial TB Programmes (PTPs) and district health authorities. The NTP central unit links closely with PTP man-agers and district TB coordinators.
TB services are integrated into the primary public health care system at district level. However, the private sec-tor is regarded as the first point of entry to the health care delivery system for most users, and the majority of private providers are not following NTP guide-lines [5–7]. A 2003 survey conducted by the NTP and PTPs in Lahore and Rawalpindi districts found that less than 3% of general practitioners (GPs) were following the national guidelines for diagnosis and management of TB, while 90% of GPs were relying on chest radi-ography for diagnosis [8,9].
At the end of July 2009, 115 463 doctors were registered with the Pa-kistan Medical and Dental Council while 42 700 registered facilities were providing formal and informal medi-cal services, of which 69% were clinics and pharmacies, while 550 were private hospitals.
Parastatal health services form another point of entry outside the public health care system and NTP regulation. Overall, 32 federal minis-tries and the cabinet secretariat with
208 autonomous (parastatal) bodies provide health services to 389 923 employees and their dependants [10], not including the Ministry of Defence, which has its own specific budgetary outlay for health services.
In recent years, a high priority has been given to developing viable partner-ships with health care providers in the private sector, adopting a systematic approach consistent with WHO guide-lines [11]. Additional initiatives such as an improved surveillance and laboratory network and improved follow-up and treatment modalities, funded by global and national sources, have contributed to the significant improvement in case detection and treatment success rates outlined above. The objective of this review is to highlight the achievements of Pakistan’s NTP over the past decade and to outline the outstanding priorities and challenges for the future.
Methods
An extensive literature review was un-dertaken. Research papers on TB in Pakistan, NTP annual reports, donor reports, joint partner review reports, technical guidelines and project propos-als were analysed.
Results
Epidemiology of TBTB is highly epidemic in Pakistan. Ac-cording to the latest WHO estimations, the incidence, prevalence and mortality of TB in Pakistan are 230 per 100 000, 310 per 100 000 and 39 per 100 000, respectively. This indicates 410 000 incident cases of TB and 69 000 TB deaths in Pakistan every year. Pakistan is the sixth highest TB burden country in the world and by far the largest among the 22 countries of WHO’s Eastern Mediterranean Region. The NTP and partners are planning to conduct a disease prevalence survey for TB in

S49
Pakistan in 2010 in order to have more precise and comprehensive information on the disease burden.
The 248 115 cases of all types (Fig-ure 1) notified in 2008 included 99 670 new SS+ cases (Table 1). The treat-ment success rate of 91% of new SS+ cases notified during 2007 exceeded the WHO target of 85% (Figure 2) due to a reduction of the default rate to under 4%, and low death, failure and transfer out rates (2%, 1% and 2%, respectively). However, the increase in notifications has slowed down since 2007, with only Punjab province reporting a substantial increase in notified cases and the major-ity of districts showing either stagnant or declining case notifications (Table 1).
Programme planning and strategic frameworkFollowing the “Islamabad Declara-tion” the Government of Pakistan called upon its development partners to make concerted efforts to control the disease. A 5-year plan was devised leading to universal DOTS coverage in the public sector towards the end of 2005. The funding was lined up efficiently by the federal Ministry of Health and provincial Departments of Health, with responsibilities delineated
and TB control activities integrated into the primary health care system. DOTS implementation was character-ized by challenges concerning human resources, suboptimal quality of serv-ices at public health outlets and lack of commitment at peripheral levels. District implementation plans were de-veloped and executed through a phased approach until the expansion of DOTS services to all tiers of the district health system was achieved. The devolution process necessitated liaison with dis-trict governments to ensure sufficient allocations for the procurement of anti-TB treatment (ATT) drugs, as 90% of drug procurement was performed by provinces and districts.
Universal DOTS coverage (DOTS All Over) was achieved in the public sec-tor in 2005. Reaching DOTS All Over signified the availability of free diag-nosis and treatment for TB patients in all districts in the public sector health care delivery network. Subsequently, the government approved the NTP fed-eral workplan (PC-1) for 5 years starting from the financial year 2006/2007 and allocated 1.181 billion Pakistan rupees (PKR), equivalent to US$ 14 million, for TB-related activities, including staff training, expansion of the laboratory
network, availability of quality drugs, surveillance, monitoring and evaluation, intra- and intersectoral partnerships, research and development, public– private mix (PPM) and behaviour change communication. In order to effectively complete these activities, the NTP has expanded its central unit with relevant expertise in laboratory, monitoring and evaluation, programme planning and management, as well as in advocacy, communication and social mobilization and research.
Partnership buildingAn interagency coordinating committee guides donor support and the multiple partners’ technical assistance for the pro-gramme. The NTP and PTPs organize annual joint programme reviews on TB care in Pakistan, in collaboration with all partners [Department for International Development (DFID), Family Health International (FHI), German Leprosy and Relief Association (GLRA), Ger-man Development Bank (KfW), Ger-man Technical Cooperation (GTZ), Japan Anti-Tuberculosis Association/Research Institute for Tuberculosis (JATA/RIT), Japanese International Cooperation Agency (JICA), Royal Netherlands Association for the Preven-tion of Tuberculosis (KNCV Tubercu-losis Foundation), International Union Against Tuberculosis and Lung Disease (The Union), United States Agency for International Development (USAID)] through WHO support. The recom-mendations of these reviews guide the follow-up action at the relevant op-erational level. A country coordination mechanism has also been formulated to facilitate partners’ coordination, particu-larly for the implementation of grants from the Global Fund to Fight AIDS, Tuberculosis and Malaria (GFATM).
Case detection through quality-assured bacteriologyThe laboratory network for TB diag-nosis by sputum smear microscopy (SSM) and bacteriology is comprised
248 115230 468
176 678
142 211
94 32770 485
52 76234 066
0
50000
100000
150000
200000
250000
2001 2002 2003 2004 2005 2006 2007 2008
All forms New SS+
Year
Figure 1 Number of notified tuberculosis (TB) cases (all forms and new sputum smear positive [SS+]) (2001–2008)

EMHJ
S50
of the National Reference Laboratory in Islamabad (operational since Sep-tember 2009), 4 Provincial Reference Laboratories, 3 intermediate (regional) laboratories, 112 district intermediary laboratories and over 1100 peripheral laboratories including 92 operated by not-for-profit civil society organizations. Laboratory services are integrated in pri-mary health care facilities at district level, serving an average of 140 000 individu-als per facility. Through PPM activities, another 52 commercial laboratories are
collaborating with the network, raising their participation from less than 50 in 2001 to over 900 in 2005.
Subsequently, the focus shifted from expansion to consolidation and improvements in quality, with external quality assurance of SSM emerging as a high priority. External quality assurance by blinded rechecking was initiated in 2005 (JICA/NTP) and the system was then piloted in 40 districts (Canadian International Development Agency/WHO) before being universally rolled
Table 1 Number of notified new sputum smear positive (SS+) tuberculosis (TB) cases by province, 2004–2008
Province 2004 2005 2006 2007 2008
Azad Jammu Kashmir 1 353 1 221 1 086 1 297 1 271
Baluchistan 1 859 2 720 3 343 3 660 3 558
Federally Administered Tribal Area 918 1 033 971 1 043 1 215
Gilgit–Baltistana 121 124 139 180 145
Khyber Pakhtunkhwab 5 887 8 554 10 063 11 874 12 342
Punjab 7 527 17 010 30 172 47 926 57 992
Sindh 12 078 16 055 18 799 21 591 22 038
Islamabad Capital Territory 1 814 1 503 1 158 1 176 1 109
Pakistan 31 557 48 220 65 711 88 747 99 670aFormerly Northern Areas; bformerly North West Frontier Province. Source: National TB Programme.
0
20
40
60
80
100
120
2001 2002 2003 2004 2005 2006 2007 2008
Year
%
CDR (all types) CDR (new SS +)
DOTS coverage TSR (new SS +)
Figure 2 Trends in Directly Observed Treatment Short-course (DOTS) expansion in Pakistan (2001–2008) (CDR = case detection rate; SS+ = sputum smear positive; TSR = treatment success rate)
out. Currently, external quality assur-ance expansion is ongoing through GFATM R-6 with WHO support, cov-ering 90% of SSM laboratories at the end of December 2009.
Standardized treatment with supervision and patient supportAccording to NTP guidelines, treat-ment is delegated from the diagnostic centre (rural health centres or hospitals) to the basic health unit (BHU) level. Lady health workers are regarded as the main treatment supporters. A standard-ized 8-month treatment regimen for new cases, with 6 months’ ethambutol and isoniazid (EH) in the continuation phase, is still in place. In all the provinces since 2008, a substantial proportion of the management of the BHUs has been delegated to the Peoples’ Primary Health Initiative, a nongovernmental entity to which most of the BHUs of the country were outsourced, requiring coordination links to be established for DOTS implementation. The Peoples’ Primary Health Initiative was launched initially by the Ministry of Industries and Special Initiatives and is currently managed by the Cabinet Division. In Punjab, the Punjab Rural Support Pro-gramme runs BHUs in a number of districts.
Effective supply and drug management system The NTP and provincial governments have ensured the availability and acces-sibility of first-line ATT drugs at all levels of the PHC system through locally produced drugs purchased through the federal and provincial budgets or through interim grants from the Global Drug Facility.
Monitoring, evaluation and impact measurementThe NTP is responsible for monitoring the overall programme performance. WHO programme officers, based at na-tional, provincial and district levels since 2003, play a critical role in monitoring

S51
TB control activities and providing technical capacity building support to provincial and district health authorities and professionals through district TB coordinators, who have the primary responsibility of implementing and supervising TB control activities at the diagnostic centres. Quarterly surveil-lance meetings at district, provincial and national level ensure data verification and validation between implementing partners. Findings and lessons learnt from external joint partner reviews con-ducted annually by WHO, local and international partners assist the NTP and PTPs in revising their implementa-tion strategies.
Public–private mix (PPM)To introduce TB control according to NTP guidelines into the lagging private sector, the NTP engaged 4 not-for-profit organizations for the implementation of PPM DOTS pilot projects in 30 selected districts (co-funded by GFATM R-2 and R-3). Public sector funds were allocated in 2003 for implementation of 1 district-led PPM model, currently being implemented in 6 districts. In addition, the Greenstar Social Marketing Pakistan (Guarantee) Limited model was introduced in 5 met-ropolitan cities through GFATM R-3, involving private laboratories for SSM, where more than 1000 GPs have been engaged in TB DOTS. Further expan-sion of PPM was based on a situational analysis and design of a range of PPM models suitable for private care provid-ers, encompassing nongovernmental
organization clinics, GPs and private hospitals.
A 2008 WHO-assisted mission found that in the preceding year (2007), PPM initiatives contributed to nearly 20% of total notifications (all cases and new SS+). Table 2 presents data from 3 provinces with 90% of all notified cases in 2007. In the 3 provinces combined, 51% of all cases detected by non-NTP providers were new SS+ cases, while among those detected in the public sec-tor, only 39% were new SS+ cases.
Another PPM strategy is “hospital DOTS linkage” which is currently im-plemented in 27 out of 67 public and pri-vate tertiary care hospitals by enhancing laboratory services for SSM, introducing standardized treatment and develop-ing referral systems between the hos-pitals and peripheral treatment centres through DOTS centres (established under GFATM R-6). Data from dis-tricts where DOTS linkages have been introduced showed an increase of up to 50% in case notifications during 2009.
Drug-resistant TBAfter achieving countrywide DOTS coverage in 2005, the NTP Pakistan expanded the scope of its activities to include multidrug-resistant tuberculosis (MDR-TB) interventions, as recom-mended in the new Stop TB Strategy.
Network for culture and drug susceptibility testing of Mycobacterium tuberculosisA few private and parastatal laborato-ries located in Karachi, Islamabad and
Rawalpindi are externally quality assured for culture and drug susceptibility test-ing (DST). The NTP is collaborating with the microbiology laboratory of Aga Khan University Hospital, Karachi for capacity building of the public sector.
TB/HIVSixteen sentinel sites have been strength-ened through collaborative efforts of the NTP, the National AIDS Control Pro-gramme and nongovernment partners for screening, care and support of TB/HIV coinfected patients.
Advocacy, communication and social mobilizationExtensive advocacy, communication and social mobilization activities in 57 districts have laid the foundation for ini-tiating MDR-TB and TB/HIV coinfec-tion interventions. Engagement of mass media took place to improve awareness and reduce stigma. A national advocacy, communication and social mobiliza-tion strategic framework, monitoring and evaluation framework, and trainer/trainee manuals for quality assurance on interpersonal communication have been developed and disseminated.
Operational research Operational research was a core com-ponent of the national strategic and operational plans. The NTP has consti-tuted 1 national and 4 provincial research groups and developed partnerships with the Pakistan Medical Research Council and linkages with international aca-demic and research institutions. WHO
Table 2 Contribution of public–private mix (PPM) to tuberculosis (TB) case notifications in 2007
Province or city Number of TB cases notified in 2007 Number of new sputum smear positive (SS+) cases notified in 2007
Total PPM % notified from PPM
Total PPM % notified from PPM
Khyber Pakhtunkwa 30 699 5 485 18 11 886 1 961 16
Sindh (excluding Karachi) 30 698 1 943 6 14 718 147 1
Karachi 14 887 7 531 51 6 882 3 625 53
Punjab 131 742 24 676 19 47 926 14 396 30
Total 208 026 39 635 19 81 412 20 129 25

EMHJ
S52
supported the programme through its initiatives of EMRO/Tropical Diseases Research (TDR) Small Grants Scheme) and priority public health areas, involving more than 20 research studies relating to DOTS expansion, defaulter tracing, drug management, external quality assurance, treatment support and drug side-effects. Two new methodologies for indirect estimation of disease burden have been piloted. The research findings were trans-lated into policy through the necessary changes in protocols and guidelines.
Discussion
The significant achievements of the NTP in expanding DOTS to the public sector of every district, initiating PPM strategy [12,13], and steadily increasing case notification and treatment success rates [14,15] hinge on sustained Gov-ernment commitment and funding for TB control, and technical and financial support from national and international partners, including WHO, USAID, DFID, GTZ/KfW, JICA, World Bank and GFATM.
A number of research studies con-ducted in Pakistan have significantly added value to the knowledge and op-erational capacity of the programme, including the TB health-seeking behav-iour and practices of the general popu-lation, and have facilitated the design of effective communication strategies [16–21]. The predictors of default and major barriers to treatment adherence were identified as poor patient–pro-vider interaction and patients’ lack of knowledge regarding side-effects and stigma [22,23].
Planned interventions to sustain and further scale-up the progress are listed below along with challenges for the future:
An uninterrupted supply and fund-ing for first-line ATT drugs and commodities has been assured until 2012 through funding from the Gov-ernment, Japanese Counter Value Funds, Global Drug Facility (grant
for paediatric drugs) and GFATM R-8. However, long-term strategies for financing an uninterrupted supply of quality-assured first- and second-line ATT drugs, including paediatric formulations, are needed.
Expansion of the TB surveillance sys-tem and preparation for the TB preva-lence survey are ongoing. An electronic nominal reporting system is being introduced through WHO technical assistance. A nationwide prevalence survey is planned for 2010/2011 with technical assistance of the USAID-funded Tuberculosis Coalition As-sistance Program partners: WHO, KNCV, The Union and JATA.
The engagement of private care providers and parastatal health care facilities, though limited, in establish-ing DOTS linkages with 27 of 67 teaching hospitals has substantially contributed to the increase in case notifications.
In view of the health-seeking behav-iour in the urban and rural popula-tions, scaling-up of DOTS in the private sector in the remaining 60 districts has been recognized as a pre-requisite for increasing case detection, provision of standardized care, and in-clusion of other health care providers and the remaining parastatal organi-zations. Funding for these activities has been secured through GFATM R-9 support.
Rolling out of the new WHO-recom-mended treatment regimen (2009) will need strengthening of case man-agement, delegating supervision of treatment from the diagnostic centres to BHUs. Partnering with the Sindh Peoples’ Primary Health Initiative and the Punjab Rural Support Pro-gramme should enable the effective use of BHUs for TB suspect detection and treatment support.
Effecting tangible improvement in the drug management system is the prime objective of GFATM R-8, with Greenstar developing a drug manage-ment logistics system. The Tubercu-
losis Coalition Assistance Program supports the NTP in the revision of drug management and forecasting guidelines. As banning across-the-counter sales of ATT drugs is cur-rently not a viable strategy in Pakistan, the NTP has opted to develop a “seal of quality” for locally produced ATT drugs that meets international quality standards, while WHO is engaged in providing technical assistance to local drug manufacturers aiming to attain a prequalification status.
Rapid improvements in the labora-tory network for culture and DST for the diagnosis of drug-resistant TB are prerequisites for its management. Nine laboratories (1 national, 4 pro-vincial, 2 intermediate and 2 in terti-ary care hospitals) are currently being upgraded. Four TB culture district-level laboratories (1 in each prov-ince) will be made functional through GFATM R-6 support while through GFATM R-9 support the laboratory network for culture and DST will be further developed and rapid testing for MDR-TB introduced in 15 terti-ary care teaching hospitals.
Scaling-up of MDR-TB care is an urgent task for Pakistan. WHO es-timates an annual incidence of over 13 000 MDR, SS+ cases in Pakistan based on estimates of 3.5% MDR in new cases and 35% in re-treatment cases [24]. A study conducted by the Aga Khan University [25] reports 1.8% primary resistance in a specified annual cohort of notified SS+ new and re-treatment cases. A representative survey in 2010 will
determine baseline drug resistance. This is a follow-up on a MDR-TB preassess-ment conducted by a WHO mission in 2008. Based on the recommendations of this mission, public and private terti-ary hospitals have been identified for pi-loting MDR-TB management through GFATM R-6 support. The NTP and partners have successfully applied to GFATM R-9 to expand MDR-TB diagnosis and care to 80% of the esti-mated SS+ cases by 2015. In 2009, the

S53
Green Light Committee approved ATT second-line drugs for 1500 cases.
Identified challenges for further scal-ing-up of TB care include: integration of TB control strategies in preservice curricula; upgrading TB control in the new province of Gilgit–Baltistan and intensifying TB control in underserved areas; innovative approaches for en-hancing case detection in marginalized groups with limited access to health services, such as workers in the informal sector and periurban slum populations; introduction of an electronic nominal recording and reporting system for
monitoring and evaluation of all pro-gramme elements; and adaptation of ACSM strategies and correlation of op-erational research studies with ACSM activities as relevant for all the 6 pillars of the Stop TB Strategy.
With TB DOTS in place at all public facilities in the country, the focus needs to shift to increased case detection by involving the majority of private providers and introducing standards of TB care in social secu-rity institutions and the substantial parastatal sector. Although sustain-ing progress for over a decade, the
NTP nevertheless needs to pursue its activities with greater vigour and expanded framework in order to achieve regional and global targets, including Millennium Development Goals. The full adoption of the WHO Stop TB Strategy in the national plan of 2010–2015 will bridge the current gaps. Moreover, the adaptation of the current NTP managerial set-up to future challenges, with continu-ous and coordinated technical and donor support, will be instrumental for ensuring sustainability and further success.
1. Dye C et al. Consensus statement. Global burden of tuberculot-sis: estimated incidence, prevalence, and mortality by country (WHO Global Surveillance and Monitoring Project). Journal American Medical Association, 1999, 282:677–686.
2. Russell S. The economic burden of illness for households in developing countries: a review of studies focusing on malaria, tuberculosis and HIV/AIDS. American Journal of Tropical Medi-cine and Hygiene, 2004, 71(Suppl. 2):147–155.
3. Global tuberculosis control– epidemiology, strategy, financing. WHO report 2009. Geneva, World Health Organization, 2009 (WHO/HTM/TB/2009.411).
4. Global tuberculosis control: a short update to the 2009 report. Geneva, World Health Organization, 2009 (WHO/HTM/TB/2009.426).
5. Pakistan social and living standards measurement (PSLM) survey, 2004–2005. Islamabad, Federal Bureau of Statistics, Statistics Division, Ministry of Finance, 2005.
6. Shah SK et al. Do private doctors follow national guidelines for managing pulmonary tuberculosis in Pakistan? Eastern Mediter-ranean Health Journal, 2003, 9(4):776–788.
7. Arif K et al. Physician compliance with national tuberculosis treatment guidelines: a university hospital study. International Journal of Tuberculosis and Lung Diseases, 1998, 2:225–230.
8. Khan JA et al. Knowledge, attitude and misconceptions regard-ing tuberculosis in Pakistani patients. Journal of Pakistan Medi-cal Association, 2006, 56(5):211–214.
9. Khan IM et al. Urging health system research: identifying gaps and fortifying tuberculosis control in Pakistan. Croatian Medical Journal, 2002, 43:480–484.
10. National health accounts Pakistan 2005–06. Islamabad, Federal Bureau of Statistics, Statistics Division, 2009.
11. Engaging all health care providers in TB control: guidance on implementing public–private mix approaches. Geneva, World Health Organization, 2006 (WHO/HTM/TB/2006.360).
12. Baloch AN, Mann G. Situation analysis. Public–private partner-ship models, operational and monitoring & evaluation guidelines for national TB control program Pakistan. Islamabad, Technical Assistance Management Agency to the National Health & Population Welfare Facility, 2006.
13. Auer C. Public–private mix DOTS in Pakistan – an assessment (report of a public– private mix TB DOTS mission commissioned by WHO EMRO, 19 August–9 September, 2008). Cairo, Regional Office for the Eastern Mediterranean Region, World Health Or-
ganization, 2008 (http://www.ntp.gov.pk/downloads/ppm/PPM%20Assessment.zip, accessed 21 June 2010).
14. Mission report – joint review of TB care in Pakistan, 8–13 August 2009. Islamabad, World Health Organization, 2009.
15. Annual report 2007. Islamabad, National TB Control Pro-gramme, Ministry of Health, 2007.
16. Liefooghe R et al. Perception and social consequences of tuber-culosis: a focus group study of tuberculosis patients in Sialkot, Pakistan. Social Science & Medicine, 1995, 41:1685–1692.
17. Agboatwalla M et al. Gender perspectives on knowledge and practices regarding tuberculosis in urban and rural areas in Pa-kistan. Eastern Mediterranean Health Journal, 2003, 9:732–740.
18. Ali SS et al. Tuberculosis: do we know enough? A study of patients and their families in an outpatient hospital setting in Karachi, Pakistan. International Journal of Tuberculosis and Lung Diseases, 2003, 7:1052–1058.
19. Khan A et al. Tuberculosis in Pakistan: socio-cultural con-straints and opportunities in treatment. Social Science & Medi-cine, 2000, 50: 247–254.
20. Mushtaq MU et al. Knowledge, attitude and practices regard-ing tuberculosis in two districts of Punjab. International Journal of Tuberculosis and Lung Diseases, 2010:303–310.
21. Khan J et al. Tuberculosis diagnosis and treatment practices of private physicians in Karachi, Pakistan. Eastern Mediterranean Health Journal, 2003, 9(4):769–775.
22. Diagnostic and treatment delay in tuberculosis: an in-depth analy-sis of the health-seeking behaviour of patients and health system response in seven countries of the Eastern Mediterranean Region. Cairo, Regional Office for the Eastern Mediterranean Region, World Health Organization, 2009 (WHO-EM/TDR/009/E).
23. Special issue of JPMA on tuberculosis research publications in Pakistan. Journal of Pakistan Medical Association, 2009, 59(Suppl.1):1–122.
24. Anti-tuberculosis drug-resistance in the world. WHO/IUATLD global project on anti-tuberculosis drug resistance surveillance, fourth global report. Geneva, World Health Organization, 2008 (WHO/HTM/TB/2008.394).
25. Javaid A et al. Prevalence of primary multidrug resistance to anti-tuberculosis drugs in Pakistan, International Journal of Tu-berculosis and Lung Diseases, 2008, 12(3):326–331.
References

EMHJ
S54
Review
Malaria control in Pakistan: new tools at hand but challenging epidemiological realitiesQ. Kakar,1 M. A. Khan2 and K. M. Bile1
ABSTRACT Malaria is endemic in Pakistan and constitutes a national health priority However the parasite and vectors are showing resistance to common antimalarial drugs and insecticides. The provinces of Balochistan, Sindh and Khyber Pakhtunkhwa and the Federally Administered Tribal Areas have the highest malaria burden. Districts and agencies bordering Afghanistan and Islamic Republic of Iran account for 37% of the malaria burden with an annual parasite incidence (API) exceeding 4.5/1000 population per year. Moreover, there has been a growing risk of Plasmodium falciparum malaria incidence in areas where previously P. vivax was predominant. New and effective control tools have been introduced such as rapid diagnostic tests, artemisinin-based combination therapy and long-lasting insecticide-treated nets. This paper reports the progress achieved in the implementation of a malaria control strategy in Pakistan, shares major outstanding challenges and unearths the potential of performance-based implementation for advancing resource mobilization and collaborative partnerships.
1World Health Organization, Country Office, Islamabad, Pakistan (Correspondence to Q. Kakar: [email protected]).2National Malaria Control Programme, Islamabad, Pakistan.
Lutte contre le paludisme au Pakistan : disponibilité de nouveaux outils et difficultés des réalités épidémiologiques
RÉSUMÉ Le paludisme, endémique au Pakistan, constitue une priorité sanitaire nationale. Cependant, les vecteurs et le parasite se montrent résistants aux insecticides et aux médicaments antipaludiques habituels. Les provinces du Baloutchistan, du Sindh et du Khyber Pakhtunkhwa, ainsi que les zones tribales sous administration fédérale sont les plus touchées par le paludisme. Les districts et agences à la frontière de l’Afghanistan et de la République islamique d’Iran participent à hauteur de 37 % à la charge de morbidité du paludisme, avec une incidence parasitaire annuelle supérieure à 4,5/1000 chaque année. En outre, un risque croissant d’incidence du paludisme à Plasmodium falciparum dans des régions où auparavant prédominait le paludisme à P. vivax est apparu. De nouveaux outils de lutte efficaces ont été introduits, comme les tests diagnostiques rapides, les associations à base d’artémisinine et les moustiquaires imprégnées d’insecticide à longue durée d’action. Cet article fait état des progrès réalisés en matière de mise en œuvre de la stratégie de lutte antipaludique au Pakistan, expose les principaux défis et révèle le potentiel de mise en œuvre fondé sur les résultats afin de promouvoir la mobilisation des ressources et les partenariats de collaboration.
4.5 37

S55
Introduction
Malaria is a mosquito-borne parasitic disease which takes almost one million lives per year and afflicts as many as half a billion people living in 109 countries in Africa, Asia and Latin America [1]. Malaria is predominantly a disease of poverty that is more prevalent in the rural areas, where the majority of the popula-tion often lives, resulting in substantial economic loss [2]. Pakistan is among the countries with a perceived growing risk of infection, in view of the extensive agricultural practices, vast irrigation net-work and monsoon rains in addition to sizeable population movements and a complex political situation in certain border areas that contribute to the coun-try’s malariogenic potential [3].
In Pakistan, malaria is the second most frequent clinically suspected disease entity after acute respiratory infection with 4.5 million probable cases reported from district health system public sector outpatient facilities in 2008. However, the estimated total number of malaria cases of 1.5 million cases per year is sig-nificantly smaller [4], which suggests a risk of erroneous treatment to about 3 million non-malaria cases. Moreover, the confirmed cases of malaria during the same period were only 104 454, of which 70% were due to Plasmodium vivax and 30% to P. falciparum, these being the only two prevalent malaria parasite species in Pakistan [5].
The Directorate of Malaria Control in the Ministry of Health endorsed the World Health Organization’s (WHO) Roll Back Malaria strategy in 2001 with the objective of halving the disease bur-den by 2010 and bringing the annual parasite incidence to 0.5/1000 [6]. The programme is being implemented in endemic areas and will continue to the end of 2010 though the target seems difficult to achieve within this time. The proposed target to be attained has con-siderable bearing on maternal and child health and related Millennium Develop-ment Goals [7,8]. However, the paucity
of comprehensive epidemiological and entomological information makes it difficult to generate reliable updates on the coverage and effectiveness of disease control interventions at the operational level [8]. This paper aims to report the progress achieved in the implementa-tion of the Roll Back Malaria strategy in Pakistan, share major outstanding chal-lenges and unearth the programmatic potential for implementation, resource mobilization and the building of col-laborative partnerships.
Methodology
An in-depth analysis of available sur-veillance data within Pakistan’s Ma-laria Control Programme and Health Management Information System was undertaken along with a Medline search for national and international reports on the malaria situation in Pakistan. National demographic and health sur-veys and field study reports were also reviewed, and major findings analysed.
Results
The prevalence and incidence of ma-laria in Pakistan varies from province to province and between districts within provinces. Figure 1 illustrates the results
of a malariometric survey conducted in 19 highly endemic districts during 2009 using antibody-based rapid diagnostic tests. The districts’ and agencies’ results were aggregated by province and region and, show the highest parasite sero-prevalence in the Federally Adminis-tered Tribal Areas (FATA), followed by Balochistan and Khyber Pakhtunkhwa (KPK), this being consistent with the programme-reported high annual ma-laria incidence from these areas.
Table 1 describes the overall an-nual parasite incidence (cases/1000 population), showing no evident reduc-tion between 2004 and 2009, with a high annual parasite incidence being maintained both in Balochistan and the Federally Administered Tribal Areas as compared to other provinces, while Punjab maintained a very low annual parasite incidence of < 1 case per 10 000 population during that period. Similarly, for the same period, the proportion of falciparum malaria, out of the total con-firmed cases, was highest in Sindh and Balochistan compared to other prov-inces and regions of the country.
The reported incidence of 2009 was higher in all provinces when compared to 2008 except in Sindh. In 2009 the highest slide positivity rate was recorded in the Federally Administered Tribal Areas, followed by Balochistan. The
Figure 1 Prevalence of malaria parasite in 19 highly endemic districts (malariometric survey 2009) FATA = Federally Administered Tribal Areas; KPK = Khyber Pakhtunkhwa

EMHJ
S56
proportion of confirmed cases reported from Punjab (low endemic area) was more in patients aged 15 years or more (82%) and lowest among 5–10 year-olds (3%), with higher rates among males (61%) compared to females (39%).
Table 2 shows the categorization of districts based annual parasite incidence during 2004–08, where all the highly endemic districts/agencies belonged to Balochistan and Sindh provinces and to the Federally Administered Tribal Areas, while all the districts of Punjab were clustered in the lowest endemicity rate category.
Studies conducted on the vector fauna of Pakistan showed that 24 dif-ferent anopheles species have been reported from Pakistan including Anopheles culicifacies and An. stephensi, the vector species with known resistance to organochlorides (DDT, dieldrin), car-bamates (propoxur) and organophos-phates (malathion, fenitrothion) [9].
Table 3 describes the findings of the demographic and health survey of Pakistan 2006–07 regarding access to malaria preventive and curative services, which include possession and use of mosquito nets and access to treatment services among children with fever, depicting the low coverage of both long-lasting insecticide-treated nets and treatment services and highlighting the need for prompt and effective action. This survey was however conducted
before the distribution of long-lasting insecticide-treated nets in 2008 attained through Global Fund support for 19 highly endemic districts.
The results of antimalarial drug ef-ficacy monitoring surveys conducted in the country are presented in Table 4. The cure rate with chloroquine treat-ment in 2004 was 58% in Punjab and only 17 % in Sindh and Balochistan. While the efficacy of sulfadoxine/py-rimethamine and amodiaquine in Ba-lochistan resulted in a cure rate of 44 % and 47% respectively, the cure rate with artesunate + sulfadoxine/pyrimeth-amine in the Federally Administered Tribal Areas in 2004 was 97%. Likewise the tested efficacy of artesunate + sulf-adoxine/pyrimethamine in Sindh, Balo-chistan and the Federally Administered Tribal Areas gave a cure rate of 100% in 2008. Similarly in 2009, the cure rate with artemether and lumefantrine in the Federally Administered Tribal Areas, Balochistan, Khyber Pakhtunkhwa and Sindh was also 100%, although such studies need to be supported by inde-pendent quality control measures.
The national Roll Back Malaria stra-tegic plan was first designed in 2001 and reviewed in 2007 to comprehensively account for the evolving malaria epi-demiological situation, harness greater partnership for the programme and scale up operations to attain the Millen-nium Development Goal 6 as relevant
to malaria. In this regard the following key strategic elements were pursued:
promoting appropriate strategies and processes with enhanced monitoring and supervision
extending and improving early diag-nosis and rapid treatment services in all health facilities and applying these when appropriate in the community
promoting insecticide treated ma-terials, the targeted use of residual spraying and health education and introducing biological and environ-mental management approaches for integrated vector control
improving preparedness, detection and response to epidemics
developing viable in-country pub-lic–private partnerships as well as international partnerships to boost programme implementation
commissioning health system re-search interventions to enhance free access to quality care and promote active community participation.During its implementation process
the programme made tangible efforts to enhance partnerships at national, pro-vincial and district levels with national nongovernmental organizations as well as with international partners, facilitated by the receipt of grants from the Glo-bal Fund to fight AIDS, Tuberculosis and Malaria (Global Fund; rounds 2, 3 and 7) and through sustained WHO
Table 1 Annual parasite incidence (API) and falciparum proportion during 2004–09 by area
Area API — cases/1000 population/year (falciparum proportion)
2004 API (%)
2005API (%)
2006API (%)
2007API (%)
2008API (%)
2009API (%)
FATA 4.0 (17.0) 4.5 (14.9) 5.4 (17.4) 6.2 (16.0) 4.6 (15.6) 4.0 (31.0)
Balochistan 4.2 (34.0) 7.4 (44.3) 6.2 (33.9) 6.3 (43.0) 4.6 (27.0) 5.8 (32.0)
KPK 1.1 (9.0) 0.9 (10.5) 0.8 (9.2) 0.8 (10.0) 0.6 (7.0) 1.1 (10.0)
Sindh 1.0 (33.0) 0.8 (36.7) 0.90 (44.6) 0.71 (33.0) 0.6 (32.3) 0.6 (31.0)
Punjab 0.05 (11.0) 0.03 (2.6) 0.02 (5.4) 0.02 (2.0) 0.04 (1.8) 0.04 (5.0)
Azad JammuKashmir 0.16 (19.0) 0.16 (23.4) 0.07 (21.5) 0.21 (19.0) 0.05 (29.9) 0.07 (13.0)
Total 1.7 (20.9) 2.3 (22.0) 2.2 (21.8) 2.4 (21.8) 1.8 (21.0) 1.9 (19.0)
FATA = Federally Administered Tribal Areas; KPK = Khyber Pakhtunkhwa.

S57
technical support. These partners included Health Net International, National Rural Support Programme, Association for Social Development, Mercy Corps, Merlin, WHO Basic Development Needs programme for community-centred interventions and Association for Community Develop-ment, all being engaged in Global Fund malaria grant projects as subrecipients. The Malaria Control Programme in Pakistan has also become an integral part of the United Nations (UN) “De-livering as One” initiative to generate synergy of action and prevent unnec-essary duplication between different stakeholders. The Global Fund has been a major source for bridging the programmatic and financial gaps experi-enced by the programme, while WHO support has guided the implementation of the programme according to WHO standards (with required adaptation) through its headquarters, regional and country level professionals. Through its rounds 2, 3 and 7 of grants, the Global Fund provided US$ 18 million to sup-port malaria control interventions in targeted highly endemic districts.
Discussion
Malaria poses a major public health challenge in Pakistan and the country has been placed in the group of high burden countries of the WHO Eastern Mediterranean Region along with So-malia, Sudan, Yemen, Afghanistan and Djibouti, which collectively report more than 95% of the regional burden [10]. Malaria endemicity in Pakistan has been categorized on the basis of the average annual parasite incidence of the past five years. The majority of the districts falling in the highly endemic category were from Balochistan, the Federally Administered Tribal Areas and Sindh, with an annual parasite incidence as high as 5.5/1000 and 3.9/1000 in Balo-chistan and the Federally Administered Tribal Areas respectively, illustrating the Ta
ble
2 C
ateg
oriz
atio
n of
dis
tric
ts b
ased
on
repo
rted
mal
aria
ann
ual p
aras
ite in
cide
nce,
20
04–
08
(ave
rage
for fi
ve y
ears
)
Ende
mic
ity:
repo
rted
API
aPu
njab
Sind
hBa
loch
ista
nK
PKFA
TAA
JK
Hig
hly
ende
mic
: ave
rage
five-
year
API
> 5
Non
eKa
shm
ore,
Ten
do
Alla
hyar
Zhob
, Pan
jgur
, Kha
ran,
N
ushk
i, G
wad
ar, K
ech,
Zi
arat
, Jha
l Mag
si,
Jafa
raba
d, S
ibi,
Kohl
u
Non
eKu
rram
, Khy
ber
Non
e
Mod
erat
ely
ende
mic
:
aver
age
five-
year
API
< 5
Non
eM
ithi,
Nau
shah
ro F
eroz
e,
Mirp
ur K
has,
Um
erko
t, Kh
airp
ur, B
adin
, N
awab
shah
San
ghar
Qill
a Sa
ifulla
h, B
olan
, N
asee
raba
d, L
oral
ai,
Mas
tung
, Cha
gai,
Was
huk,
Khu
zdar
, Pi
shin
, Mus
akhe
l, Ba
rkha
n, A
war
an,
Lasb
ela,
Kal
at
Bune
r, La
kki M
araw
at,
Bann
u, T
ank,
Han
gu,
Kara
k,
Mar
dan,
Mal
akan
d
Baja
ur, O
rakz
ai,
Moh
man
d, S
outh
and
N
orth
Waz
irist
an
Non
e
Low
end
emic
ity: a
vera
ge
fiv
e-ye
ar A
PI <
1A
ll di
stric
ts o
f Pun
jab
That
ta, S
hika
rpur
, Got
ki,
Dad
u, S
ukku
r, Ta
ndo
Muh
amm
ad K
han,
La
rkan
a, H
yder
abad
, Ja
msh
oro,
Jaco
baba
d,
Shah
dadk
ot, M
atia
ri,
Kara
chi
Qill
a A
bdul
lah,
Que
tta,
Der
a Bu
gti,
Sher
ani,
Har
nahi
Swat
, Der
a Is
mai
l Kha
n,
Cha
rsad
da, B
atag
ram
, Ko
hat,
Now
sher
a,D
ir U
pper
and
Low
er,
Chi
tral
, Sw
abi,
Har
ipur
, M
anse
hra,
Abb
otab
ad,
Pesh
awar
, Koh
ista
n,
Shan
gla
Non
ePo
onch
, Mirp
ur, K
otli,
M
uzaf
fara
bad
a case
s/10
00 p
opul
atio
n/ye
ar.
API =
ann
ual p
aras
ite in
cide
nce.
KP
K =
Khyb
er P
akht
unkh
wa.
FA
TA =
Fed
eral
ly A
dmin
iste
red
Trib
al A
reas
. AJ
K =
Azad
Jam
u an
d Ka
shm
ir.

EMHJ
S58
need for intensified and targeted control efforts in these regions.
All the districts of Punjab were ranked in the low endemic category with re-ported annual parasite incidence of < 0.1 per 1000 population per year. The low endemicity in Punjab was reported to have resulted from reduced densities of Pakistan’s primary vector An. culicifacies due to large-scale ecological changes in this province related to waterlogging and salinization, which favour the breed-ing of the salt-tolerant and less efficient vector A. Stephensi [11]. Moreover, the relatively better health infrastructure and socioeconomic status in the province may have contributed to this difference. Accordingly there has been a visible shift in the spatial pattern of malaria endemic-ity from the eastern agriculture plains to the north-western mountainous regions, particularly those bordering the Islamic Republic of Iran and Afghanistan, linked to a significant influx of refugees since 1980s [12]. Results of a malaria anti-body seroprevalence survey conducted in 2009 during the non-transmission season in 19 highly endemic districts, showed a high prevalence rate in the
Federally Administered Tribal Areas (116 per 1000 population) followed by Balochistan (47.9 per 1000 population) [13], a rate many times higher than the reported yearly parasite incidence, cor-roborating the high transmission poten-tial in these districts and the rising trend of malaria endemicity.
The demographic information of microscopically confirmed malaria cases is limited and scattered; however a situation analysis conducted in the low endemic province of Punjab in 2008 re-vealed that males of age > 14 were more affected by malaria infections compared to females of the same age group indi-cating the low immunity linked with low endemicity and the relatively higher exposure potential of males to vector bites during their late-evening agricul-ture activities [14].
Information on severe and compli-cated malaria cases and mortality is not routinely collected by the programme or district health information system. However, the evolving initiative, in which the health information system will cover hospital inpatients, will fill this information gap and generate more
comprehensive evidence on the morbid-ity and mortality burden of the disease.
P. falciparum and P. vivax are the only prevalent species of malaria parasite reported in the country; with P. vivax being the predominant species account-ing for > 70% of the malaria burden in the country. The highest burden of vivax malaria was reported from Khyber Pakhtunkhwa and the Federally Admin-istered Tribal Areas, illustrating the need for greater programmatic and health system strengthening in these regions [4]. Due to poor quality microscopy practices, mixed infections are rarely di-agnosed and reported, as confirmed by a recent study carried out in the bordering regions of Afghanistan, Islamic Republic of Iran and Pakistan [15].
Studies conducted on the genetic characterization of Plasmodium vivax populations have shown multiplicity of infections, genetic diversity and al-lelic distribution of both the species [15]. Marked polymorphism of P. vivax populations indicated by the presence of extensive allelic variation has been linked to cross-border movement of populations living in border regions of
Table 3 Coverage of malaria preventive and curative services as reflected by the findings of the demographic and health survey of Pakistan 2006–07
Variable/indicator Urbann (%)
Ruraln (%)
Totaln (%)
Household possession of nets (treated or untreated)3159 (3.5) 6096 (7.8) 9255 (6.3)
Households with at least one insecticide-treated net (ITN) 3159 (0.7) 6096 (0.8) 9255 (0.8)
Children under 5 years who slept under a mosquito net the night before the interview 2636 (1.2) 6142 (1.8) 8778 (1.6)
Children under 5 years who slept under an ITN the night before the interview 2636 (0.2) 6142 (0.2) 8778 (0.2)
Pregnant women who slept under a mosquito net the night before the interview 364 (0.7) 829 (2.0) 1193 (1.6)
Pregnant women who slept under an ITN the night before the interview 364 (0.0) 829 (0.0) 1193 (0.0)
Children under 5 years with fever in the two weeks preceding the survey who took antimalarial drugs 791 (2.5) 1777 (3.7) 2569 (3.3)
Children under 5 years with fever in the two weeks preceding the survey who took antimalarial drugs the same day/next day 791 (2.0) 1777 (2.8) 2569 (2.6)

S59
the country. The molecular characteriza-tion of P. falciparum field isolates in Paki-stan revealed that a majority of patients having monoclonal infections had a genetic diversity and allelic distribution similar to those reported from India and other south-east Asian countries having low malaria endemicity [16].
Information on prevalent vectors and their bionomics demonstrate that 24 species of anopheles are known to occur in Pakistan with An. Culicifacies being the primary vector active in rural areas [9]. An. stephensi has also been incriminated in urban transmission; nevertheless, its role as a major vector needs further evaluation. Both vectors are endophilic in resting habits and usu-ally bite from midnight till 2:30 a.m. The high density of these vectors during the post-monsoon period is linked to the seasonal peak of the disease. Of the five known sibling species of An. Culicifacies, A and B have been reported from the neighbouring countries of Islamic Re-public of Iran, India, Afghanistan and China [17]; however, the lack of infor-mation on their role in malaria transmis-sion requires further investigation.
Indoor residual spraying and long-lasting insecticide-treated nets are cur-rently the major tools of malaria control
in the country. The effectiveness of indoor residual spraying depends on the efficacy of the insecticides used and the timing and quality of the campaign. In Pakistan resistance to previously used organo-chlorides (DDT, dieldrin), carbamates (propoxur) and organophosphates (malathion, fenitrothion) has been well documented [18]. The Malaria Control Programme has used pyrethroids for both indoor residual spraying and long-lasting insecticide-treated nets since 1992, and the efficacy of this group of insecticides needs further validatation.
Resistance to the antimalarial drug chloroquine was first detected in 1981 in Sheikhupura district of Punjab. The consolidated analysis of nearly 20 years (1977–95) of susceptibility studies conducted in the former National In-stitute of Malaria Research and Train-ing (NIMRT) in Lahore (closed in 1997), published in 1997, revealed a widespread R1 level chloroquine resist-ance (good initial response to the drug but parasitaemia reappears within one month of treatment) in Pakistan, with a frequency ranging from 30% to 84% [19]. Programme surveys on the efficacy of antimalarial drugs from 2004 to 2009 have corroborated that resistance to chloroquine is common in falciparum
malaria in all parts of the country, while resistance to sulfadoxine/pyrimeth-amine has been on the rise. Moreover, artemisinin-based combination therapy has been found to be 100% effective in treating uncomplicated falciparum ma-laria cases; this is why artemisinin-based combination therapy was officially adopted as the first-line treatment for uncomplicated confirmed falciparum malaria. The absence of a external tech-nical moderator for quality assurance in the survey was a limitation to be consid-ered when conducting further surveys.
The Roll Back Malaria initiative was launched by WHO in 1998. Pakistan as a signatory to the Roll Back Malaria initiative commenced and has sustained its implementation since 2001. The plan was reviewed in 2007 to improve the national Roll Back Malaria strategic focus and recognize the existing epide-miological diversities in the country. The national strategic plan is being re-viewed in 2010 and will be updated and is considering a two-pronged approach for malaria control in Pakistan: first, to pursue a universal coverage of early diagnosis, prompt effective treatment and multiple prevention interventions and secondly to eliminate the residual foci of malaria transmission in the low
Table 4 Antimalarial drug efficacy monitoring surveys conducted at selected sentinel sites 2004–09
District Province/area Survey year Drugs tested Cure rate (%)
Khurram Federally Administered Tribal Areas
2004 Sulfadoxine/pyrimethamine, artesunate 97
2008 Artesunate+sulfadoxine/pyrimethamine 100
2009 Artemether+lumefantrine 100
Muzaffargar Punjab 2004 Chloroquine 58
Mirpur Khas Sindh 2004 Chloroquine 17
Thatta Sindh 2008 Artesunate+sulfadoxine/pyrimethamine 100
2009 Artemether+lumefantrine 100
Zhob Balochistan 2008 Artesunate+sulfadoxine/pyrimethamine 100
2009 Artemether+lumefantrine 100
Kech (Turbat) Balochistan 2004 Amodiaquine 47
Sulfadoxine/pyrimethamine 44
Chloroquine 17
2008 Artesunate+sulfadoxine/pyrimethamine 100
2009 Artemether+lumefantrine 100

EMHJ
S60
References
1. World Malaria Day, 25 April 2010. Countdown to save a million lives. Geneva, World Health Organization, 2010 [website] (http://www.rbm.who.int/worldmalariaday/background.html, accessed on 4 May 2010).
2. Mukhtar EM, ed. Economic analysis for a national study on ma-laria control in Pakistan. Islamabad, Pakistan, Malaria Control Programme, Ministry of Health, 2004.
3. World malaria report 2005. Geneva, World Health Organiza-tion, 2005.
4. Murtaza G et al. Malaria morbidity in Sindh and the plasmo-dium species distribution. Pakistan Journal of Medical Science, 2009, 25(4):646–649.
5. World malaria report 2009. Geneva, World Health Organiza-tion, 2009.
6. National strategic plan Directorate of Malaria Control 2006–2010. Islamabad, Pakistan, Malaria Control Programme, Minis-try of Health, 2006.
7. Teklehaimanot A et al. Coming to grips with malaria in the new millennium. London, UN Millennium Project, 2005.
8. Bhatti MA et al. Malaria and pregnancy: the perspective in Paki-stan. Journal of Pakistan Medical Association, 2007, 57(1):15–18.
9. Aslamkhan M. The mosquitoes of Pakistan: a checklist. Mos-quito Systematics Newsletter, 1971, 3(4).
10. Huda A, Zamani G. The progress of Roll Back Malaria in the Eastern Mediterranean Region over the past decade. Eastern Mediterranean Health Journal, 2009, 14:S82–89.
11. Herrel N. et al. Adult anopheline ecology and malaria transmis-sion in irrigated areas of south Punjab, Pakistan. Medical and Veterinary Entomology, 2004, 18:141–152.
12. Kazmi JH, Pandit K. Disease and dislocation: the impact of refugee movements on the geography of malaria in NWFP, Pakistan. Social Science & Medicine, 2001, 52:1043–1055.
13. Malariometric survey 19 districts Pakistan (draft final report) 2009. Islamabad, SoSec Consulting Services, 2009.
14. Kondrachine A. Situation analysis of malaria in the province of Punjab 1–21st September 2008. Islamabad, Pakistan, Country Office, World Health Organization, 2008.
15. Zakeri S et al. Molecular characterization of Plasmodium vivax clinical isolates in Pakistan and Iran using pvmsp-1, pvmsp-3-alpha and pvcsp genes as molecular markers. Parasitology International, 2010, 59(1):15–21.
16. Ghanchi NK et al. Genetic diversity among Plasmodium falci-parum field isolates in Pakistan measured with PCR genotyping of the merozoite surface protein 1 and 2. Malaria Journal, 2010, 9:1.
17. Barik, TK, Sahu B, Swain V. A review on Anopheles culicifacies: from bionomics to control with special reference to Indian subcontinent. Acta Tropica, 2009, 109(2):87–97.
18. Rathor HR et al. Insecticide resistance in anopheline mosqui-toes of Punjab province, Pakistan. Southeast Asian Journal of Tropical Medicine and Public Health, 1980 11(3):332–340.
19. Shah et al. Chloroquine resistance in Pakistan and the up-surge of falciparum malaria in Pakistan and Afghan refugee population. Annals of Tropical Medicine and Parasitology, 1997, 91(6):591–602.
20. Pakistan Demographic and Health Survey 2006–07: preliminary report. Islamabad, Pakistan, National Institute of Population Studies, 2007.
21. Qazi S, Sheikh BT. Social marketing of insecticide-treated bed nets: the case of Pakistan. Eastern Mediterranean Health Journal, 2007, 13(2):449–456.
22. Minutes of the 207th Meeting of the Central Licensing Board held on 20–21st July 2007. Islamabad, Pakistan, Ministry of Health, 2007.
endemic province of Punjab through the launch of a pre-elimination strategy.
The efforts of the Malaria Control Programme to scale up distribution of long-lasting insecticide-treated nets in high endemic districts did not achieve the desired coverage, as revealed by the 2002 demographic and health survey of Pakistan, where the overall ownership of one long-lasting insecticide-treated net per household was only 0.8% and the overall net use by pregnant women and children less than five years of age was only 4.2% [20]. However, one mil-lion long-lasting insecticide-treated nets have since been distributed free of cost through the Global Fund round 7 grant in support of 19 target districts, while maintaining a high coverage of artemisinin-based combination therapy. This should result in a significant en-hancement in the coverage of and access to these important interventions. Social
marketing of long-lasting insecticide-treated nets using commercial channels may help improve the delivery of long-lasting insecticide-treated nets to those at risk [21]. Pakistan is currently devel-oping a proposal for the forthcoming Global Fund round 10 with the objec-tive of mobilizing additional resources in order to consolidate the ongoing efforts for universal coverage towards achieving the defined Millennium Development Goal targets for malaria control.
Ever since the inception of the Roll Back Malaria project in Pakistan, the programme has passed significant milestones in partnership-building and development of policy guidelines for the new interventions of long-lasting insecticide-treated nets, rapid diagnostic tests and artemisinin-based combina-tion therapy. The programme has also enabled the imposition of a ban on the production and sale of oral artemisinin
monotherapies, injectable chloroquine and halofantrine, which had been inju-diciously prescribed by care providers. The latter was a major success achieved through sustained joint collaboration between the government and WHO [22]. To further enhance programme capacity, the integrated vector manage-ment approach needs be adopted as national strategy, promoting also the control of other vector-borne diseases.
Malaria constitutes a major public health threat in the highly endemic dis-tricts and agencies of Pakistan, while the risk of impending epidemics in the low endemic regions of the country is loom-ing. The government, the private sector, civil society organizations and devel-opment partners have to merge their efforts and work together to expand the available effective malaria control inter-ventions for achieving the national Mil-lennium Development Goal targets.
S61
Review
Creating synergies for health systems strengthening through partnerships in Pakistan – a case study of the national eye health programme A.A. Khan,1 N.U. Khan,2 K.M. Bile 3 and H. Awan 2
ABSTRACT Blindness and visual impairment are major causes of noncommunicable diseases in Pakistan. Two national population-based blindness surveys conducted in 1988 and 2002–04 demonstrated a reduction in prevalence of blindness from 1.78% to 0.9% with a significant drop in cataract blindness as a result of accelerated nationwide interventions and eye care integration in primary health care. In addition, between 2006 and 2008, 88 facilities were upgraded as a result of the national eye health programme. These measures resulted in a 279% increase in eye outpatient attendances and a 375% increase in eye surgeries performed. Investment in human resources development and policy change contributed significantly to the sustainability of the programme. Key challenges facing the programme include aligning national eye health strategies with health system strengthening informed through health systems research. This paper attempts to document this extraordinary success.
1National Programme for Prevention and Control of Blindness, Islamabad, Pakistan.2Sightsavers International, Islamabad, Pakistan (Correspondence to H. Awan: [email protected]).3World Health Organization, Country Office, Islamabad, Pakistan.
0.9 1.7 2004 – 2002 1988
2008 2006 88
375 279
Création de synergies en vue du renforcerment du système de santé par le biais de partenariats au Pakistan : étude du cas du programme national de santé oculaire
RÉSUMÉ La cécité et les déficiences visuelles sont des causes majeures de maladies non transmissibles au Pakistan. Deux enquêtes nationales en population sur la cécité, réalisées en 1988 et entre 2002 et 2004, ont montré une baisse de la prévalence de la cécité de 1,78 % à 0,9 %, ainsi qu’une diminution sensible de la cécité due à la cataracte, grâce à des interventions plus rapides au niveau national et à l’intégration des soins oculaires dans les soins de santé primaires. Par ailleurs, entre 2006 et 2008, 88 établissements ont été modernisés dans le cadre du programme national de santé oculaire. Ces mesures ont entraîné une hausse de 279 % des consultations ophtalmologiques externes et une augmentation de 375 % des actes de chirurgie oculaire réalisés. L’investissement dans le développement des ressources humaines et le changement de politique ont largement contribué à la viabilité du programme. Le principal enjeu auquel ce programme est confronté est l’harmonisation des stratégies nationales de santé oculaire et du renforcement du système de santé, au moyen des recherches sur les systèmes de santé. L’objectif de cet article est de décrire cette exceptionnelle réussite.

EMHJ
S62
Introduction
The importance of blindness and visual impairment as a global public health issue is illustrated by the World Health Assembly [1]. The State of the World’s Sight VISION 2020 report stated that, based on available global data, 75% of blindness and visual impairment was avoidable [2]. According to World Health Organization (WHO) esti-mates, 314 million people worldwide live with low vision and blindness [3]. Of these, 45 million people are blind, 269 million have low vision and over 50% of these are due to uncorrected refractive errors (near-sightedness, far-sightedness or astigmatism). In most cases, normal vision could be restored with eyeglasses. A total of 90% of blind people live in low-income countries.
Restoration of sight and blind-ness prevention strategies are among the most cost-effective interventions in health care [2]. Infectious causes of blindness are decreasing as a result of public health interventions and so-cioeconomic development. Blinding trachoma now affects fewer than 80 million people, compared with 360 mil-lion in 1985 [2]. Ageing populations and lifestyle changes mean that chronic blinding conditions such as diabetic retinopathy are projected to rise expo-nentially. Women face a significantly greater risk of vision loss than men.
Blindness also has profound so-cioeconomic implications [4]. It was noted that without extra interventions, the global number of blind individuals would increase from 44 million in 2000 to 76 million in 2020 [4]. A successful VISION 2020 initiative would decrease blindness to only 24 million by 2020 and lead to 429 million blind person-years avoided. A conservative estimate of the economic gain is US$ 102 billion [4]. Similar studies in Australia have also demonstrated that vision disorders cost Australia AUD 9.85 billion in 2004 [5].
In 1980, at the request of the Min-istry of Health, WHO conducted a
situation analysis of eye health in the country. It found that over two-thirds of the district (secondary-level) hospitals had no eye care services. The report further added that there were an insuf-ficient number of ophthalmologists and that there was no paramedic cadre to assist the ophthalmologists. It ob-served that the cataract surgical output was very low and insufficient to address the backlog of cataract in the country. Based on these recommendations, the Ministry of Health constituted a na-tional team in 1982 to address this issue [6]. This team was called the National Cataract Committee, which later in 1988 was changed to the National Eye Camp Planning Committee, as the gen-eral approach to reducing the burden of cataract blindness in south Asia at the time was through eye camps.
In 1987–90, the first national blind-ness survey was conducted with support from WHO [7]. The results of the survey were so staggering that the Ministry of Health took a very serious note of the prevailing situation of blindness in the country, with the effect that the National Eye Camp Planning Committee rapidly evolved into the National Committee for Prevention of Blindness in 1991. In 2008, this committee was reconstituted as the National Eye Health Committee. This new committee formulated the first national plan for prevention of blindness 1994–98 [6]. Subsequently, two further national plans were developed – the sec-ond national plan 1999–2003 [8] and third national plan 2005–10 [9].
The second national survey on blind-ness and low vision was undertaken in 2002–2004 [10,11]. After almost 15 years of joint intervention, this survey revealed that the prevalence of blindness had been halved to 0.9%.
The purpose of this paper is to dis-cuss how this exceptional progress of reducing the prevalence of blindness by 50% in less than 15 years was achieved and scaled-up further, supported by a national strategy development, consen-
sus building, multistakeholder efforts and enhanced synergies.
Methods
Desk reviews of key published peer reviewed articles and reports spanning the last 30 years were undertaken. These were obtained from the archives of the National Eye Health Committee, WHO Country Office, MEDLINE® search and situation analyses reports from donors. Health information data were obtained from the national health management information system and the national programme for family plan-ning and primary health care.
Two major population-based na-tional blindness surveys were analysed and compared. However, there were limitations in analysing the results from the surveys as there were differences in methodology. The first survey [7] employed a cluster random sampling, including all ages, in which several small surveys were carried out in 17 locations in the country. In the second survey [10,11] a multistage, stratified (rural–urban), cluster random sam-pling, with probability proportional to size procedures, was used to select a cross-sectional, nationally representa-tive sample of adults aged 30 years and above. Thus, it needed a smaller sample size than the first survey.
Specific data relating to national programmes for lady health workers (LHWs) and prevention and control of blindness were obtained from their respective programme implementa-tion units. Additional data on human resources were obtained from various training institutions, Pakistan Medical and Dental Council and relevant na-tional nongovernmental organizations.
Information on cofinancing was ob-tained from WHO, institutional donors and international nongovernmental organizations.
The data were organized into epi-demiological, disease specific, facilities,

S63
health information, health finance and health workforce categories. The fa-cilities and health workforce data were further disaggregated by province. All analysed data were reviewed by the co-ordinator of the National Eye Health Programme and relevant officials from the respective training centres to check for any inconsistencies.
Results
Table 1 illustrates the key results of two national blindness surveys undertaken about 15 years apart. The surveys re-vealed that while cataract (clouding of the lens of the eye) still remained the commonest cause of blindness, its proportion as a blinding cause had reduced from two-thirds to about half of all causes. This corroborated with the eye health workforce development and simultaneous strengthening of static facilities for eye care at the sec-ondary level which took place during this period. Furthermore, the second survey identified diabetic retinopathy and macular degeneration as emerging causes of blindness. The first survey may
have identified these conditions but these were not reported separately.
Table 2 demonstrates a rising trend in eye care interventions every five years. The period between 1988 and 1993 serves as a baseline before any formal national programme for prevention of blindness was launched. As static facili-ties were upgraded and new eye hospi-tals established in the nongovernment sector, a corresponding decrease in eye camps is noted.
Table 3 indicates the operational outcome of interventions and upgrada-tion of district hospitals in the public sector. There was a threefold increase in outpatient attendance rates and the number of cataract surgeries increased by almost four times. Even in areas of heightened security, there were modest increases. In Balochistan, 10 districts were not upgraded owing to lack of staff. A similar situation was found in two districts each in Punjab and Khyber Pa-khtunkhwa, formerly North West Fron-tier province, and one each in Sindh and Pakistan Administered Kashmir. Data from districts that were not upgraded were not reliable as no systematic re-porting was being followed.
Table 4 highlights the key eye health cadres, their respective minimum train-ing criteria and the current status of production and deployment.
Table 5 shows the professional tasks and roles assigned to the different levels of eye care facilities. The national pro-gramme identified these specific roles to ensure that the various levels of health care services could comprehensively implement the national eye strategy.
Table 6 illustrates how integration of eye health within primary health care by LHWs expanded access and cover-age of eye health services at the primary level. This step has led to promotion of eye health by a 100 000-strong force of LHWs who are resident in their re-spective communities. As a result of institutionalization of eye health within broader health initiatives, there has been a transition of facility-based care to community-based primary health care.
Discussion
Cataract blindness is a major public health problem in most developing countries, and the availability of and access to cataract surgical services often serves as a proxy indicator for the success of a national eye health programme as far as reduction of avoidable blindness is concerned [12]. The first national plan estimated that in 1988, the total cataract surgery per annum was about 140 000 [6], whereas these efforts were scaled-up during the second five-year plan. A national mapping exercise substantiated the attainment of a significant reduc-tion in the burden of blindness that was reported by the national blindness survey of 2002–2004 [13] and revealed that at least 310 752 cataract surgeries were being performed annually. Of all cataract surgeries, 55% were carried out in the nongovernment sector, 39% in the government sector and 6% by the forces services; 58% of these surgeries were using intraocular lenses.
Table 1 Causes of blindness in Pakistan obtained from two population-based surveys
Main cause of blindness
National blindness survey 1988–89
National blindness survey 2002–04
Odds ratio (95% CI)
No. % No. %
Cataract 342 66.7 289 51.5 1.83 (1.42–2.36)
Corneal opacity 66 12.6 66 11.8 1.10 (0.75–1.60)
Uncorrected refractive errorsa 60 11.4 15 2.7 0.97 (0.70–1.35)
Uncorrected aphakia NSR NSR 48 8.6
Glaucoma 21 3.9 40 7.1 0.55 (0.31–0.98)
Macular degeneration NSR NSR 12 2.1 –
Diabetic retinopathy NSR NSR 1 0.2 –
Others 29 5.4 90 16.0 –
Blindness sample total 518b 100.0 561c 100.0 –
Survey sample total 29 157 16 507aIncludes uncorrected aphakia. bThis gives a prevalence of blindness of 1.78%. cThis gives a prevalence of blindness of 3.4%. However, when adjusted for all ages, the prevalence is 0.9%. CI = confidence interval; NSR = not separately reported.
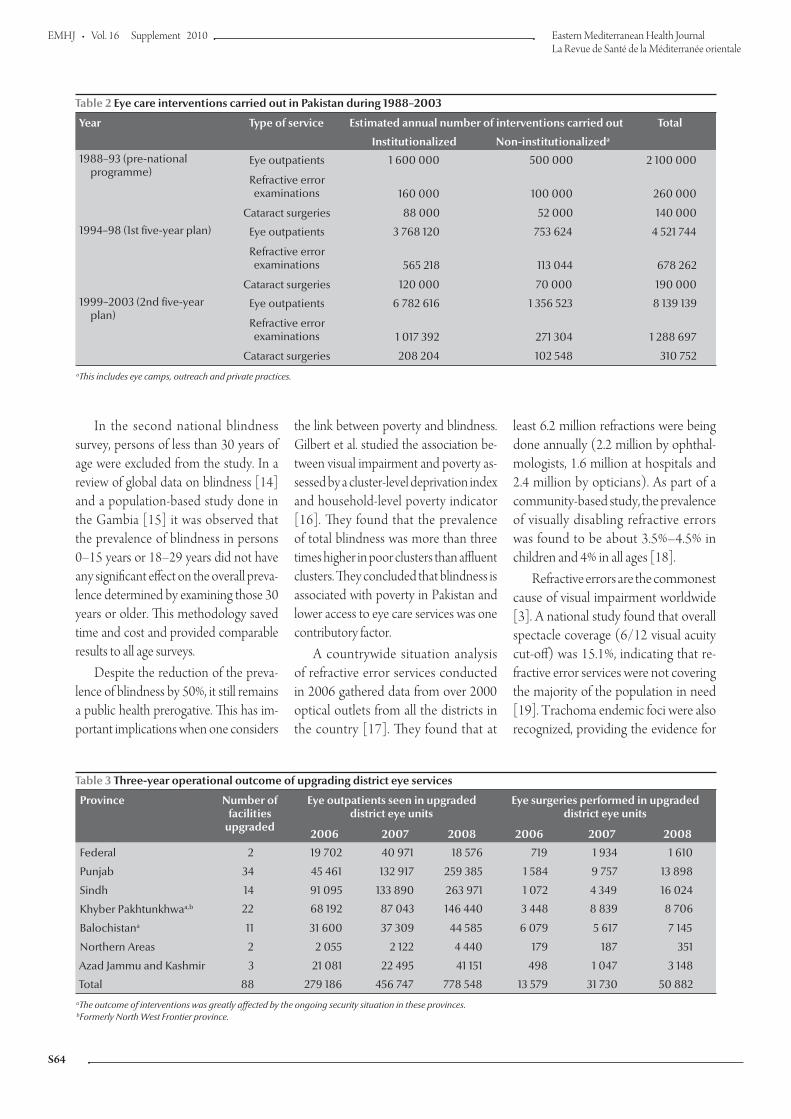
EMHJ
S64
In the second national blindness survey, persons of less than 30 years of age were excluded from the study. In a review of global data on blindness [14] and a population-based study done in the Gambia [15] it was observed that the prevalence of blindness in persons 0–15 years or 18–29 years did not have any significant effect on the overall preva-lence determined by examining those 30 years or older. This methodology saved time and cost and provided comparable results to all age surveys.
Despite the reduction of the preva-lence of blindness by 50%, it still remains a public health prerogative. This has im-portant implications when one considers
the link between poverty and blindness. Gilbert et al. studied the association be-tween visual impairment and poverty as-sessed by a cluster-level deprivation index and household-level poverty indicator [16]. They found that the prevalence of total blindness was more than three times higher in poor clusters than affluent clusters. They concluded that blindness is associated with poverty in Pakistan and lower access to eye care services was one contributory factor.
A countrywide situation analysis of refractive error services conducted in 2006 gathered data from over 2000 optical outlets from all the districts in the country [17]. They found that at
least 6.2 million refractions were being done annually (2.2 million by ophthal-mologists, 1.6 million at hospitals and 2.4 million by opticians). As part of a community-based study, the prevalence of visually disabling refractive errors was found to be about 3.5%–4.5% in children and 4% in all ages [18].
Refractive errors are the commonest cause of visual impairment worldwide [3]. A national study found that overall spectacle coverage (6/12 visual acuity cut-off) was 15.1%, indicating that re-fractive error services were not covering the majority of the population in need [19]. Trachoma endemic foci were also recognized, providing the evidence for
Table 2 Eye care interventions carried out in Pakistan during 1988–2003
Year Type of service Estimated annual number of interventions carried out Total
Institutionalized Non-institutionalizeda
1988–93 (pre-national programme)
Eye outpatients 1 600 000 500 000 2 100 000
Refractive error examinations 160 000 100 000 260 000
Cataract surgeries 88 000 52 000 140 0001994–98 (1st five-year plan) Eye outpatients 3 768 120 753 624 4 521 744
Refractive error examinations 565 218 113 044 678 262
Cataract surgeries 120 000 70 000 190 0001999–2003 (2nd five-year plan)
Eye outpatients 6 782 616 1 356 523 8 139 139
Refractive error examinations 1 017 392 271 304 1 288 697
Cataract surgeries 208 204 102 548 310 752aThis includes eye camps, outreach and private practices.
Table 3 Three-year operational outcome of upgrading district eye services
Province Number of facilities
upgraded
Eye outpatients seen in upgraded district eye units
Eye surgeries performed in upgraded district eye units
2006 2007 2008 2006 2007 2008
Federal 2 19 702 40 971 18 576 719 1 934 1 610
Punjab 34 45 461 132 917 259 385 1 584 9 757 13 898
Sindh 14 91 095 133 890 263 971 1 072 4 349 16 024
Khyber Pakhtunkhwaa,b 22 68 192 87 043 146 440 3 448 8 839 8 706
Balochistana 11 31 600 37 309 44 585 6 079 5 617 7 145
Northern Areas 2 2 055 2 122 4 440 179 187 351
Azad Jammu and Kashmir 3 21 081 22 495 41 151 498 1 047 3 148
Total 88 279 186 456 747 778 548 13 579 31 730 50 882aThe outcome of interventions was greatly affected by the ongoing security situation in these provinces. bFormerly North West Frontier province.
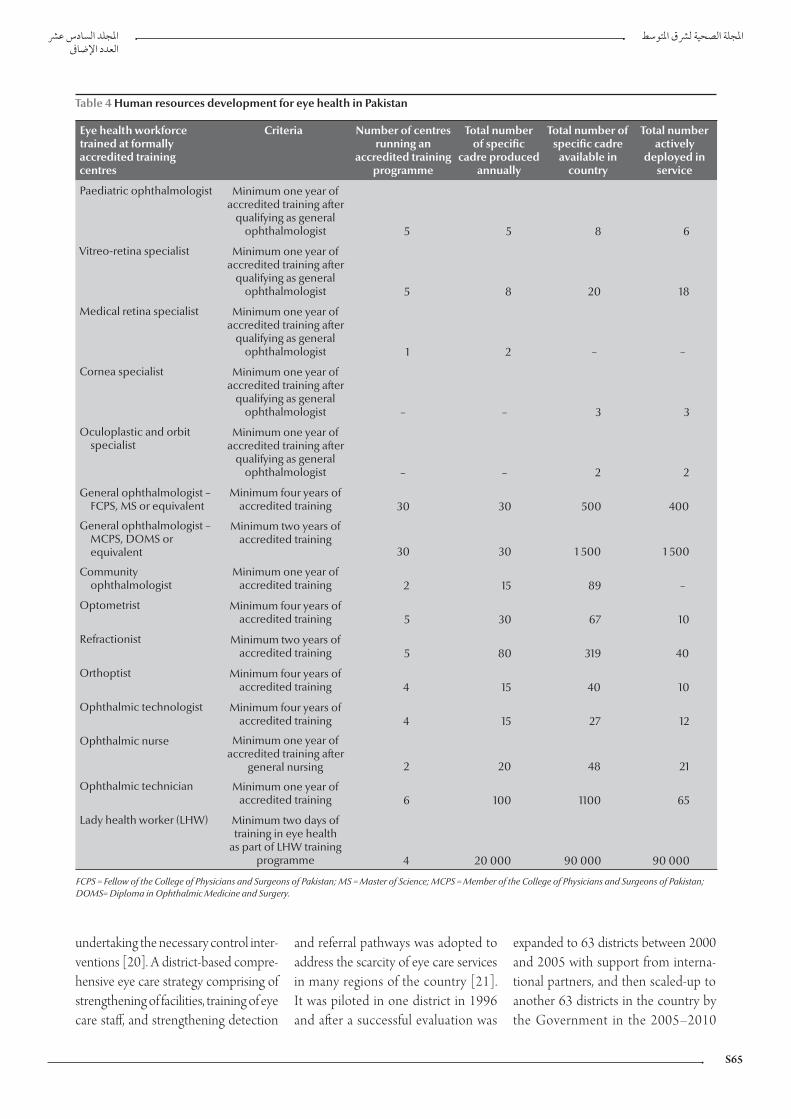
S65
undertaking the necessary control inter-ventions [20]. A district-based compre-hensive eye care strategy comprising of strengthening of facilities, training of eye care staff, and strengthening detection
and referral pathways was adopted to address the scarcity of eye care services in many regions of the country [21]. It was piloted in one district in 1996 and after a successful evaluation was
expanded to 63 districts between 2000 and 2005 with support from interna-tional partners, and then scaled-up to another 63 districts in the country by the Government in the 2005–2010
Table 4 Human resources development for eye health in Pakistan
Eye health workforce trained at formally accredited training centres
Criteria Number of centres running an
accredited training programme
Total number of specific
cadre produced annually
Total number of specific cadre
available in country
Total number actively
deployed in service
Paediatric ophthalmologist Minimum one year of accredited training after
qualifying as general ophthalmologist 5 5 8 6
Vitreo-retina specialist Minimum one year of accredited training after
qualifying as general ophthalmologist 5 8 20 18
Medical retina specialist Minimum one year of accredited training after
qualifying as general ophthalmologist 1 2 – –
Cornea specialist Minimum one year of accredited training after
qualifying as general ophthalmologist – – 3 3
Oculoplastic and orbit specialist
Minimum one year of accredited training after
qualifying as general ophthalmologist – – 2 2
General ophthalmologist – FCPS, MS or equivalent
Minimum four years of accredited training 30 30 500 400
General ophthalmologist – MCPS, DOMS or equivalent
Minimum two years of accredited training
30 30 1 500 1 500
Community ophthalmologist
Minimum one year of accredited training 2 15 89 –
Optometrist Minimum four years of accredited training 5 30 67 10
Refractionist Minimum two years of accredited training 5 80 319 40
Orthoptist Minimum four years of accredited training 4 15 40 10
Ophthalmic technologist Minimum four years of accredited training 4 15 27 12
Ophthalmic nurse Minimum one year of accredited training after
general nursing 2 20 48 21
Ophthalmic technician Minimum one year of accredited training 6 100 1100 65
Lady health worker (LHW) Minimum two days of training in eye health
as part of LHW training programme 4 20 000 90 000 90 000
FCPS = Fellow of the College of Physicians and Surgeons of Pakistan; MS = Master of Science; MCPS = Member of the College of Physicians and Surgeons of Pakistan; DOMS= Diploma in Ophthalmic Medicine and Surgery.

EMHJ
S66
Table 5 Roles of primary, secondary and tertiary level facilities for eye care
Type Tasks/role
Centre of excellence Dedicated specialized eye care services for complicated and referred cases Training in general ophthalmology for ophthalmologists and medical graduatesSubspecialty training in the areas of vitreo-retina, paediatric ophthalmology, cornea, glaucoma and community eye healthTraining for allied health personnel especially in ophthalmic services Coordination, facilitation and management of developing eye health services in the respective province and zonesLead on research/situation analysis of eye health, and advocacy for health system strengthening as part of sustainable developmentServe as Master trainers for CME, and eye health component of primary health care, school health programmes and pilot initiatives
Teaching hospital Dedicated specialized eye care services for complicated and referred cases Training in general ophthalmology for ophthalmologists and medical graduatesTraining of allied health personnel in ophthalmic services Facilitation to Centre of Excellence in developing eye health services, advocacy and research Support linkages development with district and subdistrict hospitals for referrals and medical education
DHQ/civil hospital Dedicated eye care unit with an ophthalmologist and two or three ophthalmic assistantsDiagnosis and treatment of common eye diseasesReceiving referrals from basic health units/rural health centres and THQ hospitals for treatment, and referring the complicated cases to tertiary units Serve as trainer/technical expert for school eye health programmes in refractive errors and early detection of eye problems
THQ/subdistrict hospital Dedicate eye care unit to be established where staff is available Diagnosis and treatment of common eye diseasesReceiving referrals from basic health units/rural health centres for treatment, and referring the complicated cases to DHQ hospitals or tertiary units
Rural health centre Dedicated vision screening and assessmentProvision of eye health promotion as part of primary health care Early detection and identification of priority blinding conditions Referrals of the cases to THQ/DHQ hospitals for prescription and treatment Support in school eye health programmes especially for refractive errors
Basic health unit Provision of eye health promotion as part of primary health care Early detection and identification of priority blinding conditionsReferrals of the cases to rural health centre for vision screening and THQ/DHQ hospitals for prescription and treatmentsSupport in school eye health programmes especially refractive errors
CME = continuing medical education; DHQ = district headquarter; THQ = tehsil/taluka headquarter.
national plan. The district programme not only demonstrated the feasibility of the approach even in the most dif-ficult districts, but also revealed that
there was a demonstrable increase in the number of women attending the district eye units for treatment and eye surgery [22].
The combination of micro-surgical training of district ophthalmologists, upgredation of district eye care services and the establishment of more than 25
Table 6 Expanding access to eye health services through lady health workers (LHWs)
Province Number of LHWs employed
People with eye problems examined by LHWs at the primary level
Percentage increase
At start of programme – baseline in 2005
After five years – 2009
Balochistana 6 350 201 290 230 640 15
Khyber Pakhtunkhwaa,b 13 888 1 146 462 989 322 -14
Punjab 49 000 3 008 564 4 286 896 42
Sindh 22 621 1 325 357 1 680 880 27
Total 91 859 5 681 673 7 187 738 27aThe data here show a reduction. This is due to the heightened security situation and internal displacement of people. Thus, there was a very low level of training undertaken during this period. bFormerly North West Frontier province.

S67
new eye hospitals in the non- govern-ment sector contributed to the doubling of cataract surgical output and increased uptake of services. The Layton Rahma-tullah Benevolent Trust with its 15 eye hospitals in the country has contributed significantly to social protection.
The uptake of services in the up-graded district eye units corroborated closely with the increase in eye health treatments by LHWs delivering primary health care. The upgraded district eye units demonstrated a 279% increase in eye outpatient attendances and a 375% increase in eye surgeries performed at upgraded facilities.
In 1993 there were 1500 ophthal-mologists. Based on data from the Pakistan Medical and Dental Council (personal communication 2010 – NK), there were an estimated 2000 or more ophthalmologists in the country by 2009. The strategy also developed the concept of an eye care team, with allied health professionals supporting oph-thalmologists.
One of the key successes of the national plans for eye health has been the development of provincial and na-tional centres for training an eye health workforce. To address the paucity of eye health professionals, the national committee for prevention of blind-ness prioritized the establishment of at least one training centre in each province. Two of the critical factors in this regard were the identification of eye health workforce development needs and the establishment of train-ing institutions in the public sector in all four provinces. Similar efforts were made by the nongovernment sector in key geographical regions of the country illustrated by Al-Shifa Trust Eye Hospitals, operating as a WHO Collaborating Centre for prevention of blindness with its four eye care hos-pitals, and by Ibrahim Eye Hospital.
A community-based study was con-ducted to determine the prevalence of non-vision-impairing conditions
(NVICs) such as conjunctivitis, water-ing of the eye, presbyopia (difficulty in seeing near objects, e.g. during reading), etc. that add to the burden of disease that LHWs have to attend to as part of their work [23]. This study found a prevalence of 30.6% for NVICs. If presbyopia was excluded, NVICs then accounted for 14.6%. The main NVICs included infections such as conjuncti-vitis. The average complaint frequency per month/1000 population was found to be 55. This study demonstrated that there was a significant burden of simple eye diseases that could be treated at primary level. The national programme for prevention of blindness has liaised with LHWs’ programmes to revise the curriculum of LHWs and strengthen the eye health component of primary health care.
A vital element of any national health plan is an effective health information system. The national health manage-ment information system (HMIS) team conducted a survey of eye health infor-mation needs and included eye health data in their national integrated report [24]. Eye health and disease indicators also appeared in a Gateway Paper on health indicators [25]. There is a need to develop an eye health information system as an integral part of the HMIS.
The financing of the three national plans has again been a combination of state and non-state partnership and is an example of conditional cofinancing. The first two national plans were almost solely funded by international partners. However, in 2005, after evaluating pilot programmes and demonstration ap-proaches, the Federal Ministry of Health launched a five-year national plan for prevention of blindness worth US$ 50 million. The Government now provides support to capital investment and de-ployment of trained human resources, and has committed to creating at least 2700 new posts for eye health workers. In support of this commitment, the in-ternational partners continue to provide technical and financial assistance for
training of the much needed eye health workforce.
Some of the key challenges facing the national eye health programme include sustaining cofinancing for the programme, ensuring creation of posts and deployment of eye care staff in all provinces, aligning eye health strategies with health systems and improving eye health information systems for planning interventions at various levels of health care. Furthermore, the referral pathway between the community level, first level health facilities and the sub-district level needs to be strengthened. The role of a rural health centre as a community eye health facility needs to be validated.
In developing countries, success of eye health can be achieved pro-vided there is strong policy support, health interventions and programmes are integrated into the district health system and that they avail the support of the national primary health care community-based workforce. Such ac-complishments are seen in Pakistan where a vertical programme combines horizontal health systems strengthening and requires creation of strong public–private partnerships and collaboration with professional bodies to monitor and guide progress. Pakistan’s eye health programme has demonstrated that in-vestment in, and alignment with, the six building blocks of health systems (service delivery, health workforce, medical products and technology, health information, health financing and governance) and supporting pri-mary health care reform can be a model for other developing countries. Such hard-earned success in Pakistan needs to be sustained.
Acknowledgements
The authors acknowledge the many contributions of Pakistan Institute of Community Ophthalmology, Pesha-war, Jinnah Postgraduate Medical Cen-tre, Karachi, College of Ophthalmology

EMHJ
S68
References
1. Prevention of blindness and visual impairment. Geneva, World Health Organization, 2006 (WHA59.25).
2. State of the world’s sight VISION 2020: the right to sight 1999–2005. Geneva, World Health Organization, 2005.
3. Resnikoff S et al. Global magnitude of visual impairment caused by uncorrected refractive errors in 2004. Bulletin of World Health Organization, 2008, 86(1):63–70.
4. Frick KD, Foster A. The magnitude and cost of global blindness: an increasing problem that can be alleviated. American Journal of Ophthalmology, 2002, 134(4):471–476.
5. Taylor HR, Pezzullo ML, Keeffe JE. The economic impact and cost of visual impairment in Australia. British Journal of Ophthal-mology, 2006, 90:272–275.
6. Pakistan national plan for prevention of blindness, 1st five year plan (1994–1998), Islamabad, Ministry of Health, 1994.
7. Memon MS. Prevalence and causes of blindness in Pakistan. Journal of Pakistan Medical Association, 1992, 42(8):196–198.
8. Pakistan national plan for prevention of blindness, 2nd five year plan (1999–2003). Islamabad, Ministry of Health, 1999.
9. Pakistan national plan for prevention of blindness, 3rd five year plan (2005–2010). Islamabad, Ministry of Health, 2005.
10. Jadoon MZ et al. Prevalence of blindness and visual impair-ment in Pakistan: the Pakistan National Blindness and Visual Impairment Survey. Investigative Ophthalmology & Visual Sci-ence, 2006, 47(11):4749–4755.
11. Dineen B et al. Causes of blindness and visual impairment in Pakistan: the Pakistan national blindness and visual im-pairment survey. British Journal of Ophthalmology, 2007, 91(8):1005–1010.
12. Vajpayee RB et al. Epidemiology of cataract in India: combating plans and strategies. Ophthalmic Research, 1999, 31(2):86–92.
13. Mapping of cataract surgical services in Pakistan – a report. Islam-abad, National Committee for Prevention of Blindness, 2002.
14. Resnikoff S et al. Global data on visual impairment in the year 2002. Bulletin of the World Health Organization, 2004, 82:844–851.
15. Dineen B, Foster A, Faal H. A proposed rapid methodology to assess the prevalence and causes of blindness and visual im-pairment. Ophthalmic Epidemiology, 2006, 13:31–34.
16. Gilbert CE et al. Poverty and blindness in Pakistan: results from the Pakistan national blindness and visual impairment survey. British Medical Journal, 2008, 336(7634):29–32.
17. Minto H et al. Situation analysis of refractive services in Paki-stan. Eye Care Review, 2008, 1(1):11–15.
18. Situation analysis of refractive services in Pakistan. Islamabad, National Committee for Prevention of Blindness, Ministry of Health, 2006.
19. Shah SP et al. Refractive errors in the adult Pakistani popula-tion: the national blindness and visual impairment survey. Ophthalmic Epidemiology, 2008, 15(3):183–190.
20. Report of the national trachoma rapid assessment. Islamabad, National Trachoma Task Force, National Committee for Pre-vention of Blindness, Ministry of Health, 2002.
21. Situation analysis of the existing ophthalmic resources of DHQ hospitals Sind, Baluchistan and Punjab 1998–1999 (report): re-sults and recommendations. Sydney, Fred Hollows Foundation, 1999.
22. Courtright P, Lewallen S. Improving gender equity in eye care: advocating for the needs of women. Community Eye Health Journal, 2007, 20(64):68–69.
23. Hussain A, Awan H, Khan MD. Prevalence of non-vision-impairing conditions in a village in Chakwal district, Punjab, Pakistan. Ophthalmic Epidemiology, 2004, 11(5):413–426.
24. National integrated report (analysis based on national HMIS, LH-Ws–MIS and other data sources). Islamabad, Ministry of Health, National Health Information System, 2008.
25. Disabilities, prevalence of blindness, number of people with bilateral blindness, prevalence of Functional Low Vision. In: Nishtar S. Health Indicators of Pakistan: Gateway Paper II. Is-lamabad, Heartfile, 2007:181 (http://www.heartfile.org/pdf/GWP-II.pdf, accessed 27 June 2010).
and Allied Vision Sciences, Lahore, Civil Hospital, Karachi and Helper Eye Hos-pital, Quetta who were the architects of Pakistan’s national plan for the preven-tion and control of blindness; Ministry
of Health; WHO; institutional donors (especially AusAid, European Com-mission and Irish Aid); international nongovernment partners (CBM, Fred Hollows Foundation and Sightsavers
International); corporate donors (es-
pecially Standard Chartered Bank) and
national nongovernmental organiza-
tions.

S69
Report
Environmental health needs and launching of an environmental health protection unit in PakistanM.Z.A. Khan,1 B.M. Kazi,2 K.M. Bile,3 M. Magan3 and J.A. Nasir 2
ABSTRACT Pakistan is seriously confronted by many complex and difficult environmental challenges related to air, water, soil, forests and food including issues such as climate change. The close link between environment and health is neither well understood nor appreciated. The annual cost of environmental degradation in Pakistan has been estimated to be around US$ 4.0 billion or at least 6% of the country’s GDP. Up to 35% of the burden of disease is attributable to environmental hazards and risk factors and most of this burden is preventable. A systematic process for identifying environmental health needs and issues as well as the efforts made by the government of Pakistan and the World Health Organization in establishing and launching an environmental health protection unit are described. Also presented are the mission, functions, structure (operational and logistical) and technical requirements as well as sustainability aspects of the environmental health protection unit.
1World Health Organization, New York, United States of America.2National Institute of Health, Islamabad, Pakistan.3World Health Organization, Country Office, Islamabad, Pakistan (Correspondence to K.M. Bile: [email protected]).
35 6 40
Besoins relatifs à la salubrité de l’environnement et ouverture d’un bureau de protection de la salubrité de l’environnement au Pakistan
RÉSUMÉ Le Pakistan est sérieusement confronté à de nombreux problèmes environnementaux, complexes et difficiles, qui concernent l’air, l’eau, la terre, les forêts et les denrées alimentaires, et incluent le changement climatique. Le rapport étroit entre environnement et santé n’est pas bien compris et son importance est mal perçue. Le coût annuel de la dégradation de l’environnement au Pakistan a été estimé à environ quatre milliards USD et à 6 % du PIB du pays au minimum. Les risques et les facteurs de risques environnementaux représentent jusqu’à 35 % de la charge de morbidité, qui est en grande partie évitable. Cet article décrit un processus systématique d’identification des besoins et des problèmes relatifs à la salubrité de l’environnement, ainsi que l’action du gouvernement pakistanais et de l’Organisation mondiale de la Santé pour mettre en place un bureau de protection de la salubrité de l’environnement. La mission, les fonctions, la structure opérationnelle et logistique et les règles techniques de ce bureau sont également présentés, ainsi que les aspects relatifs à sa viabilité.

EMHJ
S70
Introduction
Pakistan is one of the 22 Member States of the World Health Organization’s (WHO’s) Eastern Mediterranean Re-gion (EMR). Its current population of around 170 million makes it the most populous country in the Region [1]. The country is seriously confronted by many complex and difficult environmental challenges related to air, water, soil, forests, food and issues such as climate change as well as a double burden of disease due to communicable and non-communicable diseases [2–6]. Several agencies are mandated for the protection of environment. However none of them is responsible for protecting humans from the adverse health effects of poor environment. The close link between environment and health is neither well understood nor appreciated. Pakistan has several national policies, guidelines, laws, ordinances, rules and regulations related to the protection of the environ-ment; however their implementation and enforcement are very limited [2,4]. The annual cost of environmental degradation, in the country, has been estimated to be around US$ 4.0 billion or at least 6% of the country’s GDP [2]. The two most significant causes of environmental degradation have been identified as: air pollution, both indoor and outdoor, making up 50% of the total environmental damage and result-ing in acute respiratory infections and premature mortality; and inadequate water supply, sanitation and hygiene, accounting for 30% of the total environ-mental damage, causing diarrhoeal and other waterborne diseases [2,5,7].
A systematic process used for iden-tifying environmental health needs and issues as well as the efforts made by the government of Pakistan and WHO in establishing and launching the en-vironmental health protection unit in Pakistan are described. A brief summary of its key mission, functions, structure (operational and logistical) and techni-
cal requirements as well as sustainability aspects are also presented.
Need & process for establishing the environmental health protection unit
The WHO’s Regional Office for the Eastern Mediterranean (WHO/EMRO) has been providing technical assistance and support to the federal Ministry of Health in Pakistan in plan-ning and implementing its develop-mental activities as well as meeting urgent environmental health needs in emergencies and disasters. A team of experts from WHO came to Pakistan in 2009 and developed a “road map” broadly defining the scope, need and functions of an environmental health protection unit. As a follow-up to the team findings and recommendations, the WHO office in Islamabad recruited the services of an international expert in environmental health (a former Director of WHO’s Centre for Envi-ronmental Health Activities) to further assist the government of Pakistan in determining the feasibilityof an envi-ronmental health protection unit and carrying out efforts towards its initiation and establishment.
An overview of various environmen-tal health variables and their status in the country indicates that the environmen-tal health situation in Pakistan is not very satisfactory (Table 1).
A meta-analysis of four major envi-ronmental health–related issues—water safety, air pollution, heath care waste and food safety—was carried out highlight-ing the main focus of the surveys/stud-ies conducted by various agencies and institutions. The analysis also included the key findings and gaps (Table 2).
World Bank and WHO studies in-dicate a substantial annual economic loss and burden of disease in Pakistan resulting primarily from the two major
environmental factors, air pollution and water safety (Table 3).
A comparative analysis of the seven countries of the Region with the lowest environmental health indicators shows that Pakistan is still lagging behind in some of the key environmental health indicators in meeting the WHO’s Health for All targets as well as the Unit-ed Nations’ Millennium Development Goals (Table 4).
Considering the current situation in environmental health, the government felt that there was an urgent need to have a close collaboration, coordination and cooperation mechanism between health and other sectors dealing with environmental risks and thus decided to establish an environmental health pro-tection unit in the Ministry of Health, Islamabad. In order to jump start the process, “seed funds” and technical as-sistance and support were provided by the WHO office in Islamabad. The unit was officially launched in March 2010.
Environmental health protection unit: mission, functions and requirements
A brief summary of the environmen-tal health protection unit’s mandate, functions and structure, priority areas, linkages with other agencies and opera-tional needs are described below.
MissionThe mission of the unit is to contrib-ute to the protection of human health, prevention of diseases attributable to environmental risk factors, promotion of healthy environment and improve-ment in the quality of life.
FunctionsIts main functions will be to: serve as the health sector front line body that will ensure that health protection concerns are addressed through action by other

S71
sectors on environmental risk factors as well as contribute to developmental pol-icies, rules, guidelines, protocols, setting of national standards and legislation and programmes dealing with environmen-tal risks factors; undertake monitoring and surveillance of environmental health factors (e.g. water); generate evidence-based information for corrective action and linkages to public health; and imple-ment public awareness and education programmes and campaigns as well as conduct evidence-based advocacy to motivate health protection action by other sectors.
The unit will be headed by a coor-dinator, supported by four technical staff, experts in different environmen-tal health areas, such as water safety, environmental risk assessment and management, information manage-ment and networking. It is expected that a technical advisory group will be established that would ensure com-patibility and complementary action and coordination amongst the key re-sponsible agencies which contribute to environmental health, especially the ministries of health and environment.
The technical advisory group would advise on the development of the envi-ronmental health protection unit and guide its work.
Priority areas of focus and structureThe following seven priority areas and environmental health risk factors have been identified for action by the envi-ronmental health protection unit: drink-ing water quality, sanitation (including solid waste) and hygiene; air pollution (indoor and outdoor); health care waste and hazardous wastes; chemicals and pesticides; environmental heath impact assessment; environmental health as-pects of emergencies and disasters; and food safety.
The unit will comprise four depart-ments, namely the Water Safety, En-vironmental Sanitation and Hygiene Department (WSH); the Environmen-tal Health Surveillance and Monitoring, Risk Assessment and Management Department (ERM); the Chemical and Food Safety Department (CFS); and the Information, Networking and Data Management Department (INM).
However initially, due to limited re-sources, it was considered appropriate to start with only the WSH and ERM departments, focusing on the two major priority issues—water safety and health care waste management—for the com-ing three years.
Linkages and coordination with other agencies
The environmental health protection unit’s operations will require very close coordination, collaboration and net-working with a multitude of agencies dealing with environmental hazards and risk factors as well as with those which offer potential collaboration to the en-vironmental health protection unit in its priority areas of focus in environmental health (Figure 1). Additionally, the en-vironmental health protection unit will also draw on all the existing and available capacities—training, analysis, research, teaching, available networks, etc.—in other agencies, ensuring transparency, complementing and supporting activities (planned to be implemented by others) and avoiding duplication of any efforts.
Table 1 Overview of Environmental Health Situation in Pakistan
Variable Status
Overall environmental health situation in Pakistan Not very satisfactory Major environmental health issues Water safety, health care waste, air pollution, and food
safety
Mandate of agencies managing environmental risks and hazards Several agencies responsible, but none have the mandate of protecting human health from such hazards
Coordination and collaboration between environmental and health agencies and with other stake holders Very little
Implementation and enforcement of existing laws, rules and regulations Very weak and limited
Level of awareness of the linkage between environment and health Very little
Environmental health as a priority in the country Low as reflected by limited annual budget allocations
Availability of human resources in environmental health Extremely limited
Engagement of health sector in motivating action by other sectors for health protection Very limited, needing further efforts and urgent action
Availability of evidence based information in environmental health for sound policies and decision making Extremely limited
Regular surveillance and monitoring systems for air, water and food Very limited
Availability of environmental management tools, resources and infrastructure to provincial and local authorities Very limited
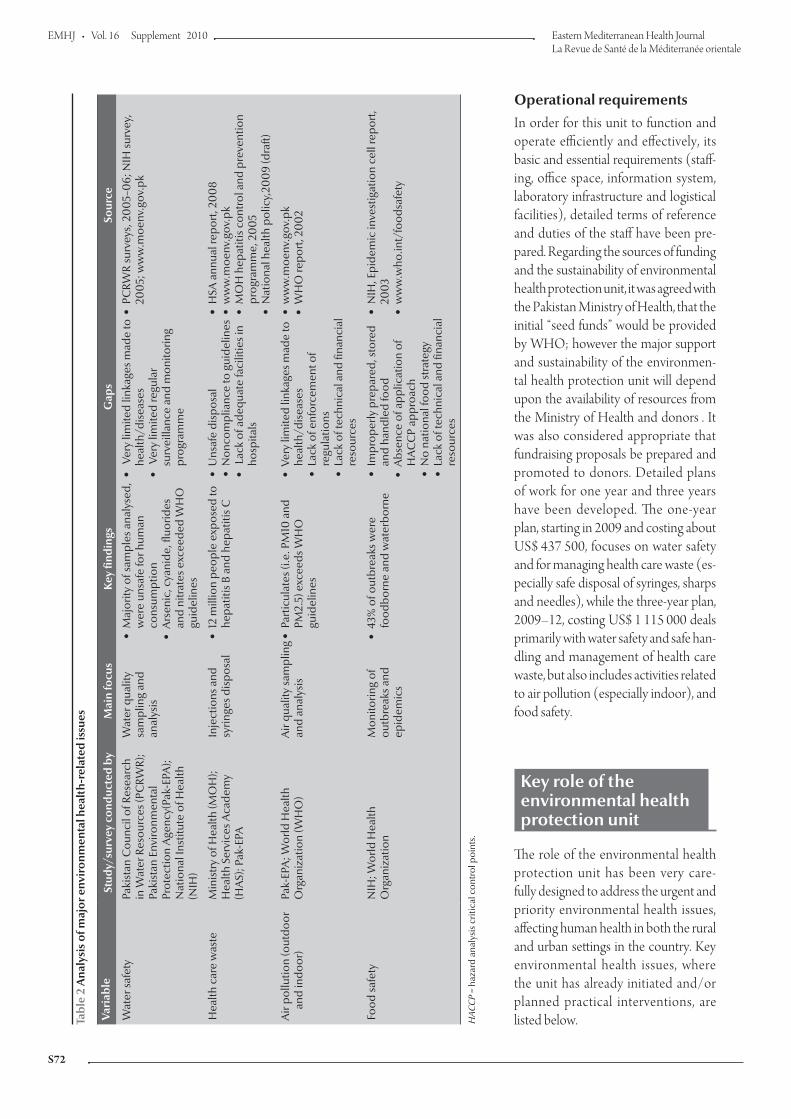
EMHJ
S72
Operational requirementsIn order for this unit to function and operate efficiently and effectively, its basic and essential requirements (staff-ing, office space, information system, laboratory infrastructure and logistical facilities), detailed terms of reference and duties of the staff have been pre-pared. Regarding the sources of funding and the sustainability of environmental health protection unit, it was agreed with the Pakistan Ministry of Health, that the initial “seed funds” would be provided by WHO; however the major support and sustainability of the environmen-tal health protection unit will depend upon the availability of resources from the Ministry of Health and donors . It was also considered appropriate that fundraising proposals be prepared and promoted to donors. Detailed plans of work for one year and three years have been developed. The one-year plan, starting in 2009 and costing about US$ 437 500, focuses on water safety and for managing health care waste (es-pecially safe disposal of syringes, sharps and needles), while the three-year plan, 2009–12, costing US$ 1 115 000 deals primarily with water safety and safe han-dling and management of health care waste, but also includes activities related to air pollution (especially indoor), and food safety.
Key role of the environmental health protection unit
The role of the environmental health protection unit has been very care-fully designed to address the urgent and priority environmental health issues, affecting human health in both the rural and urban settings in the country. Key environmental health issues, where the unit has already initiated and/or planned practical interventions, are listed below.Ta
ble
2 A
naly
sis
of m
ajor
env
iron
men
tal h
ealt
h-re
late
d is
sues
Vari
able
Stud
y/su
rvey
con
duct
ed b
y M
ain
focu
sK
ey fi
ndin
gsG
aps
Sour
ce
Wat
er sa
fety
Paki
stan
Cou
ncil
of R
esea
rch
in W
ater
Res
ourc
es (P
CRW
R);
Paki
stan
Env
ironm
enta
l Pr
otec
tion
Age
ncy(
Pak-
EPA
); N
atio
nal I
nstit
ute
of H
ealth
(N
IH)
Wat
er q
ualit
y sa
mpl
ing
and
anal
ysis
Maj
ority
of s
ampl
es a
naly
sed,
w
ere
unsa
fe fo
r hum
an
cons
umpt
ion
Ars
enic
, cya
nide
, fluo
rides
an
d ni
trat
es e
xcee
ded
WH
O
guid
elin
es
Ver
y lim
ited
linka
ges m
ade
to
heal
th/d
isea
ses
Ver
y lim
ited
regu
lar
surv
eilla
nce
and
mon
itorin
g pr
ogra
mm
e
PCRW
R su
rvey
s, 2
00
5–0
6; N
IH su
rvey
, 20
05;
ww
w.m
oenv
.gov
.pk
Hea
lth c
are
was
te
Min
istr
y of
Hea
lth (M
OH
); H
ealth
Ser
vice
s Aca
dem
y (H
AS)
; Pak
-EPA
Inje
ctio
ns a
nd
syrin
ges d
ispo
sal
12 m
illio
n pe
ople
exp
osed
to
hepa
titis
B a
nd h
epat
itis C
Uns
afe
disp
osal
Non
com
plia
nce
to g
uide
lines
Lac
k of
ade
quat
e fa
cilit
ies i
n ho
spita
ls
HSA
ann
ual r
epor
t, 20
08
ww
w.m
oenv
.gov
.pk
MO
H h
epat
itis c
ontr
ol a
nd p
reve
ntio
n pr
ogra
mm
e, 2
00
5N
atio
nal h
ealth
pol
icy,
200
9 (d
raft)
Air
pollu
tion
(out
door
and
indo
or)
Pak-
EPA
; Wor
ld H
ealth
O
rgan
izat
ion
(WH
O)
Air
qual
ity sa
mpl
ing
and
anal
ysis
Pa
rtic
ulat
es (i
.e. P
M10
and
PM
2.5)
exc
eeds
WH
O
guid
elin
es
Very
lim
ited
linka
ges m
ade
to
heal
th/d
isea
ses
Lack
of e
nfor
cem
ent o
f re
gula
tions
Lack
of t
echn
ical
and
fina
ncia
l re
sour
ces
ww
w.m
oenv
.gov
.pk
WH
O re
port
, 20
02
Food
safe
tyN
IH; W
orld
Hea
lth
Org
aniz
atio
nM
onito
ring
of
outb
reak
s and
ep
idem
ics
43%
of o
utbr
eaks
wer
e fo
odbo
rne
and
wat
erbo
rne
Impr
oper
ly p
repa
red,
stor
ed
and
hand
led
food
Abs
ence
of a
pplic
atio
n of
H
AC
CP
appr
oach
No
natio
nal f
ood
stra
tegy
Lack
of t
echn
ical
and
fina
ncia
l re
sour
ces
NIH
, Epi
dem
ic in
vest
igat
ion
cell
repo
rt,
200
3w
ww
.who
.int/
food
safe
ty
HAC
CP
= ha
zard
ana
lysi
s crit
ical
con
trol
poi
nts.

S73
Water safety The government has attempted to pro-vide safe water to its population under a national project called “Clean Drink-ing Water for All” [2]. This project has not been, so far, very successful due to inadequate water treatment facilities, and better management, improved in-frastructure and sufficient resources for repair and maintenance of such facilities are required. However, about 70% of the population still relies on contami-nated water sources, and 60% of the rural schools and health centres lack safe water and adequate sanitation facilities, thus putting schoolchildren, patients, and health care workers at increased health
risk [8–11]. Waterborne diseases and outbreaks continue to rise [9]. The envi-ronmental health protection unit plays an important role in providing the needed technical support in identifying, assessing and promoting appropriate technologies for maintaining the safety of water at the household level through its strong water-quality surveillance and monitoring capacity. This should result in an overall reduction of diarrhoeal and waterborne diseases. The unit has also undertaken an initiative of mapping of drinking-water quality and linking it to health in vari-ous districts in the country. Appropriate remedial and mitigation measures as well as awareness-raising approaches will be
proposed for safeguarding the health of the affected communities.
Health care waste managementThe federal Ministry of Environment, as part of its mandate, has published the “Health Care Waste Management Rules, 2006” (approved 2005) for hos-pitals. However very few of them are actually follow these rules [12–15]. Re-cent studies carried out in Rawalpindi and Islamabad have demonstrated that the toxic emissions from improperly operated and managed hospital incin-erators cause serious health problems for residents [16]. Unsafe management
Table 3 Economic loss and burden of disease resulting from environmental factors in Pakistan
Environmental issue/factor Economic loss, in US$ billion (% GDP loss)
Resulting diseases Annual burden of disease (DALYs/deaths)
Source
Inadequate water supply, sanitation and hygiene (water safety)
1.4(1.81% of GDP)
Diarrhoea, typhoid, hepatitis, intestinal worms, dengue fever, and others
1.6 million diarrhoea DALYs900 000 typhoid DALYS
250 000 infant deaths
World Bank, 2006
WHO, 2006
Air pollution
Outdoor 0.8(1.08% of GDP)
ARI, heart ailment, lung cancer, chronic bronchitis
and others
22 000 premature adult deaths DALYS lost = 163 432
World Bank, 2006
WHO, 2006
Indoor 0.75(1.0% of GDP)
ARI, chronic bronchitis, cataracts, tuberculosis, low
birth weight, and others
40 million cases ARI28 000 deaths/year
World Bank, 2006
Exposure to lead 0.53(0.72% of GDP)
Hypertension, blood pressure, heart disease,
and others
DALYS lost = 355 918 World Bank, 2006
GDP = gross domestic product; DALYs = disability-adjusted life years; WHO = World Health Organization; ARI = acute respiratory infection.
Table 4 A comparative analysis of seven EMR countries with worst environmental health indicators
Indicator (demographic, social and environmental)
Afghanistan Djibouti Pakistan Palestine Somalia Sudan Yemen
Total population (million) 24.5 0.72 170 3.76 7.96 37.2 21.5
Urban population (%) 22 83 35 57 36 38 29
Population under 15 years (%) 40.0 40.0 37.8 45.7 44.4 41.3 45.0
Population with access to sustained water resource (%) – 84 90 81 29 56 31
Population with access to improved sanitation (%) 67 85 54 97 37 31 23
Ministry of health budget as % of government budget 3.3 14.3 1.5 – – 7 5.6
Life expectancy at birth (total years) 46.0 44.1 65.0 72.5 47.0 58.0 61.1
Infant mortality rate (per 1000 live births) 129.0 67.0 78.0 24.2 86.0 81.0 68.5
Under-five mortality rate (per 1000 live births) 191.0 94.0 94.0 28.3 135.0 112.0 78.2

EMHJ
S74
Figure 1 Environmental health protection unit (EPHU) and its linkages with other environment related agencies and institutions
EHPU’s priority environmental health issues Institutions offering potential collaboration with
EHPU
Chemicaland food
safety
10. UN Agencies (WHO, UNICEF, UNDP, UN
Habitat)
�
�
�
AdvocacyTechnical assistance and supportInstitutional strengthening
9. Pakistan Department of Meteorology
�
�
Advocacy and awareness-raisingAdvisory on climate and health
8. Pakistan Council of Science & Industrial
Research
� Advocacy, capacity-building, research
7. International Union for Conservation of
Nature
�
�
Advocacy and awareness-raising.National strategies and plans
6. National University of Science and
Technology
� Capacity building and applied research
5. National Institute of Health
�
�
Investigative/reactive environmentalhealth laboratory
Well established and reference facility
4. Health Services Academy
�
�
Capacity-building/trainingApplied research
3. Pakistan Council of Research in Water
Resources
�
�
Water quality analysis and monitoringNational reference laboratory infrastructure(19 offices all over Pakistan)
2. Ministry of Environment
�
�
Policy, planning, strategiesAdvocacy and awareness-raising
1. Pakistan Environmental Protection
Agency
�
�
�
Regulatory agencyDeveloping, monitoring, enforcingstandards
Collection of data and information inenvironmental issues
Emergingissues
(climate,health,
noise, etc.)
Environmentalhealth
surveillancemonitoring risk
assessmentand
management
Water,environmental
sanitationand hygiene
6. Environmental health aspects of
emergencies
7. Food safety
4. Chemicals and pesticides
5. Environmental health impact
assessment
3. Health care waste (including
solid waste)
2. Air quality (indoor and outdoor)
1. Water quality, sanitation &
hygiene
of health care waste, especially the un-safe injection practices component, has seriously resulted in the rise of hepatitis
B and hepatitis C cases [13,15,17]. The environmental health protection unit has already selected and sponsored
three hospitals as pilots for identifying and promoting the best practices for hospital waste management.

S75
Food safetyFoodborne diseases remain responsible for high levels of morbidity and mortal-ity in Pakistan, but particularly at risk are infants and young children, the elderly and the immunocompromised [18]. This is confirmed by National Institute of Health (Islamabad) studies indicat-ing that the highest number of out-breaks are of foodborne origin [9]. The environmental health protection unit, as part of its workplan, will be promoting the concept of hazard analysis critical control points (HACCP) systems in reducing the incidence of foodborne diseases.
Air pollution
Air pollution, both indoor and outdoor, is the highest contributor to the envi-ronmental burden of disease in Pakistan [2]. Pakistan Environmental Protection Agency studies indicate that air quality in most cities does not meet WHO Air Quality Guidelines [19]. The extensive data and information collected are not linked to the health situation of the population living in these affected areas. One of the major goals of the environmental health protection unit is to maintain a close link between the ministries of health and environment as
well as develop and promote evidence-based information.
Conclusion
In view of the current environmental health situation, the decision of the government of Pakistan to establish and launch the environmental health pro-tection unit is very timely and a positive step towards improving environmental health in the country. The unit can act as the front end leader that will play a piv-otal role in protecting and promoting safer and healthier life in the country.
References
1. Population projections (1998–2023). Islamabad, Pakistan, Na-tional Institute of Population Studies, 2000.
2. Pakistan strategic country environmental assessment. Islamabad, South Asia Environment and Social Unit, World Bank, 2006.
3. Country profiles. Cairo, World Health Organization, 2009 (http://www.emro.who.int, accessed 5 May 2010).
4. The gazette of Pakistan: Pakistan environmental protection act, 1997. Lahore, Environment Protection Department Punjab, 1997 (No. F.9(46)/97-Legis).
5. Ustun AP, Corvalan C, eds. Preventing disease through healthy environments: towards an estimate of the environmental burden of disease. Geneva, World Health Organization, 2006.
6. Kahlown MA , Tahir MA, Rasheed R, eds. Fifth water quality monitoring report 2005–06. Islamabad, Pakistan, Council for Research in Water Resources, Ministry of Science and Technol-ogy, 2008.
7. The world health report 2002: reducing risks, promoting healthy life. Geneva, World Health Organization, 2002.
8. Demographic and health indicators for countries of the Eastern Mediterranean. Cairo, World Health Organization, Regional Office for the Eastern Mediterranean, 2004 (201 WHO-EM/HST/181).
9. Report 1998–2003. National Institute of Health, Public health laboratories, epidemic investigation cell, [Website] (http://www.nih.org.pk/eic.asp, accessed 22 May 2010).
10. National standards for drinking water quality (NSDWG ). Islama-bad, Pakistan, Environmental Protection Agency, 2008.
11. Pakistan’s water at risk. Water and health related issues in Pakistan & key recommendations. A special report. Islamabad, Pakistan, World Wide Fund For Nature Pakistan, 2007 (http://www.wwfpak.org/pdf/water-report.pdf, accessed 22 June 2010).
12. Annual progress report for the year 2007–08. Islamabad, Paki-stan, Health Services Academy, Ministry of Health, 2009.
13. Waste from health care activities Geneva, World Health Organi-zation, 2007 (WHO Fact Sheet, No. 253). (http://www.who.int/mediacentre/factsheets/fs253/en/print.html, accessed 3 May 2010).
14. The gazette of Pakistan: hospital waste management rules Paki-stan 2005.Islamabad, Pakistan, Ministry of Environment, 2005 (S.R.O.1013(1)/2005).
15. Hospital waste factsheet. Islamabad, Pakistan, World Wild Fund for Nature Pakistan, [Website] (http://www.wwfpak.org/factsheets_hwf.php, accessed 22 June 2010).
16. Javied-Sabiha, Tufail M. Heavy metal pollution from medical waste incineration at Islamabad and Rawalpindi, Pakistan. Microchemical Journal, 2008, 90(1):77–81.
17. National health policy 2009 (draft 3 ): stepping towards better health. Islamabad, Pakistan, Ministry of Health, 2009.
18. WHO Food Safety Programme. Geneva, World Health Organi-zation, 2009 (http://www.who.int/foodsafety, accessed 10 April 2010).
19. The gazette of Pakistan: national environmental quality standards for motor vehicle exhaust and noise. Islamabad, Pakistan, Minis-try of Environment, 2009.

EMHJ
S76
Report
Launching the first postgraduate diploma in medical entomology and disease vector control in PakistanH.R. Rathor,1 A. Mnzava,2 K.M. Bile,3 A. Hafeez 4 and S. Zaman 5
ABSTRACT The Health Services Academy has launched a 12-month postgraduate diploma course in medical entomology and disease vector control. The objective is to create a core of experts trained to prevent and control vector-borne diseases. The course is a response to the serious health and socioeconomic burden caused by a number of vector-borne diseases in Pakistan. The persistence, emergence and re-emergence of these diseases is mainly attributed to the scarcity of trained vector-control experts. The training course attempts to fill the gap in trained manpower and thus reduce the morbidity and mortality due to these diseases, resulting in incremental gains to public health. This paper aims to outline the steps taken to establish the course and the perceived challenges to be addressed in order to sustain its future implementation.
1Medical Entomology and Disease Vector Control, Health Services Academy, Islamabad, Pakistan (Correspondence to H. Rathor: [email protected]).2World Health Organization Regional Office for the Eastern Mediterranean, Cairo, Egypt.3World Health Organization, Country Office, Islamabad, Pakistan.4Health Services Academy, Islamabad, Pakistan.5Institute of Public Health, Lahore, Pakistan.
Lancement du premier diplôme postuniversitaire en entomologie médicale et lutte contre les vecteurs de maladies au Pakistan
RÉSUMÉ Les Health Services Academy [Académie des services de santé] ont lancé un diplôme postuniversitaire d’une durée de 12 mois dans le domaine de l’entomologie médicale et de la lutte contre les vecteurs de maladies, dans le but de constituer un noyau d’experts formés à la lutte contre les maladies à transmission vectorielle. Cette formation est une riposte à la lourde charge sanitaire et socioéconomique que représentent un certain nombre de maladies à transmission vectorielle au Pakistan. La persistance, l’émergence et la réapparition de ces maladies sont essentiellement attribuées au manque d’experts formés à la lutte contre les vecteurs de maladies. La formation vise à combler ce manque et à réduire ainsi la morbidité et la mortalité dues à ces maladies, entraînant de ce fait une amélioration croissante de la santé publique. Le but de cet article est de mettre l’accent sur les mesures prises pour mettre en place la formation et les défis à relever pour soutenir sa future mise en œuvre.

S77
Introduction
Vector-borne diseases, such as malaria, filariasis, leishmaniasis, schistosomiasis, onchocerciasis, dengue and other ar-boviruses, rodent-borne diseases, and a number of other diseases transmitted by insects, cause major public health problems and burden of diseases in countries of the World Health Organi-zation’s (WHO)’s Eastern Mediterra-nean Region, including Pakistan [1–6]. Resurgence and re-emergence of some of these diseases continues to take place in Member States [7]. In 2001, an esti-mated 14 657 000 disability-adjusted life years were lost in countries in the Region due to infections from the top 10 vector-borne diseases, accounting for 11% of the global burden in an area where only 8% of the global population lives [8,9].
According to the annual report of the Directorate of Malaria Control, Islamabad, 2008, the incidence of Plas-modium falciparum has been increas-ing in Baluchistan, Sind, North-west Frontier Province (NWFP) and Feder-ally Administered Tribal Area (FATA), causing serious health problems. Crimean-Congo haemorrhagic fever has been reported from many parts of Baluchistan, Sind and northern Punjab [10]. Cutaneous leishmaniasis of an-throponotic and zoonotic nature, earlier only found in NWFP, has become en-demic and often causes outbreaks in all four provinces [11–14]. An outbreak of dengue fever was first reported from Ka-rachi, Pakistan in 1994 [15] and since then various dengue outbreaks have been reported from different regions of Pakistan [16].
The control of vectors of dengue, malaria, leishmaniasis, etc, requires availability of medical entomologists and vector-control experts, not only to provide leadership but also to moni-tor and evaluate the impact of existing vector-control interventions. Therefore, capacity building in medical entomol-
ogy and disease vector control must be a top priority for Pakistan.
In addition to the damage caused by the known endemic vector-borne diseases, the presence of vectors capable of transmitting other diseases which, al-though not yet reported from Pakistan, have caused outbreaks in neighbouring countries and pose as an emerging risk. An important example was an outbreak of plague in 1994 that caused serious alarm in India [17,18].
WHO warned the health authorities in Pakistan of the risks the country was facing due to the persistence, emergence and possible re-emergence of vector-borne diseases and the country’s serious lack of trained medical entomologists and vector-control experts to prevent and control any adverse health impacts. To address this human resource gap, the Ministry of Health asked WHO to work with its Health Service Academy (HSA), Islamabad to review and finalize the syllabus for a postgraduate diploma course in medical entomology and vec-tor control. This initiative was fully sup-ported in the Region’s 52nd Regional Committee meeting [19]. Through the joint collaborative programme, the blueprint of a medical entomology and disease vector control (MEDVC) course was designed for implementa-tion of integrated vector management (IVM) as the most suitable strategic ap-proach to reduce the burden of vector-borne diseases and reduce the critical gap in trained manpower to carry out indigenous applied research and vector-control operations [20–23].
In view of the above, HSA, with the support of WHO and the United States Agency for International Development (USAID), launched a postgraduate diploma in MEDVC in September 1 2009. MEDVC is a remarkable innova-tion for capacity building in a neglected but essential preventive field of public health.
Methods
Information was gathered from existing technical documents to design a course curriculum that was unique to the needs of Pakistan. Such documents included an existing curriculum from the WHO Regional Office for the Eastern Medi-terranean, WHO regional courses, and curricula for other courses currently offered at HSA. The biggest challenge was to align this course with the require-ments of Quaid-e-Azam University, the diploma-awarding academic institu-tion. Teaching consultancy and course approval processes were reviewed. In-terviews with senior national and WHO experts were instrumental in evaluating the opportunities and challenges that would influence the sustainability of the course.
Results
Table 1 lists the diseases, their vectors, intermediate hosts and reservoirs found in Pakistan. Many of these vector-borne diseases are endemic; for others the vec-tor epidemiology and environmental conduciveness pose the risk of disease resurgence, though cases have not yet been reported in Pakistan.
Inception of the courseIn order to launch the MEDVC course, multisectoral discussions were held among the concerned national authori-ties and a plan of action was prepared. HSA agreed to take the initiative and launched the MEDVC course. The syl-labus, designed jointly by the Regional Office and HAS, emphasized both the applied field aspects of disease vector control and indigenous research, to ensure the application of knowledge gained.
Collaboration with Qaid-e-Azam UniversityHSA collaborated with Qaid-e-Azam University, Islamabad, for the purpose

EMHJ
S78
of awarding diplomas to students. A plan for collaborative teaching and evaluation, along with the syllabus, was approved by the academic council of the university. Consequently, the course was offered by Quaid-e-Azam University as a one-year programme to be administered by HSA.
Table 2 shows the course structure. There are two semesters, comprising of six modules in subspecialties in the field of vector biology and control and a three-month research dissertation. A brief description of the syllabus, dura-tion and the credit hours allotted to each module are explained. The table also includes arrangements for local and international faculty in relation to each module of the syllabus. A total of 25 faculty were recruited: nine were from HSA, 11 were local visiting faculty from various universities and organizations
in Pakistan, and the remainder were international visiting faculty members.
Admission proceduresAs the course was expected to attract a large number of candidates from all over the country, an advertisement was placed in different national newspapers. The target was to admit 20 students. A total of 96 candidates applied, 70 of whom were shortlisted on the basis of qualifications and experience and further screened by a written test and interview. As detailed in the prospectus, due consideration was also given to other admission criteria such as age (maximum 30 years without experi-ence or 45 years with experience), provincial quotas, English language, computer skills and no objection cer-tificate requirement for those in service. A batch of 26 students was finally admit-ted to the first MEDVC programme. Of these 26 students, 13 held BSc
degrees in agriculture (2), biology (2), bio-informatics (2), medical technol-ogy (5), pharmacy (1), microbiology (1), while 10 had MSc degrees in bio-chemistry (1), zoology (4), botany (1), microbiology (1), agriculture (1), and three had medical degrees. This clearly indicated that the course was of great interest to students from many diverse biomedical backgrounds. This diversity was considered useful, as it would help to promote multidiscipline interaction within the class and an environment of participatory learning.
By careful review of transcripts of their undergraduate studies and from the personal interviews that formed part of the admission process, it was determined that all students had a basic knowledge of biosciences from their undergraduate studies. The only weak area in the background of most stu-dents was a limited knowledge of basic
Table 1 Risk of vector-borne diseases in Pakistan
Disease Vector/intermediate hosts/reservoirs
Vector status Environment (habitat)
Disease status
Malaria Anopheles spp. Present Favourable Endemic
Cutaneous leishmaniasis Sand flies, rodents Present Favourable Endemic
Visceral leishmaniasis Sand flies, dogs, cats Present Favourable Endemic in north
Dengue and dengue haemorrhagic fever Aedes aegypti, A. albopictus Present Favourable Endemic
Crimean-Congo haemorrhagic fever Ticks (cattle, sheep) Present Favourable Endemic
Yellow fever A. aegypti Present Unknown Not reported
Japanese encephalitis Culex tritaeniorhynchus Present Favourable Not reported
Filariasis C. quinquefasciatus, Anopheles spp. Present Favourable Reported
Plague Fleas, rodents Present Favourable Not present
Murine typhus Fleas, Rattus spp. Present Favourable Reported
Salmonellas Rattus spp. Present Favourable Reported
Dysentery, diarrhoea, cholera, typhoid, helminth infections, trachoma, poliomyelitis Housefly Present Favourable Present
Relapsing fever Rattus spp., Acomys spp. Present Favourable Reported
Leptospirosis Rattus spp., Mus spp. Present Unknown Not reported
Louse-borne typhus Body louse Present Favourable Reported in north
House dust mite allergies Dust mites Present Favourable Reported
Guinea worm (dracunculiasis) Cyclops Present Eradicated 1996 Not present
Haemorrhagic fever with renal syndrome Rodents Present Favourable Not reported
Onchocerciasis Black fly (Simulium not reported) Present Unknown Not reported

S79
medical entomology. This gap was to be expected and the syllabus was designed to address this weakness. The first part of module 1 deals with the basics of medical entomology right at the begin-ning of the course, thus students do not face any difficulty in this respect.
Medical entomology laboratory
A medical entomology laboratory was established from an existing laboratory and equipped with entomological dis-secting microscopes, a CO2 circulat-ing system for restraining insects for observation and other essential instru-ments required by the students. The existing laboratory was of modest size but functioned well. It was quickly set up
with limited resources to start the pro-gramme; however, more appropriate, purpose-built laboratories will eventu-ally be needed.
Medical entomology insectary
A small temporary insectary was es-tablished for rearing and processing various insects of medical importance. It was automated for controlled humidity, temperature and daylight periodicity. A number of colonized strains of anophe-line, culicine and Aedes mosquito spe-cies are being maintained for teaching and research purposes. A team of entomology technicians make routine field collections of anopheline mosqui-toes for teaching purposes and also for establishing laboratory colonies that
will be helpful for further training and research. This team has locally devel-oped a number of field insect collection instruments and equipment.
MEDVC research centre
A modest research centre has been established, supplied with computers, library items, WHO test kits, etc. A com-puter laboratory has also been set up, where postgraduate students can search literature on the Internet. A display corner for entomological journals has been established, where 16 of the most important journals on disease vector biology and control can be accessed. A small laboratory has been set up where WHO insecticide susceptibility test kits, other rapid test kits supplied by WHO
Table 2 The Health Service Academy (HSA) postgraduate diploma course in medical entomology and disease vector control – semester-based syllabus outline
Module Duration (months)
Credit hours Faculty
Module 1
1 6 HSA + local visiting faculty
Medical entomology, disease and vectors and vector-borne disease Identification, classification, bionomics of vectors and disease transmission mechanism and significance
Module 2
1 6 HSA + local visiting faculty
Epidemiological investigations and statistics Epidemiological concepts, statistical principles and methodology, principles and methodology of study design, application of computers for vector and disease control
Module 3
1 6HSA + local visiting + international faculty
Entomological investigations Skills for sampling, monitoring, rearing, identification, incrimination of disease vectors, intermediate host and reservoirs
Module 4
1 6HSA + local visiting + international faculty
Vector control and management Concepts and techniques for vector pest prevention and control. Integrated vector management, safe use of pesticides and insecticide-resistance management
Module 5
1 6 HSA faculty
Principles of programme management: Main principals and methodology of programme management as related to vector control, especially integrated vector management
Module 6
2 16 HSA faculty
Field training Skills for field work and community empowering and involvementTotal 60 25

EMHJ
S80
and facilities for malaria parasitology are available for students. The centre has other facilities, such as photocopying, printing and scanning. To encourage open dialogue between students and teachers on current vector-control is-sues and promote a culture of continu-ing education, a programme of weekly talks by eminent vector-control experts is planned.
Discussion
The key question is why vector-borne diseases continue to cause considerable mortality, morbidity and retardation of socioeconomic development when effective IVM vector-control tools are available along with significant guid-ance, both regional and global, for their implementation [21,22]. Persistence and increase of vector-borne diseases in the Region may be explained by the number of new natural and man-made vector-breeding sources and increased transmission potential. However, one of the most important factors appears to be the shortage of trained manpower in the field of vector control. In the ab-sence of technical capability, the avail-able vector-control tools are either not used or are used inappropriately. It is important to note that experts in disease vector control, not only in Pakistan but also in other countries, are scarce. Thus, if research is not built into the national programme for vector-borne disease control, the programme may not be successful or may not grow to its full
potential. Indigenous research again requires technically trained staff.
In view of the above, the WHO con-sultations on IVM in 2007 and 2008 put considerable emphasis on capacity strengthening, including infrastructure, training and human resources for IVM [24,25]. The 52nd regional committee meeting resolution strongly recom-mended establishment of and support for a regional course in MEDVC [19].
In Pakistan, no university, institution or research centre provides formal edu-cation in the field of medical entomol-ogy, especially in disease vector control. The lack of interest in this field is largely due to the fact that the significance and extent of the burden of vector-borne diseases has not been clearly under-stood and has been underestimated. Moreover, a focus on more lucrative and thus more prestigious curative medicine, rather than on preventive medicine, may also explain the neglect in capacity building in this field.
The greatest hurdle faced in the es-tablishment of this diploma course has been the acute shortage of appropriate faculty in the field of disease vector con-trol. The Regional Office has provided international experts to supplement the local faculty. The other major hurdle was the lack of understanding of the gravity of the situation resulting from this disease burden and thus scarcity of financial resources. The most impor-tant requirement for such training was finance for internal and external faculty, field work, entomological laboratories and insectaries. As these facilities did
not exist at HSA, modest facilities were developed and at times equipment, ma-terials and facilities were shared with other national institutions.
The first training course is nearing its successful completion; however, sus-tainability of the course depends upon availability of reasonable technical and financial resources.
It is estimated that each district in Pakistan needs at least two vector-control trained staff. Therefore, to fulfil the immediate national requirement, the MEDVC course has the target of producing at least 300 qualified profes-sionals in the next 5–10 years. Those trained will go into operational disease vector-control programmes in Pakistan. This training programme will effectively respond to the priority need for training of national vector-control staff at federal level and in each district at provincial health departments.
In conclusion, it is expected that well-trained MEDVC postgraduate diploma holders will form the back-bone of health services at the district level and be able to ensure sustainable public health services at grass root level through community empowerment and involvement. The course organization and its academic programme have been successful. In order to make the best of this new public health capacity-building programme, a strong partnership needs to be developed between the Federal Government and the provincial health departments to sustain its implementa-tion, while the support of international partners will be an asset.
References1. Guidelines for planning and implementation of malaria vector
control at district level. Islamabad, Directorate of Malaria Con-trol, Ministry of Health, 2007.
2. Report on the regional workshop on the urban vector control. Cairo, World Health Organization, Regional Office for the East-ern Mediterranean, 1990 (WHO-EM/VBC/51-E).
3. Geographical description of arthropod-borne diseases and their principal vectors. Geneva, World Health Organization, 1989 (WHO/VBC/89.967).
4. Roosendaal JA. Vector control: methods for use by individuals and communities. Geneva, World Health Organization, 1997.
5. Bednets for all: regional consultation on preparation of a regional strategy on insecticide- impregnated bednets and other materials. Cairo, World Health Organization, Regional Office for the East-ern Mediterranean, 1998 (WHO-EM/VBC/097/E/L).
6. Vector control for malaria and other mosquito-borne diseases: report of a study group. Geneva, World Health Organization, 1995 (WHO Technical Report Series, No. 857).

S81
7. Rathor HR. The role of vectors in emerging and re-emerging diseases in the Eastern Mediterranean Region. Eastern Mediter-ranean Health Journal, 1996, 2(1):61–67.
8. Integrated vector management: strategic framework for the East-ern Mediterranean Region 2004–2010. Cairo, World Health Organization, Office for the Eastern Mediterranean, 2004.
9. The world health report 2002 – reducing risks, promoting healthy life. Geneva, World Health Organization, 2003.
10. Waqar S, Tariq WZ. Crimean-Congo haemorrhagic fever (CCHF) in Pakistan. Pakistan Journal of Pathology, 2006, 17(2):74–84.
11. Munir MA, ed. Guidelines for the treatment and prevention of cu-taneous leishmaniasis in Pakistan. Islamabad, Ministry of Health and World Health Organization, 2002.
12. Brooker S et al. Leishmaniasis in refugee and local Pakistani pop-ulations. Emerging Infectious Diseases, 2004, 10(9):1681–1684.
13. Khan S J, Muneeb S. Cutaneous leishmaniasis in Pakistan. Der-matology Online Journal, 2005, 11(1):4 (http://dermatology-s10.cdlib.org/111/reviews/leishmaniasis3/khan.html, accessed 1 May 2010).
14. Shakila A et al. Geographical distribution of cutaneous leish-maniasis and sand flies in Pakistan. Turkiye Parazitoloji Dergisi, 2006, 30(1):1–6.
15. Chan YC et al. Dengue hemorrhagic fever outbreak in Karachi, Pakistan. Transactions of the Royal Society of Tropical Medicine and Hygiene, 1995, 89:619–620.
16. Siddiqui FJ, Hyder SR, Bhutta ZA. Endemic dengue fever: a seldom recognized hazard for Pakistani children. Journal of Infection in Developing Countries, 2009, 3(4):306–312.
17. Dennis D. Plague in India. British Medical Journal, 1994, 309:893–894.
18. Human plague in 1994. Weekly Epidemiological Record, 1996, 71:165–172.
19. Report of the regional committee for the Eastern Mediterra-nean, fifty-second session. Cairo, World Health Organization Regional, Office for the Eastern Mediterranean, 2005 (EM/RC52/R6).
20. WHO position statement on integrated vector management. Ge-neva, World Health Organization, 2008 (WHO/HTM/NTD/VEW/2008-2).
21. Integrated vector management: regional strategic framework 2003–2006. Cairo, World Health Organization, Regional Of-fice for the Eastern Mediterranean, 2003.
22. Global strategic framework for the integrated vector manage-ment. Geneva, World Health Organization, 2004 (WHO/CDS/CPE/PVC/2004.10).
23. The work of WHO in the Eastern Mediterranean Region: annual report of the regional director 1 January–31 December 2008. Cai-ro, World Health Organization, Regional Office for the Eastern Mediterranean, 2009.
24. Report of the WHO consultation on integrated vector manage-ment. Geneva, World Health Organization, 2007 (WHO/COS/NTOWEM/2007.1).
25. Report on the WHO consultation on development of a global ac-tion plan for integrated vector management 1–3 December 2008. Geneva, World Health Organization, 2009 (WHO/HTM/NTOWEM/2009.1).

EMHJ
S82
Learning through crisis: development and implementation of a health cluster strategy for internally displaced personsK.M. Bile,1 A.F. Shadoul,1 H. Raaijmakers,1 S. Altaf 2 and K. Shabib 3
ABSTRACT Five major disasters in Pakistan affected close to 8 million people from 2005 to 2009. The 2008–09 humanitarian crisis in Khyber Pakhtunkhwa and the Federally Administered Tribal Areas (FATA) of Pakistan resulted in 2.76 million internally displaced persons (IDPs), of whom 88% were off-camp IDPs hosted by the local population. The service delivery challenges posed by the IDPs, their sparse geographical distribution and phased displacement were managed through a successful health response strategy, which focused on 13 major interventions supplemented by a set of standard guidelines for field implementation. This study evaluates the process and results attained by this coordinated health cluster strategy that has guided the mobilization and implementation of a colossal humanitarian response to an unprecedented crisis in Pakistan’s history.
1World Health Organization, Country Office, Islamabad, Pakistan (Correspondence to K.M. [email protected]). 2Department of Health, Khyber-Pakhtunkhwa, Pakistan. 3World Health Organization, Geneva, Switzerland.
2009 2005
2.76 2009 – 2008
88
13
Apprendre grâce à la crise : élaboration et mise en œuvre d’une stratégie de groupe Santé en faveur des personnes déplacées
RÉSUMÉ Au Pakistan, près de huit millions de personnes ont été frappées par quatre catastrophes majeures entre 2005 et 2009. En 2008-2009, la crise humanitaire qui a touché Khyber Pakhtunkhwa et les zones tribales sous administration fédérale du Pakistan ont fait 2,76 millions de personnes déplacées, dont 88 % se trouvent hors des camps et sont hébergées par la population locale. En termes de prestations de services, les problèmes posés par les personnes déplacées, leur dispersion géographique et leurs déplacements par étapes ont été gérés grâce à une stratégie de riposte sanitaire couronnée de succès, comprenant treize interventions principales et un ensemble de directives standard de mise en œuvre sur le terrain. Cette étude évalue les processus et les résultats obtenus grâce à cette stratégie de groupe Santé coordonnée, qui a guidé la mobilisation et la mise en œuvre d’une impressionnante riposte humanitaire à une crise sans précédent dans l’histoire du Pakistan.

S83
Introduction
Humanitarian disasters are an increas-ingly common global challenge, in ad-dressing which World Health Assembly Resolution 58.1 of 2005 stipulated the scope of health action in crisis. The World Health Organization (WHO) focuses on rapid situation and needs assessment, the coordination of health response interventions, identifying and filling critical gaps and revitalizing the capacity of a country’s health system for preparedness and response. The resolution requested Member States to integrate risk reduction in health sec-tor development interventions, apply risk mapping in order to reflect the role and importance of public health infra-structure, to pay particular attention to mental health needs and gender-based violence, to improve national mecha-nisms for emergency health response and to enhance financial contributions to generate sufficient capacity at the national level [1].
Valuable experience was gained from the five disasters which affected Pakistan since 2005: the 2005 earth-quake in northern Pakistan, the 2006 cyclone and floods which affected 14 districts in the provinces of Balochistan and Sindh, the 2007 earthquake in the Balochistan districts of Ziarat and Pishin and the 2008–09 crisis in the Federally Administered Tribal Areas and Khyber Pakhtunkhwa (formerly North-West Frontier Province), which resulted in 2.6 million internally displaced persons (IDPs) [2–4] who were forced to flee their homes but remained within their country’s borders.
The Health Cluster approach is a strategy developed to organize and co-ordinate cooperation among humani-tarian actors and build partnerships in planning and response during disasters. This approach, first tested on a large scale in Pakistan during the 2005 earthquake, has generated successful outcomes, prompting its nationwide application for managing humanitarian disasters
and complex emergencies [5,6]. Dur-ing the IDP crisis (2008–09), WHO jointly assumed with the government the health response coordination role. The Organization was able to mobilize and position, at short notice, competent professional teams and critical health technologies and assume the role as the provider of last resort in the emergency health response [6,7]. To generate a unity of purpose among health cluster partners and improve the quality and effectiveness of response interventions for the IDPs, a health cluster strategy was developed. This article aims to il-lustrate the components of this jointly formulated strategy and exhibit its influ-ence on the nationwide access to quality and life-saving services.
Methods
The emergency health response func-tions stipulated in the Global Health Cluster Guide and the country-level harmonized roles of different humani-tarian clusters, collectively steered by the UN Office for Coordinating Humanitarian Affairs (OCHA), were the basis of the health cluster strategy [6]. The participatory strategy-design consultations carried out by the health cluster, the health response operational needs reflected by the assessment teams and the published literature, including the WHA resolutions on the subject, were reviewed.
Results
The Khyber Pakhtunkhwa and Federally Administered Tribal Areas humanitar-ian crisis of 2008–09 displaced 2.76 mil-lion people, creating a massive need for humanitarian action. The IDPs moved to safer and protected districts with 12% settled in camps and 88% hosted by local communities, reflecting the gen-erosity and compassion expressed by the general population. On an average,
a hosting family adopted 1.3 families in their home and offered all affordable basic needs to their vulnerable guests.
Figure 1 shows the humanitarian health response coordination frame-work. The health cluster and the national health sector authorities worked closely together, while collaboratively interfac-ing with other members of the humani-tarian country team (HCT) and the numerous clusters engaged in different humanitarian response domains.
Figure 2 illustrates the total number of displaced families and returnees by area of origin from August 2008 to March 2010 upon restoration of secu-rity in their home towns and villages.
Figure 3 illustrates the crisis-affected areas, the routes of the IDPs’ migration and the hosting districts in which they temporarily sought sanctuary. The dis-lodgment of the IDPs occurred in sepa-rate waves. IDPs from Swat and Buner shifted in July and August 2009, while the displacement from South Waziris-tan commenced later when the majority of IDPs from Swat had returned to their homes. The large number of off-camp IDPs and their scattered presence in various districts and disjointed displace-ment required a health response strat-egy capable of addressing the evolving operational challenges.
Employing knowledge from previous disasters in Pakistan since 2005, it was evident that without a common shared health cluster strategy, the response in-tervention carried out by 46 different health cluster partners would result in fragmentation, duplication and ineffi-ciency. Against this backdrop, WHO led a participatory process of consultations engaging the government and health cluster partners. A comprehensive health cluster strategy guiding the IDPs’ emer-gency health response interventions was developed, unanimously endorsed and disseminated for implementation. The strategy had a well defined operational scope covering the following 13 health response interventions.

EMHJ
S84
Figure 2 Total number of displaced families and returnees by area of origin from August 2008 to March 2010 (Source: Special Support Group (IDPs), PDMA (Provincial Disaster Management Authority) & CAR (Commissioner Afghan Regugees) as of 22 March 2010) Average family size: 7.3 IDPs = internally displaced persons
Kurram*
Orakzai*
South Waziristan*
Shangla**
Mohmand*
Lower Dir**
Bajaur*
Buner**
Swat & Malakand**
Agencies (*)/Districts (**)
Total IDPs Families: 446 755Total returnees: 267 410 (60%)Remaining IDPs Families: 179 345 (40%)
4 809
25 348
38 524
12 547
7 933
27 462
2 124
37 527
27 788
61 173
26 346
75 255
70 553
164 110
132 666
0 20 000 40 000 60 000 80 000 100 000 120 000 140 000 160 000 180 000
Total IDP familiesReturned families
Government
EconomicAffairs Divisions
National DisasterManagement
AuthorityHealth Sector
Ministry of Health
Provincial DisasterManagement
Authority
Provincial HealthDepartment
District HealthSystem
Health Cluster Coordinator
Health Cluster
46 partners in theIDPS crisis
Humanitarian CountryTeam
HumanitarianCoordinator
OCHA
Inter -clusterCoordination
Group
UN CountryTeam/
ResidentCoordinator
Emergency Response Interventions
Clusters constituted for Humanitarian Emergency Response Interventions
WHO
Agency countryrepresentativeEmergency Health Officer
co-chairingHealth
Cluster alongwith
MoH/HD
WHO Coordinatimg Role
Figure 1 Humanitarian health response coordination framework in Pakistan (IDPs = internally displaced persons; OCHA = UN Office for Coordinating Humanitarian Affairs)

S85
Coordinating health action in crisesCoordination was recognized as the overriding strategic function providing an appropriate mechanism for manag-ing health interventions. WHO assigned a senior officer exclusively as cluster coordinator to facilitate the regular health cluster meetings at national and provincial levels, improve information sharing and joint planning, and rational-ize resource mobilization, while effec-tively liaising with other clusters and OCHA to align health with the overall humanitarian response coordination.
Initial rapid assessmentIn order to rationalize health response interventions and pave the way for need-based resource mobilization and action, the health cluster mandated the undertaking of rapid health assessment at the outset. Data were collected on the
population’s health status; their desired health needs and related perceptions. Similarly the health system infrastruc-ture and the availability of human re-sources, medical supplies, equipment (including ambulances), logistics, for referral support were assessed as well as physical access to health facilities within the prevailing security environment. These data were the foundation for ef-fective and need-based planning and enhanced the confidence of the health cluster in estimating the resources nec-essary for the response.
Establishing the disease early warning systemThe disease early warning system (DEWS) is designed to rapidly detect the occurrence of 16 pre-selected dis-eases and conditions that would en-able the health cluster to investigate
and implement immediate control measures upon outbreak confirmation. The DEWS network covered all health facilities located in the crisis-affected region, while a WHO team in coordina-tion with government health authorities prepared and widely shared a DEWS weekly bulletin. To avert the risk of outbreaks, the DEWS intervention was coupled with promotive and preven-tive health advocacy and the provision of safe drinking-water and sanitation. DEWS was sustained by the health authorities during the post-disaster re-habilitation and reconstruction period, rendering its functions, through WHO technical support, a permanent feature of the district health system.
Controlling disease outbreaksThe validated DEWS findings were classified as sporadic cases or evolv-ing outbreaks, for which the relevant response was mobilized: intensive case management and timely dispatch of medicines and supplies, while maintain-ing the supply of safe drinking-water and sanitation, hygiene promotion and vector control. The three diseases that caused over 70% of all outbreaks were diarrhoeal diseases, measles and hepati-tis (A & E) viral infections, necessitating enhanced preparedness capacities. Dis-ease control efforts also encompassed interventions for endemic priority com-municable diseases such as tuberculosis and malaria supported by a network of laboratories backed up by the special-ized National Institute of Health.
Essential services package: enhancing quality and equityThe fielding of skilled human resources and the application of best health response practices was a key compo-nent of the health cluster strategy that prompted the development of a set of institutional and service delivery guide-lines and standards for all catchment area health facilities including referral district hospitals. The package stipulated promotive, preventive and curative care services and the provision of a defined
Figure 3 The movement of the internally displaced persons from the crisis affected agencies and districts of the Federally Administered Tribal Area and Khyber Pakhtunkhwa province

EMHJ
S86
essential list of medicines, supplies and equipment as well as the deployment of human resources having the necessary skills for effective health response.
Table 1 illustrates the salient tasks for which specific operational guide-lines and standards were set. They have induced uniformity, established mini-mal quality standards and enhanced the effectiveness of the implementation process.
Mass vaccinationsMass vaccination of target child cohorts was a priority component of the health cluster strategy. During the crisis most children lost access to routine immuni-zation services. This was compounded by the departure of a significant number of the health workforce for security reasons. Following the migration of the
IDPs, children between six months and 13 years were vaccinated against measles, while the under-fives were vaccinated against polio. Moreover, the backlog in routine immunization services was covered to control the risk of vaccine-preventable diseases. Likewise, tetanus toxoid vaccination was offered to all pregnant women. These vaccinations were planned and carried out by the government with UNICEF and WHO technical assist-ance and with the active support of all health partners.
Maternal, neonatal and child healthThe delivery of maternal, neonatal and child health services including repro-ductive health and family planning con-stituted a primary health cluster strategy pillar and a fundamental element of the
essential health services package. The health workforce necessary to deliver maternal, neonatal and child health services was standardized with the in-tention to field female care providers in all health facilities. These standards were to cater for female care seekers who desired to be attended by female care providers while facilitating access to basic and comprehensive emergency obstetric and neonatal care services.
Nutrition surveillanceHealth cluster partners integrated nutrition surveillance into the health cluster strategy, linked it operationally with nutrition cluster operations and aligned it with DEWS implementation. Accordingly, nutrition surveillance and the management of severe child malnutrition was placed in the WHO
Table 1 Essential operational guidelines and standards for the provision of primary health care services at different health facilities during emergencies
Standards for health post/basic health unit
Structural standards for the establishment of a health facility/basic health unit Standards for the provision of essential health services in a camp health post/basic health unitEssential medicines for a camp health post/basic health unit
Essential supplies and equipment for camp health post/basic health unit Human resources for camp health post/basic health unit Recording and reporting toolsAmenities required at the camp level
Standards for mobile health clinic
Health services provided by a mobile health clinicEssential medicines for a mobile health clinicEssential supplies and equipmentHuman resources
Recording and reporting toolsStandards of provision of an ambulance at a mobile health clinic
Standards for rural health centre
Structural standards for a rural health centreStandards for the provision of essential health services in a rural health centreEssential medicines for a rural health centreEssential supplies and equipment for a rural health centre
Human resources Standards for the provision of an ambulance at a rural health centreRecording and reporting tools
General guidelines
Disease early warning systemRapid health assessment
Surveillance systemAlert outbreak response and control
Key communicable diseases
Acute watery diarrhoeaAcute respiratory infections in children
Acute respiratory infection control in adultsMalaria and tuberculosis
Persons with disabilities
Health; promotive, preventive, medical care, rehabilitationEducation; access to educational services
Livelihood: access to livelihood opportunities
Environmental health
Water facilities, access to water, water qualityExcreta disposal
Water waste disposal and health care waste disposalFood storage and preparation

S87
comparative advantage domain where the organization has better capacity to engage relative to other partners. These interventions contributed to child sur-vival and largely mitigated the risk of childhood mortality and morbidity.
Health promotion and education: community action for healthDisplaced communities were exposed to unhealthy environmental conditions resulting from the risk of unsafe drink-ing-water, poor hygiene and sanitation, crowded makeshift shelters and defi-ciencies in food safety practices. Health promotion and education interventions were carried out as an integral compo-nent of the health cluster strategy at all service delivery outlets and through women’s focal group sessions promot-ing hand-washing, home health care practices and improved care-seeking behaviour. To consolidate this process, WHO introduced the “Bangle Health Education” initiative for mothers resid-ing in the largest IDP camp. Colour-ful bangles, commonly worn by rural women, were distributed when a group of mothers successfully completed a health education package, as a token of their participation and learning, fa-cilitating the dissemination pace and acceptance rate of these messages.
Procurement, supply and management of essential medicinesThis important strategic component facilitated the setting of guidelines for acceptable pharmaceutical donation, procurement, warehousing, stockpiling and distribution of essential life-saving medicines and supplies to which sub-stantial humanitarian health resources were assigned. Prequalification criteria and quality control measures were in-troduced by WHO covering all medi-cines, and a committee coordinated their acquisition.
The use of WHO-managed grants earmarked for the IDPs’ health response interventions during 2008–09 ensured that over 50% of the resources were used for the procurement of essential
medicines, medical equipment for hospital capacity-building and for life-saving logistics (Figure 4).
The WHO logistic supply system database was introduced in order to control the entry of procured or do-nated supplies, facilitate the tracking of available stockpiles along with their shelf lives and maintain an inventory of the stocks released to the field. WHO-procured medicines were distributed to a large number of health cluster partners and government facilities, which de-pended primarily on this supply chain for their field operations.
Safety of drinking-water supply and sanitationThe regular supply of safe drinking-water to disaster-affected populations was carried out by the Water, Sanitation and Hygiene(WASH) cluster. Similar arrangements were also pursued for the construction of sanitary latrines for the affected population, especially those residing in camps. WHO was technically assigned to monitor water
by assessing the contamination and chlorination levels of supplied water provisions. To fulfil this vital function, WHO environmental officers closely liaised with government institutions and operated mobile testing kits to regularly check water chlorination, both at the source and at the users’ end. Contamination of water sources with coliform bacteria, largely from shallow wells, was blocked through coordina-tion with WASH to avert the risk of waterborne disease outbreaks. To enhance the use of sanitary latrines, the WASH cluster was advised to separate male and female toilets to encourage utilization and deploy sanitary workers to safeguard their cleanliness. A health education programme, promoting water safety and hygienic sanitation was implemented to reinforce the im-portance of these practices.
Mental health and psychosocial supportThe IDPs were predisposed to a range of mental and psychological conditions,
Figure 4 Use and expenditure analysis of WHO-managed grants earmarked for internally displaced populations during 2008–09 (IDPs = internally displaced persons)
Medicalwarehouses/health
facilitiesfehabilitation
3%
Emergency HealthKits in support of
IDP’s healthresponse
32%
Medical equipmentfor hospital
capacityenhancement
9%Ambulances, vehicles
and generatorsfor hospitals
13%
National trainingactivities/capacity
building2%
Field/operationalcosts
5%
International staff2%
National staff9%
Resourcesassigned to
Implementingpartners
25%
EMHJ
S88
thus mental health was a key strate-gic priority for the health cluster. The Ministry of Health and the Khyber Pakhtunkhwa Provincial Health De-partment together with academic insti-tutions and WHO mobilized a critical mass of mental health teams to serve in the disaster affected areas on a rotational basis. These professionals were also required to mainstream mental health into the primary health care network to sustain these services. A limited list of essential medicines was compiled and procured for eligible mental health cases. These interventions have offered mental health and psychosocial support services the prominence they deserve; a paradigm replacing the traditional ne-glect or focusing solely on therapeutic psychiatric care.
Assisting persons with disabilitiesAmong the IDPs, as in most humanitar-ian disasters, a substantial proportion of victims acquired disabilities, while others had disabilities before the disas-ter. During the crisis, displaced persons with disabilities were removed from their traditional supportive environ-ment and confronted serious adaptation challenges. To address these impedi-ments, WHO, in collaboration with the government and other interested health cluster partners, initiated a programme offering rehabilitation and social sup-port and offering access to specialized diagnostics facilities and opportunities for rehabilitation. These endeavours enabled many persons with disability to re-engage meaningfully in their social environment. To sustain the benefits of this intervention, the community-based rehabilitation programme, successfully implemented in the aftermath of the 2005 earthquake disaster, was also ex-panded to the IDPs.
Discussion
The immediate deterioration in access to essential health care and the rapid decline in the health status of affected
populations resulting from natural or human-made disasters leads to the mobilization of humanitarian relief operations to mitigate suffering [1,7,8]. Commonly these interventions are marred by a lack of coordination with fragmentation, implementation gaps, duplication and parallel implementa-tion [9]. These operational paradigms create inefficient distribution and use of scarce technical and material resources. The enormous challenges posed by the 2008–09 IDP crisis in Pakistan led to a serious societal disruption with grave health, economic and environmental consequences, exceeding the coping capacity of the population affected. The large number of off-camp IDPs, their sparse geographical distribution and phased displacement, with certain IDPs returning home while others were be-ing simultaneously displaced required an immediate health response action guided by a shared operational strategy to address the acute health needs and avert impending morbidities and mor-talities [10]. This vision was facilitated by the cluster approach first applied on a large scale during the 2005 south Asian earthquake, generating effective and cohesive partnerships among different national and international humanitarian organizations [5,6]. The health cluster strategy was designed to provide clearer avenues for effective coordination, joint planning, distribution of roles and responsibilities, resource mobilization and the creation of operational syn-ergies, complementarities and shared accountability between partners. These capacities were unattainable without this shared strategic vision. The coor-dination component had the greatest bearing on the comprehensiveness and quality of emergency health response interventions and enabled the partners to work in unison for the delivery of relief operations.
In order to translate the 13 succinct operational components of the strate-gy into action, a functionally integrated essential service package was devised
for the delivery of life-saving maternal, neonatal and child care services and other vital emergency health response interventions within the framework of primary health care and consistent with prevailing sociocultural norms of Pakistani society [11]. Accordingly, humanitarian health relief operations were channelled through the existing health services network from the newly established in-camp health facilities to the basic health units, rural health cen-tres, sub-district hospitals and district hospitals, which received the bulk of life-threatening emergencies and clini-cally severe referral patient load. The strategy enabled federal, provincial and district health managers to moni-tor and guide performance closely and objectively, oversee the flow of the supply chain and appraise the results attained.
A key strategic component critical at the outset of the emergency was the initial rapid assessment of the health sta-tus of the affected population, the health system performance and the availability of human and supply resources, in ad-dition to nutrition and safe water and sanitation aspects, both in the crisis-af-fected districts and in the districts host-ing IDPs. The evidence generated was immediately used to revitalize primary health care services, enhancing hospital capacities in essential medicines, sup-plies and equipment and other structur-al and competency-related operational priorities [12]. Essential medicines and supplies constituted the most cost-intensive strategic component, and the health cluster partners recognized the value of using a common procurement and supply system managed by WHO for greater economies of scale, quality and efficiency [13].
To avert a second wave of death following the initial devastation, an epidemic control approach guided by DEWS was implemented [14]. The latter built on the surveillance of 16 critical notifiable diseases and condi-tions allowing for prompt investigation

S89
of all reported alerts, while the relevant disease control interventions were set in motion. Contrary to earlier reports underrating the effectiveness of dis-aster training for health care workers, the training on DEWS was effective in averting and controlling imminent epi-demics among IDPs and their hosting communities [15]. Our observation is corroborated by an earlier experience related to health workers’ training on essential surgical skills—emergency maternal and child health following the 2005 earthquake, with tangible improvements in maternal, neonatal and child health outcomes [16]. This experience illustrates the importance of across-cluster collaboration. These efforts were supplemented by expand-ing routine immunization activities and campaigns to promote awareness of health and nutrition, which were sustained throughout the relief opera-tion.
The essential health care package implied the implementation of a range of primary health care services of a promotive, preventive, curative and rehabilitative nature defined for each level of care. The package included the provision of a standard list of life-saving medicines, supplies and equipment as well as the deployment of a minimum number of qualified human resources possessing the necessary skills for the job in hand. This has created a shared commitment to collectively meet the terms of an acceptable quality threshold for service delivery. Maternal, neonatal and child health including reproduc-tive health and family planning was a central pillar of this essential package. Accordingly, women requiring emer-gency referral support were accessing comprehensive emergency obstetric and neonatal care facilities organized in district hospitals with tangible maternal and newborn survival outcomes, thus transforming the prevailing traditional fatalistic perception about maternal and neonatal death into a purposeful
care-seeking practice. The health clus-ter strategy also emphasized extending health response interventions to include secondary prevention and treatment of chronic noncommunicable diseases, care of persons with disabilities and the provision of mental health and psycho-social support, conditions often missed from the ambit of emergency health response interventions [17–19].
Contrary to high level strategies that cannot be drilled down to the operational level, the health cluster strategy was an actionable tool, resolv-ing key challenges often faced during disasters and creating opportunities for cooperation, effective communica-tion, collective efforts for health system strengthening and shared compli-ance with set operational, technical, organizational and logistical norms and standards. It ensured the neces-sary access to life-saving services. The availability and prompt deployment of a qualified national health workforce has characterized all subsequent Paki-stani emergency health response inter-ventions, an asset that has effectively contributed to the success of these hu-manitarian endeavours. This national capacity should be harnessed in the future to promote greater self-reliance in emergency preparedness at national, provincial, district and community lev-els with special focus on the safety of health facilities and strengthening the capacity of the health system.
To strengthen the capacity of this strategy in improving health re-sponse outcomes and attending to the unresolved gaps; humanitarian partners have to adopt the necessary technical and managerial tools that would enhance the outcome and impact of these strategic interven-tions. To strengthen the level of ac-countability, an outcome and impact assessment monitoring system need to be established. The latter has to be able to respond to life-saving needs;
provide effective coverage and access to essential services with rational geo-graphical distribution; apply key health indicators to monitor progress; define expected attainable results; promote gender equity in the response action; recognize the perceived needs of the affected population; and inculcate dis-aster risk mitigation. These imperatives should be put into operation to enable an objective evaluation of the Pakistan experience and allow its subsequent replication in similar settings.
The recently established National Centre for Health Emergency Prepar-edness and Response by the Ministry of Health in Islamabad with WHO technical support aims to provide lead-ership in developing a national health emergency mass casualty plan, scale up hospital response capacity and organize the development of a health workforce possessing the required managerial and technical competencies to respond ef-fectively to future disasters following the parameters set by the health cluster strategy. The successful implementation of the strategy has generated a unity of purpose, improved the quality and effectiveness of health interventions and strengthened the cooperation and coordination between the national and international partners engaged in this complex humanitarian endeavour. The future application of this strategy would constitute a major asset in managing disasters regardless of the size of the hazard and level of population vulner-ability.
Acknowledgement
The authors wish to acknowledge the contribution of the UN Office for Coordinating Humanitarian Affairs (OCHA) for providing updated in-formation regarding the internally dis-placed families and their movement and returning trends.

EMHJ
S90
1. Health action in relation to crises and disasters, with particular emphasis on the earthquakes and tsunamis of 26 December 2004. Geneva, World Health Organization, 2005 (WHA58.1).
2. Chan EY, Kim JJ, Characteristics and health outcomes of inter-nally displaced population in unofficial rural self-settled camps after the 2005 Kashmir, Pakistan earthquake. European Journal of Emergency Medicine, 2010, 17(3):136–141.
3. Sullivan KM, Hossain SM. Earthquake mortality in Pakistan: Disasters, 2010, 34(1):176–183.
4. Bile KM, Hafeez A. Crisis in the Swat Valley of Pakistan: need for international action. Lancet, 2009, 374(9683):23.
5. Moszynski P. Cluster approach improves provision of disaster aid, says WHO. British Medical Journal, 2008, 337:a1571.
6. Health cluster guide: a practical guide for country-level implemen-tation of the health cluster. Geneva, IASC Global Health Cluster, World Health Organization, 2009.
7. Sheikh IA, Musani A. Emergency preparedness and humani-tarian action: the research deficit Eastern Mediterranean Perspective. Eastern Mediterranean Health Journal, 2006, 12(2 Suppl.):554–563.
8. Arnold JL. Risk and risk assessment in health emergence manage-ment. Prehospital and Disaster Medicine, 2005, 20(3):143–154.
9. Bagchi K et al. Nutrition in humanitarian crisis. Eastern Mediter-ranean Health Journal, 2004, 10(6):747–53.
10. Shover H. Understanding the chain of communication during a disaster. Perspectives in Psychiatric Care, 2007, 43(1):4–14.
11. Miller AC, Arquilla B. Disasters, women’s health, and conserva-tive society: working in Pakistan with the Turkish Red Crescent
following the South Asian Earthquake. Prehospital and Disaster Medicine, 2007, 22(4):274–275.
12. Hsu EB et al. Healthcare worker competencies for disaster train-ing. BMC Medical Education, 2006, 6:19.
13. Molina SL, Figge HL. Protecting the pharmaceutical supply chain. Ensuring an unbroken supply of pharmaceuticals can save lives during times of disaster. Health Management and Technology, 2008, 29(8):20–22.
14. Watson JT, Gayer M, Connolly MA. Epidemics after natural dis-asters. Emerging Infectious Diseases, 2007, 13(1):1–5.
15. Williams J, Nocera M, Casteel C. The effectiveness of disaster training for the health care workers: a systematic review. Annals of Emergency Medicine, 2008, 52(3):211–222.
16. Assad H et al. Emergency maternal and child health training courses and advocacy to achieve Millennium Development Goals in a poorly resourced country and opportunities. Journal of Pakistan Medical Association, 2009, 59(4):243–246.
17. Ruzek JI et al. Integration of disaster mental health services with emergency medicine. Prehospital and Disaster Medicine, 2004, 19(1):46–53.
18. Goyet CV. Health lessons learned from the recent earthquakes and tsunami in Asia. Prehospital and Disaster Medicine, 2007, 22(1):15–21.
19. Chan EY, Gao Y, Griffiths SM. Literature review of health impact post-earthquakes in China 1906–2007. Journal of Public Health, 2010, 32(1):52–61.
References

S91
Safe water supply in emergencies and the need for an exit strategy to sustain health gains: lessons learned from the 2005 earthquake in PakistanM. Magan,1 K.M. Bile,1 B.M. Kazi 2and Z. Gardezi 3
ABSTRACT The bacteriological quality of drinking-water supply of five major urban centres affected by the October 2005 earthquake in Pakistan were assessed in three phases: onset of emergency, during emergency response and post-emergency. A total of 1850 samples were randomly collected from the study area during each phase, and faecal coliforms were detected in 100%, 28% and 91% in Battagram, 81%, 22% and 77% in Mansehra, 100%, 27% and 92% in Rawalakot, 100%, 23% and 65% in Bagh and in 30%, 14% and 5% in Muzaffarabad respectively. Faecal contamination was high during the onset of emergency and post-emergency phases in four out of the five surveyed towns. The organization of a timely emergency response intervention depends on the level of preparedness of local water-supply service providers as well as on their institutional capacities. Bacteriological water-quality improvements in emergencies may not be sustained unless complemented by a proper exit strategy.
1World Health Organization, Country Office, Islamabad, Pakistan (Correspondence to M. Magan: [email protected]).2National Institute of Health, Islamabad, Pakistan.3Earthquake Rehabilitation and Reconstruction Authority, Islamabad, Pakistan.
Approvisionnement en eau saine lors des situations d’urgence et nécessité d’une stratégie de sortie pour conserver les gains de santé : enseignements du tremblement de terre survenu en 2005 au Pakistan
RÉSUMÉ La qualité bactériologique de l’approvisionnement en eau de boisson dans cinq grands centres urbains touchés par le tremblement de terre d’octobre 2005 au Pakistan, a été évaluée au cours de trois phases : apparition de la situation d’urgence, riposte à la situation d’urgence et phase post-urgence. Au total, 1850 échantillons ont été prélevés au hasard dans la zone d’étude au cours de chaque phase. Le pourcentage d’échantillons de chaque phase contenant des coliformes fécaux s’établissait comme suit : 100 %, 28 % and 91 % à Battagram, 81 %, 22 % et 77 % à Mansehra, 100 %, 27 % et 92 % à Rawalakot, 100 %, 23 % et 65 % à Bagh, et enfin 30 %, 14 % et 5 % à Muzaffarabad. On a constaté une contamination fécale élevée au cours des phases d’apparition de la situation d’urgence et post-urgence dans quatre des cinq villes étudiées. L’organisation d’une intervention de riposte opportune à la situation d’urgence dépend du niveau de préparation des fournisseurs locaux en eau et de leurs capacités institutionnelles. L’amélioration de la qualité bactériologique de l’eau lors des situations d’urgence peut être compromise si elle n’est pas complétée par une stratégie de sortie adaptée.
2005
1850 2005
%28 %100
%77 %22 %81 %91
%100 %92 %27 %100
5 %14 %30 %65 %23

EMHJ
S92
Introduction
The associations between water, sanita-tion and health are well known, but these associations achieve greater importance following a natural or man-made dis-aster, when waterborne disease out-breaks may spread easily. Under such situations, adequate water supply and sanitation are essential for the health and well-being of affected communities. Diarrhoeal diseases are a major cause of morbidity and mortality among popula-tions affected by emergencies, mostly, caused by unsafe drinking-water [1]. Consumption of water contaminated by faecal matter is one of the major causes of death in emergencies: for example, after the influx of 800 000 Rwandan refugees into the Democratic Republic of the Congo in 1994, 85% of the 50 000 deaths recorded in the first month were caused by diarrhoeal diseases resulting mainly from bacteriologically contami-nated water [2]. A compelling reason to promote improvement of bacteriologi-cal quality of water is the ability of this health-related intervention to reduce the infectious disease burden of the user population [3]. Microbial contaminants of drinking-water are of a higher priority than chemical contaminants, because their adverse health effects are usually immediate and more prevalent [4].
The 2005 earthquake in Pakistan affected a large population, a signifi-cant proportion of whom were living without access to safe water and proper sanitation even prior to the disaster. This situation was compounded by the devastating earthquake where 3880 wa-ter-supply schemes were damaged and needed rehabilitation and reconstruc-tion [5]. The five densely populated urban centres of Rawalakot, Bagh, Mu-zaffarabad, Manshera and Battagram, which also hosted a large number of internally displaced persons in the after-math of the earthquake, faced high risk of infectious disease outbreaks, which prompted the establishment of bac-teriological water-quality monitoring
and disease surveillance hubs in these affected towns. In each of these towns, the drinking-water supply was obtained from surface water sources or shallow springs that were easily contaminated by the disposal of untreated municipal wastewaters and drainage effluent from agricultural areas [6,7]. Earlier reports showed that surface water was faecally contaminated and required elaborate treatment for human consumption [8]. To improve bacteriological water qual-ity, various types of water treatment system had been installed, but with the exception of those in Muzaffarabad town, they never worked properly due to poor management and lack of main-tenance funds.
Prior studies have shown also that even fully protected sources and well managed systems do not guarantee that safe water is delivered to households as water collected from safe sources is likely to become contaminated during transportation and storage [9].
The aim of this study is to evaluate the bacteriological quality of drinking-water supply during emergency and post-emergency periods, assess its ef-fects on the frequency of acute diar-rhoea and advocate the formulation of proper exit strategies that sustainably improve the drinking-water’s bacterio-logical quality.
Methods
The study was conducted in five major urban centres of areas of Pakistan af-fected by the October 2005 earthquake from October 2005 till January 2010. Bacteriological water-quality data were collected in three phases: in the imme-diate aftermath of the disaster, from 10 October to 30 November 2005, when treatment systems were not fully in operation (phase 1); during emergency relief operations, 1 December 2005 to 30 May 2006, when the national and international emergency response was in full swing (phase 2); and during the
post-emergency period, 1 June 2006 to 30 January 2010, when emergency support interventions were phased out (phase 3).
Bacteriological water-quality data collected in the three phases were compiled and analysed, while obser-vations were made of the capacity of local authorities to sustain the attained improvements after scaling down the humanitarian support. Municipalities and water authorities where support was provided during the emergency period were revisited during the study in order to determine the level of safe water-sup-ply services after the departure of the aid agencies and local emergency response teams. To get representative samples for the water-supply chain as a whole, water samples were obtained from the exit of the treatment plants, water storage tanks, various randomly selected water distribution lines, household water con-tainers and from places most vulnerable to contamination. Water sampling was performed daily during the early stages of the emergency, but reduced later to weekly and monthly sampling depend-ing on population size and overall risk of water contamination.
First the survey team conducted desk analysis for identification of water sources, water treatment plants, loca-tions of storage tanks and layout of the distribution networks. To examine the bacteriological quality of drinking-wa-ter, survey teams measured water pH, turbidity, residual chlorine and faecal coliform levels during the survey period. The detection of faecal coliforms in 100 ml of water sample was taken as an indi-cator of bacteriological contamination of drinking-water supplies.
The sample size, collection, preser-vations and analysis were conducted according to the standard methods for bacteriological water-quality test-ing [10], and proper procedures and precautionary measures were followed while collecting samples from the field. During sample collection, sanitary sur-veys were conducted on the sample
S93
collection sites’ general cleanliness and possible sources of contamination. Water samples for microbiological contamination were collected in clean, sterile plastic bottles (200 ml) and 1000 ml sterilized glass bottles; and care was taken to ensure that no accidental con-tamination occurred during sampling. Aseptic techniques were followed when handling the sterile sample bottles used for microbiological sample collection. The water samples for bacteriological quality were analysed for faecal coliform contamination only. Training was con-ducted for local drinking-water service providers on methods of conducting sanitary surveys, water sampling and physical and microbiological testing of water samples.
During the first seven months of the emergency period bacteriological water-quality testing was carried out using the H2S test kit, which has a high level of specificity and an acceptable level of enhanced sensitivity [9]. The Oxfam DelAgua water testing kit apply-ing the membrane filtration method for detecting faecal coliforms was used dur-ing the remaining period of the study.
For H2S water testing, sample bot-tles were first sterilized with 6% bleach solution and then rinsed several times with the sample water before collecting the sample. A medium was then added, and the sample incubated at 25–35 °C for 24 hours. If no black precipitate (a sign of test positivity) became appar-ent after 24 hours, it was incubated for another 24 hours. If the sample still remained clear yellow, a negative test result was recorded. Portable kits were used also for testing water pH, turbidity and residual chlorine levels.
During the post-emergency phase (June 2006 to January 2010) the mem-brane filtration method was applied to estimate microbial quality of drinking-water by using the Oxfam DelAgua water testing kit for detection of faecal coliforms [11]. A measured volume of water was filtered, under vacuum, through a cellulose acetate membrane
of uniform pore diameter, 0.45 μm. Bacteria if present are retained on the surface of the membrane, which is placed on a suitable selective medium in a sterile container and incubated at an appropriate temperature. If faecal or other coliforms are present in the water sample, characteristic colonies form that are counted directly. For treated water, 10 mg of sodium thiosulfate per 100ml of chlorinated water was added to neutralize chlorine in the sample be-fore undertaking microbial testing.
The reported incidence data of acute diarrhoea, compiled for over a period of four years were obtained from the disease early warning system (a com-municable disease surveillance system designed to detect epidemics and guide timely response strategies) and analysed using EPI-Info software .
Results
This study was conducted in five major urban centres (Muzaffarabad, Bagh, Rawalakot, Mansehra and Battagram) affected by the 2005 earthquake, and water microbial quality was surveyed in three phases: in the immediate after-math of the disaster; during emergency relief operations; and during the post-emergency period.
During phase 1 some baseline data on the quality of the existing water-supply systems were obtained by the environmental health teams who were assisted by the World Health Organiza-tion (WHO). The same bacteriological water-quality parameters were tested during phase 2 and phase 3 of the study to determine any significant variation of the bacteriological quality of the drink-ing-water supplies. All surveyed towns received most of their drinking-water supplies from surface water sources that were susceptible to contamination, ex-cept Bagh, which received water from a spring source.
Results of the study revealed the poor microbial quality of most available
water supplies during phase 1 and phase 3 of the study (Table 1). It also demon-strated how microbial quality of water deteriorated in between the source and consumer end. Phase 1 of the study detected faecal coliforms in 100% of the water samples obtained from various water sampling sites in Bagh, Rawala-kot and Battagram (Table 1). With the exception of Muzaffarabad, water treatment plants in most of these urban centres had never functioned properly due to years of neglect and shortage of operational funds.
During phase 2 of the study, an extensive national and international response was mobilized, and effective measures taken to ensure the safety of drinking-water supplies by the govern-ment- and UNICEF-led Water, Sani-tation and Hygiene (WASH) cluster. Dysfunctional water treatment systems in Battagram, Mansehra, Rawalakot and Bagh were immediately rehabilitated, and proper water treatment/disinfec-tion systems introduced. This resulted in a tremendous improvement in the microbial quality of the drinking-water, where faecal coliforms were detected in only 23% of samples in Bagh, 27% in Rawalakot and 28% in Battagram (Table 1).
After May 2006, during phase 3 of the study, when the humanitarian situa-tion of the affected areas was stabilized, most international and national aid agencies scaled down their operations in the field and consequently the sup-port for bacteriological water-quality improvements dwindled substantially. Water treatment systems of four out of the five surveyed towns could not be maintained by the local authorities due to lack of sufficient funds. It was frequently observed that most water treatment plants lacked sufficient water treatment chemicals (alum and chlo-rine).
It was also observed that water mi-crobial quality deteriorated in between the source and the consumer due to intermittent supply, cross-connections
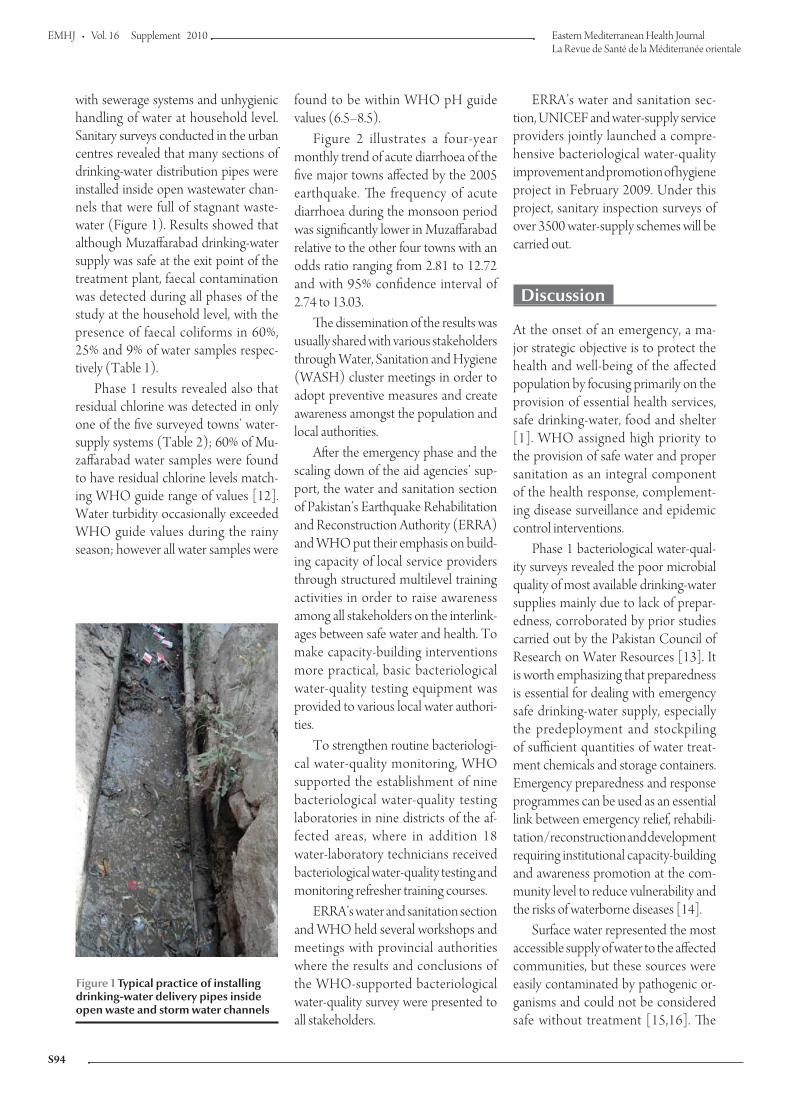
EMHJ
S94
with sewerage systems and unhygienic handling of water at household level. Sanitary surveys conducted in the urban centres revealed that many sections of drinking-water distribution pipes were installed inside open wastewater chan-nels that were full of stagnant waste-water (Figure 1). Results showed that although Muzaffarabad drinking-water supply was safe at the exit point of the treatment plant, faecal contamination was detected during all phases of the study at the household level, with the presence of faecal coliforms in 60%, 25% and 9% of water samples respec-tively (Table 1).
Phase 1 results revealed also that residual chlorine was detected in only one of the five surveyed towns’ water-supply systems (Table 2); 60% of Mu-zaffarabad water samples were found to have residual chlorine levels match-ing WHO guide range of values [12]. Water turbidity occasionally exceeded WHO guide values during the rainy season; however all water samples were
found to be within WHO pH guide values (6.5–8.5).
Figure 2 illustrates a four-year monthly trend of acute diarrhoea of the five major towns affected by the 2005 earthquake. The frequency of acute diarrhoea during the monsoon period was significantly lower in Muzaffarabad relative to the other four towns with an odds ratio ranging from 2.81 to 12.72 and with 95% confidence interval of 2.74 to 13.03.
The dissemination of the results was usually shared with various stakeholders through Water, Sanitation and Hygiene (WASH) cluster meetings in order to adopt preventive measures and create awareness amongst the population and local authorities.
After the emergency phase and the scaling down of the aid agencies’ sup-port, the water and sanitation section of Pakistan’s Earthquake Rehabilitation and Reconstruction Authority (ERRA) and WHO put their emphasis on build-ing capacity of local service providers through structured multilevel training activities in order to raise awareness among all stakeholders on the interlink-ages between safe water and health. To make capacity-building interventions more practical, basic bacteriological water-quality testing equipment was provided to various local water authori-ties.
To strengthen routine bacteriologi-cal water-quality monitoring, WHO supported the establishment of nine bacteriological water-quality testing laboratories in nine districts of the af-fected areas, where in addition 18 water-laboratory technicians received bacteriological water-quality testing and monitoring refresher training courses.
ERRA’s water and sanitation section and WHO held several workshops and meetings with provincial authorities where the results and conclusions of the WHO-supported bacteriological water-quality survey were presented to all stakeholders.
ERRA’s water and sanitation sec-tion, UNICEF and water-supply service providers jointly launched a compre-hensive bacteriological water-quality improvement and promotion of hygiene project in February 2009. Under this project, sanitary inspection surveys of over 3500 water-supply schemes will be carried out.
Discussion
At the onset of an emergency, a ma-jor strategic objective is to protect the health and well-being of the affected population by focusing primarily on the provision of essential health services, safe drinking-water, food and shelter [1]. WHO assigned high priority to the provision of safe water and proper sanitation as an integral component of the health response, complement-ing disease surveillance and epidemic control interventions.
Phase 1 bacteriological water-qual-ity surveys revealed the poor microbial quality of most available drinking-water supplies mainly due to lack of prepar-edness, corroborated by prior studies carried out by the Pakistan Council of Research on Water Resources [13]. It is worth emphasizing that preparedness is essential for dealing with emergency safe drinking-water supply, especially the predeployment and stockpiling of sufficient quantities of water treat-ment chemicals and storage containers. Emergency preparedness and response programmes can be used as an essential link between emergency relief, rehabili-tation/reconstruction and development requiring institutional capacity-building and awareness promotion at the com-munity level to reduce vulnerability and the risks of waterborne diseases [14].
Surface water represented the most accessible supply of water to the affected communities, but these sources were easily contaminated by pathogenic or-ganisms and could not be considered safe without treatment [15,16]. The
Figure 1 Typical practice of installing drinking-water delivery pipes inside open waste and storm water channels
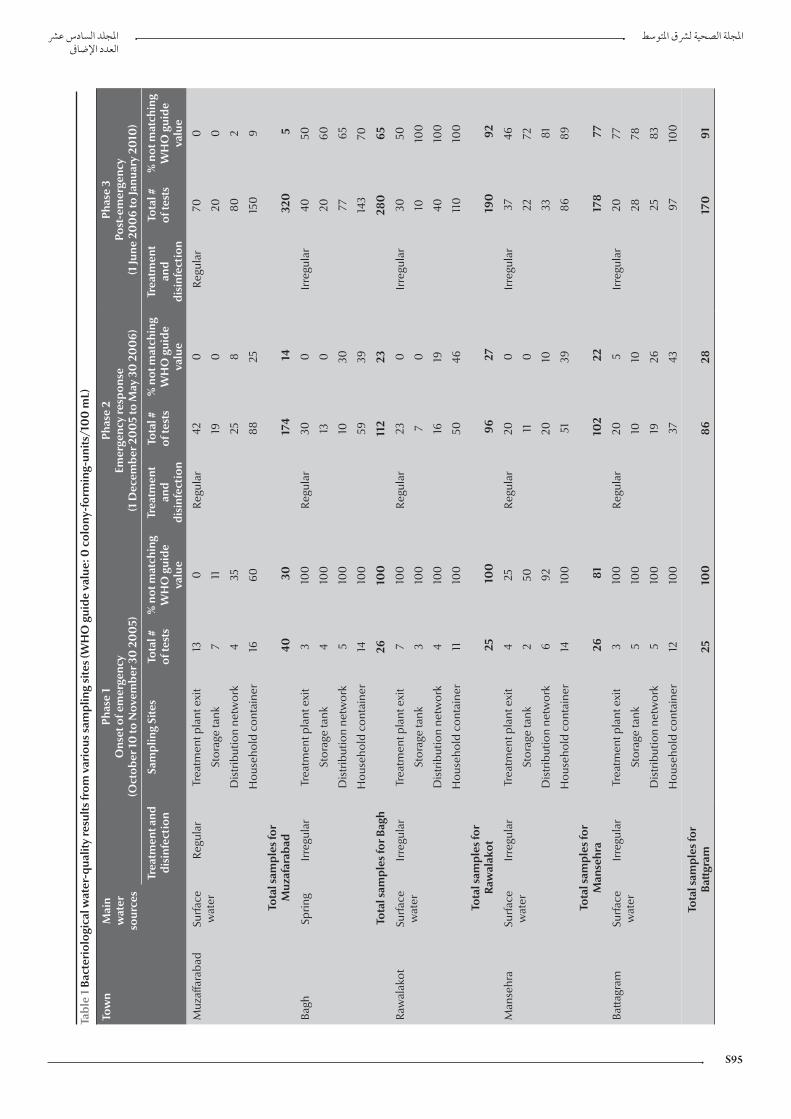
S95
Tabl
e 1
Bact
erio
logi
cal w
ater
-qua
lity
resu
lts fr
om v
ario
us s
ampl
ing
site
s (W
HO
gui
de v
alue
: 0 c
olon
y-fo
rmin
g-un
its/1
00
mL)
Tow
nM
ain
wat
er
sour
ces
Phas
e 1
Ons
et o
f em
erge
ncy
(Oct
ober
10
to N
ovem
ber 3
0 2
00
5)
Phas
e 2
Emer
genc
y re
spon
se
(1 D
ecem
ber 2
00
5 to
May
30
20
06)
Phas
e 3
Post
-em
erge
ncy
(1 Ju
ne 2
00
6 to
Janu
ary
2010
)
Trea
tmen
t and
di
sinf
ecti
onSa
mpl
ing
Site
sTo
tal #
of
test
s%
not
mat
chin
g W
HO
gui
de
valu
e
Trea
tmen
t an
d di
sinf
ecti
on
Tota
l #
of te
sts
% n
ot m
atch
ing
WH
O g
uide
va
lue
Trea
tmen
t an
d di
sinf
ecti
on
Tota
l #
of te
sts
% n
ot m
atch
ing
WH
O g
uide
va
lue
Muz
affa
raba
dSu
rface
w
ater
Regu
lar
Trea
tmen
t pla
nt e
xit
13
0Re
gula
r42
0Re
gula
r70
0
Stor
age
tank
711
190
200
Dis
trib
utio
n ne
twor
k4
3525
880
2
Hou
seho
ld c
onta
iner
1660
88
2515
09
Tota
l sam
ples
for
Muz
afar
abad
4030
174
1432
05
Bagh
Sprin
gIr
regu
lar
Trea
tmen
t pla
nt e
xit
310
0Re
gula
r30
0Ir
regu
lar
4050
Stor
age
tank
410
013
020
60
Dis
trib
utio
n ne
twor
k5
100
1030
7765
Hou
seho
ld c
onta
iner
14
100
5939
143
70
Tota
l sam
ples
for B
agh
2610
011
223
280
65
Raw
alak
otSu
rface
w
ater
Irre
gula
rTr
eatm
ent p
lant
exi
t7
100
Regu
lar
230
Irre
gula
r30
50
Stor
age
tank
310
07
010
100
Dis
trib
utio
n ne
twor
k4
100
1619
4010
0
Hou
seho
ld c
onta
iner
11
100
5046
110
100
Tota
l sam
ples
for
Raw
alak
ot
2510
096
2719
092
Man
sehr
aSu
rface
w
ater
Irre
gula
rTr
eatm
ent p
lant
exi
t4
25Re
gula
r20
0Ir
regu
lar
3746
Stor
age
tank
250
110
2272
Dis
trib
utio
n ne
twor
k6
9220
1033
81
Hou
seho
ld c
onta
iner
1410
051
3986
89
Tota
l sam
ples
for
Man
sehr
a26
8110
222
178
77
Batta
gram
Surfa
ce
wat
erIr
regu
lar
Trea
tmen
t pla
nt e
xit
310
0Re
gula
r20
5Ir
regu
lar
2077
Stor
age
tank
510
010
1028
78
Dis
trib
utio
n ne
twor
k5
100
1926
2583
Hou
seho
ld c
onta
iner
1210
037
43
9710
0
Tota
l sam
ples
for
Batt
gram
2510
086
2817
091
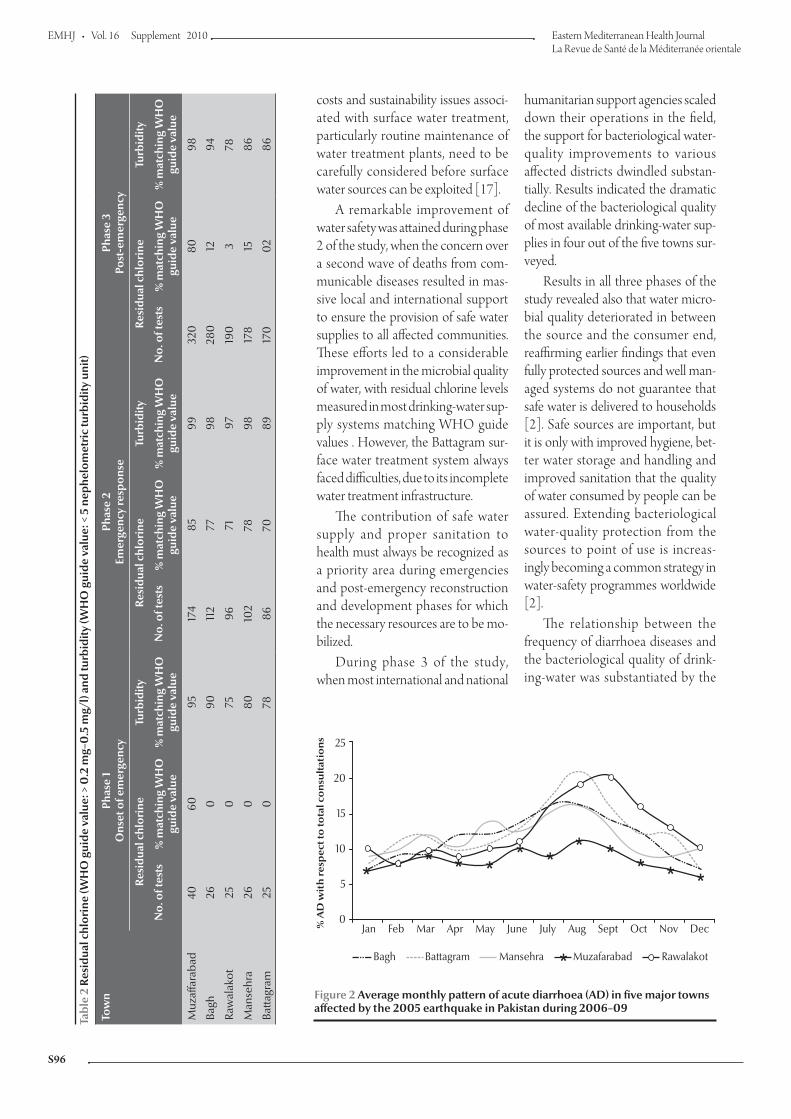
EMHJ
S96
Tabl
e 2
Resi
dual
chl
orin
e (W
HO
gui
de v
alue
: > 0
.2 m
g–0
.5 m
g/l)
and
turb
idity
(WH
O g
uide
val
ue: <
5 n
ephe
lom
etri
c tu
rbid
ity u
nit)
Tow
nPh
ase
1O
nset
of e
mer
genc
y Ph
ase
2Em
erge
ncy
resp
onse
Ph
ase
3Po
st-e
mer
genc
y
Resi
dual
chl
orin
e Tu
rbid
ityRe
sidu
al c
hlor
ine
Turb
idity
Re
sidu
al c
hlor
ine
Turb
idity
No.
of t
ests
% m
atch
ing
WH
O
guid
e va
lue
% m
atch
ing
WH
O
guid
e va
lue
No.
of t
ests
% m
atch
ing
WH
O
guid
e va
lue
% m
atch
ing
WH
O
guid
e va
lue
No.
of t
ests
% m
atch
ing
WH
O
guid
e va
lue
% m
atch
ing
WH
O
guid
e va
lue
Muz
affa
raba
d40
6095
174
8599
320
8098
Bagh
260
9011
277
9828
012
94
Raw
alak
ot25
075
9671
9719
03
78
Man
sehr
a26
080
102
7898
178
1586
Batta
gram
250
7886
7089
170
02
86
costs and sustainability issues associ-ated with surface water treatment, particularly routine maintenance of water treatment plants, need to be carefully considered before surface water sources can be exploited [17].
A remarkable improvement of water safety was attained during phase 2 of the study, when the concern over a second wave of deaths from com-municable diseases resulted in mas-sive local and international support to ensure the provision of safe water supplies to all affected communities. These efforts led to a considerable improvement in the microbial quality of water, with residual chlorine levels measured in most drinking-water sup-ply systems matching WHO guide values . However, the Battagram sur-face water treatment system always faced difficulties, due to its incomplete water treatment infrastructure.
The contribution of safe water supply and proper sanitation to health must always be recognized as a priority area during emergencies and post-emergency reconstruction and development phases for which the necessary resources are to be mo-bilized.
During phase 3 of the study, when most international and national
humanitarian support agencies scaled down their operations in the field, the support for bacteriological water-quality improvements to various affected districts dwindled substan-tially. Results indicated the dramatic decline of the bacteriological quality of most available drinking-water sup-plies in four out of the five towns sur-veyed.
Results in all three phases of the study revealed also that water micro-bial quality deteriorated in between the source and the consumer end, reaffirming earlier findings that even fully protected sources and well man-aged systems do not guarantee that safe water is delivered to households [2]. Safe sources are important, but it is only with improved hygiene, bet-ter water storage and handling and improved sanitation that the quality of water consumed by people can be assured. Extending bacteriological water-quality protection from the sources to point of use is increas-ingly becoming a common strategy in water-safety programmes worldwide [2].
The relationship between the frequency of diarrhoea diseases and the bacteriological quality of drink-ing-water was substantiated by the
Jan Feb Mar Apr May June July Aug Sept Oct Nov Dec
Bagh Battagram Mansehra Muzafarabad Rawalakot
25
20
15
10
5
0
% A
D w
ith
re
sp
ec
t to
to
tal
co
nsu
lta
tio
ns
Figure 2 Average monthly pattern of acute diarrhoea (AD) in five major towns affected by the 2005 earthquake in Pakistan during 2006–09
S97
References
1. Connolly MA ed. Communicable diseases control in emergencies: a field manual. Geneva, World Health Organization, 2005:33.
2. Connolly MA et al. Communicable diseases in complex emer-gencies: impact and challenges. Lancet, 2004; 364(9449):842–843.
3. Sobsey MD. Managing water in the home: accelerated health gains from improved water supply water. Geneva, World Health Organization, 2002 (WHO/SDE/WSH/02.07; http://www.who.int/water_sanitation_health/dwq/wsh0207/en/print.html, accessed 19 July 2010).
4. Thompson T et al. Chemical safety of drinking water: assessing priorities for risk management. Geneva, WHO, 2007.
5. Water and sanitation strategy July 2006–June 2009: Build back better. Islamabad, Pakistan, Earthquake Reconstruction and Rehabilitation Authority, 2006 (http://www.erra.pk/Reports/Watsan-Strategy/WatSan-Strategy8sep.pdf, accessed 19 July 2010).
6. Kahlown MA, Tahir MA, Rasheed H. Fifth water quality monitor-ing report 2005–2006. Islamabad, Pakistan, Pakistan Council of Research in Water Resources, 2008.
7. Aziz JA. Management of source and drinking water qual-ity in Pakistan. Eastern Mediterranean Health Journal, 2005, 11(5–6):1087–1098.
8. Nasrullah et al. Pollution load in industrial effluent and ground-water of Gadoon Amazai industrial estate (GAIE) Swabi, NWFP. Journal of Agricultural and Biological Science, 2006, 1(3):18–24 (http://www.arpnjournals.com/jabs/research_papers/jabs_0906_23.pdf, accessed 20 July 2010).
9. UNICEF handbook on water quality 2008. New York, USA, United Nations Children’s Fund, 2008
10. Standard methods for the examination of water and wastewater. Denver, USA, American Public Health Association/American
Water Works Association/Water Environment Federation, 2000.
11. DelAgua portable water testing kit. User manual. Marlborough, United Kingdom, DelAgua Water Testing Ltd, 2000.
12. Guidelines for drinking-water quality 1, 3rd ed. Geneva, World Health Organization, 2008 (http://www.who.int/water_sani-tation_health/dwq/gdwq3rev/en/index.html, accessed 20 July 2010).
13. Kahlown MA, Tahir MA, Rasheed H. Water quality status in Pa-kistan (third report 2003–2004). Islamabad, Pakistan, Pakistan Council of Research in Water Resources, 2005 (No. 131-2005).
14. Policy: integrating relief, rehabilitation and development 2006. Geneva, International Federation of Red Cross and Red Cres-cent Societies, Disaster Preparedness and Response Depart-ment, 2006.
15. Schmoll O et al, eds. Protecting groundwater for health. Manag-ing the quality of drinking-water sources. Geneva, World Health Organization, 2006 (http://www.who.int/water_sanitation_health/publications/protecting_groundwater/en/index.html, accessed 20 July 2010).
16. Hubbs SA. Understanding water supply and treatment for indi-vidual and small community systems. Arlington, USA, Volunteers in Technical Assistance, 1985 (Technical Paper 32; http://www.cd3wd.com/cd3wd_40/vita/wtrtreat/en/wtrtreat.htm, ac-cessed 20 July 2010).
17. Guidelines on technologies for water supply systems in small com-munities. Amman, WHO Regional Centre for Environmental Health Activities, 1993.
18. Water and sanitation policy. Geneva, International Federation of Red Cross and Red Crescent Societies, 2003 (http://www.ifrc.org/Docs/pubs/who/policies/watsan-policy-en.pdf, ac-cessed 20 July 2010).
evident inverse correlation between the frequency of acute diarrhoea and bacteriological water quality: there was a statistically significant diarrhoea risk variance between Muzaffarabad and the other towns surveyed. The latter illustrates that excess morbidity and mortality caused by diarrhoeal diseases are largely avoidable if bacteriological contamination of water is effectively controlled [12].
The necessary capacities of local water-supply service providers need to be built to guarantee a sustainable exit strategy after the emergency response aid organizations cease their support. To address this challenge, humanitarian organizations and the government need to establish the necessary operational steps during the early recovery phase of the emergency response in order to
meet the necessary technical, manage-rial and funding requirements to main-tain the quality of water-supply systems. The latter illustrates the necessity of formulating sustainable exit strategies during the emergency response phase, recognizing the responsibility of the lo-cal authorities to maintain the provision of safe drinking-water to the population [18]. To address the water-safety issues in the long run it is vital to sensitize all the stakeholders in such a way that water-supply service providers and consumers are fully aware of the link-ages between safe water and health. The post-earthquake experience has shown the predominant focus of humanitar-ian partners on short-term water safety solutions rather than developing sus-tainable exit strategies that can build local capacities. The human resource
and institutional capacity-development efforts undertaken by the government, assisted by WHO and UNICEF, could not produce the desired results due to paucity of recurrent financing, a matter that needs utmost priority attention.
Conclusion
Emergency health and WASH response interventions aim to promote earliest possible actions to reduce any loss of life in the aftermath of disasters. This adversity however needs to be seen as an opportunity to build-back-better and develop the capacity of local institutions in order to attain a reliable level of water safety and pursue it as an integral part of the exit strategies that render the humani-tarian response gains more sustainable.
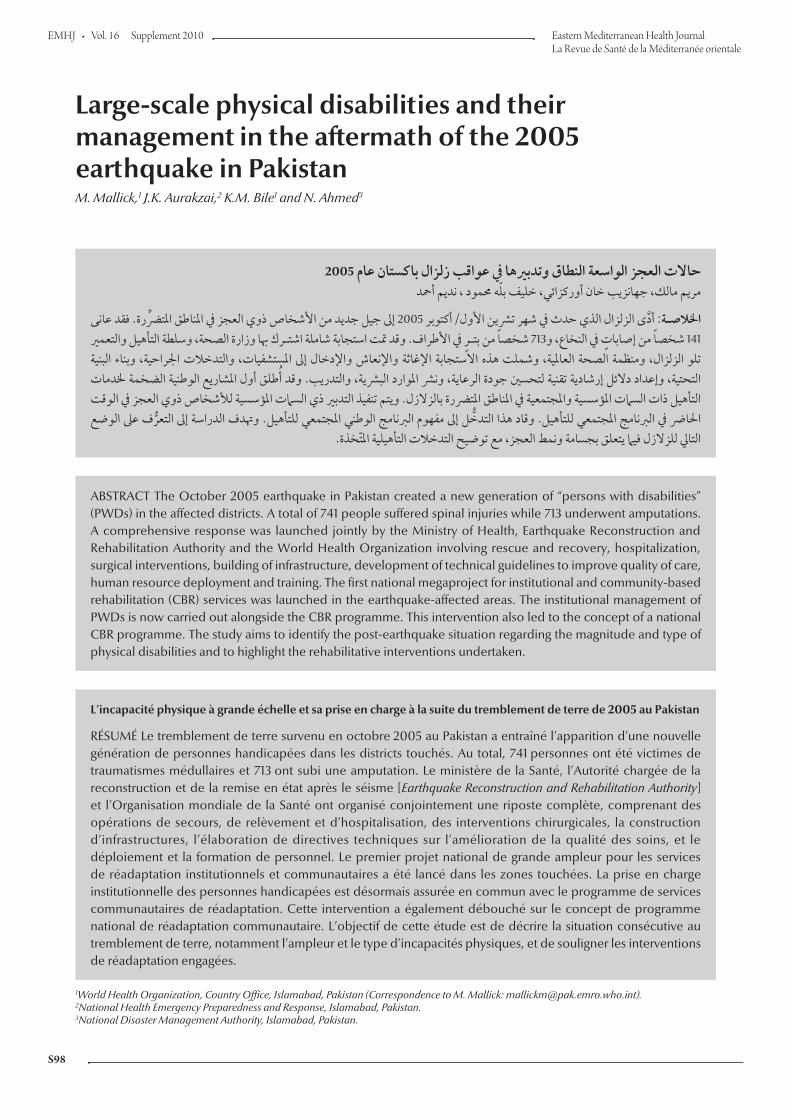
EMHJ
S98
Large-scale physical disabilities and their management in the aftermath of the 2005 earthquake in Pakistan M. Mallick,1 J.K. Aurakzai,2 K.M. Bile1 and N. Ahmed3
ABSTRACT The October 2005 earthquake in Pakistan created a new generation of “persons with disabilities” (PWDs) in the affected districts. A total of 741 people suffered spinal injuries while 713 underwent amputations. A comprehensive response was launched jointly by the Ministry of Health, Earthquake Reconstruction and Rehabilitation Authority and the World Health Organization involving rescue and recovery, hospitalization, surgical interventions, building of infrastructure, development of technical guidelines to improve quality of care, human resource deployment and training. The first national megaproject for institutional and community-based rehabilitation (CBR) services was launched in the earthquake-affected areas. The institutional management of PWDs is now carried out alongside the CBR programme. This intervention also led to the concept of a national CBR programme. The study aims to identify the post-earthquake situation regarding the magnitude and type of physical disabilities and to highlight the rehabilitative interventions undertaken.
1World Health Organization, Country Office, Islamabad, Pakistan (Correspondence to M. Mallick: [email protected]).2National Health Emergency Preparedness and Response, Islamabad, Pakistan.3National Disaster Management Authority, Islamabad, Pakistan.
2005
2005
713 141
L’incapacité physique à grande échelle et sa prise en charge à la suite du tremblement de terre de 2005 au Pakistan
RÉSUMÉ Le tremblement de terre survenu en octobre 2005 au Pakistan a entraîné l’apparition d’une nouvelle génération de personnes handicapées dans les districts touchés. Au total, 741 personnes ont été victimes de traumatismes médullaires et 713 ont subi une amputation. Le ministère de la Santé, l’Autorité chargée de la reconstruction et de la remise en état après le séisme [Earthquake Reconstruction and Rehabilitation Authority] et l’Organisation mondiale de la Santé ont organisé conjointement une riposte complète, comprenant des opérations de secours, de relèvement et d’hospitalisation, des interventions chirurgicales, la construction d’infrastructures, l’élaboration de directives techniques sur l’amélioration de la qualité des soins, et le déploiement et la formation de personnel. Le premier projet national de grande ampleur pour les services de réadaptation institutionnels et communautaires a été lancé dans les zones touchées. La prise en charge institutionnelle des personnes handicapées est désormais assurée en commun avec le programme de services communautaires de réadaptation. Cette intervention a également débouché sur le concept de programme national de réadaptation communautaire. L’objectif de cette étude est de décrire la situation consécutive au tremblement de terre, notamment l’ampleur et le type d’incapacités physiques, et de souligner les interventions de réadaptation engagées.

S99
Introduction
An estimated 650 million people live with disabilities around the world, 80% of whom are living in low-income coun-tries with limited or no access to basic health services including rehabilitation services [1].The link between conflict, emergency situations and disability is incontrovertible as conflict and natu-ral disasters are a significant cause of impairment due to increased rates of injury, lack of medical care and disrup-tion of medical health care services [2].
The 40-second duration of the 8 October 2005 south Asian earthquake emerged as the most devastating natural disaster in the history of Pakistan and the region over the past century. While the huge death toll exceeding 73 338 was overwhelming, an estimated 3.5 million people were rendered homeless and another 128 309 sustained serious causalities, including spinal injuries and limb trauma, some leading to amputa-tions [3,4].
In many rural communities of Pa-kistan, disabilities among household members are normally concealed, especially those acquired from birth or developed soon thereafter [5]. As a result, socioeconomic data regarding disabilities are not well documented. According to the 1998 population cen-sus, persons with disabilities (PWDs) constituted approximately 3.287 mil-lion (2.49%), including all types of dis-ability [6], which was significantly lower than the World Health Organization (WHO) estimate of 10% [7]. This can be attributed to the varying definitions of disabilities, methodology used and the limited capacity for data collection at the national level.
Additionally, there are only a few fragmented programmes and services that address the needs of PWDs, most of which are primarily confined to ur-ban areas, resulting in considerable so-cioeconomic burden evidenced by the limited access to health, education and employment opportunities. Disability-
inclusive legislation capable of integrat-ing a disability dimension at the national level also did not exist in the country prior to the 1980s.
Following the United Nation’s dec-laration of 1981 as the International Year of the Disabled and 1983–1992 as the Decade of the Disabled, the first disability-specific sectoral legislation was promulgated by the Government of Pakistan, consisting of the Disabled Persons Employment and Rehabili-tation Ordinance 1981. Thereafter, a national policy for PWDs was formal-ized in 2002 by the Ministry of Social Welfare and Special Education, whose National Plan of Action is currently under implementation. In September 2008, Pakistan became a signatory to the UN Convention on the Rights of Persons with Disabilities, which out-lines the obligation of states to protect and ensure the safety of people with disabilities in situations of risk, including armed conflict [8].
Though the concept of medical re-habilitation was introduced in Pakistan during the late 1990s, only a few public sector institutions provide comprehen-sive rehabilitative services. Current esti-mates show that in developing countries only 2% of PWDs receive some form of rehabilitation assistance [9].
The Government has taken certain tangible measures by establishing com-prehensive rehabilitation services such as special computerized identity cards for PWDs, free medical treatment at government hospitals, and implementa-tion of a 2% quota for their employment. However, the implementation rate of such initiatives remains very low. The Pakistan welfare fund Bait ul Maal was established in 1992 for the provision of social services to PWDs along with other marginalized members of the so-ciety. PWDs also benefit from the wel-fare fund of Zakat and from the recently launched Benazir Income Support Pro-gramme. An education quota of 1% for PWDs has been recommended by the Higher Education Commission for all
universities, along with their eligibility to participate in competitive employment exams within their allotted quota of 2%.
The above-mentioned initiatives notwithstanding, service delivery capac-ity in terms of rehabilitation measures remained highly institutionalized with a top-down approach. The community’s vital role in the provision of rehabilita-tive services was recognized only in the aftermath of the October 2005 earth-quake, resulting in the launch of the first community-based rehabilitation (CBR) programme in the country.
The objective of this paper is to evaluate the magnitude and types of post-earthquake physical disabilities, assess their consequent rehabilitative needs and highlight the efforts made during the relief and recovery phase for the provision of comprehensive reha-bilitative services for PWDs.
Methods
Data regarding major disabilities involv-ing spinal cord injuries and amputations were retrospectively collected in Octo-ber and November 2005 to assess the magnitude of the problem. A standard questionnaire was developed for data collection and several visits conducted to major hospitals in urban cities, field hos-pitals and camps in the affected districts. Detailed interviews were also conducted with health managers, district adminis-trators and patients in the provinces of Khyber–Pakhtunkhwa and Punjab, in addition to the Pakistan-administered Kashmir (PAK) territory. A total of 20 health facilities for spinal cord injuries and 36 facilities for amputations were visited. On completion of data collec-tion and verification from all the districts, a reconciliation exercise was initiated to eliminate duplications. Finally, the cumulative figures of 741 for spinal cord injuries and 713 for amputations resulting from earthquake hazard were compiled and analysed. For a tangible number of these patients, their age and

EMHJ
S100
level of spinal injuries and amputations were not effectively documented.
Results
According to the data collected for this study, a total of 741 spinal injury cases, with and without neurological deficit, were received in major hospi-tals in Rawalpindi, Islamabad, Lahore and Peshawar in October 2005 related to the earthquake, and another 713 cases experienced various kinds of limb trauma leading to major and minor amputations.
Table 1 shows the spinal injuries detected and amputations carried out post earthquake by age and gender. The majority of the spinal injury cases were females (62%) and the predominant age group was > 18–40 years (57%). In 12% of the spinal injury cases, the age of the patient could not be ascertained. Similar to spinal injuries, the majority of amputations were undertaken in females (51.3%) while the predominant age groups were > 18–40 years (33.3%) and 5–18 years (31.26%) with 6% of the total under 5 years old; in 13% of the cases age could not be ascertained.
Table 2 lists the amputations carried out by age, gender and level of amputa-tions. Out of 713 total amputations, 423 (59%) were lower-limb amputations and 290 (41%) were upper-limb ampu-tations. Of the lower-limb amputations undertaken, 389 (91%) were major
amputations: 179 (42%) were tran-stibial (below knee) amputations while 65 (15%) were transfemoral (above knee) amputations and feet were sur-gically removed in 67 (16%) cases. Seventy eight (18%) cases were simply labelled as leg amputations, without being disaggregated as transfemoral or transtibial amputations owing to inad-equate documentation.
Of the upper-limb amputations car-ried out, 192 (66%) were recorded as major upper-limb amputations, includ-ing 116 (40%) transhumeral (above elbow), 40 (14%) transradial (below elbow) and 36 (12%) hand amputa-tions. In 65 cases, it was recorded that the dominant right upper limb was amputated, which aggravated patients’ functional limitations and caused them difficulty in performing activities of daily living.
Table 3 provides details about the level of post-earthquake spinal injuries. Among the 741 spinal cases, a total of 916 injuries were reported. This differ-ence was due to multiple-level fractures involving the cervical, thoracic, lumbar and sacral vertebral column. Out of the total of 741 cases, 71.2% developed some neurological deficit resulting in complete or partial paraplegia or quad-riplegia. However, among the 50 cases with cervical injury, only 13 cases de-veloped incomplete quadriplegia while the remaining patients survived without any neurological deficit.
Of the 916 recorded injuries, the greatest share, 443 cases (48.4%) were at the lumbar level, followed by 301 (32.9%) cases at the thoracic level, while cervical injuries constituted only 5.4% (50 cases) of the surviving cases with spinal injuries. Only 0.6% of the cases experienced sacral injuries, while in 12.8% of the cases the level of the injury was neither documented nor ascertain-able. Figure 1 illustrates the geographic distribution of spinal cord injuries and amputations by district of origin. The highest percentage of patients with spi-nal cord injuries (46%) originated from Muzaffarabad district, which was also the district with the greatest devastation, followed by Mansehra (20%) and Bagh (18%). A similar pattern was observed with regard to amputations carried out, with 36% of these in Muzaffarabad, 22% in Mansehra and 16% in Bagh.
The capacity of tertiary-level hospi-tals in terms of provision of rehabilitative services was suboptimal considering the massive requirements of the catastro-phe and included a shortage of trained health professionals and necessary equipment. As a result, these patients were scattered across different wards, corridors and makeshift arrangements in various hospitals, leading to pressure sores, urinary tract infections and deep vein thrombosis.
In order to cater to the immediate needs, a young cadre of 57 males and fe-males was given a short, 2-week training
Table 1 Detected spinal injuries and amputations post-earthquake by age and sex
Injury Age group (years)
< 5 5–18 > 18–40 > 40 Not listed Total
No. % No. % No. % No. % No. % No. %Spinal cord injury
M 3 0.40 40 5.40 165 22.27 40 5.40 37 4.99 285 38.46
F 3 0.40 104 14.04 257 34.68 38 5.13 54 7.29 456 61.54Amputation M 19 2.66 113 15.84 103 14.44 61 8.55 51 7.15 347 48.66
F 24 3.36 110 15.42 135 18.93 53 7.43 44 6.17 366 51.33Total M 22 1.51 153 10.52 268 18.43 101 6.95 88 6.05 632 43.47
F 27 1.86 214 14.72 392 26.96 91 6.26 98 6.74 822 56.53
Total 49 3.37 367 25.24 660 45.39 192 13.20 186 12.79 1 454 100
M = male; F = female.

S101
course in basic rehabilitation techniques for the prevention of secondary compli-cations, in collaboration with the non-governmental organization Handicap International in October 2005. This initiative provided services for spinal injury patients, especially for those who underwent spinal fixation in major hos-pitals of Islamabad/ Rawalpindi, and presumably averted many impending complications including pressure sores, muscle wasting and contractures in the patients.
The Federal Ministry of Health up-graded and strengthened the National Institute for Rehabilitation Medicine
(NIRM), Pakistan Institute of Medi-cal Sciences (PIMS) Satellite Centre and Cantonment General Hospital Rawalpindi by inducting 100 doctors, 100 physiotherapists and 50 psycholo-gists in December 2005. WHO and United Nations Children’s Fund (UNICEF) established 100-bedded prefabricated spinal injury units at PIMS Satellite Centre and NIRM in December 2005 and January 2006, respectively, where all the spinal injury patients were subsequently moved. A comprehensive rehabilitation plan was developed for each spinal injury patient, according to his or her type and level of
disability, and the rehabilitation process was initiated through a multidisciplinary approach.
The skills of the newly recruited staff were enhanced through train-ing workshops and certificate courses conducted at NIRM. The acute shortage of occupational therapists was addressed by organizing a 3-week training course for paramedics using a special curriculum developed for this purpose.
WHO training manuals on promot-ing independence following spinal cord injuries were adapted and translated, in order to provide the necessary skills
Table 2 Post-earthquake injuries for which amputations were carried out by age, sex and level of amputation
Type of amputation Age group (years)
< 5 5–18 > 18 Not listed Total
No. % No. % No. % No. % No. %
Lower-limb Transfemoral M 1 0.14 9 1.26 15 2.10 1 0.14 26 3.65
F 1 0.14 11 1.54 24 3.37 3 0.42 39 5.47Transtibial M 4 0.56 33 4.63 45 6.31 6 0.84 88 12.34
F 7 0.98 26 3.65 48 6.73 10 1.40 91 12.76Leg amputation M 3 0.42 17 2.38 16 2.24 8 1.12 44 6.17
F 0 0.00 8 1.12 22 3.09 4 0.56 34 4.77Foot amputation
M 2 0.28 12 1.68 10 1.40 6 0.84 30 4.21
F 5 0.70 9 1.26 17 2.38 6 0.84 37 5.19Foot digits M 1 0.14 3 0.42 9 1.26 5 0.70 18 2.52
F 0 0.00 7 0.98 8 1.12 1 0.14 16 2.24Subtotal 24 3.36 135 18.92 214 30.01 50 7.01 423 59.32
Upper-limb Transhumeral M 2 0.28 14 1.96 27 3.79 9 1.26 52 7.29
F 2 0.28 17 2.38 37 5.19 8 1.12 64 8.98Transradial M 1 0.14 3 0.42 9 1.26 4 0.56 17 2.38
F 1 0.14 10 1.40 10 1.40 2 0.28 23 3.23Hand amputation
M 3 0.42 6 0.84 9 1.26 1 0.14 19 2.66
F 1 0.14 8 1.12 6 0.84 2 0.28 17 2.38Hand digits M 2 0.28 12 1.68 15 2.10 5 0.70 34 4.77
F 7 0.98 11 1.54 11 1.54 3 0.42 32 4.49Type not ascertainable
M 0 0.00 4 0.56 9 1.26 6 0.84 19 2.66
F 0 0.00 3 0.42 5 0.70 5 0.70 13 1.82
Subtotal 19 2.66 88 12.32 138 19.34 45 6.3 290 40.66Grand total M 19 2.66 113 15.85 164 23.00 51 7.15 347 48.67
F 24 3.37 110 15.43 188 26.37 44 6.17 366 51.33
Total 43 6.03 223 31.28 352 49.37 95 13.32 713 100
M = male; F = female.

EMHJ
S102
to mid-level health professionals. A manual was also developed for patients and their families, enabling them to cope with their physical limitations and increase their independence by enhanc-ing their existing potential. Another manual was compiled which provided guidelines/designs for accessibility of
wheel chairs in public buildings as well as in houses. In pursuance of directives of the Earthquake Reconstruction and Rehabilitation Authority, the guidelines provided in this manual were incor-porated into the reconstruction plan of the earthquake-affected districts by National Engineering Service Pakistan.
As the Artificial Limb Centre at the Fauji Foundation Hospital was the only public sector hospital providing pros-thetic (an artificial substitute for a miss-ing body part, such as an arm, leg, eye, or tooth, used for functional or cosmetic reasons) and orthotic (an orthopaedic appliance or apparatus used to support,
Table 3 Post-earthquake spinal injuries by age, sex and level of injury
Level of injury Age group (years)
< 5 5–18 > 18 Not listed Total
No. % No. % No. % No. % No. %Cervical M 0 0.00 2 0.22 13 1.42 5 0.55 20 2.18
F 0 0.00 8 0.87 16 1.75 6 0.66 30 3.28Thoracic M 0 0.00 21 2.29 97 10.59 10 1.09 128 13.97
F 1 0.11 28 3.06 128 13.97 16 1.75 173 18.89Lumbar M 2 0.22 30 3.28 110 12.01 23 2.51 165 18.01
F 1 0.11 66 7.21 176 19.21 35 3.82 278 30.35Sacral M 0 0.00 0 0.00 2 0.22 0 0.00 2 0.22
F 0 0.00 0 0.00 3 0.33 0 0.00 3 0.33Not ascertainable M 2 0.22 4 0.44 34 3.71 7 0.76 47 5.13
F 2 0.22 22 2.40 42 4.59 4 0.44 70 7.64Total M 4 0.44 57 6.22 256 27.95 45 4.91 362 39.52
F 4 0.44 124 13.54 365 39.85 61 6.66 554 60.48
Total 8 0.87 181 19.76 621 67.79 106 11.57 916 100.00
M = male; F = female.
Figure 1 Distribution of spinal cord injuries and amputations by district of origin
50
45
40
35
30
25
20
15
10
5
0
%
Amputation carried out
Spinal cord injuries
Muza
ffara
badBagh
Poonch
Mirp
ur
Battagra
m
Mansh
era
Abbottabad
Kohistan
Peshw
ar
Army
address
esAre
as
not list
ed
District of origin

S103
however, the majority of the services offered were for lower-limb prosthesis only.
The major challenges that emerged were the provision of long-term sus-tainable support for PWDs in their districts of origin, as well as improv-ing their quality of life in terms of dis-ability awareness and social, economic and cultural inclusion. An innovative strategy envisaging a combination of community- and institution-based reha-bilitation was introduced by WHO and the Ministry of Health for both pre- and post-earthquake PWDs. This strategy is being implemented by the Earthquake Reconstruction and Rehabilitation Au-thority through the Medical Rehabilita-tion of the Persons with Disabilities in the Earthquake Affected Areas project, with WHO technical assistance.
Table 4 illustrates the post-earth-quake initiatives undertaken for the provision of rehabilitation services to PWDs, including, health, education, livelihood and empowerment. It also gives details regarding development of infrastructure and implemented ca-pacity-building interventions, including recruitment and training of rehabilita-tion professionals and development of training manuals.
Discussion
In humanitarian emergency situations, disasters disproportionately impact persons with existing disability and create a new generation of persons with functional limitations in constant need of rehabilitative services [10]. The most common disabilities following the earthquake in Pakistan were spinal in-juries and those requiring amputations. The number of spinal cord injuries in the aftermath of the October 2005 earthquake in Pakistan were the highest among injuries reported in earthquakes occurring in other countries [11]. The reason for this can be attributed to several factors, including the mode
Table 4 Post-earthquake initiatives for the provision of rehabilitation services to people with disabilities (PWDs), development of infrastructure and implemented capacity-building interventions
Outcomes Value
Rehabilitation outcome
Independence in activities of daily living of spinal cord injury patients 62%
Spinal cord injury patients provided with livelihood 5%
Provision of lower-limb prosthetic devices to amputees 100%
Amputees provided with livelihood 8%
Provision of medical rehabilitation services
Number of PWDs provided with rehabilitation services 35 873
Number of therapeutic sessions (speech, physiotherapy, psychology) 57 506
Provision of assistive devices
Wheel chairs, spinal jackets, commodes, chairs, crutches, walkers, hearing aids, low-vision aids, etc. 5 457
Livelihood provided to PWDs
Number of PWDs provided with livelihood 1 017
Share of PWD in employment opportunities. 8%
Inclusive education
Number of children with disabilities enrolled for inclusive education 1 176
Infrastructure
100-bedded spinal injury units established at Islamabad 2
50-bedded rehabilitation centres established at Khyber–Pakhtoonkhwa and Azad Jammu & Kashmir 2
Basic rehabilitation units in earthquake-affected districts 4
Resource information centres for CBR in earthquake-affected areas 4
Recruitment of health/rehabilitation professionals for 3 years
Doctors, nurses, physiotherapists, speech therapists, psychologists 366
Community rehabilitation workers for CBR programmes 372
Development of training manuals
Management of spinal cord injuries 2
Training manuals for CBR 4
Trainings sessions
Training session each of 30 days for community rehabilitation workers 16
Awareness-raising workshops 10
Training workshops for health/rehabilitation professionals 10
CBR = community-based rehabilitation.
of Prosthetic and Orthotic Sciences in Peshawar, which subsequently es-tablished five satellite centres in the earthquake-affected districts. A total of 11 prosthetic and orthotic workshops were established by various national and international organizations for the provision of prosthetic and orthotic services in the disaster-hit districts;
align, prevent deformities to improve function of movable parts of the body) services in the twin cities of Rawalpindi/Islamabad, the provision of prosthesis to amputees was facing capacity limita-tions in meeting the increasing demand generated by newly amputated patients. Accordingly, a number of cases were also referred to the Pakistan Institute

EMHJ
S104
of evacuation, deficient seismic-proof building codes and the highly diversified rugged mountainous terrain, in addi-tion to the magnitude of the disastrous earthquake of Pakistan.
Prehospital management of spinal injury is of critical importance since 25% of spinal cord injury damage may occur, or can be aggravated, after the initial event [12]. The first to respond after the earthquake in Pakistan were usually untrained local community members, being unaware of the importance of spi-nal immobilization to prevent second-ary neurological damage, although they worked frantically to rescue as many people as possible. The use of a spinal board is considered to be an integral part of the standard operating proce-dures for evacuation and transport of spinal cord injury patients. On the con-trary, spinal cord injury patients were dragged and pulled out of the rubble and carried in a manner not conforming to international standards of transfer-ring such patients. A similar practice of rescue and recovery of spinal cord injury patients was also observed in the earthquake of Bam, Islamic Republic of Iran in December, 2003 [13].
Most patients with incomplete spi-nal cord injuries reported that they were able to move their limbs while buried under the rubble, but during shifting to health facilities, their limbs were completely paralysed [14]. By contrast, Japan's highly developed emergency preparedness and response system operating during the 1995 Hanshin earthquake resulted in only six spinal injury cases with neurological deficit, out of a total of 140 reported spinal fractures [15].
In developed as well as developing countries the epidemiological data have shown male dominance in spinal cord injuries [16,17]; however, females were the major victims in the earthquake of Pakistan [18]. It is conjectured that the high proportional risk of injury to which females were exposed may be explained by the fact that the earthquake occurred
in the morning when men had already left home for work but most of the women were at the time either inside their homes or rushed back inside their premises to save their children.
The peak incidence of spinal injuries was within the age group 18–40 years comprising of 57% of the total. In the developing world, this group represents the largest and most significant human resource cohort, constituting the main economic and social fabric of the com-munity. Lumbar-level injuries (48.2%) were most commonly followed by in-juries at the thoracic level (32.2%) as observed in the Gujarat earthquake, India, in December 2001 [19] and the Sichuan earthquake, China in May 2008 [20].
With a total population of 725 000 and located only 19 km south-west of the epicentre, Muzaffarabad district ac-counted for the maximum number of spinal injuries. This was also observed in the Northridge earthquake, United States of America, in January 1994 in which people were prone to injury risk due to the population density and prox-imity to the epicentre [21].
The post-earthquake response in the disability sector included provision of immediate rehabilitative services, while developing long-term sustainable solutions. Although the majority of spi-nal cord injury patients have completed their rehabilitation programme, a con-siderable risk of developing complica-tions yet remains for patients discharged after the initial management and having inadequate follow-up.
The lack of standardized protocols and guidelines for trauma management resulted in several unnecessary amputa-tions, improperly fashioned stumps and peripheral nerve injuries. Many ampu-tations were necessitated due to the gravity of injuries or delayed referrals from remote areas during the first 48 hours. The absence of regulatory norms for manufacturing and fitting prosthetic devices led many unqualified providers
to produce substandard prosthesis, causing complications in a number of patients.
The analysis indicated that ap-proximately 581 amputees with major amputations required various kind of prosthesis, contrary to the initial per-ception echoed by various nongovern-mental organizations that “thousands” of artificial limbs were required for rehabilitation of the post-earthquake amputees. It is therefore appropriate to carefully and proactively identify a few qualified institutions that are recognized for designing, manufacturing and fitting prosthetic devices rather than allowing a large number of unskilled organiza-tions that would not be able to perform effectively. Almost all the amputees with lower-limb amputations have been fit-ted with prosthetic devices; however due to limitations of technology in func-tional ability and high manufacturing cost, a limited number of amputees with upper-limb amputations were provided with the required prosthesis.
A female predominance was evident among the cases with reported spinal injuries and amputations. In developing countries women with disabilities face stereotypes and challenges posed by their femininity as well as by being a PWD. Out of the total reported victims, 28.6% were below 18 years age; their observed disability-related functional limitations produced damaging socio-economic effects on individuals and families and posed disproportionate psychological, emotional, social and financial hardship as they were com-pelled to cope continuously with the additional burden of providing care and ensuring basic livelihood essentials.
The major challenge was the reintegration of these large numbers of PWDs back into their communi-ties where environmental accessibil-ity, non-availability of essential and rehabilitative health care facilities and attitudinal barriers continued to impede people from reaching their full potential [15]. To surmount these difficulties, a
S105
1. Kuipers P. Disability, health, and international development. Lancet, 2009, 374(9704):1813, 28.
2. Emergency & humanitarian assistance and the UN convention on the protection and promotion of the rights and dignity of persons with disabilities. Washington DC, International Disability and Development Consortium, 2010 (http://www.iddcconsor-tium.net/joomla, accessed 16 June 2010).
3. EM-DAT. The international disaster database. Brussels, Centre for Research on the Epidemiology of Disasters, 2006 (http://www.emdat.be/dat.net/disasters/Visualisation/profiles/natural-table-emdat.php, accessed 24 April 2010).
4. Pakistan earthquake facts and figures sheet – 28 March, 2006. International Federation of Red Cross and Red Crescent Socie-ties, 2005 (http://www.ifrc.org/Docs/pubs/disasters/pakista-near thquake/factsfigures0306.pdf, accessed 15 April 2010).
5. Ahmad T. The population of persons with disabilities in Paki-stan. Asia Pacific Population Journal, 1995, 10(1):39–62.
6. Population census by nature of disability 1998. Islamabad, Popu-lation Census Organization, Ministry of Economic Affairs and Statistics, 1998.
7. Disability and rehabilitation: WHO action plan 2006–2011. Ge-neva, World Health Organization, 2006.
8. Kett M, Ommeren MV. Disability, conflict, and emergencies. Lancet, 2009, 374(9704):1801–1803.
9. Despouy L. Human rights and disabled persons (Study Series 6). Geneva, Centre for Human Rights United Nations, 1993.
10. Disaster disability and rehabilitation. Geneva, World Health Or-ganization, Department of Injuries and Violence, 2005.
11. Handicap international rehabilitation activities during Pakistan earthquake 2005. Handicap International, 2006 (http://www.handicap-international.org.uk/, accessed 1 May 2010).
12. Castellano JM. Prehospital management of spinal cord injuries. Emergencies, 2007, 19:25–31.
13. Priebe MM. Spinal cord injuries as a result of earthquakes: les-sons from Iran and Pakistan. Journal of Spinal Cord Medicine, 2007, 30(4):367–368.
14. Raissi GR. Earthquake and rehabilitation needs: experiences from Bam, Iran. Journal of Spinal Cord Medicine, 2007, 30:369–372.
15. Farooq A et al. Spinal cord injury management and rehabilita-tion: highlights and shortcomings from the 2005 earthquake in Pakistan. Archives of Physical and Medical Rehabilitation, 2008, 89:579–585.
16. Hoque MF et al. Spinal cord lesions in Bangladesh: an epide-miological study 1994–1995. Spinal Cord, 1999, 37:858–861.
17. Otom AS et al. Traumatic spinal cord injuries in Jordan: an epi-demiological study. Spinal Cord, 1997, 35:253–255.
18. Rathore MFA et al. Epidemiology of spinal cord injuries in the 2005 Pakistan earthquake. Spinal Cord, 2007, 45:658–663.
19. Dong ZU et al. Spinal injuries in the Sichuan earthquake. New England Journal of Medicine, 2009, 361:636–637.
20. Shoaf KI et al. Bourque injuries as a result of California earth-quakes in the past decade. Disasters, 1998, 22(3):218–235.
21. Prabhakar MM, Dhaval R, Jadav MB. Management of mass scale dorso-lumbar injuries for early rehabilitation. Asia Pacific Dis-ability Rehabilitation Journal, 2004, 15(1):57–82.
References
regional plan for CBR was designed for the earthquake-affected districts in April 2006, with WHO technical support. The CBR programme has increased public awareness regarding disability issues, improved functional limitations, facilitated the development of targeted livelihood programmes, mandated inclusive education and empowered PWDs through the formation of village CBR committees and disabled people organizations.
The post-earthquake response relating to disabilities was unique as for the first time in the disaster-hit re-gion, an innovative concept combining
institutional and community-based re-habilitation was introduced successfully for the pre- and post-earthquake PWDs, with the intervention ultimately lead-ing to the inception of a national CBR programme in the country.
The October 2005 earthquake was a national wake-up call, as it highlighted and brought to the fore the issue of PWDs. It has also provided an oppor-tunity for introspection on the state of disaster management related to disa-bilities. Many preventable amputations and incomplete spinal cord injuries would not have resulted in permanent damage had there generally been a high
level of emergency preparedness and appropriate steps taken for disaster re-duction, mitigation and preparedness, particularly in the context of disabilities. Timely and proper referral assumes great importance vis-à-vis spinal injuries, which necessitates mandatory training not only for health professionals, but also for front-line rescuers who are the first to reach a disaster site. Pakistan’s 2005 earthquake experience should be viewed in relation to the lessons learnt, in order to ensure that lapses in the re-sponse and management that occurred are avoided in future unforeseeable adversity.
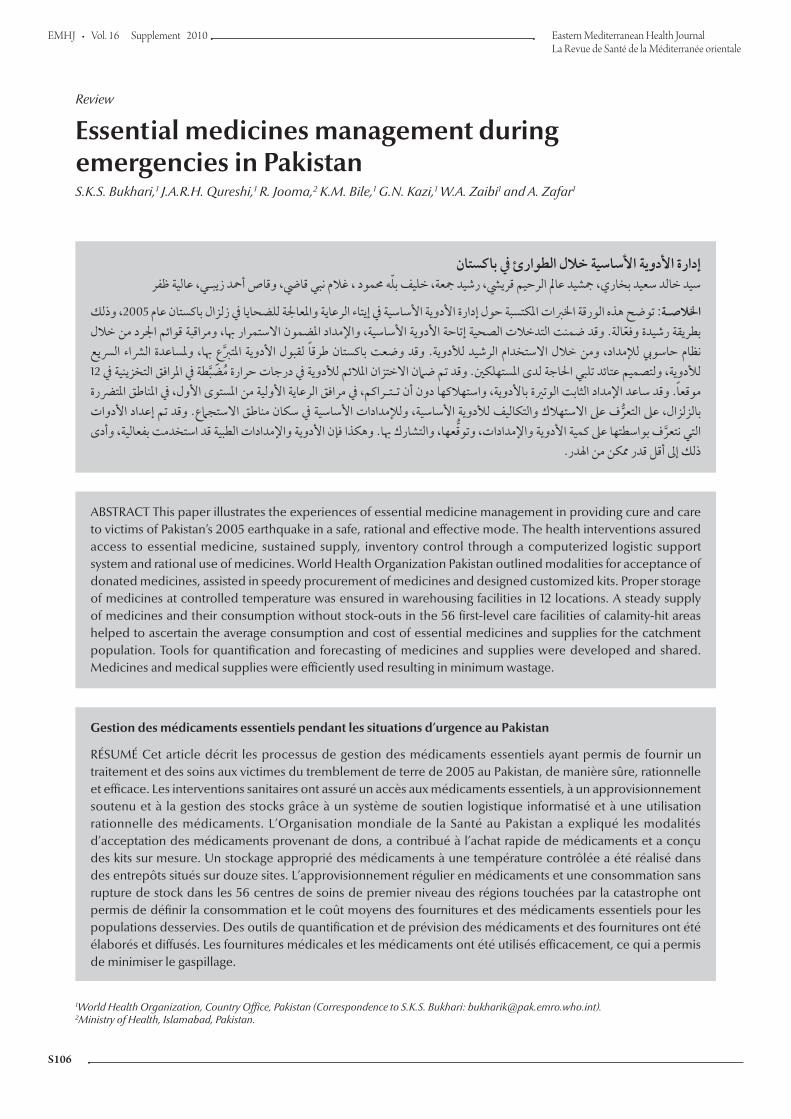
EMHJ
S106
Review
Essential medicines management during emergencies in PakistanS.K.S. Bukhari,1 J.A.R.H. Qureshi,1 R. Jooma,2 K.M. Bile,1 G.N. Kazi,1 W.A. Zaibi1 and A. Zafar1
ABSTRACT This paper illustrates the experiences of essential medicine management in providing cure and care to victims of Pakistan’s 2005 earthquake in a safe, rational and effective mode. The health interventions assured access to essential medicine, sustained supply, inventory control through a computerized logistic support system and rational use of medicines. World Health Organization Pakistan outlined modalities for acceptance of donated medicines, assisted in speedy procurement of medicines and designed customized kits. Proper storage of medicines at controlled temperature was ensured in warehousing facilities in 12 locations. A steady supply of medicines and their consumption without stock-outs in the 56 first-level care facilities of calamity-hit areas helped to ascertain the average consumption and cost of essential medicines and supplies for the catchment population. Tools for quantification and forecasting of medicines and supplies were developed and shared. Medicines and medical supplies were efficiently used resulting in minimum wastage.
1World Health Organization, Country Office, Pakistan (Correspondence to S.K.S. Bukhari: [email protected]).2Ministry of Health, Islamabad, Pakistan.
2005
12
Gestion des médicaments essentiels pendant les situations d’urgence au Pakistan
RÉSUMÉ Cet article décrit les processus de gestion des médicaments essentiels ayant permis de fournir un traitement et des soins aux victimes du tremblement de terre de 2005 au Pakistan, de manière sûre, rationnelle et efficace. Les interventions sanitaires ont assuré un accès aux médicaments essentiels, à un approvisionnement soutenu et à la gestion des stocks grâce à un système de soutien logistique informatisé et à une utilisation rationnelle des médicaments. L’Organisation mondiale de la Santé au Pakistan a expliqué les modalités d’acceptation des médicaments provenant de dons, a contribué à l’achat rapide de médicaments et a conçu des kits sur mesure. Un stockage approprié des médicaments à une température contrôlée a été réalisé dans des entrepôts situés sur douze sites. L’approvisionnement régulier en médicaments et une consommation sans rupture de stock dans les 56 centres de soins de premier niveau des régions touchées par la catastrophe ont permis de définir la consommation et le coût moyens des fournitures et des médicaments essentiels pour les populations desservies. Des outils de quantification et de prévision des médicaments et des fournitures ont été élaborés et diffusés. Les fournitures médicales et les médicaments ont été utilisés efficacement, ce qui a permis de minimiser le gaspillage.

S107
Introduction
Medicines at the right time to treat in-jured or sick people are vital elements in alleviating the anguish of people suffer-ing during catastrophes [1]. Experience with problems and solutions concern-ing the use of pharmaceutical agents during disasters is very significant for disaster health care providers [2]. Better anticipation of needs on the basis of epidemiological data of experiences and improved field disaster assessment can provide enhanced medical care during disasters [2].
A comprehensive humanitarian operation followed the massive earth-quake (7.6 on the Richter Scale), which devastated parts of northern Pakistan and Pakistan-administrated Kashmir in October 2005 affecting approximately 3.5 million people and taking a toll of about 73 000 lives in an area of around 30 000 km2 [3]. The response addressed the major challenges such as the harsh terrain hampering access, devastation of 68% of the health care infrastructure, and lifesaving relief efforts for the af-fected population residing in remote valleys. The special medical/surgical needs for 70 000 severely injured pa-tients were a priority matter [4].
Essential medicines that satisfy the priority health care needs of the popula-tion, in adequate amounts and appro-priate dosage form with uninterrupted supply, are an integral component of primary health care [5]. During emer-gencies, their significance increases many times while rational use assumes critical proportions for primary health care delivery [6].
However, during emergencies, health service delivery infrastructure may fail to provide essential medi-cines to the affected population, who are often further poverty-stricken as a consequence of a calamity. Moreover, inadequate attention to the manage-ment of medicines can result in waste of
valuable resources and deprive a suffer-ing population from equitable access to this primary assistance. The man-agement components of an essential medicine distribution system, which include warehousing facilities, supply chain system and inventorization, are interwoven, complex and crucial.
Evaluation reviews, for example from the Mexico 1985 earthquake or the Armenia 1988 earthquake, have repeatedly indicated that much of the medical supplies received from donor agencies as humanitarian assistance for the suffering population are not appropriate to their needs [7,8]. Ra-tional arrangements for negotiating and receiving need-based medicines has entailed formulation of guidelines and standard operating procedures [9,10]. Receiving inappropriate medicine sup-plies can cause management problems and jeopardize an emergency opera-tion; individuals with pharmaceutical training may facilitate the sorting of pro-cured and donated pharmaceuticals [11]. Pre-screened need-based medi-cines customized in different types of kit to cater to the requirements of suffering population may be one of the best prac-tices of essential medicine [10].
Widespread devastation caused by the earthquake in Pakistan neces-sitated significant improvements to the existing medicine management system. The pharmaceutical products and equipment arriving at disaster sites posed serious logistic and management challenges such as sorting tonnes of supplies while ensuring that urgently needed items reached the disaster vic-tims on time.
The main objective of this paper is to document the experiences gained in the management of essential medicines during the severe and prolonged calami-ties in Pakistan, highlighting the best practices and lessons learnt in managing these essential medicines and supplies for the affected population.
Methods
The data were generated through a re-view of documents that included annual reports on essential medicine manage-ment during and after the earthquake, reports of consultative workshops, World Health Organization (WHO) guidelines, standard operating proce-dures and information collected from pharmacists located in the affected dis-tricts. In addition, the relevant literature was reviewed on the subject. The re-sults were also validated from the data ascertained from the logistic support system software, which was customized and installed to suit the requirements of the warehousing, inventory control and supply chain of the essential medicines,.
Results
WHO liaised with donors on essential medicine needs, developed protocols of pre-shipment approvals, and formu-lated and disseminated guidelines on a number of critical issues.
Preparation and adaptation of guidelines/standard operating proceduresTable 1 exhibits the list of 12 guidelines and standard operating procedures developed following global principles and disseminated by WHO during the course of the emergency, as well as their objectives and the outputs received. The management of essential medicines from receiving and warehousing to their distribution to health facilities was regu-lated by these guidelines and standard operating procedures.
Prequalification of pharmaceutical productsDuring the emergency, humanitar-ian agencies and donors commenced funding the humanitarium global Health Cluster through WHO for the provision of essential medicines. The

EMHJ
S108
procurement of quality medicines in Pakistan had been a persistent concern of the donor agencies. The country has more than 500 medicine manufactur-ers and importers, having more than 50 000 registered products, making procurement of cost-effective qual-ity products complicated. To make the right selection, product-based prequali-fication criteria for local procurement were developed conforming to WHO guidelines: bioequivalence of generics in comparison with the innovator brands, biopharmaceutical classification and
compliance with current good manu-facturing practices adopted by the Drug Control Organization of the Ministry of Health, supported by its drug testing laboratories.
Preparation of customized kits based on per capita essential medicines needsTable 2 illustrates flexibility and useful-ness of the Mini Emergency Health Kit (MEHK) compared with the Inter-agency Emergency Health Kit (IEHK) listed therapeutic category and the dos-age form along with their cost. In order
to overcome size limitations, gaps and the cost of the available international kits, the medicine kits were customized to address the specific needs of the af-fected population during all phases of the emergency. The MEHK was modified from the IEHK to cater for primary health care needs including communicable, noncommunicable diseases and maternal neonatal and child health needs for a population of 6000 for one month. IEHK included 150 items: 51 medicines, 16 medical supplies and 83 assorted supplies. By
Table 1 Guidelines and standard operating procedures developed by WHO during the course of emergencies, their operational objectives and the expected outputs
Guidelines/standard operating procedures Operational objectives Outputs
WHO guidelines for medicine donations To streamline international and local medicine donations
Process of medicine donations was regulatedUnwanted, irrelevant medicines were eliminated from donations Medicine with prescribed shelf life received
Promotion of rational use of medicines To promote evidence-based use of medicine
Concept of rational use promotedEssential medicines put into practice
Standard operating procedure for BHUs and RHCs essential medicines supply chain management
To establish primary health care need-based list of medicines
Demand and supply of medicines rationalized Stock-outs were avoided
Standard treatment guidelines for outpatients for priority diseases/conditions
To provide treatment protocols at primary health care level
Prescriptions rationalizedSupply of medicines facilitated
Standard operating procedure on quantification/forecast of needs of medicines
To adopt evidence-based method of quantifying medicine needs
Medicine supply needs quantifiedStock-out avoided
Standard operating procedure for good storage and inventory control
Development of expiry calendarWarehouse assessment tool
To provide for the professional storage and inventory control of medicinesTo avoid expiry of medicineTo assess storage facility/capacity
Medicines professionally stored resulting in preservation of their efficacy
Minimum quantity of medicines expired/wastedStorage capacity/facility assessed for improvements
Standard operating procedure for safe disposal of unwanted/expired medicines
To dispose of unwanted medicines locally in safe mode Safe disposal of unwanted medicines
Monitoring tool for essential medicines at BHUs/RHCs and secondary health care facilities
To monitor essential medicines at health care facilities
The medicines supplied and used were monitored and gaps identified
Training manual for essential medicine management
To train dispensing personnel on management components of essential medicine
Dispensing personnel were trained on management components of essential medicine
Standard operating procedure for dispensing child dosage form
To ensure professional dispensation of child dosages
Dispensation of child dosage rationalized
Standard operating procedure on emergency medicine procurement
To facilitate timely procurement of quality medicines during emergencies
Quality medicines were procured in limited time
Need-based list of medicines for earthquake devastated areas
To develop a rational list of essential medicines for earthquake victims
Unwanted medicines were neither requisitioned nor procured
BHUs = basic health units; RHUs = rural health units.

S109
contrast, the MEHK consisted of 110 items: 86 medicines and 24 medical supplies catering for the treatment of malaria, diabetes, abdominal spasms, epilepsy and acute bronchial asthma. The medicines and supplies in the IEHK did not cover the diseases stated above
or the dosage forms for all age groups and conditions. The per capita cost of an IEHK was estimated at US$ 0.313 compared to US$ 0.166 for a MEHK. The customized kits also included kits for personal protective equipment, anti-scabies medicines and family hygiene,
surgery, trauma, mental health, safe birth and cholera.
In the earthquake affected areas, 56 first-level healthcare facilities were regularly provided with the essential medicines without stock-outs till their use had stabilized. This intervention
Table 2 Flexibility and usefulness of Mini Emergency Health Kit (MEHK) compared with Interagency Emergency Health Kit (IEHK) listed therapeutic category and the dosage form along with their cost comparison
Therapeutic category No. of items
Dosage form in MEHK No. of items
Dosage form in IEHK
S L INH INJ E S L INH INJ E
Local anaesthetics/preoperative medication/anaphylactic shock 3 2
Antimalarial therapy 4 0
Medicines acting on gastrointestinal tract/antacids and other anti-ulcer 3 1
Antibacterial therapy 8 2
Medicines acting on cardiovascular system/antihypertensive 6 3
Antidotes for poisoning 2 1
Scabicides/pediculicides 1 1
Antiepilepsy/anticonvulsants 1 0
Ophthalmic preparations 3 1
Disinfectants and antiseptics 2 2
Antiallergics and drugs used in anaphylaxis 3 1
Antifungal preparations 2 2
Parenterals 5 3
Analgesics, antipyretics, nonsteroidal anti-inflammatory medicines 3 2
Antianaemic medicines 2 2
Diuretics 1 1
Antidiabetic preparations 3 0
Anti-infective medicines/ anthelmintic medicines/ antiprotozoals 2 2
Oxytocics 3 1
Oral rehydration therapy 1 1
Antispasmodic preparations 1 0
Topical antibiotics 2 1
Antiasthmatic therapy 1 1
Micronutrients 1 1
Water chlorination/purification tablet/sachet 1 1
Consumables/supplies 24 16
Costing US$ 1000 for providing one month coverage to 6000 population
US$ 1881 for partial coverage to 6000 population for one month
Per capita cost US$ 0.166 US$ 0.313
S = solid preparations; L= liquid preparations; INH = inhalation; INJ = injectable; E = external preparations.
= dosage form available.

EMHJ
S110
was regularly followed by monitoring to determine the consumption of es-sential medicines and supplies. Morbid-ity data and consumption data were used for forecasting and calculating the demands. In the subsequent year, consumption data of the previous year facilitated the estimation of per capita consumption and cost. These data also assisted to determine the composition of the MEHK.
Wastage of medicines and suppliesFigure 1 presents a comparison of wast-age of medicines during major global disasters, where the authorities were confronted with operational challenges such as short shelf life, lack of expiry date and unsolicited donation: much medicine was wasted during major emergencies in recent decades com-pared to an average of 1.3% per annum waste in Pakistan varying from 0.8% to 2.1%. This wastage was calculated from data ascertained from logistic support system records. In accordance with the set standard operating procedures all the expired/wasted medicines were recalled to a central warehouse and re-entered into logistic support system. This revalidated the actual wastage and was disposed off according to WHO guidelines at high temperature incinera-tion.
Coordination with medicine donors and major stakeholdersThrough collaboration of the Minis-try of Health and WHO, a donation receiving centre was established at the Pakistan Institute of Medical Sciences, the largest tertiary care hospital in the capital. Contacts were established with international donors informing them of the essential medicines, vaccines, biologicals and surgical supplies needed. Almost 25% of the medicines offered for donations were not accepted as they were either not relevant or possessed a short shelf life. WHO established sustainable partnerships with donors such as International Health Partners (UK), Health Partners International of Canada and AmeriCares (USA) to ensure donations conformed to WHO drug donation guidelines, rational se-lection and maximum shelf life. The core principles of these guidelines are: all donations should be based on an expressed need and that unsolicited drug donations are to be discouraged; donations should be supportive of exist-ing government health policies; there should be no double standards: if the quality of an item is unacceptable in the donor country, it is also unacceptable as a donation; and there should be ef-fective communication between the donor and the recipient. The Ministry of
Health, WHO and Health Cluster part-ners closely coordinated the provision and management of essential medicine and information on their subsequent distribution was regularly shared with Health Cluster partners.
Consultative workshop for sharing best practicesThe Ministry of Health, in collabora-tion with the Pakistan Earthquake Reconstruction and Rehabilitation Au-thority, International Health Partners and WHO, organized an international partners’ consultation for experience-sharing on supply and management of essential medicine during the disaster. The deliberations identified the lessons learnt and developed pragmatic recom-mendations for future reference. The interventions that went particularly well included the speedy transfer of medi-cines by WHO from the ports to the end user, no stock-outs, sorting and inventorying and the deployment of pharmacists overseeing the key manage-ment functions. The recommendations for the best practices include: the need for technical expertise, development of standard operating procedures for fu-ture disasters; an agreed list of essential medicines for all three phases of disasters (trauma phase; relief phase and rehabili-tation phase); establishment of a focal point for medicine management; and information-sharing and a web-based network to facilitate communication between medical teams, partners and donors.
Supply chain managementTable 4 depicts the magnitude of medi-cine donations received, medicines pro-cured, the beneficiary population and wastage of medicines during 2005–09. The supply chain system was reinforced by establishing warehouses conforming to WHO standards such as good storage practices and inventory control. One central warehouse was established in Is-lamabad, two in Khyber-Pakhtunkhwa and nine in Balochistan for ongoing
Figure 1 Comparison of wastage of medicines during major global disasters
Percentage of donated medicine wasted
80
70
60
50
40
30
20
10
0Albania Armenia Bosnia Kosovo Tsunami Pakistan
%
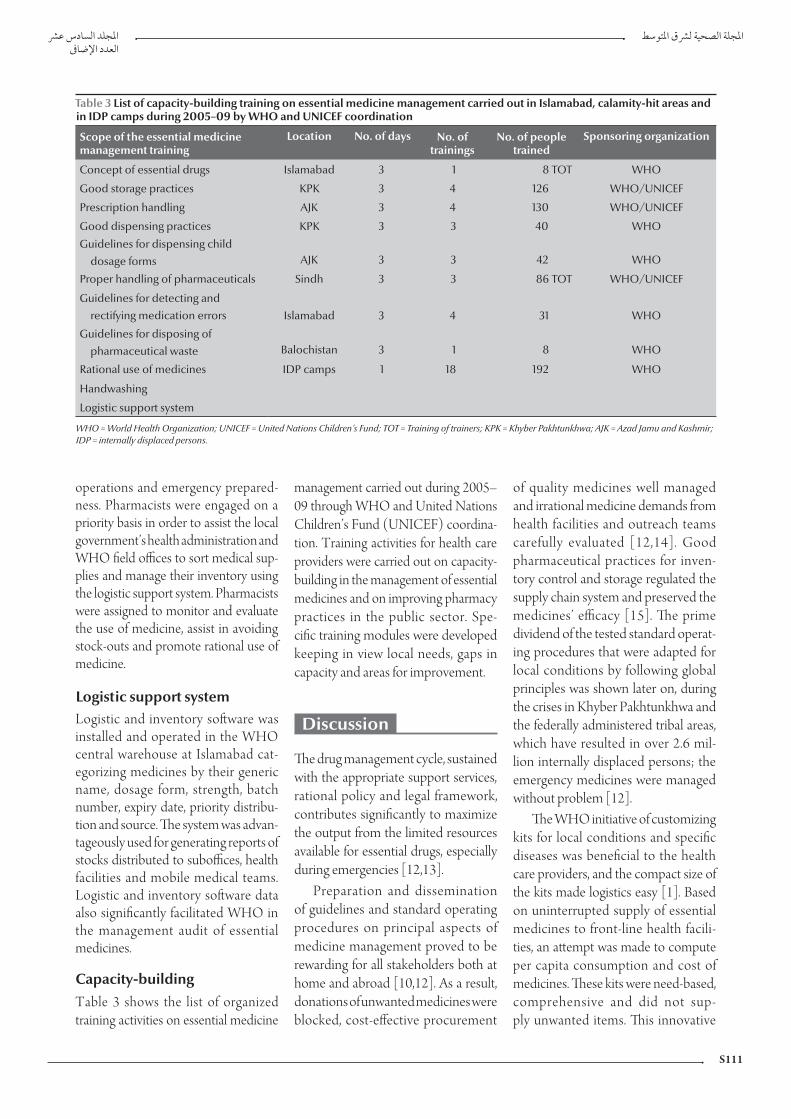
S111
operations and emergency prepared-ness. Pharmacists were engaged on a priority basis in order to assist the local government’s health administration and WHO field offices to sort medical sup-plies and manage their inventory using the logistic support system. Pharmacists were assigned to monitor and evaluate the use of medicine, assist in avoiding stock-outs and promote rational use of medicine.
Logistic support systemLogistic and inventory software was installed and operated in the WHO central warehouse at Islamabad cat-egorizing medicines by their generic name, dosage form, strength, batch number, expiry date, priority distribu-tion and source. The system was advan-tageously used for generating reports of stocks distributed to suboffices, health facilities and mobile medical teams. Logistic and inventory software data also significantly facilitated WHO in the management audit of essential medicines.
Capacity-buildingTable 3 shows the list of organized training activities on essential medicine
management carried out during 2005–09 through WHO and United Nations Children’s Fund (UNICEF) coordina-tion. Training activities for health care providers were carried out on capacity-building in the management of essential medicines and on improving pharmacy practices in the public sector. Spe-cific training modules were developed keeping in view local needs, gaps in capacity and areas for improvement.
Discussion
The drug management cycle, sustained with the appropriate support services, rational policy and legal framework, contributes significantly to maximize the output from the limited resources available for essential drugs, especially during emergencies [12,13].
Preparation and dissemination of guidelines and standard operating procedures on principal aspects of medicine management proved to be rewarding for all stakeholders both at home and abroad [10,12]. As a result, donations of unwanted medicines were blocked, cost-effective procurement
of quality medicines well managed and irrational medicine demands from health facilities and outreach teams carefully evaluated [12,14]. Good pharmaceutical practices for inven-tory control and storage regulated the supply chain system and preserved the medicines’ efficacy [15]. The prime dividend of the tested standard operat-ing procedures that were adapted for local conditions by following global principles was shown later on, during the crises in Khyber Pakhtunkhwa and the federally administered tribal areas, which have resulted in over 2.6 mil-lion internally displaced persons; the emergency medicines were managed without problem [12].
The WHO initiative of customizing kits for local conditions and specific diseases was beneficial to the health care providers, and the compact size of the kits made logistics easy [1]. Based on uninterrupted supply of essential medicines to front-line health facili-ties, an attempt was made to compute per capita consumption and cost of medicines. These kits were need-based, comprehensive and did not sup-ply unwanted items. This innovative
Table 3 List of capacity-building training on essential medicine management carried out in Islamabad, calamity-hit areas and in IDP camps during 2005–09 by WHO and UNICEF coordination
Scope of the essential medicine management training
Location No. of days No. of trainings
No. of people trained
Sponsoring organization
Concept of essential drugs Islamabad 3 1 8 TOT WHO
Good storage practices KPK 3 4 126 WHO/UNICEF
Prescription handling AJK 3 4 130 WHO/UNICEF
Good dispensing practices KPK 3 3 40 WHO
Guidelines for dispensing child dosage forms AJK 3 3 42 WHO
Proper handling of pharmaceuticals Sindh 3 3 86 TOT WHO/UNICEF
Guidelines for detecting and rectifying medication errors Islamabad 3 4 31 WHO
Guidelines for disposing of pharmaceutical waste Balochistan 3 1 8 WHO
Rational use of medicines IDP camps 1 18 192 WHO
Handwashing
Logistic support system
WHO = World Health Organization; UNICEF = United Nations Children’s Fund; TOT = Training of trainers; KPK = Khyber Pakhtunkhwa; AJK = Azad Jamu and Kashmir; IDP = internally displaced persons.

EMHJ
S112
experience of tailored kits suitable for the local conditions was cost-effective and convenient to primary health care providers [2,10].
In the aftermath of the earthquake, the bulk of the medicines first received was stored efficiently [15,16]. Concur-rent with the establishment of the central warehouse, WHO acquired the services of pharmacists for sorting and inven-torying volumes of medicine stocks, making expiry calendars and promoting rational medicine use [2,11]. Installa-tion of a logistic support system estab-lished transparency and traceability in the management of essential medicine and humanitarian supplies, facilitated audit of donated medicines along with a record of an individual Health Cluster partner’s transactions. These schemes were instrumental in optimizing the use of procured and donated medicines during emergencies and resulted in a low level of medicine expiry.
Experience has demonstrated that donated medicines can create serious problems. In the earthquakes in Mexico City (1985) and Armenia (1988) the quantity of medicines and medical sup-plies received far exceeded the need and a significant percentage of the medicines had expired by the time it arrived at the disaster site [7,8,17]. A sizable portion was destroyed by frost, while the remain-der that was relevant to the emergency was labelled without generic names [14]. In the Indian Ocean tsunami relief efforts in 2004, a substantial amount of donated medicines was reported to
have been wasted [1]. The actual cost of disposing of unwanted medicines was significantly high [18]. A WHO audit of humanitarian medicine donations received in Albania during May 1999 for Kosovo refugees revealed that half of the medicines were inappropriate and required elimination [19]. Similarly in Bosnia, medicines were wasted due to either being inappropriate or lacking expiry dates [20].
On the contrary, operational guidelines, prescreening of medicines, placement of pharmacists, sorting and computerized inventorying, and good storage practices have significantly con-tributed to the limited waste of medi-cine in Pakistan which ranged between 0.8% and 2.1% during the past five years. The experience of essential medicine management during emergencies in Pakistan is marked by realistic planning, induction of operational guidelines and standard operating procedures, focused administration and continuous coordi-nation of health cluster partners.
The medical and paramedical staff that were trained on essential medicines management in the districts affected by emergencies during the past few years were gainfully deployed by local govern-ments for good storage and dispens-ing practices and proper handling of pharmaceuticals. This pool of human resources has been providing indispen-sable technical assistance in subsequent emergencies.
The essential medicines consulta-tive workshop held eight months after
the earthquake reflected the collective wisdom of stakeholders regarding les-sons learnt, interventions that went very well and the things to bear in mind for future disasters. The factors that contributed to the successful operation in Pakistan included: effective liaison with international donors; preparation of a list of essential medicines according to the type and level of disaster; des-ignation of focal persons for medicine management; induction of pharma-ceutical expertise to implement inven-tory management software in disaster preparedness plans; preparation of a list of prequalified products; and continu-ing communication between health cluster partners for avoiding duplica-tion and optimizing the use of existing medical supplies. The collective experi-ences shared and discussed through this consultative process was reliable and provided practice-based evidence for the future.
Preparation and dissemination of standard operating procedures tailored to local conditions are remarkably ef-fective for coordination and optimal use of resources. Effective manage-ment techniques prevent stock-outs, while sound selection criteria enable filtering of quality products from a complex market. Medicine procure-ment and donations can be acquired and used most efficiently, provided the requisite standard operating pro-cedures and trained human resources and management skills are in place from the start.
Table 4 The magnitude of medicine donations received, medicines procured, the beneficiary population and wastage of medicines, Pakistan, 2005–09
Year Population catered for (million)
Donation of medicines (US$)
Procurement of medicines (US$)
Wastage (US$) Percentage wastage
2005 11 4 858 326 1 288 159 79 904 1.30
2006 15 2 728 640 557 446 69 431 2.11
2007 5 0 700 416 5 603 0.80
2008 16 795 180 806 838 25 632 1.60
2009 47 4 319 603 2 159 074 61 548 0.95

S113
References
1. Hechmann R, Bunde-Birouste A. Drug donations in emer-gencies: the Sri Lankan post tsunami experience. Journal of Humanitarian Assistance, 2007 (http://jha.ac/2007/09/26/drug-donations-in-emergencies-the-sri-lankan-post-tsunami-experience/, accessed 13 July 1020).
2. Hogan DE, Burstien JL. Disaster medicine. Philadelphia, Lippin-cott & Williams, 2007.
3. Khadim MT et al. 8th October 2005 earthquake: an experience of diagnostic laboratory services in disaster. Pakistan Armed Forces Medical Journal, 2006, 56(4):433–437.
4. Pakistan 2005 earthquake: preliminary damage and needs assess-ment. Islamabad, Asian Development Bank, 2005.
5. Understanding essential medicines and primary health care. Contact [Kenya] 2009, 187:2–3.
6. Van Damme WI, Van Lerberghe WL, Boelaert M. Primary health care vs. emergency medical assistance: a conceptual framework. Health Policy and Planning, 2002, 17(1):49–60.
7. Hairapetian A et al. Drug supply in the aftermath of the 1988 Armenian earthquake. Lancet, 1990, 335(8702):1388–1390.
8. Zeballos JL. Health aspects of the Mexico earthquake—19 Sep-tember 1985. Disasters, 1986, 10:141–149.
9. Hogerzeil HV, Couper MR, Gray R. Education and debate: guidelines for drug donations. British Medical Journal, 1997, 314:737–740.
10. Forte GB. Private donations for former Yugoslavia. WHO Drug Information, 1994, 8(4).
11. Nestor A et al. Pharmaceutical services at a medical site after Hurricane Andrew. American Journal of Hospital Pharmacy, 1993, 50(9):1896–1898.
12. Management of drugs at health centre level: Training manual. Brazzaville, Regional Office for Africa, World Health Organiza-tion, 2004.
13. Pomatto V, Schuftan C. Review of quality assurance (QA) mecha-nisms for medicines and medical supplies in humanitarian aid: guidelines. Aachen, Germany, European Commission, 2006.
14. Guidelines for drug donation. Geneva, World Health Organiza-tion, 1999 (WHO/EDM/PAR/99.4).
15. Whybark C. Issues in managing disaster relief inventories. International Journal of Production Economics, 2007, 108(1–2-):228–235.
16. Autier P et al. HNP discussion paper: drug donations in post-emergency situations. The International Bank for Reconstruction and Development, 2002.
17. Ciottone GR. Disaster medicine. St Louis, Mosby Inc., 2006.
18. Guidelines for safe disposal of unwanted pharmaceuticals in and after emergencies. Geneva, World Health Organization, 1999 (WHO/HTP/EDM/99.2).
19. WHO drug donation audit in Albania reveals many expired and unusable “gifts”. World Health Organization, 1999 (http://www.reliefweb.int/rw/rwb.nsf/db900SID/ACOS-64-BF55?OpenDocument, accessed 13 July 2010).
20. Essential Drugs Monitor. Geneva, World Health Organization, 1999, (27).
EMHJ
S114
Report
The impact of the disease early warning system in responding to natural disasters and conflict crises in PakistanM. Rahim,1 B.M. Kazi,2 K.M. Bile,1 M. Munir 1 and A.R. Khan 1
ABSTRACT The disease early warning system (DEWS) was introduced in the immediate aftermath of the 2005 earthquake in Pakistan, with the objective to undertake prompt investigation and mitigation of disease outbreaks. The DEWS network was replicated successfully during subsequent flood and earthquake disasters as well as during the 2008–09 internally displaced persons’ crisis. DEWS-generated alerts, prompt investigations and timely responses had an effective contribution to the control of epidemics. Through DEWS, 1360 reported alerts during 2005–09 averted the risk of disease outbreaks through pre-emptive necessary measures, while the 187 confirmed outbreaks were effectively controlled. In the aftermath of the disasters, DEWS technology also facilitated the development of a disease-surveillance system that became an integral part of the district health system. This study aims to report the DEWS success and substantiate its lead role as a priority emergency health response intervention.
1World Health Organization, Country Office Islamabad, Pakistan (Correspondence to M. Rahim: [email protected]).2National Institute of Health, Islamabad, Pakistan.
2005
2009 – 2008
187 2009 – 2005 1360
Effets du système d’alerte précoce pour les maladies sur la riposte aux crises entraînées par les catastrophes naturelles et les conflits au Pakistan
RÉSUMÉ Le système d’alerte précoce pour les maladies a été mis en place immédiatement après le tremblement de terre survenu au Pakistan en 2005, dans le but d’entreprendre des recherches et d’atténuer rapidement les flambées de maladies. Le réseau de ce système a été remis en service avec succès lors des inondations et des tremblements de terre suivants, ainsi qu’en 2008–2009 lors de la crise des déplacements internes de population. Les alertes générées par le système d’alerte précoce pour les maladies, les recherches rapides et la riposte opportune ont contribué efficacement à la lutte contre les épidémies. Grâce au système, 1360 alertes émises entre 2005 et 2009 ont permis d’éviter le risque de flambées de maladies au moyen de mesures préventives, et 187 flambées confirmées ont été endiguées de manière efficace. Suite aux différentes catastrophes, la technologie liée à ce système a également facilité la mise en place d’un système de surveillance des maladies qui fait désormais partie intégrante du système de santé des districts. Le but de cette étude est de décrire la réussite du système d’alerte précoce et de prouver son rôle déterminant en tant qu’intervention prioritaire dans la riposte sanitaire aux situations d’urgence.

S115
Introduction
In the past five years a range of humani-tarian disasters has cumulatively affected over eight million people and mobilized enormous national and international humanitarian responses in Pakistan. The earthquake of 8 October 2005, which jolted the northern parts of the country, was the most devastating humanitarian crisis that has hit Pakistan for many dec-ades. In June 2007, the cyclone Yemyin and flash floods devastated large parts of Sindh and Baluchistan provinces, and the situation was further exacerbated in 2008 by an earthquake that affected two districts of Baluchistan. In 2008–09, the evolving security challenges in the Federally Administered Tribal Areas (FATA) and Khyber Pakhtunkhwa re-sulted in the displacement of over 2.6 million people.
Massive population displacements are generally associated with high rates of mortality due to infectious diseases [1–3]. Death rates over 60-fold from baseline have been recorded in refugee and displaced people, with over three-quarters of these being caused by communicable diseases [2]. In 1994, between 6% and 10% of the Rwandan refugee population died during their early arrival in Zaire, a death rate that was two to three times higher than previous reports from Thailand, Sudan and Somalia and predominantly related to acute diarrhoeal disease outbreaks [4]. In the Darfur crisis between March 2003 and December 2008, 80% of the estimated excess deaths (300 000) reg-istered during the stabilization period were caused by communicable diseases such as diarrhoea [3].
Displaced populations in camp settings are at high risk of infectious diseases due to a range of risk factors that act synergistically, e.g. inadequate shelter and overcrowding, unsafe drink-ing water supply system, poor sanita-tion, poor personal hygiene, low vaccine coverage and disruption of health serv-ices [5]. A review study reported that
10 out of 11 measles’ outbreaks either occurred in postconflict situations with collapsed health systems and disrupted immunization services or in settings characterized by poor or no vaccina-tion of the target population prior to displacement; a high case fatality rate of over 5%, significantly higher than that observed in a stable population, was reported from six of the nine outbreaks reviewed [6].
No fatalities were recorded among Burundian refugees in Tanzanian camps and among tsunami victims in India, sub-stantiated by the active surveillance and early case detection and management in both of these displaced populations [7]. Applying disease-control measures after an initial assessment of the emer-gency situation is not a guarantee that communicable diseases will not spread [8]. Conversely, the organization of an early warning system, reporting a set of selected notifiable diseases and envisag-ing an effective investigation and rapid diagnostic confirmation, characterizes the core strategy for the effective con-trol of epidemics during emergencies [8–12].
DEWS is a mechanism offering prompt and early detection of potential outbreaks and providing opportunities for immediate response [13,14]. DEWS was introduced and implemented in the aftermath of the 2005 earthquake as the disease-surveillance network of choice and this successful system was replicat-ed in subsequent disasters. Under the parameters of DEWS, a regular weekly reporting system, covering 16 selected priority diseases and conditions of public health importance, was initiated [15,16]. Utilizing the DEWS network, health workers were able to detect the first indication of a DEWS-notifiable disease or condition, providing the opportunity to prevent its spread and related morbidity and mortality. Every disease alert reported from any of the participating health facilities operating in the affected areas was immediately
investigated and the necessary response action considered.
The objective of this paper is to re-view the DEWS implementation proc-ess and report the outcomes attained through this successful experience ex-tended over four major emergencies that affected Pakistan during 2005–2009.
Methods
The DEWS data included the number of consultations and deaths disaggre-gated by age and gender obtained from all participating units, including public sector health facilities, improvised facili-ties in camps and mobile medical teams, using a standard reporting form. A com-puter application in Microsoft Access was utilized for data entry and analysis. The collated information included the weekly outpatient data, reported alerts and detected outbreaks during all four major emergencies in Pakistan from 2005 to 2009.
The DEWS coverage expanded with the evolving situation and the number of reporting units changed over time. To adjust to this change, the reported data were analysed by calculating the average number of detected cases, alerts and outbreaks per 100 reporting units, as a standard measure for trend analysis that was carried out for four main diseases, measles, acute watery diarrhoea, acute jaundice syndrome and dengue fever, as they accounted for the majority of the reported alerts and detected outbreaks.
Results
The DEWS network was implemented within two weeks following the 2005 earthquake and covered the affected districts in close collaboration with the Ministry of Health, the Government of Pakistan Administered Kashmir (PAK) and Khyber Pakhtunkhwa province and health cluster partners. Standard case definitions were clearly outlined and

EMHJ
S116
alert and outbreak thresholds for the pri-ority notifiable diseases and conditions explicitly defined, to ensure uniformity of reporting, timeliness and detection accuracy and to undertake immediate control measures when necessary.
Table 1 illustrates the alert and outbreak thresholds for the priority diseases and conditions under DEWS surveillance. These stated definitions and thresholds improved the sensitiv-ity of reporting and impacted on the promptness of response interventions.
An exhaustive surveillance network was established and expanded, covering all the functioning health facilities in the affected districts. The number of reporting sites in the 2005 earthquake-affected districts had increased from an initial 19 to 133 by December 2005. The same DEWS network was established in all subsequent disasters, such as the floods in Sindh and Baluchistan, the
2008 earthquake in Baluchistan and the 2008–2009 internally displaced per-sons (IDPs) crisis in FATA and Khyber Pakhtunkhwa. By December 2009, the DEWS network had expanded to 1319 health facilities in 50 emergency-affect-ed districts. From October 2005 to December 2009, more than 28 million consultations were recorded, with acute respiratory infection being the leading cause and accounting for around seven million (25%) consultations, followed by acute diarrhoea (8%), suspected malaria (5%) and scabies (5%).
Figure 1 illustrates the framework of the sequential tasks and related support, and capacity-building activities relevant to DEWS. All detected alerts led to verification, investigation, confirmation and mitigation response interventions. Investigation results uncovered mis-diagnoses, detection of cases below the
epidemic threshold level or confirmed evident outbreaks.
DEWS teams were deployed in the target districts to develop the surveil-lance network infrastructure and train health care providers on standard case definitions, data collection and report-ing, including alerts, and to initiate an immediate response when outbreaks were confirmed. The district health of-fices were supported with information technology equipment and software for data collection and management. Contingency stockpiling of medicines and supplies was organized at strategic district locations to ensure a prompt and effective response. Sample col-lection and transportation were also facilitated to access the specialized labo-ratory facilities of the National Institute of Health, Islamabad, a World Health Organization (WHO) collaborating centre.
Table 1 The set diagnostic thresholds for alerts and outbreaks relevant to the disease entities incorporated in the disease early warning system (DEWS) surveillance network
Disease/condition Thresholds
Alerts Outbreaks
Acute lower respiratory infection
Twice the average number of cases of the previous three weeks for a given location
Clustering of cases in a single location above the alert threshold
Acute upper respiratory infection
Twice the average number of cases of the previous three weeks for a given location Not specified until infectious agent is identified
Acute diarrhoea (non cholera)
Twice the average number of cases of the previous three weeks for a given location
Clustering of cases in a single location above the alert threshold
Acute watery diarrhoea (suspected cholera)
One suspected case A confirmed case, or a cluster of three or more suspected cases in a single locality
Bloody diarrhoea Three or more cases in one location Doubling of case-load from alert threshold in one location
Haemorrhagic fever One probable case One confirmed case
Acute jaundice syndrome Three or more cases in one location A cluster of 8–10 cases in one location
Malaria Twice the average number of cases of the previous three weeks for a given location
Clustering of cases in a single location above the alert threshold
Measles One case Five or more cases in a single location
Meningococcal meningitis One case Two or more confirmed cases from a single location
Acute flaccid paralysis One suspected case One confirmed case
Unexplained fever One death or twice the average number of cases of the previous three weeks for a given location
Not specified until infectious agent is identified
Neonatal tetanus One case requires investigation for safe birth practices
None (does not spread)
Scabies Twice the average number of cases of the previous three weeks for a given location
To be determined by trends (recently added to surveillance)
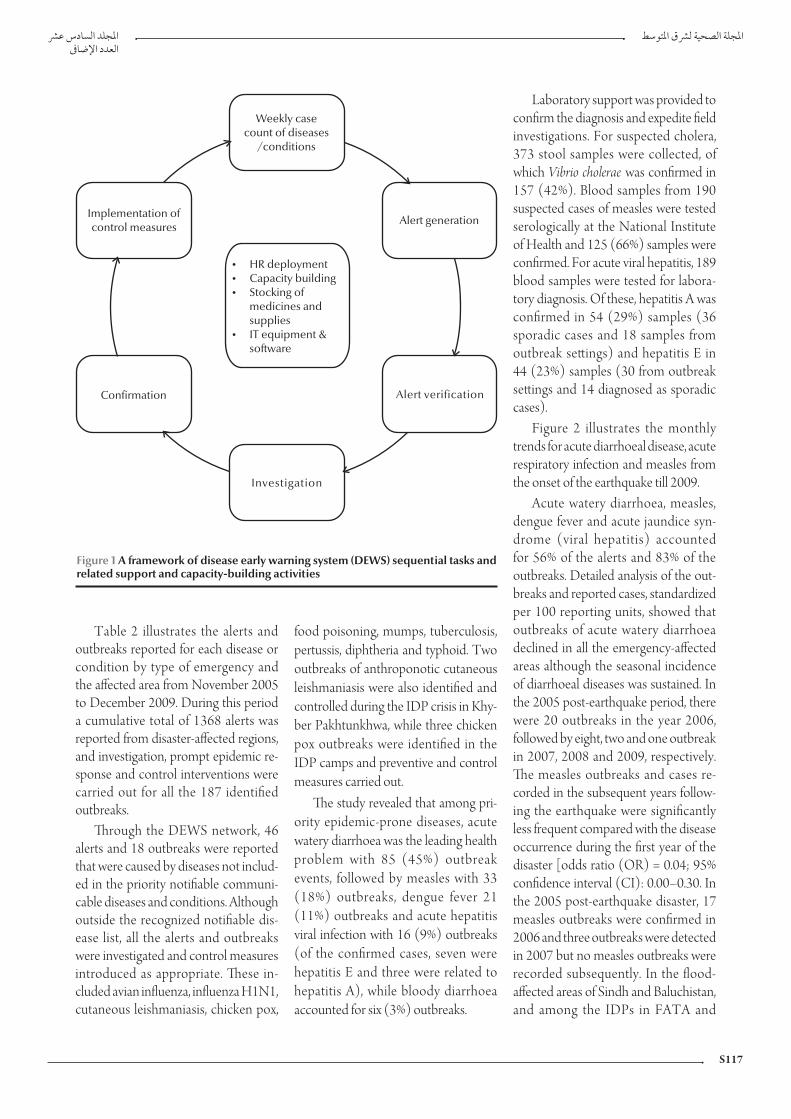
S117
Table 2 illustrates the alerts and outbreaks reported for each disease or condition by type of emergency and the affected area from November 2005 to December 2009. During this period a cumulative total of 1368 alerts was reported from disaster-affected regions, and investigation, prompt epidemic re-sponse and control interventions were carried out for all the 187 identified outbreaks.
Through the DEWS network, 46 alerts and 18 outbreaks were reported that were caused by diseases not includ-ed in the priority notifiable communi-cable diseases and conditions. Although outside the recognized notifiable dis-ease list, all the alerts and outbreaks were investigated and control measures introduced as appropriate. These in-cluded avian influenza, influenza H1N1, cutaneous leishmaniasis, chicken pox,
food poisoning, mumps, tuberculosis, pertussis, diphtheria and typhoid. Two outbreaks of anthroponotic cutaneous leishmaniasis were also identified and controlled during the IDP crisis in Khy-ber Pakhtunkhwa, while three chicken pox outbreaks were identified in the IDP camps and preventive and control measures carried out.
The study revealed that among pri-ority epidemic-prone diseases, acute watery diarrhoea was the leading health problem with 85 (45%) outbreak events, followed by measles with 33 (18%) outbreaks, dengue fever 21 (11%) outbreaks and acute hepatitis viral infection with 16 (9%) outbreaks (of the confirmed cases, seven were hepatitis E and three were related to hepatitis A), while bloody diarrhoea accounted for six (3%) outbreaks.
Laboratory support was provided to confirm the diagnosis and expedite field investigations. For suspected cholera, 373 stool samples were collected, of which Vibrio cholerae was confirmed in 157 (42%). Blood samples from 190 suspected cases of measles were tested serologically at the National Institute of Health and 125 (66%) samples were confirmed. For acute viral hepatitis, 189 blood samples were tested for labora-tory diagnosis. Of these, hepatitis A was confirmed in 54 (29%) samples (36 sporadic cases and 18 samples from outbreak settings) and hepatitis E in 44 (23%) samples (30 from outbreak settings and 14 diagnosed as sporadic cases).
Figure 2 illustrates the monthly trends for acute diarrhoeal disease, acute respiratory infection and measles from the onset of the earthquake till 2009.
Acute watery diarrhoea, measles, dengue fever and acute jaundice syn-drome (viral hepatitis) accounted for 56% of the alerts and 83% of the outbreaks. Detailed analysis of the out-breaks and reported cases, standardized per 100 reporting units, showed that outbreaks of acute watery diarrhoea declined in all the emergency-affected areas although the seasonal incidence of diarrhoeal diseases was sustained. In the 2005 post-earthquake period, there were 20 outbreaks in the year 2006, followed by eight, two and one outbreak in 2007, 2008 and 2009, respectively. The measles outbreaks and cases re-corded in the subsequent years follow-ing the earthquake were significantly less frequent compared with the disease occurrence during the first year of the disaster [odds ratio (OR) = 0.04; 95% confidence interval (CI): 0.00–0.30. In the 2005 post-earthquake disaster, 17 measles outbreaks were confirmed in 2006 and three outbreaks were detected in 2007 but no measles outbreaks were recorded subsequently. In the flood-affected areas of Sindh and Baluchistan, and among the IDPs in FATA and
Figure 1 A framework of disease early warning system (DEWS) sequential tasks and related support and capacity-building activities
Weekly casecount of diseases
/conditions
Alert generationImplementation ofcontrol measures
�
�
�
�
HR deploymentCapacity buildingStocking ofmedicines andsuppliesIT equipment &software
Confirmation Alert verification
Investigation

EMHJ
S118
Khyber Pakhtunkhwa, a declining mea-sles trend was observed, though this was not significant.
During the four-year surveillance in all disaster-affected areas, no significant decline was observed in the number of outbreaks or case-load of dengue fever, or change in the seasonality of the disease occurrence. In the 2005 earthquake-affected area, acute jaun-dice syndrome cases dropped gradually and significantly over the subsequent years as compared with the first post-earthquake year (OR = 0.18; 95% CI: 0.11–0.30). In the 2005 post-earthquake period, there were nine acute jaundice syndrome outbreaks in 2006, followed by three and two outbreaks in 2007 and 2008, respectively, while no outbreaks were detected in 2009.
Discussion
Communicable diseases are of major public health concern in Pakistan, with yearly outbreaks of waterborne, vector-borne and vaccine-preventable diseases that worsen during emergen-cies [1,10,17]. The prompt establish-ment of DEWS immediately after the October 2005 earthquake led to the early detection of potential outbreaks and prompted rapid control interven-tions that prevented a large number of alerts evolving into full-blown disease outbreaks, mitigating the risk among this vulnerable population. Drawing experience from this successful lesson, the DEWS surveillance network was replicated in subsequent emergencies in Pakistan.
The close collaboration of the Min-istry of Health and health cluster part-ners in DEWS implementation ensured its acceptability, technical soundness and practical viability [17]. Alerts and outbreaks for priority diseases were frequently detected and controlled ef-fectively, including those encountered but not officially recognized as DEWS-notifiable diseases, e.g. avian influenza, influenza H1N1 and leishmaniasis. As reported from previous humanitarian interventions elsewhere, the majority of outbreaks in Pakistan were encountered at the outset of the emergencies [1]. The successful implementation of the DEWS network in subsequent emer-gencies was substantiated by the merit of its operational feasibility, effective disease-control impact, acceptability to the health cluster partners and generous
Table 2 Alerts and outbreaks reported through the DEWS surveillance network related to the three natural disasters that hit Pakistan during 2005–2008 and the 2008–2009 IDP crisis
Diseases/conditions
Earthquake, PAK and Khyber
Pakhtunkhwa
Floods, Sindh
Floods and earthquake, Baluchistan
IDP crisis, Khyber
Pakhtunkhwa
Total
Nov. 05–Dec. 09 Aug. 07–Dec. 09 Aug. 07–Dec. 09 Aug. 08–Dec. 09
Alerts Outbreaks Alerts Outbreaks Alerts Outbreaks Alerts Outbreaks Alerts Outbreaks
No. No. No. No. No. No. No. No. No. % No. %
Acute flaccid paralysis 102 0 73 1 7 0 16 1 198 14.47 2 1.06
Acute jaundice syndrome 142 16 40 0 0 0 4 0 186 13.59 16 8.55
Acute respiratory infection 17 1 6 1 0 0 0 0 23 1.68 2 1.06
Acute watery diarrhoea 122 33 66 13 13 9 60 30 261 19.07 85 45.45
Bloody diarrhoea 42 3 15 0 2 0 5 3 64 4.67 6 3.20
Crimean-Congo haemorrhagic fever 4 0 0 0 0 0 2 1 6 0.43 1 0.53
Dengue haemorrhagic fever 20 3 24 13 0 0 11 5 55 4.02 21 11.22
Unexplained fever 3 0 0 0 0 0 0 0 3 0.21 0 0
Malaria 24 1 5 1 3 0 3 0 35 2.55 2 1.06
Measles 199 26 31 2 11 1 25 4 266 19.44 33 17.64
Meningitis 101 1 51 0 0 0 1 0 153 11.18 1 0.53
Tetanus 3 0 1 0 0 0 0 0 4 0.29 0 0
Neonatal tetanus 5 0 61 0 1 0 1 0 68 4.97 0 0
Others 14 7 3 3 0 0 29 8 46 3.36 18 9.62
Total 798 91 376 34 37 10 157 52 1368 100 187 100
PAK = Pakistan Administered Kashmir; IDP = internally displaced persons.

S119
funding support by international part-ners during the course of its implemen-tation.
Acute watery diarrhoea (cholera) and measles outbreaks were detected from most of the emergency-affected ar-eas and effective control measures were introduced. Dengue fever outbreaks
were more frequently encountered in the flood-affected areas of Sindh and IDP-hosting districts in Khyber Pakhtunkhwa, while acute hepatitis A and E viral infections were more promi-nently seen in the earthquake-affected areas of PAK and Khyber Pakhtunkhwa. The latter may partly be explained by
the multiple unprotected water supply sources and the difficulty in improving drinking water safety for a large and widely scattered population, as was the case in the post-earthquake period. Hepatitis A cases were detected more frequently in the population age group of less than 15 years, while hepatitis E was more predominant in the older age bracket, consistent with the epidemiol-ogy of these diseases. Two outbreaks of cutaneous leishmaniasis were identified in the IDP-crisis affected area and con-trol measures were undertaken
The occurrence of communicable disease outbreaks was influenced by a complex interplay of host, agent and environment-related factors [8,17,18]. Setting priorities for disease surveillance and risk assessment during humanitar-ian emergencies therefore required a careful consideration of the potential interaction of all three factors consistent with the specific geographical context and prevailing epidemiological vulner-ability of the population [16,19].
The declining rate of measles over time was partly attributed to the vac-cination campaigns carried out in the immediate aftermath of every disaster. This initial large-scale effort was further augmented by the robust surveillance system and mop-up vaccination cam-paigns conducted wherever a cluster-ing of cases was reported. Through the expansion of DEWS in 2006, measles outbreaks were detected from remote areas that did not benefit from the earlier mass vaccination campaigns in the 2005 earthquake-affected area. The two-dose vaccination strategy for the target child population may be considered during emergencies for effective immunization and disease prevention while all efforts need to be made to reach out to remote localities where the impact of disease outbreaks would be more devastating.
The higher frequency of waterborne diseases can be explained by the com-plexity of the interventions necessary to change the unfavourable hygienic and environmental conditions that allow
Figure 2 Monthly trends of acute diarrhoea, acute respiratory infection and measles following the 2005 earthquake prospectively recorded for a period of four years (2006–09)
Measles
0
50
100
150
200
No
.o
fc
ase
s
Acute diarrhoea
0
2
4
6
8
10
12
14
16
%
2006 2007 2008 2009
Acute respiratory tract infection
0
5
10
15
20
25
30
35
Jan Feb Mar Apr May June July Aug Sept Oct Nov Dec
Jan Feb Mar Apr May June July Aug Sept Oct Nov Dec
2006 2007 2008 2009
Jan Feb Mar Apr May June July Aug Sept Oct Nov Dec
2006 2007 2008 2009
%

EMHJ
S120
these diseases to spread. Undoubt-edly, lack of clean water is the most obvious risk of infection and disease outbreak. The latter was related to the use of unprotected water sources or unhygienic vessels for the transporta-tion and storage of water at homes and to the intermittent piped water distribution system that posed high risk of sewage contamination in most of the affected towns [5,20]. To monitor water quality, field water testing kits were introduced to isolate the source of contamination and implement the necessary control interventions. Health and hygiene promotion was also carried out through behaviour-change communication interventions alongside improvements in the water supply infrastructure.
The successful implementation of DEWS was helped by the cooperation between health cluster partners and the national and provincial health system. Confidence in the system has contribut-ed to DEWS’ active case finding, prompt reporting ability, close analysis of disease trends and early mitigation and outbreak control. In the first post-earthquake year, 10% of the 336 reported alerts were re-ceived late, while the delayed alerts in the second and third years were 6% and
2%, respectively, illustrating the capac-ity of the system to control epidemics. To sustain the technical role of DEWS, trained human resources, the necessary infrastructure and strong analytical and response backup support capacities, including laboratory diagnostics, need to be ensured. The mobilization of these operational capacities was the key as-set that led to the remarkable preven-tion and control of epidemics during emergency response interventions in Pakistan. The DEWS technology was further developed by introducing a new software package with automated surveillance bulletins, alert notification and disease-trend plotting, facilitating the work of surveillance officers and en-hancing their ability to detect potential outbreaks
A major contribution of DEWS was the concurrent capacity building of local human resources, where district teams were trained on disease surveil-lance, alert/outbreak investigation and response. This process has enabled the district health system to sustain DEWS surveillance, epidemic detection and control capacity beyond the disaster period.
Sensitive disease-surveillance sys-tems are absolutely essential for the
detection and control of communica-ble disease outbreaks and for averting avoidable morbidity and mortality in the disaster-affected populations. The DEWS initiative can be organized with-in a week and implemented effectively in all disaster-affected areas, despite the initial lack of accurate population data, limited communication network for data collection, scarcity of reliable labo-ratory services, absence of prior logistic arrangements for the timely dispatch of samples to a reference laboratory and the early coordination challenge with health partners. The latter substantiates the robustness, reliability and effective-ness of this system, in an environment where health services are disrupted, their capacities overwhelmed and where the prevention of epidemics becomes both a life-saving entity as well as a cop-ing necessity for the health system by lowering the burden of disease. DEWS has become an effective, tested strategy for the control of communicable dis-ease outbreaks and epidemics during emergencies. The interest shown by the health management teams to sustain DEWS in the post-emergency period was also supported by WHO to make it an integral component of the district health system capacity development.
References
1. Paquet C, Hanquet G. Control of infectious diseases in refugee and displaced populations in developing countries. Bulletin de l’Institut Pasteur, 1998, 96:3–14.
2. Connolly M et al. Communicable diseases in complex emer-gencies: impact and challenges. Lancet, 2004, 364:1974–1983.
3. Degomme O, Debarati GS. Pattern of mortality rates in Darfur conflict. Lancet, 2010, 375:294–300.
4. Goma Epidemiology Group. Public health impact of Rwandan refugee crisis: what happened in Goma, Zaire, in July 1994? Lancet, 1995, 345:339–343.
5. Toole MJ, Waldman. RJ. An analysis of mortality trends among refugee populations in Somalia, Sudan and Thailand. Bulletin of the World Health Organization, 1988, 66(2):237–247.
6. Kouadio IK, Kamigaki T, Oshitani H. Measles outbreaks in displaced populations: a review of transmission, morbidity and mortality associated factors. BMC International Health and Human Rights, 2010, 10:5.
7. Mohan A et al. Measles transmission following the tsunami in a population with a high one-dose vaccination coverage, Tamil Nadu, India 2004–2005. BMC Infectious Diseases, 2006, 6:143.
8. Abdallah S, Burnham G. Public health guide for emergencies: control of communicable diseases. United States of America, The Johns Hopkins School of Hygiene and Public Health and The International Federation of Red Cross and Red Crescent Societies (http://pdf.usaid.gov/pdf_docs/PNACU086.pdf, accessed 6 April 2010).
9. Connolly MA, ed. Communicable disease control in emergen-cies: a field manual. Geneva, World Health Organization, 2005 (WHO/CDS/2005.27).
10. Connolly MA, Heymann DL. Deadly comrades: war and infec-tious diseases. Lancet, 2002, 360 (Suppl.):S23–S24.
11. Watson JT, Gayer M, Connolly MA. Epidemics after natural disasters. Emerging Infectious Diseases, 2007, 13(1):1–5.
12. Marfin AA et al. Infectious disease surveillance during emer-gency relief to Bhutanese refugees in Nepal. Journal of the American Medical Association, 1994, 272(5):377–381.
S121
13. Valenciano M et al. Challenges for communicable disease sur-veillance and control in Southern Iraq, April–June 2003. Jour-nal of the American Medical Association, 2003, 290(5):654–658.
14. Guidelines for disease surveillance/early warning and response: Middle East crisis. Geneva, World Health Organization, 2006 (WHO/CDS/NTD/DCE/2006.6) http://www.who.int/dis-easecontrol_emergencies/guidelines/Middle%20East%20Crisis_WHO%20CD%20surveillance_early%20warning%20guidelines.pdf, accessed 27 June 2010).
15. South Asia earthquake-affected areas, 2005: operational plan and communicable diseases surveillance/early warning and re-sponse guidelines. Islamabad, Ministry of Health Pakistan and World Health Organization, 2005 (http://www.whopak.org/pdf/PostAsiaearthquakeCDrisksinterventions.pdf , accessed 19 January 2010).
16. Communicable disease risk assessment: protocol for humanitar-ian emergencies. Geneva, World Health Organization, 2007 (WHO/CDS/NTD/DCE/2007.4).
17. Noji EK. ABC of conflict and disaster: public health in aftermath of disasters. British Medical Journal, 2005, 330:1379–1381.
18. Epidemic-prone disease surveillance and response after the tsunami in Aceh province, Indonesia. Weekly Epidemiological Record, 2005, 80(18):157–164.
19. Setting priorities in communicable disease surveillance. Ge-neva, World Health Organization, 2006 (WHO/CDS/EPR/LYO/2006.3).
20. Lee E J, Schwab K J. Deficiencies in drinking water distribution systems in developing countries. Journal of Water and Health, 2005, 3(2):109–127.
EMHJ
S122
“Delivering as one” UN reform process to improve health partnerships and coordination: old challenges and encouraging lessons from PakistanK.M. Bile,1 K.A. Lashari 2 and A.F. Shadoul 1
ABSTRACT The UN Secretary-General constituted a high-level panel on system-wide coherence in 2005 within the areas of development, humanitarian assistance and the environment. The panel adopted “Delivering as One” as a slogan for its coherence initiative. Pakistan was among eight pilot countries implementing this reform initiative. Five joint programmes were developed, on health and population; agriculture, rural development and poverty reduction; disaster risk management; education; and environment . Fourteen UN agencies supported the health and population joint programme and participated in its implementation. Although confronted by many challenges, the positive results of the joint programmes confirmed the advantage of Delivering as One over the past scenarios of fragmentation, duplication and incoherent government and UN strategic operations. The paper shares the accomplishments of the health and population sector including its ability to harness the power of intersectoral collaboration and prospectively concentrate human and financial resources around the strategic national priorities.
1World Health Organization, Country Office, Islamabad, Pakistan (Correspondence to K.M. Bile: [email protected]).2Federal Ministry of Health, Islamabad, Pakistan.
2005
14
« Unis dans l’action », processus de réforme des Nations Unies pour améliorer les partenariats pour la santé et leur coordination : anciens défis et enseignements encourageants au Pakistan
RÉSUMÉ En 2005, le Secrétaire général des Nations Unies a formé un Groupe de haut niveau sur la cohérence de l’action du système des Nations Unies dans les domaines du développement, de l’aide humanitaire et de la protection de l’environnement. Celui-ci a choisi le slogan « Unis dans l’action ». Le Pakistan faisait parti des huit pays pilotes choisis pour mettre en œuvre cette réforme. Cinq programmes conjoints ont été conçus dans les domaines suivants : santé et population ; agriculture, développement rural et réduction de la pauvreté ; gestion des risques de catastrophe ; éducation ; et environnement. Quatorze agences de l’ONU ont soutenu le programme conjoint pour la santé et la population et ont participé à sa mise en œuvre. Malgré de nombreuses difficultés, les résultats positifs des programmes conjoints ont confirmé la supériorité de l’initiative « Unis dans l’action » par rapport aux scénarios précédents caractérisés par la fragmentation, la redondance et l’incohérence des opérations stratégiques gouvernementales et onusiennes. Cet article décrit les réalisations du secteur santé et population, notamment sa capacité à exploiter la puissance de la collaboration intersectorielle, et au préalable, à concentrer les ressources humaines et financières sur les priorités stratégiques nationales.

S123
Introduction
The “Millennium Declaration” of 2000 provided a global vision offering greater maternal, infant and child survival, bet-ter education for children, equal op-portunities for women, a healthier environment and national and inter-national partnerships supporting the pursuit of a sustainable development framework for action [1]. However, this commitment was undermined by a lack of focus on results, thereby failing the aspirations of many developing nations, especially the vulnerable and the poor [2–4]. Responding to this concern, the United Nations (UN) Secretary- General constituted a high-level panel on system-wide coherence in 2005 within the areas of development, hu-manitarian assistance and the environ-ment [5]. The panel reiterated the UN’s support for the Millennium Develop-ment Goals, sustainable development, rapid response to humanitarian disas-ters and for protecting the environment [4]. The panel outlined the fragmented nature of UN work, policy incoherence, duplication and poor implementation. To overcome these challenges, it em-phasized “Delivering as One” as the central theme of its recommendations and called for greater UN coherence, while linking the UN funding process to performance and results. The panel rec-ommended the pursuit of one strategy and one set of goals, while establishing one UN presence at the country level, with one leader, one programme, one budget and where appropriate one of-fice [4].
To promote the Delivering as One initiative, eight governments, including Pakistan’s, were entrusted to pilot im-plementation and generate lessons for future potential replication consistent with the principle of national ownership and “no one size fits all”, with promi-nent UN support [6,7]. Since 2007, Pakistan has introduced key reform elements that synchronize joint efforts and strengthen coordination, strategic
planning, monitoring and evaluation [8].
To accommodate this vision, the United Nations Development As-sistance Framework (UNDAF) of 2003–08 was extended till the end of 2010, reviewed and aligned with na-tional development goals, expressed in Pakistan’s medium-term development framework, poverty reduction strategy paper, UN Millennium Development Goals and Vision 2030. Nineteen UN agencies working in Pakistan endorsed the Delivering as One arrangement for 2009–10 and translated it into five thematic programmes: health and population; agriculture, rural develop-ment and poverty reduction; disaster risk management; education; and en-vironment . These programmes were jointly formulated with federal and provincial governments and shared with civil society organizations and other development partners [19–12]. They are currently being implemented through a range of 21 joint programme components.
The Delivering as One initiative aims to attain the Millennium De-velopment Goals with a focus on the poor and disadvantaged; harness the expertise of different UN agencies for effective implementation and coher-ence with sectoral development plans; promote equity, universal access to essential social services; and enhance intersectoral collaboration [4,8]. This study aims to describe Pakistan’s Deliv-ering as One implementation process and the experience gained, and share the accomplishments of the health and population sector and its ability to harness intersectoral collaboration and focus the scope of future action on the set national strategic priorities.
Methods
The information in this paper was the product of the authors’ direct participa-tory insight in the Delivering as One
process and a desk review of the experi-ence gained since the Delivering as One initiative began in Pakistan. Focused interactions with health sector policy-makers, supported by a survey of UN heads of agencies and the Resident Coordinator of their perception of the work of the Delivering as One initiative
were carried out. The reports of different UN visiting missions, proceedings of joint programme consultations and UN intercountry, regional and global policy, strategic and programmatic delibera-tions on Delivering as One were also scrutinized.
Results
The Delivering as One initiativeIn Pakistan, the high-level panel delibera-tions and established guiding principles [4] were endorsed in their entirety. The Delivering as One initiative envisioned a UN resident coordinator system that include a country team led by a resident coordinator as the single leader but jointly assisting in the planning, imple-mentation, monitoring and evaluation of the UN reform process relevant to the five joint programmes (Table 1) that complement and support nation-ally defined sectoral priorities. These joint programmes were developed through UN and government consulta-tions examining the current progress in each sector, and the inherent strengths, weaknesses, opportunities and threats. A UN capacity assessment survey was also carried out to build a broad based consensus on each agency’s compara-tive advantages in support to these joint programmes.
Translating the Delivering as One initiative into actionTo promote the Delivering as One joint efforts, the UN and government part-ners laid down the following principles to enhance the development process to-wards Millenium Development Goals:

EMHJ
S124
Align the delivery of UN develop-ment support with key sectoral pri-orities and apply national systems and procedures for their implemen-tation while engaging in “upstream” policy and programme dialogue and promoting equity and capacity de-velopment
Promote the “managing for results” concept, by introducing perform-ance-based criteria and effective re-source targeting and allocation, while advancing ownership, coherence, reduced transaction costs and flex-ibility when responding to national development challenges.
Use existing UN funding mecha-nisms of core and voluntary con-tributions effectively, as well as the supplementary expanded financing window, recognizing the need for multi-year funding predictability.
Foster harmonization by working to-gether and promoting the division of
roles in line with the agencies’ man-dates and respective comparative ad-vantages and integrate best practices in all joint programme components and assess the progress of imple-mentation, using jointly defined pro-gramme indicators and targets, and synchronized monitoring, evaluation and audit systems.
Endorse the stipulated UN dual ac-countability management of the UN country team in the Delivering as One framework, mandating unity of purpose under the resident coordina-tor system, while concurrently ren-dering UN country team members answerable to their agencies’ respec-tive organizational work.
Assess the progress of mainstreaming the cross-cutting issues of gender, hu-man rights, civil society organizations and refugees in view of their strong relevance to the successful imple-mentation of joint programmes.
Assist national partners on emergen-cy preparedness and response with focus on vulnerability and disaster risk reduction and apply best prac-tices for planning and programme implementation.
Revisit the existing interagency over-laps, duplications and operational gaps, and identify solutions to rectify these in the course of planning and implementation of the Delivering as One interventions.
Formulating joint programmesThe government-driven joint program-ming led to the formulation of five joint programmes and a subset of 21 joint programme components (Ta-ble 1). These joint programmes were translated into common operational work plans, involving two or more UN agencies along with their government counterparts. UN participation in one joint programme ranged from nine to
Table 1 Government and UN designed joint programmes, their respective joint programme components and respective UN participating agencies
Joint programmes (number of participating agencies)
Joint programme components (JPC)
Agriculture, rural developmentand poverty reduction (11)
Pro-poor sustainable agriculture and rural developmentDecent employment and poverty alleviationEmpowerment, mobilization and protection of poor and vulnerable groupsMillennium Development Goals–driven pro-poor policy framework
Disaster risk management (12) Disaster risk management: strengthened policies, norms, institutional capacities with emphasis on preparedness and response; integrated multisectoral knowledge, information and communication system and reaching out to the grass roots; human resource development at all levels
Education (9) Preschool and elementary educationAdult literacy and informal basic educationStrengthening the education system Secondary education with a focus on technical and vocational education and life skills
Environment (11) Strengthened and operational institutional mechanisms for integrated environmental managementIntegrated programme on access to safe water and sanitationIntegrated natural resources management in demonstration regionsSustainable urbanizationSupport for green industries, waste management, energy and Jobs
Health and population (14) Maternal, neonatal, and child health and family planning/reproductive health in the context of primary health careCommunicable disease controlNutrition and health promotionHealth system developmentHIV and AIDSPopulation and census

S125
fourteen agencies, reflecting the exist-ing synergies and complementarities between different UN organizations.
Governance mechanisms for joint programmingThe following mechanisms were es-tablished for coordinating and man-aging the Delivering as One reform process.
Government and UN joint mecha-nismsThe high-level committee and the joint programme steering committee are key government and UN joint mechanisms established in support of the Delivering as One process.
The high-level committee is chaired by the prime minister or his/her rep-resentative bringing together federal and provincial government line depart-ments and UN and donor members. Its job is to oversee the Delivering as One reform process, monitor its progress and provide necessary institutional sup-port. The high-level panel is assisted by an executive committee entrusted to support the implementation of the joint programmes and facilitate their resource allocation processes. The ex-ecutive committee comprise the secre-tary of the economic affairs division, the UN resident coordinator and a donor representative.
Five joint programme steering com-mittees guide the planning, resource allocation, implementation and the management of joint programmes. Each joint programme steering committee is co-chaired by a government representa-tive at the level of federal secretary (or equivalent) and the representative of a lead UN agency, with membership from all UN and government partici-pating agencies while civil society or-ganizations and donors can participate as observers. Each of the 21 joint pro-gramme components is managed by a joint programme component task force that reports to the joint programme steering committee and is accountable
for the joint programme component formulation, planning, implementation, monitoring and coordination. The par-ticipation and co-chairing of the joint programme component task force is structurally identical to the joint pro-gramme steering committee, but di-rected by senior government and UN professionals who are specialists in their respective fields.
UN joint mechanisms at the country levelAt country level, UN development as-sistance is coordinated by the resident coordinator system bringing together all resident and non-resident UN or-ganizations engaged in the country’s development support.
The resident coordinator leads the UN country team, coordinates the De-livering as One initiative and facilitates its implementation, while upholding the UN-stipulated code of conduct and maintaining regular communica-tion with the government, UN country team and the higher tiers of the UN system.
The UN country team led by the resident coordinator consists of all heads of UN agencies, funds and programmes and represent the interagency coordina-tion and decision-making body. The UN country team provides support to the different joint programmes and is responsible for achieving the Delivering as One results. To harmonize the UN technical support for this initiative, a thematic working group was created for each joint programme, co-chaired by a lead substantive agency, permanently assuming this role, and by a second par-ticipating agency rotating on a yearly basis. An interagency working group was similarly established to coordinate and enhance the UN in-house active participation in the joint programme component task force. To harmonize and simplify business practices, an operational management team was established. The operational manage-ment team identified a common human
resource management centre, a common procurement facility and standardized web-based material. A communication group was also launched to assist the Delivering as One implementation.
Headquarters and regional UN agen-cies’ support mechanismsTo promote UN system-wide coher-ence and the Delivering as One initia-tive, the following supportive structures were established.
The chief executive board is the highest UN forum that brings together the executive heads of all UN agencies under the leadership of the UN Secre-tary-General, mandated to promote co-ordination and cooperation on a range of substantive and managerial issues facing the UN system organizations. The chief executive board is supported by three high-level committees: the United Nations Development Group (UNDG) consisting of 32 UN funds, programmes, agencies, departments and offices. UNDG guides the management of resident coordinators, the regional management teams and promotes coherent oversight, capacity-building and coordination of UN development operations at country level including the implementation of the triennial comprehensive policy review of the UN System. The Development Operations Coordination Office assists UNDG by extending its technical and financial support to the UN resident coordina-tor system, conducting oversight of the multi-donor trust fund, coordinating the regional management teams’ and UN country teams’ support to the De-livering as One initiative. The High-level Committee on Management works on system-wide administrative and man-agement issues, and a the High-level Committee on Programmes addresses the global programmatic issues and provides strategic guidance, leadership and coherent technical support to the UN agencies’ regional directors team, resident coordinators and UN country teams. In addition to these institutional

EMHJ
S126
arrangements, each UN organization has established a focal desk in support of the Delivering as One initiative at their regional offices and headquarters. In the World Health Organization (WHO), the Director-General and regional directors have recognized Delivering as One since its inception as the sine qua non strategic policy choice of the Organization and have drawn the at-tention of WHO Member States on the potential of linking health to the mainstream of the Delivering as One development process.
The Regional Directors’ team pro-vides strategic leadership and policy guidance to the resident coordinator system and supports the UN country team in promoting coherence of the UN work in the country, oversees perform-ance and assumes a problem-solving role in difficult situations to consolidate interagency collaboration.
The Delivering as One joint pro-grammes are primarily financed by the assessed and voluntary contributions provided to UN organizations. Funds are also obtained by the Delivering as One incremental Development Op-erations Coordination Office manag-ing the expanded funding window of the multi-donor trust fund and other contributions. Considering all sources
of funding, the projected budgetary outlay of the five joint programmes was estimated at US$ 396 million per year, whereas the proportional allocations for agriculture, rural development and poverty reduction; disaster risk manage-ment; education; environment; and health and population were 21.3%, 17.7%, 22.0%, 6.7% and 32.3%, respec-tively. The collective resource gap of the five joint programmes was 80.4 % at the planning outset, indicating the prevailing challenges for resource mo-bilization.
The health and population joint pro-gramme was designed in close collabo-ration with federal ministries of health and population welfare along with their provincial line departments, civil soci-ety organizations and international part-ners. Apart from the population census joint programme component, the re-maining five health and population joint programme components address key public health priorities fully aligned with the poverty reduction strategy paper and Millennium Development Goals strategies and targets.
Table 2 shows the UN agencies par-ticipating in the health and population joint programme.
Table 3 shows the six formulated joint programme components of
the health and population joint pro-gramme, the participating UN agencies and their envisaged outcomes. Agen-cies’ participation in the different joint programme components reflected the scope of their technical engagement mandates and operational capacities on the ground.
As a prototype of the joint pro-gramme components’ implementation paradigm, the field implementation of the joint programme component for maternal, neonatal and child health is shown in Table 4. This targets ten dis-tricts of Sindh province, with technical roles of each participating UN agency explicitly identified, while jointly as-sisting and monitoring implementa-tion to consolidate the Delivering as One principle. Figure 1 illustrates the existing nexus between the health and population joint programme and other joint programmes whose operational roles contribute to the social deter-minants of health. The dependence of health development outcomes on the performance scope of other joint programmes is illustrated, legitimizing the role of the health and population joint programme participating agen-cies in strengthening and expanding the inter-joint programme synergies. In planning the health and popula-tion joint programme and related joint programme components, the evolving opportunities for intersectoral action were addressed, recognizing the effect social determinants of health interven-tions exert on health and population outcomes. The latter is exemplified by the incremental gains that would ac-crue to the health sector by improving the quality, accessibility and length of female education; improving cover-age of household level safe drinking water and sanitation, creating means of livelihood, availing better nutrition and disposal of hazardous solid waste, all concerns that have a major bearing on health.
Table 2 Participating UN agencies in the health and population joint programme
Abbreviated name Full name
ILO International Labour Organization
IOM International Organization for Migration
UNAIDS Joint United Nations Programme on HIV/AIDS
UNDP United Nations Development Programme
UNESCOUnited Nations Educational, Scientific and Cultural Organization
UNFPA United Nations Population Fund
UNICEF United Nations Children’s Fund
UN-HABITAT United Nations Human Settlements Programme
UNHCR Office of the United Nations High Commissioner for Refugees
UNIFEM United Nations Development Fund for Women
UNODC United Nations Office on Drugs and Crime
WFP World Food Programme
WHO World Health Organization

S127
Table 3 The six health and population joint programme components, their envisaged outcomes and the UN agencies participating in their implementation
Health and population joint programme components
Joint programme component 1: maternal, neonatal and child health including reproductive health/family planning
Outcome 1: (UNICEF, WHO, UNFPA) Infant and maternal mortalities reduced and integrated maternal, neonatal and child health, including reproductive health family planning and services, implemented
Outcome 2: (UNICEF, WHO, UNFPA) Community demand and participation and intersectoral linkages for maternal, neonatal, and child health and reproductive health/family planning services are improved
Outcome3: (UNICEF, WHO, UNFPA, WFP)
Nutrition status especially of infants, young children and child-bearing women is improved
Joint programme component 2: communicable diseases control
Outcome 1: (WHO, UNICEF, UNHCR) Morbidity and mortality due to vaccine-preventable diseases reduced; polio eradication and measles elimination programmes have achieved their targets
Outcome 2: (WHO, UNHCR, WFP, IOM)
Tuberculosis and other priority endemic communicable diseases controlled
Outcome 3: (WHO, UNICEF, UNHCR, FAO)
Malaria incidence reduced and an integrated national programme for zoonotic and other vector-borne diseases launched to mitigate burden
Outcome 4: (WHO, UNICEF) Hepatitis B and C are prevented and disease burden controlled
Outcome 5: (WHO, UNICEF) National integrated communicable disease surveillance and outbreak response system made operational
Joint programme component 3: health promotion and nutrition
Outcome 1: (WHO, UNICEF, WFP, UNFPA, UNESCO)
Knowledge and practices for health promotion (attitudes, behaviour/lifestyle) and avoidance of health risks and disease prevention are improved (including school health)
Outcome 2: (UNICEF,WHO, WFP, UNHCR)
Nutritional status of the population is improved
Joint programme component 4: health system development
Outcome 1: (WHO, UNHCR, UNICEF, ILO, UNIFEM, UNFPA)
An effective system of human resource development for health and population is adopted
Outcome 2: (ILO, WHO, UNICEF, UNFPA)
An equitable, effective health and population financing system is in place
Outcome 3: (WHO, UNHCR, UNICEF, UNFPA)
Policy and management decisions by federal, provincial and district governments on health and population issues are evidence-based using research and improved information system
Outcome 4: (WHO, UNHCR, UNICEF, UNFPA)
Effective systems for management of medical technologies are used
Outcome 5: (WHO, UNDP, ILO, UNICEF, UNFPA)
Quality assurance and regulation systems of public and private providers of essential health services delivery are fully atained
Outcome 6: (UNDP, UNFPA, UNHCR, UNICEF, WHO)
Governance in health and population systems is significantly improved
Joint programme component 5: HIV and AIDS
Outcome 1: (UNODC, UNAIDS, UNFPA, UNICEF, ILO, UNESCO, WHO)
HIV transmission is contained in the vulnerable groups by contributing 10% towards national strategic targets
Outcome 2: (UNDP, UNAIDS, ILO, UNESCO, UNICEF, IOM)
Multisectoral opinion leaders take up and integrate HIV, AIDS issues in their programme portfolios and policies (representatives from government, religious leaders, media, parliamentarians, employers, workers, educators and agriculture extension workers)
Outcome 3: (UNICEF, WHO, WFP, ILO, UNAIDS, UNIFEM, UNFPA, UNDP, UNODC, UNHCR)
Accessibility and use of quality treatment by all people living with HIV is improved (focus: women and children). Support for all persons infected and affected by HIV is increased through strengthening civil society organizations working with people living with HIV (focus: women and children) (support: social, spiritual, and economic)
Joint programme component 6: population census
Outcome 1: (ILO, UNDP, UNESCO, UNFPA, UNICEF, UN-HABITAT, UNIFEM)
Pakistan census organization to adopt modern technology and approaches to conduct accurate housing and population census
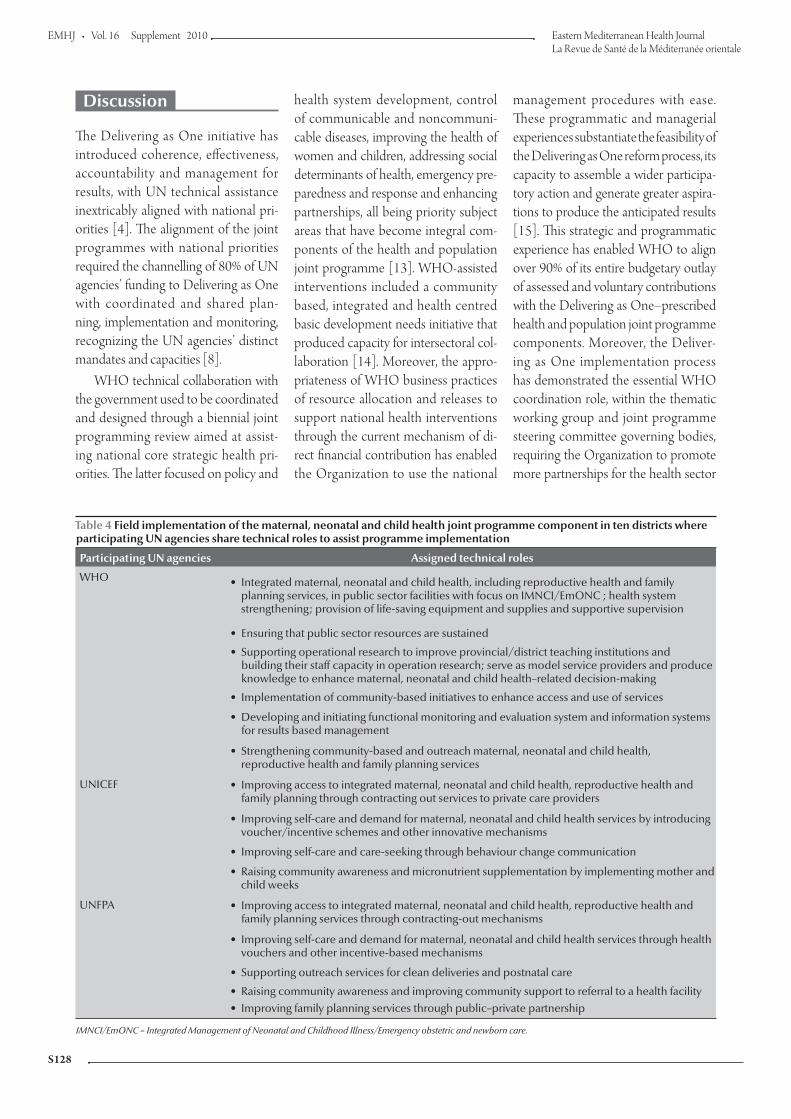
EMHJ
S128
Discussion
The Delivering as One initiative has introduced coherence, effectiveness, accountability and management for results, with UN technical assistance inextricably aligned with national pri-orities [4]. The alignment of the joint programmes with national priorities required the channelling of 80% of UN agencies’ funding to Delivering as One with coordinated and shared plan-ning, implementation and monitoring, recognizing the UN agencies’ distinct mandates and capacities [8].
WHO technical collaboration with the government used to be coordinated and designed through a biennial joint programming review aimed at assist-ing national core strategic health pri-orities. The latter focused on policy and
health system development, control of communicable and noncommuni-cable diseases, improving the health of women and children, addressing social determinants of health, emergency pre-paredness and response and enhancing partnerships, all being priority subject areas that have become integral com-ponents of the health and population joint programme [13]. WHO-assisted interventions included a community based, integrated and health centred basic development needs initiative that produced capacity for intersectoral col-laboration [14]. Moreover, the appro-priateness of WHO business practices of resource allocation and releases to support national health interventions through the current mechanism of di-rect financial contribution has enabled the Organization to use the national
management procedures with ease. These programmatic and managerial experiences substantiate the feasibility of the Delivering as One reform process, its capacity to assemble a wider participa-tory action and generate greater aspira-tions to produce the anticipated results [15]. This strategic and programmatic experience has enabled WHO to align over 90% of its entire budgetary outlay of assessed and voluntary contributions with the Delivering as One–prescribed health and population joint programme components. Moreover, the Deliver-ing as One implementation process has demonstrated the essential WHO coordination role, within the thematic working group and joint programme steering committee governing bodies, requiring the Organization to promote more partnerships for the health sector
Table 4 Field implementation of the maternal, neonatal and child health joint programme component in ten districts where participating UN agencies share technical roles to assist programme implementation
Participating UN agencies Assigned technical roles
WHO Integrated maternal, neonatal and child health, including reproductive health and family planning services, in public sector facilities with focus on IMNCI/EmONC ; health system strengthening; provision of life-saving equipment and supplies and supportive supervision
Ensuring that public sector resources are sustained
Supporting operational research to improve provincial/district teaching institutions and building their staff capacity in operation research; serve as model service providers and produce knowledge to enhance maternal, neonatal and child health–related decision-making
Implementation of community-based initiatives to enhance access and use of services
Developing and initiating functional monitoring and evaluation system and information systems for results based management
Strengthening community-based and outreach maternal, neonatal and child health, reproductive health and family planning services
UNICEF Improving access to integrated maternal, neonatal and child health, reproductive health and family planning through contracting out services to private care providers
Improving self-care and demand for maternal, neonatal and child health services by introducing voucher/incentive schemes and other innovative mechanisms
Improving self-care and care-seeking through behaviour change communication
Raising community awareness and micronutrient supplementation by implementing mother and child weeks
UNFPA Improving access to integrated maternal, neonatal and child health, reproductive health and family planning services through contracting-out mechanisms
Improving self-care and demand for maternal, neonatal and child health services through health vouchers and other incentive-based mechanisms
Supporting outreach services for clean deliveries and postnatal care
Raising community awareness and improving community support to referral to a health facility Improving family planning services through public–private partnership
IMNCI/EmONC = Integrated Management of Neonatal and Childhood Illness/Emergency obstetric and newborn care.
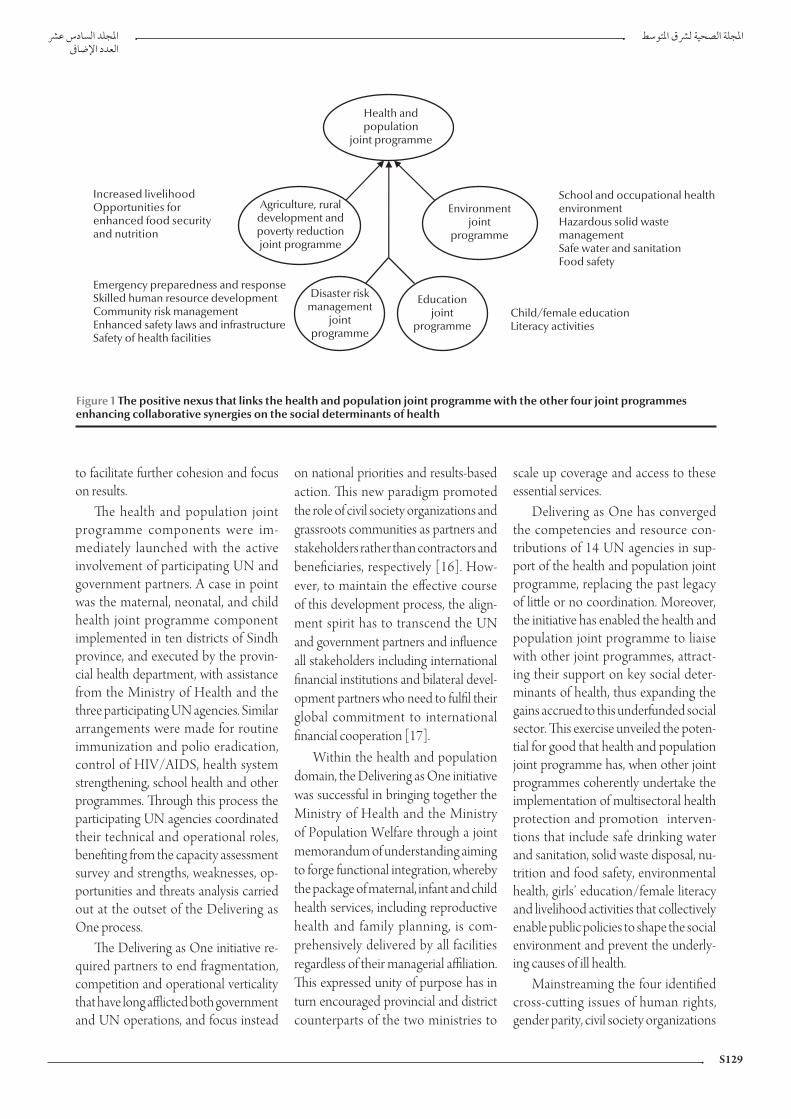
S129
to facilitate further cohesion and focus on results.
The health and population joint programme components were im-mediately launched with the active involvement of participating UN and government partners. A case in point was the maternal, neonatal, and child health joint programme component implemented in ten districts of Sindh province, and executed by the provin-cial health department, with assistance from the Ministry of Health and the three participating UN agencies. Similar arrangements were made for routine immunization and polio eradication, control of HIV/AIDS, health system strengthening, school health and other programmes. Through this process the participating UN agencies coordinated their technical and operational roles, benefiting from the capacity assessment survey and strengths, weaknesses, op-portunities and threats analysis carried out at the outset of the Delivering as One process.
The Delivering as One initiative re-quired partners to end fragmentation, competition and operational verticality that have long afflicted both government and UN operations, and focus instead
on national priorities and results-based action. This new paradigm promoted the role of civil society organizations and grassroots communities as partners and stakeholders rather than contractors and beneficiaries, respectively [16]. How-ever, to maintain the effective course of this development process, the align-ment spirit has to transcend the UN and government partners and influence all stakeholders including international financial institutions and bilateral devel-opment partners who need to fulfil their global commitment to international financial cooperation [17].
Within the health and population domain, the Delivering as One initiative was successful in bringing together the Ministry of Health and the Ministry of Population Welfare through a joint memorandum of understanding aiming to forge functional integration, whereby the package of maternal, infant and child health services, including reproductive health and family planning, is com-prehensively delivered by all facilities regardless of their managerial affiliation. This expressed unity of purpose has in turn encouraged provincial and district counterparts of the two ministries to
scale up coverage and access to these essential services.
Delivering as One has converged the competencies and resource con-tributions of 14 UN agencies in sup-port of the health and population joint programme, replacing the past legacy of little or no coordination. Moreover, the initiative has enabled the health and population joint programme to liaise with other joint programmes, attract-ing their support on key social deter-minants of health, thus expanding the gains accrued to this underfunded social sector. This exercise unveiled the poten-tial for good that health and population joint programme has, when other joint programmes coherently undertake the implementation of multisectoral health protection and promotion interven-tions that include safe drinking water and sanitation, solid waste disposal, nu-trition and food safety, environmental health, girls’ education/female literacy and livelihood activities that collectively enable public policies to shape the social environment and prevent the underly-ing causes of ill health.
Mainstreaming the four identified cross-cutting issues of human rights, gender parity, civil society organizations
Health andpopulation
joint programme
Agriculture, ruraldevelopment andpoverty reductionjoint programme
Disaster riskmanagement
jointprogramme
Educationjoint
programme
Environmentjoint
programme
Increased livelihoodOpportunities forenhanced food securityand nutrition
School and occupational healthenvironmentHazardous solid wastemanagementSafe water and sanitationFood safety
Emergency preparedness and responseSkilled human resource developmentCommunity risk managementEnhanced safety laws and infrastructureSafety of health facilities
Child/female educationLiteracy activities
Figure 1 The positive nexus that links the health and population joint programme with the other four joint programmes enhancing collaborative synergies on the social determinants of health

EMHJ
S130
and refugees posed a challenge, as it required the application of quantifiable tools to assess the level of strategic and operational integration of cross-cutting issues into the joint programmes and addressing existing gender dispari-ties and inequalities [18]. The latter implied the application of direct and proxy measures to assess and monitor their societal implications. Appointing focal points on cross-cutting issues to undertake the necessary oversight and develop relevant advocacy and com-munication strategies for their effective implementation was another positive undertaking of the UN in Pakistan.
The Delivering as One initiative provided a road map for the sustainable implementation of joint programmes [6]. To scale up the progress of this evolving reform, UN agencies ought to recognize the government leadership role, adhere to the Paris Declaration of Aid Effectiveness and endorse wider partnerships as determined by the joint programmes’ operational scope, and work with different government and nongovernmental organizations to ad-vance the Delivering as One initiative [4,5,8]. The government and the UN need to realize that the reform process is not the end goal in itself, but rather a way to achieve the planned results [5,8]. Delivering as One delineated the four critical roles of the UN—being advisor to the government, convener of stakeholders, advocate for interna-tional standards and provider of tech-nical support. Moreover, the evolving challenges for resource mobilization should not be allowed to hinder Deliv-ering as One, as greater efforts need to be made, while the efficient use of avail-able resources would provide greater leverage to the UN to expand the value of its resource outlay by achieving bet-ter results and reducing its transaction cost.
To promote horizontal collabo-ration within the UN system, intra-agency Delivering as One processes need to be actively introduced, where
the coherence envisaged at the country level is matched by direct engagement of the top executives at regional and headquarters levels in the Delivering as One process, and the different divi-sions and technical units of an organi-zation persuaded to adopt an internal transformation process, committed to achieve organization-wide results. Country offices should be supported in pursuing the targets set for the different joint programmes, rather than consid-ering the Delivering as One initiative as a function exclusively assigned to the UN field staff. The latter is even more critical for achieving unified busi-ness practices, why modest advances were made in this field . Likewise, the perception of some government sectors that the channelling of jointly mobilized resources through the UN will negatively affect government en-visaged budgetary support needs to be mitigated. The latter is attained by directing the focus on the significance of the jointly programmed interven-tions, the challenging milestones to be attained, the financing predictability for sustained implementation and the management for results through joint monitoring and evaluation.
The Delivering as One experience in Pakistan offers the best opportunity for the UN to effectively engage in and support the national efforts geared to attain the Millennium Development Goals, rendering the fragmented status quo practices extinct. The health and population joint programme policy, strategic and programmatic support significantly outweighs the disjointed single agency interventions of the past. The programmatic strategies of this joint programme were streamlined in the 2010 national health policy; as-sisted and influenced the work of the Health System and Policy Unit of the Ministry of Health; catalysed public sector investment in several joint pro-gramme component domains; scaled up the joint programme components’ implementation with significant impact
on maternal, neonatal, and child health, health promotion and nutrition, and the school health programme promot-ed the introduction of pictorial health warnings on cigarette packs; enhanced immunization services by training thousands of community-based Lady Health Workers on vaccination skills, accelerated poliomyelitis eradication efforts; and engaged parliament in pol-icy dialogues on priority public health fields such as the control of tuberculo-sis, hepatitis viral infections and HIV/AIDS. To further enhance the quality of joint programme components’ im-plementation, UN participating agen-cies need to establish an interagency programme support teams at the op-erational level, closely liaising with their government counterparts and assisting the implementation processes of each of the different joint programme com-ponents.
The Delivering as One initiative also offers a framework of principles that guide the country-level operations of the UN development system and substantiate the legitimacy of advanc-ing and guiding the nationally owned programmatic interventions. Special attention was also directed to the Pa-kistan humanitarian crisis where the principles of Delivering as One were readily applied with great success. Pa-kistan took bold steps along with the UN for scaling up and consolidating Delivering as One and focused action on national priorities, acknowledging that there must be no going back to the fragmentation and unaffordable op-portunity costs of the past. The health and population joint programme at-tracted the largest UN participation and enhanced agencies’ relevance, co-herence and comparative advantages in support of national health priorities and catalysed Delivering as One be-tween government institutions, while seamlessly interrelating health with its social determinants, providing a value added to Delivering as One imple-mentation.

S131
References1. United Nations Resolution 55/2. United Nations millennium
declaration. New York, United Nations, 2000 (http://www.un.org/millennium/declaration/ares552e.htm, accessed 2 July 2010).
2. Rome declaration on harmonization. Rome, Aid Harmoniza-tion & Alignment, 2003 (http://www.aidharmonization.org/ah-overview/secondary-pages/why-RomeDeclaration, ac-cessed 2 July 2010).
3. Human development report 2003. Millennium development goals: a compact among the nations to end human poverty. New York, Oxford, Oxford University Press, 2003 (http://hdr.undp.org/en/media/hdr03_complete.pdf, accessed 2 July 2010). (Published for the United Nations Development Programme).
4. Paris declaration on aid effectiveness: ownership, harmonisation, alignment, results and mutual accountability. Paris, United Nations, 2005 (http://www.oecd.org/dataoecd/30/63/43911948.pdf, accessed 2 July 2010).
5. Report of the high-level panel on United Nations system-wide coherence in the areas of development, humanitarian assistance and the environment. New York, United Nations General As-sembly, 2006 (http://www.undemocracy.com/A-61-583.pdf, accessed 2 July 2010) (A/61/583).
6. Delivering as one 2008 stocktaking synthesis report: joint reports by governments and UN country teams. New York, United Na-tions Development Group, 2008 (http://www.undg.org/docs/10289/UNStocktakingSynthesisReportV6.pdf, accessed 2 July 2010).
7. Regional consultation on United Nations reform, health and de-velopment: a report. Colombo, Sri Lanka, 6–8 December 2007. New Delhi, Regional Office for South East Asia, World Health Organization, 2008 (SEA-UNR-01).
8. Delivering as one: one UN in Pakistan 2008–2010. Islamabad, United Nations, 2009.
9. Mid term review of medium term development framework 2005–2010. Islamabad, Pakistan, Planning Commission, 2008.
10. Poverty Reduction Strategy Paper (PRSP) 2. Islamabad, Pakistan, Finance Division, 2009.
11. Pakistan Millennium Development Goals Report 2006. Islama-bad, Center for Research on Poverty Reduction and Income Distribution, Planning Commission, 2006 ) http://undp.org.pk/images/publications/MDG%202006.pdf, accessed 2 July 2010).
12. Pakistan in the 21st century: Vision 2030. Islamabad, Pakistan, Planning Commission of Pakistan, 2007.
13. Country cooperation strategy for WHO and Pakistan 2005–2009. Cairo, World Health Organization, Regional Office for the East-ern Mediterranean, 2006.
14. Mohamud KB. A brief overview of health and social welfare development in the Eastern Mediterranean Region of WHO: the need for integrated community-based strategies. In Pro-ceedings of third global symposium on health and welfare systems development in the 21st century. Kobe, Japan 6–8 November 2002. Kobe, WHO Kobe Centre, World Health Organization, 2002.
15. Consultation on WHO programme development and delivery at country level, including in context of UNDAF and other partner-ship platforms: Summary and way forward Hammamet, Tunisia, 8–10 2009 . Geneva, World Health Organization, 2009 WHO/DGR/CCO/09.04).
16. Hill T, Peter E. UN accountability issues and the role of NGOs and global civil society: a quick sketch. New York, UN Non-Govern-ment Liaison Service, 2007 (http://www.un-ngls.org/IMG/pdf/UN_Accountability_paper_by_Hill_and_Peter_-_NGLS.pdf, accessed 2 July 2010).
17. General Assembly Resolution A/RES/62/208. Triennial com-prehensive policy review of operational activities for development of the United Nations system. New York, United Nations, 2008 (http://www.unssc.org/web/programmes/LS/unep-unssc-precourse-material/GA%20res%20TCPR%202007.pdf, ac-cessed 2 July 2010).
18. Women and health: today’s evidence, tomorrow’s agenda. Gene-va, World Health Organization, 2009 (http://whqlibdoc.who.int/publications/2009/9789241563857_eng.pdf, accessed 2 July 2010).
Acknowledgement
The authors wish to acknowledge the contribution of the UN Resident Coordinator/UN Country Teams for responding to the given questionnaire to assess their individual perceptions
on the collectively gained experience on the Delivering as One UN reform proc-ess in Pakistan. The authors equally ac-knowledge the collaboration extended by the participating UN agencies in the health and population joint pro-gramme thematic working group and
the support and leadership provided by the ministries of health and population and by their respective provincial health departments as well as the coordination offered by the Economic Affairs Divi-sion for the effective implementation of this initiative.

EMHJ
S132
Implementing the district health system in the framework of primary health care in Pakistan: can the evolving reforms enhance the pace towards the Millennium Development Goals?F. Sabih,1 K. M. Bile,1 W. Buehler,2 A. Hafeez,3 S. Nishtar4 and S. Siddiqi5
ABSTRACT There is growing renewed trust in primary health care as the best approach for ensuring equity in the delivery of essential health services. However, Pakistan with one of the most widely spread district health system networks in the region, has not delivered at the expected capacity. A series of health system reform agendas are now stipulated which include the promulgation of an essential health service package, public private partnerships and a people-centred focus. Nevertheless, success of these reforms will hinge on the ability of the three tiers of the government and other stakeholders to work together to improve the overall performance of the district health system. This paper provides an overview of the district health system infrastructure and organization of primary health care services in Pakistan, the evolving governance pattern and the operational significance and merit of health system pillars for effective service implementation.
1World Health Organization, Country Office, Islamabad, Pakistan (Correspondence to F. Sabih: [email protected])2Global Fund to Fight AIDS, Tuberculosis and Malaria, Geneva3National Health Services Academy, Ministry of Health, Islamabad, Pakistan4Heartfile (health sector nongovernment organization), Islamabad, Pakistan 5World Health Organization, Regional Office for the Eastern Mediterranean, Cairo, Egypt.
Intégration du système de santé de district dans le cadre des soins de santé primaires au Pakistan : les réformes évolutives peuvent-elles accélérer la réalisation des objectifs du Millénaire pour le développement ?
RÉSUMÉ On observe une confiance renouvelée croissante dans les soins de santé primaires en tant que meilleure approche pour garantir l’équité dans la fourniture de services de soins de santé essentiels. Cependant, le Pakistan, dont le réseau de systèmes de santé de district est l’un des plus étendus de la région, n’a pas été en mesure d’assurer ces services au niveau attendu. Une série de calendriers de réformes du système de santé a maintenant été définie. Elle comprend notamment l’annonce d’un ensemble de services de soins de santé essentiels, des partenariats public/privé et une attention centrée sur l’individu. Mais le succès de ces réformes dépendra de la capacité de l’ensemble du gouvernement et des autres parties prenantes à travailler de concert pour améliorer les performances globales du système de santé de district. Cet article donne un aperçu des infrastructures de ce système et de l’organisation des services de soins de santé primaires au Pakistan, du mode de gouvernance évolutif et de l’importance opérationnelle des piliers du système de santé ainsi que de leur valeur pour l’intégration efficace des services.
S133
Introduction
The district health system in the frame-work of primary health care is inextrica-bly linked to the Alma Ata Declaration of 1978 and has repeatedly regained international interest and renewed fo-cus, exemplified in the Beijing Initiative and Qatar Declaration and the World health report 2008 [1–4]. After decades of focusing on vertical disease control programmes as prime drivers of health care development, a comprehensive approach to respond to the needs and legitimate health expectations of all citizens is back on the agenda. Effective community participation is the key for the successful implementation of PHC strategy; while the social determinants of health offer a dependable avenue for intersectoral collaboration.
The goal of “Health for All by the year 2000”, launched in 1977 through the World Health Assembly Resolu-tion 30.43, was endorsed in Pakistan, by organizing delivery of health services through a fairly elaborate network of first-level care facilities, mainly basic health units and rural health centres, and the establishment of hospitals at each subdistrict level and district headquarter city [5]. Furthermore, in pursuance of the Alma Ata Declaration, successive national health policies of Pakistan since 1990 have reiterated their commitment to universal health coverage and afford-able access to essential primary health care services [6]. At the grassroots level, the innovative concept of female com-munity health workers led to the in-ception of the national programme for family planning and primary health care in 1994, commonly known as the Lady Health Workers Programme, linking the community with the district health system service delivery network [7].
There are 136 districts in Pakistan, and the district health system is a critical tier of the Pakistani health care system, since it functions as an independent administrative and organizational set-up for the delivery of service to the
population. During 1999 to 2008, dis-tricts assumed even greater importance because of the devolution policy intro-duced by the previous government in 2001. This paper provides an overview of the district health system infrastruc-ture and organization of primary health care services in Pakistan, the evolving governance pattern and the operational significance of health system pillars and their merit for effective service imple-mentation and partnership.
Methods
Peer-reviewed articles on the framework of primary health care, primarily from Pakistan, were retrieved from scientific databases along with official documents of the government of Pakistan; grey literature was also reviewed. Field visits and interactions with key programme managers, primary health care staff and health policy-makers provided a valu-able insight into the functioning of the district health system. Extensive use was also made of the district information sys-tem, which collects health information data from the district health network every month, to generate necessary evidence for analysis.
Delivery of health services: district health system infrastructure The district health system in Pakistan is organized into a network of public serv-ice delivery outlets of Health Houses (community health outlets run by and set up in the homes of Lady Health Workers), a chain of first-level care facilities, and district and subdistrict hospitals. The district health system also incorporates a network of private pro-viders ranging from general practition-ers, clinics, hospitals and pharmacies to numerous alternative care providers including homeopaths and hakims for Eastern and Yunani medicine.
Table 1 shows the total number and types of health facilities including
community outlets operated by the public sector and classified into the fol-lowing categories:
Health HousesThe Lady Health Workers’ programme is arguably the largest public sector community health initiative in the re-gion, covering most of the rural and selected peri-urban population of the country with a workforce of 100 000. The Health House, at the village level, constitutes the hub from where a Lady Health Worker carries out daily field visits to her catchment area population of 1000. The scope of the Lady Health Workers’ service covers health and nu-trition promotion, maternal, neonatal and child health care including repro-ductive health and family planning, pro-motion of personal and environmental hygiene, treatment of minor ailments with options for referral and support to communicable disease control in-terventions. In 2009 LHWs’ direct in-volvement in vaccination was launched by training them in Routine EPI skills.
Basic health unitsOn an average, a basic health unit serves a population of around 10 000–25 000, providing a range of primary health care services (Table 2) along with referral support for major health problems. A basic health unit is usually staffed by a male medical officer, a Lady Health Visitor, a vaccinator, a health technician, a dispenser/dresser, a sanitary worker and other support staff.
Sub-health centresThese facilities are staffed with a physi-cian, one Lady Health Visitor and a midwife and provide primary health care services to the catchment areas where there are no basic health units.
Rural health centresRural health centres function around the clock and serve a catchment area population of 50 000–100 000, providing a comprehensive range of primary health care services (Table 2). Rural health centres are equipped with

EMHJ
S134
Tabl
e1 T
ypes
and
num
bers
of h
ealt
h fa
cilit
ies
in P
akis
tan
Prov
ince
/ Re
gion
sD
istr
icts
Urb
an/
Rura
lH
ospi
tals
(dis
tric
t he
adqu
arte
r ho
spita
l/ te
hsil
head
quar
ter
hosp
ital)
Rura
l hea
lth
cent
res
Basi
c he
alth
un
itsO
ther
firs
t–le
vel c
are
faci
litie
sH
ealt
h H
ouse
a
Dis
pens
arie
sTB
cen
tres
M
ater
nal a
nd
child
hea
lth
cent
res
Subh
ealt
h ce
ntre
s
Isla
mab
ad C
apita
l
Terr
itory
1U
rban
7–
–40
–4
–34
6Ru
ral
–3
141
––
–
Punj
ab35
Urb
an28
463
–53
154
425
77
50 3
61Ru
ral
2322
824
5297
7–
9049
3
Sind
h23
Urb
an32
846
3410
01
150
113
–
22 0
54Ru
ral
659
736
1112
3638
2
Khyb
er P
akht
unkh
wa
23U
rban
954
410
620
30–
13 9
83Ru
ral
107
8893
845
910
115
31
Balo
chis
tan
30U
rban
967
2534
2343
9
6 43
7Ru
ral
263
495
533
–50
–
Tota
l11
2U
rban
810
120
6317
1224
761
586
Rura
l13
844
146
3530
8246
293
526
Urb
an94
856
146
9847
9429
390
861
293
181
Aza
d Ja
mm
u an
d
Kash
mir
7Ru
ral
14–
613
1923
23
133
Urb
an2
3318
887
4815
427
0
Gilg
it Ba
ltist
an6
Rura
l6
––
––
––
1 293
Urb
an19
218
113
215
133
Fede
rally
adm
inis
tere
d
trib
al a
reas
7Ru
ral
––
––
––
–1 4
90
Gra
nd to
tal 1
13 13
713
2U
rban
830
120
691,7
2526
663
888
Rura
l15
947
648
4132
8211
550
292
9
Tota
l98
959
649
1050
07
381
1140
1017
99 0
97
Sour
ce: H
ealth
Man
agem
ent I
nfor
mat
ion
Syst
em, 2
008;
a Lady
Hea
lth W
orke
rs M
anag
emen
t Inf
orm
atio
n Sy
stem
, 200
9.
Not
e: T
he re
cent
adm
inis
trat
ive
rear
rang
emen
t has
incr
ease
d th
e to
tal n
umbe
r of d
istr
icts
to 13
6 sh
ortly
bei
ng re
flect
ed in
the
repo
rtin
g sy
stem
.
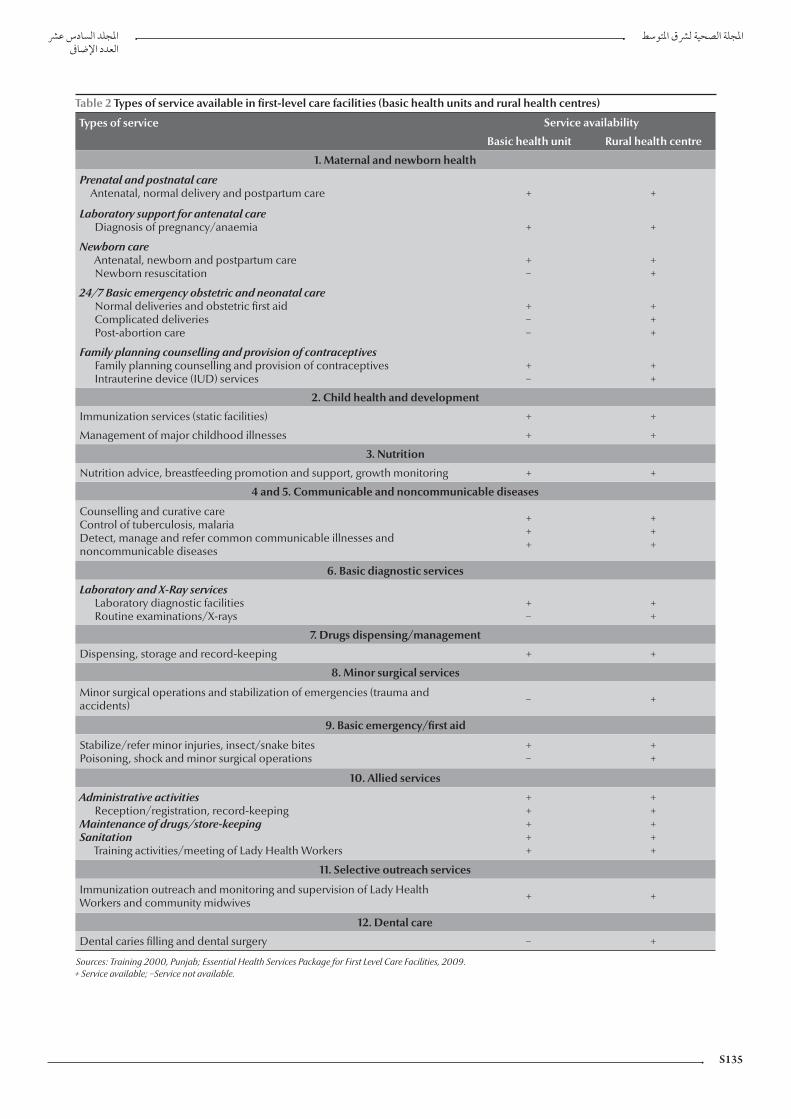
S135
Table 2 Types of service available in first-level care facilities (basic health units and rural health centres)
Types of service Service availability
Basic health unit Rural health centre
1. Maternal and newborn health
Prenatal and postnatal careAntenatal, normal delivery and postpartum care + +
Laboratory support for antenatal care Diagnosis of pregnancy/anaemia + +
Newborn careAntenatal, newborn and postpartum careNewborn resuscitation
+−
++
24/7 Basic emergency obstetric and neonatal care Normal deliveries and obstetric first aid Complicated deliveries Post-abortion care
+−−
+++
Family planning counselling and provision of contraceptivesFamily planning counselling and provision of contraceptivesIntrauterine device (IUD) services
+−
++
2. Child health and development
Immunization services (static facilities) + +
Management of major childhood illnesses + +
3. Nutrition
Nutrition advice, breastfeeding promotion and support, growth monitoring + +
4 and 5. Communicable and noncommunicable diseases
Counselling and curative careControl of tuberculosis, malaria Detect, manage and refer common communicable illnesses and noncommunicable diseases
+++
+++
6. Basic diagnostic services
Laboratory and X-Ray servicesLaboratory diagnostic facilitiesRoutine examinations/X-rays
+−
++
7. Drugs dispensing/management
Dispensing, storage and record-keeping + +
8. Minor surgical services
Minor surgical operations and stabilization of emergencies (trauma and accidents) − +
9. Basic emergency/first aid
Stabilize/refer minor injuries, insect/snake bitesPoisoning, shock and minor surgical operations
+−
++
10. Allied services
Administrative activitiesReception/registration, record-keeping
Maintenance of drugs/store-keeping Sanitation
Training activities/meeting of Lady Health Workers
+++++
+++++
11. Selective outreach services
Immunization outreach and monitoring and supervision of Lady Health Workers and community midwives + +
12. Dental care
Dental caries filling and dental surgery − +
Sources: Training 2000, Punjab; Essential Health Services Package for First Level Care Facilities, 2009. + Service available; −Service not available.

EMHJ
S136
laboratory and X-ray facilities and a 15–20 bed inpatient facility. The mini-mum rural health centre staff comprises a senior medical officer, woman medical officer, Lady Health Visitors, a midwife, a vaccinator, a health technician and a dispenser/dresser as well as laboratory, radiology, operation theatre and anaes-thesia assistants along with administra-tive and support staff.
Civil dispensariesThese facilities were established in urban settings as part of the pre-independence health care delivery system, forming the bottom of the health pyramid. Two types of dispensaries are currently recognized: the municipal corporation civil dispensary, headed by a dispenser and the health department dispensary, operated by a physician.
Maternal and child health centresThese facilities provide maternal, neo-natal and child health services including reproductive health and family planning; and are often located in urban and large rural areas. Maternal and child health centres are managed by Lady Health Visitors and assisted by a facility-based trained traditional birth attendant.
Tuberculosis centresThese centres detect and manage tuberculosis (TB) patients. The TB/DOTS Programme currently is also implemented by most first-level care facilities and hospitals of the district health system network.
Table 2 illustrates the primary health care services offered by basic health units and rural health centres to their respec-tive catchment area communities, the basic health unit having an operational scope comparable to 30% of the services offered by a rural health centre. Despite this impressive network of first-level care facilities, their utilization rate by the catchment area population is low with less than one (0.6) patient visit/person/year.
Tehsil headquarter hospitalsThese hospitals serve a catchment population of about 0.5–1 million, pro-viding a range of preventive, clinical and rehabilitative services (Table 3). Pres-ently the majority of tehsil headquarter hospitals offer 40–60 bed facilities and a range of outpatient services. There are 44 sanctioned posts including nine clinical specialists, of which at least an obstetrician and gynaecologist, a pae-diatrician and a general surgeon are almost always available.
District headquarter hospitalsThese hospitals cover a catchment population of 1 to 3 million, with an average of 125–250 beds. The district headquarter hospital provides promo-tive, preventive, curative, advanced diag-nostic and inpatient specialized services (Table 3). There are 74 sanctioned posi-tions of which 15 are clinical specialties, although the level of actual deployment may vary between provinces.
Contribution of the Ministry of Popu-lation Welfare to the district health systemThe Ministry of Population Welfare operates a network of around 3000 facilities for the delivery of reproduc-tive health and family planning services ranging from reproductive health cen-tres embedded in the tehsil headquar-ter hospital and district headquarter hospital service delivery domains and family welfare centres located at Union Council settings as well as mobile serv-ice units and community worker driven outreach services.
National priority programmesThe district health system hosts and sup-ports the implementation of numerous federally funded national programmes, that include the Lady Health Workers’ programme; maternal, neonatal and child health; national AIDS control; Roll Back Malaria, national tuberculo-sis control; nutrition; prevention and control of blindness; control of hepa-titis viral infections; and the expanded
programme on immunization, closely interfacing with the primary health care services at district level. Many of these programmes have a dedicated workforce at district level with varying degrees of functional integration with the district health system; the federal and provincial management units of all these programmes providing the nec-essary technical and logistics back-up support for effective service delivery.
Health workforceDiverse categories of health care provid-ers serve in the district health system network facilities; which range from specialist physicians and surgeons to medical officers, nurses and midwives, Lady Health Visitors and different categories of paramedics along with administrative and support staff, with the Lady Health Visitors operating at the grassroots level. On average, 50 public sector health workers, including Lady Health Visitors, serve a 20 000 population catchment area. The per-formance of this workforce is critical for the provision of essential health services to the community. In addition to the human resource capacities at commu-nity, first-level care facility and hospital levels, the country has recently launched a large-scale training of community midwives operating at the grassroots level to enhance access to safe delivery and facilitate early referral, each cov-ering a catchment area population of 5000–10 000. Although the national maternal, neonatal and child health programme has projected the train-ing of 12 000 community midwives in five years, the current vision is to attain universal coverage through deployment of community midwives in all rural and urban underprivileged communities. Provincial and district health develop-ment centres have been established nationwide to act as resource training centres for capacity-building. However, these institutions have not received ad-equate support to operate effectively.
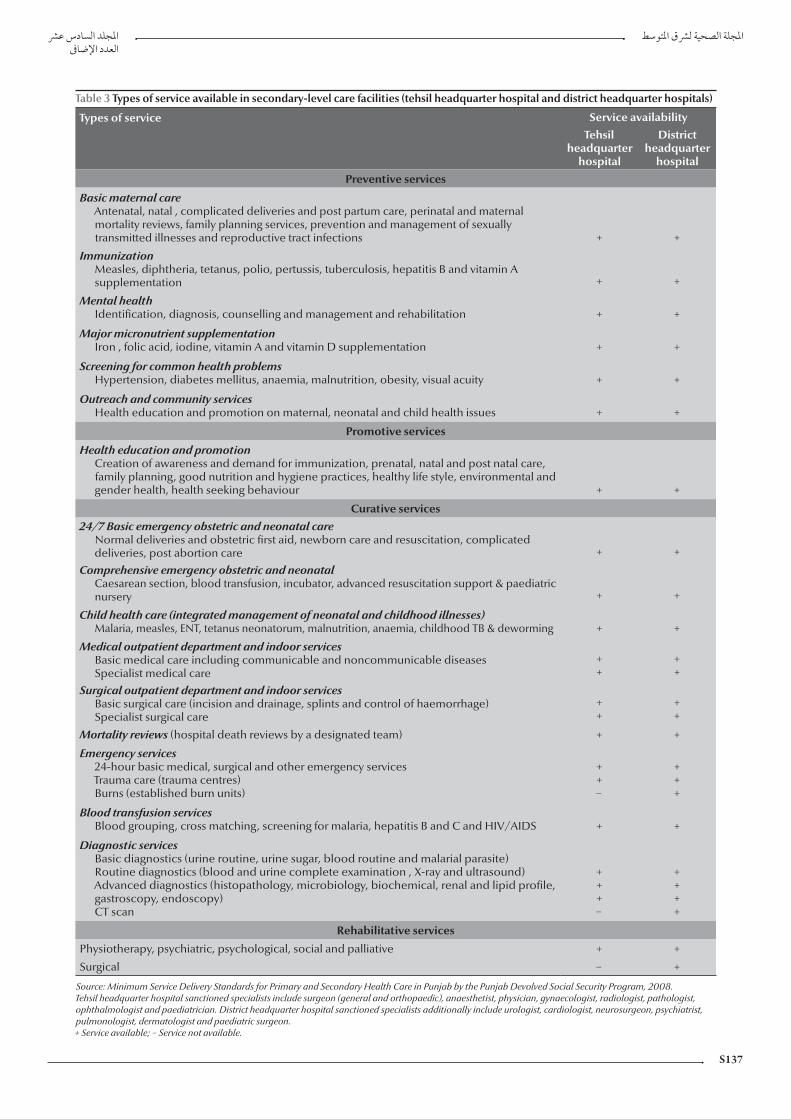
S137
Table 3 Types of service available in secondary-level care facilities (tehsil headquarter hospital and district headquarter hospitals)
Types of service Service availability
Tehsil headquarter
hospital
District headquarter
hospital
Preventive services
Basic maternal careAntenatal, natal , complicated deliveries and post partum care, perinatal and maternal mortality reviews, family planning services, prevention and management of sexually transmitted illnesses and reproductive tract infections + +
ImmunizationMeasles, diphtheria, tetanus, polio, pertussis, tuberculosis, hepatitis B and vitamin A supplementation + +
Mental healthIdentification, diagnosis, counselling and management and rehabilitation + +
Major micronutrient supplementationIron , folic acid, iodine, vitamin A and vitamin D supplementation + +
Screening for common health problemsHypertension, diabetes mellitus, anaemia, malnutrition, obesity, visual acuity + +
Outreach and community servicesHealth education and promotion on maternal, neonatal and child health issues + +
Promotive services
Health education and promotionCreation of awareness and demand for immunization, prenatal, natal and post natal care, family planning, good nutrition and hygiene practices, healthy life style, environmental and gender health, health seeking behaviour + +
Curative services
24/7 Basic emergency obstetric and neonatal care Normal deliveries and obstetric first aid, newborn care and resuscitation, complicated deliveries, post abortion care + +
Comprehensive emergency obstetric and neonatal Caesarean section, blood transfusion, incubator, advanced resuscitation support & paediatric nursery + +
Child health care (integrated management of neonatal and childhood illnesses)Malaria, measles, ENT, tetanus neonatorum, malnutrition, anaemia, childhood TB & deworming + +
Medical outpatient department and indoor servicesBasic medical care including communicable and noncommunicable diseases Specialist medical care
++
++
Surgical outpatient department and indoor servicesBasic surgical care (incision and drainage, splints and control of haemorrhage)Specialist surgical care
++
++
Mortality reviews (hospital death reviews by a designated team) + +
Emergency services24-hour basic medical, surgical and other emergency servicesTrauma care (trauma centres)Burns (established burn units)
++−
+++
Blood transfusion servicesBlood grouping, cross matching, screening for malaria, hepatitis B and C and HIV/AIDS + +
Diagnostic servicesBasic diagnostics (urine routine, urine sugar, blood routine and malarial parasite)Routine diagnostics (blood and urine complete examination , X-ray and ultrasound)Advanced diagnostics (histopathology, microbiology, biochemical, renal and lipid profile, gastroscopy, endoscopy)CT scan
+++−
++++
Rehabilitative services
Physiotherapy, psychiatric, psychological, social and palliative + +
Surgical − +
Source: Minimum Service Delivery Standards for Primary and Secondary Health Care in Punjab by the Punjab Devolved Social Security Program, 2008. Tehsil headquarter hospital sanctioned specialists include surgeon (general and orthopaedic), anaesthetist, physician, gynaecologist, radiologist, pathologist, ophthalmologist and paediatrician. District headquarter hospital sanctioned specialists additionally include urologist, cardiologist, neurosurgeon, psychiatrist, pulmonologist, dermatologist and paediatric surgeon. + Service available; − Service not available.

EMHJ
S138
Health information The national health information system covers all first-level care facilities and hospital outpatients of the district health system. Data collection forms are filled monthly by more than 110 districts. The facilities collect data on 18 priority health events, which along with malnu-trition account for 65%–70% of the care-seeking load, including information on a package of primary care services, essential drugs, contraceptives, vaccines, supplies and equipment, and a range of institutional data that include health education sessions, home visits and achievements and recommendations; cumulatively covering 118 indicators.
Table 4 shows the common dis-eases and conditions diagnosed at dif-ferent levels of the district health system network. In the past few years, efforts have been made to expand the scope of the health information system to in-corporate information from hospital inpatients and the private sector. The enhanced health information system implementation has so far covered about 54 districts of the country. There is cur-rently, however, no provision in either of the systems to collect and incorporate information from the tertiary care public hospitals and the private health sector.
Medical products and technologiesThe public sector procurement func-tions of the district, including procure-ment of medicines, are managed by a special purchase committee. The proc-ess is governed through guidelines of the
public sector procurement regulatory authority, an autonomous body with the responsibility of prescribing regulations and procedures and the monitoring of public sector procurements. At district level the procurement of the medicines has to conform to the national essential drug list that consists of 345 medicines, not restricted to generics, thus allowing the procurement of different branded items with higher price tags. Currently, of the over 60 000 entities registered under the Drugs Control Organization of the Ministry of Health, about 1300 are generics. The package of essential medicines procured for the first-level care facilities and hospitals include 30 and 37 broad categories of therapeutic drugs respectively. In principle, health facilities prescribe freely provided medicines, when available; however, most public sector facilities suffer from frequent stock-outs that force patients and families to procure drugs on their own.
Table 5 depicts the average number of days per month that essential drugs remained out of stock in various dis-trict health system outlets. On the other hand, procurement of medicines and other supplies, equipment and related technologies does not pursue nation-ally set technical guidelines. Likewise, there are no policies to replace used equipment after completing a defined depreciation period, making it difficult to sustain their functionality.
Health financingHealth financing in the public sector has long been suboptimal, with the allocated budgetary outlay for health constantly lagging below 1% of the GDP. The district health budget is released by the provincial government as part of a “one-line budget pool” allotted to 12 line departments of the district government, without any predefined preferential al-locations to support efforts of the health sector to promote delivery of life-saving primary health care services. Moreover, a large proportion of the first-level care facilities’ budgetary outlay (80%) is allocated for salaries and operational costs, while the allowance for medicines does not exceed 6%. In tehsil headquar-ter hospitals and district headquarter hospitals, however, the share for the pro-curement of medicines and equipment may reach 20% of the budget of these institutions. Although the formal sector is covered by different forms of social health insurance, the informal sector has little or no social protection, making the risk of out-of-pocket catastrophic expenditures more likely to occur.
Table 5 illustrates the classification of the district health system budget-ary allocations earmarked for different health facilities. The yearly unit costs of a basic health unit and a rural health centre vary between provinces, rang-ing from US$ 23 000 to US$ 65 000 (2005); with rural health centre alloca-tions being 1.7 to 2.7 times higher than the budget allocated for basic health units, while the allocated cost per Lady Health Worker per year is US$ 675,
Table 4 Essential drugs—days out of stock (mean number of days per month)
Essential drug Hospital Rural health centre
Basic health unit
Dispensary Maternal and child health
centre
TB centre SSC SHC
Oral rehydration salts 5 7 8 7 9 13 8 7
Co-trimoxazole tablets 5 6 6 7 8 8 7 3
Chloroquine tablets 9 8 9 9 9 12 9 3
Folate tablets 9 10 12 11 10 13 9 13
Iron tablets 8 9 11 10 10 11 9 10
Source: National Health Management Information System Data 2005–2008. TB = tuberculosis; SSC = social security centre; SHC = subhealth centre.

S139
including stipend, training, procured medicines and equipment and the ex-penditure incurred on monitoring and supervision.
Figure 1 shows the trend in alloca-tions from 2005–06 to 2010–11 at the federal and provincial levels. Federal health allocations increased over the years but decreased in 2010–11 due to the revised National Finance Com-mission award distribution, whereas provincial shares from the divisible pool were enhanced significantly. Provincial shares have increased from the present 47.5% to 56% in the first year of the National Finance Commission (2010–11) and to 57.5% in the remaining years of the award. However, provinces will have to work to make the targeting of these additional resources transparent and effective.
Organization and managementThe primary health care services in a district are managed by an executive district officer overseeing the district health system network operations, while the district headquarter hospital is run by a medical superintendent. Both the medical superintendent and execu-tive district officer report to the District Coordination Officer, provincial director-general for health services and the recently re-established divisional directors. The coordination between the executive district officer and medical superintendent is often weak and de-pends to a great extent on their efforts to generate partnerships and cooperation.
To improve the quality of service provision in rural settings, the federal and provincial governments opted to outsource a large number of basic health units on a nationwide basis to a non-governmental organization, the People’s Primary Healthcare Initiative (PPHI), introducing substantive changes in the management of these facilities. The scheme was initailly launched in 2006 under the government’s new initiative sponsored by the Ministry of Industries Ta
ble
5 C
omm
on d
isea
ses
and
cond
itio
ns d
iagn
osed
in d
istr
ict h
eadq
uart
er h
ospi
tal/
tehs
il he
adqu
arte
r hos
pita
ls a
nd fi
rst-
leve
l car
e fa
cilit
ies
in P
akis
tan
(sum
mar
ized
from
480
.50
m
illio
n pa
tien
t vis
its d
urin
g 20
01–
09)
Hea
lth
inst
ituti
on
(tot
al p
atie
nt v
isits
in
mill
ions
)
ARI %
Dia
rrho
ea
%
Feve
r
%
Dys
ente
ry
%
Scab
ies
%
Vacc
ine
prev
enta
ble
dise
ases
a
%
Cou
gh
susp
ecte
d TB
%
Goi
tre
%
Vir
al
hepa
titi
s
%
Ani
mal
bi
tesb
%
Susp
ecte
d ch
oler
a
%
Mal
nutr
itio
n
%
Rate
of c
omm
only
di
agno
sed
18 d
isea
ses/
cond
itio
nsc
%
Hos
pita
ls(1
36.1)
156
63
30
.04
1.26
0.0
30
.140
.24
0.0
133
68
Rura
l hea
lth c
entr
es(7
6.6)
196
103
40
.02
0.8
40
.02
0.0
70
.180
.01
2165
Basi
c he
alth
uni
ts(1
98.3
)23
812
45
0.0
10
.38
0.0
10
.03
0.0
70
.00
2073
Dis
pens
arie
s(4
5.3)
228
134
40
.04
0.5
60
.03
0.0
30
.04
0.0
122
74
Mat
erna
l and
chi
ld h
ealth
ce
ntre
s(7
.0)
187
113
50
.04
0.5
40
.03
0.0
30
.04
0.0
018
63
TB c
linic
(1.2)
361
10
.41
10
.02
270
.02
0.0
10
.00
0.0
23
70
Oth
ers
(16.
0)
197.0
410
3.55
2.50
0.0
30
.170
.02
0.0
30
.06
0.0
021
63
Sour
ce: H
ealth
Man
agem
ent I
nfor
mat
ion
Syst
em A
ggre
gate
d D
ata
2001
-200
9.
a Incl
udes
mea
sles
, neo
nata
l tet
anus
, dip
hthe
ria, w
hoop
ing
coug
h, m
enin
gitis
; b Incl
udes
dog
bite
s, sn
ake
bite
s; c Re
port
ed in
HM
IS (e
xcep
t AID
S) a
long
with
mal
nutr
ition
in c
hild
ren
less
than
3 y
ears
. AR
I = a
cute
resp
irato
ry in
fect
ion;
TB
= tu
berc
ulos
is.
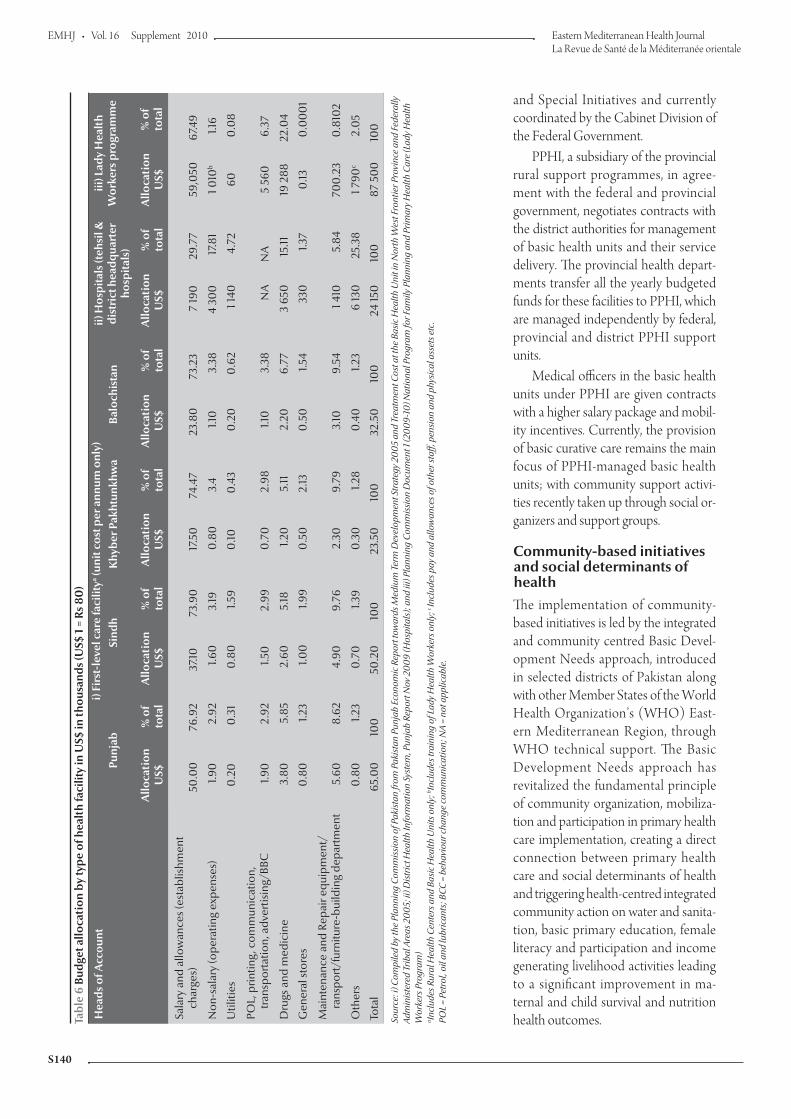
EMHJ
S140
and Special Initiatives and currently coordinated by the Cabinet Division of the Federal Government.
PPHI, a subsidiary of the provincial rural support programmes, in agree-ment with the federal and provincial government, negotiates contracts with the district authorities for management of basic health units and their service delivery. The provincial health depart-ments transfer all the yearly budgeted funds for these facilities to PPHI, which are managed independently by federal, provincial and district PPHI support units.
Medical officers in the basic health units under PPHI are given contracts with a higher salary package and mobil-ity incentives. Currently, the provision of basic curative care remains the main focus of PPHI-managed basic health units; with community support activi-ties recently taken up through social or-ganizers and support groups.
Community-based initiatives and social determinants of healthThe implementation of community-based initiatives is led by the integrated and community centred Basic Devel-opment Needs approach, introduced in selected districts of Pakistan along with other Member States of the World Health Organization’s (WHO) East-ern Mediterranean Region, through WHO technical support. The Basic Development Needs approach has revitalized the fundamental principle of community organization, mobiliza-tion and participation in primary health care implementation, creating a direct connection between primary health care and social determinants of health and triggering health-centred integrated community action on water and sanita-tion, basic primary education, female literacy and participation and income generating livelihood activities leading to a significant improvement in ma-ternal and child survival and nutrition health outcomes.Ta
ble
6 Bu
dget
allo
cati
on b
y ty
pe o
f hea
lth
faci
lity
in U
S$ in
thou
sand
s (U
S$ 1
= R
s 80
)
Hea
ds o
f Acc
ount
i) Fi
rst-
leve
l car
e fa
cilit
ya (uni
t cos
t per
ann
um o
nly)
ii) H
ospi
tals
(teh
sil &
di
stri
ct h
eadq
uart
er
hosp
itals
)
iii) L
ady
Hea
lth
Wor
kers
pro
gram
me
Punj
abSi
ndh
Khy
ber P
akht
unkh
wa
Balo
chis
tan
Allo
cati
onU
S$%
of
tota
lA
lloca
tion
US$
% o
f to
tal
Allo
cati
onU
S$%
of
tota
lA
lloca
tion
US$
% o
fto
tal
Allo
cati
onU
S$%
of
tota
lA
lloca
tion
US$
% o
f to
tal
Sala
ry a
nd a
llow
ance
s (es
tabl
ishm
ent
ch
arge
s)50
.00
76.9
237
.1073
.90
17.5
074
.47
23.8
073
.23
7 19
029
.77
59,0
5067
.49
Non
-sal
ary
(ope
ratin
g ex
pens
es)
1.90
2.92
1.60
3.19
0.8
03.
41.1
03.
384
300
17.8
11 0
10b
1.16
Util
ities
0.2
00
.31
0.8
01.5
90
.100
.43
0.2
00
.62
1 140
4.72
600
.08
POL,
prin
ting,
com
mun
icat
ion,
tran
spor
tatio
n, a
dver
tisin
g/BB
C
1.90
2.92
1.50
2.99
0.7
02.
981.1
03.
38N
AN
A5
560
6.37
Dru
gs a
nd m
edic
ine
3.80
5.85
2.60
5.18
1.20
5.11
2.20
6.77
3 65
015
.1119
288
22.0
4
Gen
eral
stor
es0
.80
1.23
1.00
1.99
0.5
02.
130
.50
1.54
330
1.37
0.13
0.0
00
1
Mai
nten
ance
and
Rep
air e
quip
men
t/
ra
nspo
rt/f
urni
ture
-bui
ldin
g de
part
men
t5.
608.
624.
909.
762.
309.
793.
109.
541 4
105.
8470
0.2
30
.810
2
Oth
ers
0.8
01.2
30
.70
1.39
0.3
01.2
80
.40
1.23
6 13
025
.38
1 790
c2.
05
Tota
l65
.00
100
50.2
010
023
.50
100
32.5
010
024
150
100
87 5
00
100
Sour
ce: i
) Com
pile
d by
the
Plan
ning
Com
mis
sion
of P
akis
tan
from
Pak
ista
n Pu
njab
Eco
nom
ic R
epor
t tow
ards
Med
ium
Ter
m D
evel
opm
ent S
trat
egy
2005
and
Tre
atm
ent C
ost a
t the
Bas
ic H
ealth
Uni
t in
Nor
th W
est F
ront
ier P
rovi
nce
and
Fede
rally
Ad
min
iste
red
Trib
al A
reas
200
5; ii
) Dis
tric
t Hea
lth In
form
atio
n Sy
stem
, Pun
jab
Repo
rt N
ov 2
009
(Hos
pita
ls);
and
iii) P
lann
ing
Com
mis
sion
Doc
umen
t 1 (2
009-
10) N
atio
nal P
rogr
am fo
r Fam
ily P
lann
ing
and
Prim
ary
Hea
lth C
are
(Lad
y H
ealth
W
orke
rs P
rogr
am)
a Incl
udes
Rur
al H
ealth
Cen
ters
and
Bas
ic H
ealth
Uni
ts o
nly;
b Incl
udes
trai
ning
of L
ady
Hea
lth W
orke
rs o
nly;
c In
clud
es p
ay a
nd a
llow
ance
s of o
ther
staf
f, pe
nsio
n an
d ph
ysic
al a
sset
s etc
. PO
L =
Petr
ol, o
il an
d lu
bric
ants
; BCC
= b
ehav
iour
cha
nge
com
mun
icat
ion;
NA
= no
t app
licab
le.
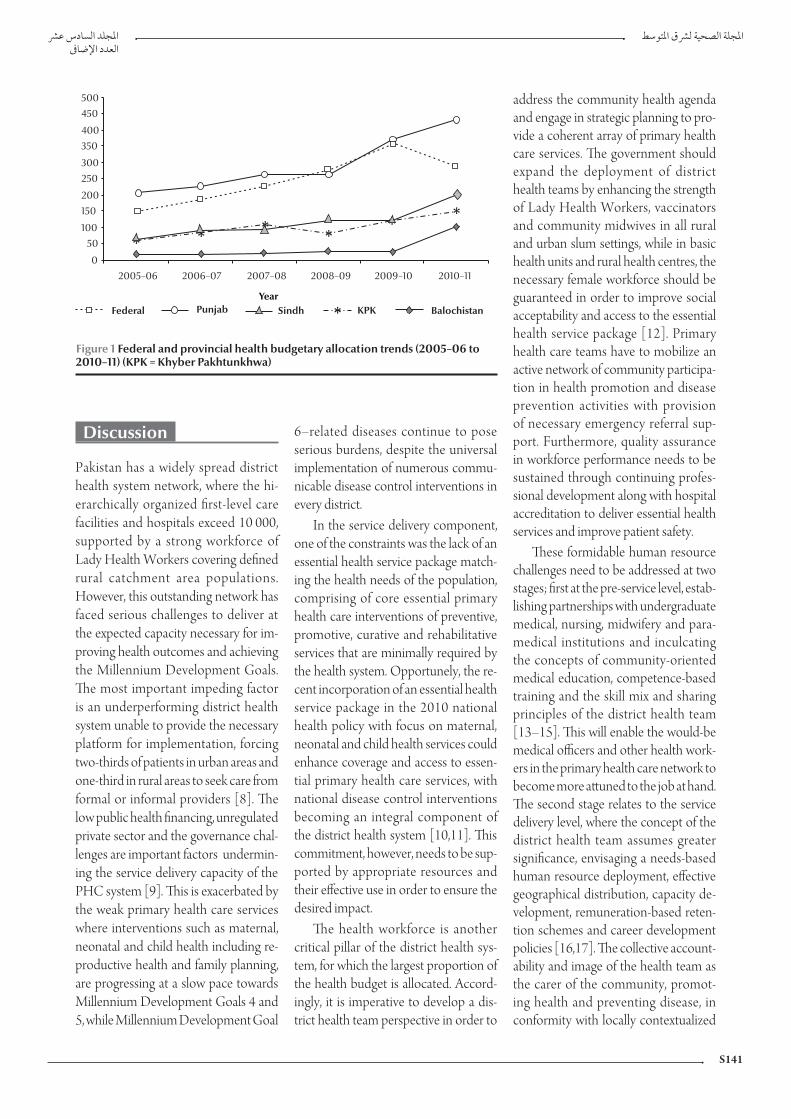
S141
Discussion
Pakistan has a widely spread district health system network, where the hi-erarchically organized first-level care facilities and hospitals exceed 10 000, supported by a strong workforce of Lady Health Workers covering defined rural catchment area populations. However, this outstanding network has faced serious challenges to deliver at the expected capacity necessary for im-proving health outcomes and achieving the Millennium Development Goals. The most important impeding factor is an underperforming district health system unable to provide the necessary platform for implementation, forcing two-thirds of patients in urban areas and one-third in rural areas to seek care from formal or informal providers [8]. The low public health financing, unregulated private sector and the governance chal-lenges are important factors undermin-ing the service delivery capacity of the PHC system [9]. This is exacerbated by the weak primary health care services where interventions such as maternal, neonatal and child health including re-productive health and family planning, are progressing at a slow pace towards Millennium Development Goals 4 and 5, while Millennium Development Goal
6–related diseases continue to pose serious burdens, despite the universal implementation of numerous commu-nicable disease control interventions in every district.
In the service delivery component, one of the constraints was the lack of an essential health service package match-ing the health needs of the population, comprising of core essential primary health care interventions of preventive, promotive, curative and rehabilitative services that are minimally required by the health system. Opportunely, the re-cent incorporation of an essential health service package in the 2010 national health policy with focus on maternal, neonatal and child health services could enhance coverage and access to essen-tial primary health care services, with national disease control interventions becoming an integral component of the district health system [10,11]. This commitment, however, needs to be sup-ported by appropriate resources and their effective use in order to ensure the desired impact.
The health workforce is another critical pillar of the district health sys-tem, for which the largest proportion of the health budget is allocated. Accord-ingly, it is imperative to develop a dis-trict health team perspective in order to
address the community health agenda and engage in strategic planning to pro-vide a coherent array of primary health care services. The government should expand the deployment of district health teams by enhancing the strength of Lady Health Workers, vaccinators and community midwives in all rural and urban slum settings, while in basic health units and rural health centres, the necessary female workforce should be guaranteed in order to improve social acceptability and access to the essential health service package [12]. Primary health care teams have to mobilize an active network of community participa-tion in health promotion and disease prevention activities with provision of necessary emergency referral sup-port. Furthermore, quality assurance in workforce performance needs to be sustained through continuing profes-sional development along with hospital accreditation to deliver essential health services and improve patient safety.
These formidable human resource challenges need to be addressed at two stages; first at the pre-service level, estab-lishing partnerships with undergraduate medical, nursing, midwifery and para-medical institutions and inculcating the concepts of community-oriented medical education, competence-based training and the skill mix and sharing principles of the district health team [13–15]. This will enable the would-be medical officers and other health work-ers in the primary health care network to become more attuned to the job at hand. The second stage relates to the service delivery level, where the concept of the district health team assumes greater significance, envisaging a needs-based human resource deployment, effective geographical distribution, capacity de-velopment, remuneration-based reten-tion schemes and career development policies [16,17]. The collective account-ability and image of the health team as the carer of the community, promot-ing health and preventing disease, in conformity with locally contextualized
Figure 1 Federal and provincial health budgetary allocation trends (2005–06 to 2010–11) (KPK = Khyber Pakhtunkhwa)
EMHJ
S142
needs, should become a major district health system domain [18,19].
The district health system data per-taining to inputs, processes, outputs and outcomes of the primary health care system should be readily available and continuously updated. In practice, the district information system solely covers the public sector district health system outpatient data flow, while the information systems of national pro-grammes, such as the Expanded Pro-gramme on Immunization and TB/DOTS, and the inpatient hospital data are reported separately in a fragmented manner. Another major limitation to be addressed constitutes the gap be-tween the district information system and the decision-making process, where the practice of data generation, analysis and presentation is often delinked from the desired and indispensible evidence-based decision-making.
The insufficient availability of medi-cines has detrimentally affected the use of public health services in Pakistan, where a very limited proportion of pub-lic sector facilities had an uninterrupted flow of essential medicines [20,21]. To enhance access to life-saving primary health care services, essential medicines should be procured in sufficient quanti-ties along with efforts to reduce stock-outs caused by improper procurement and transport, storage and management deficiencies. On the other hand, lack of standard procurement systems and effective use and maintenance of health technologies for the primary health care network, pose serious limitations to the delivery of quality care. The concept of health technology assessment may therefore be introduced to rationalize procurement, as this would enhance the essential health service package’s impact on prevailing health needs in a district.
A major challenge relates to health care financing, where the district health system struggles to obtain a fair share from the district’s one-line budget pool, distributed until recently by the
district assemblies. Excluding the sal-ary component, these funds are short of satisfying the minimum service delivery package necessary to support primary health care implementation, although the recent National Finance Commis-sion Award distribution has enhanced provincial shares and created a larger fiscal space for the health sector. Moreo-ver, the 18th constitutional amendment transferring larger budgetary outlay to the provinces should endorse the “managing for results” approach to en-hance the pace towards achieving the Millennium Development Goals. The 2005–06 study of the national health accounts indicated that district govern-ments are spending around half of the total provincial budgets [22]. However, health system strengthening demands greater allocation for health to at least 4% of GDP from the provincial share of the National Finance Commission Award to sustain the expected level of implementation.
Similarly, the health sector may further explore fairness opportunities through greater access to essential serv-ices and protection against unafford-able, out-of-pocket and catastrophic expenditure. Accordingly, there is a need to enhance the public sector budgetary outlay for health from its current level of less than 1% of the GDP leading to potential out-of-pocket expenditure, which is corroborated by a recent study estimating the public and private sector health expenditure at 2.9% of the GDP [23]. However, through appropriate linkages with ongoing expansion of social safety arrangements in Benazir Income Support Program the base of PHC financing and mandatory essential services’ utilization can be broadened [24].
In Pakistan, similar to many other developing countries, the district health system has been facing a range of governance challenges impeding the organization, implementation and man-agement of essential health services; poorly supported by weak strategic and
operational planning, irregular moni-toring and supervision, an inadequate accountability system and insufficient community participation and intersec-toral action [10,25–27]. The Pakistan Devolution Plan under the Local Government Ordinance 2001 aimed to make the districts answerable to the elected chief executive of the district (District Nazim) for better governance and improved service delivery. Analysis of the district devolution impact on the governance of district health system gave mixed results, as shifting power without transferring knowledge and skills proved counterproductive [28]. Even though the responsibilities of the district health teams have increased, non-provision of adequate management training, lack of managerial flexibility and the high turnover of executive district officers has constrained implementation.
The managerial outsourcing of a large number of basic health units to PPHI was intended to improve the per-formance and outcomes of this critical level of the district health system. PPHI has shown an immediate enhancement of attendance and use of basic health units which could be attributed to im-provement in availability of medicines and waiver of user charges. PPHI is ad-dressing the previous weakness in its model, with curative services being the exclusive focus, and is now working to-wards making its BHU hubs for delivery of comprehensive primary health care services to the community [29,30]. In future, in order to improve the coor-dination and quality of outsourcing, transparent and merits-based contrac-tual bidding and selection procedures must be designed, while the interface between the contractual partner and the district health team must allow for a formal performance oversight, account-ability, greater community participation and intersectoral action [29].
On the other hand, provincial gov-ernments when recruiting members of the district health team should be cogni-zant of the necessity to engage the right

S143
technical and managerial merit-based capacities and address the current rapid turnover of senior managers, which neg-atively affects the district health system’s operational sustainability. Special efforts need to be made to forcefully pursue the jointly promulgated memorandum of understanding for better coordination and functional integration of reproduc-tive health and family planning serv-ices provided by the ministries of health and population welfare, especially at the grassroots level [31,32]. In their monitor-ing capacities, the federal and provincial governments may jointly organize na-tionwide quality assessment and impact monitoring to enhance accountability and focus on results.
C o n c u r r e n t l y , d i s t r i c t h e a l t h promotion network action should be established to reach out to local com-munities, households, schools, working places and market settings. Integration of
emergency preparedness and response interventions into the district health sys-tem’s operational plans is also required in order to mitigate avoidable morbidities and mortalities evolving during disas-ters. A well performing district health system would also strongly benefit from national and provincial efforts to regulate key public health policy dimensions that cannot be executed independently at the district level. These include the prom-ulgation and implementation of public health legislation against the hazards of tobacco consumption; food fortification and safety; safe blood transfusion; safe drinking-water and sanitation; solid waste disposal; road traffic safety; regulation of the private sector; patient safety; and en-hancing public private partnerships while promoting health in public policies.
In conclusion, primary health care still remains the most rational way for achiev-ing Health for All and the Millennium
Development Goals, while the district health system provides an ideal platform for its implementation [19,33]. Health system strengthening in the framework of primary health care will require effec-tive deployment of coordinated strate-gies to ensure the provision of essential services, medicines and technologies, the deployment of a qualified and account-able health workforce, use of evidence in decision-making and the allocation of predictable budgetary outlay supported by an effective and transparent steward-ship at all operational levels. To attain significant progress towards the Millen-nium Development Goals, the three tiers of the government (district, provincial and federal) have to work together for better coordination and strategic unity, while forging purposeful alliances with civil society organizations, other relevant public sector line departments and inter-national development partners.
References
1. Declaration of Alma Ata. International conference on primary health care. Alma Ata, USSR, 6–12 September 1978 (http://www.who.int/publications/almaata_declaration_en.pdf, ac-cessed 13 July 2010).
2. Development of rural primary health care. Beijing initiative for responding to challenges by giving priority to health. Inter-national conference on the development of rural primary health care. Beijing, China, 1–2 November 2007 (http://www.wpro.who.int/NR/rdonlyres/10BB01FA-A891-49FA-9119-14BAFB3CD056/0/file.doc&ei=L4U8TMayGNy4jAfM39GZAQ&usg=AFQjCNGpobEtl6Q2eccaddVFMLO3g4OTHA, ac-cessed 13 July 2010).
3. Qatar declaration: health and well being through health systems based on primary health care. International conference. Doha, Qatar, 1–4 November, 2008 (http://gis.emro.who.int/health-systemobservatory/researchandpublications/Documents/Qatar%20PHC%20Conference.pdf, accessed 13 July 2010).
4. World health report 2008–primary health care: now more than ever before. Geneva, World Health Organization, 2008.
5. Seventh five-year development plan 1988–1993. Islamabad, Paki-stan, Planning Division, 1988.
6. National health policy 1990. Islamabad, Pakistan, Ministry of Health, 1990.
7. National health policy 1997. Islamabad Pakistan, Ministry of Health, 1997.
8. Karim MS. Disease pattern, health services utilization and cost of treatment in Pakistan. Journal of Pakistan Medical Association, 1993, 43:159–164.
9. Nishtar S. Mixed Health Systems Syndrome. Bulletin of the World Health Organization, 2010, 88:74–75 (doi: 10.2471/BLT.09.067868).
10. Hansen PM et al. Determinants of primary care service quality in Afghanistan. International Journal of Quality in Health Care, 2008, 20(6):378–383.
11. Ghaffar A, Kazi BM, Salman M. Health care systems in transition 3. Pakistan, part 1: an overview of the health care system in Paki-stan. Journal of Public Health Medicine, 2000, 22(1):38–42.
12. Mumtaz Z et al. Gender based barriers to primary health care provision in Pakistan: the experience of female providers. Health Policy and Planning, 2003, 18(3):261–269.
13. Aziz A et al. Knowledge and skills in community oriented medi-cal education (COME) Self-ratings of medical undergradu-ates in Karachi. Journal of Pakistan Medical Association, 2006, 56(7):313–317.
14. Farid-ul-Hasnain S, Israr SM, Jessani S. Assessing the effects of training on knowledge and skills of health personnel: a case study from the family health project in Sindh, Pakistan. Journal of Ayub Medical College Abbottabad, 2005, 17(4):26–30.
15. Begum S, Aziz-un-Nisa, Begum I. Analysis of maternal mortality in a tertiary care hospital to determine causes and prevent-able factors. Journal of Ayub Medical College Abbottabad, 2003, 15(2):49–52.
16. Kampala declaration on fair and sustainable health financing. Kampala, Uganda, WHO Country Office World Health Organi-zation, 2005 (https://www.who.int/health_financing/docu-ments/kampala.pdf, accessed 13 July 2010).
17. Serneels P et al. Who wants to work in rural health post? The role of intrinsic motivation, rural background and faith based institutions in Ethiopia and Rwanda. Bulletin of the World Health Organization, 2010; 88: 342–349.
18. Mahmood MA, Moss J, Karmaliani R. Community context of health system development: implications for health sector

EMHJ
S144
reform in Pakistan. Eastern Mediterranean Health Journal, 2003, 9(3):464–471.
19. Siddiqi S et al. Primary health care, health policies and plan-ning: lessons for the future. Eastern Mediterranean Health Jour-nal, 2008, 14:S42–S56.
20. Masud TI, Farooq N, Abdul Ghaffar. Equity shortfalls and failure of the welfare state: community willingness to pay for health care at government facilities in Jhelum (Pakistan). Journal of Ayub Medical College Abbottabad, 2003, 15(4):43–49.
21. Pakistan: Medicine price, availability, affordability and price com-ponents. Cairo, World Health Organization, Regional Office for the Eastern Mediterranean, 2008 (WHO-EM/EDB/095/E).
22. National health accounts Pakistan 2005–2006.Islamabad, Paki-stan, Statistic Division, Federal Bureau of Statistics, 2005.
23. Nishtar S. Health financing. In. Choked pipes: reforming Paki-stan’s mixed health system. Karachi, Pakistan, Oxford University Press, 2010:77–106.
24. Thailand: health care for all, at a price. Bulletin of the World Health Organization, 2010, 88:84–85.
25. Siddiqi.S et al. Framework for assessing governance of the health system in developing counties: gateway to good govern-ance. Health Policy, 2009, 90(1):13–25.
26. Tarin E et al. Policy process for health sector reforms: a case study of Punjab Province (Pakistan). International Journal of Health Planning and Management, 2009, 24(4):306–325.
27. Shaikh BT et al. Contracting of health care services in Pakistan: is up-scaling a pragmatic thinking? Journal of Pakistan Medical Association, 2010, 60(5):387–389.
28. Devolution in Pakistan: overview of the ADB/DFID/World Bank study. Islamabad, Asian Development Bank, DFID, World Bank, Pakistan, 2004.
29. Siddiqi S, Masud TI, Sabri B. Contracting but not without cau-tion: experience with outsourcing of health services in coun-tries of the Eastern Mediterranean region. Bulletin of the World Health Organization, 2006, 84(11):867–875.
30. Sheikh B T, Hatcher J. Health seeking behaviour and health service utilization in Pakistan: challenging the policy makers. Journal of Public Health, 2004, 27(1):49–54.
31. Bile K. The imperative of functional integration for achieve-ment of MDGs. Journal of Pakistan Medical Association, 2009, 50(9):S34–8.
32. Douthwaite M, Ward P. Increasing contraceptive use in rural Pakistan: an evaluation of the Lady Health Worker programme. Health Policy and Planning, 2005, 20(2):117–123.
33. Abdullatif AA. Aspiring to build health services and systems led by primary health care in the Eastern Mediterranean Region. Eastern Mediterranean Health Journal, 2008, 14:S23–S41.

S145
Pakistan human resources for health assessment, 2009A. Hafeez,1 Z. Khan,2 K.M. Bile,2 R. Jooma3 and M. Sheikh4
ABSTRACT Pakistan faces a human resources for health (HRH) crisis. A cross-sectional survey was conducted to overview frontline health workers. A total of 750 health facilities were surveyed across Pakistan. The median estimate of public sector health care workers in the district health system in Pakistan is 417 288, including 46 153 doctors and 41 032 nurses. Another estimated 20 000 doctors work in public sector tertiary care hospitals across the country. A total of 3549 health care workers were interviewed regarding job satisfaction and work environment. The private sector had better work environment scores compared with the public sector. Policy dimensions showed an absence of robust policies in practice. The public sector is inadequately staffed and job satisfaction and work environment need improvement. HRH crisis countries should share experiences, and developmental partners should support them in overcoming the HRH crisis.
1Health Services Academy, Islamabad, Pakistan.2World Health Organization, Country Office, Islamabad, Pakistan (Correspondence to Z. Khan: [email protected]).3Ministry of Health, Islamabad, Pakistan.4Global Health Workforce, Geneva, Switzerland.
2009
750
20 000 41 032 46 153 417 288
3549
Évaluation des ressources humaines pour la santé au Pakistan en 2009
RÉSUMÉ Le Pakistan est confronté à une crise des ressources humaines pour la santé. Une étude transversale a été réalisée sur les agents de santé en première ligne dans 750 établissements de soins pakistanais au total. Le système de santé de district pakistanais compte environ 417 288 agents de santé dans le secteur public, dont 46 153 médecins et 41 032 infirmières, Selon une estimation, 20 000 médecins travaillent dans les hôpitaux de soins tertiaires du secteur public dans tout le pays. Au total, 3549 agents de soins de santé ont été interrogés sur leur satisfaction et leur environnement professionnels. Le secteur privé a obtenu de meilleurs résultats que le secteur public en termes d’environnement de travail. Sur le plan politique, il a été démontré qu’aucune stratégie solide n’était mise en pratique. Le secteur public manque de personnel, et l’environnement de travail et la satisfaction des employés ont besoin d’être améliorés. Les pays affrontant une crise des ressources humaines pour la santé devraient partager leurs expériences. En outre, il serait souhaitable que des partenaires du développement les soutiennent afin de surmonter cette crise.

EMHJ
S146
Introduction
The World Health Organization (WHO) has defined the health work-force as “all people primarily engaged in actions with the primary intent of enhancing health”. This definition is consistent with the WHO definition of health systems as comprising all activi-ties with the primary goal of improving health. The health workforce is one of the most important pillars of the health system. Adequate numbers and quality of health workers have been positively associated with successful implementa-tion of health interventions, including immunization coverage, outreach of primary care, and infant, child and ma-ternal survival. [1].
Pakistan needs to gauge strategically the challenges to its health system, keep-ing in view:
demographic trends, such as the in-crease in population to around 295 million by 2030 at the current popu-lation growth rate of 1.8% [2];
the increase in life expectancy, rapid urbanization and epidemiological transition;
the increased burden of chronic dis-eases such as cardiovascular diseases and cancers;
trauma due to accidents, particular-ly among poor, disadvantaged and high-risk groups in the community [3].
The health workforce should not only be depicted in terms of num-bers of doctors, nurses and dentists, etc. expressed per 1000 population, it should also give due consideration to expected epidemiological tran-sition, equitable distribution, new cadres, proper skill mix and types and nature of services to be deliv-ered, as well as their demographic distribution. It is clear that, without prompt action, the human resources for health (HRH) crisis will worsen and health systems will be weakened even further [4].
Pakistan has been categorized as one of 57 countries that are facing an HRH crisis, below the threshold level defined by WHO to deliver the essential health interventions required to reach Millen-nium Development Goals (MDGs) by 2015 [5].
Health workforce strategy is usually low on a country’s agenda, despite the understanding that scaling-up health in-terventions to reach MDGs is not pos-sible without a minimum level of health workforce. National health workforce strategies require reliable and timely in-formation, rational system analysis and a firm knowledge base. However, data analysis, research on HRH and techni-cal expertise are still underdeveloped in many countries, in part due to low investment in HRH [6].
Pakistan’s new draft National health policy 2009 mandated the development of strategies in various key areas, includ-ing HRH [7]. To develop evidence-based policy and a strategic framework, data on HRH are desperately required. Therefore, a countrywide HRH assess-ment was undertaken. The objectives of this study were to collect data on the numbers and distribution of the health workforce, to gather information about HRH management and policy, to col-lect data on job satisfaction among the health workforce, and to gather informa-tion on the HRH work environment.
Methods
A cross-sectional survey was carried out throughout Pakistan over a period of 4 months (September–December 2009). The total sample size was 750 health facilities, with equal numbers from the public and private sectors. In order to obtain a representative sample, four districts from each province were selected at random. Since the sampling frame for the public sector facilities in each district was known, a random sam-ple of 22 facilities in the public sector was chosen from each study district.
Private sector facilities were classified as hospitals (having an indoor facility) and clinics (with only outpatient consulta-tion) and a similar number was chosen from each district. An estimate of the total number of postgraduate trainee doctors, faculty members of medical schools and medical officers of tertiary care hospitals in the public sector was also obtained from the largest post-graduate training body in the country, the College of Physicians and Surgeons Pakistan, Karachi, the Pakistan Medical and Dental Council and major tertiary hospitals, respectively.
The tools for data collection were adopted and customized from available questionnaires obtained during a lit-erature search. Four types of tools were used: a data collection form for numbers and distribution, and questionnaires for HRH management policies, work environment and job satisfaction. Pilot testing and validity checks were carried out for all tools before the survey and ap-propriate changes made based on feed-back. The survey teams were trained on use of the tools in three stages. The first stage was a master training workshop in Islamabad, followed by provincial work-shops to train district field surveyors. Supervisors were also given supervision training.
Data were collected from federal and provincial health ministries, verti-cal programmes and executive district officer health offices on numbers and distribution of health workers, job satis-faction and work environment. Howev-er, questionnaires on HRH policy were only administered in federal/provincial ministries and large private hospitals in provincial capitals. In each category, 10% of the health workforce in every sampled health facility (not exceeding a total of six in each category) were ad-ministered the job satisfaction and work environment questionnaires.
Each health worker included in the survey was asked 32 questions on job satisfaction and 34 questions on work environment. Their response to

S147
each question was scored as follows: 1 = agree; 2 = somewhat agree; 3 = neu-tral; 4 = somewhat disagree; and 5 = disagree. A lower score was therefore associated with agreement and higher scores with increasing levels of disa-greement. Individual questions were grouped by aspect covered into several composite indices and the means of the responses for these composite indices were reported. Each question carried equal weight.
The HRH policy questionnaire was used for interviewing senior manag-ers from the public and private health sectors, at federal and provincial levels. In the public sector, in each province a senior manager from the offices of the Director General Health was inter-viewed. In the private sector, a senior manager from a private hospital was interviewed in each province. Inter-views focused on the stages of the HRH management policy/plan and its im-plementation across various aspects of HRH management. The five main areas of the questionnaire were: HRH man-agement capacity; HRH data; person-nel policy and practice; performance management; and training. On each of 24 components within these five areas, respondents were asked to rate the stage their organization had achieved, and to indicate the level of policy develop-ment, from “no policy developed” to “more than five years of experience” in the particular policy area related to the component. Within each area, all the specific components for making a judgement for the organization were analysed.
Comprehensive data quality checks were performed during data collection and data entry. To reduce the number of non-respondents at the point of data collection and other reporting errors, the following steps were adopted:
introductory letters were sent to all concerned prior to initiation of field activity;
an ID card was assigned to each field surveyor;
interviewing techniques were part of surveyor training at the province level;
verbal consent was obtained from respondents;
connection between the district and provincial focal person was estab-lished in order to address discrepan-cies that may have arisen during the survey;
detailed microplans indicating the number and location of health care facilities to be visited on a daily basis were provided to enumerators;
full details of the enumerator, includ-ing contact details, were provided to facilities and provincial data coordi-nators.
Survey monitoringA “central monitoring cell” was es-tablished in the federal Ministry of Health to oversee the process of data collection, supervise the provincial focal persons/survey coordinators and monitor the survey enumerators to resolve any issues at the grass-root level. Data collection was monitored on a daily basis to assess the progress and implementation of the survey plan. The data entry team supervisors were instructed to communicate with the survey enumerators at 12:00 and at 16:00 daily, collect any faulty ques-tionnaires and report to the survey coordinators twice a day to resolve any issues and correct discrepancies. In addition, the flagged faulty question-naires were sent back to be refilled by the survey enumerators. Data entry was successfully completed in the first week of December 2009.
Data analysisData were cleaned and validated in Islamabad, before being transferred to an analysis team in Bethesda, Maryland, United States of America. Data were originally entered into SPSS software (SPSS Inc.) and converted to the Stata® version 9 format (StataCorp) for analy-sis. Further analysis and charting was
also carried out using Microsoft Excel® (Microsoft Corp.).
In view of the data quality issues in the public sector records that were experienced during this assessment, an extrapolation analysis was also con-ducted for various cadres; for example, to calculate the total number of doctors for any province, the average of sam-pled facilities was obtained by dividing the number of doctors in the sampled facilities by the number of facilities surveyed. This sample average was then multiplied by the total number of respective facilities in the province or region to obtain the total estimated number of doctors. This methodology was also helpful in obtaining national consolidated figures for unsampled regions.
Results
Results are given in two sections: the first deals with the numbers and distri-bution of health workers in the public sector and HRH policy analysis; the second describes the findings about job satisfaction and work environment in both the public and private sectors.
Numbers and distribution of health workers in the public sector and HRH policiesTable 1 shows the types of 349 dis-trict health facilities in the public sec-tor from which data on numbers and distribution were collected. Data for these 349 facilities were also collected from the office of the executive district officer (health) for cross-checking, giv-ing two data points for most facilities. In addition, consolidated data on health workers were collected from the feder-ally funded programmes, which have district-level implementation. There were a large number of basic health units in the sample. The oversampling of basic health units is rationalized, as this is the most numerous type of public health facility in Pakistan.

EMHJ
S148
Table 2 presents the median esti-mates of total HRH in the public sector by provinces and administrative areas of Pakistan. These estimates are based on district-level facility averages for health workers. These do not include tertiary hospitals, planning, supervisory, training and budgetary staff in federal, provincial and district health offices. From the total front-line public sector health workers, doctors and nurses are separated for further analysis, to illustrate the median estimate of doctors and nurses in the district health system in Pakistan in the public sector. Sindh province has the maximum number of doctors in the public sector, whereas Punjab has the maximum number of nurses, including midwives and lady health visitors, in the public sector.
In a separate exercise, data col-lected from the College of Physicians and Surgeons Pakistan, the Pakistan Medical and Dental Council and from
major tertiary care hospitals revealed an estimate of 20 000 doctors work-ing as postgraduate trainees, faculty members and medical officers in public sector facilities. About 50% of these are located in Punjab, 30% in Sindh and the remainder in the other two provinces.
In the absence of other measures of the adequacy of front-line health workers, the population ratio is a proxy indicator for adequacy. Table 3 depicts district-level doctor:population and nurse:population ratios.
Other estimates indicate that there are 2.1 managers and administrative staff for every 100 health workers of all other cadres. The five-year total of at-trition due to resignations, long-leaves, retirement and deaths does not exceed 4% of the annual stock (using median stock for 2009 as a baseline) in most provinces for all the cadres.
The responses from our sample of interviewees in HRH management
positions indicate that provinces are at different levels of achievement in developing HRH management ca-pacity and systems; this achievement varies from no policy experience to extensive experience of more than five years. The private facility managers interviewed also had varying levels of achievement. The private hospi-tal managers interviewed in Sindh reported the strongest achievement with recent policy implementation experience. Similarly, private hospital managers from Punjab also reported strong achievement on some com-ponents, e.g. establishing an Oracle-based hospital information system for employee data.
Job satisfaction and work environmentRegarding job satisfaction and work environment, 3549 health care work-ers across public and private health facilities in Pakistan were interviewed, about 40% from the private sector and the remainder from the public sec-tor. The urban:rural distribution was 48%:52%.
Table 4 compares the results on job satisfaction and work environment indices for the public:private sectors and urban:rural distribution. The general direction of the public sec-tor scores is towards neutrality, with health workers neither agreeing nor disagreeing with the questions related to positive aspects of job satisfaction. Across the entire sample (public and private), comparisons for age, gender, location (urban/rural), provinces, ba-sic pay scale (BPS) cadres for federal and provincial health workers, job type (regular/contractual) and years of service only show subtle differences in job satisfaction levels.
Work environment compari-sons were also carried out across age, gender, location (urban/rural), BPS cadres for federal and provincial health workers, job type (regular/contrac-tual) and years of service. No significant
Table 1 Number of public sector district health facilities surveyed by type of facility across four provinces of Pakistan
Province DHQs THQs RHCs BHUs Dispensaries MCHC Total
Balochistan 3 2 10 59 13 5 92
Khyber Pakhtunkhwa 4 3 6 61 4 5 83
Punjab 4 4 8 62 4 4 86
Sindh 4 4 8 44 24 4 88
Total 15 13 32 226 45 18 349
DHQs = district headquarters; THQs = tehsil headquarters; RHCs = rural health centres; BHUs = basic health units; MCHC = mother and child health centres.
Table 2 Estimated median numbers of total health workers, doctors and nurses working in the district health system in the public sector in 2009
Province/area Total health care workers Doctorsa Nursesb
Balochistan 14 538 1 409 1 892
Khyber Pakhtunkhwa 55 646 7 518 8 783
Punjab 91 696 12 601 17 773
Sindh 95 263 20 639 8 169
Islamabad Capital Territory 1 712 287 318
Azad Jammu and Kashmir 12 931 987 1 246
Northern areas 7 267 741 1 021
Total for Pakistanc 417 288 46 153 41 032aDoctors include general practitioners and specialists. bNurses include midwives and lady health visitors. cThis is not the sum of the individual medians and also includes federal vertical programmes (100 000 lady health workers).

S149
differences are seen in the responses for work environment across age or gender subcategories, or for years of service and BPS categories, but there are significant differences between urban and rural facilities.
The survey results show that posi-tive aspects of the work environment grow stronger with the size of the public sector health facility. The smallest fa-cilities – dispensaries and basic health units – face the largest constraints in terms of logistics and supplies in the opinion of the sampled health workers from such facilities. Teaching hospitals are the best resourced with supplies and logistics as well as machinery and equip-ment. The larger provinces (Punjab and
Sindh) have better scores for supplies and logistics, machinery and equipment compared with Balochistan or Khyber Pakhtunkhwa. The score on composite administrative facilitation is particularly poor for Balochistan. This composite in-dex captures responses related to clean drinking water, transport, security, food and uniforms for the health workers at the facility. Punjab and Sindh also perform significantly better on cumula-tive indicators. The score achieved by Punjab, the most populous province, mirrors the higher performance of the province on job satisfaction of sampled health workers. Federal workers show reservations about their organizational culture.
Discussion
The problem in health service delivery in Pakistan has not been the unavail-ability of physical health facilities, but rather their poor utilization and inability to yield desired health outcomes [8]. Equipping health facilities with ade-quate, well-trained and motivated health workers is the first step in improving uti-lization and quality of care. In order to address HRH issues in the country, we need to know the distribution of health workers across Pakistan, their total numbers, in terms of population, health needs and in proportion to each other (e.g. nurse:doctor ratios). Similarly, to improve utilization and quality of public health care services, we need to assess the job satisfaction and motivation of health care service providers.
The present survey is one of the largest surveys of health care workers conducted in Pakistan to assess their numbers and understand the realities of their work conditions, motivation, job satisfaction and the adequacy of their equipment and instruments. The median estimate of total health workers employed in the district health system in the public sector for 2009 is 417 288; this number does not include tertiary hospitals, or provincial, district or federal staff at Ministry of Health offices involved in planning, budget-ing, training or research. The median estimate of district doctors, both gen-eral practitioners and specialists (not including dentists) in Pakistan for 2009 is 46 153 in the public sector, which compares with an earlier estimate of 74 000 doctors in Pakistan in 2005 across public and private sectors [9]. Estimates for tertiary hospitals show that Punjab and Sindh provinces have the highest number of doctors. This is substantiated by Pakistan Medical and Dental Council data, which show that Sindh has the highest number of regis-tered doctors in both public and private sectors [10], followed by Punjab.
Table 3 Estimated district level public sector doctors and nurses per 1000 of population in 2009
Province/Area Doctors Nurses
Min. Median Max. Min. Median Max.
Balochistan 0.15 0.17 0.24 0.21 0.23 0.24
Khyber Pakhtunkhwa 0.28 0.33 0.35 0.20 0.39 0.48
Punjab 0.03 0.13 0.19 0.08 0.19 0.22
Sindh 0.23 0.53 0.66 0.09 0.21 0.23
Islamabad Capital Territory 0.26 0.28 0.43 0.21 0.23 0.24
Pakistan 0.26 0.27 0.32 0.21 0.24 0.25
Source: extrapolated from growth in Pakistan population, 1998 census (Department of Statistics).
Table 4 Composite scores on job satisfaction and work environment indices, by location and sectora
Description of composite indices Urban Rural Public Private
Recruitment/career development/skills and abilities 2.5 2.4 2.5 2.5
Benefits and grievances 3.0 3.3 3.3 2.6
Salary 3.3 3.6 3.8 2.7
Motivation, recognition and respect 2.3 2.3 2.4 2.0
Professional facilitation 2.2 2.3 2.4 2.0
Workload 2.6 3.0 3.0 2.2
Retention 1.8 1.9 1.9 1.7
Infrastructure 2.0 2.9 2.8 1.6
Logistics and supplies 2.5 3.3 3.0 2.5
Machinery and equipment 1.8 2.5 2.5 1.4
Organizational culture 2.5 2.5 2.6 2.3
Administrative facilitation 3.1 3.6 3.5 2.9
Work environment (cumulative question, positive) 1.6 1.8 1.8 1.3
aLower score is a better and more positive indication.
EMHJ
S150
Pakistan has a shortage of nurses, further exacerbated by maldistribution across provinces. This shortage is par-ticularly pronounced in Sindh, where they may not be adequate nurses and midwives to assist doctors. In contrast, Khyber Pakhtunkhwa has the high-est numbers of nursing staff, both as a total and as a ratio to the population. The number of nurses and midwives is particularly important in relation to the MDG target of all deliveries to be attended by skilled birth attendants, because this shortage will be a barrier to achieving the desired target. The short-age of managerial and administrative staff is also a challenge for a country with the health care delivery complexity that Pakistan faces. Attrition in doctors or nurses in the public sector does not appear to be significant.
The presence of a large work-force of lady health workers (almost 100 000) has favourably affected the population:health worker ratio and gender balance in the public sector in Pakistan. It is particularly pertinent to note that this large number is deployed in rural areas and is targeted towards the rural poor who have minimal or no access to the private sector. The importance of this cadre for making crucial progress towards MDG 4 and 5 has been recognized and the Global Health Workforce Alliance, in a recent meeting, Global consultation on com-munity health workers, 29–30 April 2010, has concluded that community health workers should be included in the for-mal health systems of countries. The global body has recommended bring-ing about uniformity in the selection, training, operation and other aspects of community health workers all over the world.
The HRH policy dimension, though very critical, is a less revealing area and survey results showed varying levels of
development and implementation of HRH policies. This area needs further exploration and insight.
The role of job satisfaction and the work environment on retention and recruitment is increasingly recognized [11]. Health workers may feel demo-tivated if their organization has not equipped their facility with the right equipment and supplies and a good infrastructure [12]. The results for job satisfaction indicate that, in general, public sector health workers are neither satisfied nor dissatisfied but are broadly neutral. Based on specific, related questions, there is an indication that public health workers across the cadres do not intend to leave. Male workers were slightly less dissatisfied with their salary and compensation than female workers. Urban workers are inclined to think more positively about their workload than rural workers. The pay scales at federal or provincial levels are not related to any distinct patterns of differences in job satisfaction. Regular employees are less satisfied on salary, motivation/recognition and profes-sional facilitation compared with their contractual colleagues. Regarding the work environment, the focus of assess-ment was on general issues such as organizational culture and administra-tive facilitation. Health workers from Punjab (both public and private), have the best job satisfaction scores com-pared with provinces and the federal Ministry of Health.
While there is considerable salary-related dissatisfaction in the public sector at all levels compared with the private sector, this does not necessarily translate into a choice or desire to work elsewhere, either full-time or part-time. We believe that there is evidence for a lack of salary-related “push” factors for attrition in the public sector. For the employees dissatisfied with salary,
the overall dissatisfaction with working for their organization was quite high. Though the salary-related dissatisfac-tion rates are lower than for the private sector, the “push” from such dissatisfac-tion is much stronger in the private sector than in the public sector.
Regarding work environment, there are large differences between the public and private sectors. The private sector outstrips the public sector on all aspects of work environment. The differences are particularly clear for facility-level infrastructure, machinery and equipment, and administrative facilitation. Overall, considering both the job satisfaction as well as the work environment analysis, there is an indi-cation that health facilities in Punjab province are much better than in other provinces.
In conclusion, this HRH assess-ment provides a wealth of information that could be used for policy forma-tion and to provide a basis for further steps, including: development of strategies and plans; development of national HRH observatories; establish-ment of national HRH coordination mechanisms; building national HRH expertise, including leadership and management capacity; and primary health care orientation of the health workforce. Countries facing a HRH crisis could benefit from each others’ experiences and develop a mutual mechanism for HRH capacity build-ing, with the help of WHO and other development partners.
Acknowledgement
This study was conducted with finan-cial and technical support from the Global Health Workforce Alliance, WHO and the United States Agency for International Development (US-AID), Pakistan.

S151
References
1. The world health report 2006: working together for health. Ge-neva, World Health Organization, 2006.
2. Economic survey of Pakistan 2008–09. Islamabad, Finance Divi-sion, 2009.
3. World health report 2002 – reducing risks, promoting healthy life. Geneva, World Health Organization, 2002.
4. Birch S et al. Human resource planning and the production of health: a needs-based analytical framework. Canadian Public Policy, 2007, 33(Suppl.):S1–S16.
5. Global atlas of the health workforce. Geneva, World Health Organization (http://www.who.int/globalatlas, accessed 12 December 2009).
6. Narasimhan V et al. Responding to the global human resources crisis. Lancet, 2004, 363:1469–1472.
7. National health policy 2009. Islamabad, Ministry of Health (final draft) (http://www.health.gov.pk, accessed 5 May 2010).
8. Medium term development framework 2005–2010. Islamabad, Planning and Development Commission, 2008.
9. Talati JJ, Pappas G. Migration, medical education, and health care: a view from Pakistan. Academic Medicine, 2006, 81(Suppl.);S55–S62.
10. Pakistan Medical and Dental Council, Islamabad [website] (www.pmdc.gov.pk, accessed 12 December 2009).
11. McAuliffe E et al. Measuring and managing the work environ-ment of the mid-level provider – the neglected human re-source. Human Resources for Health, 2009, 7:13.
12. Dieleman M et al. Identifying factors for job motivation of rural health workers in North Viet Nam. Human Resources for Health, 2003, 1:10.

EMHJ
S152
Impact of wealth status on health outcomes in PakistanA.Y. Alam,1 S. Nishtar,2 S. Amjad3 and K.M. Bile4
ABSTRACT Maternal and childhood morbidity and mortality are high in Pakistan and health disparities exist. Multivariate logistic regression analysis of the Pakistan Demographic and Health Survey database 2006–07 was performed. There was an excess of 25 neonatal, 34 infant and 41 under-five deaths per 1000 live births in the poorest quintile of wealth index compared with the richest. Women in the richest quintile had a 35%, 38% and 20% higher probability of getting prenatal care, delivery by skilled provider and emergency obstetric care, respectively. Pakistan needs to enhance social equity so development benefits can accrue to the underprivileged by introducing social protection interventions so that those in the informal sector are not excluded from accessing health care, scaling-up poverty reduction strategies and promoting intersectoral action. This study assesses the independent impact of wealth status, as determined by a validated index, on health outcomes in Pakistan.
1Community Health Sciences, Shifa College of Medicine, H-8/4, Islamabad, Pakistan (Correspondence to A.Y. Alam: [email protected]).2Heartfile, Islamabad, Pakistan 3Public Health Consultant, Islamabad, Pakistan. 4World Health Organization, Country Office, Islamabad, Pakistan.
34 25 2007 – 2006
41
35
20 1.38
Statut économique et impact sur les résultats sanitaires au Pakistan
RÉSUMÉ Au Pakistan, la mortalité et la morbidité maternelles et infantiles sont élevées, et des disparités sanitaires ont été observées. Une analyse de régression logistique multivariée a été effectuée sur la base de données 2006–2007 de l’Enquête démographique et de santé au Pakistan. Le quintile le plus pauvre (selon l’indice de richesse) était touché par une surmortalité de 25 nouveau-nés, 34 nourrissons et 41 enfants de moins de cinq ans pour 1000 naissances vivantes, par rapport au quintile le plus riche. Les femmes appartenant au quintile le plus riche avaient une probabilité plus élevée de 35 % de bénéficier de soins prénatals, de 38 % d’avoir un accouchement encadré par un professionnel qualifié et de 20 % de recevoir des soins obstétriques d’urgence. Le Pakistan doit améliorer l’équité sociale pour que les bénéfices de cette amélioration puissent profiter aux plus défavorisés en mettant en place des interventions de protection sociale permettant de ne pas exclure le secteur non structuré de l’accès aux soins de santé, en élargissant les stratégies de réduction de la pauvreté et en encourageant une action intersectorielle. Cette étude évalue l’impact indépendant du statut économique sur les résultats sanitaires au Pakistan, selon une échelle validée.

S153
Introduction
There is a fundamental difference be-tween inequality and inequity. The former is characterized by the determinants of health differentials between population groups or individuals that are related to biological variations (e.g. genetic pre-disposition to disease) and freely cho-sen health-damaging behaviours (e.g. smoking). On the other hand, health inequities, which have been variably defined, stem from health-damaging conditions and determinants that are not based on informed choices and could be avoided.
The World Health Organization (WHO) defines health inequity as “Differences in health status which are unnecessary and avoidable, but in addi-tion, are considered unfair and unjust” [1]. The WHO Commission on Social Determinants of Health further adds “Health equity is about equitable distri-bution of health services in the society and that means distribution in conform-ity with where the needs are greatest” [2]. Another source adds that “Equity in health is the absence of disparities in the major social determinants of health” [3]. The concept of horizontal equity states “Equity in health services implies that there are no differences in health services where health needs are equal”, while the concept of vertical equity em-phasizes “that enhanced health services are provided where greater health needs are present” [1]. Equity in policy and actions refers to “active policy decision and programmatic action directed at improving equity in health” [1]. Equity in research highlights “research to elu-cidate the genesis and characteristics of inequity in health for the purpose of identifying factors amenable to policy decisions and programmatic actions” [1].
The determinant-based approach to health inequities and broader issues implicit in the social determinants of health (e.g. education, occupation, in-come) came significantly to the fore
as factors determining health status with the publication of the report of the Commission on the Social Deter-minants of Health, which firmly es-tablished that inequities in daily living conditions and inequitable distribution of power, money and resources are the most important determinants of health status achievement [2]. As opposed to the analysis of inequities through the social determinants approach, the ma-jority of published literature on equity in health focuses on access, utilization and financing of health services, the extent of primary health care services, geographic distribution and mix of health services.
Health systems performance assess-ment is an area where normative guid-ance is currently being consolidated [4]. However, experiences of countries that have developed health systems performance assessment frameworks recommend that assessment of inequi-ties is an increasingly challenging area due to paucity of evidence. The frame-work for health systems performance assessment in Pakistan identified only a handful of studies that had examined in-equities [Unpublished data]. Data from the Pakistan Social and Living Standards Measurement Survey give an insight into prevailing social sector inequities by wealth quintiles [5]. The same survey shows that the overall national infant mortality rate for urban areas was 45 per 1000 live births whereas for rural areas it was 79 per 1000 live births. In addi-tion, rural–urban inequities and dispari-ties were evident in these data trends. While there has been an increase in safe drinking water supply and adequate sanitation facilities in Pakistan between 1991 and 2007, the wide rural–urban differences have not narrowed [5].
Existing evidence of inequities also comes from WHO’s multicountry as-sessment of inequities [6]. In this study the authors constructed a global asset score taking account of all the coun-tries with demographic health survey (DHS) databases, include Pakistan, using four variables that were common
to most countries with DHS data: urban–rural status, house construction material (usually floor material), edu-cational status of the mother and avail-ability of electricity. The lower the asset score, the higher is the probability (or prevalence in aggregate terms) of child malnutrition. The authors assumed that the average prevalence of malnutrition for children with the lowest 31% of as-set scores equated to the prevalence of malnutrition for those living on less than US$ 1 per day.
The above-mentioned studies have demonstrated the existence of inequi-ties in health outcomes with reference to rural–urban and geographic status of residence and wealth status as deter-mined by income quintiles. However, the independent effect of wealth on health outcomes has never been ascer-tained in the Pakistani indigenous set-ting. The present study was conducted to assess the independent impact of wealth status (as determined by a vali-dated index) on health outcomes.
Methods
The 2006–07 Pakistan Demographic and Health Survey (PDHS), which was part of the worldwide demographic and health survey project, was the larg-est household survey ever conducted in Pakistan to gather information on health and demographic outcomes. Its methodology has been published elsewhere [7].
PDHS used a validated wealth in-dex, which was developed and tested in a large number of countries in relation to inequalities in household income [8,9]. The index, which is fairly widely used as a measure of economic status in developing countries, is an indicator of the level of wealth that is consistent with expenditure and income measures [8]. This index was constructed using household asset data, including owner-ship of a number of consumer items ranging from a television to a bicycle

EMHJ
S154
or car, as well as dwelling characteris-tics, such as type of material used for flooring, source of drinking water and sanitation facilities. Each asset was as-signed a weight (factor score) gener-ated through principal components’ analysis and the resulting asset scores were standardized in relation to a nor-mal distribution with a mean of zero and standard deviation of one. Each household was then assigned a score for each asset and the scores were summed for each household; individuals were ranked according to the score of the household in which they resided. The sample was then divided into quintiles from one (poorest) to five (richest). The index is fairly widely used as a meas-ure of economic status in developing countries [8,9].
Raw data obtained from PDHS 2006–07 were analysed using SPSS version 10.0 and STATA version 9.0. This dataset was made available to researchers through an online registra-tion system [10]. Three PDHS data-bases were used in this analysis. The maternal dataset consisted of 10 023 women aged 12–49 years, representing all the provinces of Pakistan. The births dataset consisted of 39 049 children, while the children’s vaccination data-set consisted of 9177 children. In the PDHS, mothers were asked to show the interviewer the health cards of all children under the age of five years [8]. If a child had not received a health card, or if the mother was unable to show the card to the interviewer, the mother was asked to recall whether the child had received Bacille Calmette-Guérin (BCG), polio, diphtheria–pertussis–tetanus (DPT) (including the number of doses for polio and DPT) and mea-sles vaccinations [7]. The births data were collected by asking ever-married women of reproductive age to provide complete birth histories of all their live births and those who had died [7].
Descriptive and analytical statistical analysis was carried out on all three datasets using SPSS version 10.0 and
STATA version 9.0. The lowest quintile (poorest) was used as the reference category and all comparisons were made with reference to that. In all three databases the variables controlled in the multivariate logistic regression model were as follows: rural–urban residence, wife’s education, husband’s education, wife’s occupation and hus-band’s occupation. For the birth and child databases, sex of the child was also additionally controlled for.
The study was not able to control for other confounding variables, such as health systems performance, access to health care and health-seeking be-haviour.
Multivariate logistic regression was used to assess the impact of wealth sta-tus (as evidenced by wealth index quin-tiles). The adjusted odds ratios (OR) and 95% confidence intervals (CI) were obtained. Adjusted probabilities of each indicator variable across wealth index quintiles were obtained using the adjust command of STATA after the regression command.
Results
Health outcomes are affected by numerous factors. Figure 1 illustrates the conceptual framework of social de-terminants of health and other factors affecting health outcomes. Among the social determinants of health, level of education, occupation, income, wealth and rural–urban status are important. Outside of the social determinants, health systems performance, health-seeking behaviour and several factors in the intersectoral domain also influence health outcomes.
The distribution of children in the births database was 20 269 (52%) male children, while 24 623 (63%) children belonged to rural areas of Pakistan. The distribution of children according to quintiles of wealth index was as fol-lows: poorest 8191 (21%), poorer 8345 (21.4%), middle 7957 (20.4%), richer 7808 (20%) and richest 6748 (17.3%).
Table 1 shows the association of wealth index quintiles with child health outcomes. With reference to the
Figure 1 Conceptual framework of social determinants of health

S155
poorest quintile of wealth index (OR = 1.0) the adjusted ORs for middle, richer and richest categories of wealth index show a highly statistically signifi-cant lower odds of neonatal, infant and under-five child mortality. In absolute terms, adjusted neonatal mortality rates show an excess of 25 neonatal deaths per 1000 live births for neonates in the poorest quintile of wealth index com-pared with the richest quintile. Adjusted infant mortality rates show an excess of 34 infant deaths per 1000 live births for infants in the poorest quintile of wealth index compared with the richest quin-tile. Adjusted under-five child mortality rates show an excess of 41 under-five child deaths per 1000 live births in the poorest quintile of wealth index com-pared with the richest quintile.
Table 2 presents the association of wealth index quintiles with child health care services delivery. With reference to the poorest quintile of wealth index (OR = 1.0) the adjusted ORs for poorer, middle, richer and richest categories of wealth index show a highly statistically significant higher odds of polio vac-cine dose given at birth (polio 0), three
doses of DPT (DPT3), three doses of hepatitis B virus (HBV3) and measles vaccination. In absolute terms, adjusted probabilities of childhood vaccination status show that children in the rich-est quintile have an 18% higher prob-ability of getting polio 0 vaccination, 19% higher probability of getting DPT3 vaccination, 21% higher probability of getting HBV3 vaccination and 18% higher probability of getting measles vaccination.
Children in the richest quintile are 2.14 times more likely to get medical treatment for acute respiratory infec-tions compared with children in the poorest quintile (P < 0.0001, result not shown in table).
Table 3 shows the association of wealth index quintiles with reproductive health indicators. All the indicators of reproductive health show a higher OR favouring women in the richest quintile
Table 2 Association of wealth index with indicators of child health (n = 9177)
Dependent variable Quintiles of wealth index
OR (95% CI) adjusteda
Adjusteda probabilities (%)
Polio 0 vaccination status among under-five children
Poorest 1.0 44
Poorer 1.26 (1.11–1.43) 49
Middle 1.41 (1.23–1.63) 53
Richer 1.61 (1.37–1.89) 58
Richest 2.13 (1.73–2.62) 62
DPT3 vaccination status among under-five children
Poorest 1.0 45
Poorer 1.25 (1.10–1.42) 50
Middle 1.49 (1.30–1.72) 55
Richer 1.79 (1.52–2.11) 60
Richest 2.22 (1.80–2.75) 64
HBV3 vaccination status among under-five children
Poorest 1.0 42
Poorer 1.24 (1.09–1.41) 47
Middle 1.55 (1.35–1.79) 52
Richer 1.88 (1.59–2.21) 58
Richest 2.18 (1.77–2.69) 63
Measles vaccination status among under-five children
Poorest 1.0 45
Poorer 1.20 (1.05–1.37) 50
Middle 1.46 (1.26–1.67) 54
Richer 1.81 (1.53–2.13) 58
Richest 1.83 (1.48–2.24) 63aAdjusted for sex of child, rural–urban residence, wife’s education, husband’s education, wife’s occupation, husband’s occupation. OR = odds ratio; CI = confidence interval; DPT3 = 3 doses of diphtheria–pertussis–tetanus; HBV3 = 3 doses of hepatitis B virus.
Table 1 Association of wealth index with child health outcomes (n = 38 900)
Dependent variable Quintiles of wealth index
OR (95% CI) adjusteda
Adjusteda mortality rates (per 1000 live births)
Neonatal mortality rate Poorest 1.0 70
Poorer 0.98 (0.87–1.11) 63
Middle 0.76 (0.67–0.87) 56
Richer 0.68 (0.58–0.79) 50
Richest 0.67 (0.55–0.82) 45
Infant mortality rate Poorest 1.0 101
Poorer 0.93 (0.84–1.03) 92
Middle 0.75 (0.67–0.84) 83
Richer 0.72 (0.64–0.82) 75
Richest 0.66 (0.56–0.78) 67
Under-five mortality rate Poorest 1.0 116
Poorer 0.89 (0.81–0.97) 104
Middle 0.72 (0.65–0.81) 94
Richer 0.69 (0.62–0.78) 84
Richest 0.65 (0.55–0.76) 75aAdjusted for sex of child, rural–urban residence, wife’s education, husband’s education, wife’s occupation, husband’s occupation. OR = odds ratio; CI = confidence interval.
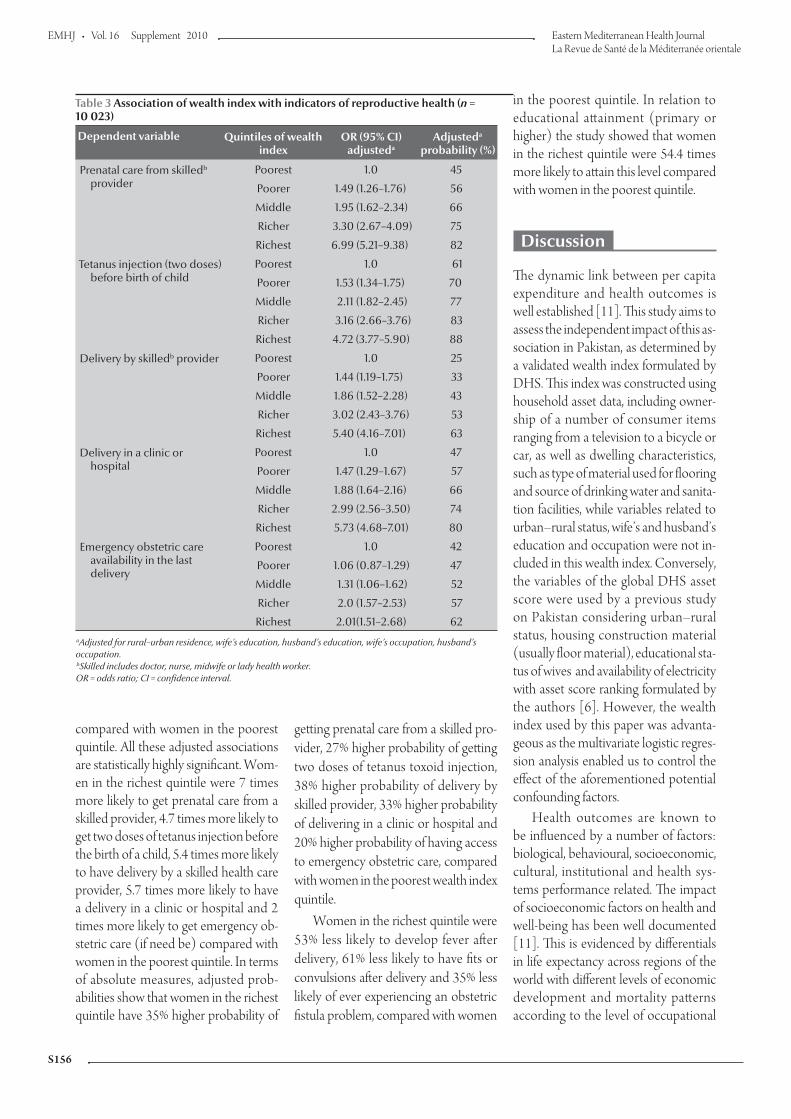
EMHJ
S156
compared with women in the poorest quintile. All these adjusted associations are statistically highly significant. Wom-en in the richest quintile were 7 times more likely to get prenatal care from a skilled provider, 4.7 times more likely to get two doses of tetanus injection before the birth of a child, 5.4 times more likely to have delivery by a skilled health care provider, 5.7 times more likely to have a delivery in a clinic or hospital and 2 times more likely to get emergency ob-stetric care (if need be) compared with women in the poorest quintile. In terms of absolute measures, adjusted prob-abilities show that women in the richest quintile have 35% higher probability of
getting prenatal care from a skilled pro-vider, 27% higher probability of getting two doses of tetanus toxoid injection, 38% higher probability of delivery by skilled provider, 33% higher probability of delivering in a clinic or hospital and 20% higher probability of having access to emergency obstetric care, compared with women in the poorest wealth index quintile.
Women in the richest quintile were 53% less likely to develop fever after delivery, 61% less likely to have fits or convulsions after delivery and 35% less likely of ever experiencing an obstetric fistula problem, compared with women
in the poorest quintile. In relation to educational attainment (primary or higher) the study showed that women in the richest quintile were 54.4 times more likely to attain this level compared with women in the poorest quintile.
Discussion
The dynamic link between per capita expenditure and health outcomes is well established [11]. This study aims to assess the independent impact of this as-sociation in Pakistan, as determined by a validated wealth index formulated by DHS. This index was constructed using household asset data, including owner-ship of a number of consumer items ranging from a television to a bicycle or car, as well as dwelling characteristics, such as type of material used for flooring and source of drinking water and sanita-tion facilities, while variables related to urban–rural status, wife’s and husband’s education and occupation were not in-cluded in this wealth index. Conversely, the variables of the global DHS asset score were used by a previous study on Pakistan considering urban–rural status, housing construction material (usually floor material), educational sta-tus of wives and availability of electricity with asset score ranking formulated by the authors [6]. However, the wealth index used by this paper was advanta-geous as the multivariate logistic regres-sion analysis enabled us to control the effect of the aforementioned potential confounding factors.
Health outcomes are known to be influenced by a number of factors: biological, behavioural, socioeconomic, cultural, institutional and health sys-tems performance related. The impact of socioeconomic factors on health and well-being has been well documented [11]. This is evidenced by differentials in life expectancy across regions of the world with different levels of economic development and mortality patterns according to the level of occupational
Table 3 Association of wealth index with indicators of reproductive health (n = 10 023)
Dependent variable Quintiles of wealth index
OR (95% CI) adjusteda
Adjusteda probability (%)
Prenatal care from skilledb provider
Poorest 1.0 45
Poorer 1.49 (1.26–1.76) 56
Middle 1.95 (1.62–2.34) 66
Richer 3.30 (2.67–4.09) 75
Richest 6.99 (5.21–9.38) 82
Tetanus injection (two doses) before birth of child
Poorest 1.0 61
Poorer 1.53 (1.34–1.75) 70
Middle 2.11 (1.82–2.45) 77
Richer 3.16 (2.66–3.76) 83
Richest 4.72 (3.77–5.90) 88
Delivery by skilledb provider Poorest 1.0 25
Poorer 1.44 (1.19–1.75) 33
Middle 1.86 (1.52–2.28) 43
Richer 3.02 (2.43–3.76) 53
Richest 5.40 (4.16–7.01) 63
Delivery in a clinic or hospital
Poorest 1.0 47
Poorer 1.47 (1.29–1.67) 57
Middle 1.88 (1.64–2.16) 66
Richer 2.99 (2.56–3.50) 74
Richest 5.73 (4.68–7.01) 80
Emergency obstetric care availability in the last delivery
Poorest 1.0 42
Poorer 1.06 (0.87–1.29) 47
Middle 1.31 (1.06–1.62) 52
Richer 2.0 (1.57–2.53) 57
Richest 2.01(1.51–2.68) 62aAdjusted for rural–urban residence, wife’s education, husband’s education, wife’s occupation, husband’s occupation. bSkilled includes doctor, nurse, midwife or lady health worker. OR = odds ratio; CI = confidence interval.

S157
hierarchy [11]. It is further evidenced by the observed differences in child mor-tality according to the income level of families and maternal level of education [11]. In many countries, the increased level of female education has been the single most important factor in decreas-ing child mortality [12,13] Pakistan suffers an inherent disadvantage in this respect with high levels of poverty and illiteracy.
Inequities in health and other social outcomes have been described in the indigenous Pakistani population; how-ever, the independent effect of wealth on health outcomes has not been as-sessed. The main value of this study lies in demonstrating that for the first time.
Although the study was not able to control for other confounding variables such as health systems performance, access to health care and health-seeking behaviour, it was able to control for a number of other variables such as rural–urban residence, and level of education and occupation of the head of the household. The differentials in outcomes are important evidence for health policy planners who predomi-nantly focus on the health care perspec-tive of interventions and often do not create the right linkages for intersectoral action.
The impact of factors outside the health care system on health outcomes can also be interpreted in another way – health care is limited in its ability to improve health status, unless the under-lying socioeconomic conditions and in-equities of power, money and resources change in the desirable direction [14]. It is precisely with this understanding in view that a recently articulated agenda for health reforms for Pakistan lays great emphasis on both the factors in the intersectoral domain as well as the over-arching factors responsible for health systems performance [14]. Pakistan suffers a “double burden” in this respect. Not only are its social disparities widely
prevalent, many overarching institu-tional impediments also act as a barrier for health systems performance.
Countries that have shown recent progress in improving child and ma-ternal health indicators and that have experienced decreasing mortality and morbidity trends have made im-provements on several fronts. Chile, a medium-resource country, is one such example. A consistent increase in an-nual per capita income and decrease in the number of people living in poverty between 1990 and 2004 are evidence of Chile’s sustained economic growth [15,16]. In Chile, declines across mater-nal, newborn and child mortality indica-tors occurred in all five income quintiles, with the largest proportional decrease in the poorest quintile.
In Sri Lanka where a third of the population is estimated to live below the national poverty line, maternal morality ratios (44 per 100 000 births in 2005) and under-five mortality rate (13 per 1000 in 2000) are among the lowest in the developing world [17]. All of this has been made possible by targeting the social determinants of health: free provision of health services to all, provision of maternal and child health care services at the community level, relatively high status of women, 88% literacy rate among women, girls having free access to education until university level, network of commu-nity midwives providing antenatal care to 75% of women, 96% skilled birth attendance rate, over 90% deliveries in health facilities, a strong referral system in place to ensure transport of women to one of the 45 hospitals if complications occur, and all first pregnancies and high-risk pregnan-cies referred to health facilities with obstetricians [14].
These findings parallel research in developed and transitional coun-tries that has shown that reversals in marginalization patterns can result in
overall improvements in survival and reductions in health care inequities [18,19].
The debate on health reforms and the divergent views on the type of solutions needed centre on the issue of inequities in access to health care and the right to health, among other things. Equity assumes fundamental importance not only as an aspirational health goal but also, as being increas-ingly recognized, as one of the three desired health systems outcomes, the other two being fairness in financing and responsiveness.
Conclusion
These representative data from Paki-stan quantify the burden of morbidity and mortality and access to health care associated with inequitable distribu-tion of wealth in the society. The country will have to make progress by enhancing social equity so that the benefits of development can accrue to the underprivileged sections of the population. Social protection interven-tions should also be introduced so that those in the informal sector are not excluded from accessing health care, including: scaling-up the implementa-tion of poverty reduction strategies and social sector investment, especially in health; promoting intersectoral action to achieve better health outcomes; and mitigating the ill effects of social deter-minants of health. The objective of this study is to assess the independent im-pact of wealth status, as determined by a validated index on health outcomes in Pakistan.
Acknowledegment
We are thankful to Yasir Abbas Mirza for the formatting and layout of this manuscript.

EMHJ
S158
References
1. Macinko JA, Starfield B. Annotated bibliography on equity in health, 1980–2001. International Journal for Equity in Health, 2002, 1(1):1.
2. Closing the gap in a generation: health equity through action on the social determinants of health. Final report of the Commis-sion on Social Determinants of Health. Geneva, World Health Organization, 2008.
3. Braveman P, Gruskin S. Defining equity in health. Journal of Epidemiology and Community Health, 2003, 57(4):254–258.
4. Everybody’s business: strengthening health systems to improve health outcomes: WHO’s framework for action. Geneva, World Health Organization, 2007 (http://www.wpro.who.int/sites/hsd/documents/Everybodys+Business.htm, accessed 16 De-cember 2009).
5. Pakistan social and living standards measurement survey 2006–07. Islamabad, Federal Bureau of Statistics (http://www.statpak.gov.pk/depts/fbs/statistics/pslm2006_07/report_pslm06_07.pdf, accessed 24 July 2009).
6. Blakely T, Hales S, Woodward A. Poverty: assessing the distribu-tion of health risks by socioeconomic position at national and local levels. Geneva, World Health Organization, 2004 (WHO Environmental Burden of Disease Series, No. 10).
7. Pakistan demographic and health survey 2006–07. Islamabad, National Institute of Population Studies and Macro Interna-tional Inc., 2008.
8. Gwatkin DR et al. Socio-economic differences in health, nutrition, and population. Washington DC, World Bank, 2000.
9. Filmer D, Pritchett LH. Estimating wealth effects without ex-penditure data – or tears: an application to educational enrol-ments in states of India. Demography, 2001, 38(1):115–132.
10. Demographic and health surveys. Measure DHS. (http://www.measuredhs.com, accessed 25 September 2009).
11. Achieving health equity: from root causes to fair outcomes. Ge-neva, World Health Organization, Commission on the Social Determinants of Health, 2007 (http://whqlibdoc.who.int/publications/2007/interim_statement_eng.pdf, accessed 23 June 2008).
12. Kaber N. Gender equality and human development: the in-strumental rationale. Brighton, United Nation Development Programme, 2005 (http://www.hdr.undp.org/en/reports/global/hdr2005/papers/hdr2005_kabeer_naila_31.pdf, ac-cessed 25 June 2008).
13. Sri Lanka shines in slashing maternal, neonatal mortal-ity: Unicef. (http://www.thaindian.com/newsportal/health/sri-lanka-shines-in-slashing-maternal-neonatal-mortality-unicef_100142713.html, accessed 27April 2010).
14. Nishtar S. Choked pipes: reforming Pakistan’s mixed health sys-tem. Karachi, Oxford University Press, 2010.
15. Bossert TJ et al. Decentralization and equity of resource alloca-tion: evidence from Colombia and Chile. Bulletin of the World Health Organization, 2003, 81:95–100.
16. Gwatkin DR. Health inequalities and the health of the poor: what do we know? What can we do? Bulletin of the World Health Organization, 2000, 78:3–18.
17. Health a key to prosperity, success stories in developing countries. (http://www.who.int/inf-new/mate1.htm, accessed 27 April 2010).
18. Braveman P, Tarimo E. Social inequalities in health within countries: not only an issue for affluent nations. Social Science & Medicine, 2002, 54:1621–1635.
19. The world health report 2005. Make every mother and child count. Geneva, World Health Organization, 2005.

S159
Review
Human organ and tissue transplantation in Pakistan: when a regulation makes a differenceK.M. Bile,1 J.A.R.H. Qureshi,1 S.A.H. Rizvi,2 S.A.A. Naqvi,2 A.Q. Usmani3 and K.A. Lashari4
ABSTRACT Organ transplantation must be viewed in relation to the prevailing cultural, religious and socio-economic conditions of a nation. Over the past two decades, Pakistan has emerged as one of the largest centres for commercial renal transplantation. Government efforts, supported by professional associations, civil society organizations and the media, along with World Health Organization technical assistance, have led to the development of legislation regulating this practice and curbing organ trade in conformity with international guidelines. Although only two years have passed since the enactment of the law, there is evidence that conditions have significantly improved, raising hopes for ethical and safe organ transplantation in Pakistan. This study reviews the salient features of the legislation and lists the foreseeable evolving challenges and opportunities.
1World Health Organization, Country Office, Islamabad, Pakistan (Correspondence to K.M. Bile: [email protected]).2Sindh Institute of Urology and Transplantation, Karachi, Pakistan.3Human Organ Transplantation Authority, Islamabad, Pakistan.4Ministry of Health, Islamabad, Pakistan.
Transplantation d'organes et de tissus humains au Pakistan : lorsque la loi fait la différence
RÉSUMÉ Les transplantations d’organes doivent être envisagées en tenant compte des valeurs culturelles et religieuses d’un pays, ainsi que de ses conditions socioéconomiques. Au cours des vingt dernières années, le Pakistan est apparu comme l’un des plus hauts lieux du commerce de la transplantation rénale. L'action gouvernementale, soutenue par les associations professionnelles, les organisations de la société civile et les médias, avec l’assistance technique de l’Organisation mondiale de la Santé, a conduit à la rédaction d’une loi régissant ces pratiques et contribuant à réduire le commerce d’organes, conformément aux directives internationales. Même si sa promulgation ne remonte qu’à deux ans, il est évident que la situation s'est considérablement améliorée, ravivant l’espoir de transplantations éthiques et sûres au Pakistan. Cette étude analyse les principales caractéristiques de la législation et récapitule les futurs défis et opportunités prévisibles.

EMHJ
S160
Introduction
Human organ transplantation, involving the therapeutic use of organs obtained from healthy living or deceased donors, is the last resort for the survival and well-being of thousands of men, women and children suffering from end-stage organ failure [1,2]. This essential medical serv-ice is viable only when the required pro-fessional skills and ethically approved, quality institutions are available and when governed by sound legislation that generates sufficient societal support [3]. At a global level, progress in setting uni-versal guidelines has been made by the World Health Organization (WHO), the World Medical Association and the international Transplantation Society [4,5]. The guidelines cover:
organ donation by living adults;
legal consent for organ removal from deceased persons;
averting conflict of interest related to a physician’s death determination;
banning exploitation and coercion;
barring remuneration exceeding a justifiable fee for services rendered by persons and for facilities involved in organ procurement and transplanta-tion;
allocating organs, cells and tissues based on clinical need;
establishing criteria guaranteeing that the result outcomes are transparent and open to scrutiny, while at the same time protecting personal ano-nymity and privacy of donors and recipients [4,5]. During the past half century this
field has progressed to a technologically advanced clinical specialty, although the practice of organ donation involves so-ciocultural, legal and ethical challenges [6].
Over a prolonged period, Pakistan has emerged as one of the largest known centres for renal trafficking owing to a lack of regulation and the presence of a large vulnerable rural population
creating a thriving market for kidney sales [7,8].
As in the rest of the Islamic world, the development of organ transplan-tation legislation in Pakistan moved slowly, owing to the lack of an outright consensus on religiously motivated ethical questions regarding the practice. Key questions included:
Does religion allow organ donation and, if granted, are restrictive condi-tions attached?
Is donation limited to relatives only?
Can organs be sold or is bestowing rewards and grants to donors accept-able?
Can organs be obtained from the de-ceased, and how and when can death be firmly ascertained?
Is the act of donation an exclusive donor’s right or are relatives of the de-ceased allowed to donate and can the Government perform this act in the case of unclaimed deceased persons?
Is xenotransplantation permissible [8,9]? Most of these challenging queries
were resolved and consensus delibera-tion attained through the promulgation of legitimate verdicts (fatwas) origi-nated by Islamic scholars of jurispru-dence such as the Al-Azhar of Egypt, the Council of Senior Scholars in Saudi Arabia, the International Union of Islamic Jurisprudence, the Union of Islamic Jurisprudence affiliated with the International Islamic Association and by many regional associations [9]. In the Islamic world, it is often manda-tory to ensure that legislation, including that relevant to organ donation, does not contradict the teachings of Islam, a responsibility undertaken by officially constituted Islamic foundations pro-viding legal opinions, including those relevant to the health and population sector. These foundations put an end to misconceptions and speculation, generate public acceptability and lead to greater service utilization.
In the global debate on transplanta-tion, Islamic rulings have substantiated the legitimacy and religious acceptabil-ity of organ donation, consistent with the internationally set ethical and tech-nical norms; however, the sale of organs and exploitative coercive donations were termed un-Islamic [9]. To en-sure correct transplantation norms, the Government of Pakistan has success-fully promulgated legislation. This study aims to review the salient features of the legislation and its compatibility with international ethical transplantation guidelines. It also lists evolving chal-lenges and foreseeable opportunities for building an ethically focused national capacity for this vital service.
Methods
A desk review was conducted on the available literature in this specialized dis-cipline using MEDLINE®. In addition, literature on the historical processes and challenges regarding the regulation of organ transplantation in Pakistan, along with the recorded contributions made by different partner institutions, was studied. WHO literature in the context of this legislation, especially the set nor-mative guidelines for organ transplanta-tion, was also reviewed as well as the Islamic verdicts on key religiously and ethically charged questions related to organ donation.
Organ transplantlegislation
Prior to the legislation, the unethical practice of organ transplantation was constantly a major concern since renal transplantation surgery took root in Pakistan in early 1973. Institutions pur-suing and supporting ethical guidelines for life-saving organ transplantation were led by the Sindh Institute of Urol-ogy and Transplantation. This institute was founded in 1972 and became an

S161
autonomous institution in 1991 and is the largest centre in Pakistan offer-ing free dialysis and transplantation services to the underprivileged, with a legacy of 2700 transplants until 2009. However, commercial kidney transplantation flourished in many other institutions in Pakistan, where organs were advertised for sale on the Internet. In early 2005, an Internet search for “kidney transplantation in Pakistan” generated more than 800 000 entries. Key milestones in the practice of kidney transplantation in Pakistan and the chronological events that combated organ trade and led to
the successful enactment of legislation are summarized in Table 1.
Transplantation ordinance: efforts, achievements and challengesFollowing the intervention by the Su-preme Court of Pakistan in July 2007, an ordinance to regulate organ transplanta-tion and curb the burgeoning kidney trade was drafted by the Ministries of Health and Law. The Transplantation of Human Organs and Tissues Ordi-nance 2007 was then promulgated by the President of Pakistan, regulating the removal, storage and transplanta-tion of human organs and tissues for
therapeutic purposes and related proce-dural matters all over the country. The principal features of the ordinance, later promulgated as an act, are summarized below.
Donation of organ or tissue by a living personThe ordinance stipulated that a donor should not be less than 18 years of age, donation should be a voluntary act and that donation should be permissible to a living person genetically and legally related, i.e. a close blood relative. In the case of regenerative tissues, such as stem cells, there was no restriction of
Table 1 Efforts to curb unethical practices related to organ transplantation in Pakistan and the processes pursued to attain this goal
Year Events
1979 Renal transplantation started in Pakistan in public sector hospitals using living related family donors
1990s Renal transplantations exceeded 500 transplantations per year with first violations observed, whereby some hospitals shifted from dealing exclusively with living, related donor to unrelated, paid donors until these unethical practices accounted for more than 80% of all transplantations. Later in the decade transplantations exceeded 1000 per year.A transplantation bill was introduced by the Senate in 1992, based on ethical norms and conforming to World Health Organization (WHO) and International Transplantation Society guidelines, but the attempt was defeated by the then strong counter lobby.
2000s Opposition to promulgating the law was sustained and commercial kidney transplantation flourished with over 1500 expatriates receiving locally procured kidneys. The Ministry of Health, supported by SIUT, media and civil society organizations, sustained its efforts to promote legislation and bring an end to these unethical practices. WHO provided the necessary technical support through its country, regional and headquarter institutions.
2004 A bill was tabled in the Pakistan Senate by a member raising the momentum for action. Subsequently, the subject was tabled as an agenda item in the Federal Cabinet.
2006 The organ transplantation agenda submitted to the Cabinet in 2004 was deferred in October 2006. This action ignited an active campaign, where informed and investigative media reports and SIUT’s bold and challenging technical deliberations exposed the growing unethical lucrative kidney trade.
2007 Exploitative organ transplantation led to a judicial action in July 2007, whereby the Supreme Court of Pakistan took a suo moto notice advising the Government to promulgate the transplantation law.
2007 The transplantation ordinance was promulgated in September 2007 by the President of Pakistan.
2008 Attempts were made by the counter lobby through the Standing Committee for Health at the National Assembly to water down the law by introducing loopholes implicitly condoning organ sale and allowing expatriates to acquire kidneys for lucrative fees. These endeavours were rejected by the Standing Committees for Health and Human Rights.
2008 A case was filed before the Federal Shariat Court of Pakistan, challenging the law, whereby 12 hearing sessions were held in Islamabad, Lahore and Karachi, unanimously defeating all submitted objections and rendering all stipulated clauses of the law sustained, including the illegality of all forms of organ sale.
2009 On 23 June 2009, the Supreme Court took suo moto notice against private hospitals accused of violating the law and performing illegal transplantations, who when summoned by the court made commitments to comply with the law.
2009 On 12 November 2009, the National Assembly of Pakistan unanimously passed the bill on the recommendation of its Standing Committee on Health.
2010 On 10 February 2010, the Senate of Pakistan passed the bill.
2010 On 17 March 2010, the President of Pakistan signed the bill making it a law.
SIUT = Sindh Institute of Urology and Transplantation.

EMHJ
S162
age between siblings. The ordinance de-fined “close blood relatives” as parent, son, daughter, sister and brother, and included spouse provided that trans-plantation was voluntary, motivated and free of duress or coercion. How-ever, in the case of non-availability of a close blood relative donor, the organ transplantation evaluation committee had the prerogative to allow donation by non-close blood relative donors after ensuring that such donation was voluntary. The ordinance was quite unambiguous that the donation of an organ or tissue from a living national should not be permissible to citizens of other countries.
Donations of human organs or tissues after deathThe ordinance instructed that any per-son not less than 18 years of age may, before his or her death, in writing duly signed by the evaluation committee, donate any of his or her organs or tis-sues, and may also assign a medical institution or hospital recognized by the monitoring authority for transplan-tation. This donation willed after death could be revoked by the donor at any time during his or her lifetime.
Evaluation committees Evaluation committees were consti-tuted through the legislation and consisted of surgical, medical and trans-plantation specialists, nephrologists, a neurophysician and an intensivist where available, along with two local notables with a good record of social service. They were accountable for: (a) exercising control over transplantation procedures in medical institutions and hospitals for ensuring that no organ or tissue was retrieved from non-related living donor without the prior approval of the evaluating committee; (b) de-termining brain death of a person; (c) determining propriety of removal of a human organ from any living person using brain death protocol; and (d) determining fitness or otherwise for
transplantation of a human organ into any other body.
Monitoring authority A monitoring authority was established headed by the Federal Minister for Health and comprising of the Federal Health Secretary and seven eminent transplantation surgeons. The authority is responsible for:
monitoring transplantations and enforcing prescribed standards for recognized medical institutions and hospitals;
investigating allegations of breach of any provisions of the ordinance;
inspecting medical institutions and hospitals to assess the quality of transplantation;
establishing a national registry and national and regional networks eval-uating the performance and quality outcome of transplantation centres;
exploring and supporting interna-tional collaboration on xenotrans-plantation. The monitoring authority is to ap-
point an administrator and other offic-ers required to carry out its business.
Penalties for commercial dealings in human organs Commercial dealings in human organs were rendered an offence, punishable with imprisonment for up to 10 years along with monetary penalty and pos-sible removal of the practitioner’s name from the register of the Pakistan Medi-cal and Dental Council, initially for a 3-year period and permanently for sub-sequent offences. Activities constitut-ing an offence included: (a) making or receiving any payment for supply of, or for an offer to supply, any human organ; (b) seeking to find a person willing to supply for payment any human organ; (c) offering to supply any human organ for payment; and (d) publishing or distributing any advertisement invit-ing persons to supply for payment any human organ, or offering to supply any human organ for payment, or indicating
that the advertiser is willing to undertake any commercial arrangement.
Furthermore, transplantations were only to be carried out by transplan-tation surgeons and physicians after ensuring that written certification had been obtained from the evaluation committee. The monitoring author-ity was mandated to publish a list of medical institutions and hospitals that were recognized for the practice of operative surgery in transplantation of human organs and tissues. The Federal Government could revise this list when necessary.
ImplementationAs stipulated in the legislation, soon after the approval of the ordinance, the national Human Organ and Tissues Transplantation Authority (HOTA) was established. HOTA is led by an administrator and has as members a number of senior medical experts nom-inated by the Ministry of Health. The WHO Representative is also a member, whose major role is to liaise WHO’s technical support and expertise with HOTA. This institution has the pri-mary focus of framing rules, certifying eligibility of hospitals for transplantation services and the professional expertise required. These functions are carried out through performance-monitoring inspections. The minimum basic cri-teria set by HOTA as preconditions for a hospital to be eligible to carry out transplantation procedures are outlined in Table 2.
To permit donation by unrelated individuals, HOTA pursues a verifica-tion checklist where the authenticity of the recipient's claim of lacking eligible family members is endorsed only upon confirmation of lack of family members from the computerized National Da-tabase and Registration Authority and from the local authority of the recipi-ent’s residential area, along with blood grouping of any identified relatives when deemed necessary.

S163
Tabl
e 2
Min
imum
bas
ic c
rite
ria
for t
he re
cogn
itio
n of
tran
spla
ntat
ion
cent
res
in P
akis
tan
Hum
an re
sour
ces
Infr
astr
uctu
res,
equ
ipm
ent a
nd fa
cilit
ies
requ
ired
Man
agem
ent a
nd c
are
Dia
gnos
tics
, lab
orat
orie
s an
d bl
ood
bank
Ava
ilabi
lity
of sp
ecia
lists
with
pre
scrib
ed
qual
ifica
tions
and
exp
erie
nce
Gas
troe
nter
olog
y, h
epat
olog
y,
pulm
onol
ogy,
car
diol
ogy
and
haem
atol
ogy
cons
ulta
nts r
eadi
ly a
vaila
ble
roun
d th
e cl
ock
24-h
our a
vaila
bilit
y of
med
ical
and
surg
ical
st
aff,
incl
udin
g st
aff f
or a
fully
func
tiona
l op
erat
ing
thea
tre
faci
lity,
ICU
and
nur
sing
st
aff a
nd m
edic
al so
cial
offi
cer
Hos
pita
l str
uctu
re to
be
purp
ose-
built
Suita
ble
desi
gn o
f ope
ratin
g th
eatr
e, w
ith
qual
ity m
aint
enan
ce o
f war
ds a
nd su
itabl
e ho
spita
l bed
s
Min
imum
12 h
ospi
tal b
eds w
ith sp
ecifi
ed
beds
for t
rans
plan
tatio
n an
d is
olat
ion
faci
litie
s
ICU
– m
inim
um 4
bed
s with
pro
per
faci
litie
s (i.e
. mon
itors
, ven
tilat
ors,
art
eria
l bl
ood
gas a
naly
sis,
etc
.)
Ava
ilabi
lity
of d
ialy
sis f
acili
ty in
the
ICU
w
ith m
inim
um o
f 3 d
ialy
sis m
achi
nes
Sepa
rate
thea
tre
for t
rans
plan
tatio
n pr
oced
ure
desi
rabl
e
Hos
pita
l pha
rmac
y w
ith a
ll ne
cess
ary
esse
ntia
l med
icin
es
Com
mun
icat
ion
syst
em a
nd c
ontin
uous
po
wer
supp
ly b
acku
p by
gen
erat
ors
Patie
nt re
cord
mai
nten
ance
, man
ual o
r co
mpu
teriz
ed
Libr
ary
and
Inte
rnet
faci
litie
s
Rese
arch
faci
litie
s
Med
ical
aud
it sy
stem
in p
lace
Patie
nt c
ouns
ellin
g fa
cilit
ies
Syst
em fo
r obt
aini
ng e
xplic
it co
nsen
t fro
m
dono
r and
reci
pien
ts
Follo
w-u
p pl
an fo
r rec
ipie
nts a
nd d
onor
s
Ava
ilabi
lity
of e
thic
al c
omm
ittee
Bloo
d ba
nk c
ross
-mat
chin
g fa
cilit
ies
avai
labl
e
Roun
d th
e cl
ock
avai
labi
lity
of m
ulti-
disc
iplin
e te
stin
g fa
cilit
ies,
esp
ecia
lly
bioc
hem
istr
y an
d m
icro
biol
ogy
Radi
olog
y fa
cilit
ies
Ultr
asou
nd a
nd D
oppl
er
ICU
= in
tens
ive
care
uni
t.
In the 2 years since the legislation was en-acted, HOTA has accorded recognition to 42 hospitals and medical institutions to perform organ transplantation, following a satisfactory evaluation outcome.
The numbers of kidney transplants performed by 28 of the 42 HOTA-authorized hospitals, from the outset of the ordinance promulgation in 5 September 2007 to 31 December 2009 were recorded (Table 3). Most hospitals in Punjab performed transplantations from donors that were unrelated to their recipients; however, the donor–recipient analysis was consistent in all cases with HOTA legislation norms and guide-lines.
Implementation challengesChallenging the ordinance at the Federal Shariat Court Counter lobby groups aspiring to sustain the prelegislation status quo attempted to revoke the effective implementation of the law through a petition filed before the Federal Shariat Court. The petition aimed to remove the limitations imposed by the legislation on donors and prospective foreign recipients, claiming their inconsistency with Islamic principles. The peti-tion also requested that the clauses related to Section 3 of the legislation, addressing donation by close blood relative; Section 5, relating to the evaluation committee; and Section 7, bar-ring donations to foreign nationals, be declared un-Islamic and annulled. The Federal Shariat Court, through 12 hearings where experts, reli-gious scholars, human rights activists and medi-cal professionals participated as amicus curiae, unanimously rejected the petition and affirmed that the ethical practice of organ transplantation is a noble act fully condoned by Islam, while the sale of human organs is not permissible. The court also upheld that the Transplantation of Human Organs and Tissues Ordinance 2007 does not contradict the principles of Islam.
Notice of the Supreme Court of PakistanOn 23 June 2009, the Supreme Court of Pakistan expressed concern that the sale of human organs for transplantation was continuing, despite the ordinance. A member of the bench noted that “It seems that provisions of the ordinance are not adhered to strictly and despite prohibition of the sale of human organs in Pakistan, the

EMHJ
S164
trade is going on allegedly in some hospitals”, the names of which were mentioned in a letter sent by the Transplantation Society of Pakistan.
Table 3 Kidney transplantations performed from 5 September 2007 to 31 December 2009 by 28 of the 42 Human Organ Transplantation Authority (HOTA) authorized hospitals in Pakistan
Hospitals with recorded transplantations Authorized hospitals Transplanted kidneys
Public Private Total Live related Live unrelated
Total
Islamabad/Punjab 17 16 33 579 93 672
Islamabad
Pakistan Institute of Medical Sciences 7 0 7
Shifa International Hospital 39 0 39
Islamic International Medical Complex 33 0 33
Rawalpindi
Kidney Centre 45 32 77
Hearts International Hospital 2 3 5
Jinnah Memorial Hospital 73 0 73
Bilal Hospital 24 1 25
Armed Forces Institute of Urology 84 1 85
Lahore
National Hospital 14 23 37
Sharif City Hospital 23 10 33
Ihsan Mumtaz Hospital 78 9 87
Sarwat Anvar Hospital 6 9 15
Mayo Hospital 48 3 51
Adil Hospital 35 1 36
Shaikh Zayed Hospital 29 0 29
Surgimed Hospital 11 0 11
SIMS Services Hospital 5 0 5
Allama Iqbal Medical college 9 0 9
Akram Medical Complex 4 0 4
Masood Hospital 2 0 2
Multan/Bahawalpur
City Hospital Multan 2 1 3
Quaid-i-Azam Medical College 6 0 6
Sindha 4 4 8 1 033 1 1 036a
Karachi
Sindh Institute of Urology and Transplantation (SIUT) 1 020 0 1 022a
Karachi National Hospital 8 1 9
The Kidney Centre, Karachi 2 0 2
Jinnah Post Graduate Medical Centre 3 0 3
Khyber–Pakhtunkhwa
Centre for Kidney Diseases, Peshawar 1 1 12 0 12Balochistan
Gilani Hospital, Quetta 0 0 0 1b 0 1Total 22 20 42 1 625 94 1 721a
aTwo additional transplantations from deceased donors were performed at SIUT; bRecognition withdrawn. Source: HOTA, Pakistan.
Ratification of the bill by the National Assembly, the Senate and the President of Pakistan
On 13 November 2009, the National
As a result of this strong legal notice, the owners of the private hospitals in question assured their full compliance with the ordinance.

S165
Assembly took up the Transplantation of Human Organs and Tissues Bill im-mediately on receipt of a supportive report from its Standing Committee on Health. The house unanimously adopted the bill, promptly signifying the importance that law-makers attach to regulating organ transplantation in Pakistan. Subsequently, on 10 February 2010, the Senate of Pakistan passed the bill and on 17 March 2010, the President of Pakistan signed the bill to make it a law.
Discussion
The evolution of organ transplantation and trade problems can only be truly appreciated in relation to the prevail-ing socio economic environment of any country [1,7,12]. In Pakistan, and elsewhere in developing countries, a tangible proportion of the population lives below the poverty line, predispos-ing many underprivileged individuals and families to coercive organ donation [13,14]. Major professional bodies, including Sindh Institute of Urology and Transplantation, the Transplanta-tion Society of Pakistan, the Pakistan Society of Neph rology and the Pakistan Association of Urological Surgeons, supported by WHO, have been advo-cating for legislation denouncing the sale of kidneys for transplantation for over 2 decades. Since 2004, WHO has provided extensive technical advisory support to the Ministry of Health on ethical regulation of organ transplanta-tion and suggested the banning of organ trafficking. The Ministry of Health and Sindh Institute of Urology and Trans-plantation pioneered the drafting of the law and took a catalytic role in speeding up the technical processes for regulat-ing organ transplantation. This venture was supported by numerous profes-sional and civil organizations as well as the media, whose deliberations and advocacy generated sufficient voice for action. These efforts forged an alliance
between the Ministry of Health and the Standing Committee for Health of the National Assembly, culminating in the jointly mobilized technical and political support that led to the promulgation of this law.
With the promulgation of the ordinance, opportunities for unre-lated donations became limited to the exceptional cases envisaged by the law, while buying and selling of organs became illegal and punishable offences, resulting in a complete ban of these practices, including organ donations to foreigners unless accom-panied by related donors [15]. The need to develop an effective deceased donation programme to encompass the transplantation needs of the population was clearly recognized by the Government and professional medical organizations. Furthermore, measures to increase organ availabil-ity from deceased donors have been strongly recommended. This could be substantiated by health professional training, public advocacy and promo-tion, mobilization of religious scholars and bestowing recognition to families of deceased donors [16].
In accordance with constitutional provisions, the Federal Shariat Court is vested with the power and jurisdiction to test the laws on the criteria of Shariat with the assistance of religious scholars [17]. With jurisdiction to determine laws on Islamic principles, the court declared that the transplantation bill was not contrary to the injunctions of Islam.
Implementation of the law con-stitutes an uphill task, not achievable unless all stakeholders engaged in these activities extend support. Until such time when deceased donations become an operational reality, the Pakistan health system will face the challenge of contesting the predicted temptation of organ trafficking, which poses serious risk to the life of donors and recipients alike as such illegal practices would most likely be conducted in unaccept-able settings that would endanger life.
The success of this new law therefore hinges on the collective efforts of the Government and society to combat all possible violations of the law [18].
To attain self-sufficiency in organ transplantation, health professionals and their associations in Pakistan must adhere to the stated norms of the act and perform transplantations from living donors with minimal physical and psychological risk [19]. This will avert jeopardizing public trust and will enhance the health system’s ability to operate effectively within the param-eters of the law, preserving the safety and ethics of this practice [7,20]. The decision to donate should be made in an environment that enables the potential donor to decide independ-ently, without coercion or duress [4]. Of the 42 HOTA-authorized hospi-tals, 28 have performed 1721 kidney transplants following the legislation. Prospective research studies should be commissioned to evaluate the me-dium- and long-term impact of the legislation and to assess the extent to which the number of kidney transplants performed responds to the anticipated load in organ donation in Pakistan.
In the development of an organ transplantation structure in Pakistan, major areas require public education, including the ethical and Islamic per-spectives related to live organ donation in general and to cadaver donation in particular [9]. Although this paper fo-cuses on kidney transplantation, the legislation may be applied to other forms of organ transplants from live and cadaver donors alike. It may hope-fully encourage the transplantation of other organs such as corneas and thus rectify the current situation whereby over 90% of corneas for transplants are imported. A better understanding is also needed regarding “brain death”, legal heirs’ right of substitute decision-making in the absence of anticipated will of the deceased, and the State’s role in the case of unclaimed dead bodies [9,14,21,22]. The transgressors

EMHJ
S166
1. Human organ transplantation in Europe: an overview. Luxem-bourg, European Commission, Directorate-General Health and Consumer Protection, Public Health and Risk Assessment Directorate, 2003.
2. Hakim NS, Papalois VE. History of organ and cell transplantation. London, Imperial College Press, 2003.
3. Song RL et al. Brain death and organ transplant legislation: analysis of 969 respondents by classroom questionnaire. Hepa-tobiliary Pancreatic Disease International, 2009, 8(5):483–493.
4. WHO guiding principles on human cell, tissue and organ trans-plantation (updated edition). Geneva, World Health Organiza-tion, 2008 (EB 123/5) (http://www.who.int/transplantation/TxGP08-en.pdf).
5. Statement on human organ donation and transplantation. Edin-burgh, World Medical Association, 2006.
6. Linden PK. History of solid organ transplantation and organ donation. Critical Care Clinics, 2009, 25(1):165–184.
7. Naqvi SAA et al. A socio-economic survey of kidney vendors in Pakistan. Transplant International, 2007, 20:934–939.
8. Jafar TH. Organ trafficking: global solution for a global problem. American Journal of Kidney Diseases, 2009, 54(6):1145–1157.
9. Al Qardawi Y. Organ transplantation in the Islamic sharia. Paper presented at the Conference of the Congregation of the Islamic Studies, Doha, Qatar, 2009.
10. Al-Khader AA. The Iranian transplant programme: comment from an Islamic perspective. Nephrology Dialysis Transplanta-tion, 2002, 17(2):213–215.
11. Rizvi SA, Naqvi SAA. Renal replacement therapy in Pakistan. Saudi Journal of Kidney Diseases and Transplantation, 1996, 7(4):404–408.
12. Shimazono Y. The state of the international organ trade: a pro-visional picture based on integration of available information.
Bulletin of the World Health Organization, 2007, 85(12):901–980.
13. Rizvi AH et al. Regulated compensated donation in Pakistan and Iran. Current Opinion in Organ Transplantation, 2009, 14 (2):124–128.
14. International summit on transplant tourism and organ traffick-ing: the declaration of Istanbul on organ trafficking and trans-plant tourism. Clinical Journal of American Society of Nephrology, 2008, 3(5):1227–1231.
15. The transplantation of human organs and tissues: an ordinance. Ordinance Gazette of Pakistan, Government of Pakistan, 2007 (XLIII of 2007).
16. Abouna GM. Ethical issues in organ transplantation. Medical Principles and Practice, 2003, 12(1):54–69.
17. The constitution of Islamic Republic of Pakistan 1973 (Chapter 3A, Article 203). Islamabad, Islamic Republic of Pakistan, 1973.
18. Usmani AQ. From kidney bazaar to ethical practices in organ transplantation. Pakistan Journal of Medical Research, 2007, 46(3):56.
19. Rizvi SAH et al. Commercial transplants in local Pakistanis from vended kidneys: a socio-economic and outcome study. Trans-plant International, 2010, 22(6):615–621.
20. Noel L, Martin D. Progress towards national self-sufficiency in organ transplants [Editorial]. Bulletin of the World Health Organi-zation, 2009, 87:647.
21. Robert DT, Miller FD. The dead donor rule and organ trans-plantation. New England Journal of Medicine, 2008, 359(7):674–675.
22. Aldawood A et al. Organ donation after brain death: experi-ence over five years in a tertiary hospital. Saudi Journal of Kidney Diseases and Transplantation, 2007, 18(1):60–64.
References
involved in kidney trafficking may con-tinue appealing to the Supreme Court Appellate Bench to revert the Shariat Court verdict, hence the need to in-culcate a high level of public education and build alliance with Islamic scholars and jurists.
To evaluate the public health contribution of organ transplantation
services, the Ministry of Health needs to establish a database, for both do-nors and recipients, supported by the centres providing these services. The capacity of the health system to offer dialysis to end-stage chronic renal failure needs to be strengthened, to reduce patient morbidity and improve quality of life. Moreover, the Ministry
of Health should closely monitor sur-gical, medical and immunosuppressive protocols and establish a mandatory 2-year follow-up of donors and recipi-ents to provide medical, emotional and psychosocial support and also evaluate the outcome of these interventions nationwide.

