contents lists available at sciencedirect chemical engineering journal
TRANSCRIPT

RT
Ja
b
c
a
ARR1A
KCACZAW
1
wppitc(trpheaa
iot
f
1d
Chemical Engineering Journal 150 (2009) 25–39
Contents lists available at ScienceDirect
Chemical Engineering Journal
journa l homepage: www.e lsev ier .com/ locate /ce j
emoval of chromium(VI) from wastewater by activated carbon developed fromamarind wood activated with zinc chloride
yotikusum Acharyaa, J.N. Sahub, B.K. Sahoob, C.R. Mohantyc, B.C. Meikapb,∗
School of Energy and Environment Management, Rajiv Gandhi Proudyogiki Vishwavidyalaya, Gandhinagar, Bhopal, Madhya Pradesh, IndiaDepartment of Chemical Engineering, Indian Institute of Technology (IIT), Kharagpur, P.O. Kharagpur Technology, West Bengal 721302, IndiaState Pollution Control Board, Orissa (Department of Forest & Environment, Govt. of Orissa) Paribesh Bhawan, Bhubaneswar 751012, India
r t i c l e i n f o
rticle history:eceived 6 October 2008eceived in revised form8 November 2008ccepted 21 November 2008
a b s t r a c t
In this work, the adsorption of chromium(VI) was studied on activated carbon prepared from Tamarindwood with zinc chloride activation. Adsorption studies were conducted in the range of 10–50 mg/l initialchromium(VI) concentration and at temperature in the range of 10–50 ◦C. The experimental data wereanalyzed by the Freundlich isotherm and the Langmuir isotherm. Equilibrium data fitted well with theLangmuir model and Freundlich model with maximum adsorption capacity of 28.019 mg/g. The rates of
eywords:hromium removalctivated carbonhemical activationinc chloridedsorption
adsorption were found to confirm to pseudo-second-order kinetics with good correlation and the overallrate of chromium(VI) uptake was found to be controlled by pore diffusion, film diffusion and particlediffusion, throughout the entire adsorption period. Boyd plot confirmed that external mass transfer wasthe rate-limiting step in the adsorption process. Different thermodynamic parameters, viz., �H◦, �S◦ and�G◦ have also been evaluated and it has been found that the adsorption was feasible, spontaneous andendothermic in nature. The results indicate that the Tamarind wood activated could be used to effectively
m aqu
astewater treatment adsorb chromium(VI) fro. Introduction
Chromium compounds are among the most dangerous inorganicater pollutants. Chromium is considered to be one of the priorityollutants, chromium is soluble in water and hence mobile and itossesses a great threat to surface and ground water quality, which
s a threat to human health. The rapid development and prolifera-ion of process industries have made wastewater treatment a majoroncern in industrial areas. The presence of metal ions in naturalmainly by volcanic activity and weathering of rocks) [1] or indus-rial wastewater and their potential impact has been a subject ofesearch in environmental science for a long time. Chromium com-ounds mainly occur in the environment as trivalent, Cr(III), andexavalent, chromium(VI), chromium. Trivalent chromium is anssential element in humans and is much less toxic than the hex-valent one, which is recognised as a carcinogenic and mutagenicgent [2].
The wastewater from the dyes, pigments, metal cleaning, plat-ng, leather and mining industries contain undesirable amountf chromium(VI) ions and therefore priority is given to regulatehese pollutants at the discharge level. The maximum contami-
∗ Corresponding author. Tel.: +91 3222 283958(O)/2283959(R);ax: +91 3222 282250.
E-mail address: [email protected] (B.C. Meikap).
385-8947/$ – see front matter © 2008 Elsevier B.V. All rights reserved.oi:10.1016/j.cej.2008.11.035
eous solutions.© 2008 Elsevier B.V. All rights reserved.
nant level goal of chromium for the drinking water is 0.05 mg/l asper the World Health Organization (WHO) set standard [3]. Depu-ration technologies usually adopted to remove chromium fromindustrial wastewaters include precipitation, membrane filtration,solvent extraction with amines, ion exchange, activated carbonadsorption, electro-deposition, and various biological processes[4–9]. The choice of treatment depends on effluent character-istics such as concentration of chromium(VI), pH, temperature,flow volume, biological oxygen demand (BOD), the economicsinvolved and the social factor like standard set by government agen-cies.
Adsorption is a versatile treatment technique practiced widelyin fine chemical and process industries for wastewater and wastegas treatment. The usefulness of the adsorption process lies in theoperational simplicity and reuse potential of adsorbents duringlong-term applications. Activated carbon adsorption has provedto be the least expensive treatment option, particularly in treatinglow concentrations of wastewater streams and in meeting strin-gent treatment levels. Activated carbon is a black solid substanceresembling granular or powder charcoal and are carbonaceousmaterial that have highly developed porosity, internal surface area
and relatively high mechanical strength. Activated carbon-basedsystems can remove a wide variety of toxic pollutants with veryhigh removal efficiencies. For these reasons, activated carbonadsorption has been widely used for the treatment of chromiumcontaining wastewaters [10–12]. However, commercially available
26 J. Acharya et al. / Chemical Engineering Journal 150 (2009) 25–39
Nomenclature
1/n adsorption intensity (dimensionless)b Langmuir constant (l/g)Ce equilibrium lead(II) concentration (mg/l)Co initial lead(II) concentration (mg/l)Di effective diffusion coefficient (m2/s)dp diameter of the adsorbent particles (mm)F represents the fraction of solute adsorbed at any
time t (mg/g)k measure of adsorbent capacity (l/g)K the constant obtained by multiplying KL and b (Lang-
muir’s constants) (mg l/g2)K2 equilibrium rate constant of pseudo-second-order
adsorption (min−1)Kad equilibrium rate constant of pseudo-first-order
adsorption (min−1)Kc equilibrium constant (dimensionless)kid rate constants of intraparticle diffusion
(mg/g min−1/2)KL Langmuir constant (mg/g)M mass of the adsorbent per unit volume (g/l)qe amount of lead(II) adsorbed at equilibrium (mg/g)R radius of the adsorbent particles (�m)Ss outer specific surface of the adsorbent particles per
unit volume of particle free slurry (g/m3)T temperature (◦C)t time (min)V volume of the solution (l)W weight of adsorbent (g)ˇ1 mass transfer coefficient (cm s−1)�G◦ free energy of adsorption (kJ mol−1)�H◦ heat of adsorption (kJ mol−1)�S◦ standard entropy (k cal mol−1 K−1)
Greek letters
amumpapc[h
cttavatpcrioti
Table 1Physico-chemical characteristics of the activated Tamarind wood.
Parameters Values
Moisture (%) 10Ash (%) 4.55Volatile matter (%) 36.48Fixed carbon (%) 48.97Bulk density (g/ml) 0.791
2.1. Adsorbate: chromium(VI)
A stock solution of chromium(VI) was prepared (1000 mg/l) bydissolving required amount of, potassium dichromate (K2Cr2O7)
ıp density of the adsorbent particles (g/l)εp porosity of the adsorbent particles (m Dc)
ctivated carbons may be expensive and, for this reason, any cheapaterial, with a high carbon content and low inorganic, can be
sed as a raw material for the production of activated carbon. Theaterials developed for this purpose range from agricultural waste
roducts, biomass and various solid substances. Some examplesre activated groundnut husk carbon [13], coconut husk and palmressed fibers [14], coconut shell [15], wood and dust coal activatedarbons [16,17], coconut tree sawdust carbon [18], rice husk carbon19], almond shell carbon [20], fly ash [21], agricultural wastes [22]ave been reported in literature.
Most of the activated carbons are produced by a two-stage pro-ess carbonization followed by activation. The first step is to enrichhe carbon content and to create an initial porosity and the activa-ion process helps in enhancing the pore structure. Basically, thectivation is two different processes for the preparation of acti-ated carbon: physical activation and chemical activation. Therere two important advantages of chemical activation in comparisono physical activation. One is the lower temperature in which therocess is accomplished. The other is that the global yield of thehemical activation tends to be greater since burn off char is not
equired. Among the numerous dehydrating agents, zinc chloriden particular is the widely used chemical agent in the preparationf activated carbon [23]. Knowledge of different variables duringhe activation process is very important in developing the poros-ty of carbon sought for a given application. Chemical activation byBET surface area (m2/g) 1322Total pore volume (cm2/g) 1.042Mean pore radius (Å) 5.3
zinc chloride improves the pore development in the carbon struc-ture, and because of the effect of chemicals, the yields of carbon areusually high [24].
In this work it has been reported the results obtained on thepreparation of activated carbon from Tamarind wood with zincchloride activation and their ability to remove chromium(VI) fromwastewater. The influence of several operating parameters foradsorption of chromium(VI), such as contact time, initial concen-tration, temperature, pH, particle size and adsorbent dose, etc. wereinvestigated in batch mode. The kinetic data were fitted to differentmodels and the isotherm equilibrium data were fitted to Langmuirand Freundlich.
2. Experimental technique
Fig. 1. FTIR result of prepared activated carbon and adsorbed with chromium(VI).

J. Acharya et al. / Chemical Engineering Journal 150 (2009) 25–39 27
Table 2Adsorption isotherms parameter at pH 6.5 and temperature = 30 ◦C for chromium(VI) removal.
Parameters KL (mg/g) b (l/g) R2 K (1/g) 1/n
Values 28.019 0.0256 0.9951 Langumir 1.8765 0.65550.9967 Freundlich
TW m
ittMg
Fig. 2. Particle size distribution of A
n distilled water. The stock solution was diluted with dis-
illed water to obtain desired concentration ranging from 10o 50 mg/l. All the chemicals used in the study were fromerck (India) Ltd. and Qualigens Glaxo (India) Ltd. analyticalrade.
Fig. 3. N2 adsorption/desorption isothe
easured using Malvern Master Size.
2.2. Adsorbent: Tamarind wood activated
The Tamarind wood was collected from Indian Institute of Tech-nology campus of Kharagpur, West Bengal, India and washed withdeionized water four to five times for removing dirt and dust par-
rm of prepared activated carbon.
28 J. Acharya et al. / Chemical Engineering Journal 150 (2009) 25–39
ution
twpmcoimwcrthbNiHueTvwmwfrt
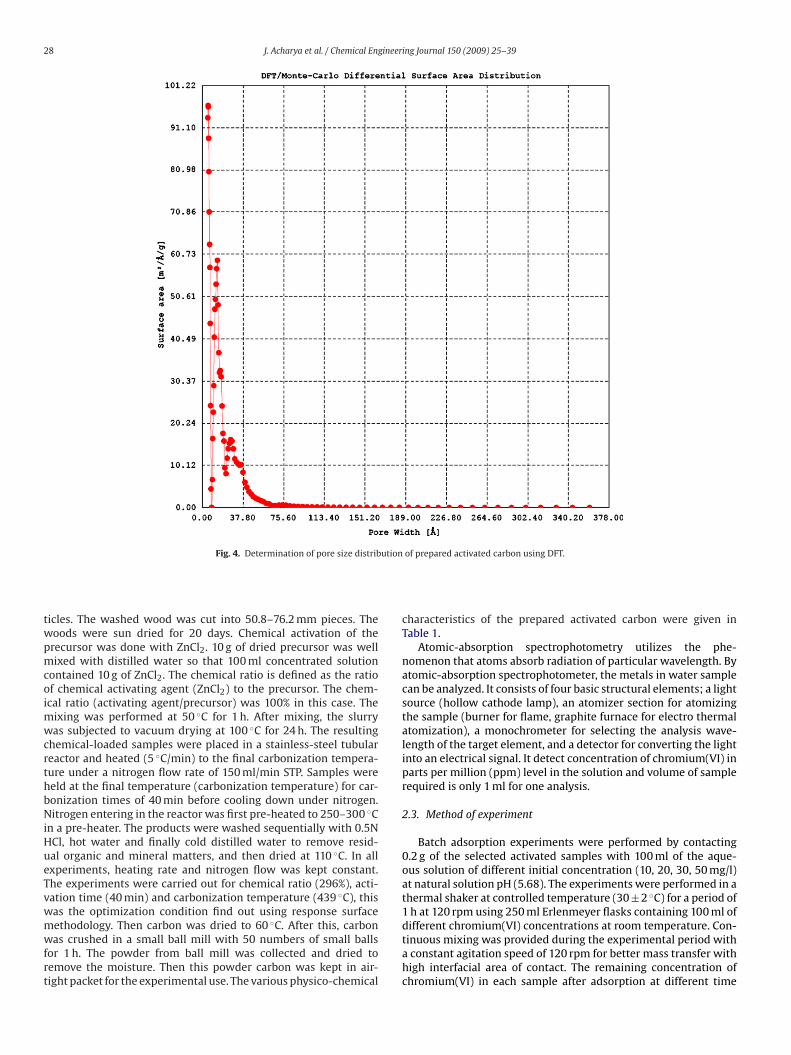
Fig. 4. Determination of pore size distrib
icles. The washed wood was cut into 50.8–76.2 mm pieces. Theoods were sun dried for 20 days. Chemical activation of therecursor was done with ZnCl2. 10 g of dried precursor was wellixed with distilled water so that 100 ml concentrated solution
ontained 10 g of ZnCl2. The chemical ratio is defined as the ratiof chemical activating agent (ZnCl2) to the precursor. The chem-cal ratio (activating agent/precursor) was 100% in this case. The
ixing was performed at 50 ◦C for 1 h. After mixing, the slurryas subjected to vacuum drying at 100 ◦C for 24 h. The resulting
hemical-loaded samples were placed in a stainless-steel tubulareactor and heated (5 ◦C/min) to the final carbonization tempera-ure under a nitrogen flow rate of 150 ml/min STP. Samples wereeld at the final temperature (carbonization temperature) for car-onization times of 40 min before cooling down under nitrogen.itrogen entering in the reactor was first pre-heated to 250–300 ◦C
n a pre-heater. The products were washed sequentially with 0.5NCl, hot water and finally cold distilled water to remove resid-al organic and mineral matters, and then dried at 110 ◦C. In allxperiments, heating rate and nitrogen flow was kept constant.he experiments were carried out for chemical ratio (296%), acti-ation time (40 min) and carbonization temperature (439 ◦C), thisas the optimization condition find out using response surface
ethodology. Then carbon was dried to 60 ◦C. After this, carbonas crushed in a small ball mill with 50 numbers of small ballsor 1 h. The powder from ball mill was collected and dried toemove the moisture. Then this powder carbon was kept in air-ight packet for the experimental use. The various physico-chemical
of prepared activated carbon using DFT.
characteristics of the prepared activated carbon were given inTable 1.
Atomic-absorption spectrophotometry utilizes the phe-nomenon that atoms absorb radiation of particular wavelength. Byatomic-absorption spectrophotometer, the metals in water samplecan be analyzed. It consists of four basic structural elements; a lightsource (hollow cathode lamp), an atomizer section for atomizingthe sample (burner for flame, graphite furnace for electro thermalatomization), a monochrometer for selecting the analysis wave-length of the target element, and a detector for converting the lightinto an electrical signal. It detect concentration of chromium(VI) inparts per million (ppm) level in the solution and volume of samplerequired is only 1 ml for one analysis.
2.3. Method of experiment
Batch adsorption experiments were performed by contacting0.2 g of the selected activated samples with 100 ml of the aque-ous solution of different initial concentration (10, 20, 30, 50 mg/l)at natural solution pH (5.68). The experiments were performed in athermal shaker at controlled temperature (30 ± 2 ◦C) for a period of1 h at 120 rpm using 250 ml Erlenmeyer flasks containing 100 ml of
different chromium(VI) concentrations at room temperature. Con-tinuous mixing was provided during the experimental period witha constant agitation speed of 120 rpm for better mass transfer withhigh interfacial area of contact. The remaining concentration ofchromium(VI) in each sample after adsorption at different time
J. Acharya et al. / Chemical Engineer
F(
ifibva
q
wtvrp
ataictm
2
2
anv
2.4.2. Surface chemistry determinationThe surface chemistry of the precursor and modified carbons
were determined using Fourier transform infrared radiation (FTIR).
ig. 5. (a) Scanning electron micrograph (1000×) of precursor (raw Tamarind wood).b) Scanning electron micrograph (1000×) of prepared activated carbon.
ntervals was determined by atomic-absorption spectroscopy afterltering the adsorbent with Whatmen filter paper to make it car-on free. The batch process was used so that there is no need forolume correction. The chromium(VI) concentration retained in thedsorbent phase was calculated according to
e = (Ci − Ce) V
W(1)
here Ci and Ce are the initial and equilibrium concentra-ions (mg/l) of chromium(VI) solution, respectively; V is theolume (l); and W is the weight (g) of the adsorbent. Twoeplicates per sample were done and the average results areresented.
The effect of adsorbent dosages (1–5 g/l) on the equilibriumdsorption of chromium(VI) on the selected carbon was inves-igated by employing different initial concentrations (10, 20, 30nd 50 mg/l) at different temperature (10–50 ◦C). For these exper-ments, the flasks were shaken, keeping the pH at natural (6.2)onstant and agitation speed (120 rpm) for the minimum contactime required to attain equilibrium, as determined from the kinetic
easurements detailed above.
.4. Characterization of the prepared activated carbon
.4.1. Pore structure characterizationThe pore structure of the precursor and modified carbons were
nalyzed using N2 adsorption, X-ray diffraction (XRD), and scan-ing electron microscopy (SEM). The BET surface area, total poreolume and density functional theory (DFT) pore size distribution
ing Journal 150 (2009) 25–39 29
were determined from nitrogen adsorption/desorption isothermsmeasured at −194 ◦C (boiling point of nitrogen gas at atmosphericpressure) by a Quantachrome Autosorb-I. Prior to gas adsorp-tion measurements, the activated carbon was degassed at 200 ◦Cin a vacuum condition for a period at least 4 h. The BET sur-face area was determined by means of the standard BET equationapplied in the relative pressure range from 0.05 to 0.30. The totalpore volume was calculated at a relative pressure of approxi-mately 0.98 and at this relative pressure all pores were completelyfilled with nitrogen gas. The DFT pore size distribution of acti-vated carbon sample was obtained based on nitrogen adsorptionisotherms, using Autosorb software package with medium regular-ization.
Powder X-ray diffraction patterns were recorded on a RigakuMiniflex Goniometer at 30 kV and 15 mA (Cu K� radiation). Scan-ning electron microscopy analysis was carried out on the activatedcarbon prepared under optimum conditions, to study its surfacetexture and the development of porosity. In this study, SEM imageswere recorded using JEOL JSM-6300F field emission SEM. A thinlayer of platinum was sputter-coated on the samples for charge dis-sipation during SEM imaging. The sputter-coated was operated inan argon atmosphere using a current of 6 mA. The coated sampleswere then transferred to the SEM specimen chamber and observedat an accelerating voltage of 10 kV, 8 spot size, 4 aperture and 5 mmworking distance.
Fig. 6. X-ray diffraction result of precursor (raw Tamarind wood) and prepared acti-vated carbon.

30 J. Acharya et al. / Chemical Engineer
Fc
Fm(4
2
dpsdastl
3
3
3
amabwot
150 �m.Density is particularly important in removal. If two carbons dif-
fering in bulk density are used at the same weight per liter, thecarbon having higher bulk density will be able to remove more
ig. 7. Effect of contact time on adsorption of chromium(VI) at different initial feedoncentration and at constant temperature 30 ◦C, adsorbent dose 2 g/l and pH 6.5.
TIR analysis was applied on the same activated carbon to deter-ine the surface functional groups, by using FTIR spectroscope
FTIR-2000, PerkinElmer), where the spectra were recorded from00 to 4000 cm−1.
.4.3. Particle size analysisParticle size analysis of powder activated carbon samples was
one on using a Malvern instruments, mastersizer 2000 (UK). Sam-les were dispersed in water with the help of an ultrasonic magnetictirrer before feeding into the instrument. Through use of laseriffraction technology, the technique of laser diffraction is basedround principle that particles passing through a laser beam willcatter light at an angle that is directly related to their size. Ashe particle size decreases, the observed scattering angle increasesogarithmically.
. Results and discussions
.1. Physical and chemical characterization of the adsorbent
.1.1. Chemical propertiesAdsorbent pH may influence the removal efficiency. Distinctly
cidic adsorbent may react with the material to be removed anday hamper the surface properties of the adsorbent. The pH of
ctivated Tamarind wood (ATW) was measured by using the methody Al-Ghouti et al. [25] as follows: 3 g of activated carbon was mixedith 30 ml of distilled water and agitated for 24 h. Then the pH value
f the mixture was recorded with a pH meter. For our experimenthe pH of ATW was found 6.77.
ing Journal 150 (2009) 25–39
Ash content of the activated carbon is the residue that remainswhen the carbonaceous portion is burned off. The ash consistsmainly of minerals such as silica, aluminum, iron, magnesium andcalcium. Ash in activated carbon is not required and considered tobe an impurity. Table 2 shows the proximity analysis of ATW. As theash content is 4.55% it resembles good adsorbent.
The spectra of the prepared activated carbon, under the opti-mum preparation conditions and adsorbed chromium(VI) activatedcarbon were measured by an FTIR spectrometer within the rangeof 400–4000 cm−1 wave number. The FTIR spectrum plot obtainedfor the prepared activated carbon and adsorbed chromium(VI) acti-vated carbon was shown in Fig. 1.
3.1.2. Physical propertiesThe smaller the particle sizes of a porous carbon, the greater
the rate of diffusion and adsorption. Intraparticle diffusion isreduced as the particle size reduces, because of the shortermass transfer zone, causing a faster rate of adsorption. Sincewe have prepared our carbon in a powdered form so it has agreat efficiency of removal. The particle size analysis of the pre-pared activated carbon was done using Malvern analyzer. FromFig. 2 it shows that there are no particles above the size of
Fig. 8. Effect of contact time on adsorption of chromium(VI) at different adsorbentdoses and at constant temperature 30 ◦C, initial feed concentration 50 mg/l and pH6.5.

J. Acharya et al. / Chemical Engineer
Fa
epow
afat6
matamivwa
caiatT
adsorption and consequently the attainment of equilibrium adsorp-tion may be due to limited mass transfer of the adsorbate moleculesfrom the bulk liquid to the external surface of ATW, initially andsubsequently by slower internal mass transfer within the ATW par-ticles.
ig. 9. Effect of initial feed concentration on adsorption of chromium(VI) at differentdsorbent doses and at constant temperature 30 ◦C and pH 6.5.
fficiently. Average bulk density can be calculated by water dis-lacement method. In this method, volume of water displaced isbserved by a particular amount of carbon. The average bulk densityas found to be 0.791 g/ml.
The BET surface area of ATW was measured from Fig. 3nd it was found 1322 m2/g. The average pore diameter wasound as 5.3 Å. This shows that ATW is reasonably good fordsorption. The DFT result is given in Fig. 4 and it showshat the activated carbon consists mainly pore width from 5 to0 Å.
Fig. 5(a) and (b), respectively shows the scanning electronicroscope images of the precursor (raw Tamarind wood) and the
ctivated carbon obtained under the optimum preparation condi-ions. As can be seen from Fig. 5(a), there was very little poresvailable on the surface of the precursor. However, after ZnCl2 treat-ent under the optimum preparation conditions, many large pores
n a honeycomb shape were developed on the surface of the acti-ated carbon and a smooth melt surface appeared, interspersedith generally large pores due to some of the volatiles being evolved
s shown in Fig. 5(b).The XRD result in Fig. 6 shows the crystalline structure of the
arbon layers for the precursor (raw Tamarind wood) and preparedctivated carbons. In general, there were no significant changes
n the shape of the XRD graph for the precursor and preparedctivated carbons. This confirms that the crystalline structure ofhe carbons remain unchanged after different thermal treatments.his result is expected since the treatments are limited only toing Journal 150 (2009) 25–39 31
moderate temperatures up to 439 ◦C. From the pore structure char-acterization, it can be seen that the thermal treatment used inthis study caused insignificant effect on the textural propertiesof the carbons, thus confirms that the carbon pore structure wasnot altered by the thermal modification applied on the precur-sor.
3.2. Chromium adsorption
3.2.1. Contact time studyThe relationship between contact time and chromium adsorp-
tion onto ATW at different initial chromium concentrations isshown in Fig. 7. The adsorption was very fast from the beginningto 20 min and the adsorption capacities increased from 39 to 95%with the chromium concentration range of 50–10 mg/l at a contacttime of 20 min. With further increase of time, the adsorption kinet-ics decreased progressively, and finally the adsorption approachedto equilibrium within 40 min in all the cases. The adsorption capac-ities corresponding to equilibrium adsorption increased from 44to 99% with the decrease in chromium concentration from 50 to10 mg/l. The fast adsorption at the initial stage is probably due to theincreased concentration gradient between the adsorbate in solutionand adsorbate in adsorbent as there must be increased number ofvacant sites available in the beginning. The progressive increase in
Fig. 10. Effect of adsorbent doses on adsorption of chromium(VI) at different initialfeed concentration and at constant temperature 30 ◦C and pH 6.5.

32 J. Acharya et al. / Chemical Engineer
Ft
wpteoc
3
auta8t5
3
ctsvsictt
suggests that the negatively charged species (chromate/dichromatein the sample solution) bind through electrostatic attraction to pos-itively charged functional groups on the surface of activated carbonbecause at this pH more functional groups carrying positive chargewould be exposed. But at above pH 3.0, it seems that activated
ig. 11. Effect of pH on adsorption of chromium(VI) at different initial feed concen-ration at constant temperature 30 ◦C and adsorbent dose 2 g/l.
A comparison at different activated carbon dose (1, 2 and 3 g/l)ith a constant temperature 30 ◦C and pH 6.5 has been made andresented in Fig. 8 for the adsorption efficiency. It has been foundhat under identical conditions higher doses of activated carbonnhances the removal efficiency of chromium. This is quite obvi-us that at higher dose activated carbon adsorb more quantity ofhromium(VI), which resulted in increased efficiency.
.2.2. Initial feed concentrationThe effect of chromium concentration in the solution on the
dsorption has been shown in Fig. 9. It can be seen from the fig-re that with increased initial feed concentration of chromium(VI),here was decrease in percentage of adsorption of chromium. Thedsorption capacities for chromium(VI) decreased from 61 to 27%,2 to 49% and 88 to 63% at adsorbent doses 1, 2 and 3 g/l, respec-ively with the increase in the initial feed concentration from 10 to0 mg/l at constant temperature 30 ◦C and pH 6.5.
.2.3. Adsorbent dose studyThe effect of adsorbent dosage on the percentage removal
hromium(VI) has been shown in Fig. 10. It can be seen fromhe figure that initially the percentage removal increases veryharply with the increase in adsorbent dosage but beyond a certainalue 0.25–0.3 g, the percentage removal reaches almost a con-
tant value. This trend is expected because as the adsorbent dosencreases the number adsorbent particles increases and thus morehromium(VI) is attached to their surfaces. The adsorption capaci-ies for chromium(VI) increased from 47 to 89%, 36 to 87% and 22o 82% at 20, 30 and 50 mg/l initial feed concentration, respectivelying Journal 150 (2009) 25–39
with the increase in the adsorbent doses from 1 to 5 g/l at con-stant temperature 30 ◦C and pH 6.5. A maximum removal of 89.5%was observed at adsorbent dosage of 5 g/l at pH 6.5 for an initialchromium(VI) concentration of 20 mg/l. Therefore, the use of 2 g/ladsorbent dose is justified for economical purposes.
3.3. Effect of solution pH on chromium adsorption
Earlier studies have indicated that solution pH is an impor-tant parameter affecting adsorption of heavy metals. Chromium(VI)removal was studied as a function of pH for two different initialconcentrations for a fixed adsorbent dose (2 g/l) and the results areshown in Fig. 11. It is clear from this figure that the percent adsorp-tion of chromium(VI) decreases with increase in pH from pH 1.0 to6.0 and after pH 6.5 (natural pH) no adsorption takes place at all. Itis important that the maximum adsorption at all the concentrationstakes place at pH 1.0.
This behaviour can be explained considering the nature of theadsorbent at different pH in metal adsorption. The cell wall of acti-vated carbon contains a large number of surface functional groups.The pH dependence of metal adsorption can largely be related to thetype and ionic state of these functional groups and also on the metalchemistry in solution. Adsorption of chromium(VI) below pH 3.0
Fig. 12. Kinetics of chromium(VI) removal according to the Lagergren model at initialfeed concentration of 10, 20, 30 and 50 mg/l.
J. Acharya et al. / Chemical Engineer
Fm
cctrpooaoa
3
tpt
3
i
l
w((
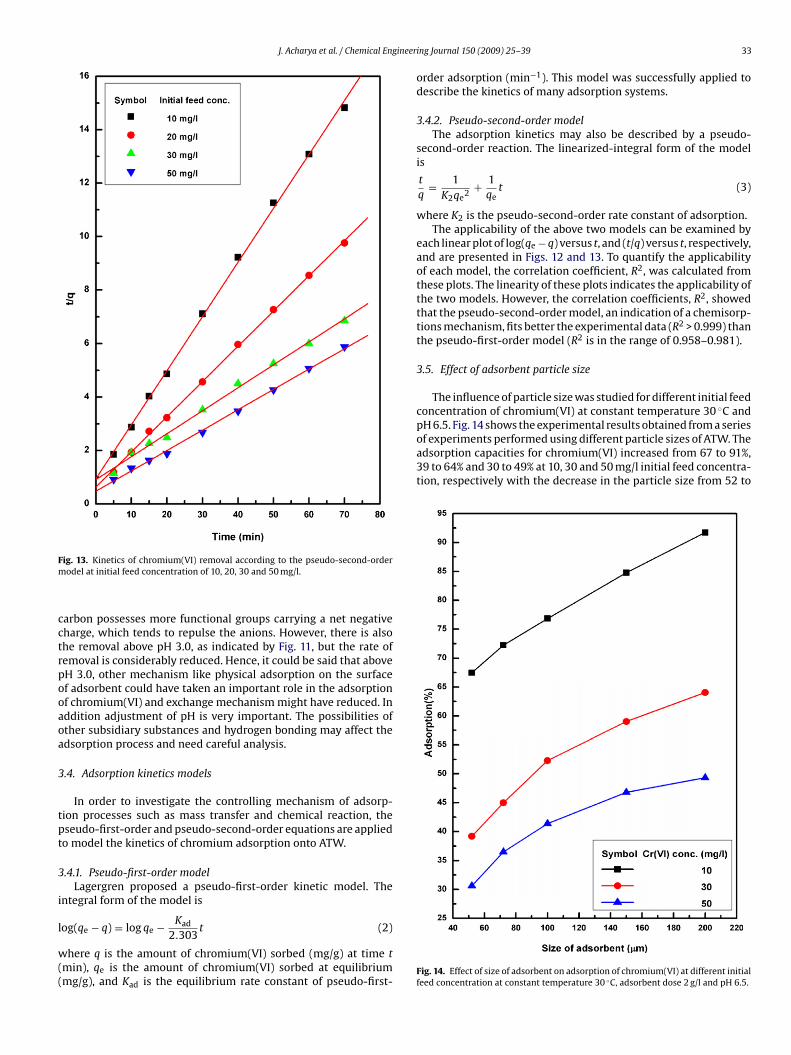
pH 6.5. Fig. 14 shows the experimental results obtained from a seriesof experiments performed using different particle sizes of ATW. Theadsorption capacities for chromium(VI) increased from 67 to 91%,39 to 64% and 30 to 49% at 10, 30 and 50 mg/l initial feed concentra-tion, respectively with the decrease in the particle size from 52 to
ig. 13. Kinetics of chromium(VI) removal according to the pseudo-second-orderodel at initial feed concentration of 10, 20, 30 and 50 mg/l.
arbon possesses more functional groups carrying a net negativeharge, which tends to repulse the anions. However, there is alsohe removal above pH 3.0, as indicated by Fig. 11, but the rate ofemoval is considerably reduced. Hence, it could be said that aboveH 3.0, other mechanism like physical adsorption on the surfacef adsorbent could have taken an important role in the adsorptionf chromium(VI) and exchange mechanism might have reduced. Inddition adjustment of pH is very important. The possibilities ofther subsidiary substances and hydrogen bonding may affect thedsorption process and need careful analysis.
.4. Adsorption kinetics models
In order to investigate the controlling mechanism of adsorp-ion processes such as mass transfer and chemical reaction, theseudo-first-order and pseudo-second-order equations are appliedo model the kinetics of chromium adsorption onto ATW.
.4.1. Pseudo-first-order modelLagergren proposed a pseudo-first-order kinetic model. The
ntegral form of the model is
K
og(qe − q) = log qe − ad2.303t (2)
here q is the amount of chromium(VI) sorbed (mg/g) at time tmin), qe is the amount of chromium(VI) sorbed at equilibriummg/g), and Kad is the equilibrium rate constant of pseudo-first-
ing Journal 150 (2009) 25–39 33
order adsorption (min−1). This model was successfully applied todescribe the kinetics of many adsorption systems.
3.4.2. Pseudo-second-order modelThe adsorption kinetics may also be described by a pseudo-
second-order reaction. The linearized-integral form of the modelis
t
q= 1
K2qe2+ 1
qet (3)
where K2 is the pseudo-second-order rate constant of adsorption.The applicability of the above two models can be examined by
each linear plot of log(qe − q) versus t, and (t/q) versus t, respectively,and are presented in Figs. 12 and 13. To quantify the applicabilityof each model, the correlation coefficient, R2, was calculated fromthese plots. The linearity of these plots indicates the applicability ofthe two models. However, the correlation coefficients, R2, showedthat the pseudo-second-order model, an indication of a chemisorp-tions mechanism, fits better the experimental data (R2 > 0.999) thanthe pseudo-first-order model (R2 is in the range of 0.958–0.981).
3.5. Effect of adsorbent particle size
The influence of particle size was studied for different initial feedconcentration of chromium(VI) at constant temperature 30 ◦C and
Fig. 14. Effect of size of adsorbent on adsorption of chromium(VI) at different initialfeed concentration at constant temperature 30 ◦C, adsorbent dose 2 g/l and pH 6.5.

34 J. Acharya et al. / Chemical Engineer
Fca
2tso
3
attia
2
3
3
rbs
to identify the slowest step in the adsorption process, Boyd kineticequation [27] was applied, which is represented as
F = 1 − 6�2
exp(−Bt) (5)
ig. 15. Weber and Morris (intraparticle diffusion) plot for the adsorption ofhromium(VI) for different initial feed concentration at pH 6.5, temperature 30 ◦Cnd adsorbent dosage 2 g/l.
00 �m because the higher adsorption with smaller adsorbent par-icle may be attributed to the fact that smaller particles give largeurface areas. The result showed that there was a gradual increasef adsorption with the decrease in particle size.
.6. Adsorption mechanisms
It is always important to predict the rate-limiting step in andsorption process to understand the mechanism associated withhe phenomena. For a solid liquid adsorption process, the soluteransfer is usually characterized by either external mass transfer orntraparticle diffusion or both. Generally three types of mechanismsre involved in the adsorption process, mentioned as follows [26]:
1. Film diffusion, which involves the movement of adsorbatemolecules from the bulk of the solution towards the externalsurface of the adsorbent.
. Particle diffusion, where the adsorbate molecules move in theinterior of the adsorbent particles.
. Adsorption of the adsorbate molecules on the interior of theporous adsorbent.
.6.1. Weber and Morris modelIntraparticle diffusion model is of major concern because it is
ate-determining step in the liquid adsorption systems. During theatch mode of operation, there was a possibility of transport oforbate species into the pores of sorbent, which is often the rate-
ing Journal 150 (2009) 25–39
controlling step. The rate constants of intraparticle diffusion (kid) atdifferent temperatures were determined using the following equa-tion:
q = kidt1/2 (4)
where q is the amount sorbed at time t and t1/2 is the squareroot of the time. The values of kid (0.282, 0.446, 0.954 and0.969 mg/g min−1/2) at different initial feed concentrations 10, 20,30, 50 mg/l, respectively, were calculated from the slopes of respec-tive plot (q versus t1/2 of Fig. 15) at later stages. Also from Fig. 16, itclears the dual nature for different temperatures 20, 30 and 40 ◦Cat constant initial feed concentration 50 mg/l and pH 6.5. The dualnature of the curves was obtained due to the varying extent ofadsorption in the initial and final stages of the experiment. This canbe attributed to the fact that in the initial stages, adsorption wasdue to boundary layer diffusion effect whereas, in the later stages(linear portion of the curve) was due to the intraparticle diffusioneffects. However, these plots indicated that the intraparticle diffu-sion was not the only rate controlling step because it did not passthrough the origin.
3.6.2. Boyd modelOf the three steps, the third step is assumed to be very rapid and
can be considered negligible. For design purposes, it is required todistinguish between film diffusion and particle diffusion. In order
Fig. 16. Intraparticle diffusion plot at different temperatures for the initial concen-tration 50 mg/l, adsorbent dose 2 g/l and pH 6.5.

J. Acharya et al. / Chemical Engineer
F
w(aar
B
tesvnitr
B
wbv4t
ln(Ce/C0 − (1/1 + mK)) versus t (min) at different initial feed concen-tration of chromium(VI) (10, 20, 30 and 50 mg/l). The values of ˇ1obtained show that the rate of transfer of mass from bulk solutionto the adsorbent surface was rapid enough so it cannot be rate-controlling step [29]. It can also be mentioned that the deviation
Fig. 17. Boyd plot for the adsorption of chromium(VI).
and
= q
qe(6)
here qe is the amount of chromium(VI) adsorbed at equilibriummg/g) and q represents the amount of chromium(VI) adsorbed atny time t (min), F represents the fraction of solute adsorbed atny time t, and Bt is a mathematical function of F. Eq. (5) can beearranged by taking the natural logarithm to obtain the equation:
t = −0.4977 − ln(1 − F). (7)
The plot of [−0.4977 − ln(1 − F)] against time t can be employedo test the linearity of the experimental values. If the plots are lin-ar and pass through origin, then the slowest (rate controlling)tep in the adsorption process is the internal diffusion, and viceersa. From Fig. 17, it was observed that the plots are linear but doot pass though the origin suggesting that the adsorption process
s controlled by film diffusion. The calculated B values were usedo calculate the effective diffusion coefficient, Di (m2/s) using theelationship:
= �2Di
r2(8)
here Di is the effective diffusion coefficient of solute in the adsor-ent phase and r is the radius of the adsorbent particles. The Dialues were found to be 2.54 × 10⁻¹¹, 2.63 × 10⁻¹¹, 3.22 × 10⁻¹¹ and.37 × 10−11 m2/s, respectively for an initial chromium(VI) concen-ration of 10, 20, 30 and 50 mg/l.
ing Journal 150 (2009) 25–39 35
3.6.3. McKay et al. modelDuring the present investigation, step (2) has been assumed
rapid enough with respect to the other steps and therefore it is notrate limiting in any kinetic study. Taking in to account these prob-able steps, McKay et al. model [28] has been used for the presentinvestigation:
ln(
Ce
C0− 1
1 + mK
)= ln
(mK
1 + mK
)−
(1 + mK
mK
)ˇ1Sst (9)
where m is the mass of the adsorbent per unit volume, K the con-stant obtained by multiplying KL and b (Langmuir’s constants), ˇ1the mass transfer coefficient, and Ss is the outer specific surface ofthe adsorbent particles per unit volume of particle free slurry. Thevalues of m and Ss were calculated using the following relations:
m = W
V(10)
Ss = 6m
dpıp(
1 − εp) (11)
where W is the weight of the adsorbent, V the volume of particle-free slurry solution, and dp, ıp and εp are the diameter, density andporosity of the adsorbent particles, respectively. The values of ˇ1(4.467 × 10⁻⁴, 7.419 × 10⁻⁴, 9.903 × 10⁻⁴ and 1.192 × 10⁻³ cm s−1)calculated from the slopes and intercepts of the plots (Fig. 18) of
Fig. 18. Mass transfer plot for the adsorption of chromium(VI) at pH 6.5, initialconcentration 50 mg/l, and adsorbent dosage 2 g/l.

36 J. Acharya et al. / Chemical Engineer
ova
3
eLp
Fmm
l
wtFat
tf
q
the adsorption with the rise of temperature may be diffusion con-trolled which is endothermic process, i.e. the rise of temperaturesfavors the sorbate transport with in the pores of sorbent [23]. Theincreased adsorption with the rise of temperature is also due to the
Fig. 19. Freundlich adsorption isotherm.
f some of the points from the linearity of the plots indicated thearying extent of mass transfer at the initial and final stages of thedsorption.
.7. Adsorption isotherms
Several models have been used in the literature to describe thexperimental data of adsorption isotherms. The Freundlich andangmuir models are the most frequently employed models. In theresent work both models were used.
The chromium(VI) adsorption isotherm followed the linearizedreundlich model as shown in Fig. 19. The relation between theetal uptake capacity ‘qe’ (mg/g) of adsorbent and the residualetal ion concentration ‘Ce’ (mg/l) at equilibrium is given by
n qe = ln k + 1n
ln Ce (12)
here the intercept ln k is a measure of adsorbent capacity, andhe slope 1/n is the adsorption intensity. The isotherm data fit thereundlich model well (R2 = 0.996). The values of the constants knd 1/n were calculated to be 1.876 and 0.273, respectively. Sincehe value of 1/n is less than 1, it indicates a favorable adsorption.
The Langmuir equation relates solid phase adsorbate concentra-
ion (qe), the uptake, to the equilibrium liquid concentration (Ce) asollows:e =(
KLbCe
1 + bCe
). (13)
ing Journal 150 (2009) 25–39
where KL and b are the Langmuir constants, representing the maxi-mum adsorption capacity for the solid phase loading and the energyconstant related to the heat of adsorption, respectively. It can beseen from Fig. 20 that the isotherm data fits the Langmuir equationwell (R2 = 0.995). The values of KL & b were determined from thefigure and were found to be 28.019 mg/g and 0.025 l/mg, respec-tively. The outcome values of parameters k, n, KL, b, R2 for all theexperiments with pH of solution equal to 6.5 for maximum removalof chromium(VI) are presented in Table 2.
3.8. Effect of temperature on chromium adsorption
Experiments were performed at different temperatures 20, 30and 40 ◦C at a concentration of 50 mg/l and pH of 6.5. The adsorptionincreased from 27.5, 49.1 to 64.4% with the rise in temperature from20 to 40 ◦C (Fig. 21). Equilibrium time for 20, 30 and 40 ◦C was foundto be 30 min indicating that the equilibrium time was indepen-dent of temperature. Also Fig. 22 shows the effect of temperaturefor different initial feed concentration at constant adsorbent dose2 g/l and pH 6.5. It can be seen from the figure that initially thepercentage removal increases very sharply with the increase intemperature but beyond a certain value 30–40 ◦C, the percent-age removal reaches almost a constant value. The above resultsalso showed (Figs. 21 and 22) that, the adsorption was endother-mic in nature. Since sorbent is porous in nature and possibilitiesof diffusion of sorbate cannot be ruled out therefore, increase in
Fig. 20. Langmuir adsorption isotherm.

J. Acharya et al. / Chemical Engineering Journal 150 (2009) 25–39 37
Fd
ios
3
(f
K
�
wat(i
TT
C
1235
ig. 21. Effect of temperature with time for the concentration of 50 mg/l at adsorbentose 2 g/l and pH 6.5.
ncrease in the number of the adsorption sites generated becausef breaking of some internal bonds near the edge of active surfaceites of sorbent.
.8.1. Thermodynamic parametersThermodynamic parameters such as free energy (�G◦), enthalpy
�H◦) and entropy (�S◦) change of adsorption can be evaluatedrom the following equations [14,15]:
c = CAe
Ce(14)
G0 = −RT ln Kc (15)
here K is the equilibrium constant and C and C (both in mg/l)
c Ae ere the equilibrium concentrations for solute on the sorbent and inhe solution, respectively. The Kc values are used in Eqs. (14) and15) to determine the �G◦, �H◦ and �S◦. The Kc may be expressedn terms of the �H◦ (kJ mol−1) and �S◦ (cal mol−1 K−1) as a function
able 3hermodynamic parameters for the adsorption of chromium(VI).
0 (mg/l) �H◦ (kJ mol−1) �S◦ (kJ mol−1 K−1) �G◦ (kJ m
10 ◦C
0 53.529 0.1884 −107.160 53.695 0.1812 −104.990 44.158 0.1465 −85.630 34.544 0.1108 −65.91
Fig. 22. Effect of temperature for different initial feed concentration at constantadsorbent dose 2 g/l and pH 6.5.
of temperature:
ln Kc = −�H◦
RT+ �S◦
R. (16)
Thermodynamic parameters such as free energy of adsorption(�G◦), the heat of adsorption (�H◦) and standard entropy (�S◦)changes during the adsorption process were calculated using Eqs.(14)–(16) on a temperature range of 10–50 ◦C at different initialfeed concentration of chromium(VI), (�H◦) and (�S◦) and wereobtained from the slope and intercept of a plot of ln Kc against 1/T(Fig. 23). The values of these parameters are recorded in Table 3. Thenegative values of �G◦ indicate the spontaneous nature of the pro-cess and more negative value with increase of temperature shows
that an increase in temperature favors the adsorption process. Thepositive values of �H◦ indicate that the adsorption process wasendothermic in nature and the negative values of �S◦ suggest theprobability of a favorable adsorption.ol−1)
20 ◦C 30 ◦C 40 ◦C 50 ◦C
−109.04 −110.93 −112.81 −114.69−106.80 −108.61 −110.43 −112.24−87.09 −88.56 −90.02 −91.49−67.02 −68.13 −69.24 −70.35

38 J. Acharya et al. / Chemical Engineer
Ff
4
bpbff
•
•
•
•
•
•
[
[
[
[
[
ig. 23. A plot of ln Kc against 1/T for chromium(VI) adsorption for different initialeed concentration at constant adsorbent dose 2 g/l and pH 6.5.
. Conclusions
Removal of chromium(VI) from aqueous solutions is possi-le using several abundantly available low-cost adsorbents. Theresent investigation shows that Tamarind wood activated car-on is an effective adsorbent for the removal of chromium(VI)rom aqueous solutions. Conclusions from the present study are asollows:
Characterization has shown a clear demarcation in the physico-chemical properties of the adsorbent.From the kinetics studies it is observed that adsorption ofchromium(VI) is very rapid in the initial stage and decreases whileapproaching equilibrium. The equilibrium time increases withinitial chromium(VI) concentration.The percentage removal of chromium(VI) increases with theincrease in adsorbent dosage and decrease with increase in initialchromium(VI) concentration.Experimental results are in good agreement with Langmuiradsorption isotherm model, and have shown a better fitting to theexperimental data. Adsorption of chromium(VI) obeys pseudo-second-order equation.The overall rate of chromium(VI) uptake was found to be con-trolled by pore diffusion, film diffusion and particle diffusion,throughout the entire adsorption period. Boyd plot confirmed
that external mass transfer was the rate-limiting step in theadsorption process.Different thermodynamic parameters, viz., �H◦, �S◦ and �G◦have also been evaluated and it has been found that the adsorp-tion was feasible, spontaneous and endothermic in nature. The
[
[
ing Journal 150 (2009) 25–39
positive value of the entropy change suggests the increased ran-domness.
• Under the prevailing conditions, the maximum chromium(VI)removal efficiency was found to be 99%. As the adsorbent isderived from an agricultural waste, activated carbon may beuseful for the economic treatment of wastewater containingchromium(VI).
However, more investigations are needed on different types ofindustrial wastewaters and different operating conditions beforesuch conclusions can be generalized.
References
[1] N. Serpone, E. Borgarello, E. Pelizzeti, E. Schiavello (Eds.), Photocatalysis andEnvironment, Kluwer Academic, The Netherlands, 1988.
[2] S.L. Brauer, K.E. Wetterhahn, Chromium(VI) forms a thiolate complex with glu-tathione, J. Am. Chem. Soc. 113 (8) (1991) 3001–3007.
[3] WHO, Guidelines for Drinking-Water Quality, 3rd ed., World Health Organiza-tion, Geneva, Switzerland, 2006, p. 54.
[4] D. Mohan, K.P. Singh, V.K. Singh, Removal of hexavalent chromium from aque-ous solution using low-cost activated carbons derived from agricultural wastematerials and activated carbon fabric cloth, Ind. Eng. Chem. Res. 44 (4) (2005)1027–1042.
[5] G. Tiravanti, D. Petruzzelli, R. Passino, Pretreatment of tannery wastewaters byan ion exchange process for Cr(III) removal and recovery, Water Sci. Technol. 36(2–3) (1997) 197–207.
[6] C.A. Kozlowski, W. Walkowiak, Removal of chromium(VI) from aqueoussolutions by polymer inclusion membranes, Water Res. 36 (2002) 4870–4876.
[7] N. Kongsricharoern, C. Polprasert, Chromium removal by a bipolar electrochem-ical precipitation process, Water Sci. Technol. 34 (1996) 109–116.
[8] J.J. Testa, M.A. Grela, M.I. Litter, Heterogeneous photocatalytic reductionof chromium(III) over TiO2 particles in the presence of oxalate: involve-ment of Chromium(VI) species, Environ. Sci. Technol. 38 (5) (2004) 1589–1594.
[9] V.K. Gupta, A.K. Shrivastava, N. Jain, Biosorption of chromium(VI) from aqueoussolutions by green algae spirogyra species, Water Res. 35 (2001) 4079–4085.
[10] N.R. Bishnoi, M. Bajaj, N. Sharma, Adsorption of Chromium(VI) from aqueousand electroplating wastewater, Environ. Technol. 25 (8) (2004) 899–905.
[11] O.A. Fadali, Y.H. Magdy, A.A.M. Daifullah, E.E. Ebrahiem, M.M. Nassar, Removalof chromium from tannery effluents by adsorption, J. Environ. Sci. Health PartA: Toxic/Hazard. Subst. Environ. Eng. 39 (2) (2004) 465–472.
12] V. Sarin, K.K. Pant, Removal of chromium from industrial waste by using euca-lyptus bark, Bioresour. Technol. 97 (1) (2006) 15–20.
[13] K. Periasamy, K. Srinivasan, P.R. Muruganan, Studies on chromium(VI) removalby activated ground nut husk carbon, Indian J. Environ. Health 33 (1991)433–439.
[14] W.T. Tan, S.T. Ooi, C.K. Lee, Removal of Chromium(VI) from solution by coconuthusk and palm pressed fibres, Environ. Technol. 14 (1993) 277–282.
[15] C.P. Dwivedi, J.N. Sahu, C.R. Mohanty, B. Raj Mohan, B.C. Meikap, Column per-formance of granular activated carbon packed bed for Pb(II) removal, J. Hazard.Mater. 156 (1–3) (2008) 596–603.
[16] C.K. Singh, J.N. Sahu, K.K. Mahalik, C.R. Mohanty, B. Raj Mohan, B.C. Meikap,Studies on the removal of Pb(II) from wastewater by activated carbon developedfrom Tamarind wood activated with sulphuric acid, J. Hazard. Mater. 153 (2008)221–228.
[17] C. Selomulya, V. Meeyoo, R. Amal, Mechanisms of Cr(VI) removal from waterby various types of activated carbons, J. Chem. Technol. Biotechnol. 74 (1994)111–122.
[18] K. Selvi, S. Pattabhi, K. Kadirvelu, Removal of Cr(VI) from aqueous solution byadsorption onto activated carbon, Bioresour. Technol. 80 (2001) 87–89.
[19] J.N. Sahu, S. Agarwal, B.C. Meikap, M.N. Biswas, Performance of a modifiedmulti-stage bubble column reactor for lead(II) and biological oxygen demandremoval from wastewater using activated rice husk, J. Hazard. Mater. 161 (1)(2009) 317–324.
20] M. Kobya, Adsorption, kinetic and equilibrium studies of Cr(VI) by hazelnutshell activated carbon, Adsorpt. Sci. Technol. 22 (2004) 51–64.
21] K. Rastogi, J.N. Sahu, B.C. Meikap, M.N. Biswas, Removal of methylene blue fromwastewater using fly ash as an adsorbent by hydrocyclone, J. Hazard. Mater. 158(2–3) (2008) 531–540.
22] E. Demirbas, M. Kobya, E. Senturk, T. Ozkan, Adsorption kinetics for the removalof chromium(VI) from aqueous solutions on the activated carbons preparedfrom agricultural waster, Water SA 30 (2004) 533–539.
23] K. Mohanty, M. Jha, B.C. Meikap, M.N. Biswas, Removal of chromium(VI) fromdilute aqueous solutions by activated carbon developed from Terminalia arjuna
nuts activated with zinc chloride, Chem. Eng. Sci. 60 (2005) 3049–3059.24] A. Ahmadpour, D.D. Do, The preparation of activated carbon from MacademiaNutshell by chemical activation, Carbon 35 (12) (1997) 1723–1732.
25] M. Al-Ghouti, M.A.M. Khraisheh, S. Allen, M.N.M. Ahmad, The removal of dyesfrom textile wastewater: a study of the physical characteristics and adsorptionmechanisms of diatomaceous earth, J. Environ. Manage. 69 (2003) 229–238.

gineer
[
[
J. Acharya et al. / Chemical En
26] P. Chingombe, B. Saha, R.J. Wakeman, Sorption of atrazine on conventional andsurface modified activated carbons, J. Colloid Interf. Sci. 302 (2006) 408–416.
27] G.E. Boyd, A.W. Adamson, L.S. Myers Jr., The exchange adsorption of ions fromaqueous solutions by organic zeolites, II: kinetics, J. Am. Chem. Soc. 69 (1947)2836–2848.
[
[
ing Journal 150 (2009) 25–39 39
28] G. McKay, M.S. Otterburn, A.G. Sweeny, Surface mass transfer processduring colour removal from effluents using silica, Water Res. 15 (1981)321–331.
29] G.S. Gupta, G. Prasad, V.N. Singh, Removal of colour from wastewater by sorptionfor water reuse, J. Environ. Sci. Health A 23 (1988) 205–218.