preventive veterinary medicine 102 (2011) 175–184 contents lists available at sciencedirect...
TRANSCRIPT
Fs
Fa
Ub
c
a
KIFMSC
0d
Preventive Veterinary Medicine 102 (2011) 175– 184
Contents lists available at ScienceDirect
Preventive Veterinary Medicine
j ourna l ho me pag e: ww w.elsev i er .com/ locate /prev etmed
arm-level reproduction number during an epidemic of infectiousalmon anemia virus in southern Chile in 2007–2009
.O. Mardonesa,b,∗, A.M. Pereza,c, P. Valdes-Donosoa, T.E. Carpentera
Center for Animal Disease Modeling and Surveillance (CADMS), Department of Medicine and Epidemiology, School of Veterinary Medicine,niversity of California, Davis, CA 95616, USAEpiVet Consulting, Santiago, ChileCONICET and Facultad de Ciencias Veterinarias UNR, Argentina
r t i c l e i n f o
eywords:SAVarm level reproduction numberodeling infectious diseases
almon farminghile
a b s t r a c t
An epidemic of infectious salmon anemia virus (ISAV) has greatly impacted salmon produc-tion in Chile with devastating social and economic consequences. The epidemic is analyzedhere and is likely the largest ISAV outbreak reported affecting one of the most productiveregions for salmon farming activities in the world. After re-emerging in 2007, ISAV rapidlyexpanded the following two years, both in magnitude and geographic range, affecting about65% and 50% of salmon farms located at the 10th and 11th regions of Chile, respectively.A useful metric for the control of infectious diseases that quantifies the progression of anepidemic is the reproduction number at the farm level (Rf), which describes the mean num-ber of secondary cases generated by an infectious farm. The parameter in this study wasestimated for individual farms (Rfi), specific phases (Rtf), and for the entire epidemic (Rf) byusing several analytical approaches based on the characterization of the epidemic curvesfor the two regions. For the initial spread and the epidemic growth phase, initial and intrin-sic growth rates were used to estimate Rtf. In addition, two approaches (epidemic final sizeand nearest neighbor analyses) were used to obtain an individual (Rfi) and overall estimateof Rf for the complete epidemic. In general, two distinct regional patterns of spread wereidentified. In the 10th region, after an explosive initial spread of ISAV in which Rtf reached12.0–16.9, a smaller epidemic growth of 1.6 ≤ Rtf ≥ 2.5 and a final burnout with Rtf < 1 wereobserved. For the 11th region, Rtf only reached 2.4 during the initial spread phase, rangedfrom 1.6 ≤ Rtf ≥ 4.4 during the epidemic growth phases and ended when Rtf was <1.0. Theepidemic was characterized by clustering of ISAV ‘superspreaders’ farms i.e., farms withstatistically significantly (P < 0.047) higher Rfi values. Distances between pairs of infectedfarms were statistically significantly (P = 0.003) shorter in the 10th compared to the 11thregion. Overall, Rf ranged from 1.6 to 2.5 and 1.3 to 1.7 in the 10th and 11th regions, respec-
tively. Our findings suggest that control efforts were able to protect 38–60% and 23–41% ofthe farms in the 10th and 11th regions, respectively, and may have resulted in the epidemicnot spreading further. In addition, control strategies in highly populated areas using a con-trol zone of at least 10 km radius may be more effective than the 5 km zone recommendedby the World Animal Health Organization.∗ Corresponding author.E-mail address: [email protected] (F.O. Mardones).
167-5877/$ – see front matter © 2011 Elsevier B.V. All rights reserved.oi:10.1016/j.prevetmed.2011.07.005
© 2011 Elsevier B.V. All rights reserved.
1. Introduction
Infectious salmon anemia virus (ISAV; family Orthomyx-oviridae) is a World Animal Health Organization (OIE)notifiable disease that has re-emerged as one of the most

eterina
176 F.O. Mardones et al. / Preventive Veconomically devastating infectious diseases of salmonfarming. It has been found in every country in which salmonfarming is intensively practiced (Lyngstad et al., 2008;Mardones et al., 2009; Murray et al., 2010). ISAV is primarilya disease of farmed Atlantic salmon (Salmo salar), but it hasalso been isolated from farmed Coho salmon (Oncorhynchuskisutsch) in Chile (Kibenge et al., 2001), rainbow trout (O.mykiss) in Ireland (Anonymous, 2002) and wild fish pop-ulations (Raynard et al., 2001; Plarre et al., 2005) withoutclinical disease.
A number of risk factors for ISAV infection have beenidentified in epidemics reported throughout the world.Proximity to an infected farm is considered the mostimportant single risk factor for infection due to water-borne transmission of the virus (Jarp and Karlsen, 1997;McClure et al., 2005; Gustafson et al., 2007a,b). In addi-tion, closeness to processing plants or nearby harbors isan important risk factor for presence of the virus, whichhighlights the value of understanding the network struc-ture of the salmon industry for preventing or controllingISAV spread. Management-related risk factors include highdensity, poor smolts quality, short fallowing periods, pre-vious history of ISAV, and multiple origins and ages of fishwithin a farm. Factors associated with the long distancespread of the virus between farms include movementsof live fish, indirect contacts with contaminated materi-als or people, wild fish contacts, and abundance of sealice.
In 2007, ISAV was isolated for the first time from anAtlantic salmon farm located in the most productive regionof Southern Chile, the 10th region (Godoy et al., 2008;Mardones et al., 2009). After two years, the virus spreadquickly, expanding along 1300 km of shoreline from thenorthern part of the 10th region to extreme latitudes in the12th region where marine farming also occurs (Fig. 1). Thisepidemic has had devastating economic and social conse-quences in the most important animal production systemof the country. Direct economic impact of ISAV has beenestimated at US$ 2 billion from 2007 to 2009, includingincreased production costs of about 30% due to new san-itary actions and improved biosecurity (FIS, 2010). It hasalso been estimated that the volume of Atlantic salmonharvested in 2009 was 61% lower than in the previousyear, and will not increase to pre-outbreak levels until2015 (Asche et al., 2009). The epidemic has resulted insocial disruption in many communities of affected regions,where people’s livelihoods are dependent on the sector:15,000 jobs have reportedly been lost in the industry (FIS,2010).
One of the key concepts in theoretical epidemiology(the use of mathematical models to explain and exam-ine disease spread) is the reproduction number (R), whichis typically defined as the mean number of secondaryinfections that result from a single infected individual(Dieckmann and Heesterbeek, 2000). This parameter isfundamental in the epidemiology of infectious diseasesbecause it can be used to determine population-level infec-
tion dynamics. Unfortunately, it is difficult to estimate apriori, because it requires knowledge of all transmissionmechanisms. Alternatively, epidemic data can be used toapproximate the value of this parameter and subsequentlyry Medicine 102 (2011) 175– 184
evaluate mitigation strategies, and simulate disease spreadin disease-free areas.
The present study was based on information from activeand passive surveillance activities conducted during theISAV epidemic in Chile from June 2007 to 2009. In thispaper, R is calculated for individual farms (Rfi), specific epi-demic phases (Rtf), and for the entire epidemic (Rf) usingseveral approaches according to the characteristic of theepidemic curves for the 10th and 11th regions. Estimates ofRf were used to calculate the proportion of protected farmsthat would have been necessary to prevent the spread ofISAV. Results presented here will help the design of contin-gency plans for future epidemics.
2. Materials and methods
2.1. Data source, study regions and distribution of ISAVfarms
Data were obtained from official active and passivesurveillance programs carried out in Chile by the NationalFisheries Service (Sernapesca) from June 2007 to 2009 –starting from the index case in the 10th region (IC10). Inaddition, industry representatives provided key informa-tion, including sanitary and production records as wellas laboratory reports, to estimate the most likely ISAV-detection date for subsequent cases. The epidemiologicalunit in this study was the salmon farm at the marine-stage that actively raised Atlantic salmon. Farmed Coho andChinook (O. tshawytscha) salmon, two additional salmonidspecies raised in southern Chile, were excluded as theyare not considered to play a role in the transmission ofISAV (OIE, 2009). However, subclinical infection of ISAVwas detected in farmed rainbow trout and for that reasonsensitivity analyses were carried out including and exclud-ing farmed trout as susceptible species. In this study, a casewas defined as a farm that reported positive test resultsfor at least one of the two official laboratory techniques(OIE, 2009): reverse transcriptase-polymerase chain reac-tion (RT-PCR) or immuno-fluorescent antibody technique(IFAT).
This study was undertaken separately for the 10thand 11th regions (Fig. 1), which account for about 98%of the total production of farmed salmon in Chile andare geographically separated by about 90 km by theGulf and Strait of Corcovado (43◦38′13′′S, 73◦50′53′′W).There are 530 (10th region) and 620 (11th region)salmon farming sea sites officially registered by theUnder Secretariat of Fisheries (www.subpesca.cl); how-ever, a substantial proportion were inactive during theepidemic. During 2007, there were 300 and 210 sites inthe 10th and 11th regions, respectively, that reportedfarming activity of the susceptible species considered inthis study. Vertex coordinates for polygons represent-ing each marine site were obtained from the ChileanFisheries Development Institute (IFOP). Farm locations(latitude and longitude) were estimated as the cen-
troid of the polygon in which they were located, whichwere then projected using the WGS 1984 datum andvisualized using ArcGISTM v9.3 (ESRI Inc., Redlands, CA,USA).
F.O. Mardones et al. / Preventive Veterinary Medicine 102 (2011) 175– 184 177
F rner), anw 9. Farmo Animal
g gions.
2r
w
ig. 1. The marine salmon farming regions of southern Chile (upper left coere actively operating during the epidemic of ISAV from June 2007 to 200
ne of the two confirmatory diagnostic tests recommended by the Worldrey dashed line approximates the political division between the study re
.2. Characterization of the farm-level basic
eproduction number (Rf)Four-week moving averages of weekly epidemic dataere created for each region to remove unwanted fluctua-
d the spatial distribution of Atlantic salmon and rainbow trout farms thats are classified here according to the ISAV status i.e., positive (+) to at leastHealth Organization, ISAV (+) with clinical signs, and ISAV-susceptible. A
tions and improve visual identification of different phases
(Martin et al., 1987). Phases were determined by identify-ing epidemic peaks, with the exception of the end of theinitial spread in the 11th region, which was determinedby the end of an extended lag between the fourth and fifth
eterina
178 F.O. Mardones et al. / Preventive Vcases, after which the incidence rate steadily increased. Sta-sis phases were defined by the period that followed the endof the epidemic growth phase. Rtf were estimated duringeach of the epidemic phases by two approaches: (1) initialgrowth rate and, (2) intrinsic growth rate. Two additionalapproaches were used to estimate the overall Rf in bothregions: (1) epidemic final size and (2) nearest infectedneighbor.
For all approaches, it was assumed that the popula-tion was fully susceptible at the beginning of the epidemicand there were no new introductions (stocking) of salmonthroughout the epidemic. In addition, duration of farm-level infectiousness (Df) was estimated as the number ofdays from when a farm was reported as ISAV positive untildepopulation, according to government reported informa-tion. Regional estimates of Df were compared using theWilcoxon signed-rank test for significance (P < 0.05). Sen-sitivity analyses of Rtf and Rf were performed using Dfmedians and interquartile values.
2.3. Phase-specific estimation of Rtf
2.3.1. Initial growth rateRtf was estimated (Anderson et al., 1986) as
1 + (Df/td)ln 2, where td is the number of days for thenumber of new cases to double during the epidemic. Foreach td, the median Df for all cases included in that intervalwas used, and so on for subsequent Rtf, until the end ofthe epidemic. Although it is possible to approximate anoverall Rf for the epidemic by averaging each estimated Rtf,it is not possible to calculate td at the end of the epidemic.Therefore, this approach was preferred to describe Rtffor the earliest stages of the outbreak rather than for theentire epidemic.
2.3.2. Intrinsic growth rateRtf was estimated (Pybus et al., 2001) as 1 + rDf, where r
is the growth rate for the weekly number of cases and is cal-culated as the slope obtained after fitting an ordinary linearregression model for the growth periods identified from theepidemic curves. Rtf values were obtained for each regionduring the epidemic growth phases (i.e., initial phase in the10th region, and both regional growth phases) and by usingdifferent Df values.
2.4. Estimation of the overall Rf for the ISAV epidemic
2.4.1. Final epidemic sizeRf was estimated (Smith, 1964) as [ln(S0/S∞)]/(S0 − S∞),
where S0 and S∞ are the proportion (fraction) of suscepti-ble farms at the beginning and at the end of the epidemic,respectively. Estimations for Rf were evaluated by includ-ing/excluding rainbow trout farms as a susceptible species.Because some ISAV-non-infected (or negative) farms werelikely harvested earlier or preemptively depopulated dur-ing the epidemic, it is possible that the final number offarms was less than the initial number of farms.
2.4.2. Nearest neighbor analysesHorizontal transmission was estimated assuming the
nearest infectious farm was the source of ISAV for an
ry Medicine 102 (2011) 175– 184
infected farm, except for the index case in each region.Previous work on the ISAV epidemic in Chile identifiedclustering of ISAV-infected farms within a 15 km radius(Mardones et al., 2009). Similarly, adjacent farms within aseaway distance <10 km in Norway (Lyngstad et al., 2008)and <7 km in the recent epidemic in Scotland (Murrayet al., 2010) have been epidemiologically linked. Thus itis likely that infected farms that were long distances fromtheir nearest infected neighbor were not infected horizon-tally through water-borne transmission. For these reasons,the analysis was repeated imposing a maximum of 15 kmrestriction for an infected farm to be able to infect a nearestsusceptible farm.
Euclidean distances were estimated using the Carte-sian method by transforming the latitude and longitudeof each farm into two-dimensional coordinates, fromwhich straight distances were calculated applying thePythagorean Theorem between pairs of farms. Secondly,seaway or commercial distances that represent the ratio-nal route between a pair of farms were calculated by theusing the cost distance tool included at the Spatial AnalystTools (ESRI Inc., Redlands, CA, USA).
Rfi was computed for each farm i as the sum of infectedfarms for which infection was attributed to that partic-ular farm i. The estimated duration of infectiousness forpotential source farms was assumed to be the median Df.The mean Rf was obtained by averaging all Rfi through-out the ISAV epidemic. Finally, the spatial distribution ofRfis was characterized by Moran’s autocorrelation statis-tic, and if statistically significant (P < 0.05), local analysesfor clusters were explored using Anselin’s local indicatorof spatial autocorrelation (LISA) statistic (Anselin, 1995).This technique identifies clusters of features with similarvalues (e.g., high Rfi) by comparing the values of each farmand its neighbors with the population mean. Since the focusof this paper was to identify local variation, a neighbor-hood based on adjacent features with a row-standardizedweighting process to obtain equal weights based on thenumber of neighbors surrounding the target farm waschosen (Mitchell, 2005). Those farms with a statisticallysignificantly larger value of Rfi, as indicated by the resultsof the LISA statistic, were referred to as ‘superspreaders’,i.e., capable of transmitting ISAV to susceptible farms ata rate that exceeds the transmission rate for a substantialfraction of all those infected farms. Distance estimates andspatial analyses were performed using ArcGIS 9.3 and theextension Spatial Statistics Tools (ESRI Inc., Redlands, CA,USA).
3. Results
3.1. ISAV epidemic in the 10th and 11th regions
ISAV was reported in 152/277 (54.9%) farms in the 10thregion, affecting 4/80 (5.0%) of trout farms and 148/197(75.1%) of Atlantic salmon farms. In general, the movingaverage curves in both regions were characterized by three
periods: (1) initial spread, (2) growth, and (3) stasis (Fig. 2).In the 10th region, initial spread was abrupt and peaked 13weeks after the IC10 and included 20 cases. The epidemicgrowth and stasis phases lasted about 1 year each.
F.O. Mardones et al. / Preventive Veterinary Medicine 102 (2011) 175– 184 179
F epidemic phases (separated by a vertical line) of ISAV from June 2007 to 2009 int
f(wisfdsr
3
3
1wrawot(amr
safritt
Fig. 3. Frequency distribution for the weekly duration of the farm-level infectiousness (Df), from ISAV infected farms at the 10th (mean20.6, median 15.1, interquartile range 9.3–25.4) and 11th (mean 17.4,
ig. 2. Four-week moving average of ISAV outbreaks and corresponding
he 10th and 11th regions of Chile.
In the 11th region, ISAV was reported in 91/202 (45.0%)arms, affecting 1/48 (2.1%) of trout farms and 90/15458.4%) of Atlantic salmon farms. The epidemic started 24eeks after the IC10 and 250 km south from the nearest
nfected farm in the 10th region. Initial spread was con-iderably longer (5–6 months) and included substantiallyewer cases (n = 4) compared with the 10th region. Epi-emic growth was shorter than in the 10th region, and thetasis period was of about the same duration as in the 10thegion.
.2. Phase-specific estimation of Rtf
.2.1. Initial growth rateMedian farm-level infectious duration (Df) ranged from
5 to 17 weeks (11th and 10th region, respectively), andas not statistically significantly different between study
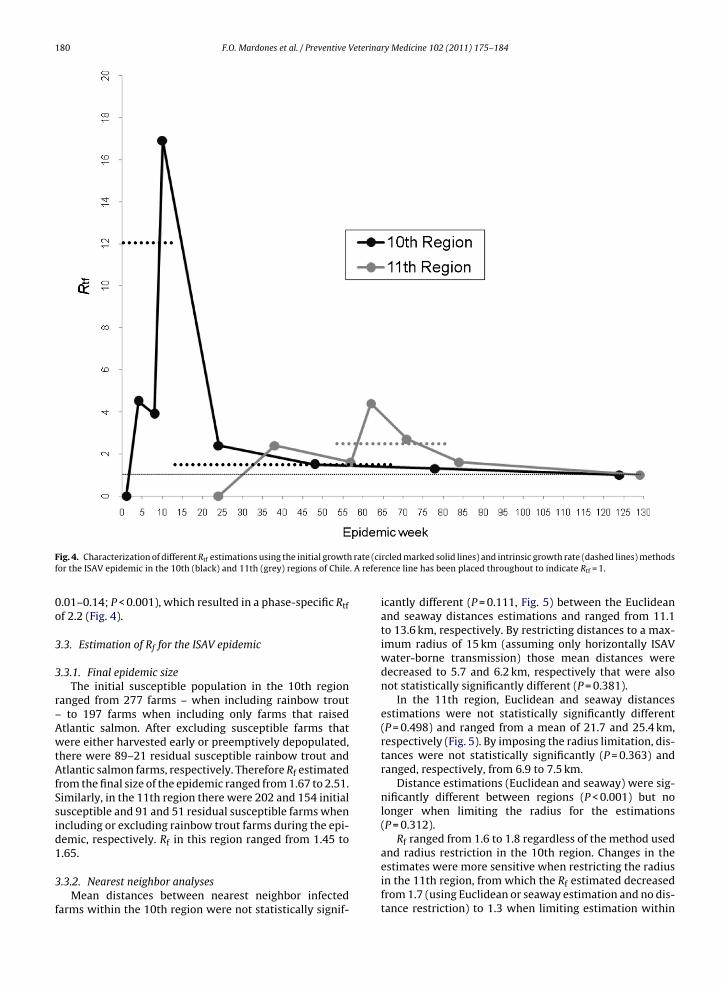
egions (P = 0.251, Fig. 3). In the 10th region, Rtf was 4.5nd 3.9 at epidemic weeks 4 and 8, when two and four casesere reported, respectively (Fig. 4). Rtf reached a maximum
f 16.9 (10 weeks after IC10) by the 8th case and declinedo 2.4, 1.5 and 1.3 by the 16th (24 weeks after IC10), 32nd48 weeks after IC10) and 64th reported cases (78 weeksfter IC10), respectively, after which it could not be esti-ated (Fig. 4). Mean and median td was 91 and 66 days,
espectively.For the initial spread of ISAV in the 11th region, the
econd case was reported about 15 weeks after IC11 withn estimated Rtf of 2.4. Rtf was 1.6 and 4.4 between theourth and eighth cases, 8 and 9 months after the IC11,
espectively, and declined to 2.7 and 1.6 for the follow-ng 16th and 32nd reported cases 11 and 14 months afterhe IC11. Mean and median td was 84 and 92 days, respec-ively.median 16.6, interquartile range 9.3–23.3) regions, respectively, of Chile(P = 0.251).
3.2.2. Intrinsic growth rateIntrinsic growth rates were estimated to be 0.413 (95%
CI 0.24–0.59; P < 0.001), for the initial spread phase, and0.068 (95% CI 0.05–0.09; P < 0.001) for the epidemic growthphase in the 10th region, and consequently, estimates of Rtfof 12 and 1.4, respectively (Fig. 4).
In the 11th region, the slope of the initial spread wasclose to 0. Therefore the intrinsic growth rate was onlyestimated for the epidemic growth phase as 0.12 (95% CI
180 F.O. Mardones et al. / Preventive Veterinary Medicine 102 (2011) 175– 184
rate (ci. A refer
Fig. 4. Characterization of different Rtf estimations using the initial growthfor the ISAV epidemic in the 10th (black) and 11th (grey) regions of Chile
0.01–0.14; P < 0.001), which resulted in a phase-specific Rtfof 2.2 (Fig. 4).
3.3. Estimation of Rf for the ISAV epidemic
3.3.1. Final epidemic sizeThe initial susceptible population in the 10th region
ranged from 277 farms – when including rainbow trout– to 197 farms when including only farms that raisedAtlantic salmon. After excluding susceptible farms thatwere either harvested early or preemptively depopulated,there were 89–21 residual susceptible rainbow trout andAtlantic salmon farms, respectively. Therefore Rf estimatedfrom the final size of the epidemic ranged from 1.67 to 2.51.Similarly, in the 11th region there were 202 and 154 initialsusceptible and 91 and 51 residual susceptible farms whenincluding or excluding rainbow trout farms during the epi-demic, respectively. Rf in this region ranged from 1.45 to1.65.
3.3.2. Nearest neighbor analysesMean distances between nearest neighbor infected
farms within the 10th region were not statistically signif-
rcled marked solid lines) and intrinsic growth rate (dashed lines) methodsence line has been placed throughout to indicate Rtf = 1.
icantly different (P = 0.111, Fig. 5) between the Euclideanand seaway distances estimations and ranged from 11.1to 13.6 km, respectively. By restricting distances to a max-imum radius of 15 km (assuming only horizontally ISAVwater-borne transmission) those mean distances weredecreased to 5.7 and 6.2 km, respectively that were alsonot statistically significantly different (P = 0.381).
In the 11th region, Euclidean and seaway distancesestimations were not statistically significantly different(P = 0.498) and ranged from a mean of 21.7 and 25.4 km,respectively (Fig. 5). By imposing the radius limitation, dis-tances were not statistically significantly (P = 0.363) andranged, respectively, from 6.9 to 7.5 km.
Distance estimations (Euclidean and seaway) were sig-nificantly different between regions (P < 0.001) but nolonger when limiting the radius for the estimations(P = 0.312).
Rf ranged from 1.6 to 1.8 regardless of the method usedand radius restriction in the 10th region. Changes in the
estimates were more sensitive when restricting the radiusin the 11th region, from which the Rf estimated decreasedfrom 1.7 (using Euclidean or seaway estimation and no dis-tance restriction) to 1.3 when limiting estimation within
F.O. Mardones et al. / Preventive Veterina
Fig. 5. Summary of distance estimations between pairs of nearest infectedfarms for the 10th and 11th regions of Chile during the epidemic of ISAVfrom June 2007 to 2009. The box contains the middle 50% of the data, andthe thick line inside indicates the median value. The upper and lower edge(hinge) of the box indicates the 75th and 25th percentile of the data set,respectively. The ends of the vertical lines (“whiskers”) indicate the 95thand 5th percentiles, and dots indicate remaining outliers of the data.
Fig. 6. Frequency distribution (%) for the estimated reproduction numberat individual farm-level (Rfi) using seaway and Euclidean distance esti-mations at the 10th (n = 148) and 11th (n = 90) regions during the ISAVepidemic from June 2007 to 2009 in Chile. There were no statistically sig-nae
1tct
P
transmission of ISAV.
ificant differences for the estimated Rfs either within region (P > 0.775)nd when comparing seaway (P = 0.085) and Euclidean (P = 0.105) distancestimations between regions.
5 km. There were no statistically significant differences forhe estimated Rfs either within region (P > 0.775) and whenomparing seaway (P = 0.085) and Euclidean (P = 0.105) dis-
ance estimations between regions (Fig. 6).A statistically significant global Moran’s I index (I = 0.12, < 0.001) was detected when estimations were carried
ry Medicine 102 (2011) 175– 184 181
out using seaway distances in the 10th region, indicatinga significant spatial dependency between infected farms.Further analysis using the local indicators for spatial asso-ciation identified 7 farms in the 10th region that werestatistically significantly (0.048 < P < 0.001) clustered withhigh Rf values (average Rf = 3R̄fi, Fig. 7). Of those farms,three experienced ISA close in time during the initial spreadphase and four experienced ISA in close in time during theepidemic growth phase.
4. Discussion
Distinct patterns of ISAV spread between salmon farmswere identified for two regions in Chile. By using differ-ent approaches to estimate the farm-level reproductionnumber, key epidemiological parameters of the ISAV epi-demic were characterized. These include the size, duration,dynamics and spatial and temporal patterns of the ISAV epi-demics in those regions. Results were robust to changes inthe methodologies applied for the computations, suggest-ing that the mean value of Rf for the ISAV epidemic in Chileranged from 1.3 to 1.9. However, estimates for the 10thregion were usually larger in magnitude than estimatesobtained for the 11th region.
Considering all methods used, we found the nearestneighbor analysis superior because it is able to capturethe spatial heterogeneities for the ISAV spread, thus allow-ing the identification of superspreaders. Conversely, theestimation using the final epidemic size tended to overes-timate Rf compared to other methods because it does notcapture demographic changes – such as earlier harvest orpreemptive culling of ISAV-non-infected farms, which maybe at a higher risk of infection – that occurred during theepidemic. This approach might be useful if the ISAV epi-demic was shorter than the nearly two years observed here,because it is likely that such demographic changes wouldhave a smaller effect on the estimate of Rf.
Patterns of cases were different during the early stagesof the epidemic in the two regions. In general, the mag-nitude of Rf in the 10th region was almost double that ofthe 11th region. In addition, mean distances of secondarycases from the first case were substantially less for the 10thregion compared to the 11th region. These findings suggesttwo distinct regional-specific modes of transmission at thebeginning of the epidemic. In the 10th region, many farmswere infected in a relative short period of time, implyingthat initial spread in this region may have been facilitatedby three major factors: (1) the IC and mostly immediatesecondary cases corresponded to the same owner com-pany; in addition, 5 of the 7 superspreaders were identifiedby the nearest neighbor and spatial analyses (Table 1); (2)network characteristics of the 10th region were consider-ably more aggregated compared to the 11th region, witha large proportion of potential high risk points (processingplants, harvest stations, harbors, major and minor ports);and (3) distances between farms were significantly shorterwithin the 10th region, which was conducive for passive
Initial disease spread in the 11th region was slowerand of smaller magnitude compared to the 10th region.In the 11th region, the epidemic growth phase was the

182 F.O. Mardones et al. / Preventive Veterinary Medicine 102 (2011) 175– 184
Fig. 7. Distribution of ISAV susceptible farms (green circles) in the 10th region of Chile. Red circles indicate farms with statistically significantly(0.048 < P < 0.001) high Moran’s I values that defined clusters of farms with high values of Rfi (Table 1). Numbers indicate the week of ISAV infection.A buffer zone (salmon color) restricted to a maximum of 15 km was created around the ‘superspreaders’ (average Rfi of 3) during the epidemic in Chile inorder to represent the magnitude of the potential water-borne ISAV spread. Clustering at this level was only significant at the 10th region of Chile and onlyby using seaway distances. (For interpretation of the references to color in this figure legend, the reader is referred to the web version of the article.)
Table 1Characterization of ‘superspreaders’ identified during the ISAV epidemic in Chile by using seaway distances as an approach to identify the nearest infectedneighbor to estimate Rf .
Farm ID Company Date ISAV positivity ISAV epidemic period Nearest neighborestimated Rfi
Mean seawaydistance (km)
Slr01 A 15 June 2007 Initial spread 6 22.2Slr21 A 7 August 2007 Initial spread 3 10.3Slr25 A 21 August 2007 Initial spread 4 5.7Slr35 A 28 November 2007 Growth 2 3.8Slr55 A 7 December 2007 Growth 2 3.5Slr75 B 18 June 2008 Growth 2 4.8Slr98 C 6 August 2008 Growth 2 5.8

eterina
mftawlaIaw
tteoeaRdsig“u(mtiaiotiiih
tabrlsiiotItrifCwttTtsft
F.O. Mardones et al. / Preventive V
ost important phase in terms of the influence on Rtfor the entire ISAV epidemic. Possible explanations arehat the 11th region experienced the first case of ISAVbout 6 months after the initial case in the 10th region,hen quarantine and other control measures were estab-
ished, and veterinarians and laboratory techniques werelso prepared for new incursions. Consequently, althoughSAV spread throughout the 11th region, its initial spreadnd final epidemic size were much smaller compared withhat was reported in the 10th region.
Nearest neighbor and spatial analyses led to the iden-ification of superspreaders, defined as infected farmsransmitting ISAV to susceptible farms at a rate thatxceeds the transmission rate for a substantial fractionf all those infected (Woolhouse et al., 2005; Matthewst al., 2006). Although infectiousness heterogeneity is often
feature of disease spread within populations (Garske andhodes, 2008), identification of superspreaders is oftenifficult (Galvani and May, 2005). The impact of super-preader farms was evident during the initial spread phasen the ISAV epidemic, because as few as 3 farms may haveenerated 13 out of 21 cases (62%), consistent with the20/80 rule” i.e., about 20% of the most infectious individ-als are responsible for 80% of the disease transmissionsWoolhouse et al., 1997). If the nearest infected neighbor
ethod used here approximates the true Rf, by assuminghat horizontal transmission was the main source of ISAVnfection this finding has important practical implicationsnd consequences for the design and implementation ofntervention strategies. For example, by early identificationf superspreaders it may be possible to greatly improvehe efficiency of control efforts by focusing on the mostnfectious (targeted farm control) rather than random farmntervention (Lloyd-Smith et al., 2005). Consequently, theres a need for identifying risk factors associated with theseighly infectious farms.
Results reported here may have been biased by cer-ain assumptions. First, for most of approaches used wessumed that the salmon population was fully suscepti-le to ISAV at the beginning of the epidemic. It has beeneported recently that the common ancestor of the preva-ent Chilean strains of ISAV originated from Norwegiantrains and that these ISAV strains may have been circulat-ng in Chile for the last 10 years (Cottet et al., 2010). Thus,t is unknown whether immunological memory (presencef residual antibodies after exposure) was present at theime of the epidemic and whether it was effective againstSAV. However, the large proportion of farms infected overhe epidemic is consistent with the hypothesis of lack ofesidual immunity. Moreover, ISAV was not detected dur-ng active surveillance activities (sampling and testing fishrom salt water) carried out since 2004 for all farms inhile. This supports our assumption that salmon farmsere susceptible to ISAV infection. We also assumed that
he population was ‘closed’ throughout the epidemic i.e.,hat there were no new introductions or new fish stocking.he data available for this study did not include informa-
ion about the production and commercial aspects of mostalmon farms. However, it seems counter-intuitive thatarmers would stock fish in affected regions in the face ofhe epidemic. On the contrary, if there were new intro-ry Medicine 102 (2011) 175– 184 183
ductions, it is likely that they would have taken place atthe beginning of the epidemic, which may have led to anunderestimation of Rf.
Mean distances in the 10th region were consistent withthe size of the spatio-temporal clusters (mean = 15 km)identified in a previous study that explored the first yearof the ISAV epidemic in Chile (Mardones et al., 2009) andapproximately half of the mean distances (25.4 km) esti-mated for the 11th region. These results suggest that futurecontrol strategies at a 10–15 km control zone might bemore appropriate than the 5 km control zone currently rec-ommended by the OIE and applied in Chile.
In this paper, relatively simple methods and modelswere used to analyze epidemic data obtained from surveil-lance activities to better understand infection dynamics ofthe largest epidemic of ISAV ever reported. Results can beused in the formulation of epidemiological models to pre-dict disease spread and evaluate alternative control andintervention strategies that could be used during futureepidemics.
Acknowledgments
FOM and PVD were supported by the Becas-Chileprogram of the National Commission for Scientific andTechnological Research (CONICYT). Additional funding wasprovided by the project INNOVA-CHILE 09MCSS-7393through the Fisheries Development Institute (IFOP), andthe UC Davis Graduate Group in Epidemiology block grantfellowship. We thank numerous representatives of thesalmon industry who provided data, and Dr. Laurel Beck-ett, Dr. Loreto Godoy and Dr. Ron Hedrick from UC Davisand Dr. Francisco J. Zagmutt from EpiX Analytics for theirinsightful suggestions. No other conflicts of interest exist.
References
Anderson, R.M., Medley, G.F., May, R.M., Johnson, A.M., 1986. A preliminarystudy of the transmission dynamics of the human immunodeficiencyvirus (HIV), the causative agent of AIDS. IMA J. Math. Appl. Med. Biol.3, 229–263.
Anonymous, 2002. Salmon Virus Detected in Clew Bay Fish Farm. The IrishTimes, Dublin.
Anselin, L., 1995. Local indicators of spatial association – LISA. Geogr. Anal.27, 93–115.
Asche, F., Hansen, H., Tveteras, R., Tveteras, S., 2009. The salmon diseasecrisis in Chile. Mar. Resour. Econ. 24, 405–411.
Cottet, L., Cortez-San Martin, M., Tello, M., Olivares, E., Rivas-Aravena, A.,Vallejos, E., Sandino, A.M., Spencer, E., 2010. Bioinformatic analysisof the genome of infectious salmon anemia viruses associated withoutbreaks of high mortality in Chile. J. Virol. 84, 11916–11928.
Dieckmann, O., Heesterbeek, J.A.P., 2000. Mathematical Epidemiologyof Infectious Diseases: Model Building, Analysis and Interpretation.Wiley, Hoboken, NJ.
FIS, 2010. Salmon Industry Lost USD 2,000 Million Due to ISA Virus.Fish Information & Services, Tokyo, Japan, http://www.fis.com/fis/worldnews/worldnews.asp?l=e&id=39160&ndb=1.
Galvani, A.P., May, R.M., 2005. Epidemiology: dimensions of superspread-ing. Nature 438, 293–295.
Garske, T., Rhodes, C.J., 2008. The effect of superspreading on epidemicoutbreak size distributions. J. Theor. Biol. 253, 228–237.
Godoy, M.G., Aedo, A., Kibenge, M.J., Groman, D.B., Yason, C.V., Grothusen,
H., Lisperguer, A., Calbucura, M., Avendano, F., Imilan, M., Jarpa, M.,Kibenge, F.S., 2008. First detection, isolation and molecular charac-terization of infectious salmon anaemia virus associated with clinicaldisease in farmed Atlantic salmon (Salmo salar) in Chile. BMC Vet. Res.4, 28.
eterina
184 F.O. Mardones et al. / Preventive VGustafson, L., Ellis, S., Robinson, T., Marenghi, F., Merrill, P., Hawkins, L.,Giray, C., Wagner, B., 2007a. Spatial and non-spatial risk factors asso-ciated with cage-level distribution of infectious salmon anaemia atthree Atlantic salmon, Salmo salar L., farms in Maine, USA. J. Fish Dis.30, 101–109.
Gustafson, L.L., Ellis, S.K., Beattie, M.J., Chang, B.D., Dickey, D.A., Robinson,T.L., Marenghi, F.P., Moffett, P.J., Page, F.H., 2007b. Hydrograph-ics and the timing of infectious salmon anemia outbreaks amongAtlantic salmon (Salmo salar L.) farms in the Quoddy region ofMaine, USA and New Brunswick, Canada. Prev. Vet. Med. 78,35–56.
Jarp, J., Karlsen, E., 1997. Infectious salmon anaemia (ISA) risk factorsin sea-cultured Atlantic salmon Salmo salar L. Dis. Aquat. Organ. 28,79–86.
Kibenge, F.S., Garate, O.N., Johnson, G., Arriagada, R., Kibenge, M.J., Wad-owska, D., 2001. Isolation and identification of infectious salmonanaemia virus (ISAV) from Coho salmon in Chile. Dis. Aquat. Organ.45, 9–18.
Lloyd-Smith, J.O., Schreiber, S.J., Kopp, P.E., Getz, W.M., 2005. Superspread-ing and the effect of individual variation on disease emergence. Nature438, 355–359.
Lyngstad, T.M., Jansen, P.A., Sindre, H., Jonassen, C.M., Hjortaas, M.J.,Johnsen, S., Brun, E., 2008. Epidemiological investigation of infectioussalmon anaemia (ISA) outbreaks in Norway 2003–2005. Prev. Vet.Med. 84, 213–227.
Mardones, F.O., Perez, A.M., Carpenter, T.E., 2009. Epidemiologic investi-gation of the re-emergence of infectious salmon anemia virus in Chile.Dis. Aquat. Organ. 84, 105–114.
Martin, S.W., Meek, A.H., Willeberg, P., 1987. Veterinary Epidemiology:Principles and Methods. Iowa State University Press, Ames.
Matthews, L., Low, J.C., Gally, D.L., Pearce, M.C., Mellor, D.J., Heesterbeek,J.A., Chase-Topping, M., Naylor, S.W., Shaw, D.J., Reid, S.W., Gunn, G.J.,Woolhouse, M.E., 2006. Heterogeneous shedding of Escherichia coli
ry Medicine 102 (2011) 175– 184
O157 in cattle and its implications for control. Proc. Natl. Acad. Sci.U.S.A. 103, 547–552.
McClure, C.A., Hammell, K.L., Dohoo, I.R., 2005. Risk factors for outbreaksof infectious salmon anemia in farmed Atlantic salmon, Salmo salar.Prev. Vet. Med. 72, 263–280.
Mitchell, A., 2005. The ESRI gGuide to GIS Analysis. Volume 2, SpatialMeasurements & Statistics. ESRI Press, Redlands (CA).
Murray, A.G., Munro, L.A., Wallace, I.S., Berx, B., Pendrey, D., Fraser,D.I., Raynard, R., 2010. Epidemiological investigation into the re-emergence and control of an outbreak of infectious salmon anaemiain the Shetland Islands, Scotland. Dis. Aquat. Organ. 91, 189–200.
OIE, 2009. Diagnostic Manual for Aquatic Animal Diseases (Chap-ter 2.3.5.: Infectious Salmon Anaemia). World Organization forAnimal Health (OIE), Paris, France, http://www.oie.int/fileadmin/Home/eng/Health standards/aahm/2009/2.3.05 ISA%20.pdf.
Plarre, H., Devold, M., Snow, M., Nylund, A., 2005. Prevalence of infectioussalmon anaemia virus (ISAV) in wild salmonids in western Norway.Dis. Aquat. Organ. 66, 71–79.
Pybus, O.G., Charleston, M.A., Gupta, S., Rambaut, A., Holmes, E.C., Harvey,P.H., 2001. The epidemic behavior of the hepatitis C virus. Science 292,2323–2325.
Raynard, R.S., Murray, A.G., Gregory, A., 2001. Infectious salmon anaemiavirus in wild fish from Scotland. Dis. Aquat. Organ. 46, 93–100.
Smith, C.E., 1964. Factors in the transmission of virus infections from ani-mals to man. Sci. Basis Med. Annu. Rev., 125–150.
Woolhouse, M.E., Dye, C., Etard, J.F., Smith, T., Charlwood, J.D., Garnett, G.P.,Hagan, P., Hii, J.L., Ndhlovu, P.D., Quinnell, R.J., Watts, C.H., Chandi-wana, S.K., Anderson, R.M., 1997. Heterogeneities in the transmission
of infectious agents: implications for the design of control programs.Proc. Natl. Acad. Sci. U.S.A. 94, 338–342.Woolhouse, M.E., Shaw, D.J., Matthews, L., Liu, W.C., Mellor, D.J., Thomas,M.R., 2005. Epidemiological implications of the contact network struc-ture for cattle farms and the 20–80 rule. Biol. Lett. 1, 350–352.