fluid phase equilibria 345 (2013) 68–80 contents lists available at sciverse sciencedirect fluid...
TRANSCRIPT

Aa
WJa
Ib
E
a
ARRAA
KITARF
1
ipHvoas(iSevtop
vR
0h
Fluid Phase Equilibria 345 (2013) 68–80
Contents lists available at SciVerse ScienceDirect
Fluid Phase Equilibria
journa l h o me page: www.elsev ier .com/ locate / f lu id
ctivity model and consistent thermodynamic features for acetic acid–isoamyllcohol–isoamyl acetate–water reactive system
ilmar Osorio-Vianaa, Miguel Duque-Bernala, Jesús David Quintero-Ariasa, Izabela Dobrosz-Gómezb,avier Fontalvoa, Miguel Ángel Gómez-Garcíaa,∗
Grupo de Investigación en Aplicación de Nuevas Tecnologías, Laboratorio de Intensificación de Procesos y Sistemas Híbridos, Departamento de Ingeniería Química, Facultad dengeniería y Arquitectura, Universidad Nacional de Colombia Sede Manizales, Campus Palogrande, Cra 27 64-60, Apartado Aéreo 127, Manizales, Caldas, ColombiaGrupo de Investigación en Aplicación de Nuevas Tecnologías, Laboratorio de Intensificación de Procesos y Sistemas Híbridos, Departamento de Física y Química, Facultad de Cienciasxactas y Naturales, Universidad Nacional de Colombia Sede Manizales, Campus Palogrande, Cra 27 64-60, Apartado Aéreo 127, Manizales, Caldas, Colombia
r t i c l e i n f o
rticle history:eceived 6 September 2012eceived in revised form 30 January 2013ccepted 1 February 2013vailable online 20 February 2013
a b s t r a c t
A new set of parameters for NRTL activity coefficient model was correlated, for the quaternary mix-ture acetic acid/isoamyl alcohol/isoamyl acetate/water based on the experimental vapor–liquid andliquid–liquid equilibrium data. A complete and consistent thermodynamic topological characterizationof the non-reactive and reactive mixtures was proposed, checking if the consistency equations of theresidue curve maps are satisfied. The structure of the residue curve maps for the non-reactive quater-
eywords:soamyl acetateopological thermodynamicsctivity modelesidue curve map
nary mixture presents three binary azeotropes and one ternary azeotrope. No reactive azeotropes werefound for the reactive mixture. The new set of NRTL activity model parameters presented better pre-dictive capabilities for liquid–liquid and vapor–liquid phase equilibria than current available models. Asuccessful liquid–liquid equilibrium phase stability test was also performed using the adjusted model.The results can be used to achieve conceptual design and simulation of conventional and intensified
e isoa
usel oil chemical processes for th. Introduction
Recently esterification reactions have attracted a lot of interestn the connection with the development of new synthetic routes toroduce fuels and chemicals based on renewable feedstocks [1–4].owever, the esterification of acetic acid with isoamyl alcohol, aalue added product which can be obtained from fusel oil (a residuef the bioethanol industry) has been rarely studied [5,6]. As fars we know, three studies related to the thermodynamics of thisystem are available in the open literature [7–9], but a completetheoretical and experimental) topological description is still lack-ng: e.g., its fixed points, azeotropes and partial miscibility region.ets of parameters for different activity models, correlated based onxperimental Vapor–Liquid equilibrium (VLE) data, has been pre-iously presented by Lee and Lin [7]. Nevertheless, neither none of
his sets has been used to calculate the complete phase diagramf the quaternary system nor checked for topological consistentredictions of its phase diagrams. It requires the development ofAbbreviations: NRTL, non random two liquid; HOC, Hayden–O’Connell; VLE,apor–liquid equilibrium; LLE, liquid–liquid equilibrium; RCM, residue curve map;-RCM, reactive residue curve map.∗ Corresponding author. Tel.: +57 6 8879300x50210; fax: +57 6 8879300x50129.
E-mail address: [email protected] (M.Á. Gómez-García).
378-3812/$ – see front matter © 2013 Elsevier B.V. All rights reserved.ttp://dx.doi.org/10.1016/j.fluid.2013.02.006
myl acetate production.© 2013 Elsevier B.V. All rights reserved.
a systematic study of the phase diagrams structure and topologyfor this mixture, considering that a reliable thermodynamic modelmust include: (i) phase equilibrium and (ii) chemical equilibrium.
For the first requirement, it is impossible to make a preciseand reliable calculation of phase diagrams if a successful phasestability analysis is not conducted for the predicted phases, a nec-essary condition to validate a proposed phase diagram [10–14].Special methods and techniques have been proposed to performa phase stability test, based on the tangent plane distance func-tion criteria [11]. Generally, once the phase diagram with verifiedphase stability has been calculated, its geometrical structure mustbe subject to a topological consistency evaluation. It verifies if thetype and number of located fixed points are in agreement withappropriate algebraic relations (independent of thermodynamicmodels and numerical methods used), established from mathemat-ical properties of the fundamental models that describe the mixtureGibbs free energy hyper surface [15,16]. To our knowledge, thereare not available reports in the open literature over the completethermodynamic and topological features of the acetic acid/isoamylalcohol/isoamyl acetate/water mixture.
For the second requirement, special topological constrains for
reactive mixtures can be used for fixed point characterization. Areliable study must include the existence of independent reversibleor irreversible chemical reactions [17,18]. In fact, chemical reac-tion reduces the system degrees of freedom (Gibbs phase rule)
W. Osorio-Viana et al. / Fluid Phase
Nomenclature
SymbolsN number of stable or unstable nodesS number of saddle pointsa activityKeq reaction equilibrium constanta NRTL adjustable parameterb NRTL adjustable parameter (K)c NRTL adjustable parameterd NRTL adjustable parameter (K−1)e NRTL adjustable parameterf NRTL adjustable parameter (K−1)G NRTL excess Gibbs energy (J/mol)˛ NRTL non-randomness parameter� NRTL binary interaction parameterT temperature (K)P pressure (mbar)x liquid phase molar fraction (mol/mol)y vapor phase molar fraction (mol/mol)x liquid phase transformed molar fractiony vapor phase transformed molar fraction� stoichiometric coefficient in chemical reaction
equationı algebraic sum of stoichiometric coefficients� activity coefficient� deviation (%)
Superscripts+ positive index for node− negative index for nodei componentj componente estimated valuem measured value
Subscriptsk number of components/componenti data pointk reference component for transformed molar com-
positions (isoamyl acetate)I liquid phase in equilibrium with phase IIII liquid phase in equilibrium with phase IE isoamyl acetateW waterHAc acetic acidOH isoamyl alcoholMAX maximaMIN minima
ltvwha
tcaFor
sion of the two liquid phase zone. In turn, NRTL model predicts a
SAD saddle
eading to the significant changes in the topological structure ofhe system [15,19–22]. In this context, typical phase diagrams likeapor–liquid and vapor–liquid–liquid equilibria are supplementedith residue curve maps (RCM) for identification, localization ofomogeneous and heterogeneous (reactive) azeotropes [16,23,24]nd design of distillation and reactive distillation systems [25–28].
In this work, a conceptual RCM is used as a reliable toolo validate an activity model that predicts a complete andonsistent thermodynamic behavior for the acetic acid/isoamyllcohol/isoamyl acetate/water reactive mixture at 101,325 kPa.
irst, a conceptual analysis for the most likely topological structuref its RCMs is presented, followed by parameter estimation for nonandom two liquid (NRTL) activity model (by means of available andEquilibria 345 (2013) 68–80 69
new experimental phase equilibrium data) that is able to predictconsistently the established topological structure. The developedmodel is validated against experimental data and its ability to pre-dict likely phase diagrams, which in turn are verified with phasestability test.
2. Thermodynamic information background
The acetic acid/isoamyl alcohol/isoamyl acetate/water quater-nary system is a reactive mixture. It can be divided into fourternary and six binary subsystems (Table 1). Physico-chemical evi-dence has shown that these subsystems have significant deviationsfrom ideality in the liquid and vapor phases [29]. Additionally,they are characterized with the presence of both homogeneousand heterogeneous azeotropes. Also, the esterification reactionunder study is reversible and limited by chemical equilibrium [9].Table 1 presents the available information over the azeotropes forthe acetic acid/isoamyl alcohol/isoamyl acetate/water quaternarysystem. Four binary azeotropes (isoamyl acetate/water, isoamylalcohol/water, isoamyl alcohol/isoamyl acetate, acetic acid/isoamylalcohol), two ternary azeotropes for the mixture isoamyl alco-hol/isoamyl acetate/water have been reported [8,30] and a ternaryazeotrope for isoamyl acetate/isoamyl alcohol/acetic acid mixture[58]. In fact, experimental data published for these mixtures arescarce. Phia et al. [32] measured amyl alcohol/acetic acid/waterliquid–liquid equilibrium at 20 ◦C using a mixture of 18 wt.% ofn-amyl alcohol and 82 wt.% of isoamyl alcohol. According to Leeand Lin [7], who measured quaternary mixture vapor–liquid equi-librium (VLE) at 1 atm, there is no experimental evidence of thepresence of quaternary or reactive azeotropes for this system. How-ever, Saha et al. [8] reported the existence of a quaternary reactiveazeotrope at high water concentrations, measuring the residuecurves of the mixture. Neither Lee and Lin [7] nor Saha et al. [8]reported the presence of two liquid phases, which are known totake place at high water concentrations. There is more informa-tion about acetic acid/water VLE, which is zeotropic at atmosphericpressure and completely miscible [29,33]. Only Wyczesany [9]presents a correlation, as a function of temperature, for the equi-librium constant of the acetic acid–isoamyl alcohol esterificationreaction, obtained based on the VLE experimental data of Lee andLin [7]. He concluded that this esterification is limited by the chem-ical equilibrium and is characterized with a low heat of reaction (inthe range −20 to 20 kJ/mol) [35], almost independent of tempera-ture. This conclusion is supported by the study of esterifications ofacetic acid with C1–C5 alcohols [9] and kinetic experiments madeby Teo and Saha [34] and Duque-Bernal et al. [35].
The currently available activity models for the aceticacid/isoamyl alcohol/isoamyl acetate/water quaternary sys-tem are: UNIFAC, UNIFAC Dortmund (group contribution genericmodels) and NRTL model [37], NRTL and UNIQUAC (models withspecific parameters reported by Lee and Lin [7] which werecorrelated using his own VLE experimental data). Lee and Lin [7]and Wyczesany [9] concluded that Hayden and O’Connell [36]equation of state for mixtures with association is appropriate forthe acetic acid/isoamyl alcohol/isoamyl acetate/water mixture.
To illustrate the discrepancies between predictions of thoseactivity models, available liquid–liquid phase envelope experimen-tal data are compared with predictive results of UNIFAC Dortmund,NRTL and UNIQUAC models using ASPEN Plus® (Fig. 1). The testedmodels predict two liquid phases for three ternary subsystems.UNIFAC, a completely predictive model, underestimates the exten-
smaller immiscibility zone for the ternary equilibrium of isoamylalcohol/acetic acid/water than that of experimental data and abigger immiscibility zone for the ternary equilibrium of isoamyl

70 W. Osorio-Viana et al. / Fluid Phase Equilibria 345 (2013) 68–80
Table 1Available azeotropic information for acetic acid/isoamyl alcohol/isoamyl acetate/water mixtures at 1 atm [8,30,31,58].
Azeotropes Temperature (◦C) Concentration (% molar)
Water–acetic acid [30,31] Zeotropic ZeotropicAcetic acid–isoamyl acetate [30] Zeotropic ZeotropicIsoamyl acetate–water [30] 93.8 80.46% waterb
Isoamyl alcohol–water [30,31] 95.15 82.81% waterb
Isoamyl acetate–isoamyl alcohol [30] 130.8 0.88% acetatec
Isoamyl alcohol–acetic acid [8,30] 133 21.85% acidIsoamyl acetate–isoamyl alcohol–water 93.6 [30] 82.21% water; 6.09% acetateb
132 [8] 15.11% water; 31.37% acetateIsoamyl acetate–acetic acid–water Xa XIsoamyl alcohol–acetic acid–water X XIsoamyl acetate–isoamyl alcohol–acetic acid 132 [58] 22.6% acid, 55.6% alcoholIsoamyl alcohol–acetic acid–isoamyl acetate–water [8] 95 97.33% water; 2.03% alcohol, 0.33% acidd
Pure substances (normal boiling point) [30]Isoamyl alcohol 132.05Acetic acid 118.0Isoamyl acetate 142.0Water 100.0
a No information available.
aaoqt
FEL
b Heterogeneous azeotrope.c Homogeneous azeotrope.d Reactive azeotrope.
cetate/acetic acid/water than that of UNIFAC predictions. Visu-
lly, UNIQUAC model generates the closest prediction to the dataf Piha et al. [32]. In summary, these activity models can representualitatively but not quantitatively the mixture liquid phase split-ing. A report of predicted azeotropes for the acetic acid/isoamylig. 1. Discrepancies between prediction and experimental data of liquid–liquid phase experimental data of Phia et al. [32] (upper left: UNIQUAC; upper right: NRTL; lower leftLE.
alcohol/isoamyl acetate/water quaternary system, using the above
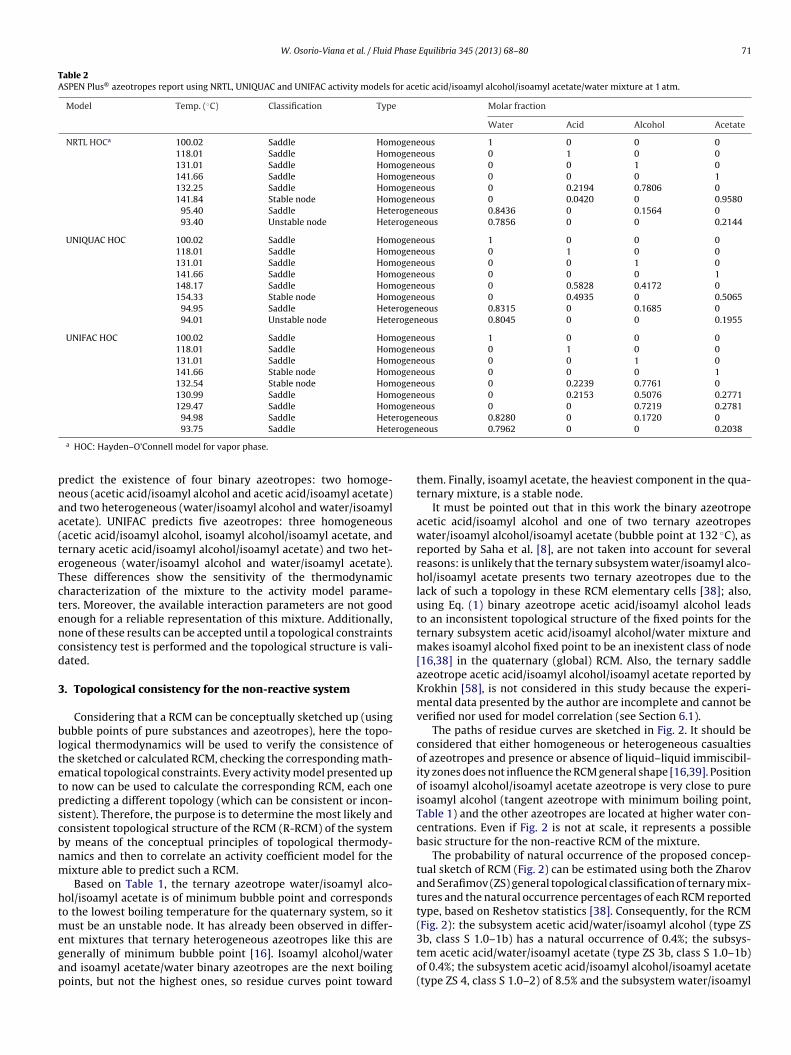
activity models and Hayden–O’Connell equation of state for vaporphase using ASPEN Plus®, is presented in Table 2. Number,composition and temperature of predicted azeotropes changes sig-nificantly for each applied activity model. NRTL and UNIQUACnvelope for the acetic acid/isoamyl alcohol/isoamyl acetate/water system at 1 atm.: UNIFAC). ©, Experimental tie line; �, Experimental cloud point; and –, simulated
W. Osorio-Viana et al. / Fluid Phase Equilibria 345 (2013) 68–80 71
Table 2ASPEN Plus® azeotropes report using NRTL, UNIQUAC and UNIFAC activity models for acetic acid/isoamyl alcohol/isoamyl acetate/water mixture at 1 atm.
Model Temp. (◦C) Classification Type Molar fraction
Water Acid Alcohol Acetate
NRTL HOCa 100.02 Saddle Homogeneous 1 0 0 0118.01 Saddle Homogeneous 0 1 0 0131.01 Saddle Homogeneous 0 0 1 0141.66 Saddle Homogeneous 0 0 0 1132.25 Saddle Homogeneous 0 0.2194 0.7806 0141.84 Stable node Homogeneous 0 0.0420 0 0.9580
95.40 Saddle Heterogeneous 0.8436 0 0.1564 093.40 Unstable node Heterogeneous 0.7856 0 0 0.2144
UNIQUAC HOC 100.02 Saddle Homogeneous 1 0 0 0118.01 Saddle Homogeneous 0 1 0 0131.01 Saddle Homogeneous 0 0 1 0141.66 Saddle Homogeneous 0 0 0 1148.17 Saddle Homogeneous 0 0.5828 0.4172 0154.33 Stable node Homogeneous 0 0.4935 0 0.5065
94.95 Saddle Heterogeneous 0.8315 0 0.1685 094.01 Unstable node Heterogeneous 0.8045 0 0 0.1955
UNIFAC HOC 100.02 Saddle Homogeneous 1 0 0 0118.01 Saddle Homogeneous 0 1 0 0131.01 Saddle Homogeneous 0 0 1 0141.66 Stable node Homogeneous 0 0 0 1132.54 Stable node Homogeneous 0 0.2239 0.7761 0130.99 Saddle Homogeneous 0 0.2153 0.5076 0.2771129.47 Saddle Homogeneous 0 0 0.7219 0.2781
94.98 Saddle Heterogeneous 0.8280 0 0.1720 0rogen
pnaa(teTctencd
3
bltetpscbnm
htmegap
93.75 Saddle Hete
a HOC: Hayden–O’Connell model for vapor phase.
redict the existence of four binary azeotropes: two homoge-eous (acetic acid/isoamyl alcohol and acetic acid/isoamyl acetate)nd two heterogeneous (water/isoamyl alcohol and water/isoamylcetate). UNIFAC predicts five azeotropes: three homogeneousacetic acid/isoamyl alcohol, isoamyl alcohol/isoamyl acetate, andernary acetic acid/isoamyl alcohol/isoamyl acetate) and two het-rogeneous (water/isoamyl alcohol and water/isoamyl acetate).hese differences show the sensitivity of the thermodynamicharacterization of the mixture to the activity model parame-ers. Moreover, the available interaction parameters are not goodnough for a reliable representation of this mixture. Additionally,one of these results can be accepted until a topological constraintsonsistency test is performed and the topological structure is vali-ated.
. Topological consistency for the non-reactive system
Considering that a RCM can be conceptually sketched up (usingubble points of pure substances and azeotropes), here the topo-
ogical thermodynamics will be used to verify the consistence ofhe sketched or calculated RCM, checking the corresponding math-matical topological constraints. Every activity model presented upo now can be used to calculate the corresponding RCM, each oneredicting a different topology (which can be consistent or incon-istent). Therefore, the purpose is to determine the most likely andonsistent topological structure of the RCM (R-RCM) of the systemy means of the conceptual principles of topological thermody-amics and then to correlate an activity coefficient model for theixture able to predict such a RCM.Based on Table 1, the ternary azeotrope water/isoamyl alco-
ol/isoamyl acetate is of minimum bubble point and correspondso the lowest boiling temperature for the quaternary system, so it
ust be an unstable node. It has already been observed in differ-
nt mixtures that ternary heterogeneous azeotropes like this areenerally of minimum bubble point [16]. Isoamyl alcohol/waternd isoamyl acetate/water binary azeotropes are the next boilingoints, but not the highest ones, so residue curves point towardeous 0.7962 0 0 0.2038
them. Finally, isoamyl acetate, the heaviest component in the qua-ternary mixture, is a stable node.
It must be pointed out that in this work the binary azeotropeacetic acid/isoamyl alcohol and one of two ternary azeotropeswater/isoamyl alcohol/isoamyl acetate (bubble point at 132 ◦C), asreported by Saha et al. [8], are not taken into account for severalreasons: is unlikely that the ternary subsystem water/isoamyl alco-hol/isoamyl acetate presents two ternary azeotropes due to thelack of such a topology in these RCM elementary cells [38]; also,using Eq. (1) binary azeotrope acetic acid/isoamyl alcohol leadsto an inconsistent topological structure of the fixed points for theternary subsystem acetic acid/isoamyl alcohol/water mixture andmakes isoamyl alcohol fixed point to be an inexistent class of node[16,38] in the quaternary (global) RCM. Also, the ternary saddleazeotrope acetic acid/isoamyl alcohol/isoamyl acetate reported byKrokhin [58], is not considered in this study because the experi-mental data presented by the author are incomplete and cannot beverified nor used for model correlation (see Section 6.1).
The paths of residue curves are sketched in Fig. 2. It should beconsidered that either homogeneous or heterogeneous casualtiesof azeotropes and presence or absence of liquid–liquid immiscibil-ity zones does not influence the RCM general shape [16,39]. Positionof isoamyl alcohol/isoamyl acetate azeotrope is very close to pureisoamyl alcohol (tangent azeotrope with minimum boiling point,Table 1) and the other azeotropes are located at higher water con-centrations. Even if Fig. 2 is not at scale, it represents a possiblebasic structure for the non-reactive RCM of the mixture.
The probability of natural occurrence of the proposed concep-tual sketch of RCM (Fig. 2) can be estimated using both the Zharovand Serafimov (ZS) general topological classification of ternary mix-tures and the natural occurrence percentages of each RCM reportedtype, based on Reshetov statistics [38]. Consequently, for the RCM(Fig. 2): the subsystem acetic acid/water/isoamyl alcohol (type ZS
3b, class S 1.0–1b) has a natural occurrence of 0.4%; the subsys-tem acetic acid/water/isoamyl acetate (type ZS 3b, class S 1.0–1b)of 0.4%; the subsystem acetic acid/isoamyl alcohol/isoamyl acetate(type ZS 4, class S 1.0–2) of 8.5% and the subsystem water/isoamyl
72 W. Osorio-Viana et al. / Fluid Phase Equilibria 345 (2013) 68–80
WaterAcid
Acid
Acid
Alcohol Acetate
Fig. 2. Conceptual sketch of the most likely structure of RCM for hypothetical non-rUA
atho
nfic
2
2
wppitc[te
4
siocnmNrcT(triaaph
Alcohol Acetate
Water Acid
Fig. 3. Conceptual sketch of R-RCM structure in transformed molar compositions
eactive mixture acetic acid/isoamyl alcohol/isoamyl acetate/water at 1 atm. ©,nstable node, �, saddle point type I, �, saddle point type II, and �, stable node.rrows points toward increasing bubble point temperature. Not at scale.lcohol/isoamyl acetate (type ZS 23, class S 3.1–2) of 26%. Even withhese low natural occurrence percentages, these are some of theighest values reported, so the proposed RCM corresponds to onef the most observed in nature [38].
In order to explore how likely the proposed RCM is, it is alsoecessary to check that general topological constraints are satis-ed [16]. In the case of ternary and quaternary mixtures, theseonstraints are expressed by Eqs. (1) and (2), respectively [40,41]:
N3 + N2 + N1 = 2S3 + S2 + 2 (1)
(N+1 + S+
1 − N−1 − S−
1 ) + 4(N+2 + S+
2 − N−2 − S−
2 )
+ 8(N+3 + S+
3 − N−3 − S−
3 ) = 0 (2)
here N is the number of (stable + and unstable −) nodes of k com-onents with positive (negative) index, S is the number of saddleoints of k components with positive (negative) index. The index
s determined by the signs of the fixed points eigenvalues. For qua-ernary mixtures, topological index and its geometrical structureorresponding to each type of index can be consulted in Kiva et al.16]. Based on Fig. 2, it can be proved that the proposed RCM isopologically consistent (assuming that no quaternary azeotropesxists) (Table 3).
. Topological consistency for the reactive system
Esterification reaction of acetic acid with isoamyl alcohol hasignificant chemical equilibrium limitations due to the low value ofts equilibrium constant (ca. 5), which presents a weak dependencen temperature [9,35]. Reactive phenomena can induce multiplehanges in RCM structure [19,23,42]. To evaluate such changes, it isecessary to simulate the RCM using an available thermodynamicodel, including an expression for the equilibrium constant.evertheless, it is possible to propose a conceptual structure for
eactive residue curve map (R-RCM) and to check its topologicalonsistency, following the methodology proposed by Doherty [15].hus, using transformed molar compositions (see Eqs. (11) and12)) and the information in Table 1, a sketch of the R-RCM forhe mixture can be proposed (Fig. 3). It assumes that there is noeactive azeotrope – as proposed by Lee and Lin [7] – and thatsoamyl acetate/water and isoamyl alcohol/isoamyl acetate/water
zeotropes (which include the two reaction products) do not existfter chemical reaction [15]. The quaternary minimum bubbleoint reactive azeotrope, reported by Saha et al. [8], is discardedere, considering that the applied experimental technique isfor acetic acid/isoamyl alcohol/isoamyl acetate/water reactive mixture at 1 atm. ©,Unstable node, �, saddle point type I, �, saddle point type II, and �, stable node.Arrows points toward increasing bubble point temperature. Not at scale.
not able to identify the existence of a minimum bubble pointazeotrope. Also, the presented experimental evidence is insuffi-cient to be conclusive and it is in contradiction to more completeexperimental evidence previously reported by Lee and Lin [7].
The consistency test of the topological constraint for the reactivesystem can be graphically represented by a square and it is givenby the following expression [15]:
2N4 + N2 + N1 = 2S4 + S2 + 2 (3)
where Nk stands for (stable or unstable) nodes of one component(corners in Fig. 3, k = 1), two components (sides, k = 2) and points oftwo, three or four components that lies on the map face (k = 4). Skhas the same meaning for saddle points. Topological consistency forthe proposed R-RCM is verified for different cases (Table 4). Basedon the results in Table 4, the proposed R-RCM (Fig. 3) is topologicallyconsistent. Nevertheless, like in the non-reactive case, there areseveral topological structures that are consistent. However, in bothcases, it will be necessary to validate the conceptual model againstexperimental data in order to confirm its reliability.
5. Experimental
5.1. Materials and methods
Reactive grade chemicals were used in the experiments withoutfurther purification: isoamyl alcohol (Merck, 98%), isoamyl acetate(Merck, 99%), acetic acid (Punreac, 99.7%), water (HPLC grade pro-duced in Thermo Scientific Barnsted Nanopure unit, resistivity at25 ◦C: 18.0 ��-cm).
If vapor–liquid equilibrium is established in the time of theexperimental run and reaction toward chemical equilibrium occursat a rate significantly higher than phase equilibrium, it will be pos-sible to setup an experiment in which a pseudo equilibrium stateis reached. This is a simple approach to measure of VLE in reactivesystems, as proposed elsewhere [7,43–45].
Vapor–liquid equilibrium (VLE) experiments were carried outfor homogenous quaternary mixtures coming from previous kineticexperiments; samples were at chemical equilibrium. Compositionchanges due to chemical reaction (without catalyst and triggered byvapor phase formation) were assumed as insignificant during thetime of the experiment, considering that the rate of homogeneous
reaction was proved to be low at the PVT experimental conditions[35].The experimental setup consisted of a conventional laboratoryglass distillation still with distillation balloon, thermowheel, reflux

W. Osorio-Viana et al. / Fluid Phase Equilibria 345 (2013) 68–80 73
Table 3Local and global topological constraint test for acetic acid/isoamyl alcohol/isoamyl acetate/water mixture based on proposed RCM in Fig. 2.
Mixture Fixed point Characterization Consistency check
Isoamyl alcohol/isoamyl acetate/aceticacid
Isoamyl alcohol Stable node N3 = 0, N2 = 0, N1 = 3, S3 = 0, S2 = 12 × 0 + 0 + 3 = 2 × 0 + 1 + 2Isoamyl acetate Stable node
Acetic acid Unstable nodeIsoamyl acetate/isoamyl alcohol azeotrope Saddle node
Water/isoamyl acetate/acetic acid Isoamyl acetate Stable node N3 = 0, N2 = 1, N1 = 1, S3 = 0, S2 = 02 × 0 + 1 + 1 = 2 × 0 + 0 + 2Acetic acid Saddle node
Water Saddle nodeWater/isoamyl acetate azeotrope Unstable node
Isoamyl alcohol/water/acetic acid Isoamyl alcohol Stable node N3 = 0, N2 = 1, N1 = 1, S3 = 0, S2 = 02 × 0 + 1 + 1 = 2 × 0 + 0 + 2Acetic acid Saddle node
Water Saddle nodeIsoamyl alcohol/water azeotrope Unstable node
Isoamyl alcohol/isoamyl acetate/water Isoamyl acetate Stable node N3 = 1, N2 = 0, N1 = 3 S3 = 0, S2 = 32 × 1 + 0 + 3 = 2 × 0 + 3 + 2Isoamyl alcohol Stable node
Water Stable nodeIsoamyl alcohol/water azeotrope Saddle nodeIsoamyl acetate/water azeotrope Saddle nodeIsoamyl acetate/isoamyl alcohol azeotrope Saddle nodeIsoamyl acetate/isoamyl alcohol/water azeotrope Unstable node
Acetic acid/isoamyl alcohol/isoamylacetate/water
Isoamyl acetate Stable node N−1 N+
1 = 0, S+1 = 1, N−
1 = 2, S−1 = 1N+
2 = 0,S+
2 = 1, N−2 = 0, S−
2 = 2, N+3 = 1, S+
3 = 0,N−
3 = 0, S−3 = 0
2 × (0 + 1 − 2 − 1)+4 × (0 + 1 − 0 − 2) +8 × (1 + 0 − 0 − 0) = 0
Isoamyl alcohol Stable node N−1
Water Saddle node S+1
Acetic acid Saddle node S−1
Isoamyl alcohol/water azeotrope Saddle node S−2−
otropeter aze
cuctr2bhu
TT
Isoamyl acetate/water azeotropeIsoamyl acetate/isoamyl alcohol azeIsoamyl acetate/isoamyl alcohol/wa
ondenser and port for condensate samples. A vacuum pump (vac-brand GMBH) was connected to the still and pressure was heldonstant at a fixed value using a controller. A hot plate was usedo heat the liquid sample for approx. 15 min and a magnetic stir-er were used to guaranty intense agitation. A liquid sample of
50 ml was heated continuously until the mixture reaches its bub-le point and a vapor phase started to be form. With constanteat flux, a quasi steady state occurs at which vapor and liq-id phases are in equilibrium. A constant liquid temperature forable 4opological constraint test for acetic acid/isoamyl alcohol/isoamyl acetate/water reactive
Case Fixed point
1. Acetate/water azeotrope andalcohol/acetate/water azeotrope doesnot survive reaction and maximumboiling point reactive azeotrope occurs
Acetate
Alcohol
Water
Acid
Alcohol/water azeotrope
Acetate/alcohol azeotrope
Reactive azeotrope
2. Acetate/water azeotrope andalcohol/acetate/water azeotrope doesnot survive reaction and minimumboiling point reactive azeotrope occurs
Acetate
Alcohol
Water
Acid
Alcohol/water azeotrope
Acetate/alcohol azeotrope
Reactive azeotrope
3. Acetate/water azeotrope andalcohol/acetate/water azeotrope doesnot survive reaction and none reactiveazeotrope occurs
AcetateAlcohol
Water
Acid
Alcohol/water azeotrope
Acetate/alcohol azeotrope
4. Acetate/water azeotrope andalcohol/acetate/water azeotrope doesnot survive reaction and none reactiveazeotrope occurs (no acetate/alcoholazeotrope predicted)
Acetate
Alcohol
Water
AcidAlcohol/water azeotrope
Saddle node S2 Saddle node S+
2otrope Unstable node N+
3
at least 2 min was taken as criteria for phase equilibrium. Liq-uid and condensate vapor samples of 1 ml were collected andrefrigerated immediately to posterior composition analysis by gaschromatography (Perkin Elmer Autosystem XL GC, FID detector,TBR 620 column, injector temperature 200 ◦C, column temperature
150 ◦C, detector temperature 200 ◦C, carrier gas He at 5 mL/min,H2 35 mL/min, Air 350 mL/min, split 25:1, injection sample volume4 �L) and water titration by Karl–Fisher method (Titrino Metrohm702-MS).mixture based on proposed R-RCM in Fig. 3.
Characterization Consistency check
Saddle node S1 N4 = 1, S4 = 0, N2 = 1, S2 = 1, N1 = 12 × 1 + 1 + 1 = 2 × 0 + 1 + 2Inconsistent
Stable node N1
Saddle node S1
Saddle node S1
Unstable node N2
Saddle node S2
Stable node N4
Stable node N1 N4 = 1, S4 = 0, N2 = 0, S2 = 2, N1 = 22 × 1 + 0 + 2 = 2 × 0 + 2 + 2Consistent
Stable node N1
Saddle node S1
Saddle node S1
Saddle node S2
Saddle node S2
Unstable node N4
Stable node N1 N4 = 0, S4 = 0, N2 = 1, S2 = 1, N1 = 22 × 0 + 1 + 2 = 2 × 0 + 1 + 2Consistent
Stable node N1
Saddle node S1
Saddle node S1
Unstable node N2
Saddle node S2
Stable node N1 N4 = 0, S4 = 0, N2 = 1, S2 = 0, N1 = 12 × 0 + 1 + 1 = 2 × 0 + 0 + 2Consistent
Saddle node S1
Saddle node S1
Saddle node S1
Unstable node N2
74 W. Osorio-Viana et al. / Fluid Phase Equilibria 345 (2013) 68–80
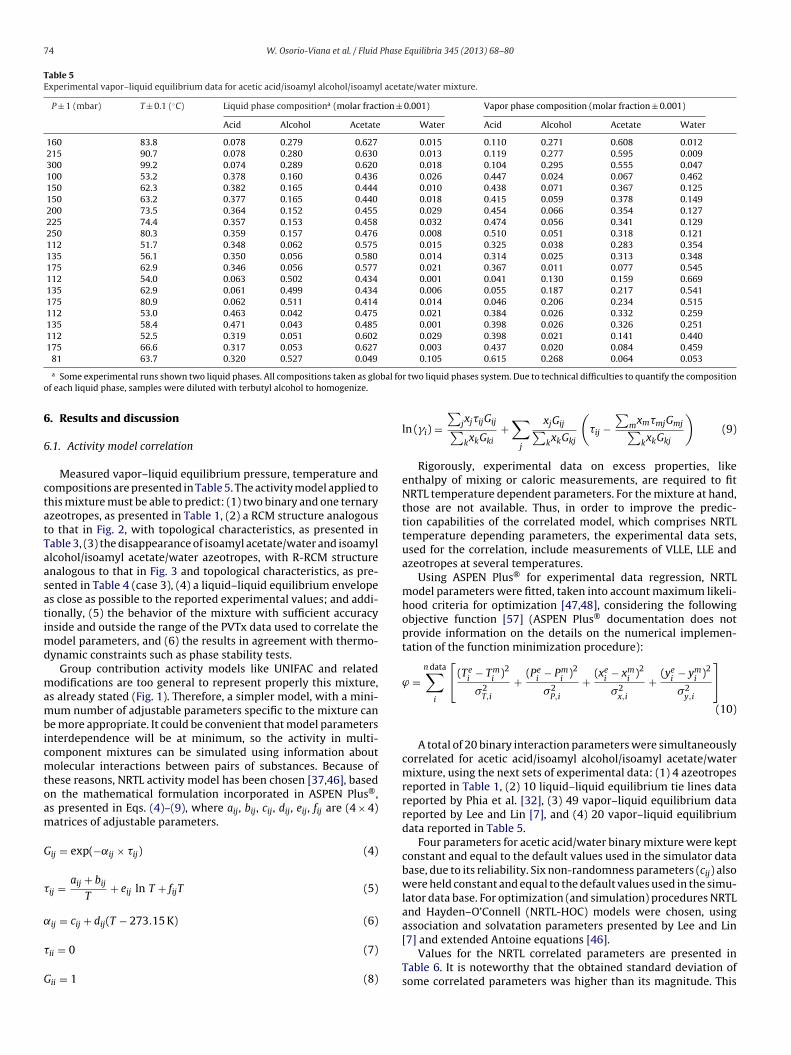
Table 5Experimental vapor–liquid equilibrium data for acetic acid/isoamyl alcohol/isoamyl acetate/water mixture.
P ± 1 (mbar) T ± 0.1 (◦C) Liquid phase compositiona (molar fraction ± 0.001) Vapor phase composition (molar fraction ± 0.001)
Acid Alcohol Acetate Water Acid Alcohol Acetate Water
160 83.8 0.078 0.279 0.627 0.015 0.110 0.271 0.608 0.012215 90.7 0.078 0.280 0.630 0.013 0.119 0.277 0.595 0.009300 99.2 0.074 0.289 0.620 0.018 0.104 0.295 0.555 0.047100 53.2 0.378 0.160 0.436 0.026 0.447 0.024 0.067 0.462150 62.3 0.382 0.165 0.444 0.010 0.438 0.071 0.367 0.125150 63.2 0.377 0.165 0.440 0.018 0.415 0.059 0.378 0.149200 73.5 0.364 0.152 0.455 0.029 0.454 0.066 0.354 0.127225 74.4 0.357 0.153 0.458 0.032 0.474 0.056 0.341 0.129250 80.3 0.359 0.157 0.476 0.008 0.510 0.051 0.318 0.121112 51.7 0.348 0.062 0.575 0.015 0.325 0.038 0.283 0.354135 56.1 0.350 0.056 0.580 0.014 0.314 0.025 0.313 0.348175 62.9 0.346 0.056 0.577 0.021 0.367 0.011 0.077 0.545112 54.0 0.063 0.502 0.434 0.001 0.041 0.130 0.159 0.669135 62.9 0.061 0.499 0.434 0.006 0.055 0.187 0.217 0.541175 80.9 0.062 0.511 0.414 0.014 0.046 0.206 0.234 0.515112 53.0 0.463 0.042 0.475 0.021 0.384 0.026 0.332 0.259135 58.4 0.471 0.043 0.485 0.001 0.398 0.026 0.326 0.251112 52.5 0.319 0.051 0.602 0.029 0.398 0.021 0.141 0.440175 66.6 0.317 0.053 0.627 0.003 0.437 0.020 0.084 0.459
81 63.7 0.320 0.527 0.049 0.105 0.615 0.268 0.064 0.053
bal foo
6
6
ctatTaasatimd
mambicmtoam
G
�
˛
�
G
a Some experimental runs shown two liquid phases. All compositions taken as glof each liquid phase, samples were diluted with terbutyl alcohol to homogenize.
. Results and discussion
.1. Activity model correlation
Measured vapor–liquid equilibrium pressure, temperature andompositions are presented in Table 5. The activity model applied tohis mixture must be able to predict: (1) two binary and one ternaryzeotropes, as presented in Table 1, (2) a RCM structure analogouso that in Fig. 2, with topological characteristics, as presented inable 3, (3) the disappearance of isoamyl acetate/water and isoamyllcohol/isoamyl acetate/water azeotropes, with R-RCM structurenalogous to that in Fig. 3 and topological characteristics, as pre-ented in Table 4 (case 3), (4) a liquid–liquid equilibrium envelopes close as possible to the reported experimental values; and addi-ionally, (5) the behavior of the mixture with sufficient accuracynside and outside the range of the PVTx data used to correlate the
odel parameters, and (6) the results in agreement with thermo-ynamic constraints such as phase stability tests.
Group contribution activity models like UNIFAC and relatedodifications are too general to represent properly this mixture,
s already stated (Fig. 1). Therefore, a simpler model, with a mini-um number of adjustable parameters specific to the mixture can
e more appropriate. It could be convenient that model parametersnterdependence will be at minimum, so the activity in multi-omponent mixtures can be simulated using information aboutolecular interactions between pairs of substances. Because of
hese reasons, NRTL activity model has been chosen [37,46], basedn the mathematical formulation incorporated in ASPEN Plus®,s presented in Eqs. (4)–(9), where aij, bij, cij, dij, eij, fij are (4 × 4)atrices of adjustable parameters.
ij = exp(−˛ij × �ij) (4)
ij = aij + bij
T+ eij ln T + fijT (5)
ij = cij + dij(T − 273.15 K) (6)
ii = 0 (7)
ii = 1 (8)
r two liquid phases system. Due to technical difficulties to quantify the composition
ln (�i) =∑
jxj�ijGij∑kxkGki
+∑
j
xjGij∑kxkGkj
(�ij −
∑mxm�mjGmj∑
kxkGkj
)(9)
Rigorously, experimental data on excess properties, likeenthalpy of mixing or caloric measurements, are required to fitNRTL temperature dependent parameters. For the mixture at hand,those are not available. Thus, in order to improve the predic-tion capabilities of the correlated model, which comprises NRTLtemperature depending parameters, the experimental data sets,used for the correlation, include measurements of VLLE, LLE andazeotropes at several temperatures.
Using ASPEN Plus® for experimental data regression, NRTLmodel parameters were fitted, taken into account maximum likeli-hood criteria for optimization [47,48], considering the followingobjective function [57] (ASPEN Plus® documentation does notprovide information on the details on the numerical implemen-tation of the function minimization procedure):
ϕ =n data∑
i
[(Te
i− Tm
i)2
�2T,i
+ (Pei
− Pmi
)2
�2P,i
+ (xei
− xmi
)2
�2x,i
+ (yei− ym
i)2
�2y,i
](10)
A total of 20 binary interaction parameters were simultaneouslycorrelated for acetic acid/isoamyl alcohol/isoamyl acetate/watermixture, using the next sets of experimental data: (1) 4 azeotropesreported in Table 1, (2) 10 liquid–liquid equilibrium tie lines datareported by Phia et al. [32], (3) 49 vapor–liquid equilibrium datareported by Lee and Lin [7], and (4) 20 vapor–liquid equilibriumdata reported in Table 5.
Four parameters for acetic acid/water binary mixture were keptconstant and equal to the default values used in the simulator database, due to its reliability. Six non-randomness parameters (cij) alsowere held constant and equal to the default values used in the simu-lator data base. For optimization (and simulation) procedures NRTLand Hayden–O’Connell (NRTL-HOC) models were chosen, usingassociation and solvatation parameters presented by Lee and Lin
[7] and extended Antoine equations [46].Values for the NRTL correlated parameters are presented inTable 6. It is noteworthy that the obtained standard deviation ofsome correlated parameters was higher than its magnitude. This

W. Osorio-Viana et al. / Fluid Phase Equilibria 345 (2013) 68–80 75
Table 6Correlated NRTL activity model parameters for acetic acid/isoamyl alcohol/isoamyl acetate/water mixture.
i Watera Water Water Acid Acid Alcohol
j Acida Alcohol Acetate Alcohol Acetate Acetate
aij 3.3293 1.5598 0.3194 0.4521 −0.6992 0.1291aji −1.9763 −1.0959 −2.5596 1.1307 0.0741 1.5083bij −723.8881 1096.2001 1180.3569 −335.9220 74.0710 −229.6133bji 609.8886 166.2337 996.9415 −53.1049 440.9815 −311.0556cij
a,b 0.3 0.2 0.2 0.3 0.3 0.3
a Non-correlated parameters. Values taken as constant directly from ASPEN Plus® simulator data base.b Other parameters are eij = fij = 0. See Eqs. (4)–(9).
Table 7Topological characterization of fixed points for acetic acid/isoamyl alcohol/isoamyl acetate/water mixture as reported by ASPEN Plus® using new correlated parameters forNRTL activity model.
T (◦C) Classification Type No. comp. Molar fraction
Acetate Alcohol Acid Water
141.66 Stable node Homogeneous 1 1 0 0 0130.91 Stable node Homogeneous 1 0 1 0 0118.01 Saddle node Homogeneous 1 0 0 1 0100.02 Saddle node Homogeneous 1 0 0 0 1
95.21 Saddle node Heterogeneous 2 0 0.1725 0 0.827594.79 Saddle node Heterogeneous 2 0.1930 0 0 0.807094.78 Unstable node Heterogeneous 3 0.1723 0.0203 0 0.8074
Table 8Calculated activity coefficients for acetic acid/isoamyl alcohol/isoamyl acetate/water mixture at 80 ◦C and several liquid phase compositions. Application test case of Eqs.(4)–(9) and its parameters (Table 6).
Component i xi �i xi �i xi �i xi �i
Acid 0.25 0.9785 0.4 1.0421 0.1 0.8606 0.4 1.0451Alcohol 0.25 1.0856 0.4 1.0995 0.2 1.1176 0.3 1.0788Acetate 0.25 1.4203 0.1 1.2976 0.3 1.5509 0.2 1.2891
2.329
pwTheleia
6
6
tToetttt(e(
6
ta
6.2.3. Non-reactive residue curve mapsFig. 4 shows residue curve maps for four ternary subsystems
of the quaternary mixture acetic acid/isoamyl alcohol/isoamyl
Table 9Deviations in azeotropes prediction using correlated parameters for NRTL activitymodel of acetic acid/isoamyl alcohol/isoamyl acetate/water mixture.
�Ta (%) Molar fraction �Xa (%)
Acetate Alcohol Acid Water
Water 0.25 2.4498 0.1
roblem can be also seen in the case of Lee and Lin work [7],here they correlated some activity models to their own VLE data.
his indicates that the objective function has local minima due toigh dimensionality and non-linearity. Taken into account that sev-ral sets of correlated parameters can be found [57], one with theowest parameter uncertainty was selected in this study. Consid-ring that now a new set of NRTL model parameters is available,t is necessary to check that it agrees with constraints discussedbove.
.2. Predictions and validation of correlated NRTL activity model
.2.1. Topological characterization of simulated fixed pointsASPEN Plus® fixed points report for quaternary mixture using
he new correlated NRTL parameters (Table 6) is shown in Table 7.he new set of model parameters identifies three of four azeotropesf the system and predicts topological consistency for seven ofight RCM fixed points, according to Table 3. It was establishedhat the correlated NRTL model is unable to predict the tangen-ial isoamyl alcohol/isoamyl acetate binary azeotrope consideringhat such experimental data are not available. Additionally, in ordero offer an application test case of Eqs. (4)–(9) and its parametersTable 6), the calculated values of the activity coefficients for sev-ral liquid phase compositions of the quaternary mixture are givenTable 8).
.2.2. Deviations in VLE predictionAs an example of the fit goodness to VLE data obtained with
he correlated NRTL parameters, Table 9 presents percentage devi-tions in temperature and composition predictions for the three
3 0.4 2.3835 0.1 2.4851
localized azeotropes (Table 1). Maximum deviation of 5% in com-position and of 0.8% in temperature for binary azeotropes wasobserved; predictions for the ternary azeotrope present a devia-tion of −0.01% in temperature and of 1.79% in water composition, of82.63% in isoamyl alcohol composition and of −182.46% in isoamylacetate composition (Table 9). Due to the absence of enough experi-mental VLLE data near the azeotropes, high deviations are observed.
Table 10 shows comparative percentage deviations betweenVLE data of Lee and Lin [7] and predictions with previous avail-able activity models and the new correlated one. NRTL activitymodel with the new set of parameters presents better capabilitiesfor VLE prediction considering the lowest deviation in temperatureand composition (2.78 and 0.1935, respectively), followed by UNI-FAC and UNIQUAC (4.93 and 0.3627), UNIFAC-Dortmund (5.06 and0.2526), and NRTL with parameters proposed by Lee and Lin [7](6.89 and 0.2757).
0.06 0 0.818 0 0.169−0.79 5.345 0 0 −1.369−0.01 −182.46 82.63 0 1.788
a Deviations calculated as [(experimental − calculated)/experimental] × 100.

76 W. Osorio-Viana et al. / Fluid Phase Equilibria 345 (2013) 68–80
Table 10Predicted deviations between experimental VLE data of Lee & Lin [7] using available activity models and new correlated parameters for NRTL model (Table 6) for aceticacid/isoamyl alcohol/isoamyl acetate/water mixture.
Activity modelc
NRTL (this work)b UNIFAC-Dort. UNIFAC UNIQUAC NRTL WILSONe
�yf �Tf �y �T �y �T �y �T �y �T �y �T
Substance
Calculationsof this worka
Acid 0.0360
2.78
0.0672
5.06
0.0681
4.39
0.0772
4.93
0.0358
6.89
–
–Alcohol 0.0352 0.0353 0.0353 0.0348 0.0348 –Acetate 0.0456 0.0415 0.0408 0.1052 0.0964 –Water 0.0767 0.1086 0.1018 0.1455 0.1087 –
0.1935 0.2526 0.2460 0.3627 0.2757
Original data ofLee & Lin [7]d
Acid 0.0087
1.0
0.0184
1.4
0.0146
1.5Alcohol 0.0029 0.0052 0.0058Acetate 0.0136 0.0157 0.0134Water 0.0157 0.0158 0.0203
UNIFAC UNIQUAC UNIQUAC*
Original data ofWyczesany [9]d
Acid 0.0119
4.44
0.0150
2.20
0.0252
1.56Alcohol 0.0588 0.0341 0.0608Acetate 0.0858 0.0676 0.1354Water 0.0345 0.0384 0.0645
a VLE calculations implemented in MatLab® for this work.b Using NRTL parameters presented in Table 6.c All activity models have in common chemical theory with Hayden-O’Conell model (parameters from Lee & Lin [7]) for vapor phase. Parameters for UNIQUAC, NRTL, and
WILSON models as reported by Lee & Lin [7]. Parameters for UNIFAC from Poling et al. [46] and parameters for UNIFAC Dortmund by Weidlich & Gmehling [53] and Gmehlinget al. [54–56]. Pure substances properties from Lee & Lin [7], except acentric factors.
d Original experimental data from Lee & Lin [7] and Wyczesany [9]. UNIQUAC correlated by Wyczesany [9], UNIQUAC* with parameters from Lee & Lin [7]. These publicationsdo not report exact values used to obtain the results presented so it was not possible to reproduce them.
e It was not possible to simulate VLE equilibrium with WILSON model according to parameters presented by Lee & Lin [7].f Deviations between experimental and calculated values of vapor phase composition (y) and equilibrium temperature (T) according to deviations measures as proposed
b
N
− yical
N
atbbiapnt
Ftai
y Wyczesany [9] where N is the number of experimental runs: �y = 1N
∑i=1
∣∣yiexp
cetate/water. They were considered as non-reactive for calcula-ion, using the correlated NRTL activity model (Table 6). It cane seen that simulated RCM structure is similar to that suggestedy conceptual topological analysis (Fig. 2). In particular, the sim-
larities between those figures are: (1) Isoamyl alcohol/isoamyl
cetate/acetic acid system: consider that the model is unable toredict the isoamyl alcohol/isoamyl acetate tangential azeotrope;evertheless, as this azeotrope is very close to pure alcohol ver-ex, the conceptual sketch of the RCM in Fig. 2 (not at scale) willig. 4. Simulated RCM for acetic acid/isoamyl alcohol/isoamyl acetate/water mix-ure as reported by ASPEN Plus® at 1 atm, using new correlated parameters for NRTLctivity model in Table 6. Composition scale in molar fraction. Partial miscibility zones enclosed in the shaded area.
∣∣ , �T = 1N
∑i=1
∣∣Texp − Tcal
∣∣.
looks like that calculated in Fig. 4. (2) Isoamyl alcohol/isoamylacetate/water system: the model is able to predict the two binaryazeotropes between alcohol/water and acetate/water as well as the(minimum) ternary azeotrope, all at high water concentrations andwith the same sequence of their bubble points. As in the previouscase, the position of the alcohol/acetate azeotrope makes that onlyone branch of the RCM in Fig. 2 can be seen in Fig. 4. (3) Isoamyl alco-hol/acetic acid/water system. (4) Isoamyl acetate/acetic acid/watersystem: the same general trend and topology of the RCM in Fig. 2(not at scale) and that in Fig. 4 shows the resemblance and congru-ence between the conceptual prediction and the calculation withthe correlated model.
6.2.4. Reactive residue curve mapThe R-RCM for the mixture was calculated using the reactive
residue curves formulation proposed by Barbosa and Doherty [20],in transformed molar compositions as defined in Eqs. (11) and(12), and the algorithm of Ung and Doherty [17,18] which wasimplemented in MatLab®. The results are presented in Fig. 5. Thenew NRTL parameters (Table 6) and Hayden–O’Connell fugacitycoefficients for vapor phase were used in the calculations. A valueof 5 for the reaction equilibrium constant was assumed [35].
xi = (xi/�i) − (xk/�k)(�k − ıxk)
(11)
yi = (yi/�i) − (yk/�k)(�k − ıyk)
(12)
As it can be seen (Fig. 5), topological features of the simu-
lated R-RCM include: an unique unstable node (isoamyl alcohol/water azeotrope) and an unique stable node (isoamyl acetate ver-tex) – notice that the model is unable to predict the isoamyl alcohol/isoamyl acetate tangential azeotrope – and the disappearance of
W. Osorio-Viana et al. / Fluid Phase
Fh
iass(tdp
t
to subestimate the equilibrium temperature and is able to make
Fa
ig. 5. Simulated R-RCM in transformed molar fraction for acetic acid/isoamyl alco-ol/isoamyl acetate/water mixture at 1 atm, using parameters presented in Table 6.
soamyl acetate/water and isoamyl alcohol/isoamyl acetate/waterzeotropes which do not exist after chemical reaction. Pureubstances vertex for water, isoamyl alcohol and acetic acid areaddle nodes and no reactive azeotropes appear for this mixturein agreement with the observations of Lee and Lin [7]). Considerhat the Fig. 5 R-RCM is represented in transformed molar fractionsefined by Eqs. (11) and (12), and moves from the lowest bubble
oint toward the highest bubble point (isoamyl acetate vertex).As in the non-reactive case, even if the model cannot predicthe isoamyl alcohol/isoamyl acetate tangential azeotrope, the
-1-0.9-0.8-0.7-0.6-0.5-0.4-0.3-0.2-0.10
-1
-0.9
-0.8
-0.7
-0.6
-0.5
-0.4
-0.3
-0.2
-0.1
0
Calculated Yacid
Exp
erim
enta
l Yac
id
0 0.1 0.2 0.3 0.4 0.5 0.6 0.7 0.8 0.9 10
0.1
0.2
0.3
0.4
0.5
0.6
0.7
0.8
0.9
1
Calculated Y water
Exp
erim
enta
l Yw
ater
ig. 6. Parity plots between experimental and calculated VLE for acetic acid/isoamyl alccetic acid, isoamyl alcohol, water and equilibrium temperature. Experimental data of Le
Equilibria 345 (2013) 68–80 77
R-RCM in Fig. 5 is consistent with this topological restriction (noalcohol/acetate azeotrope), as can be seen in Table 4 (case 4), andboth R-RCM (Figs. 3 and 5) look similar (due to the coordinates ofthis fixed point), considering that only one branch of the residuecurves in Fig. 3 (not at scale) can be seen in Fig. 5. The similitudebetween the conceptual prediction and the calculation with thecorrelated model is enough to state that the model is able topredict a topologically congruent R-RCM.
Following Okasinski and Doherty [49], a search was per-formed to check the existence of the reactive azeotropes inthe acetic acid/isoamyl alcohol/isoamyl acetate/water mixture at1 atm, applying the new correlated NRTL activity model (calcu-lations not presented here). All algorithms were implemented inMatLab®. None binary non-reactive azeotrope degenerates intoreactive azeotrope while chemical reaction occurs until chemi-cal equilibrium is reached at infinite Damköhler number. Singularpoints do not lead to reactive azeotrope because there is no forma-tion of the quaternary mixture observed at chemical equilibrium,as it does in similar systems [50,51]. Moreover, there is no dis-placement to a fixed point characteristic for a reactive azeotrope.This is another theoretical evidence for reliability of the proposedtopological structure for the reactive system presented in Fig. 5.
Computation of R-RCM also makes possible a graphical com-parison between VLE experimental data of Lee and Lin [7] andpredictions of the correlated NRTL parameters. Fig. 6 shows par-ity plots for vapor phase transformed molar fractions for eachcomponent and for equilibrium temperature. The model tends
predictions with low deviation in the case of acetic acid andisoamyl alcohol molar fractions. For water molar fractions, devi-ation is higher, particularly for high concentrations, which can be
-1-0.9-0.8-0.7-0.6-0.5-0.4-0.3-0.2-0.10
-1
-0.9
-0.8
-0.7
-0.6
-0.5
-0.4
-0.3
-0.2
-0.1
0
Calculated Yalcohol
Exp
erim
enta
l Yal
coh
ol
370 375 380 385 390 395370
375
380
385
390
395
Calculated T (K)
Exp
erim
enta
l T (
K)
ohol/isoamyl acetate/water mixture. Vapor phase transformed molar fractions fore and Lin [7] and calculated values using NRTL with parameters in Table 6.

78 W. Osorio-Viana et al. / Fluid Phase Equilibria 345 (2013) 68–80
Fig. 7. LLE phase stability test for a mixture of 71% water, 24% isoamyl acetate and5% acetic acid (molar) at 80 ◦C calculated using new correlated parameters for NRTLapp
alatbul
6
mawoibidtcdtst
N
wiwoealipnspw
Acid
AcidAcid Acetate
Alcohol Water
Fig. 8. Liquid–liquid phase envelope for acetic acid/isoamyl alcohol/isoamylacetate/water mixture at 20 ◦C, calculated using new correlated parameters for NRTL
ctivity model in Table 6. , Tangent plane distance function contours; – –, searchaths for stationary points of tangent plane distance function; and �, located fixedoints. Note that Eq. (10) is satisfied.
ttributed to the fact that the experimental data (used for the corre-ation procedure) were measured for low water concentrations tovoid liquid–liquid–vapor equilibrium. Here, no attempt was madeo quantitatively compare the predicted R-RCM with that presentedy Saha et al. [8], as they do not report the experimental data in tab-lar form, but both exhibit the same general trend, especially for
ow water concentrations.
.2.5. Non-reactive phase stability test and liquid–liquid envelopeAs it was stated previously, the new correlated NRTL activity
odel must be able to predict appropriately mixture stability at given composition, temperature and pressure conditions, as itas established by Gibbs criteria: “for phase stability, no point
n Gibbs energy surface should be below tangent plane at givennitial composition”. Following Wasylkiewicz et al. [10], phase sta-ility test for liquid–liquid equilibria (LLE) for ternary subsystems
n acetic acid/isoamyl alcohol/isoamyl acetate/water mixture wasone using MatLab®. The method finds the fixed points in theangent plane distance function (for a mixture at given globalomposition) using numerical integration of a system of ordinaryifferential equations (from function gradient) in different direc-ions according to eigenvectors of the system. Using the gradientystem properties, a topological constraint to phase stability forernary systems as presented in Eq. (13) was defined [10]:
MAX + NMIN − NSAD = 1 (13)
here NMAX stands for number of maxima, NMIN for number of min-ma and NSAD for saddles, among identified fixed points. In this
ay, a criterion for topologically consistent results arises in anal-gy to topological constrains discussed in Section 3. Fig. 7 depicts anxample of phase stability test application for acetic acid/isoamylcetate/water subsystem, using NRTL activity model with corre-ated parameters presented in Table 6. Results show that testednitial global composition is unstable and will split into two liquidhases and that the topological criterion in Eq. (13) is satisfied. The
ew set of correlated parameters for NRTL activity model for thetudied mixture can be used to develop a successful and consistenthase stability test; more important, phase stability test togetherith phase equilibrium computations leads to a number of phasesactivity model in Table 6 and comparison with experimental cloud points and tielines. ©, Experimental tie line (Phia et al. [32]); �, experimental cloud point (Phiaet al. [32]); *, experimental cloud point (this work); and –, simulated LLE.
in agreement with the experimental evidence. This is another evi-dence of the correlated model reliability.
To evaluate the prediction capabilities of the new correlatedNRTL model for this mixture, six liquid–liquid equilibrium cloudpoints were measured for binary and ternary subsystems at 20 ◦C(not included in the correlation) and compared to model predic-tions in graphical form in Fig. 8 (those calculations were done bystandard algorithm for LLE and results from LL phase stability testas initial estimates of equilibrium compositions). The same figureshows tie lines of Phia et al. [32] (included in correlation procedure).It can be seen a reasonable similitude between experimental andcalculated values and with lower deviations than using the otheractivity models (see Fig. 1). This interpolation prediction stands asanother evidence of model reliability.
6.2.6. Reactive phase stability test and liquid–liquid envelopeApplication of liquid–liquid stability test to reactive systems
is discussed by Wasylkiewicz and Ung [11]. Chemical equilibriumcondition is directly taken into account by transformed molar com-positions, in the fixed points search algorithm for tangent planedistance function, and transformed molar Gibbs free energy of themixture [52]. Nevertheless, in this case the authors do not present atopological constraint for consistency check of the obtained results.Graphically, the result can be understood as the surface limitedby points that belong simultaneously to chemical equilibrium andphase equilibrium surfaces, forming the so called equilibrium man-ifold. They are defined by the simultaneous solution of Eqs. (14) and(15):
XIi �I
i = XIIi �II
i (14)
Keq = aEaW
aHAcaOH(15)
For acetic acid/isoamyl alcohol/isoamyl acetate/water mixture,direct calculation of reactive liquid–liquid equilibrium was doneusing correlated NRTL activity model for two temperatures. Results
are presented in Fig. 9. They present similar structure to thatobserved for other esterification systems [11]. The new set ofparameters consistently predicts a reduction in partial miscibilityzone with increasing temperature, as expected.
W. Osorio-Viana et al. / Fluid Phase Equilibria 345 (2013) 68–80 79
0 0.2 0.4 0.6 0.8 10
0.2
0.4
0.6
0.8
1
xHAc*
x OH*
Water
Alcoho l
Acid
Acetate
Aqueou s pha se
Organ ic pha seMidd le po int
Tie li ne
0 0.2 0.4 0.6 0.8 10
0.2
0.4
0.6
0.8
1
xHAc*
x OH*
Water
Alcoho l
Acid
Acetate
Aqueou s pha se
Organ ic pha se
Midd le po int
Tie li ne
F ns, fo( cibilitd
7
lhAlntrttVwawp
earrrdctrbdaUanlet
A
Nt
[
[[[[
[[[[[[[[[[[[[
[[[[
[[[[
[
ig. 9. Simulated reactive liquid–liquid phase envelope in transformed molar fractioright), using parameters presented in Table 6. The middle line inside the partial misata included.
. Conclusions and significance
A complete thermodynamic characterization for vapor–liquid–iquid equilibria phase diagrams of acetic acid/isoamyl alco-ol/isoamyl acetate/water reactive mixture has been presented.
new set of NRTL activity model parameters has been corre-ated using available experimental phase equilibria data and aew set of VLE measurements for the quaternary mixture. Usinghis model, it is possible to predict the reactive and non-reactiveesidue curve maps that are topologically consistent, and to predicthe liquid–liquid phase envelope according to the phase stabilityest. The new set of parameters for NRTL activity model predictLE experimental data with lower deviations than those obtainedith other previous available activity models. Inside the limit of its
pplicability, the proposed thermodynamic model is a reliable toolhich can be used for conceptual design and process simulationrocedures for isoamyl acetate production.
Using ASPEN Plus® as a tool for correlation of phase equilibriaxperimental data, 20 NRTL binary interaction parameters weredjusted simultaneously taking into account: (1) 4 azeotropeseported in Table 1, (2) 10 liquid–liquid equilibrium tie lines dataeported by Phia et al. [32], (3) 49 vapor–liquid equilibrium dataeported by Lee and Lin [7], and (4) 20 vapor–liquid equilibriumata reported in Table 5. The residue curve map, predicted using theorrelated model, is topologically consistent, most likely accordingo Reshetov’s natural occurrence statistics and congruent with noeactive azeotropy. NRTL with this new set of parameters presentsetter capabilities for VLE prediction than current activity models,ue to the lowest deviation in temperature and composition (2.78nd 0.1935 respectively), followed by UNIFAC (4.39 and 0.2460) andNIQUAC (4.93 and 0.3627), UNIFAC-Dortmund (5.06 and 0.2526),nd NRTL of Lee and Lin [7] (6.89 and 0.2757). Additionally, the sameew set of NRTL parameters can be used to simulate the reactive
iquid–liquid phase envelope, with better fit to the available LLExperimental data for acetic acid/isoamyl alcohol/water mixturehan current activity models.
cknowledgments
The authors thank to Ecopetrol, Colciencias and Universidadacional de Colombia Sede Manizales, for the financial support of
his research, through the project “Producción de acetato de amilo
[[[[[
r acetic acid/isoamyl alcohol/isoamyl acetate/water mixture at 20 ◦C (left) and 80 ◦Cy zone represents the starting point for calculation of the tie lines. No experimental
mediante un proceso intensificado utilizando tecnologías de mem-branas”, code 1119-490-26022, contract RC no. 556-2009.
References
[1] S.J. Perulekar, Ind. Eng. Chem. Res. 46 (2007) 8490–8504.[2] K.C. de Souza Figueiredo, V.M.M. Salim, C.P. Borges, Catal. Today 133–135
(2008) 809–814.[3] S. Khajavi, J. Jansen, F. Kapteijn, Catal. Today 156 (2010) 132–139.[4] E.A.F. El-Zanati, S.M. Ritchie, H.M. Abdallah, R. Ettouny, M.A. El-Rifai, Int. J.
Chem. React. Eng. 9 (2011), Note S6.[5] Z. Kücük, K. Ceylan, Turk. J. Chem. 22 (1998) 289–300.[6] B. Saha, H.T.R. Teo, A. Alqahtani, Int. J. Chem. React. Eng. 3 (2005) A11.[7] L.S. Lee, R.G. Lin, Fluid Phase Equilib. 165 (1999) 261–278.[8] B. Saha, A. Alqahtani, H.T.R. Teo, Int. J. Chem. React. Eng. 3 (2005) A30.[9] A. Wyczesany, Chem. Proc. Eng. 30 (2009) 243–265.10] S.K. Wasylkiewicz, L.N. Sridhar, M.F. Doherty, M.F. Malone, Ind. Eng. Chem. Res.
35 (1996) 1395–1408.11] S.K. Wasylkiewicz, S. Ung, Fluid Phase Equilib. 175 (2000) 253–272.12] F. Jalali, J.D. Seader, Comp. Chem. Eng. 24 (2000) 1997–2008.13] H. Gecegormez, Y. Demirel, Fluid Phase Equilib. 237 (2005) 48–58.14] A. Bonilla-Petriciolet, R. Vázquez, G.A. Iglesias, K.R. Hall, Ind. Eng. Chem. Res.
45 (2006) 4764–4772.15] M.F. Doherty, Proc. Math. Phys. Sci. 430 (1880) (1990) 669–678.16] V.N. Kiva, E.K. Hilmen, S. Skogestad, Chem. Eng. Sci. 58 (2003) 1903–1953.17] S. Ung, M.F. Doherty, Chem. Eng. Sci. 50 (1995) 23–48.18] S. Ung, M.F. Doherty, Chem. Eng. Sci. 50 (1995) 3201–3216.19] D. Barbosa, M.F. Doherty, Proc. R. Soc. Lond. A 413 (1987) 459–464.20] D. Barbosa, M.F. Doherty, Chem. Eng. Sci. 43 (1988) 529–540.21] S. Hauan, A.W. Westerberg, K.M. Lien, Chem. Eng. Sci. 55 (2000) 1053–1075.22] D. Flockerzi, A. Bohmann, A. Kienle, Chem. Eng. Sci. 62 (2007) 4811–4816.23] S. Ung, M.F. Doherty, AIChE J. 41 (1995) 2383–2392.24] M.J. Okashinski, M.F. Doherty, AIChE J. 43 (1997) 2227–2237.25] A. Gert-Jan, F. Fien, Y.A. Liu, Ind. Eng. Chem. Res. 33 (1994) 2505–2522.26] S.K. Wasylkiewicz, Comp. Chem. Eng. Supp. 23 (1999) S125–S128.27] D. Glasser, D. Hildebrandt, B. Hausberger, Comp. Chem. Eng. 24 (2000)
1275–1280.28] C. Almeida-Rivera, J. Grievink, Comp. Chem. Eng. 28 (2004) 17–25.29] W. Chang, G. Guan, X. Li, H. Yao, J. Chem. Eng. Data 52 (2005) 2171–2173.30] L.H. Horsley, Anal. Chem. 21 (1949) 831–873.31] E.W. Flick (Ed.), Industrial Solvents Handbook, 5th ed., Noyes Data Corporation,
New Jersey, 1998.32] P. Piha, R.J. Peltonen, M. Kitunen, J. Appl. Chem. 8 (1958) 576–580.33] T. Ito, F. Yoshida, J. Chem. Eng. Data 8 (1963) 315–320.34] H.T.R. Teo, B. Saha, J. Catal. 228 (2004) 174–182.35] M. Duque-Bernal, J.D. Quintero-Arias, W. Osorio-Viana, I. Dobrosz- Gómez, J.
Fontalvo, M.A. Gómez-García, Int. J. Chem. Kinet. 45 (2013) 10–18.36] J.G. Hayden, J.P. O’Connell, Ind. Eng. Chem. Res. 14 (1975) 209–216.
37] H. Renon, J.M. Prausnitz, AIChE J. 14 (1968) 135–144.38] E.K. Hilmen, V.N. Kiva, S. Skogestad, AIChE J. 48 (2002) 752–759.39] Z. Qi, A. Kolah, K. Sundmacher, Chem. Eng. Sci. 57 (2002) 163–178.40] Y.V. Gurikov, Russ. J. Phys. Chem. 32 (1958) 1980–1996.41] V.T. Zharov, Russ. J. Phys. Chem. 43 (1969) 1563–1567.
8 Phase
[[[[[
[[
[[
[
[[[[
4876–4882.
0 W. Osorio-Viana et al. / Fluid
42] D. Barbosa, M.F. Doherty, Proc. R. Soc. Lond. A 413 (1987) 443–458.43] W. Arlt, Fluid Phase Equilib. 158–160 (1999) 973–977.44] F. Alsmeyer, W. Marquardt, G. Olf, Fluid Phase Equilib. 203 (2002) 31–51.45] M. Tischmeyer, W. Arlt, Chem. Eng. Process. 43 (2004) 357–367.46] B.E. Poling, J.M. Prausnitz, J.P. O’Connell, The Properties of Gases and Liquids,
5th ed., McGraw Hill, New York, 2004.47] L. Stragevitch, S.G. d’Ávila, Braz. J. Chem. Eng. 14 (1997) 1–10.
48] P. Englezos, N. Kalogerakis, Applied Parameter Estimation for Chemical Engi-neers, Marcel Dekker Inc., New York, 2001.49] M.J. Okashinski, M.F. Doherty, Chem. Eng. Sci. 55 (2000) 5263–5271.50] W. Song, G. Venimadhavan, J.M. Manning, M.F. Malone, M.F. Doherty, Ind. Eng.
Chem. Res. 37 (1998) 1917–1928.
[
[[
Equilibria 345 (2013) 68–80
51] O. Sanchez, G. Vidriales, E. Morales, E. Ortiz, Chem. Eng. J. 117 (2006)123–129.
52] S.K. Wasylkiewicz, Chem. Eng. Sci. 55 (2000) 5177–5182.53] U. Weidlich, J. Gmehling, Ind. Eng. Chem. Res. 26 (1987) 1372–1381.54] J. Gmehling, J. Li, M. Schiller, Ind. Eng. Chem. Res. 32 (1993) 178–193.55] J. Gmehling, J. Lohmann, A. Jakob, J. Li, R. Joh, Ind. Eng. Chem. Res. 37 (1998)
56] J. Gmehling, R. Wittig, J. Lohmann, R. Joh, Ind. Eng. Chem. Res. 41 (2002)1678–1688.
57] R. Schefflan, Teach Yourself the Basics of Aspen Plus, Wiley, New Jersey, 2011.58] N.G. Krokhin, Russ. J. Phys. Chem. 43 (1969) 235–238.