co2 -evoked release of pge2 modulates sighs and inspiration as demonstrated in brainstem organotypic...
TRANSCRIPT

For correspondence eric
herleniuskise
daggerThese authors contributed
equally to this work
Competing interest See
page 36
Funding See page 36
Received 03 January 2016
Accepted 21 June 2016
Published 05 July 2016
Reviewing editor Jan-Marino
Ramirez Seattle Childrenrsquos
Research Institute and University
of Washington United States
Copyright Forsberg et al This
article is distributed under the
terms of the Creative Commons
Attribution License which
permits unrestricted use and
redistribution provided that the
original author and source are
credited
CO2-evoked release of PGE2 modulatessighs and inspiration as demonstrated inbrainstem organotypic cultureDavid Forsberg12 Zachi Horn12dagger Evangelia Tserga12dagger Erik Smedler3Gilad Silberberg4 Yuri Shvarev12 Kai Kaila5 Per Uhlen3 Eric Herlenius12
1Department of Womenrsquos and Childrenrsquos Health Karolinska Institutet StockholmSweden 2Karolinska University Hospital Stockholm Sweden 3Department ofMedical Biochemistry and Biophysics Karolinska Institutet Stockholm Sweden4Department of Neuroscience Karolinska Institutet Stockholm Sweden5Department of Biosciences and Neuroscience Center University of HelsinkiHelsinki Finland
Abstract Inflammation-induced release of prostaglandin E2 (PGE2) changes breathing patterns
and the response to CO2 levels This may have fatal consequences in newborn babies and result in
sudden infant death To elucidate the underlying mechanisms we present a novel breathing
brainstem organotypic culture that generates rhythmic neural network and motor activity for 3
weeks We show that increased CO2 elicits a gap junction-dependent release of PGE2 This alters
neural network activity in the preBotzinger rhythm-generating complex and in the chemosensitive
brainstem respiratory regions thereby increasing sigh frequency and the depth of inspiration We
used mice lacking eicosanoid prostanoid 3 receptors (EP3R) breathing brainstem organotypic slices
and optogenetic inhibition of EP3R++ cells to demonstrate that the EP3R is important for the
ventilatory response to hypercapnia Our study identifies a novel pathway linking the inflammatory
and respiratory systems with implications for inspiration and sighs throughout life and the ability
to autoresuscitate when breathing fails
DOI 107554eLife14170001
IntroductionBreathing is essential for life but the underlying mechanisms that control breathing movements and
neuronal pattern generation are under debate (Jasinski et al 2013) Breathing maintains tissue
homeostasis and an adequate response to increased carbon dioxide (CO2) levels is crucial
(Kaila and Ransom 1998 Guyenet and Bayliss 2015) Failure to adequately respond to pCO2
alterations is linked to breathing disturbances apnea of prematurity centrally mediated sickness
such as noxious sensations and panic and premature death as in sudden infant death syndrome
(Guyenet and Bayliss 2015)
Neuronal networks in the parafacial respiratory groupretrotrapezoid nucleus (pFRGRTN) and
the preBotzinger complex (preBotC) are important networks implicated in the central control of
breathing pFRGRTN paired-like homeobox 2b (Phox2b)-expressing neurons are sensitive to
changes in CO2 levels or their proxy pH ([H+]) (Mellen and Thoby-Brisson 2012 Onimaru and
Dutschmann 2012) This responsiveness to hypercapnia is independent of synaptic transmission
and the Phox2b+ neurons detect CO2H+ via intrinsic proton receptors (TASK-2 and GPR4) in paral-
lel pathways (Kumar et al 2015) Moreover medullary astrocytes contribute to central chemosensi-
tivity Slight acidification leads to an increased astrocytic intracellular concentration of calcium ions
(Ca2+) resulting in vesicle-independent ATP release (Gourine et al 2010)
Forsberg et al eLife 20165e14170 DOI 107554eLife14170 1 of 41
RESEARCH ARTICLE
In addition a CO2 sensitivity of astrocytes also mediates a vesicular-independent ATP release
(Huckstepp and Dale 2011) Some connexins which are expressed on astrocytes eg connexin 26
(Cx26) and Cx30 are indeed sensitive to CO2 (Meigh et al 2013 Reyes et al 2014)
These cellular processes of chemosensitivity result in an altered respiratory pattern that lowers
the blood CO2 levels Inflammation reduces the CO2 response and particularly in neonatal mam-
mals can induce sighs an altered response to hypoxia and potentially life-threatening apnea epi-
sodes as shown in humans sheep piglets and rodents (Guerra et al 1988 Long 1988
Herlenius 2011 Siljehav et al 2014 Koch et al 2015 Siljehav et al 2015)
In the inflammatory pathway prostaglandin E2 (PGE2) is an important molecular mediator that
together with its main receptor the EP3R play roles in the hypoxic and hypercapnic responses eg
seen in patients with bronchopulmonary dysplasia (Kovesi et al 2006 Siljehav et al 2014
Koch et al 2015) PGE2 also seems to induce a sigh oriented respiratory pattern (Koch et al
2015) Sighs are regularly occurring events of augmented breaths with a biphasic inspiratory pattern
with the initial phase being comparable to eupnea and the second having larger amplitude
(Toporikova et al 2015) Such breaths are necessary for life and have been linked to several patho-
logical states (Ramirez 2014 Li et al 2016)
Here we hypothesized that both PGE2 and EP3R constitute parts of the respiratory machinery
and that they are involved in the induction of sighs and the hypercapnic response We established a
viable brainstem organotypic slice culture that maintains respiratory-related activity for several weeks
in vitro and used this to investigate how PGE2 and EP3R alter breathing and control of chemosensi-
tivity Our novel data reveal an important role of the EP3R in the pFRGRTN hypercapnic response
and furthermore suggest that PGE2 is released during hypercapnia possibly through CO2-sensitive
connexin hemichannels Inflammation with its associated PGE2 release exogenous PGE2 and a lack
of EP3R blunts the hypercapnic response These data link the inflammatory and respiratory systems
eLife digest Humans and other mammals breathe air to absorb oxygen into the body and to
remove carbon dioxide We know that in a part of the brain called the brainstem several regions
work together to create breaths but it is not clear precisely how this works These regions adjust
our breathing to the demands placed on the body by different activities such as sleeping or
exercising Sometimes especially in newborn babies the brainstemrsquos monitoring of oxygen and
carbon dioxide does not work properly which can lead to abnormal breathing and possibly death
In the brain cells called neurons form networks that can rapidly transfer information via electrical
signals Here Forsberg et al investigated the neural networks in the brainstem that generate and
control breathing in mice They used slices of mouse brainstem that had been kept alive in a dish in
the laboratory The slice contained an arrangement of neurons and supporting cells that allowed it
to continue to produce patterns of electrical activity that are associated with breathing Over a
three-week period Forsberg et al monitored the activity of the cells and calculated how they were
connected to each other The experiments show that the neurons responsible for breathing were
organized in a ldquosmall-worldrdquo network in which the neurons are connected to each other directly or
via small numbers of other neurons
Further experiments tested how various factors affect the behavior of the network For example
carbon dioxide triggered the release of a small molecule called prostaglandin E2 from cells This
molecule is known to play a role in inflammation and fever However in the carbon dioxide sensing
region of the brainstem it acted as a signaling molecule that increased activity Therefore
inflammation could interfere with the bodyrsquos normal response to carbon dioxide and lead to
potentially life-threatening breathing problems Furthermore prostaglandin E2 induced deeper
breaths known as sighs which may be vital for newborn babies to be able to take their first deep
breaths of life Future challenges include understanding how the brainstem neural networks
generate breathing and translate this knowledge to improve the treatment of breathing difficulties
in babies
DOI 107554eLife14170002
Forsberg et al eLife 20165e14170 DOI 107554eLife14170 2 of 41
Research article Computational and Systems Biology Neuroscience
with implications for sighs and inspiration throughout life as well as for the ability to autoresuscitate
when breathing fails
Results
EP3R is involved in respiratory control sighs and the hypercapnicresponseTo investigate the role of PGE2 and EP3R in respiration and sigh activity we performed whole
body plethysmography on 9-day old mice We found EP3R and its ligand PGE2 to be important
modulators of breathing and the response to hypercapnia (5 CO2 in normoxia Table 1) The sigh
frequency increased after the intracerebroventricular (icv) injection of PGE2 (1 mM in 2ndash4 ml artifi-
cial cerebrospinal fluid aCSF) in an EP3R-dependent manner (Figure 1cndashd Table 2) as did the
tidal volume (VT) (during eupnea excluding sighs) in wild-type mice (Figure 1e) Furthermore
hypercapnic exposure also induced an increase in sigh frequency (Figure 1f Table 2) This increase
was larger in wild-type mice than in mice lacking the EP3R (Ptger3-- mice) This CO2-induced
increase in sigh frequency was abolished in wild-type mice after icv injection of PGE2 (Figure 1f
Table 2) The mice also responded to hypercapnia with increases in respiratory frequency (FR) VT
and minute ventilation (VE Figure 1g) Icv injection of PGE2 abolished the VT but not the FRresponse during hypercapnia (Table 1) This provides new information on how PGE2 induces sigh
activity and how increased PGE2 levels as during inflammation may both induce sighs and attenu-
ate responsiveness to CO2
To unravel the mechanistic details of the PGE2-EP3R system in respiratory regulation and its con-
nection to the hypercapnic response and sighs we set out to create a model system that would
allow long-term detailed studies of the respiratory neural networks ie networks with neurons as
well as glial cells
Establishment of a viable respiratory brainstem organotypic slicecultureBrainstem organotypic slice cultures of the mouse brainstem from 3-day-old mice were prepared
at the preBotC brainstem level (Figure 2a) To validate this new model system we first exam-
ined survival and expression of various neural markers in the brainstem slice cultures during
cultivation
Neural marker staining showed intact neurons and neurokinin 1 receptor (NK1R)-positive respira-
tory regions were cytoarchitectonically well preserved (Figure 2beg Figure 2mdashfigure supplement
1) The expression pattern of vesicular glutamate transporter 2 (VGlut2) similar to that in vivo
Table 1 Respiratory parameters under basal conditions Ptger3-- mice are heavier than wild-type mice of the same age They do not
however differ in respiratory frequency (FR) tidal volume (VT) or minute ventilation (VE) Icv injection of PGE2 increases VT and VE in
wild-type mice but not Ptger3-- mice Respiratory frequency tidal volume and minute ventilation all increased during hypercapnic
exposure n number of animals Data are presented as mean plusmn SD
Weight (g) FR (breathsmin) VT (ml g) VE (mlgmin)FR (breathsmin)Hypercapnia
VT (ml g)Hypercapnia
VE (ml g)Hypercapnia
WT - vehiclen=5
37 plusmn 05 206 plusmn 28 97 plusmn 29 dagger 20 plusmn 08dagger 259 plusmn 20 123 plusmn 31 32 plusmn 10
WT - PGE2n=8
39 plusmn 04 210 plusmn 15 151 plusmn 33dagger 32 plusmn 08dagger 267 plusmn 31 159 plusmn 26 42 plusmn 08
Ptger3-- - vehiclen=5
48 plusmn 04 215 plusmn 32 142 plusmn 24 30 plusmn 05 240 plusmn 37 157 plusmn 31 34 plusmn 11
Ptger3-- - PGE2n=7
44 plusmn 03 211 plusmn 18 138 plusmn 27 29 plusmn 06 241 plusmn 30 149 plusmn 27 35 plusmn 04
plt005 (normocapnia vs hypercapnia)
plt005 (WT vs Ptger3--)
daggerplt005 (vehicle vs PGE2)
DOI 107554eLife14170003
Forsberg et al eLife 20165e14170 DOI 107554eLife14170 3 of 41
Research article Computational and Systems Biology Neuroscience
Figure 1 PGE2 and CO2 increase sigh activity via EP3R signaling Respiratory activity was recorded in vivo in a two-chamber plethysmograph (a) Sighs
defined by an increase in inspiratory volume and respiratory cycle period with a biphasic inspiration (b) increase in frequency after
intracerebroventricular injection (icv) of PGE2 This effect is absent in mice lacking EP3R (Ptger3-- c arrows d) Icv injection of PGE2 also increases
the tidal volume (VT) in wild-type C57BL6J (WT) mice (e) The sigh frequency is increased by hypercapnic (5 CO2 in normoxia) conditions in wild-type
and Ptger3-- mice but less so in Ptger3-- mice (f) In wild-type mice the increase is abolished after icv injection of PGE2 (f) Hypercapnic exposure
causes an increase in respiratory frequency (FR) tidal volume (VT) and minute ventilation (VE) (g) but the increase is attenuated in Ptger3-- mice Data
are presented as means plusmn SD plt005 Source data are available in a separate source data file
DOI 107554eLife14170004
The following source data is available for figure 1
Source data 1 In vivo plethysmography data
DOI 107554eLife14170005
Table 2 PGE2 and hypercapnia induce sighs Sigh frequency does not differ between wild-type mice
and Ptger3-- mice In wild-type mice PGE2 increases sigh frequency Hypercapnia also increases sigh
frequency more in wild-type mice than in Ptger3-- mice PGE2 abolishes this increase in wild-type
mice but not in Ptger3-- mice (plt005) n number of animals Data are presented as mean plusmn SD
Sighsmin Normocapnia Sighsmin Hypercapnia
WT - vehicle n=5 04 plusmn 01 10 plusmn 02
WT - PGE2 n=8 07 plusmn 01 09 plusmn 03
Ptger3--- vehicle n=5 04 plusmn 01 07 plusmn 03
Ptger3-mdash- PGE2 n=7 04 plusmn 01 06 plusmn 02
DOI 107554eLife14170006
Forsberg et al eLife 20165e14170 DOI 107554eLife14170 4 of 41
Research article Computational and Systems Biology Neuroscience
Figure 2 Brainstem slice cultures have a preserved structure and neurons with functional potential Brainstem
slices containing the preBotC were used to create slice cultures Anatomical landmarks including the nucleus
ambiguus (NA) nucleus tractus solitarius (NTS) and nucleus hypoglossus (XII a) as well as the distinct expression
of NK1R (b c g) enabled the identification of the preBotC region The brainstem slice displayed MAP2-Tuj1-
positive neurons expressing NK1R (b c) VGlut2 (d) andor KCC2 (e) The abundant MAP2-Tuj1-positive cells
demonstrated a preserved neuronal network within the preBotC (g) KCC2 expression was found in the NTS NA
and preBotC (e) DIV days in vitro Arrowheads double-labeled cells Scale bars 100 mm in bndashf 500 mm in g
DOI 107554eLife14170007
The following figure supplements are available for figure 2
Figure supplement 1 Protein expression pattern is preserved during cultivation
DOI 107554eLife14170008
Figure supplement 2 Slices flatten during cultivation
DOI 107554eLife14170009
Figure supplement 3 Brainstem slice cultures are viable
DOI 107554eLife14170010
Forsberg et al eLife 20165e14170 DOI 107554eLife14170 5 of 41
Research article Computational and Systems Biology Neuroscience
indicates the functional potential of the brainstem slice culture because glutamatergic synapses are
essential for the development of the breathing rhythm generator (Wallen-Mackenzie et al 2006)
(Figure 2d) Neuronal markers MAP2 and KCC2 (Kaila et al 2014) were expressed in the preBotC
(Figure 2cndashf Figure 2mdashfigure supplement 2) The protein expression in the preBotC remained sta-
ble for 3 weeks of cultivation (Figure 2mdashfigure supplement 1) The brainstem slice cultures became
thinner with longer cultivation as the tissue spread out (Figure 2mdashfigure supplement 2) However
they remained viable and exhibited a low degree of necrosis and apoptosis even after 3 weeks (Fig-
ure 2mdashfigure supplement 3)
Figure 3 Neuronal electrical activity indicates preserved networks Neurons in a preBotC slice (7 DIV) patched in
the whole-cell configuration in current-clamp mode (a) exhibit regular rhythmic bursting activity (b) The neurons
exhibited a hyperpolarized resting potential action potentials synaptic input and spontaneous electrical activity
with epochs of action potential activity (b c) The different measured variables indicated healthy and normally
functioning neurons (d) Depicted here are two simultaneously patched neurons that also received common
synaptic input (e arrows) Spiking epochs occurred simultaneously suggesting synchronized network oscillations
Direct connectivity between the depicted neurons showed that they were neither chemically nor electrically
synaptically connected to each other This finding indicates that the observed correlation was induced by common
input from a preserved network structure AP action potential DIV days in vitro Source data are available in a
separate source data file
DOI 107554eLife14170011
The following source data and figure supplement are available for figure 3
Source data 1 Electrophysiology patch clamp data
DOI 107554eLife14170012
Figure supplement 1 Cells of brainstem slice cultures retain neuronal electrical properties
DOI 107554eLife14170013
Forsberg et al eLife 20165e14170 DOI 107554eLife14170 6 of 41
Research article Computational and Systems Biology Neuroscience
Figure 4 Neural activity in the preBotC is arranged in a functional respiratory network with respiratory-related motor output In the preBotC slice (a) a
cross-correlation analysis of Ca2+ time-lapse imaging data (Figure 4mdashfigure supplement 1) revealed small-world network-structured correlated activity
in the preBotC (bndashd) The number of correlating cell pairs did not change over time (e) nor did the small-world network parameter or connectivity (f)
TMR-SP-positive regions contained more correlated cell pairs than TMR-SP-negative regions (621 plusmn 284 N=14 and 56 plusmn 48 N=9 respectively plt005)
although there was no difference in the number of active cells (112 plusmn 57 N=14 and 144 plusmn 68 N=9 respectively NS g) As in the preBotC the nucleus
hypoglossus maintained correlated neural network activity (h) Ten percent of the cells (n=8ndash12slice) in the hypoglossal nucleus exhibited a regular
spiking frequency of ~50ndash100 mHz (i) The multicolored bar indicates the correlation coefficient in bndashh warmer colors indicate more strongly correlated
activity between two cells connected by the line DIV days in vitro AU arbitrary units w week N number of slices n number of cells Scale bars 500
mm in a 100 mm in bndashd and gndashh Multicolored bar color-coded correlation coefficient values Data are presented as means plusmn SD Source data are
available in a separate source data file
DOI 107554eLife14170014
The following source data and figure supplements are available for figure 4
Source data 1 Correlation data preBotC
DOI 107554eLife14170015
Source data 2 Frequency data with DAMGO
DOI 107554eLife14170016
Figure supplement 1 Single cell events provide information about correlated activity
DOI 107554eLife14170017
Figure supplement 2 Spontaneous Ca2+ activity is preserved for 3 weeks
DOI 107554eLife14170018
Forsberg et al eLife 20165e14170 DOI 107554eLife14170 7 of 41
Research article Computational and Systems Biology Neuroscience
Physiological measurements of brainstem respiratory activitydemonstrate functional and responsive networksAfter evaluating morphology we investigated the cellular activity within the brainstem slice
culture
Neurons in the brainstem slice cultures retained their electrical properties at 7 days in vitro (DIV)
including a resting membrane potential of 55 plusmn 6 mV (Figure 3bndashc) and overshooting action poten-
tials (Figure 3c) The resting membrane potential action potential threshold half-width and peak
amplitudes of the action potential and membrane time constant were within the ranges of acute
respiratory slices (Figure 3c Figure 3mdashfigure supplement 1) Action potentials occurred in clusters
of regular rhythmic bursting activity Neuronal connections were also similar to those seen immedi-
ately ex vivo eg in acute slices (Ballanyi and Ruangkittisakul 2009) as evidenced by the postsyn-
aptic potentials and concurrent inputs to neighboring neurons resulting in correlated activity
(Figure 3b Figure 3mdashfigure supplement 1)
Thus on an individual neuronal level the cells behave as expected However breathing is gener-
ated through cellular interactions in respiration-related neural networks
To investigate how individual cells interact we applied live time-lapse Ca2+ imaging to allow
simultaneous recording of the activity of hundreds of cells Tetramethyl rhodamine coupled Sub-
stance P (TMR-SP) visualizing NK1R-expressing neurons was used to identify the preBotC In the
brainstem slice cultures the preBotC contained networks with correlated activity between cells
(Figure 4bndashd) which was analyzed using a recently reported cross-correlation analysis method
(Smedler et al 2014) (Figure 4mdashfigure supplement 1) We found clusters of cells with highly cor-
related activity Such groups of cells in close proximity to each other were interconnected via a few
cells that seem to function as hubs (Watts and Strogatz 1998) The correlated network activity in
the preBotC was preserved for 1 2 and 3 weeks (Figure 4bndashe) The number of active cells and the
correlations per active cell remained similar over time (Figure 4e) These data suggest that the brain-
stem slice culture approach can indeed be used to perform long-term studies of respiratory neural
network activity
Analysis of the network structure revealed stable connectivity values (ie the number of cell
pairs with a correlation coefficient exceeding the cut-off value divided by the total number of cell
pairs) during the cultivation of preBotC slices for up to 3 weeks (Figure 4f Table 3) These values
were slightly higher than those estimated in a previous study (Hartelt et al 2008) in which only
neurons were accounted for However both neurons and glia are involved in respiratory control
(Erlichman et al 2010 Giaume et al 2010) and our analysis provides information on both cell
types Moreover other analyzed network parameters ie the normalized mean path-length (l)
and the normalized mean clustering-coefficient (s) also remained stable (Figure 4f Table 3)
Overall the small-world parameter (Watts and Strogatz 1998) g frac14 slwas unchanged after 3
weeks in culture Inhibiting the firing of action potentials and consequent activation of synapses by
tetrodotoxin (TTX 20 nM) abolished the coordinated network activity and revealed a population
of cells that retained rhythmic alterations of cytosolic Ca2+ levels (31 plusmn 4 of the total number of
cells N=14 slices) Most of these cells (76 plusmn 12 N=14) were NK1R-positive neurons indicating
Table 3 The preBotC network parameters remain unchanged for 21-DIV culturesThe results of
correlation analysis for the preBotC are shown NS not significant N number of slices Data are
presented as mean plusmn SD
preBotC 7 DIV (N=12) 14 DIV (N=13) 21 DIV (N=8)
Correlating cell pairs 560 plusmn 325 501 plusmn 277 517 plusmn 327 NS
Active cells 110 plusmn 40 100 plusmn 59 110 plusmn 69 NS
Correlations per active cell 6 plusmn 4 6 plusmn 5 7 plusmn 6 NS
Connectivity 08 plusmn 01 08 plusmn 02 08 plusmn 02 NS
Mean shortest path length (l) 07 plusmn 02 08 plusmn 02 08 plusmn 02 NS
Clustering coefficient (s) 27 plusmn 15 28 plusmn 16 2 plusmn 06 NS
Small-world parameter (g) 42 plusmn 30 34 plusmn 17 27 plusmn 17 NS
DOI 107554eLife14170019
Forsberg et al eLife 20165e14170 DOI 107554eLife14170 8 of 41
Research article Computational and Systems Biology Neuroscience
Figure 5 Breathing brainstem in a dish ongoingpersistent rhythmic XII motor activity The connected preBotC neural networks generate respiratory-
related motor neuronal output delivered through the 12th cranial nerve (XII) The hypoglossal nucleusnerve discharge frequency varied among the
brainstem slice cultures but did not depend on brainstem slice culture age (a N=16 at 7 DIV N=3 at 14 DIV and N=6 at 21 DIV) The regularity of
respiration-related motor activity measured as CV (coefficient of variation) remained stable during 3 weeks of culture (b) The m-opioid receptor
agonist DAMGO (05 mM) silenced the XII nerve activity in 55 brainstem slice cultures as depicted here in (c) from a 7-DIV brainstem culture (filtered
trace above and rectified and smoothed trace below) DAMGO lowered the Ca2+ In the hypoglossal nucleus DAMGO (05 mM) lowered the
frequency of regularly-spiking cells (f g) N number of slices Data are presented as means plusmn SD plt005 Source data are available in a separate
source data file
DOI 107554eLife14170020
The following source data and figure supplement are available for figure 5
Source data 1 12th cranial nerve electrophysiology recordings
DOI 107554eLife14170021
Source data 2 Frequency data with DAMGO
DOI 107554eLife14170022
Source data 3 High potassium frequency data
DOI 107554eLife14170023
Source data 4 Network topology and frequency data with DAMGO
DOI 107554eLife14170024
Figure supplement 1 Rhythmic respiratory-related output is preserved
DOI 107554eLife14170025
Forsberg et al eLife 20165e14170 DOI 107554eLife14170 9 of 41
Research article Computational and Systems Biology Neuroscience
the presence of functioning pacemaker neurons
(Figure 4mdashfigure supplement 2) The Ca2+ sig-
nals from synapse-independent cells remained
however with a lower frequency and higher
coefficient of variation (Figure 4mdashfigure sup-
plement 2) Regions outside the brainstem
nuclei contained active cells without intercellu-
lar coordination (Figure 4g) This cellular activ-
ity ceased during TTX treatment In conclusion
the brainstem slice cultures contain a preserved
preBotC network with a small-world structure
As the preBotC delivers part of its motor out-
put through the hypoglossal nerve (Smith et al
2009) we also examined the hypoglossal motor
nucleus In this region of the hypoglossal motor
nucleus we found correlated cell activity orga-
nized similarly to that found in the preBotC net-
work (Figure 4h) Within this network frequency
analysis revealed regularly spiking cells with a
frequency between 50 and 100 mHz corresponding to a rhythmic motor neuron output of 3ndash6
bursts of respiration-related activitymin (average 37 plusmn 09 burstsmin Figure 4i) This suggests a
preserved respiratory-related output in the brainstem slice cultures
Subsequent recordings of extracellular potentials from the 12th cranial nerve and hypoglossal
nucleus revealed a corresponding rhythmic respiratory-related output at 7 (N=16) 14 (N=3) and 21
DIV (N=6) Respiratory output from acute slices varied between 1 and 8 bursts per min (neonatal
mice 3 mM K+) with frequencies in the lower range after a longer incubation time in vitro
(Ramirez et al 1997 Ruangkittisakul et al 2011) In our model we observed a respiratory-related
frequency of 37 plusmn 25 bursts per min (average of frequencies at 7 14 and 21 DIV no significant dif-
ference was observed between different DIV Figure 5a) which is within the expected range for a
slice Among individual cultures there was some variability in frequency (Figure 5a) However the
intrinsic rhythm was stable with an average coefficient of variation of 22 plusmn 8 (no difference between
the different DIV Figure 5b) Rhythmic XII activity was observed for more than 2 hr during record-
ings (Figure 5mdashfigure supplement 1)The activity could be inhibited by a m-opioid receptor agonist
[D-Ala2 N-Me-Phe4 Gly5-ol]-enkephalin (DAMGO 05 mM Figure 5c Figure 5mdashfigure supplement
1) and stimulated by NK1R agonist Substance P (1 mM 19 plusmn 13 increase in frequency plt005
N=7 Figure 5mdashfigure supplement 1)
In the preBotC DAMGO also inhibited the Ca2+ activity of individual NK1R+ neurons and lowered
the network frequency significantly (Figure 5d Video 1) This was accompanied by an increase in
the coefficient of variation in this area (36 plusmn 4 vs 47 plusmn 6 N=7 slices plt005) The network structure
was not affected An increase in [K+] from 3 mM to 9 mM with subsequent membrane potential
depolarization increased the frequency in the preBotC (Figure 5e) In the hypoglossal nucleus
DAMGO caused a frequency reduction in the regularly spiking cells (Figure 5fg) Thus the preBotC
brainstem slice culture remained active and responsive and generated rhythmic respiration-related
motor output activity
Gap junctions are essential parts of correlated preBotC activityGap junction signaling plays an important role in the development of the respiratory system the
maintenance of respiratory output and likely the CO2pH response (Elsen et al 2008 Fortin and
Thoby-Brisson 2009 Gourine et al 2010 Huckstepp et al 2010a) Thus we used the brainstem
slice cultures to investigate the involvement of gap junctions in the neural networks and their
response to CO2
In the brainstem slice cultures immunohistochemistry showed high Cx43 expression in neurons of
the preBotC (Figure 6a) and lower and persistent Cx26 and Cx32 expression in the respiratory
regions (Figure 6bndashd) at 7 DIV To assess the function of these intercellular gap junctions and hemi-
channels we treated the brainstem slice cultures at 7 DIV with gap junction inhibitors carbenoxolone
(CBX) or 18a-glycyrrhetinic acid (18-a-GA) Both inhibitors decreased the number of correlating cell
Video 1 NK1R+ respiratory neurons in the preBotC are
identified using TMR-SP (red dye) followed by Ca2+
oscillations visualized with Fluo-4 After 25 s the m-
opioid receptor agonist DAMGO (05 mM) is added and
reduces the signaling frequency of the network fps
frames per second
DOI 107554eLife14170026
Forsberg et al eLife 20165e14170 DOI 107554eLife14170 10 of 41
Research article Computational and Systems Biology Neuroscience
Figure 6 Gap junctions are necessary to maintain part of the correlated respiratory network In the respiratory regions the gap junction proteins Cx43
(a N=9) Cx32 (b c N=8) and Cx26 (d arrowheads double-labeling with NK1R N=5) are present Gap junction inhibitors CBX (e) and 18-a-GA (f)
reduced network synchronization in the preBotC Notably the Ca2+ activity of individual NK1R-positive cells was not affected (hndashj m) Correlating cell
pair numbers decreased to 21 (N=8) and 20 (N=6) of their respective controls after treatment with CBX and 18-a-GA respectively (k) Network
properties were not affected by GZA an analog to CBX that lacks the ability to block gap junctions (g jndashk N=7) or aCSF (N=8) An initial increase in
fluorescence intensity was noted after adding CBX and GZA but not after adding 18-a-GA indicating an immediate excitatory effect of CBX and GZA
(l) 18-a-GA reduced the number of active cells in the network at 1 min after application (53) but CBX did not (91 NS) At the same time point an
increased number of active cells were observed with GZA treatment (139) After 10 min a reduction of the number of active cells was found after
Figure 6 continued on next page
Forsberg et al eLife 20165e14170 DOI 107554eLife14170 11 of 41
Research article Computational and Systems Biology Neuroscience
pairs and active cells in the preBotC whereas glycyrrhizic acid (GZA) an analog to CBX that lacks
the ability to block gap junctions and the aCSF control did not (Figure 6endashg kndashl) However the
individual activity of NK1R expressing neurons was not affected (Figure 6hndashjm) These findings sug-
gest a role for gap junctions in the maintenance of correlated network activity in the preBotC
Conversely the rhythmic activity of NK1R+ neurons does not depend on gap junctions Moreover
gap junction inhibition did not affect the mean correlation values connectivity or small-world
parameter of the remaining correlated cell pairs (Figure 6mdashfigure supplement 1) This demon-
strates that the cells connected in a gap junction-independent manner are organized as a small-
world network These results are in line with topological data showing that respiratory neurons are
organized in small clusters in the preBotC (Hartelt et al 2008)
PGE2 modulates preBotC activityOur in vivo data as well as othersrsquo indicate that PGE2 and hypercapnia induce sigh activity (Ram-
irez 2014 Koch et al 2015) We hypothesized that this is due to effects on the respiratory centers
in the brainstem We used our brainstem slice cultures of the preBotC to study the direct effects of
PGE2 and hypercapnia in vitro
PGE2 levels in cerebrospinal fluid measured in experimental models and in human infants are in
the pico- to nanomolar range (Hofstetter et al 2007) In the brainstem slice cultures at 7 DIV
the application of PGE2 (10 nM) lowered the Ca2+ signaling frequency of respiratory neurons in
the preBotC (Figure 7andashb) PGE2 also induced longer Ca2+ transients and the signal amplitudes
increased compared to those of the controls (Figure 7b) Koch and colleagues (Koch et al 2015)
suggested that the increase in sighs induced by PGE2 is mediated through persistent sodium chan-
nels (INaP) (Koch et al 2015) Indeed in the preBotC 10 mM Riluzole a blocker of the persistent
sodium current (INaP) attenuated effect of PGE2 on Ca2+ signal amplitude and length as well as
decreasing the signal frequency (Figure 7b) As in previous studies (Toporikova et al 2015) Rilu-
zole did not affect the Ca2+ signal compared to control periods Riluzole is used as an INaP blocker
but may also affect other parts of neuronal signaling such as glutamate release (Wang et al
2004) Therefore we cannot completely determine whether the PGE2 effect is due to an effect on
the persistent sodium current or interference with glutamate signaling although an effect on INaP
is likely (Koch et al 2015)
EP3Rs were present in the preBotC (Figure 7cndashd) qRT-PCR showed that 20 of the EP3Rs were
of the a-subtype (Figure 7e) EP3Ra inhibits adenylate cyclase via Gi-protein and reduced cAMP
levels inhibit FR (Ballanyi et al 1997) The EP3Rg subtype however which couples to the GS-pro-
tein was the most abundant (Figure 7e)
In vivo hypercapnia increases sigh activity VT FR and VE (Figure 1) Therefore we exposed the
preBotC brainstem slice culture to increased levels of CO2 by raising the pCO2 levels from 46 kPa
to hypercapnic 66 kPa while maintaining a constant pH of 75 in the aCSF by the addition of bicar-
bonate This did not have any effect on the Ca2+ signaling frequency the Ca2+ signaling pattern or
the network structure in wild-type or Ptger3-- mice (Figure 7fndashg Figure 7mdashfigure supplement 1)
However the preBotC is not the main central chemosensitive region Instead the sensitivity to CO2
is more profound in the pFRG Therefore we generated organotypic slice cultures of the pFRGRTN
brainstem level
Figure 6 continued
treatment with both 18-a-GA and CBX (54 and 43) However the number of active cells returned to normal after GZA application (89 NS l) DIV
days in vitro N number of slices Scale bars 10 mm in a c and d 100 mm in others Multicolored bar color-coded correlation coefficient values Data
are presented as means plusmn SD plt005 Source data are available in a separate source data file
DOI 107554eLife14170027
The following source data and figure supplement are available for figure 6
Source data 1 Gap junction inhibition data
DOI 107554eLife14170028
Figure supplement 1 A gap junction-independent network is present within the preBotC
DOI 107554eLife14170029
Forsberg et al eLife 20165e14170 DOI 107554eLife14170 12 of 41
Research article Computational and Systems Biology Neuroscience
The pFRGRTN respiratory region exhibited correlated network activityand retained CO2 sensitivityThe analysis of network structure and function that we conducted on the preBotC was previously
not possible to perform in the pFRGRTN on acute transverse slices Studies of the pFRGRTN
are particularly interesting because of its crucial role in central respiratory chemosensitivity
(Onimaru et al 2009) We therefore created the same type of brainstem slice culture as with
the preBotC slice using slices containing the pFRGRTN instead (Figure 8a) These brainstem slice
Figure 7 PGE2 modulates preBotC network activity PGE2 lowered the Ca2+ signaling frequency of the preBotC network in WT mice but not in
Ptger3-- mice (andashb) The effect was attenuated but not abolished by Riluzole (b) PGE2 also increased signal amplitude and length (andashb) an effect that
was abolished after Riluzole application (b) Ptger3 is expressed in the preBotC (c d) and 20 of the EP3Rs were of the a (Gi-protein coupled) subtype
and 77 of the g (Gs-protein coupled) subtype (e) Hypercapnic exposure (pCO2 elevated from 46 to 66 kPa) did not affect the signal frequency of the
preBotC (fndashg) DIV days in vitro Scale bars 50 mm in c and 10 mm in d plt005 Source data are available in a separate source data file
DOI 107554eLife14170030
The following source data and figure supplement are available for figure 7
Source data 1 PGE2 data preBotC
DOI 107554eLife14170031
Source data 2 Hypercapnia data preBotC
DOI 107554eLife14170032
Source data 3 Hypercapnia data preBotC 2
DOI 107554eLife14170033
Figure supplement 1 Hypercapnia had no effect on the preBotC
DOI 107554eLife14170034
Forsberg et al eLife 20165e14170 DOI 107554eLife14170 13 of 41
Research article Computational and Systems Biology Neuroscience
Figure 8 pFRGRTN brainstem slice culture pFRGRTN slices were selected based on the location of the facial nucleus (VII a) In the brainstem slice
culture pFRGRTN expressed the neuronal markers NK1R (b) KCC2 (c) Phox2b (c) vGlut2 (d) and MAP2 (d) The pFRGRTN neurons also retained
adequate electrical properties and generated spontaneous action potentials individually or in clusters (endashf) Data are presented as box plots with
minimum and maximum values DIV days in vitro Scale bars 100 mm
DOI 107554eLife14170035
The following source data and figure supplement are available for figure 8
Source data 1 pFRGRTN characterization
DOI 107554eLife14170036
Figure supplement 1 Cultivation of pFRGRTN slices
DOI 107554eLife14170037
Forsberg et al eLife 20165e14170 DOI 107554eLife14170 14 of 41
Research article Computational and Systems Biology Neuroscience
Figure 9 The pFRGRTN respiration-related network generates correlated neural activity and responds to CO2
The pFRGRTN network is arranged in a small-world manner just ventral to the facial nucleus The network
structure was preserved during cultivation (andashd) The number of correlating cell pairs did not change with longer
culturing times but the number of active cells was higher at 3 weeks than at 2 weeks (45 plusmn 27lt76 plusmn 19 plt005 e)
The network parameters were stable during cultivation (f) The pFRGRTN network did not respond to the m-
opioid receptor agonist DAMGO (05 mM n=420 N=4 a) but the average network frequency increased with
higher potassium concentrations (22 plusmn 5 mHz and 38 plusmn 7 mHz N=12 b) Both the neural network and individual
NK1RTMR-SP-labeled cells responded to increases in CO2 pressure (pCO2 elevated to 66 kPa) indicating that
the chemosensitivity was preserved in the pFRGRTN brainstem slice culture Suramin a P2 receptor antagonist
and TNP-APT a P2X receptor antagonist attenuated the CO2 response but did not abolish it (g) DIV days in
vitro Scale bars 100 mm Multicolored bar color-coded correlation coefficient values N number of slices n
number of cells Data are presented as means plusmn SD plt005 Source data are available in a separate source data
file
DOI 107554eLife14170038
The following source data and figure supplements are available for figure 9
Source data 1 Correlation data pFRGRTN
DOI 107554eLife14170039
Source data 2 Hypercapnia data
DOI 107554eLife14170040
Source data 3 High potassium frequency data
DOI 107554eLife14170041
Source data 4 Riluzole and TTX data
DOI 107554eLife14170042
Figure supplement 1 Spontaneous Ca2+ activity is preserved during cultivation
DOI 107554eLife14170043
Figure supplement 2 Hypercapnia reduces mean path lengths in the pFRGRTN of wild-type mice
DOI 107554eLife14170044
Forsberg et al eLife 20165e14170 DOI 107554eLife14170 15 of 41
Research article Computational and Systems Biology Neuroscience
cultures expressed neuronal markers as expected (Figure 8bndashd Figure 8mdashfigure supplement 1)
and displayed retention of electrical properties in a manner similar to the preBotC brainstem slice
cultures (Figure 8endashf)
Looking at multiple cells using time-lapse Ca2+ imaging the activity of the pFRGRTN was corre-
lated in a scale-free small-world network akin the one in the preBotC (Figure 9bndashd) and was stable
during cultivation (Figure 9endashf) There was a slight difference in the number of active cells between
2 week and 3 week cultures (Figure 7e) However all network properties remained unchanged
(Figure 9f and Table 4) The inhibition of neuronal spiking and synapses by TTX (20 nM) disrupted
the coordinated activity (21 plusmn 9 of correlated cell pairs remained N=11) However rhythmic Ca2+
activity persisted in a subset of primarily (64 plusmn 9 N=11) NK1R-positive cells (Figure 9mdashfigure sup-
plement 1) The pFRGRTN cells did not exhibit any change in signaling frequency after DAMGO
application (Figure 9g average levels from 7- 14- and 21-DIV cultures are displayed as there were
no significant differences among cultures of these ages) confirming the absence of preBotC m-opi-
oid-sensitive regions in these slices (Ballanyi and Ruangkittisakul 2009) Similarly to the preBotC
brainstem slice culture the pFRGRTN responded to higher [K+] with an increase in frequency
(Figure 9h average levels from 7- 14- and 21-DIV cultures are displayed as there were no signifi-
cant differences among cultures of these ages)
Table 4 The pFRGRTN network parameters remain unchanged for 21-DIV cultures The results of
correlation analysis for the pFRGRTN are shown Among the analyzed network parameters only the
number of active cells differed at the analyzed time points and only between 14 and 21 DIV NS
not significant N number of slices Data are presented as mean plusmn SD
pFRGRTN 7 DIV (N=12) 14 DIV (N=11) 21 DIV (N=6)
Correlating cell pairs 118 plusmn 69 61 plusmn 31 74 plusmn 42 NS
Active cells 49 plusmn 26 41 plusmn 21 76 plusmn 19 plt005
Correlations per active cell 31 plusmn 22 17 plusmn 11 10 plusmn 07 NS
Connectivity 07 plusmn 02 06 plusmn 02 07 plusmn 02 NS
Mean shortest path length (l) 07 plusmn 02 07 plusmn 03 08 plusmn 05 NS
Clustering coefficient (s) 27 plusmn 16 30 plusmn 17 45 plusmn 36 NS
Small-world parameter (g) 36 plusmn 25 42 plusmn 26 33 plusmn 16 NS
DOI 107554eLife14170045
Table 5 pFRGRTN slices respond to CO2 if the EP3R is present The average mean frequency of all
cells in the network and the average mean frequency of NK1R-positive cells during the control period
or during exposure to hypercapnia are shown (pCO2 = 55 mmHg pH = 75) NS not significant N
number of slices n number of cells Data are presented as mean plusmn SD
Mean frequency (mHz)
Network NK1R+ cells
Control Hypercapnia Control Hypercapnia
pFRGRTN - WT(N=7 n=343)
216 plusmn 32 541 plusmn 27 plt005 144 plusmn 09 385 plusmn 55 plt005
pFRGRTN - Ptger3
(N=5 n=448)250 plusmn 79 260 plusmn 19 NS 114 plusmn 58 116 plusmn 38 NS
preBotC - WT(N=5 n=1737)
164 plusmn 25 165 plusmn 13 NS 166 plusmn 46 157 plusmn 53 NS
preBotC - Ptger3
(N=4 n=822)211 plusmn 86 173 plusmn 38 NS 227 plusmn 59 178 plusmn 77 NS
DOI 107554eLife14170046
Forsberg et al eLife 20165e14170 DOI 107554eLife14170 16 of 41
Research article Computational and Systems Biology Neuroscience
Next we examined the CO2 sensitivity of the
pFRGRTN (Onimaru et al 2008) This resulted
in increased signal frequency of the Ca2+ oscilla-
tions (Figure 9i Table 5 Video 2 data from 7-
DIV cultures are displayed and no significant dif-
ferences in the response among 7- 14- and 21-
DIV cultures were observed) and the activation
of some previously dormant cells During hyper-
capnic exposure the pFRGRTN network topol-
ogy remained essentially unchanged (Figure 9mdash
figure supplement 2)
Response to hypercapnia involves pFRGRTN
astrocytes which release ATP that acts on puri-
nergic P2-receptors (Erlichman et al 2010
Gourine et al 2010 Huckstepp et al 2010a)
We sought to examine whether this kind of sig-
naling pathway was active in the 7-DIV brainstem
slice cultures and we found that blocking puri-
nergic receptors with Suramin or TNP-ATP application did not abolish the hypercapnic response in
agreement with previous data (Sobrinho et al 2014) However both the unspecific P2 receptor
and the more specific P2X receptor antagonist attenuated the CO2 response by approximately one
third (30 plusmn 6 Figure 9i) as observed in adult and neonatal rats (Wenker et al 2012) and 9-day-
old mice (Gourine et al 2010) Thus the CO2-induced release of ATP acting on P2 receptors may
contribute to the CO2 response
In conclusion our brainstem organotypic slice culture contains an active pFRGRTN network
that retains its structural integrity over time and responds to CO2 exposure with increased
activity
The CO2 response is dependent on EP3R signaling and gap junctionsGap junctions both intercellular and hemichannels are linked to respiratory chemosensitivity
(Huckstepp et al 2010a Meigh et al 2013 Reyes et al 2014) Recently CO2 was shown to
interact with the hemichannel Cx26 inducing an open state through the formation of carbamate
bridges thus increasing the release of compounds such as ATP (Meigh et al 2013) Therefore we
hypothesized that gap junctions exert functions within the pFRGRTN network However gap junc-
tion inhibitors did not affect signaling frequency or network topology of the pFRGRTN (Figure 10a
Figure 10mdashfigure supplement 1) Instead the frequency response to hypercapnia was both inhib-
ited and reversed by the application of the gap junction inhibitor 18-a-GA (Figure 10bndashc) GZA (a
structural analog of CBX without gap junction-inhibiting properties) did not alter the CO2 response
(Figure 10bndashc)
We conclude that 18-a-GA inhibits the hypercapnic response while inhibition of purinergic signal-
ing pathways attenuates it Thus we suggest that the CO2 response is not entirely explained by the
connexin-mediated release of ATP Furthermore inflammation via PGE2 and EP3R alters the hyper-
capnic response in vivo and in brainstem spinal cord en bloc preparations (Figure 1 and Siljehav and
colleagues Figures 1 and 4 [Siljehav et al 2014]) Therefore we hypothesized that hypercapnic
responses involve PGE2 signaling and next analyzed the PGE2 content of the aCSF under control
and hypercapnic conditions In all examined slices (N=1212 7 DIV) a transient doubling of the
PGE2 concentration after pCO2 elevation was evident (Figure 11) When gap junction blockers were
applied this peak was absent (N=44 7 DIV Figure 11) This indicates a hypercapnia-induced gap
junction-mediated release of PGE2
Immunohistochemistry showed expression of microsomal prostaglandin E synthase 1 (mPGEs-1)
in GFAP positive astrocytes (Figure 11mdashfigure supplement 1) mPGEs-1 the main PGE2 producing
enzyme has previously been found mainly in endothelial cells of the blood brain barrier of adult rats
(Yamagata et al 2001) Our findings suggest that astrocytes in the vicinity of the ventral brainstem
border of neonates express mPGEs-1 and might therefore be candidates for modulation of breath-
ing through CO2-induced release of PGE2
Video 2 Ca2+ oscillations visualized with Fluo-4 in the
chemosensitive region pFRGRTN Low network activity
is increased by exposure to hypercapnia after 15 s fps
frames per second
DOI 107554eLife14170047
Forsberg et al eLife 20165e14170 DOI 107554eLife14170 17 of 41
Research article Computational and Systems Biology Neuroscience
Figure 10 Correlated pFRGRTN network activity is not dependent on gap junctions but hypercapnic responses are Blocking gap junctions in the
pFRGRTN did not change the functional network structure of the respiratory center or alter its frequency (a and c N=7) However hypercapnic
responses (CO2) were abolished when gap junctions were inhibited by 18-a-GA (b top trace c left graph N=7) GZA (a structural analog of CBX
without gap junction-inhibiting properties) increased the frequency and hypercapnia increased it further (b middle trace c middle graph N=7) An
initiated hypercapnic response was attenuated but not completely reversed by 18-a-GA (b bottom trace c lower graph N=5) This dynamic was not
seen after application of GZA DIV days in vitro Scale bars 200 mm N number of slices Multicolored bar color-coded correlation coefficient values
Data are presented as means plusmn SD plt005 Source data are available in a separate source data file
DOI 107554eLife14170048
The following source data and figure supplement are available for figure 10
Source data 1 Hypercapnia and gap junction inhibition frequency data
DOI 107554eLife14170049
Source data 2 Hypercapnia and gap junction inhibition network data
DOI 107554eLife14170050
Figure supplement 1 Network structure in the pFRGRTN is not dependent on gap junctions
DOI 107554eLife14170051
Forsberg et al eLife 20165e14170 DOI 107554eLife14170 18 of 41
Research article Computational and Systems Biology Neuroscience
PGE2 has a primarily inhibitory effect on respiration in neonatal mice and humans
(Hofstetter et al 2007) which we confirmed to account for its effects on the preBotC (Figure 7)
However as hypercapnia seems to induce a release of PGE2 while stimulating breathing activity we
hypothesized that PGE2 has a direct stimulatory effect on the pFRGRTN Indeed PGE2 increased
the signaling frequency of pFRGRTN neurons (Figure 12andashb Table 6) This effect was EP3R depen-
dent and EP3Rs were present in the pFRGRTN expressed both on respiratory neurons and on
astrocytes (Figure 12cndashe) We also observed a non-significant increase in amplitude (8 plusmn 3 and 11
plusmn 4 increase compared to control period NS) Neither the PGE2 effect nor the hypercapnic
response of the pFRGRTN was affected by Riluzole (30 plusmn 5 mHz vs 25 plusmn 2 mHz NS N=6 and 36 plusmn
2 mHz vs 35 plusmn 6 mHz NS N=6) qRT-PCR showed abundant expression of the EP3Rg subtype
Figure 11 PGE2 is released during hypercapnia The aCSF contents exhibited an increase in microenvironmental PGE2 levels during hypercapnia in 12
out of 12 slices Here the PGE2 concentration of a brainstem slice culture is displayed during control and hypercapnic periods (a) When gap junctions
were inhibited (18-a-GA blue line) the PGE2 levels remained unaltered during hypercapnia (N=4) The average PGE2 level throughout the whole
experiment was not affected by hypercapnia but the peak value was higher during hypercapnia than under control conditions (b) N number of slices
Data are presented as means plusmn SD plt005 Source data are available in a separate source data file
DOI 107554eLife14170052
The following source data and figure supplement are available for figure 11
Source data 1 Hypercapnia PGE2 ELISA data
DOI 107554eLife14170053
Figure supplement 1 mPGEs-1 is expressed in astrocytes in the proximity of the ventral border of the pFRG
DOI 107554eLife14170054
Table 6 PGE2 increases the frequency of pFRGRTN neurons and decreases the frequency of
preBotC neuronsThe mean frequencies of NK1R-positive cells during the control period or during
exposure to 10 nM PGE2 are shown NS not significant N number of slices n number of cells
Data are presented as mean plusmn SD
Mean frequency (mHz)
Control PGE2
pFRGRTN - WT(N=5 n=343)
137 plusmn 11 215 plusmn 29 plt005
pFRGRTN - Ptger3(N=4 n=448)
121 plusmn 20 85 plusmn 29 NS
preBotC - WT(N=7 n=1737)
203 plusmn 22 87 plusmn 14 plt005
preBotC - Ptger3(N=5 n=822)
228 plusmn 23 164 plusmn 11 NS
DOI 107554eLife14170057
Forsberg et al eLife 20165e14170 DOI 107554eLife14170 19 of 41
Research article Computational and Systems Biology Neuroscience
Figure 12 PGE2 alters respiratory network activity In the pFRGRTN PGE2 increased the frequency of respiratory (NK1R-expressing) neurons This
PGE2 effect was absent in brainstem slice cultures lacking EP3R (Ptger3-- andashb) EP3Rs were present in NK1R-expressing neurons in the pFRGRTN (c
arrowheads f) and co-localized with Phox2b (d arrowheads) EP3Rs were also found on S100B-expressing astrocytes (e arrowheads) Staining was
performed on acutely fixed tissue (cndashe) and brainstem slice cultures (f) qRT-PCR showed an abundance of the EP3Rg (Gs-protein coupled) in the pFRG
RTN (N=7 f) N number of slices DIV days in vitro Scale bars 100 mm Data are presented as means plusmn SD plt005 Source data are available in a
separate source data file
DOI 107554eLife14170055
The following source data is available for figure 12
Source data 1 PGE2 frequency data pFRGRTN
DOI 107554eLife14170056
Forsberg et al eLife 20165e14170 DOI 107554eLife14170 20 of 41
Research article Computational and Systems Biology Neuroscience
Figure 13 PGE2 acting through EP3R is crucial for the hypercapnic response Pharmacological inhibition of EP3R
by the EP receptor antagonist AH6809 inhibited the response to hypercapnia (increased pCO2[CO2]) in the
Figure 13 continued on next page
Forsberg et al eLife 20165e14170 DOI 107554eLife14170 21 of 41
Research article Computational and Systems Biology Neuroscience
which couples to the GS-protein (Namba et al 1993) This would lead to an increase in intracellular
cAMP in the pFRGRTN Ptger3-expressing cells in response to PGE2 (Figure 12f)
To further characterize the PGE2 signaling during hypercapnia we blocked its main receptor
EP3R Notably pharmacological blocking of EP receptors (using AH6809 10 mM) abolished the
hypercapnic response (Figure 13andashb 7 DIV) in line with our in vivo data from Ptger3-- mice
pFRGRTN slices (7 DIV) from Ptger3-- mice did not respond to hypercapnia (Figure 13cndashd)
Thus EP3R is important for pFRGRTN CO2 responsiveness We next generated a lentiviral vector in
which the mouse EP3R (Ptger3) promoter controls the expression of the red light-activated halorho-
dopsin Halo57 fused to eGFP (Figure 13e) After transduction we detected eGFP expression in 90
plusmn 6 of Phox2b-positive neurons in the pFRGRTN (Figure 13mdashfigure supplement 1) Stimulation
by red (625 nm) light of the transduced brainstem slice cultures (7 DIV) triggered hyperpolarization
of Ptger3-halo57-expressing cells and immediately reduced the calcium signaling frequency of both
the network and individual NK1R+ neurons (Figure 13mdashfigure supplement 1) This finding indicates
a fundamental role for Ptger3-expressing cells in the network Additionally the response to hyper-
capnia in the pFRGRTN was abolished during the light-induced silencing of Ptger3-expressing cells
The CO2 response was also reversed by the light-induced halo57 hyperpolarization of Ptger-
expressing cells (Figure 13fndashg Table 7)
Based on these findings we suggest that the PGE2-EP3R pathway is an important mechanism in
the hypercapnic response and a modulator of respiratory activity
Figure 13 continued
pFRGRTN (N=6 n=472 NS andashb) The hypercapnic response was also absent in pFRGRTN slices lacking EP3R
(Ptger3 N=5 n=348 NS cndashd) Layout of the lentivirus containing Halo57 (ER2) and eGFP genes under the
control of the EP3R promoter (Ptger3) used for optogenetics (WPRE=gene enhancing element e) During
optogenetic silencing of Ptger3-expressing cells no frequency changes were observed in response to hypercapnia
(f top trace g left graph) The hypercapnic response was also reversed by activating Ptger3-Halo57 (f middle and
bottom trace g middle and right graph) Red line Halo57 activation in response to 625 nm light N slices n
cells Data are presented as means plusmn SD plt005 Source data are available in a separate source data file
DOI 107554eLife14170058
The following source data and figure supplement are available for figure 13
Source data 1 EP antagonist data
DOI 107554eLife14170059
Source data 2 Hypercapnia EP3R data
DOI 107554eLife14170060
Source data 3 Optogenetics data
DOI 107554eLife14170061
Figure supplement 1 Optogenetic silencing of Ptger3-expressing cells decreases respiration-related activity
DOI 107554eLife14170062
Table 7 Silencing of Ptger3-expressing cells inhibits the response to hypercapniaMean frequencies
of the pFRGRTN network during the control period and during exposure to hypercapnia with and
without Halo57 stimulation are shown NS not significant N number of slices Data are presented
as mean plusmn SD
N=41
Mean frequency (mHz)
Control Hypercapnia
Control 229 plusmn 90 340 plusmn 43 plt005
Halo57 stimulation 90 plusmn 17 103 plusmn 11 NS
DOI 107554eLife14170063
Forsberg et al eLife 20165e14170 DOI 107554eLife14170 22 of 41
Research article Computational and Systems Biology Neuroscience
DiscussionHere we present two novel breathing brainstem organotypic cultures in which the respiration-
related preBotC and pFRGRTN regions maintain their functional organization activity and respon-
siveness to environmental cues Using these cultures we show that PGE2 is involved in the control of
sigh activity and the response to hypercapnia via EP3R in the preBotC and the pFRGRTN respec-
tively These findings provide novel insights into central respiratory central pattern generation its
modulation and the mechanisms underlying breathing disorders during the neonatal period
Due to the complexity of the respiratory mechanisms it is difficult to create optimal in vitro
model systems that represent in vivo conditions while allowing sufficient depth in detailed mecha-
nisms and their manipulation The majority of previous studies were performed on brainstem-spinal
cord preparations (en bloc) (Onimaru 1995) or acute slices (Ruangkittisakul et al 2006) However
these preparations remain active only for hours making it difficult to study development and long-
term effects on respiratory rhythm Organotypic slice cultures provide a bridge between cell cultures
and animals in vivo (Yamada and Cukierman 2007) Their preserved three dimensional structure
allows functional circuits to be studied and manipulated over time under microenvironmental control
(Gahwiler et al 1997 Gogolla et al 2006 Yamada and Cukierman 2007 Preynat-
Seauve et al 2009) First used with hippocampal tissue (Gahwiler 1988) the organotypic culturing
method has since expanded to research on the cerebellum (Lu et al 2011) as well as on the brain-
stem auditory circuits (Thonabulsombat et al 2007) Recently Phillips and colleagues
(Phillips et al 2016) presented an organotypic model system of the preBotzinger complex with res-
piration-related neuronal rhythm that persists for a month Here we characterize this new type of
brainstem slice culture further and also provide details on respiratory network structure and func-
tional respiratory-related motor output In addition we show that also the pFRGRTN retains respira-
tion-related rhythmic activity and chemosensitivity As with all model systems it has its limitations e
g the slices lose several respiratory-related regions (Smith et al 2009) Nonetheless in contrast to
acute slices and the brainstem-spinal cord preparation our new experimental model system allows
long-term studies and manipulation of respiratory networks This enables the use of different techni-
ques and methods and significantly reduces the number of procedures that otherwise need to be
performed on live animals as well as the total number of experimental animals We have exploited
this advantage by transfecting the brainstem slice cultures in vitro to be suitable for optogenetic
techniques
Using a newly developed cross-correlation analysis algorithm (Smedler et al 2014) we revealed
in the brainstem slice culture a clustering of cells within the two central pattern generators a small-
world network A small-world network is characterized by a mean clustering coefficient exceeding
that in random networks but has a mean shortest path-length as short as that in random networks
(Watts and Strogatz 1998 Malmersjo et al 2013) Furthermore the presence of the connective
nodes and hubs gives the network a scale-free organization This finding is in line with a previous
topological analysis based on neuronal staining in the preBotC (Hartelt et al 2008) The present
insights into the network structure of the pFRGRTN have not been achieved previously with other
methods Notably scale-free and small-world networks have been suggested to have evolutionary
advantages (Barabasi and Oltvai 2004 Malmersjo et al 2013)
Subsequently we examined how the networks and individual cells were connected Early in devel-
opment gap junctions connect the respiration-related fetal neural networks (Thoby-Brisson et al
2009) During development gap junction-mediated Ca2+-transients stimulate the proliferation of
neural progenitor cells (Malmersjo et al 2013) and form a template for chemical synapses to coor-
dinate more mature neural networks (Jaderstad et al 2010) Using CBX and 18-a-GA we demon-
strated that intercellular connections still play a role in postnatal preBotC network activity This is in
line with previous findings (Elsen et al 2008) Notably even though fewer cells remained active
respiratory neuron frequency and network structure were not affected Although both CBX and 18-
a-GA are commonly used as gap junction inhibitors (Solomon et al 2003 Elsen et al 2008
Veliz et al 2008 Jaderstad et al 2010) these drugs have side effects (Rekling et al 2000
Schnell et al 2012) We used GZA as a control substance because it is structurally similar to CBX
but does not have any gap junction inhibiting properties (Solomon et al 2003 Li and Duffin
2004 Elsen et al 2008) However it mimics many of the side effects of CBX eg the initial stimula-
tory effect seen in the present study These limitations need to be kept in mind when interpreting
Forsberg et al eLife 20165e14170 DOI 107554eLife14170 23 of 41
Research article Computational and Systems Biology Neuroscience
our results on gap junction functions and further studies are needed to confirm them preferably
using more specific methods of connexin blockage such as RNAi
However our findings do suggest the presence of a neuron-specific subnetwork connected by
chemical synapses that is able to maintain the network structure Furthermore another subnetwork
likely a glial one (Giaume et al 2010 Okada et al 2012) driven by the electrical connections that
modulate network output also seems to be present Thus neonatal preBotC synchronization is both
gap junction-and synaptic signal-dependent (Feldman and Kam 2015) and it probably contains
both neuronal and glial subnetworks The pFRGRTN by contrast requires gap junctions for its
establishment in rodents but is not dependent on them postnatally for rhythmic correlated network
activity (Fortin and Thoby-Brisson 2009) The main mechanism that drives activity in the pFRGRTN
is glutamatergic (Guyenet et al 2013) By contrast pFRGRTN gap junctions seem here to be
involved in the hypercapnic response (Figure 10 and 11) It has been suggested that Cx26 is directly
modulated by CO2 independent of H+ through the formation of carbamate bridges (Meigh et al
2013) Our data do not distinguish between intracellular pH-dependent and -independent mecha-
nisms However since PGE2 can pass through connexins (Reyes et al 2014) the present data are
in line with a CO2-induced connexin-mediated release of PGE2 (Figure 14)
Prostaglandins are important regulators of autonomic functions in mammals In many disease
states acute inflammatory responses are initially protective but become harmful under chronic con-
ditions In our previous reports we demonstrated how the pro-inflammatory cytokine interleukin (IL)-
1b impairs respiration during infection by inducing a PGE2 release in the vicinity of respiratory
Figure 14 Model of how PGE2 modulates respiration and sighs in the preBotC and pFRGRTN Systemic inflammation through the proinflammatory
cytokine IL-1b and hypoxia induces the production of PGE2 in blood brain barrier (BBB) endothelial cells (Hofstetter et al 2007)PGE2 subsequently
induces respiratory depression and increases sigh activity via the inhibitory G-protein coupled receptor EP3Ra in the preBotC In the pFRGRTN PGE2plays a role in the response to elevated pCO2 CO2 directly modulates connexin 26 (Cx26) hemichannels leading to ATP release The results in this
study suggest that Cx26 also releases PGE2 possiblyfrom mPGEs-1+ astrocytes PGE2 increases respiratory activity via the stimulatory G-protein
coupled receptor EP3Rg on pFRGRTN neurons Thus inflammation hypoxia and hypercapnia alter respiratory neural network and motor output and
breathing activity through distinct effects of PGE2 in the pFRGRTN and the preBotC respectively Chronically elevated PGE2 levels as observed during
ongoing inflammation may decrease the central pattern generatorsrsquo ability to respond to hypoxic and hypercapnic events In extreme cases this
decrease may have fatal consequences
DOI 107554eLife14170064
Forsberg et al eLife 20165e14170 DOI 107554eLife14170 24 of 41
Research article Computational and Systems Biology Neuroscience
centers We also showed that infection is the
main cause of respiratory disorders in preterm
infants (Hofstetter et al 2007 2008) and in
the case of apneas bradycardias and desatura-
tions (ABD) events in neonates (Siljehav et al
2015) PGE2 is also a key component in the reg-
ulation of sigh frequency (Ramirez 2014
Koch et al 2015) During and immediately after
birth PGE2 levels are increased (Mitchell et al
1978) Indeed the first breaths of extrauterine
life are deep and sigh-like facilitating alveolar
recruitment and CO2 removal (Mian et al
2015) In the brainstem slice cultures PGE2 had
a direct EP3R-dependent effect on both respira-
tory centers Notably PGE2 increased pFRG
RTN but inhibited preBotC frequency (Video 3)
This finding might be explained by the different
distributions of EP3R subtypes in the different
regions (Figure 12) The coupling to inhibitory
or stimulatory G proteins depends on the alter-
native post-transcriptional splicing of the C-ter-
minal tail of the EP3R preprotein (Namba et al 1993) Furthermore PGE2 caused a longer Ca2+
transient and a higher relative amplitude in an INaP-dependent manner mimicking the PGE2-based
induction of sighs that we observe in vivo and that were recently reported by Koch and colleagues in
acute preBotC slices (Koch et al 2015)
Recent data reveal a role of neuromedin B (NMB) and gastrin-related peptide (Grp) and NMB-
GPR-expressing preBotC neurons in sighing (Li et al 2016) In addition to these peptidergic path-
ways the present and recent data from Koch and colleagues (Koch et al 2015) suggest that low
concentrations of the inflammation-associated PGE2 induce sighs acting through modulation of the
persistent sodium current in preBotC neurons
The preBotC results presented in this study provide evidence for how the general respiratory
depression induced by inflammatory signaling previously reported in vivo and in vitro
(Hofstetter et al 2007) and in human neonates (Hofstetter et al 2007 Siljehav et al 2015) is
mediated by a direct effect of PGE2 on EP3R (Siljehav et al 2012) in the preBotC The present
data may help to further explain the mechanism underlying apneas that occur during infectious peri-
ods in neonates (Hofstetter et al 2007 2008 Di Fiore et al 2013 Siljehav et al 2015)
Another common respiratory problem in neonates particularly premature infants is an inability to
respond adequately to hypoxia and hypercapnia This may cause recurrent hypoxia leading to cog-
nitive disabilities later in life (Greene et al 2014) A disruption of central CO2 chemosensitivity is
commonly seen in children with bronchopulmonary dysplasia (Di Fiore et al 2013) leading to
chronic hypoventilation which may explain why these infants have an increased risk of sudden infant
death syndrome (Martin et al 2011) Therefore we investigated the role of the pFRGRTN in che-
mosensitivity (Guyenet et al 2013) and found that the response to hypercapnia is dependent on
functioning gap junctions This is in line with previous findings showing that Cx26 is directly modified
by CO2 (Meigh et al 2013)
These CO2-sensitive connexin hemichannels can release ATP and indeed the hypercapnic
response is partly mediated by purinergic type 2 receptors (Erlichman et al 2010 Gourine et al
2010 Guyenet et al 2013) In addition to these purinergic pathways we suggest that EP3R-
dependent signaling is involved in the response to altered pCO2 Genetic ablation of Ptger3
reduced the hypercapnic response both in vivo and in vitro as did pharmacological blockage in
vitro in line with our previous experiments (Siljehav et al 2014) Moreover the optogenetic inhibi-
tion of Ptger3-expressing cells in the pFRGRTN revealed that these cells are essential for the CO2
response We also demonstrated that PGE2 is released during hypercapnic exposure likely through
Cx26 or other CO2-sensitive connexins (Huckstepp et al 2010b) Thus part of the CO2 response
seems to be mediated by a gap junction-dependent release of PGE2
Video 3 Parallel display of Ca2+ oscillations visualized
with Fluo-4 in the pFRGRTN (left) and preBotC (right)
After 15 s PGE2 (10 nM) is added This increases the
activity of the pFRGRTN network while the preBotC
activity is inhibited fps frames per second For high-
resolution versions of the videos please follow this link
to the Karolinska Institutet Cloud Storage system (Box)
httpskiboxcoms
abzuei0yzl4dzbn99995382va6btsq4l
DOI 107554eLife14170065
Forsberg et al eLife 20165e14170 DOI 107554eLife14170 25 of 41
Research article Computational and Systems Biology Neuroscience
Generation of active expiration is another important function of the pFRGRTN (Feldman et al
2013) It is possible that PGE2 stimulates both chemosensitive neurons and neurons important for
active expiration Such neuronal populations could overlap but the ventral part pFRGRTN seems to
have a more chemosensitive character while the lateral part displays rhythmic activity and enforces
active expiration when stimulated (Pagliardini et al 2011 Feldman et al 2013 Huckstepp et al
2015) The CO2-sensing of the pFRGRTN slice remains functional Whether the rhythmic activity we
observe in the pFRGRTN is generated by ldquoactive expiration-neuronsrdquo is outside the scope of the
present study Future studies should aim to investigate whether PGE2 also may affect active
expiration
The pFRGRTN is the best-recognized central chemosensitive region However in our pFRGRTN
brainstem slice culture neurons of the raphe nucleus should be present (Smith et al 2009) Such
neurons may also have chemosensing properties (Richerson 2004) though this has not been shown
conclusively (Depuy et al 2011) From the raphe nucleus there are evidence of projections to the
pFRGRTN (Guyenet et al 2009) and we cannot exclude the possibility that these are preserved in
the brainstem slice culture
The effects of CO2 in the present study are based on a change in carbamylation of specific pro-
teins eg Cx26 (Meigh et al 2013) or intracellular pH but testing these alternatives goes beyond
the scope of the present work In our experimental setup the extracellular pH remained stable while
the dissolved CO2 increased This specific approach was selected because CO2 has a direct modulat-
ing effect on connexins allowing passage of small molecules (Huckstepp et al 2010a
Huckstepp and Dale 2011 Meigh et al 2013) and our hypothesis was that PGE2 is released
through such connexins
What still remains to be determined the exact source of the PGE2 released during hypercap-
nia The indication of a gap junction-dependent release of PGE2 together with the presence of
mPGEs-1 in pFRGRTN astrocytes suggests that the PGE2 is of astrocytic origin This would be in
line with previous findings of astrocytic ATP release during hypercapnia (Gourine et al 2010
Huckstepp et al 2010a) The astrocytic involvement in the CO2 response is also evident in a
Rett syndrome model (methyl-CpG-binding protein 2 (MeCP2) knockout) in which conditional
MeCP2 knockout in astroglia blunts the CO2 response (Turovsky et al 2015) We think that
mPGEs-1-expressing astrocytes are the likely source even though alternative sources of PGE2
such as endothelial cells or microglia remain to be investigated with regards to their possible
involvement in the pFRG CO2 response Nonetheless CO2-mediated PGE2 release introduces a
novel chemosensitive pathway (Figure 14)
As PGE2 and the EP3R are directly involved in and modulate both the respiratory rhythm-gen-
erating preBotC and the Phox2b chemosensitive neurons PGE2 from other sources such as
endothelial cells during hypoxia and inflammation (Hofstetter et al 2007) will alter the hyper-
capnic and the hypoxic responses PGE2 has prominent respiratory depressant effects in humans
sheep pigs and rodents (Guerra et al 1988 Long 1988 Ballanyi et al 1997
Hofstetter et al 2007 Siljehav et al 2015) The PGE2-induced attenuation of these vital brain-
stem neural networks eg during an infectious response could result in gasping autoresuscita-
tion failure and ultimately death However how chronic PGE2 release associated with ongoing
inflammation alters plasticity and the responsiveness to CO2 must be further investigated
To conclude we identified a novel pathway in the hypercapnic response of brainstem neural
networks that control breathing This pathway depends on EP3R and gap junctions and is partly
mediated by the release of PGE2 linking chemosensitivity control to the inflammatory system The
present findings have important implications for understanding why and how ventilatory responses
to hypoxia and hypercapnia are impaired and inhibitory reflexes exaggerated in neonates particu-
larly during infectious episodes
Materials and methods
SubjectsC57 black (C57BL6J) inbred mice (Charles River Wilmington MA) were utilized in the experiments
The eicosanoid prostanoid 3 receptor (EP3R) gene (Ptger3) was selectively deleted in knockout mice
(Ptger3) with a C57BL6J background as described preciously (Fabre et al 2001) C57BL6J
Forsberg et al eLife 20165e14170 DOI 107554eLife14170 26 of 41
Research article Computational and Systems Biology Neuroscience
mice were then used as experimental controls for Ptger3 mice As results from Ptger3 mice
were consistent with pharmacological and optogenetic inhibition of EP3Rs we can confirm the lost
EP3R function in the mice
To determine the location of mPGEs-1 mice expressing green fluorescent protein (GFP) under
the GFAP promoter were used Frozen sperm from the GFAP-tTA (Lin et al 2004 Pascual et al
2005) and tetO-Mrgpra1 (Fiacco et al 2007) mouse strains were purchased from the Mutant
Mouse Regional Resource Centers supported by NIH (MMRRC) The strains were re-derived by Karo-
linska Center for Transgene Technologies (KCTT) and the offspring was crossed as previously
described (Fiacco et al 2007) Double transgenics were identified by PCR according to MMRRCrsquos
instructions
All mice were reared by their mothers under standardized conditions with a 1212-hr light-dark
cycle Food and water was provided ad libitum The studies were performed in accordance with
European Community Guidelines and approved by the regional ethic committee The animals were
reared and kept at the Department of Comparative Medicine Karolinska Institutet Stockholm
Sweden
Dual-chamber plethysmography in vivoVentilatory measurements were made using dual-chamber plethysmography in 9-day old (P9) mice
Mice were cooled on ice for 2ndash3 min and then prostaglandin E2 (PGE2 1 mM Sigma-Aldrich St
Louis MO USA cat no P5640) or vehicle (artificial cerebrospinal fluid aCSF containing in mM
1501 Na+ 3 K+ 2 Ca2+ 2 Mg2+ 135 Cl 11 H2PO4 25 HCO3
- and 10 glucose) was slowly
injected into the lateral ventricle by using a thin pulled glass pipette attached to polyethylene tubing
(Siljehav et al 2014) The mouse was then immediately placed into the plethysmograph chamber
After a 10-min recovery period confirming stable respiration and body temperature respiratory
parameters in normocapnia (air) was established followed by a hypercapnic challenge (5 CO2 and
20 O2 in N2) for 5 min This was followed by 5 min of normocapnia Skin temperature was mea-
sured throughout experimentation and remained stable After experimentation the mice were anes-
thetized with 100 CO2 and decapitated The brain was dissected and examined at the injection
site and for the presence of any intracranial hemorrhage Three of 28 animals had visible intracranial
bleeding and were excluded from analysis
Brainstem organotypic cultureP3 mice pups were used for the establishment of brainstem organotypic slice cultures The pups
were decapitated at the cervical C3ndashC4 level The heads were washed with cold dissection medium
consisting of 55 Dulbeccorsquos modified Eaglersquos medium (Invitrogen Paisley UK) 03 glucose
(Sigma-Aldrich St Louis MO USA) 1 HEPES buffer (Invitrogen UK) and 1 Antibiotic-Antimy-
cotic (Invitrogen UK) After washing the heads were moved to fresh dissection medium on ice The
entire brain was dissected During dissection extra caution was taken around the cerebellopontine
angle to ensure that the respiratory regions of the brainstem were not damaged Nerves were cut
with microscissors
The brain was sectioned into 300-mm-thick transverse slices by using a McIlwain Tissue Chopper
(Ted Pella Inc Redding CA USA) Slices were selected by using anatomical landmarks such as the
shape and size of the entire slice and the fourth ventricle For location of the preBotzinger complex
(preBotC) the presence of nucleus hypoglossus nucleus spinalis nervi trigemini pyramis medullae
oblongatae and nucleus tractus solitarius (not always clearly seen) together with the absence of the
anterior horn for the nucleus cochlearis according to online references (Ruangkittisakul et al
2006 2011 2014) For location of the parafacial respiratory groupretrotrapezoid nucleus (pFRG
RTN) the presence of the nucleus facialis was used On the slices the preBotC is located within ven-
trolateral regions and the pFRGRTN is located at the ventrolateral edge
Selected slices were washed by moving them to brain slice medium (55 Dulbeccorsquos modified
Eaglersquos medium 325 Hankrsquos balanced salt solution 03 glucose 10 fetal bovine serum 1
HEPES buffer and 1 Antibiotic-Antimycotic [Invitrogen UK]) after which they were carefully
placed on insert membranes (Millicell Culture Plate Inserts Millipore Billerica MA USA) in six-
well plates The membranes were coated in advance with poly-L-lysine (03 ml 01 mgml Sigma-
Aldrich St Louis MO USA) Brain slice medium (1 ml) was placed underneath the membrane
Forsberg et al eLife 20165e14170 DOI 107554eLife14170 27 of 41
Research article Computational and Systems Biology Neuroscience
and all fluid on top of the membrane was removed It is important not to cover the slices with
medium because this may impair oxygenation (Frantseva et al 1999) The brainstem slice cul-
tures were maintained in an incubator (37˚C 5 CO2) and the brain slice medium was changed
every second day The brainstem slices were kept in culture for 7ndash21 days in vitro (DIV) before
fixation or live imaging experiments For a detailed protocol see Herlenius and colleagues
(Herlenius et al 2012)
ImmunohistochemistryFor immunohistochemistry brainstem slice cultures were fixed with cold paraformaldehyde (4) in
PBS for 1 hr at 4˚C and 20 ice-cold methanol in PBS for 10 min Permeabilization was conducted
by using 02 Triton X-100 (Roche Diagnostics Hofgeismar Germany) and 01 Tween 20 (Invitro-
gen UK) in PBS for 40 min at room temperature (RT) Thereafter slices were blocked in 5 bovine
serum albumin (BSA Invitrogen UK) and 005 Tween 20 in PBS for 2 hr at RT The Millicell insert
membranes were carefully cut with a scalpel and placed back into the wells The primary antibodies
were diluted 1200 in 005 Tween 20PBS and incubated at 4˚C for 48 hr Next the slices were
washed 3 10 min with PBS and incubated for 15 hr at RT with Alexa Fluor-conjugated secondary
antibodies (Invitrogen UK) diluted 1200 in 005 Tween 20PBS The slices were then washed 3
10 min with PBS and mounted in ProLong Gold Antifade Reagent with DAPI (Invitrogen UK cat no
P36931) Primary antibodies used were mouse anti-microtubule associated protein 2 (MAP2 Invitro-
gen cat no P11137) rabbit anti-neurokinin 1 receptor (NK1R Sigma-Aldrich St Louis MO USA
cat no S8305) mouse anti-GFAP (Chemicon Temecula CA USA cat no MAB360) rabbit anti-
S100b (Millipore cat no 04ndash1054) mouse anti-neuron-specific class III b-tubulin (Tuj1 Covance
Princeton NJ USA cat no MMS-435P) rabbit anti-K+Cl cotransporter 2 (KCC2 Millipore cat no
07ndash432) rabbit anti-vesicular glutamate transporter 2 (VGLUT2 Synaptic Systems Goettingen Ger-
many cat no 135ndash402) mouse anti-connexin 26 (Cx26 Invitrogen Inc San Francisco CA cat no
13ndash8100) rabbit anti-connexin 32 (Cx32 Invitrogen cat no 71ndash0600) mouse anti-connexin 43
(Cx43 Zymed cat no 13ndash8300) goat anti-Phox2b (Santa Cruz Biotechnology Santa Cruz CA USA
cat no 13224) goat Phox2b antibody (R amp D Systems Minneapolis MN USA) and rabbit anti-cas-
pase 3 (Cell Signaling Technology Beverly MA USA cat no 9661) Negative controls with only sec-
ondary antibodies showed no staining
For EP3R staining a different protocol was used Initially brains were fixed with 4 paraformal-
dehyde overnight followed by 10 sucrose overnight and then frozen to -80 The frozen brain-
stems were cryosectioned and blocked in blocking buffer (1 BSA 5 donkey serum 5 dimethyl
sulfoxide (DMSO) 1 Triton X-100 in Tris-buffered saline (TBS consisting of 6 mM Tris-HCl 1 mM
Tris base and 9 mM NaCl in ddH2O) for 1 hr at RT After blocking the slices were incubated with
polyclonal rabbit anti-EP3R antibody (Cayman Chemical Co Ann Arbor MI USA) diluted 150 in
10 DMSO containing 02 Triton X-100 in TBS at RT overnight Next slices were washed 3
15 min with TBS with agitation followed by incubation for 1 hr in the dark with Alexa Fluor 488-con-
jugated donkey anti-rabbit secondary antibody (Life Technologies Grand Island NY USA) diluted
11000 in 1 BSA 2 donkey serum 2 DMSO and 5 Triton X-100 in TBS The slices were then
washed 3 15 min with TBS with agitation and blocked again for 1 hr at RT in the same blocking
buffer as used previously After blocking the slices were incubated with the second primary anti-
body diluted 1200 in 10 DMSO containing 02 Triton X-100 in TBS at 4˚C overnight Following
overnight incubation the slices were washed 3 15 min with TBS with agitation and incubated with
Alexa Flour 647-conjugated donkey anti-goat secondary antibody (Life Technologies Grand Island
NY USA) diluted 11000 in 1 BSA 2 donkey serum 2 DMSO and 5 Triton X-100 in TBS
Finally the slices were washed 3 15 min with TBS with agitation and mounted in ProLong Gold
Antifade Reagent with DAPI
Antibody binding was controlled by including an irrelevant rabbit polyclonal IgG isotype control
(Bioss Woburn MA USA) EP3R staining was controlled by including an EP3R blocking peptide
reconstituted in distilled water mixed with EP3R antibody at a 11 (vv) ratio A pre-incubation of
EP3R antibody with the blocking peptide for 1 hr at RT was necessary before the antibody was
added to the slice The peptide was used in conjunction with the antibody to block protein-antibody
complex formation during immunohistochemical analysis for the EP3Rs These controls showed no
staining
Forsberg et al eLife 20165e14170 DOI 107554eLife14170 28 of 41
Research article Computational and Systems Biology Neuroscience
Double immunofluorescence staining was also performed according to Westman and colleagues
(Westman et al 2004) using polyclonal rabbit anti-human microsomal prostaglandin E synthase 1
antiserum (mPGES-1 Cayman chemicals cat no 160140) and monoclonal anti-mouse glial fibrillary
acidic protein antibody (GFAP Chemicon Temecula CA USA cat no MAB360) PBS supplemented
with 01 saponin (PBS-saponin) was used as a buffer through the experiment Endogenous peroxi-
dase activity was blocked using PBS containing 1 H2O2 and 01 saponin for 60 min in darkness
Endogenous biotin was blocked using an avidin-biotin blocking kit (Vector
Laboratories Burlingame CA) supplemented with 01 saponin The sections were incubated with
primary antibodies overnight in PBS-saponin containing 3 BSA antibody solution Thereafter they
were blocked with 1 normal goat serum or normal donkey serum (depending on the host of sec-
ondary antibody) in PBS-saponin for 15 min followed by 1-hr incubation with secondary antibody
donkey anti-rabbit alexa fluorophore 488 or goat anti-mouse Alexa Fluor 546
Propidium iodide stainingPropidium iodide (1 mlL Invitrogen UK) was added to brain slice medium (dilution 11000) Stain-
ing solution (1 ml) was added on top of the membrane with the brainstem slice cultures and incu-
bated at 37˚C (5 CO2) for 3 hr Immediately after incubation the brainstem slice cultures were
fixed in 4 paraformaldehyde for 1 hr Positive controls were made by first treating the brainstem
slice culture for oxygen glucose deprivation (OGD) for 1 h as described by Montero Dominguez and
colleagues (Montero Domınguez et al 2009)
ElectrophysiologyWhole-cell patch recordings were obtained from brainstem slice cultures at a temperature of 34˚CCells were visualized by using IR-differential contrast microscopy (Axioskop FS Carl Zeiss Jena Ger-
many) Recorded cells were selected visually and paired recordings were obtained for neurons with
lateral somatic distances of lt100 mm Recordings were amplified by using 700B amplifiers (Molecular
Devices Sunnyvale CA USA) filtered at 2 kHz digitized at 5ndash20 kHz by using ITC-18 (Instrutech
Longmont CO USA) and acquired by using Igor Pro (Wavemetrics Lake Oswego OR USA) Patch
pipettes were pulled with a P-97 FlammingBrown micropipette puller (Sutter Instruments Novato
CA USA) and had an initial resistance of 5ndash10 MW in a solution containing in mM 110 K-gluconate
10 KCl 10 HEPES 4 Mg-ATP 03 GTP and 10 phosphocreatine Recordings were performed in cur-
rent-clamp mode with access resistance compensated throughout the experiments Recordings
were discarded when access resistance increased beyond 35 MW To characterize the electrical prop-
erties of the recorded cells depolarizing and hyperpolarizing current steps and ramps were injected
enabling the extraction of properties such as input resistance membrane time constant and action
potential threshold Electrophysiological properties were presented as box plots with maximum and
minimum values
For recording of hypoglossal nerve activity and hypoglossal nucleus neuronal population dis-
charge an extracellular suction electrode was used together with a Model 1700 AC amplifier (A-M
systems Carlsborg WA USA) and AxoScope software version 92 (Axon Instruments Union City
CA USA) Recordings were made with a sampling interval of 03 ms
Ca2+ time-lapse imagingFor Ca2+ imaging Fluo-4 AM (Invitrogen UK) dissolved in DMSO (Invitrogen UK) was used at 10
mM in serum free brain slice medium or artificial cerebrospinal fluid (aCSF containing in mM 1501
Na+ 3 K+ 2 Ca2+ 2 Mg2+ 135 Cl 11 H2PO4 25 HCO3
- and 10 glucose) together with 002
pluronic acid (Invitrogen UK) We did not observe any differences in Ca2+activity between HEPES-
free brain slice medium and aCSF during Ca2+imaging despite slight differences in [K+] and [Ca2+]
which both affect the rhythm of the slice (Ballanyi and Ruangkittisakul 2009) A higher [Ca2+] or an
increase in [K+] from 3 mM to 48 mM did not affect the network properties in our system To local-
ize the preBotC or the pFRGRTN tetramethylrhodamine-conjugated Substance P (TMR-SP Biomol
Oakdale NY USA) was used at a final concentration of 3 mM in brain slice medium or aCSF The
TMR-SP solution was placed on top on the brainstem slice and incubated for 10ndash12 min at 37˚C in
an atmosphere of 5 CO2 The TMR-SP solution was then replaced with 1 ml of 10 mM Fluo-4
Forsberg et al eLife 20165e14170 DOI 107554eLife14170 29 of 41
Research article Computational and Systems Biology Neuroscience
solution The Fluo-4 solution was incubated for 30ndash40 min (37˚C 5 CO2) Before imaging the slice
was washed with brain slice mediumaCSF for 10 min (37˚C 5 CO2)
During time-lapse imaging slices were kept in an open chamber perfused with HEPES-free brain
slice medium (containing in mM 132 Na+ 48 K+ 14 Ca2+ 074 Mg2+ 112 Cl- 076 H2PO4- 256
HCO3- and 168 glucose) or aCSF (25 mlmin) by using a peristaltic pump A Chamlide Inline Heater
(Live Cell instruments Seoul Korea cat no IL-H-10) was used for temperature control and a Cham-
lide AC-PU perfusion chamber for 25-mm coverslips (Live Cell instruments Seoul Korea cat no
ACPU25) was used for perfusion HEPES-free medium was used to minimize the risk for hydrogen
peroxide formation (Lepe-Zuniga and Gery 1987) The medium or aCSF was constantly bubbled
with 5 CO2 and 95 O2 The temperature of the chamber was set to 32˚C which Hartelt and col-
leagues (Hartelt et al 2008) showed to be well tolerated by neurons Images were captured by
using a Zeiss AxioExaminer D1 microscope equipped with 20 and 40 water immersion objectives
(NA 10) a monochromatic Zeiss MrM CCD-camera a Photometrics eVolve EMCCD-camera and fil-
ter sets 38HE (Zeiss) 43 (Zeiss) and et560hq605 (Chroma Bellows Falls VT USA) For live imaging
a frame interval of 01ndash2 s was used Exposure time was set to 100ndash300 ms
Substances added during imaging were [D-Ala2 N-Me-Phe4 Gly5-ol]-enkephalin (DAMGO 05
mM Sigma-Aldrich St Louis MO USA cat no E7384) carbenoxolone (CBX 50 mM Sigma-Aldrich
St Louis MO USA cat no C4790) 18a-glycyrrhetinic acid (18-a-GA 25 mM Sigma-Aldrich St
Louis MO USA cat no G10105) glycyrrhizic acid (GZA 50 mM Sigma-Aldrich St Louis MO USA
cat no 50531) tetrodotoxin (TTX 20 nM Abcam Cambridge UK catno 120055) riluzole (10 mM
Sigma-Aldrich St Louis MO USA catno R116) flufenamic acid (FFA 50 mM Sigma-Aldrich St
Louis MO USA catno F9005) Suramin (100 mM Sigma-Aldrich St Louis MO USA cat no
S2671) TNP-ATP (20 nM Sigma-Aldrich St Louis MO USA cat no SML0740) AH6809 (Cayman
Chemicals catno 33458-93-4) and prostaglandin E2 (PGE2 10 nM Sigma-Aldrich St Louis MO
USA cat no P5640) All substances were dissolved in brain slice mediumaCSF prior to experimenta-
tion and added to the chamber by using a continuous flow system For each experiment a control
period with regular mediumaCSF was followed by drug application GZA was used as a negative
control for the gap junction inhibitors CBX and 18a-GA because it has non-gap junction-inhibiting
properties but similar side effects to those of CBX Specificity was tested by using a second batch
of medium or aCSF During infections in neonatal children PGE2 is present at a concentration of 15
pM in cerebrospinal fluid (Hofstetter et al 2007) A higher concentration (10 nM) was used to
compensate for the in vivo metabolism of the molecule
Exposure to isohydric hypercapnia was done by using aCSF adjusted with a high bicarbonate
buffer concentration (in mM 1501 Na+ 3 K+ 2 Ca2+ 2 Mg2+ 111 Cl 11 H2PO4 50 HCO3
and
10 glucose) This generated a hypercapnic carbon dioxide partial pressure (pCO2) of 66 kPa at pH
75 when aCSF was saturated with 8 CO2
Viral transfection and optogeneticsA subgroup of 1-DIV-old brainstem slices were moved to a separate BSL-2 laboratory where they
were transduced with a mouse prostaglandin E receptor 3 (subtype EP3) lentivirus (Ptger3) contain-
ing Halo57 developed in collaboration with Dr Robert Finney (Xactagen Shoreline WA USA) by
applying 02 ml of virus suspension on top of the slice The brainstem slice cultures were then placed
in an incubator for 5 days and after washing with warm brain slice medium at time points 2 and 5
days the brainstem slice cultures were moved back to the original laboratory and placed in an incu-
bator overnight Ca2+ time-lapse imaging was performed on the slices as described above Halo57
was stimulated continuously during Ca2+ time-lapse imaging by using a 625-nm LED in a custom-
built system (Thorlabs Newton NJ USA)
The optogenetically inhibited network and NK1R positive neurons retained their response to gen-
eral depolarization induced by elevated [K+] (Supplementary Fig S6)
PGE2 ELISAThe release of PGE2 in aCSF during control and hypercapnic conditions was assessed by ELISA The
aCSF samples were collected through perfusion system during control and hypercapnic period and
either analyzed immediately or stored at -80˚C For the validation of the experiments two different
ELISA kits have been used
Forsberg et al eLife 20165e14170 DOI 107554eLife14170 30 of 41
Research article Computational and Systems Biology Neuroscience
Prostaglandin E2 EIA monoclonal kit by Cayman Chemical (Ann Arbor MI US) was performed
according to standard procedure Firstly the PGE2 EIA Standard was prepared from 1 to 8 The
96-well plate was ready to use and contained a minimum of two blanks (Blk) two non-specific bind-
ing wells (NSB) two maximum binding wells (B0) and an eight point standard curve run in duplicate
Each sample was assayed in triplicate The 96-well plate was coated for 18 hr at 4˚C with 50 ml of
Prostaglandin E2 AChE Tracer and 50 ml of Prostaglandin E2 Monoclonal Antibody per well Plate
was washed three times with specific Wash Buffer and in consequence it was developed in the dark
at room temperature on a plate shaker for 60ndash90 min by adding 200 ml of Ellmanrsquos Reagent to each
well Finally the plate was read at 405 nm
PGE2 ELISA kit by Enzo Life Sciences (Farmdale NY US) was also used for the confirmation
of the results A similar process was followed but a bit shorter Samples were assayed in dupli-
cate The 96-well plate was incubated at room temperature on a plate shaker for 2 hr with 50 ml
of PGE2 conjugate and 50 ml of antibody solution per well Then the plate was washed three
times with washing solution After the wash 200 ml of the pNpp substrate solution were added
to every well and the plate was incubated at room temperature for 45 min Finally 50 ml of Stop
Solution were added to every well in order to stop the reaction and the plate was read immedi-
ately at 405 nm
Quantitative real-time PCRThe preBotC and pFRGRTN regions were cut out from brainstem slices with micro scissors The
samples were pooled together litterwise to minimize the effect of different tissue piece sizes and
provide enough cells for accurate analysis RNA was isolated from the tissue samples using the miR-
CURY RNA isolation Kit (Exiqon) according to manufacturerrsquos instructions cDNA was synthesized
from 20 ng RNA using SuperScript VILO cDNA Synthesis Kit (Invitrogen) The reverse transcription
was performed according to the manufacturerrsquos protocol Real-time PCR was run with Power SYBR
Green PCR Master Mix (Applied Biosystems) and amplified in a 7500 Real Time PCR system (Applied
Biosystems) Primers are listed in Table 8 As endogenous control glucose-3 phosphate dehydroge-
nase (GAPDH Applied Biosystems) was used Relative quantification (RQ) values were calculated
using the CT(DDCT) method (Livak and Schmittgen 2001)
Data analysisFrom in vivo plethysmograph recording (LabChart Pro v 8010 AD Instruments Dunedin New Zea-
land) periods of calm respiration without movement artifacts were selected for analysis based upon
visual observations during experimentation as in previous studies (Hofstetter and Herlenius 2005)
Mean respiratory frequency (FR breathsmin) tidal volume (VT) and minute ventilation (VE) during
normocapnic and hypercapnic periods were calculated as described previously (Hofstetter and Her-
lenius 2005) Sighs were excluded from the analysis VT and VE were divided by body weight (BW)
and expressed as milliliters per gram and milliliters per gram per min respectively The number of
sighs defined as breath with larger amplitude and a biphasic inspiratory phase was calculated man-
ually and expressed as sighs per min
Immunohistochemical staining was analyzed in a Zeiss AxioExaminer D1 microscope (10 20
and 40 water immersion objectives) or a Zeiss LSM700 confocal (40 and 63 oil-immersion
objectives) and captured images were processed by adjusting contrast in ImageJ (142q
National Institutes of Health Bethesda MD USA) to reduce background staining
Table 8 Primers used for qRT-PCR
Oligo name Sequence
EP3alfa forwardEP3alfa reverse
GCTTCCAGCTCCACCTCCTTCATCATCTTTCCAGCTGGTCACT
EP3 senseEP3beta anti-sense
50-TGACCTTTGCCTGCAACCTG-30
50-GACCCAGGGAAACAGGTACT-30
EP3gamma forwardEP3gamma reverse
AGTTCTGCCAGGTAGCAAACGGCCTGCCCTTTCTGTCCAT
DOI 107554eLife14170066
Forsberg et al eLife 20165e14170 DOI 107554eLife14170 31 of 41
Research article Computational and Systems Biology Neuroscience
Table 9 Successful experiments behind representative images
Figure Panel Number of experiments
1 c 25
2 bcdefg
312391914112
2 ndash S1 112 23 1233 23 1027 12 1122 15 815 8 8
2 ndash S2 5
2 ndash S3 abc
12520
3 ab
55
3 ndash S1 ab
55
4 bcdgh
1213895
4-S2 840 621 456
5 a 16
5 ndash S1 a 6
5 ndash S2 ac
115
6 abcdefghij
9883867867
7 acdf
5 49125 4
7 ndash S1 4 4
8 bcde
9995
8 ndash S1 35 22 199 95
9 bcd
12116
9 ndash S1 315 429 192
9 ndash S2 18 7
10 a 7
Table 9 continued on next page
Forsberg et al eLife 20165e14170 DOI 107554eLife14170 32 of 41
Research article Computational and Systems Biology Neuroscience
Ca2+ imaging time traces were analyzed with a recently published method (Malmersjo et al
2013 Smedler et al 2014) Regions of interest were marked for all cells based on the standard
deviation of fluorescence intensity over time by using a semiautomatic-adapted ImageJ script
kindly provided by Dr John Hayes (The College of William and Mary Williamsburg VA
USA httpphysimagesourceforgenet) The mean intensity value and coordinates were measured
using ImageJ Average intensities of regions of interest were quantified for each frame and
dynamic fluorescence signals were normalized to baseline values The linear similarity (Pearson cor-
relation) was calculated (Figure 4mdashfigure supplement 1) between pairs of Ca2+ traces with a cus-
tom-made script in MATLAB (version 790529 R2009b MathWorks Natick MA USA) and by
using the mic2net toolbox (Smedler et al 2014) (version 612 MathWorks) Calculating the pair-
wise correlation coefficients resulted in a correlation matrix that was converted to an adjacency
matrix by applying a cut-off level The cut-off level was selected by calculating the mean of the
99th percentile of correlation coefficients for a set of experiments with scrambled signals Scram-
bling was performed by randomly translating all traces in the time-domain The network structure
was visualized by plotting a line between pairs of cells where the color of the lines was propor-
tionate to the correlation coefficient This was plotted on top of an image of the standard devia-
tions of the fluorescence over time per pixel Connectivity was defined as the number of cell pairs
with a correlation coefficient larger than the cut-off value divided by the total number of the pairs
of cells This provided a measure of the degree of connections within a network Small-world
parameter mean shortest path length (l) and mean clustering coefficient (s) were calculated by
using the MATLAB BGL library (httpwwwmathworkscommatlabcentralfileexchange10922) and
compared to corresponding randomized networks Many biological networks have a small-world
structure where the mean shortest path length is as short as in random networks and the mean
clustering coefficient is higher This signifies that the average number of nodes (for example neu-
ral cells) that a signal has to pass is low and that many of the nodes are connected in clusters
(Watts and Strogatz 1998) A small-world network structure creates the possibilities of regional
specialization and efficient signal transfer and is a common organization of networks within the
brain (Telesford et al 2011)
Data were further processed to produce graphs in OriginPro version 91 (OriginLab Corporation
Northamptom MA USA) Time-lapse Ca2+ imaging time traces were normalized individually
through DFF0 where DF=F1F0 F1 is the specific fluorescence intensity at a specific time point and
F0 is the average intensity of 30 s before and after F1
A previously published toolbox was used for the frequency analysis of time traces
(Uhlen 2004)
Recordings of hypoglossal nerve activity were filtered (006-Hz low-pass) rectified and
smoothed (1 s) (Talpalar et al 2011) by using OriginPro (version 91 OriginLab Corporation
USA)
Table 9 continued
Figure Panel Number of experiments
b 7 7 and 5
11 a 12 4
11 ndash S1 abc
11116
12 acdef
5 41644612
13 acf
6 57 541
13 ndash S1 ab
627
DOI 107554eLife14170067
Forsberg et al eLife 20165e14170 DOI 107554eLife14170 33 of 41
Research article Computational and Systems Biology Neuroscience
Table 10 Statistical details for presented figures
Figure Test used Exact p-value Degrees of freedomampFtzR value
1d Full factorial two-way ANOVA 00084 F=0612 DFE=21
1e Full factorial two-way ANOVA 00365 F=0284 DFE=21
1f Full factorial two-way ANOVA 00157 F=0329 DFE=21
1g Full factorial two-way ANOVA 0001700180007
F=0547F=0332F=1618DFE=23
2 ndash S1d Studentrsquos t-test 035045
DF = 9 19
4e Studentrsquos t-test 063076091
DF=11 12 8
4f Studentrsquos t-test 013 034 068021 028 086076 076 100
DF=11 12 8
4 ndash S2 Studentrsquos t-test 043 034 012011 057 019
DF=1916
4 ndash S2 Paired t-test 002 002 004003 002 001
DF=1916
5b Studentrsquos t-test 042 051 080 DF=15
5c Studentrsquos t-test 050 062 098 DF=15
5 ndash S2a Paired t-test 00029 DF=6
5 ndash S2b Paired t-test 0041 DF=10
5 ndash S2d Paired t-test 003 DF=4
6k Paired t-test 003125000391031250625
DF=23
6l Paired t-test 001563000781028125025
DF=23
6i Paired t-test 0492033103900390
DF=23
6m Paired t-test 0457012405670143
DF=23
6 ndash S1a Paired t-test 015625046094006250625
DF=23
6 ndash S1b Paired t-test 01562507421901562508125
DF=23
6 ndash S1c Paired t-test 012460078130312508125
DF=23
7b Paired t-test 00180034004700790132
DF= 4 3 7
Table 10 continued on next page
Forsberg et al eLife 20165e14170 DOI 107554eLife14170 34 of 41
Research article Computational and Systems Biology Neuroscience
Table 10 continued
Figure Test used Exact p-value Degrees of freedomampFtzR value
008400280063006700120077090
7g Paired t-test 095051
DF=4 3
7-S1 Paired t-test 05186101555806973305150803641502433
DF=16
9e Studentrsquos t-test 015 051 057029 0061 00081
DF=11 10 7
9f Studentrsquos t-test 038 051 075059 066 099010 010 095
DF=11 10 7
9g Paired t-test 043 DF=3
9h Paired t-test 00334 DF=11
9i Paired t-test 0014100283000475
DF=6 5 3
9 ndash S1 Studentrsquos t-test 077 051 092028 007 060
DF=935
9 ndash S1 Paired t-test 004 004 001003 002 001
DF=935
9 ndash S2 Paired t-test 00050705745022731068788081018066252
DF=16
10c Paired t-test 053 020 0610009 0015 00410023 0045 0035001 009 014
DF=11 7 7 9
10 ndash S1a Paired t-test 0153008480388
DF=6
10 ndash S1b Paired t-test 059043
DF=6
11b Full factorial two-way ANOVA 041800161
F=0054F=097
12b Paired t-test 000038028
DF= 6 4
13b Paired t-test 013 056 016024 012 0012
DF=7
13d Paired t-test 000046087
DF=6 4 4 3
13g Paired t-test 0411200001
DF=40
13 ndash S1c Paired t-test 00125000098
DF=5
DOI 107554eLife14170068
Forsberg et al eLife 20165e14170 DOI 107554eLife14170 35 of 41
Research article Computational and Systems Biology Neuroscience
StatisticsStatistical analysis of paired comparisons was performed by Studentrsquos t-test Full factorial two-way
ANOVA was performed when there was more than one independent variable or multiple observa-
tions Both tests were two-sided The compared data was of equal variance and normally distrib-
uted All calculations for the statistical tests were conducted with JMP (v 111 SAS Institute Inc
Cary NC US) In all cases plt005 was considered statistically significant Data are presented as
means plusmn SD All data sets were compared less than 20 times which is why no statistical correc-
tions were made As these experiments were expended to provide new descriptive data no
explicit power analysis was performed Instead sample sizes similar to previous publications with
similar methods were used Details on the statistics are presented in Tables 9 and 10
AcknowledgementsWe thank Markus Kruusmagi Josephine Forsberg Ruth Detlofsson Dorina Ujvari David Lagman
Torkel Mattesson and Lars Bjork for their technical assistance John Hayes for ImageJ scripts and
advice Marie Carlen and Thomas Ringstedt for their advice and discussion concerning optogenetics
Anders Blomqvist and Unn Ortegren Kugelberg (Linkoping University Sweden) for providing
Ptger3-- mice and Ed Boyden for providing halorhodopsin-57 This study was supported by the
Swedish Research Council the Stockholm County Council the Karolinska Institutet and grants from
the VINNOVA M amp M Wallenberg Fraenkel Axel Tielman Freemasons Childrenrsquos House and Swed-
ish National Heart and Lung Foundations
Additional information
Competing interests
EH employed at the Karolinska University Hospital and the Karolinska Institutet and is a coinventor
of a patent application regarding biomarkers and their relation to breathing disorders
WO2009063226 The other authors declare that no competing interests exist
Funding
Funder Grant reference number Author
Karolinska Institutet Graduate MD PhD studentfellowship
David Forsberg
Vetenskapsradet 2010-4392 Per Uhlen
Hjarnfonden FO2014+0220 Per Uhlen
Vetenskapsradet 2013-3189 Per Uhlen
Vetenskapsradet Senior Clinical researcher 6-year position 2008-5829
Eric Herlenius
VINNOVA Future Health Innovationgrant 2010-00534
Eric Herlenius
Stockholms Lans Landsting 2011-0095 Eric Herlenius
Hjarnfonden FO2011-008 Eric Herlenius
The Swedish National Heartand Lung foundation
20120373 Eric Herlenius
Vetenskapsradet 2009-3724 Eric Herlenius
Knut och Alice WallenbergsStiftelse
Senior clinical researcheraward and research grant102179
Eric Herlenius
Stockholms Lans Landsting 2012-0465 Eric Herlenius
Stockholms Lans Landsting 2014-0011 Eric Herlenius
Hjarnfonden FO2012-0036 Eric Herlenius
Hjarnfonden FO2015-0020 Eric Herlenius
Forsberg et al eLife 20165e14170 DOI 107554eLife14170 36 of 41
Research article Computational and Systems Biology Neuroscience
The Swedish National Heartand Lung foundation
20150558 Eric Herlenius
the Freemasonsrsquo ChildrenrsquosHouse
2015 Eric Herlenius
the Axel Tielman Foundation 2015-00220 Eric Herlenius
The Fraenckel Foundation FRAE0018 Eric Herlenius
The funders had no role in study design data collection and interpretation or the decision tosubmit the work for publication
Author contributions
DF ZH Conception and design Acquisition of data Analysis and interpretation of data Drafting or
revising the article ET GS YS Acquisition of data Analysis and interpretation of data Drafting or
revising the article ES KK PU Analysis and interpretation of data Drafting or revising the article
EH Conception and design Analysis and interpretation of data Drafting or revising the article
Author ORCIDs
David Forsberg httporcidorg0000-0002-4719-2201
Erik Smedler httporcidorg0000-0003-4609-3620
Gilad Silberberg httporcidorg0000-0001-9964-505X
Yuri Shvarev httporcidorg0000-0001-6622-1453
Kai Kaila httporcidorg0000-0003-0668-5955
Per Uhlen httporcidorg0000-0003-1446-1062
Eric Herlenius httporcidorg0000-0002-6859-0620
Ethics
Animal experimentation The studies were performed in strict accordance with European Community
Guidelines and protocols approved by the regional ethic committee (Permit numbers N24713
N26514b amp N18515)
Additional filesSupplementary files Source code 1 Cross-correlation analysis
DOI 107554eLife14170069
ReferencesBallanyi K Lalley PM Hoch B Richter DW 1997 cAMP-dependent reversal of opioid- and prostaglandin-mediated depression of the isolated respiratory network in newborn rats The Journal of Physiology 504127ndash134 doi 101111j1469-77931997127bfx
Ballanyi K Ruangkittisakul A 2009 Structurendashfunction analysis of rhythmogenic inspiratory pre-Botzingercomplex networks in ldquocalibratedrdquo newborn rat brainstem slices Respiratory Physiology amp Neurobiology 168158ndash178 doi 101016jresp200904020
Barabasi AL Oltvai ZN 2004 Network biology understanding the cellrsquos functional organization Nature ReviewsGenetics 5101ndash113 doi 101038nrg1272
Depuy SD Kanbar R Coates MB Stornetta RL Guyenet PG 2011 Control of breathing by raphe obscurusserotonergic neurons in mice Journal of Neuroscience 311981ndash1990 doi 101523JNEUROSCI4639-102011
Di Fiore JM Martin RJ Gauda EB 2013 Apnea of prematurityndashperfect storm Respiratory Physiology ampNeurobiology 189213ndash222 doi 101016jresp201305026
Elsen FP Shields EJ Roe MT Vandam RJ Kelty JD 2008 Carbenoxolone induced depression ofrhythmogenesis in the pre-Botzinger Complex BMC Neuroscience 946 doi 1011861471-2202-9-46
Erlichman JS Leiter JC Gourine AV 2010 ATP glia and central respiratory control Respiratory Physiology ampNeurobiology 173305ndash311 doi 101016jresp201006009
Fabre JE Nguyen M Athirakul K Coggins K McNeish JD Austin S Parise LK FitzGerald GA Coffman TMKoller BH 2001 Activation of the murine EP3 receptor for PGE2 inhibits cAMP production and promotesplatelet aggregation Journal of Clinical Investigation 107603ndash610 doi 101172JCI10881
Forsberg et al eLife 20165e14170 DOI 107554eLife14170 37 of 41
Research article Computational and Systems Biology Neuroscience
Feldman JL Del Negro CA Gray PA 2013 Understanding the rhythm of breathing so near yet so far AnnualReview of Physiology 75423ndash452 doi 101146annurev-physiol-040510-130049
Feldman JL Kam K 2015 Facing the challenge of mammalian neural microcircuits taking a few breaths mayhelp The Journal of Physiology 5933ndash23 doi 101113jphysiol2014277632
Fiacco TA Agulhon C Taves SR Petravicz J Casper KB Dong X Chen J McCarthy KD 2007 Selectivestimulation of astrocyte calcium in situ does not affect neuronal excitatory synaptic activity Neuron 54611ndash626 doi 101016jneuron200704032
Fortin G Thoby-Brisson M 2009 Embryonic emergence of the respiratory rhythm generator RespiratoryPhysiology amp Neurobiology 16886ndash91 doi 101016jresp200906013
Frantseva MV Carlen PL El-Beheiry H 1999 A submersion method to induce hypoxic damage in organotypichippocampal cultures Journal of Neuroscience Methods 8925ndash31 doi 101016S0165-0270(99)00030-8
Gahwiler BH 1988 Organotypic cultures of neural tissue Trends in Neurosciences 11484ndash489 doi 1010160166-2236(88)90007-0
Gahwiler BH Capogna M Debanne D McKinney RA Thompson SM 1997 Organotypic slice cultures atechnique has come of age Trends in Neurosciences 20471ndash477 doi 101016S0166-2236(97)01122-3
Giaume C Koulakoff A Roux L Holcman D Rouach N 2010 Astroglial networks a step further in neuroglial andgliovascular interactions Nature Reviews Neuroscience 1187ndash99 doi 101038nrn2757
Gogolla N Galimberti I DePaola V Caroni P 2006 Preparation of organotypic hippocampal slice cultures forlong-term live imaging Nature Protocols 11165ndash1171 doi 101038nprot2006168
Gourine AV Kasymov V Marina N Tang F Figueiredo MF Lane S Teschemacher AG Spyer KM Deisseroth KKasparov S 2010 Astrocytes control breathing through pH-dependent release of ATP Science 329571ndash575doi 101126science1190721
Greene MM Patra K Khan S Karst JS Nelson MN Silvestri JM 2014 Cardiorespiratory events in extremely lowbirth weight infants neurodevelopmental outcome at 1 and 2 years Journal of Perinatology 34562ndash565 doi101038jp201444
Guerra FA Savich RD Wallen LD Lee CH Clyman RI Mauray FE Kitterman JA 1988 Prostaglandin E2 causeshypoventilation and apnea in newborn lambs Journal of Applied Physiology 642160ndash2166
Guyenet PG Bayliss DA Stornetta RL Fortuna MG Abbott SB DePuy SD 2009 Retrotrapezoid nucleusrespiratory chemosensitivity and breathing automaticity Respiratory Physiology amp Neurobiology 16859ndash68doi 101016jresp200902001
Guyenet PG Abbott SB Stornetta RL 2013 The respiratory chemoreception conundrum light at the end of thetunnel Brain Research 1511126ndash137 doi 101016jbrainres201210028
Guyenet PG Bayliss DA 2015 Neural Control of Breathing and CO2 Homeostasis Neuron 87946ndash961 doi 101016jneuron201508001
Hartelt N Skorova E Manzke T Suhr M Mironova L Kugler S Mironov SL 2008 Imaging of respiratory networktopology in living brainstem slices Molecular and Cellular Neuroscience 37425ndash431 doi 101016jmcn200710011
Herlenius E 2011 An inflammatory pathway to apnea and autonomic dysregulation Respiratory Physiology ampNeurobiology 178449ndash457 doi 101016jresp201106026
Herlenius E Thonabulsombat C Forsberg D Jaderstad J Jaderstad LM Bjork L Olivius P 2012 Functionalstem cell integration assessed by organotypic slice cultures Current Protocols in Stem Cell Biology 2D13 doi1010029780470151808sc02d13s23
Hofstetter AO Herlenius E 2005 Interleukin-1beta depresses hypoxic gasping and autoresuscitation in neonatalDBA1lacJ mice Respiratory Physiology amp Neurobiology 146135ndash146 doi 101016jresp200411002
Hofstetter AO Saha S Siljehav V Jakobsson P-J Herlenius E 2007 The induced prostaglandin E2 pathway is akey regulator of the respiratory response to infection and hypoxia in neonates PNAS 1049894ndash9899 doi 101073pnas0611468104
Hofstetter AO Legnevall L Herlenius E Katz-Salamon M 2008 Cardiorespiratory development in extremelypreterm infants vulnerability to infection and persistence of events beyond term-equivalent age ActaPaediatrica 97285ndash292 doi 101111j1651-2227200700618x
Huckstepp RT id Bihi R Eason R Spyer KM Dicke N Willecke K Marina N Gourine AV Dale N 2010aConnexin hemichannel-mediated CO2-dependent release of ATP in the medulla oblongata contributes tocentral respiratory chemosensitivity The Journal of Physiology 5883901ndash3920 doi 101113jphysiol2010192088
Huckstepp RT Eason R Sachdev A Dale N 2010b CO2-dependent opening of connexin 26 and related bconnexins The Journal of Physiology 5883921ndash3931 doi 101113jphysiol2010192096
Huckstepp RT Dale N 2011 Redefining the components of central CO2 chemosensitivityndashtowards a betterunderstanding of mechanism The Journal of Physiology 5895561ndash5579 doi 101113jphysiol2011214759
Huckstepp RT Cardoza KP Henderson LE Feldman JL 2015 Role of parafacial nuclei in control of breathing inadult rats Journal of Neuroscience 351052ndash1067 doi 101523JNEUROSCI2953-142015
Jaderstad J Jaderstad LM Li J Chintawar S Salto C Pandolfo M Ourednik V Teng YD Sidman RL Arenas ESnyder EY Herlenius E Li J CS 2010 Communication via gap junctions underlies early functional and beneficialinteractions between grafted neural stem cells and the host PNAS 1075184ndash5189 doi 101073pnas0915134107
Jasinski PE Molkov YI Shevtsova NA Smith JC Rybak IA 2013 Sodium and calcium mechanisms of rhythmicbursting in excitatory neural networks of the pre-Botzinger complex a computational modelling studyEuropean Journal of Neuroscience 37212ndash230 doi 101111ejn12042
Forsberg et al eLife 20165e14170 DOI 107554eLife14170 38 of 41
Research article Computational and Systems Biology Neuroscience
Kaila K Ransom BR 1998 pH and Brain Function New York Wiley-LissKaila K Price TJ Payne JA Puskarjov M Voipio J 2014 Cation-chloride cotransporters in neuronaldevelopment plasticity and disease Nature Reviews Neuroscience 15637ndash654 doi 101038nrn3819
Koch H Caughie C Elsen FP Doi A Garcia AJ Zanella S Ramirez JM 2015 Prostaglandin E2 differentiallymodulates the central control of eupnoea sighs and gasping in mice The Journal of Physiology 593305ndash319doi 101113jphysiol2014279794
Kovesi T Abdurahman A Blayney M 2006 Elevated carbon dioxide tension as a predictor of subsequentadverse events in infants with bronchopulmonary dysplasia Lung 1847ndash13 doi 101007s00408-005-2556-1
Kumar NN Velic A Soliz J Shi Y Li K Wang S Weaver JL Sen J Abbott SB Lazarenko RM Ludwig MG Perez-Reyes E Mohebbi N Bettoni C Gassmann M Suply T Seuwen K Guyenet PG Wagner CA Bayliss DA et al2015 Physiology Regulation of breathing by CO2 requires the proton-activated receptor GPR4 inretrotrapezoid nucleus neurons Science 3481255ndash1260 doi 101126scienceaaa0922
Lepe-Zuniga JL Zigler JS Gery I 1987 Toxicity of light-exposed Hepes media Journal of ImmunologicalMethods 103145 doi 1010160022-1759(87)90253-5
Li YM Duffin J 2004 Developmental changes in transmission of respiratory rhythm in the rat RespiratoryPhysiology amp Neurobiology 142153ndash163 doi 101016jresp200406013
Li P Janczewski WA Yackle K Kam K Pagliardini S Krasnow MA Feldman JL Li P JWA 2016 The peptidergiccontrol circuit for sighing Nature 530293ndash297 doi 101038nature16964
Lin W Kemper A McCarthy KD Pytel P Wang JP Campbell IL Utset MF Popko B 2004 Interferon-gammainduced medulloblastoma in the developing cerebellum Journal of Neuroscience 2410074ndash10083 doi 101523JNEUROSCI2604-042004
Livak KJ Schmittgen TD 2001 Analysis of relative gene expression data using real-time quantitative PCR andthe 2(-Delta Delta C(T)) Method Methods 25402ndash408 doi 101006meth20011262
Long WA 1988 Prostaglandins and control of breathing in newborn piglets Journal of Applied Physiology 64409ndash418
Lu Hai-xia Levis H Liu Y Parker T Lu HX 2011 Organotypic slices culture model for cerebellar ataxia Potentialuse to study Purkinje cell induction from neural stem cells Brain Research Bulletin 84169ndash173 doi 101016jbrainresbull201012001
Malmersjo S Rebellato P Smedler E Planert H Kanatani S Liste I Nanou E Sunner H Abdelhady S Zhang SAndang M El Manira A Silberberg G Arenas E Uhlen P 2013 Neural progenitors organize in small-worldnetworks to promote cell proliferation PNAS 110E1524ndashE1532 doi 101073pnas1220179110
Martin RJ Wang K Koroglu O Di Fiore J Kc P 2011 Intermittent hypoxic episodes in preterm infants do theymatter Neonatology 100303ndash310 doi 101159000329922
Meigh L Greenhalgh SA Rodgers TL Cann MJ Roper DI Dale N 2013 CO2directly modulates connexin 26 byformation of carbamate bridges between subunits eLife 2e01213 doi 107554eLife01213
Mellen NM Thoby-Brisson M 2012 Respiratory circuits development function and models Current Opinion inNeurobiology 22676ndash685 doi 101016jconb201201001
Mian Q Cheung PY OrsquoReilly M Pichler G van Os S Kushniruk K Aziz K Schmolzer GM 2015 Spontaneouslybreathing preterm infants change in tidal volume to improve lung aeration Immediately after birth The Journalof Pediatrics 167274ndash278 doi 101016jjpeds201504047
Mitchell MD Brunt J Bibby J Flint AP Anderson AB Turnbull AC 1978 Prostaglandins in the human umbilicalcirculation at birth BJOG An International Journal of Obstetrics and Gynaecology 85114ndash118 doi 101111j1471-05281978tb10463x
Montero Domınguez M Gonzalez B Zimmer J 2009 Neuroprotective effects of the anti-inflammatorycompound triflusal on ischemia-like neurodegeneration in mouse hippocampal slice cultures occur independentof microglia Experimental Neurology 21811ndash23 doi 101016jexpneurol200903023
Namba T Sugimoto Y Negishi M Irie A Ushikubi F Kakizuka A Ito S Ichikawa A Narumiya S 1993 Alternativesplicing of C-terminal tail of prostaglandin E receptor subtype EP3 determines G-protein specificity Nature365166ndash170 doi 101038365166a0
Okada Y Sasaki T Oku Y Takahashi N Seki M Ujita S Tanaka KF Matsuki N Ikegaya Y 2012 Preinspiratorycalcium rise in putative pre-Botzinger complex astrocytes The Journal of Physiology 5904933ndash4944 doi 101113jphysiol2012231464
Onimaru H 1995 Studies of the respiratory center using isolated brainstem-spinal cord preparationsNeuroscience Research 21183ndash190 doi 1010160168-0102(94)00863-B
Onimaru H Ikeda K Kawakami K 2008 CO2-sensitive preinspiratory neurons of the parafacial respiratory groupexpress Phox2b in the neonatal rat Journal of Neuroscience 2812845ndash12850 doi 101523JNEUROSCI3625-082008
Onimaru H Ikeda K Kawakami K 2009 Phox2b RTNpFRG neurons and respiratory rhythmogenesisRespiratory Physiology amp Neurobiology 16813ndash18 doi 101016jresp200903007
Onimaru H Dutschmann M 2012 Calcium imaging of neuronal activity in the most rostral parafacial respiratorygroup of the newborn rat The Journal of Physiological Sciences 6271ndash77 doi 101007s12576-011-0179-2
Pagliardini S Janczewski WA Tan W Dickson CT Deisseroth K Feldman JL 2011 Active expiration induced byexcitation of ventral medulla in adult anesthetized rats Journal of Neuroscience 312895ndash2905 doi 101523JNEUROSCI5338-102011
Pascual O Casper KB Kubera C Zhang J Revilla-Sanchez R Sul JY Takano H Moss SJ McCarthy K HaydonPG 2005 Astrocytic purinergic signaling coordinates synaptic networks Science 310113ndash116 doi 101126science1116916
Forsberg et al eLife 20165e14170 DOI 107554eLife14170 39 of 41
Research article Computational and Systems Biology Neuroscience
Phillips WS Herly M Del Negro CA Rekling JC 2016 Organotypic slice cultures containing the preBotzingercomplex generate respiratory-like rhythms Journal of Neurophysiology 1151063ndash1070 doi 101152jn009042015
Preynat-Seauve O Suter DM Tirefort D Turchi L Virolle T Chneiweiss H Foti M Lobrinus JA Stoppini L FekiA Dubois-Dauphin M Krause KH 2009 Development of human nervous tissue upon differentiation ofembryonic stem cells in three-dimensional culture Stem Cells 27509ndash520 doi 101002stem20080600
Ramirez JM Quellmalz UJ Wilken B 1997 Developmental changes in the hypoxic response of the hypoglossusrespiratory motor output in vitro Journal of Neurophysiology 78383ndash392
Ramirez JM 2014 The integrative role of the sigh in psychology physiology pathology and neurobiologyProgress in Brain Research 20991ndash129 doi 101016B978-0-444-63274-600006-0
Rekling JC Shao XM Feldman JL 2000 Electrical coupling and excitatory synaptic transmission betweenrhythmogenic respiratory neurons in the preBotzinger complex The Journal of Neuroscience 20RC113
Reyes EP Cerpa V Corvalan L Retamal MA 2014 Cxs and Panx- hemichannels in peripheral and centralchemosensing in mammals Frontiers in Cellular Neuroscience 8123 doi 103389fncel201400123
Richerson GB 2004 Serotonergic neurons as carbon dioxide sensors that maintain pH homeostasis NatureReviews Neuroscience 5449ndash461 doi 101038nrn1409
Ruangkittisakul A Schwarzacher SW Secchia L Poon BY Ma Y Funk GD Ballanyi K 2006 High sensitivity toneuromodulator-activated signaling pathways at physiological [K+] of confocally imaged respiratory centerneurons in on-line-calibrated newborn rat brainstem slices Journal of Neuroscience 2611870ndash11880 doi 101523JNEUROSCI3357-062006
Ruangkittisakul A Panaitescu B Ballanyi K 2011 K(+) and Ca2(+) dependence of inspiratory-related rhythm innovel calibrated mouse brainstem slices Respiratory Physiology amp Neurobiology 17537ndash48 doi 101016jresp201009004
Ruangkittisakul A Kottick A Picardo MCD Ballanyi K Del Negro CA 2014 Identification of the pre-Botzingercomplex inspiratory center in calibrated sandwich slices from newborn mice with fluorescent Dbx1interneurons Physiological Reports 2e12111 doi 1014814phy212111
Schnell C Hagos Y Hulsmann S 2012 Active sulforhodamine 101 uptake into hippocampal astrocytes PLoSONE 7e49398 doi 101371journalpone0049398
Siljehav V Olsson Hofstetter A Jakobsson PJ Herlenius E 2012 mPGES-1 and prostaglandin E2 vital role ininflammation hypoxic response and survival Pediatric Research 72460ndash467 doi 101038pr2012119
Siljehav V Shvarev Y Herlenius E 2014 Il-1b and prostaglandin E2 attenuate the hypercapnic as well as thehypoxic respiratory response via prostaglandin E receptor type 3 in neonatal mice Journal of AppliedPhysiology 1171027ndash1036 doi 101152japplphysiol005422014
Siljehav V Hofstetter AM Leifsdottir K Herlenius E 2015 Prostaglandin E2 Mediates CardiorespiratoryDisturbances during Infection in Neonates The Journal of Pediatrics 1671207ndash1213e3 doi 101016jjpeds201508053
Smedler E Malmersjo S Uhlen P 2014 Network analysis of time-lapse microscopy recordings Frontiers inNeural Circuits 8111 doi 103389fncir201400111
Smith JC Abdala APL Rybak IA Paton JFR 2009 Structural and functional architecture of respiratory networks inthe mammalian brainstem Philosophical Transactions of the Royal Society B Biological Sciences 3642577ndash2587doi 101098rstb20090081
Sobrinho CR Wenker IC Poss EM Takakura AC Moreira TS Mulkey DK 2014 Purinergic signalling contributesto chemoreception in the retrotrapezoid nucleus but not the nucleus of the solitary tract or medullary rapheThe Journal of Physiology 5921309ndash1323 doi 101113jphysiol2013268490
Solomon IC Chon KH Rodriguez MN 2003 Blockade of brain stem gap junctions increases phrenic burstfrequency and reduces phrenic burst synchronization in adult rat Journal of Neurophysiology 89135ndash149 doi101152jn006972002
Talpalar AE Endo T Low P Borgius L Hagglund M Dougherty KJ Ryge J Hnasko TS Kiehn O 2011Identification of minimal neuronal networks involved in flexor-extensor alternation in the mammalian spinalcord Neuron 711071ndash1084 doi 101016jneuron201107011
Telesford QK Joyce KE Hayasaka S Burdette JH Laurienti PJ 2011 The ubiquity of small-world networksBrain Connectivity 1367ndash375 doi 101089brain20110038
Thoby-Brisson M Karlen M Wu N Charnay P Champagnat J Fortin G 2009 Genetic identification of anembryonic parafacial oscillator coupling to the preBotzinger complex Nature Neuroscience 121028ndash1035 doi101038nn2354
Thonabulsombat C Johansson S Spenger C Ulfendahl M Olivius P 2007 Implanted embryonic sensoryneurons project axons toward adult auditory brainstem neurons in roller drum and Stoppini co-cultures BrainResearch 117048ndash58 doi 101016jbrainres200706085
Toporikova N Chevalier M Thoby-Brisson M 2015 Sigh and Eupnea Rhythmogenesis Involve DistinctInterconnected Subpopulations A Combined Computational and Experimental Study(123) eNeuro 2ENEURO0074-14 doi 101523ENEURO0074-142015
Turovsky E Karagiannis A Abdala AP Gourine AV 2015 Impaired CO2 sensitivity of astrocytes in a mousemodel of Rett syndrome The Journal of Physiology 5933159ndash3168 doi 101113JP270369
Uhlen P 2004 Spectral Analysis of Calcium Oscillations Science Signaling 2004pl15 doi 101126stke2582004pl15
Forsberg et al eLife 20165e14170 DOI 107554eLife14170 40 of 41
Research article Computational and Systems Biology Neuroscience
Veliz LP Gonzalez FG Duling BR Saez JC Boric MP 2008 Functional role of gap junctions in cytokine-inducedleukocyte adhesion to endothelium in vivo AJP Heart and Circulatory Physiology 295H1056ndashH1066 doi 101152ajpheart002662008
Wallen-Mackenzie A Gezelius H Thoby-Brisson M Nygard A Enjin A Fujiyama F Fortin G Kullander K 2006Vesicular glutamate transporter 2 is required for central respiratory rhythm generation but not for locomotorcentral pattern generation Journal of Neuroscience 2612294ndash12307 doi 101523JNEUROSCI3855-062006
Wang SJ Wang KY Wang WC 2004 Mechanisms underlying the riluzole inhibition of glutamate release from ratcerebral cortex nerve terminals (synaptosomes) Neuroscience 125191ndash201 doi 101016jneuroscience200401019
Watts DJ Strogatz SH 1998 Collective dynamics of rsquosmall-worldrsquo networks Nature 393440ndash442 doi 10103830918
Wenker IC Sobrinho CR Takakura AC Moreira TS Mulkey DK 2012 Regulation of ventral surface CO2H+-sensitive neurons by purinergic signalling The Journal of Physiology 5902137ndash2150 doi 101113jphysiol2012229666
Westman M Korotkova M af Klint E Stark A Audoly LP Klareskog L Ulfgren AK Jakobsson PJ 2004Expression of microsomal prostaglandin E synthase 1 in rheumatoid arthritis synovium Arthritis amp Rheumatism501774ndash1780 doi 101002art20286
Yamada KM Cukierman E 2007 Modeling tissue morphogenesis and cancer in 3D Cell 130601ndash610 doi 101016jcell200708006
Yamagata K Matsumura K Inoue W Shiraki T Suzuki K Yasuda S Sugiura H Cao C Watanabe Y Kobayashi S2001 Coexpression of microsomal-type prostaglandin E synthase with cyclooxygenase-2 in brain endothelialcells of rats during endotoxin-induced fever The Journal of Neuroscience 212669ndash2677
Forsberg et al eLife 20165e14170 DOI 107554eLife14170 41 of 41
Research article Computational and Systems Biology Neuroscience
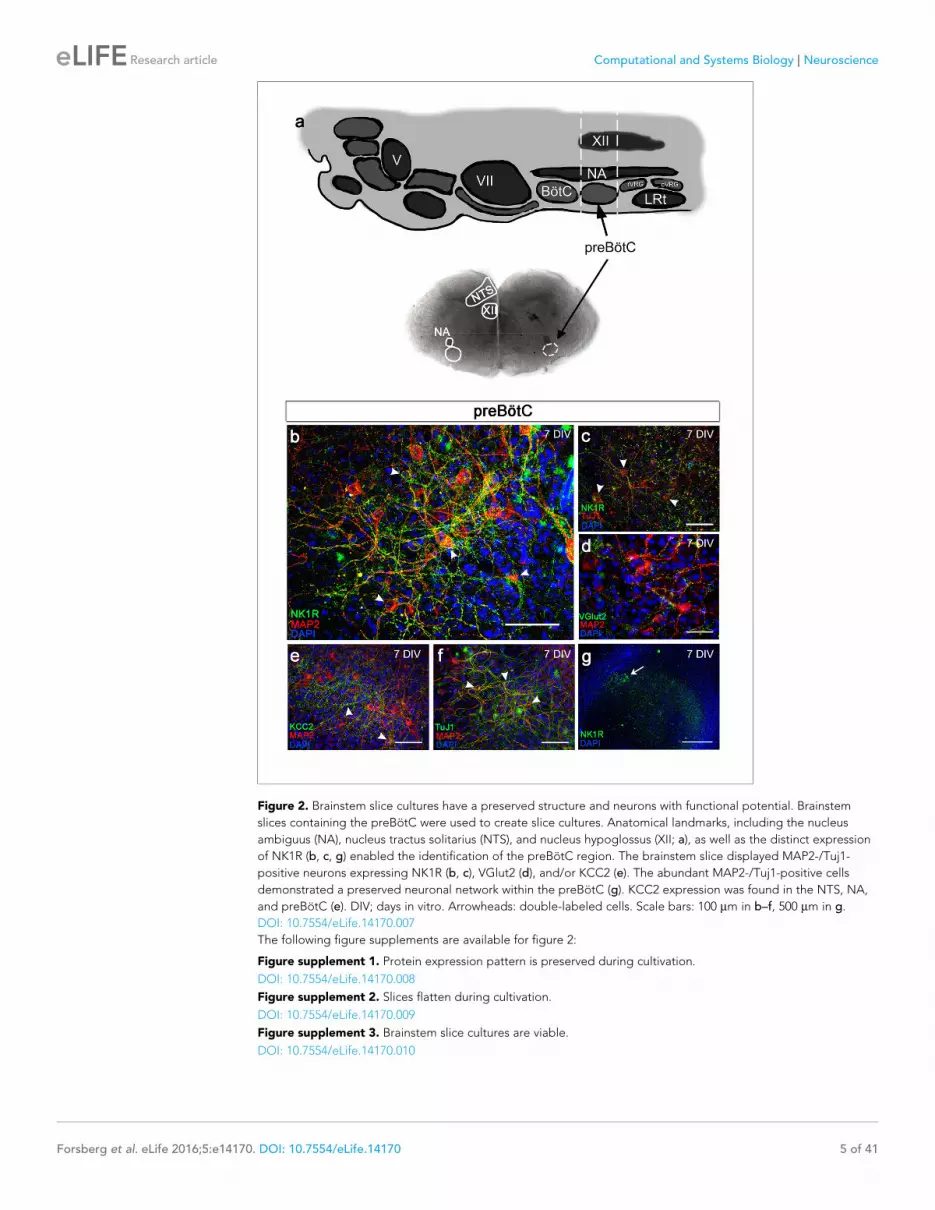
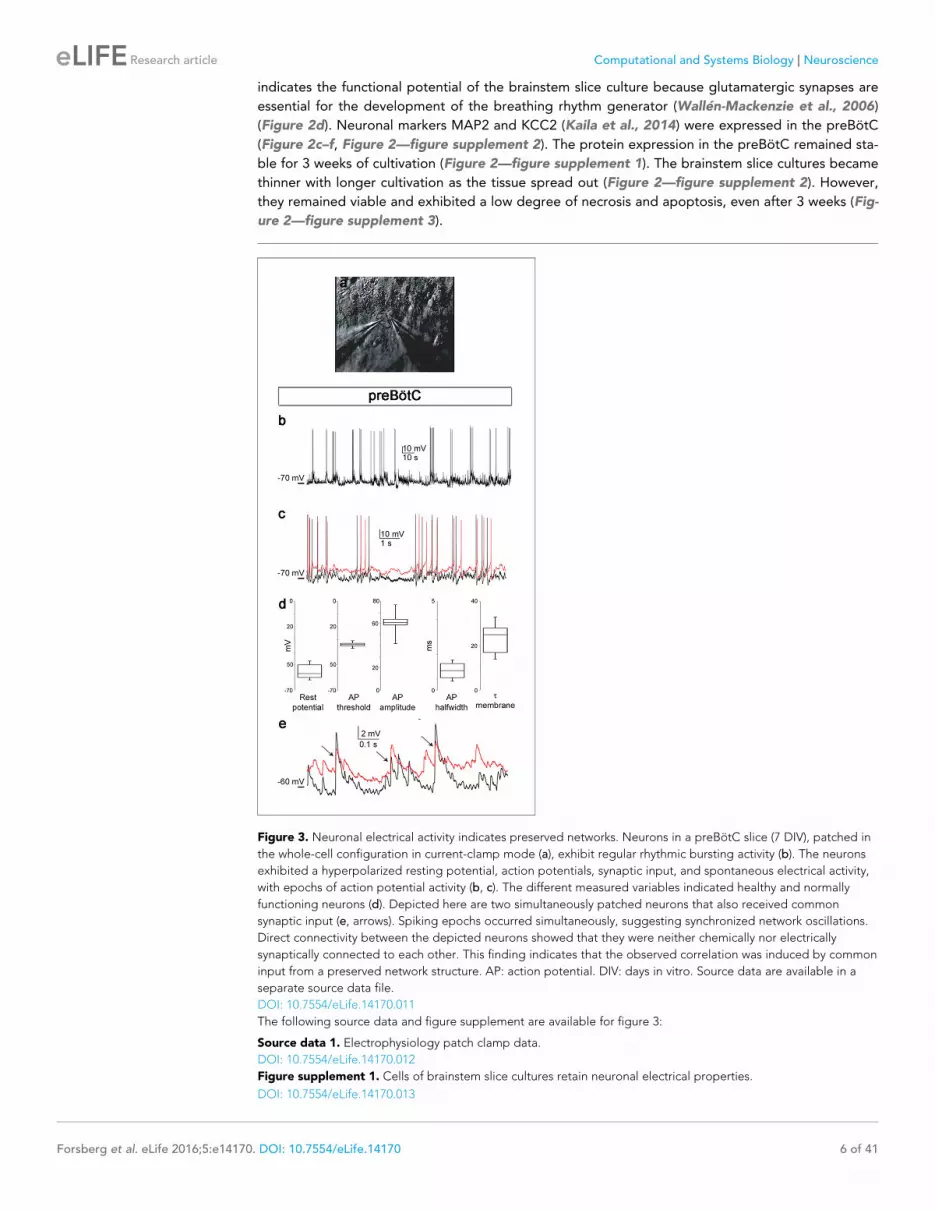
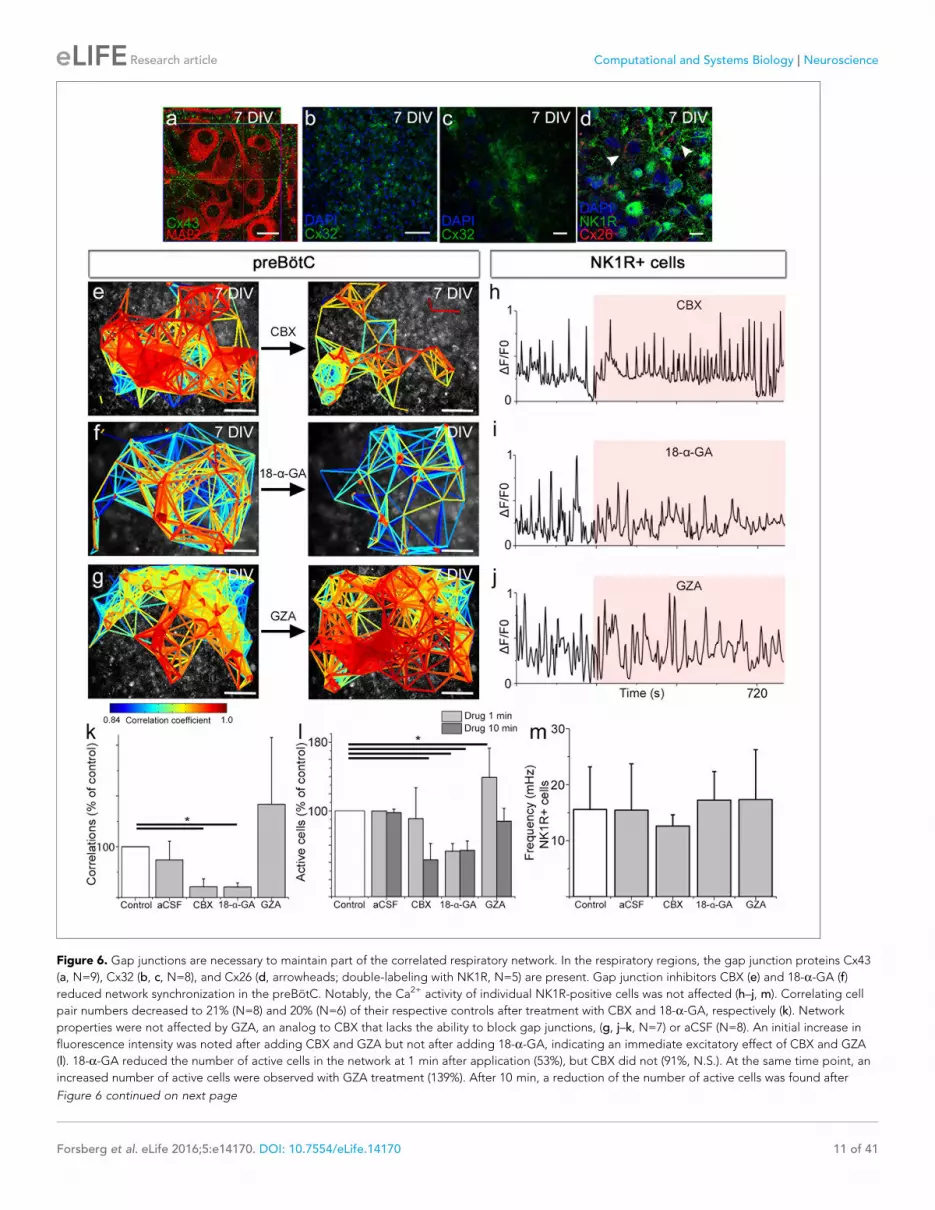
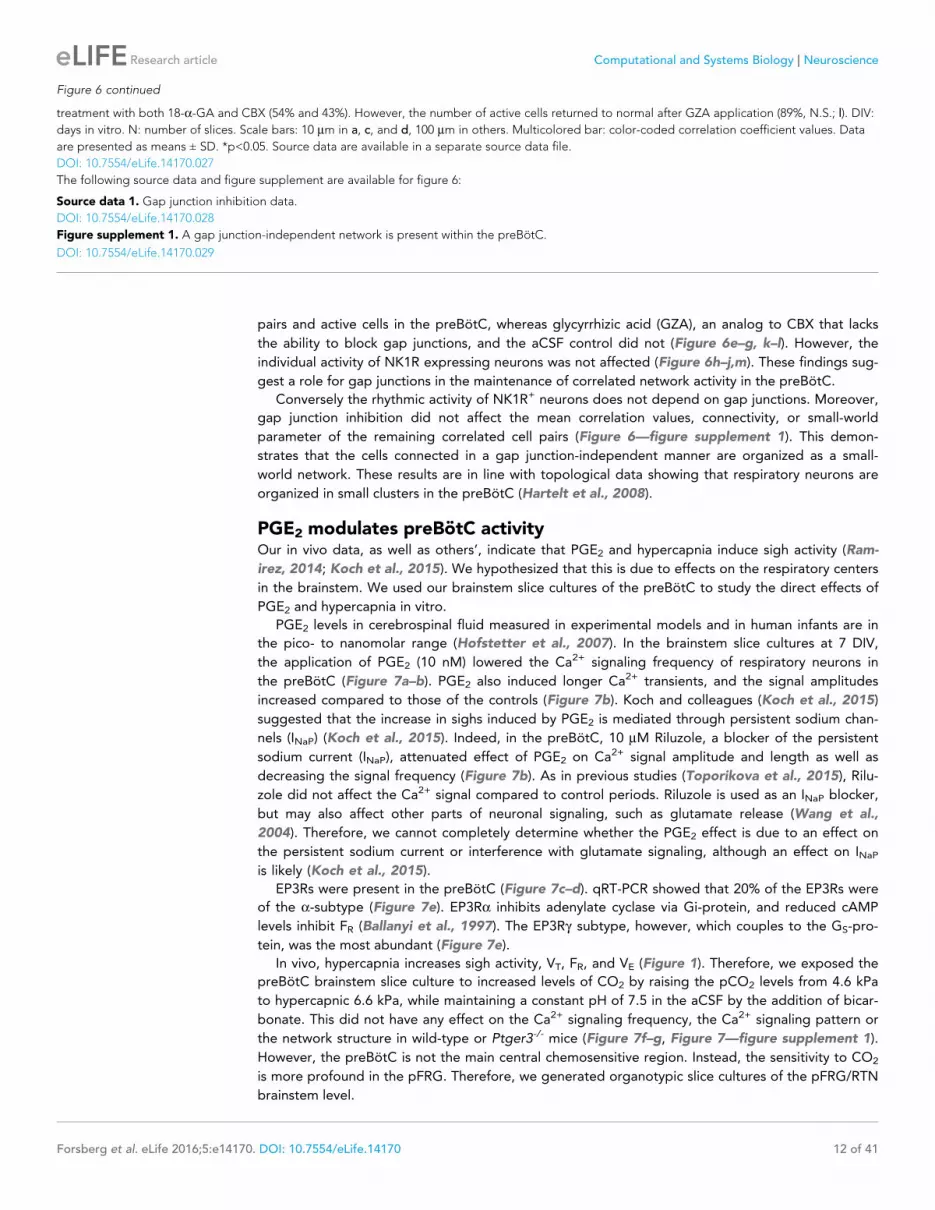
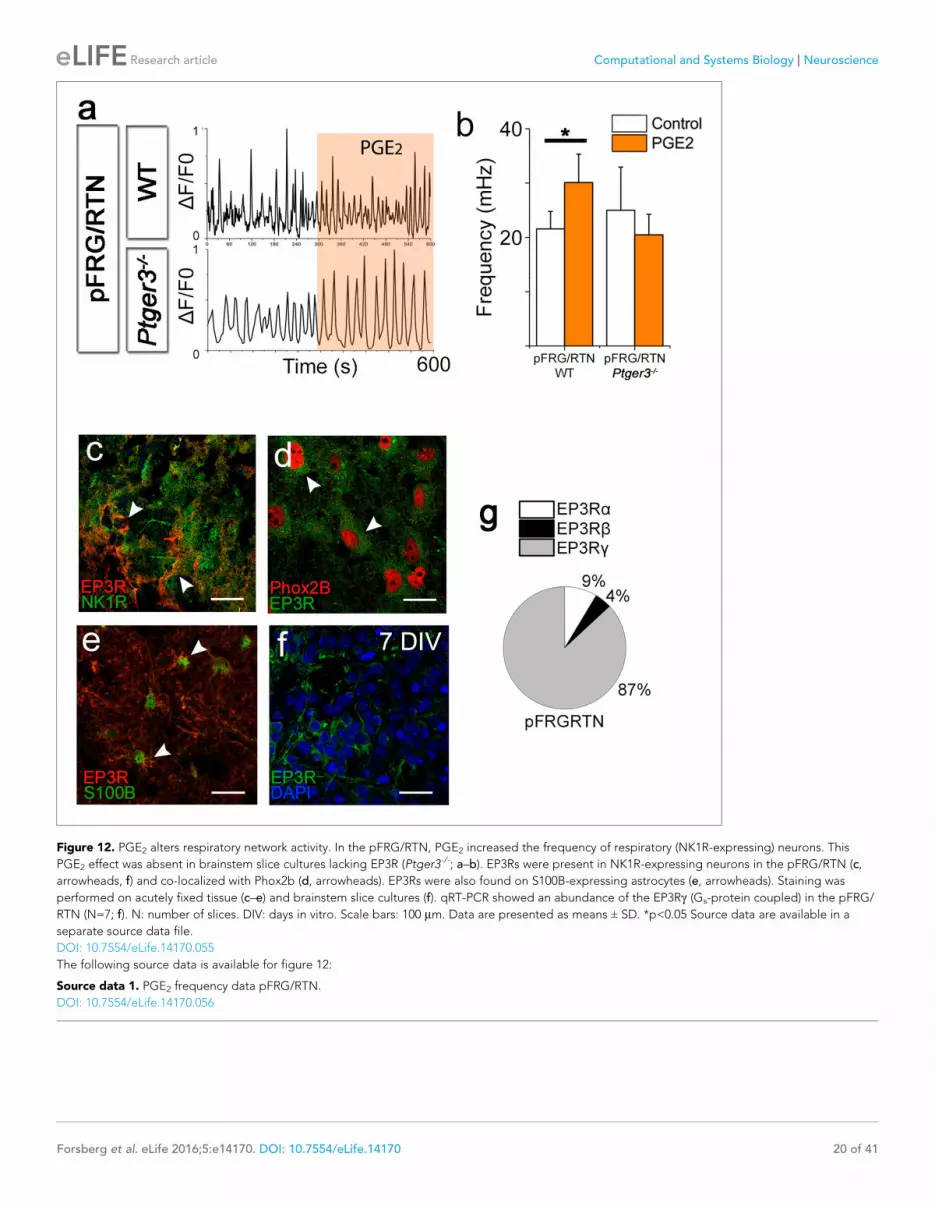
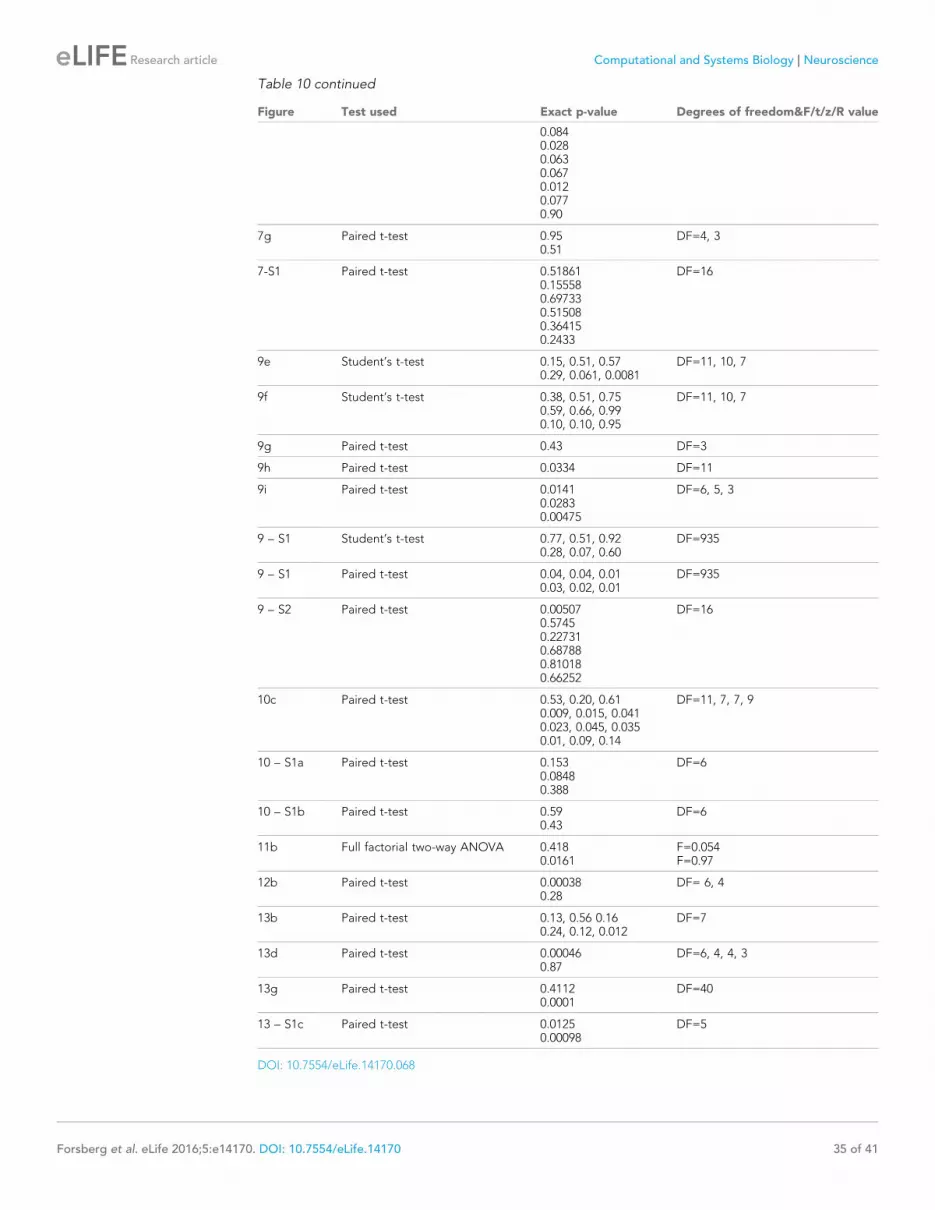