organotypic brain slice co-cultures of the dopaminergic system -
TRANSCRIPT

Organotypic brain slice co-cultures of the dopaminergic system -
A model for the identification of neuroregenerative substances and cell populations
Der Fakultät für Biowissenschaften, Pharmazie und Psychologie
der Universität Leipzig
genehmigte
D I S S E R T A T I O N
zur Erlangung des akademischen Grades
doctor rerum naturalium
Dr. rer. nat.
vorgelegt von
Dipl. Biochem. Katja Sygnecka, geb. Kohlmann
geboren am 23.12.1983 in Lutherstadt Wittenberg
Dekan: Prof. Dr. Erich Schröger
Gutachter: Prof. Dr. Andrea Robitzki Prof. Dr. Bernd Heimrich
Verteidigung: Leipzig, den 23.10.2015

i
BIBLIOGRAPHY
Katja Sygnecka
Organotypic brain slice co‐cultures of the dopaminergic system –
A model for the identification of neuroregenerative substances and cell populations
Faculty of Biosciences, Pharmacy and Psychology
Leipzig University
Dissertation
89 pages, 130 references, 29 figures, and 3 tables
The development of new therapeutical approaches, devised to foster the regeneration of neuronal circuits after injury and/or in neurodegenerative diseases, is of great importance. The impairment of dopaminergic projections is especially severe, because these projections are involved in crucial brain functions such as motor control, reward and cognition. In the work presented here, organotypic brain slice co‐cultures of (a) the mesostriatal and (b) the mesocortical dopaminergic projection systems consisting of tissue sections of the ventral tegmental area/substantia nigra (VTA/SN), in combination with the target regions of (a) the striatum (STR) or (b) the prefrontal cortex (PFC), respectively, were used to evaluate different approaches to stimulate neurite outgrowth: (i) inhibition of cAMP/cGMP turnover with 3’,5’ cyclic nucleotide phosphodiesterase inhibitors (PDE‐Is), (ii) blockade of calcium currents with nimodipine, and (iii) the co‐cultivation with bone marrow‐derived mesenchymal stromal/stem cells (BM‐MSCs). The neurite growth‐promoting properties of the tested substances and cell populations were analyzed by neurite density quantification in the border region between the two brain slices, using biocytin tracing or tyrosine hydroxylase labeling and automated image processing procedures. In addition, toxicological tests and gene expression analyses were conducted. (i) PDE‐Is were applied to VTA/SN+STR rat co‐cultures. The quantification of neurite density after both biocytin tracing and tyrosine hydroxylase labeling revealed a growth promoting effect of the PDE2A‐Is BAY60‐7550 and ND7001. The application of the PDE10‐I MP‐10 did not alter neurite density in comparison to the vehicle control. (ii) The effects of nimodipine were evaluated in VTA/SN+PFC rat co‐cultures. A neurite growth‐promoting effect of 0.1 µM and 1 µM nimodipine was demonstrated in a projection system of the CNS. In contrast, the application of 10 µM nimodipine did not alter neurite density, compared to the vehicle control, but induced the activation of the apoptosis marker caspase 3. The expression levels of the investigated genes, including Ca2+ binding proteins (Pvalb, S100b), immediate early genes (Arc, Egr1, Egr2, Egr4, Fos and JunB), glial fibrillary acidic protein, and myelin components (Mal, Mog, Plp1) were not significantly changed (with the exception of Egr4) by the treatment with 0.1 µM and 1 µM nimodipine. (iii) Bulk BM‐MSCs that were classically isolated by plastic adhesion were compared to the subpopulation Sca‐1+Lin‐CD45‐‐derived MSCs (SL45‐MSCs). The neurite growth‐promoting properties of both MSC populations were quantified in VTA/SN+PFC mouse co‐cultures. For this purpose, the MSCs were seeded on glass slides that were placed underneath the co‐cultures. A significantly enhanced neurite density within the co‐cultures was induced by both bulk BM‐MSCs and SL45‐MSCs. SL45‐MSCs increased neurite density to a higher degree. The characterization of both MSC populations revealed that the frequency of fibroblast colony forming units (CFU‐f ) is 105‐fold higher in SL45‐MSCs. SL45‐MSCs were morphologically more homogeneous and expressed higher levels of nestin, BDNF and FGF2 compared to bulk BM‐MSCs. Thus, this work emphasizes the vast potential for molecular targeting with respect to the development of therapeutic strategies in the enhancement of neurite regrowth.

ii
Table of contents
Abbreviations ....................................................................................................... 1
1. Introduction ............................................................................................... 2
1.1 The dopaminergic system ..................................................................................................... 2
1.2 Neurite regeneration following mechanical lesions of the CNS ........................................... 7
1.3 Organotypic brain slice co‐cultures ...................................................................................... 8
1.4 Promising substances and cells to enhance neuroregeneration ........................................ 10
1.5 The aim of the thesis .......................................................................................................... 14
2. The original research articles ..................................................................... 16
2.1 Phosphodiesterase 2 inhibitors promote axonal outgrowth in organotypic slice co‐
cultures ..................................................................................................................................... 17
2.2 Nimodipine enhances neurite outgrowth in dopaminergic brain slice co‐cultures ........... 35
2.3 Mesenchymal stem cells support neuronal fiber growth in an organotypic brain slice co‐
culture model ........................................................................................................................... 50
......................................................................................................................................................
3. References ................................................................................................ 66
Appendices ................................................................................................... 73
Summary ........................................................................................................................... 73
Zusammenfassung ............................................................................................................ 78
Curriculum Vitae ...................................................................................................................... 84
Track Record ............................................................................................................................ 85
Selbständigkeitserklärung ........................................................................................................ 87
Acknowledgments .................................................................................................................... 88

Abbreviations
BM bone marrow
BM‐MSC bone marrow‐derived mesenchymal stromal/stem cell
cAMP adenosine 3’,5’ cyclic monophosphate
CD cluster of differentiation
CFU‐f fibroblast colony forming units
cGMP guanosine 3’,5’ cyclic monophosphate
CNS central nervous system
DA dopamine
DHP dihydropyridine
Fig. figure
GABA ɣ‐aminobutyric acid
GFAP glial fibrillary acidic protein
LDH lactate dehydrogenase
MAP2 microtubule‐associated protein 2
MSC mesenchymal stromal/stem cell
NGF nerve growth factor
P postnatal day
PDE 3’,5’‐cyclic‐nucleotide phosphodiesterase
PDE‐I 3’,5’‐cyclic‐nucleotide phosphodiesterase inhibitor
PFC prefrontal cortex
PI propidium iodide
qPCR quantitative real time reverse transcription polymerase chain reaction
SL45‐MSC Sca‐1+Lin‐CD45‐‐derived mesenchymal stromal/stem cell
SN substantia nigra
SNc substantia nigra pars compacta
STR striatum
TH tyrosine hydroxylase
VM ventral mesencephalon
VTA ventral tegmental area
ABBREVIATIONS
1

1. Introduction
Axonal projections can get lost as a consequence of (i) brain injury (e.g. traumatic brain injury),
(ii) the occurrence of cell death in neurodegenerative diseases, such as Parkinson’s disease, and
(iii) the malformation of neuronal processes during development. The loss of these projections
results in the impairment of the basic organization of neuronal circuits. To date, there are no
adequate therapy strategies available that would lead to the complete regeneration of these
neuronal circuits after injury or with the onset of neurodegenerative diseases.
Of special interest is the loss or impairment of dopaminergic projections, because they play
important roles in the regulation of physiological and psychological functions in the central nervous
system (CNS). The dysfunctions that occur within these projections are pathophysiological features of
Parkinson’s disease, depression, and schizophrenia. The recent and detailed studies of the anatomy
of dopaminergic projections, as well as its specific physiological functions, and the growing
knowledge around the pathophysiology of the above mentioned disorders have been of great benefit
to the development of effective therapy strategies. However, the current therapeutic options are still
insufficient.
Taking into account the considerable consequences of disturbances of dopaminergic neuronal
projections and regrowth failures after injury and/or in neurodegenerative diseases, there is a strong
need for experimental models, in which these projections are reproduced. These experimental
models would attempt to accelerate development, as well as the characterization and the selection
of effective neurite outgrowth‐promoting substances. Organotypic brain slice co‐cultures that
reconstruct dopaminergic projections could be such an experimental model.
To fully understand the scale of the problem, there will be an introduction into the anatomy and the
(patho)physiological characteristics of the dopaminergic projection system, as well as into general
mechanisms of neurite regeneration. Next, the history and principles of dopaminergic organotypic
co‐cultures will be looked at. Finally, the particular substances and cells that have been characterized
with regard to their (neuroregenerative) effects in organotypic brain slice co‐cultures will be
introduced.
1.1 The dopaminergic system
The catecholamine dopamine (DA, Fig. 1A) is a neuromodulator that is involved in the regulation of
the diverse functions of the CNS. Among these functions are motor control, reward and cognition.
The five DA receptors (D1‐D5) that have been described so far belong to the family of seven
transmembrane domain G‐protein coupled receptors (Fig. 1B). The DA receptors are divided into two
subfamilies: the D1‐like (D1, D5) and the D2‐like (D2, D3, D4) DA receptors (1). While the former
INTRODUCTION - The dopaminergic system
2

interact with a stimulatory Gs‐protein, the stimulation of the latter leads to the activation of
inhibitory Gi‐proteins as reviewed in more detail in (2). This means that the DA can be an activating
or an inhibitory neurotransmitter, depending on the DA receptor subtype. The main influences on
subsequent signaling events are indicated in Fig. 1C.
Fig. 1(A) The catecholamine neurotransmitter dopamine (DA). (B) The structure of the DA receptor (D1‐subtype). Seven transmembrane helices are indicated (1‐7). Potential phosphorylation sites are represented on the intracellular loop and the intracellular COOH‐terminal tail. Potential glycosylation sites are indicated on the extracellular NH2 tail. (C) Intracellular events, following the stimulation of D1‐like and D2‐like DA receptors, respectively. AC ‐ adenylate cyclase. (B,C) are adopted from (3).
1.1.1 The anatomy of dopaminergic projections
Using the brain of a rat, groups of dopaminergic and other catecholaminergic neurons were mapped
out and grouped together as A1‐17. This was carried out with the formaldehyde histofluorescence
method (4,5). Ninety percent of all brain DA neurons are located in the ventral mesencephalon (VM)
and belong to the cell groups A8 (retrorubal area), A9 (substantia nigra (SN) pars compacta(c)) and
A10 (ventral tegmental area, VTA) (6–9). These cell groups give rise to important projections to the
forebrain with a topography organized in three planes: dorso‐ventral, medial‐lateral and anterior‐
posterior (10). Among them, the three main pathways are the mesostriatal (also termed
nigrostriatal), mesocortical and mesolimbic dopaminergic pathways (11) (Fig. 2). The mesolimbic DA
pathway is involved in reward and emotions and is comprised of dopaminergic projections from the
ventral portions of the SNc and the VTA to the limbic forebrain (including e.g. nucleus accumbens,
INTRODUCTION - The dopaminergic system
3

amygdala and piriform cortex). As they are quite relevant for the work presented here, the
mesostriatal and the mesocortical projections are described in more detail below.
Fig. 2(A) Scheme of dopaminergic projections in a rodent’s brain arising in the ventral tegmental area/substantia nigra‐complex (VTA/SN). It was not attempted to distinguish VTA and SN, because of retrograde labeling studies, which indicated that both the striatum and the cerebral cortex are innervated by dopaminergic projections originating in both VTA and SN (12,13). The mesocortical pathway (innervating e.g. the anterior cingulate cortex, ACg; and the prefrontal cortex, PFC), the mesolimbic pathway (innervating e.g. the amygdala, Amg; the nucleus accumbens, NAc; and the olfactory tubercle, OTb) and the mesostriatal pathway (innervating the striatum, STR) are indicated with arrows. Another target region of mesencephalic dopaminergic projections is the hippocampus, Hip. Regions that are relevant for the here presented work are highlighted with bold letters. (B) Coronal section of the ventral mesencephalon at the midrostral level of VTA/SN indicating the localization of VTA, SN pars compacta (SNc) and SN pars reticulata (SNr). (C‐E) Location of dopaminergic neurons of the VTA/SN projecting to (C) the PFC and ACg, (D) the STR and (E) the NAc. (A) adapted from (14); (B‐E) adapted from (9,15)
INTRODUCTION - The dopaminergic system
4

1.1.1.1 Mesostriatal Projections
The mesostriatal pathway arises from the ventral and intermediate sheets of the SNc and the
ventrolateral VTA and projects to the dorsal striatum (STR), which contains caudate and putamen (9).
This pathway is important for motor planning and the execution of movement (11). Moreover, it
seems to be involved in non‐motor functions, such as cognition (16).
dopaminergic fibers of this particular projection have been shown to innervate patch structures
within the patch‐matrix organization of the STR. The striatal "patch" compartment is identified by
substance P‐like or leu‐enkephalin‐like immunoreactivity (17). Cortical and thalamic afferents, as well
as the efferent targets (SNc and SN pars reticulata) of the two compartments are distinct, suggesting
that patch and matrix are segregated, parallel input‐output systems (12).
In the STR, ɣ‐aminobutyric acid (GABA)ergic medium spiny neurons are the most prevalent cell type,
representing 95% of all striatal neurons (18). The major targets for the dopaminergic innervation are
the dendritic shafts and spines of these medium spiny neurons, on which dopaminergic afferents
form symmetric synapses (19).
There is ultrastructural evidence that striatal cell types such as large aspiny cholinergic interneurons
are targets of a few other TH‐immunoreactive boutons (20). The neuronal processes originating from
the ventral tier of the SNc and projecting to the striatal patches have a diameter of 0.2‐0.6 µm and
frequent varicosities (0.4‐1.0 µM), giving them a crinkled appearance (12). Additionally, they have
been shown to be negative for the 28kDa calcium binding protein (now referred to as calbindin‐
D28k), in contrast to those innervating matrix structures of the STR (21).
The STR is the major input structure of the basal ganglia, receiving projections from the cerebral
cortex, the brainstem, and the thalamus. Among the projections from the brainstem are the
mesostriatal projections that modulate two distinct pathways within the complex basal ganglia
circuits: the direct and the indirect pathway. Dopaminergic projections from the SNc activate the
direct pathway through the activation of DA receptors of the D1‐type. In contrast, the indirect
pathway is inhibited by the activation of inhibitory D2 receptors. The balance between the direct and
indirect pathway is believed to be important for normal motor function (22).
1.1.1.2 Mesocortical Projections
The mesocortical projections arise in the dorsal tier of SNc and VTA and project to the anterior
cingulate cortex, the entorhinal cortex, perirhinal cortex and the PFC (23,24). These pathways play a
prominent role in concentration and the executive functions, such as the working memory
(16,25,26).
INTRODUCTION - The dopaminergic system
5

Only 33% of all PFC projections originating in the VTA are dopaminergic (27). There is evidence to
suggest that most of the other neurons projecting from the VTA to the PFC are GABAergic (28–30). In
addition to these two well‐recognized pathways, parallel glutamate‐only and glutamate‐DA pathways
from the VTA to the PFC exist, as established by recent findings (31). The neurons in the PFC, which
receive the dopaminergic inputs, are mainly pyramidal cells in the deeper layers (V,VI) of the PFC
(32,33). They conduct excitatory signals to, for example, the VTA by mainly using the
neurotransmitter glutamate. Additionally, DA receptors have been described on inhibitory cortical
interneurons, which use GABA as a neurotransmitter (34). In contrast to the pyramidal cells, cortical
interneurons do not conduct signals outside the cortical region (33,35,36).
1.1.2 The (patho)physiology of dopaminergic projections
The afferents of the dopaminergic cell bodies of the VM innervate the STR, the cortical and limbic
regions. These projections are involved in the regulation of crucial brain functions such as the motor
function, emotions and cognitive control. Thus, the impairment of the dopaminergic neurocircuits is
a common feature of neurological and psychiatric diseases:
Parkinson’s disease. The degeneration of dopaminergic neurons in the SNc entails a reduction of
dopaminergic projections to the dorsal STR, which leads to the dysregulation of the basal ganglia
motor circuit. The cardinal motor symptoms of Parkinson’s disease ‐ tremor, rigidity and akinesia ‐
highlight the importance of DA projections for movement control (22,37,38).
Depression. Disturbances in neurotransmission are believed to present the molecular basis of
depression. Among them is the deficiency of the mesolimbic DA transmission that results in
(i) reduced DA levels in the ventral STR, including the nucleus accumbens, and (ii) the dysfunction of
the closely connected reward system. These particular disturbances are expected to cause
anhedonia, a frequent symptom of depression (16,39). Moreover, lower extracellular DA in the
dorsal STR has been associated with motor retardation in major depression disorder (40). New
approaches targeting the dopaminergic system are of high interest, considering the current lack of
therapy options that could reverse these effects.
Schizophrenia. Much evidence suggests that schizophrenia is a neurodevelopmental disorder with
genetic and environmental factors, which can cumulatively lead to different developmental
trajectories (41). The reduced elaboration of inhibitory interneuron activity, and the exceeded
pruning of the excitatory pathways cause an imbalance in the inhibitory and excitatory pathways in
the PFC (42). The impairment of DA transmission in the PFC is associated with deficits in working
memory ‐a core dysfunction in schizophrenia (25,26). Additionally, deficient DA function results in
the hypostimulation of D1 receptors in the PFC. It has been suggested that this reduced stimulation
INTRODUCTION - The dopaminergic system
6

can play a role in the development of the “negative” symptoms and cognitive impairments of the
disease (43).
It is of great importance to find therapeutic strategies to overcome the loss of dopaminergic
projections or dysregulations of DA transmission in the described diseases. New approaches have to
be developed and evaluated with the aim of enhancing the outgrowth of neuronal processes within
the projection systems.
1.2 Neurite regeneration following mechanical lesions of the CNS
Following brain injury, membrane resealing at the transection site of the severed axons is the first
prerequisite for survival of the neuron. Another requirement for regeneration after mechanical
lesions is the growth cone formation and extension. It has been demonstrated that high calcium
influx leads to membrane resealing (44). In contrast, growth cone formation and axon elongation
necessitate optimal calcium levels that are reached by cytoplasmic calcium homeostasis mechanisms,
as reviewed by (45).
Compared to the peripheral nervous system or to neurite growth during development, regenerative
capacities of mammalian adult CNS neurons are limited. The regrowth of injured axons in the mature
CNS is inhibited by extrinsic and intrinsic mechanisms. Extracellular growth‐inhibitory mechanisms
include (i) repellent guidance cues that are important during development and upregulated following
injury, for example ephrins and their receptors (46–48). Additionally, (ii) myelin proteins like Nogo‐A,
myelin‐associated glycoprotein (MAG) and oligodendrocyte myelin glycoprotein (OMgp) present
growth‐inhibitory factors. Furthermore, (iii) the glial scar impedes the regrowth of severed axons. It
consists of activated astrocytes and the secreted extracellular matrix components, e.g. chondroitin
sulfate proteoglycan, (as reviewed in more detail by (49,50)). A therapeutic approach to overcome
this non‐permissive environment is the neutralization of growth‐inhibitory factors like Nogo‐A with
specific antibodies (51–53), and the enzymatic digestion of chondroitin sulfate proteoglycan by
chondroitinase ABC (53,54).
Despite these extrinsic factors that impede axon regrowth, spontaneous axon regeneration has been
observed under certain circumstances (55,56) as reviewed in (57). These observations suggest that
there must be intrinsic mechanisms that enable the regenerating axon to overcome the inhibitory
environment, which is created by the above mentioned factors. Examples of the intrinsic
mechanisms, which lead to growth cone formation and extension, are the activation of gene
expression, local protein synthesis and microtubule assembly (57). These processes are regulated by
intracellular signaling pathways including the MAPK/ERK pathway and the PI3K/Akt pathway. These
pathways interact with each other and with other signaling cascades in a complex manner that
INTRODUCTION - Neurite regeneration
7

additionally differs between distinct neuronal cell types {Cui 2006 #213}{Heine 2015 #123}. Within
this complex signaling network, the second messenger adenosine 3’,5’ cyclic monophosphate (cAMP)
seems to be a key player, because it appears to interact with the above‐mentioned and other
signaling pathways (58). Elevated intracellular cAMP levels have been shown to enable regenerating
axons to overcome the growth‐inhibitory action of MAG (59,60). A therapeutic approach to enhance
the intrinsic regeneration‐promoting processes could be the application of neurotrophic factors, e.g.
NGF and BDNF that activate the respective signal transduction pathways, as well as the elevation of
intracellular cAMP concentrations and subsequent activation of gene expression (58).
1.3 Organotypic brain slice co‐cultures
Organotypic brain slice co‐cultures present an experimental model that provides some important
advantages, in contrast to single‐cell culture or in vivo models. The complex cytoarchitecture of the
brain tissue is preserved within these models. For example, Snyder‐Keller et al. demonstrated that
the complex striatal matrix‐patch organization can be found in striatal slice cultures after ex vivo‐
cultivation and, to an even greater extent, in mesostriatal co‐cultures (VM+STR) (61). Moreover,
within co‐cultures that reconstruct projection systems, the specific innervation of target regions
corresponds to the in vivo situation. This has been shown by applying tracing methods, e.g. biocytin
tracing (62), immunohistochemical stainings (63–65) and electrophysiological measurements (66,67).
Additionally, organotypic (co‐)cultures provide good experimental access to the sample material, as
well as precise control over the extracellular environment.
The ex vivo cultivation and the characterization of explants of the VM can be traced back to the
1970s (68,69). In the first study of co‐cultures, tissue explants of the midbrain and the STR (caudate
nucleus), derived from the brains of newborn dogs, were combined (70). In this study, the outgrowth
of catecholamine containing fibers from the midbrain portion into the striatal slice was observed.
This target‐oriented fiber growth, with plexiform nerve terminals in the STR, was confirmed in
mesostriatal rat co‐cultures (63). The combination of VM slices with slices of (a) STR, (b)
hippocampus or (c) cerebellum clearly demonstrated that the ex vivo observed target‐oriented
neurite outgrowth correlates with the projections, which are built in vivo during the development.
While there was significant ingrowth into STR, which represents a major target of mesencephalic
dopaminergic neurons, only a few neurites grew into the hippocampal slice, a minor target region.
No ingrowth of dopaminergic fibers was observed in co‐cultures with the cerebellum, a non‐target
region for mesencephalic DA neurons (64). These findings were confirmed in a later study working
with triple cultures containing (a) cerebral cortex+SN+STR or (b) cerebral cortex+VTA+STR,
respectively (71). This study further demonstrated the specific innervation of (a) the STR by
INTRODUCTION - Organotypic brain slice co-cultures
8

dopaminergic neurons from the SN and (b) the ingrowth into the cortex by DA neurons originating in
the VTA.
It should also be noted that the capacity to innervate the respective target regions is dependent on
the age of the donor of the VM tissue explants: The innervation of the striatal tissue by dopaminergic
cells of VM explants prepared from newborn rats (P0) is more intensive than those of P7‐derived VM
explants (72). Furthermore, the importance of the striatal tissue donor’s age in nigrostriatal co‐
cultures has been demonstrated: dopaminergic fibers originating from the VM are only attracted to
the STR at late embryonic (i.e. E19+) and early postnatal stages (i.e. <P4) (64,73). Triple cultures of
the VM, the STR and a cortical part, revealed a rather moderate innervation of the cortex, when
compared to the STR (66,71).
Two principle cultivation techniques have become prevalent in recent decades and both methods
consider the major requirements of organotypic cultivation. The necessary conditions are as follows:
sufficient oxygenation, stable attachment to a substrate, and an appropriate culture medium (74).
(i) The roller tube technique has been proven to allow the organotypic growth of neuronal tissue
explants (75,76). However, there is a non‐physiological flattening to quasi‐monolayers, which is
preferable when optimal optical conditions are required (74). (ii) If the maintenance of the semi‐
three‐dimensional structure is desired, the membrane interface technique would be the preferred
method of choice (77). Modifications of the interface method have been mostly utilized in more
recent studies (78). A preparation scheme of mesocortical and mesostriatal co‐cultures, which were
used in the work presented here, is shown in Fig. 3
INTRODUCTION - Organotypic brain slice co-cultures
9

Fig. 3 Illustration of the preparation of mesocortical (left) or mesostriatal (right) co‐cultures. (A) Dorsal view on a neonatal rat brain. The regions containing ventral tegmental area/substantia nigra (VTA/SN) and the prefrontal cortex (PFC) are highlighted in dark and bright red, respectively. The region containing the striatum (STR) is highlighted in blue. (B) Coronal sections of the rat brain. Additional cuts are indicated by dashed lines to isolate PFC (*), VTA/SN (#) and the STR (*), respectively. (C) Coronal sections were placed side by side on membrane inserts as co‐cultures. During the ex vivo cultivation, co‐cultures were treated with nimodipine or MSC populations (VTA/SN+PFC) or with different PDE‐Is (VTA/SN+STR), respectively. (A,B) adapted from (79).
1.4 Promising substances and cells to enhance neuroregeneration
As discussed above (see section 1.2), the regrowth of neurites after mechanical lesions is a very
complex process. Many intrinsic and extrinsic factors influence the regrowth capacities of injured
neurites. These factors provide a wide range of molecular targets for therapeutical approaches to
enhance intrinsic regrowth mechanisms. In the following, substance candidates and cells with
potential neuroregenerative properties that influence intracellular signaling, calcium currents or the
extracellular microenvironment by the secretion of e.g. growth factors, will be presented.
1.4.1 Phosphodiesterase inhibitors
3’,5’‐cyclic‐nucleotide phosphodiesterases (PDEs, EC 3.1.4.17) are enzymes that hydrolyze the 3’
cyclic phosphate bond of the second messenger molecules cAMP and/or guanosine 3’, 5’ cyclic
monophosphate (cGMP, the chemical structures of both molecules are presented in Fig. 1 of the
original article, p. 29). These enzymes, therefore, regulate intracellular cell signaling.
The superfamily of PDEs comprises of at least 21 genes/isoforms that are subdivided into 11 families
(80,81). These PDE families differ in their substrate specificity, their kinetic and regulatory properties
and their distribution in tissues and cells. The activity of PDEs is regulated (i) by their expression level
INTRODUCTION - Tested compounds and cell populations
10

in the cell, (ii) by their posttranslational modifications (e.g. phosphorylation/dephosphorylation) and
(iii) by their allosteric regulators, such as cAMP, cGMP and Ca2+/calmodulin.
Early after the discovery of PDE activity, the nonselective inhibitors caffeine and theophylline, both
methylxanthines, were found (82,83). These early PDE‐inhibitors (PDE‐Is) were used as therapeutic
agents, e.g. for the treatment of airway diseases due to their bronchodilating clinical efficacy.
However, their therapeutic index is narrow, because of the inhibition of nearly all PDEs in all tissues.
More recently developed PDE‐Is target specific PDE isoforms (84).
In the study presented here, we focused on two PDE families: PDE2 and PDE10. As there is only one
gene/isoform belonging to each of these two families ‐PDE2A and PDE10A, respectively‐ I will refer to
them as PDE2 and PDE10 in the following description. Both isoforms are dual substrate enzymes,
being capable of the hydrolysis of both cAMP and cGMP. Another common feature is the N‐terminal
GAF domain. In the case of PDE2, the binding of the allosteric factor cGMP to this domain activates
the enzyme. Thus, PDE2 activity requires elevated cGMP concentrations to be functionally significant
(85).
PDE2 has been detected in the brain in unique neuronal populations. Its activity has, for example,
been shown in striatal cells (86). It regulates cGMP levels in neurons, and is believed to be involved in
long‐term memory (81). BAY60‐7550 is one example of potent and highly selective PDE2‐Is. It was
shown in an in vivo mouse model that treatment with this PDE‐I enhances memory and learning by
enhancing synaptic plasticity (87).
PDE10 is highly expressed in the STR of the rodent brain (88). Thus, its involvement in the modulation
of striatonigral and striatopallidal pathways has been suggested (89). Within the STR, PDE10 is
expressed in medium spiny neurons, where it is supposed to regulate the metabolism of both cAMP
and cGMP (89). The selective inhibition of PDE10 is discussed as a possibility to treat psychosis,
because studies have demonstrated its efficacy in behavioral models predictive of antipsychotic
activity (90). Moreover, with regard to the corticostriatal projections, PDE10‐Is could improve some
of the cognitive symptoms of schizophrenia by increasing the activity of the GABAergic striatal
medium spiny neurons (91). An effect on neurite outgrowth in the dopaminergic mesostriatal
projection system by PDE2‐Is and PDE10‐Is has not been investigated, so far.
1.4.2 Nimodipine
Nimodipine (isopropyl‐(2‐methoxyethyl)‐1,4‐dihydro‐2,6‐dimethyl‐4‐(3‐nitrophenyl)‐3,5‐pyridinedi‐
carboxylate, Bay e 9736, Fig. 4) is a dihydropyridine (DHP) derivative that has been found to
selectively block the slow calcium currents (92) by specifically binding to L‐type voltage gated calcium
channels. Nimodipine and other DHP derivatives block the calcium current by specifically binding to
the α1 subunit of the channel protein (93).
INTRODUCTION - Tested compounds and cell populations
11

Fig. 4 The dihydropyridine (DHP) derivate nimodipine. The DHP core is highlighted with bold lines and letters.
Nimodipine is a highly lipophilic molecule. Thus, it can pass the blood brain barrier, resulting in a high
distribution volume in the brain. However, when using it as a therapeutic agent, low oral
bioavailability, short half‐life and high protein binding have to be considered (94). Nimodipine’s low
adverse effect profile has been confirmed in numerous clinical trials and is advantageous for the
clinical application of the substance (95–97).
In the early eighties nimodipine was regarded as a vasodilatory agent with a preferential effect on
cerebral vessels (98–100). Therefore, it has since been considered as an agent to counteract
pathophysiological situations that are caused by insufficient blood supply to the brain. In addition to
nimodipine’s dilatory effects on cerebral microvessels, a protective effect on nervous tissue, exerted
by the modulation of metabolic processes, has been assumed (101). Later on in the eighties, direct
neuronal effects were discussed and the application of nimodipine in epileptic seizures or withdrawal
syndromes has since been pondered (102,103). Additionally, a preventive treatment of migraine was
suggested (104,105). However, the clinical application of nimodipine was mainly related to its
beneficial effects when applied after subarachnoid hemorrhage. In this clinical situation, nimodipine
reduces the deleterious effects of related delayed cerebral vasospasm (106). Nevertheless, later
research discovered other fields of application. Experimental studies in animal models demonstrated
the neuroregenerative effects of nimodipine after mechanical peripheral nerve injury (107,108).
Moreover, clinical studies have demonstrated improved nerve function after vestibular schwannoma
surgery, especially when nimodipine was applied intravenously before, during and after the surgery
(109). The studies described above investigated the effects of nimodipine treatment on neurite
growth in the peripheral nervous system. Thus, a neurite growth‐promoting effect of nimodipine in
experimental models of CNS projection systems remains to be elucidated.
1.4.3 MSC‐derived cell populations
Mesenchymal stromal/stem cells (MSCs) have been intensively investigated as promising candidates
for cell therapies in regenerative medicine. Currently, clinical trials are ongoing, applying bone
INTRODUCTION - Tested compounds and cell populations
12

marrow (BM)‐derived MSCs to treat a variety of disorders: neurodegenerative disorders such as
multiple sclerosis and Parkinson’s disease, disorders of the locomotor system, like osteoarthritis and
injury of the articular cartilage, and others, e.g. acute respiratory distress symptoms, chronic and
ischemic stroke, liver failure and spinal cord injury (http://www.clinicaltrials.gov/ 2015‐03‐03).
In addition to the BM, MSCs have been isolated from nearly every adult tissue (as reviewed by (110)),
mainly due to their presence in the perivascular region (111,112). However, the main sources of
MSCs are adult BM (113,114), adipose tissue (115), and umbilical cord blood (116).
MSCs are classically characterized by their ability to adhere to plastic surfaces and to undergo
sustained proliferation. Their trilineage differentiation capacity into adipocytes, chondrocytes and
osteoblasts in vitro has been first described by Pittenger (117) and became an important criterion for
the definition of MSCs (118). Moreover, for human MSCs, cell surface expression of cluster of
differentiation (CD)73, CD90 and CD105 as well as the absence of hematopoietic lineage markers
such as CD11b, CD14, CD19 or CD34, CD45 or CD79 are required, to refer to the cells as MSCs (118).
The characteristics for murine MSCs overlap partly with those described for human MSCs, but are
generally less well defined (119).
With regard to the development of new strategies for the treatment of neurological and
neurodegenerative disorders, (i) it was assumed that MSCs would replace lost cells in the damaged
tissue. In addition to their trilineage potential, the transdifferentiation into cells of other lineages,
such as neurons, has been described in several studies (e.g. (120,121)). However, the experimental
approach to characterize the neuronal phenotype, varies between the different laboratories and the
validity of the results is controversial (as discussed by (122)). (ii) Immunomodulatory mechanisms
have been described. MSCs limit stress response/inflammation and apoptosis following injury (123–
125). (iii) The capacity of MSCs to produce and secrete neurotrophic factors and, in addition, to
induce growth factor secretion in host cells can be another powerful mechanism, creating a
microenvironment around a lesion site that fosters the regeneration and repair of the damaged
tissue, as it has been shown in preclinical studies (125–127). These paracrine effects are thought to
contribute more significantly to the broad therapeutic efficacy of MSCs, as opposed to their
plasticity, in achieving tissue repair.
However, the composition of the secreted cytokines and growth factors varies significantly between
different MSC preparations, because the proportions of the respective subpopulations of the
intrinsically heterogeneous MSCs and their biological activity strongly depend on isolation and
cultivation protocols (128). As a consequence, the effect of applied MSCs in the context of clinical
application is hardly predictable. Some recent advances in experimentation allowed for attempts to
isolate defined homogeneous MSC subpopulations. Thus, specific surface markers, in addition to the
ones mentioned above, have been identified. Kucia et al. described a multiparameter sorting
INTRODUCTION - Tested compounds and cell populations
13

method, yielding a homogeneous murine BM‐derived cell population that expresses the stem cell
antigen‐1 (Sca‐1) and is hematopoietic lineage‐depleted and CD45‐negative (Sca‐1+Lin‐CD45‐). These
cells expressed the pluripotency markers SSEA‐1, Oct‐4, Nanog and Rex‐1 (129). Therefore, and
because of their small size, the group termed them “very small embryonic‐like (VSEL) cells”.
However, the pluripotency has not yet been rigorously proven (130). In another study, the surface
markers, platelet‐derived growth factor receptor‐ (PDGFR‐ ), and Sca‐1 were described as suitable
for the isolation of a homogeneous cell population from murine BM that fulfills MSC criteria (111).
The potential to enhance neurite outgrowth of the described subpopulations has not been compared
to the growth‐promoting potential of bulk BM‐MSCs, yet.
1.5 The aim of the thesis
As pointed out above, there is a need for the development of new therapeutic options to treat the
consequences of axon (re)growth failures, especially within dopaminergic projections. Utilizing
organotypic brain slice co‐cultures of the mesostriatal and the mesocortical projection systems, it
was intended to evaluate different approaches that could help to enhance neuronal fiber growth:
(i) Selective PDE‐Is, which interfere with intracellular second messenger turnover
In particular, the specific inhibitors of PDE2 (BAY60‐7550, ND7001) and PDE10 (MP‐10) are of
interest in the study presented here.
(ii) Nimodipine, an inhibitor of transmembrane calcium currents
The effects of the treatment with different concentrations of nimodipine (0.1 µM‐10 µM)
were compared.
(iii) Mesenchymal stromal/stem cells (MSCs), whose therapeutic potential is supposed to be
based i.a. on the secretion of growth factors, which act extracellularly on the respective
receptors
In the work presented here, the neurite outgrowth‐enhancing potential of the prospectively
isolated (Sca‐1+Lin‐CD45‐) murine MSC subpopulation that we name “SL45‐MSC” was
compared to murine bulk BM‐MSC, classically isolated through plastic adhesion.
Being already an established model for the analysis of the neurite growth‐promoting properties of
pharmacological compounds, dopaminergic brain slice co‐cultures were applied to characterize
substances and cells with regard to their:
(a) neurite outgrowth‐promoting effect within DA projection systems,
(b) possible toxic properties,
(c) potential influence on gene expression.
The work program is summarized in Fig. 5.
INTRODUCTION - The aim of the thesis
14

Fig. 5 Work program. (A) The treatment of each study is indicated. (B) The projection systems that have been used for the respective study are represented as schemes. As indicated in the left and middle panel, PDE‐Is and nimodipine have been applied to the medium. The MSCs are plated on glass slides that were placed underneath the membrane inserts (right panel). In (C), the main analyses that have been conducted during or after the cultivation are specified. Neurite outgrowth was quantified in all studies.
INTRODUCTION - The aim of the thesis
15

2. The original research articles
In the following, the original research articles that have been published in peer reviewed journals are
presented. Reprints were made by kind permission of the publishers:
“Phosphodiesterase 2 inhibitors promote axonal outgrowth in organotypic slice co‐cultures.”
(published in Neurosignals by S. Karger AG)
“Nimodipine enhances neurite outgrowth in dopaminergic brain slice co‐cultures.”
(published in International journal of developmental neuroscience by Elsevier Ltd.)
“Mesenchymal Stem Cells Support Neuronal Fiber Growth in an Organotypic Brain Slice Co‐
culture Model.” (published in Stem cells and development by Mary Ann Liebert Inc.
Publishers)
RESEARCH ARTICLES
16

Fax +41 61 306 12 34E-Mail [email protected]
Original Paper
Neurosignals DOI: 10.1159/000338020
Phosphodiesterase 2 Inhibitors Promote Axonal Outgrowth in Organotypic Slice Co-Cultures
C. Heine a, b K. Sygnecka a, b N. Scherf c, d A. Berndt e U. Egerland e T. Hage e
H. Franke b
a Translational Centre for Regenerative Medicine (TRM), b Rudolf Boehm Institute of Pharmacology and Toxicology, and c Interdisciplinary Centre for Bioinformatics, University of Leipzig, Leipzig , d Institute for Medical Informatics and Biometry, Dresden University of Technology, Dresden , and e biocrea, Radebeul , Germany
tyrosine hydroxylase-positive fibers indicated a significant increase after treatment with BAY60-7550 and nerve growth factor in relation to dimethyl sulfoxide. Additionally, a dose-dependent increase of intracellular cGMP levels in response to the applied PDE2-Is in PDE2-transfected HEK293 cells was found. In summary, our findings show that PDE2-Is are able to significantly promote axonal outgrowth in organotypic slice co-cultures, which are a suitable model to assess growth-related effects in neuro(re)generation.
Copyright © 2012 S. Karger AG, Basel
Introduction
Axonal projections and the basic organization of mid-brain dopaminergic (DAergic) neurons are the subject of interest when studying human neurological disorders, e.g. Parkinson’s disease [1] , schizophrenia [2] , and drug abuse or addiction [3, 4] . The mesencephalon as a region of com-plex anatomical organization, and projection patterns of the DAergic neurons are divided into the retrorubral area
Key Words
Axonal outgrowth � Biocytin � Development � Dopaminergic system � Organotypic slice co-culture � Phosphodiesterase � Regeneration � Repair � Tracing � Tyrosine hydroxylase
Abstract
The development of appropriate models assessing the po-tential of substances for regeneration of neuronal circuits is of great importance. Here, we present procedures to analyze effects of substances on fiber outgrowth based on organo-typic slice co-cultures of the nigrostriatal dopaminergic sys-tem in combination with biocytin tracing and tyrosine hy-droxylase labeling and subsequent automated image quan-tification. Selected phosphodiesterase inhibitors (PDE-Is) were studied to identify their potential growth-promoting capacities. Immunohistochemical methods were used to vi-sualize developing fibers in the border region between ven-tral tegmental area/substantia nigra co-cultivated with the striatum as well as the cellular expression of PDE2A and PDE10. The quantification shows a significant increase of fi-ber density in the border region induced by PDE2-Is (BAY60-7550; ND7001), comparable with the potential of the nerve growth factor and in contrast to PDE10-I (MP-10). Analysis of
Received: November 3, 2011 Accepted after revision: February 29, 2012 Published online: August 31, 2012
PD Dr. Heike Franke Rudolf Boehm Institute of Pharmacology and Toxicology University of Leipzig, Härtelstrasse 16–18 DE–04107 Leipzig (Germany) Tel. +49 341 972 4602, E-Mail Heike.Franke @ medizin.uni-leipzig.de
© 2012 S. Karger AG, Basel1424–862X/12/0000–0000$38.00/0
Accessible online at:www.karger.com/nsg
C.H. and K.S. contributed equally to the study.
RESEARCH ARTICLES - Phosphodiesterase Inhibitors (PDE-Is)
17

Heine /Sygnecka /Scherf /Berndt /Egerland /Hage /Franke
Neurosignals2
(A8 cell group), substantia nigra (SN; A9 cell group), and the ventral tegmental area (VTA; A10 cell group) [5–7] . Tract-tracing techniques have revealed three projections to forebrain targets, namely the mesolimbic, the mesocor-tical, and the nigrostriatal pathways (for references, see [8] ). The trajectories from the SN and VTA target all in-trinsic nuclei of the basal ganglia while exhibiting prefer-ential concentrations of terminals in the dorsal and ven-tral striatum (STR) [1, 8] . The balance between these pro-jections is thought to be regulated by afferent DAergic signals from the VTA and SN pars compacta, acting on differentially distributed D1 and D2 dopamine (DA) re-ceptors, e.g. on striatal medium spiny neurons. The activa-tion of D1 receptors leads to an intracellular accumulation of cyclic adenosine 3 � ,5 � -monophosphate (cAMP) via the adenylyl cyclase and following activation of cAMP-depen-dent protein kinase. Otherwise, DA inhibits the adenylyl cyclase via D2 receptors (for references, see [9] ).
It is well known that disruption of DAergic cell activ-ity and the loss of ascending projections to the basal gan-glia results in the emergence of fundamental pathological features. Due to the necessity for therapeutic strategies promoting neuro(re)generation, there is a clear need to develop appropriate test systems to assess the potential of different substances regarding regeneration and repair of neuronal circuits. Over the last years, we established ex vivo models of organotypic slice co-cultures of the DA-ergic system [10–12] . Parts of this system were recon-structed using tissue slices from the VTA/SN and STR or the prefrontal cortex, respectively, to analyze the cytoar-chitectural organization of the VTA/SN and the innerva-tions of the target regions by DAergic fibers. Our results demonstrated that tyrosine hydroxylase (TH)-immu-nopositive neurons are also able to develop their charac-teristic innervation patterns in organotypic slice co-cul-tures [10] . A number of intracellular and extracellular molecules are involved in the regulation of neuronal dif-ferentiation. Using our model system, we were able to identify a trophic support in axonal outgrowth after pu-rinergic stimulation [11, 12] . Moreover, second messen-gers cAMP and cyclic guanosine 3 � ,5 � -monophosphate (cGMP), formed from the triphosphates ATP and GTP, appear to play prominent roles in regulating neuronal differentiation and neuroplasticity [13, 14] . Elevated in-tracellular levels of the cyclic nucleotides are important for axon regeneration, even beyond the required increase in cAMP levels needed to respond to most factors that support cell survival [15] . Cyclic nucleotide phosphodies-terases (PDEs) comprise a superfamily of metallophos-phohydrolases that specifically cleave the 3 � ,5 � -cyclic
phosphate moiety of cAMP and/or cGMP and terminate the action of cyclic nucleotide signaling [16] . Eleven indi-vidual PDE subfamilies (PDE1–PDE11) with varying se-lectivity for cAMP or cGMP have been identified in mammalian tissues based on sequence similarities, in-hibitor sensitivity, and biochemical properties. They are involved in mediating a range of different functions, in-cluding cytoskeletal rearrangement, gene transcription, and regulation of ion channel function [17, 18] . Recent data have shown that PDE2 and PDE10 are localized in the nigrostriatal system and hydrolyze both cAMP and cGMP. The inhibition of PDE2 selectively increases cyclic nucleotide levels, influencing synaptic plasticity and memory formation [19, 20] . Inhibition of PDE10 modu-lates neuronal activity within the striatopallidal and ni-grostriatal pathway and leads to efficacy in behavioral models predicting an antipsychotic effect [21–24] .
The aim of the present study was to characterize pos-sible trophic/regenerative properties of selected PDE2 in-hibitors (PDE2-Is; BAY60-7550 and ND7001) and PDE10-I (MP-10), as compared to the effect of the neurotrophin nerve growth factor (NGF) by using an organotypic slice co-culture model (VTA/SN+STR). To quantify the po-tential of stimulating fiber growth, density of neuronal fibers in the border region of slice co-cultures was de-termined using both biocytin-tracing technique andTH immunolabeling, and subsequent automated image quantification.
Materials and Methods
Materials/Substances Selected PDE-Is with different subclass specificities were used
(details, see table 1 ; structural formula, see fig. 1 ): BAY60-7550 (2-(3,4-dimethoxybenzyl)-7-{(1R)-1-[(1R)-1-hydroxyethyl]-4-phenyl-butyl}-5-methyl imidazo[5,1-f][1,2,4]triazin-4(3H)-one; Alexis Biochemicals, San Diego, Calif., USA), ND7001 (3-(8-meth-oxy-1-methyl-2-oxo-7-phenyl-2,3-dihydro-1H-benzo[e][1,4]di-azepin-5-yl)-benzamide), and MP-10 (2-[4-(1-methyl-4-pyridin-4-yl-1H-pyrazol-3-yl)-phenoxymethyl]-quinoline 3) were syn-thesized at biocrea (Radebeul, Germany).
Furthermore, the following substances/factors were applied: NGF (Sigma-Aldrich, Taufkirchen, Germany), dimethyl sulfox-ide (DMSO; AppliChem GmbH, Darmstadt, Germany), artificial cerebrospinal fluid (ACSF) of the composition (m M ): 126 NaCl; 2.5 KCl; 1.2 NaH 2 PO 4 ; 1.3 MgCl 2 , and 2.4 CaCl 2 (pH 7.4; Hospital Pharmacy, University of Leipzig, Germany).
In vitro PDE Assay PDE activity was measured by the conversion of [ 3 H]-cAMP
and [ 3 H]-cGMP into [ 3 H]-AMP and [ 3 H]-GMP, respectively, as described previously [25] . PDEs 1B, 2A, 3A, 4A, 5A, 7B, 8A, 9A, 10A, and 11A were generated from full-length human recombi-
RESEARCH ARTICLES - Phosphodiesterase Inhibitors (PDE-Is)
18

Phosphodiesterase 2 Inhibitors Promote Axonal Outgrowth
Neurosignals 3
nant clones. PDE6 was isolated from bovine retina as described previously [26] . PDE activity was measured with the preferred substrates, in detail, for PDE1B, 2A, 3A, 4A, 7B, 8A, 10A, and 11A cAMP was used and for PDE5A, 6, and 9A cGMP, at or below the K m value (Michaelis-Menten constant). PDE1B and PDE2A were activated by Ca 2+ /calmodulin and by cGMP, respectively. The other PDEs did not need any additional activation procedure. In-hibition of PDE activity was measured using a scintillation prox-imity assay at varied compound concentrations and optimized fixed enzyme concentrations for each enzymatic assay. IC 50 (half maximal inhibitory concentration) values were calculated with the Hill2 parameter model from at least four independent exper-iments, done in duplicates.
Intracellular cGMP Assay The selected PDE-Is BAY60-7550 and ND7001 were tested in
a cellular test system to analyze the effects on intracellular cGMP levels. Human embryonic kidney (HEK) 293 cells, stably trans-fected with the full-length sequence of human PDE2A (NM002599), were cultured in collagen I-coated 96-well plates (70,000 cells/well) over night. On the next day, the test com-pounds were administered at a final DMSO concentration of 0.5% and incubated for 30 min at 37 ° C and 5% CO 2 . This was followed by incubation with the guanylyl cyclase (GC)-activating agent so-dium nitroferricyanide(III) dihydrate (sodium nitroprusside, SNP, 100 � M ; Sigma-Aldrich) for 10 min. Wells incubated without test compound in the presence and absence of SNP were used as controls for statistical analysis. The level of intracellular cGMP was determined with the enzyme-linked immunosorbent assay system (cGMP EIA System; GE Healthcare UK Ltd., Little Chalf-ont, England).
Animals Neonatal rat pups (WISTAR RjHan, own breed; animal house
of the Rudolf Boehm Institute of Pharmacology and Toxicology, University of Leipzig) of postnatal day 1–5 (P1–5) were used for preparation of the organotypic slice co-cultures. The animals were housed under standard laboratory conditions, under a 12-
Fig. 1. Chemical structures of the PDE substrates cGMP and cAMP and of the PDE-Is BAY60-7550, ND7001, and MP-10.
Table 1. I C50 values (nM) of the PDE2-Is BAY60-7550 and ND7001, and the PDE10-I MP-10 against individual phosphodi-esterases
PDE BAY60-7550 ND7001 MP-10
hPDE2A 0.18 57 2,630hPDE1B 426 >5,000 >5,000hPDE3A >5,000 >10,000 >5,000hPDE4A 2,130 >10,000 2,230hPDE5A 516 >10,000 >5,000bPDE6 2,200 >10,000 >5,000hPDE7B 1,740 >10,000 >5,000hPDE8A >5,000 >10,000 >5,000hPDE9A >5,000 >10,000 >5,000hPDE10A 1,640 1,460 1.14hPDE11A >5,000 >10,000 >5,000
O verview of the IC50 values (nM) of the PDE2-Is BAY60-7550 and ND7001, and the PDE10-I MP-10 against individual human (h) PDEs as well as the bovine (b) PDE6.
RESEARCH ARTICLES - Phosphodiesterase Inhibitors (PDE-Is)
19

Heine /Sygnecka /Scherf /Berndt /Egerland /Hage /Franke
Neurosignals4
hour light/12-hour dark cycle and allowed access to lab food and water ad libitum.
All of the animal use procedures were approved by the Com-mittee of Animal Care and Use of the relevant local governmental body in accordance with the law of experimental animal protec-tion.
Preparation of Slice Cultures Slice co-cultures were prepared from P1–5 old rats and culti-
vated according to the ‘static’ culture protocol described by Fran-ke et al. [10] (for details, see also fig. 2 ). Briefly, rat pups were de-capitated and the brains were removed from the skull under ster-ile conditions. The brains were apposed to an agar block and fixed onto the specimen stage of a slicer (Leica VT 1000S; Nussloch , Germany) with cyanoacrylate glue (Histoacryl � ; B. Braun, Tutt-lingen, Germany). Coronal sections (thickness 300 � m) were cut at mesencephalic ( fig. 2 : A) and forebrain levels ( fig. 2 : B). During the preparation of organotypic slice cultures of the ventral mes-encephalon we did not attempt to separate the VTA and the SN. For further discussion, this area will be named VTA/SN. After preparation of the VTA/SN ( fig. 2 : A’, asterisk) and the STR ( fig. 2 : B’, asterisk), respectively, the slices were transferred into petri dishes filled with cold (4 ° C) preparation solution (MEM, Mini-mum Essential Medium, 2 m M glutamine; Invitrogen GmbH, Darmstadt, Germany) supplemented with the antibiotic gentami-cin (50 � g/ml; Invitrogen GmbH). Selected sections were placed next to each other on moistened translucent membrane inserts (0.4 � m; Millicell-CM, Millipore, Bedford, Mass., USA) as co-cultures (VTA/SN+STR) and were put in 6-well plates each filled with 1 ml incubation medium (50% MEM, 25% Hank’s Balanced Salt Solution, 25% heat inactivated horse serum; glutamine to a final concentration of 2 m M ; all from Invitrogen GmbH and with 0.044% sodium hydrogen carbonate, NaHCO 3 ; Sigma-Aldrich). The pH was adjusted to 7.2. The cultures were stored at 37 ° C in 5% CO 2 and the medium was changed 3 times a week.
Fixation of the Tissues After 10 days in vitro (DIV), the cultures were fixed in a solu-
tion consisting of 4% paraformaldehyde, 0.1% glutaraldehyde, 15% picric acid in phosphate buffer (PB, 0.1 M ; pH 7.4) for 2 h and subsequently washed with PB intensively. Following fixation, the co-cultures were cut into 50- � m thick slices by means of the vi-bratome.
Immunohistochemistry (a) Qualitative Characterization of PDEs. Following pre-incu-
bation in 1% H 2 O 2 solution for 25 min as well as in blocking solu-tion containing 10% normal horse serum in 0.1 M PB for 1 h, re-spectively, the slices were incubated with goat anti-PDE2A (1: 100; Santa Cruz Biotechnology, Inc., Santa Cruz, Calif., USA) or rabbit anti-PDE10 (1: 500; FabGennix Inc., Frisco, Tex., USA) for 48 h at 4 ° C.
(b) Quantitative Characterization of TH-Positive Fibers. After pre-treatment with H 2 O 2 and incubation with blocking solution, the slices were incubated with mouse anti-TH (1: 1,000; Chemi-con, Temecula, Calif., USA) for 48 h at 4 ° C.
(a, b) After washing with PB, the slices were incubated with biotinylated anti-goat, biotinylated anti-rabbit or biotinylated an-ti-mouse immunoglobulin IgG (H+L) (1: 65; Vector Laboratories, Inc., Burlingame, Calif., USA), respectively, for 2 h at room tem-
perature. Afterwards, the avidin-biotin-horseradish peroxidase complex (1: 50; ABC-Elite Kit, Vector Laboratories, Inc.) was ap-plied and visualized by 3,3 � -diaminobenzidine hydrochloride (DAB; Sigma-Aldrich) as the chromogen. For the TH immunola-beling, nickel/cobalt-intensified DAB was used. After mounting on glass slides, the stained slices were dehydrated in a series of graded ethanol, processed through n-butylacetate and cover-slipped with Entellan (Merck, Darmstadt, Germany).
A
VTA/SN + STR
VTA/SN
STR
B
B‘A‘
**
Fig. 2. Schematic illustration of the preparation procedure to ob-tain organotypic slice co-cultures of the DAergic system as de-scribed previously by Franke et al. [10]. Intact brains were re-moved from 1- to 5-day-old rats. Afterwards, transverse cuts were made at the level of A to isolate the mesencephalon and the stria-tal region (B). Additional horizontal cuts were made indicated by the dashed lines to separate the VTA/SN (A’ * ) and the STR (B’ * ). In the last step, selected coronal sections (thickness 300 � m) were placed next to each other on moistened membranes as co-cultures as shown in the pictures.
RESEARCH ARTICLES - Phosphodiesterase Inhibitors (PDE-Is)
20

Phosphodiesterase 2 Inhibitors Promote Axonal Outgrowth
Neurosignals 5
Immunofluorescence Single Labeling. After washing with Tris-buffered saline (TBS,
0.05 M ; pH 7.6) and blocking with TBS containing fetal calf serum (FCS, 5%) and Triton X-100 (0.3%), the slices were incubated with mouse anti-TH (1: 1,000; Chemicon); mouse anti- � III-tubulin(1: 400; Promega GmbH, Mannheim, Germany) or mouse anti-glial fibrillary acidic protein (GFAP, 1: 1,000; Sigma-Aldrich), re-spectively, for 48 h at 4 ° C. The visualization of the respective pri-mary antibodies was performed with carbocyanine (Cy)2-conju-gated goat anti-mouse IgG (1: 400; Jackson ImmunoResearch, West Grove, Pa., USA). In addition, slices were stained with the nucleic acid probe Hoechst 33342 (Hoe, final concentration 40 μg/ml; Molecular Probes, Leiden, The Netherlands) to identify the cell nuclei.
Multiple Fluorescence Labeling . After the blocking step, per-formed as described above, the slices were incubated with an an-tibody mixture of rabbit anti-microtubule-associated protein-2 (MAP2, 1: 500; Millipore, Temecula, Calif., USA), mouse anti-GFAP (1: 1,000; Sigma-Aldrich) and goat anti-PDE2A (1: 100; San-ta Cruz Biotechnology, Inc.) or mouse anti-MAP2 (1: 1,000; Mil-lipore), goat anti-GFAP (1: 300; Santa Cruz Biotechnology, Inc.) and rabbit anti-PDE10 (1: 500; FabGennix Inc.), respectively, in TBS-containing 5% FCS and 0.3% Triton X-100 for 48 h at 4 ° C. The simultaneous visualization of the different primary antisera was performed with a mixture of secondary antibodies specific for the appropriate species IgG (rabbit, mouse, goat; all from Jack-son ImmunoResearch). In detail, Cy2- (1: 400), Cy3- (1: 1000), and
Cy5- (1: 100) conjugated IgGs were diluted in TBS supplemented with 5% FCS and 0.3% Triton X-100 and the mixture was applied for 2 h at room temperature.
TH-double immunofluorescence was performed using anti-bodies against mouse anti-TH (1: 1,000; Chemicon) and goat anti-PDE2A (1: 100; Santa Cruz Biotechnology, Inc.) or rabbit anti-PDE10 (1: 500; FabGennix Inc.), respectively, in TBS-containing 5% FCS and 0.3% Triton X-100 for 48 h at 4 ° C. The visualization was performed with a mixture of DyLight TM 649-conjugated don-key anti-mouse IgG (1: 100, color coded in green) and Cy3-conju-gated donkey anti-rabbit or anti-goat (1: 1,000; Jackson Immu-noResearch, each). Subsequently, all slices were stained with the nucleic acid probe Hoechst as described above.
After intensive washing and mounting on glass slides, all stained sections were dehydrated in a series of graded ethanol, processed through n-butylacetate and covered with Entellan.
Confocal Microscopy Imaging of the fluorescence-labeled specimen was done using
a confocal laser scanning microscope (LSM 510 Meta; Zeiss, Oberkochen, Germany). Excitation wave lengths were 633 nm (helium/neon2), 543 nm (helium/neon1), and 488 nm (argon). An ultraviolet laser (351/364 nm, Enterprise) was used to evoke the Hoechst fluorescence.
Treatment Procedure According to the treatment procedure described in Heine et
al. [12] (for a detailed time schedule, see fig. 3 ), the slice co-cul-tures were divided into different experimental groups and were treated with the following substances (final concentration): BAY60-7550 (10 � M ), ND7001 (10 � M ), MP-10 (10 � M ), and NGF (50 ng/ml). The experiments were performed in a blinded fashion, i.e. the compound identity was only provided after final data anal-ysis.
The substances (except NGF) were dissolved in DMSO, steril-ized by filters (0.2 � m; Sarstedt, Nümbrecht, Germany) and fi-nally added to 1 ml incubation medium. To exclude influences resulting from the solvent DMSO (final concentration 0.1%), an additional control group was used, treated only with ACSF (1%). The substances were applied at each medium change (4 times within the incubation period).
Tracing Procedure At DIV 8, small biocytin crystals (Sigma-Aldrich) of similar
size were placed on the VTA/SN part of the co-cultures (accord-ing to [10] ) under binocular control (for detailed time schedule, see fig. 3 ). Cultures were left in contact with the crystals for 2 h to allow the uptake of biocytin, followed by careful rinsing with fresh incubation medium. Then, the cultures were reincubated with medium containing the substances to allow for anterograde transport of the tracer. After DIV 10, the cultures were fixed as described above and cut into 50- � m thick slices by means of the vibratome.
The visualization of the traced axons was performed using a previously described protocol [10] . Briefly, the anterogradely transported tracer biocytin was labeled using the ABC-Elite Kit (1: 50; Vector Laboratories, Inc.), in combination with nickel/co-balt-intensified DAB. After mounting on glass slides, all stained sections were handled as described above.
Preparation of slice co-cultures(P1–5 old rats)
Biocytin tracing
Fixation
ST1
ST2
ST3
ST42 h
48 h
3 ×
STMedium change
Acute exposureto biocytin
DIV 0
DIV 1
DIV 10
DIV 8
Fig. 3. A detailed chronological scheme of the experimental pro-cedure is illustrated. During the incubation period of the cultures, the treatment was executed 4 times (ST), starting on DIV 1 using the respective substances. At DIV 8, the biocytin tracing was per-formed as described and, finally, at DIV 10, the co-cultures were fixed and analyzed. ST = Substance treatment.
RESEARCH ARTICLES - Phosphodiesterase Inhibitors (PDE-Is)
21

Heine /Sygnecka /Scherf /Berndt /Egerland /Hage /Franke
Neurosignals6
a b
c
d
e
f
g h
�
i
Fig. 4. a Overview of a DAergic nigrostriatal co-culture (VTA/SN+STR) using the biocytin-tracing technique in combination with DAB labeling. The small biocytin crystals had been placed onto the VTA/SN part of the co-culture; afterwards, the antero-grade tracer was transported from the cell bodies to the outgrow-ing fibers. The cell bodies (labeled black) of the VTA/SN and the respective outgrowing fibers, linking the border region and grow-ing into the STR, are shown. b–f Examples of TH immunofluo-rescence labeling to characterize the expression of the DAergic marker in the co-cultures: TH-IR was observed on cell bodies and outgrowing fibers within the VTA/SN ( b , e ) as well as on fiber
processes in the border region ( c , d ) and the STR ( d , f ). In the bor-der region, strong TH-IR was observed (e.g. arrowhead in c , d ) on fibers, but also an increased number of ‘dot-like’ structures (e.g. arrows in c , d ) was found. Finally, within the STR, a fine network of TH-positive fibers and ‘dot-like’ structures is characteristic ( f ). g–i The expression of � III-tubulin- ( g ), GFAP- (astroglial marker) ( h ), as well as MAP2- (neuronal marker) ( i ) positive fibers in the border region is demonstrated, together with the nuclear stain Hoechst (Hoe) 33342. Scale bars: a 10 � m; b–d , f 20 � m; e 50 � m; g–i 10 � m.
RESEARCH ARTICLES - Phosphodiesterase Inhibitors (PDE-Is)
22
Phosphodiesterase 2 Inhibitors Promote Axonal Outgrowth
Neurosignals 7
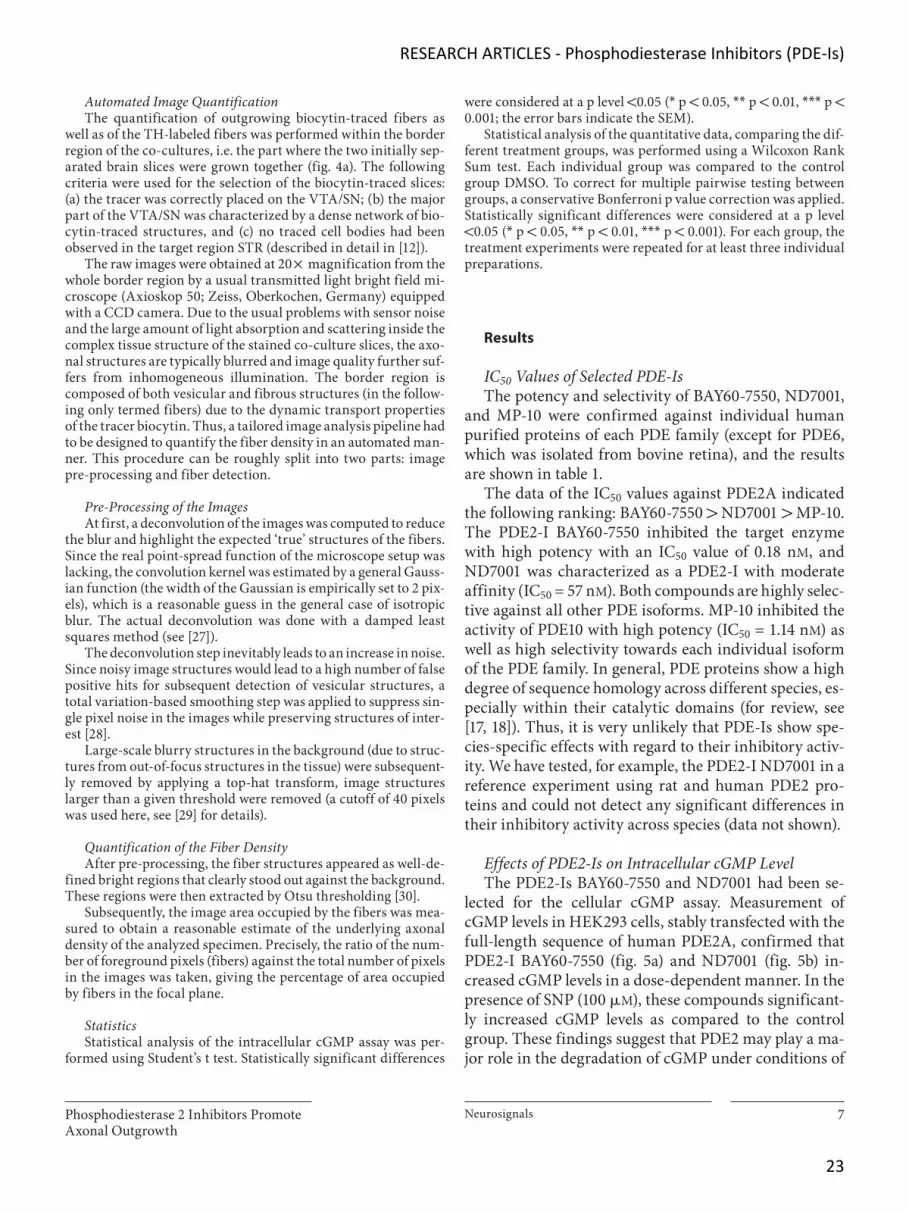
Automated Image Quantification The quantification of outgrowing biocytin-traced fibers as
well as of the TH-labeled fibers was performed within the border region of the co-cultures, i.e. the part where the two initially sep-arated brain slices were grown together ( fig. 4 a). The following criteria were used for the selection of the biocytin-traced slices: (a) the tracer was correctly placed on the VTA/SN; (b) the major part of the VTA/SN was characterized by a dense network of bio-cytin-traced structures, and (c) no traced cell bodies had been observed in the target region STR (described in detail in [12] ).
The raw images were obtained at 20 ! magnification from the whole border region by a usual transmitted light bright field mi-croscope (Axioskop 50; Zeiss, Oberkochen, Germany) equipped with a CCD camera. Due to the usual problems with sensor noise and the large amount of light absorption and scattering inside the complex tissue structure of the stained co-culture slices, the axo-nal structures are typically blurred and image quality further suf-fers from inhomogeneous illumination. The border region is composed of both vesicular and fibrous structures (in the follow-ing only termed fibers) due to the dynamic transport properties of the tracer biocytin. Thus, a tailored image analysis pipeline had to be designed to quantify the fiber density in an automated man-ner. This procedure can be roughly split into two parts: image pre-processing and fiber detection.
Pre-Processing of the Images At first, a deconvolution of the images was computed to reduce
the blur and highlight the expected ‘true’ structures of the fibers. Since the real point-spread function of the microscope setup was lacking, the convolution kernel was estimated by a general Gauss-ian function (the width of the Gaussian is empirically set to 2 pix-els), which is a reasonable guess in the general case of isotropic blur. The actual deconvolution was done with a damped least squares method (see [27] ).
The deconvolution step inevitably leads to an increase in noise. Since noisy image structures would lead to a high number of false positive hits for subsequent detection of vesicular structures, a total variation-based smoothing step was applied to suppress sin-gle pixel noise in the images while preserving structures of inter-est [28] .
Large-scale blurry structures in the background (due to struc-tures from out-of-focus structures in the tissue) were subsequent-ly removed by applying a top-hat transform, image structures larger than a given threshold were removed (a cutoff of 40 pixels was used here, see [29] for details).
Quantification of the Fiber Density After pre-processing, the fiber structures appeared as well-de-
fined bright regions that clearly stood out against the background. These regions were then extracted by Otsu thresholding [30] .
Subsequently, the image area occupied by the fibers was mea-sured to obtain a reasonable estimate of the underlying axonal density of the analyzed specimen. Precisely, the ratio of the num-ber of foreground pixels (fibers) against the total number of pixels in the images was taken, giving the percentage of area occupied by fibers in the focal plane.
Statistics Statistical analysis of the intracellular cGMP assay was per-
formed using Student’s t test. Statistically significant differences
were considered at a p level ! 0.05 ( * p ! 0.05, * * p ! 0.01, * * * p ! 0.001; the error bars indicate the SEM).
Statistical analysis of the quantitative data, comparing the dif-ferent treatment groups, was performed using a Wilcoxon Rank Sum test. Each individual group was compared to the control group DMSO. To correct for multiple pairwise testing between groups, a conservative Bonferroni p value correction was applied. Statistically significant differences were considered at a p level ! 0.05 ( * p ! 0.05, * * p ! 0.01, * * * p ! 0.001). For each group, the treatment experiments were repeated for at least three individual preparations.
Results
IC 50 Values of Selected PDE-Is The potency and selectivity of BAY60-7550, ND7001,
and MP-10 were confirmed against individual human purified proteins of each PDE family (except for PDE6, which was isolated from bovine retina), and the results are shown in table 1 .
The data of the IC 50 values against PDE2A indicated the following ranking: BAY60-7550 1 ND7001 1 MP-10. The PDE2-I BAY60-7550 inhibited the target enzyme with high potency with an IC 50 value of 0.18 n M , and ND7001 was characterized as a PDE2-I with moderate affinity (IC 50 = 57 n M ). Both compounds are highly selec-tive against all other PDE isoforms. MP-10 inhibited the activity of PDE10 with high potency (IC 50 = 1.14 n M ) as well as high selectivity towards each individual isoform of the PDE family. In general, PDE proteins show a high degree of sequence homology across different species, es-pecially within their catalytic domains (for review, see [17, 18] ). Thus, it is very unlikely that PDE-Is show spe-cies-specific effects with regard to their inhibitory activ-ity. We have tested, for example, the PDE2-I ND7001 in a reference experiment using rat and human PDE2 pro-teins and could not detect any significant differences in their inhibitory activity across species (data not shown).
Effects of PDE2-Is on Intracellular cGMP Level The PDE2-Is BAY60-7550 and ND7001 had been se-
lected for the cellular cGMP assay. Measurement of cGMP levels in HEK293 cells, stably transfected with the full-length sequence of human PDE2A, confirmed that PDE2-I BAY60-7550 ( fig. 5 a) and ND7001 ( fig. 5 b) in-creased cGMP levels in a dose-dependent manner. In the presence of SNP (100 � M ), these compounds significant-ly increased cGMP levels as compared to the control group. These findings suggest that PDE2 may play a ma-jor role in the degradation of cGMP under conditions of
RESEARCH ARTICLES - Phosphodiesterase Inhibitors (PDE-Is)
23

Heine /Sygnecka /Scherf /Berndt /Egerland /Hage /Franke
Neurosignals8
GC stimulations. The numbers of independent experi-ments per compound were: BAY60-7550, n = 8, and ND7001, n = 4, performed in duplicates.
Characterization of the Organotypic Co-Cultures (VTA/SN+STR) In the present study, the VTA/SN and the STR, main
parts of the DAergic nigrostriatal projection system, were prepared from P1–5 old rats, a period during which the rat exhibits an adult localization of the neurons, although the axonal network is still immature [31] . Following fixa-tion of the cultures at DIV 10, the slices were character-ized using different labeling techniques.
Biocytin Tracing The morphology of the biocytin-traced cell bodies as
well as the outgrowth of the fibers were analyzed in treat-ed as well as untreated control co-cultures. An example of an untreated biocytin-traced co-culture is shown in figure 4 a. In general, numerous biocytin-marked fibers (labeled in black) originating from the VTA/SN, ramified and crossed the border region between the two brain slic-es. Moreover, their fiber processes were observed to grow into the striatal part of the culture. The fiber pathways of the VTA/SN+STR co-cultures developed an innervation pattern similar to that found in vivo [10] . These findings are in accordance with other studies, showing that the projections of axons to their targets follow special stereo-
typical routes during the development of the central ner-vous system and that selected guidance molecules sup-port this innervation [32–34] .
Immunohistochemistry/Immunofluorescence The expression of TH, a marker for DAergic neurons,
was shown using immunofluorescence labeling in combi-nation with confocal laser scanning microscopy. The re-sults indicate the presence of TH-positive cell bodies and fibers in the VTA/SN ( fig. 4 b, e), whereas the expression of the marker was restricted to fibers within the border region ( fig. 4 c, d) and the STR ( fig. 4 d, f). Fluorescence images illustrating the differences in the expression of TH immunoreactivity (IR) in the respective anatomical parts of the DAergic system are shown in figure 4 b–d. The pic-tures especially exemplify the expression of the ‘dot-like’ structures in the border region and the target area (also observed after biocytin tracing, see fig. 6 ). Furthermore, antibodies against neuronal markers, i.e. � III-tubulin and MAP2 and the astroglial marker GFAP, were used to prove the existence of neuronal processes and glial cells, especially within the border region of the co-cultures. A positive IR for all investigated markers was observed in VTA/SN and STR. Examples are shown in figure 4 g–i, where the existence of � III-tubulin- ( fig. 4 g), MAP2- ( fig. 4 i), and GFAP- ( fig. 4 h) labeled fibers spanning the border region and, thus, linking the two slices could be verified. These results are consistent with the results
Fig. 5. Dose-dependent effects of PDE2-Is BAY60-7550 ( a ) and ND7001 ( b ) on intracellular cGMP levels in a PDE2-HEK293 cell line. BAY60-7550 and ND7001 (in the presence of the GC stimu-lator SNP) increased the intracellular cGMP level in a dose-de-pendent fashion. Values are shown in fmol cGMP per well. The
error bars indicate SEM. The numbers of independent experi-ments per compound were: BAY60-7550 (n = 8) and ND7001 (n = 4), performed in duplicates. Differences to SNP were considered to be statistically significant according to a p level ! 0.05 ( * p ! 0.05, * * p ! 0.01, * * * p ! 0.001).
350 BAY60-7550 (μM)
300
250
200
150
cGM
P (f
mol
/wel
l)
100
50
0a Medium SNP 0.005 0.01 0.05 0.1 0.5 1 5 10
*
***
****
***
70 ND7001 (μM)
60
50
40
30
cGM
P (f
mol
/wel
l)
20
10
0b Medium SNP 0.005 0.01 0.05 0.1 0.5 1 5 10
**
RESEARCH ARTICLES - Phosphodiesterase Inhibitors (PDE-Is)
24

Phosphodiesterase 2 Inhibitors Promote Axonal Outgrowth
Neurosignals 9
found in our previous studies, demonstrating the expres-sion of neuronal and glial fiber connections within VTA/SN + prefrontal cortex co-cultures [12] .
Further light microscopic and triple immunofluores-cence labeling studies with specific antibodies directed against PDE2A and PDE10 were performed to demon-strate the expression of these isoforms. Examples are shown in figure 7 .
The light microscopic data indicated the expression of PDE2A on cell bodies and fibrous structures in the STR and VTA/SN (data not shown) and correlate with the im-munofluorescence data. The immunofluorescence label-ing was predominately found at the plasma membrane as well as in the cytoplasm (an example for the STR is given in fig. 7 a–c, arrows). Moreover the co-localization of the PDE2A-IR on MAP2-immunopositive cells could be ob-served (example for VTA/SN; fig. 7 f–h, arrows). We did not find PDE2-positive fibers in the border region (an ex-ample is shown in fig. 7 d, e). Double immunofluores-cence experiments using TH and PDE2A indicated no co-expression on cell bodies or fibers in all parts of the studied co-cultures, as shown in figure 7 i–m.
Light microscopic images also confirmed the evidence of PDE10-marked cell bodies and fibers in the STR and the VTA/SN. Additional investigations using double im-munofluorescence labeling with antibodies against TH and the PDE10 isoform indicated the expression of PDE10 on cell bodies and single fibers. On the other hand, no co-expression with TH-positive fibers (STR, VTA/SN) or the localization on TH-positive neurons (VTA/SN) could be found ( fig. 7 n–q).
The obtained results thus clearly underline the expres-sion of the investigated isoforms in the VTA/SN+STR co-cultures during development.
Treatment of Organotypic Co-Cultures with PDE2- and PDE10-Is Qualitative Results of the Fiber Growth (Biocytin Tracing) Further co-cultures (VTA/SN+STR) had been used to
study the influence of selected PDE-Is, with different subclass specificities, on fiber growth and sprouting. All experiments were performed in a blinded fashion, i.e. the compound identity was provided after final data analysis.
a b c
d e f
Fig. 6. Results of the biocytin tracing after substance treatments are demonstrated within the border region of the co-cultures. Compared to control conditions applying ACSF ( a ) and DMSO ( b ) an increase in biocytin-positive fibers in PDE2-Is-treated co-cultures using BAY60-7550 ( d ) and ND7001 ( e ) was observed.
These effects were comparable with the effect evoked by the growth factor NGF ( c ). Co-cultures treated with MP-10 ( f ) were characterized by few biocytin-traced innervations within the bor-der region. Scale bar: a–f 20 � m.
RESEARCH ARTICLES - Phosphodiesterase Inhibitors (PDE-Is)
25

Heine /Sygnecka /Scherf /Berndt /Egerland /Hage /Franke
Neurosignals10
a b c d e
f g h
i j k l m
n o p q
Fig. 7. Confocal images of multiple immunofluorescence labeling using antibodies against PDE2A ( a–m ) and PDE10 ( n –q ) in com-bination with MAP2 (neuronal marker), TH (DAergic marker), and Hoechst (Hoe) are shown. a–h PDE2A is expressed in the STR and VTA/SN especially on cell bodies (plasma membrane, cyto-plasm; co-expression with MAP2 is indicated by arrows). No la-beling was found on fibers in the border region (example given in
d , e ). The double-labeling experiments with antibodies against TH indicated neither co-localization of PDEA2 and TH in the STR, VTA/SN, nor in the border region ( i–m ). PDE10 was found to be expressed on cell bodies and also on fibers (indicated by ar-rows in n–q ), but no co-localization was found with TH-positive structures in the studied regions. Scale bars: a–c 5 � m; d–h 10 � m; i 20 � m; j , k 20 � m; l–o 10 � m; p , q 20 � m.
RESEARCH ARTICLES - Phosphodiesterase Inhibitors (PDE-Is)
26

Phosphodiesterase 2 Inhibitors Promote Axonal Outgrowth
Neurosignals 11
As described in the Methods section, the co-cultures were treated 4 times with the respective substances, over an incubation time of 10 days and, afterwards, the out-growth of the biocytin-traced fibers in the border region was analyzed.
Differences in fiber outgrowth within the border re-gion could be observed for the different treatments, and examples of these results are illustrated in figure 6 . An increase in biocytin-positive fibers was apparent in PDE2-I- (e.g. BAY60-7750, fig. 6 d) treated co-cultures in comparison to control conditions (ACSF, fig. 6 a; DMSO, fig. 6 b). The growth factor NGF evoked an effect compa-rable to the PDE2-Is under study ( fig. 6 c). Co-cultures treated with MP-10, an inhibitor of the PDE10, were char-acterized by fewer biocytin-traced innervations within the border region compared to the effects induced by the PDE2-Is ( fig. 6 f). Furthermore, the ‘dot-like’ structures
are of particular interest. They could be observed in the border region and the target region (STR) after substance treatment. This expression was also found after TH label-ing of outgrowing fibers (see also fig. 4 , 8 ). A significant increase in the number of puncta was noticeable after treatment with BAY60-7550.
Quantification of Fiber Density (Biocytin Tracing) Starting from light microscopic images, the density of
the biocytin-positive fibers was measured for all treat-ment groups in the border region of the co-cultures using the automated image quantification described above. The respective results of the tested substances are shown as box-whisker plots in figure 9 . A significant increase in neuronal fiber outgrowth after application of the PDE2-Is BAY60-7550 and ND7001 was observed, with BAY60-7550 exhibiting the strongest effect. These results were of
a b c d
Perc
enta
ge
of im
age
pix
els
bel
ong
ing
to T
H-p
osit
ive
fiber
s
0.02
0.04
0.06
0.08
0.10
0ACSF NGF DSMO BAY60-7550
*
***
e
Fig. 8. a–d TH-positive fibers after substance treatment ( a ACSF; b NGF, c DMSO, d BAY60-7550 solved in DMSO) within the bor-der region of the co-cultures are shown (scale bar: a–d 20 � m). e Results of automated image quantification to measure the den-sity of the TH-positive fibers in the border region of differently treated co-cultures in comparison to control conditions. After TH labeling, the fiber density was quantified, taking the ratio of the number of foreground pixels (fibers) over the total number of pixels in the images to reveal the size of the area occupied by fi-bers. The box-whisker plots represent the empirical distribution of the fiber densities in the different groups (the vertical axis cor-responds to the percentage of image pixels belonging to labeled fibers). Compared with ACSF and DMSO, the growth factor NGF induced a significant increase in TH-positive fibers in the studied co-cultures. In contrast, the PDE2-I BAY60-7550 evoked only a small but significant increase of the number of TH-positive fibers, in comparison with the solvent DMSO. The numbers of analyzed images per group are: ACSF (n = 8), DMSO (n = 20), NGF (n = 33) and BAY60-7550 (n = 94). Differences were considered statisti-cally significant at a p level ! 0.05 ( * p ! 0.05, * * * p ! 0.001).
RESEARCH ARTICLES - Phosphodiesterase Inhibitors (PDE-Is)
27

Heine /Sygnecka /Scherf /Berndt /Egerland /Hage /Franke
Neurosignals12
comparable effect size as for the neurotrophic factor NGF. MP-10 (PDE10-I) caused a clearly lower fiber density in the border region, akin to the effects observed in the con-trol groups. Moreover, no significant differences in fiber density could be observed between the ACSF and the DMSO control group, thus excluding adverse effects re-sulting from the solvent DMSO. The numbers of ana-lyzed images per group are: ACSF (n = 22), DMSO (n = 62), NGF (n = 41), BAY60-7550 (n = 101), ND 7001 (n = 103), and MP-10 (n = 76).
Treatment of Organotypic Co-Cultures with PDE2-I and NGF – Characterization of DAergic Fibers Qualitative Results of the Fiber Growth (TH Immunolabeling) Treatment of the co-cultures with ACSF, NGF, DMSO,
and BAY60-7550 (solved in DMSO) and immunolabeling with antibodies against TH indicated differences in the
expression of TH-positive fibers in the border region (ex-amples are shown in fig. 8 a–d). Especially the effect of NGF as trophic factor was clearly visible.
Quantification of the Fiber Density(TH Immunolabeling) Moreover, the density of the TH-positive fibers was
analyzed and quantified for all treatment groups as de-scribed above. The results are shown in figure 8 e. The growth factor NGF induced a significant increase in TH-positive fibers in the studied co-cultures as compared to ACSF and DMSO. In contrast, the PDE2-I BAY60-7550 evoked a smaller (in comparison to the biocytin tracing) but statistically significant increase in the density of TH-positive fibers under these conditions (as compared with the DMSO group). The observed difference in effect size of BAY60-7550 treatment between biocytin tracing and TH labeling suggests an involvement of additional neu-rotransmitter populations, other than the TH-positive (DAergic) subgroup. Although small differences between DMSO and ACSF exist, they were not found to be statisti-cally significant.
The numbers of analyzed images per group are: ACSF (n = 8), DMSO (n = 20), NGF (n = 33), and BAY60-7550 (n = 94). Differences were considered statistically signifi-cant at a p level ! 0.05 ( * p ! 0.05, * * p ! 0.01, * * * p ! 0.001).
Discussion
The characterization of determinants of innervation patterns and the activities of growth promoting factors are of special interest for the development of clinical strategies to promote fiber development and, thereby, the regeneration of neuronal circuits. Using the ex vivo mod-el of organotypic slice co-cultures, consisting of the VTA/SN and the STR, in combination with biocytin tracing, TH immunolabeling, and subsequent automated image quantification, it was shown that substances with the po-tential to inhibit PDE2 (BAY60-7550, ND7001) were able to increase neuronal fiber outgrowth, in contrast to the studied PDE10-I (MP-10) and the control substances ACSF and DMSO.
The data suggest a role for PDE2-Is, possibly mediat-ed via cGMP, in the induction of fiber outgrowth in the nigrostriatal projection system. In PDE2-transfected HEK293 cells, a dose-dependent increase of intracellular cGMP levels in response to PDE2-Is, the previously de-scribed reference compounds BAY60-7550 and ND7001,
Fib
er d
ensi
ty(p
erce
nta
ge
of p
ixel
s b
elon
gin
g to
fib
ers) 0.14
0.12
0.10
0.08
0.06
0.04
0.02
0
ACSF DMSO NGF BAY60-7550
ND7001 MP-10
***
***
***
Fig. 9. Automated image quantification to measure the fiber den-sity in the border region of different treated co-cultures in com-parison to control conditions. After biocytin tracing, the fiber density was quantified, taking the ratio of the number of fore-ground pixels (fibers) over the total number of pixels in the im-ages to reveal the size of the area occupied by fibers. The box-whisker plots represent the empirical distribution of the fiber densities in the different groups (the vertical axis corresponds to the percentage of image pixels belonging to traced fibers). The analysis revealed a significant increase in neuronal fiber out-growth after application of PDE2-Is BAY60-7550 and ND7001, with effects comparable to the stimulation capacity of NGF. The inhibitor of PDE10, MP-10, caused a significantly lower fiber den-sity in the border region, similar to the results of ACSF and DMSO. The numbers of analyzed images per group were: ACSF (n = 22), DMSO (n = 62), NGF (n = 41), BAY60-7550 (n = 101), ND7001(n = 103), and MP-10 (n = 76). Statistically significant differences were considered at a p level ! 0.05 ( * * * p ! 0.001).
RESEARCH ARTICLES - Phosphodiesterase Inhibitors (PDE-Is)
28

Phosphodiesterase 2 Inhibitors Promote Axonal Outgrowth
Neurosignals 13
could further be shown. These data indicate that inhibi-tion of PDE2 results in a dose-dependent augmentation of intracellular cGMP levels.
In vivo studies on rats have shown that DAergic neu-rons emerged around embryonic day 10, with the first nerve fibers appearing in the STR around embryonic days 14–15. The innervations are completed at about P15 [35] . Thus, the situation in the established ex vivo model strongly correlates with the developmental processes of physiological neuronal circuits. The observed neurite outgrowth pattern is consistent with our own previous data obtained under in vivo conditions [10] .
PDEs are involved in distinct tasks in the brain, both in the mature rat brain and at embryonic as well as post-natal stages when significant developmental and matura-tional events are in progress [19, 20, 36] . An increasein PDE activity was reported during development ofthe brain from fetus to adulthood [37, 38] . Our data indi-cate an expression of PDE2A and PDE10 on cells in the DAergic co-culture preparations, consequently underlin-ing a role of these isoenzymes in early development.
Hydrolyzing PDE families have distinct expression patterns within the central nervous system. For instance, striatal medium spiny neurons express mRNA for the PDE1B, 2A, 4B, 7B, 9A, and 10A isoforms (for references, see [39, 40] ). A prominent PDE2A-IR was found besides the STR in the isocortex, hippocampus, and basal gan-glia. Moreover, a high expression was observed in the SN and VTA on cell bodies and terminals [20, 36] , which is supported by the findings presented in this work. PDE10 mRNA and protein are highly enriched in medium spiny neurons in the STR, within the cell bodies and dendrites as well as on SN axons [22, 41, 42] . PDE10A is associated with post-synaptic membranes of these medium spiny neurons and their dendrites and spines [43] .
Under physiological conditions, the dual substrate en-zyme PDE2(A) plays a critical role in the feedback control of cellular cAMP and cGMP levels, resulting in acute and long-term changes of neuronal functions. The basal PDE2 activity in neurons is low, but it is stimulated by an acute increase in cGMP following GC activation during signal transduction. In detail, a characteristic feature of PDE2 is the positive cooperativity with the substrate cGMP due to an allosteric cGMP binding site at N-terminal domains [40, 44] . This cyclic nucleotide stimulates cAMP degrada-tion such that higher concentrations of cGMP inhibit cAMP hydrolysis and low levels of cGMP enhance the rate of cAMP hydrolysis [39, 44] . Besides the described fea-tures of PDE2, also special GAF domains of PDEs 5, 6, 10, and 11 bind cGMP and may regulate the catalytic activity
or protein-protein interactions (for references, see [45] ). As a consequence, inhibition of PDE2 selectively increas-es cGMP and cAMP in brain active synapses [19, 44] . In-cubation of cultured neurons and hippocampal slices with the selective PDE2-I BAY60-7550 resulted in in-creased cGMP levels [44] . This is in accordance with our present data, indicating a dose-dependent increase of in-tracellular cGMP levels in response to the investigated PDE2-Is obtained in the HEK cell line. Inhibition of the PDE10A causes also increased levels of cAMP and cGMP [40] , with the difference that the regulation of the two cy-clic nucleotides by PDE10A is independent [22] .
The involvement of cAMP/cGMP during neuronal de-velopment in synaptic plasticity and memory formation has been described [19, 36, 44] . Recent data suggest a role of cAMP (via cAMP-dependent protein kinase) in neuri-togenesis and synaptogenesis during neuronal differen-tiation in NG108-15 cells [14] . The particular role of ex-change proteins directly activated by cAMP (Epac) will be of specific interest for further studies as they are known to be involved in mediating cAMP responses. These are implicated in various cellular processes such as integrin-mediated cell adhesion and cell-cell junction formation or influencing, for example, cortical actin cy-toskeleton (for review, see [46] ).
cGMP can regulate directional guidance of growth cones [13, 47] and is involved in the outgrowth of cortical neurons during maturation [32] . The observed trophic effects clearly show that inhibitors of PDE2 are able to modulate neuronal fiber outgrowth in VTA/SN+STR co-cultures in contrast to the studied PDE10-I (MP-10), sug-gesting an involvement of PDE2, via cGMP signaling, in synaptic plasticity. Data from Boess et al. [44] confirm that inhibition of PDE2, e.g. by the selective PDE2-I BAY60-7550, increases cGMP/cAMP in cultured neurons and hippocampal slices, resulting in enhanced long-term potentiation of synaptic transmission, which is thought to be a key factor implicated in pro-cognitive activity without affecting basal synaptic transmission. A role of PDE2A activity in memory processes is further support-ed by the results of Song et al. [47] and Rutten et al. [19] showing that BAY60-7550 reportedly improves perfor-mance of rodents in recognition memory tasks.
Inhibition of PDE10 promotes effects modulating basal ganglia function in ways that suggest a particular thera-peutic utility in the treatment of psychosis in schizophre-nia [22, 23, 48] . It has also been shown that PDE10-Iincreases phosphorylation of key cAMP-dependentsubstrates, such as cAMP response element-binding pro-tein, extracellular receptor kinase, or, more recently, the
RESEARCH ARTICLES - Phosphodiesterase Inhibitors (PDE-Is)
29

Heine /Sygnecka /Scherf /Berndt /Egerland /Hage /Franke
Neurosignals14
References 1 Redgrave P, Rodriguez M, Smith Y, Rodri-guez-Oroz MC, Lehericy S, Bergman H, et al: Goal-directed and habitual control in the basal ganglia: implications for Parkinson’s disease. Nat Rev Neurosci 2010; 11: 760–772.
2 Sesack SR, Carr DB: Selective prefrontal cor-tex inputs to dopamine cells: implications for schizophrenia. Physiol Behav 2002; 77: 513–517.
3 Dailly E, Chenu F, Renard CE, Bourin M: Dopamine, depression and antidepressants. Fundam Clin Pharmacol 2004; 18: 601–607.
4 Wise RA: Roles for nigrostriatal – not just mesocorticolimbic – dopamine in reward and addiction. Trends Neurosci 2009; 32: 517–524.
AMPA-receptor GluR1 subunit [48–51] . Sotty et al. [51] further suggest a modulatory role of PDE10A on mesolim-bic DAergic neurotransmission, via the D1-regulated feed-back loop controlling midbrain DAergic neuronal activity. Therefore, investigating its modulatory role to affect the confluence of the corticostriatal glutamatergic and the midbrain DAergic pathways will be of particular interest.
The regulation of cAMP synthesis by DA and other neurotransmitter receptors has been extensively studied. But the importance of cAMP degradation by PDEs and the precise roles of each PDE isoform in DAergic signal-ing are not yet completely understood, owing to the di-versity of PDE isoforms expressed in the STR and the complexity of their potential regulation (for review, see [24] ). The authors conclude that the inhibition of PDEs upregulates cAMP/PKA signaling in three neuronal sub-types, resulting in (a) the stimulation of DA synthesis at DAergic terminals, (b) the inhibition of D2 receptor sig-naling in striatopallidal neurons, and (c) the stimulation of D1 receptor signaling in striatonigral neurons. How-ever, it should be noted that the striatopallidal system as well as the corticostriatal glutamatergic projection are not constituents of the organotypic slice co-culture sys-tem used in the present study – possibly causing the dif-ferent inhibitory effects of the investigated PDE-Is (espe-cially for PDE10-I). However, the mechanism of inhibi-tion responsible for the observed effects of the two kinds of PDE-Is needs further experimental investigations, es-pecially the role of PDE10 to affect the corticostriatal glu-tamatergic and the midbrain DAergic pathways.
Finally, in the present study, the growth-promoting ef-fect of the PDE-Is was compared with the stimulating ca-pacity of NGF, which elicited a significant increase in fi-ber outgrowth intensity. Neurotrophins, like NGFs and their receptors, are the major regulators of neuronal sur-vival during development, after injury or nervous system diseases [52] . NGF promotes neurite extension through a cAMP-independent signaling pathway involving Ras, PKC, and extracellular signal-regulated protein kinase [53] . It has been shown that cAMP also induces neuronal differentiation in PC12 cells and that the co-treatment of NGF and dibutyryl cAMP exhibits synergistic effects on neurite outgrowth [54] . Moreover, NGF increases cGMP level and activates PDEs in PC12 cells [55] . Also other trophic molecules have been shown to enhance survival and neurite outgrowth of mesencephalic DAergic neu-rons in single cell cultures or slice cultures [56–58] . Treat-ment of organotypic slice co-cultures with BDNF result-ed in enhanced survival of TH-positive neurons and an increased growth of TH-positive fibers into the striatal
tissue [58] . GDNF has been shown to act as a powerful chemoattractant for outgrowing DAergic axons in organ-otypic co-cultures [33, 59] as well as under in vivo condi-tions [60] . Finally, Thompson et al. [60] showed that axo-nal regrowth in the nigrostriatal trajectory can be further enhanced by the addition of trophic support by overex-pression of GDNF in the striatal target.
In summary, cAMP/cGMP are involved in survival, repair, and remodeling in the nervous system both dur-ing development and after injury, and PDE2 appears to act as an important regulator in these processes. In the present study, we were able to analyze the specific poten-tial of PDE-Is in mediating the growth of defined fiber connections under controlled conditions, using the ex vivo model of organotypic slice co-cultures of the nigro-striatal system in combination with an automated image quantification. Hence, our results strongly support a tro-phic role of PDE2-Is in shaping interneuronal connec-tions during the early phase of neuronal development. The characterization of the molecular and functional ba-sis underlying the observed effects of PDE2-Is in regen-eration and repair of disrupted neuronal circuits will be an important next step to foster the development of im-proved ways for the treatment of neurological disorders.
Acknowledgements
The authors thank Katrin Becker and Katrin Krause (Rudolf Boehm Institute of Pharmacology and Toxicology) for technical assistance.
The work presented in this paper was made possible by fund-ing from the German Federal Ministry of Education and Research (BMBF, PtJ-Bio, 0313909) and was supported by the European Fund for Regional Development (EFRE) and by the Free State of Saxony (grant No. SAB12525).
RESEARCH ARTICLES - Phosphodiesterase Inhibitors (PDE-Is)
30

Phosphodiesterase 2 Inhibitors Promote Axonal Outgrowth
Neurosignals 15
5 Hökfelt T, Johansson O, Fuxe K, Goldstein M, Park D: Immunohistochemical studies on the localization and distribution of monoamine neuron systems in the rat brain. I. Tyrosine hydroxylase in the mes- and di-encephalon. Med Biol 1976; 54: 427–453.
6 Fallon JH, Loughlin SE: Substantia nigra; in Paxinos G (ed): The Rat Nervous System. San Diego, Academic Press, 1995, pp 215–237.
7 Lindvall O, Björklund A: Cell therapy in Par-kinson’s disease. Neurotherapeutics 2004; 1: 382–393.
8 Björklund A, Dunnett SB: Dopamine neuron systems in the brain: an update. Trends Neu-rosci 2007; 30: 194–202.
9 Sasaki T, Kotera J, Omori K: Transcriptional activation of phosphodiesterase 7B1 by do-pamine D1 receptor stimulation through the cyclic AMP/cyclic AMP-dependent protein kinase/cyclic AMP-response element bind-ing protein pathway in primary striatal neu-rons. J Neurochem 2004; 89: 474–483.
10 Franke H, Schelhorn N, Illes P: Dopaminer-gic neurons develop axonal projections to their target areas in organotypic co-cultures of the ventral mesencephalon and the stria-tum/prefrontal cortex. Neurochem Int 2003; 42: 431–439.
11 Franke H, Illes P: Involvement of P2 recep-tors in the growth and survival of neurons in the CNS. Pharmacol Ther 2006; 109: 297–324.
12 Heine C, Wegner A, Grosche J, Allgaier C, Illes P, Franke H: P2 receptor expression in the dopaminergic system of the rat brain during development. Neuroscience 2007; 149: 165–181.
13 Song HJ, Poo MM: Signal transduction un-derlying growth cone guidance by diffusible factors. Curr Opin Neurobiol 1999; 9: 355–363.
14 Tojima T, Kobayashi S, Ito E: Dual role of cy-clic AMP-dependent protein kinase in neu-ritogenesis and synaptogenesis during neu-ronal differentiation. J Neurosci Res 2003; 74: 829–837.
15 Cai D, Shen Y, De Bellard M, Tang S, Filbin MT: Prior exposure to neurotrophins blocks inhibition of axonal regeneration by MAG and myelin via a cAMP-dependent mecha-nism. Neuron 1999; 22: 89–101.
16 Francis SH, Turko IV, Corbin JD: Cyclic nu-cleotide phosphodiesterases: relating struc-ture and function. Prog Nucleic Acid Res Mol Biol 2001; 65: 1–52.
17 Bender AT, Beavo JA: Cyclic nucleotide phosphodiesterases: molecular regulation to clinical use. Pharmacol Rev 2006; 58: 488–520.
18 Conti M, Beavo J: Biochemistry and physiol-ogy of cyclic nucleotide phosphodiesterases: essential components in cyclic nucleotide signaling. Annu Rev Biochem 2007; 76: 481–511.
19 Rutten K, Prickaerts J, Hendrix M, van der Staay FJ, Sik A, Blokland A: Time-dependent involvement of cAMP and cGMP in consoli-dation of object memory: studies using selec-tive phosphodiesterase type 2, 4 and 5 inhib-itors. Eur J Pharmacol 2007; 558: 107–112.
20 Stephenson DT, Coskran TM, Wilhelms MB, Adamowicz WO, O’Donnell MM, Mu-ravnick KB, et al: Immunohistochemical lo-calization of phosphodiesterase 2A in mul-tiple mammalian species. J Histochem Cyto-chem 2009; 57: 933–949.
21 Siuciak JA, Chapin DS, Harms JF, Lebel LA, McCarthy SA, Chambers L, et al: Inhibition of the striatum-enriched phosphodiesterase PDE10A: a novel approach to the treatment of psychosis. Neuropharmacology 2006; 51: 386–396.
22 Chappie T, Humphrey J, Menniti F, Schmidt C: PDE10A inhibitors: an assessment of the current CNS drug discovery landscape. Curr Opin Drug Discov Devel 2009; 12: 458–467.
23 Grauer SM, Pulito VL, Navarra RL, Kelly MP, Kelley C, Graf R, et al: Phosphodiester-ase 10A inhibitor activity in preclinical mod-els of the positive, cognitive, and negative symptoms of schizophrenia. J Pharmacol Exp Ther 2009; 331: 574–590.
24 Nishi A, Snyder GL: Advanced research on dopamine signaling to develop drugs for the treatment of mental disorders: biochemical and behavioral profiles of phosphodiesterase inhibition in dopaminergic neurotransmis-sion. J Pharmacol Sci 2010; 114: 6–16.
25 Höfgen N, Stange H, Schindler R, Lankau HJ, Grunwald C, Langen B, et al: Discovery of imidazo[1,5-a]pyrido[3,2-e]pyrazines as a new class of phosphodiesterase 10A inhibi-tors. J Med Chem 2010; 53: 4399–4411.
26 Paglia MJ, Mou H, Cote RH: Regulation of photoreceptor phosphodiesterase (PDE6) by phosphorylation of its inhibitory gamma subunit re-evaluated. J Biol Chem 2002; 277: 5017–5023.
27 Vivas FA, Pestana RC, Ursin B: A new stabi-lized least-squares imaging condition. J Geo-phys Eng 2009; 6: 264–268.
28 Rudin LI, Osher S, Fatemi E: Nonlinear total variation based noise removal algorithms. Physica D: Nonlinear Phenomena 1992; 60: 259–268.
29 Gonzalez RC, Woods RE: Digital Image Pro-cessing, ed 2. Prentice Hall International, 2001.
30 Otsu N: A threshold selection method from gray-level histograms. IEEE Trans Syst Man Cybern 1979; 9: 62–66.
31 Gomez-Urquijo SM, Hökfelt T, Ubink R, Lu-bec G, Herrera-Marschitz M: Neurocircuit-ries of the basal ganglia studied in organo-typic cultures: focus on tyrosine hydroxy-lase, nitric oxide synthase and neuropeptide immunocytochemistry. Neuroscience 1999; 94: 1133–1151.
32 Polleux F, Morrow T, Ghosh A: Semaphorin 3A is a chemoattractant for cortical apical dendrites. Nature 2000; 404: 567–573.
33 Jaumotte JD, Zigmond MJ: Dopaminergic innervation of forebrain by ventral mesen-cephalon in organotypic slice co-cultures: effects of GDNF. Brain Res Mol Brain Res 2005; 134: 139–146.
34 Tamariz E, Díaz-Martínez NE, Díaz NF, García-Peña CM, Velasco I, Varela-Echa-varría A: Axon responses of embryonic stem cell-derived dopaminergic neurons to sema-phorins 3A and 3C. J Neurosci Res 2010; 88: 971–980.
35 Voorn P, Kalsbeek A, Jorritsma-Byham B, Groenewegen HJ: The pre- and postnatal de-velopment of the dopaminergic cell groups in the ventral mesencephalon and the dopa-minergic innervation of the striatum of the rat. Neuroscience 1988; 25: 857–887.
36 Van Staveren WCG, Steinbusch HWM, Markerink-Van Ittersum M, Repaske DR, Goy MF, Kotera J, et al: mRNA expression patterns of the cGMP-hydrolyzing phospho-diesterases types 2, 5, and 9 during develop-ment of the rat brain. J Comp Neurol 2003; 467: 566–580.
37 Smoake JA, Song SY, Cheung WY: Cyclic 3 � ,5 � -nucleotide phosphodiesterase. Distri-bution and developmental changes of the en-zyme and its protein activator in mammali-an tissues and cells. Biochim Biophys Acta 1974; 341: 402–411.
38 Davis CW, Kuo JF: Ontogenetic changes in levels of phosphodiesterase for adenosine 3 � :5 � -monophosphate and glucosine 3 � :5 � -monophosphate in the lung, brain and heart from guinea pigs. Biochim Biophys Acta 1976; 444: 554–562.
39 Juilfs DM, Soderling S, Burns F, Beavo JA: Cyclic GMP as substrate and regulator of cy-clic nucleotide phosphodiesterases (PDEs). Rev Physiol Biochem Pharmacol 1999; 135: 67–104.
40 Mehats C, Andersen CB, Filopanti M, Jin SLC, Conti M: Cyclic nucleotide phosphodi-esterases and their role in endocrine cell sig-naling. Trends Endocrinol Metab 2002; 13: 29–35.
41 Fujishige K, Kotera J, Michibata H, Yuasa K, Takebayashi S, Okumura K, et al: Cloning and characterization of a novel human phos-phodiesterase that hydrolyzes both cAMP and cGMP (PDE10A). J Biol Chem 1999; 274: 18438–18445.
42 Seeger TF, Bartlett B, Coskran TM, Culp JS, James LC, Krull DL, et al: Immunohisto-chemical localization of PDE10A in the rat brain. Brain Res 2003; 985: 113–126.
43 Xie Z, Adamowicz WO, Eldred WD, Jakows-ki AB, Kleiman RJ, Morton DG, et al: Cellu-lar and subcellular localization of PDE10A, a striatum-enriched phosphodiesterase. Neu-roscience 2006; 139: 597–607.
RESEARCH ARTICLES - Phosphodiesterase Inhibitors (PDE-Is)
31

Heine /Sygnecka /Scherf /Berndt /Egerland /Hage /Franke
Neurosignals16
44 Boess FG, Hendrix M, van der Staay F-J, Erb C, Schreiber R, van Staveren W, et al: Inhibi-tion of phosphodiesterase 2 increases neuro-nal cGMP, synaptic plasticity and memory performance. Neuropharmacology 2004; 47: 1081–1092.
45 Deng C, Wang D, Bugaj-Gaweda B, De Vivo M: Assays for cyclic nucleotide-specific phosphodiesterases (PDEs) in the central nervous system (PDE1, PDE2, PDE4, and PDE10). Curr Protoc Neurosci 2007;Chapter 7:Unit 7.21.
46 Bos LB: Epac proteins: multi-purpose cAMP targets. Trends Biochem Sci 2006; 12: 680–686.
47 Song H, Ming G, He Z, Lehmann M, Mc-Kerracher L, Tessier-Lavigne M, et al: Con-version of neuronal growth cone responses from repulsion to attraction by cyclic nucleo-tides. Science 1998; 281: 1515–1518.
48 Schmidt CJ, Chapin DS, Cianfrogna J, Cor-man ML, Hajos M, Harms JF, et al: Preclini-cal characterization of selective phosphodi-esterase 10A inhibitors: a new therapeutic approach to the treatment of schizophrenia. J Pharmacol Exp Ther 2008; 325: 681–690.
49 Siuciak JA, McCarthy SA, Chapin DS, Fuji-wara RA, James LC, Williams RD, et al: Ge-netic deletion of the striatum-enriched phos-phodiesterase PDE10A: evidence for altered striatal function. Neuropharmacology 2006; 51: 374–385.
50 Nishi A, Kuroiwa M, Miller DB, O’Callaghan JP, Bateup HS, Shuto T, et al: Distinct roles of PDE4 and PDE10A in the regulation of cAMP/PKA signaling in the striatum. J Neu-rosci 2008; 28: 10460–10471.
51 Sotty F, Montezinho LP, Steiniger-Brach B, Nielsen J: Phosphodiesterase 10A inhibition modulates the sensitivity of the mesolimbic dopaminergic system to D-amphetamine: involvement of the D1-regulated feedback control of midbrain dopamine neurons. J Neurochem 2009; 109: 766–775.
52 Chao MV: Neurotrophins and their recep-tors: a convergence point for many signalling pathways. Nat Rev Neurosci 2003; 4: 299–309.
53 Vaudry D, Stork PJS, Lazarovici P, Eiden LE: Signaling pathways for PC12 cell differentia-tion: making the right connections. Science 2002; 296: 1648–1649.
54 Ng YP, Wu Z, Wise H, Tsim KWK, Wong YH, Ip NY: Differential and synergisticeffect of nerve growth factor and cAMP on the regulation of early response genes dur-ing neuronal differentiation. Neurosignals 2009; 17: 111–120.
55 Laasberg T, Pihlak A, Neuman T, Paves H, Saarma M: Nerve growth factor increases the cyclic GMP level and activates the cyclic GMP phosphodiesterase in PC12 cells. FEBS Lett 1988; 239: 367–370.
56 Engele J, Bohn MC: The neurotrophic effects of fibroblast growth factors on dopaminer-gic neurons in vitro are mediated by mesen-cephalic glia. J Neurosci 1991; 11: 3070–3078.
57 Nikkhah G, Odin P, Smits A, Tingström A, Othberg A, Brundin P, et al: Platelet-derived growth factor promotes survival of rat and human mesencephalic dopaminergic neu-rons in culture. Exp Brain Res 1993; 92: 516–523.
58 Østergaard K, Jones SA, Hyman C, Zimmer J: Effects of donor age and brain-derived neurotrophic factor on the survival of dopa-minergic neurons and axonal growth in postnatal rat nigrostriatal cocultures. Exp Neurol 1996; 142: 340–350.
59 Schatz DS, Kaufmann WA, Saria A, Humpel C: Dopamine neurons in a simple GDNF-treated meso-striatal organotypic co-culture model. Exp Brain Res 1999; 127: 270–278.
60 Thompson LH, Grealish S, Kirik D, Björk-lund A: Reconstruction of the nigrostriatal dopamine pathway in the adult mouse brain. Eur J Neurosci 2009; 30: 625–638.
RESEARCH ARTICLES - Phosphodiesterase Inhibitors (PDE-Is)
32

Nachweis über Anteile der Co-Autoren, Dipl. Biochem. Katja Sygnecka Organotypische Gewebe-Co-Kulturen des dopaminergen Systems –Ein Modell zur Identifikation neuroregenerativer Substanzen und Zellen
Nachweis über Anteile der Co-Autoren: Titel: Phosphodiesterase 2 inhibitors promote axonal outgrowth in organotypic
slice co-cultures
Journal: Neurosignals
Autoren: C. Heine, K. Sygnecka, N. Scherf, A. Berndt, U Egerland, T. Hage, H. Franke (geteilte Erstautorinnenschaft: CH und KS)
Anteil Sygnecka (Erstautorin): - Gewebekulturen (Präparation, Behandlung, Aufarbeitung) - Immunhistochemie - Faserquantifizierung - Analyse und Verarbeitung der Daten - Revision und Fertigstellung des Manuskripts
Anteil Heine (Erstautorin): - Projektidee - Konzeption - Gewebekulturen (Präparation, Behandlung, Aufarbeitung) - Immunhistochemie - Faserquantifizierung - Analyse und Verarbeitung der Daten - Erstellen der Abbildungen - Schreiben der Publikation
Anteil Scherf: - Bioinformatische Bildauswertung
Anteil Bernd, Egerland, Hage: - Synthese von applizierten Substanzen - In vitro PDE Assay - Intrazellulärer cGMP Assay
Anteil Franke (Letztautorin): - Projektidee - Konzeption - Gewebekulturen (Präparation, Tracing) - Schreiben der Publikation
RESEARCH ARTICLES - Phosphodiesterase Inhibitors (PDE-Is)
33

RESEARCH ARTICLES - Phosphodiesterase Inhibitors (PDE-Is)
34

Nc
KCa
b
c
d
e
a
ARRAA
KCDNNOR
rimNtn
T
m(
h0
Int. J. Devl Neuroscience 40 (2015) 1–11
Contents lists available at ScienceDirect
International Journal of Developmental Neuroscience
j ourna l ho me page: www.elsev ier .com/ locate / i jdevneu
imodipine enhances neurite outgrowth in dopaminergic brain sliceo-cultures
atja Sygneckaa,b,∗,1, Claudia Heinea,b,1, Nico Scherf c, Mario Fasoldd, Hans Binderd,hristian Schellera,e, Heike Frankeb
Translational Centre for Regenerative Medicine (TRM), University of Leipzig, Philipp-Rosenthal-Straße 55, 04103 Leipzig, GermanyRudolf Boehm Institute of Pharmacology and Toxicology, University of Leipzig, Härtelstr. 16-18, 04107 Leipzig, GermanyInstitute for Medical Informatics and Biometry, Dresden University of Technology, Fetscherstraße 74, 01307 Dresden, GermanyInterdisciplinary Centre for Bioinformatics, University of Leipzig, Härtelstr. 16-18, 04107 Leipzig, GermanyDepartment of Neurosurgery, University of Halle-Wittenberg, Ernst-Grube-Str. 40, 06120 Halle/Saale, Germany
r t i c l e i n f o
rticle history:eceived 19 September 2014eceived in revised form 24 October 2014ccepted 26 October 2014vailable online 4 November 2014
eywords:alcium channel blockadeevelopmenteurite growthimodipinerganotypic slice co-cultureegeneration
a b s t r a c t
Calcium ions (Ca2+) play important roles in neuroplasticity and the regeneration of nerves. IntracellularCa2+ concentrations are regulated by Ca2+ channels, among them L-type voltage-gated Ca2+ channels,which are inhibited by dihydropyridines like nimodipine. The purpose of this study was to investigate theeffect of nimodipine on neurite growth during development and regeneration. As an appropriate modelto study neurite growth, we chose organotypic brain slice co-cultures of the mesocortical dopaminergicprojection system, consisting of the ventral tegmental area/substantia nigra and the prefrontal cortexfrom neonatal rat brains. Quantification of the density of the newly built neurites in the border region(region between the two cultivated slices) of the co-cultures revealed a growth promoting effect ofnimodipine at concentrations of 0.1 �M and 1 �M that was even more pronounced than the effect of thegrowth factor NGF.
This beneficial effect was absent when 10 �M nimodipine were applied. Toxicological tests revealedthat the application of nimodipine at this higher concentration slightly induced caspase 3 activation inthe cortical part of the co-cultures, but did neither affect the amount of lactate dehydrogenase release orpropidium iodide uptake nor the ratio of bax/bcl-2. Furthermore, the expression levels of different geneswere quantified after nimodipine treatment. The expression of Ca2+ binding proteins, immediate early
RESEARCH ARTICLES - Nimodipine
genes, glial fibrillary acidic protein, and myelin components did not change significantly after treatment,indicating that the regulation of their expression is not primarily involved in the observed nimodipinemediated neurite growth. In summary, this study revealed for the first time a neurite growth promotingeffect of nimodipine in the mesocortical dopaminergic projection system that is highly dependent on theapplied concentrations.
© 2014 ISDN. Published by Elsevier Ltd. All rights reserved.
Abbreviations: ANOVA, analysis of variance; Arc, activity-regulated cytoskeleton-associde; DIV, days in vitro; Egr, early growth response protein; FCS, fetal calf serum; Fos, pmmediate early genes; Junb, transcription factor jun-B; LDH, lactate dehydrogenase;
yelin and lymphocyte protein; MAP2, microtubule associated protein-2; Mog, myelin oeurobasal-A; NGF, nerve growth factor; P, postnatal day; PFC, prefrontal cortex; PI, prop
itative reverse transcription polymerase chain reaction; SOM, self-organizing maps; TBigra.∗ Corresponding author at: Rudolf Boehm Institute of Pharmacology and Toxicology, Unel.: +49 0341 97 24606; fax: +49 0341 97 24609.
E-mail addresses: [email protected] (K. Sygnecka), claudia.heine@[email protected] (M. Fasold), [email protected] (H. Binder), christian.
H. Franke).1 Both authors contributed equally to the study.
ttp://dx.doi.org/10.1016/j.ijdevneu.2014.10.005736-5748/© 2014 ISDN. Published by Elsevier Ltd. All rights reserved.
iated protein; CBPs, Ca2+ binding proteins; DAB, 3,3′-diaminobenzidine hydrochlo-roto-oncogene c-Fos; GFAP, glial fibrillary acidic protein; HS, horse serum; IEGs,
LSM, laser scanning microscope; LVCC, L-type voltage-gated Ca2+ channels; Mal,ligodendrocyte glycoprotein; MrpL32, mitochondrial ribosomal protein L32; NB-A,idium iodide; Plp1, myelin proteolipid protein 1; Pvalb, parvalbumin; qPCR, quan-S, tris buffered saline; Ubc, ubiquitin; VTA/SN, ventral tegmental area/substantia
iversity of Leipzig, Härtelstr. 16-18, 04107 Leipzig, Germany.
.uni-leipzig.de (C. Heine), [email protected] (N. Scherf),[email protected] (C. Scheller), [email protected]
35

2 vl Neu
1
nC(fn(pi1ni
deSwedp2atint2
n1ten
nlNiipt1gtinanmwe2
dwgrmspap
i
K. Sygnecka et al. / Int. J. De
. Introduction
Nimodipine is a blocker of the L-type voltage-gated Ca2+ chan-els (LVCC), which regulate the intracellular Ca2+ concentration.alcium ions (Ca2+) play an important role in neuronal plasticityGispen et al., 1988). Their intracellular concentration is crucialor the regulation of axonal and dendritic growth, guidance duringeuronal development and for resprouting of axons after injuryfor review see Gomez and Zheng, 2006). It has been shown thatroper neuronal development proceeds when the intracellular Ca2+
s within an optimal range (Fields et al., 1993; Kater and Mills,991; Kater et al., 1988). Therefore, the modulation of Ca2+ chan-els such as the LVCC is of special interest, when neurite (re)growth
s desired.Being one of the examined LVCC blockers, the dihydropyridine
erivate nimodipine has been intensively studied. Its beneficialffects have been confirmed in clinical studies (Liu et al., 2011,cheller and Scheller, 2012) and in diverse experimental studies,here it has been applied to models of various disorders. These
xperimental studies, analyzing the effect of nimodipine (and otherihydropyridine LVCC blockers), focused on (i) the neuroprotectiveroperties after different kinds of neuronal injury (Harkany et al.,000; Krieglstein et al., 1996; Lecht et al., 2012; Li et al., 2009; Ramind Krieglstein, 1994; Weiss et al., 1994), for example by reducinghe consequent intracellular free Ca2+ overload after e.g. ischemicnjury and excitotoxic lesion (Kobayashi and Mori, 1998) and (ii) theeurite growth promoting characteristics, mainly investigated inhe peripheral nervous system (Angelov et al., 1996; Lindsay et al.,010; Mattsson et al., 2001).
LVCC are expressed in a couple of brain regions of the centralervous system, among them the mesencephalon (Mercuri et al.,994; Nedergaard et al., 1993; Takada et al., 2001), the cortex, andhe hippocampus (Dolmetsch et al., 2001; Quirion et al., 1985; Tangt al., 2003). In the cortex, LVCC are located on the entire postnataleuron including dendrites and axonal processes (Tang et al., 2003).
Although the beneficial outcomes of LVCC modulation byimodipine are well established, the exact cellular and molecu-
ar mechanisms by which this modulation occurs are still unclear.evertheless, results of some previously published studies may
n part explain how neurite growth after nimodipine treatments accomplished. An upregulation of Ca2+ binding proteins (CBPs,arvalbumin (Pvalb), S100b, calbindin) has been observed in cor-ical neurons after nimodipine administration (Buwalda et al.,994; Luiten et al., 1994). Furthermore, the expression of thelial fibrillary acidic protein (GFAP) was enhanced following long-erm nimodipine treatment (Guntinas-Lichius et al., 1997). Anncrease in myelination was found surrounding the recoveringeurons after unilateral facial crush injury and interestingly alsoround neurons located in the contralateral nonlesioned site inimodipine treated animals (Mattsson et al., 2001). Moreover,icroglial-mediated oxidative stress and inflammatory responseas attenuated by nimodipine (but not by other LVCC block-
rs) in dopaminergic neurons/microglial co-cultures (Li et al.,009).
In this study, we wanted to investigate whether nimodipineirectly influences neurite growth. We further aimed to elucidatehich genes are potentially involved in the nimodipine mediated
rowth effects. To address these questions, we determined the neu-ite density in the border region of organotypic co-cultures of theesocortical dopaminergic system, which culture together brain
lices of the ventral tegmental area/substantia nigra (VTA/SN) andrefrontal cortex (PFC) (Heine et al., 2007; Heine and Franke, 2014),
nd analyzed gene expression patterns of nimodipine treated sam-les and control samples.Our findings indicate that nimodipine, at appropriate dosages,s a promising substance to enhance neurite outgrowth as shown in
roscience 40 (2015) 1–11
the applied co-culture model of the dopaminergic (CNS)-projectionsystem.
2. Experimental procedures
2.1. Materials
The solvent ethanol was purchased from AppliChem GmbH (Darmstadt,Germany) and VWR International (Dresden, Germany), respectively. Glutamate,nerve growth factor (NGF), and staurosporine were purchased from Sigma–AldrichCo. (St. Louis, MO, USA). Nimodipine (pure substance) was a gift from Bayer VitalGmbH (Leverkusen, Germany). 1000-fold stock solutions of nimodipine were pre-pared in absolute ethanol and finally added to 1 ml of incubation medium (resultingethanol concentration 0.1%, details see Section 2.3). Untreated cultures (“untreated”)or cultures treated with the vehicle ethanol (“ethanol”, resulting end concentration0.1%) were used as control groups.
2.2. Animals
Neonatal rat pups (WISTAR RjHan, own breed; animal house of the Rudolf BoehmInstitute of Pharmacology and Toxicology, University of Leipzig) of postnatal day1–4 (P1-4) were used for the preparation of the organotypic slice co-cultures. Theanimals were housed under standard laboratory conditions of 12 h light–12 h darkcycle and allowed free access to lab food and water ad libitum.
All of the animal use procedures were approved by the Committee of AnimalCare and Use of the relevant local governmental body in accordance with the law ofexperimental animal protection. All efforts were made to minimize animal sufferingand to reduce the number of animals used.
2.3. Preparation, culture and treatment of slice co-cultures
Dopaminergic brain slice co-cultures were prepared from P1-4 rats and cul-tured according to the “static” culture protocol described previously (Heine et al.,2007; Heine and Franke, 2014). In brief, coronal sections (300 �m) were cut at mes-encephalic and forebrain levels using a vibratome (Leica, Typ VT 1200S, Nussloch,Germany). For details see also supplementary Fig. S1. After separation of VTA/SNand PFC, respectively, the slices were transferred into petri dishes, filled with cold(4 ◦C) preparation solution (Minimum Essential Medium (MEM) supplemented withglutamine (final concentration 2 mM) and the antibiotic gentamicin (50 �g/ml);all from Invitrogen GmbH, Darmstadt, Germany). Thereafter, the selected sectionswere placed as co-cultures (VTA/SN + PFC, 4 co-cultures per well) on moistenedmembrane inserts (0.4 �m, Millicell-CM, Millipore, Bedford, MA, USA) in 6-wellplates (Fig. S1.A3), each filled with 1 ml incubation medium (50% Minimal Essen-tial Medium, 25% Hank’s Balanced Salt Solution, 25% heat inactivated horse serum(HS), 2 mM glutamine and 50 �g/ml gentamicin; all from Invitrogen GmbH supple-mented with 0.044% sodium bicarbonate, Sigma-Aldrich; pH was adjusted to 7.2),referred to as “25% HS incubation medium”.
Supplementary Fig. S1 can be found, in the online version, at http://dx.doi.org/10.1016/j.ijdevneu.2014.10.005.
The preliminary gene expression studies (microarray analysis, quantitativereverse transcription polymerase chain reaction, qPCR) have been conducted afterculture under serum-free culture conditions. Therefore, after 4 days in vitro (DIV)the 25% HS incubation medium was replaced by serum-free medium (Neurobasal-A(NB-A) medium, 1 mM glutamine supplemented with 2% B27 and 50 �g/ml gen-tamicin; all from Invitrogen GmbH), referred to as “NB-A incubation medium”.Nimodipine (final concentration 10 �M) or the vehicle ethanol (0.1%), respectivelywere added to the incubation medium at DIV4, 6, 8 and 11.
To determine the concentration of nimodipine that would be appropriate,we first analyzed previous published studies and the therein used concentrations(10 �M: Blanc et al., 1998; Krieglstein et al., 1996; Lecht et al., 2012; Tang et al.,2003; 20 �M: Martínez-Sánchez et al., 2004; Pisani et al., 1998; Pozzo-Miller et al.,1999; 50 �M: Bartrup and Stone, 1990, toxic at higher concentrations: Turner et al.,2007). Second, we quantified nimodipine uptake into the co-cultures with appliednimodipine concentrations ranging from 10 �M to 40 �M in a preliminary experi-ment. We found the lowest dose applied (10 �M nimodipine in the culture medium)yielded a sufficiently high concentration in the tissue (unpublished results). There-fore, the following studies were at first conducted with 10 �M nimodipine.
The analysis of neurite growth in the organotypic brain slice co-cultures isa well-established technique in our lab (Heine et al., 2013; Heine et al., 2007).Therefore, the neurite growth analysis has been performed after culture in 25% HSincubation medium. For the neurite growth quantification, slice co-cultures weredivided into different experimental groups and were treated with nimodipine atdifferent concentrations (first 10 �M, later 0.1 �M and 1 �M) or the vehicle controlethanol. A second control group was left untreated. Nimodipine and ethanol wereadded directly after the preparation and at each medium change at DIV1,4,6 and
RESEARCH ARTICLES - Nimodipine
8 (Fig. 1). In a second study the effect of 1 �M nimodipine alone or in combinationwith 50 ng/ml NGF (final concentration) was compared to 50 ng/ml NGF alone. Theseculture conditions (25% HS incubation medium, substance application five timesas indicated in Fig. 1) were also applied for toxicity tests and later gene expressionstudies. In addition, tissue slices of the nimodipine treated groups were dissected
36

K. Sygnecka et al. / Int. J. Devl Neu
Fig. 1. Culture and treatment schedule. For neurite growth, toxicity and later geneexpression analysis, nimodipine or ethanol were applied at day in vitro (DIV)0, 1, 4,6aw
idep
2
2
toasTTnatgasw
2
tMoBi(wpqRca22
2
coMtsspa1bfbi
and 8. Neurite growth was quantified after biocytin tracing at DIV8 and fixationt DIV11, as indicated. For the analysis of toxicity and gene expression, co-culturesere harvested at DIV11.
n nimodipine containing preparation medium. This is in accordance to in vivoata of a human study, where prophylactic treatment had the strongest beneficialffect (Scheller et al., 2012). For this reason, 36 nM nimodipine were added to thereparation solution on the basis of findings in the literature (Lindsay et al., 2010).
.4. Analysis of gene expression
.4.1. RNA extraction and quality controlRNA extraction was performed for microarray analysis and quantitative reverse
ranscription polymerase chain reaction (qPCR). At the end of culture, both regionsf the co-cultures (PFC and VTA/SN) were separated with a scalpel and all PFC-nd VTA/SN-slices from one well, containing four co-cultures, were pooled to oneample, respectively. Afterwards total RNA was isolated using TRIzol reagent (Lifeechnologies, Gaithersburg, MD, USA) according to the manufacturer’s instructions.he total RNA was alcohol precipitated for a second time with addition of ammo-ium acetate and GlycoBlue (Life Technologies) for optimal recovery of the nucleiccids. RNA integrity and concentration for each sample that was later on applied tohe microarray, was examined on an Agilent 2100 Bioanalyser (Agilent Technolo-ies, Palo Alto, CA, USA) using the RNA 6.000 LabChip Kit (Agilent Technologies)ccording to the manufacturer’s instructions. RNA integrity and concentration ofamples, that were investigated by qPCR, were examined on a 1.5% agarose gel andith NanoDrop1000 (NanoDrop Technologies, Wilmington, DE, USA), respectively.
.4.2. Microarray analysisMicroarray measurements were conducted at the microarray core facility of
he Interdisziplinäres Zentrum für klinische Forschung (IZKF) Leipzig (Faculty ofedicine, University of Leipzig). Biotin labeled probes were prepared from 250 ng
f total RNA using the TargetAmpTM-Nano Labeling Kit for Illumina® ExpressioneadChip (Biozym, Hessisch Oldendorf, Germany) according to the manufacturer’s
nstructions. Hybridization of labeled probes to an Illumina Rat Ref12 BeadChipIllumina Inc., San Diego, CA, USA) using the respective BeadChip kit (Illumina)as done according to the protocol of the manufacturer. Bead level data wasreprocessed using standard Illumina software resulting in background-corrected,uantile-normalized expression estimates which were used for further analysis.anked lists of differentially expressed genes were obtained in treatment-vs.-controlomparisons and judged using the Welch’s t-test and subsequent False Discovery Ratedjustment (Opgen-Rhein and Strimmer, 2007). Gene Set Z-scoring (Törönen et al.,009) was used to perform gene set analysis using gene-ontology terms (Wirth et al.,012).
.4.3. qPCRReverse transcription was performed using the RevertAidTM H Minus First Strand
DNA Synthesis Kit (Fermentas, St. Leon-Rot, Germany) with 1 �g total RNA andligo(dT)18 primer. qPCR was conducted using a LightCycler (Roche Diagnostics,annheim, Germany) in a total volume of 10 �l per capillary containing 5 �l Quan-
iTect SYBR Green 2× Master Mix (Roche), 0.4 �l cDNA, 1 �l primer (5 �M, each)pecific for the different target genes or the reference genes (mitochondrial ribo-omal protein L32, MrpL32 and ubiquitin, Ubc) and 3.6 �l water. The oligonucleotiderimer sequences are listed in Table A.1. The Hot Start Polymerase was activated by
15 min pre-incubation at 95 ◦C, followed by 55 amplification cycles at 95 ◦C for◦ ◦
0 s, 60 C for 10 s and 72 C for 10 s. The obtained crossing point (CP) values wereetween 15 and 28 for the different target genes. A melting curve analysis was per-ormed to verify correct qPCR products. The following appropriate controls haveeen used: no template control (water) and “reverse transcription-minus control”,
n order to exclude the presence of genomic DNA in the samples. Quantification of
roscience 40 (2015) 1–11 3
gene expression was performed by the �CP method with MrpL32 and Ubc servingas reference housekeeping genes.
2.5. Neurite quantification
2.5.1. Tracing and neurite visualizationTo quantify neurite outgrowth between the two slices of the co-cultures,
biocytin-tracing (detailed time schedule in Fig. 1) was performed according to apreviously described protocol (Franke et al., 2003; Heine et al., 2007). At DIV8,small biocytin-crystals of similar size were placed onto the VTA/SN slice of theco-cultures. Co-cultures were left in contact with the crystals for 2 h to allow theuptake of biocytin. Afterwards they were reincubated with medium containingthe respective nimodipine concentrations for 48 h. At DIV11, the cultures werefixed and cut into 50 �m vibrosections. Afterwards, the anterograde tracer biocytinwas labeled using the avidin–biotin-complex (1:50, ABC-Elite Kit, Vector Labora-tories, Inc., Burlingame, CA, USA), in combination with nickel/cobalt-intensified3.3′-diaminobenzidine hydrochloride (DAB; Sigma–Aldrich) as a chromogen. Aftermounting on glass slides, all stained sections were dehydrated in a series of gradedethanol, processed through n-butylacetate and covered with Entellan (Merck, Darm-stadt, Germany).
2.5.2. Automated image quantificationThe quantification of outgrowing biocytin-traced neurites was performed as
previously described (Heine et al., 2013; Heine and Franke, 2014). Briefly, micro-scopic images were taken at 40-fold magnification in the border region (where thetwo initially separated brain slices were grown together, for details see also Fig.S1.B1) using an usual transmitted light bright field microscope (Axioskop 50; ZeissOberkochen, Germany) equipped with a CCD camera (DCX-950P, SONY Corporation,Tokyo, Japan). The following criteria were used for the selection of the biocytin-traced slices: (a) the tracer was correctly placed on the VTA/SN, (b) the major part ofthe VTA/SN was characterized by a dense network of biocytin-traced structures and(c) no traced cell bodies had been observed in the target region PFC (in more detaildescribed in Heine et al., 2007). During image acquisition, preceding treatments ofthe observed tissue slices were hidden from the experimenter.
After pre-processing of the images (for details see Heine et al., 2013), neuritestructures appeared as well-defined bright regions. Subsequently, the image areaoccupied by the neurites was measured to obtain a reasonable estimate of the under-lying neurite density of the analyzed specimens. Precisely, the ratio of the numberof foreground pixels (neurites) against the total number of pixels in the images wastaken, giving the percentage of area occupied by neurites in the focal plane. Neuritedensity was subsequently normalized to the median values of the untreated controlsof each individual experiment.
2.6. Analysis of cell death
2.6.1. Lactate dehydrogenase (LDH) activity in conditioned culture mediumLDH release into the 25% HS incubation medium was quantified after treatment
with 0.1 �M, 1 �M and 10 �M (time schedule according to Fig. 1). Medium sampleswere collected at every medium exchange (DIV1, 4, 6, 8) and before fixation (DIV11),and stored at −20 ◦C until further analysis.
When the samples reached room temperature after thawing, LDH activity wasmeasured by the method of Koh and Choi (1987) applied to 96-well plate formatusing filter-based plate reader device (Polarstar Omega von BMG Labtech, Offenburg,Germany) measuring the absorption at 340 nm. Briefly, the LDH substrate pyru-vate and the coenzyme NADH (both Sigma–Aldrich) were added to the conditionedmedium samples and the decrease of NADH due to LDH activity was measured overthe time (every 10 s for 3 min).
To exclude variations due to temperature changes between individual sets ofmeasurements, LDH activity of all samples has been normalized to the control sam-ple (untreated) at DIV1 of the respective preparation.
2.6.2. Active caspase 3 immunolabeling and propidium iodide (PI) uptakeFor the active caspase 3 immunolabeling and PI (Invitrogen GmbH) uptake quan-
tification, nimodipine was applied at 0.1 �M, 1 �M and 10 �M as described abovefor the neurite quantification study. As positive controls for caspase 3 activationand the induction of necrosis, 5 �M staurosporine (for 4 h) and 10 mM glutamate(for 48 h), respectively, have been added to the incubation medium prior to fixationof the co-cultures at DIV11. PI (7.5 �M) was added 3 h before the fixation to everyculture well.
After fixation, co-cultures were cut into 50 �m slices as described above andstained. In detail, slices were blocked with Tris buffered saline (TBS, 0.05 M; pH7.6) containing fetal calf serum (FCS, 5%) and Triton X-100 (0.3%) for 30 min. Then,the slices were incubated with a primary antibody directed against active caspase3 (produced in rabbit, 1:50, MBL International, Inc., Woburn, MA, USA) for 48 h at4 ◦C. After washing with TBS, the secondary antibody (donkey anti rabbit Alexa488
RESEARCH ARTICLES - Nimodipine
conjugated IgG, 1:400, Jackson ImmunoResearch, West Grove, PA, USA), dilutedin TBS supplemented with 5% FCS and 0.3% Triton X-100, was applied for 2 h atroom temperature. For further characterization of active caspase 3 positive cells,multiple fluorescence labeling was performed. The slices were incubated with amixture of primary antibodies (rabbit anti-active caspase 3, 1:50, MBL International,
37

4 vl Neuroscience 40 (2015) 1–11
iMoaAawaMo
2
mwAaVroa(uMfFncmc
2
Ss
3
3t
aescPGnego
uhrapfastFF2J(Iihm
Fig. 2. Results of qPCR validation experiments. (A–F) Expression levels of the IEGs,which were found to be upregulated in the PFC in the microarray study: Arc, activity-regulated cytoskeleton-associated protein; Egr1,2 and 4, early growth responseprotein 1, 2 and 4; Fos, proto-oncogene c-Fos; Junb, transcription factor jun-B areexpressed as �CP, normalized to untreated control (y-axis), while x-axis repre-sents the different treatments (application of 0.1% ethanol (in the figure: eth) or10 �M nimodipine (in the figure: Nim), respectively at DIV4, 6, 8 and 11). Statisticalanalysis was done in comparison to vehicle control ethanol. (A–E) Treatment with
RESEARCH ARTICLES - Nimodipine
K. Sygnecka et al. / Int. J. Den combination with mouse anti-microtubule associated protein-2 (MAP2), 1:1000,illipore, Temecula, CA, USA and goat anti-GFAP, 1:1000, Santa Cruz Biotechnol-
gy, Inc., Santa Cruz, CA, USA) for 48 h at 4 ◦C. After washing with TBS, the secondaryntibodies (donkey anti rabbit Cy3 conjugated IgG, 1:1000 and donkey anti mouselexa488 conjugated IgG, 1:400 and donkey anti goat Dyelight 647 conjugated IgG,ll Jackson ImmunoResearch, West Grove, PA, USA), diluted in TBS supplementedith 5% FCS and 0.3% Triton X-100, was applied for 2 h at room temperature. In
ddition, slices were stained with the nucleic acid probe Hoechst 33342 (40 �g/ml,olecular Probes, Leiden, Netherlands), to identify the cell nuclei. After mounting
n glass slides, all stained sections were dehydrated and covered as described above.
.6.3. Image analysisFluorescence labeled specimens were imaged with a confocal laser scanning
icroscope (LSM 510 Meta; Zeiss, Oberkochen, Germany). Excitation wavelengthsere 633 nm, 543 nm, 488 nm and 351 nm/364 nm to evoke the Dyelight 647, PI,lexa488 and Hoechst fluorescence, respectively. Microscopic images were takent 20-fold magnification. For each group, 6 slices were analyzed within the PFC andTA/SN, (3 pictures per slice and region, resulting in 18 pictures per group andegion). During image acquisition and manual cell counting preceding treatmentsf the observed tissue slices were hidden from the experimenter. Cells positive forctive caspase 3 were counted manually with the help of ImageJ cell counter pluginhttp://rsb.info.nih.gov/ij/; http://rsbweb.nih.gov/ij/plugins/cell-counter.html). PIptake quantification was conducted with an algorithm implemented in Wolframathematica 9.0.1. To assess the number of PI positive cell nuclei, a global threshold
or binarization was chosen to divide the image in PI positive nuclei and background.urthermore, a maximal particle size was defined to estimate the number of celluclei in regions where the segmentation could not separate single nuclei. In thoseases, the area of the region was divided by the mean cell size (which was deter-ined from a visually verified image), to obtain a rough estimate of the number of
ells which are connected in this region.
.7. Statistics
All quantitative data (except microarray analysis) has been analyzed withigmaPlot 12 statistical analysis program. Details referring to the applied tests arepecified in the respective result section and in the figure legends.
. Results
.1. Upregulation of immediate early genes (IEGs) in the PFC afterreatment with 10 �M nimodipine
To elucidate the mode of action of nimodipine, we conducted microarray study to preliminarily identify the genes whosexpression is modulated by nimodipine application. After sub-tance application (4 times 10 �M, for details regarding the chosenoncentration see Section 2.3), co-cultures were separated intoFC and VTA/SN. The two regions were analyzed individually.ene expression patterns of untreated, vehicle control ethanol, orimodipine treated samples were compared. There were no differ-ntially expressed genes in the VTA/SN, but we found upregulatedenes in the nimodipine treated PFC samples. Therefore, we focusedn the PFC samples for further gene expression analyses.
Self-organizing map (SOM) analysis of the microarray data wassed to visualize the expression patterns of each sample thatas been applied to the microarray. The comparison of the SOMsevealed that the expression patterns of both controls (untreatednd ethanol) were very similar to each other. Therefore, the sam-les of the two groups were combined to a single control groupor further analysis of the microarray study. Differential expressionnalysis of nimodipine versus control group within the PFC yieldedeven genes with log fold changes > 2 (log2 FC, p-value Welch’s t-est): Arc (activity-regulated cytoskeleton-associated protein, log2C 3.487, p = 0.018), Egr1 (early growth response protein 1, log2C 2.466, p = 0.06), Egr2 (log2 FC 3.568, p = 0.095), Egr4 (log2 FC.844, p = 0.177), Fos (proto-oncogene c-Fos, log2 FC 2.05, p = 0.219),unB (transcription factor jun-B, log2 FC 2.069, p = 0.280), and Pmchpro-MCH precursor, log2 FC 2.853, p = 0.499). The transcripts of the
EGs (Arc, Egr1,2,4, Fos and JunB) were quantified by qPCR of fivendependent preparations. With the exception of JunB, significantlyigher gene expressions were confirmed after nimodipine treat-ent, with median values ranging from 5-fold to 36-fold compared10 �M nimodipine increased expression of the investigated genes of interest signifi-cantly. Data are shown as box plots, n(independent samples) = 5, *p < 0.05, **p < 0.01,Mann–Whitney rank sum test.
to vehicle control ethanol, Mann–Whitney rank sum test, p < 0.05,p < 0.01 (Fig. 2). All of these validated upregulated genes belong tothe group of IEGs. The transcriptional activation of these genes afternimodipine treatment, which are involved in neurite growth andplasticity (reviewed in Pérez-Cadahía et al., 2011; Shepherd andBear, 2011) strongly suggested a nimodipine induced enhancementin neurite growth in our test system under the applied conditions.
3.2. No enhanced neurite growth after treatment with 10 �Mnimodipine
In parallel to preliminary gene expression analysis, we inves-tigated whether nimodipine may enhance neurite growth in thedopaminergic system. Therefore a treatment study with 10 �Mnimodipine in comparison to untreated and vehicle ethanol treated
control co-cultures was performed, following a well-establishedtreatment schedule for neurite growth analysis (Fig. 1 and Heineet al., 2007, 2013). Surprisingly, treatment with nimodipine at thisconcentration did not enhance neurite growth in the border region38

vl Neu
(ttccM
3pb
nf0sd(ib
dbtwt(
qsspctrbiftlc(pb
a1rftso
3w
30octcooe
K. Sygnecka et al. / Int. J. De
for details see Fig. S1) of the co-cultures. Automated image quan-ification of at least 60 analyzed pictures per group revealed thathe median value for neurite density in 10 �M nimodipine treatedo-cultures was even lower than neurite density in the vehicleontrol (10 �M nimodipine was 85% of ethanol group, p = 0.283;ann–Whitney rank sum test, data not shown).
.3. 10 �M nimodipine induces an increase in active caspase 3ositive cells, but has no influence on PI uptake, LDH release andax/bcl-2 ratio
We wanted to clarify whether the application of 10 �Mimodipine to the co-cultures induces (neuro-)toxic effects. Dif-
erent toxicological methods have been used after application of.1 �M, 1 �M, and 10 �M nimodipine (according to the treatmentchedule shown in Fig. 1) to quantify apoptotic and necrotic celleath: (i) measurement of LDH release into the incubation medium,ii) PI uptake quantification, (iii) analysis of caspase 3 activationn immunostained co-culture slices, and (iv) calculation of theax/bcl-2 ratio.
The highest LDH activity was detected at DIV1 (Fig. 3A ). Itecreased during the culture period without a significant differenceetween the differently treated groups. These findings are substan-iated by the analysis of PI uptake into the PFC and the VTA/SN,here no significant changes were observed after the different
reatments, except in the positive control treated with glutamate10 mM, 48 h). Data are shown in Fig. 3B.
Moreover, the number of the active caspase 3 positive cells wasuantified after immunofluorescence labeling (exemplary micro-copic images are shown in Fig. 3D–F). We found a slightly butignificantly increased number of cells being positive for active cas-ase 3 staining after treatment with nimodipine (10 �M) in theortical part of the cell culture compared to the vehicle ethanolreated control (p < 0.05). In comparison, the positive control stau-osporine, which is known to induce apoptosis, was characterizedy an obviously much higher number of active caspase 3 pos-
tive cells (p < 0.01); n(analyzed images) = 18, ANOVA on ranksollowed by all pairwise multiple comparison procedures (Dunn’sest) (Fig. 3C). To assess apoptosis with a second method, expressionevels of bax and bcl-2 were quantified and bax/bcl-2 ratio was cal-ulated for all different treatments (untreated, ethanol, nimodipine0.1–10 �M)) in PFC and VTA/SN samples. In contrast to active cas-ase 3 immunoreactivity, no significant changes were detectedetween the different groups (data not shown).
With multiple fluorescence labeling, we further aimed to char-cterize the identity of the cells being apoptotic after application of0 �M nimodipine. Active caspase 3 positive cells are often sur-ounded by GFAP positive structures (Fig. 3G). Additionally, weound active caspase 3 immunoreactivity and apoptotic fragmen-ation of cell nuclei (Fig. 3G, insert) located in areas where MAP2taining is less defined (Fig. 3H,I), indicating a locally restricted lossf MAP2 immunoreactivity during apoptosis.
.4. Significant enhancement of neurite growth after treatmentith 0.1 �M and 1 �M nimodipine
After having shown that 10 �M nimodipine induces caspase activation in the organotypic brain slice co-cultures whereas.1 �M and 1 �M do not, the neurite growth promoting potentialf nimodipine was investigated again by applying these lower con-entrations to the co-cultures (according to the time schedule ofreatment in Fig. 1). After application of nimodipine at both con-
entrations (0.1 �M, 1 �M), a visible increase in biocytin-tracedutgrowing neurites in the border region of the co-cultures wasbserved in comparison to control conditions (untreated control,thanol; Fig. 4A). In contrast, neurite density after the application ofroscience 40 (2015) 1–11 5
10 �M nimodipine is as low as in the images of the controls (Fig. 4A).These qualitative observations have been confirmed by automatedimage quantification, revealing a significant augmentation of theneurite density in co-cultures which had been treated with 0.1 �Mand 1 �M nimodipine (116% and 127% of vehicle control ethanol,respectively), n(analyzed images) > 225, p < 0.01, ANOVA on ranksfollowed by all pairwise multiple comparison procedures (Dunn’stest) (Fig. 4B).
For a better estimation of the neurite growth promoting impactof nimodipine in our co-culture system, the effect of 1 �M nimodip-ine was compared to the well-known growth factor NGF. To checkadditionally for potential synergistic action, both compounds werealso applied together. The strongest effect was observed for thecombination of both compounds (138% of vehicle control ethanol),followed by 1 �M nimodipine (127% of vehicle control ethanol) andNGF alone (119% of vehicle control ethanol), (see supplementaryFig. S2). All of these treatments were significantly higher than thevehicle control ethanol (p < 0.01). The combination of nimodipine(1 �M) and NGF was significantly higher than NGF alone (p < 0.05)but not significantly higher than 1 �M nimodipine, n(analyzedimages) > 173, ANOVA on ranks followed by all pairwise multiplecomparison procedures (Dunn’s test).
Supplementary Fig. 2 can be found, in the online version, athttp://dx.doi.org/10.1016/j.ijdevneu.2014.10.005.
3.5. Expression levels of CBPs, IEGs and myelin constituents arenot altered by 0.1 �M and 1 �M nimodipine
With neurite density quantification, we did show a neuritegrowth promoting effect of nimodipine (0.1 �M, 1 �M) in thedopaminergic projection system. Nevertheless, the mode of actionremained unclear and we wanted to address this issue. After cul-ture under the conditions, where enhanced neurite outgrowth wasfound, we quantified the changes in expression levels of severalgenes in PFC and VTA/SN separately (Fig. 5 exemplarily shows theresults for the PFC, treatment according to Fig. 1): (i) The CBPs Pvalband S100b have been reported to be upregulated after nimodipinetreatment (Buwalda et al., 1994; Luiten et al., 1994). Our resultsrevealed no significant changes in gene expression in our model inresponse to nimodipine application. (ii) It was shown that nimodip-ine treatment causes an increase in the thickness of the myelinsheath (Mattsson et al., 2001). Therefore, we quantified expressionlevels of the myelin constituents myelin and lymphocyte protein(Mal), myelin oligodendrocyte glycoprotein (Mog) and myelin pro-teolipid protein 1 (Plp1). Again, no significant changes in geneexpression were found. (iii) Guntinas-Lichius et al. (1997) describeda nimodipine induced increase in transcripts of GFAP. We quan-tified GFAP in our experimental model, detecting no significantchange in expression levels. (iv) Furthermore, we tested if the IEGsthat were found to be up-regulated in the microarray will also beup-regulated under the conditions that lead to enhanced neuritegrowth. The findings from the microarray and subsequent qPCRvalidation (with 10 �M nimodipine) were not confirmed after cul-ture under neurite growth conditions. We found that the expressionof Arc, Egr1, Egr2, Fos and Junb was not significantly changed aftertreatment with nimodipine (0.1 �M, 1 �M). Nevertheless, there isa tendency of a concentration dependent reduction of expressionlevels of the above mentioned genes, which was significant for Egr4after application of 1 �M nimodipine, n(independent samples) = 6for all analyzed transcripts (Fig. 5).
RESEARCH ARTICLES - Nimodipine
4. Discussion
We investigated the effects of nimodipine in an organotypicco-culture model of the dopaminergic system and we found
39

6 K. Sygnecka et al. / Int. J. Devl Neuroscience 40 (2015) 1–11
Fig. 3. Toxicity testing. (A) LDH release into 25% HS incubation medium. Data have been normalized to the control value at DIV1 of the respective preparation. Being maximalat DIV1, LDH activity decreased during the culture period without significant differences between the differently treated groups. (B) Propidium iodide uptake quantificationin the co-cultures, shown as percentage of maximal damage after treatment with 10 mM glutamate. No significant changes were found after nimodipine (in the figure:Nim) application in comparison to the vehicle control ethanol (in the figure: eth). Data are shown as means, error bars indicate standard error, n(analyzed pictures) = 18,except glutamate: n = 9, **p < 0.01, ANOVA followed by all pairwise multiple comparison procedures (Holm–Sidak test). (C) Quantification of active caspase 3 positive cells
RESEARCH ARTICLES - Nimodipine
40

K. Sygnecka et al. / Int. J. Devl Neuroscience 40 (2015) 1–11 7
Fig. 4. Neurite outgrowth quantification. (A) Representative microscopic images of biocytin positive neurites in the border region, as they were used for neurite densityquantification. For comparison and reference, an image of neurites treated with 10 �M nimodipine is included, (scale bar: 50 �m). (B) Neurite growth is significantly increaseda n to tm e showa
ia1n3o
(cfevcHha
RESEARCH ARTICLES - Nimodipine
fter treatment with 0.1 �M and 1 �M nimodipine (in the figure: Nim) in comparisoedian value of the untreated control group of each individual preparation. Data ar
ll pairwise multiple comparison procedures (Dunn’s test).
ncreased density of neurites in the border region of the co-culturesfter application of nimodipine at certain concentrations (0.1 �M,
�M). The application of 10 �M nimodipine did not enhance
eurite density. In contrast, we observed a moderate caspaseactivation following application of 10 �M nimodipine. More-ver, we quantified the expression of several genes (CBPs, IEGs,
in the graph: active caspase 3+ cells) in the cortical parts of the co-cultures detected by imells found after application of 10 �M nimodipine, but not as pronounced as after applicor the induction of apoptosis. Data are shown as box plots, n(analyzed pictures) = 18, *p <thanol. (D–F) Confocal fluorescence microscopic images of the cortical part of the co-culehicle control ethanol. The number of active caspase 3 positive cells after treatment withaspase 3 positive cell after treatment with 10 �M nimodipine; the active caspase 3 pooechst staining exhibits the fragmentation of the nucleus, typical for apoptotic cells, hias been found, probably due to reduced immunoreactivity in apoptotic neurons (I). Activrrowheads. (Scale bars: D–F = 50 �m; G–I = 20 �m)
he vehicle control (0.1% ethanol). Neurite density data have been normalized to then as box plots, n(analyzed pictures) > 225, **p < 0.01, ANOVA on ranks followed by
GFAP and myelin constituents) in the co-cultures after incuba-tion under the conditions, where enhanced neurite growth hasbeen found. The expression of the investigated genes did not
change significantly after treatment, indicating that other mech-anisms are involved in the observed nimodipine mediated neuritegrowth.munofluorescence staining. There are significantly more active caspase 3 positiveation of 5 �M staurosporine (in the figure: sts), which served as a positive control
0.05, **p < 0.01, ANOVA on ranks followed by Dunn’s multiple comparison againsttures after application of (E) 1 �M and (F) 10 �M nimodipine in comparison to (D)
10 �M nimodipine is markedly increased. (G–I) Higher magnification of an activesitive cell body (red, arrow) is surrounded by GFAP positive structures (green, G).ghlighted in the insert in (G). No clear co-localization with MAP2 (green, H and I)e caspase 3 negative neurons with well-defined cell bodies are indicated by empty
41

8 K. Sygnecka et al. / Int. J. Devl Neuroscience 40 (2015) 1–11
Fig. 5. Gene expression analysis in the PFC after treatment under “neurite growth promoting conditions”. (A–E, G) Expression levels of immediate early genes decreaseafter application of 0.1 �M and 1 �M nimodipine. (F, H–L) Expression levels of GFAP, myelin constituents (Mal, Mog, Plp1) and Ca2+ binding proteins (Pvalb, S100b) are notsignificantly altered by nimodipine treatment under the applied conditions. Results are expressed as �CP, normalized to the untreated control (y-axis), while the x-axisrepresents the different treatments according to Fig. 1. n(independent samples) = 6, *p < 0.05. (A–H, K) Data are shown as means, error bars indicate standard error, ANOVAf (Holme
4
CggcefpsLCig2la2teto
RESEARCH ARTICLES - Nimodipine
ollowed by multiple comparisons vs. vehicle control ethanol (in the figure: eth),
xpression levels were not significant.
.1. Calcium and neurite growth
Axon outgrowth occurs within optimal levels of intracellulara2+. If levels rise above or fall below a narrow optimal levelrowth is decelerated or inhibited (Kater et al., 1988). This sug-ests that nimodipine at concentrations of 0.1 �M and 1 �M – theoncentrations that enhanced neurite density in our study – influ-nces intracellular Ca2+ concentrations in a way that is optimalor neurite outgrowth in the used model. Even though it is notroven by our experiments, based on the published literature iteems very likely that Ca2+ is the causative agent in our model:VCC play an active and specific role in mediating the effects ofa2+ on growth cone motility and morphology, and different stud-
es reported that Ca2+ influx through these channels affect axonalrowth (Nishiyama et al., 2003; Schmitz et al., 2009; Tang et al.,003). In addition, process extension is not only regulated by pro-
onged shifts in Ca2+ influx or intracellular baseline changes, butlso by temporal intracellular Ca2+ fluctuations (Gomez and Zheng,006). Transient elevations of intracellular Ca2+ levels, either spon-
aneous or electrically stimulated, are known to affect neuritextension. It was shown that the incidence, frequencies, and ampli-udes of Ca2+ transients are inversely related to the rate of axonutgrowth (Gomez et al., 1995; Gomez and Spitzer, 1999; Gu and–Sidak test). (I, J, L) Data are shown as box plots, ANOVA on ranks; differences of
Spitzer, 1995). This is consistent with our observations and theresults of other studies, which have shown that partial blockingor silencing of Ca2+ influx by LVCC blockade accelerated axonalsprouting and outgrowth (Angelov et al., 1996; Lindsay et al., 2010;Mattsson et al., 2001).
As already mentioned above, the concentration of the appliedLVCC blockers seems to be crucial. Daschil and Humpel (2014) haveshown a dose-dependent effect of LVCC blockers on the survivalof SN pars compacta neurons in dopaminergic brain slices. Amongthe tested concentrations (0.1 �M, 1 �M and 10 �M), only 1 �Mand 10 �M nifedipine and 1 �M nimodipine markedly enhancedthe survival of SN neurons. In addition, after blockade of LVCCwith nifedipine at increasing concentrations (5–30 �M), Tang et al.(2003) observed increased axon lengths of cortical neurons incell culture experiments. They also applied nimodipine (10 �M)and found neurite growth enhancement. In contrast, we did notfind growth promotion, but rather toxic effects with nimodipineused at this concentration. This discrepancy likely relates to dif-ferences between the two model systems and application schemes
(single versus repeated long-term application). The latter is espe-cially likely to be a relevant difference as Koh and Cotman (1992)reported that prolonged LVCC blockade has detrimental effects onneurons.42

vl Neu
4
pHT(bootr
thecTwm
(aia1pg2aae
nisTlirmsn1aat
4
eeIGretafma
ipm
K. Sygnecka et al. / Int. J. De
.2. Neuroprotection and neurotoxicity
In this study, we focused on the regenerative and growthromoting potential of nimodipine in the dopaminergic system.owever, parameters of neuroprotection have also been analyzed.he absence of a reduction of LDH release in the nimodipine0.1 �M, 1 �M, 10 �M) treated samples after the preparation of therain slices (representing a mechanical insult with deteriorationf neuronal connections) does not suggest a neuroprotective effectf nimodipine in the used experimental model. In contrast, quan-ification of active caspase 3 after nimodipine (10 �M) applicationevealed the induction of apoptosis.
Recently, it was reported that 10 �M nimodipine is toxic to cul-ured hippocampal neurons (Sendrowski et al., 2013). Additionally,igh concentrations and prolonged administration of LVCC block-rs like nimodipine have been reported to be toxic in primary cellultures (Koh and Cotman, 1992) and in vivo (Turner et al., 2007).here is an increased vulnerability to Ca2+ deprivation especiallyithin a tight time window during postnatal neuronal develop-ent (around P7) (Turner et al., 2007).Moreover, Puopolo et al. (2007) have found that nimodipine
3 �M) completely blocks spontaneous firing in acutely dissoci-ted SN pars compacta neurons, and Mercuri et al. (1994) did shown mesencephalic brain slice cultures that spontaneous electricalctivity of dopaminergic neurons is blocked by the application of0 �M nimodipine. It is widely accepted that electrical activity is arerequisite for neuronal survival and its blockade leads to pro-rammed cell death (as reviewed by Mennerick and Zorumski,000). Therefore, we suggest that the observed caspase 3 activationnd the absence of enhanced neurite growth in the co-cultures afterpplication of 10 �M nimodipine could be a result of the reducedlectrical activity (due to the LVCC blockade).
With multiple fluorescence labeling after application of 10 �Mimodipine, we found active caspase 3 immunoreactivity located
n areas where MAP2 staining is less defined compared to theurroundings where MAP2 staining is distinctly demarcated.herefore, our interpretation of the multiple immunofluorescenceabeling is that presumably neurons undergoing apoptosis follow-ng LVCC blockade by 10 �M nimodipine. This is in line with othereports, indicating that disappearance of MAP2 can be used as aarker for neurotoxic events (Koczyk, 1994). Moreover, earlier
tudies demonstrated that only neurons – not glial cells – are vul-erable to higher concentrations of nimodipine (Koh and Cotman,992). We suggest that the GFAP positive structures surroundingctive caspase 3 positive cell bodies most likely belong to reactivestrocytes, which envelop apoptotic neurons and thereby isolatehe dying cells from the environment.
.3. Nimodipine’s mode of action and target cells
To elucidate the mechanism leading to the reported beneficialffects of nimodipine, gene expression has been analyzed usingxpression microarrays. We found a group of genes belonging toEGs to be upregulated in the nimodipine treated PFC samples.iven that (i) the PFC is the target region of the dopaminergic neu-
ite processes and therefore the region where new connections arestablished; (ii) the PFC is supposed to produce guiding signalshat trigger neurite ingrowth (Gomez-Urquijo et al., 1999; Plenznd Kitai, 1996) and (iii) changes in gene expression in the VTA/SNollowing nimodipine application were not found in the applied
odel, we focused on the PFC samples for further gene expressionnalyses.
Applying qPCR after culture under the conditions promot-ng enhanced neurite growth, we pursued the leads from otherublished investigations and interpreted our own preliminaryicroarray analysis as discussed below:
roscience 40 (2015) 1–11 9
Transient upregulation of Pvalb and S100b until P10 wasobserved in the neocortex and the hippocampus after mater-nal perinatal nimodipine administration in rats (Buwalda et al.,1994). This upregulation of CBPs was supposed to be one of themechanisms that lead to the observed neuroprotective effect ofnimodipine after perinatally occurring ischemic insults. We didnot find such an increase in transcripts encoding for the cho-sen CBPs (Pvalb, S100b) in response to nimodipine treatmentin the cortical part of the co-cultures at the end of the cultureperiod.
LVCC are also present on glia (D’Ascenzo et al., 2004; Latouret al., 2003; Westenbroek et al., 1998). It was shown that long-termtreatment with nimodipine (in vivo, >42 days) led to enhanced andprolonged astroglial ensheathment of axotomized, target deprivedneurons in an in vivo model of facial and hypoglossal nerveresection, (Guntinas-Lichius et al., 1997). It was further shown thatnimodipine reduced cell loss and increased GFAP immunoreac-tivity in a model of traumatic brain injury (Thomas et al., 2008).However, quantification of GFAP encoding mRNA transcripts didnot reveal changes of gene expression levels in our model atDIV11.
In addition, application of nimodipine increased not only thenumber and size of myelinated axons of the facial nerve but alsoincreased the degree of myelination, both in lesioned and non-lesioned facial nerves (Mattsson et al., 2001). In order to explorewhether nimodipine application affects myelination and therebystabilizes axonal growth in our model, we quantified the transcriptsof the myelin components Mal, Mog and Plp1. No significant geneexpression changes have been found, suggesting that this aspect isnot relevant for the enhanced neurite growth observed in dopami-nergic brain slice co-cultures.
In the microarray and qPCR analysis, we found IEGs to be upre-gulated after 10 �M nimodipine application. We wanted to confirmthis upregulation under the conditions that enhanced neurite out-growth. IEGs are closely related to neuronal growth and plasticityand therefore are interesting candidates for the regulation of neu-rite growth (reviewed in Pérez-Cadahía et al., 2011; Shepherdand Bear, 2011). However, the findings from the microarray anal-ysis were not reproduced after application of 0.1 �M or 1 �Mnimodipine. In contrast, we found a decrease in expression levelsafter nimodipine (0.1 �M, 1 �M) treatment. The down-regulatingeffect of a dihydropyridine LVCC blocker on the expression of IEGs(e.g. c-Fos, JunB, Egr1 and others) is in line with the results ofMurphy et al. in cultured cortical neurons (Murphy et al., 1991)and with the findings reviewed by Sheng and Greenberg, whichdemonstrated an upregulation of these genes not only after stim-ulation with growth factors (NGF and Epidermal Growth Factor,EGF) but also after Ca2+ influx and depolarization (Sheng andGreenberg, 1990). This study further corroborates the notion thatblockade of Ca2+ influx inhibits IEG expression rather than inducesit.
In summary, the results of the gene expression analysisindicate that the regulation of the expression of the investi-gated genes cannot clearly explain the observed nimodipinemediated neurite growth in the applied model of the dopami-nergic projection system. Therefore, referring to the investigatedgenes, nimodipine-induced neurite outgrowth does not seem todepend on mRNA synthesis. In contrast, mechanisms includingnon-coding RNA or nimodipine-induced protein modificationsshould be considered and examined in further investiga-tions.
RESEARCH ARTICLES - Nimodipine
4.4. Conclusion and translational outlook
Nimodipine – at certain concentrations (0.1 �M, 1 �M) –seems to influence the intracellular Ca2+ concentration in a way
43

10 K. Sygnecka et al. / Int. J. Devl Neuroscience 40 (2015) 1–11
Table A.1Sequences of primers for quantitative polymerase chain reaction (qPCR).
Target Accession ID Forward primer Reverse primer
Genes of interestArc NM 019361.1 GCCAGTCTTGGGCAGCATAG CACTGGTATGAATCACTGCTGGBax NM 017059.2 ACCCGGCGAGAGGCAG CTCGATCCTGGATGAAACCCTBcl-2 NM 016993.1 GACTGAGTACCTGAACCGGC AGTTCCACAAAGGCATCCCAGEgr1 NM 012551.2 ACCTGACCACAGAGTCCTTTTC GCAACCGGGTAGTTTGGCTEgr2 NM 053633.1 CTACCCGGTGGAAGACCTCG GATCATGCCATCTCCAGCCACEgr4 NM 019137.1 TATCCTGGAGGCGACTTCTTG TCCAGGAAGCAGGAGTCTGTTFos NM 022197.2 TACTACCATTCCCCAGCCGA CTGCGCAAAAGTCCTGTGTGJunb NM 021836.2 AGGCAGCTACTTTTCGGGTC TTGCTGTTGGGGACGATCAAGfap NM 017009.2 AGCTTACTACCAACAGTGCCC TCATCTTGGAGCTTCTGCCTCMal NM 012798.1 CTGCAGTGGTGTTCGCCTAT GCTCCCAATCTGCTGTCCTAMog NM 022668.2 TGTGTGGAGCCTTTCTCTGC TGAACTGTCCTGCGTAGCTGPlp1 NM 030990.2 CTGCAAAACAGCCGAGTTCC AGGGAAACTAGTGTGGCTGCPvalb NM 022499 AAGAGTGCGGATGATGTGAAGA CAGAATGGACCCCAGCTCATCS100b(eta) NM 013191.1 AGAGGGTGACAAGCACAAGC TTCCTGCTCTTTGATTTCCTCCA
Housekeeping genesMrpL32 NM 001106116.1 TTCCGGACCGCTACATAGGTG CTAGTGCTGGTGCCCACTGAG
CACC
temt
lsn
oc(dfc(tans–gs
A
(tctamiLtDwEwftot
RESEARCH ARTICLES - Nimodipine
Ubc NM 017314.1 A
hat is advantageous for neurite outgrowth. Thereby nimodipinenhances neurite density in organotypic co-cultures of the dopa-inergic projection system, as demonstrated for the first time in
his study.In addition, we did show that a set of genes whose expression
evels were quantified are not changed by nimodipine application,uggesting that other mechanisms are involved in the observedimodipine mediated effects.
The here presented data support previous clinical observationsf the beneficial effect of nimodipine e.g. on the preservation ofranial nerve functions following vestibular schwannoma surgeryScheller et al., 2007). Regarding the use of nimodipine againstiseases affecting especially the dopaminergic system, primarilyurther in vivo data and eventually clinical studies will have to beonducted. In general, nimodipine is a usually well-tolerated drugCastanares-Zapatero and Hantson, 2011). Therefore no barriers inhe use of nimodipine for neurite outgrowth in clinical situationsre expected. The elucidation of the detailed mode of action ofimodipine as a neuroprotective and neuroregeneration promotingubstance – especially within the dopaminergic projection system
will help to foster its application and the identification of new tar-ets and therapy options also within the dopaminergic projectionystem.
cknowledgements
The authors thank Katrin Becker and Anne-Kathrin KrauseRudolf Boehm Institute of Pharmacology and Toxicology) forechnical assistance. We thank Dr. Martin Reinsch at the Analytis-hes Zentrum Biopharm GmbH (Berlin, Germany) for quantifyinghe nimodipine concentrations in the co-culture tissues. Theuthors are grateful to Dr. Knut Krohn and the members of theicroarray core facility of the Interdisziplinäres Zentrum für klin-
sche Forschung (IZKF) Leipzig (Faculty of Medicine, University ofeipzig) for performing the microarray measurements. We alsohank Christin Zöller for her secretarial contribution and Jennifering for providing language help. The work presented in this paperas made possible by funding from the German Federal Ministry of
ducation and Research (BMBF 1315883). Furthermore, the studyas supported by Bayer Vital GmbH (Leverkusen, Germany). The
unding sources have not been involved in the study design, inhe collection, analysis and interpretation of data; in the writingf the report; or in the decision to submit the article for publica-ion.
AAGAAGGTCAAACAGGA CACCTCCCCATCAAACCCAA
Appendix A.
Table A.1
References
Angelov, D.N., Neiss, W.F., Streppel, M., Andermahr, J., Mader, K., Stennert, E., 1996.Nimodipine accelerates axonal sprouting after surgical repair of rat facial nerve.J. Neurosci. 16, 1041–1048.
Bartrup, J.T., Stone, T.W., 1990. Dihydropyridines alter adenosine sensitivity in therat hippocampal slice. Br. J. Pharmacol. 101, 97–102.
Blanc, E.M., Bruce-Keller, A.J., Mattson, M.P., 1998. Astrocytic gap junctional commu-nication decreases neuronal vulnerability to oxidative stress-induced disruptionof Ca2+ homeostasis and cell death. J. Neurochem. 70, 958–970.
Buwalda, B., Naber, R., Nyakas, C., Luiten, P.G., 1994. Nimodipine accelerates thepostnatal development of parvalbumin and S-100 beta immunoreactivity in therat brain. Brain Res. Dev. Brain Res. 78, 210–216.
Castanares-Zapatero, D., Hantson, P., 2011. Pharmacological treatment of delayedcerebral ischemia and vasospasm in subarachnoid hemorrhage. Ann. Intens.Care 1, 12.
D’Ascenzo, M., Vairano, M., Andreassi, C., Navarra, P., Azzena, G.B., Grassi, C., 2004.Electrophysiological and molecular evidence of L-(Cav1), N-(Cav2.2), and R-(Cav2.3) type Ca2+ channels in rat cortical astrocytes. Glia 45, 354–363.
Daschil, N., Humpel, C., 2014. Nifedipine and nimodipine protect dopaminergic subs-tantia nigra neurons against axotomy-induced cell death in rat vibrosections viamodulating inflammatory responses. Brain Res. 1581, 1–11.
Dolmetsch, R.E., Pajvani, U., Fife, K., Spotts, J.M., Greenberg, M.E., 2001. Signalingto the nucleus by an L-type calcium channel-calmodulin complex through theMAP kinase pathway. Science 294, 333–339.
Fields, R.D., Guthrie, P.B., Russell, J.T., Kater, S.B., Malhotra, B.S., Nelson, P.G., 1993.Accommodation of mouse DRG growth cones to electrically induced collapse:kinetic analysis of calcium transients and set-point theory. J. Neurobiol. 24,1080–1098.
Franke, H., Schelhorn, N., Illes, P., 2003. Dopaminergic neurons develop axonalprojections to their target areas in organotypic co-cultures of the ventral mes-encephalon and the striatum/prefrontal cortex. Neurochem. Int. 42, 431–439.
Gispen, W.H., Schuurman, T., Traber, J., 1988. Nimodipine and neural plasticity inthe peripheral nervous system of adult and aged rats. In: Morad, M., Nayler, W.,Kazda, S., Schramm, M. (Eds.), The Calcium Channel: Structure, Function andImplications. Springer, New York, pp. 491–502.
Gomez, T.M., Snow, D.M., Letourneau, P.C., 1995. Characterization of spontaneouscalcium transients in nerve growth cones and their effect on growth cone migra-tion. Neuron 14, 1233–1246.
Gomez, T.M., Spitzer, N.C., 1999. In vivo regulation of axon extension and pathfindingby growth-cone calcium transients. Nature 397, 350–355.
Gomez, T.M., Zheng, J.Q., 2006. The molecular basis for calcium-dependent axonpathfinding. Nat. Rev. Neurosci. 7, 115–125.
Gomez-Urquijo, S.M., Hökfelt, T., Ubink, R., Lubec, G., Herrera-Marschitz, M., 1999.Neurocircuitries of the basal ganglia studied in organotypic cultures: focus ontyrosine hydroxylase, nitric oxide synthase and neuropeptide immunocyto-
chemistry. Neuroscience 94, 1133–1151.Gu, X., Spitzer, N.C., 1995. Distinct aspects of neuronal differentiation encoded byfrequency of spontaneous Ca2+ transients. Nature 375, 784–787.
Guntinas-Lichius, O., Martinez-Portillo, F., Lebek, J., Angelov, D.N., Stennert, E., Neiss,W.F., 1997. Nimodipine maintains in vivo the increase in GFAP and enhances the
44

vl Neu
H
H
H
H
K
K
K
K
K
K
K
L
L
L
L
L
L
M
M
M
M
M
N
K. Sygnecka et al. / Int. J. De
astroglial ensheathment of surviving motoneurons in the rat following perma-nent target deprivation. J. Neurocytol. 26, 241–248.
arkany, T., Dijkstra, I.M., Oosterink, B.J., Horvath, K.M., Abrahám, I., Keijser, J., vander Zee, E.A., Luiten, P.G., 2000. Increased amyloid precursor protein expressionand serotonergic sprouting following excitotoxic lesion of the rat magnocellularnucleus basalis: neuroprotection by Ca(2+) antagonist nimodipine. Neuro-science 101, 101–114.
eine, C., Wegner, A., Grosche, J., Allgaier, C., Illes, P., Franke, H., 2007. P2 receptorexpression in the dopaminergic system of the rat brain during development.Neuroscience 149, 165–181.
eine, C., Sygnecka, K., Scherf, N., Berndt, A., Egerland, U., Hage, T., Franke, H., 2013.Phosphodiesterase 2 inhibitors promote axonal outgrowth in organotypic sliceco-cultures. Neurosignals 21, 197–212.
eine, C., Franke, H., 2014. An ex vivo organotypic culture system to study axonregeneration in the dopaminergic system. In: Axon Growth and Regeneration:Methods and Protocols. Humana Press, Springer, Clifton, N.J.
ater, S.B., Mattson, M.P., Cohan, C., Connor, J., 1988. Calcium regulation of theneuronal growth cone. Trends Neurosci. 11, 315–321.
ater, S.B., Mills, L.R., 1991. Regulation of growth cone behavior by calcium. J. Neu-rosci. 11, 891–899.
obayashi, T., Mori, Y., 1998. Ca2+ channel antagonists and neuroprotection fromcerebral ischemia. Eur. J. Pharmacol. 363, 1–15.
oczyk, D., 1994. Differential response of microtubule-associated protein 2 (MAP-2)in rat hippocampus after exposure to trimethyltin (TMT): an immunocytochem-ical study. Acta Neurobiol. Exp. (Wars) 54, 55–58.
oh, J.Y., Choi, D.W., 1987. Quantitative determination of glutamate mediated cor-tical neuronal injury in cell culture by lactate dehydrogenase efflux assay. J.Neurosci. Methods 20, 83–90.
oh, J.Y., Cotman, C.W., 1992. Programmed cell death: its possible contributionto neurotoxicity mediated by calcium channel antagonists. Brain Res. 587,233–240.
rieglstein, J., Lippert, K., Pöch, G., 1996. Apparent independent action of nimodipineand glutamate antagonists to protect cultured neurons against glutamate-induced damage. Neuropharmacology 35, 1737–1742.
atour, I., Hamid, J., Beedle, A.M., Zamponi, G.W., Macvicar, B.A., 2003. Expres-sion of voltage-gated Ca2+ channel subtypes in cultured astrocytes. Glia 41,347–353.
echt, S., Rotfeld, E., Arien-Zakay, H., Tabakman, R., Matzner, H., Yaka, R., Lelkes, P.I.,Lazarovici, P., 2012. Neuroprotective effects of nimodipine and nifedipine in theNGF-differentiated PC12 cells exposed to oxygen-glucose deprivation or trophicwithdrawal. Int. J. Dev. Neurosci. 30, 465–469.
i, Y., Hu, X., Liu, Y., Bao, Y., An, L., 2009. Nimodipine protects dopaminergic neuronsagainst inflammation-mediated degeneration through inhibition of microglialactivation. Neuropharmacology 56, 580–589.
indsay, R.W., Heaton, J.T., Edwards, C., Smitson, C., Hadlock, T.A., 2010. Nimodipineand acceleration of functional recovery of the facial nerve after crush injury.Arch. Facial Plast. Surg. 12, 49–52.
iu, G.J., Luo, J., Zhang, L.P., Wang, Z.J., Xu, L.L., He, G.H., Zeng, Y.J., Wang, Y.F., 2011.Meta-analysis of the effectiveness and safety of prophylactic use of nimodipinein patients with an aneurysmal subarachnoid haemorrhage. CNS Neurol. Disord.Drug Targets 10, 834–844.
uiten, P.G., Buwalda, B., Traber, J., Nyakas, C., 1994. Induction of enhanced postnatalexpression of immunoreactive calbindin-D28k in rat forebrain by the calciumantagonist nimodipine. Brain Res. Dev. Brain Res. 79, 10–18.
artínez-Sánchez, M., Striggow, F., Schröder, U.H., Kahlert, S., Reymann, K.G., Reiser,G., 2004. Na+ and Ca2+ homeostasis pathways, cell death and protection afteroxygen–glucose-deprivation in organotypic hippocampal slice cultures. Neuro-science 128, 729–740.
attsson, P., Janson, A.M., Aldskogius, H., Svensson, M., 2001. Nimodipine promotesregeneration and functional recovery after intracranial facial nerve crush. J.Comp. Neurol. 437, 106–117.
ennerick, S., Zorumski, C.F., 2000. Neural activity and survival in the developingnervous system. Mol. Neurobiol. 22, 41–54.
ercuri, N.B., Bonci, A., Calabresi, P., Stratta, F., Stefani, A., Bernardi, G., 1994. Effectsof dihydropyridine calcium antagonists on rat midbrain dopaminergic neurones.Br. J. Pharmacol. 113, 831–838.
urphy, T.H., Worley, P.F., Baraban, J.M., 1991. L-type voltage-sensitive calcium
channels mediate synaptic activation of immediate early genes. Neuron 7,625–635.edergaard, S., Flatman, J.A., Engberg, I., 1993. Nifedipine- and omega-conotoxin-sensitive Ca2+ conductances in guinea-pig Substantia nigra pars compactaneurones. J. Physiol. (Lond.) 466, 727–747.
roscience 40 (2015) 1–11 11
Nishiyama, M., Hoshino, A., Tsai, L., Henley, J.R., Goshima, Y., Tessier-Lavigne, M., Poo,M., Hong, K., 2003. Cyclic AMP/GMP-dependent modulation of Ca2+ channels setsthe polarity of nerve growth-cone turning. Nature 423, 990–995.
Opgen-Rhein, R., Strimmer, K., 2007. Accurate ranking of differentially expressedgenes by a distribution-free shrinkage approach. Stat. Appl. Genet. Mol. Biol. 6,Article9.
Pérez-Cadahía, B., Drobic, B., Davie, J.R., 2011. Activation and function of immediate-early genes in the nervous system. Biochem. Cell Biol. 89, 61–73.
Pisani, A., Calabresi, P., Tozzi, A., D’Angelo, V., Bernardi, G., 1998. L-type Ca2+ channelblockers attenuate electrical changes and Ca2+ rise induced by oxygen/glucosedeprivation in cortical neurons. Stroke 29, 196–202.
Plenz, D., Kitai, S.T., 1996. Organotypic cortex-striatum-mesencephalon cultures:the nigrostriatal pathway. Neurosci. Lett. 209, 177–180.
Pozzo-Miller, L.D., Inoue, T., Murphy, D.D., 1999. Estradiol increases spine densityand NMDA-dependent Ca2+ transients in spines of CA1 pyramidal neurons fromhippocampal slices. J. Neurophysiol. 81, 1404–1411.
Puopolo, M., Raviola, E., Bean, B.P., 2007. Roles of subthreshold calcium current andsodium current in spontaneous firing of mouse midbrain dopamine neurons. J.Neurosci. 27, 645–656.
Quirion, R., Lal, S., Nair, N.P., Stratford, J.G., Ford, R.M., Olivier, A., 1985. Comparativeautoradiographic distribution of calcium channel antagonist binding sites for1,4-dihydropyridine and phenylalkylamine in rat, guinea pig and human brain.Prog. Neuropsychopharmacol. Biol. Psychiatry 9, 643–649.
Rami, A., Krieglstein, J., 1994. Neuronal protective effects of calcium antagonists incerebral ischemia. Life Sci. 55, 2105–2113.
Scheller, C., Richter, H., Engelhardt, M., Köenig, R., Antoniadis, G., 2007. The influenceof prophylactic vasoactive treatment on cochlear and facial nerve functions aftervestibular schwannoma surgery: a prospective and open-label randomized pilotstudy. Neurosurgery 61, 92–98.
Scheller, K., Scheller, C., 2012. Nimodipine promotes regeneration of peripheral facialnerve function after traumatic injury following maxillofacial surgery: an off labelpilot-study. J. Craniomaxillofac. Surg. 40, 427–434.
Scheller, C., Vogel, A., Simmermacher, S., Rachinger, J.C., Prell, J., Strauss, C., Reinsch,M., Kunter, U., Wienke, A., Neumann, Scheller, K., 2012. Prophylactic intravenousnimodipine treatment in skull base surgery: pharmacokinetic aspects. J. Neurol.Surg. A: Cent. Eur. Neurosurg. 73, 153–159.
Schmitz, Y., Luccarelli, J., Kim, M., Wang, M., Sulzer, D., 2009. Glutamate con-trols growth rate and branching of dopaminergic axons. J. Neurosci. 29,11973–11981.
Sendrowski, K., Rusak, M., Sobaniec, P., Iłendo, E., Dabrowska, M., Bockowski, L.,Koput, A., Sobaniec, W., 2013. Study of the protective effect of calcium channelblockers against neuronal damage induced by glutamate in cultured hippocam-pal neurons. Pharmacol. Rep. 65, 730–736.
Sheng, M., Greenberg, M.E., 1990. The regulation and function of c-fos and otherimmediate early genes in the nervous system. Neuron 4, 477–485.
Shepherd, J.D., Bear, M.F., 2011. New views of Arc, a master regulator of synapticplasticity. Nat. Neurosci. 14, 279–284.
Takada, M., Kang, Y., Imanishi, M., 2001. Immunohistochemical localization ofvoltage-gated calcium channels in substantia nigra dopamine neurons. Eur. J.Neurosci. 13, 757–762.
Tang, F., Dent, E.W., Kalil, K., 2003. Spontaneous calcium transients in developingcortical neurons regulate axon outgrowth. J. Neurosci. 23, 927–936.
Thomas, S., Herrmann, B., Samii, M., Brinker, T., 2008. Experimental subarachnoidhemorrhage in the rat: influences of nimodipine. Acta Neurochir. Suppl. 102,377–379.
Törönen, P., Ojala, P.J., Marttinen, P., Holm, L., 2009. Robust extraction of functionalsignals from gene set analysis using a generalized threshold free scoring func-tion. BMC Bioinform. 10, 307.
Turner, C.P., Miller, R., Smith, C., Brown, L., Blackstone, K., Dunham, S.R., Strehlow,R., Manfredi, M., Slocum, P., Iverson, K., West, M., Ringler, S.L., 2007. Widespreadneonatal brain damage following calcium channel blockade. Dev. Neurosci. 29,213–231.
Weiss, J.H., Pike, C.J., Cotman, C.W., 1994. Ca2+ channel blockers attenuate beta-amyloid peptide toxicity to cortical neurons in culture. J. Neurochem. 62,372–375.
Westenbroek, R.E., Bausch, S.B., Lin, R.C., Franck, J.E., Noebels, J.L., Catterall,W.A., 1998. Upregulation of L-type Ca2+ channels in reactive astro-
RESEARCH ARTICLES - Nimodipine
cytes after brain injury, hypomyelination, and ischemia. J. Neurosci. 18,2321–2334.
Wirth, H., von Bergen, M., Binder, H., Mining, S.O.M., 2012. expression portraits:feature selection and integrating concepts of molecular function. Biodata Mining5, 18.
45

Supplementary Fig.S.1: Experimental set‐up. (A) Preparation of brain slice co‐cultures of the mesocortical dopaminergic projection system. (A1) Photograph of a neonatal rat brain. The regions containing ventral tegmental area/substantia nigra (VTA/SN) and prefrontal cortex (PFC) are highlighted in dark and bright red. (A2) Coronal sections of the rat brain; additional cuts are made as indicated by dashed lines to isolate VTA/SN (#) and PFC (*), respectively. (A3) Coronal sections of 300µm thickness were placed side by side on membrane inserts as co‐cultures. (B1) Schema of a co‐culture consisting of PFC and VTA/SN; the transparent box indicates the border region, where the two initially separated slices were grown together and where neurite density was quantified after biocytin‐tracing and histochemical processing (described in detail in section 2.5.1). (B2) Microscopic image of a biocytin‐traced co‐culture slice after treatment with 1µM nimodipine. Biocytin‐traced cell bodies are located in the VTA/SN. Outgrowing neurites cross the border region between VTA/SN and PFC and grow into the PFC. (Scale bar: 500µm)
RESEARCH ARTICLES - Nimodipine (Suppl.)
46

Supplementary Fig.S.2: Neurite outgrowth quantification after application of 1µM nimodipine (in the figure: Nim) and 50ng/ml nerve growth factor (NGF) alone or in combination. (A) Representative microscopic images of biocytin positive neurites in the border region as they were used for neurite density quantification, (scale bar: 50µm). (B) Neurite density data has been normalized to the median value of the untreated control group of each individual preparation. Neurite growth is significantly increased after treatment with 1µM nimodipine, 50ng/ml NGF and the combination of both in comparison to the vehicle control (0.1% ethanol). No significant increase in neurite density has been observed among the Nim‐, NGF‐ and Nim+NGF‐treated groups. Neurite density data have been normalized to the median value of the untreated control group of each individual preparation. Data are shown as box plots, n(analyzed pictures)>173, **p<0.01, ANOVA on Ranks followed by All Pairwise Multiple Comparison Procedures (Dunn's Method).
RESEARCH ARTICLES - Nimodipine (Suppl.)
47

Nachweis über Anteile der Co-Autoren, Dipl. Biochem. Katja Sygnecka Organotypische Gewebe-Co-Kulturen des dopaminergen Systems –Ein Modell zur Identifikation neuroregenerativer Substanzen und Zellen
Nachweis über Anteile der Co-Autoren: Titel: Nimodipine enhances neurite outgrowth in dopaminergic brain slice co-
cultures
Journal: International Journal of Developmental Neuroscience
Autoren: K. Sygnecka, C. Heine, N. Scherf, M. Fasold, H. Binder, C. Scheller, H. Franke (geteilte Erstautorinnenschaft: KS und CH)
Anteil Sygnecka (Erstautorin): - Konzeption - Gewebekulturen (Präparation, Behandlung, Aufarbeitung) - Immunhistochemie - Faserquantifizierung - Genexpressionsstudien - Erstellen der Abbildungen - Schreiben der Publikation
Anteil Heine (Erstautorin): - Projektidee - Konzeption - Gewebekulturen (Präparation) - Schreiben der Publikation
Anteil Scherf: - Bioinformatische Bildauswertung
Anteil Fasold, Binder: - Unterstützung bei der Analyse der Microarray-Ergebnisse
Anteil Scheller: - Projektidee
Anteil Franke (Letztautorin): - Konzeption - Gewebekulturen (Präparation, Tracing) - Schreiben der Publikation
RESEARCH ARTICLES - Nimodipine
48

RESEARCH ARTICLES - Nimodipine
49

ORIGINAL RESEARCH REPORT
Mesenchymal Stem Cells Support Neuronal Fiber Growthin an Organotypic Brain Slice Co-culture Model
Katja Sygnecka,1,2 Andreas Heider,1 Nico Scherf,3 Rudiger Alt,1,4
Heike Franke,2,* and Claudia Heine1,2,*
Mesenchymal stem cells (MSCs) have been identified as promising candidates for neuroregenerative celltherapies. However, the impact of different isolation procedures on the functional and regenerative charac-teristics of MSC populations has not been studied thoroughly. To quantify these differences, we directlycompared classically isolated bulk bone marrow-derived MSCs (bulk BM-MSCs) to the subpopulation Sca-1 +Lin -CD45 - -derived MSCs - (SL45-MSCs), isolated by fluorescence-activated cell sorting from bulk BM-cell suspensions. Both populations were analyzed with respect to functional readouts, that are, frequency offibroblast colony forming units (CFU-f), general morphology, and expression of stem cell markers. The SL45-MSC population is characterized by greater morphological homogeneity, higher CFU-f frequency, and sig-nificantly increased nestin expression compared with bulk BM-MSCs. We further quantified the potential ofboth cell populations to enhance neuronal fiber growth, using an ex vivo model of organotypic brain slice co-cultures of the mesocortical dopaminergic projection system. The MSC populations were cultivated under-neath the slice co-cultures without direct contact using a transwell system. After cultivation, the fiber densityin the border region between the two brain slices was quantified. While both populations significantly en-hanced fiber outgrowth as compared with controls, purified SL45-MSCs stimulated fiber growth to a largerdegree. Subsequently, we analyzed the expression of different growth factors in both cell populations. Theresults show a significantly higher expression of brain-derived neurotrophic factor (BDNF) and basic fibroblastgrowth factor in the SL45-MSCs population. Altogether, we conclude that MSC preparations enriched forprimary MSCs promote neuronal regeneration and axonal regrowth, more effectively than bulk BM-MSCs, aneffect that may be mediated by a higher BDNF secretion.
Introduction
Studying neuronal regeneration and regrowth isimportant in potentially treating neurological diseases as-
sociated with the loss of neurons and their corresponding fiberprojections. In this context, stem cells that positively influenceneuronal regeneration and axonal regrowth are of great interestfor the development of cell therapeutic strategies.
Mesenchymal stem cells (MSCs) are multipotent precur-sors, which are capable of differentiation into bone, cartilage,and adipose tissues. They can be obtained easily from, forexample, adult bone marrow (BM), adipose tissue, or um-bilical cord blood. Conventionally, MSCs are isolated fromhuman or animal tissue through plastic adhesion and cultureprocedures [1–3].
Recent reports and reviews suggest a beneficial role ofMSCs in recovery after neuronal injury and in neurode-generative diseases like Parkinson’s disease [4–8]. Forexample, positive effects of MSCs on fiber regenerationhave been shown under various experimental condi-tions, such as cell cultures [9,10], organotypic slice culturemodels [11–13] and also in vivo [14,15]. Besides thesynthesis of extracellular matrix molecules, stabilizationof the microenvironment, and immune modulatory prop-erties, the production of humoral factors appears to be oneof the relevant processes for the observed regenerativeeffects of MSCs [16,17]. In this context, the expressionand secretion of growth factors such as brain-derivedneurotrophic factor (BDNF), nerve growth factor (NGF),glial cell-derived neurotrophic factor (GDNF), or basic
1Translational Centre for Regenerative Medicine (TRM), University of Leipzig, Leipzig, Germany.2Rudolf Boehm Institute of Pharmacology and Toxicology, University of Leipzig, Leipzig, Germany.3Faculty of Medicine Carl Gustav Carus, Institute for Medical Informatics and Biometry (IMB), Dresden University of Technology,
Dresden, Germany.4Vita 34 AG, Leipzig, Germany.*These two authors contributed equally to the work.
STEM CELLS AND DEVELOPMENT
Volume 00, Number 00, 2014
� Mary Ann Liebert, Inc.
DOI: 10.1089/scd.2014.0262
1
RESEARCH ARTICLES - MSCs
50

fibroblast growth factor (bFGF, also known as FGF2) havebeen elucidated [9,13,14,18–20].
MSCs are intrinsically heterogeneous and are comprisedof a diverse repertoire of distinct subpopulations (for reviewsee Phinney [21]). It is accepted that methods used to iso-late, expand, and cultivate MSCs significantly affect theiroverall composition and therefore their therapeutic potential[22–25]. Current limitations in the use of MSCs underlinethe need to identify specific surface markers that can be usedto investigate the physiological functions and biologicalproperties of MSCs [26]. Morikawa et al. have recentlyshown that MSCs need not necessarily be isolated by cultureexpansion, but can be prospectively isolated from primarytissue, yielding a highly enriched homogeneous subpopu-lation [3]. These PaS cells are a subpopulation of the verysmall embryonic-like stem cell population described earlierby Kucia et al. that have shown a broad differentiation po-tential beyond the mesenchymal lineage in vitro [27,28].The prospective isolation of MSCs will certainly have to beconsidered for safer and more effective clinical treatmentsin the future [26]. Therefore, gaining knowledge about thedifferent MSC populations and the use of standardizedprotocols for the preparation of homogenous cell popula-tions and their expansion is integral.
We set out to investigate the impact of the isolation pro-cedure on the functional and regenerative characteristics ofMSC populations. In this study, bulk BM-derived MSCs (bulkBM-MSCs), directly expanded from cell suspensions of iso-lated BM of 8-week-old mice, were compared to Sca-1+
Lin-CD45- -derivedMSCs (SL45-MSCs), which were sortedfrom lineage depleted BM suspensions via fluorescence-activated cell sorting (FACS) from mice of the same age. Theproperties of both populations were analyzed in regards to their(i) ability to form fibroblast colony-forming units (CFU-f), (ii)general appearance and morphology, (iii) expression of stemcell markers and growth factors, and (iv) neuronal fiber growthpromoting potential. To examine fiber growth, an organotypicbrain slice co-culture model of the mesocortical dopaminergicprojection system consisting of brain slices of the ventraltegmental area/substantia nigra (VTA/SN) and the prefrontalcortex (PFC) of newborn mice was employed. Fiber density inthe border region between the two slices was quantified after co-cultivation with either BM-MSCs or sorted SL45-MSCsunderneath the slice co-cultures using biocytin tracing andsubsequent automated image analysis. The growth factor BDNFwas applied to the co-culture medium as a positive control forfiber growth enhancement. The co-cultures serve as a model ofboth development and regeneration, as the growth of fiberconnections under ex vivo conditions strongly correlates withthe development of neuronal circuits in vivo, and the dopami-nergic projections in the neonatal mouse brains are cut duringpreparation. Therefore, this model is suitable to analyze growthpromoting effects of substances and cells in a context that isclose to the in vivo situation, as demonstrated in a number ofprevious studies [29–31].
Materials and Methods
Animals
For the preparation of the organotypic brain slice co-cultures,neonatal mouse pups of postnatal day 2 (P2) were used (C57BL/6, own breed; animal house of the Rudolf Boehm Institute of
Pharmacology and Toxicology, University of Leipzig, Leipzig,Germany). For the isolation of the MSC populations, 8-week-old C57BL/6 mice were used (Medizinisch-ExperimentellesZentrum, University of Leipzig, Leipzig, Germany). Bothgenders were used for the preparation of the organotypic brainslice co-cultures and the isolation of both MSC populations. Nogender-specific differences between male or female mice wereobserved. The animals were housed under standard laboratoryconditions, under a 12 h light–12h dark cycle and allowed ac-cess to lab food and water ad libitum.
All of the animal use procedures were approved by theCommittee of Animal Care and Use of the relevant localgovernmental body in accordance with the law of experi-mental animal protection.
Isolation and expansion of investigated cells
Isolation of murine BM. BM was isolated following amethod modified fromMorikawa et al. [3]. Tibiae and femurawere dissected out of 8– 1-week-old C57BL/6 mice. Aftercleaning, the bones were crushed with a pestle, and marrowwas flushed out with 5mL of wash buffer [phosphate bufferedsaline (PBS) with 0.3% citrate phosphate dextrose buffer(both Sigma-Aldrich, Taufkirchen, Germany) and 1% bovineserum albumin (BSA; SERVA, Heidelberg, Germany)]. Theresulting solution was passed through a 0.45mm cell strainer(Greiner Bio-One GmbH, Frickenhausen, Germany) beforeproceeding. The remaining bone chips were further mincedusing scissors and digested at 37�C using an enzyme solu-tion: Accutase containing penicillin/streptomycin (Pen/Strep100U/mL and 100mg/mL, respectively; both PAA Labora-tories GmbH, Colbe, Germany), 2mM calcium chloride(Sigma-Aldrich), and 1mg/mL collagenase IV (SERVA).Afterward, the pooled cell fractions were then washed oncewith wash buffer and manually counted using a Neubauercounting chamber (Carl Roth GmbH andCo. KG, Karlsruhe,Germany).
Derivation of MSCs from murine BM. About 107 bulk BMcells were seeded in 75 cm2 culture flasks (Greiner Bio-OneGmbH) and cultivated in bulk BM-MSCs maintenance medium[alpha-modification of Eagle’s minimal essential medium with10% fetal bovine serum (FBS), supplemented with Pen/Strep(100U/mL and 100mg/mL, respectively; all from PAA La-boratories)] to derive MSCs. After 2 days, an initial washingstep with PBS was performed to remove nonadherent cells.Afterward, fresh bulk BM-MSCs maintenance medium wasapplied. For further expansion the medium was changed every2–3 days. Cells were passaged via trypsinization (using trypsin;PAA Laboratories) when reaching 80% confluency. Passages3–5 have been used for all experiments in this study except forthe colony forming unit-fibroblast (CFU-f) assay (see below).
Isolation of SL45-MSCs. The isolation procedure wasadapted from Kucia et al. and Morikawa et al. [3,28]. Ma-ture blood cells were removed from BM preparations via themagnetic activated cell sorting lineage depletion kit (bio-tinylated antibody cocktail; Miltenyi Biotech, BergischGladbach, Germany). Lineage negative (Lin - ) cells werestained with anti-Sca-1-phycoerythrin(-PE) and anti-CD45-PE-carbocyanine(-Cy)7 in addition to Streptavidin-Alexa-Fluor-488 to label and exclude any remaining Lin + cells (allfrom eBiosciences, Frankfurt a.M., Germany), for 30min at4�C using saturation concentrations recommended by the
2 SYGNECKA ET AL.
RESEARCH ARTICLES - MSCs
51

manufacturer. To discriminate living cells from deadcells and debris, Hoechst (5 mg/mL) and propidium iodide(PI; 2 mg/mL) stains (all Sigma-Aldrich) were employed.Sca-1 +CD45 -Lin -Hoe +PI- (SL45)-MSCs were sorted byFACS in FACS sort buffer (PBS with 1% FBS, 1mM eth-ylenediaminetetraaceticacid, and 25mM HEPES; all Sigma-Aldrich; 0.2 mm sterile filtered) using a BD FACS VantageSE cell sorter (BD Biosciences, Heidelberg, Germany).
Cultivation of SL45-MSCs. Sorted SL45-MSCs were cul-tivated in 25 cm2 culture flasks (Greiner Bio-One GmbH) inbulk BM-MSCs maintenance medium until passage 2.Afterward, cells were cultivated in SL45-MSCs maintenancemedium [alpha MEM with 30% FBS, Pen/Strep (100U/mLand 100 mg/mL, respectively); PAA Laboratories] and 50 ng/mL recombinant human FGF2 (Peprotech, Hamburg, Ger-many). The administration of FGF2 and additional serum tothe medium was needed for the prolonged in vitro growth ofSL45-MSCs, as the cells would stop growing after 3 pas-sages without additional FGF2. For further expansion, themedium was changed every 2–3 days. Upon reaching 80%confluence the cells were passaged using Accutase (PAALaboratories). Passages 3–5 have been used for all experi-ments in this study except for the CFU-f assay (see below).
CFU-f assay
To empirically determine the frequency of CFU-f in cellsuspensions, freshly isolated cells, either sorted SL45-MSCs(starting with 1,000 cells) or bulk BM-MSCs (starting with107 cells), were cultivated for 14 days in Ø 3 cm culturedishes or in 75 cm2 culture flasks, respectively (both GreinerBio-One GmbH). The cell numbers are a consequence ofintrinsic differences in availability of the cells and theirrespective colony frequencies. The frequency of colonyforming cells in bulk BM-MSCs is far lower than in theSL45 population. Plating the same number of cells wouldtherefore generate either too many SL45-derived colonies ortoo few BM-MSC-derived colonies for reliable quantifica-tion. For this reason, we adjusted the input cell number toyield quantifiable numbers of colonies.
The CFU-f assays were performed for both MSC popu-lations in bulk BM-MSC maintenance medium. The cellswere fixed using methanol (AppliChem GmbH, Darmstadt,Germany) and stained using Giemsa stain (Sigma-Aldrich).The resulting primary colonies were counted using a bin-ocular microscope.
Immunofluorescence staining
The two MSC preparations from either bulk BM or SL45cells were characterized by applying immunofluorescencestaining after cultivation under maintenance conditions. Whenthe cultures reached 80% confluency, cells were fixed for10min with 4% paraformaldehyde (PFA; Merck, Darmstadt,Germany) in PBS at room temperature (RT). After the fixationstep, cells were washed with PBS with 0.5% Tween 20 (PBS-T; both Sigma-Aldrich). Reactive PFA endings were saturatedin a 30min incubation step with 20mM glycine (Carl RothGmbH and Co. KG) in PBS. After permeabilization with0.1% Triton-X 100 (Applichem GmbH) for 5min, cells werewashed and incubated over night at 4�C in blocking solution[PBS-T with addition of 3% FBS (PAA Laboratories), 1%
BSA (SERVA)] and primary antibodies: mouse anti-bIII tu-bulin (1:500; Promega, Mannheim, Germany) and rabbit anti-nestin (1:400; Chemicon, Temecula, CA). Cells were washedagain and stained for 1.5 h at RT in blocking solution con-taining secondary antibodies: donkey anti-mouse and donkeyanti-rabbit conjugated with Cy2 or Cy3 (1:400/1:800, re-spectively; both Jackson Immunoresearch, West Grove, PA)followed by washes with Tris-buffered saline with 0.5%Tween 20 (Sigma-Aldrich). Finally, staining of the cell nucleiwas performed using Hoechst 33342 (Sigma-Aldrich) atconcentration of 5mg/mL for 10min. Then cells were washedagain, embedded in fluorescence mounting medium (DakoDeutschland GmbH, Hamburg, Germany), and immunofluo-rescence labeling was analyzed using an inverted microscope(Nikon Eclipse Ti) equipped for the detection of Cy2, Cy3 andHoechst.
RNA extraction and quantitative real-timepolymerase chain reaction
Quantitative real-time polymerase chain reaction (qPCR)was conducted to quantify the expression of (i) stem cellmarkers nestin and bIII tubulin under maintenance condi-tions and (ii) growth factors: BDNF, ciliary neurotrophicfactor (CNTF), FGF2, GDNF, hepatocyte growth factor(HGF), insulin-like growth factor 1 (IGF1), NGF, andneuregulin 1 (NRG1) after cultivation in maintenance me-dium or in brain slice culture medium (for composition seesection ‘‘Preparation and cultivation of slice co-cultures’’)in both bulk BM-MSCs and SL45-MSCs.
For gene expression analysis under co-culture cultivationconditions (meaning in brain slice culture medium, rather thanin co-culture with brain slices), 1 day after seeding of the bulkBM-MSCs or SL45-MSCs, respectively, into 25 cm2 cultureflasks,maintenance mediumwas changed to brain slice culturemedium. Corresponding to the duration of cultivation of cellsunderneath the co-cultures, after 3.5 days cells were harvestedfor RNA-extraction. Total RNA was isolated using TRIzolreagent (Life Technologies, Gaithersburg, MD) according tothe manufacturer’s instructions. RNA concentration was mea-sured with NanoDrop1000 (NanoDrop Technologies, Wil-mington, DE).
Reverse transcription was performed using the RevertAidTMHMinus First Strand cDNASynthesisKit (Fermentas, St. Leon-Rot, Germany) with 0.1mg total RNA and oligo(dT)18 primerin 20mL total reaction volume. qPCR was conducted using aLightCycler (Roche Diagnostics, Mannheim, Germany) in atotal volume of 10mL per capillary [LightCycler� Capillaries(20mL); Roche Applied Science, Mannheim, Germany] con-taining 5mL QuantiTect SYBR Green 2·Master Mix (RocheApplied Science), 0.4mL cDNA, 1mL primer (5mM each)specific for the different target genes or the reference genes[mitochondrial ribosomal protein L32 (MrpL32) and ubiquitin(Ubc)], and 3.6mL water. Sequences of all used primers arelisted in the Supplementary Table S1 (Supplementary Dataare available online at www.liebertpub.com/scd). The HotStart Polymerase (contained in the QuantiTect SYBRGreen 2·Master Mix) was activated by a 15min preincubation at95�C, followed by 55 amplification cycles at 95�C for 10 s, 60�Cfor 10 s, and 72�C for 10 s. A melting curve analysis was per-formed to verify correct qPCR products. The following appro-priate controls have been used: no template control (water) and
MESENCHYMAL STEM CELLS SUPPORT NEURONAL FIBER GROWTH 3
RESEARCH ARTICLES - MSCs
52

‘‘reverse transcription-minus control,’’ to exclude the presenceof genomic DNA in the samples. Quantification of gene ex-pression was performed by the DCP method with MrpL32 andUbc serving as reference housekeeping genes.
Determination of the BDNF concentrationin the conditioned media
To further investigate growth factor production and se-cretion on the protein level, the concentration of BDNF hasbeen quantified in conditioned brain slice culture medium.Conditioned medium of cells that were used for RNA ex-traction (see above) was collected and kept at - 80�C untilanalysis. BDNF levels were measured using a multiplexedparticle-based flow cytometric cytokine assay [32]. Assaykits were purchased from Millipore (Zug, Switzerland). Theprocedures closely followed the manufacturer’s instructions.The analysis was conducted using a conventional flowcytometer (Guava EasyCyte Plus; Millipore).
Preparation and cultivation of slice co-cultures
Slice co-cultures consisting of a prefrontal and a mes-encephalic slice were prepared from P2 mice and culti-vated according to the ‘‘static’’ culture protocol using atranswell system as described previously for rats [29,33].After decapitation of the pups, the brains were removedfrom the skull and immersed into low melting agar. Fore-brain- and mesencephalon-containing brain parts wereseparated with coronal cuts and the resulting tissue blockswere fixed onto the specimen stage of a vibratome (Leica,Typ VT 1200S, Nussloch, Germany). Coronal sections(thickness 300 mm) were cut at mesencephalic and fore-brain levels to obtain slices of the VTA/SN and the PFC,respectively. A scheme to illustrate the preparation pro-cedure is shown in Fig. 1. Four co-cultures were placed onone membrane insert (0.4 mm, Millicell-CM; Millipore) ina six-well plate (NuncTM Multidish; Thermo Scientific viaVWR International GmbH, Dresden, Germany), filled with1mL of the brain slice culture medium [25% MEM, 25%Basal Medium Eagle without glutamine, 25% horse serum,glutamine to a final concentration of 2mM, gentamicin50 mg/mL (all from Invitrogen GmbH, Darmstadt, Ger-many), and 0.6% glucose (Hospital Pharmacy, Universityof Leipzig, Leipzig, Germany), pH adjusted to 7.2].
Twenty-four hours before the preparation of the orga-notypic co-cultures, 105 bulk BM-MSCs or SL45-MSCs,respectively were seeded on poly-l-lysine (Sigma-Aldrich)-coated glass slides (Carl Roth GmbH and Co. KG) and werecultivated in the respective maintenance medium (seeabove). After the completion of the preparation these glassslides were transferred underneath the membrane insertswith the organotypic co-cultures. Co-cultures were kept at37�C and 5% CO2. Culture medium was changed every 2–3days and glass slides were changed at days in vitro (DIV)4and DIV7. The cells used for the exchange were derivedfrom continuing cultures of the original input cells, ensuringthat cells of the same batch and age were used throughouteach experiment. Control cultures were cultivated withoutany additional cells or substances. As a reference for thegrowth promoting potential, BDNF (75 ng/mL; Peprotech)was added to the brain slice culture medium with every
medium exchange in an additional experimental group(BDNF group). For detailed information see also Fig. 2.
Tracing procedure, fixation, and visualizationof fibers
Biocytin tracing, fixation, and subsequent processing ofthe co-cultures were performed as previously described[29,31,33]. At DIV8, small biocytin crystals (Sigma-Aldrich) were placed on the VTA/SN part of the co-cultures
FIG. 1. Preparation of brain slice co-cultures of the me-socortical dopaminergic projection system [(A), black ar-row]. After decapitation of the mouse pups, the brain wasremoved from the skull under sterile conditions. Coronalcuts were made at the level of forebrain and mesencephalon[(A), dashed lines]. The brain parts were fixed on thespecimen stage of a slicer and cut as indicated [(B), dashedlines] to isolate PFC (*) and VTA/SN (#), respectively.Coronal sections of 300 mm thickness were cut and resultingsections were placed as co-cultures on the moistenedmembranes (C) and inserted in six-well plates filled withbrain slice culture medium. After DIV10 the slices werefixed and the biocytin tracing was visualized. (D) Schematicco-culture slice to illustrate the localization of the PFC, theborder region and the VTA/SN in greater magnification.PFC, prefrontal cortex; VTA/SN, ventral tegmental area/substantia nigra; DIV, days in vitro.
4 SYGNECKA ET AL.
RESEARCH ARTICLES - MSCs
53

under binocular control. After 2 h, the co-cultures wererinsed carefully with brain slice culture medium. To allowthe anterograde transport of the tracer, the co-cultures werereincubated for 48 h.
At DIV10, the co-cultures were fixed in a solution con-sisting of 4% PFA, 0.1% glutaraldehyde (SERVA), and 15%picric acid (Sigma-Aldrich) in phosphate buffer (PB, 0.1M,pH 7.4) for 2 h and were subsequently washed with PB.Afterward, co-cultures were cut into 50mm thick slices withthe vibratome and collected in PB.
Biocytin was visualized with the avidin-biotin-horserad-ish peroxidise complex (1:50, ABC-Elite Kit; Vector La-boratories, Inc., Burlingame, CA) and ammonium nickel (II)sulfate hexahydrate/Cobalt (II) chloride hexahydrate (Ni/Co; both Sigma-Aldrich) intensified 3,3¢-diaminobenzidinehydrochloride (Sigma-Aldrich). Stained slices were moun-ted on glass slides and embedded with Entellan (Merck)when completely dried.
Quantification of fiber density
Microscopic images from the whole border region wereobtained with a transmitted light bright field microscope(Axioskop 50; Zeiss, Oberkochen, Germany) equipped with aCCD camera at 40·magnification. The border region of theco-culture is the part where the two initially separated brainslices were grown together (for illustrations see also Figs. 1Dand 3A, B2). Slices were used for analysis only if they ful-filled the following criteria: (i) the tracer was correctly placedon the VTA/SN, (ii) the major part of the VTA/SN wascharacterized by a dense network of biocytin-traced structuresand (iii) no traced cell bodies had been observed in the targetregion PFC (previously described in more detail in [30]).
A tailored image analysis procedure had been designed toquantify the fiber density in an automated manner, describedpreviously in detail [31]. After preprocessing and imagebinarization, the ratio of the number of foreground pixels(fibers) to the total number of pixels in the images wastaken, yielding an estimate of the percentage of area occu-pied by fibers (fiber density) in the focal plane.
Statistics
Statistical significance of the frequency of CFU-f and ofthe expression level of nestin and bIII tubulin between thedifferent cell populations was assayed by Student’s t-test.Statistical analysis of the fiber growth promoting effect of thedifferent MSC populations was performed using Kruskal–Wallis analysis of variance on Ranks followed by Dunn’s test
for multiple comparisons against the control group andagainst the BDNF group. Statistical significance of the ex-pression of various growth factors (mRNA-level; BDNF ad-ditional protein-level) was determined by Student’s t-test orMann–Whitney Rank Sum Test, as indicated. All quantitativedata have been analyzed with SigmaPlot 12 statistical analysisprogram, all significant differences were considered at a P-level below 0.05 (*P< 0.05, **P< 0.01, ***P< 0.001).
Results
Characterization of bulk BM-MSCs and sortedSL45-MSCs under maintenance conditions
Primary CFU-f are 10,000-fold enriched in SL45-MSCs versus
bulk BM-MSCs. While bulk BM-MSCs were directly ex-panded from cell suspensions of freshly isolated BM of8-week-old mice, SL45-MSCs were sorted from lineagedepleted BM suspensions via FACS-sorting from mice ofthe same age (for details see Fig. 4A1–A4).
FIG. 2. Time schedule indicatingpreparation at DIV0 and subse-quent medium changes, exchangeof glass slides with bulk BM-MSCsand SL45-MSCs, tracing at DIV8and fixation at DIV10. BDNF wasapplied after every medium ex-change to the ‘‘BDNF group.’’BM-MSCs, bone marrow-derivedmesenchymal stem cells; BDNF,brain-derived neurotrophic factor;SL45-MSCs, Sca-1 +Lin -CD45 - -derived MSCs.
FIG. 3. Biocytin labeling. (A) Overview of a biocytin-traced co-culture slice (after cultivation with bulk BM-MSCs). (B1–B3) Microscopic images of traced cell bodiesin the VTA/SN (B3), traced fibers in the border region of theco-culture (B2) and in the PFC (B1) at higher magnification.Scale bars: (A) 500mm, (B1–B3) 100mm. PFC, prefrontalcortex; VTA/SN, ventral tegmental area/substantia nigra.
MESENCHYMAL STEM CELLS SUPPORT NEURONAL FIBER GROWTH 5
RESEARCH ARTICLES - MSCs
54

Primary sorted SL45-MSCs (1,000 cells) and bulk BM-MSCs (107 cells) were subjected to a CFU-f assay. Thesecell numbers are a consequence of intrinsic differences inavailability of the cells and their respective colony fre-quencies (for details see section ‘‘CFU-f assay’’ in ‘‘Mate-rials and Methods’’). Two weeks after inoculation, bothunsorted and sorted cells gave rise to newly formed coloniescomprising spindle-shaped, fibroblast-like cells. As an ex-ample, sorted SL45-MSCs are shown in Fig. 4C1 at day 0and in Fig. 4C2 at day 14 after sorting, respectively. Thefrequency of CFU-f was 5.3 · 10 - 6 – 4.1 · 10 - 6 (n = 8) inbulk BM-MSCs and 5.3 · 10 - 2 – 3.3 · 10 - 2 (n = 5) in SL45-MSCs (Fig. 4B). Primary CFU-f were 10,000-fold enrichedin prospectively isolated SL45-MSCs compared to bulkBM-MSCs. This suggests that SL45-MSCs are a more ho-mogeneous cell population not only with respect to surfacemarker expression but also in terms of functional properties.
Higher expression of nestin in SL45-MSCs versus bulk BM-
MSC. Nestin and bIII tubulin are markers for immatureneuronal cells. Nestin on its own, however, has been shown tomark precursor cells of both neuronal and mesenchymal lines[34–36]. bIII Tubulin on the other hand is co-expressed in
some mesenchymal cells together with nestin before anyneuronal differentiation takes place [37]. A characterization ofthe nestin and bIII tubulin protein expression in both unsortedbulk BM-MSCs and sorted SL45-MSCs was performed usingimmunofluorescence staining with antibodies against thesemarkers. We observed a difference in nestin and bIII tubulinexpression between classically isolated MSCs and those de-rived from sorted SL45 cells (Fig. 5A, B). While almost allSL45-MSCs expressed nestin, the population of bulk BM-MSCs was heterogeneous and also contained many cells thatdid not express nestin. This observation was compatible withour general impression that bulk BM-MSCs are generallymore heterogeneous, with some cells showing a classicalspindle-shaped MSC morphology, others appearing broaderand less well defined in shape. In contrast, in SL45-MSCs thepredominant cell type shows a smaller spindle-shaped or oli-gopolar morphology with rather small or condensed nuclei, aclearly defined cell body, and a prominent expression ofnestin. bIII Tubulin-positive cells occurred with similar fre-quency in both cell populations.
Furthermore, the expression of nestin and bIII tubulin inboth populations was determined on a mRNA level. The
FIG. 4. Primary CFU-f and representative illustration of the isolation of SL45 cells. (A1–A4) SL45-MSCs were sorted fromsuspensions of murine bone marrow of 8-week-old mice. For this purpose, cells were stained with Hoechst, PI, lineage markers(Lin), and a combination of Sca-1 and CD45. (A1) All events plotted with regard to forward scatter (FSC) and Hoechst signalintensity. (A2) Histogram showing PI staining of Hoechst+ cells from (A1). (A3) Hoechst+ , PI- cells were stained for Linexpression. (A4)The dot plot showsHoechst+ , PI- , andLin- cells thatwere analyzed for expression ofCD45andSca-1. Sca-1+ ,Hoechst+ , PI- , Lin- , andCD45- cells (SL45-MSCs)were found at a frequency of 3.75%. (B)After 2weeks of cultivation,CFU-f contained in both bulk BM-MSCs and SL45-MSCs and both cell populations gave rise to newly formed colonies comprised ofspindle-shaped, fibroblast-like cells. TheCFU-f frequencywas far higher in SL45-MSCs than in bulkBM-MSCs.Data are shownas box-whisker plots; SL45-MSCs: n= 5, bulk BM-MSCs: n= 8; Student’s t-test, ***P< 0.001. (C1,C2) Sorted SL45-MSCs areshown in themicrographs at day 0 (d0) and 14 (d14) after sorting. Scale bars: (C1) 100mm, (C2) 250mm.CFU-f, fibroblast colonyforming units; PI, propidium iodide. Color images available online at www.liebertpub.com/scd
6 SYGNECKA ET AL.
RESEARCH ARTICLES - MSCs
55

qPCR-results confirmed our qualitative observations fromthe immunostaining experiments. Nestin was detectable inboth MSC populations with a significant higher expressionin the sorted SL45-MSCs (mean DCP= 13.793) comparedwith the bulk BM-MSCs (mean DCP = 0.0318) (Fig. 5C).The mRNA expression of bIII tubulin was comparable inboth MSC populations. There was no significant differencein the number of bIII tubulin-transcripts between the twoanalyzed cell populations (Fig. 5D).
MSCs derived from enriched SL45-MSCswere more potent in stimulating fibergrowth than classically isolated bulk BM-MSCs
After fixation of the dopaminergic co-cultures at DIV10and visualization of the biocytin tracing, the target orien-
tated fiber outgrowth of cell bodies originating from theVTA/SN could be observed. Neuronal processes sproutingfrom the black labeled cell bodies of the VTA/SN sur-mounted the border region between the initially separatedslices and grew into the target region PFC. An example of aVTA/SN +PFC co-culture after cultivation with bulk BM-MSCs is shown in Fig. 3.
We compared the fiber growth promoting potential ofMSCs derived from sorted SL45 cells and bulk BM-MSCsto BDNF-treated and untreated controls, respectively. Ex-amples of biocytin traced fibers within the border region areshown for all groups in Fig. 6A. The quantification of thefiber density in the border region revealed a significantgrowth promoting effect for both MSC preparations. Thecorresponding box-whisker plots are shown in Fig. 6B. BothSL45-MSCs and bulk BM-MSCs exhibit a significantlystronger growth promoting effect compared with control. Asexpected, BDNF also enhanced fiber growth in comparisonto untreated control conditions. However, the effect wassignificantly less pronounced than that of the co-cultureswith SL45-MSCs, suggesting a greater neurosupportivestimulus of these mesenchymal cells.
Sorted SL45-MSCs expressed significantly higherlevels of the growth factors BDNF and FGF2
We assessed the expression of growth factors that could beresponsible for the observed fiber growth promoting effect ofbulk BM-MSCs and sorted SL45-MSCs. The mRNA of thegrowth factors BDNF, CNTF, FGF2, GDNF, HGF, IGF1,NGF, and NRG1 was detected by qPCR in cell samples bothafter cultivation in maintenance medium and in brain sliceculture medium, respectively. Under maintenance conditions,the mRNA of BDNF, FGF2, and NGF was significantlyhigher expressed in SL45-MSCs than in bulk BM-MSCs(Student’s t-test, P< 0.05, data not shown). Consistent withthis observation, BDNF and FGF2 were expressed to a sig-nificantly greater extent in the SL45-MSC population (Fig.7A, B) after cultivation in brain slice culture medium. Underthis condition, the median DCP for NGF transcripts was alsohigher in SL45-MSCs, but the difference between the twogroups was not significant (Fig. 7C).
Additionally, secreted BDNF protein has been quantified inthe conditioned brain slice culture medium of both cell popu-lations. The BDNF concentration in SL45-supernatants wassignificantly higher (median value: 0.487 fg/mL/cell) than inbulk BM-MSC supernatants (median value: 0.026 fg/mL/cell),P< 0.01, n= 6.However, the resultingBDNFconcentrations inthe incubation media with SL45 or bulk BM-MSCs (meanvalues: 288 and 17pg/mL, respectively) were lower than in theBDNF-positive control, where 75ng/mL BDNF was added.
Taken together, these measurements show a production ofimportant growth factors by both cells types. This might be oneof the major reasons for the observed effect on fiber growth inthose cultures, which could explain the additional cell-specificbenefit of the MSCs over the BDNF-treated control.
Discussion
The present study confirms the previously reported neu-rosupportive and regenerative features of MSCs, and addi-tionally highlights the importance of isolation and expansion
FIG. 5. Nestin and bIII tubulin expression. (A, B) Im-munofluorescence staining against nestin (red), bIII tubulin(green), and Hoechst (blue) of (A) unsorted bulk BM-MSCsand (B) sorted SL45-MSCs expanded nondifferentiatedcells growing in maintenance medium: (A) Only some bulkBM-MSCs show immunoreactivity for nestin, whereas(B) almost all SL45-MSCs were positive for nestin. bIIITubulin-positive cells occurredwith similar frequency in bothcell populations. (C,D)mRNAexpression levels of nestin andbIII tubulin (Tubb3) in the two cell populations after culti-vation under maintenance conditions are expressed as DCP(relative expression normalized to the housekeeper genesUbcandMRPL32, y-axis). (C)Nestin expressionwas significantlyhigher in SL45-MSC samples (mean > 400-fold compared tobulk BM-MSCs, P< 0.05). (D) No significant difference inthe expression of bIII tubulin was detected by quantificationof the mRNA transcripts (P= 0.63). Data are shown asmean – standard error of the mean, n > 4 independent cellpreparations, *P < 0.05, Student’s t-test. Scale bars: (A, B)100 mm. MrpL32, mitochondrial ribosomal protein L32; n.s.,not significant; Ubc, ubiquitin. Color images available onlineat www.liebertpub.com/scd
MESENCHYMAL STEM CELLS SUPPORT NEURONAL FIBER GROWTH 7
RESEARCH ARTICLES - MSCs
56

conditions. We provided evidence that sorted SL45-MSCsdiffer from bulk BM-MSCs in certain aspects: SL45-MSCswere enriched for primary CFU-f, were more homogeneous,expressed higher protein- and mRNA-levels of nestin, andexpressed higher amounts of the growth factors BDNF andFGF2 compared with the more heterogeneous bulk BM-derived cell population. Moreover, utilizing organotypicdopaminergic slice co-cultures, we have shown that both
BM-MSC populations significantly enhanced neuronal fibergrowth in comparison with control conditions. The growthpromoting effect of the cells was more pronounced than theeffect of the growth factor BDNF. Interestingly, sortedSL45-MSCs were more potent in stimulating fiber growth inour co-culture system, indicating that this cell population isenriched for cells that are responsible for the observed re-generative and trophic effects.
FIG. 6. Quantification of fiber density in the border region of organotypic brain slice co-cultures after application ofdifferent BM-derived stem cell populations. (A) Microscopic images of traced fibers in the border regions of the co-culturesafter cultivation with (A2) classically isolated bulk BM-MSCs, (A3) SL45-MSCs in comparison to (A4) BDNF-treatmentand to (A1) control conditions. (B) Fiber quantification revealed that SL45-MSCs showed the highest benefit for fibergrowth, followed by bulk BM-MSCs. The effect of BDNF was less pronounced than after co-cultivation with any of theMSC preparations. Data are shown as box-whisker plots and represent the empirical distribution of fiber densities of theinvestigated groups, control: n = 50 images, bulk BM-MSCs: n = 111 images, SL45-MSCs: n = 186 images, BDNF: n = 93images; **P< 0.01 in comparison to control, #P < 0.01 in comparison to BDNF, Kruskal–Wallis analysis of variance onRanks followed by Dunn’s test for multiple comparisons. Scale bar: (A1–A4) 50 mm.
FIG. 7. The expression of BDNF, FGF2, and NGF in bulk BM-MSCs and sorted SL45-MSCs, quantified by quantitativereal-time polymerase chain reaction. (A–C) Expression levels of BDNF, FGF2, and NGF in the two cell populations areexpressed as DCP (relative expression normalized to the housekeeper genes Ubc and Mrpl32, y-axis). Significantly higherexpression levels of (A) BDNF and (B) FGF2 were revealed in the SL45-MSC population. No significant difference in theexpression of (C) NGF between the two cell populations was detected, but there is a tendency to higher expression in theSL45-MSC samples. Data are shown as box-whisker plots, n > 4 independent cell preparations, *P< 0.05, **P < 0.01,Mann–Whitney Rank Sum Test. FGF2, basic fibroblast growth factor; NGF, nerve growth factor; n.s., not significant.
8 SYGNECKA ET AL.
RESEARCH ARTICLES - MSCs
57

Conventionally cultured MSCs yield heterogeneous pop-ulations that often contain contaminating cells due to thesignificant variability in the isolation method, the tissueorigin, and the lack of specific MSC markers [21,23,26].Moreover, experimental artifacts introduced by inconsistentcell culture protocols or following extensive culture ma-nipulation may result in changes of the MSCs’ properties orin the aging processes of the cells, both causing complica-tions in the utilization of MSCs as therapeutic tools (forreview see Wang et al. [25]). As an example, the number ofpassages was shown to greatly influence the survival rate,migration, and neuroprotective capacities of MSCs [38].With regard to the use of MSCs in clinical medicine, it isanticipated that more homogeneous cell preparations willyield more consistent clinical outcomes that exhibit bothdose responsiveness and more reproducible outcomes [21].Collectively, these studies underline the importance of pre-paring adequate homogenous cell populations of MSCs.
In our study, we found a higher frequency of nestin-positive cells and significantly more mRNA transcripts ofnestin in SL45-MSCs compared with classically isolatedbulk BM-MSCs. This is in accordance with results of otherstudies, where the heterogeneity of primary MSC culturesand an increase in the percentage of nestin-positive MSCs asa function of the number of passages were observed [39].This further implicated the superior proliferative capacity ofnestin-positive MSCs.
The expression of nestin and bIII tubulin in undifferenti-ated cells has been reported previously and has been taken asevidence for proliferative and progenitor potential [35,40–42]. Furthermore, nestin has been described as a marker forMSCs in the recent literature [34,37,43]. In this context, itwas shown that nestin-positive MSCs contain all the CFU-factivity of the BM, can self-renew in serial transplantation,and are able to differentiate toward mesenchymal lineages[34,37]. Indeed, we could confirm multilineage differentia-tion capacity into adipogenic, chondrogenic, and osteogeniclineages in both bulk BM-MSCs and SL45-MSCs (Supple-mentary Fig. S1).
Several findings point to an active role of MSCs in ex-perimental in vitro and in vivo models of different diseases ofthe CNS, including Parkinson’s disease, stroke, multiplesclerosis, traumatic brain or spinal cord injury [8,44–48]. Asan example, animal studies in traumatic brain injury haveshown improved functional outcome when MSCs were in-jected intracerebrally or intravenously [49,50]. Human MSCswere beneficial after spinal cord injury due to the increase inaxonal sprouting and in the number of surviving rat corticalneurons in vivo [51]. Further underlining the importance ofMSCs, there are 77 clinical trials registered using MSCs inneuropathological conditions (www.clinicaltrials.gov, websiteof the National Institutes of Health, Bethesda, MD, search for‘‘mesenchymal stem cells and CNS,’’ October 2014, eg, re-garding Parkinson’s disease: NCT01446614).
The regeneration of injured neuronal cells and the cor-responding fiber projections are of great interest with respectto the described neurological diseases. Organotypic brainslices that can be maintained in culture for several weeksfacilitate the study of cellular interactions and mechanismsin this context. Furthermore, this technique represents apowerful tool for the development of ex vivo models ofneurological disorders and to investigate approaches for
potential stem cell therapies (for review see Daviaud et al.[52]). For example, MSCs revealed a significant neuropro-tective effect in ischemia models of organotypic hippo-campal slices [19,53]. In organotypic spinal cord slices,topically applied MSCs survived, migrated into the slice,and promoted host neurite extension [11,12] and axonaloutgrowth from the cortex to the spinal cord [13]. Here, wedescribe a beneficial effect of BM-MSC preparations with aparticular focus on the clinically relevant parameter of ax-onal outgrowth in the dopaminergic system. Our data indi-cate that SL45-MSCs are more potent than bulk BM-MSCs.Therefore, SL45-MSCs appear to be particularly well suitedto promote neuro(re)generation ex vivo.
Our findings show that MSC preparations derived from adefined cell population enriched for primary MSCs are ad-vantageous in different aspects. (i) SL45-MSCs have ahigher fiber growth promoting potential compared to con-ventional bulk BM-MSCs. (ii) A more homogenous MSCpopulation can be obtained much faster starting from pre-enriched CFU-f, allowing for a shorter expansion phase invitro, and hence a lower risk of culture prone alterations ormutation accumulations on the MSC population. (iii) Due tothe more homogeneous population derived from enrichedprimary MSCs, the risk of contamination with alloreactiveimmune cells might potentially be lower. Summarizing, wesuggest the use of cell material that is more homogeneousand highly enriched in CFU-f activity as a starting point forcell therapeutic development. This is in line with previouslypublished studies and their conclusions [1,3,26,28,54].
Earlier studies were based on the assumption that the neu-roregenerative effects ofMSCs are caused by the replacement ofdamaged cells by differentiation into neurons or glia [55,56].However, the current opinion favors a model of regenerationinduced by the release of soluble factors, such as trophic factors.Thus, the capacity of MSCs to actively alter the microenvi-ronment via these factors may contribute more significantly totissue repair than their plasticity [16,24,47]. Our findings alsosuggest a stimulating effect mediated via soluble secreted fac-tors as the main reason for the observed impact on fiber growth,as the cells where plated underneath the co-cultures withoutdirect contact to the brain slices in our study. This hypothesis isin line with findings by other groups, demonstrating the secre-tion of trophic factors byMSCs, includingBDNF,NGF,GDNF,FGF2, and the vascular endothelial growth factor [9,18,57–59].
We detected the mRNA of the growth factors BDNF,CNTF, FGF2, GDNF, HGF, IGF1, NGF, and NRG1 by qPCRin all assessed cell samples. The significantly higher ex-pression of BDNF and FGF2 in the SL45-MSC population,which has exemplarily been confirmed on the protein levelfor BDNF, could be a reason for the more pronounced effectevoked by the sorted SL45-MSC population as compared tothe classically isolated bulk BM-MSCs. This might resultfrom the homogeneity of the populations with SL45-MSCswhere the cells express similar levels of growth factors, whilethe more heterogeneous bulk BM-MSCs consist of a mixtureof both secreting and non-secreting cells.
The observed growth promoting effect of the growthfactor producing MSC populations in the dopaminergicprojection system is not surprising, taking into account thatprevious studies have shown the beneficial effects of BDNF,GDNF, and FGF2 on mesencephalic dopaminergic neurons[60–62]. These growth factors are considered to mediate
MESENCHYMAL STEM CELLS SUPPORT NEURONAL FIBER GROWTH 9
RESEARCH ARTICLES - MSCs
58

dopaminergic neuronal survival and neuroprotection. Thus,they had become potential candidates for the therapy ofParkinson’s disease [63–66]. For example, BDNF providessupport for both developing and adult dopaminergic neurons[67–70]. So BDNF resulted in enhanced survival of tyrosinehydroxylase-positive neurons and increased growth of ty-rosine hydroxylase-positive fibers into striatal tissue [71].GDNF, which is especially important for the development ofembryonic dopaminergic neurons [72], induced neuronalsurvival and promoted the innervation of target areas [73–76]. FGF2 stimulated the proliferation of dopaminergicprogenitor cells, promoted survival and neurite outgrowth ofdopaminergic neurons, and participated in nigrostriatalpathway formation and target innervation [66,77,78].
The impact of the BDNF application to the brain sliceculture medium was less pronounced than the growth fa-cilitating properties of both MSC populations under study.This is in agreement with previous studies showing that thecombined application of neurotrophins (eg, BDNF andNGF) elicited greater axon growth than treatment with eachneurotrophin alone [79]. Moreover, Crigler et al. revealedthat MSCs express potent neuroregulatory molecules in arestricted manner in addition to growth factors like BDNFand NGF. These growth factors may further contribute toMSC-induced effects on neuronal survival and nerve re-generation [9].
Conclusion
In conclusion, both MSC preparations exerted highlybeneficial effects on fiber outgrowth in organotypic brainslices of the dopaminergic system well above the level ofuntreated controls, and had also a stronger effect than thepositive control BDNF. Thus, MSCs appear to be very wellsuited to promote neuro(re)generation. The outcome wasdependent on the isolation and expansion conditions and wecould show that the more homogeneous sorted SL45-MSCswere more potent in stimulating fiber growth, indicating anenrichment of cells that are responsible for the observed re-generative and trophic effects. The higher expression levelsof nestin, BDNF, and FGF2 in SL45-MSCs compared toclassically isolated BM-MSCs may serve as an explanationfor the higher potential in stimulating fiber growth as dem-onstrated in this study.
Acknowledgments
The authors thank Katrin Becker and Katrin Krause(Rudolf Boehm Institute of Pharmacology and Toxicology)as well as Gabrielle Ohme and Sabine Hecht (TRM Leipzig)for excellent technical assistance. The authors are grateful toAdrian Urwyler (Cytolab, Regensdorf, Switzerland) forperforming the BDNF measurements in the conditionedmedia. The authors thank Jennifer Ding for providing lan-guage help. The work presented in this article was madepossible by funding from the German Federal Ministry ofEducation and Research (BMBF 1315883).
Author Disclosure Statement
None of the authors has any disclosure to declare. Nocompeting financial interests exist.
References
1. Tondreau T, L Lagneaux, M Dejeneffe, A Delforge, MMassy, C Mortier and D Bron. (2004). Isolation of BMmesenchymal stem cells by plastic adhesion or negativeselection: phenotype, proliferation kinetics and differenti-ation potential. Cytotherapy 6:372–379.
2. Zhang Z, X Wang and S Wang. (2008). Isolation andcharacterization of mesenchymal stem cells derived frombone marrow of patients with Parkinson’s disease. In VitroCell Dev Biol Anim 44:169–177.
3. Morikawa S, Y Mabuchi, Y Kubota, Y Nagai, K Niibe, EHiratsu, S Suzuki, C Miyauchi-Hara, N Nagoshi, et al.(2009). Prospective identification, isolation, and systemictransplantation of multipotent mesenchymal stem cells inmurine bone marrow. J Exp Med 206:2483–2496.
4. Torrente Y and E Polli. (2008). Mesenchymal stem celltransplantation for neurodegenerative diseases. Cell Trans-plant 17:1103–1113.
5. Castillo-Melendez M, T Yawno, G Jenkin and SL Miller.(2013). Stem cell therapy to protect and repair the devel-oping brain: a review of mechanisms of action of cord bloodand amnion epithelial derived cells. Front Neurosci 7:194.
6. Uccelli A, A Laroni and MS Freedman. (2011). Mesench-ymal stem cells for the treatment of multiple sclerosis andother neurological diseases. Lancet Neurol 10:649–656.
7. Lee PH and HJ Park. (2009). Bone marrow-derived mesen-chymal stem cell therapy as a candidate disease-modifyingstrategy in Parkinson’s disease and multiple system atrophy. JClin Neurol 5:1–10.
8. Azari MF, L Mathias, E Ozturk, DS Cram, RL Boyd and SPetratos. (2010). Mesenchymal stem cells for treatment ofCNS injury. Curr Neuropharmacol 8:316–323.
9. Crigler L, RC Robey, A Asawachaicharn, D Gaupp and DGPhinney. (2006). Human mesenchymal stem cell subpop-ulations express a variety of neuro-regulatory moleculesand promote neuronal cell survival and neuritogenesis. ExpNeurol 198:54–64.
10. Wright KT, W El Masri, A Osman, S Roberts, G Cham-berlain, BA Ashton and WEB Johnson. (2007). Bone mar-row stromal cells stimulate neurite outgrowth over neuralproteoglycans (CSPG), myelin associated glycoprotein andNogo-A. Biochem Biophys Res Commun 354:559–566.
11. Cho JS, HWPark, SK Park, S Roh, SKKang, KS Paik andMSChang. (2009). Transplantation of mesenchymal stem cellsenhances axonal outgrowth and cell survival in an organotypicspinal cord slice culture. Neurosci Lett 454:43–48.
12. Shichinohe H, S Kuroda, S Tsuji, S Yamaguchi, S Yano, JBLee, H Kobayashi, S Kikuchi, K Hida and Y Iwasaki.(2008). Bone marrow stromal cells promote neurite ex-tension in organotypic spinal cord slice: significance forcell transplantation therapy. Neurorehabil Neural Repair22:447–457.
13. Kamei N, N Tanaka, Y Oishi, M Ishikawa, T Hamasaki, KNishida, K Nakanishi, N Sakai and M Ochi. (2007). Bonemarrow stromal cells promoting corticospinal axon growththrough the release of humoral factors in organotypic co-cultures in neonatal rats. J Neurosurg Spine 6:412–419.
14. Chen CJ, YC Ou, SL Liao, WY Chen, SY Chen, CW Wu,CC Wang, WY Wang, YS Huang and SH Hsu. (2007).Transplantation of bone marrow stromal cells for peripheralnerve repair. Exp Neurol 204:443–453.
15. Cuevas P, F Carceller, I Garcia-Gomez, M Yan and MDujovny. (2004). Bone marrow stromal cell implantationfor peripheral nerve repair. Neurol Res 26:230–232.
10 SYGNECKA ET AL.
RESEARCH ARTICLES - MSCs
59

16. Marconi S, G Castiglione, E Turano, G Bissolotti, S An-giari, A Farinazzo, G Constantin, G Bedogni, A Bedogniand B Bonetti. (2012). Human adipose-derived mesenchy-mal stem cells systemically injected promote peripheralnerve regeneration in the mouse model of sciatic crush.Tissue Eng Part A 18:1264–1272.
17. Horwitz E and M Dominici. (2008). How do mesenchymalstromal cells exert their therapeutic benefit? Cytotherapy10:771–774.
18. Whone AL, K Kemp, M Sun, A Wilkins and NJ Scolding.(2012). Human bone marrow mesenchymal stem cellsprotect catecholaminergic and serotonergic neuronal peri-karya and transporter function from oxidative stress by thesecretion of glial-derived neurotrophic factor. Brain Res1431:86–96.
19. Sarnowska A, H Braun, S Sauerzweig and KG Reymann.(2009). The neuroprotective effect of bone marrow stemcells is not dependent on direct cell contact with hypoxicinjured tissue. Exp Neurol 215:317–327.
20. Zacharek A, A Shehadah, J Chen, X Cui, C Roberts, M Luand M Chopp. (2010). Comparison of bone marrow stromalcells derived from stroke and normal rats for stroke treat-ment. Stroke 41:524–530.
21. Phinney DG. (2012). Functional heterogeneity of mesen-chymal stem cells: implications for cell therapy. J CellBiochem 113:2806–2812.
22. Bieback K, S Kinzebach and M Karagianni. (2011).Translating research into clinical scale manufacturing ofmesenchymal stromal cells. Stem Cells Int 2010:193519.
23. Ho AD, W Wagner and W Franke. (2008). Heterogeneityof mesenchymal stromal cell preparations. Cytotherapy 10:320–330.
24. Phinney DG. (2007). Biochemical heterogeneity of mes-enchymal stem cell populations: clues to their therapeuticefficacy. Cell Cycle 6:2884–2889.
25. Wang Y, Z Han, Y Song and ZC Han. (2012). Safety ofmesenchymal stem cells for clinical application. Stem CellsInt 2012:652034.
26. Mabuchi Y, DD Houlihan, C Akazawa, H Okano and YMatsuzaki. (2013). Prospective isolation of murine andhuman bone marrow mesenchymal stem cells based onsurface markers. Stem Cells Int 2013:507301.
27. Heider A, R Danova-Alt, D Egger, M Cross and R Alt.(2013). Murine and human very small embryonic-like cells:a perspective. Cytometry A 83:72–75.
28. Kucia M, R Reca, FR Campbell, E Zuba-Surma, M Majka,J Ratajczak and MZ Ratajczak. (2006). A population ofvery small embryonic-like (VSEL) CXCR4( + )SSEA-1( + )Oct-4 + stem cells identified in adult bone marrow.Leukemia 20:857–869.
29. Franke H, N Schelhorn and P Illes. (2003). Dopaminergicneurons develop axonal projections to their target areas inorganotypic co-cultures of the ventral mesencephalon andthe striatum/prefrontal cortex. Neurochem Int 42:431–439.
30. Heine C, A Wegner, J Grosche, C Allgaier, P Illes and HFranke. (2007). P2 receptor expression in the dopaminergicsystem of the rat brain during development. Neuroscience149:165–181.
31. Heine C, K Sygnecka, N Scherf, A Berndt, U Egerland, THage and H Franke. (2013). Phosphodiesterase 2 inhibitorspromote axonal outgrowth in organotypic slice co-cultures.Neurosignals 21:197–212.
32. Vignali DA. (2000). Multiplexed particle-based flow cy-tometric assays. J Immunol Methods 243:243–255.
33. Heine C and H Franke. (2014). Organotypic slice co-culturesystems to study axon regeneration in the dopaminergicsystem ex vivo. Methods Mol Biol 1162:97–111.
34. Mendez-Ferrer S, TV Michurina, F Ferraro, AR Mazloom,BD Macarthur, SA Lira, DT Scadden, A Ma’ayan, GNEnikolopov and PS Frenette. (2010). Mesenchymal andhaematopoietic stem cells form a unique bone marrowniche. Nature 466:829–834.
35. Wiese C, A Rolletschek, G Kania, P Blyszczuk, KV Tar-asov, Y Tarasova, RP Wersto, KR Boheler and AMWobus.(2004). Nestin expression—a property of multi-lineageprogenitor cells? Cell Mol Life Sci 61:2510–2522.
36. Wislet-Gendebien S, F Bruyere, G Hans, P Leprince, GMoonen and B Rogister. (2004). Nestin-positive mesen-chymal stem cells favour the astroglial lineage in neuralprogenitors and stem cells by releasing active BMP4. BMCNeurosci 5:33.
37. Tondreau T, L Lagneaux, M Dejeneffe, M Massy, CMortier, A Delforge and D Bron. (2004). Bone marrow-derived mesenchymal stem cells already express specificneural proteins before any differentiation. Differentiation72:319–326.
38. Charriere K, PY Risold and D Fellmann. (2010). In vitrointeractions between bone marrow stromal cells and hip-pocampal slice cultures. C R Biol 333:582–590.
39. Wislet-Gendebien S, F Wautier, P Leprince and B Rogister.(2005). Astrocytic and neuronal fate of mesenchymal stemcells expressing nestin. Brain Res Bull 68:95–102.
40. Lendahl U, LB Zimmerman and RD McKay. (1990). CNSstem cells express a new class of intermediate filamentprotein. Cell 60:585–595.
41. Menezes JR and MB Luskin. (1994). Expression of neuron-specific tubulin defines a novel population in the prolifer-ative layers of the developing telencephalon. J Neurosci14:5399–5416.
42. Lee MK, LI Rebhun and A Frankfurter. (1990). Post-translational modification of class III beta-tubulin. ProcNatl Acad Sci U S A 87:7195–7199.
43. Wislet-Gendebien S, P Leprince, G Moonen and B Rog-ister. (2003). Regulation of neural markers nestin andGFAP expression by cultivated bone marrow stromal cells.J Cell Sci 116:3295–3302.
44. Li Y and M Chopp. (2009). Marrow stromal cell trans-plantation in stroke and traumatic brain injury. NeurosciLett 456:120–123.
45. Kan I, E Melamed and D Offen. (2007). Autotransplantationof bone marrow-derived stem cells as a therapy for neuro-degenerative diseases. Handb Exp Pharmacol 219–242.
46. Park HJ, PH Lee, OY Bang, G Lee and YH Ahn. (2008).Mesenchymal stem cells therapy exerts neuroprotection ina progressive animal model of Parkinson’s disease. JNeurochem 107:141–151.
47. Rivera FJ and L Aigner. (2012). Adult mesenchymal stemcell therapy for myelin repair in multiple sclerosis. Biol Res45:257–268.
48. Joyce N, G Annett, L Wirthlin, S Olson, G Bauer and JANolta. (2010). Mesenchymal stem cells for the treatment ofneurodegenerative disease. Regen Med 5:933–946.
49. MahmoodA, DLu andMChopp. (2004).Marrow stromal celltransplantation after traumatic brain injury promotes cellularproliferation within the brain. Neurosurgery 55:1185–1193.
50. Qu C, A Mahmood, D Lu, A Goussev, Y Xiong and MChopp. (2008). Treatment of traumatic brain injury in micewith marrow stromal cells. Brain Res 1208:234–239.
MESENCHYMAL STEM CELLS SUPPORT NEURONAL FIBER GROWTH 11
RESEARCH ARTICLES - MSCs
60

51. Sasaki M, C Radtke, AM Tan, P Zhao, H Hamada, KHoukin, O Honmou and JD Kocsis. (2009). BDNF-hypersecreting human mesenchymal stem cells promotefunctional recovery, axonal sprouting, and protection ofcorticospinal neurons after spinal cord injury. J Neurosci29:14932–14941.
52. Daviaud N, E Garbayo, PC Schiller, M Perez-Pinzon andCN Montero-Menei. (2013). Organotypic cultures as toolsfor optimizing central nervous system cell therapies. ExpNeurol 248:429–440.
53. Zhong C, Z Qin, CJ Zhong, Y Wang and XY Shen. (2003).Neuroprotective effects of bone marrow stromal cells on ratorganotypic hippocampal slice culture model of cerebralischemia. Neurosci Lett 342:93–96.
54. Sivasubramaniyan K, D Lehnen, R Ghazanfari, M Sobie-siak, A Harichandan, E Mortha, N Petkova, S Grimm, FCerabona, et al. (2012). Phenotypic and functional hetero-geneity of human bone marrow- and amnion-derived MSCsubsets. Ann N Y Acad Sci 1266:94–106.
55. Kopen GC, DJ Prockop and DG Phinney. (1999). Marrowstromal cells migrate throughout forebrain and cerebellum,and they differentiate into astrocytes after injection intoneonatal mouse brains. Proc Natl Acad Sci U S A 96:10711–10716.
56. Woodbury D, EJ Schwarz, DJ Prockop and IB Black.(2000). Adult rat and human bone marrow stromal cellsdifferentiate into neurons. J Neurosci Res 61:364–370.
57. Chen X, M Katakowski, Y Li, D Lu, L Wang, L Zhang, JChen, Y Xu, S Gautam, A Mahmood and M Chopp. (2002).Human bone marrow stromal cell cultures conditioned bytraumatic brain tissue extracts: growth factor production. JNeurosci Res 69:687–691.
58. Mahmood A, D Lu and M Chopp. (2004). Intravenousadministration of marrow stromal cells (MSCs) increasesthe expression of growth factors in rat brain after traumaticbrain injury. J Neurotrauma 21:33–39.
59. Wilkins A, K Kemp, M Ginty, K Hares, E Mallam and NScolding. (2009). Human bone marrow-derived mesen-chymal stem cells secrete brain-derived neurotrophic factorwhich promotes neuronal survival in vitro. Stem Cell Res3:63–70.
60. Krieglstein K. (2004). Factors promoting survival ofmesencephalic dopaminergic neurons. Cell Tissue Res 318:73–80.
61. Von Bohlen und Halbach O and K Unsicker. (2009).Neurotrophic support of midbrain dopaminergic neurons.Adv Exp Med Biol 651:73–80.
62. Rangasamy SB, K Soderstrom, RAE Bakay and JH Kor-dower. (2010). Neurotrophic factor therapy for Parkinson’sdisease. Prog Brain Res 184:237–264.
63. Sullivan AM and A Toulouse. (2011). Neurotrophic factorsfor the treatment of Parkinson’s disease. Cytokine GrowthFactor Rev 22:157–165.
64. Peterson AL and JG Nutt. (2008). Treatment of Parkinson’sdisease with trophic factors. Neurotherapeutics 5:270–280.
65. Fumagalli F, G Racagni and MA Riva. (2006). Sheddinglight into the role of BDNF in the pharmacotherapy ofParkinson’s disease. Pharmacogenomics J 6:95–104.
66. Grothe C and M Timmer. (2007). The physiological andpharmacological role of basic fibroblast growth factor inthe dopaminergic nigrostriatal system. Brain Res Rev 54:80–91.
67. Hyman C, M Hofer, YA Barde, M Juhasz, GD Yanco-poulos, SP Squinto and RM Lindsay. (1991). BDNF is a
neurotrophic factor for dopaminergic neurons of the sub-stantia nigra. Nature 350:230–232.
68. Hyman C, M Juhasz, C Jackson, P Wright, NY Ip and RMLindsay. (1994). Overlapping and distinct actions of theneurotrophins BDNF, NT-3, and NT-4/5 on cultured do-paminergic and GABAergic neurons of the ventral mes-encephalon. J Neurosci 14:335–347.
69. Knusel B, JW Winslow, A Rosenthal, LE Burton, DP Seid,K Nikolics and F Hefti. (1991). Promotion of central cho-linergic and dopaminergic neuron differentiation by brain-derived neurotrophic factor but not neurotrophin 3. ProcNatl Acad Sci U S A 88:961–965.
70. Hagg T. (1998). Neurotrophins prevent death and differ-entially affect tyrosine hydroxylase of adult rat nigrostriatalneurons in vivo. Exp Neurol 149:183–192.
71. Østergaard K, SA Jones, C Hyman and J Zimmer. (1996). Ef-fects of donor age and brain-derived neurotrophic factor on thesurvival of dopaminergic neurons and axonal growth in post-natal rat nigrostriatal co-cultures. Exp Neurol 142:340–350.
72. Lin LF,DHDoherty, JDLile, SBektesh and FCollins. (1993).GDNF: a glial cell line-derived neurotrophic factor for mid-brain dopaminergic neurons. Science 260:1130–1132.
73. Granholm AC, M Reyland, D Albeck, L Sanders, G Ger-hardt, G Hoernig, L Shen, H Westphal and B Hoffer.(2000). Glial cell line-derived neurotrophic factor is es-sential for postnatal survival of midbrain dopamine neu-rons. J Neurosci 20:3182–3190.
74. Jaumotte JD and MJ Zigmond. (2005). Dopaminergic in-nervation of forebrain by ventral mesencephalon in orga-notypic slice co-cultures: effects of GDNF. Brain Res MolBrain Res 134:139–146.
75. Schatz DS, WA Kaufmann, A Saria and C Humpel. (1999).Dopamine neurons in a simple GDNF-treated meso-striatalorganotypic co-culture model. Exp Brain Res 127:270–278.
76. Thompson LH, S Grealish, D Kirik and A Bjorklund.(2009). Reconstruction of the nigrostriatal dopamine path-way in the adult mouse brain. Eur J Neurosci 30:625–638.
77. Engele J. (1998). Changing responsiveness of developingmidbrain dopaminergic neurons for extracellular growthfactors. J Neurosci Res 51:508–516.
78. Baron O, A Ratzka and C Grothe. (2012). Fibroblastgrowth factor 2 regulates adequate nigrostriatal pathwayformation in mice. J Comp Neurol 520:3949–3961.
79. Oishi Y, J Baratta, RT Robertson and O Steward. (2004).Assessment of factors regulating axon growth between thecortex and spinal cord in organotypic co-cultures: effects ofage and neurotrophic factors. J Neurotrauma 21:339–356.
Address correspondence to:Katja Sygnecka
Translational Centre for Regenerative Medicine (TRM)c/o Rudolph Boehm Institute of Pharmacology
and ToxicologyUniversity of Leipzig
Hartelstr. 16-18Leipzig 04107
Germany
E-mail: [email protected]
Received for publication May 27, 2014Accepted after revision November 10, 2014
Prepublished on Liebert Instant Online XXXX XX, XXXX
12 SYGNECKA ET AL.
RESEARCH ARTICLES - MSCs
61

Supplementary Data
Materials and Methods
Differentiation protocols
Adipogenesis. Five thousand cells/cm2 were seeded inmaintenance medium and expanded. At a confluency of80%, medium was replaced by adipogeneic differentiationmedium [Dulbecco’s modified Eagle’s medium (DMEM)/F12 (1:1; PAA Laboratories, GmbH, Colbe, Germany), 5%rabbit serum, 3.925mg/L dexamethasone, 10mg/L insulin,111.1mg/L 3-isobutyl-1-methylxanthin, 35.76mg/L in-domethacine, and 10mM HEPES (all from Sigma-Aldrich)supplemented with Pen/Strep (100U/mL and 100 mg/mL,respectively; all from PAA Laboratories)]. This mediumwas partly (50%) changed every 2–3 days. After 7 days,cells were fixed and adipogenesis was analyzed.
Chondrogenesis. About 250,000–500,000 cells werecentrifuged in 1mL maintenance medium in a 15mL-falcontube at 270 g for 3min. After 24 h incubation at 37�C, me-dium was replaced by chondrogeneic differentiation medium[DMEM/F12 (1:1; PAA Laboratories), 10% fetal calf serum(FCS; PAA Laboratories), 39.25mg/L dexamethasone, 1%ITS-Premix, 37.84mg/mL l-ascorbic acid 2-phosphate (allfrom Sigma-Aldrich, Taufkirchen, Germany), 46.24mg/mLproline, and 10 ng/mL transforming growth factor beta 1(Peprotech) supplemented with Pen/Strep (100U/mL and100mg/mL, respectively; all from PAA Laboratories)]. Thismedium was partly (50%) changed every 2–3 days. After 21days, chondrogenesis was analyzed.
Osteogenesis. Five thousand cells/cm2 were seeded inmaintenance medium and expanded. At a confluency of80%, medium was replaced by osteogenic differentia-tion medium [DMEM/F12 (1:1; PAA Laboratories), 10%FCS (PAA Laboratories), 39.25 mg/L dexamethasone,2.16 mg/mL b-glycerophosphate, and 25.61 mg/mL l-ascorbic acid (all from Sigma-Aldrich) supplemented withPen/Strep (100U/mL and 100mg/mL, respectively; all fromPAA Laboratories)]. This medium was partly (50%)
changed every 2–3 days. After 21 days, osteogenesis wasanalyzed.
Analysis of differentiation
Adipogenesis. Cells were fixed with 3.7% paraformalde-hyde (PFA) for 30min, washed with propylene glycol(Sigma-Aldrich), and incubated in Oil Red O solution(0.5%; Sigma-Aldrich in propylene glycol) for 10min atroom temperature. Afterward, cells were washed with pro-pylene glycol until washing reagent remained colorless.Cells were analyzed with a usual light microscope (Nikon).
Chondrogenesis. Processing of the cell aggregates: Cellswere fixed with 3.7% PFA for 120min and washed twicewith phosphate-buffered saline (PBS) followed by histo-logical processing: dehydration in graded series of ethanol,xylole, and melted paraffin (Vogel GmbH and Co. KG,Giessen, Germany), embedding in paraffin, hematoxyline/erythrosine staining [10–15 s in Mayer’s hematoxylin solu-tion (Merck, Darmstadt, Germany), 10–15 s in 0.6% eryth-rosine solution (Merck) in 35% ethanol, four drops of aceticacid/200mL added directly before use], sectioning with amicrotome (Leica RM 2165, 4 mm), mounting on glassslides, rehydration in series of xylole and graded ethanol,washing in water, and staining.
Masson’s Trichrome staining: After postfixation at 60�C for60min with Bouin’s fluid (Sigma-Aldrich), slices were wa-shed under running tap water for 10 min at room temperature(RT). All followed steps were conducted at RT. Slices wereincubated for 10min in Weigert’s iron hematoxylin solution(Sigma-Aldrich) followed by washing with water for 10min.Then, slices were stained with ponceau fuchsine solution[0.75 g/L ponceau de xylidin, 0.25 g/L acid fuchsine (bothSigma-Aldrich) 1% acetic acid] for 30min, followed by arinsing step with 1% acetic acid. Incubation in phospho-tungstic acid (2%; Sigma-Aldrich) for 2min was conductedfollowed by a rinsing step with 1% acetic acid. Finally, sliceswere incubated in Fast Green solution (0.2% Fast Green FCF;
Supplementary Table S1. Sequences of Primers for Quantitative Polymerase Chain Reaction
Target Accession ID Forward primer Reverse primer
Bdnf NM_007540.4 GGCTGACACTTTTGAGCACG CAAGTCCGCGTCCTTATGGTCntf NM_170786.2 ACCTCTGTAGCCGCTCTATCT AGGCCTTGATGTTTTACATAAGATTFgf2 NM_008006.2 CGACCCACACGTCAAACTAC GTTGGCACACACTCCCTTGAGdnf NM_010275.2 CTGAAGACCACTCCCTCGG TCTTCAGGCATATTGGAGTCACHgf NM_010427.4 TCAGGACCATGTGAGGGAGAT ACATCCACGACCAGGAACAAIgf1 NM_010512.4 GGACCGAGGGGCTTTTACTT TCCGGAAGCAACACTCATCCMrpl32 NM_029271.2 CAGAGCTGGAGTCGCTTTGT TGAGGATGGATGGTCTCTGGANes NM_016701.3 AGAGGACCCAAGGCATTTCG TGCCTTCACACTTTCCTCCCNgf NM_013609.3 GGGGGAGTTCTCAGTGTGTG CACCTCCTTGCCCTTGATGTNrg1 NM_178591.2 ACTGGCATCTGTATCGCCCT CTGCCGCTGTTTCTTGGTTTTTubb3 NM_023279.2 TTCGTCTCTAGCCGCGTGAA CTCCCAGAACTTGGCCCCTATCUbc NM_019639.4 CCCACACAAAGCCCCTCAAT AAGATCTGCATCGTCTCTCTCAC
Bdnf, brain-derived neurotrophic factor; Cntf, ciliary neurotrophic factor; Fgf2, basic fibroblast growth factor; Gdnf, glial cell-derivedneurotrophic factor; Hgf, hepatocyte growth factor; Igf-1, insulin-like growth factor 1; Mrpl32, mitochondrial ribosomal protein L32; Ngf,nerve growth factor; Nrg1, neuregulin 1; Ubc, ubiquitin.
RESEARCH ARTICLES - MSCs (Suppl.)
62

Sigma-Aldrich in 1% acetic acid) for 5min, followed by alast rinsing step with 1% acetic acid.Safranin O staining: Slices were incubated with SafraninO solution (0.2%; Sigma-Aldrich in 1% acetic acid) for10min, followed by a washing step with aqua dest.Thereafter, slices were stained with Fast Green solu-tion [0.04% Fast Green (Chroma, Stuttgart, Germany) in0.2% acetic acid] for 15 s. Slices were then washed withaqua dest. and embedded when dried. All steps wereconducted at RT.
Embedding of stained slices: After the staining, sliceswere washed with 96% ethanol for 3min and rinsed withxylole. After having dried, slices were embedded with Roti�
Histokit (Carl Roth GmbH and Co. KG, Karlsruhe, Germany).Osteogenesis. Cells were fixed with 3.7% PFA for
30min, washed with PBS and incubated in 1% Alzarin Redsolution (Sigma-Aldrich) for 5min at room temperature.Afterwards, cells were washed with PBS until washing re-agent remained colorless. Cells were analyzed, after havingdried with a usual light microscope.
SUPPLEMENTARY FIG. S1. In vitro differentiation assays showing tri-lineage potential of bulk bone marrow-derivedmesenchymal stem cell (BM-MSC) (A–C) and Sca-1 +Lin -CD45 - -derived MSC (SL45-MSC) (D–F) populations startingfrom fibroblast colony forming units. (A, D) Adipogenesis was demonstrated by Oil red O staining of lipid globules. (B, E)Chondrogenesis was confirmed by (B1, E1) Masson’s Trichrom staining (collagene appears green; nuclei are blue-black;cytoplasm is stained red); (B2, E2) Safranin O staining (proteoglycans appear orange-red; nuclei are blue-black; cytoplasmis stained gray-green). (C, F) Osteogenesis of bulk BM-MSCs (C1, C2) and SL-45-MSCs (F1, F2) was indicated byAlizarin Red staining of depositions of calcium mineralized matrix. Micrographs of representative experiments are shown.Scale bars: (A–E) 100 mm, (F) 200mm.
RESEARCH ARTICLES - MSCs (Suppl.)
63

Nachweis über Anteile der Co-Autoren, Dipl. Biochem. Katja Sygnecka Organotypische Gewebe-Co-Kulturen des dopaminergen Systems –Ein Modell zur Identifikation neuroregenerativer Substanzen und Zellen
Nachweis über Anteile der Co-Autoren: Titel: Mesenchymal stem cells support neuronal fiber growth in an organotypic
brain slice co-culture model
Journal: Stem cells and Development
Autoren: K. Sygnecka, A. Heider, N. Scherf, R. Alt, H. Franke, C. Heine
Anteil Sygnecka (Erstautorin): - Konzeption - Gewebekulturen (Präparation, Behandlung, Aufarbeitung) - Immunhistochemie (Zellen) - Faserquantifizierung (Co-Kulturen) - Genexpressionsstudien (Zellen) - Quantifizierung sezernierter Wachstumsfaktoren: Generierung der Proben,
Auswertung - Erstellen der Abbildungen - Schreiben der Publikation
Anteil Heider: - Präparation und Kultivierung der Zellen - CFU-f-Analyse - Differenzierung der Zellen
Anteil Scherf: - Bioinformatische Bildauswertung (Faserquantifizierung)
Anteil Alt: - Projektidee - Konzeption
Anteil Franke (Letztautorin): - Projektidee - Gewebekulturen (Präparation, Tracing) - Schreiben der Publikation
Anteil Heine (Letztautorin): - Projektidee - Konzeption - Gewebekulturen (Präparation) - Schreiben der Publikation
RESEARCH ARTICLES - MSCs
64

RESEARCH ARTICLES - MSCs
65

3. References
(1) Kebabian JW and Calne DB. 1979. Multiple receptors for dopamine. Nature 277(5692):93–96.
(2) Gingrich JA and Caron MG. 1993. Recent advances in the molecular biology of dopamine receptors. Annu. Rev. Neurosci. 16:299–321.
(3) Missale C, Nash SR, Robinson SW, Jaber M and Caron MG. 1998. Dopamine receptors: from structure to function. Physiol. Rev. 78(1):189–225.
(4) Falck B, Hillarp NA, Thieme G and Torp A. 1982. Fluorescence of catechol amines and related compounds condensed with formaldehyde. Brain Res. Bull. 9(1‐6):xi–xv.
(5) Francis SH, Turko IV and Corbin JD. 2001. Cyclic nucleotide phosphodiesterases: relating structure and function. Prog. Nucleic Acid Res. Mol. Biol. 65:1–52.
(6) Dahlstroem A and Fuxe K. 1964. Evidence for the existence of monoamine‐containing neurons in the central nervous system. I. Demonstrations of monoamines in the cell bodies of brain stem neurons. Acta Physiol. Scand. Suppl:232:1‐55.
(7) German DC and Manaye KF. 1993. Midbrain dopaminergic neurons (nuclei A8, A9, and A10): three‐dimensional reconstruction in the rat. J. Comp. Neurol. 331(3):297–309.
(8) Björklund A and Lindvall O. 1984. Dopamine‐containing systems in the CNS. In: Björklund A and Hökfelt T, editors. Handbook of Chemical Neuroanatomy. (Classical Transmitters in the CNS, Part I), Vol. 2. Elsevier, Amsterdam. 55–122.
(9) Fallon JH and Loughlin SE. 1995. Substantia Nigra. In: Paxinos G, editor. The Rat Nervous System. Academic Press, San Diego, CA. 215–237.
(10) Fallon JH and Moore RY. 1978. Catecholamine innervation of the basal forebrain. IV. Topography of the dopamine projection to the basal forebrain and neostriatum. J. Comp. Neurol. 180(3):545–580.
(11) Rutten K, Prickaerts J, Hendrix M, van der Staay, F Josef, Sik A and Blokland A. 2007. Time‐dependent involvement of cAMP and cGMP in consolidation of object memory: studies using selective phosphodiesterase type 2, 4 and 5 inhibitors. Eur. J. Pharmacol. 558(1‐3):107–112.
(12) Gerfen CR, Herkenham M and Thibault J. 1987. The neostriatal mosaic: II. Patch‐ and matrix‐directed mesostriatal dopaminergic and non‐dopaminergic systems. J. Neurosci. 7(12):3915–3934.
(13) Fallon JH. 1988. Topographic organization of ascending dopaminergic projections. Ann. N. Y. Acad. Sci. 537:1–9.
(14) Björklund A and Dunnett SB. 2007. Dopamine neuron systems in the brain: an update. Trends Neurosci. 30(5):194–202.
(15) Swanson LW. 1992. Brain Maps: Structure of the Rat Brain. Elsevier, Amsterdam. Level 38.
(16) Dunlop BW and Nemeroff CB. 2007. The role of dopamine in the pathophysiology of depression. Arch. Gen. Psychiatry 64(3):327–337.
(17) Gerfen CR. 1985. The neostriatal mosaic. I. Compartmental organization of projections from the striatum to the substantia nigra in the rat. J. Comp. Neurol. 236(4):454–476.
(18) Kemp JM and Powell TP. 1971. The structure of the caudate nucleus of the cat: light and electron microscopy. Philos. Trans. R. Soc. Lond., B, Biol. Sci. 262(845):383–401.
(19) Pickel VM, Beckley SC, Joh TH and Reis DJ. 1981. Ultrastructural immunocytochemical localization of tyrosine hydroxylase in the neostriatum. Brain Research 225(2):373–385.
REFERENCES
66

(20) Freund TF, Powell JF and Smith AD. 1984. Tyrosine hydroxylase‐immunoreactive boutons in synaptic contact with identified striatonigral neurons, with particular reference to dendritic spines. Neuroscience 13(4):1189–1215.
(21) Gerfen CR, Baimbridge KG and Thibault J. 1987. The neostriatal mosaic: III. Biochemical and developmental dissociation of patch‐matrix mesostriatal systems. J. Neurosci. 7(12):3935–3944.
(22) DeLong MR and Wichmann T. 2007. Circuits and circuit disorders of the basal ganglia. Arch. Neurol. 64(1):20–24.
(23) Fallon JH and Loughlin SE. 1995. The Substantia Nigra. In: Paxinos G, editor. The Rat Nervous System. Academic Press, San Diego, CA. 353–374.
(24) Fallon JH and Loughlin SE. 1987. Monoamine innervation of cerebral cortex and a theory of the role of monoamines in cerebral cortex and basal ganglia. In: Jones EG, Peters A, editor. Cerebral Cortex. Plenum, New York. 41–127.
(25) Tanaka S. 2006. Dopaminergic control of working memory and its relevance to schizophrenia: a circuit dynamics perspective. Neuroscience 139(1):153–171.
(26) Goldman‐Rakic PS, Castner SA, Svensson TH, Siever LJ and Williams GV. 2004. Targeting the dopamine D1 receptor in schizophrenia: insights for cognitive dysfunction. Psychopharmacology 174(1):3–16.
(27) Swanson L. 1982. The projections of the ventral tegmental area and adjacent regions: A combined fluorescent retrograde tracer and immunofluorescence study in the rat. Brain Res. Bull. 9(1‐6):321–353.
(28) Steffensen SC, Svingos AL, Pickel VM and Henriksen SJ. 1998. Electrophysiological characterization of GABAergic neurons in the ventral tegmental area. J. Neurosci. 18(19):8003–8015.
(29) Thierry AM, Deniau JM, Herve D and Chevalier G. 1980. Electrophysiological evidence for non‐dopaminergic mesocortical and mesolimbic neurons in the rat. Brain Res. 201(1):210–214.
(30) Carr DB and Sesack SR. 2000. GABA‐containing neurons in the rat ventral tegmental area project to the prefrontal cortex. Synapse 38(2):114–123.
(31) Yamaguchi T, Wang H, Li X, Ng TH and Morales M. 2011. Mesocorticolimbic glutamatergic pathway. J. Neurosci. 31(23):8476–8490.
(32) Emson P and Koob G. 1978. The origin and distribution of dopamine‐containing afferents to the rat frontal cortex. Brain Res. 142(2):249–267.
(33) Sesack SR and Pickel VM. 1992. Prefrontal cortical efferents in the rat synapse on unlabeled neuronal targets of catecholamine terminals in the nucleus accumbens septi and on dopamine neurons in the ventral tegmental area. J. Comp. Neurol. 320(2):145–160.
(34) Vincent SL, Khan Y and Benes FM. 1993. Cellular distribution of dopamine D1 and D2 receptors in rat medial prefrontal cortex. J. Neurosci. 13(6):2551–2564.
(35) Yang CR, Seamans JK and Gorelova N. 1999. Developing a neuronal model for the pathophysiology of schizophrenia based on the nature of electrophysiological actions of dopamine in the prefrontal cortex. Neuropsychopharmacology 21(2):161–194.
(36) Tzschentke TM. 2001. Pharmacology and behavioral pharmacology of the mesocortical dopamine system. Prog. Neurobiol. 63(3):241–320.
(37) Sulzer D. 2007. Multiple hit hypotheses for dopamine neuron loss in Parkinson's disease. Trends Neurosci. 30(5):244–250.
REFERENCES
67

(38) Vallone D, Picetti R and Borrelli E. 2000. Structure and function of dopamine receptors. Neurosci. Biobehav. Rev. 24(1):125–132.
(39) Dailly E, Chenu F, Renard CE and Bourin M. 2004. Dopamine, depression and antidepressants. Fundam. Clin. Pharmacol. 18(6):601–607.
(40) Meyer JH. 2013. Neurochemical imaging and depressive behaviours. Curr. Top. Behav. Neurosci. 14:101–134.
(41) Lewis DA and Levitt P. 2002. Schizophrenia as a disorder of neurodevelopment. Annu. Rev. Neurosci. 25:409–432.
(42) Insel TR. 2010. Rethinking schizophrenia. Nature 468(7321):187–193.
(43) Faludi G, Dome P and Lazary J. 2011. Origins and perspectives of schizophrenia research. Neuropsychopharmacol. Hung. 13(4):185–192.
(44) Rehder V, Jensen JR and Kater SB. 1992. The initial stages of neural regeneration are dependent upon intracellular calcium levels. Neuroscience 51(3):565–574.
(45) Zheng JQ and Poo M. 2007. Calcium signaling in neuronal motility. Annu. Rev. Cell Dev. Biol. 23:375–404.
(46) Goldshmit Y, McLenachan S and Turnley A. 2006. Roles of Eph receptors and ephrins in the normal and damaged adult CNS. Brain Res. Rev. 52(2):327–345.
(47) Hou ST, Jiang SX and Smith RA. 2008. Permissive and repulsive cues and signalling pathways of axonal outgrowth and regeneration. Int. Rev. Cell Mol. Biol. 267:125–181.
(48) Bolsover S, Fabes J and Anderson PN. 2008. Axonal guidance molecules and the failure of axonal regeneration in the adult mammalian spinal cord. Restor. Neurol. Neurosci. 26(2‐3):117–130.
(49) Liu BP, Cafferty, William B J, Budel SO and Strittmatter SM. 2006. Extracellular regulators of axonal growth in the adult central nervous system. Philos. Trans. R. Soc. Lond., B, Biol. Sci. 361(1473):1593–1610.
(50) Murray AJ. 2014. Axon regeneration: what needs to be overcome? Methods Mol. Biol. 1162:3–14.
(51) Caroni P and Schwab ME. 1988. Antibody against myelin associated inhibitor of neurite growth neutralizes nonpermissive substrate properties of CNS white matter. Neuron 1(1):85–96.
(52) Schnell L and Schwab ME. 1990. Axonal regeneration in the rat spinal cord produced by an antibody against myelin‐associated neurite growth inhibitors. Nature 343(6255):269–272.
(53) Zhao R, Andrews MR, Wang D, Warren P, Gullo M, Schnell L, Schwab ME and Fawcett JW. 2013. Combination treatment with anti‐Nogo‐A and chondroitinase ABC is more effective than single treatments at enhancing functional recovery after spinal cord injury. Eur. J. Neurosci. 38(6):2946–2961.
(54) Bradbury EJ, Moon LDF, Popat RJ, King VR, Bennett GS, Patel PN, Fawcett JW and McMahon SB. 2002. Chondroitinase ABC promotes functional recovery after spinal cord injury. Nature 416(6881):636–640.
(55) Harel NY and Strittmatter SM. 2006. Can regenerating axons recapitulate developmental guidance during recovery from spinal cord injury? Nat. Rev. Neurosci. 7(8):603–616.
(56) Steward O, Zheng B, Tessier‐Lavigne M, Hofstadter M, Sharp K and Yee KM. 2008. Regenerative growth of corticospinal tract axons via the ventral column after spinal cord injury in mice. J. Neurosci. 28(27):6836–6847.
REFERENCES
68

(57) Muramatsu R, Ueno M and Yamashita T. 2009. Intrinsic regenerative mechanisms of central nervous system neurons. Biosci. Trends 3(5):179–183.
(58) Cui Q. 2006. Actions of neurotrophic factors and their signaling pathways in neuronal survival and axonal regeneration. Mol. Neurobiol. 33(2):155–179.
(59) Gao Y, Nikulina E, Mellado W and Filbin MT. 2003. Neurotrophins elevate cAMP to reach a threshold required to overcome inhibition by MAG through extracellular signal‐regulated kinase‐dependent inhibition of phosphodiesterase. J. Neurosci. 23(37):11770–11777.
(60) Cai D, Shen Y, Bellard M de, Tang S and Filbin MT. 1999. Prior exposure to neurotrophins blocks inhibition of axonal regeneration by MAG and myelin via a cAMP‐dependent mechanism. Neuron 22(1):89–101.
(61) Snyder‐Keller A, Costantini LC and Graber DJ. 2001. Development of striatal patch/matrix organization in organotypic co‐cultures of perinatal striatum, cortex and substantia nigra. Neuroscience 103(1):97–109.
(62) Heimrich B and Frotscher M. 1993. Slice cultures as a model to study entorhinal‐hippocampal interaction. Hippocampus 3 Spec No:11–17.
(63) Gähwiler BH. 1988. Organotypic cultures of neural tissue. Trends Neurosci. 11(11):484–489.
(64) Ostergaard K, Schou JP and Zimmer J. 1990. Rat ventral mesencephalon grown as organotypic slice cultures and co‐cultured with striatum, hippocampus, and cerebellum. Exp. Brain Res. 82(3):547–565.
(65) Franke H, Schelhorn N and Illes P. 2003. Dopaminergic neurons develop axonal projections to their target areas in organotypic co‐cultures of the ventral mesencephalon and the striatum/prefrontal cortex. Neurochem. Int. 42(5):431–439.
(66) Plenz D and Kitai ST. 1996. Organotypic cortex‐striatum‐mesencephalon cultures: the nigrostriatal pathway. Neurosci. Lett 209(3):177–180.
(67) Dossi E, Heine C, Servettini I, Gullo F, Sygnecka K, Franke H, Illes P and Wanke E. 2013. Functional regeneration of the ex‐vivo reconstructed mesocorticolimbic dopaminergic system. Cereb. Cortex 23(12):2905–2922.
(68) Coyle JT, Jacobowitz D, Klein D and Axelrod J. 1973. Dopaminergic neurons in explants of substantia nigra in culture. J. Neurobiol. 4(5):461–470.
(69) Schlumpf M, Shoemaker WJ and Bloom FE. 1977. Explant cultures of catecholamine‐containing neurons from rat brain: biochemical, histofluorescence, and electron microscopic studies. Proc. Natl. Acad. Sci. U.S.A. 74(10):4471–4475.
(70) Whetsell WO, Mytilineou C, Shen J and Yahr MD. 1981. The development of the dog nigrostriatal system in organotypic culture. J. Neural Transm. 52(3):149–161.
(71) Jaumotte JD and Zigmond MJ. 2005. Dopaminergic innervation of forebrain by ventral mesencephalon in organotypic slice co‐cultures: effects of GDNF. Brain Res. Mol. Brain Res 134(1):139–146.
(72) Ostergaard K, Jones SA, Hyman C and Zimmer J. 1996. Effects of donor age and brain‐derived neurotrophic factor on the survival of dopaminergic neurons and axonal growth in postnatal rat nigrostriatal cocultures. Exp. Neurol. 142(2):340–350.
(73) Gates MA, Coupe VM, Torres EM, Fricker‐Gates RA and Dunnett SB. 2004. Spatially and temporally restricted chemoattractive and chemorepulsive cues direct the formation of the nigro‐striatal circuit. Eur. J. Neurosci. 19(4):831–844.
(74) Gähwiler BH, Capogna M, Debanne D, McKinney RA and Thompson SM. 1997. Organotypic slice cultures: a technique has come of age. Trends Neurosci. 20(10):471–477.
REFERENCES
69

(75) Gähwiler BH. 1981. Morphological differentiation of nerve cells in thin organotypic cultures derived from rat hippocampus and cerebellum. Proc. R. Soc. Lond., B, Biol. Sci. 211(1184):287–290.
(76) Gähwiler BH. 1981. Organotypic monolayer cultures of nervous tissue. J. Neurosci. Methods 4(4):329–342.
(77) Stoppini L, Buchs PA and Muller D. 1991. A simple method for organotypic cultures of nervous tissue. J. Neurosci. Methods 37(2):173–182.
(78) Cho S, Wood A and Bowlby MR. 2007. Brain slices as models for neurodegenerative disease and screening platforms to identify novel therapeutics. Curr. Neuropharmacol. 5(1):19–33.
(79) Heine C and Franke H. 2014. Organotypic slice co‐culture systems to study axon regeneration in the dopaminergic system ex vivo. Methods Mol. Biol. 1162:97–111.
(80) Soderling SH and Beavo JA. 2000. Regulation of cAMP and cGMP signaling: new phosphodiesterases and new functions. Curr. Opin. Cell Biol. 12(2):174–179.
(81) Bender AT and Beavo JA. 2006. Cyclic nucleotide phosphodiesterases: molecular regulation to clinical use. Pharmacol. Rev. 58(3):488–520.
(82) Sutherland EW and Rall TW. 1958. Fractionation and characterization of a cyclic adenine ribonucleotide formed by tissue particles. J. Biol. Chem. 232(2):1077–1091.
(83) Butcher RW and Sutherland EW. 1962. Adenosine 3',5'‐phosphate in biological materials. I. Purification and properties of cyclic 3',5'‐nucleotide phosphodiesterase and use of this enzyme to characterize adenosine 3',5'‐phosphate in human urine. J. Biol. Chem. 237:1244–1250.
(84) Barnes PJ. 2013. Theophylline. Am. J. Respir. Crit. Care Med. 188(8):901–906.
(85) Menniti FS, Faraci WS and Schmidt CJ. 2006. Phosphodiesterases in the CNS: targets for drug development. Nat. Rev. Drug. Discov. 5(8):660–670.
(86) Wykes V, Bellamy TC and Garthwaite J. 2002. Kinetics of nitric oxide‐cyclic GMP signalling in CNS cells and its possible regulation by cyclic GMP. J. Neurochem. 83(1):37–47.
(87) Boess FG, Hendrix M, van der Staay, Franz‐Josef, Erb C, Schreiber R, van Staveren W, Vente J de, Prickaerts J, Blokland A and Koenig G. 2004. Inhibition of phosphodiesterase 2 increases neuronal cGMP, synaptic plasticity and memory performance. Neuropharmacology 47(7):1081–1092.
(88) Fujishige K, Kotera J and Omori K. 1999. Striatum‐ and testis‐specific phosphodiesterase PDE10A isolation and characterization of a rat PDE10A. Eur. J. Biochem. 266(3):1118–1127.
(89) Seeger TF, Bartlett B, Coskran TM, Culp JS, James LC, Krull DL, Lanfear J, Ryan AM, Schmidt CJ, Strick CA, Varghese AH, Williams RD, Wylie PG and Menniti FS. 2003. Immunohistochemical localization of PDE10A in the rat brain. Brain Res. 985(2):113–126.
(90) Siuciak JA, Chapin DS, Harms JF, Lebel LA, McCarthy SA, Chambers L, Shrikhande A, Wong S, Menniti FS and Schmidt CJ. 2006. Inhibition of the striatum‐enriched phosphodiesterase PDE10A: a novel approach to the treatment of psychosis. Neuropharmacology 51(2):386–396.
(91) Menniti FS, Chappie TA, Humphrey JM and Schmidt CJ. 2007. Phosphodiesterase 10A inhibitors: a novel approach to the treatment of the symptoms of schizophrenia. Curr. Opin. Investig. Drugs 8(1):54–59.
(92) Fleckenstein A. 1983. History of calcium antagonists. Circ. Res. 52(2):I3‐16.
(93) Knorr A. 2005. Pharmakologie der Calcium‐Antagonisten. Pharm. Unserer Zeit 34(5):380–387.
(94) Yasuda SU and Tietze KJ. 1989. Nimodipine in the treatment of subarachnoid hemorrhage. DICP 23(6):451–455.
REFERENCES
70

(95) Katz AM and Leach NM. 1987. Differential effects of 1,4‐dihydropyridine calcium channel blockers: therapeutic implications. J. Clin. Pharmacol. 27(11):825–834.
(96) Welty TE. 1987. Use of nimodipine for prevention and treatment of cerebral arterial spasm in patients with subarachnoid hemorrhage. Clin. Pharm. 6(12):940–946.
(97) Tomassoni D, Lanari A, Silvestrelli G, Traini E and Amenta F. 2008. Nimodipine and its use in cerebrovascular disease: evidence from recent preclinical and controlled clinical studies. Clin. Exp. Hypertens. 30(8):744–766.
(98) Harper AM, Craigen L and Kazda S. 1981. Effect of the calcium antagonist, nimodipine, on cerebral blood flow and metabolism in the primate. J. Cereb. Blood Flow Metab. 1(3):349–356.
(99) Kazda S and Towart R. 1982. Nimodipine: a new calcium antagonistic drug with a preferential cerebrovascular action. Acta Neurochir. 63(1‐4):259–265.
(100) Tanaka K, Gotoh F, Muramatsu F, Fukuuchi Y, Amano T, Okayasu H and Suzuki N. 1980. Effects of nimodipine (Bay e 9736) on cerebral circulation in cats. Arzneimittelforschung 30(9):1494–1497.
(101) Przuntek H, Baumgarten F v. and Mertens HG. 1986. Treatment of vasospasm due to subarachnoid hemorrhage with calcium entry blockers. Eur. Neurol. 25 Suppl 1:86–92.
(102) Brandt L, Andersson KE, Ljunggren B, Säveland H and Ryman T. 1988. Cerebrovascular and cerebral effects of nimodipine‐an update. Acta Neurochir. Suppl. 45:11–20.
(103) Hasan M, Pulman J and Marson AG. 2013. Calcium antagonists as an add‐on therapy for drug‐resistant epilepsy. Cochrane Database Syst. Rev. 3: Art. No. CD002750, 47 pages.
(104) Gelmers HJ. 1985. Calcium‐channel blockers in the treatment of migraine. Am. J. Cardiol. 55(3):B139‐B143.
(105) Greenberg DA. 1986. Calcium channel antagonists and the treatment of migraine. Clin. Neuropharmacol. 9(4):311–328.
(106) Tanaka K, Gotoh F, Muramatsu F, Fukuuchi Y, Okayasu H, Suzuki N and Kobari M. 1982. Effect of nimodipine, a calcium antagonist, on cerebral vasospasm after subarachnoid hemorrhage in cats. Arzneimittelforschung 32(12):1529–1534.
(107) Angelov DN, Neiss WF, Streppel M, Andermahr J, Mader K and Stennert E. 1996. Nimodipine accelerates axonal sprouting after surgical repair of rat facial nerve. J. Neurosci. 16(3):1041–1048.
(108) Mattsson P, Janson AM, Aldskogius H and Svensson M. 2001. Nimodipine promotes regeneration and functional recovery after intracranial facial nerve crush. J. Comp. Neurol. 437(1):106–117.
(109) Scheller C, Wienke A, Wurm F, Simmermacher S, Rampp S, Prell J, Rachinger J, Scheller K, Koman G, Strauss C and Herzfeld E. 2014. Neuroprotective efficacy of prophylactic enteral and parenteral nimodipine treatment in vestibular schwannoma surgery: a comparative study. J Neurol Surg A Cent Eur Neurosurg 75(4):251–258.
(110) Keating A. 2012. Mesenchymal stromal cells: new directions. Cell Stem Cell 10(6):709–716.
(111) Morikawa S, Mabuchi Y, Kubota Y, Nagai Y, Niibe K, Hiratsu E, Suzuki S, Miyauchi‐Hara C, Nagoshi N, Sunabori T, Shimmura S, Miyawaki A, Nakagawa T, Suda T, Okano H and Matsuzaki Y. 2009. Prospective identification, isolation, and systemic transplantation of multipotent mesenchymal stem cells in murine bone marrow. J. Exp. Med. 206(11):2483–2496.
(112) Sensebé L, Krampera M, Schrezenmeier H, Bourin P and Giordano R. 2010. Mesenchymal stem cells for clinical application. Vox Sang. 98(2):93–107.
REFERENCES
71

(113) Friedenstein AJ, Chailakhjan RK and Lalykina KS. 1970. The development of fibroblast colonies in monolayer cultures of guinea‐pig bone marrow and spleen cells. Cell Tissue Kinet. 3(4):393–403.
(114) Friedenstein AJ, Petrakova KV, Kurolesova AI and Frolova GP. 1968. Heterotopic of bone marrow. Analysis of precursor cells for osteogenic and hematopoietic tissues. Transplantation 6(2):230–247.
(115) Zuk PA, Zhu M, Ashjian P, De Ugarte, Daniel A, Huang JI, Mizuno H, Alfonso ZC, Fraser JK, Benhaim P and Hedrick MH. 2002. Human adipose tissue is a source of multipotent stem cells. Mol. Biol. Cell 13(12):4279–4295.
(116) Erices A, Conget P and Minguell JJ. 2000. Mesenchymal progenitor cells in human umbilical cord blood. Br. J. Haematol. 109(1):235–242.
(117) Pittenger MF, Mackay AM, Beck SC, Jaiswal RK, Douglas R, Mosca JD, Moorman MA, Simonetti DW, Craig S and Marshak DR. 1999. Multilineage potential of adult human mesenchymal stem cells. Science 284(5411):143–147.
(118) Dominici M, Le Blanc K, Mueller I, Slaper‐Cortenbach I, Marini F, Krause D, Deans R, Keating A, Prockop D and Horwitz E. 2006. Minimal criteria for defining multipotent mesenchymal stromal cells. The International Society for Cellular Therapy position statement. Cytotherapy 8(4):315–317.
(119) Mabuchi Y, Houlihan DD, Akazawa C, Okano H and Matsuzaki Y. 2013. Prospective isolation of murine and human bone marrow mesenchymal stem cells based on surface markers. Stem Cells Int 2013:Art. ID 507301, 7 pages.
(120) Phinney DG and Isakova I. 2005. Plasticity and therapeutic potential of mesenchymal stem cells in the nervous system. Curr. Pharm. Des. 11(10):1255–1265.
(121) Woodbury D, Schwarz EJ, Prockop DJ and Black IB. 2000. Adult rat and human bone marrow stromal cells differentiate into neurons. J. Neurosci. Res. 61(4):364–370.
(122) Parr AM, Tator CH and Keating A. 2007. Bone marrow‐derived mesenchymal stromal cells for the repair of central nervous system injury. Bone Marrow Transplant. 40(7):609–619.
(123) Uccelli A, Moretta L and Pistoia V. 2008. Mesenchymal stem cells in health and disease. Nat. Rev. Immunol. 8(9):726–736.
(124) Tolar J, Le Blanc K, Keating A and Blazar BR. 2010. Concise review: hitting the right spot with mesenchymal stromal cells. Stem Cells 28(8):1446–1455.
(125) Aertker BM, Bedi S and Cox CS. 2015. Strategies for CNS repair following TBI. Exp. Neurol. in press.
(126) Drago D, Cossetti C, Iraci N, Gaude E, Musco G, Bachi A and Pluchino S. 2013. The stem cell secretome and its role in brain repair. Biochimie 95(12):2271–2285.
(127) Horwitz EM and Dominici M. 2008. How do mesenchymal stromal cells exert their therapeutic benefit? Cytotherapy 10(8):771–774.
(128) Pevsner‐Fischer M, Levin S and Zipori D. 2011. The origins of mesenchymal stromal cell heterogeneity. Stem Cell Rev 7(3):560–568.
(129) Kucia M, Reca R, Campbell FR, Zuba‐Surma E, Majka M, Ratajczak J and Ratajczak MZ. 2006. A population of very small embryonic‐like (VSEL) CXCR4(+)SSEA‐1(+)Oct‐4+ stem cells identified in adult bone marrow. Leukemia 20(5):857–869.
(130) Heider A, Danova‐Alt R, Egger D, Cross M and Alt R. 2013. Murine and human very small embryonic‐like cells: a perspective. Cytometry A 83(1):72–75.
REFERENCES
72

Summary
Introduction and the aim of the thesis
The loss of neurons and their projections, is a common feature of mechanical injuries of the brain
and of neurological diseases. This loss results in the disturbance of the affected neuronal circuits.
Due to their importance in the regulation of many physiological and psychological functions in the
CNS, the impairment of dopaminergic projections, resulting in disorders like e.g. Parkinson’s disease,
depression and schizophrenia, is especially severe. The most important dopaminergic projections
originate in the ventral mesencephalon (VM) containing among others the ventral tegmental area
(VTA) and the substantia nigra (SN) pars compacta. Cell bodies of most of the brains dopaminergic
cells, which are characterized by the expression of the key enzyme of dopamine (DA) synthesis: the
tyrosine hydroxylase (TH), are located in the VM. Mesostriatal projections innervating the striatum
(STR), mesocortical projections targeting cortical regions such as the prefrontal cortex (PFC), and
mesolimbic projections innervating in limbic regions, are distinguished according to their target
regions.
New therapeutical approaches have to be developed and evaluated for the treatment of those
diseases resulting from the impairment of dopaminergic projections or from mechanical lesions e.g.
after traumatic brain injury. For this purpose, appropriate experimental models are needed. In recent
decades, organotypic brain slice cultures were established as versatile and effective models. One of
the main advantages of these models, in comparison to primary cell culture, is the preservation of
the complex cytoarchitecture in the brain tissue under ex vivo conditions. Moreover, the specific
innervation of target regions within slice co‐cultures of projection systems corresponds to the in vivo
situation. Compared to in vivo experimental models, there is better accessibility to the sample
material, and the extracellular milieu can be controlled more precisely.
The aim of the work presented here was (i) to evaluate substances and cell populations with regard
to their neuronal fiber/neurite growth‐promoting properties, utilizing mesostriatal (VTA/SN+STR) and
mesocortical (VTA/SN+PFC) co‐cultures. Furthermore, it was intended (ii) to analyze possible toxic
effects with appropriate methods and (iii) to investigate the influence of the treatment on gene
expression after the cultivation.
Summary of the applied methods
The preparation of the above introduced brain slice co‐cultures started with brains of neonatal mice
or rats (P0‐3). The co‐cultures were cultivated on semipermeable membrane inserts for 10‐11 days in
vitro. The substances were added to the culture medium, whenever the medium was changed. The
SUMMARY - Introduction, aim and methods
73

cell populations to be tested were seeded on coated glass slides and placed underneath the
membrane inserts without direct contact to the co‐cultures. The glass slides were replaced by new
ones when cells were confluent.
For the analysis of neuroregenerative processes within the co‐cultures, newly built neurites were
visualized by biocytin tracing; dopaminergic structures were detected with the immunostaining of
TH. For the tracing, biocytin crystals were placed directly onto the VTA/SN. After the uptake of the
tracer by the cells, it was transported anterogradely into the cellular processes. After the fixation of
the co‐cultures the biocytin‐labeled structures were visualized with immunohistochemical methods.
Microscopic images of the border region between the two brain slices of the co‐cultures that were
taken, following biocytin tracing or TH labeling, were used for the quantification of fiber density,
applying automated image processing procedures. The percentage of pixels belonging to fibrous
structures was determined using this procedure.
In addition to fiber growth analysis, toxicological effects and the effects on gene expression
potentially exerted by the tested substances or cells were analyzed. Necrotic cell death was assessed
by the quantification of (a) the activity of the lactate dehydrogenase (LDH) released from the tissue,
and (b) propidium iodide (PI) uptake by the cells. Apoptotic events were detected by the
immunostaining of active caspase 3 in tissue sections and subsequently quantified by the counting of
active caspase 3‐positive cell bodies. Further, gene expression in co‐cultures and cells has been
analyzed on microarrays and with quantitative real time reverse transcription polymerase chain
reaction (qPCR), on the RNA level, and by immunostainings, on the protein level.
Results
Phosphodiesterase inhibitors in rat mesostriatal co‐cultures
Cyclic adenosine/guanosine monophosphates (cAMP/cGMP) are second messengers that mediate
many important signaling pathways within a cell. The degradation of cAMP and cGMP by 3’,5’‐cyclic‐
nucleotide phosphodiesterases (PDEs) inactivates these pathways. In the work presented here, we
focused on two PDE families: PDE2 and PDE10. As there is only one gene/isoform (PDE2A and
PDE10A, respectively) belonging to each of these two families, I will refer to them as PDE2 and
PDE10, in the following. Both PDE2 and PDE10 are strongly expressed in the STR.
With the first experiments, IC50 values of the tested PDE inhibitors (PDE‐I) were determined, using
human purified proteins from each PDE family. It was shown that both the inhibitors of PDE2 (BAY60‐
7550, ND7001) and of PDE10 (MP‐10) are highly potent and highly specific for the respective isoform.
In addition, the cGMP level was measured following the PDE2‐I application to HEK293 cells stably
transfected with the complete sequence encoding for the human PDE2. It was found that PDE2‐Is
increased the cGMP level in a concentration‐dependent manner.
SUMMARY - Results
74

In another set of experiments, co‐cultures of the mesostriatal projection system of rats were
characterized immunohistochemically after 10‐11 days in vitro. Besides the analysis of the expression
of dopaminergic (TH), neuronal (microtubule‐associated protein 2, MAP2, βIII‐tubulin) and glial (glial
fibrillary acidic protein, GFAP) markers employing multiple fluorescence stainings, the expression of
PDE2 and PDE10 in the co‐cultures was of interest. Both PDE isoforms were detected on fibers and
cell bodies in VTA/SN and STR, respectively. No co‐localization of the PDE2 or PDE10 with TH was
found.
Following the characterization of substances and co‐cultures as described above, the co‐cultures
were treated with BAY60‐7550, ND7001 and MP‐10. The biocytin tracing and immunohistochemical
staining of TH revealed that BAY60‐7550 and ND7001 increased neurite outgrowth in a similar
fashion to the nerve growth factor (NGF). In contrast, MP‐10 did not enhance fiber density compared
to the vehicle control (0.1% DMSO). These observations suggest an involvement of PDE2‐regulated
cell signaling pathways in the neuronal fiber outgrowth within the mesostriatal system.
Nimodipine in rat mesocortical co‐cultures
The dihydropyridine derivative nimodipine is a specific inhibitor of L‐type voltage gated calcium
channels with a vasodilatory effect, preferentially on cerebral blood vessels. Additionally, nimodipine
was shown to inhibit calcium channels that are expressed by neurons. Studies in animal models and
clinical trials have demonstrated the neuroregenerative and neuroprotective properties of
nimodipine in the peripheral nervous system. However, the underlying mode of action had not been
elucidated so far.
The aim of the work presented here was to examine the influence of nimodipine on gene expression
and neurite outgrowth in mesocortical rat co‐cultures. Employing microarrays, the comparison of
gene expression patterns of VTA/SN and PFC, which were divided after the cultivation and analyzed
separately, revealed that the expression of the immediate early genes (Arc, Egr1, Egr2, Egr4, Fos and
JunB) was increased in the 10 µM nimodipine‐treated samples of the PFC. However, neuronal fiber
growth quantification following treatment with 10 µM nimodipine revealed that there was no
significant change in fiber density in the border region between the two brain slices of the co‐
cultures in comparison to vehicle control co‐cultures (0.1% ethanol). Instead, it was found that 10 µM
nimodipine induced the activation of caspase 3. In contrast, the number of active caspase 3‐positive
cells was not altered by the application of 0.1 µM and 1 µM nimodipine. None of the tested
concentrations of nimodipine (0.1‐10 µM) influenced the amount of LDH release nor the uptake of PI
by the co‐cultures. Neurite growth analysis was repeated with 0.1 µM and 1 µM nimodipine and a
significant enhancement in fiber density was found, similar to the effect of NGF.
SUMMARY - Results
75
To get some insight into the mechanisms, underlying the observed enhanced neurite outgrowth
induced by 0.1 µM and 1 µM nimodipine, the expression levels of selected genes were quantified
with qPCR, following cultivation and treatment. The genes were coding for (a) glial (Gfap) and
oligodendrocytic structure proteins (Mal, Mog, Plp1), (b) calcium binding proteins (Pvalb, S100b) and
(c) immediate early genes (Arc, Egr1, Egr2, Egr4, Fos and JunB). With one exception (Egr4), the
expression of the genes of interest was not significantly altered by nimodipine treatment, when
compared to the vehicle control samples.
In conclusion, besides the well‐described indications of nimodipine application (inhibition of delayed
cerebral ischemia caused by vasospasms following subarachnoid hemorrhage; perioperative
application during surgery of vestibular schwannoma), this study demonstrates the concentration‐
dependent neurite growth‐promoting effect of nimodipine within a model of a CNS projection
system.
MSC‐derived cell populations and mouse mesocortical co‐cultures
With regard to new therapeutical strategies for the treatment of neurological and neurodegenerative
diseases, research on cell therapies has attracted enormous attention in the last decades with a
special focus on mesenchymal stromal/stem cells (MSCs). An enhancement of neurite outgrowth by
MSCs has been shown in many in vitro and in vivo studies. These findings indicate a
neuroregenerative potential of these cells that seems to result from the release of
immunomodulatory and trophic factors.
Bulk MSCs, classically obtained by plastic adhesion, are generally heterogeneous. Different isolation
and cultivation protocols yield MSC cultures with different proportions of the respective
subpopulations, resulting in varying compositions of the above‐mentioned secreted factors. There
have been efforts to isolate and characterize homogeneous subpopulations, e.g. with regard to
specific surface markers by fluorescence‐activated cell sorting from bulk MSCs. One of these
described subpopulations are Sca‐1+Lin‐CD45‐‐derived MSCs (SL45‐MSCs).
The aim of the present work was the comparison of bulk bone marrow (BM) derived MSCs (bulk BM‐
MSCs) and SL45‐MSCs, both obtained from the BM of adult mice. The basic characterization of the
two MSC populations revealed that (a) SL45‐MSCs contain 105‐fold higher portion of fibroblast colony
forming units (CFU‐f), (b) the morphological appearance of the rather small SL45‐MSCs was more
homogeneous, (c) nestin was significantly higher expressed in SL45‐MSCs, while there was no
difference in βIII‐tubulin expression between the cell populations (both proteins are considered as
markers for mesenchymal cells as well as for progenitors of the mesenchymal and neuronal lineage)
and (d) transcripts coding for several growth factors (e.g. BDNF, FGF2, GDNF, and NGF) were
SUMMARY - Results
76

detected in RNA extracts of samples of both cell populations, with a significantly higher expression of
BDNF and FGF2 in SL45‐MSCs, which was confirmed for BDNF on the protein level.
For the evaluation of neurite growth‐promoting properties on mesocortical mouse co‐cultures, the
MSCs were seeded on glass slides that were placed underneath the membrane inserts without direct
contact to the co‐cultures. A significantly enhanced neuronal fiber growth within the co‐cultures was
induced by both bulk BM‐MSCs and SL45‐MSCs, when compared to untreated and BDNF‐treated
control co‐cultures. Comparing the two MSC populations, neurite density in the co‐cultures was
increased to a higher degree by SL45‐MSCs (being significantly higher than the fiber density resulting
from BDNF treatment), possibly due to the higher expression of BDNF and FGF2, as described and to
other factors secreted by SL45‐MSCs.
Hence, this study clearly demonstrated that the isolation method applied to obtain MSC preparations
influences their neuroregenerative properties. The more homogeneous SL45‐MSCs possess a higher
potency with regard to CFU‐f and to the fiber growth enhancement potential in the mesocortical
projection system.
Conclusions and Outlook
The neurite regrowth after injury or in neurological diseases is a complex process with many intrinsic
and extrinsic orchestrating factors. The growth‐promoting effects of (i) the modulation of second
messenger (cAMP, cGMP) turnover with PDE‐Is, (ii) the partial blockade of calcium currents by
nimodipine and (iii) the paracrine effects of MSCs, e.g. by secretion of growth factors, as
demonstrated in the studies presented here, reflect the diversity of potential molecular targets for
the enhancement of regenerative neurite regrowth.
However, the detailed molecular mechanisms underlying the above mentioned observations remain
to be elucidated in further studies. Moreover, it is not fully understood, to which extent the different
cell types of the CNS contribute to the beneficial effects of the applied treatments during the
different phases of regeneration. A better understanding of the intracellular signaling events and
their interactions would allow to make use of potential synergistic effects of different treatment,
more efficiently.
SUMMARY - Conclusions and outlook
77

Zusammenfassung
Einführung und Zielstellung der Arbeit
Der Verlust von Nervenzellen und deren Fortsätzen ist sowohl die Folge mechanischer Verletzungen
des Gehirns als auch ein gemeinsamer Aspekt vieler neurologischer Erkrankungen. Dieser Verlust
führt zur Störung betroffener Projektionsbahnen. Bedingt durch die große Bedeutung dopaminerger
(DAerger) Projektionen für physiologische und psychologische Funktionen, wie die gezielte
Ausführung von Bewegungsabläufen, Belohnung und Kognition; sind Beeinträchtigungen dieser
Projektionssysteme besonders schwerwiegend und werden in Krankheitsbildern, wie zum Beispiel
Morbus Parkinson, Depression oder Schizophrenie deutlich. Die wichtigsten DAergen
Projektionsbahnen haben ihren Ursprung im ventralen Mesencephalon (VM), das unter anderem das
ventrale tegmentale Areal (VTA) und die Substantia nigra (SN) pars compacta enthält. In diesen
Regionen des Gehirns befindet sich ein Großteil der DAergen Zellkörper des Gehirns, die sich durch
die Expression des Schlüsselenzyms der Dopamin (DA)‐Synthese, der Tyrosin‐Hydroxylase (TH),
auszeichnen. Die einzelnen Projektionsbahnen werden nach den Zielgebieten unterschieden:
mesostriatale Projektionen innervieren das Striatum (STR), mesokortikale Projektionen innervieren
kortikale Regionen, z.B. den präfrontalen Kortex (PFC), und mesolimbische Projektionen innervieren
limbische Areale.
Um die Störungen der DAergen Projektionen oder auch mechanische Verletzungen des Gehirns, z.B.
nach Schädel‐Hirn‐Traumen, adäquat behandeln zu können, müssen neue Therapieformen
entwickelt und geprüft werden. Dafür sind geeignete Modellsysteme notwendig. In den letzten
Jahrzehnten wurden organotypische Hirnschnittkulturen als vielseitige und effektive Modelle
etabliert. Ein entscheidender Vorteil dieser Modelle gegenüber Primärzellkulturen ist der Erhalt der
komplexen Cytoarchitektur des Gehirngewebes unter Kulturbedingungen. Darüber hinaus wurde in
Co‐Kulturen aus zwei oder mehreren Hirnschnitten gezeigt, dass das zielgerichtete Auswachsen
neuronaler Fortsätze unter ex vivo‐Bedingungen den in vivo‐Mustern entsprechend erfolgt.
Gegenüber klassischen in vivo‐Versuchen bieten organotypische Kulturen eine bessere Zugänglichkeit
zum Probenmaterial und erlauben die genaue Kontrolle des extrazellulären Milieus.
Ziel der hier dargestellten Arbeit war die Charakterisierung verschiedener Substanzen und
Zellpopulationen hinsichtlich ihrer Wirkung auf das neuronale Faserwachstum (auch als
Neuritenwachstum bezeichnet) unter Verwendung von mesostriatalen (VTA/SN+STR) und
mesokortikalen (VTA/SN+PFC) Gewebe‐Co‐Kulturen. Mögliche toxische (Neben‐)Wirkungen an den
Co‐Kulturen sollten mit geeigneten Methoden erfasst werden. Weiterhin sollten im Anschluss an die
Kultivierung eventuelle Einflüsse der Behandlung auf die Genexpression untersucht werden.
ZUSAMMENFASSUNG - Einführung und Zielstellung
78

Überblick über die angewandten Methoden
Auf die Präparation der oben beschriebenen Co‐Kulturen aus Hirngewebsschnitten neugeborener
Ratten oder Mäuse (P0‐3) folgte die Kultivierung auf semipermeablen Membraneinsätzen für einen
Zeitraum von 10‐11 Tagen. Die Substanzen wurden bei jedem Medienwechsel über das
Kulturmedium appliziert. Die zu testenden Zellen wurden auf Glasplättchen unterhalb der
Membraneinsätze ohne direkten Kontakt zu den Co‐Kulturen platziert und bei Konfluenz
ausgetauscht.
Zur Analyse neuroregenerativer Prozesse in den Co‐Kulturen wurden die neu auswachsenden
Neuriten mittels Biocytin‐Tracing dargestellt bzw. die DAergen Strukturen durch
immunohistochemische Färbung von TH nachgewiesen. Für die erstgenannte Methode wurden
Biocytinkristalle auf die VTA/SN aufgebracht. Der Tracer wurde von den Zellen aufgenommen und
anterograd in die Fortsätze transportiert. Nach Fixierung der Co‐Kulturen wurden die so markierten
Zellkörper und Fortsätze mit immunhistochemischen Methoden sichtbar gemacht. Die
Quantifizierung der Faserdichte nach Tracing oder TH‐Färbung erfolgte an mikroskopischen
Aufnahmen der Grenzregion zwischen den zwei Hirnschnitten einer Co‐Kultur mittels digitaler
Bildverarbeitung. Dabei wurde der Anteil der Pixel im Bild, der Neuriten zuzuordnen ist, bestimmt.
Darüber hinaus kamen Methoden zur Untersuchung toxischer Eigenschaften der Substanzen und der
Wirkung auf die Genexpression in den Co‐Kulturen zum Einsatz: Die Quantifizierung nekrotischer
Zelluntergänge erfolgte durch (a) die Aktivitätsbestimmung der aus dem Gewebe freigesetzten
Laktatdehydrogenase (LDH) und (b) die Quantifizierung der Propidiumiodid (PI)‐Aufnahme durch
beschädigte Zellen. Apoptotische Vorgänge infolge der Substanzapplikation wurden mittels
Immunfluoreszenz‐Markierung und Quantifizierung des frühen Apoptose‐Markers, der aktivierten
Caspase 3, in den Gewebeschnitten erfasst. Weiterhin war die Analyse der Expression verschiedener
Gene in den Co‐Kulturen und Zellen Gegenstand der experimentellen Arbeiten. Verwendete
Methoden waren auf RNA‐Ebene Microarray‐Untersuchungen und quantitative Echtzeit‐Reverse‐
Transkriptase‐Polymerase‐Kettenreaktion (qPCR), sowie auf Proteinebene immunhistochemische
Färbungen.
Ergebnisse
Phosphodiesterase‐Inhibitoren in mesostriatalen Co‐Kulturen der Ratte
Die zyklischen Mononukleotide cAMP und cGMP (zyklisches Adenosin‐bzw. Guanosinmonophosphat)
sind second messenger, über die viele wichtige Vorgänge in der Zelle vermittelt werden. Die
„Abschaltung“ des Signals erfolgt enzymatisch durch Phosphodiesterasen (PDEs). In der vorliegenden
Arbeit lag der Fokus auf PDE2A und PDE10A. Da dies jeweils die einzigen Isoformen der PDE2‐ bzw.
ZUSAMMENFASSUNG - Methoden und Ergebnisse
79

PDE10‐Familie sind, werde ich mich im Folgenden mit PDE2 bzw. PDE10 auf sie beziehen. Eine
deutliche Expression von beiden PDEs, PDE2 und PDE10, ist im STR gezeigt worden.
Der erste Teil dieser Studie bestand in der Bestimmung der IC50‐Werte der ausgewählten PDE‐
Inhibitoren (Is) unter Verwendung gereinigter humaner Proteine jeder PDE‐Familie. Es konnte gezeigt
werden, dass sowohl die PDE2‐Is (BAY60‐7550, ND7001) als auch der PDE10‐I (MP‐10) hochspezifisch
und potent wirken. Die Applikation der PDE2‐Is in Kulturen der Zelllinie HEK293, die stabil mit der
vollständigen Sequenz der humanen PDE2 transfeziert war, führte zu einer
konzentrationsabhängigen Erhöhung von cGMP.
Mit weiteren Versuchen wurden organotypische Co‐Kulturen (VTA/SN+STR) im Anschluss an die
Kultivierung immunhistochemisch charakterisiert. Neben der Untersuchung der Expression DAerger
(Tyrosinhydroxylase, TH), neuronaler (Mikrotubuli‐assoziiertes Protein 2, MAP2, βIII‐Tubulin) und
gliärer (Saures Gliafaserprotein, GFAP) Markerproteine mittels Mehrfachfluoreszenzfärbungen war
die Expression von PDE2 und PDE10 von Interesse. Beide PDEs wurden jeweils in den Zellkörpern und
Fasern in VTA/SN und STR detektiert. Weder PDE2 noch PDE10 war mit TH co‐lokalisiert.
Nach den oben beschriebenen Charakterisierungen der PDE‐Is und der Co‐Kulturen erfolgte die
Behandlung der Co‐Kulturen mit BAY60‐7550, ND7001 und MP‐10, gefolgt von der Quantifizierung
des neuronalen Faserwachstums mittels Biocytin‐Tracing und nach immunhistochemischer Detektion
der TH. BAY60‐7550 und ND7001 verstärkten das Auswachsen der Neuriten, ähnlich dem
Wachstumsfaktor NGF (engl. nerve growth factor). MP‐10 bewirkte hingegen keinen
wachstumsfördernden Effekt im Vergleich zur Lösungsmittel‐Kontrolle (0,1% DMSO). Diese
Beobachtungen legen eine Beteiligung PDE2‐regulierter Signalwege am neuronalen Faserwachstum
nahe.
Nimodipin in mesokortikalen Co‐Kulturen der Ratte
Das Dihydropyridinderivat Nimodipin ist ein spezifischer Inhibitor des spannungsgesteuerten
Calciumkanals vom L‐Typ mit gefäßerweiternder Wirkung ‐ vorwiegend auf zerebrale Blutgefäße.
Zudem ist eine Wirkung der Substanz auf die Calciumkanäle von Neuronen bekannt. Präklinische und
klinische Studien konnten eine neuroregenerative bzw. neuroprotektive Wirkung von Nimodipin im
peripheren Nervensystem zeigen, wobei der zugrunde liegende Wirkmechanismus bisher nicht
bekannt ist. In der vorliegenden Arbeit sollte in mesokortikalen Co‐Kulturen der Ratte eine mögliche
Regulation der Genexpression mittels Microarray‐Untersuchungen sowie ein Einfluss auf das
Auswachsen von Neuriten durch Nimodipin geprüft werden. Die Analyse der Genexpressionsmuster
in VTA/SN und PFC, die nach der Kultivierung und Behandlung der Co‐Kulturen getrennt voneinander
untersucht wurden, ergab eine erhöhte Expression von sogenannten „Frühe‐Antwort‐Genen (engl.
immediate early genes)“ (Arc, Egr1, Egr2, Egr4, JunB und Fos) in den Proben des PFC in der mit 10 µM
ZUSAMMENFASSUNG - Ergebnisse
80

Nimodipin behandelten Gruppe. Die nachfolgende Quantifizierung des Neuritenwachstums nach
Behandlung mit 10 µM Nimodipin ergab jedoch, dass diese Konzentration der Substanz die
Neuritendichte in der Grenzregion zwischen VTA/SN und PFC im Vergleich zu Kontroll‐Co‐Kulturen
nicht signifikant veränderte. Stattdessen ergaben toxikologische Untersuchungen, dass 10 µM
Nimodipin die Aktivierung der Caspase 3 induzierte. Nach Behandlung mit 0,1 µM und 1 µM
Nimodipin wurde keine Veränderung der Anzahl aktiver Caspase 3‐positiver Zellen beobachtet. Ein
Einfluss auf die Freisetzung von LDH bzw. der Aufnahme von PI wurde bei keiner der applizierten
Nimodipin‐Konzentrationen (0,1 µM‐10 µM) gefunden. Eine erneute Neuritenwachstumsstudie mit
0,1 µM und 1 µM Nimodipin zeigte eine Erhöhung der Neuritendichte, ähnlich der nach Applikation
des Wachstumsfaktors NGF. Um Einblick in den molekularen Wirkmechanismus zu bekommen, der
dem verstärkten Auswachsen der Neuriten zu Grunde liegen könnte, wurde im Anschluss an die
Kultivierung und die Behandlung mit 0,1 µM und 1 µM Nimodipin die Expression von Genen
kodierend für (a) Strukturproteine von Gliazellen (Gfap) und Oligodendrozyten (Mal, Mog, Plp1), (b)
Calcium‐bindende Proteine (Pvalb, S100b) und (c) „Frühe‐Antwort‐Gene“ (Arc, Egr1, Egr2, Egr4, JunB
und Fos) mittels qPCR untersucht. Mit einer Ausnahme (Egr4) wurden durch die Behandlung mit
Nimodipin keine signifikanten Veränderungen der Expression der betrachteten Gene im PFC im
Vergleich zu den Kontrollgruppen (unbehandelt und Lösungsmittelkontrolle: 0,1% Ethanol) gefunden.
Mit dieser Studie konnte am Beispiel mesokortikaler Co‐Kulturen erstmals gezeigt werden, dass
Nimodipin neben den bisher bekannten Anwendungen (z.B. Verhinderung von verzögerter zerebraler
Ischämie durch Vasospasmen infolge von Subarachnoidalblutung, perioperative Applikation bei
operativer Entfernung von Vestibularschwannomen) in Abhängigkeit der Konzentration einen
regenerativen Effekt im zentralen Nervensystem hat.
MSC‐Populationen und mesokortikale Co‐Kulturen der Maus
Im Hinblick auf neue Behandlungsstrategien für neurologische und neurodegenerative Erkrankungen
ist die Verwendung von Zelltherapien seit einigen Jahren ein intensiv beforschtes Feld. Dabei richtete
sich besondere Aufmerksamkeit auf mesenchymale Stroma‐/Stammzellen (MSCs). Das in zahlreichen
in vitro‐ und in vivo‐Studien beobachtete neuroregenerative Potential von MSCs, das sich u.a. durch
eine Verstärkung des neuronalen Faserwachstums zeigte, scheint auf die Sezernierung
immunmodulatorischer und wachstumsfördernder Faktoren zurückzuführen zu sein. Bei klassisch
durch Adhäsion auf Plastikoberflächen gewonnenen MSCs handelt es sich um eine heterogene
Zellpopulation (bulk MSCs), wobei die Anteile der entsprechenden Subpopulationen in Abhängigkeit
von Isolierungs‐ und Kultivierungsprotokollen variieren können. Daraus ergeben sich voneinander
abweichende Zusammensetzungen der freigesetzten Faktoren. In der Vergangenheit gab es
Bemühungen, einzelne Subpopulationen zu isolieren und zu charakterisieren. Dies erfolgt zum
ZUSAMMENFASSUNG - Ergebnisse
81

Beispiel anhand der exprimierten Zelloberflächenmarker mittels Fluoreszenz‐aktivierter
Zellsortierung ausgehend von bulk MSCs. Eine der bisher beschriebenen Subpopulationen sind die
Sca‐1+Lin‐CD45‐(SL45)‐MSCs.
In der vorliegenden Studie sollten aus dem Knochenmark (engl. bone marrow, BM) von adulten
Mäusen gewonnene bulk BM‐MSCs mit der daraus isolierten SL45‐MSC‐Subpopulation verglichen
werden. Die Grundcharakterisierung der beiden Zellpopulationen zeigte, dass sich die SL45‐MSCs von
den bulk BM‐MSCs durch einen 105‐fach höheren Anteil an kolonieformenden Einheiten (CFU‐f)
unterschieden. Zudem waren sie von gleichmäßigerer Morphologie, mit vorwiegend kleineren Zellen.
Die Expression von Nestin war in den SL45‐MSCs signifikant höher, während es keinen Unterschied in
Bezug auf die Expression von βIII‐Tubulin gab. Beide Proteine gelten als Marker sowohl für
mesenchymale Zellen als auch für Vorläuferzellen neuronaler und mesenchymaler Linien. Die
Expression verschiedener Wachstumsfaktoren (BDNF, FGF2, GDNF, NGF, u.a.) wurde mittels qPCR in
RNA‐Extrakten beider Zellpopulationen nachgewiesen, wobei eine signifikant höhere Expression von
BDNF und FGF2 durch SL45‐MSCs festgestellt wurde, die im Fall von BDNF auch auf Proteinebene
bestätigt werden konnte.
Zur Bestimmung wachstumsfördernder Eigenschaften der MSC‐Populationen auf Neuriten in
mesokortikalen Co‐Kulturen der Maus wurden bulk BM‐MSCs und SL45‐MSCs jeweils auf
Glasplättchen ohne direkten Kontakt zu den Gewebe‐Co‐Kulturen unterhalb der Membraneinsätze
eingebracht.
Beide untersuchten Zellpopulationen steigerten das Neuriten‐Wachstum in den Co‐Kulturen
signifikant, wobei der Effekt der SL45‐MSCs stärker (signifikant höhere Neuritendichte als nach
Behandlung mit BDNF) ausfiel als der der bulk BM‐MSCs. Eine mögliche Erklärung dafür könnte u.a.
die gezeigte höhere Expression von BDNF und FGF2 sowie weiterer nicht identifizierter durch die
SL45‐MSCs sezernierter Faktoren sein.
Die Studie machte also deutlich, dass MSC‐Populationen, die mit verschiedenen Isolationsmethoden
gewonnen wurden, unterschiedliche neuroregenerative Eigenschaften aufweisen. Die homogeneren
SL45‐MSCs sind potenter als die bulk BM‐MSCs, sowohl im Hinblick auf die Bildung von Kolonien als
auch im Hinblick auf die regenerationsfördernde Wirkung im mesokortikalen Projektionssystem.
Fazit und Ausblick
Das erneute Auswachsen von Neuriten infolge mechanischer Schädigung oder neurologischer
Erkrankungen umfasst ein komplexes Zusammenspiel verschiedener extrinsischer und intrinsischer
Faktoren. Die wachstumsfördernden Wirkungen (i) der PDE‐Is, die in die Deaktivierung der second
messenger cAMP/cGMP eingreifen, (ii) der teilweisen Blockade von Calciumströmen durch Nimodipin
und (iii) der parakrinen Effekte von MSCs, z.B. durch die Freisetzung von Wachstumsfaktoren; wie es
ZUSAMMENFASSUNG - Fazit und Ausblick
82

in den hier dargestellten Studien gezeigt wurde, verdeutlicht die Vielfältigkeit möglicher molekularer
Angriffspunkte für die Verstärkung regenerativen Auswachsens neuronaler Fasern.
Die molekularen Mechanismen, die den beschriebenen Effekten zugrunde liegen, müssen jedoch
Gegenstand zukünftiger Studien sein. Darüber hinaus ist bisher nicht vollständig verstanden, über
welche Zelltypen des ZNS die Effekte der Behandlungen in den verschiedenen Phasen der
Regeneration vermittelt werden. Mit einem umfassenden Verständnis der intrazellulären Signalwege
und deren Wechselwirkungen könnten mögliche synergistische Effekte von verschiedenen
Behandlungen effizient genutzt werden.
ZUSAMMENFASSUNG - Fazit und Ausblick
83

Curriculum Vitae
Personal Data Name Katja Sygnecka, born Kohlmann Contact private: Oststr. 95, 04317 Leipzig Phone: 01577 195 44 93 [email protected]
functional: Rudolf Boehm Institute of Pharmacology and Toxicology, Leipzig University
Härtelstr. 16‐18, 04107 Leipzig [email protected]‐leipzig.de [email protected]‐leipzig.de
Date of birth 23rd December 1983
Nationality German
Research Experience
since 2009/07 Research assistant, PhD student TRM Leipzig/ Rudolf Boehm Institute of Pharmacology and Toxicology, Leipzig University
Subject: Organotypic brain slice co‐cultures: an ex vivo high content analysis tool for multiple applications.
2008/12‐2009/06 Research assistant Institute of Anatomy, Leipzig University Subject: Regulated intramembranous proteolysis of KIT – a process relevant for arteriosclerosis?
2007/05‐12 Student research assistant Endocrinological Research Laboratory, University Hospital Leipzig Techniques: PCR, cloning, protein isolation, chelate‐chromatography and western blot
Formal Education 2008/09 Graduation with public defense as Dipl. Biochem.
2008/04‐09 Diploma thesis Institute of Biochemistry, Faculty of Medicine, Leipzig University, Subject: Establishment of a protocol for chromatin immune precipitations (ChIP).
2007/03‐04 Project work Division of Molecular biological‐biochemical Processing Technology, Center for Biotechnology and Biomedicine (BBZ) Subject: Establishment of an impedance‐based screening system for the detection of apoptotic events in suspension cell lines
2005 – 2006 Study abroad: Biochemistry/Biotechnology at INSA de Lyon in Lyon, France
2003 – 2008 Study of Biochemistry at the Leipzig University
1994 – 2003 Grammar school Lucas‐Cranach‐Gymnasium, Lutherstadt Wittenberg, Certificate: Abitur
CV
84

Track Record
Research Articles
C. Heine, K. Sygnecka, N. Scherf, M. Grohmann, A. Bräsigk, H. Franke (2015) P2Y1 receptor mediated neuronal fibre outgrowth in organotypic brain slice co‐cultures. Neuropharmacology 93:252‐266
K. Sygnecka, A. Heider, N. Scherf, R. Alt R, H. Franke, C. Heine. (2015) Mesenchymal Stem Cells Support Neuronal Fiber Growth in an Organotypic Brain Slice Co‐culture Model. Stem cells and development 24(7):824‐835
K. Sygnecka*, C. Heine*, N. Scherf, M. Fasold, H. Binder, C. Scheller, H. Franke. (2015) Nimodipine enhances neurite outgrowth in dopaminergic brain slice co‐cultures. International journal of developmental neuroscience 40:1–11.
E. Dossi, C. Heine, I. Servettini, F. Gullo, K. Sygnecka, H. Franke, P. Illes, E. Wanke. (2013) Functional regeneration of the ex‐vivo reconstructed mesocorticolimbic dopaminergic system. Cerebral cortex 23:2905–2922.
C. Heine*, K. Sygnecka* N. Scherf, A. Berndt, U. Egerland, T. Hage, H. Franke. (2013) Phosphodiesterase 2 inhibitors promote axonal outgrowth in organotypic slice co‐cultures. Neurosignals 21:197–212.
C. Merkwitz, P. Lochhead, N. Tsikolia, D. Koch, K. Sygnecka, M. Sakurai, K. Spanel‐Borowski, A.M. Ricken. (2011) Expression of KIT in the ovary, and the role of somatic precursor cells. Progress in histochemistry and cytochemistry 46(3):131‐84.
* The authors KS and CH contributed equally to the studies
Poster Presentations
K. Sygnecka, C. Heine, N. Scherf, H. Franke. Organotypic brain slice co‐cultures as a screening system
for fibre growth promoting substances. 8th Leipzig Research Festival for Life Sciences 2009; Leipzig,
17 – 18 Dec. 2009
K. Sygnecka, C. Heine, N. Scherf, H. Franke. The model of organotypic dopaminergic slice co‐cultures
–a screening system for fibre growth promoting substances. 7th FENS Forum of European
Neuroscience; Amsterdam, 3 – 7 July 2010
K. Sygnecka, C. Heine, M. Grohmann, N. Scherf, H. Franke. Qualitative and quantitative toxicological
methods in organotypic brain slice co‐cultures. 9th Leipzig Research Festival for Life Sciences 2010;
Leipzig, 16 – 17 Dec. 2010
K. Sygnecka, C. Heine, M. Grohmann, N. Scherf, H. Franke. Organotypic brain slice co‐cultures of the
dopaminergic system –a versatile tool for the investigation of toxicological properties of novel
substances. 9th Göttingen Meeting of the German Neuroscience Society; Göttingen, 23 – 27 March
2011
TRACK RECORD
85

K. Sygnecka, C. Heine, N. Scherf, H. Franke. Organotypic brain slice co‐cultures – an ex vivo test
system to investigate regeneration supporting substances in the central nervous system. 10th Leipzig
Research Festival for Life Sciences 2011; Leipzig, 15 – 16 Dec. 2011
K. Sygnecka, C. Heine, N. Scherf, H. Franke. Enhancement of neuronal fibre growth in organotypic
brain slice co‐cultures. 11th Leipzig Research Festival for Life Sciences 2012; Leipzig, 13 – 14 Dec.
2012
K. Sygnecka, C. Heine, N. Scherf, H. Franke. Different approaches to enhance neuronal fibre growth
in organotypic dopaminergic brain slice co‐cultures. 10th Göttingen Meeting of the German
Neuroscience Society; Göttingen, 13 – 16 March 2013
K. Sygnecka, C. Heine, N. Scherf, C. Strauss, C. Scheller, H. Franke. Enhanced Regeneration of
Neuronal Fibres after Nimodipine Treatment in an Organotypic Dopaminergic Brain Slice Co‐Culture
Model. World Conference on Regenerative Medicine; Leipzig, 23 – 25 Oct. 2013
K. Sygnecka, C. Heine, A. Heider, N. Scherf, R. Alt, H. Franke. Mesenchymal stem cells support
neuronal fiber growth in organotypic brain slice co‐cultures of the dopaminergic projection system.
Fraunhofer Life Science Symposium Leipzig 2014; Leipzig, 9 – 10 Oct. 2014
TRACK RECORD
86

Selbstständigkeitserklärung
Hiermit erkläre ich, die vorliegende Dissertation selbständig und nur unter Verwendung der
aufgeführten Literatur und Hilfsmittel angefertigt zu haben. Direkt oder indirekt übernommene
Gedanken aus fremden Quellen wurden in dieser Arbeit als solche kenntlich gemacht.
Leipzig, 20.05.2015
____________________________________
Katja Sygnecka
87

Acknowledgments
I would like to thank Prof. Robitzki and Prof. Schaefer for being the formal supervisors of this
dissertation. This constellation allowed me, on the one hand, to submit the dissertation to the
Institute of Biochemistry at the Faculty of Biosciences, Pharmacy and Psychology and, on the other
hand, to do the experimental work in PD Dr. Heike Franke's group at the Rudolf Boehm Institute for
Pharmacology and Toxicology (RBI) at the Medical Faculty of the University of Leipzig.
I would like to thank Prof. Bernd Heimrich from the Department of Anatomy and Cell Biology,
University of Freiburg for taking time out from his busy schedule to serve as my external reader.
A very special thanks goes out to my supervisors, Dr. Claudia Heine and PD Dr. Heike Franke, who
were always open to my questions, ideas and sorrows. They were always on hand to listen and give
helpful advice and inspiration regarding the experimental work in the lab, as well as during the
writing process of research reports and this dissertation. This thoroughly engaging project that I was
entrusted with, presented many challenges as well as the opportunity to apply a wide range of
techniques allowing me to grow as a research scientist. I owe them thanks for giving me the
opportunity to gain experience outside the lab in terms of participation at conferences and a summer
school, and the archival position at the GLP facilities of the Translational Center for Regenerative
Medicine (TRM) Leipzig. In addition to this, they supported me in my first attempts to guide younger
researchers. This was made possible when I applied for DAAD grants within the RISE project
(Research Internships in Science and Engineering); and also when they entrusted me with the
guidance of undergraduates. I appreciate all the freedom, trust and encouragement I received during
my PhD from these two ladies.
Two other very important ladies during my PhD were the technical assistants Anne‐Kathrin Krause
and Katrin Becker. Anne‐Kathrin Krause took care of the laboratory animals used for this work. Katrin
Becker took over increasingly more of the laboratory work, especially during the last half of my work,
which allowed me to focus on data analysis and the publication of results.
I must also acknowledge the members of the Schaefer group and the Aigner group (Division of
Clinical Pharmacology, RBI) for giving me access to the various instruments in their laboratories and
their kind help with my technical questions. I would further like to thank Prof. Bechmann and PD Dr.
Ricken for the use of the laser scanning microscope at the Institute for Anatomy. The members of the
core unit “DNA technologies”, led by PD Dr. Knut Krohn at the Interdisciplinary Center for Clinical
Research, were very helpful with the preparation of the samples for gene expression analysis and the
conduction of the microarray analysis.
ACKNOWLEDGMENTS
88

I thank all my co‐authors for the fruitful cooperation and helpful discussions during the various
experimental phases of the studies, as well as during the writing process of the research articles.
I recognize that this research would not have been possible without financial support from the
BMBF. This financed the research project via the TRM Leipzig. Moreover, I would like to thank the
TRM Leipzig for the organization of numerous training sessions and workshops (e.g. project
management, intercultural communication). I am also grateful for having been made an associate
member of the graduate school InterNeuro, which gave me the opportunity to meet other
neuroscientists and gain insight into their research topics. Additionally, I would like to thank
InterNeuro for providing travel grants for my participation at conferences. I also want to express my
gratitude to the DAAD and InterNeuro who provided scholarships, within the framework of RISE, for
the undergraduates from American universities with whom I worked. Their names are Susan Sheng
and Jennifer Ding. Of course, I am also very thankful for Susan and Jennifer's ambitious engagement
and demonstrable interest in my PhD project. I would also like to thank Ria Hylton for language
editing.
Finally, I would like to express my gratitude to my friends and my family for being there in times of
intense hardship, as well as during the more enjoyable and relaxing moments. Among other things, it
was the exchange of perspectives and ideas beyond (bio‐)scientific questions that provided me with
the drive and energy that I needed to get through the PhD and to finish it.
ACKNOWLEDGMENTS
89