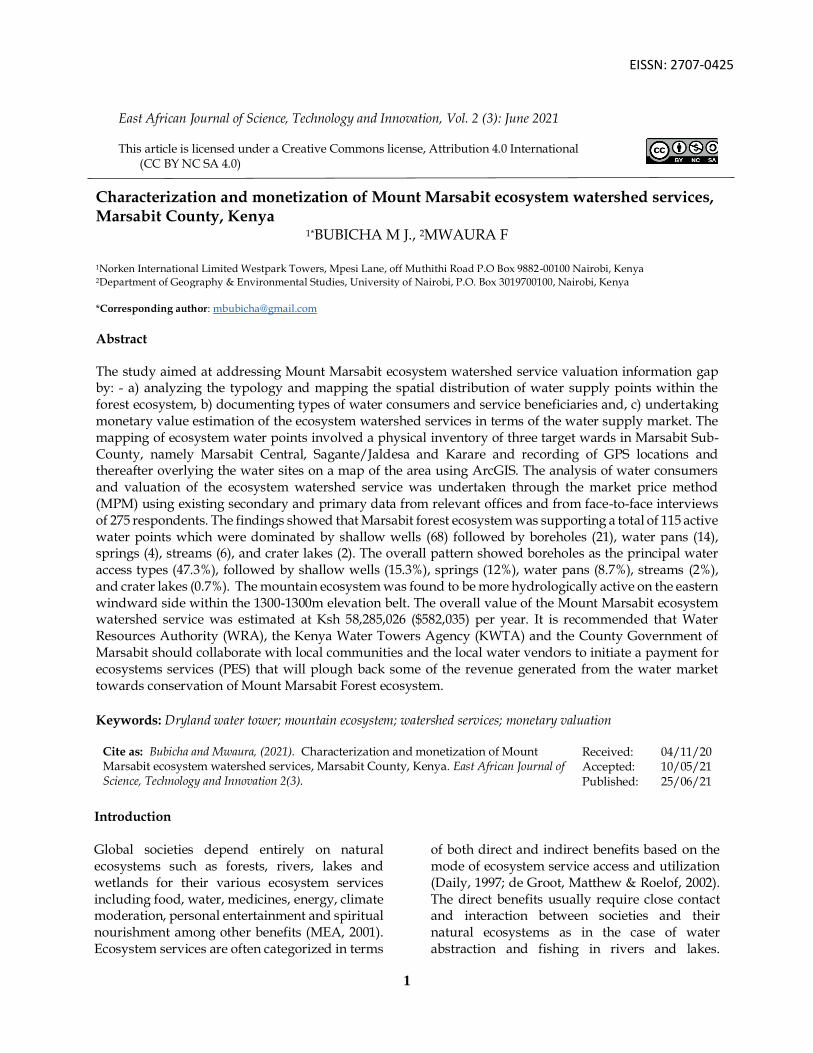
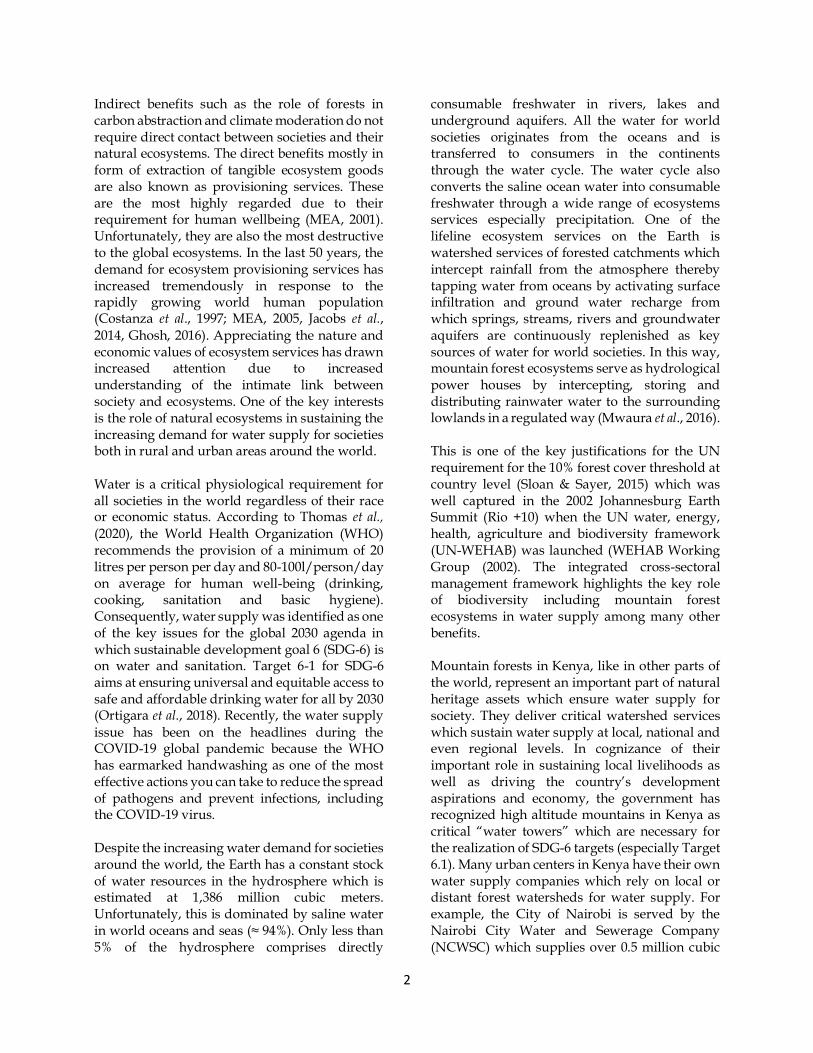
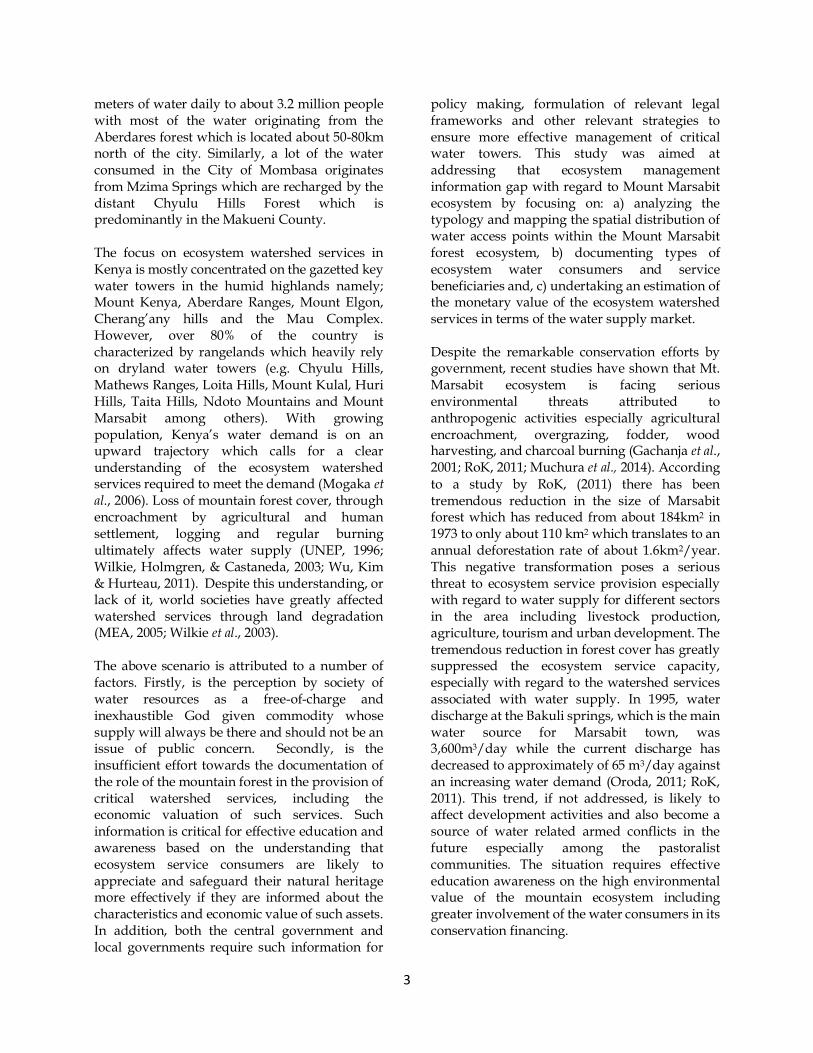
characterization and monetization of mount marsabit
TRANSCRIPT
1
East African Journal of Science, Technology and Innovation, Vol. 2 (3): June 2021 This article is licensed under a Creative Commons license, Attribution 4.0 International (CC BY NC SA 4.0)
Characterization and monetization of Mount Marsabit ecosystem watershed services, Marsabit County, Kenya
1*BUBICHA M J., 2MWAURA F
1Norken International Limited Westpark Towers, Mpesi Lane, off Muthithi Road P.O Box 9882-00100 Nairobi, Kenya 2Department of Geography & Environmental Studies, University of Nairobi, P.O. Box 3019700100, Nairobi, Kenya
*Corresponding author: [email protected] Abstract The study aimed at addressing Mount Marsabit ecosystem watershed service valuation information gap by: - a) analyzing the typology and mapping the spatial distribution of water supply points within the forest ecosystem, b) documenting types of water consumers and service beneficiaries and, c) undertaking monetary value estimation of the ecosystem watershed services in terms of the water supply market. The mapping of ecosystem water points involved a physical inventory of three target wards in Marsabit Sub-County, namely Marsabit Central, Sagante/Jaldesa and Karare and recording of GPS locations and thereafter overlying the water sites on a map of the area using ArcGIS. The analysis of water consumers and valuation of the ecosystem watershed service was undertaken through the market price method (MPM) using existing secondary and primary data from relevant offices and from face-to-face interviews of 275 respondents. The findings showed that Marsabit forest ecosystem was supporting a total of 115 active water points which were dominated by shallow wells (68) followed by boreholes (21), water pans (14), springs (4), streams (6), and crater lakes (2). The overall pattern showed boreholes as the principal water access types (47.3%), followed by shallow wells (15.3%), springs (12%), water pans (8.7%), streams (2%), and crater lakes (0.7%). The mountain ecosystem was found to be more hydrologically active on the eastern windward side within the 1300-1300m elevation belt. The overall value of the Mount Marsabit ecosystem watershed service was estimated at Ksh 58,285,026 ($582,035) per year. It is recommended that Water Resources Authority (WRA), the Kenya Water Towers Agency (KWTA) and the County Government of Marsabit should collaborate with local communities and the local water vendors to initiate a payment for ecosystems services (PES) that will plough back some of the revenue generated from the water market towards conservation of Mount Marsabit Forest ecosystem.
Keywords: Dryland water tower; mountain ecosystem; watershed services; monetary valuation
Introduction
Global societies depend entirely on natural ecosystems such as forests, rivers, lakes and wetlands for their various ecosystem services including food, water, medicines, energy, climate moderation, personal entertainment and spiritual nourishment among other benefits (MEA, 2001). Ecosystem services are often categorized in terms
of both direct and indirect benefits based on the mode of ecosystem service access and utilization (Daily, 1997; de Groot, Matthew & Roelof, 2002). The direct benefits usually require close contact and interaction between societies and their natural ecosystems as in the case of water abstraction and fishing in rivers and lakes.
Cite as: Bubicha and Mwaura, (2021). Characterization and monetization of Mount Marsabit ecosystem watershed services, Marsabit County, Kenya. East African Journal of Science, Technology and Innovation 2(3).
Received: 04/11/20 Accepted: 10/05/21 Published: 25/06/21
EISSN: 2707-0425
2
Indirect benefits such as the role of forests in carbon abstraction and climate moderation do not require direct contact between societies and their natural ecosystems. The direct benefits mostly in form of extraction of tangible ecosystem goods are also known as provisioning services. These are the most highly regarded due to their requirement for human wellbeing (MEA, 2001). Unfortunately, they are also the most destructive to the global ecosystems. In the last 50 years, the demand for ecosystem provisioning services has increased tremendously in response to the rapidly growing world human population (Costanza et al., 1997; MEA, 2005, Jacobs et al.,
2014, Ghosh, 2016). Appreciating the nature and economic values of ecosystem services has drawn increased attention due to increased understanding of the intimate link between society and ecosystems. One of the key interests is the role of natural ecosystems in sustaining the increasing demand for water supply for societies both in rural and urban areas around the world. Water is a critical physiological requirement for all societies in the world regardless of their race or economic status. According to Thomas et al.,
(2020), the World Health Organization (WHO) recommends the provision of a minimum of 20 litres per person per day and 80-100l/person/day on average for human well-being (drinking, cooking, sanitation and basic hygiene). Consequently, water supply was identified as one of the key issues for the global 2030 agenda in which sustainable development goal 6 (SDG-6) is on water and sanitation. Target 6-1 for SDG-6 aims at ensuring universal and equitable access to safe and affordable drinking water for all by 2030 (Ortigara et al., 2018). Recently, the water supply
issue has been on the headlines during the COVID-19 global pandemic because the WHO has earmarked handwashing as one of the most effective actions you can take to reduce the spread of pathogens and prevent infections, including the COVID-19 virus. Despite the increasing water demand for societies around the world, the Earth has a constant stock of water resources in the hydrosphere which is estimated at 1,386 million cubic meters. Unfortunately, this is dominated by saline water in world oceans and seas (≈ 94%). Only less than 5% of the hydrosphere comprises directly
consumable freshwater in rivers, lakes and underground aquifers. All the water for world societies originates from the oceans and is transferred to consumers in the continents through the water cycle. The water cycle also converts the saline ocean water into consumable freshwater through a wide range of ecosystems services especially precipitation. One of the lifeline ecosystem services on the Earth is watershed services of forested catchments which intercept rainfall from the atmosphere thereby tapping water from oceans by activating surface infiltration and ground water recharge from which springs, streams, rivers and groundwater aquifers are continuously replenished as key sources of water for world societies. In this way, mountain forest ecosystems serve as hydrological power houses by intercepting, storing and distributing rainwater water to the surrounding lowlands in a regulated way (Mwaura et al., 2016).
This is one of the key justifications for the UN requirement for the 10% forest cover threshold at country level (Sloan & Sayer, 2015) which was well captured in the 2002 Johannesburg Earth Summit (Rio +10) when the UN water, energy, health, agriculture and biodiversity framework (UN-WEHAB) was launched (WEHAB Working Group (2002). The integrated cross-sectoral management framework highlights the key role of biodiversity including mountain forest ecosystems in water supply among many other benefits. Mountain forests in Kenya, like in other parts of the world, represent an important part of natural heritage assets which ensure water supply for society. They deliver critical watershed services which sustain water supply at local, national and even regional levels. In cognizance of their important role in sustaining local livelihoods as well as driving the country’s development aspirations and economy, the government has recognized high altitude mountains in Kenya as critical “water towers” which are necessary for the realization of SDG-6 targets (especially Target 6.1). Many urban centers in Kenya have their own water supply companies which rely on local or distant forest watersheds for water supply. For example, the City of Nairobi is served by the Nairobi City Water and Sewerage Company (NCWSC) which supplies over 0.5 million cubic
3
meters of water daily to about 3.2 million people with most of the water originating from the Aberdares forest which is located about 50-80km north of the city. Similarly, a lot of the water consumed in the City of Mombasa originates from Mzima Springs which are recharged by the distant Chyulu Hills Forest which is predominantly in the Makueni County. The focus on ecosystem watershed services in Kenya is mostly concentrated on the gazetted key water towers in the humid highlands namely; Mount Kenya, Aberdare Ranges, Mount Elgon, Cherang’any hills and the Mau Complex. However, over 80% of the country is characterized by rangelands which heavily rely on dryland water towers (e.g. Chyulu Hills, Mathews Ranges, Loita Hills, Mount Kulal, Huri Hills, Taita Hills, Ndoto Mountains and Mount Marsabit among others). With growing population, Kenya’s water demand is on an upward trajectory which calls for a clear understanding of the ecosystem watershed services required to meet the demand (Mogaka et al., 2006). Loss of mountain forest cover, through encroachment by agricultural and human settlement, logging and regular burning ultimately affects water supply (UNEP, 1996; Wilkie, Holmgren, & Castaneda, 2003; Wu, Kim & Hurteau, 2011). Despite this understanding, or lack of it, world societies have greatly affected watershed services through land degradation (MEA, 2005; Wilkie et al., 2003).
The above scenario is attributed to a number of factors. Firstly, is the perception by society of water resources as a free-of-charge and inexhaustible God given commodity whose supply will always be there and should not be an issue of public concern. Secondly, is the insufficient effort towards the documentation of the role of the mountain forest in the provision of critical watershed services, including the economic valuation of such services. Such information is critical for effective education and awareness based on the understanding that ecosystem service consumers are likely to appreciate and safeguard their natural heritage more effectively if they are informed about the characteristics and economic value of such assets. In addition, both the central government and local governments require such information for
policy making, formulation of relevant legal frameworks and other relevant strategies to ensure more effective management of critical water towers. This study was aimed at addressing that ecosystem management information gap with regard to Mount Marsabit ecosystem by focusing on: a) analyzing the typology and mapping the spatial distribution of water access points within the Mount Marsabit forest ecosystem, b) documenting types of ecosystem water consumers and service beneficiaries and, c) undertaking an estimation of the monetary value of the ecosystem watershed services in terms of the water supply market. Despite the remarkable conservation efforts by government, recent studies have shown that Mt. Marsabit ecosystem is facing serious environmental threats attributed to anthropogenic activities especially agricultural encroachment, overgrazing, fodder, wood harvesting, and charcoal burning (Gachanja et al., 2001; RoK, 2011; Muchura et al., 2014). According
to a study by RoK, (2011) there has been tremendous reduction in the size of Marsabit forest which has reduced from about 184km2 in 1973 to only about 110 km2 which translates to an annual deforestation rate of about 1.6km2/year. This negative transformation poses a serious threat to ecosystem service provision especially with regard to water supply for different sectors in the area including livestock production, agriculture, tourism and urban development. The tremendous reduction in forest cover has greatly suppressed the ecosystem service capacity, especially with regard to the watershed services associated with water supply. In 1995, water discharge at the Bakuli springs, which is the main water source for Marsabit town, was 3,600m3/day while the current discharge has decreased to approximately of 65 m3/day against an increasing water demand (Oroda, 2011; RoK, 2011). This trend, if not addressed, is likely to affect development activities and also become a source of water related armed conflicts in the future especially among the pastoralist communities. The situation requires effective education awareness on the high environmental value of the mountain ecosystem including greater involvement of the water consumers in its conservation financing.
4
Materials and Methods
Study Area Mount Marsabit forest ecosystem is located in Marsabit County (70,961.2 km2) which is one of the 47 counties in Kenya bordering, Ethiopia to the north, Turkana County to the west, Samburu County to the south and Wajir and Isiolo counties to the east thereby making it one of the largest in Kenya (County Government of Marsabit (CGoM),
2018). The forest ecosystem has evolved around Mount Marsabit, a solitary mid-elevation (1750m) basaltic shield volcano which serves as the lifeline water tower for the surrounding lowlands including Marsabit town (Gachanja et al., 2001;
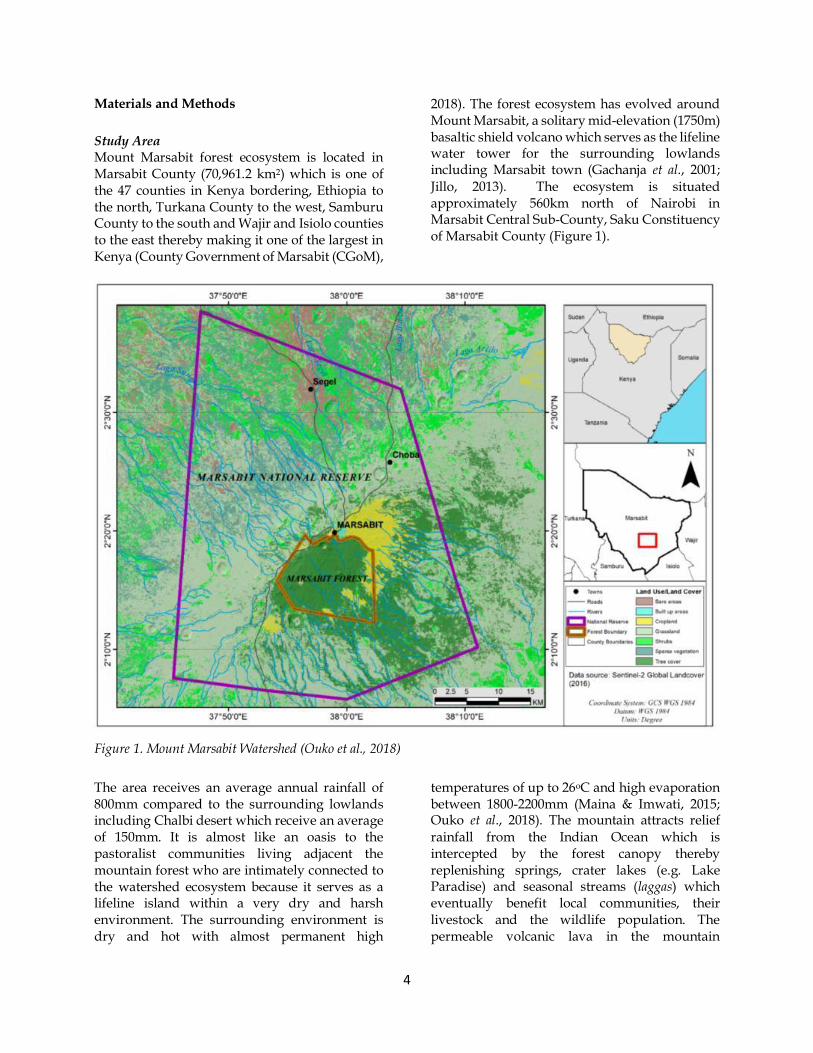
Jillo, 2013). The ecosystem is situated approximately 560km north of Nairobi in Marsabit Central Sub-County, Saku Constituency of Marsabit County (Figure 1).
Figure 1. Mount Marsabit Watershed (Ouko et al., 2018)
The area receives an average annual rainfall of 800mm compared to the surrounding lowlands including Chalbi desert which receive an average of 150mm. It is almost like an oasis to the pastoralist communities living adjacent the mountain forest who are intimately connected to the watershed ecosystem because it serves as a lifeline island within a very dry and harsh environment. The surrounding environment is dry and hot with almost permanent high
temperatures of up to 26oC and high evaporation between 1800-2200mm (Maina & Imwati, 2015; Ouko et al., 2018). The mountain attracts relief
rainfall from the Indian Ocean which is intercepted by the forest canopy thereby replenishing springs, crater lakes (e.g. Lake Paradise) and seasonal streams (laggas) which eventually benefit local communities, their livestock and the wildlife population. The permeable volcanic lava in the mountain
5
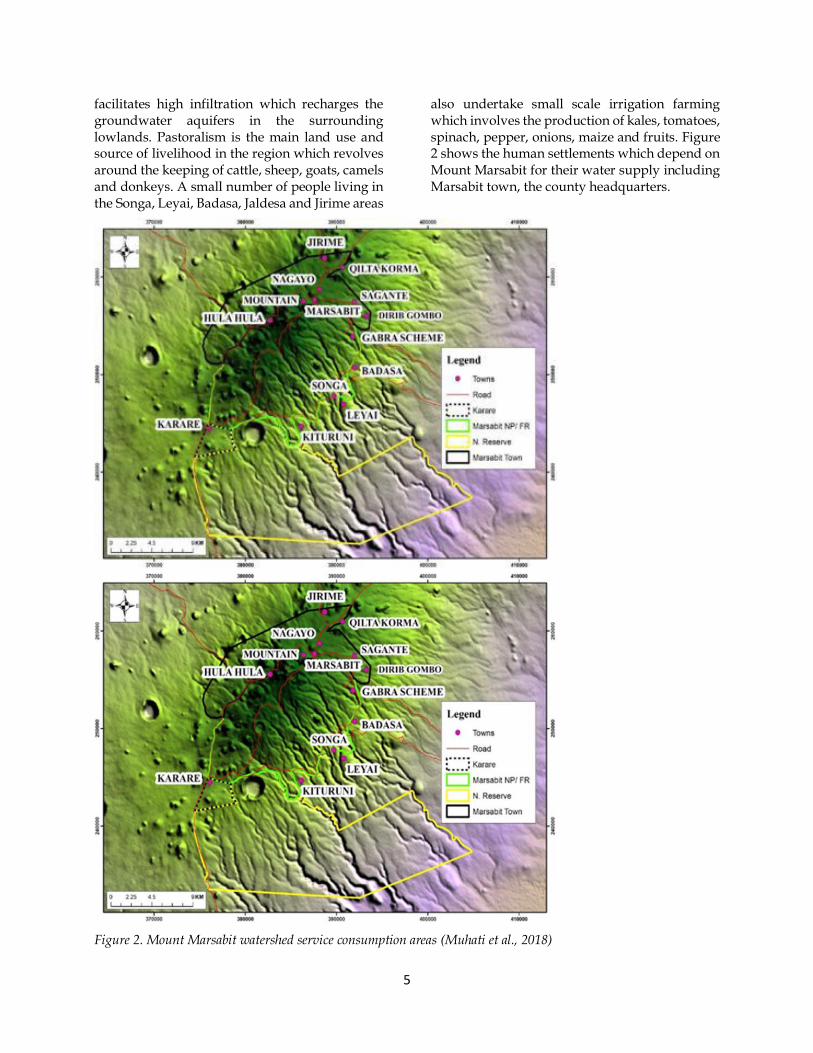
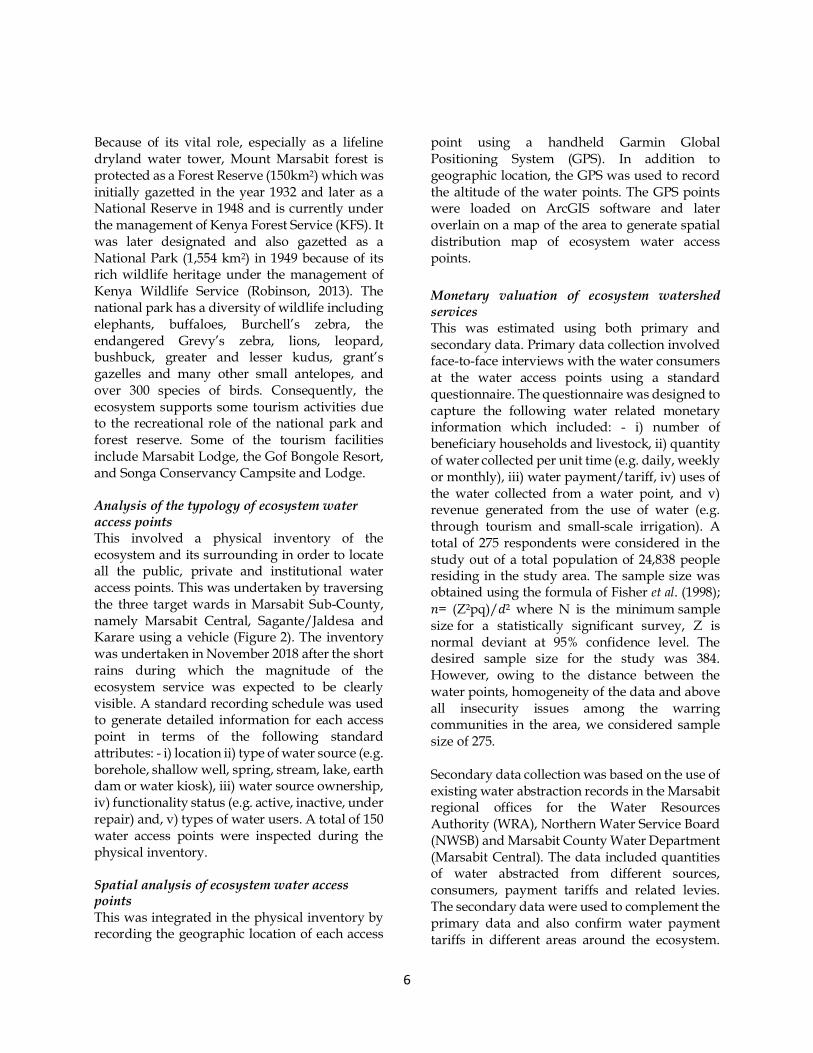
facilitates high infiltration which recharges the groundwater aquifers in the surrounding lowlands. Pastoralism is the main land use and source of livelihood in the region which revolves around the keeping of cattle, sheep, goats, camels and donkeys. A small number of people living in the Songa, Leyai, Badasa, Jaldesa and Jirime areas
also undertake small scale irrigation farming which involves the production of kales, tomatoes, spinach, pepper, onions, maize and fruits. Figure 2 shows the human settlements which depend on Mount Marsabit for their water supply including Marsabit town, the county headquarters.
Figure 2. Mount Marsabit watershed service consumption areas (Muhati et al., 2018)
6
Because of its vital role, especially as a lifeline dryland water tower, Mount Marsabit forest is protected as a Forest Reserve (150km2) which was initially gazetted in the year 1932 and later as a National Reserve in 1948 and is currently under the management of Kenya Forest Service (KFS). It was later designated and also gazetted as a National Park (1,554 km2) in 1949 because of its rich wildlife heritage under the management of Kenya Wildlife Service (Robinson, 2013). The national park has a diversity of wildlife including elephants, buffaloes, Burchell’s zebra, the endangered Grevy’s zebra, lions, leopard, bushbuck, greater and lesser kudus, grant’s gazelles and many other small antelopes, and over 300 species of birds. Consequently, the ecosystem supports some tourism activities due to the recreational role of the national park and forest reserve. Some of the tourism facilities include Marsabit Lodge, the Gof Bongole Resort, and Songa Conservancy Campsite and Lodge. Analysis of the typology of ecosystem water access points This involved a physical inventory of the ecosystem and its surrounding in order to locate all the public, private and institutional water access points. This was undertaken by traversing the three target wards in Marsabit Sub-County, namely Marsabit Central, Sagante/Jaldesa and Karare using a vehicle (Figure 2). The inventory was undertaken in November 2018 after the short rains during which the magnitude of the ecosystem service was expected to be clearly visible. A standard recording schedule was used to generate detailed information for each access point in terms of the following standard attributes: - i) location ii) type of water source (e.g. borehole, shallow well, spring, stream, lake, earth dam or water kiosk), iii) water source ownership, iv) functionality status (e.g. active, inactive, under repair) and, v) types of water users. A total of 150 water access points were inspected during the physical inventory. Spatial analysis of ecosystem water access points This was integrated in the physical inventory by recording the geographic location of each access
point using a handheld Garmin Global Positioning System (GPS). In addition to geographic location, the GPS was used to record the altitude of the water points. The GPS points were loaded on ArcGIS software and later overlain on a map of the area to generate spatial distribution map of ecosystem water access points.
Monetary valuation of ecosystem watershed services This was estimated using both primary and secondary data. Primary data collection involved face-to-face interviews with the water consumers at the water access points using a standard questionnaire. The questionnaire was designed to capture the following water related monetary information which included: - i) number of beneficiary households and livestock, ii) quantity of water collected per unit time (e.g. daily, weekly or monthly), iii) water payment/tariff, iv) uses of the water collected from a water point, and v) revenue generated from the use of water (e.g. through tourism and small-scale irrigation). A total of 275 respondents were considered in the study out of a total population of 24,838 people residing in the study area. The sample size was obtained using the formula of Fisher et al. (1998);
𝑛= (Z²pq)/𝑑² where N is the minimum sample size for a statistically significant survey, Z is normal deviant at 95% confidence level. The desired sample size for the study was 384. However, owing to the distance between the water points, homogeneity of the data and above all insecurity issues among the warring communities in the area, we considered sample size of 275. Secondary data collection was based on the use of existing water abstraction records in the Marsabit regional offices for the Water Resources Authority (WRA), Northern Water Service Board (NWSB) and Marsabit County Water Department (Marsabit Central). The data included quantities of water abstracted from different sources, consumers, payment tariffs and related levies. The secondary data were used to complement the primary data and also confirm water payment tariffs in different areas around the ecosystem.
7
Additional secondary data were acquired from institutional and private water consumers including KWS, KFS, tourist facilities (e.g. Marsabit Lodge, Gof Bongole) and faith related water supply groups and NGOs (e.g. Community Initiative Facilitation and Assistance). The study used the market price method (MPM) for the estimation of ecosystem watershed service. This involved the determination of quantities and market prices of water abstracted from different water access points which were hydrologically related to the forest watershed. This approach was considered suitable because of its simplicity. The method only requires information on the quantity of ecosystem goods and services and their current market prices in order to estimate the monetary value as explained by Lovett & Noel (2008). The beneficiary categories of the ecosystem watershed services were used in the estimation of the monetary value for the watershed ecosystem. This was based on an average water price of Ksh 5 per 20 litres jerry can (equivalent to 0.05USD) as provided by the National Drought Management Authority at the time of the study (NDMA, 2017). The calculation of monetary value for irrigation water use assumed that irrigation was undertaken throughout the entire duration of the annual 5-month dry season in the area. Crop water need in mm/growing periods were obtained from Ministry of Water and Irrigation Manual, (RoK, 2005). The estimation of monetary value for the commercial water vendors category was undertaken as follows; a) household consumers - amount of water extracted and the selling price, b) water kiosks - consumer households who mostly used electronic water purchase smartcards at Ksh 5 for 20 litres, c) water bowsers – water was retailed at Ksh 5 for a 20 litres, and d) boarding schools - they were assumed to use 50 litres per head per day (RoK 2005) at an average price of Ksh 5 for 20 litres. The monetary value for tourism operators was estimated according to water consumption at designated tourism facilities multiplied with the market price of water. The value was estimated on full occupancy basis according to facility bed
capacity, star rating category and the National Drought Management Authority (NDMA) water market prices for Marsabit.
The estimation of the water use monetary value for conservation institutions was based on the consumption levels as disclosed by the institutions at an average price of Ksh 5/20ltr (NDMA, 2017). Further, the administrative offices were assumed to consume 25 litres a day/head (after RoK 2005). Data analysis Data analysis was undertaken using the Statistical Package for Social Sciences (SPSS) mainly through the computation of descriptive summary statistics including arithmetic mean, standard deviation, percentages and frequencies. The analyzed data were then presented in figures, charts, tables.
Results
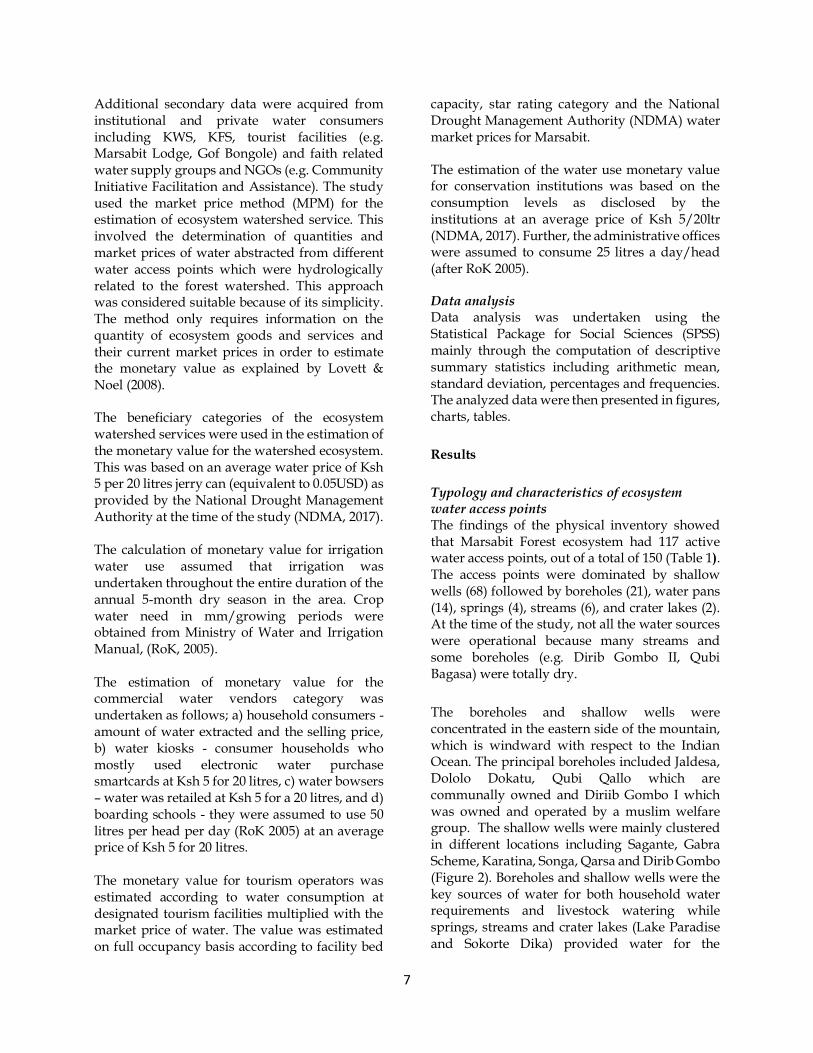
Typology and characteristics of ecosystem water access points The findings of the physical inventory showed that Marsabit Forest ecosystem had 117 active water access points, out of a total of 150 (Table 1). The access points were dominated by shallow wells (68) followed by boreholes (21), water pans (14), springs (4), streams (6), and crater lakes (2). At the time of the study, not all the water sources were operational because many streams and some boreholes (e.g. Dirib Gombo II, Qubi Bagasa) were totally dry.
The boreholes and shallow wells were concentrated in the eastern side of the mountain, which is windward with respect to the Indian Ocean. The principal boreholes included Jaldesa, Dololo Dokatu, Qubi Qallo which are communally owned and Diriib Gombo I which was owned and operated by a muslim welfare group. The shallow wells were mainly clustered in different locations including Sagante, Gabra Scheme, Karatina, Songa, Qarsa and Dirib Gombo (Figure 2). Boreholes and shallow wells were the key sources of water for both household water requirements and livestock watering while springs, streams and crater lakes (Lake Paradise and Sokorte Dika) provided water for the
8
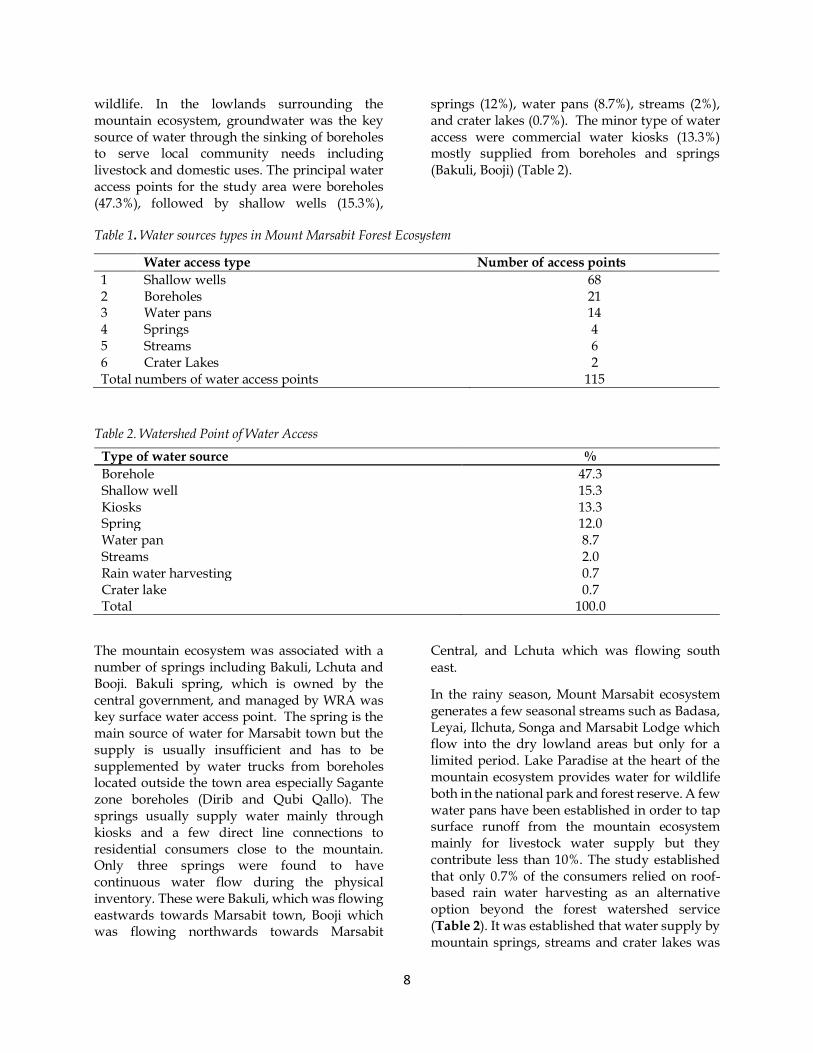
wildlife. In the lowlands surrounding the mountain ecosystem, groundwater was the key source of water through the sinking of boreholes to serve local community needs including livestock and domestic uses. The principal water access points for the study area were boreholes (47.3%), followed by shallow wells (15.3%),
springs (12%), water pans (8.7%), streams (2%), and crater lakes (0.7%). The minor type of water access were commercial water kiosks (13.3%) mostly supplied from boreholes and springs (Bakuli, Booji) (Table 2).
Table 1. Water sources types in Mount Marsabit Forest Ecosystem
Table 2. Watershed Point of Water Access
Type of water source %
Borehole 47.3 Shallow well 15.3 Kiosks 13.3 Spring 12.0 Water pan 8.7 Streams 2.0 Rain water harvesting 0.7 Crater lake 0.7 Total 100.0
The mountain ecosystem was associated with a number of springs including Bakuli, Lchuta and Booji. Bakuli spring, which is owned by the central government, and managed by WRA was key surface water access point. The spring is the main source of water for Marsabit town but the supply is usually insufficient and has to be supplemented by water trucks from boreholes located outside the town area especially Sagante zone boreholes (Dirib and Qubi Qallo). The springs usually supply water mainly through kiosks and a few direct line connections to residential consumers close to the mountain. Only three springs were found to have continuous water flow during the physical inventory. These were Bakuli, which was flowing eastwards towards Marsabit town, Booji which was flowing northwards towards Marsabit
Central, and Lchuta which was flowing south
east.
In the rainy season, Mount Marsabit ecosystem generates a few seasonal streams such as Badasa, Leyai, Ilchuta, Songa and Marsabit Lodge which flow into the dry lowland areas but only for a limited period. Lake Paradise at the heart of the mountain ecosystem provides water for wildlife both in the national park and forest reserve. A few water pans have been established in order to tap surface runoff from the mountain ecosystem mainly for livestock water supply but they contribute less than 10%. The study established that only 0.7% of the consumers relied on roof-based rain water harvesting as an alternative option beyond the forest watershed service (Table 2). It was established that water supply by mountain springs, streams and crater lakes was
Water access type Number of access points
1 Shallow wells 68 2 Boreholes 21 3 Water pans 14 4 Springs 4 5 Streams 6 6 Crater Lakes 2 Total numbers of water access points 115
9
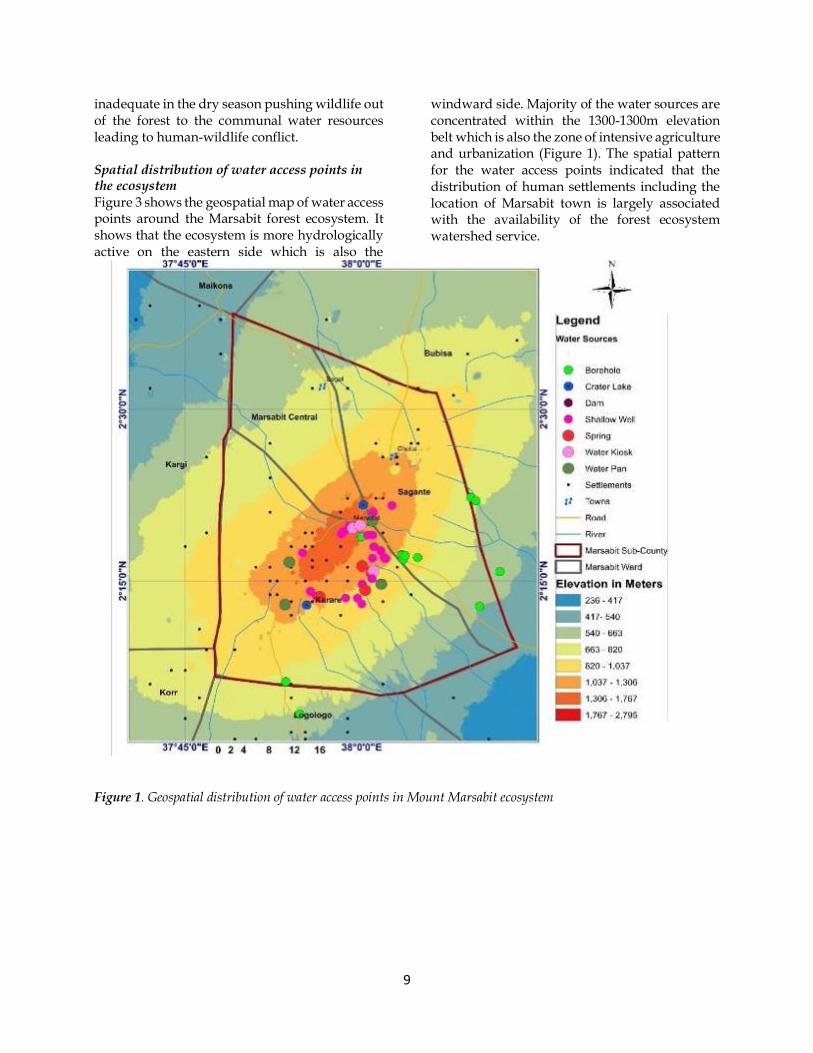
inadequate in the dry season pushing wildlife out of the forest to the communal water resources leading to human-wildlife conflict. Spatial distribution of water access points in the ecosystem Figure 3 shows the geospatial map of water access points around the Marsabit forest ecosystem. It shows that the ecosystem is more hydrologically active on the eastern side which is also the
windward side. Majority of the water sources are concentrated within the 1300-1300m elevation belt which is also the zone of intensive agriculture and urbanization (Figure 1). The spatial pattern for the water access points indicated that the distribution of human settlements including the location of Marsabit town is largely associated with the availability of the forest ecosystem watershed service.
Figure 1. Geospatial distribution of water access points in Mount Marsabit ecosystem
10
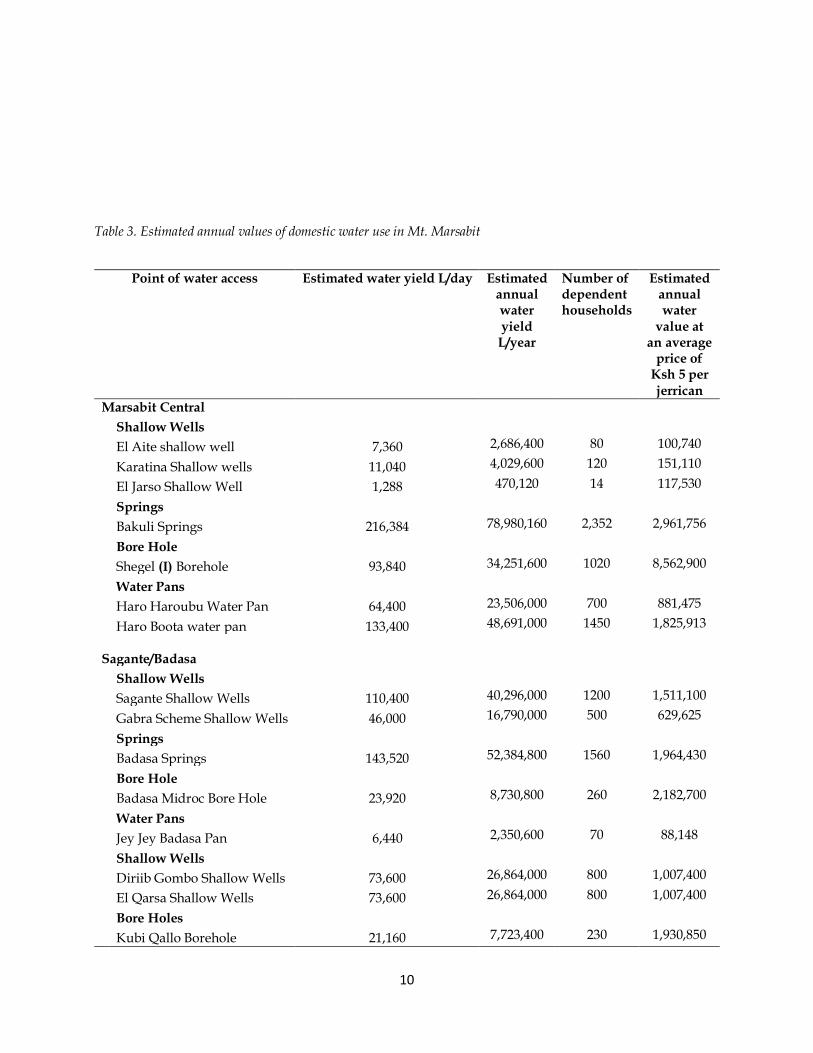
Table 3. Estimated annual values of domestic water use in Mt. Marsabit
Point of water access Estimated water yield L/day Estimated annual water yield
L/year
Number of dependent households
Estimated annual water
value at an average
price of Ksh 5 per jerrican
Marsabit Central
Shallow Wells
El Aite shallow well 7,360 2,686,400 80 100,740
Karatina Shallow wells 11,040 4,029,600 120 151,110
El Jarso Shallow Well 1,288 470,120 14 117,530
Springs
Bakuli Springs 216,384 78,980,160 2,352 2,961,756
Bore Hole
Shegel (I) Borehole 93,840 34,251,600 1020 8,562,900
Water Pans
Haro Haroubu Water Pan 64,400 23,506,000 700 881,475
Haro Boota water pan 133,400 48,691,000 1450 1,825,913
Sagante/Badasa
Shallow Wells
Sagante Shallow Wells 110,400 40,296,000 1200 1,511,100
Gabra Scheme Shallow Wells 46,000 16,790,000 500 629,625
Springs
Badasa Springs 143,520 52,384,800 1560 1,964,430
Bore Hole
Badasa Midroc Bore Hole 23,920 8,730,800 260 2,182,700
Water Pans
Jey Jey Badasa Pan 6,440 2,350,600 70 88,148
Shallow Wells
Diriib Gombo Shallow Wells 73,600 26,864,000 800 1,007,400
El Qarsa Shallow Wells 73,600 26,864,000 800 1,007,400
Bore Holes
Kubi Qallo Borehole 21,160 7,723,400 230 1,930,850
11
Point of water access Estimated water yield L/day Estimated annual water yield
L/year
Number of dependent households
Estimated annual water
value at an average
price of Ksh 5 per jerrican
Dololo Dokatu Borehole 4,140 1,511,100 45 377,775
Diriib Gombo (I) Borehole 6,440 2,350,600 70 587,650
Diriib Muslim Borehole 1840 671,600 20 167,900
Jaldesa Borehole 6,440 2,350,600 70 587,650
St Paul Sec. Borehole 1,840 671,600 20 167,900
Karare
Shallow Wells
Songa Shallow Wells 7,728 2,820,720 84 105,777
Ula Ula Wells 16,100 5,876,500 175 220,369
El Lekope wells 5,336 1,947,640 58 73,037
Serenanayeki Shallow wells 4,140 1,511,100 45 56,666
Lchuta shallow Wells 4,140 1,511,100 45 56,666
Ewaso Wells 4,600 1,679,000 50 62,963
Lng’urus shallow Wells 11,040 4,029,600 120 151,110
Water Pans
Lelerai water pan 3,680 1,343,200 40 50,370
Springs
Songa Springs 110,400 40,296,000 1200 1,511,100
Lchuta Springs 101,200 36,938,000 1100 1,385,175
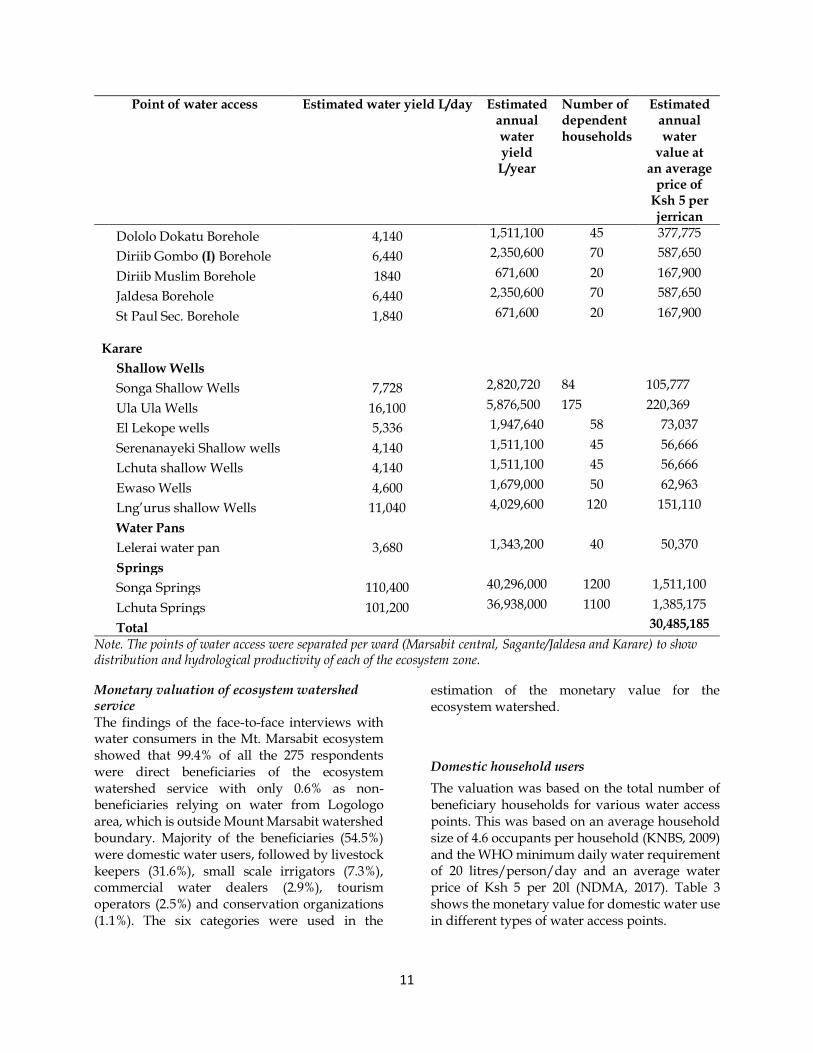
Total 30,485,185
Note. The points of water access were separated per ward (Marsabit central, Sagante/Jaldesa and Karare) to show distribution and hydrological productivity of each of the ecosystem zone.
Monetary valuation of ecosystem watershed service The findings of the face-to-face interviews with water consumers in the Mt. Marsabit ecosystem showed that 99.4% of all the 275 respondents were direct beneficiaries of the ecosystem watershed service with only 0.6% as non-beneficiaries relying on water from Logologo area, which is outside Mount Marsabit watershed boundary. Majority of the beneficiaries (54.5%) were domestic water users, followed by livestock keepers (31.6%), small scale irrigators (7.3%), commercial water dealers (2.9%), tourism operators (2.5%) and conservation organizations (1.1%). The six categories were used in the
estimation of the monetary value for the ecosystem watershed.
Domestic household users
The valuation was based on the total number of beneficiary households for various water access points. This was based on an average household size of 4.6 occupants per household (KNBS, 2009) and the WHO minimum daily water requirement of 20 litres/person/day and an average water price of Ksh 5 per 20l (NDMA, 2017). Table 3 shows the monetary value for domestic water use in different types of water access points.
12
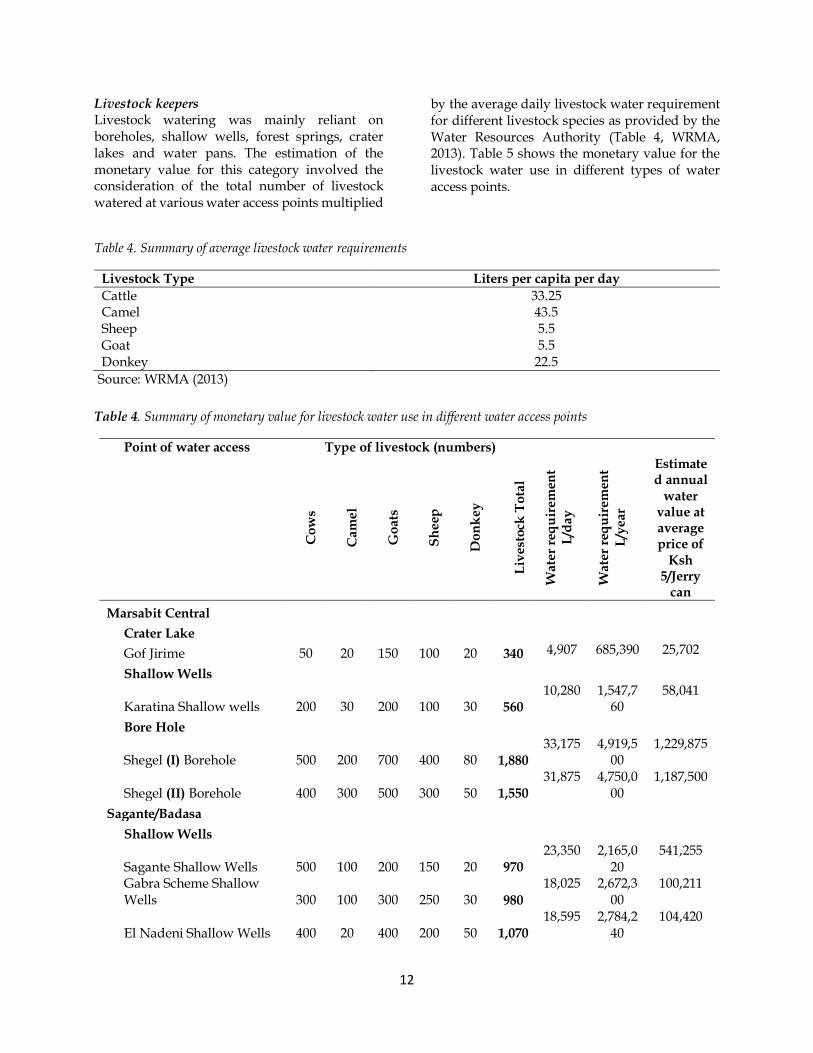
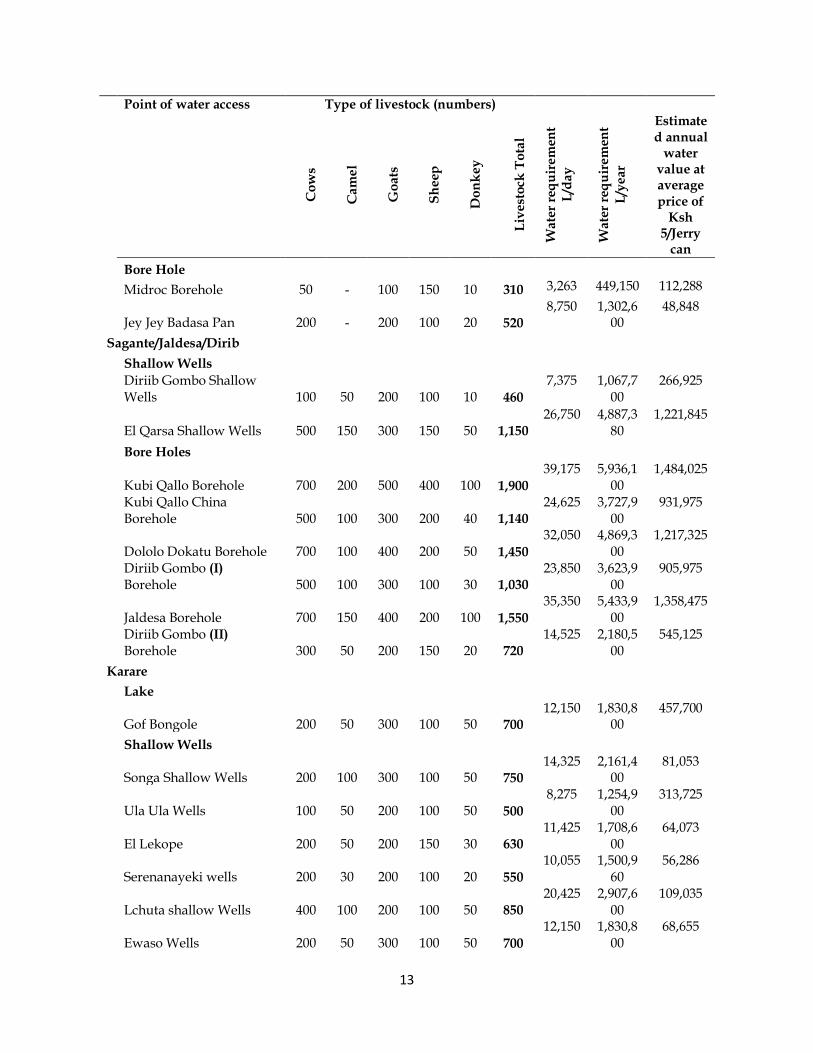
Livestock keepers Livestock watering was mainly reliant on boreholes, shallow wells, forest springs, crater lakes and water pans. The estimation of the monetary value for this category involved the consideration of the total number of livestock watered at various water access points multiplied
by the average daily livestock water requirement for different livestock species as provided by the Water Resources Authority (Table 4, WRMA, 2013). Table 5 shows the monetary value for the livestock water use in different types of water access points.
Table 4. Summary of average livestock water requirements
Livestock Type Liters per capita per day
Cattle 33.25 Camel 43.5 Sheep 5.5 Goat 5.5 Donkey 22.5
Source: WRMA (2013)
Table 4. Summary of monetary value for livestock water use in different water access points
Point of water access Type of livestock (numbers)
Co
ws
Ca
me
l
Go
ats
Sh
eep
Do
nk
ey
Liv
est
ock
To
tal
Wa
ter
req
uir
em
ent
L/d
ay
Wa
ter
req
uir
em
ent
L/y
ea
r
Estimated annual
water value at average price of
Ksh 5/Jerry
can
Marsabit Central
Crater Lake
Gof Jirime 50 20 150 100 20 340 4,907 685,390 25,702
Shallow Wells
Karatina Shallow wells 200 30 200 100 30 560 10,280 1,547,7
60 58,041
Bore Hole
Shegel (I) Borehole 500 200 700 400 80 1,880 33,175 4,919,5
00 1,229,875
Shegel (II) Borehole 400 300 500 300 50 1,550 31,875 4,750,0
00 1,187,500
Sagante/Badasa
Shallow Wells
Sagante Shallow Wells 500 100 200 150 20 970 23,350 2,165,0
20 541,255
Gabra Scheme Shallow Wells 300 100 300 250 30 980
18,025 2,672,300
100,211
El Nadeni Shallow Wells 400 20 400 200 50 1,070
18,595 2,784,240
104,420
13
Point of water access Type of livestock (numbers)
Co
ws
Cam
el
Go
ats
Sh
eep
Do
nk
ey
Liv
est
ock
To
tal
Wate
r re
qu
irem
ent
L/d
ay
Wate
r re
qu
irem
ent
L/y
ear
Estimated annual
water value at average price of
Ksh 5/Jerry
can
Bore Hole
Midroc Borehole 50 - 100 150 10 310 3,263 449,150 112,288
Jey Jey Badasa Pan 200 - 200 100 20 520 8,750 1,302,6
00 48,848
Sagante/Jaldesa/Dirib
Shallow Wells
Diriib Gombo Shallow Wells 100 50 200 100 10 460
7,375 1,067,700
266,925
El Qarsa Shallow Wells 500 150 300 150 50 1,150 26,750 4,887,3
80 1,221,845
Bore Holes
Kubi Qallo Borehole 700 200 500 400 100 1,900
39,175 5,936,100
1,484,025
Kubi Qallo China Borehole 500 100 300 200 40 1,140
24,625 3,727,900
931,975
Dololo Dokatu Borehole 700 100 400 200 50 1,450
32,050 4,869,300
1,217,325
Diriib Gombo (I) Borehole 500 100 300 100 30 1,030
23,850 3,623,900
905,975
Jaldesa Borehole 700 150 400 200 100 1,550
35,350 5,433,900
1,358,475
Diriib Gombo (II) Borehole 300 50 200 150 20 720
14,525 2,180,500
545,125
Karare
Lake
Gof Bongole 200 50 300 100 50 700 12,150 1,830,8
00 457,700
Shallow Wells
Songa Shallow Wells 200 100 300 100 50 750 14,325 2,161,4
00 81,053
Ula Ula Wells 100 50 200 100 50 500
8,275 1,254,900
313,725
El Lekope 200 50 200 150 30 630 11,425 1,708,6
00 64,073
Serenanayeki wells 200 30 200 100 20 550
10,055 1,500,960
56,286
Lchuta shallow Wells 400 100 200 100 50 850 20,425 2,907,6
00 109,035
Ewaso Wells 200 50 300 100 50 700
12,150 1,830,800
68,655
14
Point of water access Type of livestock (numbers)
Co
ws
Cam
el
Go
ats
Sh
eep
Do
nk
ey
Liv
est
ock
To
tal
Wate
r re
qu
irem
ent
L/d
ay
Wate
r re
qu
irem
ent
L/y
ear
Estimated annual
water value at average price of
Ksh 5/Jerry
can
Lng’urus shallow Wells 400 100 200 50 30 780
19,700 3,019,400
113,228
Water Pans
Silango water pan 200 80 300 150 20 750 13,055 1,917,3
60 71,901
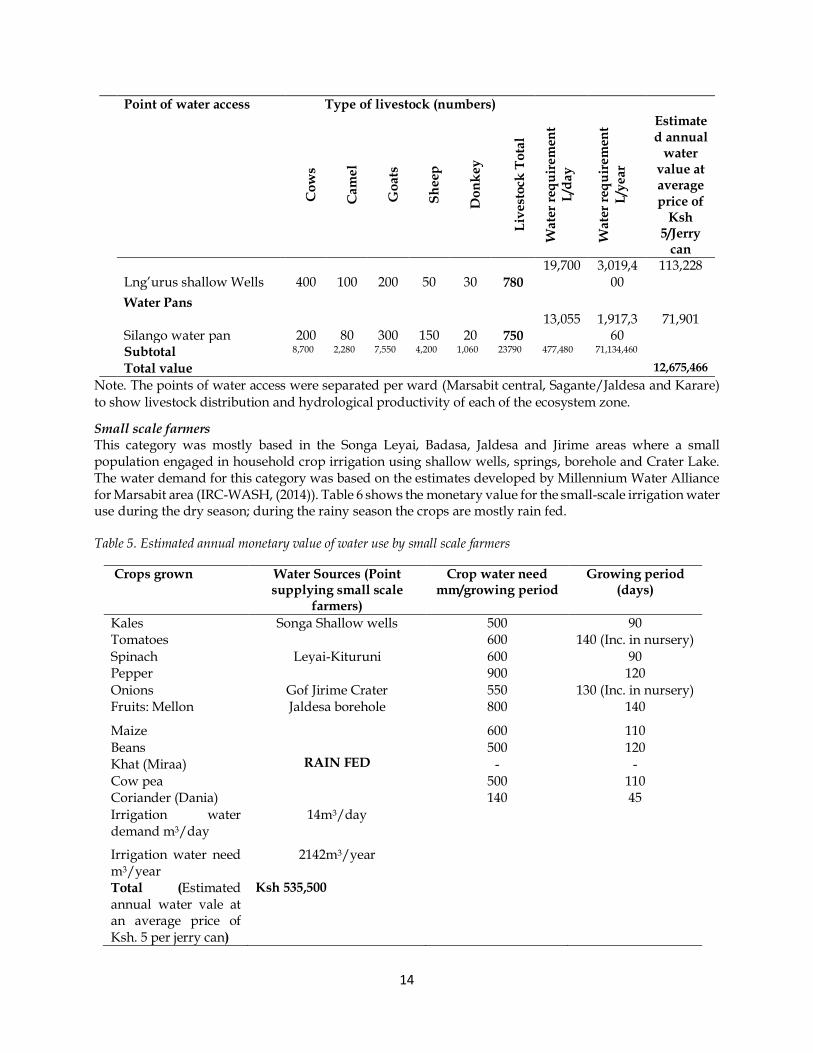
Subtotal 8,700 2,280 7,550 4,200 1,060 23790 477,480 71,134,460 Total value 12,675,466
Note. The points of water access were separated per ward (Marsabit central, Sagante/Jaldesa and Karare)
to show livestock distribution and hydrological productivity of each of the ecosystem zone.
Small scale farmers This category was mostly based in the Songa Leyai, Badasa, Jaldesa and Jirime areas where a small population engaged in household crop irrigation using shallow wells, springs, borehole and Crater Lake. The water demand for this category was based on the estimates developed by Millennium Water Alliance for Marsabit area (IRC-WASH, (2014)). Table 6 shows the monetary value for the small-scale irrigation water use during the dry season; during the rainy season the crops are mostly rain fed. Table 5. Estimated annual monetary value of water use by small scale farmers
Crops grown Water Sources (Point supplying small scale
farmers)
Crop water need mm/growing period
Growing period (days)
Kales Songa Shallow wells 500 90 Tomatoes 600 140 (Inc. in nursery)
Spinach Leyai-Kituruni 600 90 Pepper 900 120
Onions Gof Jirime Crater 550 130 (Inc. in nursery) Fruits: Mellon Jaldesa borehole 800 140
Maize
RAIN FED
600 110
Beans 500 120 Khat (Miraa) - -
Cow pea 500 110 Coriander (Dania) 140 45
Irrigation water demand m3/day
14m3/day
Irrigation water need m3/year
2142m3/year
Total (Estimated annual water vale at an average price of Ksh. 5 per jerry can)
Ksh 535,500
15
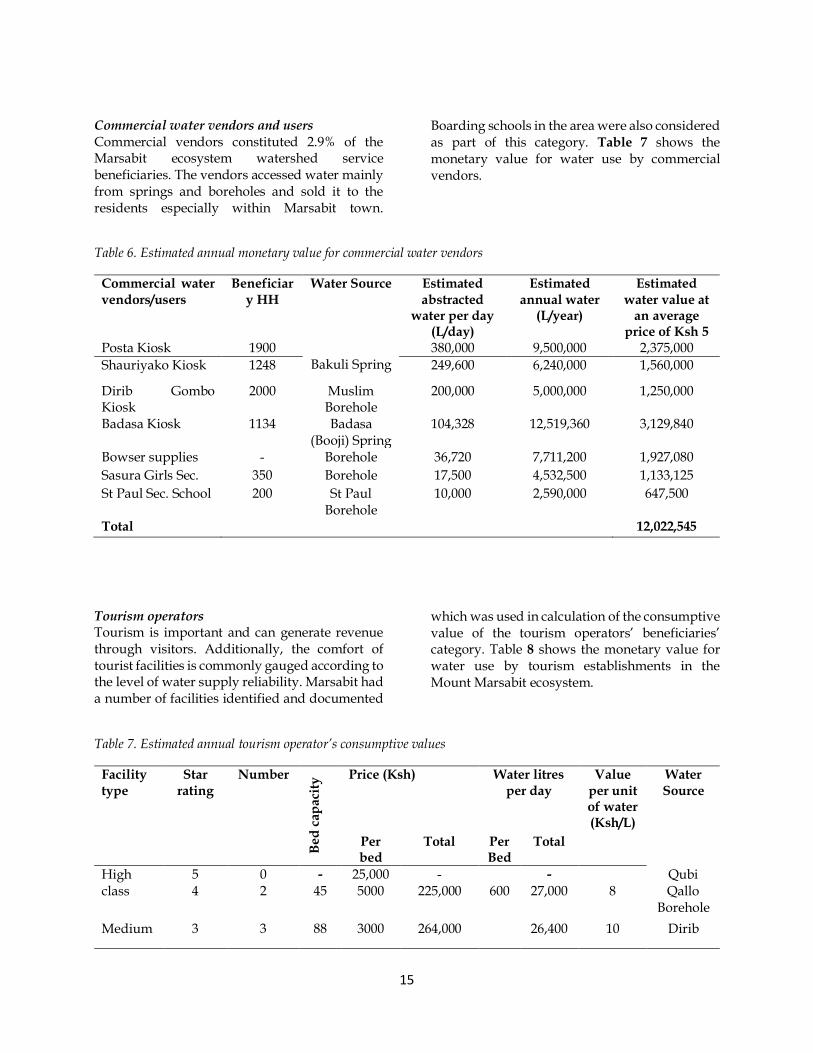
Commercial water vendors and users Commercial vendors constituted 2.9% of the Marsabit ecosystem watershed service beneficiaries. The vendors accessed water mainly from springs and boreholes and sold it to the residents especially within Marsabit town.
Boarding schools in the area were also considered as part of this category. Table 7 shows the monetary value for water use by commercial vendors.
Table 6. Estimated annual monetary value for commercial water vendors
Commercial water vendors/users
Beneficiary HH
Water Source Estimated abstracted
water per day (L/day)
Estimated annual water
(L/year)
Estimated water value at
an average price of Ksh 5
Posta Kiosk 1900 Bakuli Spring
380,000 9,500,000 2,375,000
Shauriyako Kiosk 1248 249,600 6,240,000 1,560,000
Dirib Gombo Kiosk
2000 Muslim Borehole
200,000 5,000,000 1,250,000
Badasa Kiosk 1134 Badasa (Booji) Spring
104,328 12,519,360 3,129,840
Bowser supplies - Borehole 36,720 7,711,200 1,927,080
Sasura Girls Sec. 350 Borehole 17,500 4,532,500 1,133,125
St Paul Sec. School 200 St Paul Borehole
10,000 2,590,000 647,500
Total 12,022,545
Tourism operators Tourism is important and can generate revenue through visitors. Additionally, the comfort of tourist facilities is commonly gauged according to the level of water supply reliability. Marsabit had a number of facilities identified and documented
which was used in calculation of the consumptive value of the tourism operators’ beneficiaries’ category. Table 8 shows the monetary value for water use by tourism establishments in the Mount Marsabit ecosystem.
Table 7. Estimated annual tourism operator’s consumptive values
Facility type
Star rating
Number
Bed
cap
aci
ty Price (Ksh) Water litres
per day Value
per unit of water (Ksh/L)
Water Source
Per bed
Total Per Bed
Total
High class
5 0 - 25,000 - 600
- Qubi Qallo
Borehole 4 2 45 5000 225,000 27,000 8
Medium 3 3 88 3000 264,000 26,400 10 Dirib
16
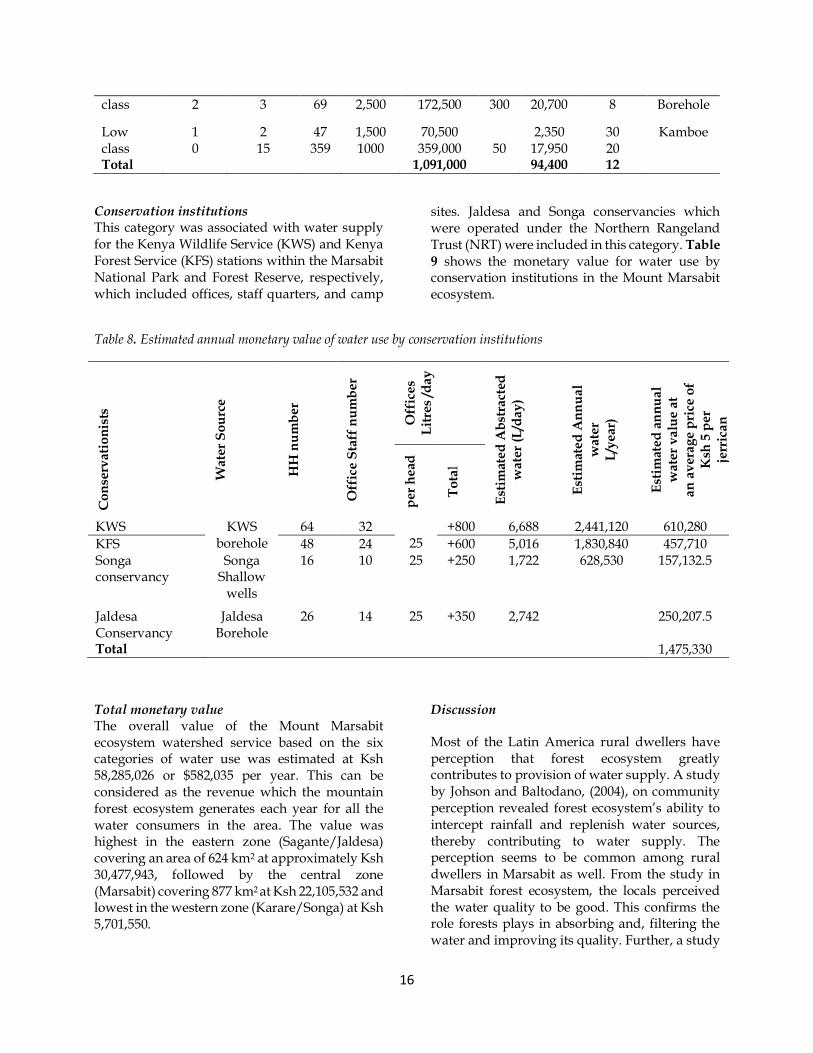
class 2 3 69 2,500 172,500 300 20,700 8 Borehole
Low class
1 2 47 1,500 70,500 50
2,350 30 Kamboe 0 15 359 1000 359,000 17,950 20
Total 1,091,000 94,400 12
Conservation institutions This category was associated with water supply for the Kenya Wildlife Service (KWS) and Kenya Forest Service (KFS) stations within the Marsabit National Park and Forest Reserve, respectively, which included offices, staff quarters, and camp
sites. Jaldesa and Songa conservancies which were operated under the Northern Rangeland Trust (NRT) were included in this category. Table 9 shows the monetary value for water use by conservation institutions in the Mount Marsabit ecosystem.
Table 8. Estimated annual monetary value of water use by conservation institutions
Co
nse
rva
tio
nis
ts
Wa
ter
So
urc
e
HH
nu
mb
er
Off
ice
Sta
ff n
um
be
r
Off
ice
s L
itre
s /d
ay
Est
imat
ed
Ab
stra
cted
w
ate
r (L
/da
y)
Est
imat
ed
An
nu
al
wa
ter
L/y
ea
r)
Est
imat
ed
an
nu
al
wa
ter
va
lue
at
an
av
era
ge
pri
ce o
f K
sh 5
pe
r je
rric
an
pe
r h
ead
To
tal
KWS KWS borehole
64 32 25
+800 6,688 2,441,120 610,280
KFS 48 24 +600 5,016 1,830,840 457,710 Songa conservancy
Songa Shallow
wells
16 10 25 +250 1,722 628,530 157,132.5
Jaldesa Conservancy
Jaldesa Borehole
26 14 25 +350 2,742 250,207.5
Total 1,475,330
Total monetary value The overall value of the Mount Marsabit ecosystem watershed service based on the six categories of water use was estimated at Ksh 58,285,026 or $582,035 per year. This can be considered as the revenue which the mountain forest ecosystem generates each year for all the water consumers in the area. The value was highest in the eastern zone (Sagante/Jaldesa) covering an area of 624 km2 at approximately Ksh 30,477,943, followed by the central zone (Marsabit) covering 877 km2 at Ksh 22,105,532 and lowest in the western zone (Karare/Songa) at Ksh 5,701,550.
Discussion
Most of the Latin America rural dwellers have perception that forest ecosystem greatly contributes to provision of water supply. A study by Johson and Baltodano, (2004), on community perception revealed forest ecosystem’s ability to intercept rainfall and replenish water sources, thereby contributing to water supply. The perception seems to be common among rural dwellers in Marsabit as well. From the study in Marsabit forest ecosystem, the locals perceived the water quality to be good. This confirms the role forests plays in absorbing and, filtering the water and improving its quality. Further, a study
17
by Calder et al., (2007) revealed that forest
ecosystem protects soils, reducing soil erosion and siltation of water bodies.
The typology of water sources in the Marsabit dryland water tower (150km2) resembles those in other ecosystems of similar nature. A study by Kiringe et al., (2016), for example, recorded
different types of water sources in Kirisia forest ecosystem watershed (≈700km2) in neighbouring Samburu County including earth dams, water pans, shallow wells, boreholes, springs and streams. However, unlike the situation in Marsabit forest, the Kirisia forest ecosystem watershed service was dominated by earth dams and water pans as the water sources supporting the highest population including Maralal town. This was followed by boreholes while streams, springs and shallow wells were used by the least number of watershed service beneficiaries (Kiringe et al., 2016). In the Chyulu Hills (741km2),
the key water sources are dominated by springs, rivers, boreholes and shallow wells (Mwaura et al., 2016). The difference in the typology of water
sources is related to both the size of the water tower and climatic conditions. The smaller the size of the water tower, the fewer the springs, streams and rivers especially in very dry areas which appear to be the case for Marsabit water tower.
Unlike the situation in other dryland water towers, there is limited investment on rainwater harvesting through the use of water pans in Marsabit as an alternative option for supplementing the existing water sources which are increasingly becoming overwhelmed by the high-water demand. This has been identified for similar areas in Sub-Saharan Africa (Amede et al., 2014). Alternative water supply options will become increasingly necessary due to the increasing demand for water resources against the expected negative impacts of climate change in Kenya (RoK, 2009). According to Muhati et al.,
(2018) Marsabit town has continued to suffer acute water stress in recent years due to reduction in supply from Bakuli spring which is strongly linked to over abstraction. All the 27 sub-locations in Saku sub-county with a population of 79,181 entirely depend on Mount Marsabit ecosystem for their water provision (KNBS, 2020).
According to Otele et al., (2020) Marsabit is likely
to experience high population growth in five to ten years, owing to high fertility rate. Marsabit has a fertility rate of 5 which is higher than the national average of 3.9 (KNBS, 2012).
The valuation estimate of the Mount Marsabit water tower at Ksh 58,285,026 or $582,035 per year is quite similar to the monetary estimates for other dryland water towers in Kenya despite its smaller size. A study by Mwaura et al., (2016), for
example estimated a lower monetary value for the water resources in the Chyulu Hills (consumptive use only) at Ksh 46, 676,192 (≈$466,862) per annum. The Chyulu Hills watershed ecosystem is a very critical dryland water tower which supports large populations of people, livestock and wildlife in the Makueni, Kajiado, Taita Taveta and Mombasa Counties in terms of water supply. However, the Chyulu Hills is in a less dry environment with several other alternative water supply options compared to Marsabit including the Athi River which transverses the area. The economic value of watershed services for the Marsabit water tower was lower when compared to the Mukogodo dryland forest (260km2) in Laikipia county where a study by Kinuthia (2005), estimated the economic value of water resources using the contingent valuation method (CVM) by asking local people in the area how much they were willing to pay (WTP) for the conservation of the forest ecosystem. He estimated the mean WTP at Ksh 330,089 or $3,300 per household per year for 2,898 households and the aggregate WTP at Ksh 4,289,277 per household per year which translated to Ksh 5,117,107,461 or approximately $51,171,075 per year. The difference is attributed to the valuation methods used, on one hand, as well as the fact that the scope of the Mukogodo valuation considered other ecosystem benefits beyond watershed services. Unlike the MPM which deals with the actual market situation, the CVM is based on perceived values based on hypothetical market scenarios. The economic value of watershed services for the Marsabit water tower was lower when compared to the values of the larger national water towers
18
in Kenya such as Mount Kenya which has been estimated at US$ 20.4 million, Aberdares ($7.4 million), Mount Elgon ($3.7 million), Cherang’any ($0.4 million) and Mau ($238 million) as determined by Emerton et al., (1998) and (Kipkoech et al., 2011). The difference is
attributed to the larger size of the national water towers which have more vibrant watershed services compared to the smaller dryland water towers. Conclusion and Recommendations
The findings showed that the Marsabit water tower is characterized by different types of water sources which are dominated by shallow wells and boreholes with the latter as the major source due to the dry conditions and higher reliance on groundwater. The high-water demand in the Marsabit area was mostly associated with household domestic water uses and livestock watering because pastoralism is the key economic sector. The findings are consistent with those of other studies which indicate that isolated dryland mountain ecosystems play a fundamental role in water production and supply in areas associated with poor and unreliable rainfall. The spatial analysis of ecosystem water access points showed that most of the water sources are concentrated on the eastern side of the water tower which is also the windward side in relation to the Indian Ocean. This has strongly influenced the distribution of human settlements in the area including the location of Marsabit town. The valuation estimate of the Mount Marsabit water tower at Ksh 58,285,026 or $582,035 per year signifies the high importance of dryland water towers despite their small sizes. It is expected that the information generated in this
study will be useful in enhancing awareness among various water users on the linkage between the mountain ecosystem and water supply in order to raise the level of community education and public awareness (CEPA) towards such ecosystems. It is expected that this will raise public motivation for ecosystem conservation financing. In this regard, it is recommended that the WRA, Kenya Water Towers Agency (KWTA) and the County Government of Marsabit should collaborate with local communities and the local water vendors to initiate a Payment for Ecosystems Services (PES) scheme that will plough back some of the revenue generated from the water market towards conservation financing in the Mount Marsabit Forest ecosystem. In the same vein, there is need for water consumers to be encouraged to embrace the use of alternative water sources such as rainwater harvesting in order to reduce the pressure on the Marsabit water tower.
Acknowledgement
This study couldn’t have been possible without the support of National Drought Management Authority, Marsabit-Kenya office, who provided logistical support. Technical contribution provided by Mr. Hussein Wario of WRMA and Qalicha Malicha of Marsabit County department of economic planning. Additionally, we are greatly indebted to Wario Halakhe, Ibrahim Fayo, and Fugicha Jillo who assisted in field work activities. Many thanks to Mrs. Batula Hirsi who facilitated for our security while in the field. The authors are grateful to the anonymous reviewers who provided very useful comments for the improvement of this journal article.
References
Amede, T., Awulachew, S. B., Matti, B., & Yitayew, M.
(2014). Managing Rainwater for Resilient
Dryland Systems in Sub-Saharan Africa:
Review of Evidences. 517-540. Springer
International Publishing.
https://doi.org/10.1007/978-3-319-02720-
3_26
Johson, N., Baltodano, M.E., 2004. The economics of
community watershed management: some
evidence from Nicaragua. Ecological
Economics 49, 57–71.
Calder, I. & Hofer, T. & Vermont, Sibylle & Warren, P.
(2007). Towards a new understanding of
forests and water. Unasylva. 58. 3-10.
19
Costanza, R., d’Arge, R., de Groot, R., Farberk, S.,
Grasso, M., Hannon, B., van den Belt, M.
(1997). The value of the world's ecosystem
services and natural capital. Nature, 387, 253–
260.
County Government of Marsabit (CGoM) (2018).
Marsabit County integrated development
plan 2018-2022
Daily, G. C. (ed.) (1997). Nature’s Services: societal
dependence on natural ecosystems. Island Press,
Washington, DC.
de Groot, R, S., Matthew A. W., & Roelof, M. J. B. (2002).
A typology for the classification, description
and valuation of ecosystem functions, goods
and services. Ecological Economics, 41, 393–408.
Emerton, L., Ndugire, N. & C. Bokea (1998). The Costs
of Environmental Degradation to the Kenyan
Economy: A Review of the Literature, Policy
Research Group, Nairobi.
Gachanja, M., Kariuki, D., Lambrechts, C. & Munuve, J.
(2001). Mount Marsabit forest status report.
Kenya Forestry Working group.
Ghosh, N., In Mukhopadhyay, P., & In Panda, M., eds.
(2016). Nature, Economy and Society:
Understanding the Linkages. New Delhi:
Springer India.
IRC (2014), Water Master Plan, towards a better balance
between water demand and supply Marsabit
County: Kenya Arid Land Disaster Risk
Reduction Program (KALLDRR-WASH. The
Hague, Netherlands.
Jacobs, S., Dendoncker, N., & Keune, H. (2014).
Ecosystem services: Global issues, local
practices. San Diego, CA: Elsevier.
Jillo, A.J. (2013), Water Cooperation and Peace building
in Marsabit County, (1991-2009). MA
Research Project. Department of History,
University of Nairobi.
Kenya National Bureau of Statistics (KNBS). (2020).
2020 population census. Kenya National
Bureau of Statistics, Nairobi, Kenya.
Kenya National Bureau of Statistics. (2012). 2009 Kenya
Population and Housing Census: Analytical
report on population projections. Ministry of
State for Planning, National Development
and Vision 2030.
Kenya National Bureau of Statistics (KNBS). (2009).
2009 population census. Kenya National
Bureau of Statistics, Nairobi, Kenya.
Kinuthia, H. M. (2005). The total economic valuation
of natural resources: Perceived community
livelihood values of Mukogodo Forest,
Laikipia, Kenya. M. A. thesis, University of
Nairobi
Kipkoech A., Mogaka H., Cheboiywo J., & D. Kimaro
(2011). The total economic value of Maasai
Mau, Trans Mara and Eastern Mau forest
blocks, of the Mau Forest, Kenya. Lake
Victoria Basin Commission, Kisumu, Kenya.
Kiringe, J.W., Mwaura F., Warinwa, F. (2016):
Characterization of Water Sources Types and
Uses in Kirisia Forest Watershed, Samburu
County, Kenya. Environment and Natural
Resources Research Journal 6(3), 77-90.
Lovett, J. C., & Noel, S. (2008). Valuing ecosystem goods
and services. African journal of ecology, 46(2),
117-118. https://doi.org/10.1111/j.1365-
2028.2008.00988.x.
Maina, P.M., Imwati, A.T., (2015) Use of
Geoinformation Technology in Assessing
Nexus between Ecosystem Changes and
Wildlife Distribution: A Case Study of Mt.
Marsabit Forest. International Journal of
Science and Research (IJSR). 4, 718–724.
Millennium Ecosystem Assessment - MEA (2005).
Ecosystems and human well-being: synthesis.
Island Press, Washington, DC.
Millennium Ecosystem Assessment (Program). (2001).
Millennium Ecosystem Assessment.
Washington, D.C.
Mogaka, H., Gichere, S. Davis, R., & Hirji, R. (2006).
Climate variability and water resources
degradation in Kenya: improving water
resources development and management.
World Bank Working Papers Number 69, 1-105.
Muchura, Henry M., Min S., Chua, Mworia, John K., N.
N. Gichuki. (2014), Role of Bryophytes and Tree
Canopy in Mist Trapping in Mt. Marsabit Forest,
Kenya. Journal of Environment and Earth
Science. Vol. 4, No. 21, 2014, pp. 128-138.
Muhati G.L, Olago D., & L. Olaka. (2018). Land use and
land cover changes in a sub-humid Montane
forest in an arid setting: A case study of the
20
Marsabit forest reserve in northern Kenya.
Global Ecology and Conservation, 16.
Mwaura, Francis & Kiringe, John & Warinwa, Fiesta &
Wandera, Phillip. (2016). Estimation of the
Economic Value for the Consumptive Water
Use Ecosystem Service Benefits of the Chyulu
Hills Watershed, Kenya. 4. 36-48.
National Drought Managemnt Authority-NDMA
(2017) Marsabit County 2017–18 short rains
assessment report, February, 2017. Nairobi:
NDMA.
Oroda, A.S. (2011). The Impact of Increased Population and
Sedentarization of the Pastoral Communities on
Land Cover and the Resources of Mount Marsabit
Forest and Surrounding Lands (Ph.D. Thesis),
Kenyatta University, Nairobi, Kenya.
Retrieved from https://ir-
library.ku.ac.ke/handle/123456789/3704
Ortigara A.R.C., Kay M. and S. Uhlenbrook (2018). A
review of the SDG 6 synthesis report 2018
from an education, training, and research
perspective. Water 2018, 10(10), 1353;
https://doi.org/10.3390/w10101353.
Ouko, C.A.; Mulwa, R.; Kibugi, R.; Owuor, M.A.;
Zaehringer, J.G.; Oguge, N.O. (2018)
Community Perceptions of Ecosystem Services
and the Management of Mt. Marsabit Forest in
Northern Kenya. Environments, 5, 121.
Republic of Kenya (RoK). (2005) Practice manual for
water supply services in Kenya, October,
2005. Ministry of Water and Irrigation,
Republic of Kenya, Kenya – Belgium Study
and Consultancy Fund
Republic of Kenya (RoK). (2009). National Climate
Change Response Strategy, Nairobi.
Republic of Kenya (RoK). (2011). Northern Wildlife
Conservation Project 2011-2017. Nairobi: BRL
Ingénierie & ESF Consultants.
Robinson, Lance W. (2013). Mt. Marsabit, Kenya: An
Assessment of the Governance System. Landscape-
Level Ecosystem-Based Management Working
Paper no. 2. [online] URL: retrieved from
http://www.viu.ca/landscapelevel/.
Sloan, S., & Sayer, J. A. (2015). Forest Resources
Assessment of 2015 shows positive global
trends but forest loss and degradation persist
in poor tropical countries. Forest Ecology and
Management, 352, 134-145.
Thomas M.L.H., Channon A.A., Bain R.E.S., Nyamai M.
& J.A. Wright (2020). Household Reported
Availability of Drinking Water in Africa: A
Systematic Review. Water 2020, 12, 2603;
doi:10.3390/w12092603
United Nations Environment Programme (UNEP).
(1996). Convention on general biological
diversity: biological diversity in forests. Meeting
of Subsidiary body on scientific, technical and
technological advice. September 1996.
UNEP/CBD/SBSTTA/2/11, Montreal.
WRMA (2013) Final report: surface and groundwater
assessment and planning in respect to the
Marsabit County mid-term ASAL program
study. Volume 1, main report.
WEHAB Working Group (2002): ‘A Framework for
Action on Biodiversity and Ecosystem
Management’ (United Nations World Summit
on Sustainable Development, Johannesburg
2002).
Wilkie M. L., Holmgren P., & Castaneda, F. (2003).
Sustainable forest management and the ecosystem
approach: two concepts, one goal. Forest
management working paper 25, Forest
Department, FAO, Rome.
Wu, T., Kim, S. Y., & Hurteau, M. D. (2011). Investing in
natural capital: using economic incentives to
overcome barriers to forest restoration.
Restoration Ecology, 18(4), 441–445.