by mount zion college of nursing
TRANSCRIPT
A Study to determine the incidence of secondary lactose intolerance and
evaluate the effect of lactose free feeds in controlling diarrhea and
correcting dehydration among the children.
A Thesis
Submitted to The Tamil Nadu Dr. M.G.R. Medical University, Chennai,
for the award of the Degree of
DOCTOR OF PHILOSOPHY IN NURSING
By
HIRUTHAYADHASON MARY JASMINE SHEELA
Principal
Mount Zion College of Nursing
Under the Guidance of
Prof .Dr.R.RAJKUMAR MBBS, MD., PhD.,
RESEARCH GUIDE
C.S.I JEYARAJ ANNAPACKIAM COLLEGE OF NURSING
MADURAI
OCTOBER - 2015
A Study to determine the incidence of secondary lactose intolerance and
evaluate the effect of lactose free feeds in controlling diarrhea and
correcting dehydration among children.
Signature of the Guide: ______________________________________
Prof .Dr.R.RAJKUMAR MBBS, MD, Ph.D.,
RESEARCH GUIDE
C.S.I JEYARAJ ANNAPACKIAM COLLEGE OF
NURSING
MADURAI
Signature of the Co-Guide: __________________________________
Prof.Dr. SHANTHI APPAVU, M.Sc(N),Ph.D.,
RESEARCH CO-GUIDE
C.S.I JEYARAJ ANNAPACKIAM COLLEGE OF
NURSING
MADURAI
A Thesis
Submitted to The Tamil Nadu Dr. M.G.R. Medical University, Chennai,
for the award of the Degree of
Doctor of Philosophy
in Nursing
OCTOBER 2015
A Study to determine the incidence of secondary lactose intolerance and
evaluate the effect of lactose free feeds in controlling diarrhea and
correcting dehydration among children.
Research Guide: _____________________________________
Prof .Dr.R.RAJKUMAR MBBS, MD, Ph.D.,
RESEARCH GUIDE
C.S.I JEYARAJ ANNAPACKIAM COLLEGE OF
NURSING
MADURAI
A THESIS SUBMITTED TO THE TAMIL NADU DR. M.G.R. MEDICAL
UNIVERSITY, CHENNAI, INDIA, FOR THE AWARD OF THE DEGREE
OF DOCTOR OF PHILOSOPHY IN NURSING
OCTOBER 2015
CERTIFICATE BY GUIDE
This is to certify that the thesis entitled “A Study to determine the incidence of
secondary lactose intolerance and evaluate the effect of lactose free feeds in
controlling diarrhea and correcting dehydration among children” submitted by
HIRUDHAYADHASON MARY JASMINE SHEELA who registered for Ph.D in 2010
is a bonafide record of the research done by her under my supervision and guidance and
that it is not formed on any basis for the award of any other Degree, or Diploma,
Associateship, Fellowship (or) any other similar title in this University (or) any other
Universities (or) Institution of higher learning.
I also certify that this thesis is her original independent work. I recommend this
thesis should be placed before the examiners for the award of Ph.D degree.
____________________________________________________ Prof .Dr.R.RAJKUMAR MBBS, MD, Ph.D.,
Research Guide
C.S.I Jeyaraj Annapackiam College of Nursing
Madurai
DECLARATION
I hereby declare that this thesis entitled “A Study to determine the incidence of
secondary lactose intolerance and evaluate the effect of lactose free feeds in
controlling diarrhea and correcting dehydration among children” is an original work
done by me under the guidance of Prof.Dr.R.RAJKUMAR MBBS, MD, Ph.D.,
Research Guide C.S.I Jeyaraj Annapackiam College of Nursing Madurai, and has not
been submitted elsewhere, either partially or fully for the award of any other degree, or
diploma, Associateship, Fellowship or any other similar title.
HIRUTHAYADHASON MARY JASMINE SHEELA Principal Mount Zion College of Nursing Pudukkottai
ACKNOWLEDGEMENT
....To The Respected Ones
I thank GOD ALMIGHTY for keeping me close to him, for abundant blessings
that he has showered upon me, for taking me through life, the way he has bestowed
happiness upon me, which had reaffirmed my belief in the art of life and living, for his
guidance, wisdom, courage and strength to do this research study.
It is with a deep sense of pleasure that I use this opportunity to express my
gratitude to many helping hands that made this study possible.
It is my privilege to express the deepest sense of gratitude Prof.Dr.C.Jothi
Sophia, M.Sc.,(N)., Ph.D., Principal, C.S.I. Jeyaraj Annapackiam College of Nursing for
giving me the opportunity to carry out my doctoral research. I would like to thank her for
encouraging my research and for helped me to grow in this profession.
It is my duty to extend my thanks and express my deep sense of gratitude to
Prof.Dr.R.Rajkumar MBBS, MD, Ph.D., Research Guide, C.S.I Jeyaraj Annapackiam
College of Nursing, Madurai, for his valuable guidance with constructive encouragement,
and for having steered me in the right direction.
I owe my deepest gratitude to Prof.Dr. Santhi Appavu, M.Sc.,(N), M.Phil(N),
Ph.D., Research Co-Guide, CSI Jeyaraj Annapackiam College of Nursing, Madurai, for
her valuable suggestions, helped me to bring out the work in successful way.
I am extremely grateful to Dr. Prabhakar Navamani, MBBS.,DCH., of
Navamani Pediatric Hospital, Arasaradi, Madurai and Mrs.Rabeka Prabhakar,
Administrator Navamani Pediatric Hospital, Madurai for allowing me to conduct the
research in their esteemed institution for their valuable guidance. I extend special thanks
to Mrs.Chandra, Nursing Superintend of Navamani pediatric hospital , Madurai for
helping me in completing this clinical study.
I would especially like to thank Prof.Merlin Jeyapal, M.Sc., (N), Vice Principal,
C.S.I. Jeyaraj Annapackiam College of Nursing for her support guidance and
encouragement.
I would like to thank Dr.Gabriel Jeyachandran, Ph.D., Director CSI College of
Education, for his valuable suggestions rendered throughout my study.
I would like to extend my sincere thanks to Mr. Jayabarathan Chellaiah,
M.A.,(USA)., B.Ed., Chairman, Mount Zion Educational Institutions, Lenavilaku,
Thirumeyam Taluk, Pudukkottai District and Mrs.Florance Jayabarathan,M.A., B.Ed.,
Vice Chairperson, Prof. Jayson K. Jayabharathan,M.Tech., Ph.D., Director Mount
Zion College of Nursing for their consent support and for providing the required facilities
for the successful completion of this study.
I articulate my sincere thanks to Prof.Dr.Mahalingam Kannan, professor in
Statistics– Madurai Institute of Social Sciences, Madurai. for his expert guidance in
analyzing and interpreting the data in a meaningful way.
I would like to express my heartfelt thanks to Dr. Reena, Principal, St. Xavier
College of Nursing, Chungankadai, K.K.District for energetic and pleasant
encouragement to complete this study and also for validating the tool. I express my
sincere thanks to Dr. Rajalakshmi, Research Guide, and Prof.Dr.Angella Ganadurai,
Research Guide CSI Jeyaraj Annapackiyam College of Nursing, Madurai, for her
valuable corrections and suggestions and spending time on going through the manuscript.
Dr. Juliet Sylvia, Professor, Sacred Heart College of Nursing, Prof.Mrs.Sumithra,
Principal, Karpaga Vinayaga College of Nursing, Pudukkottai, Prof.Saraswathi,
Principal, Sri Ramachandra Naidu College of Nursing, Tirunelveli, for their valuable
help, contributed with their valuable suggestion in validating the tool.
I am immensely grateful to Prof.Dr.Mrs.Nalini Jeyavantha Santha, Principal,
Sacred Heart College of Nursing, Madurai, for her motivation and valuable suggestions.
My deep sense of gratitude to Prof.Dr.Jaya Thangaselvi, M.Sc., (N), Ph.D., and
my friend Prof.Dr.Jansi Rachel Daisy, M.Sc., (N), Ph.D., CSI College of Nursing,
Madurai, for her valuable corrections suggestions and spending time on going through
the manuscript, for their valuable help and constant encouragement and I also express my
sincere thanks to Prof.Dr.Jessy Mettleda, M.Sc., (N), Ph.D., for the valuable
suggestions.
My affectionate thanks to all my colleagues who helped me throughout this
project. I express my hearty thanks Prof.Dr.O.T.John PhD., H.O.D, Department of
English, MZCET for his timely help in editing the thesis.
I am thankful to the librarians of CMC Vellore, C.S.I JACON, The Tamil Nadu
Dr.M.G.R Medical University, SRMC Porur, Chennai for their co-operation in collecting
the related literature for the study .
I heartly express my sincere thanks to all the participants who agreed to
participate in this research work and had shown interest in sharing their opinions and
providing the needed information to complete this research work successfully.
I am indebted, blessed and lucky to have my friend Prof.Mrs.N.Sarasvathy,
Principal, Sri KR Naidu College of Nursing for her consent encouragement, and support
to complete this research work.
I also express my heartfelt gratitude to Mrs.Sangeetha,M.sc.,(N), Vice Principal
and Mrs.N.Sathya, M.Sc.,(N), Lecturer Mount Zion college of nursing, Pudukkottai for
her timely help completing this research work . .
It is an honour for me to dedicate this work to my mother A.Helen Mary, and my
father Mr.A.Hiruthayadhason, who brought me to the world of knowledge. My beloved
sister Mrs.H.M.Daphini B.E, My brother H.Kingsly, MLS, My father in law
Mr.M.Arulanandam and my mother in Law A.Micheal mary who provided necessary
help and support, with their constant smile and very much eager to know the result of my
work.
Lastly, my heartfelt thanks to my lovable husband Mr.A.Benedict Micheal, Sons
B.Jenin Arul & Lenin Arul who cheered every inch of the progress I made. They acted
as sounding boards, editors, and censors and lent me a hand whenever I needed and
shared readily the frustrations and tensions that seemed to the lot of every researcher. To
them and to several others who prefer to be anonymous, I am greatly indebted especially
my sons for their computer assistance.
A special bouquet of thanks to all my lovable friends and Co-Ph.D scholars,
Mrs.Thamarai Selvi for her encouragement.
My heartful thanks to all the children and their mothers and care givers who
enthusiastically participated the study.
I extend a special word of appreciation and thank to Laserpoint Computers,
Madurai, for their sincere effort in typing the manuscript, untiring patience and full
co – operation with much valued computer skills in bringing this study in to a printed
form.
ABSTRACT
A Study to determine the incidence of secondary lactose intolerance and evaluate the
effect of lactose free feeds in controlling diarrhea and correcting dehydration among
the children.
Introduction
Diarrhea is the second leading cause of deaths among under five children more
than 10 million children die each year from diarrhea.
Dehydration remains a major cause of morbidity and mortality in infants and
young children. Infants are more susceptible for dehydration. The effect of
dehydration is greater because of higher metabolic rate, greater baseline fluid
requirement inability to communicate thirst or seek fluid. Dehydration is also
associated with electrolyte imbalance.
With this idea, the researcher developed a cereal (Rice) and soya based
lactose free, homemade feed for infants which effectively controls diarrhea and
correct dehydration among children with secondary lactose intolerance and also easily
available and digestible, having all essential nutrients for child’s growth and
development.
Aim and Objective
The present study is aimed to develop a lactose free feed with cereal based
(matta red rice) and soya and to evaluate the effectiveness of the developed lactose
free feeds in controlling diarrhea and correcting dehydration among children with
secondary lactose intolerance induced diarrhea.
The first objective of the study was to determine the incidence of secondary
lactose intolerance among children. 2. To evaluate the effect of lactose free Risoy
feeds in controlling diarrhea and controlling dehydration among children. 3. To find
out the correlation between the diarrheal status of children with hydration in Pre-test
and Post-test I and Post-test II.
Methods
A quasi experimental study based on ‘before and after’, control group design
was used. A total of 120 children aged between 4 months to 12 months were taken as
study sample, experimental group (n=60) and control group (n=60) through purposive
sampling technique. Prior to this, the incidence of secondary lactose intolerance was
assessed, totally 618 children having diarrhea for 3 and more than 3 days were
assessed between the age group of 4-12 months. The effectiveness of lactose free
Risoy feeds were assessed by administering lactose free Risoy feeds to children
among experimental group for 3 days. The day of admission, Day I score is taken as
pre-test, and Day II as post-test I and Day III as post-test II. The effectiveness of the
feed was determined by comparing with the control group.
The tools include
Demographic data of the child and mother
Observational rating scale for assessing the diarrheal status .
Observational rating scale for assessing the hydration status.
5 point likert scale to assess the level of satisfaction regarding Risoy feeds
among mothers of children.
Results
A total number of 618 children with diarrhea for 3 and more than three days
were screened for presence of reducing sugar in stool and stool pH, among which
(56.63%) 350 children between the age of 4to 12 months were identified to have
secondary lactose intolerance. The scores of Diarrheal status and Hydration status
were compared within the group by paired ‘t’ test and between group by independent
‘t’ tests. The Day I assessment was taken as Pre-test and Day II. Post-test I and Day 3
assessment considered as Post-test II. The children were found to improve in all
aspects of diarrhea and hydration status on Day III. After the introduction of lactose
free RISOY feeds among experimental group. In Post-test I, the total mean post test
score of hydration status in all aspects in experimental group is 81.62 is more than the
control group mean score 77.93. The calculated ‘t’-value 3.213 is statistically
significant at P<.00 level. This indicates that there is a difference between the
experimental and control group. The children in experimental group attained better
hydration status when compared with the control group.
The total mean post test score of diarrheal status in all aspects in experimental
group on Post-test I is 66.27 which is less than the control group mean score 74.88.
The calculated ‘t’-value -7.952 is statistically significant at P<.00 level. Hence the
diarrheal status among experimental group is statistically significant at P<.00 level.
This indicates that there is a difference between the experimental and control group.
The total mean post intervention score of diarrheal status in all aspects in
experimental group on Post-test II is 38.1667 which is less than the control group
mean score 41.2778. The calculated ‘t’-value 2.246 is statistically significant at P<.00
level. This shows that there is a difference between the experimental and control
group.
The total mean post test score of hydration status in all aspects in experimental
group on Post-test II is 97.4603 is more than the control group mean score 93.7302.
The calculated ‘t’-value 4.445 is statistically significant at P<.032 level. This
indicates that there is a difference between the experimental and control group. The
hydration status of the children were found to be to the maximum level in most of the
subjects among experimental group. Hence the lactose free RISOY feeds were
effective in correcting the dehydration by controlling the episodes of diarrhea.
There was a negative correlation found between the diarrheal and hydration
status was increasing. Regarding the level of satisfaction in utilizing the lactose free
Risoy feeds, the mother were not very much satisfied in the pretest and in post-test II,
all the mother experienced that, they were very satisfied with the Risoy feeds.
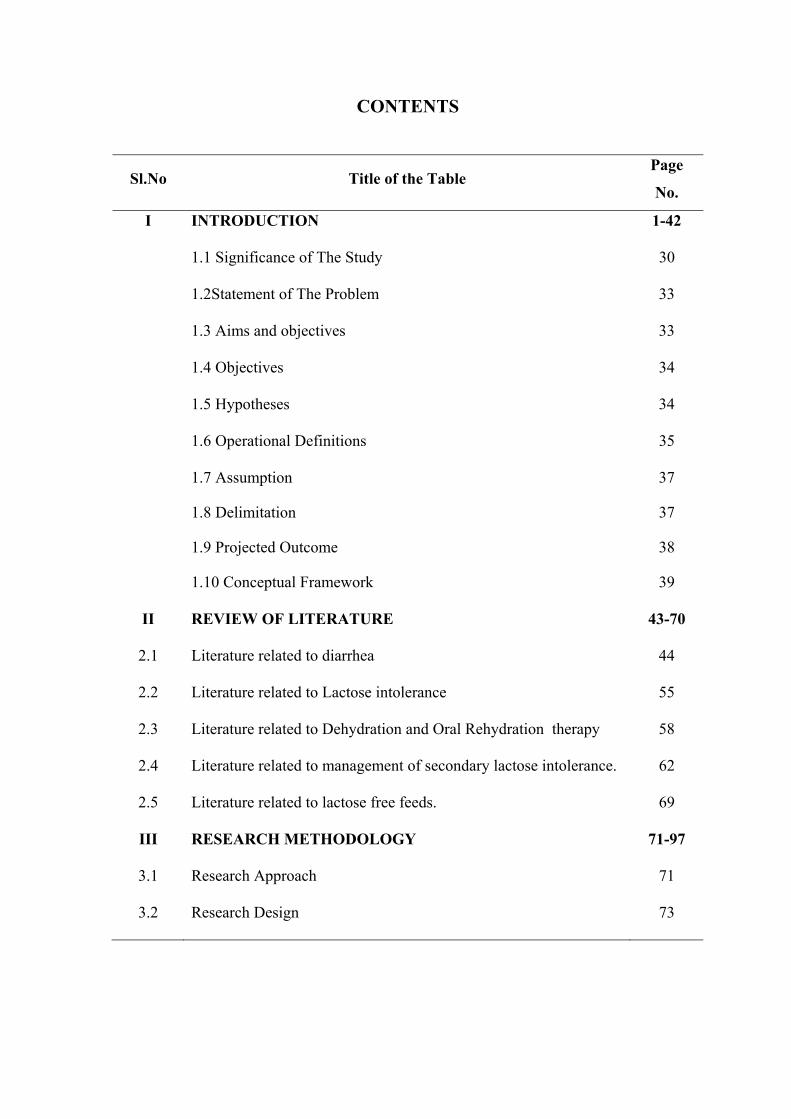
CONTENTS
Sl.No Title of the Table Page
No.
I INTRODUCTION 1-42
1.1 Significance of The Study 30
1.2Statement of The Problem 33
1.3 Aims and objectives 33
1.4 Objectives 34
1.5 Hypotheses 34
1.6 Operational Definitions 35
1.7 Assumption 37
1.8 Delimitation 37
1.9 Projected Outcome 38
1.10 Conceptual Framework 39
II REVIEW OF LITERATURE 43-70
2.1 Literature related to diarrhea 44
2.2 Literature related to Lactose intolerance 55
2.3 Literature related to Dehydration and Oral Rehydration therapy 58
2.4 Literature related to management of secondary lactose intolerance. 62
2.5 Literature related to lactose free feeds. 69
III RESEARCH METHODOLOGY 71-97
3.1 Research Approach 71
3.2 Research Design 73
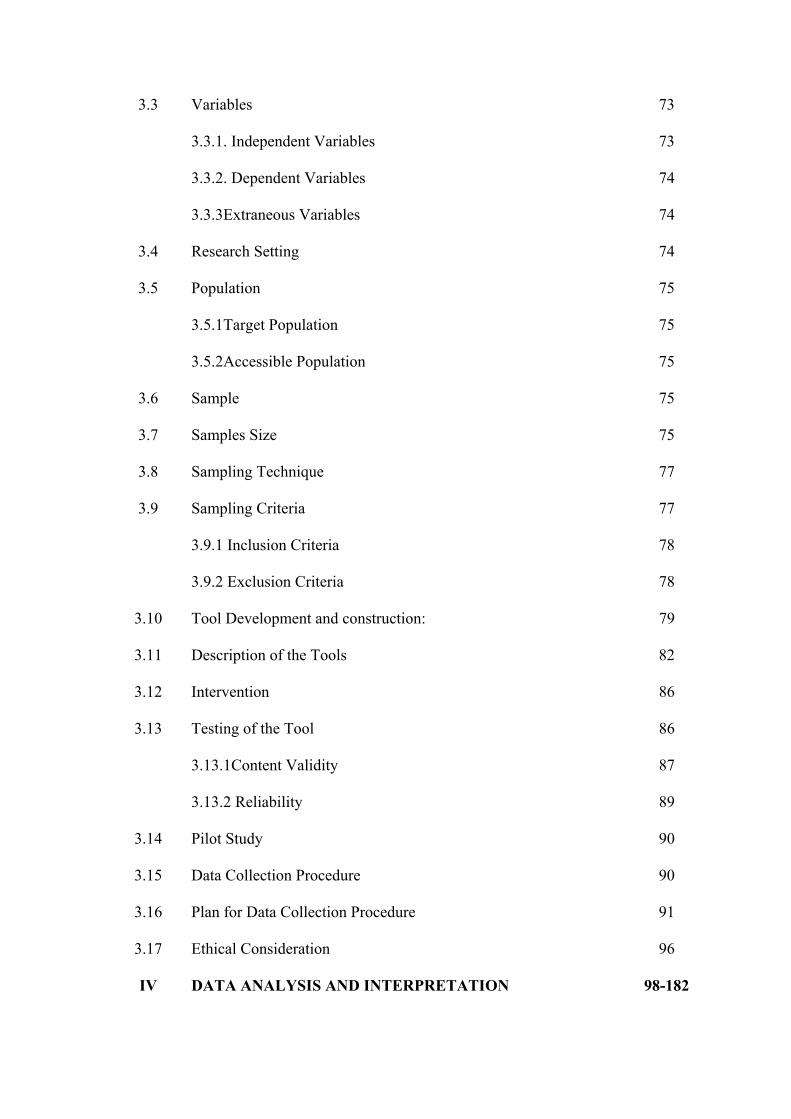
3.3 Variables 73
3.3.1. Independent Variables 73
3.3.2. Dependent Variables 74
3.3.3Extraneous Variables 74
3.4 Research Setting 74
3.5 Population 75
3.5.1Target Population 75
3.5.2Accessible Population 75
3.6 Sample 75
3.7 Samples Size 75
3.8 Sampling Technique 77
3.9 Sampling Criteria 77
3.9.1 Inclusion Criteria 78
3.9.2 Exclusion Criteria 78
3.10 Tool Development and construction: 79
3.11 Description of the Tools 82
3.12 Intervention 86
3.13 Testing of the Tool 86
3.13.1Content Validity 87
3.13.2 Reliability 89
3.14 Pilot Study 90
3.15 Data Collection Procedure 90
3.16 Plan for Data Collection Procedure 91
3.17 Ethical Consideration 96
IV DATA ANALYSIS AND INTERPRETATION 98-182
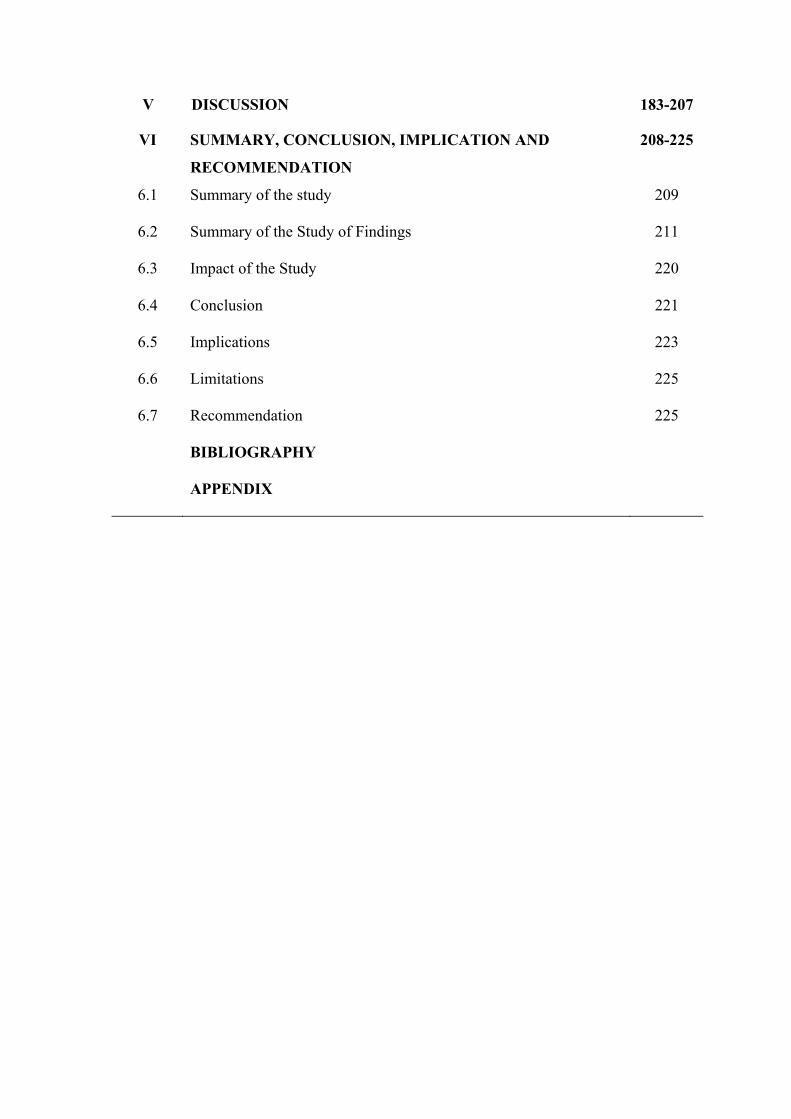
V DISCUSSION 183-207
VI SUMMARY, CONCLUSION, IMPLICATION AND
RECOMMENDATION
208-225
6.1 Summary of the study 209
6.2 Summary of the Study of Findings 211
6.3 Impact of the Study 220
6.4 Conclusion 221
6.5 Implications 223
6.6 Limitations 225
6.7 Recommendation 225
BIBLIOGRAPHY
APPENDIX
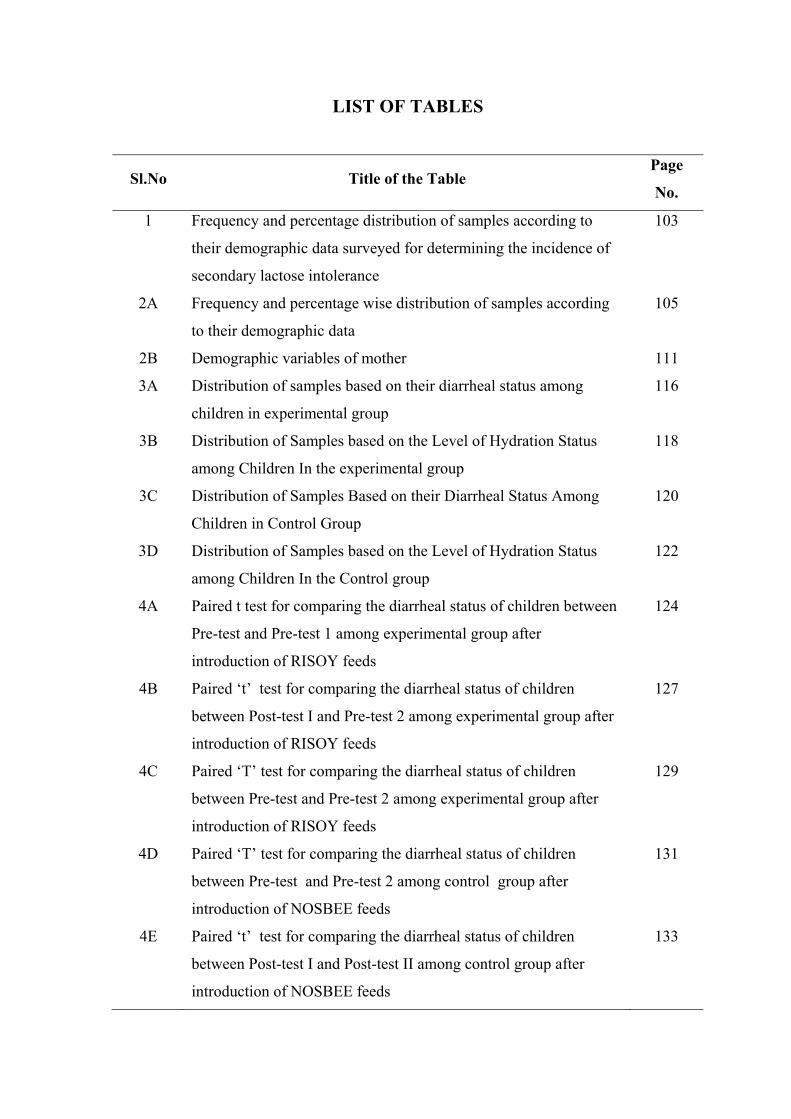
LIST OF TABLES
Sl.No Title of the Table Page
No.
1 Frequency and percentage distribution of samples according to
their demographic data surveyed for determining the incidence of
secondary lactose intolerance
103
2A Frequency and percentage wise distribution of samples according
to their demographic data
105
2B Demographic variables of mother 111
3A Distribution of samples based on their diarrheal status among
children in experimental group
116
3B Distribution of Samples based on the Level of Hydration Status
among Children In the experimental group
118
3C Distribution of Samples Based on their Diarrheal Status Among
Children in Control Group
120
3D Distribution of Samples based on the Level of Hydration Status
among Children In the Control group
122
4A Paired t test for comparing the diarrheal status of children between
Pre-test and Pre-test 1 among experimental group after
introduction of RISOY feeds
124
4B Paired ‘t’ test for comparing the diarrheal status of children
between Post-test I and Pre-test 2 among experimental group after
introduction of RISOY feeds
127
4C Paired ‘T’ test for comparing the diarrheal status of children
between Pre-test and Pre-test 2 among experimental group after
introduction of RISOY feeds
129
4D Paired ‘T’ test for comparing the diarrheal status of children
between Pre-test and Pre-test 2 among control group after
introduction of NOSBEE feeds
131
4E Paired ‘t’ test for comparing the diarrheal status of children
between Post-test I and Post-test II among control group after
introduction of NOSBEE feeds
133
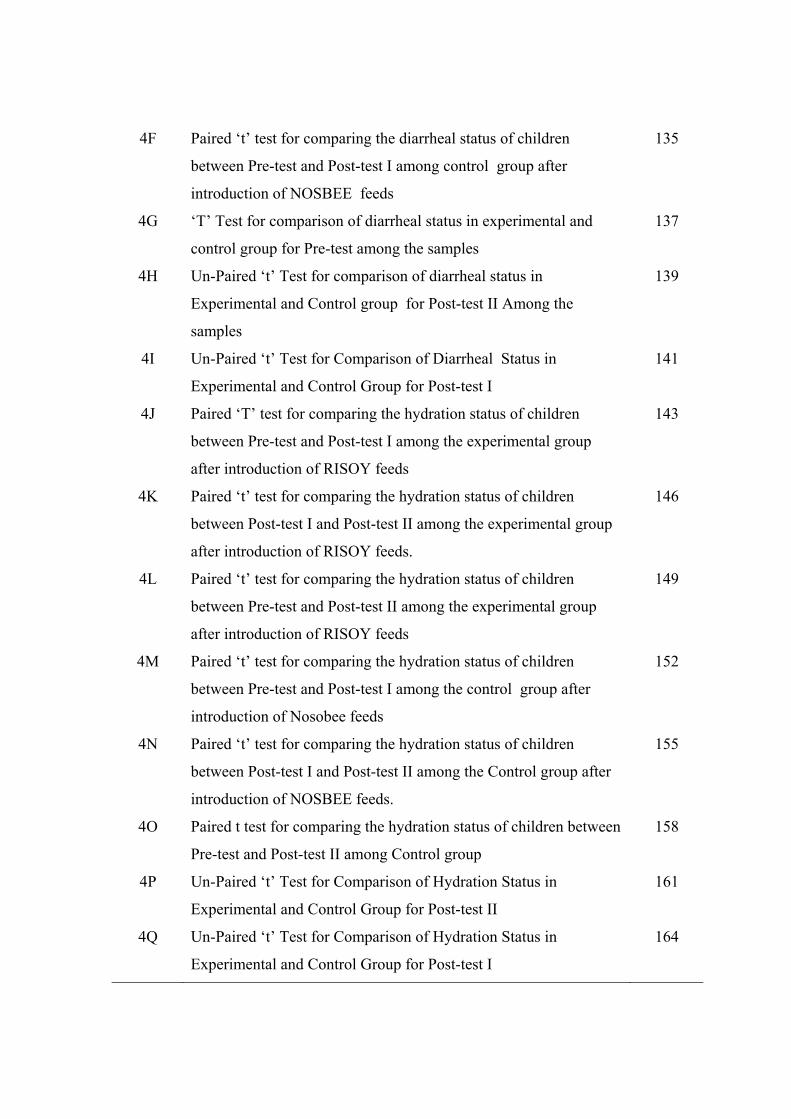
4F Paired ‘t’ test for comparing the diarrheal status of children
between Pre-test and Post-test I among control group after
introduction of NOSBEE feeds
135
4G ‘T’ Test for comparison of diarrheal status in experimental and
control group for Pre-test among the samples
137
4H Un-Paired ‘t’ Test for comparison of diarrheal status in
Experimental and Control group for Post-test II Among the
samples
139
4I Un-Paired ‘t’ Test for Comparison of Diarrheal Status in
Experimental and Control Group for Post-test I
141
4J Paired ‘T’ test for comparing the hydration status of children
between Pre-test and Post-test I among the experimental group
after introduction of RISOY feeds
143
4K Paired ‘t’ test for comparing the hydration status of children
between Post-test I and Post-test II among the experimental group
after introduction of RISOY feeds.
146
4L Paired ‘t’ test for comparing the hydration status of children
between Pre-test and Post-test II among the experimental group
after introduction of RISOY feeds
149
4M Paired ‘t’ test for comparing the hydration status of children
between Pre-test and Post-test I among the control group after
introduction of Nosobee feeds
152
4N Paired ‘t’ test for comparing the hydration status of children
between Post-test I and Post-test II among the Control group after
introduction of NOSBEE feeds.
155
4O Paired t test for comparing the hydration status of children between
Pre-test and Post-test II among Control group
158
4P Un-Paired ‘t’ Test for Comparison of Hydration Status in
Experimental and Control Group for Post-test II
161
4Q Un-Paired ‘t’ Test for Comparison of Hydration Status in
Experimental and Control Group for Post-test I
164
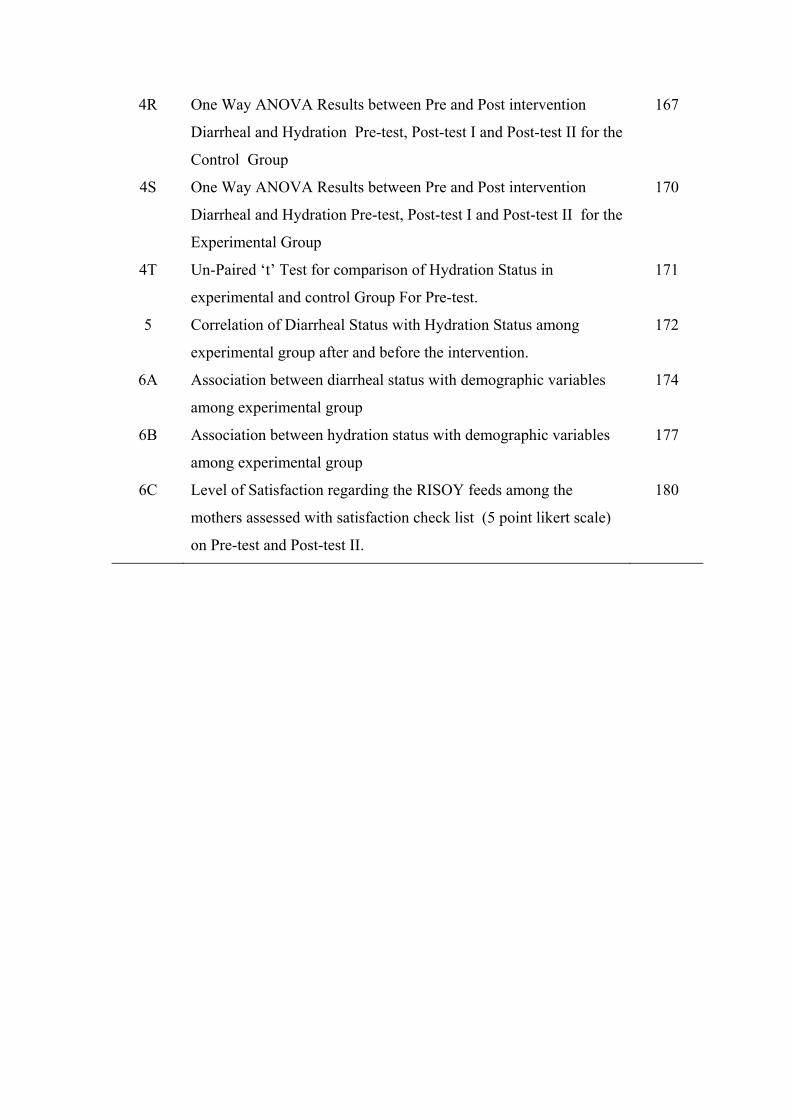
4R One Way ANOVA Results between Pre and Post intervention
Diarrheal and Hydration Pre-test, Post-test I and Post-test II for the
Control Group
167
4S One Way ANOVA Results between Pre and Post intervention
Diarrheal and Hydration Pre-test, Post-test I and Post-test II for the
Experimental Group
170
4T Un-Paired ‘t’ Test for comparison of Hydration Status in
experimental and control Group For Pre-test.
171
5 Correlation of Diarrheal Status with Hydration Status among
experimental group after and before the intervention.
172
6A Association between diarrheal status with demographic variables
among experimental group
174
6B Association between hydration status with demographic variables
among experimental group
177
6C Level of Satisfaction regarding the RISOY feeds among the
mothers assessed with satisfaction check list (5 point likert scale)
on Pre-test and Post-test II.
180
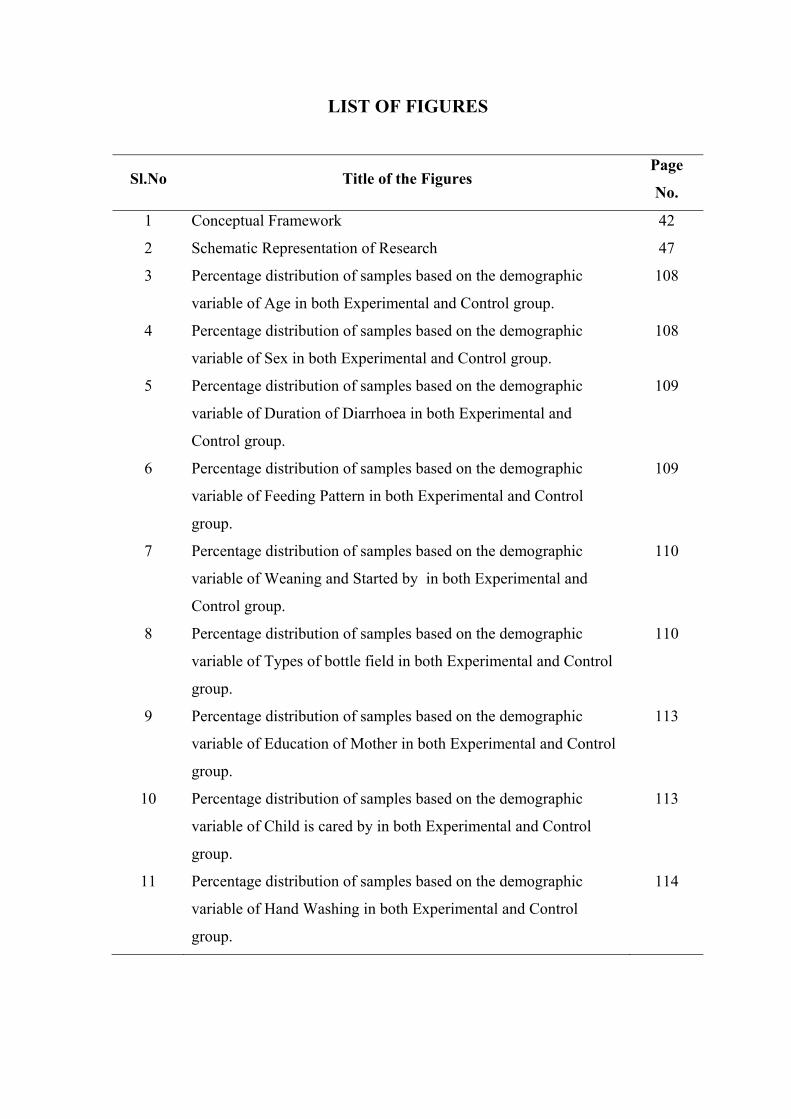
LIST OF FIGURES
Sl.No Title of the Figures Page
No.
1 Conceptual Framework 42
2 Schematic Representation of Research 47
3 Percentage distribution of samples based on the demographic
variable of Age in both Experimental and Control group.
108
4 Percentage distribution of samples based on the demographic
variable of Sex in both Experimental and Control group.
108
5 Percentage distribution of samples based on the demographic
variable of Duration of Diarrhoea in both Experimental and
Control group.
109
6 Percentage distribution of samples based on the demographic
variable of Feeding Pattern in both Experimental and Control
group.
109
7 Percentage distribution of samples based on the demographic
variable of Weaning and Started by in both Experimental and
Control group.
110
8 Percentage distribution of samples based on the demographic
variable of Types of bottle field in both Experimental and Control
group.
110
9 Percentage distribution of samples based on the demographic
variable of Education of Mother in both Experimental and Control
group.
113
10 Percentage distribution of samples based on the demographic
variable of Child is cared by in both Experimental and Control
group.
113
11 Percentage distribution of samples based on the demographic
variable of Hand Washing in both Experimental and Control
group.
114
12 Percentage distribution of samples based on the demographic
variable of Feeding Vessels sterilization in both Experimental and
Control group.
114
13 Percentage distribution of samples based on the demographic
variable of drinking water in both Experimental and Control group.
115
14 Distribution of samples based on their diarrheal status among
children in experimental group
117
15 Distribution of Samples based on the Level of Hydration Status
among Children In the experimental group
119
16 Distribution of Samples Based on Their Diarrheal Status Among
Children In Control Group
121
17 Distribution of Samples based on the Level of Hydration Status
among Children In the Control group
123
LIST OF APPENDIX
Appendix Title
A Letter seeking permission for data collection
B Letter seeking permission for content validity
C List of experts
D Ethical clearance certificate
E Instrument (Tool 1,2,3)
F Proximate analysis of intervention in IICPT
G Certificate of developing the intervention
H Schedule for data collection
I Plagiarism Snapshot
1
CHAPTER - I
INTRODUCTION
“Children are heritage of the Lord the fruit of the womb, it is his reward”
Health and wellbeing are the responsibility as well as a right of all individuals.
As a whole, protecting the wellness and development of children is a lifelong
contribution to the growth and development of the nation. Children under five years
of age constitute to 15-20% of the India’s population. Preserving the wellbeing of
children is one of the greatest investments for the country’s economic growth and
political stability.1
Throughout the world, approximately 10 million infants die each year, and
about 90% of this infant mortality occurs in the developing world. In third world
countries, it is estimated that about 10-20% of all infants die before their first
birthday. High infant mortality rate is linked to diarrhea epidemics.2
Diarrhea is one of the most debilitating diseases in both children and adults
and largest single cause of death among infants and children. World level statistics
proves that 9% of all deaths among children under age is due to dreaded disease
diarrhea. In 2013, this escalated into 1,600 young children are dying each day, or
about 58,000 deaths due to diarrhea was seen every year. While in South Asia and sub
Saharan Africa, death due to diarrhea is seen in children below two years of age.3
Acute diarrhea is the most important cause of morbidity and hospitalization
among young children in United States. More than1.5 million outpatient visits,
200,000 hospitalizations, and approximately 300 deaths per year due to diarrhea alone
is reported. About 250 million direct medical costs are estimated for almost a quarter
of all hospitalizations due to diarrhea among United State children between 0-5 years
2
of age annually, accounting for 1 billion total costs to society per year. Universally,
diarrheal diseases are the fore most cause of pediatric morbidity and mortality, with
1.5 billion incidents and 1.5-2.5 million deaths estimated to occur yearly among
children aged below 5 years.4
The yearly number of deaths from diarrhea among under five children has
declined by above 50%- from 1.2 million to less than 0.6 million as seen from 2000-
20133. Diarrhea is still the second major cause of mortality among children under five
globally. Every year the mortality in children under five due to diarrhea is around 760,
0005. Approximately, one in every five child dies making up 1.5 million a year. Death
rate due to Diarrhea is higher than AIDS, malaria and measles put together.6
According to the 2015 statistics,1.2 million children die due to diarrhea and related
diseases, 80% of them die in the first two years of their life7. Almost every year 1.7
billion cases of diarrheal disease are recorded globally as a result, irrespective of the
fact that diarrheal diseases are both preventable and treatable8.Diarrhea is the leading
etiological factor of malnutrition in children under five years old and most of them die
due to dehydration and excessive fluid loss. And therefore it becomes the important
threat in relation to mortality and morbidity in the universe.9
All over the world almost 30,000 children below the age of 5, are dying every
day that accounts for more than 10 million children per year, especially from
avoidable or curable conditions like diarrhea, pneumonia, measles and malaria10.
Diarrhea is responsible for about one in five deaths of children in the world. About
1.5 million children below five go on to death each year as a result of acute
gastroenteritis in developing countries6. Eighty percentage of under-five mortality are
due to diarrhea happens in the first two years of their life and as many as 10% of
infant deaths in India result from diarrhea.11
3
Diarrhea can go on for more than few days, and deprive the body from the
water and salts which is vital for survival. Many of them who die due to diarrhea truly
die because of severe dehydration and fluid loss. Emaciated Children with decreased
immunity as well as those with HIV are at high risk of life-threatening diarrhoea12.A
study was conducted on estimating child mortality due to Diarrhea, which provided
estimates of diarrhea globally. The finding was that the Global mortality of children
due to diarrhea below 5 years was estimated at 1.87 million (95% confidence interval,
CI: 1.56–2.19), accounting for about 19% of total child deaths. According to WHO,
African and South-East Asia regions together contain 78% (1.46 million) of every
diarrhea deaths happening amid children in the developing countries, of which 73%
is found in nearly 15 developing world.13.
In developing world, children under 18 months of age come across
approximately 3 episodes of diarrhea per year. Every loose stool deprives the child of
nutrients required for normal growth and development. Diarrhea is the main culprit of
malnutrition and thereby malnourished children are more prone to fall ill due to these
kinds of gastro enteritis12.
The under-five mortality rate has reduced by half, that is approximately
17,000 lives per day, which happens to be a great achievement in the public health
community as reported in one of the study conducted between 1990-2013. In the past
13 years alone (from 2000 to 2013), death in children due to diarrhea has come down
to almost half still diarrhea goes onto be the leading cause of death among the under-
five ,claiming the lives of more than 1.5 million children in a single year that is 2013.
From 1.5 million children who lost their lives due to diarrhea, a disproportionate
fraction (71%) transpired in just 15 countries, even though only about 56% of the
world’s children under-five are found in these countries.14
4
World statistics report that four billion episodes of diarrhea occur each year,
with > 90% seen in developing countries. Diarrheal is one of the leading public health
issue among under-five children. Death due to diarrhea in children aged 0-6 years was
estimated to be 158,209 and at the same rate mortality due to diarrhea in this age-
group was 9.1% in India. Whereas the incidence of diarrhea in rural and urban in
children aged 0-6 years was 1.71 and 1.09 episodes per person per year respectively.15
The reasons for high incidence of diarrhea in young children are mainly due to
young age, low socioeconomic status, poor maternal literacy, multiple under-five
sibling in the family, birth weight, inadequate breastfeeding, malnutrition, poor
sanitation and hygiene practices of the mother.16
It is also seen that children belonging to poor economic status reported higher
diarrheal incidence when compared to higher social economic group. The education
of the mother also plays a crucial role in prevention of diarrhea.15 Studies also have
proven that families having more children are more prone for diarrheal disease (22-
70%) which is comparably higher than those with just with one child below five years
of age .Frequency of diarrhea was not found to be significantly greater among under
7weight or stunted children as compared to well-nourished children as seen in few
studies though nutrition of the child is important determinant of diarrhea. Every year
in developed countries, 21- 37 million episodes of diarrhea is seen among 60.5million
children in the age group of five and below, where as in the tropical belt 15 -40% of
all death among under five are due to diarrhea.15
A study was conducted on the burden of diarrheal disease. Approximately 3.2
incidence of diarrhea was accounted yearly among under five children. The mortality
revealed that 4.9 children among 1000 population in a year who died because of
diarrhea during the first 5 years of life. Diarrhea is responsible for a median of 21% of
5
deaths amounting to 2.5 million deaths annually. Diarrhea is frequent among children
and adds substantially to pediatric morbidity and mortality globally. Diarrhea is a
most important public health issue in developing countries. It is likely that 1.8 billion
episodes of diarrhea occurs and 3 million children below five year die as a result of
diarrhea every year.17
A study was conducted at seven areas of sub-Saharan Africa and South Asian
countries including India. The objective of the study was to find the causes of diarrhea
which revealed rotavirus is responsible for most diarrheal cases .According to Global
Enteric Multicenter Study (GEMS), in their latest issue of Lancet, diarrheal disease
is responsible for one in every ten child deaths during the first five years of life all
over world. Highest incidence was found in India when compared to other sites. The
World Health Organization(WHO) approximates that 90,000 to 153,000 children die
from rotavirus infection in India each year. Among the 2.3 million deaths that occur in
children below five years ,334,000 deaths are due to diarrhea-related diseases alone. 18
Therefore in India Diarrhea stands among the top five causes of death among
infants and under-five children, irrespective of the availability of interventions that
can be easily implemented and presence of national guidelines that guides in
improved management at the community level9.In consideration to other child related
problems, pneumonia and diarrhea, alone, are responsible for 17% and 9% of child
deaths respectively and both the conditions together claimed more than 1.7 million
lives of under-five children in 2012 . The burden of the neonatal health problems is
escalated of which pneumonia and diarrhea were evidently identified as diseases that
needs special attention in order to meet national and international goals for dropping
death rate and thereby improving wellbeing and quality of life of children in india.19
6
National Family Health Survey-3 (NFHS-3) report that 9% of all under-five
children suffer from diarrhea20.Yet in accordance in some studies, diarrheal episodes
has drop to as low as one episode per child in a year in some urban areas across
india.21
Despite the fall in mortality rate, diarrhea still remains the second leading
cause of death of children under the age of five resulting in 5,50,00022 death annually .
The global report released on March, 2004, states that more than five lakh (500,000)
Indian children die as a result of diarrheal disease of every year. Almost half of the
children aged under five are not growing normally and the mortality rate for this
group is 93 per one thousand live births.23
About 1,00,000 children are succumbed to death even before reaching one
year of life24. According to the findings of The Global Enteric Multicenter Study
(GEMS) on diarrheal diseases in developing countries, approximately 4,57,000 to
8,84,000 children were hospitalized and two million outpatient clinic visits were
noted every year in India.25
Diarrhea is the predominant cause of mortality among the under-five and is
viewed as significant public health problem. The economic load on health services
incurred due to diarrheal diseases is immense. One-third of total pediatric admissions
are because of diarrheal diseases and nearly 17% of all deaths in indoor pediatric
patients are diarrhea related .Calculation of mortality due to diarrhea in India was
done by the National Institute of Cholera and Enteric Diseases, Kolkata. According to
their findings, the crude death rate related to diarrhea per 1,000 populations was
9.3,especially in the age group of 0–6 years which accounted for 22% of total rural
deaths. Therefore being a prominent killer of under five children, diarrhea holds a tuff
challenge to health planners. In 2009, one of the leading donor organizations in India,’
7
Rotary International has joined with government of India to help to fight against
diarrhea’. Diarrhea kills nearly 5 lack’s children a year in India.26
During 2005 nearly one million case of acute Diarrhea were identified in India
with 2040 deaths .Approximately 4.6 million children continue to die each year due
to diarrhea related dehydration even after WHO initiated diarrheal disease control
programme in 198027.Though the mortality due to rotavirus diarrhea has been reduced
to 1.6 million during year 2002, it still remains a heavy burden in developing
countries.28
According to a study conducted in India, hundred million children (14.1% of
the total population) still face 300 million episodes of diarrhea per year and 10% or 30
million progress to dehydration and 1% or 3 Million assumed to face death. Diarrheal
diseases are main reasons for death and disease among under five. A child an average
as 2-3 attacks of diarrhea every year.
Diarrheal diseases cause a heavy economic burden for health services as well
as to the country. The Hindu Newspaper report states that nearly one lakh children
died in India every year owing to diarrhea, which was easily preventable. The country
should promote preventive and community-based quality healthcare. It also
encourages private practitioners to carry a significant share of the burden of public
health care24.
India has made steady and sound progress in decreasing mortality among
under five. The total deaths have declined from 2.5 million in 2001 to 1.5 million in 2
standing drop 01229. This outstanding drop was possible due to the successful
initiation of many universal programs like expanded program on immunization,
program for the control of diarrheal diseases and acute respiratory infection that has
given promising results. Despites this decline, the proportional mortality caused by
8
diarrheal diseases is still high killing thirty thousand children each year in countries
like India. Therefore Diarrhea is considered as the third most predominant cause for
under five death, responsible for 13% deaths in this age-group, killing an estimated
300,000 children in India each year.30
Diarrhea is the condition were the normal net absorptive status of water and
electrolyte can be reversed. The increased water content in the feces (above the
standard value of about 10 ml/kg/d in the infant and young child, or 200 g/d in the
teenager and adult) is due to unevenness in the physiology of the small and large
intestinal processes integrated in the absorption of ions, organic substrates, and
consequently water.31
Acute diarrhea is defined as the abrupt onset of 3 or more loose stools per day
and lasts no longer than 14 days; chronic or persistent diarrhea is defined as an
episode that lasts longer than 14 days32. Diarrhea is typically and indication of an
infection in the intestinal tract, that can be caused by a range of bacterial, viral and
parasitic organisms. Infection can be passed through contaminated drinking-water and
food, or due to poor personal hygiene.12
The mechanism of diarrhea is mainly as follows:
a. Osmotic overload-osmotic diarrhea
b. Secretary diarrhea
c. Alteration of motility
d. Decreased surface area.33
9
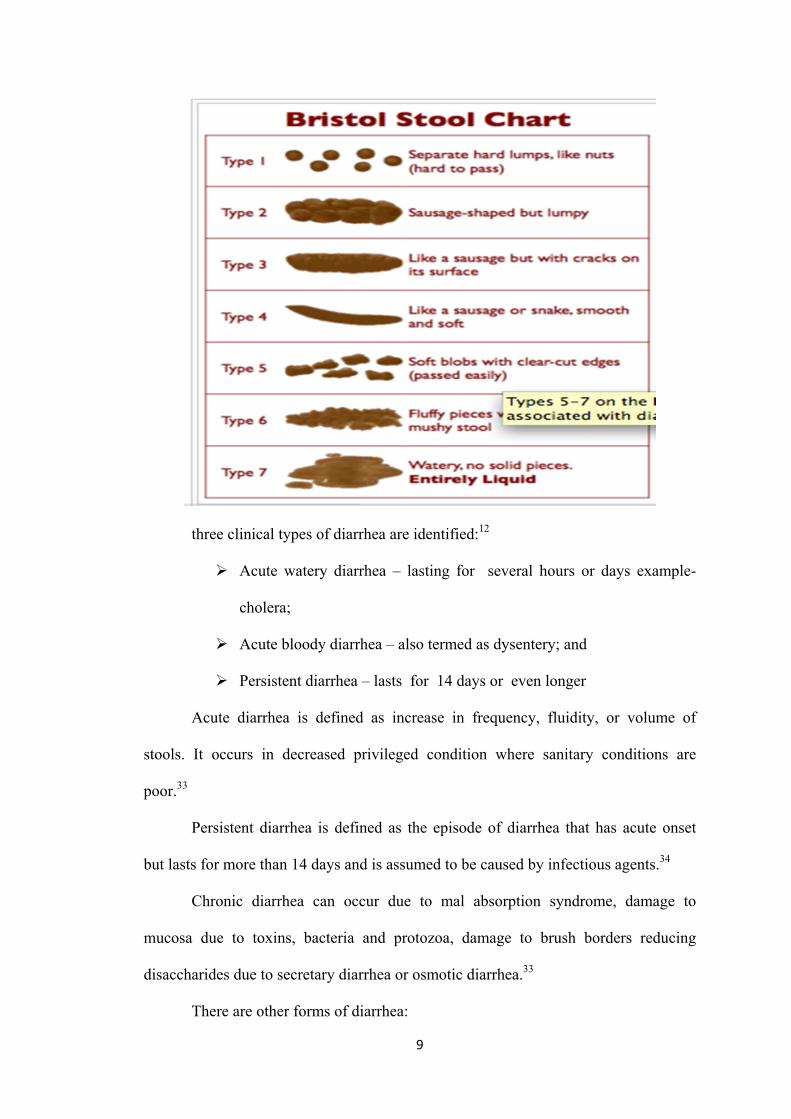
three clinical types of diarrhea are identified:12
Acute watery diarrhea – lasting for several hours or days example-
cholera;
Acute bloody diarrhea – also termed as dysentery; and
Persistent diarrhea – lasts for 14 days or even longer
Acute diarrhea is defined as increase in frequency, fluidity, or volume of
stools. It occurs in decreased privileged condition where sanitary conditions are
poor.33
Persistent diarrhea is defined as the episode of diarrhea that has acute onset
but lasts for more than 14 days and is assumed to be caused by infectious agents.34
Chronic diarrhea can occur due to mal absorption syndrome, damage to
mucosa due to toxins, bacteria and protozoa, damage to brush borders reducing
disaccharides due to secretary diarrhea or osmotic diarrhea.33
There are other forms of diarrhea:
10
1. Noninfectious diarrhea: maybe caused by allergy to foods and mal
absorption.
2. Recurrent mild diarrhea may be due to manifestation of irritable bowel
syndrome.
3. Created diarrhea that perhaps produced due to infection elsewhere. E.g.
otitis media, urinary tract infection, broad spectrum antibiotics that may be
due to interference with normal intestinal flora.
4. Toddler’s diarrhea is seen in age group of 2-6 years and presents clinically
as recurrent diarrhea episodes. Here child never develops dehydration or
malnourishment.
5. Dysentery is passage of loose stools with blood.
A single episode of diarrhea in a well-nourished child may be harmless
and recurrent episodes in malnourished infants may be life threatening.
The effect of repeated diarrheal episodes is cumulative and leads to
retardation of growth. The damaged intestinal mucosa may not recover
completely and ensuring mucosal atrophy results in malabsorption.34
Diarrheal disease leads to fluid and electrolyte malnutrition and PEM.
Osmotic secretory and invasive processes are three main pathogenic pathways.
Osmotic and secretory diarrhea are watery diarrheas with small bowel involvement.
Villus cell damage leads to reduce digestion and absorption leading top osmotic
diarrhea. Entero toxins lead to secretory diarrhea. Rota virus diarrhea absorption
decreases and secretion exceeds absorption. In chronic diarrhea crypt cell hyperplasia
leads to secretory diarrhea and villus cell damage leads to disaccharides deficiency
and osmotic diarrhea. Villus cells are absorptive and crypt cells are secretory. Villus
cell damage may stimulate crypt cell hyperplasia and secretory disorder may crop up
11
on an osmotic diarrhea. Invasive diarrhea produces blood and mucus due to cyto toxin
mediated inflammation in large bowel35
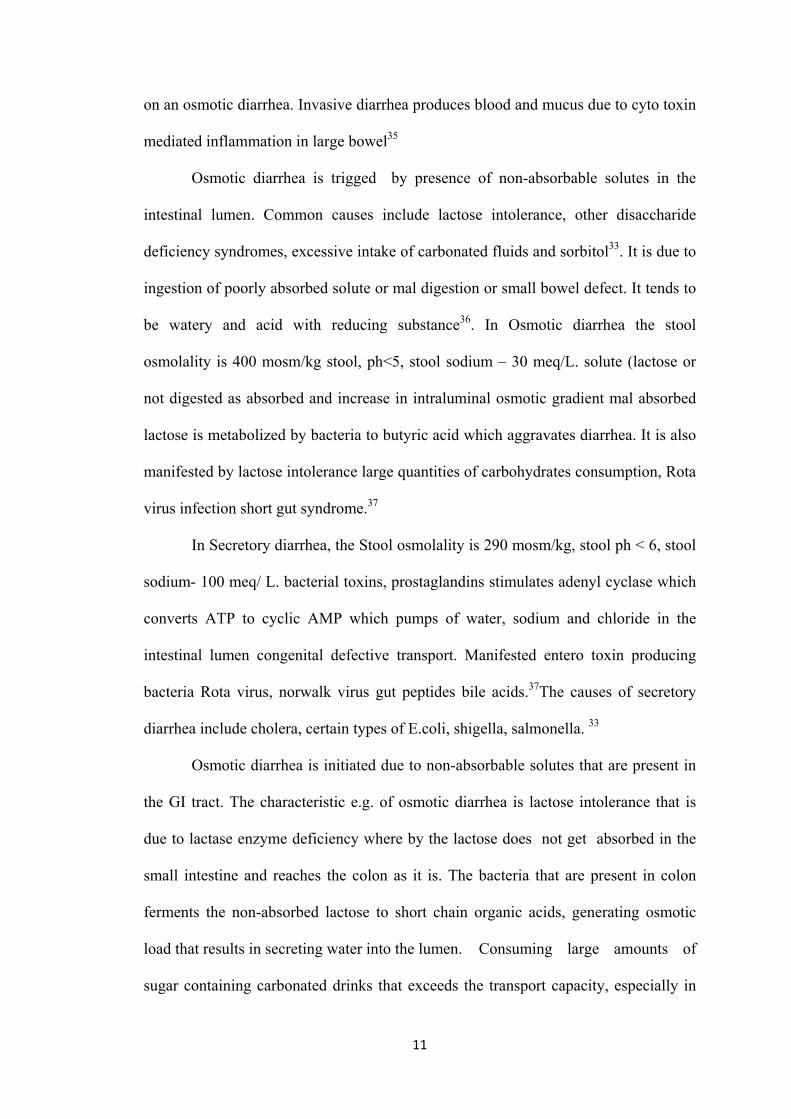
Osmotic diarrhea is trigged by presence of non-absorbable solutes in the
intestinal lumen. Common causes include lactose intolerance, other disaccharide
deficiency syndromes, excessive intake of carbonated fluids and sorbitol33. It is due to
ingestion of poorly absorbed solute or mal digestion or small bowel defect. It tends to
be watery and acid with reducing substance36. In Osmotic diarrhea the stool
osmolality is 400 mosm/kg stool, ph<5, stool sodium – 30 meq/L. solute (lactose or
not digested as absorbed and increase in intraluminal osmotic gradient mal absorbed
lactose is metabolized by bacteria to butyric acid which aggravates diarrhea. It is also
manifested by lactose intolerance large quantities of carbohydrates consumption, Rota
virus infection short gut syndrome.37
In Secretory diarrhea, the Stool osmolality is 290 mosm/kg, stool ph < 6, stool
sodium- 100 meq/ L. bacterial toxins, prostaglandins stimulates adenyl cyclase which
converts ATP to cyclic AMP which pumps of water, sodium and chloride in the
intestinal lumen congenital defective transport. Manifested entero toxin producing
bacteria Rota virus, norwalk virus gut peptides bile acids.37The causes of secretory
diarrhea include cholera, certain types of E.coli, shigella, salmonella. 33
Osmotic diarrhea is initiated due to non-absorbable solutes that are present in
the GI tract. The characteristic e.g. of osmotic diarrhea is lactose intolerance that is
due to lactase enzyme deficiency where by the lactose does not get absorbed in the
small intestine and reaches the colon as it is. The bacteria that are present in colon
ferments the non-absorbed lactose to short chain organic acids, generating osmotic
load that results in secreting water into the lumen. Consuming large amounts of
sugar containing carbonated drinks that exceeds the transport capacity, especially in
12
toddlers and ingestion of magnesium salts and sorbitol, can result in a rise in an
osmotic load, are both are not observed in the lumen. 37
Lactulose, a synthetic therapeutic disaccharide is not absorbed in the small
intestine and is fermented by the colonic bacteria to form organic acids resulting in
osmotic diarrhea. Osmotic diarrhea stop with fasting has low pH, and positive for
reducing substance. The sum of sodium and potassium multiplied by 2 in the stools
will be less than the measured stool osmolality, a finding suggesting the presence of
other osmols in the stools.37
The mechanism for secretory diarrhea involves activation of the intracellular
mediator like cyclic AMP and cyclic GMP and intracellular calcium that stimulates
active chloride secretion from the crypt cells thus inhibiting the absorption of
neutral coupled sodium chloride absorption. These mediators changes the Para
cellular iron flex since the toxin mediates injury to the tight junction.
13
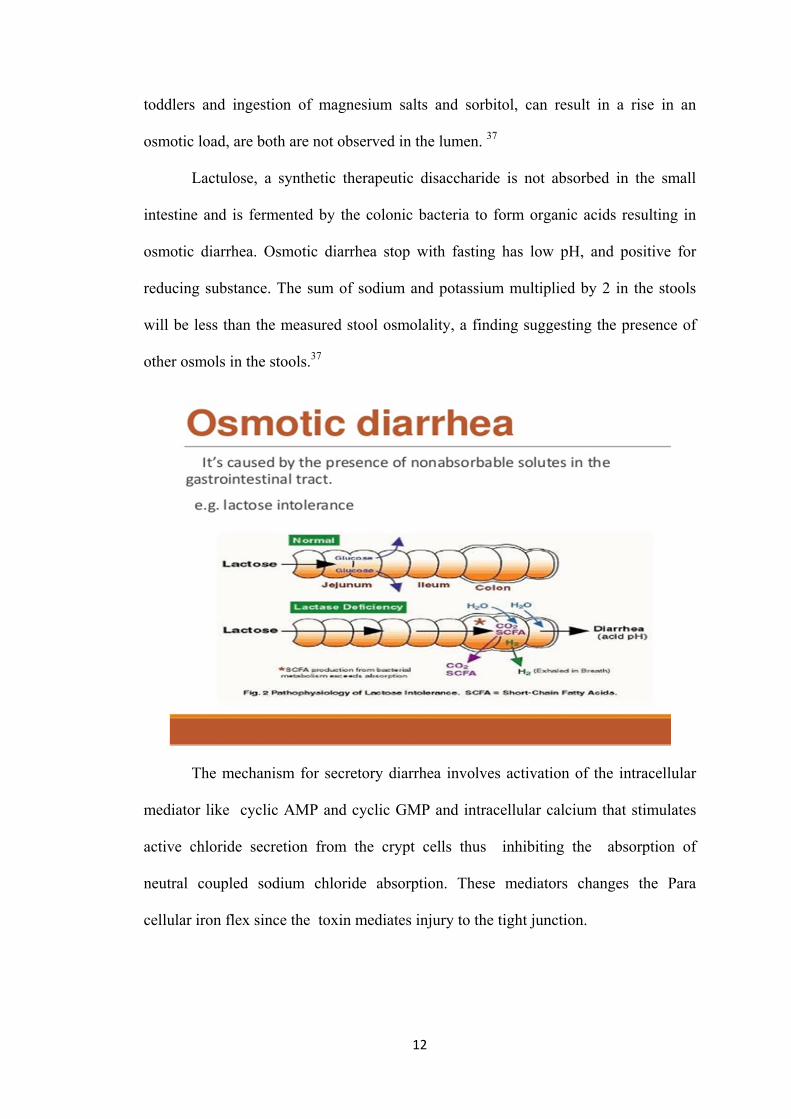
Osmotic Secretory
Volume of stool <200ml/24 hour >200ml/24 hour
Response to fasting Stops Continues
Stool Na <70 meq/L >70meq/L
Reducing substance Present Absent
PH <5 >6
Typical example of secretory diarrhea are those caused by cholera and E coli
enterotoxin that bind specific enterocyte on the surface receptor. A small portion of
toxin enters the cell and activates adenylate cyclase on the basolateral membrane
through interfere with a stimulatory G protein. This in turn raises intracellular cyclic
AMP. The entrotoxigenic E. coli, mediate secretory diarrhea by producing heat labile
toxin and heat stable toxin in the small bowel. Other causes of secretory diarrhea
include vaso active peptides, which activates G protein coupled receptor resulting in
an increasing intra cellular mediators causing secretory diarrhea.
The characteristic features of Secretary diarrhea are high volume stools that
are extremely watery and has high sodium chloride content which continues even
during fasting .37
14
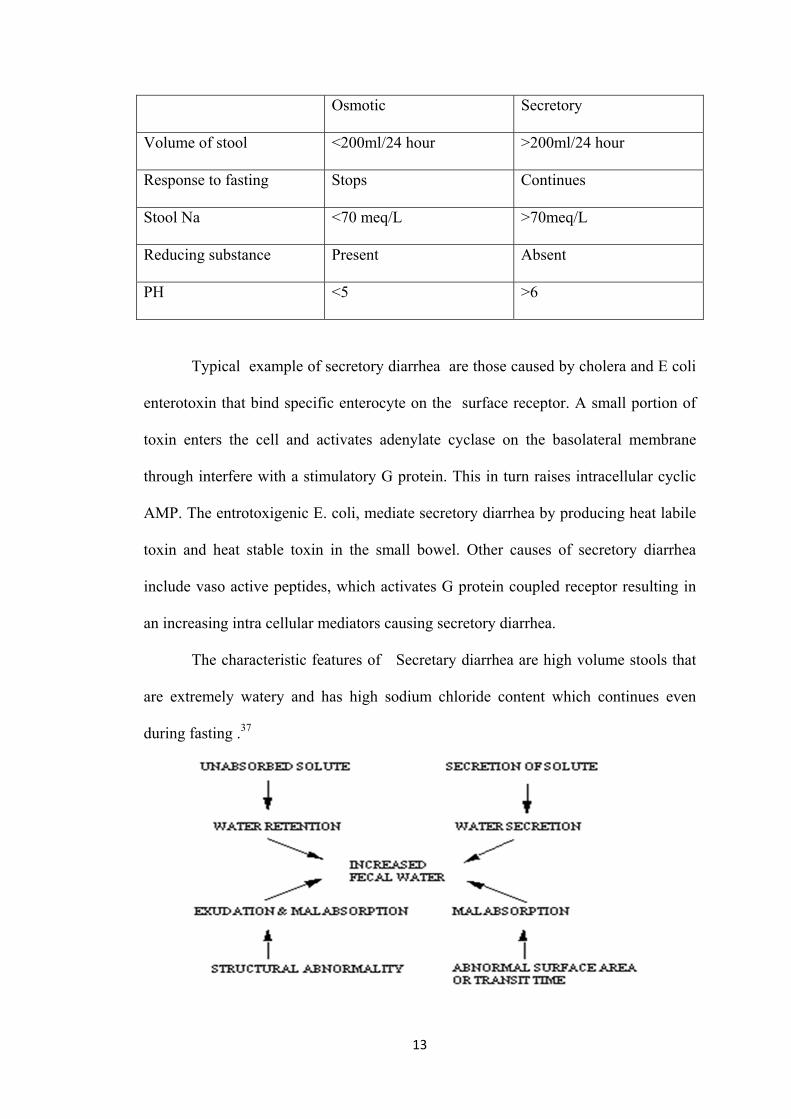
The difference between secretory and osmotic diarrhea can be identified
through fecal electrolytes and osmolality. Low fecal sodium and chloride and increase
osmolality suggests osmotic diarrhea and high fecal sodium and chloride and decrease
osmolality suggests secretory diarrhea. Fecal pH <5 suggests fermentation of
unabsorbed sugar.38
One of the prominent cause of mortality and morbidity in children throughout
the world, is diarrhea that usually results and mostly results from food and water
sources that are contaminated. Worldwide, 780 million individuals to not have access
to improve drinking-water and 2.5 billion are deficient of improved sanitation.
Therefore diarrhea caused by infection is very commonly spread throughout
developing countries. Children below three years usually present on average at least
three episodes of diarrhea every year12.
Intestinal infection due to Virus results in explosive watery diarrhea, tenuous
(spasmodic) contraction of anal sphincter with pain, with constant desire to defecate,
cramping abdominal pain, and perianal skin irritation. Other Systematic
manifestations includes increased temperature, nausea, vomiting, malaise. Stool
analysis may show presence of leukocytes, blood and mucus depending on the
causative agent. The onset of diarrhea due to Rotavirus infection is usually 18-24
hours and can go up to 24-48 hours duration. Children usually present with explosive
watery diarrhea, nausea, vomiting, and abdominal cramps.39
The significant causative agent of acute diarrhea in children around the world
is Rotavirus. Approximately 527,000 children below 5 years die from rotavirus
diarrhea each year, with more than 85% of these deaths occurring in third world
countries of Africa and Asia40. Rotavirus is the key cause of dehydrating diarrhea in
young children throughout the globe. Its symptoms may range from no manifestations
15
to death from dehydration41. Rotavirus accounts for most hospitalizations for severe
diarrhea in younger children and is a significant nosocomial pathogen. Variety of
factors can produce diarrhea in the infant or child either as the presenting symptoms
or an associated symptoms most are self-limited and will ultimately subside without
specific treatment, if dehydration does not create a serious complication. According to
the findings of a study, 38% of 528 children were hospitalized due to acute watery
diarrhea. Rotavirus accounted for 34% while dehydration was detected in 16%.42
The commonest cause of gastroenteritis among children under 2 years of age
living in either developed or developing countries rotavirus. Rotavirus perhaps causes
diarrhea by enhancing the changes of enterocytes along the villus axis, by making
numerous villus blunt due to immature cells that make them incapable of normal
absorption, creating crypt-like shape that makes them secretory in nature. Also
rotavirus blocks the sucrose is maltase transport to the apical membrane without much
cell destruction and thereby reduce sucrose isomaltase activity which alters the
enterocyte cytoskeleton.43
Diarrhea usually lasts longer than expected in children due to rotavirus,
because they become intolerant to one of the sugars in food (called lactose). The virus
in the gut makes it difficult to breakdown the sugar and the condition can last for few
weeks together.44.
Lactose is the sugar in the milk. It occurs in the whey (liquid) part of milk.
Foods made from milk will contain specific quantities of lactose, depending on the
amount of whey in their composition. The enzyme lactase is responsible for breaking
down the lactose into two monosaccharide’s or single sugars: glucose and galactose.
Someone who produces very little lactase cannot break down large quantities of
16
lactose. So the undigested lactose moves into the colon, where it provides an excellent
base for microbial fermentation.45
Lactose is a disaccharide consisting of two monosaccharide, glucose and
galactose. This is a primary carbohydrate founds solely in mammalian milk. The
amount of lactose in a mature human milk is about 7.2 g/100 ml and 4.7 g/100ml in
cow’s milk but is negligible in the milk of some marine mammals.46
Beta galactosidase called lactase phlorizin hydrolase is the enzyme that is
responsible for lactose activity in the intestinal mucosa .In order to observe this
enzyme splits the bond of lactose into two monosaccharide in the brush border of the
small intestine. Lactase is found in the small intestine and especially is more
concentrated on the tips of the villi, a factor of clinical significance that helps in
explaining the effect of diarrheal illness on the ability to tolerate milk.47
Lactose intolerance can at times result for a period of time after rotavirus
infection. This is termed as 'secondary' or 'acquired' lactose intolerance. The intestinal
lining in a child is damaged after diarrheal episodes making it deficient of enzyme
that is required for the digestion of lactose. The common clinical manifestation of
lactose intolerance are bloating, abdominal pain, flatulence and watery stools (feces)
after intake of milk . This is a reversible condition. The condition improves once the
intestinal lining heals after infection48.
Physiologically in neonate high concentration of lactose enzymes are present.
In the presence of any genetically programmed factors or reduction in enzyme activity
may result in primary lactose mal absorption especially after weaning is initiated. This
enzyme is usually present in brush border membrane of the intestinal mucosa.
Therefore lactose intolerance is the resultant of lactase deficiency.49
17
Hippocrates first identified lactose intolerance around 400 years BC, but the
clinical manifestations have come to light recognized only in the last 50 years. The
main features of lactose intolerance in susceptible individuals are varying abdominal
symptoms which can be treated with dietary restriction or by enzyme replacement,
based on the amount of lactose consumed and the extent of lactase deficiency.50
Symptoms of disaccharide intolerance are Diarrhea, abdominal distention,
pain, and flatulence (wind) are the usual symptoms of disaccharide intolerance. These
symptoms are the result of microbial fermentation and a change in osmotic pressure in
the large bowel.51
Lactose intolerance can arise as a complication of some episodes of diarrhea.
It is of clinical significance in few children with acute diarrhea but is more common
with persistent diarrhea.52If the enzyme deficiency is a result of damage to the
intestinal cells, caused by infection, food allergy, food protein enteropathy, or strong
drugs, it is called a secondary deficiency and is usually temporary. When the cause is
removed, the cells will start to heal and gradually resume production of the enzymes.
Over time, foods to which an affected individual was intolerant will we processed
adequately and tolerated. If the baby’s lactose intolerance is secondary, as a result of
gastro intestinal tract infection or other transient condition, most specialist advice
continuing breast feeding and as the diarrhea will gradually diminish as the
underlying inflammation disappears.45
The other reasons to acquire secondary lactase deficiency are illness, injury,
medication any diseases of the small intestine like ulcerative colitis or crohn’s disease
or infections from Rota virus and giardia, chemotherapy and long use of anti-
bioticsetc. Lactose intolerance acquired due to any of the above reasons may be
temporary unless the problem continues to for longer period making it permanent.53
18
Small bowel injury due to persistent diarrhea, long time exposure of the small
intestine to bacterial infections or any other injury to small bowel mucosa at any age
specially in infancy deprives the intestine of lactose enzyme. This underlying
pathophysiological condition is the cause for lactose deficiency and subsequent
lactose mal absorption. Acute infections and injuries to the intestine will result in loss
of the lactose containing epithelial cells from the tip of the villi. This loss is replaced
by the immature cells that do not have lactase thereby rendering it lactase deficient
causing lactose malabsorption.54
After several exploration and investigations, the investigators have concluded
that those children who are infected with rotavirus having no or mild dehydration can
securely and continue human milk or standard formula as it won’t cause any
substantial effect. Never the less infants who are intolerant to lactose due to infective
diarrhea caused by giardiasis, cryptosporidiosis and other parasites requires carefully
monitoring. These factors directly injury the epithelial cells leading to lactose mal
absorption. Children with celiac disease or other enteropathies need to be ruled out for
lactose intolerance. Infants with gross malnutrition are also prone to develop small
intestinal atrophy that can lead to secondary lactose intolerance. Proper diagnosis is
essential in order to rule out the exact cause whenever a child presents with secondary
lactose intolerance. 55
About 70% of the global population has primary lactase deficiency. The
prevalence of lactose intolerance is greater than 50% in South America and Africa,
whereas in some Asian countries, the prevalence reaches almost 100%. Although
lactose intolerance is common in children with acute diarrhea, yet it is clinically
significant in children with profound diarrhea. A study showed that among 54
hospitalized children with acute diarrhea aged between 6 and 36 months, about 26%
19
of them were found to have sugar intolerance. Congenital lactose deficiency is an
extremely infrequent condition and is ruled out in fewer than 50 individuals
globally.56
The distribution of lactose intolerance differs widely in different human
populations even between and within continents. It is more commonly seen in among
European descends. Hundred percent frequency was found among the Dutch
population when compared Swedish people showing 99% prevalence. Although about
70% of the world population has intolerance to lactose, yet not everyone have
nutritional and genetic factors that can cause influence lactose intolerance. This
condition is also widespread among Asian and African countries people with80 to
100%. Prevalence of lactose intolerance in adult is infrequent especially in European
countries. In Asia, higher prevalence is seen in Pakistan (60%), 90% in and Thailand
and 90% in china. Considering the incidence of lactose intolerance among children, it
was found that, 38. 5% was seen among 3 to 5 year age group, 80% in the 7 to 8 and
11 to 13 year old group in china. Among the north Indians population, the frequency
was reported to be 48% out of 200 participants. 57
The activity of the enzyme lactase can be noticed as early as 8 week of
gestation on mucosal surface of the intestine, and from 34 weeks till birth the lactase
activity is at its highest. Never the less lactase activity began to decline during the first
few months. Once weaning starts, activity reduces at different rates becoming
minimal due to normal maturation However within the first few month of life lactase
activity starts to decrease. In most mammals it declines at variable rates following
weaning to and detectable levels as a consequence of the normal maturational down
regulation of lactase activity. In 30% of the humans, lactase activity has continued
beyond weaning and in to adult.46
20
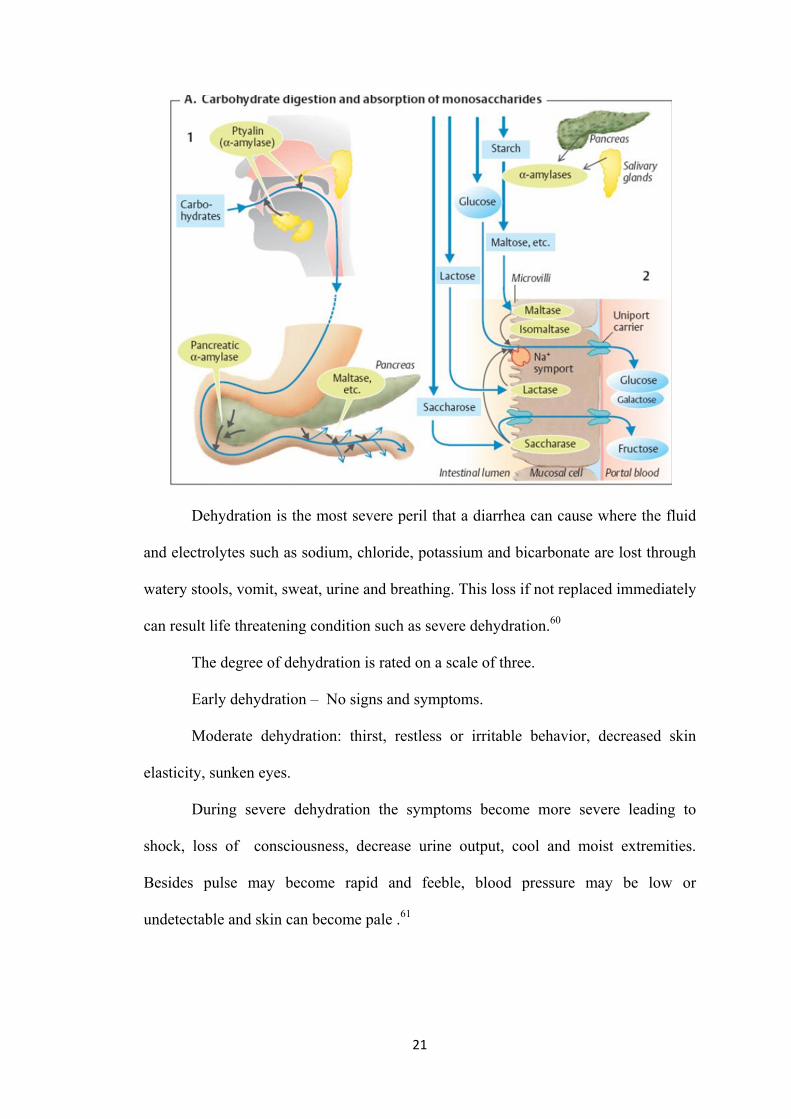
About 50% of lactase activity is required in order to effectively use the lactase. Any
lactose that is not digested gets fermented in the colon by the micro flora that is
present in the intestine. This results in the production of hydrogen that can be detected
in the pulmonary excretion and thereby is a useful diagnostic evaluation technique.58
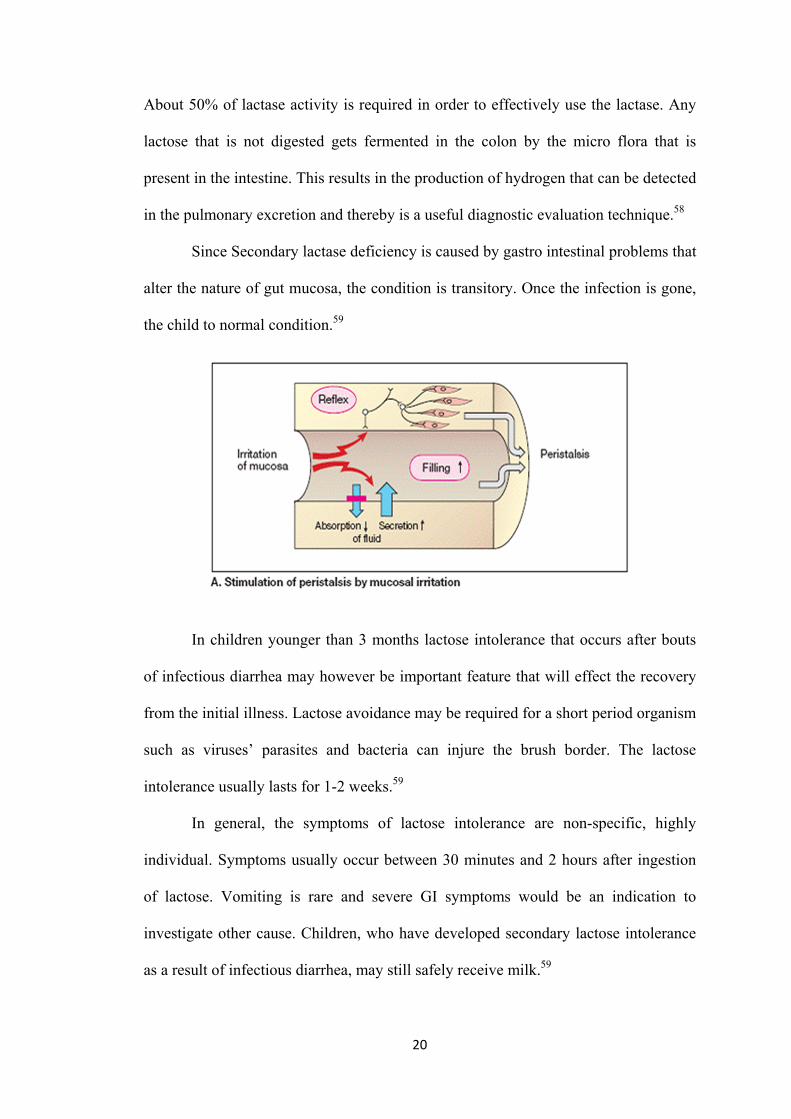
Since Secondary lactase deficiency is caused by gastro intestinal problems that
alter the nature of gut mucosa, the condition is transitory. Once the infection is gone,
the child to normal condition.59
In children younger than 3 months lactose intolerance that occurs after bouts
of infectious diarrhea may however be important feature that will effect the recovery
from the initial illness. Lactose avoidance may be required for a short period organism
such as viruses’ parasites and bacteria can injure the brush border. The lactose
intolerance usually lasts for 1-2 weeks.59
In general, the symptoms of lactose intolerance are non-specific, highly
individual. Symptoms usually occur between 30 minutes and 2 hours after ingestion
of lactose. Vomiting is rare and severe GI symptoms would be an indication to
investigate other cause. Children, who have developed secondary lactose intolerance
as a result of infectious diarrhea, may still safely receive milk.59
21
Dehydration is the most severe peril that a diarrhea can cause where the fluid
and electrolytes such as sodium, chloride, potassium and bicarbonate are lost through
watery stools, vomit, sweat, urine and breathing. This loss if not replaced immediately
can result life threatening condition such as severe dehydration.60
The degree of dehydration is rated on a scale of three.
Early dehydration – No signs and symptoms.
Moderate dehydration: thirst, restless or irritable behavior, decreased skin
elasticity, sunken eyes.
During severe dehydration the symptoms become more severe leading to
shock, loss of consciousness, decrease urine output, cool and moist extremities.
Besides pulse may become rapid and feeble, blood pressure may be low or
undetectable and skin can become pale .61
22
Dehydration takes a heavy toll of precious life of children. Infants are at
higher risk for losing their life due to dehydration related to their physiological
constitution. The reasons are as follows. The reasons for this are as follows:
• Increased surface area to weight ratio, leading to greater insensible loss
(300ml/me/day) corresponding in infants to 15 -17 ml/kg/day.
• Inability to gain access to water, related to the stage of development.
• Basal fluid requirements is increased to 100 -120 ml/kg/day, i.e. 10-
12% of body weight.
• Immature renal tubular reabsorption. 62
Body fluids and electrolytes that are lost during severe gastroenteritis should
be replaced either by oral rehydration salts (ORS) solution, or intravenous drip in
order to prevent serious form of dehydration.60 If this losses are not corrected
instantly, death can occur due to severe dehydration. Therefore correcting any form of
dehydration becomes the utmost priority need. Never the less if the child is not
dehydrated, which is common in many to starve a child who is infected with Rota
virus.63
Clinical manifestation of dehydration includes thirst, lethargy, dry mucosa,
decreased urine output, and, as the degree of dehydration progresses, tachycardia,
hypotension, and shock. This occurs due to major reduction in body fluids and even
electrolytes to an extent. Therefore appropriate diagnosis through history collection
and physical evaluation should be made and prompt oral or IV replacement of fluid
and electrolytes should be initiated.64
Dehydration on itself is not a disorder manifestation of some other disorder.
Yet it remains foremost cause of mortality and morbidity among infants and young
children around the world. Infants have a larger baseline fluid requirement as they
23
have high metabolic rate, as well as have high evaporative losses owing to higher
ratio of surface area to volume. Infants are also incapable to express their thirst and
fluid needs. All this factors combined together make the infants most susceptible to
unpleasant effects of dehydration.65
Electrolytes are present in different concentration, therefore with all type of
fluid loss some amount of electrolytes are lost. But the actual amount and type of
electrolyte loss varies depending on the cause for example, significant amounts of
HCO 3 - may be lost with diarrhea but not with vomiting. However, fluid lost always
contains a lower concentration of Na than the plasma. Thus, in the absence of any
fluid replacement, there will be increased serum sodium level . Hypernatremia causes
water to move from the intracellular and interstitial space into intravascular area,
helping, at least temporarily, to maintain vascular volume. With hypotonic fluid
replacement (example, with plain water), serum Na may normalize. but also
decreases (hyponatremia). Hyponatremia results in some fluid shifting out of the
intravascular space into the interstitial at the expense of vascular volume.65
It is a well-known fact that the complication of gastroenteritis is dehydration
and this can be prevented by proper management. Effective rehydration strategy will
help combat the effects of dehydration. Sometimes even after rehydration, there are
still chances of dehydration. Therefore appropriate management through fluid
replacement is the main goal of treatment. National Diarrheal Disease Control
Program was started during the Sixth plan to bring down diarrhea-related mortality.
The key element of the WHO Diarrheal Disease Control Program was implementation
of oral rehydration therapy. The objective is to educate mothers to enable them to
take care of children suffering from diarrhea by homemade fluids, continued feeding
during diarrhea, and to recognize early signs of dehydration. The other strategy of
24
diarrhea prevention is to promote exclusive breastfeeding for the first 4-6 months of
life and proper weaning. Ultimately, it aims at improving knowledge and practice of
appropriate home management among caretakers of young children.16
Acute diarrhea is often a self-limiting condition. If dehydration is prevented or
corrected with oral rehydration therapy, no specific treatment is recommended even if
the diarrhea is due to infection. A study was conducted on Management of Diarrhea
in children below five years at Home and Health Facilities in Kashmir. The findings
of the study revealed that ORS was not used appropriately in past or even in present
days. Rather dangerous cultural practices like starving the child to get rid of diarrhea
were followed. There was high (77%) use of antibiotics .Hence even now there is no
upto mark management of diarrhea in not only Kashmir but even across India and
other parts of the world. Still harmful practices like resting bowel and antibiotic use is
followed.67
Statistics reveals that use of oral rehydration therapy has prevented almost
3million deaths due to dehydration in a year other therapies like giving of butter milk
is also safe in managing diarrhea .Use of butter milk is both inexpensive and safe and
easily improve the hydration status.68
In order to combat the mortality and morbidity among under-five the
government of India has provided various treatment modalities and guidelines that
can be easily implemented in community center. UNICEF and WHO in the year 2004
have suggested that ORT along with continued feeding and zinc supplement will help
to prevent and treat dehydration. This modality not only effective but easily
affordable and cheap. Yet only 40% of population across the globe use this strategy. It
is also seen that only about 4 in 10 urban children and 3in10 rural children use ORS.
Across all reason of the country the use of ORS still is lagging behind.9
25
It is well established fact that dehydration is the complication of diarrhea
.Sometimes even after rehydration there are still high chances of recurrence.
Therefore management should be safe and effective .Introduction of ORT is one of
the greatest medical achievement of 20thcentury.ORTis the process of compensating
the lost fluid and electrolytes among the dehydrated children using oral rehydration
salt solution (ORS).ORS is special fluid formulation that comprises of needed
ingredients like amino acid and sodium chloride. Glucose and sodium chloride is
present in specific amount in the solid which helps in active co-transport in the
intestine and enhance salt and water absorption.66
Oral rehydration therapy with oral rehydration salt (ORS) solution remains the
foundation of suitable controlling strategy of diarrheal dehydration and is proven to be
the single most effective strategy to combat diarrheal deaths in children. Nevertheless,
statistics from United Nations Children’s Fund (UNICEF) coverage evaluation survey
(CES) and the third National Family Health Survey (NFHS -3) reveals that use of
ORS is still not acceptable rather than anti-diarrheal medicines and injections are
often given. Even the health care providers still lack knowledge on the
implementation and are unaware on how to advertise the use of these cost effective
interventions that already exist.9
Since 1970’s and 1980’s ORS and RHF have been endorsed as the best
method to manage dehydration caused by diarrhea. This is one of the single that is
found effective to bring down the mortality due to diarrhea. About 93% of the death
can be prevented in home and community.69
One of the most important mile stone that can be attributed for the treatment of
diarrheal is the propagation of the solution of oral rehydration salt solution and of a
wider concept of oral rehydration therapy, adequate management of dysentery,
26
amended dietary treatment of childhood diarrhea and gradually reducing rates of
severe malnutrition. The restriction of the present management modality grounded on
oral rehydration is that it does not deliver all the expected goals of therapy. Thereby
diarrhea still remains the main reason of hospitalization and deaths in children below
the age of 5 and has severe economic concerns.70
Physicians and care providers have expressed their strong opinion for further
treatment protocols that will help reducing the duration and severity of the illness,
treatment failure rates and need for intra venous fluids. Few of these newer
therapeutic modalities that are presently under the investigation includes a new
generation oral rehydration solutions, probiotics, micronutrients and alternate feeding
regimens.70
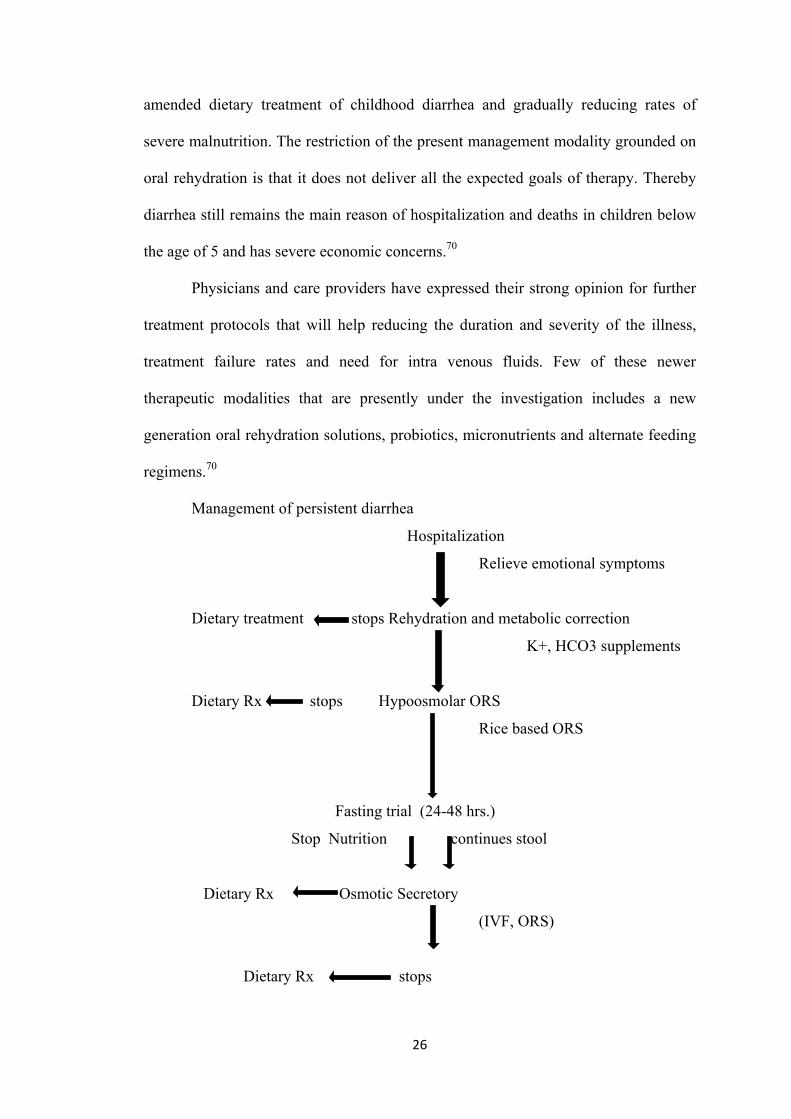
Management of persistent diarrhea
Hospitalization
Relieve emotional symptoms
Dietary treatment stops Rehydration and metabolic correction
K+, HCO3 supplements
Dietary Rx stops Hypoosmolar ORS
Rice based ORS
Fasting trial (24-48 hrs.)
Stop Nutrition continues stool
Dietary Rx Osmotic Secretory
(IVF, ORS)
Dietary Rx stops
27
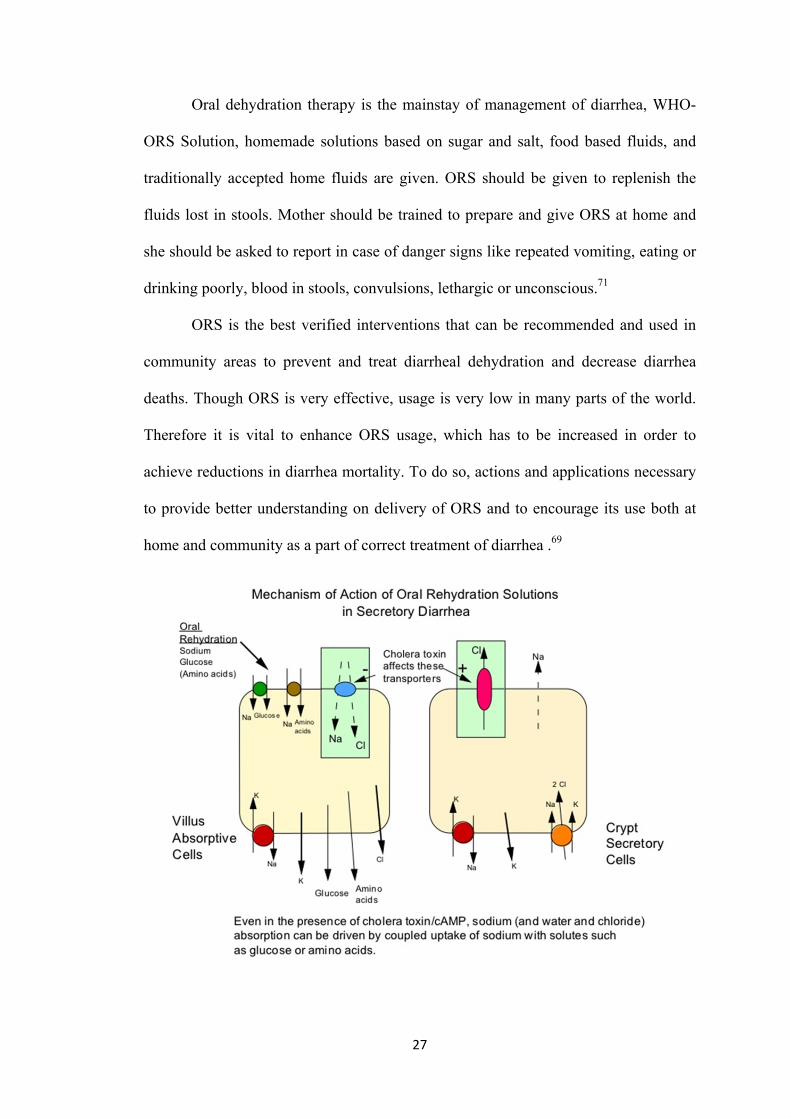
Oral dehydration therapy is the mainstay of management of diarrhea, WHO-
ORS Solution, homemade solutions based on sugar and salt, food based fluids, and
traditionally accepted home fluids are given. ORS should be given to replenish the
fluids lost in stools. Mother should be trained to prepare and give ORS at home and
she should be asked to report in case of danger signs like repeated vomiting, eating or
drinking poorly, blood in stools, convulsions, lethargic or unconscious.71
ORS is the best verified interventions that can be recommended and used in
community areas to prevent and treat diarrheal dehydration and decrease diarrhea
deaths. Though ORS is very effective, usage is very low in many parts of the world.
Therefore it is vital to enhance ORS usage, which has to be increased in order to
achieve reductions in diarrhea mortality. To do so, actions and applications necessary
to provide better understanding on delivery of ORS and to encourage its use both at
home and community as a part of correct treatment of diarrhea .69
28
Oral rehydration therapy has revolutionized the management of diarrhea and it
also has reduced morbidity and mortality. The control of diarrheal disease and ORT
program was started in full swing in1984-1985. ORS trials were started in
1971diarrhea can be demarcated as a rise in both frequency and fluidity and also
volume of bulk of stool compared to the normal bowel habit of that individual. Out of
the various terminologist used the prefer terms or acute diarrheal disease acute
dysentery persistent diarrhea of > 14 days duration and chronic diarrhea with features
of malabsorption or failure to thrive.72
Lactose intolerance that is secondary to the infection is often a result of
extension of diarrheal incidence. As suitable treatment of lactose intolerance is
removal of lactose from diet, lactose free formulae which are costly are often
recommended in acute diarrheal cases without diagnostic confirmation of lactose
intolerance.56
Weaning diets that are affordable and locally available cereals have been found
useful in managing of persistent diarrhea, that is weaning diet made of rice lentil and
yogurt (K-Y diet) is effective in managing diarrhea related to secondary lactose
intolerance. K-Y diet with milk protein-based lactose free and soy-protein formula
was then instituted. It was found that stool frequency was significantly reduced.
Therefore it was suggested that cheap weaning diet made of locally available cereals
and yogurt can be used effectively in management of secondary lactose intolerance
associated with acute childhood diarrhea.73
A diagnosis of lactose intolerance requires a good nutritional, medical and
family history. Intolerance should be considered if diarrhea or gaseousness are present
daily, progresses during the day and is related to meal time. Proper dietary
management depends on the infants or child diagnosis i.e., secondary lactose
29
intolerance.74. Yoghurt with live culture curds and cheese is tolerated well, as the
lactose is partially hydrolyzed by bacteria during its preparation and also due to its
thick consistency, which slows down gastric emptying. Skim milk cause more severe
symptoms then whole milk.59
Therefore management of secondary lactose intolerance is not removing
lactose from the diet, but prime most concern should be to treat underlying cause.
Once the prime most condition is solved, the lactose can be taken normally because
lactose are the rich source of ions like Calicum and should not be excluded.55
For infants with secondary lactose intolerance the choice of formula depends
on the degree to which lactose absorption is impaired. The use of lactose free
formulas and feedings in infants with AGE with diarrhea is controversial. Treatment
consists of restriction of the offending carbohydrates. Lactase replacement enzymes
are commercially available and may be taken along with lactose. Children with
intestinal mal absorption a need a detailed work up to reach a confirmatory diagnosis.
Endoscopy and duodenal biopsy are very useful. Presence of total villous atrophy
suggest diagnosis of celiac disease but if there is partial villous atrophy, it can be
caused by cow’s milk protein intolerance, celiac disease, post enteritis state, immune
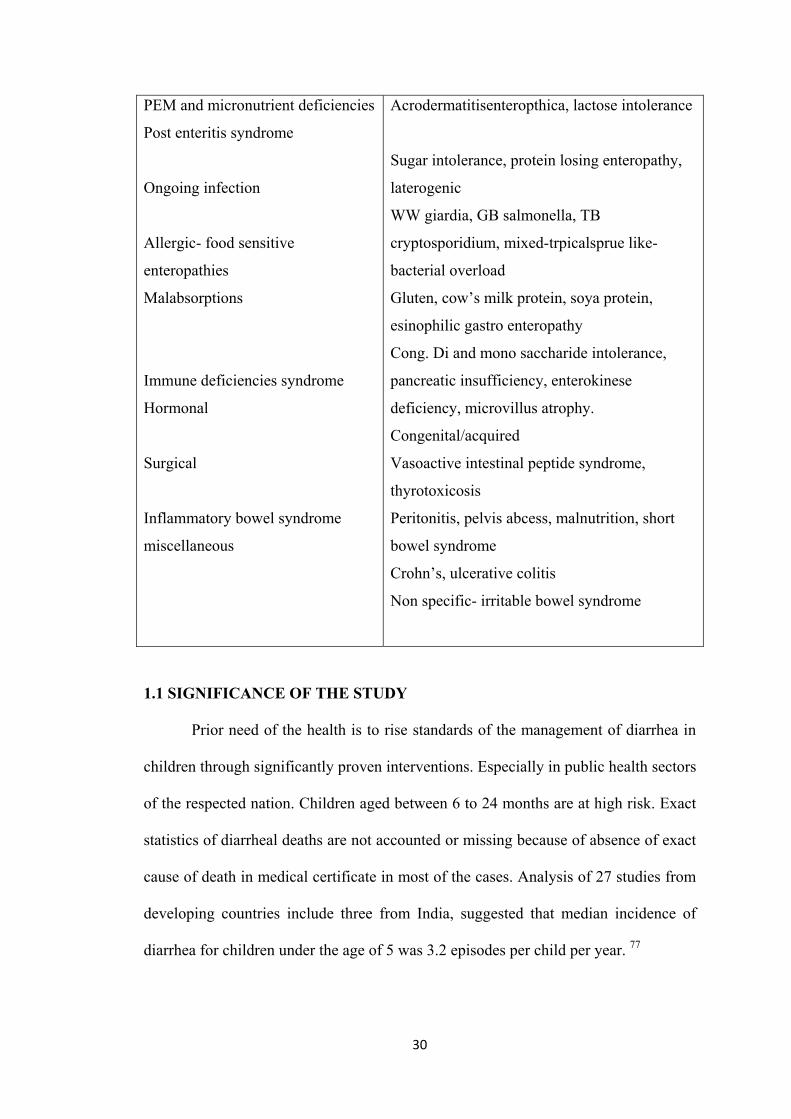
deficiency, giardiasis and bacterial over growth.75
30
PEM and micronutrient deficiencies
Post enteritis syndrome
Ongoing infection
Allergic- food sensitive
enteropathies
Malabsorptions
Immune deficiencies syndrome
Hormonal
Surgical
Inflammatory bowel syndrome
miscellaneous
Acrodermatitisenteropthica, lactose intolerance
Sugar intolerance, protein losing enteropathy,
laterogenic
WW giardia, GB salmonella, TB
cryptosporidium, mixed-trpicalsprue like-
bacterial overload
Gluten, cow’s milk protein, soya protein,
esinophilic gastro enteropathy
Cong. Di and mono saccharide intolerance,
pancreatic insufficiency, enterokinese
deficiency, microvillus atrophy.
Congenital/acquired
Vasoactive intestinal peptide syndrome,
thyrotoxicosis
Peritonitis, pelvis abcess, malnutrition, short
bowel syndrome
Crohn’s, ulcerative colitis
Non specific- irritable bowel syndrome
1.1 SIGNIFICANCE OF THE STUDY
Prior need of the health is to rise standards of the management of diarrhea in
children through significantly proven interventions. Especially in public health sectors
of the respected nation. Children aged between 6 to 24 months are at high risk. Exact
statistics of diarrheal deaths are not accounted or missing because of absence of exact
cause of death in medical certificate in most of the cases. Analysis of 27 studies from
developing countries include three from India, suggested that median incidence of
diarrhea for children under the age of 5 was 3.2 episodes per child per year. 77
31
In low income settings, where resources are not available easily, diarrheal
disease is of serious concern across globe. Morbidity and mortality rates are highest
globally among children under the age of 5, with millions of preventable deaths
occurring each year as a result. Almost global 25 % of all childhood diarrheal deaths
occur in India, there is a great need for appropriate programs and interventions to
suppress this pressing public health challenge.78
To treat mild to moderate diarrhea caused by diarrhea, ORT is proven to be a
choice of effective management strategy for three days and can be counted on, saving
millions of people in developing nations, bringing down the mortality rate to the very
great extent. 79 However, in spite its remarkable success; the currently-recommended
oral rehydration solution (ORS) have not sufficiently reduced the stool volume or
duration of the diarrheal illness. Therefore the research is still on for the improved
formulations of ORS that will be helpful reducing the severity of diarrhea .79
The principle behind the ORT is that Na-glucose co transport across the small
intestine epithelial membrane, should remain intact during the series of diarrheal
episodes as ORT should stimulate the absorption of water and electrolytes. Many
trails are in process to improve ORS and concentrating on the fact about its proper
absorption in Small Intestine. Search for the right kind of ORS that has ability to
reduce challenges for many clinical and basic medical scientists. Clinical trials using
glycine, alanine, maltodextrins and cereal based ORS was carried out in 1970s and
1980s have shown promising results. Yet, findings of large scale succeeding large
trials and large scale therapeutic benefits of these formulations in comparison to
WHO-ORS , with the exception of rice based ORS. 80
Infants and children below the age of five , otherwise patients with Diarrhea
of infectious etiologies will stop producing lactose temporarily. In the absence of
32
enzyme lactase, in the intestine, lactose cannot be digested this condition can worsen
if the diarrheal episodes are prolonged for longer periods. Therefore to shorten the
duration and severity of illness, lactose containing products should be avoided for the
time being.
An open-label randomized clinical trial on 40 infants with acute
gastroenteritis, age between 2 and 12 months, who came to emergency department
and were randomized to control or intervention group.Experimental group were fed
with lactose-free milk, whereas the control group continued on regular infant formula
for a total of 7 days. The infants were followed up for 7 days. The findings of the
study revealed that Diarrhea duration, weight loss, illness clinic visits, hospitalization
rate, parental satisfaction, and time to symptom were resolved.81
Secondary lactose intolerance in infants occurs as a result of damage to the
brush border of the intestinal mucosa or maybe due to less intake of fat. Underlying
physiological condition is irresponsible for lactase deficiency and subsequent lactose
mal absorption. Acute infection (e.g. rotavirus) causing small intestinal injury with
loss of lactase containing epithelial cells from tips of villi is a common cause.
Immature cells that replace them are lactase deficient. Lactose-free formula for
children presenting with acute diarrhea should be introduced as early as possible in
order to combat diarrhea rapidly and probably lessen mortality and morbidity.
There is a double burden of diarrhea and malnutrition among children
belonging to the low and middle income countries, where access to proprietary
formulas and specialized ingredients is limited the use of locally available age-
appropriate foods should be promoted for the majority of acute diarrhea cases.
Nutritionally complete diets comprised of locally available ingredients can be used at
least as effectively as commercial preparations or specialized ingredients.15
33
Based on the review of literature and researcher experience it was felt that a
lactose free feed can be developed with available ingredients like soya and rice.
Clinical trials have proved that rice gruel is beneficial for the management of diarrhea.
Studies also have supported the use of soya in the management of lactose intolerance
diarrhea and are used as lactose free diet. In developing countries like India, people
cannot afford commercial lactose free feeds. Therefore the investigator felt the need
to prepare a lactose free feed with ingredients that is low of cost and easily available
at homes. Hence the investigator selected these two ingredients (Rice and soya) to
prepare lactose free ORS feed and named as “RISOY”.
1.2 STATEMENT OF THE PROBLEM
A Study to determine the incidence of secondary lactose intolerance and
evaluate the effect of lactose free feeds in controlling diarrhea and correcting
dehydration among children.
1.3 AIMS AND OBJECTIVES
Overall aim:
The overall aim of the research was to develop a lactose free feed prepared
with locally available ingredients like rice and soya, economical, supply all essential
nutrients and calories and find out the effectiveness of this feed in controlling
diarrhea and correcting dehydration among children with secondary lactose
intolerance over the commercial lactose free formula based on soya.
1.4 OBJECTIVES
1. To find out the incidence of secondary lactose intolerance among children.
2. To assess the pre and post-test diarrheal status of children in both control and
experimental group.
34
3. To assess pre and post-test hydration status of children in both control and
experimental group.
4. To compare the pre and post-test diarrheal status of children in control and
experimental group.
5. To compare the pre and post-test hydration status of children in control and
experimental group.
6. To evaluate the effectiveness of lactose free feeds in controlling diarrhea and
correcting dehydration among children between control and experimental group.
7. To correlate the diarrheal and hydration status of children in experimental group.
8. To associate the diarrheal and hydration status of children with their selected
demographic variables in experimental group.
1.5 HYPOTHESES
H1. The mean post-test diarrheal status among experimental group will be
significantly lower than the control group.
H2 The mean post-test hydration status among experimental group will be
significantly higher than the control group.
H3 There is a significant difference in diarrheal status of children before and after
introduction of lactose free feeds in control and experimental group.
H4 There is a significant difference in hydration status of children before and after
introduction of lactose free feeds in both control and experimental group
H5 There is a statistical significant difference between mean post test scores of
diarrheal and hydration status of children in control and experimental group
H6 There is a significant correlation between the diarrheal and hydration status
among children in the experimental group.
35
H7 There is a significant association between the diarrheal and hydration status of
the children and their selected demographic variables.
1.6 OPERATIONAL DEFINITIONS
Incidence
It refers to the rate at which the secondary lactose intolerance occurs in
children, the number of new cases identified during a certain period of time. In this
study it refers to the children who are attending to the OPD with diarrhea for 3 days or
more than 3 days and diagnosed to have secondary lactose intolerance based on the
lab report of presence of reducing sugar and decreased stool pH.
Diarrhea
Diarrhea is defined as the passage of loose, liquid or watery stools.
In this study it refers to osmotic diarrhea in which there is increased passage of
loose watery stool more than three times a day, the duration is more than three days,
with presence of reducing sugar and decreased stool pH.
Lactose
Lactose is a disaccharide. It is present in the milk of all mammals. Cow milk
contains 4% of lactose and human milk contains 7% of lactose. In this study it refers
to lactose that present in milk.
Secondary Lactose Intolerance
Inability to digests lactose, due to damage of villi, the stools become acid and
watery. This can be identified with stool for acidity (litmus paper test) and Benedict
test system to identify the presence of reducing sugar in the stools.
36
In this study it refers the absence of lactase enzyme in gut or had developed
temporary lactase deficiency that has resulted intolerance in children and causing
diarrhea.
Lactose free feeds
Lactose-free feeds are intended to feed the children who suffer from lactose
intolerance.
In this study it refers to a formula or diet prepared without any form of milk,
(cow milk, powder milk) and also free from sugar or syrup. This feed is prepared with
locally available ingredients like cereal bar boiled red rice (matta rice) and legumes
like soya in required proposition 3:1.
Children:
In this study it refers to children of both sex between the age of 4months to 12
months and having diarrhea for more than three days and are diagnosed to have
secondary lactose intolerance.
Control Diarrhea
In this study it refers to the decrease in frequency of diarrhea, duration and
decrease in quantity of loose stools, decrease in presence of reduced sugar and
increase of stool pH.
Correct dehydration
In this study, it refers to maintenance of normal fluid balance which will be
evidenced by normal skin turgor, moist mouth and lips, normal fontanels, normal vital
signs, urine output and capillary refill
37
Effectiveness
It is defined as the degree to which objectives are achieved and the extent to
which targeted problem is solved after introduction of intervention.
In this study it refers to the digestibility and acceptability of the lactose free
feeds (RISOY) in reducing the episodes of diarrhea and correcting dehydration and
maintaining adequate hydration level of children.
1.7 ASSUMPTION
Nursing is aimed at early detection of lactose intolerance and replaces the fluid
with lactose free supplementary feeds to control the diarrhea and correct dehydration.
Damage to the villus system of the small intestine, as the result of infection leads to
temporary lactase deficiency. Therefore, lactose containing feeds are strictly avoided
as it would further damage the intestinal mucosa.
1.8 DELIMITATION
The following delimitation were applied
• Since infants between 4-12 months were only were included in the study
findings may not be generalized to other age group.
• Child with secondary lactose intolerance only included other children with
diarrhea are not included.
• Participants constitute purposive convenience samples that may limit the
transferability of results to other opportunity.
1.9 PROJECTED OUTCOME
The study findings will help the Nursing personnel to identify lactose
intolerance among children in early stage and to provide lactose free supplementary
feeds to control diarrhea and correct dehydration .Nurses can educate the mothers
38
regarding care of children with diarrhea at home setting. For children with secondary
lactose intolerance the commercially available soya based malto-dextrin feeds are
prescribed. Researcher intended to develop a new lactose free feed in powder form
with rice and soya in 3:1 proportion as basic ingredients. It is a ready to cook powder
and can be prepared in porridge or Conjee form by adding salt for taste which can be
easily prepared by mixing with water and then boiled.
39
1.10 CONCEPTUAL FRAMEWORK
Conceptual framework provides a frame of reference for clinical practice,
research and education. Conceptual framework is the conceptual underpinning of the
study. Conceptual frameworks (theoretical frameworks) are a type of intermediate
theory that has the potential to connect to all aspects of enquiry (e.g. problems,
definition, purpose, literature review, methodology, data collection and analysis).
Conceptual frame work acts like maps that give coherence to empirical inquiry. It is a
set of coherent ideas or concepts organized in a manner that makes them easy to
communicate to others.
A model is used to denote symbolic representation of concepts (Patrizi and
Nevi, 1996). The conceptual framework set up for the study is based on modified
general system theory (Ludwig Von Bertalamffy and JJ Kenny).83 This is regarded as
a universal grand theory because of its relevancy and applicability (Johnson and
Webber, 2005).84 According to general system theory, a system is a set of interrelated
components and units interacting with each other in a boundary. The individual is
capable of taking energy and information from the environment and revealing them to
the environment. Because of this exchange, individual is an open system. This model
comprises of four phases i.e. input, throughput, output and feedback.
The following elements are common to the system:
The system is a unit that is greater than the sum of its parts and it has got
various subsystems which has boundaries. Communication and feedback mechanism
is essential for system to function as a goal or end can be reached in various ways and
any change in one part causes change in the whole system.
According to Von Bertalamffy “INPUT” which is the matter, energy and
information is received from the environment and in this study the various
40
demographic characteristics of samples of both experimental and control group is
considered as the input. These includes demographic variables of infants, who were
admitted with diarrhea for more than three days and the diagnostic criteria for
diagnosing lactose intolerance such as Benedict testing and stool acidity or pH
screening. If both tests were positive the subject was confirmed as study sample and
they are selected by purposive sampling technique.
According to Von Bertalanffy’s “throughput refers to matter, energy and
information that is modified or transformed within the system. The process by which
the system processes an input, releases an output. In this study the throughput
includes the introduction of Risoy feeds for the experimental group developed by the
investigator. The subjects in the control group were treated with regular secondary
lactose intolerance treatment protocol with “Nosobee” (soya based) feeds and the
experimental group were subjected to Risoy feeds which was developed by the
investigator. Each subject was observed with structured observation rating scale for
assessing the diarrheal status and hydration status on Pre-test, Post-test I, and
Post-test II.
According to systems theory, output refers to energy, matter and information
that leave a system into the environment. In the present study it is the change in the
diarrheal episodes and the hydration status after the introduction of Risoy feed
developed by the investigator. The experimental output is improved in hydration
status and control over diarrheal episodes in both experimental and control group. In
experimental group there was a significant control over the diarrheal status of infant
than control group. Similarly there was a significant improvement in hydration status
of infants after starting the Risoy feeds in experimental group when compared with
control group.
41
According to systems theory, feedback refers to information regarding
responses used by the system (may be positive, negative or neutral). In the present
study the changes in status of hydration and diarrheal episodes is compared with the
experimental and control group.
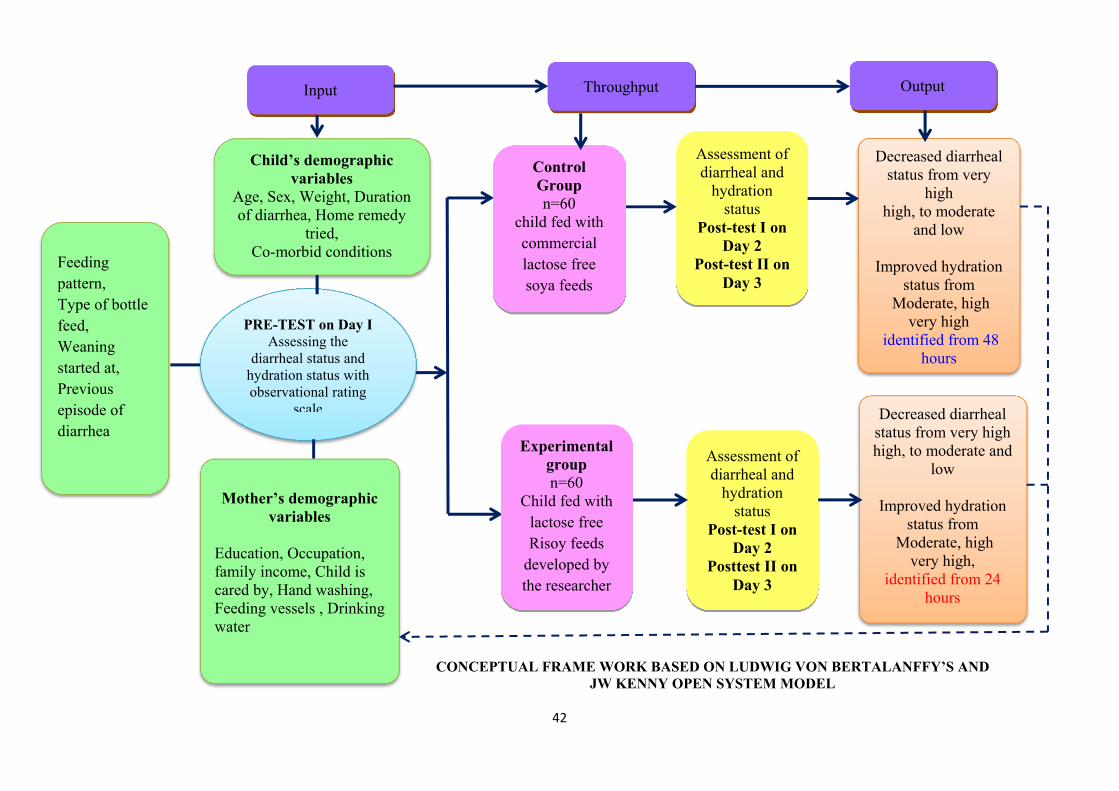
42
Feeding pattern, Type of bottle feed, Weaning started at, Previous episode of diarrhea
Child’s demographic variables
Age, Sex, Weight, Duration of diarrhea, Home remedy
tried, Co-morbid conditions
Assessment of diarrheal and
hydration status
Post-test I on Day 2
Post-test II on Day 3
Mother’s demographic variables
Education, Occupation, family income, Child is cared by, Hand washing, Feeding vessels , Drinking water
PRE-TEST on Day I Assessing the
diarrheal status and hydration status with observational rating
scale
CONCEPTUAL FRAME WORK BASED ON LUDWIG VON BERTALANFFY’S AND JW KENNY OPEN SYSTEM MODEL
Assessment of diarrheal and
hydration status
Post-test I on Day 2
Posttest II on Day 3
Decreased diarrheal status from very high high, to moderate and
low
Improved hydration status from
Moderate, high very high,
identified from 24 hours
Decreased diarrheal status from very
high high, to moderate
and low
Improved hydration status from
Moderate, high very high
identified from 48 hours
Control Group n=60
child fed with commercial lactose free soya feeds
Experimental group n=60
Child fed with lactose free Risoy feeds
developed by the researcher
Input Throughput Output
43
CHAPTER - II
REVIEW OF LITERATURE
Literature review is a critical summary of research on a topic of interest
generally prepared to put a research problem in context to identify gaps and weakness
in prior studies so as to justify a new investigation literature review plays a vital role
for nurses seeking to create are evidence based practice. It can inspire nurses for
taking advanced research ideas and help to lay the foundation and be a base for new
studies.
Review of Literature is an essential step in the whole process of research. It is
done in order to broaden the understanding and create an insight in the researcher
regarding the selected area of interest. It also helps to select the appropriate
methodology, tool development and also analysis.
Review of Literature for the present study is brought under the following
headings.
2.1. Literature related to diarrhea
2.2. Literature related to Lactose intolerance
2.3. Literature related to Dehydration and Oral Rehydration therapy
2.4. Literature related to management of secondary lactose intolerance.
2.5. Literature related to lactose free feeds.
44
2.1 Review of literature related to types of Diarrhea
Though child may survive diarrhea, yet the child’s overall growth may be
altered due to the severity of diarrhea and the type of organism that caused diarrhea. 85
Diarrhea remains to be one of the main causes for mortality and morbidity
among children across the world. National and international report on mortality rate
due to diarrhea in children have shown that every year, about 10 million children die
of which is really 1.5 million is due to diarrhea alone, and in developing nations,
diarrhea is the mainstream reason for increased mortality and morbidity among
children of age under five86. According to another statistics, acute diarrhea has
resulted in 16 % of death among children below the age of five, across the globe. It is
also said that these deaths are prominently seen among middle and poor nations, even
though there are lot of opportunities and management protocols to prevent diarrheal
deaths87. The reasons quoted for this high mortality rate is illiteracy of mothers, non
compliance to exclusive breast feeding protocol especially for the first year of the life,
worm infestation like round worm, nutritional and immunization status, night
blindness and personal hygiene, disposal of waste and garbage, source waste and
garbage, source of water, open field defecation and congested living conditions. Many
children with severe diarrhea may end up with problems like malnutrition, anemia,
growth retardation, delay in cognitive development, irritability, prone to infections
and severe complications88.
According to a study that was conducted in the southern part of India, 22.5 %
of children were reported to have diarrhea of which, acute diarrhea was seen among
40.7% of infants aged 7 to 12 months, 32.1 % among children of age 13 to 24 months
and only 17 % among 0 to 6 months and these findings emphasizes the consequence
45
thereby requiring necessary and prompt steps to combat diarrhea and its recurrence. It
also suggests that breast feeding practices are best way of protecting the children.89
In yet another study conducted in Bhopal on the prevalence of diarrhea, it was
seen that 27.4 % of children under the age of 5 had diarrhea90, where as in Aligarh
(Uttar Pradesh), the prevalence of diarrhea was 16 %.when a cross sectional study
was done, population based analysis was done in urban slums of Bunkura, West
Bengal among 152 children 22.73 % were males and 21.73% were females. He
highest rate was seen among 7 – 12 months old children (59.69%) and 25.41% among
13-24 month old children. The findings also revealed that episodes of diarrhea was
seen in 20.33% of infants who were breast feed in comparison to 31.57% who are
breast feed for 6 months and 26.08 % among bottle fed children91. The occurrence of
diarrhea among completely immunized was 21.83 % and 30 % among those who did
not receive immunizations. About 19.80 % of children participated in the study were
at the risk of diarrhea, while 27.45 % was seen in children who are not nourished
adequately.92
Infections and other causes in children have led to the occurrence of diarrhea ,
despite the successful strategies complemented to cut down the mortality rate across
the globe, still it remains the second cause of death with 9.9 % of 6.9 million deaths
are diarrhea related. 93
Diarrhea is defined as passing of more than three episodes of loose watery
stools in frequent intervals than it is normal for an individual. Therefore diarrhea is
the main cause of illness among infants and children. It is manifested by rise in
frequency, volume and form (watery). Sometimes even one can notice change in color
and appearance of the stool.94
46
Diarrhea is also defined as change in normal consistency and frequency of
stools, that is, liquid or watery stools at >3/day. If there is associated presence of
blood in stools then it is known as dysentery. In the vast majority, these acute
episodes subside in 7days, and cases where diarrhea episodes persist for more than
two weeks are labeled persistent diarrhea. Two most important consequences of the
diarrhea in children are mal nutrition and dehydration. Malnutrition and diarrhea form
vicious cycle as malnutrition increases the risk of diarrhea there impaired absorption
as well as lose of nutrients, increased catabolism and improper feeding all of which
increase malnutrition. Acute infectious diarrhea is the leading cause of childhood
morbidity and mortality in the developing world.95
The following are the types of diarrhea based on their clinical presentation.
I. Persistent diarrhea that lasts for 14 days aboard above
II. Acute watery diarrhea that has no blood and will be less than 14 days.
III. Acute diarrhea with blood and mucus. Dehydration is one of the complication
of acute diarrhea contributing to death. Persistent diarrhea can lead to
malnutrition growth and development delay, Infection of various system,
vitamin A deficiency etc..96
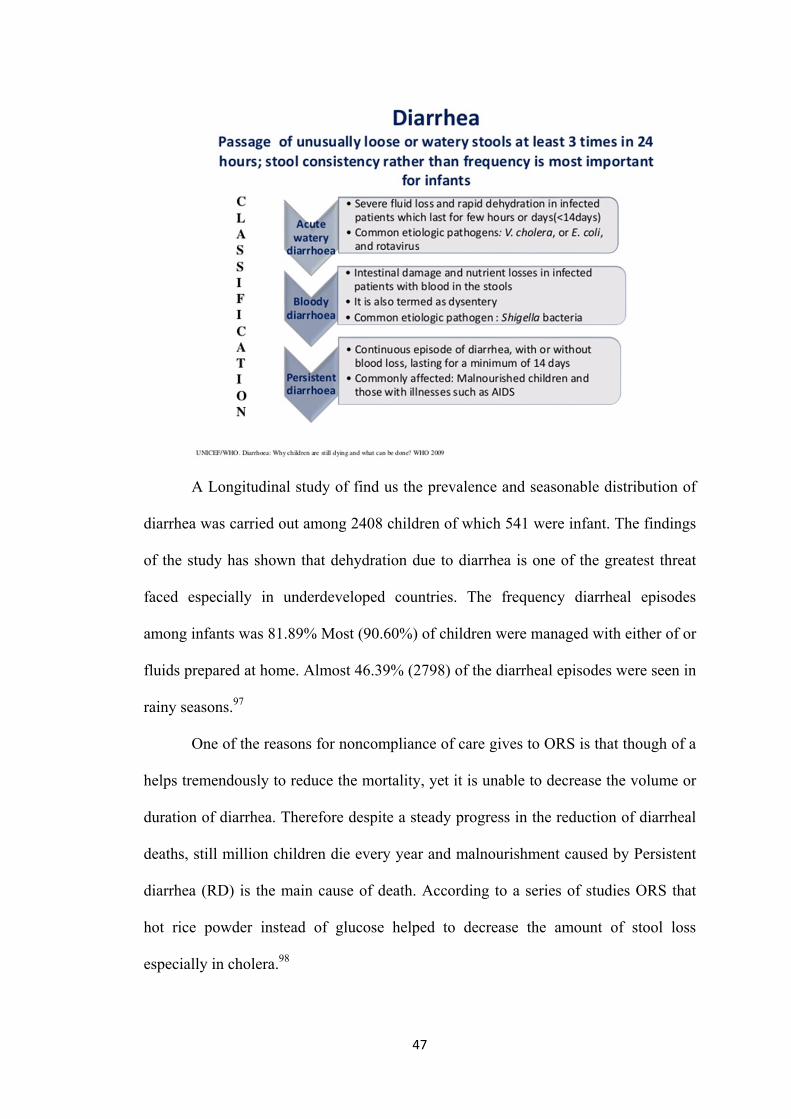
47
A Longitudinal study of find us the prevalence and seasonable distribution of
diarrhea was carried out among 2408 children of which 541 were infant. The findings
of the study has shown that dehydration due to diarrhea is one of the greatest threat
faced especially in underdeveloped countries. The frequency diarrheal episodes
among infants was 81.89% Most (90.60%) of children were managed with either of or
fluids prepared at home. Almost 46.39% (2798) of the diarrheal episodes were seen in
rainy seasons.97
One of the reasons for noncompliance of care gives to ORS is that though of a
helps tremendously to reduce the mortality, yet it is unable to decrease the volume or
duration of diarrhea. Therefore despite a steady progress in the reduction of diarrheal
deaths, still million children die every year and malnourishment caused by Persistent
diarrhea (RD) is the main cause of death. According to a series of studies ORS that
hot rice powder instead of glucose helped to decrease the amount of stool loss
especially in cholera.98
48
In a study carried out at seven countries around the worth, among children
between one to five years. All the children in their age group from all the houses were
included and it was carried out from 2000 to 2012. The total number of children were
between 60,000, to 600,000 findings of the study revealed the cause of death among 1
to 11 marks (49-85%) were due to acute loose stools while dysentery claimed 5-15%
and 10-61% of deaths were to persistent diarrhea.99
Certain infections covers acute diarrhea initially and may last for several days
leading persistent diarrhea. According to WHO estimating 10% 2 children have
persistent diarrhea but 35% of deaths are due to PD. It also shows that for every 100
children less than 4 years, there is a minimum of 7 cases related to persistent diarrhea
in a year, resulting in 1/3rd to ½ of all deaths as a whole. About 20% of diarrhea
episode occur in malnourished children. By 6 months of age, nearly 60% of them
have persistent diarrhea 90% below one year. 100
Chronic diarrhea is a non infectious lasting for more than 14 days and occurs
along with mal absorption. The exact incidence of chronic diarrhea is still not
repeated in India. Many factor contribute to the cause of chronic diarrhea among 137
children who had chronic diarrhea, 26% was due to celiac disease, 9% due to women
infestation and tuberculosis accounted for 5% of chronic diarrhea is children.
(44.2), While shigella (28.2%) salmonella (13.6%) Klebsila and
cemphylobaetes (6.11.) were the other organisms, infection by Klebsiella was mainly
seen in 0-6 months old. While other (1-3year) had diarrhea by other organisms.
Dehydration due to diarrhea was mainly due to salmonella, The children also
presented both other symptoms like fever, vomiting, and increased frequency of stools
(>10+mc).101
49
Besides the bacterial infections, diarrhea, caused by viral infections is also
common among children. About 1.5 million, children die due to viral related diarrhea
throughout the world. Among these, Rotavirus is the most important cause children
worth rotavirus infection either remain asymptomatic or may land up having life
threatening diarrhea. It is also repeated 29% of all diarrhea deaths is due to sofa virus
and about 23% of sofa virus death are found in Indian subcontinent, affect 95% of
children below t years. Rotavirus infection can be seen in any group, irrespective of
socioeconomic and environment factor oxide also leads more frequently to
dehydration than other etiological facture.102
A total of 99 Survey was carried out to find out the number of children
admitted in hospitals for diarrhea related dehydration. Among the 6 geographical
areas selected across the world, countries belonging low and middle income reported
higher rates of diarrhea.103
A cross sectional observational study was carried out to demarcate the
prevalence of rotavirus infection amongst children less than 2 years presenting with
diarrhea and to determine the factors associated with rotavirus infection in them. The
clinical profile of the children were analyzed along with detection of rotavirus antigen
in stool. A total of 250 children with diarrhea were included in the study. The Male:
Female ratio was 0.97:1. It was found that 24% children presenting with diarrhea to
be positive for rotavirus antigen. 78.3% of children with rotaviral diarrhea were in the
age group of 6 to15 months. There was a significant association between type of
feeding and rotavirus diarrhea with reduced prevalence while on exclusive breast-
feeding. Though only 10.4% of children with rotavirus diarrhea had severe
dehydration, 61.5% of children with severe dehydration were positive for rotavirus.
Conclusion: Rotavirus diarrhea caused substantial morbidity in our study population.
50
The rotavirus positivity in these children was 24% and there was a significant
association of rotavirus infection with type of feeding and severity of dehydration.104
In a cross sectorial study done in eight centers in kerala, among 1827
children, 648 (35.9%) were positive for rotavirus, infants less than 6 months of age
were at a higher risk accounting fed 24.2% compared to other age groups that
includes 31.9% among 6-11 months, 41.9% in 12-23 month, 46.9% in 24-35 month
and 33% in 36-55months. The infection was more common during summer.105
Thus rotavirus is to be believed to cause of severe diarrhea especially in
children below 5 across the world causing death especially in II nd world countries. It
is approximated that rotavirus infections are found to be the underlying cause for
21% hospitalized cases with gastroenteritis from 1986 to 1999, which increased to
39% of hospitalized children with gastroenteritis in the period 2000-2004. This
marked increase in hospitalizations may explained by a number of reasons. The
foremost is improvise the sanitation as well as can be beneficial and reducing diarrhea
especially caused by bacteria and warm infestations.
Secondly ORS can be given to rotaviral affected children because of severe
vomiting, while it has decreased morbidity and mortality due to bacterial and parasitic
diarrhea. Third, there is no specific treatment against rotavirus while effective therapy
is available against bacterial and parasitic agents. Rotavirus diarrhea causes about
611,000 childhood deaths above 80% mortality occurs in poor countries.106
A study was undertaken to determine the incidence of children admitted due to
Rotavirus in southern part of Rajaasthan. Hospitalized children less than 5 years
admitted for loose watering diarrhea were studied. Standard proforma were used to
collect profile of the children. Severity of the illness was classified as per Vesikari
scoring system and the dehydration was treated as per WHO protocol. Stool samples
51
were collected and tested for gross appearance, routine microscopy, pH , reducing
sugar and Rotaviral antigen by a commercial enzyme Immunoassay kit. Out of 300
children, 94(31.33%) were positive for Rotavirus. The prevalence of Rotavirus
associated diarrhea in children was as follows: <6 months of age-14.8%, 6-12 months
of age- 45.7%, 12-24 months of age- 38.3% and >24 months of age- 0.01%. Rotavirus
related diarrhea was more common during winter and Spring months (September to
April) 91.4%, with highest prevalence in the months of November (52%), December
(68%) and January (56%). Rotavirus negative diarrhea had high prevalence (62.6%)
during summer and monsoon months (March-August). Out of 94 rotavirus positive
children, 6 cases (6.38%) had no dehydration, 55(58.51%) had some dehydration and
33 (35.10%) had severe dehydration. Among the Rotavirus positive children,
vomiting was present in 70 (74.46%) children and fever in 52 (55.31%) children. The
prevalence of Rotaviral diarrhea in children less than 5 years in southern Rajasthan is
high and it is more common during winter and spring seasons of the year.107
The manifestation of diarrhea caused due to Rotavirus in mainly either mild,
loose fluid diarrhea that is self-limiting to life threatening along with vomiting, and
fever that can end up in dehydration, shock, electrolyte imbalance and death. These
systems usually subside with 3-7 days. However diarrhea related to rotavirus is a
threat to the health of children as it has claimed nearly half million deaths in a year.108
Based on WHO estimate of 3.2 episodes of diarrhea per year per child (2008)
and 110.07 million children below 5 in India as per census 2001, it is estimated that
there are 352.23 million episodes of diarrhea among below 5 each year. As 7-8% of
community-based diarrhea episodes are due to rotavirus, 24.6-28.2 million episodes
are expected to be caused by rotavirus.109
52
Studies between 2001 and 2009 in India also showed an increasing trend of
rotavirus isolation from 23.5 to 39.2% among hospitalized children with diarrhea.109
This is similar to global trends of decrease in hospitalizations due to diarrhea caused
by bacterial and parasitic agents, following better implementation of oral rehydration
therapy, which perhaps has not reduced hospitalizations due to rotavirus diarrhea as
these episodes are more severe and there is longer duration of vomiting. NICED in its
report estimated that the total diarrheal mortality in India in 0-6 years of age is
1,58,2009.110 This is lower than the estimated of 2, 15, 000 mortality due to diarrhea
among children under 5 worked out on the basis of total population of 1028.7 million,
crude death rate of 8 per 1000 population, 19% of total deaths being in 0-4 years, and
13.8% deaths among under 5 being due to diarrhea. Considering the figure of
estimated 2, 15, 000 deaths due to diarrhea and 39.2% cases to be due to rotavirus, it
comes to >84000 deaths due to rotavirus diarrhea annually in India which is close to
estimate of about 1 lakh deaths due to rotavirus diarrhea annually in India. Thus, the
above assessment of the burden of rotavirus in India highlights the importance of
rotavirus as an important public health problem of under 5 children in India.111
An epidemiological study was done to investigate various strategies that can
be implemented to prevent rotavirus infection among children below 3 years. The
investigators quoted that 95% less than 3 years and 0.49 children below 1 year had at
least one incidence of rotavirus diarrhea in parts of admission of children below 5
years was 337 per 100,000 of and among one year infants it was 1.270 per 1,00,000
admissions. But incidents was comparatively low among 0-3 months olds. Nearly
40% of admission to hospital is due to rotavirus.112
Every possible steps are being taken for reducing to deaths but still death due
to diarrhea remains the 2nd most cause of mortality in India. In developing countries it
53
becomes difficult to choose the right interventions to cause optimal health care
facilities are difficult to access especially, due to up take diagnostic and information
system.
Child health Epidemiology Reference group (CHERG) along with who have
estimated 11.37 million episodes gastroenteritis occur every year in India due to
Rotavirus. Out patient visits due to this is about 3.27 million while patient admitted
are 872,000, resulting in a economic burden of Rs. 10.37 billion every year to total of
78,000 deaths as a result of rotavirus infection of which 59,000 in the first two year is
respected every year.113
In Comparison to other parts of world, in India alone admission due to
rotavirus is in the range of 5-7% and is believed to be the most important cave of
reverse diarrhea among 0-5 year olds. This infection is mainly seen in winter months
in northern parts of India where the relative humidity is low during the season. A
hospital-based cross-sectional study aimed to determine the incidence of infection in
children aged 0-5 years to learn about the genotypic distribution of rotaviruses
causing diarrhea in the pediatrics department of a tertiary care Government hospital,
Tirupati, India. Stool specimens from all hospitalized children aged under 5 years who
had presented with acute watery diarrhea were collected and tested for rotavirus by
the enzyme-linked immunosorbent assay (ELISA). Positive samples were tested for G
and P typing by the reverse transcription-polymerase chain reaction (RT-PCR)
technique. Among the study sample, 68.7% of children were in the age group
between 1-12 months and 25.6% children showed positive result for rotavirus by
ELISA. Of the rotavirus positives, 50% were G1P8 viruses. Rotavirus is an important
cause of diarrhea in hospitalized children.114
54
A quantitative descriptive study was under taken to find out the incidence and
clinical manifestations of rotavirus among children at Buri Ram Hospital, admitted
with the diagnosis of acute diarrhea between November 2005 and February 2006.
Hundred and three stool samples obtained from inpatients below the age of 5 years
were examined for rotavirus by RT- PCR. Data on signs and symptoms, medical
treatment, duration of hospital stay and hospital cost were obtained by means of
questionnaires distributed among physicians. The statistics used were revealed the
percentage, mean and 95% confidence interval, while chi-square and unpaired t-test
were used to establish significant differences at p < 0.05. Rotavirus was detected in 45
of 103 stool samples (43.68%, 95%CI = 33.93, 53.81). No significant differences
were found between clinical manifestations of children with rotavirus infection and
non-rotavirus infection as both groups displayed acute watery diarrhea (p = 0.33),
fever (p = 0.80), nausea or vomiting (p = 0.08), predominant lymphocytes (p = 0.54),
absence of red blood cells (p = 0.63) or white blood cells (p = 0.57) in the stool
examination, moderate or severe dehydration (p = 0.06), lactose intolerance (p =
0.41), hypokalemia (p = 0.55), metabolic acidosis (0.18) Administration of antibiotics
was significantly reduced for treatment of rotavirus acute diarrhea (31.1% vs 63.8%, p
= 0.001). Hospital cost and length of admission were significantly reduced in
rotavirus acute diarrhea (1,845.04 baht vs 2,297.00 baht, p < 0.01) (2.09 days vs 2.81
days, p < 0.001). Compared to previous studies, no differences were found in the
percentage of rotavirus acute diarrhea. Rotavirus infection is a major cause for
hospitalization of children below the age of 5 years with acute diarrhea. Clinical
characteristics of rotavirus acute diarrhea were not significantly different from those
due to other etiologies. Diagnosis of rotavirus infection should be based on various
clinical manifestations and specific laboratory methods.115
55
2.2 Review of literature related lactose intolerance
Lactose intolerance is extensively prevalent across the worth. Those with
lactose intolerance are usually advised to avoid consuming milk and milk related food
items to get relieved from the intolerant. Lactose is commonly present only in a
Mammalian milk, of which 72g/100ml is seen in breast milk and 4.7 g/100ml in coals
milk. This lactose has to be hydrolyzed by lactose enzyme as it levels as an energy
provider to infants during which infants grow rapidly.
Lactose comp arises of two molecules of Monosaccharide. It is an important
component of breast milk. This distortion is broken down into two molecules by
lactase enzyme that is present in epithelium of small bowel mucosa. The enzyme is
situated on the surface of the entrecotes, the cells that line the small bowel. But in
certain cases, like children who are mal nourished or are receiving antibiotics, may
not be able to digest the lactose, as these factors damager the cells that line the
mucosa, causing a decrease in the amount of lactase. This condition is called as
acquired or temporary lactose deficiency. 116
Once the person develops lactase deficiency, the bacteria that is present in the
small bowel will act on the huge among of lactose present in the diet consumed. The
lactose then is broken down into shoot chain acids which will both irritate the bowel
mucosa as well will prevent the proper absorption of lactose resulting in acidic and
watery. Stool accompanied if stomach pain and excessive gas.117
Primary are in born lactose deficiency is an absolute or complete absence of
lactase enzymes in gut to digest any little amount of Lactose this leads to Lactose
intolerance other wise known as adult type hypolactamia.118
56
Secondary Lactose intolerance is the indigestion of Lactose due to take of
enzyme lactose may be resulted by various causes including injury due to persisted
diarrheal chemotherapy, gastroenteritis infections more common infancy.119
Any types of infections diarrhea mainly viral gastro enteritis in infants damage
the normal functioning of digestion and absorption of lactose specially in under 5
children. Every impart out hurt be given to young infants on breast feeding to
continue feeding them.120
The progress of lactase deficiency and lactose intolerance leads to mal
absorption. These indigested and non-absorbed lactose causes an osmotic load that
attracts fluid and electrolyte in the intestinal lumen leading to loose stools.122
Secondary lactose intolerance is more likely to develop in a child with
persistent diarrhea (34.2%) companied with other types of diarrhea (20.0%) and
18.2% persistent diarrhea respectively long term infections of intestinal tract which
can damage the epithelial cells of intestinal mucosa-which is considered as major
reason, the child go into secondary Lactose intolerance.122
Many students has proved that Lactose injure is a compilation of diarrhea
infants. Prevalence of secondary many lacto inst. Reported in a study status that 26%
is 100% of diseased child has a history of two or more episodes of diarrhea.122The
type of disaccharide lactose is essential for nourishing the new born and infants from
2nd to 24 months.123
Secondary Lactose intolerance has some indulging conditions like acute
Rotavirus infection. This may lead to intestinal injury there by cause lactose reduced
epithelial cells and it leads to secondary lactose intolerance.124
The high risk infant (less than 3 month) or any under nourished child who is
affected with any inflation of the gastro intestinal system may lead to lactose
57
intolerance from injury to epithelial cells of small intestine. If the children develop
intestinal atrophy due to any other cause also the chiding develop secondary Lactose
intolerance.125
When malnutrition occurs due to mal absorption it may lead to poor growth
and development represented in developing countries. Most of the infants with mal
absorption persistently develops post infectious diarrhea, they will not respond to any
treatment like dietary trails or yogurt. The management of secondary lactose
intolerance is an underlying condition does not indicate to stop breast feeding .but the
dietary lactose intake should be avoided for a specific period of time and can be
restarted.125
It is estimated that 1.4 million children are admitted every years due to
diarrhea (IAP, 2003). Chronic diarrhea is due to mal absorption and 50% of all
persistent and chronic diarrhea is due to lactose intolerance in children between the
age of 0-24 months. It was also found that 33% of children with lactose intolerance
had abdominal pain which was associated with diarrhea. According to their findings
among 110 children with watery diarrhea in the age group of one to two years, 75
(68%) had lactose intolerance and 97% had Ph< 6 and positive sugar test.126
In another study conducted to identify the major associated factors with
protracted diarrhea in children below two years during a period of nine months, it was
found that 40.2% had E.coli infestation, 35.65 had secondary carbohydrate
intolerance, 22% had lactose intolerance and 2 % had monosaccharide intolerance.
Yet in another prospective study that was conducted to identify the prevalence of
diarrheal disease, it was found that 40 % of children had lactose intolerance. 127
A study that was undertaken to find out the incidence of lactose intolerance
among 220 children with diarrhea for more than three days. It was found that among
58
the children with persistent diarrhea, 22% had lactose intolerance and 8% had
disaccharide intolerance.128Another study assessed the major factors associated with
protected diarrhea in children below two years of age. It was found that among 87
randomly assigned children, 35.6% of them had secondary lactose intolerance and
22% had lactose intolerance, while 2% had monosaccharide and 9 % had both lactose
and monosaccharide .128
It is also reported in one of the study that secondary lactose intolerance
induced diarrhea is aggravated with milk feeds and the incidence is seen among 22%
of all children having persistent diarrhea under two years. In a study conducted in
Karnataka to find the incidence of lactose intolerance, 22 % of the children had
lactose intolerance induced diarrhea. In a study conducted among 88 children
suffering from acute gastroenteritis, lactose was found to be the offending sugar
determined by benedict test and stool Ph. Lactose intolerance was found in 34.6%.129
2.3 Literature related to oral rehydration therapy
An improved strategy of managing diarrheal illness in children is a major
concern and thereby reducing mortality and morbidity due to dehydration.
Appropriate management of diarrheal disease is essential to reduce malnutrition in
many children of developing nations with ORS is freely available for usage in all
areas and due to poor utilization these children need hospital admission and
intravenous therapy. 130
Dehydration remains a major cause of morbidity and mortality in infants and
young children worldwide. Dehydration is a symptom or sign of another disorder,
most commonly diarrhea. Infants are prone to ill effects of dehydration because of
their increased fluid requirement and higher basic metabolic rate. In case of diarrhea
of children going through more fluid loss along with electrolyte in varying
59
percentage, the exact amount and type of electrolyte loss varies depending on the
cause (eg, significant amounts of HCO 3 - may be lost with diarrhea but not with
vomiting). However, fluid lost always contains a lower concentration of Na than the
plasma. Thus, in the absence of any fluid replacement, serum Na rises
(hypernatremia). Hypernatremia causes water to shift from the intracellular and
interstitial space into the intravascular space, helping, at least temporarily, to maintain
vascular volume. With hypotonic fluid replacement (eg, with plain water), Serum Na
maybe normalized, but can also decrease (hyponatremia). Hyponatreamia results in
some fluid shifting out of the intravascular space into the interstium at the expense of
vascular volume.131
For more than 25 years, WHO and UNICEF have recommended glucose based
ORS to prevent or treat diarrheal dehydration, no matter the cause or affected age
group. This solution has played a major role in dramatically reducing global mortality
due to diarrhea. WHO and UNICEF are recommending reduced osmolarity ORS
solution, especially for children with acute, non-cholera diarrhea because of the
improved effectiveness. 132
The worldwide campaign to treat acute diarrhea with oral rehydration therapy
represents successful collaboration between basic and applied bio medical research.
The normal protocols to treat diarrhea is treatment with oral rehydration therapy
replace the existing fluid loss, second phase is maintaining phase which includes
fluids and electrolyte maintenance along with appropriate nutrition. 133
The systematic review was conducted to identify studies on recommended
base fluids, in management of diarrhea among children below the age of 5. The results
revealed that ORS may prevent 93% of diarrheal deaths and morbidity were reduced
due to diarrhea and dehydration .134
60
American academy of pediatrics suggested WHO and other groups to include
administering oral diet followed by rehydration following an acute diarrhea., the small
intestine mucosa is getting damaged, undergoes structural and functional changes.
This may lead to secondary carbohydrate malabsorption. Early enhanced nutrition
plays a crucial role in mucosa repair, improves the children nutritional status by
providing adequate calories and thereby duration of illness is reduced. 134
Fiber rich diet plays a role in reducing the length of diarrheal status. The child
is focused not only towards rehydration with ORS but also followed with diet like
banana , rice, apple, bread, tea(BRAT) diet which will improve the nutritional status
of the child, thereby preventing malnutrition and improves cure of mucosal damage of
intestine. 135
Rice is considered to be having anti secretary property .Thereby leading to
reduction in watery stools and length of diarrheal episodes. Rice also aids in sodium-
glucose co transport , thereby effective rehydration function is possible. 136
In another clinical study about dietary management of persistent diarrhea was
conducted. Children below the age of 5 to 12 months (mean is 7 to 8 months) were
treated with rice based banana feeds and rice based pectin formula, these feeds were
given by mothers. The primary objective was the recovery from the diarrhea. Most
children had banana pectin formed stool also hydrated adequately, than child with
Rice based feed. 137
A rice based ORT have been shown superior to glucose based ORS in
reducing stool quantity and duration of diarrhea. Rice based ORS used for young
children in a randomized control trail from 52 young infants 72% (27 children)
received rice based ORS and 25 children received WHO-ORS. It was found that
61
children received rice based ORS were having significantly lower stool output,
diarrhea and rice based ORS was tolerated well. 138
A study was carried out to compare the efficacy of a cereal based ORS
(prepared with 50 G of sagodana (cereal), 3.5 GIL sodium chloride, 1.5 GIL
potassium chloride, 2.9 GIL tri sodium citrate) with rice based oral rehydration
solution (using same amounts of rice and electrolytes) for treatment of diarrhea, One
hundred and twelve children aged 3 months to 2 years with watery diarrhea of less
than 5 days duration with mild to moderate dehydration and no sepsis, were included
in the study. The amount of ORS intake, stool volume and frequency were similar in
both groups. Clinical success was seen in 79% of rice ORS group and 81% in
sagodana group. The study results suggest that both can be used as a cereal based
ORS in the management of acute diarrhea in communities where it is culturally
accepted and used as a weaning diet.139
Another study was undertaken to compare the efficiency of ready to use pre
mixed rice based Oral rehydration solution(R-ORS) and glucose based ORS among
Mexican children with diarrhea. Between the age of 3-24 months with 3 hours
introduction of Rice based ORS, there was significant reduction in diarrheal episodes
of children. 140
Specific usage of 2 ORS (rice based general and oral rehydration salts) were
assured among the mothers of 162 children under the age of 5. Among that 86
mothers were from village, mothers responded to the Rice based gruel was found to
be effective in controlling diarrheal symptoms .141
A study with 167 boys with cholera were compared with cerealyte (rice based
ORS) to standard WHO formula. The results revealed that rice based ORS improved
the diarrheal status of 90 boys by reducing the stool output up to 20%. 142
62
A study conducted with 257 children between the age of 4to15 months who
had acute diarrhea were randomly assigned to treatment with WHO ORS with cereal
based ORS (maize, millet, sorghum, rice). After initial assessment of diarrheal and
dehydration status. It was found that Children who received cereal based ORS
improved in terms of stool output , duration of diarrhea , weight gain after 24,48,72
hours. 143
A study with 189 children from 3-24 month old who were admitted with acute
diarrhea were compared with safety and effectiveness of ready to use premixed rice
based ORS with glucose based ORS . The study revealed that mean stool output was
significantly lower in children who received cereal based ORS. 143
A study documented to evaluate the use of rice based Oral rehydration
solution with glucose based Oral Rehydration solution in management of diarrheal
symptoms. Any 200 hospitalized Egyptian infants below 3-18 months of age, it was
found that there was a statistically significant difference among 4 group in the mean
duration of diarrhea. And the study findings concluded that the child fed with rice
based ORS reduced the stool output when compared to the control group who were on
formula feed.144
2.4. Literature related to management of secondary lactose intolerance.
Secondary lactose intolerance is mainly due to increased duration of diarrhea
without investigating for the cause many times lactose free feeds are prescribed.
There are cheaply available weaning foods which are found to be effective in
reducing diarrheal episodes. Cereal based weaning foods without dairy products and
yogurt can be effectively used to manage secondary lactose intolerance .145
63
The following are the advantages of cereal based ORT over glucose based
formulations.
1. Greater effectiveness in many clinical trials showing less diarrhea fluid loses,
shorter duration of diarrhea, less vomiting during treatment.
2. More rapid return of normal digestion and improved nutrition even if used
without feeding
3. Availability of cereal and starchy vegetables in all countries and households.
Once the child is diagnosed to have lactose intolerance milk and diary
products are avoided to stop the symptoms. However if there is primary lactose
intolerance it is mandatory to supplement with lactose free feeds, where the child is
capable of going into calcium deficit . The supplementary feed should be fortified
with required amount of dietary calcium to improve bone mineralization.146
When there is a damage to mucosal lining of the intestines the children go into
persistent diarrhea, therefore the child develops malnutrition. Treating this is a
challenge in community settings. Milk free diet with simple or complex of
carbohydrate diet is ideal. A study involve 500 children between the age of 4-36
months , the success rate is 80% for the above regimen.147
Lactose free milk is found to be more expensive than lactose containing feeds.
Substitutes for cow milk based on rice, soya and other proteins are available and
nutrient content are equal to milk product which can be given to infants with lactose
intolerance.148
Children who suffer from lactose intolerance tolerate plain yogurt. Yogurt is
semi solid in nature which slow down the gastric emptying and gastrointestinal transit
and reducing the symptoms of lactose intolerance .149
64
Intake of other solid foods delay gastric emptying which provides extra time
for digestion of dietary lactose 150.
A study was conducted for a period of one year in diarrhea training and
treatment unit at a children hospital in Delhi. Involved normal diarrheal case
management along with detailed data of history and duration of diarrheal onset , types
of loose stool etc. total number children were 9195 cases. The study findings revealed
that most of the children were treated as OPD (88%) 11.6% needed hospitalization
and among total children. 32 % were found to have lactose intolerance. Among that
81.8% children responded to lactose free feeds.152
In a study it was reported that secondary carbohydrate intolerance was found
in children with diarrhea. The authors suggested that breastfeeding can be continued
when 2/3 of children were tolerant to breast feeding while rest of them responded to
lactose free formula.153 Yet another study suggests that secondary lactose deficiency
following diarrhea should be treated with lactose free formula but breast milk should
be continued. In a study that reported secondary carbohydrate intolerance during
diarrhea, it was found that majority children tolerated breast feed.153
Findings of various studies have shown that consumption of yogurt helps in
controlling diarrhea. In one study it was suggested that yogurt feeding during acute
diarrhea can become important nutritional intervention to control morbidity as well as
duration of hospital stay among secondary lactose intolerance children. Another
study that was done to find the relationship between lactose digestion and diarrhea,
yogurt feeds were effectively absorbed instead of milk feeds and it also had
contributed in the control of diarrhea. 149
A study was done to compare the rice based ORS with lactose free formula
among Egyptians infants with acute diarrhea. Infants from 3 TO 18 months with
65
watery diarrhea were selected who had 5-8 stools per day. With 5% dehydrated four
cell randomized controlled trial taken up where two groups were given general ORS,
third group was given rice based ORS and fourth group was given soya based lactose
free formula. The findings revealed that rice based ORS and soya based lactose free
formula were effective in controlling diarrhea in 35% of the subjects. The results of
one study also has proven that persistent diarrhea can be effectively controlled when
milk is reduced in the diet and if replaced by yogurt or feeds based on rice or soya.
Yet another study suggests that lactobacillus supplement may be useful as
prophylactic measures in controlling diarrhea due lactose intolerance.154
Transient lactose intolerance secondary to infective diarrhea is common in
developing countries and soya milk is commonly prescribed for its management was
reported in one of the study done on management of lactose intolerance. Lactose
predigested milk feeding was done in 70 patients. The results reveal that 84.3% had
control of diarrhea when lactose diet was withdrawn. And 83.3% in control group
who were fed with soya milk showed some improvement. The results also revealed
that 30% refused the feed.155
Another study reported that infant formula added with soya bean and
hydrolyzes the carbohydrate and fat components. Protein and fat , are available to
treat secondary lactose intolerance and also lactose treated feed can be preferentially
supplemented if needed feed dairy products, who have varying degree of lactose
intolerance. 156
A Meta analysis done on Asian infants revealed that genetically Asian
children are prone for rotavirus infections. Delayed recovery may lead to secondary
lactose intolerance. Lactose free foods decrease the duration of diarrhea and correct
the stool acidity in 24 hours and reduce the risk of going into intravenous fluid
66
replacement. The study also found that 50 % children revealed lactose free foods,
tolerated well, corrected all parameters assessed. 157
Among children with acute diarrhea, diluting or fermenting lactose containing
formulates lactose free fuels, reducing the duration of diarrhea and decrease the risk
of treatment failure compared with lactose containing foods.158
A comparative study was done to find out the effectiveness of lactose free
Rice based ORS and glucose containing ORS. 22 randomized trials were undertaken
for the study. These findings revealed that Rice based ORS was effective in reducing
stool output.159
Child with acute infectious gastroenteritis tend to develop lactose intolerance
and it is a common complication. 160
In infants with disorders of carbohydrate metabolism (e.g. galactosemia and
primary lactase deficiency, both of which are rare), soy protein-based formulas are
found to be safe and cost-effective. In infants with acute diarrhea and secondary
lactase deficiency, recovery was generally similar between breast fed, cow milk-based
formula fed, and soy protein-based formula fed infants. However, some studies
reported a shorter duration of diarrhea in soy-fed infants, and a reduced duration of
liquid stools when additional soy polysaccharide fiber was included.161
A study of case control method found that soya based infant feeds compared
with other types of formula. Soya based fuel were very useful in improving growth
and development, cognitive skills and immunity. 162
Soya based infant feeds has shown good results in treating diarrhea. As they
conducted as clinical trial with.73 children, revealed comparative analysis of children
who is fed with lactose free diet has reduced the episodes of diarrhea with cow milk
fed children. Soya is found to be very useful in decreasing the duration of diarrhea.163
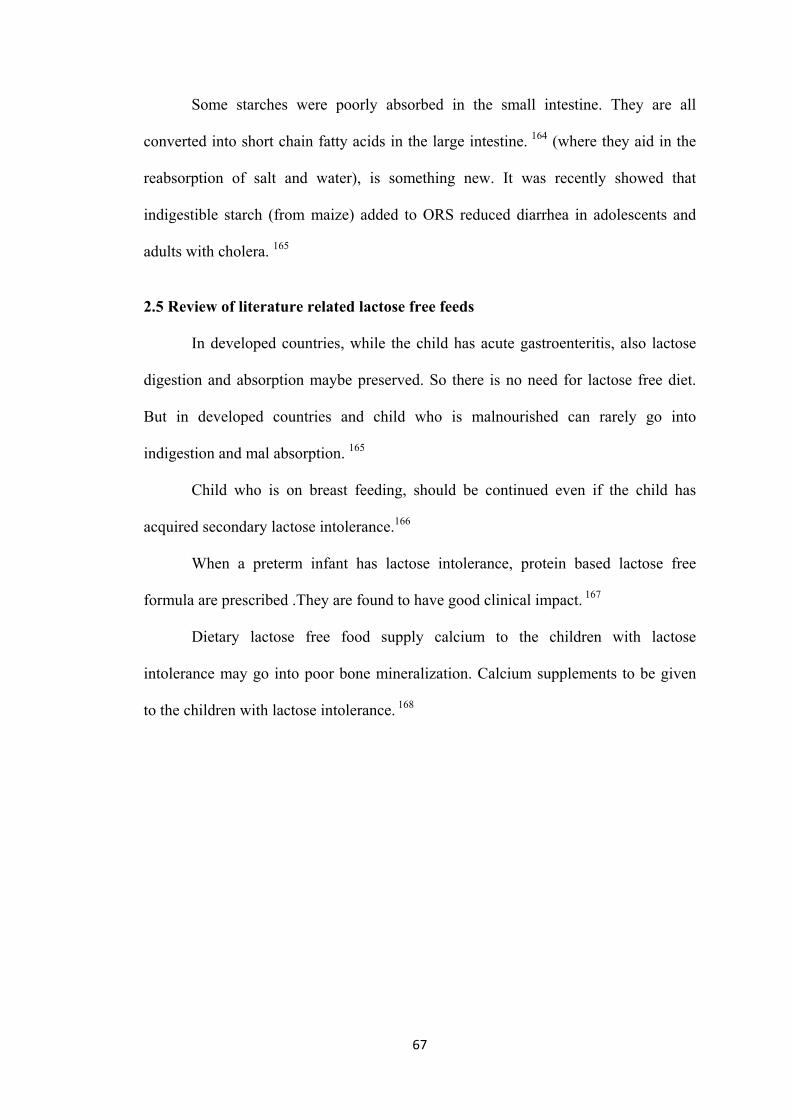
67
Some starches were poorly absorbed in the small intestine. They are all
converted into short chain fatty acids in the large intestine. 164 (where they aid in the
reabsorption of salt and water), is something new. It was recently showed that
indigestible starch (from maize) added to ORS reduced diarrhea in adolescents and
adults with cholera. 165
2.5 Review of literature related lactose free feeds
In developed countries, while the child has acute gastroenteritis, also lactose
digestion and absorption maybe preserved. So there is no need for lactose free diet.
But in developed countries and child who is malnourished can rarely go into
indigestion and mal absorption. 165
Child who is on breast feeding, should be continued even if the child has
acquired secondary lactose intolerance.166
When a preterm infant has lactose intolerance, protein based lactose free
formula are prescribed .They are found to have good clinical impact. 167
Dietary lactose free food supply calcium to the children with lactose
intolerance may go into poor bone mineralization. Calcium supplements to be given
to the children with lactose intolerance. 168
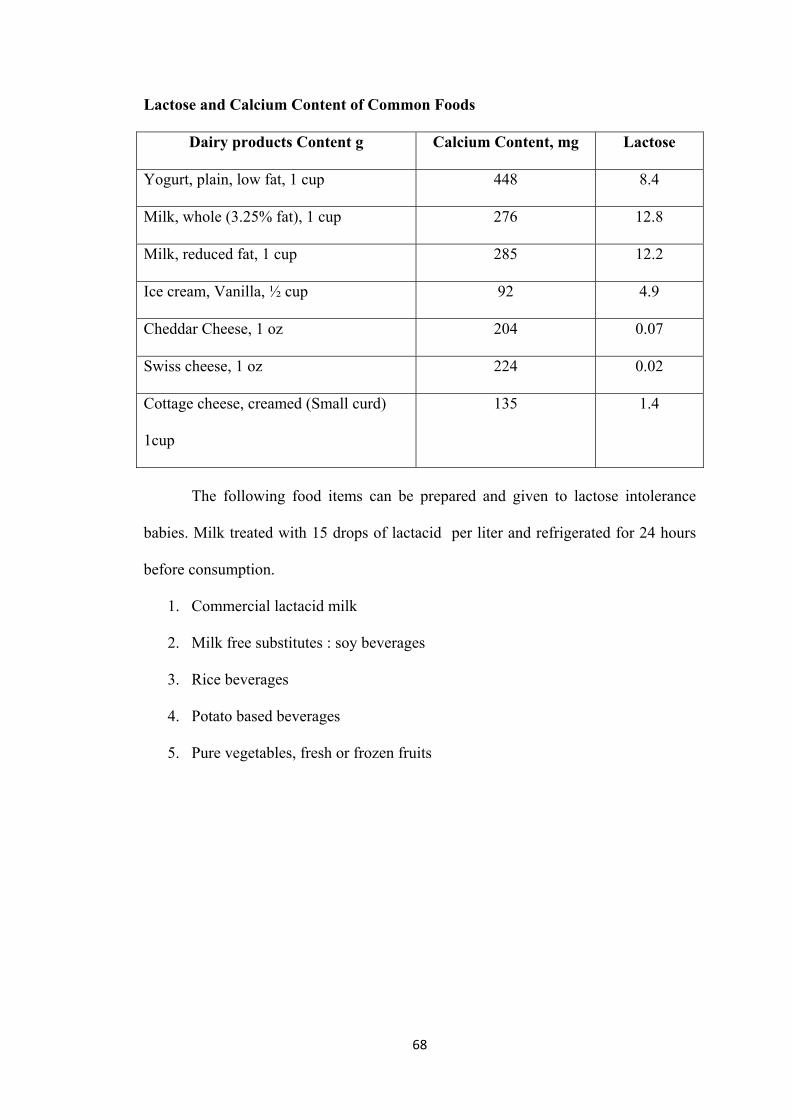
68
Lactose and Calcium Content of Common Foods
Dairy products Content g Calcium Content, mg Lactose
Yogurt, plain, low fat, 1 cup 448 8.4
Milk, whole (3.25% fat), 1 cup 276 12.8
Milk, reduced fat, 1 cup 285 12.2
Ice cream, Vanilla, ½ cup 92 4.9
Cheddar Cheese, 1 oz 204 0.07
Swiss cheese, 1 oz 224 0.02
Cottage cheese, creamed (Small curd)
1cup
135 1.4
The following food items can be prepared and given to lactose intolerance
babies. Milk treated with 15 drops of lactacid per liter and refrigerated for 24 hours
before consumption.
1. Commercial lactacid milk
2. Milk free substitutes : soy beverages
3. Rice beverages
4. Potato based beverages
5. Pure vegetables, fresh or frozen fruits
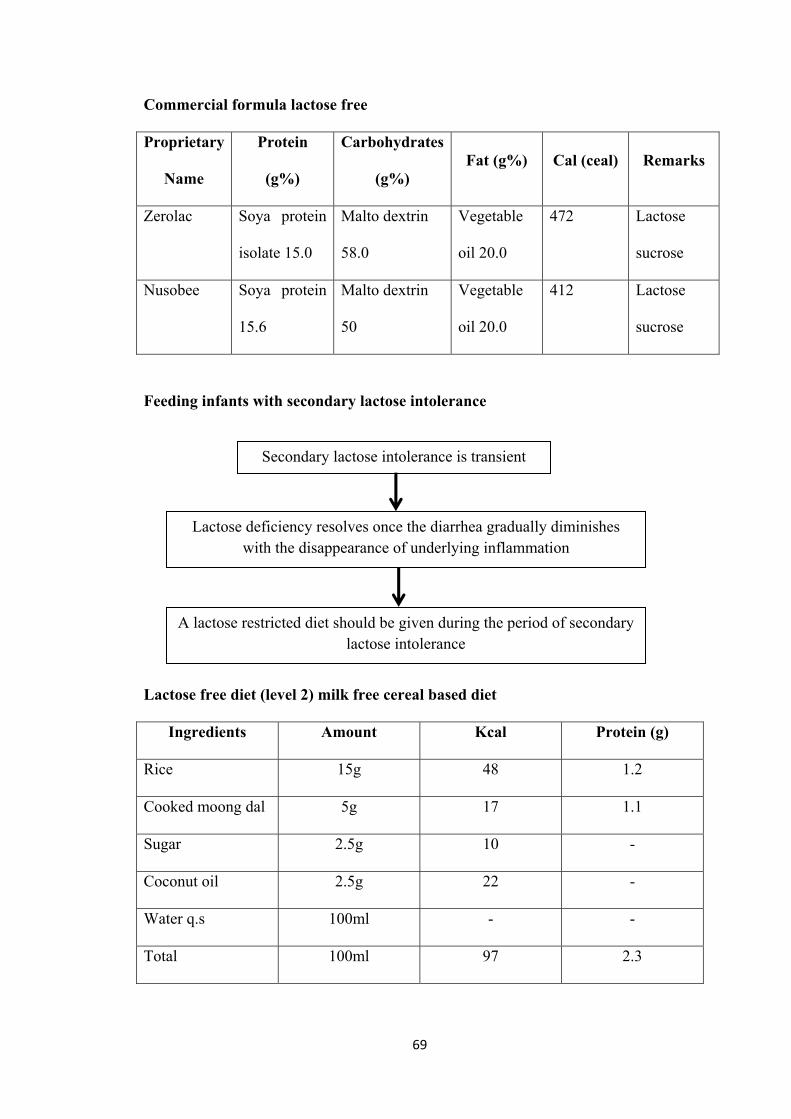
69
Commercial formula lactose free
Proprietary
Name
Protein
(g%)
Carbohydrates
(g%) Fat (g%) Cal (ceal) Remarks
Zerolac Soya protein
isolate 15.0
Malto dextrin
58.0
Vegetable
oil 20.0
472 Lactose
sucrose
Nusobee Soya protein
15.6
Malto dextrin
50
Vegetable
oil 20.0
412 Lactose
sucrose
Feeding infants with secondary lactose intolerance
Lactose free diet (level 2) milk free cereal based diet
Ingredients Amount Kcal Protein (g)
Rice 15g 48 1.2
Cooked moong dal 5g 17 1.1
Sugar 2.5g 10 -
Coconut oil 2.5g 22 -
Water q.s 100ml - -
Total 100ml 97 2.3
Secondary lactose intolerance is transient
Lactose deficiency resolves once the diarrhea gradually diminishes with the disappearance of underlying inflammation
A lactose restricted diet should be given during the period of secondary lactose intolerance
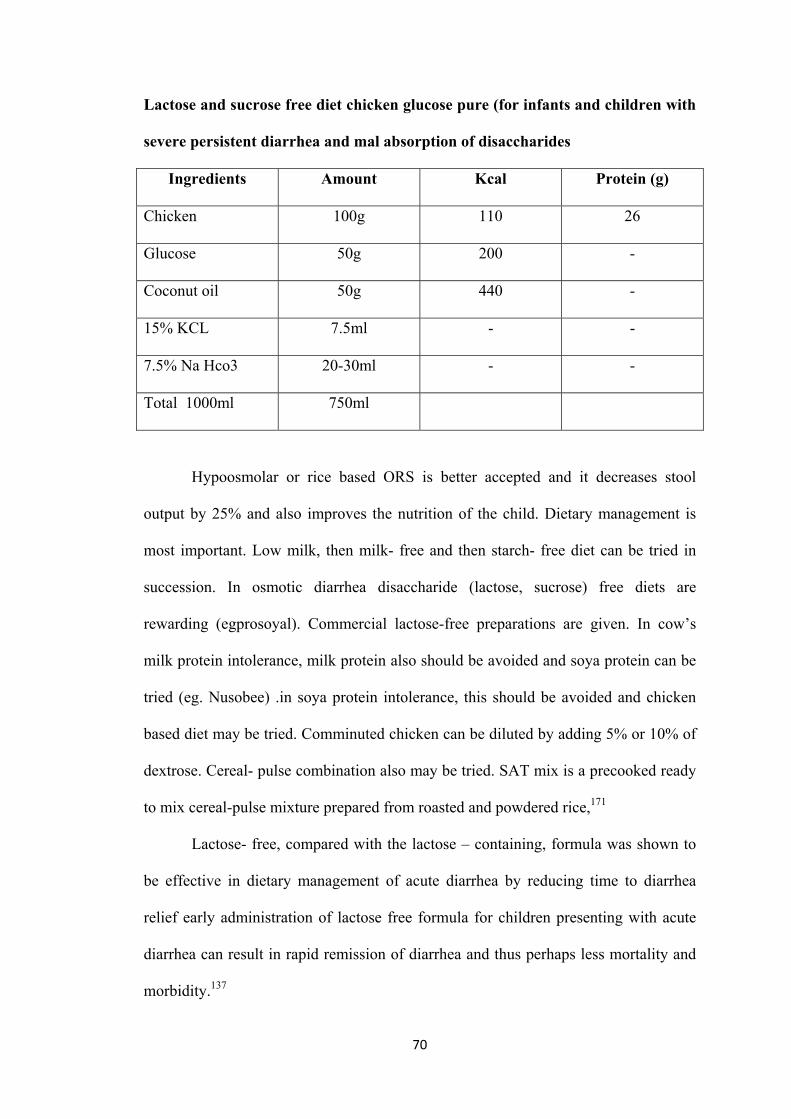
70
Lactose and sucrose free diet chicken glucose pure (for infants and children with
severe persistent diarrhea and mal absorption of disaccharides
Ingredients Amount Kcal Protein (g)
Chicken 100g 110 26
Glucose 50g 200 -
Coconut oil 50g 440 -
15% KCL 7.5ml - -
7.5% Na Hco3 20-30ml - -
Total 1000ml 750ml
Hypoosmolar or rice based ORS is better accepted and it decreases stool
output by 25% and also improves the nutrition of the child. Dietary management is
most important. Low milk, then milk- free and then starch- free diet can be tried in
succession. In osmotic diarrhea disaccharide (lactose, sucrose) free diets are
rewarding (egprosoyal). Commercial lactose-free preparations are given. In cow’s
milk protein intolerance, milk protein also should be avoided and soya protein can be
tried (eg. Nusobee) .in soya protein intolerance, this should be avoided and chicken
based diet may be tried. Comminuted chicken can be diluted by adding 5% or 10% of
dextrose. Cereal- pulse combination also may be tried. SAT mix is a precooked ready
to mix cereal-pulse mixture prepared from roasted and powdered rice,171
Lactose- free, compared with the lactose – containing, formula was shown to
be effective in dietary management of acute diarrhea by reducing time to diarrhea
relief early administration of lactose free formula for children presenting with acute
diarrhea can result in rapid remission of diarrhea and thus perhaps less mortality and
morbidity.137
71
CHAPTER - III
RESEARCH METHODOLOGY
Research methodology is a way to systematically solve the research problem.
It may be understood as a science of studying how research is done scientifically. In
includes the various steps that are generally adopted by a researcher in studying his
research problem along with the logic behind them. Research design is the conceptual
structure within which research would be conducted.
Research methodology includes research approach, research design, setting,
samples, sampling techniques, population, criteria for sample selection, method of
sample selection, and description of the tool, validity, reliability, pilot study,
procedure for data collection, plan for data analysis and protection of human subjects.
The present study is to determine the incidence of secondary lactose
intolerance and evaluate the effect of lactose free feeds in controlling diarrhea and
correcting dehydration among children who are admitted in Dr. Navamani Prabhakar
Pediatric Hospital Arasaradi, Madurai.
3.1 Research Approach
The quantitative approach to gather information focuses on describing a
phenomenon across a larger number of participants thereby providing the possibility
of summarizing characteristics across groups or relationships.
Research approach used for this study is Quantitative approach. Intervention
research is a blue print of the procedure that enables the researcher to test the
hypothesis by reaching valid conclusions about relationships between independent
and dependent variables.
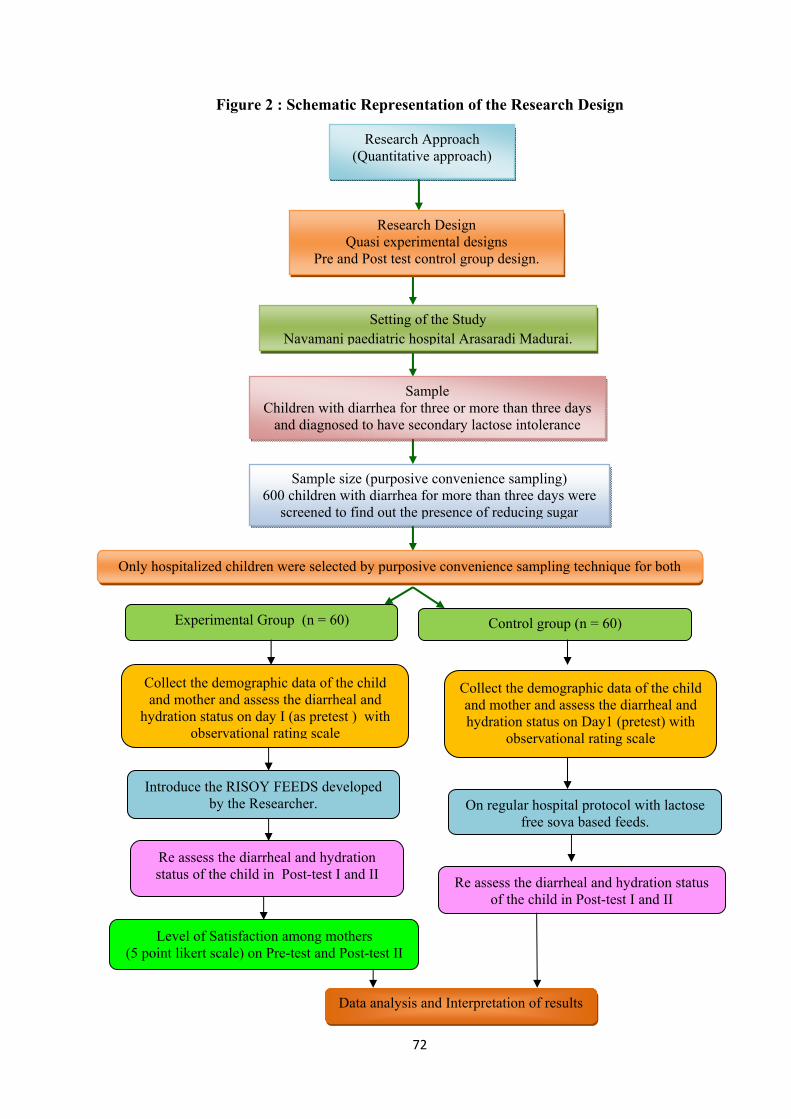
72
Figure 2 : Schematic Representation of the Research Design
Research Approach (Quantitative approach)
Research Design Quasi experimental designs
Pre and Post test control group design.
Setting of the Study Navamani paediatric hospital Arasaradi Madurai.
Sample Children with diarrhea for three or more than three days
and diagnosed to have secondary lactose intolerance
Sample size (purposive convenience sampling) 600 children with diarrhea for more than three days were
screened to find out the presence of reducing sugar
Only hospitalized children were selected by purposive convenience sampling technique for both
Experimental Group (n = 60) Control group (n = 60)
Collect the demographic data of the child and mother and assess the diarrheal and
hydration status on day I (as pretest ) with observational rating scale
Collect the demographic data of the child and mother and assess the diarrheal and hydration status on Day1 (pretest) with
observational rating scale
Introduce the RISOY FEEDS developed by the Researcher. On regular hospital protocol with lactose
free soya based feeds.
Re assess the diarrheal and hydration status of the child in Post-test I and II
Re assess the diarrheal and hydration status of the child in Post-test I and II
Level of Satisfaction among mothers (5 point likert scale) on Pre-test and Post-test II
Data analysis and Interpretation of results
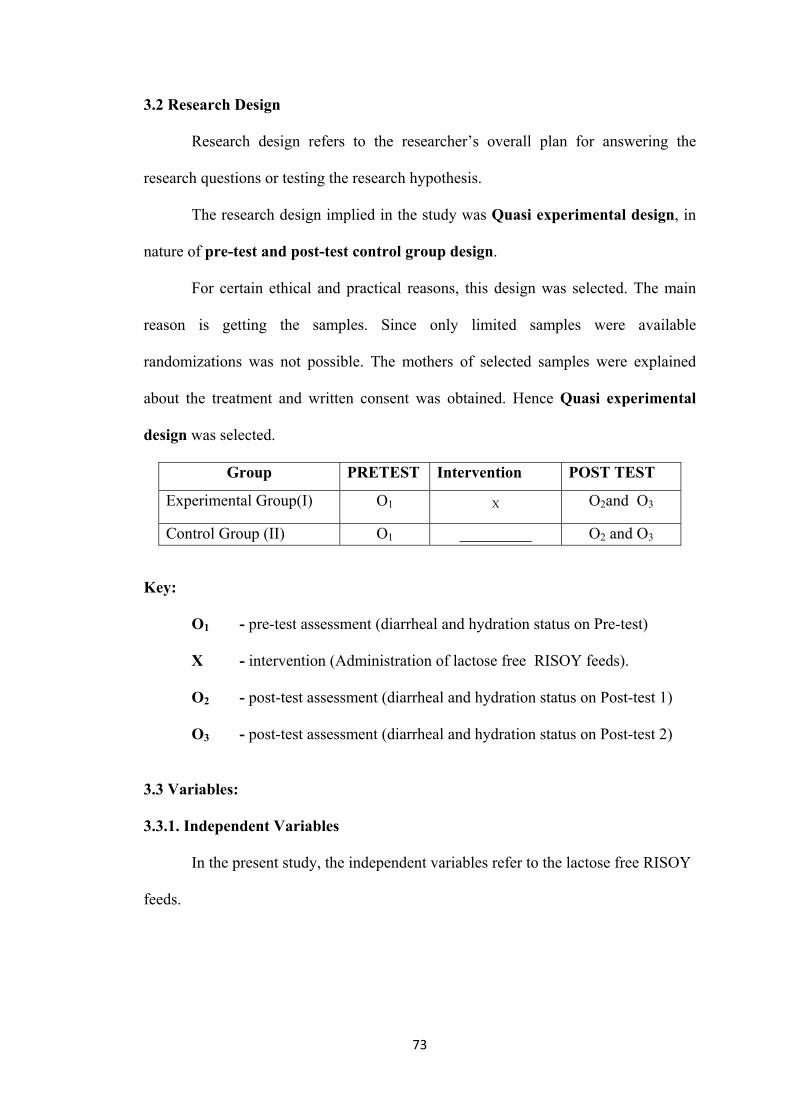
73
3.2 Research Design
Research design refers to the researcher’s overall plan for answering the
research questions or testing the research hypothesis.
The research design implied in the study was Quasi experimental design, in
nature of pre-test and post-test control group design.
For certain ethical and practical reasons, this design was selected. The main
reason is getting the samples. Since only limited samples were available
randomizations was not possible. The mothers of selected samples were explained
about the treatment and written consent was obtained. Hence Quasi experimental
design was selected.
Group PRETEST Intervention POST TEST
Experimental Group(I) O1 X O2and O3
Control Group (II) O1 _________ O2 and O3
Key:
O1 - pre-test assessment (diarrheal and hydration status on Pre-test)
X - intervention (Administration of lactose free RISOY feeds).
O2 - post-test assessment (diarrheal and hydration status on Post-test 1)
O3 - post-test assessment (diarrheal and hydration status on Post-test 2)
3.3 Variables:
3.3.1. Independent Variables
In the present study, the independent variables refer to the lactose free RISOY
feeds.
74
3.3.2. Dependent Variables
There are two dependent variables in the present study. It includes, diarrheal
status and hydration status of children.
3.3.3. Extraneous Variables
In this present study, extraneous variables refer to the demographic variables,
such as age, sex, weight day1,day2 and day3, duration of diarrhea, history of other
health problem, feeding pattern, type of bottle feed who’s weaning started, previous
episode of diarrhea, any home remedy taken, education of mother, occupation of
mother, total family income, child is cared by, hand washing, feeding vessels
sterilization and drinking water
3.4. Research Setting
The setting of this present study is Navamani pediatric hospital, Arasaradi,
Madurai, Tamil Nadu. It is a 75 bedded pediatric hospital exclusively for children. It
includes OPD. NICU,PICU, OT General ward, diarrhea ward, sharing rooms, single
rooms, and equipped laboratory, ultra sound, scanning, x-ray rooms, phototherapy
unit, incubators, radiant warmers, mechanical ventilators, monitors, pulse oxymetry,
rehabilitation centre for spastic and cerebral palsy children, physiotherapy and speech
therapy etc. Everyday more than 200 children attend for OP. Among all the
outpatients 30-40% of children come with diarrheal disease. Out of 200, Nearly 30
babies attend well baby clinic for immunization. The routine nursing care to the
children includes health assessment, neonatal reflexes, fluid management, feeding,
maintaining intake output chart, TPR chart and administration of medications.

75
3.5. Population
The entire population is the aggregate of children in which the researcher is
interested and would like to generalize the study results.
3.5.1. Target Population
The target population of the present study is children having diarrhea 3 or
more than 3 days ,who’s stool for reducing sugar is positive and PH of the stool is
altered (<7 acidity) and admitted in the Navamani Pediatric hospital with mild to
moderate dehydration.
3.5.2. Accessible Population
Children who were admitted in wards of Navamani Pediatric Hospital,
Madurai, Tamil Nadu with diarrhea for 3 or more than 3 days and diagnosed to have
secondary lactose with mild to moderate dehydration.
3.6. Sample
Sample is the process of selecting a subset of subjects that is representative of
the entire population. This representative portion of a population is called samples.
Children between the age 4 to 12 months and admitted in Navamani Pediatric
Hospital with positive reducing sugar in stools with stool PH < 7 and diagnosed to
have secondary lactose intolerance with mild to moderate dehydration.
3.7. Samples Size
The sample size taken to determine the incidence of secondary lactose
intolerance among children are 120.The sample selected for the experimental group
was 60 and control group also 60. Sample size calculation was done based on two
means from pilot study.
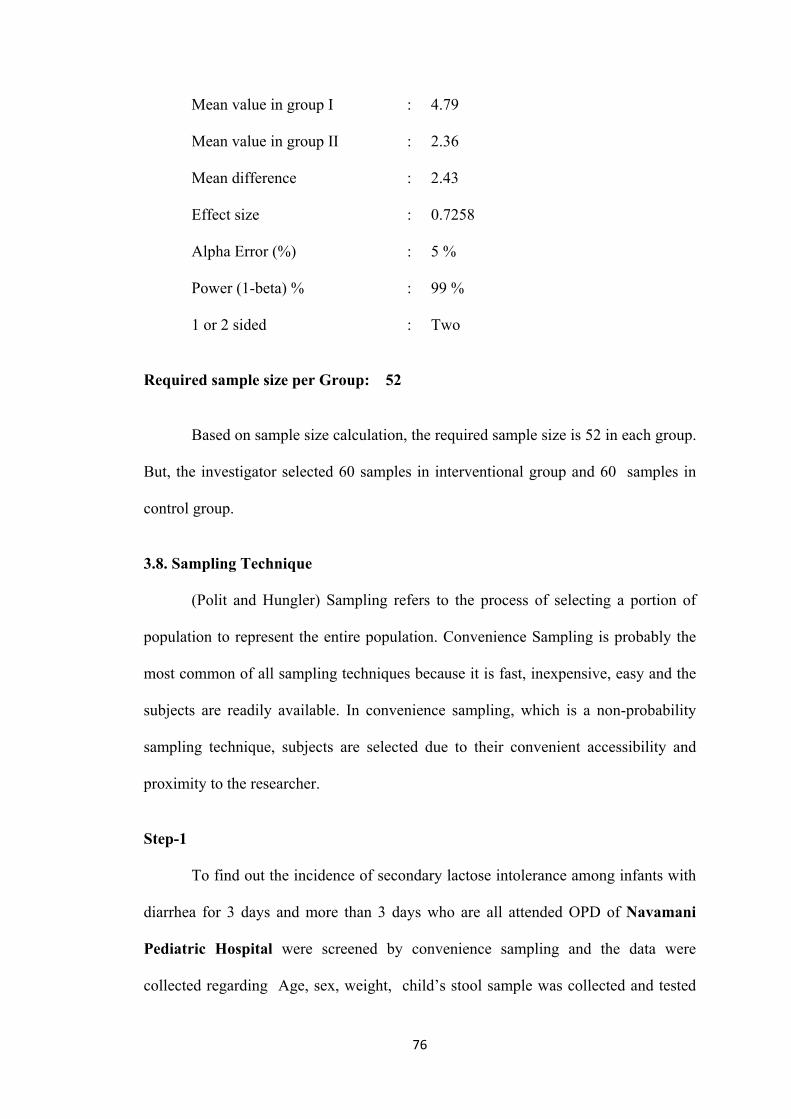
76
Mean value in group I : 4.79
Mean value in group II : 2.36
Mean difference : 2.43
Effect size : 0.7258
Alpha Error (%) : 5 %
Power (1-beta) % : 99 %
1 or 2 sided : Two
Required sample size per Group: 52
Based on sample size calculation, the required sample size is 52 in each group.
But, the investigator selected 60 samples in interventional group and 60 samples in
control group.
3.8. Sampling Technique
(Polit and Hungler) Sampling refers to the process of selecting a portion of
population to represent the entire population. Convenience Sampling is probably the
most common of all sampling techniques because it is fast, inexpensive, easy and the
subjects are readily available. In convenience sampling, which is a non-probability
sampling technique, subjects are selected due to their convenient accessibility and
proximity to the researcher.
Step-1
To find out the incidence of secondary lactose intolerance among infants with
diarrhea for 3 days and more than 3 days who are all attended OPD of Navamani
Pediatric Hospital were screened by convenience sampling and the data were
collected regarding Age, sex, weight, child’s stool sample was collected and tested
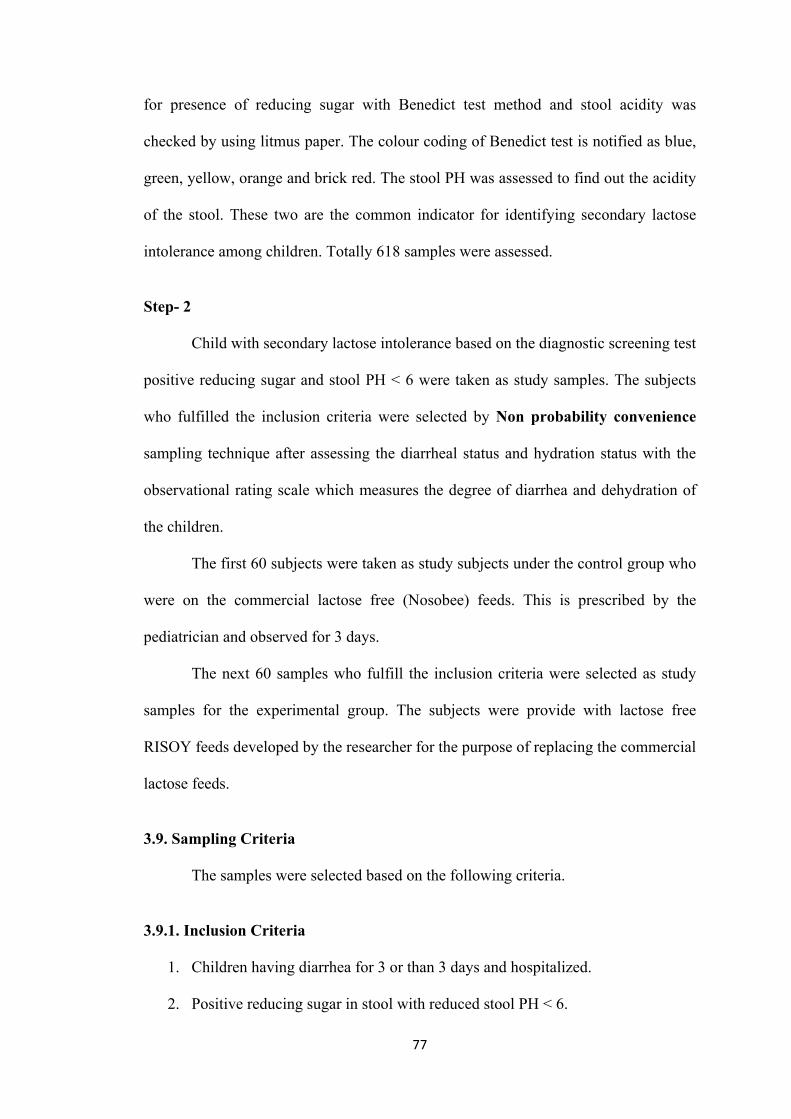
77
for presence of reducing sugar with Benedict test method and stool acidity was
checked by using litmus paper. The colour coding of Benedict test is notified as blue,
green, yellow, orange and brick red. The stool PH was assessed to find out the acidity
of the stool. These two are the common indicator for identifying secondary lactose
intolerance among children. Totally 618 samples were assessed.
Step- 2
Child with secondary lactose intolerance based on the diagnostic screening test
positive reducing sugar and stool PH < 6 were taken as study samples. The subjects
who fulfilled the inclusion criteria were selected by Non probability convenience
sampling technique after assessing the diarrheal status and hydration status with the
observational rating scale which measures the degree of diarrhea and dehydration of
the children.
The first 60 subjects were taken as study subjects under the control group who
were on the commercial lactose free (Nosobee) feeds. This is prescribed by the
pediatrician and observed for 3 days.
The next 60 samples who fulfill the inclusion criteria were selected as study
samples for the experimental group. The subjects were provide with lactose free
RISOY feeds developed by the researcher for the purpose of replacing the commercial
lactose feeds.
3.9. Sampling Criteria
The samples were selected based on the following criteria.
3.9.1. Inclusion Criteria
1. Children having diarrhea for 3 or than 3 days and hospitalized.
2. Positive reducing sugar in stool with reduced stool PH < 6.
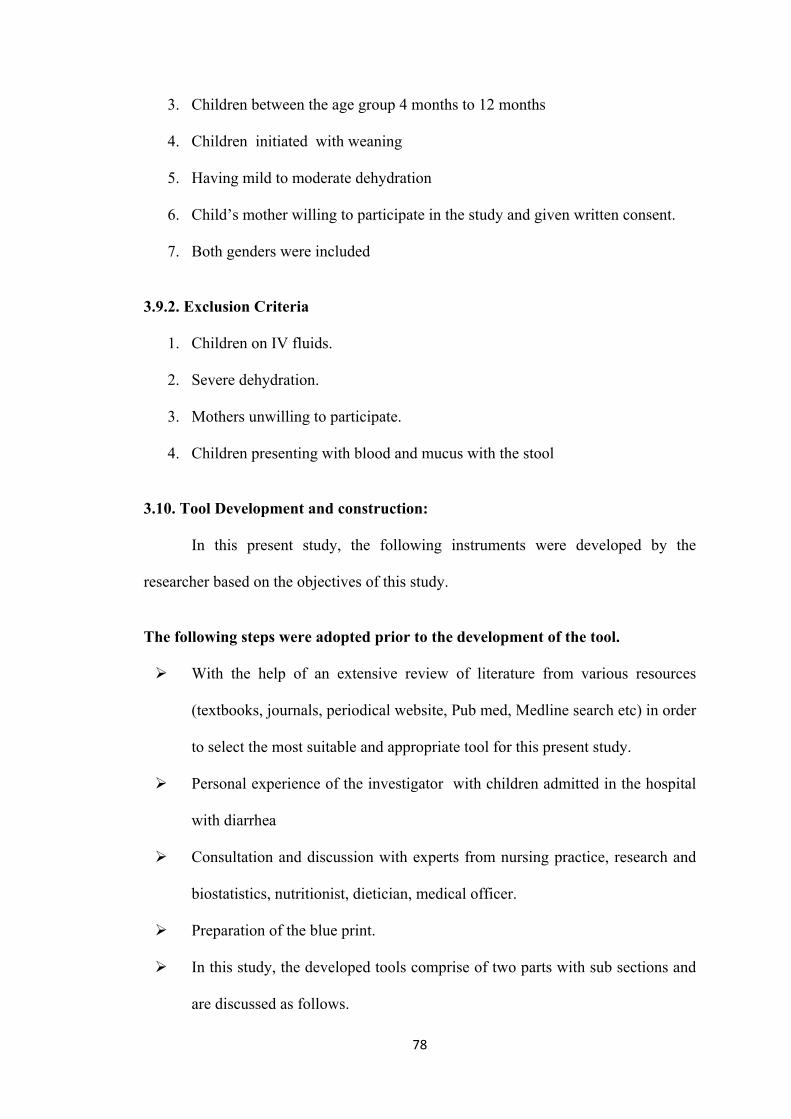
78
3. Children between the age group 4 months to 12 months
4. Children initiated with weaning
5. Having mild to moderate dehydration
6. Child’s mother willing to participate in the study and given written consent.
7. Both genders were included
3.9.2. Exclusion Criteria
1. Children on IV fluids.
2. Severe dehydration.
3. Mothers unwilling to participate.
4. Children presenting with blood and mucus with the stool
3.10. Tool Development and construction:
In this present study, the following instruments were developed by the
researcher based on the objectives of this study.
The following steps were adopted prior to the development of the tool.
With the help of an extensive review of literature from various resources
(textbooks, journals, periodical website, Pub med, Medline search etc) in order
to select the most suitable and appropriate tool for this present study.
Personal experience of the investigator with children admitted in the hospital
with diarrhea
Consultation and discussion with experts from nursing practice, research and
biostatistics, nutritionist, dietician, medical officer.
Preparation of the blue print.
In this study, the developed tools comprise of two parts with sub sections and
are discussed as follows.
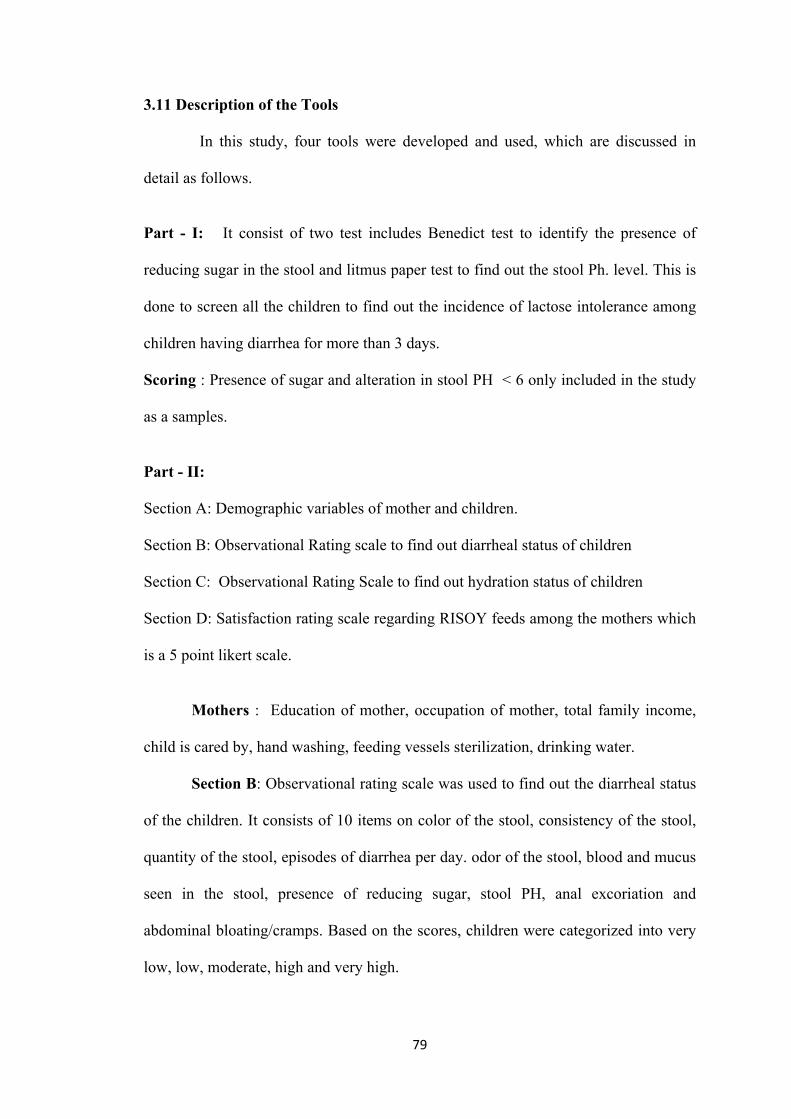
79
3.11 Description of the Tools
In this study, four tools were developed and used, which are discussed in
detail as follows.
Part - I: It consist of two test includes Benedict test to identify the presence of
reducing sugar in the stool and litmus paper test to find out the stool Ph. level. This is
done to screen all the children to find out the incidence of lactose intolerance among
children having diarrhea for more than 3 days.
Scoring : Presence of sugar and alteration in stool PH < 6 only included in the study
as a samples.
Part - II:
Section A: Demographic variables of mother and children.
Section B: Observational Rating scale to find out diarrheal status of children
Section C: Observational Rating Scale to find out hydration status of children
Section D: Satisfaction rating scale regarding RISOY feeds among the mothers which
is a 5 point likert scale.
Mothers : Education of mother, occupation of mother, total family income,
child is cared by, hand washing, feeding vessels sterilization, drinking water.
Section B: Observational rating scale was used to find out the diarrheal status
of the children. It consists of 10 items on color of the stool, consistency of the stool,
quantity of the stool, episodes of diarrhea per day. odor of the stool, blood and mucus
seen in the stool, presence of reducing sugar, stool PH, anal excoriation and
abdominal bloating/cramps. Based on the scores, children were categorized into very
low, low, moderate, high and very high.
80
Scoring: The tool consists of 10 items. It is a 3 points observational rating
scale which was observed by the researcher. The scale was graded as 3 for very high,
2 for moderate, 1 for low. The maximum possible total score is 30. For each day after
the assessment the total score was obtained. To have a better comparison mean
percentage was calculated for each in that by using the formula.
Mean percentage score = score obtained. Maximum possible score is 100
Afterwards the diarrheal status was categorized as follows:
Very low - (0-20%)
Low - (21-40%)
Moderate - (41-60%)
High - (61-80%)
Very high - (81-100%)
Section C: Observational rating scale was used to find out the dehydration status of
the children. It consists of 14 items on general condition of the child, eyes,
mouth(lips),tongue, thirst, urine output, tears ,skin turgor, fontanels, arm sand legs,
capillary refill, pulse rate, respiration, BP . Based on the scores, children were
categorized into very low, low, moderate, high and very high.
Scoring: The tool consists of 14 statements. It is a 3 points rating scale which was
observed by the researcher. The scale was graded as 3 for very high, 2 for moderate,
1 for low. The maximum possible total score is 42. For each day after the assessment
the total score was obtained. To have a better comparison mean percentage was
calculated for each in that by using the formula
Mean percentage score = score obtained maximum possible score *100
Afterwards the hydration status was categorized as follows:
81
Very low (0-20%)
Low -(21-40%)
Moderate-(41-60%)
High -(61-80%)
Very high-(81-100%)
Section D: It consists of a satisfaction rating scale which is a 5 point Likert scale
developed by the researcher based on 6 factors, which include researcher’s approach,
Preparation of feed, general characteristics of feed, availability and cost effectiveness,
benefits to the baby and mother’s perceived views and attitudes. Each factor has 3 sub
factors which will help the researcher to assess the level of satisfaction regarding the
RISOY feeds among the mothers.
Scoring: These scoring was done with a 5 point likert scale which states not at all
satisfied, not satisfied, satisfied, very satisfied , extremely satisfied. the comparison of
the scores was done between pre-test and post-test 2.
Health Benefits of Matta Red Rice
Supplies adequate energy required.
Best source of magnesium which has lot of health benefits like enzyme
reaction sources of vitamin A and B
Retains the outer coat, high qualities of minerals vitamins and fibre
Parboiled rice retains nutrients as it is unpolished
Reduce the risk of cancer Decrease the risk of diabetes Contains calcium
82
White Soya
Contains High protein, electrolytes like potassium, and minerals like calcium
and magnesium
Effective Antioxidant and as power house of human body
Promote digestive health, Enhance immune function
Strengthen tissue and organ, Improve the energy
Contain Iron and Zinc. Zinc has anti-diarrheal property
Potassium contains energy 100gm (1503 milligram), which supplement
enough amount of potassium.
Improve the metabolism of protein, fat, Observes the fat soluble vitamin
3.12. Intervention
Objectives of preparing RISOY feeds:
1. Can be easily made in home.
2. Replaces the commercial lactose free feeds in low socio economic group
3. Easily available and supply all essential nutrients.
4. Can be readily prepared with low cost
Development of RISOY feeds
The lactose free RISOY feed was developed and prepared in Indian Institute
of Crops Processing Technology at Tanjore. In the incubation centre under the
guidance of two nutritional experts this feed was developed with the basic ingredients
Matta Red rice and White soya. The first quality red rice and white soya were
processed separately in different methods .The red rice was roasted under a medium
flame and kept for cooling. The soya was soaked in water for 3 hours and then water
83
was drained. Soaked soya dried in drier in 140 degree Celsius. Both processed red rice
and soya were powdered in a mini flour mill and blended in 3:1 ratio .
This powdered product was named as RISOY feed. Then researcher also tried
to produce the product in a readily available form that can be easily mixed with hot
water. Since children started on weaning food were taken as study samples it was
prepared in the form of conjee (porridge}.The product was prepared as porridge and
then dried in a roller drier, then it was again powdered and the nutritional proximate
analysis was done for both raw material and processed and cooked powder . Since the
result was in favor with fresh powder it was decided to use for children with
secondary lactose intolerance among experimental group.
4-12 months infant’s nutritional requirement
98kcal / kg body weight
Protein 1.6gm /
Fluid – 400-600ml / day
Sodium – 500mg / day
Potassium – 850mg/day
The researcher developed Risoy feed was analysed for the nutritive contents
in order to standardize. After proximate analysis it was standardized and used in this
present study. The proximate analysis of the prepared Risoy feed powder as follows.
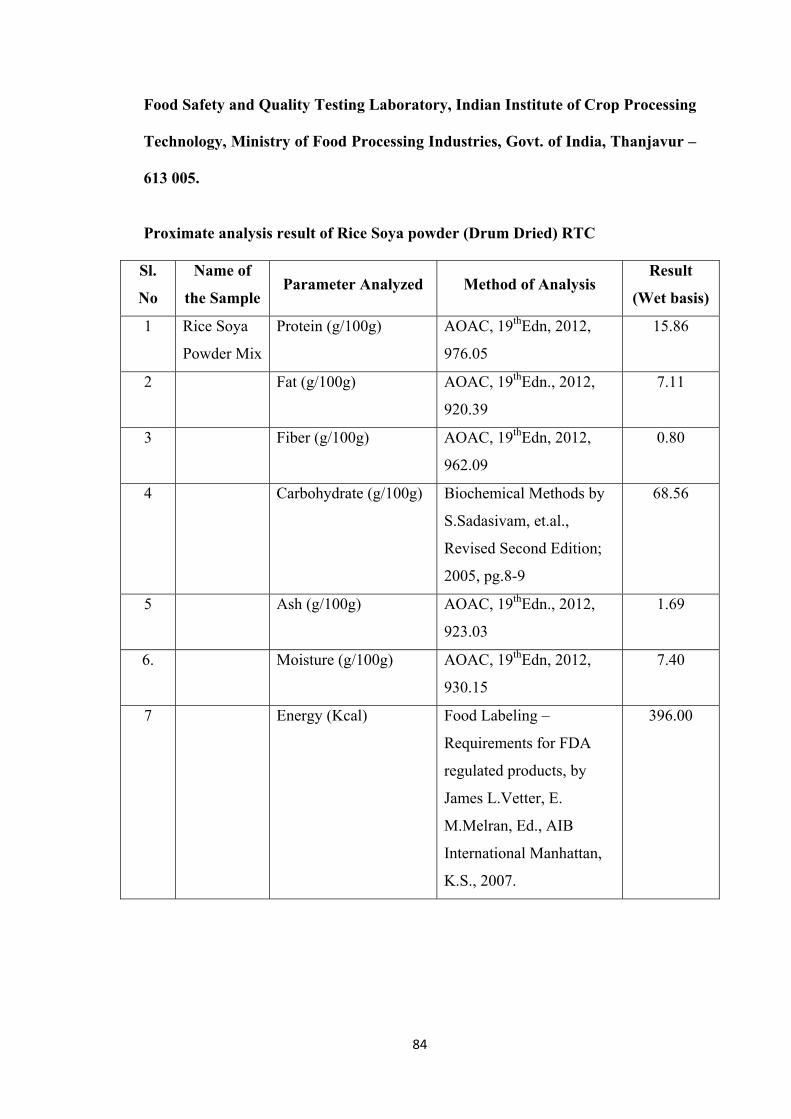
84
Food Safety and Quality Testing Laboratory, Indian Institute of Crop Processing
Technology, Ministry of Food Processing Industries, Govt. of India, Thanjavur –
613 005.
Proximate analysis result of Rice Soya powder (Drum Dried) RTC
Sl.
No
Name of
the Sample Parameter Analyzed Method of Analysis
Result
(Wet basis)
1 Rice Soya
Powder Mix
Protein (g/100g) AOAC, 19thEdn, 2012,
976.05
15.86
2 Fat (g/100g) AOAC, 19thEdn., 2012,
920.39
7.11
3 Fiber (g/100g) AOAC, 19thEdn, 2012,
962.09
0.80
4 Carbohydrate (g/100g) Biochemical Methods by
S.Sadasivam, et.al.,
Revised Second Edition;
2005, pg.8-9
68.56
5 Ash (g/100g) AOAC, 19thEdn., 2012,
923.03
1.69
6. Moisture (g/100g) AOAC, 19thEdn, 2012,
930.15
7.40
7 Energy (Kcal) Food Labeling –
Requirements for FDA
regulated products, by
James L.Vetter, E.
M.Melran, Ed., AIB
International Manhattan,
K.S., 2007.
396.00
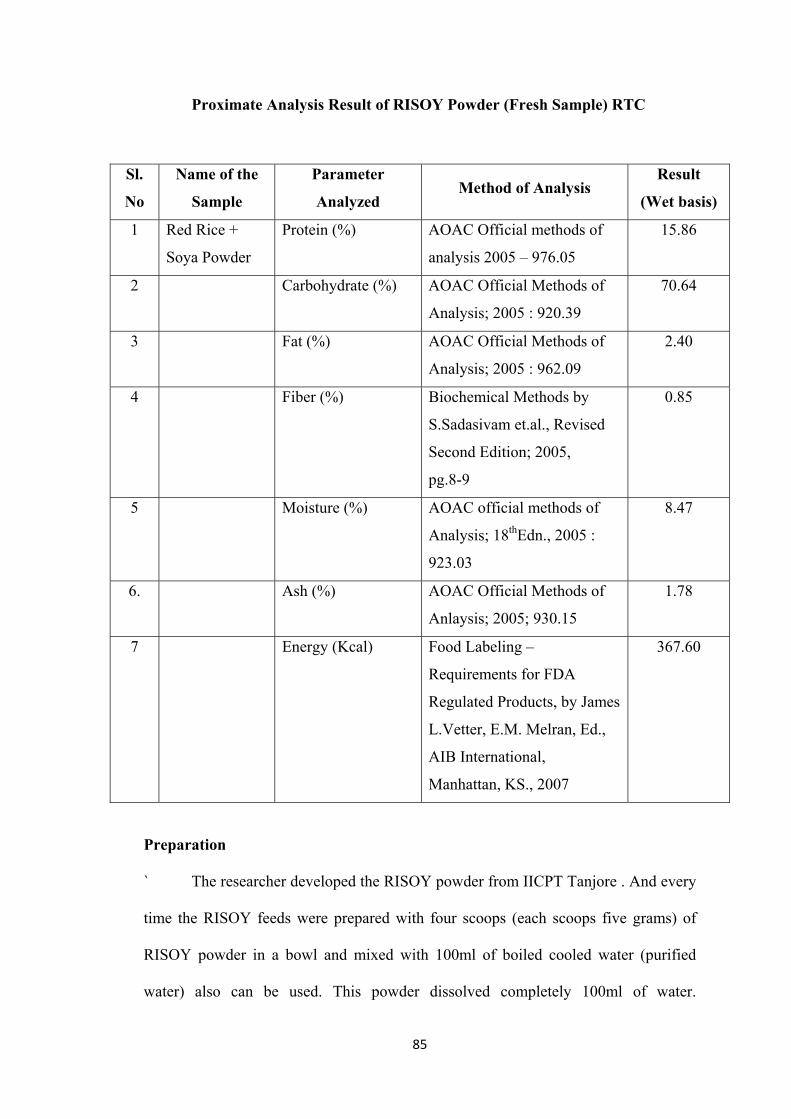
85
Proximate Analysis Result of RISOY Powder (Fresh Sample) RTC
Sl.
No
Name of the
Sample
Parameter
Analyzed Method of Analysis
Result
(Wet basis)
1 Red Rice +
Soya Powder
Protein (%) AOAC Official methods of
analysis 2005 – 976.05
15.86
2 Carbohydrate (%) AOAC Official Methods of
Analysis; 2005 : 920.39
70.64
3 Fat (%) AOAC Official Methods of
Analysis; 2005 : 962.09
2.40
4 Fiber (%) Biochemical Methods by
S.Sadasivam et.al., Revised
Second Edition; 2005,
pg.8-9
0.85
5 Moisture (%) AOAC official methods of
Analysis; 18thEdn., 2005 :
923.03
8.47
6. Ash (%) AOAC Official Methods of
Anlaysis; 2005; 930.15
1.78
7 Energy (Kcal) Food Labeling –
Requirements for FDA
Regulated Products, by James
L.Vetter, E.M. Melran, Ed.,
AIB International,
Manhattan, KS., 2007
367.60
Preparation
` The researcher developed the RISOY powder from IICPT Tanjore . And every
time the RISOY feeds were prepared with four scoops (each scoops five grams) of
RISOY powder in a bowl and mixed with 100ml of boiled cooled water (purified
water) also can be used. This powder dissolved completely 100ml of water.
86
Approximately add 150ml of water to make the expanded quality and add table salt to
taste. Keep the pan in moderate flam and cook it, boil it. Continuously stirring with
spoon. Make it to porridge consistency keep it for cooling. Feed this to the children
who are admitted with secondary lactose intolerance and reassess the baby for
tolerating the feeds.
3.13. Testing of the Tool
3.13.1. Content Validity
To ensure the content validity, the instrument were given to 15 experts in the
field of pediatric nursing, medicine, dietician and biostatistician. The experts were
requested to give their opinion and suggestion regarding relevance of the tool for
modification and to improve the clarity and control of the item based on their opinion
necessary correction made on the final tool.
Validity of the tool was determined as follows.
• The prepared tool (Part-I, Part-II) along with objectives, hypothesis,
operational definition, blue print and criteria checklist were given to experts
and requested to give their valuable suggestions regarding accuracy, relevance
and appropriateness of the content.
• The evaluator was asked to put “” against above mentioned columns. The
validated tool was received from 15 experts.
• The intervention preparation of RISOY feeds were done in the Indian institute
of crops processing technology and proximate analysis was done in the food
analysis lab in IICPT and the certificate copies submitted to the experts
Suggestions given by experts as follows:
87
Majority of the experts suggested to assess the stool PH and pressure of
reducing sugar in stools for three days or on the first and third day.
The nursing expert suggested to go for porridge type preparation with
RISOY powder rather than drying it.
3.13.2 Reliability
‘Reliability is defined as the ability of an instrument to create reproductive
results.’ Therefore, reliability is concerned with consistency of the measurement tools.
A tool only can be considered reliable if it measures an attribute results on repeated
use.
The reliability of the tool was established after collecting data from 12
samples from Dr. Navamani Prabahar Pediatric Hospital Madurai. The reliability of
the tool was established by inter rater reliability.
Observational rating scale was prepared to assess the diarrheal and hydration
status of samples. The reliability use to assess the degree to which different judges or
rates agree in their assessed decision. The reliability obtained by IRR method as
follows.
Inter-rater Reliability
Inter-rater reliability technique was used to establish the reliability of
diarrheal status observational rating scale and dehydration status observational rating
scale. The reliability of inter-rater method was obtained by using Croanbachs alpha
formula. The reliability of satisfaction check list were found out by using Croanbachs
alpha reliability formula.
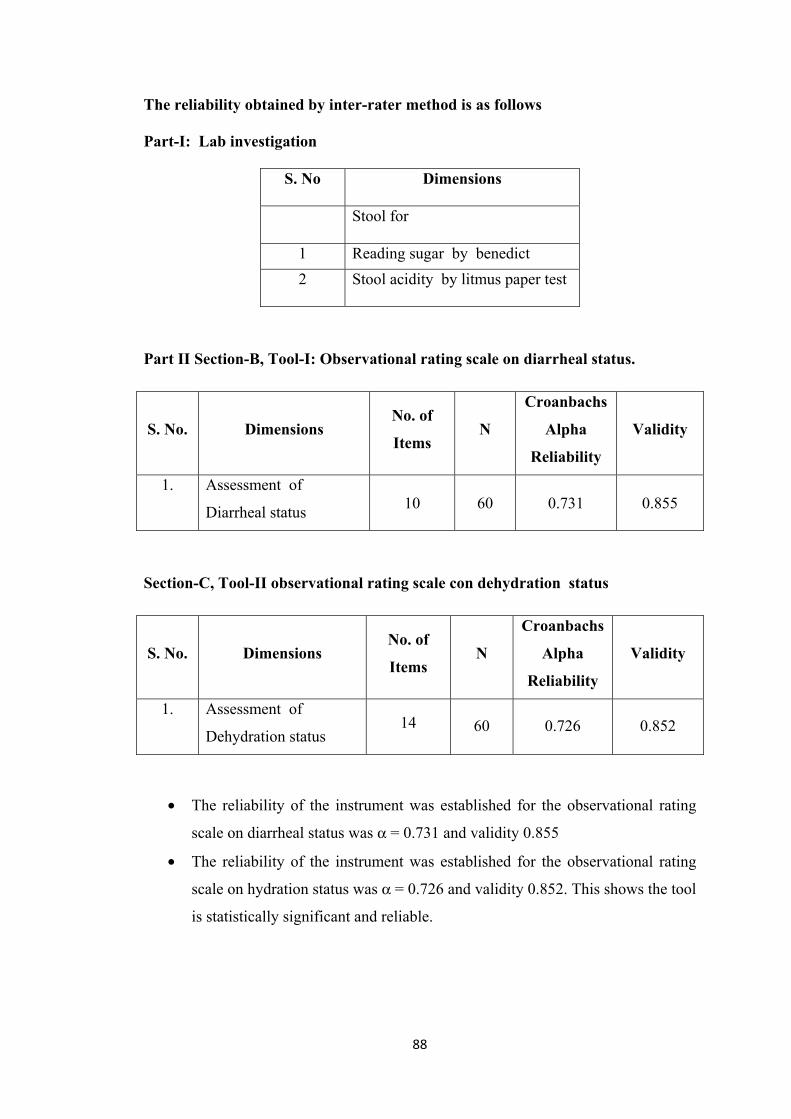
88
The reliability obtained by inter-rater method is as follows
Part-I: Lab investigation
S. No Dimensions
Stool for
1 Reading sugar by benedict
2 Stool acidity by litmus paper test
Part II Section-B, Tool-I: Observational rating scale on diarrheal status.
S. No. Dimensions No. of
Items N
Croanbachs
Alpha
Reliability
Validity
1. Assessment of
Diarrheal status 10 60 0.731 0.855
Section-C, Tool-II observational rating scale con dehydration status
S. No. Dimensions No. of
Items N
Croanbachs
Alpha
Reliability
Validity
1. Assessment of
Dehydration status 14 60 0.726 0.852
• The reliability of the instrument was established for the observational rating
scale on diarrheal status was α = 0.731 and validity 0.855
• The reliability of the instrument was established for the observational rating
scale on hydration status was α = 0.726 and validity 0.852. This shows the tool
is statistically significant and reliable.
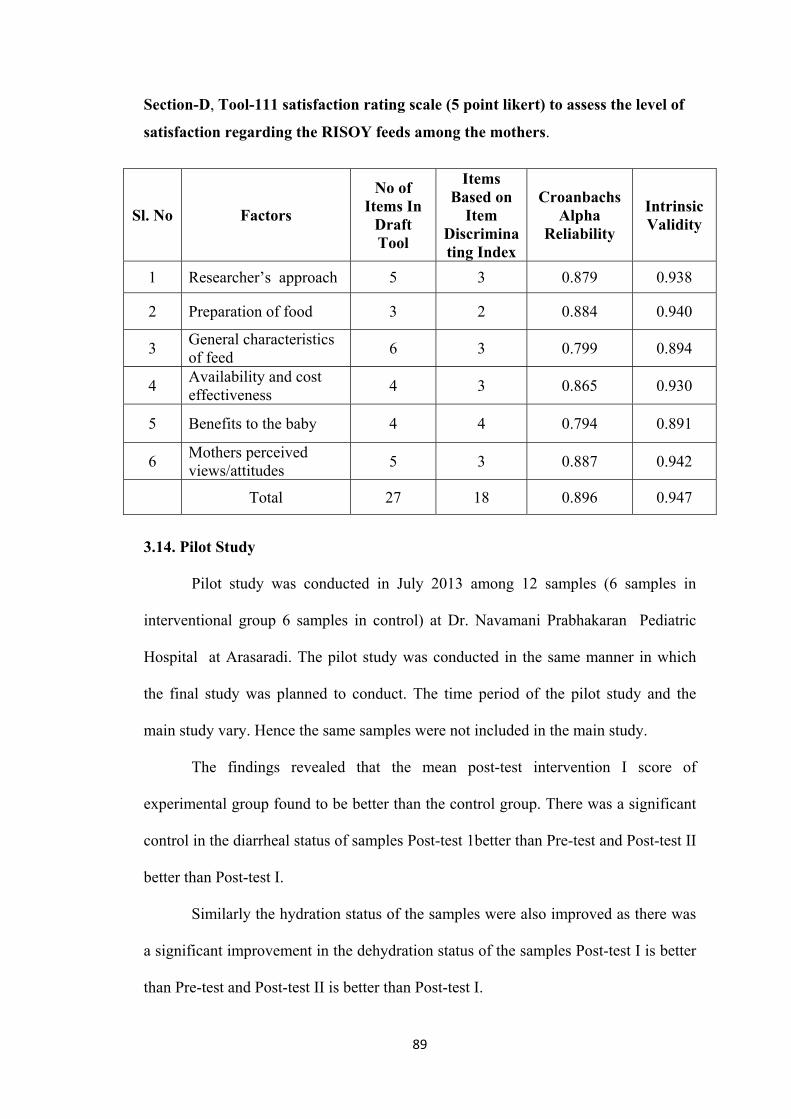
89
Section-D, Tool-111 satisfaction rating scale (5 point likert) to assess the level of
satisfaction regarding the RISOY feeds among the mothers.
Sl. No Factors
No of Items In
Draft Tool
Items Based on
Item Discriminating Index
Croanbachs Alpha
Reliability
Intrinsic Validity
1 Researcher’s approach 5 3 0.879 0.938
2 Preparation of food 3 2 0.884 0.940
3 General characteristics of feed
6 3 0.799 0.894
4 Availability and cost effectiveness
4 3 0.865 0.930
5 Benefits to the baby 4 4 0.794 0.891
6 Mothers perceived views/attitudes
5 3 0.887 0.942
Total 27 18 0.896 0.947
3.14. Pilot Study
Pilot study was conducted in July 2013 among 12 samples (6 samples in
interventional group 6 samples in control) at Dr. Navamani Prabhakaran Pediatric
Hospital at Arasaradi. The pilot study was conducted in the same manner in which
the final study was planned to conduct. The time period of the pilot study and the
main study vary. Hence the same samples were not included in the main study.
The findings revealed that the mean post-test intervention I score of
experimental group found to be better than the control group. There was a significant
control in the diarrheal status of samples Post-test 1better than Pre-test and Post-test II
better than Post-test I.
Similarly the hydration status of the samples were also improved as there was
a significant improvement in the dehydration status of the samples Post-test I is better
than Pre-test and Post-test II is better than Post-test I.
90
The control group also had significant reduction in the diarrheal and hydration
status who were fed with commercial lactose free feeds (nosobee)
But significant reduction in diarrheal status of children in the experimental
group than the control group on Post-test I and Post-test II
3.15. Data Collection Procedure
The researcher obtained formal permission to conduct the study from the
ethical committee at CSI JACON Madurai. Obtained prior and written permission
from Dr. Navamani Prabahar Pediatric Hospital, Arasaradi, Madurai. The data
collection period was from July 2013 to February 2015.
Informed written consent obtained was taken from the mother of study
samples. Explained the procedure, purpose of the study, confidentiality of the research
, findings to the mothers. It was also told to them at any point of the study period they
can withdraw if they are satisfied.
3.15.1. Step I
To find out the incidence of secondary lactose intolerance among all children
coming with diarrhea to the hospital, the stool was assessed for presence of reducing
sugar stool PH was also assessed to find out the acidity of stool.
Children attending to the OPD with diarrhea for 3 and more than three days
were assessed to find out the incidence for secondary lactose intolerance which is the
first objective of the study.
Totally 618 samples with diarrhea for 3 and more than three days were
assessed for presence of reducing sugar by Benedict test system and litmus paper test
to find out the stool acidity. It was found that more than 50% of the samples were
having presence of reducing sugar in stool and altered pH. The data collection for the
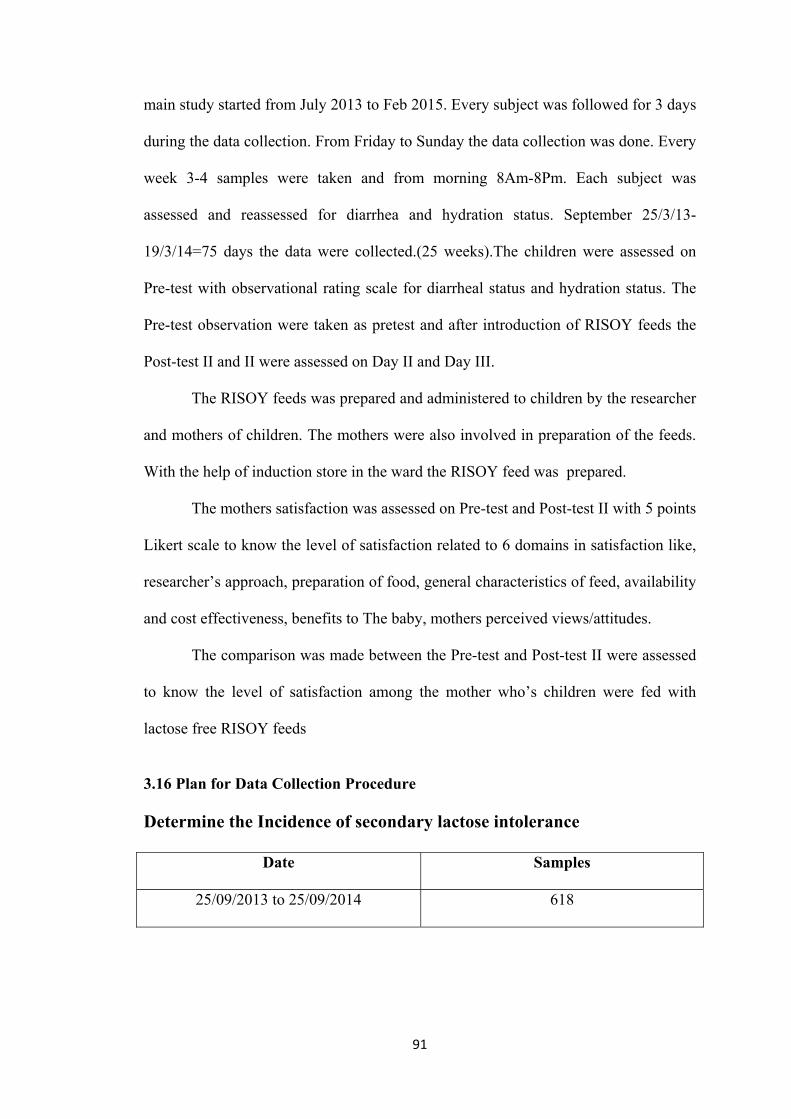
91
main study started from July 2013 to Feb 2015. Every subject was followed for 3 days
during the data collection. From Friday to Sunday the data collection was done. Every
week 3-4 samples were taken and from morning 8Am-8Pm. Each subject was
assessed and reassessed for diarrhea and hydration status. September 25/3/13-
19/3/14=75 days the data were collected.(25 weeks).The children were assessed on
Pre-test with observational rating scale for diarrheal status and hydration status. The
Pre-test observation were taken as pretest and after introduction of RISOY feeds the
Post-test II and II were assessed on Day II and Day III.
The RISOY feeds was prepared and administered to children by the researcher
and mothers of children. The mothers were also involved in preparation of the feeds.
With the help of induction store in the ward the RISOY feed was prepared.
The mothers satisfaction was assessed on Pre-test and Post-test II with 5 points
Likert scale to know the level of satisfaction related to 6 domains in satisfaction like,
researcher’s approach, preparation of food, general characteristics of feed, availability
and cost effectiveness, benefits to The baby, mothers perceived views/attitudes.
The comparison was made between the Pre-test and Post-test II were assessed
to know the level of satisfaction among the mother who’s children were fed with
lactose free RISOY feeds
3.16 Plan for Data Collection Procedure
Determine the Incidence of secondary lactose intolerance
Date Samples
25/09/2013 to 25/09/2014 618
92
Phase I:
The first phase was related to finding out the incidence of secondary lactose
intolerance. Weekly 3 days were assigned for data collection. Every day 6-10 children
attended OPD with acute diarrhea and diarrhea for more than 3 days. The children
who were having diarrhea 3 or more than 3 days were assessed and the stool sample
was collected from them and in the laboratory the test for presence reducing sugar in
stool and ph was assessed. The results were entitled in the register. Totally 618
subjects were assessed and results were interpreted.
Phase II:
Control Group:
Assessing the diarrheal and hydration status of the subjects who are all on
regular treatment. Protocol of the hospital with Nosobee(soya based) after diagnosed
to have secondary lactose in tolerance. The data were collected weekly 3 days mostly
on Friday, Saturday and Sunday. Every subject was assessed for 72 hours after
starting the commercial lactose free formula feeds for the diarrhea /hydration status by
using a structured observational rating scale. According to the availability of the
samples, the data collected. Totally 60 samples were selected by purposive
convenience sampling technique.
Experimental Group:
The interventional group, the subjects were selected by purposive convenience
sampling technique according to the inclusion criteria. The mothers were explained
about the RISOY feeds and then written consent obtained. The preparation of RISOY
feed were demonstrated to the mothers and then feed was given to the children for 72
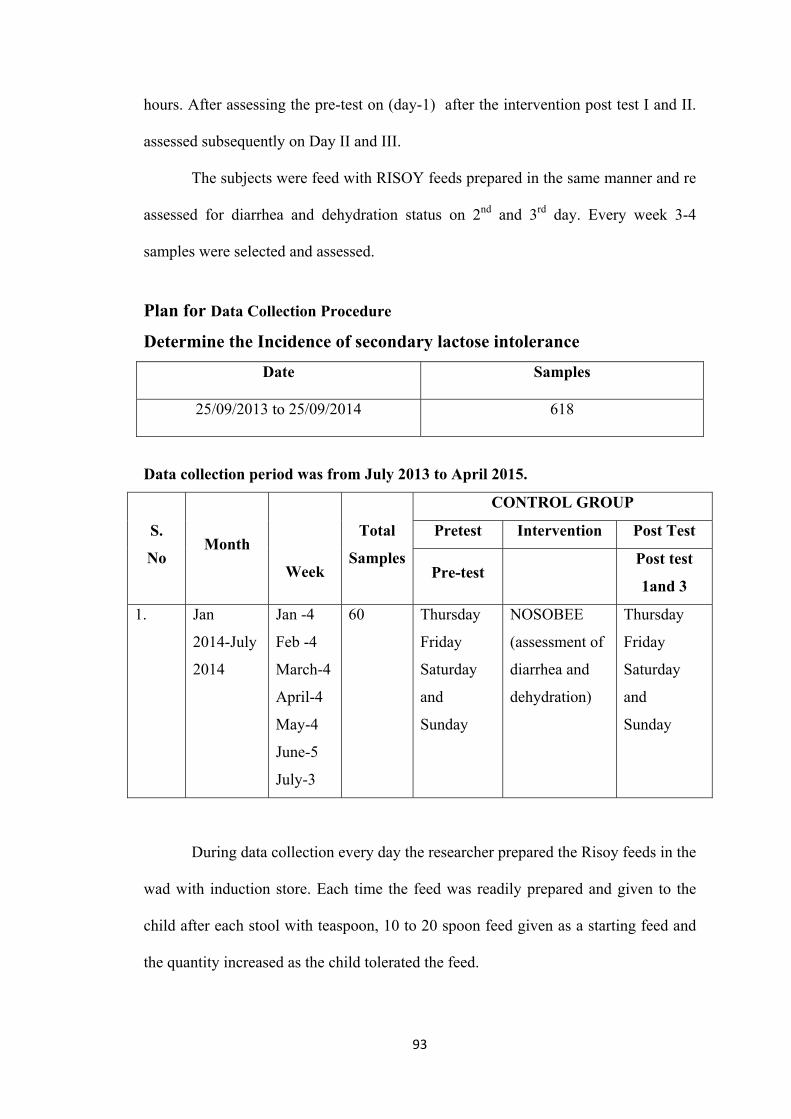
93
hours. After assessing the pre-test on (day-1) after the intervention post test I and II.
assessed subsequently on Day II and III.
The subjects were feed with RISOY feeds prepared in the same manner and re
assessed for diarrhea and dehydration status on 2nd and 3rd day. Every week 3-4
samples were selected and assessed.
Plan for Data Collection Procedure
Determine the Incidence of secondary lactose intolerance
Date Samples
25/09/2013 to 25/09/2014 618
Data collection period was from July 2013 to April 2015.
S.
No Month
Week
Total
Samples
CONTROL GROUP
Pretest Intervention Post Test
Pre-test Post test
1and 3
1.
Jan
2014-July
2014
Jan -4
Feb -4
March-4
April-4
May-4
June-5
July-3
60
Thursday
Friday
Saturday
and
Sunday
NOSOBEE
(assessment of
diarrhea and
dehydration)
Thursday
Friday
Saturday
and
Sunday
During data collection every day the researcher prepared the Risoy feeds in the
wad with induction store. Each time the feed was readily prepared and given to the
child after each stool with teaspoon, 10 to 20 spoon feed given as a starting feed and
the quantity increased as the child tolerated the feed.
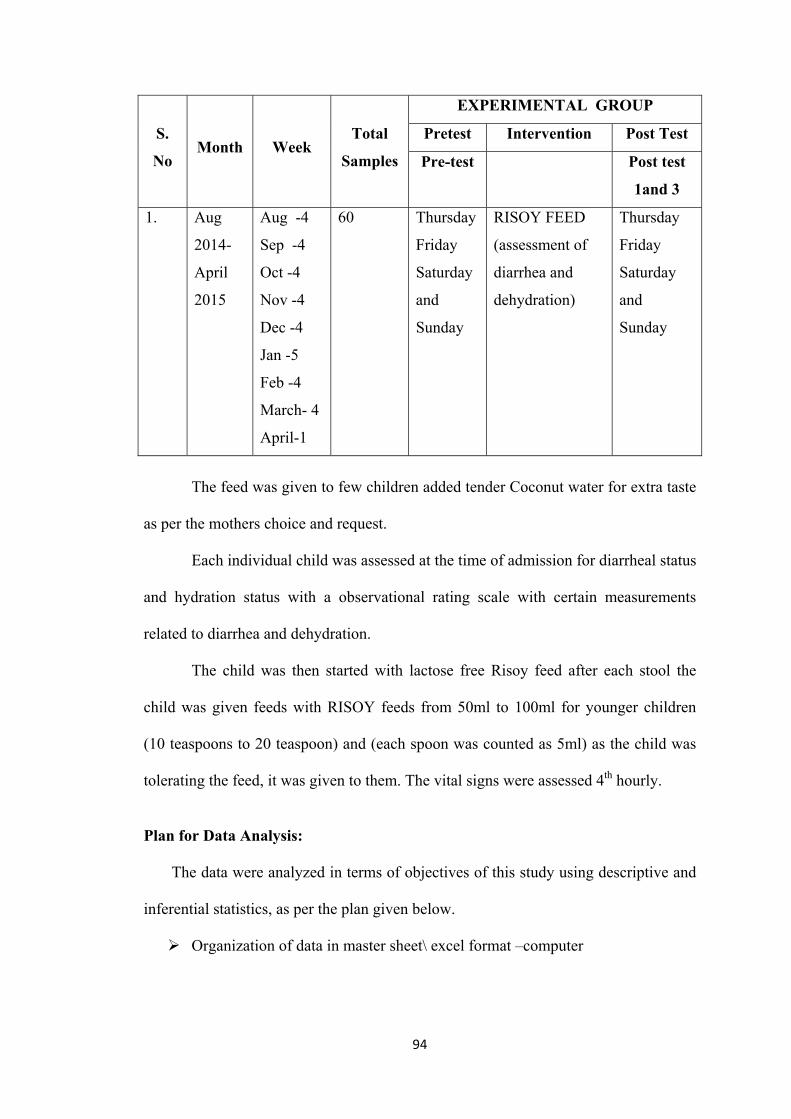
94
S.
No Month Week
Total
Samples
EXPERIMENTAL GROUP
Pretest Intervention Post Test
Pre-test Post test
1and 3
1.
Aug
2014-
April
2015
Aug -4
Sep -4
Oct -4
Nov -4
Dec -4
Jan -5
Feb -4
March- 4
April-1
60
Thursday
Friday
Saturday
and
Sunday
RISOY FEED
(assessment of
diarrhea and
dehydration)
Thursday
Friday
Saturday
and
Sunday
The feed was given to few children added tender Coconut water for extra taste
as per the mothers choice and request.
Each individual child was assessed at the time of admission for diarrheal status
and hydration status with a observational rating scale with certain measurements
related to diarrhea and dehydration.
The child was then started with lactose free Risoy feed after each stool the
child was given feeds with RISOY feeds from 50ml to 100ml for younger children
(10 teaspoons to 20 teaspoon) and (each spoon was counted as 5ml) as the child was
tolerating the feed, it was given to them. The vital signs were assessed 4th hourly.
Plan for Data Analysis:
The data were analyzed in terms of objectives of this study using descriptive and
inferential statistics, as per the plan given below.
Organization of data in master sheet\ excel format –computer
95
To find out the incidence of secondary lactose in tolerance, survey method
followed and 618 children with diarrhea for 3 and more than 3 days were
increased alteration stool ph and presence of reducing sugar in stool. The data
were analyzed in terms of frequency and distribution, mean and standard
deviation.
Pretest(Pre-test) and posttest( Post-test I and Post-test II) were assessed to find
out the diarrheal status and hydration status of the children..
Paired ‘T’ test and one way “ANOVA” were used to find out the difference
in mean scores before and after interventional strategy in interventional and
control group.
Karl Pearson’s correlation (r) was used to find the relationship between
diarrheal and hydration status.
One way “ANOVA” (F ratio), independent ‘T’ test were used to find out the
association between diarrheal and hydration status of the children with selected
demographic variables.
The rights to full disclosure:-
The mothers of the children were explained about the significance of the study
and were allowed to stop the intervention if they are not satisfied in any
means.
The participants were not required to be identified after a period of data
collection
Benefits of the study were explained to the mothers.
96
3.17. Ethical Consideration
Beneficence
The right to freedom from harm:
• Since the study is a interventional study. The intervention RISOY was tested
in the food proximity analysis laboratory to find out the nutritive value.
• The RISOY feed powder was prepared with incubation centre of the IICPT
Thanjavur and it is certified.
• Assurance was given to mothers regarding intervention after discussing with
the pediatrician.
• This feed was given to the children in hospital who are admitted with diarrhea
for more than 3 days without affecting routine care of the hospital.
Respect for human dignity
The right to self determination:
• Research proposal was approved by the screening committee of The Tamil
Nadu Dr.M.G.R. Medical University, Chennai and Tamilnadu.
• Ethical clearance was obtained from the ethical committee of the study centre.
• Prior permission was sought from higher authorities in concerned study
settings before commencing the study.
• Before consent is sought, the researcher has given details of the nature,
purpose of the research, and the proposed outcome of the research.
• written consent was formally obtained from the study participants and the
confidentiality of their responses was assured
97
The right to full disclosure:
• Participants were advised about the voluntary nature of the study and were
given the option to with draw from the study at any stage without being
subjected to any penalty.
• Participants were not required to identify themselves by name and have not been
identified during data analysis or during discussion of the results and
conclusions.
• Purpose of the research was explained thoroughly and the researcher was
available to provide information and support as needed.
Justice
The right to privacy:
• The participants were informed that, the collected information was stored in
the computer disc for final analysis and it would be shredded after the study
has been computed.
98
CHAPTER - IV
DATA ANALYSIS AND INTERPRETATION
Data analysis is the systematic organization and synthesis of research data and
the testing of research hypothesis using those data.
This chapter deals with the analysis and interpretation of collected data
relevant to determine the incidence of secondary lactose intolerance and evaluate the
effect of Lactose free feeds in controlling diarrhea and correcting hydration among the
children with diarrhea and attending selected pediatric hospitals. The data were
tabulated and analyzed according to the objectives.
The data obtained were tabulated, analyzed, and interpreted using descriptive
and inferential statistics on the basis of objective and hypothesis formulated for the
purpose of this study.
Descriptive Statistics were used to Present the following
Frequency and percentage were used to present the demographic variable of
the children and mother of children in both experimental and control group.
Frequency and percentage were used to assess the level of diarrhea and
hydration status among children both in experimental group and control group.
Frequency and percentage were also used to assess the level of satisfaction
among the mother of children in experimental group.
Inferential Statistics
Paid ‘t’ test was used to find out the difference in diarrheal and hydration
status within group in both experimental and control group.
99
Unpaired ‘t’ used compare the diarrheal and hydration status of children
between groups including Experimental group and control group.
Pearson’s correlation co-efficient was used to find out the relationship
between diarrheal and hydration status among children in experimental group.
‘t’ the and F Ratio was used to determine association between the diarrheal
and hydration status in experimental group with their selected demographic
variables.
Objectives
1. To find out the incidence of secondary lactose intolerance among children.
2. To assess the pre and post-test diarrheal status of children in both control and
experimental group.
3. To assess pre and post-test hydration status of children in both control and
experimental group.
4. To compare the pre and post-test diarrheal status of children in control and
experimental group.
5. To compare the pre and post-test hydration status of children in control and
experimental group.
6. To evaluate the effectiveness of lactose free feeds in controlling diarrhea and
correcting dehydration among children between control and experimental group.
7. To correlate the diarrheal and hydration status of children in experimental group.
8. To associate the diarrheal and hydration status of children with their selected
demographic variables in experimental group.
100
Hypotheses
H1. The mean post-test diarrheal status among experimental group will be
significantly lower than the control group.
H2 The mean post-test hydration status among experimental group will be
significantly higher than the control group.
H3 There is a significant difference in diarrheal status of children before and after
introduction of lactose free feeds in control and experimental group.
H4 There is a significant difference in hydration status of children before and after
introduction of lactose free feeds in both control and experimental group
H5 There is a statistical significant difference between mean post test scores of
diarrheal and hydration status of children in control and experimental group
H6 There is a significant correlation between the diarrheal and hydration status
among children in the experimental group.
H7 There is a significant association between the diarrheal and hydration status of
the children and their selected demographic variables.
Section A
Section (A) presents the distribution of samples according to their
demographic variables and indicates the incidence of secondary Lactose intolerance
among children.
Section B
This section (B) displays the distribution of samples according to their
demographic variables in experimental and control group.
101
Section C
This section (C) displays the comparison of diarrheal status and hydration
status among children on Pre-test, Post-test I and Post-test II, among experimental and
control groups.
Section D
This section presents within group comparison of diarrheal and hydration of
children after and before the introducing of intervention between Pre-test and Post-
test I, Post-test I, and Post-test II, Pre-test and Post-test I
(a) Paired ‘t’ test comparison diarrheal and hydration status of children to find out
the effectiveness of Lactose free feeds in controlling diarrheal children among
experimental group.
(b) ) Paired ‘t’ there, for comparison of hydration status of children before and
after introduction of Lactose free feeds among experimental and control
group.
(c) Unpaired ‘t’ test for the comparison of diarrheal and hydration status of
children between the experimental and control group on Pre-test, Post-test I
and Post-test II before and the introduction of Lactose free feeds.
(d) Analysis of variance (ANOVA) for effectiveness of intervention on
controlling diarrheal and correcting dehydration among children in
experimental and control group.
Section E
This section deals with the relationship between diarrheal and hydration status
of children in both experimental and control group on Pre-test, Post-test I and Post-
test II.

102
Section F
This section Explains the association between diarrheal and hydration status of
children with their selected demographic variables in the Experimental group.
(a) Association between diarrheal status and demographic variables of children
and their mothers experimental group.
(b) Association between hydration status and demographic variables of children
and their mother in experimental group.
Section G
This section explains the level of satisfaction among mothers regarding the
utilization of the Risoy feeds by comparing between Pre-test and Post-test II in the
experimental group.
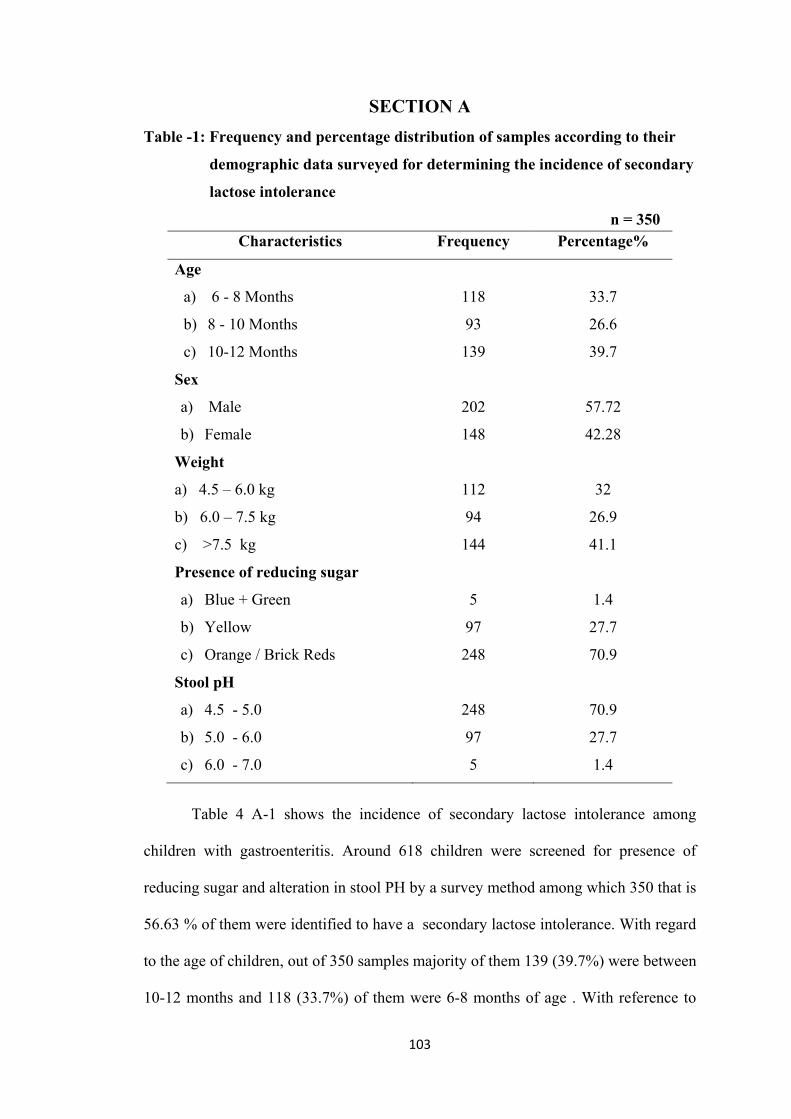
103
SECTION A
Table -1: Frequency and percentage distribution of samples according to their
demographic data surveyed for determining the incidence of secondary
lactose intolerance
n = 350 Characteristics Frequency Percentage%
Age
a) 6 - 8 Months
b) 8 - 10 Months
c) 10-12 Months
118
93
139
33.7
26.6
39.7
Sex
a) Male
b) Female
202
148
57.72
42.28
Weight
a) 4.5 – 6.0 kg
b) 6.0 – 7.5 kg
c) >7.5 kg
112
94
144
32
26.9
41.1
Presence of reducing sugar
a) Blue + Green
b) Yellow
c) Orange / Brick Reds
5
97
248
1.4
27.7
70.9
Stool pH
a) 4.5 - 5.0
b) 5.0 - 6.0
c) 6.0 - 7.0
248
97
5
70.9
27.7
1.4
Table 4 A-1 shows the incidence of secondary lactose intolerance among
children with gastroenteritis. Around 618 children were screened for presence of
reducing sugar and alteration in stool PH by a survey method among which 350 that is
56.63 % of them were identified to have a secondary lactose intolerance. With regard
to the age of children, out of 350 samples majority of them 139 (39.7%) were between
10-12 months and 118 (33.7%) of them were 6-8 months of age . With reference to
104
the sex of the children139 (57.72%) of them were male and 148 (42.28%) of the
children were females. With regard to the weight of the children94 (26.9%) of them
were below 6 -7.5kg and 112 (32%) of them were 4.5-6kg and 144 (41.1%) of them
were 7.5kg and above. Regarding the presence of reducing sugar of the children248
(70.9%) had orange and brick red, 97 (27.7%) had yellow colour and 5 (1.4%) had
blue and green colour. With regards alteration of pH of the children248 (70.9%) of
them had pH 4.5-5, 97 (27.7%) of them had pH of 5-6 and 5(1.4%) of them of pH of
6-7 respectively.
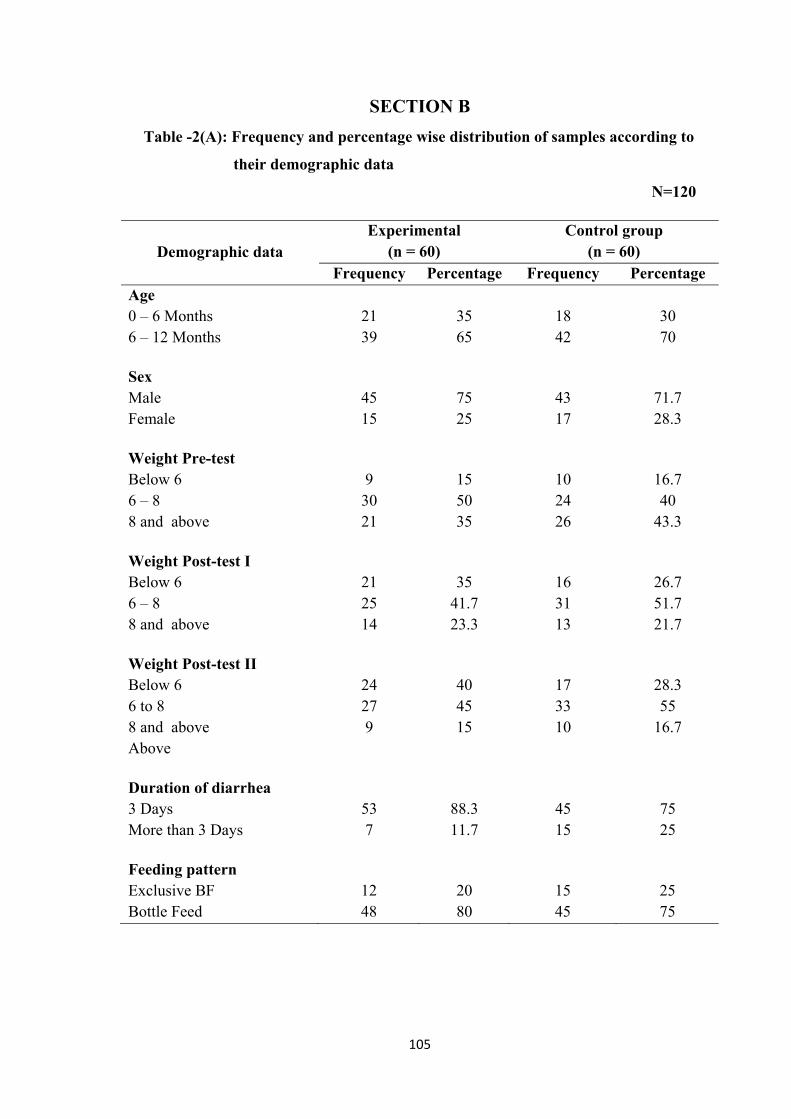
105
SECTION B
Table -2(A): Frequency and percentage wise distribution of samples according to
their demographic data
N=120
Demographic data Experimental
(n = 60) Control group
(n = 60) Frequency Percentage Frequency Percentage
Age 0 – 6 Months 6 – 12 Months
21 39
35 65
18 42
30 70
Sex Male Female
45 15
75 25
43 17
71.7 28.3
Weight Pre-test Below 6 6 – 8 8 and above
9
30 21
15 50 35
10 24 26
16.7 40
43.3 Weight Post-test I Below 6 6 – 8 8 and above
21 25 14
35
41.7 23.3
16 31 13
26.7 51.7 21.7
Weight Post-test II Below 6 6 to 8 8 and above Above
24 27 9
40 45 15
17 33 10
28.3 55
16.7
Duration of diarrhea 3 Days More than 3 Days
53 7
88.3 11.7
45 15
75 25
Feeding pattern Exclusive BF Bottle Feed
12 48
20 80
15 45
25 75
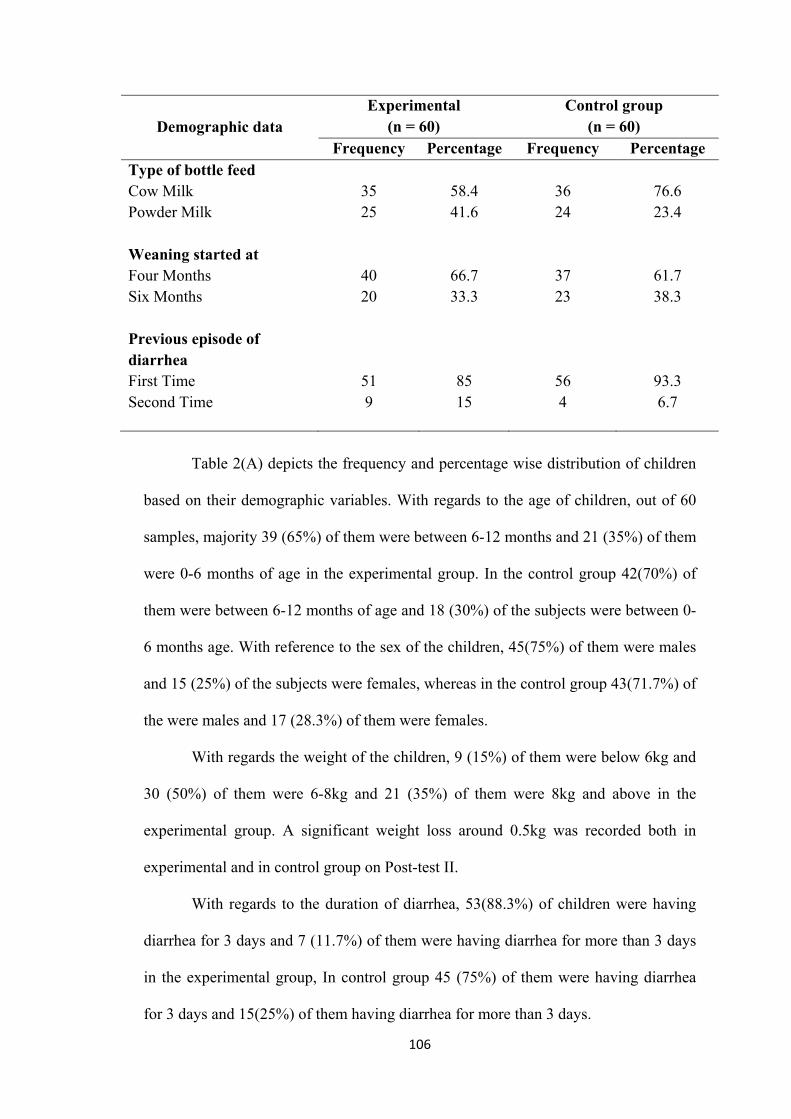
106
Demographic data Experimental
(n = 60) Control group
(n = 60) Frequency Percentage Frequency Percentage
Type of bottle feed Cow Milk Powder Milk
35 25
58.4 41.6
36 24
76.6 23.4
Weaning started at Four Months Six Months
40 20
66.7 33.3
37 23
61.7 38.3
Previous episode of diarrhea First Time Second Time
51 9
85 15
56 4
93.3 6.7
Table 2(A) depicts the frequency and percentage wise distribution of children
based on their demographic variables. With regards to the age of children, out of 60
samples, majority 39 (65%) of them were between 6-12 months and 21 (35%) of them
were 0-6 months of age in the experimental group. In the control group 42(70%) of
them were between 6-12 months of age and 18 (30%) of the subjects were between 0-
6 months age. With reference to the sex of the children, 45(75%) of them were males
and 15 (25%) of the subjects were females, whereas in the control group 43(71.7%) of
the were males and 17 (28.3%) of them were females.
With regards the weight of the children, 9 (15%) of them were below 6kg and
30 (50%) of them were 6-8kg and 21 (35%) of them were 8kg and above in the
experimental group. A significant weight loss around 0.5kg was recorded both in
experimental and in control group on Post-test II.
With regards to the duration of diarrhea, 53(88.3%) of children were having
diarrhea for 3 days and 7 (11.7%) of them were having diarrhea for more than 3 days
in the experimental group, In control group 45 (75%) of them were having diarrhea
for 3 days and 15(25%) of them having diarrhea for more than 3 days.
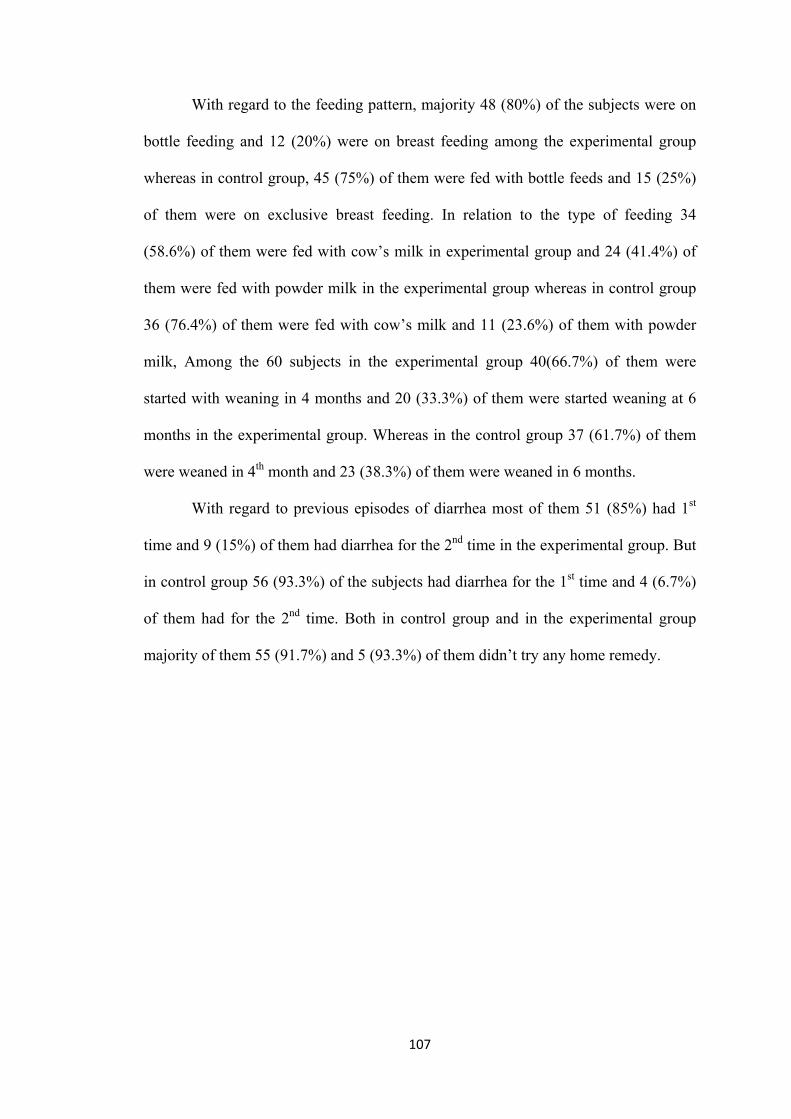
107
With regard to the feeding pattern, majority 48 (80%) of the subjects were on
bottle feeding and 12 (20%) were on breast feeding among the experimental group
whereas in control group, 45 (75%) of them were fed with bottle feeds and 15 (25%)
of them were on exclusive breast feeding. In relation to the type of feeding 34
(58.6%) of them were fed with cow’s milk in experimental group and 24 (41.4%) of
them were fed with powder milk in the experimental group whereas in control group
36 (76.4%) of them were fed with cow’s milk and 11 (23.6%) of them with powder
milk, Among the 60 subjects in the experimental group 40(66.7%) of them were
started with weaning in 4 months and 20 (33.3%) of them were started weaning at 6
months in the experimental group. Whereas in the control group 37 (61.7%) of them
were weaned in 4th month and 23 (38.3%) of them were weaned in 6 months.
With regard to previous episodes of diarrhea most of them 51 (85%) had 1st
time and 9 (15%) of them had diarrhea for the 2nd time in the experimental group. But
in control group 56 (93.3%) of the subjects had diarrhea for the 1st time and 4 (6.7%)
of them had for the 2nd time. Both in control group and in the experimental group
majority of them 55 (91.7%) and 5 (93.3%) of them didn’t try any home remedy.
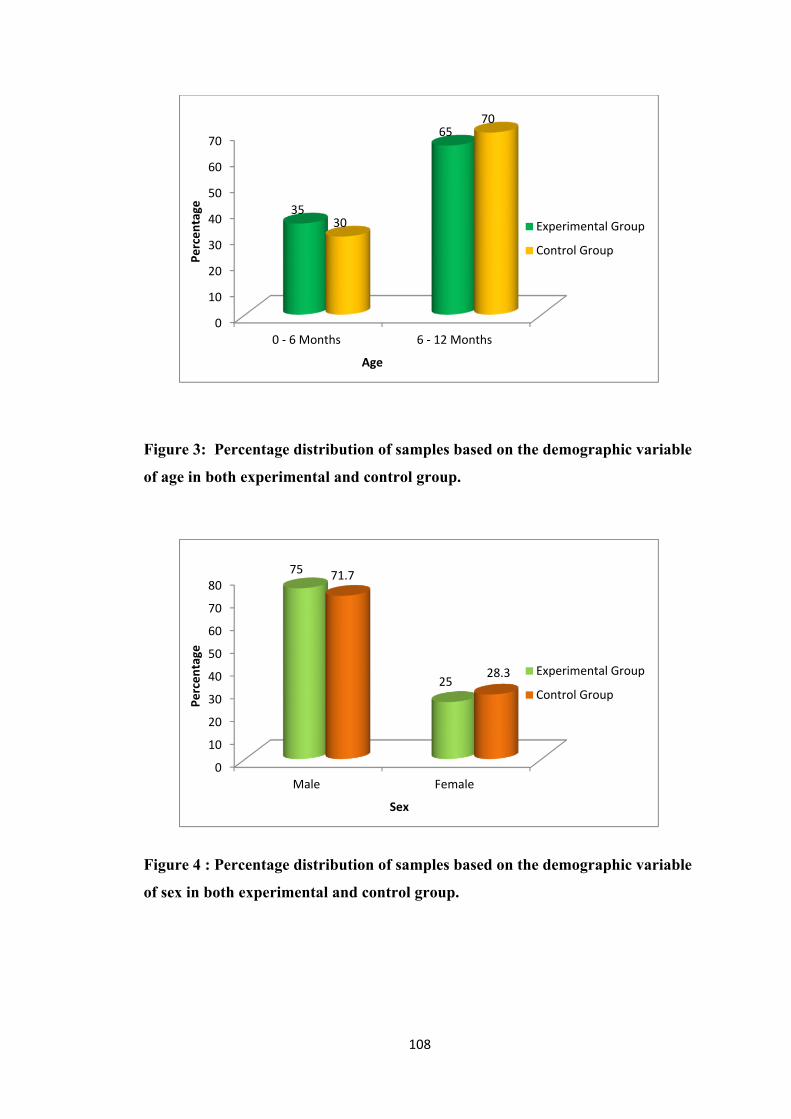
108
Figure 3: Percentage distribution of samples based on the demographic variable
of age in both experimental and control group.
Figure 4 : Percentage distribution of samples based on the demographic variable
of sex in both experimental and control group.
0
10
20
30
40
50
60
70
0 - 6 Months 6 - 12 Months
35
65
30
70
Perc
enta
ge
Age
Experimental Group
Control Group
0
10
20
30
40
50
60
70
80
Male Female
75
25
71.7
28.3
Perc
enta
ge
Sex
Experimental Group
Control Group
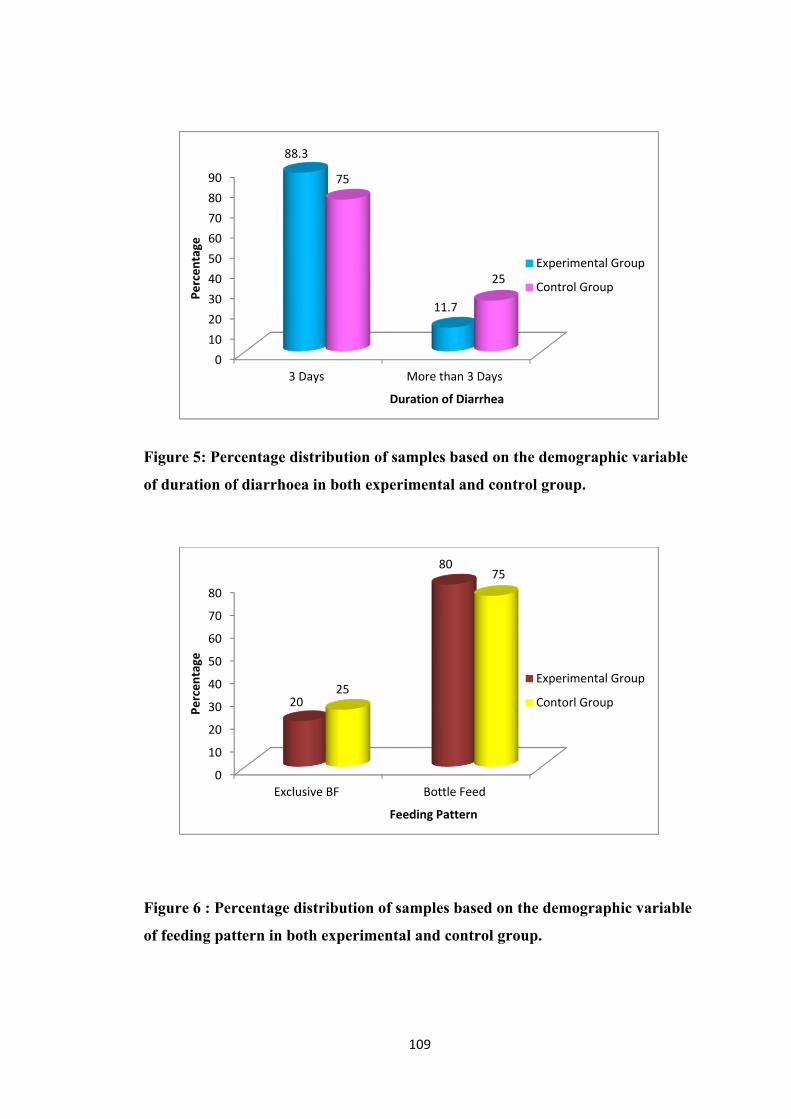
109
Figure 5: Percentage distribution of samples based on the demographic variable
of duration of diarrhoea in both experimental and control group.
Figure 6 : Percentage distribution of samples based on the demographic variable
of feeding pattern in both experimental and control group.
0102030405060708090
3 Days More than 3 Days
88.3
11.7
75
25
Perc
enta
ge
Duration of Diarrhea
Experimental Group
Control Group
0
10
20
30
40
50
60
70
80
Exclusive BF Bottle Feed
20
80
25
75
Perc
enta
ge
Feeding Pattern
Experimental Group
Contorl Group
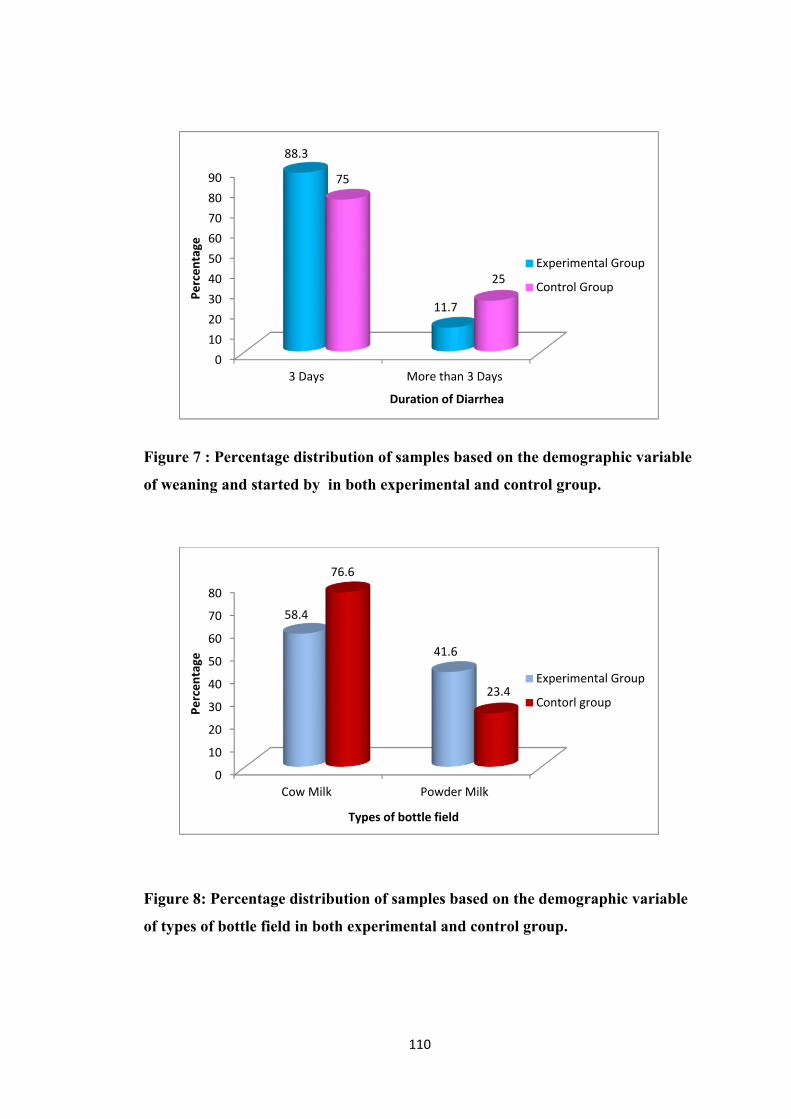
110
Figure 7 : Percentage distribution of samples based on the demographic variable
of weaning and started by in both experimental and control group.
Figure 8: Percentage distribution of samples based on the demographic variable
of types of bottle field in both experimental and control group.
0102030405060708090
3 Days More than 3 Days
88.3
11.7
75
25
Perc
enta
ge
Duration of Diarrhea
Experimental Group
Control Group
0
10
20
30
40
50
60
70
80
Cow Milk Powder Milk
58.4
41.6
76.6
23.4
Perc
enta
ge
Types of bottle field
Experimental Group
Contorl group
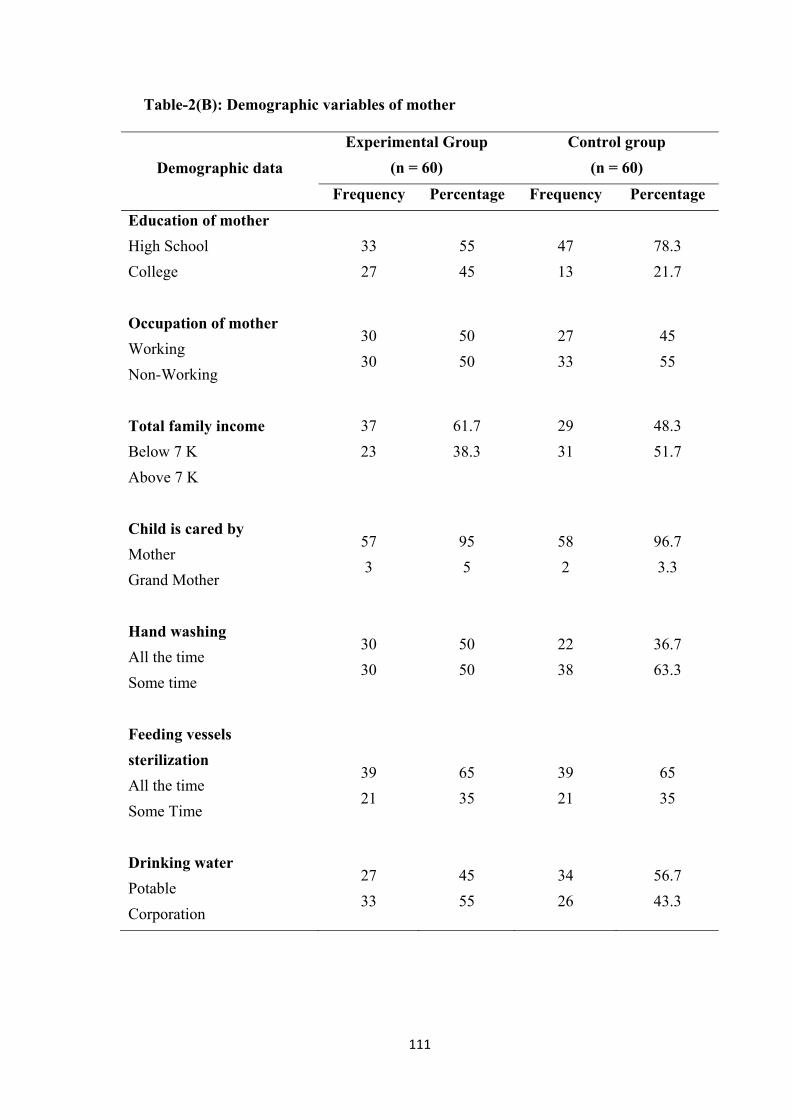
111
Table-2(B): Demographic variables of mother
Demographic data
Experimental Group
(n = 60)
Control group
(n = 60)
Frequency Percentage Frequency Percentage
Education of mother
High School
College
33
27
55
45
47
13
78.3
21.7
Occupation of mother
Working
Non-Working
30
30
50
50
27
33
45
55
Total family income
Below 7 K
Above 7 K
37
23
61.7
38.3
29
31
48.3
51.7
Child is cared by
Mother
Grand Mother
57
3
95
5
58
2
96.7
3.3
Hand washing
All the time
Some time
30
30
50
50
22
38
36.7
63.3
Feeding vessels
sterilization
All the time
Some Time
39
21
65
35
39
21
65
35
Drinking water
Potable
Corporation
27
33
45
55
34
26
56.7
43.3
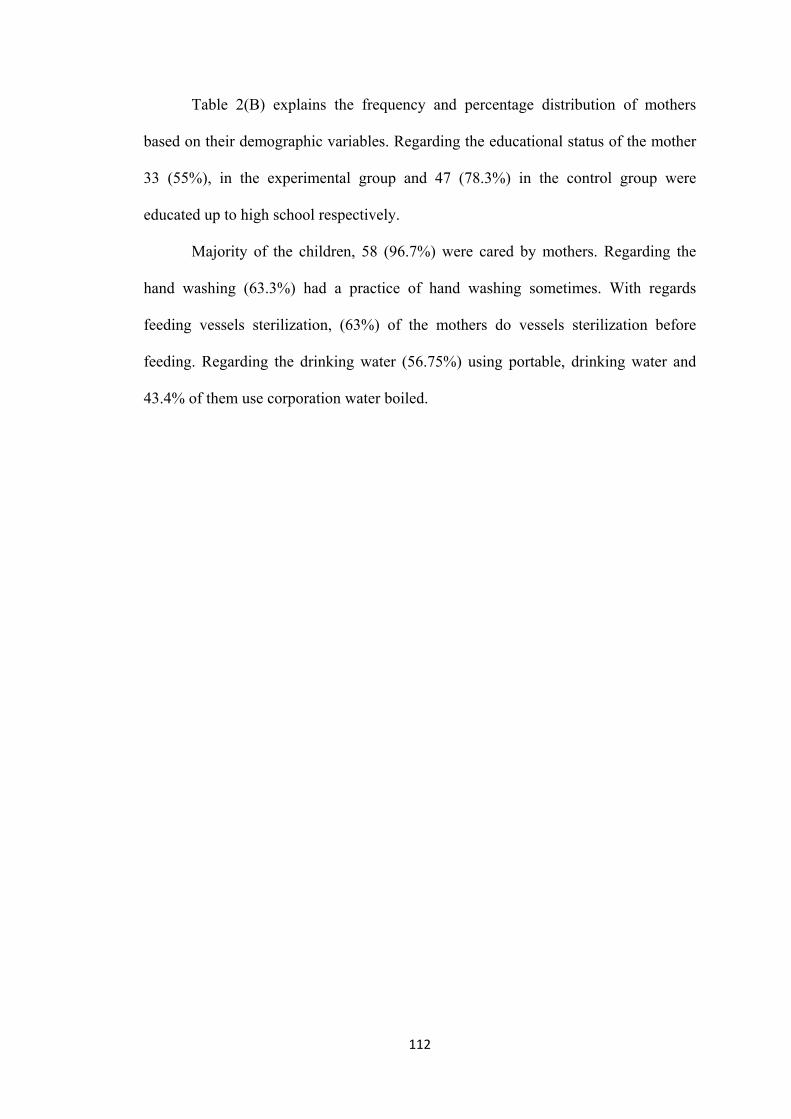
112
Table 2(B) explains the frequency and percentage distribution of mothers
based on their demographic variables. Regarding the educational status of the mother
33 (55%), in the experimental group and 47 (78.3%) in the control group were
educated up to high school respectively.
Majority of the children, 58 (96.7%) were cared by mothers. Regarding the
hand washing (63.3%) had a practice of hand washing sometimes. With regards
feeding vessels sterilization, (63%) of the mothers do vessels sterilization before
feeding. Regarding the drinking water (56.75%) using portable, drinking water and
43.4% of them use corporation water boiled.
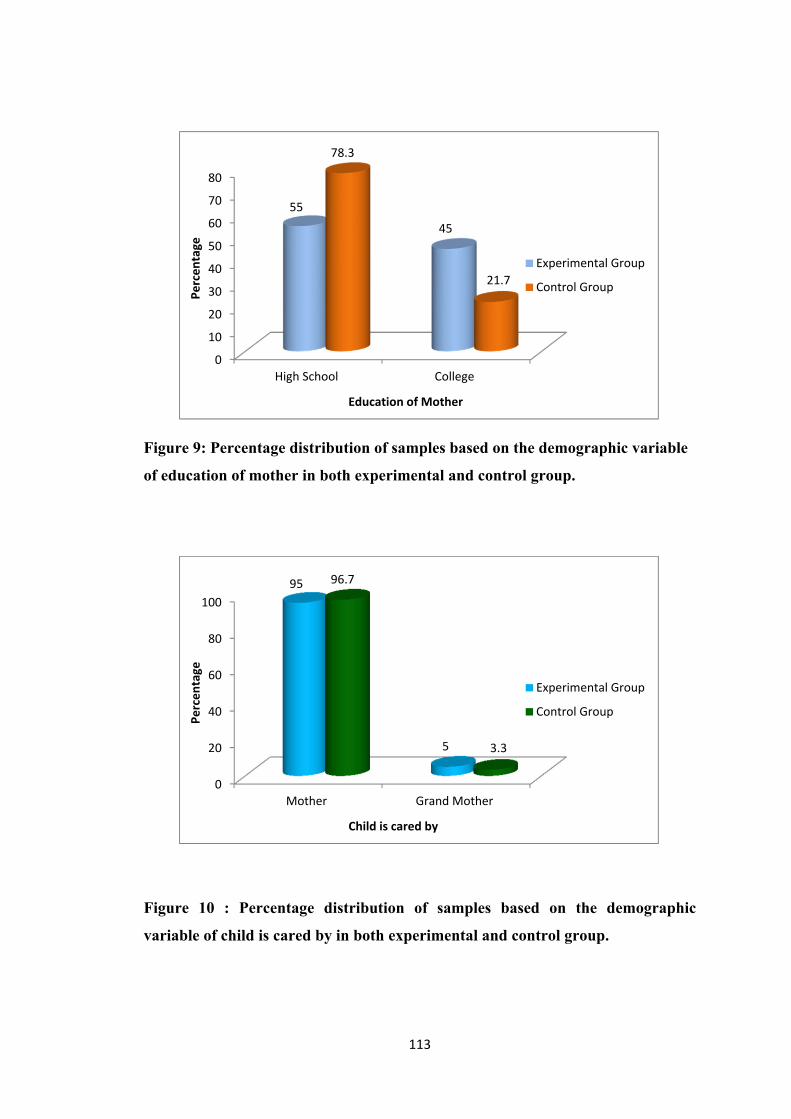
113
Figure 9: Percentage distribution of samples based on the demographic variable
of education of mother in both experimental and control group.
Figure 10 : Percentage distribution of samples based on the demographic
variable of child is cared by in both experimental and control group.
0
10
20
30
40
50
60
70
80
High School College
55
45
78.3
21.7
Perc
enta
ge
Education of Mother
Experimental Group
Control Group
0
20
40
60
80
100
Mother Grand Mother
95
5
96.7
3.3
Perc
enta
ge
Child is cared by
Experimental Group
Control Group
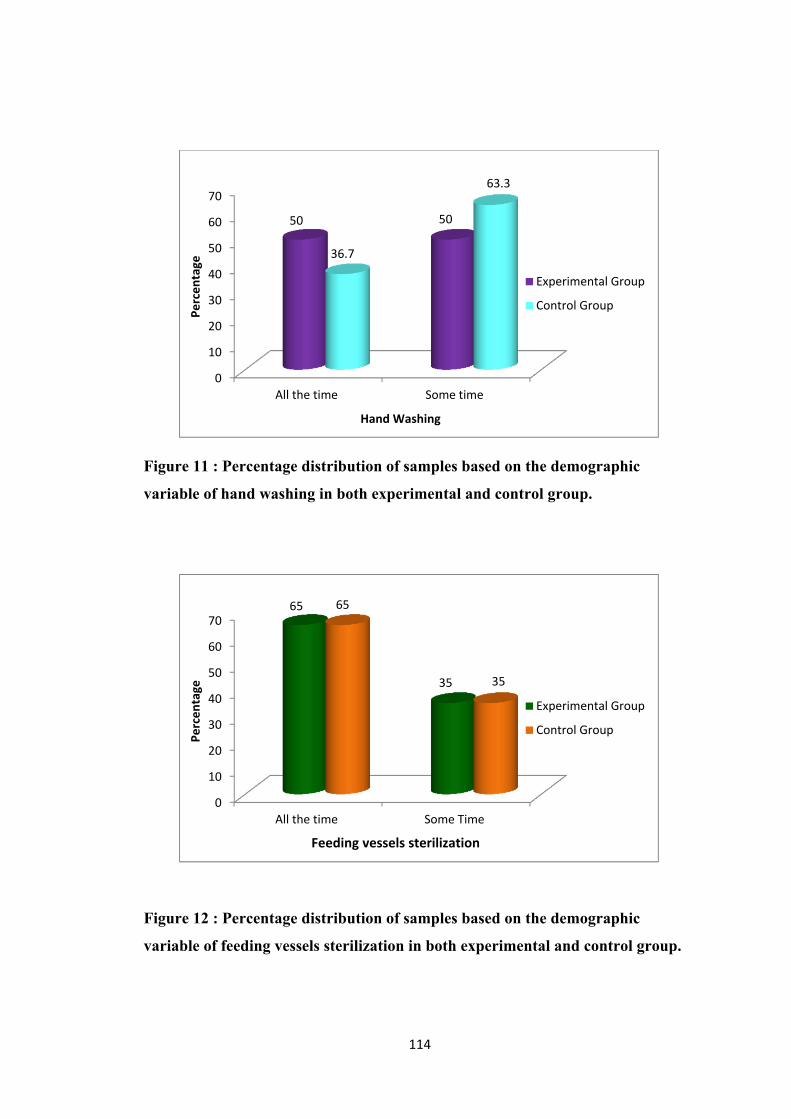
114
Figure 11 : Percentage distribution of samples based on the demographic
variable of hand washing in both experimental and control group.
Figure 12 : Percentage distribution of samples based on the demographic
variable of feeding vessels sterilization in both experimental and control group.
0
10
20
30
40
50
60
70
All the time Some time
50 50
36.7
63.3 Pe
rcen
tage
Hand Washing
Experimental Group
Control Group
0
10
20
30
40
50
60
70
All the time Some Time
65
35
65
35
Perc
enta
ge
Feeding vessels sterilization
Experimental Group
Control Group
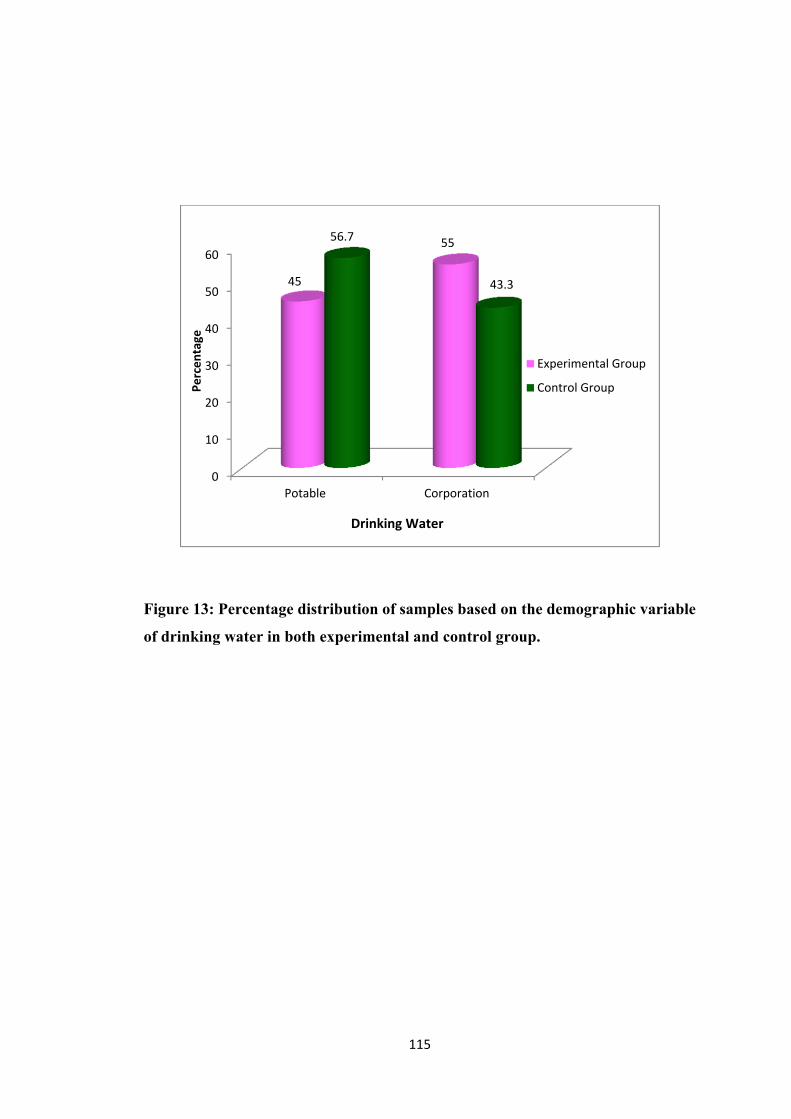
115
Figure 13: Percentage distribution of samples based on the demographic variable
of drinking water in both experimental and control group.
0
10
20
30
40
50
60
Potable Corporation
45
55 56.7
43.3
Perc
enta
ge
Drinking Water
Experimental Group
Control Group
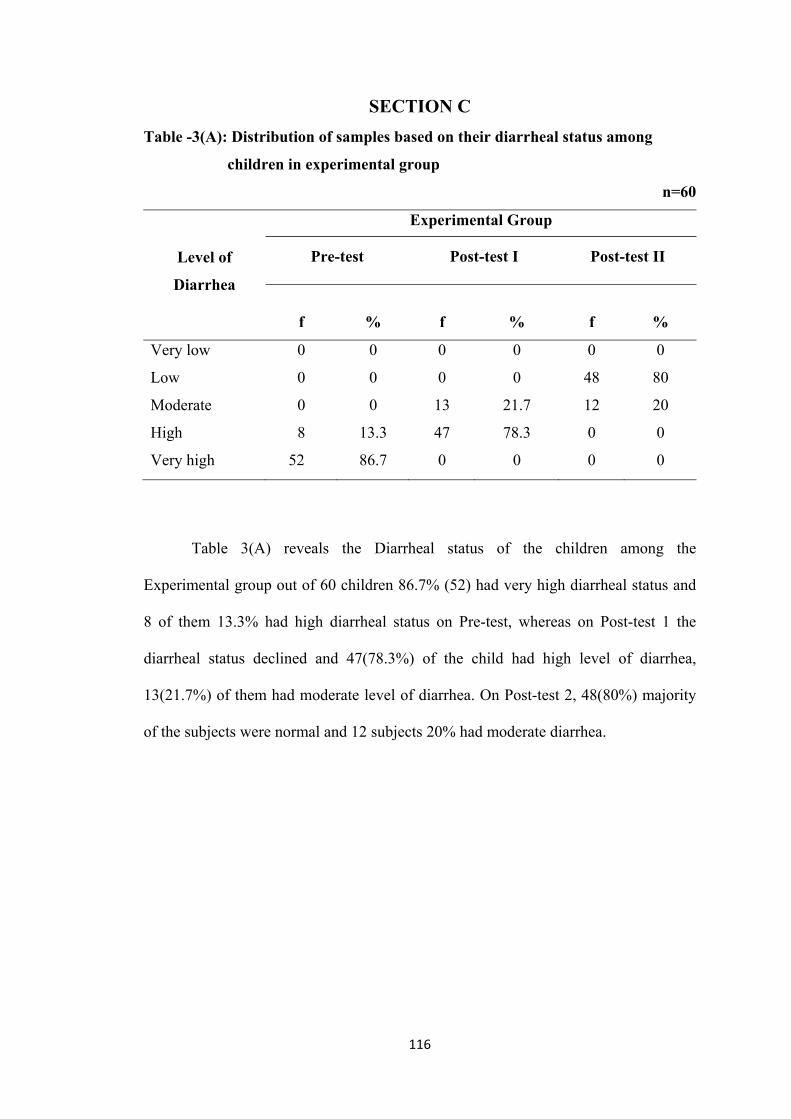
116
SECTION C
Table -3(A): Distribution of samples based on their diarrheal status among
children in experimental group
n=60
Level of
Diarrhea
Experimental Group
Pre-test Post-test I Post-test II
f
%
f
%
f
%
Very low 0 0 0 0 0 0
Low 0 0 0 0 48 80
Moderate 0 0 13 21.7 12 20
High 8 13.3 47 78.3 0 0
Very high 52 86.7 0 0 0 0
Table 3(A) reveals the Diarrheal status of the children among the
Experimental group out of 60 children 86.7% (52) had very high diarrheal status and
8 of them 13.3% had high diarrheal status on Pre-test, whereas on Post-test 1 the
diarrheal status declined and 47(78.3%) of the child had high level of diarrhea,
13(21.7%) of them had moderate level of diarrhea. On Post-test 2, 48(80%) majority
of the subjects were normal and 12 subjects 20% had moderate diarrhea.
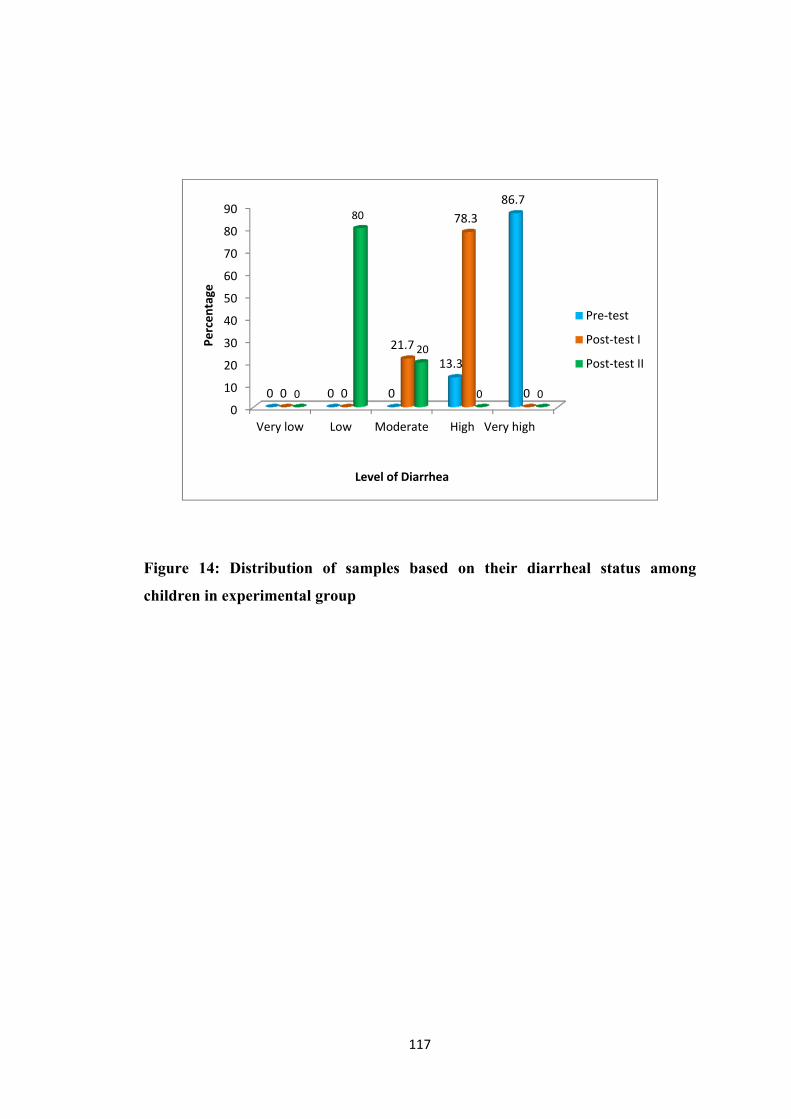
117
Figure 14: Distribution of samples based on their diarrheal status among
children in experimental group
0
10
20
30
40
50
60
70
80
90
Very low Low Moderate High Very high
0 0 0
13.3
86.7
0 0
21.7
78.3
0 0
80
20
0 0
Perc
enta
ge
Level of Diarrhea
Pre-test
Post-test I
Post-test II
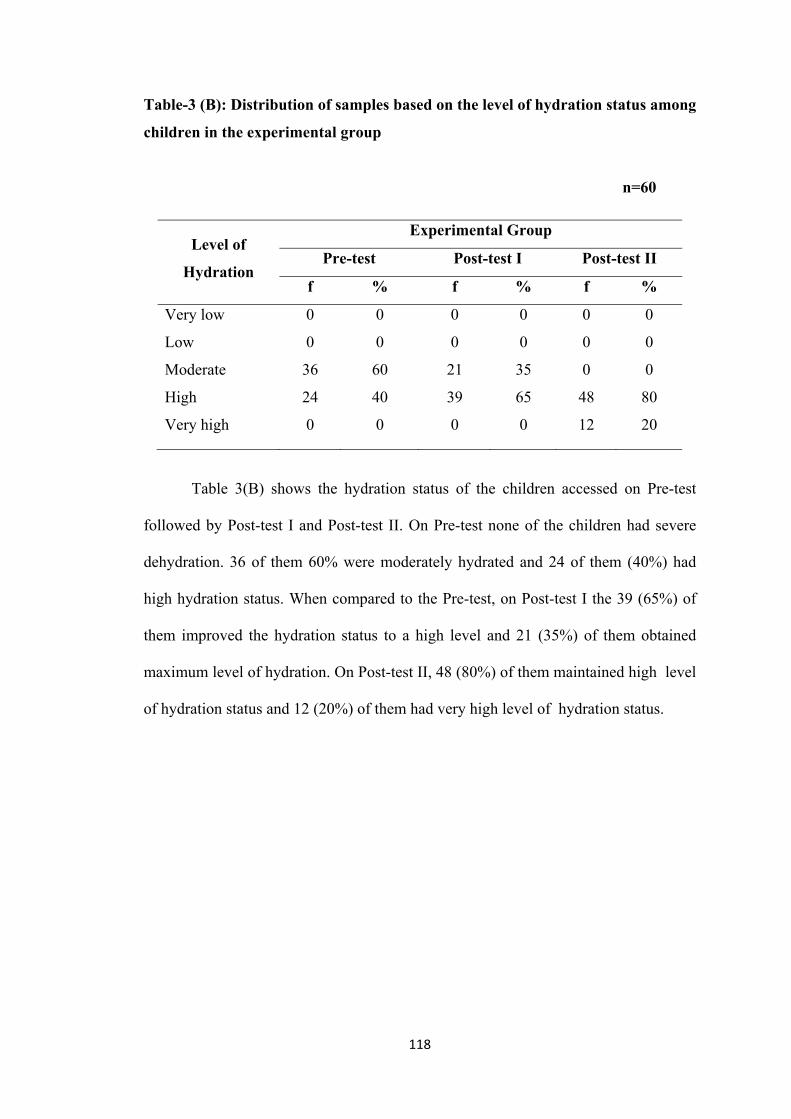
118
Table-3 (B): Distribution of samples based on the level of hydration status among
children in the experimental group
n=60
Level of
Hydration
Experimental Group
Pre-test Post-test I Post-test II
f % f % f %
Very low 0 0 0 0 0 0
Low 0 0 0 0 0 0
Moderate 36 60 21 35 0 0
High 24 40 39 65 48 80
Very high 0 0 0 0 12 20
Table 3(B) shows the hydration status of the children accessed on Pre-test
followed by Post-test I and Post-test II. On Pre-test none of the children had severe
dehydration. 36 of them 60% were moderately hydrated and 24 of them (40%) had
high hydration status. When compared to the Pre-test, on Post-test I the 39 (65%) of
them improved the hydration status to a high level and 21 (35%) of them obtained
maximum level of hydration. On Post-test II, 48 (80%) of them maintained high level
of hydration status and 12 (20%) of them had very high level of hydration status.
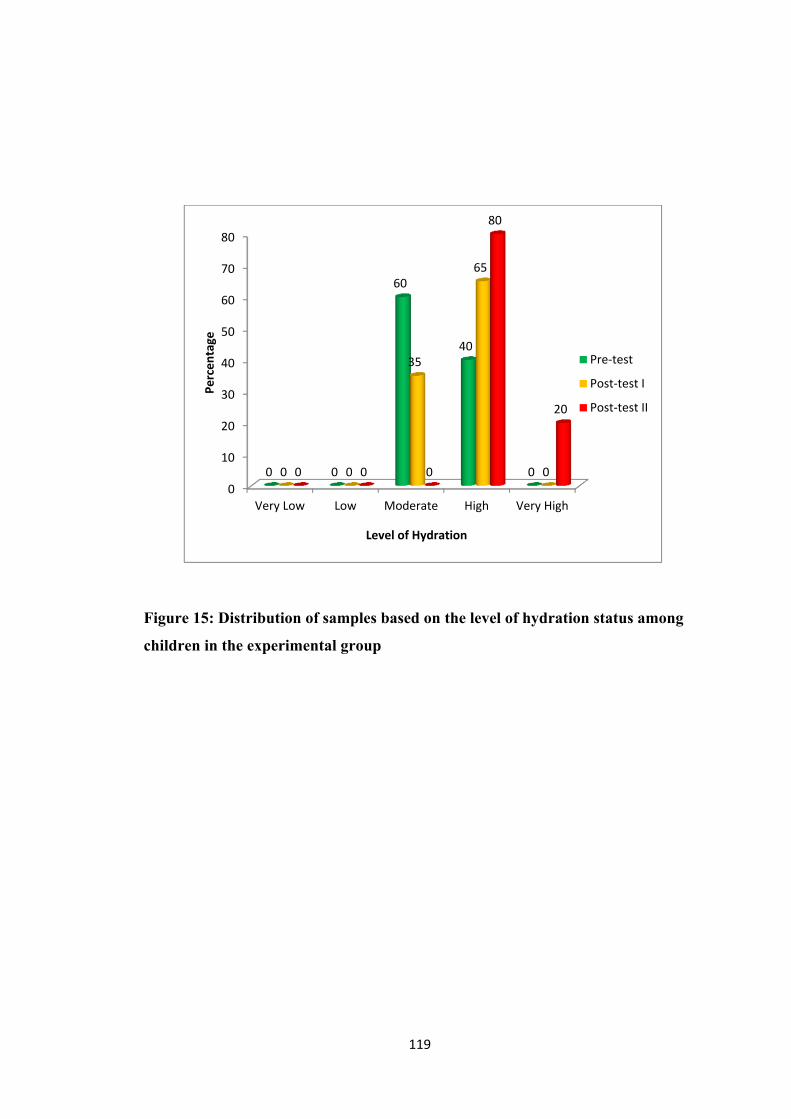
119
Figure 15: Distribution of samples based on the level of hydration status among
children in the experimental group
0
10
20
30
40
50
60
70
80
Very Low Low Moderate High Very High
0 0
60
40
0 0 0
35
65
0 0 0 0
80
20
Perc
enta
ge
Level of Hydration
Pre-test
Post-test I
Post-test II
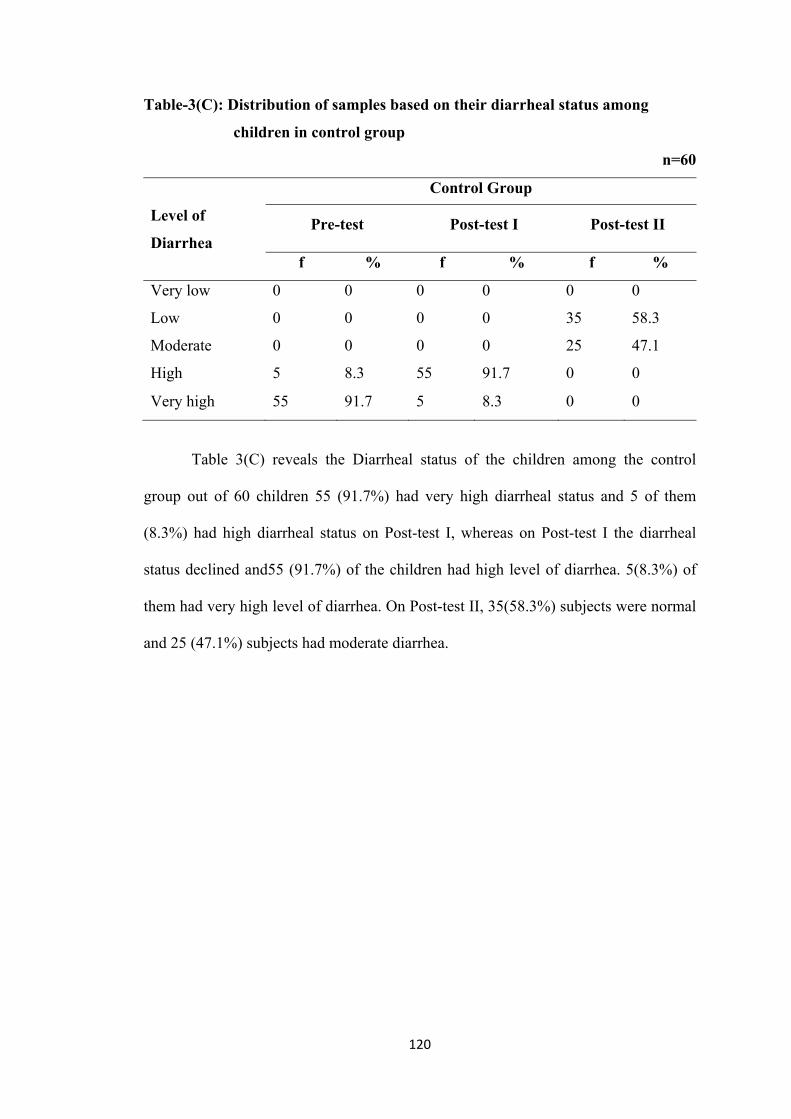
120
Table-3(C): Distribution of samples based on their diarrheal status among
children in control group
n=60
Level of
Diarrhea
Control Group
Pre-test Post-test I Post-test II
f % f % f %
Very low 0 0 0 0 0 0
Low 0 0 0 0 35 58.3
Moderate 0 0 0 0 25 47.1
High 5 8.3 55 91.7 0 0
Very high 55 91.7 5 8.3 0 0
Table 3(C) reveals the Diarrheal status of the children among the control
group out of 60 children 55 (91.7%) had very high diarrheal status and 5 of them
(8.3%) had high diarrheal status on Post-test I, whereas on Post-test I the diarrheal
status declined and55 (91.7%) of the children had high level of diarrhea. 5(8.3%) of
them had very high level of diarrhea. On Post-test II, 35(58.3%) subjects were normal
and 25 (47.1%) subjects had moderate diarrhea.
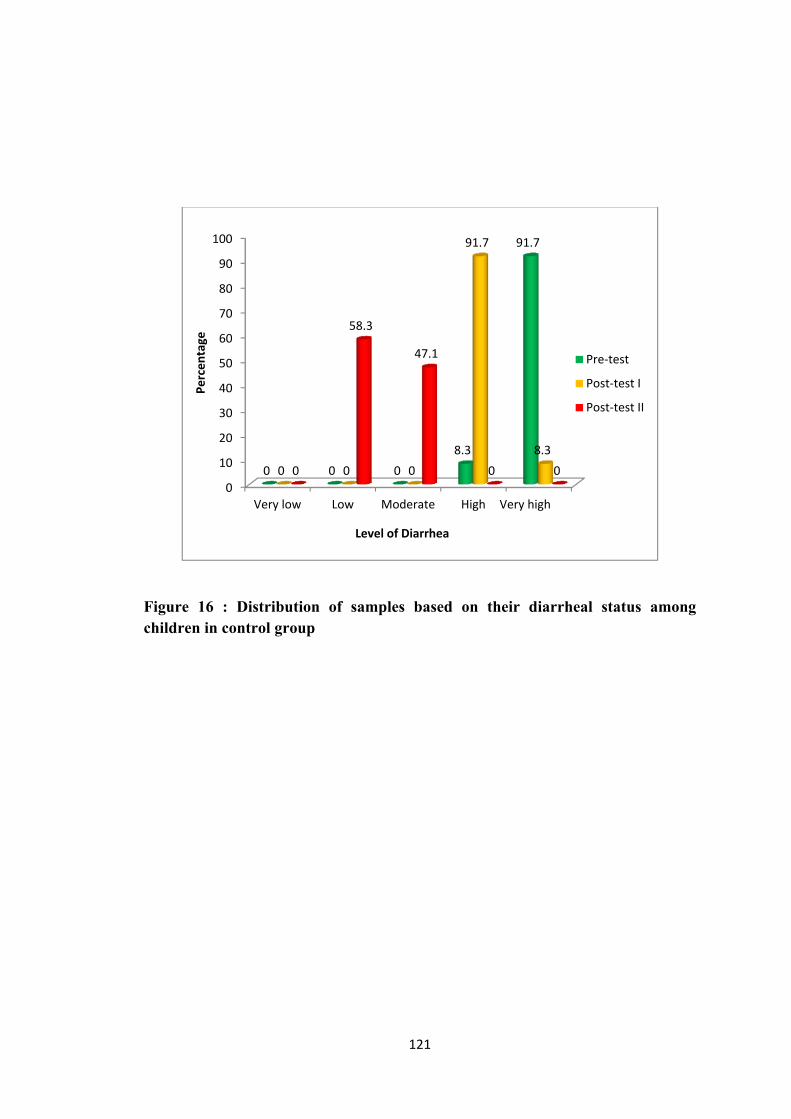
121
Figure 16 : Distribution of samples based on their diarrheal status among children in control group
0
10
20
30
40
50
60
70
80
90
100
Very low Low Moderate High Very high
0 0 0 8.3
91.7
0 0 0
91.7
8.3 0
58.3
47.1
0 0
Perc
enta
ge
Level of Diarrhea
Pre-test
Post-test I
Post-test II
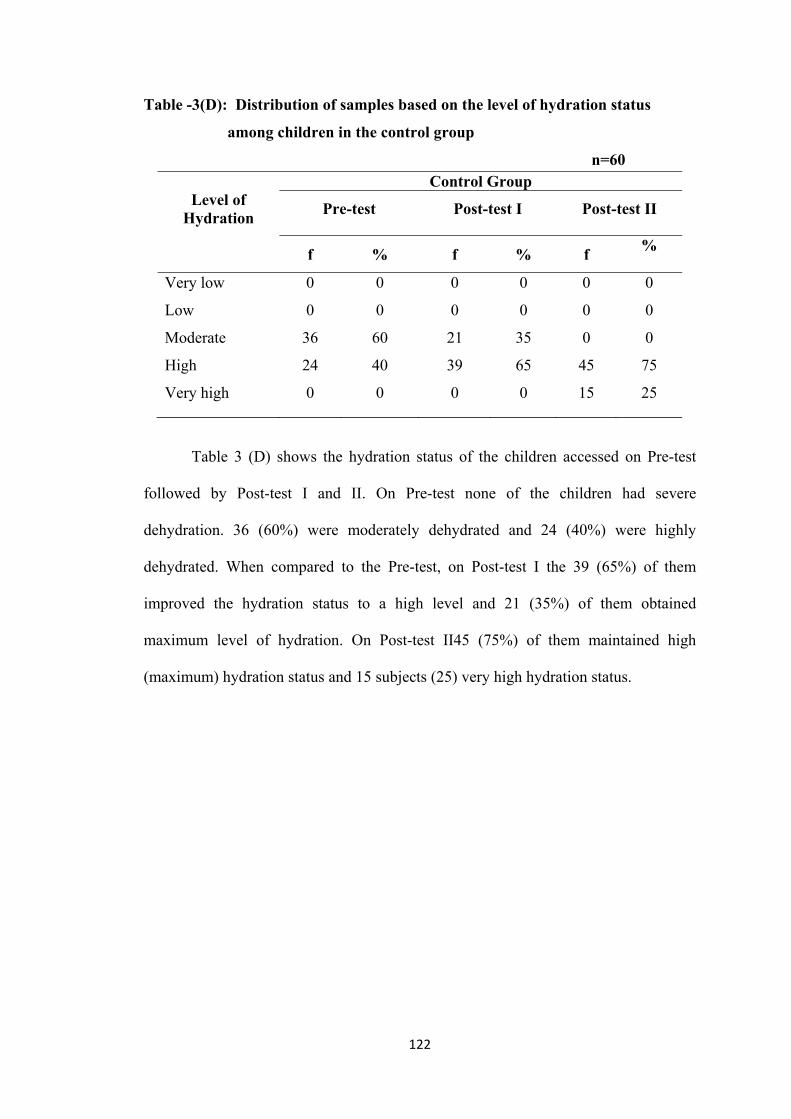
122
Table -3(D): Distribution of samples based on the level of hydration status
among children in the control group
n=60
Level of Hydration
Control Group
Pre-test Post-test I Post-test II
f % f % f
%
Very low 0 0 0 0 0 0
Low 0 0 0 0 0 0
Moderate 36 60 21 35 0 0
High 24 40 39 65 45 75
Very high 0 0 0 0 15 25
Table 3 (D) shows the hydration status of the children accessed on Pre-test
followed by Post-test I and II. On Pre-test none of the children had severe
dehydration. 36 (60%) were moderately dehydrated and 24 (40%) were highly
dehydrated. When compared to the Pre-test, on Post-test I the 39 (65%) of them
improved the hydration status to a high level and 21 (35%) of them obtained
maximum level of hydration. On Post-test II45 (75%) of them maintained high
(maximum) hydration status and 15 subjects (25) very high hydration status.
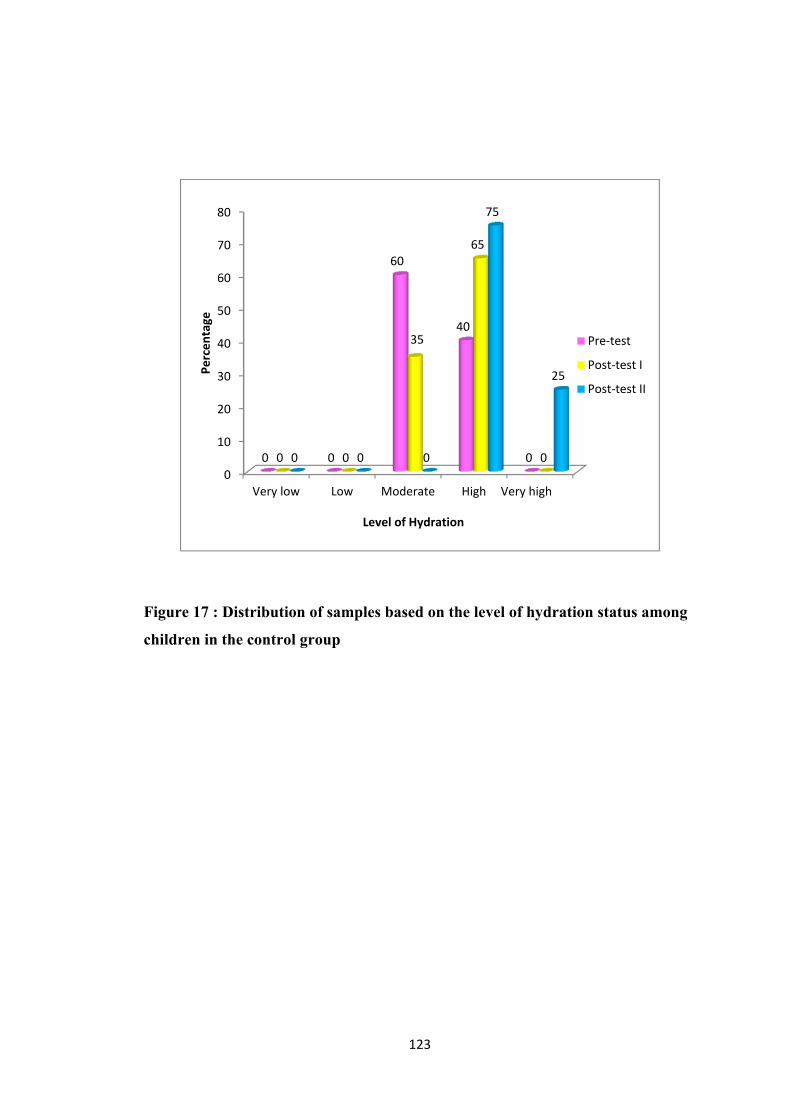
123
Figure 17 : Distribution of samples based on the level of hydration status among
children in the control group
0
10
20
30
40
50
60
70
80
Very low Low Moderate High Very high
0 0
60
40
0 0 0
35
65
0 0 0 0
75
25 Perc
enta
ge
Level of Hydration
Pre-test
Post-test I
Post-test II
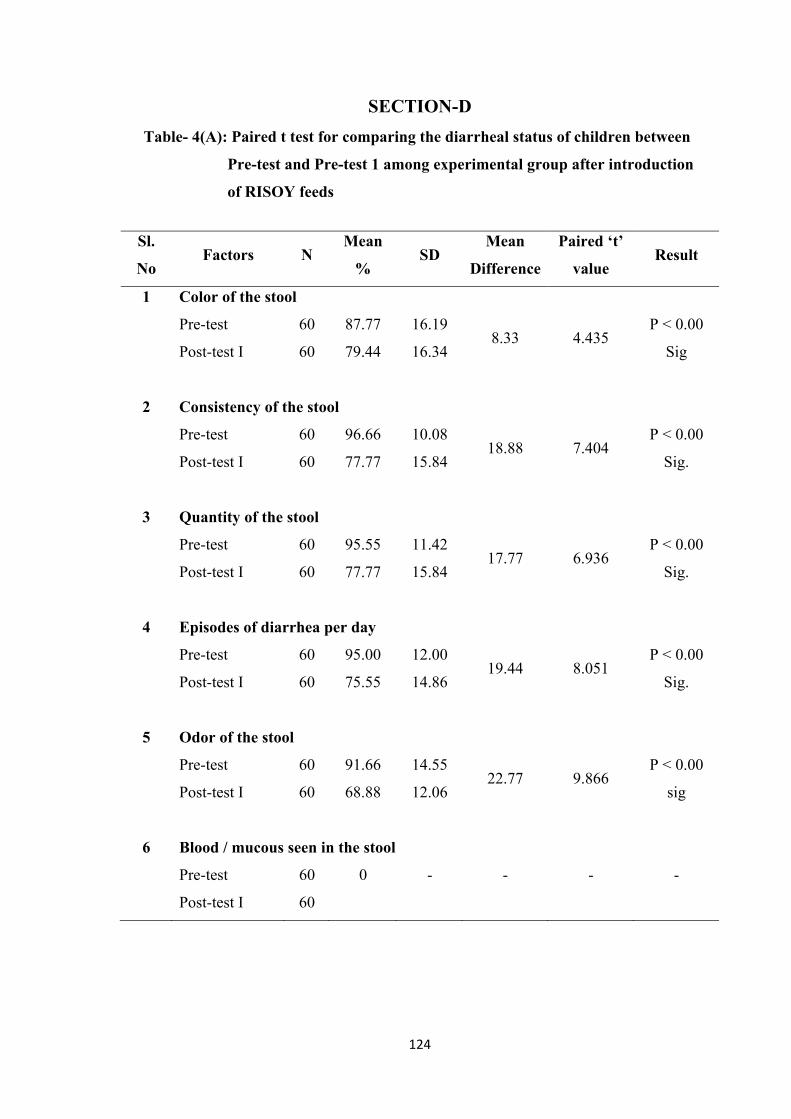
124
SECTION-D
Table- 4(A): Paired t test for comparing the diarrheal status of children between
Pre-test and Pre-test 1 among experimental group after introduction
of RISOY feeds
Sl.
No Factors N
Mean
% SD
Mean
Difference
Paired ‘t’
value Result
1 Color of the stool
Pre-test 60 87.77 16.19 8.33 4.435
P < 0.00
Sig Post-test I 60 79.44 16.34
2 Consistency of the stool
Pre-test 60 96.66 10.08 18.88 7.404
P < 0.00
Sig. Post-test I 60 77.77 15.84
3 Quantity of the stool
Pre-test 60 95.55 11.42 17.77 6.936
P < 0.00
Sig. Post-test I 60 77.77 15.84
4 Episodes of diarrhea per day
Pre-test 60 95.00 12.00 19.44 8.051
P < 0.00
Sig. Post-test I 60 75.55 14.86
5 Odor of the stool
Pre-test 60 91.66 14.55 22.77 9.866
P < 0.00
sig Post-test I 60 68.88 12.06
6 Blood / mucous seen in the stool
Pre-test 60 0 - - - -
Post-test I 60
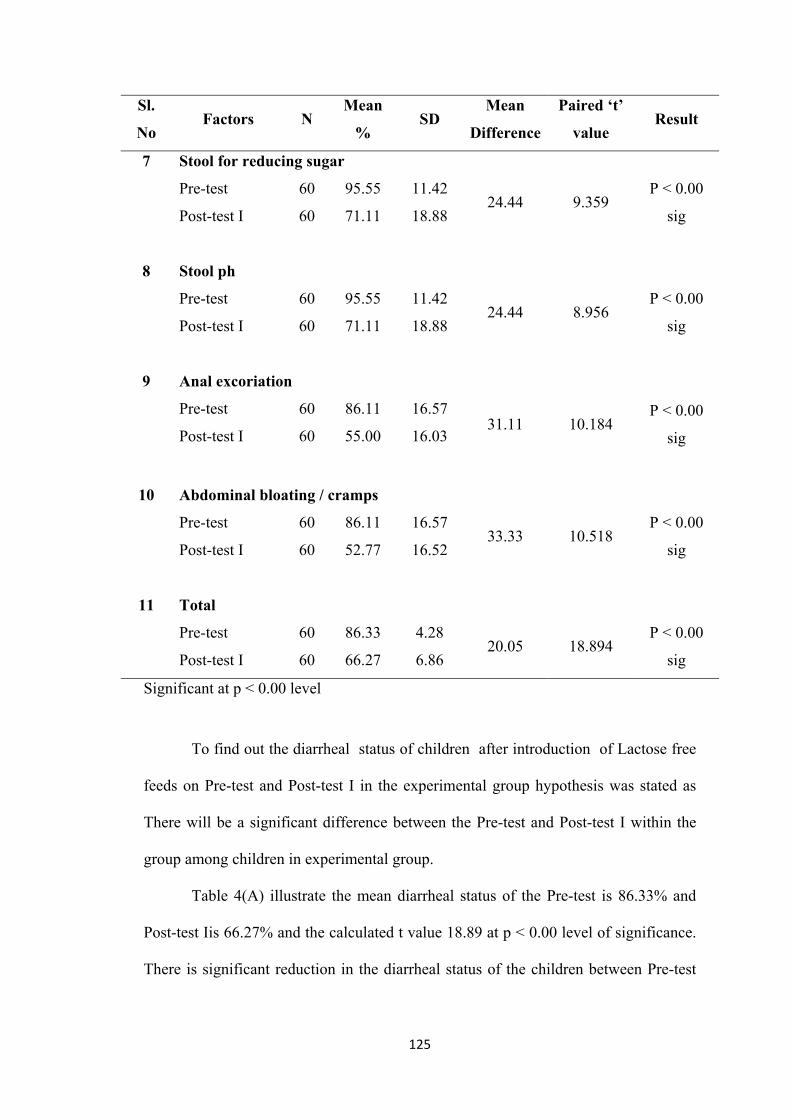
125
Sl.
No Factors N
Mean
% SD
Mean
Difference
Paired ‘t’
value Result
7 Stool for reducing sugar
Pre-test 60 95.55 11.42 24.44 9.359
P < 0.00
sig Post-test I 60 71.11 18.88
8 Stool ph
Pre-test 60 95.55 11.42 24.44 8.956
P < 0.00
sig Post-test I 60 71.11 18.88
9 Anal excoriation
Pre-test 60 86.11 16.57 31.11 10.184
P < 0.00
sig Post-test I 60 55.00 16.03
10 Abdominal bloating / cramps
Pre-test 60 86.11 16.57 33.33 10.518
P < 0.00
sig Post-test I 60 52.77 16.52
11 Total
Pre-test 60 86.33 4.28 20.05 18.894
P < 0.00
sig Post-test I 60 66.27 6.86
Significant at p < 0.00 level
To find out the diarrheal status of children after introduction of Lactose free
feeds on Pre-test and Post-test I in the experimental group hypothesis was stated as
There will be a significant difference between the Pre-test and Post-test I within the
group among children in experimental group.
Table 4(A) illustrate the mean diarrheal status of the Pre-test is 86.33% and
Post-test Iis 66.27% and the calculated t value 18.89 at p < 0.00 level of significance.
There is significant reduction in the diarrheal status of the children between Pre-test
126
and Post-test I. Thus, it infers that the experimental group had a significance of
control over the diarrheal status.
Hence there is a difference between the Pre-test and Post-test I after
introducing the lactose free intervention among experimental group. The above
findings support the research hypothesis H2 accepted.
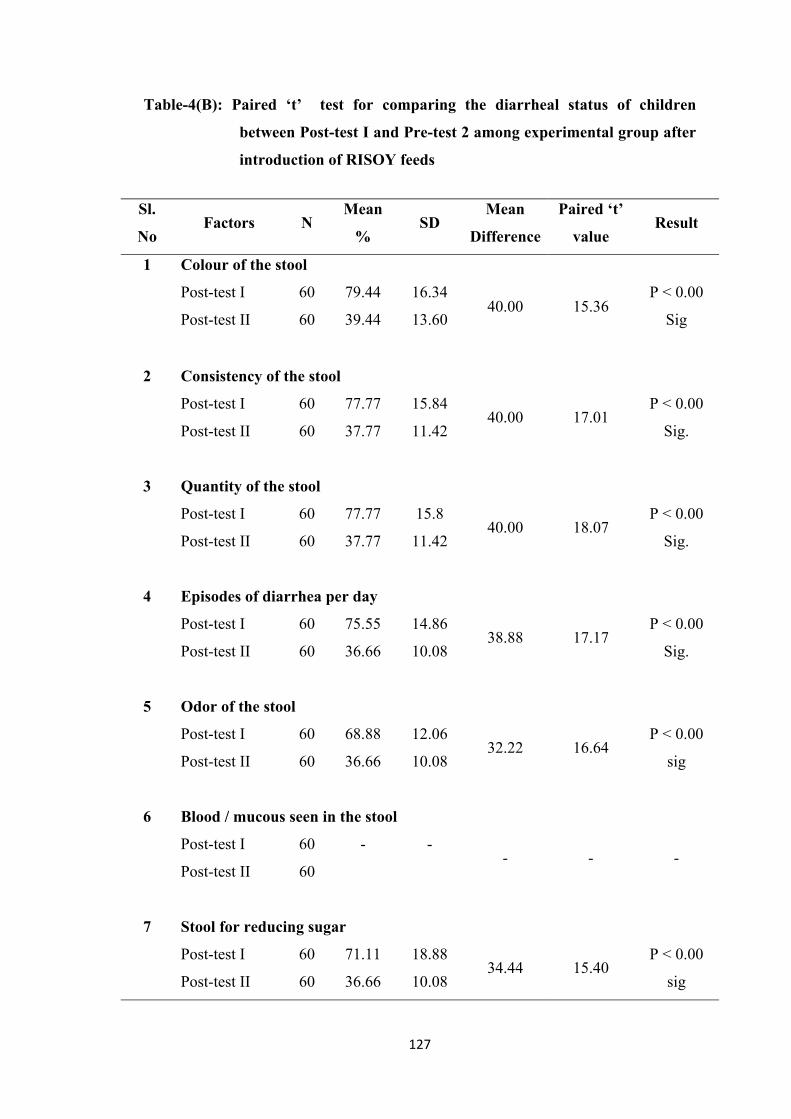
127
Table-4(B): Paired ‘t’ test for comparing the diarrheal status of children
between Post-test I and Pre-test 2 among experimental group after
introduction of RISOY feeds
Sl.
No Factors N
Mean
% SD
Mean
Difference
Paired ‘t’
value Result
1 Colour of the stool
Post-test I 60 79.44 16.34 40.00 15.36
P < 0.00
Sig Post-test II 60 39.44 13.60
2 Consistency of the stool
Post-test I 60 77.77 15.84 40.00 17.01
P < 0.00
Sig. Post-test II 60 37.77 11.42
3 Quantity of the stool
Post-test I 60 77.77 15.8 40.00 18.07
P < 0.00
Sig. Post-test II 60 37.77 11.42
4 Episodes of diarrhea per day
Post-test I 60 75.55 14.86 38.88 17.17
P < 0.00
Sig. Post-test II 60 36.66 10.08
5 Odor of the stool
Post-test I 60 68.88 12.06 32.22 16.64
P < 0.00
sig Post-test II 60 36.66 10.08
6 Blood / mucous seen in the stool
Post-test I 60 - - - - -
Post-test II 60
7 Stool for reducing sugar
Post-test I 60 71.11 18.88 34.44 15.40
P < 0.00
sig Post-test II 60 36.66 10.08
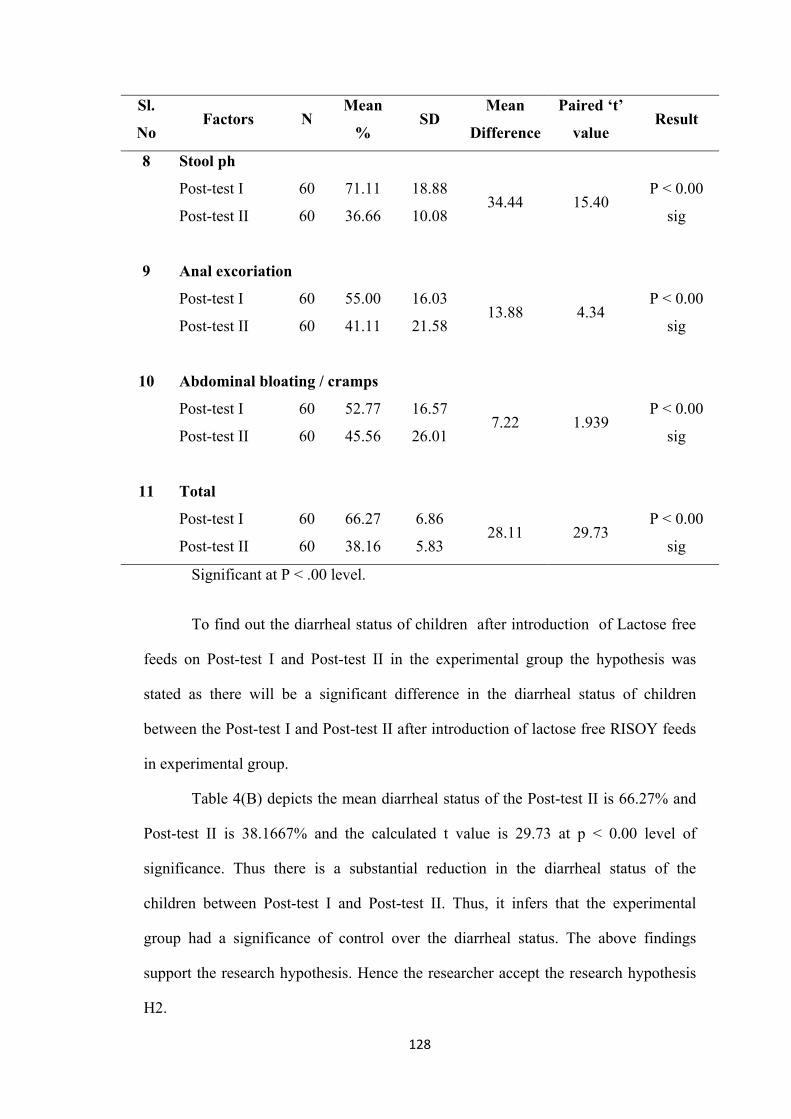
128
Sl.
No Factors N
Mean
% SD
Mean
Difference
Paired ‘t’
value Result
8 Stool ph
Post-test I 60 71.11 18.88 34.44 15.40
P < 0.00
sig Post-test II 60 36.66 10.08
9 Anal excoriation
Post-test I 60 55.00 16.03 13.88 4.34
P < 0.00
sig Post-test II 60 41.11 21.58
10 Abdominal bloating / cramps
Post-test I 60 52.77 16.57 7.22 1.939
P < 0.00
sig Post-test II 60 45.56 26.01
11 Total
Post-test I 60 66.27 6.86 28.11 29.73
P < 0.00
sig Post-test II 60 38.16 5.83
Significant at P < .00 level.
To find out the diarrheal status of children after introduction of Lactose free
feeds on Post-test I and Post-test II in the experimental group the hypothesis was
stated as there will be a significant difference in the diarrheal status of children
between the Post-test I and Post-test II after introduction of lactose free RISOY feeds
in experimental group.
Table 4(B) depicts the mean diarrheal status of the Post-test II is 66.27% and
Post-test II is 38.1667% and the calculated t value is 29.73 at p < 0.00 level of
significance. Thus there is a substantial reduction in the diarrheal status of the
children between Post-test I and Post-test II. Thus, it infers that the experimental
group had a significance of control over the diarrheal status. The above findings
support the research hypothesis. Hence the researcher accept the research hypothesis
H2.
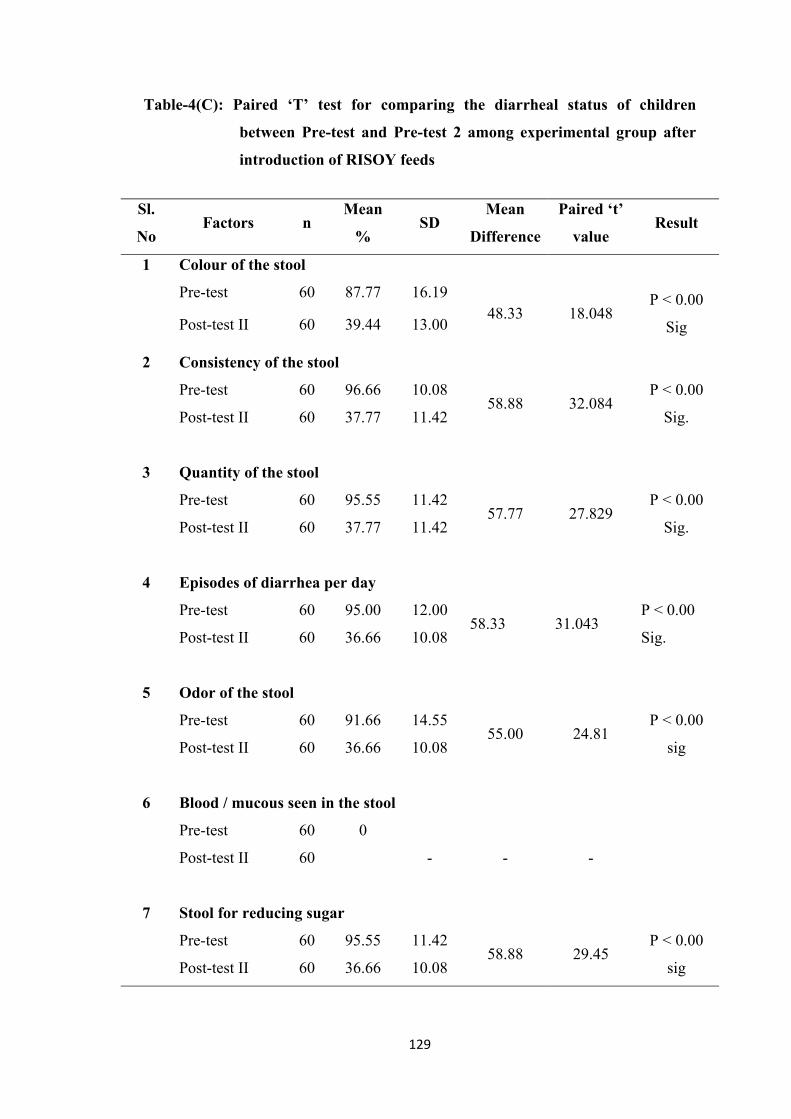
129
Table-4(C): Paired ‘T’ test for comparing the diarrheal status of children
between Pre-test and Pre-test 2 among experimental group after
introduction of RISOY feeds
Sl.
No Factors n
Mean
% SD
Mean
Difference
Paired ‘t’
value Result
1 Colour of the stool
Pre-test 60 87.77 16.19 48.33 18.048
P < 0.00
Sig Post-test II 60 39.44 13.00
2 Consistency of the stool
Pre-test 60 96.66 10.08 58.88 32.084
P < 0.00
Sig. Post-test II 60 37.77 11.42
3 Quantity of the stool
Pre-test 60 95.55 11.42 57.77 27.829
P < 0.00
Sig. Post-test II 60 37.77 11.42
4 Episodes of diarrhea per day
Pre-test 60 95.00 12.00 58.33 31.043
P < 0.00
Sig. Post-test II 60 36.66 10.08
5 Odor of the stool
Pre-test 60 91.66 14.55 55.00 24.81
P < 0.00
sig Post-test II 60 36.66 10.08
6 Blood / mucous seen in the stool
Pre-test 60 0
- - -
Post-test II 60
7 Stool for reducing sugar
Pre-test 60 95.55 11.42 58.88 29.45
P < 0.00
sig Post-test II 60 36.66 10.08
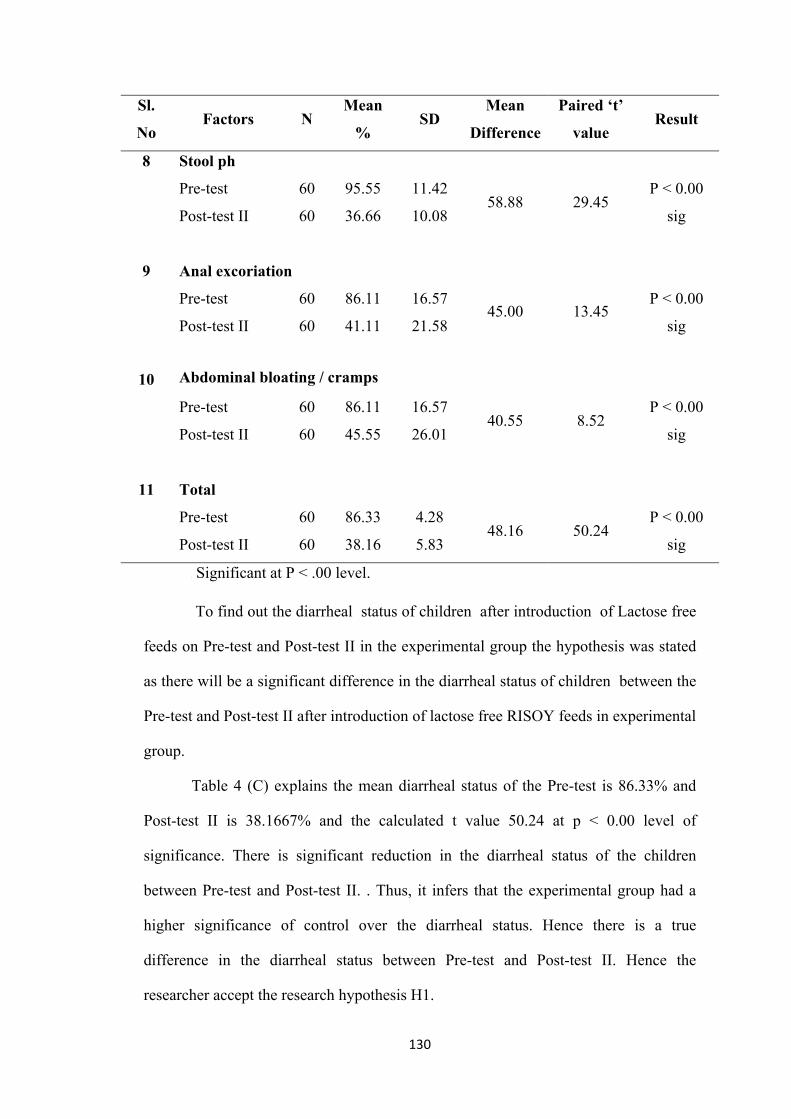
130
Sl.
No Factors N
Mean
% SD
Mean
Difference
Paired ‘t’
value Result
8 Stool ph
Pre-test 60 95.55 11.42 58.88 29.45
P < 0.00
sig Post-test II 60 36.66 10.08
9 Anal excoriation
Pre-test 60 86.11 16.57 45.00 13.45
P < 0.00
sig Post-test II 60 41.11 21.58
10
Abdominal bloating / cramps
Pre-test 60 86.11 16.57 40.55 8.52
P < 0.00
sig Post-test II 60 45.55 26.01
11 Total
Pre-test 60 86.33 4.28 48.16 50.24
P < 0.00
sig Post-test II 60 38.16 5.83
v Significant at P < .00 level.
To find out the diarrheal status of children after introduction of Lactose free
feeds on Pre-test and Post-test II in the experimental group the hypothesis was stated
as there will be a significant difference in the diarrheal status of children between the
Pre-test and Post-test II after introduction of lactose free RISOY feeds in experimental
group.
Table 4 (C) explains the mean diarrheal status of the Pre-test is 86.33% and
Post-test II is 38.1667% and the calculated t value 50.24 at p < 0.00 level of
significance. There is significant reduction in the diarrheal status of the children
between Pre-test and Post-test II. . Thus, it infers that the experimental group had a
higher significance of control over the diarrheal status. Hence there is a true
difference in the diarrheal status between Pre-test and Post-test II. Hence the
researcher accept the research hypothesis H1.
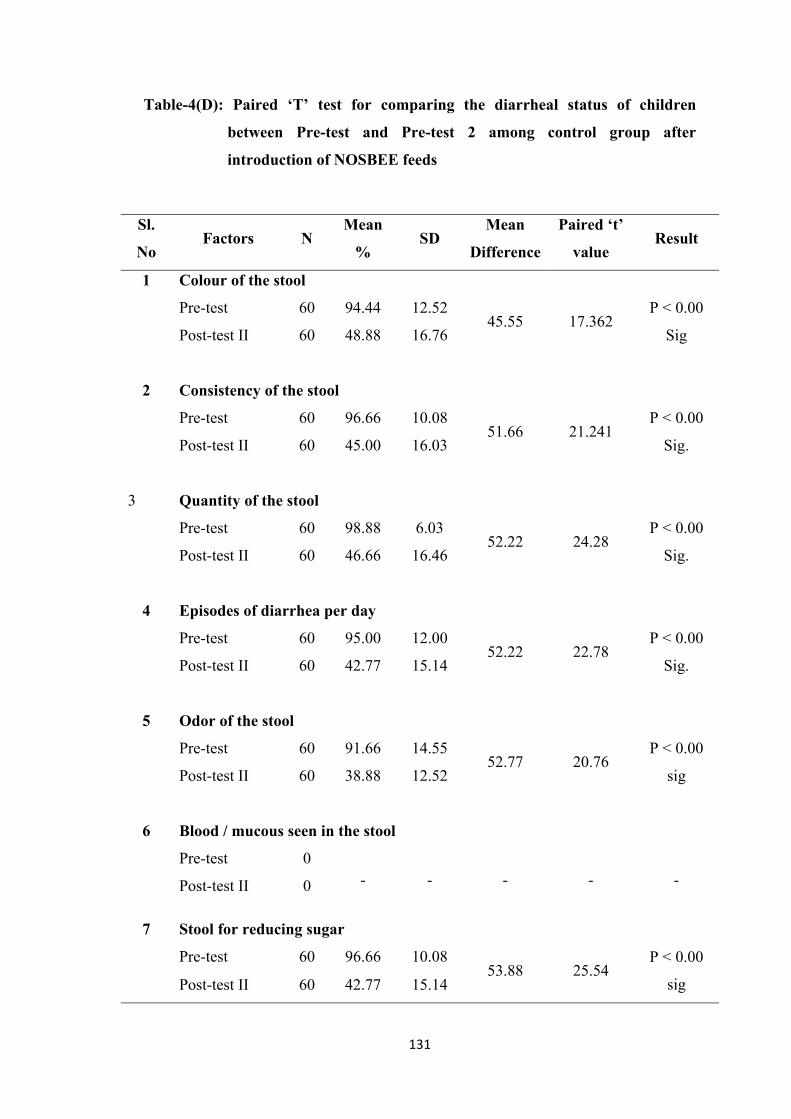
131
Table-4(D): Paired ‘T’ test for comparing the diarrheal status of children
between Pre-test and Pre-test 2 among control group after
introduction of NOSBEE feeds
Sl.
No Factors N
Mean
% SD
Mean
Difference
Paired ‘t’
value Result
1 Colour of the stool
Pre-test 60 94.44 12.52 45.55 17.362
P < 0.00
Sig Post-test II 60 48.88 16.76
2 Consistency of the stool
Pre-test 60 96.66 10.08 51.66 21.241
P < 0.00
Sig. Post-test II 60 45.00 16.03
3 Quantity of the stool
Pre-test 60 98.88 6.03 52.22 24.28
P < 0.00
Sig. Post-test II 60 46.66 16.46
4 Episodes of diarrhea per day
Pre-test 60 95.00 12.00 52.22 22.78
P < 0.00
Sig. Post-test II 60 42.77 15.14
5 Odor of the stool
Pre-test 60 91.66 14.55 52.77 20.76
P < 0.00
sig Post-test II 60 38.88 12.52
6 Blood / mucous seen in the stool
Pre-test 0 - - - - - Post-test II 0
7 Stool for reducing sugar
Pre-test 60 96.66 10.08 53.88 25.54
P < 0.00
sig Post-test II 60 42.77 15.14
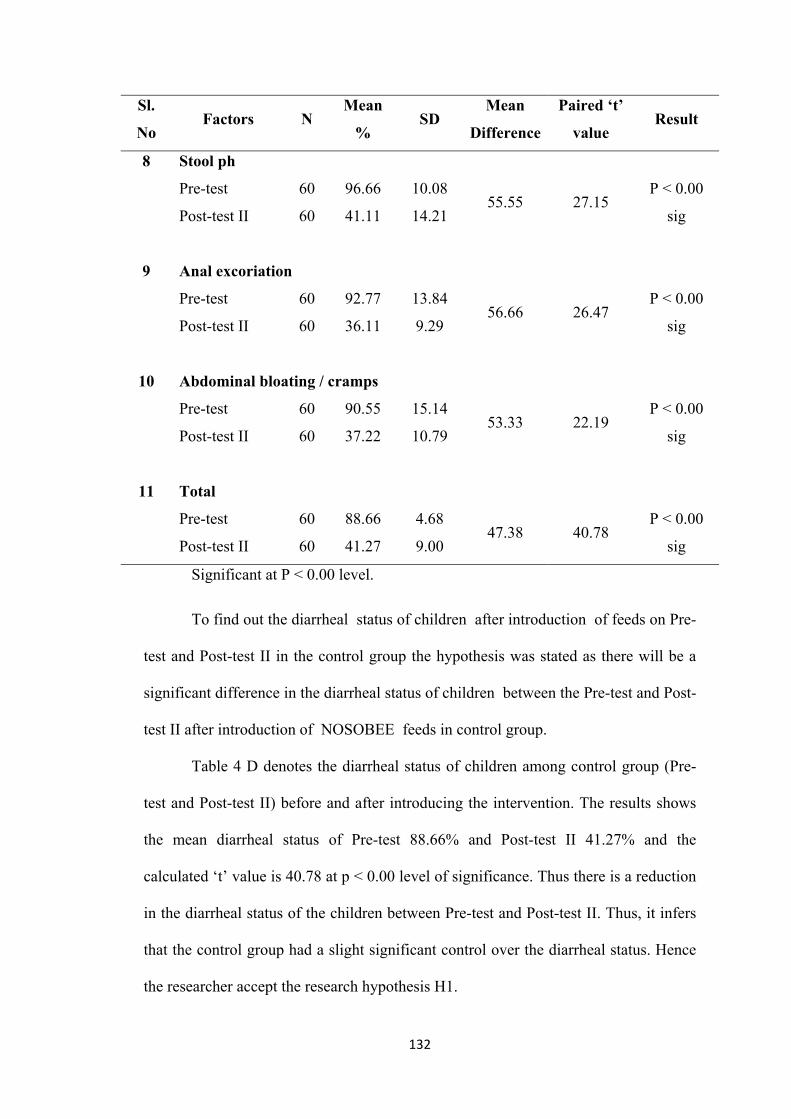
132
Sl.
No Factors N
Mean
% SD
Mean
Difference
Paired ‘t’
value Result
8 Stool ph
Pre-test 60 96.66 10.08 55.55 27.15
P < 0.00
sig Post-test II 60 41.11 14.21
9 Anal excoriation
Pre-test 60 92.77 13.84 56.66 26.47
P < 0.00
sig Post-test II 60 36.11 9.29
10 Abdominal bloating / cramps
Pre-test 60 90.55 15.14 53.33 22.19
P < 0.00
sig Post-test II 60 37.22 10.79
11 Total
Pre-test 60 88.66 4.68 47.38 40.78
P < 0.00
sig Post-test II 60 41.27 9.00
Significant at P < 0.00 level.
To find out the diarrheal status of children after introduction of feeds on Pre-
test and Post-test II in the control group the hypothesis was stated as there will be a
significant difference in the diarrheal status of children between the Pre-test and Post-
test II after introduction of NOSOBEE feeds in control group.
Table 4 D denotes the diarrheal status of children among control group (Pre-
test and Post-test II) before and after introducing the intervention. The results shows
the mean diarrheal status of Pre-test 88.66% and Post-test II 41.27% and the
calculated ‘t’ value is 40.78 at p < 0.00 level of significance. Thus there is a reduction
in the diarrheal status of the children between Pre-test and Post-test II. Thus, it infers
that the control group had a slight significant control over the diarrheal status. Hence
the researcher accept the research hypothesis H1.
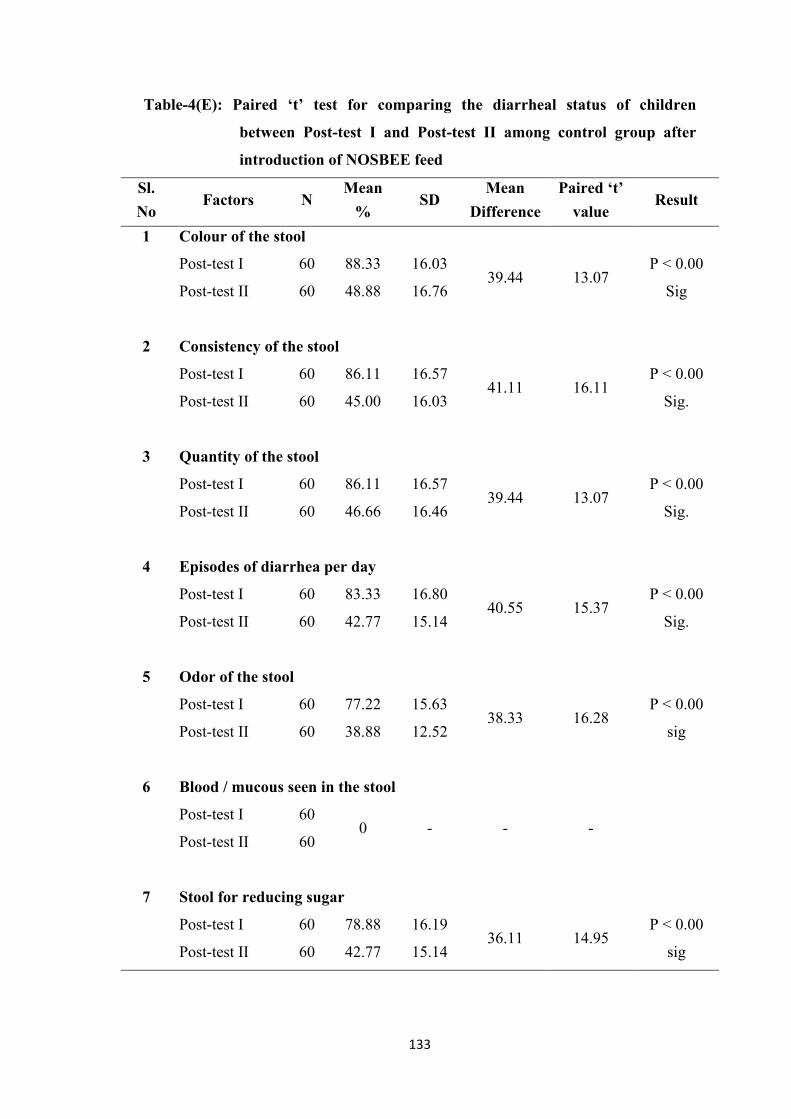
133
Table-4(E): Paired ‘t’ test for comparing the diarrheal status of children
between Post-test I and Post-test II among control group after
introduction of NOSBEE feed
Sl.
No Factors N
Mean
% SD
Mean
Difference
Paired ‘t’
value Result
1 Colour of the stool
Post-test I 60 88.33 16.03 39.44 13.07
P < 0.00
Sig Post-test II 60 48.88 16.76
2 Consistency of the stool
Post-test I 60 86.11 16.57 41.11 16.11
P < 0.00
Sig. Post-test II 60 45.00 16.03
3 Quantity of the stool
Post-test I 60 86.11 16.57 39.44 13.07
P < 0.00
Sig. Post-test II 60 46.66 16.46
4 Episodes of diarrhea per day
Post-test I 60 83.33 16.80 40.55 15.37
P < 0.00
Sig. Post-test II 60 42.77 15.14
5 Odor of the stool
Post-test I 60 77.22 15.63 38.33 16.28
P < 0.00
sig Post-test II 60 38.88 12.52
6 Blood / mucous seen in the stool
Post-test I 60 0 - - -
Post-test II 60
7 Stool for reducing sugar
Post-test I 60 78.88 16.19 36.11 14.95
P < 0.00
sig Post-test II 60 42.77 15.14
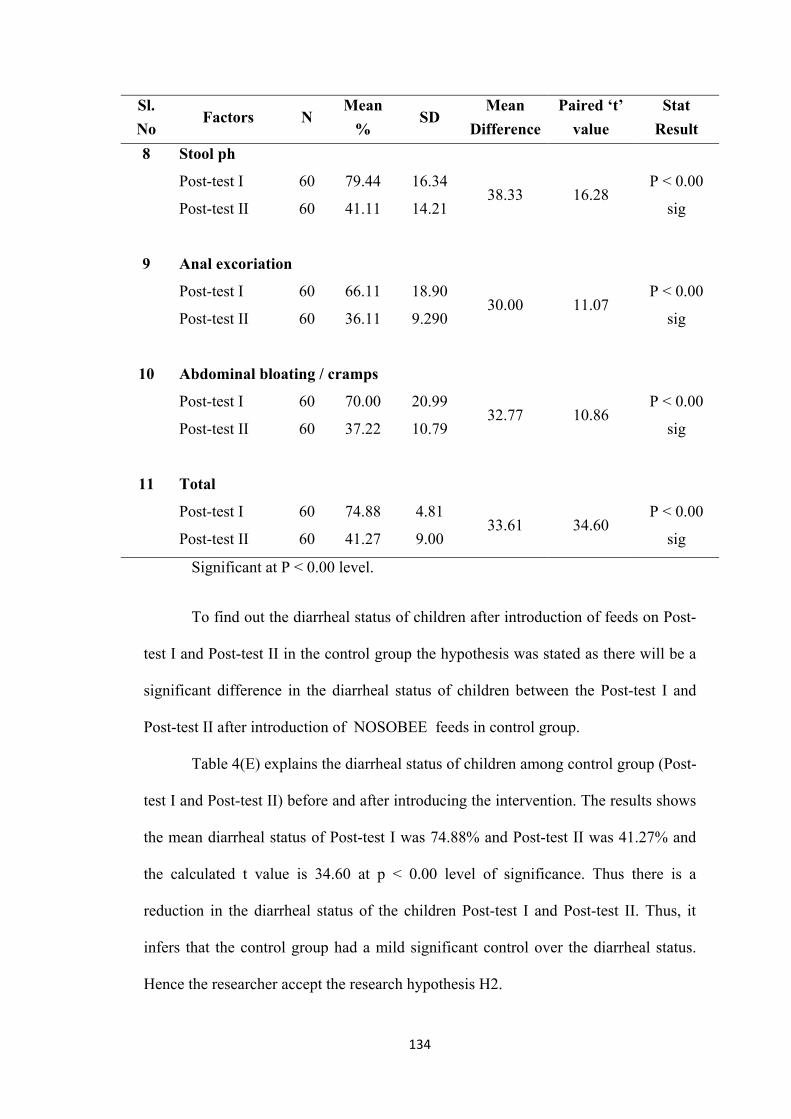
134
Sl.
No Factors N
Mean
% SD
Mean
Difference
Paired ‘t’
value
Stat
Result
8 Stool ph
Post-test I 60 79.44 16.34 38.33 16.28
P < 0.00
sig Post-test II 60 41.11 14.21
9 Anal excoriation
Post-test I 60 66.11 18.90 30.00 11.07
P < 0.00
sig Post-test II 60 36.11 9.290
10 Abdominal bloating / cramps
Post-test I 60 70.00 20.99 32.77 10.86
P < 0.00
sig Post-test II 60 37.22 10.79
11 Total
Post-test I 60 74.88 4.81 33.61 34.60
P < 0.00
sig Post-test II 60 41.27 9.00
Significant at P < 0.00 level.
To find out the diarrheal status of children after introduction of feeds on Post-
test I and Post-test II in the control group the hypothesis was stated as there will be a
significant difference in the diarrheal status of children between the Post-test I and
Post-test II after introduction of NOSOBEE feeds in control group.
Table 4(E) explains the diarrheal status of children among control group (Post-
test I and Post-test II) before and after introducing the intervention. The results shows
the mean diarrheal status of Post-test I was 74.88% and Post-test II was 41.27% and
the calculated t value is 34.60 at p < 0.00 level of significance. Thus there is a
reduction in the diarrheal status of the children Post-test I and Post-test II. Thus, it
infers that the control group had a mild significant control over the diarrheal status.
Hence the researcher accept the research hypothesis H2.
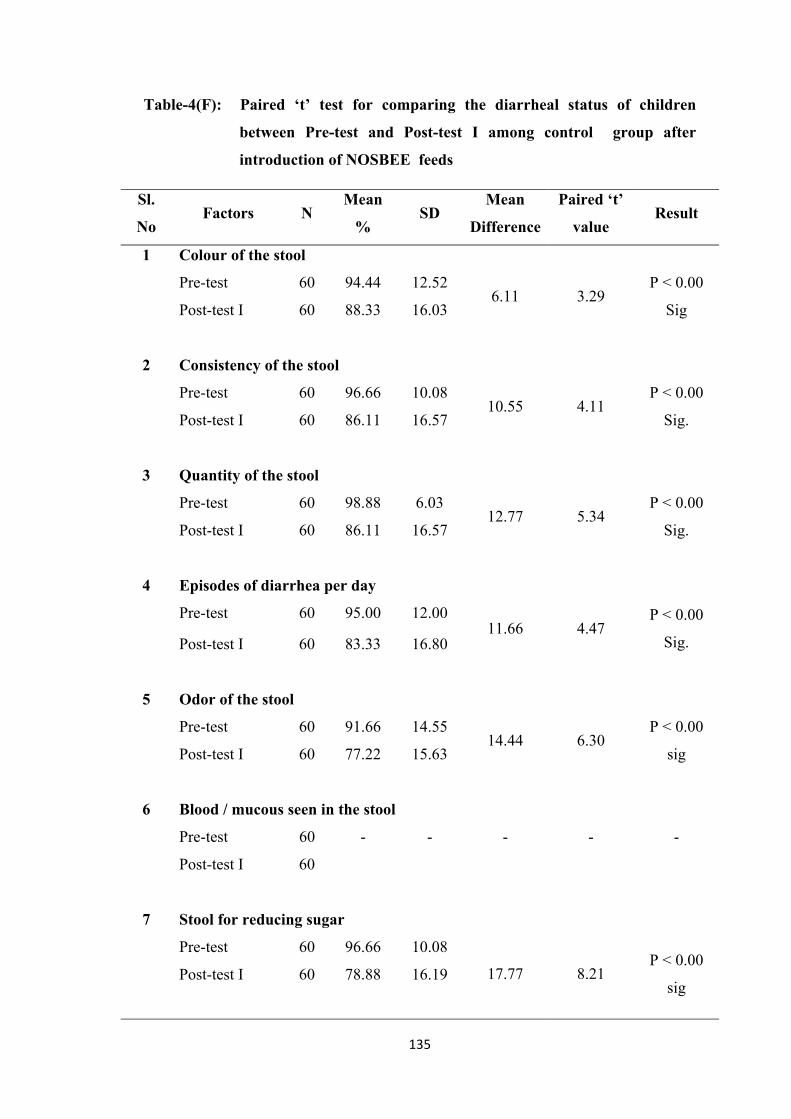
135
Table-4(F): Paired ‘t’ test for comparing the diarrheal status of children
between Pre-test and Post-test I among control group after
introduction of NOSBEE feeds
Sl.
No Factors N
Mean
% SD
Mean
Difference
Paired ‘t’
value Result
1 Colour of the stool
Pre-test 60 94.44 12.52 6.11 3.29
P < 0.00
Sig Post-test I 60 88.33 16.03
2 Consistency of the stool
Pre-test 60 96.66 10.08 10.55 4.11
P < 0.00
Sig. Post-test I 60 86.11 16.57
3 Quantity of the stool
Pre-test 60 98.88 6.03 12.77 5.34
P < 0.00
Sig. Post-test I 60 86.11 16.57
4 Episodes of diarrhea per day
Pre-test 60 95.00 12.00 11.66 4.47
P < 0.00
Sig. Post-test I 60 83.33 16.80
5 Odor of the stool
Pre-test 60 91.66 14.55 14.44 6.30
P < 0.00
sig Post-test I 60 77.22 15.63
6 Blood / mucous seen in the stool
Pre-test 60 - - - - -
Post-test I 60
7 Stool for reducing sugar
Pre-test 60 96.66 10.08
17.77 8.21 P < 0.00
sig Post-test I 60 78.88 16.19
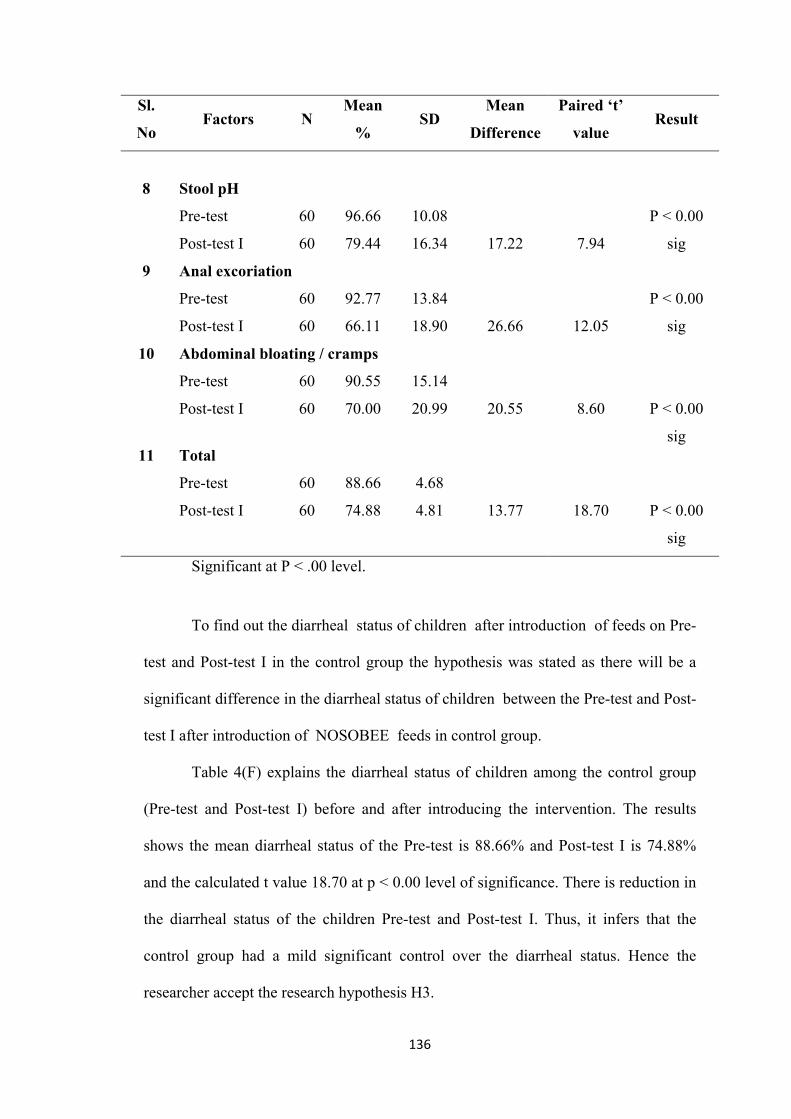
136
Sl.
No Factors N
Mean
% SD
Mean
Difference
Paired ‘t’
value Result
8 Stool pH
Pre-test 60 96.66 10.08
17.22
7.94
P < 0.00
sig Post-test I 60 79.44 16.34
9 Anal excoriation
Pre-test 60 92.77 13.84
26.66
12.05
P < 0.00
sig Post-test I 60 66.11 18.90
10 Abdominal bloating / cramps
Pre-test 60 90.55 15.14
20.55
8.60
P < 0.00
sig
Post-test I 60 70.00 20.99
11 Total
Pre-test 60 88.66 4.68
13.77
18.70
P < 0.00
sig
Post-test I 60 74.88 4.81
Significant at P < .00 level.
To find out the diarrheal status of children after introduction of feeds on Pre-
test and Post-test I in the control group the hypothesis was stated as there will be a
significant difference in the diarrheal status of children between the Pre-test and Post-
test I after introduction of NOSOBEE feeds in control group.
Table 4(F) explains the diarrheal status of children among the control group
(Pre-test and Post-test I) before and after introducing the intervention. The results
shows the mean diarrheal status of the Pre-test is 88.66% and Post-test I is 74.88%
and the calculated t value 18.70 at p < 0.00 level of significance. There is reduction in
the diarrheal status of the children Pre-test and Post-test I. Thus, it infers that the
control group had a mild significant control over the diarrheal status. Hence the
researcher accept the research hypothesis H3.
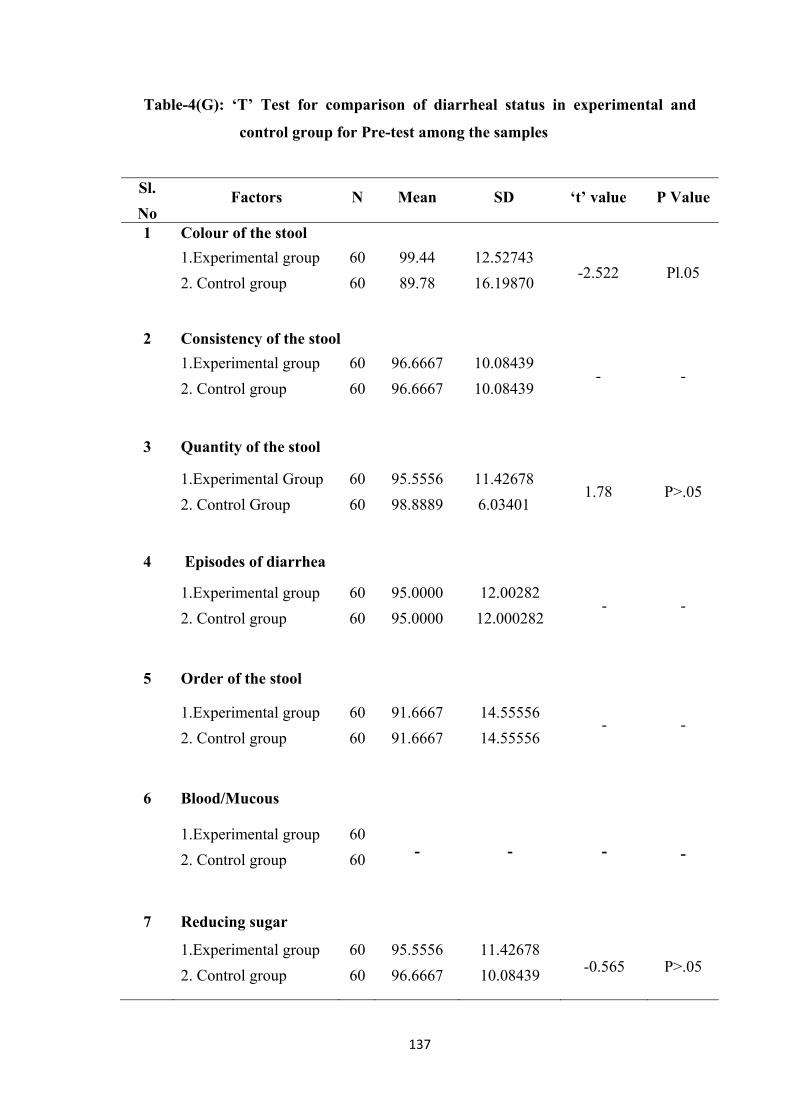
137
Table-4(G): ‘T’ Test for comparison of diarrheal status in experimental and
control group for Pre-test among the samples
Sl.
No Factors N Mean SD ‘t’ value P Value
1 Colour of the stool
1.Experimental group
2. Control group
60
60
99.44
89.78
12.52743
16.19870 -2.522 Pl.05
2 Consistency of the stool
1.Experimental group
2. Control group
60
60
96.6667
96.6667
10.08439
10.08439 - -
3 Quantity of the stool
1.Experimental Group
2. Control Group
60
60
95.5556
98.8889
11.42678
6.03401 1.78 P>.05
4 Episodes of diarrhea
1.Experimental group
2. Control group
60
60
95.0000
95.0000
12.00282
12.000282 - -
5 Order of the stool
1.Experimental group
2. Control group
60
60
91.6667
91.6667
14.55556
14.55556 - -
6 Blood/Mucous
1.Experimental group
2. Control group
60
60 - - -
-
7 Reducing sugar
1.Experimental group
2. Control group
60
60
95.5556
96.6667
11.42678
10.08439 -0.565 P>.05
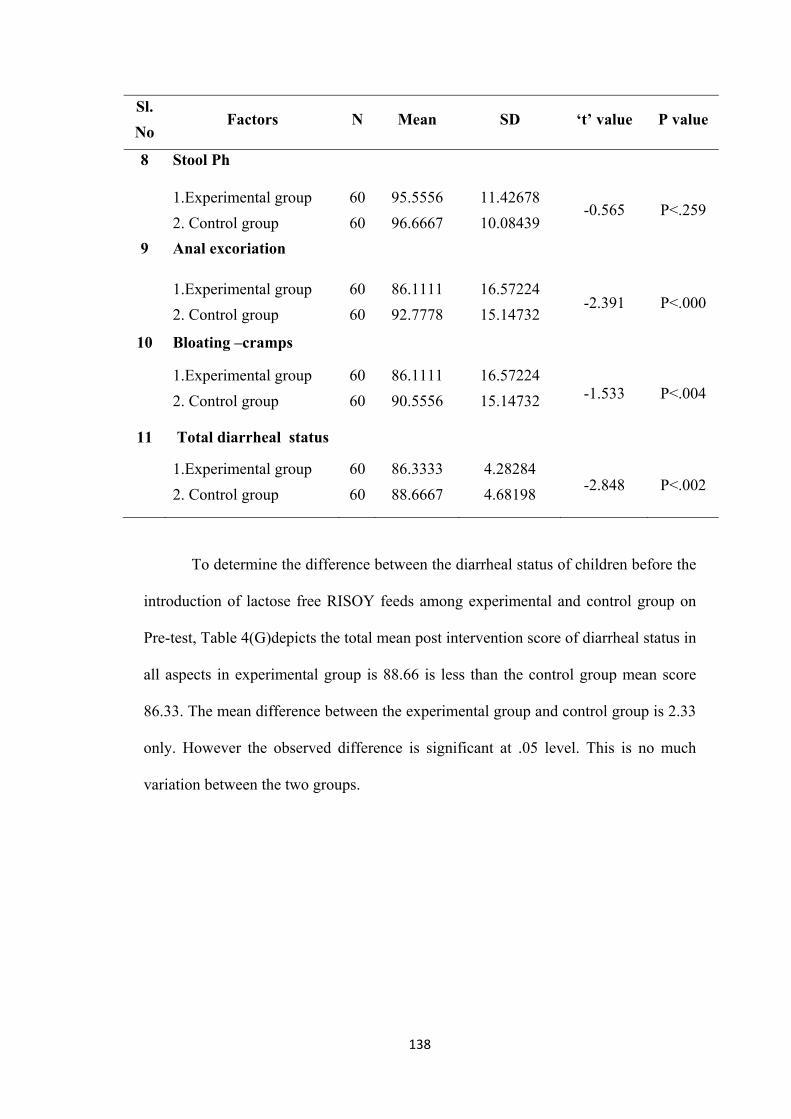
138
Sl.
No Factors N Mean SD ‘t’ value P value
8 Stool Ph
1.Experimental group
2. Control group
60
60
95.5556
96.6667
11.42678
10.08439 -0.565 P<.259
9 Anal excoriation
1.Experimental group
2. Control group
60
60
86.1111
92.7778
16.57224
15.14732 -2.391 P<.000
10 Bloating –cramps
1.Experimental group
2. Control group
60
60
86.1111
90.5556
16.57224
15.14732 -1.533 P<.004
11 Total diarrheal status
1.Experimental group
2. Control group
60
60
86.3333
88.6667
4.28284
4.68198 -2.848 P<.002
To determine the difference between the diarrheal status of children before the
introduction of lactose free RISOY feeds among experimental and control group on
Pre-test, Table 4(G)depicts the total mean post intervention score of diarrheal status in
all aspects in experimental group is 88.66 is less than the control group mean score
86.33. The mean difference between the experimental group and control group is 2.33
only. However the observed difference is significant at .05 level. This is no much
variation between the two groups.
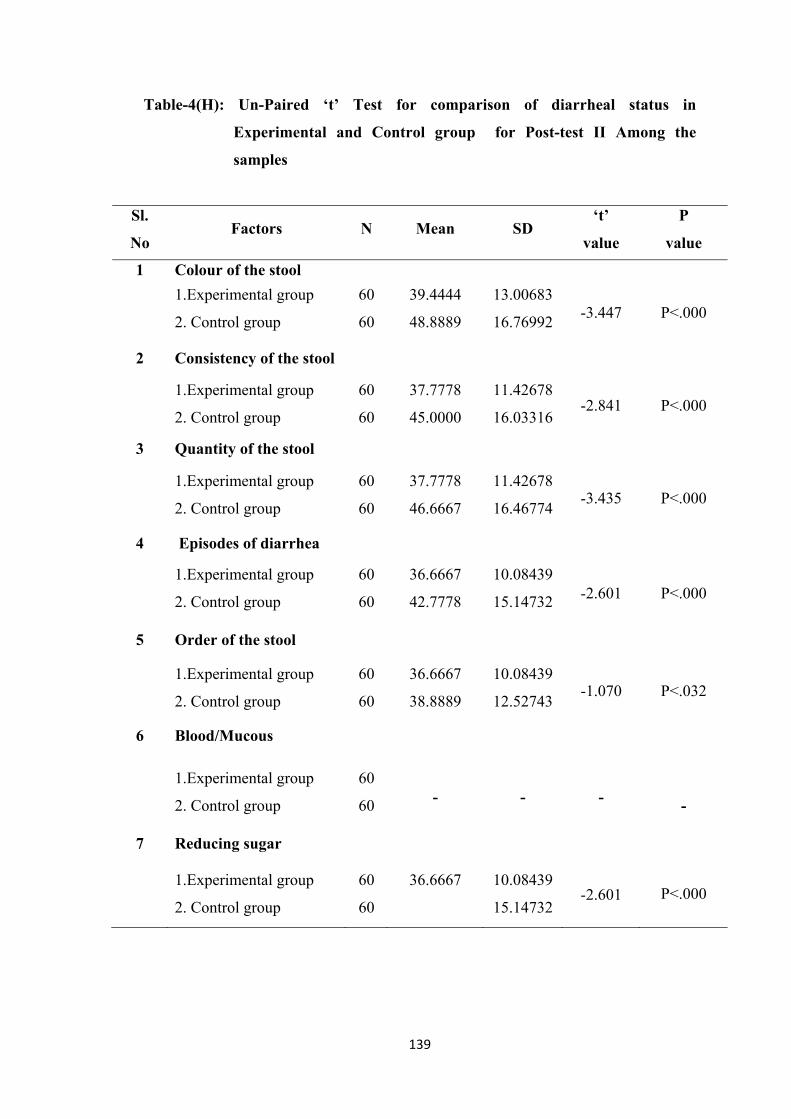
139
Table-4(H): Un-Paired ‘t’ Test for comparison of diarrheal status in
Experimental and Control group for Post-test II Among the
samples
Sl.
No Factors N Mean SD
‘t’
value
P
value
1 Colour of the stool
1.Experimental group
2. Control group
60
60
39.4444
48.8889
13.00683
16.76992 -3.447 P<.000
2 Consistency of the stool
1.Experimental group
2. Control group
60
60
37.7778
45.0000
11.42678
16.03316 -2.841 P<.000
3 Quantity of the stool
1.Experimental group
2. Control group
60
60
37.7778
46.6667
11.42678
16.46774 -3.435 P<.000
4 Episodes of diarrhea
1.Experimental group
2. Control group
60
60
36.6667
42.7778
10.08439
15.14732 -2.601 P<.000
5 Order of the stool
1.Experimental group
2. Control group
60
60
36.6667
38.8889
10.08439
12.52743 -1.070 P<.032
6 Blood/Mucous
1.Experimental group
2. Control group
60
60 - - -
-
7 Reducing sugar
1.Experimental group
2. Control group
60
60
36.6667 10.08439
15.14732 -2.601
P<.000
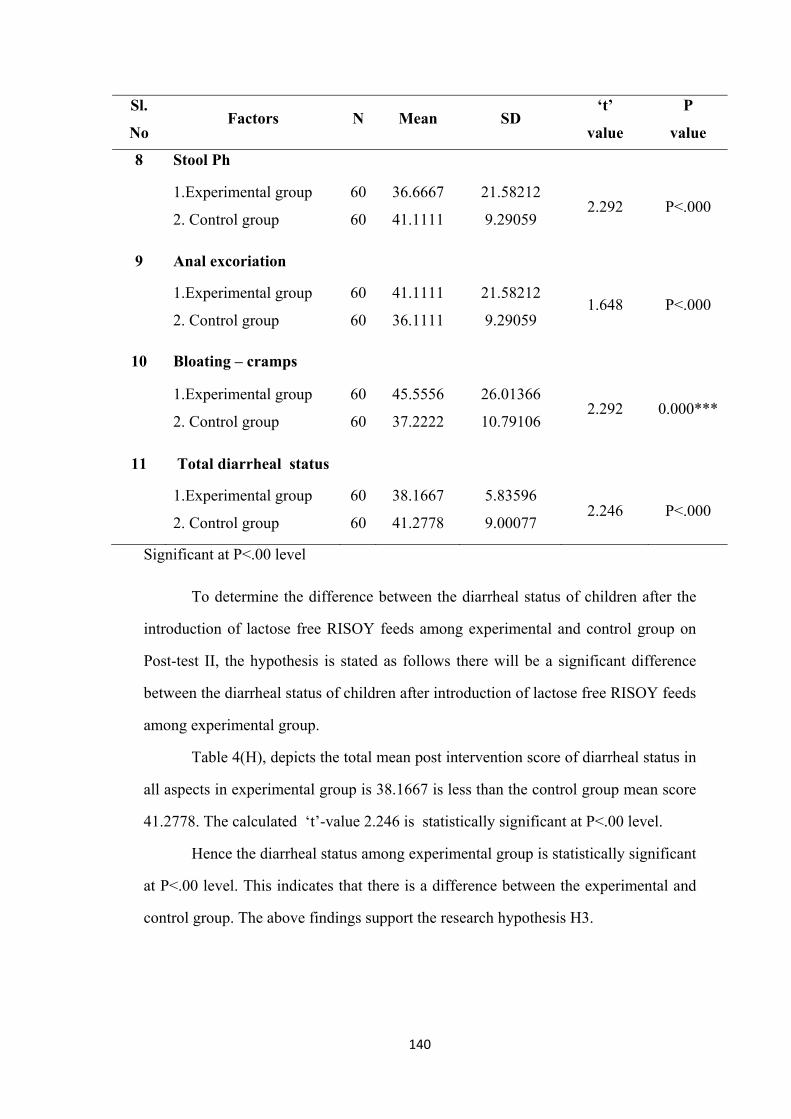
140
Sl.
No Factors N Mean SD
‘t’
value
P
value
8 Stool Ph
1.Experimental group
2. Control group
60
60
36.6667
41.1111
21.58212
9.29059 2.292 P<.000
9 Anal excoriation
1.Experimental group
2. Control group
60
60
41.1111
36.1111
21.58212
9.29059 1.648 P<.000
10 Bloating – cramps
1.Experimental group
2. Control group
60
60
45.5556
37.2222
26.01366
10.79106 2.292 0.000***
11 Total diarrheal status
1.Experimental group
2. Control group
60
60
38.1667
41.2778
5.83596
9.00077 2.246 P<.000
Significant at P<.00 level
To determine the difference between the diarrheal status of children after the
introduction of lactose free RISOY feeds among experimental and control group on
Post-test II, the hypothesis is stated as follows there will be a significant difference
between the diarrheal status of children after introduction of lactose free RISOY feeds
among experimental group.
Table 4(H), depicts the total mean post intervention score of diarrheal status in
all aspects in experimental group is 38.1667 is less than the control group mean score
41.2778. The calculated ‘t’-value 2.246 is statistically significant at P<.00 level.
Hence the diarrheal status among experimental group is statistically significant
at P<.00 level. This indicates that there is a difference between the experimental and
control group. The above findings support the research hypothesis H3.
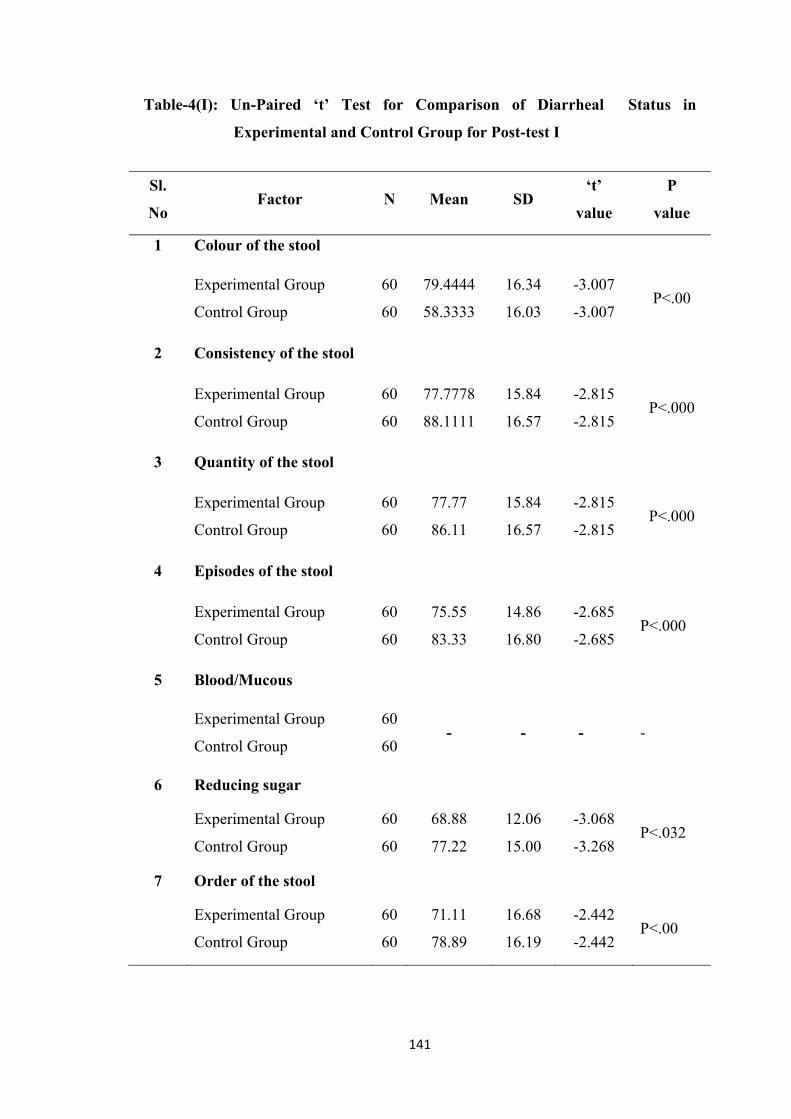
141
Table-4(I): Un-Paired ‘t’ Test for Comparison of Diarrheal Status in
Experimental and Control Group for Post-test I
Sl.
No Factor N Mean SD
‘t’
value
P
value
1 Colour of the stool
Experimental Group
Control Group
60
60
79.4444
58.3333
16.34
16.03
-3.007
-3.007 P<.00
2 Consistency of the stool
Experimental Group
Control Group
60
60
77.7778
88.1111
15.84
16.57
-2.815
-2.815 P<.000
3 Quantity of the stool
Experimental Group
Control Group
60
60
77.77
86.11
15.84
16.57
-2.815
-2.815 P<.000
4 Episodes of the stool
Experimental Group
Control Group
60
60
75.55
83.33
14.86
16.80
-2.685
-2.685 P<.000
5 Blood/Mucous
Experimental Group
Control Group
60
60 - - - -
6 Reducing sugar
Experimental Group
Control Group
60
60
68.88
77.22
12.06
15.00
-3.068
-3.268 P<.032
7 Order of the stool
Experimental Group
Control Group
60
60
71.11
78.89
16.68
16.19
-2.442
-2.442 P<.00
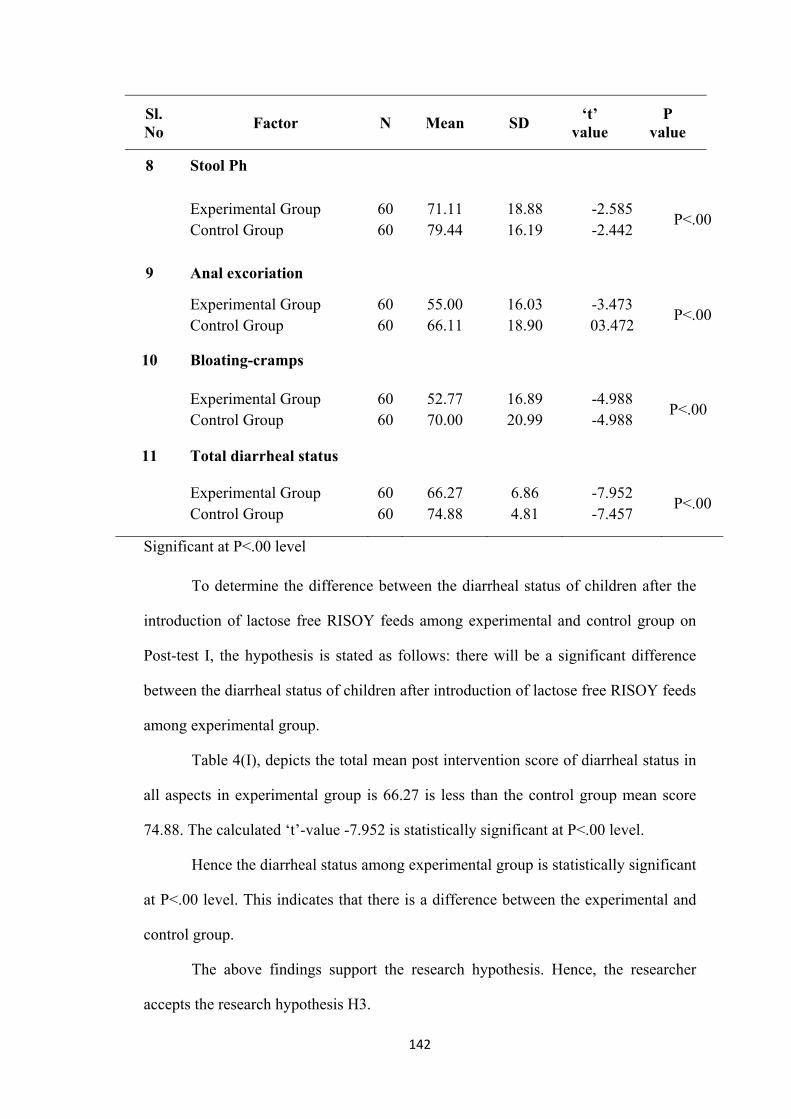
142
Sl. No
Factor N Mean SD ‘t’
value P
value
8 Stool Ph
Experimental Group Control Group
60 60
71.11 79.44
18.88 16.19
-2.585 -2.442
P<.00
9 Anal excoriation
Experimental Group Control Group
60 60
55.00 66.11
16.03 18.90
-3.473 03.472
P<.00
10 Bloating-cramps
Experimental Group Control Group
60 60
52.77 70.00
16.89 20.99
-4.988 -4.988
P<.00
11 Total diarrheal status
Experimental Group Control Group
60 60
66.27 74.88
6.86 4.81
-7.952 -7.457
P<.00
Significant at P<.00 level To determine the difference between the diarrheal status of children after the
introduction of lactose free RISOY feeds among experimental and control group on
Post-test I, the hypothesis is stated as follows: there will be a significant difference
between the diarrheal status of children after introduction of lactose free RISOY feeds
among experimental group.
Table 4(I), depicts the total mean post intervention score of diarrheal status in
all aspects in experimental group is 66.27 is less than the control group mean score
74.88. The calculated ‘t’-value -7.952 is statistically significant at P<.00 level.
Hence the diarrheal status among experimental group is statistically significant
at P<.00 level. This indicates that there is a difference between the experimental and
control group.
The above findings support the research hypothesis. Hence, the researcher
accepts the research hypothesis H3.
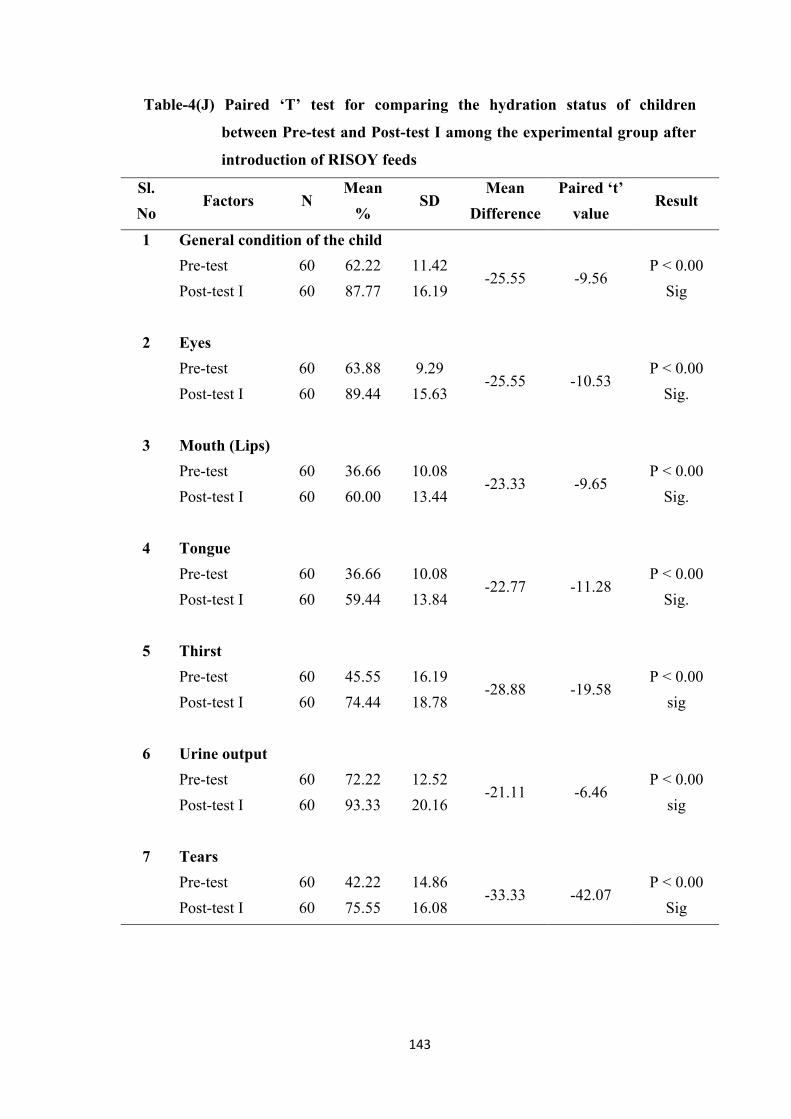
143
Table-4(J) Paired ‘T’ test for comparing the hydration status of children
between Pre-test and Post-test I among the experimental group after
introduction of RISOY feeds
Sl.
No Factors N
Mean
% SD
Mean
Difference
Paired ‘t’
value Result
1 General condition of the child
Pre-test 60 62.22 11.42 -25.55 -9.56
P < 0.00
Sig Post-test I 60 87.77 16.19
2 Eyes
Pre-test 60 63.88 9.29 -25.55 -10.53
P < 0.00
Sig. Post-test I 60 89.44 15.63
3 Mouth (Lips)
Pre-test 60 36.66 10.08 -23.33 -9.65
P < 0.00
Sig. Post-test I 60 60.00 13.44
4 Tongue
Pre-test 60 36.66 10.08 -22.77 -11.28
P < 0.00
Sig. Post-test I 60 59.44 13.84
5 Thirst
Pre-test 60 45.55 16.19 -28.88 -19.58
P < 0.00
sig Post-test I 60 74.44 18.78
6 Urine output
Pre-test 60 72.22 12.52 -21.11 -6.46
P < 0.00
sig Post-test I 60 93.33 20.16
7 Tears
Pre-test 60 42.22 14.86 -33.33 -42.07
P < 0.00
Sig Post-test I 60 75.55 16.08
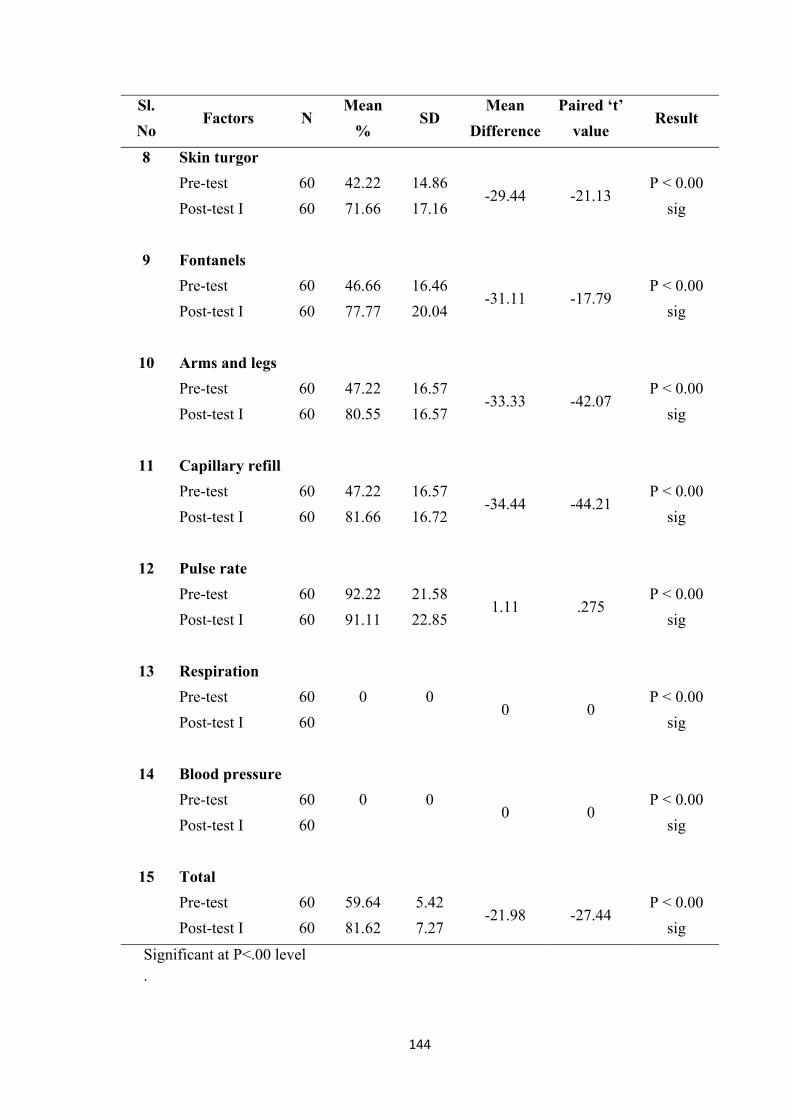
144
Sl.
No Factors N
Mean
% SD
Mean
Difference
Paired ‘t’
value Result
8 Skin turgor
Pre-test 60 42.22 14.86 -29.44 -21.13
P < 0.00
sig Post-test I 60 71.66 17.16
9 Fontanels
Pre-test 60 46.66 16.46 -31.11 -17.79
P < 0.00
sig Post-test I 60 77.77 20.04
10 Arms and legs
Pre-test 60 47.22 16.57 -33.33 -42.07
P < 0.00
sig Post-test I 60 80.55 16.57
11 Capillary refill
Pre-test 60 47.22 16.57 -34.44 -44.21
P < 0.00
sig Post-test I 60 81.66 16.72
12 Pulse rate
Pre-test 60 92.22 21.58 1.11 .275
P < 0.00
sig Post-test I 60 91.11 22.85
13 Respiration
Pre-test 60 0 0 0 0
P < 0.00
sig Post-test I 60
14 Blood pressure
Pre-test 60 0 0 0 0
P < 0.00
sig Post-test I 60
15 Total
Pre-test 60 59.64 5.42 -21.98 -27.44
P < 0.00
sig Post-test I 60 81.62 7.27
Significant at P<.00 level .
145
To find out the hydration status of children after introduction of Lactose free
feeds on Pre-test and Post-test I in the experimental group the hypothesis was stated
as there will be a significant difference in the hydration status of children between the
Pre-test and Post-test I after introduction of lactose free RISOY feeds in experimental
group.
Table 4 (J) explains the paired to ‘t’ test values to find out the difference in
the hydration status of the children within the experimental group. Compared between
Pre-test and Post-test. The calculated overall mean value of all the items on Pre-test
was 59.64% and Post-test I was 81.62 and overall ‘t’ value was 27.44 which is greater
than the table value of statistics and P value <0.000, which show that there is a
significant difference between hydration status on Pre-test and Post-test I. This infers
that within the group Comparison, hydration status was improved on the Second Day.
Hence the researcher accept the research hypothesis H2.
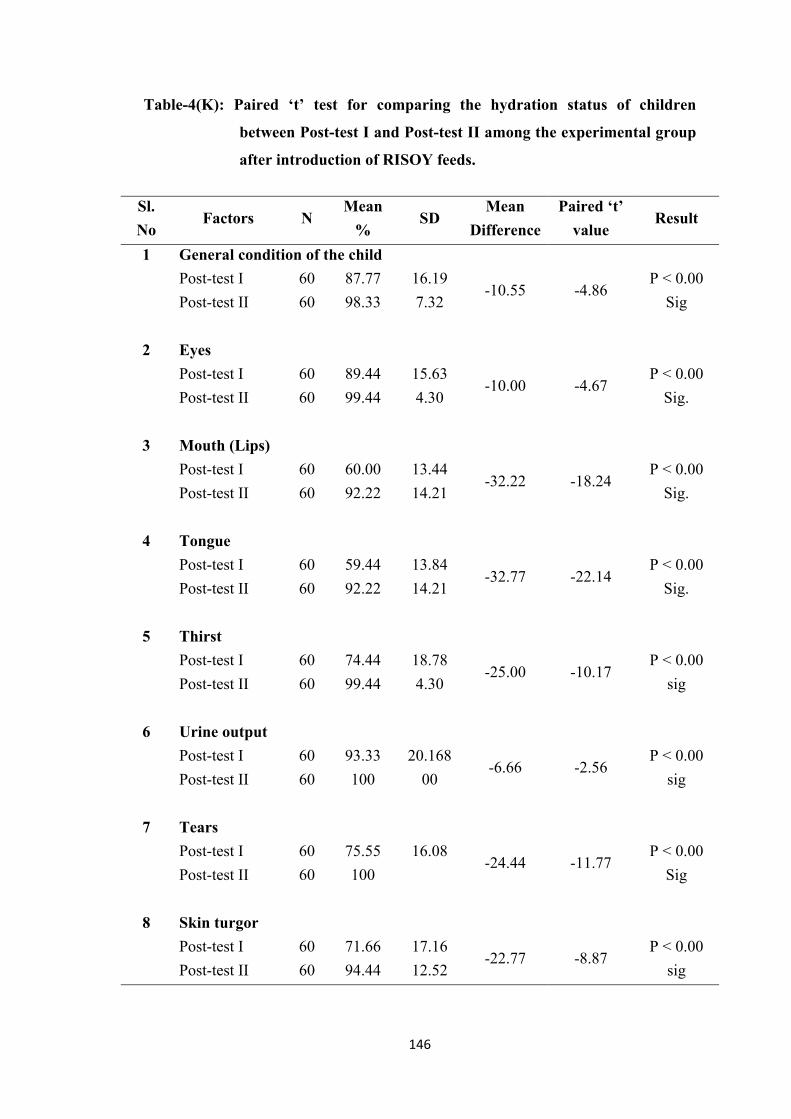
146
Table-4(K): Paired ‘t’ test for comparing the hydration status of children
between Post-test I and Post-test II among the experimental group
after introduction of RISOY feeds.
Sl.
No Factors N
Mean
% SD
Mean
Difference
Paired ‘t’
value Result
1 General condition of the child
Post-test I 60 87.77 16.19 -10.55 -4.86
P < 0.00
Sig Post-test II 60 98.33 7.32
2 Eyes
Post-test I 60 89.44 15.63 -10.00 -4.67
P < 0.00
Sig. Post-test II 60 99.44 4.30
3 Mouth (Lips)
Post-test I 60 60.00 13.44 -32.22 -18.24
P < 0.00
Sig. Post-test II 60 92.22 14.21
4 Tongue
Post-test I 60 59.44 13.84 -32.77 -22.14
P < 0.00
Sig. Post-test II 60 92.22 14.21
5 Thirst
Post-test I 60 74.44 18.78 -25.00 -10.17
P < 0.00
sig Post-test II 60 99.44 4.30
6 Urine output
Post-test I 60 93.33 20.168 -6.66 -2.56
P < 0.00
sig Post-test II 60 100 00
7 Tears
Post-test I 60 75.55 16.08 -24.44 -11.77
P < 0.00
Sig Post-test II 60 100
8 Skin turgor
Post-test I 60 71.66 17.16 -22.77 -8.87
P < 0.00
sig Post-test II 60 94.44 12.52
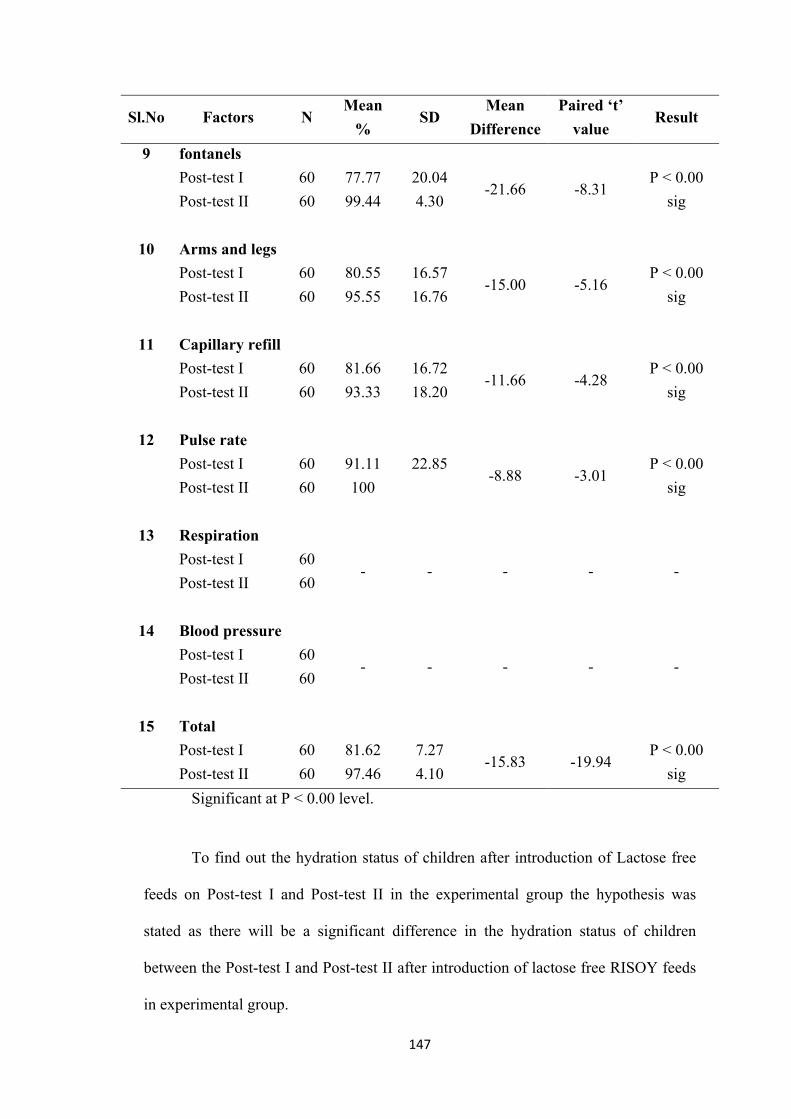
147
Sl.No Factors N Mean
% SD
Mean
Difference
Paired ‘t’
value Result
9 fontanels
Post-test I 60 77.77 20.04 -21.66 -8.31
P < 0.00
sig Post-test II 60 99.44 4.30
10 Arms and legs
Post-test I 60 80.55 16.57 -15.00 -5.16
P < 0.00
sig Post-test II 60 95.55 16.76
11 Capillary refill
Post-test I 60 81.66 16.72 -11.66 -4.28
P < 0.00
sig Post-test II 60 93.33 18.20
12 Pulse rate
Post-test I 60 91.11 22.85 -8.88 -3.01
P < 0.00
sig Post-test II 60 100
13 Respiration
Post-test I 60 - - - - -
Post-test II 60
14 Blood pressure
Post-test I 60 - - - - -
Post-test II 60
15 Total
Post-test I 60 81.62 7.27 -15.83 -19.94
P < 0.00
sig Post-test II 60 97.46 4.10
Significant at P < 0.00 level.
To find out the hydration status of children after introduction of Lactose free
feeds on Post-test I and Post-test II in the experimental group the hypothesis was
stated as there will be a significant difference in the hydration status of children
between the Post-test I and Post-test II after introduction of lactose free RISOY feeds
in experimental group.
148
Table 4(K) explains the paired t”: test Values to find out the significance
difference in the hydration status of the children within the experimental group
compared between Post-test I and Post-test II. The calculated over all mean value of
all the items on Post-test I was 81.62% and Post-test II was 97.46% and the over all
‘t’ value was 19.94 which is greater than the table value of Statistics and P Value
< 0.000, which shows that there is a difference between the hydration Status on Post-
test I and Post-test II. This infers that within the group comparison, Post-test II
hydration status was significantly improved than Post-test I. Hence the researcher
accept the research hypothesis H2.
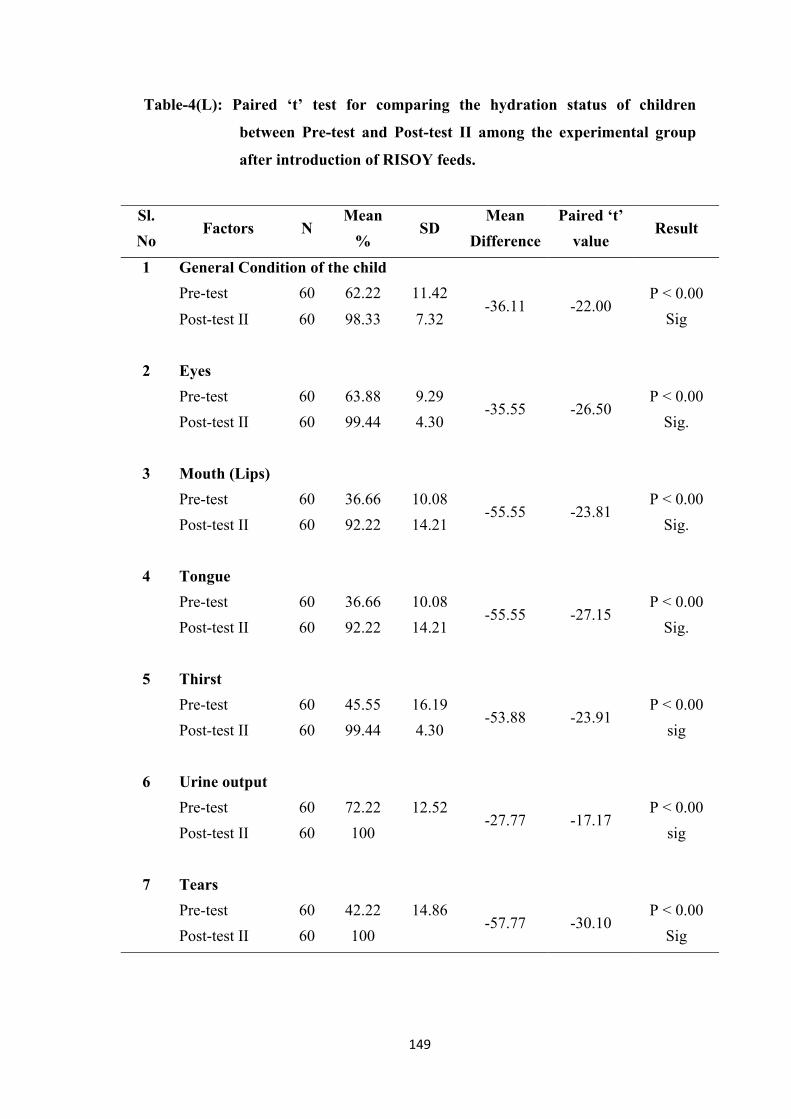
149
Table-4(L): Paired ‘t’ test for comparing the hydration status of children
between Pre-test and Post-test II among the experimental group
after introduction of RISOY feeds.
Sl.
No Factors N
Mean
% SD
Mean
Difference
Paired ‘t’
value Result
1 General Condition of the child
Pre-test 60 62.22 11.42 -36.11 -22.00
P < 0.00
Sig Post-test II 60 98.33 7.32
2 Eyes
Pre-test 60 63.88 9.29 -35.55 -26.50
P < 0.00
Sig. Post-test II 60 99.44 4.30
3 Mouth (Lips)
Pre-test 60 36.66 10.08 -55.55 -23.81
P < 0.00
Sig. Post-test II 60 92.22 14.21
4 Tongue
Pre-test 60 36.66 10.08 -55.55 -27.15
P < 0.00
Sig. Post-test II 60 92.22 14.21
5 Thirst
Pre-test 60 45.55 16.19 -53.88 -23.91
P < 0.00
sig Post-test II 60 99.44 4.30
6 Urine output
Pre-test 60 72.22 12.52 -27.77 -17.17
P < 0.00
sig Post-test II 60 100
7 Tears
Pre-test 60 42.22 14.86 -57.77 -30.10
P < 0.00
Sig Post-test II 60 100
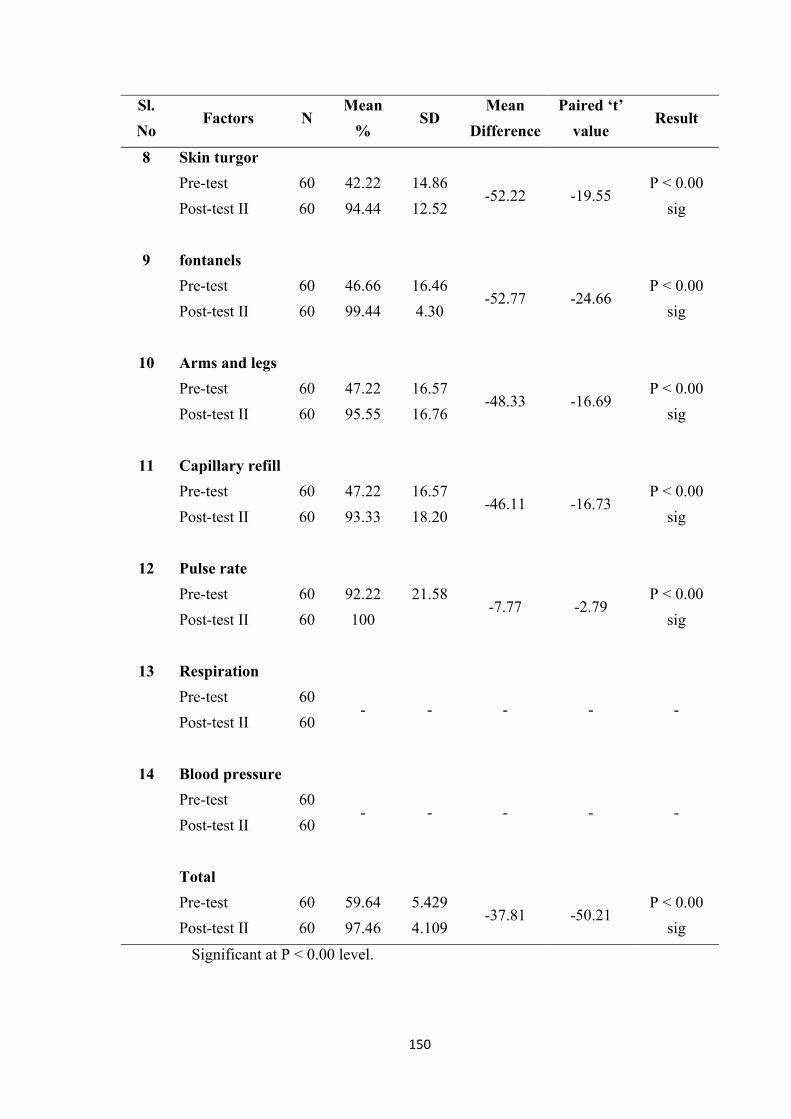
150
Sl.
No Factors N
Mean
% SD
Mean
Difference
Paired ‘t’
value Result
8 Skin turgor
Pre-test 60 42.22 14.86 -52.22 -19.55
P < 0.00
sig Post-test II 60 94.44 12.52
9 fontanels
Pre-test 60 46.66 16.46 -52.77 -24.66
P < 0.00
sig Post-test II 60 99.44 4.30
10 Arms and legs
Pre-test 60 47.22 16.57 -48.33 -16.69
P < 0.00
sig Post-test II 60 95.55 16.76
11 Capillary refill
Pre-test 60 47.22 16.57 -46.11 -16.73
P < 0.00
sig Post-test II 60 93.33 18.20
12 Pulse rate
Pre-test 60 92.22 21.58 -7.77 -2.79
P < 0.00
sig Post-test II 60 100
13 Respiration
Pre-test 60 - - - - -
Post-test II 60
14 Blood pressure
Pre-test 60 - - - - -
Post-test II 60
Total
Pre-test 60 59.64 5.429 -37.81 -50.21
P < 0.00
sig Post-test II 60 97.46 4.109
Significant at P < 0.00 level.
151
To find out the hydration status of children after introduction of Lactose free
feeds on Pre-test and Post-test II in the experimental group the hypothesis was stated
as there will be a significant difference in the hydration status of children between the
Pre-test and Post-test II after introduction of lactose free RISOY feeds in experimental
group.
Table-4(L) explains the paired ‘t’ test values to find out the significant
difference in the hydration status of the children within the experimental group
compared between Pre-test and Post-test II. The calculated overall mean value of all
the items on Pre-test was 59.64% and Post-test II was 97.46% and the overall ‘t’
value was 50.215 which is greater than the table value of statistics and P value
< 0.000, which shows that there is a significant difference between the hydration
status on Pre-test and Post-test II. Therefore the hypothesis H2 is accepted. This
infers that within the group comparison, hydration status was highly improved on the
third Day. These findings reveals, that there is significant improvement in the
hydration status of children after the introduction lactose free RISOY feeds by
decrease in the episodes of diarrhea and improved hydration status. Hence the
researchers accept the research hypothesis H2.
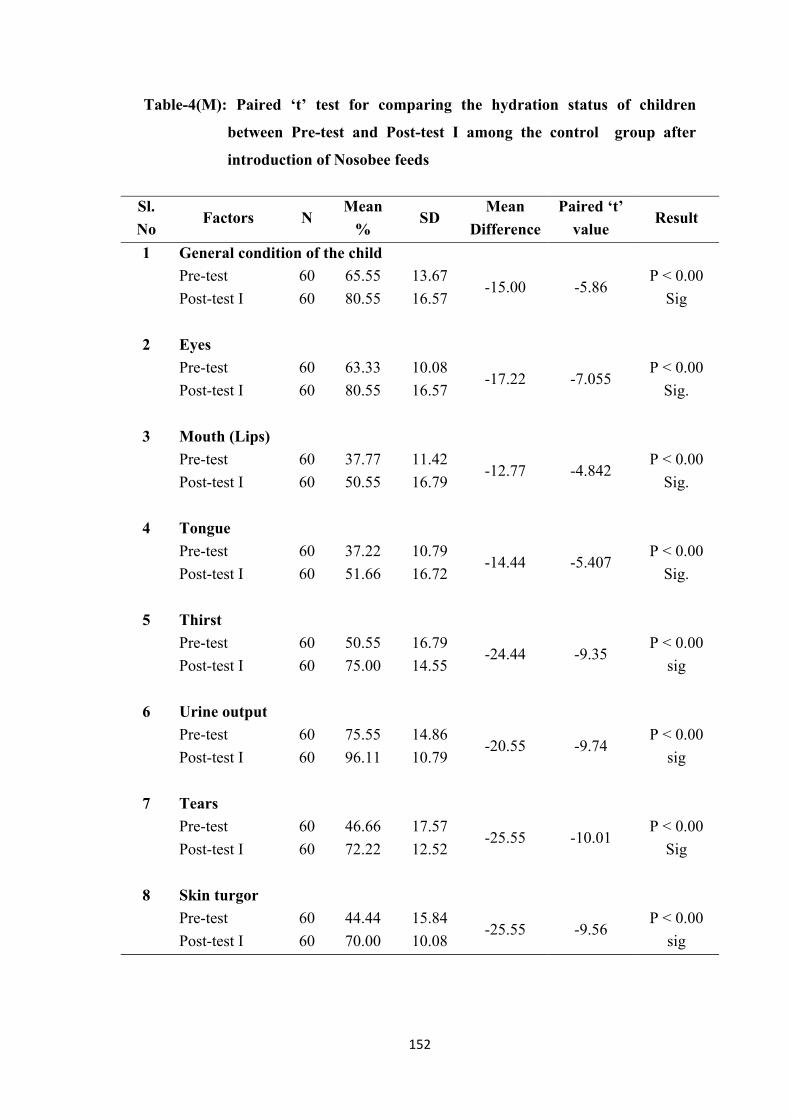
152
Table-4(M): Paired ‘t’ test for comparing the hydration status of children
between Pre-test and Post-test I among the control group after
introduction of Nosobee feeds
Sl.
No Factors N
Mean
% SD
Mean
Difference
Paired ‘t’
value Result
1 General condition of the child
Pre-test 60 65.55 13.67 -15.00 -5.86
P < 0.00
Sig Post-test I 60 80.55 16.57
2 Eyes
Pre-test 60 63.33 10.08 -17.22 -7.055
P < 0.00
Sig. Post-test I 60 80.55 16.57
3 Mouth (Lips)
Pre-test 60 37.77 11.42 -12.77 -4.842
P < 0.00
Sig. Post-test I 60 50.55 16.79
4 Tongue
Pre-test 60 37.22 10.79 -14.44 -5.407
P < 0.00
Sig. Post-test I 60 51.66 16.72
5 Thirst
Pre-test 60 50.55 16.79 -24.44 -9.35
P < 0.00
sig Post-test I 60 75.00 14.55
6 Urine output
Pre-test 60 75.55 14.86 -20.55 -9.74
P < 0.00
sig Post-test I 60 96.11 10.79
7 Tears
Pre-test 60 46.66 17.57 -25.55 -10.01
P < 0.00
Sig Post-test I 60 72.22 12.52
8 Skin turgor
Pre-test 60 44.44 15.84 -25.55 -9.56
P < 0.00
sig Post-test I 60 70.00 10.08
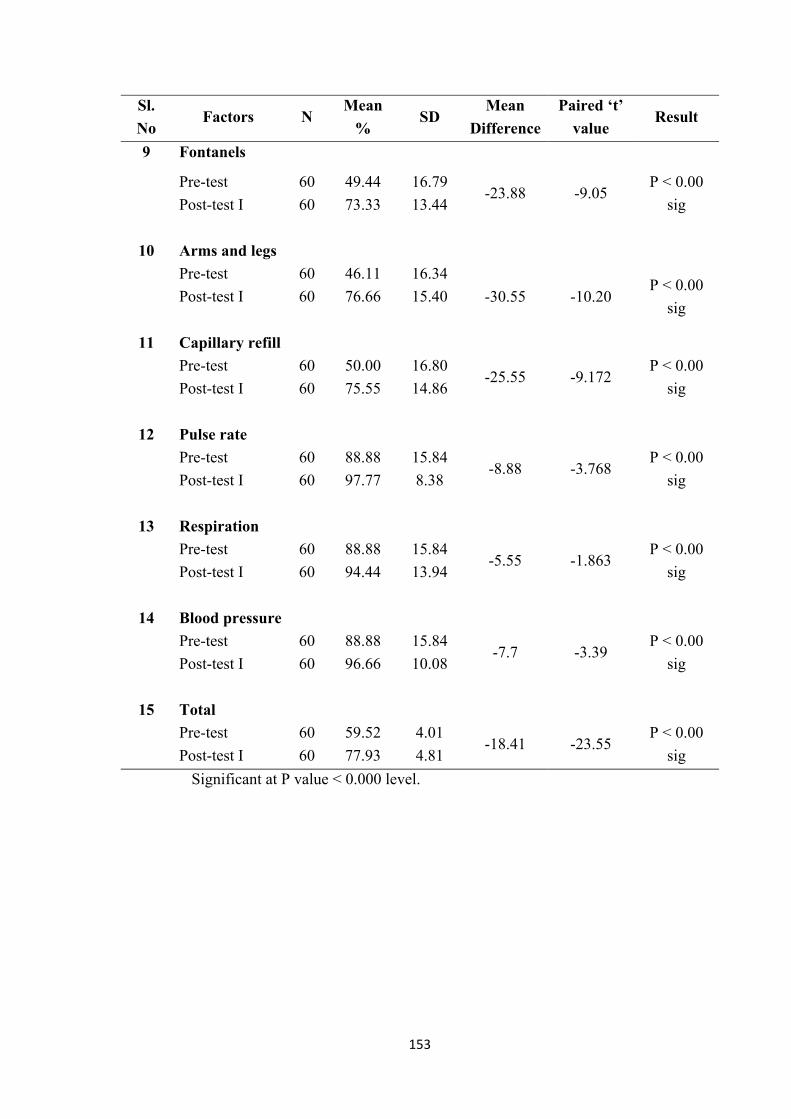
153
Sl.
No Factors N
Mean
% SD
Mean
Difference
Paired ‘t’
value Result
9 Fontanels
Pre-test 60 49.44 16.79 -23.88 -9.05
P < 0.00
sig Post-test I 60 73.33 13.44
10 Arms and legs
Pre-test 60 46.11 16.34
-30.55 -10.20 P < 0.00
sig Post-test I 60 76.66 15.40
11 Capillary refill
Pre-test 60 50.00 16.80 -25.55 -9.172
P < 0.00
sig Post-test I 60 75.55 14.86
12 Pulse rate
Pre-test 60 88.88 15.84 -8.88 -3.768
P < 0.00
sig Post-test I 60 97.77 8.38
13 Respiration
Pre-test 60 88.88 15.84 -5.55 -1.863
P < 0.00
sig Post-test I 60 94.44 13.94
14 Blood pressure
Pre-test 60 88.88 15.84 -7.7 -3.39
P < 0.00
sig Post-test I 60 96.66 10.08
15 Total
Pre-test 60 59.52 4.01 -18.41 -23.55
P < 0.00
sig Post-test I 60 77.93 4.81
Significant at P value < 0.000 level.
154
To find out the hydration status of children after introduction of NOSOBEE
feeds on Pre-test and Post-test I in the control group the hypothesis was stated as there
will be a significant difference in the hydration status of children between the Pre-test
and Post-test I after introduction of NOSOBEE feeds in control group.
Table 4(M) explains the paired ‘t’ test values to find out the significance
difference in the hydration status of the children within the control group compared
between Pre-test and Post-test I. The calculated overall mean value of all the items on
Pre-test was 59.52% and Post-test I was 77.93% and the overall ‘t’ value was 23.55
which is greater than the table value of statistics and P value < 0.000, which shows
that there is a difference between the hydration status on Pre-test and Post-test I.
This infers that within the group comparison, hydration status was improved on the
second Day. Hence the researcher accept the research hypothesis H2.
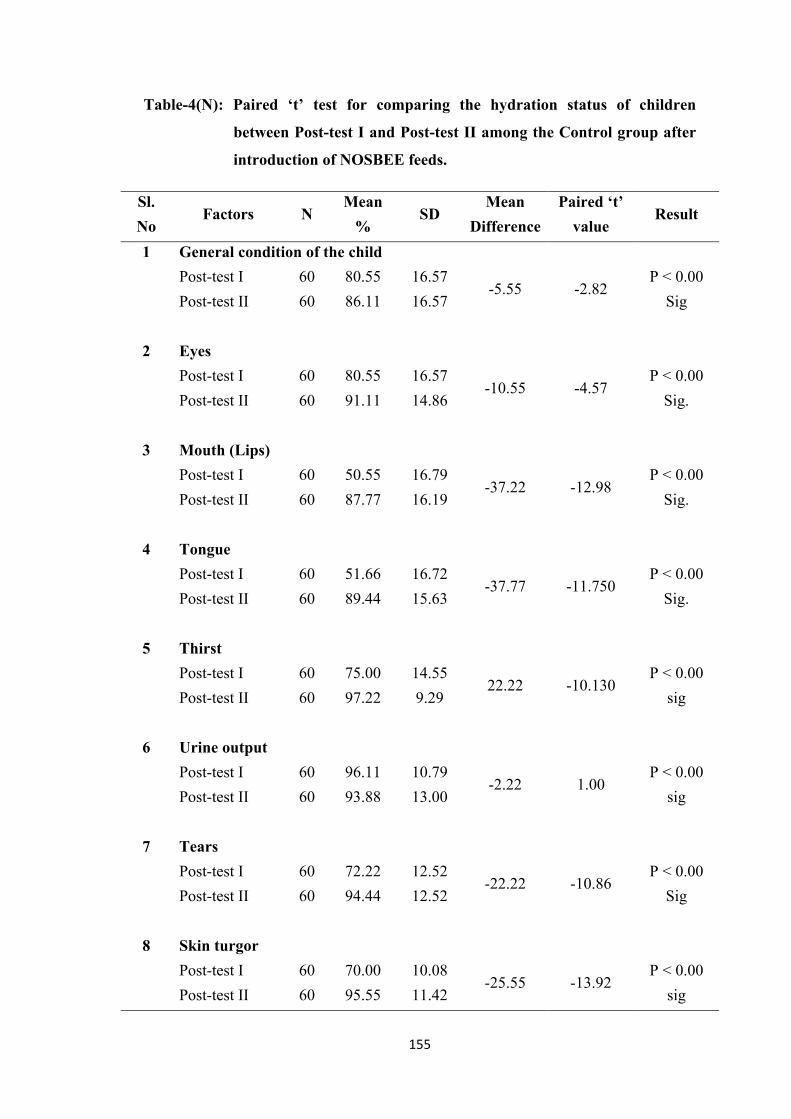
155
Table-4(N): Paired ‘t’ test for comparing the hydration status of children
between Post-test I and Post-test II among the Control group after
introduction of NOSBEE feeds.
Sl.
No Factors N
Mean
% SD
Mean
Difference
Paired ‘t’
value Result
1 General condition of the child
Post-test I 60 80.55 16.57 -5.55 -2.82
P < 0.00
Sig Post-test II 60 86.11 16.57
2 Eyes
Post-test I 60 80.55 16.57 -10.55 -4.57
P < 0.00
Sig. Post-test II 60 91.11 14.86
3 Mouth (Lips)
Post-test I 60 50.55 16.79 -37.22 -12.98
P < 0.00
Sig. Post-test II 60 87.77 16.19
4 Tongue
Post-test I 60 51.66 16.72 -37.77 -11.750
P < 0.00
Sig. Post-test II 60 89.44 15.63
5 Thirst
Post-test I 60 75.00 14.55 22.22 -10.130
P < 0.00
sig Post-test II 60 97.22 9.29
6 Urine output
Post-test I 60 96.11 10.79 -2.22 1.00
P < 0.00
sig Post-test II 60 93.88 13.00
7 Tears
Post-test I 60 72.22 12.52 -22.22 -10.86
P < 0.00
Sig Post-test II 60 94.44 12.52
8 Skin turgor
Post-test I 60 70.00 10.08 -25.55 -13.92
P < 0.00
sig Post-test II 60 95.55 11.42
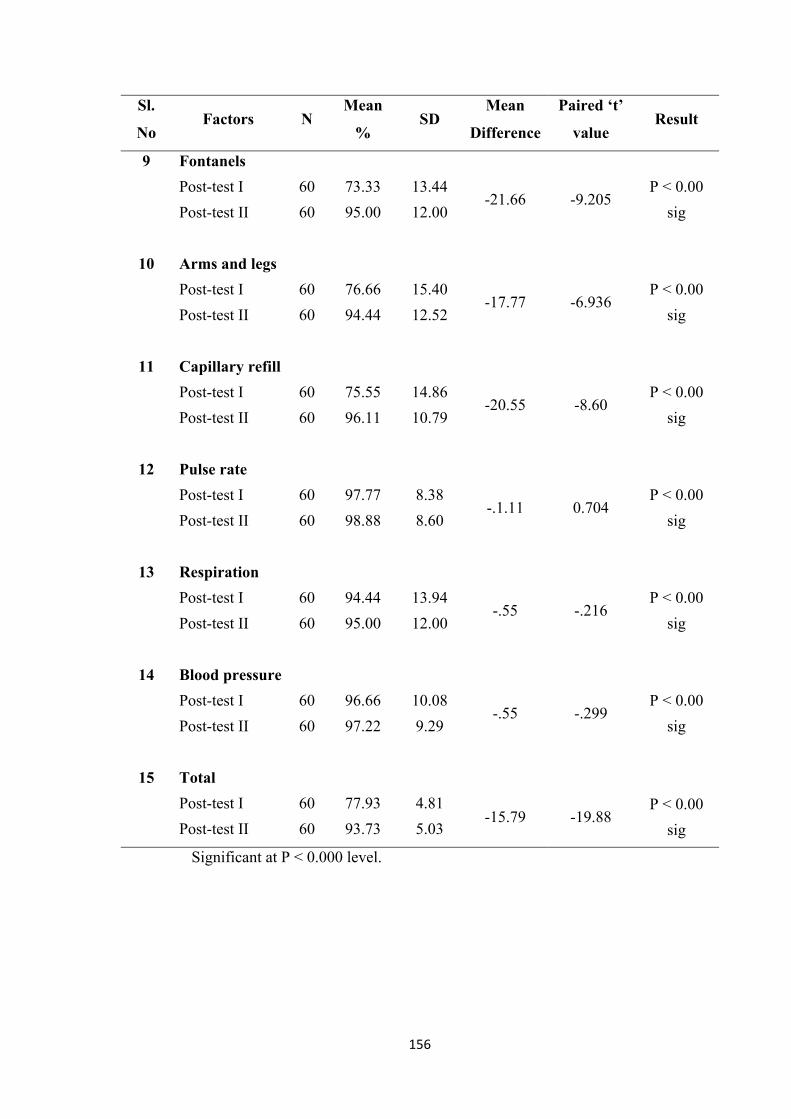
156
Sl.
No Factors N
Mean
% SD
Mean
Difference
Paired ‘t’
value Result
9 Fontanels
Post-test I 60 73.33 13.44 -21.66 -9.205
P < 0.00
sig Post-test II 60 95.00 12.00
10 Arms and legs
Post-test I 60 76.66 15.40 -17.77 -6.936
P < 0.00
sig Post-test II 60 94.44 12.52
11 Capillary refill
Post-test I 60 75.55 14.86 -20.55 -8.60
P < 0.00
sig Post-test II 60 96.11 10.79
12 Pulse rate
Post-test I 60 97.77 8.38 -.1.11 0.704
P < 0.00
sig Post-test II 60 98.88 8.60
13 Respiration
Post-test I 60 94.44 13.94 -.55 -.216
P < 0.00
sig Post-test II 60 95.00 12.00
14 Blood pressure
Post-test I 60 96.66 10.08 -.55 -.299
P < 0.00
sig Post-test II 60 97.22 9.29
15 Total
Post-test I 60 77.93 4.81 -15.79 -19.88
P < 0.00
sig Post-test II 60 93.73 5.03
Significant at P < 0.000 level.
157
To find out the hydration status of children after introduction of NOSOBEE
feeds on Post-test I and Post-test II in the control group the hypothesis was stated as
there will be a significant difference in the hydration status of children between the
Post-test I and Post-test II after introduction of NOSOBEE feeds in control group.
Table 4(N) explains the paired ‘t’ test values to find out the significance
difference in the hydration status of the children within the control group compared
between Post-test I and Post-test II. The calculated overall mean value of all the items
on Post-test I was 77.93% and Post-test II was 93.73% and the overall ‘t’ value was
19.85 which is greater than the table value of statistics and P value < 0.000, which
shows that there is a difference between the hydration status on Post-test I and Post-
test II. This infers that within the group comparison, hydration status was improved
on the third Day. Hence the researcher accept the research hypothesis H2.
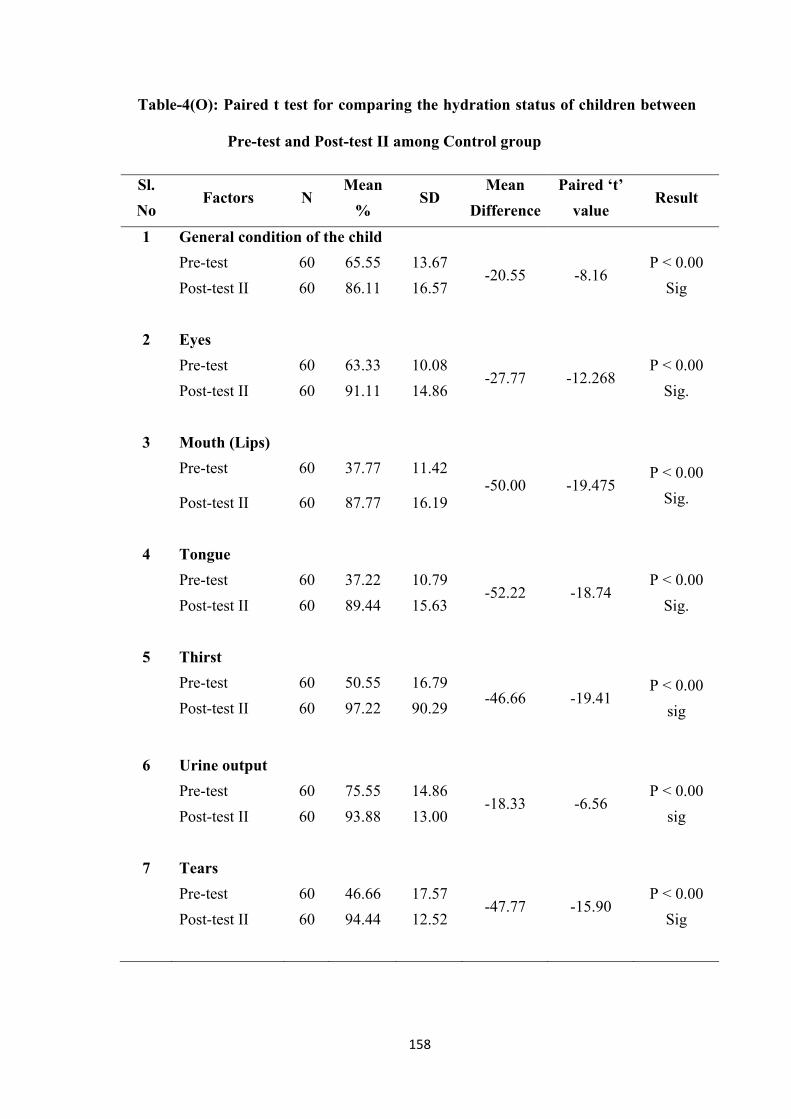
158
Table-4(O): Paired t test for comparing the hydration status of children between
Pre-test and Post-test II among Control group
Sl.
No Factors N
Mean
% SD
Mean
Difference
Paired ‘t’
value Result
1 General condition of the child
Pre-test 60 65.55 13.67 -20.55 -8.16
P < 0.00
Sig Post-test II 60 86.11 16.57
2 Eyes
Pre-test 60 63.33 10.08 -27.77 -12.268
P < 0.00
Sig. Post-test II 60 91.11 14.86
3 Mouth (Lips)
Pre-test 60 37.77 11.42 -50.00 -19.475
P < 0.00
Sig. Post-test II 60 87.77 16.19
4 Tongue
Pre-test 60 37.22 10.79 -52.22 -18.74
P < 0.00
Sig. Post-test II 60 89.44 15.63
5 Thirst
Pre-test 60 50.55 16.79 -46.66 -19.41
P < 0.00
sig Post-test II 60 97.22 90.29
6 Urine output
Pre-test 60 75.55 14.86 -18.33 -6.56
P < 0.00
sig Post-test II 60 93.88 13.00
7 Tears
Pre-test 60 46.66 17.57 -47.77 -15.90
P < 0.00
Sig Post-test II 60 94.44 12.52
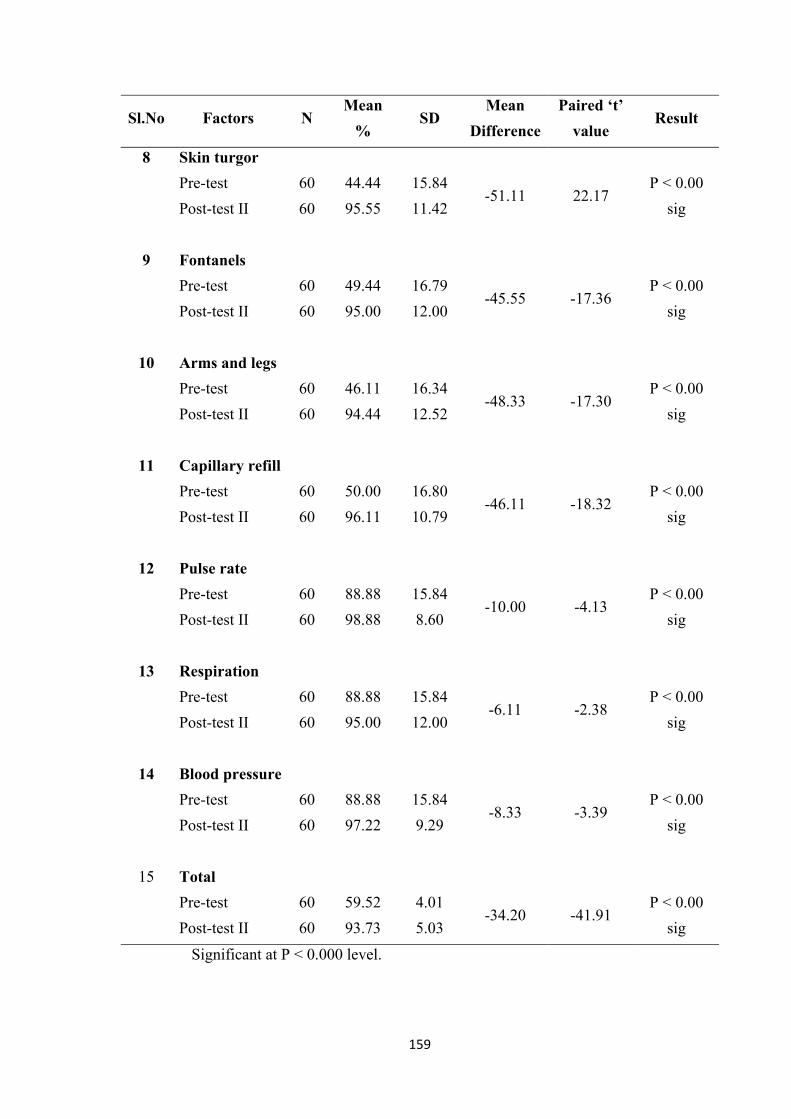
159
Sl.No Factors N Mean
% SD
Mean
Difference
Paired ‘t’
value Result
8 Skin turgor
Pre-test 60 44.44 15.84 -51.11 22.17
P < 0.00
sig Post-test II 60 95.55 11.42
9 Fontanels
Pre-test 60 49.44 16.79 -45.55 -17.36
P < 0.00
sig Post-test II 60 95.00 12.00
10 Arms and legs
Pre-test 60 46.11 16.34 -48.33 -17.30
P < 0.00
sig Post-test II 60 94.44 12.52
11 Capillary refill
Pre-test 60 50.00 16.80 -46.11 -18.32
P < 0.00
sig Post-test II 60 96.11 10.79
12 Pulse rate
Pre-test 60 88.88 15.84 -10.00 -4.13
P < 0.00
sig Post-test II 60 98.88 8.60
13 Respiration
Pre-test 60 88.88 15.84 -6.11 -2.38
P < 0.00
sig Post-test II 60 95.00 12.00
14 Blood pressure
Pre-test 60 88.88 15.84 -8.33 -3.39
P < 0.00
sig Post-test II 60 97.22 9.29
15 Total
Pre-test 60 59.52 4.01 -34.20 -41.91
P < 0.00
sig Post-test II 60 93.73 5.03
Significant at P < 0.000 level.
160
To find out the hydration status of children after introduction of NOSOBEE
feeds on Pre-test and Post-test II in the control group the hypothesis was stated as
there will be a significant difference in the hydration status of children between the
Pre-test and Post-test II after introduction of NOSOBEE feeds in control group.
Table 4(O) explains the paired ‘t’ test values to find out the significance
difference in the hydration status of the children within the control group compared
between Pre-test and Post-test II. The calculated overall mean value of all the items
on Pre-test was 59.52% and Post-test II was 93.73% and the overall ‘t’ value was
41.91 which is greater than the table value, and significant at P < 0.000 level which
shows that there is a difference between the hydration status on Pre-test and Post-test
II. This infers that within the group comparison, hydration status was improved on the
third Day. Hence the researcher accept the research hypothesis H2.
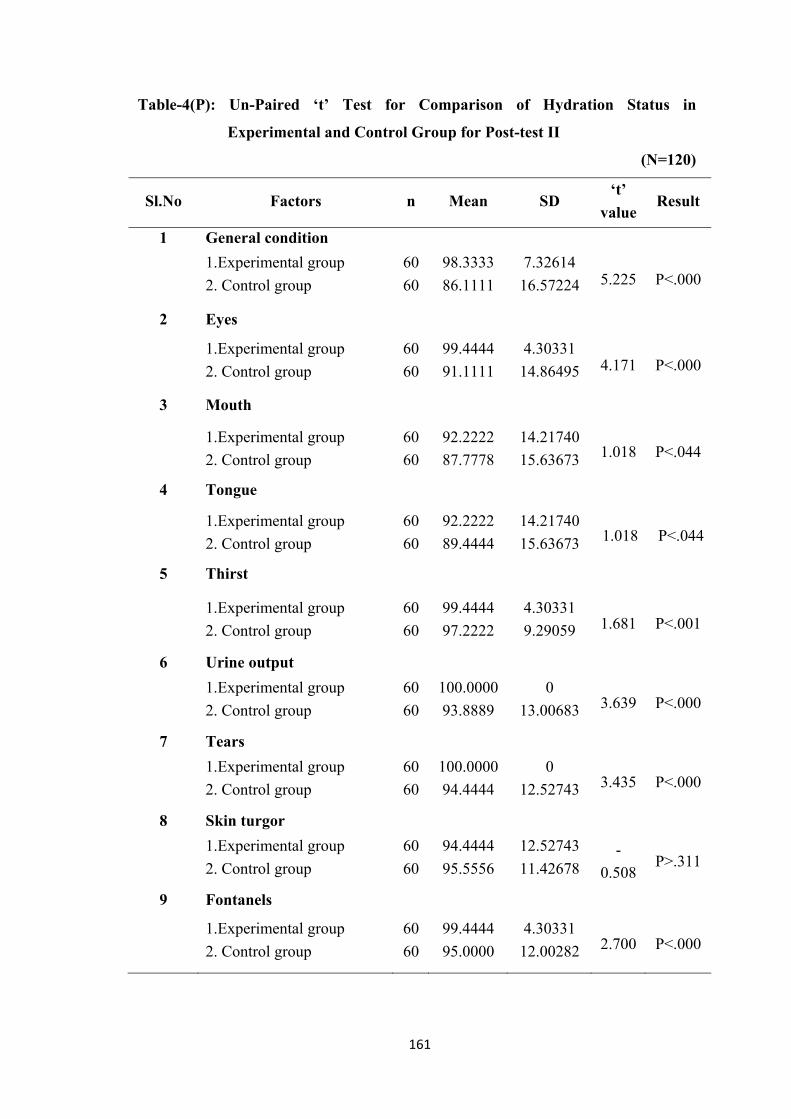
161
Table-4(P): Un-Paired ‘t’ Test for Comparison of Hydration Status in
Experimental and Control Group for Post-test II
(N=120)
Sl.No Factors n Mean SD ‘t’
value Result
1 General condition
1.Experimental group
2. Control group
60
60
98.3333
86.1111
7.32614
16.57224 5.225 P<.000
2 Eyes
1.Experimental group
2. Control group
60
60
99.4444
91.1111
4.30331
14.86495 4.171 P<.000
3 Mouth
1.Experimental group
2. Control group
60
60
92.2222
87.7778
14.21740
15.63673 1.018 P<.044
4 Tongue
1.Experimental group
2. Control group
60
60
92.2222
89.4444
14.21740
15.63673 1.018 P<.044
5 Thirst
1.Experimental group
2. Control group
60
60
99.4444
97.2222
4.30331
9.29059 1.681 P<.001
6 Urine output
1.Experimental group
2. Control group
60
60
100.0000
93.8889
0
13.00683 3.639 P<.000
7 Tears
1.Experimental group
2. Control group
60
60
100.0000
94.4444
0
12.52743 3.435 P<.000
8 Skin turgor
1.Experimental group
2. Control group
60
60
94.4444
95.5556
12.52743
11.42678 -
0.508 P>.311
9 Fontanels
1.Experimental group
2. Control group
60
60
99.4444
95.0000
4.30331
12.00282 2.700 P<.000
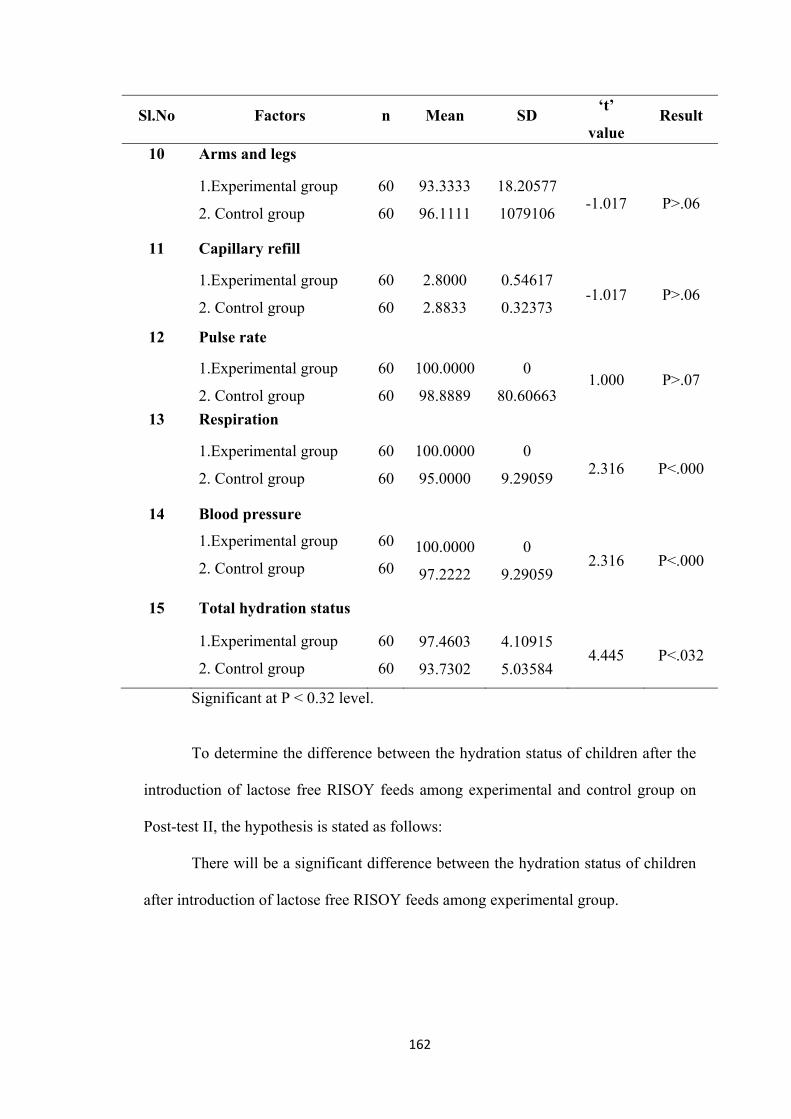
162
Sl.No Factors n Mean SD ‘t’
value Result
10 Arms and legs
1.Experimental group
2. Control group
60
60
93.3333
96.1111
18.20577
1079106 -1.017 P>.06
11 Capillary refill
1.Experimental group
2. Control group
60
60
2.8000
2.8833
0.54617
0.32373 -1.017 P>.06
12 Pulse rate
1.Experimental group
2. Control group
60
60
100.0000
98.8889
0
80.60663 1.000 P>.07
13 Respiration
1.Experimental group
2. Control group
60
60
100.0000
95.0000
0
9.29059 2.316 P<.000
14 Blood pressure
1.Experimental group
2. Control group
60
60 100.0000
97.2222
0
9.29059 2.316 P<.000
15 Total hydration status
1.Experimental group
2. Control group
60
60
97.4603
93.7302
4.10915
5.03584 4.445 P<.032
Significant at P < 0.32 level.
To determine the difference between the hydration status of children after the
introduction of lactose free RISOY feeds among experimental and control group on
Post-test II, the hypothesis is stated as follows:
There will be a significant difference between the hydration status of children
after introduction of lactose free RISOY feeds among experimental group.
163
Table (27), depicts the total mean post intervention score of hydration status in
all aspects in experimental group is 97.4603 is less than the control group mean score
93.7302. The calculated ‘t’-value 4.445 is statistically significant at P<.032 level.
Hence the hydration status among experimental group is statistically significant at
P<.032 level. This indicates that there is a difference between the experimental and
control group. The above findings support the research hypothesis. Hence, the
researcher accepts the research hypothesis H4.
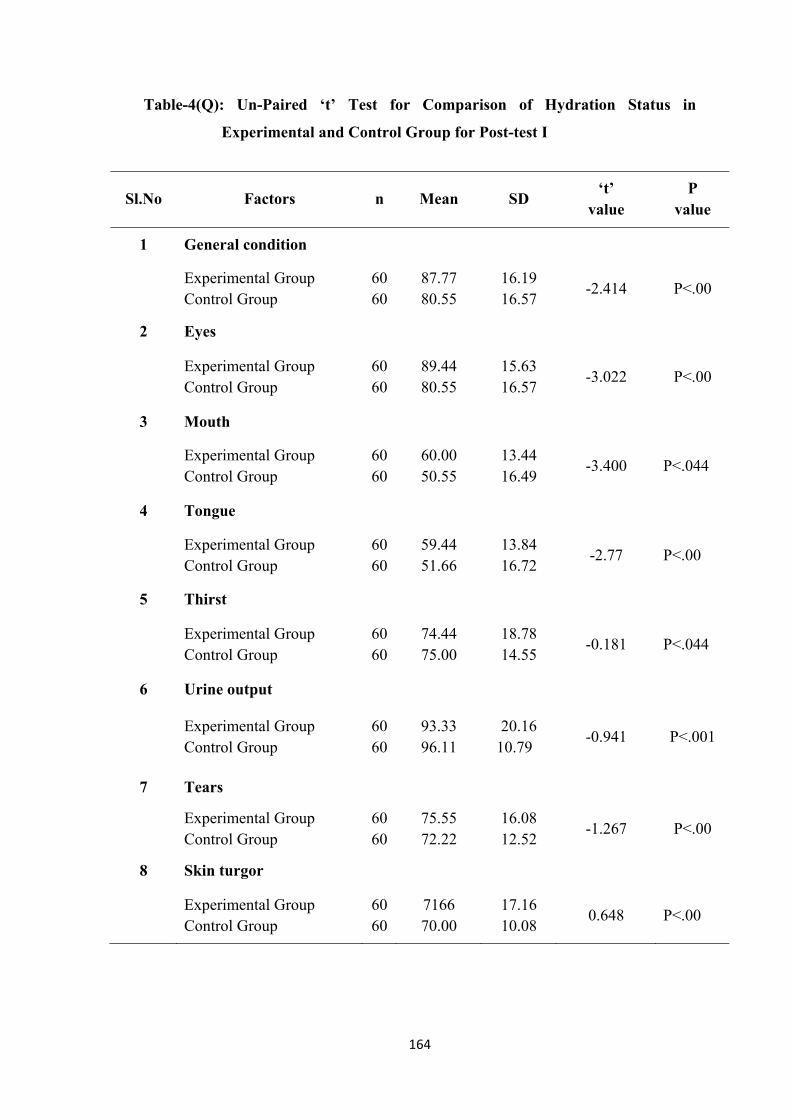
164
Table-4(Q): Un-Paired ‘t’ Test for Comparison of Hydration Status in
Experimental and Control Group for Post-test I
Sl.No Factors n Mean SD ‘t’
value P
value
1 General condition
Experimental Group Control Group
60 60
87.77 80.55
16.19 16.57
-2.414 P<.00
2 Eyes
Experimental Group Control Group
60 60
89.44 80.55
15.63 16.57
-3.022 P<.00
3 Mouth
Experimental Group Control Group
60 60
60.00 50.55
13.44 16.49
-3.400 P<.044
4 Tongue
Experimental Group Control Group
60 60
59.44 51.66
13.84 16.72
-2.77 P<.00
5 Thirst
Experimental Group Control Group
60 60
74.44 75.00
18.78 14.55
-0.181 P<.044
6 Urine output
Experimental Group Control Group
60 60
93.33 96.11
20.16 10.79
-0.941 P<.001
7 Tears
Experimental Group Control Group
60 60
75.55 72.22
16.08 12.52
-1.267 P<.00
8 Skin turgor
Experimental Group Control Group
60 60
7166 70.00
17.16 10.08
0.648 P<.00
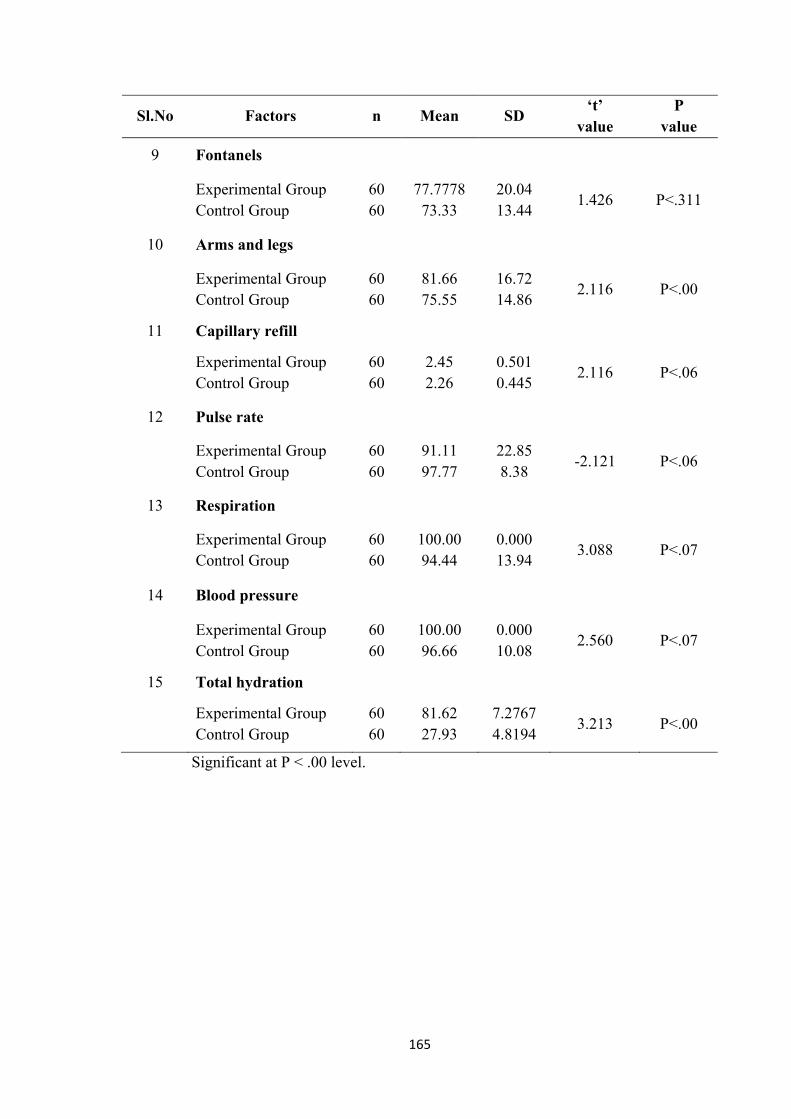
165
Sl.No Factors n Mean SD ‘t’
value P
value
9 Fontanels
Experimental Group Control Group
60 60
77.7778 73.33
20.04 13.44
1.426 P<.311
10 Arms and legs
Experimental Group Control Group
60 60
81.66 75.55
16.72 14.86
2.116 P<.00
11 Capillary refill
Experimental Group Control Group
60 60
2.45 2.26
0.501 0.445
2.116 P<.06
12 Pulse rate
Experimental Group Control Group
60 60
91.11 97.77
22.85 8.38
-2.121 P<.06
13 Respiration
Experimental Group Control Group
60 60
100.00 94.44
0.000 13.94
3.088 P<.07
14 Blood pressure
Experimental Group Control Group
60 60
100.00 96.66
0.000 10.08
2.560 P<.07
15 Total hydration
Experimental Group Control Group
60 60
81.62 27.93
7.2767 4.8194
3.213 P<.00
Significant at P < .00 level.
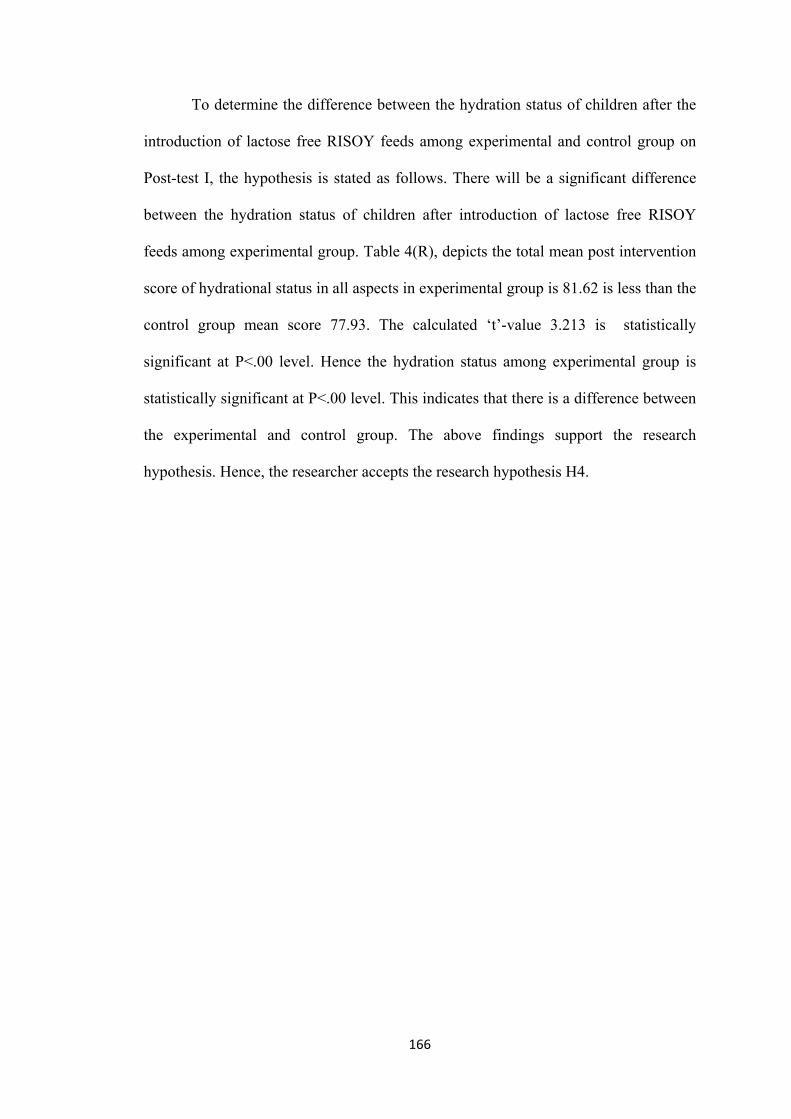
166
To determine the difference between the hydration status of children after the
introduction of lactose free RISOY feeds among experimental and control group on
Post-test I, the hypothesis is stated as follows. There will be a significant difference
between the hydration status of children after introduction of lactose free RISOY
feeds among experimental group. Table 4(R), depicts the total mean post intervention
score of hydrational status in all aspects in experimental group is 81.62 is less than the
control group mean score 77.93. The calculated ‘t’-value 3.213 is statistically
significant at P<.00 level. Hence the hydration status among experimental group is
statistically significant at P<.00 level. This indicates that there is a difference between
the experimental and control group. The above findings support the research
hypothesis. Hence, the researcher accepts the research hypothesis H4.
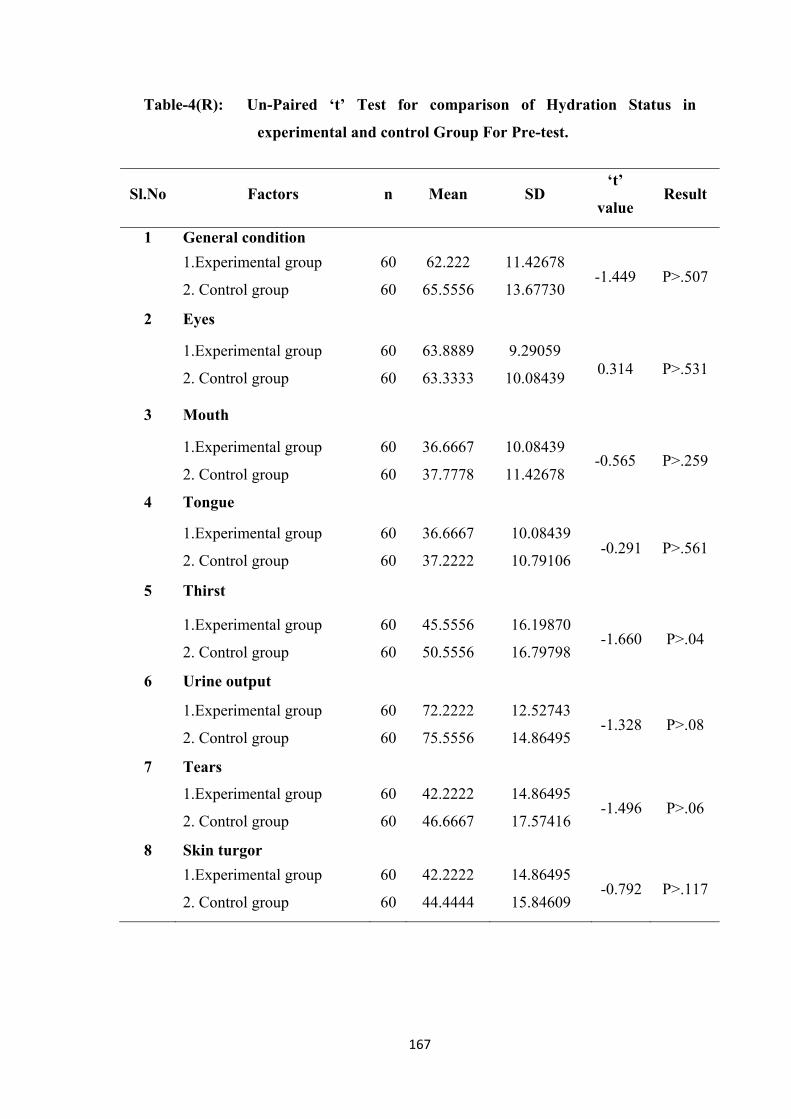
167
Table-4(R): Un-Paired ‘t’ Test for comparison of Hydration Status in
experimental and control Group For Pre-test.
Sl.No Factors n Mean SD ‘t’
value Result
1 General condition
1.Experimental group
2. Control group
60
60
62.222
65.5556
11.42678
13.67730 -1.449 P>.507
2 Eyes
1.Experimental group
2. Control group
60
60
63.8889
63.3333
9.29059
10.08439 0.314 P>.531
3 Mouth
1.Experimental group
2. Control group
60
60
36.6667
37.7778
10.08439
11.42678 -0.565 P>.259
4 Tongue
1.Experimental group
2. Control group
60
60
36.6667
37.2222
10.08439
10.79106 -0.291 P>.561
5 Thirst
1.Experimental group
2. Control group
60
60
45.5556
50.5556
16.19870
16.79798 -1.660 P>.04
6 Urine output
1.Experimental group
2. Control group
60
60
72.2222
75.5556
12.52743
14.86495 -1.328 P>.08
7 Tears
1.Experimental group
2. Control group
60
60
42.2222
46.6667
14.86495
17.57416 -1.496 P>.06
8 Skin turgor
1.Experimental group
2. Control group
60
60
42.2222
44.4444
14.86495
15.84609 -0.792 P>.117
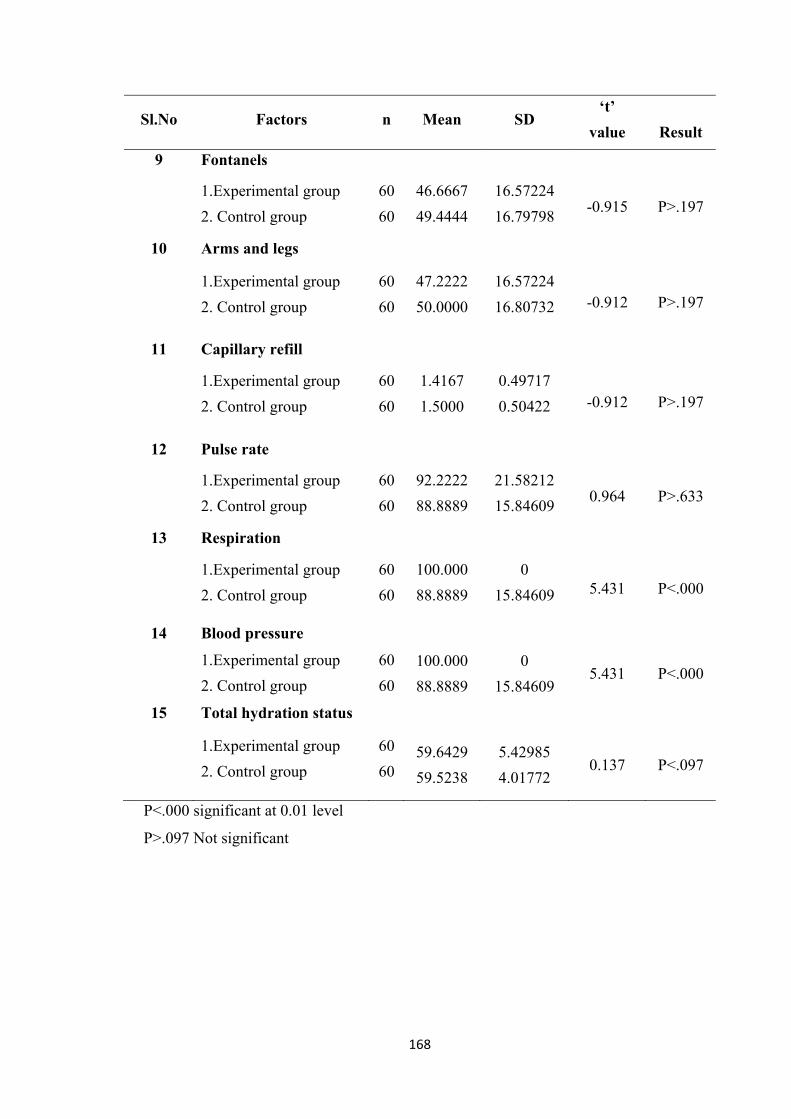
168
Sl.No Factors n Mean SD ‘t’
value
Result
9 Fontanels
1.Experimental group
2. Control group
60
60
46.6667
49.4444
16.57224
16.79798 -0.915 P>.197
10 Arms and legs
1.Experimental group
2. Control group
60
60
47.2222
50.0000
16.57224
16.80732 -0.912 P>.197
11 Capillary refill
1.Experimental group
2. Control group
60
60
1.4167
1.5000
0.49717
0.50422 -0.912 P>.197
12 Pulse rate
1.Experimental group
2. Control group
60
60
92.2222
88.8889
21.58212
15.84609 0.964 P>.633
13 Respiration
1.Experimental group
2. Control group
60
60
100.000
88.8889
0
15.84609 5.431 P<.000
14 Blood pressure
1.Experimental group
2. Control group
60
60
100.000
88.8889
0
15.84609 5.431 P<.000
15 Total hydration status
1.Experimental group
2. Control group
60
60 59.6429
59.5238
5.42985
4.01772 0.137 P<.097
P<.000 significant at 0.01 level
P>.097 Not significant
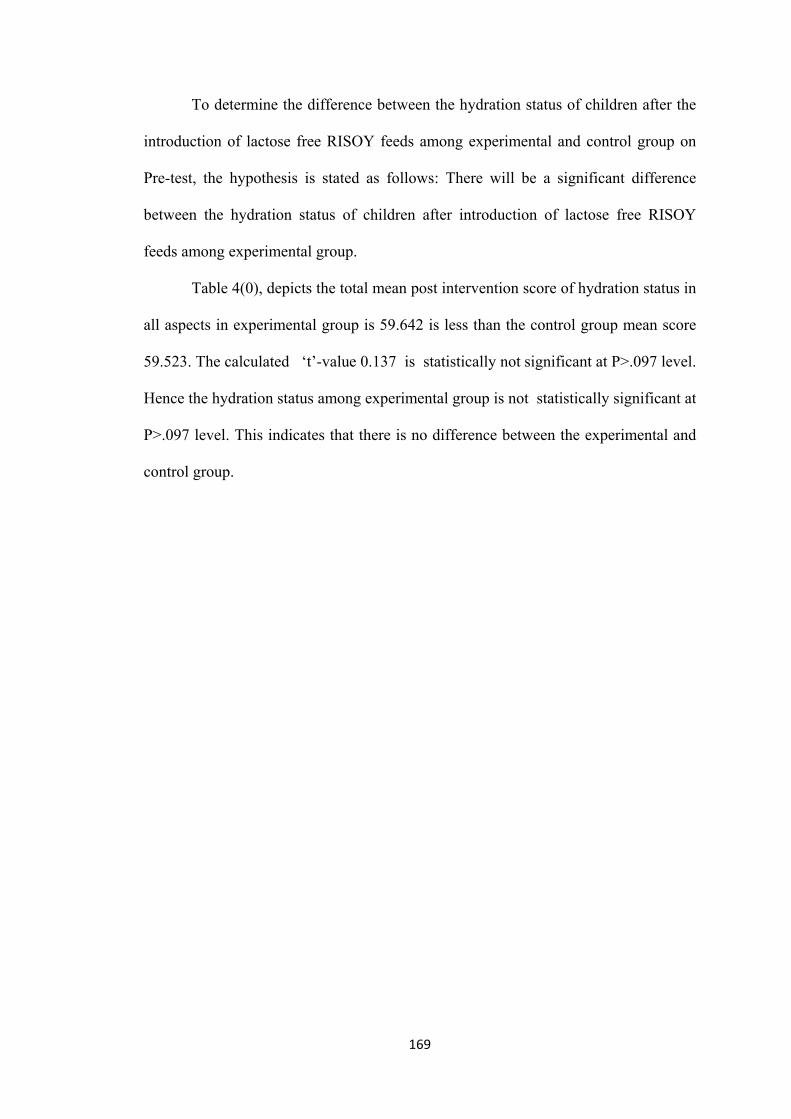
169
To determine the difference between the hydration status of children after the
introduction of lactose free RISOY feeds among experimental and control group on
Pre-test, the hypothesis is stated as follows: There will be a significant difference
between the hydration status of children after introduction of lactose free RISOY
feeds among experimental group.
Table 4(0), depicts the total mean post intervention score of hydration status in
all aspects in experimental group is 59.642 is less than the control group mean score
59.523. The calculated ‘t’-value 0.137 is statistically not significant at P>.097 level.
Hence the hydration status among experimental group is not statistically significant at
P>.097 level. This indicates that there is no difference between the experimental and
control group.
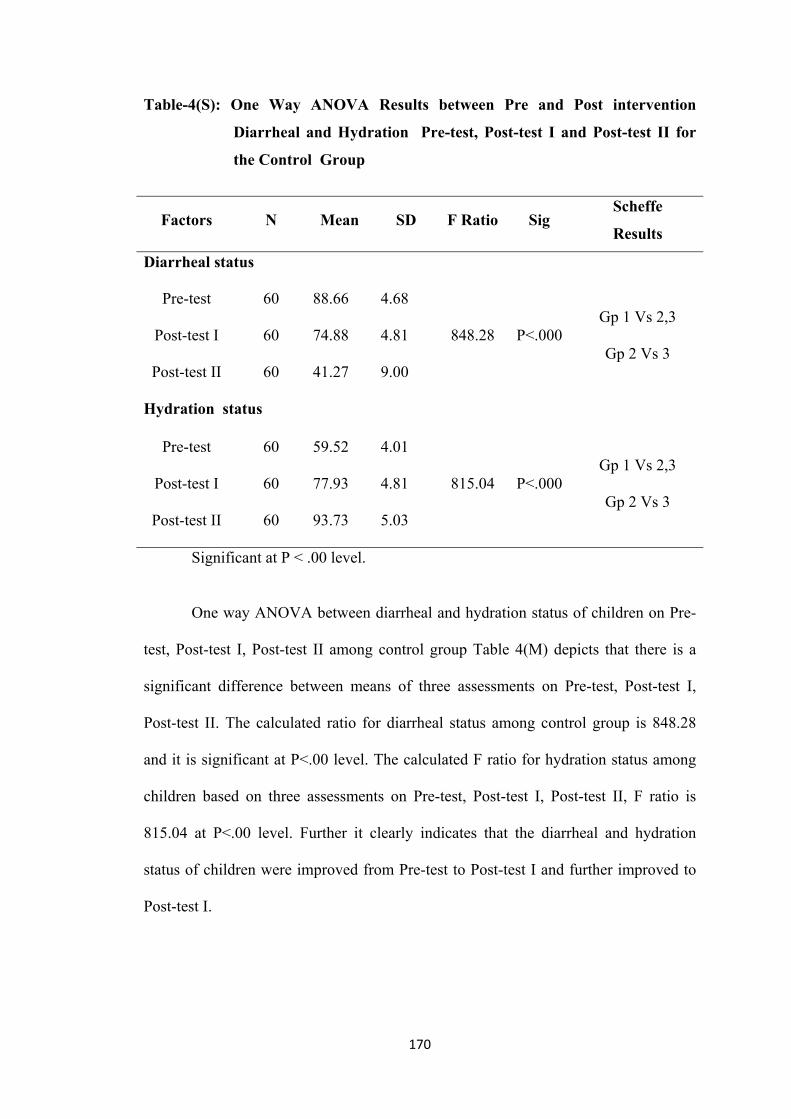
170
Table-4(S): One Way ANOVA Results between Pre and Post intervention
Diarrheal and Hydration Pre-test, Post-test I and Post-test II for
the Control Group
Factors N Mean SD F Ratio Sig Scheffe
Results
Diarrheal status
Pre-test 60 88.66 4.68
848.28 P<.000 Gp 1 Vs 2,3
Gp 2 Vs 3 Post-test I 60 74.88 4.81
Post-test II 60 41.27 9.00
Hydration status
Pre-test 60 59.52 4.01
815.04 P<.000 Gp 1 Vs 2,3
Gp 2 Vs 3 Post-test I 60 77.93 4.81
Post-test II 60 93.73 5.03
Significant at P < .00 level.
One way ANOVA between diarrheal and hydration status of children on Pre-
test, Post-test I, Post-test II among control group Table 4(M) depicts that there is a
significant difference between means of three assessments on Pre-test, Post-test I,
Post-test II. The calculated ratio for diarrheal status among control group is 848.28
and it is significant at P<.00 level. The calculated F ratio for hydration status among
children based on three assessments on Pre-test, Post-test I, Post-test II, F ratio is
815.04 at P<.00 level. Further it clearly indicates that the diarrheal and hydration
status of children were improved from Pre-test to Post-test I and further improved to
Post-test I.
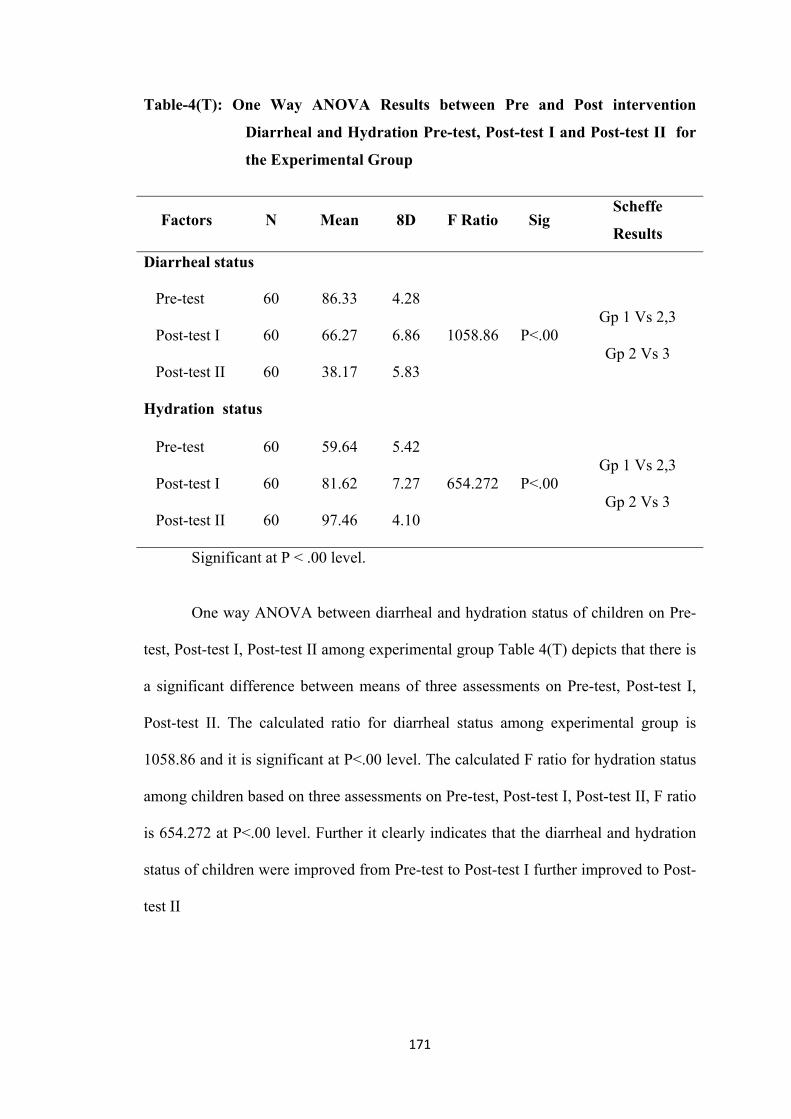
171
Table-4(T): One Way ANOVA Results between Pre and Post intervention
Diarrheal and Hydration Pre-test, Post-test I and Post-test II for
the Experimental Group
Factors N Mean 8D F Ratio Sig Scheffe
Results
Diarrheal status
Pre-test 60 86.33 4.28
1058.86 P<.00 Gp 1 Vs 2,3
Gp 2 Vs 3 Post-test I 60 66.27 6.86
Post-test II 60 38.17 5.83
Hydration status
Pre-test 60 59.64 5.42
654.272 P<.00 Gp 1 Vs 2,3
Gp 2 Vs 3 Post-test I 60 81.62 7.27
Post-test II 60 97.46 4.10
Significant at P < .00 level.
One way ANOVA between diarrheal and hydration status of children on Pre-
test, Post-test I, Post-test II among experimental group Table 4(T) depicts that there is
a significant difference between means of three assessments on Pre-test, Post-test I,
Post-test II. The calculated ratio for diarrheal status among experimental group is
1058.86 and it is significant at P<.00 level. The calculated F ratio for hydration status
among children based on three assessments on Pre-test, Post-test I, Post-test II, F ratio
is 654.272 at P<.00 level. Further it clearly indicates that the diarrheal and hydration
status of children were improved from Pre-test to Post-test I further improved to Post-
test II
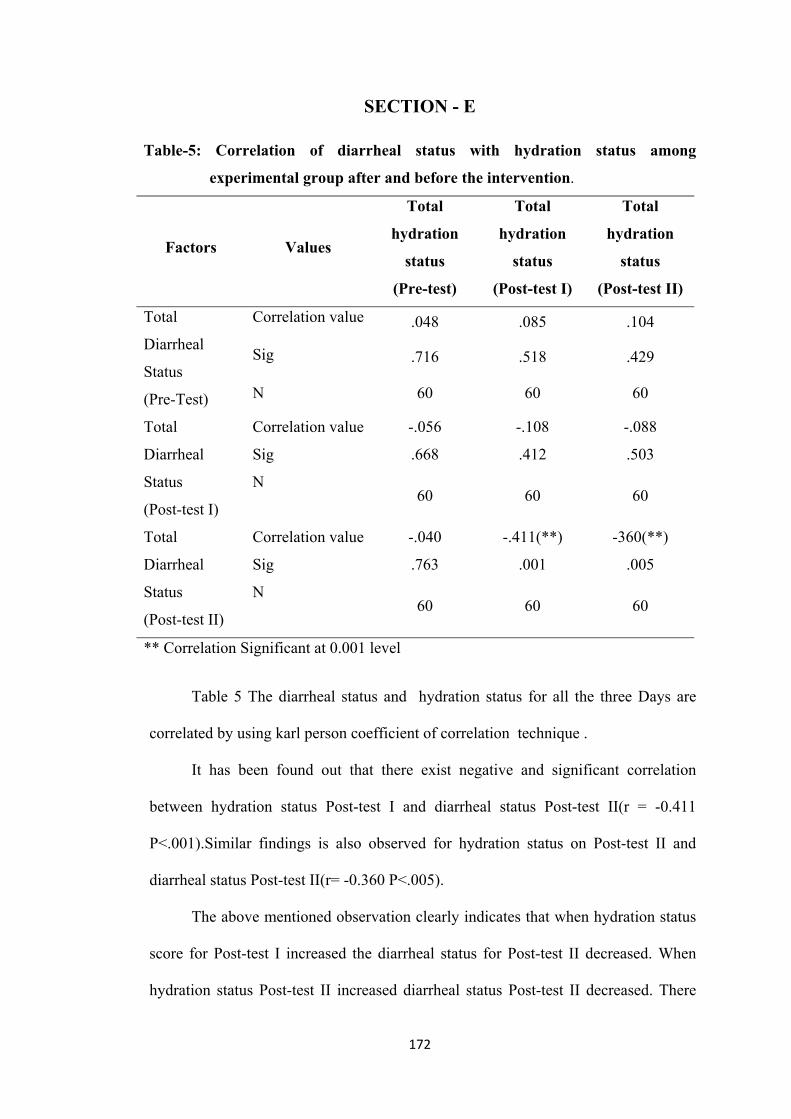
172
SECTION - E Table-5: Correlation of diarrheal status with hydration status among
experimental group after and before the intervention.
Factors Values
Total
hydration
status
(Pre-test)
Total
hydration
status
(Post-test I)
Total
hydration
status
(Post-test II)
Total
Diarrheal
Status
(Pre-Test)
Correlation value .048 .085 .104
Sig .716 .518 .429
N 60 60 60
Total
Diarrheal
Status
(Post-test I)
Correlation value -.056 -.108 -.088
Sig .668 .412 .503
N 60 60 60
Total
Diarrheal
Status
(Post-test II)
Correlation value -.040 -.411(**) -360(**)
Sig .763 .001 .005
N 60 60 60
** Correlation Significant at 0.001 level
Table 5 The diarrheal status and hydration status for all the three Days are
correlated by using karl person coefficient of correlation technique .
It has been found out that there exist negative and significant correlation
between hydration status Post-test I and diarrheal status Post-test II(r = -0.411
P<.001).Similar findings is also observed for hydration status on Post-test II and
diarrheal status Post-test II(r= -0.360 P<.005).
The above mentioned observation clearly indicates that when hydration status
score for Post-test I increased the diarrheal status for Post-test II decreased. When
hydration status Post-test II increased diarrheal status Post-test II decreased. There
173
exists negative and significant correlation between the two study variables on
different observations.
Similar trend for the subject variables on different Days (Pre-test and II) are
also observed. But there exists no significant relationship between the subject
variables.
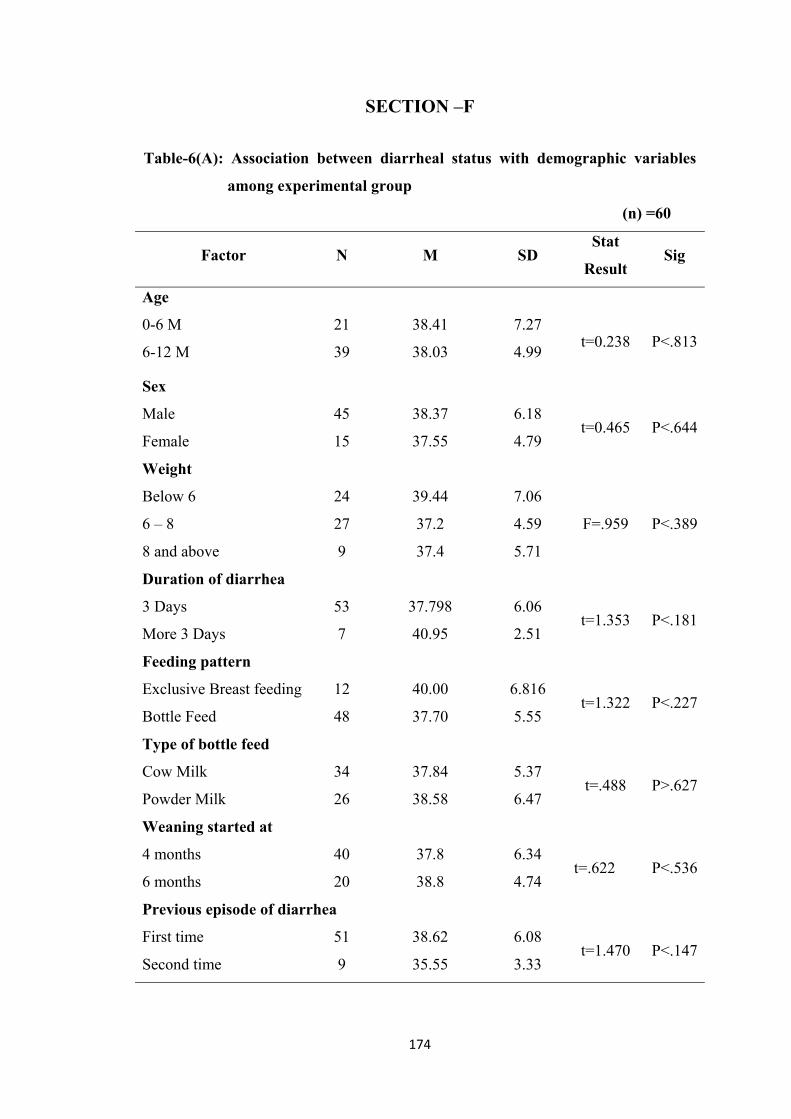
174
SECTION –F
Table-6(A): Association between diarrheal status with demographic variables
among experimental group
(n) =60
Factor N M SD Stat
Result Sig
Age
0-6 M 21 38.41 7.27 t=0.238 P<.813
6-12 M 39 38.03 4.99
Sex
Male 45 38.37 6.18 t=0.465 P<.644
Female 15 37.55 4.79
Weight
Below 6 24 39.44 7.06
F=.959 P<.3896 – 8 27 37.2 4.59
8 and above 9 37.4 5.71
Duration of diarrhea
3 Days 53 37.798 6.06 t=1.353 P<.181
More 3 Days 7 40.95 2.51
Feeding pattern
Exclusive Breast feeding 12 40.00 6.816 t=1.322 P<.227
Bottle Feed 48 37.70 5.55
Type of bottle feed
Cow Milk 34 37.84 5.37 t=.488 P>.627
Powder Milk 26 38.58 6.47
Weaning started at
4 months 40 37.8 6.34 t=.622 P<.536
6 months 20 38.8 4.74
Previous episode of diarrhea
First time 51 38.62 6.08 t=1.470 P<.147
Second time 9 35.55 3.33
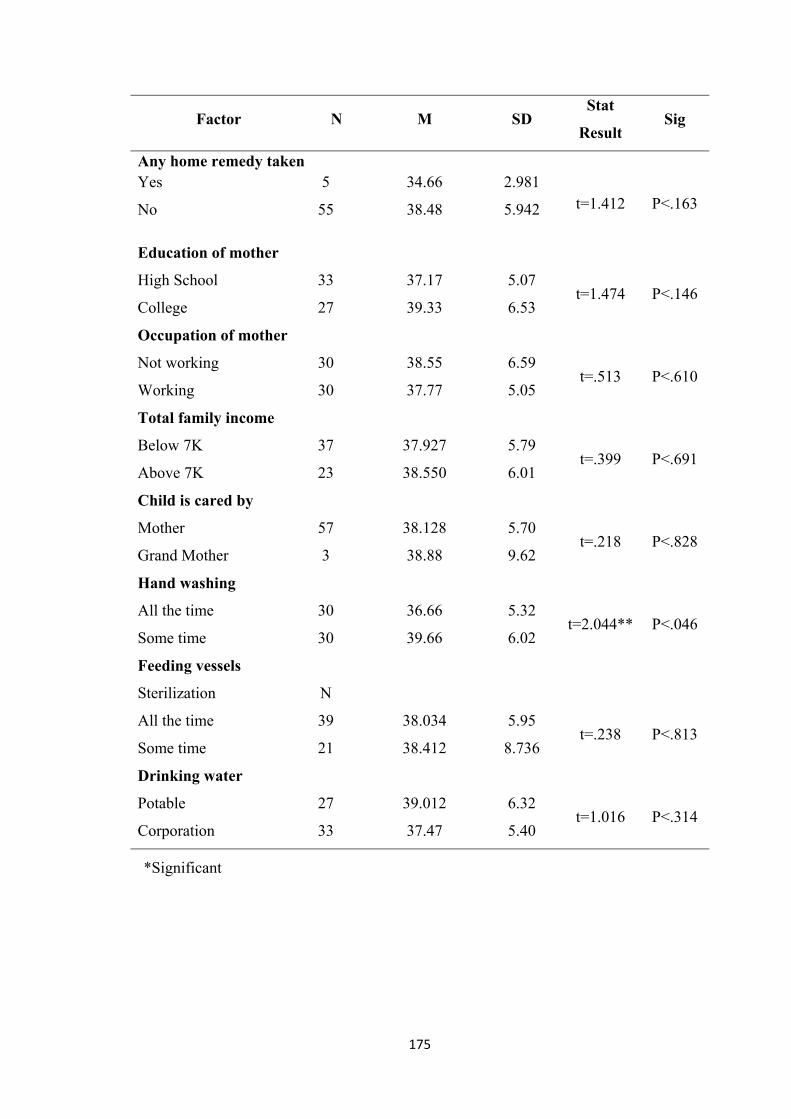
175
Factor N M SD Stat
Result Sig
Any home remedy taken Yes 5 34.66 2.981
t=1.412 P<.163 No 55 38.48 5.942
Education of mother
High School 33 37.17 5.07 t=1.474 P<.146
College 27 39.33 6.53
Occupation of mother
Not working
Working
30
30
38.55
37.77
6.59
5.05 t=.513 P<.610
Total family income
Below 7K 37 37.927 5.79 t=.399 P<.691
Above 7K 23 38.550 6.01
Child is cared by
Mother 57 38.128 5.70 t=.218 P<.828
Grand Mother 3 38.88 9.62
Hand washing
All the time 30 36.66 5.32 t=2.044** P<.046
Some time 30 39.66 6.02
Feeding vessels
Sterilization N
All the time 39 38.034 5.95 t=.238 P<.813
Some time 21 38.412 8.736
Drinking water
Potable 27 39.012 6.32 t=1.016 P<.314
Corporation 33 37.47 5.40
*Significant
176
The table 6(A) determine there is no association found between Diarrheal
status of children with their Selected demographic variables such as Age, Sex,
weight, Duration of Diarrhea, Feeding pattern, Type of bottle feed, weaning started at,
previous episode of diarrhea, any Home Remedy taken, Education of mother, Total
family income, child is cared by, Feeding vessels Sterilization, drinking water. There
is a significant association was found only for hand washing with statistical result
2.044 at P<.046.
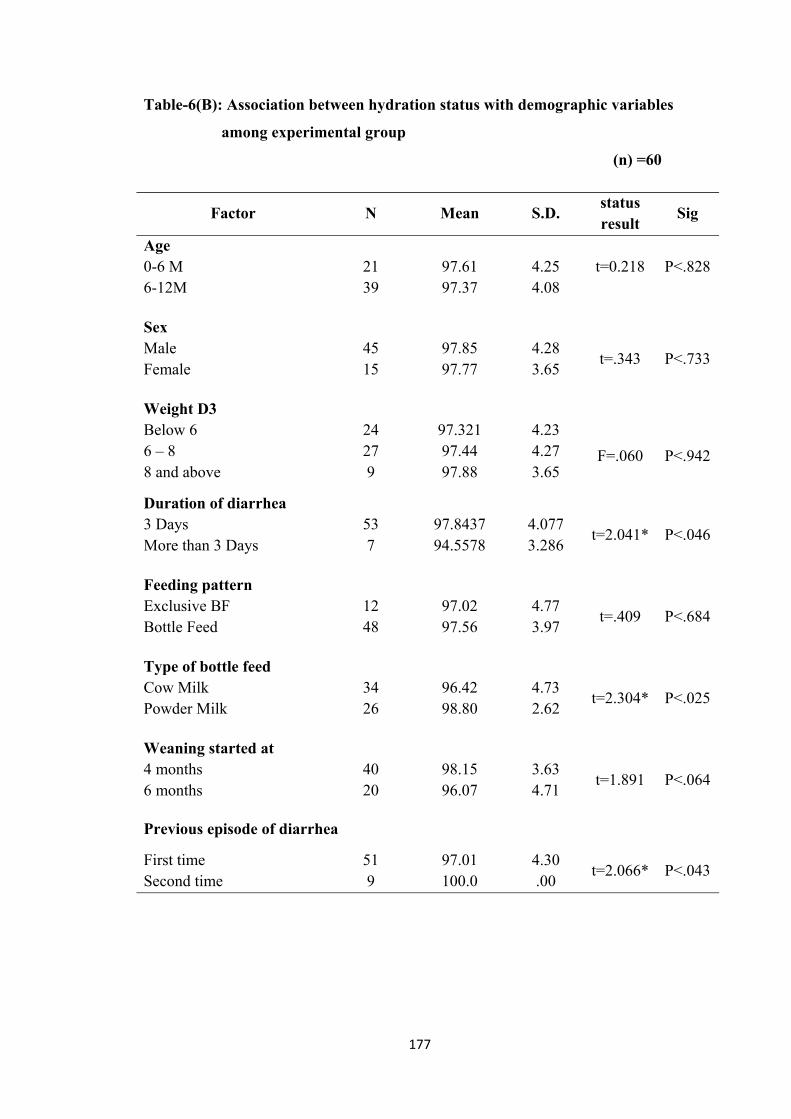
177
Table-6(B): Association between hydration status with demographic variables
among experimental group
(n) =60
Factor N Mean S.D. status result
Sig
Age 0-6 M 21 97.61 4.25 t=0.218 P<.828 6-12M 39 97.37 4.08 Sex Male 45 97.85 4.28
t=.343 P<.733 Female 15 97.77 3.65 Weight D3 Below 6 24 97.321 4.23
F=.060 P<.942 6 – 8 8 and above
27 9
97.44 97.88
4.27 3.65
Duration of diarrhea 3 Days 53 97.8437 4.077
t=2.041* P<.046 More than 3 Days 7 94.5578 3.286 Feeding pattern Exclusive BF 12 97.02 4.77
t=.409 P<.684 Bottle Feed 48 97.56 3.97 Type of bottle feed Cow Milk 34 96.42 4.73
t=2.304* P<.025 Powder Milk 26 98.80 2.62 Weaning started at 4 months 40 98.15 3.63
t=1.891 P<.064 6 months 20 96.07 4.71 Previous episode of diarrhea
First time 51 97.01 4.30 t=2.066* P<.043
Second time 9 100.0 .00
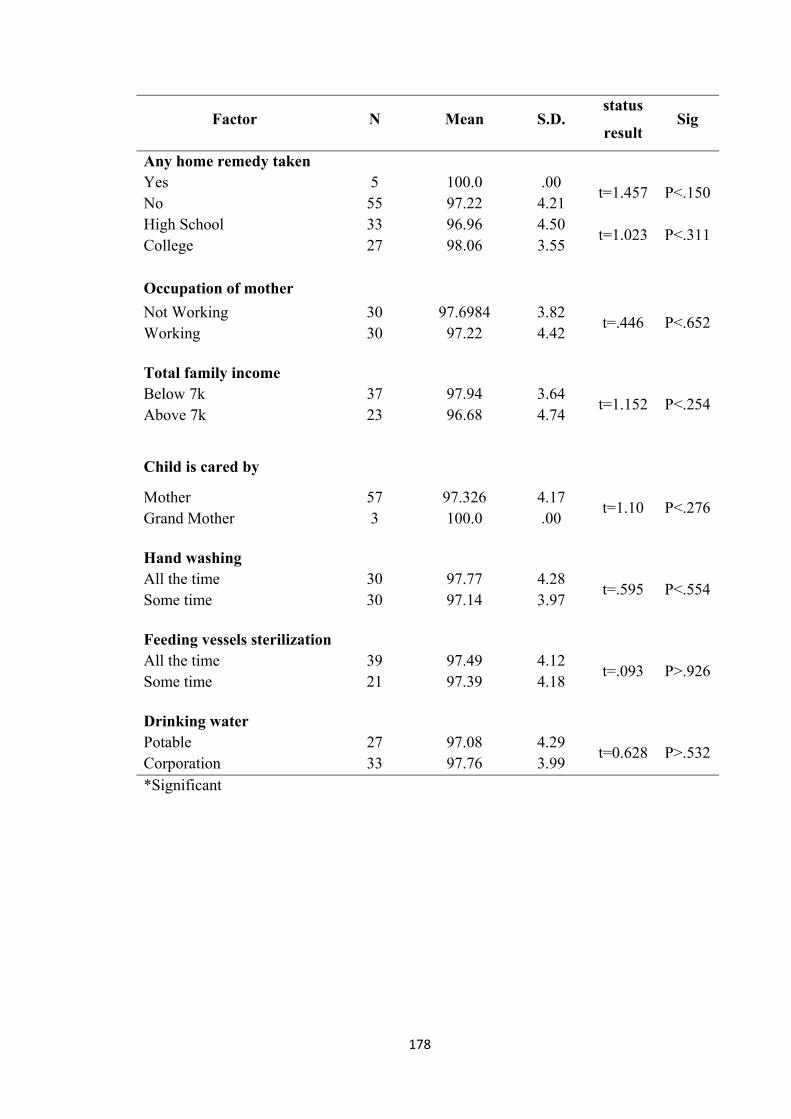
178
Factor N Mean S.D. status
result Sig
Any home remedy taken Yes 5 100.0 .00
t=1.457 P<.150 No 55 97.22 4.21 High School 33 96.96 4.50
t=1.023 P<.311 College 27 98.06 3.55 Occupation of mother
Not Working 30 97.6984 3.82 t=.446 P<.652
Working 30 97.22 4.42 Total family income Below 7k 37 97.94 3.64
t=1.152 P<.254 Above 7k 23 96.68 4.74
Child is cared by
Mother 57 97.326 4.17 t=1.10 P<.276
Grand Mother 3 100.0 .00 Hand washing All the time 30 97.77 4.28
t=.595 P<.554 Some time 30 97.14 3.97 Feeding vessels sterilization All the time 39 97.49 4.12
t=.093 P>.926 Some time 21 97.39 4.18 Drinking water Potable 27 97.08 4.29
t=0.628 P>.532 Corporation 33 97.76 3.99 *Significant
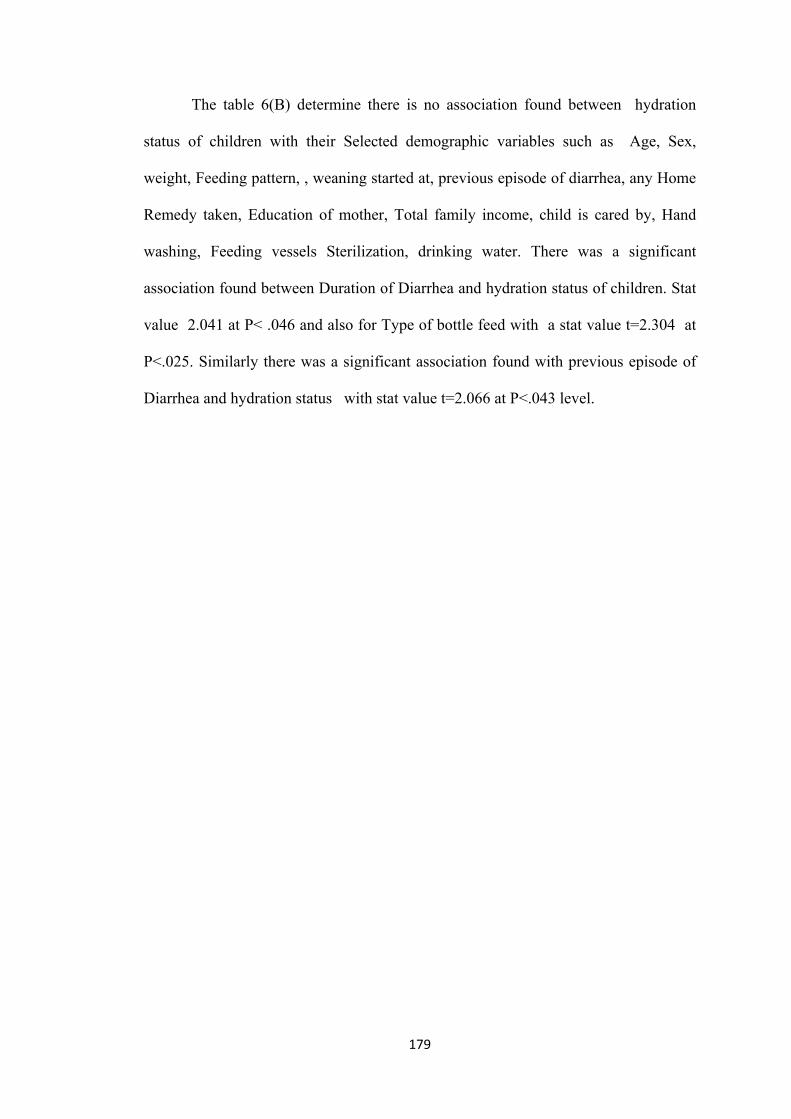
179
The table 6(B) determine there is no association found between hydration
status of children with their Selected demographic variables such as Age, Sex,
weight, Feeding pattern, , weaning started at, previous episode of diarrhea, any Home
Remedy taken, Education of mother, Total family income, child is cared by, Hand
washing, Feeding vessels Sterilization, drinking water. There was a significant
association found between Duration of Diarrhea and hydration status of children. Stat
value 2.041 at P< .046 and also for Type of bottle feed with a stat value t=2.304 at
P<.025. Similarly there was a significant association found with previous episode of
Diarrhea and hydration status with stat value t=2.066 at P<.043 level.
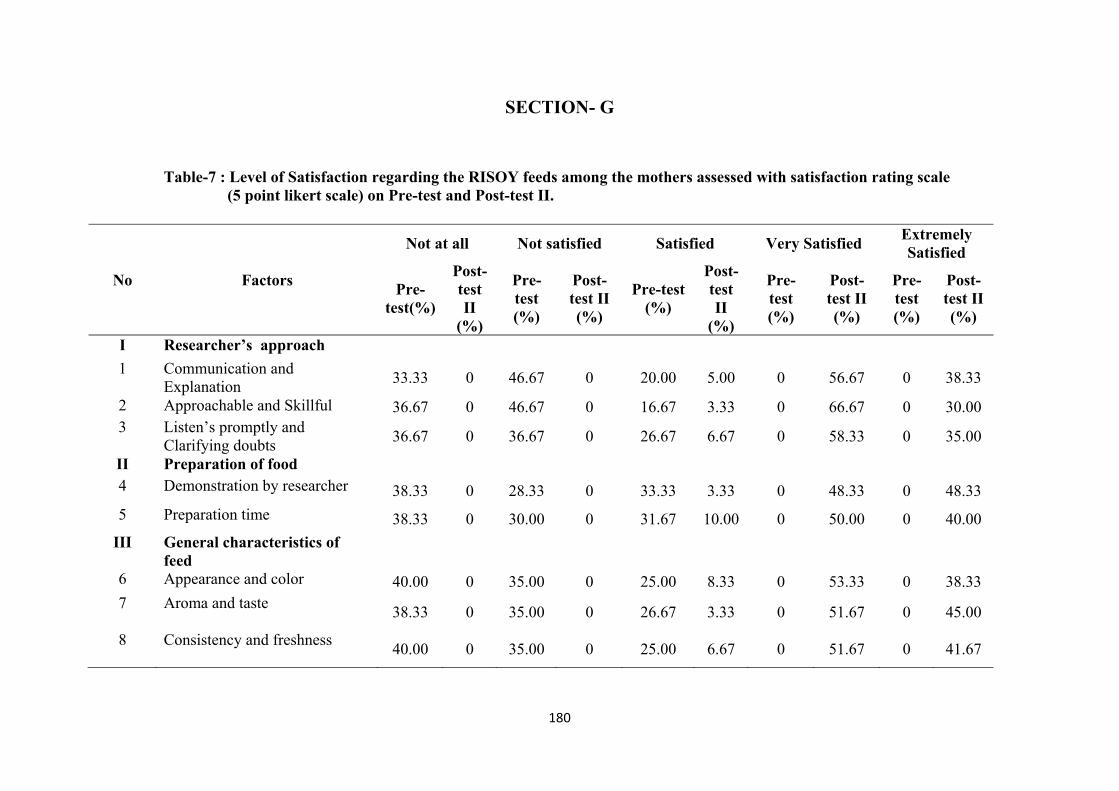
180
SECTION- G
Table-7 : Level of Satisfaction regarding the RISOY feeds among the mothers assessed with satisfaction rating scale (5 point likert scale) on Pre-test and Post-test II.
No Factors
Not at all Not satisfied Satisfied Very Satisfied Extremely Satisfied
Pre-test(%)
Post-test II
(%)
Pre-test (%)
Post-test II (%)
Pre-test (%)
Post-test II
(%)
Pre-test (%)
Post-test II (%)
Pre-test (%)
Post-test II (%)
I Researcher’s approach
1 Communication and Explanation
33.33 0 46.67 0 20.00 5.00 0 56.67 0 38.33
2 Approachable and Skillful 36.67 0 46.67 0 16.67 3.33 0 66.67 0 30.00 3 Listen’s promptly and
Clarifying doubts 36.67 0 36.67 0 26.67 6.67 0 58.33 0 35.00
II Preparation of food 4 Demonstration by researcher 38.33 0 28.33 0 33.33 3.33 0 48.33 0 48.33
5 Preparation time 38.33 0 30.00 0 31.67 10.00 0 50.00 0 40.00
III General characteristics of feed
6 Appearance and color 40.00 0 35.00 0 25.00 8.33 0 53.33 0 38.33 7 Aroma and taste
38.33 0 35.00 0 26.67 3.33 0 51.67 0 45.00
8 Consistency and freshness 40.00 0 35.00 0 25.00 6.67 0 51.67 0 41.67
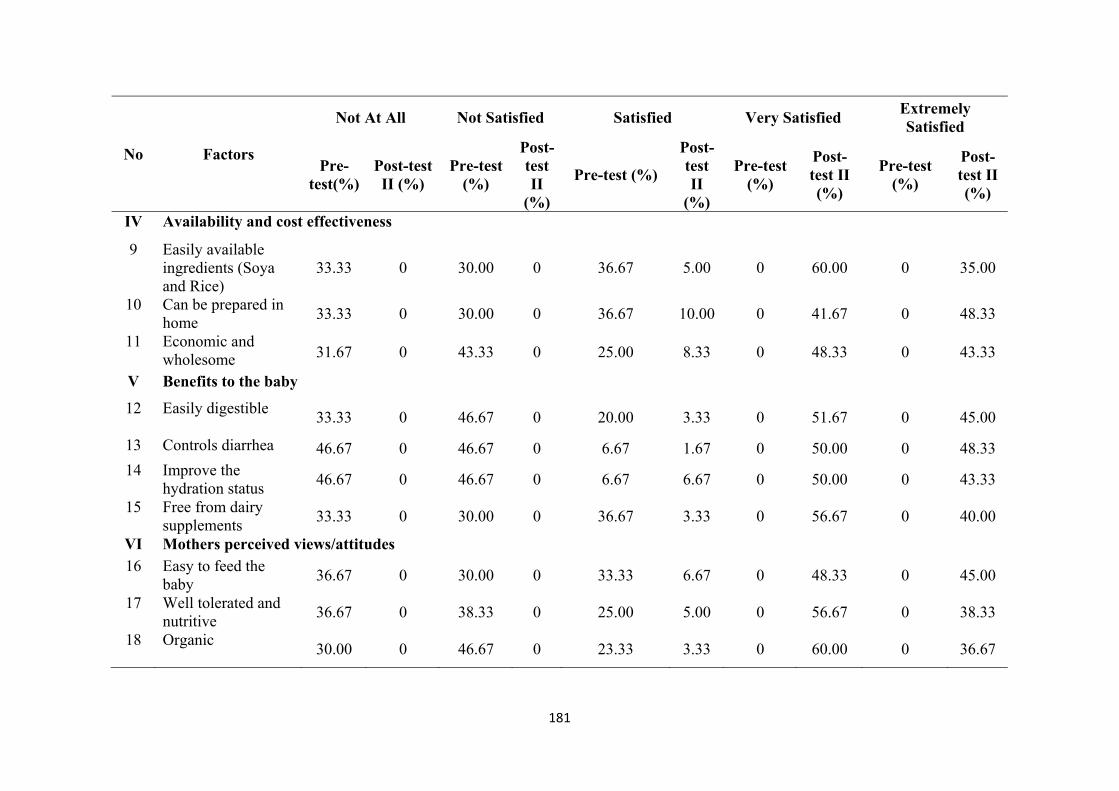
181
No Factors
Not At All Not Satisfied Satisfied Very Satisfied Extremely Satisfied
Pre-test(%)
Post-test II (%)
Pre-test (%)
Post-test II
(%)
Pre-test (%)
Post-test II
(%)
Pre-test (%)
Post-test II (%)
Pre-test (%)
Post-test II (%)
IV Availability and cost effectiveness
9 Easily available ingredients (Soya and Rice)
33.33 0 30.00 0 36.67 5.00 0 60.00 0 35.00
10 Can be prepared in home
33.33 0 30.00 0 36.67 10.00 0 41.67 0 48.33
11 Economic and wholesome 31.67 0 43.33 0 25.00 8.33 0 48.33 0 43.33
V Benefits to the baby
12 Easily digestible 33.33 0 46.67 0 20.00 3.33 0 51.67 0 45.00
13 Controls diarrhea 46.67 0 46.67 0 6.67 1.67 0 50.00 0 48.33 14 Improve the
hydration status 46.67 0 46.67 0 6.67 6.67 0 50.00 0 43.33
15 Free from dairy supplements
33.33 0 30.00 0 36.67 3.33 0 56.67 0 40.00
VI Mothers perceived views/attitudes 16 Easy to feed the
baby 36.67 0 30.00 0 33.33 6.67 0 48.33 0 45.00
17 Well tolerated and nutritive
36.67 0 38.33 0 25.00 5.00 0 56.67 0 38.33
18 Organic 30.00 0 46.67 0 23.33 3.33 0 60.00 0 36.67
182
Table 7 depicts the level of satisfaction among mothers of children in
experimental group. With regard to the researchers approach on Pretest related to
communication and explanation, 33.3% of the mothers were not at all satisfied and on
Post-test II60% were extremely satisfied and 40% were very satisfied.
With regard to approachable and skillfulness, 36.67% of them not at all
satisfied, 46.61% not satisfied, and 16.67% only were satisfied in Pre-test. On Post-
test II none of them either not or not at all satisfied. Most of them 66.7% were very
satisfied and 38.33% were extremely satisfied.
With respect to preparation of lactose free feed, on Pre-test one third of the
subjects 38.33%, were not at all satisfied regarding of the demonstration and the
preparation time. Where as in Post-test II, 48.3% very satisfied and 48.33% extremely
satisfied.
In relation to the general characteristics of feed, on Pre-test the appearance and
color and aroma and taste 70% of them very not satisfied and on Post-test II 53.33%
were very satisfied and 38.33% extremely satisfied.
Regard to availability and cost effectiveness one third of the samples were not
satisfied and on Pre-test and most of them 65% of them very satisfied and 35% were
extremely satisfied on Post-test II.
With regard to benefits to baby digestibility, control diarrhea, improve the
hydration status and replace the weaving food, two third of the mother were not
satisfied on Pre-test and all of mother were very satisfied and extremely satisfied on
Post-test II.
In regard to mother perceived views attitudes one third of the mother were not
satisfied on Pre-test and on Post-test II all the mother attend were very satisfied and
extremely satisfied.
183
CHAPTER - V
DISCUSSION
This chapter presents discussion part of this study according to the results
obtained from statistical analysis based on the literature review, objectives,
hypotheses and finding of this study.
Acute diarrhea is defined as the abrupt onset of 3 or more loose stools per Day
and lasts no longer than 14 Days.
Diarrhea is one of the most debilitating disease in children and causes of death
among infants and children. It is a leading killer disease among children accounting
for 9% of all death among children under 5 worldwide.
Diarrhea is a leading cause of malnutrition in children under five years old and
most of them die due to dehydration and fluid loss and therefore, it becomes the
leading cause of mortality and morbidity in the world. Most diarrheal disease can be
prevented through the preventing and treating of dehydration. Since 2004 UNICEF
and WHO recommended treating diarrhea by replacing fluids and electrolytes by
ORS.
Lactose intolerance is widespread through out the world and subjects usually
avoid milk and dairy products to improve symptoms due to deficit of lactase enzyme.
Primary lactose intolerance is defined as an attributable to relatively less or
absolute absence of lactase that develops in childhood at various ages in different
racial groups, community leads to lactose intolerance.
Secondary lactose intolerance occurs due to temporary lactase deficiency due
to small bowel injury such as acute gastro enteritis, persistent diarrhea, small bowl
injury .
184
Infectious diarrhea particularly Rota viral in young children may damage the
intestinal mucosal layer, which leads to reduce the quality of enzyme lactase.
This continuous as the diarrhea, episodes progress as the milk has large
amount of Lactose. Usually leads to presence of reading sugar and altered stool Ph.
(Acidity) often with excess flatus and abdominal bloating.
The most affected children who are between 6-12 month who were on milk
feed should be replaced with another feed equally good for the baby, which supplies
all essential nutrients and minerals also replaces water and electrolytes.
In clinical area usually Nosobee (lactonil) feed based on soya and Malto
dextrin are prescribed. The commercial products comes in 400 gm pack with a cost of
Rs 385/-.
Other lactose free feed like yogurt could be effectively used, weaning children
with rice and Lentil are also commonly used world wide.
The important aspect of diarrhea is loss of failed and electrolytes from the
body and leads to severe dehydration. Dehydration is the leading cause of mortality
and morbidity in any kind of diarrhea.
The setting of the study was Navamani paediatric hospital Arasaradi Madurai.
The first objective of the study was to determine the incidence of secondary Lactose
intolerance among children between 4 to 18 months. Totally 618 children were
screened by purposive convenience sampling technique for a period of the year. All
children who attend the OPD with diarrhea for 3and more than 3 Days were assessed
for diarrheal status with screening test of stool for reducing sugar and stool pH over a
period of 12 months on Thursday, Fridayand Saturday.
185
Development of the Intervention (lactose free RISOY feed)
The primary aim of this present study is to develop and prepare a lactose free
feed with available ingredients like matta Rice (Red) parboiled and White soya.
The idea of developing and testing this feed to children with secondary lactose
intolerance. This was discussed with the experts in the same field.
The process of developing this intervention was done in IICPT, Thanjavore.
The concept was discussed with the director IICPT and Two nutrition experts who
guided me to prepare this cost effective Risoy feed at the incubation center. Under
several proposition and types of Rice the feed was developed.
When the parboiled Red Rice and white Soya were added in 3:1 proposition it
was adequately supplying the essential nutrition. The proximity analysis revealed the
nutritive value, it also replace the weaving feed which was very effective in
controlling diarrhea and correcting dehydration among children.
The Ricsoy feed were prepared in the ward with a induction stove and it was
issued to the children after every episode of diarrhea. Quasi experimental design was
selected for this study.
Totally 120 children were selected as study samples, 60 in experimental and
60 in control group by purposive sampling technique for both groups before and after
control group design was used in this study.
The effectiveness of the prepared and certified Lactose feed RISOY feed in
controlling diarrhea and correcting the dehydration among children with diarrhea for
3 and more than 3 Days for a period of one year from Aug 2014 to April 2015 in
experimental group. The samples were selected for control group prior to
experimental group between Jan 2014 to July 2014 who fulfilled the inclusion criteria
by convenience sampling technique. Every child was assessed for 3 Days with
186
observational rating scale for diarrhea with 10 observations and for hydration status
with 14 assessments. The assessment taken on Day I was considered as Pre-test Day
II as Post-test I and Day III as Post-test II.
The indicators for diagnosing the secondary lactose intolerance is presence of
reducing sugar in stool, and assessing the stool acidity by litmus paper test along with
that 8 other assessments, like colour, consistency of the stool, episodes of diarrhea,
abdominal cramps and bloating, anal excoriation, quantity of stool were assessed
with observational rating scale.
The hydration status of the children were assessed with 14 aspects
observational rating scale involving General Condition of the Child like Eyes, Mouth
(Lips), Tongue, Thirst, Urine Output, Tears, Skin Turgor, Fontanels, Arms and Legs,
Capillary Refill, Pulse Rate, Respiration, Blood pressure.
The obtained data were entered into a master sheet for tabulation and
statistical processing the finding of the study are discussed in terms of objectives and
hypothesis. The findings of the study were compared and contrasted in different
aspects of study variables.
The analyzed data are discussed under the following headings
5.1. Development of Instrument
5.2. Distribution of samples according to demographic variables among the
samples selected to find out the incidence of secondary lactose intolerance.
5.3. Demographic variables of samples both in control and experimental group.
5.4.a. Diarrheal status of children on Pre-test, Post-test I, Post-test II among
experimental group.
5.4.b. Hydration status of children on Pre-test, Post-test I, Post-test II among
experimental group .
187
5.4.c. Diarrheal status of children on Pre-test, Post-test I, Post-test II among Control
group .
5.4.d. Hydration status of children on Pre-test, Post-test I, Post-test II among
Control group .
5.5.a. Effectiveness of Lactose free feeds in controlling diarrhea among children
with in experimental group between Pre-test andPost-test I, and Post-test II.
5.5.b. Effectiveness of Lactose free feeds in correcting dehydration among children
in experimental group Pre-test, Post-test I, and Post-test II
5.5.c. Effectiveness of Lactose free feeds in controlling diarrhea among children
with in control group between Pre-test and Post-test I, and Post-test II.
5.5.d. Effectiveness of Lactose free feeds in correcting dehydration among children
in control group Pre-test, Post-test I, and Post-test II
5.6. a. comparison of diarrheal status of children on Pre-test among experimental and
control group
5.6 b comparison of diarrheal status of children on Post-test I among experimental
and control group
5.6 c comparison of diarrheal status of children on Post-test II between experimental
and control group
5.6.d. comparison of hydration status of children on Pre-test between experimental
and control group
5.6 e. comparison of hydration status of children on Post-test I between experimental
and control group
5.6 f comparison of hydration status of children on Post-test II between
experimental and control group
188
5.7. Correlation between diarrheal and hydration status of children between
experimental group.
5.8. Association between diarrheal status and demographic variables among
experimental group.
5.9 Association between hydration status and demographic variables among
experimental group.
5.10 Level of Satisfaction regarding the RISOY feeds among the mothers assessed
with satisfaction check list (5 point likert scale) on Pre-test and Post-test II.
5.1. Development of the Instrument
The researcher found that there was standardized instruments available
regarding assessment of diarrhea and dehydration. Since the study sample were
children between the age of 4-12 months the tool was modified by the researcher with
appropriate to assess the infants with in nurses role and feasible.
In the present study, the following instruments were developed by the
researcher with the help of an extensive review literature from various resons and
based on the objectives of the study.
The instruments include :
1. Demographic variables
2. Observational rating scale for diarrhea
3. Observational rating scale for dehydration
4. 5 point likert scale for assessing for level of satisfaction regarding RISOY
feeds among mothers.
The content validity of the instrument was evaluated by a panel of fifteen
experts.
189
The prepared tool (part 1,2,3,4) along with objectives, hypothesis, operation
definition blue print and criteria checklist were given to experts and requested were
given to their valuable suggestions regarding accuracy, relevance and appropriateness
of the content there were two response column against each item and a column for
remarks and suggestion for the evaluation.
The evaluator was asked to put against mentioned column. The validated
tool was recurring from the 13 judge in the field of nursing, medicine, nutritionist,
biostatistics with their valuable opinion.
The reliability of the instrument was established by administering the
instrument to 20 children who were admitted in the hospital with secondary lactose
intolerance from both experimental and control group during pilot study.
The reliability were tested and presented as follows.
The reliability of observational rating scale to assess the diarrheal status of the
children were done by inter rater reliability. It was obtained by Cronbachs - Alpha
formula and it was r = 0.731 validity 0.855. This shows the tool was reliable.
The reliability of observational rating scale to assess the hydration status of the
children were done by inter rater reliability. It was obtained by Cronbachs - Alpha
formula and it was r = 0.726 validity 0.852. This shows the tool was reliable.
The five point likert scale for level of satisfaction regarding the RISOY feeds
many mothers was tested by internal consistency and tested by Cronbachs – Alpha
reliability was .896 and intrinsic validity was .947. Hence the tool was considered as
statistically significant and reliable.
190
5.2. Distribution of samples according to demographic variables among the
samples selected to find out the incidence of secondary lactose intolerance.
Regarding the incidence of secondary lactose intolerance among children with
gastroenteritis. Around 618 children were screened for presence of reducing sugar and
alteration in stool PH by a survey method among which 350 that is 56.63 % of them
were identified to have a secondary lactose intolerance. With regard to the age of
children, out of 350 samples majority of them 139 (39.7%) were between 10-12
months and 118 (33.7%) of them were 6-8 months of age . With reference to the sex
of the children, 139 (57.72%) of them were male and 148 (42.28%) of the children
were female. With regard to the weight of the children94 (26.9%) of them were below
6 -7.5kg and 112 (32%) of them were 4.5-6kg and 144 (41.1%) of them were 7.5kg
and above. Regarding the presence of reducing sugar of the children, 248 (70.9%)
had orange and brick red, 97 (27.7%) had yellow and 5 (1.4%) had blue and green
colour. With regards alteration of pH of the children, 248 (70.9%) of them had pH
4.5-5, 97 (27.7%) of them had pH of 5-6 and 5(1.4%) of them of pH of 6-7.
The findings were supported by a longitudinal study on prevalence and the
seasonal distribution of diarrheal disease amongst 2408 under-five children including
541 infants, acute diarrheal disease with its accompanying dehydration has remained a
challenging health problem to the medical profession and the community in the third
world countries especially in the age below five years. The findings revealed that
most of the cases of diarrhea (81.89%) were infants. Most of the children i.e,
(90.60%) cases were treated at home with oral rehydration solution and/ or home
available fluids.97
A population-based study was conducted including both demographic
surveillance and randomized cohort study based on different geographical areas,
191
Seven sites i.e., Bangladesh, Ethiopia, Ghana, India, Pakistan, Uganda and the United
Republic of Tanzania provided sufficient verbal autopsy data. The population
includes children of age 1 to 59 months. The data collected during the process
revealed that childhood deaths collected between 2000 and 2012. The population
covered at the seven study sites ranged from approximately 60 000 to 600 000, Study
findings showed that 49–85% of diarrheal deaths in infants aged 1 to 11 months were
due to acute watery diarrhea at six of the seven study sites, whereas 5–15% of
diarrheal deaths at all sites were due to acute bloody diarrhea and 10–61% at all sites
were due to persistent diarrhea. These rates were near same findings to those reported
in 1993, which indicate that acute diarrhea accounted for 28% of diarrheal deaths
among infants and that persistent diarrhea accounted for 62% in infants less than 11
months of age in Brazil.22 Moreover, persistent diarrhea accounted for more than
30% of diarrheal deaths in infants aged 1–11 months at five of the seven sites and
more than 25% of deaths in children aged 1–4 years at three of the five sites where
data were available. While there is evidence that persistent childhood diarrhea has
decreased, our data shows that in some countries it is a major contributor to diarrheal
deaths.99
5.3. Demographic variables of samples both in control and experimental group.
Analysis of demographic data revealed that the children in both groups were
similar in most aspects and it is presented as follows :
Age
Regarding to the age of children, out of 60 samples, majority 39 (65%) of
them were between 6-12 months and ie., 21 (35%) of them were 0-6 months of age in
192
the experimental group. In the control group 42(70%) of them were between 6-12
months of age and 18 (30%) of the subjects were between 0-6 months age.
Sex
With regard to the sex of the children 45(75%) of them were males and 15
(25%) of the subjects were females, whereas in the control group 43(71.7%) of the
were males and 17 (28.3%) of them were female.
Weight
While seeing the weight of the children 9 (15%) of them were below 6kg and
30 (50%) of them were 6-8kg and 21 (35%) of them were 8kg and above in the
experimental group. A significant weight loss around 0.5kg was recorded both in
experimental and in control group on Post-test II.
Duration of diarrhea
Regarding to the duration of diarrhea 53(88.3%) of children were having
diarrhea for 3 days and 7 (11.7%) of them were having diarrhea for more than 3 days
in the experimental group, In control group 45 (75%) of them were having diarrhea
for 3 days and 15(25%) of them having diarrhea for more than 3 days.
Feeding Pattern
When discussing the feeding pattern of children majority of them 48 (80%) of
were on bottle feeding and 12 (20%) of the were on breast feeding among the
experimental group whereas in control group, 45 (75%) of them were fed with bottle
feeds and 15 (25%) of them were on exclusive breast feeding. In relation to the type
of feeding 34 (58.6%) of them were fed with cow’s milk in experimental group and
24 (41.4%) of them were fed with powder milk in the experimental group whereas in
193
control group 36 (76.4%) of them were fed with cow’s milk and 11 (23.6%) of them
with powder milk.
Weaning
With regard the 60 subjects in the experimental group 40(66.7%) of them were
started with weaning in 4 months and 20 (33.3%) of them were started weaning at 6
months in the experimental group. Whereas in the control group 37 (61.7%) of them
were weaned in 4th month and 23 (38.3%) of them were weaned in 6 months.
Previous episodes of diarrhea
Regarding to previous episodes of diarrhea most of them 51 (85%) had 1st
time and 9 (15%) of them had diarrhea for the 2nd time in the experimental group. But
in control group 56 (93.3%) of the subjects had diarrhea for the 1st time and 4 (6.7%)
of them had for the 2nd time. Both in control group and in the experimental group
majority of them 55 (91.7%) and 5 (93.3%) of them didn’t try any home remedy.
Mother
With regard to the educational status of the mother 33 (55%), in the
experimental group and 47 (78.3%) in the control group were educated up to high
school respectively. Majority of the children, 58 (96.7%) were cared by mothers.
Regarding the hand washing (63.3%) had a practice of hand washing sometimes .With
regards feeding vessels sterilization, (63%) of the mothers do vessels sterilization
before feeding. Regarding the drinking water (56.75%) using portable, drinking water
and 43.4% of them use corporation water.
194
5.4.a. Diarrheal status of children on Pre-test, Post-test I, Post-test II among
experimental group
Regarding the diarrheal status of the children among the experimental group
out of 60 child, 86.7% (52) had very high diarrheal status and 8 of them 13.3% had
high diarrheal status on Pre-test, whereas on Post-test I, the diarrheal status was
declined and 47 (78.3%) of the child had high level of diarrhea and 13(21.7%)of
them had moderate level of diarrhea. On Post-test II 48(80%) majority of the subjects
were normal and 12 (20%) subjects had moderate diarrhea.
5.4.b. Hydration status of children on Pre-test, Post-test I, Post-test II among
experimental group
Regarding the hydration status of the children accessed on Pre-test followed
by Post-test I and Post-test II, in Pre-test none of the children had severe dehydration.
36(60%) of them were moderately hydrated and 24 (40%) of them had high hydration
status. When compared to the Pre-test, on Post-test I the 39 (65%) of them improved
the hydration status to a high level and 21 (35%) of them obtained maximum level of
hydration. In Post-test II, 48 (80%) of them maintained high level of hydration status
and 12 (20%) of them had very high level of hydration status.
5.4.c. Diarrheal status of children on Pre-test, Post-test I, Post-test II among
Control group
Revealed the diarrheal status of the children among the control group out of 60
children 55 (91.7%) had very high diarrheal status and 5(8.3%) of them had high
diarrheal status in Pre-test, whereas in Post-test I the diarrheal status declined and 55
(91.7%) of the children had high level of diarrhea, 5 (8.3%) of them had very high
195
level of diarrhea. On Post-test II 35(58.3%) subjects were normal and 25 (47.1%)
subjects had moderate diarrhea.
5.4.d. Hydration status of children on Pre-test, Post-test I, Post-test II among
Control group
Regarding the hydration status of the children assessed on Pre-test followed by
Post-test I and Post-test II. On Pre-test none of the children had severe dehydration.
36 (60%) were moderately dehydrated and 24 (40%) were highly dehydrated. When
compared to the Pre-test, on Post-test I the 39 (65%) of them improved the hydration
status to a high level and 21 (35%) of them obtained maximum level of hydration. On
Post-test II, 45 (75%) of them maintained high (maximum) hydration status and 15
subjects (25%) reached very high hydration status.
5.5.a. Effectiveness of Lactose free feeds in controlling diarrhea among children
with in experimental group between Pre-test and Post-test I, Post-test I and Post-
test II, Pre-test and Post-test II
The mean diarrheal status of the Pre-test is 86.33% and Post-test I is 66.27%
and the calculated ‘t’ value 18.89 at p < 0.00 level of significance. There is
significant reduction in the diarrheal status of the children between Pre-test and Post-
test I. Thus, it infers that the experimental group had a significance of control over
the diarrheal status.
Where as diarrheal status of the Post-test I is 66.27% and Post-test II is
38.1667% and the calculated ‘t’ value is 29.73 at p < 0.00 level of significance. Thus
there is a substantial reduction in the diarrheal status of the children between Post-test
I and Post-test II. Thus, it infers that the experimental group had a significance of
control over the diarrheal status.
196
While comparing the mean diarrheal status of the Pre-test is 86.33% and Post-
test II is 38.1667% and the calculated t value 48.166 at p < 0.00 level of significance.
There is significant reduction in the diarrheal status of the children between Pre-test
and Post-test II. Thus, it infers that the experimental group had a higher significance
of control over the diarrheal status.
5.5.b. Effectiveness of Lactose free feeds in correcting dehydration among
children in experimental group Pre-test, Post-test I, and Post-test II
The hydration status of the children within the experimental group compared
between Pre-test and Post-test I. The calculated overall mean value of all the items in
Pre-test was 59.64% and Post-test I was 81.62 and overall ‘t’ Value was 27.44 which
is greater than the table value of statistics and P Value <0.000, which show, that there
is a significant difference between hydration status on Pre-test and Post-test I. This
infers that within the group Comparison, hydration status was improved on the
Second day.
Where as the hydration status of children compared between Post-test I and
Post-test II. The calculated overall mean value of all the items on Post-test I was
81.62% and Post-test II was 97.46% and the overall t value was 19.94 which is
greater than the table value of Statistics and P Value < 0.000, which shows that there
is a difference between the hydration Status on Post-test I and Post-test II. This infers
that within the group comparison, Post-test II hydration status was significantly
improved than Post-test I.
While comparing the hydration status of the children compared between Pre-
test and Post-test II. The calculated overall mean value of all the items on Pre-test
was 59.64% and Post-test II was 97.46% and the overall ‘t’ value was 50.215 which
is greater than the table value of statistics and P value < 0.000, which shows that
197
there is a significant difference between the hydration status on Pre-test and Post-test
II. This infers that within the group comparison, hydration status was highly improved
on the third day. These findings reveals, that there is significant improvement in the
hydration status of children after the introduction lactose free RISOY feeds by
decrease in the episodes of diarrhea and improved hydration status.
5.5.c. Effectiveness of Lactose free feeds in controlling diarrhea among children
with in control group between Pre-test and Post-test I, and Post-test II.
The diarrheal status of children among the control group (Pre-test and Post-
test II) before and after introducing the intervention. The results shows the mean
diarrheal status of the Pre-test is 88.66% and Post-test I is 74.88% and the calculated t
value 18.70 at p < 0.00 level of significance. There is reduction in the diarrheal status
of the children Pre-test and Post-test I. Thus, it infers that the control group had
average control over the diarrheal status.
The diarrheal status of children among control group (Post-test I and Post-test
II) before and after introducing the intervention. The results shows the mean diarrheal
status of Post-test I was 74.88% and Post-test II was 41.27% and the calculated t
value is 34.60 at p < 0.00 level of significance. Thus there is a reduction in the
diarrheal status of the children Post-test I and Post-test II. Thus, it infers that the
control group had a moderately significant control over the diarrheal status.
When compared Pre-test with Post-test II, the mean diarrheal status of Pre-test
88.66% and Post-test II was 41.27% and the calculated ‘t’ value is 40.78 at p < 0.00
level of significance. Thus there is a reduction in the diarrheal status of the children
between Pre-test and Post-test II. Thus, it infers that the control group also had a
slight significant control over the diarrheal status.
198
5.5.d. Effectiveness of Lactose free feeds in correcting dehydration among
children in control group Pre-test, Post-test I, and Post-test II
The hydration status of the children within the control group compared
between Pre-test and Post-test I, overall mean value of all the items on Pre-test was
59.52% and Post-test I, was 77.93% and the overall ‘t’ value was 23.55 which is
greater than the table value and significant at P < 0.000 level, which shows that there
is a difference between the hydration status on Pre-test and Post-test I. This infers
that within the group comparison, hydration status was improved on the second day.
When compared between Post-test I and Post-test II. The calculated overall
mean value of all the items on Post-test I was 77.93% and Post-test II was 93.73%
and the overall ‘t’ value was 19.85 which is greater than the table value of statistics
and P value < 0.000, which shows that there is a difference between the hydration
status on Post-test I and Post-test II. This infers that within the group comparison,
hydration status was improved on the third day.
The hydration status of the children within the control group compared
between Pre-test and Post-test II, overall mean value of all the items on Pre-test was
59.52% and Post-test II was 93.73% and the overall ‘t’ value was 41.91 which is
greater than the table value of statistics and P value < 0.000, which shows that there
is a difference between the hydration status on Pre-test and Post-test II. This infers
that within the group comparison, hydration status was improved on the third day.
A rice based ORT have been shown superior to glucose based ORS in
reducing stool quantity and duration of diarrhea. Rice based ORS used for young
children in a randomized control trail from 52 young infants 72% (27 children)
received rice based ORS and 25 children received WHO-ORS. It was found that
199
children received rice based ORS were having significantly lower stool output,
diarrhea and rice based ORS was tolerated well.138
This was consisted the study findings to compare the efficacy of a cereal based
ORS (prepared with 50 G of sagodana (cereal), 3.5 GIL sodium chloride, 1.5 GIL
potassium chloride, 2.9 GIL tri sodium citrate) with rice based oral rehydration
solution (using same amounts of rice and electrolytes) for treatment of diarrhea, One
hundred and twelve children aged 3 months to 2 years with watery diarrhea of less
than 5 days duration with mild to moderate dehydration and no sepsis, were included
in the study. The amount of ORS intake, stool volume and frequency were similar in
both groups. Clinical success was seen in 79% of rice ORS group and 81% in
sagodana group. The study results suggest that both can be used as a cereal based
ORS in the management of acute diarrhea in communities where it is culturally
accepted and used as a weaning diet.139
Another study was undertaken to compare the efficiency of ready to use pre
mixed rice based Oral rehydration solution(R-ORS) and glucose based ORS among
Mexican children with diarrhea. Between the age of 3-24 months with 3 hours
introduction of Rice based ORS, there was significant reduction in diarrheal episodes
of children. 140
Specific usage of 2 ORS (rice based general and oral rehydration salts) were
assured among the mothers of 162 children under the age of 5. Among that 86
mothers were from village, mothers responded to the Rice based gruel was found to
be effective in controlling diarrheal symptoms .141
A study documented to evaluate the use of rice based Oral rehydration
solution with glucose based Oral Rehydration solution in management of diarrheal
symptoms. Among 200 hospitalized Egyptian infants below 3-18 months of age , it
200
was found that there was a statistically significant difference among 4 group in the
mean duration of diarrhea. And the study findings concluded that the child fed with
rice based ORS reduced the stool output when compared to the control group who
were on formula feed. 144
5.6.a. Comparison of diarrheal status of children on Pre-test among
experimental and control group
To determine the difference between the diarrheal status of children before the
introduction of lactose free RISOY feeds among experimental group and regular
lactose free feed for the control group as prescribed by the doctor. The total mean pre
intervention score of diarrheal status in all aspects in experimental group is 88.66
which is less than the control group mean score 86.33. The calculated ‘t’-value 2.848
which is statistically significant at P<.002 level. Hence the diarrheal status among
experimental group is statistically significant at P<.00 level. This indicates that there
is a difference between the experimental and control group.
5.6.b. Comparison of diarrheal status of children on Post-test I among
experimental and control group
The total mean post intervention score of diarrheal status in all aspects in
experimental group on Post-test I is 66.27 which is less than the control group mean
score 74.88. The calculated ‘t’ value -7.952 is statistically significant at P<.00 level.
Hence the diarrheal status among experimental group is statistically significant at
P<.00 level. This indicates that there is a difference between the experimental and
control group.
201
5.6.c. Comparison of diarrheal status of children on Post-test II between
experimental and control group
The total mean post intervention score of diarrheal status in all aspects in
experimental group on Post-test II is 38.1667 which is less than the control group
mean score 41.2778. The calculated ‘t’ value 2.246 is statistically significant at P<.00
level. Hence the diarrheal status among experimental group is statistically significant
at P<.00 level. This indicates that there is a difference between the experimental and
control group.
5.6.d. Comparison of hydration status of children on Pre-test between
experimental and control group
The hydration status of children before the introduction of lactose free RISOY
feeds among experimental and lactose free commercial feed for control group on Pre-
test, the total mean pre intervention score of hydration status in all aspects in
experimental group is 59.642 is less than the control group mean score 59.523. The
calculated ‘t’-value 0.137and it is statistically not significant at P>.097 level. This
indicates that there is no difference between the experimental and control group.
5.6 e. Comparison of hydration status of children on Post-test I between
experimental and control group
To determine the difference between the hydration status of children after the
introduction of lactose free RISOY feeds among experimental and control group on
Post-test I, the total mean post intervention score of hydration status in all aspects in
experimental group is 81.62 is more than the control group mean score 77.93. The
calculated ‘t’-value 3.213 is statistically significant at P<.00 level. Hence the
hydration status among experimental group is statistically significant at P<.00 level.
202
This indicates that there is a difference between the experimental and control group.
The children in experimental group attained better hydration status when compared
with the control group.
5.6.f. Comparison of hydration status of children on Post-test II between
experimental and control group
The total mean post intervention score of hydration status in all aspects in
experimental group on Post-test II is 97.4603 is more than the control group mean
score 93.7302. The calculated ‘t’-value 4.445 is statistically significant at P<.032
level. Hence the hydration status among experimental group is statistically significant
at P<.032 level. This indicates that there is a difference between the experimental and
control group. The hydration status of the children were found to be to the maximum
level in most of the subjects among experimental group. Hence the lactose free
RISOY feeds were effective in correcting the dehydration by controlling the episodes
of diarrhea
5.6.g. One Way ANOVA results between Pre and Post intervention Diarrheal
and Hydration Pre-test, Post-test I and Post-test II for the Control Group
One way ANOVA between diarrheal and hydration status of children on Pre-
test, Post-test I, Post-test II among control group that there is a significant difference
between means of three assessments on Pre-test, Post-test I and Post-test II. The
calculated ratio for diarrheal status among control group is 848.28 and it is significant
at P<.00 level. The calculated F ratio for hydration status among children based on
three assessments on Pre-test, Post-test I and Post-test II, F ratio is 815.04 at P<.00
level. Further it clearly indicates that the diarrheal and hydration status of children
were improved from Pre-test to Post-test I and further improved to Post-test II.
203
5.6.h.One Way ANOVA Results between Pre and Post intervention Diarrheal
and Hydration Pre-test, Post-test I and Post-test II for the Experimental Group
One way ANOVA between diarrheal and hydration status of children on Pre-
test, Post-test I, Post-test II among experimental group that there is a significant
difference between means of three assessments of Pre-test, Post-test I, Post-test II.
The calculated ratio for diarrheal status among experimental group is 1058.86 and it is
significant at P<.00 level. The calculated F ratio for hydration status among children
based on three assessments of Pre-test, Post-test I, Post-test II , F ratio is 654.272 at
P<.00 level. Further it clearly indicates that the diarrheal and hydration status of
children were improved from Pre-test to Post-test I and further improved to
Post-test II.
5.7. Correlation between diarrheal and hydration status of children between
experimental group.
The relationship between diarrheal with hydration status of children among
experimental group. The result shows that the correlation value of pre experimental
diarrheal and hydration status with the post intervention shows the significant
negative correlation at 0.01 level. The Correlation Value of Post intervention Post-
test I was – .108 and -.411** and the Post intervention diarrheal and hydration status
on Post-test II was – .088 and -.360 was significant at 0.01 level and which shows a
Negative correlation at 0.001 level. As the diarrhea status was under control the
hydration status of the children were found to be increasing.
This findings were similar to, A study was done to compare the rice based
ORS with lactose free formula among Egyptians infants with acute diarrhea. Infants
from 3 to 18 months with watery diarrhea were selected who had 5-8 stools per day.
With 5% dehydrated four cell randomized controlled trial taken up where two groups
204
were given general ORS, third group was given rice based ORS and fourth group was
given soya based lactose free formula. The findings revealed that rice based ORS and
soya based lactose free formula were effective in controlling diarrhea in 35% of the
subjects. (Madhasam S. Comparision of rice based ORS with lactose free formulas.
Indian journal of pediatrics. 2000)
Another study reports that infant formula including both soya protein and
hydrolyses formulas with specially designed carbohydrate, protein and fat
components are available to treat the infants with diarrheal syndromes and secondary
lactase deficiency. It also states that the diet can be supplemented with lactase.
Specialized lactose reduced products as well as cultured and fermented diary products
may be used in varying degrees for lactose intolerant children.(Siden a et al, dietary
Management of lactose intolerance, 2004)
A study was conducted to assess the effects of rice based oral rehydration salt
solution and compared with glucose based oral rehydration salt solution on reduction
of stool output and duration of diarrhea in patients with acute watery diarrhea. Twenty
two randomized trials were included in the study. The findings of the study revealed
that the rate of stool in infants and children was reduced by only four ml/kg body
weight. It was therefore suggested that rice based oral rehydration appears to be
effective in reducing stool output. (Fontaine O,Gore SM, Pierce NF. Rice based oral
rehydration for treating diarrhea. Conchrane database Syst Rev. 2007 Jul18;
(4):CD001264.)
Soy-based infant formula has shown positive results in treating diarrhea in a
well-designed clinical trial of 73 infants. The total duration of diarrhea was
significantly longer in those receiving cow s milk than in those receiving soy-based
formula. Similarly, in a study of Nigerian children with diarrhea and malnutrition,
205
commercially available soymilk, homemade soymilk, and soybeans were shown to
decrease the severity and duration of diarrhea while stimulating weight gain42 . Bone
mineralization and vitamin D metabolism in infants fed soy formula is comparable
with infants fed cow s milk formula and breast milk.
5.8. Association between diarrheal status and demographic variables among
experimental group.
There is no significant association found between diarrheal status of children
with their Selected demographic variables such as Age, Sex, weight, Duration of
Diarrhea, Feeding pattern, Type of bottle feed, weaning started at, previous episode of
diarrhea, any Home Remedy taken, Education of mother, Total family income, child
is cared by, Hand washing, Feeding vessels Sterilization, drinking water.
5.9 Association between hydration status and demographic variables among
experimental group.
There is no significant association found between hydration status of children
with their Selected demographic variables such as Age, Sex, weight, Duration of
Diarrhea, Feeding pattern, Type of bottle feed, weaning started at, previous episode of
diarrhea, any Home Remedy taken, Education of mother, Total family income, child
is cared by, Hand washing, Feeding vessels Sterilization, drinking water.
5.10 Level of Satisfaction regarding the RISOY feeds among the mothers
assessed with satisfaction check list (5 point likert scale) on Pre-test and
Post-test II.
Researcher’s approach
The level of satisfaction among mothers of children in experimental group.
With regard to the researchers approach on Pre-test related to communication and
206
explanation, 33.3% of the mothers were not at all satisfied and on Post-test II 60%
were extremely satisfied, and 40% were very satisfied.
With regard to approachable and skillfulness, 36.67% of them not at all
satisfied, 46.61% not satisfied, and 16.67% only were satisfied on Pre-test. On Post-
test II none of them either not or not at all satisfied. Most of them 66.7% were very
satisfied and 38.33% were extremely satisfied.
Preparation of food
With respect to preparation of lactose free feed. On Pre-test one third of the
subjects 38.33%, were not at all satisfied regarding of the demonstration and the
preparation time. Where as in Post-test II, 48.3% very satisfied and 48.33% extremely
satisfied.
General characteristics of feed
In relation to the general characteristics of feed on Pre-test the appearance and
color and aroma and taste 70% of them very not satisfied and on Post-test II 53.33%
were very satisfied and 38.33% extremely satisfied.
Availability and cost effectiveness
Regard to availability and cost effectiveness one third of the samples were not
satisfied and on Pre-test and most of them 65% of them very satisfied and 35% were
extremely satisfied on Post-test II.
Benefits to the baby
With regard to benefits to baby digestibility, control diarrhea, improve the
hydration status and replace the weaving food ,two third of the mother were not
207
satisfied on Pre-test and all of mother were very satisfied and extremely satisfied on
Post-test II.
Mothers perceived views/attitudes
In regard to mother perceived views attitudes one third of the mother were not
satisfied on Pre-test and on Post-test II all the mother attend were very satisfied and
extremely satisfied.
208
CHAPTER-VI
SUMMARY AND CONCLUSION
Diarrhea is the one of the top five causes of death among infants and under-
five children in India, despite the availability of easily implementable interventions
and existence of national guidelines for management at the community level9.
Pneumonia and diarrhea, respectively, are responsible for 17% and 9% of global child
deaths, together claiming the lives of more than 1.7 million under-five children in
2012 alone. In addition to the high burden of neonatal health problems, pneumonia
and diarrhea were clearly identified as diseases that must be addressed in order to
meet national and international goals for reducing child deaths and improving
wellbeing and quality of life for India’s children.
Diarrhea is a major cause of mortality among the under-five children in India
and is considered an important public health problem. The economic burden on health
services caused due to diarrheal diseases is immense, as up to one-third of total
pediatric admissions are due to diarrheal diseases and up to 17% of all deaths in
indoor pediatric patients are diarrhea related. An estimation of mortality due to
diarrhea in India was carried out by the National Institute of Cholera and Enteric
Diseases, Kolkata. According to their estimates, the crude death rate due to diarrhea in
rural India is 9.3 per 1,000 populations. The total number of deaths due to diarrhea in
the age group of 0–6 years accounted for 22% of total rural deaths. Diarrhea, as a
prominent killer for 0–5 years children possess a formidable challenge to health
planners. In 2009 one of the leading donor organizations in India ‘Rotary
International has joined with government of India to help to fight against diarrhea.
Diarrhea kills nearly 5,00,000 children a year in India.
209
Diarrheal diseases causes heavy economic burden for health services and as
well as to the country. The Hindu Newspaper report states that nearly one lakh
children died in India every year owing to diarrhea, which could have been easily
prevented. The country should promote preventive and community-based quality
healthcare. It also encourages private practioners are encouraged to carry a significant
share of the burden of public health care.
6.1 Summary of the study
The present study was under taken to assess the effectiveness of lactose free
feeds in controlling diarrhea and correcting dehydration among children with
secondary lactose intolerance in a selected hospital, Tamilnadu.
A quasi-experimental research design was selected for the present study
nonprobability convenience sampling technique was used with before and after
control group design. The study period was for about 2 years at a selected pediatric
hospital Madurai district of Tamilnadu.
The study sample are children who are having diarrhea for 3 days or more than
3 days who are diagnosed to have secondary lactose intolerance and admitted in the
hospital by purposive convenience sampling techniques. The study sample size is 60
each in both experimental and control group.
The tool for data collection was the structured observational rating scale for
assessing diarrheal and hydration status, and 5 point likert scale for assessing the level
of satisfaction among mothers regarding the lactose free feeds. The conceptual frame
work for this study was based on Ludwig von Bertalamffy and J.W Kenny open
system model.
210
Objectives
1. To find out the incidence of secondary lactose intolerance among children.
2. To assess the pre and post-test diarrheal status of children in both control and
experimental group.
3. To assess pre and post-test hydration status of children in both control and
experimental group.
4. To compare the pre and post-test diarrheal status of children in control and
experimental group.
5. To compare the pre and post-test hydration status of children in control and
experimental group.
6. To evaluate the effectiveness of lactose free feeds in controlling diarrhea and
correcting dehydration among children between control and experimental group.
7. To correlate the diarrheal and hydration status of children in experimental group.
8. To associate the diarrheal and hydration status of children with their selected
demographic variables in experimental group.
Hypotheses
H1. The mean post-test diarrheal status among experimental group will be
significantly lower than the control group.
H2 The mean post-test hydration status among experimental group will be
significantly higher than the control group.
H3 There is a significant difference in diarrheal status of children before and after
introduction of lactose free feeds in control and experimental group.
H4 There is a significant difference in hydration status of children before and after
introduction of lactose free feeds in both control and experimental group
211
H5 There is a statistical significant difference between mean post test scores of
diarrheal and hydration status of children in control and experimental group
H6 There is a significant correlation between the diarrheal and hydration status
among children in the experimental group.
H7 There is a significant association between the diarrheal and hydration status of
the children and their selected demographic variables.
6.2 Summary of the Study of Findings
Regarding the incidence of secondary lactose intolerance among children with
gastroenteritis. Around 618 children were screened for presence of reducing sugar and
alteration in stool PH by a survey method among which 350 that is 56.63 % of them
were identified to have secondary lactose intolerance. With regard to the age of
children, out of 350 samples majority of them 139 (39.7%) were between 10-12
months and 118 (33.7%) of them were 6-8 months of age. With reference to the sex of
the children139 (57.72%) of them were male and 148 (42.28%) of the children were
female. With regard to the weight of the children 94 (26.9%) of them were below
6 -7.5kg and 112 (32%) of them were 4.5-6kg and 144 (41.1%) of them were 7.5kg
and above. Regarding the presence of reducing sugar of the children 248 (70.9%) had
orange and brick red, 97 (27.7%) had yellow colour and 5 (1.4%) had blue and green
colour. With regards alteration of pH of the children 248 (70.9%) of them had pH
4.5-5, 97 (27.7%) of them had pH of 5-6 and 5(1.4%) of them of pH of 6-7.
Analysis of demographic data revealed that the children in both groups were
similar in most aspects and it is presented as follows :
Regarding the age of children, out of 60 samples, majority 39 (65%) of them
were between 6-12 months and 21 (35%) of them were 0-6 months of age in the
212
experimental group. In the control group 42(70%) of them were between 6-12 months
of age and 18 (30%) of the subjects were between 0-6 months age.
With regard to the sex of the children it was found that 45 (75%) of them were
males and 15 (25%) of the subjects were females, whereas in the control group
43(71.7%) of the were males and 17 (28.3%) of them were female.
Regarding to the duration of diarrhea, 53(88.3%) of children were having
diarrhea, the findings revealed that for 3 Days and 7 (11.7%) of them had diarrhea for
more than 3 Days in the experimental group, in control group 45 (75%) of them had
diarrhea for three Days and 15(25%) of them had diarrhea for more than 3 Days.
When discussing about the feeding pattern of children majority of them i.e., 48
(80%) of were on bottle fed while 12 (20%) were breast fed among the experimental
group whereas in control group, 45 (75%) of them were fed with bottle feeds and 15
(25%) of them were on exclusive breast feeding. In relation to the type of feeding 34
(58.6%) of them were fed with cow’s milk in experimental group and 24 (41.4%) of
them were feed with powder milk in the experimental group whereas in control group
36 (76.4%) of them were fed with cow’s milk and 11 (23.6%) of them with powder
milk.
With regards to weaning among 60 subjects in the experimental group,
40(66.7%) of them were started with weaning in 4 months and 20 (33.3%) of them
started weaning at 6 months in the experimental group. Whereas in the control group
37 (61.7%) of them were weaned in 4th month and 23 (38.3%) of them were weaned
in 6 months.
With regard to the educational status of the mother, 33 (55%), in the
experimental group and 47 (78.3%) in the control group were educated up to high
school respectively. Majority of the children, 58 (96.7%) were cared by mothers.
213
Regarding the hand washing (63.3%) had a practice of hand washing sometimes. With
regards to sterilization of feeding vessels, (63%) of the mothers sterilized the utensils
before feeding. Regarding the drinking water, 56.75% used portable, drinking water
and 43.4% of them used corporation water.
Regarding the Diarrheal status of the children among the Experimental group
out of 60 children 86.7% (52) had very high diarrheal status and 8 (13.3%) of them
had high diarrheal status on Pre-test, whereas on Post-test I the diarrheal status
declined and 47 (78.3%) of the children had high level of diarrhea, while
13(21.7%)of them had moderate level of diarrhea. On Post-test II majority 48(80%) of
the subjects had normal while 12 subjects 20% had moderate diarrhea.
Regarding the hydration status of the children accessed on Pre-test followed
by Post-test I and III. On Day1 none of the children had severe dehydration. 36 (60%)
of them were moderately hydrated and 24 (40%) of them had high hydration status.
When compared to the Pre-test, on Post-test I, 39 (65%) of them had improved
hydration status to a high level and 21 (35%) of them obtained maximum level of
hydration. On Post-test II 48 (80%) of them maintained high level of hydration status
and 12 (20%) of them had very high level of hydration status.
Reveals the Diarrheal status of the children among the control group out of 60
children, 55 (91.7%) had very high diarrheal status and 5 of them (8.3%) had high
diarrheal status on Day1, whereas on Post-test I the diarrheal status declined, that
is,55 (91.7%) of the children had high level of diarrhea whereas five (8.3%) of them
had moderate level of diarrhea. On Post-test II 35 (58.3%) subjects had low while
normal and 25 (47.1%) subjects had moderate diarrhea.
The hydration status of the children was accessed on Pre-test followed by
Post-test I and II. On Day1 none of the children had severe dehydration. Thirty six
214
(60%) were moderately dehydrated and 24 (40%) were highly dehydrated. When
compared to the Day1, on Post-test I 39 (65%) of them had improved hydration
status to a high level and 21 (35%) of them obtained maximum level of hydration. On
Post-test II 45 (75%) of them maintained high (maximum) hydration status and 15
subjects (25) very high hydration status.
The mean diarrheal status on the Pre-test was 86.33% and on Post-test I it was
66.27% and the calculated t value was 18.89 at p < 0.00 level of significance. There is
significant reduction in the diarrheal status of the children between Pre-test and Post-
test I. Thus, it infers that the experimental group had a significance of control over
the diarrheal status.
Whereas diarrheal status on the Post-test I was 66.27% on Post-test II it was
38.1667% and the calculated ‘t’ value was 29.73 at p < 0.00 level of significance.
Thus there is a substantial reduction in the diarrheal status of the children between
Post-test I and Post-test II. Thus, it infers that the experimental group had a
significance of control over the diarrheal status.
While comparing the mean diarrheal status of Pre-test was 86.33% and on
Post-test II it was 38.1667% and the calculated ‘t’ value 48.166 at p < 0.00 level of
significance. There is significant reduction in the diarrheal status of the children
between Pre-test and Post-test II. Thus, it infers that the experimental group had a
higher significant control over the diarrheal status.
The findings hydration status of the children within the experimental group
compared between Pre-test and Post-test I were as follows. The calculated overall
mean value of all the items on Pre-test was 59.64% and Post-test I was 81.62 and
overall ‘t’ value was 27.44 which is greater than the table value of statistics and P
value < 0.000, which show that there is a significant difference between hydration
215
status on Pre-test and Post-test I. This infers that within the group comparison,
hydration status was improved on the Second day.
Whereas the hydration status of children compared between Post-test I and
Post-test II. The calculated overall mean value of all the items on Post-test I was
81.62% and Post-test II was 97.46% and the overall ‘t’ value was 19.94 which is
greater than the table value and significant at P < 0.000 level, which shows that there
is a difference between the hydration Status on Post-test I and Post-test II. This infers
that within the group comparison, Post-test II hydration status was significantly
improved than Post-test I.
While comparing the hydration status of the children compared between Pre-
test and Post-test II. The calculated overall mean value of all the items on Pre-test was
59.64% and Post-test II was 97.46% and the overall ‘t’ value was 50.215 which is
greater than the table value of statistics and P value < 0.000, which shows that there
is a significant difference between the hydration status on Pre-test and Post-test II.
This infers that within the group comparison, hydration status was highly improved
on the third day. These findings reveals, that there is significant improvement in the
hydration status of children after the introduction lactose free RISOY feeds by
decrease in the episodes of diarrhea and improved hydration status.
The diarrheal status of children among the control group (Pre-test and Post-
test I) before and after introducing the intervention. The results shows the mean
diarrheal status of the Pre-test is 88.66% and Post-test I is 74.88% and the calculated t
value was 18.70 at p < 0.00 level of significance. There is reduction in the diarrheal
status of the children Pre-test and Post-test I. Thus, it infers that the control group had
average control over the diarrheal status.
216
The diarrheal status of children among control group (Post-test I and Post-test
II) before and after introducing the intervention. The results shows the mean diarrheal
status of Post-test I was 74.88% and on Post-test II it was 41.27% and the calculated t
value was 34.60 at p < 0.00 level of significance. Thus there is a reduction in the
diarrheal status of the children on Post-test I and Post-test II. Thus, it infers that the
control group had a moderately significant control over the diarrheal status.
When compared Pre-test with Post-test II were compared the mean diarrheal
status of was Pre-test 88.66% and Post-test II was 41.27% and the calculated ‘t’ value
was 40.78 at p < 0.00 level of significance. Thus there was a reduction in the diarrheal
status of the children between Pre-test and Post-test II. Thus, it infers that the control
group also had a slight significant control over the diarrheal status.
The hydration status of the children within the control group were also
compared between Pre-test and Post-test I, overall mean value of all the items on
Pre-test was 59.52% and Post-test I was 77.93% and the overall ‘t’ value was 23.55
which is greater than the table value of statistics and P value < 0.000, which shows
that there is a difference between the hydration status on day1 and Post-test I. This
infers that within the group comparison, hydration status was improved on the second
day.
When compared between Post-test I and Post-test II. The calculated overall
mean value of all the items on Post-test I was 77.93% and Post-test II was 93.73%
and the overall ‘t’ value was 19.85 which is greater than the table value of statistics
and P value < 0.000, which shows that there is a difference between the hydration
status on Post-test I and Post-test II. This infers that within the group comparison,
hydration status had improved on the third day.
217
The hydration status of the children within the control group compared
between Pre-test and Post-test II, overall mean value of all the items on Pre-test was
59.52% and Post-test II was 93.73% and the overall ‘t’ value was 41.91 which is
greater than the table value of statistics and P value < 0.000, which shows that there
is a difference between the hydration status on Pre-test and Post-test II. This infers
that within the group comparison, hydration status was improved on the third day.
To determine the difference between the diarrheal status of children before the
introduction of lactose free RISOY feeds among experimental group and regular
lactose free feed for the control group as prescribed by the doctor. The total mean pre
intervention score of diarrheal status in all aspects in experimental group was 88.66
which is less than the control group mean score 86.33. The calculated ‘t’-value 2.848
is statistically significant at P<.002 level. Hence the diarrheal status among
experimental group is statistically significant at P<.00 level. This indicates that there
is a difference between the experimental and control group.
The total mean post intervention score of diarrheal status in all aspects in
experimental group on Post-test I is 66.27 which is less than the control group mean
score 74.88. The calculated ‘t’-value -7.952 is statistically significant at P<.00 level.
Hence the diarrheal status among experimental group is statistically significant at
P<.00 level. This indicates that there is a difference between the experimental and
control group.
The total mean post intervention score of diarrheal status in all aspects in
experimental group on Post-test II is 38.1667 which is less than the control group
mean score 41.2778. The calculated ‘t’-value 2.246 is statistically significant at P<.00
level. Hence the diarrheal status among experimental group is statistically significant
218
at P<.00 level. This indicates that there is a difference between the experimental and
control group.
The hydration status of children before the introduction of lactose free RISOY
feeds among experimental and lactose free commercial feed for control group on Pre-
test, the total mean pre intervention score of hydration status in all aspects in
experimental group is 59.642 is less than the control group mean score 59.523. The
calculated ‘t’-value 0.137 and it is statistically not significant at P >.097 level. This
indicates that there is no difference between the experimental and control group.
To determine the difference between the hydration status of children after the
introduction of lactose free RISOY feeds among experimental and control group on
Post-test I, the total mean post intervention score of hydration status in all aspects in
experimental group is 81.62 is more than the control group mean score 77.93. The
calculated ‘t’-value 3.213 is statistically significant at P<.00 level. Hence the
hydration status among experimental group is statistically significant at P<.00 level.
This indicates that there is a difference between the experimental and control group.
The children in experimental group attained better hydration status when compared
with the control group.
The total mean post intervention score of hydration status in all aspects in
experimental group on Post-test II was 97.4603 which is more than the control group
mean score 93.7302. The calculated ‘t’-value was 4.445 which is statistically
significant at P<.032 level. Hence the hydration status among experimental group is
statistically significant at P<.032 level. This indicates that there is a difference
between the experimental and control group. The hydration status of the children were
found to be to the maximum level in most of the subjects among experimental group.
219
Hence the lactose free RISOY feeds were effective in correcting the dehydration by
controlling the episodes of diarrhea
The relationship between diarrheal with hydration status of children among
experimental group. The result shows that the correlation value of pre experimental
diarrheal and hydration status with the post intervention shows the significant
negative correlation at 0.01 level. The Correlation Value of Post intervention Post-
test I was – .108 and -.411** and the post intervention diarrheal and hydration status
on Post-test II was – .088 and -.360 which was significant at 0.01 level which is
Negatively correlated at 0.001 level. As the diarrhea status was under control the
hydration status of the children were found to be increasing.
Regarding researcher’s approach on the level of satisfaction among mothers of
children in experimental group, the findings are as follows. With regard to the
researchers approach on Pre-test related to communication and explanation, 33.3% of
the mothers were not at all satisfied and on Post-test II 60% of them were extremely
satisfied, and 40% were very satisfied.
With regard to Approachable and skill fullness, 36.67% of them not at all
satisfied, 46.61% not satisfied, and 16.67% only were satisfied on Pre-test. On Post-
test II none of them either not or not at all satisfied. Most of them (66.7%) were very
satisfied and 38.33% were extremely satisfied.
Preparation of food with respect to preparation of lactose free feed. On Pre-
test one third of the subjects (38.33%), were not at all satisfied regarding the
demonstration and the preparation time. Where as in Post-test II, 48.3% very satisfied
and 48.33% extremely satisfied.
General characteristics of feed In relation to the general characteristics of feed
on Pre-test the appearance and color and aroma and taste, 70% of them were not
220
satisfied and on Post-test II, 53.33% were very satisfied and 38.33% extremely
satisfied.
Availability and cost effectiveness in regards to availability and cost
effectiveness one third of the samples were not satisfied and on Pre-test, most of them
65% of them very satisfied and 35% were extremely satisfied on Post-test II.
Benefits to the baby with regard to benefits to baby digestibility, control
diarrhea, improve the hydration status and replace the weaving food, two third of the
mother were not satisfied on Pre-test and all of mother were very satisfied and
extremely satisfied on Post-test II.
Mothers perceived views/attitudes in regard to mother perceived views
attitudes one third of the mother were not satisfied on Pre-test and on Post-test II all
the mother who attended were very satisfied and extremely satisfied.
6.3 Impact of the Study
Diarrheal disease is the leading cause of childhood mortality and morbidity
throughout the world, and mostly results from contaminated food and water resources.
Diarrhea due to infections is widespread throughout developing countries. In
developing countries, children under 3 years old , experience an average of 3 diarrheal
episodes per year. Diarrhea is the major cause of malnutrition and malnourished
children likely to develop diarrhea. Rotavirus is the major cause of acute and severe
diarrhea among young children.
Secondary lactose intolerance can occur as the result of damaged brush border
of intestinal mucosa, which is leading to the temporary deficiency of the enzyme
lactase. Early diagnosis and administration of lactose free formula for children
presenting with acute diarrhea with positive stool reducing sugar and reduced stool
pH <5 will effectively control diarrhea and correct dehydration.
221
With this view the researcher developed a lactose free feed which will supply
all essential nutrients like carbohydrate, protein, fat, vitamins and minerals,
electrolytes in sufficient amount.
When compared with other commercial lactose free feeds this RISOY FEED
is homemade, cost effective, nutritive, easily available ingredients, easily digestible
and organic .
The feed was accepted by mothers and Doctors and Nutritionists. All the
children tolerated the feeds well. Tender coconut water and fresh sweet curds were
also added for few children. No table sugar was added to give taste.
The researcher has planned to get it Registered for Patent ship of this product.
The mothers were empowered with knowledge regarding importance of breast
feeding, hand washing, care of child during diarrhea and dehydration.
6.4 Conclusions
It is clear from the study that the children with secondary lactose intolerance
can be effectively managed with Lactose free Risoy feeds among the children
between the age of 4 -12 months.
The overall importance is to identify the children who suffer from secondary
Lactose intolerance and feed them with lactose free diet according to the age group.
Prepared with available ingredients, which may control diarrheal episodes and correct
dehydration among children between the age group of 4 to 12 months.
Proper assessment of diarrheal status with an observational rating scale. With
ten assessments that include colour, consistency of quantity of stool, episodes, odor,
of stool, blood, for reducing of sugar, anal excoriation, abdominal bloating etc., will
guide the nurse to identify the level of diarrhea (high, low very high) and also asses
the hydration status of the children with 14 observations like (general conditions,
222
eyes, mouth, tongue, thirst, urine output, tears, skin turgor, fontanels, arms and legs,
capillary refill, pulse rate, respiration, blood pressure). Pre interventional assessment
on Pre-test is taken as pre-test and two post tests were assessed on Post-test I and
Post-test II taken to find out, how effectively the lactose free Risoy feeds controlled
diarrhea and corrected the dehydrate among children.
The researcher prepared lactose free Risoy feeds, when comparing with the
commercial lactose free feeds it is highly nutritious. All the nutrients are preserved in
it including minerals like calcium, magnesium and electrolytes like potassium also has
adequate amount of protein. The cereals parboiled (red rice) supply essential
carbohydrate and vitamins to the baby. The table salt added for taste also provides the
sodium required for baby to prevent hypernatremia
The enriched, nutritious and homemade Risoy feed was found to be very
effective in controlling diarrhea and there by corrected dehydration and whole some,
economical easily digestible, tastes good and can be prepared in the form of porridge
or conjee and can also feed with spoon or paladai. The mother were also found to be
very satisfied in using this. The mother were also taught to prepare the feed. Since the
preparation was done in a certified lab with the food analyses for proximity it was
very safe to use for the children with secondary Lactose intolerance. Diarrhea,
Malnutrition, and infection are in a cyclic manner one follows another.
Every diarrhea can be managed effectively with ideal rehydration and proper
monitoring of the children thereby reduce the mortality and morbidity of children due
to diarrhea.
223
6.5 Implications
The findings of the study has practical application in the nursing field. The
implication of the study could be discussed in four areas namely nursing service,
nursing administration, nursing education, nursing research.
Contribution of this research in scientific knowledge
The findings of the study will help in following ways:
1. The findings will provide an insight to all nursing personnel to identify lactose
intolerance in early stage. By using the benedict test system to find out lactose
intolerance and litmus paper to assess the pH level of the stool in ward
settings.
2. It will help the nurses to have an insight about the lactose free formula in
controlling diarrhea and correction of dehydration among children.
3. Nursing personnel are in best position to assess the diarrheal status and
hydration status at ward settings and take steps in correcting them.
4. It will signify the importance of formulating and implementing health
education to mother regarding lactose intolerance and feeding changes during
that period.
5. Bring out new type of lactose free homemade preparation.
Implication for Nursing Education
1. The study findings will clearly provide the idea regarding lactose intolerance
diarrhea. So the nursing personnel need to institute the benedicts test and stool
pH test to identify lactose intolerance in children.
2. Nursing personnel working at different settings will be able to diagnose
lactose intolerance in children.
224
3. To gain more knowledge regarding management of lactose intolerance with
lactose free formula the commercially prepared soya based formula and cereal
preparations like conjee, iddlies, and other homemade lactose free
preparations.
Implication for Nursing Administration
1. The nurses must be given in service education to improve the knowledge in
various aspects of scientific principles.
2. Charts regarding assessing hydration parameters and assessing diarrheal
status should be fixed in pediatric wards.
3. To set protocol regarding diarrheal management of different types.
4. To set standards in managing lactose intolerance.
5. To provide with instruction manual or booklet regarding the assessment of
lactose intolerance by doing investigations like (benedict test, litmus paper
test) and treating lactose intolerance with suitable lactose free formula.
Implications for Nursing Research
1. The study helps the nursing students to learn about lactose intolerance
2. The identification of lactose intolerance among the children with diarrhea.
3. The study also brings about fact that more studies need to done be in different
setting on a large scale.
4. The study has brought out the approaches to manage the lactose intolerance
with lactose free formula.
5. The study will motivate the other investigator to conduct further studies
related to this study. Which ultimately lead the way to do many more
researches in the field and more information can be obtained.
225
This study can be a base live for future study.
6.6 Limitations
The limitation of this study is the small sample size for generalizing the
finding to the entire children.
The use of purposive sampling technique is another limitation as
randomization of samples were not possible due to less no of cases available at a time.
The study was conducted in a selected hospital in Madurai, Tamilnadu.
6.7 Recommendation
• A study can be conducted in another true experimental design or a double blind
study can be done to further prove the efficacy of the Risoy feeds.
• Replication can be done in another community setting after training mothers to
prepare lactose free Risoy feeds.
• Other protein rich preparation can be developed with locally available ingredients
to children with protein energy mal nutrition.
• A qualitative study can be conducted.
• The sample size can be increased with Random sampling technique.
REFERENCES
1. BT Basavanthappa. Textbook of medical surgical nursing. 1st edition. New
Delhi: Jaypee brothers medical publications; 2003. P.271.
2. http://www.who.int/maternal_child_adolescent/documents/pdfs/lancet_child_s
urvival_10mill_dying.pdf
3. http://data.unicef.org/child-health/diarrhoeal-disease updated 2015
4. Managing Acute Gastroenteritis among Children. Oral Rehydration,
Maintenance, and Nutritional
Therapyhttp://www.cdc.gov/mmwr/preview/mmwrhtml/rr5216a1.htm
5. Arwa M. AL-Shuwaikh ,, Israa AJ, Ibrahim, , Rana M , Al- Shwai.
Detection of E. coli and Rotavirus in Diarrhea among Children Under Five
Years Old. Iraqi Journal of Biotechnology, 2015: 14(1); 85-92
6. http://www.unicef.org/media/files/Final_Diarrhoea_Report_October_2009_fin
al.pdf
7. http://rehydrate.org/diarrhoea/
8. Water, Sanitation & Hygiene. http://internationalmedicalcorps.org/
9. Shah D, Choudhary P, Gupta P, Mathew LJ, Gera T, Gogia S, et al. Promoting
appropriate management of diarrhea: A systematic review of literature for
advocacy and action: UNICEF-PHFI series on newborn and child health,
India. Indian Pediatrics. 2012 Aug;49(8):627-649
10. U.S. Leadership Needed to Finish the Child Survival Agenda Sharper Focus
and Further Funding Can Save Children’s Lives.
http://www.savethechildren.org/E
11. http://data.unicef.org/child-health/diarrhoeal-disease updated 2015
12. http://www.who.int/mediacentre/factsheets/fs330/en/ April 2013
13. Pinto CB, Velebit L, Shibuya K. Estimating child mortality due to diarrhoea in
developing countries. Bull World Health Organ. 2008 Sep; 86(9): 710–717.
14. Pneumonia and Diarrhea Progress Report 2014.
http://www.jhsph.edu/research/centers-and-institutes/ivac/resources/IVAC-
2014-Pneumonia-Diarrhea-Progress-Report.pdf
15. Lakshminarayanan S, Ramakhrisnan J. diarrheal disease among children in
india: current scenario and future perspectives. J Nat Sci Bio Med 2015. Jan –
Jun 6(1):24-28.
16. Park K. Park’s Textbook of Preventive and Social Medicine. 23rd ed.
M/sBanarasidas Bhannot. Publishers Jabalpur, India.2014
17. Kosek M, Bern C, Guerrant RL. The global burden of diarrhoeal disease, as
estimated from studies published between 1992 and 2000. Bull World Health
Organ. 2003;81(3):197-204. Epub 2003 May 16
18. timesofindia.indiatimes.com/india/India-has...diarrhoeal...Study May 14, 2013
19. UNICEF. (2013). Committing to Child Survival: A Promise Renewed.
Progress Report 2013. Retrieved from
http://www.unicef.org/publications/files/APR_Progress_
Report_2013_9_Sept_2013.pdf
20. I. Mumbai: IIPS; 2007. [Last accessed on 21 May 2014]. International
Institute for Population Sciences (IIPS) and Macro International. National
Family Health Survey (NFHS-3), 2005-06: India. Available from:
http://www.rchiips.org/NFHS/report.shtml
21. Jayalakshmy R, Roy G, Premarajan KC. Incidence and risk factors of acute
diarrheal disease among under-five children in urban slums in Pondicherry z—
One year follow-up study. Indian J Matern Child Health. 2011;13:1–11.
22. http://www.csmonitor.com/2005/0610/p07s01-wosc.html
23. http://www.who.int/macrohealth/action/NCMH_Burden%20of%20disease_(2
9%20Sep%202005).pdf
24. The Hindu- one lakh children in india die of diarrhea annually Lancet. New
Delhi. May 14, 2013
25. New global study pinpoints main causes of childhood diarrheal diseases,
suggests effective solutions, May 13, 2013.
http://somvweb.som.umaryland.edu/absolutenm/templates/?a=2303
26. Joshi PC, Kaushal S, Bijaya S, Aribam, Khattri P, Aoust OD. Singh Recurrent
floods and prevalence of diarrhea among under five children: observations
from Bahraich district, Uttar Pradesh, India. Glob Health Action. 2011; 4:
10.3402/gha.v4i0.6355
27. Ahmed SF, Farheen A, Muzaffar A Mattoo GM. Prevalence of Diarrhoeal
Disease, its Seasonal and Age Variation in under- fives in Kashmir, India. Int J
Health Sci (Qassim). 2008 Jul; 2(2): 126–133
28. Clinical Management of Acute Diarrhoea WHO/UNICEF Joint Statement.
http://rehydrate.org/diarrhoea/acute-diarrhoea.htm
29. Bhan MK. Accelerated progress to reduce under-five mortality. Lancet glob
health 2013
30. http://www.ncbi.nlm.nih.gov/pmc/articles/PMC4367049/
31. Guandalini S. Diarrhea. http://www.emedicine.medscape.com/ article
32. http://www.clevelandclinicmeded.com/medicalpubs/diseasemanagement/gastr
oenterology/acute-diarrhea/Default.htm
33. Bhat SR. Achar’s textbook of pediatrics. 4th edition. Universities (press)
private limited. 2009
34. Srivastav RN, Kabra SK. Pediatrics- a concise textbook. Elsevier publications.
New Delhi. 2011
35. http://www.unicef.org/media/files/Final_Diarrhoea_Report_October_2009_fin
al.pdf
36. Datta P. Pediatric Nursing. 3rd edition. Jaypee brothers medical publishers
(p)LTD New Delhi. 2010.
37. Behrman RE, Jenson HB, Kleigman RM. Nelson textbook of pediatrics.17th
edition. 2006. Reed Elsevier Pvt. India Ltd. Saunders company. New Delhi. p
1278
38. Joshi NC. Clinical Pediatrics. 2nd edition. 2012. Reed Elsevier Pvt. India Ltd.
Gurgaon
39. http://www.tcmwell.com/TCMDiagnosis/diarrhea-therapeutic-
management.html
40. MMWR Morb Mortal wkly Rep. Rotavirus surveillance-worldwide. Centers
for disease control and prevention (CDC). 2008 Nov 21;57(46):1255-7.
41. Elzouki AY, Harfi HA, Stapleton FB. Text book of clinical pediatrics. 2nd ed.
Springer publications. 2012.
42. Siddique AK, Ahmed S. Epidemiology of rotavirus and cholera in children
aged less than 5 years in rural Bangladesh. J Health Popul Nutri. 2011
Feb:29(1):1-8
43. http://www.whqlibdoc.whoint/hq/2004/WHO_FCH_CAH.pdf
44. http://www. Chy.com/health topic/health topics details.
45. Joneja J. Lactose and other disaccharides intolerance. http://www.
Foodsmatter.com/allergy_intolerance/lactose_intolerance/articles.
46. Rieno TD, D’Angelo G, D’Aversa F, Campanale MC, Cesario V, Montalto M.
Lactose intolerance:from diagnosis to current management..Eur Rev for Med
and Pharmaco Sci. 2013;17((2): 18-25
47. Arora S, Singla N. Lactose intolerance in infants, children and adolescents.
Pediatric oncall journal.2011Nov; 8(11):
48. http://www.patient.info/health/rotavirus-leaflet
49. Montalto M, Curigliano V. Management and treatment of lactose
malabsorption. World J Gastroenterol.2006;12(2) :187-191
50. http://www.medscape.com/viewarticles/
51. Parthasarathy A, Thakur N, Choudhary P, Agarwal RK. IAP textbook of
pediatrics..7th edition. Vol 1. Jaypee brothers publishers (p) LTD New Delhi.
2005.
52. Penny ME, Brown KH. Lactose feeding during persistent diarrhea.
http://www.gatesfoundation.org/whatwedo/globalhealth/enteric and diarheal
disease
53. http://www.whitelies.org.uk/health-nutrition/lactose-intolerance
54. http://www.pediatriconcall.com/fordoctor/.../Gastrointestinal_disorders/lactose
.asp
55. Heyman HB. Lactose Intolerance in Infants, Children, and Adolescents.
PEDIATRICS. 2006:118 (3): 1279-86
56. Nizami SQ, Bhutta ZA, Molla AM. Efficacy of traditional rice-lentil-yogurt
diet, lactose free milk protein-based formula and soy protein formula in
management of secondary lactose intolerance with acute childhood diarrhea. J.
Trop. Pediatrics.1996 Jun; 42(3):133-7.Available from
http://www.ncbi.nlm.nih.gov/pubmed/8699577
57. Gerbault P, Liebert A, Itan Y, Powel l A, Currat M, Burger J. Evolution of
lactase persistence: an example of human niche construction. Philos Trans R
Soc Lond B Biol Sci. 2011 Mar 27; 366(1566): 863–877.
http://www.ncbi.nlm.nih.gov/pmc/articles/PMC3048992/
58. Perino A, Cabras S, Obinu, Cavalli L Sforza. Lactose intolerance: a non-
allergic disorder often managed by allergologists. Eur Ann Allergy Clin
Immunol. 2009; 41(1): 3-16.
http://www.eurannallergyimm.com/cont/journals-articles/138/volume-l
59. http://www.bpac.org.nz/BPJ/2007/October/docs/bpj9_lactose_pages_30-
35.pdf
60. http://www.whoint/mediacentre/new/releases/2014/child_mortality_estimates.
61. Dorathy R Marlow and Barbara A Redding. Textbook of pediatric nursing. 6th
edition. Pennsylvania: WB. Saunders company; 2008.
62. Assuma Beevi TM. Textbook of pediatric nursing. 4th ed. Reed Elsevier India
Private Limited. New Delhi. 2014.
63. Gupta S. Recent advances in pediatrics. Jaypee brothers publishers (p) LTD
New Delhi. 2000
64. Basanvanthapa BT. Community Health Nursing. 2nd edition. Jaypee brothers
publishers (p) LTD New Delhi. 2008. P746
65. http://www.msdmanuals.com/professional/pediatrics/dehydration-and-fluid-
therapy-in-children/dehydration-in-children
66. Diarrhoea and Vomiting Caused by Gastroenteritis: Diagnosis, Assessment
and Management in Children Younger than 5 Years.
http://www.ncbi.nlm.nih.gov/books/NBK63837/
67. Ahmed F, Farheen A, Ali I, Thakur M, Muzaffar A, Samina M. Management
of Diarrhea in Under-fives at Home and Health Facilities in Kashmir. Int J
Health Sci (Qassim). 2009 Jul; 3(2): 171–175.
68. Guarner F.Probiotics:Giving your gut the “Friendliness”.2003;512-19.
69. Munos MK, Walker CL, Black ER. The effect of oral rehydration solution and
recommended home fluids on diarrhoea mortality. Int. J Epidemiology.2010
Apr;39(1):75-87. Available from
http://www.ncbi.nlm.nih.gov/pubmed/20348131
70. Bhan MK. Current Concepts in Management of Acute Diarrhea. Indian
Pediatrics 2003; 40:463-476
71. Parthasarathy A. Textbook of pediatric infectious disease. 1st edition. . Jaypee
brothers publishers (p) LTD New Delhi. 2013. P593
72. Atia AN, Buchman AL. Oral rehydration solutions in non-cholera diarrhea: a
review. Am J Gastroenterol. 2009 Oct;104(10):2596-604; quiz 2605. doi:
10.1038/ajg.2009.329. Epub 2009 Jun 23.
73. Walker CLF, Perin J, Aryee JM, Pinto BC, Black ER. Diarrhea incidence in
low- and middle-income countries in 1990 and 2010: a systematic review.
BMC Public Health. 2012; 12: 220
74. Suchy FJ, Brannon PM, Carpenter TO, et al. National Institutes of Health
Consensus Development Conference: lactose intolerance and health. Annals of
Internal Medicine. 2010;152(12):792–796.
75. Valli. K. Ekvall. Pediatric Nutrion in chronic disease and developmental
disorders. oxford university press. New york. 2005.
76. Kliegman RM, Stanton B. Nelson textbook of pediatrics. 20th edition. Vol 2.
Elsevier publishers. 2014
77. Emerging infectious diseases. http://www.cdc.gov/eid.feb2006;12(2)
78. BarberS, Leege E , Richardson E. Reducing morbidity and mortality of
diarrheal disease in children under 5: intervention, implementation, and
evaluation plan. http://www.ictph.org.in/tps-2011/paper3-introduction.html
79. Victora CG, Bryce J, Fontaine O, Monasch R. Reducing deaths from diarrhoea
through oral rehydration therapy. Bull World Health Organ. 2000;78:1246–55.
[PMC free article] [PubMed]Saneian H, Yaghini O, Modaresi M, Razmkhah
N. Lactose-Free Compared with Lactose-Containing Formula in Dietary
Management of Acute Childhood Diarrhea. Iran J Pediatr. 2012 Mar; 22(1):
82–86
80. Zavaleta N, Figueroa D,Rivera T,Sarrchez J, Altaro S, Lonnerdal B. Glucose
and rice based ORS. Journal of pediatrics gastroentrol.Nutri.2007 Feb, 44 (2)
:258.
81. Nabulsi M, Yazbeck N, Charafeddine F.Lactose-free milk for infants with
acute gastroenteritis in a developing country: study protocol for a randomized
controlled trial. Trials. 2015 Feb 8;16:46. doi: 10.1186/s13063-015-0565-9.
82. George J. Nursing theories: the base for nursing practice. 2nd edition. Engle
wood cliff, new jersy: prentice Hall.
83. Bertanalany LV (1956). General systems theory. General system I(1)
84. Johnson J (2000). How conceptual problems migrate: rationale choice
interpretation and hazards of pluralism. Available from https://www.trentu.ca
85. UNICEF/WHO, diarrhea. Why children are still dying? What can be done?
WHO, 2009. whqlibdoc.who.int/publications/2009/9789241598415_eng.pdf)
86. Black RE, Morris SS, Bryce J. Where and why are 10 million children dying
every year? Lancet. 2003;361:2226–34. [PubMed]
87. Bbaale E. Determinants of diarrhea and acute respiratory infection among
under- fives in Uganda. [Last accessed on 2014 Nov 10];AMJ. 2011 4(7):400–
9. Available from: http//www.dx.doi.org/10.4066/AMJ.2011.723 . [PMC free
article] [PubMed].
88. Shah SM, Yousafzai M, Lakhani NB, Chotani RA, Nowshad G. Prevalence
and correlates of diarrhea. Indian J Pediatr. 2003;70:207–11. [PubMed]
89. Stanly AM, Sathiyasekaran BW, Palani G. A population based study of acute
diarrhea among children under 5 years in a rural community in South India.
Sri Ramchandra J Med. 2009;1:1–7.
90. Tivari SC, Saraf Y, Nambiar G. Study of diarrheal diseases in 0-5 years old
children and practices of oral rehydration solution, Bhopal, Madhya Pradesh in
Conference Proceedings of the 9th Asian conference on diarrheal diseases and
nutrition; Sep 28-30, 2001; New Delhi.
91. Ansari MA, Khan Z, Khan IM. A clinico social study to assess the magnitude
of diarrheal diseases among children in rural areas of Alligarh, Uttar Pradesh
in Conference Proceedings of the 9th Asian conference on diarrheal diseases
and nutrition; Sep 28-30, 2001; New Delhi.
92. Gupta A, Sarker G, Rout AJ, Mondal T, Pal R. Risk Correlates of Diarrhea in
Children Under 5 Years of Age in Slums of Bankura, West Bengal. J Glob
Infect Dis. 2015 Jan-Mar; 7(1): 23–29
93. Lanata CF , Christa L. Fischer-Walker, Ana C. Olascoaga, Carla X. Torres, et
al. Global Causes of Diarrheal Disease Mortality in Children <5 Years of Age:
A Systematic Review.
http://journals.plos.org/plosone/article?id=10.1371/journal.pone.0072788
94. http://www.vestergaard.com/diarrheal-disease
95. http://www.diagnose-me.com/symptoms-of/diarrhea.html
96. www.who.int/bulletin/volumes/92/9/13-134809/en/
97. Sutariya S, Talsania N, Shah C. Study Of Prevalence Of Diarrhoeal Diseases
Amongst Under Five population. National Journal of Community Medicine.
2011; 2(1):96-9
98. ( Fontaine O, Gore SM, Pierce NF. Rice-based oral rehydration solution for
treating diarrhoea. Cochrane Database Syst Rev 2001;(4):CD001264.)
99. AE Rahman, Md Moinuddin, M Worku , L Hurt , B Kirkwood. Childhood
diarrhoeal deaths in seven low- and middle-income countries. Bulletin of the
World Health Organization. http://www.who.int/bulletin/volumes/92/9/13-
134809/en/
100. Matthai J. Chronic and Persistent Diarrhea in Infants and Young Children:
Status Statement. Pediatric Gastroenterology Chapter, Indian Academy of
Pediatrics. Indian Pediatr 2011;48: 37-42
101. VK Rathaur, M Pathania, A Jayara, N Yadav. Clinical Study of Acute
Childhood Diarrhoea Caused by Bacterial Enteropathogens. J Clin Diagn Res.
2014 May; 8(5): PC01–PC05.
102. John BM, Devgan A, Mitra CB. Prevalence of rotavirus infection in children
below two years presenting with diarrhea. Med J Armed Forces India. 2014
Apr; 70(2): 116–119
103. Global Seasonality of Rotavirus Disease ,Manish M. Patel, Virginia Pitzer,
Wladimir J. Alonso, David Vera, Ben LopmanJacqueline Tate Cecile Viboud,
and Umesh D. Parashar, Pediatr Infect Dis J. Pediatr Infect Dis J. 2013 Apr;
32(4): e134–e147.
104. Prevalence of rotavirus infection in children below two years presenting with
diarrhea Wg Cdr B.M. John , , Col Amit Devgan , Maj Barnali Mitra,
medical journal armed forces india 70 (2014) 116 -119
105. Mathew MA, Paulose A, Chitralekha S, Nair Mkc , Kang G, Kilgore P.
Prevalence of Rotavirus Diarrhea among Hospitalized Under-five Children.
Indian pediatrics. 2014 january; 51(15): 27 -31
106. Taneja DK, Malik A. Burden of rotavirus in India - Is rotavirus vaccine an
answer to it?. Indian J Public Health 2012;56:17-21
107. Ameta P, Nayak VH, Goyal SC. Prevalence and Seasonal distribution of
Rotavirus Diarrhea in hospitalized children less than 5 year old in South
Rajasthan. International journal of biomedical research. 2015; 6(3)
http://www.ssjournals.com/index.php/ijbr/article/view/1672
108. Daniel C. Payne, Wikswo M, Umesh D. Parashar, Manual for the
Surveillance of Vaccine-Preventable Diseases.
http://www.cdc.gov/vaccines/pubs/surv-manual/chpt13-rotavirus.html Apr 1,
2014
109. Kundra S, Kumar M, Singh T. Rotavirus Disease in Developing World.
Pediat Therapeut 2015; 5(3).
http://www.omicsonline.org/open-access/rotavirus-disease-in-developing-
world-2161-0665-1000e128.pdf.
110. National institute of cholera and enteric diseases, Kolkata. Estimation of the
burden of diarrhoeal diseases in India. In: NCMH Background Papers: Burden
of Disease in India. New Delhi, India: National Commission on
Macroeconomics and Health, Ministry of Health & Family Welfare, Govt. of
India, September 2005. p. 182-7.
111. Available from: http://censusindia.gov.in/2011-
common/CensusDataSummary.html. [Last Accessed on 2012 Mar 20]. Back
to cited text no. 11
112. Kahn G, Fitzwater S, Tate J, Kang G, Ganguly S, Nair G, et.al. Epidemiology
and Prospects for Prevention of Rotavirus Disease in India. Indian Pediatr
2012;49: 467-474.
113. Johna J, Sarkara R, Muliyila J, Bhandarib N, Maharaj K, Kang G. Rotavirus
gastroenteritis in India, 2011–2013: Revised estimates of disease burden and
potential impact of vaccines. Vaccine. 2014 August;32 (1) A5–A9.
http://www.sciencedirect.com/science/article/pii/S0264410X14003429)
114. Tirupati M, Naramalli ML, Panabaka RK, Dudala SR, Shaik SA, Kang G.
Prevalence of Rotavirus diarrhea among under-5 hospitalized children in a
Government tertiary hospital. 2015; 4(2): 112-116
.http://www.jdrntruhs.org/article.asp
115. Sungkapalee T1, Puntukosit P, Eunsuwan O, Theamboonlers A,
Chongsrisawat V, Poovorawan Y. Incidence and clinical manifestations of
rotavirus infection among children with acute diarrhea admitted at Buri Ram
Hospital, Thailand. Southeast Asian J Trop Med Public Health. 2006
Nov;37(6):1125-31.
116. http://pediatrics.aappublications.org/content/118/3/1279.full.pdf
117. Srinivasan R, Minocha A. Systemic Lactose intolerance: a new perspective to
old problem. US National Library of Medicine. 2003 Sep 15;12(18):2333–
2340. [PubMed]
118. available at http://www.ahrq.gov/downloads/pub/evidence
/pdf/lactoseint/lactint.pdf.
119. Noble R,Bovey A. Resolution of lactose intolerance and colic in breast fed
babies. http://www.health –e-learning.com/resources/articles
120. Guandalini S, Pediatric Lactose Intolerance Clinical Presentation.
http://emedicine.medscape.com/article/930971-clinical.
121. Kalyesubula I, Mworozi E Bachou H. Lactose intolerance among severely
malnourished children with diarrhoea admitted to the nutrition unit, BMC
Pediatrics 2010, 10:31. http://www.biomedcentral.com/1471-2431/10/31
122. Nyeko R ,Kalyesubula I, Mworozi E, Bachou H. Lactose intolerance among
severely malnourished children with diarrhoea admitted to the nutrition unit,
Mulago hospital, Uganda. BMC Pediatrics 2010, 10:31
123. Mattar R, Ferraz D, Mazo C, Carrilho FJ.Lactose intolerance: diagnosis,
genetic, and clinical factors. Clin Exp Gastroenterol. 2012; 5: 113–121.
http://www.ncbi.nlm.nih.gov/pmc/articles
124. Sandhu BK, Isolauri E, Walker-Smith JA, et al. A multicenter study on behalf
of the European Society of Paediatric Gastroenterology and Nutrition Working
Group on Acute Diarrhoea. Early feeding in childhood gastroenteritis. J
Pediatr Gastroenterol Nutr. 1997;24:522–527
125. http://www.foodintolerances.org/pdf/lactose-intolerance-in-paeds-rev-
2006.pdf.
126. http://www.indianpediatrics.net/aug2012/aug-627-649.htm
127. http://pediatriconcall.com/fordoctor/diseasesandcondition/Gastrointestinal.
Nov 2011
128. Talbert A, Thuo N, Karisa J, Chesaro C, Ohuma E, Ignas J, et.al. Diarrhoea
Complicating Severe Acute Malnutrition in Kenyan Children: A Prospective
Descriptive Study of Risk Factors and Outcome. PLoS One. 2012; 7(6):
e38321
129. Henna MD. Efficacy of lactobacilli in treating diarrhea. Journal of pediatrics.
2001
130. Bhan MK. Current Concepts in Management of Acute Diarrhea. Indian
Pediatrics 2003; 40:463-476.
131. http://www.msdmanuals.com/professional/pediatrics/dehydration-and-fluid-
therapy-in-children/dehydration-in-children
132. http://www.unicef.org/nutrition/files/ENAcute_Diarrhoea_reprint.pdf
133. http://www.indianpediatrics.net/may2003/may-463-476.htm
134. http://ije.oxfordjournals.org/content/39/suppl_1/i75.full
135. The BRAT Diet for Acute Diarrhea in Children: Should It Be Used?
http://www.medicine.virginia.edu/clinical/departments/medicine/
136. A rice based diet with green banana or pectin reduced diarrhoea in infants
better than a rice alone diet. Evid Based Med 2002;7:55
doi:10.1136/ebm.7.2.55. http://ebm.bmj.com/content/7/2/55.full
137. Saneian H,Yaghini O, Modaresi M,Razmkhah N. Lactose-Free Compared
with Lactose-Containing Formula in Dietary Management of Acute Childhood
Diarrhea. Iran J Pediatr. 2012 Mar; 22(1): 82–86
138. Zavaleta N, Figueroa D,Rivera T,Sarrchez J, Altaro S, Lonnerdal B. Glucose
and rice based ORS. Journal of pediatrics gastroentrol.Nutri.2007 Feb, 44 (2)
:258.
139. Ibrahim S, Isani Z. Sagodana Based Verses Rice Based Oral Rehydration
Solution in the Management of Acute Diarrhoea in Pakistani Children.
Available from http://www.jpma.org.pk/full_article_text.php?article_id=3981
140. Radovan M, -Castrellón P, Hashem M, Neylan M, Baggs G, Zaldo R, Ndife et
al. Safety and efficacy of a premixed, rice-based oral rehydration solution. J
PediatrGastroenterolNutr. 2004 Feb; 38(2):159-63.
141. Martnez h , Bojalil R, Guiscaf H. Promotion of ORS therapy comparing a
homemade rice powder gruel and oral rehydration salts.
http://archive.unu.edu/unupress/food/8F172e/8F172E0a.htm
142. Zaman , Yunus , Rahman , Chowdhury , Sack MD. Rice based ORS product
clinically superior to glucose based ORS study in Swedish ped journal.
marryland , ACTA PAEDIATRICA Stockholm. July 2001
143. Safety and efficacy of a premixed, rice based ORS johns Hopkins university ,
blatimore , mary land , US , journal of pediatrics gastro entrology and nutrition
01/2004: 38(2) :159 – 163 DOI 10.1097/00005176-200402000-00011
144. Gregorio GV, Gonzales ML, Dans LF, Martinez EG. Polymer based oral
rehydration for treating acute diarrhea. 2009 April 15 (2)
145. www.researchgate.net/profile/.../publications
146. Di Stefano M, Veneto G, Malservisi S, et al. Lactose malabsorption and
intolerance and peak bone mass. Gastroenterology. 2002;122:1793–1799
147. www.indianpediatrics.net/jan2011/jan-37-42.htm
148. Pribila BA, Hertzler SR, Martin BR, Weaver CM, Savaiano DA. Improved
lactose digestion and intolerance among African American adolescent girls fed
a dairy-rich diet. J Am Diet Assoc. 2000;100:524 –528
149. Labayen I, Forga L, Gonzalez A, Lenoir-Wijnkoop I, Nutr R, Martinez JA.
Relationship between lactose digestion, gastrointestinal transit time and
symptoms in lactose malabsorbers after dairy consumption. Aliment
Pharmacol Ther. 2001;15: 543–549
150. Wooten WJ, Price W. The role of dairy and dairy nutrients in the diet of
African Americans. J Natl Med Assoc. 2004;96(12 suppl):5S–31S).
151. .Pfefferkorn MD, Fitzgerald JF, Croffie JM, Gupta SK, Corkins MR,
Molleston JP. Lactase deficiency: not more common in pediatric patients with
inflammatory bowel disease than in patients with chronic abdominal pain. J
Pediatr Gastroenterol Nutr. 2002;35:339 –343)
152. Patwari AK. Anand S. Aneja D. Sharma. Persistent Diarrhea: Management in
a Diarrhea Treatment Unit. http://www.indianpediatrics.net/
153. Ashoka BA, Gowda K A, carbohydrate intolerance. Indian journal of
pediatrics, 2001; 55
154. Madhasam S. Comparision of rice based ORS with lactose free formulas.
Indian journal of pediatrics. 2000
155. Gupta R, Gupta S. Management of lactose intolerance, 2001
156. Siden A l, Dietary Management of lactose intolerance, 2004
157. Simakachorn N , Tongpenyai , Tongtan , Varavithya. Randomized, double –
blind clinical trial of a lactose –free and lactose – containing formula in the
dietary management of acute childhood diarrhea. J of Med . Asso , Thai 2004
Jun : 87 (6) : 641 – 9 .
158. Gaffey MF, Wazny.K, Bassani DG, Bhutta ZA. Sep 17 . Dietary management
of childhood diarrhea in low and middle income countries ; a systematic
review. BMC 2013 ;13 Suppl 3:s17 ..
159. Fontaine O,Gore SM, Pierce NF. Rice based oral rehydration for treating
diarrhea. Conchrane database Syst Rev. 2007 Jul18; (4):CD001264.
160. http://www.biomedcentral.com/1471-2431/10/31)
161. Bhatia J, Greer F. Use of soy protein-based formulas in infant feeding. For the
AAP Committee on Nutrition. Pediatrics. 2008;121:1062-1068.
162. Yvan Vandenplas Pedro Gutierrez astrellon Pedro Gutierrez Castrellon
Rodolfo Rivas-Ruiz. Safety of soya-based infant formulas in children. British
Journal Of Nutrition (Impact Factor: 3.34). 02/2014; Available from:
http://www.researchgate.net/publication/260124371_Safety_of_soya-
based_infant_formulas_in_children.
163. http://www.soyfoods.org/wp-content/uploads/2006/11/soy_and_child_diet.pdf
164. Ramakrishna BS, Venkataraman S, Srinivasan P, et al. Amylase-resistant
starch plus oral rehydration solution for cholera. N Engl J Med 2000;342:
308–13.
165. Kukuruzovic RH, Brewster DR. Milk formulas in acute gastroenteritis and
malnutrition: a randomized trial. J Paediatr Child Health. 2002;38:571–577
166. Wooten WJ, Price W. The role of dairy and dairy nutrients in the diet of
African Americans. J Natl Med Assoc. 2004;96(12 suppl):5S–31S
167. Heubi J, Karasov R, Reisinger K, et al. Randomized multicenter trial
documenting the efficacy and safety of a lactose-free and a lactose-containing
formula for term infants. J Am Diet Assoc. 2000;100:212–217
168. Abrams SA, Griffin IJ, Davila PM. Calcium and zinc absorption from lactose-
containing and lactose-free infant formulas. Am J Clin Nutr. 2002;76:442–
446
169. Obermayer-Pietsch BM, Bonelli CM, Walter DE, et al. Genetic predisposition
for adult lactose intolerance and relation to diet, bone density, and bone
fractures. J Bone Miner Res. 2004;19: 42– 47
170. Joneja JMV. Maldigestion of carbohydrates. New Jersey: Reuters press;
2004:116-134.
i
APPENDIX - A
LETTER SEEKING PERMISSION FOR DATA COLLECTION
From
H M JASMINE SHEELA, M.Sc., (N)., Principal, Mount Zion College of Nursing Lena Vilakku, Thirumayam Tk Pilivalam Po, Pudukottai - 7
To Dr. Prabhkar Navamani, MD, DCH., Navamani Pediatric Hospital Arasaradi, Madurai Respected Madam /Sir,
Sub: Seeking permission to do Ph.D data collection – reg.
I, Mrs.HM JASMINE SHEELA, M.Sc., (N)., doing Ph.D in Nursing at C.S.I
Jeyaraj Annapackiam College of Nursing, Madurai, which is affiliated to The Tamil
Nadu Dr.M.G.R. Medical University, Chennai have undertaken the topic for thesis as
“A Study to determine the incidence of secondary lactose intolerance and evaluate the
effect of lactose free feeds in controlling diarrhea and correcting dehydration among
the children”.
My study topic requires children who are having diarrhea with positive
reducing sugar in stool and stool ph < 6 who are admitted in the hospital for
management of secondary lactose intolerance inorder to carry out the study to find out
the effectiveness of lactose free (Riosy) feeds in controlling diarrhea and correcting
dehydration among the children.
Thanking you
Yours Sincerely
Mrs.H M Jasmine Sheela, M.Sc., (N).,
ii
APPENDIX - B
LETTER SEEKING PERMISSION FOR CONTENT VALIDITY
From
H M JASMINE SHEELA, M.Sc., (N)., Principal, Mount Zion College of Nursing Lena Vilakku, Thirumayam Tk Pilivalam Po, Pudukottai - 7
To
Respected Madam /Sir,
Sub: Expert opinion for tool validity.
*****
I, Mrs.HM JASMINE SHEELA, M.Sc., (N)., doing Ph.D in Nursing at C.S.I
Jeyaraj Annapackiam College of Nursing, Madurai, which is affiliated to The Tamil
Nadu Dr. M.G.R Medical University, Chennai seek your expert validation on my
study topic “A Study to determine the incidence of secondary lactose intolerance and
evaluate the effect of lactose free feeds in controlling diarrhea and correcting
dehydration among the children”.
I am herewith sending a copy of the tool along with the criteria check list
prepared by me for its content validation.
Hence, I request you to kindly examine the tool item wise and give your
valuable opinion and suggestions for improvement of this tool. I would appreciate if
this tool will be returned to me after verification with suggestions within a week time,
so as to enable me proceeds with my pilot study.
Please forward the tool and the signed content validity certificate to the
address mentioned on the stamped cover sent along with this letter.
Thanking you in anticipation,
Yours sincerely,
(Mrs.HM JASMINE SHEELA, M.Sc., (N).,)
iii
CONTENT VALIDITY CERTIFICATE
This is to certify that, I ___________________________________________
have gone through the tool submitted by HM JASMINE SHEELA, Ph.D scholar
doing her research under The Tamilnadu Dr. M.G.R Medical University, Chennai.
A study to “A Study to determine the incidence of secondary lactose
intolerance and evaluate the effect of lactose free feeds in controlling diarrhea
and correcting dehydration among the children”.
I have gone through the tool for construct, content and criterion validity. I
certify that this tool can be used for above mentioned study.
Signature of the Expert
iv
APPENDIX - C
LIST OF EXPERTS
1. Dr.Rajkumar, MBBS, MD.,Ph.D., Research Guide, CSI Jacon, Madurai
2. Dr. Shanthi Appavu, M.Sc.,(N),Ph.D., Principal, CSI college of Nursing, Neiyoor, Kanyakumaril Dist. 3. Prof. Dr. Jeyasingh, M.D., M.V., Ph.D., Professor in Medicine, Research Guide, CSI Jeyaraj Annapackiam College of Nursing, Madurai. 4. Dr. Rajalakshmi, M.Sc., (N), Ph.D., Professor in Nursing, Research Guide, CSI Jeyaraj Annapackiam College Of Nursing, Madurai. 5. Dr.Prabhakar Navamani, MD., DCH., Navamani Pediatric Hospital Arasaradi, Madurai 6. Dr.Macklin Raja, MD., DCH., Thakkalai, Kanyakumari District 7. Dr.Mahadevan, MBBS., DCH., Mahadevan Pediatric Hospital Sivagangai 9. Prof. Dr. C. Nalini Jeyavantha Shantha M.Sc., (N), Ph.D., Professor in Nursing, Principal, Sacred heart Nursing College, Madurai. 10. Dr. M. Kannan, Ph.D., Professor in Social Research Biostatics, Madurai Institute of Social Sciences, Madurai.
v
11. Dr.Jayathangaselvi, M.Sc., Ph.D., CSI Jeyaraj Annapackiam College of Nursing, Madurai. 12. Dr.Jansy Rachel Daisy, M.Sc., Ph.D., CSI Jeyaraj Annapackiam College of Nursing, Madurai. 13. Dr.Jessy Mettlda, M.Sc., Ph.D., CSI Jeyaraj Annapackiam College of Nursing, Madurai. 14. Prof. Dr. Juliet Sylvia, M.Sc., (N),Ph.D., Professor in Nursing, HOD in Community Health Nursing Department, Sacred College of Nursing, Madurai. 15. Prof.Mrs.N.Sarswathi, M.Sc., (N)., Ph.D., Principal Sri K. Ramachandra Naidu College of Nursing 16. Dr.Reena, M.Sc.,(N), Ph.D., Principal, St.Xavier College of Nursing, Chungankadai,
K.K.District 17. Prof. Sumithra, M.Sc., Ph. D* Principal Cum HOD in pediatric Nursing, Karpagavinayagar College Of Nursing, Pudhukottai.
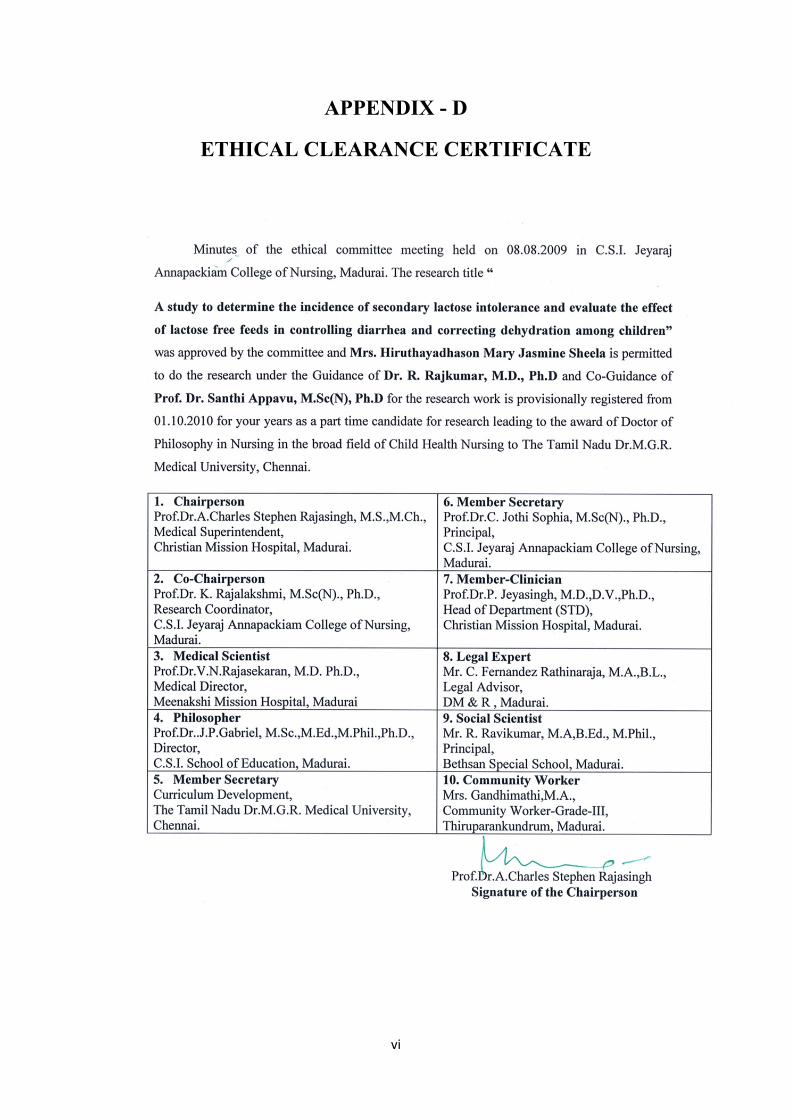
vi
APPENDIX - D
ETHICAL CLEARANCE CERTIFICATE
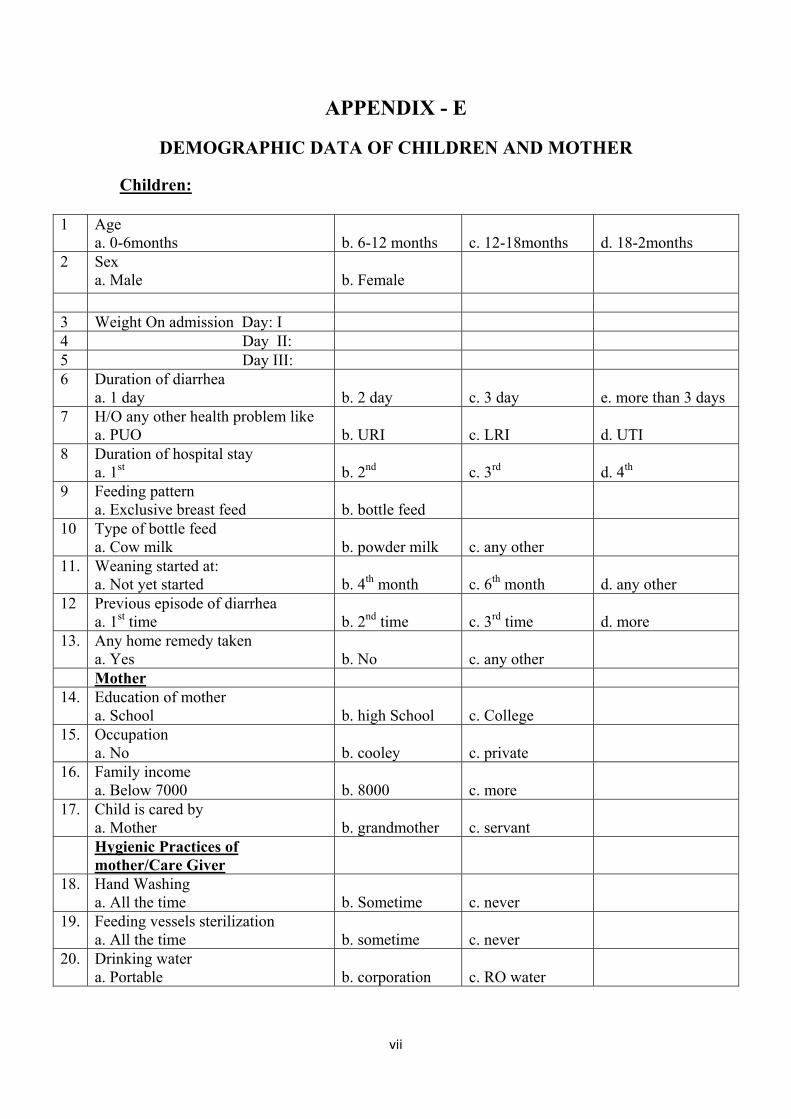
vii
APPENDIX - E
DEMOGRAPHIC DATA OF CHILDREN AND MOTHER
Children:
1 Age a. 0-6months
b. 6-12 months
c. 12-18months
d. 18-2months
2 Sex a. Male
b. Female
3 Weight On admission Day: I 4 Day II: 5 Day III: 6 Duration of diarrhea
a. 1 day b. 2 day
c. 3 day
e. more than 3 days
7 H/O any other health problem like a. PUO
b. URI
c. LRI
d. UTI
8 Duration of hospital stay a. 1st
b. 2nd
c. 3rd
d. 4th
9 Feeding pattern a. Exclusive breast feed
b. bottle feed
10 Type of bottle feed a. Cow milk
b. powder milk
c. any other
11. Weaning started at: a. Not yet started
b. 4th month
c. 6th month
d. any other
12 Previous episode of diarrhea a. 1st time
b. 2nd time
c. 3rd time
d. more
13. Any home remedy taken a. Yes
b. No
c. any other
Mother 14. Education of mother
a. School b. high School
c. College
15. Occupation a. No
b. cooley
c. private
16. Family income a. Below 7000
b. 8000
c. more
17. Child is cared by a. Mother
b. grandmother
c. servant
Hygienic Practices of mother/Care Giver
18. Hand Washing a. All the time
b. Sometime
c. never
19. Feeding vessels sterilization a. All the time
b. sometime
c. never
20. Drinking water a. Portable
b. corporation
c. RO water
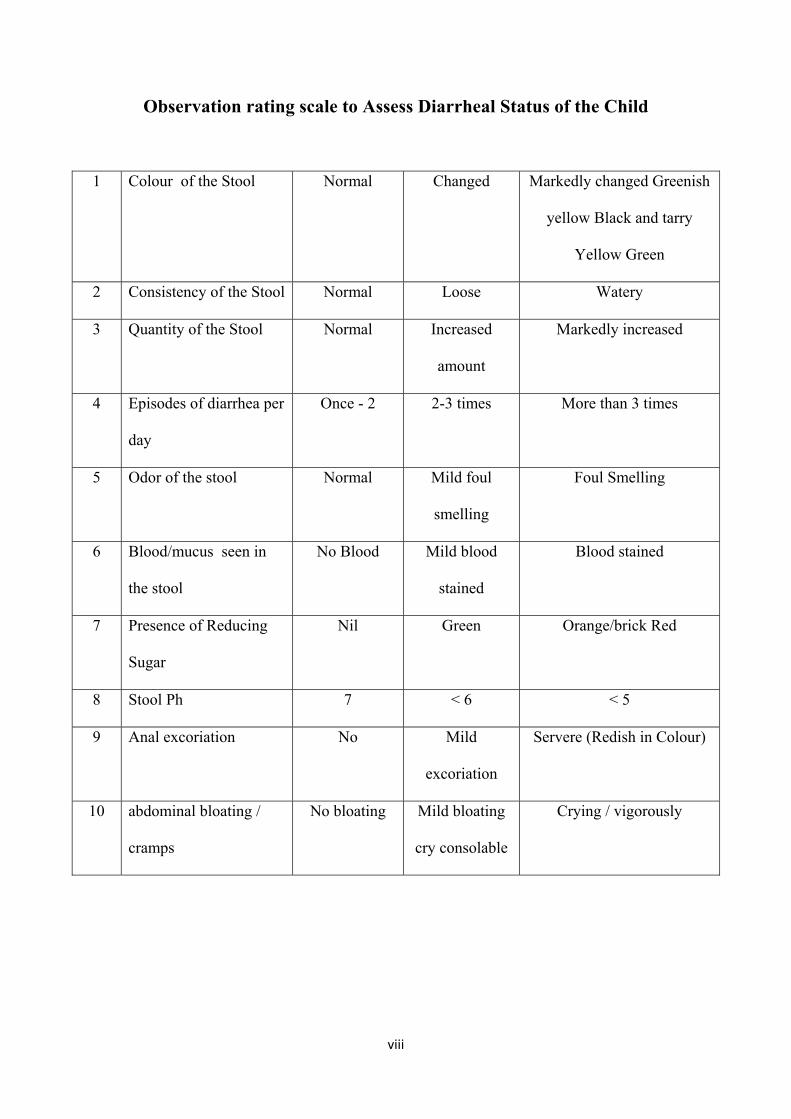
viii
Observation rating scale to Assess Diarrheal Status of the Child
1 Colour of the Stool Normal Changed Markedly changed Greenish
yellow Black and tarry
Yellow Green
2 Consistency of the Stool Normal Loose Watery
3 Quantity of the Stool Normal Increased
amount
Markedly increased
4 Episodes of diarrhea per
day
Once - 2 2-3 times More than 3 times
5 Odor of the stool Normal Mild foul
smelling
Foul Smelling
6 Blood/mucus seen in
the stool
No Blood Mild blood
stained
Blood stained
7 Presence of Reducing
Sugar
Nil Green Orange/brick Red
8 Stool Ph 7 < 6 < 5
9 Anal excoriation No Mild
excoriation
Servere (Redish in Colour)
10 abdominal bloating /
cramps
No bloating Mild bloating
cry consolable
Crying / vigorously
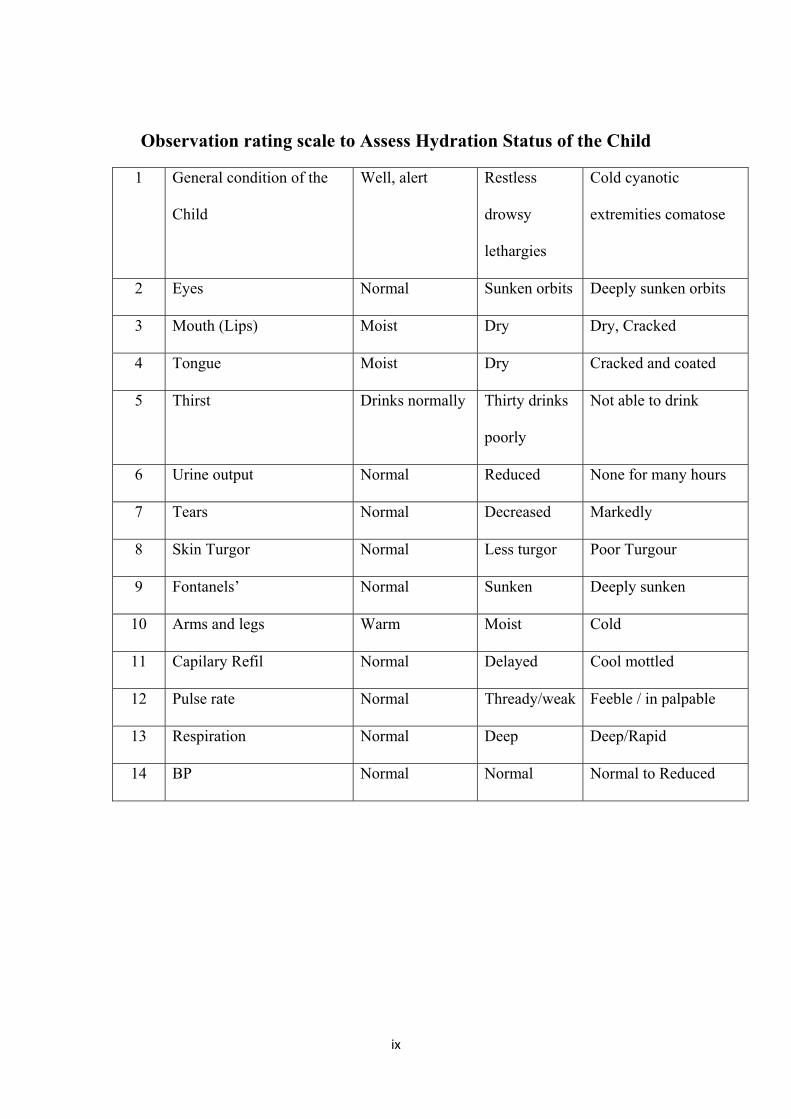
ix
Observation rating scale to Assess Hydration Status of the Child
1 General condition of the
Child
Well, alert Restless
drowsy
lethargies
Cold cyanotic
extremities comatose
2 Eyes Normal Sunken orbits Deeply sunken orbits
3 Mouth (Lips) Moist Dry Dry, Cracked
4 Tongue Moist Dry Cracked and coated
5 Thirst Drinks normally Thirty drinks
poorly
Not able to drink
6 Urine output Normal Reduced None for many hours
7 Tears Normal Decreased Markedly
8 Skin Turgor Normal Less turgor Poor Turgour
9 Fontanels’ Normal Sunken Deeply sunken
10 Arms and legs Warm Moist Cold
11 Capilary Refil Normal Delayed Cool mottled
12 Pulse rate Normal Thready/weak Feeble / in palpable
13 Respiration Normal Deep Deep/Rapid
14 BP Normal Normal Normal to Reduced
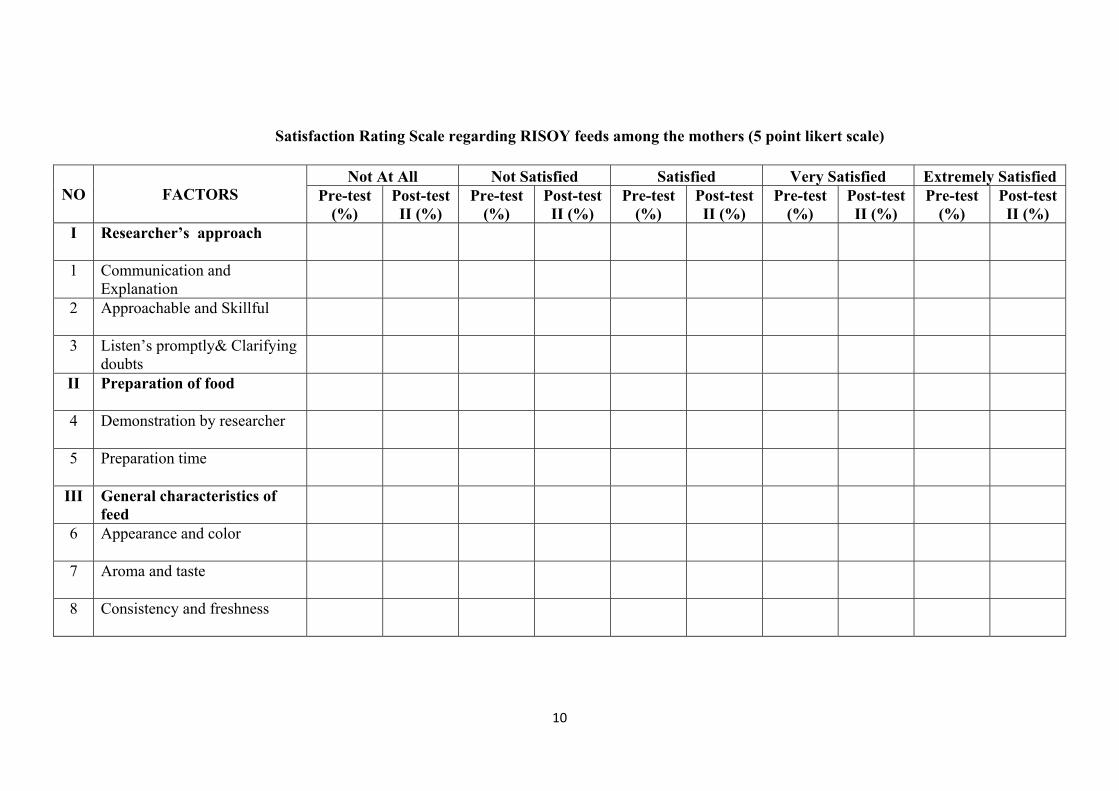
10
Satisfaction Rating Scale regarding RISOY feeds among the mothers (5 point likert scale)
NO FACTORS Not At All Not Satisfied Satisfied Very Satisfied Extremely Satisfied
Pre-test (%)
Post-test II (%)
Pre-test (%)
Post-test II (%)
Pre-test (%)
Post-test II (%)
Pre-test (%)
Post-test II (%)
Pre-test (%)
Post-test II (%)
I Researcher’s approach
1 Communication and Explanation
2 Approachable and Skillful
3 Listen’s promptly& Clarifying doubts
II Preparation of food
4 Demonstration by researcher
5 Preparation time
III General characteristics of feed
6 Appearance and color
7 Aroma and taste
8 Consistency and freshness
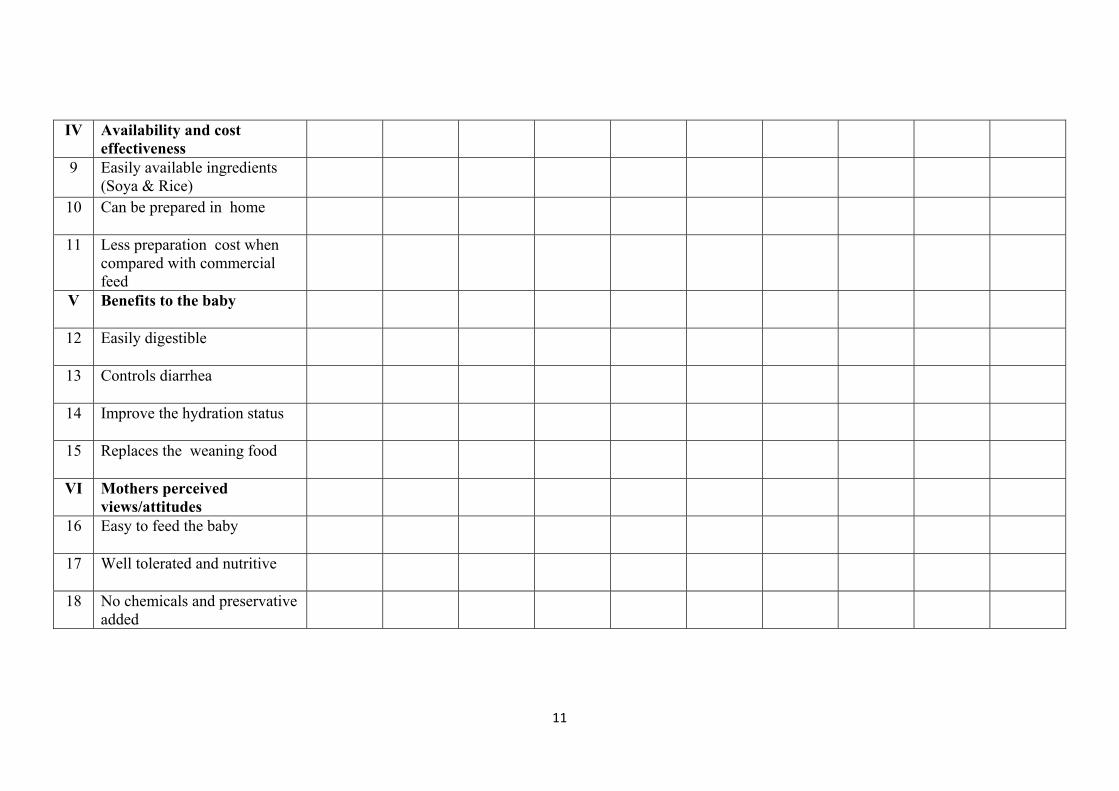
11
IV Availability and cost effectiveness
9 Easily available ingredients (Soya & Rice)
10 Can be prepared in home
11 Less preparation cost when compared with commercial feed
V Benefits to the baby
12 Easily digestible
13 Controls diarrhea
14 Improve the hydration status
15 Replaces the weaning food
VI Mothers perceived views/attitudes
16 Easy to feed the baby
17 Well tolerated and nutritive
18 No chemicals and preservative added
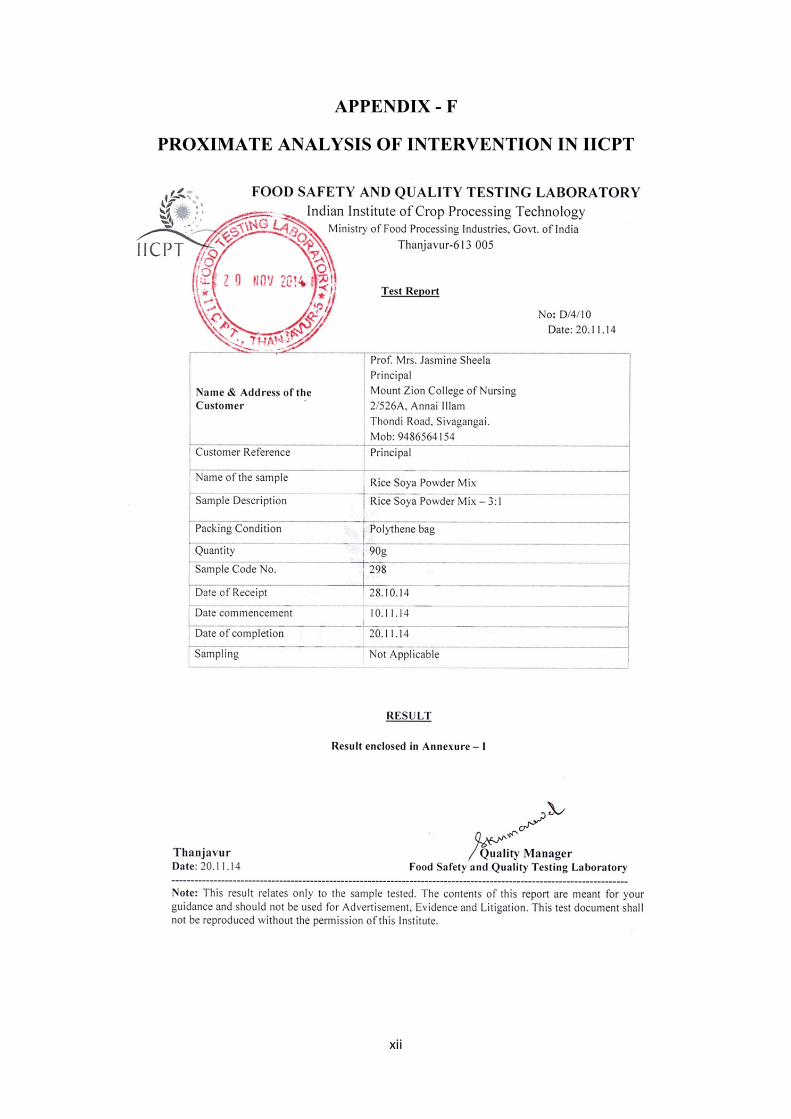
xii
APPENDIX - F
PROXIMATE ANALYSIS OF INTERVENTION IN IICPT
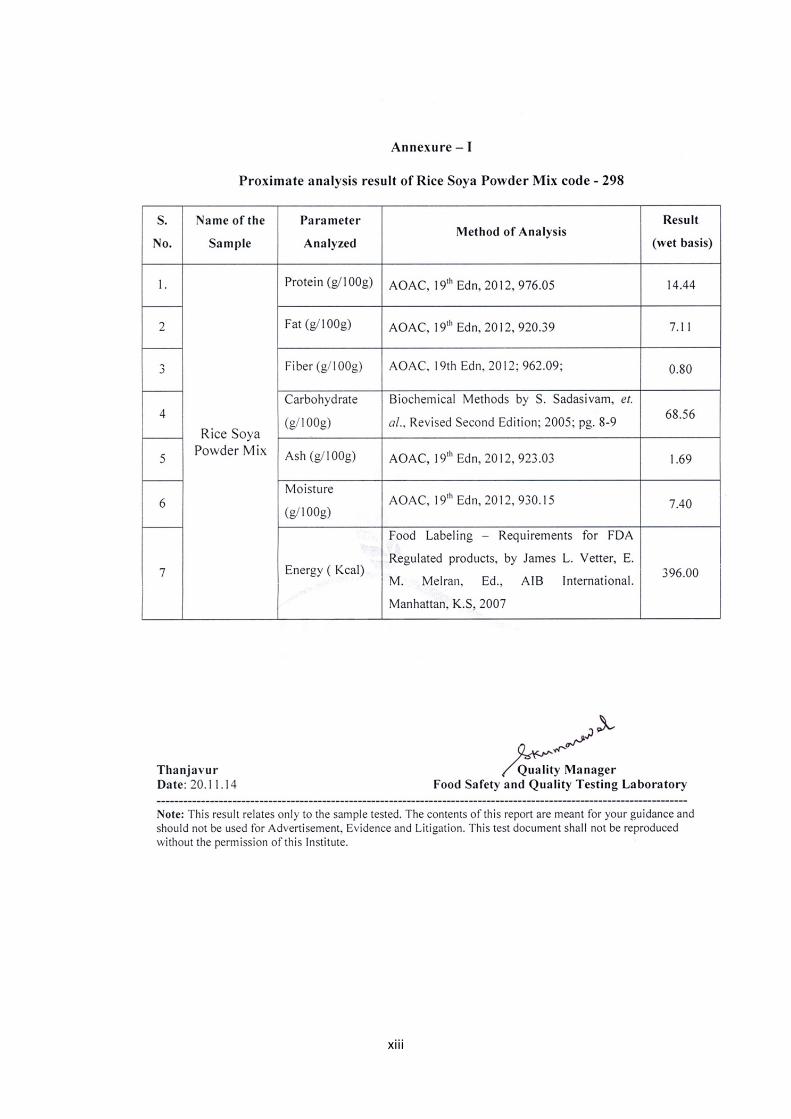
xiii
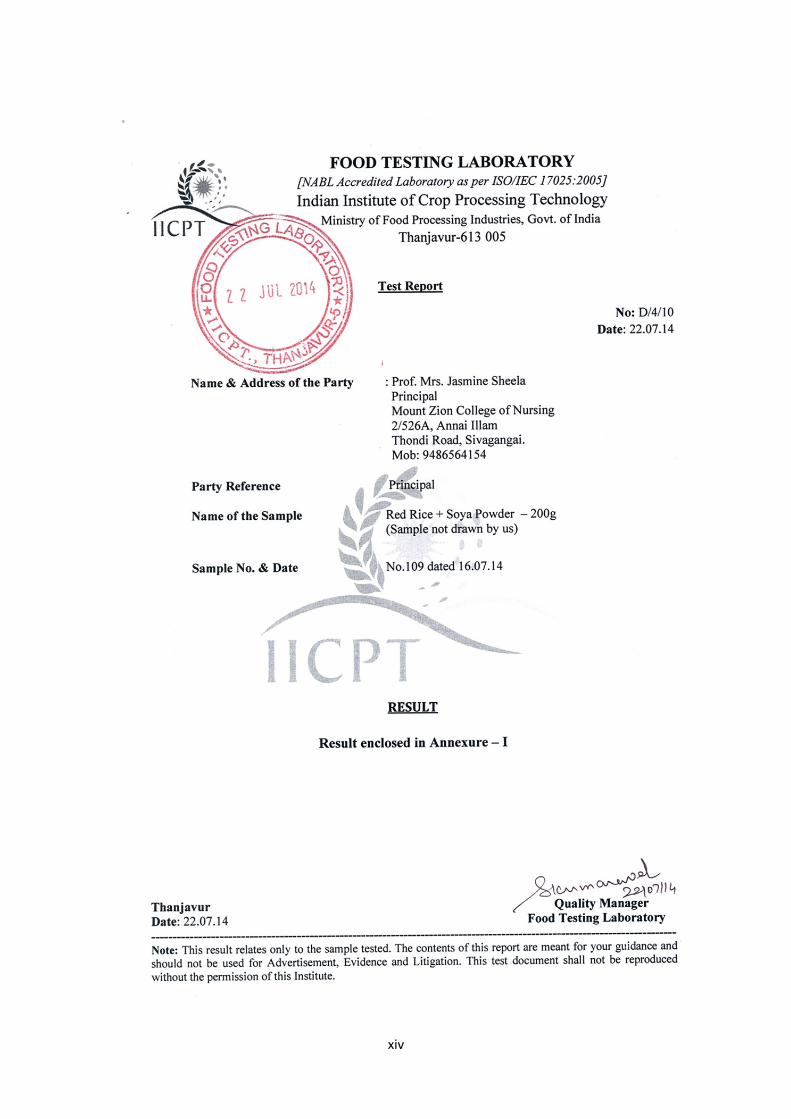
xiv
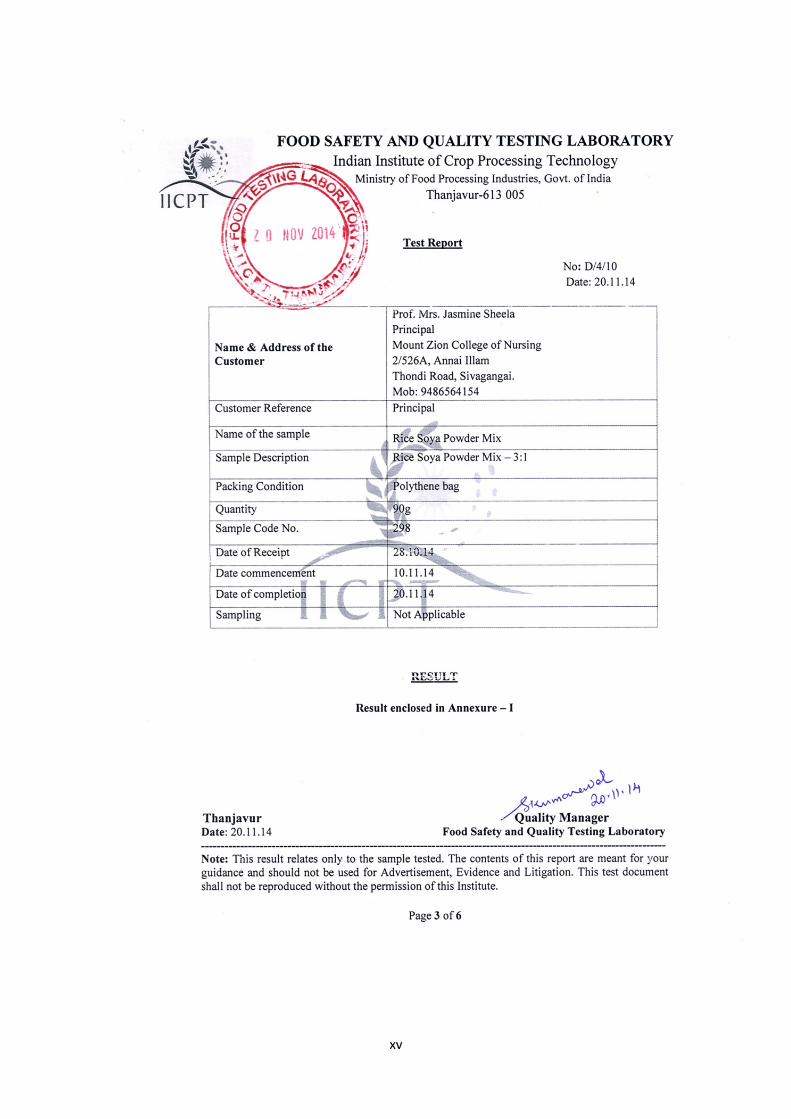
xv
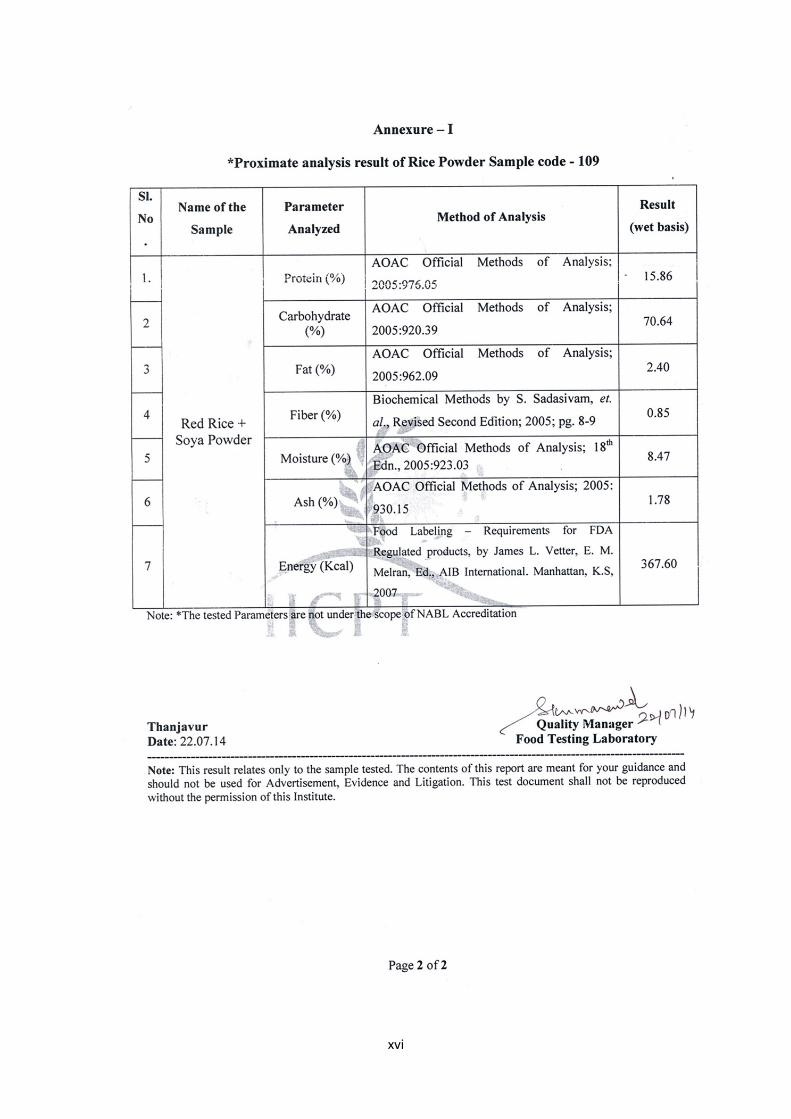
xvi
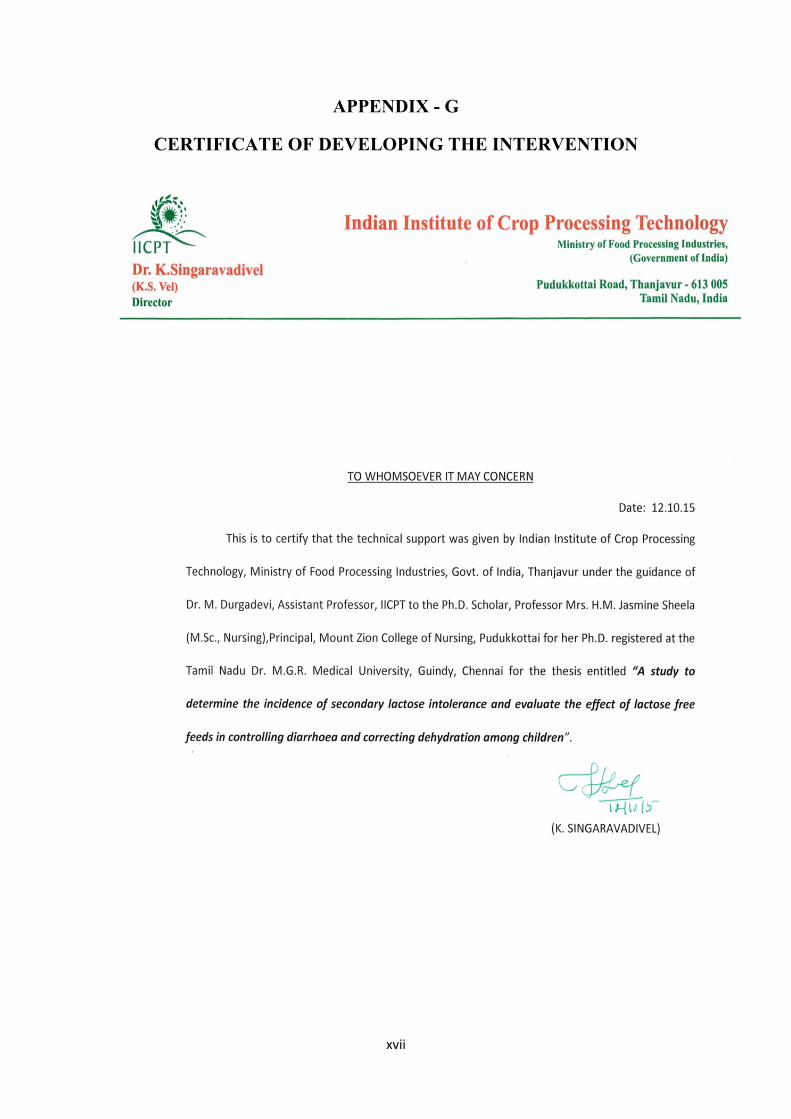
xvii
APPENDIX - G
CERTIFICATE OF DEVELOPING THE INTERVENTION
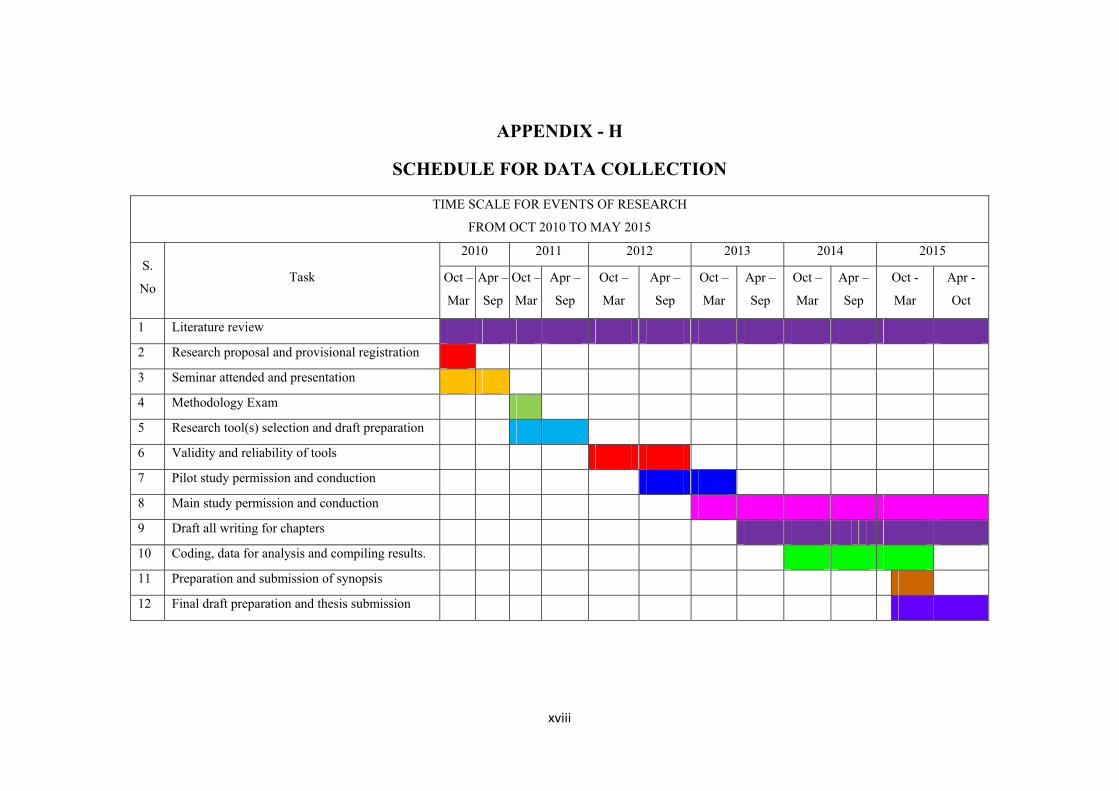
xviii
APPENDIX - H
SCHEDULE FOR DATA COLLECTION
TIME SCALE FOR EVENTS OF RESEARCH
FROM OCT 2010 TO MAY 2015
S.
No Task
2010 2011 2012 2013 2014 2015
Oct –
Mar
Apr –
Sep
Oct –
Mar
Apr –
Sep
Oct –
Mar
Apr –
Sep
Oct –
Mar
Apr –
Sep
Oct –
Mar
Apr –
Sep
Oct -
Mar
Apr -
Oct
1 Literature review
2 Research proposal and provisional registration
3 Seminar attended and presentation
4 Methodology Exam
5 Research tool(s) selection and draft preparation
6 Validity and reliability of tools
7 Pilot study permission and conduction
8 Main study permission and conduction
9 Draft all writing for chapters
10 Coding, data for analysis and compiling results.
11 Preparation and submission of synopsis
12 Final draft preparation and thesis submission
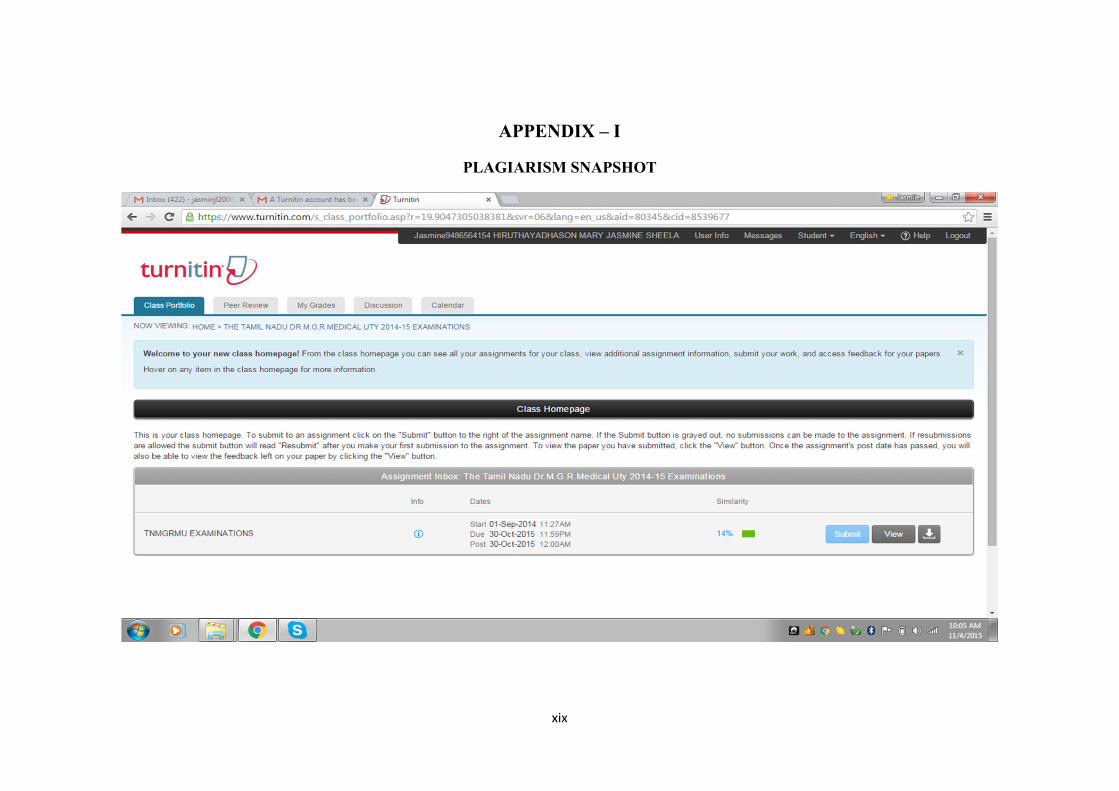
xix
APPENDIX – I
PLAGIARISM SNAPSHOT