automated cloud detection and classification of data collected by the visible infrared imager...
TRANSCRIPT

Ref: Int’l J. Rem.Sens., Vol 26, Issue 21, 2005, DOI: 10.1080/01431160500196786
1
Automated Cloud Detection and Classification of Data Collected by the Visible Infrared Imager Radiometer Suite (VIIRS)
Keith D. Hutchison*, John K. Roskovensky#, John M. Jackson#, Andrew K. Heidinger+,
Thomas J. Kopp^, Michael J. Pavolonis&, and Richard Frey&
ABSTRACT The Visible Infrared Imager Radiometer Suite (VIIRS) is the high-resolution Earth
imager of the United States National Polar-orbiting Operational Environmental Satellite
System (NPOESS). VIIRS has its heritage in three sensors currently collecting imagery
of the Earth, including the Advanced Very High Resolution Radiometer, the Moderate
Resolution Imaging Spectroradiometer, and the Operational Linescan Sensor. First
launch of the VIIRS sensor comes on NASA’s NPOESS Preparatory Project (NPP). Data
collected by VIIRS will provide products to a variety of users that support applications
from the real-time to long-term, climate change timescales and VIIRS has been uniquely
designed to satisfy this full range of requirements. Cloud masks derived from the
automated analyses of VIIRS data are critical data products for the NPOESS program. In
this paper, the VIIRS Cloud Mask (VCM) performance requirements are highlighted,
along with the algorithm developed to satisfy these requirements. The expected
performance for the VCM algorithm is established using global synthetic cloud
simulations and manual cloud analyses of VIIRS proxy imagery. These results show the
VCM analyses will satisfy the performance expectations of products created from it,
including land and ocean surface products, cloud microphysical products, and automated
cloud forecast products. Finally, minor deficiencies that remain in the VCM algorithm

Ref: Int’l J. Rem.Sens., Vol 26, Issue 21, 2005, DOI: 10.1080/01431160500196786
2
logic are identified along with a mitigation plan to resolve each prior to NPP launch or
shortly thereafter.
Corresponding Author: Keith D. Hutchison, Center for Space Research (CSR), The University of Texas at Austin, 3925 W. Braker Lane, Ste. 200, Austin, TX 78759, [email protected], (512)-471-7295 John K. Roskovensky and John M. Jackson, Northrop Grumman Space Technology (NGST), NPOESS System Engineering, Modeling & Simulations, One Space Park, Redondo Beach, CA 90245 Andrew K. Heidinger, NOAA National Environmental Satellite, Data, and Information Service (NESDIS) Office of Research and Applications, 1225 W. Dayton Street, Madison, WI 53706 Michael J. Pavolonis and Richard Frey, Cooperative Institute for Meteorological Satellite Studies (CIMSS), University of Wisconsin, Madison, WI 53706 Thomas J. Kopp, The Aerospace Corporation, 2350 E. El Segundo Blvd., El Segundo, CA 90245 Key Words: cloud analysis, cloud detection, cloud screening, MODIS, VIIRS,
NPOESS

Ref: Int’l J. Rem.Sens., Vol 26, Issue 21, 2005, DOI: 10.1080/01431160500196786
3
1.0 INTRODUCTION
The National Polar-orbiting Operational Environmental Satellite System (NPOESS) was
established by Presidential Decision Directive NSTC-2 on May 5, 1994. This directive
required the Departments of Commerce (DoC) and Defense (DoD), and NASA to create
an Integrated Program Office (IPO) to develop, acquire, manage, and operate the next
generation of polar-orbiting operational environmental satellites for the United States.
The NPOESS IPO was established on October 3, 1994 and has partnered with the
European Organisation for the Exploitation of Meteorological Satellites (EUMETSAT)
and the National Space Development Agency of Japan (NASDA) to ensure a long-term
continuity of observations from polar orbit will continue to support improvements in the
operational meteorological, environmental, and climate monitoring services of its user
communities.
NPOESS satellites will carry numerous sensors that collect data from the ultraviolet
through the microwave regions of the electromagnetic spectrum. VIIRS (Visible Infrared
Imager Radiometer Suite) is the NPOESS high-resolution Earth viewing sensor and has
its heritage in three sensors currently collecting imagery of the Earth, including NOAA’s
Advanced Very High Resolution Radiometer (AVHRR), NASA’s MODerate Resolution
Imaging Spectroradiometer (MODIS), and the Operational Linescan Sensor (OLS) flown
by the Defense Meteorological Satellite Program (DMSP). Like MODIS, VIIRS will
provide highly calibrated data in all channels collected using four-focal plane assemblies.
In addition, it relies heavily upon its MODIS and AVHRR heritage for spectral bandpass

Ref: Int’l J. Rem.Sens., Vol 26, Issue 21, 2005, DOI: 10.1080/01431160500196786
4
definitions used in automated cloud detection tests. VIIRS also relies upon its DMSP
OLS heritage to provide data at edge of scan that grows to no more than twice its spatial
resolution at nadir and to collect visible data during low-light, nighttime conditions with a
channel known as the Day-Night Band (DNB) . VIIRS will collect data at two nominal
resolutions at nadir: 375 m in “Imagery” channels and 750 m in “Radiometric” channels.
First launch of the VIIRS sensor comes on NASA’s NPOESS Preparatory Project (NPP).
Data collected by the VIIRS sensor will be used to create nearly 30 environmental data
products including cloud analyses, land and ocean surface products, and aerosol products.
These products will be delivered to a diverse user community in the DoC, DoD, and at
NASA that support applications from the real-time to long-term, climate change
timescales and VIIRS has been designed to satisfy this full range of requirements.
The cloud mask derived from the automated analysis of VIIRS data is a critical data
product for the NPOESS program and has been designed to exploit the unique data
collected by the VIIRS sensor. In the next section, the VIIRS Cloud Mask (VCM)
performance requirements are highlighted, along with the algorithmic logic developed to
satisfy these requirements. Next, the expected performance for the VCM algorithm is
established using global synthetic cloud simulations and manual cloud analyses of VIIRS
proxy imagery created from MODIS granules. These results show the VCM analyses will
satisfy the performance expectations of products created from it, including land and
ocean surface products, cloud microphysical products, and automated cloud forecast

Ref: Int’l J. Rem.Sens., Vol 26, Issue 21, 2005, DOI: 10.1080/01431160500196786
5
products. Finally, minor deficiencies that continue in the VCM algorithm are identified
along with a mitigation plan to resolve each prior to NPP launch or shortly thereafter.
2.0 THE VIIRS CLOUD MASK ALGORITHM Stringent requirements have been levied upon the VCM analyses as shown in Table 1,
which is taken from the NPOESS System Specification, the document that defines
acceptable performance for the total NPOESS system and each sub-system. These
requirements vary according to cloud optical depth (OD) and solar illumination
conditions. For example, during daytime conditions, over the ocean, and outside sun glint
regions, the VCM algorithm is required to detect 99% of the pixels that contain clouds
that are optically thick (OD > 0.5) and 92% of more optically thin clouds. Inside regions
of sun glint, defined by the reflected sun angle < 36 degrees, the cloud mask must meet
nighttime performance requirements of 96% and 90% respectively. For purposes of
validation, performance will be based upon manual classification of VIIRS imagery and
cloud masks used to generate synthetic data sets, using procedures discussed in Section 3.
No other sensor is known to have such stringent performance requirements for cloud
analyses.
Table 1 here.
2.1 VIIRS SENSOR DESIGN ENHANCEMENTS The VIIRS sensor was designed to meet the rigorous cloud product performance
requirements originally established by the IPO and later incorporated into the NPOESS
System Specification. A summary of VIIRS channel characteristics useful for cloud

Ref: Int’l J. Rem.Sens., Vol 26, Issue 21, 2005, DOI: 10.1080/01431160500196786
6
detection is shown in Table 2 along with those of heritage sensors, VIIRS design
enhancements, and the value of each enhancement to the overall performance of the
VCM algorithm.
Table 2 here.
The VIIRS design contains numerous enhancements to channels used in heritage sensors.
The value of these enhancements can be summarized as follows:
The M1 band has proven valuable for cloud detection over arid surfaces in
daytime imagery (Hutchison and Jackson, 2003); however, MODIS data in this
band can saturate in cloudy conditions. VIIRS channels used for ocean color
monitoring, including the M1 channel, are dual-gain to ensure saturation does not
occur. As an added precaution, all dual-gain bands and M13 are downlinked at
full resolution, i.e. not subject to on-board aggregation as done with single gain
bands. (Oversampling and on-board aggregation are used to restrict growth in
spatial resolution as VIIRS scans from nadir to edge of swath.)
VIIRS reflective bands (e.g. I1, M5) are accurately calibrated, compared to its
OLS and AVHRR counterparts. The M5 and M7 Channels have a narrow
bandpass, similar to MODIS, which reduces global variations in atmospheric
transmittance due to changes in viewing geometry and atmospheric conditions.
Thus, cloud signatures in these VIIRS bandpasses will also be less variability than
observed in data collected by the OLS and AVHRR sensors.
The bandwidth of VIIRS Channel M9 has been reduced 50%, from 30 nm in
MODIS to 15 nm, which will reduce contamination from the Earth’s surface that

Ref: Int’l J. Rem.Sens., Vol 26, Issue 21, 2005, DOI: 10.1080/01431160500196786
7
is present in MODIS data. This reduced bandpass will help provide more accurate
cloud detection and typing in the presence of lower amounts of atmospheric water
vapor, especially associated with polar environments and mountainous regions.
Data collected in VIIRS channels I4 and I5 have a much higher spatial resolution,
i.e. 375 m at nadir compared to 1 km resolution in MODIS data, which reduces
sub-pixel effects on VCM analyses.
Similarly, restrictions on cross-scan spatial resolution growth in VIIRS imagery
and radiometric channels to 2:1, compared to almost 6:1 in AVHRR and MODIS
further reduces impacts of sub-pixel effects on cloud detection. (This growth
applies to a MODIS data swath of 2330 km compared to a VIIRS 3000 km swath,
which makes VIIRS data contiguous at the equator.)
Finally, all VIIRS data, including the DNB, are more highly calibrated than OLS
data. This allows the VCM algorithm to produce improved cloud analyses even in
terminator regions.
The VIIRS design has less capability than MODIS in some spectral bands. First, some
MODIS bands have higher spatial resolutions than similar VIIRS bands. The
aforementioned cloud tests that utilize VIIRS imagery channels could be applied more
effectively near nadir with MODIS Channel 1, which has a resolution of 250 m.
However, this apparent value is quickly lost as the sensor scans away from nadir due to
the unconstrained growth of nearly 6:1 in the resolution of MODIS compared to a 2:1
constraint associated with the VIIRS design. Secondly, some MODIS channels are not
part of the VIIRS design, e.g. MODIS channels 33-36 which are used to retrieve cloud

Ref: Int’l J. Rem.Sens., Vol 26, Issue 21, 2005, DOI: 10.1080/01431160500196786
8
top altitudes. In addition, VIIRS initially will not include a 6.7 m water vapor band,
(MODIS Channel 27) which has proven highly valuable for cloud detection in the polar
night (Liu et al., 2004). This band is currently being considered for inclusion beginning
with VIIRS Flight Unit #3 and instruments launched thereafter.
2.2 VIIRS CLOUD DETECTION ARCHITECTURE
The methodology for multi-spectral, automated cloud detection algorithms follows
closely that first described in the literature by Saunders and Kriebel (1988) which formed
the theoretical basis for APOLLO or AVHRR Processing scheme Over Land, Clouds,
and Ocean (Kriebel et al 2003), CLAVR (CLouds from AVHRR by Stowe et al., 1999l;
Heidinger, 2004), SERCAA (Support of Environmental Requirements for Cloud
Analyses and Archive by Gustafson et al., 1994), and the MODIS cloud mask algorithm
(Ackerman et al., 1997; Ackerman et al., 1998; Ackerman et al., 2002). The five
processing paths of the VCM algorithm, shown in Figure 1, for daytime conditions
follow closely that of MODIS. (The schematic of the processing paths for nighttime
conditions is not shown since it is more simplistic.)
Figure 1 here.
Multispectral cloud detection algorithms normally start with the assumption that each
pixel is cloud-free. Then, a set of bi-spectral cloud tests are employed to exploit the
different signatures of clouds and their surrounding backgrounds. If the sensor
observations exceed a predetermined value or “threshold” for any single cloud test, the
pixel is assumed to be cloud-contaminated. The goal of each cloud test is to maximize the

Ref: Int’l J. Rem.Sens., Vol 26, Issue 21, 2005, DOI: 10.1080/01431160500196786
9
number of cloudy pixels detected while simultaneously minimizing the number of cloud-
free pixels inaccurately classified as cloud contaminated, i.e. minimizing false alarms.
Cloud detection algorithms may also incorporate single-channel cloud tests; however,
care must be taken since cloud and background signatures are highly variable in global
satellite observations and these variations may be difficult to describe in the logic
available with a single spectral band, as will be demonstrated in Section 4.3. Shown in
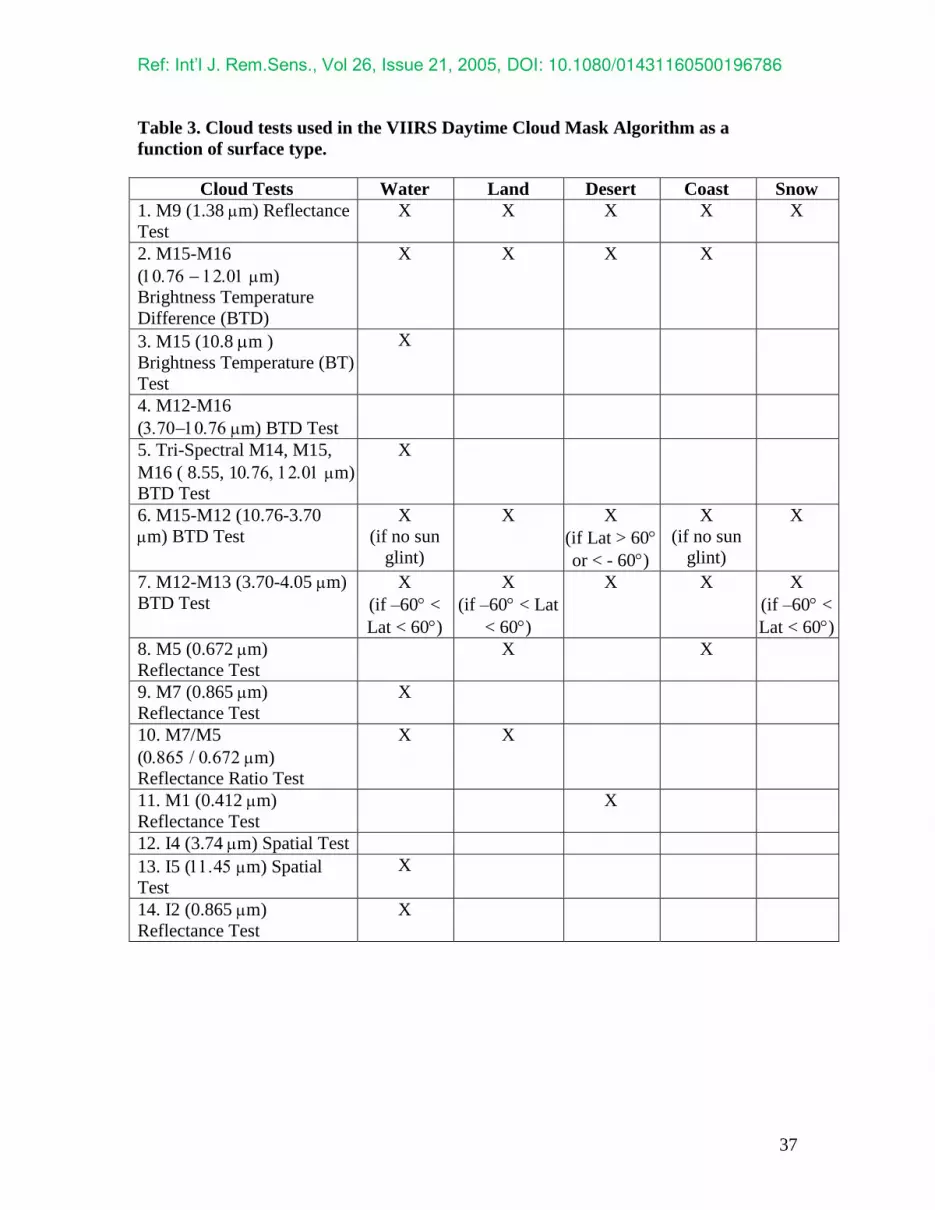
Table 3 are cloud tests used in the VCM daytime algorithm. (Note: units in Table 3 are
reflectance (R) for solar bands in percent and brightness temperatures (BT) for emissive
bands in degrees Kelvin. Brightness temperature differences (BTD) are also in degrees
Kelvin.)
Table 3 here.
There are currently four cloud tests unique to the VCM algorithm, i.e. not used in the
corresponding MODIS algorithm. These tests (11 - 14) were either created specifically
for the VIIRS Cloud Mask Algorithm (Hutchison and Jackson, 2003) or have a heritage
in the CLAVR Cloud Mask Algorithm (Heidinger, 2004).
The VCM algorithm outputs a cloud confidence based upon results of the cloud tests
shown in Table 3. Possible cloud confidences are confidently clear, probably clear,
probably cloudy, and confidently cloudy. A binary cloud mask is created by grouping
together both classes of cloudy pixels and separately both classes of clear pixels.
Confidences are established based upon the proximity of sensor observations to a range

Ref: Int’l J. Rem.Sens., Vol 26, Issue 21, 2005, DOI: 10.1080/01431160500196786
10
of thresholds used in each cloud test. For example, the reflectance is very low in the M5
band (0.672 m bandpass) over densely vegetated surfaces and ocean surfaces outside
sun glint regions. Therefore, the cloud confidences (given as a fraction between 0 and 1)
for the original M5 Reflectance Test (Reed, 2002) were assigned according to criteria
shown in Table 4
Table 4 here.
Cloud confidence is also assigned based upon a combination of results from multiple
tests that exploit cloud and background signatures in VIIRS reflective and emissive
bands, as shown in Figure 2. For example, in the original VIIRS cloud mask algorithm
(Reed, 2002), if the outcome of either cloud test that exploits the solar energy (i.e. the
M7/M5 Ratio or the M5 Reflectance Tests) is confidently cloudy, then the pixel is
assigned this classification, as shown by “min” in Figure 2. Similarly, if the outcome of
either the M15-M12 BTD Test or the M12-M13 BTD Test is confidently cloudy, the
pixel is assigned this classification. Therefore, it is imperative that none of these cloud
tests generate an unacceptable number of false alarms. The result of each individual cloud
test is also produced as output for each pixel.
Figure 2 here.
Finally, the VCM algorithm produces a cloud top phase classification. Initially the
approach used was based upon the NASA MODIS algorithm (Strabala et al., 1994;

Ref: Int’l J. Rem.Sens., Vol 26, Issue 21, 2005, DOI: 10.1080/01431160500196786
11
Menzel et al., 2002). However, a new technique that identifies overlap conditions, i.e.
occurrence of ice clouds over water clouds in a single VIIRS pixel, has been developed
through the NPOESS IPO (Pavolonis and Heidinger, 2005; Pavolonis and Heidinger,
2005, Pavolonis and Heidinger, 2004). This logic has been recently integrated into the
VCM algorithm, which now produces seven cloud phase classifications including water,
thin cirrus, thick cirrus, mixed phase, and overlap, along with clear, partly cloudy, and
not executed.
3.0 TEST DATA SETS The performance of the VCM algorithm has been established using two types of data
sets: truth data sets used in the generation of global synthetic data and manual cloud
analyses of MODIS granules using well-known procedures (Hutchison et al., 1995;
Hutchison and Choe, 1996; Hutchison and Jackson, 2003). The test data used to
determine VCM performance is now briefly highlighted.
3.1 GENERATION OF GLOBAL SYNTHETIC CLOUD DATA
The global geophysical database, used to generate synthetic cloud data, has been
discussed in the literature and is briefly highlighted here (Grano et al., 2004). The
database contains 24 days of NCEP analyses, consisting of 2 days/month between July
2001 and June 2002, which provides an ensemble of over 6 million surface/atmosphere
situations. From this data set, sub-sampling is used to create about 700,000
surface/atmosphere situations for performance verification.

Ref: Int’l J. Rem.Sens., Vol 26, Issue 21, 2005, DOI: 10.1080/01431160500196786
12
Top of the atmosphere (TOA) VIIRS radiances are generated for the three NPOESS
orbits, i.e. 1330, 1730, and 2130 ascending nodes, using the VIIRS swath and scan
specifications illustrated in Figure 3 with various radiative transfer models such as
MODTRAN (Berk et al., 1989). It has been shown that TOA radiances generated from a
newly upgraded MODTRAN4.v4 using the 16-stream DISORT option along with user-
defined ice and water cloud phase functions compares quite well, in most cases, with the
more precise UCLA Line-by-Line Equivalent Model that employs the Adding-Doubling
Method with 200-term expansions of the scattering phase functions (Ou et al, 2004).
These TOA radiances are then passed through the VIIRS sensor model, calibrated, and
converted to engineering units, i.e. reflectances or equivalent blackbody (brightness)
temperatures. The approach used to construct the geophysical database includes the
following steps:
Tropospheric data from the NCEP AVN-FNL are used to describe the state of the
atmosphere and surface backgrounds. These data are assimilated by the US
National Weather Service (NWS) and re-generated onto a uniform one-degree
equal-angle lat/lon grid covering the globe. Atmospheric profiles of temperature,
geo-potential height, relative humidity, cloud liquid water, ozone, and vector-
winds are specified at up to 25 pressure levels, from 1000 mb to 10 mb. These
data are generated four-times daily, at 00Z plus 6-hours.
Stratospheric and climatologic data provided by the NCEP CIRA-86 and UARS
reference atmospheres are used to extend key atmospheric profiles to higher
altitudes (i.e., pressures less than 10mb).

Ref: Int’l J. Rem.Sens., Vol 26, Issue 21, 2005, DOI: 10.1080/01431160500196786
13
Cloud liquid water profiles contained in the NCEP tropospheric datasets, are
converted to cloud parameters (i.e. cloud layers, cloud type, phase, top-height,
base-height, optical thickness, and effective particle size) by the Cloud Scene
Simulation Model (Cianciolo et al., 1996).
Aerosols are extracted from the MODIS L3 8-Day Joint Aerosol/Water
Vapor/Cloud Product (MOD08_E3), which in turn is derived from the
corresponding MODIS Level 3 daily dataset (MOD08_D3).
Surface elevation, material determination, and spectral albedos come from a high-
resolution (30 arc-seconds) terrain database available through Photon Research
Associates.
Figure 3 here.
3.2 VIIRS PROXY DATA BASED UPON MODIS GRANULES
In addition, six MODIS granules were selected to quantify VCM performance. In these
cases, truth consisted of a manual interpretation of the imagery using procedures
described in the VIIRS Imagery Algorithm Theoretical Basis Document (Hutchison et al.,
2002). These manual analyses are binary cloud maps generated with special software that
allows a trained image analyst to identify clouds in a given channel by making all pixels
cloudy that have values that exceed a user-defined threshold. Similarly, all pixels with
values less than the threshold value remain cloud-free. Each scene typically needs to be
segmented into many sub-regions to accurately delineate cloudy and cloud-free regions,
especially for scenes of large geographic regions or highly heterogeneous conditions,

Ref: Int’l J. Rem.Sens., Vol 26, Issue 21, 2005, DOI: 10.1080/01431160500196786
14
since some cloud-free land surfaces may have pixel values similar to clouds in another
part of the scene. In addition, manual analyses from multiple channels may be merged
into a single, composite cloud, no cloud analysis.
Color composite images of the MODIS granules used to establish initial VCM
performance, as discussed in Section 4.1, are shown in Panels (a) – (d) of Figure 4.
Additional MODIS granules continue to be added to the VCM verification test data base
including those in Panels (e) and (f) of Figure 4, which are discussed further in Sections
4.2 and 4.3. These scenes include a variety of cloud fields observed over diverse
atmospheric and surface conditions:
Western Africa desert, with blowing sand, ocean, and various clouds shown in
Figure 4, Panel A - and collected at 1210 UTC on August 1, 2001.
Greenland with ice, vegetated land, bare soil, ocean and various clouds shown in
Figure 4, Panel B - collected at 2240 UTC on July 15, 2001.
Intermountain West USA with sparsely vegetated land and various clouds shown
in Figure 4, Panel C - collected at 1750 UTC on February 1, 2002.
Tropical Atlantic with vegetated land, ocean, and various clouds, shown in Figure
4, Panel D - collected at 1220 UTC on July 15, 2001.
Gulf Stream along US East Coast region with strong sun glint, ocean thermal
gradients, various clouds, shown in Figure 4, Panel E – collected at 1600 UTC on
June 1, 2001.
Northwest China with desert, snow, blowing snow, mountains, various clouds
shown in Figure 4, Panel F – collected at 0340 UTC on January 1, 2002.

Ref: Int’l J. Rem.Sens., Vol 26, Issue 21, 2005, DOI: 10.1080/01431160500196786
15
Figure 4 here.
4.0 VIIRS CLOUD MASK ALGORITHM PERFORMANCE 4.1 PRELIMINARY RESULTS
Initial VCM results, based upon the analysis of global synthetic data, showed an overall
error rate in the binary cloud mask of about 36% for nearly 700,000 pixels of which
115,000 were cloudy. These results were stratified by solar illumination conditions, (e.g.
daytime versus nighttime), surface backgrounds, and orbital nodes. For all pixels, false
alarm rates (defined as the number of confidently cloud in the VCM but clear in the truth
divided by the number of pixels) were over 44%, while leakage (defined as the number of
confidently clear in the VCM but cloudy in the truth divided by the number of pixels)
exceeded 18%. Over the ocean, the false alarm rate exceeded 30% in areas outside sun
glint while the leakage rate was 28.5% within sun glint regions.
Through diagnostic analyses, it was found that several coding errors were made while
translating the MODIS Cloud Mask Algorithm code into the VIIRS Cloud Mask
Algorithm. After these coding errors were corrected, results were re-generated with the
corrected algorithm, and stratified by NPOESS orbital node, as shown in Table 5.
Table 5 here.

Ref: Int’l J. Rem.Sens., Vol 26, Issue 21, 2005, DOI: 10.1080/01431160500196786
16
Performance of the VCM algorithm, based upon the analysis of MODIS granules shown
in Figure 4, was also found to be inadequate, as shown in Table 6. Error rates ranged
between about 6-25% with false alarms being the primary cause for concern. A reanalysis
of these scenes was completed after the coding errors, mentioned above, were corrected.
In this case, the results are shown for land pixels only in Table 7. It is evident that the
corrected algorithm reduced the number of false alarms but their numbers continued to be
too large, especially in the US Great Basin scene which is almost entirely over land.
While the false alarm rates in the Greenland scene are high, there are few land pixels in
the scene to impact the overall error rate.
Table 6 here.
Table 7 here.
The corrected VCM algorithm produced more accurate results but performance remained
grossly inadequate to meet NPOESS system requirements. Thus, the VCM algorithm was
entered into a remediation program by Northrop Grumman Space Technology (NGST) in
collaboration with staff from NOAA’s National Satellite, Data, and Information Service
(NESDIS), and the Aerospace Corporation. More recently, members of the University of
Wisconsin Cooperative Institute for Meteorological Satellite Studies (CIMSS) became a
partner in this collaboration. Results of those remediation activities are shown in the next
sub-sections.
It is emphasized at this point that, while based upon the MODIS cloud mask algorithm,
the VCM algorithm does not reflect the performance of the former. Due to differences

Ref: Int’l J. Rem.Sens., Vol 26, Issue 21, 2005, DOI: 10.1080/01431160500196786
17
between schedules for the VIIRS acquisition process and first launch of the NASA
MODIS sensor, the VCM algorithm was based upon the 1997 version of the MODIS
algorithm. On the other hand, the MODIS algorithm continued to mature after the launch
of the NASA Earth Observing System (EOS) Terra spacecraft in 2000 and a newer
version of the MODIS Cloud Mask Algorithm has been released (Ackerman et al., 2002).
At about the same time, the NGST NPOESS algorithm verification team identified
deficiencies in the original VCM algorithm and proposed enhancements to resolve them.
The approaches selected differ from procedures used in the MODIS algorithm due to
differences in MODIS and VIIRS sensor characteristics and the more rigorous VIIRS
performance requirements established for the NPOESS system.
Two major class problems were identified during initial VIIRS Cloud Mask Algorithm
verification testing including an unacceptable leakage rate over ocean surfaces and an
unacceptable false alarm rate over land surfaces. These problems were believed to result
from two primary sources which could readily be addressed. First, a failure to use a sea
surface temperature field in the VCM algorithm contributed to leakage over ocean
surfaces. Initially the use of an M15 (11 m) test based upon a sea surface temperature
database was proposed to correct this problem. In fact, a different solution was
implemented, i.e. spatial tests that use 375 m VIIRS imagery channels, based upon
CLAVR heritage (Heidinger, 2004). This enhancement will be discussed at length in
Section 4.2. Secondly, false alarms over land surfaces resulted from the use of single-
valued thresholds in cloud tests, e.g. as shown in Table 4, with a static land surface data
base that had an insufficient number of land classes, as shown in Figure 1. The proposed

Ref: Int’l J. Rem.Sens., Vol 26, Issue 21, 2005, DOI: 10.1080/01431160500196786
18
solution for this problem was to add additional land classes but the solution implemented
uses a routinely updated vegetation index, again based upon CLAVR heritage (Heidinger,
2004) along with a new technique to vary the cloud detection thresholds with changes in
vegetation index and scattering geometry, as will be shown in Section 4.3.
4.2 REDUCING LEAKAGE OVER OCEAN SURFACES
VIIRS will provide high (375 m) resolution Imagery data in the 0.640, 0.865, 1.6, 3.74,
and 11.45 m bandpasses, which are nested inside the moderate resolution (750 m)
Radiometric channels. Therefore, it was decided that a straightforward approach to
reduce leakage over ocean surfaces could be implemented in both daytime and nighttime
conditions using spatial tests based upon Imagery channels. Thus, spatial tests with the I2
Channel (0.865 m band) and I4 Channel (3.74 m band) were implemented to detect
water clouds during the daytime and nighttime conditions respectively while another
spatial test, with the I5 Channel (11.45 m band), is used to detect cirrus. However, these
spatial tests can only change the pixel cloud confidence from confidently clear or
probably clear to either probably clear or probably cloudy. The maximum, minimum, and
the mean are determined from the four imagery pixels that make up the radiometry pixel.
If the difference between the maximum and minimum exceeds a threshold and the mean
is larger (smaller) than the average of the reflectance (brightness temperature) maximum
and minimum values, the moderate resolution pixel is classified at probably cloudy. If
the difference between the maximum and minimum exceeds the threshold and the mean
is smaller (larger) than the average of the reflectance (brightness temperature) maximum
and minimum values, the moderate resolution pixel is classified as probably clear.

Ref: Int’l J. Rem.Sens., Vol 26, Issue 21, 2005, DOI: 10.1080/01431160500196786
19
The concept of using a spatial test to detect cloudy pixels over all ocean conditions,
including sun glint regions, was prototyped and results compared against a sub-set of the
MODIS granules shown in Figure 4. The prototype uses the MODIS M13 band (~0.667
m) in daytime conditions since its 500 m resolution nests within the 1 km MODIS
channels in a manner similar to that planned for use with the VIIRS Imagery and
Radiometry bands. Spatial tests based upon the 1 km resolution 3.74 m and 11.45 m
bands were also prototyped for use in nighttime conditions; however, results obtained
from applying these tests are biased strongly toward false alarms, since a large area is
effected by the tests, as shown in Figure 5. Once VIIRS Imagery data become available
with the NPP launch, all spatial tests will be applied with the logic shown for the 500 m
data in Figure 5.
Figure 5 here.
Results from the analysis of the MODIS scene shown in Figure 4(e) are given in Figure
6. The four panels, (a) – (d), show the manual truth cloud mask, the region of sun glint,
the VCM cloud confidence, and the comparison between the cloud confidence and the
truth cloud mask, respectively. In panel (d), under-clouding or leakage occurs when the
cloud confidence of a pixel is classified as confidently clear or probably clear and the
truth is cloudy. Over-clouding or false alarms occur when the cloud confidence of a pixel
is classified as confidently cloudy or probably cloudy and the truth is clear. Areas of
agreement result from pixels possessing the VCM clear labels and clear as truth or the

Ref: Int’l J. Rem.Sens., Vol 26, Issue 21, 2005, DOI: 10.1080/01431160500196786
20
VCM cloudy labels and cloud as truth or by being non-ocean. Much of the disagreement
between the truth cloud mask and the VCM cloud confidence occurs within the
confidence categories of probably clear and probably cloudy.
Figure 6 here.
Results from the analysis of the three scenes consisting primarily of ocean surfaces, both
without (original VCM) and with (final VCM) the spatial tests, are presented in Table 8.
These statistics clearly show that leakage is greatly reduced by the spatial test in every
case, especially within sun glint regions and is within the NPOESS System Specification
that calls for 99% accuracy, as shown in Table 1. False alarms and errors in the binary
cloud mask, shown as fractions, continue to be larger than desirable but these numbers
will be reduced after VIIRS data become available. These reductions will result from two
reasons: first, the superior VIIRS spatial resolution (375 m at nadir growing to only 750
m at edge of a 3000 km scan) will produce fewer sub-pixel cloud situations compared to
MODIS. Secondly, thresholds for the spatial cloud tests used in these analyses were taken
from the CLAVR algorithm, i.e. they were optimized to detect clouds in AVHRR data.
As the launch date for VIIRS approaches, these thresholds will be tuned for the VIIRS
sensor, once instrument characterization is complete.
Table 8 here.

Ref: Int’l J. Rem.Sens., Vol 26, Issue 21, 2005, DOI: 10.1080/01431160500196786
21
4.3 REDUCING FALSE ALARMS OVER LAND SURFACES
From Table 6, it was seen that false alarms were large in the US Great Basin scene. They
were also large in the Greenland and West Africa scenes; however, in the former the
number of pixels was extremely small and false alarms in the latter occurred only in the
vicinity of heavy sand blowing over the ocean surface, which can be eliminated by
adding a cloud-free restore test based upon the 0.412 m band (Hutchison and Jackson,
2003). Therefore, attention turns to the MODIS scenes collected over the US Great Basin,
shown in Panel (c), plus a new scene over NW China, shown in Panel (f) of Figure 4,
which was selected based upon difficulties this region represents for heritage cloud mask
algorithms. Results of individual cloud tests for these scenes best illustrate the second
class problem found with the VCM algorithm, i.e. high false alarm rates associated with
cloud detection tests shown as fractions in Table 9 and Table 10.
Table 9 here.
Table 10 here.
It is evident from these tables that four cloud tests were generating false alarms; however,
the cirrus solar (CIRSOL) test, which is based upon the 1.38 m bandpass, does not
represent a concern at this time since improved performance with this band will result
from the VIIRS hardware design, i.e. a 50% more narrow VIIRS bandpass compared to
MODIS, along with smaller pixel size and growth. More concern centered on the other
cloud tests, including.

Ref: Int’l J. Rem.Sens., Vol 26, Issue 21, 2005, DOI: 10.1080/01431160500196786
22
The M12 – M13 BTD Test produced the largest number of false alarms. It was
subsequently found that this clouds test had been applied incorrectly. In reality, a
cloud is indicated if this difference is greater than the threshold; but, the test was
erroneously coded to classify a pixel as cloudy when this difference was less than
the threshold value. The large number of false alarms was greatly reduced after
the coding error was corrected.
A large number of false alarms were also generated by the M15-M12 BTD test.
Results from this cloud test were plotted for the entire global synthetic data set,
shown in Figure 7, as a function of total precipitable water (TPW). It is seen that
the original threshold midpoint of –14 0C, shown by the dashed line, falls in the
cloudy pixels (red dots). It is also evident that better separation between cloudy
and cloud-free pixels (blue dots) occurs at a threshold near –18 0C for most values
of TPW greater than about 2 cm. After changing this threshold midpoint to its
new value of –18 0C, results from re-testing showed a reduction in false alarms in
the MODIS scene over the U.S. Great Basin from 53.89% to 4.8% as seen in
Table 13 under without NDVI.
The final large contributor to false alarms was the M5 reflectance test. While, in
some cases, the false alarm rate for this test was less than that of the other tests
already discussed, its solution is more complex. (Additionally, a similar M7
reflectance test was eliminated since it is redundant with and inferior to the M5
Reflectance Test.)

Ref: Int’l J. Rem.Sens., Vol 26, Issue 21, 2005, DOI: 10.1080/01431160500196786
23
Figure 7 here.
As shown in Table 4, the M5 Reflectance Test was originally implemented with a
constant threshold value that was applied to all land surface types shown in Figure 1,
except snow. In reality, this test is most useful for densely vegetated surface where cloud-
free M5 reflectances are small. As surfaces become more sparsely vegetated, reflectances
in this band typically increase significantly, as shown in Figure 8, and cloud-free surfaces
can become indistinguishable from clouds. Unfortunately, the original VCM algorithm
did not have sufficient land stratifications to compensate for global variations in land
cover. In addition, the original cloud mask algorithm did not include a geographic
database that changed with seasonal variations in vegetation. For example, Figure 9
illustrates the variations in global Normalized Difference Vegetation Index (NDVI) in
composites for July and January which are due to seasonal oscillations in global
precipitation patterns.
Figure 8 here.
Figure 9 here.
First, the VCM algorithm was modified to accept an NDVI field constructed from a
daily-composite top-of-canopy (TOC) NDVI product. To assess its value to VCM
performance, TOC NDVI data sets were generated from the MODIS 17-day 0.65 m and
0.86 m surface reflectance composites. The NDVI field constructed for the NW China
scene is shown in the left panel of Figure 10 along with the manually-generated cloud
analysis which serves as truth for comparisons against VCM analyses.

Ref: Int’l J. Rem.Sens., Vol 26, Issue 21, 2005, DOI: 10.1080/01431160500196786
24
Figure 10 here.
Next, the logic used in the M5 Reflectance Test was modified from that shown in Table 4
to a dynamic threshold based on analyses of AVHRR data using a procedure from the
heritage CLAVR algorithm (Heidinger, 2004). The three levels of thresholds, shown in
Figure 11, were each determined by separate third degree polynomials as a function of
scattering angle for ten individual TOC NDVI bins (0 - 0.1, 0.1 - 0.2, …, 0.9 - 1).
Scattering angles less than 40º were not found in the data but may be expected in the
VIIRS terminator orbits so constant thresholds, equaling the values at a scattering angle
of 40º, were used in these regions. The three separate thresholds were also interpolated
according to the TOC NDVI value.
Figure 11 here.
Finally, VCM algorithms, with the addition of the NDVI field and algorithmic logic
described above and without it, were executed on the MODIS granules. Differences
between performance of the M5 Reflectance Test contained in the original VCM
algorithm (without an NDVI field) and current VCM algorithm (with the NDVI fields)
are shown for the NW China scene in Figure 12 and Figure 13 respectively while the
results are summarized in Table 11 with detection and false alarm rates given in fractions.
It is seen that false alarms produced by the M5 Reflectance Test over land surfaces have
been substantially reduce, i.e. from 60.9 % to 6.9% in Table 112, by exploiting the NDVI

Ref: Int’l J. Rem.Sens., Vol 26, Issue 21, 2005, DOI: 10.1080/01431160500196786
25
data. (In addition, cloud tests that use the daytime 3.7 and 4.0 m bands, i.e. M12 and
M13 respectively, are not used when NDVI falls below 0.2 which results in a negligible
number of false alarms being produced by these tests.) Similar but less dramatic results
are shown in Table 12 for the MODIS scene over the US Great Basin.
Table 11 here.
Table 12 here.
Figure 12 here.
Figure 13 here.
Additional analyses were undertaken to examine possible reasons for continued false
alarms and leakage (shown by the detection rate) with the M5 Reflectance Tests as shown
in Tables 11 and 12. While not fully presented here due to space limitations, it was found
that most of the leakage with this test occurs when NDVI values fall below 0.1 while
false alarms occur at NDVI values closer to 0.3, which suggests that no single M5
reflectance threshold, based on NDVI, will be able to accurately classify all VIIRS pixels.
Thus, a change toward another band is considered essential perhaps using a VIIRS M1
(0.412 m) Reflectance Test. Evidence for this change is shown in Figure 14, which
shows reflectance values for the MODIS 0.66 m band (left panel) and MODIS 0.412
m band (right panel) as a function of NDVI for pixels classified by a prototype of the
VCM as cloudy (light, broad) and cloudy-free (dark, narrow) pixels. This MODIS
granule contained the western Sahel region of Africa, which is characterized by strong
NDVI gradients. The data were collected on April 4, 2003. The reduced area of overlap

Ref: Int’l J. Rem.Sens., Vol 26, Issue 21, 2005, DOI: 10.1080/01431160500196786
26
in the 0.412 m band compared to the substantial overlap at 0.66 m suggests that fewer
false alarms and improved cloud detection will result by switching from an M5
Reflectance Test to an M1 Reflectance Test at low NDVI values.
5. FUTURE WORK
The task of meeting NPOESS system specification for VCM performance is daunting.
Routinely achieving performance measures of 99% accuracy in the daytime product over
ocean surfaces outside sun glint regions or 93% accuracy over land surfaces requires that
every VCM cloud test perform correctly. Additional minor enhancements to the VCM
have been identified and are planned to implementation, including:
Using a variable threshold technique with the M9 (1.38) m channel for
improved cloud screening during daytime conditions (Roskovensky and Liou,
2003). Tables 9 and 10 show that this test is now the largest source of error
during daytime conditions. However, implementation of this enhancement
awaits the characterization of the VIIRS sensor,
Implementing an aerosol restoration procedure to ensure aerosols are not
classified as confident cloudy pixels. For example, it may suffice to use the
dual-gain M1 (0.412) m channel over ocean regions adjacent to deserts to
restore heavy aerosols into cloud-free conditions (Hutchison and Jackson,
2003). Over land, another approach is being evaluated using this band with the
M11 (2.25) m channel (Ou et al, in press),

Ref: Int’l J. Rem.Sens., Vol 26, Issue 21, 2005, DOI: 10.1080/01431160500196786
27
Replacing the current VCM ecosystem map with a VIIRS Quarterly Surface Type
IP and EOS Land/Sea Mask. The VCM currently uses an outdated and static
USGS (Olson) Ecosystem map that is considered inadequate,
Using the M7/M5 ratio test with the M5 reflectance test to resolve
misclassifications that are associated with cloud-free, mixed pixels that contain
both land and water surfaces which have spectral signatures similar to clouds
(Hutchison and Hardy, 1995),
Using the NDVI field with the I1 (0.640 m) imagery channel spatial test for
enhanced cumulus cloud detection over land and coastal surfaces, and
Replacing the VCM fire detection logic with the VIIRS active fire mask product.
Prior to the launch of the first VIIRS on the NASA NPP mission, all cloud thresholds will
be re-evaluated using a new sensor model based upon more completed sensor
characterization analyses. After delivery of the engineering development unit (EDU) and
Flight Vehicle 1 (FV1) to NGST, these updated sensor models will be used along with
new simulations based upon recent enhancements to MODTRAN to re-generate global
synthetic data as discussed in Section 3. With the launch of the NPP, these thresholds
will be fine-tuned to obtain the highest quality analyses from VIIRS data collected on-
orbit.
6. CONCLUSIONS Highly accurate automated cloud analyses are essential for the production of operational
environmental data products from meteorological satellite data collected by the NPOESS

Ref: Int’l J. Rem.Sens., Vol 26, Issue 21, 2005, DOI: 10.1080/01431160500196786
28
system. While the VIIRS Cloud Mask Algorithm was based upon sound technology
developed by the NASA MODIS Cloud Mask team, the algorithm was not updated after
the launch of the first MODIS sensor. During initial testing of the VCM algorithm at
NGST, it was determined to be grossly inadequate to meet NPOESS requirements. Two
classes of problems were identified: one resulted in a failure to detect cloud-contaminated
pixels over ocean surfaces while the other was a gross over-clouding of land surfaces
where clouds are not present. Spatial tests using simulated, VIIRS imagery resolution
channels greatly reduced errors due to leakage over the ocean while using the M5
Reflectance Test with thresholds that vary with NDVI value and scattering geometry
reduced false alarms over land. In addition, the NDVI field is used to define the lower
limits for applying other tests that use brightness temperature differences between bands
in the short-wave IR region. Finally, evidence suggests that further reductions can be
achieved in both leakage and false alarm error rates over land surfaces by switching from
the M5 Reflectance Test to one using the M1 (0.412 m) band at very low NDVI values.
7. ACKNOWLEDGMENTS While we acknowledge the support and encouragement received from the leadership at
NGST, the NPOESS IPO, NOAA NESDIS, CIMSS, and The Aerospace Corporation, the
views, opinions, and findings contained in this report are those of the authors and should
not be construed as an official position of these organizations.

Ref: Int’l J. Rem.Sens., Vol 26, Issue 21, 2005, DOI: 10.1080/01431160500196786
29
8. REFERENCES Ackerman, S. Strabala, K., Menzel, P., Frey, R., Moeller, C., Gumley, L., Baum, B.,
Schaaf, C., and G. Riggs, 1997: Discriminating clear-sky from cloud with MODIS,
NASA Algorithm Theoretical Basis Document (MOD35), pp 95.
Ackerman, S. A., Strabala, K. I., Menzel, W. P., Frey, R. A., Moeller, C. C. and L. E.
Gumley, 1998: Discriminating clear sky from clouds with MODIS, J. Geophy. Res., 103
(D24), 32,141-32,156.
Ackerman, S., Strabala, K., Menzel, P., Frey, R., Moeller, C., Gumley, L., Baum, B.,
Seeman, S. W. and H. Zhong, 2002: Discriminating Clear-Sky from Cloud with MODIS
Algorithm Theoretical Basis Document, MODIS ATBD Reference Number ATBD-
MOD-06, pp 115.
Berk, A., Bernstein, L. S., and D. C. Robertson, 1989: MODTRAN: A Moderate
Resolution Model for LOWTRAN 7, A. F. Geophysics Laboratory Technical Report,
GL-TR-89-0122, Hanscom Air Force Base, MA, pp 38.
Cianciolo, M.E., Raffensberger, M.E., Schmidt, E.O., and J.R. Stearns, 1996:
Atmospheric scene simulation modeling and visualization. Phillips Laboratory (PL)
Technical Report (TR), PL-TR-96-2079, Hanscom Air Force Base, MA, pp 110.
Grano, V., Scalione, T., Emch, P., Agravante, H., Hauss, B., Jackson, J., Mills, S.,
Samec, T. and M. Shoucri, 2004: End-to-end performance assessment of the National
Polar-orbiting Operational Environmental Satellites System Environmental Data Records,
Weather and Environmental Satellites, Proc. of SPIE, 5549, 53-59.
Gustafson, G. B., Isaacs, R. G., d’Entremont, R. P., Sparrow, J. M., Hamill, R. M.,
Johnson, D. W., Sarkisian, C. P., Peduzzi, D. C., Pearson, B. T., Jakabhazy, V. D.,
Belfiore, J. S., and A. S. Lisa, 1994: Support of environmental requirements for cloud

Ref: Int’l J. Rem.Sens., Vol 26, Issue 21, 2005, DOI: 10.1080/01431160500196786
30
analyses and archive (SERCAA): algorithm descriptions, US Air Force Phillips
Laboratory Tech. Report, 94-2114, Hanscom Air Force Base, MA, pp 100.
Heidinger, A., 2004: CLAVR Cloud Mask Algorithm Theoretical Basis Document,
NOAA NESDIS Office of Research and Applications, pp 68.
Hutchison, K. D. and K. Hardy, 1995: Threshold functions for automated cloud
analyses of global meteorological satellite imagery, International Journal of
Remote Sensing, 16, 3665-3680.
Hutchison, K. D. and J. M. Jackson, 2003: Cloud detection over desert regions using the
412 nanometer MODIS channel, Geophysical Research Letters, 30,
doi:10:1029/2003GL018446.
Hutchison, K. Jensen, K. and S. Miller, 2002, , VIIRS Imagery Algorithm Theoretical
Basis Document, Appendix A – User’s Guide for VIIRS Cloud Imagery Products, pp.
157.
Kriebel, K. T., Gesell, G., Kaestner, M. and H. Mannstein, 2003: The cloud analysis tool
APOLLO: Improvements and validations, Journal of Remote Sensing, 24, 2389-2408.

Ref: Int’l J. Rem.Sens., Vol 26, Issue 21, 2005, DOI: 10.1080/01431160500196786
31
Liu Y. H., Key J. R., Frey R. A., Ackerman S. A., and W. P. Menzel, 2004: Nighttime
polar cloud detection with MODIS, Remote Sensing of Environment, 92, 181-194.
Menzel W. P., Baum, B. A., Strabala, K. I. and R. A. Frey, 2002: Cloud Top Properties
and Cloud Phase Algorithm Theoretical Basis Document, MODIS ATBD Reference
Number: ATBD-MOD-04, pp 61.
Ou, S. C., Liou, K. N., Takano, Y. , Wong, E., Hutchison, K., and T. Samec, 2004:
Comparison of the UCLA-LBLE Radiative Transfer Model and MODTRAN for
Accuracy Assessment of the NPOESS-VIIRS Cloud Optical Property Algorithms,
Weather and Environmental Satellites, Proc. of SPIE, 5549, 80-89.
Pavolonis, M. J. and A. K. Heidinger, 2004: Daytime cloud overlap detection from
AVHRR and VIIRS, Journal of Applied Meteorology, 43, 762-778
Pavolonis, M. J. and A. K. Heidinger, 2005: Daytime global cloud typing from AVHRR
and VIIRS: Algorithm description, validation, and comparisons, Journal of Applied
Meteorology (in press)
Pavolonis, M. J. and A. K. Heidinger, 2005: Advancements in identifying cirrus and
multiplayered cloud systems from operational satellite imagers at night, Proceedings of
Conference on Applications of Weather Satellites II, International Society for Optical
Engineering (SPIE), Honolulu, HI, pp 225-234.
Reed, B., 2002: VIIRS Cloud Mask (VCM) Algorithm Theoretical Basis Document for
the Visible/Infrared Imager/Radiometer Suite, Version 5, Revision 2, pp 33.
Roskovensky J. K. and K-N Liou, 2003 Detection of thin cirrus using a combination of
1.38-m reflectance and window brightness temperature difference, J. Geophys, Res.,
108(D18), 4570, doi:10:1029/2002JD003346.

Ref: Int’l J. Rem.Sens., Vol 26, Issue 21, 2005, DOI: 10.1080/01431160500196786
32
Saunders, R. W. and K. T. Kriebel, 1988: An improved method for detecting clear sky
and cloudy radiances from AVHRR data, International Journal of Remote Sensing, 9,
123-150.
Stowe et al., 1999 Scientific basis and initial evaluation of the CLAVR-1 global clear
cloud classification algorithm for the advanced very high resolution radiometer, Journal
of Atmospheric and Oceanic Technology, 16, 656-681.
Strabala K. I., Ackerman, S. A., and W. P. Menzel, 1994: Cloud properties inferred from
8-12 m data, Journal of Applied Meteorology, 33, 212-229.

Ref: Int’l J. Rem.Sens., Vol 26, Issue 21, 2005, DOI: 10.1080/01431160500196786
33
Table Captions
Table 1. Performance requirements for the VIIRS cloud mask algorithm as shown in the
NPOESS System Specification.
Table 2. Comparisons between VIIRS channels used for cloud detection and those of
heritage sensors.
Table 3. Cloud tests used in the VIIRS Daytime Cloud Mask Algorithm as a function of
surface type.
Table 4. Classification of cloud confidence for M5 Reflectance Test in original VIIRS
Cloud Mask (Reed, 2002).
Table 5. VIIRS Cloud Mask Algorithm performance for the analysis of global synthetic
data.
Table 6. Initial VIIRS Cloud Mask Algorithm performance of MODIS proxy data.
Table 7. VIIRS Cloud Mask Algorithm performance for the analysis of MODIS scenes in
Panels A – D of Figure 4.
Table 8. Results from the analysis of MODIS data in and outside sun glint regions with
and without spatial tests.
Table 9. Performance of individual cloud tests used in the VCM analysis of the MODIS
scene containing the U.S. Great Basin and shown in Panel C of Figure 4
Table 10. Performance of individual cloud tests used in the VCM analysis of the MODIS
scene containing the NW China and shown in Panel F of Figure 4

Ref: Int’l J. Rem.Sens., Vol 26, Issue 21, 2005, DOI: 10.1080/01431160500196786
34
Table 11. VCM performance with and without NDVI for MODIS Scene
A2002_001_0340 (NW China).
Table 12. VCM performance with and without NDVI for MODIS Scene
A2002_032_1750 (US Great Basin).

Ref: Int’l J. Rem.Sens., Vol 26, Issue 21, 2005, DOI: 10.1080/01431160500196786
35
Table 1. Performance requirements for the VIIRS cloud mask algorithm as shown in the NPOESS System Specification.

Ref: Int’l J. Rem.Sens., Vol 26, Issue 21, 2005, DOI: 10.1080/01431160500196786
36
Table 2. Comparisons between VIIRS channels used for cloud detection and those of heritage sensors.
VIIRS Channel
Band Center and Width (m)
Heritage Sensor VIIRS Enhancement
Value to VIIRS Cloud Mask Algorithm
M1 0.412/0.020 MODIS Channel 8 SeaWifs Channel 1
Dual Gain Will not saturate in presence of clouds
I1 M5
0.640/0.080 0.672/0.020
MODIS Channel 1 MODIS Channel 13 AVHRR Channel 1 OLS LF
More accurately calibrated compare to AVHRR/OLS
Calibration provides more accurate analyses
I2 M7
0.865/0.039 0.865/0.039
MODIS Channel 2 MODIS Channel 16 AVHRR Channel 2
More accurately calibrated compare to AVHRR/OLS with more narrow bandpasses than AVHRR
Calibration provides more accurate analyses and narrow bandpasses reduce atmospheric attenuation due to water vapor
M9 1.378/0.015 MODIS Channel 26 Bandpass 50% more narrow
Reduces surface contamination
I3 M10
1.610/0.060 1.610/0.060
MODIS Channel 6 AVHRR Channel 3A
375 m in I3 Provides more accurate snow mask
I4 M12
3.740/0.380 3.700/0.180
MODIS Channel 20 AVHRR Channel 3B
375 m in I4 Reduces impacts from sub-pixel cloud
M13 4.050/0.155 MODIS Channel 23 750 m Reduces impacts from sub-pixel cloud
M14 8.550/0.300 MODIS Channel 29 750 m Reduces impacts from sub-pixel cloud
M15 10.763/1.00 MODIS Channel 31 AVHRR Channel 4
750 m Reduces impacts from sub-pixel cloud
I5 11.450/1.90 OLS TF Highly Calibrated 375 m in I5
Reduced impacts from sub-pixel cloud
M16 12.013/0.95 MODIS Channel 32 AVHRR Channel 5
750 m Reduced impacts from sub-pixel cloud
DNB 0.7/0.4 OLS DNB Accurately calibrated
Not used currently
Ref: Int’l J. Rem.Sens., Vol 26, Issue 21, 2005, DOI: 10.1080/01431160500196786
37
Table 3. Cloud tests used in the VIIRS Daytime Cloud Mask Algorithm as a function of surface type.
Cloud Tests Water Land Desert Coast Snow 1. M9 (1.38 m) Reflectance Test
X X X X X
2. M15-M16 (m) Brightness Temperature Difference (BTD)
X X X X
3. M15 (10.8 m ) Brightness Temperature (BT) Test
X
4. M12-M16 (m) BTD Test
5. Tri-Spectral M14, M15, M16 ( 8.55, 1m) BTD Test
X
6. M15-M12 (10.76-3.70 m) BTD Test X
(if no sun glint)
X X (if Lat > 60 or < - 60)
X (if no sun
glint)
X
7. M12-M13 (3.70-4.05 m) BTD Test
X (if –60 < Lat < 60)
X (if –60 < Lat
< 60) X X X
(if –60 < Lat < 60)
8. M5 (0.672 m) Reflectance Test
X X
9. M7 (0.865 m) Reflectance Test
X
10. M7/M5 (m) Reflectance Ratio Test
X X
11. M1 (0.412 m) Reflectance Test
X
12. I4 (3.74 m) Spatial Test 13. I5 (m) Spatial Test
X
14. I2 (0.865 m) Reflectance Test
X

Ref: Int’l J. Rem.Sens., Vol 26, Issue 21, 2005, DOI: 10.1080/01431160500196786
38
Table 4. Classification of cloud confidence for M5 Reflectance Test in original VIIRS Cloud Mask (Reed, 2002).
VIIRS M5 Reflectance
Test
Cloud Detection Threshold (percent)
VIIRS Cloud Confidence Remarks
M5 equals or greater
18 Confidently Cloudy 0 Highest Threshold
14 <M5 <18 Probably Cloudy Linearly interpolated between 0 and 0.5
M5 14 0.5 Midpoint Threshold 10 < M5 < 14 Probably Clear Linearly
interpolated between 0.5 and 1
M5 equals or less than
10 Confidently Clear 1 Lowest Threshold

Ref: Int’l J. Rem.Sens., Vol 26, Issue 21, 2005, DOI: 10.1080/01431160500196786
39
Table 5. VIIRS Cloud Mask Algorithm performance for the analysis of global synthetic data.
Global Simulation
Data
Original Algorithm Error Rate (Nighttime
Water Clouds)
Corrected Algorithm Error Rate (Nighttime
Water Clouds)
Original Algorithm Error Rate
(All Conditions)
Corrected Algorithm Error Rate
(All Conditions)
1330 Orbit 65% 7% 36% 19%
1730 Orbit 65% 7% 45% 25%
2130 Orbit 66% 6% 37% 19%

Ref: Int’l J. Rem.Sens., Vol 26, Issue 21, 2005, DOI: 10.1080/01431160500196786
40
Table 6. Initial VIIRS Cloud Mask Algorithm performance of MODIS proxy data.
Scene 2002.032.1750 (US Great Basin Error Rate Leakage False Alarm All Pixels 25.1% 1.37% 57.6% Scene 2001.213.1210 (West Africa) All Pixels 25.2% 31.3% 22.9% Scene 2001.196.2240 (Greenland) All Pixels 11.1% 2.4% 25.0% Scene 2001.213.1220 (Amazon Coast) All Pixels 6.3% 9.0% 2.6%

Ref: Int’l J. Rem.Sens., Vol 26, Issue 21, 2005, DOI: 10.1080/01431160500196786
41
Table 7. VIIRS Cloud Mask Algorithm performance for the analysis of MODIS scenes in Panels A – D of Figure 4.
Scene 2001.213.1220 (Amazon Coast) Error Rate Leakage False Alarm Land Pixels – Original algorithm 7.0% 03.3% 12.2% Land Pixels – Corrected algorithm 7.0% 11.9% 0.0% Scene 2002.032.1750 (US Great Basin) Land Pixels – Original algorithm 14.9% 2.1% 36.1% Land Pixels – Corrected algorithm 8.2% 4.8% 13.7% Scene 2001.213.1210 (West Africa) Land Pixels – Original algorithm 42.9% 7.0% 49.3% Land Pixels – Corrected algorithm 31.1% 11.3% 34.5% Scene 2001.196.2240 (Greenland) Land Pixels – Original algorithm 12.4% 0.0% 98.7% Land Pixels – Corrected algorithm 12.4% 0.0% 98.9%

Ref: Int’l J. Rem.Sens., Vol 26, Issue 21, 2005, DOI: 10.1080/01431160500196786
42
Table 8. Results from the analysis of MODIS data in and outside sun glint regions with and without spatial tests.
Binary Cloud Mask Error Rate Without (With)
Spatial Tests
Leakage Rate Without
(With) Spatial Tests
False Alarm Rate
Without (With) Spatial Tests
Scene 20012131210 (All Pixels) 0.252 (0.1177) 0.313 (0.0003) 0.229 (0.053)
Water Day Sun Glint 0.137 (0.0998) 0.519 (0.0006) 0.021 (0.0012) Water Day No Sun Glint 0.538 (0.1356) 0.033 (0.0000) 0.659 (0.105) Scene 20012131210 (All Pixels) 0.0626 (0.1287) 0.0904 (0.0118) 0.0260 (0.0094)
Water Day Sun Glint 0.1104 (0.1771) 0.1974 (0.0122) 0.0001 (0.0000) Water Day No Sun Glint 0.0362 (0.0943) 0.0360 (0.0116) 0.0365 (0.0161) Scene 20012131210 (All Pixels) 0.1109 (0.1711) 0.1793 (0.0064) 0.0744 (0.0467)
Water Day Sun Glint 0.1032 (0.1976) 0.2991 (0.0083) 0.0341 (0.0240) Water Day No Sun Glint 0.1253 (0.1218) 0.0656 (0.0028) 0.1878 (0.0891)

Ref: Int’l J. Rem.Sens., Vol 26, Issue 21, 2005, DOI: 10.1080/01431160500196786
43
Table 9. Performance of individual cloud tests used in the VCM analysis of the MODIS scene containing the U.S. Great Basin and shown in Panel C of Figure 4

Ref: Int’l J. Rem.Sens., Vol 26, Issue 21, 2005, DOI: 10.1080/01431160500196786
44
Table 10. Performance of individual cloud tests used in the VCM analysis of the MODIS scene containing the NW China and shown in Panel F of Figure 4.

Ref: Int’l J. Rem.Sens., Vol 26, Issue 21, 2005, DOI: 10.1080/01431160500196786
45
Table 11. VCM performance with and without NDVI for MODIS Scene A2002_001_0340 (NW China).

Ref: Int’l J. Rem.Sens., Vol 26, Issue 21, 2005, DOI: 10.1080/01431160500196786
46
Table 12. VCM performance with and without NDVI for MODIS Scene
A2002_032_1750 (US Great Basin).

Ref: Int’l J. Rem.Sens., Vol 26, Issue 21, 2005, DOI: 10.1080/01431160500196786
47
Figure Captions
Figure 1. The five processing paths of the VIIRS Cloud Mask Algorithm for the analysis
of data collected in daytime conditions.
Figure 2. Architecture of cloud tests used to make cloudy confidences in the VIIRS
Daytime Cloud Mask Algorithm.
Figure 3. Process of point sampling for global datasets. Figure 4. MODIS granules used to assess performance of the VIIRS Daytime Cloud
Mask Algorithm. (Note: some clouds may be indiscernible in the color composites.)
Figure 5. Pre-Launch Implementation of VIIRS Spatial Tests for Cloud Detection over
Ocean Surfaces with MODIS Data.
Figure 6. Performance of the VIIRS Automated Cloud Analysis for the MODIS scene
shown in Figure 4(e) employing the I2 band spatial uniformity test . Manual analysis of
clouds based upon human interpretation of imagery is in Panel (a). Sun glint region is
shown in Panel (b). The VIIRS Automated cloud analysis is shown in Panel (c) along
with differences between the manual analysis and the automated analysis in Panel (d).
Figure 7. Observed B15-B12 BTD values found in the global synthetic data set for
cloudy (red) and cloud-free (blue) pixels as a function of total precipitable water (TPW).
Figure 8. Spectral signatures of cloud particles and surface backgrounds in 0.3 - 1.0
micron range. (Key: Reflectivities: vegetated land = green, ocean = dark blue, snow =
white, bare soil or sand = yellow., solar illumination = gold and atmospheric transmission
= black. VIIRS bands blue, solid turquoise = index of refraction for water droplets, and
dashed turquoise = index of refraction for ice.)
Figure 9. Typical changes in global NDVI fields during (a) January and (b) July due to
variations in seasonal precipitation patterns (Heidinger, 2004).

Ref: Int’l J. Rem.Sens., Vol 26, Issue 21, 2005, DOI: 10.1080/01431160500196786
48
Figure 10. NDVI field used in the of MODIS Scene A2002_001_0340 (left) along with
manually generated cloud analyses used as truth in comparisons with VCM analyses
(right)..
Figure 11.Logic for thresholds used with M5 Reflectance Test employs a 3-degree
polynomial fit to curves shown for NDVI bin 0.20 - 0.30.
Figure 12. Cloud confidence (left) based upon the original VCM algorithm along
with results of the M5 Reflectance Test (right). No NDVI data base was used in this
analysis and the VCM used M5 Reflectance Test thresholds shown in Table 4.)
Figure 13. Cloud confidence (left) based upon the current VCM algorithm along with
results of the M5 Reflectance Test (right). The NDVI data base shown in Figure 12 was
used in this analysis along with M5 Reflectance Test thresholds shown in Table 11.
Figure 14. Reflectance in the M5 band (left) and M1 band (right) for pixels classified as
cloud-free (green) and cloudy (red) by the MODIS cloud mask algorithm.

Ref: Int’l J. Rem.Sens., Vol 26, Issue 21, 2005, DOI: 10.1080/01431160500196786
49
Figure 1. The five processing paths of the VIIRS Cloud Mask Algorithm for the
analysis of data collected in daytime conditions.

Ref: Int’l J. Rem.Sens., Vol 26, Issue 21, 2005, DOI: 10.1080/01431160500196786
50
Figure 2. Architecture of cloud tests used to make cloudy confidences in the VIIRS
Daytime Cloud Mask Algorithm.

Ref: Int’l J. Rem.Sens., Vol 26, Issue 21, 2005, DOI: 10.1080/01431160500196786
51
Figure 3. Process of point sampling for global datasets.

Ref: Int’l J. Rem.Sens., Vol 26, Issue 21, 2005, DOI: 10.1080/01431160500196786
52
MODIS A2001.213.1210 (West Africa) MODIS A2001.196.2240 (Greenland)
MODIS A2002.032.1750 (US Great Basin) MODIS A2001.213.1220 (Amazon Coast)
MODIS A2001.152.1600 (US East Coast) MODIS A2002.001.0340 (NW China)
Figure 4. MODIS granules used to assess performance of the VIIRS Daytime Cloud
Mask Algorithm. (Note: some clouds may be indiscernible in the color composites.)

Ref: Int’l J. Rem.Sens., Vol 26, Issue 21, 2005, DOI: 10.1080/01431160500196786
53
Figure 5. Pre-Launch Implementation of VIIRS Spatial Tests for Cloud Detection
over Ocean Surfaces with MODIS Data.

Ref: Int’l J. Rem.Sens., Vol 26, Issue 21, 2005, DOI: 10.1080/01431160500196786
54
Figure 6. Performance of the VIIRS Automated Cloud Analysis for the MODIS
scene shown in Figure 4(e) employing the I2 band spatial uniformity test . Manual
analysis of clouds based upon human interpretation of imagery is in Panel (a). Sun
glint region is shown in Panel (b). The VIIRS Automated cloud analysis is shown in
Panel (c) along with differences between the manual analysis and the automated
analysis in Panel (d).

Ref: Int’l J. Rem.Sens., Vol 26, Issue 21, 2005, DOI: 10.1080/01431160500196786
55
Figure 7. Observed B15-B12 BTD values found in the global synthetic data set for
cloudy (red) and cloud-free (blue) pixels as a function of total precipitable water
(TPW).

Ref: Int’l J. Rem.Sens., Vol 26, Issue 21, 2005, DOI: 10.1080/01431160500196786
56
Figure 8. Spectral signatures of cloud particles and surface backgrounds in 0.3 - 1.0
micron range. (Key: Reflectivities: vegetated land = green, ocean = dark blue,
snow = white, bare soil or sand = yellow., solar illumination = gold and atmospheric
transmission = black. VIIRS bands blue, solid turquoise = index of refraction for
water droplets, and dashed turquoise = index of refraction for ice.)

Ref: Int’l J. Rem.Sens., Vol 26, Issue 21, 2005, DOI: 10.1080/01431160500196786
57
(a)
(b)
Figure 9. Typical changes in global NDVI fields during (a) January and (b) July due
to variations in seasonal precipitation patterns (Heidinger, 2004).

Ref: Int’l J. Rem.Sens., Vol 26, Issue 21, 2005, DOI: 10.1080/01431160500196786
58
Figure 10. NDVI field used in the of MODIS Scene A2002_001_0340 (left) along
with manually generated cloud analyses used as truth in comparisons with VCM
analyses (right).

Ref: Int’l J. Rem.Sens., Vol 26, Issue 21, 2005, DOI: 10.1080/01431160500196786
59
Figure 11. Logic for thresholds used with M5 Reflectance Test employs a 3-degree
polynomial fit to curves shown for NDVI bin 0.20 - 0.30.

Ref: Int’l J. Rem.Sens., Vol 26, Issue 21, 2005, DOI: 10.1080/01431160500196786
60
Figure 12. Cloud confidence (left) based upon the original VCM algorithm along
with results of the M5 Reflectance Test (right). No NDVI data base was used in this
analysis and the VCM used M5 Reflectance Test thresholds shown in Table 4.)

Ref: Int’l J. Rem.Sens., Vol 26, Issue 21, 2005, DOI: 10.1080/01431160500196786
61
Figure 13. Cloud confidence (left) based upon the current VCM algorithm along
with results of the M5 Reflectance Test (right). The NDVI data base shown in
Figure 10 was used in this analysis along with M5 Reflectance Test thresholds
shown in Table 11.

Ref: Int’l J. Rem.Sens., Vol 26, Issue 21, 2005, DOI: 10.1080/01431160500196786
62
Figure 14. Reflectance in the M5 band (left) and M1 band (right) for pixels classified
as cloud-free (dark, narrow) and cloudy (light, broad) by the MODIS cloud mask
algorithm.