sovap/picard, a spaceborne radiometer to measure the total solar irradiance
TRANSCRIPT

Solar PhysicsDOI: 10.1007/•••••-•••-•••-••••-•
SOVAP/Picard, a spaceborne radiometer to measure
the Total Solar Irradiance
M. Meftah1 · S. Dewitte2 · A. Irbah1 ·A. Chevalier2 · C. Conscience2 ·D. Crommelynck2 · E. Janssen2 ·S. Mekaoui2 ·
c© Springer ••••
Abstract – The Picard spacecraft was successfully launched on June 15, 2010,into a Sun synchronous orbit. The mission represents one of the Europeancontributions to solar observations and Essential Climate Variables (ECVs) mea-surements. The payload is composed of a Solar Diameter Imager and SurfaceMapper (SODISM) and two radiometers: SOlar VAriability Picard (SOVAP)and PREcision MOnitor Sensor (PREMOS). SOVAP, a dual side-by-side cavityradiometer, measures the total solar irradiance (TSI). It is the sixth of a seriesof differential absolute radiometer type instruments developed and operated inspace by the Royal Meteorological Institute of Belgium. The measurements ofSOVAP in the summer of 2010, yielded a TSI value of 1362.1 W.m−2 with anuncertainty of ±2.4 W.m−2 (k=1 ). During the periods of November 2010 andJanuary 2013, the amplitude of the changes in TSI has been of the order of0.18%, corresponding to a range of about 2.4 W.m−2.
Keywords: Instrumentation and Data Management; Instrumental Effects; SolarCycle Observations; Solar Irradiance;
1. Introduction
The solar irradiance (SI) is the primary source of energy reaching the Earth-atmosphere system. Nevertheless, neither its direct or indirect influence is ableto explain the global warming over the past century (Foukal et al., 2006; Foukal,2012), and certainly not over the past 35 years (changes in solar activity andclimate have been going in opposite directions), which limits the role of solarirradiance variation in twentieth century global warming. On longer time scales,
1 LATMOS - Laboratoire Atmospheres, Milieux etObservations Spatiales, CNRS – Universite Paris VI &Universite de Versailles Saint-Quentin-en-Yvelines – IPSL,F-78280 Guyancourt, FranceEmail: [email protected] RMIB, Avenue Circulaire, 3, 1180 Uccle, BelgiqueEmail: [email protected]
SOLA: "SOVAP TSI - 20131009".tex; 9 October 2013; 0:02; p. 1

Meftah et al.
records of the solar radiative output become essential when addressing the ques-tion of solar variability and its link with past climate changes, particularly duringthe Holocene period. However, solar irradiance measurements are only availablefor the last three decades, which calls for the use of models over longer timescales. These total solar irradiance (TSI) reconstructions (Vieira et al., 2011)rely, amongst other, on solar activity indices like the sunspot number (Lean,2000; Foster, 2004), geomagnetic indices like the the aa index (Lockwood andStamper, 1999; Wenzler et al., 2006), cosmogenic isotopes like the 14C or 10Be(Solanki et al., 2004; Steinhilber, Beer, and Frohlich, 2009; Roth and Joos, 2013),or solar models like the flux transport models (Wang, Lean, and Sheeley, 2005).The TSI is a crucial input for all climate models. The actual absolute value of TSIis still a matter of debate. Claude Pouillet (1790-1868), a French physicist made,between 1837 and 1838, the first measurements of this fundamental astrophysicalquantity. The “solar constant” was in fact the name that he gave to the amountof incoming solar electromagnetic radiation per unit area, at a Sun-Earth dis-tance of one astronomical unit (AU). The first estimate of the “solar constant”was 1228 W.m−2 (Pouillet, 1838), very close to the current estimate. The “solarconstant” is in fact not constant. Charles Greeley Abbot (1872-1973) claimedthat his data showed variations in the solar constant and therefore the TSI, buthe was not able to demonstrate this (Abbot, Fowle, and Aldrich, 1923; Abbot,Aldrich, and Hoover, 1942). Indeed, the Earth’s atmosphere affects ground-basedmeasurements, which make the determination of the TSI difficult. In particular,the solar spectral flux distribution (when transiting the Earth’s atmosphere)is modified by absorption and scattering processes. Therefore, TSI measure-ments from space are required. Indeed, TSI variations were undetectable untilspacecraft observations began in 1978. Theses observations showed that the TSIvariations are within Abbot’s data accuracy. First long-term TSI measurementsoutside the Earth’s atmosphere were conducted with the sensors of the Earthradiation budget (ERB) experiment on the Nimbus 7 spacecraft (from the Latinfor “dark cloud”). Results provided a mean TSI value of 1370.56 W.m−2 from1978 to 1987, and a range of 5.95 W.m−2 (Hickey et al., 1980; Hickey et al.,1988). The Active Cavity Radiometer Irradiance Monitor (ACRIM) on the SolarMaximum Mission (SMM) gave a TSI variability of ±0.05% for a mean valueof 1368.31 W.m−2 throughout the first 153 days of observations (Willson et al.,1981).During a solar cycle, TSI variations are relatively small. Nevertheless, thesechanges have been proposed as a possible driver of climate change (Willsonand Hudson, 1991; Frohlich and Lean, 1998). Based on measurements collectedfrom various spaceborne instruments over the last 35 years, the measured TSIabsolute value (for the mean annual TSI representative of solar minimum) hasincrementally declined from 1371 W.m−2 in 1978, to around 1361 W.m−2 in 2013.The Total Irradiance Monitor (TIM) instrument onboard the Solar Radiationand Climate Experiment (SORCE) measured a TSI around 1361 W.m−2 (Kopp,Lawrence, and Rottman, 2004; Kopp and Lean, 2011). Results were furtherconfirmed by the PREcision MOnitor Sensor (PREMOS) instrument (Schmutzet al., 2009; Schmutz et al., 2013). This measurement is lower than the meanTSI value of 1366.6 ±1.3 W.m−2, computed from the TSI composite of Royal
SOLA: "SOVAP TSI - 20131009".tex; 9 October 2013; 0:02; p. 2

SOVAP/Picard, a spaceborne radiometer to measure the Total Solar Irradiance
Meteorological Institute of Belgium (RMIB) from 17 December 1984, to 24December 2008. The RMIB model gives a 11-year TSI modulation.Initially, TSI measurements were performed from the ground and soundingrockets. The quality of these data may not be sufficiently good to convergeto the TSI absolute value (effects of the atmosphere). Space-borne observationshighlight other difficulties (behavior in space and on-orbit degradation). Space isa harsh environment for radiometers with many physical interactions leading topotentially severe degradation of performance (optical, thermal, and electrical).Investigation and analysis of the degradation of space radiometers are crucialparts of achieving the scientific goals of all such instruments. The TSI absolutevalue depends on each radiometer (ground calibration, behavior in space, spacecalibration, mastery of degradation, uncertainties budget). The TSI absolutevalue remains difficult to obtain.Regarding TSI variations, the problem is different. TSI variations were too smallto detect with technology available before the spacecraft era. The instruments,currently in space, yield a TSI variation to be substantially identical. Total solaroutput is now measured to vary (over the last three 11-year sunspot cycles)by approximately ±0.05%. The TSI is in phase with solar activity because theSun is faculae-dominated, which is not the case for every Sun-like stars. Thevariations in TSI represent the integrated change across ultraviolet (UV), visible,and near infrared regions. In the UV, the amplitude of the variations is muchhigher, with relative changes of 1 to 20% observed in the UV band (Cebula andDeland, 1998; Deland and Cebula, 2012). In the visible and near infrared bands,the amplitude of the variations rarely exceeds 0.5% over a solar cycle. Spectralsolar irradiance (SSI) variability influence the Earth’s atmosphere (Ermolli et al.,2012). SSI changes are more delicate to be observed during the 11-year cycle.Indeed, the degradation of the instruments limits this observation, and moreparticularly in the UV (BenMoussa et al., 2013). The Solar Diameter Imager andSurface Mapper (SODISM) onboard the Picard space mission provides wide-fieldimages of the chromosphere and photosphere of the Sun in 5 narrow-bandpasscentered at 215.0, 393.37, 535.7, 607.1, and 782.2 nm. TSI variations have beensuccessfully modeled by using solar surface magnetic features (Domingo et al.,2009). A comparison between the normalized TSI and the SSI time series canbe made over the whole timespan of the Picard mission.The SOlar VAriability Picard (SOVAP) radiometer measures one of the essentialclimate variable (TSI) onboard Picard. In this paper, we report on the TSImeasurements of SOVAP (absolute value and variations) during the years 2011and 2012.
2. SOVAP Flight Operations
SOVAP (Conscience et al., 2011) is a DIfferential Absolute RADiometer (DI-ARAD) developed at RMIB (Crommelynck and Domingo, 1984). DIARAD-typeradiometers are the first side by side absolute cavity radiometers operating inspace. SOVAP radiometric core is formed by two blackened cavities constructedside by side on a common heat sink. A heat flux transducer (thermo-electric
SOLA: "SOVAP TSI - 20131009".tex; 9 October 2013; 0:02; p. 3

Meftah et al.
sensor) is mounted between each cavity and the heat sink (Figure 1). The differ-ence between the two balanced sensors outputs (open circuit voltage V) gives aninstantaneous differential temperature measurement (∆T ), in which the commonpart of the thermal surrounding radiation seen by the two cavities is eliminated.By symmetrical construction, good insulation and proper selection of thermo-optical materials, thermal asymmetry is minimized. Both channels are equippedwith a shutter in front of them, by which sunlight can be occulted (“closedshutter”) or allowed into the cavity (“open shutter”). In the open shutter phase,the solar flux (SI) flows into the cavity through a precision aperture (mirror)and is absorbed. The cavity is cylindrical (tube) and is covered with diffuse blackpaint. Besides solar radiative power, electrical power (P) can be dissipated by aresistor mounted in the cavity (heating resistor). During the design of the cavi-ties, special attention has been paid to obtain corresponding spatial locations anddistributions for the solar and the electrical heating power flowing directly intothe heat flux sensor. SOVAP-DIARAD has a double differential design, allowingdifferential “Left-Right” and differential open-closed measurements. Dependingon the “Left” and “Right” channel shutter operations, the following operationmodes have been used, and analyzed in this paper.
Figure 1. Schematic representation of the radiometer.
2.1. Nominal Right channel measurements - “Auto 3”
Nominal right channel measurements are done in the instrument’s “Auto 3”mode. During this mode, the left shutter is closed while the right shutter se-quentially opens and closes. This mode corresponds to a double differentialoperation. It has a sampling period of 3 minutes and an instrument noise levelof 0.1 W.m−2. This mode has been used to measure the absolute level of the TSIand to verify the short-term stability of the right channel. This mode has beenused intermittently from 22 July 2010 until 28 August 2010. It was abandoneddue to a failure of the right shutter mechanism which left it permanently open.
SOLA: "SOVAP TSI - 20131009".tex; 9 October 2013; 0:02; p. 4

SOVAP/Picard, a spaceborne radiometer to measure the Total Solar Irradiance
2.2. Nominal Left channel measurements - “Auto 2”
The “Auto 2” mode corresponds to left shutter opened and closed states whilethe right shutter is closed (similarly to the “Auto 3” mode). This mode was usedto measure the TSI absolute level as well as the TSI variability from 28 August2010 to 27 October 2010. This mode was used during around half an hour everymonth (at the beginning of the mission). Therefore, the left cavity is deliberatelykept less exposed to solar radiation in order to minimize the degradation due tosolar UV radiation. In early 2013, this mode is used again because we are nearthe end of life of the spacecraft. This channel (with low aging) provides us a TSImeasurement with the lowest uncertainty (Table 4).
2.3. Continuously opened Right channel measurements - “Rad 10”
During the so-called “Rad 10” mode, the right shutter is permanently open andthe left shutter is kept closed. This new mode was used since the first occultationperiod on the 18th of November 2010 (after an update of the flight software).Indeed, an abnormal increase of the temperature of the shutters have beenobserved since the beginning of the mission (Figure 2). This rise of temperaturecaused a failure of the right shutter mechanism leading to the adoption of thisnew mode of operation. The “Rad 10” mode has the advantage of increasingthe time resolution at the cost of a decrease in the accuracy and stability ofthe measurements. In fact, SOVAP measurements are organized in packets of90 seconds (90-s), containing nine frames of 10 seconds measurements each. TSIacquisition are made at seconds 20, 40, 70, 80 and 90. During nominal modes(“Auto 2” and “Auto 3”), only the acquisition at second 90 is used. Indeed, allother acquisitions correspond to a transient state during which the thermal equi-librium between the two cavities is not reached. In the “Rad 10” measurementsmode, this equilibrium is observed. Therefore, all TSI measurements at seconds20, 40, 70, 80 and 90 can be used. Since early 2013, we have stopped using thismode to focus on nominal measurements with the left channel.
Figure 2. The temperature of the shutters (red circles: left; black circles: right) has signifi-cantly varied since the beginning of the mission. We can observe the temperature drop of theright shutter at its permanent opening. SOVAP is particularly vulnerable because its shut-ters and radiators are exposed to unshielded solar radiation. SOVAP has suffered substantialdegradation due to a combination of solar irradiation and contamination.
SOLA: "SOVAP TSI - 20131009".tex; 9 October 2013; 0:02; p. 5

Meftah et al.
3. SOVAP TSI Equation and Measurements Uncertainty
To extract the maximum amount of information about TSI variation it isnecessary to minimize the instrumental errors of the available radiometers asmuch and as objectively as possible. Minimization of the instrumental errorsrequires a careful instrument design, pre-flight characterization, flight data pro-cessing, and detailed data analysis including aging corrections. To derive themost accurate TSI measurements, it is important to understand the error sourcesof the measuring instrument in order to apply appropriate corrections and toquantify the remaining uncertainties for the temperature and the electrical powermeasurements. These corrections are used to deliver the final scientific TSI value.The determination of the TSI from SOVAP requires the establishment of aninstrumental equation presented hereafter.
3.1. SOVAP TSI equation - “Auto 2” and “Auto 3” modes
The TSI (“Auto 3” mode, for example) is defined as the solar irradiance atthe mean Earth-Sun distance according to:
TSIr = SIrz2
(1AU)21
(1− ∂z∂t
1c )2
, (1)
where TSIr is the total solar irradiance for the right cavity at 1 AU (W.m−2), SIris the solar irradiance seen through the right cavity (W.m−2), z is the distancebetween the spacecraft and the Sun (km), 1 AU is one astronomical unit (km),c is the speed of light (299,792.458 km per second), and t is the time (second).A small uncertainty on the TSI measurement associated with the Doppler effect(Frohlich et al., 1997) is about ±50 ppm (according to the spacecraft velocity ofabout ±7.5 km.s−1, in the worst case).
SIr is derived from the measurement of the electrical power supplied to theactive cavity (right) of the radiometer to maintain the active cavity with thesame heat sink flux in the open and closed states (Equation (3)) according to:
SIr = C5((Pcl,r − Po,r)−∆Po,r + C1 + C6)(1− C2)
αeff,rAr(1 + ∆r + ∆′r + ∆′′r ) cos θ+ C3 + C4 , (2)
Pcl,r =Pcl,r,t1 + Pcl,r,t3
2, (3)
where Pcl,r,t1 is the electrical power (W) fed to the right cavity in closed stateof the shutter at the time t1, Pcl,r,t3 is the electrical power (W) fed to the rightcavity in closed state of the shutter at the time t3, Po,r is the electrical power (W)fed to the right cavity in open state of the shutter at the time t2. The definitionof the parameters of Equation (2) is provided in Table 1. Each parameter isdescribed in more detail in the instrumental paper (Conscience et al., 2011).
SOLA: "SOVAP TSI - 20131009".tex; 9 October 2013; 0:02; p. 6
SOVAP/Picard, a spaceborne radiometer to measure the Total Solar Irradiance
Table 1. Radiometer parameters definition.
Parameters Definition
C1 Correction to take into account the heating effects by the wires
C2 Correction for the accuracy of the servo-system (almost negligible)
C3 Correction of the thermal radiative effects of the active shutter
C4 Correction of the thermal radiative effects of the mirror above the cavity
C5 Total correction factor for the optical effects (diffraction and scattering)
C6 (at 90-s) Dynamic non equivalence of the sensors (radiometric modes)
αeff,r Efficiency of the right cavity
Ar at 20oC Measured accurate aperture area at +20oC
∆r Correction factor of the aperture area (expansion of the mirror)
∆′r Correction factor of the aperture area (expansion of the radiometer)
∆′′r Correction factor of the aperture area (constraints during the integration)
cos θ Solar pointing angle of the radiometer
∆Po,r Thermo-electrical non-equivalence of the cavity (open and closed)
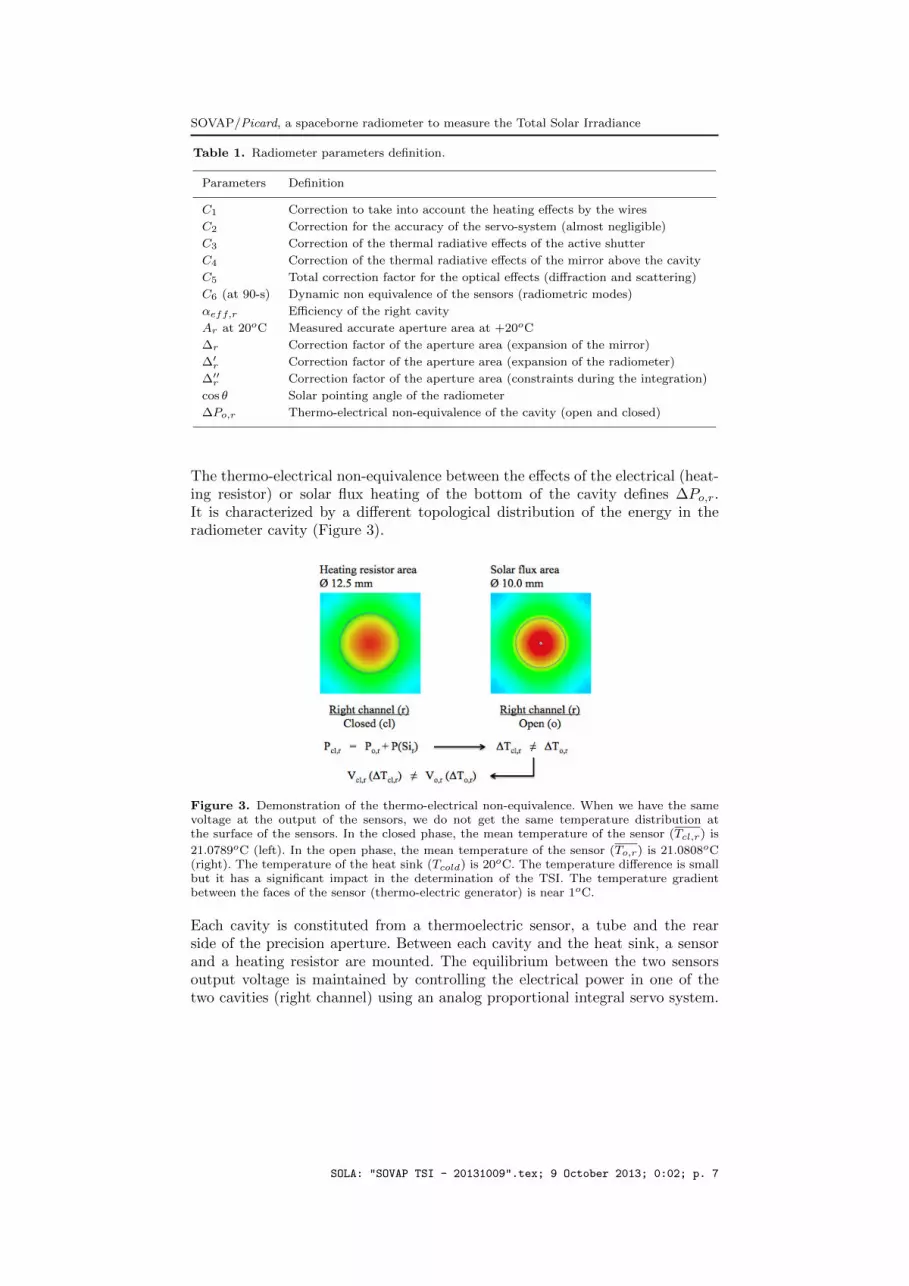
The thermo-electrical non-equivalence between the effects of the electrical (heat-ing resistor) or solar flux heating of the bottom of the cavity defines ∆Po,r.It is characterized by a different topological distribution of the energy in theradiometer cavity (Figure 3).
Figure 3. Demonstration of the thermo-electrical non-equivalence. When we have the samevoltage at the output of the sensors, we do not get the same temperature distribution atthe surface of the sensors. In the closed phase, the mean temperature of the sensor (Tcl,r) is
21.0789oC (left). In the open phase, the mean temperature of the sensor (To,r) is 21.0808oC(right). The temperature of the heat sink (Tcold) is 20oC. The temperature difference is smallbut it has a significant impact in the determination of the TSI. The temperature gradientbetween the faces of the sensor (thermo-electric generator) is near 1oC.
Each cavity is constituted from a thermoelectric sensor, a tube and the rearside of the precision aperture. Between each cavity and the heat sink, a sensorand a heating resistor are mounted. The equilibrium between the two sensorsoutput voltage is maintained by controlling the electrical power in one of thetwo cavities (right channel) using an analog proportional integral servo system.
SOLA: "SOVAP TSI - 20131009".tex; 9 October 2013; 0:02; p. 7
Meftah et al.
The sensor voltage V (∆T ) (in Volt) for each cavity may be written as :
V (∆T ) = Nαs∆T , (4)
where N is the number of series connected elements of the sensor (70), αs is theSeebeck coefficient (2.07× 10⁻⁴ V.K−1) of the sensor, and ∆T is the temperaturegradient (between hot and cold sides) of the sensor (∼1 Kelvin).
“Auto 3” mode (nominal right channel) corresponds to a double differentialoperation (this is similar to the “Auto 2” mode). One differential operation iseffective (between the two cavities). Another differential operation represents anon-equivalence (the same cavity in open and closed phase) according to:
Vcl,r(∆Tcl,r) 6= Vo,r(∆To,r) , (5)
where Vcl,r(∆Tcl,r) is the sensor voltage in closed state of the shutter (V) andVo,r(∆To,r) is the sensor voltage in the open shutter phase (V). ∆Tcl,r is themean temperature of the sensor in closed state of the shutter (in Kelvin), and∆To,r is the mean temperature of the sensor in the open shutter phase (K).In closed state of the shutter, the electrical power is dissipated on a disk ofdiameter of 12.5 mm (left side). In the open shutter state, the solar flux (SI) isabsorbed on a circular spot of diameter of 10 mm (right side) and an additionalelectrical power dissipated on a disk of diameter of 12.5 mm (right resistor). Thethermo-electrical configuration is given in the Figure 3.
3.2. Typical values of the parameters
Typical values are provided in Table 2. The method for the determination ofthe parameter ∆Po is given below.
Table 2. SOVAP radiometer typical values.
Parameters Right channel - “Auto 3” Parameters Left channel - “Auto 2”
Pcl,r − Po,r ∼0.1045 W Pcl,l − Po,l ∼0.1052 W
C1 5.9× 10⁻⁶ W C1 5.9× 10⁻⁶ W
C2 1.2× 10⁻⁶ C2 1.2× 10⁻⁶
C3 ∼0.350 W.m−2 C3 ∼0.360 W.m−2
C4 ∼-0.057 W.m−2 C4 ∼-0.064 W.m−2
C5 0.999447805 C5 0.999447805
C6 (at 90-s) 16.8× 10⁻⁶ W C6 (at 90-s) 16.8× 10⁻⁶ W
αeff,r 0.9987 αeff,l 0.9987
Ar at 20oC 7.875925× 10⁻⁵ m2 Al at 20oC 7.874565× 10⁻⁵ m2
∆r ∼7.6× 10⁻⁵ ∆l ∼1.1× 10⁻⁴
∆′r ∼2.3× 10⁻⁴ ∆′l ∼3.2× 10⁻⁴
∆′′r ∼0 ∆′′l ∼0
cos θ ∼1 cos θ ∼1
∆Po,r ∼0.3× 10⁻³ W ∆Po,l ∼0.3× 10⁻³ W
SOLA: "SOVAP TSI - 20131009".tex; 9 October 2013; 0:02; p. 8

SOVAP/Picard, a spaceborne radiometer to measure the Total Solar Irradiance
The parameter ∆Po,r was determined from a theoretical analysis (by a sym-metrical construction we tend to have ∆Po,r = ∆Po,l). The thermal analysisincludes effects of passive heat losses from radiation and conduction (Figure 4)on the mechanical part (ceramic sensor, silver tube, contacts).
Figure 4. (left) Shape of the temperature gradient in the cylindrical cavity (tube). Theelectrical power is dissipated on a diameter of 12.5 mm of the sensor (closed phase). (right)Shape of the temperature gradient in the sensor (closed phase).
We establish the differential equations relating temperature in the sensor asa function of the radial coordinate x (in meters). The equations come from anenergy balance on a differential ring element of the sensor. This can be expressedmathematically by:
x2∂2To,r∂x2
+ x∂To,r∂x
+x2
λt
(εσ
(T 4t − To,r
4)
+P (SIr)
Ar+
Po,r
Aheater
)+x2
λt(Rp(Tcold − To,r) +Rc(Tt − To,r)) = 0, (6)
x2∂2Tcl,r∂x2
+ x∂Tcl,r∂x
+x2
λt
(εσ
(T 4t − Tcl,r
4)
+∆Po,r
Aheater+
Pcl,r
Aheater
)+x2
λt(Rp(Tcold − Tcl,r) +Rc(Tt − Tcl,r)) = 0, (7)
where To,r is the temperature of the sensor hot plate (SHP) in the open phase(in Kelvin), Tcl,r is the temperature of the SHP in the closed phase, Tt is thetemperature of the tube, Tcold is the temperature of the heat sink (or sensorcold plate), To,r is the mean temperature of the SHP in the open phase withThot,o,r = To,r, Tcl,r is the mean temperature of the SHP in the closed phasewith Thot,cl,r = Tcl,r, ε is the equivalent emissivity between the SHP and thetube (∼ 0.8), σ is the Stefan-Boltzmann constant (5.6704× 10⁻⁸ W.m−2.K−4),λ is the thermal conductivity of the SHP (∼ 40 W.m−1.K−1), t is the thicknessof the SHP (m), P (SIr) represents the power consumption that has a solarorigin, Ar is the SHP area illuminated by the Sun, Aheater is the heater area(∼ 1.227× 10⁻⁴ m2), Rp is the thermal coupling between the SHP and the heatsink (∼ 200 W.m−2.K−1), and Rc is the thermal coupling between the SHP andthe tube (∼ 1000 W.m−2.K−1).
SOLA: "SOVAP TSI - 20131009".tex; 9 October 2013; 0:02; p. 9
Meftah et al.
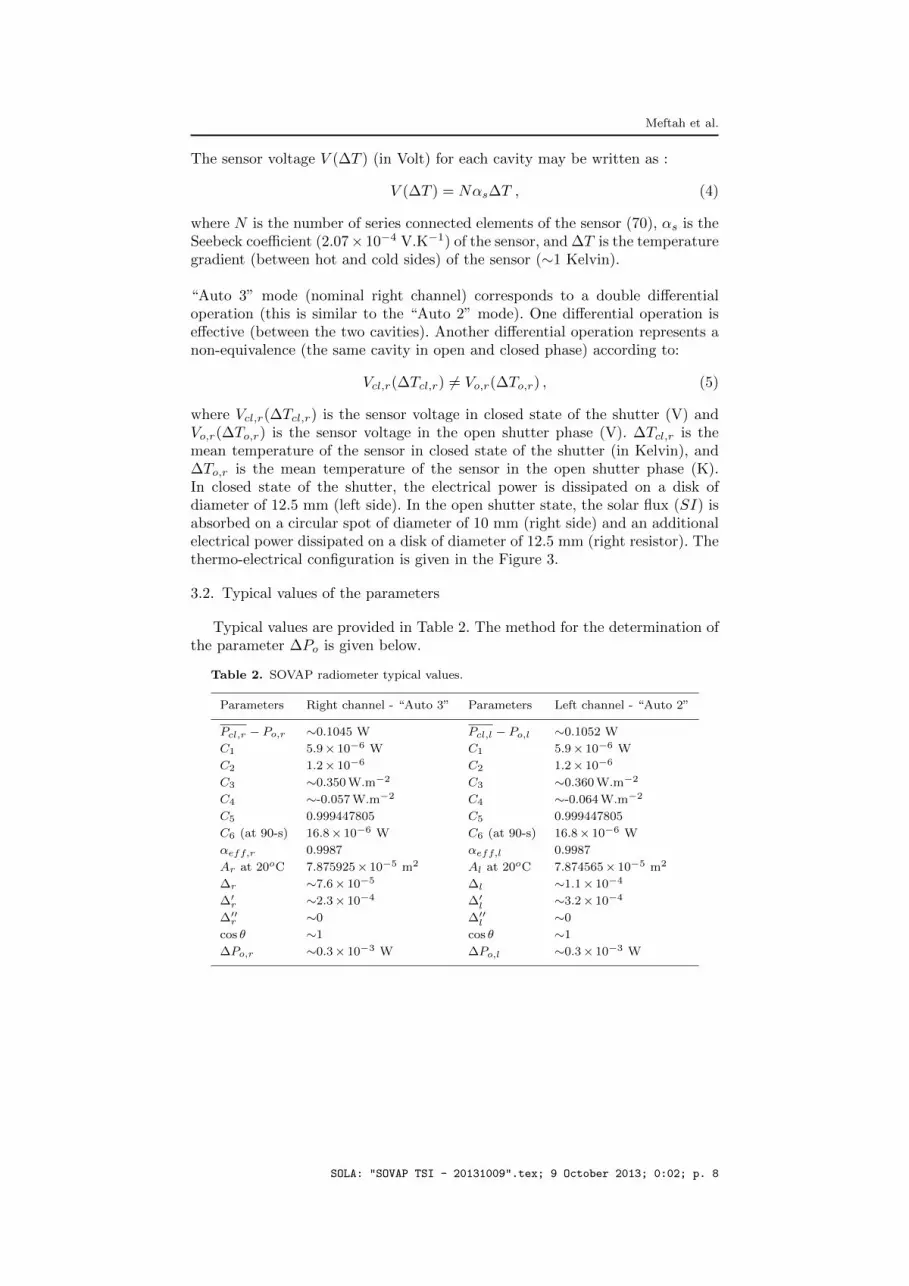
From the model (when ∆Po,r = 0), we obtain the temperature variations withinthe sensors (Figure 5). We can see the slight differences related to the state ofthe radiometer (∆Tcl,r 6= ∆To,r). With an equivalent energy balance, the voltagecontrol system must compensate the slight temperature difference between thetwo cavities (or two states) according the following equation:
Vcl,r(∆Tcl,r = Tcl,r − Tcold) = Vo,r(∆To,r = To,r − Tcold) , (8)
where Vo,r is the mean voltage of the SHP in the open phase (in V), Vcl,r is themean voltage of the SHP in the closed phase (in V).
If we add a small amount of power (∆Po,r), we can balance the voltage of bothsensors (Table 3). The thermo-electric non-equivalence ∆Po,r is about 0.3 mW.This result is achieved with an uncertainty of about 30% (thickness, thermalconductivity, emissivity, contacts, thermoelectric parameters, modeling).
0 1 2 3 4 5 6 7 8 920.9
20.95
21
21.05
21.1
21.15
21.2
21.25
21.3
Distance (x) from the center to the edge of the sensor [mm]
Ho
t sid
e t
em
pe
ratu
re o
f th
e s
en
so
r [°
C]
Right channel (open)
Right channel (closed)
Figure 5. Hot-side temperature of the sensor (open and closed phases). These two curvesshow the non-equivalence of the radiometer in both open and closed phases.
Table 3. Thermo-electrical analysis: Vcl,r = Vo,r.
State Parameters Right channel - “closed” Right channel - “open”
Non-equilibrium P (SIr) – 0.10681 W
Pr Pcl,r = 0.10681 W + 0.06 W Po,r = 0.06 W
Tcold 20oC 20oC
Thot 21.0789oC 21.0808oC
Vcl,r/Vo,r 15.631× 10⁻³ V 15.661× 10⁻³ V
Equilibrium ∆Po,r 0.3× 10⁻³ W –
Tcold 20oC 20oC
Thot 21.0808oC 21.0808oC
Vcl,r/Vo,r 15.661× 10⁻³ V 15.661× 10⁻³ V
SOLA: "SOVAP TSI - 20131009".tex; 9 October 2013; 0:02; p. 10

SOVAP/Picard, a spaceborne radiometer to measure the Total Solar Irradiance
3.3. Absolute accuracy synthesis
Uncertainty for the absolute accuracy is given in Table 4. TSI uncertaintyfrom SOVAP is less than ±1.52 W.m−2 (k=1, or “one sigma”) for the rightchannel (“Auto 3”), and ±1.39 W.m−2 (k=1 ) for the left channel (“Auto 2”).
Table 4. Uncertainties of the TSI measurements.
Channel Right Left
Parameters [ppm] [W.m−2] [ppm] [W.m−2]
Wires heating effect C1 1.5 0.002 0.8 0.001
Accuracy of the servo-system C2 1.2 0.002 1.2 0.002
Infrared emission of the shutter C3 39 0.053 39 0.053
Infrared emission of the mirror C4 19 0.026 19 0.026
Optical effects C5 110 0.150 110 0.150
Sensor thermal equilibrium error C6 (at 90-s) 162 0.221 214 0.293
Absorption factor αeff,r 190 0.259 190 0.259
Precision Aperture Ar at 20oC 117 0.160 107 0.146
Thermal effects ∆r 30 0.041 30 0.041
Thermo-mechanical effect ∆′r 250 0.341 250 0.341
Fixation of the aperture ∆′′r 250 0.341 250 0.341
Thermo-mechanical sliding cos θ 6 0.008 6 0.008
Thermo-electrical non-equivalence ∆Po 837 1.143 837 1.143
Thermal radiative effects of the baffle 13 0.018 13 0.018
Electrical chains (general effects) 518 0.707 294 0.401
Electrical chains (transfer of calibration) 124 0.169 121 0.165
Electrical chains (ground parasitic resistance) 201 0.270 20 0.027
Doppler effect 50 0.068 50 0.068
Mean quadratic uncertainty (k=1 ) 1114 1.52 1018 1.39
3.4. Resolution
The resolution is better than 0.01 W.m−2 (for “Auto 2” and “Auto 3”modes). The DIfferential Absolute Radiometer has been making measurementsof the total solar irradiance as part of the Variability of Irradiance and GravityOscillations (VIRGO) experiment on the Solar and Heliospheric Observatory(SOHO). SOVAP-DIARAD has the same heritage than VIRGO-DIARAD (De-witte, Crommelynck, and Joukoff, 2004). VIRGO-DIARAD has a repeatabilityof 0.1 W.m−2 as SOVAP-DIARAD (for “Auto 2” and “Auto 3” modes).
4. TSI Absolute Value from SOVAP Nominal Modes
First light of the SOVAP radiometer (“Auto 3”) was on 22 July 2010. Apply-ing the TSI equation (see Section 3.1) to the SOVAP measurements (“Auto 3”),provides a TSI value of 1363.0±0.08 W.m−2 (1σ on the set of measurements),
SOLA: "SOVAP TSI - 20131009".tex; 9 October 2013; 0:02; p. 11

Meftah et al.
with an uncertainty of ±1.52 W.m−2 (k=1 ). Applying the TSI equation to theSOVAP measurements (“Auto 2”), provides a TSI value of 1361.2±0.12 W.m−2
(1σ on the set of measurements), with an uncertainty of ±1.39 W.m−2 (k=1 ).The measurements of SOVAP in summer 2010, yield a mean TSI value of1362.1 W.m−2 with an uncertainty of ±2.4 W.m−2 (k=1 ) for both cavities. Fromthis new approach, we obtain values that are lower than those previously pro-vided with instruments of the same type (Crommelynck, Domingo, and Frohlich,1991; Crommelynck et al., 1996; Dewitte, Helizon, and Wilson, 2001; Dewitte,Crommelynck, and Joukoff, 2004; Mekaoui et al., 2010). SOVAP mean TSI istherefore approximately 1 W.m−2 higher than that of the simultaneously flyingradiometers (TIM, PREMOS and ACRIM 3). SOVAP TSI (“Auto 2” mea-surements, or left channel) is consistent with the PREMOS result (Schmutzet al., 2013) when using the Total solar irradiance Radiometer Facility (TRF)calibration. Recent characterizations have revealed that the World RadiometricReference (WRR) (Frohlich et al., 1995) is 0.34% (∼4.6 W.m−2) higher than theSI scale (Fehlmann et al., 2012). Before its flight, PREMOS was also comparedto the TRF at the Laboratory for Atmospheric and Space Physics (LASP).Using the TRF calibration, PREMOS gives a TSI absolute value of around1360.9 W.m−2 (Schmutz et al., 2013). ACRIM 3 data (http://acrim.com/) werefurther reevaluated after TRF comparisons. The new TSI value from ACRIM 3is now within the uncertainties of TIM measurements. This triggered the interestof performing new SOVAP calibration. In particular, a better quantification ofthe inherent uncertainties associated with thermo-electrical non-equivalence ofthe cavities have been investigated. The stray light contribution is not a ma-jor parameter on the SOVAP TSI determination. Indeed multiple contributionssuch as the bias due to launch, vacuum, outgassing, contamination, radiations,thermo-mechanical and thermo-electrical behavior may be better estimated.
5. SOVAP TSI time series
Due to a failure of its mechanism, the right shutter of SOVAP has remainedpermanently open since November 2010. The instrument was therefore set toa new mode of functioning and a new instrument equation was required toaccommodate this situation. In this new mode (“Rad 10”), the radiometer isno longer differential (see Equations (2) and (3)) and both channels have beenused to determine the TSI. During the “Rad 10” mode, the right shutter isopened, and the left shutter is closed. SI is derived from the measurement ofthe difference between the electrical power supplied to the closed cavity and theelectrical power supplied to the open cavity according to:
SIr = C5((Pcl,l − Po,r)−∆Po,r −KRad10 + C1)(1− C2)
αeff,rAr(1 + ∆r + ∆′r + ∆′′r ) cos θ+ C3 + C4 , (9)
where SIr is the Solar Irradiance for the right cavity of the radiometer, andKRad10 is the thermo-electrical non equivalence between the right and the leftcavities of the radiometer (obtained during space calibration).
SOLA: "SOVAP TSI - 20131009".tex; 9 October 2013; 0:02; p. 12
SOVAP/Picard, a spaceborne radiometer to measure the Total Solar Irradiance
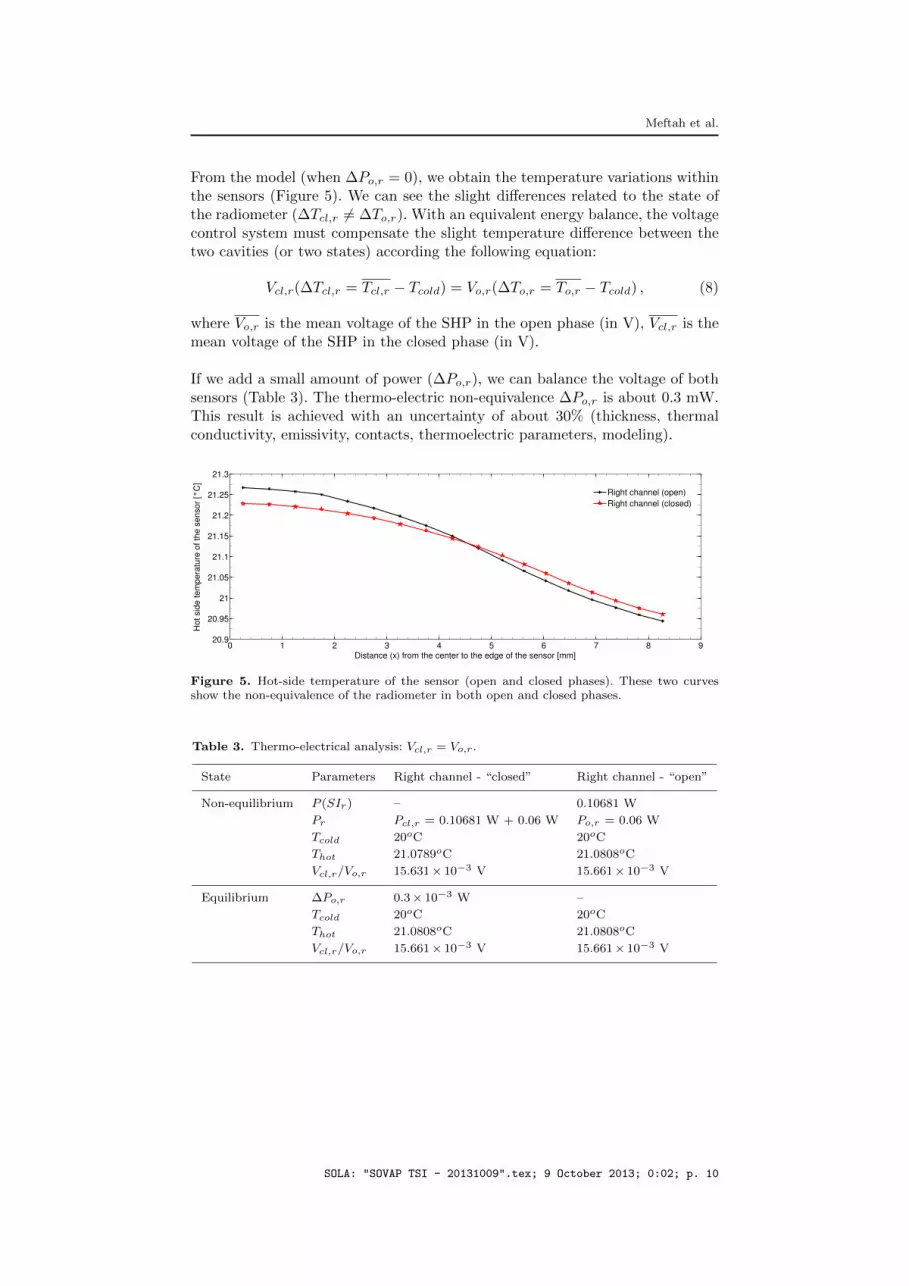
KRad10 parameter changes over time (Figure 6). It highlights a difference be-
tween the two calibration channels (ground calibration).
28−Dec−2010 07−Apr−2011 16−Jul−2011 24−Oct−2011 01−Feb−2012 11−May−2012 19−Aug−2012 27−Nov−2012
2.4
2.6
2.8
3
3.2
3.4
x 10−3
K
Rad10
[W
]
Figure 6. Evolution of the parameter KRad10 over time.
Applying the TSI Equation (9) to SOVAP measurements, provides a TSI value
of 1362.9±0.39 W.m−2 (1σ on the set of “Rad 10” measurements during two
years), and a range of 2.4 W.m−2. The uncertainty of these measurements de-
pends on several parameters (see Table 4). The uncertainty in the determination
of the parameter KRad10 is estimated at ±0.6 W.m−2 (Figure 6). For the “Rad
10” mode, the mean quadratic uncertainty (k=1 ) is equal to ±1.63 W.m−2.
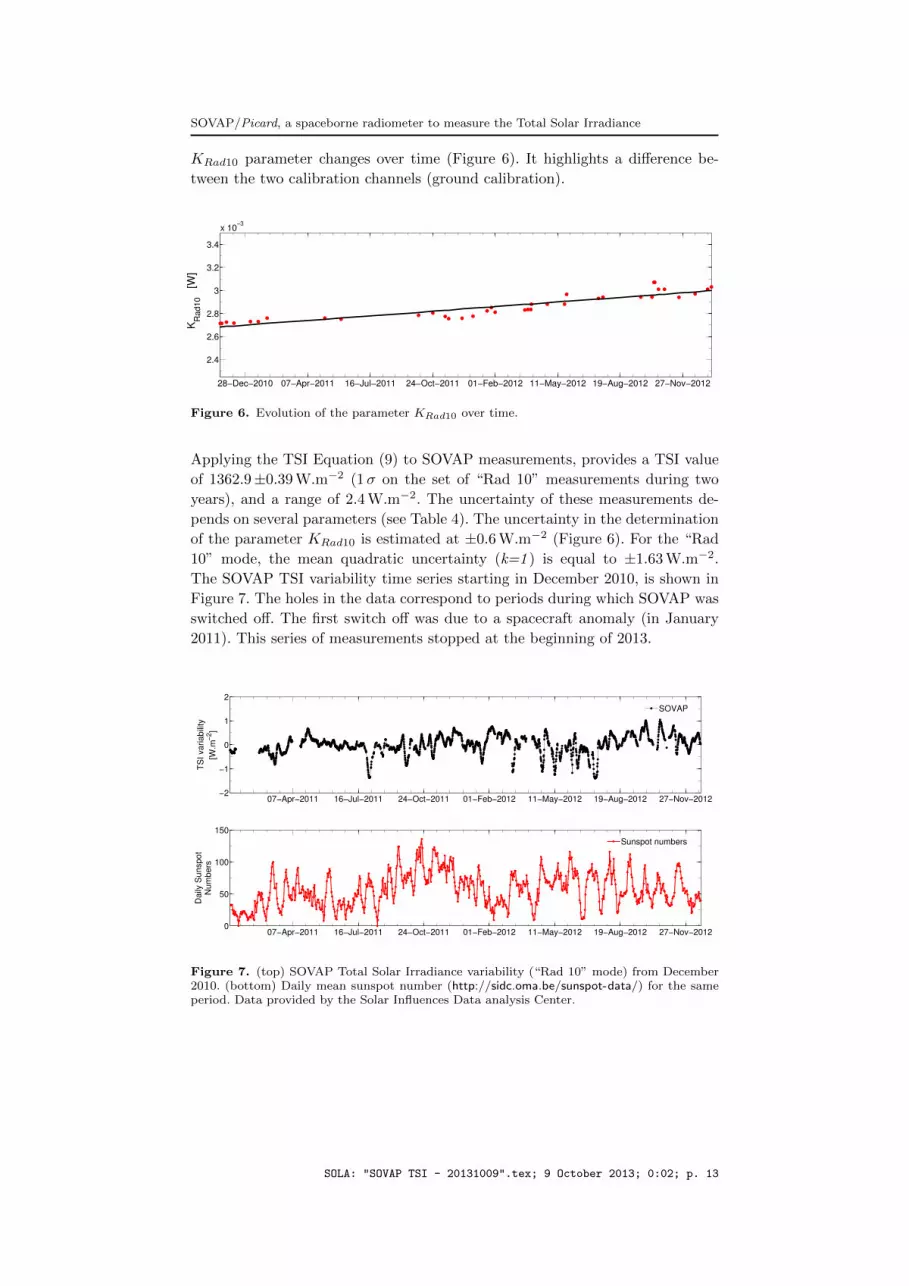
The SOVAP TSI variability time series starting in December 2010, is shown in
Figure 7. The holes in the data correspond to periods during which SOVAP was
switched off. The first switch off was due to a spacecraft anomaly (in January
2011). This series of measurements stopped at the beginning of 2013.
07−Apr−2011 16−Jul−2011 24−Oct−2011 01−Feb−2012 11−May−2012 19−Aug−2012 27−Nov−2012−2
−1
0
1
2
TS
I va
ria
bili
ty
[W.m
−2]
SOVAP
07−Apr−2011 16−Jul−2011 24−Oct−2011 01−Feb−2012 11−May−2012 19−Aug−2012 27−Nov−20120
50
100
150
Da
ily S
un
sp
ot
Nu
mb
ers
Sunspot numbers
Figure 7. (top) SOVAP Total Solar Irradiance variability (“Rad 10” mode) from December2010. (bottom) Daily mean sunspot number (http://sidc.oma.be/sunspot-data/) for the sameperiod. Data provided by the Solar Influences Data analysis Center.
SOLA: "SOVAP TSI - 20131009".tex; 9 October 2013; 0:02; p. 13

Meftah et al.
The instruments, currently in space, yield a TSI variation to be substantiallyidentical (Figure 8). The SOVAP radiometer operating in a degraded mode, alsoprovides the TSI variation; it shows the robustness of the RMIB design.
16−Feb−2011 07−Apr−2011 27−May−2011 16−Jul−2011 04−Sep−2011 24−Oct−2011 13−Dec−2011−2
−1.5
−1
−0.5
0
0.5
1
1.5
2
TS
I va
ria
bili
ty
[W.m
−2]
TIM
PREMOS
SOVAP
Figure 8. Total Solar Irradiance variability time series (average of 6 hours) for three spaceradiometers: TIM (http://lasp.colorado.edu/home/sorce/data/tsi-data/), PREMOS (Schmutzet al., 2013), and SOVAP.
6. Conclusion
The determination of the TSI from SOVAP has required the establishmentof a new instrumental equation. A new parameter has been integrated froma theoretical analysis which highlights the thermo-electrical non-equivalence ofthe radiometric cavity. From this new approach, we obtain values that are lowerthan those previously provided with the same type of instruments. The SOVAPright channel yield a TSI value of 1363.0 W.m−2 (summer 2010) with an uncer-tainty of ±1.52 W.m−2 (k=1 ). The SOVAP left channel measured a TSI valueof 1361.2 W.m−2 (summer 2010) with an uncertainty of ±1.39 W.m−2 (k=1 ).This latter measurement is consistent with the PREMOS result (using Totalsolar irradiance Radiometer Facility calibration). Based on the SOVAP data, weobtain the TSI input at the top of the Earth’s atmosphere at a distance of 1AU from the Sun to be 1362.1 W.m−2 (from the mean value of the left and theright channels) with an uncertainty of ±2.4 W.m−2 (k=1 ). In this paper, thethermo-electrical non-equivalence ∆Po of the radiometer is based on a theoreticalmodel. Accurate estimates of the non-equivalence of the effects of the radiativeand electrical heating can be obtained using the pre-fligth characterizations. Dueto a failure on its mechanism, SOVAP right shutter has remained permanentlyopen since November 2010 up to the beginning of 2013.. The instrument wastherefore set to a new mode of functioning. From this non-differential modeoperation, we were able to give the TSI variations. SOVAP right channel (in non-differential mode) yield a mean TSI value of 1362.9 W.m−2 with an uncertaintyof ±1.63 W.m−2, and continuing the solar data record (from end of 2010 to thebeginning of 2013). During this period, the instruments in space (TIM, PREMOSand ACRIM 3), yield a TSI variation to be substantially identical.
SOLA: "SOVAP TSI - 20131009".tex; 9 October 2013; 0:02; p. 14

SOVAP/Picard, a spaceborne radiometer to measure the Total Solar Irradiance
Acknowledgements Picard is a mission supported by the Centre National d’Etudes Spa-tiales (CNES), the CNRS/INSU, the Belgian Space Policy (BELSPO), the Swiss Space Of-fice (SSO), and the European Space Agency (ESA). The following institutes are acknowl-edged for providing the data: Solar Influences Data Center (Belgium), the “Physikalisch-Meteorologisches Observatorium Davos” (Switzerland), and the Laboratory for Atmosphericand Space Physics (United Sates). We thank RMIB, and CNRS for their support, as wellas all participants providing their expertise to this study (Sami Bali, Pierre Malcorps, andJoel Pierard). We wish to express our gratitude to Dominique Crommelynck (RMIB), whodesigned and developed the DIARAD type radiometers. The authors thank the referee for theconstructive remarks and suggestions.
References
Abbot, C.G., Aldrich, L.B., Hoover, W.H.: 1942, Chapter 6. Discussion of Solar-ConstantValues Accuracy. Annals of the Astrophysical Observatory of the Smithsonian Institution6, 163 – 197.
Abbot, C.G., Fowle, F.E., Aldrich, L.B.: 1923, Chapter VII. Annals of the AstrophysicalObservatory of the Smithsonian Institution 4, 217 – 257.
BenMoussa, A., Gissot, S., Schuhle, U., Del Zanna, G., Auchere, F., Mekaoui, S., Jones, A.R.,Walton, D., Eyles, C.J., Thuillier, G., Seaton, D., Dammasch, I.E., Cessateur, G., Meftah,M., Andretta, V., Berghmans, D., Bewsher, D., Bolsee, D., Bradley, L., Brown, D.S.,Chamberlin, P.C., Dewitte, S., Didkovsky, L.V., Dominique, M., Eparvier, F.G., Foujols,T., Gillotay, D., Giordanengo, B., Halain, J.P., Hock, R.A., Irbah, A., Jeppesen, C., Judge,D.L., Kretzschmar, M., McMullin, D.R., Nicula, B., Schmutz, W., Ucker, G., Wieman, S.,Woodraska, D., Woods, T.N.: 2013, On-Orbit Degradation of Solar Instruments. SolarPhys.. doi:10.1007/s11207-013-0290-z.
Cebula, R.P., Deland, M.T.: 1998, Comparisons of the NOAA-11 SBUV/2, UARS SOLSTICE,and UARS SUSIM MG II Solar Activity Proxy Indexes. Solar Phys. 177, 117 – 132.
Conscience, C., Meftah, M., Chevalier, A., Dewitte, S., Crommelynck, D.: 2011, Thespace instrument SOVAP of the PICARD mission. In: SPIE, Society of Photo-OpticalInstrumentation Engineers Conference Series 8146. doi:10.1117/12.895447.
Crommelynck, D., Domingo, V.: 1984, Solar Irradiance Observations. Science 225, 180 – 181.doi:10.1126/science.225.4658.180.
Crommelynck, D., Domingo, V., Frohlich, C.: 1991, The Solar Variations (SOVA) experimentin the EURECA space platform. Advances in Space Research 11, 83 – 87. doi:10.1016/0273-1177(91)90442-M.
Crommelynck, D., Fichot, A., Domingo, V., Lee, R. III: 1996, SOLCON Solar Con-stant Observations from the ATLAS Missions. Geophys. Res. Lett. 23, 2293 – 2295.doi:10.1029/96GL01878.
Deland, M.T., Cebula, R.P.: 2012, Solar UV variations during the decline ofCycle 23. Journal of Atmospheric and Solar-Terrestrial Physics 77, 225 – 234.doi:10.1016/j.jastp.2012.01.007.
Dewitte, S., Crommelynck, D., Joukoff, A.: 2004, Total solar irradiance observationsfrom DIARAD/VIRGO. Journal of Geophysical Research (Space Physics) 109, 2102.doi:10.1029/2002JA009694.
Dewitte, S., Helizon, R., Wilson, R.S.: 2001, Contribution of the Solar Constant (SOLCON)program to the long-term total solar irradiance observations. J. Geophys. Res. 106, 15759 –15766. doi:10.1029/2000JA900160.
Domingo, V., Ermolli, I., Fox, P., Frohlich, C., Haberreiter, M., Krivova, N., Kopp, G.,Schmutz, W., Solanki, S.K., Spruit, H.C., Unruh, Y., Vogler, A.: 2009, Solar SurfaceMagnetism and Irradiance on Time Scales from Days to the 11-Year Cycle. Space Sci.Rev. 145, 337 – 380. doi:10.1007/s11214-009-9562-1.
Ermolli, I., Matthes, K., Dudok de Wit, T., Krivova, N.A., Tourpali, K., Weber, M., Unruh,Y.C., Gray, L., Langematz, U., Pilewskie, P., Rozanov, E., Schmutz, W., Shapiro, A.,Solanki, S.K., Thuillier, G., Woods, T.N.: 2012, Recent variability of the solar spectral irra-diance and its impact on climate modelling. Atmospheric Chemistry & Physics Discussions12, 24557 – 24642. doi:10.5194/acpd-12-24557-2012.
SOLA: "SOVAP TSI - 20131009".tex; 9 October 2013; 0:02; p. 15

Meftah et al.
Fehlmann, A., Kopp, G., Schmutz, W., Winkler, R., Finsterle, W., Fox, N.: 2012, FourthWorld Radiometric Reference to SI radiometric scale comparison and implications for on-orbit measurements of the total solar irradiance. Metrologia 49, 34. doi:10.1088/0026-1394/49/2/S34.
Foster, S.S.: 2004, Reconstruction of solar irradiance variations, for use in studies of globalclimate change: Application of recent SoHO observations with historic data from theGreenwich observations. PhD thesis, Ph.D dissertation, 2004. England: University ofSouthampton (United Kingdom); 2004. Publication Number: AAT C820450. DAI-C 66/02,p. 430, Summer 2005.
Foukal, P.: 2012, A New Look at Solar Irradiance Variation. Solar Phys. 279, 365 – 381.doi:10.1007/s11207-012-0017-6.
Foukal, P., Frohlich, C., Spruit, H., Wigley, T.M.L.: 2006, Variations in solar luminosity andtheir effect on the Earth’s climate. Nature 443, 161 – 166. doi:10.1038/nature05072.
Frohlich, C., Lean, J.: 1998, The Sun’s total irradiance: Cycles, trends and relatedclimate change uncertainties since 1976. Geophys. Res. Lett. 25, 4377 – 4380.doi:10.1029/1998GL900157.
Frohlich, C., Philipona, R., Romero, J., Wehrli, C.: 1995, Radiometry at the Physikalisch-Meteorologisches Observatorium Davos and World Radiation Centre. Optical Engineering34, 2757 – 2766. doi:10.1117/12.205682.
Frohlich, C., Crommelynck, D.A., Wehrli, C., Anklin, M., Dewitte, S., Fichot, A., Finsterle, W.,Jimenez, A., Chevalier, A., Roth, H.: 1997, In-Flight Performance of the Virgo Solar Irra-diance Instruments on SOHO. Solar Phys. 175, 267 – 286. doi:10.1023/A:1004929108864.
Hickey, J.R., Stowe, L.L., Jacobowitz, H., Pellegrino, P., Maschhoff, R.H., House, F., Von-der Haar, T.H.: 1980, Initial Solar Irradiance Determinations from Nimbus 7 CavityRadiometer Measurements. Science 208, 281 – 283. doi:10.1126/science.208.4441.281.
Hickey, J.R., Alton, B.M., Kyle, H.L., Hoyt, D.: 1988, Total solar irradiance measure-ments by ERB/Nimbus-7 - A review of nine years. Space Sci. Rev. 48, 321 – 342.doi:10.1007/BF00226011.
Kopp, G., Lean, J.L.: 2011, A new, lower value of total solar irradiance: Evidence and climatesignificance. Geophys. Res. Lett. 38, 1706. doi:10.1029/2010GL045777.
Kopp, G., Lawrence, G., Rottman, G.: 2004, Total irradiance monitor design and on-orbitfunctionality. In: Fineschi, S., Gummin, M.A. (eds.) SPIE, Society of Photo-Optical In-strumentation Engineers (SPIE) Conference Series 5171, 14 – 25. doi:10.1117/12.505235.
Lean, J.: 2000, Evolution of the Sun’s Spectral Irradiance Since the Maunder Minimum.Geophys. Res. Lett. 27, 2425 – 2428. doi:10.1029/2000GL000043.
Lockwood, M., Stamper, R.: 1999, Long-term drift of the coronal source magnetic flux and thetotal solar irradiance. Geophys. Res. Lett. 26, 2461 – 2464. doi:10.1029/1999GL900485.
Mekaoui, S., Dewitte, S., Conscience, C., Chevalier, A.: 2010, Total solar irradiance abso-lute level from DIARAD/SOVIM on the International Space Station. Advances in SpaceResearch 45, 1393 – 1406. doi:10.1016/j.asr.2010.02.014.
Pouillet, C.S.M.: 1838, Memoire sur la chaleur solaire. Paris, Bachelier.Roth, R., Joos, F.: 2013, A reconstruction of radiocarbon production and total solar irradiance
from the Holocene 14C and CO2 records: implications of data and model uncertainties.Climate of the Past 9, 1879 – 1909. doi:10.5194/cp-9-1879-2013.
Schmutz, W., Fehlmann, A., Hulsen, G., Meindl, P., Winkler, R., Thuillier, G., Blattner, P.,Buisson, F., Egorova, T., Finsterle, W., Fox, N., Grobner, J., Hochedez, J.-F., Koller, S.,Meftah, M., Meissonnier, M., Nyeki, S., Pfiffner, D., Roth, H., Rozanov, E., Spescha, M.,Wehrli, C., Werner, L., Wyss, J.U.: 2009, The PREMOS/PICARD instrument calibration.Metrologia 46, 202. doi:10.1088/0026-1394/46/4/S13.
Schmutz, W., Fehlmann, A., Finsterle, W., Kopp, G., Thuillier, G.: 2013, Total solar irradiancemeasurements with PREMOS/PICARD. AIP Conference Proceedings 1531(1), 624 – 627.doi:10.1063/1.4804847. http://link.aip.org/link/?APC/1531/624/1.
Solanki, S.K., Usoskin, I.G., Kromer, B., Schussler, M., Beer, J.: 2004, Unusual activity of theSun during recent decades compared to the previous 11,000 years. Nature 431, 1084 – 1087.doi:10.1038/nature02995.
Steinhilber, F., Beer, J., Frohlich, C.: 2009, Total solar irradiance during the Holocene.Geophys. Res. Lett. 36, 19704. doi:10.1029/2009GL040142.
Vieira, L.E.A., Solanki, S.K., Krivova, N.A., Usoskin, I.: 2011, Evolution of the solar irradianceduring the Holocene. Astron. Astrophys. 531, A6. doi:10.1051/0004-6361/201015843.
Wang, Y.-M., Lean, J.L., Sheeley, N.R. Jr.: 2005, Modeling the Sun’s Magnetic Field andIrradiance since 1713. Astrophys. J. 625, 522 – 538. doi:10.1086/429689.
SOLA: "SOVAP TSI - 20131009".tex; 9 October 2013; 0:02; p. 16

SOVAP/Picard, a spaceborne radiometer to measure the Total Solar Irradiance
Wenzler, T., Solanki, S.K., Krivova, N.A., Frohlich, C.: 2006, Reconstruction of solar irradiancevariations in cycles 21-23 based on surface magnetic fields. Astron. Astrophys. 460, 583 –595. doi:10.1051/0004-6361:20065752.
Willson, R.C., Hudson, H.S.: 1991, The Sun’s luminosity over a complete solar cycle. Nature351, 42 – 44. doi:10.1038/351042a0.
Willson, R.C., Gulkis, S., Janssen, M., Hudson, H.S., Chapman, G.A.: 1981, Observations ofsolar irradiance variability. Science 211, 700 – 702. doi:10.1126/science.211.4483.700.
SOLA: "SOVAP TSI - 20131009".tex; 9 October 2013; 0:02; p. 17

SOLA: "SOVAP TSI - 20131009".tex; 9 October 2013; 0:02; p. 18