automated exploration of the radio plasma imager data
TRANSCRIPT

Revised for submission to JGR Space Physics
1
Automated Exploration of the Radio Plasma Imager Data
Ivan Galkin1, Bodo Reinisch1, Georges Grinstein2, Grigori Khmyrov1,
Alexander Kozlov1, Xueqin Huang1, and Shing Fung3
1 Center for Atmospheric Research, University of Massachusetts, 600 Suffolk Street,
Lowell, MA 01854
2 Computer Science Department, University of Massachusetts Lowell, One University
Avenue, Lowell, MA 01854
3 Space Physics Data Facility, Code 632, NASA/Goddard Space Flight Center,
Greenbelt, MD 20771

Revised for submission to JGR Space Physics
2
Abstract
As research instruments with large information capacities become a reality, automated systems
for intelligent data analysis become a necessity. Scientific archives containing huge volumes of
data preclude manual manipulation or intervention and require automated exploration and
mining that can at least pre-classify information in categories. The large dataset from the radio
plasma imager (RPI) instrument onboard the IMAGE satellite shows a critical need for such
exploration in order to identify and archive features of interest in the volumes of visual
information. In this research we have developed such a pre-classifier through a model of pre-
attentive vision capable of detecting and extracting traces of echoes from the RPI plasmagrams.
The overall design of our model complies with Marr’s paradigm of vision where elements of
increasing perceptual strength are built bottom up under the Gestalt constraints of good
continuation and smoothness. The specifics of the RPI data, however, demanded extension of
this paradigm to achieve greater robustness for signature analysis. Our pre-attentive model now
employs a feedback neural network that refines alignment of the oriented edge elements
(edgels) detected in the plasmagram image by subjecting them to collective global-scale
optimization. The level of interaction between the oriented edgels is determined by their
distance and mutual orientation in accordance with the Yen and Finkel model of the striate
cortex that encompasses findings in psychophysical studies of human vision. The developed
models have been implemented in an operational system “CORPRAL” (Cognitive Online RPI
Plasmagram Ranking Algorithm) that currently scans daily submissions of the RPI
plasmagrams for the presence of echo traces. Qualifying plasmagrams are tagged in the mission
database, making them available for a variety of queries. We discuss CORPRAL performance
and its impact on scientific analysis of RPI data.

Revised for submission to JGR Space Physics
3 18.06.2004
1 Introduction
The radio plasma imager (RPI) [Reinisch et al., 2000] aboard the IMAGE
spacecraft [Burch, 2000] belongs to a class of active remote sensing instruments that
work by sending out a signal toward a target and detecting reflected signal to infer
characteristics of the target and the signal propagation medium. Imaging radars are rarely
used in space because of the limited onboard power available for signal transmission, and
exceptionally complex systems are required to overcome this limitation. For example,
RPI uses a unique antenna system consisting of two 500 m tip-to-tip dipoles and one 20
m tip-to-tip dipole, currently the largest construction ever flown in space, to radiate a
signal with the nominal power of less than 10 W and to detect weak reflections that travel
up to 100,000 km in space. Mustering the power required by imaging radars will become
easier with introduction of the cerium-fueled nuclear generators developed under
NASA’s Project Prometheus, bringing new prospects to the active remote sensing
technique.
Opportunities for scientific exploration with the RPI instrument are unique. Using
remote echo data collected at multiple operating frequencies, it is possible to infer
distribution of the electron density in a large area of Earth’s magnetosphere to effectively
monitor how magnetospheric plasma responds to the events in the solar-terrestrial
system. For example, Reinisch et al. [2004] analyzed RPI-radiated waves to derive the
mass loss in Earth’s magnetosphere as the result of a magnetic storm. Other scientific
uses of the RPI dataset are emerging [Green et al., 2004], driven by new insights in the
instrument capabilities, as well as new discoveries of RPI measurement nuggets.
Common visual representation of the RPI active sounding data is in the form of
plasmagram [Reinisch et al., 2001], an image where the electric field strength registered
by the receiving antennas is plotted as image intensity in the frame of sounding frequency
versus signal propagation time t expressed as a virtual range 12R ct′ = , where c is the
free space speed of light. Figure 1 shows a sample plasmagram taken on March 20, 2002,

Revised for submission to JGR Space Physics
4 18.06.2004
04:28 UT, containing two types of signatures that constitute the RPI potential for
exploration: remote reflections forming echo traces, and stimulated short-range response
of the local plasma at resonance frequencies.
Figure 1. Sample RPI plasmagram showing signal reflections from remote plasma locations (traces) and a variety of stimulated resonances in the local plasma.
From the point of view of a data analyst, the RPI plasmagram set, currently over
900,000 images and growing at a rate of about 600 images/day, presents a formidable
challenge for knowledge discovery. With radiated power below 10 W and often as little
as 0.001 W, plasmagram traces are typically seen in less than 20% of all data. The
IMAGE spacecraft has a highly elliptical orbit with an apogee at 7.2 RE and perigee of
1000 km, exposing the RPI instrument to several orders of plasma density within a few
hours. The need to adjust RPI measurement programs depending on the orbit position and
assortment of scientific goals results in a highly irregular stream of plasmagrams that
have to be visually inspected for presence of echo signatures in a frame-by-frame fashion.
Considering the volume of acquired imagery data, manual analysis is prohibitively
expensive and by now has covered less than 4% of all active sounding data. By contrast,
the homogeneous nature of data collected by passive imagers such as optical cameras and
spectrographs allows quick analysis of hours and days of data in form of a movie or a
dynamic spectrogram.
Galkin et al. [2004] suggested algorithmic solutions to the problem of automated
detection and identification of resonance signatures in RPI plasmagrams. In this paper we
present feature extraction techniques for detecting the echo traces in plasmagrams as
illustrated in Figure 1.
2 Automated Data Exploration Methods in Space Physics
There are three major classes of space physics and engineering applications that
unavoidably create a need for automated image recognition, (1) real-time nowcasting and
warning systems (e.g., Spaceguard asteroid monitors, real-time solar event detectors at

Revised for submission to JGR Space Physics
5 18.06.2004
Big Bear Solar Observatory, Demeter earthquake warning system, etc.), (2) autonomous
and collaborative exploration systems such as the Mars Rover, and (3) imagery archives
whose size precludes manual manipulation and analysis (e.g., NASA’s EOSDIS project
holding data from remote Earth observing sensors, virtual astronomical observatories of
the IVOA alliance, and others). A computer vision model assumes a powerful and
enabling role in these applications and solves scientifically viable, significant problem of
replicating intelligent tasks of feature extraction and learning. Systematic efforts in
building intelligent systems are now coordinated by dedicated funding programs
established by space agencies, such as NASA’s upcoming Discovery Systems program
that replaces the currently ongoing Intelligent Data Understanding (IDU) project.
For consistency and uniformity of our terminology, we shall enlist common image
processing terms and, where applicable, their counterparts from the radar imaging
domain. Computer representation of an image is a 2D matrix of pixels (picture elements).
We constrain our discussion to so-called gray-scale images, where each pixel is described
by a single value of its intensity. In radar applications, the image intensity is simply
amplitude of the sampled antenna voltage. The image recognition task is to locate and
identify objects in the image. In the radar imaging data the objects of interest are usually
called signatures to reflect their association with traveling signals. The recognition
process starts with image processing techniques that modify pixel intensity values in
order to enhance objects and suppress or remove noise pixels. Removal of noise pixels is
often viewed as labeling of the object pixels; the equivalent operation in radar
applications is called echo detection. A common labeling technique is the thresholding
operation that selects pixels of particular intensity range, usually above a threshold value.
The second phase of image recognition is called feature extraction, where “feature”
loosely denotes any low-level visual element such as a line or a region of particular
texture or shape. The feature extraction itself can be a multiple-stage procedure involving
visual elements of lesser perceptual strength such as edge elements (edgels) or object
contours. Typical feature extraction operation locates edgels and groups them in
contours. The final recognition phase is the object classification that interprets the

Revised for submission to JGR Space Physics
6 18.06.2004
collection of extracted features to single out individual objects and classify them in
categories.
Algorithmic approaches to feature extraction from the space physics imagery data
vary in complexity. When the sought objects are distinctly visible in the image
background (e.g., solar sunspots or filaments on images of the solar disk), they can be
extracted by a thresholding algorithm followed by the bottom-up clustering of qualifying
pixels into contiguous regions. Robust implementations of this segmentation approach
benefit from additional feature processing steps such as edge detection [Canny, 1986,
Ziou and Tabbone, 1998], as well as constrained region growing strategies [Zucker,
1976]; algorithms of this class can be found in numerous projects ranging from the
SKICAT sky survey cataloging system [Fayyad et al., 1996] to space weather solar event
monitors [Gao et al., 2002] and remote sensing systems [Tilton, 2003].
Image features of a perfect geometric shape (straight line, circle, or a polynomial)
are commonly extracted by so-called rigid-contour techniques such as the Hough
transform [Hough, 1962]. The Hough transform finds best matches of the feature model
to the image by testing all possible combinations of the model parameters. Although
Hough transform can be generalized to extract an object of arbitrary shape [Ballard,
1981], a more efficient and widely used generalized rigid-contour technique is a
classification feed-forward artificial neural network (ANN) such as the back-propagating
multi-layer perceptron [Rummelhart and McLelland, 1986]. The classification ANN is
first trained to associate particular pixel patterns with its outputs and then is applied in a
sliding-window fashion to novel images to detect similar patterns. Trained ANNs are
more tolerable to deviations from the stored patterns than the generalized Hough
transform, and their small footprint helps flight software implementations in the
spaceborne warning systems [Elie et al., 1999]. Straightforward back-propagation
training of the feed-forward ANNs, however, is commonly criticized for a little insight
into the training results presented as an unfathomable collection of synaptic weights for
an arbitrarily chosen network configuration. By contrast, self-organizing maps (SOMs)
[Kohonen, 1982] and polynomial “learning” GMDH networks [Madala and Ivakhnenko,
1994] respond to the features in the training dataset to organize themselves optimally and

Revised for submission to JGR Space Physics
7 18.06.2004
thus avoid the “trial-and-error” design phase of the feed-forward ANN configurations.
Resulting configurations of SOM/GMHD networks can be studied for separation of the
image features, and so they are frequently used in this segmentation/clustering role as
pre-processors for further object classification process [Villmann et al., 2003].
Finally, when little is known about the actual shape of the image features except for
their perceptual qualities such as good continuation and smoothness of the object contour,
so-called “deformable contour” approaches come into play. No direct assumptions on the
feature shape are made and no a priori learning of the shapes is arranged in the
deformable model. The feature extraction process is governed by a set of generic
perceptual restrictions known in the literature since the 1930s as the Gestalt principles of
perception [Rock and Palmer, 1990]. The Gestalt principles merely capture apparent
preferences in human perception of visual patterns; presented, for example, with a binary
image containing points and bars, it turns out that this perceptual process prefers to single
out subset of points lying on some long, smooth and dense curve (corresponding Gestalt
principles are good continuation, smoothness, and proximity). The deformable contour is
a dynamic (iterative) system that seeks the optimal balance between three terms in its
energy function, (1) internal energy that imposes smoothness and continuity requirements
on the object contour, (2) image energy that attracts the contour to the edgels, and (3)
external energy that moves and scales (stretches/shrinks) the object contour. Because the
optimal balance of these terms in a dynamic system corresponds to the minimum of its
energy function, this approach is often referred to as “energy minimization”. A great
variety of energy functions have been engineered for the purpose of feature extraction,
appearing in the literature under such names as snake, elastic arm, and active contours.
Deformable contours algorithms are frequently used in remote sensing and autonomous
applications for extraction of varying shape objects (rocks [Castano et al., 2004], line
networks such as the coast lines, roads and rivers [Rochery et el., 2003, Laptev et al.,
2000]).
Of particular interest to the RPI plasmagram data exploration task are successful
solutions to similarly formulated problem of the automated trace extraction from
bottomside and topside ionograms [Reinisch and Huang, 1983, Galkin et al., 1996,
Revised for submission to JGR Space Physics
8 18.06.2004
Huang et al., 2002], as well as image recognition projects where signal to noise ratio is
low (e.g., [Milani et al., 1996]).
3 Trace Extraction in Plasmagrams: Choice of the Approach
No simple model can describe shape of plasmagram traces and their amplitudes are
not consistent along the trace because of the changing noise background and signal
propagation conditions. This leaves practically no room for region-growing and rigid-
contour approaches that are based on certain trace models or learned patterns of the past.
We therefore accepted the bottom-up strategy in which the extraction algorithm seeks
detectable low-level image features that can be grouped together in salient segments
belonging to the same trace. The concept of saliency was coined by Sha’ashua and
Ullman [1988] as a particular measure of length and smoothness of a contour, together
with an algorithm for contour saliency calculations. They have shown that indeed, the
image features of high calculated saliency are those considered as more important by
common human subjective judgment. Following the saliency concept, the edgel grouping
process is governed by the perceptual restrictions of Gestalt, just like in the deformable
contour techniques. The closest analogous system for feature extraction that inspired our
development is so-called early vision that is found in many living organisms, including
the human.
The early vision extracts salient cues in the field of view without willful
concentration of attention on the scene elements, and for that reason is often called pre-
attentive. Pre-attentive vision works unattended in the background, responsible for
locating objects and “popping up” those that may require immediate attention and action
such as movement of eyes, head, or body. Existing model descriptions of the early vision
are consistent with the Marr’s paradigm of vision [Marr and Nishihara, 1978], a
reductionist approach that builds a pyramid of perception in a bottom-up fashion, level by
level, where each new level holds visual elements of higher perceptual strength and lower
levels are unaware of considerations happening at the higher levels. Though largely
simplified, the pyramid model is in a good agreement with in vitro biophysical studies of
Revised for submission to JGR Space Physics
9 18.06.2004
the eye retina and brain cortex cells responding to simple shape stimuli such as line
segments. Based on Marr’s vision paradigm, we introduced the following stepwise
process of reducing the raw plasmagram image to the echo traces, described here in terms
of the seven pyramid levels:
1. Raw image. We start with the gray-scale image, an (N x M) matrix of pixels,
each pixel representing the image intensity.
2. Echoes. The first stage of processing labels the pixels of the plasmagram image
that potentially belong to the RPI signal. The labeling is accomplished using an adaptive
echo detection algorithm that evaluates the threshold level for each frequency
individually using an estimate of background noise and then labels those pixels that
exceed the threshold levels as potential echoes.
3. Edgels. The range interval taken by an echo is reduced to a single point
corresponding to its time of arrival (TOA). An analogy can be drawn to the automated
analysis of visual scenes where objects are analyzed by first locating their boundaries
(edges). We refer to the TOA points as edgels (edge elements) to indicate that they
constitute the leading edge of a trace.
4. Rotors. In the classic pre-attentive vision model, the next level above the edgels
is called “oriented edgels” or “oriented cells” (as in the brain cortex). The oriented edgel
contains a local estimate of the contour direction at the edgel location. We use the term
“rotor” to stress the point that our pre-attentive vision model allows oriented edgels to
change their orientation in the process of optimization, as described in the next section of
the paper.
5. Saliency map. Local context techniques applied to obtain oriented edgels do not
always produce correct orientation; extraction of the trace in various situations requires
much larger context area around the edgels. The long-range, collective analysis of edgel
data results in the evaluation of a perceptually stronger quantity, saliency, which reflects
how likely an edgel is part of a trace. Saliency measures calculated for all edgels in an
image constitute its saliency map.

Revised for submission to JGR Space Physics
10 18.06.2004
6. Segments. The saliency map is analyzed to find subsets of edgels belonging to
the same trace. This is a bottom-up procedure typical of pre-attentive vision, and the
found subsets may correspond to segments of traces to be further grouped into complete
traces.
7. Traces. The perceptual grouping of segments into traces corresponds to attention-
driven recognition, where certain assumptions are made about the model of the trace
shape. The grouping algorithm switches attention between discovered pre-attentive vision
cues to evaluate their support of the model.
We will now briefly describe our technique for trace extraction in RPI plasmagrams
in terms of transitions from level to level in Marr’s pyramid.
4 CORPRAL Description
CORPRAL (Cognitive Online RPI Plasmagram Ranking Algorithm) for the
extraction of traces in RPI plasmagrams combines a model of pre-attentive vision that
detects salient segments of traces in the image with an attention-driven technique that
chains the segments together to form complete traces. The algorithm description is
arranged in terms of transitions from a level to level in Marr’s computer vision pyramid
introduced in the previous section.
4.1. Image to Edgels
Direct application of the conventional leading edge detectors to the plasmagrams
would cause a severe false positive rate because of their sensitivity to every gradient of
intensity in the image. Robust edgel detectors explore various possibilities to distinguish
signal from noise. Common approaches to the problem (e.g., [Ziou and Tabbone, 1998])
involve smoothing to remove the noise jitter, thresholding to suppress weaker noise, and
local tests of the signal integrity across adjacent pixels. Most of these commonly used
measures are damaging, to a various degree, on the signal in plasmagrams. In contrast to
the typical scenarios of object identification in visual scenes, the plasmagram traces are

Revised for submission to JGR Space Physics
11 18.06.2004
thin and faint signatures in the irregular and varying background noise, often just 1 pixel
wide.
Figure 2 presents an example of the leading edge detection in the plasmagram taken
on March 2, 2002, 04:46 UT. The first row shows the raw plasmagram image in Panel
2(a) and direct detection results obtained by the “zero-crossing” double differentiation
operator [Ziou and Tabbone, 1998] that seeks the point of largest intensity gradient, Panel
2(b). Even though we suppressed found amplitude gradients that are smaller than 6 dB,
the background emissions captured by the RPI receivers still produce an overwhelming
number of false edgels. The second row illustrates common effects of a smoothing filter
that protects the differentiation operator from jitter noise. The plasmagram image is
smoothed with a 3x3 median filter, Panel 2(c), and then the edgel detection is done with
the same algorithm as before. The results shown in Panel 2(d) indicate that the amount of
smoothing is still not sufficient to suppress all noise, whereas the thin traces in the upper
frequency band are already damaged.
Figure 2. Edgel labeling for an example plasmagram (a) taken on March 2, 2002, 04:46 UT. Direct edgel detection (b) produces a large number of false edgels even with the thresholding of the amplitude gradient. (c) Application of the smoothing 3x3 median filter prior to edgel detection reduces the noise edgels but damages thin traces (d). The chosen approach (e) uses the adaptive local thresholding to detect echoes and then labels the leading edges (f).
The third row of Figure 2 shows the plasmagram processed by an adaptive 1D echo
detection algorithm that eliminates background noise without the artifacts of smoothing.
The echo detection algorithm uses a common running-average technique that compares
intensity of each pixel to a threshold value calculated over an enclosing window around
the pixel and then labels pixels above the threshold as echoes. The 1D window is placed
on the plasmagrams vertically to avoid influence of the neighboring frequencies that may
have significantly different levels of noise and signal.
Revised for submission to JGR Space Physics
12 18.06.2004
4.2. Edgels to Rotors
The orientation of edgels is obtained with a steerable narrow sector placed on top of
the edgel. After a number of sector orientations are tested, the edgel orientation is set to
the same direction as the maximum number of other edges found within the sector. The
actual steering algorithm implements an angular histogramming technique [Baginyan et
al., 1994], which is a version of the linear Hough Transform (HT) reworked for a higher
computing efficiency.
4.3. Rotors to Saliency Map
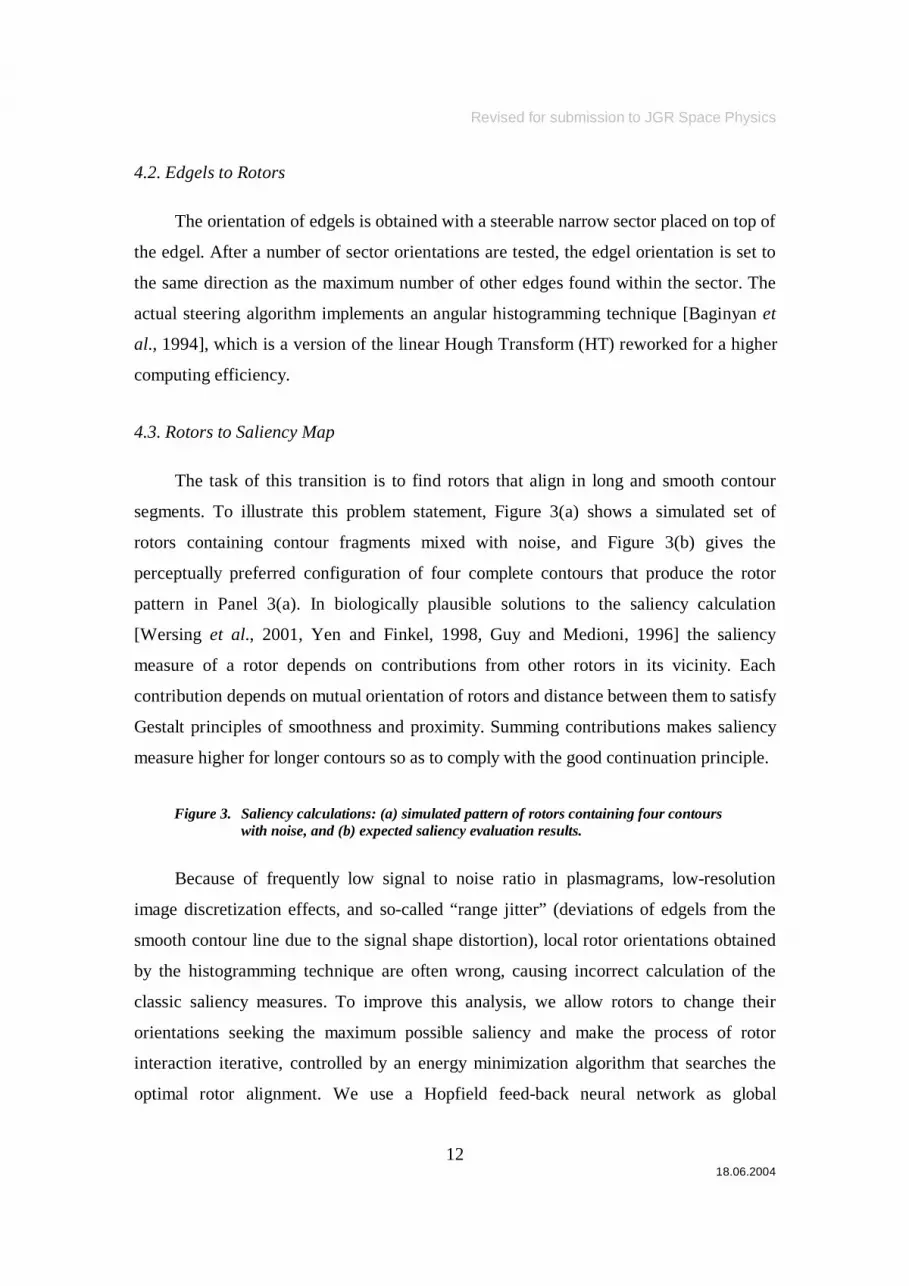
The task of this transition is to find rotors that align in long and smooth contour
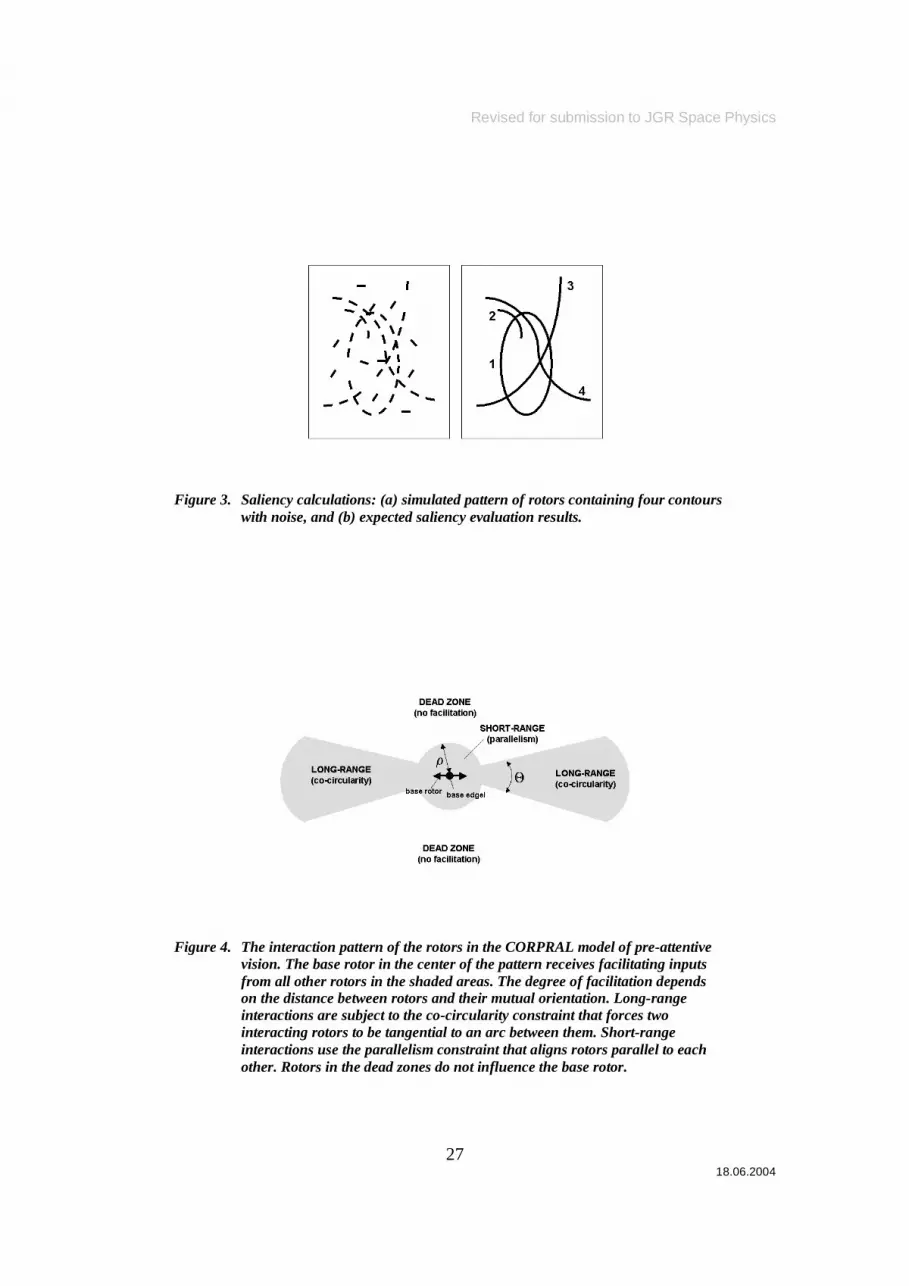
segments. To illustrate this problem statement, Figure 3(a) shows a simulated set of
rotors containing contour fragments mixed with noise, and Figure 3(b) gives the
perceptually preferred configuration of four complete contours that produce the rotor
pattern in Panel 3(a). In biologically plausible solutions to the saliency calculation
[Wersing et al., 2001, Yen and Finkel, 1998, Guy and Medioni, 1996] the saliency
measure of a rotor depends on contributions from other rotors in its vicinity. Each
contribution depends on mutual orientation of rotors and distance between them to satisfy
Gestalt principles of smoothness and proximity. Summing contributions makes saliency
measure higher for longer contours so as to comply with the good continuation principle.
Figure 3. Saliency calculations: (a) simulated pattern of rotors containing four contours with noise, and (b) expected saliency evaluation results.
Because of frequently low signal to noise ratio in plasmagrams, low-resolution
image discretization effects, and so-called “range jitter” (deviations of edgels from the
smooth contour line due to the signal shape distortion), local rotor orientations obtained
by the histogramming technique are often wrong, causing incorrect calculation of the
classic saliency measures. To improve this analysis, we allow rotors to change their
orientations seeking the maximum possible saliency and make the process of rotor
interaction iterative, controlled by an energy minimization algorithm that searches the
optimal rotor alignment. We use a Hopfield feed-back neural network as global
Revised for submission to JGR Space Physics
13 18.06.2004
optimizing system that evolves in its global minimum of energy with the help of the
Mean Field Theory (MFT) processing [Peterson and Anderson, 1987]. Similar to the
rotor model introduced by Peterson [1989], the synaptic weights of the neural network
are determined dynamically for each pair of interacting rotors. To determine
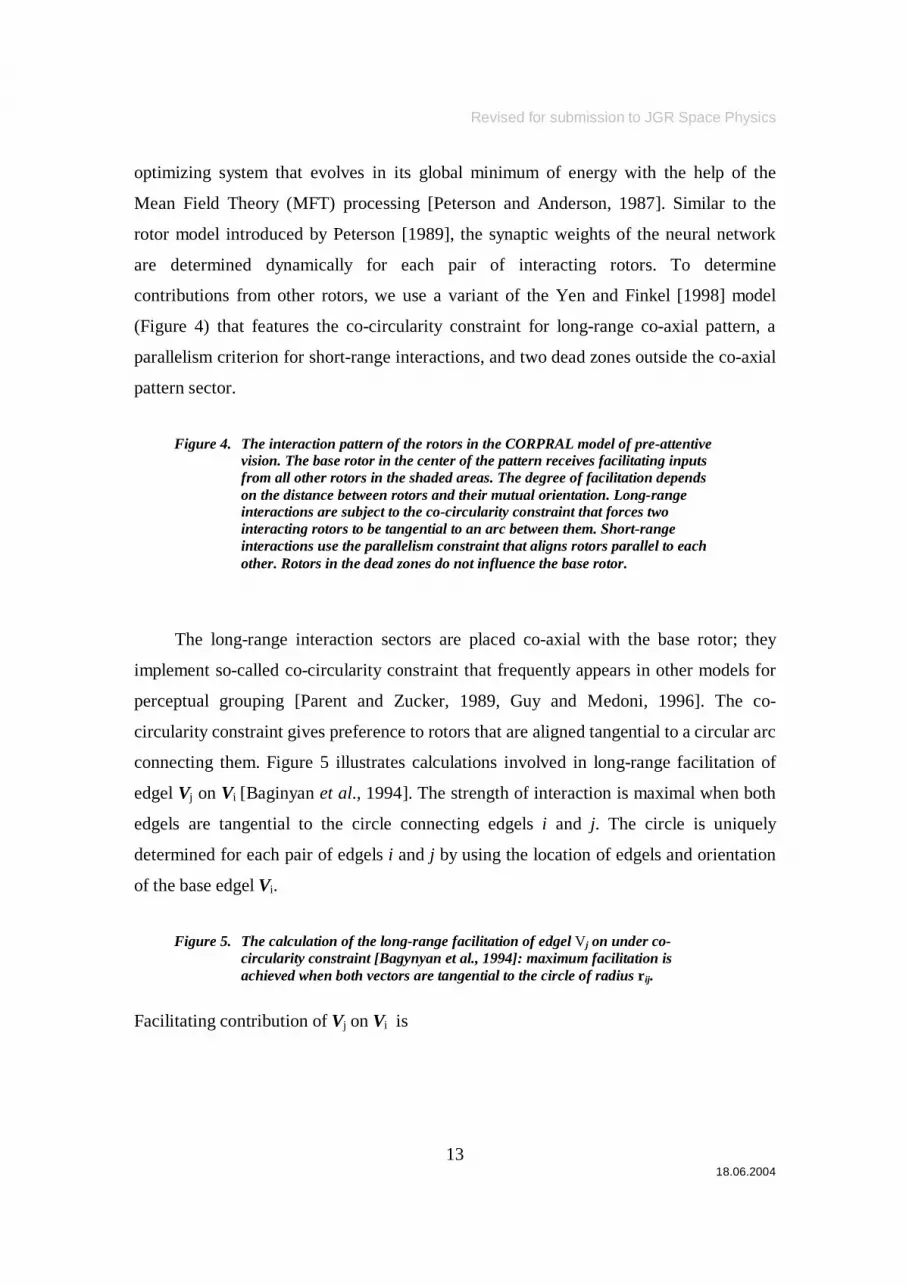
contributions from other rotors, we use a variant of the Yen and Finkel [1998] model
(Figure 4) that features the co-circularity constraint for long-range co-axial pattern, a
parallelism criterion for short-range interactions, and two dead zones outside the co-axial
pattern sector.
Figure 4. The interaction pattern of the rotors in the CORPRAL model of pre-attentive vision. The base rotor in the center of the pattern receives facilitating inputs from all other rotors in the shaded areas. The degree of facilitation depends on the distance between rotors and their mutual orientation. Long-range interactions are subject to the co-circularity constraint that forces two interacting rotors to be tangential to an arc between them. Short-range interactions use the parallelism constraint that aligns rotors parallel to each other. Rotors in the dead zones do not influence the base rotor.
The long-range interaction sectors are placed co-axial with the base rotor; they
implement so-called co-circularity constraint that frequently appears in other models for
perceptual grouping [Parent and Zucker, 1989, Guy and Medoni, 1996]. The co-
circularity constraint gives preference to rotors that are aligned tangential to a circular arc
connecting them. Figure 5 illustrates calculations involved in long-range facilitation of
edgel Vj on Vi [Baginyan et al., 1994]. The strength of interaction is maximal when both
edgels are tangential to the circle connecting edgels i and j. The circle is uniquely
determined for each pair of edgels i and j by using the location of edgels and orientation
of the base edgel Vi.
Figure 5. The calculation of the long-range facilitation of edgel V j on under co-circularity constraint [Bagynyan et al., 1994]: maximum facilitation is achieved when both vectors are tangential to the circle of radius r ij .
Facilitating contribution of Vj on Vi is

Revised for submission to JGR Space Physics
14 18.06.2004
( )cosa
j ij
ij b
ij
ξ′=
VL
C (1)
The vector j′V is obtained by flipping vector Vj around chord Cij. Use of the j′V factor
assures that longer vectors give higher contributions, whereas the ( )cosa
ijξ factor
enforces co-circularity of the vectors. Finally, bijC1 attenuates facilitation of farther
edgels. Parameters a and b regulate how fast the contribution falls with misalignment and
distance. Smaller a increases contributions from misaligned rotors, thus allowing for
greater deviations from the circularity requirement. Smaller b increases the length of co-
axial long-range sectors and corresponds to a larger spatial scale of saliency analysis.
Optimal settings of a and b were selected using results of the parameter sensitivity study
[Galkin, 2004] that suggested a greater spatial scale (smaller b) and weaker misalignment
attenuation (smaller a) for the RPI plasmagrams.
The long-range model is inappropriate at short range, where resolution jitter causes
the unwanted attenuation of contributions calculated under the co-circularity constraint.
The short-range model uses a simpler criterion of parallelism for facilitation:
jij b
ij
=V
SC
(2)
Adding the dead zones outside the co-axial pattern, the overall facilitation of Vj on
Vi becomes
,
, and 2
0, and 2
ij ij
ij ij ij ij
ij ij
C
C
C
ρ
ρ θ
ρ θ
< Θ= > < Θ> >
S
F L (3)
where ρ is the radius of short-term interaction, and Θ is the central angle of the long-term
interaction sector. The elevation angle θij is normally measured between the base edgel Vi

Revised for submission to JGR Space Physics
15 18.06.2004
and the chord Cij , but we calculate θij between the facilitating rotor Vj and the chord Cij to
better handle cases where the initial orientation of the base edgel Vi is estimated
incorrectly. Choice of the short-range radius ρ is determined by the typical jitter of edgels
in the plasmagrams and nominally set to not more than 3 pixels. Selecting larger central
angles Θ of the long-range sectors makes dead zone smaller and decreases ability of the
algorithm to process short weak traces in vicinity of the stronger and longer traces.
Making the long-range sectors too narrow causes difficulties in calculating saliencies for
traces that do not conform to the constant curvature restriction. Optimal values of
algorithm setting are further discussed by Galkin [2004] using synthesized rotor
configurations.
The saliency measure for edgel i is thus calculated as vector sum of all
contributions F ij from the neighboring edgels on edgel Vi:
i ijj i≠
=∑Y F (4)
Thus, the saliency measure is a vector quantity reflecting both perceptual strength and
trace orientation of the edgels.
4.4. Saliency Map to Segments
Combining edgels to trace segments is done bottom-up using the degree of rotor
alignment as the clustering criterion. The clustering is started with the highest degree of
alignment and continues until the stop value is reached. Additional measures are taken to
avoid bifurcation during the process of joining segments together.
4.5. Segments to Traces
Additional grouping may be required to combine segments produced by the
clustering algorithm. All possible segment combinations are searched exhaustively, and a
grouping score Qij is determined for each pair of segments i and j similarly to the
reconnection criterion of Lee and Talbot [1995] as:

Revised for submission to JGR Space Physics
16 18.06.2004
( )1 (1 )ij ij ijij ij ij
dQ A G
D
α βλ λ λ λ
π+
= + − = + − (5)
The score Qij includes a connection smoothness term Aij and a connection gap term Gij .
The coefficient λ regulates the relative contribution of terms Aij and Gij to the overall
score. The smoothness of connection, Aij, is characterized by angles αij and βij between
the straight line connecting two segments and the straight lines fitted through the
connection area to the segment tips. Figure 6 illustrates evaluation of Aij with an example
where two segments i and j, each containing 7 points, are considered for connection. The
gap connector line is first built, joining the end points of the segments (shown in red)
with a straight line. Then two fit windows are placed at the end points of the segments to
determine orientation of the segment tips in the gap area. The fit window in this example
is 7 points wide. A straight line is fitted to the points within the window using least-
square fit technique (shown in blue). Inclusion of the gap connector points in the fit
window accomplishes a greater robustness to the range resolution jitter. Angles αij and βij
are taken between the gap connector line and the lines fitted to the segment tips. The
connection gap term Gij governs contribution of the gap between segments, dij , to the
grouping score. D is the scale parameter keeping Gij within the interval of (0,1).
Figure 6. Calculation of angles αij and βij for the connection smoothness term in the segment grouping score. The angles are measured between the gap connector line joining two segments together and straight lines fitted to the segment tips.
On each iteration of the connection algorithm, all candidates are tested, and only
two segments with the best connection score are combined together, provided that their
grouping score is below a fixed threshold value Tq. Larger Tq causes connection of
segments that are less likely to belong to the same trace; the optimal value was chosen
based on simulated segment patterns. The segment grouping operations are continued
until no segments can be joined.
Figure 7 illustrates the CORPRAL processing stages on the RPI plasmagram taken
on March 1, 2002 00:02:58 UT.

Revised for submission to JGR Space Physics
17 18.06.2004
Figure 7. Example of CORPRAL processing stages for RPI plasmagram taken on March 01, 2002 00:02:58 UT. The raw plasmagram (a) is thresholded to obtain echoes (b), which are then reduced to the edgels (c). The edgel orientations are obtained and optimized to derive the saliency map (d) of the image. The saliency measures are analyzed to obtain trace segments (e) that are then combined together to form traces (f).
5 Performance Study, Science Discovery Implications, and Future
Refinements
All of the nearly 900,000 RPI plasmagrams acquired by June 2004 have been
processed automatically, and over 150,000 of them are now annotated in the mission
database as containing traces. New data are arriving daily at a rate of about 600 images a
day for immediate CORPRAL analysis; average processing time is 2 sec per plasmagram
on a desktop grade PC. Figure 8 shows a sample subset of plasmagrams taken in July
2001 that were found to contain 6 or more traces; this is the exact scenario that
CORPRAL was developed for: an automated exploration of a very large RPI imagery
archive for data nuggets.
Figure 8. Some of July 2001 plasmagrams selected by CORPRAL as containing 6 or more traces.
Considering a very high demand of manual labor involved in plasmagram
processing, only a brief survey of CORPRAL performance is provided at this time, based
on the expert analysis of 1420 plasmagrams taken during three consecutive orbits in May
2001. Over 97% of CORPRAL-rated plasmagrams were annotated correctly. At 11%
prevalence of trace-containing plasmagrams during the tested period, positive and
negative predictive values were 91% and 98%, respectively, indicating that the balance is
slightly shifted towards false negative decisions (CORPRAL missing faint traces). A
comprehensive CORPRAL performance test will be reported upon completion of a
dedicated campaign of manual plasmagram scaling, currently at the feasibility study
phase.

Revised for submission to JGR Space Physics
18 18.06.2004
Special efforts were made to provide means for exploratory analysis of the subset of
CORPRAL-rated plasmagrams. Each rating is submitted to the RPI database of
telemetry, derived, and expert knowledge data [Galkin et al., 2001] together with
extracted traces and algorithm settings description available for queries. Each
plasmagram can have more than one rating record associated with it to allow analysis of
multiple processing results from different experts and CORPRAL versions. Access to the
ratings is available via remote connections over the Internet to the database using RPI
BinBrowser software tool for data visualization and editing. BinBrowser installation
instructions and query examples are available at the CORPRAL homepage,
http://car.uml.edu/rpi/corpral/. Once connection of BinBrowser software to RPI Level 2
database at University of Massachusetts Lowell is established, remote queries can be
initiated for plasmagrams rated by the V1 CORPRAL expert. Querying one month of
ratings to select qualifying plasmagrams takes only a few seconds to generate the results.
Beside clear benefits of the automated exploration of RPI data that has dramatically
reduced labor and time needed from the experts that browse plasmagram images to look
for a new knowledge, the CORPRAL ratings provide other ways of getting new insights
in the RPI scientific mission and instrument performance. CORPRAL is a well-defined
algorithm providing a uniform, consistent, repeatable view of the collected data of highly
variable content and quality. This view is computationally tractable and, assuming that
accuracy of the automated analysis is sufficiently high, it still captures the essence of
data. This data model can be studied in explanatory, exploratory and predictive modes, as
well as mined for previously unknown associations with other measurement variables
such as the instrument orbital position and Geospace conditions. As an example, we
generated a plot of trace occurrence (ratio of number of plasmagrams with traces to the
total number of plasmagrams) over 4 years of mission from May 1, 2000 to May 1, 2004
as a function of magnetic local time (MLT) and invariant latitude (Figure 9). Data
acquired below 30˚ of invariant latitude are relatively scarce because of the IMAGE orbit
geometry, so that occurrence ratios are estimated less reliably. The plot shows higher
trace occurrence within the plasmasphere, as well as a peculiar pattern of high trace
occurrence in plasmagrams collected inside the plasmasphere in the sector between 01:00
Revised for submission to JGR Space Physics
19 18.06.2004
and 06:00 MLT. Figure 9 is provided here to illustrate the ease of manipulating nearly
1,000,000 RPI records to analyze available expert knowledge data and potential for
scientific analyses that CORPRAL ratings provide.
Figure 9. Trace occurrence (ratio of number of CORPRAL-rated plasmagrams to total number of plasmagrams) as function of MLT and invariant latitude, calculated over 4 years of RPI mission.
We are extending CORPRAL along several directions. One area of concern is the
robustness of the performance of CORPRAL on imagery data of highly variable content
and quality. As the spacecraft orbits the Earth, the imager is exposed to a great variety of
plasma and noise conditions forcing the recognition algorithms to adapt. Even though
most processing stages are data-driven, the need to seek a balance between false positives
and false negatives still exists. False positives, although not very frequent, are a real
problem caused primarily by the adaptive echo detection whose errors propagate up
Marr’s pyramid levels uncompensated. To strengthen robustness to the false positives in
the early processing stages, it should be possible to find additional support information in
the raw image to verify the pre-attentive vision cues.
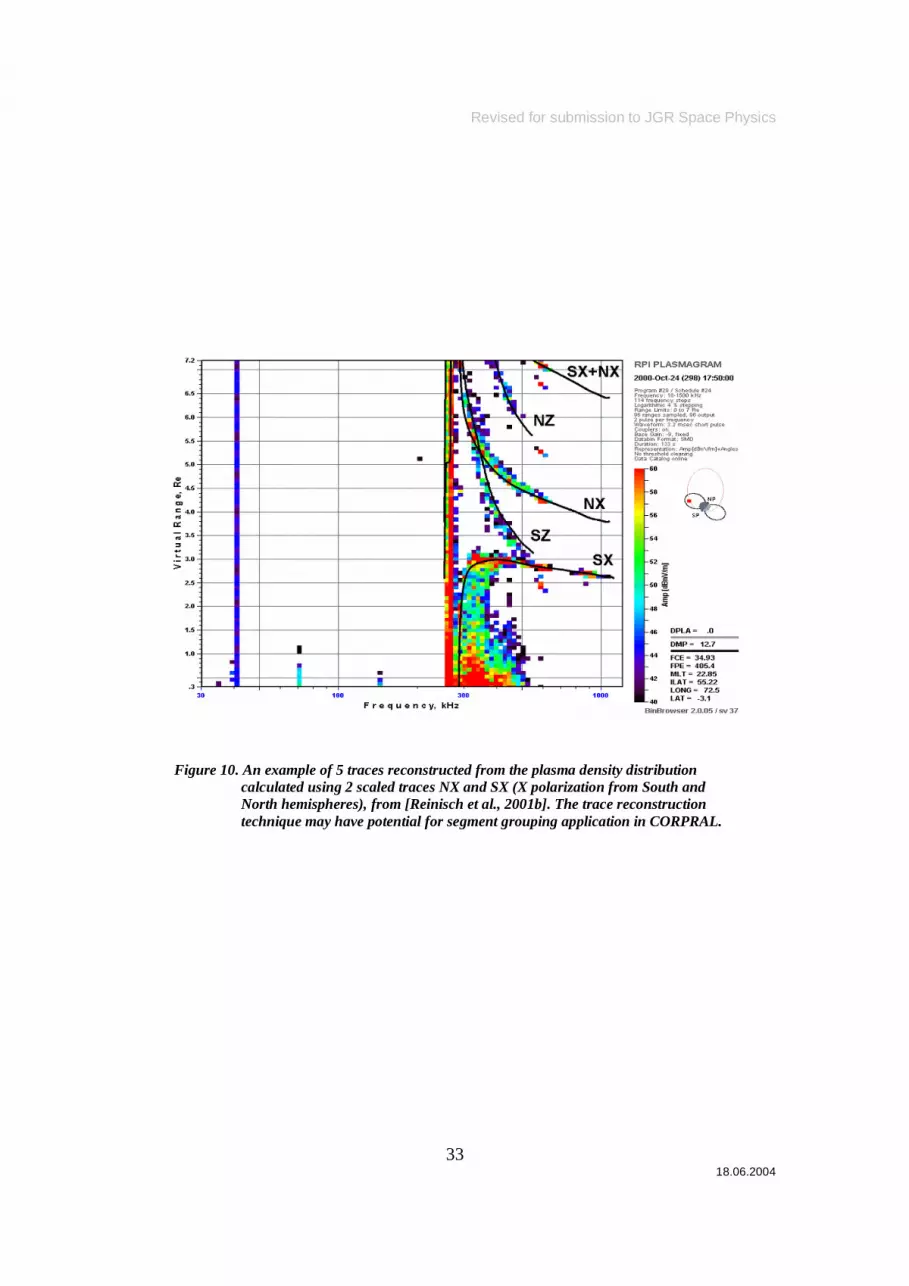
Another direction for future work lies in inferring complete traces from their
segments. This task can be approached from the point of linguistic analysis that
identifies the shape using a dictionary of known shapes and completes the shape. Such a
linguistic algorithm could, for example, restore the missing parts of the epsilon feature in
Figure 10, provided that it can identify the epsilon shape from pre-attentive signatures.
Another possibility is to use found segments to drive a physical model of the plasma
density distribution and use the solution of the trace inversion problem to solve the direct
task of reconstructing complete traces from the plasma distribution and matching them to
the image. Figure 10 shows an example of RPI plasmagram taken on October 24, 2000
17:50 UT, where reconstructed traces are superimposed with the original plasmagram
with good agreement.
Revised for submission to JGR Space Physics
20 18.06.2004
Figure 10. An example of 5 traces reconstructed from the plasma density distribution calculated using 2 scaled traces NX and SX (X polarization from South and North hemispheres), from [Reinisch et al., 2001b]. The trace reconstruction technique may have potential for segment grouping application in CORPRAL.
Summary
Intelligent systems with increased automation for research instruments now
collecting massive data sets are becoming a necessity as any manual manipulation or
intervention is beginning to be unrealistic. The scientific archives containing these huge
volumes of data generated by space missions require automated exploration and mining
that can at least pre-classify information in categories. Our operational system
“CORPRAL” has been developed to scan the daily submissions of RPI plasmagrams for
the presence of echo traces and to identify qualifying plasmagrams in the mission
database, thus making them available for a variety of queries. This automated screening
of the plasmagrams provides new ways of getting insights into the depths of the RPI data
mine.
Acknowledgements
The authors gratefully acknowledge Robert Benson, Paul Song, and Gary Sales for valuable
suggestions and manuscript critique. The authors are indebted to Leif Finkel and Mark Matlin for
their helpful discussions, demonstrations, and technical assistance with the Yen and Finkel early
vision model. The work at the University of Massachusetts Lowell was supported by NASA
under subcontract 83822 to the Southwest Research Institute and through the Intelligent Systems
(IS) Grant NAG5-13387. The authors would like to thank the manuscript reviewers for their
thoughtful guidance.

Revised for submission to JGR Space Physics
21 18.06.2004
References
Baginyan, S., A. Glazov, I. Kisel, E. Konotopskaya, V. Neskoromnyi, and G. Ososkov, Tracking by a modified rotor model of neural network, Comp. Phys. Comm., 79, 165-178, 1994.
Ballard, D.H., Generalizing the Hough Transform to detect arbitrary shapes, Pattern Recognition, 13(2), 111-122, 1981.
Burch, J.L., IMAGE mission overview, Space Science Reviews, 91, 1-14, 2000.
Canny, J.F., A computational approach to edge detection, IEEE Pattern Analysis Machine Intelligence, 8, 679-698, 1986.
Castano A., R. C. Anderson, R. Castano, T. Estlin, and M. Judd, Intensity-based rock detection for acquiring onboard rover science, XXXV Lunar and Planetary Science Conference, March 15-19, 2004, Paper #2015, 2004.
Elie, F., M. Hayakawa, M. Parrot, J-L Pincon and F. Lefeuvre, “Neural network system for the analysis of transient phenomena on board the Demeter micro-satellite,” IEICE Trans. Fundamentals, vol. E82-A, 8, 1575-1581, 1999.
Fayyad, U. M., S. G. Djorgovski, N. Weir, Automating the Analysis and Cataloging of Sky Surveys. Advances in Knowledge Discovery and Data Mining, AAAI Press/The MIT Press, Menlo Park, CA, 471-493, 1996.
Freeman, W.T. and E.H. Adelson, The design and use of steerable filters, IEEE Trans. Pattern Analysis and Machine Intelligence, 13, 891-906, 1991.
Galkin, I.A., B.W. Reinisch, G.A. Ososkov, E.G. Zaznobina, and S.P. Neshyba, Feedback neural networks for ARTIST ionogram processing, Radio Sci., 31, 1119-1129, 1996.
Galkin, I.A., G. M. Khmyrov, A. Kozlov, B.W. Reinisch, X. Huang, and G. Sales, New tools for analysis of space-borne sounding data, Proc. 2001 USNC/URSI Nat. Radio Sci. Meeting, Boston, MA, 304, 2001.
Galkin, I A., B. W. Reinisch, X. Huang, R. F. Benson, and S. F. Fung, Automated diagnostics for resonance signature recognition on IMAGE/RPI plasmagrams, Radio Sci., 39, 1, RS1015, 10.1029/2003RS002921, 24 February 2004.
Galkin, I.A., A pre-attentive vision model for automated data exploration applied to space plasma remote sensing data, Sc.D. Thesis, University of Massachusetts, Lowell, 2004.
Gao, J.,Wang, H. and Zhou, M., Development of an automatic filament disappearance detection system, Solar Physics 205, 93–103, 2002.

Revised for submission to JGR Space Physics
22 18.06.2004
Green, J. L. , S. Boardsen, S. F. Fung, H. Matsumoto, K. Hashimoto, R. R. Anderson, B. R. Sandel, and B. W. Reinisch, Association of kilometric continuum radiation with plasmaspheric structures, J. Geophys. Res., 109, A03203, doi:10.1029/2003JA010093, 2004.
Guy, G. and G.Medoni, Inferring global perceptual contours from local features. Int. J. Computer Vision , 20, 113-133, 1996.
Hough, P.V.C., A method and means for recognizing complex patterns. US Patent 3,069,654, 1962.
Huang, X., B.W. Reinisch, D. Bilitza, and R.F. Benson, Electron density profiles of the topside ionosphere. Annals of Geophysics, 45, 125-130, 2002.
Kohonen, T., Self-organizing formation of topologically correct feature maps, Biological Cybernetics, 43, 59-69, 1982.
Laptev, I., H. Mayer, T. Lindeberg, W. Eckstein, C. Steger, and A. Baumgartner, Automatic extraction of roads from aerial images based on scale-space and snakes, Machine Vision and Applications, 12, 23-31, 2000.
Lee, T.C.M. and H. Talbot, A fast method for detecting and matching linear features in images. Proc. DICTA-95, 649-654, 1995.
Madala, H. R. and A.G. Ivakhnenko, Inductive Learning Algorithms for Complex Systems Modeling, CRC Press Inc., Boca Raton, 1994.
Marr, D. and H.K. Nishihara, Visual information processing: Artificial intelligence and the sensorium of light, Tech. Review, 81, 2-23, 1978.
Milani, A., A. Villani, and M. Stiavelli, Discovery of very small asteroids by automated trail detection, Earth, Moon and Planets, 72, 257-262, 1996.
Parent, P. and S.W. Zacker, Trace inference, curvature consistency, and curve detection, IEEE Trans., PAMI-11, 823-839, 1989.
Peterson, C., Track finding with neural networks, Nucl.Instr.Meth.Phys.Res., A279, 537-545, 1989.
Peterson, C. and J.R. Anderson, A mean field theory learning algorithm for neural networks, Complex Systems, 1, 995-1019, 1987.
Reinisch, B. W. and X. Huang, Automatic Calculation of Electron Density Profiles from Digital Ionograms, 3, Processing of Bottomside Ionograms, Radio Sci., 18, 472-492, 1983.
Reinisch, B.W. et al., The Radio Plasma Imager investigation on the IMAGE spacecraft, Space Science Reviews, 91, 319-35, 2000.

Revised for submission to JGR Space Physics
23 18.06.2004
Reinisch, B.W. et al., Radio sounding in space: magnetosphere and topside ionosphere, J. Atmos. Solar-terr. Phys., 63, 87-98, 2001.
Reinisch, B. W., X. Huang, P. Song, J. L. Green, S. F. Fung, V. M.Vasyliunas, D. L. Gallagher, and B.R. Sandel, Plasmaspheric mass loss and refilling as a result of a magnetic storm, J. Geophys. Res., 109, A1, A01202, 1-11, 2004.
Rochery, M., I. Jermyn, and J. Zerubia. Higher order active contours and their application to the detection of line networks in satellite imagery. 2nd IEEE Workshop on Variational, Geometric and Level Set Methods in Computer Vision, Nice, France, 11-12 October 2003, 81-88, 2003.
Rock, I. and S. Palmer, The legacy of Gestalt psychology, Sci. American, SCA9012, 84-90, 1990.
Rummelhart, D. E., and J. L. McClelland, Parallel Distributed Processing, MIT Press, Cambridge, MA, 1986.
Sha’ashua, A. and S. Ullman, Structural saliency: the detection of globally salient structures using a locally connected network, 2nd Int. Conf. Computer Vision, 321-327, 1988.
Tilton, J. C., Analysis of Hierarchically Related Image Segmentations, Proc. IEEE Workshop on Advances in Techniques for Analysis of Remotely Sensed Data, Greenbelt, MD, USA, October 27-28, 60-69, 2003.
Villmann, T., E. Merenyi, and B. Hammer, Neural maps in remote sensing image analysis, Neural Networks, 16(3-4), 389-403, 2003.
Wersing, H., J.J.Steil, and H. Ritter (2001), A competitive layer model for feature binding and sensory segmentation of features. Neural Computation, 13, 357-387.
Yen, S.C. and L.H. Finkel, Extraction of perceptually salient contours by striate cortical networks. Vision Research, 38, 719-741, 1998.
Ziou, D., and S. Tabbone, Edge detection techniques – an overview, Int. J. Pattern Rec. & Image Analysis, 8, 537-559, 1998.
Zucker, S. W., Region growing: childhood and adolescence, Computer Graphics and Image Processing, 5, 382-399, 1976.
Revised for submission to JGR Space Physics
24 18.06.2004
Figure Captions
Figure 1. Sample RPI plasmagram showing signal reflections from remote plasma locations (traces) and a variety of stimulated resonances in the local plasma.
Figure 2. Edgel labeling for an example plasmagram (a) taken on March 2, 2002, 04:46 UT. Direct edgel detection (b) produces a large number of false edgels even with the thresholding of the amplitude gradient. (c) Application of the smoothing 3x3 median filter prior to edgel detection reduces the noise edgels but damages thin traces (d). The chosen approach (e) uses the adaptive local thresholding to detect echoes and then labels the leading edges (f).
Figure 3. Saliency calculations: (a) simulated pattern of rotors containing four contours with noise, and (b) expected saliency evaluation results.
Figure 4. The interaction pattern of the rotors in the CORPRAL model of pre-attentive vision. The base rotor in the center of the pattern receives facilitating inputs from all other rotors in the shaded areas. The degree of facilitation depends on the distance between rotors and their mutual orientation. Long-range interactions are subject to the co-circularity constraint that forces two interacting rotors to be tangential to an arc between them. Short-range interactions use the parallelism constraint that aligns rotors parallel to each other. Rotors in the dead zones do not influence the base rotor.
Figure 5. The calculation of the long-range facilitation of edgel V j on under co-circularity constraint [Bagynyan et al., 1994]: maximum facilitation is achieved when both vectors are tangential to the circle of radius r ij .
Figure 6. Calculation of angles αij and βij for the connection smoothness term in the segment grouping score. The angles are measured between the gap connector line joining two segments together and straight lines fitted to the segment tips.
Figure 7. Example of CORPRAL processing stages for RPI plasmagram taken on March 01, 2002 00:02:58 UT. The raw plasmagram (a) is thresholded to obtain echoes (b), which are then reduced to the edgels (c). The edgel orientations are obtained and optimized to derive the saliency map (d) of the image. The saliency measures are analyzed to obtain trace segments (e) that are then combined together to form traces (f).
Figure 8. Some of July 2001 plasmagrams selected by CORPRAL as containing 6 or more traces.
Figure 9. Trace occurrence (ratio of number of CORPRAL-rated plasmagrams to total number of plasmagrams) as function of MLT and invariant latitude, calculated over 4 years of RPI mission.
Figure 10. An example of 5 traces reconstructed from the plasma density distribution calculated using 2 scaled traces NX and SX (X polarization from South and North hemispheres), from [Reinisch et al., 2001b]. The trace reconstruction technique may have potential for segment grouping application in CORPRAL.

Revised for submission to JGR Space Physics
25 18.06.2004
Figure 1. Sample RPI plasmagram showing signal reflections from remote plasma locations (traces) and a variety of stimulated resonances of local plasma.

Revised for submission to JGR Space Physics
26 18.06.2004
(a)
(b)
(c)
(d)
(e)
(f)
Figure 2. Edgel labeling for an example plasmagram (a) taken on March 2, 2002, 04:46 UT. Direct edgel detection (b) produces a large number of false edgels even with the thresholding of the amplitude gradient. (c) Application of the smoothing 3x3 median filter prior to edgel detection reduces the noise edgels but damages thin traces (d). The chosen approach (e) uses the adaptive local thresholding to detect echoes and then labels the leading edges (f).
Revised for submission to JGR Space Physics
27 18.06.2004
Figure 3. Saliency calculations: (a) simulated pattern of rotors containing four contours with noise, and (b) expected saliency evaluation results.
Figure 4. The interaction pattern of the rotors in the CORPRAL model of pre-attentive vision. The base rotor in the center of the pattern receives facilitating inputs from all other rotors in the shaded areas. The degree of facilitation depends on the distance between rotors and their mutual orientation. Long-range interactions are subject to the co-circularity constraint that forces two interacting rotors to be tangential to an arc between them. Short-range interactions use the parallelism constraint that aligns rotors parallel to each other. Rotors in the dead zones do not influence the base rotor.

Revised for submission to JGR Space Physics
28 18.06.2004
Figure 5. The calculation of the long-range facilitation of edgel V j on under co-circularity constraint [Bagynyan et al., 1994]: maximum facilitation is achieved when both vectors are tangential to the circle of radius r ij .

Revised for submission to JGR Space Physics
29 18.06.2004
Figure 6. Calculation of angles αij and βij for the connection smoothness term in the segment grouping score. The angles are measured between the gap connector line joining two segments together and straight lines fitted to the segment tips.

Revised for submission to JGR Space Physics
30 18.06.2004
(a) Raw plasmagram image (b) Echoes
(c) Edgels (d) Saliency Map
(e) Trace Segments (f) Traces
Figure 7. Example of CORPRAL processing stages for RPI plasmagram taken on March 01, 2002 00:02:58 UT. The raw plasmagram (a) is thresholded to obtain echoes (b), which are then reduced to the edgels (c). The edgel orientations are obtained and optimized to derive the saliency map (d) of the image. The saliency measures are analyzed to obtain trace segments (e) that are then combined together to form traces (f).

Revised for submission to JGR Space Physics
31 18.06.2004
Figure 8. Some of July 2001 plasmagrams selected by CORPRAL as containing 6 or more traces.

Revised for submission to JGR Space Physics
32 18.06.2004
Figure 9. Trace occurrence (ratio of number of CORPRAL-rated plasmagrams to total number of plasmagrams) as function of MLT and invariant latitude, calculated over 4 years of RPI mission.
Revised for submission to JGR Space Physics
33 18.06.2004
Figure 10. An example of 5 traces reconstructed from the plasma density distribution calculated using 2 scaled traces NX and SX (X polarization from South and North hemispheres), from [Reinisch et al., 2001b]. The trace reconstruction technique may have potential for segment grouping application in CORPRAL.