association between circulating specific leukocyte types and incident chronic kidney disease: the...
TRANSCRIPT

ASSOCIATION BETWEEN CIRCULATING SPECIFIC LEUKOCYTETYPES AND BLOOD PRESSURE: THE ATHEROSCLEROSISRISK IN COMMUNITIES (ARIC) STUDY
Niu Tiana, Alan D. Penmanb, Anthony R. Mawsona, R. Davis Manning Jr.c, and Michael F.FlessnerbaDepartment of Pediatrics, University of Mississippi Medical Center, Jackson, Mississippi 39216,USAbDepartment of Medicine, University of Mississippi Medical Center, Jackson, Mississippi 39216,USAcDepartment of Physiology and Biophysics, University of Mississippi Medical Center, Jackson,Mississippi 39216, USA
AbstractBackground—Although total white blood cell (WBC) count has been associated withhypertension, the association between specific WBC types and blood pressure (BP) levels has notbeen studied.
Methods—In a cohort of 5,746 middle-aged African-American and white adults free of clinicalcardiovascular disease and cancer and not taking hypertension or anti-inflammatory medications,BP was measured at baseline and 3, 6, and 9 years later. Levels of circulating neutrophils,lymphocytes, and monocytes were measured at baseline.
Results—In African-Americans, but much less so in whites, increased neutrophil levels anddecreased lymphocyte levels were significantly associated with elevation of BP but did notinfluence the rate of change of BP over time. The mean BP difference between the highest andlowest quartiles of neutrophils was approximately 8 mmHg for systolic BP (SBP), 4 mmHg formean arterial pressure (MAP), and 5 mmHg for pulse pressure (PP). The mean BP differencebetween the lowest and highest quartiles of lymphocytes was approximately 6 mmHg for SBP, 2mmHg for diastolic BP (DBP), 3 mmHg for MAP, and 4 mmHg for PP.
Conclusions—Increased neutrophils and decreased lymphocytes are significantly correlatedwith the regulation of BP and the development of hypertension, especially in African-Americans.
KeywordsInflammation; Hypertension; Neutrophil; Lymphocyte
© 2010 American Society of Hypertension. All rights reserved.Corresponding Author: Niu Tian, Research Wing R125, University of Mississippi Medical Center, 2500 North State Street, Jackson,MS 39216, USA; Phone: 601-984-5973; Fax: 601-815-5902; [email protected]'s Disclaimer: This is a PDF file of an unedited manuscript that has been accepted for publication. As a service to ourcustomers we are providing this early version of the manuscript. The manuscript will undergo copyediting, typesetting, and review ofthe resulting proof before it is published in its final citable form. Please note that during the production process errors may bediscovered which could affect the content, and all legal disclaimers that apply to the journal pertain.Conflicts of interest: the authors have no conflicts of interest to declare
NIH Public AccessAuthor ManuscriptJ Am Soc Hypertens. Author manuscript; available in PMC 2011 November 1.
Published in final edited form as:J Am Soc Hypertens. 2010 ; 4(6): 272–283. doi:10.1016/j.jash.2010.09.005.
NIH
-PA Author Manuscript
NIH
-PA Author Manuscript
NIH
-PA Author Manuscript

INTRODUCTIONHypertension is a well-known risk factor for cardiovascular disease 1,2 and cardiovascular -related death 3. It was recently reported that 29% of adults ≥20 years age in the UnitedStates had hypertension and an additional 37% had pre-hypertension 4. Therefore,hypertension continues to be an important public health problem. For the past 200 years, avariety of etiologies for essential hypertension has been proposed 5. However, themechanisms underlying the pathogenesis of this disease remain unclear. In recent years,inflammation has emerged as a potential mechanism of hypertension and a prospectivetherapeutic target 6,7. A number of epidemiological studies have shown that markers ofsystemic low-grade inflammation are increased in hypertensive patients, and their levelspredict the onset of hypertension 8. Circulating leukocytes are the most stable, well-standardized, readily available and inexpensive measure of systemic inflammation. Thepredictive role of circulating total white blood cell (WBC) level in the incidence orprevalence of hypertension has been well documented 9,10,11. Nevertheless, littleinformation is available on the independent contribution of specific WBC types.
Blood pressure (BP) differences between African-Americans and whites have been noted fora long time 12. A recent study found that 35% of African-Americans have hypertension,which accounts for 20% of African-American deaths in the United States - twice thepercentage in whites. Compared to whites, hypertension develops earlier in life and averageBPs are much higher in African-Americans 13. The reason for these differences is stillpoorly understood. We hypothesized that circulating levels of specific leukocytes contributeto the development of hypertension, especially in African-Americans. The objectives of thisstudy were to determine: 1) whether there is an independent association between the levelsof circulating specific leukocytes (neutrophils, lymphocytes, and monocytes) and BPparameters [systolic BP (SBP), diastolic BP (DBP), mean arterial pressure (MAP) and pulsepressure (PP)]; 2) whether the levels of circulating specific leukocytes are associated withthe rate of change of BP with age.
METHODSStudy Population
The ARIC study is a prospective investigation of atherosclerosis and clinical atheroscleroticdiseases in four US communities. A population sample totaling 15,792 persons aged 45–64was selected from Forsyth County, NC, Jackson, Miss., the northwest suburbs ofMinneapolis, MN, and Washington County, MD, using a published study design, samplingstrategy, and examination techniques 14. Each community's cohort was a probability sample,except that only African-Americans were sampled in Jackson. A baseline examination (visit1) was conducted from 1986 to 1989, with response rates of 46% in Jackson and 65–67% inthe other three communities. Participants were re-examined every three years (visit 2,1990-92; visit 3, 1993-95; visit 4, 1996-98). At each clinic visit, sociodemographiccharacteristics, medical history, medication use, diet, and physical activity were assessed,and a variety of biochemical, physiologic, and anthropomorphic measures were obtained.
For the cross-sectional analysis component of this study we analyzed data from visit 1. Weexcluded 48 participants who were neither white nor African-American and 55 African-Americans in the Minneapolis, MN and Washington County, MD field centers (due to theirsmall numbers); 874 with a history of cancer; 766 with prevalent coronary heart diseaseCHD; 284 with prior stroke; 401 who had had heart/arterial surgery; 261 who had hadballoon angioplasty; 635 with a history of peripheral artery disease; 16 persons missing BPat visit 1; and 4,846 persons on hypertension medications or whose medication status wasunknown. In addition, 173 persons on steroids, 2,842 on Ibuprofen or other non-steroidal
Tian et al. Page 2
J Am Soc Hypertens. Author manuscript; available in PMC 2011 November 1.
NIH
-PA Author Manuscript
NIH
-PA Author Manuscript
NIH
-PA Author Manuscript

anti-inflammatory drugs, and 4,251 on aspirin/salicylates were also excluded because of theanti-inflammatory actions of these drugs. Finally, we excluded persons with cell counts inthe top 1% of the leukocyte distributions [total WBC >12,000 (n=155), neutrophils >78%(n=114), lymphocytes >63% (n=62), monocytes >14% (n=102)] because these extremelevels could represent occult disease. This left 5,746 participants available for study. For thelongitudinal analysis, the BP readings at visits 2, 3, or 4 were marked as missing if theparticipant reported use of hypertension medications in the 2 weeks prior to that visit. Allparticipants with at least 1 BP reading (at visit1) were used in the longitudinal analysis.Thirteen percent had only the visit 1 BP reading, 16% had 2 BP readings, 18% had 3 BPreadings, and 53% had all 4 BP readings (mean 3.1 readings per person).
Clinical measurements and definitionsAll clinical measures were assessed at baseline using standardized instruments and a strictprotocol. SBP and DBP were taken in the sitting position by trained technicians using arandom-zero sphygmomanometer after a 5-minute rest, and the average of the last twovalues was computed. Hypertension was defined based on Joint National Committee VIIguidelines as SBP ≥140 mmHg or DBP ≥90 mmHg, or self-reported use of anti-hypertensive medication within the 2 weeks before the exam, or a history of physiciandiagnosis. Pre-hypertension was defined as SBP ≥120 mmHg but <140 mmHg or DBP ≥80mmHg but < 90 mmHg. Diabetes was defined based on the American Diabetes Associationguidelines as fasting serum glucose of ≥126 mg/dL (7 mmol/L) or non-fasting glucose of≥200 mg/dL (11.1 mmol/L), or self-reported use of diabetic medications within two weeksof the clinic visit, or a history of physician-diagnosed diabetes. Body mass index (BMI) wascalculated as weight (kg) divided by height (m) squared. Self-reported smoking and drinkingstatus were categorized into 3 levels (current, former, never). Fasting serum total lipoproteincholesterol concentration was assessed with Roche enzymatic methods using a Cobrascentrifuge analyzer (Hoffman-La Roche), with the laboratory certified by the CDC-NHLBILipid Standardization Program. Physical activity was assessed on a scale 0-5 using the sportscore from the modified Baecke instrument used in the ARIC Study 15. Usual dietarysodium intake was collected at baseline using a semi-quantitative, interviewer-administeredfood frequency questionnaire (FFQ). The ARIC FFQ contains 66-items and was based onthe original Willett 61-item FFQ 16.
Statistical AnalysisBecause we were interested in examining differences between race groups, and because inalmost all cases the interaction term for race*quartile of leukocyte level was statisticallysignificant, results are presented separately for African-Americans and whites. Descriptivedata are presented by race in Table 1 as mean ± standard error (SE) for continuous variablesand percentages for categorical variables. In the cross-sectional analysis, BP was regressedon leukocyte level (as a continuous variable) in a linear regression model, with adjustmentfor age, sex, center, diabetes, smoking (current, former, never), drinking (current, former,never), BMI, total cholesterol, physical activity, and usual dietary sodium intake. Also,differences in mean BP by quartile of leukocyte level (tertile of monocyte level because ofthe more restricted range of values) were tested in an ANOVA model, with adjustment forthe same covariates.
Analysis of longitudinal change in BP by quartile of leukocyte level (tertile of monocytelevel) was done using linear mixed models (SAS PROC MIXED) with a random interceptand slope and an unstructured correlation matrix 17. Age was used as the metameter for timeand was centered at age 55, the approximate median age of the study population. When agewas decomposed into baseline age and time since baseline, both terms were found to bestatistically significant (indicating both cross-sectional and longitudinal associations
Tian et al. Page 3
J Am Soc Hypertens. Author manuscript; available in PMC 2011 November 1.
NIH
-PA Author Manuscript
NIH
-PA Author Manuscript
NIH
-PA Author Manuscript
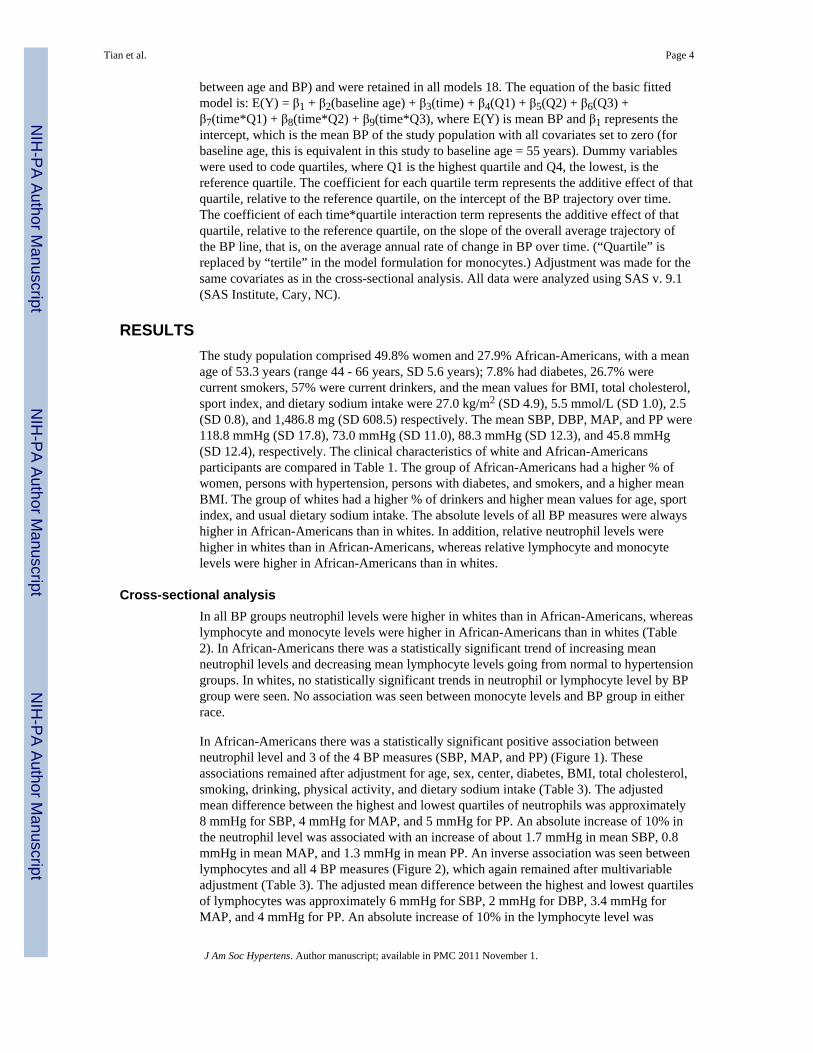
between age and BP) and were retained in all models 18. The equation of the basic fittedmodel is: E(Y) = β1 + β2(baseline age) + β3(time) + β4(Q1) + β5(Q2) + β6(Q3) +β7(time*Q1) + β8(time*Q2) + β9(time*Q3), where E(Y) is mean BP and β1 represents theintercept, which is the mean BP of the study population with all covariates set to zero (forbaseline age, this is equivalent in this study to baseline age = 55 years). Dummy variableswere used to code quartiles, where Q1 is the highest quartile and Q4, the lowest, is thereference quartile. The coefficient for each quartile term represents the additive effect of thatquartile, relative to the reference quartile, on the intercept of the BP trajectory over time.The coefficient of each time*quartile interaction term represents the additive effect of thatquartile, relative to the reference quartile, on the slope of the overall average trajectory ofthe BP line, that is, on the average annual rate of change in BP over time. (“Quartile” isreplaced by “tertile” in the model formulation for monocytes.) Adjustment was made for thesame covariates as in the cross-sectional analysis. All data were analyzed using SAS v. 9.1(SAS Institute, Cary, NC).
RESULTSThe study population comprised 49.8% women and 27.9% African-Americans, with a meanage of 53.3 years (range 44 - 66 years, SD 5.6 years); 7.8% had diabetes, 26.7% werecurrent smokers, 57% were current drinkers, and the mean values for BMI, total cholesterol,sport index, and dietary sodium intake were 27.0 kg/m2 (SD 4.9), 5.5 mmol/L (SD 1.0), 2.5(SD 0.8), and 1,486.8 mg (SD 608.5) respectively. The mean SBP, DBP, MAP, and PP were118.8 mmHg (SD 17.8), 73.0 mmHg (SD 11.0), 88.3 mmHg (SD 12.3), and 45.8 mmHg(SD 12.4), respectively. The clinical characteristics of white and African-Americansparticipants are compared in Table 1. The group of African-Americans had a higher % ofwomen, persons with hypertension, persons with diabetes, and smokers, and a higher meanBMI. The group of whites had a higher % of drinkers and higher mean values for age, sportindex, and usual dietary sodium intake. The absolute levels of all BP measures were alwayshigher in African-Americans than in whites. In addition, relative neutrophil levels werehigher in whites than in African-Americans, whereas relative lymphocyte and monocytelevels were higher in African-Americans than in whites.
Cross-sectional analysisIn all BP groups neutrophil levels were higher in whites than in African-Americans, whereaslymphocyte and monocyte levels were higher in African-Americans than in whites (Table2). In African-Americans there was a statistically significant trend of increasing meanneutrophil levels and decreasing mean lymphocyte levels going from normal to hypertensiongroups. In whites, no statistically significant trends in neutrophil or lymphocyte level by BPgroup were seen. No association was seen between monocyte levels and BP group in eitherrace.
In African-Americans there was a statistically significant positive association betweenneutrophil level and 3 of the 4 BP measures (SBP, MAP, and PP) (Figure 1). Theseassociations remained after adjustment for age, sex, center, diabetes, BMI, total cholesterol,smoking, drinking, physical activity, and dietary sodium intake (Table 3). The adjustedmean difference between the highest and lowest quartiles of neutrophils was approximately8 mmHg for SBP, 4 mmHg for MAP, and 5 mmHg for PP. An absolute increase of 10% inthe neutrophil level was associated with an increase of about 1.7 mmHg in mean SBP, 0.8mmHg in mean MAP, and 1.3 mmHg in mean PP. An inverse association was seen betweenlymphocytes and all 4 BP measures (Figure 2), which again remained after multivariableadjustment (Table 3). The adjusted mean difference between the highest and lowest quartilesof lymphocytes was approximately 6 mmHg for SBP, 2 mmHg for DBP, 3.4 mmHg forMAP, and 4 mmHg for PP. An absolute increase of 10% in the lymphocyte level was
Tian et al. Page 4
J Am Soc Hypertens. Author manuscript; available in PMC 2011 November 1.
NIH
-PA Author Manuscript
NIH
-PA Author Manuscript
NIH
-PA Author Manuscript

associated with a decrease of about 2.3 mmHg in mean SBP, 0.7 mmHg in mean DBP, 1.2mmHg in mean MAP, and 1.6 mmHg in mean PP. There was no clear pattern of associationof any BP measure with monocyte tertiles, and in most cases the differences were notstatistically significant (Table 3).
In whites, differences in the BP measures between quartiles of neutrophils and oflymphocytes were, in most cases, much smaller than those seen in African-Americans(Figures 1 and 2), and after multivariable adjustment, statistically significant associationswere seen only between quartiles of neutrophils and PP and between quartiles oflymphocytes and SBP and PP (Table 3).
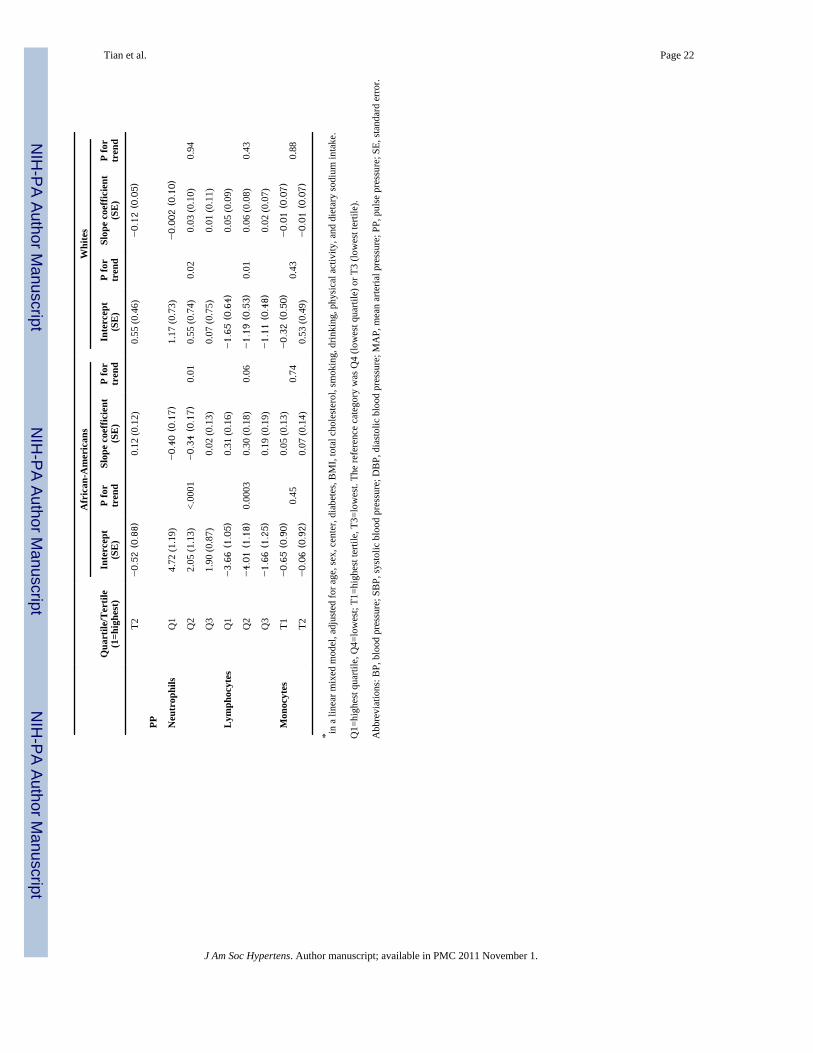
Longitudinal analysisThe crude (unadjusted) average intercept and slope for each BP trajectory over time isshown, by race, in Table 4. The additive effect of leukocyte quartile (using the lowestquartile (Q4) as the reference group) on these average intercepts and slopes, after adjustmentfor baseline age, sex, center, diabetes, BMI, total cholesterol, smoking, drinking, physicalactivity, and dietary sodium intake, is shown in Table 5. In African-Americans thetrajectories of all 4 BP measures showed a trend of increasing average intercept withincreasing quartile of neutrophils, consistent with the cross-sectional findings. Persons in thehighest quartile of neutrophils had an increase in the average intercept of 6.4 mmHg forSBP, 1.6 mmHg for DBP, 3.2 mmHg for MAP, and 4.7 mmHg for PP. Persons in the secondhighest quartile of neutrophils had an increase in the average intercept of 3.3 mmHg forSBP, 1.3 mmHg for DBP, 1.9 mmHg for MAP, and 2.1 mmHg for PP. All quartiles oflymphocytes were associated with the opposite effect on the average intercept, againconsistent with the cross-sectional findings, although there was no clear trend by increasingquartile. Persons in the highest quartile of lymphocytes had a decrease in the averageintercept of 5.8 mmHg for SBP, 2.2 mmHg for DBP, 3.4 mmHg for MAP, and 3.7 mmHgfor PP. Persons in the second highest quartile of lymphocytes had a decrease in the averageintercept of 6.4 mmHg for SBP, 2.4 mmHg for DBP, 3.8 mmHg for MAP, and 4 mmHg forPP. The effect of neutrophil and lymphocyte quartiles on the average slope of the trajectorieswas statistically significant only for the highest 2 quartiles of neutrophils which wereassociated with a decrease of about 0.3 - 0.4 in the slope of the PP trajectory. To betterillustrate the results of the regression models, the predicted average intercept and slope areshown for 2 situations, SBP by quartile of neutrophils and SBP by quartile of lymphocytes,in African-Americans with the baseline age set at 55 years (Figure 3).
In whites, the quartiles of neutrophils and lymphocytes were associated with much smallereffects on the intercept and slope of all 4 BP trajectories, which in most cases were notstatistically significant (Table 5). The only statistically significant effects were seen withneutrophils and SBP (a very small change in the slope coefficient), neutrophils and PP,lymphocytes and SBP, and lymphocytes and PP.
In both African-Americans and whites there was no consistent effect of monocyte tertile oneither intercept or slope of the trajectory of any BP measure.
DISCUSSIONOur study has shown that in African-Americans, but much less so in whites, increasedneutrophil levels and decreased lymphocyte levels are associated with elevated BP but donot influence the rate of change of BP over time. The most striking finding in the currentstudy was the inverse association between the BP parameters and lymphocyte levels,especially in African-Americans. To our knowledge, this is the first report suggesting thatthere is a negative relationship between lymphocytes and BP.
Tian et al. Page 5
J Am Soc Hypertens. Author manuscript; available in PMC 2011 November 1.
NIH
-PA Author Manuscript
NIH
-PA Author Manuscript
NIH
-PA Author Manuscript

Previous epidemiologic studies have suggested that clinical hypertension and systemicinflammation are associated 8. Even though the relationship between circulating total WBCand hypertension has been well documented 9,10,11, the association of different specificcirculating leukocytes with BP and their roles in the regulation of BP and development ofhypertension remain unknown. Our cross-sectional data showed that some of the BPparameters in the white group and nearly all the BP parameters in the African-Americansgroup were positively and significantly associated with increased quartiles of neutrophilseven after adjustment for the main cardiovascular risk factors, indicating that neutrophils aresignificantly correlated with the regulation of BP and the development of hypertension. Theresults of our longitudinal analysis are consistent with a report that neutrophil count is apredictor of hypertension. 19. However, the question remains: what is the role of neutrophilsin the pathogenesis of hypertension?
Since Guyton et al 20 established that the kidney has an overriding influence in arterialpressure regulation and hypertension, support for a key role for the kidney in thepathogenesis of hypertension has come from transplant studies in experimental models ofhypertension 21,22,23 and in humans 24. Using animal models, we and others have suggestedthat increased renal oxidative stress 25,26,27, renal inflammation 28,29, and renal localangiotensin II (Ang II) activity 30,31,32 are all important in the pathogenesis of hypertension33. The combination and interaction of these detrimental renal factors, especially throughthe inactivation of NO bioavailability 34,35 by oxidative stress, favors sodium retention andthe development and maintenance of hypertension.
Evidence has shown that increased renal oxidative stress precedes the occurrence ofhypertension in genetic hypertensive animals 36,37,38. The source of oxidative stress couldbe renal in origin. However, it is possible that primary systemic oxidative stress caused byelevated and activated circulating leukocytes, capable of releasing reactive oxygen species(ROS), can be directly delivered into kidney by these mobile blood-borne cells. In animalstudies, Shen et al. 39 have found a highly significant elevation in the total leukocyte,neutrophil and monocyte counts, as well as in the level of activated neutrophils andmonocytes in Dahl salt-sensitive rat, a salt-sensitive hypertensive model, but not in Dahlsalt-resistance rats. Besides, in both spontaneously hypertensive rats 40 and Sabra rats 41,another model of salt-sensitive hypertension, elevation and activation of leukocytes andincreased superoxide (O2
−.) release from polymorphonuclear leukocytes (PMNLs) precedethe occurrence of experimental hypertension 41. In human studies, elevated leukocyte countand enhanced PMNL activation are also correlated with the development and progress ofhypertension and cardiovascular disease 42. Oxidative stress in hypertensive patients'neutrophils is evidenced by an increased NADPH oxidase production and lipid peroxidationand decreased cytosolic and mitochondrial superoxide dismutase concentration 42,43,44,45.Recently, Ramasamy et al.46 evaluated the effect of neutrophil oxidative burst activity inessential hypertensive patients. They found that freshly isolated neutrophils fromuncontrolled human subjects diagnosed with essential hypertension acquire the ability ofproducing a higher amount of ROS in response to stimuli indicating that oxidative bustactivity is impaired.
Previous studies have shown that African-Americans have a lower mean neutrophil count47, 48 but the reason is unknown. Our results confirmed that neutrophil levels in general andat all BP levels (normal, pre-hypertension and hypertension) in the African-American groupwere lower than in the white group. The reason, we believe, is due to the PMNLs oxidativeburst and consequent apoptosis 49 and self-necrosis 50. Study on PMNLs in essentialhypertensive patients has shown that survival of PMNLs in vitro decreases linearly with theincreased rate of superoxide (O2
−.) release 50. Therefore, there could be more neutrophildeath and more ROS release from neutrophils in African-Americans than in the whites and
Tian et al. Page 6
J Am Soc Hypertens. Author manuscript; available in PMC 2011 November 1.
NIH
-PA Author Manuscript
NIH
-PA Author Manuscript
NIH
-PA Author Manuscript
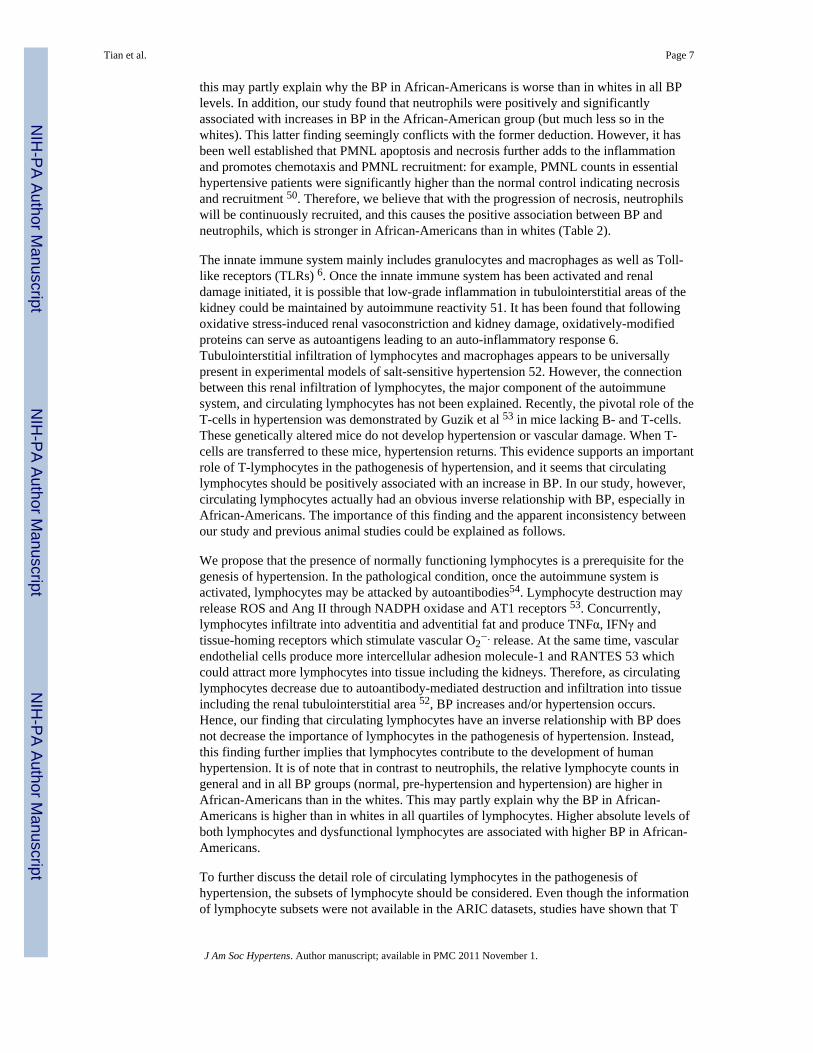
this may partly explain why the BP in African-Americans is worse than in whites in all BPlevels. In addition, our study found that neutrophils were positively and significantlyassociated with increases in BP in the African-American group (but much less so in thewhites). This latter finding seemingly conflicts with the former deduction. However, it hasbeen well established that PMNL apoptosis and necrosis further adds to the inflammationand promotes chemotaxis and PMNL recruitment: for example, PMNL counts in essentialhypertensive patients were significantly higher than the normal control indicating necrosisand recruitment 50. Therefore, we believe that with the progression of necrosis, neutrophilswill be continuously recruited, and this causes the positive association between BP andneutrophils, which is stronger in African-Americans than in whites (Table 2).
The innate immune system mainly includes granulocytes and macrophages as well as Toll-like receptors (TLRs) 6. Once the innate immune system has been activated and renaldamage initiated, it is possible that low-grade inflammation in tubulointerstitial areas of thekidney could be maintained by autoimmune reactivity 51. It has been found that followingoxidative stress-induced renal vasoconstriction and kidney damage, oxidatively-modifiedproteins can serve as autoantigens leading to an auto-inflammatory response 6.Tubulointerstitial infiltration of lymphocytes and macrophages appears to be universallypresent in experimental models of salt-sensitive hypertension 52. However, the connectionbetween this renal infiltration of lymphocytes, the major component of the autoimmunesystem, and circulating lymphocytes has not been explained. Recently, the pivotal role of theT-cells in hypertension was demonstrated by Guzik et al 53 in mice lacking B- and T-cells.These genetically altered mice do not develop hypertension or vascular damage. When T-cells are transferred to these mice, hypertension returns. This evidence supports an importantrole of T-lymphocytes in the pathogenesis of hypertension, and it seems that circulatinglymphocytes should be positively associated with an increase in BP. In our study, however,circulating lymphocytes actually had an obvious inverse relationship with BP, especially inAfrican-Americans. The importance of this finding and the apparent inconsistency betweenour study and previous animal studies could be explained as follows.
We propose that the presence of normally functioning lymphocytes is a prerequisite for thegenesis of hypertension. In the pathological condition, once the autoimmune system isactivated, lymphocytes may be attacked by autoantibodies54. Lymphocyte destruction mayrelease ROS and Ang II through NADPH oxidase and AT1 receptors 53. Concurrently,lymphocytes infiltrate into adventitia and adventitial fat and produce TNFα, IFNγ andtissue-homing receptors which stimulate vascular O2
−. release. At the same time, vascularendothelial cells produce more intercellular adhesion molecule-1 and RANTES 53 whichcould attract more lymphocytes into tissue including the kidneys. Therefore, as circulatinglymphocytes decrease due to autoantibody-mediated destruction and infiltration into tissueincluding the renal tubulointerstitial area 52, BP increases and/or hypertension occurs.Hence, our finding that circulating lymphocytes have an inverse relationship with BP doesnot decrease the importance of lymphocytes in the pathogenesis of hypertension. Instead,this finding further implies that lymphocytes contribute to the development of humanhypertension. It is of note that in contrast to neutrophils, the relative lymphocyte counts ingeneral and in all BP groups (normal, pre-hypertension and hypertension) are higher inAfrican-Americans than in the whites. This may partly explain why the BP in African-Americans is higher than in whites in all quartiles of lymphocytes. Higher absolute levels ofboth lymphocytes and dysfunctional lymphocytes are associated with higher BP in African-Americans.
To further discuss the detail role of circulating lymphocytes in the pathogenesis ofhypertension, the subsets of lymphocyte should be considered. Even though the informationof lymphocyte subsets were not available in the ARIC datasets, studies have shown that T
Tian et al. Page 7
J Am Soc Hypertens. Author manuscript; available in PMC 2011 November 1.
NIH
-PA Author Manuscript
NIH
-PA Author Manuscript
NIH
-PA Author Manuscript

lymphocyte CD4+ (T helper cell) and CD 8+ (Cytotoxic T cell) are involved in the Ang II-induced hypertensive cardiac hypertrophy and fibrosis and adoptive immunosupressiveCD4+, CD 25+ regulatory T cell transfer resulted in a marked reduction of these cells'infiltration and the improvement of cardiac damage 55. Moreover, in the aorta of Dahl salt-sensitive hypertensive rats, CD4+ mRNA was increased compared with the Brown Norwaynormotensive rat 56. Most interestingly, recent studies on pulmonary arterial hypertensionsuggested that alteration in circulating T cell subsets, particularly CD8+ T lymphocytes maycontribute to disease pathogenesis. In these studies, significantly decreased CD8+ T cellswere found in the peripheral blood of patients compared to control 57 together with apreponderance of CD3+ and CD8+ T cells infiltration in the patients' lung 58. This offersstrong evidence to support our above speculation for the mechanism of lymphocytes in thetissue damage-related pathogenesis of hypertension.
In our longitudinal analysis, levels of specific leukocytes types did not influence the rate ofchange of BP with age. In other words, once the innate and autoimmune systems wereactivated, the increase in arterial pressure with age did not depend on the level of leukocytesat baseline. Instead, it may depend on the inflammation-related consequences such as tissueor organ damage or other factors. We believe that renal damage is initiated by activation ofthe innate immune system and exacerbated by activation of autoimmune system. Onceinflammation-associated renal damage has been initiated, however, inflammation may nolonger be a dominant factor in the further development of hypertension.
Limitations of the above study include its cross-sectional component, which limits ourability to infer a causal relationship between increased neutrophils and decreasedlymphocytes and elevation of BP. Therefore, the data do not prove that the increasedneutrophils or decreased lymphocytes cause the increase in BP. Besides, due to thelimitation of ARIC data, we were not able to evaluate sodium excretion. This may limit ourability to interpret BP changes. In addition, although we controlled for the major cardiac riskfactors, the existence of unrecognized confounding is always possible.
Our findings may have important clinical implications. Our data show that neutrophils andlymphocytes have an important association with BP, especially SBP in African-Americans.The mean difference in SBP among between the highest and lowest quartiles of neutrophilswas approximately 8 mmHg, and the mean difference in SBP between the highest andlowest quartiles of lymphocytes was approximately 6 mmHg. A meta-analysis of over 1million patients calculated that even a small 2 mmHg decrease in SBP could lower strokeand coronary and other vascular related mortality by 10% and 7%, respectively,3 indicatingthat neutrophils and lymphocytes could be important biomarkers not only for predictinghigher BP but also for identifying persons at greater risk of hypertension-relatedcardiovascular events, who might benefit from earlier intervention. Interestingly, the T-cell-modulating agent mycophenolate mofetil has been shown to lower BP in experimentally-induced 59,60 and genetic hypertensive models 29,61 and in humans with psoriasis andrheumatoid arthritis (which are T-cell-dependant autoimmune disorder) 62. Acute or short-term treatment by immune-modulation in the initial stage of hypertension may be worthexploring further.
AcknowledgmentsThe Atherosclerosis Risk in Communities Study is carried out as a collaborative study supported by National Heart,Lung, and Blood Institute contracts N01-HC-55015, N01-HC-55016, N01-HC-55018, N01-HC-55019, N01-HC-55020, N01-HC-55021, and N01-HC-55022. The authors thank the staff and participants of the ARIC study fortheir important contributions.
Tian et al. Page 8
J Am Soc Hypertens. Author manuscript; available in PMC 2011 November 1.
NIH
-PA Author Manuscript
NIH
-PA Author Manuscript
NIH
-PA Author Manuscript

REFERENCES1. Burt VL, Whelton P, Roccella EJ, Brown C, Cutler JA, Higgins M, Horan MJ, Labarthe D.
Prevalence of hypertension in the US adult population. Results from the Third National Health andNutrition Examination Survey, 1988-1991. Hypertension 1995;25:305–313. [PubMed: 7875754]
2. Palmer A, Bulpitt C, Beevers G, Coles E, Fletcher A, Ledingham J, Petrie J, Webster J, Dollery C.Risk factors for ischaemic heart disease and stroke mortality in young and old hypertensive patients.J Hum.Hypertens 1995;9:695–697. [PubMed: 8523394]
3. Lewington S, Clarke R, Qizilbash N, Peto R, Collins R. Age-specific relevance of usual bloodpressure to vascular mortality: a meta-analysis of individual data for one million adults in 61prospective studies. Lancet 2002;360:1903–1913. [PubMed: 12493255]
4. Ostchega Y, Yoon SS, Hughes J, Louis T. Hypertension awareness, treatment, and control--continued disparities in adults: United States, 2005-2006. NCHS.Data Brief 2008:1–8. [PubMed:19389317]
5. Johnson RJ, Feig DI, Nakagawa T, Sanchez-Lozada LG, Rodriguez-Iturbe B. Pathogenesis ofessential hypertension: historical paradigms and modern insights. J Hypertens 2008;26:381–391.[PubMed: 18300843]
6. Harrison DG, Guzik TJ, Goronzy J, Weyand C. Is hypertension an immunologic disease?Curr.Cardiol.Rep 2008;10:464–469. [PubMed: 18950555]
7. Rodriguez-Iturbe B, Johnson RJ. Role of inflammatory cells in the kidney in the induction andmaintenance of hypertension. Nephrol Dial.Transplant 2006;21:260–263. [PubMed: 16326746]
8. Pauletto P, Rattazzi M. Inflammation and hypertension: the search for a link. NephrolDial.Transplant 2006;21:850–853. [PubMed: 16464884]
9. Chrysohoou C, Pitsavos C, Panagiotakos DB, Skoumas J, Stefanadis C. Association betweenprehypertension status and inflammatory markers related to atherosclerotic disease: The ATTICAStudy. Am J Hypertens 2004;17:568–573. [PubMed: 15233975]
10. Kim DJ, Noh JH, Lee BW, Choi YH, Chung JH, Min YK, Lee MS, Lee MK, Kim KW. Theassociations of total and differential white blood cell counts with obesity, hypertension,dyslipidemia and glucose intolerance in a Korean population. J Korean Med.Sci 2008;23:193–198.[PubMed: 18436999]
11. Shankar A, Klein BE, Klein R. Relationship between white blood cell count and incidenthypertension. Am J Hypertens 2004;17:233–239. [PubMed: 15001197]
12. Gillum RF. Pathophysiology of hypertension in blacks and whites. A review of the basis of racialblood pressure differences. Hypertension 1979;1:468–475. [PubMed: 541040]
13. Cooper RS, Rotimi CN, Ward R. The puzzle of hypertension in African-Americans. Sci.Am1999;280:56–63. [PubMed: 9924813]
14. The ARIC investigators. The Atherosclerosis Risk in Communities(ARIC) Study:design andobjectives. Am J Epidemiol 1989;129:687–702. [PubMed: 2646917]
15. Richardson MT, Ainsworth BE, Wu HC, Jacobs DR Jr. Leon AS. Ability of the AtherosclerosisRisk in Communities (ARIC)/Baecke Questionnaire to assess leisure-time physical activity. Int.JEpidemiol 1995;24:685–693. [PubMed: 8550264]
16. Willett WC, Sampson L, Stampfer MJ, Rosner B, Bain C, Witschi J, Hennekens CH, Speizer FE.Reproducibility and validity of a semiquantitative food frequency questionnaire. Am J Epidemiol1985;122:51–65. [PubMed: 4014201]
17. Fitzmaurice, GM.; laird, NM.; Ware, JH. Applied longitu-dinal analysis. John Wiley; Hoboken,NewJersey: 2004.
18. Morrell CH, Brant LJ, Ferrucci L. Model choice can obscure results in longitudinal studies. JGerontol.A Biol.Sci.Med.Sci 2009;64:215–222. [PubMed: 19196902]
19. Tatsukawa Y, Hsu WL, Yamada M, Cologne JB, Suzuki G, Yamamoto H, Yamane K, AkahoshiM, Fujiwara S, Kohno N. White blood cell count, especially neutrophil count, as a predictor ofhypertension in a Japanese population. Hypertens.Res 2008;31:1391–1397. [PubMed: 18957810]
20. Guyton AC, Coleman TG, Cowley AV Jr. Scheel KW, Manning RD Jr. Norman RA Jr. Arterialpressure regulation. Overriding dominance of the kidneys in long-term regulation and inhypertension. Am.J.Med 1972;52:584–594. [PubMed: 4337474]
Tian et al. Page 9
J Am Soc Hypertens. Author manuscript; available in PMC 2011 November 1.
NIH
-PA Author Manuscript
NIH
-PA Author Manuscript
NIH
-PA Author Manuscript

21. Bianchi G, Fox U, Di Francesco GF, Giovanetti AM, Pagetti D. Blood pressure changes producedby kidney cross-transplantation between spontaneously hypertensive rats and normotensive rats.Clin.Sci.Mol.Med 1974;47:435–448. [PubMed: 4611680]
22. Dahl LK, Heine M. Primary role of renal homografts in setting chronic blood pressure levels inrats. Circ.Res 1975;36:692–696. [PubMed: 1093748]
23. Rettig R, Folberth C, Kopf D, Stauss H, Unger T. Role of the kidney in the pathogenesis ofprimary hypertension. Clin.Exp.Hypertens.A 1990;12:957–1002. [PubMed: 2245518]
24. Curtis JJ, Luke RG, Dustan HP, Kashgarian M, Whelchel JD, Jones P, Diethelm AG. Remission ofessential hypertension after renal transplantation. N.Engl.J Med 1983;309:1009–1015. [PubMed:6353230]
25. Tian N, Thrasher KD, Gundy PD, Hughson MD, Manning RD Jr. Antioxidant treatment preventsrenal damage and dysfunction and reduces arterial pressure in salt-sensitive hypertension.Hypertension 2005;45:934–939. [PubMed: 15837840]
26. Tian N, Rose RA, Jordan S, Dwyer TM, Hughson MD, Manning RD Jr. N-Acetylcysteineimproves renal dysfunction, ameliorates kidney damage and decreases blood pressure in salt-sensitive hypertension. J.Hypertens 2006;24:2263–2270. [PubMed: 17053549]
27. Tian N, Moore RS, Phillips WE, Lin L, Braddy S, Pryor JS, Stockstill RL, Hughson MD, ManningRD Jr. NADPH oxidase contributes to renal damage and dysfunction in Dahl salt-sensitivehypertension. Am J Physiol Regul.Integr.Comp Physiol 2008;295:R1858–R1865. [PubMed:18922960]
28. Tian N, Moore RS, Braddy S, Rose RA, Gu JW, Hughson MD, Manning RD Jr. Interactionsbetween oxidative stress and inflammation in salt-sensitive hypertension. Am.J.Physiol HeartCirc.Physiol 2007;293:H3388–H3395. [PubMed: 17921322]
29. Tian N, Gu JW, Jordan S, Rose RA, Hughson MD, Manning RD Jr. Immune suppression preventsrenal damage and dysfunction and reduces arterial pressure in salt-sensitive hypertension. Am JPhysiol Heart Circ.Physiol 2007;292:H1018–H1025. [PubMed: 17040973]
30. Kobori H, Ozawa Y, Suzaki Y, Nishiyama A. Enhanced intrarenal angiotensinogen contributes toearly renal injury in spontaneously hypertensive rats. J Am Soc Nephrol 2005;16:2073–2080.[PubMed: 15888567]
31. Kobori H, Nishiyama A. Effects of tempol on renal angiotensinogen production in Dahl salt-sensitive rats. Biochem.Biophys.Res.Commun 2004;315:746–750. [PubMed: 14975764]
32. Lin L, Phillips WE, Manning RD. Intrarenal Angiotensin ii is associated with inflammation, renaldamage and dysfunction in dahl salt-sensitive hypertension. J Am Soc Hypertens 2009;3:306–314.[PubMed: 20160914]
33. Vaziri ND, Rodriguez-Iturbe B. Mechanisms of disease: oxidative stress and inflammation in thepathogenesis of hypertension. Nat.Clin.Pract.Nephrol 2006;2:582–593. [PubMed: 17003837]
34. Wilcox CS. Oxidative stress and nitric oxide deficiency in the kidney: a critical link tohypertension? Am.J Physiol Regul.Integr.Comp Physiol 2005;289:R913–R935. [PubMed:16183628]
35. Rubanyi GM, Vanhoutte PM. Superoxide anions and hyperoxia inactivate endothelium-derivedrelaxing factor. Am J Physiol 1986;250:H822–H827. [PubMed: 3010744]
36. Chabrashvili T, Tojo A, Onozato ML, Kitiyakara C, Quinn MT, Fujita T, Welch WJ, Wilcox CS.Expression and cellular localization of classic NADPH oxidase subunits in the spontaneouslyhypertensive rat kidney. Hypertension 2002;39:269–274. [PubMed: 11847196]
37. Meng S, Roberts LJ, Cason GW, Curry TS, Manning RD Jr. Superoxide dismutase and oxidativestress in Dahl salt-sensitive and -resistant rats. Am.J.Physiol Regul.Integr.Comp Physiol2002;283:R732–R738. [PubMed: 12185008]
38. Meng S, Cason GW, Gannon AW, Racusen LC, Manning RD Jr. Oxidative stress in Dahl salt-sensitive hypertension. Hypertension 2003;41:1346–1352. [PubMed: 12719439]
39. Shen K, DeLano FA, Zweifach BW, Schmid-Schonbein GW. Circulating leukocyte counts,activation, and degranulation in Dahl hypertensive rats. Circ.Res 1995;76:276–283. [PubMed:7834839]
Tian et al. Page 10
J Am Soc Hypertens. Author manuscript; available in PMC 2011 November 1.
NIH
-PA Author Manuscript
NIH
-PA Author Manuscript
NIH
-PA Author Manuscript

40. Schmid-Schonbein GW, Seiffge D, DeLano FA, Shen K, Zweifach BW. Leukocyte counts andactivation in spontaneously hypertensive and normotensive rats. Hypertension 1991;17:323–330.[PubMed: 1999363]
41. Sela S, Mazor R, Amsalam M, Yagil C, Yagil Y, Kristal B. Primed polymorphonuclear leukocytes,oxidative stress, and inflammation antecede hypertension in the Sabra rat. Hypertension2004;44:764–769. [PubMed: 15452031]
42. Hopps E, Lo PR, Caimi G. Pathophysiology of polymorphonuclear leukocyte in arterialhypertension. Clin.Hemorheol.Microcirc 2009;41:209–218. [PubMed: 19276518]
43. Sheppard FR, Kelher MR, Moore EE, McLaughlin NJ, Banerjee A, Silliman CC. Structuralorganization of the neutrophil NADPH oxidase: phosphorylation and translocation during primingand activation. J Leukoc.Biol 2005;78:1025–1042. [PubMed: 16204621]
44. Hampton MB, Kettle AJ, Winterbourn CC. Inside the neutrophil phagosome: oxidants,myeloperoxidase, and bacterial killing. Blood 1998;92:3007–3017. [PubMed: 9787133]
45. Sedeek M, Hebert RL, Kennedy CR, Burns KD, Touyz RM. Molecular mechanisms ofhypertension: role of Nox family NADPH oxidases. Curr.Opin.Nephrol Hypertens 2009;18:122–127. [PubMed: 19430333]
46. Ramasamy R, Maqbool M, Mohamed AL, Noah RM. Elevated neutrophil respiratory burst activityin essential hypertensive patients. Cell Immunol 2010;263:230–234. [PubMed: 20471005]
47. Freedman DS, Gates L, Flanders WD, Van Assendelft OW, Barboriak JJ, Joesoef MR, Byers T.Black/white differences in leukocyte subpopulations in men. Int.J Epidemiol 1997;26:757–764.[PubMed: 9279607]
48. Reich D, Nalls MA, Kao WH, Akylbekova EL, Tandon A, Patterson N, Mullikin J, Hsueh WC,Cheng CY, Coresh J, Boerwinkle E, Li M, Waliszewska A, Neubauer J, Li R, Leak TS, Ekunwe L,Files JC, Hardy CL, Zmuda JM, Taylor HA, Ziv E, Harris TB, Wilson JG. Reduced neutrophilcount in people of African descent is due to a regulatory variant in the Duffy antigen receptor forchemokines gene. PLoS.Genet 2009;5:e1000360. [PubMed: 19180233]
49. Elbim C, Lizard G. Flow cytometric investigation of neutrophil oxidative burst and apoptosis inphysiological and pathological situations. Cytometry A 2009;75:475–481. [PubMed: 19358285]
50. Kristal B, Shurtz-Swirski R, Chezar J, Manaster J, Levy R, Shapiro G, Weissman I, Shasha SM,Sela S. Participation of peripheral polymorphonuclear leukocytes in the oxidative stress andinflammation in patients with essential hypertension. Am J Hypertens 1998;11:921–928.[PubMed: 9715783]
51. Caetano EP, Zatz R, Praxedes JN. The clinical diagnosis of hypertensive nephrosclerosis--howreliable is it? Nephrol Dial.Transplant 1999;14:288–290. [PubMed: 10069175]
52. Rodriguez-Iturbe B, Quiroz Y, Herrera-Acosta J, Johnson RJ, Pons HA. The role of immune cellsinfiltrating the kidney in the pathogenesis of salt-sensitive hypertension. J Hypertens.Suppl2002;20:S9–14. [PubMed: 12184057]
53. Guzik TJ, Hoch NE, Brown KA, McCann LA, Rahman A, Dikalov S, Goronzy J, Weyand C,Harrison DG. Role of the T cell in the genesis of angiotensin II induced hypertension and vasculardysfunction. J Exp.Med 2007;204:2449–2460. [PubMed: 17875676]
54. Takeichi N, Ba D, Kobayashi H. Natural cytotoxic autoantibody against thymocytes inspontaneously hypertensive rats. Cell Immunol 1981;60:181–190. [PubMed: 6972263]
55. Kvakan H, Kleinewietfeld M, Qadri F, Park JK, Fischer R, Schwarz I, Rahn HP, Plehm R, WellnerM, Elitok S, Gratze P, Dechend R, Luft FC, Muller DN. Regulatory T cells ameliorate angiotensinII-induced cardiac damage. Circulation 2009;119:2904–2912. [PubMed: 19470887]
56. Viel EC, Lemarie CA, Benkirane K, Paradis P, Schiffrin EL. Immune regulation and vascularinflammation in genetic hypertension. Am J Physiol Heart Circ.Physiol 2010;298:H938–H944.[PubMed: 20044442]
57. Ulrich S, Nicolls MR, Taraseviciene L, Speich R, Voelkel N. Increased regulatory and decreasedCD8+ cytotoxic T cells in the blood of patients with idiopathic pulmonary arterial hypertension.Respiration 2008;75:272–280. [PubMed: 18025812]
58. Austin ED, Rock MT, Mosse CA, Vnencak-Jones CL, Yoder SM, Robbins IM, Loyd JE, MeyrickBO. T lymphocyte subset abnormalities in the blood and lung in pulmonary arterial hypertension.Respir.Med 2010;104:454–462. [PubMed: 19880300]
Tian et al. Page 11
J Am Soc Hypertens. Author manuscript; available in PMC 2011 November 1.
NIH
-PA Author Manuscript
NIH
-PA Author Manuscript
NIH
-PA Author Manuscript

59. Bravo Y, Quiroz Y, Ferrebuz A, Vaziri ND, Rodriguez-Iturbe B. Mycophenolate mofetiladministration reduces renal inflammation, oxidative stress, and arterial pressure in rats with lead-induced hypertension. Am J Physiol Renal Physiol 2007;293:F616–F623. [PubMed: 17567935]
60. Pechman KR, Basile DP, Lund H, Mattson DL. Immune suppression blocks sodium-sensitivehypertension following recovery from ischemic acute renal failure. Am J PhysiolRegul.Integr.Comp Physiol 2008;294:R1234–R1239. [PubMed: 18256138]
61. Mattson DL, James L, Berdan EA, Meister CJ. Immune suppression attenuates hypertension andrenal disease in the Dahl salt-sensitive rat. Hypertension 2006;48:149–156. [PubMed: 16754791]
62. Herrera J, Ferrebuz A, MacGregor EG, Rodriguez-Iturbe B. Mycophenolate mofetil treatmentimproves hypertension in patients with psoriasis and rheumatoid arthritis. J Am Soc Nephrol2006;17:S218–S225. [PubMed: 17130265]
Tian et al. Page 12
J Am Soc Hypertens. Author manuscript; available in PMC 2011 November 1.
NIH
-PA Author Manuscript
NIH
-PA Author Manuscript
NIH
-PA Author Manuscript

Figure 1. Unadjusted mean BP measures by quartile of neutrophil level, by raceQ1=highest quartile, Q4=lowest; Abbreviations: BP, blood pressure; SBP, systolic bloodpressure; DBP, diastolic blood pressure; MAP, mean arterial pressure; PP, pulse pressure.
Tian et al. Page 13
J Am Soc Hypertens. Author manuscript; available in PMC 2011 November 1.
NIH
-PA Author Manuscript
NIH
-PA Author Manuscript
NIH
-PA Author Manuscript

Figure 2. Unadjusted mean BP measures by quartile of lymphocyte level, by raceQ1=highest quartile, Q4=lowest; Abbreviations: BP, blood pressure; SBP, systolic bloodpressure; DBP, diastolic blood pressure; MAP, mean arterial pressure; PP, pulse pressure.
Tian et al. Page 14
J Am Soc Hypertens. Author manuscript; available in PMC 2011 November 1.
NIH
-PA Author Manuscript
NIH
-PA Author Manuscript
NIH
-PA Author Manuscript

Figure 3.Multivariable-adjusted* predicted average intercept and slope of SBP trajectory, by quartileof neutrophils and by quartile of lymphocytes (African-Americans only, baseline age set at55 years). Q1=highest quartile, Q4=lowest; Abbreviations: SBP, systolic blood pressure; *in a linear mixed model, adjusted for age, sex, center, diabetes, BMI, total cholesterol,smoking, drinking, physical activity, and dietary sodium intake.
Tian et al. Page 15
J Am Soc Hypertens. Author manuscript; available in PMC 2011 November 1.
NIH
-PA Author Manuscript
NIH
-PA Author Manuscript
NIH
-PA Author Manuscript

NIH
-PA Author Manuscript
NIH
-PA Author Manuscript
NIH
-PA Author Manuscript
Tian et al. Page 16
Table 1
Clinical characteristics of study population by race.
CharacteristicAfrican-
Americans(n=1,605)
Whites(n=4,141)
P fordifference
Systolic BP, mmHg 126.1 (0.51) 116.0 (0.25) <.0001
Diastolic BP, mmHg 78.9 (0.30) 70.8 (0.15) <.0001
MAP, mmHg 94.6 (0.34) 85.8 (0.17) <.0001
PP, mmHg 47.2 (0.36) 45.2 (0.18) <.0001
Hypertension, % 26.6 8.5 <.0001
Age, yrs [min, max] 52.4 (0.14) 53.7 (0.09) <.0001
Women, % 54.6 48.0 <.0001
Diabetes, % 12.2 6.1 <.0001
Current cigarettesmoking, % 31.6 24.8 <.0001
Current drinking, % 37.2 64.6 <.0001
BMI, kg/m2 28.4 (0.14) 26.4 (0.07) <.0001
Total serumcholesterol, mmol/L 5.5 (0.03) 5.5 (0.02) 0.91
Sport index 2.2 (0.02) 2.6 (0.01) <.0001
Usual dietary sodiumintake, mg 1,384.6 (14.3) 1,525.7 (9.75) <.0001
Neutrophils, % 48.1 60.2 <.0001
Lymphocytes, % 38.9 31.4 <.0001
Monocytes¶ 5.64 (1.01) 5.47 (1.01) 0.01
Values are means (standard error) or percentages.
¶Geometric mean (because of the highly skewed distribution).
Abbreviations: BP, blood pressure; MAP, mean arterial pressure; PP, pulse pressure; BMI, body mass index.
J Am Soc Hypertens. Author manuscript; available in PMC 2011 November 1.

NIH
-PA Author Manuscript
NIH
-PA Author Manuscript
NIH
-PA Author Manuscript
Tian et al. Page 17
Table 2
Multivariable-adjusted* mean leukocyte levels by BP group, by race.
HT group P value fortrendNormal Pre-HT HT
Whites
Neutrophils 60.2 (0.24) 60.6 (0.31) 60.5 (0.52) 0.30
Lymphocytes 32.1 (0.22) 31.9 (0.28) 31.2 (0.48) 0.09
Monocytes¶ 5.55 (1.01) 5.33 (1.02) 5.48 (1.03) 0.16
African-Americans
Neutrophils 49.7 (0.67) 50.4 (0.67) 51.4 (0.79) 0.04
Lymphocytes 38.7 (0.60) 37.9 (0.59) 36.6 (0.70) 0.005
Monocytes¶ 5.59 (1.03) 5.66 (1.03) 5.87 (1.03) 0.15
Values are means (standard error).
¶Geometric mean (because of the highly skewed distribution).
*in a general linear model, adjusted for age, sex, center, diabetes, BMI, total cholesterol, smoking, drinking, physical activity, and dietary sodium
intake.
Abbreviations: HT, hypertension; Pre-HT, pre-hypertension; BMI, body mass index.
J Am Soc Hypertens. Author manuscript; available in PMC 2011 November 1.

NIH
-PA Author Manuscript
NIH
-PA Author Manuscript
NIH
-PA Author Manuscript
Tian et al. Page 18
Tabl
e 3
Mul
tivar
iabl
e-ad
just
ed* m
ean
BP
leve
ls b
y qu
artil
e/te
rtile
and
by
incr
emen
t of l
euko
cyte
leve
l, by
race
.
SBP
DB
PM
AP
PP
Afr
ican
-A
mer
ican
sW
hite
sA
fric
an-
Am
eric
ans
Whi
tes
Afr
ican
-A
mer
ican
sW
hite
sA
fric
an-
Am
eric
ans
Whi
tes
Neu
trop
hils
Q1
129.
811
6.9
77.7
70.9
95.0
86.2
52.1
46.0
Q2
124.
811
5.7
75.4
70.2
91.9
85.4
49.4
45.4
Q3
123.
611
5.8
74.9
70.6
91.1
85.7
48.7
45.2
Q4
121.
911
5.1
75.1
70.8
90.7
85.6
46.8
44.3
P fo
r tre
nd<.
0001
0.06
0.06
0.86
0.00
20.
31<.
0001
0.02
BP
chan
ge (S
E) p
er1.
650.
540.
40−0.
020.
820.
171.
250.
55
10%
incr
emen
t(0
.44)
(0.3
6)(0
.26)
(0.2
2)(0
.29)
(0.2
4)(0
.31)
(0.2
6)
P va
lue
0.00
020.
130.
120.
950.
006
0.49
<.00
010.
03
Lym
phoc
ytes
Q1
122.
011
5.2
74.9
70.4
90.6
85.3
47.2
44.8
Q2
121.
411
5.7
74.7
70.5
90.3
85.6
46.8
45.2
Q3
126.
811
6.1
76.3
70.6
93.1
85.8
50.5
45.6
Q4
128.
211
6.9
76.9
70.7
94.0
86.1
51.3
46.2
P fo
r tre
nd<.
0001
0.03
0.01
0.58
0.00
020.
17<.
0001
0.01
BP
chan
ge (S
E) p
er−2.
26−0.
82−0.
66−0.
14−1.
19−0.
36−1.
60−0.
68
10%
incr
emen
t(0
.49)
(0.3
8)(0
.29)
(0.2
4)(0
.33)
(0.2
6)(0
.34)
(0.2
8)
P va
lue
<.00
010.
030.
020.
570.
0003
0.17
<.00
010.
01
Mon
ocyt
es
T112
3.8
115.
376
.270
.192
.185
.147
.645
.2
T212
3.4
116.
874
.770
.990
.986
.248
.746
.0
T312
3.8
115.
675
.070
.491
.385
.548
.845
.2
P fo
r tre
nd0.
990.
490.
110.
350.
350.
370.
190.
88
BP
chan
ge (S
E) p
er2.
56−0.
772.
63−0.
532.
60−0.
61−0.
06−0.
24
10%
incr
emen
t(1
.97)
(1.2
5)(1
.16)
(0.7
7)(1
.33)
(0.8
6)(1
.39)
(0.9
1)
P va
lue
0.19
0.54
0.02
0.49
0.05
0.48
0.96
0.79
Val
ues a
re m
eans
(sta
ndar
d er
ror)
.
J Am Soc Hypertens. Author manuscript; available in PMC 2011 November 1.

NIH
-PA Author Manuscript
NIH
-PA Author Manuscript
NIH
-PA Author Manuscript
Tian et al. Page 19* in
a li
near
mix
ed m
odel
, adj
uste
d fo
r age
, sex
, cen
ter,
diab
etes
, BM
I, to
tal c
hole
ster
ol, s
mok
ing,
drin
king
, phy
sica
l act
ivity
, and
die
tary
sodi
um in
take
.
Q1=
high
est q
uarti
le, Q
4=lo
wes
t; T1
=hig
hest
terti
le, T
3=lo
wes
t. Th
e re
fere
nce
cate
gory
was
Q4
(low
est q
uarti
le) o
r T3
(low
est t
ertil
e).
Abb
revi
atio
ns: B
P, b
lood
pre
ssur
e; S
BP,
syst
olic
blo
od p
ress
ure;
DB
P, d
iast
olic
blo
od p
ress
ure;
MA
P, m
ean
arte
rial p
ress
ure;
PP,
pul
se p
ress
ure;
SE,
stan
dard
err
or.
J Am Soc Hypertens. Author manuscript; available in PMC 2011 November 1.

NIH
-PA Author Manuscript
NIH
-PA Author Manuscript
NIH
-PA Author Manuscript
Tian et al. Page 20
Table 4
Unadjusted average intercept and slope coefficient for each BP trajectory over time, by race.
African-Americans Whites
Intercept(SE)
Slopecoefficient
(SE)
Intercept(SE)
Slopecoefficient
(SE)
SBP 126.73 (0.52) 1.01 (0.6) 115.93 (0.24) 1.13 (0.03)
DBP 77.8 (0.31) −0.28 (0.04) 70.7 (0.15) −0.01 (0.02)
MAP 94.1 (0.35) 0.15 (0.04) 85.8 (0.17) 0.37 (0.02)
PP 48.8 (0.36) 1.2 (0.05) 45.2 (0.16) 1.1 (0.02)
Values are means (standard error).
Abbreviations: SBP, systolic blood pressure; DBP, diastolic blood pressure; MAP, mean arterial pressure; PP, pulse pressure; SE, standard error.
J Am Soc Hypertens. Author manuscript; available in PMC 2011 November 1.

NIH
-PA Author Manuscript
NIH
-PA Author Manuscript
NIH
-PA Author Manuscript
Tian et al. Page 21
Tabl
e 5
Mul
tivar
iabl
e-ad
just
ed* e
stim
ates
of t
he a
dditi
ve e
ffec
t of q
uarti
le/te
rtile
of l
euko
cyte
s on
mea
n in
terc
ept a
nd sl
ope
of B
P tra
ject
orie
s ove
r tim
e, b
y ra
ce.
Val
ues a
re m
eans
(sta
ndar
d er
ror)
.
Afr
ican
-Am
eric
ans
Whi
tes
Qua
rtile
/Ter
tile
(1=h
ighe
st)
Inte
rcep
t(S
E)
P fo
rtr
end
Slop
e co
effic
ient
(SE
)P
for
tren
dIn
terc
ept
(SE
)P
for
tren
dSl
ope
coef
ficie
nt(S
E)
P fo
rtr
end
SBP
Neu
trop
hils
Q1
6.39
(1.7
1)−0.
25 (0.
22)
1.30
(1.0
1)0.
001
(0.1
2)
Q2
3.27
(1.6
3)0.
0001
−0.
21 (0.
22)
0.31
0.56
(1.0
2)0.
910.
01 (0
.13)
0.04
Q3
1.09
(1.2
6)0.
30 (0
.16)
−0.
16 (1.
03)
−0.
01 (0.
13)
Lym
phoc
ytes
Q1
−5.
78 (1.
50)
0.12
(0.2
0)−1.
68 (0.
89)
0.08
(0.1
1)
Q2
−6.
39 (1.
69)
<.00
010.
11 (0
.23)
0.58
−1.
72 (0.
74)
0.02
0.00
2 (0
.09)
0.61
Q3
−2.
46 (1.
80)
0.08
(0.2
5)−1.
16 (0.
67)
0.03
(0.0
8)
Mon
ocyt
esT1
0.47
(1.2
9)0.
66−0.
04 (0.
17)
0.69
−0.
57 (0.
69)
0.31
−0.
06 (0.
09)
0.53
T2−0.
54 (1.
32)
0.15
(0.1
7)0.
91 (0
.68)
−0.
12 (0.
08)
DB
P
Neu
trop
hils
Q1
1.61
(0.9
9)0.
12 (0
.14)
0.14
(0.6
2)−0.
002
(0.0
7)
Q2
1.28
(0.9
4)0.
080.
09 (0
.14)
0.19
0.06
(0.6
2)0.
51−0.
02 (0.
08)
0.93
Q3
−0.
87 (0.
73)
0.28
(0.1
0)−0.
21 (0.
63)
−0.
01 (0.
08)
Lym
phoc
ytes
Q1
−2.
16 (0.
87)
−0.
12 (0.
12)
−0.
06 (0.
55)
0.05
(0.0
6)
Q2
−2.
43 (0.
98)
0.01
−0.
11 (0.
14)
0.30
−0.
51 (0.
45)
0.51
−0.
05 (0.
05)
0.93
Q3
−0.
85 (1.
04)
−0.
03 (0.
15)
−0.
04 (0.
41)
0.02
(0.0
5)
Mon
ocyt
esT1
1.15
(0.7
5)0.
08−0.
08 (0.
10)
0.33
−0.
22 (0.
42)
0.51
−0.
05 (0.
05)
0.51
T2−0.
52 (0.
76)
0.11
(0.2
5)0.
36 (0
.41)
−0.
12 (0.
05)
MA
P
Neu
trop
hils
Q1
3.22
(1.1
4)0.
01 (0
.15)
0.53
(0.6
9)−0.
00 (0.
08)
Q2
1.94
(1.0
9)0.
003
−0.
01 (0.
15)
0.73
0.22
(0.7
0)0.
15−0.
01 (0.
08)
0.90
Q3
−0.
21 (0.
84)
0.28
(0.1
1)−0.
20 (0.
71)
−0.
01 (0.
08)
Lym
phoc
ytes
Q1
−3.
37 (1.
01)
−0.
05 (0.
14)
−0.
61 (0.
61)
0.06
(0.0
7)
Q2
−3.
75 (1.
13)
0.22
−0.
05 (0.
15)
0.68
−0.
93 (0.
50)
0.11
−0.
03 (0.
06)
0.80
Q3
−1.
38 (1.
21)
−0.
02 (0.
17)
−0.
42 (0.
46)
0.03
(0.0
5)
Mon
ocyt
esT1
0.92
(0.8
7)0.
22−0.
07 (0.
11)
0.41
−0.
34 (0.
47)
0.38
−0.
05 (0.
06)
0.47
J Am Soc Hypertens. Author manuscript; available in PMC 2011 November 1.
NIH
-PA Author Manuscript
NIH
-PA Author Manuscript
NIH
-PA Author Manuscript
Tian et al. Page 22
Afr
ican
-Am
eric
ans
Whi
tes
Qua
rtile
/Ter
tile
(1=h
ighe
st)
Inte
rcep
t(S
E)
P fo
rtr
end
Slop
e co
effic
ient
(SE
)P
for
tren
dIn
terc
ept
(SE
)P
for
tren
dSl
ope
coef
ficie
nt(S
E)
P fo
rtr
end
T2−0.
52 (0.
88)
0.12
(0.1
2)0.
55 (0
.46)
−0.
12 (0.
05)
PP Neu
trop
hils
Q1
4.72
(1.1
9)−0.
40 (0.
17)
1.17
(0.7
3)−0.
002
(0.1
0)
Q2
2.05
(1.1
3)<.
0001
−0.
34 (0.
17)
0.01
0.55
(0.7
4)0.
020.
03 (0
.10)
0.94
Q3
1.90
(0.8
7)0.
02 (0
.13)
0.07
(0.7
5)0.
01 (0
.11)
Lym
phoc
ytes
Q1
−3.
66 (1.
05)
0.31
(0.1
6)−1.
65 (0.
64)
0.05
(0.0
9)
Q2
−4.
01 (1.
18)
0.00
030.
30 (0
.18)
0.06
−1.
19 (0.
53)
0.01
0.06
(0.0
8)0.
43
Q3
−1.
66 (1.
25)
0.19
(0.1
9)−1.
11 (0.
48)
0.02
(0.0
7)
Mon
ocyt
esT1
−0.
65 (0.
90)
0.45
0.05
(0.1
3)0.
74−0.
32 (0.
50)
0.43
−0.
01 (0.
07)
0.88
T2−0.
06 (0.
92)
0.07
(0.1
4)0.
53 (0
.49)
−0.
01 (0.
07)
* in a
line
ar m
ixed
mod
el, a
djus
ted
for a
ge, s
ex, c
ente
r, di
abet
es, B
MI,
tota
l cho
lest
erol
, sm
okin
g, d
rinki
ng, p
hysi
cal a
ctiv
ity, a
nd d
ieta
ry so
dium
inta
ke.
Q1=
high
est q
uarti
le, Q
4=lo
wes
t; T1
=hig
hest
terti
le, T
3=lo
wes
t. Th
e re
fere
nce
cate
gory
was
Q4
(low
est q
uarti
le) o
r T3
(low
est t
ertil
e).
Abb
revi
atio
ns: B
P, b
lood
pre
ssur
e; S
BP,
syst
olic
blo
od p
ress
ure;
DB
P, d
iast
olic
blo
od p
ress
ure;
MA
P, m
ean
arte
rial p
ress
ure;
PP,
pul
se p
ress
ure;
SE,
stan
dard
err
or.
J Am Soc Hypertens. Author manuscript; available in PMC 2011 November 1.