work organization and atherosclerosis
TRANSCRIPT
Work Organization and Atherosclerosis: Findings from the ARK Study Carles Muntaner, MD PhD, F. Javier Nieto, MD, PhD, Lawton Cooper, MD, John Meyer, MD, Moyses Szklo, DrPH, Herman A. Tyroler, PhD
Introduction:
Methods:
Resulk
Conclusions:
The aim of this investigation was to examine the extent to which work organization (i.e., occupational stress) is associated with subclinical carotid atherosclerosis.
For that purpose we used a cross-sectional study of four U.S. community samples conducted between 1987 and 1989. Participants in the study were 10,801 adults aged 45 to 64 years. Subclinical carotid atherosclerosis was assessed by measuring the intima-media thickness (IMT) of the carotid artery wall using B-mode ultrasound. Occupational stress was defined using six indicators: substantive complexity of work, physical demands, .job insecurity, skill discretion, decision authority, and physical exertion. Information from U.S. national surveys on occupational stress indicators was linked to the study participants’ occupation.
We observed negative associations of complexity of work and skill discretion with mean IMT of the carotid artery wall among the four race-gender groups. In addition, physical demands was positively associated with mean IMT among blacks and job insecurity was positively associated with IMT among white women and black men. After adjustment for well-established risk factors, the magnitude of these associations was substantially reduced.
Taken in combination with results from recent European studies, our findings suggest that work organization plays a role in the etiology of atherosclerosis.
Medical Subject Headings (MeSH): cardiovascular disease, atherosclerosis, socioeconomic factors, stressful events, stress, occupational health. (Am J Prev Med 1998;14:9-18) 0 1998 American Journal of Preventive Medicine
T he association between work organization (i.e., occupational stress) and cardiovascular disease has received growing empirical support during
the last decade.’ Investigators have reported associa- tions between occupational stressors and several cardio- vascular outcomes (e.g., blood pressure, angina, myo- cardial infarction) .I Individuals working under conditions of monotony, lack of autonomy, high de- mands (how fast and how hard the worker must per- form the necessary tasks, physical exertion on the job, time pressure), and job insecurity appear to be at
From Prevention Research Center and Institute of Occupational and Environmental Health (Muntdner and Meyer), West Virginia Univer- sity School of Medicine, Morgantown, West Virginia; Laboratory of Socio-Environmental Studies (Muntaner), National Institutes of Men- tal Health. Bethesda. MD; Department of Epidemiology, The Johns Hopkins University School of Hygiene and Public Health (Nieto and Srklo). Baltimore, Maryland; Epidemiology and Biometry Program, National Heart, Lung, and Blood Institute (Cooper), Department of Epidemiology, School of Public Health (Tyroler), University of North Carolina at Chapel Hill, North Carolina.
Address reprint requests to Dr. Muntaner, Prevention Research Center and Institute of Occupational and Environmental Health, P.O. Box 9190, 3801 Health Sciences South, WVU, Morgantown V$‘V 26.506.
greater risk of cardiovascular disease.‘-” In particular, job strain (the combination of high demands and low control) has been shown to predict cardiovascular outcomes in a number of studies.’ Despite the relative consistency of these associations7 theoretical and methodological problems regarding the association between occupational stress and cardiovascular disease remain unresolved. In assessing exposure to occupa- tional stress, most studies have relied on self-report of job stress, thus making it difficult to rule out biases in the ascertainment of associations when information on both occupational stress and outcome is gathered simul- taneous(v from the study participant.” Second, in assess- ing cardiovascular outcomes, investigators have relied on clinically manifest cardiovascular disease,’ thus pre- cluding differentiation between risk factors for athero- sclerosis and precursors or precipitants of clinical epi- sodes.
The present study aims at investigating the relation- ship of both imputed observers’ ratings and workers’ self-reports of occupational stressors to asymptomatic atherosclerosis in a gender- and racially diverse middle-
Am J Prev Med 199&14(l) 0 1998 American Journal of Preventive Medicine
0749-3797/98/$19.00 9 PI1 s0749-3797(97)000184
aged population sample. Growing evidence indicating that women and blacks experience different work en- vironments that might modify the effect of occupa- tional stressors provides a rationale for stratification.g,10
The organization of work during the current period of market globalization has been associated with an increase in stressful working conditions (less autonomy and complexity, more demands) and greater threat of unemployment (more job insecurity).l’ We hypothe- sized that complexity, autonomy, monotony of work, job demands, and job insecurity would be associated with atherosclerosis in our study.
Methods Participants
The study sample was drawn from the Atherosclerosis Risk in Communities (ARIC) Study, a longitudinal study of cardiovascular disease.12 Participants in the present analyses (N = 10,801; 1,820 black women, 3,697 white women, 1,162 black men, and 4,122 white men) are part of the ARIC cohort baseline examination that was selected as a probability sample of men and women between the ages of 45 and 64 from four U.S. communities: Forsyth County, North Carolina; Jackson, Mississippi; Minneapolis suburbs, Minnesota; and Washington County, Maryland.
These communities were selected to represent di- verse geographic, socioeconomic, and racial composi- tions.12 ARIC samples from Forsyth County, Minneap- olis suburbs, and Washington County approximately represent the demographic composition of the commu- nities from which they were drawn. The Jackson sample is an all-black sample. Sampling frames and methods have been described in detail elsewhere.12 Black or white participants with available information on most recent occupation (not including homemaking) and who were employed at the time of the interview were included in the present analysis (N = 10,801). Sixty- one percent of white women and 68 percent of black women were employed. Occupations have been coded according to the 1980 census code of occupations.13 The five most frequent occupations were “managers and administrators” (n = 854), “secretaries” (n = 417)) “sales supervisors and proprietors” (n = 340)) and primary (n = 292) and secondary (n = 263) teachers.
Clinical Examination and Ultrasound Measurement
The ARIC examination included the assessment of cardiovascular morbidity as well as suspected risk fac- tors.12 Participants gave their informed consent for study procedures and examination.
Carotid artery wall thickening, a surrogate measure
of early atherosclerosis, was measured by B-mode ultra- sound, according to the methods developed by Pignoli et a1.14 Details about these methods have been reported elsewhere.15 Ultrasound readings are used to obtain measures of intima-media thickness (IMT) of the ca- rotid artery wall, 1 centimeter in length, from the near and far walls of the common carotid, the carotid bifurcation, and the internal carotid. The measure of IMT used in this study is a weighted mean of the far-wall thickness at these three sites on both left and right sides.
Arterial hypertension was defined as diastolic blood pressure equal or greater than 90 mmHg or systolic blood pressure greater or equal than 140 mmHg or the current use of antihypertensive medication. Obesity was defined by a body mass index (BMI) greater than or equal to 27.8 kg/m2 among men and 27.3 kg/m2 among women. I6 Low levels of high-density lipoprotein (HDL) cholesterol were defined as equal or less than 50 mg/dl, while high levels of low density lipoprotein (LDL) cholesterol were defined as more than 160 mg/dl. Cigarette smoking in pack-years was classified in three categories: “O”, “2 l-28 pack/years,” and “> 28 pack/years.” Family income was categorized into less than $25,000, between $25,000 and $50,000 and more than $50,000 per year. ” A detailed description of procedures to measure these variables as well as others such as employment status can be found in the ARIC operations manua1s.l’
Occupational Stress Measures
Indicators of occupational stress (substantive complex- ity of work, and physical demands and hazards) were derived from the Dictionary of Occupational Titles (DOT) ratings. lg Substantive camp lexity of work is the complexity of dealing with people, data, and things, whereas physical demands and hazards comprise the physical effort and potential for harm characteristic of a given occupation. lg The DOT rating system has the advantage of being based on direct observation, as opposed to self-report. 2o It provides 12,099 different occupational descriptions derived from on-site ratings made by occupational analysts. In addition to these descriptions, the DOT provides ratings for 44 occupa- tional characteristics (measurements of complexity of work, education and training required, aptitudes and interests characteristic of the occupation, physical de- mands of the occupation, and physical conditions un- der which the work is performed.lg
In the present study, we used the occupational rat- ings from the DOT for the 1980 U.S. Census occupa- tional categories developed by England and Kil- bourne,21 which yield a score for each of the 44 DOT occupational ratings for each 1980 occupational cate- gory. A factor analysis was performed on DOT ratings
10 American Journal of Preventive Medicine, Volume 14, Number 1
for each occupation coded in the 1980 Census (N = 502).20 As in Cain and Treiman, ‘a this procedure yielded a substantive complexity of work factor and a physical demands factor. ‘c’ Substantive complexity, a major theoretical construct in contemporary occupa- tional and organizational sociology,” expresses the complexity of working with people, data, and things for a given occupation,” and explains over 40% of the total variance of the DOT ratings. Ratings of “complex- ity of working with data and people,” “direction, con- trol and planning, ” “abstract and creative activities,” and “variety and change” show high loadings on this factor. Examples of occupations with low substantive complexity are launderers, winding and twisting ma- chine operators, and hand packers and packagers. Examples of occupations with high substantive com- plexity are managers, physicians, and architects. The physical demands factor shows high loading on ratings of “eye-hand-foot coordination,” “lifting, carrying, pull- ing and pushing,” and “stooping, kneeling, crouching and crawling.” Occupations with high scores on this factor are fire fighters, farmers, and lumberers. Several construct-validity studies have shown that the DOT scale of physical demands is a measure of physical exhaustion, and not merely a measure of vigorous activity on the job.20.“-‘”
Substantive complexity and physical demands factor scores were linked with ARIC data based on the occu-
pational code of the ARIC respondent. The validity of these factors in the description of the psychosocial dimensions of work associated with health outcomes has been previously reported.‘0,‘3 Substantive complex- ity and physical demands factorial scales were con- structed using 0.40 loadings as cut-point, as in Cain and Treiman. ‘a No psychosocial work environment scales were directly administered to ARIC participants. How- ever, scores developed by England and Kilbourne”’ for the work environment scales of census occupations were used and assigned to the ARIC respondents’ occupational category. Indicators of control over work (i.e., skill discretion and decision authority), physical demands (i.e., physical exertion), and job insecurity were derived from a second system of scoring the occupational characteristics of census categories.2”,9s Skill discretion is defined by the sum of responses to six items (degree to which the job involves learning new things, requires skills, task variety, repetitiveness, cre- ativity, and development of the individual’s special abilities). Decision authority is defined by the sum of responses to 4 items (the individual’s freedom to make decisions, to choose how to perform work, to have a lot to say on the job, and to influence company policy). Physical exertion is defined by one item, which mea- sures the degree to which a job involves physical exertion. Job insecurity is defined by the sum of re- sponses to three items (degree of job security, how
steady is the job, possibility of lay-off). This inference system consists of scale scores based on self-reports from three national surveys on employment conditions conducted by the Department of Labor. Self-reports of individual workers are aggregated to provide a score for each particular occupation. Questions are scored on a Likert scale (1 = Strongly Disagree; 2 = Disagree; 3 = Agree; 4 = Strongly Agree) .2’,25 Internal consistencies and stabilities have been reported.‘s
For the analyses presented here, occupational stress indicators of substantive complexity of work, physical demands, skill discretion, decision authority, physical exertion, and job insecurity were operationalized as tertiles based on the total cohort. Tertiles were chosen because they provided a more interpretable scale than the original scores.
Data Analysis
Mean differences in IMT between risk-factor categories were tested by t and F tests. Next, we performed linear multivariate regressions to assess the relation between occupational stress and atherosclerosis. Age-adjustment was performed with age as a continuous variable. Stratified regression analyses were conducted to con- trol for the potential confounding associations of gen- der and race/ethnicity based on previous theory, find- ings of effect modification of stress effects by gender and race, and consistency with other ARIC stud- ies.‘~“~“‘,” Given the large sample size of our subgroups study,” the effect of stratification on the statistical precision of our estimates was limited.
Occupational stress indicators were coded as ordinal variables from 1 to 3. During exploratory analyses, codes using dummy variables and occupational stress indicators in their original scales were examined. Al- though none of these alternative codes would substan- tially modify the conclusions of our analysis, the ordinal variables were preferred because of their congruence with a trend test of the occupational stress hypothesis.
We also estimated multivariate models, including education and study site as indicators of socioeconomic stratification and potential interactions with income. In addition, the high demands/low control (i.e., job strain) operationalization of stress showed weak nonsig- nificant effects. Results were not sensitive to these alternative specifications of the model and are not presented.
Results
Age-adjusted associations between occupational stress indicators and well-established risk factors for cardio- vascular disease for race-gender-specific strata are pre- sented in Table 1. Substantive complexity shows an inverse association with systolic blood pressure and
Am J Prev Med 1998;14(1) 11
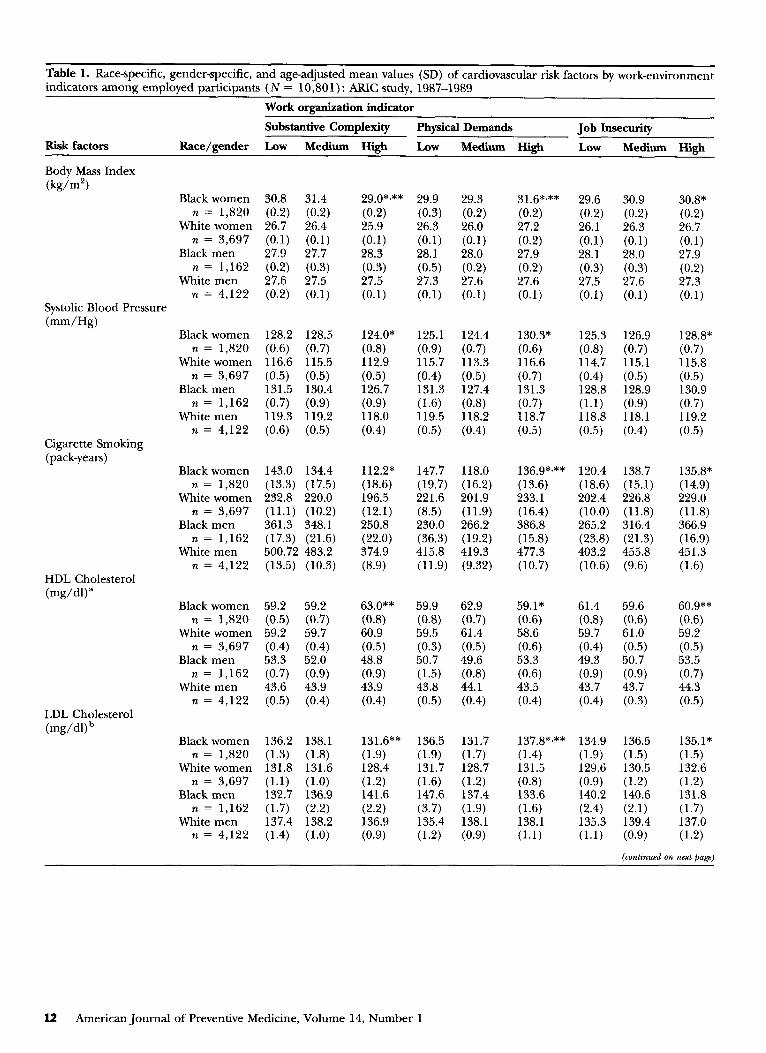
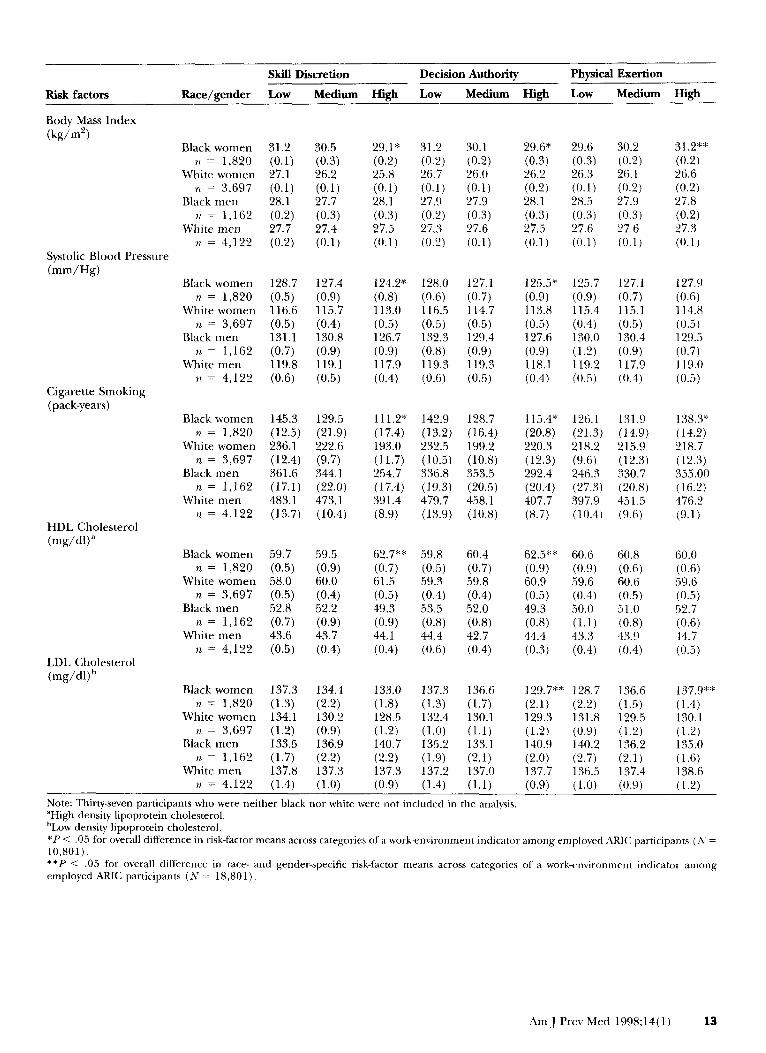
Table 1. Race-specific, gender-specific, and age-adjusted mean values (SD) of cardiovascular risk factors by work-environment indicators among employed participants (N = 10,801) : ARIC study, 1987-1989
Work organization indicator
Substantive Complexity Physical Demands Job Insecurity Risk factors Race/gender Low Medium High Low Medium High Low Medium High
Body Mass Index (kg/m’)
Systolic Blood Pressure (mm/Hg)
Cigarette Smoking (pack-years)
HDL Cholesterol (mg/dl)”
Black women 30.8 31.4 n = 1,820 (0.2) (0.2)
White women 26.7 26.4 n = 3,697 (0.1) (0.1)
Black men 27.9 27.7 n = 1,162 (0.2) (0.3)
White men 27.6 27.5 n = 4,122 (0.2) (0.1)
Black women 128.2 128.5 n = 1,820 (0.6) (0.7)
White women 116.6 115.5 n = 3,697 (0.5) (0.5)
Black men 131.5 130.4 n = 1,162 (0.7) (0.9)
White men 119.3 119.2 n = 4.122 (0.6) (0.5)
Black women 143.0 134.4 n = 1,820 (13.3) (17.5)
White women 232.8 220.0 n = 3,697 (11.1) (10.2)
Black men 361.3 348.1 n = 1,162 (17.3) (21.6)
White men 500.72 483.2 n = 4.122 (13.5) (10.3)
Black women 59.2 59.2 n = 1,820 (0.5) (0.7)
White women 59.2 59.7 n = 3,697 (0.4) (0.4)
Black men 53.3 52.0 n = 1,162 (0.7) (0.9)
White men 43.6 43.9 n = 4,122 (0.5) (0.4)
LDL Cholesterol @g/d) b
Black women 136.2 138.1 n = 1,820 (1.3) (1.8)
White women 131.8 131.6 n = 3,697 (1.1) (1.0)
Black men 132.7 136.9 n = 1,162 (1.7) (2.2)
White men 137.4 138.2 n = 4,122 (1.4) (1.0)
29.0*,** (0.2) 25.9 (0.1) 28.3 (0.3) 27.5 (0.1)
29.9 29.3 (0.3) (0.2) 26.3 26.0 (0.1) (0.1) 28.1 28.0
(“.5) :07.26) 27.3 (0.1) (0:l)
124.0* 125.1 124.4 (0.8) (0.9) (0.7) 112.9 115.7 113.3 (0.5) (0.4) (0.5) 126.7 131.3 127.4 (0.9) (1.6) (0.8) 118.0 119.5 118.2 (0.4) (0.5) (0.4)
112.2” (18.6) 196.5 (12.1) 250.8 (22.0) 374.9 (8.9)
147.7 118.0 (19.7) (16.2) 221.6 201.9 (8.5) (11.9) 230.0 266.2 (36.3) (19.2) 415.8 419.3 (11.9) (9.32)
63.0”* (0.8) 60.9 (0.5) 48.8 (0.9) 43.9 (0.4)
59.9 62.9 (0.8) (0.7) 59.5 61.4 (0.3) (0.5) 50.7 49.6 (1.5) (0.8) 43.8 44.1 (0.5) (0.4)
131.6** (1.9) 128.4 (1.2) 141.6 (2.2) 136.9 (0.9)
136.5 131.7 (1.9) (1.7) 131.7 128.7 (1.6) (1.2) 147.6 137.4 (3.7) (1.9) 135.4 138.1 (1.2) (0.9)
31.6*x** 29.6 (0.2) (0.2) 27.2 26.1 (0.2) (0.1) 27.9 28.1 (0.2) (0.3) 27.6 27.5 (0.1) (0.1)
130.3* 125.3 (0.6) (0.8) 116.6 114.7 (0.7) (0.4) 131.3 128.8 (0.7) (1.1) 118.7 118.8 (0.5) (0.5)
136.9*,** 120.4 (13.6) (18.6) 233.1 202.4 (16.4) (10.0) 386.8 265.2 (15.8) (23.8) 477.3 403.2 (10.7) (10.6)
59.1* 61.4 (0.6) (0.8) 58.6 59.7 (0.6) (0.4) 53.3 49.3 (0.6) (0.9) 43.5 43.7 (0.4) (0.4)
137.8*~** 134.9 (1.4) (1.9) 131.5 129.6 (0.8) (0.9) 133.6 140.2 (1.6) (2.4) 138.1 135.3 (1.1) (1.1)
30.9 (0.2) 26.3 (0.1) 28.0 (0.3) 27.6 (0.1)
126.9 (0.7) 115.1 (0.5) 128.9 (0.9) 118.1 (0.4)
138.7 (15.1) 226.8 (11.8) 316.4 (21.3) 455.8 (9.6)
59.6 (0.6) 61.0 (0.5) 50.7 (0.9) 43.7 (0.3)
136.5 (1.5) 130.5 (1.2) 140.6 (2.1) 139.4 (0.9)
30.8* (0.2) 26.7 (0.1) 27.9 (0.2) 27.3 (0.1)
128.8* (0.7) 115.8 (0.5) 130.9 (0.7) 119.2 (0.5)
135.8% (14.9) 229.0 (11.8) 366.9 (16.9) 451.3 (1.6)
60.9** (0.6) 59.2 (0.5) 53.5 (0.7) 44.3 (0.5)
135.1* (1.5) 132.6 (1.2) 131.8 (1.7) 137.0 (1.2)
12 American Journal of Preventive Medicine, Volume 14, Number 1
Risk factors
Skill Discretion Decision Authority Physical Exertion
Race/gender Low Medium High Low Medium High Low Medium High
Body Mass Index (kg/m?
Black women 31.2 n = 1,820 (0.1)
White women 27.1 n = 3,697 (0.1)
Black men 28.1 I/ = 1,162 (0.2)
White men 27.7 ?I = 4,122 (0.2)
30.5 (0.3) 26.2 (0.1) 27.7 (0.3) 27.4 (0.1)
29.1* 31.2 30.1 (0.2) (0.2) (0.2) 25.8 26.7 26.0 (0.1) (0.1) (0.1) 28.1 27.9 27.9 (0.3) (0.2) (0.3) 27.5 27.3 27.6 (0.1) (0.2) (0.1)
124.2* (0.8) 113.0 (0.5) 126.7 (0.9) 117.9 (0.4)
128.0 127.1 (0.6) (0.7) 116.5 114.7 (0.5) (0.5) 132.3 129.4 (0.8) (0.9) 119.3 119.3 (0.6) (0.5)
111.2* (17.4) 193.0 (11.7) 254.7 (17.4) 391.4 (8.9)
142.9 128.7 (13.2) (16.4) 232.5 199.2 (10.5) (10.8) 336.8 353.5 (19.3) (20.5) 479.7 458.1 (13.9) (10.8)
62.7** (0.7) 61.5 (0.5) 49.3 (0.9) 44.1 (0.4)
59.8 60.4 (0.5) (0.7) 59.3 59.8 (0.4) (0.4) 53.5 52.0 (0.8) (0.8) 44.4 42.7 (0.6) (0.4)
133.0 (1.8) 128.5 (1.2) 140.7 (2.2) 137.3 (0.9)
137.3 136.6 (1.3) (1.7) 132.4 130.1 (1.0) (1.1) 135.2 133.1 (1.9) (2.1) 137.2 137.0 (1.4) (1.1)
29.6* (0.3) 26.2 (0.2) 28.1 (0.3) 27.5 (0.1)
29.6 (0.3) 26.3 (0.1) 28.5 (0.3) 27.6 (0.1)
30.2 (0.2) 26.1 (0.2) 27.9 (0.3) 27.6 (0.1)
31.2** (0.2) 26.6 (0.2) 27.8 (0.2) 27.3 (0.1)
127.9 (0.6) 114.8 (0.5) 129.5 (0.7) 119.0 (0.5)
138.3* (14.2) 218.7 (12.3) 355.00 (16.2) 476.2 (9.1)
60.0 (0.6) .59.6 (0.5) 52.7 (0.6) 44.7 (0.5)
Systolic Blood Pressure (mm/H&
127.4 (0.9) 115.7 (0.4) 130.8 (0.9) 119.1 (0.5)
125.7 (0.9) 115.4 (0.4) 130.0 (1.2) 119.2 (0.5)
Black women 128.7 n = 1,820 (0.5)
White women 116.6 n = 3,697 (0.5)
Black men 131.1 n = 1,162 (0.7)
White men 119.8 77 = 4,122 (0.6)
125.5* (0.9) 113.8 (0.5) 127.6 (0.9) 118.1 (0.4)
127.1 (0.7) 115.1 (0.5) 130.4 (0.9) 117.9 (0.4)
Cigarette Smoking (pack-years)
Black women 145.3 129.5 n = 1,820 (12.5) (21.9)
White women 236.1 222.6 n = 3,697 (12.4) (9.7)
Black men 361.6 344.1 ,L = 1,162 (17.1) (22.0)
White men 483.1 473.1 t7 = 4.122 (13.7) (10.4)
115.4* (20.8) 220.3 (12.3) 292.4 (20.4) 407.7 (8.7)
126.1 (21.3) 218.2 (9.6) 246.3 (27.3) 397.9 (10.4)
131.9 (14.9) 215.9 (12.3) 330.7 (20.8) 451.5 (9.6)
HDL Cholesterol (mg/dU”
Black women 59.7 n = 1,820 (0.5)
White women 58.0 n = 3,697 (0.5)
Black men 52.8 n = 1,162 (0.7)
White men 43.6 n = 4,122 (0.5)
59.5
(0.9) 60.0 (0.4) 52.2 (0.9) 43.7 (0.4)
62.5** (0.9) 60.9 (0.5) 49.3 (0.8) 44.4 (0.3)
60.6 (0.9) 59.6 (0.4) 50.0 (1.1) 43.3 (0.4)
60.8 (0.6) 60.6 (0.5) 51.0 (0.8) 43.9 (0.4)
LDL Cholesterol (mg/dljb
Black women 137.3 n = 1,820 (1.3)
White women 134.1 n = 3,697 (1.2)
Black men 133.5 n = 1,162 (1.7)
White men 137.8 n = 4,122 (1.4)
134.4 (2.2) 130.2 (0.9) 136.9 (2.2) 137.3 (1.0)
129.7** (2.1) 129.3 (1.2) 140.9 (2.0) 137.7 (0.9)
128.7 (2.2) 131.8 (0.9) 140.2 (2.7) 136.5 (1.0)
136.6 (1.5) 129.5 (1.2) 136.2 (2.1) 137.4 (0.9)
1.4) 30.1 1.2) 35.0 1.6) 38.6 1.2)
Note: Thirty-seven participants who were neither black nor white were not included in the analysis. “High density lipoprotein cholesterol. blot density lipoprotein cholesterol. *P < .05 for overall difference in risk-factor means across categories of a work-environment indicator among employed ARIC participants (h’ = 10,801). **P < .05 for overall difference in race- and gender-specific risk-factor means across categories of a work-environment indicator among employed ARIC participants (AT = 18,801)
Am J Prev Med 1998;14(1) 13
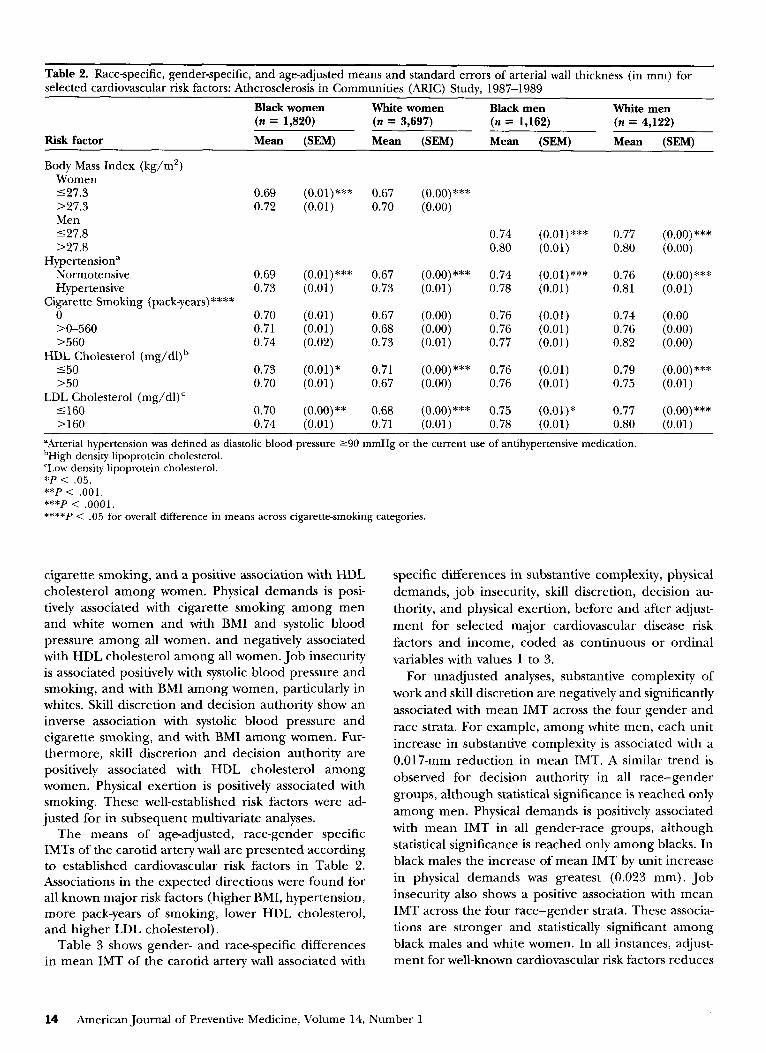
Table 2. Race-specific, gender-specific, and age-adjusted means and standard errors of arterial wall thickness (in mm) for selected cardiovascular risk factors: Atherosclerosis in Communities (ARIC) Study, 1987-1989
Black women White women Black men White men (n = 1,820) (n = 3,697) (n = 1,162) (n = 4,122)
Risk factor Mean @EM) Mean (SEM) Mean @EM) Mean @EM)
Body Mass Index (kg/m*) Women 127.3 0.69 (O.Ol)*** 0.67 (o.oo)*** >27.3 0.72 (0.01) 0.70 (0.00) Men 127.8 0.74 (o.ol)*** 0.77 (0.00) *** >27.8 0.80 (0.01) 0.80 (0.00)
Hypertension” Normotensive 0.69 (O.Ol)*** 0.67 (0.00) *** 0.74 (o.ol)*** 0.76 (o.oo)*** Hypertensive 0.73 (0.01) 0.73 (0.01) 0.78 (0.01) 0.81 (0.01)
Cigarette Smoking (pack-years)**** 0 0.70 (0.01) 0.67 (0.00) 0.76 (0.01) 0.74 (0.00 X-560 0.71 (0.01) 0.68 (0.00) 0.76 (0.01) 0.76 (0.00) >560 0.74 (0.02) 0.73 (0.01) 0.77 (0.01) 0.82 (0.00)
HDL Cholesterol (mg/dl)b 150 0.73 (o.ol)* 0.71 (0.00) *** 0.76 (0.01) 0.79 (o.oo)*** >50 0.70 (0.01) 0.67 (0.00) 0.76 (0.01) 0.75 (0.01)
LDL Cholesterol (mg/dl)’ 5160 0.70 (o.oo)** 0.68 (o.oo)*** 0.75 (o.ol)* 0.77 (o.oo)*** >160 0.74 (0.01) 0.71 (0.01) 0.78 (0.01) 0.80 (0.01)
“Arterial hypertension was defined as diastolic blood pressure 290 mmHg or the current use of antihypertensive medication. bHigh density lipoprotein cholesterol. ‘Low density lipoprotein cholesterol. *P < .05. **p < .OOl. ***p < .OOOl. ****P < .05 for overall difference in means across cigarette-smoking categories.
cigarette smoking, and a positive association with HDL cholesterol among women. Physical demands is posi- tively associated with cigarette smoking among men and white women and with BMI and systolic blood pressure among all women, and negatively associated with HDL cholesterol among all women. Job insecurity is associated positively with systolic blood pressure and smoking, and with BMI among women, particularly in whites. Skill discretion and decision authority show an inverse association with systolic blood pressure and cigarette smoking, and with BMI among women. Fur- thermore, skill discretion and decision authority are positively associated with HDL cholesterol among women. Physical exertion is positively associated with smoking. These well-established risk factors were ad- justed for in subsequent multivariate analyses.
The means of age-adjusted, race-gender specific IMTs of the carotid artery wall are presented according to established cardiovascular risk factors in Table 2. Associations in the expected directions were found for all known major risk factors (higher BMI, hypertension, more pack-years of smoking, lower HDL cholesterol, and higher LDL cholesterol).
Table 3 shows gender- and race-specific differences in mean IMT of the carotid artery wall associated with
specific differences in substantive complexity, physical demands, job insecurity, skill discretion, decision au- thority, and physical exertion, before and after adjust- ment for selected major cardiovascular disease risk factors and income, coded as continuous or ordinal variables with values 1 to 3.
For unadjusted analyses, substantive complexity of work and skill discretion are negatively and significantly associated with mean IMT across the four gender and race strata. For example, among white men, each unit increase in substantive complexity is associated with a 0.017-mm reduction in mean IMT. A similar trend is observed for decision authority in all race-gender groups, although statistical significance is reached only among men. Physical demands is positively associated with mean IMT in all gender-race groups, although statistical significance is reached only among blacks. In black males the increase of mean IMT by unit increase in physical demands was greatest (0.023 mm). Job insecurity also shows a positive association with mean IMT across the four race-gender strata. These associa- tions are stronger and statistically significant among black males and white women. In all instances, adjust- ment for well-known cardiovascular risk factors reduces
14 American Journal of Preventive Medicine, Volume 14, Number I
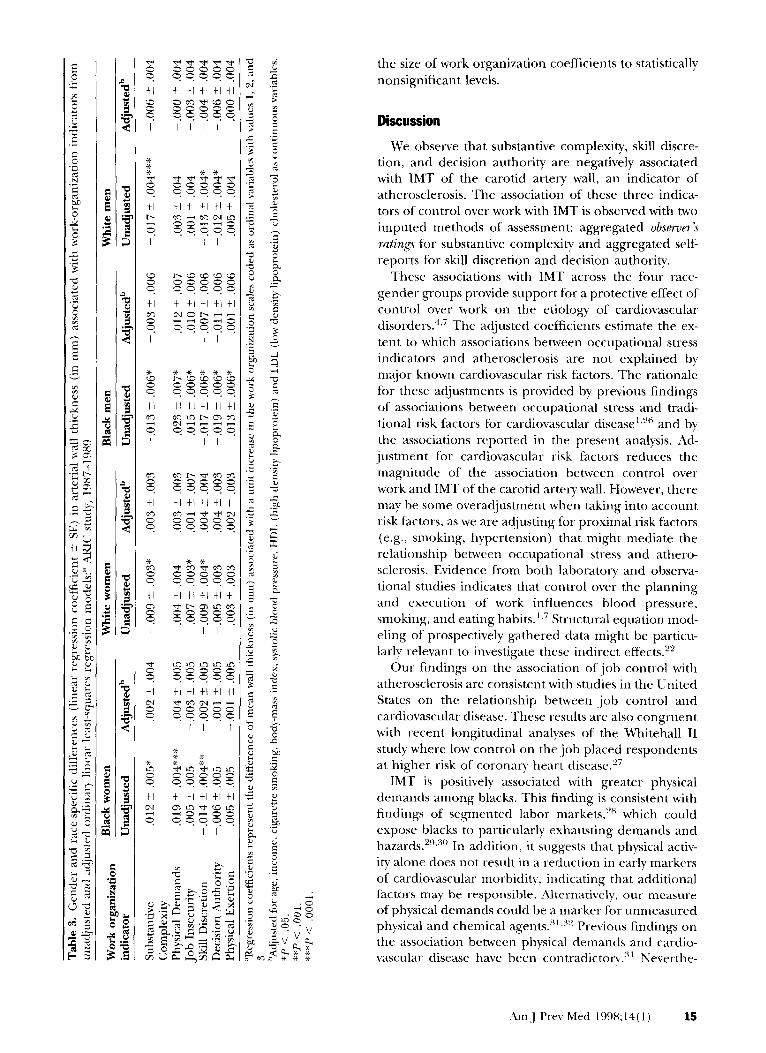
the size of work organization coefficients to statistically nonsignificant levels.
Discussion
We observe that substantive complexity, skill discre- tion, and decision authority are negatively associated with IMT of the carotid artery wall, an indicator of atherosclerosis. The association of these three indica- tors of control over work with IMT is observed with two imputed methods of assessment: aggregated obsmrr’s ratings for substantive complexity and aggregated self- reports for skill discretion and decision authority.
These associations with IMT across the four race- gender groups provide support for a protective effect of control over work on the etiology of cardiovascular disorders.4,’ The adjusted coefficients estimate the ex- tent to which associations between occupational stress indicators and atherosclerosis are not explained by major known cardiovascular risk factors. The rationale for these adjustments is provided by previous findings of associations between occupational stress and tradi- tional risk factors for cardiovascular disease1.26 and by the associations reported in the present analysis. Ad- justment for cardiovascular risk factors reduces the magnitude of the association between control over work and IMT of the carotid artery wall. However, there may be some overadjustment when taking into account risk factors, as we are adjusting for proximal risk factors (e.g., smoking, hypertension) that might mediate the relationship between occupational stress and athero- sclerosis. Evidence from both laboratory and observa- tional studies indicates that control over the planning and execution of work influences blood pressure, smoking, and eating habits.‘.7 Structural equation mod- eling of prospectively gathered data might be particu- larly relevant to investigate these indirect effects.2”
Our findings on the association of job control with atherosclerosis are consistent with studies in the United States on the relationship between -job control and cardiovascular disease. These results are also congruent with recent longitudinal analyses of the Whitehall II study where low control on thejob placed respondents at higher risk of coronary heart disease.”
IMT is positively associated with greater physical demands among blacks. This finding is consistent with findings of segmented labor markets,‘” which could expose blacks to particularly exhausting demands and hazards.‘“.“” In addition, it suggests that physical activ- ity alone does not result in a reduction in early markers of cardiovascular morbidity, indicating that additional factors may be responsible. Alternatively, our measure of physical demands could be a marker for unmeasured physical and chemical agents.“‘.3” Previous findings on the association between physical demands and cardio- vascular disease have been contradictorv.‘” Neverthe-
Am~J Prev Med 1998;34(3) 15
less, a recent Finnish studys3 where work demands (including physical strain) were associated with athero- sclerosis makes a physical demands hypothesis31 more plausible.
A limitation of our study is that we relied on “current occupation” for the assessment of the exposure rather than using a complete occupational history.34 Using “current occupation” might miss psychosocial expo- sures in previous jobs that were critical for the devel- opment of atherosclerosis. However, a U.S. study con- ducted shortly before the ARIC baseline35 indicates that “current or most recent” occupation captured “usual occupation” for most respondents. In addition, “usual” and “current” occupations are likely to be similar in terms of job characteristics even for those persons who change job titles.34 Thus, a core assump- tion of our study is that the job held at the time of the interview is an appropriate proxy for long-term expo- sure to occupational stress. Recent results from the Kupio study in Finland suggest that 4 years of exposure to occupational stressors will be significantly associated with a greater progression of carotid atherosclerosis.33
Another limitation of exposure assessment in our study is the use of imputed work environment scales. Although imputed work-environment scales eschew self-report bias, 34 these indicators should be considered as rough surrogates for the actual exposures.6 Several sources of measurement error have been associated with imputation methods in occupational stress re- search.6,20,34 A potential source of error stems from the separation in time between the development of the imputed scales and when the study using them was conducted. In our study we relied on a system devel- oped in the late 1980s,21 closely approximating the same years that the baseline ARIC data on occupation were collected. l2 This reduces the likelihood that major changes in the psychosocial work environment of spe- cific occupations (e.g., taxi driver) had occurred. An- other potential source of error is the validity of the original observer ratings that were used to develop the inference system. Several studies conducted with the DOT scales and the scales developed by Karasek and his colleagues 4,20,23,25 have yielded high correlations be- tween DOT observer’s ratings and psychosocial work environment scales based on self-reports (i.e., construct validity). Other studies have shown convergent validity between expert assessment and self-reports with both the DOT36 and other imputation systems2’ A third source of error of imputation methods is that they estimate only between-occupation variance-that is, imputation methods do not measure variation between jobs within a particular occupation (e.g., “gypsy” cab driver vs. driver working for a ‘Yellow Cab” compa- ny). 32,34 Misclassification due to these measurement errors is expected to be nondifferentia14*6,32 and would thus produce a considerable underestimate of the
association between occupational stress and atheroscler- osis.
Previous research on occupational stress and cardio- vascular disease has presented estimates of occupa- tional stress adjusted for social class, usually operation- alized as educational level or income.’ In the present study, adjustment for family income was used to deter- mine the association between occupational stress and atherosclerosis regardless of the association with prox- imal risk factors determined by income differentials.26 Adjusting the regression model for family income did not substantially change occupational stress coefficients in regressions that included either occupational stres- sors or occupational stressors and traditional cardiovas- cular risk factors (stepwise regressions not shown). Adjustment for income in alternative operationaliza- tions (e.g., finer gradations) also did not result in any significant change upon occupational stress coeffi- cients. It might be difficult to separate occupational stress from social class,22 as adjustment for income or education, frequently used proxies for social class, might leave substantial residual confounding. To ad- dress this problem, future studies examining the effects of occupational stress might use an even larger sample size, followed by fine stratification by measures of social class whose validity has been established.
Nonetheless, according to current conceptual frame- works, stress associated with occupations can arise from two factors. One is the relative level of income gener- ated by the occupation; the other is the working conditions or “transaction co~ts,“~‘~~* which take place in the workplace proper. These working conditions include characteristics such as control over work (i.e., complexity, autonomy, freedom of schedule, and cre- ativity), demands (pace and intensity, physical effort required to perform the tasks, hectic nature of the job, conflicting requirements), and threats of being fired or
job insecurity. 1,3*5,30,37,38 The income-adjusted esti- mates of the associations of work organization indica- tors on mean IMT can be interpreted as the associa- tions with these working conditions. Our inference method for the assessment of occupational stress has the advantage of diminishing the likelihood of self- reporting bias or worker subjectivity. On the other hand, the use of an indirect inferential method most likely underestimates a real association between occu- pational stressors and atherosclerosis.33,34 This proce- dure probably underestimates the strength of the asso- ciation between indicators and disease because the only information we obtain about a respondent’s job is its occupation title. Work organization indicators with relatively little between-occupation variance such as psychological demands4*20,24v25 are more likely to suffer from this limitation.
Because the study population is constituted exclu- sively of currently employed participants, it is also likely
16 American Journal of Preventive Medicine, Volume 14, Number 1
that a “healthy worker effect” weakens the association between occupational stress and atherosclerosis. How- ever, cross-sectional biases are much less of a concern with mean IMT measurements because participants were asymptomatic. Moreover, atherosclerotic lesions of the coronary artery disease have been detected in young men of military service age at autopsy.sg That the healthy-worker effect may be reducing the number of symptomatic participants in this study does not pre- clude the ability of these methods to detect an associ- ation between atherogenesis and occupational stress. In particular, elucidation of potentially modifiable risk factors for atherosclerosis when individuals are in a detectable preclinical phase is essential in devising preventive strategies.
We have adjusted for relevant risk factors, including income.‘” Even in the presence of such constraints, we detected some associations of occupational stressors with mean IMT of the carotid artery wall indicating that these potential risk factors deserve closer attention. Together with recent evidence from a Finnish study showing a significant association between work de- mands and atherosclerosis progression,33 the present results are consistent with the hypothesis for an etiolog- ical role for work organization in atherosclerosis. Lon- gitudinal studies involving direct assessment of working conditions will be needed before the hypothesis that work organization contributes to the development of subclinical atherosclerosis can be more firmly estab- lished in 1J.S. populations.
References 1. Schnall PL, Landsbergis PA, Baker D. Job strain and
cardiovascular disease. Annu Rev Public Health 1994;15: 381-411.
2. Schnall PL, Pieper CF, Schwartz JE, et al. The relationship between ‘Job Strain,’ workplace diastolic blood pressure, and ventricular mass index. JAMA 1990;263:1929-35.
3. Marmot MG, Smith GD, Stansfeld S, et al. Health inequal- ities among British civil servants: the Whitehall II study. Lanret 1991;337:1387-93.
4. JohnsonJV, Stewart W, Hall EM, Fredlund P, Theorell T. Long-term psychosocial work environment and cardiovas- cular mortality among Swedish men. Am J Public Health 1996;86:324-31. Schnall PL, Landsbergis, PA, Pieper, CF, et al. The impact of anticipation of job loss on psychological distress and worksite blood pressure. Am J Ind Med 1992;21:417-32. Auterman T, Shekelle RB, Vernon SW, Burau KD. Deci- sion latitude, psychological demand, job strain, and cor- onary heart disease in the Western Electric study. Am J Epidemiol 1994;139:620-7. Fine I,]. The psychosocial work environment and heart disease Am J Public Health 1996;86:301-33. Kristensen TS. The demand-control-support model: methodological challenges for future research. Stress Medicine 1996;11:17-26.
9.
10.
11.
12.
13.
14.
15.
16.
17.
18.
19.
20.
21.
22.
23.
24.
25.
26.
27.
Anderson NB. Racial differences in stress-induced cardio- vascular reactivity and hypertension: current status and substantive issues. Psycho1 Bull 1989;105:89-105. Rosenfield S. The effects of women’s employment: per- sonal control and sex differences in mental health. J Health Sot Behav 1989;30:77-91. Fenwick R, Tausig M. The macroeconomic context ofjob stress. J Health Sot Behav 1994:35:266-82. The ARIC Investigators. The Atherosclerosis Risk in Com- munities (ARIC) study. Am J Epidemiol 1989;129:687- 702. U.S. Bureau of the Census. Classified index of industries and occupations. Washington, DC: U.S. Department of Commerce; 1980. Pignoli P, Tremoli E, Poli A, et al. Intimal plus medial thickness of arterial wall: a direct measurement with ultrasound imaging. Circulation 1986;74:1399-1406. Bond MG, Riley WA, Barnes RW, et al. Ultrasound scanning procedure in the Atherosclerosis Risk in Com- munities (ARIC) study. Neuroimaging 1991;1:68-73. Abraham S, Carrol MD, Najar MF, et al. Obese and overweight adults in the United States. NCHS 1983; Series 11, No 230:1-93. Robins LN, Regier DA. Psychiatric disorders in America. The E.C.A. study. New York: The Free Press; 1991. National Heart, Lung, and Blood Institute. ARIC manuals of operation. Chapel Hill, NC: ARIC Coordinating Cen- ter, School of Public Health, University of North Caro- lina; 1987. Cain PS, Treiman DJ. The dictionary of occupational titles as a source of occupational data. Am Sociological Rev 1981;46:253-78. Muntaner C, Eaton WW, Garrison R. Dimensions of the psychosocial work environment in a sample of the U.S. metropolitan population. Work and Stress 1993;7:351- 63. England P, Kilbourne B. Occupational measures from the Dictionary of Occupational Titles for 1980 census detailed occupations. Ann Arbor, MI: Inter-University Consortium for Political and Social Research; 1988. Kohn ML, Naoi A, Schoenbach C, Schooler C, Slomzynski K. Position in the class structure and psychological func- tioning in the United States, Japan, and Poland. Am J Sociology 95 1990;964-1008. Muntaner C, Schoenbach C. Psychosocial work environ- ment and health in US. metropolitan areas. IntJ Health Serv 1994;24:337-53. Karasek RA, Schwartz JE, Pieper C. A job characteristics scoring system for occupational analysis: Part I. NewYork: Center for the Social Sciences. Columbia University; 1982. Schwartz J, Pieper C, Karasek RA. A procedure for linking job characteristics to health surveys. Am J Public Health 1988;78:904-9. Kaplan GA, Keil J. Socioeconomic factors and cardiovas- cular disease: a review of the literature. Circulation 1993;88:1973-98. Bosma H, Marmot MG, Hemingway H, Nicholson AC, Brunner E, Stansfeld SA. Low .job control and risk of coronary heart disease in Whitehall II (prospective co- hort) study. BMJ 1997;314:558-65.
Am J Prev Med 1998:14(l) 17
28. Gordon DM, Edwards R, Reich M. The historical trans- formation of work in the United States. New York: Cambridge University Press; 1982.
29. Robinson JC. Trends in racial inequality and the proba- bility of occupational related injury or illness. Milbank Q 1987;62:567-90.
30. Schor JB. The overworked American: The unexpected decline of leisure. New York: Basic Books; 1992.
31. Karasek R, Theorell T. Health work: Stress, productivity and the reconstruction of working life. New York: Basic Books; 1990.
32. Murphy LR. Job dimensions associated with severe dis- ability due to cardiovascular disease. J Clin Epidemiol 1991;44:155-66.
33. Lynch J, Krause N, Kaplan GA, Salonen R, Salonen JT. Workplace demands, economic reward and progression of carotid atherosclerosis. Circulation 1997;96:302-7.
34. Pieper C, LaCroix A, Rarasek RA. The relation of psycho-
social dimensions of work with coronary heart disease risk factors: a meta-analysis of five United States data bases. Am J Epidemiol 1989;129:483-94.
35. Illis WR, Swanson GM, Satariano ER, Schwartz AG. Am J Public Health 1987;77:1532-34.
36. Muntaner C, Tien A, Eaton WW, Garrison R. Occupa- tional characteristics and the occurrence of psychotic disorders. Sot Psychiatry Psychiatr Epidemiol 1991;26: 273-80.
37. Muntaner C, Crum R, Anthony J, Eaton WW. Psychoso cial dimensions of work and the incidence of drug-abuse dependence syndromes among adults. Am J Epidemiol 1995;142:183-90.
38. Bowles S, Gintis H. The revenge of Homo economicus. J Econ Perspectives 1993;7:83-102.
39. Enos WF, Beyer JC. Coronary artery disease in younger men. JAMA 1971;218:1434.
18 American Journal of Preventive Medicine, Volume 14, Number 1