analytical methods in exploration geochemistry - association
TRANSCRIPT
Analytical Methods inExploration Geochemistry
Gwendy E.M. HallGeological Survey of Canada
Ottawa
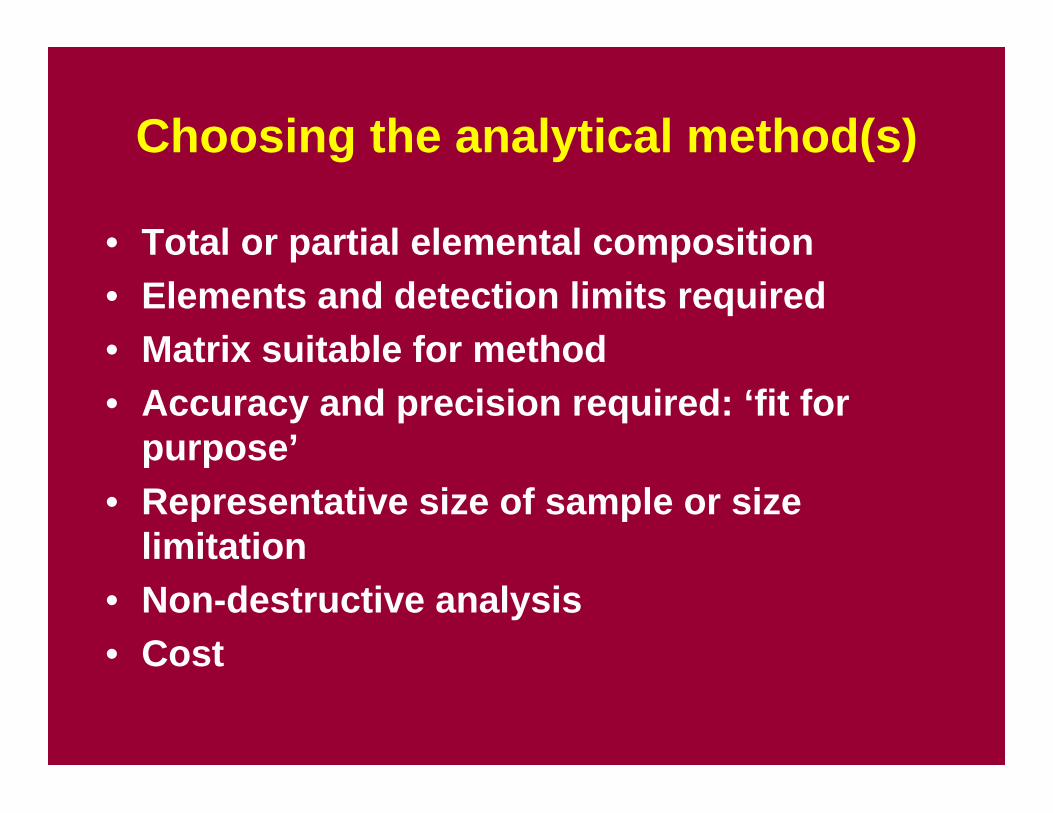
Choosing the analytical method(s)
• Total or partial elemental composition• Elements and detection limits required• Matrix suitable for method• Accuracy and precision required: ‘fit for
purpose’• Representative size of sample or size
limitation• Non-destructive analysis• Cost
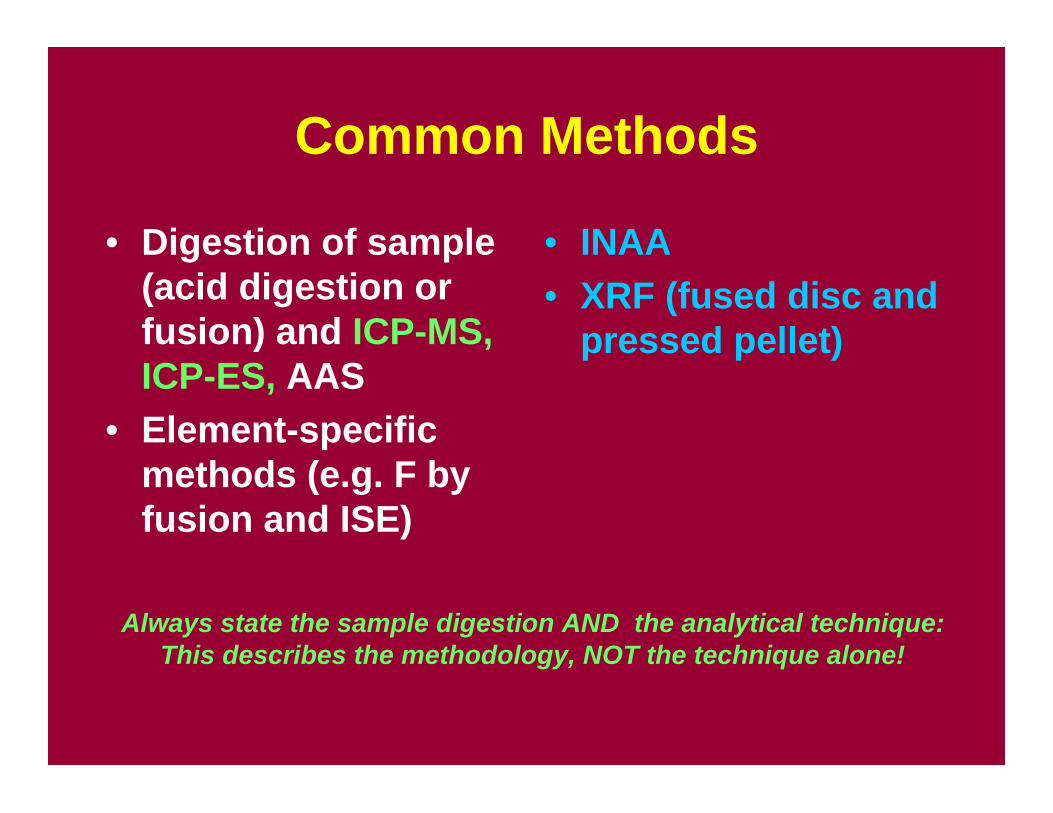
Common Methods
• Digestion of sample(acid digestion orfusion) and ICP-MS,ICP-ES, AAS
• Element-specificmethods (e.g. F byfusion and ISE)
• INAA• XRF (fused disc and
pressed pellet)
Always state the sample digestion AND the analytical technique:This describes the methodology, NOT the technique alone!
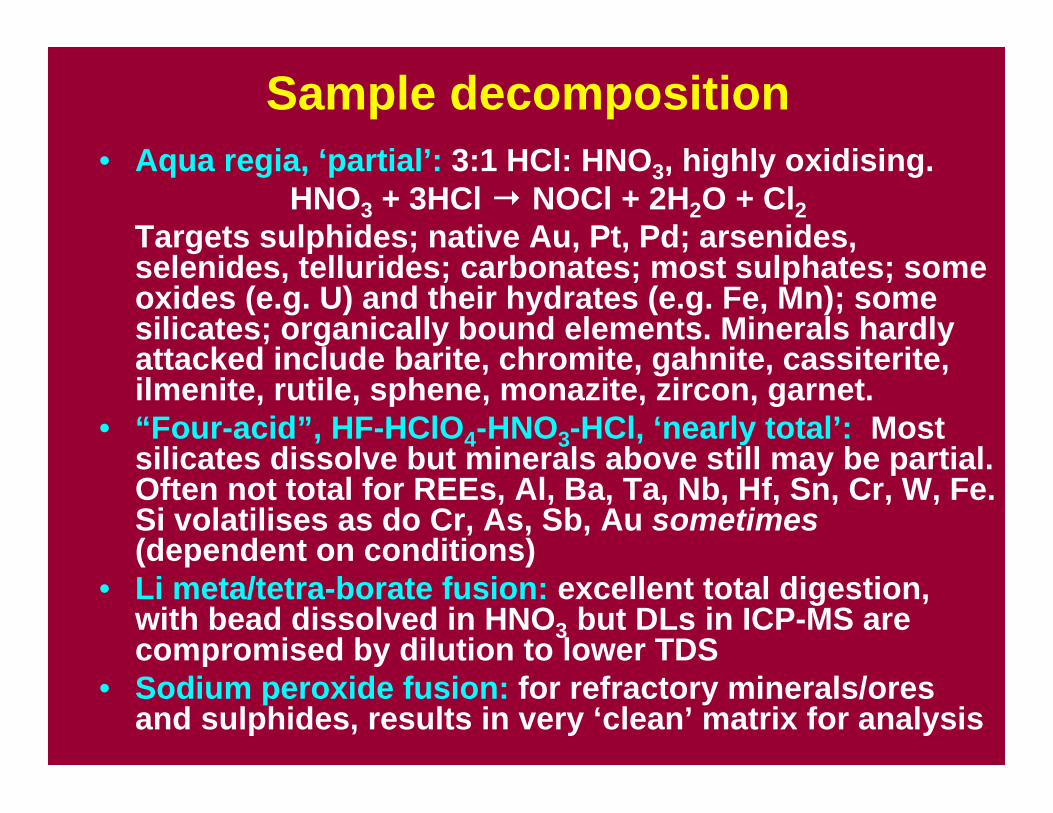
Sample decomposition• Aqua regia, ‘partial’: 3:1 HCl: HNO3, highly oxidising.
HNO3 + 3HCl → NOCl + 2H2O + Cl2Targets sulphides; native Au, Pt, Pd; arsenides,selenides, tellurides; carbonates; most sulphates; someoxides (e.g. U) and their hydrates (e.g. Fe, Mn); somesilicates; organically bound elements. Minerals hardlyattacked include barite, chromite, gahnite, cassiterite,ilmenite, rutile, sphene, monazite, zircon, garnet.
• “Four-acid”, HF-HClO4-HNO3-HCl, ‘nearly total’: Mostsilicates dissolve but minerals above still may be partial.Often not total for REEs, Al, Ba, Ta, Nb, Hf, Sn, Cr, W, Fe.Si volatilises as do Cr, As, Sb, Au sometimes(dependent on conditions)
• Li meta/tetra-borate fusion: excellent total digestion,with bead dissolved in HNO3 but DLs in ICP-MS arecompromised by dilution to lower TDS
• Sodium peroxide fusion: for refractory minerals/oresand sulphides, results in very ‘clean’ matrix for analysis
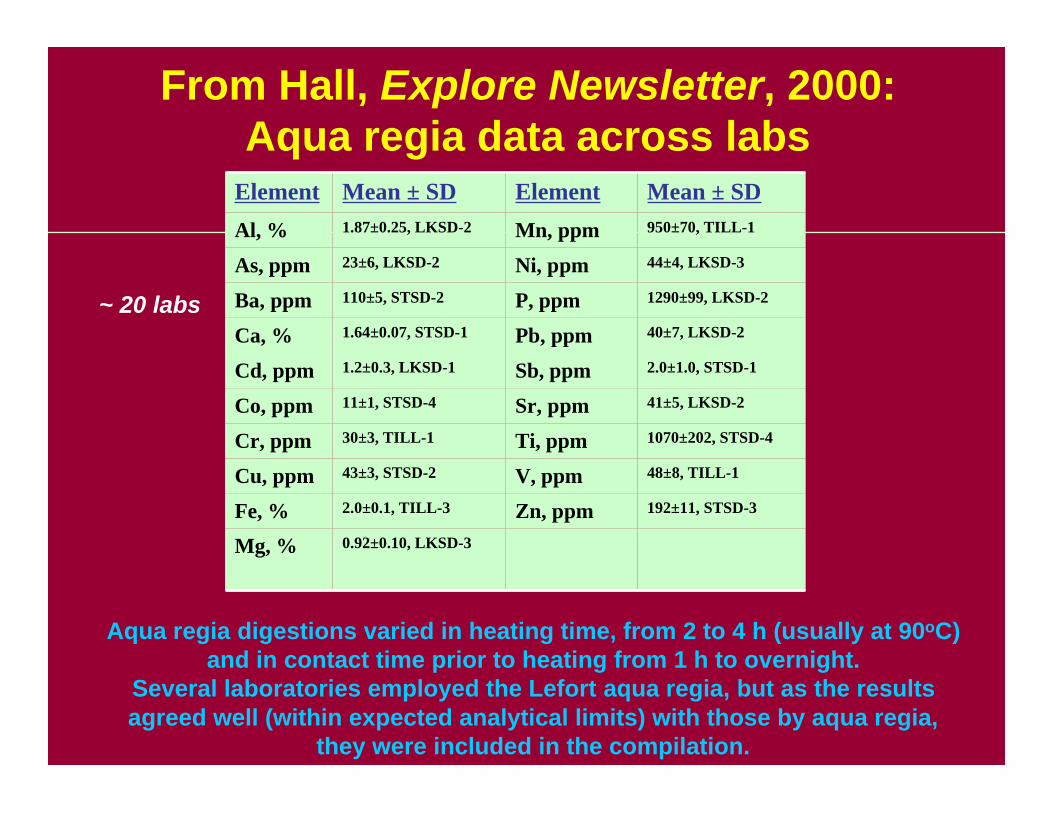
From Hall, Explore Newsletter, 2000:Aqua regia data across labs
0.92±0.10, LKSD-3Mg, %
192±11, STSD-3Zn, ppm2.0±0.1, TILL-3Fe, %
48±8, TILL-1V, ppm43±3, STSD-2Cu, ppm
1070±202, STSD-4Ti, ppm30±3, TILL-1Cr, ppm
41±5, LKSD-2Sr, ppm11±1, STSD-4Co, ppm
2.0±1.0, STSD-1Sb, ppm1.2±0.3, LKSD-1Cd, ppm
40±7, LKSD-2Pb, ppm1.64±0.07, STSD-1Ca, %
1290±99, LKSD-2P, ppm110±5, STSD-2Ba, ppm
44±4, LKSD-3Ni, ppm23±6, LKSD-2As, ppm
950±70, TILL-1Mn, ppm1.87±0.25, LKSD-2Al, %
Mean ± SDElementMean ± SDElement
Aqua regia digestions varied in heating time, from 2 to 4 h (usually at 90oC) and in contact time prior to heating from 1 h to overnight.
Several laboratories employed the Lefort aqua regia, but as the results agreed well (within expected analytical limits) with those by aqua regia,
they were included in the compilation.
~ 20 labs
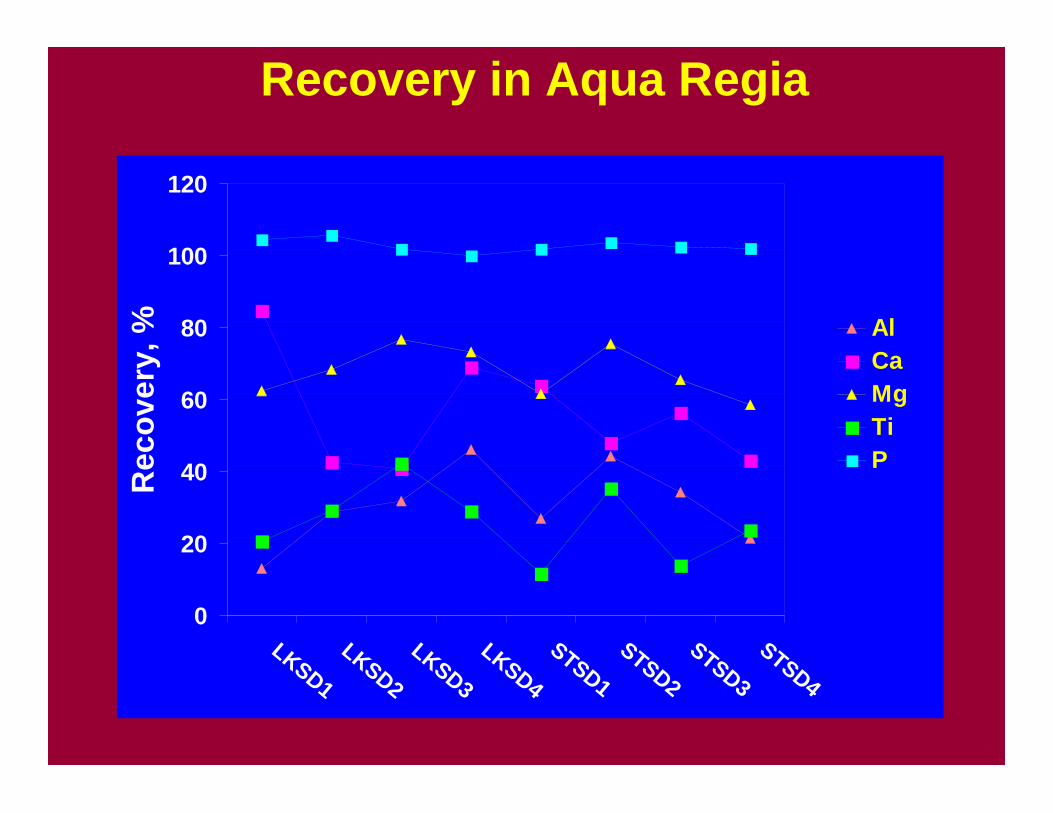
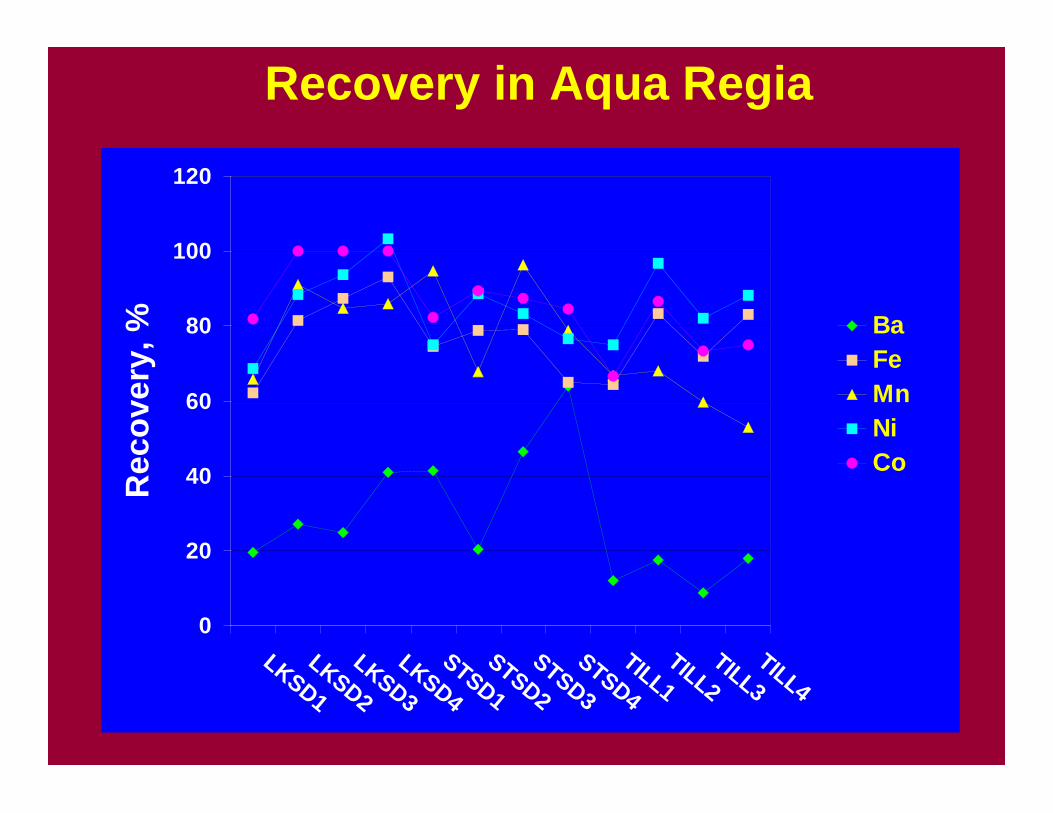
Recovery in Aqua Regia
0
20
40
60
80
100
120
LKSD1
LKSD2
LKSD3
LKSD4
STSD1STSD2
STSD3STSD4
Rec
over
y, % Al
CaMgTiP
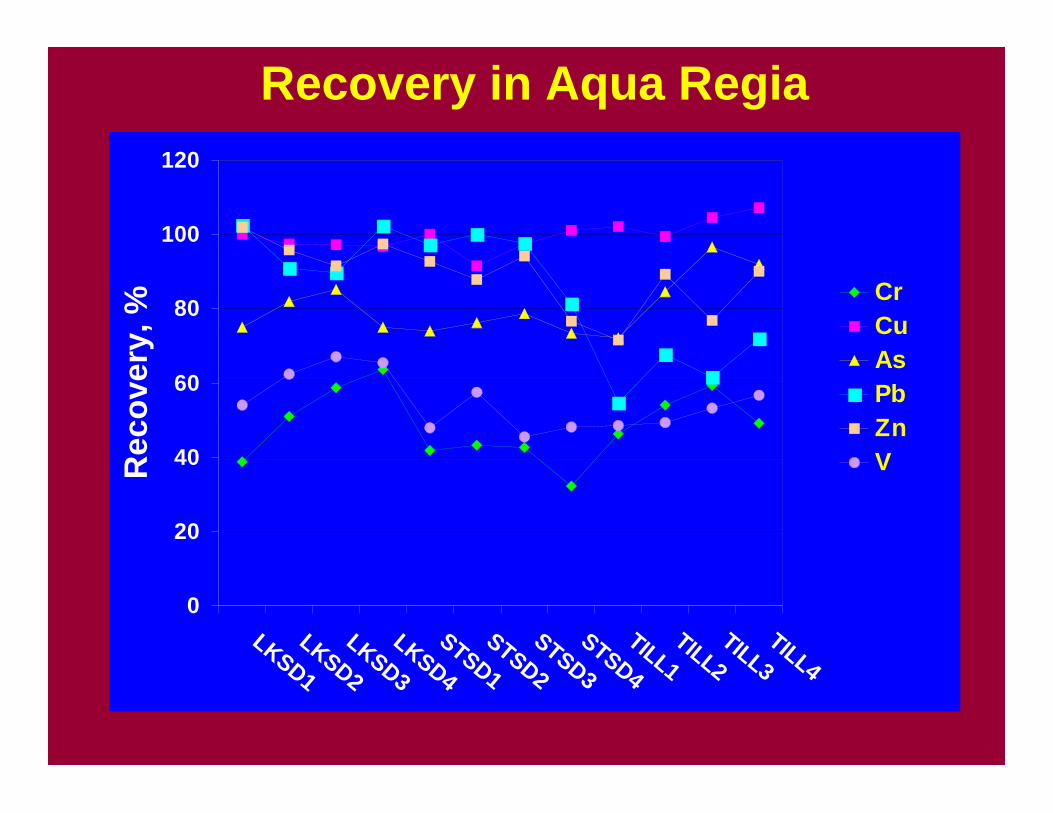
Recovery in Aqua Regia
0
20
40
60
80
100
120
LKSD1
LKSD2
LKSD3
LKSD4
STSD1STSD2
STSD3STSD4
TILL1TILL2
TILL3TILL4
Rec
over
y, %
CrCuAsPbZnV
Recovery in Aqua Regia
0
20
40
60
80
100
120
LKSD1
LKSD2
LKSD3
LKSD4
STSD1STSD2
STSD3STSD4
TILL1TILL2
TILL3TILL4
Rec
over
y, % Ba
FeMnNiCo
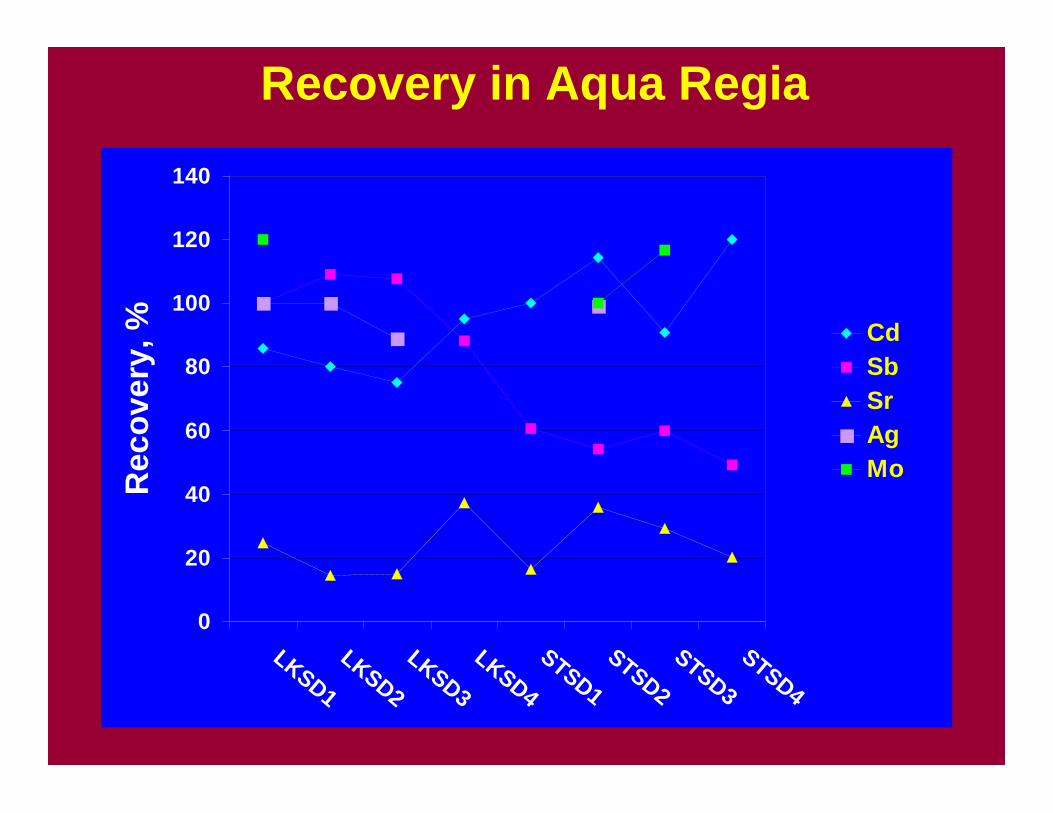
Recovery in Aqua Regia
0
20
40
60
80
100
120
140
LKSD1
LKSD2
LKSD3
LKSD4
STSD1STSD2
STSD3STSD4
Rec
over
y, % Cd
SbSrAgMo
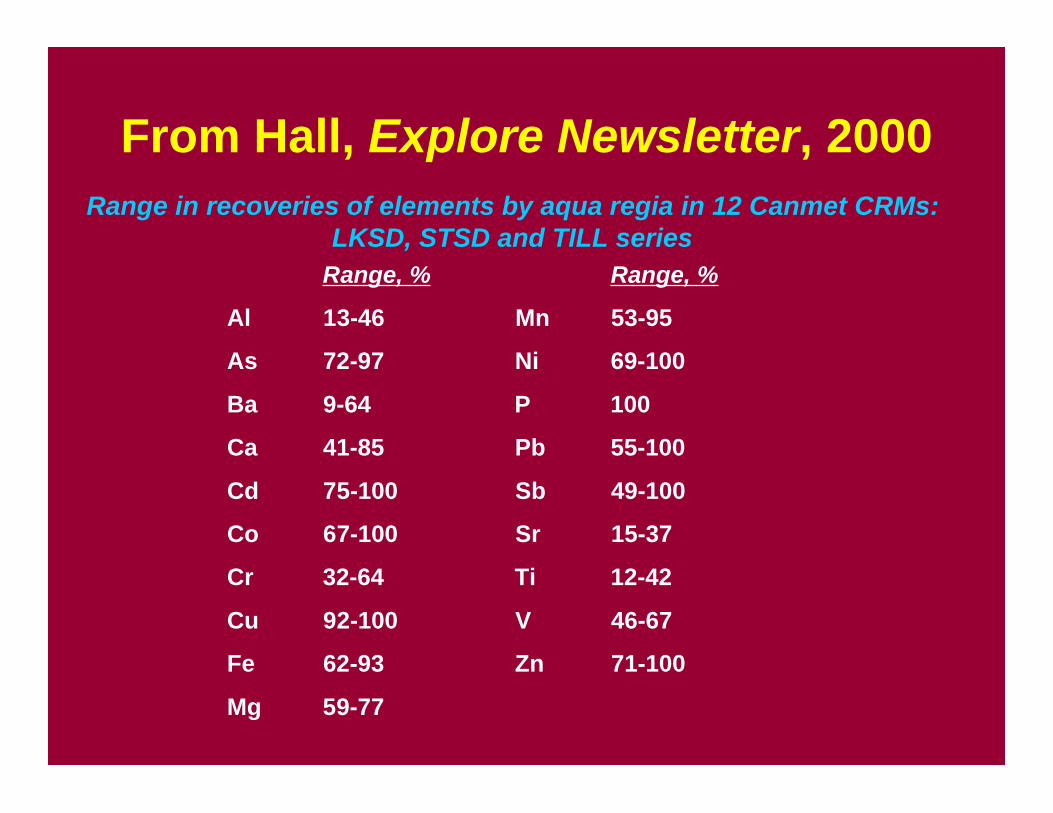
From Hall, Explore Newsletter, 2000
Range, % Range, %
Al 13-46 Mn 53-95
As 72-97 Ni 69-100
Ba 9-64 P 100
Ca 41-85 Pb 55-100
Cd 75-100 Sb 49-100
Co 67-100 Sr 15-37
Cr 32-64 Ti 12-42
Cu 92-100 V 46-67
Fe 62-93 Zn 71-100
Mg 59-77
Range in recoveries of elements by aqua regia in 12 Canmet CRMs:LKSD, STSD and TILL series
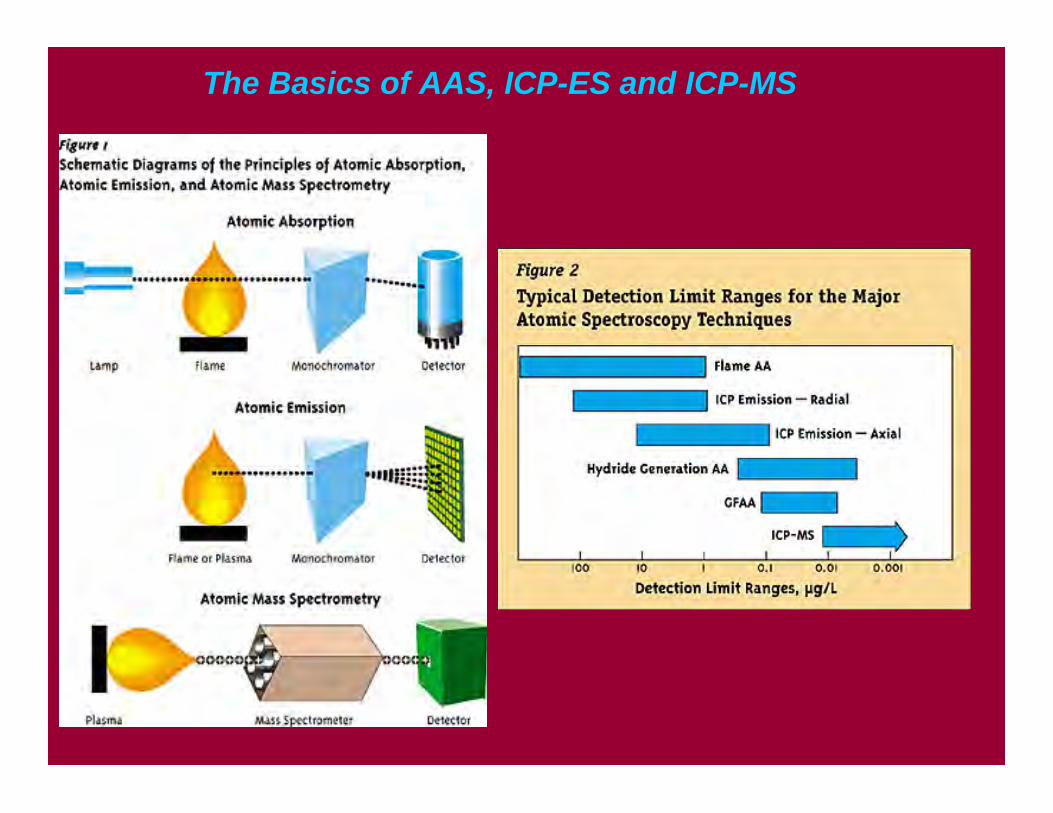
The Basics of AAS, ICP-ES and ICP-MS
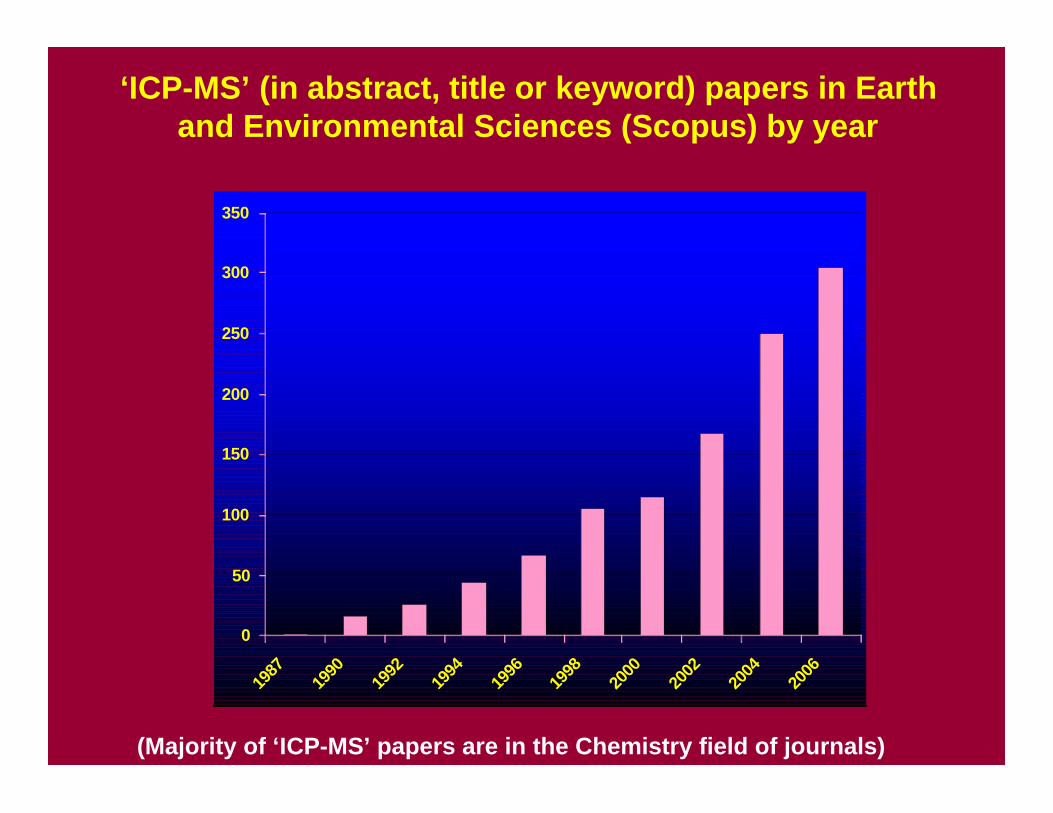
‘ICP-MS’ (in abstract, title or keyword) papers in Earthand Environmental Sciences (Scopus) by year
0
50
100
150
200
250
300
350
1987
1990
1992
1994
1996
1998
2000
2002
2004
2006
(Majority of ‘ICP-MS’ papers are in the Chemistry field of journals)
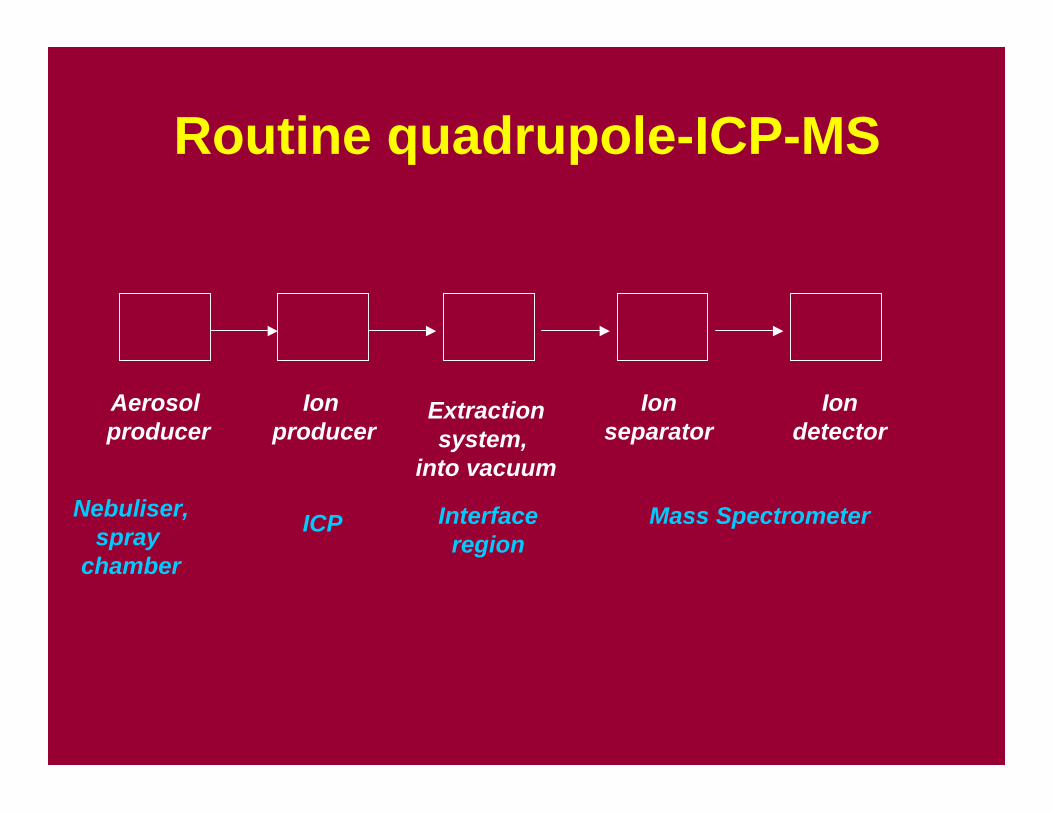
Routine quadrupole-ICP-MS
Aerosol producer
Ion producer
Extractionsystem,
into vacuum
Ionseparator
Iondetector
Nebuliser,spray
chamber
ICP Mass SpectrometerInterfaceregion
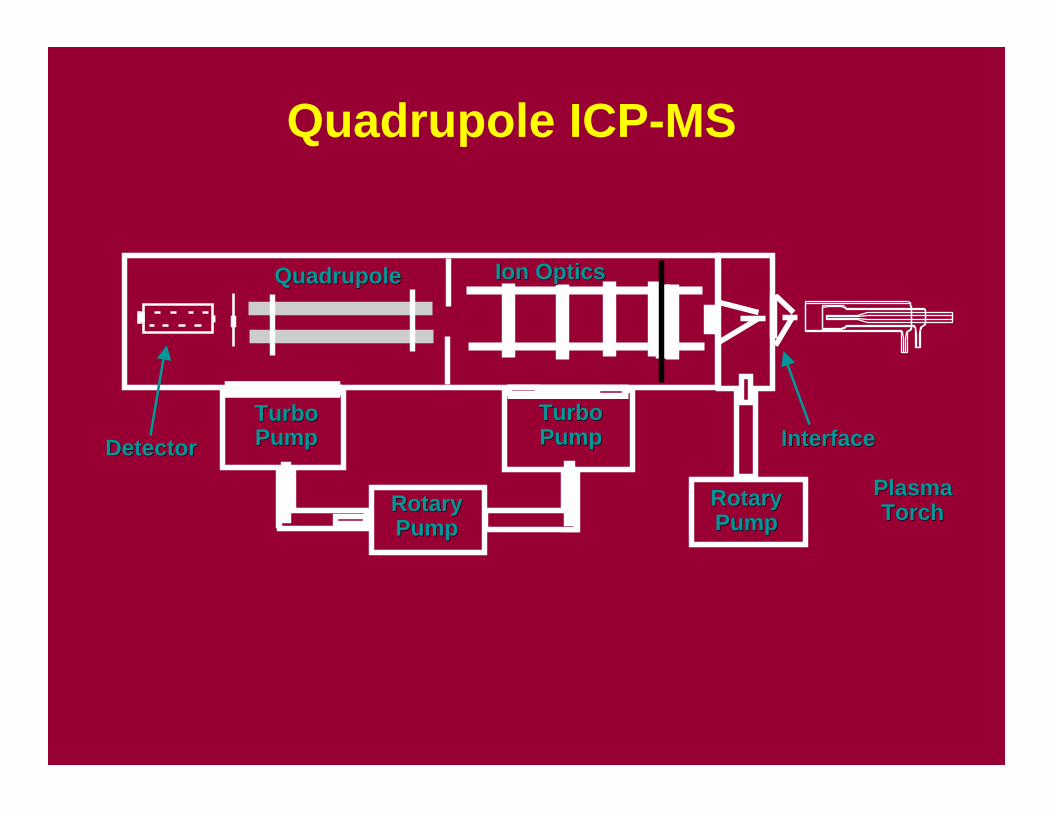
PlasmaPlasmaTorchTorch
InterfaceInterfaceTurboTurboPumpPump
TurboTurboPumpPump
RotaryRotaryPumpPump
RotaryRotaryPumpPump
Ion OpticsIon OpticsQuadrupoleQuadrupole
DetectorDetector
Quadrupole ICP-MS
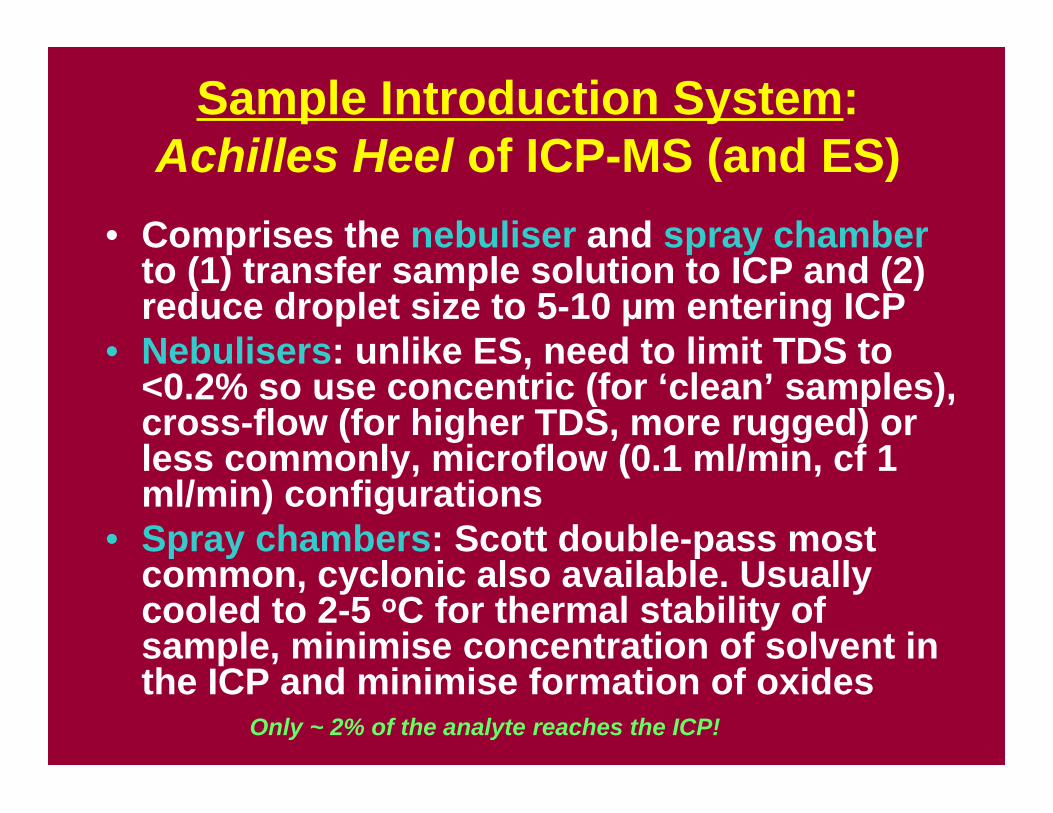
Sample Introduction System:Achilles Heel of ICP-MS (and ES)
• Comprises the nebuliser and spray chamberto (1) transfer sample solution to ICP and (2)reduce droplet size to 5-10 µm entering ICP
• Nebulisers: unlike ES, need to limit TDS to<0.2% so use concentric (for ‘clean’ samples),cross-flow (for higher TDS, more rugged) orless commonly, microflow (0.1 ml/min, cf 1ml/min) configurations
• Spray chambers: Scott double-pass mostcommon, cyclonic also available. Usuallycooled to 2-5 oC for thermal stability ofsample, minimise concentration of solvent inthe ICP and minimise formation of oxides
Only ~ 2% of the analyte reaches the ICP!
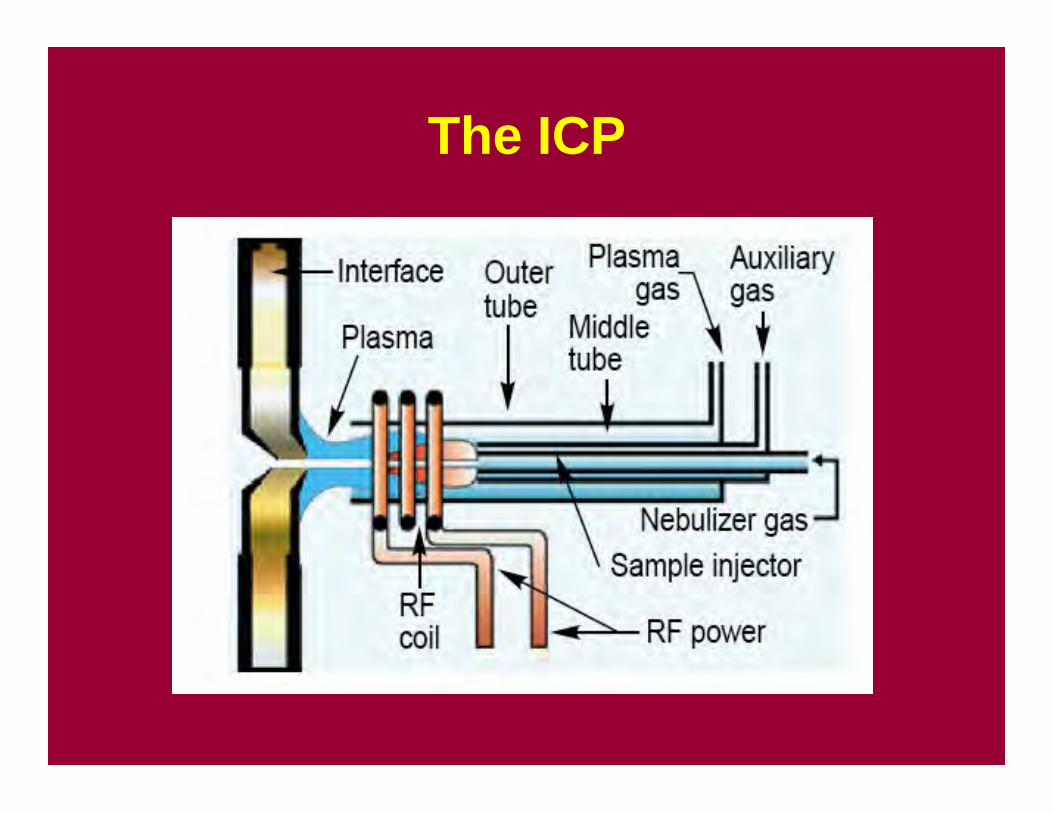
The ICP
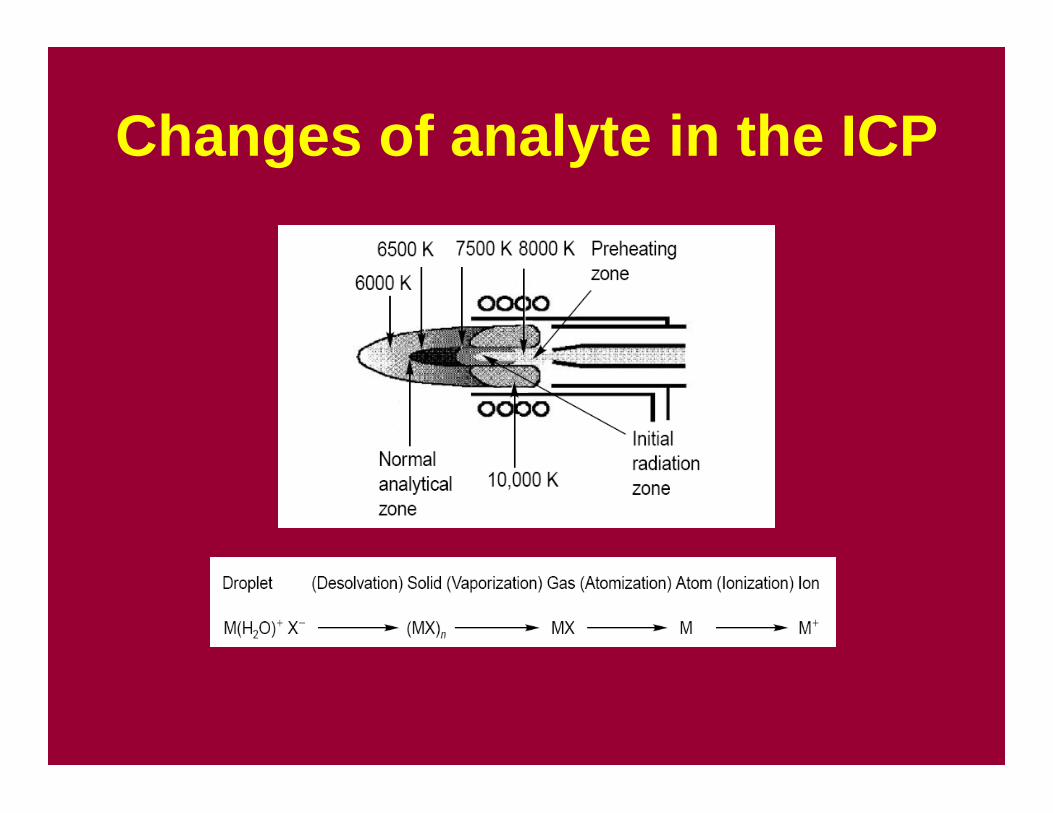
Changes of analyte in the ICP
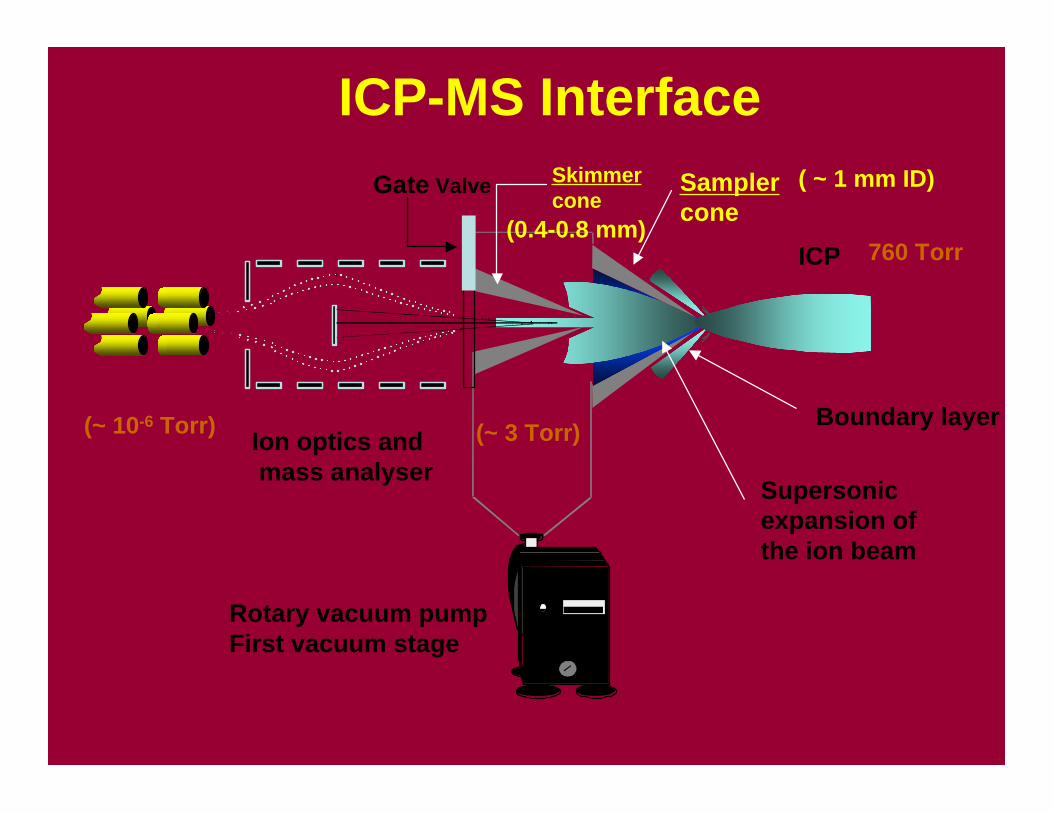
ICP-MS Interface
ICP
Samplercone
Skimmercone
Rotary vacuum pumpFirst vacuum stage
Ion optics and mass analyser
Supersonicexpansion ofthe ion beam
Boundary layer
Gate Valve
(~ 3 Torr)
( ~ 1 mm ID)
(0.4-0.8 mm)760 Torr
(~ 10-6 Torr)
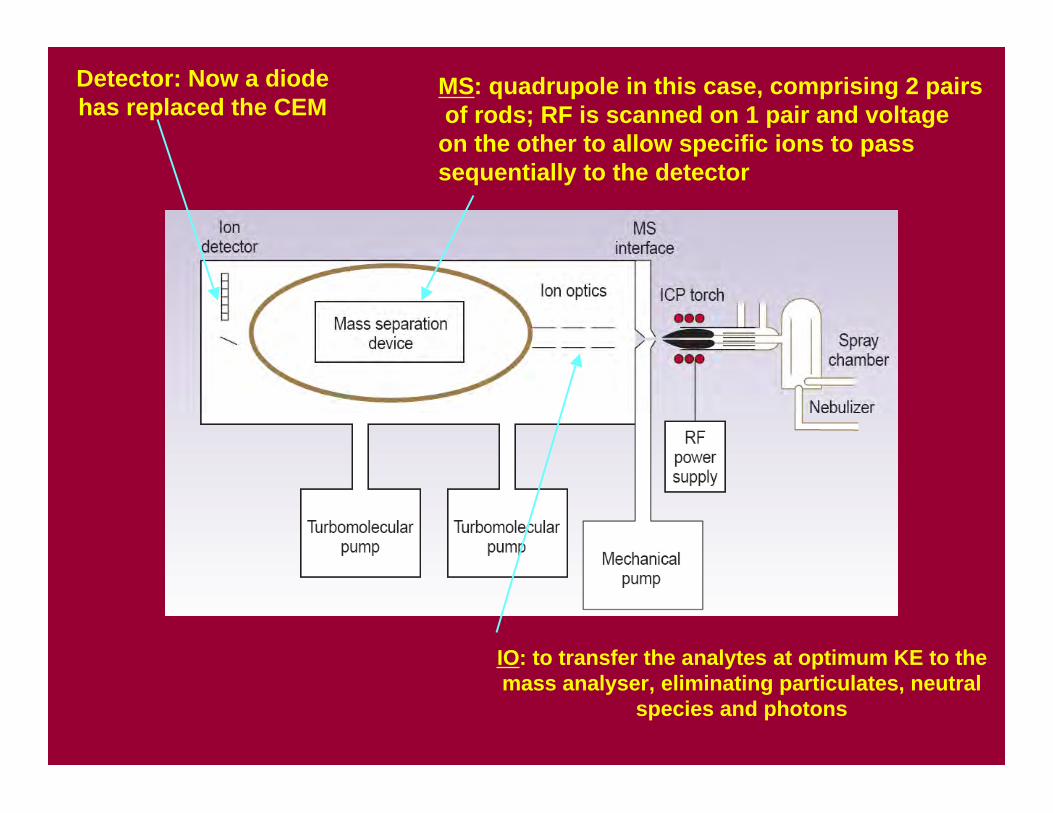
IO: to transfer the analytes at optimum KE to themass analyser, eliminating particulates, neutral
species and photons
MS: quadrupole in this case, comprising 2 pairs of rods; RF is scanned on 1 pair and voltageon the other to allow specific ions to pass sequentially to the detector
Detector: Now a diodehas replaced the CEM
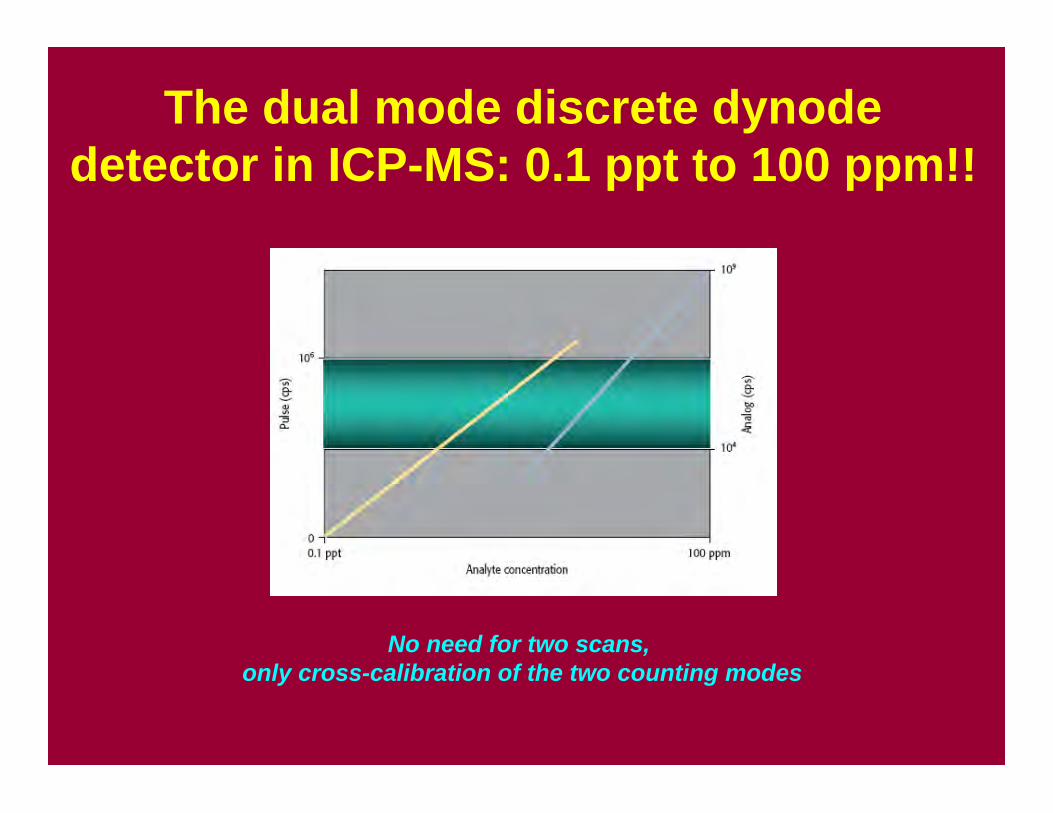
The dual mode discrete dynodedetector in ICP-MS: 0.1 ppt to 100 ppm!!
No need for two scans, only cross-calibration of the two counting modes
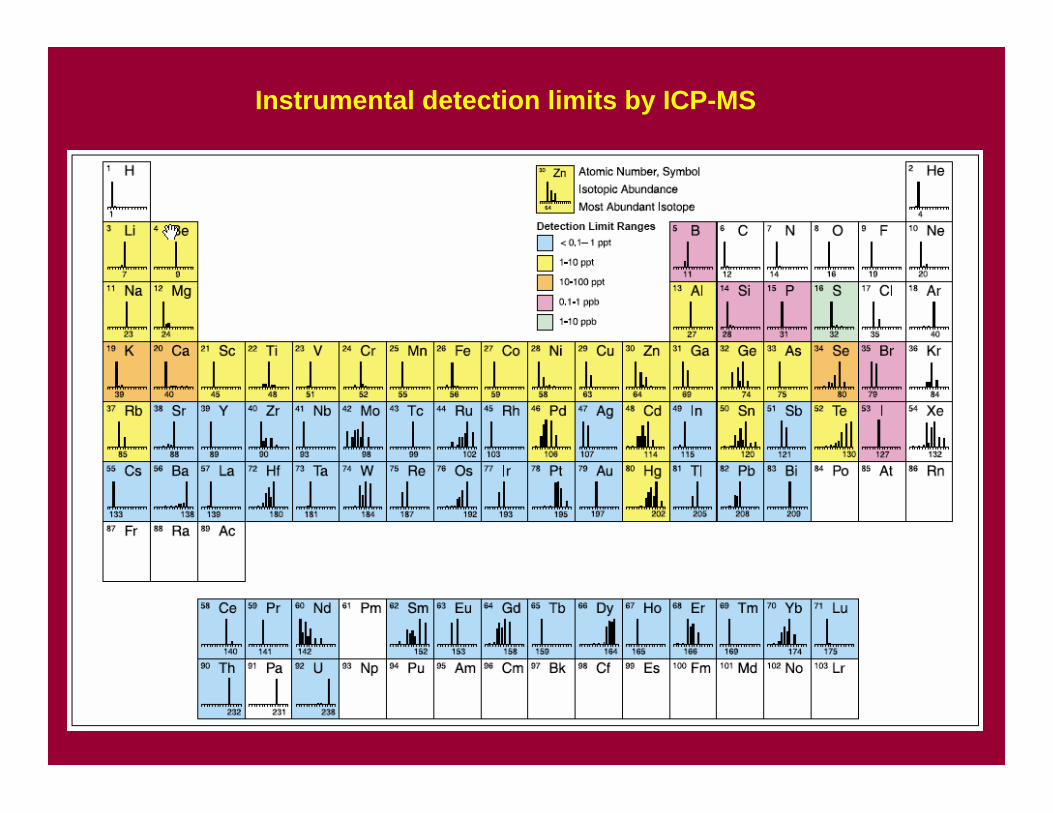
Instrumental detection limits by ICP-MS
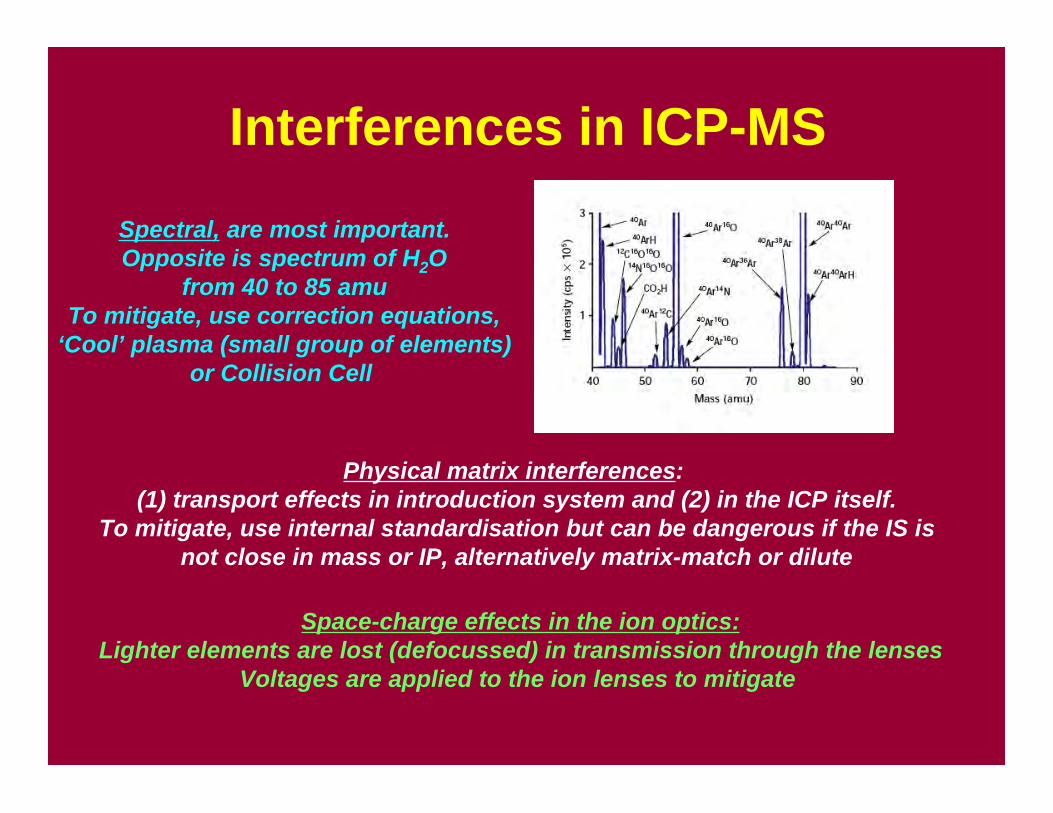
Interferences in ICP-MS
Spectral, are most important.Opposite is spectrum of H2O
from 40 to 85 amuTo mitigate, use correction equations,
‘Cool’ plasma (small group of elements)or Collision Cell
Physical matrix interferences: (1) transport effects in introduction system and (2) in the ICP itself.
To mitigate, use internal standardisation but can be dangerous if the IS isnot close in mass or IP, alternatively matrix-match or dilute
Space-charge effects in the ion optics:
Lighter elements are lost (defocussed) in transmission through the lensesVoltages are applied to the ion lenses to mitigate
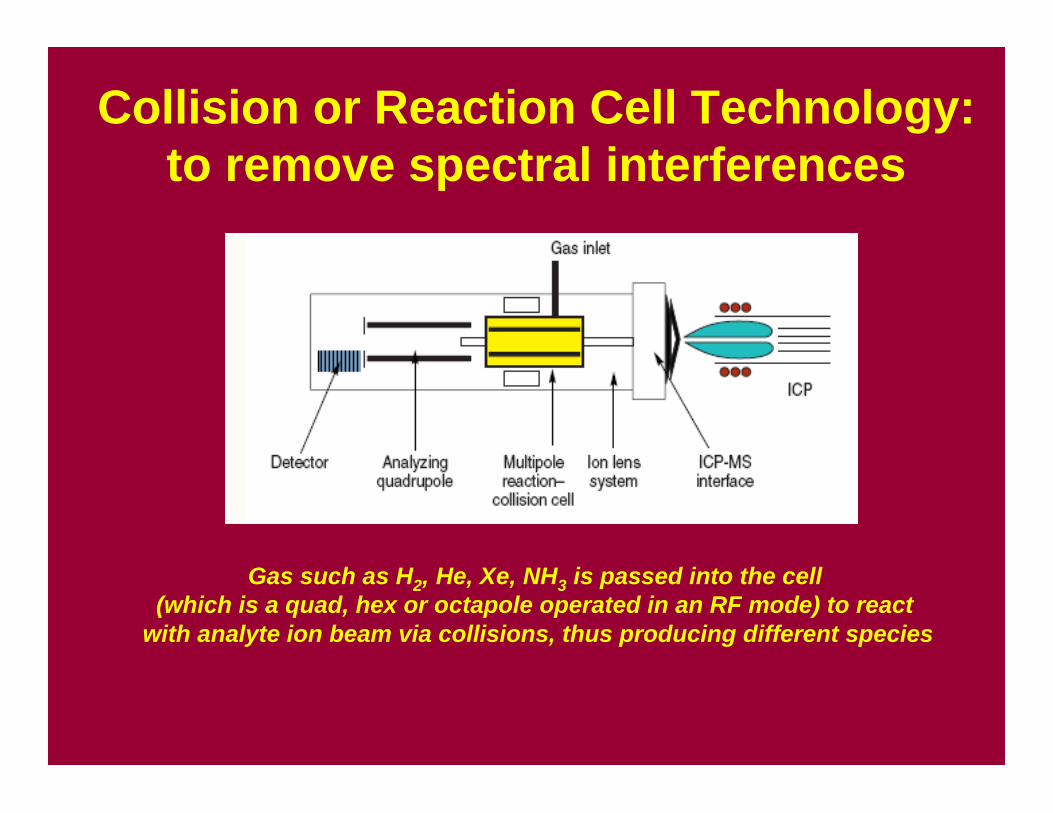
Collision or Reaction Cell Technology:to remove spectral interferences
Gas such as H2, He, Xe, NH3 is passed into the cell (which is a quad, hex or octapole operated in an RF mode) to react
with analyte ion beam via collisions, thus producing different species
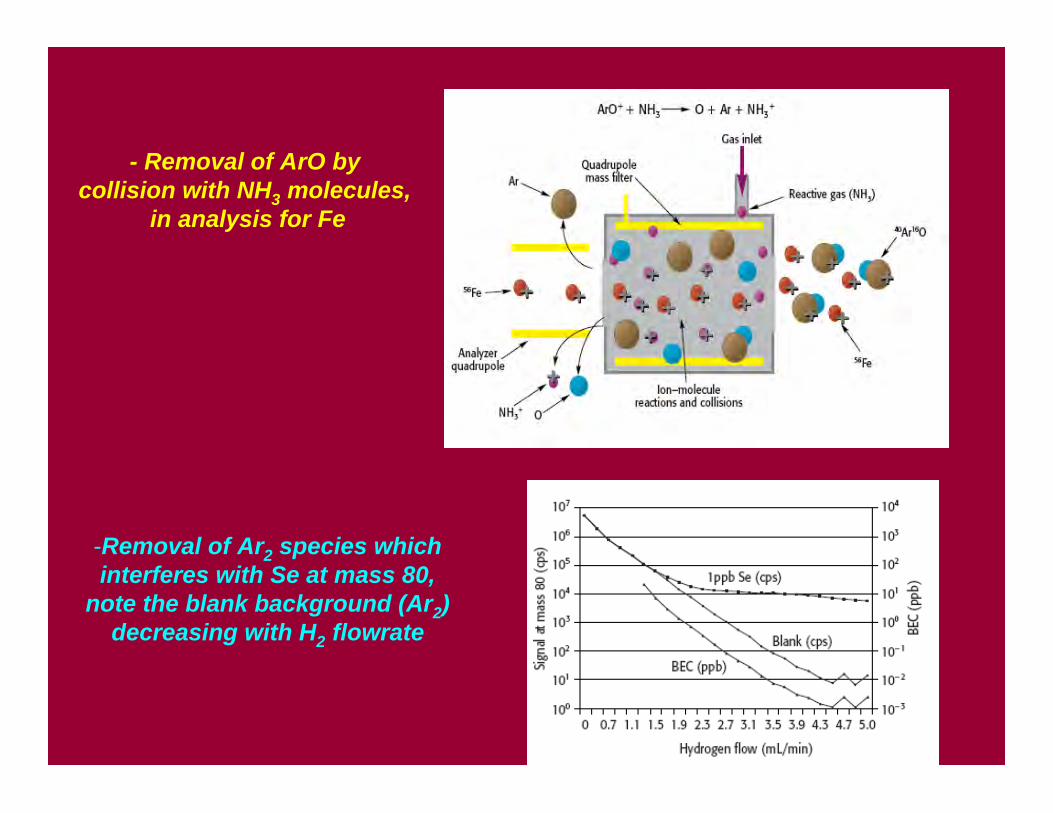
- Removal of ArO by collision with NH3 molecules,
in analysis for Fe
-Removal of Ar2 species whichinterferes with Se at mass 80,
note the blank background (Ar2)decreasing with H2 flowrate
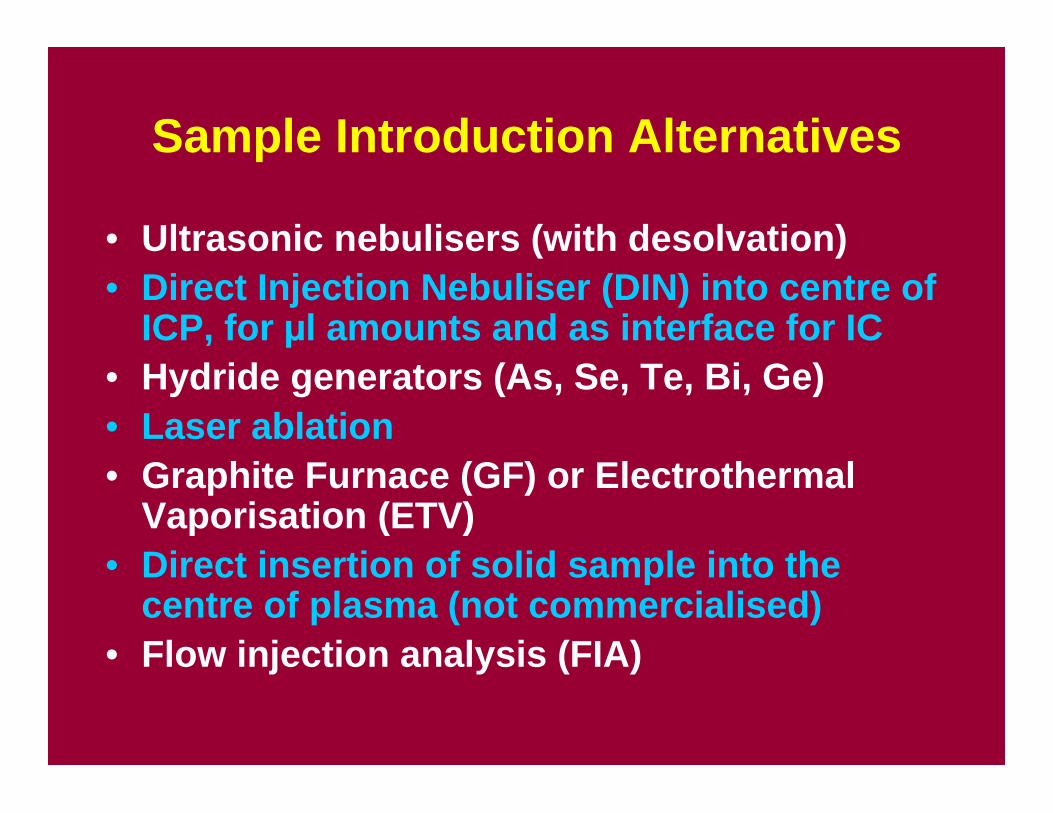
Sample Introduction Alternatives
• Ultrasonic nebulisers (with desolvation)• Direct Injection Nebuliser (DIN) into centre of
ICP, for µl amounts and as interface for IC• Hydride generators (As, Se, Te, Bi, Ge)• Laser ablation• Graphite Furnace (GF) or Electrothermal
Vaporisation (ETV)• Direct insertion of solid sample into the
centre of plasma (not commercialised)• Flow injection analysis (FIA)
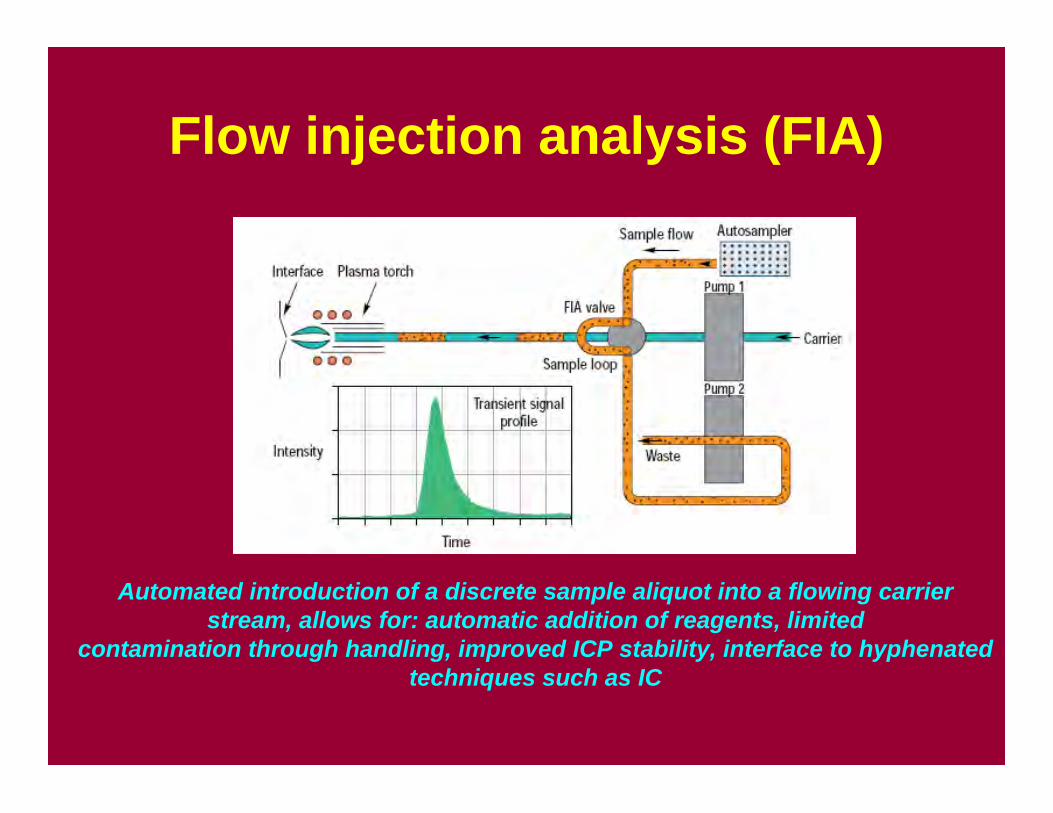
Flow injection analysis (FIA)
Automated introduction of a discrete sample aliquot into a flowing carrierstream, allows for: automatic addition of reagents, limited
contamination through handling, improved ICP stability, interface to hyphenatedtechniques such as IC
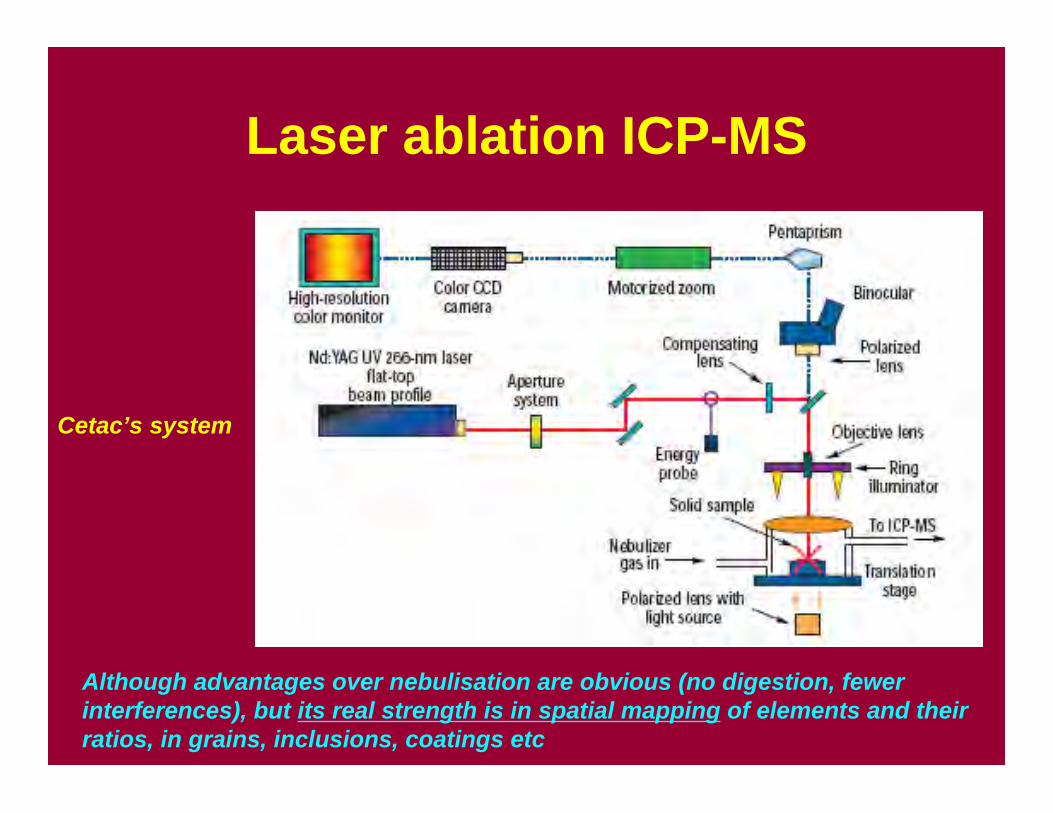
Laser ablation ICP-MS
Cetac’s system
Although advantages over nebulisation are obvious (no digestion, fewer interferences), but its real strength is in spatial mapping of elements and their ratios, in grains, inclusions, coatings etc
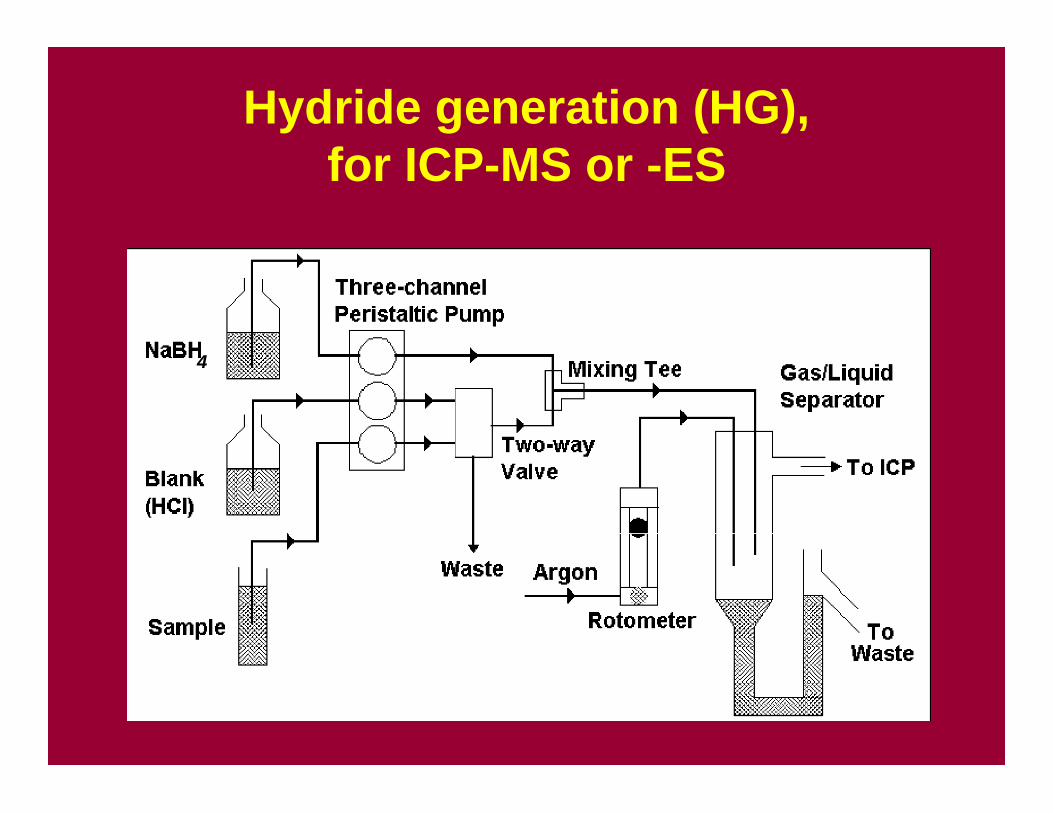
Hydride generation (HG),for ICP-MS or -ES
4
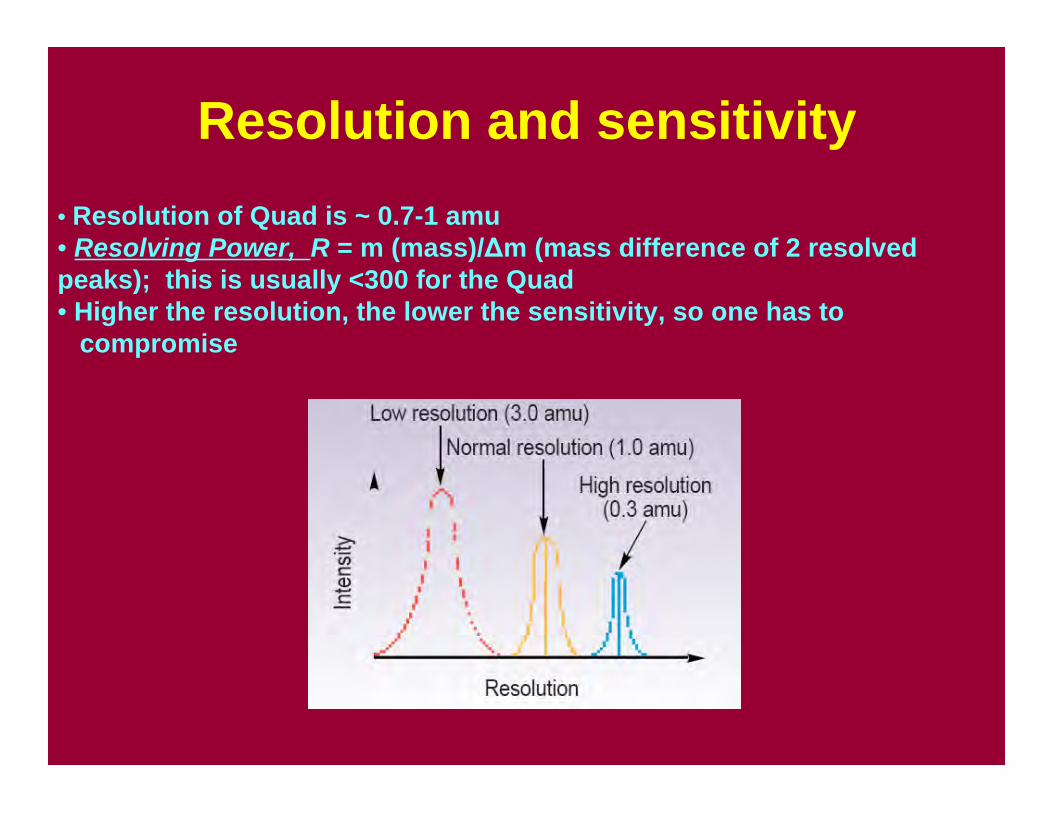
Resolution and sensitivity• Resolution of Quad is ~ 0.7-1 amu• Resolving Power, R = m (mass)/Δm (mass difference of 2 resolvedpeaks); this is usually <300 for the Quad• Higher the resolution, the lower the sensitivity, so one has to compromise
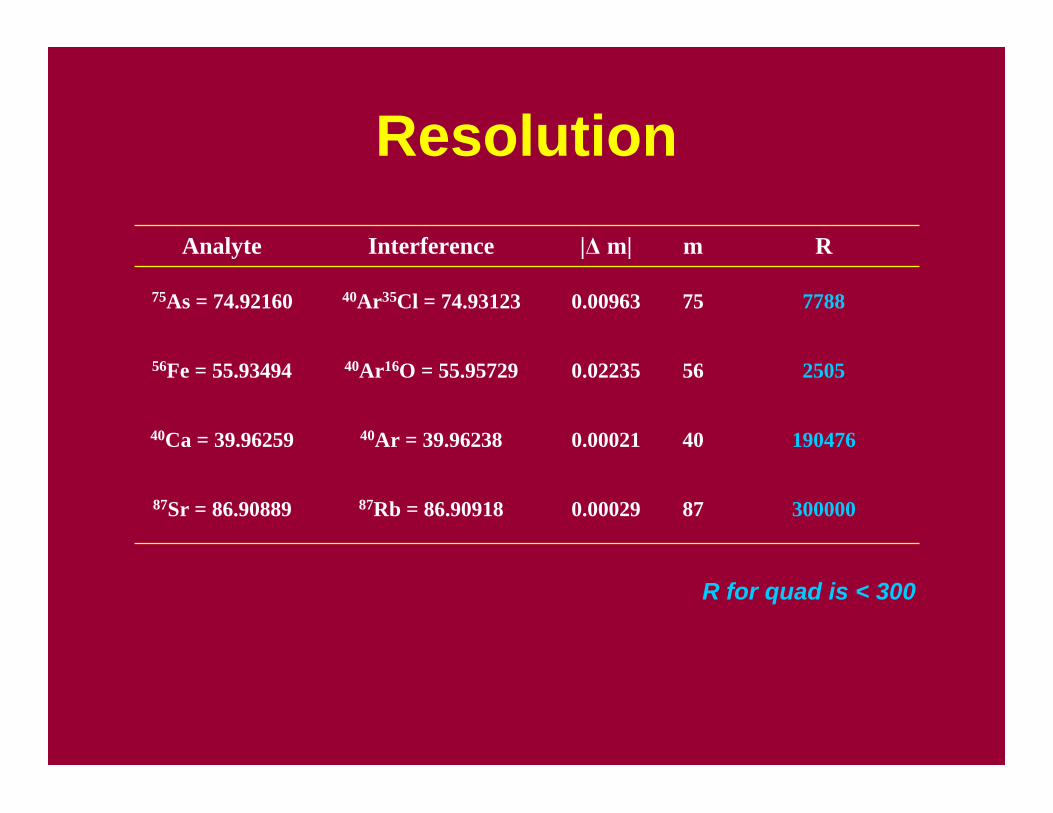
Resolution
300000870.0002987Rb = 86.9091887Sr = 86.90889
190476400.0002140Ar = 39.9623840Ca = 39.96259
2505560.0223540Ar16O = 55.9572956Fe = 55.93494
7788750.0096340Ar35Cl = 74.9312375As = 74.92160
Rm|Δ m|InterferenceAnalyte
R for quad is < 300
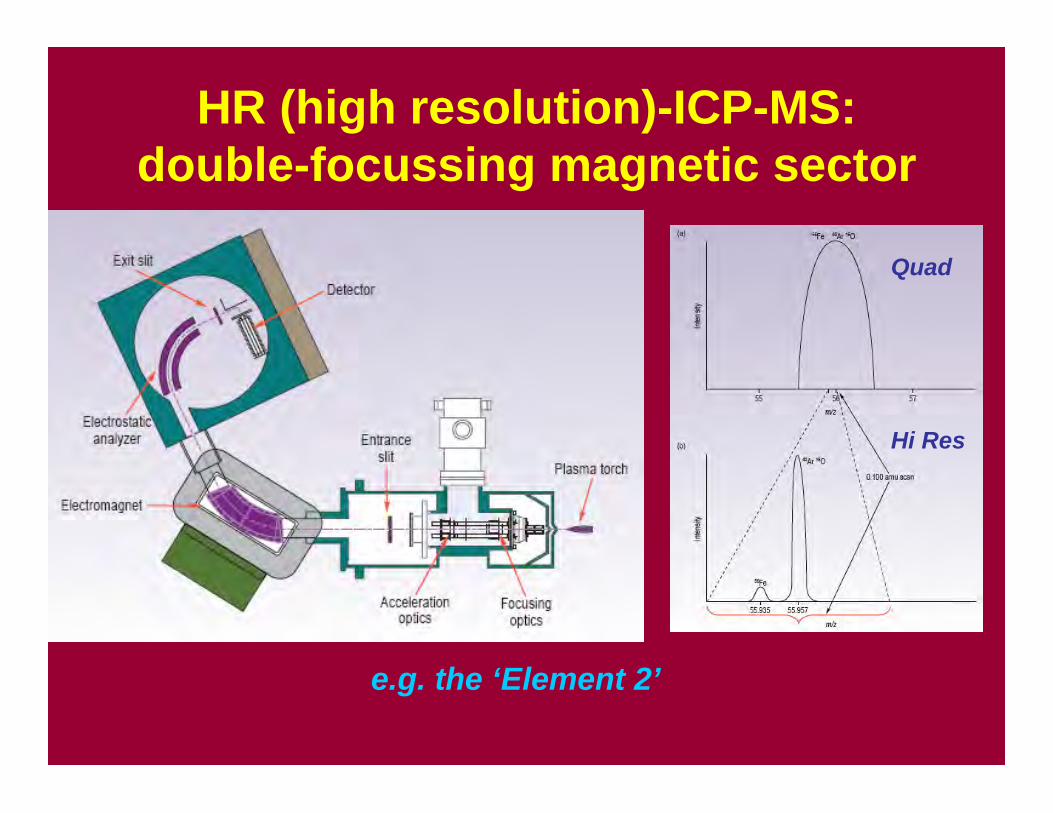
HR (high resolution)-ICP-MS:double-focussing magnetic sector
Quad
Hi Res
e.g. the ‘Element 2’
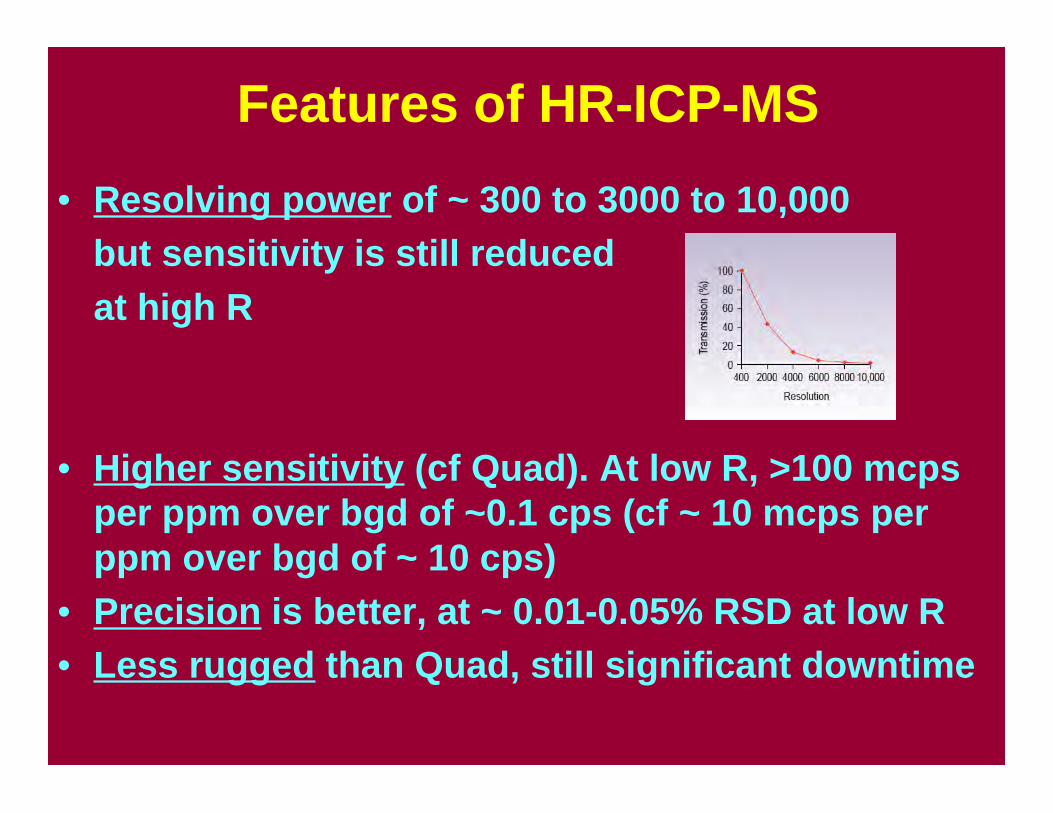
Features of HR-ICP-MS• Resolving power of ~ 300 to 3000 to 10,000
but sensitivity is still reduced at high R
• Higher sensitivity (cf Quad). At low R, >100 mcpsper ppm over bgd of ~0.1 cps (cf ~ 10 mcps perppm over bgd of ~ 10 cps)
• Precision is better, at ~ 0.01-0.05% RSD at low R• Less rugged than Quad, still significant downtime
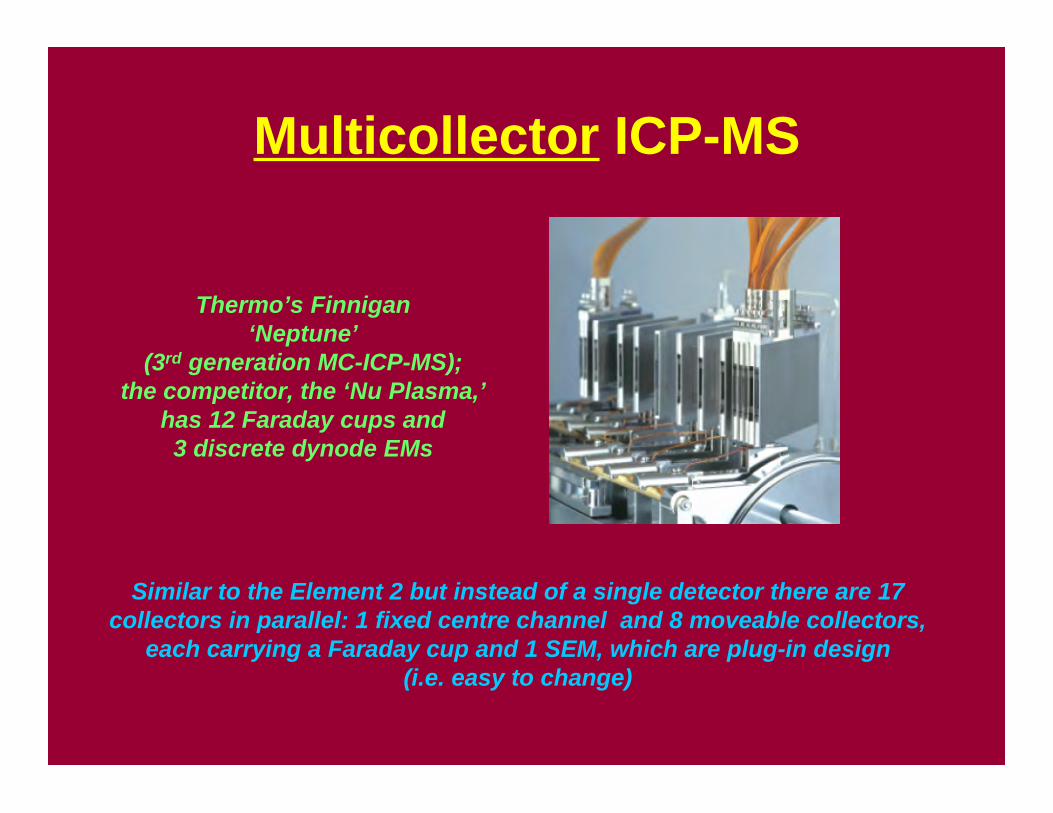
Multicollector ICP-MS
Similar to the Element 2 but instead of a single detector there are 17 collectors in parallel: 1 fixed centre channel and 8 moveable collectors,
each carrying a Faraday cup and 1 SEM, which are plug-in design (i.e. easy to change)
Thermo’s Finnigan‘Neptune’
(3rd generation MC-ICP-MS);the competitor, the ‘Nu Plasma,’
has 12 Faraday cups and3 discrete dynode EMs
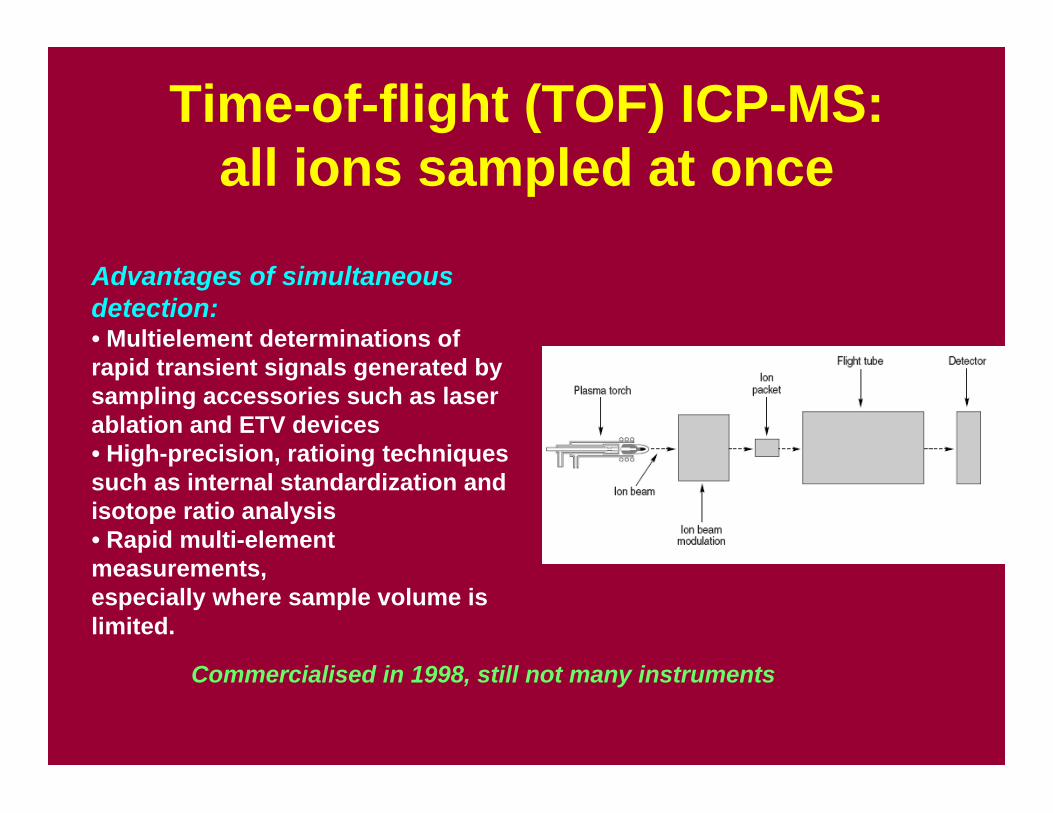
Time-of-flight (TOF) ICP-MS:all ions sampled at once
Advantages of simultaneousdetection:• Multielement determinations ofrapid transient signals generated bysampling accessories such as laserablation and ETV devices• High-precision, ratioing techniquessuch as internal standardization andisotope ratio analysis• Rapid multi-elementmeasurements,especially where sample volume islimited.
Commercialised in 1998, still not many instruments
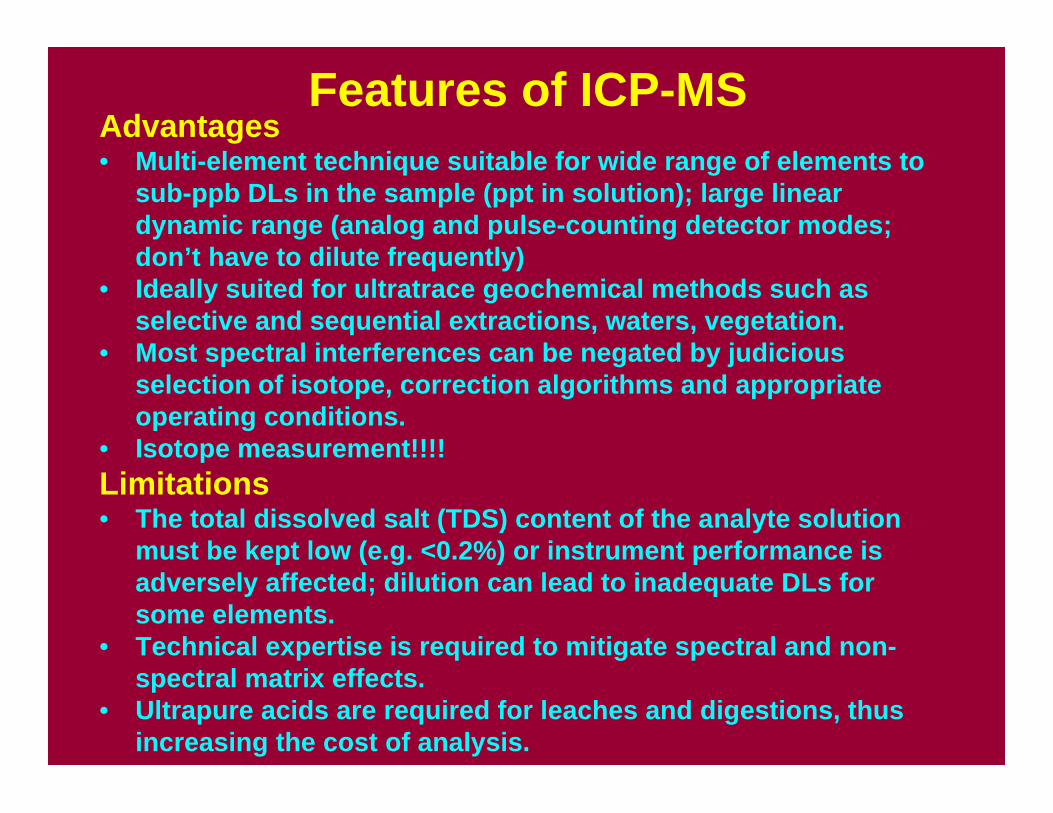
Features of ICP-MSAdvantages• Multi-element technique suitable for wide range of elements to
sub-ppb DLs in the sample (ppt in solution); large lineardynamic range (analog and pulse-counting detector modes;don’t have to dilute frequently)
• Ideally suited for ultratrace geochemical methods such asselective and sequential extractions, waters, vegetation.
• Most spectral interferences can be negated by judiciousselection of isotope, correction algorithms and appropriateoperating conditions.
• Isotope measurement!!!!Limitations• The total dissolved salt (TDS) content of the analyte solution
must be kept low (e.g. <0.2%) or instrument performance isadversely affected; dilution can lead to inadequate DLs forsome elements.
• Technical expertise is required to mitigate spectral and non-spectral matrix effects.
• Ultrapure acids are required for leaches and digestions, thusincreasing the cost of analysis.
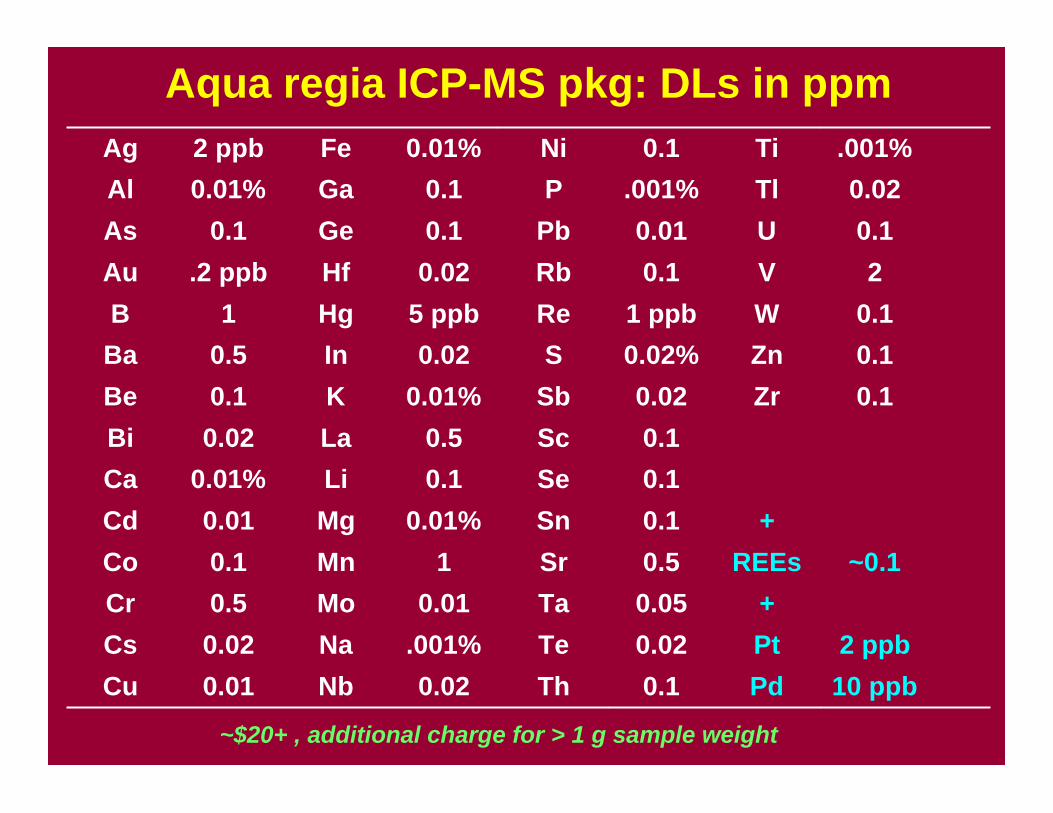
Aqua regia ICP-MS pkg: DLs in ppm
10 ppbPd0.1Th0.02Nb0.01Cu2 ppbPt0.02Te.001%Na0.02Cs
+0.05Ta0.01Mo0.5Cr~0.1REEs0.5Sr1Mn0.1Co
+0.1Sn0.01%Mg0.01Cd0.1Se0.1Li0.01%Ca0.1Sc0.5La0.02Bi
0.1Zr0.02Sb0.01%K0.1Be0.1Zn0.02%S0.02In0.5Ba0.1W1 ppbRe5 ppbHg1B2V0.1Rb0.02Hf.2 ppbAu
0.1U0.01Pb0.1Ge0.1As0.02Tl.001%P0.1Ga0.01%Al
.001%Ti0.1Ni0.01%Fe2 ppbAg
~$20+ , additional charge for > 1 g sample weight
ICP-ES
• Has gone through a revolution in the pastdecade, improving DLs and resolution
• Most instruments now are simultaneous withechelle grating design
• Spectral interferences (eg background shifts,direct overlap) corrected by simultaneouscorrection of background, alternate choice ofline or inter-element correction (IEC) andnon-spectral by matrix-matching (eg [EIE]such as Na, K, [acid])
• Detection limits generally in low ppb range insolution
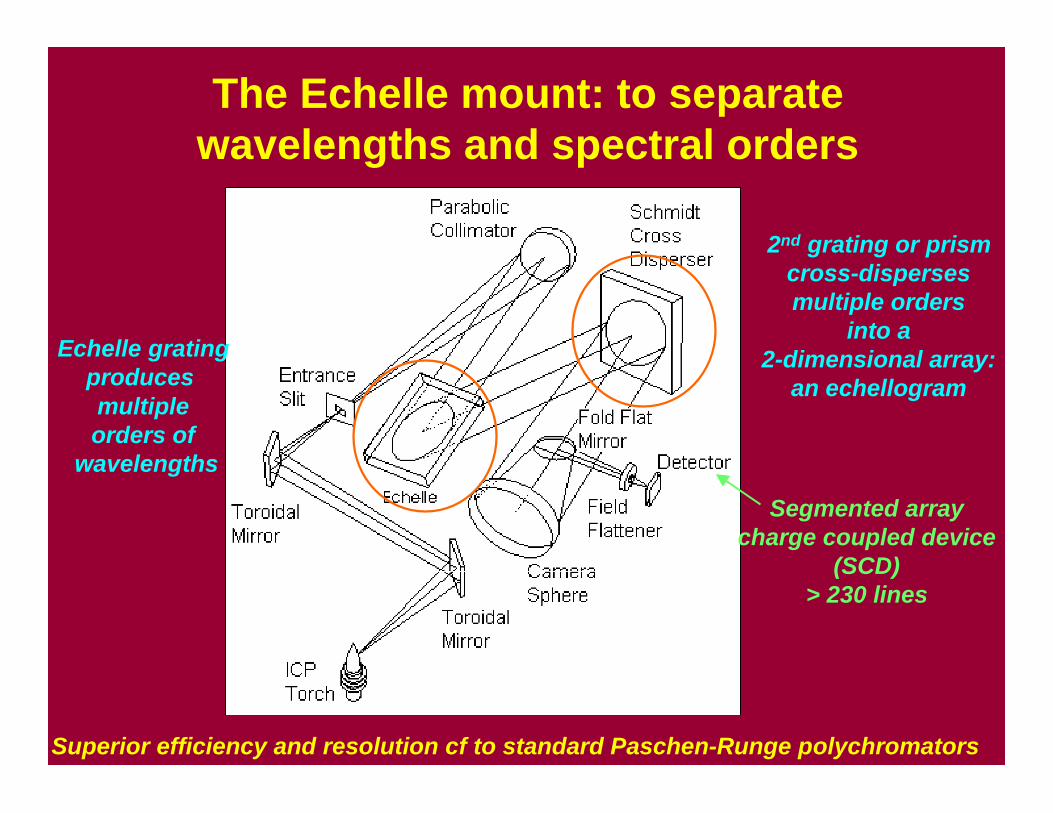
The Echelle mount: to separatewavelengths and spectral orders
Echelle gratingproduces multipleorders of
wavelengths
2nd grating or prismcross-dispersesmultiple orders
into a2-dimensional array:
an echellogram
Superior efficiency and resolution cf to standard Paschen-Runge polychromators
Segmented arraycharge coupled device
(SCD)> 230 lines
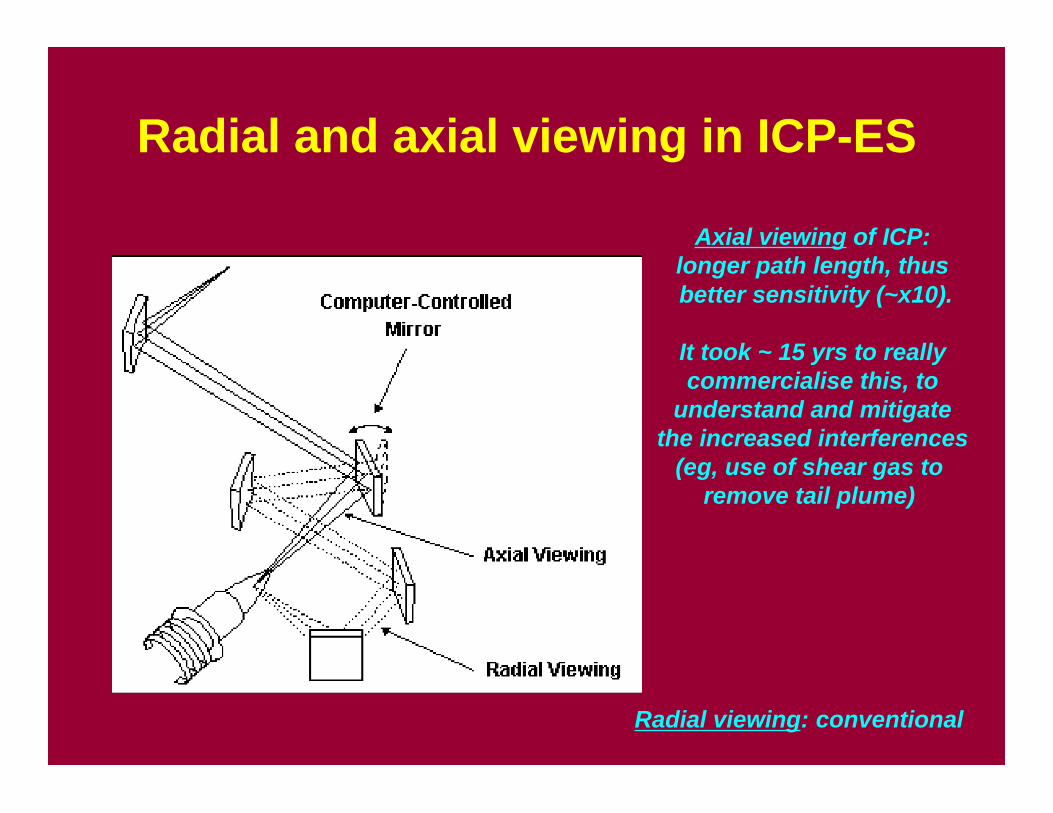
Radial and axial viewing in ICP-ES
Radial viewing: conventional
Axial viewing of ICP:longer path length, thus better sensitivity (~x10).
It took ~ 15 yrs to reallycommercialise this, to
understand and mitigatethe increased interferences
(eg, use of shear gas to remove tail plume)
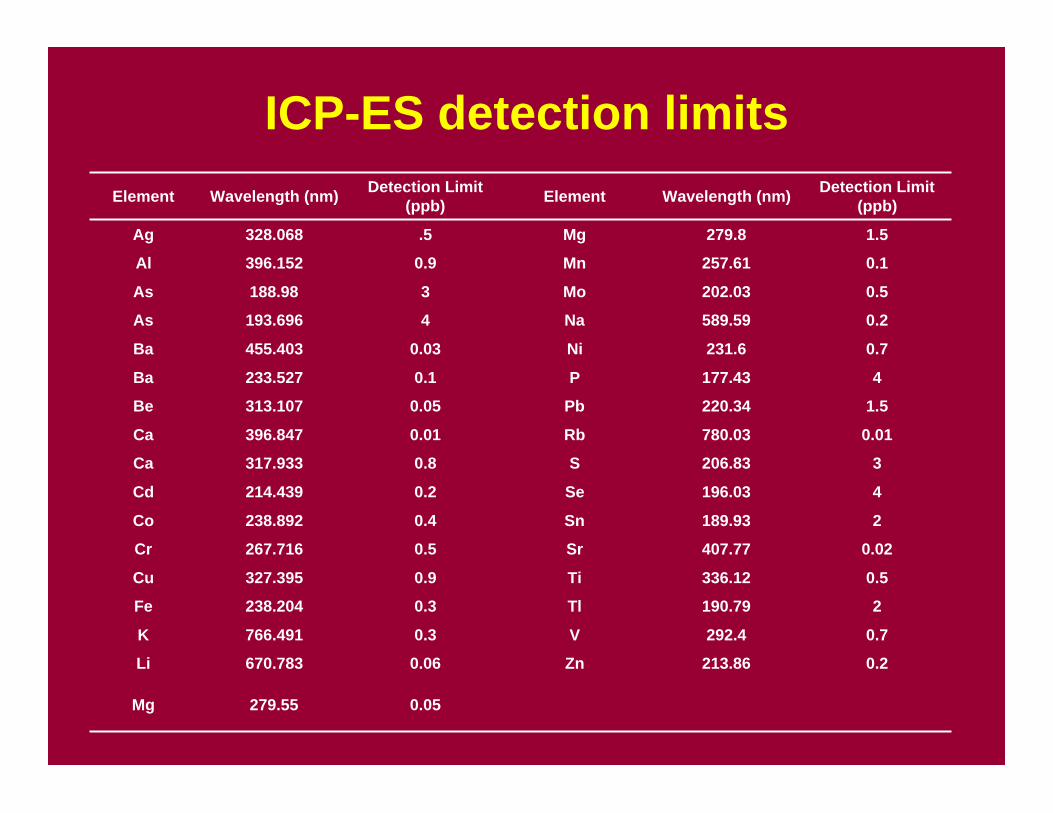
ICP-ES detection limits
0.05279.55Mg
0.2213.86Zn0.06670.783Li
0.7292.4V0.3766.491K
2190.79Tl0.3238.204Fe
0.5336.12Ti0.9327.395Cu
0.02407.77Sr0.5267.716Cr
2189.93Sn0.4238.892Co
4196.03Se0.2214.439Cd
3206.83S0.8317.933Ca
0.01780.03Rb0.01396.847Ca
1.5220.34Pb0.05313.107Be
4177.43P0.1233.527Ba
0.7231.6Ni0.03455.403Ba
0.2589.59Na4193.696As
0.5202.03Mo3188.98As
0.1257.61Mn0.9396.152Al
1.5279.8Mg.5328.068Ag
Detection Limit(ppb)Wavelength (nm)ElementDetection Limit
(ppb)Wavelength (nm)Element
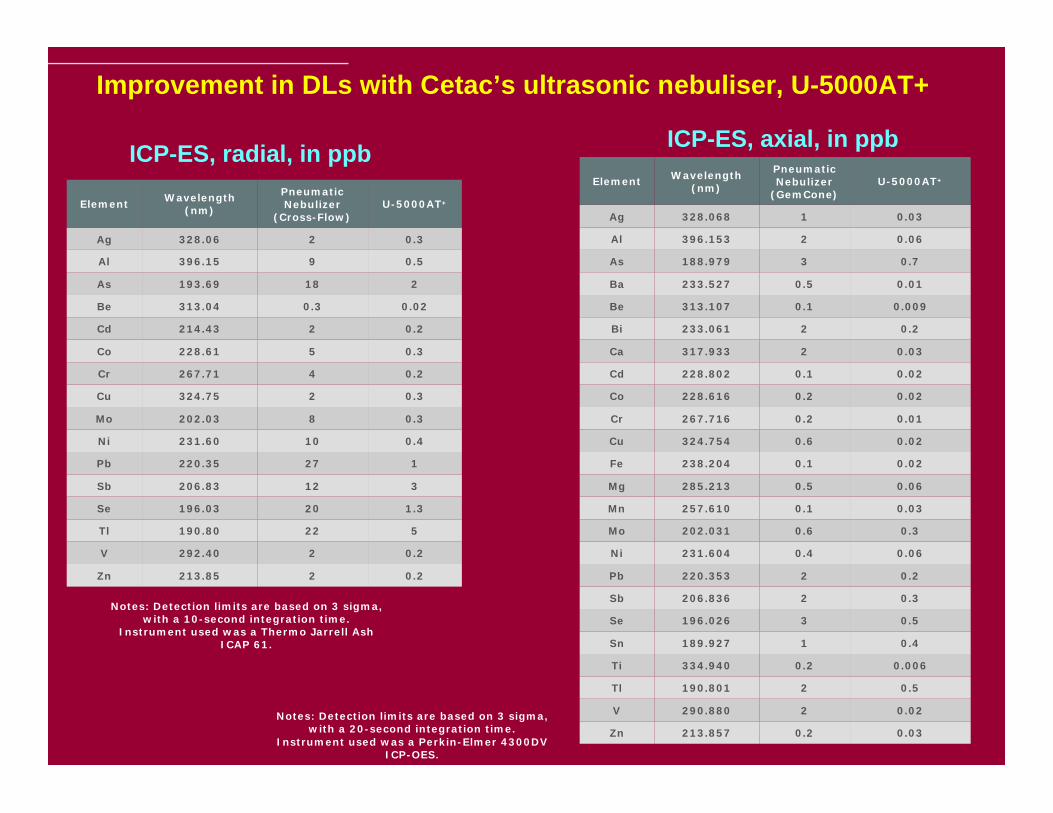
0.22213.85Zn
0.22292.40V
522190.80Tl
1.320196.03Se
312206.83Sb
127220.35Pb
0.410231.60Ni
0.38202.03Mo
0.32324.75Cu
0.24267.71Cr
0.35228.61Co
0.22214.43Cd
0.020.3313.04Be
218193.69As
0.59396.15Al
0.32328.06Ag
U-5000AT+PneumaticNebulizer
(Cross-Flow)
Wavelength(nm)
Element
Notes: Detection limits are based on 3 sigma,with a 10-second integration time.
Instrument used was a Thermo Jarrell AshICAP 61.
0.030.2213.857Zn
0.022290.880V
0.52190.801Tl
0.0060.2334.940Ti
0.41189.927Sn
0.53196.026Se
0.32206.836Sb
0.22220.353Pb
0.060.4231.604Ni
0.30.6202.031Mo
0.030.1257.610Mn
0.060.5285.213Mg
0.020.1238.204Fe
0.020.6324.754Cu
0.010.2267.716Cr
0.020.2228.616Co
0.020.1228.802Cd
0.032317.933Ca
0.22233.061Bi
0.0090.1313.107Be
0.010.5233.527Ba
0.73188.979As
0.062396.153Al
0.031328.068Ag
U-5000AT+PneumaticNebulizer
(GemCone)
Wavelength(nm)
Element
Notes: Detection limits are based on 3 sigma,with a 20-second integration time.
Instrument used was a Perkin-Elmer 4300DVICP-OES.
Improvement in DLs with Cetac’s ultrasonic nebuliser, U-5000AT+
ICP-ES, radial, in ppb ICP-ES, axial, in ppb
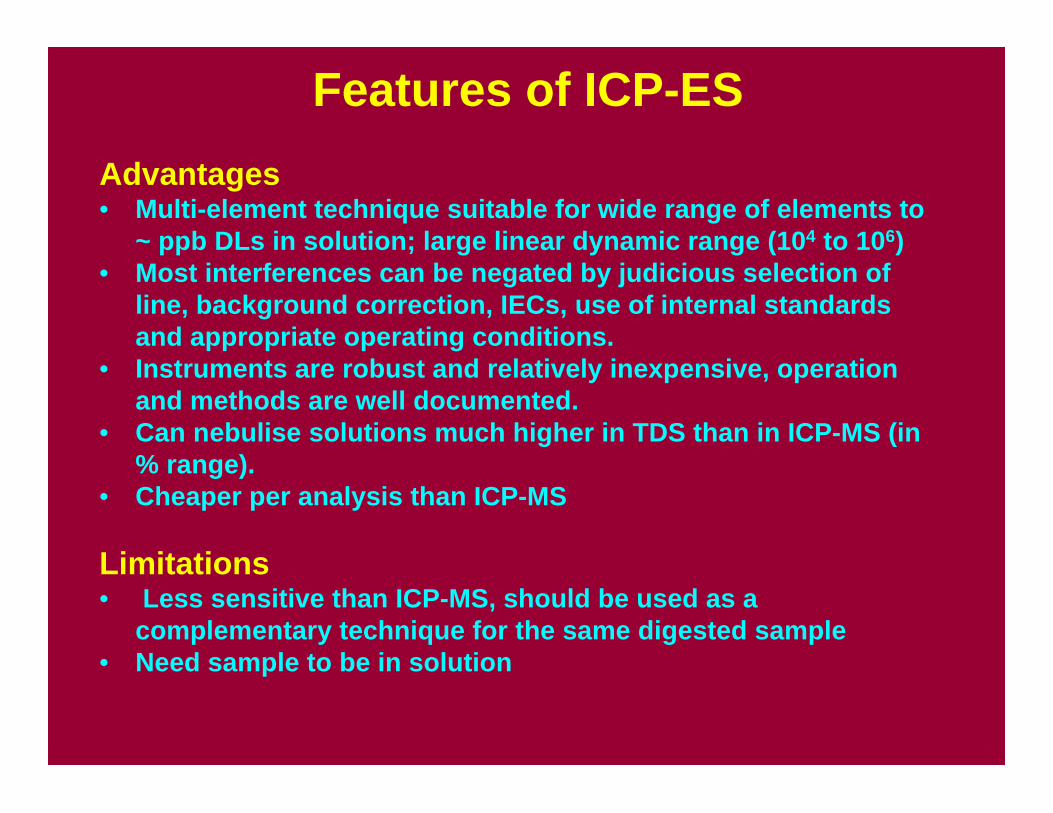
Features of ICP-ESAdvantages• Multi-element technique suitable for wide range of elements to
~ ppb DLs in solution; large linear dynamic range (104 to 106)• Most interferences can be negated by judicious selection of
line, background correction, IECs, use of internal standardsand appropriate operating conditions.
• Instruments are robust and relatively inexpensive, operationand methods are well documented.
• Can nebulise solutions much higher in TDS than in ICP-MS (in% range).
• Cheaper per analysis than ICP-MS
Limitations• Less sensitive than ICP-MS, should be used as a
complementary technique for the same digested sample• Need sample to be in solution
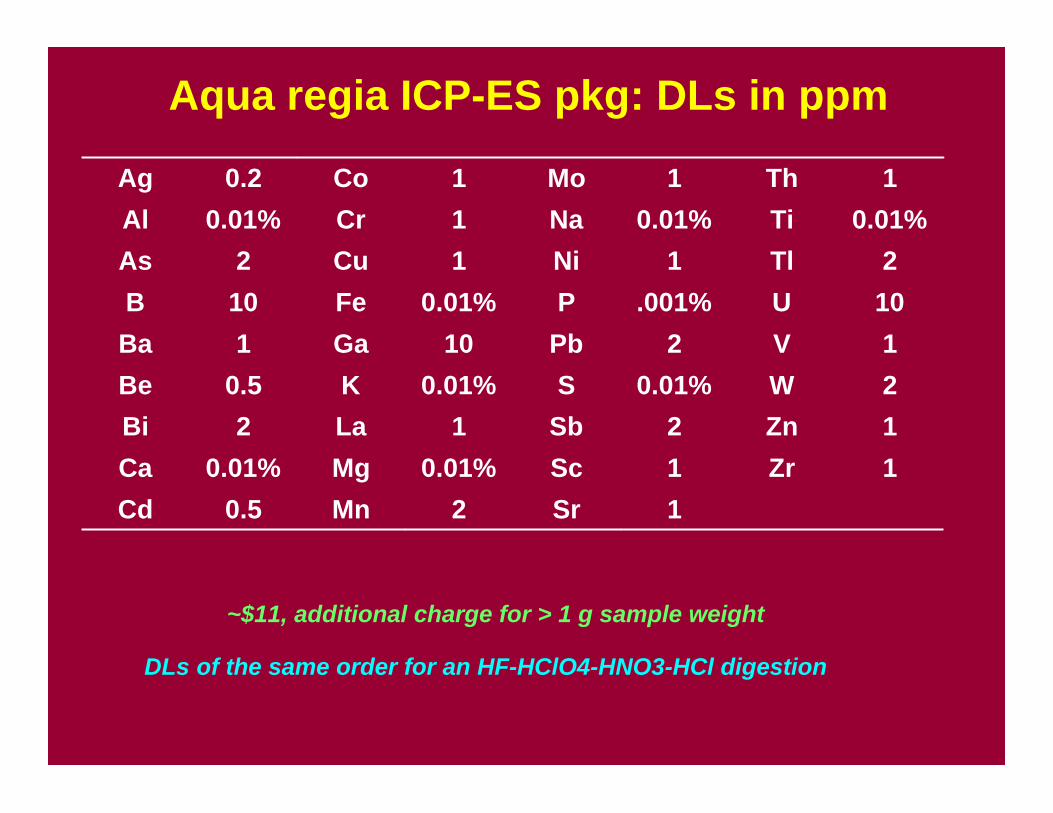
Aqua regia ICP-ES pkg: DLs in ppm
1Sr2Mn0.5Cd1Zr1Sc0.01%Mg0.01%Ca1Zn2Sb1La2Bi2W0.01%S0.01%K0.5Be1V2Pb10Ga1Ba
10U.001%P0.01%Fe10B2Tl1Ni1Cu2As
0.01%Ti0.01%Na1Cr0.01%Al1Th1Mo1Co0.2Ag
~$11, additional charge for > 1 g sample weight
DLs of the same order for an HF-HClO4-HNO3-HCl digestion
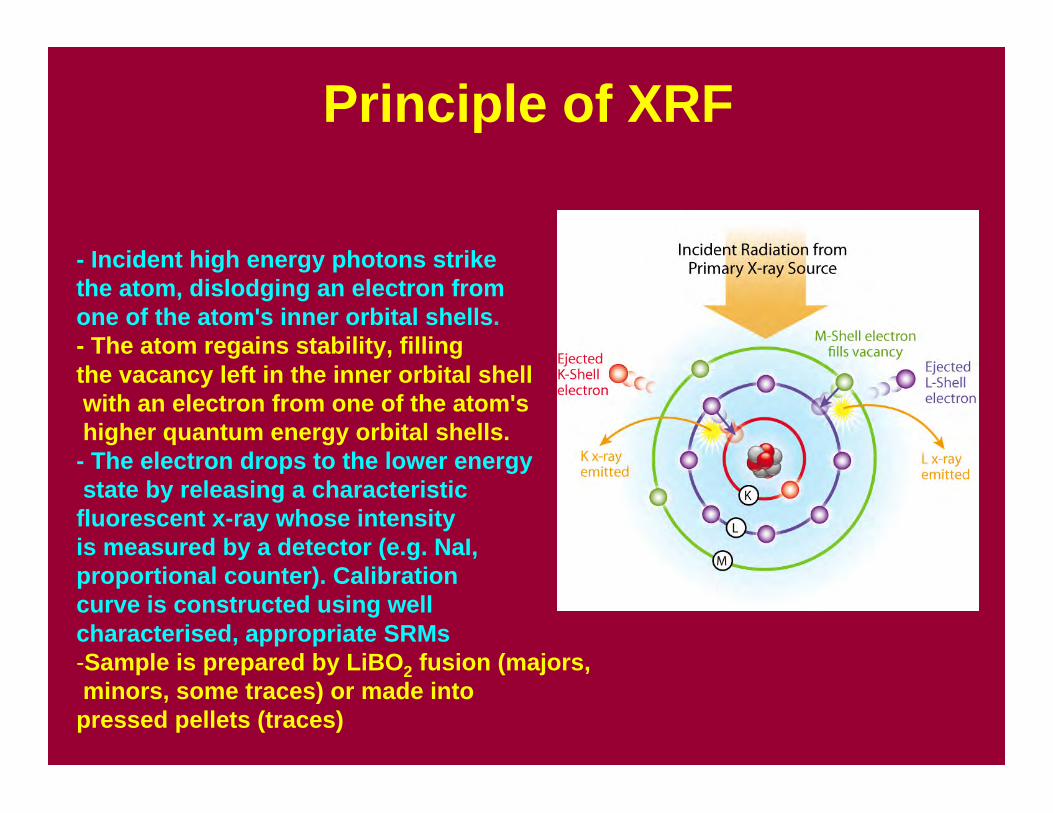
Principle of XRF
- Incident high energy photons strike the atom, dislodging an electron from one of the atom's inner orbital shells.- The atom regains stability, filling the vacancy left in the inner orbital shell with an electron from one of the atom's higher quantum energy orbital shells.- The electron drops to the lower energy state by releasing a characteristicfluorescent x-ray whose intensityis measured by a detector (e.g. NaI, proportional counter). Calibrationcurve is constructed using wellcharacterised, appropriate SRMs-Sample is prepared by LiBO2 fusion (majors, minors, some traces) or made intopressed pellets (traces)
Features of XRF
Advantages• The fusion technique minimises particle size/matrix effects that
could otherwise cause problems with the measurement process.Excellent for ‘whole rock’ analysis.
• Numerous trace elements can also be determined from the samefused disk, e.g. Y, Nb, Zr. The disks can be stored indefinitely.
Limitations• Fluorescent X-rays can be easily absorbed by the sample itself
(self-absorption), also enhanced. Important to matrix match thecalibration standards, or empirical correction factors must beapplied.
• Lighter elements are not easily determined (less sensitive).• With respect to the fusion, sometimes refractory minerals
dissolve slowly and do not give satisfactory melts or discs.• Samples high in sulphide minerals do not fuse well with lithium
borate.• Sensitivity not high for trace/ultra-trace analysis
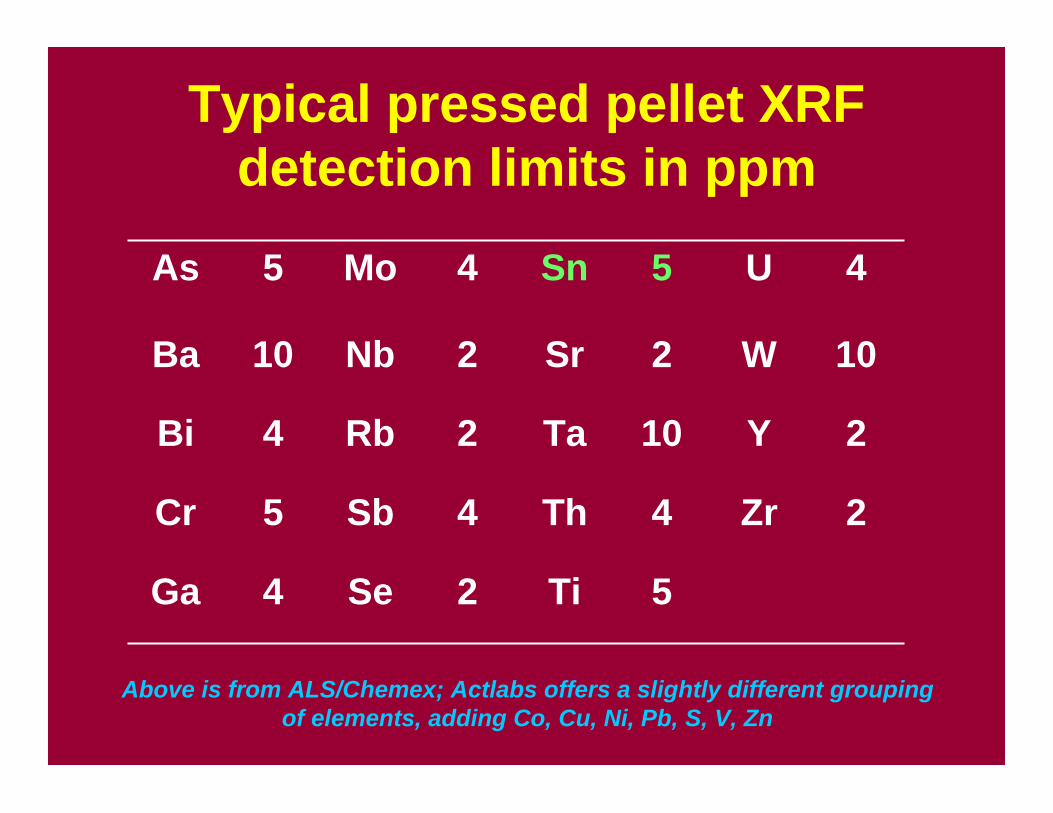
Typical pressed pellet XRFdetection limits in ppm
5Ti2Se4Ga
2Zr4Th4Sb5Cr
2Y10Ta2Rb4Bi
10W2Sr2Nb10Ba
4U5Sn4Mo5As
Above is from ALS/Chemex; Actlabs offers a slightly different groupingof elements, adding Co, Cu, Ni, Pb, S, V, Zn
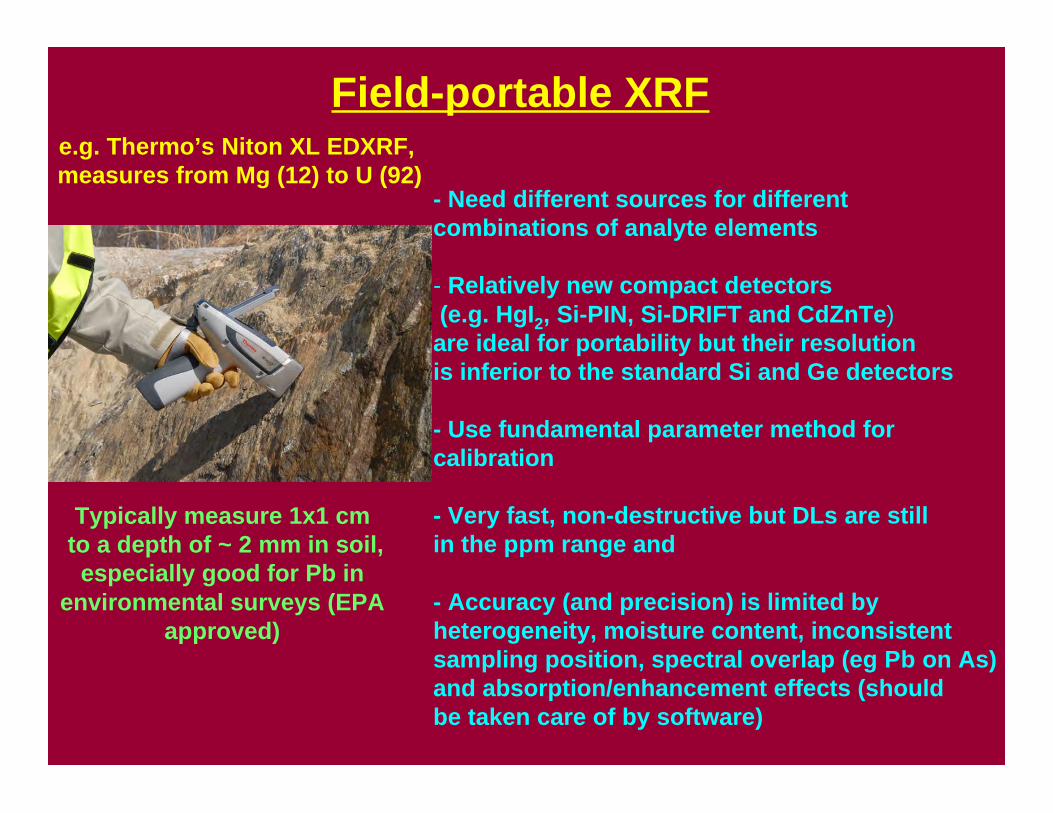
Field-portable XRF
- Need different sources for different combinations of analyte elements
- Relatively new compact detectors (e.g. HgI2, Si-PIN, Si-DRIFT and CdZnTe)are ideal for portability but their resolutionis inferior to the standard Si and Ge detectors
- Use fundamental parameter method forcalibration
- Very fast, non-destructive but DLs are stillin the ppm range and
- Accuracy (and precision) is limited by heterogeneity, moisture content, inconsistentsampling position, spectral overlap (eg Pb on As)and absorption/enhancement effects (shouldbe taken care of by software)
Typically measure 1x1 cm to a depth of ~ 2 mm in soil, especially good for Pb in
environmental surveys (EPAapproved)
e.g. Thermo’s Niton XL EDXRF, measures from Mg (12) to U (92)
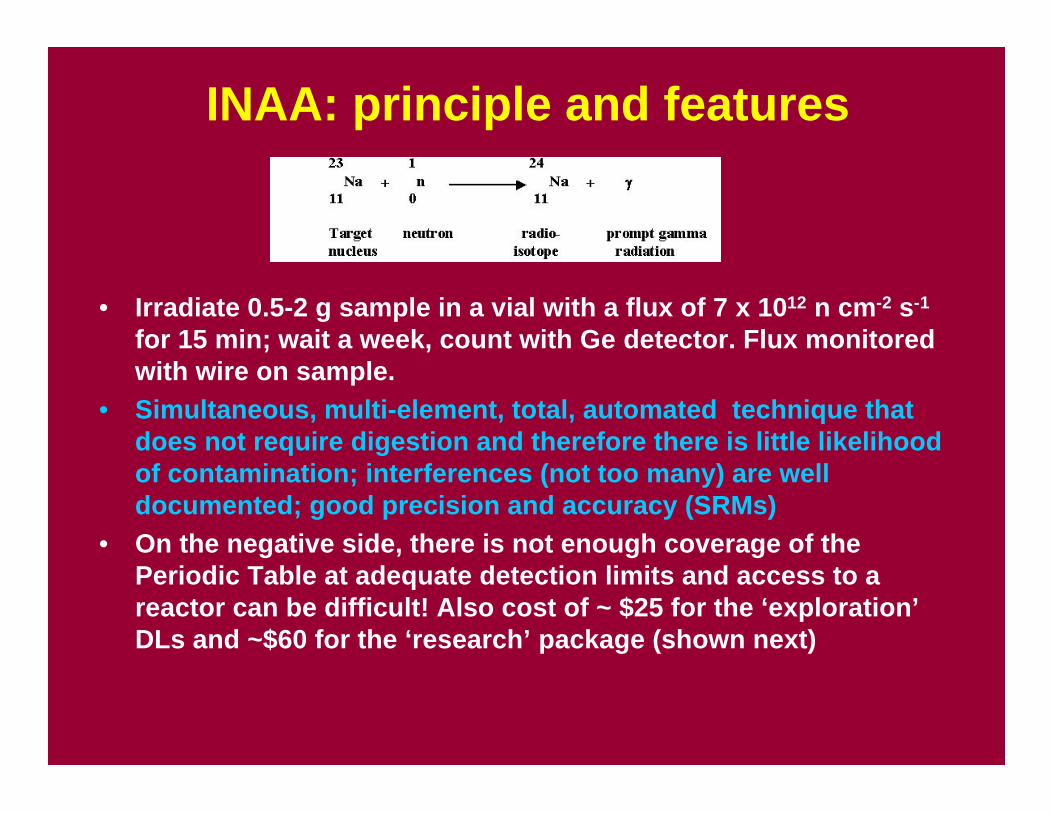
INAA: principle and features
• Irradiate 0.5-2 g sample in a vial with a flux of 7 x 10¹² n cm-2 s-1
for 15 min; wait a week, count with Ge detector. Flux monitoredwith wire on sample.
• Simultaneous, multi-element, total, automated technique thatdoes not require digestion and therefore there is little likelihoodof contamination; interferences (not too many) are welldocumented; good precision and accuracy (SRMs)
• On the negative side, there is not enough coverage of thePeriodic Table at adequate detection limits and access to areactor can be difficult! Also cost of ~ $25 for the ‘exploration’DLs and ~$60 for the ‘research’ package (shown next)
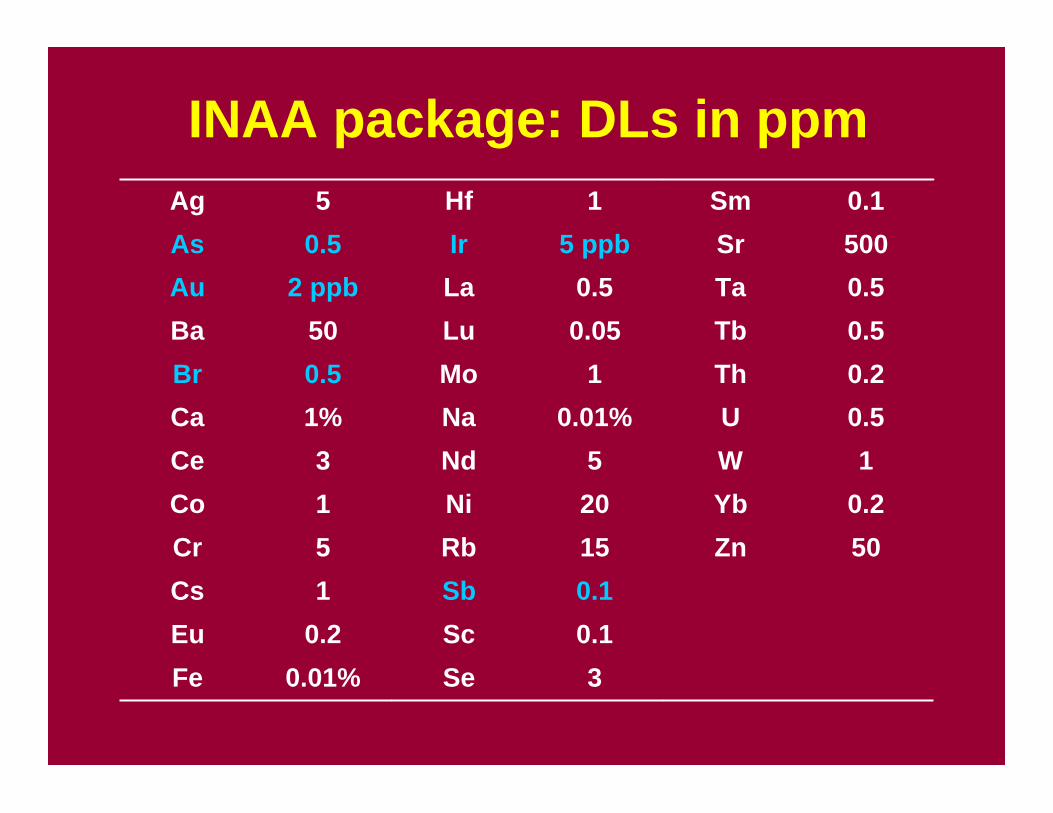
INAA package: DLs in ppm
0.5U0.01%Na1%Ca1W5Nd3Ce
0.2Yb20Ni1Co50Zn15Rb5Cr
0.1Sb1Cs0.1Sc0.2Eu3Se0.01%Fe
0.2Th1Mo0.5Br0.5Tb0.05Lu50Ba0.5Ta0.5La2 ppbAu500Sr5 ppbIr0.5As0.1Sm1Hf5Ag
Whole-rock analysis
• Majors oxides (inc P2O5) to 0.01%; MnO andTiO2 to 0.001%; by Li metaborate/tetraboratefusion and ICP-ES or XRF
• C and S to 0.01% by IR (Leco); LOI to 0.01%• Trace elements by fusion/ICP-MS (especially
for those in refractory minerals) and by 4-acid ICP-MS (better DLs but not always total)
• Can combine ICP-MS, ICP-ES, INAA and XRFfor full coverage
Au and PGEs
• Au by aqua regia/ICP-MS to ~ 0.2 ppb using weightsfrom 2 to 30 g for ~ $10. Not always total; shouldroast sample at ~500oC first if high in carbon andsulphides. Can determine Pt and Pd off same attackbut digestion is likely partial (especially for Pt).
• Au by cyanide leach (BLEG) for ‘free Au’ using largesample weights (~ 1 kg or more), to DLs easily of < 1ppb, if heterogeneity is a major concern.
• ‘Metallics Sieve Analysis’ for heterogeneous Au: 500to 1000 g sample is sieved to 100-mesh. A Pb fireassay is carried out on a split (30 g) of the finefraction (replicated) whereas the entire coarsefraction is subjected to FA. Weight of each fractionis used to compute the final result.
Au and PGEs
• Lead fire assay ICP-MS with collection in Ag, using a30-g sample, for Au (1 ppb), Pt (0.1 ppb), Pd (0.2 ppb),~$20. For a few $ less, DLs of ~ 2-5 ppb. Rhodium canbe collected in Au rather than Ag by Pb fire assay.
• NiS fire assay is used for all the PGEs; not amenableto Zn concentrates and not ideal for Au. With ICP-MSfinish, DLs for ~ 1 ppb for Au, Pt, Pd, Re, Rh, Ru and Ir.Os volatilises (OsO4) during the digestion. With anINAA finish, DLs, in ppb, are Au-0.5, Pd-2, Pt-5, Re-5,Rh-0.2, Ru-5, Os-2, Ir-0.1. INAA DLs are compromisedby high concentrations of Au, Sb and Cu. From~$150/sample.
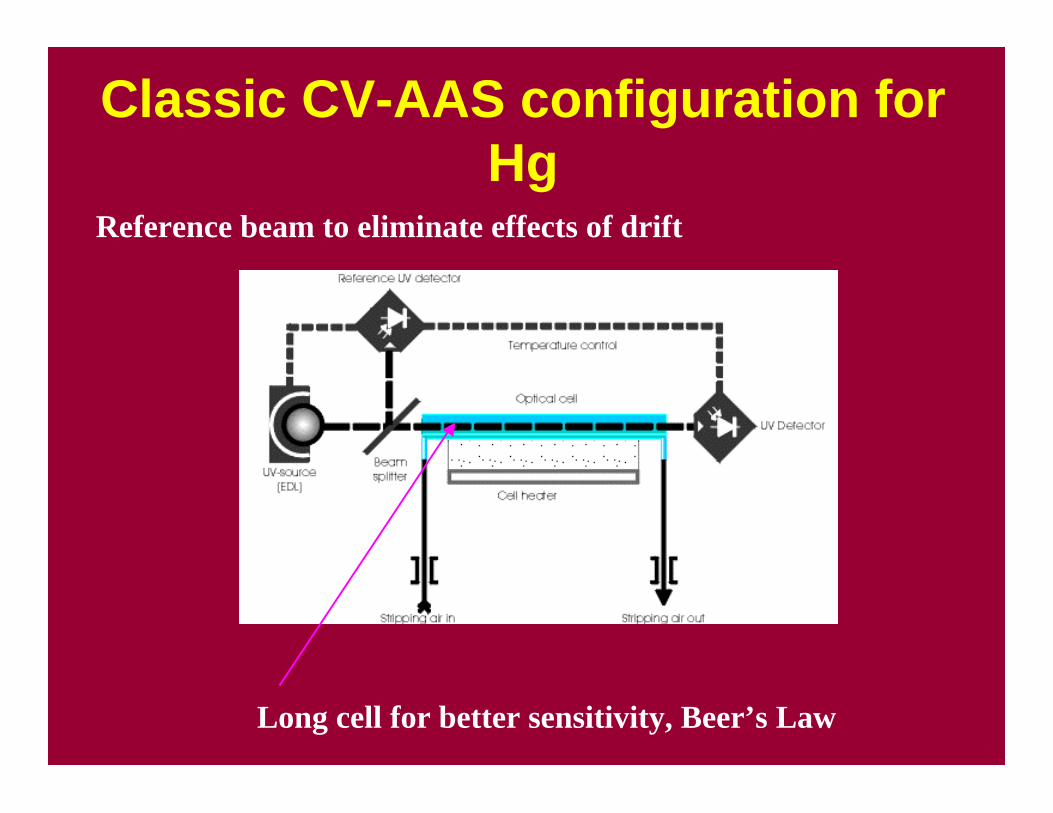
Classic CV-AAS configuration forHg
Long cell for better sensitivity, Beer’s Law
Reference beam to eliminate effects of drift
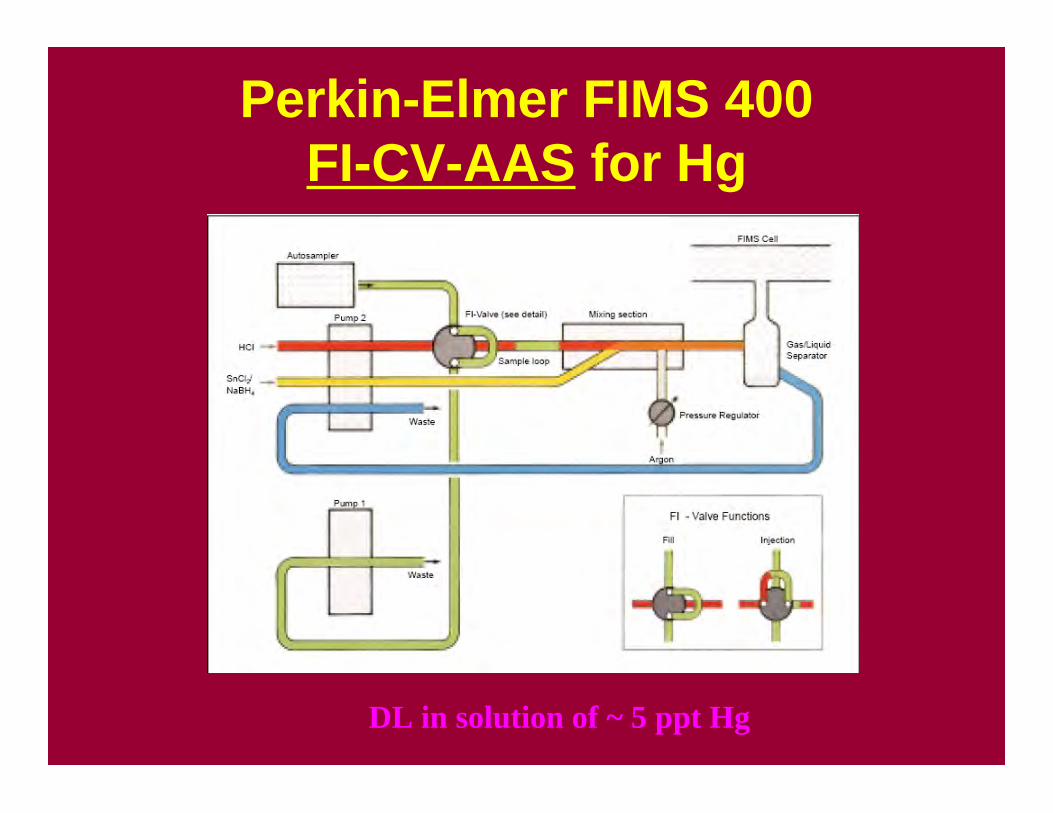
Perkin-Elmer FIMS 400FI-CV-AAS for Hg
DL in solution of ~ 5 ppt Hg
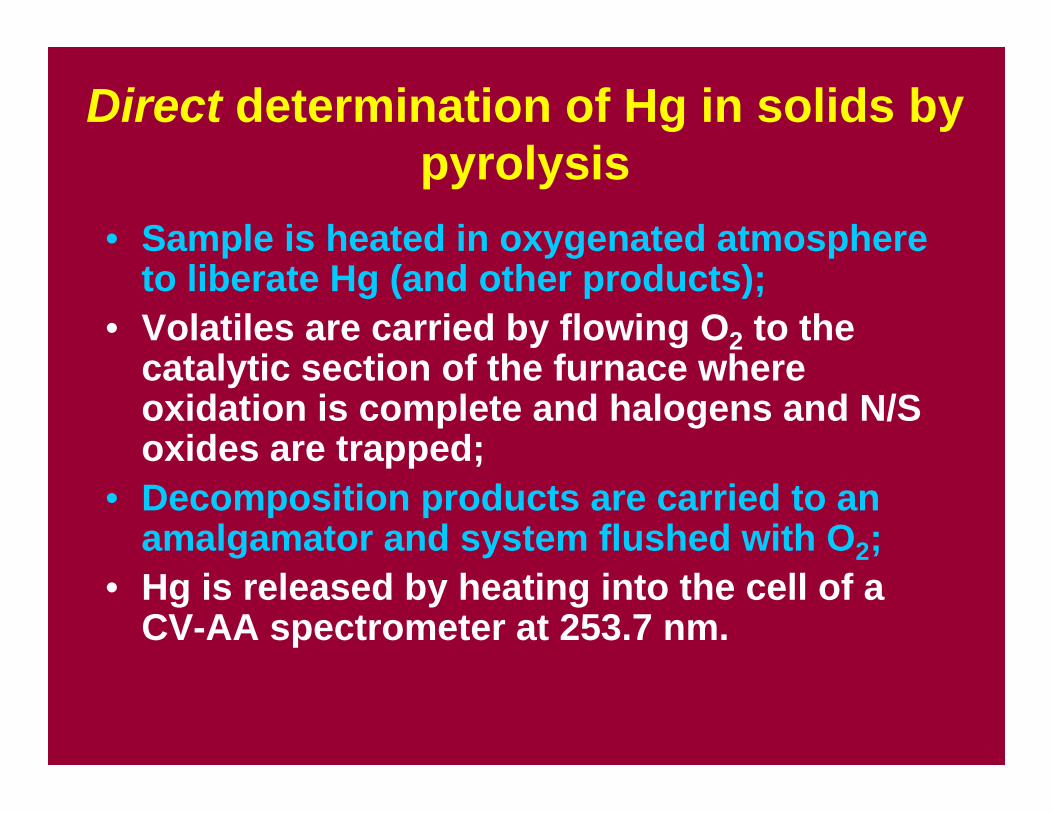
Direct determination of Hg in solids bypyrolysis
• Sample is heated in oxygenated atmosphereto liberate Hg (and other products);
• Volatiles are carried by flowing O2 to thecatalytic section of the furnace whereoxidation is complete and halogens and N/Soxides are trapped;
• Decomposition products are carried to anamalgamator and system flushed with O2;
• Hg is released by heating into the cell of aCV-AA spectrometer at 253.7 nm.
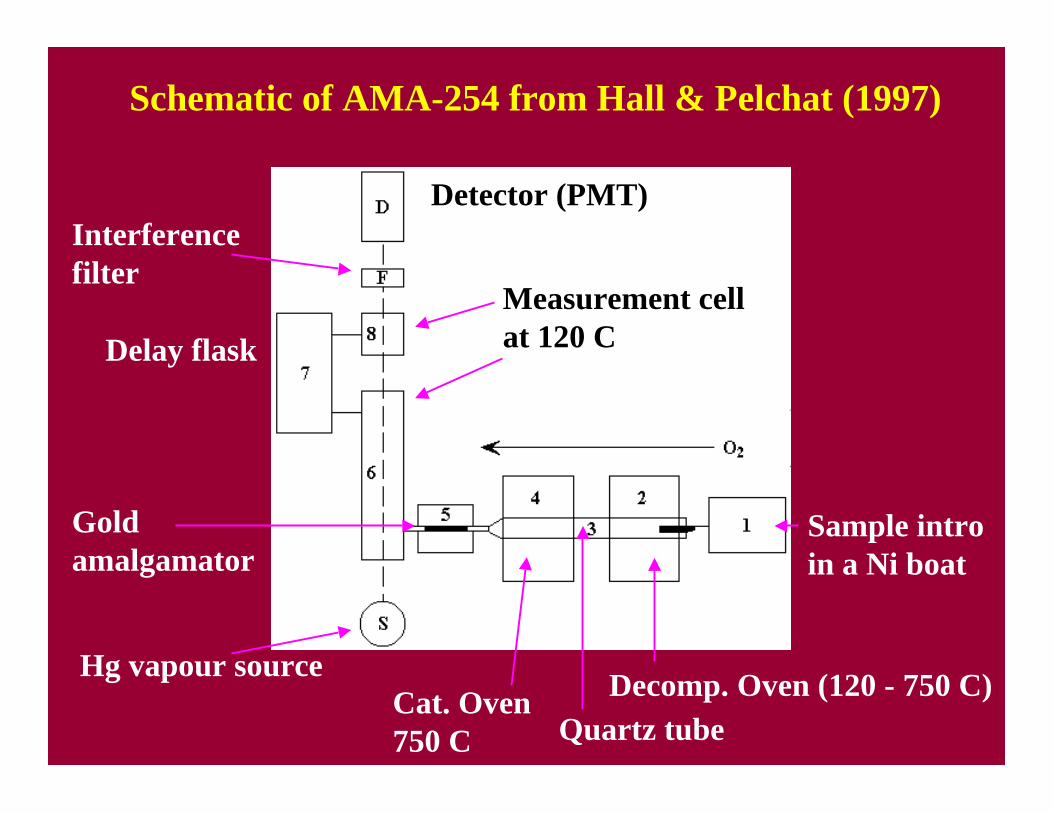
Schematic of AMA-254 from Hall & Pelchat (1997)
Sample introin a Ni boat
Decomp. Oven (120 - 750 C)Quartz tube
Cat. Oven750 C
Measurement cellat 120 CDelay flask
Hg vapour source
Interferencefilter
Detector (PMT)
Gold amalgamator
Pyrolysis CV-AAS• Highly sensitive (absolute DL of ~ 0.01 ng Hg,
translates to < 0.1 ppb Hg), RSDs better than5% over 33 reference materials (4-6250 ppbHg);
• Eliminates errors inherent in digestions andis rapid (every 5 min);
• Milestone markets the ‘DMA-80’, Leco the‘AMA-254’, and Nippon the MA-2000;
• This technique is the basis of EPA Method7473, working range of 0.05 – 600 ng of Hg.
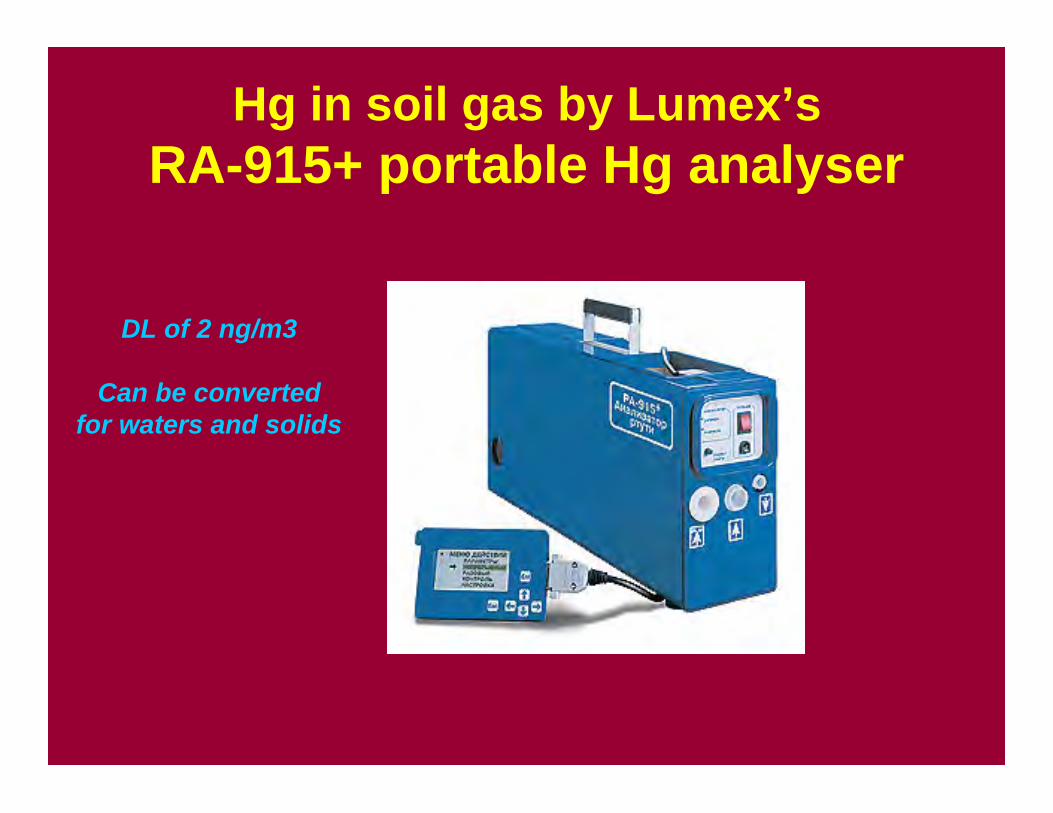
Hg in soil gas by Lumex’sRA-915+ portable Hg analyser
DL of 2 ng/m3
Can be convertedfor waters and solids
Analysis of vegetation
Ashing (i.e. preconcentration) is nolonger necessary to reach required
detection limits, thanks to latestgeneration of ICP-MS
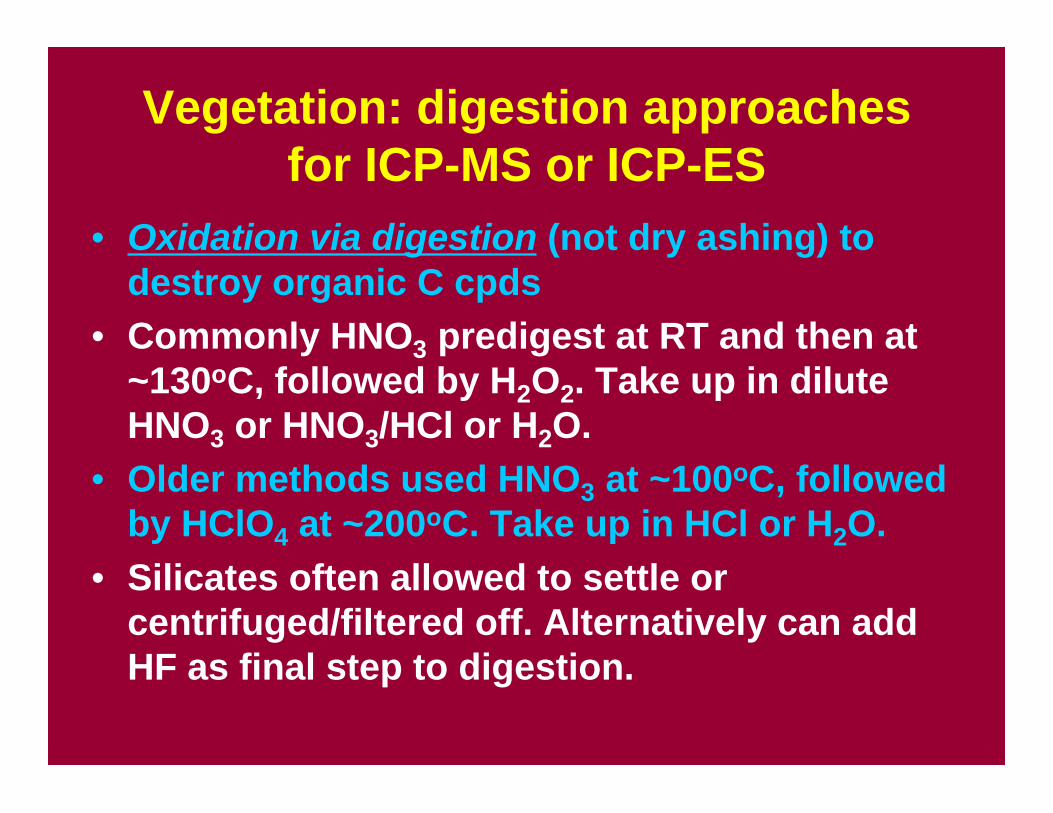
Vegetation: digestion approachesfor ICP-MS or ICP-ES
• Oxidation via digestion (not dry ashing) todestroy organic C cpds
• Commonly HNO3 predigest at RT and then at~130oC, followed by H2O2. Take up in diluteHNO3 or HNO3/HCl or H2O.
• Older methods used HNO3 at ~100oC, followedby HClO4 at ~200oC. Take up in HCl or H2O.
• Silicates often allowed to settle orcentrifuged/filtered off. Alternatively can addHF as final step to digestion.
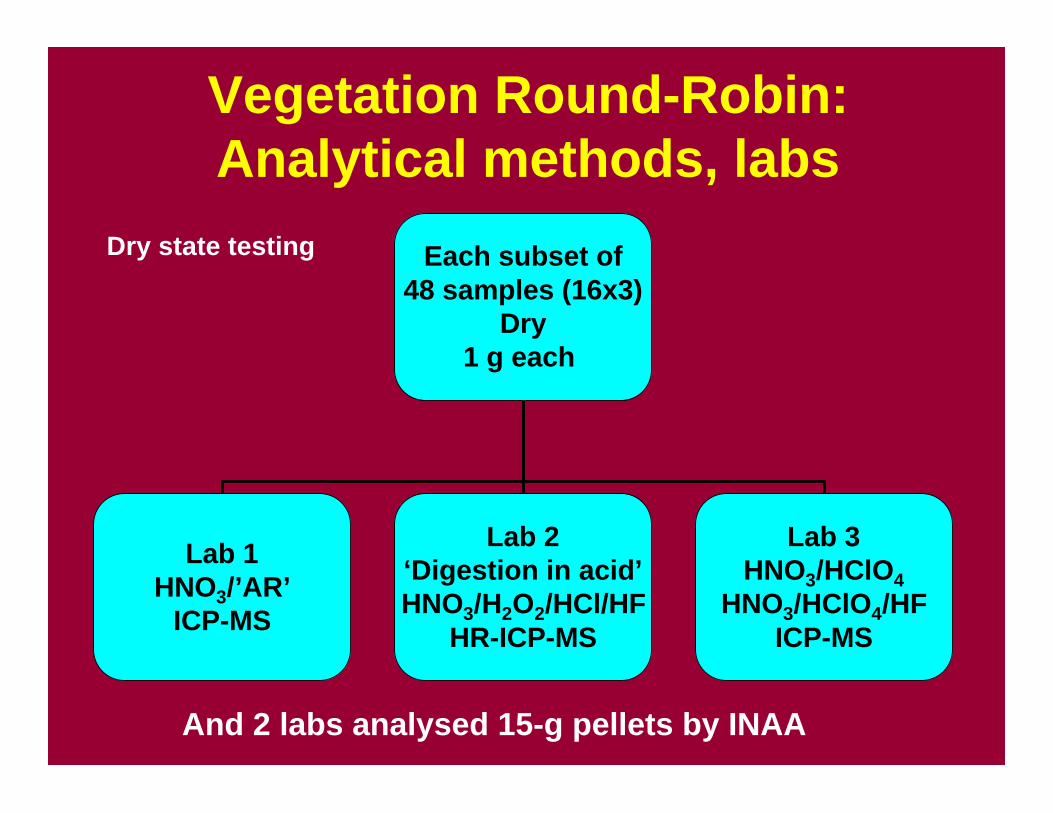
Vegetation Round-Robin:Analytical methods, labs
Each subset of48 samples (16x3)
Dry1 g each
Lab 1HNO3/’AR’
ICP-MS
Lab 2‘Digestion in acid’HNO3/H2O2/HCl/HF
HR-ICP-MS
Lab 3HNO3/HClO4
HNO3/HClO4/HFICP-MS
And 2 labs analysed 15-g pellets by INAA
Dry state testing
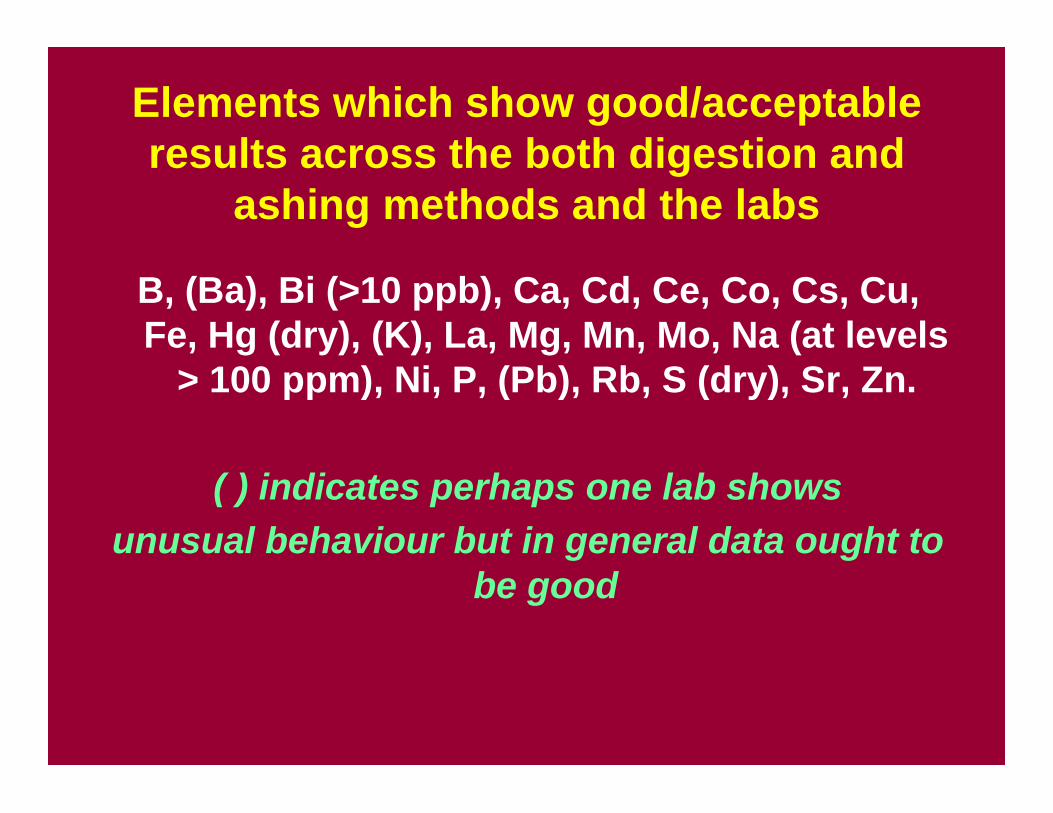
Elements which show good/acceptableresults across the both digestion and
ashing methods and the labs
B, (Ba), Bi (>10 ppb), Ca, Cd, Ce, Co, Cs, Cu,Fe, Hg (dry), (K), La, Mg, Mn, Mo, Na (at levels
> 100 ppm), Ni, P, (Pb), Rb, S (dry), Sr, Zn.
( ) indicates perhaps one lab showsunusual behaviour but in general data ought to
be good
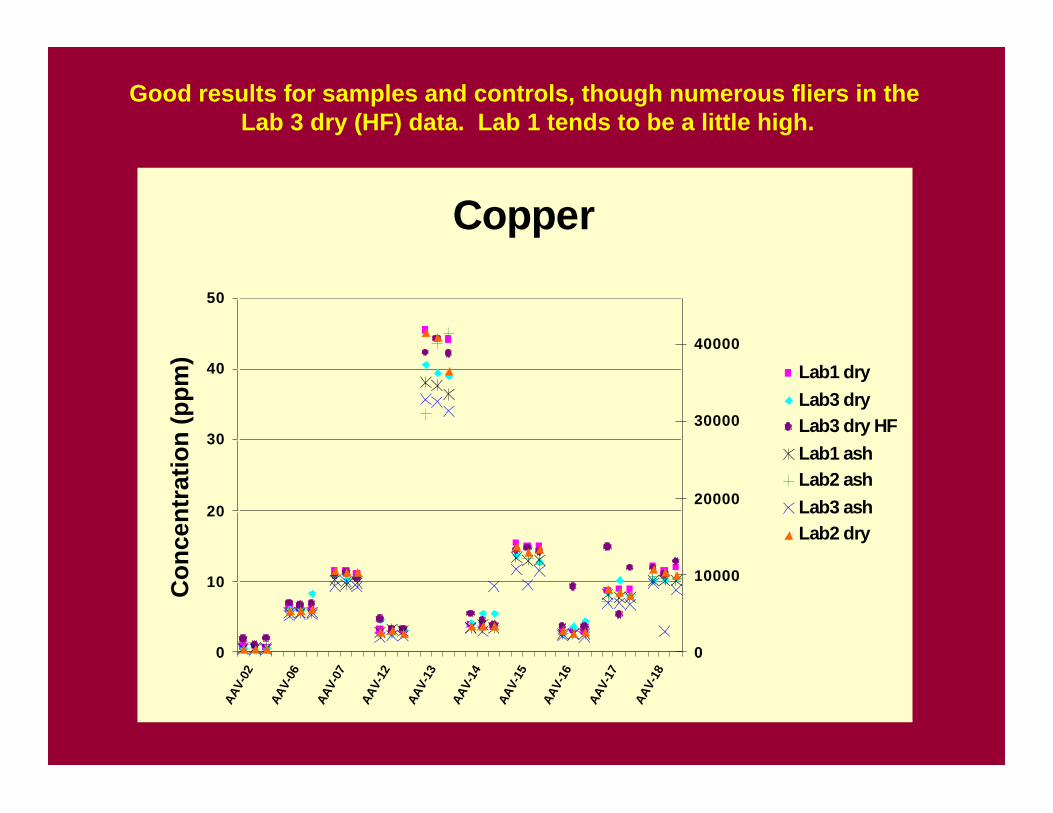
Good results for samples and controls, though numerous fliers in the Lab 3 dry (HF) data. Lab 1 tends to be a little high.
Copper
0
10
20
30
40
50
AAV-
02
AAV-
06
AAV-
07
AAV-
12
AAV-
13
AAV-
14
AAV-
15
AAV-
16
AAV-
17
AAV-
18
Con
cent
ratio
n (p
pm)
0
10000
20000
30000
40000
Lab1 dryLab3 dryLab3 dry HFLab1 ashLab2 ashLab3 ashLab2 dry
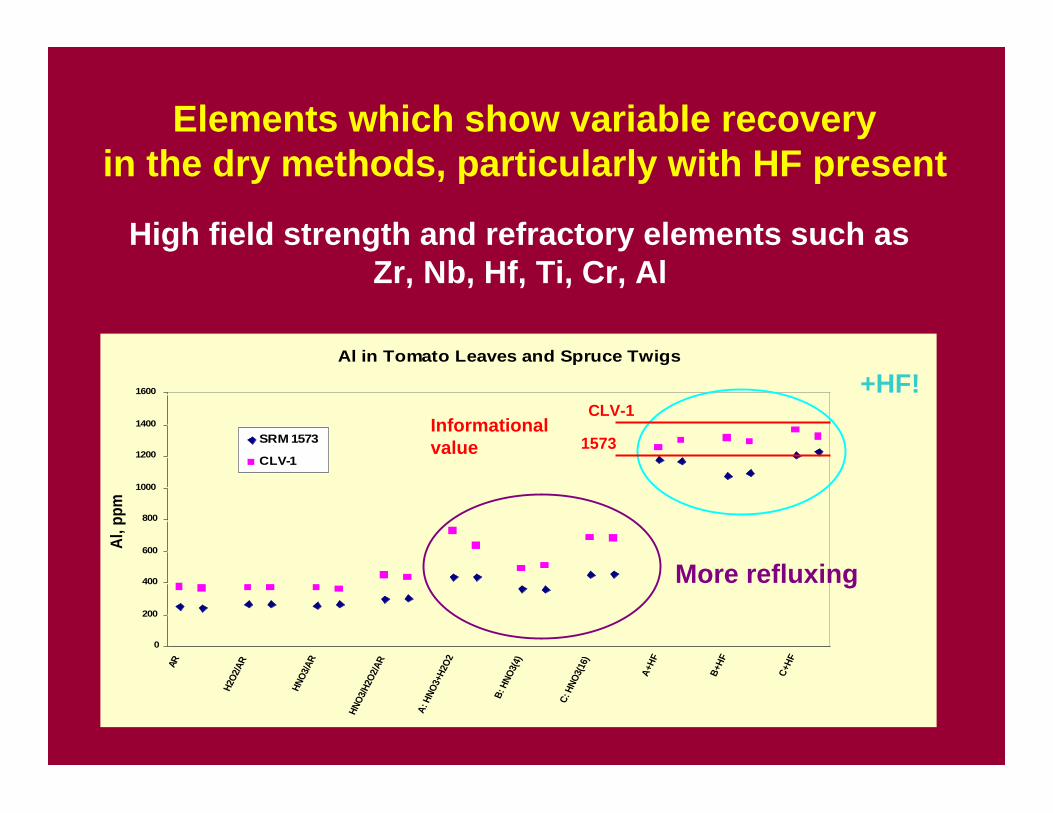
Elements which show variable recoveryin the dry methods, particularly with HF present
High field strength and refractory elements such asZr, Nb, Hf, Ti, Cr, Al
Al in Tomato Leaves and Spruce Twigs
0
200
400
600
800
1000
1200
1400
1600
AR
H2O2
/AR
HNO3
/AR
HNO3
/H2O
2/AR
A: H
NO3+
H2O2
B: H
NO3(
4)
C: H
NO3(1
6)
A+HF
B+HF
C+HF
Al, p
pm
SRM 1573
CLV-1
+HF!
More refluxing
Informationalvalue
CLV-1
1573
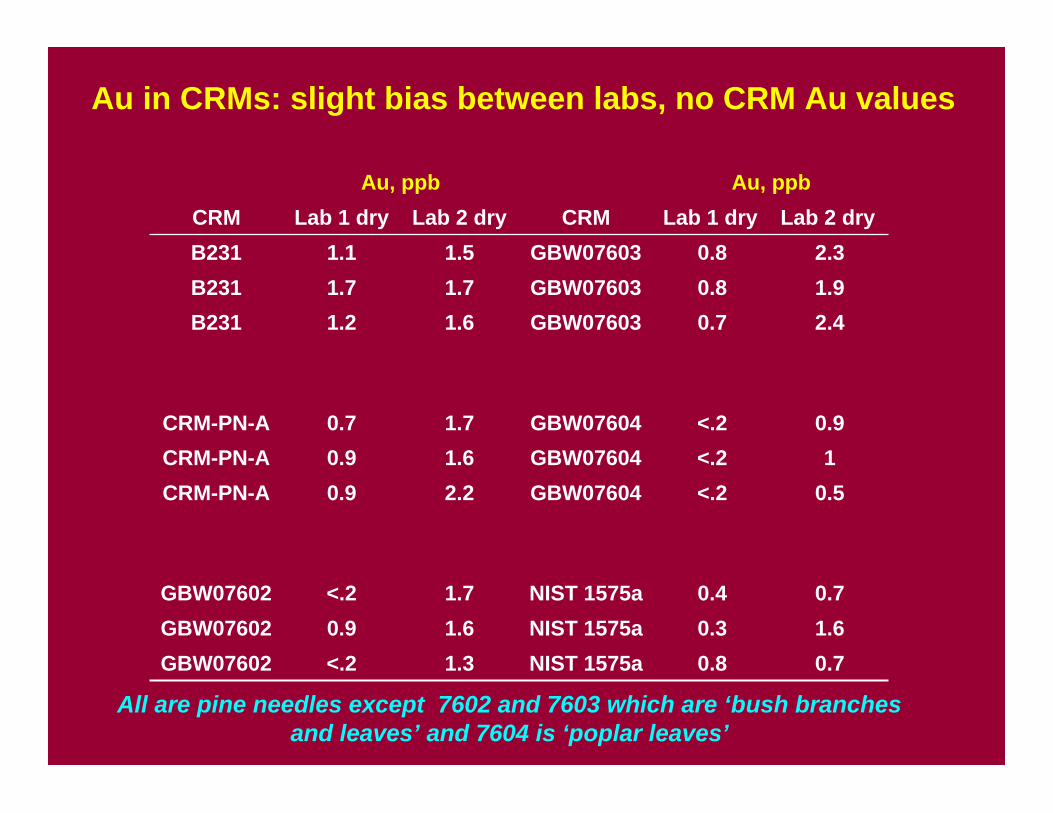
0.70.8NIST 1575a1.3<.2GBW076021.60.3NIST 1575a1.60.9GBW076020.70.4NIST 1575a1.7<.2GBW07602
0.5<.2GBW076042.20.9CRM-PN-A1<.2GBW076041.60.9CRM-PN-A
0.9<.2GBW076041.70.7CRM-PN-A
2.40.7GBW076031.61.2B2311.90.8GBW076031.71.7B2312.30.8GBW076031.51.1B231
Lab 2 dryLab 1 dryCRMLab 2 dryLab 1 dryCRMAu, ppbAu, ppb
Au in CRMs: slight bias between labs, no CRM Au values
All are pine needles except 7602 and 7603 which are ‘bush branches and leaves’ and 7604 is ‘poplar leaves’
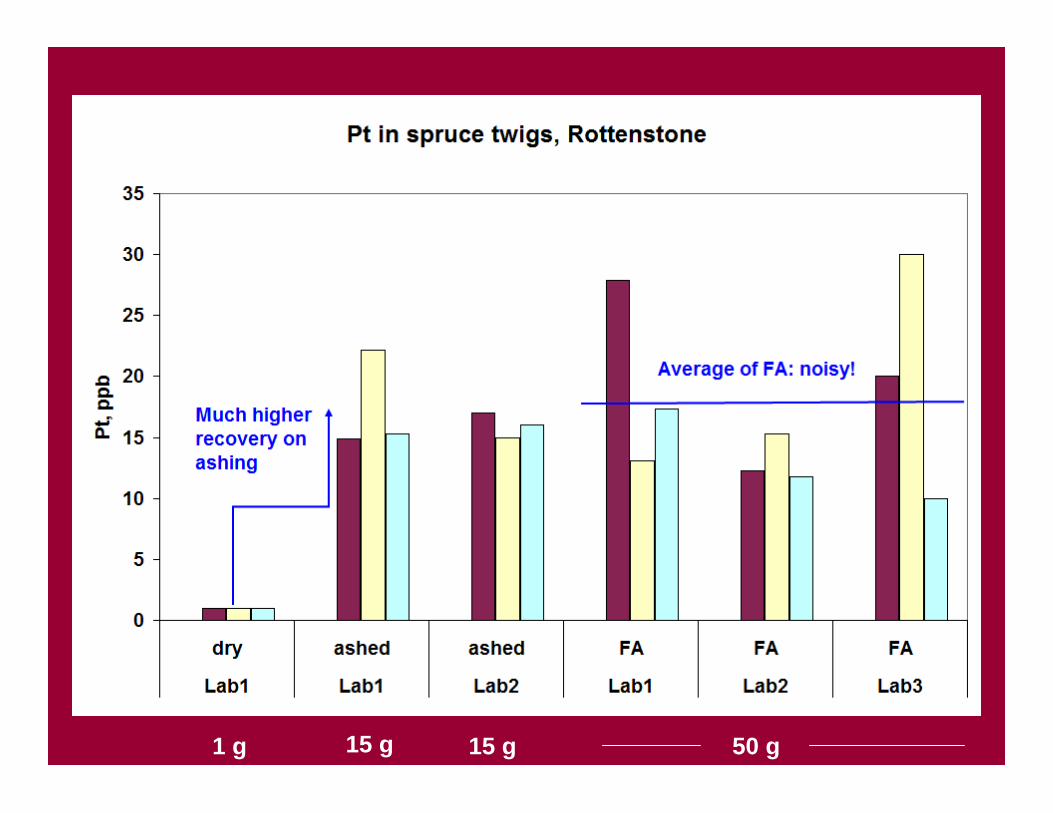
50 g1 g 15 g 15 g
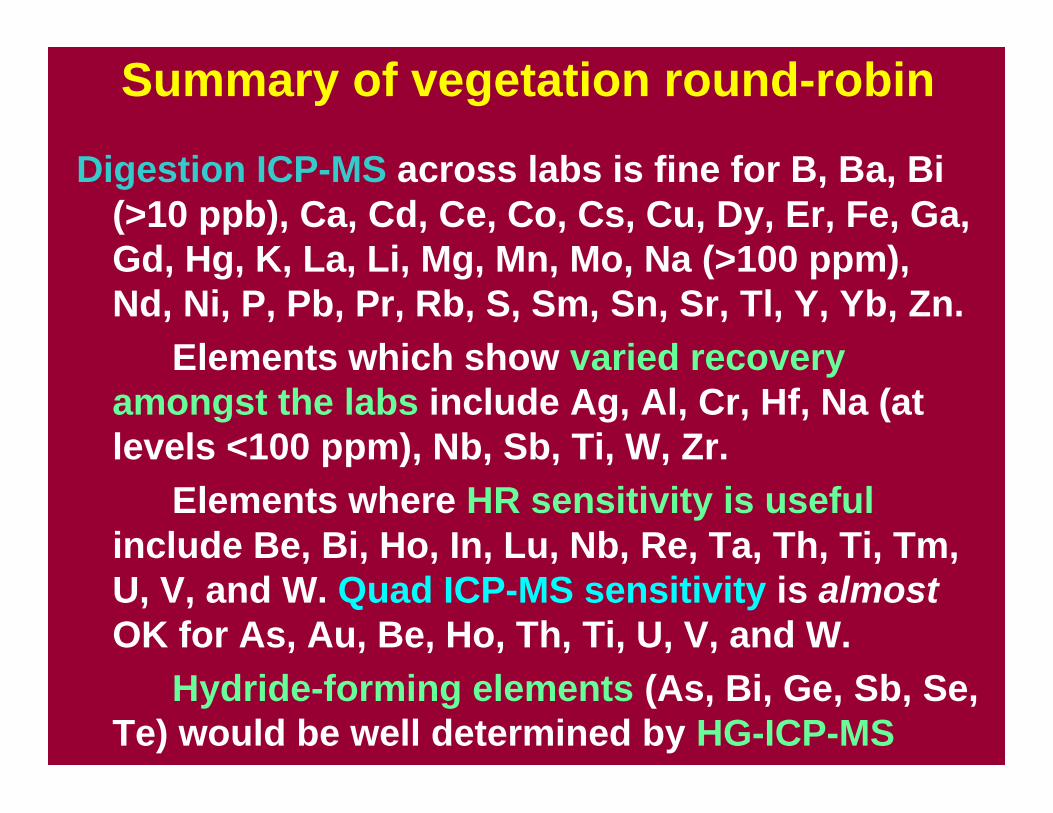
Summary of vegetation round-robin
Digestion ICP-MS across labs is fine for B, Ba, Bi(>10 ppb), Ca, Cd, Ce, Co, Cs, Cu, Dy, Er, Fe, Ga,Gd, Hg, K, La, Li, Mg, Mn, Mo, Na (>100 ppm),Nd, Ni, P, Pb, Pr, Rb, S, Sm, Sn, Sr, Tl, Y, Yb, Zn.
Elements which show varied recoveryamongst the labs include Ag, Al, Cr, Hf, Na (atlevels <100 ppm), Nb, Sb, Ti, W, Zr.
Elements where HR sensitivity is usefulinclude Be, Bi, Ho, In, Lu, Nb, Re, Ta, Th, Ti, Tm,U, V, and W. Quad ICP-MS sensitivity is almostOK for As, Au, Be, Ho, Th, Ti, U, V, and W.
Hydride-forming elements (As, Bi, Ge, Sb, Se,Te) would be well determined by HG-ICP-MS
Hydrogeochemistry:sampling and analysis
Preconcentration techniques usedin the ‘90s are not necessary now
for most elements but take care withsampling, filtration and preservation
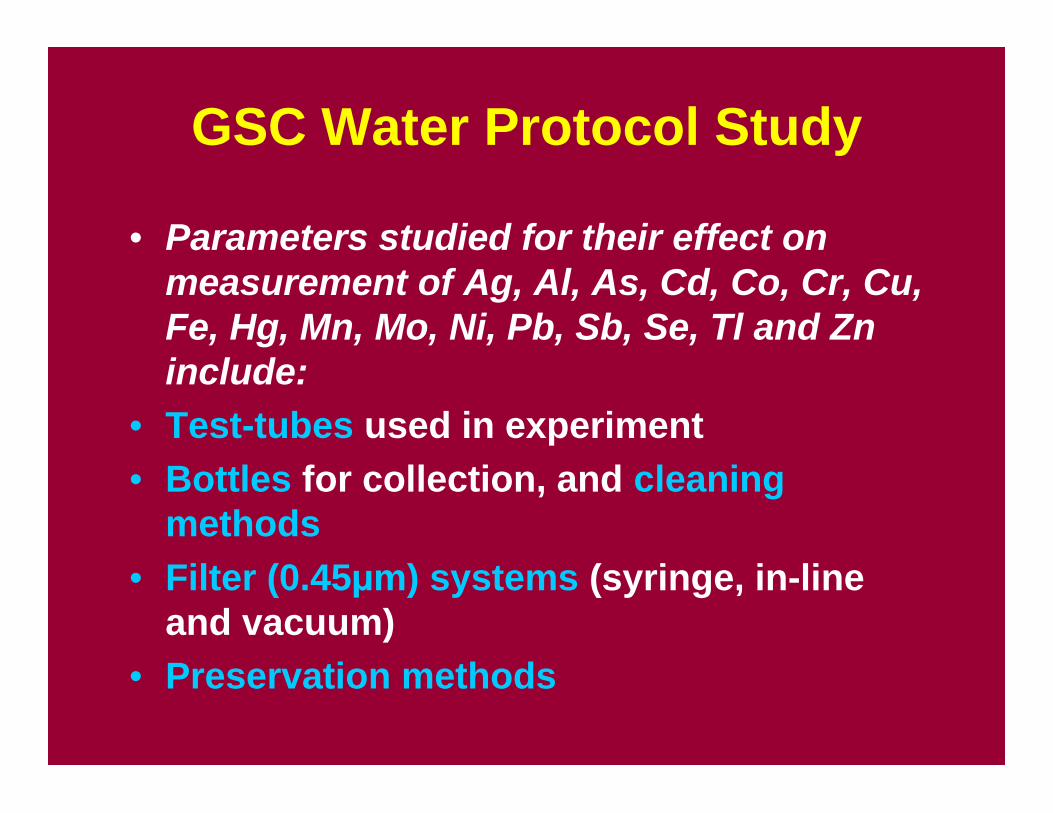
GSC Water Protocol Study
• Parameters studied for their effect onmeasurement of Ag, Al, As, Cd, Co, Cr, Cu,Fe, Hg, Mn, Mo, Ni, Pb, Sb, Se, Tl and Zninclude:
• Test-tubes used in experiment• Bottles for collection, and cleaning
methods• Filter (0.45µm) systems (syringe, in-line
and vacuum)• Preservation methods
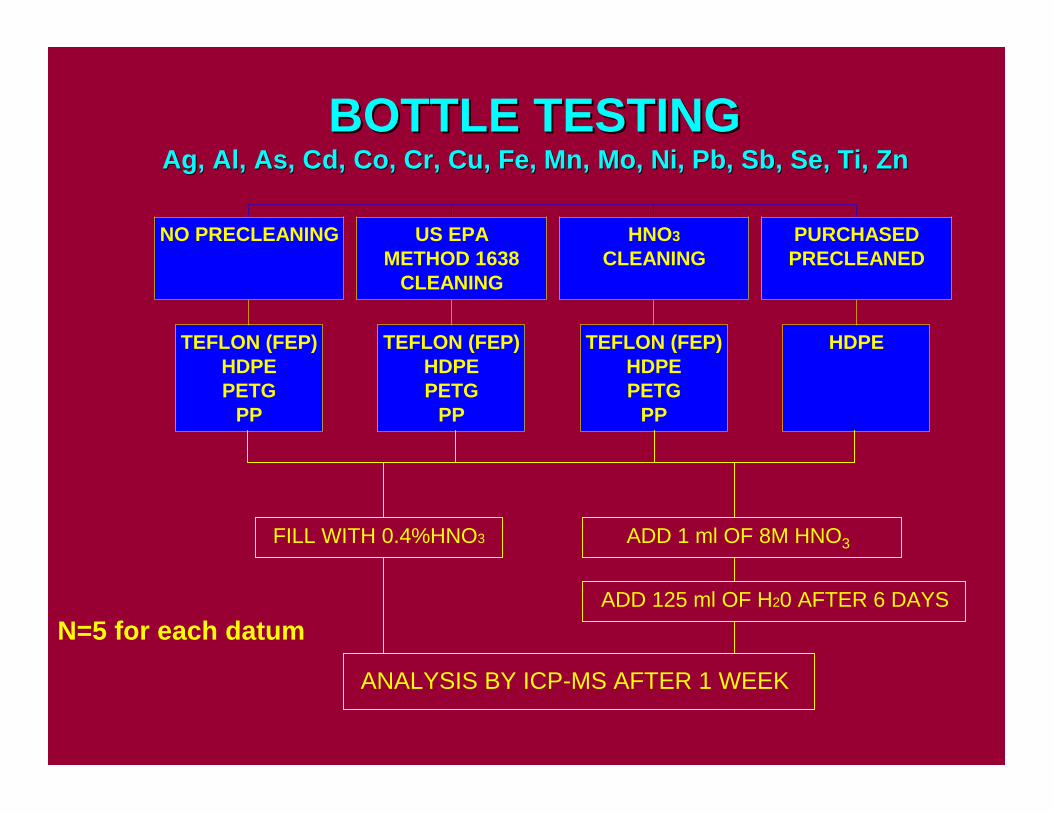
BOTTLE TESTINGBOTTLE TESTINGAg, Al, As, Ag, Al, As, CdCd, Co, Cr, Cu, Fe, , Co, Cr, Cu, Fe, MnMn, Mo, Ni, , Mo, Ni, PbPb, , SbSb, Se, Ti, Zn, Se, Ti, Zn
TEFLON (FEP)HDPEPETG
PP
NO PRECLEANING
TEFLON (FEP)HDPEPETG
PP
US EPAMETHOD 1638
CLEANING
TEFLON (FEP)HDPEPETG
PP
HNO3CLEANING
HDPE
PURCHASEDPRECLEANED
ADD 1 ml OF 8M HNO3FILL WITH 0.4%HNO3
ADD 125 ml OF H20 AFTER 6 DAYS
ANALYSIS BY ICP-MS AFTER 1 WEEK
N=5 for each datum
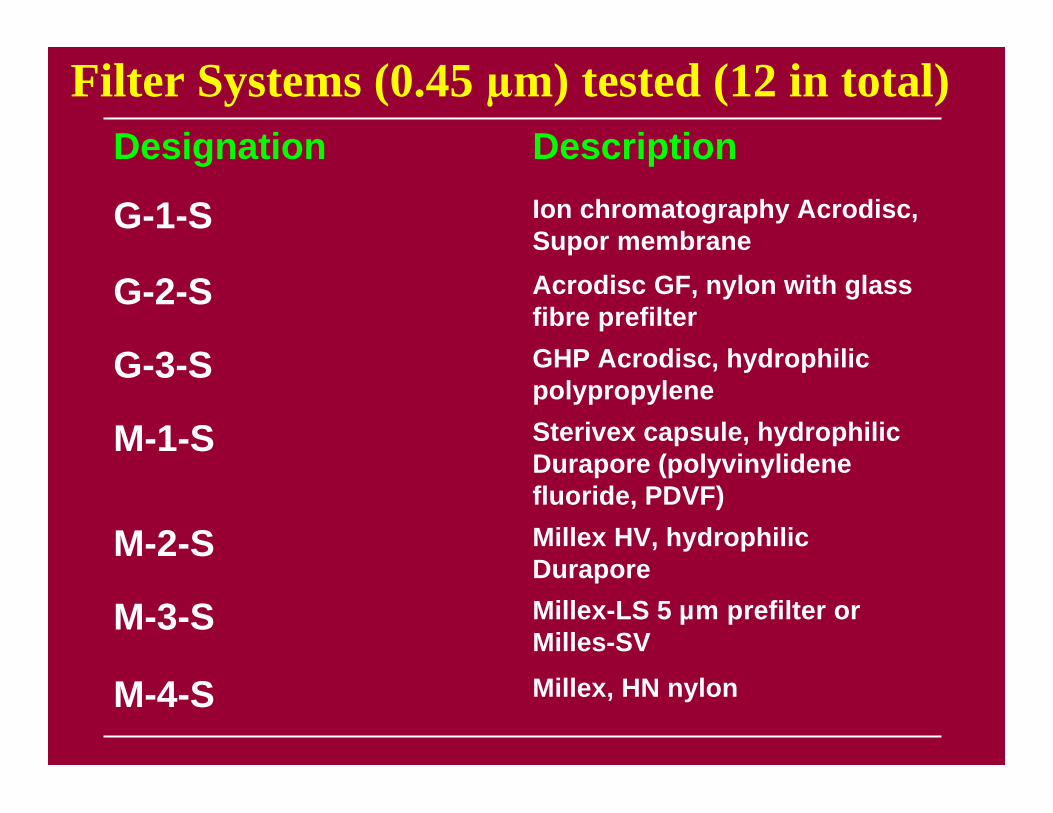
Millex-LS 5 µm prefilter orMilles-SV
M-3-S
Millex, HN nylonM-4-S
Millex HV, hydrophilicDurapore
M-2-S
Sterivex capsule, hydrophilicDurapore (polyvinylidenefluoride, PDVF)
M-1-S
GHP Acrodisc, hydrophilicpolypropylene
G-3-S
Acrodisc GF, nylon with glassfibre prefilter
G-2-S
Ion chromatography Acrodisc,Supor membrane
G-1-S
DescriptionDesignationFilter Systems (0.45 µm) tested (12 in total)
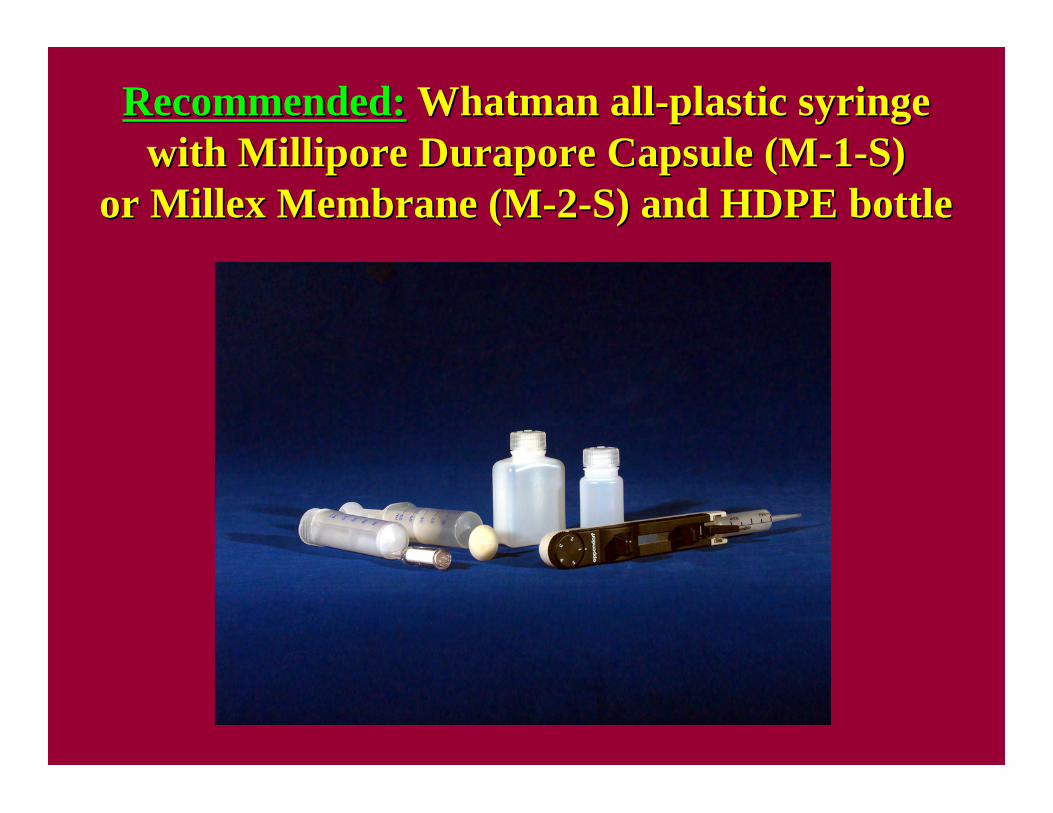
Recommended:Recommended: WhatmanWhatman all-plastic syringe all-plastic syringewith Millipore with Millipore DuraporeDurapore Capsule (M-1-S) Capsule (M-1-S)
or or MillexMillex Membrane (M-2-S) and HDPE bottle Membrane (M-2-S) and HDPE bottle
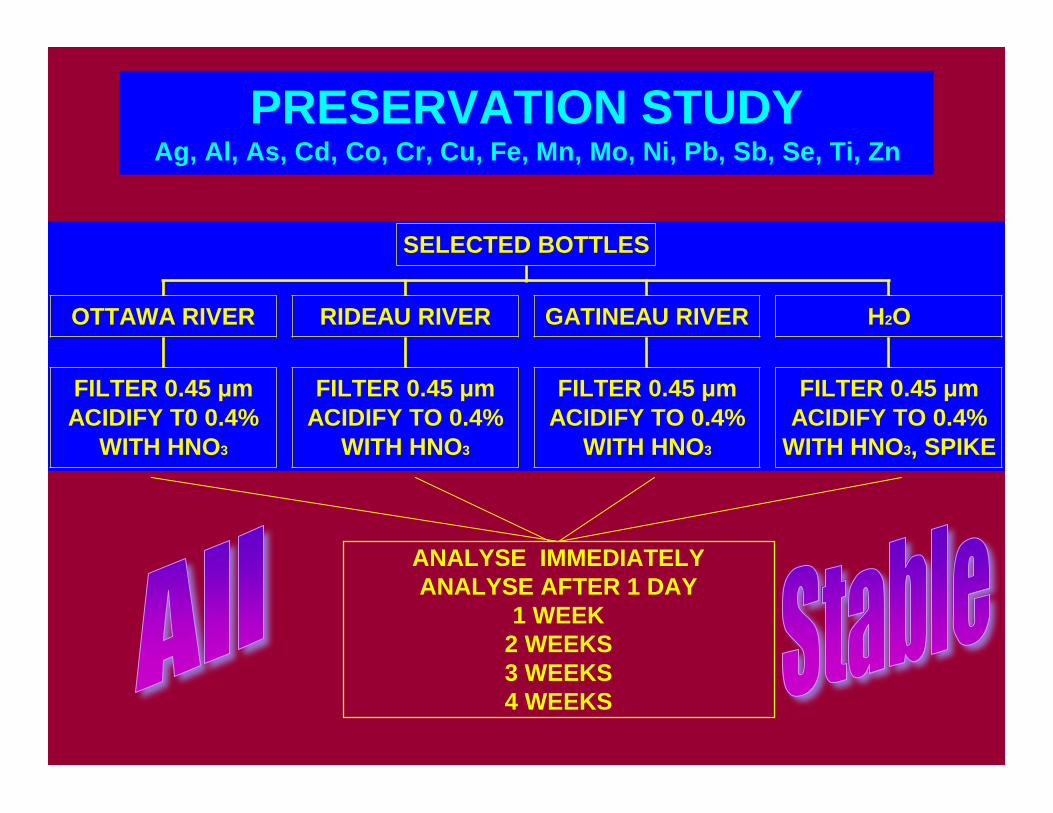
PRESERVATION STUDYAg, Al, As, Cd, Co, Cr, Cu, Fe, Mn, Mo, Ni, Pb, Sb, Se, Ti, Zn
FILTER 0.45 !mACIDIFY T0 0.4%
WITH HNO3
OTTAWA RIVER
FILTER 0.45 !mACIDIFY TO 0.4%
WITH HNO3
RIDEAU RIVER
FILTER 0.45 !mACIDIFY TO 0.4%
WITH HNO3
GATINEAU RIVER
FILTER 0.45 !mACIDIFY TO 0.4%
WITH HNO3, SPIKE
H2O
SELECTED BOTTLES
ANALYSE IMMEDIATELYANALYSE AFTER 1 DAY
1 WEEK2 WEEKS3 WEEKS4 WEEKS
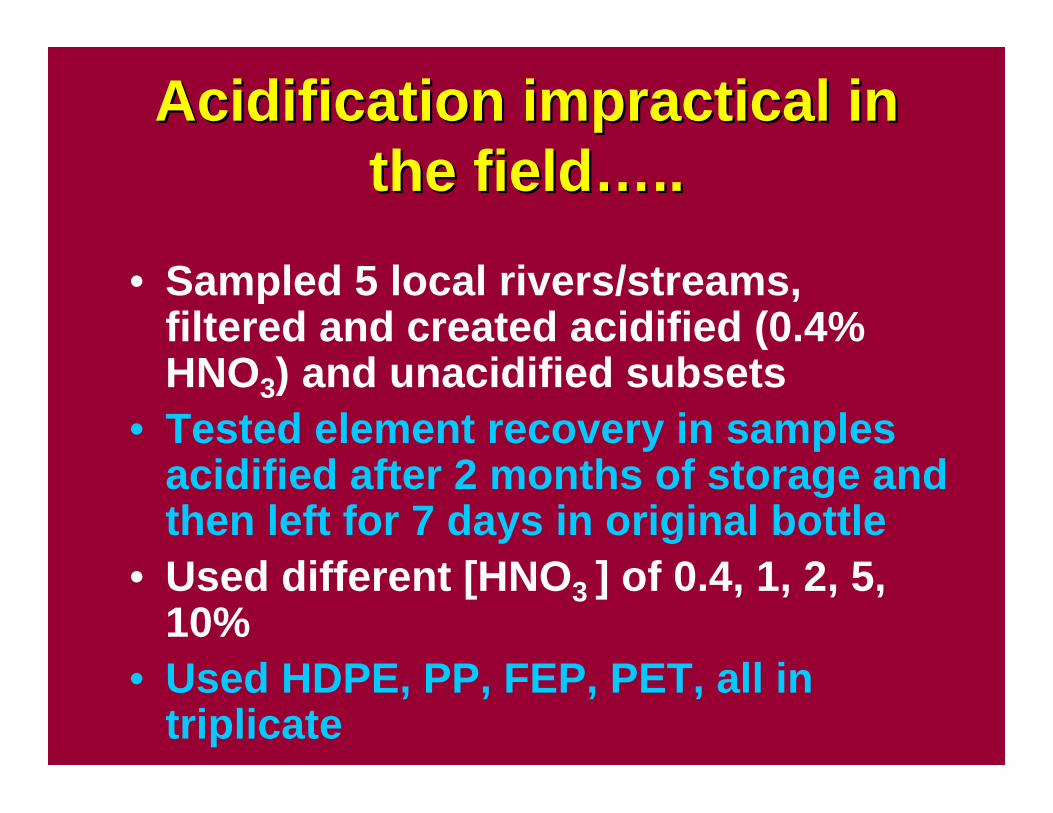
Acidification impractical inAcidification impractical inthe fieldthe field……....
• Sampled 5 local rivers/streams,filtered and created acidified (0.4%HNO3) and unacidified subsets
• Tested element recovery in samplesacidified after 2 months of storage andthen left for 7 days in original bottle
• Used different [HNO3 ] of 0.4, 1, 2, 5,10%
• Used HDPE, PP, FEP, PET, all intriplicate
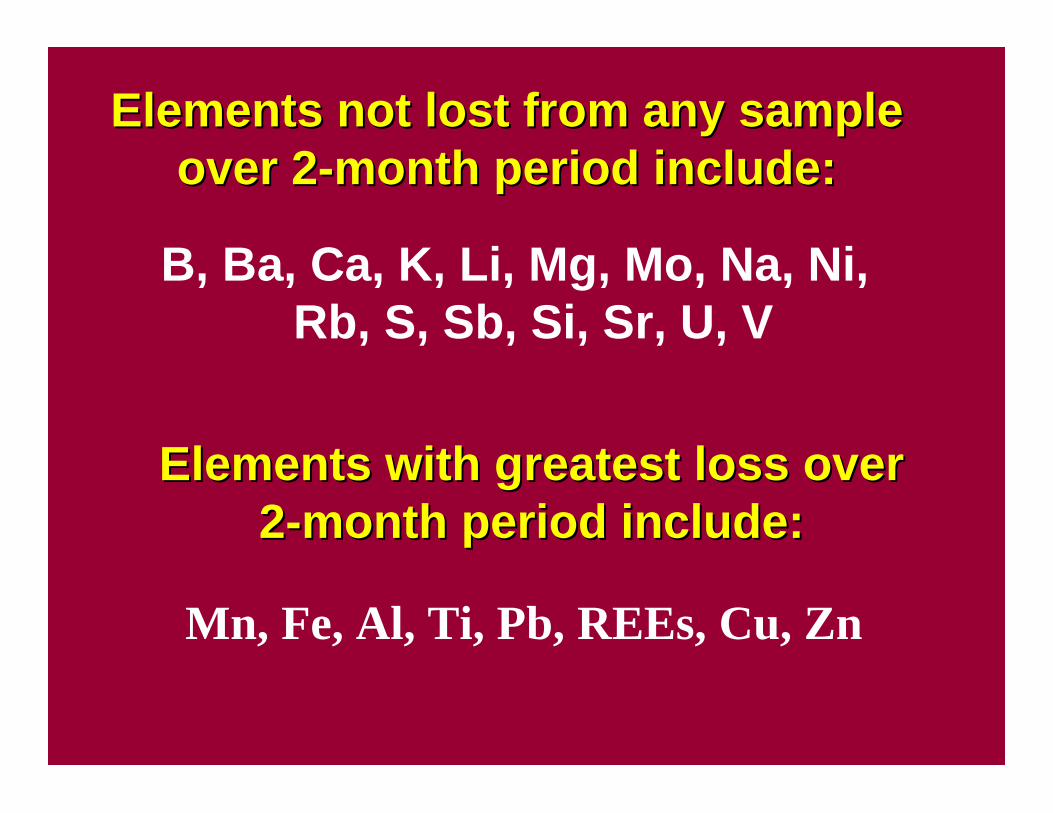
Elements not lost from any sampleElements not lost from any sampleover 2-month period include:over 2-month period include:
B, Ba, Ca, K, Li, Mg, Mo, Na, Ni,Rb, S, Sb, Si, Sr, U, V
Elements with greatest loss overElements with greatest loss over2-month period include:2-month period include:
Mn, Fe, Al, Ti, Pb, REEs, Cu, Zn
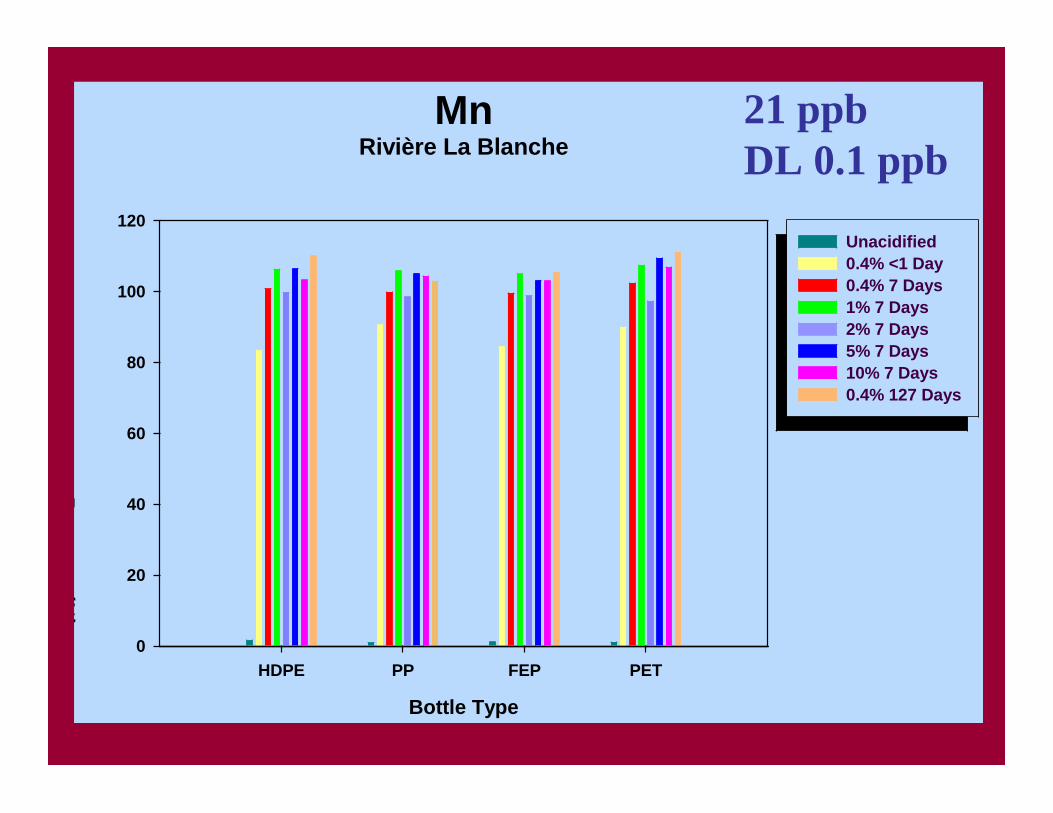
MnRivière La Blanche
Bottle Type
HDPE PP FEP PET
Recovery (%
)
0
20
40
60
80
100
120Unacidified 0.4% <1 Day 0.4% 7 Days 1% 7 Days 2% 7 Days 5% 7 Days 10% 7 Days 0.4% 127 Days
21 ppbDL 0.1 ppb
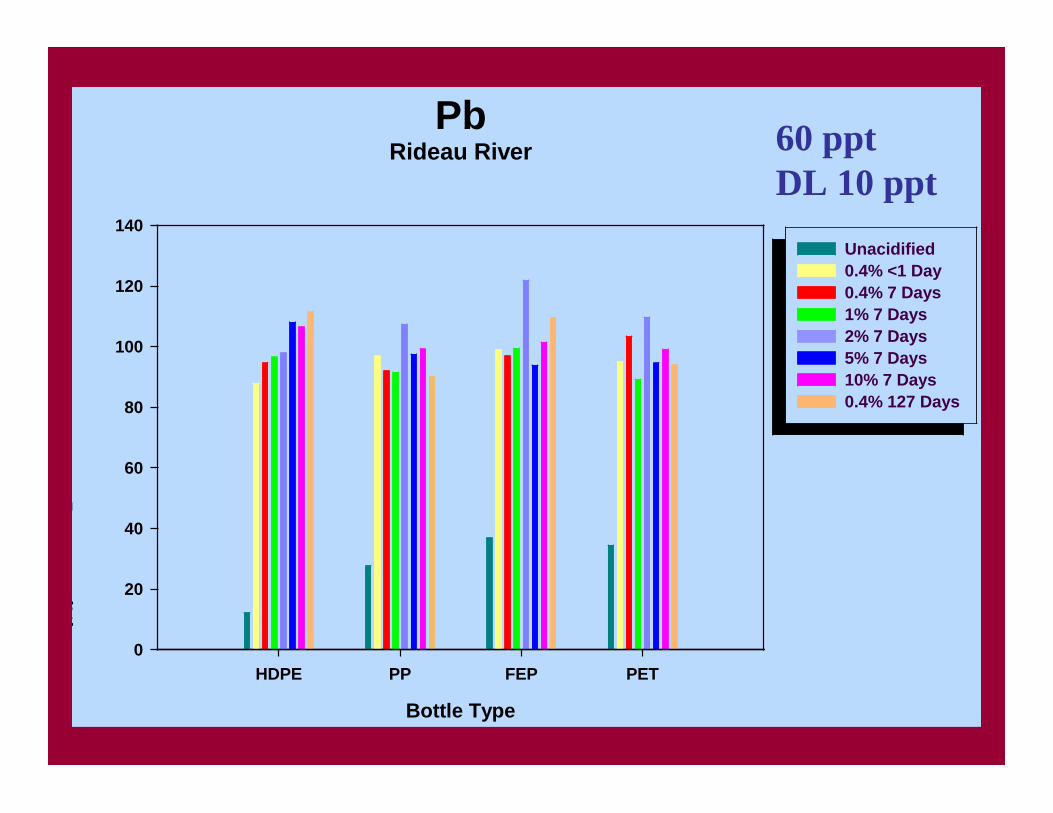
PbRideau River
Bottle Type
HDPE PP FEP PET
Recovery (%
)
0
20
40
60
80
100
120
140Unacidified 0.4% <1 Day 0.4% 7 Days 1% 7 Days 2% 7 Days 5% 7 Days 10% 7 Days 0.4% 127 Days
60 pptDL 10 ppt
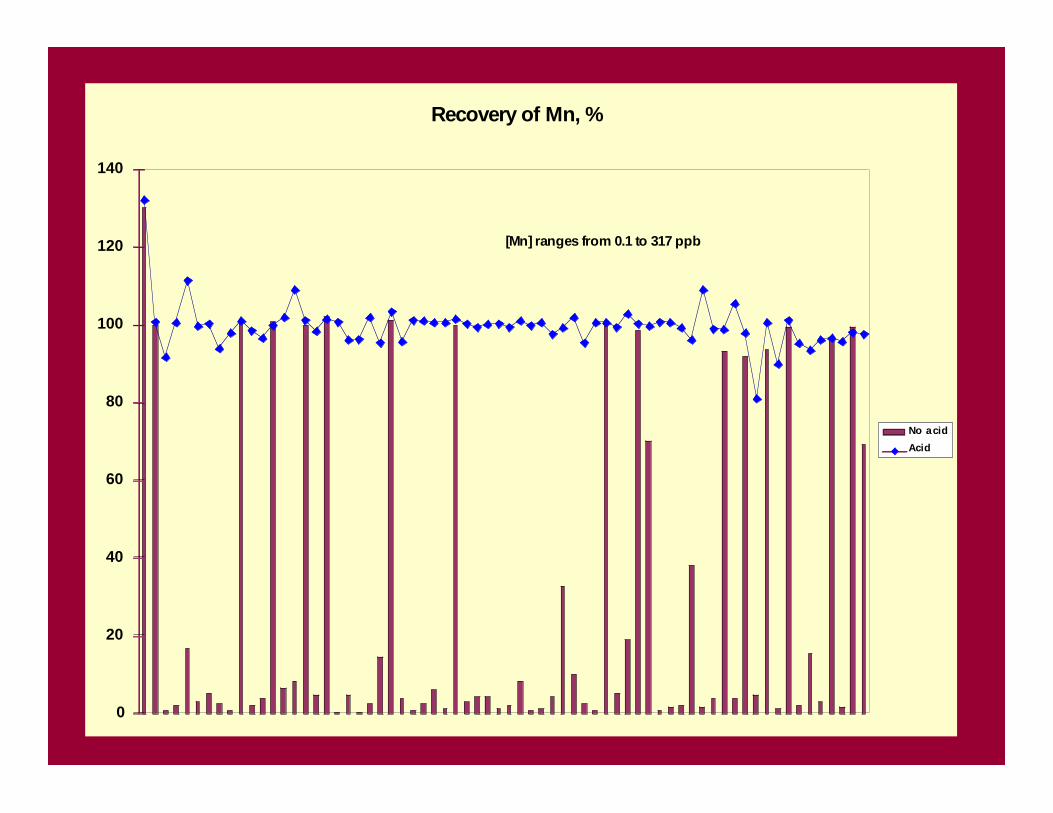
Recovery of Mn, %
0
20
40
60
80
100
120
140
No acidAcid
[Mn] ranges from 0.1 to 317 ppb
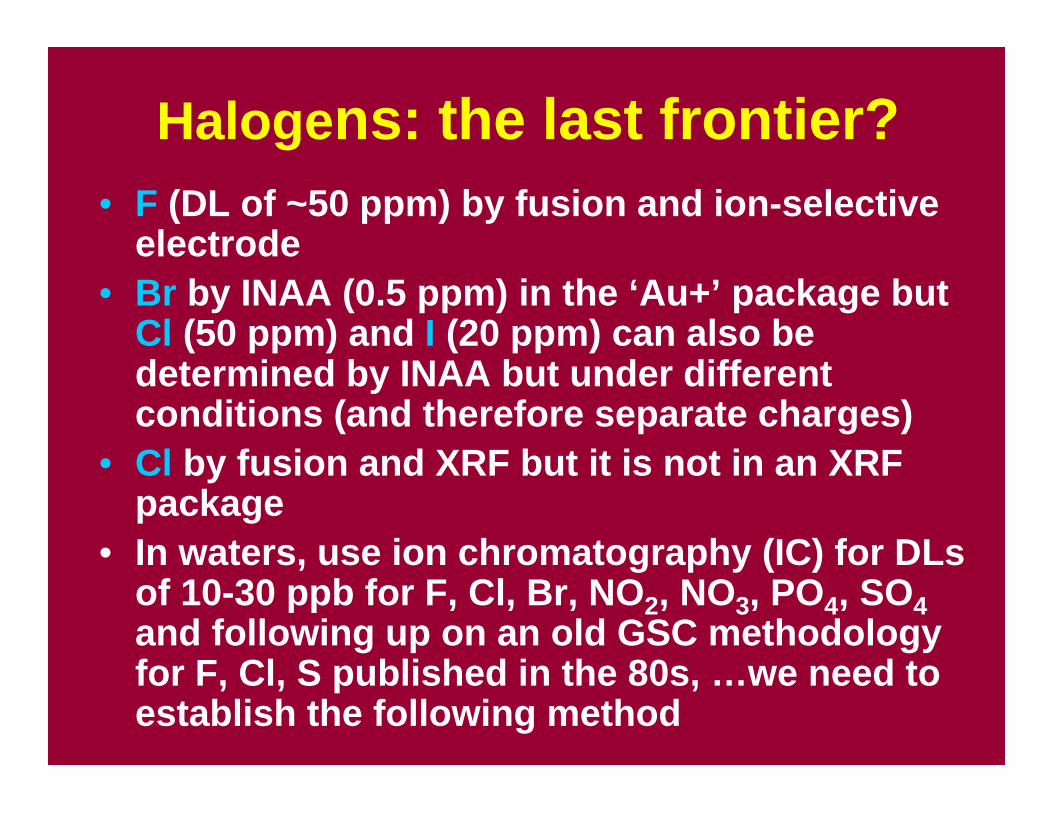
Halogens: the last frontier?• F (DL of ~50 ppm) by fusion and ion-selective
electrode• Br by INAA (0.5 ppm) in the ‘Au+’ package but
Cl (50 ppm) and I (20 ppm) can also bedetermined by INAA but under differentconditions (and therefore separate charges)
• Cl by fusion and XRF but it is not in an XRFpackage
• In waters, use ion chromatography (IC) for DLsof 10-30 ppb for F, Cl, Br, NO2, NO3, PO4, SO4and following up on an old GSC methodologyfor F, Cl, S published in the 80s, …we need toestablish the following method
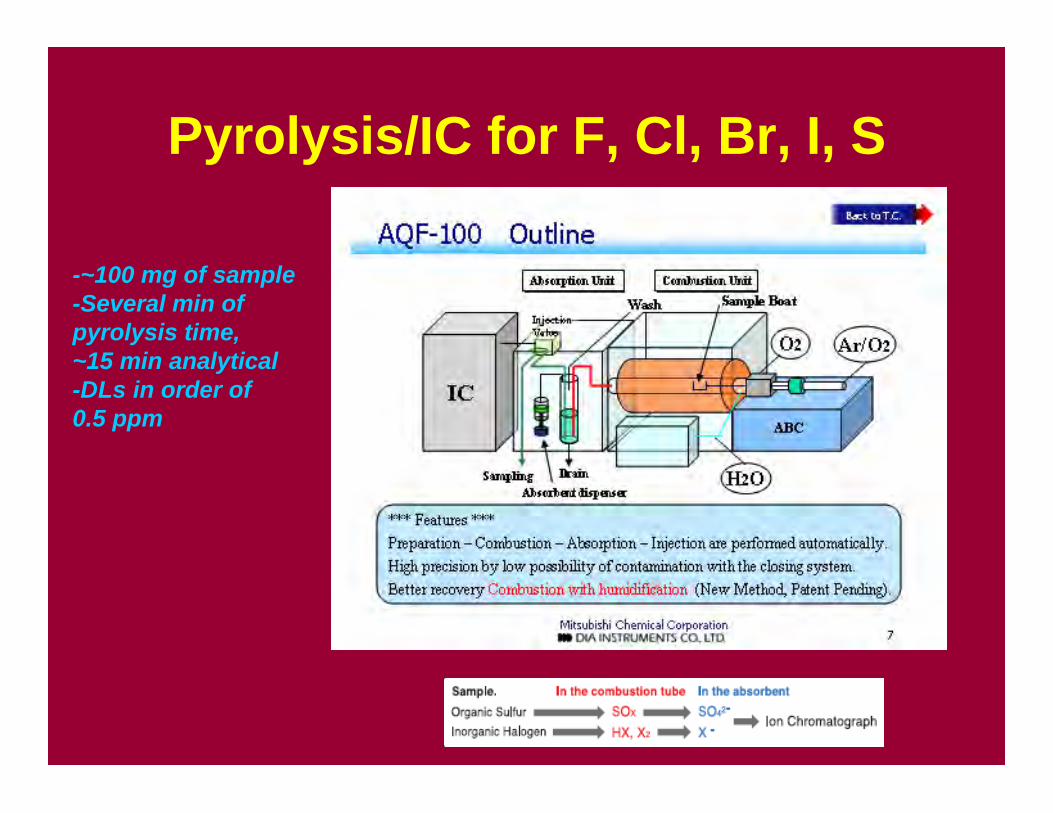
Pyrolysis/IC for F, Cl, Br, I, S
-~100 mg of sample-Several min ofpyrolysis time,~15 min analytical-DLs in order of0.5 ppm