beyond frontier exploration
TRANSCRIPT
Beyond frontier exploration
Arnoud Visser, Xingrui-Ji, Merlijn van Ittersum, Luis A. Gonzalez Jaime, andLaurentiu A. Stancu
February 25, 2007
Abstract
This article investigates the prerequisites for a global exploration strategy in anunknown environment on a virtual disaster site. Assume that a robot equippedwith a laser range scanner can build a detailed map of a previous unknownenvironment. The remaining question is how to use this information on this mapfor further exploration.
On a map several interesting locations can be present where the explorationcan be continued, referred as exploration frontiers. Typically, a greedy algo-rithm is used for the decision which frontier to explore next. Such a greedy al-gorithm only considers interesting locations locally, focused to reduce the move-ment costs. More sophisticated algorithms also take into account the informationthat can be gained along each frontier. This shifts the problem to estimate theamount of unexplored area behind the frontiers on the global map. Our algo-rithm exploits the long range of current laser scanners. Typically, during theprevious exploration a small number of laser rays already passed the frontier,but this number is too low to have major impact on the generated map. Yet, thefew rays through a frontier can be used to estimate the potential informationgain from unexplored area beyond the frontier.
1 Introduction
Robocup Rescue is a competition in which (teams of) fully autonomous robotsvisit a hypothetical disaster site. This situation is either simulated in the realworld [1] or a virtual world within the USARSim simulator [2]. The task forthe robots in the competition is to explore the site and locate victims. Thereis a limited amount of time in which the robots can explore. Afterwards thecompeting teams will be scored on a various criteria, among them are the sizeof the explored area, the quality of the map and most importantly, the numberof located victims (for a more detailed list and scoring see [3]).
An important problem in the competition is the autonomous explorationproblem; to decide on the basis of the current map where to send the robotto improve the future map [4]. A correct choice would improve the competitionscore, which depends on the explored area and the quality of the map. Predictionsabout what would be visible on the edges of the current map could help to makebetter decisions for the robot.
In this work we build upon the contribution of the XXX Rescue team [5],which provided a fully autonomous agent system that controls up to eight vir-tual robots in the USARSim simulator [2]. The system already has a state of theart method for simultaneously locating and mapping (SLAM) unknown environ-ments, based on the Manifold approach [6] combined with the Weighted ScanMatching algorithm [?]. The exploration strategy of the robots is kept simple.The behavior is reactive and makes decision based on direct measurements, noton the current map. The goal of this work is to improve the exploration strategyby intelligently using global information that can be derived from the map. Inthe article the focus is on the exploration behavior of a single robot (or agent).
The outline of this paper is as follows. In Sect. 2 we will introduce sometheoretical background behind this research. In Sect. 3 our algorithm will beworked out. The robustness of our method on maps from the Robocup RescueCompetition will be demonstrated in Sect. 4. Finally, we draw our conclusionsin Sect. 5.
2 Background
Exploration is the problem of directing a robot so that the knowledge aboutthe external world is maximized [7]. Knowledge about the external world for amobile robot is location dependent, and typically stored on a map m. Increasingthe knowledge stored on a map can mean that the uncertainty about informationon the map is reduced, or that new information is added to the map. The lattermeans that the map coverage is extended with parts of the external world thatthe robot has not seen before. Knowledge about the map m can be passively ac-quired, while the robot is wandering around busy with other tasks (for instancefinding victims), as demonstrated by [5]. Here the focus is on autonomous ex-ploration; the planning of the next exploration action a which will increase theknowledge about the world the most. Before this estimate is worked out in moredetail, it should be noticed that such an exploration action can be quite complexfrom navigational point of view. Executing such an exploration action can meanthat large parts of the current map are traversed, which can only be efficientlydone with the availability of on-line path-planning functionality.
For a mobile robot it is important to remember were obstacles are located.This information can be represented with an occupancy grid map [8], where eachgrid cell indicates the probability p(x) if that location x is occupied or free. Activeexploration can been seen as minimizing the entropy H(m) [9] of the probabilitydistribution p(x) for all x on the map m, which requires an integration over thecomplete occupancy grid map:
H(m) =∫
x∈m
p(x)log(p(x)) (1)
When all grid cells are initialized as unknown by giving them a uniform value ofp(x) = 0.5, the entropy of the map H(m) is maximal. When the boundaries ofthe map m are not known, the limits of the integral are slowly extended when
new areas are discovered. The interest is not in the absolute value of the entropy,but in the difference in entropy before H(m) and after H(m|a) an explorationaction a; the information gain ∆I(a)[10–12]. Remember that the explorationaction a could be a complex maneuver, consisting of a number of controls ui andobservations zi for multiple timesteps i.
∆I(a) = H(m|a) − H(m) (2)
Because the set of possible exploration actions can grow very fast when predic-tions are needed multiple timesteps in the future, this set is approximated. Inexisting exploration methods the number of exploration actions is reduced byconsidering only the path to a finite number of candidate observation points.Typically, those candidate observation points are chosen on the boundary ofexplored and unexplored areas; frontier-based exploration [13].
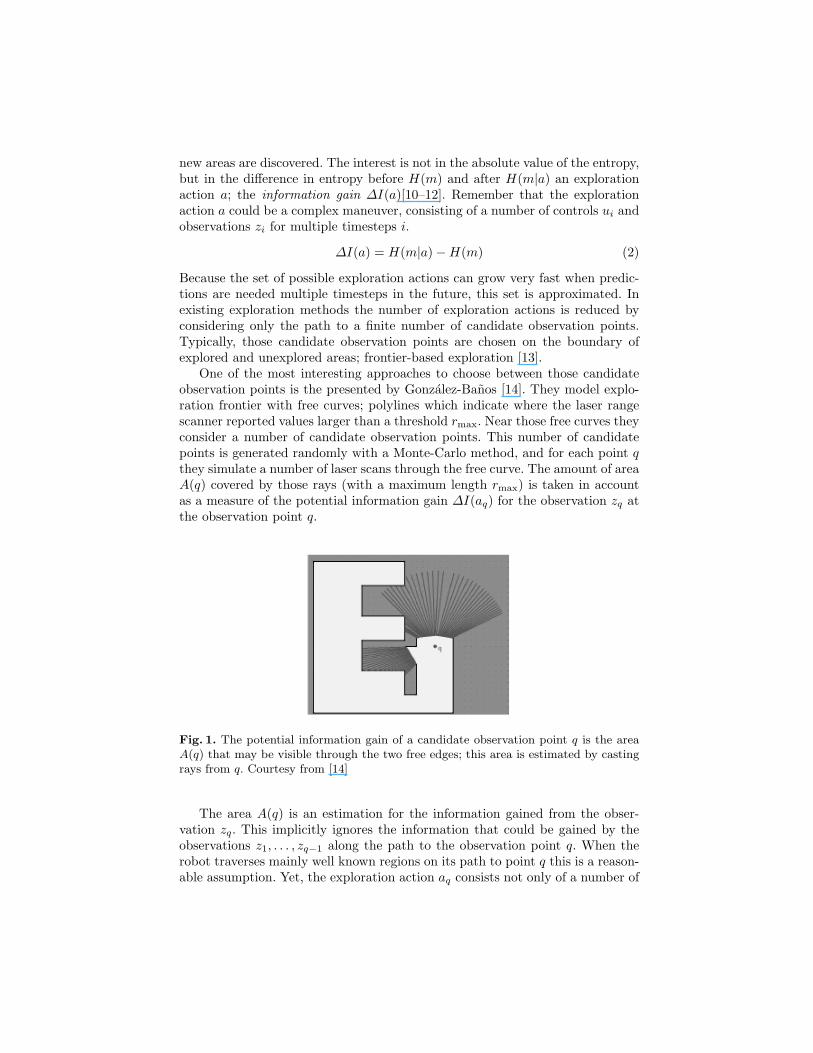
One of the most interesting approaches to choose between those candidateobservation points is the presented by Gonzalez-Banos [14]. They model explo-ration frontier with free curves; polylines which indicate where the laser rangescanner reported values larger than a threshold rmax. Near those free curves theyconsider a number of candidate observation points. This number of candidatepoints is generated randomly with a Monte-Carlo method, and for each point qthey simulate a number of laser scans through the free curve. The amount of areaA(q) covered by those rays (with a maximum length rmax) is taken in accountas a measure of the potential information gain ∆I(aq) for the observation zq atthe observation point q.
Fig. 1. The potential information gain of a candidate observation point q is the areaA(q) that may be visible through the two free edges; this area is estimated by castingrays from q. Courtesy from [14]
The area A(q) is an estimation for the information gained from the obser-vation zq. This implicitly ignores the information that could be gained by theobservations z1, . . . , zq−1 along the path to the observation point q. When therobot traverses mainly well known regions on its path to point q this is a reason-able assumption. Yet, the exploration action aq consists not only of a number of
observations z1, . . . , zq, but also of a number of controls u1, . . . , uq to drive thepath. Because control is never perfect, confidence about the location of the robotis lost for every control step ui. Probabilities spread out over the map, resultingin a loss of information. An optimal exploration action a∗ can only be chosenwhen the cost of traveling along a path u1, . . . , uq is taken into account. Typicaltraveling cost functions are the distance traveled, the time taken or the energyexpended. Gonzalez-Banos has chosen to use as cost-function the length L(q) ofthe path u1, . . . , uq to a candidate observation point q. They combine the cost ofthe path u1, . . . , uq and the gain of the observation zq for the evaluation actionaq into the following value function V (q):
V (q) = A(q)e−λL(q) (3)
The constant λ can be used balance the cost of motion against the expected gainof information.
For the observation points found in this article an equivalent value functioncould be calculated. Note, however, that the area A(q) of Gonzalez-Banos is ex-trapolated from the current map by simulating a number of laser-rays throughthe frontier, while in our case the area A(q) is directly estimated from the laserrange measurements. Another difference is the generation of observation points.Gonzalez-Banos generates multiple candidate observation points on a short ran-dom distance from the exploration frontiers. In our approach, per frontier asingle candidate observation point is generated, in the center of the explorationfrontier.
3 Estimation of exploration frontiers and observationpoints
A good autonomous exploration algorithm should navigate the robot to an op-timal observation point. This point will be close to an exploration frontier. Tofind such an exploration frontier is not trivial. Exploration frontiers can be foundbased on occupancy grid map. The probability that a point that there is an ob-stacle or not on a certain location can be stored in occupancy grid with arbitraryresolution. An example of such occupancy grid map is given in Fig. 2, an actualmap produced during the Virtual RoboCup Rescue competition by the XXXRescue team. The map gives a top view of an office environment, where clearlythree corridors are visible that are well explored, and a number of adjacent roomsthat are not entered yet.
Grid points on a map can be combined to regions, when the edges of theregions can be found. As can be seen from the example (Fig 2), the boundariesof the safe region are only sharp along walls. Inside the rooms and at the end ofthe corridors the boundaries of the safe region are fuzzy. Selecting an absolutethreshold for this boundary is difficult [15]. Still, a human can clearly distin-guished safe regions and indicate the regions that should be further explored(observation regions). What is difficult, also for a human, is the precise locationof the boundary between those regions; the exploration frontier.

Fig. 2. The occupancy grid map produced during the semi-final by one the robots
The method used in this paper to distinguish safe regions from observationregions is based on a simple ray-casting technique. Ray-casting is used to gener-ate an occupancy grid from the scan-data stored in the manifold [5]. The trick isto generate two occupancy grids at the same time; one with a short range con-straint rsafe and one with a long range constraint rmax equal to maximum rangeof the laser scanner. A typical value for rsafe is 2 meters and for rmax 20 meters.The occupancy grid with a short range constraint rsafe generates a conservativeestimate of the obstacle free space; the safe region.
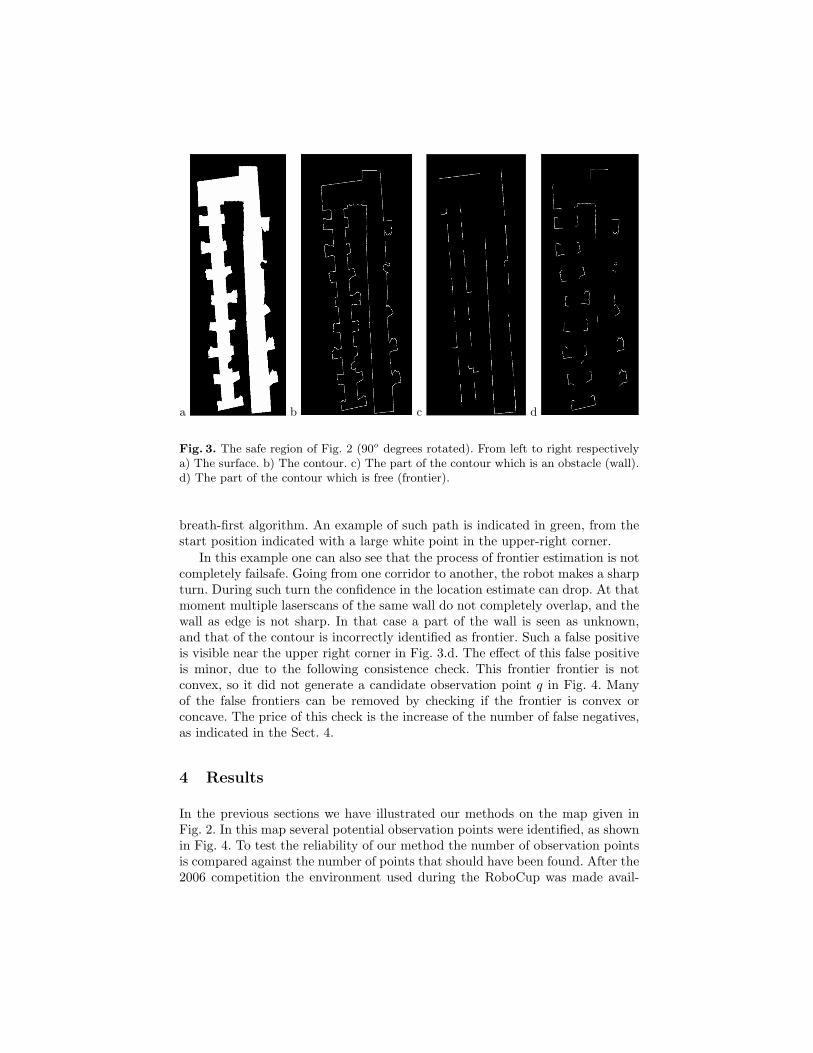
An example of such safe region is given in Fig 3.a. The three corridors of theoffice environment can be recognized in this picture. From the contour of the saferegion the exploration frontier can be derived. The contour of the safe region isindicated in Fig 3.b. The exploration frontier is only a part of the contour, theother part of the contour are walls (Fig 3.c). The part of the safe region contourthat is no wall can be identified as the exploration frontier (Fig 3.d).
The same ray-tracing can be repeated with the long range constraint rmax.With the long range constraint a less conservative estimate of free space is gen-erated. The areas are probably free of obstacles, but not guaranteed to be safe.The result is visualized in Fig. 4. Outside the corridors new contours are visible:the rooms along the corridor. These contours are the areas which are probablyfree, but not guaranteed to be safe: the observation regions (indicated in yellow).These observation regions are not equivalent with unknown areas; there also ex-ist large parts of the map where the probability p(x) is still on its initial value.The frontiers between the observation regions and the safe regions, as shown inFig. 3.d, are also given (indicated in grey). The convex frontiers contours are ex-tended with a small white point which is the center of the contour. These centerscan be associated with potential observation points. From each point in the saferegion the path to such a potential observation point q can be estimated with a
a b c d
Fig. 3. The safe region of Fig. 2 (90o degrees rotated). From left to right respectivelya) The surface. b) The contour. c) The part of the contour which is an obstacle (wall).d) The part of the contour which is free (frontier).
breath-first algorithm. An example of such path is indicated in green, from thestart position indicated with a large white point in the upper-right corner.
In this example one can also see that the process of frontier estimation is notcompletely failsafe. Going from one corridor to another, the robot makes a sharpturn. During such turn the confidence in the location estimate can drop. At thatmoment multiple laserscans of the same wall do not completely overlap, and thewall as edge is not sharp. In that case a part of the wall is seen as unknown,and that of the contour is incorrectly identified as frontier. Such a false positiveis visible near the upper right corner in Fig. 3.d. The effect of this false positiveis minor, due to the following consistence check. This frontier frontier is notconvex, so it did not generate a candidate observation point q in Fig. 4. Manyof the false frontiers can be removed by checking if the frontier is convex orconcave. The price of this check is the increase of the number of false negatives,as indicated in the Sect. 4.
4 Results
In the previous sections we have illustrated our methods on the map given inFig. 2. In this map several potential observation points were identified, as shownin Fig. 4. To test the reliability of our method the number of observation pointsis compared against the number of points that should have been found. After the2006 competition the environment used during the RoboCup was made avail-

Fig. 4. The interpreted map of Fig.2. The yellow contours indicate the observationregions. The grey contours indicate the exploration frontiers, The large white circleindicates the current position of the robot, the small white circles indicates potentialobservation points. The green line indicates a possible path to those observation points.Red lines indicate the walls.
able1. A top view of this environment is visible in Fig. 5. The three corridorsexplored on the map can be found in the upper-right corner of Fig. 5.
With the provided environment as reference, the number of doorways andcorridors that the robot has passed during its exploration can be counted. Forthe map given in Fig. 2 this number is 22: 2 corridors and 20 doorways to 20rooms. There is another doorway to a 21th room, but this doorway is blockedby a victim. The algorithm did not select this doorway correctly. The resultsare summarized in Tab. 4. Next to the expected and found number of doorways,the number of false positives and false negatives are given. This is done for boththe exploration frontiers (both convex and concave) and the observation points(center of convex exploration frontier). One can see that the number of falsepositives is reduced by only selecting convex exploration frontiers.
To demonstrate the robustness of the algorithm, the procedure is repeatedfor two other maps that could have been encountered during the competition.The first map is tour that begins and ends in the lobby, the light-grey area at thebottom of Fig. 5. During this tour 6 corridors and 7 doorways to rooms shouldhave been found. For the majority of the corridors and rooms an observationpoint is found, as can be seen from Tab. 4 and Fig. 6. The missed corridorand room are located in the left lower corner. The robot turned back towards
1 urlhttp://sourceforge.net/projects/usarsim
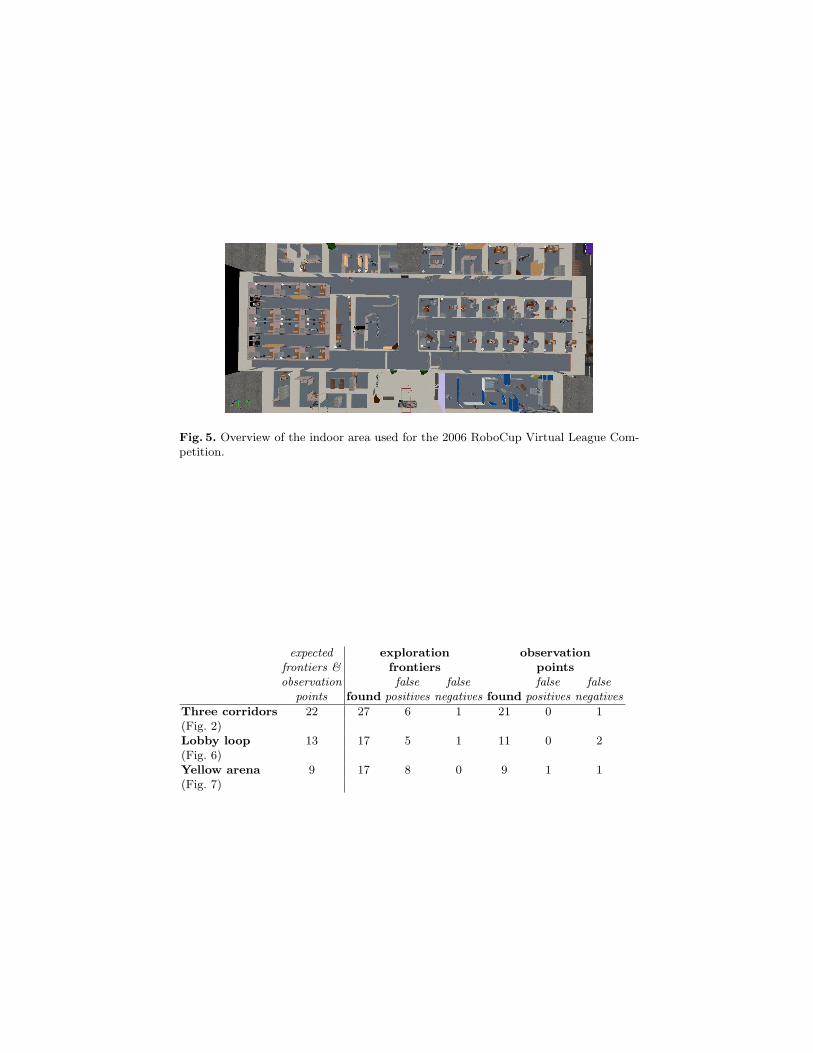
Fig. 5. Overview of the indoor area used for the 2006 RoboCup Virtual League Com-petition.
expected exploration observationfrontiers & frontiers pointsobservation false false false false
points found positives negatives found positives negatives
Three corridors 22 27 6 1 21 0 1(Fig. 2)Lobby loop 13 17 5 1 11 0 2(Fig. 6)Yellow arena 9 17 8 0 9 1 1(Fig. 7)

the lobby, and did not direct its laser scanner into the other direction. The 6thcorridor stayed hidden behind the robot. The room, at the same location, shouldnot have been missed.
a b
Fig. 6. Results of exploring a loop starting and ending in the lobby of the environmentat the bottom of Fig. 5
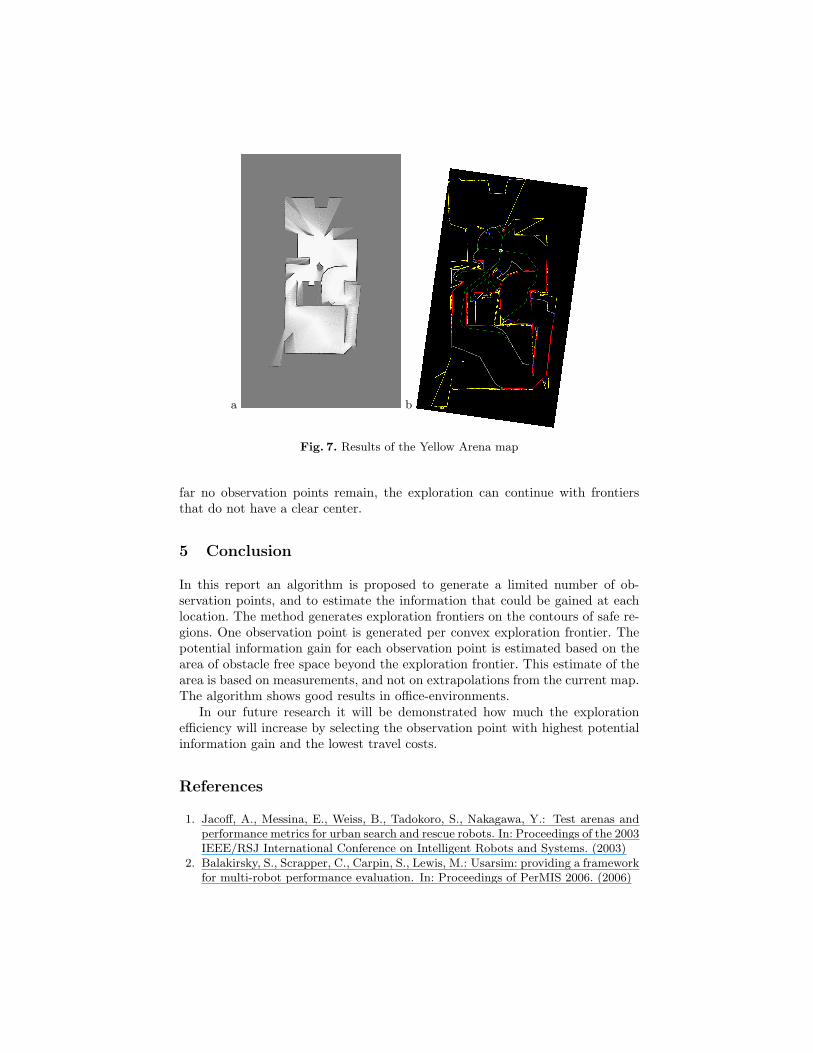
Last, but not least, the algorithm was tested on the Yellow arena. This isclassical benchmark in the RoboCup Rescue competition, where an irregularoffice-maze is build with flexible walls. The Yellow arena is also visible in Fig. 5,the large room to the right of the lobby. In this office-maze it is less obviousto indicate what the frontiers are that should have been explored. For instance,central in the Yellow arena is a bed. The algorithm indicated that an observationshould be made at the left, at the right and under the bed. This was classified asa correct decision. Another aspect was the open space in the rooms. The roomswere sometimes that large that frontiers appeared in the corners. These frontiersin the corner could have a convex shape, and could be selected if the observationspace behind the frontier was large enough. Checking the corners of a room isprobably quite robust, but probably not highly efficient. Both the false positiveand negative were related with a corner. At the bottom left of Fig. 7 a doorwayis missed, because that corner was not explored from close enough distance.On the other hand an observation point is generated to check the tiny spacebehind the ’W’-shaped obstacle. Fortunately many other observation points aregenerated which much more area behind the frontier, but this observation pointwas classified as a false positive.
Overall, this experiments demonstrate the robustness of the algorithm. Thealgorithm generated a limited number of potential observation points. The im-pact of the false negatives (4 of the 44 potential observation points were missed)on the exploration behavior will be minor. As long as there are enough remainingobservation points the exploration can continue. When the exploration is that
a b
Fig. 7. Results of the Yellow Arena map
far no observation points remain, the exploration can continue with frontiersthat do not have a clear center.
5 Conclusion
In this report an algorithm is proposed to generate a limited number of ob-servation points, and to estimate the information that could be gained at eachlocation. The method generates exploration frontiers on the contours of safe re-gions. One observation point is generated per convex exploration frontier. Thepotential information gain for each observation point is estimated based on thearea of obstacle free space beyond the exploration frontier. This estimate of thearea is based on measurements, and not on extrapolations from the current map.The algorithm shows good results in office-environments.
In our future research it will be demonstrated how much the explorationefficiency will increase by selecting the observation point with highest potentialinformation gain and the lowest travel costs.
References
1. Jacoff, A., Messina, E., Weiss, B., Tadokoro, S., Nakagawa, Y.: Test arenas andperformance metrics for urban search and rescue robots. In: Proceedings of the 2003IEEE/RSJ International Conference on Intelligent Robots and Systems. (2003)
2. Balakirsky, S., Scrapper, C., Carpin, S., Lewis, M.: Usarsim: providing a frameworkfor multi-robot performance evaluation. In: Proceedings of PerMIS 2006. (2006)

3. Authors: Title. Journal (2007) to appear, deleted for blind review.4. Hasegawa, B.R.: Continues observation planning for autonomous exploration. Mas-
ter’s thesis, Massachusetts Institute of Technology (2004)5. Slamet, B., Pfingsthorn, M.: Manifoldslam: a multi-agent simultaneous localization
and mapping system for the robocup rescue virtual robots competition. Master’sthesis, Universiteit van Amsterdam (2006)
6. Howard, A., Sukhatme, G.S., Mataric, M.J.: Multi-robot mapping using manifoldrepresentations. Proceedings of the IEEE - Special Issue on Multi-robot Systems(2006)
7. Thrun, S., Burgard, W., Fox, D.: Probabilistic Robotics (Intelligent Robotics andAutonomous Agents). The MIT Press (2005)
8. Moravec, H.: Sensor fusion in certainty grids for mobile robots. AI Magazine 9(1988) 61–74
9. Fox, D., Burgard, W., Thrun, S.: Active markov localization for mobile robots.Robotics and Autonomous Systems 25 (1998) 195–207
10. Roy, N., Burgard, W., Fox, D., Thrun, S.: Coastal navigation - mobile robotnavigation with uncertainty in dynamic environments. In: Proceedings of the IEEEInternational Conference on Robotics and Automation. (1999) 34–40
11. Simmons, R.G., Apfelbaum, D., Burgard, W., Fox, D., Moors, M., Thrun,S., Younes, H.: Coordination for multi-robot exploration and mapping. In:AAAI/IAAI. (2000) 852–858
12. Sim, R., Roy, N.: Global a-optimal robot exploration in slam. In: Proceedings of theIEEE International Conference on Robotics and Automation (ICRA), Barcelona,Spain (2005)
13. Yamauchi, B.: A frontier based approach for autonomous exploration. In: Proceed-ings of IEEE International Symposium on Computational Intelligence in Roboticsand Automation, Monterey, CA, July 10-11, 1997. (1997)
14. Gonzalez-Banos, H.H., Latombe, J.C.: Navigation Strategies for Exploring IndoorEnvironments. The International Journal of Robotics Research 21(10-11) (2002)829–848
15. Authors: title (2007) online available, deleted for blind review.