analytical techniques
TRANSCRIPT

130
■ SPECTROPHOTOMETRY AND PHOTOMETRYBeer’s LawSpectrophotometric InstrumentsComponents of a SpectrophotometerSpectrophotometer Quality AssuranceAtomic Absorption SpectrophotometerFlame PhotometryFluorometryChemiluminescenceTurbidity and NephelometryLaser Applications
■ ELECTROCHEMISTRYGalvanic and Electrolytic CellsHalf-CellsIon-Selective ElectrodespH ElectrodesGas-Sensing ElectrodesEnzyme ElectrodesCoulometric Chloridometers and Anodic StrippingVoltametry
■ ELECTROPHORESISProcedureSupport MaterialsTreatment and Application of Sample
Detection and QuantitationElectroendosmosisIsoelectric FocusingCapillary Electrophoresis
■ CHROMATOGRAPHYModes of SeparationChromatographic ProceduresHigh-Performance Liquid ChromatographyGas Chromatography
■ MASS SPECTROMETRYSample Introduction and IonizationMass AnalyzerDetectorApplications of Mass Spectrometry in the ClinicalLaboratory
■ INSTRUMENTATION FOR PROTEOMICSTwo-dimensional ElectrophoresisMALDI-TOF and SELDI-TOF Mass Spectrometry
■ OSMOMETRYFreezing-Point Osmometer
■ ANALYTIC TECHNIQUES FOR POINT-OF-CARETESTING
■ REFERENCES
Analytical TechniquesJulia C. Drees, Alan H. B. Wu 5
C H A P T E R O U T L I N E
C H A P T E R
Analytic techniques and instrumentation provide thefoundation for all measurements made in a modern
clinical chemistry laboratory. The majority of techniquesfall into one of four basic disciplines within the field ofanalytic chemistry: spectrometry (including spectropho-tometry, atomic absorption, and mass spectrometry[MS]); luminescence (including fluorescence, chemilumi-nescence, and nephelometry); electroanalytic methods(including electrophoresis, potentiometry, and amperom-etry); and chromatography (including gas, liquid, andthin-layer). With the improvements in optics, electronics,and computerization, instrumentation has become minia-turized. This miniaturization has enabled the developmentof point-of-care testing (POCT) devices that produce re-sults as accurate as those provided by large laboratory-based instrumentation.
SPECTROPHOTOMETRY AND PHOTOMETRY
The instruments that measure electromagnetic radiationhave several concepts and components in common.Shared instrumental components are discussed in somedetail in a later section. Photometric instruments meas-ure light intensity without consideration of wavelength.Most instruments today use filters (photometers),prisms, or gratings (spectrometers) to select (isolate) anarrow range of the incident wavelength. Radiant energythat passes through an object will be partially reflected,absorbed, and transmitted.
Electromagnetic radiation is described as photons ofenergy traveling in waves. The relationship betweenwavelength and energy E is described by Planck’s formula:
E � hv (Eq. 5-1)
14460_Ch05.qxd 12/4/08 8:06 PM Page 130

CHAPTER 5 ■ ANALYTICAL TECHNIQUES 131
where h is a constant (6.62 � 10�27 erg sec), known asPlanck’s constant, and v is frequency.
Because the frequency of a wave is inversely pro-portional to the wavelength, it follows that the energyof electromagnetic radiation is inversely proportional towavelength. Figure 5-1A shows this relationship. Elec-tromagnetic radiation includes a spectrum of energyfrom short-wavelength, highly energetic gamma raysand x-rays on the left in Figure 5-1B to long-wavelengthradiofrequencies on the right. Visible light falls in be-tween, with the color violet at 400-nm and red at 700-nm wavelengths being the approximate limits of thevisible spectrum.
The instruments discussed in this section measureeither absorption or emission of radiant energy to de-termine concentration of atoms or molecules. The twophenomena, absorption and emission, are closely re-lated. For a ray of electromagnetic radiation to beabsorbed, it must have the same frequency as a rota-tional or vibrational frequency in the atom or moleculethat it strikes. Levels of energy that are absorbed movein discrete steps, and any particular type of moleculeor atom will absorb only certain energies and not oth-ers. When energy is absorbed, valence electrons moveto an orbital with a higher energy level. Following en-ergy absorption, the excited electron will fall back tothe ground state by emitting a discrete amount ofenergy in the form of a characteristic wavelength ofradiant energy.
Absorption or emission of energy by atoms results ina line spectrum. Because of the relative complexity ofmolecules, they absorb or emit a bank of energy over alarge region. Light emitted by incandescent solids (tung-sten or deuterium) is in a continuum. The three types ofspectra are shown in Figure 5-2.1–3
Beer’s Law
The relationship between absorption of light by a solu-tion and the concentration of that solution has beendescribed by Beer and others. Beer’s law states that theconcentration of a substance is directly proportional tothe amount of light absorbed or inversely proportional tothe logarithm of the transmitted light. Percent transmit-tance (% T) and absorbance (A) are related photometricterms that are explained in this section.
Figure 5-3A shows a beam of monochromatic light en-tering a solution. Some of the light is absorbed. The re-mainder passes through, strikes a light detector, and isconverted to an electric signal. Percent transmittance isthe ratio of the radiant energy transmitted (T) divided bythe radiant energy incident on the sample (I). All lightabsorbed or blocked results in 0% T. A level of 100% T isobtained if no light is absorbed. In practice, the solventwithout the constituent of interest is placed in the light
FIGURE 5-1. Electromagnetic radiation—relationship of energy andwavelength.
FIGURE 5-2. Characteristic absorption or emission spectra.(Reprinted with permission from Coiner D. Basic concepts in laboratory instrumentation. Bethesda, Md.: ASMT Education andResearch Fund, 1975–1979.)
FIGURE 5-3. Percent transmittance (% T) defined.
14460_Ch05.qxd 12/4/08 8:06 PM Page 131

PART I ■ BASIC PRINCIPLES AND PRACTICE OF CLINICAL CHEMISTRY132
path, as in Figure 5-3B. Most of the light is transmitted,but a small amount is absorbed by the solvent and cuvetor is reflected away from the detector. The electricalreadout of the instrument is set arbitrarily at 100% T,while the light is passing through a “blank” or reference.The sample containing absorbing molecules to be meas-ured is placed in the light path. The difference in amountof light transmitted by the blank and that transmitted bythe sample is due only to the presence of the compoundbeing measured. The % T measured by commercial spec-trophotometers is the ratio of the sample transmittedbeam divided by the blank transmitted beam.
Equal thicknesses of an absorbing material will absorba constant fraction of the energy incident upon the lay-ers. For example, in a tube containing layers of solution(Fig. 5-4A), the first layer transmits 70% of the light in-cident upon it. The second layer will, in turn, transmit70% of the light incident upon it. Thus, 70% of 70%(49%) is transmitted by the second layer. The third layertransmits 70% of 49%, or 34% of the original light.Continuing on, successive layers transmit 24% and 17%,respectively. The % T values, when plotted on lineargraph paper, yield the curve shown in Figure 5-4B.Considering each equal layer as many monomolecularlayers, we can translate layers of material to concentra-tion. If semilog graph paper is used to plot the same fig-ures, a straight line is obtained (Fig. 5-4C), indicating
that, as concentration increases, % T decreases in a loga-rithmic manner.
Absorbance A is the amount of light absorbed. It can-not be measured directly by a spectrophotometer butrather is mathematically derived from % T as follows:
%T � � 100 (Eq. 5-2)
where I0 is incident light and I is transmitted light.Absorbance is defined as follows:
A � �log(I/I0) � log (100%) � log %T
� 2 � log %T (Eq. 5-3)
According to Beer’s law, absorbance is directly pro-portional to concentration (Fig. 5-4D):
A � � � b � c (Eq. 5-4)
where � � molar absorptivity, the fraction of a specificwavelength of light absorbed by a given type of molecule;b is the length of light path through the solution; and cis the concentration of absorbing molecules.
Absorptivity depends on molecular structure and theway in which the absorbing molecules react with differ-ent energies. For any particular molecular type, absorp-tivity changes as wavelength of radiation changes. Theamount of light absorbed at a particular wavelength
II0
FIGURE 5-4. (A) Percent of original incident light transmitted by equal layers of light-absorbing solution. (B) Percent T versus concentration on linear graph paper. (C) Percent T versus concentration onsemilog graph paper. (D) A versus concentration on linear graph paper.
14460_Ch05.qxd 12/4/08 8:06 PM Page 132

depends on the molecular and ion types present and mayvary with concentration, pH, or temperature.
Because the path length and molar absorptivity areconstant for a given wavelength,
A � C (Eq. 5-5)
Unknown concentrations are determined from a cali-bration curve that plots absorbance at a specific wave-length versus concentration for standards of knownconcentration. For calibration curves that are linear andhave a zero y-intercept, unknown concentrations can bedetermined from a single calibrator. Not all calibrationcurves result in straight lines. Deviations from linearityare typically observed at high absorbances. The straylight within an instrument will ultimately limit the max-imum absorbance that a spectrophotometer can achieve,typically 2.0 absorbance units.
Spectrophotometric Instruments
A spectrophotometer is used to measure the light trans-mitted by a solution to determine the concentration of thelight-absorbing substance in the solution. Figure 5-5 illus-trates the basic components of a single-beam spectropho-tometer, which are described in subsequent sections.
Components of a Spectrophotometer
Light SourceThe most common source of light for work in the visibleand near-infrared region is the incandescent tungsten ortungsten-iodide lamp. Only about 15% of radiant energyemitted falls in the visible region, with most emitted asnear-infrared.1–3 Often, a heat-absorbing filter is insertedbetween the lamp and sample to absorb the infraredradiation.
The lamps most commonly used for ultraviolet (UV)work are the deuterium-discharge lamp and the mer-cury-arc lamp. Deuterium provides continuous emissiondown to 165 nm. Low-pressure mercury lamps emit asharp-line spectrum, with both UV and visible lines.Medium and high-pressure mercury lamps emit a con-tinuum from UV to the mid visible region. The most im-portant factors for a light source are range, spectraldistribution within the range, the source of radiant pro-duction, stability of the radiant energy, and temperature.
MonochromatorsIsolation of individual wavelengths of light is an impor-tant and necessary function of a monochromator. Thedegree of wavelength isolation is a function of the type ofdevice used and the width of entrance and exit slits. Thebandpass of a monochromator defines the range of wave-lengths transmitted and is calculated as width at morethan half the maximum transmittance (Fig. 5-6).
Numerous devices are used for obtaining monochro-matic light. The least expensive are colored-glass filters.These filters usually pass a relatively wide band of radi-ant energy and have a low transmittance of the selectedwavelength. Although not precise, they are simple, inex-pensive, and useful.
Interference filters produce monochromatic lightbased on the principle of constructive interference ofwaves. Two pieces of glass, each mirrored on one side,are separated by a transparent spacer that is preciselyone-half the desired wavelength. Light waves enter oneside of the filter and are reflected at the second surface.Wavelengths that are twice the space between the twoglass surfaces will reflect back and forth, reinforcing oth-ers of the same wavelengths, and finally passing onthrough. Other wavelengths will cancel out because ofphase differences (destructive interference). Becauseinterference filters also transmit multiples of the desired
Lightsource
Entranceslit
Monochromator
Exitslit
Samplecuvet
PM tube
A/D DisplayGrating
FIGURE 5-5. Single-beam spectrophotometer.
FIGURE 5-6. Spectral transmittance of two monochromators withband pass at half height of 5 nm and 20 nm.
CHAPTER 5 ■ ANALYTICAL TECHNIQUES 133
14460_Ch05.qxd 12/4/08 8:06 PM Page 133

PART I ■ BASIC PRINCIPLES AND PRACTICE OF CLINICAL CHEMISTRY134
wavelengths, they require accessory filters to eliminatethese harmonic wavelengths. Interference filters can beconstructed to pass a very narrow range of wavelengthswith good efficiency.
The prism is another type of monochromator. A nar-row beam of light focused on a prism is refracted as itenters the more dense glass. Short wavelengths arerefracted more than long wavelengths, resulting in dis-persion of white light into a continuous spectrum. Theprism can be rotated, allowing only the desired wave-length to pass through an exit slit.
Diffraction gratings are most commonly used as mo-nochromators. A diffraction grating consists of manyparallel grooves (15,000 or 30,000 per inch) etched ontoa polished surface. Diffraction, the separation of lightinto component wavelengths, is based on the principlethat wavelengths bend as they pass a sharp corner. Thedegree of bending depends on the wavelength. As thewavelengths move past the corners, wave fronts areformed. Those that are in phase reinforce one another,whereas those not in phase cancel out and disappear.This results in complete spectra. Gratings with very fineline rulings produce a widely dispersed spectrum. Theyproduce linear spectra, called orders, in both directionsfrom the entrance slit. Because the multiple spectra havea tendency to cause stray light problems, accessory filtersare used.
Sample CellThe next component of the basic spectrophotometer isthe sample cell or cuvet, which may be round or square.The light path must be kept constant to have absorbanceproportional to concentration. This is easily checked bypreparing a colored solution to read midscale when usingthe wavelength of maximum absorption. Fill each cuvetto be tested, take readings, and save those that matchwithin an acceptable tolerance (e.g., �0.25% T). Becauseit is difficult to manufacture round tubes with uniformdiameters, they should be etched to indicate the positionfor use. Cuvets are sold in matched sets. Square cuvetshave plane-parallel optical surfaces and a constant lightpath. They have an advantage over round cuvets in thatthere is less error from the lens effect, orientation in thespectrophotometer, and refraction. Cuvets with scratch-ed optical surfaces scatter light and should be discarded.Inexpensive glass cuvets can be used for applications inthe visible range, but they absorb light in the UV region.Quartz cuvets must, therefore, be used for applicationsrequiring UV radiation.
PhotodetectorsThe purpose of the detector is to convert the transmit-ted radiant energy into an equivalent amount of electri-cal energy. The least expensive of the devices is knownas a barrier-layer cell, or photocell. The photocell is
composed of a film of light-sensitive material, frequentlyselenium, on a plate of iron. Over the light-sensitive ma-terial is a thin, transparent layer of silver. When exposedto light, electrons in the light-sensitive material are ex-cited and released to flow to the highly conductive silver.In comparison with the silver, a moderate resistance op-poses the electron flow toward the iron, forming a hypo-thetical barrier to flow in that direction. Consequently,this cell generates its own electromotive force, whichcan be measured. The produced current is proportionalto incident radiation. Photocells require no externalvoltage source but rely on internal electron transfer toproduce a current in an external circuit. Because of theirlow internal resistance, the output of electrical energy isnot easily amplified. Consequently, this type of detectoris used mainly in filter photometers with a wide band-pass, producing a fairly high level of illumination sothat there is no need to amplify the signal. The photocellis inexpensive and durable; however, it is temperaturesensitive and nonlinear at very low and very high levelsof illumination.
A phototube (Fig. 5-7) is similar to a barrier-layercell in that it has photosensitive material that gives offelectrons when light energy strikes it. It differs in thatan outside voltage is required for operation. Phototubescontain a negatively charged cathode and a positivelycharged anode enclosed in a glass case. The cathode iscomposed of a material (e.g., rubidium or lithium) thatacts as a resistor in the dark but emits electrons whenexposed to light. The emitted electrons jump over tothe positively charged anode, where they are collectedand return through an external, measurable circuit. Thecathode usually has a large surface area. Varying thecathode material changes the wavelength at which thephototube gives its highest response. The photocurrentis linear, with the intensity of the light striking the cath-ode as long as voltage between the cathode and anode
FIGURE 5-7. Phototube drawing and schematic.
14460_Ch05.qxd 12/4/08 8:06 PM Page 134

remains constant. A vacuum within the tubes avoidsscattering of the photoelectrons by collision with gasmolecules.
The third major type of light detector is the photomul-tiplier (PM) tube, which detects and amplifies radiant en-ergy. As shown in Figure 5-8, incident light strikes thecoated cathode, emitting electrons. The electrons are at-tracted to a series of anodes, known as dynodes, each hav-ing a successively higher positive voltage. These dynodesare of a material that gives off many secondary electronswhen hit by single electrons. Initial electron emission atthe cathode triggers a multiple cascade of electrons withinthe PM tube itself. Because of this amplification, the PMtube is 200 times more sensitive than the phototube. PMtubes are used in instruments designed to be extremelysensitive to very low light levels and light flashes of veryshort duration. The accumulation of electrons strikingthe anode produces a current signal, measured in am-peres, that is proportional to the initial intensity of thelight. The analog signal is converted first to a voltageand then to a digital signal through the use of an analog-to-digital (A/D) converter. Digital signals are processedelectronically to produce absorbance readings.
In a photodiode, absorption of radiant energy by a reverse-biased pn-junction diode (pn, positive-negative)produces a photocurrent that is proportional to the inci-dent radiant power. Although photodiodes are not as
sensitive as PM tubes because of the lack of internal am-plification, their excellent linearity (6–7 decades of radi-ant power), speed, and small size make them useful inapplications where light levels are adequate.4 Photodiodearray (PDA) detectors are available in integrated circuitscontaining 256 to 2,048 photodiodes in a linear arrange-ment. A linear array is shown in Figure 5-9. Each photo-diode responds to a specific wavelength, and as a result,a complete UV/visible spectrum can be obtained in lessthan 1 second. Resolution is 1 to 2 nm and depends onthe number of discrete elements. In spectrophotometersusing PDA detectors, the grating is positioned after thesample cuvet and disperses the transmitted radiationonto the PDA detector (Fig. 5-9).
For single-beam spectrophotometers, the absorbancereading from the sample must be blanked using an ap-propriate reference solution that does not contain thecompound of interest. Double-beam spectrophotome-ters permit automatic correction of sample and refer-ence absorbance, as shown in Figure 5-10. Because the
Dynode chain
Incidentlight
Photocathode
Shield
Anode
FIGURE 5-8. Dynode chain in a photomultiplier.
Grating
Cell
Slit
Lamp
Photodiodearray
FIGURE 5-9. Photodiode array spectrophotometer illustrating theplacement of the sample cuvet before the monochromator.
Lightsource
Entranceslit
Monochromator
Exitslit
Grating
Samplecuvet
Referencecuvet
Beamsplitters
PM tube
A/D Display
FIGURE 5-10. Double-beam spectrophotometer.
CHAPTER 5 ■ ANALYTICAL TECHNIQUES 135
14460_Ch05.qxd 12/4/08 8:06 PM Page 135

PART I ■ BASIC PRINCIPLES AND PRACTICE OF CLINICAL CHEMISTRY136
intensities of light sources vary as a function of wave-length, double-beam spectrophotometers are necessarywhen the absorption spectrum for a sample is to be ob-tained. Computerized, continuous zeroing, single-beamspectrophotometers have replaced most double-beamspectrophotometers.
Spectrophotometer Quality Assurance
Performing at least the following checks should validateinstrument function: wavelength accuracy, stray light,and linearity. Wavelength accuracy means that the wave-length indicated on the control dial is the actual wave-length of light passed by the monochromator. It is mostcommonly checked using standard absorbing solutionsor filters with absorbance maxima of known wavelength.Didymium or holmium oxide in glass is stable and fre-quently used as filters. The filter is placed in the lightpath and the wavelength control is set at the wavelengthat which maximal absorbance is expected. The wave-length control is then rotated in either direction to locatethe actual wavelength that has maximal absorbance. Ifthese two wavelengths do not match, the optics must beadjusted to calibrate the monochromator correctly.
Some instruments with narrow bandpass use a mer-cury-vapor lamp to verify wavelength accuracy. The mer-cury lamp is substituted for the usual light source, andthe spectrum is scanned to locate mercury emissionlines. The wavelength indicated on the control is com-pared with known mercury emission peaks to determinethe accuracy of the wavelength indicator control.
Stray light refers to any wavelengths outside the bandtransmitted by the monochromator. The most commoncauses of stray light are reflection of light from scratcheson optical surfaces or from dust particles anywhere in the
light path and higher-order spectra produced by diffract-ion gratings. The major effect is absorbance error, espe-cially in the high-absorbance range. Stray light isdetected by using cutoff filters, which eliminate all radi-ation at wavelengths beyond the one of interest. Tocheck for stray light in the near-UV region, for example,insert a filter that does not transmit in the region of 200nm to 400 nm. If the instrument reading is greater than0% T, stray light is present. Certain liquids, such asNiSO4, NaNO2, and acetone, absorb strongly at shortwavelengths and can be used in the same way to detectstray light in the UV range.
Linearity is demonstrated when a change in concen-tration results in a straight-line calibration curve, asdiscussed under Beer’s law. Colored solutions may becarefully diluted and used to check linearity, using thewavelength of maximal absorbance for that color. Sealedsets of different colors and concentrations are availablecommercially. They should be labeled with expected ab-sorbance for a given bandpass instrument. Less than ex-pected absorbance is an indication of stray light or of abandpass that is wider than specified. Sets of neutral-density filters to check linearity over a range of wave-lengths are also commercially available.
A routine system should be devised for each instrumentto check and record each parameter. The probable causeof a problem and the maintenance required to eliminate itare generally described in the instrument’s manual.
Atomic Absorption Spectrophotometer
The atomic absorption spectrophotometer is used tomeasure concentration by detecting absorption of elec-tromagnetic radiation by atoms rather than by molecules.The basic components are shown in Figure 5-11. The
FIGURE 5-11. Single-beam atomic absorption spectrophotometer—basic components.
14460_Ch05.qxd 12/4/08 8:06 PM Page 136

usual light source, known as a hollow-cathode lamp,consists of an evacuated gas-tight chamber containing ananode, a cylindrical cathode, and an inert gas, such ashelium or argon. When voltage is applied, the filler gas isionized. Ions attracted to the cathode collide with themetal, knock atoms off, and cause the metal atoms to beexcited. When they return to the ground state, light en-ergy is emitted that is characteristic of the metal in thecathode. Generally, a separate lamp is required for eachmetal (e.g., a copper hollow-cathode lamp is used tomeasure Cu).
Electrodeless discharge lamps are a relatively newlight source for atomic absorption spectrophotometers. Abulb is filled with argon and the element to be tested. Aradiofrequency generator around the bulb supplies theenergy to excite the element, causing a characteristicemission spectrum of the element.
The analyzed sample must contain the reduced metalin the atomic vaporized state. Commonly, this is doneby using the heat of a flame to break the chemical bondsand form free, unexcited atoms. The flame is the sam-ple cell in this instrument, rather than a cuvet. Thereare various designs; however, the most common burneris the premix long-path burner. The sample, in solu-tion, is aspirated as a spray into a chamber, where it ismixed with air and fuel. This mixture passes throughbaffles, where large drops fall and are drained off. Onlyfine droplets reach the flame. The burner is a long, nar-row slit, to permit a longer path length for absorptionof incident radiation. Light from the hollow-cathodelamp passes through the sample of ground-state atomsin the flame. The amount of light absorbed is propor-tional to the concentration. When a ground-state atomabsorbs light energy, an excited atom is produced. Theexcited atom then returns to the ground state, emittinglight of the same energy as it absorbed. The flame sam-ple thus contains a dynamic population of ground-stateand excited atoms, both absorbing and emitting radiantenergy. The emitted energy from the flame will go in alldirections, and it will be a steady emission. Because thepurpose of the instrument is to measure the amount oflight absorbed, the light detector must be able to distin-guish between the light beam emitted by the hollow-cathode lamp and that emitted by excited atoms in theflame. To do this, the hollow-cathode light beam ismodulated by inserting a mechanical rotating chopperbetween the light and the flame or by pulsing the elec-tric supply to the lamp. Because the light beam beingabsorbed enters the sample in pulses, the transmittedlight also will be in pulses. There will be less light inthe transmitted pulses because part of it will be ab-sorbed. There are, therefore, two light signals from theflame—an alternating signal from the hollow-cathodelamp and a direct signal from the flame emission. The
measuring circuit is tuned to the modulated frequency.Interference from the constant flame emission is elec-tronically eliminated by accepting only the pulsed sig-nal from the hollow cathode.
The monochromator is used to isolate the desiredemission line from other lamp emission lines. In addi-tion, it serves to protect the photodetector from excessivelight emanating from flame emissions. A PM tube is theusual light detector.
Flameless atomic absorption requires an instrumentmodification that uses an electric furnace to break chem-ical bonds (electrothermal atomization). A tiny graphitecylinder holds the sample, either liquid or solid. An elec-tric current passes through the cylinder walls, evaporatesthe solvent, ashes the sample and, finally, heats the unitto incandescence to atomize the sample. This instru-ment, like the spectrophotometer, is used to determinethe amount of light absorbed. Again, Beer’s law is usedfor calculating concentration. A major problem is thatbackground correction is considerably more necessaryand critical for electrothermal techniques than for flame-based atomic absorption methods. Currently, the mostcommon approach uses a deuterium lamp as a secondarysource and measures the difference between the two ab-sorbance signals. However, there has also been extensivedevelopment of background correction techniques basedon the Zeeman effect.1 The presence of an intense staticmagnetic field will cause the wavelength of the emittedradiation to split into several components. This shift inwavelength is the Zeeman effect.
Atomic absorption spectrophotometry is sensitive andprecise. It is routinely used to measure concentration oftrace metals that are not easily excited. It is generallymore sensitive than flame emission because the vast ma-jority of atoms produced in the usual propane or air-acetylene flame remain in the ground state available forlight absorption. It is accurate, precise, and specific. Onedisadvantage, however, is the inability of the flame todissociate samples into free atoms. For example, phos-phate may interfere with calcium analysis by formationof calcium phosphate. This may be overcome by addingcations that compete with calcium for phosphate.Routinely, lanthanum or strontium is added to samplesto form stable complexes with phosphate. Another possi-ble problem is the ionization of atoms following dissoci-ation by the flame, which can be decreased by reducingthe flame temperature. Matrix interference, due to theenhancement of light absorption by atoms in organic sol-vents or formation of solid droplets as the solvent evap-orates in the flame, can be another source of error. Thisinterference may be overcome by pretreatment of thesample by extraction.5
Recently, inductively coupled plasma (ICP) has beenused to increase sensitivity for atomic emission. The
CHAPTER 5 ■ ANALYTICAL TECHNIQUES 137
14460_Ch05.qxd 12/4/08 8:06 PM Page 137

PART I ■ BASIC PRINCIPLES AND PRACTICE OF CLINICAL CHEMISTRY138
torch, an argon plasma maintained by the interaction ofa radiofrequency field and an ionized argon gas, is re-ported to have used temperatures between 5,500 K and8,000 K. Complete atomization of elements is thoughtto occur at these temperatures. Use of inductively cou-pled plasma as a source is recommended for determina-tions involving refractory elements such as uranium,zirconium, and boron. ICP with MS detection is themost sensitive and specific assay technique for all ele-ments on the periodic chart. Atomic absorption spec-trophotometry is used less frequently because of thisnewer technology.
Flame Photometry
The flame-emission photometer, which measures lightemitted by excited atoms, was widely used to determineconcentration of Na�, K�, or Li�. With the developmentof ion selective electrodes for these analytes, flame pho-tometers are no longer routinely used in clinical chem-istry laboratories. Discussion of this technique, therefore,is no longer included in this edition; the reader shouldrefer to previous editions of this book.
Fluorometry
As seen with the spectrophotometer, light entering a so-lution may pass mainly on through or may be absorbedpartly or entirely, depending on the concentration andthe wavelength entering that particular solution.Whenever absorption occurs, there is a transfer of energyto the medium. Each molecular type possesses a series ofelectronic energy levels and can pass from a lower energylevel to a higher level only by absorbing an integral unit(quantum) of light that is equal in energy to the differ-ence between the two energy states. There are additionalenergy levels owing to rotation or vibration of molecularparts. The excited state lasts about 10�5 seconds beforethe electron loses energy and returns to the ground state.Energy is lost by collision, heat loss, transfer to othermolecules, and emission of radiant energy. Because themolecules are excited by absorption of radiant energyand lose energy by multiple interactions, the radiant en-ergy emitted is less than the absorbed energy. The differ-ence between the maximum wavelengths, excitation, andemitted fluorescence is called Stokes shift. Both excita-tion (absorption) and fluorescence (emission) energiesare characteristic for a given molecular type; for example,Figure 5-12 shows the absorption and fluorescence spec-tra of quinine in 0.1 N sulfuric acid. The dashed line onthe left shows the short-wavelength excitation energythat is maximally absorbed, whereas the solid line on theright is the longer-wavelength (less energy) fluorescentspectrum.
Basic InstrumentationFilter fluorometers measure the concentrations of so-lutions that contain fluorescing molecules. A basic in-strument is shown in Figure 5-13. The source emitsshort-wavelength high-energy excitation light. A mecha-nical attenuator controls light intensity. The primary fil-ter, placed between the radiation source and the sample,selects the wavelength that is best absorbed by the solu-tion to be measured. The fluorescing sample in the cuvetemits radiant energy in all directions. The detector(placed at right angles to the sample cell) and a secon-dary filter that passes the longer wavelengths of fluo-rescent light prevent incident light from striking thephotodetector. The electrical output of the photodetectoris proportional to the intensity of fluorescent energy. Inspectrofluorometers, the filters are replaced by prisms orgrating monochromators.
Gas-discharge lamps (mercury and xenon-arc) are themost frequently used sources of excitation radiant en-ergy. Incandescent tungsten lamps are seldom usedbecause they release little energy in the UV region.Mercury-vapor lamps are commonly used in filter fluo-rometers. Mercury emits a characteristic line spectrum.Resonance lines at 365 nm to 366 nm are commonlyused. Energy at wavelengths other than the resonancelines is provided by coating the inner surface of the lampwith a material that absorbs the 254-nm mercury radia-tion and emits a broad band of longer wavelengths. Mostspectrofluorometers use a high-pressure xenon lamp.Xenon has a good continuum, which is necessary for de-termining excitation spectra.
Monochromator fluorometers use grating, prisms, orfilters for isolation of incident radiation. Light detectorsare almost exclusively PM tubes because of their highersensitivity to low light intensities. Double-beam instru-ments are used to compensate for instability due toelectric-power fluctuation.
FIGURE 5-12. Absorption and fluorescence spectra of quinine in0.1 N sulfuric acid. (Reprinted with permission from Coiner D. Basicconcepts in laboratory instrumentation. Bethesda, Md.: ASMTEducation and Research Fund, 1975–1979.)
14460_Ch05.qxd 12/4/08 8:06 PM Page 138

Fluorescence concentration measurements are relatedto molar absorptivity of the compound, intensity of theincident radiation, quantum efficiency of the energyemitted per quantum absorbed, and length of the lightpath. In dilute solutions with instrument parametersheld constant, fluorescence is directly proportional toconcentration. Generally, a linear response will be ob-tained until the concentration of the fluorescent speciesis so high that the sample begins to absorb significantamounts of excitation light. A curve demonstrating non-linearity as concentration increases is shown in Figure 5-14. The solution must absorb less than 5% of the ex-citing radiation for a linear response to occur.6 As withall quantitative measurements, a standard curve must be
prepared to demonstrate that the concentration used fallsin a linear range.
In fluorescence polarization, radiant energy is polar-ized in a single plane. When the sample (fluorophor) isexcited, it emits polarized light along the same plane asthe incident light if the fluorophor is attached to a largemolecule. In contrast, a small molecule emits depolar-ized light because it will rotate out of the plane of polar-ization during its excitation lifetime. This technique iswidely used for the detection of therapeutic and abuseddrugs. In the procedure, the sample analyte is allowed tocompete with a fluorophor-labeled analyte for a limitedantibody to the analyte. The lower the concentration ofthe sample analyte, the higher is the macromolecular
Dilute solution:
Concentrated solution:
FIGURE 5-14. Dependence of fluorescence on the concentration offluorophor. (Reprinted with permission from Guilbault GG. Practicalfluorescence, theory, methods and techniques. New York, N.Y.:Marcel Dekker, 1973.)
FIGURE 5-13. Basic filter fluorometer. (Reprinted with permissionfrom Coiner D. Basic concepts in laboratory instrumentation.Bethesda, Md.: ASMT Education and Research Fund, 1975–1979.)
CHAPTER 5 ■ ANALYTICAL TECHNIQUES 139
14460_Ch05.qxd 12/4/08 8:06 PM Page 139

PART I ■ BASIC PRINCIPLES AND PRACTICE OF CLINICAL CHEMISTRY140
antibody-analyte-fluorophor formed and the lower is thedepolarization of the radiant light.
Advantages and Disadvantages of FluorometryFluorometry has two advantages over conventional spec-trophotometry: specificity and sensitivity. Fluorometryincreases specificity by selecting the optimal wavelengthfor both absorption and fluorescence, rather than just theabsorption wavelength seen with spectrophotometry.
Fluorometry is approximately 1,000 times more sen-sitive than most spectrophotometric methods.6 One rea-son is because emitted radiation is measured directly; itcan be increased simply by increasing the intensity of theexciting radiant energy. In addition, fluorescence meas-ures the amount of light intensity present over a zerobackground. In absorbance, however, the quantity of ab-sorbed light is measured indirectly as the difference be-tween the transmitted beams. At low concentrations, thesmall difference between 100% T and the transmittedbeam is difficult to measure accurately and precisely,limiting the sensitivity.
The biggest disadvantage is that fluorescence is verysensitive to environmental changes. Changes in pH affectavailability of electrons, and temperature changes theprobability of loss of energy by collision rather than fluo-rescence. Contaminating chemicals or a change of solventsmay change the structure. UV light used for excitation cancause photochemical changes. Any decrease in fluores-cence resulting from any of these possibilities is known asquenching. Because so many factors may change the in-tensity or spectra of fluorescence, extreme care is manda-tory in analytic technique and instrument maintenance.
Chemiluminescence
In chemiluminescence reactions, part of the chemical en-ergy generated produces excited intermediates that decayto a ground state with the emission of photons.7 Theemitted radiation is measured with a PM tube, and thesignal is related to analyte concentration. Chemilumi-nescence is different than fluorescence in that no excita-tion radiation is required and no monochromators areneeded because the chemiluminescence arises from onespecies. Most important, chemiluminescence reactionsare oxidation reactions of luminol, acridinium esters,and dioxetanes characterized by a rapid increase in in-tensity of emitted light followed by a gradual decay.Usually, the signal is taken as the integral of the entirepeak. Enhanced chemiluminescence techniques increasethe chemiluminescence efficiency by including an en-hancer system in the reaction of a chemiluminescentagent with an enzyme. The time course for the light in-tensity is much longer (60 minutes) than that for con-ventional chemiluminescent reactions, which last forabout 30 seconds (Fig. 5-15).
Advantages of chemiluminescence assays include sub-picomolar detection limits, speed (with flash-type reac-tions, light is only measured for 10 seconds), ease of use(most assays are one-step procedures), and simple in-strumentation.7 The main disadvantage is that impuritiescan cause a background signal that degrades sensitivityand specificity.
Turbidity and Nephelometry
Turbidimetric measurements are made with a spec-trophotometer to determine concentration of particu-late matter in a sample. The amount of light blocked bya suspension of particles depends not only on concen-tration but also on size. Because particles tend to aggre-gate and settle out of suspension, sample handlingbecomes critical. Instrument operation is the same asfor any spectrophotometer.
Nephelometry is similar, except that light scattered bythe small particles is measured at an angle to the beamincident on the cuvet. Figure 5-16 demonstrates twopossible optical arrangements for a nephelometer. Lightscattering depends on wavelength and particle size. Formacromolecules with a size close to or larger than the
Inte
nsity
Time
FIGURE 5-15. Representative intensity-versus-time curve for a transient chemiluminescence signal.
Cuvet
Detector,spectrophotometerturbidometry
Detector, nephelometerforward light scatter
Lightsource
Detectornephelometer
90° light scatter
FIGURE 5-16. Nephelometer versus spectrophotometer—opticalarrangements.
14460_Ch05.qxd 12/4/08 8:06 PM Page 140

wavelength of incident light, sensitivity is increased bymeasuring forward light scatter.8 Instruments areavailable with detectors placed at various forward angles,as well as at 90 degrees to the incident light. Mono-chromatic light obtains uniform scatter and minimizessample heating. Certain instruments use lasers as asource of monochromatic light; however, any mono-chromator may be used.
Measuring light scatter at an angle other than at 180degrees in turbidimetry minimizes error from colored so-lutions and increases sensitivity. Because both methodsdepend on particle size, some instruments quantitate ini-tial change in light scatter rather than total scatter.Reagents must be free of any particles, and cuvets mustbe free of any scratches.
Laser Applications
Light amplification by stimulated emission of radiation(LASER) is based on the interaction of radiant energyand suitably excited atoms or molecules. The interac-tion leads to stimulated emission of radiation. Thewavelength, direction of propagation, phase, and planeof polarization of the emitted light are the same as thoseof the incident radiation. Laser light is polarized andcoherent and has narrow spectral width and smallcross-sectional area with low divergence. The radiantemission can be very powerful and either continuousor pulsating.
Laser light can serve as the source of incident energyin a spectrometer or nephelometer. Some lasers pro-duce bandwidths of a few kilohertz in both the visibleand infrared regions, making these applications aboutthree to six orders more sensitive than conventionalspectrometers.9
Laser spectrometry also can be used for the determi-nation of structure and identification of samples, as wellas for diagnosis. Quantitation of samples depends on thespectrometer used. An example of the clinical applica-tion of the laser is the Coulter counter, which is used fordifferential analysis of white blood cells.10
ELECTROCHEMISTRY
Many types of electrochemical analyses are used in theclinical laboratory, including potentiometry, amperome-try, coulometry, and polarography. The two basic elec-trochemical cells involved in these analyses are galvanicand electrolytic cells.
Galvanic and Electrolytic Cells
An electrochemical cell can be set up as shown in Figure5-17. It consists of two half-cells and a salt bridge, whichcan be a piece of filter paper saturated with electrolytes.Instead of two as shown, the electrodes can be immersedin a single, large beaker containing a salt solution. Insuch a setup, the solution serves as the salt bridge.
In a galvanic cell, as the electrodes are connected,there is spontaneous flow of electrons from the electrodewith the lower electron affinity (oxidation; e.g., silver).These electrons pass through the external meter to thecathode (reduction), where OH� ions are liberated. Thisreaction continues until one of the chemical componentsis depleted, at which point, the cell is “dead” and cannotproduce electrical energy to the external meter.
Current may be forced to flow through the dead cellonly by applying an external electromotive force E. Thisis called an electrolytic cell. In short, a galvanic cell canbe built from an electrolytic cell. When the external E isturned off, accumulated products at the electrodes willspontaneously produce current in the opposite directionof the electrolytic cell.
Half-Cells
It is impossible to measure the electrochemical activityof one half-cell; two reactions must be coupled and onereaction compared with the other. To rate half-cell reac-tions, a specific electrode reaction is arbitrarily assigned0.00 V. Every other reaction coupled with this arbi-trary zero reaction is either positive or negative, depend-ing on the relative affinity for electrons. The electrodedefined as 0.00 V is the standard hydrogen electrode: H2
E
e�
Salt bridgeAnode Cathode
Oxidation2Ag° 2Ag� � 2E� O2 � 2e� 2OH�
Reduction
FIGURE 5-17. Electrochemical cell.
CHAPTER 5 ■ ANALYTICAL TECHNIQUES 141
14460_Ch05.qxd 12/4/08 8:06 PM Page 141

PART I ■ BASIC PRINCIPLES AND PRACTICE OF CLINICAL CHEMISTRY142
gas at 1 atmosphere (atm). The hydrogen gas in con-tact with H� in solution develops a potential. The hydro-gen electrode coupled with a zinc half-cell is cathodic,with the reaction 2H� � 2e� → H2, because H2 has agreater affinity than Zn for electrons. Cu, however, has agreater affinity than H2 for electrons, and thus the anodicreaction H2 → 2H� � 2e� occurs when coupled to theCu-electrode half-cell.
The potential generated by the hydrogen-gas electrodeis used to rate the electrode potential of metals in 1 mol/Lsolution. Reduction potentials for certain metals areshown in Table 5-1.11 A hydrogen electrode is used todetermine the accuracy of reference and indicator elec-trodes, the stability of standard solutions, and the poten-tials of liquid junctions.
Ion-Selective Electrodes
Potentiometric methods of analysis involve the directmeasurement of electrical potential due to the activity offree ions. Ion-selective electrodes (ISEs) are designed tobe sensitive toward individual ions.
pH Electrodes
An ISE universally used in the clinical laboratory is thepH electrode. The basic components of a pH meter arepresented in Figure 5-18.
Indicator ElectrodeThe pH electrode consists of a silver wire coated withAgCl, immersed into an internal solution of 0.1 mmol/LHCl, and placed into a tube containing a special glassmembrane tip. This membrane is only sensitive to hy-drogen ions (H�). Glass membranes that are selectivelysensitive to H� consist of specific quantities of lithium,cesium, lanthanum, barium, or aluminum oxides in sili-cate. When the pH electrode is placed into the testsolution, movement of H� near the tip of the electrodeproduces a potential difference between the internalsolution and the test solution, which is measured as pHand read by a voltmeter. The combination pH electrode
also contains a built-in reference electrode, eitherAg/AgCl or calomel (Hg/Hg2Cl2) immersed in a solutionof saturated KCl.
The specially formulated glass continually dissolvesfrom the surface. The present concept of the selectivemechanism that causes formation of electromotive forceat the glass surface is that an ion-exchange process isinvolved. Cationic exchange occurs only in the gellayer—there is no penetration of H� through the glass.Although the glass is constantly dissolving, the process isslow, and the glass tip generally lasts for several years.pH electrodes are highly selective for H�; however, othercations in high concentration interfere, the most com-mon of which is sodium. Electrode manufacturersshould list the concentration of interfering cations thatmay cause error in pH determinations.
Reference ElectrodeThe reference electrode commonly used is the calomelelectrode. Calomel, a paste of predominantly mercurouschloride, is in direct contact with metallic mercury in anelectrolyte solution of potassium chloride. As long as theelectrolyte concentration and the temperature remainconstant, a stable voltage is generated at the interface ofthe mercury and its salt. A cable connected to the mer-cury leads to the voltmeter. The filling hole is needed foradding potassium chloride solution. A tiny opening atthe bottom is required for completion of electric contactbetween the reference and indicator electrodes. Theliquid junction consists of a fiber or ceramic plug thatallows a small flow of electrolyte filling solution.
Construction varies, but all reference electrodes mustgenerate a stable electrical potential. Reference elec-trodes generally consist of a metal and its salt in contactwith a solution containing the same anion. Mercury/mer-curous chloride, as in this example, is a frequently used
TABLE 5-1 STANDARD REDUCTION POTENTIALS
POTENTIAL, V
Zn2� � 2e ↔ Z �0.7628
Cr2� � 2e ↔ Cr �0.913
Ni2� � 2e ↔ Ni �0.257
2H� � 2e ↔ H2 0.000
Cu2� � 2e ↔ Cu 0.3419
Ag� � e ↔ Ag 0.7996
Data presented are examples from Lide DR. CRC handbook of chemistry and physics. 83rd ed. Boca Raton, Fla.: CRC Press, 2003–2004.
FIGURE 5-18. Necessary components of a pH meter.
14460_Ch05.qxd 12/4/08 8:06 PM Page 142

reference electrode; the disadvantage is that it is slow toreach a new stable voltage following temperature changeand it is unstable above 80°C.1,2 Ag/AgCl is another com-mon reference electrode. It can be used at high tempera-tures, up to 275°C, and the AgCl-coated Ag wire makesa more compact electrode than that of mercury. In meas-urements in which chloride contamination must beavoided, a mercury sulfate and potassium sulfate refer-ence electrode may be used.
Liquid JunctionsElectrical connection between the indicator and refer-ence electrodes is achieved by allowing a slow flow ofelectrolyte from the tip of the reference electrode. Ajunction potential is always set up at the boundary be-tween two dissimilar solutions because of positive andnegative ions diffusing across the boundary at unequalrates. The resultant junction potential may increase ordecrease the potential of the reference electrode.Therefore, it is important that the junction potential bekept to a minimum reproducible value when the refer-ence electrode is in solution.
KCl is a commonly used filling solution because K�
and Cl� have nearly the same mobilities. When KCl isused as the filling solution for Ag/AgCl electrodes, theaddition of AgCl is required to prevent dissolution ofthe AgCl salt. One way of producing a lower junctionpotential is to mix K�, Na�, NO3
�, and Cl� in appro-priate ratios.
Readout MeterElectromotive force produced by the reference and indi-cator electrodes is in the millivolt range. Zero potentialfor the cell indicates that each electrode half-cell is gener-ating the same voltage, assuming there is no liquid junc-tion potential. The isopotential is that potential at whicha temperature change has no effect on the response of theelectrical cell. Manufacturers generally achieve this bymaking midscale (pH 7.0) correspond to 0 V at all tem-peratures. They use an internal buffer whose pH changesdue to temperature compensate for the changes in the in-ternal and external reference electrodes.
Nernst EquationThe electromotive force generated because of H� at theglass tip is described by the Nernst equation, which isshown in a simplified form:
� � �pH � � �pH � 0.059 V (Eq. 5-6)
where � is the electromotive force of the cell, F is theFaraday constant (96,500 C/mol), R is the molar gas con-stant, and T is temperature, in Kelvin.
As the temperature increases, H� activity increasesand the potential generated increases. Most pH metershave a temperature-compensation knob that amplifiesthe millivolt response when the meter is on pH function.pH units on the meter scale are usually printed for use atroom temperature. On the voltmeter, 59.16 is read as 1pH unit change. The temperature compensation changesmillivolt response to compensate for changes due to tem-perature from 54.2 at 0°C to 66.10 at 60°C. However,most pH meters are manufactured for greatest accuracyin the 10°C to 60°C range.
CalibrationThe steps necessary to standardize a pH meter are fairlystraightforward. First, balance the system with the elec-trodes in a buffer with a 7.0 pH. The balance or interceptcontrol shifts the entire slope, as shown in Figure 5-19.Next, replace the buffer with one of a different pH. If themeter does not register the correct pH, amplification ofthe response changes the slope to match that predictedby the Nernst equation. If the instrument does not havea slope control, the temperature compensator performsthe same function.
pH Combination ElectrodeThe most commonly used pH electrode has both the in-dicator and reference electrodes combined in one smallprobe, which is convenient when small samples aretested. It consists of an Ag/AgCl internal reference elec-trode sealed in a narrow glass cylinder with a pH-sensitiveglass tip. The reference electrode is an Ag/AgCl wire
RT ln 10F
FIGURE 5-19. pH meter calibration. (Reprinted with permission fromWillard HH, Merritt LL, Dean JA, Settle FA. Instrumental methods ofanalysis. Belmont, Calif.: Wadsworth, 1981.)
CHAPTER 5 ■ ANALYTICAL TECHNIQUES 143
14460_Ch05.qxd 12/4/08 8:06 PM Page 143

PART I ■ BASIC PRINCIPLES AND PRACTICE OF CLINICAL CHEMISTRY144
wrapped around the indicator electrode. The outer glassenvelope is filled with KCl and has a tiny pore near the tipof the liquid junction. The solution to be measured mustcompletely cover the glass tip. Examples of other ISEs areshown in Figure 5-20. The reference electrode, electrom-eter, and calibration system described for pH measure-ments are applicable to all ISEs.
There are three major ISE types: inert-metal elec-trodes in contact with a redox couple, metal electrodesthat participate in a redox reaction, and membrane elec-trodes. The membrane can be solid material (e.g., glass),liquid (e.g., ion-exchange electrodes), or special mem-brane (e.g., compound electrodes), such as gas-sensingand enzyme electrodes.
The standard hydrogen electrode is an example of aninert-metal electrode. The Ag/AgCl electrode is an exampleof the second type. The electrode process AgCl � e� →Ag� � Cl� produces an electrical potential proportional tochloride ion (Cl�) activity. When Cl� is held constant, theelectrode is used as a reference electrode. The electrode incontact with varying Cl� concentrations is used as an in-dicator electrode to measure Cl� concentration.
The H�-sensitive gel layer of the glass pH electrode isconsidered a membrane. A change in the glass formu-lation makes the membrane more sensitive to sodiumions (Na�) than to H�, creating a sodium ISE. Othersolid-state membranes consist of either a single crystal orfine crystals immobilized in an inert matrix such as si-licone rubber. Conduction depends on a vacancy defectmechanism, and the crystals are formulated to be se-lective for a particular size, shape, and change—forexample, F�-selective electrodes of LaF, Cl�-sensitiveelectrodes with AgCl crystals, and AgBr electrodes for thedetection of Br�.
The calcium ISE is a liquid-membrane electrode. Anion-selective carrier, such as dioctyphenyl phosphatedissolved in an inert water-insoluble solvent, diffuses
through a porous membrane. Because the solvent isinsoluble in water, the test sample cannot cross themembrane, but calcium ions (Ca2�) are exchanged.The Ag/AgCl internal reference in a filling solution ofCaCl2 is in contact with the carrier by means of themembrane.
Potassium-selective liquid membranes use the anti-biotic valinomycin as the ion-selective carrier. Vali-nomycin membranes show great selectivity for K�.Liquid-membrane electrodes are recharged every fewmonths to replace the liquid ion exchanger and the porousmembrane.
Gas-Sensing Electrodes
Gas electrodes are similar to pH glass electrodes but aredesigned to detect specific gases (e.g., CO2 and NH3)in solutions and are usually separated from the solutionby a thin, gas-permeable hydrophobic membrane. Figure5-21 shows a schematic illustration of the pCO2 elec-trode. The membrane in contact with the solution is per-meable only to CO2, which diffuses into a thin film ofsodium bicarbonate solution. The pH of the bicarbonatesolution is changed as follows:
CO2 � H2O ↔ H2CO3 ↔ H� � HCO3� (Eq. 5-7)
The change in pH of the HCO3� is detected by a pH
electrode. The pCO2 electrode is widely used in clinicallaboratories as a component of instruments for measur-ing serum electrolytes and blood gases.
In the NH3 gas electrode, the bicarbonate solution isreplaced by ammonium chloride solution, and the mem-brane is permeable only to NH3 gas. As in the pCO2 elec-trode, NH3 changes the pH of NH4Cl as follows:
NH3 � H2O ↔ NH4� � OH� (Eq. 5-8)
The amount of OH�produced varies linearly with the logof the partial pressure of NH3 in the sample.
MicroelectrodeSurface
electrodeFlow-through
electrode
Field effecttransistor Macroelectrode
FIGURE 5-20. Other examples of ion-selective electrodes.
FIGURE 5-21. The pCO2 electrode.
14460_Ch05.qxd 12/4/08 8:06 PM Page 144

Other gas-sensing electrodes function on the basis ofan amperometric principle—that is, measurement ofthe current flowing through an electrochemical cell at aconstant applied electrical potential to the electrodes.Examples are the determination of pO2, glucose, andperoxidase.
The chemical reactions of the pO2 electrode (Clarkelectrode), an electrochemical cell with a platinum cath-ode and an Ag/AgCl anode, are illustrated in Figure 5-17.The electrical potential at the cathode is set to �0.65 Vand will not conduct current without oxygen in thesample. The membrane is permeable to oxygen, whichdiffuses through to the platinum cathode. Current passesthrough the cell and is proportional to the pO2 in thetest sample.
Glucose determination is based on the reduction inpO2 during glucose oxidase reaction with glucose andoxygen. Unlike the pCO2 electrode, the peroxidase elec-trode has a polarized platinum anode and its potential isset to �0.6 V. Current flows through the system whenperoxide is oxidized at the anode as follows:
H2O2 → 2H� � 2e� � O2 (Eq. 5-9)
Enzyme Electrodes
The various ISEs may be covered by immobilized en-zymes that can catalyze a specific chemical reaction.Selection of the ISE is determined by the reaction prod-uct of the immobilized enzyme. Examples include ure-ase, which is used for the detection of urea, and glucoseoxidase, which is used for glucose detection. A urea elec-trode must have an ISE that is selective for NH4
� or NH3,whereas glucose oxidase is used in combination with apH electrode.
Coulometric Chloridometers and AnodicStripping Voltammetry
Chloride ISEs have largely replaced coulometric titra-tions for determination of chloride in body fluids.Anodic stripping voltammetry was widely used for analy-sis of lead and is best measured by electrothermal(graphite furnace) atomic absorption spectroscopy or,preferably, ICP-MS.
ELECTROPHORESIS
Electrophoresis is the migration of charged solutes orparticles in an electrical field. Iontophoresis refers to themigration of small ions, whereas zone electrophoresis isthe migration of charged macromolecules in a poroussupport medium such as paper, cellulose acetate, oragarose gel film. An electrophoretogram is the result ofzone electrophoresis and consists of sharply separatedzones of a macromolecule. In a clinical laboratory, the
macromolecules of interest are proteins in serum, urine,cerebrospinal fluid (CSF), and other biologic body fluidsand erythrocytes and tissue.
Electrophoresis consists of five components: the driv-ing force (electrical power), the support medium, thebuffer, the sample, and the detecting system. A typicalelectrophoretic apparatus is illustrated in Figure 5-22.
Charged particles migrate toward the oppositecharged electrode. The velocity of migration is controlledby the net charge of the particle, the size and shape of theparticle, the strength of the electric field, chemical andphysical properties of the supporting medium, and theelectrophoretic temperature. The rate of mobility12 of themolecule () is given by
� ↔ r ↔ n (Eq. 5-10)
where Q is net charge of particle, k is constant, r is ionicradius of the particle, and n is viscosity of the buffer.
From the equation, the rate of migration is directly pro-portional to the net charge of the particle and inverselyproportional to its size and the viscosity of the buffer.
Procedure
The sample is soaked in hydrated support for approxi-mately 5 minutes. The support is put into the elec-trophoresis chamber, which was previously filled withthe buffer. Sufficient buffer must be added to the cham-ber to maintain contact with the support. Electrophoresisis carried out by applying a constant voltage or constantcurrent for a specific time. The support is then removedand placed in a fixative or rapidly dried to prevent diffu-sion of the sample. This is followed by staining the zoneswith appropriate dye. The uptake of dye by the sampleis proportional to sample concentration. After excessdye is washed away, the supporting medium may needto be placed in a clearing agent. Otherwise, it is com-pletely dried.
QK
FIGURE 5-22. Electrophoresis apparatus—basic components.
CHAPTER 5 ■ ANALYTICAL TECHNIQUES 145
14460_Ch05.qxd 12/4/08 8:06 PM Page 145

PART I ■ BASIC PRINCIPLES AND PRACTICE OF CLINICAL CHEMISTRY146
Power SupplyPower supplies operating at either constant current orconstant voltage are available commercially. In electro-phoresis, heat is produced when current flows through amedium that has resistance, resulting in an increase inthermal agitation of the dissolved solute (ions) and lead-ing to a decrease in resistance and an increase in current.The increase leads to increases in heat and evaporation ofwater from the buffer, increasing the ionic concentrationof the buffer and subsequent further increases in the cur-rent. The migration rate can be kept constant by using apower supply with constant current. This is true because,as electrophoresis progresses, a decrease in resistance asa result of heat produced also decreases the voltage.
BuffersTwo buffer properties that affect the charge of am-pholytes are pH and ionic strength. The ions carry theapplied electric current and allow the buffer to maintainconstant pH during electrophoresis. An ampholyte is amolecule, such as protein, whose net charge can be ei-ther positive or negative. If the buffer is more acidic thanthe isoelectric point (pI) of the ampholyte, it binds H�,becomes positively charged, and migrates toward thecathode. If the buffer is more basic than the pI, the am-pholyte loses H�, becomes negatively charged, and mi-grates toward the anode. A particle without a net chargewill not migrate, remaining at the point of application.During electrophoresis, ions cluster around a migratingparticle. The higher the ionic concentration, the higherthe size of the ionic cloud and the lower the mobility ofthe particle. Greater ionic strength produces sharper pro-tein-band separation but leads to increased heat produc-tion. This may cause denaturation of heat-labile proteins.Consequently, the optimal buffer concentration shouldbe determined for any electrophoretic system. Generally,the most widely used buffers are made of monovalentions because their ionic strength and molality are equal.
Support Materials
Cellulose AcetatePaper electrophoresis use has been replaced by celluloseacetate or agarose gel in clinical laboratories. Cellulose isacetylated to form cellulose acetate by treating it withacetic anhydride. Cellulose acetate, a dry, brittle filmcomposed of about 80% air space, is produced commer-cially. When the film is soaked in buffer, the air spacesfill with electrolyte and the film becomes pliable. Afterelectrophoresis and staining, cellulose acetate can bemade transparent for densitometer quantitation. Thedried transparent film can be stored for long periods.Cellulose acetate prepared to reduce electroendosmosisis available commercially. Cellulose acetate is also usedin isoelectric focusing.
Agarose GelAgarose gel is another widely used supporting medium.Used as a purified fraction of agar, it is neutral and,therefore, does not produce electroendosmosis. Afterelectrophoresis and staining, it is detained (cleared),dried, and scanned with a densitometer. The dried gelcan be stored indefinitely. Agarose gel electrophoresisrequires small amounts of sample (approximately 2 mL);it does not bind protein and, therefore, migration isnot affected.
Polyacrylamide GelPolyacrylamide gel electrophoresis involves separation ofprotein on the basis of charge and molecular size. Layersof gel with different pore sizes are used. The gel isprepared before electrophoresis in a tube-shaped elec-trophoresis cell. The small-pore separation gel is at thebottom, followed by a large-pore spacer gel and, finally,another large-pore gel containing the sample. Each layerof gel is allowed to form a gelatin before the next gel ispoured over it. At the start of electrophoresis, the proteinmolecules move freely through the spacer gel to itsboundary with the separation gel, which slows theirmovement. This allows for concentration of the samplebefore separation by the small-pore gel. Polyacrylamidegel electrophoresis separates serum proteins into 20 ormore fractions rather than the usual five fractions sepa-rated by cellulose acetate or agarose. It is widely used tostudy individual proteins (e.g., isoenzymes).
Starch GelStarch gel electrophoresis separates proteins on the basisof surface charge and molecular size, as does polyacry-lamide gel. The procedure is not widely used because oftechnical difficulty in preparing the gel.
Treatment and Application of Sample
Serum contains a high concentration of protein, espe-cially albumin and, therefore, serum specimens areroutinely diluted with buffer before electrophoresis. Incontrast, urine and CSF are usually concentrated.Hemoglobin hemolysate is used without further concen-tration. Generally, preparation of a sample is doneaccording to the suggestion of the manufacturer of theelectrophoretic supplies.
Cellulose acetate and agarose gel electrophoresis re-quire approximately 2 to 5 mL of sample. These are themost common routine electrophoreses performed inclinical laboratories. Because most commercially manu-factured plates come with a thin plastic template that hassmall slots through which samples are applied, overload-ing of agarose gel with sample is not a frequent problem.After serum is allowed to diffuse into the gel for approx-imately 5 minutes, the template is blotted to remove
14460_Ch05.qxd 12/4/08 8:06 PM Page 146

excess serum before being removed from the gel surface.Sample is applied to cellulose acetate with a twin-wireapplicator designed to transfer a small amount.
Detection and Quantitation
Separated protein fractions are stained to reveal their lo-cations. Different stains come with different plates fromdifferent manufacturers. The simplest way to accomplishdetection is visualization under UV light, whereas den-sitometry is the most common and reliable way for quan-titation. Most densitometers will automatically integratethe area under a peak, and the result is printed as per-centage of the total. A schematic illustration of a densit-ometer is shown in Figure 5-23.
Electroendosmosis
The movement of buffer ions and solvent relative to thefixed support is called endosmosis or electroendosmosis.Support media, such as paper, cellulose acetate, and agargel, take on a negative charge from adsorption of hy-droxyl ions. When current is applied to the electro-phoresis system, the hydroxyl ions remain fixed whilethe free positive ions move toward the cathode. The ionsare highly hydrated, resulting in net cathodic movementof solvent. Molecules that are nearly neutral are swept to-ward the cathode with the solvent. Support media suchas agarose and acrylamide gel are essentially neutral,eliminating electroendosmosis. The position of proteinsin any electrophoresis separation depends not only onthe nature of the protein but also on all other technicalvariables.
Isoelectric Focusing
Isoelectric focusing is a modification of electrophoresis.An apparatus is used similar to that shown in Figure 5-24. Charged proteins migrate through a supportmedium that has a continuous pH gradient. Individualproteins move in the electric field until they reach a pHequal to their isoelectric point, at which point they haveno charge and cease to move.
Capillary Electrophoresis
In capillary electrophoresis (CE), separation is performedin narrow-bore fused silica capillaries (inner diameter,
2575 mm). Usually, the capillaries are only filled withbuffer, although gel media can also be used. A CE instru-mentation schematic is shown in Figure 5-24. Initially,the capillary is filled with buffer and then the sample isloaded; applying an electric field performs the separation.Detection can be made near the other end of the capillarydirectly through the capillary wall.13
A fundamental CE concept is the electro-osmotic flow(EOF). EOF is the bulk flow of liquid toward the cathodeupon application of electric field and it is superimposedon electrophoretic migration. EOF controls the amountof time solutes remain in the capillary. Cations migratefastest because both EOF and electrophoretic attractionare toward the cathode; neutral molecules are all carriedby the EOF but are not separated from each other; andanions move slowest because, although they are carriedto the cathode by the EOF, they are attracted to theanode and repelled by the cathode (Fig. 5-25). Widelyused for monitoring separated analytes, UV-visible de-tection is performed directly on the capillary; however,sensitivity is poor because of the small dimensions of thecapillary, resulting in a short path length. Fluorescence,laser-induced fluorescence, and chemiluminescence de-tection can be used for higher sensitivity.
CE has been used for the separation, quantitation, anddetermination of molecular weights of proteins and pep-tides; for the analysis of polymerase chain reaction (PCR)products; and for the analysis of inorganic ions, organicacids, pharmaceuticals, optical isomers, and drugs ofabuse in serum and urine.14
CHROMATOGRAPHY
Chromatography refers to the group of techniques used toseparate complex mixtures on the basis of different phys-ical interactions between the individual compounds andthe stationary phase of the system. The basic components
FIGURE 5-23. Densitometer—basic components.
Detector
Capillary
Buffer(�)
Buffer(�)
Sample
Powersupply
FIGURE 5-24. Schematic of capillary electrophoresis instrumentation. Sample is loaded on the capillary by replacing theanode buffer reservoir with the sample reservoir. (Reprinted withpermission from Heiger DN. High-performance capillary electrophoresis. Waldbronn, Germany: Hewlett-Packard, 1992.)
CHAPTER 5 ■ ANALYTICAL TECHNIQUES 147
14460_Ch05.qxd 12/4/08 8:06 PM Page 147

PART I ■ BASIC PRINCIPLES AND PRACTICE OF CLINICAL CHEMISTRY148
in any chromatographic technique are the mobile phase(gas or liquid), which carries the complex mixture (sam-ple); the stationary phase (solid or liquid), through whichthe mobile phase flows; the column holding the station-ary phase; and the separated components (eluate).
Modes of Separation
AdsorptionAdsorption chromatography, also known as liquid-solidchromatography, is based on the competition betweenthe sample and the mobile phase for adsorptive sites onthe solid stationary phase. There is an equilibrium ofsolute molecules being adsorbed to the solid surface anddesorbed and dissolved in the mobile phase. The mole-cules that are most the soluble in the mobile phase, movefastest; the least soluble, move slowest. Thus, a mixtureis typically separated into classes according to polarfunctional groups. The stationary phase can be eitheracidic polar (e.g., silica gel), basic polar (e.g., alumina),or nonpolar (e.g., charcoal). The mobile phase can be asingle solvent or a mixture of two or more solvents, de-pending on the analytes to be desorbed. Liquid-solidchromatography is not widely used in clinical laborato-ries because of technical problems with the preparationof a stationary phase that has homogeneous distributionof absorption sites.
PartitionPartition chromatography is also referred to as liquid-liquid chromatography. Separation of solute is based onrelative solubility in an organic (nonpolar) solvent andan aqueous (polar) solvent. In its simplest form, partition(extraction) is performed in a separatory funnel. Mole-cules containing polar and nonpolar groups in an aque-ous solution are added to an immiscible organic solvent.After vigorous shaking, the two phases are allowed toseparate. Polar molecules remain in the aqueous solvent;nonpolar molecules are extracted in the organic solvent.
This results in the partitioning of the solute moleculesinto two separate phases.
The ratio of the concentration of the solute in the twoliquids is known as the partition coefficient:
K � (Eq. 5-11)
Modern partition chromatography uses pseudo liquidstationary phases that are chemically bonded to thesupport or high-molecular-weight polymers that are in-soluble in the mobile phase.15 Partition systems are con-sidered normal phase when the mobile solvent is lesspolar than the stationary solvent and reverse phase whenthe mobile solvent is more polar.
Partition chromatography is applicable to any sub-stance that may be distributed between two liquidphases. Because ionic compounds are generally solubleonly in water, partition chromatography works best withnonionic compounds.
Steric ExclusionSteric exclusion, a variation of liquid-solid chromatogra-phy, is used to separate solute molecules on the basis ofsize and shape. The chromatographic column is packedwith porous material, as shown in Figure 5-26. A samplecontaining different-sized molecules moves down thecolumn dissolved in the mobile solvent. Small moleculesenter the pores in the packing and are momentarilytrapped. Large molecules are excluded from the smallpores and so move quickly between the particles.Intermediate-sized molecules are partially restrictedfrom entering the pores and, therefore, move through thecolumn at an intermediate rate that is between those ofthe large and small molecules.
Early methods used hydrophilic beads of cross-linkeddextran, polyacrylamide, or agarose, which formed a gelwhen soaked in water. This method was termed gelfiltration. A similar separation process using hydrophobic
solute in stationary phasesolute in mobile phase
FIGURE 5-25. Differential solute migration superimposed on electro-osmotic flow in capillary zone electrophoresis. (Reprinted with permission from Heiger DN. High-performance capillary electrophoresis.France: Hewlett-Packard, 1992.)
14460_Ch05.qxd 12/4/08 8:06 PM Page 148

gel beads of polystyrene with a nonaqueous mobile phasewas called gel permeation chromatography. Currentporous packing uses rigid inorganic materials such as sil-ica or glass. The term steric exclusion includes all thesevariations. Pore size is controlled by the manufacturer,and packing materials can be purchased with differentpore sizes, depending on the size of the molecules beingseparated.
Ion-Exchange ChromatographyIn ion-exchange chromatography, solute mixtures areseparated by virtue of the magnitude and charge of ionicspecies. The stationary phase is a resin, consisting oflarge polymers of substituted benzene, silicates, or cellu-lose derivatives, with charge functional groups. The resinis insoluble in water, and the functional groups are im-mobilized as side chains on resin beads that are used tofill the chromatographic column. Figure 5-27A showsresin with sulfonate functional groups. Hydrogen� ionsare loosely held and free to react. This is an example of a
cation-exchange resin. When a cation such as Na� comesin contact with these functional groups, an equilibriumis formed, following the law of mass action. Becausethere are many sulfonate groups, Na� is effectively andcompletely removed from solution. The Na� concen-trated on the resin column can be eluted from the resinby pouring acid through the column, driving the equilib-rium to the left.
Anion-exchange resins are made with exchangeablehydroxyl ions such as the diethylamine functional groupillustrated in Figure 5-27B. They are used like cation-ex-change resins, except that hydroxyl ions are exchangedfor anions. The example shows Cl� in sample solutionexchanged for OH� from the resin functional group.Anion and cation resins mixed together (mixed-bedresin) are used to deionize water. The displaced protonsand hydroxyl ions combine to form water. Ionic func-tional groups other than the illustrated examples areused for specific analytic applications. Ion-exchangechromatography is used to remove interfering substancesfrom a solution, to concentrate dilute ion solutions, andto separate mixtures of charged molecules, such asamino acids. Changing pH and ionic concentration of themobile phase allows separation of mixtures of organicand inorganic ions.
Chromatographic Procedures
Thin-Layer ChromatographyThin-layer chromatography (TLC) is a variant of columnchromatography. A thin layer of sorbent, such as alumina,silica gel, cellulose, or cross-linked dextran, is uniformlycoated on a glass or plastic plate. Each sample to be ana-lyzed is applied as a spot near one edge of the plate, asshown in Figure 5-28. The mobile phase (solvent) is usu-ally placed in a closed container until the atmosphere issaturated with solvent vapor. One edge of the plate isplaced in the solvent, as shown. The solvent migrates upthe thin layer by capillary action, dissolving and carryingsample molecules. Separation can be achieved by any ofthe four processes previously described, depending on thesorbent (thin layer) and solvent chosen. After the solventreaches a predetermined height, the plate is removed anddried. Sample components are identified by comparisonwith standards on the same plate. The distance a compo-nent migrates, compared with the distance the solventfront moves, is called the retention factor, Rf:
Rf � (Eq. 5-12)
Each sample-component Rf is compared with the Rf ofstandards. Using Figure 5-28 as an example, standard Ahas an Rf value of 0.4, standard B has an Rf value of 0.6,and standard C has a value of 0.8. The first unknown
distance leading edge of component movestotal distance solvent front moves
FIGURE 5-27. Chemical equilibrium of ion-exchange resins.(A) Cation exchange resin. (B) Anion exchange resin.
FIGURE 5-26. Pictorial concept of steric exclusion chromatography.Separation of sample components by their ability to permeate porestructure of column-packing material. Smaller molecules (a) permeating the interstitial pores; large excluded molecules (b).(Reprinted with permission from Parris NA. Instrumental liquid chromatography: a practical manual on high performance liquidchromatographic methods. New York, N.Y.: Elsevier, 1976.)
CHAPTER 5 ■ ANALYTICAL TECHNIQUES 149
14460_Ch05.qxd 12/4/08 8:06 PM Page 149

PART I ■ BASIC PRINCIPLES AND PRACTICE OF CLINICAL CHEMISTRY150
contains A and C, because the Rf values are the same.This ratio is valid only for separations run under identi-cal conditions. Because Rf values may overlap for somecomponents, further identifying information is obtainedby spraying different stains on the dried plate and com-paring colors of the standards.
TLC is most commonly used as a semiquantitativescreening test. Technique refinement has resulted inthe development of semiautomated equipment and theability to quantitate separated compounds. For exam-ple, sample applicators apply precise amounts ofsample extracts in concise areas. Plates prepared withuniform sorbent thickness, finer particles, and new
solvent systems have resulted in the technique of high-performance thin-layer chromatography (HPTLC).16
Absorbance of each developed spot is measured using adensitometer, and the concentration is calculated bycomparison with a reference standard chromatographedunder identical conditions.
High-Performance Liquid Chromatography
Modern liquid chromatography uses pressure for fast sep-arations, controlled temperature, in-line detectors, andgradient elution techniques.17,18 Figure 5-29 illustrates thebasic components.
FIGURE 5-29. HPLC basic components. (Reprinted with permission from Bender GT. Chemical instrumentation: a labora-tory manual based on clinical chemistry. Philadelphia, Pa.: WB Saunders, 1972.)
FIGURE 5-28. TLC plate in chromatographic chamber.
14460_Ch05.qxd 12/4/08 8:06 PM Page 150

PumpsA pump forces the mobile phase through the column ata much greater velocity than that accomplished by grav-ity-flow columns and includes pneumatic, syringe, re-ciprocating, or hydraulic amplifier pumps. The mostwidely used pump today is the mechanical reciprocat-ing pump, which is now used as a multihead pump withtwo or more reciprocating pistons. During pumping,the pistons operate out of phase (180 degrees for twoheads, 120 degrees for three heads) to provide constantflow. Pneumatic pumps are used for preoperative pur-poses; hydraulic amplifier pumps are no longer com-monly used.
ColumnsThe stationary phase is packed into long stainless steelcolumns. HPLC is usually run at ambient temperatures,although columns can be put in an oven and heated toenhance the rate of partition. Fine, uniform columnpacking results in much less band broadening but re-quires pressure to force the mobile phase through. Thepacking also can be either pellicular (an inert core with aporous layer), inert and small particles, or macroporousparticles. The most common material used for columnpacking is silica gel. It is very stable and can be used indifferent ways. It can be used as solid packing in liquid-solid chromatography or coated with a solvent, whichserves as the stationary phase (liquid-liquid). As a resultof the short lifetime of coated particles, molecules of themobile-phase liquid are now bonded to the surface ofsilica particles.
Reversed-phase HPLC is now popular; the stationaryphase is nonpolar molecules (e.g., octadecyl C-18 hy-drocarbon) bonded to silica gel particles. For this typeof column packing, the mobile phase commonly used isacetonitrile, methanol, water, or any combination ofsolvents. A reversed-phase column can be used to sepa-rate ionic, nonionic, and ionizable samples. A buffer isused to produce the desired ionic characteristics andpH for separation of the analyte. Column packings varyin size (3 mm to 20 mm), using smaller particles mostlyfor analytic separations and larger ones for preparativeseparations.
Sample InjectorsA small syringe can be used to introduce the sample intothe path of the mobile phase that carries it into the col-umn (Fig. 5-29). The best and most widely used method,however, is the loop injector. The sample is introducedinto a fixed-volume loop. When the loop is switched, thesample is placed in the path of the flowing mobile phaseand flushed onto the column.
Loop injectors have high reproducibility and areused at high pressures. Many HPLC instruments haveloop injectors that can be programmed for automatic
injection of samples. When the sample size is less thanthe volume of the loop, the syringe containing the sam-ple is often filled with the mobile phase to the volumeof the loop before filling the loop. This prevents thepossibility of air being forced through the column be-cause such a practice may reduce the lifetime of the col-umn packing material.
DetectorsModern HPLC detectors monitor the eluate as it leavesthe column and, ideally, produce an electronic signalproportional to the concentration of each separated com-ponent. Spectrophotometers that detect absorbances ofvisible or UV light are most commonly used. PDA andother rapid scanning detectors are also used for spectralcomparisons and compound identification and purity.These detectors have been used for drug analyses inurine. Obtaining a UV scan of a compound as it elutesfrom a column can provide important information as toits identity. Unknowns can be compared against libraryspectra in a similar manner to MS. Unlike gas chro-matography (GC)/MS, which requires volatilization oftargeted compounds, liquid chromatography/photodiodearray (LC/PDA) enables direct injection of aqueous urinesamples.
Because many biologic substances fluoresce strongly,fluorescence detectors are also used, involving the sameprinciples discussed in the section on spectrophotomet-ric measurements. Another common HPLC detector isthe amperometric or electrochemical detector, whichmeasures current produced when the analyte of interestis either oxidized or reduced at some fixed potential setbetween a pair of electrodes.
A mass spectrometer (MS) can also be used as a de-tector, as described later.
RecordersThe recorder is used to record detector signal versus thetime the mobile phase passed through the instrument,starting from the time of sample injection. The graph iscalled a chromatogram (Fig. 5-30). The retention time isused to identify compounds when compared with stan-dard retention times run under identical conditions.Peak area is proportional to concentration of the com-pounds that produced the peaks.
When the elution strength of the mobile phase isconstant throughout the separation, it is called isocraticelution. For samples containing compounds of widelydiffering relative compositions, the choice of solvent is acompromise. Early eluting compounds may have reten-tion times close to zero, producing a poor separation(resolution), as shown in Figure 5-30A. Basic com-pounds often have low retention times because C-18columns cannot tolerate high pH mobile phases. The ad-dition of cation-pairing reagents to the mobile phase
CHAPTER 5 ■ ANALYTICAL TECHNIQUES 151
14460_Ch05.qxd 12/4/08 8:06 PM Page 151

PART I ■ BASIC PRINCIPLES AND PRACTICE OF CLINICAL CHEMISTRY152
(e.g., octane sulfonic acid) can result in better retentionof negatively charged compounds onto the column.
The late-eluting compounds may have long retentiontimes, producing broad bands resulting in decreasedsensitivity. In some cases, certain components of a sam-ple may have such a great affinity for the stationaryphase that they do not elute at all. Gradient elution isan HPLC technique that can be used to overcome thisproblem. The composition of the mobile phase is var-ied to provide a continual increase in the solventstrength of the mobile phase entering the column (Fig.5-30B). The same gradient elution can be performedwith a faster change in concentration of the mobilephase (Fig. 5-30C).
Gas Chromatography
Gas chromatography is used to separate mixtures ofcompounds that are volatile or can be made volatile.19
Gas chromatography may be gas-solid chromatogra-phy (GSC), with a solid stationary phase, or gas-liquid
FIGURE 5-30. Chromatograms. (A) Isocratic ion-exchange separation mobile phase contains0.055 mol/L NaNO3. (B) Gradient elution mobile phase gradient from 0.01 to 0.1 mol/L NaNO3 at2% per minute. (C) Gradient elution—5% per minute. (Reprinted with permission from Horváth C.High performance liquid chromatography, advances and perspectives. New York, N.Y.: AcademicPress, 1980.)
chromatography (GLC), with a nonvolatile liquid sta-tionary phase. GLC is commonly used in clinical labora-tories. Figure 5-31 illustrates the basic components of aGC system. The setup is similar to HPLC, except that themobile phase is a gas and samples are partitioned be-tween a gaseous mobile phase and a liquid stationaryphase. The carrier gas can be nitrogen, helium, or argon.The selection of a carrier gas is determined by the detec-tor used in the instrument. The instrument can be oper-ated at a constant temperature or programmed to run atdifferent temperatures if a sample has components withdifferent volatilities. This is analogous to gradient elutiondescribed for HPLC.
The sample, which is injected through a septum,must be injected as a gas or the temperature of the in-jection port must be above the boiling point of the com-ponents so that they vaporize upon injection. Samplevapor is swept through the column partially as a gasand partially dissolved in the liquid phase. Volatilecompounds that are present mainly in the gas phasewill have a low partition coefficient and will move
14460_Ch05.qxd 12/4/08 8:06 PM Page 152

quickly through the column. Compounds with higherboiling points will move slowly through the column.The effluent passes through a detector that produces anelectric signal proportional to the concentration of thevolatile components. As in HPLC, the chromatogram isused both to identify the compounds by the retentiontime and to determine their concentration by the areaunder the peak.
ColumnsGLC columns are generally made of glass or stainlesssteel and are available in a variety of coil configurationsand sizes. Packed columns are filled with inert particlessuch as diatomaceous earth or porous polymer or glassbeads coated with a nonvolatile liquid (stationary) phase.These columns are usually 1⁄8 to 1⁄4 inch wide and 3 to 12feet long. Capillary-wall coated open tubular columnshave inside diameters in the range of 0.25 mm to 0.50mm and are up to 60 m long. The liquid layer is coatedon the walls of the column. A solid support coated witha liquid stationary phase may in turn be coated on col-umn walls.
The liquid stationary phase must be nonvolatile at thetemperatures used, must be thermally stable, and mustnot react chemically with the solutes to be separated. Thestationary phase is termed nonselective when separationis primarily based on relative volatility of the com-pounds. Selective liquid phases are used to separate polarcompounds based on relative polarity (as in liquid-liquidchromatography).
DetectorsAlthough there are many types of detectors, only thermalconductivity (TC) and flame ionization detectors are dis-cussed because they are the most stable (Fig. 5-32). TCdetectors contain wires (filaments) that change electrical
resistance with change in temperature. The filamentsform opposite arms of a Wheatstone bridge and areheated electrically to raise their temperature. Helium,which has a high thermal conductivity, is usually the car-rier gas. Carrier gas from the reference column flowssteadily across one filament, cooling it slightly. Carriergas and separated compounds from the sample columnflow across the other filament. The sample componentsusually have a lower thermal conductivity, increasing thetemperature and resistance of the sample filament. Thechange in resistance results in an unbalanced bridge cir-cuit. The electrical change is amplified and fed to therecorder. The electrical change is proportional to theconcentration of the analyte.
Flame ionization detectors are widely used in theclinical laboratory. They are more sensitive than TC de-tectors. The column effluent is fed into a small hydro-gen flame burning in excess air or atmospheric oxygen.The flame jet and a collector electrode around the flamehave opposite potentials. As the sample burns, ionsform and move to the charged collector. Thus, a current
FIGURE 5-32. (A) Schematic diagram of a thermal conductivitydetector. (B) Schematic diagram of a flame ionization detector.(Reprinted with permission from Tietz NW, ed. Fundamentals ofclinical chemistry. Philadelphia, Pa.: WB Saunders, 1987.)
FIGURE 5-31. GLC basic components. (Reprinted with permissionfrom Bender GT. Chemical instrumentation: a laboratory manualbased on clinical chemistry. Philadelphia, Pa.: WB Saunders, 1972.)
CHAPTER 5 ■ ANALYTICAL TECHNIQUES 153
14460_Ch05.qxd 12/4/08 8:06 PM Page 153

PART I ■ BASIC PRINCIPLES AND PRACTICE OF CLINICAL CHEMISTRY154
proportional to the concentration of the ions is formedand fed to the recorder.
MASS SPECTROMETRY
Definitive identification of samples eluting from GC orHPLC columns is possible when an MS is used as a de-tector.20 The coupled techniques, GC/MS and LC/MS,have powerful analytic capabilities with widespreadclinical applications. The sample in an MS is firstvolatilized and then ionized to form charged molecularions and fragments that are separated according to theirmass-to-charge (m/z) ratio; the sample is then meas-ured by a detector, which gives the intensity of theion current for each species. These steps take place inthe four basic components that are standard in allMSs: the sample inlet, ionization source, mass analyzer,and ion detector (Fig. 5-33). Ultimately, moleculeidentification is based on the formation of characteris-tic fragments. Figure 5-34 illustrates the mass spec-trum of �9-carboxytetrahydrocannabinol, a metaboliteof marijuana.
Sampleinlet
Vacuum pumps
Data
Mass Spectrometer Components
Massanalyzer
Ionizationsource
Ionizationdetection
FIGURE 5-33. The components of a mass spectrometer. In this case, the ionization source pic-tured is electrospray ionization and the mass analyzer is a quadrupole.
8000
6000
4000
2000
0m/z– – >
Abundance
150 200 250 300 450 500400350
#16: THC tms (*) 371
208 231 265 289 327355 298 417
445
473
488
297
FIGURE 5-34. Mass spectrum of the trimethylsilane derivative of �9-carboxytetrahydrocannabinol (marijuanametabolite).
Sample Introduction and Ionization
Direct infusion is commonly used to interface a GC orLC with an MS; however, the challenge of introducing aliquid sample from an LC column into an MS was a sig-nificant barrier until recent technological advances inionization techniques.
Electron IonizationThe most common form of ionization used in GC/MS iselectron ionization (EI). This method requires a sourceof electrons in the form of a filament to which an elec-tric potential is applied, typically at 70 electron volts.21
The molecules in the source are bombarded with high-energy electrons, resulting in the formation of chargedmolecular ions and fragments. Molecules break downinto characteristic fragments according to their molecu-lar structure (Fig. 5-35). The ions formed and their rel-ative proportions are reproducible and can be used forqualitative identification of the compound. Since mostinstruments use the same 70 eV potential, the fragmen-tation of molecules on different days and different
14460_Ch05.qxd 12/4/08 8:06 PM Page 154

instruments is remarkably similar, allowing the com-parison of unknown spectra to spectra in a publishedreference library.21
Atmospheric Pressure IonizationUnlike EI in GC/MS, most LC/MS ionization techniquesare conducted at atmospheric pressure. As such, the ionsource of this type of instrument is not included in thehigh vacuum region of the instrument. Two types ofionization for LC/MS will be discussed here: electrosprayionization (ESI) and atmospheric pressure chemicalionization (APCI), while matrix-assisted laser desorption(MALDI) and surface-enhanced laser desorption (SELDI)ionization will be discussed later in the section on pro-teomics. ESI and APCI also differ from EI in that they are“soft” ionization techniques that leave the molecular ionlargely intact in the source. Many LC/MS techniques em-ploy technologies after the source, in the mass analyzer, tofragment molecules and generate the “fingerprint” spectraused in identification. However, ionization techniquesused in LC/MS produce fragments and therefore massspectra that are somewhat less reproducible between in-struments than EI used in GC/MS. This may prove to limitthe utility of reference library spectra produced on otherinstruments.
Electrospray IonizationThanks to its wide mass range and high sensitivity, ESI canbe applied to a wide range of biological macromolecules
in addition to small molecules and has become the mostcommon ionization source for LC/MS.
ESI involves passing the LC effluent through a capil-lary to which a voltage has been applied. The energy istransferred to the solvent droplets, which becomecharged.21 Evaporation of the solvent through heat andgas causes the droplets to decrease in size, which in-creases the charge density on the surface. Eventually,the Coulombic repulsion of like charges lead to theejection of ions from the droplet22 (Fig. 5-36). The in-dividually charged molecules are drawn into the MS formass analysis.
ESI is adept at forming singly charged small mole-cules, but larger molecules can also be ionized usingthis method. Larger molecules such as proteins be-come multiply charged in ESI, and since MSs measurethe m/z, even these large molecules can be observedin an instrument with a relatively small mass range22
(Fig. 5-37).
Atmospheric Pressure Chemical IonizationAnother important ionization source is APCI, which issimilar to ESI in that the liquid from LC is introduced di-rectly into the ionization source. However, the dropletsare not charged and the source contains a heated vapor-izer to allow rapid desolvation of the drops.22 A highvoltage is applied to a corona discharge needle, whichemits a cloud of electrons to ionize compounds after theyare converted to the gas phase.
Electrons
303
303
182
182
82
82
105
105
OCH3
O
O
C
OC
CH3
N
FIGURE 5-35. Electron bombardment breaks cocaine into frag-ments, with number and size quantified. Unlike the illustrative glasstumbler, the result of mass fragmentation of cocaine or other chemi-cal compounds is both predictable and reproducible, especially withelectron ionization.
CHAPTER 5 ■ ANALYTICAL TECHNIQUES 155
14460_Ch05.qxd 12/4/08 8:06 PM Page 155

PART I ■ BASIC PRINCIPLES AND PRACTICE OF CLINICAL CHEMISTRY156
Mass Analyzer
The actual measuring of the m/z occurs when the gasphase ions pass into the mass analyzer. Two types ofmass analyzers will be discussed here: the quadrupoleand ion trap, while time-of-flight (TOF) will be dis-cussed later in the proteomics section. Both quadru-pole and ion trap mass analyzers contain rods orplates that are charged with varying AC and DC volt-ages to form electric fields. These electric fields manip-ulate the charged molecules to sort them according totheir m/z.
QuadrupoleA diagram of a quadrupole MS is shown in Figure 5-38.The quadrupole is the most common mass analyzer in usetoday. The electric field on the two sets of diagonally op-posed rods allows only ions of a single selected m/z value
to pass through the analyzer to the detector. All otherions are deflected into the rods. The rods can be scannedfrom low to high mass to allow ions of increasing mass toform stable sinusoidal orbits and traverse the filtering sec-tor. This technique will generate a full scan mass spec-trum. Alternatively, specific masses can be selected tomonitor a few target analytes. This technique is called se-lected ion monitoring (SIM) and it allows for a longerdwell time (time spent monitoring a single ion) andtherefore higher sensitivity.21 A full scan provides moreinformation than SIM since ions not specifically selectedin SIM are not detected. Therefore, a full scan would bepreferable for general unknown screening while SIManalysis is more suitable for target compound analysis.
Ion TrapThe ion trap can be thought of as a modified quadrupole.A linear ion trap employs a stopping potential on the end
5+
[M + 5H]5+
m/z = 10,005 + 5= 2001
4+
0 m/z 10,000
5+2001
4+2501
3+3334 2+
5001 1+10,001
[M + 4H]4+
m/z = 10,004 + 4= 2501
3+
[M + 3H]3+
m/z = 10,003 + 3= 3334
2+
[M + 2H]2+
m/z = 10,002 + 2= 5,001
1+
[M + 1H]1+
m/z = 10,001 + 1= 10,001
FIGURE 5-37. A theoretical protein with a molecular weight of 10,000 can be multiply charged, whichwill generate numerous peaks. A mass spectrometer with a relatively small mass range can still detectthe multiply charged ions since the m/z is reduced.
Spray needle tipMultiply
charged droplet
Analytemolecule
Solventevaporation
“Coulombic”explosion
Cone(counterelectrode)
Analyteions
Multiplycharged droplet
Power supply+ve –ve
FIGURE 5-36. Diagram of electrospray ionization, the most common ionization source for LC/MS.
14460_Ch05.qxd 12/4/08 8:06 PM Page 156
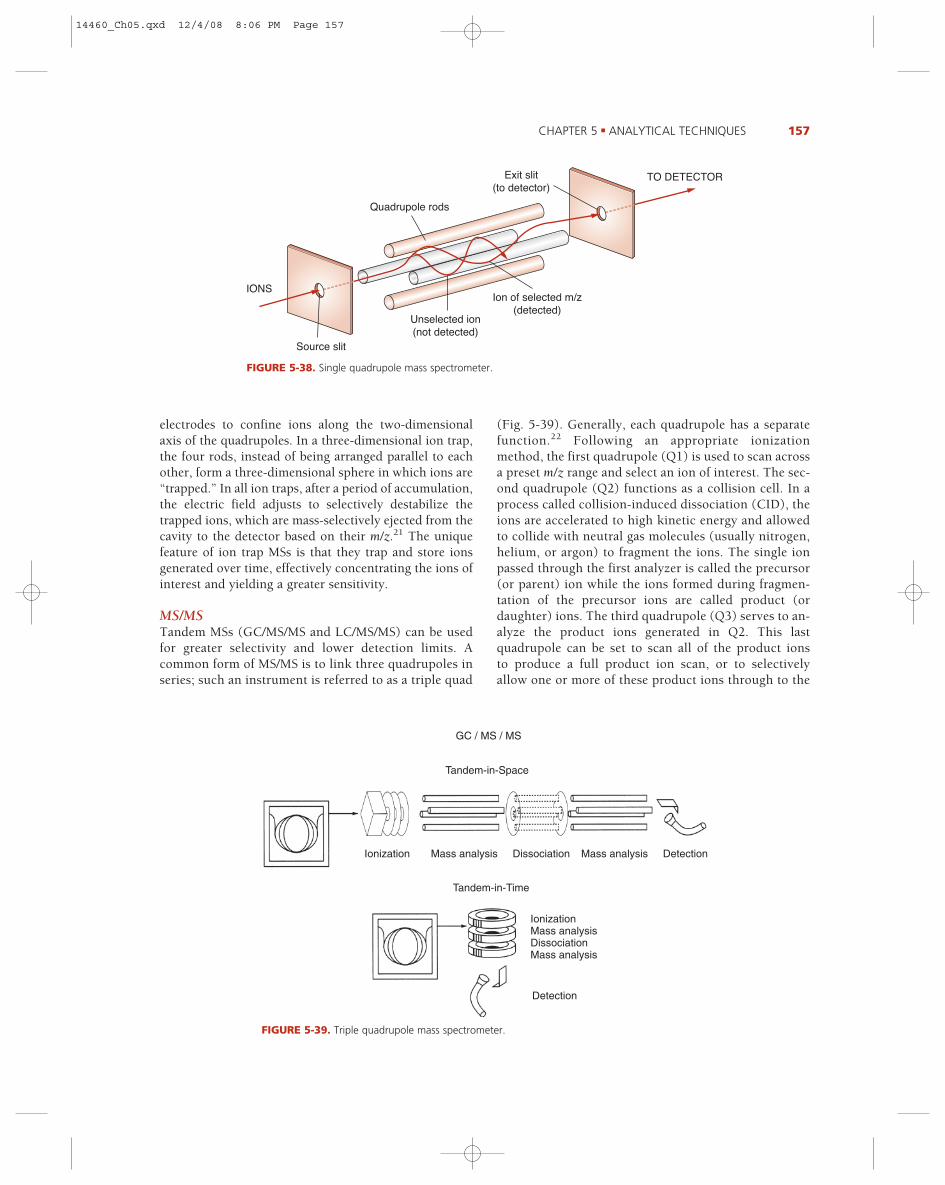
electrodes to confine ions along the two-dimensionalaxis of the quadrupoles. In a three-dimensional ion trap,the four rods, instead of being arranged parallel to eachother, form a three-dimensional sphere in which ions are“trapped.” In all ion traps, after a period of accumulation,the electric field adjusts to selectively destabilize thetrapped ions, which are mass-selectively ejected from thecavity to the detector based on their m/z.21 The uniquefeature of ion trap MSs is that they trap and store ionsgenerated over time, effectively concentrating the ions ofinterest and yielding a greater sensitivity.
MS/MSTandem MSs (GC/MS/MS and LC/MS/MS) can be usedfor greater selectivity and lower detection limits. Acommon form of MS/MS is to link three quadrupoles inseries; such an instrument is referred to as a triple quad
(Fig. 5-39). Generally, each quadrupole has a separatefunction.22 Following an appropriate ionizationmethod, the first quadrupole (Q1) is used to scan acrossa preset m/z range and select an ion of interest. The sec-ond quadrupole (Q2) functions as a collision cell. In aprocess called collision-induced dissociation (CID), theions are accelerated to high kinetic energy and allowedto collide with neutral gas molecules (usually nitrogen,helium, or argon) to fragment the ions. The single ionpassed through the first analyzer is called the precursor(or parent) ion while the ions formed during fragmen-tation of the precursor ions are called product (ordaughter) ions. The third quadrupole (Q3) serves to an-alyze the product ions generated in Q2. This lastquadrupole can be set to scan all of the product ionsto produce a full product ion scan, or to selectivelyallow one or more of these product ions through to the
GC / MS / MS
Tandem-in-Space
Ionization Mass analysis Dissociation Mass analysis Detection
Tandem-in-Time
IonizationMass analysisDissociationMass analysis
Detection
FIGURE 5-39. Triple quadrupole mass spectrometer.
IONS
Source slit
Quadrupole rods
Unselected ion(not detected)
Ion of selected m/z(detected)
Exit slit(to detector)
TO DETECTOR
FIGURE 5-38. Single quadrupole mass spectrometer.
CHAPTER 5 ■ ANALYTICAL TECHNIQUES 157
14460_Ch05.qxd 12/4/08 8:06 PM Page 157

PART I ■ BASIC PRINCIPLES AND PRACTICE OF CLINICAL CHEMISTRY158
detector in a process called selected reaction monitor-ing (SRM). Various scanning modes commonly usedin a triple quad are shown in Figure 5-40. In sometriple quad instruments, the third quadrupole can alsofunction as a linear ion trap to add further sensitivityto MS/MS.
Detector
The most common means of detecting ions employs anelectron multiplier (Fig. 5-41). In this detector, a seriesof dynodes with increasing potentials are linked. Whenions strike the first dynode surface, electrons are emitted.
These electrons are attracted to the next dynode wheremore secondary electrons are emitted due to the higherpotential of subsequent dynodes. A cascade of electronsis formed by the end of the chain of dynodes, resultingin overall signal amplification on the order of 1 millionor greater.22
Applications of Mass Spectrometry in theClinical Laboratory
Mass spectrometers coupled to GC or LC can be used notonly for the identification and quantitation of compoundsbut also for structural information and molecular weight
Ions in
Dry node
Signal out(x106)
FIGURE 5-41. Diagram of an electron multiplier detector in a mass spectrometer.
Full Scan IAS
SIM
IAS/MSProduct Ion Scan
IAS/MSSRM
Q1 Q2
CID gas
Q3
A.
B.
C.
D.
FIGURE 5-40. Scanning modes used in a triple quadrupole mass spectrometer. (A) Full scan MS de-tects all ions. (B) Selected ion monitoring (SIM) detects ions of one selected m/z. (C) Product ion scansselect ions of one m/z in Q1 to pass on to Q2, the collision cell, where the ion is fragmented. All ionfragments are allowed to pass through to the detector. (D) Selected reaction monitoring (SRM) is simi-lar to the product ion scan, but only fragments of one selected m/z are allowed to pass on to the de-tector. Both C and D are examples of tandem mass spectrometry (MS/MS).
14460_Ch05.qxd 12/4/08 8:06 PM Page 158

determination.23 GC/MS systems are widely used formeasuring drugs of abuse in urine toxicology confirma-tions. Drugs and metabolites must be extracted from bodyfluids and typically reacted with derivatizing reagents toform compounds that are more volatile for the GCprocess. Computerized libraries and matching algorithmsare available within the instrument to compare mass spec-tral results of an unknown substance obtained from asample to the reference library.
Increasingly, LC/MS (including LC/MS/MS) technol-ogy is taking its place alongside GC/MS in clinical labo-ratories. LC offers a number of advantages over GC.Typically, LC requires less extensive extraction proce-dures and derivatization is rarely used, saving time andexpense. In addition, polar and heat-labile compoundsfare better in LC.21 However, the chromatography itselfin LC can be somewhat less robust than in GC, resultingin wider peaks, more variable retention times and poten-tially requiring more frequent maintenance. Anotherdisadvantage of LC/MS is the less reproducible massspectra, as mentioned earlier.
Besides its use in toxicology, LC/MS also has greatpotential for measuring low-level and mixed-polarityanalytes such as vitamin D, testosterone, and immuno-suppressant drugs due to its superior sensitivity andspecificity over immunoassays. In addition, LC/MS hasthe advantage of being able to detect multiple analytes(such as a panel of drugs or a series of metabolites) inone run. LC/MS is free from the antibody interferencesseen in immunoassays, although LC/MS has its own typeof interference in the form of ion suppression. This effectis seen when a co-eluting chemical in the sample pre-vents a compound of interest from being ionized, therebyreducing or eliminating its signal. LC/MS also requireshighly skilled operators and is not nearly as automated asimmunoassay instruments.
INSTRUMENTATION FOR PROTEOMICS
The next generation of biomarkers for human dis-eases will be discovered using techniques found withinthe research fields of genomics and proteomics.Genomics use the known sequences of the entirehuman genome for determining the role of genetics incertain human diseases. Proteomics is the investiga-tion of the protein products encoded by these genes.Protein expression is equal to and, in many cases, moreimportant for disease detection than genomics becausethese products determine what is currently occurringwithin a cell, rather than the genes, which indicatewhat a cell might be capable of performing. Moreover,many (posttranslational) changes can occur to theprotein, as influenced by other proteins and enzymesthat cannot be easily predicted by knowledge at thegenomic level.
A “shotgun” approach is often used in the discovery ofnew biochemical markers. The proteins from samples(e.g., serum, urine, tissue extract) from normal individu-als are compared with those derived from patients withthe disease being studied. Techniques such as two-dimensional electrophoresis can be used to separate pro-teins into individual spots or bands. Proteins that onlyappear in either the normal or diseased specimens arefurther studied. Computer programs are available thatdigitally compare gels to determine spots or areas thatare different. When candidate proteins have been found,the spots can be isolated and subjected to sophisticatedMS analysis to identify the protein and possibly any post-translational modifications that may have occurred.Using this approach, the researcher does not have anypreconceptions or biases as to what directions or partic-ular proteins to look for.
Two-Dimensional Electrophoresis
This electrophoresis assay combines two different elec-trophoresis dimensions to separate proteins from com-plex matrices such as serum or tissue. In the firstdimension, proteins are resolved according to theirisoelectric points (pIs), using immobilized pH gradi-ents. Commercial gradients are available in a varietyof pH ranges. In the second dimension, proteins areseparated according to their relative size (molecularweight), using sodium dodecyl sulfate-polyacrylamidegel electrophoresis (SDS-PAGE). A schematic of thisprocedure is shown in Figure 5-42. Gels can be rununder denaturing or nondenaturing conditions (e.g.,for the maintenance of enzyme activity) and visualizedby a variety of techniques, including the use of col-orimetric dyes (e.g., Coomassie blue or silver stain),radiographic, fluorometric, or chemiluminescence ofappropriately labeled polypeptides. These latter tech-niques are considerably more sensitive than the colori-metric dyes.
MALDI-TOF and SELDI-TOF MassSpectrometry
Matrix-assisted laser desorption ionization time-of-flight mass spectrometry (MALDI-TOF) is used for theanalysis of biomolecules, such peptides and proteins.Protein samples, such as those isolated from a two-dimensional electrophoretogram, are mixed with an ap-propriate matrix solvent and spotted onto a stainlesssteel plate. The solvent is dried and the plate is intro-duced into the vacuum system of the MALDI-TOF ana-lyzer. As shown in Figure 5-43, a laser pulse irradiatesthe sample causing desorption and ionization of boththe matrix and sample. Because the monitored massspectral range is high (500 daltons), the ionization
CHAPTER 5 ■ ANALYTICAL TECHNIQUES 159
14460_Ch05.qxd 12/4/08 8:06 PM Page 159

PART I ■ BASIC PRINCIPLES AND PRACTICE OF CLINICAL CHEMISTRY160
FIGURE 5-42. Hypothetical example of a two-dimensional elec-trophoretogram from a patient with a disease (panel 1) comparedwith a normal subject (panel 2). The patient exhibits a protein (oval )that is not expressed in the normal subject. This protein might be apotential marker for this disease. (Gels courtesy of KendrickLaboratories, Madison, Wis.)
of the low-molecular-weight matrix can be readilydistinguished from high-molecular-weight peptides andproteins and do not interfere with the assay of the pro-tein. Ions from the sample are focused into the massspectrum. The time required for a mass to reach the de-tector is a nonlinear function of the mass, with largerions requiring more time than smaller ions. The molec-ular weight of the proteins acquired by mass spectrumis used to determine the identity of the sample and ishelpful in determining posttranslational modificationsthat may have occurred. For very large proteins, sam-ples can be pretreated with trypsin, which cleaves pep-tide bonds between lysine and arginine, to producelower-molecular-weight fragments that can then bemeasured. The detection limit of this assay is about10�15 to 10�18 moles. A modification of MALDI-TOFMS is surface-enhanced laser desorption ionizationtime-of-flight (SELDI-TOF) MS, in which proteins aredirectly captured on a chromatographic biochip with-out the need of sample preparation. Figure 5-44 illus-trates the SELDI-TOF process.
OSMOMETRY
An osmometer is used to measure the concentration ofsolute particles in a solution. The mathematic defini-tion is
Osmolality � � � n � C (Eq. 5-13)
where � is osmotic coefficient, n is number of dissociableparticles (ions) per molecule in the solution, and C is �concentration in moles per kilogram of solvent.
The osmotic coefficient is an experimentally derivedfactor to correct for the fact that some of the molecules,even in a highly disociated compound, exist as moleculesrather than ions.
The four physical properties of a solution that changewith variations in the number of dissolved particles inthe solvent are osmotic pressure, vapor pressure, boilingpoint, and freezing point. Osmometers measure osmo-lality indirectly by measuring one of these colligativeproperties, which change proportionally with osmoticpressure. Osmometers in clinical use measure eitherfreezing-point depression or vapor-pressure depression;results are expressed in milliosmolal per kilogram(mOsm/kg) units.
Freezing-Point Osmometer
Figure 5-45 illustrates the basic components of a freez-ing-point osmometer. The sample in a small tube islowered into a chamber with cold refrigerant circulat-ing from a cooling unit. A thermistor is immersed in thesample. To measure temperature, a wire is used to gen-tly stir the sample until it is cooled to several degreesbelow its freezing point. It is possible to cool water toas low as �40°C and still have liquid water, providedno crystals or particulate matter are present. This is
Laser
Analyte
Matrix
Time-of-flightmass spectrometry
FIGURE 5-43. Sample desorption process prior to MALDI-TOFanalysis. (Diagram courtesy of Stanford Research Systems,Sunnyvale, Ca.)
14460_Ch05.qxd 12/4/08 8:06 PM Page 160

1
2
3
4
5
6
7
8
Laser
Desorption/ Ionization
Detector
Flight tube
Inte
nsity
Low Mass/ Charge High
(+)
(+) (+) (+)
+
+
Work station
Sample
Wash
EAM
SELDIReader(PBSII)
Rawspectra
Gray scale(gel) view
Select Chip Array: Hydrophobic Anionic Cationic Metal binding AntibodyRemove unbound proteins,salts, and other contaminants.
Sinapic Acid (SPA) or α-Cyano-4-hydroxyCinnamic Acid (CHCA)
1 2 3 4 5 6 7 8
1 2 3 4 5 6 7 8
1 2 3 4 5 6 7 8
AFIGURE 5-44. (A, B) Overview of the SELDI-TOF process. (Diagram courtesy of Ciphergen Biosystems, Fremont, Ca.) (continues)
CHAPTER 5 ■ ANALYTICAL TECHNIQUES 161
14460_Ch05.qxd 12/4/08 8:06 PM Page 161

PART I ■ BASIC PRINCIPLES AND PRACTICE OF CLINICAL CHEMISTRY162
TOF-MS
1
2
3
4
5
6
7
8
N-Laser
Detector
1. Apply supernatant from CD8+ cells
Supernatant from stimulated andunstimulated CD8+ cell culturesfrom Normal, LTPN, and Progressorsis added to a Protein Chip Array.Proteins bind to chemical orbiological "docking" sites on thearray surface through an affinityinteraction.
2. Wash Protein Chip Array
Proteins that bind non-specificallyand buffer contaminants arewashed away, eliminatingsample noise.
3. Add energy absorbing molecules or "matrix"
After sample processing, the arrayis dried and EAM is applied to eachspot to facilitate desorption andionization.
4. Analyze in a Protein Chip Reader
The proteins that are retained on thearray are detected on the Protein ChipReader.
BFIGURE 5-44. (Continued)
14460_Ch05.qxd 12/4/08 8:06 PM Page 162

referred to as a supercooled solution. Vigorous agita-tion when the sample is supercooled results in rapidfreezing. Freezing also can be started by “seeding” a su-percooled solution with crystals. When the supercooledsolution starts to freeze as a result of the rapid stirring,a slush is formed and the solution actually warms to itsfreezing-point temperature. The slush, an equilibriumof liquid and ice crystals, will remain at the freezing-point temperature until the sample freezes solid anddrops below its freezing point.
Impurities in a solvent will lower the temperature atwhich freezing or melting occurs by reducing the bond-ing forces between solvent molecules so that the mole-cules break away from each other and exist as a fluid at alower temperature. The decrease in the freezing-point
temperature is proportional to the number of dissolvedparticles present.
The thermistor is a material that has less resistancewhen the temperature increases. The readout uses aWheatstone bridge circuit that detects temperaturechange as proportional to change in thermistor resist-ance. Freezing-point depression is proportional to thenumber of solute particles. Standards of known con-centration are used to calibrate the instruments inmOsm/kg.
ANALYTIC TECHNIQUES FOR POINT-OF-CARETESTING
Point-of-care testing (POCT) devices are widely used fora variety of clinical applications, including physician of-fices, emergency departments, intensive care units, andeven for self-testing. Because analyses can be done at pa-tient-side by primary caregivers, the major attraction ofPOCT is the reduced turnaround time needed to deliverresults. In some cases, total costs can be reduced if the de-vices eliminate the need for laboratory-based instrumen-tation or if increased turnaround times lead to shorterhospital stays. POCT relies on the same analytic tech-niques as laboratory-based instrumentation: spectrome-try, electroanalytic techniques, and chromatography. Assuch, the same steps needed to perform an analysis fromthe central laboratory are needed for POCT, including in-strument validation, periodic assay calibration, qualitycontrol testing, operator training, and proficiency testing.Chapter 9 provides an in-depth discussion of this tech-nology. The analytic techniques used in these devices aregiven in this section.
FIGURE 5-45. Freezing-point osmometer. (Reprinted with permis-sion from Coiner D. Basic concepts in laboratory instrumentation.Bethesda, Md.: ASMT Education and Research Fund, 1975–1979.)
FIGURE 5-46. Dual-wavelength reflectance photometry used inpoint-of-care glucose monitors. A microporous hydrophilic membraneis used as a reservoir of the sample to filter out solid cellular materialfrom the reservoir and provide a smooth, optical surface for re-flectance measurements. (Figure courtesy of Lifescan Inc. One touchsystem technology. Challenges in diabetes management: clinical pro-tocols for professional practice. New York, N.Y.: Health EducationTechnologies, 1988.)
CHAPTER 5 ■ ANALYTICAL TECHNIQUES 163
14460_Ch05.qxd 12/4/08 8:06 PM Page 163

PART I ■ BASIC PRINCIPLES AND PRACTICE OF CLINICAL CHEMISTRY164
REFERENCES
1. Christian GD, et al. Instrumental analysis. 2nd ed. Boston, Mass.:Allyn and Bacon, 1986.
2. Willard HH, et al. Instrumental methods of analysis. Belmont,Calif.: Wadsworth, 1981.
3. Coiner D. Basic concepts in laboratory instrumentation. Bethesda,Md.: ASMT Education and Research Fund, 1975–1979.
4. Ingle JD, Crouch SR. Spectrochemical analysis. Upper SaddleRiver, N.J.: Prentice-Hall, 1988.
5. Holland JF, et al. Mass spectrometry on the chromatographic timescale: realistic expectations. Anal Chem 1983;55:997A.
6. Guilbault GG. Practical fluorescence, theory, methods and tech-niques. New York, N.Y.: Marcel Dekker, 1973.
7. Kricka LJ. Chemiluminescent and bioluminescent techniques. ClinChem 1991;37:1472.
8. Wild D. The immunoassay handbook. London, UK: MacmillanPress, 1994.
****
**
Membranebarrier
Targetanalytes
BIODETECTION TRANSDUCTION ELECTRONICS
Signalprocessing
Biodetectionagent
Transducer
Biodetectionproduct
Display
FIGURE 5-47. Schematic diagram of a biosensor. (Reprinted with permission from Rosen A. Biosensors:where do we go from here? MLO Med Lab Obs 1995;27:24.)
The most commonly used POCT devices used at bed-side, in physician offices, and at home are the fingerstickblood glucose monitors. The first-generation devices use aphotometric approach, whereby glucose produces hydro-gen peroxide (H2O2) with glucose oxidase immobilizedonto test strips. The H2O2 is coupled to peroxidase to pro-duce a color whose intensity is measured as a function ofconcentration and measured using reflectance photome-try. A schematic of this technique is shown in Figure 5-46.These strips are measured for glucose concentration with-out the need to wipe the blood off the strips.
The strip technology in a POCT platform can also beused to measure proteins and enzymes, such as cardiacmarkers. The separation of analytes from the matrix isaccomplished by paper chromatography, in which spe-cific antibodies immobilized onto the chromatographicsurface capture the target analyte as it passes through.For qualitative analysis, detection is made by visualmeans. Reflectance meters similar to those used for glu-cose are also available for quantitative measurements.
The next generation of POCT devices use biosen-sors.22 A biosensor couples a specific biodetector, suchas an enzyme, antibody, or nucleic acid probe, to atransducer for the direct measurement of a target ana-lyte without the need to separate it from the matrix24
(Fig. 5-47). The field has exploded in recent years withthe development of microsilicon chip fabricationbecause biosensors can be miniaturized and made avail-able at low costs. An array of biosensors can beproduced onto a single silicon wafer to produce a mul-tipanel of results, such as an electrolyte profile.Commercial POCT devices use electrochemical (e.g.,microion-selective electrodes) and optical biosensorsfor the measurement of glucose, electrolytes, and arte-rial blood gases. With the immobilization of antibodiesand specific DNA sequences, biosensor probes will soonbe available for detection of hormones, drugs and drugsof abuse, and hard-to-culture bacteria and viruses suchas Chlamydia, tuberculosis, or human immunodefi-ciency virus.22
14460_Ch05.qxd 12/4/08 8:06 PM Page 164

9. Svelto O, et al. Principles of lasers. 2nd ed. New York, N.Y.:Plenum Press, 1982.
10. Coulter hematology analyzer: multidimensional leukocyte differ-ential analysis, vol. 11 (1). Miami, Fla.: Beckman Coulter, 1989.
11. Weast RC. CRC handbook of chemistry and physics. 61st ed.Cleveland, Ohio: CRC Press, 1981.
12. Burtis CA. Tietz textbook of clinical chemistry. 2nd ed.Philadelphia, Pa.: WB Saunders, 1993.
13. Heiger DN. High-performance capillary electrophoresis: an intro-duction. 2nd ed. Waldbronn, Germany: Hewlett-Packard, 1992.
14. Monnig CA, Kennedy RT. Capillary electrophoresis. Anal Chem1994;66:280R.
15. Parris NA. Instrumental liquid chromatography: a practical man-ual on high performance liquid chromatographic methods. NewYork, N.Y.: Elsevier, 1976.
16. Jurk H. Thin-layer chromatography. reagents and detection meth-ods, vol. 1a. Weinheim, Germany: Verlagsgesellschaft, 1990.
17. Bender GT. Chemical instrumentation: a laboratory manualbased on clinical chemistry. Philadelphia, Pa.: WB Saunders,1972.
18. Horváth C. High performance liquid chromatography, advancesand perspectives. New York, N.Y.: Academic Press, 1980.
19. Constantin E, et al. Mass spectrometry. New York, N.Y.: EllisHorwood, 1990.
20. Kebarle E, Liang T. From ions in solution to ions in the gas phase.Anal Chem 1993;65:972A.
21. Karasek FW, Clement RE. Basic gas chromatography: mass spec-trometry. New York, N.Y.: Elsevier, 1988.
22. Levine, B. Principles of forensic toxicology. Washington, D.C.:AACC Press, 2006.
23. Siuzdak, G. The expanding role of mass spectrometry in biotech-nology. San Diego: MCC Press, 2006.
24. Rosen A. Biosensors: where do we go from here? MLO Med LabObs 1995;27:24.
CHAPTER 5 ■ ANALYTICAL TECHNIQUES 165
14460_Ch05.qxd 12/4/08 8:06 PM Page 165