supporting information for "comparison of analytical techniques for dynamic trace metal...
TRANSCRIPT

S1
Supporting information for “Comparison of analytical techniques for
dynamic trace metal speciation in natural freshwaters” ES051245k
Laura Sigg, Frank Black, Jacques Buffle, Jun Cao, Rob Cleven, William Davison,
Josep Galceran, Peggy Gunkel, Erwin Kalis, David Kistler, Michel Martin, Stéphane
Noël, Yusuf Nur, Niksa Odzak, Jaume Puy, Willem van Riemsdijk, Erwin
Temminghoff, Mary-Lou Tercier-Waeber, Stefanie Toepperwien, Raewyn M. Town,
Emily Unsworth, Kent W. Warnken, Liping Weng, Hanbin Xue, Hao Zhang
Contents pp.
Experimental part 2 -12
Table S1. Parameters for calculation of permeability criterion for HFPLM and
FTPLM 9
Table S2: Blank values of the methods 13
Table S3: Total dissolved concentrations measured in samples of Lake Greifen and of
Furtbach by four laboratories using ICP-MS 14
Fig. S1. Total dissolved concentrations of Cu, Zn, Cd and Pb as measured by four laboratories 15
Table S4: Total unfiltered and dissolved concentrations measured in samples of River
Wyre by four laboratories using ICP-MS. 16-19
Table S5: Concentrations measured by DGT on three successive days in River Wyre
20
Table S6: Single measurements obtained by GIME-VIA-Field over two days in River
Wyre 21-22
References 23-24

S2
Experimental part
Major ion and DOC measurements
Major cation concentrations in Lake Greifen and Furtbach were measured by ICP-
OES (Spectro Ciros). Major cation concentrations in River Wyre were measured by
flame photometry (Model 410 flame photometer, Corning, Essex, UK) for Na and K
and flame atomic absorption (AAnalyst atomic absorption spectrometer, Perkin
Elmer, Buckinghamshire, UK) for Ca and Mg. Major anions were measured by ion
chromatography in Lake Greifen and Furtbach (Metrohm IC 761) and in River Wyre
(Dionex 4000I ion chromatography system with a AS14 4x250 mm column, Dionex
corporation). Dissolved organic carbon was measured by oxidative combustion in
River Wyre (Shimadzu TOC-VCPH analyser) and in Lake Greifen and in Furtbach
(High TOCII, Gerber Instruments). Alkalinity was determined by titration with
hydrochloric acid.
DGT sampling and handling
DGT Lancaster. An acrylamide diffusive gel was prepared as using 40% w/v
acrylamide solution (Electran, BDH) 3.75 cm3, 2% gel cross-linker (DGT Research
Ltd, Lancaster, UK.) 1.5 cm3, purified water (18 MΩ, Milli-Q, Millipore SA,
Molshelm, France) 4.75cm3, a 10% solution of ammonium persulphate (Electran,
BDH) 0.070 cm3 and N,N,N’N’-tetramethylethylenediamine (TEMED, Electran,
BDH) 0.025 cm3, to give a final composition of 15% monomer and 0.3% cross-linker.
After the gel had been set in the oven (45°C for 1 hour) it was soaked in purified
water, to both hydrate the gel and to allow unreacted reagents to diffuse out of the gel
(1). One litre of water was used per sheet of gel and was changed three times, with a
two to three hour soaking period between each change. The pH of the water decreased

S3
between successive washes from pH 10 to 6. The gel was transferred into a 10 mM
NaNO3 solution for overnight conditioning prior to use. The various components of
the DGT plastic units were assembled in a laminar flow hood within a clean room. A
0.14 mm thick filter membrane (Supor-450, PALL Life Sciences, USA) overlay a
layer of diffusive gel (1.2mm thick) and then a layer of Chelex-100 resin (Bio-Rad,
Hercules, CA, USA) embedded in gel. For in-situ deployment, DGT units were held
in a Perspex cube shaped holder with two open sides, which was attached to the
underside of a plastic foam float. After deployment the whole cube was taken out of
the water, rinsed with MQ water, and taken back to the laboratory before the DGT
units were disassembled under clean room conditions. The gel layers were separated
and the resin-gel layer was placed in a 1.5 cm3 plastic tube. 1 cm3 of 1 M nitric acid
(prepared from Suprapure nitric acid) was added, the tube shaken and left overnight to
extract the metal from the Chelex-100. Samples were analysed by ICP-MS (Thermo
X-7, Thermo Elemental, Cheshire, UK) using indium 115 (SpectrosoL standard
solution, BDH) as an internal standard. The metal concentration measured in the
eluent from the resin gel was converted in to a ‘mass of metal bound by the resin-gel’
and then into the concentration of ‘labile metal species’ using established procedures
(2) and were corrected for the blanks (Table S2). The blank value for Mn was 0.002
nmol/gel unit.
DGT Duebendorf. Gels were prepared according to the same procedures as described
above in a clean bench. Diffusive gel (0.8 mm thickness) and resin gel (0.4 mm
thickness) were prepared according to the procedure recommended by (3). After
hydration, the gel sheets were cut into discs (d = 25 mm) and assembled into the
plastic gel holders (made by EAWAG Workshop) according to the procedure
recommended by (4). In Lake Greifen, DGT units were deployed for three days at of

S4
2.5, 5 and 28 m depth. At each depth, 4 DGT units were attached to the rope
(connected to a buoy and a 10-kg weight) using acid-washed reusable plastic strip
(PE) made at EAWAG Workshop. On recovery, DGT holders were rinsed thoroughly
with deionized water and immediately stored in clean zip-lock plastic bags. In stream
Furtbach, DGT units were deployed for three days at a depth of about 20 cm. In River
Wyre, DGT units were deployed on one hand over 75 hours, and on the other hand
over 3 1-day periods.
At each deployment the background concentrations of trace metals were checked by
analysing the resin gel layers from 4 DGT units which were prepared the same way
but not deployed in the water column (blank samples). These concentrations were
used to correct those of the units deployed.
Upon return to the laboratory, the resin gel layers were carefully removed from the
DGT holders and transferred to the 15-ml pre-cleaned PP-Test tubes (Greiner
labortechnik, Cellstar), each containing 2 ml of 2 M HNO3 (Merck, Suprapur). This
procedure was performed under a clean bench, using plastic tools. To elute metals, the
resin gel was kept in the acid for 48 h. The trace metal concentrations were analysed
by inductively coupled plasma – mass spectrometry (ICP-MS, Perkin-Elmer ELAN
5000). The diffusion coefficients used for calculation of the DGT-labile
concentrations are those for free aquo ions, as measured by Hao Zhang, DGT
Research Ltd., Lancaster, UK (personal communication). The calculated DGT-labile
concentrations are corrected for the blanks.
DGT Bilthoven. DGT units were assembled in the lab according to the manufacturers
instructions, subsequently sealed in clean plastic bags impregnated with a few drops
of 0.01 M NaNO3 and transported to the sampling sites. In the field, the DGT units
were attached in a deployment device and immersed in the river water, and time and

S5
tempearture were measured. After one or two days, DGT units were retrieved from
device, washed with Milli-Q water, and kept with a minimum air space in clean
plastic bags. They were then transported in a cool box. Upon retrieval of the DGT
units from the field sites, the river water temperature and pH were again measured
and a water sample was taken for additional analyses. After retrieval of the DGT units
to the laboratory, the Chelex resin layer was placed in 2- cm3 vials and 1.0 cm3 of 1.0
M HNO3 solution was added. The Chelex resin was kept in this solution at least one
night to elute the metal ions from the resin. The solution was then analyzed by
inductively coupled plasma mass spectrometry (ICP-MS - HP4500plus for Cd, Pb and
Zn, and ELEMENT2 for Cu).
In situ / on-site GIME measurements
In situ GIME measurements in lake Greifen were performed using the VIP system.
The system consists on: i) a submersible unit which comprises a voltammetric probe,
an on-line oxygen removal system and a multiparameter probe integrated in a
protective titanium cage, and ii) a telemetry deck unit and an IBM compatible PC
(5,6). The VIA-Field, used for measurements in Furtbach and Wyre is a compact
version of the VIP developed for on site measurements. A detailed description of this
system is given in (www.idronaut.it/research_project/VAMP/pdf/vip.pdf).
The heart of both systems is a gel integrated microelectrode (GIME) which consists of
an 100 interconnected Hg-plated Ir-based microelectrode array covered by a 300 µm
thin layer of agarose gel (7).
Hg deposition on the 5x20 interconnected Ir microdisk arrays was performed
at a constant E of –400 mV in a N2 degassed 5 mM Hg(CH3COO)2, 10-2 M HClO4,
S6
using a deposition time of 7 min (8). The same Hg layers were used over the complete
field work period. An average Hg radius of 5.41 µm was obtained from the Hg
deposition charge Qred (8). In-field trace metal measurements on GIME sensors were
performed using square wave anodic stripping voltammetry (SW-SV). Conditions
used were as follows: pumping time of the sample before each measurement = 8 min
using a flow-rate of 4 ml min-1 which allows 3 times complete renewal of the sample
in the fluidic system (i.e. sampling tube + GOD-module + voltammetric flow-through
cell); equilibration of the agarose gel with the sample = 6 min; SWASV: pre-cleaning
E = final E, pre-cleaning t = 60 sec, equilibrium E = Edep, equilibrium t = 30 s, Ed = -
1200 to -1050 mV; td = 8 to 40 min; final E = +70 to +110 mV, pulse amplitude = 25
mV, step amplitude = 8 mV; frequency = 200 Hz. Deposition times at the electrode
were 25 to 40 min in Lake Greifen, 8 to 10 min in Furtbach and 20 to 30 min in River
Wyre.
Laboratory calibration of the VIP and VIA-Field were performed in N2
degassed 0.1 M NaNO3 suprapure solutions spiked with various concentrations of Cu,
Pb, Cd and Zn the day before the start of the field work. Influence of the deposition
time, in a range of 5 to 30 min, on the peak current intensities of the three metals, as
well as the possible formation of Cu-Zn intermetallic compounds during the pre-
concentration step (9) was also checked.
PLM sampling and handling
Hollow Fiber PLM (HFPLM). An Accurel® ppq3/2 (Akzo) hydrophobic
polypropylene hollow fiber membrane (inner diameter = 600 µm; outer diameter =
800 µm; pore size = 0.2 µm; porosity = 75%; length between 15-25 cm) was used. It
was impregnated with the carrier solution, by slowly running a solution of 0.1 M

S7
1,10-didecyl-1,10-diaza-18-crown-6 and 0.1 M lauric acid in a 1/1 (v/v) mixture of
toluene/phenyl hexane, outside the fiber. The strip solution, in the lumen of the
hollow fiber, was 5.10-4 mol/L CDTA (cyclohexane diamine tetraacetic acid) at pH =
6.. After filling the lumen, the two ends of the fibre were connected together to form
a loop which was attached to a plexiglass frame hung inside the test water body and
largely open to the natural water flow. After deployment the strip solution in the
lumen was collected and analysed by ICPMS. Pre-concentration factors for a
deployment time ≥ 2 hours are typically 1200, 5000 and 100 for Cu2+, Pb2+, and Cd2+
respectively.
Flow-through PLM (FTPLM). A Celgard 2500 (Celanese Plastic, Charlotte, NC)
membrane (membrane thickness 25 µm, active surface area 1.98 cm2 , pore diameter
0.04 µm) was impregnated with the same carrier solution as the HFPLM and was
rinsed with water before being mounted. A new membrane was used for the
successive replicates measurements. The strip solution was a 10-2 M pyrophosphate
solution adjusted to pH 6.0 with HNO3.
Filtered samples from Lake Greifen , Furtbach and River Wyre were pumped at a
constant flow rate of of 0.087 ml/s through the FTPLM system during a
preconcentration time of 30 minutes (River Wyre), or 90 minutes (Lake Greifen and
Furtbach). Under the conditions used, the pre-concentration factors for Cu were
typically 2300 for measurements of lake Greifen and Furtbach stream samples and
350 for measurements of the river Wyre samples. The strip solution was then
collected and the metal concentration in the strip solution was analysed by ICP-MS.

S8
Calculation of permeability criterion for HFPLM and FTPLM
The measured PLM flux is controlled by i) the free metal ion concentration or
ii) the sum of the dynamic complexes, depending on the nature of the rate limiting
step, namely diffusion through the PLM (for (i)) or diffusion through the aqueous
source diffusion layer at the PLM surface (case (ii)). Which situation applies depends
on the permeability criterion (Π) (10, 11) .
Π = (KD.DMC.δso) / (Dso.l.αso) (1)
Where KD =distribution coefficient of the metal between the aqueous and organic
phase, DMC= diffusion coefficient of the metal-complex in the membrane, δso = mean
source diffusion layer thickness, Dso = diffusion coefficient of the free metal ion in
solution, l = membrane thickness, αso = degree of complexation (= ratio of total to free
M ion) in the source solution. These parameters are given in Table S1. αso is not
known in a test medium, but a minimum (αsomin) and a maximum value (αso
max) can
be computed from the experimentally measured preconcentration factor, F (= ratio of
total metal concentrations in the strip and the source solution) and the theoretical
value of F (10, 11) assuming either fully inert complexes or fully labile complexes
respectively. αsomin can also be obtained by computing the maximum free metal ion
concentration in the source solution using a value of F determined experimentally
with standard solutions of fully inert complexes.
For Π<<1, the diffusion through PLM is rate-limiting and free metal ion is measured,
in absence of lipophilic complexes, whereas for Π>>1, diffusion through the source
diffusion layer is rate limiting and the dynamic complexes contribute to the metal
concentration measured in the strip solution.
The values of αsomin were used to compute the upper limit of Π (eq. 1) for both
HFPLM and FTPLM. The value of δso around the HFPLM deployed in situ, could not

S9
be measured, but it was assumed to be in between 20 µm (well-stirred medium) and
100 µm (poor-stirred medium). The upper limits of Π for HFPLM were obtained with
δso = 100 µm and were in the ranges 0.005 – 0.02 for Cu, 0.01 – 0.2 for Pb, and
0.0003 to 0.04 for Cd in all natural waters. Thus the condition Π << 1 was always
fulfilled with HFPLM.
For FTPLM measurements in the river Wyre, the Π values were 0.4 - 0.8 for
Cu. Since Π is close to 1, it can be expected that a fraction of the dynamic complexes
may contribute to the measured flux. On the other hand, for both the lake Greifen and
the Furtbach stream, values of Π for Cu were in the range 0.04 and 0.1, i.e. Π << 1.
Table S1. Parameters for calculation of permeability criterion for HFPLM and
FTPLM
a) Diffusion coefficients and distribution coefficient of metals
Parameter Cu Pb Cd
KD 1200 832 13
DMC cm2 s-1 5.2x10⁻⁸ 5.2x10⁻⁸ 5.2x10⁻⁸
Dso cm2 s-1 7.8x10⁻⁶ 9.5x10⁻⁶ 7.2x10⁻⁶
KD = distribution coefficient of the metal between the aqueous and organic phase.
DMC = diffusion coefficient of the metal-complex in the membrane
Dso = diffusion coefficient of the free metal ion in solution
b) Diffusion layer and membrane thickness
HFPLM FTPLM
δso µm 20 – 100 90
l µm 100 25
δso = mean source diffusion layer thickness

S10
l = membrane thickness
DMT : in-situ measurement of free metal ion concentrations
The in-situ measurements with DMT were carried out using cells designed for field
application (field DMT cells). Whereas the lab DMT cell consisted of two chambers
(12), a donor and an acceptor side, the field DMT cell has only one chamber
(acceptor), on two sides separated from the donor (the lake, river, etc.) by a negatively
charged cation exchange membrane (BDH Laboratory Supplies, Poole, UK) (13,14).
The membrane has a matrix of polystyrene and divinylbenzene with sulphonic acid
groups, which are fully deprotonated at pH > 2. The negative potential in the
membrane allows cations to pass through the membrane with a much higher flux than
uncharged complexes and anions. Before being applied, the membranes were washed
successively with 0.1 M HNO3, 1 M Ca(NO3)2 and the background solution of the
acceptor side. Because the free metal ion concentrations in surface waters are usually
below the detection limit of the ICP-MS, 30 mg dm-3 purified humic acid (15) was
added to the acceptor side of the DMT to accumulate metal ions.
After hanging the DMT cells in-situ into the surface water for two to four days,
samples were taken from both the surface water and the acceptor solution of the
DMT. Besides measuring the pH, macro-elements (Ca, Mg, Na, K) were measured
with ICP-OES and micro-elements (Cu, Pb, Cd, Zn, Ni) with ICP-MS. The free metal
ion concentrations were then derived based on either the Donnan membrane
equilibrium or ion transport kinetics.
1). Equilibrium approach. Using the total metal concentrations in the acceptor
solution measured after the deployment, the free metal ion concentrations in the
acceptor were calculated by taking into account ion complexation with inorganic ions

S11
(hydrolysis, carbonate) and with the purified humic acid added. The calculation was
done using the computer program ECOSAT, in which ion binding to the humic acid is
described using the NICA-Donnan model (16). The free ion concentrations in the
sample waters are then derived from the calculated free ion concentrations in the
acceptor solution using the Donnan membrane equilibrium principle (12):
zj
j
jzi
ri
i
a
a
a
a1
acceptor,
donor,
1
accepto,
donor,
=
(1)
where ai and aj are the activity of ion i and j respectively, and z represents the charge
of the ion. Ionic strength of the donor and acceptor solution was calculated from the
concentration of the major ions measured and the activity coefficients of the ions is
calculated using the adjusted Davies equation.
2). Kinetic approach. The free metal ion concentration in the samples can be derived
from the total ion concentration in the acceptor measured at the end of the deployment
time using the kinetic approach when ion diffusion in the membrane is limiting ion
transport (17). The free metal ion concentrations can be calculated according to the
following formula (17):
t
CC
BDA
VC t
z
0Tacceptor,tot,Tacceptor,tot,
m
m
e
acceptordonorfree,
== −=
δ (2)
in which Cfree,donor is the free metal ion concentration in the surface water (mol/m3),
Vacceptor is the acceptor solution volume (m3), Ae is the effective surface area of the
membrane (m2), Dm is the diffusion coefficient of the free metal ion in the membrane
(m2/s), B is the Boltzmann factor for a monovalent cation in the Donnan phase of the
membrane, δm is the membrane thickness (m), Ctot,acceptor,T=t is the total metal

S12
concentration (mol/m3) in the acceptor side at time t (S) after the deployment, and
Ctot,acceptor,T=0 is the total metal concentration in the acceptor side before the cells are
deployed into the samples. Details of the used parameters are available in (12, 17).
CLE-SV measurements of cadmium speciation
Differential pulse stripping voltammetry (DP-SV) measurements were performed with
a hanging mercury drop electrode, an Ag/AgNO3 reference and a graphite counter
electrode held in a Metrohm 746 VA analyzer combined with 694 VA processor or
757 VA computrace. The working parameters are the following: stirring speed 1200
rpm, purging time 5 min, and accumulation at potential -1.1 V for 240s on the 757
VA and for 260s on the 694 VA, rest time 15s, scanning pulse height 50 mV, and
scanning rate 15 mV s-1. The detection limit for labile Cd was checked in a UV-
oxidized lake Greifen sample as 0.090 nM.

S13
Table S2: Blank values of the methods
Method Laboratory Field
campaign1 Cu /nM Zn/ nM Cd /nM Pb/ nM
ICP-MS Lancaster D 0.40 0.80 0.002 0.003 L 0.40 0.80 0.002 0.003
ICP-MS Duebendorf D 0.2 1 <0.04 0.05 L 0.2 1 <0.04 0.05
ICP-MS Geneva D < 0.4 0.3 1.2 < 0.03 L < 0.4 1.8 <0.05 0.1
ICP-MS Wageningen D 0.15 23 0.01 0.06 L 0.15 23 0.01 0.06
DGT 2 Lancaster D 0.015 0.21 0.000307 0.00046 L 0.0065 0.068 0.000026 0.00013
DGT 2 Duebendorf D 0.036 0.08 0.00018 0.00071 L 0.037 0.12 0.00016 0.0012
DGT 2 Bilthoven D 0.09 2 0.01 0.002 L
GIME Geneva D VIP <0.15 <0.013 <0.010 D VIA <0.15 <0.013 <0.010 L 20 0.20±0.02 <0.2 <0.013 <0.010 L 21 <0.15 <0.2 0.028±0.005 <0.010
SCP Belfast D 0.02 0.2 0.02 0.02 L 0.02 0.2 0.02 0.02
HFPLM Geneva D 0.005 0.0005 0.0003 L 0.0047 0.0005 0.0003
FTPLM3 Geneva D 0.001 L 0.006
DMT 4 Wageningen D 0.0048 0.026 0.00081 L 0.002 < 5E-04 < 5E-04
CLE-ASV 5 Duebendorf D <0.07 L <0.07
1 field campaign: D = Duebendorf, Switzerland; L = Lancaster, England,
L20: Lancaster, 20 April 2004, L21: Lancaster, 21 April 2004
2 Blanks for DGT measurements in nmol/gel unit
3 Strip solution
4 Free metal concentrations in the humic acids in acceptor solution
5 Labile Cd concentration
< indicates blank measurements below the detection limit of the method.

S14
Table S3: Total dissolved concentrations measured in samples (0.45 µm filtered)
of Lake Greifen and of Furtbach by four laboratories using ICP-MS
Lake Greifen, 2.5 m Cu/ nM Zn/ nM * Cd/ nM Pb/ nM
Date Lab 02.09.2003 Duebendorf 17 8 0.04 0.24
Geneva 22 15 0.10 Wageningen 17 <dl 0.19 0.22
04.09.2003 Duebendorf 17 5 0.04 0.19 Geneva 23 11 0.10 average 19 ± 3 10 ± 4 0.09 ± 0.06 0.22 ± 0.03
Lake Greifen, 5.0 m 02.09.2003 Duebendorf 17 12 0.05 0.19
Geneva 21 21 0.09 < dl Wageningen 18 0.06 0.17
04.09.2003 Duebendorf 14 6 < 0.04 0.10 Geneva 23 14 <dl <dl average 19 ± 3 13 ± 6 0.07 ± 0.02 0.15 ± 0.05
Furtbach 03.09.2003 Duebendorf am 25 60 0.11 0.58
Duebendorf pm 24 44 0.08 0.34 Geneva am 38 116 <dl Geneva pm 35 74 Wageningen 32 0.10 0.65 Lancaster 40 76 0.11 0.62 average 32 ± 7 74 ± 27 0.10 ± 0.01 0.55 ± 0.14
05.09.2003 Duebendorf am 20 40 0.06 0.34 Duebendorf pm 22 29 0.06 0.29 Geneva am 38 90 average 27 ± 10 53 ± 33 0.06 0.32 ± 0.04
3 - 5.9.03, 24 samples Duebendorf 27 ± 2 39 ± 16 0.08 ± 0.01 0.19 ± 0.03
* Large standard deviations between results for Zn from the different laboratories indicate difficulties in reliably measuring Zn.

S15
Fig. S1. Total concentrations of Cu, Zn, Cd and Pb as measured by four laboratories in Lake Greifen and Furtbach
0
5
10
15
20
25
30
35
40
45
Lake Greifen 2.5 lake Greifen 5 Furtbach
Cu
nM
D
G
W
D
G
D
G
L
0
20
40
60
80
100
120
140
Lake Greifen 2.5 lake Greifen 5 Furtbach
Zn
nM
D
G
D
G
L
D
G
0.00
0.10
0.20
0.30
0.40
Lake Greifen 2.5 lake Greifen 5 Furtbach
Cd
nM
D
G
W
L
D
G
0.00
0.10
0.20
0.30
0.40
0.50
0.60
0.70
Lake Greifen 2.5 lake Greifen 5 Furtbach
Pb
nM
D
W
L
D
D
D

S1
6
Tab
le S
4: T
otal
unf
ilter
ed a
nd d
isso
lved
con
cent
rati
ons
mea
sure
d in
sam
ples
of
Riv
er W
yre
by f
our
labo
rato
ries
usi
ng I
CP
-
MS.
Fou
r ty
pes
of s
ampl
es w
ere
obta
ined
: unf
ilter
ed o
n-si
te (
fille
d in
to b
ottle
s on
-sit
e); u
nfilt
ered
bul
k la
b (f
illed
into
bot
tles
from
the
bulk
sam
ples
take
n to
the
labo
rato
ry);
filt
ered
on-
site
: (fi
ltere
d on
-sit
e us
ing
syri
nges
and
in-l
ine
filte
r ho
lder
s); f
ilter
ed la
bora
tory
(bul
k sa
mpl
e fi
ltere
d in
the
labo
rato
ry).
a)
Cu
and
Zn;
b)
Cd
and
Pb; c
) di
ssol
ved
conc
entr
atio
ns in
fie
ld f
ilter
ed s
ampl
es b
y L
anca
ster
labo
rato
ry.
Tw
o se
para
te m
easu
rem
ents
on
diff
eren
t sam
ples
wer
e ob
tain
ed in
Gen
eva.
*: c
onta
min
atio
n su
spec
ted.
The
re w
as in
par
ticu
lar
a pr
oble
m w
ith
Cd
in th
e la
bora
tory
filt
ered
sam
ples
.

S1
7
Tab
le S
4 a)
C
u / n
M
Zn/
nM
Dat
e
Lab
un
f. o
n-si
te
unf.
bul
k la
b fi
lt. o
n-si
te
filt.
lab
un
f. O
n-si
te
unf.
bul
k la
b fi
lt. o
n-si
te
filt.
lab
19
.04.
2004
L
anca
ster
21
19
36
45
Due
bend
orf
24
± 2
31
± 2
26
± 2
22
55
± 5
*
48 ±
5
35
G
enev
a
24
38
± 4
W
agen
inge
n
22
<
dl
av
erag
e
23
± 1
37 ±
2
20.0
4.20
04
Lan
cast
er
21
22
36
39
D
uebe
ndor
f
29 ±
2
26 ±
2
24
77
± 5
57
± 5
48
G
enev
a
27±
5 28
± 0.
7
24±
0.7
54±
1.3
62±
3
40±
2
Gen
eva
2
26
± 0.
5
25±
0.7
88
± 5
60
± 4
W
agen
inge
n
22
<
dl
av
erag
e
2
3 ±
1
47 ±
10
21.0
4.20
04
Lan
cast
er
20
20
18
31
D
uebe
ndor
f
28 ±
2
26 ±
2
21
56
87
38
G
enev
a
22±
0.7
24±
0.4
21
± 0.
3 37
± 1
39±
1
31±
1
Gen
eva
2
30
± 2.
8
27±
1.6
70
± 4.
7
68±
7.7
W
agen
inge
n
20
<
dl
av
erag
e
22
± 3
42 ±
18
22.0
4.20
04
Lan
cast
er a
m
17
19
18
36
L
anca
ster
pm
20
29
Due
bend
orf
18
20
21
22
26
38
39
*
G
enev
a
21±
0.4
20±
0.6
18±
0.3
21±
0.4
50±
1.4
29±
0.6
22±
0.5
32±
3
Gen
eva
2
20±
0.5
19±
0.4
45±
1 35
± 2.
8
Wag
enin
gen
19
<dl
aver
age
1
9 ±
2 20
± 2
34 ±
2
S1
8
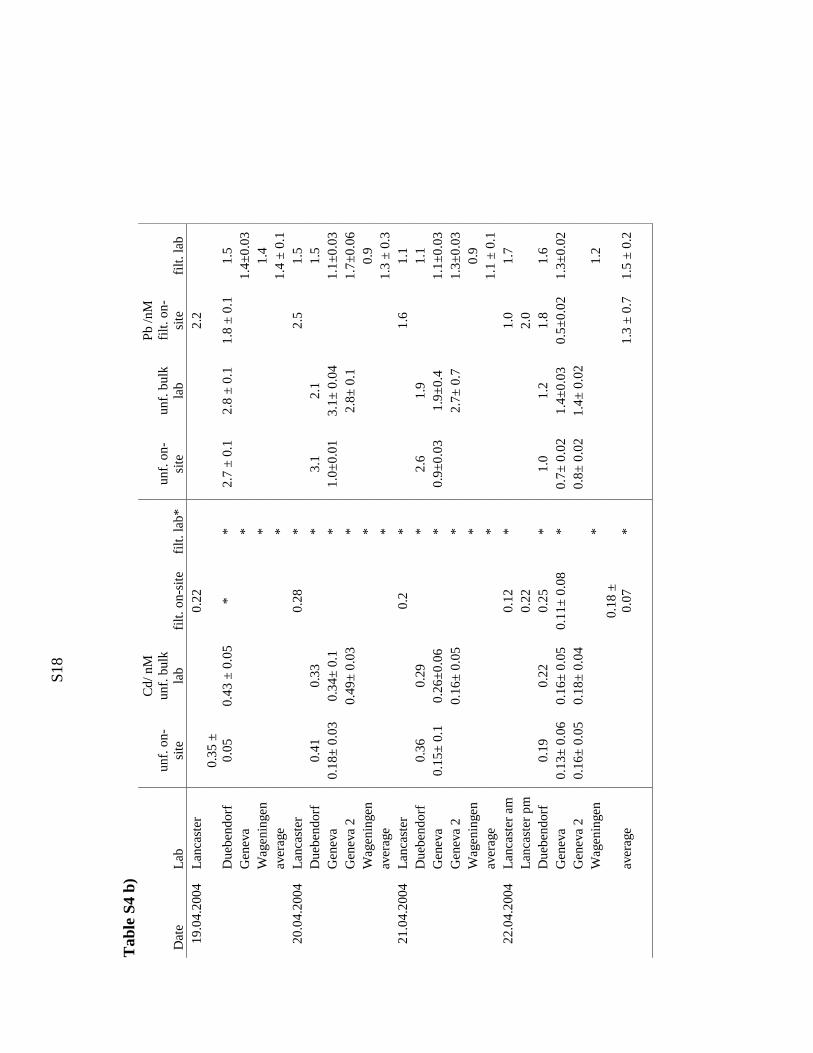
Tab
le S
4 b)
Cd/
nM
P
b /n
M
Dat
e
Lab
un
f. o
n-si
te
unf.
bul
k la
b fi
lt. o
n-si
te
filt.
lab*
un
f. o
n-si
te
unf.
bul
k la
b fi
lt. o
n-si
te
filt.
lab
19
.04.
2004
L
anca
ster
0.
22
2.
2
D
uebe
ndor
f
0.35
±
0.05
0.
43 ±
0.0
5 *
* 2.
7 ±
0.1
2.8
± 0.
1 1.
8 ±
0.1
1.5
G
enev
a
*
1.4±
0.03
Wag
enin
gen
*
1.
4
aver
age
*
1.4
± 0.
1 20
.04.
2004
L
anca
ster
0.
28
*
2.
5 1.
5
Due
bend
orf
0.
41
0.33
* 3.
1 2.
1
1.5
G
enev
a
0.18
± 0.
03
0.34
± 0.
1
* 1.
0±0.
01
3.1±
0.0
4
1.1±
0.03
Gen
eva
2
0.
49±
0.03
*
2.8±
0.1
1.7±
0.06
Wag
enin
gen
*
0.
9
aver
age
*
1.3
± 0.
3 21
.04.
2004
L
anca
ster
0.
2 *
1.6
1.1
D
uebe
ndor
f
0.36
0.
29
*
2.6
1.9
1.
1
Gen
eva
0.
15±
0.1
0.26
±0.0
6
* 0.
9±0.
03
1.9±
0.4
1.
1±0.
03
G
enev
a 2
0.16
± 0.
05
*
2.
7± 0
.7
1.
3±0.
03
W
agen
inge
n
*
0.9
av
erag
e
*
1.
1 ±
0.1
22.0
4.20
04
Lan
cast
er a
m
0.12
*
1.0
1.7
L
anca
ster
pm
0.
22
2.
0
D
uebe
ndor
f
0.19
0.
22
0.25
*
1.0
1.2
1.8
1.6
G
enev
a
0.13
± 0.
06
0.16
± 0.
05
0.11
± 0.
08
* 0.
7± 0
.02
1.4±
0.03
0.
5±0.
02
1.3±
0.02
Gen
eva
2
0.16
± 0.
05
0.18
± 0.
04
0.8±
0.0
2 1.
4± 0
.02
W
agen
inge
n
*
1.2
av
erag
e
0.18
±
0.07
*
1.3
± 0.
7 1.
5 ±
0.2

S1
9
Tab
le S
4 c)
Dis
solv
ed c
once
ntra
tion
s m
easu
red
in f
ield
filt
ered
sam
ples
of
Riv
er W
yre
by IC
P-M
S (L
anca
ster
labo
rato
ry);
rep
licat
es
are
show
n fo
r ea
ch s
ampl
ing
tim
e.
T
ime
h
Clo
ck
tim
e
Cu
nM
Stde
v Z
n nM
St
dev
Cd
nM
Stde
v Pb
nM
St
dev
Fe
µM
St
de
v A
l µ
M
St
dev
Mn
nM
St
dev
0.00
3:
00 P
M
22.0
0.
55
36.9
1.
02
0.24
9 0.
027
2.37
0.
005
6.34
0.
15
4.40
0.
03
266
5
22
.0
0.66
35
.4
0.29
0.
196
0.00
9 2.
31
0.01
0 5.
37
0.03
3.
38
0.00
19
8 1
20.0
0 11
:00
AM
23
.4
0.38
43
.0
0.35
0.
222
0.02
7 2.
33
0.02
4 5.
85
0.06
4.
80
0.25
27
4 4
22.6
0.
58
44.3
0.
66
0.24
9 0.
027
2.18
0.
029
5.43
0.
14
4.23
0.
06
289
6 26
.00
5:00
PM
23
.2
0.13
36
.9
0.70
0.
249
0.01
8 2.
34
0.03
9 5.
19
0.02
5.
13
0.26
27
6 3
23.1
0.
19
36.3
0.
66
0.24
9 0.
018
2.52
0.
039
5.91
0.
07
5.32
0.
11
285
1 43
.00
11:1
5 A
M
20.1
0.
54
27.8
0.
18
0.19
6 0.
018
1.44
0.
019
5.36
0.
03
2.39
0.
03
276
4
20
.6
0.52
30
.7
0.84
0.
178
0.00
9 1.
59
0.02
9 5.
23
0.06
2.
64
0.03
26
9 5
49.7
5 4:
45 P
M
18.4
0.
54
20.6
0.
57
0.14
2 0.
018
1.15
0.
005
4.65
0.
09
2.24
0.
01
221
4
17
.3
0.35
15
.5
0.21
0.
160
0.02
7 1.
16
0.01
9 4.
70
0.05
2.
31
0.04
22
4 2
68.5
0 11
:30
AM
16
.9
0.42
18
.3
0.63
0.
133
0.01
8 1.
04
0.01
9 4.
44
0.10
1.
78
0.07
17
8 3
16.8
0.
33
17.6
0.
17
0.15
1 0.
000
1.05
0.
029
4.35
0.
04
1.84
0.
01
177
1 71
.75
2:45
PM
20
.0
0.60
29
.1
0.37
0.
187
0.01
8 2.
17
0.05
8 4.
80
0.09
4.
65
0.08
24
1 3
19.6
0.
22
24.9
0.
40
0.19
6 0.
027
1.99
0.
029
5.33
0.
11
4.27
0.
08
214
3

S2
0
Tab
le S
5: C
once
ntra
tion
s m
easu
red
by D
GT
on
thre
e su
cces
sive
day
s in
Riv
er W
yre
(all
data
in n
M).
Dep
loym
ent t
imes
wer
e 22
– 2
7 ho
urs.
Dat
e C
u
Zn
C
d Pb
19-2
0/04
/04
2.5
± 0.
4 8.
2 ±
1.6
0.08
± 0
.01
0.07
± 0
.01
20-2
1/04
/04
2.2
± 0.
4 9.
3 ±
1.2
0.09
± 0
.02
0.06
± 0
.02
21-2
2/04
/04
3.4
± 0.
2 10
.4 ±
0.8
0.
12 ±
0.0
2 0.
09 ±
0.0
1
S2
1
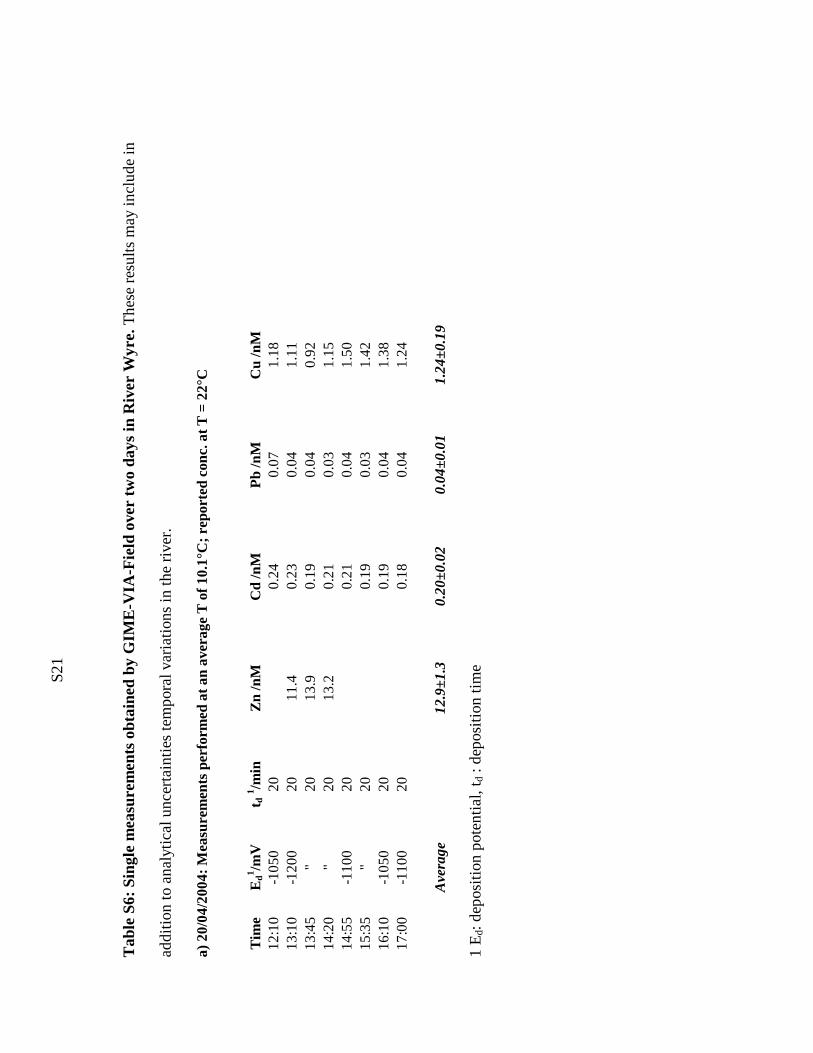
Tab
le S
6: S
ingl
e m
easu
rem
ents
obt
aine
d by
GIM
E-V
IA-F
ield
ove
r tw
o da
ys in
Riv
er W
yre.
The
se r
esul
ts m
ay in
clud
e in
addi
tion
to a
naly
tica
l unc
erta
inti
es te
mpo
ral v
aria
tion
s in
the
rive
r.
a) 2
0/04
/200
4: M
easu
rem
ents
per
form
ed a
t an
aver
age
T o
f 10.
1°C
; rep
orte
d co
nc. a
t T =
22°
C
Tim
e E
d1 /mV
t d
1 /min
Z
n /n
M
Cd
/nM
P
b /n
M
Cu
/nM
12:1
0 -1
050
20
0.
24
0.07
1.
18
13
:10
-120
0 20
11
.4
0.23
0.
04
1.11
13:4
5 "
20
13.9
0.
19
0.04
0.
92
14
:20
" 20
13
.2
0.21
0.
03
1.15
14:5
5 -1
100
20
0.
21
0.04
1.
50
15
:35
" 20
0.19
0.
03
1.42
16:1
0 -1
050
20
0.
19
0.04
1.
38
17
:00
-110
0 20
0.18
0.
04
1.24
A
vera
ge
12
.9±1
.3
0.20
±0.0
2 0.
04±0
.01
1.24
±0.1
9
1 E
d: d
epos
itio
n po
tent
ial,
t d :
depo
siti
on ti
me

S2
2
b) 2
1.04
.200
4: M
easu
rem
ents
per
form
ed a
t an
aver
age
T o
f 10.
3°C
; rep
orte
d co
nc. a
t T =
22°
C
Tim
e E
d 1 /m
V
t d1 / m
in
Zn
/nM
C
d /n
M
Pb
/nM
C
u /n
M
11
:05
-110
0 20
0.23
0.
04
1.06
11:3
5 "
20
0.
28
0.04
1.
12
12
:15
" 25
0.20
0.
05
1.18
12:5
5 "
30
0.
22
0.05
1.
13
13
:50
-115
0 20
0.15
0.
05
1.25
14:2
5 "
20
0.
18
0.05
1.
36
15
:00
-120
0 20
8.
3 0.
14
0.05
1.
21
15
:35
" 20
5.
2 0.
13
0.05
1.
31
16
:15
" 20
4.
7 0.
14
0.04
1.
33
Ave
rage
6.1
± 2.
0 0.
19 ±
0.0
5 0.
04±
0.01
1.
22 ±
0.1
0
1 E
d: d
epos
itio
n po
tent
ial,
t d :
depo
siti
on ti
me

S23
References
(1) Warnken, K. W.; Zhang, H.; Davison, W. Trace metal measurements in low ionic strength synthetic solutions by diffusive gradients in thin films. Anal. Chem. 2005, 77, 5440-5446. (2) Zhang, H.; Davison, W. Performance characteristics of diffusion gradients in thin films for the in situ measurements of trace metals in aqueous solution. Anal. Chem. 1995, 67, 3391-3400. (3) Zhang, H. "Practical guide for making gels for DGT and DET," DGT Research Ltd., 1997. (4) Zhang, H. "Practical guide to using DGT and DET," DGT Research Ltd., 1997. (5) Tercier-Waeber, M.-L.; Buffle, J.; Koudelka-Hep, M.; Graziottin, F. Submersible voltammetric probes for real-time continuous monitoring of trace elements in natural aquatic systems. In Environmental Electrochemistry. analyses of trace element biogeochemistry; Taillefert, M., Rozan, T. F., Eds.; American Chemical Society: Washington DC, 2002; Vol. 811, pp 16-39. (6) Tercier-Waeber, M.-L.; Buffle, J. Submersible online oxygen removal system coupled to an in situ voltammetric probe for trace element monitoring in freshwater. Environ. Sci. Technol. 2000, 34, 4018-4024. (7) Tercier, M.-L.; Parthasarathy, N.; Buffle, J. Reproducible, reliable and rugged Hg-plated Ir-based microelectrode for in situ measurements in natural waters. Electroanalysis 1995, 7, 55-63. (8) Belmont-Hébert, C.; Tercier, M.-L.; Buffle, J.; Fiaccabrino, G. C.; Koudelka-Hep, M. Gel-integrated microelectrode arrays for direct voltammetric measurements of heavy metals in natural waters an other complex media. Anal. Chem. 1998, 70, 2949-2956. (9) Pei, J.; Tercier-Waeber, M.-L.; Buffle, J. Simultaneous determination and specation of zinc, cadmium, lead and copper in natural water with minimum handling and artifacts, by voltammetry on a gel-integrated microelectrode array. Anal. Chem. 2000, 72, 161-171. (10) Buffle, J.; Parthasarathy, N.; Djane, N. K.; Matthiasson, L. Permeation Liquid Membrane for Field Analysis and Speciation of Trace Compounds in Waters. In In Situ Monitoring of Aquatic Systems; Chemical Analysis and Speciation; Buffle, J., Horvai, G., Eds.; Wiley, 2000. (11) Salaun, P.; Buffle, J. Integrated microalanytical system coupling permeable liquid membrane and voltammetric detection for trace metal speciation. Theory and applications. Anal. Chem. 2004, 76, 31-39. (12) Temminghoff, E. J. M.; Plette, A. C. C.; Van Eck, R.; Van Riemsdijk, W. H. Determination of the chemical speciation of trace metals in aqueous systems by the Wageningen Donnan membrane technique. Anal. Chim. Acta 2000, 417, 149-157. (13) Stelt, B. v. d.; Temminghoff, E. J. M.; van Riemsdijk, W. H. Measurement of ion speciation in slurry manures using Donnan Membrane Technique. Anal. Chim. Acta 2005, 552, 135-140. (14) Kalis, E. J. J.; Weng, L. P.; Dousma, F.; Temminghoff, E. J. M.; van Riemsdijk, W. H. Measuring free metal ion concentrations in-situ in natural waters using Donnan Membrane Technique. Environ. Sci. Technol. 2006, 40, in press .

S24
(15) Temminghoff, E. J. M.; Van der Zee, S. E. A. T. M.; De Haan, F. A. M. Copper mobility in a copper-contaminated sandy soil as affected by pH and solid and dissolved organic matter. Environ. Sci. Technol. 1997, 31, 1109-1115. (16) Kinniburgh, D. G.; van Riemsdijk, W. H.; Koopal, L. K.; Borkovec, M.; Benedetti, M. F.; Avena, M. J. Ion binding to natural organic matter: competition, heterogeneity, stoichiometry and thermodynamic consistency. Colloid Surf. A 1999, 151, 147-166. (17) Weng, L. P.; Van Riemsdijk, W. H.; Temminghoff, E. J. M. Kinetic aspects of DMT for measuring free metal ion concentrations. Anal. Chem. 2005, 77, 2852-2861.