an ecological approach to understanding gut microbiota and
TRANSCRIPT
An Ecological Approach to
Understanding Gut Microbiota
and Macrobiota Interactions
Emily Louise Pascoe
A thesis submitted for the degree of Doctor of Philosophy (Ph.D.)
in the Organisms and Environment Division, Cardiff University
2017
Declaration and Statements
Declaration and Statements
DECLARATION
This work has not been submitted in substance for any other degree or award at this or any otheruniversity or place of learning, nor is being submitted concurrently in candidature for any degreeor other award.
STATEMENT 1
This thesis is being submitted in partial fulfilment of the requirements for the degree of PhD
STATEMENT 2
This thesis is the result of my own independent work/investigation, except where otherwise stated,and the thesis has not been edited by a third party beyond what is permitted by CardiffUniversity’s Policy on the Use of Third Party Editors by Research Degree Students. Other sourcesare acknowledged by explicit references. The views expressed are my own.
STATEMENT 3
I hereby give consent for my thesis, if accepted, to be available online in the University’s OpenAccess repository and for inter-library loan, and for the title and summary to be made available tooutside organisations.
STATEMENT 4: PREVIOUSLY APPROVED BAR ON ACCESS
I hereby give consent for my thesis, if accepted, to be available online in the University’s OpenAccess repository and for inter-library loans after expiry of a bar on access previously approvedby the Academic Standards & Quality Committee.
1
Frontispiece
Frontispiece
Emily Pascoe,Goes where the mice go,Goes where the voles go,But mostly near Trento.
Parasites! Parasites!Up their bums and in their poo.
Parasites! Parasites!There are microbes in there too.
Emily Pascoe,Fiat Panda goes so slow,The headlights have no glow,No handbrake, but hey ho?!
Parasites! Parasites!Looking in their guts to see.
Parasites! Parasites!What happens when they’re helminth free?
Beware the foxes and the stoats,They didn’t come for the oats...They came for the mice!They came in the night(sss)!!!10 inch nails couldn’t keep them away,There was only one person who could save the day!
And her name is...Emily Pascoe, Emily Pascoe
EMILY PASCOE!!!
“Apodemus flavicollis” by Nia Thomas
2
Acknowledgements
AcknowledgementsI wouldn’t have had the opportunity to study such an amazing topic if it hadn’t been for Sarah and Heidi. Ithas been an amazing experience being supervised by two strong and smart women. I am so grateful forSarah’s limitless enthusiasm; from accidentally agreeing that 8 data chapters was a fabulous idea, tosending me down a black slope 20 minutes after stepping onto a snowboard for the first time, her energyhas kept me so excited about the topics I have studied and helped me achieve more than I imaginedpossible. I am also so thankful to Heidi for being so patient and supportive of me, her calmness andpracticality kept me going, even when I felt absolute despair! On both a professional and personal level thedoors to the offices (and homes) of Sarah and Heidi have always been open, regardless of how busy theyhave been, which has meant an awful lot. In addition, I would like to thank Julian, due to geographicalconstraints we didn’t get to talk as much as I would of liked, but the times that we did were invaluable, hisinput shed new light onto my work and opened new avenues. I am also grateful to Liz, for telling meexactly how it is and helping me understand that its okay for things to not go according to plan, there arealways solutions (in the form of amphibian backpacks). The two Jo's have been instrumental in getting meto where I am now; Lello for never saying no to my requests for statistical advice or to a glass of Prosecco,and Cable for making my first collaboration a stimulating, non-scary experience and for her kind words ofsupport. I’m eternally grateful to Matt for patiently answering all of my questions on bioinformatics and forsaving the day numerous times when technology got the better of me. Likewise, Jakub has been a pillar ofbioinformatics support and advice, plus his barbecuing skills also deserve a mention. The work within thisthesis was labour intensive, and I am indebted to many extra pairs of hands. Margherita was so kind andhelped me when I was drowning in a sea of poo samples. Jess helped me navigate my first chaotic year offield work, and again, helped me when I was drowning in poo. Scruffpuff (Kath) was the sweetest fieldassistant anyone could wish for, and kept me strong and sane whilst juggling 4 experiments, and Guy keptme laughing and well supplied in all the essentials (chocolate deliveries in the library were very muchappreciated) right until the very end. I also wish to thank all those in the lab who guided me throughout(and put up with mud tramped through the lab for 6 months of each year), especially Valentina andDaniele, Matteo (for also making sense of my Italian), Chiara and Fausta.
I was also greatly supported on a personal level. I am so thankful to my family, especially my parents foraccepting that I would often disappear with no word for months during the field season, then appear with ahungry stomach at Christmas, and for doing their best to understand the crazy world of academia and beingso curious (“That T. ghandi parasite is amazing, have you heard what it can do to mice and humans?!”).Thanks goes to Lisa for keeping me well stocked in cat memes and for always being a good sister. I amgrateful to the Italy crew (if I named you all this section would be longer than the thesis itself) for makingme feel at home in a foreign country, but Loris, Karolina and Beppe deserve a special mention for all thehelp and beer they have provided me. I also wish to thank the Cardiff lab/office group, CRIPES group andthe Lerkins team for accepting this nomad and making my short time there enjoyable.
Last but not least, thank you Matteo. For being there both literally and figuratively at my highest points(Monte Vioz, 3,645 m, completing this thesis) and my lowest (Death Valley, -82 m, when <insert any partof Ph.D. here> got the better of me). You have been my rock; sometimes a little hard and stubborn (that IWILL succeed) but also my solid foundation. Thank you for always believing in me, for helping me withmy statistical woes, and for making the graphs looks so pretty.
“Truth is born into this world only with pangs and tribulations, and every fresh truth is received
unwillingly.”
Alfred R. Wallace
3
Thesis Summary
Thesis Summary
Despite a plethora of research on the positive and negative impacts of gut microbiota (community
of micro-organisms) and macrobiota (parasitic helminths), as yet there is little focus on how these
two sympatric and ubiquitous communities interact. Given that there are increasing evolutionary
pressures imposed on microbiota and macrobiota, which have currently unknown system-wide
implications, e.g., antibiotic and anthelmintic treatment, it is timely to investigate microbiota-
macrobiota interactions. This thesis uses an ecological approach to understand microbiota-
macrobiota interactions in a wild rodent system. First, a review of animal gut microbiota literature
established the current research landscape of this topic, which highlighted the lack of studies on
wild animals, despite the advantages that these animals can provide, e.g., as model systems
(Chapter 2). In addition, perturbation field experiments were used to tease apart microbiota-
macrobiota interactions in a wild rodent. The impact of helminth removal (using anthelmintic) on
microbiota was investigated, which revealed that, with the exception of faecal microbiota
composition, gut bacterial communities remained stable following anthelmintic treatment
(Chapter 3). Following perturbation of the microbiota (using antibiotic), both fecundity and size of
helminths increased (Chapter 4). Helminths were found to be associated with a microbiota that
exhibits interspecific variation as well as intraspecific variation, which was driven by gut location
of helminths, although composition of helminth microbiota also significantly differed to that of
the gut (Chapter 5). Finally, the effect of faecal microbiota on helminth development was tested;
egg hatching was less successful in host faeces, compared to faeces from another individual,
indicating that faecal microbiota may have some resistance to helminth development (Chapter 6).
This thesis highlights the importance of considering systemwide implications of a treatment or
perturbation, particularly on gut microbiota-macrobiota interactions.
4
Thesis Summary
Table of ContentsDeclaration and Statements.......................................................................................................................................2Acknowledgements....................................................................................................................................................4Thesis Summary.......................................................................................................................................................5Chapter 1 - General introduction: Gut microbiota and macrobiota.................................................................9
1.1 Chapter overview....................................................................................................................................101.2 Gut microbiota acquisition and functions...............................................................................................101.3 Manipulation of the gut microbiota........................................................................................................151.4 Sharing the gut: parasitic helminths – the macrobiota...........................................................................181.5 Microbiota-macrobiota interactions – what do we know so far?...........................................................211.6 Investigating microbiota-macrobiota interactions in a free-living system.............................................241.7 Thesis aims..............................................................................................................................................25
Chapter 2 - Network analysis of gut microbiota literature...............................................................................272.1 Abstract.........................................................................................................................................................282.2 Review of literature......................................................................................................................................292.3 Author Acknowledgements..........................................................................................................................44
Chapter 3 - Does disruption of the helminth community with anthelmintic affect the gut microbiota?.....453.1 Abstract.........................................................................................................................................................463.2 Introduction..................................................................................................................................................473.3 Materials and methods.................................................................................................................................493.4 Results..........................................................................................................................................................583.5 Discussion.....................................................................................................................................................713.6 Author Acknowledgements..........................................................................................................................77
Chapter 4 - Does disruption of the gut microbiota with antibiotic affect the helminth population?...........794.1 Abstract.........................................................................................................................................................804.2 Introduction..................................................................................................................................................804.3 Materials and methods.................................................................................................................................834.4 Results..........................................................................................................................................................914.5 Discussion...................................................................................................................................................1074.6 Author Acknowledgements........................................................................................................................112
Chapter 5 - Composition and diversity of the microbiota of parasitic helminths........................................1145.1 Abstract.......................................................................................................................................................1155.2 Introduction................................................................................................................................................1165.3 Materials and Methods...............................................................................................................................1195.4 Results........................................................................................................................................................1245.5 Discussion...................................................................................................................................................1405.6 Author Acknowledgements........................................................................................................................147
Chapter 6 - Faecal microbiota affects helminth development........................................................................1496.1 Abstract.......................................................................................................................................................1506.2 Introduction................................................................................................................................................1516.3 Materials and methods...............................................................................................................................1556.4 Results........................................................................................................................................................1646.5 Discussion...................................................................................................................................................1706.6 Author Acknowledgements........................................................................................................................175
Chapter 7 - General discussion...........................................................................................................................176Bibliography..........................................................................................................................................................191Appendix A.1: Supplementary table of data presented in Chapter 2....................................................................210Appendix A.2: Supplementary figure for data presented in Chapters 3, 4, 5 & 6................................................301Appendix A.3: Supplementary tables of data presented in Chapter 3..................................................................302Appendix A.4: Supplementary tables of data presented in Chapter 4..................................................................314Appendix A.5: Supplementary tables of data presented in Chapter 5..................................................................322Appendix A.6: Supplementary tables of data presented in Chapter 5..................................................................333Appendix A.7: Supplementary table of data presented in Chapter 6....................................................................365Appendix A.8: Supplementary thesis information................................................................................................366
5
Thesis Summary
Chapter 1
General introduction: Gut microbiota andmacrobiota
“One touch of nature makes the whole world kin.”
William Shakespeare
6

General introduction: Gut microbiota and macrobiota
1.1 Chapter overview
In this introductory chapter, the current knowledge on gut microbiota and macrobiota are briefly
reviewed, followed by a synopsis of the literature on microbiota-macrobiota interactions, which
are given more attention in each of the relevant data chapters. The study system used in this thesis
is a wild rodent, namely the yellow-necked mouse (Apodemus flavicollis) in northeastern Italy.
Finally, the overarching aims of the thesis are presented, which collectively intend to further the
knowledge on microbiota-macrobiota interactions using an ecological approach.
1.2 Gut microbiota acquisition and functions
Every multicellular organism is colonised by a community of micro-organisms, which may
include bacteria, single celled eukaryotes, fungi and viruses (Marchesi and Ravel, 2015).
Collectively, these micro-organisms are often inaccurately described as the ‘microbiome’,
however this more specifically describes the cumulative genome of these micro-organisms and the
environment with which they interact, and instead 'metataxome' or 'microbiota' more accurately
describe the taxonomic composition of a microbial community (Marchesi and Ravel, 2015). Every
niche of an organism is inhabited by microbes, including the skin (Grice et al., 2009), oral cavities
(Dewhirst et al., 2010) and pulmonary system (Barfod et al., 2013) of animals, and likewise the
roots (Kristin and Miranda, 2013), seeds (Johnston-Monje and Raizada, 2011) and the above-
ground phyllosphere of plants (Lindow and Brandl, 2003). The microbial communities inhabiting
each niche have a highly specific composition, for example, microbiota composition varies
between each tooth of an individual (Bik et al., 2010), and differs between the crypts and the
lumen of the colon (Pédron et al., 2012). The number of microbial cells associated with a host
often exceeds the number of autochthonous cells; for example, in mammals microbes are
estimated to outnumber host cells by around ten times (Palmer et al., 2007).
7
General introduction: Gut microbiota and macrobiota
In vertebrates, the gut harbours the most densely populated and diverse microbiota of the body.
Humans typically possess 1011-1012 microbes/ml of luminal content (Palmer et al., 2007),
comprised of an estimated 500 to 1,000 species (Hrncir et al., 2008), which equates to a genome
consisting of 150 times more genes than that of a human (Gill et al., 2006). Gut microbiota
composition continually changes throughout the lifespan of an individual (Lozupone et al., 2012;
Rodríguez et al., 2015). Although it was previously believed that the gut was sterile until birth
(Dominguez-Bello et al., 2010; Koenig et al., 2011), it is now accepted that some intrauterine
vertical transmission of gut bacteria is likely (Jiménez et al., 2008). However, the first critical
inoculum that has significant impacts on the host is received during birth (Dominguez-Bello et al.,
2010; Jakobsson et al., 2014), when the gut of vaginally delivered babies is initially colonised by
maternal gut (faecal) and vaginal microbes (Dominguez-Bello et al., 2010; Jakobsson et al.,
2014). However, the guts of individuals delivered by caesarean section are instead colonised by
microbes typically found on the skin; this difference in birth inoculum significantly affects
maturation of the immune system (Dominguez-Bello et al., 2010; Jakobsson et al., 2014; Figure
1.1). Consequently, caesarean section born individuals are more likely to be susceptible to
autoimmune diseases (Dominguez-Bello et al., 2010; Jakobsson et al., 2014). Hence, in humans
the mode of birth can have lifelong consequences.
Due to changes in diet, development of the immune system and high levels of environmental
transmission associated with the first years of life, the gut microbiota of humans is highly dynamic
until about three years of age, after which time the microbiota remains comparatively stable, but
can still fluctuate (Koenig et al., 2011; Faith et al., 2013). A study on adult humans found that
40% of bacterial OTUs previously identified were no longer present in the gut when analyses
8
General introduction: Gut microbiota and macrobiota
were repeated five years later (Faith et al., 2013). Factors that influence the microbiota include
host characteristics, e.g., age (Biagi et al., 2013), gender (Mueller et al., 2006; Markle et al.,
2013) and genetics (Khachatryan et al., 2008), and environmental characteristics such as diet
(Gibson et al., 2004), and seasonality (Carey et al., 2013; Jia et al., 2013). Therefore, as a result of
experience and exposure, the microbiota can vary greatly between individuals within the same
species, and within an individual throughout time (e.g., Benson et al., 2010; Faith et al., 2013;
Rodríguez et al., 2015). Consequently, despite an effort to categorise the gut microbiota into
'enterotypes', based on statistical clustering patterns of microbial taxa (Arumugam et al., 2011),
this approach is controversial. Critics claim that microbiota cannot be categorised into disparate
groups, as variation between individuals exists along a gradient (Jeffery et al., 2012).
Microbiota studies have propelled, but have also been driven by, advances in technologies that
characterise microbiota composition and functions, such as multi-‘omic platforms including
metataxonomics and metagenomics (Marchesi and Ravel, 2015). The subsequent plethora of gut
microbiota studies have been motivated by knowledge that this community is vital for host health
and physiological processes, thus research on this ‘microbial organ’ (Bäckhed et al., 2005) has
rapidly expanded, and continues to do so (Marchesi and Ravel, 2015). The relationship between
the host and its microbiota is largely mutualistic: in return for nutrients from gut contents, the
microbiota is essential to the host for chemical functions within the body, including digestion of
complex carbohydrates, production of secondary metabolites such as vitamins, and the regulation
of sex hormones (Schluter and Foster, 2012; Markle et al., 2013; Figure 1.1). However, gut
microbiota may also exert negative impacts on the host, particularly if there is an imbalance in
microbial composition (termed ‘dysbiosis’). Dysbiosis has been associated with non-infectious
diseases such as Crohn’s disease (Dicksved et al., 2008), obesity (Ley et al., 2005), and both type
9

General introduction: Gut microbiota and macrobiota
1 and type 2 diabetes (Qin et al., 2012; Peng et al., 2014). In addition, not all microbes in the gut
are beneficial to the host, and micro-organisms that are pathogenic in the gut include some strains
of Escherichia coli, while other micro-organisms, such as Clostridium difficile, are usually benign,
but can become pathogenic under certain dysbiotic conditions, such as when there is a deficiency
in the bacteria which normally suppress over-growth, allowing C. difficile to proliferate (Aas et
al., 2003).
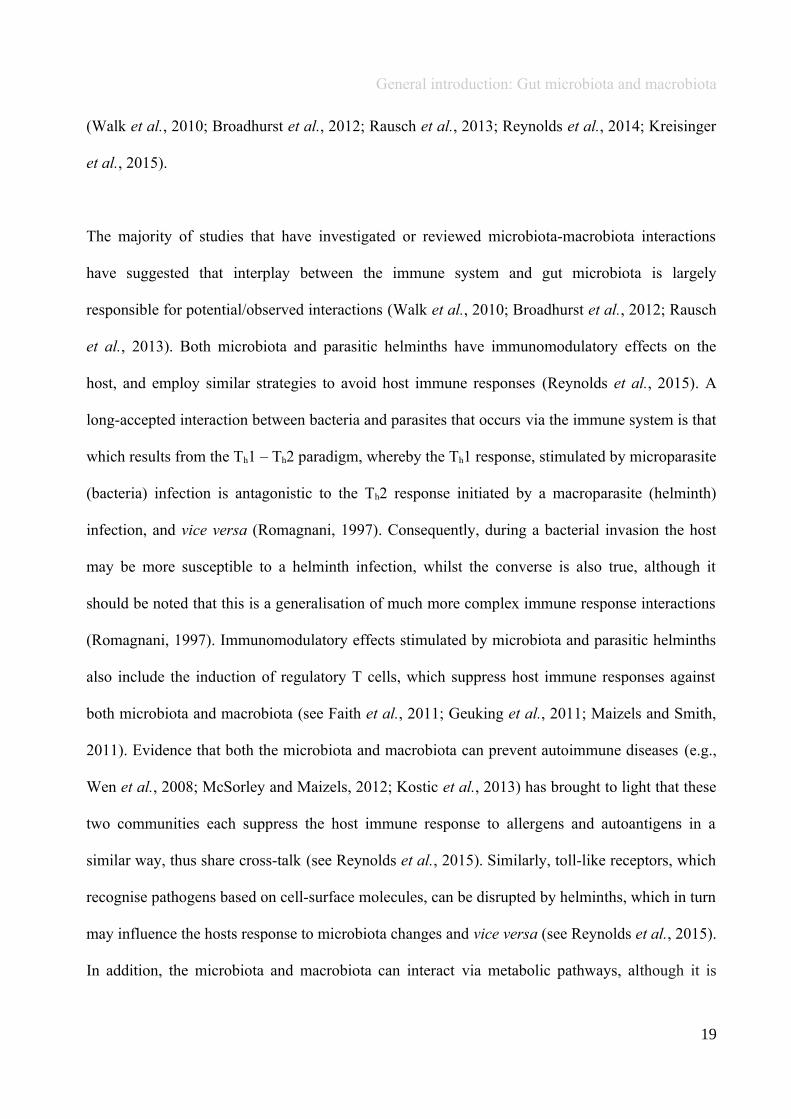
Figure 1.1: Gut microbiota studies have been driven by the knowledge that microbes are involved in manycrucial functions within the host, including resistance to pathogens, immune system development andfunctions, digestion and hormone production, as well as interactions with organs such as the brain andliver.
Microbiota also plays a role in cognition, emotion and behaviour exhibited by the host (Figure
1.1). The gut-brain axis describes the bidirectional interactions that occur between the microbiota
10
General introduction: Gut microbiota and macrobiota
and the central nervous system, which result from a complex network of cytokines, hormones and
the neural system (reviewed by Bercik et al., 2012). This gut-brain intercommunication can result
in behavioural phenotypes associated with microbiota composition; for example, when newly
hatched Kudzu bugs (Megacopta cribraria) are prevented from ingesting maternal symbiotic
capsules, they exhibit wandering behaviour in search of the probiotic (Hosokawa et al., 2008). In
the laboratory, behaviours associated with anxiety are reduced in both germ-free mice (Diaz
Heijtz et al., 2011), and in mice administered the probiotic Lactobacillus rhamnosus (see Bravo et
al., 2011). Moreover, non-infectious diseases that affect cognition and behaviour have been linked
to certain microbiota profiles; e.g., autism has been associated with higher abundances and
diversity of Clostridium spp. in faeces (Finegold et al., 2002), and infection with specific enteric
pathogens has been associated with decreased cognitive abilities (Gareau et al., 2011). The
microbiota is associated with another vital organ; the liver, through a cross-talk of bile acids,
lipopolysaccharides and deoxycholic acids, high levels of which may be reached during gut
dysbiosis and can lead to damage and disease of the liver (reviewed by Bourzac, 2014).
Microbiota also plays a crucial role in immune system functions in the host. A layer of just 30 µm
of intestinal epithelial cells separates potential pathogens ingested by the host from the other
internal organs of the body, as well as the circulatory, respiratory and other systems (Cahenzli et
al., 2012), thus microbiota composition must be continuously monitored by immune cells to
maintain homoeostasis and prevent dysbiosis and pathogenic infection. This very microbiota is
also vital for the development of the immune cells and immune system: gut microbes promote
lymphocyte and immunoglobulin production (Round and Mazmanian, 2009; Cahenzli et al.,
2012), influence the ability of the gut to act as a physical barrier against pathogens (Deplancke
and Gaskins, 2001), are involved in the development of immune structures such as Peyer's patches
11
General introduction: Gut microbiota and macrobiota
(Kamada and Núñez, 2013), and affect the ability of bacteria to colonise the gut (Rolfe et al.,
1981). Indeed, gnotobiotic mammals (i.e., those with a sterile gut, or which possess a limited and
specific microbiota) are unable to develop a fully functioning immune system (Schluter and
Foster, 2012).
1.3 Manipulation of the gut microbiota
As a result of the impact that gut microbiota has on host health (e.g., Round and Mazmanian,
2009; Bercik et al., 2012; Schluter and Foster, 2012; Markle et al., 2013) a great deal of research
has been dedicated to understanding how microbiota can be manipulated or modulated to incite
health benefits and treat disease. Antibiotics, which were discovered in the early 1900s, have been
widely administered to kill or prevent the proliferation of pathogenic bacteria since the 1940s
(Aminov, 2010; Hauser, 2012). However, antibiotics usually function on a ‘broad-spectrum’, and
induce changes in the entire microbial composition, by also affecting non-target and non-
pathogenic bacteria, which can exacerbate or even cause dysbiosis (Francino, 2016). Impacts on
microbiota that result from antibiotic treatment can be long-term; in humans antibiotic associated
perturbation of gut microbiota is significant up to four years after antibiotic administration
(Kilkkinen et al., 2002; Jakobsson et al., 2010). Furthermore, bacterial resistance to antibiotics is
increasing at a rate greater than drug development (Shlaes, 2010), and concerns associated with
overuse of antibiotics (McEwen and Fedorka-Cray, 2002; Dibner and Richards, 2005) led to a ban
in 2006 within the EU on their use as a feed-additive to promote growth in livestock (Anadón,
2006). However, antibiotics continue to be used in alarming quantities; for example, hundreds of
tonnes are used annually in salmon farms in Chile alone (Cabello et al., 2013). In addition, it is
currently unknown if antibiotics also affect other components of the gut biome (including viruses,
protozoa and macroparasites). Instead, treatments which promote the natural community of
12
General introduction: Gut microbiota and macrobiota
microbes, such as probiotics and prebiotics, may be used to treat dysbiosis, and incite other
benefits to the host such as improved immunity and growth (Edens, 2003; Patterson and
Burkholder, 2003; Geraylou et al., 2013).
Probiotics (viable micro-organisms derived from maternal symbiotic capsules, faeces, or from
culture) are ingested both intentionally and unintentionally by humans and wild animals, and are
administered to livestock to directly improve gut microbiota composition. Probiotics have been
consumed by humans for centuries in fermented foods such as dairy products and preserved
meats, albeit without specific intention (Soomro et al., 2002). As knowledge on beneficial
microbes has grown, testing and subsequent production of probiotics, particularly lactic acid
bacteria (Naidu et al., 1999), has become an area of interest for food and pharmaceutical
companies (Saxelin, 2008). Probiotics containing Lactobacillus, Bifidobacterium and
Enterococcus are frequently administered to livestock due to their health inducing benefits;
anaerobic gut bacteria lead to weight gain and improved food conversion efficiency (Fuller,
1989). As part of their normal behavioural repertoire, wildlife, such as the Kudzu bug (Megacopta
cribraria) and bumble bees (Bombus terrestris), may consume probiotics, for example in the form
of maternal symbiotic capsules, which prevent disease and improve general gut health (Hosokawa
et al., 2008; Koch and Schmid-Hempel, 2011).
Although commercial probiotics are typically composed of a single species or strain of bacteria, it
is possible to administer an entire community of micro-organisms by faecal microbiota transplant
(FMT). FMT involves transplanting faeces, or ingesting tablets or capsules containing bacterial
communities derived from faecal microbiota, from a healthy individual into the gut of a recipient
suffering severe dysbiosis, whereby faecal bacteria act as a multi-species probiotic for the
13
General introduction: Gut microbiota and macrobiota
recipient (Lagier, 2014). FMT has proved successful in relieving symptoms of otherwise difficult
to treat infections such as C. difficile (e.g., Aas et al., 2003; MacConnachie et al., 2009). Despite
many years of anecdotal and small-scale study claims of FMT success (e.g., Eiseman et al., 1958)
there are concerns regarding the safety of FMT, due to a lack of studies on long-term impacts and
potential risks associated with transferring an entire faecal microbiota between individuals. For
example, infectious pathogens from the faecal donor may also be transferred to the recipient. In
addition, evidence also suggests that microbiota may revert to its previous composition if FMT is
not regularly administered (Aas et al., 2003; Rawls et al., 2006; Brandt and Aroniadis, 2013).
‘Bacterial interference’ is another category of probiotics, which exploit the antagonistic
interactions between bacterial species known to ‘interfere’ with a pathogen. Bacterial interference
is mainly based on the concept that in order to infect a host, bacteria must adhere to a biological
surface (Reid and Sobel, 1987). Certain bacterial species (administered as a probiotic) can prevent
colonisation of pathogenic bacteria by ‘interfering’ with the adhesion of the pathogen to the host
gut (Reid et al., 2001). Interference may be achieved by bacteria out-competing the pathogen for
host-cell-binding sites and nutrients, inhibiting the toxin-receptor interactions of the pathogen, or
simply by killing it (Reid et al., 2001). A similar concept to bacterial interference is
‘paratransgenesis’, whereby symbionts of a host are genetically modified to express effector
molecules, which interfere with pathogen functions (Coutinho-Abreu et al., 2010).
Paratransgenesis may have a role in biocontrol for disease vectors, as the host is also less
competent at vectoring pathogens after paratransgenesis administration, and transmission of the
symbiont throughout an animal population is self-perpetuating through vertical or coprophagous
transmission (Coutinho-Abreu et al., 2010).
14
General introduction: Gut microbiota and macrobiota
Alternatively, the gut microbiota may be modulated indirectly, for example through diet or
prebiotics. Prebiotics, such as carbohydrates, are ingested to provide a growth substrate for
specific microbes already present in the gut, in order to regain or maintain intestinal homoeostasis
(Pourabedin et al., 2014). A prebiotic can be administered in combination with a probiotic (a
‘synbiotic’), to amalgamate the benefits of both, often with enhanced results. For example
Bifidobacteria, beneficial for its saccharolytic (Gibson et al., 1995) and mucosal barrier enhancing
properties (Cani et al., 2007), can be administered together with oligofructose, a carbohydrate
readily available to stimulate Bifidobacteria growth (Collins and Gibson, 1999). Diet acts as an
arguably less refined prebiotic, and both diet composition and quantity can have major impacts on
microbiota, which are both rapid and reproducible (Desai et al., 2012; Deusch et al., 2014;
Roggenbuck et al., 2014; Sonnenburg and Bäckhed, 2016), thus can be a powerful tool for
modulating microbiota.
1.4 Sharing the gut: parasitic helminths – the macrobiota
The gut not only hosts the microbiota, but harbours an interacting biome of multiple organisms,
including macroparasites (multicellular parasites). Although not as ubiquitous as the microbiota,
macroparasite infections are the norm: billions of humans are infected with helminths worldwide
(Hotez et al., 2006). Infections are equally pervasive in animals, with dramatic economic
consequences in livestock; for example, in the United States of America the annual loss associated
with nematode infection of sheep alone is estimated to be USD 42 million (Waller, 2006).
Although helminths can infect the majority of organs in the body, including the liver, brain and
lungs, of interest here is the macroparasite community that is, spatially, most closely associated
with the gut microbiota; the enteric parasitic helminths or ‘macrobiota’.
15
General introduction: Gut microbiota and macrobiota
Low level helminth infections can be relatively benign and well tolerated by the host, but high
intensity helminth infections can have sub-lethal effects on the host, such as malnutrition, appetite
loss, anaemia and reduced fecundity, and are consequently considered one of the main causes of
poor productivity and ill health in domesticated animals (Beaver, 1975; Shetty, 2010; Sutherland
and Scott, 2010). Despite these negative effects, it is important to note that an absence or
reduction in helminth infections, as observed in most westernised societies (where there is better
access to healthcare and flushing toilets, breaking the life-cycle of faecal-oral transmitted species),
is not necessarily positive for host health (Bilbo et al., 2011). A rise in the prevalence of auto- and
hyperimmune diseases has been associated with reduced contact with helminths (Bilbo et al.,
2011), which has been linked to the fact that helminth infection stimulates a cellular immune
response in the host (Yazdanbakhsh et al., 2002). The resulting increase in immunoglobulin
antibodies is similar to that observed during autoimmunity; however, the physiological response
differs: the immune regulatory network is strengthened by a consequential response by T-helper 2
(Th2) cells to allergens, in effect ‘training’ the immune system to elicit an appropriate response to
pathogens (Yazdanbakhsh et al., 2002).
An individual may be infected by macroparasites from a number of sources. Trophic transmission
can occur by drinking or eating contaminated foodstuffs (Udeh, 2004), or ingesting an infected
intermediate host, such as for Hymenolepis species (see Baker, 2008). Other macroparasites such
as Ancylostoma duodenale infect the host by penetrating the skin (Bethony et al., 2006).
Depending on the life-cycle of the parasite, transmission and infection may occur at different life
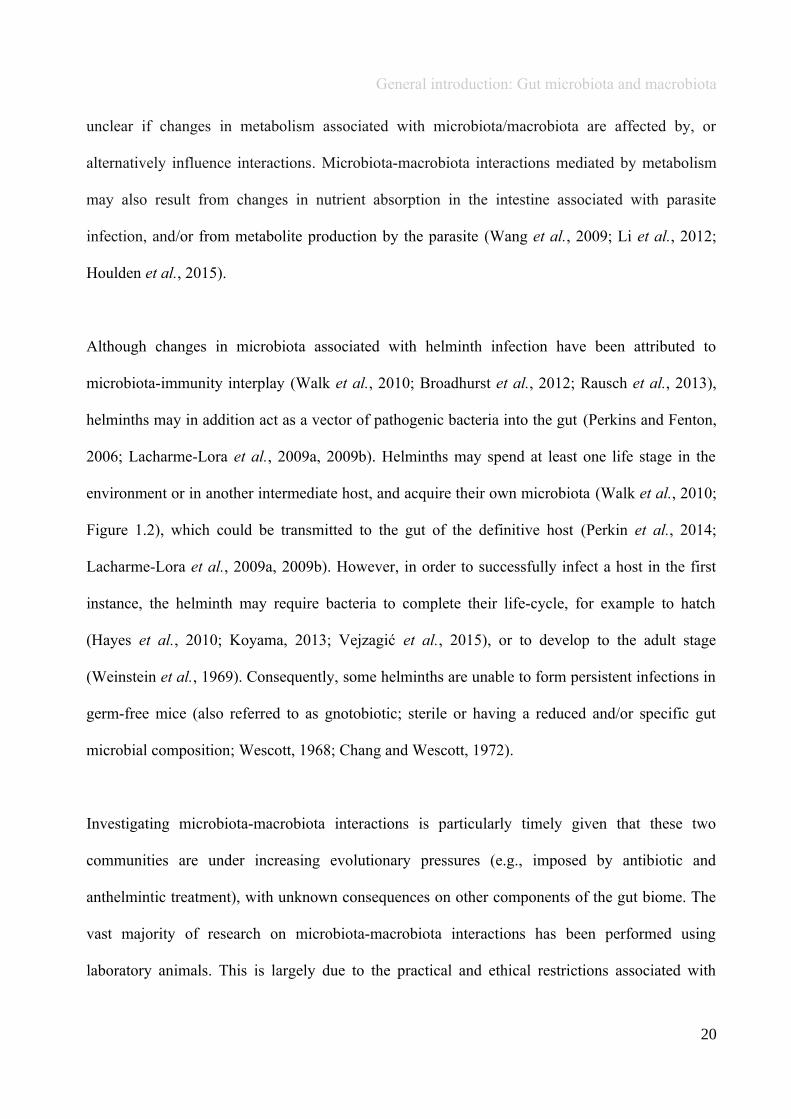
stages. Typically, the life-cycle of parasitic helminths undergoes three separate stages: the egg, at
least one larval stage, and the adult stage (Engelkirk et al., 2011), although not all of these stages
are necessarily parasitic, and may occur in the environment (Figure 1.2). For example, Trichuris
16

General introduction: Gut microbiota and macrobiota
suis are infective from the first larval stage (L1) after eggs have hatched in the environment,
however, Heligmosomoides polygyrus hatch in the environment but are not infective until
undergoing two larval moults (L3 larval stage; Acton, 2011; Figure 1.2). Meanwhile, some
parasites can infect the host during the egg stage, for example Trichuris trichiura (see Bethony et
al., 2006).
Figure 1.2: An overview of the life-cycle of a typical parasitic helminth that infects the gut. Generally, thelife-cycle undergoes three separate stages: the egg, at least one larval stage and the adult stage, althoughnot all of these life stages are necessarily parasitic, and may occur in the environment. For example,Heligmosomoides polygyrus eggs are shed in host faeces and hatch in the environment. Following multiplelarval stages, the infective larvae are ingested by the host, where they develop into adults, reproduce andshed eggs in the gut.
17
General introduction: Gut microbiota and macrobiota
1.5 Microbiota-macrobiota interactions – what do we know so far?
The microbiota and macrobiota share the gut in space and time, and have co-evolved as part of the
gut biome. As these two communities have profound positive and negative effects on host health,
research on the interactions between the microbiota and macrobiota is starting to grow, but still
very little is known. While to date around ten papers review microbiota-helminth interactions
(Bancroft et al., 2012; Berrilli et al., 2012; Glendinning et al., 2014; Loke and Lim, 2015; Mutapi,
2015; Reynolds et al., 2015; Gause and Maizels, 2016; Giacomin et al., 2016a; Zaiss and Harris,
2016; Guernier et al., 2017), these are largely conceptual, and rely on evidence from fewer than
25 studies which have directly investigated microbiota-helminth interactions (see Martínez-
Gómez et al., 2009; Hayes et al., 2010; Walk et al., 2010; Jensen et al., 2011; Broadhurst et al.,
2012; Li et al., 2012; Wu et al., 2012; Coêlho et al., 2013; Cooper et al., 2013; Rausch et al.,
2013; Cantacessi et al., 2014; Lee et al., 2014; Osborne et al., 2014; Reynolds et al., 2014;
Houlden et al., 2015; Kreisinger et al., 2015; McKenney et al., 2015; Zaiss et al., 2015; Cattadori
et al., 2016; Duarte et al., 2016; Giacomin et al., 2016b; Newbold et al., 2017). However,
evidence thus far indicates that the microbiota and parasitic helminths do interact (see Martínez-
Gómez et al., 2009; Hayes et al., 2010; Walk et al., 2010; Jensen et al., 2011; Broadhurst et al.,
2012; Li et al., 2012; Wu et al., 2012; Coêlho et al., 2013; Cooper et al., 2013; Rausch et al.,
2013; Cantacessi et al., 2014; Lee et al., 2014; Osborne et al., 2014; Reynolds et al., 2014;
Houlden et al., 2015; Kreisinger et al., 2015; McKenney et al., 2015; Zaiss et al., 2015; Cattadori
et al., 2016; Duarte et al., 2016; Giacomin et al., 2016b; Newbold et al., 2017). For example,
microbiota composition can affect the susceptibility of an individual to helminth infection
(Martínez-Gómez et al., 2009; Hayes et al., 2010; Coêlho et al., 2013; Reynolds et al., 2014), and
in turn infection can influence the microbial community, usually by increasing bacterial diversity
18
General introduction: Gut microbiota and macrobiota
(Walk et al., 2010; Broadhurst et al., 2012; Rausch et al., 2013; Reynolds et al., 2014; Kreisinger
et al., 2015).
The majority of studies that have investigated or reviewed microbiota-macrobiota interactions
have suggested that interplay between the immune system and gut microbiota is largely
responsible for potential/observed interactions (Walk et al., 2010; Broadhurst et al., 2012; Rausch
et al., 2013). Both microbiota and parasitic helminths have immunomodulatory effects on the
host, and employ similar strategies to avoid host immune responses (Reynolds et al., 2015). A
long-accepted interaction between bacteria and parasites that occurs via the immune system is that
which results from the Th1 – Th2 paradigm, whereby the Th1 response, stimulated by microparasite
(bacteria) infection is antagonistic to the Th2 response initiated by a macroparasite (helminth)
infection, and vice versa (Romagnani, 1997). Consequently, during a bacterial invasion the host
may be more susceptible to a helminth infection, whilst the converse is also true, although it
should be noted that this is a generalisation of much more complex immune response interactions
(Romagnani, 1997). Immunomodulatory effects stimulated by microbiota and parasitic helminths
also include the induction of regulatory T cells, which suppress host immune responses against
both microbiota and macrobiota (see Faith et al., 2011; Geuking et al., 2011; Maizels and Smith,
2011). Evidence that both the microbiota and macrobiota can prevent autoimmune diseases (e.g.,
Wen et al., 2008; McSorley and Maizels, 2012; Kostic et al., 2013) has brought to light that these
two communities each suppress the host immune response to allergens and autoantigens in a
similar way, thus share cross-talk (see Reynolds et al., 2015). Similarly, toll-like receptors, which
recognise pathogens based on cell-surface molecules, can be disrupted by helminths, which in turn
may influence the hosts response to microbiota changes and vice versa (see Reynolds et al., 2015).
In addition, the microbiota and macrobiota can interact via metabolic pathways, although it is
19
General introduction: Gut microbiota and macrobiota
unclear if changes in metabolism associated with microbiota/macrobiota are affected by, or
alternatively influence interactions. Microbiota-macrobiota interactions mediated by metabolism
may also result from changes in nutrient absorption in the intestine associated with parasite
infection, and/or from metabolite production by the parasite (Wang et al., 2009; Li et al., 2012;
Houlden et al., 2015).
Although changes in microbiota associated with helminth infection have been attributed to
microbiota-immunity interplay (Walk et al., 2010; Broadhurst et al., 2012; Rausch et al., 2013),
helminths may in addition act as a vector of pathogenic bacteria into the gut (Perkins and Fenton,
2006; Lacharme-Lora et al., 2009a, 2009b). Helminths may spend at least one life stage in the
environment or in another intermediate host, and acquire their own microbiota (Walk et al., 2010;
Figure 1.2), which could be transmitted to the gut of the definitive host (Perkin et al., 2014;
Lacharme-Lora et al., 2009a, 2009b). However, in order to successfully infect a host in the first
instance, the helminth may require bacteria to complete their life-cycle, for example to hatch
(Hayes et al., 2010; Koyama, 2013; Vejzagić et al., 2015), or to develop to the adult stage
(Weinstein et al., 1969). Consequently, some helminths are unable to form persistent infections in
germ-free mice (also referred to as gnotobiotic; sterile or having a reduced and/or specific gut
microbial composition; Wescott, 1968; Chang and Wescott, 1972).
Investigating microbiota-macrobiota interactions is particularly timely given that these two
communities are under increasing evolutionary pressures (e.g., imposed by antibiotic and
anthelmintic treatment), with unknown consequences on other components of the gut biome. The
vast majority of research on microbiota-macrobiota interactions has been performed using
laboratory animals. This is largely due to the practical and ethical restrictions associated with
20
General introduction: Gut microbiota and macrobiota
experimentation and research using humans (McGuire et al., 2008), an approach which is often
necessary to tease apart interactions within a system, as illustrated by traditional ecological
experiments (Paine, 1966). Given that many variables such as environmental and host
characteristics affect microbiota (Gibson et al., 2004; Khachatryan et al., 2008; Jakobsson et al.,
2010; Carey et al., 2013; Markle et al., 2013) and macrobiota composition (Bundy and Golden,
1987; Bundy et al., 1988; Schalk and Forbes, 1997), carefully controlled studies are vital. On the
other hand, laboratory studies are limited as they lack context in the complex environment of the
‘real world’ (Amato, 2013). This thesis aims to investigate the interactions that occur between
natural microbiota and macrobiota by using a wild animal model system with natural and intact
microbiota and macrobiota composition.
1.6 Investigating microbiota-macrobiota interactions in a free-living system
The yellow-necked mouse (Apodemus flavicollis) was used in this thesis as a wild model system
to investigate microbiota-macrobiota interactions. Apodemus flavicollis is normally associated
with mature deciduous woodland habitat (Ferrari et al., 2004). Fieldwork to collect samples for
the data chapters was performed in mature beech forests (Fagus sylvatica L.) with understorey,
within multiple grids/transects at four field sites in; San Michele all’Adige (46°11'24.8"N,
11°08'27.6"E; 46°11'31.6"N 11°08'20.2"E and 46°11'17.9"N 11°08'16.2"E), Cavedine
(45°59'10.6"N, 10°57'47.1"E; 45°58'30.8"N, 10°57'22.0"E and 45°59'21.2"N, 10°57'59.6"E),
Pietramurata (46°00'52.2"N, 10°55'27.7"E; 46°00'47.7"N, 10°55'40.7"E and 46°01'01.4"N,
10°55'22.8"E) and Lagolo (46°03'28.6"N, 11°00'47.9"E), in the Province of Trento, situated in the
Region of Trentino-Alto Adige of the northeastern Italian Alps. The parasitic helminth community
of the A. flavicollis gut has been well described previously, and studies on natural gut microbiota
21
General introduction: Gut microbiota and macrobiota
composition have also been performed on this species, including in the chosen study area (Ferrari,
2005; Perkins et al., 2008; Ferrari et al., 2009; Kreisinger et al., 2015).
1.7 Thesis aims
This thesis uses an ecological approach to understand the interactions between gut microbiota and
gut macrobiota (Figure 1.3). The thesis is composed of five self-contained data chapters; one
literature review (Chapter 2), and four experimental chapters (Chapter 3-6; Figure 1.3). First, a
literature review was performed on non-human animal gut microbiota, which established the
research landscape of animal microbiota studies. The experimental chapters follow, which largely
used manipulation as a means to tease apart microbiota-macrobiota interactions. A field
experiment that examined the effect of helminth perturbation (by anthelmintic) on microbiota
composition is presented (Chapter 3), followed by a field study on the effect of microbiota
depletion (by antibiotic) on helminth prevalence, burden and fecundity (Chapter 4, Figure 1.3).
Next, the diversity and composition of helminth-associated microbiota was investigated, and
compared to that of the host gut (Chapter 5, Figure 1.3). The effect of faecal microbiota on
helminth development was then explored, whereby probability and rate of helminth egg
development in microbiota of ‘self’ faeces from the original host, and of ‘non-self’ faeces from
another individual were compared (Chapter 6, Figure 1.3). Finally, the cumulative results of these
data are discussed in context, and any subsequent research questions and implications are
addressed (Chapter 7). In Appendix A.8 additional work is presented, which although not directly
part of this thesis, has contributed to it. With the exceptions of Chapters 1 and 7, each chapter has
been written as a manuscript in preparation for submission, and Chapter 2 is currently in press for
publication in ISME Journal. Therefore, this has led to some overlap in content between chapters,
particularly with respect to methods (Figure 1.3).
22
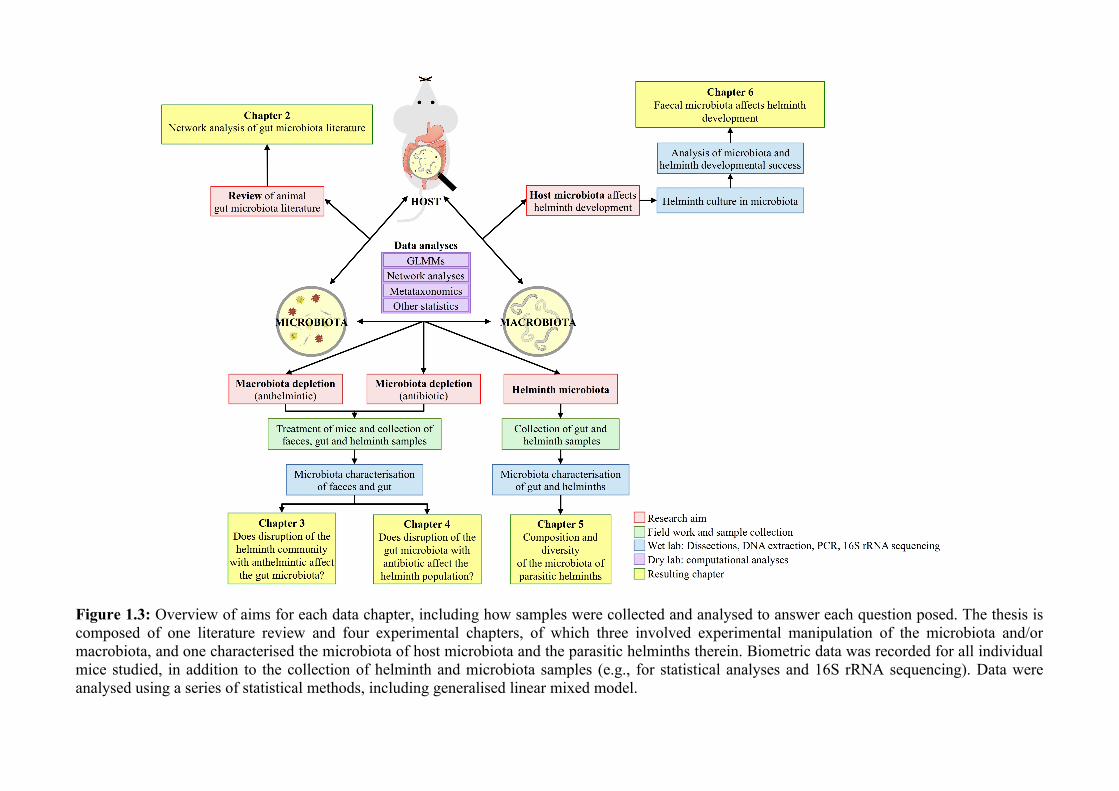
Figure 1.3: Overview of aims for each data chapter, including how samples were collected and analysed to answer each question posed. The thesis iscomposed of one literature review and four experimental chapters, of which three involved experimental manipulation of the microbiota and/ormacrobiota, and one characterised the microbiota of host microbiota and the parasitic helminths therein. Biometric data was recorded for all individualmice studied, in addition to the collection of helminth and microbiota samples (e.g., for statistical analyses and 16S rRNA sequencing). Data wereanalysed using a series of statistical methods, including generalised linear mixed model.
Chapter 2
Network analysis of gut microbiota literature
“In all works on Natural History, we constantly find details of the marvellous adaptation of
animals to their food, their habits, and the localities in which they are found.”
Alfred R. Wallace
24
Network analysis of gut microbiota literature
2.1 Abstract
A wealth of human studies has demonstrated the importance of gut microbiota to health. Research
on non-human animal gut microbiota is now increasing, but what insight does it provide? We
reviewed 650 publications from this burgeoning field (2009-2016) and determined that animals
driving this research were predominantly ‘domestic’ (48.2%), followed by ‘model’ (37.5%), with
least studies on ‘wild’ (14.3%) animals. Domestic studies largely experimentally perturbed
microbiota (81.8%) and studied mammals (47.9%), often to improve animal productivity.
Perturbation was also frequently applied to model animals (87.7%), mainly mammals (88.1%), for
forward translation of outcomes to human health. In contrast, wild animals largely characterised
natural, unperturbed microbiota (79.6%), particularly in pest or pathogen vectoring insects
(42.5%). We used network analyses to compare the research foci of each animal group. ‘diet’ was
the main focus in all three, but to different ends: to enhance animal production (domestic), to
study non-infectious diseases (model), or to understand microbiota composition (wild). Network
metrics quantified model animal studies as most interdisciplinary, while wild animals incorporated
the fewest disciplines. Overall, animal studies, especially model and domestic, cover a broad array
of research. Wild animals, however are the least investigated, but offer under-exploited
opportunities to study ‘real-life’ microbiota.
25
Network analysis of gut microbiota literature
2.2 Review of literature
2.2.1 The dawn of modern microbiota research
Technological advances in multi-‘omic platforms such as metataxonomics and metagenomics,
have helped fuel the recent expansion of microbiota research (Marchesi and Ravel, 2015),
especially on humans, as exemplified by large-scale efforts such as The Human Microbiome
Project, started in 2007 (Peterson et al., 2009). Research on microbiota from non-human habitats
has followed: in 2010 the Earth Microbiome Project (www.earthmicrobiome.org) was initiated to
document microbial diversity across multiple biomes (Gilbert et al., 2014). Studies focussing on
microbiota of the gut have especially captivated scientific interest; it is the most dense and diverse
microbial community of the body, is influenced by a range of intrinsic and extrinsic variables
including diet, genetics and environmental factors (Khachatryan et al., 2008; Phillips, 2009;
Bright and Bulgheresi, 2010; Claesson et al., 2012), and is vital to host health and development
(Round and Mazmanian, 2009; Lozupone et al., 2012). In recent years non-human animal gut
microbiota studies have started to emerge, for example, characterising the microbiota of giant
pandas, Ailuropoda melanoleuca, to make microbial comparisons across age groups (Tun et al.,
2014), or of the European honey bee, Apis mellifera, to understand the role of bacteria in nutrition
(Engel et al., 2012). But, what other species have been studied, and why? Given this field of
research is starting to prosper, it is timely to take stock of the non-human animal gut microbiota
literature and determine the research landscape thus far.
Here, we ask ‘what drives research in animal gut microbiota?’ by quantifying the subject as a
domestic, model or wild animal. Within these three animal groups we determine whether data
collection is purely observational or instead the result of experimentation, which animal taxa are
used, and which research questions are addressed. In addition, we use network analyses to
26
Network analysis of gut microbiota literature
determine unique and overlapping research foci for each animal group. Finally, we determine the
extent that animal groups consider microbiota-host-environment interactions, by calculating the
interdisciplinarity of studies within each group.
2.2.2 Data-mining the literature
A search for peer-reviewed articles on non-human gut microbiota published between the years
1911 and 2016 was performed in Web of Science® and PubMed. Search terms were ‘microbi*’
AND ‘gut’ OR other gut-related terms (‘anal’ OR ‘anus’ OR ‘caec*’ OR ‘cec*’ OR ‘cloac*’ OR
‘colon’ OR ‘duoden*’ OR ‘faec*’ OR ‘fec*’ OR ‘gastro*’ OR ‘ile*’ OR ‘intest*’ OR ‘jejun*’ OR
‘rect*’ OR ‘rum*’ OR ‘stomach’). The search excluded common irrelevant terms (‘ferment*’,
‘microbiol*’, ‘reactor*’, ‘review*’, ‘vitro’), and those related to humans (‘child*’, ‘human*’,
‘infan*’, ‘men’, ‘paedi*’, ‘patient*’). All abstracts of the resulting 3,095 articles were reviewed
manually and 1,419 were found to characterise the microbiota of the non-human animal gut
(either the entire digestive tract, one or more sections, and/or faeces). A sub-set of 650 studies
(November 2009 – July 2016) were randomly selected for analysis based on corresponding
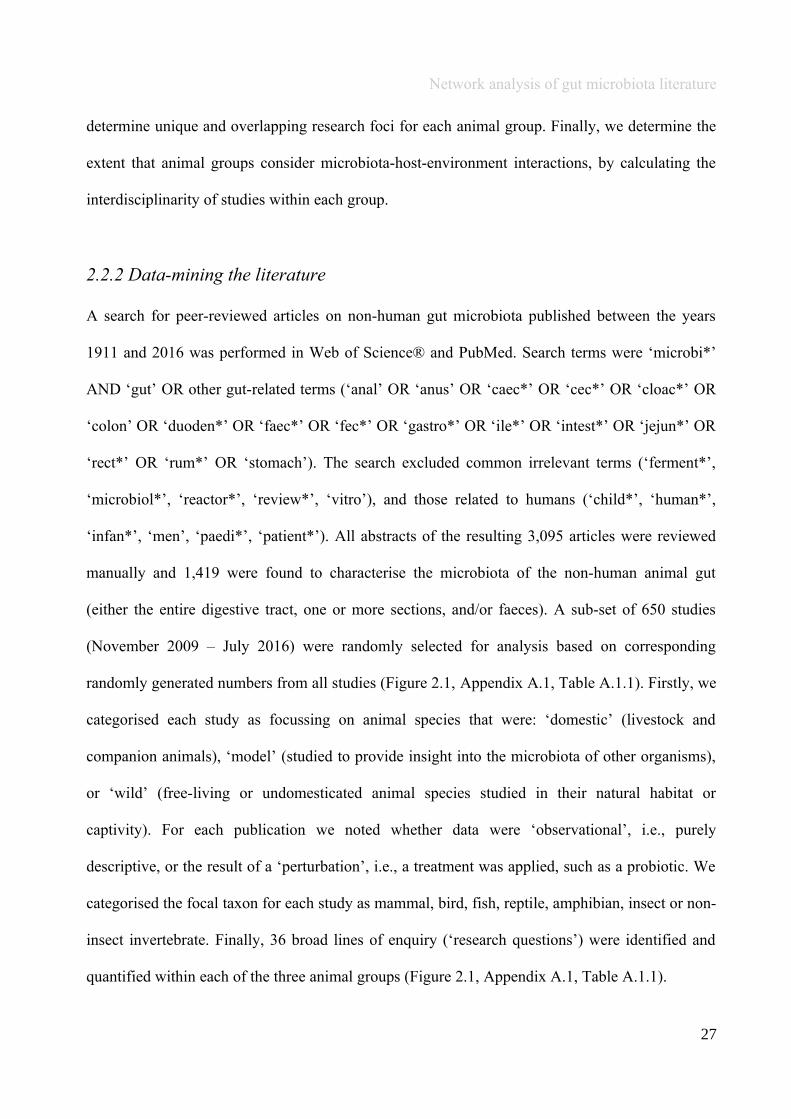
randomly generated numbers from all studies (Figure 2.1, Appendix A.1, Table A.1.1). Firstly, we
categorised each study as focussing on animal species that were: ‘domestic’ (livestock and
companion animals), ‘model’ (studied to provide insight into the microbiota of other organisms),
or ‘wild’ (free-living or undomesticated animal species studied in their natural habitat or
captivity). For each publication we noted whether data were ‘observational’, i.e., purely
descriptive, or the result of a ‘perturbation’, i.e., a treatment was applied, such as a probiotic. We
categorised the focal taxon for each study as mammal, bird, fish, reptile, amphibian, insect or non-
insect invertebrate. Finally, 36 broad lines of enquiry (‘research questions’) were identified and
quantified within each of the three animal groups (Figure 2.1, Appendix A.1, Table A.1.1).
27
Network analysis of gut microbiota literature
Figure 2.1: Work flow for categorising gut microbiota studies on non-human animals followingsearches in Web of Science® and PubMed. Of the 1,419 relevant articles identified, 650 recentlypublished studies (2009-2016) were categorised into one of three animal groups (domestic, modelor wild animals). Data collection method, animal taxon and research question(s) addressed weredetermined for each study.
2.2.3 Using network analyses to visualise and quantify the research landscape
To visualise research foci and interdisciplinarity, network graphs were constructed for domestic,
model and wild animal studies based on research questions. A network graph consists of nodes
28
Network analysis of gut microbiota literature
linked by edges; in this case, a node represented one of the 36 research questions identified, and
an edge the co-occurrence of those questions within a scientific paper(s). Each network was
constructed from an n by n symmetrical adjacency matrix; whereby a row and a column were
present for each of the 36 research questions, and numbers within the matrix represented the total
number of studies in which each pairwise combination of research questions co-occurred, in a
given animal group. Numbers at the intercept of a given research question (at the diagonal centre)
indicated the total number of studies in which that research question was addressed, regardless of
whether it co-occurred with any other research questions. As the matrix was symmetrical, edges
were non-directed, i.e., a link between any pairwise combination of research questions had the
same value in both directions: for example, the nodes i to j had the same value as j to i. In each
network graph, the size of each circle (node size; s) was weighted according to the total number of
studies addressing that question, and the width of lines joining each circle (edge width) was
weighted by the number of studies in which two given research questions co-occurred (Figure
2.2). To quantify and compare the foci of research questions between animal groups, we
calculated a series of network metrics. Node size (s), or the number of studies investigating any
given question depicts how common a question is; node degree (k) represents the number of edges
connected to a question, thus its importance in forging links between disciplines, and node
strength (NS) is the sum of weighted connections to a question, hence how core the question is to
the research.
2.2.4 What is driving animal microbiota studies?
The 650 publications reviewed here were dominated by studies on domestic animals (48.2%),
followed by model animals (37.5%), while wild animal studies were comparatively few (14.3%;
Table 2.1). Perturbation is crucial to understand how a system functions, as exemplified by classic
29
Network analysis of gut microbiota literature
ecological experiments (Paine, 1966), and it was used heavily, as opposed to observational data, in
domestic studies (81.1%; Table 2.1). Likewise, perturbation was frequent in model studies
(87.7%), but was rarely used in wild animals (20.4%), where instead observational data (79.6%)
were favoured. All of the reviewed studies focussed on the bacterial communities of the
microbiota, and of these, 12.5% studies also characterised at least one other microbial community;
archaea (8.8%), fungi (4.3%), protozoa (2.8%) and/or viruses (0.6%; Appendix A.1, Table A.1.1).
Just over half (54.3%) of studies that investigated the non-bacterial microbiota used perturbation,
the remaining half being observational, and investigated domestic animals (53.1%), followed by
wild (32.1%) and model (14.8%) animals.
In domestic animals, perturbation was used with the aim of improving animal productivity
(29.7%), for example by administering probiotics (16.3%, e.g., Ahmed et al., 2014) or prebiotics
(6.4%, e.g., Hoseinifar et al., 2014; Figure 2.2). In model animals perturbation was used to determine
interactions between gut microbiota and host health, e.g., the role of microbiota in eliciting an
immune response (‘immunity’; 36.6%; e.g., Brinkman et al., 2011) for forward translation to
humans. For model animals, perturbation also included therapeutics, such as antibiotics (13.5%;
e.g., Carvalho et al., 2012), and more rarely, organ transplants (1.2%; Li et al., 2011) and other
surgical procedures (0.8%; Devine et al., 2013; Figure 2.2). The few wild animal studies to use
perturbation did so to understand system functions, e.g., by examining the effect of dietary
treatments on microbiota of wild-caught giraffes, Giraffa camelopardalis, as a means to
understand microbial symbioses (Roggenbuck et al., 2014). Instead, observational data were the norm
for wild animals in order to characterise ‘natural’ microbiota structure and function, especially
community composition (41.9%; Figure 2.2).
30

Table 2.1: The number of studies categorised into three animal study groups: domestic, model or wild, from 650 non-human animal gut microbiotastudies, showing data collection methods (observation or perturbation) and network indices of three network graphs investigating research questioninterdisciplinarity and overlap.
Animal group
Data collection methodNumber of
nodes
(N)
Maximum
node size
(s)
Maximum
node degree*
(k)
Maximum
node strength†
(NS)
Network
density§
(D)
Mean
betweenness
centrality¤
(± SEM)
(BC)
Perturbation Observation
Domestic
(48.2%)256 (81.8%) 57 (18.2%) 27
Diet
(158)
Diet
(20)
Diet
(175)0.17 15.99 (± 3.41)
Model
(37.5%)214 (87.7%) 30 (12.3%) 34
Diet
(95)
Immunity
(23)
Immunity
(164)0.23 19.09 (± 3.99)
Wild
(14.3%)19 (20.4%) 74 (79.6%) 22
Community
composition
(39)
Diet
(13)
Community
composition
(41)
0.08 12.19 (± 3.41)
* Node degree (k): The number of edges connected to a node, i.e., the number of research questions that co-occur.
† Node strength (NS): The sum of the weighted edges connected to a node, i.e., the total number of separate co-occurrences of a research question and
all others that it is connected to.
§Network density (D): The connections present in a network as a proportion of the total number of possible connections.
¤Mean betweenness centrality (BC): The mean shortest number of paths required to pass through each research question in the network, i.e., how well
connected research questions are and thus interdisciplinarity of the whole network.
Network analysis of gut microbiota literature
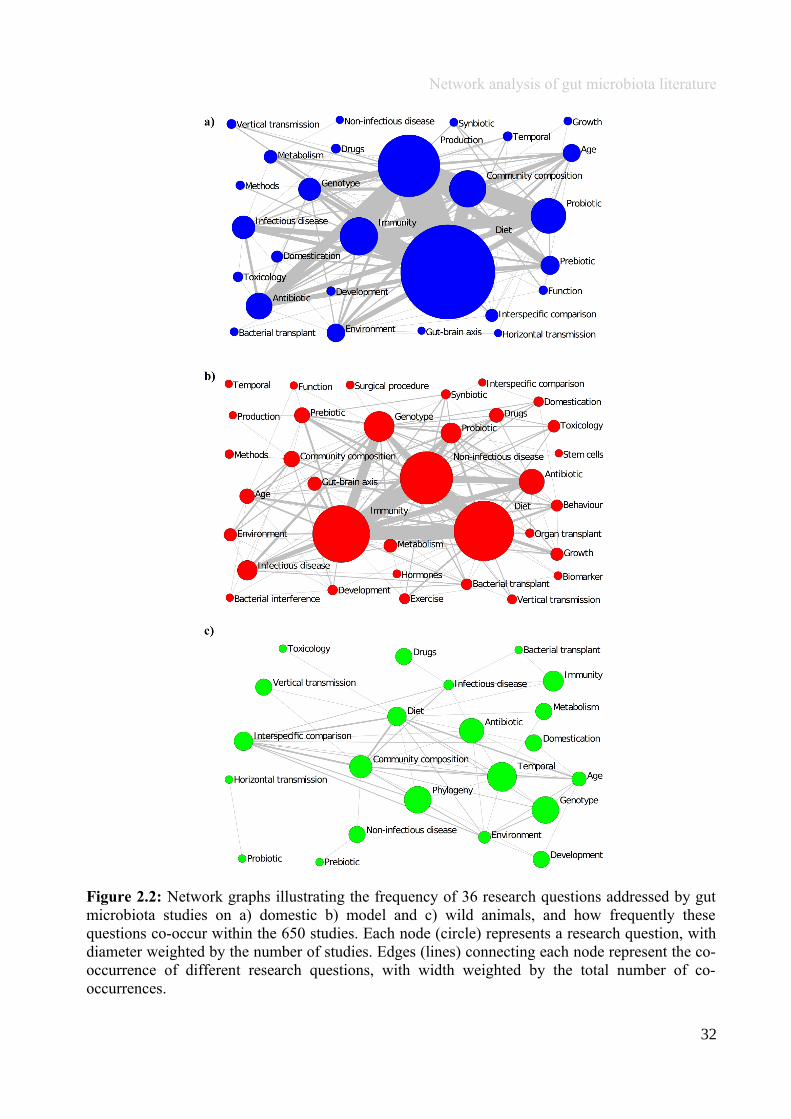
Figure 2.2: Network graphs illustrating the frequency of 36 research questions addressed by gutmicrobiota studies on a) domestic b) model and c) wild animals, and how frequently thesequestions co-occur within the 650 studies. Each node (circle) represents a research question, withdiameter weighted by the number of studies. Edges (lines) connecting each node represent the co-occurrence of different research questions, with width weighted by the total number of co-occurrences.
32
Network analysis of gut microbiota literature
Although perturbation, under controlled conditions, is more straightforward in domestic and
model animals, thus facilitating treatment comparisons and reducing confounding factors such as
genetic variation and diet, the complex combination of factors that influence microbiota are
unlikely to be understood by looking at laboratory animals alone (McGuire et al., 2008; Amato,
2013). Standardisation may appear logical to obtain less noisy data, but it does not reflect the
human condition, where such identical factors are not experienced throughout life nor between
individuals, and risks, what Ronald Fisher stated as “(supplying) direct information only in
respect of the narrow range of conditions achieved by standardisation” (Fisher, 1937). It would
appear that wild animals could provide an opportunity not only to examine natural gut microbiota
function, but to extend observations to incorporate understanding of complex multidirectional
microbiota-host-environment interactions that they are subject to. Already, other areas of
traditionally animal-model dominated research, such as immunology, study and sometimes
perturb wild model systems, giving rise to ‘wild immunology’ (Pedersen and Babayan, 2011), and
it could be timely for microbiota research to follow suit. Consequently, the obvious progression of
wild studies is to understand how ‘natural’ microbiota responds to perturbation as a model for
humans and other species, and to determine directionality of microbiota-host-environment
interactions (Gordon, 2012). Difficulties in doing so may be imposed, however, by legislation
relating to scientific procedures on wild animals in any given country. In the UK, for example, the
Animals Scientific Procedures Act 1986, must be complied with under Home Office regulations.
In addition, species may be afforded protection from perturbation due to their international
conservation status, for example, those appearing on the International Union for Conservation of
Nature (IUCN) red list. Movement of samples between collaborators working on protected species
may also be complex due to Convention on International Trade in Endangered Species (CITES)
regulations; permits are required for the translocation of samples from given species between
33
Network analysis of gut microbiota literature
countries. In a compromise between studying wild animals and meeting legal and logistical
requirements, 40.9% of wild studies examined here used wild-caught (captured for purposes of
study) or captive (e.g., from a zoo or research facility) ‘wild’ animals, with the remaining 59.1%
investigating free-living, or a combination of free-living and captive animals. Even this level of
compromise may significantly alter research outcomes, as it has consistently been found that wild
animals exhibit a loss of natural microbes following captivity (Xenoulis et al., 2010; Nelson et al.,
2013; Kohl and Dearing, 2014).
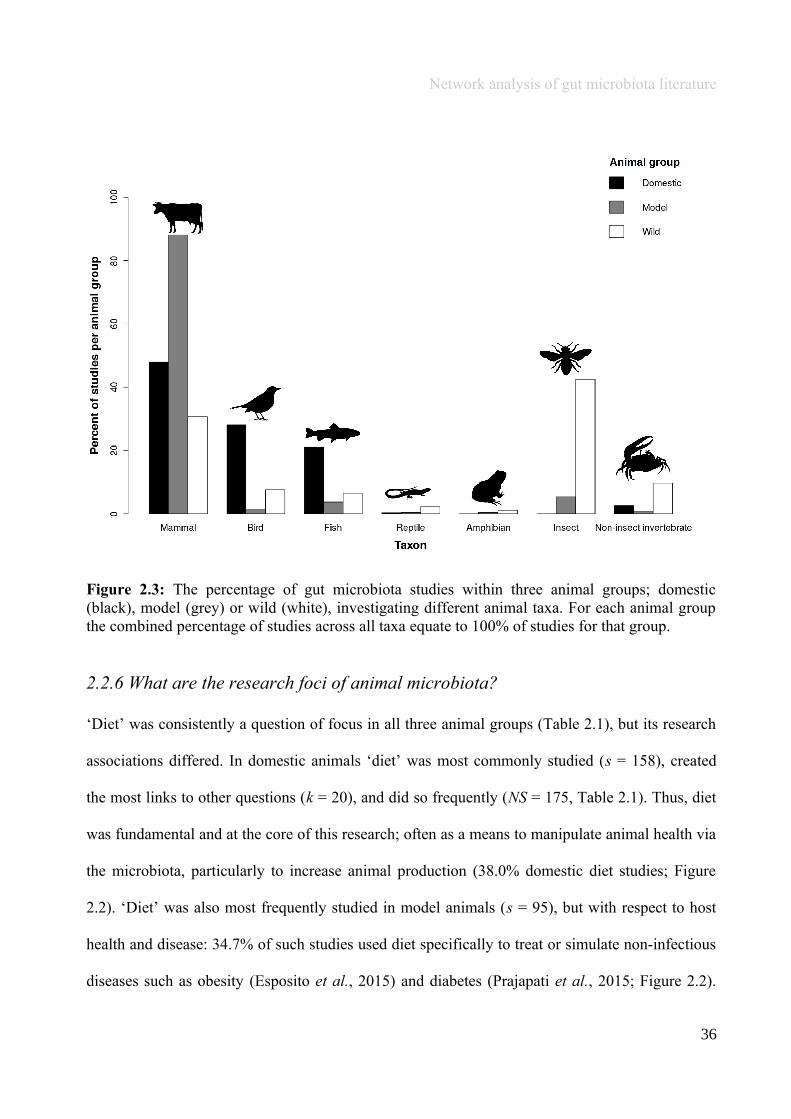
2.2.5 How taxonomically diverse are animal microbiota studies?
Domestic and model studies were composed of similar taxonomic groups (predominantly
vertebrates, i.e., mammals, birds and fish, in 97.1% and 93.0% of studies respectively), but the
opposite was true of wild studies, which predominantly focussed on invertebrates (52.2%; Figure
2.3). Domestic animals that have large farmed populations in economically developed regions
were most studied; i.e., pigs, cattle (49.7% and 28.7% of mammals respectively), and chickens
(80.5% of birds; Figure 2.3). Species from all six taxonomic categories have been exploited as
models, but model studies mostly focused on laboratory mice (70.2% mammals) or rats (23.3%
mammals; Figure 2.3), in part because the dominant bacterial phyla in the rodent and human gut
are similar - Firmicutes, Bacteroidetes and Actinobacteria (Spor et al., 2011).
Laboratory model rodent studies have been fundamental for progressing our understanding of
microbiota function and modulation, for example rats have demonstrated microbiota may be used
as a biomarker to predict liver transplant rejection (Ren et al., 2013). However, extrapolating data
from laboratory animals to other species (including humans) has limitations, e.g., similarities in
microbiota between rodents and humans are reduced beyond the phyla level (Spor et al., 2011;
34

Network analysis of gut microbiota literature
Nguyen et al., 2015). In addition, laboratory animals have a highly inbred genetic background
(Hufeldt et al., 2010), and are exposed to very different conditions to those experienced by
humans and wild animals, but which influence microbiota, e.g., captive rearing (Zeng et al.,
2012), and constant extrinsic factors such as diet and housing conditions (Le Floc’h et al., 2014).
Indeed, the disparity between laboratory animals and humans is believed to be a major
contributing factor towards attrition; whereby drug trials are successful in laboratory animals but
later fail in human trials (Garner, 2014), and this same lack of successful forward translation is
likely to also occur in microbiota research. As such, there appears to be a niche for utilising wild
rodents as model organisms: wild rodents are physiologically and genetically similar to those
already used and understood in the laboratory (Pedersen and Babayan, 2011), but host an intact
and diverse gut microbiota (Amato, 2013). Microbiota studies, however, on wild mammals are
currently relatively uncommon (30.6%) and include species not related to those traditionally used
as model organisms e.g., Arctic ground squirrels (Urocitellus parryii) have been studied to
monitor temporal changes in microbiota composition (Stevenson et al., 2014). Instead, wild
studies focussed on insects (42.5%), and although wild insects such as Drosophila, whose simple
microbiota has provided insight into host-microbe interactions, could be developed as a model
system (Chandler et al., 2011), studies were instead driven by the potential for microbiota
manipulation to be used in biocontrol. As such, wild insect studies were mainly focussed on
agricultural pests and vectors of pathogens e.g., bee (23.4%), termite (22.1%) and mosquito
species (13.0%; Figure 2.3). These, and similar studies, have suggested that removal of important
symbiotic bacteria responsible for lignocellulose digestion could be used to control crop pests
(Schloss et al., 2006), and probiotics may be used to control vector-borne pathogens such as
Plasmodium (malaria) in mosquitoes, since bacteria can stimulate an up-regulation of immunity
genes that reduce Plasmodium acquisition (Dong et al., 2009; Boissière et al., 2012).
35
Network analysis of gut microbiota literature
Figure 2.3: The percentage of gut microbiota studies within three animal groups; domestic(black), model (grey) or wild (white), investigating different animal taxa. For each animal groupthe combined percentage of studies across all taxa equate to 100% of studies for that group.
2.2.6 What are the research foci of animal microbiota?
‘Diet’ was consistently a question of focus in all three animal groups (Table 2.1), but its research
associations differed. In domestic animals ‘diet’ was most commonly studied (s = 158), created
the most links to other questions (k = 20), and did so frequently (NS = 175, Table 2.1). Thus, diet
was fundamental and at the core of this research; often as a means to manipulate animal health via
the microbiota, particularly to increase animal production (38.0% domestic diet studies; Figure
2.2). ‘Diet’ was also most frequently studied in model animals (s = 95), but with respect to host
health and disease: 34.7% of such studies used diet specifically to treat or simulate non-infectious
diseases such as obesity (Esposito et al., 2015) and diabetes (Prajapati et al., 2015; Figure 2.2).
36
Network analysis of gut microbiota literature
Despite its popularity, ‘diet’ was not the most integrated or interdisciplinary question in the
network, but instead ‘immunity’ was (k = 23 and NS = 164; Table 2.1), highlighting the
importance of the shared relationship between microbiota and immunity, and how it consequently
affects many other aspects of health (Round and Mazmanian, 2009). In contrast ‘community
composition’ was most studied (k = 13) and embedded (NS = 41) within wild studies, but ‘diet’
was key to creating research links between questions (s = 39, Table 2.1). This link results from the
fact that wild studies focus on microbiota structure (e.g., Delsuc et al., 2014), and suggests that we
are currently acquiring more basal knowledge on wild animal microbiota. In addition, only 25.9%
of wild animal ‘diet’ studies used perturbations, with the remaining 74.1% observing microbiota
composition under a ‘natural’ diet (33.3%; Figure 2.2). Given that 72% of emerging zoonotic
pathogens are transmitted to humans from wildlife (Jones et al., 2008), and microbiota and
immunity are strongly interlinked (Round and Mazmanian, 2009), determining how microbiota
interacts with host immunity and/or infectious disease (currently only 17.9% and 9.3% in
domestic animals which have frequent contact with humans, and 3.2% and 10.8% of wild studies,
respectively) deserves further consideration.
2.2.7 Do animal microbiota studies take an interdisciplinary approach?
Animal microbiota studies with a single research focus have provided important basal knowledge
on microbial composition and function e.g., in-depth analyses of microbiota community
composition in laboratory mice have revealed that the intestinal crypts, which harbour gut stem
cells, also accommodate a niche microbial community (Pédron et al., 2012). Likewise, there is
also great value in an interdisciplinary approach, in which multiple factors are studied
simultaneously, and can aid in progressing knowledge and teasing apart complex and
multidirectional host-microbiota-environment interactions (Gordon, 2012). We quantified the
37
Network analysis of gut microbiota literature
‘interdisciplinarity’ of each group by measuring the mean ‘betweenness centrality’ (BC) of each
network: BC indicates how closely associated all questions are in relation to each other, and is the
number of shortest paths required to pass through each question to connect it to all other
questions; larger values indicate questions that are more closely associated (Leydesdorff, 2007).
Network density (D), indicates the level at which interdisciplinarity has been exploited in each
group, calculated as a proportion of the total number of possible connections, whereby 0 = no
connections present, and 1 = all possible connections are present and maximum interdisciplinarity
has been reached. Network analyses were conducted using the igraph package in R v. i386 3.0.3
(Csardi and Nepusz, 2006).
Model studies exploited the ability to take an interdisciplinary approach the most, with the highest
proportion of possible links between questions (D = 0.23), followed by domestic (D = 0.17) and
wild (D = 0.08) studies (Table 2.1). In addition, research questions in model studies were more
closely associated, directly or indirectly, with one another, (mean BC = 19.09 ± 3.99), than in
domestic (BC = 15.99 ± 3.41) or wild (BC = 12.19 ± 3.41) studies (Table 2.1). The comparatively
high interdisciplinarity of model studies reflects the large range of questions addressed (N = 34),
compared to the domestic (N = 27) and wild (N = 22) groups, and the motivation of many model
studies to improve medical treatments, which often requires an interdisciplinary approach in order
to monitor the range of subsequent effects on health (e.g., to investigate the associations between
organ transplantation, non-infectious disease, immunity and microbiota; Xie et al., 2014).
Conversely, wild studies were least integrated and interdisciplinary; questions were addressed
more independently of one another. However, this group did address a unique research question:
‘phylogeny’ – and how phylogeny is driven across species by gut microbiota and diet, and vice
versa; for example, myrmecophagous mammals from different evolutionary lineages exhibit
38
Network analysis of gut microbiota literature
striking convergence with respect to gut microbial composition, driven by dietary adaptations
(Delsuc et al., 2014).
While the more focussed approach of wild animal research has allowed us to assemble
fundamental microbiota knowledge, it has been argued that an interdisciplinary approach is
necessary to progress research on basic and applied gut microbiota (Gordon, 2012). We predict
that the interdisciplinarity of wild animal studies will increase as they are adopted in microbiota
research, particularly if done so as model organisms. Indeed, the first interdisciplinary microbiota
studies using wild populations provide interesting insight into the interactions between host,
microbiota and environment. For example, parasitic helminths infecting the gut have up- and
down-stream effects on microbiota composition (Kreisinger et al., 2015) and seasonal variation in
wild rodent microbiota is largely driven by changes in food availability (Maurice et al., 2015).
2.2.8 Conclusion and outlooks
Although more than 10% of studies investigated the microbial community of non-bacterial species
in addition to the bacterial component of the microbiota, of these only 0.6% studies investigated
the virome, despite evidence that viruses bestow a number of functional traits to bacteria (Ogilvie
and Jones, 2015). Complementary studies that simultaneously investigate multiple components of
the gut biome are likely to shed light on microbiota composition and functionality (see for
example, Glendinning et al., 2014). We demonstrate that most animal gut microbiota studies are
driven by economic (domestic animals) or human health (model animals) issues, although more
microbiota studies on immunity and/or infectious disease in domestic animals could benefit both
livestock and humans in close proximity to them. There are, however, well-founded concerns
regarding the limitations of laboratory animals as model organisms, as highlighted by attrition
39
Network analysis of gut microbiota literature
(Fisher, 1937; Garner, 2014). In 2013 the former director of the NIH, Prof. Elias Zerhouni, stated
that “We have moved away from studying human disease in humans” (NIH Record:
http://bit.ly/2f5UpII), arguing that we should “….refocus and adapt new methodologies for use in
humans to understand disease biology in humans”; raising interesting issues about the use of
animal models, including in microbiota research, and whether it is scientifically legitimate to
forward translate our findings to humans. This does not mean that we should not use animal
models, but rather that we should consider changing the way in which we study them, so that they
may more accurately represent human inter-individuality. The intact gut biomes of wild species
that experience inter-individual and environmental variation more similar to humans than their
laboratory counterparts, rendering the results more ‘realistic’, could form the basis of more
relevant models to study microbiota. However, field experiments would need to be carefully
designed to provide statistical power in the face of extensive variation (e.g., controlling for genetic
background, diet, sex, etc.). Under some circumstances, manipulation of microbiota in wildlife is
not possible (e.g., for rare, elusive or protected species). In these cases, development of
mathematical and/or statistical models to assign directionality to observational data could be
beneficial. Examples of applications in other fields include identifying interactions between
immune components using network theory (Thakar et al., 2012), and determining interspecific
interactions among an unperturbed community of gut parasites, using generalised linear mixed
models (Fenton et al., 2010). Studies on wild animals are currently comparatively few, and
generally aim to characterise natural microbiota, combining few disciplines. However, it is likely
that interdisciplinarity will increase in wild animals should they be developed as model systems.
40
Network analysis of gut microbiota literature
2.3 Author Acknowledgements
The manuscript resulting from this chapter is currently in press in The ISME Journal and is
authored by the following:
Emily L. Pascoe, Heidi C. Hauffe (Fondazione Edmund Mach), Julian R. Marchesi (Cardiff
University and Imperial College), Sarah E. Perkins (Cardiff University and Fondazione Edmund
Mach).
E.L.P: Conceived and designed study, collected, analysed and interpreted data, wrote manuscript.
H.C.H: Provided detailed comments on methods and interpretation of data, as well as all versions
of the manuscript.
J.R.M: Provided comments on the final version of the manuscript.
S.E.P: Conceived and designed study, supervised network analyses, provided comments on the
manuscript.
41
Chapter 3
Does disruption of the helminth communitywith anthelmintic affect the gut microbiota?
“To expect the world to receive a new truth, or even an old truth, without challenging it, is to look
for one of those miracles which do not occur.”
Alfred R. Wallace
42
Does disruption of the helminth community with anthelmintic affect the gut microbiota?
3.1 Abstract
Helminth infection of the gut is associated with morbidity and economic loss, and anthelmintics
are widely administered to humans, livestock, and companion animals to control infections.
Although helminth resistance has been well studied, it is largely unknown if perturbation of the
helminth community by an anthelmintic treatment has knock-on effects on other components of
the gut ecosystem, namely the microbiota. Here, anthelmintic (ivermectin) and a sham control
(ultra-pure water) were administered to wild, Apodemus flavicollis harbouring natural helminth
infections of the gut. The diversity, composition and OTU abundances of gut and faecal
microbiota were recorded pre- and post-treatment in both the anthelmintic and the control group.
Gut microbiota did not show significant taxonomical differences in composition associated with
anthelmintic treatment, but faecal microbiota did (Bray Curtis: p <0.01; weighted UniFrac: p
<0.01). In addition, bacterial OTUs did not exhibit significant differences in abundance in the
small intestine or colon after anthelmintic treatment, but did in the caecum, faeces, and gut
microbiota of the small intestine, caecum and colon combined. The results demonstrate that
although the abundances of some OTUs do significantly change between pre- and post-treatment,
overall, gut microbiota composition is resilient to anthelmintic treatment, but faecal microbiota is
not. Changes in faecal microbiota composition that were associated with anthelmintic treatment
may have resulted from changes in host immune factors shed in faeces following a reduction in
helminth infection load. Given that many helminth species undergo development in host faeces,
and faecal microbiota may provide an extension of the host immune phenotype against helminth
resistance, the significant changes in faecal microbiota following anthelmintic treatment found
here may have implications for helminth development.
43
Does disruption of the helminth community with anthelmintic affect the gut microbiota?
3.2 Introduction
Billions of humans, as well as wildlife and livestock, harbour parasitic helminth infections of the
gut (Morgan et al., 2004; Hotez et al., 2008; Lello et al., 2013). Helminth infections can be
asymptomatic (Checkley et al., 2010), but can also lead to malnutrition, anaemia, reduced
fecundity and other health issues (Shetty, 2010; Sutherland and Scott, 2010). As a result, helminth
infections can have significant economic consequences; for example, in the United States of
America the annual economic loss associated with nematode infection of sheep alone has been
estimated at USD 42 million (Waller, 2006). Humans in westernised countries have access to
flushing toilets that interrupt the life-cycle of many helminth species and prevent infection (Bilbo
et al., 2011), however, such simple hygiene measures are not currently accessible worldwide.
Instead, widespread treatment with broad-spectrum anthelmintics is often employed to control
helminth abundances in livestock, companion animals (Vlassoff et al., 2001) and humans
(Vercruysse et al., 2012). During mass drug administrations, individuals are often indiscriminately
treated with anthelmintic, regardless of whether or not there is evidence that they are infected
(Truscott et al., 2015). In addition, many anthelmintic products are available ‘over-the-counter’
and thus can be administered inappropriately and without professional medical or veterinary
advice (Nielsen, 2009), factors which can all contribute to resistance of helminths to the currently
available pharmaceutical treatments (Wolstenholme et al., 2004). Furthermore, we do not know at
present if anthelmintics affect other components of the gut biome, and it is timely to understand
these wider implications of treatment.
Helminths share the gut biome with the microbiota; the microbial community which includes
bacteria, viruses and archaea. Helminths and microbiota share a long evolutionary history within
the gut and therefore, like other organismal communities, interact with, and affect one another
44
Does disruption of the helminth community with anthelmintic affect the gut microbiota?
(Glendinning et al., 2014). Helminth infection is usually associated with changes in microbial
composition, which can occur in the gut at the site of infection, but also up- and downstream of
this location (Cebra, 1999; Walk et al., 2010; Broadhurst et al., 2012; Rausch et al., 2013;
Kreisinger et al., 2015). For example, Hymenolepis species, which normally infect the small
intestine, have been associated with variation in the microbiota of the host stomach (Kreisinger et
al., 2015), while infection by the small intestinal nematode H. polygyrus bakeri induces microbial
changes in the caecum and colon (Rausch et al., 2013). It is not conclusively known how parasite
infection influences microbiota, but a variety of factors have been proposed, including the
secretion of bacterial growth inhibitors by some helminths (Hewitson et al., 2009; Ditgen et al.,
2014), manipulation directly by the parasite to optimise conditions for helminth viability
(Reynolds et al., 2014), and/or three-way interactions between the microbiota, macrobiota and
host immune system (Glendinning et al., 2014). However, it is currently unknown if the changes
in host microbiota associated with helminth infection can be reversed or altered when an
established helminth community is perturbed. Seminal papers in ecology have demonstrated that
manipulating a system is crucial to understanding how its components interact (Paine, 1966). As
such, perturbing the helminth community and monitoring the subsequent effects on the microbial
community could shed light on the more extensive effects of anthelmintic on the host, and in
addition, also help to determine the nature of helminth-microbiota interactions.
While there are numerous studies that perturb the helminth community by experimental infection
of the host (e.g., Walk et al., 2010; Li et al., 2012; Rausch et al., 2013; Reynolds et al., 2014), to
date only three studies have investigated the effects on microbiota of removing or reducing
helminth infection (Cooper et al., 2013; Sirois, 2013; Houlden et al., 2015). Results are not
consistent between these three studies, and range from the observation that microbiota can revert
45
Does disruption of the helminth community with anthelmintic affect the gut microbiota?
to a composition more similar to that of non-infected individuals following anthelmintic treatment
(Houlden et al., 2015), to no detection of significant effects of anthelmintic (Cooper et al., 2013).
However, each study administered anthelmintic to hosts harbouring an infection of a single
helminth species (Cooper et al., 2013; Houlden et al., 2015; note, Sirois, 2013 did not quantify
helminth diversity or abundance), thus did not take into account the complexities of synergistic
and antagonistic interactions that occur between coinfecting helminth species (Lello et al., 2004;
Telfer et al., 2010), which in turn may also impact the microbiota. The current study aims to test if
microbiota composition undergoes changes following treatment with the commonly used
anthelmintic ivermectin, in wild rodents naturally infected with multiple helminth species.
3.3 Materials and methods
3.3.1 Study area and small rodent sampling
Live-trapping of Apodemus flavicollis was conducted using Ugglan multi-capture traps (Ugglan
Type 2; Grahnab, Sweden) arranged in four grids of 64 traps each (8×8), with a 10 m inter-trap
interval. Two grids were established at the locality of Cavedine (45°59'10.6"N, 10°57'47.1"E and
45°58'30.8"N, 10°57'22.0"E), and two at Pietramurata (46°00'52.2"N, 10°55'27.7"E and
46°00'47.7"N, 10°55'40.7"E) in the Province of Trento (Italy). Each grid occupied woodland with
similar vegetation composition and structure (dominated by mature stands of Fagus sylvatica L.),
and was situated at least 250 m from neighbouring grids to minimise inter-grid movement of
animals. Trapping grids at each locality were randomly assigned to either anthelmintic or sham
control treatment. Traps were baited with sunflower seeds and potato for two nights on a
consecutive biweekly basis, at each locality, from mid-May to August 2014. Following this pre-
treatment monitoring of microbiota and macrobiota, trapping was conducted at both localities
46
Does disruption of the helminth community with anthelmintic affect the gut microbiota?
intensively for four nights on a weekly basis during the treatment (August) and post-treatment
monitoring periods (end of August to September). Throughout the course of trapping, a total of
144 different individuals were captured, 54 from anthelmintic assigned grids and 90 from control
assigned grids. However, some of these individuals were excluded from analyses as they were not
re-captured following treatment; of the 144 mice, 55.6% were captured on more than one
occasion; 53.7% in anthelmintic assigned grids and 64.8% in control assigned grids. Animal
trapping and handling procedures were authorised by the Comitato Faunistico Provinciale della
Provincia di Trento, prot. n. 595 issued on 04 May 2011.
Upon initial capture, each mouse was tagged with a subcutaneous passive integrated transponder
(Trovan ID 100; Ghislandi and Ghislandi, Italy), to identify individuals at subsequent recaptures.
Body mass, sex and breeding status were recorded. Mice were regarded as juveniles if the pelage
indicated that the post-juvenile moult had not yet occurred (Gurnell et al., 1990), while adults
were categorised according to breeding condition (descended testes for males and perforated
vagina or pregnant for females; after Gurnell et al., 1990); individuals with adult pelage that were
not in breeding condition were classified as sub-adults. Faeces that had accumulated overnight
inside traps containing a single individual were collected and transported to the laboratory at 4°C.
For each week, faeces collected at first capture of an individual were collected for faecal egg
count (FEC) analyses, using a standard McMaster technique with saturated NaCl flotation solution
(after Dunn and Keymer, 1986) to calculate helminth eggs per gram of faeces (EPG), used as a
proxy measure of helminth egg shedding. When an individual was captured more than once
during a trapping week, subsequent faecal samples were collected for microbiota analyses, and
upon returning to the laboratory were immediately frozen at -80°C until DNA extraction (see
‘3.3.4 16S rRNA gene sequencing’ below). After occupation, traps were sterilised using sodium
47
Does disruption of the helminth community with anthelmintic affect the gut microbiota?
hypochlorite (bleach), followed by 4% chlorhexidine solution (Nuova Farmec, Italy), re-baited
and replaced. A total of 25 mice were randomly selected for sacrifice throughout the course of the
experiment for gut microbiota and adult helminth analyses; three pre-treatment (Cavedine n = 3,
Pietramurata n = 0) and nine post-treatment (Cavedine n = 5, Pietramurata n = 4) from the
anthelmintic group, plus six pre-treatment (Cavedine n = 6, Pietramurata n = 0) and seven post-
treatment (Cavedine n = 5, Pietramurata n = 2) from the control group. Animals selected for
sacrifice were transported to the laboratory, whereupon they were euthanised by an overdose of
isoflurane, followed by cervical dislocation, and immediately frozen at -80°C until dissection (see
‘3.3.3 Analyses of gut samples’ below).
3.3.2 Macrobiota manipulation
During an 18-day period in August 2014, all adult and sub-adult mice captured at each grid were
administered up to three doses of a respective treatment, with a minimum of seven days between
each dose. The anthelmintic treatment consisted of ivermectin (Ivomec; Merial, Merck Sharp &
Dohme, Netherlands) diluted in ultra-pure water. The anthelmintic solution was vigorously
vortexed for 10 minutes each day before use. The sham control consisted of ultra-pure water. Each
treatment was administered using a curved gavage needle (18 G × 50 mm) at a dose of 2 ml/Kg
(following manufacturer’s instructions for Ivomec; and after Ostlind et al., 1985, see also Pritchett
and Johnston, 2002). Between each administration of a treatment the gavage needle was sterilised
using 4% chlorhexidine solution (Nuova Farmec, Italy). Due to the vagaries of trapping wild
animals, not every individual was captured three times/with a sufficient time interval between
doses throughout the treatment period to receive the intended three doses of treatment: a total of
23 individuals were treated with anthelmintic (one dose n = 3, two doses n = 9, three doses n =
48

Does disruption of the helminth community with anthelmintic affect the gut microbiota?
11), while due to differences in population density in the control group, 42 individuals were
treated with the control sham gavage (one dose n = 30, two doses n = 11, three doses n = 1).
3.3.3 Analyses of gut samples
The 25 euthanised A. flavicollis were dissected under sterile conditions following methods
adapted from Kreisinger et al. (2015). Briefly, the gut was washed in sterile Tris-buffered saline
(TBS; Tris-NaCl; 50 mM Tris, 200 mM NaCl, pH8) and separated into four functional sections
(stomach, small intestine, caecum, and colon). The luminal contents and membrane of each gut
section were diluted with TBS and scanned for helminths at 10× magnification (Leica© MS5
microscope with a Leica© CLS100 light attachment). Faeces were homogenised in TBS and
scanned for helminths at 10× magnification. Helminths were quantified and collected according to
species, gut section and mouse individual in 70% ethanol in case of future analyses. After
thoroughly scraping the gut membrane with tweezers under TBS to dislodge bacteria, the
membrane and the TBS containing bacteria were collected with the rest of the luminal contents in
a centrifugation tube. A bacterial pellet was obtained from the gut and faecal material using the
following centrifugation steps: total contents of the tube were centrifuged for 950 G for 10
minutes at 4°C, resulting in a pellet containing the gut membrane and non-bacterial lumen
contents (e.g., digested food). This pellet was discarded, but the supernatant was further
centrifuged at 9000 G for 15 minutes at 4°C. The resulting supernatant was discarded and the
remaining bacterial pellet was immediately stored at -80°C for future bacterial DNA analysis (see
‘3.3.4 16S rRNA gene sequencing’ below).
49
Does disruption of the helminth community with anthelmintic affect the gut microbiota?
3.3.4 16S rRNA gene sequencing
A total of 56 frozen faecal samples, which included at least one pre- and one post-treatment
sample from any given individual, were sequenced for microbiota analyses; 37 samples from 15
individuals (Cavedine n = 8, Pietramurata n = 7 individuals) from the anthelmintic group, and 19
samples from 8 individuals from the control group (Cavedine n = 1, Pietramurata n = 7
individuals). In addition, the bacterial pellets from the small intestine, caecum and colon samples
(the microbiota of the stomach was not analysed) from the 25 euthanised individuals were
sequenced. The QIAmp DNA Stool Mini kit (Qiagen, Valencia, CA, USA) was used for total
genomic DNA extraction from each bacterial pellet sample. In addition to the methods provided
by the manufacturer for pathogen detection, a 2 minute homogenisation step at 30 Hz was
performed to enhance bacterial cell lysis, using a Mixer Mill MM200 (Retsch GmbH, Haan,
Germany) with 5 mm stainless steel beads (Qiagen, Valencia, CA, USA). Recovered DNA was
quantified using a Qubit 2.0 Fluorometer with a Qubit® dsDNA BR Assay Kit (Invitrogen,
Carlsbad, CA, USA). The V3-V4 region (464 nucleotides) of the bacterial 16S rRNA gene was
amplified using the 341F and 805R primers (see Appendix A.2, Figure A.2.1 for details on primer
sequences, including degenerate nucleotides). The PCR reactions were carried out in a total
volume of 25 μl, containing 0.4 µM of each primer, 0.4 mM of dNTP (Promega, Madison, WI,
USA), 1× FastStart reaction buffer (Roche Diagnostics GmbH, Mannheim, Germany), 1 mM of
MgCl2, 1.25 unit of FastStart HiFi Polymerase (Roche Diagnostics GmbH, Mannheim, Germany),
and 12.5 ng of genomic DNA for each sample amplification. Thermal cycling was performed on a
GeneAmp™ PCR System 9700 instrument (Thermo Fisher Scientific, Waltham, MA, USA) as
follows: initial denaturation at 94°C for 3 minutes, followed by 28 cycles of 94°C for 30 seconds,
55°C for 45 seconds, 72°C for 1 minute 15 seconds, and a final extension at 72°C for 8 minutes.
50
Does disruption of the helminth community with anthelmintic affect the gut microbiota?
Negative controls for DNA extraction and PCR reactions were included, and genomic DNA from
the Microbial Mock Community B (Staggered, Low Concentration), v5.2L (BEI Resources,
Manassas, VA, USA) was also included in the sequencing library to assess the effect of data
processing on observed community content. Purity and quality of PCR products were determined
using a QIAxcel capillary electrophoresis system (Qiagen, Valencia, CA, USA). PCR products
were purified using XP AMPure beads (Beckman Coulter Inc., Brea, CA, USA) and dual indices
were attached by a second PCR (8 cycles) using the Nextera XT Index Kit (Illumina, San Diego,
CA, USA). The resulting libraries were pooled in an equimolar way to produce the final amplicon
library, which was sequenced on an Illumina® MiSeq (PE300) platform (MiSeq Control Software
2.5.0.5 and Real-Time Analysis software 1.18.54.0) at the CIBIO Next Generation Sequencing
Platform of the University of Trento, Trento, Italy.
3.3.5 Bioinformatic processing of 16S data
Sequences were merged, trimmed and filtered using MICCA software (version 1.5.0, Albanese et
al., 2015). Overlapping regions of the forward and reverse read sequences that differed by more
than eight nucleotides or did not contain both the forward and reverse PCR primer sequences were
discarded. Primers were trimmed from the resulting, merged 16S fragments, and fragments were
then discarded if they had an average expected error (AvgEE) probability greater than 0.1.
Operational taxonomic units (OTUs) were assigned using a de novo, greedy strategy using a cut-
off of 97% similarity, based on the VSEARCH clustering algorithm implemented in MICCA
(Rognes et al., 2016). Chimeric sequences were discarded. Resulting representatives of each OTU
were classified using the Ribosomal Database Project classifier (RDP classifier, version 2.12;
Michigan State University [http://rdp.cme.msu.edu/]). Samples that had final read counts of less
51

Does disruption of the helminth community with anthelmintic affect the gut microbiota?
than 10,000 merged and quality-filtered reads were discarded. The resulting OTUs were analysed
at the phylum and class level using phyloseq version 1.16.2 (McMurdie and Holmes, 2013).
3.3.6 Statistical analyses of helminth abundance and EPG
Generalised linear mixed models (GLMMs) were used to test for significant differences associated
with anthelmintic treatment on total helminth abundance (total number of helminths present,
including zero values of uninfected hosts, as defined by Bush et al., 1997), and abundance of
Heligmosomoides polygyrus and Hymenolepis spp. Due to a lack of power, differences in the
abundances of the other two species identified, T. muris and S. frederici, were not analysed
separately, but were included in total helminth abundance analyses; only a single T. muris infected
one individual and 15 S. frederici in another individual were present in the anthelmintic group.
In addition, GLMMs were used to test for significant differences associated with anthelmintic
treatment on total helminth EPG (here defined as the total number of helminth eggs present in
faeces, including zero values of uninfected hosts), and EPG of H. polygyrus and Hymenolepis spp.
A total of 118 FEC measurements were used for statistical analyses of EPG, which included at
least one pre- and one post-treatment sample from any given individual; 63 FECs from 10
individuals in the anthelmintic group (Cavedine n = 5, Pietramurata n = 5) and 55 FECs from 14
individuals in the control group (Cavedine n = 6, Pietramurata n = 8). Due to a lack of statistical
power, differences in T. muris and S. frederici EPG were not analysed separately but were
included in total EPG analyses; only one T. muris egg and one S. frederici egg were present in
faeces from the anthelmintic group. In each model, the response variable was abundance or EPG
of either H. polygyrus, Hymenolepis spp., or of all species combined. Host sex, host breeding
status, host body mass, helminth diversity (total number of helminth species found in an
52
Does disruption of the helminth community with anthelmintic affect the gut microbiota?
individual), treatment group (anthelmintic or control), treatment period (pre- or post-treatment)
and the number of doses administered were explanatory variables. In addition, the model included
the following two-way interaction terms as explanatory variables: treatment group with treatment
period, and treatment group with number of doses administered, plus all possible two-way
interactions between host sex, host breeding status and host body mass. The identity code of the
individual, geographical location (Cavedine or Pietramurata) and sampling month were all
modelled as random intercepts for each model. Statistical analyses used the package glmmADMB,
version 8.3.3 (Fournier et al., 2012; Skaug et al., 2016). A process of multi-model inference was
used to compare all possible models using the R package MuMIn (Bartoń, 2015) and the most
parsimonious model was selected using a threshold of ΔAICc <2 (Burnham and Anderson, 2003).
3.3.7 Statistical analyses of microbiota - diversity
GLMMs were used to assess whether there was a significant association between microbiota alpha
diversity and anthelmintic treatment. The inverse Simpson index was chosen to calculate alpha
diversity as it is less affected by the presence of rare OTUs, (which frequently result from
sequencing error, e.g., Wen et al., 2017), indicates OTU richness with consistent evenness, and is
also considered the most robust alpha diversity metric (e.g., compared to Shannon index; DeJong,
1975; Gihring et al., 2012). Preliminary analyses indicated that data had insufficient power to
include treatment and treatment period (anthelmintic and control data pooled) as a two-way
interaction explanatory variable, thus anthelmintic and control data were analysed in separate
GLMMs; firstly a GLMM was used to test that there were no significant differences in microbiota
alpha diversity between the anthelmintic and control group, to ensure changes between pre- and
post-treatment individuals in each of the two groups were comparable. When this assumption was
met, separate GLMMs for the anthelmintic and control group were run with alpha diversity of
53
Does disruption of the helminth community with anthelmintic affect the gut microbiota?
either the small intestine, caecum, colon, whole gut (small intestine, caecum and colon combined)
or faeces as the response variable. Host sex, breeding status and treatment period (pre- or post-
treatment) were explanatory variables. The identity code of the individual, geographical location
and sampling month were each modelled as a nested random intercept for each model.
3.3.8 Statistical analyses of microbiota - composition
A distance-based redundancy analysis (db-RDA; capscale function in R package vegan; Oksanen
et al., 2017) was used to test for differences in microbiota composition associated with
anthelmintic treatment, in the small intestine, caecum, colon, whole gut (small intestine, caecum
and colon combined) and faeces. The db-RDA performs constrained ordinations, but unlike most
other methods of constrained ordination, uses non-Euclidean distance measures (data which has
>2 dimensions, e.g., OTU abundance tables). Here, distance matrices of microbiota data (OTU
abundance tables) were calculated using Bray–Curtis dissimilarities (i.e., compositional
dissimilarity indices that account for proportional differences in OTUs among samples) and
weighted UniFrac dissimilarities (which account both for proportional differences in OTUs and
their phylogenetic relatedness; Lozupone and Knight, 2005). OTU abundance tables were scaled
before calculation of dissimilarity matrices to achieve an even sequencing depth, corresponding to
the minimal number of reads per sample in gut sections or faeces that were included in a given
analysis. For each dissimilarity matrix a constrained analysis of principal coordinates (CAP) was
performed, which tested whether changes in microbiota composition were associated with
environmental variables (i.e., anthelmintic treatment). The resulting eigenvalues were visualised
on an ordination plot, with ordinations starting at [0,0], for optimal and consistent visualisation.
Significance (p <0.05) of the effect of environmental variables on the ordination was assessed
using permutation-based ANOVA tests on the constrained axes.
54
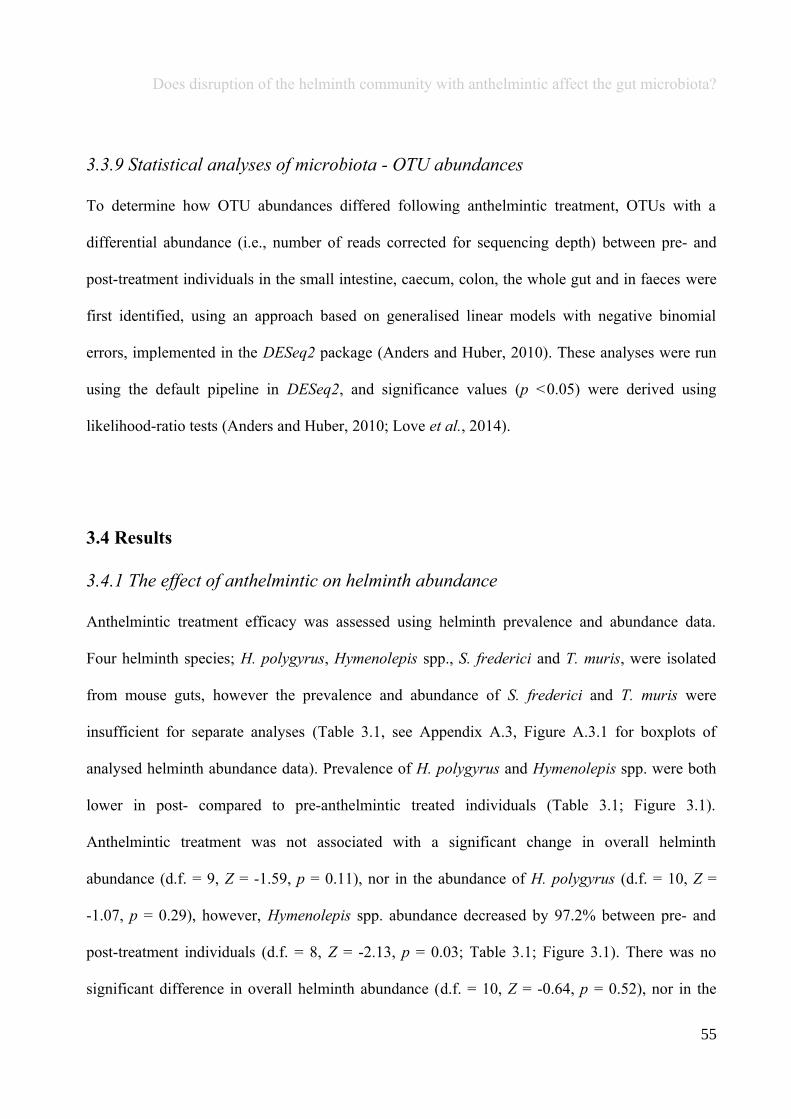
Does disruption of the helminth community with anthelmintic affect the gut microbiota?
3.3.9 Statistical analyses of microbiota - OTU abundances
To determine how OTU abundances differed following anthelmintic treatment, OTUs with a
differential abundance (i.e., number of reads corrected for sequencing depth) between pre- and
post-treatment individuals in the small intestine, caecum, colon, the whole gut and in faeces were
first identified, using an approach based on generalised linear models with negative binomial
errors, implemented in the DESeq2 package (Anders and Huber, 2010). These analyses were run
using the default pipeline in DESeq2, and significance values (p <0.05) were derived using
likelihood-ratio tests (Anders and Huber, 2010; Love et al., 2014).
3.4 Results
3.4.1 The effect of anthelmintic on helminth abundance
Anthelmintic treatment efficacy was assessed using helminth prevalence and abundance data.
Four helminth species; H. polygyrus, Hymenolepis spp., S. frederici and T. muris, were isolated
from mouse guts, however the prevalence and abundance of S. frederici and T. muris were
insufficient for separate analyses (Table 3.1, see Appendix A.3, Figure A.3.1 for boxplots of
analysed helminth abundance data). Prevalence of H. polygyrus and Hymenolepis spp. were both
lower in post- compared to pre-anthelmintic treated individuals (Table 3.1; Figure 3.1).
Anthelmintic treatment was not associated with a significant change in overall helminth
abundance (d.f. = 9, Z = -1.59, p = 0.11), nor in the abundance of H. polygyrus (d.f. = 10, Z =
-1.07, p = 0.29), however, Hymenolepis spp. abundance decreased by 97.2% between pre- and
post-treatment individuals (d.f. = 8, Z = -2.13, p = 0.03; Table 3.1; Figure 3.1). There was no
significant difference in overall helminth abundance (d.f. = 10, Z = -0.64, p = 0.52), nor in the
55

Does disruption of the helminth community with anthelmintic affect the gut microbiota?
abundances of H. polygyrus (d.f. = 8, Z = -0.84, p = 0.40) or Hymenolepis spp. (d.f. = 9, Z = 0.70,
p = 0.49) in the control group (Table 3.1; Figure 3.1).
Table 3.1: Mean abundance (± standard error of mean) of helminths isolated from the gut of pre-or post-treatment individuals in an anthelmintic or control group.
Helminth species
Helminth abundance
Anthelmintic Control
Pre Post Pre Post
Total 153.0 ± 143.0 7.0 ± 1.4 75.3 ± 43.9 25.1 ± 10.7
H. polygyrus 6.3 ± 0.7 2.8 ± 0.8 11.7 ± 5.0 7.3 ± 1.6
Hymenolepis spp. 141.7 ± 138.7 4.0 ± 1.4* 10.2 ± 4.8 17.9 ± 11.2
S. frederici 5.0 ± 5.0 0.1 ± 0.1 53.5 ± 41.0 0
T. muris 0 0.1 ± 0.1 0 0
* Represents a significant decrease in helminth abundance between pre- and post-treatmentindividuals in either an anthelmintic or control group.
56
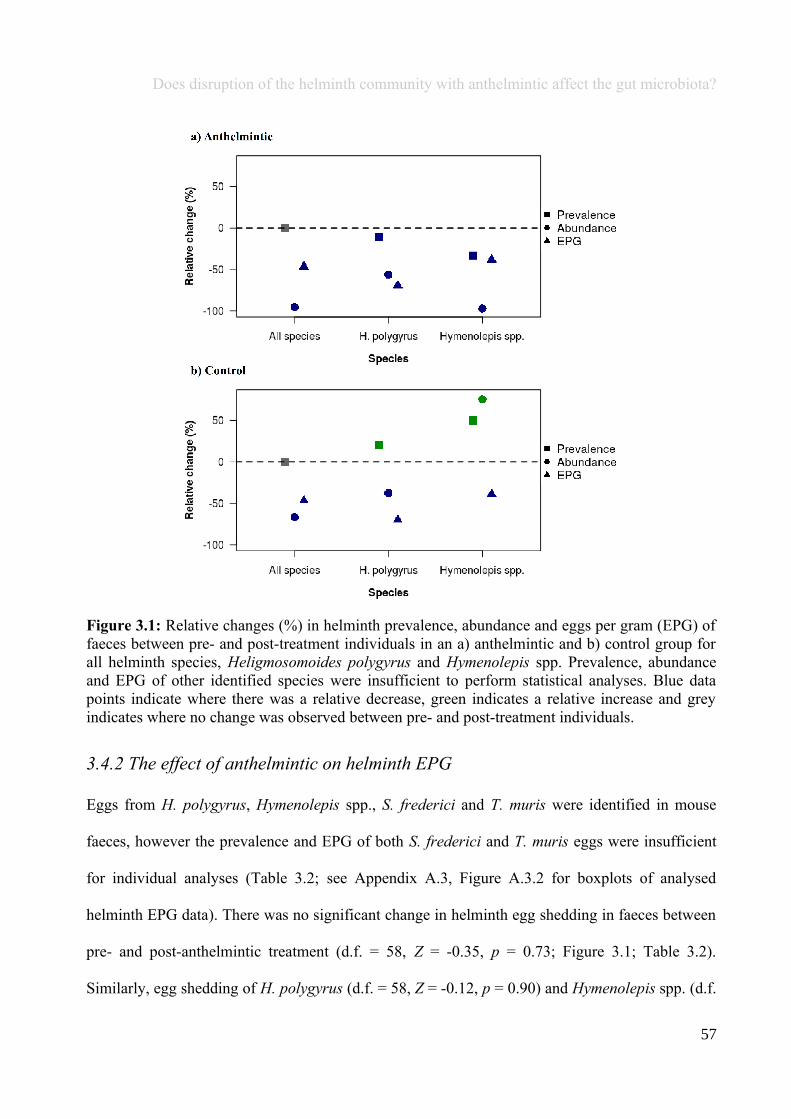
Does disruption of the helminth community with anthelmintic affect the gut microbiota?
Figure 3.1: Relative changes (%) in helminth prevalence, abundance and eggs per gram (EPG) offaeces between pre- and post-treatment individuals in an a) anthelmintic and b) control group forall helminth species, Heligmosomoides polygyrus and Hymenolepis spp. Prevalence, abundanceand EPG of other identified species were insufficient to perform statistical analyses. Blue datapoints indicate where there was a relative decrease, green indicates a relative increase and greyindicates where no change was observed between pre- and post-treatment individuals.
3.4.2 The effect of anthelmintic on helminth EPG
Eggs from H. polygyrus, Hymenolepis spp., S. frederici and T. muris were identified in mouse
faeces, however the prevalence and EPG of both S. frederici and T. muris eggs were insufficient
for individual analyses (Table 3.2; see Appendix A.3, Figure A.3.2 for boxplots of analysed
helminth EPG data). There was no significant change in helminth egg shedding in faeces between
pre- and post-anthelmintic treatment (d.f. = 58, Z = -0.35, p = 0.73; Figure 3.1; Table 3.2).
Similarly, egg shedding of H. polygyrus (d.f. = 58, Z = -0.12, p = 0.90) and Hymenolepis spp. (d.f.
57

Does disruption of the helminth community with anthelmintic affect the gut microbiota?
= 58, Z = -1.21, p = 0.23) did not significantly change post-anthelmintic treatment (Figure 3.1;
Table 3.2). In the control group there was no significant change in total egg shedding (d.f. = 51, Z
= 0.75, p = 0.45), nor in H. polygyrus (d.f. = 51, Z = -0.55, p = 0.58) and Hymenolepis spp. egg
shedding (d.f. = 51, Z = 0.58, p = 0.56) between pre- and post-treatment individuals (Figure 3.1;
Table 3.2).
Table 3.2: Mean number of helminth eggs per gram (EPG) of faeces (± standard error of mean) infaecal samples collected from pre- or post-treatment individuals in an anthelmintic or controlgroup, used as a proxy measure for helminth egg shedding.
Helminth species
Helminth EPG
Anthelmintic Control
Pre Post Pre Post
Total 1,076.7 ± 500.8 574.1 ± 148.3 546.5 ± 223.2 814.3 ± 246.8
H. polygyrus 290.0 ± 123.9 88.5 ± 38.1 207.6 ± 98.3 172.0 ± 68.4
Hymenolepis spp. 786.7 ± 449.1 483.8 ± 147.3 317.8 ± 212.6 622.1 ± 252.2
S. frederici 0 0.9 ± 0.9 0 0
T. muris 0 0.9 ± 0.9 21.2 ± 21.2 17.7 ± 13.0
3.4.3 The effect of anthelmintic on gut and faecal microbiota diversity
Of the sequenced samples, reads from two faecal, one small intestine, one caecum and one colon
sample were discarded as they did not meet the quality filtering criteria. The filtered microbiota
dataset consisted of 2,639,407 high-quality reads from 126 samples (mean ± standard error =
20,948 ± 598 range = 10,363 – 49,083), within which 15 phyla were identified. Anthelmintic
treatment did not affect gut microbiota alpha diversity; inverse Simpson indices for microbiota of
the small intestine (d.f. = 6, Z = -1.70, p = 0.09), caecum (d.f. = 7, Z = -0.82, p = 0.41), colon (d.f.
= 7, Z = 0.37, p = 0.71) and faeces (d.f. = 32, Z = -1.83, p = 0.07) were not significantly different
between pre- and post-treatment individuals (Table 3.3; Figure 3.2). Similarly, in the control
group there were no significant differences in microbiota alpha diversity of the caecum (d.f. = 7, Z
58
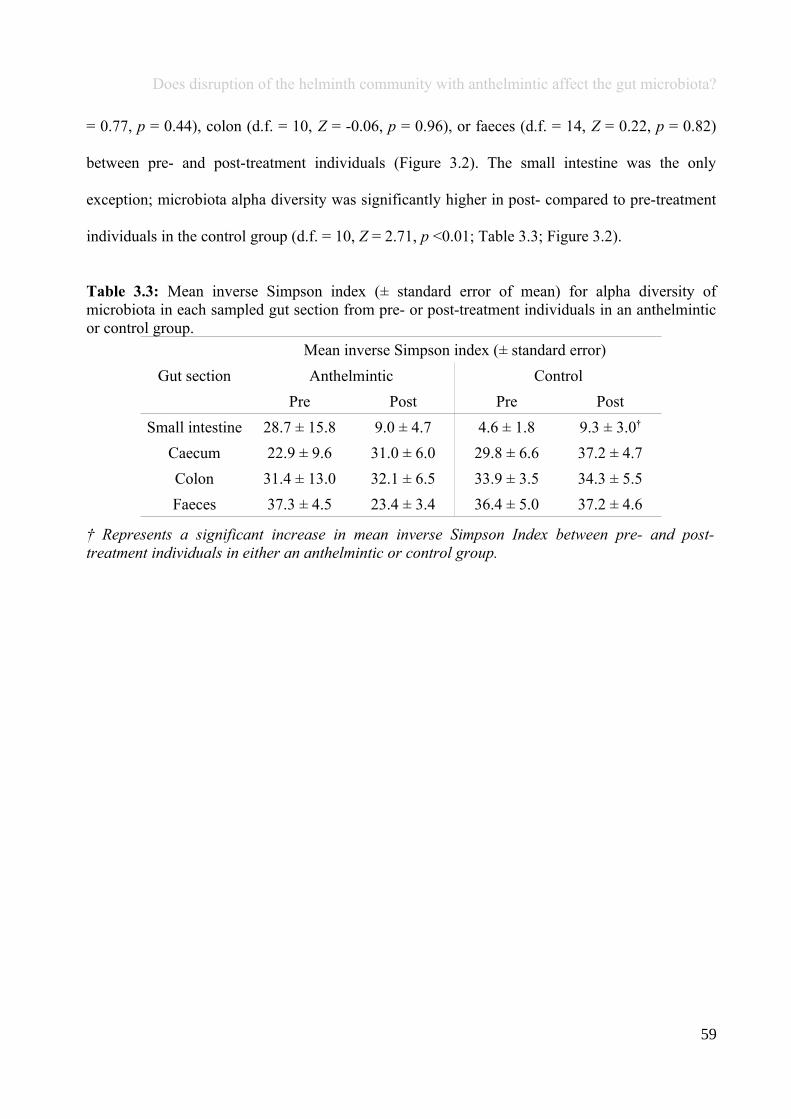
Does disruption of the helminth community with anthelmintic affect the gut microbiota?
= 0.77, p = 0.44), colon (d.f. = 10, Z = -0.06, p = 0.96), or faeces (d.f. = 14, Z = 0.22, p = 0.82)
between pre- and post-treatment individuals (Figure 3.2). The small intestine was the only
exception; microbiota alpha diversity was significantly higher in post- compared to pre-treatment
individuals in the control group (d.f. = 10, Z = 2.71, p <0.01; Table 3.3; Figure 3.2).
Table 3.3: Mean inverse Simpson index (± standard error of mean) for alpha diversity ofmicrobiota in each sampled gut section from pre- or post-treatment individuals in an anthelminticor control group.
Gut section
Mean inverse Simpson index (± standard error)
Anthelmintic Control
Pre Post Pre Post
Small intestine 28.7 ± 15.8 9.0 ± 4.7 4.6 ± 1.8 9.3 ± 3.0†
Caecum 22.9 ± 9.6 31.0 ± 6.0 29.8 ± 6.6 37.2 ± 4.7
Colon 31.4 ± 13.0 32.1 ± 6.5 33.9 ± 3.5 34.3 ± 5.5
Faeces 37.3 ± 4.5 23.4 ± 3.4 36.4 ± 5.0 37.2 ± 4.6
† Represents a significant increase in mean inverse Simpson Index between pre- and post-treatment individuals in either an anthelmintic or control group.
59
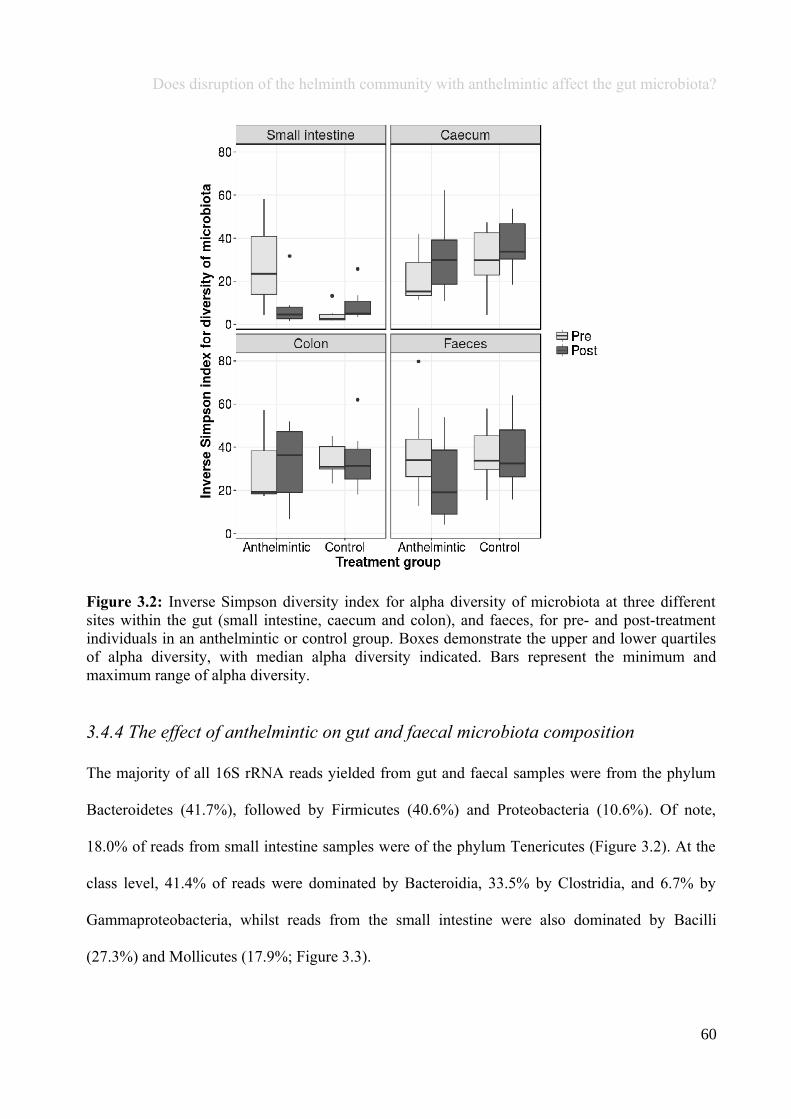
Does disruption of the helminth community with anthelmintic affect the gut microbiota?
Figure 3.2: Inverse Simpson diversity index for alpha diversity of microbiota at three differentsites within the gut (small intestine, caecum and colon), and faeces, for pre- and post-treatmentindividuals in an anthelmintic or control group. Boxes demonstrate the upper and lower quartilesof alpha diversity, with median alpha diversity indicated. Bars represent the minimum andmaximum range of alpha diversity.
3.4.4 The effect of anthelmintic on gut and faecal microbiota composition
The majority of all 16S rRNA reads yielded from gut and faecal samples were from the phylum
Bacteroidetes (41.7%), followed by Firmicutes (40.6%) and Proteobacteria (10.6%). Of note,
18.0% of reads from small intestine samples were of the phylum Tenericutes (Figure 3.2). At the
class level, 41.4% of reads were dominated by Bacteroidia, 33.5% by Clostridia, and 6.7% by
Gammaproteobacteria, whilst reads from the small intestine were also dominated by Bacilli
(27.3%) and Mollicutes (17.9%; Figure 3.3).
60
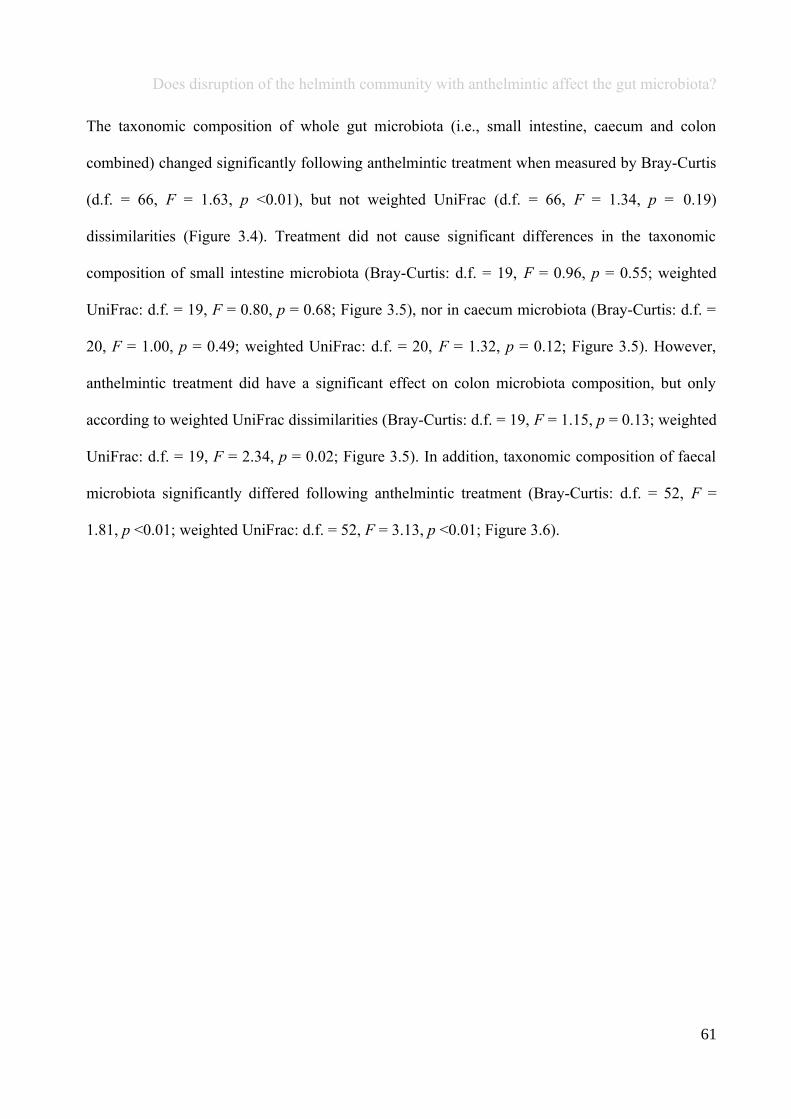
Does disruption of the helminth community with anthelmintic affect the gut microbiota?
The taxonomic composition of whole gut microbiota (i.e., small intestine, caecum and colon
combined) changed significantly following anthelmintic treatment when measured by Bray-Curtis
(d.f. = 66, F = 1.63, p <0.01), but not weighted UniFrac (d.f. = 66, F = 1.34, p = 0.19)
dissimilarities (Figure 3.4). Treatment did not cause significant differences in the taxonomic
composition of small intestine microbiota (Bray-Curtis: d.f. = 19, F = 0.96, p = 0.55; weighted
UniFrac: d.f. = 19, F = 0.80, p = 0.68; Figure 3.5), nor in caecum microbiota (Bray-Curtis: d.f. =
20, F = 1.00, p = 0.49; weighted UniFrac: d.f. = 20, F = 1.32, p = 0.12; Figure 3.5). However,
anthelmintic treatment did have a significant effect on colon microbiota composition, but only
according to weighted UniFrac dissimilarities (Bray-Curtis: d.f. = 19, F = 1.15, p = 0.13; weighted
UniFrac: d.f. = 19, F = 2.34, p = 0.02; Figure 3.5). In addition, taxonomic composition of faecal
microbiota significantly differed following anthelmintic treatment (Bray-Curtis: d.f. = 52, F =
1.81, p <0.01; weighted UniFrac: d.f. = 52, F = 3.13, p <0.01; Figure 3.6).
61
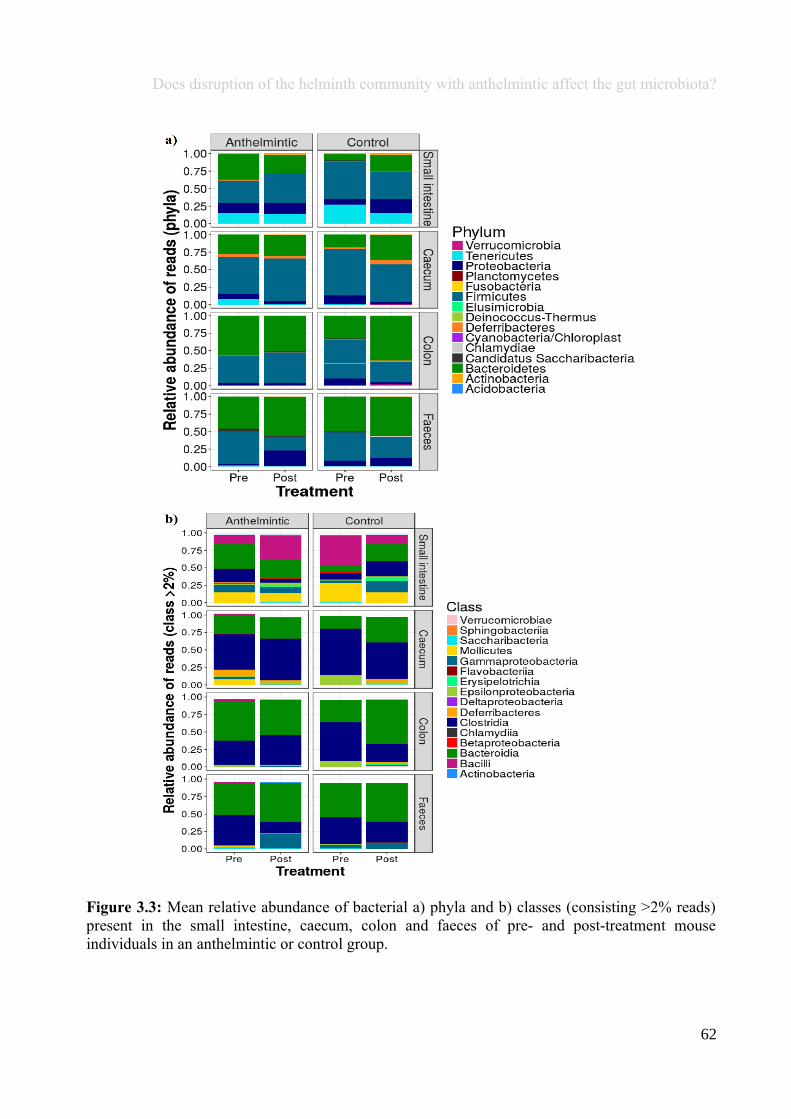
Does disruption of the helminth community with anthelmintic affect the gut microbiota?
Figure 3.3: Mean relative abundance of bacterial a) phyla and b) classes (consisting >2% reads)present in the small intestine, caecum, colon and faeces of pre- and post-treatment mouseindividuals in an anthelmintic or control group.
62
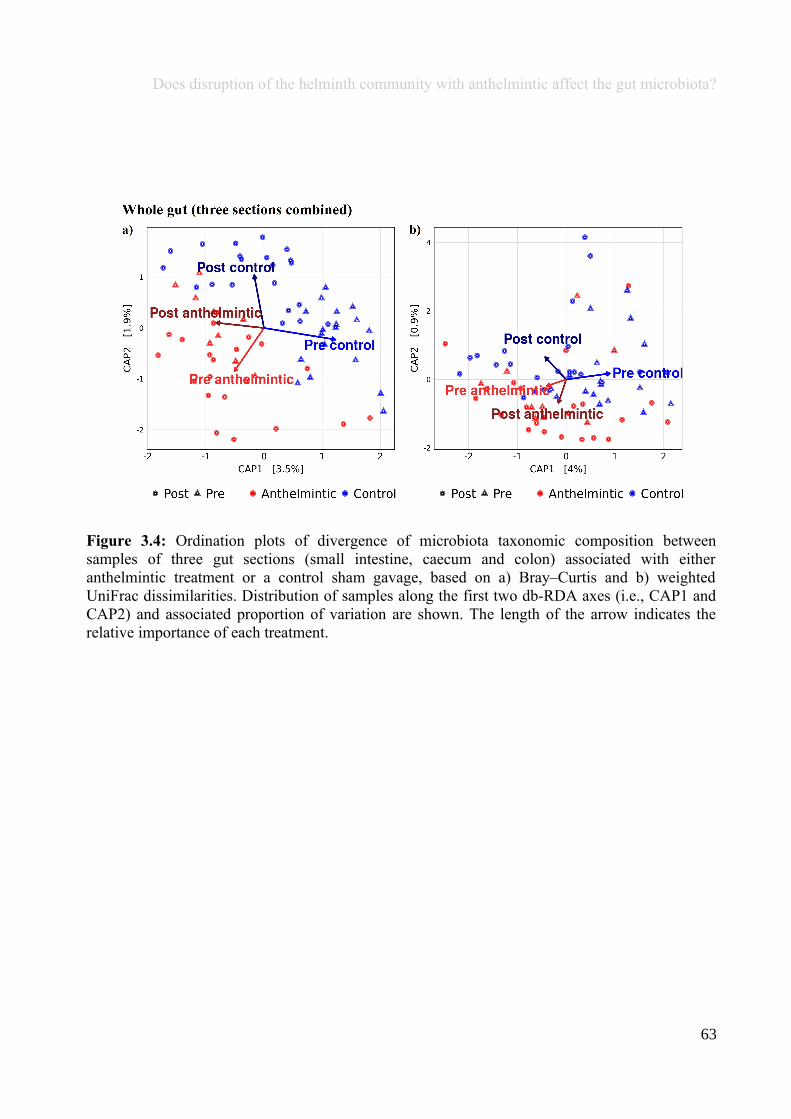
Does disruption of the helminth community with anthelmintic affect the gut microbiota?
Figure 3.4: Ordination plots of divergence of microbiota taxonomic composition betweensamples of three gut sections (small intestine, caecum and colon) associated with eitheranthelmintic treatment or a control sham gavage, based on a) Bray–Curtis and b) weightedUniFrac dissimilarities. Distribution of samples along the first two db-RDA axes (i.e., CAP1 andCAP2) and associated proportion of variation are shown. The length of the arrow indicates therelative importance of each treatment.
63
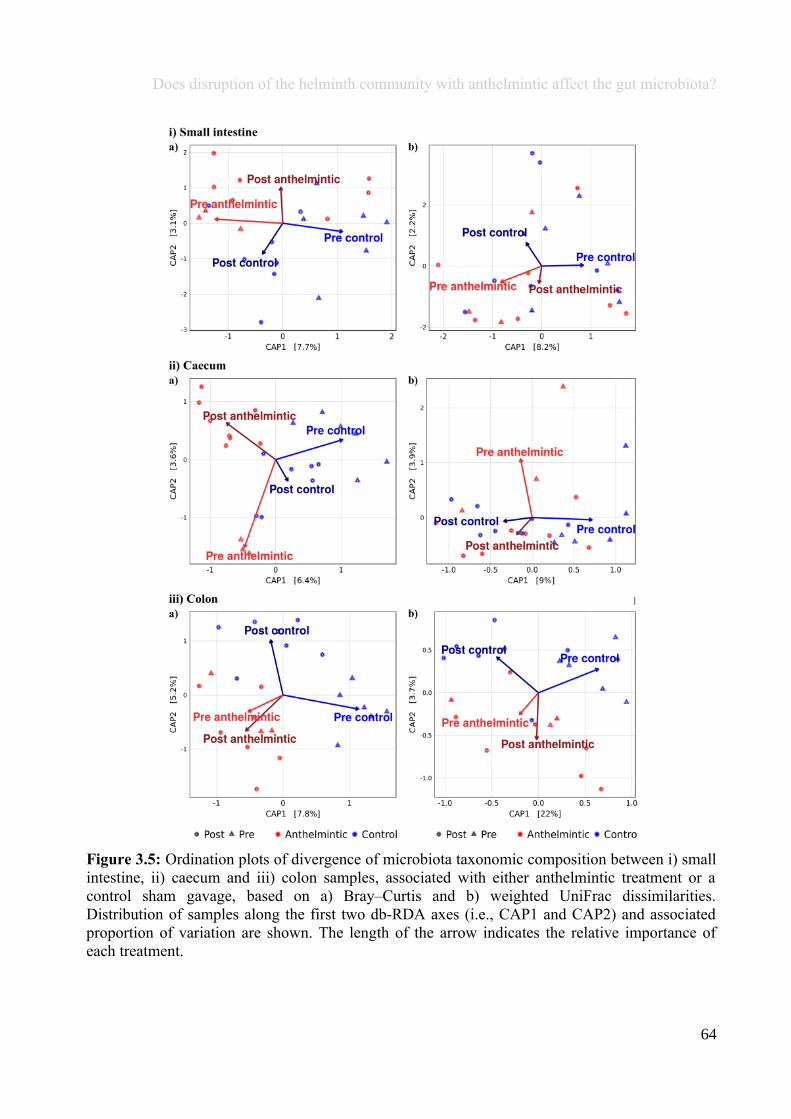
Does disruption of the helminth community with anthelmintic affect the gut microbiota?
Figure 3.5: Ordination plots of divergence of microbiota taxonomic composition between i) smallintestine, ii) caecum and iii) colon samples, associated with either anthelmintic treatment or acontrol sham gavage, based on a) Bray–Curtis and b) weighted UniFrac dissimilarities.Distribution of samples along the first two db-RDA axes (i.e., CAP1 and CAP2) and associatedproportion of variation are shown. The length of the arrow indicates the relative importance ofeach treatment.
64
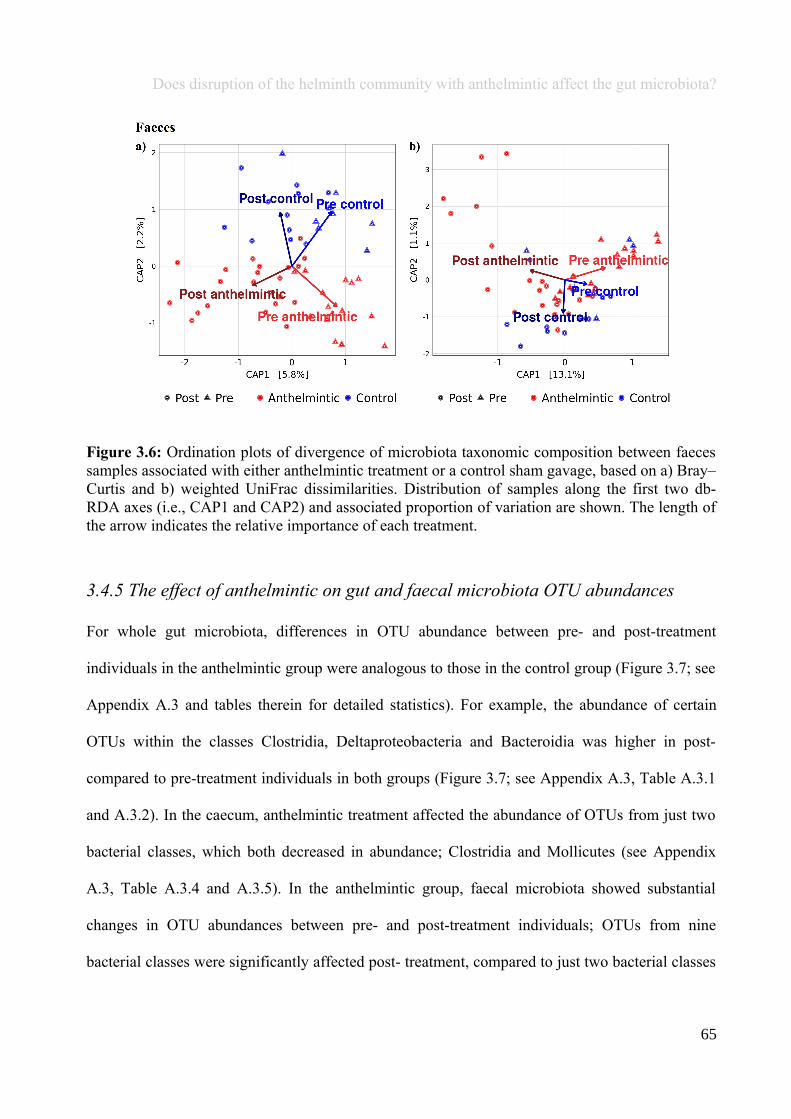
Does disruption of the helminth community with anthelmintic affect the gut microbiota?
Figure 3.6: Ordination plots of divergence of microbiota taxonomic composition between faecessamples associated with either anthelmintic treatment or a control sham gavage, based on a) Bray–Curtis and b) weighted UniFrac dissimilarities. Distribution of samples along the first two db-RDA axes (i.e., CAP1 and CAP2) and associated proportion of variation are shown. The length ofthe arrow indicates the relative importance of each treatment.
3.4.5 The effect of anthelmintic on gut and faecal microbiota OTU abundances
For whole gut microbiota, differences in OTU abundance between pre- and post-treatment
individuals in the anthelmintic group were analogous to those in the control group (Figure 3.7; see
Appendix A.3 and tables therein for detailed statistics). For example, the abundance of certain
OTUs within the classes Clostridia, Deltaproteobacteria and Bacteroidia was higher in post-
compared to pre-treatment individuals in both groups (Figure 3.7; see Appendix A.3, Table A.3.1
and A.3.2). In the caecum, anthelmintic treatment affected the abundance of OTUs from just two
bacterial classes, which both decreased in abundance; Clostridia and Mollicutes (see Appendix
A.3, Table A.3.4 and A.3.5). In the anthelmintic group, faecal microbiota showed substantial
changes in OTU abundances between pre- and post-treatment individuals; OTUs from nine
bacterial classes were significantly affected post- treatment, compared to just two bacterial classes
65
Does disruption of the helminth community with anthelmintic affect the gut microbiota?
(Clostridia and Gammaproteobacteria), which both showed similar changes in abundance as in the
anthelmintic group in the control group (Figure 3.7; see Appendix A.3, Table A.3.7 and A.3.8).
No OTUs in either the small intestine or the colon changed significantly in abundance between
pre- and post-anthelmintic treatment.
66
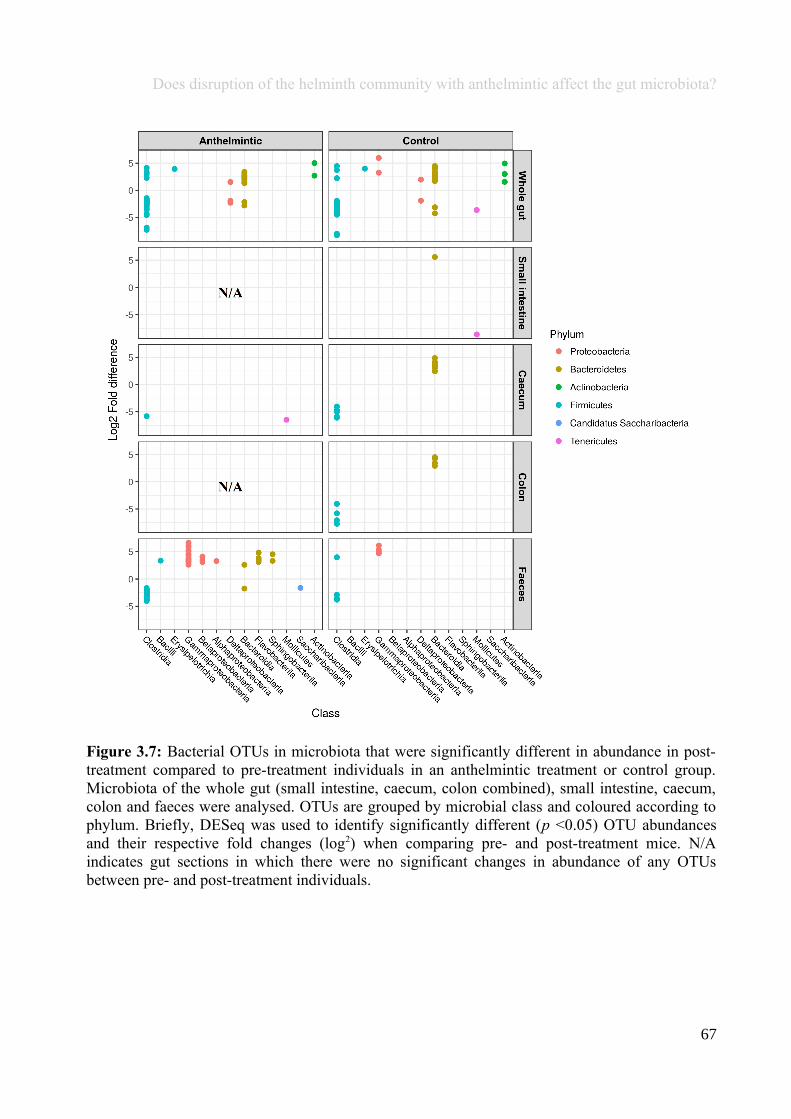
Does disruption of the helminth community with anthelmintic affect the gut microbiota?
Figure 3.7: Bacterial OTUs in microbiota that were significantly different in abundance in post-treatment compared to pre-treatment individuals in an anthelmintic treatment or control group.Microbiota of the whole gut (small intestine, caecum, colon combined), small intestine, caecum,colon and faeces were analysed. OTUs are grouped by microbial class and coloured according tophylum. Briefly, DESeq was used to identify significantly different (p <0.05) OTU abundancesand their respective fold changes (log2) when comparing pre- and post-treatment mice. N/Aindicates gut sections in which there were no significant changes in abundance of any OTUsbetween pre- and post-treatment individuals.
67
Does disruption of the helminth community with anthelmintic affect the gut microbiota?
3.5 Discussion
Anthelmintic treatment did not affect the alpha diversity of microbiota (Figure 3.2), but did have a
significant effect on microbiota taxonomic composition of the colon and faeces, and when all
three gut sections where considered together (Figure 3.3 - 3.5). Anthelmintic had little affect on
the abundance of bacteria: differences in OTU abundances between pre- and post-treatment
individuals mirrored those seen between pre- and post-treatment individuals in the control group,
or were non-existent (Figure 3.6, see Appendix A.3 for detailed statistics). Together, these results
suggest that changes in microbiota associated with anthelmintic treatment were either driven by
changes in the abundances of bacteria already present in the gut, or the net loss and gain of
different bacterial OTUs associated with anthelmintic treatment remained constant.
In the current study there was a significant change in taxonomic composition of faeces following
anthelmintic treatment (Figure 3.5), and OTUs from four phyla changed significantly in
abundance in these samples (Figure 3.6). All OTUs, barring one from the phylum Bacteroidetes,
increased post-anthelmintic treatment. Despite including sampling month as a random intercept in
all statistical analyses, as the study was conducted over the course of four months it is possible
that changes in microbiota and OTU abundances resulted from natural seasonal variation (Maurice
et al., 2015), and not necessarily anthelmintic treatment. However, in support of the possibility
that anthelmintic treatment was responsible for faecal microbiota changes, Houlden et al., (2015)
also observed increases in Bacteroidetes abundance (and diversity) following anthelmintic
treatment. Interestingly, the opposite pattern was observed in horses treated with anthelmintic; the
Bacteroidetes/Firmicutes ratio shifted such that Bacteroidetes relative abundance decreased, but
Firmicutes increased (Sirois, 2013). Furthermore, no affect of anthelmintic treatment on
microbiota composition was observed in naturally infected humans (Cooper et al., 2013). The
68
Does disruption of the helminth community with anthelmintic affect the gut microbiota?
disparity in results between this study and the three others which have investigated the effect of
anthelmintics on microbiota could be due to the comparison of such few publications, and may
also be a result of variation between studies in the host species which were investigated, as well as
the anthelmintic used (Cooper et al., 2013; Sirois, 2013; Houlden et al., 2015).
In order to understand the lack of significant changes in microbiota associated with anthelmintic
treatment in the current study, it is first necessary to consider how helminths may induce changes
in microbiota composition. Bacteria already present in the host gut, or transmitted by other means
(e.g., ingested within food), are able to colonise more successfully during helminth infection, due
to immune system suppression (Steenhard et al., 2002) and tissue damage (Murray et al., 1970),
and these bacteria could endure after helminth removal. Helminths may also alter microbiota
composition of the host via three-way interactions that also involve the immune system, which are
stimulated by helminth infection, and may result in microbial changes in the gut (e.g., Walk et al.,
2010; Rausch et al., 2013). While immune responses, such as immunoglobulin antibodies, return
to pre-infection levels following anthelmintic treatment (Loukas and Prociv, 2001), this requires
the complete eradication of helminth infection, which did not occur in the present study. Thus
some immune responses against helminth infection may have remained, maintaining the resulting
impact on microbiota.
Notably, there was a significant increase in the alpha diversity of the small intestine microbiota
between pre- and post-treatment individuals in the control group (Table 3.3; Figure 3.2), but no
such change was observed in the anthelmintic group. As individuals in the control group were
administered a sham gavage of ultra-pure water using a gavage needle which was sterilised
between each use, it is unlikely (although not impossible) that there was a subsequent introduction
69
Does disruption of the helminth community with anthelmintic affect the gut microbiota?
of bacteria into the small intestine associated with the control sham treatment. Instead, it is more
likely that the significant differences observed in microbiota diversity in the control group were
due to stochastic factors related to small sample sizes (pre-treatment n = 3; post-treatment n = 6),
were a consequence of stress related to repeated animal trapping and handling (e.g., see
Bangsgaard Bendtsen et al., 2012; Le Floc’h et al., 2014), and/or were a result of natural seasonal
variation driven largely by changes in the availability of different food items (Maurice et al.,
2015). If the latter were true, it would be tempting to speculate that, as there was no significant
difference in microbiota diversity between pre- and post-treatment individuals, nor in OTU
abundances in small intestine or colon microbiota in the anthelmintic group, anthelmintic
treatment may have a modulatory effect on microbiota, such that natural seasonal variation in the
microbiota is inhibited. However, with the small samples sizes of the current study it is not
possible to reliably make such statements.
Previous studies on the effect of anthelmintic treatment on microbiota have yielded mixed results;
one study reported that the microbiota of faeces from individuals experimentally infected with
helminths was ‘restored’ to a microbial community more similar to uninfected individuals
(Houlden et al., 2015), while another study did not observe significant changes in microbiota
following anthelmintic treatment (Cooper et al., 2013). The results of the current chapter were not
as dramatic as those of Houlden et al., (2015), and instead more closely resemble those observed
by Cooper et al., (2013), with anthelmintic treatment associated with very few significant changes
in host microbiota. However, there are limited comparisons that can be made between the studies
that have investigated the effect of anthelmintic on microbiota due to differences in study design.
For example, in the Houlden et al., (2015) study, helminth infection was experimental, and the
model system was a laboratory rodent, while in Cooper et al., (2013) treated patients harboured a
70
Does disruption of the helminth community with anthelmintic affect the gut microbiota?
single species parasite infection, neither of which represent the same complexities of microbiota
and macrobiota interactions as represented by the wild, replete system studied here (Amato,
2013). However, a strength of the Cooper et al., (2013) study which could not be achieved here
due to high parasite prevalence, is that uninfected individuals were also treated with anthelmintic,
which allows us to tease apart the effect of the properties of the anthelmintic itself versus the act
of helminth removal.
Whilst faecal samples were collected as a time series for each individual, evidence suggests that
faeces from laboratory mice are not a reliable proxy for microbiota elsewhere in the gut (Pang et
al., 2012), and it should further be noted that faecal samples used in the current study were
exposed overnight to potential contaminants in the field. In an effort to reconcile the limitations
associated with faecal sample use, microbiota within different gut sections were also sampled and
analysed, however, due to the destructive nature of gut sampling it was not possible to create a
time series of gut microbiota samples from any given individual, and as such the ‘pre’ and ‘post’
data from gut samples were from unmatched individuals (with a bias towards individuals from
Cavedine, due to small population sizes at Pietramurata), which may have naturally varied from
one another, regardless of treatment. Furthermore, despite every effort to treat and sample animals
at consistent time intervals, this was not always possible due to the unpredictable nature of
capturing wild animals, and the resulting data provide evidence of a response to anthelmintic at a
non-standardised time point. Consequently, results presented here should be interpreted with
caution and future studies should aim to improve sample sizes and consider the benefits that an
external rodent enclosure may provide (e.g., improved recapture rates).
71
Does disruption of the helminth community with anthelmintic affect the gut microbiota?
There is widespread and often ungoverned use of anthelmintics in humans, livestock and
companion animals (Vlassoff et al., 2001; Nielsen, 2009; Vercruysse et al., 2012), but the current
study suggests that host microbiota can remain mostly stable following anthelmintic treatment. It
is no surprise that anthelmintic did not directly affect host microbiota; although the avermectin
family of anthelmintics (which includes ivermectin) have demonstrated antimicrobial activity, and
have been tested as a possible alternative to antibiotics for treating microbial pathogen infections
(Pettengill et al., 2012; Lim et al., 2013), avermectins have yielded limited positive results in their
ability to affect bacteria (Woerde et al., 2015). Indeed, when first discovered, avermectins were
stated as “lacking significant antibacterial properties” (Burg et al., 1979). Ivermectin functions by
targeting the glutamate-gated chloride channels of nematodes, thus rendering them paralysed
(Wolstenholme and Rogers, 2005). However, these ion channels are only present in protostome
invertebrate phyla (Wolstenholme, 2012), and bacteria are not affected by this mechanism.
Results from the present study also indicate that anthelmintic largely does not affect the
microbiota via perturbation of the helminth community (e.g., through alteration of host immune
responses resulting from depletion of infection, see Walk et al., 2010; Rausch et al., 2013).
However, given that the World Health Organisation has committed to increase the percentage of
children treated with anthelmintic to 75% by 2020 in areas where helminth infection prevalence is
greater than 20% (Truscott et al., 2015), it is important to consider that bacterial composition of
microbiota did significantly change in some gut sections (colon and faeces) following
anthelmintic treatment, and even comparatively small changes in microbiota composition can
influence host health and vice versa (Bongers et al., 2014; Sun and Kato, 2016).
To date, only the current study, and three others (Cooper et al., 2013; Sirois, 2013; Houlden et al.,
2015) have investigated the affect of anthelmintic treatment on microbiota. Results from these
72
Does disruption of the helminth community with anthelmintic affect the gut microbiota?
experiments show a range of effects on the microbial community associated with anthelmintic
treatment, including reversion of microbiota composition to one which is more similar to
uninfected individuals (Houlden et al., 2015), shifts in Bacteroidetes/Firmicutes ratios (Sirois,
2013), to very little effect on microbiota composition (Cooper et al., 2013; current Chapter).
Interest in the effect of anthelmintic on the microbiota is growing due to the potential health and
economic consequences of anthelmintic treatment for both humans and livestock. In 2016 a
proposal to trial how the anthelmintic albendazole affects microbiota of children was approved
(Leung et al., 2016). Indeed, the removal and control of helminths is such a pertinent topic that the
effect of non-pharmaceutical anthelmintics on microbiota has also received some interest. For
example, chicory roots reportedly have both anthelmintic and antibiotic properties following
ingestion, and have been fed to domestic pigs experimentally infected with two helminth species
(Jensen et al., 2011). While dietary supplementation with chicory roots did successfully decrease
the abundance of one helminth species, the other helminth species subsequently showed an
increase in abundance, and no significant changes were reported in microbiota composition
(Jensen et al., 2011). It is evident that there are pressing concerns regarding anthelmintic
resistance and knock-on effects on microbiota, but at present there have been few studies
investigating the effect of anthelmintics/helminth removal on the microbiota, despite potential
implications for human and livestock health.
To conclude, diversity of gut microbiota of wild rodents harbouring a natural helminth infection
remains stable following anthelmintic treatment, and reduction in helminth infection. The results
presented here support previous evidence that the avermectin family of anthelmintics does not
have any significant antimicrobial effects (Burg et al., 1979; Woerde et al., 2015). In addition, the
results presented here indicate that changes in microbiota composition associated with helminth
73
Does disruption of the helminth community with anthelmintic affect the gut microbiota?
infection (Cebra, 1999; Maizels et al., 2004; Walk et al., 2010; Broadhurst et al., 2012; Rausch et
al., 2013; Kreisinger et al., 2015) may persist after infection load is reduced. There are a number
of possible reasons that microbiota does not exhibit significant alterations following anthelmintic
treatment, based on the different modes by which helminth infection may affect microbiota. For
example, suppression of the immune system by some helminths may allow previously non-
abundant bacteria to flourish (e.g., Walk et al., 2010; Rausch et al., 2013), and may persist even
after infection has been reduced but not cleared. However, microbiota of faeces did show
significant changes in composition following anthelmintic treatment. Given that the eggs of many
helminth species are expelled and undergo development within host faeces, and bacteria can affect
helminth development (e.g., H. polygyrus; and T. muris; Hayes et al., 2010; see also Chapter 6),
further research into the effect of anthelmintic on faecal microbiota, and subsequent implications
for helminth development is a future area of discovery. This study provides evidence that low
doses of anthelmintic have limited short-term impacts on the microbiota, mostly of the faeces, but
the effect of higher doses over prolonged periods, as are sometimes administered to humans and
livestock, are unknown.
3.6 Author Acknowledgements
The manuscript resulting from this chapter is authored by:
Emily L. Pascoe, Jakub Kreisinger (Charles University, Prague), Margherita Collini (Fondazione
Edmund Mach), Heidi C. Hauffe (Fondazione Edmund Mach), Julian R. Marchesi (Cardiff
University and Imperial College) and Sarah E. Perkins (Cardiff University and Fondazione
Edmund Mach).
74
Does disruption of the helminth community with anthelmintic affect the gut microbiota?
E.L.P: Designed study, collected, analysed and interpreted data, wrote manuscript.
J.K: Involved in designing study, provided guidance regarding appropriate analyses for microbiota
data.
M.C: Provided guidance regarding processing of microbiota samples/data collection.
H.C.H: Involved in conceiving the study and organising field work and logistics, provided
comments on each version of the manuscript.
J.R.M: Provided comments on the manuscript.
S.E.P: Conceived and designed study, involved in data interpretation, provided comments on each
version of the manuscript.
75
Chapter 4
Does disruption of the gut microbiota withantibiotic affect the helminth population?
“True knowledge exists in knowing that you know nothing”
Socrates
76
Does disruption of the gut microbiota with antibiotic affect the helminth population?
4.1 Abstract
Antibiotics are widely administered to humans and animals due to their ability to prevent and treat
bacterial infections, and induce growth in livestock. Although a diverse bacterial community
shares the gut niche with other micro- and macro-organisms, the effect of antibiotic treatment on
other components of the gut biome, such as the parasitic helminths, has been given little regard.
Here, the effect of antibiotic on the helminth community was investigated in a wild, naturally
infected rodent host. Antibiotic treatment did not significantly effect helminth abundance.
However, fecundity of both Heligmosomoides polygyrus and Hymenolepis spp. significantly
increased; egg shedding increased by 362% (p <0.01) and 2,165% respectively (p = 0.03), but
there was no difference between pre- and post-treatment individuals for in utero eggs/µm2. There
was no difference in H. polygyrus size, however Hymenolepis spp. were 229.5% larger in post-
compared to pre-treatment individuals (p <0.01). The results suggest that antibiotic treatment of
the host increases absolute (but not net) helminth egg production. Increased egg shedding
associated with antibiotic treatment may be a result of competitive release from bacteria or
changes in the expression of genes within the host that protect against helminth infection. The
implications of increased egg shedding following antibiotic treatment could include higher
numbers of helminth eggs present in the environment, leading to increased rates of helminth
transmission in the host population.
4.2 Introduction
Antibiotics have revolutionised human and veterinary medicine, they relatively quickly treat
microbial infections by killing pathogenic bacteria or preventing their proliferation (Hauser,
2012). They are also exploited for their growth-inducing properties in livestock (Goossens et al.,
2005). However, antibiotics usually function on a ‘broad-spectrum’, meaning that many non-
77
Does disruption of the gut microbiota with antibiotic affect the helminth population?
target and non-pathogenic bacteria can be affected, often leading to gut dysbiosis; the effects of
which can persist years after administration (Kilkkinen et al., 2002; Hawrelak and Myers, 2004;
Jernberg et al., 2007; Jakobsson et al., 2010). In addition, over- and inappropriate use of
antibiotics have led to an alarming rate of antibiotic resistance in many strains of pathogenic
bacteria (Shlaes, 2010). Concerns related to antibiotic resistance led to an EU ban in 2006 on their
use as a growth-promoter in livestock (Anadón, 2006). In spite of this ban, worldwide antibiotic
use remains widespread in both humans and animals; in Chile alone hundreds of tonnes of
antibiotics are used annually only within the salmon farm industry (Landers et al., 2012; Cabello
et al., 2013; Versporten et al., 2014), while the annual worldwide antibiotic consumption of
humans is 70 billion standard units (where one unit is equivalent to one pill; Van Boeckel et al.,
2014). In addition, there are minimal restrictions regarding administration of antibiotics to
companion animals (Prescott, 2008). Yet despite this excessive use of antibiotics, we still do not
know the full extent of how disrupting gut bacteria may affect the other components of the gut
biome.
The gut biome also has a ‘macrobiota’ component; the parasitic helminths, which may cause
malnutrition and reduce fecundity of the host (Shetty, 2010; Sutherland and Scott, 2010), but on
the flip-side, can also elicit a protective defence against autoimmune diseases in humans (Bilbo et
al., 2011). Parasitic helminths have co-evolved with microbiota within the gut for millennia, and
interactions between these two communities are likely to be highly complex (e.g., Glendinning et
al., 2014). For instance, studies have found that helminth infection influences microbiota
composition, generally causing an increase in bacterial diversity (Walk et al., 2010; Broadhurst et
al., 2012; Rausch et al., 2013), with effects observable both up- and down-stream from the site of
helminth infection (Kreisinger et al., 2015; McKenney et al., 2015). Likewise, the consortia of
78
Does disruption of the gut microbiota with antibiotic affect the helminth population?
bacteria present in the host gut can affect the susceptibility of an individual to helminth infection
(Martínez-Gómez et al., 2009; Hayes et al., 2010; Coêlho et al., 2013). Since bacteria can
influence helminth infection, depletion or disruption of microbiota composition by antibiotic is
also likely to affect the helminth community.
There is already evidence that antibiotics affect the helminth community and were tested as a
possible treatment for helminth infections more than half a century ago. Results were promising;
antibiotics such as chlortetracycline hydrochloride, oxytetracycline and bacitracin reduced
pinworm abundances in mice and humans by up to 80%, while in some individuals the infection
was entirely removed (Wells, 1951, 1952a, 1952b), and the gut remained uninfected for up to 72
hours after treatment (Chan, 1952). Cestodes were also successfully removed in humans treated
with paromomycin (Salem and el-Allaf, 1969). Even substances with weak antibacterial effects,
such as gentian violet, reduced helminth abundances by around 50% (Wells, 1951; Brown, 1952).
In addition, helminths that remained within the host following antibiotic administration were
smaller in size, while fecundity and virulence were also reduced (Wells, 1951; Brown, 1952;
Chan, 1952; Wells, 1952a, 1952b; Salem and el-Allaf, 1969; Hoerauf et al., 1999; Saint André et
al., 2002). However, antibiotics did not consistently have a negative effect on helminth
abundance; for example, administration of neomycin, dihydrostreptomycin and chloramphenicol
resulted in increased helminth abundance (Wells, 1952a). The majority of these studies were
performed before the advent of metataxonomic analyses, thus did not associate specific changes in
microbiota with changes in the helminth community.
Although initial studies simply observed the effect of antibiotic on the helminth community, more
recent work has attempted to tease apart the mechanisms by which removal of bacteria may
79
Does disruption of the gut microbiota with antibiotic affect the helminth population?
impact the macrobiota. For example, parasite establishment is less successful following antibiotic
treatment, since helminths may rely on a ‘service’ provided by bacteria (e.g., carbohydrate
digestion; Biswal et al., 2016, or to initiate egg hatching; Hayes et al., 2010), which is disrupted
by the effect of antibiotic on the respective bacteria. Conversely, antibiotics may influence the
abundance of helminths or other endoparasites through changes in host immune responses
associated with the removal of microbiota (Mathis et al., 2005), or by killing the symbiotic
bacteria crucial for helminth survival (e.g., Wolbachia in filarial nematodes; Saint André et al.,
2002). However, until now studies on the affect of antibiotic on helminths have used laboratory
model organisms infected with a single helminth species, thus are unable to assess how a replete
helminth community with interspecific interactions (Lello et al., 2004; Telfer et al., 2010)
responds to antibiotic.
Antibiotics can affect some helminth species in laboratory animals, possibly due to a cascade
effect of disrupting the gut microbiota. However, as yet, antibiotic-helminth interactions have not
been investigated in a wild system harbouring a full, interacting consortia of microbiota and
macrobiota (Lello et al., 2004; Telfer et al., 2010; Glendinning et al., 2014). The aim of the
current study is to establish if microbiota perturbation by antibiotic treatment of a host affects
parasitic helminth abundance, fecundity or size in a natural, replete system.
4.3 Materials and methods
4.3.1 Study area and small rodent sampling
Live-trapping of Apodemus flavicollis was conducted following methods in Chapter 3 (‘3.3.1
Study area and small rodent sampling’). Briefly, Ugglan multi-capture traps (Ugglan Type 2;
80
Does disruption of the gut microbiota with antibiotic affect the helminth population?
Grahnab, Sweden) were arranged in four grids of 64 traps each (8×8). Two grids were established
at the locality of Cavedine (45°59'21.2"N, 10°57'59.6"E and 45°58'30.8"N, 10°57'22.0"E) and two
at Pietramurata (46°01'01.4"N, 10°55'22.8"E and 46°00'47.7"N, 10°55'40.7"E) in the Province of
Trento (Italy). Trapping grids at each locality were randomly assigned to either antibiotic or sham
control treatment. Traps were baited with sunflower seeds and potato for two nights on a
consecutive biweekly basis, at each locality, from mid-May to August 2014. Following this pre-
treatment monitoring of microbiota and macrobiota, trapping was conducted at both localities
intensively for four nights on a weekly basis during the treatment (August) and post-treatment
monitoring periods (end of August to September). Throughout the course of trapping, a total of
147 individuals were captured, 57 from antibiotic assigned grids and 90 from control assigned
grids. However, some of these individuals were excluded from analyses as they were not re-
captured following treatment. Of these 147 mice, 64.6% were captured on more than one
occasion; 61.4% in antibiotic assigned grids and 64.8% in control assigned grids. Animal trapping
and handling procedures were authorised by the Comitato Faunistico Provinciale della Provincia
di Trento, prot. n. 595 issued on 04 May 2011.
Upon capture, mice were processed following methods in Chapter 3 (‘3.3.1 Study area and small
rodent sampling’), whereby individuals were tagged with a subcutaneous passive integrated
transponder (Trovan ID 100; Ghislandi and Ghislandi, Italy), and host body mass, sex and
breeding status were recorded. Faeces that had accumulated overnight inside traps occupied by a
single individual were collected, and transported to the laboratory at 4°C. During each week,
faeces collected at first capture of an individual were collected for faecal egg count (FEC)
analyses, using a standard McMaster technique with saturated NaCl flotation solution (after Dunn
and Keymer, 1986) to calculate helminth eggs per gram of faeces (EPG). When an individual was
81
Does disruption of the gut microbiota with antibiotic affect the helminth population?
captured more than once during a trapping week, subsequent faecal samples were collected for
microbiota analyses, which, upon returning to the laboratory were immediately frozen at -80°C
until DNA extraction (see ‘4.3.4 16S rRNA gene sequencing’ below). A total of 26 mice were
randomly selected throughout the course of the experiment for gut microbiota and adult helminth
analyses; six pre-treatment (Cavedine n = 6, Pietramurata n = 0) and seven post-treatment
(Cavedine n = 6, Pietramurata n = 1) from the antibiotic group, plus six pre-treatment (Cavedine n
= 6, Pietramurata n = 0) and seven post-treatment (Cavedine n = 5, Pietramurata n = 2) from the
control group. These animals were transported to the laboratory, and euthanised by an overdose of
isoflurane, followed by cervical dislocation, and immediately frozen at -80°C until dissection (see
‘4.3.3 Analyses of gut samples’ below).
4.3.2 Microbiota manipulation
During an 18-day period in August 2014 all adult and sub-adult mice captured at each grid were
administered up to three doses of antibiotic or a sham control, with a minimum of seven days
between each dose. The antibiotic treatment consisted of a solution of 5 mg/ml vancomycin, 10
mg/ml neomycin, 10 mg/ml metronidazol, 10 mg/ml ampicillin and 0.1 mg/ml amphotericin B
(Sigma-Aldrich, USA), dissolved in sterile PBS solution (after Reikvam et al., 2011). The
antibiotic solution was vigorously vortexed for 10 minutes each day before use. The sham control
consisted of a dose of ultra-pure water. Each treatment was administered using a curved gavage
needle (18 G × 50 mm) at a dose of 2 ml/Kg (adapted from Reikvam et al., 2011). Due to the
vagaries of trapping wild animals, not every individual was captured three times/with a sufficient
time interval between doses throughout the treatment period to receive the intended three doses of
treatment: a total of 25 individuals were treated with antibiotic (one dose n=8, two doses n=9,
82
Does disruption of the gut microbiota with antibiotic affect the helminth population?
three doses n=8), while due to a difference in population densities, 42 individuals were treated
with the control sham gavage (one dose n=30, two doses n=11, three doses n=1).
4.3.3 Analyses of gut samples
The 26 euthanised A. flavicollis were dissected under sterile conditions following methods
presented in Chapter 3 (see ‘3.3.3 Analyses of gut samples’, see also Kreisinger et al., 2015).
Briefly, the gut was washed in sterile Tris-buffered saline (TBS; Tris-NaCl; 50 mM Tris, 200 mM
NaCl, pH8) and separated into the stomach, small intestine, caecum, and colon. The luminal
contents and membrane of each section was scanned for helminths at 10× magnification (Leica©
MS5 microscope with a Leica© CLS100 light attachment). Faeces were homogenised in TBS and
scanned for helminths at 10× magnification. Helminths were collected and pooled according to
species, gut section and mouse individual in 70% ethanol for future size and fecundity analyses
(see ‘4.3.9 Helminth size and fecundity measurements’). A bacterial pellet was obtained from the
gut and faecal material using the following centrifugation steps: total contents of the tube were
centrifuged for 950 G for 10 minutes at 4°C, resulting in a pellet containing the gut membrane and
non-bacterial lumen contents (e.g., digested food). This pellet was discarded, but the supernatant
was further centrifuged at 9000 G for 15 minutes at 4°C. The resulting supernatant was discarded
and the remaining bacterial pellet was immediately stored at -80°C for future bacterial DNA
analysis (see ‘4.3.4 16S rRNA gene sequencing’ below).
4.3.4 16S rRNA gene sequencing
A total of 53 frozen faecal samples, which included at least one pre- and one post-treatment
sample from any given individual, were sequenced for microbiota analyses; 34 samples from 14
individuals (Cavedine n = 9, Pietramurata n = 5 individuals) from the antibiotic group, and 19
83
Does disruption of the gut microbiota with antibiotic affect the helminth population?
samples from 8 individuals from the control group (Cavedine n = 1, Pietramurata n = 7
individuals). In addition, small intestine, caecum and colon samples from the 26 euthanised
individuals were sequenced. Preparation of samples (DNA extraction, DNA quantification, PCR
and PCR product purification), and subsequent sequencing of the resulting amplicon library
followed methods presented in Chapter 3 (see ‘3.3.4 16S rRNA gene sequencing’).
4.3.5 Bioinformatic processing of 16S data
Sequences were merged, trimmed and filtered using MICCA software (version 1.5.0, Albanese et
al., 2015) following methods provided in Chapter 3 (see ‘3.3.5 Bioinformatic processing of 16S
data’).
4.3.6 Statistical analyses of microbiota - diversity
Generalised linear mixed models (GLMMs) were used to assess whether there was an association
between microbiota alpha diversity and antibiotic treatment, using the inverse Simpson index.
Preliminary analyses indicated that data had insufficient power to include treatment interacting
with treatment period (antibiotic and control data pooled) as an explanatory variable, thus
antibiotic and control data were analysed in separate GLMMs. Firstly, a GLMM was used to test
that there were no significant differences in microbiota alpha diversity in pre-treatment individuals
between the antibiotic and control group, to ensure changes in post-treatment individuals were
comparable. Once this assumption was confirmed separate GLMMs were run with alpha diversity
of either the small intestine, caecum, colon, whole gut (small intestine, caecum and colon
combined) or faeces as the response variable. Host sex, breeding status and treatment period (pre-
or post-treatment) were explanatory variables. The identity code of the individual, geographical
location (Cavedine or Pietramurata) and sampling month were each modelled as random
84
Does disruption of the gut microbiota with antibiotic affect the helminth population?
intercepts for each model. Statistical analyses used the package glmmADMB, version 8.3.3
(Fournier et al., 2012; Skaug et al., 2016). A process of multi-model inference was used to
compare all possible models using the R package MuMIn (Bartoń, 2015), and the most
parsimonious model was selected using a threshold of ΔAICc <2 (Burnham and Anderson, 2003).
4.3.7 Statistical analyses of microbiota - composition
A distance-based redundancy analysis (db-RDA; capscale function in R package vegan; Oksanen
et al., 2017) was used to test for differences in microbiota composition associated with antibiotic
treatment, in the small intestine, caecum, colon, whole gut (small intestine, caecum and colon
combined) or faeces (see ‘3.3.8 Statistical analyses of microbiota – composition’ in Chapter 3 for
more details). Ecological distances between microbiota communities from pre-treatment and post-
treatment individuals (for both antibiotic and control) were assessed using Bray–Curtis
dissimilarities (i.e., compositional dissimilarity index that accounts for proportional differences of
OTUs among samples) and weighted UniFrac dissimilarity matrices (which accounts both for
proportional differences of OTUs and their phylogenetic relatedness; Lozupone and Knight,
2005). OTU tables were scaled before calculation of dissimilarity matrices to achieve an even
sequencing depth, corresponding to the minimal number of reads per sample in gut sections that
were included in a given analysis. Significance was assessed using permutation-based marginal
tests.
4.3.8 Statistical analyses of microbiota - OTU abundances
To determine how OTU abundances varied following antibiotic treatment, OTUs with a
differential abundance (i.e., number of reads corrected for sequencing depth) between pre- and
post-treatment individuals in the whole gut, each gut section and in faeces were first identified,
85
Does disruption of the gut microbiota with antibiotic affect the helminth population?
using an approach based on generalised linear models with negative binomial errors implemented
in the DESeq2 package (Anders and Huber, 2010). These analyses were run using the default
pipeline in DESeq2, and significance values (p <0.05) were derived using likelihood-ratio tests
(Anders and Huber, 2010; Love et al., 2014).
4.3.9 Helminth size and fecundity measurements
Helminths were removed from storage in 70% ethanol and submerged in sterile water for one hour
to ‘relax’ brittle helminths; a condition associated with ethanol storage, in preparation for
morphological analyses. Individual helminths were transferred onto a slide and fixed/cleared using
70% ethanol and 100% glycerol in a volume ratio of 1:1 (Heligmosomoides polygyrus,
Hymenolepis spp., Trichuris muris; adapted from Berland, 1984) or 1:1 of 70% ethanol and
lactophenol (Aspicularis tetraptera, Syphacia frederici and Trichuris muris). Due to their size or
transparency, Mastophorus muris and Corrigia vitta could not be/did not require fixing/clearing.
Each helminth was photographed at 10× magnification using a Leica© DFC420C camera attached
to a Leica© MZ75 microscope. Leica© software was used to provide a fine scale for each image,
and from these photographs the length and width (at three random points along the length) of each
helminth was measured using ImageJ software, from which helminth area was calculated. At this
stage it was also possible to identify Hymenolepis from two species; H. diminuta and H.
straminea. Female helminths from H. polygyrus, S. frederici and A. tetraptera were photographed
using a Leica© DMLB microscope at 50× magnification to perform an in utero egg count as a
proxy for fecundity. An in utero egg count was performed on T. muris, and the three posterior
proglottids from each Hymenolepis (including pieces of Hymenolepis from which the scolex had
detached), by macerating the helminth/proglottids, in sterile water and observing at 100×
magnification. For Hymenolepis spp. the mean egg count of the three proglottids was multiplied
86

Does disruption of the gut microbiota with antibiotic affect the helminth population?
by the number of mature proglottids from all Hymenolepis within a mouse, and divided by the
number of scolices found, to give an in utero egg count/helminth accounting for proglottids that
had detached from scolices. Preliminary analyses found that the number of eggs did not differ
substantially between mature proglottids of the same helminth.
4.3.10 Statistical analyses of helminth abundance, EPG, fecundity, percentage of
females and size
A total of 1,179 helminths were collected from 26 euthanised mice, of which 1,001 were in a
condition which allowed further analysis of size and in utero egg counts (178 were lost/damaged
after quantification during host dissection). A total of 134 FEC measurements, which included at
least one pre- and one post-treatment sample from any given individual (79 FECs from 12
individuals in the antibiotic group and 55 FECs from 14 individuals in the control group) were
used for statistical analyses of of helminth egg shedding (eggs per gram of faeces; EPG).
Generalised linear mixed models (GLMM) were used to test for significant differences in
helminth abundance (total number of helminths present, including zero values of uninfected hosts,
as defined by Bush et al., 1997) and helminth EPG (here defined as the total number of helminth
eggs present in faeces, including zero values of uninfected hosts) associated with antibiotic
treatment. In addition, GLMMs were run to test for significant differences in fecundity (in utero
egg counts), the percentage of females (in sexually dimorphic helminth species) and helminth size
of both H. polygyrus and Hymenolepis. Due to a lack of statistical power (abundance <5, or
present in only one individual), the other helminth species could not be analysed separately for
any of these parameters, but were included in analyses of total helminth prevalence, abundance
and EPG analyses. Preliminary analyses indicated that data had insufficient power to include
treatment interacting with treatment period (antibiotic and control data pooled) as an explanatory
87
Does disruption of the gut microbiota with antibiotic affect the helminth population?
variable, thus antibiotic and control data were analysed in separate GLMMs; firstly, a GLMM was
used to test that there were no significant differences in helminth abundance, EPG, fecundity,
female percentage and size in pre-treatment individuals between the antibiotic and control group
to ensure changes in post-treatment individuals were comparable. Once this assumption was
confirmed, for all GLMMs host sex, host breeding status, host body mass and treatment period
(pre- or post-treatment) were explanatory variables. In addition, the model included the following
two-way interaction terms as explanatory variables: all possible two-way interactions between
host sex, host breeding status and host body mass. The identity code of the individual,
geographical location (Cavedine or Pietramurata) and sampling month were all modelled as
random intercepts for each model. Statistical analyses used the package glmmADMB, version
8.3.3 (Fournier et al., 2012; Skaug et al., 2016). For each GLMM, a process of multi-model
inference was used to compare all possible models using the R package MuMIn (Bartoń, 2015).
The most parsimonious model was selected using a threshold of ΔAICc <2 (Burnham and
Anderson, 2003).
4.4 Results
4.4.1 The effect of antibiotic on gut and faecal microbiota diversity
The sequences from one faecal and one small intestine sample were discarded as they did not meet
the quality filtering criteria. The filtered dataset consisted of 2,896,364 high-quality reads from
124 samples (mean ± standard error = 23,358 ± 32,124, range = 10,073-49,083), within which 14
phyla were identified. Antibiotic treatment did not affect gut microbiota alpha diversity; there was
no significant difference in inverse Simpson indices for microbiota of the small intestine (d.f. = 7,
Z = 1.89, p = 0.06), caecum (d.f. = 7, Z = -0.98, p = 0.33), colon (d.f. = 8, Z = -1.14, p = 0.25) or
88

Does disruption of the gut microbiota with antibiotic affect the helminth population?
faeces (d.f. = 30, Z = -1.60, p = 0.11) between pre- and post-treatment individuals. In the control
group there were also no significant differences in microbiota alpha diversity of the caecum (d.f. =
7, Z = 0.77, p = 0.44), colon (d.f. = 10, Z = -0.06, p = 0.96), or faeces (d.f. = 14, Z = 0.22, p =
0.82) between pre- and post-treatment individuals (Figure 4.1). However, in the control group the
microbiota alpha diversity of the small intestine was significantly higher in post- compared to pre-
treatment individuals (d.f. = 10, Z = 2.71, p <0.01; Figure 4.1).
Figure 4.1: Inverse Simpsons diversity index for microbiota in different gut sections and faeces ofpre- and post-treatment mice in an antibiotic or control group. Boxes demonstrate the upper andlower quartiles of alpha diversity, with median alpha diversity indicated. Bars represent theminimum and maximum range of alpha diversity.
89
Does disruption of the gut microbiota with antibiotic affect the helminth population?
4.4.2 The effect of antibiotic on gut and faecal microbiota composition
In brief, the majority of all reads from gut and faecal microbiota were from the phylum Firmicutes
(39.2%), followed by Bacteroidetes (38.3%) and Proteobacteria (15.5%; Figure 4.2). Of note,
22.9% of reads from small intestine samples were of the phylum Tenericutes. At the class level,
the majority of reads were Bacteroidia (37.9%), Clostridia (31.6%) and Gammaproteobacteria
(11.1%), plus in the small intestine 29.4% of reads were Bacilli and 22.7% were Mollicutes
(Figure 4.2).
Antibiotic treatment was associated with significant changes in taxonomical composition of
microbiota for all gut sections, with the exception of the small intestine (Bray-Curtis: d.f. = 19, F
= 1.18, p =0.20; weighted UniFrac: d.f. = 19, F = 0.89, p = 0.57; Figure 4.2, 4.3, 4.4 and 4.5).
Significant differences in taxonomic composition of microbiota in post- compared to pre-
treatment individuals were observed in whole gut (Bray-Curtis: d.f. = 67, F = 2.37, p <0.01;
weighted UniFrac: d.f. = 67, F = 3.23, p <0.01; Figure 4.3), caecum (Bray-Curtis: d.f. = 20, F =
1.46, p = 0.01; weighted UniFrac: d.f. = 20, F = 2.7, p = 0.02; Figure 4.4), and colon microbiota
(Bray-Curtis: d.f. = 20, F = 1.29, p = 0.02; weighted UniFrac: d.f. = 20, F = 2.14, p = 0.03;
Figure 4.4). Faeces partially followed this pattern; faecal microbiota showed a significant change
in taxonomic composition post-antibiotic treatment, but only according to Bray-Curtis
dissimilarities (Bray-Curtis: d.f. = 49, F = 1.88, p <0.01; weighted UniFrac: d.f. = 49, F = 1.3, p
= 0.17; Figure 4.5).
90
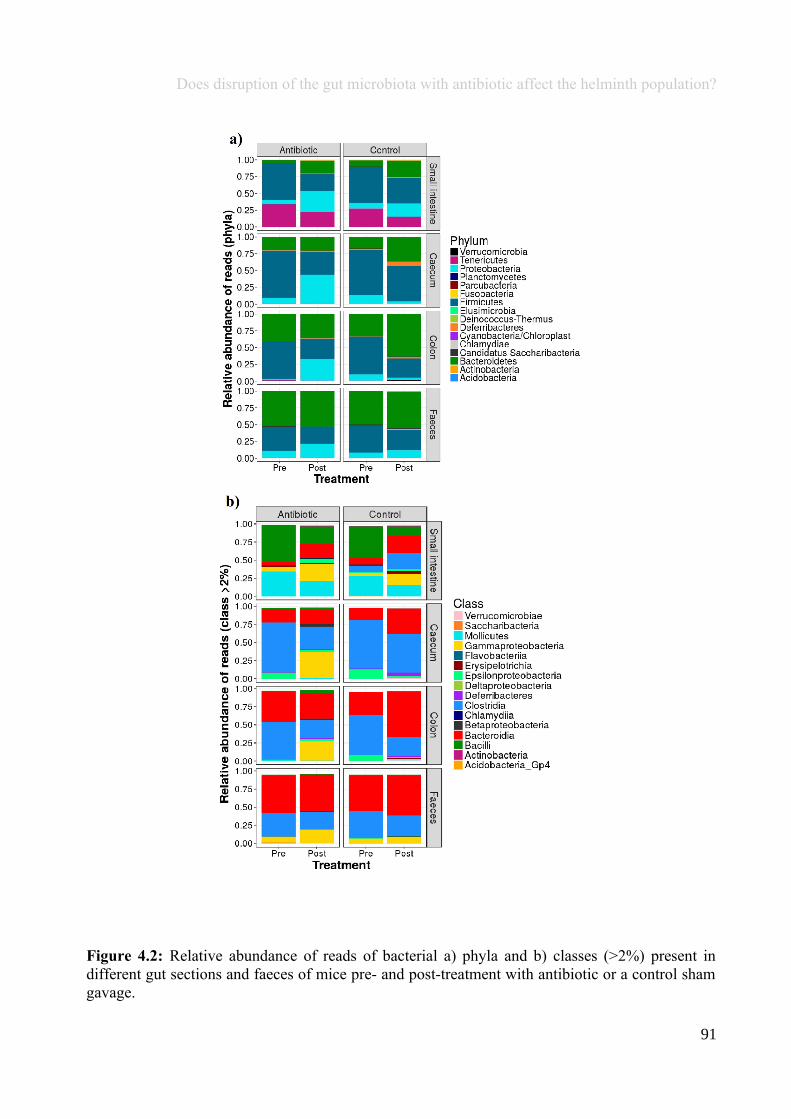
Does disruption of the gut microbiota with antibiotic affect the helminth population?
Figure 4.2: Relative abundance of reads of bacterial a) phyla and b) classes (>2%) present indifferent gut sections and faeces of mice pre- and post-treatment with antibiotic or a control shamgavage.
91
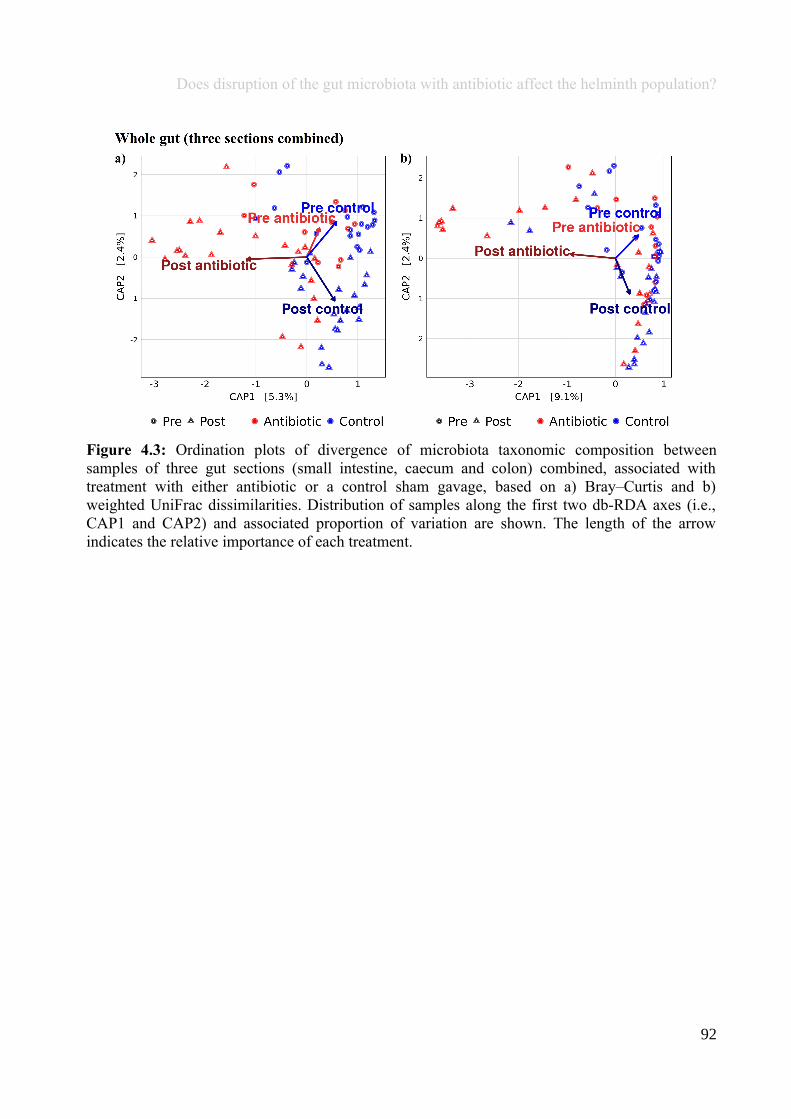
Does disruption of the gut microbiota with antibiotic affect the helminth population?
Figure 4.3: Ordination plots of divergence of microbiota taxonomic composition betweensamples of three gut sections (small intestine, caecum and colon) combined, associated withtreatment with either antibiotic or a control sham gavage, based on a) Bray–Curtis and b)weighted UniFrac dissimilarities. Distribution of samples along the first two db-RDA axes (i.e.,CAP1 and CAP2) and associated proportion of variation are shown. The length of the arrowindicates the relative importance of each treatment.
92
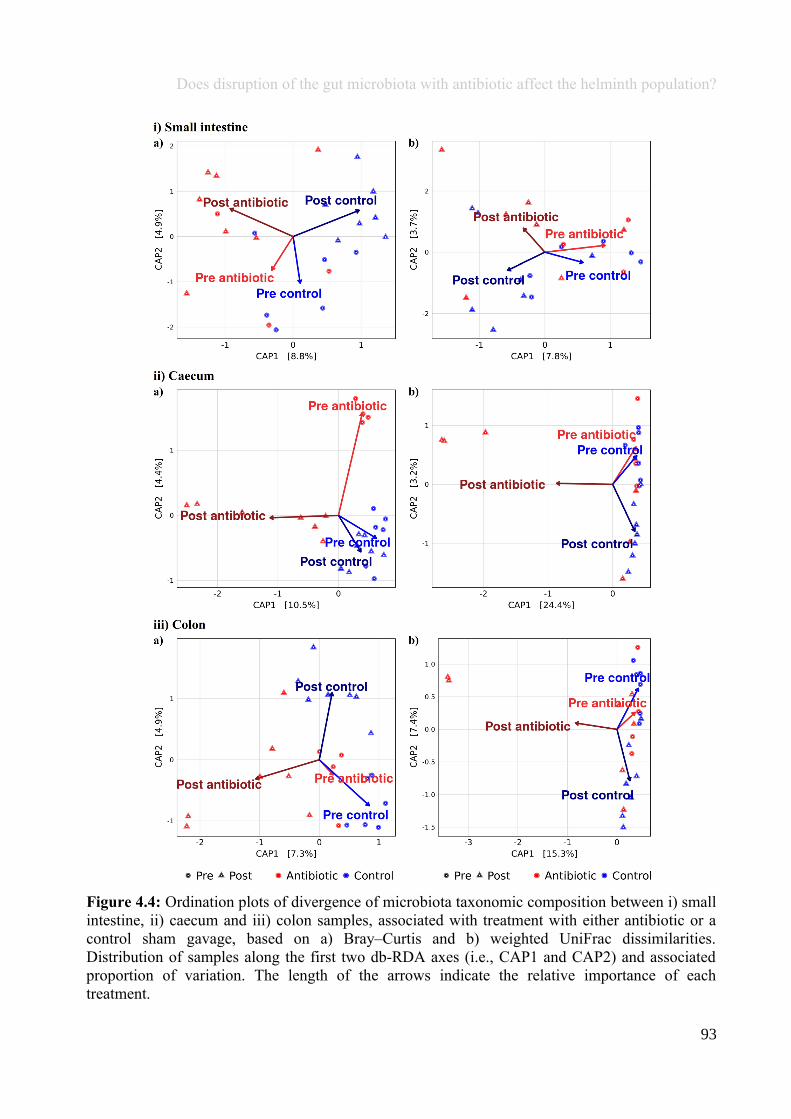
Does disruption of the gut microbiota with antibiotic affect the helminth population?
Figure 4.4: Ordination plots of divergence of microbiota taxonomic composition between i) smallintestine, ii) caecum and iii) colon samples, associated with treatment with either antibiotic or acontrol sham gavage, based on a) Bray–Curtis and b) weighted UniFrac dissimilarities.Distribution of samples along the first two db-RDA axes (i.e., CAP1 and CAP2) and associatedproportion of variation. The length of the arrows indicate the relative importance of eachtreatment.
93

Does disruption of the gut microbiota with antibiotic affect the helminth population?
Figure 4.5: Ordination plots of divergence of microbiota taxonomic composition between faecalsamples associated with treatment with either antibiotic or a control sham gavage, based on a)Bray–Curtis and b) weighted UniFrac dissimilarities. Distribution of samples along the first twodb-RDA axes (i.e., CAP1 and CAP2) and associated proportion of variation are shown. The lengthof the arrows indicate the relative importance of each treatment.
4.4.3 The effect of antibiotic on gut and faecal microbiota OTU abundances
Antibiotic treatment was associated with significant changes in microbial OTUs for all gut
sections, and in faeces (see Appendix A.4 and tables therein for detailed statistics).
Gammaproteobacteria and Epsilonproteobacteria from the Proteobacteria phylum consistently
showed changes in abundance in post- compared to pre- antibiotic treatment individuals (Figure
4.6; Appendix A.4). OTUs from the Firmicutes phylum also consistently exhibited changes in
abundance, generally decreasing, between pre- and post-treatment individuals, including also in
the control group (Figure 4.6). Notably, in the control group Bacteroidia was higher in abundance
in post-treatment compared to pre-treatment individuals in all gut sections, but not faeces.
However, Bacteroidia were not significantly different in abundance between pre- and post-
antibiotic treatment individuals, except in faeces, in which abundance decreased. Bacteria in four
94
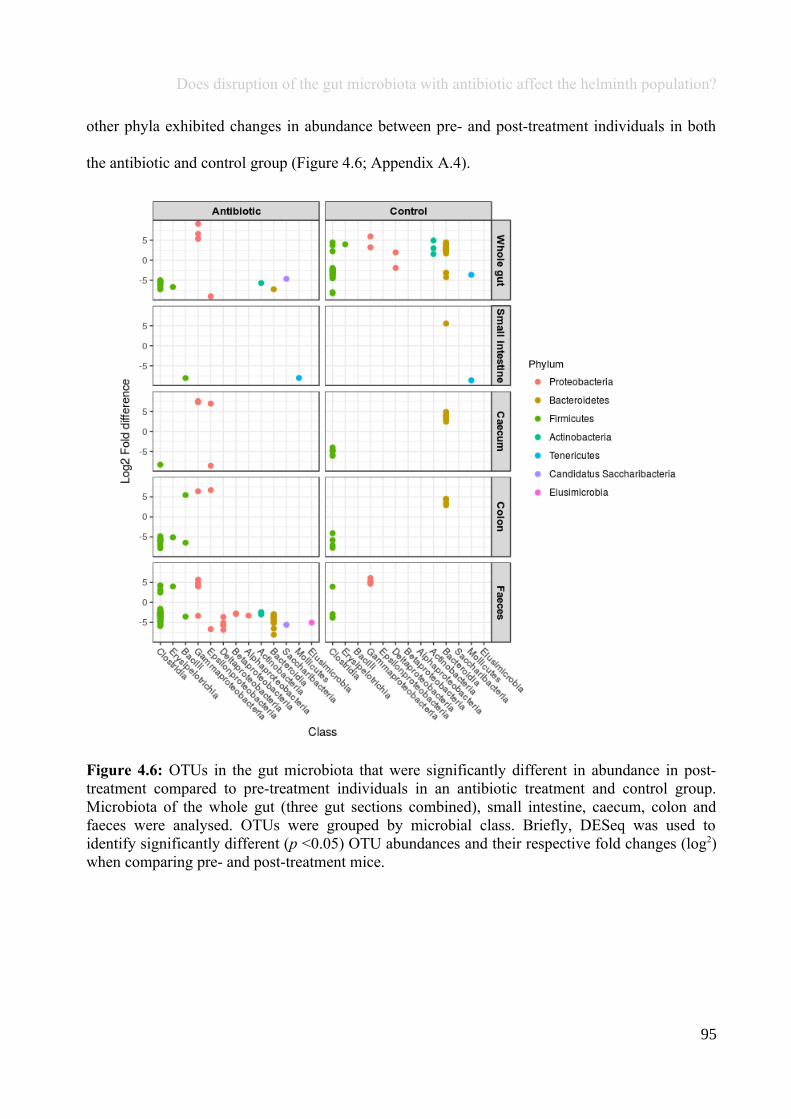
Does disruption of the gut microbiota with antibiotic affect the helminth population?
other phyla exhibited changes in abundance between pre- and post-treatment individuals in both
the antibiotic and control group (Figure 4.6; Appendix A.4).
Figure 4.6: OTUs in the gut microbiota that were significantly different in abundance in post-treatment compared to pre-treatment individuals in an antibiotic treatment and control group.Microbiota of the whole gut (three gut sections combined), small intestine, caecum, colon andfaeces were analysed. OTUs were grouped by microbial class. Briefly, DESeq was used toidentify significantly different (p <0.05) OTU abundances and their respective fold changes (log2)when comparing pre- and post-treatment mice.
95
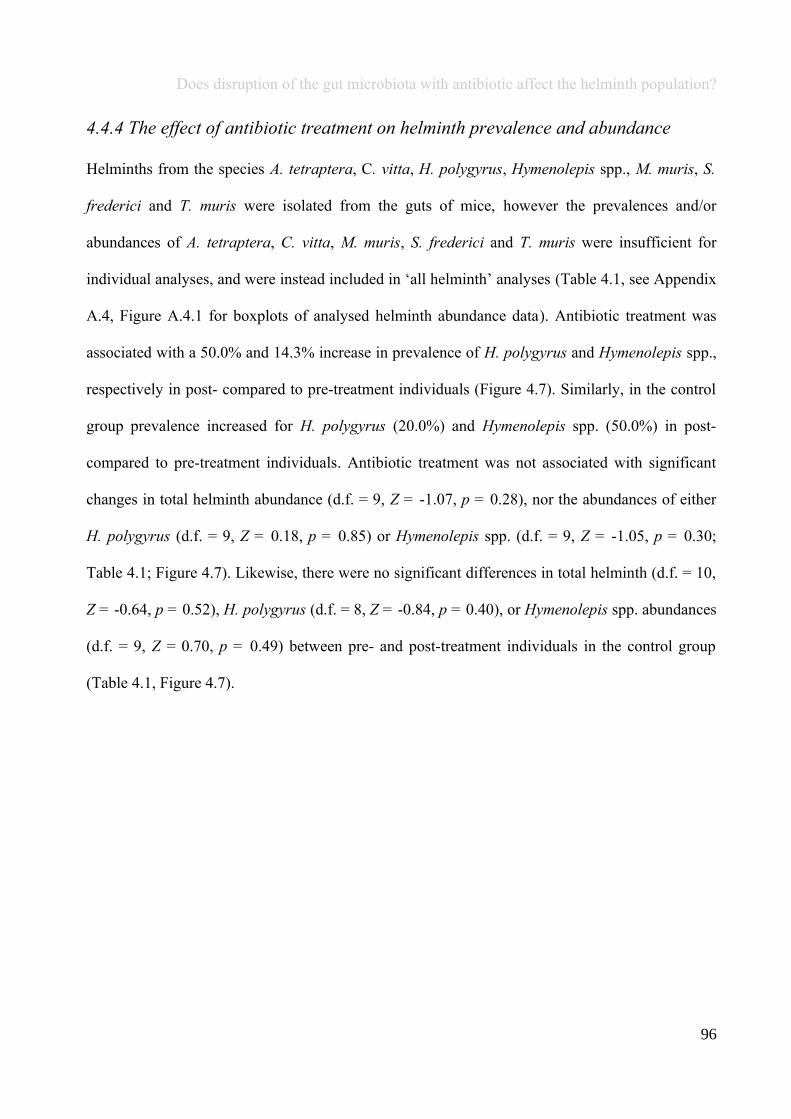
Does disruption of the gut microbiota with antibiotic affect the helminth population?
4.4.4 The effect of antibiotic treatment on helminth prevalence and abundance
Helminths from the species A. tetraptera, C. vitta, H. polygyrus, Hymenolepis spp., M. muris, S.
frederici and T. muris were isolated from the guts of mice, however the prevalences and/or
abundances of A. tetraptera, C. vitta, M. muris, S. frederici and T. muris were insufficient for
individual analyses, and were instead included in ‘all helminth’ analyses (Table 4.1, see Appendix
A.4, Figure A.4.1 for boxplots of analysed helminth abundance data). Antibiotic treatment was
associated with a 50.0% and 14.3% increase in prevalence of H. polygyrus and Hymenolepis spp.,
respectively in post- compared to pre-treatment individuals (Figure 4.7). Similarly, in the control
group prevalence increased for H. polygyrus (20.0%) and Hymenolepis spp. (50.0%) in post-
compared to pre-treatment individuals. Antibiotic treatment was not associated with significant
changes in total helminth abundance (d.f. = 9, Z = -1.07, p = 0.28), nor the abundances of either
H. polygyrus (d.f. = 9, Z = 0.18, p = 0.85) or Hymenolepis spp. (d.f. = 9, Z = -1.05, p = 0.30;
Table 4.1; Figure 4.7). Likewise, there were no significant differences in total helminth (d.f. = 10,
Z = -0.64, p = 0.52), H. polygyrus (d.f. = 8, Z = -0.84, p = 0.40), or Hymenolepis spp. abundances
(d.f. = 9, Z = 0.70, p = 0.49) between pre- and post-treatment individuals in the control group
(Table 4.1, Figure 4.7).
96
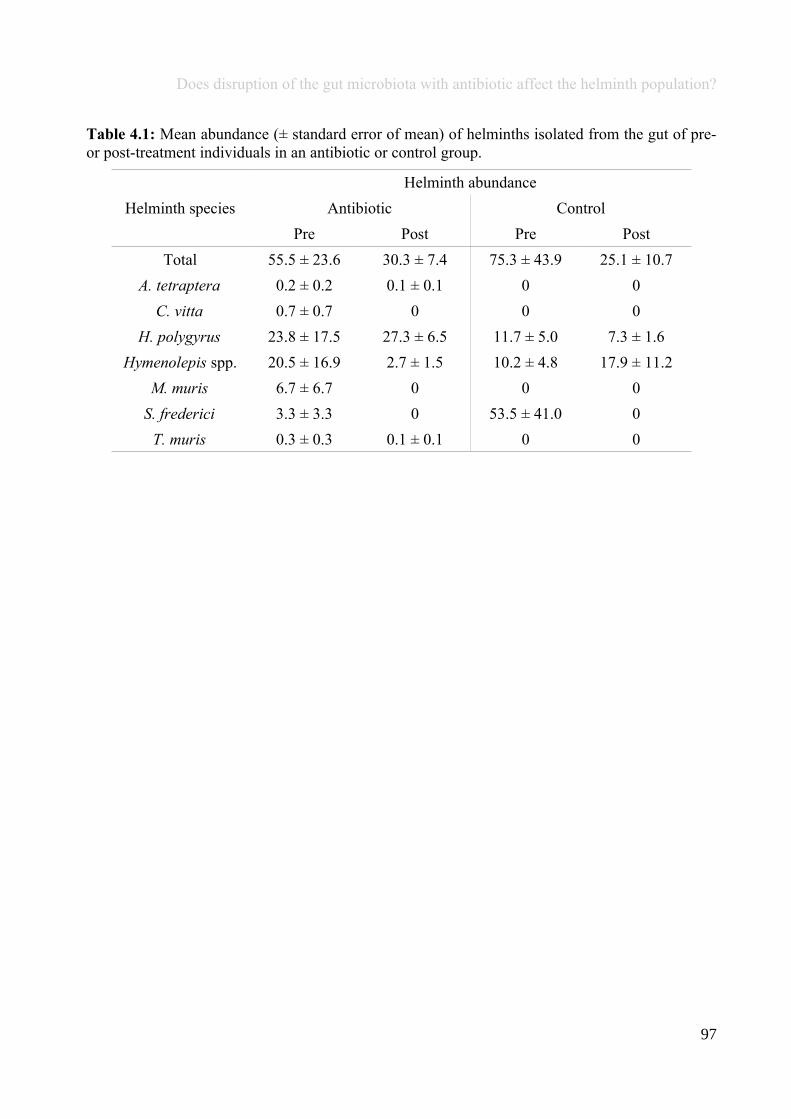
Does disruption of the gut microbiota with antibiotic affect the helminth population?
Table 4.1: Mean abundance (± standard error of mean) of helminths isolated from the gut of pre-or post-treatment individuals in an antibiotic or control group.
Helminth species
Helminth abundance
Antibiotic Control
Pre Post Pre Post
Total 55.5 ± 23.6 30.3 ± 7.4 75.3 ± 43.9 25.1 ± 10.7
A. tetraptera 0.2 ± 0.2 0.1 ± 0.1 0 0
C. vitta 0.7 ± 0.7 0 0 0
H. polygyrus 23.8 ± 17.5 27.3 ± 6.5 11.7 ± 5.0 7.3 ± 1.6
Hymenolepis spp. 20.5 ± 16.9 2.7 ± 1.5 10.2 ± 4.8 17.9 ± 11.2
M. muris 6.7 ± 6.7 0 0 0
S. frederici 3.3 ± 3.3 0 53.5 ± 41.0 0
T. muris 0.3 ± 0.3 0.1 ± 0.1 0 0
97
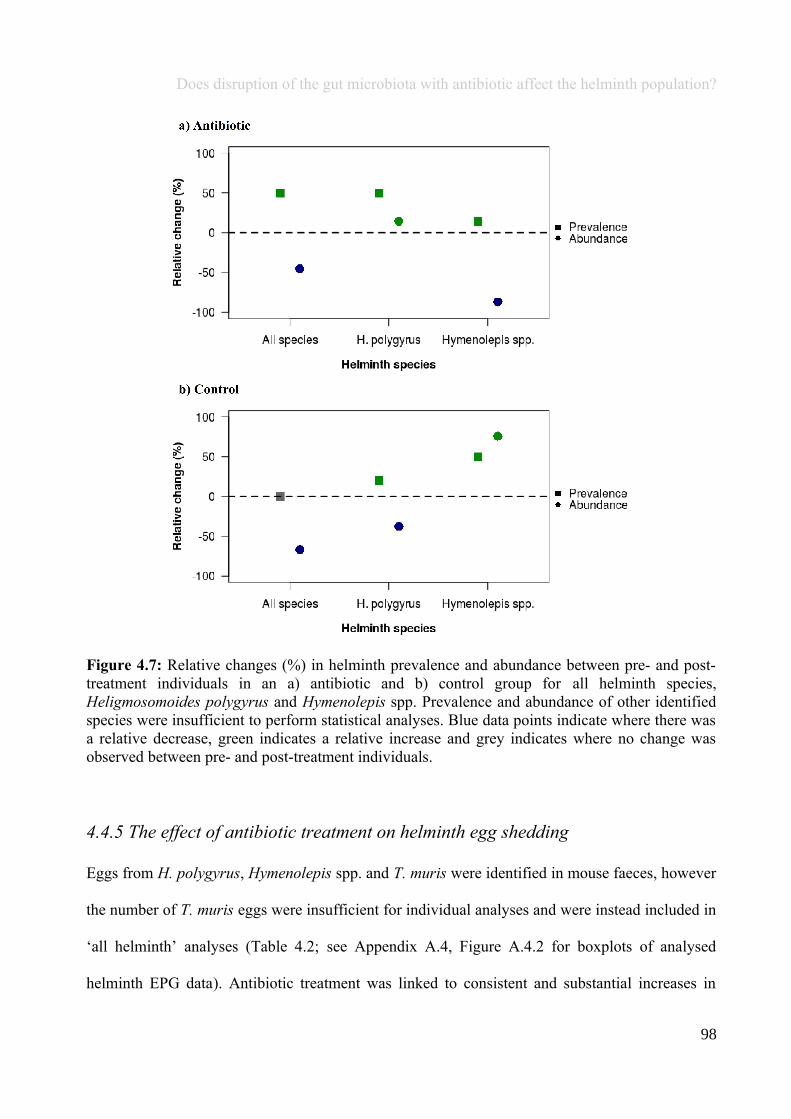
Does disruption of the gut microbiota with antibiotic affect the helminth population?
Figure 4.7: Relative changes (%) in helminth prevalence and abundance between pre- and post-treatment individuals in an a) antibiotic and b) control group for all helminth species,Heligmosomoides polygyrus and Hymenolepis spp. Prevalence and abundance of other identifiedspecies were insufficient to perform statistical analyses. Blue data points indicate where there wasa relative decrease, green indicates a relative increase and grey indicates where no change wasobserved between pre- and post-treatment individuals.
4.4.5 The effect of antibiotic treatment on helminth egg shedding
Eggs from H. polygyrus, Hymenolepis spp. and T. muris were identified in mouse faeces, however
the number of T. muris eggs were insufficient for individual analyses and were instead included in
‘all helminth’ analyses (Table 4.2; see Appendix A.4, Figure A.4.2 for boxplots of analysed
helminth EPG data). Antibiotic treatment was linked to consistent and substantial increases in
98
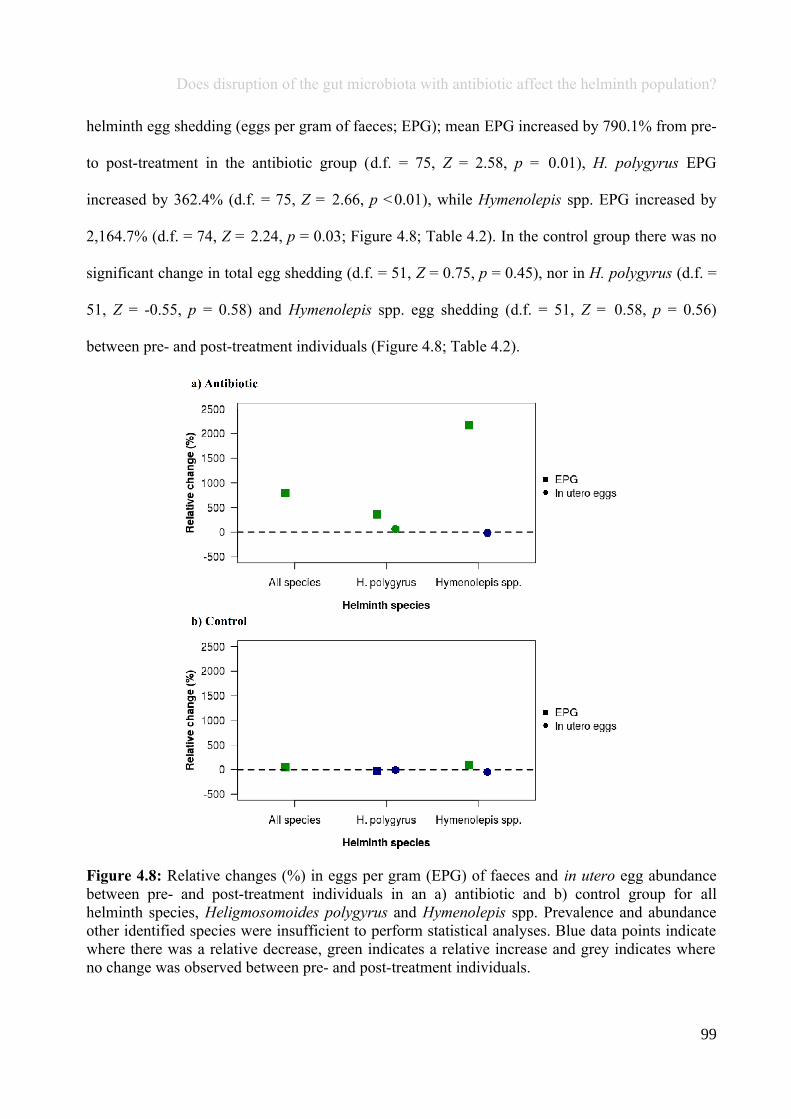
Does disruption of the gut microbiota with antibiotic affect the helminth population?
helminth egg shedding (eggs per gram of faeces; EPG); mean EPG increased by 790.1% from pre-
to post-treatment in the antibiotic group (d.f. = 75, Z = 2.58, p = 0.01), H. polygyrus EPG
increased by 362.4% (d.f. = 75, Z = 2.66, p <0.01), while Hymenolepis spp. EPG increased by
2,164.7% (d.f. = 74, Z = 2.24, p = 0.03; Figure 4.8; Table 4.2). In the control group there was no
significant change in total egg shedding (d.f. = 51, Z = 0.75, p = 0.45), nor in H. polygyrus (d.f. =
51, Z = -0.55, p = 0.58) and Hymenolepis spp. egg shedding (d.f. = 51, Z = 0.58, p = 0.56)
between pre- and post-treatment individuals (Figure 4.8; Table 4.2).
Figure 4.8: Relative changes (%) in eggs per gram (EPG) of faeces and in utero egg abundancebetween pre- and post-treatment individuals in an a) antibiotic and b) control group for allhelminth species, Heligmosomoides polygyrus and Hymenolepis spp. Prevalence and abundanceother identified species were insufficient to perform statistical analyses. Blue data points indicatewhere there was a relative decrease, green indicates a relative increase and grey indicates whereno change was observed between pre- and post-treatment individuals.
99
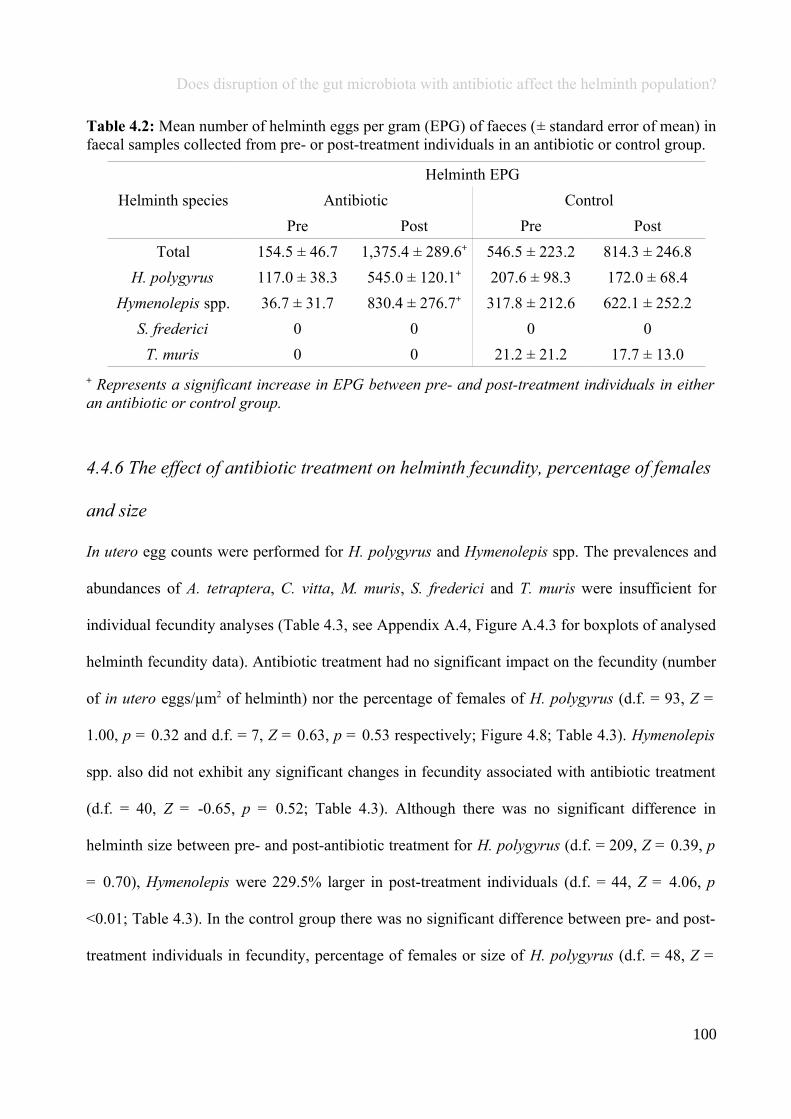
Does disruption of the gut microbiota with antibiotic affect the helminth population?
Table 4.2: Mean number of helminth eggs per gram (EPG) of faeces (± standard error of mean) infaecal samples collected from pre- or post-treatment individuals in an antibiotic or control group.
Helminth species
Helminth EPG
Antibiotic Control
Pre Post Pre Post
Total 154.5 ± 46.7 1,375.4 ± 289.6+ 546.5 ± 223.2 814.3 ± 246.8
H. polygyrus 117.0 ± 38.3 545.0 ± 120.1+ 207.6 ± 98.3 172.0 ± 68.4
Hymenolepis spp. 36.7 ± 31.7 830.4 ± 276.7+ 317.8 ± 212.6 622.1 ± 252.2
S. frederici 0 0 0 0
T. muris 0 0 21.2 ± 21.2 17.7 ± 13.0
+ Represents a significant increase in EPG between pre- and post-treatment individuals in eitheran antibiotic or control group.
4.4.6 The effect of antibiotic treatment on helminth fecundity, percentage of females
and size
In utero egg counts were performed for H. polygyrus and Hymenolepis spp. The prevalences and
abundances of A. tetraptera, C. vitta, M. muris, S. frederici and T. muris were insufficient for
individual fecundity analyses (Table 4.3, see Appendix A.4, Figure A.4.3 for boxplots of analysed
helminth fecundity data). Antibiotic treatment had no significant impact on the fecundity (number
of in utero eggs/µm2 of helminth) nor the percentage of females of H. polygyrus (d.f. = 93, Z =
1.00, p = 0.32 and d.f. = 7, Z = 0.63, p = 0.53 respectively; Figure 4.8; Table 4.3). Hymenolepis
spp. also did not exhibit any significant changes in fecundity associated with antibiotic treatment
(d.f. = 40, Z = -0.65, p = 0.52; Table 4.3). Although there was no significant difference in
helminth size between pre- and post-antibiotic treatment for H. polygyrus (d.f. = 209, Z = 0.39, p
= 0.70), Hymenolepis were 229.5% larger in post-treatment individuals (d.f. = 44, Z = 4.06, p
<0.01; Table 4.3). In the control group there was no significant difference between pre- and post-
treatment individuals in fecundity, percentage of females or size of H. polygyrus (d.f. = 48, Z =
100

Does disruption of the gut microbiota with antibiotic affect the helminth population?
-0.43, p = 0.67; d.f. = 9, Z = 0.38; and p = 0.70; d.f. = 105, Z = -0.17, p = 0.86 respectively), nor
the fecundity or size of Hymenolepis spp. (Figure 4.8; Table 4.3).
101
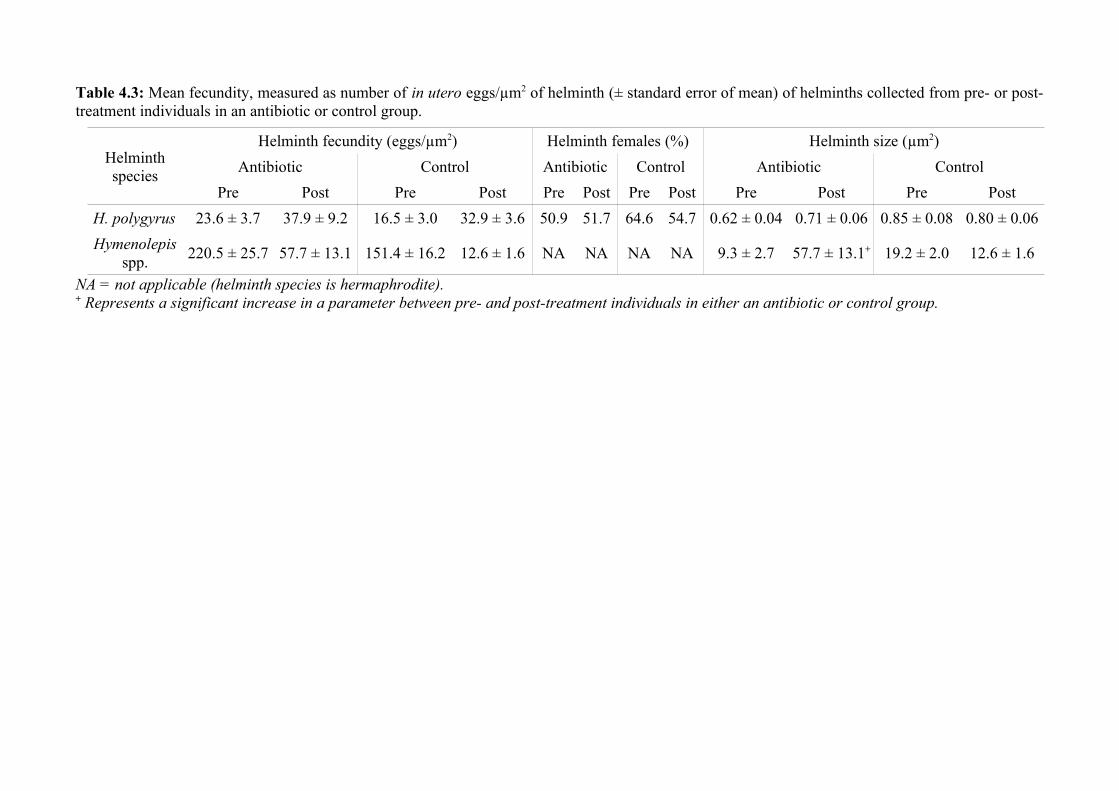
Table 4.3: Mean fecundity, measured as number of in utero eggs/µm2 of helminth (± standard error of mean) of helminths collected from pre- or post-treatment individuals in an antibiotic or control group.
Helminthspecies
Helminth fecundity (eggs/µm2) Helminth females (%) Helminth size (µm2)
Antibiotic Control Antibiotic Control Antibiotic Control
Pre Post Pre Post Pre Post Pre Post Pre Post Pre Post
H. polygyrus 23.6 ± 3.7 37.9 ± 9.2 16.5 ± 3.0 32.9 ± 3.6 50.9 51.7 64.6 54.7 0.62 ± 0.04 0.71 ± 0.06 0.85 ± 0.08 0.80 ± 0.06
Hymenolepisspp.
220.5 ± 25.7 57.7 ± 13.1 151.4 ± 16.2 12.6 ± 1.6 NA NA NA NA 9.3 ± 2.7 57.7 ± 13.1+ 19.2 ± 2.0 12.6 ± 1.6
NA = not applicable (helminth species is hermaphrodite).+ Represents a significant increase in a parameter between pre- and post-treatment individuals in either an antibiotic or control group.
Does disruption of the gut microbiota with antibiotic affect the helminth population?
4.5 Discussion
The present study demonstrates that antibiotic treatment of the host is associated with significant
increase in helminth egg shedding, and a significant increase in the size of Hymenolepis spp.
While it has been argued that faecal egg counts are an unreliable method of establishing helminth
fecundity (Michael and Bundy, 1989; Tompkins and Hudson, 1999), the differences in egg
shedding observed in the current study were both substantial (790.1% for all helminth species,
362.4% for H. polygyrus eggs and 2,164.7% for Hymenolepis eggs) and significant. However, in
utero egg counts were not significantly different between pre- and post-antibiotic treatment
individuals, suggesting that the absolute (but not net) rate of egg production within helminths
increased, to match the higher rate of egg shedding, such that the number of in utero eggs
remained constant.
It should be noted that egg shedding data (faecal egg counts) were collected over time for each
individual, however due to the destructive nature of sampling adult helminths within the gut, it
was possible to perform in utero egg counts only at a single time point for each mouse individual,
which may have differed from the time point that egg shedding data were collected. Consequently,
it is not possible to accurately ‘match’ the in utero fecundity and egg shedding data, not least
because they were collected from different individuals (not all individuals were euthanised due to
ethical reasons, e.g., pregnant females were not euthanised). Thus, it is also possible that antibiotic
treatment of the host stimulated helminths to simultaneously shed all eggs, which were ‘replaced’
by newly produced eggs by the time in utero egg counts were performed. Unfortunately, it is not
possible to distinguish from the collected data if the increase in egg shedding associated with
antibiotic treatment was persistent or increased as a ‘pulse’ after treatment; although trapping was
performed frequently and consistently animals were not always re-captured at regular time
103
Does disruption of the gut microbiota with antibiotic affect the helminth population?
intervals (as discussed in more detail in Chapter 3). Consequently, data collected post-treatment
ranged from 1 – 29 days from the first date of treatment of an individual, such that little can be
reliably ascertained (statistically) about the temporal pattern since time of treatment of EPG
increases following antibiotic treatment.
Despite substantial differences in abundance and in utero fecundity of helminths between pre- and
post-treatment individuals, antibiotic was not found to have a significant effect on any of these
parameters. Previous studies from the 1950s demonstrated that antibiotic treatment of a host did
have a significant negative impact on helminth prevalence and abundance (Wells, 1951, 1952a,
1952b; Chan, 1952; Salem and el-Allaf, 1969), however crude statistical analyses were used to
test for these significances. In addition, these studies largely investigated the effect of antibiotic on
a single helminth species in experimentally infected laboratory rodents (Wells, 1951, 1952a,
1952b; Chan, 1952; instead Salem and el-Allaf, 1969 studied human patients), thus did not take
into account the effects of antibiotic on interacting coinfections of a replete helminth community
(Lello et al., 2004; Telfer et al., 2010). For example, while antibiotics may have an effect on the
abundance of a single helminth species, if this species also interacts synergistically or
antagonistically with other species in the helminth community, the net effect of antibiotic on
abundance may be reduced or exacerbated. Here, GLMMs testing the effect of antibiotic on
helminth abundance included data from pre- and post-treatment individuals from the control group
in an attempt to control for the seasonal variation in abundance exhibited by helminth species
(Montgomery and Montgomery, 1988), however, it should be noted that the helminth community
in the control group stochastically differed to that of the antibiotic group. For example, control
individuals harboured only three of the seven species present in the antibiotic group, which may
have made statistical comparisons between these two groups erroneous. In addition, sample sizes
104
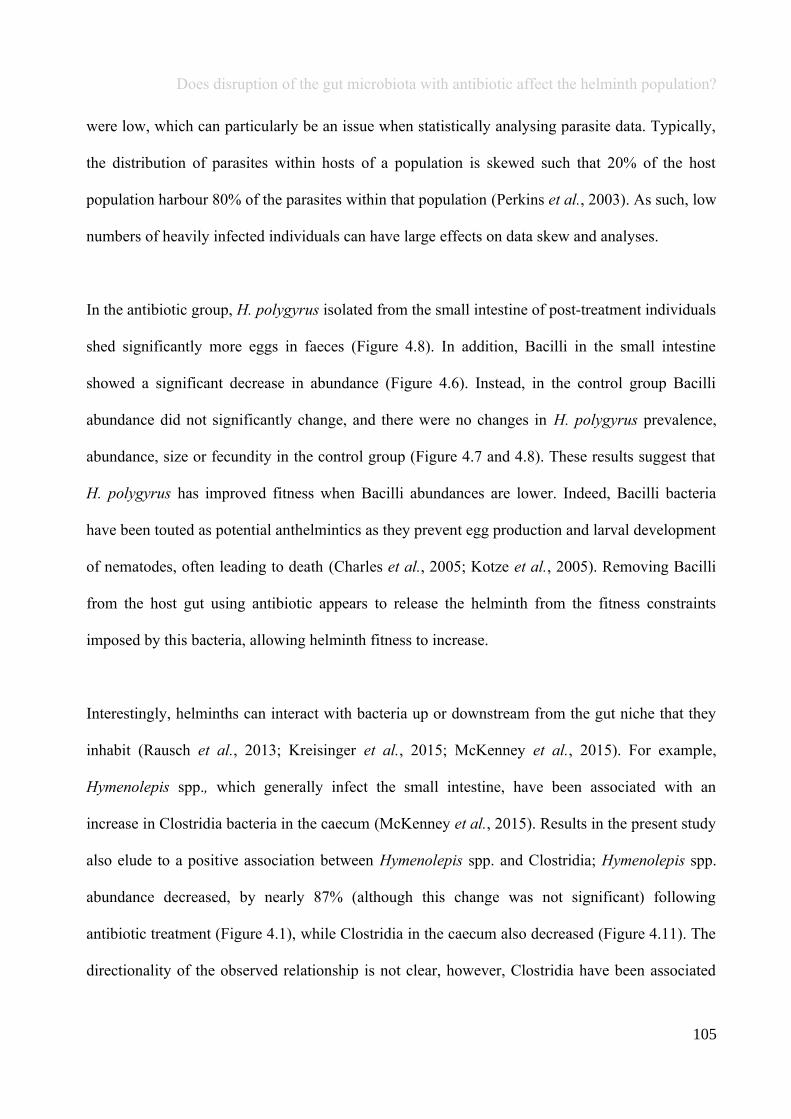
Does disruption of the gut microbiota with antibiotic affect the helminth population?
were low, which can particularly be an issue when statistically analysing parasite data. Typically,
the distribution of parasites within hosts of a population is skewed such that 20% of the host
population harbour 80% of the parasites within that population (Perkins et al., 2003). As such, low
numbers of heavily infected individuals can have large effects on data skew and analyses.
In the antibiotic group, H. polygyrus isolated from the small intestine of post-treatment individuals
shed significantly more eggs in faeces (Figure 4.8). In addition, Bacilli in the small intestine
showed a significant decrease in abundance (Figure 4.6). Instead, in the control group Bacilli
abundance did not significantly change, and there were no changes in H. polygyrus prevalence,
abundance, size or fecundity in the control group (Figure 4.7 and 4.8). These results suggest that
H. polygyrus has improved fitness when Bacilli abundances are lower. Indeed, Bacilli bacteria
have been touted as potential anthelmintics as they prevent egg production and larval development
of nematodes, often leading to death (Charles et al., 2005; Kotze et al., 2005). Removing Bacilli
from the host gut using antibiotic appears to release the helminth from the fitness constraints
imposed by this bacteria, allowing helminth fitness to increase.
Interestingly, helminths can interact with bacteria up or downstream from the gut niche that they
inhabit (Rausch et al., 2013; Kreisinger et al., 2015; McKenney et al., 2015). For example,
Hymenolepis spp., which generally infect the small intestine, have been associated with an
increase in Clostridia bacteria in the caecum (McKenney et al., 2015). Results in the present study
also elude to a positive association between Hymenolepis spp. and Clostridia; Hymenolepis spp.
abundance decreased, by nearly 87% (although this change was not significant) following
antibiotic treatment (Figure 4.1), while Clostridia in the caecum also decreased (Figure 4.11). The
directionality of the observed relationship is not clear, however, Clostridia have been associated
105
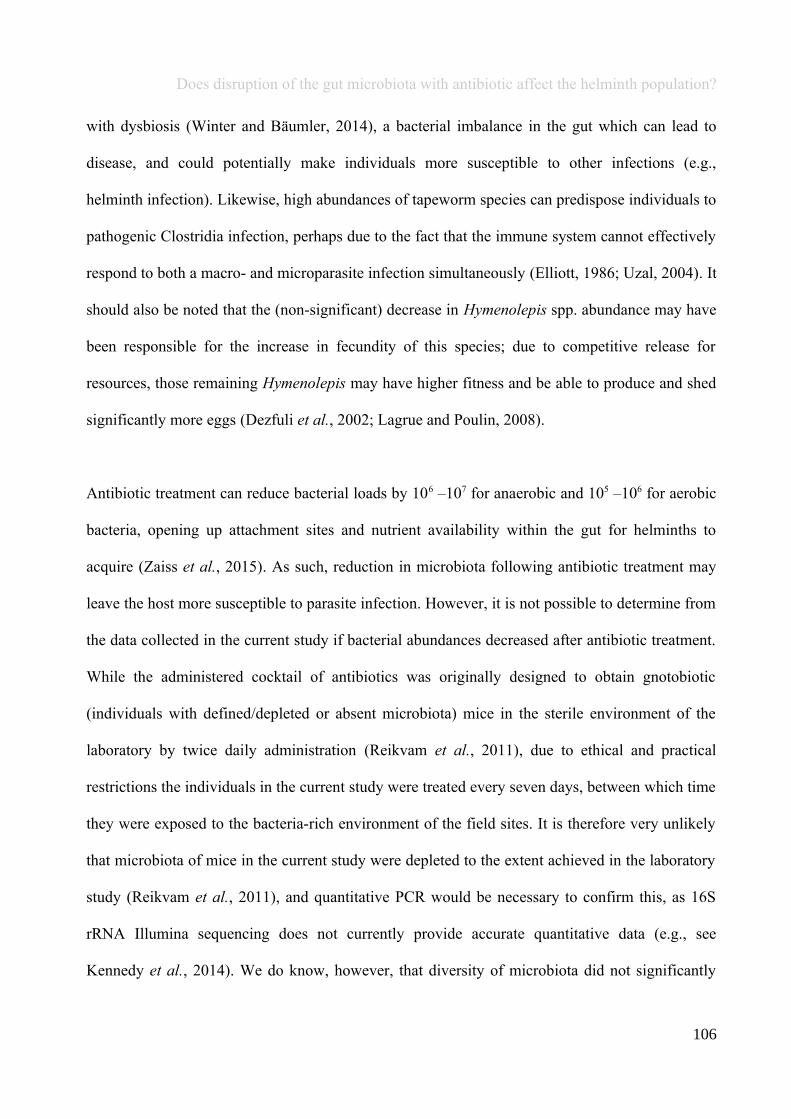
Does disruption of the gut microbiota with antibiotic affect the helminth population?
with dysbiosis (Winter and Bäumler, 2014), a bacterial imbalance in the gut which can lead to
disease, and could potentially make individuals more susceptible to other infections (e.g.,
helminth infection). Likewise, high abundances of tapeworm species can predispose individuals to
pathogenic Clostridia infection, perhaps due to the fact that the immune system cannot effectively
respond to both a macro- and microparasite infection simultaneously (Elliott, 1986; Uzal, 2004). It
should also be noted that the (non-significant) decrease in Hymenolepis spp. abundance may have
been responsible for the increase in fecundity of this species; due to competitive release for
resources, those remaining Hymenolepis may have higher fitness and be able to produce and shed
significantly more eggs (Dezfuli et al., 2002; Lagrue and Poulin, 2008).
Antibiotic treatment can reduce bacterial loads by 106 –107 for anaerobic and 105 –106 for aerobic
bacteria, opening up attachment sites and nutrient availability within the gut for helminths to
acquire (Zaiss et al., 2015). As such, reduction in microbiota following antibiotic treatment may
leave the host more susceptible to parasite infection. However, it is not possible to determine from
the data collected in the current study if bacterial abundances decreased after antibiotic treatment.
While the administered cocktail of antibiotics was originally designed to obtain gnotobiotic
(individuals with defined/depleted or absent microbiota) mice in the sterile environment of the
laboratory by twice daily administration (Reikvam et al., 2011), due to ethical and practical
restrictions the individuals in the current study were treated every seven days, between which time
they were exposed to the bacteria-rich environment of the field sites. It is therefore very unlikely
that microbiota of mice in the current study were depleted to the extent achieved in the laboratory
study (Reikvam et al., 2011), and quantitative PCR would be necessary to confirm this, as 16S
rRNA Illumina sequencing does not currently provide accurate quantitative data (e.g., see
Kennedy et al., 2014). We do know, however, that diversity of microbiota did not significantly
106
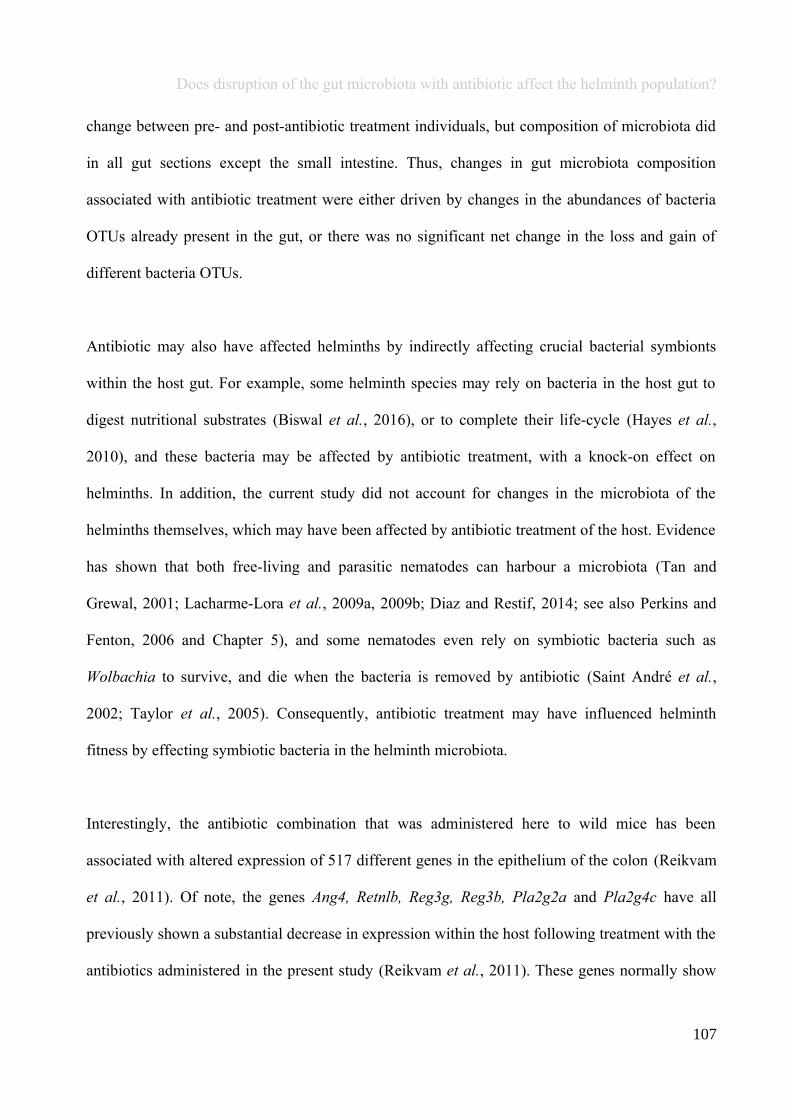
Does disruption of the gut microbiota with antibiotic affect the helminth population?
change between pre- and post-antibiotic treatment individuals, but composition of microbiota did
in all gut sections except the small intestine. Thus, changes in gut microbiota composition
associated with antibiotic treatment were either driven by changes in the abundances of bacteria
OTUs already present in the gut, or there was no significant net change in the loss and gain of
different bacteria OTUs.
Antibiotic may also have affected helminths by indirectly affecting crucial bacterial symbionts
within the host gut. For example, some helminth species may rely on bacteria in the host gut to
digest nutritional substrates (Biswal et al., 2016), or to complete their life-cycle (Hayes et al.,
2010), and these bacteria may be affected by antibiotic treatment, with a knock-on effect on
helminths. In addition, the current study did not account for changes in the microbiota of the
helminths themselves, which may have been affected by antibiotic treatment of the host. Evidence
has shown that both free-living and parasitic nematodes can harbour a microbiota (Tan and
Grewal, 2001; Lacharme-Lora et al., 2009a, 2009b; Diaz and Restif, 2014; see also Perkins and
Fenton, 2006 and Chapter 5), and some nematodes even rely on symbiotic bacteria such as
Wolbachia to survive, and die when the bacteria is removed by antibiotic (Saint André et al.,
2002; Taylor et al., 2005). Consequently, antibiotic treatment may have influenced helminth
fitness by effecting symbiotic bacteria in the helminth microbiota.
Interestingly, the antibiotic combination that was administered here to wild mice has been
associated with altered expression of 517 different genes in the epithelium of the colon (Reikvam
et al., 2011). Of note, the genes Ang4, Retnlb, Reg3g, Reg3b, Pla2g2a and Pla2g4c have all
previously shown a substantial decrease in expression within the host following treatment with the
antibiotics administered in the present study (Reikvam et al., 2011). These genes normally show
107
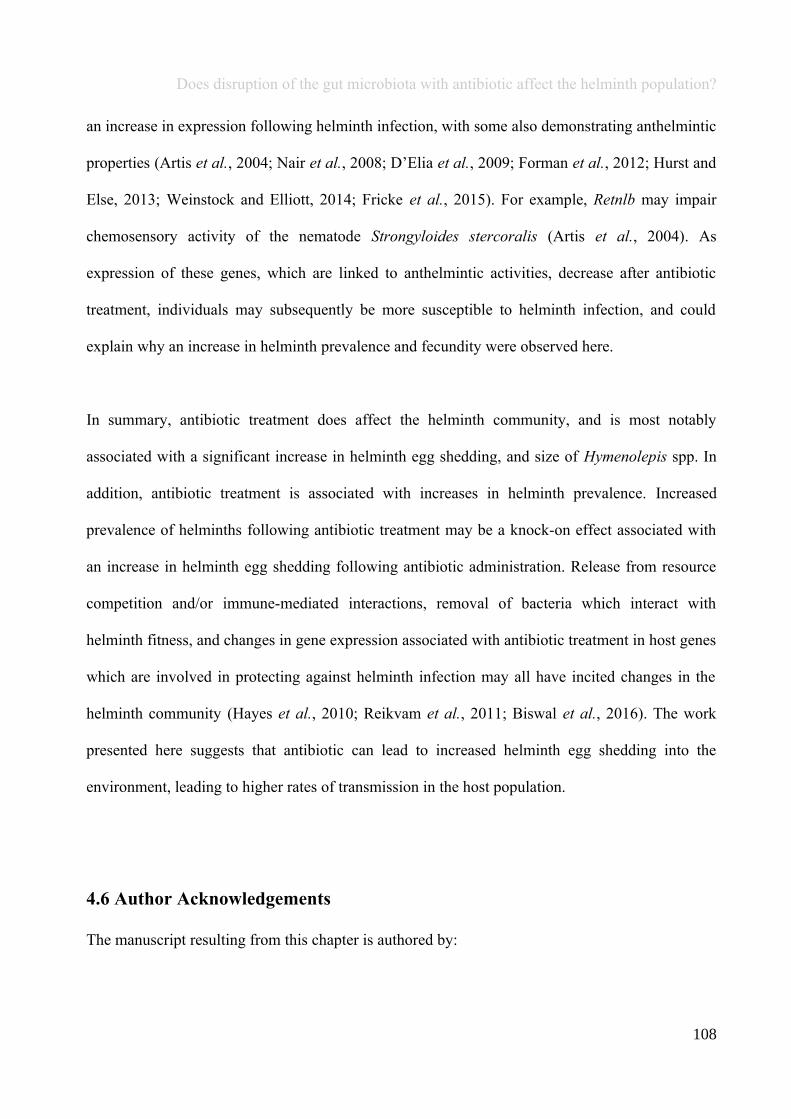
Does disruption of the gut microbiota with antibiotic affect the helminth population?
an increase in expression following helminth infection, with some also demonstrating anthelmintic
properties (Artis et al., 2004; Nair et al., 2008; D’Elia et al., 2009; Forman et al., 2012; Hurst and
Else, 2013; Weinstock and Elliott, 2014; Fricke et al., 2015). For example, Retnlb may impair
chemosensory activity of the nematode Strongyloides stercoralis (Artis et al., 2004). As
expression of these genes, which are linked to anthelmintic activities, decrease after antibiotic
treatment, individuals may subsequently be more susceptible to helminth infection, and could
explain why an increase in helminth prevalence and fecundity were observed here.
In summary, antibiotic treatment does affect the helminth community, and is most notably
associated with a significant increase in helminth egg shedding, and size of Hymenolepis spp. In
addition, antibiotic treatment is associated with increases in helminth prevalence. Increased
prevalence of helminths following antibiotic treatment may be a knock-on effect associated with
an increase in helminth egg shedding following antibiotic administration. Release from resource
competition and/or immune-mediated interactions, removal of bacteria which interact with
helminth fitness, and changes in gene expression associated with antibiotic treatment in host genes
which are involved in protecting against helminth infection may all have incited changes in the
helminth community (Hayes et al., 2010; Reikvam et al., 2011; Biswal et al., 2016). The work
presented here suggests that antibiotic can lead to increased helminth egg shedding into the
environment, leading to higher rates of transmission in the host population.
4.6 Author Acknowledgements
The manuscript resulting from this chapter is authored by:
108
Does disruption of the gut microbiota with antibiotic affect the helminth population?
Emily L. Pascoe, Jakub Kreisinger (Charles University, Prague), Margherita Collini (Fondazione
Edmund Mach), Heidi C. Hauffe (Fondazione Edmund Mach), Julian R. Marchesi (Cardiff
University and Imperial College) and Sarah E. Perkins (Cardiff University and Fondazione
Edmund Mach).
E.L.P: Designed study, collected, analysed and interpreted data, drafted the manuscript.
J.K: Involved in designing study, provided guidance regarding appropriate analyses for microbiota
data.
M.C: Provided guidance regarding processing of microbiota samples/data collection.
H.C.H: Involved in conceiving the study and organising field work and logistics, provided
comments on each version of the manuscript.
J.R.M: Provided comments on the manuscript.
S.E.P: Conceived and designed study, involved in data interpretation, provided comments on each
version of the manuscript.
109
Chapter 5
Composition and diversity of the microbiotaof parasitic helminths
“An understanding of the natural world and what's in it is a source of not only a great curiosity
but great fulfilment.”
David F. Attenborough
110
Composition and diversity of the microbiota of parasitic helminths
5.1 Abstract
A burgeoning research area focusses on the importance of, and interactions between, microbiota
and parasitic helminths in the gut. However, as yet unconsidered, are the helminth-associated
microbiota; which could affect helminth and even host health. Here we describe, for the first time,
the diversity and taxonomic composition of microbiota associated with six parasitic helminth
species from naturally infected wild rodents, and the gut niche in which they were co-located.
Helminth microbiota exhibited both intra- and interspecific variation. Heligmosomoides polygyrus
were associated with the most taxonomically rich microbiota: 257 different genera were identified
across all sequenced sample. However, mean alpha diversity was highest in T. muris (33.0 ± 4.3
standard error). At the other extreme, samples from three helminth species were associated with a
single OTU that constituted ≥99% microbiota, including putatively pathogenic bacteria genera:
50.5% of Hymenolepis diminuta samples, 12.5% Aonchotheca murissylvatici, and a single M.
muris. For all helminth species except H. diminuta, intraspecific microbiota variation was driven
by gut location of the helminth. In addition, for all but one species (Mastophorus muris), alpha
diversity of the helminth microbiota exceeded that of its gut niche for at least one sequenced
sample, and the taxonomic composition of helminth microbiota was significantly different to that
of the gut, e.g., Deferribacteres constituted 38.0% bacterial reads from S. frederici, but only 1.0%
reads from all gut sections. Thus, community assembly of helminth-associated microbiota may
occur and/or bacteria are derived from non-host sources, e.g., an intermediate host or during free-
living stages in the environment. These data provide the first steps to identifying microbes
associated with helminths that are potentially crucial for helminth survival.
111
Composition and diversity of the microbiota of parasitic helminths
5.2 Introduction
The number of studies on microbiota have rapidly increased in the last decade (Marchesi and
Ravel, 2015), and although research on this topic initially focussed on microbial communities of
the human gut, the microbiota of non-human animals is now also a rapidly expanding area of
research (Chapter 2). The gut microbiota in particular has so many important functions within the
host that it has earned the accolade ‘the undiscovered organ’ (Bäckhed et al., 2005). The parasitic
helminths are frequent and abundant in the gut, and ubiquitous across species, causing
considerable morbidity in both humans and animals (Huffman and Seifu, 1989; Chan, 1997;
Hotez et al., 2008; Shetty, 2010; Sutherland and Scott, 2010; Morgan et al., 2012). Recent work
has shown a clear interaction between the gut microbiota and helminths, for example, bacterial
diversity within the host gut often increases following helminth infection (Walk et al., 2010;
Rausch et al., 2013; Cantacessi et al., 2014; Lee et al., 2014; Kreisinger et al., 2015).
Interestingly, the discovery of parasite-microbiota interactions has led to further discussion on the
positive health benefits of parasites, resulting from the helminth-driven changes in bacterial
diversity and composition (Walk et al., 2010; Broadhurst et al., 2012; Giacomin et al., 2016b).
While there is uncertainty surrounding the mechanisms by which helminths may modulate host
microbiota, a number of theories have been proposed; parasite secretions may have antimicrobial
properties, damage to the gut epithelium resulting from parasite attachment may alter the gut
environment and therefore the ability of certain bacterial species to proliferate, and/or microbial
changes may be mediated by parasite-microbiota immune interplay (Glendinning et al., 2014;
Reynolds et al., 2014; Giacomin et al., 2016a).
The microbiota of parasitic species is currently an area of research interest; mainly on the
microbial communities associated with biting ectoparasitic arthropods, such as fleas (Jones et al.,
112
Composition and diversity of the microbiota of parasitic helminths
2013), ticks (Carpi et al., 2011), tsetse flies (Weiss et al., 2013) and mosquitoes (e.g., Dong et al.,
2009; Chandel et al., 2013), no doubt due to the importance of these parasites as pathogen vectors.
In addition, previous work has shown that both parasitic and non-parasitic helminths can be
associated with bacteria, such as Wolbachia (Taylor et al., 2005; Lacharme-Lora et al., 2009;
Plieskatt et al., 2013; Berg et al., 2016; Derycke et al., 2016), and some helminths may be able to
vector bacteria to the host which is either pathogenic to the host in its own right (Tan and Grewal,
2001; see also Perkins and Fenton, 2006), or may contribute to the pathogenesis of the helminth
infection (Saint André et al., 2002; Brattig, 2004). However, very little research has been
dedicated to characterising the entire microbial community associated with parasitic helminth
species (Walk et al., 2010; Plieskatt et al., 2013). Insight into the bacterial composition of
parasites may lead to an avenue for their control; for example, symbiotic bacteria crucial for
pathogen or parasite survival could be targeted for removal by targeted antibiotics; indeed, some
antibiotics have already been shown to reduce fitness, slow development and inhibit motility of
helminths (Wells, 1951; Brown, 1952; Wells, 1952a, 1952b; Salem and el-Allaf, 1969; Hoerauf et
al., 1999; Saint André et al., 2002; but see also Chapter 4).
Some bacteria are known to be important to helminth ‘health’, as is the case with Wolbachia spp.,
which, within helminths, appears to be found strictly within some filarial nematodes (Taylor et al.,
2005; Duron and Gavotte, 2007; Foster et al., 2014). Antibiotics that target Wolbachia spp. can
reduce or eliminate certain filarial infections (Bandi et al., 2001; Taylor et al., 2005). Microscopy
and imaging have identified possible ectosymbionts (Bakke et al., 2006) and bacteria in the lumen
(Cable and Tinsley, 1991) of different monogenean species, bacteria associated with the tegument
of cestodes (Poddubnaya and Izvekova, 2005), as well as vertically transmitted micro-organisms
within helminth tissue, e.g., the hypodermis, which in some cases may adversely affect helminth
113

Composition and diversity of the microbiota of parasitic helminths
development (Anderson et al., 1973; Mclaren et al., 1975; Kozek and Marroquin, 1977; Franz and
Büttner, 1983; see also Bakke et al., 2006; Morley, 2016 for reviews). Pathogenic bacteria have
also been observed in helminths, although largely within free-living non-parasitic nematodes, and
only rarely in parasitic species (Mclaren et al., 1975; Kozek and Marroquin, 1977; Franz and
Büttner, 1983; Perkins and Fenton, 2006), but this lack of evidence may well be due to a lack of
observations. Collectively, these studies certainly suggest that bacteria are associated with
helminths. However, there are few studies that have examined or indeed characterised a larger
microbial community associated with parasitic helminths.
Although few in number, studies have thus far provided positive evidence for a helminth
microbiota composed of multiple bacteria species. Cultured livestock nematodes are associated
with a bacterial community, possibly acquired from the host faeces in which the helminths
develop (Lacharme-Lora et al., 2009). Notably, Lacharme-Lora et al., (2009) utilised culture-
dependent techniques, which are unlikely to have identified the full consortia of bacteria
associated with the parasites, since not all bacteria in microbiota can be cultured (Suau et al.,
1999). More recently, culture-independent techniques have shown that non-parasitic nematodes
(Caenorhabditis elegans) harbour a consistent core microbiota, regardless of its external microbial
environment (Berg et al., 2016), although environment, as well as the developmental stage and
genetics of the helminth, do have a role in shaping overall C. elegans microbiota composition
(Berg et al., 2016; Dirksen et al., 2016). Until now just two studies have described microbiota of
parasitic helminths using culture-independent techniques; laboratory strains of the small intestinal
nematode of mice; H. polygyrus bakeri (Walk et al., 2010), and the liver fluke Opisthorchis
viverrini, which can infect humans (Plieskatt et al., 2013). However, as observed in other taxa it is
possible that the microbiota of laboratory-derived helminths is reduced in diversity in comparison
114
Composition and diversity of the microbiota of parasitic helminths
with wild individuals (Amato, 2013; Wang et al., 2014). The microbiota of enteric helminths has
yet to be investigated in a wild, naturally infected system.
Understanding the composition of microbiota associated with parasitic helminths has multiple
implications. As demonstrated by studies on C. elegans, characterising the microbiota of parasitic
helminths is the first step to understanding helminth-microbe interactions, which in the future
could lead to identification of bacteria crucial to helminth survival or fitness, that could be
targeted in parasite control strategies. Given that studies using microscopy, and both culture-
dependent and -independent methods have found initial evidence of a helminth microbiota, it is
timely that helminth-associated microbiota should be investigated more comprehensively in a
wild, replete system. Here, the diversity and composition of microbiota associated with helminths
isolated from naturally infected wild mice (Apodemus flavicollis), and the gut location from which
the helminths were isolated is described, in order to ask the questions ‘what is the microbiota
composition and diversity of a helminth community?’, ‘is there intraspecific variation of helminth
microbiota between gut locations?’ and ‘is the helminth microbiota unique, or similar to that of
the host?’
5.3 Materials and Methods
5.3.1 Sample collection
Thirty-two adult Apodemus flavicollis (14 females and 18 males) were live-trapped from April to
July 2015 in mature beech forests (Fagus sylvatica L.) with understorey at San Michele all’Adige
(46°11'24.8"N, 11°08'27.6"E) and at Lagolo, Monte Bondone (46°03'28.6"N, 11°00'47.9"E), in
the Province of Trento, Italy. Animals were euthanised by an overdose of isoflurane, followed by
115
Composition and diversity of the microbiota of parasitic helminths
cervical dislocation. Faeces were collected from traps occupied by a single individual. The
following steps were performed under sterile conditions. The entire digestive tract was dissected
from the animal and submerged in Tris-buffered saline (TBS; 50 mM Tris, 200 mM NaCl, pH8).
Following external washing with TBS, the digestive tract of each mouse was divided into five
sections: stomach, small intestine, caecum, proximal colon and distal colon. The membrane and
luminal contents of each gut location were diluted with TBS and scanned for parasitic helminths
under a Leica MS5 stereomicroscope (Leica Microsystems, Wetzlar, Germany), at 10×
magnification. Faeces collected from traps from each individual were homogenised in TBS and
scanned for parasitic helminths at 10× magnification. Helminths from a single individual were
collected in TBS according to species and the gut location from which the helminths were isolated
(herein referred to as a ‘sample’ of helminths, see Appendix A.5, Table A.5.1, A.5.2 and A.5.3 for
details) and quantified. Additionally, at this stage any host gut membrane or luminal content
attached to any helminth were manually removed using sterile tweezers. External debris was
further removed from each sample of helminths by transferring helminths to a 20 µm pore cell
strainer and washing with 50 ml of fresh TBS four times. Helminth samples were then stored at
-80°C for future DNA extraction (see ‘5.3.2 16S rRNA gene sequencing’ below). After thoroughly
scraping the gut membrane with tweezers under TBS to dislodge bacteria, the membrane and the
TBS containing gut contents and bacteria were collected with the rest of the luminal contents in a
centrifugation tube. A bacterial pellet was obtained from faecal and gut samples by centrifugation
(950 G for 10 minutes at 4°C, resulting supernatant 9,000 G for 15 minutes at 4°C. The membrane
did not form part of the pellet during the second centrifugation and was discarded). The bacterial
pellet was immediately stored at -80°C for future bacterial DNA analysis (see ‘5.3.2 16S rRNA
gene sequencing’ below).
116
Composition and diversity of the microbiota of parasitic helminths
5.3.2 16S rRNA gene sequencing
Preliminary analyses showed that low quantities of DNA were recovered from single helminths of
some species (data not shown). Thus, DNA extraction was performed on helminth samples that
had previously been pooled according to species, gut location, and mouse individual from which
the helminths had been isolated (See Figure 5.1 and Appendix A.5, Table A.5.1, A.5.2 and A.5.3
for details). Consequently, due to natural variation in helminth prevalence and abundance between
hosts, the number of individual helminths varied per sequenced sample (see Figure 5.1 and
Appendix A.5, Table A.5.3 for helminth sampling details). Total genomic DNA was extracted
from 273 samples (115 gut sections and 158 helminth samples; composed of 2,091 individual
helminths) using the QIAamp DNA Micro kit (Qiagen, Valencia, CA, USA), following methods
provided by the manufacturer for the isolation of genomic DNA from tissue, with the addition of
carrier RNA. Recovered DNA was quantified using a Qubit 2.0 Fluorometer with a Qubit®
dsDNA BR Assay Kit (Invitrogen, Carlsbad, CA, USA). The V3-V4 region of the bacterial 16S
rRNA gene was amplified using the primers 341F and 805R (see Appendix A.2, Figure A.2.1 for
details on primer sequences, including degenerate nucleotides). Polymerase chain reactions
(PCRs) were carried out in a total volume of 25 µl with 0.2 µM of each primer, 1.5 µl of 2×
KAPA HiFi HotStart ReadyMix and 1.5 ng (gut sections) or 25 ng (helminths) of template DNA.
Thermal cycling was performed on a GeneAmp™ PCR System 9700 instrument (Thermo Fisher
Scientific, Waltham, MA, USA) as follows: initial denaturation at 95°C for 5 minutes, followed
by 28 (gut sections) or 35 (helminth samples) cycles of 95°C for 30 seconds, 55°C for 30 seconds,
72°C for 30 seconds, and a final extension at 72°C for 5 minutes. Negative controls were
included, and genomic DNA from a Microbial Mock Community B (Staggered, Low
Concentration), v5.2L (BEI Resources, Manassas, VA, USA) was included to assess the effect of
data processing on observed community content. Quantification, purification and normalisation of
117
Composition and diversity of the microbiota of parasitic helminths
the PCR products, plus subsequent sequencing of the resulting amplicon library followed methods
presented in Chapter 3 (see ‘3.3.4 16S rRNA gene sequencing’).
5.3.3 Bioinformatic processing of 16S data
Sequences were merged, trimmed and filtered using MICCA software (version 1.5.0, Albanese et
al., 2015). Overlapping regions of the forward and reverse read sequences that differed by more
than eight nucleotides, or did not contain both the forward and reverse PCR primer sequences
were discarded. Primers were trimmed from the resulting merged 16S rRNA fragments, which
were then discarded if they had an average expected error (AvgEE) probability greater than 0.23.
OTUs were assigned using a de novo, greedy strategy with a cut-off of 97% similarity based on
the VSEARCH clustering algorithm (Rognes et al., 2016). Chimeric samples were discarded.
Resulting representatives of each OTU were classified using the Ribosomal Database Project
classifier (RDP classifier, version 2.12; Michigan State University [http://rdp.cme.msu.edu/]).
Samples that had final read counts of less than 2,000 merged and quality-filtered reads were
discarded. The resulting OTUs were analysed using phyloseq version 1.16.2 (McMurdie and
Holmes, 2013).
5.3.4 Statistical analyses of microbiota – diversity and composition
The inverse Simpson index was used to calculate alpha diversity of OTUs in each gut section and
helminth batch. Spearman’s rank correlation coefficient was used to test if alpha diversity of a
helminth batch was correlated with the number of individual helminths within a batch, for each
species. Distance-based redundancy analyses (db-RDA; capscale function in R package vegan)
were used to test if intraspecific variation in microbiota composition observed between batches
within a given helminth species was associated with presence within different gut locations. In
118
Composition and diversity of the microbiota of parasitic helminths
addition, db-RDA analyses were used to test for taxonomical differences in microbiota
composition between a given gut section (each sequenced stomach, small intestine, caecum,
proximal colon, distal colon or faecal sample, regardless if gut section was infected by helminths)
and batches of helminth species therein. No helminths were isolated from within faeces, but
helminth and faecal microbiota comparison analyses were included, as faeces may provide a
source of helminth-associated bacteria. Ecological distances between microbiota taxonomy were
assessed using Bray–Curtis dissimilarities (i.e., compositional dissimilarity index that accounts for
proportional differences of OTUs among samples), and weighted UniFrac distances (which
account for both proportional differences of OTUs and their phylogenetic relatedness; Lozupone
and Knight, 2005). OTU tables were scaled before calculation of dissimilarity matrices, to achieve
an even sequencing depth corresponding to a minimal number of reads per sample in gut sections
and helminths included in any given analysis. Significance was assessed using permutation-based
marginal tests.
5.3.5 Statistical analyses of microbiota – BLAST comparison with soil microbiota
To determine if helminths acquired bacteria from the soil during free-living life stages, helminth
microbiota sequences were compared to those of soil using the BLAST (Basic Local Alignment
Search Tool) algorithm. A search in Web of Science® was performed to find publically available
soil microbiota sequences from similar habitat to that of the study area. Search terms were
‘microbi*’ AND ‘soil’ AND ‘alp*’ OR ‘Italy’ OR ‘beech’ OR ‘forest’. The titles of resulting
articles were scanned for relevance and Rasche et al., (2011) was considered to contain the most
relevant data; soil microbiota from a temperate beech forest in Austria. The publically available
soil microbiota sequences were downloaded (from NCBI PopSet: 300807846) and concatenated
into a single fasta file with which to provide a reference. The sequences from each helminth
119
Composition and diversity of the microbiota of parasitic helminths
species were also concatenated into single fasta files, from which nucleotide databases were
produced. These databases containing helminth microbiota sequences were BLASTed against
those from the soil microbiota, using BLAST software (Altschul et al., 1990). Significance was
based on an E value threshold of E <0.05 and bitscore of 300.
5.3.6 Statistical analyses of microbiota – OTU abundances
To determine how OTUs varied for a given helminth species isolated from different gut sections,
differentially abundant OTUs (i.e., number of reads corrected for sequencing depth) were
identified using an approach based on generalised linear models with negative binomial errors
(Anders and Huber, 2010). These analyses were conducted using the default pipeline set-up in
DESeq2, and significance values (p <0.05) were derived using likelihood-ratio tests. Analyses
were performed using the DESeq2 package, version 1.14.1 (Anders and Huber, 2010; Love et al.,
2014).
5.4 Results
5.4.1 What is the diversity and composition of the helminth microbiota?
From 32 mice, a total of six helminth species were identified, five species of nematode:
Aonchotheca murissylvatici, Heligmosomoides polygyrus, Mastophorus muris, Syphacia frederici
and Trichuris muris, and one cestode species: Hymenolepis diminuta (Figure 5.1). With the
exception of H. polygyrus, which were found only in the small intestine, and T. muris, which were
only found within caeca samples, each helminth species infected multiple locations in the gut
(Figure 5.1; Appendix A.5, Table A.5.3). Prevalence and abundance (total number of helminths,
including zero values of uninfected hosts, as defined by Bush et al., 1997) of each helminth
120
Composition and diversity of the microbiota of parasitic helminths
species varied and not every species of helminth infected every mouse individual (Table 5.1;
Appendix A.5, Table A.5.2). The filtered dataset consisted of 5,956,246 high-quality reads from
115 gut samples (mean ± standard error = 20,221 ± 724, range = 3,966-39,769). Sequences from
one distal colon sample did not meet the quality filtering criteria and were excluded from
analyses. In addition, 158 helminth samples, equating to 2,091 individual helminths were
sequenced (see Appendix A.5, Table A.5.3 for details of helminth sampling, see Table 5.1 for
mean number of reads obtained from each species, range = 2,228 - 42,980). Note, sequences from
two samples of S. frederici, composed of one helminth each, did not meet the quality filtering
criteria and were excluded from analyses. The mean number of reads per sample of helminth
species varied between 16,949 – 22,711, with H. polygyrus having fewest mean reads per sample
and M. muris the highest (Table 5.1). The number of reads yielded from A. murissylvatici varied
most (19,258 ± 13,692), but the number of reads from T. muris remained most consistent (18,022
± 6,764; Table 5.1).
121
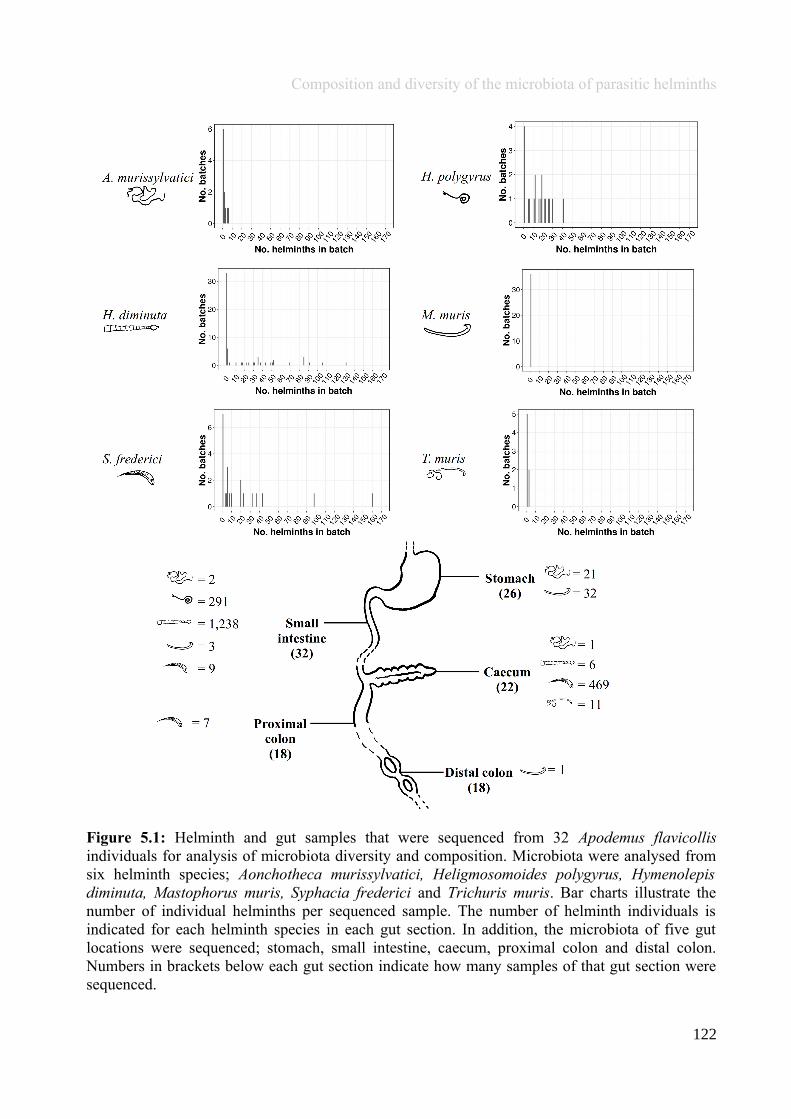
Composition and diversity of the microbiota of parasitic helminths
Figure 5.1: Helminth and gut samples that were sequenced from 32 Apodemus flavicollisindividuals for analysis of microbiota diversity and composition. Microbiota were analysed fromsix helminth species; Aonchotheca murissylvatici, Heligmosomoides polygyrus, Hymenolepisdiminuta, Mastophorus muris, Syphacia frederici and Trichuris muris. Bar charts illustrate thenumber of individual helminths per sequenced sample. The number of helminth individuals isindicated for each helminth species in each gut section. In addition, the microbiota of five gutlocations were sequenced; stomach, small intestine, caecum, proximal colon and distal colon.Numbers in brackets below each gut section indicate how many samples of that gut section weresequenced.
122
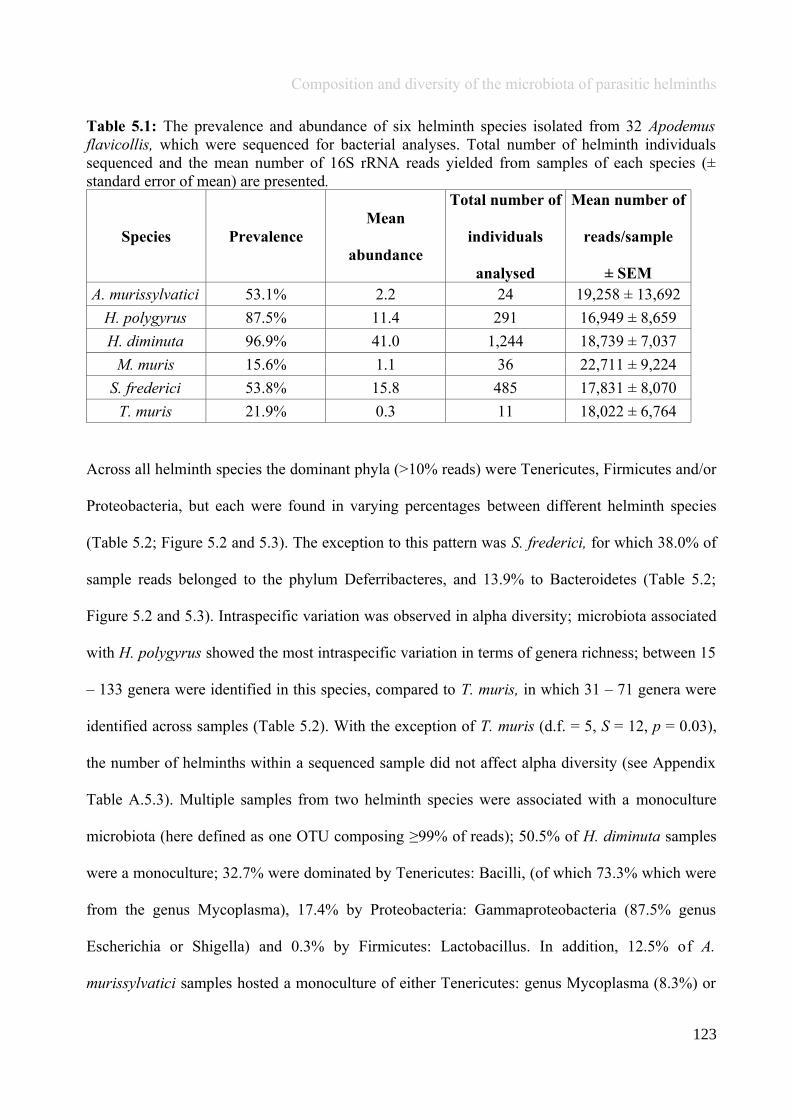
Composition and diversity of the microbiota of parasitic helminths
Table 5.1: The prevalence and abundance of six helminth species isolated from 32 Apodemusflavicollis, which were sequenced for bacterial analyses. Total number of helminth individualssequenced and the mean number of 16S rRNA reads yielded from samples of each species (±standard error of mean) are presented.
Species PrevalenceMean
abundance
Total number of
individuals
analysed
Mean number of
reads/sample
± SEMA. murissylvatici 53.1% 2.2 24 19,258 ± 13,692
H. polygyrus 87.5% 11.4 291 16,949 ± 8,659
H. diminuta 96.9% 41.0 1,244 18,739 ± 7,037
M. muris 15.6% 1.1 36 22,711 ± 9,224
S. frederici 53.8% 15.8 485 17,831 ± 8,070
T. muris 21.9% 0.3 11 18,022 ± 6,764
Across all helminth species the dominant phyla (>10% reads) were Tenericutes, Firmicutes and/or
Proteobacteria, but each were found in varying percentages between different helminth species
(Table 5.2; Figure 5.2 and 5.3). The exception to this pattern was S. frederici, for which 38.0% of
sample reads belonged to the phylum Deferribacteres, and 13.9% to Bacteroidetes (Table 5.2;
Figure 5.2 and 5.3). Intraspecific variation was observed in alpha diversity; microbiota associated
with H. polygyrus showed the most intraspecific variation in terms of genera richness; between 15
– 133 genera were identified in this species, compared to T. muris, in which 31 – 71 genera were
identified across samples (Table 5.2). With the exception of T. muris (d.f. = 5, S = 12, p = 0.03),
the number of helminths within a sequenced sample did not affect alpha diversity (see Appendix
Table A.5.3). Multiple samples from two helminth species were associated with a monoculture
microbiota (here defined as one OTU composing ≥99% of reads); 50.5% of H. diminuta samples
were a monoculture; 32.7% were dominated by Tenericutes: Bacilli, (of which 73.3% which were
from the genus Mycoplasma), 17.4% by Proteobacteria: Gammaproteobacteria (87.5% genus
Escherichia or Shigella) and 0.3% by Firmicutes: Lactobacillus. In addition, 12.5% of A.
murissylvatici samples hosted a monoculture of either Tenericutes: genus Mycoplasma (8.3%) or
123
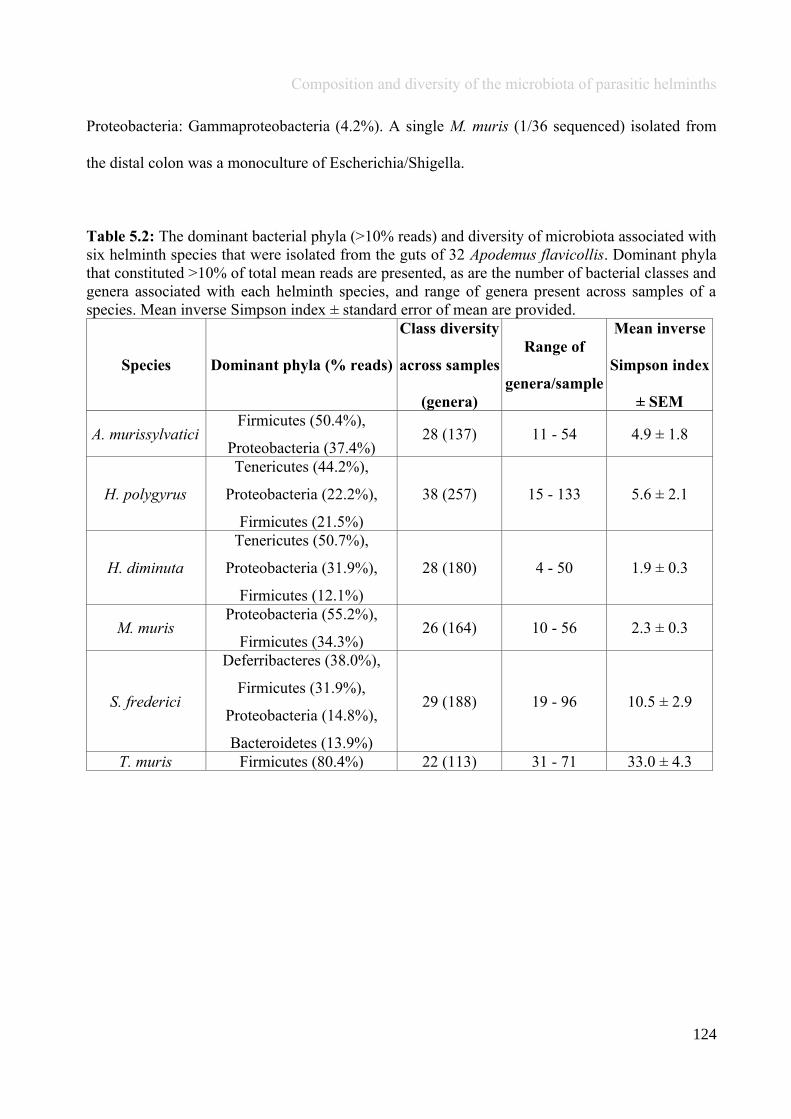
Composition and diversity of the microbiota of parasitic helminths
Proteobacteria: Gammaproteobacteria (4.2%). A single M. muris (1/36 sequenced) isolated from
the distal colon was a monoculture of Escherichia/Shigella.
Table 5.2: The dominant bacterial phyla (>10% reads) and diversity of microbiota associated withsix helminth species that were isolated from the guts of 32 Apodemus flavicollis. Dominant phylathat constituted >10% of total mean reads are presented, as are the number of bacterial classes andgenera associated with each helminth species, and range of genera present across samples of aspecies. Mean inverse Simpson index ± standard error of mean are provided.
Species Dominant phyla (% reads)
Class diversity
across samples
(genera)
Range of
genera/sample
Mean inverse
Simpson index
± SEM
A. murissylvaticiFirmicutes (50.4%),
Proteobacteria (37.4%)28 (137) 11 - 54 4.9 ± 1.8
H. polygyrus
Tenericutes (44.2%),
Proteobacteria (22.2%),
Firmicutes (21.5%)
38 (257) 15 - 133 5.6 ± 2.1
H. diminuta
Tenericutes (50.7%),
Proteobacteria (31.9%),
Firmicutes (12.1%)
28 (180) 4 - 50 1.9 ± 0.3
M. murisProteobacteria (55.2%),
Firmicutes (34.3%)26 (164) 10 - 56 2.3 ± 0.3
S. frederici
Deferribacteres (38.0%),
Firmicutes (31.9%),
Proteobacteria (14.8%),
Bacteroidetes (13.9%)
29 (188) 19 - 96 10.5 ± 2.9
T. muris Firmicutes (80.4%) 22 (113) 31 - 71 33.0 ± 4.3
124
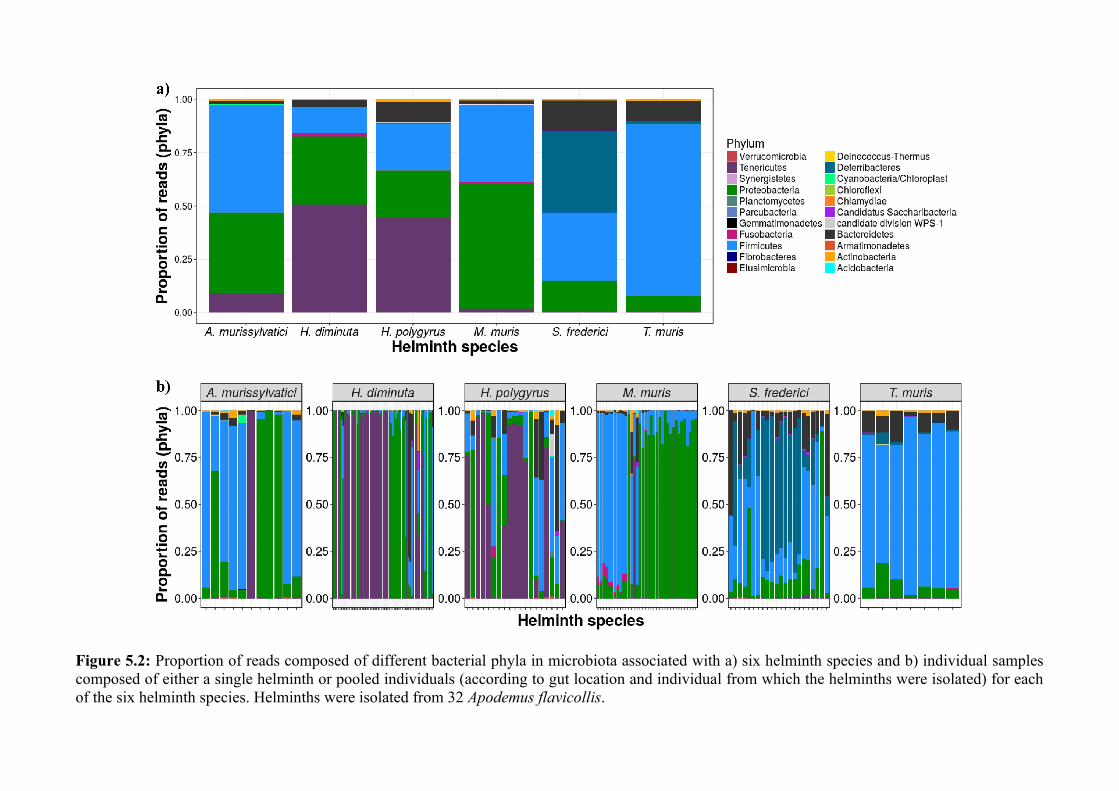
Figure 5.2: Proportion of reads composed of different bacterial phyla in microbiota associated with a) six helminth species and b) individual samplescomposed of either a single helminth or pooled individuals (according to gut location and individual from which the helminths were isolated) for eachof the six helminth species. Helminths were isolated from 32 Apodemus flavicollis.
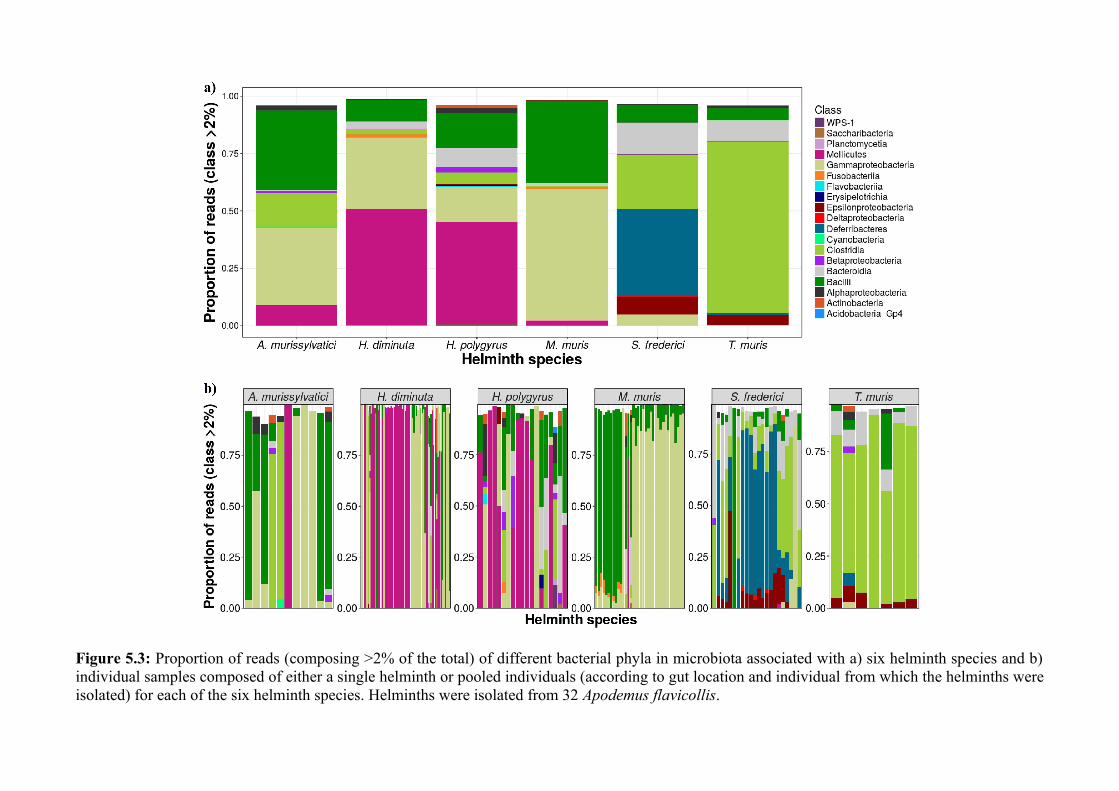
Figure 5.3: Proportion of reads (composing >2% of the total) of different bacterial phyla in microbiota associated with a) six helminth species and b)individual samples composed of either a single helminth or pooled individuals (according to gut location and individual from which the helminths wereisolated) for each of the six helminth species. Helminths were isolated from 32 Apodemus flavicollis.
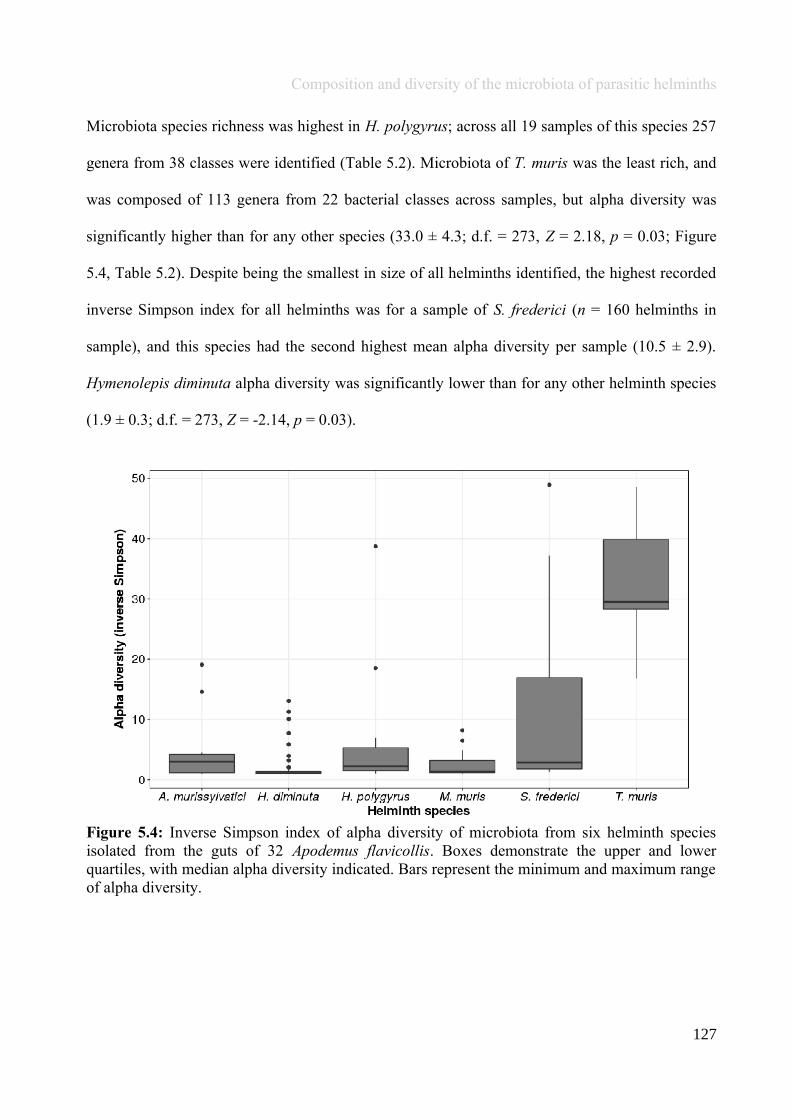
Composition and diversity of the microbiota of parasitic helminths
Microbiota species richness was highest in H. polygyrus; across all 19 samples of this species 257
genera from 38 classes were identified (Table 5.2). Microbiota of T. muris was the least rich, and
was composed of 113 genera from 22 bacterial classes across samples, but alpha diversity was
significantly higher than for any other species (33.0 ± 4.3; d.f. = 273, Z = 2.18, p = 0.03; Figure
5.4, Table 5.2). Despite being the smallest in size of all helminths identified, the highest recorded
inverse Simpson index for all helminths was for a sample of S. frederici (n = 160 helminths in
sample), and this species had the second highest mean alpha diversity per sample (10.5 ± 2.9).
Hymenolepis diminuta alpha diversity was significantly lower than for any other helminth species
(1.9 ± 0.3; d.f. = 273, Z = -2.14, p = 0.03).
Figure 5.4: Inverse Simpson index of alpha diversity of microbiota from six helminth speciesisolated from the guts of 32 Apodemus flavicollis. Boxes demonstrate the upper and lowerquartiles, with median alpha diversity indicated. Bars represent the minimum and maximum rangeof alpha diversity.
127

Composition and diversity of the microbiota of parasitic helminths
5.4.2 Intraspecific variation of helminth microbiota between gut locations
Both H. polygyrus and T. muris were found in one gut location, however the other four helminth
species were found across multiple gut sections. Intraspecific variation in taxonomic composition
of microbiota associated with a given helminth species was associated with gut location; the
taxonomic composition of A. murissylvatici microbiota significantly differed between samples
isolated from the stomach, small intestine and caecum (Bray-Curtis: d.f. = 8, F = 1.70, p = 0.02;
weighted UniFrac: d.f. = 8, F = 2.72, p = 0.02). However, it should be noted that only one A.
murissylvatici was isolated from the caecum, and one from the small intestine. The majority of M.
muris (88.9%) were mainly isolated from the stomach, but were also present in the small intestine
(8.3%) and distal colon (2.8%), and taxonomic composition significantly varied between samples
from each of these locations (Bray-Curtis: d.f. = 33, F = 2.60, p = 0.04; weighted UniFrac: d.f. =
33, F = 3.36, p = 0.02). Microbiota of S. frederici that were found in the small intestine, caecum
and proximal colon were also significantly different to one another (Bray-Curtis: d.f. = 19, F =
2.41, p = 0.01; weighted UniFrac: d.f. = 19, F = 2.36, p = 0.01). However, H. diminuta microbiota
was not significantly associated with gut location (Bray-Curtis: d.f. = 61, F = 0.99, p = 0.43;
weighted UniFrac: d.f. = 61, F = 1.83, p = 0.14).
5.4.3 Comparison of helminth microbiota with gut and soil microbiota diversity
Across both helminth and gut samples, 354 different bacterial genera were identified. Of these,
189 occurred in both gut and helminth samples, and 16 were found uniquely within helminths,
with the remaining 149 present only in gut samples. In general, alpha diversity (as measured by
inverse Simpson index) of each helminth species was lower than that of the gut location from
within which the helminth was isolated (Figure 5.5). However, five out of six of the helminth
species were associated with a microbiota with higher alpha diversity than that of the gut
128

Composition and diversity of the microbiota of parasitic helminths
microbiota in at least one sequenced sample. Two A. murissylvatici samples possessed a
microbiota of greater alpha diversity than stomach microbiota, but overall stomach alpha diversity
was significantly higher (d.f. = 33, W = 190, p = 0.01; Figure 5.5). Likewise, in the small intestine
four samples of H. polygyrus, two of H. diminuta, and one of S. frederici had microbiota with
higher alpha diversity than the respective host small intestine microbiota, but small intestine
microbiota mean alpha diversity still remained higher than for helminths (d.f. = 31, W = 530, p
<0.01; d.f. = 40, W = 1,800, p <0.01; d.f. = 1, W = 32, p = 1 respectively.) In addition, four T.
muris samples from the caeca were associated with higher microbial diversity than the host
caecum in which the helminths were present (d.f. = 12, W = 62, p =0.5; Figure 5.5). Following
BLAST analyses, 28.6% (8/28) of the bacterial classes identified in A. murissylvatici were present
in soil microbiota, followed by 25.0% (7/28) in H. diminuta, 24.1% (7/29) in S. frederici, 23.1%
(6/26) in M. muris and 15.8% (6/38) in H. polygyrus. There were no classes of bacteria from soil
microbiota that were significantly present in T. muris.
129
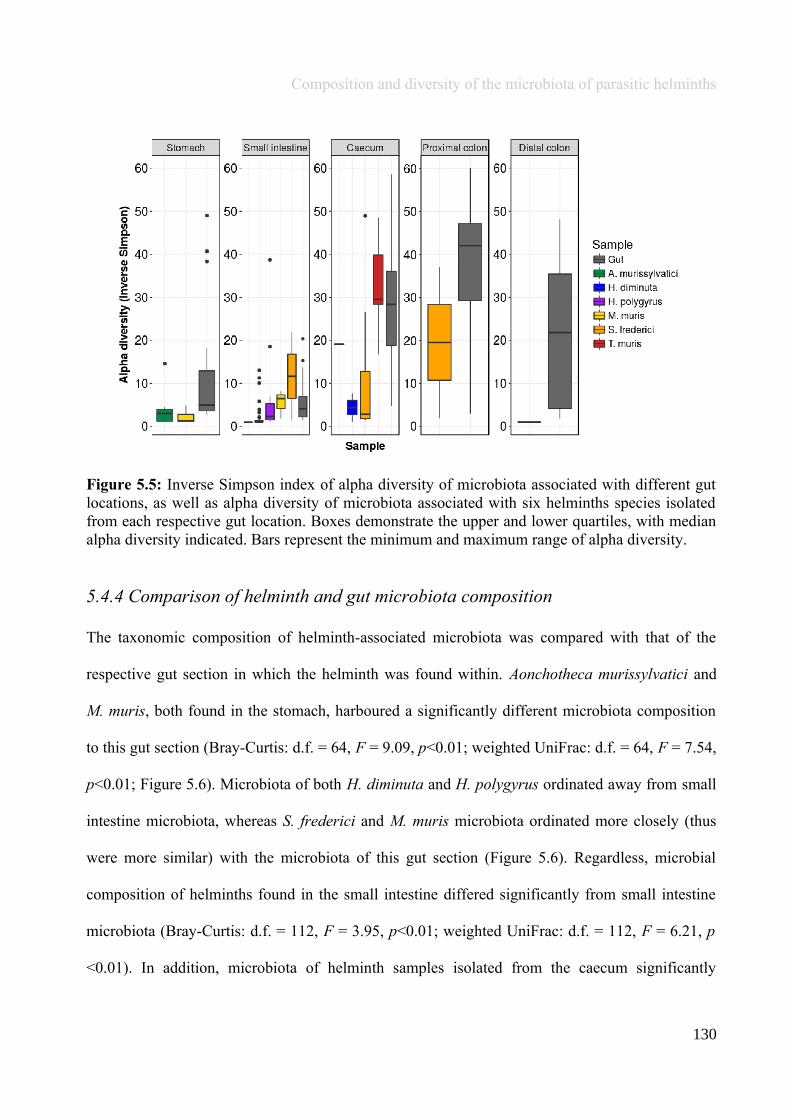
Composition and diversity of the microbiota of parasitic helminths
Figure 5.5: Inverse Simpson index of alpha diversity of microbiota associated with different gutlocations, as well as alpha diversity of microbiota associated with six helminths species isolatedfrom each respective gut location. Boxes demonstrate the upper and lower quartiles, with medianalpha diversity indicated. Bars represent the minimum and maximum range of alpha diversity.
5.4.4 Comparison of helminth and gut microbiota composition
The taxonomic composition of helminth-associated microbiota was compared with that of the
respective gut section in which the helminth was found within. Aonchotheca murissylvatici and
M. muris, both found in the stomach, harboured a significantly different microbiota composition
to this gut section (Bray-Curtis: d.f. = 64, F = 9.09, p<0.01; weighted UniFrac: d.f. = 64, F = 7.54,
p<0.01; Figure 5.6). Microbiota of both H. diminuta and H. polygyrus ordinated away from small
intestine microbiota, whereas S. frederici and M. muris microbiota ordinated more closely (thus
were more similar) with the microbiota of this gut section (Figure 5.6). Regardless, microbial
composition of helminths found in the small intestine differed significantly from small intestine
microbiota (Bray-Curtis: d.f. = 112, F = 3.95, p<0.01; weighted UniFrac: d.f. = 112, F = 6.21, p
<0.01). In addition, microbiota of helminth samples isolated from the caecum significantly
130
Composition and diversity of the microbiota of parasitic helminths
differed to caecum microbiota (Bray-Curtis: d.f. = 45, F = 3.83, p<0.01; weighted UniFrac: d.f. =
45, F = 5.8, p<0.01). There were no helminths isolated from within faeces collected from
occupied traps, and helminth microbiota was significantly different to that of the faecal microbiota
(Bray-Curtis: d.f. = 163, F = 8.83, p<0.01; weighted UniFrac: d.f. = 163, F = 13.5, p<0.01; Figure
5.6)
131
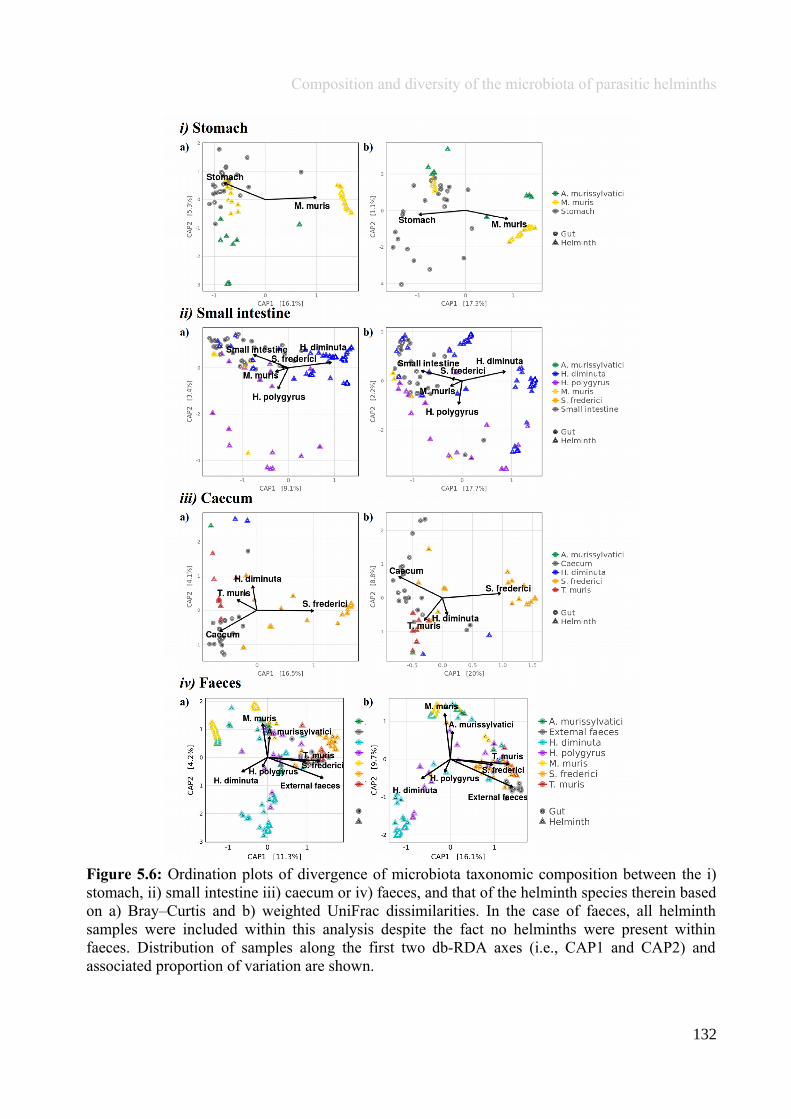
Composition and diversity of the microbiota of parasitic helminths
Figure 5.6: Ordination plots of divergence of microbiota taxonomic composition between the i)stomach, ii) small intestine iii) caecum or iv) faeces, and that of the helminth species therein basedon a) Bray–Curtis and b) weighted UniFrac dissimilarities. In the case of faeces, all helminthsamples were included within this analysis despite the fact no helminths were present withinfaeces. Distribution of samples along the first two db-RDA axes (i.e., CAP1 and CAP2) andassociated proportion of variation are shown.
132
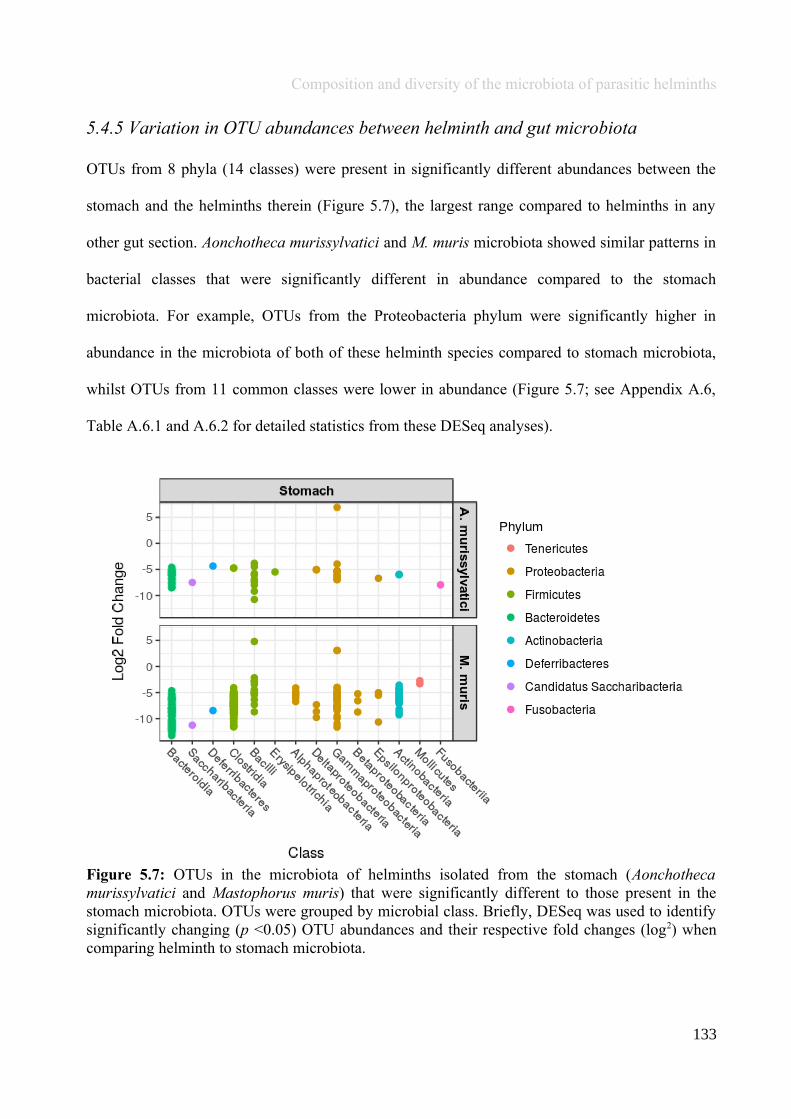
Composition and diversity of the microbiota of parasitic helminths
5.4.5 Variation in OTU abundances between helminth and gut microbiota
OTUs from 8 phyla (14 classes) were present in significantly different abundances between the
stomach and the helminths therein (Figure 5.7), the largest range compared to helminths in any
other gut section. Aonchotheca murissylvatici and M. muris microbiota showed similar patterns in
bacterial classes that were significantly different in abundance compared to the stomach
microbiota. For example, OTUs from the Proteobacteria phylum were significantly higher in
abundance in the microbiota of both of these helminth species compared to stomach microbiota,
whilst OTUs from 11 common classes were lower in abundance (Figure 5.7; see Appendix A.6,
Table A.6.1 and A.6.2 for detailed statistics from these DESeq analyses).
Figure 5.7: OTUs in the microbiota of helminths isolated from the stomach (Aonchothecamurissylvatici and Mastophorus muris) that were significantly different to those present in thestomach microbiota. OTUs were grouped by microbial class. Briefly, DESeq was used to identifysignificantly changing (p <0.05) OTU abundances and their respective fold changes (log2) whencomparing helminth to stomach microbiota.
133
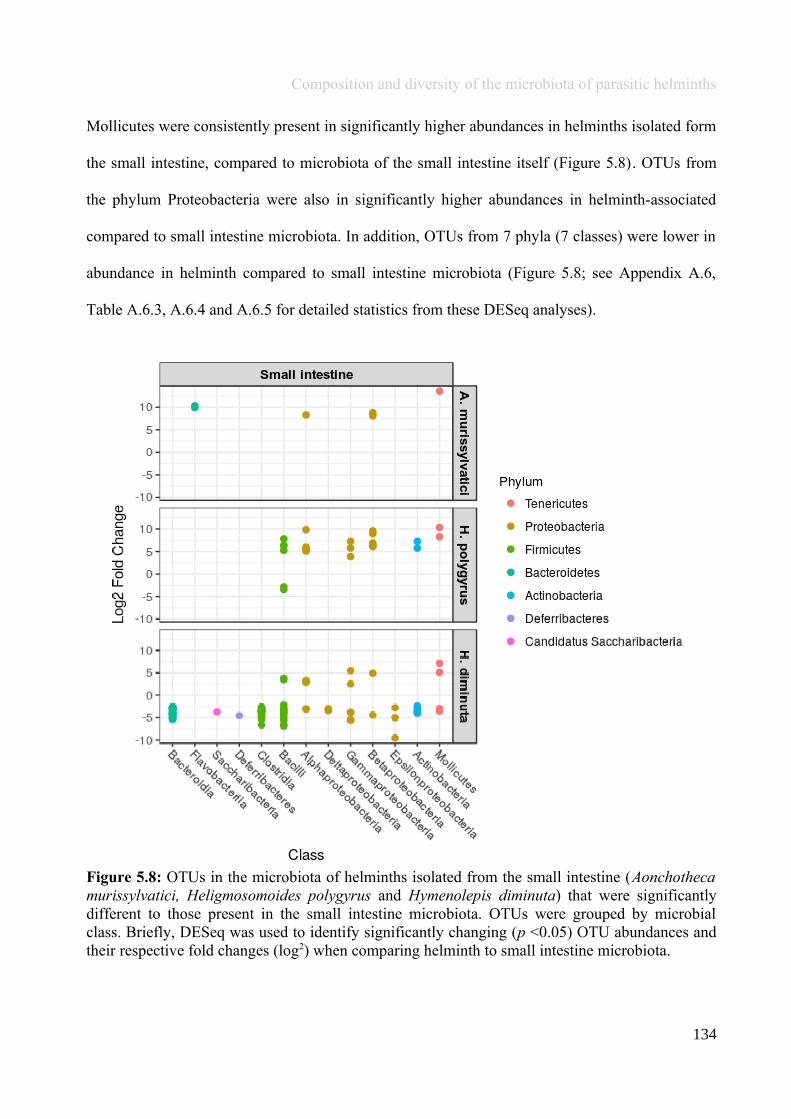
Composition and diversity of the microbiota of parasitic helminths
Mollicutes were consistently present in significantly higher abundances in helminths isolated form
the small intestine, compared to microbiota of the small intestine itself (Figure 5.8). OTUs from
the phylum Proteobacteria were also in significantly higher abundances in helminth-associated
compared to small intestine microbiota. In addition, OTUs from 7 phyla (7 classes) were lower in
abundance in helminth compared to small intestine microbiota (Figure 5.8; see Appendix A.6,
Table A.6.3, A.6.4 and A.6.5 for detailed statistics from these DESeq analyses).
Figure 5.8: OTUs in the microbiota of helminths isolated from the small intestine (Aonchothecamurissylvatici, Heligmosomoides polygyrus and Hymenolepis diminuta) that were significantlydifferent to those present in the small intestine microbiota. OTUs were grouped by microbialclass. Briefly, DESeq was used to identify significantly changing (p <0.05) OTU abundances andtheir respective fold changes (log2) when comparing helminth to small intestine microbiota.
134
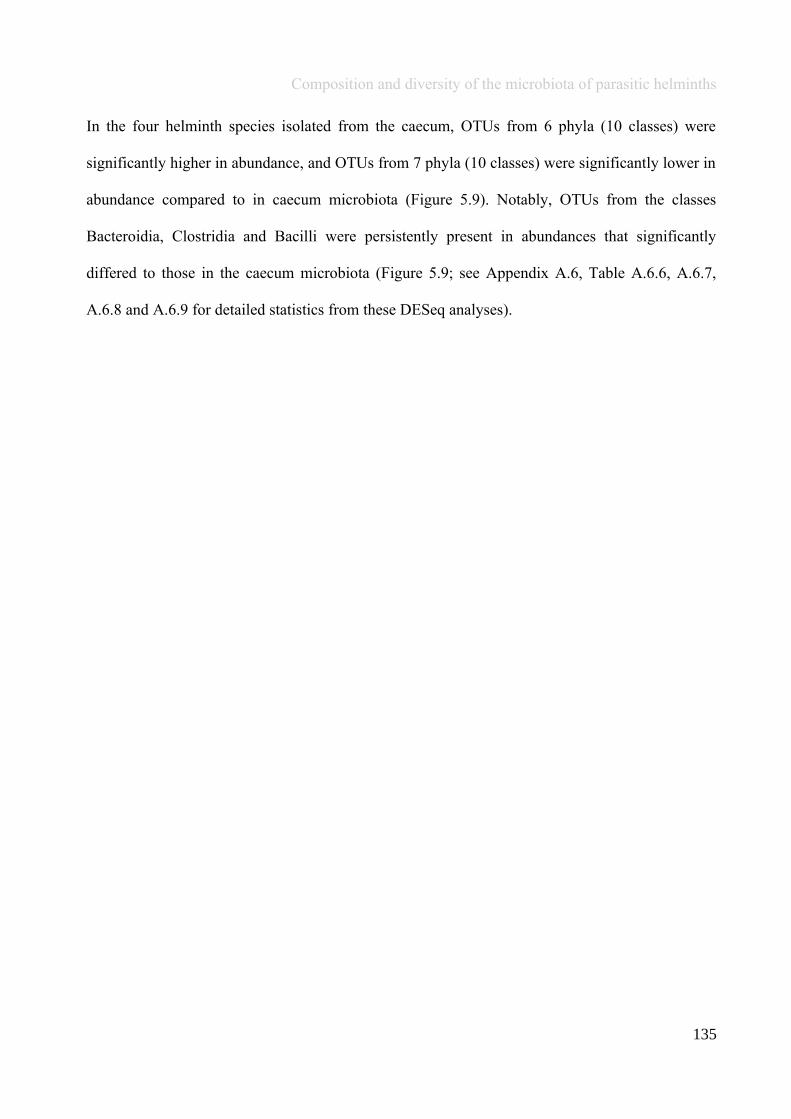
Composition and diversity of the microbiota of parasitic helminths
In the four helminth species isolated from the caecum, OTUs from 6 phyla (10 classes) were
significantly higher in abundance, and OTUs from 7 phyla (10 classes) were significantly lower in
abundance compared to in caecum microbiota (Figure 5.9). Notably, OTUs from the classes
Bacteroidia, Clostridia and Bacilli were persistently present in abundances that significantly
differed to those in the caecum microbiota (Figure 5.9; see Appendix A.6, Table A.6.6, A.6.7,
A.6.8 and A.6.9 for detailed statistics from these DESeq analyses).
135
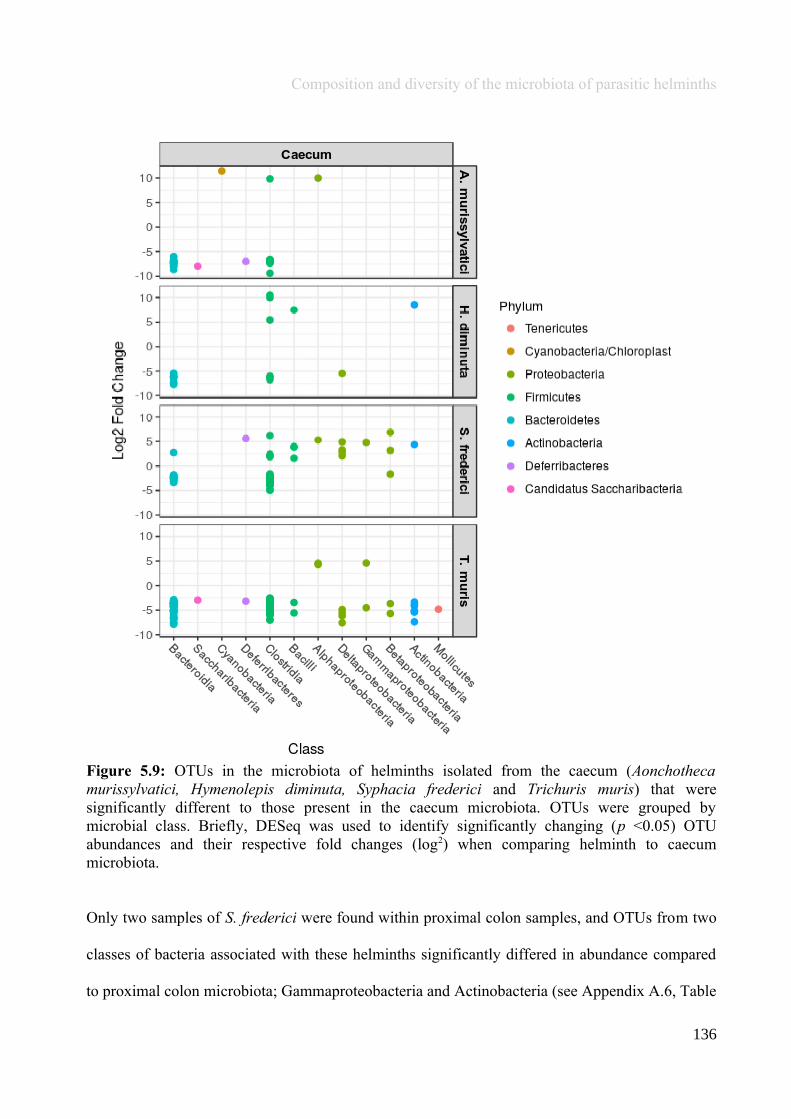
Composition and diversity of the microbiota of parasitic helminths
Figure 5.9: OTUs in the microbiota of helminths isolated from the caecum (Aonchothecamurissylvatici, Hymenolepis diminuta, Syphacia frederici and Trichuris muris) that weresignificantly different to those present in the caecum microbiota. OTUs were grouped bymicrobial class. Briefly, DESeq was used to identify significantly changing (p <0.05) OTUabundances and their respective fold changes (log2) when comparing helminth to caecummicrobiota.
Only two samples of S. frederici were found within proximal colon samples, and OTUs from two
classes of bacteria associated with these helminths significantly differed in abundance compared
to proximal colon microbiota; Gammaproteobacteria and Actinobacteria (see Appendix A.6, Table
136
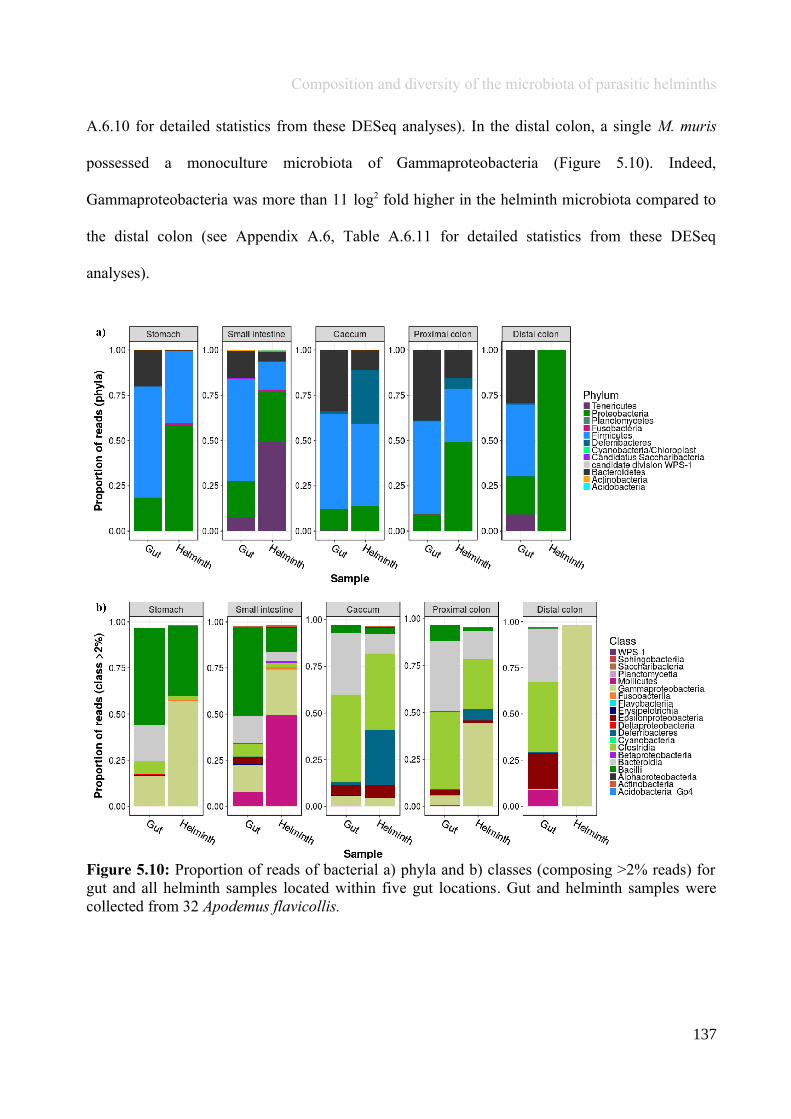
Composition and diversity of the microbiota of parasitic helminths
A.6.10 for detailed statistics from these DESeq analyses). In the distal colon, a single M. muris
possessed a monoculture microbiota of Gammaproteobacteria (Figure 5.10). Indeed,
Gammaproteobacteria was more than 11 log2 fold higher in the helminth microbiota compared to
the distal colon (see Appendix A.6, Table A.6.11 for detailed statistics from these DESeq
analyses).
Figure 5.10: Proportion of reads of bacterial a) phyla and b) classes (composing >2% reads) forgut and all helminth samples located within five gut locations. Gut and helminth samples werecollected from 32 Apodemus flavicollis.
137

Composition and diversity of the microbiota of parasitic helminths
5.5 Discussion
Here, composition and diversity of microbiota associated with parasitic helminths was quantified
for five nematode species and one cestode species, all of which were isolated from the
gastrointestinal tracts of naturally infected, wild rodents. Each species of helminth was associated
with a unique microbiota, and exhibited intraspecific diversity which was significantly associated
with inhabitation of different gut sections. In addition, helminth-associated microbiota was
significantly different to gut microbiota.
Although microbiota composition of each helminth species was dominated (>10% of mean
number of reads) by Firmicutes, Proteobacteria and Tenericutes, the relative abundances of these
phyla varied, such that each species arguably had a distinct microbiota (Figure 5.2 and 5.3). Of
note, the microbiota of S. frederici was unique compared to that of other helminth species,
because Deferribacteres was also a dominant bacteria and constituted more than 1/3 of the
microbiota community. In addition, helminth microbiota exhibited intraspecific variation in
diversity and composition (Figure 5.1, 5.2 and 5.3). Interestingly, more than half of the sequenced
samples of H. diminuta were associated with a monoculture microbiota, including bacteria from
the genera Mycoplasma, Escherichia/Shigella or Lactobacillus. Likewise, A. murissylvatici
samples had a monoculture microbiota of Mycoplasma, and a single M. muris had a microbiota
composed of a Escherichia/Shigella monoculture. Members of both the Escherichia/Shigella and
Mycoplasma genera are pathogenic to vertebrates; some species of Shigella can cause bacillary
dysentery, and invade the epithelia of the colon and rectum, eventually leading to severe tissue
damage. Similarly, members of the Shigella genus (S. flexneri) invade the intestinal cells of, and
can even kill the C. elegans nematode (Burton et al., 2006; Kesika et al., 2011; George et al.,
2014), however it is unknown if these bacteria are also pathogenic to the helminth species
138
Composition and diversity of the microbiota of parasitic helminths
presented here, and further analyses including culture dependent techniques or metagenomics
would be necessary to confirm that the OTUs observed here were indeed pathogenic species (at
least to mammals).
All but two helminth species (H. polygyrus and T. muris) were present in multiple sections of the
gut, and taxonomic composition and diversity of microbiota significantly differed between
samples isolated from different gut locations. However, the microbiota associated with the cestode
species, H. diminuta, did not significantly differ between gut locations. It is possible that H.
diminuta microbiota does not differ between gut sections as cestodes are typically composed of a
tegument with very few internal organ ‘niches’ that could be colonised by different bacteria at
different host gut sections. Although A. murissylvatici significantly formed different taxonomic
clusters between the stomach, small intestine and caecum, little can be robustly ascertained from
this result, as only one helminth individual was found from the small intestine and one from the
caecum. Interestingly, M. muris were found in the stomach, small intestine and distal colon, and
differences in helminth microbiota were significantly associated with gut location. Normally, M.
muris infect the stomach (Lafferty et al., 2010; Grzybek et al., 2015), thus it was unusual to find
this species in the small intestine or distal colon; it is possible that these individuals were in the
process of being ejected by the host. As such, it could be speculated that the microbiota of M.
muris from these gut sections varied because the helminth had died, and/or an immune response
from the host that had acted upon the helminth to stimulate ejection had impacted the helminth
microbiota composition. Indeed, the M. muris from the distal colon was amongst those to harbour
a monoculture bacteria, suggesting that a single genera of bacteria had proliferated within the
helminth, perhaps because the helminth could no longer modulate microbiota due to death.
139
Composition and diversity of the microbiota of parasitic helminths
In general, helminth microbiota had lower alpha diversity than the microbiota of the gut section
from within which the helminth was isolated (Figure 5.5). It is no surprise that the bacteria able to
flourish within the gut may not also colonise the helminth, as some bacteria species have very
specific growth requirements (as demonstrated by the limited success of culture-dependent
techniques e.g., Suau et al., 1999), which the helminth may not provide. Conversely, much like in
the vertebrate gut (Rawls et al., 2006), assembly of the helminth microbiota is not random (Berg
et al., 2016), and may be modulated by the helminth to allow or prevent the growth of bacterial
species that are beneficial (or not) to the helminth host. However, with the exception of M. muris,
all helminth species possessed a microbiota with higher alpha diversity than the respective gut
section in which the helminth species was found, in at least one sequenced sample, suggesting that
microbiota were acquired from sources other than the host gut (Figure 5.5).
Of the 189 bacterial genera identified across all helminth and gut samples, 16 occurred
exclusively in helminths, suggesting that bacteria may be acquired from other sources in addition
to the definitive host. Many helminth species have a free-living stage outside of the host and may
undergo development in the environment, or are parasitic to an intermediate host, during which
time the helminth could be colonised by microbes. For example, H. diminuta have an indirect life-
cycle; eggs are ingested by an insect intermediate host, penetrate the gut, and develop in the
haemocoel. The definitive host (small mammal) becomes infected when it eats an insect infected
with H. diminuta cysticercoids (infective stage, Smyth, 1994). It is therefore possible that H.
diminuta possess microbiota which originates from the insect intermediate host, either through
ingestion of microbes while in the intermediate host, or by colonisation of microbiota on the
exterior of the helminth. In another example, the eggs of H. polygyrus are shed in host faeces and
hatch in the environment. Following a moult, the L2 larvae feed on bacteria within the
140
Composition and diversity of the microbiota of parasitic helminths
environment, and partially moult again into ensheathed, L3 infective larvae, which are non-
feeding. The larvae become ex-sheathed following ingestion by a host (Bryant, 1973;
Valanparambil et al., 2014). Although larvae are non-feeding once they become infective, until
after they develop into tissue-feeding adults in the gut, larvae may still harbour microbes acquired
during the bacteria-feeding L2 stage, which would be acquired from host faeces and the
environment. Syphacia frederici are unlikely to have acquired microbiota in the environment in
the same way, as the life-cycle of this genus is direct and may involve retroinfection (Prince,
1950). However, helminths are mobile within the gut and could be colonised by microbiota from
multiple gut locations; both H. diminuta and S. frederici have a circadian routine of migration in
the gut, e.g., S. frederici migrate from the caecum to the rectum to lay eggs (Kerboeuf and Lewis,
1987). Adult S. frederici typically inhabit the caecum, suggesting that helminths may have
acquired microbiota from the microbially richer habitat of the caecum and distal gut sections, and
later been displaced into the small intestine.
The current study aimed to test if helminth microbiota may have been acquired from faeces or soil
during the free-living stages of the helminth. Microbiota associated with faecal samples was
significantly different to microbiota associated with all helminth species, thus it is unlikely that a
significant amount of bacteria associated with helminths is acquired from faeces. However, faecal
microbiota were obtained from faeces that had accumulated overnight in occupied traps, over
which time the faecal microbiota may have changed and become contaminated (e.g., with
concentrated levels of mouse urine associated with being in a confined space, etc.), thus may not
have provided an accurate representation of the faecal microbiota to which helminths in the free-
living stage are exposed to. Comparison of soil and helminth microbiota was achieved by
BLASTing helminth microbiota sequences against those from soil microbiota in a beech forest
141
Composition and diversity of the microbiota of parasitic helminths
(similar habitat in which mice were captured). There were bacteria classes present in the helminth
microbiota that were also present in soil for all helminth species except T. muris, and for some
species (A. murissylvatici and H. diminuta) more than a quarter of bacterial classes present in the
helminth microbiota were also identified in soil. While this does not provide direct evidence that
helminths acquire microbiota from the soil, it does suggest that future experiments on the
helminth microbiota should also sequence soil samples from the site of study for more reliable
comparisons of helminth and soil microbiota; as the beech forest soil microbiota study (Rasche et
al., 2011) used very different methods to those used in the current chapter (e.g., qPCR analyses,
annotation of sequences based on the NCBI as opposed to RDP database), this very much limited
the analyses that could be performed on these data. Results should therefore be cautiously
interpreted, particularly as soil microbiota can vary significantly between areas even of similar
habitat (Lazzaro et al., 2015).
In the current study excess bacteria on the external surface of helminths was removed by multiple
TBS washing steps, however, bacteria originating from the host gut would undoubtedly have
remained on helminths. It is very difficult to tease apart whether the bacteria that remained on
helminths following external washing are part of the helminth associated microbiota, or are
primarily associated with the host gut and are simply passively present on the helminth. Despite
the high chance that these external host-acquired microbes were a significant contribution to
helminth-associated microbiota, this was not the case. Indeed, in the majority of instances
helminth microbiota clustered away from the microbiota of the gut section within which the
helminth was isolated (Figure 5.6). The disparity between the taxonomic compositions of the gut
and helminth microbiota provides further evidence that helminths either acquire microbiota from
additional sources other than from the host gut (e.g., the environment or an intermediate host)
142
Composition and diversity of the microbiota of parasitic helminths
and/or helminths do not passively obtain microbes, but microbiota acquisition and composition is
structured according to the needs of the helminth (Berg et al., 2016).
There is overwhelming evidence that parasitic helminths possess a microbiota, however the
current study characterised bacteria associated with the entire helminth, and did not take into
consideration which tissues/organs of the helminth these microbes were associated with. Previous
microscopy and imaging studies have identified bacteria in the gut lumen, body surface/tegument,
reproductive apparatus and glandular cells of helminths (Anderson et al., 1973; Mclaren et al.,
1975; Kozek and Marroquin, 1977; Franz and Büttner, 1983; Cable and Tinsley, 1991;
Poddubnaya and Izvekova, 2005; see also Bakke et al., 2006; Morley, 2016 for reviews).
Characterising microbiota associated with specific niches of the helminth could help to clarify
where these micro-organisms originate from, and the function that they have within the helminth,
to build on work achieved by microscopy and imaging. For example, it has been suggested that
bacteria in the gut lumen of mongeneans are acquired by ingestion (Cable and Tinsley, 1991) and
microbes in the reproductive organs of female nematodes are likely transovarially transmitted
endosymbionts (Kozek and Marroquin, 1977). However, such microscopy work is unable to
identify the taxonomy of bacteria, and further detail of the microbial genera associated with
specific tissues/organs of the helminth, e.g., by laser microdissection (for example, see Ranjit et
al., 2006; De Hertogh et al., 2012) of the helminth, would greatly advance the current knowledge.
The current study provides the first account of interspecific and intraspecific variation in
microbiota of a whole community of helminths, and dissimilarities between the associated gut
microbiota. Previous studies have characterised the microbiota of endoparasites; the liver fluke
Opisthorchis viverrini (Plieskatt et al., 2013) and H. polygyrus (Walk et al., 2010). As suggested
143
Composition and diversity of the microbiota of parasitic helminths
in the current chapter with S. frederici, Plieskatt et al., (2013) proposed that the liver fluke is
capable of relocating microbiota during its migration through the host body. The sequences
obtained here for H. polygyrus are rather different to those reported by Walk et al., (2010); here
14 bacterial families were identified, whereas Walk et al., (2010) identified nine families, and
only two of these families are common between the two studies (Lactobacilliaceae and
Erysipelotrichaceae). In addition, in the laboratory study, Lactobacillaceae dominated the H.
polygyrus microbiota and were present in more than 50% of reads, whereas in the current study
Lactobacillaceae constituted only 21.8% of the H. polygyrus microbiota, and instead Mycoplasma
were the dominant family (40.7%; Walk et al., 2010). The disparity in the current results
compared to those of Walk et al., (2010) are likely due to the fact that in the present study
helminths were isolated from naturally infected wild animals, as opposed to helminths that had
been artificially cultured and administered as an experimental infection to laboratory rodents,
which would likely result in helminths with an altered and depauperate microbiota due to a lack of
environmental acquisition. It is also important to note that Walk et al., (2010) utilised a different
method of bacterial DNA sequencing (Sanger-style and quantitative PCR), which may have
influenced results.
To summarise, parasitic helminths are associated with a microbiota, which shows intraspecific
variation associated with inhabitation of different gut sections. Helminth microbiota is largely
composed of the common gut phyla Firmicutes and Proteobacteria, as well as Tenericutes, and
diversity of microbiota is generally lower than that of the host gut. However, in some instances
helminth microbiota diversity exceeds that of the host gut, and shows significant differences in
taxonomic composition and OTU abundances, suggesting that helminths may acquire microbiota
from prior life stages e.g., from the environment or an intermediate host, and/or the helminth
144
Composition and diversity of the microbiota of parasitic helminths
allows selective colonisation of microbes (Berg et al., 2016). Further research to identify bacteria
that are key symbionts of helminths, perhaps by identifying how and where helminths acquire
microbiota, could indicate specific targets for removal as a form of helminth control.
5.6 Author Acknowledgements
The manuscript resulting from this chapter is authored by:
Emily L. Pascoe, Francesca Albonico (Fondazione Edmund Mach), Matthew J. Bull (Cardiff
University), Heidi C. Hauffe (Fondazione Edmund Mach), Julian R. Marchesi (Cardiff University
and Imperial College) and Sarah E. Perkins (Cardiff University and Fondazione Edmund Mach).
E.L.P: Conceived and designed study, collected, analysed and interpreted data, wrote manuscript.
F.A: Collected data.
M.J.B: Provided guidance regarding processing of microbiota samples.
H.C.H: Involved in conceiving the study and organising field work and logistics, provided
comments on each version of the manuscript.
J.R.M: Provided comments on the manuscript.
S.E.P: Conceived and designed study, involved in data interpretation, provided comments on each
version of the manuscript.
145
Chapter 6
Faecal microbiota affects helminthdevelopment
“I love fools' experiments. I am always making them”
Charles R. Darwin
146
Faecal microbiota affects helminth development
6.1 Abstract
Gut microbiota is integral to immunity, and differing microbial compositions between individuals
have been linked to specific immune phenotypes that can provide defence against pathogens.
Immune responses linked to gut microbiota composition have been observed in response to adult
helminths inhabiting the gut, including phenotypes that can impact upon helminth development.
However, the eggs of many helminth species are expelled in host faeces, and may subsequently
undergo development and hatch in faecal microbiota. The current study investigates if faecal
microbiota could be an extended immune phenotype of the host by also affecting helminth
development. Differences in probability and rate of egg development between eggs cultured in
different faecal microbiota were measured. Transplants of eggs into ‘self’ faeces, and faeces of a
randomly selected ‘non-self’ individual, were performed for eggs of Heligmosomoides polygyrus
and Trichuris muris that were isolated from the faeces of naturally infected wild mice, Apodemus
flavicollis. On average, significantly more H. polygyrus eggs (p = 0.02) hatched in non-self
(40.3%) compared to self faeces (20.4%). Probability of hatching was not significantly associated
with the alpha diversity of self or non-self faecal microbiota, nor with the faecal egg burden of self
or non-self faeces. In contrast, there was no significant difference in the probability of T. muris
egg development between non-self and self faeces, however T. muris egg deterioration was
signficantly higher in non-self faeces (p = 0.05). These results suggest that faeces provide an
extended immune phenotype to the host, and can reduce the development of H. polygyrus eggs
which the host has already had contact with.
147
Faecal microbiota affects helminth development
6.2 Introduction
Gut microbiota is vital for immune system development and function; the human foetus, which
develops in an almost sterile environment, and germ-free mice, both exhibit immature immune
systems, which are able to fully develop following colonisation of the gut by bacteria (Round and
Mazmanian, 2009; Weng and Walker, 2013). Microbiota stimulate the function and development
of immune cells, as well as pro-inflammatory responses, so that the host may be primed to defend
against pathogen invasion (Cahenzli et al., 2012; Chung et al., 2012; Wingender et al., 2012;
Buffie and Pamer, 2013). In turn, the microbiota can lead the host to express distinct immune
phenotypes, for example, the first source of bacterial inoculum received by humans can influence
susceptibility to autoimmune diseases; babies delivered by caesarean section are initially
colonised by skin microbes, as opposed to vaginally born individuals that receive an inoculum of
faecal and vaginal microbes (Dominguez-Bello et al., 2010; Neu and Rushing, 2011; Jakobsson et
al., 2014). As a result of this difference in gut colonisation, the development of the immune
system differs between caesarean section and vaginally born babies, such that caesarean section
babies are more predisposed than those vaginally born to asthma and other autoimmune diseases
(Jakobsson et al., 2014). Specific bacterial compositions have also been linked to increased
susceptibility to inflammatory bowel diseases (Hold et al., 2014), viral replication (Kuss et al.,
2011), and resistance to pathogenic bacteria such as Salmonella spp. (Bäumler and Sperandio,
2016). Immune phenotypes associated with gut microbiota are, like the microbe composition,
highly dynamic, and can change when the microbiota is altered by antibiotic or probiotic
treatment (e.g., Bautista-Garfias et al., 2001; Martínez-Gómez et al., 2009; Kuss et al., 2011;
Weng and Walker, 2013). In addition, microbiota has been identified as a stronger driver of
specific immune defences than genotype of the host, and the microbiota-associated immune
148
Faecal microbiota affects helminth development
phenotype can be transferred between individuals by microbiota transplant (Koch and Schmid-
Hempel, 2012), and vertical transmission (Oliver et al., 2014).
Due to the shared evolutionary history of microbiota and parasitic helminths within the gut, as
well as microbiota-immunity interplay, it is not surprising that bacteria in the gut can provide the
host with resistance (the ability of a host to reduce establishment) to macroparasites (e.g., Hayes
et al., 2010; Coêlho et al., 2013; Reynolds et al., 2014). Parasites are in a constant arms race with
their host to evolve adaptations so that each maintain their relative fitness (Brockhurst et al.,
2014). For example, the host may mount an immune response against a given parasite, which the
parasite in turn can override (Maizels et al., 2004). The response by the host to a helminth
infection may target any given life stage of the parasite. For instance, particular bacterial families
have been associated with host immunity against adult helminth fecundity and/or abundance
(Bautista-Garfias et al., 2001; Martínez-Gómez et al., 2009; Coêlho et al., 2013). Administration
of probiotics which increase the abundance of Lactobacillus bacteria in the gut can have an
anthelmintic effect in domestic dogs, leading to a decrease in the number of hookworm eggs (from
the Ancylostomatidae family) shed in faeces (Coêlho et al., 2013) and can also promote an
immune response in mice against Trichinella spiralis, causing a decrease in the number of adults
and larvae in the gut (Bautista-Garfias et al., 2001; Martínez-Gómez et al., 2009). However, when
T. spiralis are cultured in vitro in the presence of Lactobacillus there is a positive effect on the
number of adult helminths able to survive, and their subsequent fecundity (Jiang et al., 2016),
suggesting that other bacteria within the gut may contribute to the anthelmintic effects of
Lactobacillus observed in vivo.
149
Faecal microbiota affects helminth development
Gut bacteria have also been associated with immune phenotypes related to helminth development
and egg hatching e.g., larvae of the laboratory rodent nematode, Heligmosomoides polygyrus
(bakeri) reared in axenic conditions do not survive past the L2 stage, as the helminth body wall
develops with malformations (Weinstein et al., 1969). In addition, the eggs of Trichuris muris,
which hatch within the mouse gut, require physical contact with specific bacteria, e.g.,
Enterococcus caccae, Staphylococcus aureus and Streptococcus hyointestinalis, and other
common gut bacteria with type 1 fimbriae, such as Escherichia coli and Salmonella typhimurium
to activate the hatching process (Hayes et al., 2010; Koyama, 2013; Vejzagić et al., 2015a,
2015b). Meanwhile, other physical conditions of the gut previously believed to provide a hatching
cue, such as low pH or gastric enzymes, are unnecessary for T. muris hatching (Hayes et al., 2010;
Wimmersberger et al., 2013). The life-cycle of faecal-oral transmitted parasites is such that
progeny are expelled in the faeces, in which they typically hatch and develop into the infective
stage of the life-cycle, before being able to infect a host. Whilst in the faeces, helminth eggs are in
direct contact with the unique faecal microbiota of the host. Given that gut microbiota are
associated with resistance to helminth infection, it is not unreasonable to assume that faecal
microbiota, which originates from the gut, could also provide resistance to helminths.
In addition to the direct impacts of bacteria on helminth development, host immune responses to
parasites may be affected by microbiota (Koch and Schmid-Hempel, 2012; Weng and Walker,
2013), the composition of which can change following helminth infection (Walk et al., 2010; Li et
al., 2012; Rausch et al., 2013; Reynolds et al., 2014), with potential subsequent effects on
immune phenotype. For instance, faeces of infected individuals may provide the host with
resistance to helminth infection; the host can produce antibodies against the helminth which are
shed in faeces, binding to the egg of some helminth species such as Ostertagia circumcincta, and
150
Faecal microbiota affects helminth development
inhibiting development (Jørgensen et al., 1998), a response that could be modulated by microbiota
(Reynolds et al., 2015). However, faecal composition does not prevent development of all
helminths species; the hatchability of nematode eggs from a rabbit host (Trichostrongylus
retortaeformis and Graphidium strigosum) are unaffected by antibodies present in faeces
(Lambert et al., 2015). Understanding if, and how, faecal microbiota affects helminth
development will not only alter current perceptions of the host immune phenotype and the ability
of helminths to develop in faeces, but could also have implications for human and livestock
health, as the ability to disrupt parasite development can be an effective method of its control and
eradication (e.g., Barry, 2007).
Here the ability of faeces to act as an extended immune phenotype of the host by inhibiting
helminth development is tested. The development of eggs from two helminth species, H.
polygyrus and T. muris, which are both shed and undergo development in host faeces, were tested
in faeces from different individuals of a naturally infected wild rodent (yellow-necked mouse;
Apodemus flavicollis). Following sterilisation of external egg-associated microbiota, eggs were
cultured in faeces from the host in which they were shed (‘self’) and in faeces from another
randomly selected individual, with a presumably different microbiota composition (‘non-self’),
and the probability and rate of egg development between culture in self and non-self faeces were
compared.
151
Faecal microbiota affects helminth development
6.3 Materials and methods
6.3.1 Study area and rodent sampling
Live-trapping of Apodemus flavicollis was conducted using Ugglan multi-capture live traps
(Ugglan Type 2; Grahnab, Sweden) arranged in two transects of 100 traps each, with a 10 m inter-
trap interval. Transects, which were separated by 500 m of vineyard, were situated in San Michele
all’Adige, Trento (transects situated at 46°11'31.6"N 11°08'20.2"E and 46°11'17.9"N
11°08'16.2"E). Traps were baited with sunflower seeds and potato between March and June, for
four nights per week, during which time they were checked every 24 hours. Animal trapping and
handling procedures were authorised by the Comitato Faunistico Provinciale della Provincia di
Trento, prot. n. 595 issued on 04 May 2011.
At first capture of each mouse, sex was recorded (known to influence the helminth community
and microbiota of mice; Ferrari et al., 2004; Markle et al., 2013) and a Passive Integrated
Transponder tag (Trovan™ ID 100; Trovan Ltd., UK) was inserted subcutaneously to identify the
individual at subsequent capture events. Faeces were collected from each trap occupied by a
single animal. During each trapping week, faeces collected at first weekly capture of an individual
were frozen at -80°C for future faecal microbiota analyses (see ‘6.3.5 Microbiota analysis’
below). Faeces from subsequent recaptures of an individual during that week were used for faecal
egg count (FEC) analyses, using a standard McMaster technique with saturated NaCl flotation
solution (after Dunn and Keymer, 1986). The mean number of eggs per gram (EPG) of faeces
(including zeros) was calculated from all FEC measurements collected for a given individual to
account for daily variation in egg shedding (Michael and Bundy, 1989; Kumazawa, 1992; see
Appendix A.7; Table A.7.1). After occupation, traps were sterilised using sodium hypochlorite
(bleach), followed by 4% chlorhexidine solution (Nuova Farmec, Italy), re-baited and replaced.
152
Faecal microbiota affects helminth development
Each mouse (with the exception of pregnant/nursing females, juveniles and individuals trapped <4
days previously) was then transferred into a sterilised Longworth trap (Longworth Scientific
Instruments Co., United Kingdom) containing sunflower seeds, potato and hay, and kept overnight
in situ. The following morning mice were released from Longworth traps, and faecal samples
within were transported to the laboratory at 4°C for use in an egg transplant (see ‘6.3.3 Egg
transplant: culture in ‘self’ and ‘non-self’ faeces’ below). In the laboratory, each faecal sample
was immediately placed on filter paper (previously sterilised under UV light) which was saturated
with ultra-pure water in a sealed Petri dish at 4°C, for 2 hours to standardise humidity content.
6.3.2 Egg isolation and sterilisation of external microbiota
Each faecal sample from animals kept overnight was termed an egg ‘recipient’ and was processed
in the following way. Faeces were homogenised with sterile Tris-NaCl buffered saline (TBS: 50
mM Tris, 200 mM NaCl pH 8) at a ratio of 1 g/10 ml, and centrifuged at 700 G for 3 minutes. The
resulting supernatant containing bacteria (henceforth referred to as ‘faecal bacteria solution’) was
maintained at 4°C until further use. Meanwhile, the pellet containing eggs and faecal debris was
re-suspended in TBS and passed through a 1 mm strainer to remove larger faecal debris, followed
by three cell strainers (pluriSelect® pluriStrainers, Germany) of decreasing pore size (200 µm,
100 µm and 40 µm) to progressively remove smaller debris, whilst capturing helminth eggs. As
most bacteria are 0.2 - 2.0 µm in diameter (Tortora et al., 2009), faecal microbiota could pass
through all filters and the liquid filtrate containing these bacteria was collected and pooled with
the previously prepared faecal bacteria solution. The faecal bacteria solution was passed through a
15 µm pore strainer to ensure it was free of all eggs (this step was found to be necessary during a
pilot experiment in which a FEC was performed on aliquots of faecal bacteria solution to ensure it
was egg-free). Eggs of H. polygyrus are typically 75.0 ± 5.5 µm × 49.2 ± 3.1 µm (Camberis et al.,
153
Faecal microbiota affects helminth development
2003) and T. muris eggs are <74.5 µm long (Koyama, 2013), thus eggs were captured on the 40
µm and 15 µm strainers, where they were retained throughout the following external sterilisation
procedure. Eggs isolated on strainers were washed with 15 ml of TBS, submerged in 15 ml of 4%
chlorhexidine solution for 5 minutes and rinsed with a further 15 ml of TBS. In a pilot experiment,
there was no visible growth of bacteria resulting from sterilised eggs after five days of culture on
NGM agar, and egg viability was unaffected (data not shown). Sterilised eggs were transferred
into a Petri dish by inverting the strainer and washing through with TBS, from which eggs were
separated using a pipette according to species (H. polygyrus or T. muris, other species were
discarded due to difficulties in culturing in vitro), and maintained in TBS during preparation of
culture dishes (see ‘6.3.3 Egg transplant’). Individuals whose faeces contained eggs were also
designated as an egg ‘donor’ to donate eggs to either ‘self’ or ‘non-self’ faeces of egg recipients
(see ‘6.3.3 Egg transplant’ and Table 7.1; 7.2). However, due to individual and daily variation in
faecal and egg yield, not every individual throughout the study could be designated as both a
recipient and a donor (see ‘6.3.3 Egg transplant’). For a full breakdown of usage of faeces from
each individual see Table 6.1 and 6.2.
6.3.3 Egg transplant: culture in ‘self’ and ‘non-self’ faeces
The following steps were performed under sterile conditions, and each culture dish containing
filter paper saturated with ultra-pure water (constructed following methods adapted from Johnston
et al., 2015) was sterilised under UV light for 15 minutes immediately prior to the addition of
eggs and faeces. The faecal bacteria solution of each recipient was vortexed for 15 seconds and
divided into equal aliquots of approximately 5 ml (0.5 g of starting faecal material). Each aliquot
equated to a replicate, and was centrifuged at 5,500 G for 15 minutes. The resulting supernatant
was discarded, and the pellet containing faecal bacteria was spread as a thin ‘faecal smear’ on
154
Faecal microbiota affects helminth development
filter paper of a culture dish (Figure 6.1). Equal numbers of eggs from each donor were
transplanted by pipette into the replicate faecal smears of a recipient to make a ‘donor-recipient
combination’ of individuals; a ‘self’ combination whereby the donor and recipient were the same
individual, and a ‘non-self’ combination where the recipient was another randomly selected
individual (including those from which no eggs were isolated, see Figure 6.1 for schematic
representation, see Tables 6.1 and 6.2, and Appendix A.7; Table A.7.1 for list of egg donor and
recipient mice). Due to variation in egg yield between egg donors, the number of eggs per dish
varied between different donor-recipient combinations, but remained constant between replicates
(range: 1-5 H. polygyrus eggs/culture, and 5-10 T. muris eggs/culture). For H. polygyrus, seven
self and nine non-self donor-recipient combinations were made (from which 16 self and 16 non-
self cultures were made, including replicates, see Table 6.1), while for T. muris five self and nine
non-self donor-recipient combinations were made (from which 12 self and 13 non-self cultures
were made, including replicates, see Table 6.2). To avoid dehydration, 2 ml of ultra-pure water
was added to the bottom of each culture dish, which were then sealed with Parafilm® ‘M’ and
maintained at a constant 23°C in the dark.
155
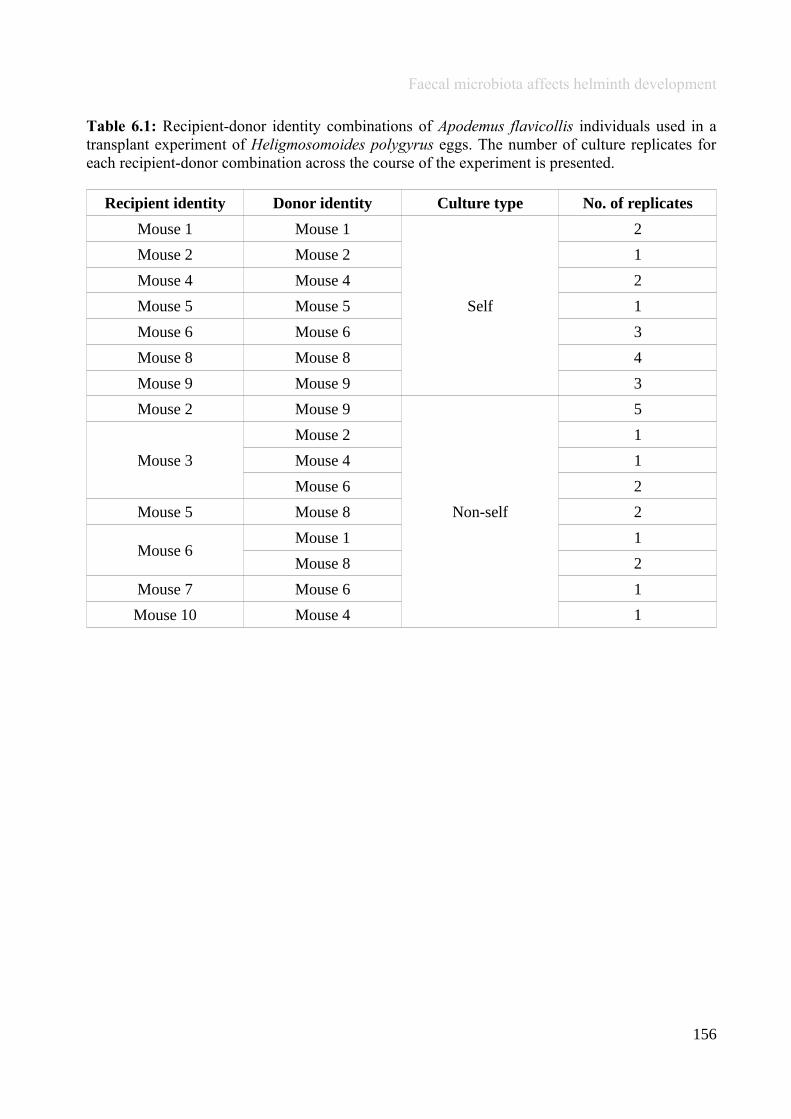
Faecal microbiota affects helminth development
Table 6.1: Recipient-donor identity combinations of Apodemus flavicollis individuals used in atransplant experiment of Heligmosomoides polygyrus eggs. The number of culture replicates foreach recipient-donor combination across the course of the experiment is presented.
Recipient identity Donor identity Culture type No. of replicates
Mouse 1 Mouse 1
Self
2
Mouse 2 Mouse 2 1
Mouse 4 Mouse 4 2
Mouse 5 Mouse 5 1
Mouse 6 Mouse 6 3
Mouse 8 Mouse 8 4
Mouse 9 Mouse 9 3
Mouse 2 Mouse 9
Non-self
5
Mouse 3
Mouse 2 1
Mouse 4 1
Mouse 6 2
Mouse 5 Mouse 8 2
Mouse 6Mouse 1 1
Mouse 8 2
Mouse 7 Mouse 6 1
Mouse 10 Mouse 4 1
156
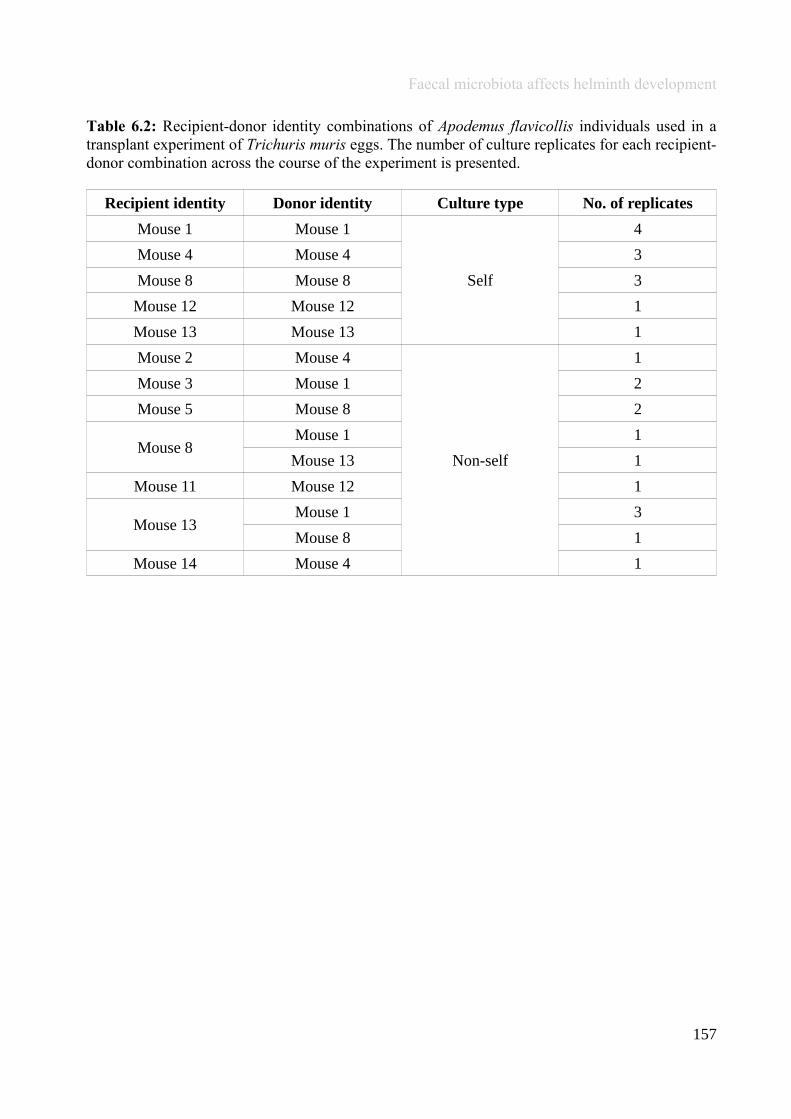
Faecal microbiota affects helminth development
Table 6.2: Recipient-donor identity combinations of Apodemus flavicollis individuals used in atransplant experiment of Trichuris muris eggs. The number of culture replicates for each recipient-donor combination across the course of the experiment is presented.
Recipient identity Donor identity Culture type No. of replicates
Mouse 1 Mouse 1
Self
4
Mouse 4 Mouse 4 3
Mouse 8 Mouse 8 3
Mouse 12 Mouse 12 1
Mouse 13 Mouse 13 1
Mouse 2 Mouse 4
Non-self
1
Mouse 3 Mouse 1 2
Mouse 5 Mouse 8 2
Mouse 8Mouse 1 1
Mouse 13 1
Mouse 11 Mouse 12 1
Mouse 13Mouse 1 3
Mouse 8 1
Mouse 14 Mouse 4 1
157
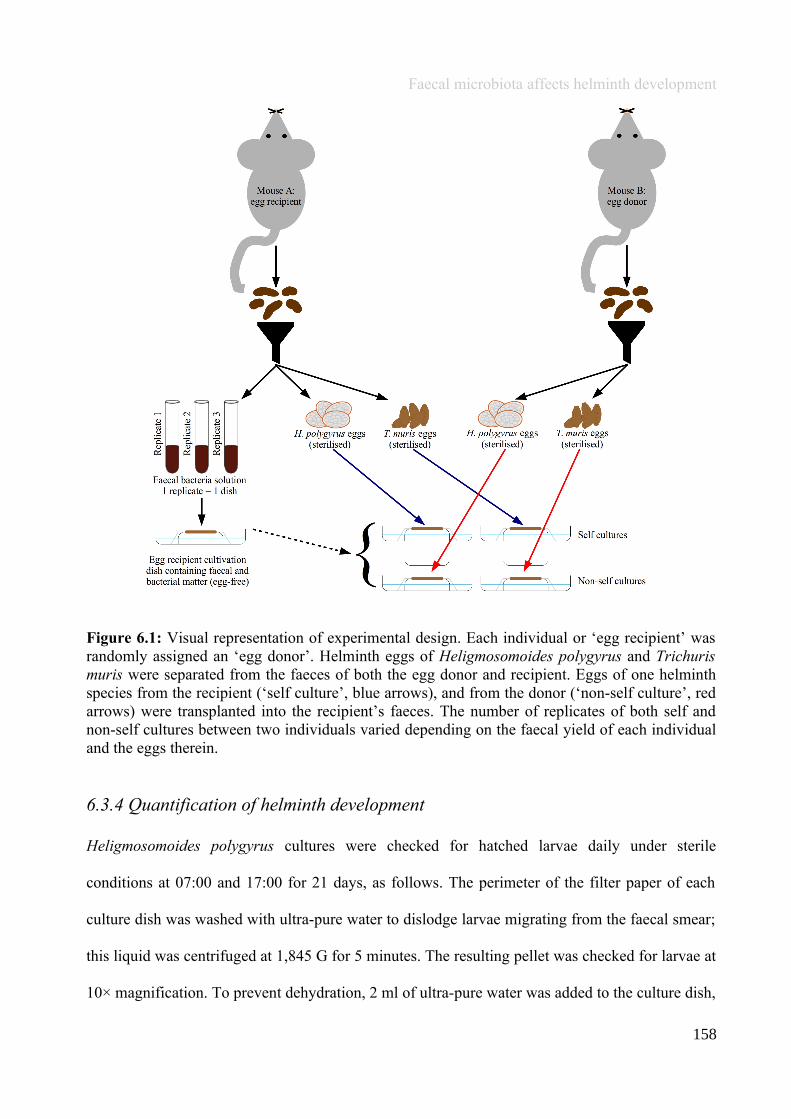
Faecal microbiota affects helminth development
Figure 6.1: Visual representation of experimental design. Each individual or ‘egg recipient’ wasrandomly assigned an ‘egg donor’. Helminth eggs of Heligmosomoides polygyrus and Trichurismuris were separated from the faeces of both the egg donor and recipient. Eggs of one helminthspecies from the recipient (‘self culture’, blue arrows), and from the donor (‘non-self culture’, redarrows) were transplanted into the recipient’s faeces. The number of replicates of both self andnon-self cultures between two individuals varied depending on the faecal yield of each individualand the eggs therein.
6.3.4 Quantification of helminth development
Heligmosomoides polygyrus cultures were checked for hatched larvae daily under sterile
conditions at 07:00 and 17:00 for 21 days, as follows. The perimeter of the filter paper of each
culture dish was washed with ultra-pure water to dislodge larvae migrating from the faecal smear;
this liquid was centrifuged at 1,845 G for 5 minutes. The resulting pellet was checked for larvae at
10× magnification. To prevent dehydration, 2 ml of ultra-pure water was added to the culture dish,
158
Faecal microbiota affects helminth development
which was re-sealed with Parafilm® ‘M’ after every larval check. Trichuris muris cultures were
checked once, at least six weeks post-culture (range: 6 - 11 weeks; number of weeks had no
significant effect on egg degradation, Kendall’s Tau: Z = -1, p = 0.3), after embryonation is
expected to occur (Zaph and Artis, 2015). For T. muris, the faecal smear was scraped from each
culture and homogenised with ultra-pure water, before centrifugation at 700 G for 5 minutes. To
the resulting pellet, 2 ml of saturated NaCl floatation solution was added to float eggs, and the
solution was scanned on a McMaster slide at 100× magnification. The number of embryonated
eggs (see Fahmy, 1954), and eggs that had deteriorated (e.g., shape or structure lost, egg
discoloured) were quantified. Hatching and embryonation success were calculated for H.
polygyrus and T. muris, respectively, as a percentage of the total number of eggs in each culture
dish.
6.3.5 16S rRNA gene sequencing
For eight host individuals (see Appendix A.7; Table A.7.1), frozen faeces collected throughout the
experiment (2 – 5 samples from different time points, depending on capture rate of individual)
were pooled, to account for any seasonal variation in microbiota (Maurice et al., 2015).
Preparation of samples (DNA extraction, DNA quantification, PCR and PCR product
purification), and subsequent sequencing of the resulting amplicon library followed methods
presented in Chapter 3 (see ‘3.3.4 16S rRNA gene sequencing’). Samples with a final read count
of less than 8,000 merged and quality-filtered reads were discarded. The resulting OTUs were
analysed at the phylum and class level using phyloseq version 1.16.2 (McMurdie and Holmes,
2013).
159

Faecal microbiota affects helminth development
6.3.6 Statistical analyses of helminth development data
A Generalised Linear Mixed Model (GLMM) was used to detect differences in probability of egg
hatching of H. polygyrus eggs between culture in self and non-self faeces. The response variable
was the percentage of successfully hatched eggs in each dish (including replicates). Time (number
of culture days), culture type (non-self or self), faecal microbiota alpha diversity of the donor
(inverse Simpson index), and of the recipient, plus average helminth burden (EPG of faeces) of
the donor, and of the recipient were all fixed variables. To test the effect of sex of donor and
recipient on hatch success, a fixed factor was defined as: female donor with female recipient,
female donor with male recipient, male donor with female recipient and male donor with male
recipient. Culture type with time was a two-way interacting factor. Donor and recipient identity
code, as well as culture start date, and culture dish identity were random factors, and the model
was weighted by the number of eggs in each culture. A Cox proportional hazards (survival
analysis) model was used to test for variation in hatch rate between cultures, where hatch rate was
a response variable and culture type was the independent variable. Egg recovery from T. muris
cultures was too low (16%, n = 42 eggs from 14/25 cultures) to build a GLMM; instead, a Mann-
Whitney U test was used to test for differences in the percentage of embryonated eggs and
deteriorated eggs between cultures. GLMM’s were built using the lme4 package, version 1.1.12
(Bates et al., 2015), while survival analyses were performed in the survival package, version
2.39.5 (Therneau and Grambsch, 2000), in R, version 3.3.2.
6.3.7 Statistical analyses of microbiota data
To determine how OTU abundances varied between egg donors and recipient, OTUs with a
differential abundance (i.e., number of reads corrected for sequencing depth) between donors and
recipients were first identified, using an approach based on generalised linear models with
160
Faecal microbiota affects helminth development
negative binomial errors implemented in the DESeq2 package (Anders and Huber, 2010). These
analyses were run using the default pipeline set-up in DESeq2, and significance values (p <0.05)
were derived using likelihood-ratio tests (Anders and Huber, 2010; Love et al., 2014).
In addition, a non-metric multidimensional scaling (NMDS) analysis was used to test for
differences in microbiota composition between egg donors and egg recipients. Ecological
distances between donors and recipients were assessed using Bray–Curtis dissimilarities (i.e.,
compositional dissimilarity indices that account for proportional differences of OTUs among
samples) and weighted UniFrac dissimilarity matrices (which accounts both for proportional
differences of OTUs and their phylogenetic relatedness; Lozupone and Knight, 2005). OTU tables
were scaled before calculation of dissimilarity matrices to achieve an even sequencing depth,
corresponding to a minimal number of reads per sample in gut sections or faeces that were
included in a given analysis.
6.4 Results
6.4.1 Helminth egg burden of faeces
The faecal yield was sufficient in only 12 out of 14 mice to perform reliable FEC analyses
(Appendix A.7, Table A.7.1). Heligmosomoides polygyrus was the least prevalent helminth, in
41.7% of mice, and had the lowest mean egg burden (mean EPG ± standard error = 29.2 ± 7.5)
compared to other species. Trichuris muris was prevalent in 50.0% of individuals, and had a mean
egg burden of 475.5 (± 251.5) EPG. Hymenolepis spp. were present in 100% of sampled mice and
had the highest mean burden of 1,238.5 (± 273.0) EPG. No eggs from other helminth species were
detected in faeces.
161
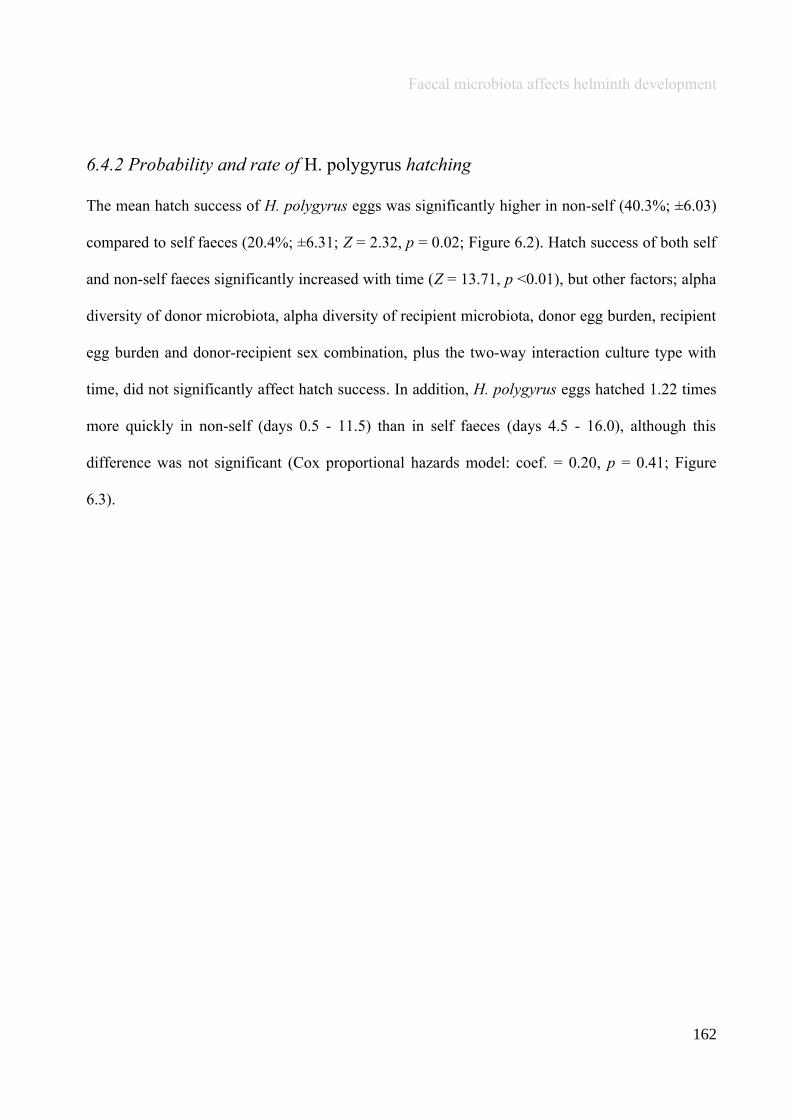
Faecal microbiota affects helminth development
6.4.2 Probability and rate of H. polygyrus hatching
The mean hatch success of H. polygyrus eggs was significantly higher in non-self (40.3%; ±6.03)
compared to self faeces (20.4%; ±6.31; Z = 2.32, p = 0.02; Figure 6.2). Hatch success of both self
and non-self faeces significantly increased with time (Z = 13.71, p <0.01), but other factors; alpha
diversity of donor microbiota, alpha diversity of recipient microbiota, donor egg burden, recipient
egg burden and donor-recipient sex combination, plus the two-way interaction culture type with
time, did not significantly affect hatch success. In addition, H. polygyrus eggs hatched 1.22 times
more quickly in non-self (days 0.5 - 11.5) than in self faeces (days 4.5 - 16.0), although this
difference was not significant (Cox proportional hazards model: coef. = 0.20, p = 0.41; Figure
6.3).
162
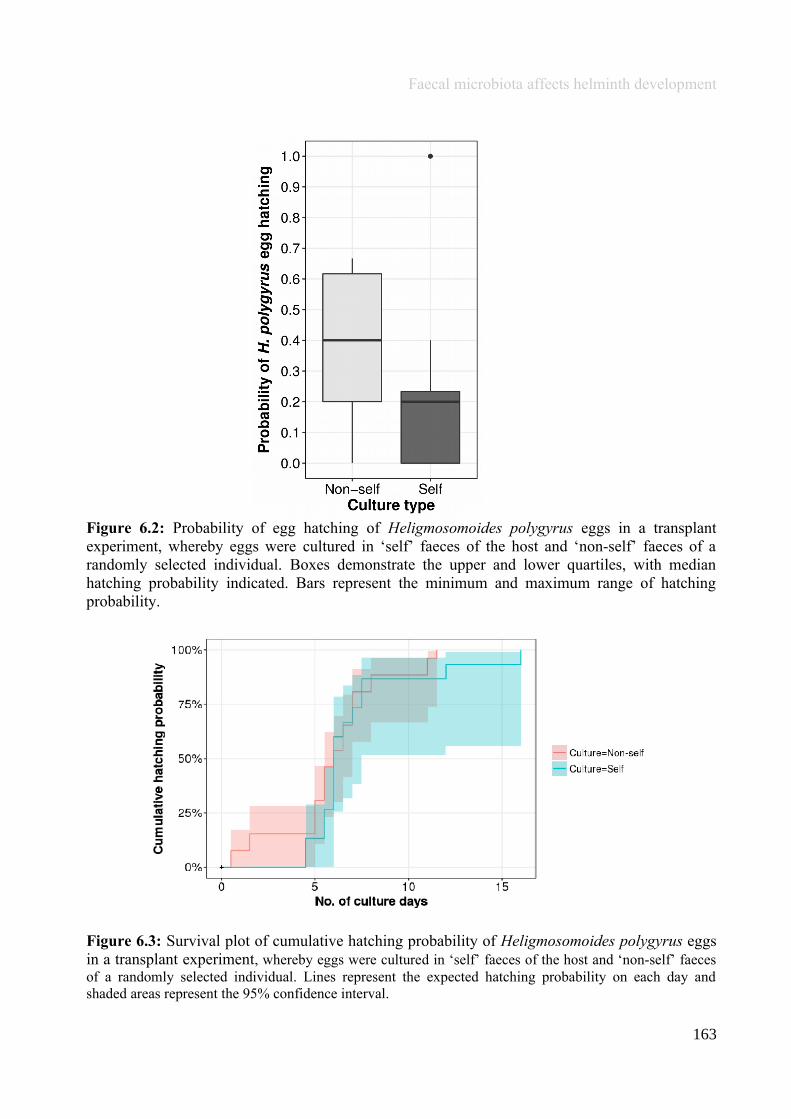
Faecal microbiota affects helminth development
Figure 6.2: Probability of egg hatching of Heligmosomoides polygyrus eggs in a transplantexperiment, whereby eggs were cultured in ‘self’ faeces of the host and ‘non-self’ faeces of arandomly selected individual. Boxes demonstrate the upper and lower quartiles, with medianhatching probability indicated. Bars represent the minimum and maximum range of hatchingprobability.
Figure 6.3: Survival plot of cumulative hatching probability of Heligmosomoides polygyrus eggsin a transplant experiment, whereby eggs were cultured in ‘self’ faeces of the host and ‘non-self’ faecesof a randomly selected individual. Lines represent the expected hatching probability on each day andshaded areas represent the 95% confidence interval.
163

Faecal microbiota affects helminth development
6.4.3 Probability of T. muris egg embryonation
Only 22.1% of T. muris eggs in non-self and 12.2% eggs in self faeces were successfully
recovered from cultures. The mean probability of egg embryonation did not significantly differ
between non-self and self faeces (Mann Whitney U: W = 18, p = 0.30). Of the eggs that were
recovered, 94.4% (±3.93) had embryonated in non-self and 100% (±0.00) in self faeces. The mean
percentage of deteriorated eggs was significantly higher in non-self compared to self faeces (W =
100, p = 0.05); 31.5% (± 14.28) exhibited deterioration, of which 58.3% had also embryonated,
compared to eggs within self faeces which did not exhibit any deterioration.
6.4.4 Microbiota composition of faeces
It was possible to characterise the faecal microbiota of eight individuals (8 recipients, of which 6
were also donors, Appendix A.7, Table A.7.1). The filtered dataset consisted of 93,909 high-
quality reads for eight samples (mean ± standard error = 1,739 ± 1,071, range = 8,074 - 16,153).
The mean inverse Simpson index for all samples was 33.0 (± 4.8, range = 17.4 - 59.6). In brief,
the faecal microbiota was dominated by Bacteroidetes (68.5%), Firmicutes (26.3%) and
Proteobacteria (2.8%), but five other phyla were also identified (Figure 6.4). At the class level,
68.5% of reads belonged to Bacteroidia and 20.1% to Clostridia (Figure 6.4). Of note, Tenericutes
(class: Mollicutes) was present in the faeces of one individual, which was a recipient but not
donor, and Actinobacteria (class: Actinobacteria) was present in the gut of one individual, which
was both a donor and recipient (Figure 6.4).
164
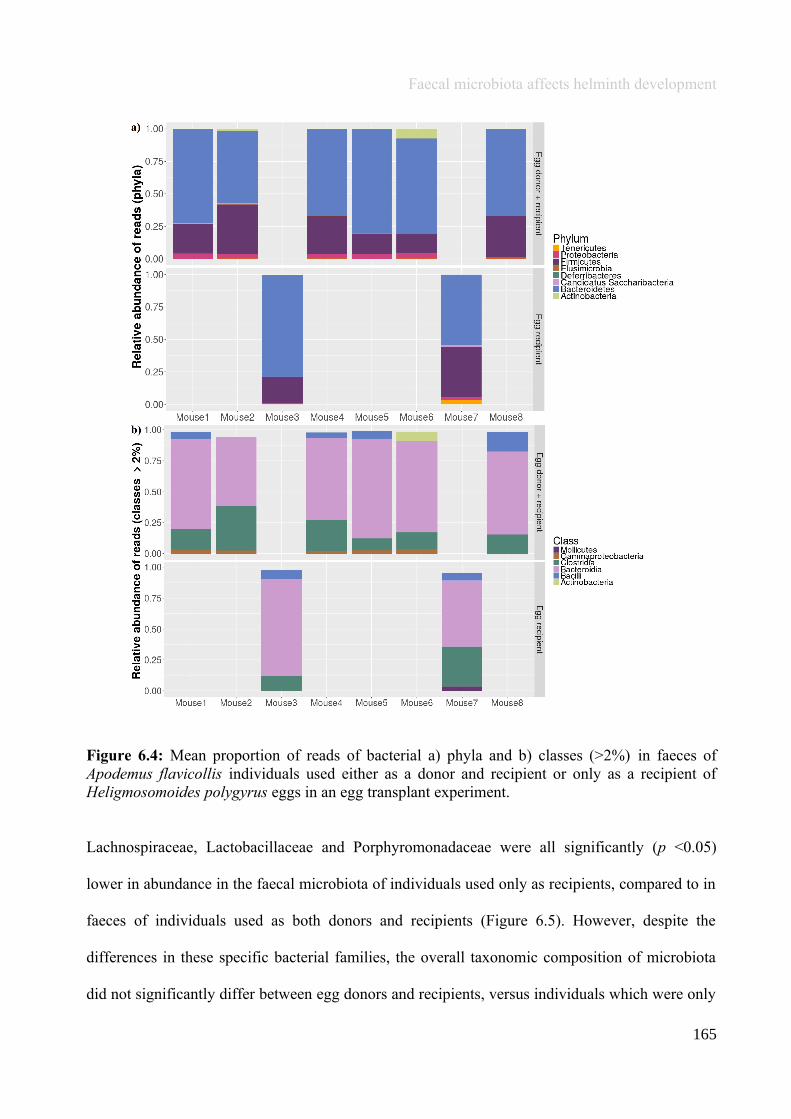
Faecal microbiota affects helminth development
Figure 6.4: Mean proportion of reads of bacterial a) phyla and b) classes (>2%) in faeces ofApodemus flavicollis individuals used either as a donor and recipient or only as a recipient ofHeligmosomoides polygyrus eggs in an egg transplant experiment.
Lachnospiraceae, Lactobacillaceae and Porphyromonadaceae were all significantly (p <0.05)
lower in abundance in the faecal microbiota of individuals used only as recipients, compared to in
faeces of individuals used as both donors and recipients (Figure 6.5). However, despite the
differences in these specific bacterial families, the overall taxonomic composition of microbiota
did not significantly differ between egg donors and recipients, versus individuals which were only
165

Faecal microbiota affects helminth development
egg recipients, based on both Bray-Curtis (p = 0.38) and weighted UniFrac dissimilarities (p =
0.65; Figure 6.6).
Figure 6.5: OTUs in faecal microbiota that were significantly different in abundance betweendonor and recipient individuals versus only recipient individuals in an egg transplant experimentwith Heligmosomoides polygyrus eggs, grouped by microbial class. Briefly, DESeq was used toidentify significantly different (p <0.05) OTU abundances and their respective fold changes (log2)when comparing faecal microbiota between egg donor and recipient individuals, and only eggrecipient individuals.
Figure 6.6: Non-metric multidimensional scaling plot of microbiota divergence between faecalsamples of individuals used as egg donor and recipients, or only as egg recipient individuals in anegg transplant experiment with Heligmosomoides polygyrus eggs based on a) Bray–Curtis(explaining 44.3% variation) and b) weighted UniFrac dissimilarities (explaining 62.7%variation).
166
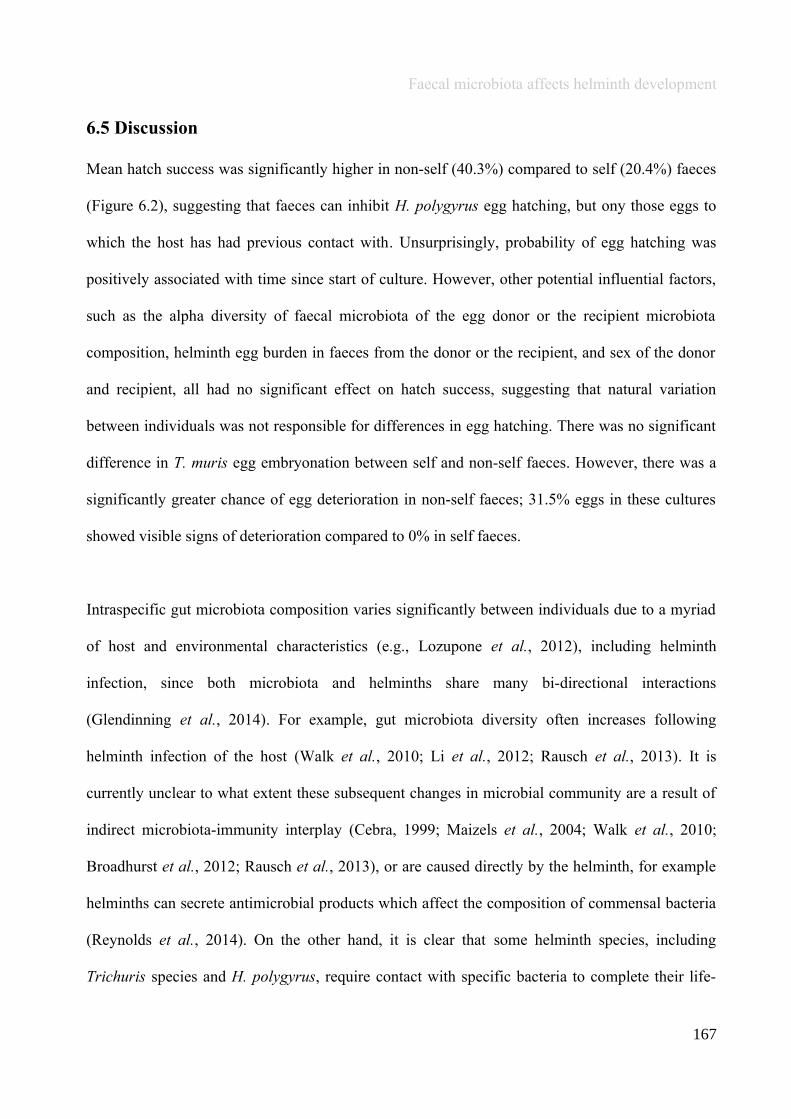
Faecal microbiota affects helminth development
6.5 Discussion
Mean hatch success was significantly higher in non-self (40.3%) compared to self (20.4%) faeces
(Figure 6.2), suggesting that faeces can inhibit H. polygyrus egg hatching, but ony those eggs to
which the host has had previous contact with. Unsurprisingly, probability of egg hatching was
positively associated with time since start of culture. However, other potential influential factors,
such as the alpha diversity of faecal microbiota of the egg donor or the recipient microbiota
composition, helminth egg burden in faeces from the donor or the recipient, and sex of the donor
and recipient, all had no significant effect on hatch success, suggesting that natural variation
between individuals was not responsible for differences in egg hatching. There was no significant
difference in T. muris egg embryonation between self and non-self faeces. However, there was a
significantly greater chance of egg deterioration in non-self faeces; 31.5% eggs in these cultures
showed visible signs of deterioration compared to 0% in self faeces.
Intraspecific gut microbiota composition varies significantly between individuals due to a myriad
of host and environmental characteristics (e.g., Lozupone et al., 2012), including helminth
infection, since both microbiota and helminths share many bi-directional interactions
(Glendinning et al., 2014). For example, gut microbiota diversity often increases following
helminth infection of the host (Walk et al., 2010; Li et al., 2012; Rausch et al., 2013). It is
currently unclear to what extent these subsequent changes in microbial community are a result of
indirect microbiota-immunity interplay (Cebra, 1999; Maizels et al., 2004; Walk et al., 2010;
Broadhurst et al., 2012; Rausch et al., 2013), or are caused directly by the helminth, for example
helminths can secrete antimicrobial products which affect the composition of commensal bacteria
(Reynolds et al., 2014). On the other hand, it is clear that some helminth species, including
Trichuris species and H. polygyrus, require contact with specific bacteria to complete their life-
167

Faecal microbiota affects helminth development
cycle (Weinstein et al., 1969; Hayes et al., 2010; Vejzagić et al., 2015a, 2015b). As such, gut
microbiota composition of an individual may influence immune phenotypes of helminth
development and resistance. In the present study there were significant differences in the
abundances of Lachnospiraceae, Lactobacillaceae and Porphyromonadaceae in faecal microbiota
of donors and recipients, versus only recipient individuals (which were used only in non-self
cultures), wherein these bacterial families were all found in lower abundances in recipient only
individuals (Figure 6.5). It is interesting to note that Lactobacillaceae decreases host resistance to
H. polygyrus and T. muris (Dea-Ayuela et al., 2008; Reynolds et al., 2014), thus one may expect
that individuals with higher abundances of these bacteria may be more susceptible to helminth
infection. However, these differences in bacterial abundances may have been an artefact of small
sample sizes; of the eight individuals which underwent faecal microbiota analysis, just two
individuals were only recipients, and the other six were both donors and recipients, thus any
differences between the two populations were likely amplified. Despite significant differences in
the abundances of these specific classes of bacteria, the overall taxonomic composition of
microbiota was not significantly different between individual hosts (Figure 6.6), suggesting that
overall microbiota composition was not responsible for differences in helminth development.
Egg shedding and faecal yield varied between individuals, as well as between days for any given
individual. In addition, due to the unpredictable and uncontrollable nature of wild animal trapping,
sample sizes were small and not every individual within the experiment was used as both an egg
donor and recipient (see Appendix A.7, Table A.7.1 for details). Consequently, it was not possible
to directly compare the difference in egg development between self and non-self faeces for all
individuals, and results obtained from small sample sizes should be interpreted with caution.
However, the results in the current chapter do suggest that cultivation of surface-sterilised eggs in
168
Faecal microbiota affects helminth development
non-self faeces (40.3% hatch success) increases the probability of egg hatching compared to other
culture techniques; previous studies using trypan blue staining have predicted that H. polygyrus
egg viability is at least 92%, however mean egg hatching in culture on nematode growth medium
is 25.3% (Donskow-Łysoniewska et al., 2013).
In general, potential helminth hosts have evolved a number of specific and non-specific immune
responses that may be mediated by the microbiota to prevent helminth infection (Glendinning et
al., 2014; Kabat et al., 2014). Helminth eggs may be affected by these immune responses, which
can be stimulated either by the egg itself or by other life stages of the parasite e.g., the adult
(Lambert et al., 2015). Immune responses targeted specifically at the egg stage have been
recorded in Schistosoma mansoni (see Pearce et al., 2004), the sheep liver fluke Fasciola hepatica
(see Moxon et al., 2010), and nematodes such as Strongyloides venezuelensis (see Gonçalves et
al., 2012), Ostertagia circumcincta (see Jørgensen et al., 1998), and other rabbit parasites (see
Lambert et al., 2015). Antibodies produced by the host, may be shed in faeces, and can
subsequently bind to parasite eggs and affect development of some (e.g., O. circumcincta, see
Jørgensen et al., 1998), but not all, helminth species (Lambert et al., 2015), which is perhaps why
no significant effects on probability of egg development were observed for T. muris. Should host
antibodies, either present in the faeces or bound to the egg surface, affect H. polygyrus egg
hatching, external washing and sterilisation of the egg, and introduction into non-self faeces may
release eggs from antibodies and the inhibitory action that they induce on egg development,
increasing the probability of hatching. However, in self faeces, the constraint observed on
helminth development could potentially limit self re-infection, a particularly apt adaptation for
rodents against parasitism, which engage in coprophagy; a behaviour that can increase the risk of
ingesting infective eggs and larvae in faeces (coprophagy has been observed in laboratory mice,
169
Faecal microbiota affects helminth development
although there is no evidence for this behaviour in wild Apodemus flavicollis; see Ghazal and
Avery, 1976).
Although bacteria are involved in the development of multiple helminth species, microbial
requirements for development can be specific to the species and even the isolate of the helminth.
For example, helminth eggs may be unable to hatch in bacteria from a species which is not the
definitive host (Vejzagić et al., 2015a), and each laboratory isolate of T. muris responds
differently when exposed to certain wild-type bacteria species; some isolates may hatch when
cultured in wild-type bacteria (E and E-J isolate), whilst the eggs of the S isolate do not respond to
bacteria and can hatch in a sterile environment (Kopper and Mansfield, 2010; Koyama, 2013).
The laboratory rodents that host these strains of T. muris provide an environment that varies little
between host individuals and across generations, due to inbreeding and careful control of external
factors such as diet, ambient conditions and host contact with conspecifics in the laboratory. Thus,
the conditions to which helminth laboratory isolates are subjected to, including host microbiota,
remain relatively constant for generations. As such, different isolates of T. muris may have
evolved specific adaptations to these constant laboratory conditions. As each T. muris isolate is
passaged through mice with specific immune phenotypes (Johnston et al., 2005), it is possible that
variation in hatching requirements is associated with adaptation to the immune phenotype and
microbiota of the host. In the present study no significant differences in the embryonation of T.
muris eggs were observed between self and non-self faeces, suggesting that T. muris from wild
hosts do not have such specific bacterial requirements for development as their laboratory
counterparts (see Kopper and Mansfield, 2010; Koyama, 2013). This may be due to the great
variation (in terms of genetics, microbiota, immunity, diet, etc.,) between wild host individuals,
and even within the same individual between seasons (e.g., Maurice et al., 2015) compared to
170
Faecal microbiota affects helminth development
laboratory rodents. Thus, it would be disadvantageous for wild T. muris to evolve such specific
bacterial requirements for hatching as observed in laboratory strains. Indeed, hatching and
establishment in laboratory mice of T. muris recently isolated from the wild proves difficult, likely
because of the disparity in wild and captive mouse microbiota (Hurst and Else, 2013).
Due to the small sample sizes of the current study, results should be interpreted with caution.
Similarly, because of variable re-capture rates of individuals, as well as daily variation in egg and
faecal shedding, some individuals were sampled as egg donors or recipients more frequently than
other individuals, which may have skewed results. Likewise, due to insufficient faeces, faecal egg
counts and faecal microbiota analyses were not performed for all individuals. Further
investigation could be made into the effect of host faecal microbiota on the development of
helminth eggs by transplanting eggs into faeces between individuals harbouring low and high
burden infections. Comparing helminth development in faeces from hosts with different burdens
may shed light on the common skew of parasite populations which results in 20% of the host
population harbouring 80% of parasites (Perkins et al., 2003); highly parasitised individuals may
be more susceptible to infection due to differences in faecal microbiota compared to more
resistant hosts.
In conclusion, the current study suggests that host faeces may affect hatching of H. polygyrus eggs
shed within, which may in turn provide the host with some resistance to self re-infection. The
ability of faeces to suppress helminth development is not affected by faecal egg burden, nor is it
associated with a given faecal microbiota composition or diversity, however it is only effective
against eggs shed in faeces by helminths already infecting the host. These results may have
implications for helminth control efforts; treatments that alter microbiota composition, e.g.,
171
Faecal microbiota affects helminth development
antimicrobials which change faecal microbiota composition (Chapter 4), may alter the ability of
faeces to inhibit parasite development.
6.6 Author Acknowledgements
The manuscript resulting from this chapter is authored by:
Emily L. Pascoe, Kathryn E. Whittey (Cardiff University), Heidi C. Hauffe (Fondazione Edmund
Mach), Julian R. Marchesi (Cardiff University and Imperial College) and Sarah E. Perkins
(Cardiff University and Fondazione Edmund Mach).
E.L.P: Conceived and designed study, collected, analysed and interpreted data, wrote manuscript.
K.E.W: Involved in designing study, collected data.
H.C.H: Involved in conceiving the study and organising field work and logistics, provided
comments on each version of the manuscript.
J.R.M: Provided comments on the manuscript.
S.E.P: Conceived and designed study, involved in data interpretation, provided comments on each
version of the manuscript.
172

Chapter 7
General discussion
“He who is not courageous enough to take risks will accomplish nothing in life.”
Cassius M. Clay Jr.
173
General discussion
Every gut is colonised with a microbiota (Ley et al., 2008), and the vast majority of humans and
animals (both wild and domesticated) also harbour a parasitic helminth community (macrobiota)
composed of at least one species (Hotez et al., 2008; Morgan et al., 2012; Lello et al., 2013). The
microbiota and macrobiota have coinfected the gut of both vertebrates and invertebrates
throughout evolutionary history, and consequently are likely to interact, both antagonistically and
synergistically, with knock-on effects for the host (Glendinning et al., 2014; Reynolds et al.,
2015). While some studies have begun to investigate or conceptualise how the microbiota and
macrobiota interact (e.g., Hayes et al., 2010; Walk et al., 2010; Bancroft et al., 2012; Cooper et
al., 2013; Glendinning et al., 2014; Kreisinger et al., 2015; Reynolds et al., 2015 Hayes et al.,
2010; Walk et al., 2010; Cooper et al., 2013; Kreisinger et al., 2015; please see Chapter 1 for
more comprehensive list of references), the number of studies on this topic are currently relatively
few, despite a plethora of research indicating that, individually, these two communities each have
positive (Round and Mazmanian, 2009; Bilbo et al., 2011) and negative (Tamboli et al., 2004;
Sutherland and Scott, 2010; Shetty, 2010) effects on the host. It is therefore pertinent to
understand how the microbiota and macrobiota interact, so that future work can extrapolate to the
overall effect on host health. Given also, that the gut biome is under increasing evolutionary
pressures, for example, excessive, ungoverned, and often inappropriate antibiotic and anthelmintic
use (Vlassoff et al., 2001; Anadón, 2006; Nielsen, 2009; Vercruysse et al., 2012), and ‘Western’
diets which deviate from what the human gut has evolved to digest (Hou et al., 2011), it is
particularly timely to investigate these interactions so that we can understand the wider
implications on the whole gut biome. Due to recent advances in technologies enabling research on
microbial communities (Marchesi and Ravel, 2015), researching microbiota-macrobiota
interactions using next generation methods is now feasible for many laboratories. This thesis uses
an ecological approach to tease apart some of these microbiota-macrobiota interactions in wild
174
General discussion
rodents, using manipulation as a means to tease apart mechanisms; as advocated by seminal
papers in ecology (Paine, 1966).
A review of the gut microbiota literature of animals was performed to provide an overview of the
current research landscape (Chapter 2). This review brought to attention the current lack of studies
on wild animal gut microbiota. Although studying wild animals can be problematic due to a
myriad of logistical and legal restraints (e.g., elusive or rare species which cannot be sampled due
to practicalities and laws, and CITES permissions for the translocation of samples collected from
endangered species), wild animals can provide insight into natural, intact microbiota composition
and functions (Amato, 2013). Gut microbiota studies on wild animals can provide interesting and
sometimes surprising insights into the biology of the animal being studied, e.g., myrmecophagous
mammals from different evolutionary lineages exhibit striking convergence with respect to gut
microbial composition, driven by dietary adaptations (Delsuc et al., 2014) and the giant panda
(Ailuropoda melanoleuca) relies on gut microbes for cellulose digestion, as its gut is otherwise
physiologically adapted to a carnivorous diet (Zhu et al., 2011). In addition, wild animals can
provide a model system, which unlike laboratory animals, harbour a diverse microbiota in terms
of both the OTUs present and microbiota variation between individuals. Furthermore, wild
animals are exposed to a range of intrinsic and extrinsic factors, rendering study results more
‘realistic’ and comparable to humans and other species, than laboratory animals. Once again, it
could be argued that studying wild animals is difficult, as manipulation is often required in a
model system to assign causality and/or directionality of interactions (e.g., Paine, 1966), yet
manipulation of wildlife is not always logistically or legally possible. Although sophisticated
mathematical and statistical models can be used to assign directionality and causality to
interactions (Fenton et al., 2010; Thakar et al., 2012) in species that cannot be perturbed, this
175
General discussion
thesis exemplifies the possibilities of manipulating a wild species in order to understand
microbiota-macrobiota interactions.
Reviewing the animal gut microbiota literature highlighted that, despite constituting just a fraction
of the gut biome (which also includes archaea, viruses, protozoa, fungi and macroparasites), the
majority of microbiota research focusses purely on the study of bacteria, with almost 13% of
studies also investigating at least one other microbial component of the gut biome (Chapter 2).
Although studies on bacteria of the gut have shed light on the many functions and interactions of
this community (e.g., the gut-brain axis; Aidy et al., 2012), other components of the gut biome,
such as the virome and macrobiota, also impact how the microbiota functions and should be given
more attention in order to truly understand gut microbiota (Glendinning et al., 2014; Ogilvie and
Jones, 2015). Indeed, this thesis has addressed one of these literature gaps by studying both the
microbiota and macrobiota components of the gut biome, and how they interact. However, to
study other components of the gut microbiota is currently more challenging; for example, there
are no universal primers for viruses as there are for bacteria, thus comprehensive characterisation
of the virome is time consuming and costly (Wylie et al., 2015). However, like 16S rRNA bacteria
sequencing, technologies for virome characterisation are improving (Wylie et al., 2015).
Given the growing knowledge that helminths and microbiota interact (Glendinning et al., 2014), it
is important that we consider the effects of helminth infection on the microbiota. Chapter 3
assessed the effect of anthelmintic treatment on microbiota diversity, composition and OTU
abundances. The microbiota of post-treatment individuals remained largely similar to pre-
treatment individuals; diversity was not significantly affected, while the taxonomic composition
and OTU abundances of only some gut sections, which included faeces, were significantly
176
General discussion
affected. These results suggest that taxonomic composition of microbiota (in the small intestine
and caecum), and OTU abundances in some gut sections (small intestine and colon) remain stable
following helminth perturbation, a reassuring result given the present-day excessive use of
anthelmintics (Vlassoff et al., 2001; Vercruysse et al., 2012). It is possible that a greater effect of
anthelmintic treatment on the microbiota was not observed because, although abundance and
fecundity of helminths were reduced post-treatment, some helminths did remain in the gut of
treated individuals. Interestingly, more variation in microbiota composition and OTU abundances
between pre- and post-treatment individuals were observed in the control group than in the
anthelmintic group. As samples were collected over the course of five months, it is possible that
the microbiota changes between pre- and post-treatment in the control group were natural fluxes
driven by seasonality, e.g., changing food availability (Maurice et al., 2015). In addition, it could
be speculated that anthelmintic treatment inhibited seasonal variation in the microbiota, although
other factors, such as animal stress through handling, stochastic differences between individuals
and treatment groups cannot be discounted as other potential drivers of microbiota differences in
the anthelmintic and control groups.
Another study which claimed to completely clear an experimental helminth infection using
anthelmintic (however no data were provided in the published article to confirm infection
clearance) observed a significant shift in microbiota to a composition more similar to uninfected
individuals (Houlden et al., 2015). This does raise the controversial question of whether it is
necessarily beneficial to eradicate all helminths? While it is true that parasitic infections can have
negative impacts on host health, with subsequent detrimental effects on economy, low level
infections can be relatively benign (Waller, 2006; Hotez et al., 2008; Shetty, 2010; Sutherland and
Scott, 2010; Morgan et al., 2012). Indeed, helminth infections can even have a positive influence
177
General discussion
on host health and microbiota, and can protect against autoimmune diseases (Bilbo et al., 2011).
Like any ecosystem, a gut microbiota which shows diversity in taxonomic composition is more
likely to be a healthy one (Mosca et al., 2016), and microbiota diversity can increase following
helminth infection (Lee et al., 2014), which can even restore a dysbiotic microbiota (Broadhurst
et al., 2012). In order to retain the benefits to microbiota that are associated with helminth
infection (which could be lost if helminths are completely eradicated, as suggested by Houlden et
al., 2015), helminth treatment approaches could avoid current mass drug administration to humans
and livestock (Vlassoff et al., 2001; Vercruysse et al., 2012) and target just those individuals
showing morbidity associated with infection (although this would require ethical considerations).
While Chapter 3 provides initial evidence that microbiota remains largely stable following
anthelmintic treatment, the long-term impacts, as well as the effects of higher dosages of
anthelmintic more similar to those routinely applied to livestock, should also be considered in
future studies.
Although some gut sections were unaffected by anthelmintic, faecal microbiota showed
significant shifts in taxonomic composition and OTU abundances following treatment (Chapter 3).
Many helminth species (including H. polygyrus; see Valanparambil et al., 2014, and T. muris; see
Hayes et al., 2010) develop and hatch in host faeces. Host faecal microbiota composition can
affect the probability and rate of egg development and hatching (Chapter 6), thus changes in
faecal microbiota associated with anthelmintic treatment could have consequences for the
numbers of helminth progeny, and thus potentially the perpetuation of helminth infection. To
investigate this possibility, helminth eggs could be cultured in faeces from anthelmintic treated
individuals, and hatching probability and rate compared with eggs cultured in faeces from
untreated individuals. Results may establish if reduction in helminth burden associated with
178
General discussion
anthelmintic treatment is also associated with changes in the development of progeny, which may
also impact transmission events. By understanding if the composition of faecal microbiota
following anthelmintic infection affects helminth development, strategies could be employed
during treatment regimes to avoid further parasite transmission, such as faecal clearing of pastures
with recently treated livestock (Corbett et al., 2014).
Investigating how dietary anthelmintics affect microbiota could help us to further understand how
helminth removal and anthelmintics affect the gut microbial community, particularly in wild
animals. Many species of animal, including primates (Huffman and Seifu, 1989), and ruminants
such as sheep (Lisonbee et al., 2009; Villalba et al., 2014), self-medicate during helminth
infection, usually by consuming substances rich in tannins. Some dietary compounds, such as
tannins, have anthelmintic properties and can decrease nematode abundances and faecal egg
counts (Coop and Kyriazakis, 2001; Niezen et al., 2002; Williams et al., 2014). The anthelmintic
effect of tannins has been attributed to their protein-binding properties; tannins may bind to
proteins in the stomach/rumen, protecting the proteins from degradation so that the host has more
protein available for nutrition, thus potentially strengthening host immune responses (Min and
Hart, 2003; Min et al., 2004). In addition, tannins may limit the protein available for helminth
nutrition, or may bind to the helminth larvae cuticle, both of which can lead to helminth death
(Athanasiadou et al., 2001). Diet, including consumption of tannins (Walenciak et al., 2002) has a
rapid and reproducible effect on microbiota (David et al., 2014; Sonnenburg and Bäckhed, 2016),
which could in turn effect host resistance to helminths, or effect the microbiota associated with the
helminths themselves (see Chapter 5). However, it is currently unknown if the anthelmintic effect
of tannins, or the tannins themselves, are linked to changes in microbiota following consumption.
Using diet as a means to treat helminth infection, e.g., consuming concentrated tannins, could
179
General discussion
avoid some of the negative impacts associated with treating infection with anthelmintics (e.g.,
anthelmintic-resistance). Initial investigations have shown that dietary supplementation with
chicory roots (which have anthelmintic properties) successfully decreased the burden of one of
two helminth species, but the other helminth species present exhibited a higher helminth burden,
and no significant changes were reported in microbiota composition (Jensen et al., 2011).
However, more research should be conducted on the effect of other tannin-rich foods, or those
with anthelmintic properties, on host microbiota to understand the mechanisms and health
implications associated with this potential method of helminth treatment.
As well as anthelmintics, antibiotics are also routinely administered to treat bacteria infections in
humans, livestock and companion animals (Goossens et al., 2005; Prescott, 2008; Landers et al.,
2012). A plethora of research has established that antibiotics have significant and often long-
lasting impacts on microbiota (Hawrelak and Myers, 2004; Jernberg et al., 2007), and studies
from the 1950s suggest that antibiotic treatment may decrease helminth burden and health (Wells,
1951, 1952a, 1952b; Brown, 1952; Chan, 1952; Salem and el-Allaf, 1969; Hoerauf et al., 1999;
Saint André et al., 2002). However, these studies investigated the effect of antibiotic on infection
with a single helminth species, without taking into consideration the possible subsequent
interactions that may occur between coinfecting helminths (Telfer et al., 2010). In Chapter 4,
antibiotic treatment was found to have a positive effect on prevalence and fecundity of helminths.
Chapter 4 exemplifies the need for long-term and detailed studies on the effect of antibiotic (and
anthelmintic) treatments on components of the gut biome other than those being intentionally
targeted by the treatment: although in previous studies antibiotics initially appeared to be an
effective method of treating helminth infection (Wells, 1951, 1952a, 1952b; Chan, 1952),
implications may include the shedding of more eggs in the environment, which could increase
180
General discussion
possible transmission events. However, although greater in number, the eggs shed in the
environment by helminths within anthelmintic-treated hosts may not necessarily be viable; in
utero egg counts of helminths increased but not significantly so, and it is possible that helminth
eggs were spontaneously discharged (Boyce, 1974) following antibiotic treatment, as opposed to
antibiotic increasing in utero egg production. As such, eggs may have been shed prior to
maturation, thus net infectiousness of helminths may not have changed following antibiotic
treatment. To confirm infectiousness, eggs shed by helminths from antibiotic treated hosts should
be cultured, the subsequent infective larvae inoculated into hosts, and establishment of infection
confirmed.
Future work to complement Chapter 4 could include testing the effect of individual antibiotics on
the helminth community. It was appropriate in Chapter 4 to initially test the effect of a five
antibiotic cocktail on the helminth community; wild, treated mice were subjected to a natural,
bacteria-rich environment, that would rapidly repopulate the microbiota between the weekly
administered doses of antibiotic (compared to humans or livestock, who are usually administered
a daily course of antibiotics). The data provide good evidence that the topic of antibiotic and
helminth interactions are worthy of study. However, there are very few real-life situations in
which five different antibiotics would be administered simultaneously, and investigating the effect
of single antibiotics on a helminth community would not only provide data more applicable to
humans and livestock, but may also help to determine more specifically what drives these
changes; whether it be specific ingredients within different antibiotics, or removal of certain
bacterial groups. In addition, while ampicillin, vancomycin and neomycin (which comprised three
of five of the antibiotic cocktail) are considered important antibiotics to human and animal
medicine, and cover three main classes of antibiotic, there are also many other antibiotics that are
181
General discussion
commonly administered to animals and humans, and which may pose an environmental risk, that
should also be considered for study (for example, see Kemper, 2008), however sample sizes and
experimental design should be carefully considered to avoid the risk of antibiotic resistance in the
environment (Kemper, 2008).
To progress Chapter 4, the knowledge and methods from Chapter 5 on the basal microbiota
associated with helminths could be used to sequence the microbiota of helminths isolated from the
guts of antibiotic treated individuals. Comparing the microbiota of helminths from treated and
untreated mice could shed light on whether antibiotic treatment of the host effects bacteria in the
helminth, and thus which bacteria may be associated with the increases in helminth egg shedding.
In turn, this information could indicate which bacteria within helminths (Chapter 5) are crucial
symbionts; those which are removed from the helminths by antibiotic treatment, and therefore
linked to reduction in abundance, are likely to have crucial functions within the helminth, which it
cannot survive without.
Chapter 5 provided the first characterisation of microbiota associated with multiple species of
helminth from naturally infected wild hosts. It is somewhat surprising that, to date, only two other
studies have used a culture-independent method to characterise the microbiota associated with
parasitic helminths, given that there is a growing body of literature on the microbiota of other
parasitic species (mainly biting ectoparasites), such as ticks (Carpi et al., 2011) and mosquitoes
(e.g., Dong et al., 2009; Chandel et al., 2013). It has long been acknowledged that parasitic
helminths are associated with bacteria, including intracellular symbionts (Anderson et al. 1973;
Mclaren et al., 1975; Kozek and Marroquin, 1977; Franz and Büttner, 1983; Cable and Tinsley
1991 see also Bakke et al. 2006; Morley 2016 for reviews), while filarial nematodes harbour
182
General discussion
Wolbachia spp. infections (Taylor et al., 2005; Duron and Gavotte, 2007; Foster et al., 2014). In
other parasites, mosquito species in particular, gut microbiota has been exploited as possible
means of biocontrol (Dong et al., 2009; Boissière et al., 2012), and while studies on filarial
nematodes have investigated how antibiotics that target Wolbachia can eliminate infection from
within treated hosts (Bandi et al., 2001; Taylor et al., 2005), this is still an underexploited area of
research. The characterisation of microbiota (as achieved in Chapter 5) from more helminth
species, particularly those of veterinary or medical significance, could inform potential
experiments by which to treat helminth infection using antibiotic (following Chapter 4), as a
future revenue of helminth control.
In Chapter 5 alpha diversity of helminths sometimes exceeded that of the gut, and bacterial OTUs
were identified in association with helminths that were not found in gut microbiota, implying that
helminth microbiota can be acquired from additional sources to the host gut, such as the
environment or an intermediate host. It is evident that helminths are associated with a unique
microbial composition, which is not randomly acquired, but instead undergoes community
assembly (Berg et al., 2016), and future work should pinpoint specific microbial groups that are
crucial symbionts of the helminth. This could be achieved by culturing helminths within specific
bacterial media, passaging larvae through gnotobiotic mice, and measuring consequent survival
and fitness of the helminth. Once identified, crucial bacterial symbionts required for helminth
survival could be targeted by antimicrobials to treat helminth infection. However, as results in
Chapter 4 demonstrate, antibiotics used to treat helminth infection would have to be carefully
selected to avoid subsequent increases in fecundity, and potential perpetuation of infection, of
those helminths remaining following treatment.
183
General discussion
Further work could also investigate microbiota associated with specific niches of the helminth. In
Chapter 5, helminths that were sampled for microbiota analyses first underwent a series of
washing steps in a buffer solution (TBS), which is likely to have removed some excess bacteria
from the host gut (as demonstrated by the fact that microbiota composition significantly differed
between host gut section and that of the helminths therein). However external bacteria no doubt
would of remained on the helminth. It could be argued that, much like the mammalian skin
microbiota (e.g., Cogen et al., 2008; Belkaid and Segre, 2014), or mucosal microbiota of
amphibians (Colombo et al., 2015) and fish (Lazado and Caipang, 2014), the microbiota
associated with the external surface of the helminth is of importance to helminth survival and
internal functions. However, in future studies, prior to bacterial sequencing, helminths could be
surface sterilised (perhaps using techniques adapted from Chapter 6 for egg sterilisation), in order
to characterise just those bacteria associated with the internal structures of the helminth. Likewise,
although microbiota characterisation of specific helminth tissue would not be possible for the likes
of Hymenolepis spp., which are mainly composed of a nutrient-absorbing tegument, and thus lack
a digestive system (Lumsden, 1975), laser microdissection (for example, see Ranjit et al. 2006; De
Hertogh et al. 2012) could be employed to isolate microbiota from specific tissues of other
helminth species. Understanding where bacteria are located within helminths may shed light on
how/where bacteria associated with helminths is acquired (e.g., Cable and Tinsley, 1991), as well
as their function within the helminth.
Much of the previous work on microbiota-macrobiota interactions has investigated how
microbiota of the gut affects helminth infection and development (Weinstein et al., 1969;
Bautista-Garfias et al., 2001; Martínez-Gómez et al., 2009; Hayes et al., 2010; Coêlho et al.,
2013), with no consideration paid to the interactions between faecal microbiota and the
184
General discussion
macrobiota. Chapter 6 aimed to understand if faecal microbiota is an extended immune phenotype
of the host by affecting helminth development, by transplanting eggs into faeces from non-self
and self individuals, and monitoring the subsequent probability and rate of egg
hatching/development. Results demonstrated that self faecal microbiota of the host provides
resistance against helminth egg development, but in faeces from another, non-self individual, eggs
are freed from these constraints, and the probability of egg hatching is increased. Given that
helminths are associated with a microbiota that may be acquired from outside of the host (Chapter
5), and many species of helminth egg are shed and undergo development within faeces (Hayes et
al., 2010; Valanparambil et al., 2014) it is not surprising that faecal microbiota does affect
helminth egg development and hatching. These findings may have implications for helminth
control efforts; treatments that alter faecal microbiota composition, e.g., anthelmintics (Chapter 3)
or antibiotics (Chapter 4), may alter the ability of faeces to inhibit parasite development. As
increased hatching probability and rate may equate to more progeny, this could increase the
chance of transmission events, with negative impacts on the host population. As such, studying
the effect of helminth development in faeces from an anthelmintic or antibiotic treated host may
indicate if certain precautions should be made following these treatments to avoid increased
helminth transmission, e.g., faeces removal from pastures (Corbett et al., 2014).
It is important to emphasise that sample sizes in Chapter 3, 4, 6 and to some extent also 5, are very
low, as a result of small rodent populations within the study sites. In addition, despite efforts to
provide repeat data by sampling mice from two different locations (Cavedine and Pietramurata),
the population size at Pietramurata was low. Small sample sizes not only risks that statistical
models (including GLMMs) are overfitted (Subramanian and Simon, 2013), but are also
especially problematic when analysing parasite data, as parasite infections are typically distributed
185
General discussion
throughout the host population such that 20% of individuals harbour 80% of the parasite burden
(Perkins et al., 2003). Consequently, data obtained from a small population size can be
dramatically skewed by just a few heavily parasitised individuals. In addition, the destructive
nature of gut microbiota and adult helminth sampling meant that it was only possible to sample
these parameters at a single time point (at either pre- or post-treatment) for a given individual,
with the consequence that stochastic variation between individuals may have affected results.
Both the helminth and microbial community of the European shag (Phalacrocorax aristotelis) gut
have been successfully characterised using non-destructive endoscope technologies (Newbold et
al., 2017), allowing microbiota and macrobiota to be described for a given individual over
multiple time points, and is a method that could be further exploited for future microbiota-
macrobiota studies (for some animal species) to overcome the limitations associated with
destructive sampling. Data presented within this thesis could also be advanced by combining the
current qualitative data on microbiota composition with that of quantitative data, for example
using qPCR techniques, to quantify how the absolute abundances of OTUs change following
treatment.
To conclude, this thesis identifies the need for animal gut microbiota research to progress to the
study of wild animals, with natural and intact microbiota (Chapter 2). Perturbation of either the
microbiota or macrobiota has wider implications on other components of the gut biome;
anthelmintic treatment was associated with significant changes in taxonomic composition of
faecal microbiota and the OTU abundances therein (Chapter 3). Moreover, antibiotic treatment
was associated with significant increases in helminth egg shedding (Chapter 4). In addition, the
microbiota associated with helminths was characterised, providing the first steps to identifying
possible symbionts that could be targeted for removal to treat helminth infections (Chapter 5).
186
General discussion
Finally, the effect of faecal microbiota on helminth development was investigated, with results
indicating that faecal microbiota from infected hosts can be self-limiting to helminth development
(Chapter 6). Future work should combine the knowledge from Chapter 5 on helminth microbiota
with the effects seen following microbiota and macrobiota perturbation, to tease apart how these
perturbations may function and identify helminth symbionts. In addition, long-term studies of
microbiota-macrobiota interactions would be beneficial, to determine the net effect of such
perturbations, for example whilst in the short-term antibiotic decreases helminth abundances,
treatment also increases egg output of helminths which in the longer term could lead to more
progeny and increased chances of transmission events.
187
General discussion
Bibliography
Aas J, Gessert CE, Bakken JS. (2003). Recurrent Clostridium difficile colitis: case series involving 18patients treated with donor stool administered via a nasogastric tube. Clin Infect Dis 36: 580–585.
Acton Q. (2011). Issues in Life Sciences: Bacteriology, Parasitology, and Virology: 2011 Edition.ScholarlyEditions.
Ahmed HA, Sirohi SK, Dagar SS, Puniya AK, Singh N. (2014). Effect of supplementation of Selenomonasruminantium NDRI-PAPB 4 as direct fed microbial on rumen microbial population in Karan Fries malecalves. Indian J Anim Nutr 31: 20–26.
Aidy SE, Kunze W, Bienenstock J, Kleerebezem M. (2012). The microbiota and the gut-brain axis:insights from the temporal and spatial mucosal alterations during colonisation of the germfree mouseintestine. Benef Microbes 3: 251–9.
Albanese D, Fontana P, Filippo CD, Cavalieri D, Donati C. (2015). MICCA: a complete andaccurate software for taxonomic profiling of metagenomic data. Sci Rep 5: 9743.
Amato KR. (2013). Co-evolution in context: The importance of studying gut microbiomes in wild animals.Microbiome Sci Med 1: 10–29.
Aminov RI. (2010). A brief history of the antibiotic era: lessons learned and challenges for the future.Front Microbiol 1: 134.
Anadón A. (2006). WS14 The EU ban of antibiotics as feed additives (2006): alternatives and consumersafety. J Vet Pharmacol Ther 29: 41–44.
Anders S, Huber W. (2010). Differential expression analysis for sequence count data. Genome Biol 11:R106.
Artis D, Wang ML, Keilbaugh SA, He W, Brenes M, Swain GP, et al. (2004). RELMbeta/FIZZ2 is agoblet cell-specific immune-effector molecule in the gastrointestinal tract. Proc Natl Acad Sci U S A 101:13596–13600.
Arumugam M, Raes J, Pelletier E, Le Paslier D, Yamada T, Mende DR, et al. (2011). Enterotypes of thehuman gut microbiome. Nature 473: 174–180.
Athanasiadou S, Kyriazakis I, Jackson F, Coop RL. (2001). The effects of condensed tanninssupplementation of foods with different protein content on parasitism, food intake and performance ofsheep infected with Trichostrongylus colubriformis. Br J Nutr 86: 697–706.
Bäckhed F, Ley RE, Sonnenburg JL, Peterson DA, Gordon JI. (2005). Host-bacterial mutualism in thehuman intestine. Science 307: 1915–1920.
Bandi C, Trees AJ, Brattig NW. (2001). Wolbachia in filarial nematodes: evolutionary aspects andimplications for the pathogenesis and treatment of filarial diseases. Vet Parasitol 98: 215–238.
Barfod KK, Roggenbuck M, Hansen LH, Schjørring S, Larsen ST, Sørensen SJ, et al. (2013). The murinelung microbiome in relation to the intestinal and vaginal bacterial communities. BMC Microbiol 13: 303.
Barry M. (2007). The tail end of guinea worm - global eradication without a drug or a vaccine. N Engl JMed 356: 2561–2564.
Bartoń K. (2016). MuMIn: Multi-model inference. R package
188
Bibliography
Bates D, Mächler M, Bolker B, Walker S. (2015). Fitting linear mixed-effects models using lme4. J StatSoftw 67: 1–48.
Bäumler AJ, Sperandio V. (2016). Interactions between the microbiota and pathogenic bacteria in the gut.Nature 535: 85–93.
Bautista-Garfias CR, Ixta-Rodríguez O, Martínez-Gómez F, López MG, Aguilar-Figueroa BR. (2001).Effect of viable or dead Lactobacillus casei organisms administered orally to mice on resistance againstTrichinella spiralis infection. Parasite 8: S226–S228.
Bercik P, Collins SM, Verdu EF. (2012). Microbes and the gut-brain axis. Neurogastroenterol Motil 24:405–413.
Berg M, Stenuit B, Ho J, Wang A, Parke C, Knight M, et al. (2016). Assembly of the Caenorhabditiselegans gut microbiota from diverse soil microbial environments. ISME J 10: 1998–2009.
Berland B. (1984). Basic techniques involved in helminth preservation. Syst Parasitol 6: 242–245.
Bethony J, Brooker S, Albonico M, Geiger SM, Loukas A, Diemert D, et al. (2006). Soil-transmittedhelminth infections: ascariasis, trichuriasis, and hookworm. Lancet 367: 1521–1532.
Biagi E, Candela M, Turroni S, Garagnani P, Franceschi C, Brigidi P. (2013). Ageing and gut microbes:Perspectives for health maintenance and longevity. Pharmacol Res 69: 11–20.
Bik EM, Long CD, Armitage GC, Loomer P, Emerson J, Mongodin EF, et al. (2010). Bacterial diversity inthe oral cavity of 10 healthy individuals. ISME J 4: 962–974.
Bilbo SD, Wray GA, Perkins SE, Parker W. (2011). Reconstitution of the human biome as the mostreasonable solution for epidemics of allergic and autoimmune diseases. Med Hypotheses 77: 494–504.
Biswal D, Nandi AP, Chatterjee S. (2016). Helminth-bacteria interaction in the gut of domestic pigeonColumba livia domestica. J Parasit Dis 40: 116–123.
Boissière A, Tchioffo MT, Bachar D, Abate L, Marie A, Nsango SE, et al. (2012). Midgut microbiota ofthe malaria mosquito vector Anopheles gambiae and interactions with Plasmodium falciparum infection.PLoS Pathog 8: e1002742.
Bourzac K. (2014). Microbiome: the bacterial tightrope. Nature 516: S14–S16.
Boyce NPJ. (1974). Biology of Eubothrium salvelini (Cestoda: Pseudophyllidea), a Parasite of JuvenileSockeye Salmon (Oncorhynchus nerka) of Babine Lake, British Columbia. J Fish Res Board Can 31:1735–1742.
Brandt LJ, Aroniadis OC, Mellow M, Kanatzar A, Kelly C, Park T, et al. (2012). Long-term follow-up ofcolonoscopic fecal microbiota transplant for recurrent Clostridium difficile infection. Am J Gastroenterol107: 1079–1087.
Bravo JA, Forsythe P, Chew MV, Escaravage E, Savignac HM, Dinan TG, et al. (2011). Ingestion ofLactobacillus strain regulates emotional behavior and central GABA receptor expression in a mouse viathe vagus nerve. Proc Natl Acad Sci U S A 108: 16050–16055.
Bright M, Bulgheresi S. (2010). A complex journey: transmission of microbial symbionts. Nat RevMicrobiol 8: 218–230.
Brinkman BM, Hildebrand F, Kubica M, Goosens D, Del Favero J, Declercq W, et al. (2011). Caspasedeficiency alters the murine gut microbiome. Cell Death Dis 2: e220.
Broadhurst MJ, Ardeshir A, Kanwar B, Mirpuri J, Gundra UM, Leung JM, et al. (2012). Therapeutichelminth infection of macaques with idiopathic chronic diarrhea alters the inflammatory signature andmucosal microbiota of the colon. PLoS Pathog 8: e1003000.
189

Bibliography
Brockhurst MA, Chapman T, King KC, Mank JE, Paterson S, Hurst GDD. (2014). Running with the RedQueen: the role of biotic conflicts in evolution. Proc R Soc Lond B Biol Sci 281: 20141382.
Brown HW. (1952). The use of antibiotics in the treatment of helminthic infections. Ann N Y Acad Sci 55:1133–1138.
Bryant V. (1973). The life cycle of Nematospiroides dubius, Baylis, 1926 (Nematoda: Heligmosomidae). JHelminthol 47: 263–268.
Buffie CG, Pamer EG. (2013). Microbiota-mediated colonization resistance against intestinal pathogens.Nat Rev Immunol 13: 790–801.
Bundy DAP, Golden MHN. (1987). The impact of host nutrition on gastrointestinal helminth populations.Parasitology 95: 623–635.
Bundy DAP, Kan SP, Rose R. (1988). Age-related prevalence, intensity and frequency distribution ofgastrointestinal helminth infection in urban slum children from Kuala Lumpur, Malaysia. Trans R SocTrop Med Hyg 82: 289–294.
Burg RW, Miller BM, Baker EE, Birnbaum J, Currie SA, Hartman R, et al. (1979). Avermectins, newfamily of potent anthelmintic agents: producing organism and fermentation. Antimicrob Agents Chemother15: 361–367.
Burnham KP, Anderson DR. (2003). Model Selection and Multimodel Inference: A Practical Information-Theoretic Approach. Springer Science & Business Media.
Burton EA, Pendergast AM, Aballay A. (2006). The Caenorhabditis elegans ABL-1 tyrosine kinase isrequired for Shigella flexneripathogenesis. Appl Environ Microbiol 72: 5043–5051.
Bush AO, Lafferty KD, Lotz JM, Shostak AW. (1997). Parasitology meets ecology on its own terms:Margolis et al. revisited. J Parasitol 83: 575–583.
Cabello FC, Godfrey HP, Tomova A, Ivanova L, Dölz H, Millanao A, et al. (2013). Antimicrobial use inaquaculture re-examined: its relevance to antimicrobial resistance and to animal and human health.Environ Microbiol 15: 1917–1942.
Cahenzli J, Balmer ML, McCoy KD. (2012). Microbial – immune cross-talk and regulation of the immunesystem. 138: 12–22.
Camberis M, Le Gros G, Urban Jr. J. (2003). Animal model of Nippostrongylus brasiliensis andHeligmosomoides polygyrus. Curr Protoc Immunol Chapter 19: Unit 19.12.
Cani PD, Neyrinck AM, Fava F, Knauf C, Burcelin RG, Tuohy KM, et al. (2007). Selective increases ofbifidobacteria in gut microflora improve high-fat-diet-induced diabetes in mice through a mechanismassociated with endotoxaemia. Diabetologia 50: 2374–2383.
Carey HV, Walters WA, Knight R. (2013). Seasonal restructuring of the ground squirrel gut microbiotaover the annual hibernation cycle. Am J Physiol 304: R33–R42.
Carpi G, Cagnacci F, Wittekindt NE, Zhao F, Qi J, Tomsho LP, et al. (2011). Metagenomic profile of thebacterial communities associated with Ixodes ricinus ticks. PLoS ONE 6: e25604.
Carvalho BM, Guadagnini D, Tsukumo DML, Schenka AA, Latuf-Filho P, Vassallo J, et al. (2012).Modulation of gut microbiota by antibiotics improves insulin signalling in high-fat fed mice. Diabetologia55: 2823–34.
Cebra JJ. (1999). Influences of microbiota on intestinal immune system development. Am J Clin Nutr 69:1046S–1051S.
Chan KF. (1952). Chemotherapeutic studies on Syphacia obvelata infection in mice. Am J Hyg 56: 22–30.
190

Bibliography
Chan M-S. (1997). The global burden of intestinal nematode infections — Fifty years on. Parasitol Today13: 438–443.
Chandel K, Mendki MJ, Parikh RY, Kulkarni G, Tikar SN, Sukumaran D, et al. (2013). Midgut microbialcommunity of Culex quinquefasciatus mosquito populations from India. PLoS ONE 8: e80453.
Chandler JA, Lang JM, Bhatnagar S, Eisen JA, Kopp A. (2011). Bacterial communities of diverseDrosophila species: ecological context of a host–microbe model system. PLoS Genet 7: e1002272.
Chang J, Wescott RB. (1972). Infectivity, fecundity, and survival of Nematospiroides dubius in gnotobioticmice. Exp Parasitol 32: 327–334.
Charles L, Carbone I, Davies KG, Bird D, Burke M, Kerry BR, et al. (2005). Phylogenetic analysis ofPasteuria penetrans by use of multiple genetic loci. J Bacteriol 187: 5700–5708.
Checkley AM, Chiodini PL, Dockrell DH, Bates I, Thwaites GE, Booth HL, et al. (2010). Eosinophilia inreturning travellers and migrants from the tropics: UK recommendations for investigation and initialmanagement. J Infect 60: 1–20.
Chung H, Pamp SJ, Hill JA, Surana NK, Edelman SM, Troy EB, et al. (2012). Gut immune maturationdepends on colonization with a host-specific microbiota. Cell 149: 1578–1593.
Chylinski C, Boag B, Stear MJ, Cattadori IM. (2009). Effects of host characteristics and parasite intensityon growth and fecundity of Trichostrongylus retortaeformis infections in rabbits. Parasitology 136: 117–123.
Claesson MJ, Jeffery IB, Conde S, Power SE, O’Connor EM, Cusack S, et al. (2012). Gut microbiotacomposition correlates with diet and health in the elderly. Nature 488: 178–184.
Coêlho MDG, Coêlho FA da S, de Mancilha IM. (2013). Probiotic therapy: a promising strategy for thecontrol of canine hookworm. J Parasitol Res 2013: 430413.
Collins MD, Gibson GR. (1999). Probiotics, prebiotics, and synbiotics: approaches for modulating themicrobial ecology of the gut. Am J Clin Nutr 69: 1052S–1057S.
Coop RL, Kyriazakis I. (2001). Influence of host nutrition on the development and consequences ofnematode parasitism in ruminants. Trends Parasitol 17: 325–330.
Cooper P, Walker AW, Reyes J, Chico M, Salter SJ, Vaca M, et al. (2013). Patent human infections withthe whipworm, Trichuris trichiura , are not associated with alterations in the faecal microbiota. PLoS ONE8: e76573.
Corbett CJ, Love S, Moore A, Burden FA, Matthews JB, Denwood MJ. (2014). The effectiveness of faecalremoval methods of pasture management to control the cyathostomin burden of donkeys. Parasit Vectors7: 48.
Coutinho-Abreu IV, Zhu KY, Ramalho-Ortigao M. (2010). Transgenesis and paratransgenesis to controlinsect-borne diseases: current status and future challenges. Parasitol Int 59: 1–8.
Csardi G, Nepusz T. (2006). The igraph software package for complex network research. InterJournalComplex Systems: 1695.
D’Elia R, deSchoolmeester ML, Zeef LA, Wright SH, Pemberton AD, Else KJ. (2009). Expulsion ofTrichuris muris is associated with increased expression of angiogenin 4 in the gut and increased acidity ofmucins within the goblet cell. BMC Genomics 10: 492.
David LA, Maurice CF, Carmody RN, Gootenberg DB, Button JE, Wolfe BE, et al. (2014). Diet rapidlyand reproducibly alters the human gut microbiome. Nature 505: 559–563.
191
Bibliography
Dea-Ayuela MA, Rama-Iñiguez S, Bolás-Fernandez F. (2008). Enhanced susceptibility to Trichuris murisinfection of B10Br mice treated with the probiotic Lactobacillus casei. Int Immunopharmacol 8: 28–35.
Delsuc F, Metcalf JL, Wegener Parfrey L, Song SJ, González A, Knight R. (2014). Convergence of gutmicrobiomes in myrmecophagous mammals. Mol Ecol 23: 1301–1317.
Deplancke B, Gaskins HR. (2001). Microbial modulation of innate defense: goblet cells and the intestinalmucus layer. Am J Clin Nutr 73: 1131S–1141S.
Desai AR, Links MG, Collins SA, Mansfield GS, Drew MD, Van Kessel AG, et al. (2012). Effects ofplant-based diets on the distal gut microbiome of rainbow trout (Oncorhynchus mykiss). Aquaculture 350–353: 134–142.
Deusch O, O’Flynn C, Colyer A, Morris P, Allaway D, Jones PG, et al. (2014). Deep Illumina-basedshotgun sequencing reveals dietary effects on the structure and function of the fecal microbiome ofgrowing kittens. PLoS ONE 9: e101021.
Devine AA, Gonzalez A, Speck KE, Knight R, Helmrath M, Lund PK, et al. (2013). Impact of ileocecalresection and concomitant antibiotics on the microbiome of the murine jejunum and colon. PLoS ONE 8:e73140.
Dewhirst FE, Chen T, Izard J, Paster BJ, Tanner ACR, Yu W-H, et al. (2010). The human oralmicrobiome. J Bacteriol 192: 5002–5017.
Dezfuli BS, Volponi S, Beltrami I, Poulin R. (2002). Intra- and interspecific density-dependent effects ongrowth in helminth parasites of the cormorant, Phalacrocorax carbo sinensis. Parasitology 124: 537–544.
Diaz Heijtz R, Wang S, Anuar F, Qian Y, Björkholm B, Samuelsson A, et al. (2011). Normal gutmicrobiota modulates brain development and behavior. Proc Natl Acad Sci U S A 108: 3047–3052.
Diaz SA, Restif O. (2014). Spread and transmission of bacterial pathogens in experimental populations ofthe nematode Caenorhabditis elegans. Appl Environ Microbiol 80: 5411–5418.
Dibner JJ, Richards JD. (2005). Antibiotic growth promoters in agriculture: history and mode of action.Poult Sci 84: 634–643.
Dicksved J, Halfvarson J, Rosenquist M, Järnerot G, Tysk C, Apajalahti J, et al. (2008). Molecular analysisof the gut microbiota of identical twins with Crohn’s disease. ISME J 2: 716–727.
Dirksen P, Marsh SA, Braker I, Heitland N, Wagner S, Nakad R, et al. (2016). The native microbiome ofthe nematode Caenorhabditis elegans: gateway to a new host-microbiome model. BMC Biol 14: 38.
Ditgen D, Anandarajah EM, Meissner KA, Brattig N, Wrenger C, Liebau E. (2014). Harnessing thehelminth secretome for therapeutic immunomodulators. BioMed Res Int 2014: e964350.
Dominguez-Bello MG, Costello EK, Contreras M, Magris M, Hidalgo G, Fierer N, et al. (2010). Deliverymode shapes the acquisition and structure of the initial microbiota across multiple body habitats innewborns. Proc Natl Acad Sci 107: 11971–11975.
Dong Y, Manfredini F, Dimopoulos G. (2009). Implication of the mosquito midgut microbiota in thedefense against malaria parasites. PLoS Pathog 5: e1000423.
Dunn A, Keymer A. (1986). Factors affecting the reliability of the McMaster technique. J Helminthol 60:260–262.
Duron O, Gavotte L. (2007). Absence of Wolbachia in nonfilariid worms parasitizing arthropods. CurrMicrobiol 55: 193–197.
Edens F. (2003). An alternative for antibiotic use in poultry: probiotics. Rev Bras Ciênc Avícola 5. e-pubahead of print, doi: 10.1590/S1516-635X2003000200001.
192
Bibliography
Eiseman B, Silen W, Bascom GS, Kauvar AJ. (1958). Fecal enema as an adjunct in the treatment ofpseudomembranous enterocolitis. Surgery 44: 854–859.
Elliott DC. (1986). Tapeworm (Moniezia expansa) and its effect on sheep production: The evidencereviewed. N Z Vet J 34: 61–65.
Engel P, Martinson VG, Moran NA. (2012). Functional diversity within the simple gut microbiota of thehoney bee. Proc Natl Acad Sci U S A 109: 11002–7.
Engelkirk PG, Duben-Engelkirk JL, Burton GRW. (2011). Burton’s microbiology for the health sciences.9th ed. Wolters Kluwer Health/Lippincott Williams & Wilkins: Philadelphia.
Fenton A, Viney ME, Lello J. (2010). Detecting interspecific macroparasite interactions from ecologicaldata: patterns and process. Ecol Lett 13: 606–615.
Ferrari N, Cattadori IM, Nespereira J, Rizzoli A, Hudson PJ. (2004). The role of host sex in parasitedynamics: field experiments on the yellow-necked mouse Apodemus flavicollis. Ecol Lett 7: 88–94.
Ferrari N, Cattadori IM, Rizzoli A, Hudson PJ. (2009). Heligmosomoides polygyrus reduces infestation ofIxodes ricinus in free-living yellow-necked mice, Apodemus flavicollis. Parasitology 136: 305–316.
Ferrari N. (2005). Macroparasite transmission and dynamics in Apodemus flavicollis. Ph. D. Thesis,University of Stirling: UK. http://hdl.handle.net/1893/105.
Finegold SM, Molitoris D, Song Y, Liu C, Vaisanen M-L, Bolte E, et al. (2002). Gastrointestinalmicroflora studies in late-onset autism. Clin Infect Dis 35: S6–S16.
Fisher RA. (1937). The Design of Experiments. Second Edition. Oliver and Boyd: London.
Forman RA, deSchoolmeester ML, Hurst RJM, Wright SH, Pemberton AD, Else KJ. (2012). The gobletcell is the cellular source of the anti-microbial angiogenin 4 in the large intestine post Trichuris murisinfection. PLoS ONE 7: e42248.
Foster JM, Landmann F, Ford L, Johnston KL, Elsasser SC, Schulte-Hostedde AI, et al. (2014). Absenceof Wolbachia endobacteria in the human parasitic nematode Dracunculus medinensis and two relatedDracunculus species infecting wildlife. Parasit Vectors 7: 140.
Fournier DA, Skaug HJ, Ancheta J, Ianelli J, Magnusson A, Maunder MN, et al. (2012). AD ModelBuilder: using automatic differentiation for statistical inference of highly parameterized complex nonlinearmodels. Optim Methods Softw 27: 233–249.
Francino MP. (2016). Antibiotics and the human gut microbiome: dysbioses and accumulation ofresistances. Front Microbiol 6: 1543.
Franz M, Büttner DW. (1983). The fine structure of adult Onchocerca volvulus IV. The hypodermal chordsof the female worm. Tropenmed Parasitol 34: 122–128.
Fricke WF, Song Y, Wang A-J, Smith A, Grinchuk V, Pei C, et al. (2015). Type 2 immunity-dependentreduction of segmented filamentous bacteria in mice infected with the helminthic parasite Nippostrongylusbrasiliensis. Microbiome 3: 40.
Fuller R. (1989). Probiotics in man and animals. J Appl Microbiol 66: 365–378.
Gareau MG, Wine E, Rodrigues DM, Cho JH, Whary MT, Philpott DJ, et al. (2011). Bacterial infectioncauses stress-induced memory dysfunction in mice. Gut 60: 307–317.
Garner JP. (2014). The significance of meaning: why do over 90% of behavioral neuroscience results failto translate to humans, and what can we do to fix it? ILAR J 55: 438–456.
193
Bibliography
George DT, Behm CA, Hall DH, Mathesius U, Rug M, Nguyen KCQ, et al. (2014). Shigella flexneriinfection in Caenorhabditis elegans: cytopathological examination and identification of host responses.PLoS ONE 9: e106085.
Geraylou Z, Souffreau C, Rurangwa E, De Meester L, Courtin CM, Delcour JA, et al. (2013). Effects ofdietary arabinoxylan-oligosaccharides (AXOS) and endogenous probiotics on the growth performance,non-specific immunity and gut microbiota of juvenile Siberian sturgeon (Acipenser baerii). Fish ShellfishImmunol 35: 766–775.
Ghazal AM, Avery RA. (1976). Observations on coprophagy and the transmission of Hymenolepis nanainfections in mice. Parasitology 73: 39–45.
Gibson GR, Beatty ER, Wang X, Cummings JH. (1995). Selective stimulation of bifidobacteria in thehuman colon by oligofructose and inulin. Gastroenterology 108: 975–982.
Gibson GR, Probert HM, Van Loo J, Rastall RA, Roberfroid MB. (2004). Dietary modulation of thehuman colonic microbiota: updating the concept of prebiotics. Nutr Res Rev 17: 259–275.
Gilbert JA, Jansson JK, Knight R. (2014). The Earth Microbiome project: successes and aspirations. BMCBiol 12. e-pub ahead of print, doi: 10.1186/s12915-014-0069-1.
Gill S, Pop M, DeBoy R, Eckburg P, Turnbaugh PJ, Samuel B, et al. (2006). Metagenomic analysis of thehuman distal gut microbiome. Science 312: 1355–1359.
Glendinning L, Nausch N, Free A, Taylor DW, Mutapi F. (2014). The microbiota and helminths: sharingthe same niche in the human host. Parasitology 141: 1255–1271.
Gonçalves ALR, Rocha CA, Gonzaga HT, Gonçalves-Pires M do R de F, Ueta MT, Costa-Cruz JM.(2012). Specific IgG and IgA to larvae, parthenogenetic females, and eggs of Strongyloides venezuelensisin the immunodiagnosis of human strongyloidiasis. Diagn Microbiol Infect Dis 72: 79–84.
Goossens H, Ferech M, Vander Stichele R, Elseviers M, ESAC Project Group. (2005). Outpatientantibiotic use in Europe and association with resistance: a cross-national database study. Lancet Lond Engl365: 579–587.
Gordon JI. (2012). Honor thy gut symbionts redux. Science 336: 1251–1253.
Grice EA, Kong HH, Conlan S, Deming CB, Davis J, Young AC, et al. (2009). Topographical andtemporal diversity of the human skin microbiome. Science 324: 1190–1192.
Grzybek M, Bajer A, Behnke-Borowczyk J, Al-Sarraf M, Behnke JM. (2015). Female host sex-biasedparasitism with the rodent stomach nematode Mastophorus muris in wild bank voles (Myodes glareolus).Parasitol Res 114: 523–533.
Gurnell J, Flowerdew JR, Mammal Society. (1990). Live Trapping Small Mammals: A Practical Guide.Mammal Society.
Hauser AR. (2012). Antibiotic basics for clinicians: the ABCs of choosing the right antibacterial agent.Second edition. Wolters Kluwer Health/Lippincott Williams & Wilkins: Philadelphia.
Hawrelak JA, Myers SP. (2004). The causes of intestinal dysbiosis: a review. Altern Med Rev J Clin Ther9: 180–197.
Hayes KS, Bancroft AJ, Goldrick M, Portsmouth C, Roberts IS, Grencis RK. (2010). Exploitation of theintestinal microflora by the parasitic nematode Trichuris muris. Science 328: 1391–1394.
Hewitson JP, Grainger JR, Maizels RM. (2009). Helminth immunoregulation: The role of parasite secretedproteins in modulating host immunity. Mol Biochem Parasitol 167: 1–11.
194
Bibliography
Hoerauf A, Nissen-Pähle K, Schmetz C, Henkle-Dührsen K, Blaxter ML, Büttner DW, et al. (1999).Tetracycline therapy targets intracellular bacteria in the filarial nematode Litomosoides sigmodontis andresults in filarial infertility. J Clin Invest 103: 11–18.
Hold GL, Smith M, Grange C, Watt ER, El-Omar EM, Mukhopadhya I. (2014). Role of the gut microbiotain inflammatory bowel disease pathogenesis: What have we learnt in the past 10 years? World JGastroenterol 20: 1192–1210.
Hoseinifar SH, Sharifian M, Vesaghi MJ, Khalili M, Esteban MÁ. (2014). The effects of dietaryxylooligosaccharide on mucosal parameters, intestinal microbiota and morphology and growthperformance of Caspian white fish (Rutilus frisii kutum) fry. Fish Shellfish Immunol 39: 231–6.
Hosokawa T, Kikuchi Y, Shimada M, Fukatsu T. (2008). Symbiont acquisition alters behaviour of stinkbugnymphs. Biol Lett 4: 45–48.
Hotez PJ, Brindley PJ, Bethony JM, King CH, Pearce EJ, Jacobson J. (2008). Helminth infections: thegreat neglected tropical diseases. J Clin Invest 118: 1311–1321.
Hotez PJ, Bundy DAP, Beegle K, Brooker S, Drake L, de Silva N, et al. (2006). Helminth Infections: Soil-transmitted Helminth Infections and Schistosomiasis. In: Jamison DT, Breman JG, Measham AR, AlleyneG, Claeson M, Evans DB, et al. (eds). Disease Control Priorities in Developing Countries. The WorldBank and Oxford University Press: Washington (DC), pp 467–482.
Hou JK, Abraham B, El-Serag H. (2011). Dietary intake and risk of developing inflammatory boweldisease: a systematic review of the literature. Am J Gastroenterol 106: 563–573.
Houlden A, Hayes KS, Bancroft AJ, Worthington JJ, Wang P, Grencis RK, et al. (2015). ChronicTrichuris muris infection in C57BL/6 mice causes significant changes in host microbiota and metabolome:effects reversed by pathogen clearance. PLoS ONE 10: e0125945.
Hrncir T, Stepankova R, Kozakova H, Hudcovic T, Tlaskalova-Hogenova H. (2008). Gut microbiota andlipopolysaccharide content of the diet influence development of regulatory T cells: studies in germ-freemice. BMC Immunol 9: 65.
Hufeldt MR, Nielsen DS, Vogensen FK, Midtvedt T, Hansen AK. (2010). Variation in the gut microbiotaof laboratory mice is related to both genetic and environmental factors. Comp Med 60: 336–347.
Huffman MA, Seifu M. (1989). Observations on the illness and consumption of a possibly medicinal plantVernonia amygdalina (Del.), by a wild chimpanzee in the Mahale Mountains National Park, Tanzania.Primates 30: 51–63.
Hurst RJM, Else KJ. (2013). Trichuris muris research revisited: a journey through time. Parasitology 140:1325–1339.
Jakobsson HE, Abrahamsson TR, Jenmalm MC, Harris K, Quince C, Jernberg C, et al. (2014). Decreasedgut microbiota diversity, delayed Bacteroidetes colonisation and reduced Th1 responses in infantsdelivered by Caesarean section. Gut 63: 559–566.
Jakobsson HE, Jernberg C, Andersson AF, Sjölund-Karlsson M, Jansson JK, Engstrand L. (2010). Short-term antibiotic treatment has differing long-term impacts on the human throat and gut microbiome. PLoSONE 5: e9836.
Jeffery IB, Claesson MJ, O’Toole PW, Shanahan F. (2012). Categorization of the gut microbiota:enterotypes or gradients? Nat Rev Microbiol 10: 591–592.
Jensen AN, Mejer H, Mølbak L, Langkjær M, Jensen TK, Angen Ø, et al. (2011). The effect of a diet withfructan-rich chicory roots on intestinal helminths and microbiota with special focus on Bifidobacteria andCampylobacter in piglets around weaning. Animal 5: 851–860.
195
Bibliography
Jernberg C, Löfmark S, Edlund C, Jansson JK. (2007). Long-term ecological impacts of antibioticadministration on the human intestinal microbiota. ISME J 1: 56–66.
Jia S, Zhang X, Zhang G, Yin A, Zhang S, Li F, et al. (2013). Seasonally variable intestinal metagenomesof the red palm weevil (Rhynchophorus ferrugineus). Environ Microbiol 15: 3020–3029.
Jiang H-Y, Zhao N, Zhang Q-L, Gao J-M, Liu L-L, Wu T-F, et al. (2016). Intestinal microbes influence thesurvival, reproduction and protein profile of Trichinella spiralis in vitro. Int J Parasitol 46: 51–58.
Jiménez E, Marín ML, Martín R, Odriozola JM, Olivares M, Xaus J, et al. (2008). Is meconium fromhealthy newborns actually sterile? Res Microbiol 159: 187–193.
Johnston CE, Bradley JE, Behnke JM, Matthews KR, Else KJ. (2005). Isolates of Trichuris muris elicitdifferent adaptive immune responses in their murine host. Parasite Immunol 27: 69–78.
Johnston CJC, Robertson E, Harcus Y, Grainger JR, Coakley G, Smyth DJ, et al. (2015). Cultivation ofHeligmosomoides polygyrus: An immunomodulatory nematode parasite and its secreted products. JoVE JVis Exp e52412–e52412.
Johnston-Monje D, Raizada MN. (2011). Conservation and diversity of seed associated endophytes in Zeaacross boundaries of evolution, ethnography and ecology. PLoS ONE 6: e20396.
Jones RT, Vetter SM, Montenieiri J, Holmes J, Bernhardt SA, Gage KL. (2013). Yersinia pestis infectionand laboratory conditions alter flea-associated bacterial communities. ISME J 7: 224–228.
Jørgensen LT, Leathwick DM, Charleston WA, Godfrey PL, Vlassoff A, Sutherland IA. (1998). Variationbetween hosts in the developmental success of the free-living stages of trichostrongyle infections of sheep.Int J Parasitol 28: 1347–1352.
Kabat AM, Srinivasan N, Maloy KJ. (2014). Modulation of immune development and function byintestinal microbiota. Trends Immunol 35: 507–517.
Kamada N, Núñez G. (2013). Role of the gut microbiota in the development and function of lymphoidcells. J Immunol 190: 1389–1395.
Kerboeuf D, Lewis JW. (1987). Rhythmic behaviour of intestinal helminths in rodents. Mammal Rev 17:127–134.
Kesika P, Karutha Pandian S, Balamurugan K. (2011). Analysis of Shigella flexneri-mediated infections inmodel organism Caenorhabditis elegans. Scand J Infect Dis 43: 286–295.
Khachatryan ZA, Ktsoyan ZA, Manukyan GP, Kelly D, Ghazaryan KA, Aminov RI. (2008). Predominantrole of host genetics in controlling the composition of gut microbiota. PLoS ONE 3: e3064.
Kilkkinen A, Pietinen P, Klaukka T, Virtamo J, Korhonen P, Adlercreutz H. (2002). Use of oralantimicrobials decreases serum enterolactone concentration. Am J Epidemiol 155: 472–477.
Koch H, Schmid-Hempel P. (2011). Socially transmitted gut microbiota protect bumble bees against anintestinal parasite. Proc Natl Acad Sci 108: 19288–19292.
Koch H, Schmid-Hempel P. (2012). Gut microbiota instead of host genotype drive the specificity in theinteraction of a natural host-parasite system. Ecol Lett 15: 1095–1103.
Koenig JE, Spor A, Scalfone N, Fricker AD, Stombaugh J, Knight R, et al. (2011). Succession of microbialconsortia in the developing infant gut microbiome. Proc Natl Acad Sci U S A 108: 4578–4585.
Kohl KD, Dearing MD. (2014). Wild-caught rodents retain a majority of their natural gut microbiota uponentrance into captivity. Environ Microbiol Rep 6: 191–195.
Kopper JJ, Mansfield LS. (2010). Development of improved methods for delivery of Trichuris muris to thelaboratory mouse. Parasitol Res 107: 1103–1113.
196
Bibliography
Kotze AC, O’Grady J, Gough JM, Pearson R, Bagnall NH, Kemp DH, et al. (2005). Toxicity of Bacillusthuringiensis to parasitic and free-living life-stages of nematode parasites of livestock. Int J Parasitol 35:1013–1022.
Koyama K. (2013). Evidence for bacteria-independent hatching of Trichuris muris eggs. Parasitol Res112: 1537–1542.
Kozek WJ, Marroquin HF. (1977). Intracytoplasmic bacteria in Onchocerca volvulus. Am J Trop Med Hyg26: 663–678.
Kreisinger J, Bastien G, Hauffe HC, Marchesi J, Perkins SE. (2015). Interactions between multiplehelminths and the gut microbiota in wild rodents. Philos Trans R Soc Lond B Biol Sci 370. e-pub ahead ofprint, doi: 10.1098/rstb.2014.0295.
Kristin A, Miranda H. (2013). The root microbiota—a fingerprint in the soil? Plant Soil 370: 671–686.
Kumazawa H. (1992). A kinetic study of egg production, fecal egg output, and the rate of proglottidshedding in Hymenolepis nana. J Parasitol 78: 498–504.
Kuss SK, Best GT, Etheredge CA, Pruijssers AJ, Frierson JM, Hooper LV, et al. (2011). Intestinalmicrobiota promote enteric virus replication and systemic pathogenesis. Science 334: 249–252.
Lacharme-Lora L, Perkins SE, Humphrey TJ, Hudson PJ, Salisbury V. (2009a). Use of bioluminescentbacterial biosensors to investigate the role of free-living helminths as reservoirs and vectors of Salmonella.Environ Microbiol Rep 1: 198–207.
Lacharme-Lora L, Salisbury V, Humphrey TJ, Stafford K, Perkins SE. (2009). Bacteria isolated fromparasitic nematodes - a potential novel vector of pathogens? Environ Health 8: S17.
Lafferty KD, Hathaway SA, Wegmann AS, Shipley FS, Backlin AR, Helm J, et al. (2010). Stomachnematodes (Mastophorus muris) in rats (Rattus rattus) are associated with coconut (Cocos nucifera) habitatat Palmyra Atoll. J Parasitol 96: 16–20.
Lagrue C, Poulin R. (2008). Intra- and interspecific competition among helminth parasites: effects onCoitocaecum parvum life history strategy, size and fecundity. Int J Parasitol 38: 1435–1444.
Lambert KA, Pathak AK, Cattadori IM. (2015). Does host immunity influence helminth egg hatchability inthe environment? J Helminthol 89: 446–452.
Landers TF, Cohen B, Wittum TE, Larson EL. (2012). A review of antibiotic use in food animals:perspective, policy, and potential. Public Health Rep 127: 4–22.
Le Floc’h N, Knudsen C, Gidenne T, Montagne L, Merlot E, Zemb O. (2014). Impact of feed restriction onhealth, digestion and faecal microbiota of growing pigs housed in good or poor hygiene conditions. Animal8: 1632–1642.
Lee SC, Tang MS, Lim YAL, Choy SH, Kurtz ZD, Cox LM, et al. (2014). Helminth colonization isassociated with increased diversity of the gut microbiota. PLoS Negl Trop Dis 8: e2880.
Legesse M, Erko B. (2004). Zoonotic intestinal parasites in Papio anubis (baboon) and Cercopithecusaethiops (vervet) from four localities in Ethiopia. Acta Trop 90: 231–236.
Lello J, Boag B, Fenton A, Stevenson IR, Hudson PJ. (2004). Competition and mutualism among the guthelminths of a mammalian host. Nature 428: 840–844.
Lello J, Hussell T. (2008). Functional group/guild modelling of inter-specific pathogen interactions: apotential tool for predicting the consequences of co-infection. Parasitology 135: 825–839.
Lello J, Knopp S, Mohammed KA, Khamis IS, Utzinger J, Viney ME. (2013). The relative contribution ofco-infection to focal infection risk in children. Proc R Soc B Biol Sci 280: 20122813.
197
Bibliography
Leung JM, Hong CTT, Trung NHD, Thi HN, Minh CNN, Thi TV, et al. (2016). The impact of albendazoletreatment on the incidence of viral- and bacterial-induced diarrhea in school children in southern Vietnam:study protocol for a randomized controlled trial. Trials 17: 279.
Ley RE, Bäckhed F, Turnbaugh P, Lozupone CA, Knight RD, Gordon JI. (2005). Obesity alters gutmicrobial ecology. Proc Natl Acad Sci U S A 102: 11070–11075.
Ley RE, Hamady M, Lozupone C, Turnbaugh PJ, Ramey RR, Bircher JS, et al. (2008). Evolution ofmammals and their gut microbes. Science 320: 1647–1651.
Leydesdorff L. (2007). Betweenness centrality as an indicator of the interdisciplinarity of scientificjournals. J Assoc Inf Sci Technol 58: 1303–1319.
Li Q, Zhang Q, Wang C, Tang C, Zhang Y, Li N, et al. (2011). Fish oil enhances recovery of intestinalmicrobiota and epithelial integrity in chronic rejection of intestinal transplant. PLoS ONE 6: e20460.
Li RW, Wu S, Li W, Navarro K, Couch RD, Hill D, et al. (2012). Alterations in the porcine colonmicrobiota induced by the gastrointestinal nematode Trichuris suis. Infect Immun 80: 2150–2157.
Lim LE, Vilchèze C, Ng C, Jacobs Jr. WR, Ramón-García S, Thompson CJ. (2013). Anthelminticavermectins kill Mycobacterium tuberculosis, including multidrug-resistant clinical strains. AntimicrobAgents Chemother 57: 1040–1046.
Lindow SE, Brandl MT. (2003). Microbiology of the phyllosphere. Appl Environ Microbiol 69: 1875–1883.
Lisonbee LD, Villalba JJ, Provenza FD, Hall JO. (2009). Tannins and self-medication: Implications forsustainable parasite control in herbivores. Behav Processes 82: 184–189.
Loukas A, Prociv P. (2001). Immune responses in hookworm infections. Clin Microbiol Rev 14: 689–703.
Love MI, Huber W, Anders S. (2014). Moderated estimation of fold change and dispersion for RNA-seqdata with DESeq2. Genome Biol 15: 550.
Lozupone C, Knight R. (2005). UniFrac: a new phylogenetic method for comparing microbialcommunities. Appl Environ Microbiol 71: 8228–8235.
Lozupone CA, Stombaugh JI, Gordon JI, Jansson JK, Knight R. (2012). Diversity, stability and resilienceof the human gut microbiota. Nature 489: 220–230.
MacConnachie AA, Fox R, Kennedy DR, Seaton RA. (2009). Faecal transplant for recurrent Clostridiumdifficile-associated diarrhoea: a UK case series. QJM 102: 781–784.
Maizels RM, Balic A, Gomez-Escobar N, Nair M, Taylor MD, Allen JE. (2004). Helminth parasites--masters of regulation. Immunol Rev 201: 89–116.
Marchesi JR, Ravel J. (2015). The vocabulary of microbiome research: a proposal. Microbiome 3. e-pubahead of print, doi: 10.1186/s40168-015-0094-5.
Markle JGM, Frank DN, Mortin-Toth S, Robertson CE, Feazel LM, Rolle-Kampczyk U, et al. (2013). Sexdifferences in the gut microbiome drive hormone-dependent regulation of autoimmunity. Science 339:1084–1088.
Martínez-Gómez F, Santiago-Rosales R, Ramón Bautista-Garfias C. (2009). Effect of Lactobacillus caseiShirota strain intraperitoneal administration in CD1 mice on the establishment of Trichinella spiralis adultworms and on IgA anti-T. spiralis production. Vet Parasitol 162: 171–175.
Mathis A, Wild P, Boettger EC, Kapel CMO, Deplazes P. (2005). Mitochondrial ribosome as the target forthe macrolide antibiotic clarithromycin in the helminth Echinococcus multilocularis. Antimicrob AgentsChemother 49: 3251–3255.
198
Bibliography
Maurice CF, Knowles SC, Ladau J, Pollard KS, Fenton A, Pedersen AB, et al. (2015). Marked seasonalvariation in the wild mouse gut microbiota. ISME J 9: 2423–2434.
McEwen SA, Fedorka-Cray PJ. (2002). Antimicrobial use and resistance in animals. Clin Infect Dis 34:S93–S106.
McGuire AL, Colgrove J, Whitney SN, Diaz CM, Bustillos D, Versalovic J. (2008). Ethical, legal, andsocial considerations in conducting the Human Microbiome Project. Genome Res 18: 1861–1864.
McKenney EA, Williamson L, Yoder AD, Rawls JF, Bilbo SD, Parker W. (2015). Alteration of the ratcecal microbiome during colonization with the helminth Hymenolepis diminuta. Gut Microbes 6: 182–193.
Mclaren DJ, Worms MJ, Laurence BR, Simpson MG. (1975). Micro-organisms in filarial larvae(Nematoda). Trans R Soc Trop Med Hyg 69: 509–514.
McMurdie PJ, Holmes S. (2013). phyloseq: An R package for reproducible interactive analysis andgraphics of microbiome census data. PLoS ONE 8: e61217.
Michael E, Bundy DA. (1989). Density dependence in establishment, growth and worm fecundity inintestinal helminthiasis: the population biology of Trichuris muris (Nematoda) infection in CBA/Ca mice.Parasitology 98: 451–458.
Min BR, Hart SP. (2003). Tannins for suppression of internal parasites. J Anim Sci 81: E102–E109.
Min BR, Pomroy WE, Hart SP, Sahlu T. (2004). The effect of short-term consumption of a foragecontaining condensed tannins on gastro-intestinal nematode parasite infections in grazing wether goats.Small Rumin Res 51: 279–283.
Minard G, Mavingui P, Moro CV. (2013). Diversity and function of bacterial microbiota in the mosquitoholobiont. Parasit Vectors 6: 146.
Montgomery SS, Montgomery WI. (1988). Cyclic and non-cyclic dynamics in populations of the helminthparasites of wood mice, Apodemus sylvaticus. J Helminthol 62: 78–90.
Morgan ER, Clare EL, Jefferies R, Stevens JR. (2012). Parasite epidemiology in a changing world: canmolecular phylogeography help us tell the wood from the trees? Parasitology 139: 1924–1938.
Morgan ER, Milner-Gulland EJ, Torgerson PR, Medley GF. (2004). Ruminating on complexity:macroparasites of wildlife and livestock. Trends Ecol Evol 19: 181–188.
Mosca A, Leclerc M, Hugot JP. (2016). Gut microbiota diversity and human diseases: should wereintroduce key predators in our ecosystem? Front Microbiol 7: 455.
Moxon JV, Flynn RJ, Golden O, Hamilton JV, Mulcahy G, Brophy PM. (2010). Immune responsesdirected at egg proteins during experimental infection with the liver fluke Fasciola hepatica. ParasiteImmunol 32: 111–124.
Mueller S, Saunier K, Hanisch C, Norin E, Alm L, Midtvedt T, et al. (2006). Differences in fecalmicrobiota in different European study populations in relation to age, gender, and country: a cross-sectional study. Appl Environ Microbiol 72: 1027–1033.
Murray M, Jennings FW, Armour J. (1970). Bovine ostertagiasis: structure, function and mode ofdifferentiation of the bovine gastric mucosa and kinetics of the worm loss. Res Vet Sci 11: 417–427.
Naidu AS, Bidlack WR, Clemens RA. (1999). Probiotic spectra of lactic acid bacteria (LAB). Crit RevFood Sci Nutr 39: 13–126.
Nair MG, Guild KJ, Du Y, Zaph C, Yancopoulos GD, Valenzuela DM, et al. (2008). Goblet cell-derivedresistin-like molecule β augments CD4+ T cell production of IFN-γ and infection-induced intestinalinflammation. J Immunol 181: 4709.
199
Bibliography
Nelson TM, Rogers TL, Carlini AR, Brown MV. (2013). Diet and phylogeny shape the gut microbiota ofAntarctic seals: a comparison of wild and captive animals. Environ Microbiol 15: 1132–45.
Neu J, Rushing J. (2011). Cesarean versus vaginal delivery: long-term infant outcomes and the hygienehypothesis. Clin Perinatol 38: 321–331.
Nguyen TLA, Vieira-Silva S, Liston A, Raes J. (2015). How informative is the mouse for human gutmicrobiota research? Dis Model Mech 8: 1–16.
Nielsen MK. (2009). Restrictions of anthelmintic usage: perspectives and potential consequences. ParasitVectors 2: S7.
Niezen JH, Charleston W a. G, Robertson HA, Shelton D, Waghorn GC, Green R. (2002). The effect offeeding sulla (Hedysarum coronarium) or lucerne (Medicago sativa) on lamb parasite burdens anddevelopment of immunity to gastrointestinal nematodes. Vet Parasitol 105: 229–245.
Ogilvie LA, Jones BV. (2015). The human gut virome: a multifaceted majority. Front Microbiol 6: 918.
Oliver KM, Smith AH, Russell JA. (2014). Defensive symbiosis in the real world – advancing ecologicalstudies of heritable, protective bacteria in aphids and beyond. Funct Ecol 28: 341–355.
Ostlind DA, Nartowicz MA, Mickle WG. (1985). Efficacy of ivermectin against Syphacia obvelata(Nematoda) in mice. J Helminthol 59: 257–261.
Paine RT. (1966). Food web complexity and species diversity. Am Nat 100: 65–75.
Palmer C, Bik EM, DiGiulio DB, Relman DA, Brown PO. (2007). Development of the human infantintestinal microbiota. PLoS Biol 5: e177.
Parvez S, Malik KA, Ah Kang S, Kim H-Y. (2006). Probiotics and their fermented food products arebeneficial for health. J Appl Microbiol 100: 1171–1185.
Patterson JA, Burkholder KM. (2003). Application of prebiotics and probiotics in poultry production.Poult Sci 82: 627–631.
Pearce EJ, M Kane C, Sun J, J Taylor J, McKee AS, Cervi L. (2004). Th2 response polarization duringinfection with the helminth parasite Schistosoma mansoni. Immunol Rev 201: 117–126.
Pedersen AB, Babayan S a. (2011). Wild immunology. Mol Ecol 20: 872–880.
Pédron T, Mulet C, Dauga C, Frangeul L, Chervaux C, Grompone G, et al. (2012). A crypt-specific coremicrobiota resides in the mouse colon. mBio 3: e00116–12.
Peng J, Narasimhan S, Marchesi JR, Benson A, Wong FS, Wen L. (2014). Long term effect of gutmicrobiota transfer on diabetes development. J Autoimmun 53: 85–94.
Perkins SE, Cattadori IM, Tagliapietra V, Rizzoli AP, Hudson PJ. (2003). Empirical evidence for key hostsin persistence of a tick-borne disease. Int J Parasitol 33: 909–917.
Perkins SE, Fenton A. (2006). Helminths as vectors of pathogens in vertebrate hosts: A theoreticalapproach. Int J Parasitol 36: 887–894.
Perkins SE, Ferrari MF, Hudson PJ. (2008). The effects of social structure and sex-biased transmission onmacroparasite infection. Parasitology 135: 1561–1569.
Peterson J, Garges S, Giovanni M, McInnes P, Wang L, Schloss JA, et al. (2009). The NIH HumanMicrobiome Project. Genome Res 19: 2317–2323.
Pettengill MA, Lam VW, Ollawa I, Marques-da-Silva C, Ojcius DM. (2012). Ivermectin inhibits growth ofChlamydia trachomatis in epithelial cells. PLoS ONE 7: e48456.
200
Bibliography
Phillips ML. (2009). Gut reaction: environmental effects on the human microbiota. Environ HealthPerspect 117: A198–A205.
Plieskatt JL, Deenonpoe R, Mulvenna JP, Krause L, Sripa B, Bethony JM, et al. (2013). Infection with thecarcinogenic liver fluke Opisthorchis viverrini modifies intestinal and biliary microbiome. FASEB J 27:4572–4584.
Pourabedin M, Xu Z, Baurhoo B, Chevaux E, Zhao X. (2014). Effects of mannan oligosaccharide andvirginiamycin on the cecal microbial community and intestinal morphology of chickens raised undersuboptimal conditions. Can J Microbiol 60: 255–266.
Prescott JF. (2008). Antimicrobial use in food and companion animals. Anim Health Res Rev 9: 127–133.
Prince MJR. (1950). Studies on the life cycle of Syphacia obvelata, a common nematode parasite of rats.Science 111: 66–67.
Pritchett KR, Johnston NA. (2002). A review of treatments for the eradication of pinworm infections fromlaboratory rodent colonies. J Am Assoc Lab Anim Sci 41: 36–46.
Pullola T, Vierimaa J, Saari S, Virtala A-M, Nikander S, Sukura A. (2006). Canine intestinal helminths inFinland: prevalence, risk factors and endoparasite control practices. Vet Parasitol 140: 321–326.
Qin J, Li Y, Cai Z, Li S, Zhu J, Zhang F, et al. (2012). A metagenome-wide association study of gutmicrobiota in type 2 diabetes. Nature 490: 55–60.
Ramirez JL, Souza-Neto J, Torres Cosme R, Rovira J, Ortiz A, Pascale JM, et al. (2012). Reciprocaltripartite interactions between the Aedes aegypti midgut microbiota, innate immune system and denguevirus influences vector competence. PLoS Negl Trop Dis 6. e-pub ahead of print, doi:10.1371/journal.pntd.0001561.
Rausch S, Held J, Fischer A, Heimesaat MM, Kühl AA, Bereswill S, et al. (2013). Small intestinalnematode infection of mice is associated with increased enterobacterial loads alongside the intestinal tract.PLoS ONE 8: e74026.
Rawls JF, Mahowald MA, Ley RE, Gordon JI. (2006). Reciprocal gut microbiota transplants fromzebrafish and mice to germ-free recipients reveal host habitat selection. Cell 127: 423–433.
Reid G, Howard J, Gan BS. (2001). Can bacterial interference prevent infection? Trends Microbiol 9: 424–428.
Reid G, Sobel JD. (1987). Bacterial adherence in the pathogenesis of urinary tract infection: a review. RevInfect Dis 9: 470–487.
Reikvam DH, Erofeev A, Sandvik A, Grcic V, Jahnsen FL, Gaustad P, et al. (2011). Depletion of murineintestinal microbiota: effects on gut mucosa and epithelial gene expression. PLoS ONE 6: e17996.
Ren Z, Cui G, Lu H, Chen X, Jiang J, Liu H, et al. (2013). Liver ischemic preconditioning (IPC) improvesintestinal microbiota following liver transplantation in rats through 16s rDNA-based analysis of microbialstructure shift. PLoS ONE 8: e75950.
Reynolds LA, Finlay BB, Maizels RM. (2015). Cohabitation in the intestine: interactions between helminthparasites, bacterial microbiota and host immunity. J Immunol 195: 4059–4066.
Reynolds LA, Smith KA, Filbey KJ, Harcus Y, Hewitson JP, Redpath SA, et al. (2014). Commensal-pathogen interactions in the intestinal tract. Gut Microbes 5: 522–532.
Roggenbuck M, Sauer C, Poulsen M, Bertelsen MF, Sørensen SJ. (2014). The giraffe (Giraffacamelopardalis) rumen microbiome. FEMS Microbiol Ecol 90: 237–246.
201

Bibliography
Rognes T, Flouri T, Nichols B, Quince C, Mahé F. (2016). VSEARCH: a versatile open source tool formetagenomics. PeerJ 4: e2584.
Rolfe RD, Helebian S, Finegold SM. (1981). Bacterial interference between Clostridium difficile andnormal fecal flora. J Infect Dis 143: 470–475.
Round JL, Mazmanian SK. (2009). The gut microbiota shapes intestinal immune responses during healthand disease. Nat Rev Immunol 9: 313–23.
Saint André AV, Blackwell NM, Hall LR, Hoerauf A, Brattig NW, Volkmann L, et al. (2002). The role ofendosymbiotic Wolbachia bacteria in the pathogenesis of river blindness. Science 295: 1892–1895.
Salem HH, el-Allaf G. (1969). Treatment of Taenia saginata and Hymenolepis nana infections withparomomycin. Trans R Soc Trop Med Hyg 63: 833–836.
Saxelin M. (2008). Probiotic formulations and applications, the current probiotics market, and changes inthe marketplace: a European perspective. Clin Infect Dis 46 Suppl 2: S76–S79.
Schalk G, Forbes MR. (1997). Male biases in parasitism of mammals: effects of study type, host age, andparasite taxon. Oikos 78: 67–74.
Schloss PD, Delalibera I, Handelsman J, Raffa KF. (2006). Bacteria associated with the guts of two wood-boring beetles: Anoplophora glabripennis and Saperda vestita (Cerambycidae). Environ Entomol 35: 625–629.
Schluter J, Foster KR. (2012). The evolution of mutualism in gut microbiota via host epithelial selection.PLoS Biol 10: e1001424.
Shalaby HA. (2013). Anthelmintics resistance; how to overcome it? Iran J Parasitol 8: 18–32.
Shetty P. (2010). Nutrition, immunity and infection. CABI: Wallingford.
Shlaes DM. (2010). Antibiotics: the perfect storm. Springer: Dordrecht ; New York.
Sirois R. (2013). Comparison of the fecal microbiota of horses before and after treatment for parasitichelminths: massively parallel sequencing of the V4 region of the 16s ribosomal RNA gene. Master’s thesis,Smith College.
Skaug HJ, Fournier DA, Bolker B, Magnusson A, Nielsen A. (2016). Generalized Linear Mixed Modelsusing ‘AD Model Builder’.
Smyth JD. (1994). Introduction to Animal Parasitology. 3 edition. Cambridge University Press:Cambridge, Eng. ; New York.
Sonnenburg JL, Bäckhed F. (2016). Diet–microbiota interactions as moderators of human metabolism.Nature 535: 56–64.
Spor A, Koren O, Ley R. (2011). Unravelling the effects of the environment and host genotype on the gutmicrobiome. Nat Rev Microbiol 9: 279–290.
Steenhard NR, Jensen TK, Baggesen DL, Roepstorff A, Møller K. (2002). Excretion in feces and mucosalpersistence of Salmonella ser. Typhimurium in pigs subclinically infected with Oesophagostomum spp. AmJ Vet Res 63: 130–136.
Stevenson TJ, Buck CL, Duddleston KN. (2014). Temporal dynamics of the cecal gut microbiota ofjuvenile arctic ground squirrels: a strong litter effect across the first active season. Appl Environ Microbiol80: 4260–4268.
Stien A, Irvine RJ, Langvatn R, Albon SD, Halvorsen O. (2002). The population dynamics of Ostertagiagruehneri in reindeer: a model for the seasonal and intensity dependent variation in nematode fecundity.Int J Parasitol 32: 991–996.
202
Bibliography
Suau A, Bonnet R, Sutren M, Godon J-J, Gibson GR, Collins MD, et al. (1999). Direct analysis of genesencoding 16S rRNAfrom complex communities reveals many novel molecular species within the humangut. Appl Environ Microbiol 65: 4799–4807.
Sutherland I, Scott I. (2010). Gastrointestinal nematodes of sheep and cattle ; biology and control. JohnWiley & Sons: Chichester, West Sussex.
Tamboli CP, Neut C, Desreumaux P, Colombel JF. (2004). Dysbiosis in inflammatory bowel disease. Gut53: 1–4.
Tan L, Grewal PS. (2001). Pathogenicity of Moraxella osloensis, a bacterium associated with the nematodePhasmarhabditis hermaphrodita, to the slug Deroceras reticulatum. Appl Environ Microbiol 67: 5010–5016.
Taylor MJ, Bandi C, Hoerauf A. (2005). Wolbachia bacterial endosymbionts of filarial nematodes. AdvParasitol 60: 245–284.
Telfer S, Lambin X, Birtles R, Beldomenico P, Burthe S, Paterson S, et al. (2010). Species interactions in aparasite community drive infection risk in a wildlife population. Science 330: 243–246.
Thakar J, Pathak AK, Murphy L, Albert R, Cattadori IM. (2012). Network model of immune responsesreveals key effectors to single and co-infection dynamics by a respiratory bacterium and a gastrointestinalhelminth. PLoS Comput Biol 8: e1002345.
Therneau TM, Grambsch PM. (2000). Modeling Survival Data: Extending the Cox Model. Springer-VerlagNew York.
Tompkins DM, Hudson PJ. (1999). Regulation of nematode fecundity in the ring-necked pheasant(Phasianus colchicus): not just density dependence. Parasitology 118 ( Pt 4): 417–423.
Tortora GJ, Funke BR, Case CL. (2009). Microbiology: An Introduction. 10 edition. Benjamin Cummings:Place of publication not identified.
Truscott J, Turner H, Anderson R. (2015). What impact will the achievement of the current World HealthOrganisation targets for anthelmintic treatment coverage in children have on the intensity of soiltransmitted helminth infections? Parasit Vectors 8: 551.
Tun HM, Mauroo NF, Yuen CS, Ho JCW, Wong MT, Leung FC-C. (2014). Microbial diversity andevidence of novel homoacetogens in the gut of both geriatric and adult giant pandas (Ailuropodamelanoleuca). PLoS ONE 9: e79902.
Udeh PJ. (2004). A Guide to Healthy Drinking Water: All You Need to Know about the Water You Drink.iUniverse.
Uzal FA. (2004). Diagnosis of Clostridium perfringens intestinal infections in sheep and goats. Anaerobe10: 135–143.
Valanparambil RM, Segura M, Tam M, Jardim A, Geary TG, Stevenson MM. (2014). Production andanalysis of immunomodulatory excretory-secretory products from the mouse gastrointestinal nematodeHeligmosomoides polygyrus bakeri. Nat Protoc 9: 2740–2754.
Van Boeckel TP, Gandra S, Ashok A, Caudron Q, Grenfell BT, Levin SA, et al. (2014). Global antibioticconsumption 2000 to 2010: an analysis of national pharmaceutical sales data. Lancet Infect Dis 14: 742–750.
Vejzagić N, Adelfio R, Keiser J, Kringel H, Thamsborg SM, Kapel CMO. (2015a). Bacteria-induced egghatching differs for Trichuris muris and Trichuris suis. Parasit Vectors 8: 371.
Vejzagić N, Thamsborg SM, Kringel H, Roepstorff A, Bruun JM, Kapel CMO. (2015b). In vitro hatchingof Trichuris suis eggs. Parasitol Res 114: 2705–2714.
203
Bibliography
Vercruysse J, Levecke B, Prichard R. (2012). Human soil-transmitted helminths: implications of mass drugadministration. Curr Opin Infect Dis 25: 703–708.
Versporten A, Bolokhovets G, Ghazaryan L, Abilova V, Pyshnik G, Spasojevic T, et al. (2014). Antibioticuse in eastern Europe: a cross-national database study in coordination with the WHO Regional Office forEurope. Lancet Infect Dis 14: 381–387.
Villalba JJ, Miller J, Ungar ED, Landau SY, Glendinning J. (2014). Ruminant self-medication againstgastrointestinal nematodes: evidence, mechanism, and origins. Parasite 21. e-pub ahead of print, doi:10.1051/parasite/2014032.
Vlassoff A, Leathwick DM, Heath ACG. (2001). The epidemiology of nematode infections of sheep. N ZVet J 49: 213–221.
Walenciak O, Zwisler W, Gross EM. (2002). Influence of Myriophyllum spicatum-derived tannins on gutmicrobiota of its herbivore Acentria ephemerella. J Chem Ecol 28: 2045–2056.
Walk ST, Blum AM, Ewing SA-S, Weinstock JV, Young VB. (2010). Alteration of the murine gutmicrobiota during infection with the parasitic helminth Heligmosomoides polygyrus. Inflamm Bowel Dis16: 1841–1849.
Waller PJ. (2006). Sustainable nematode parasite control strategies for ruminant livestock by grazingmanagement and biological control. Anim Feed Sci Technol 126: 277–289.
Wang J, Linnenbrink M, Künzel S, Fernandes R, Nadeau M-J, Rosenstiel P, et al. (2014). Dietary historycontributes to enterotype-like clustering and functional metagenomic content in the intestinal microbiomeof wild mice. Proc Natl Acad Sci 111: E2703–E2710.
Weinstein P, Newton W, Sawyer T, Sommerville R. (1969). Nematospiroides dubius: development andpassage in the germfree mouse, and a comparative study of the free-living stages in germfree feces andconventional cultures. Trans Am Microsc Soc 88: 95–117.
Weinstock JV, Elliott DE. (2014). Helminth infections decrease host susceptibility to immune-mediateddiseases. J Immunol 193: 3239–3247.
Weiss BL, Wang J, Maltz MA, Wu Y, Aksoy S. (2013). Trypanosome infection establishment in the tsetsefly gut is influenced by microbiome-regulated host immune barriers. PLoS Pathog 9: e1003318.
Wells HS. (1951). Studies of the effect of antibiotics on infections with the mouse pinworm, Aspiculuristetraptera. I. The action of terramycin hydrochloride. J Infect Dis 89: 190–192.
Wells HS. (1952a). Studies of the effect of antibiotics on infections with the mouse pinworm Aspiculuristetraptera. II. The actions of neomycin, dihydrostreptomycin and chloramphenicol. J Infect Dis 90: 34–37.
Wells HS. (1952b). Studies of the effect of antibiotics on infections with the mouse pinworm, Aspiculuristetraptera. III. The actions of aureomycin, bacitracin and polymyxin B. J Infect Dis 90: 110–115.
Weng M, Walker WA. (2013). The role of gut microbiota in programming the immune phenotype. J DevOrig Health Dis 4: 203–214.
Wescott RB. (1968). Experimental Nematospiroides dubius infection in germfree and conventional mice.Exp Parasitol 22: 245–249.
Williams AR, Fryganas C, Ramsay A, Mueller-Harvey I, Thamsborg SM. (2014). Direct anthelminticeffects of condensed tannins from diverse plant sources against Ascaris suum. PLoS ONE 9: e97053.
Wimmersberger D, Tritten L, Keiser J. (2013). Development of an in vitro drug sensitivity assay forTrichuris muris first-stage larvae. Parasit Vectors 6: 42.
204
Bibliography
Wingender G, Stepniak D, Krebs P, Lin L, McBride S, Wei B, et al. (2012). Intestinal microbes affectphenotypes and functions of invariant natural killer T cells in mice. Gastroenterology 143: 418–428.
Winter SE, Bäumler AJ. (2014). Why related bacterial species bloom simultaneously in the gut: principlesunderlying the ‘Like will to like’ concept. Cell Microbiol 16: 179–184.
Woerde DJ, Martin PA, Govendir M. (2015). Susceptibility of rapidly growing mycobacteria isolated fromAustralian cats to ivermectin, moxidectin, ceftiofur and florfenicol. J Feline Med Surg 17: 1065–1068.
Wolstenholme AJ, Fairweather I, Prichard R, von Samson-Himmelstjerna G, Sangster NC. (2004). Drugresistance in veterinary helminths. Trends Parasitol 20: 469–476.
Wolstenholme AJ, Rogers AT. (2005). Glutamate-gated chloride channels and the mode of action of theavermectin/milbemycin anthelmintics. Parasitology 131: S85–S95.
Wolstenholme AJ. (2012). Glutamate-gated chloride channels. J Biol Chem 287: 40232–40238.
Xenoulis PG, Gray PL, Brightsmith D, Palculict B, Hoppes S, Steiner JM, et al. (2010). Molecularcharacterization of the cloacal microbiota of wild and captive parrots. Vet Microbiol 146: 320–5.
Xie Y, Chen H, Zhu B, Qin N, Chen Y, Li Z, et al. (2014). Effect of intestinal microbiota alteration onhepatic damage in rats with acute rejection after liver transplantation. Microb Ecol 68: 871–880.
Yazdanbakhsh M, Kremsner PG, van Ree R. (2002). Allergy, parasites, and the hygiene hypothesis.Science 296: 490–494.
Zaiss MM, Rapin A, Lebon L, Dubey LK, Mosconi I, Sarter K, et al. (2015). The intestinal microbiotacontributes to the ability of helminths to modulate allergic inflammation. Immunity 43: 998–1010.
Zaph C, Artis D. (2015). Parasite infection of the mucosal surfaces. In: Mestecky J, Strober W, RussellMW, Kelsall BL, Cheroutre H, Lambrecht (eds) Vol. 1. Mucosal immunology. Elsevier/AP, AcademicPress is an imprint of Elsevier: Amsterdam, pp 1023–1038.
Zeng B, Yuan J, Li W, Tang H, Wei H. (2012). The effect of artificial rearing on gut microbiota in a mousepup-in-a-cup model. Exp Anim 61: 453–460.
Zhu L, Wu Q, Dai J, Zhang S, Wei F. (2011). Evidence of cellulose metabolism by the giant panda gutmicrobiome. Proc Natl Acad Sci 108: 17714–17719.
205

206
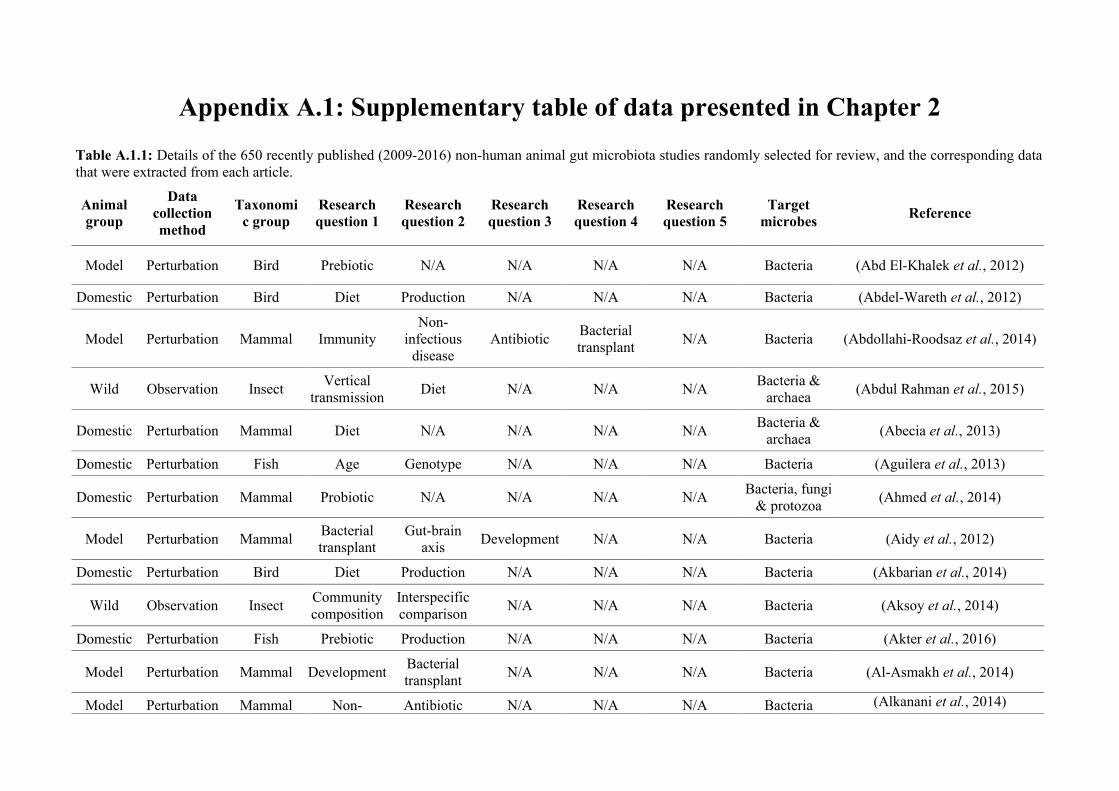
Appendix A.1: Supplementary table of data presented in Chapter 2
Table A.1.1: Details of the 650 recently published (2009-2016) non-human animal gut microbiota studies randomly selected for review, and the corresponding datathat were extracted from each article.
Animalgroup
Datacollectionmethod
Taxonomic group
Researchquestion 1
Researchquestion 2
Researchquestion 3
Researchquestion 4
Researchquestion 5
Targetmicrobes
Reference
Model Perturbation Bird Prebiotic N/A N/A N/A N/A Bacteria (Abd El-Khalek et al., 2012)
Domestic Perturbation Bird Diet Production N/A N/A N/A Bacteria (Abdel-Wareth et al., 2012)
Model Perturbation Mammal ImmunityNon-
infectiousdisease
AntibioticBacterialtransplant
N/A Bacteria (Abdollahi-Roodsaz et al., 2014)
Wild Observation InsectVertical
transmissionDiet N/A N/A N/A
Bacteria &archaea
(Abdul Rahman et al., 2015)
Domestic Perturbation Mammal Diet N/A N/A N/A N/ABacteria &
archaea(Abecia et al., 2013)
Domestic Perturbation Fish Age Genotype N/A N/A N/A Bacteria (Aguilera et al., 2013)
Domestic Perturbation Mammal Probiotic N/A N/A N/A N/ABacteria, fungi
& protozoa(Ahmed et al., 2014)
Model Perturbation MammalBacterialtransplant
Gut-brainaxis
Development N/A N/A Bacteria (Aidy et al., 2012)
Domestic Perturbation Bird Diet Production N/A N/A N/A Bacteria (Akbarian et al., 2014)
Wild Observation InsectCommunitycomposition
Interspecificcomparison
N/A N/A N/A Bacteria (Aksoy et al., 2014)
Domestic Perturbation Fish Prebiotic Production N/A N/A N/A Bacteria (Akter et al., 2016)
Model Perturbation Mammal DevelopmentBacterialtransplant
N/A N/A N/A Bacteria (Al-Asmakh et al., 2014)
Model Perturbation Mammal Non- Antibiotic N/A N/A N/A Bacteria (Alkanani et al., 2014)
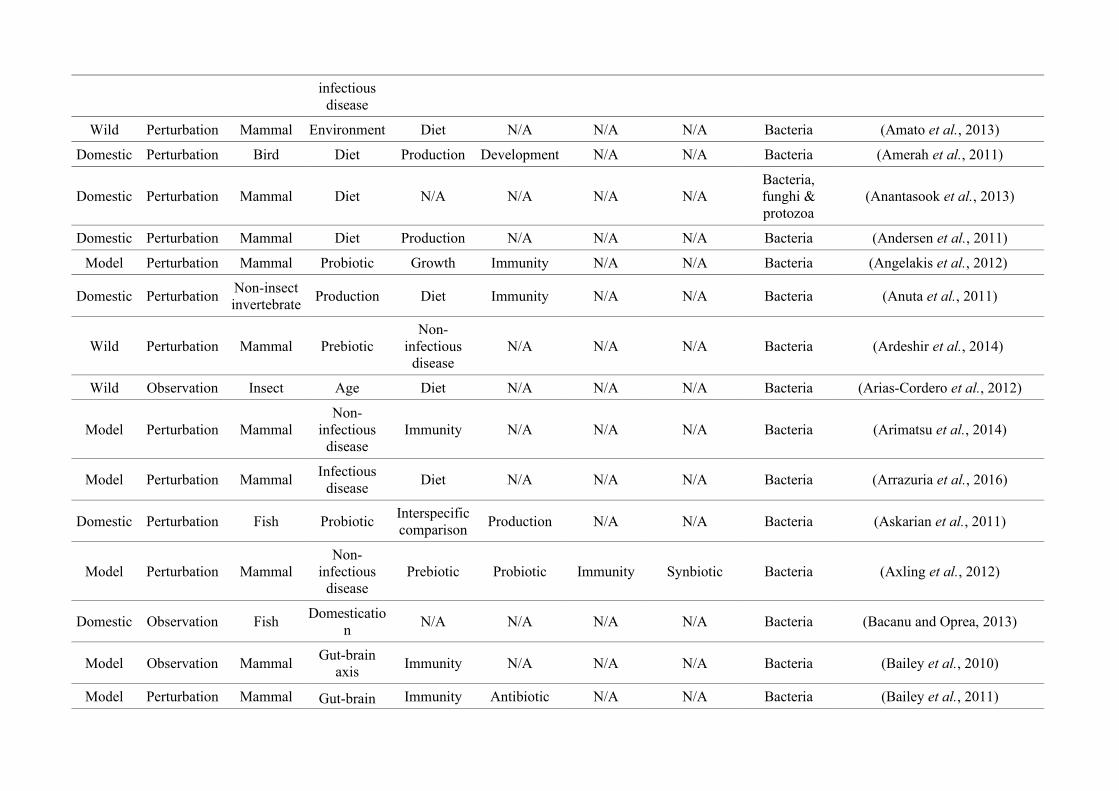
infectiousdisease
Wild Perturbation Mammal Environment Diet N/A N/A N/A Bacteria (Amato et al., 2013)
Domestic Perturbation Bird Diet Production Development N/A N/A Bacteria (Amerah et al., 2011)
Domestic Perturbation Mammal Diet N/A N/A N/A N/ABacteria,funghi &protozoa
(Anantasook et al., 2013)
Domestic Perturbation Mammal Diet Production N/A N/A N/A Bacteria (Andersen et al., 2011)
Model Perturbation Mammal Probiotic Growth Immunity N/A N/A Bacteria (Angelakis et al., 2012)
Domestic PerturbationNon-insectinvertebrate
Production Diet Immunity N/A N/A Bacteria (Anuta et al., 2011)
Wild Perturbation Mammal PrebioticNon-
infectiousdisease
N/A N/A N/A Bacteria (Ardeshir et al., 2014)
Wild Observation Insect Age Diet N/A N/A N/A Bacteria (Arias-Cordero et al., 2012)
Model Perturbation MammalNon-
infectiousdisease
Immunity N/A N/A N/A Bacteria (Arimatsu et al., 2014)
Model Perturbation MammalInfectious
diseaseDiet N/A N/A N/A Bacteria (Arrazuria et al., 2016)
Domestic Perturbation Fish ProbioticInterspecificcomparison
Production N/A N/A Bacteria (Askarian et al., 2011)
Model Perturbation MammalNon-
infectiousdisease
Prebiotic Probiotic Immunity Synbiotic Bacteria (Axling et al., 2012)
Domestic Observation FishDomesticatio
nN/A N/A N/A N/A Bacteria (Bacanu and Oprea, 2013)
Model Observation MammalGut-brain
axisImmunity N/A N/A N/A Bacteria (Bailey et al., 2010)
Model Perturbation Mammal Gut-brain Immunity Antibiotic N/A N/A Bacteria (Bailey et al., 2011)

axis
Domestic Perturbation Mammal Probiotic ProductionVertical
transmissionN/A N/A Bacteria (Baker et al., 2013)
Model Perturbation Mammal Diet Immunity N/A N/A N/A Bacteria (Baldwin et al., 2016)
Model Perturbation MammalDomesticatio
nBehaviour
Gut-brainaxis
Immunity N/A Bacteria(Bangsgaard Bendtsen et al.,
2012)
Model Perturbation MammalCommunitycomposition
N/A N/A N/A N/ABacteria &
archaea(Barfod et al., 2013)
Model Perturbation Mammal ProbioticDomesticatio
nImmunity
Gut-brainaxis
N/A Bacteria (Barouei et al., 2012)
Model Perturbation MammalVertical
transmissionGenotype Diet N/A N/A Bacteria (Barron Pastor and Gordon, 2016)
Domestic Perturbation Fish Immunity Diet Genotype Production N/A Bacteria (Batista et al., 2016)
Domestic Perturbation Bird Diet Production N/A N/A N/A Bacteria (Baurhoo et al., 2011)
Model Perturbation MammalNon-
infectiousdisease
Antibiotic N/A N/A N/A Bacteria (Bazett et al., 2016)
Domestic Perturbation MammalInfectious
diseaseImmunity N/A N/A N/A Bacteria (Bearson et al., 2013)
Domestic Perturbation Mammal DietBacterialtransplant
N/A N/A N/ABacteria,funghi &protozoa
(Belanche et al., 2012)
Model Perturbation Mammal DietNon-
infectiousdisease
Immunity N/A N/A Bacteria (Belcheva et al., 2014)
Domestic Perturbation Bird Diet N/A N/A N/A N/A Bacteria (Bennett et al., 2013)
Model Perturbation MammalInfectious
diseaseImmunity Genotype N/A N/A Bacteria (Bereswill et al., 2014)
Domestic Observation Mammal Community N/A N/A N/A N/A Bacteria & (Berg Miller et al., 2012)
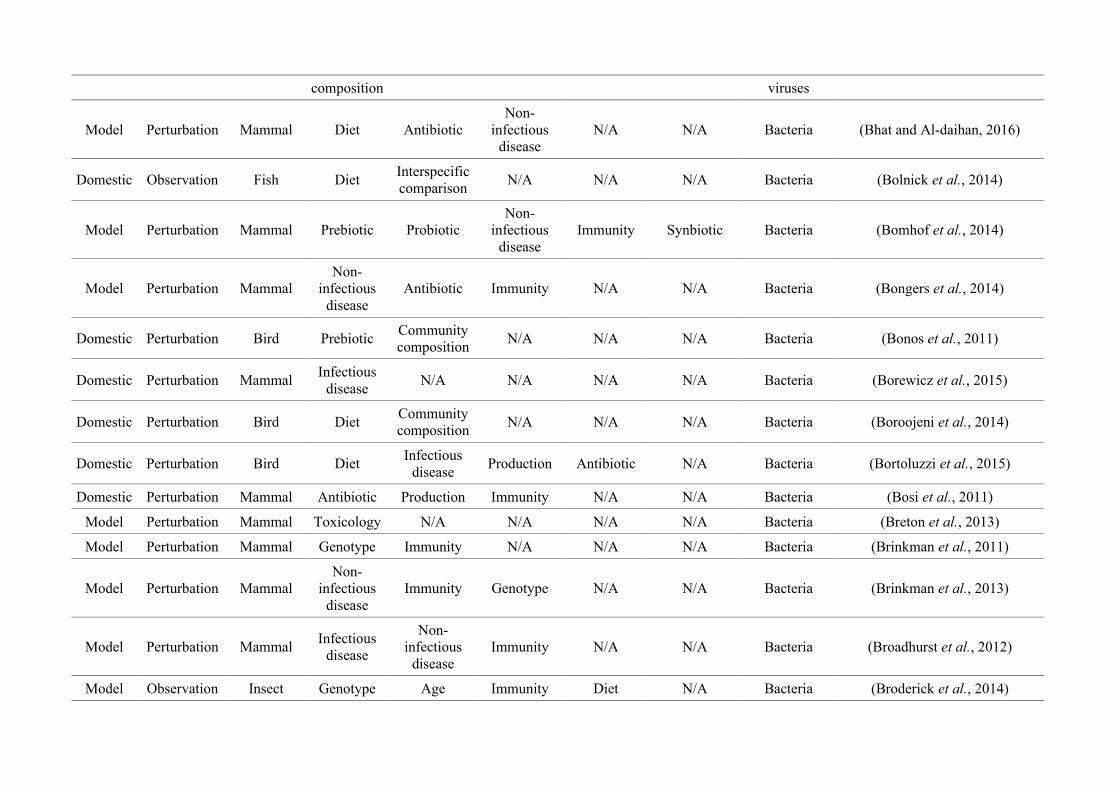
composition viruses
Model Perturbation Mammal Diet AntibioticNon-
infectiousdisease
N/A N/A Bacteria (Bhat and Al-daihan, 2016)
Domestic Observation Fish DietInterspecificcomparison
N/A N/A N/A Bacteria (Bolnick et al., 2014)
Model Perturbation Mammal Prebiotic ProbioticNon-
infectiousdisease
Immunity Synbiotic Bacteria (Bomhof et al., 2014)
Model Perturbation MammalNon-
infectiousdisease
Antibiotic Immunity N/A N/A Bacteria (Bongers et al., 2014)
Domestic Perturbation Bird PrebioticCommunitycomposition
N/A N/A N/A Bacteria (Bonos et al., 2011)
Domestic Perturbation MammalInfectious
diseaseN/A N/A N/A N/A Bacteria (Borewicz et al., 2015)
Domestic Perturbation Bird DietCommunitycomposition
N/A N/A N/A Bacteria (Boroojeni et al., 2014)
Domestic Perturbation Bird DietInfectious
diseaseProduction Antibiotic N/A Bacteria (Bortoluzzi et al., 2015)
Domestic Perturbation Mammal Antibiotic Production Immunity N/A N/A Bacteria (Bosi et al., 2011)
Model Perturbation Mammal Toxicology N/A N/A N/A N/A Bacteria (Breton et al., 2013)
Model Perturbation Mammal Genotype Immunity N/A N/A N/A Bacteria (Brinkman et al., 2011)
Model Perturbation MammalNon-
infectiousdisease
Immunity Genotype N/A N/A Bacteria (Brinkman et al., 2013)
Model Perturbation MammalInfectious
disease
Non-infectious
diseaseImmunity N/A N/A Bacteria (Broadhurst et al., 2012)
Model Observation Insect Genotype Age Immunity Diet N/A Bacteria (Broderick et al., 2014)
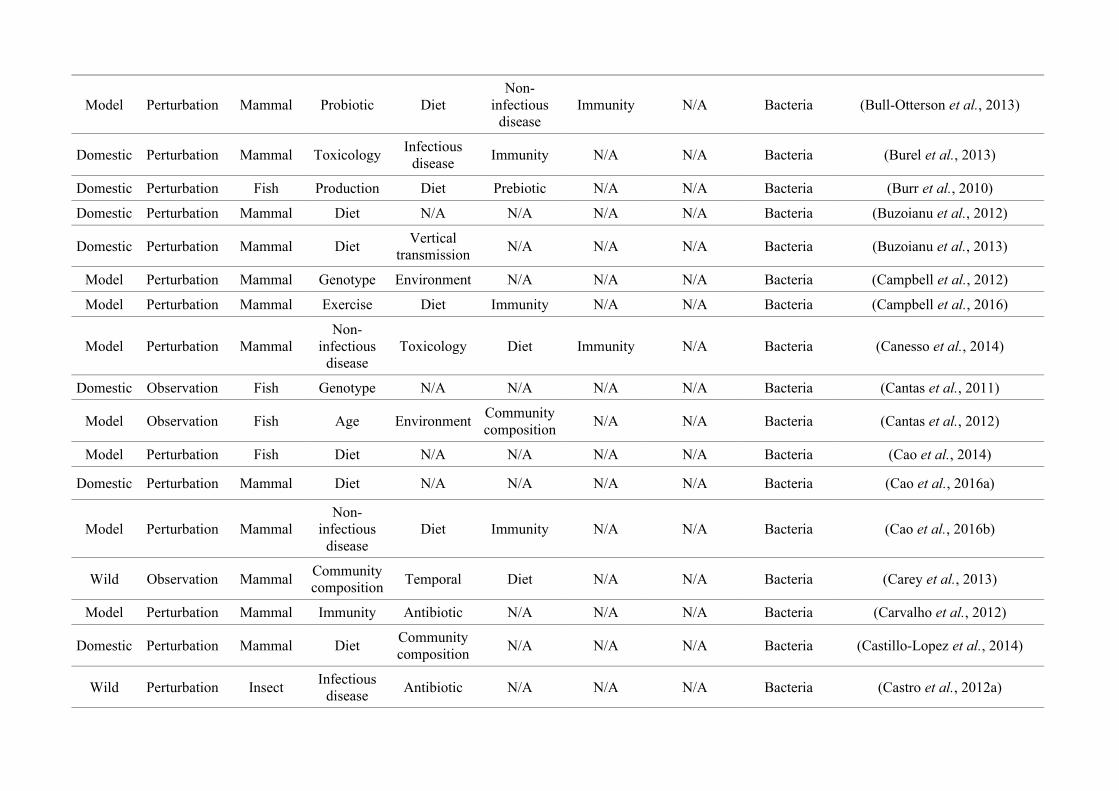
Model Perturbation Mammal Probiotic DietNon-
infectiousdisease
Immunity N/A Bacteria (Bull-Otterson et al., 2013)
Domestic Perturbation Mammal ToxicologyInfectious
diseaseImmunity N/A N/A Bacteria (Burel et al., 2013)
Domestic Perturbation Fish Production Diet Prebiotic N/A N/A Bacteria (Burr et al., 2010)
Domestic Perturbation Mammal Diet N/A N/A N/A N/A Bacteria (Buzoianu et al., 2012)
Domestic Perturbation Mammal DietVertical
transmissionN/A N/A N/A Bacteria (Buzoianu et al., 2013)
Model Perturbation Mammal Genotype Environment N/A N/A N/A Bacteria (Campbell et al., 2012)
Model Perturbation Mammal Exercise Diet Immunity N/A N/A Bacteria (Campbell et al., 2016)
Model Perturbation MammalNon-
infectiousdisease
Toxicology Diet Immunity N/A Bacteria (Canesso et al., 2014)
Domestic Observation Fish Genotype N/A N/A N/A N/A Bacteria (Cantas et al., 2011)
Model Observation Fish Age EnvironmentCommunitycomposition
N/A N/A Bacteria (Cantas et al., 2012)
Model Perturbation Fish Diet N/A N/A N/A N/A Bacteria (Cao et al., 2014)
Domestic Perturbation Mammal Diet N/A N/A N/A N/A Bacteria (Cao et al., 2016a)
Model Perturbation MammalNon-
infectiousdisease
Diet Immunity N/A N/A Bacteria (Cao et al., 2016b)
Wild Observation MammalCommunitycomposition
Temporal Diet N/A N/A Bacteria (Carey et al., 2013)
Model Perturbation Mammal Immunity Antibiotic N/A N/A N/A Bacteria (Carvalho et al., 2012)
Domestic Perturbation Mammal DietCommunitycomposition
N/A N/A N/A Bacteria (Castillo-Lopez et al., 2014)
Wild Perturbation InsectInfectious
diseaseAntibiotic N/A N/A N/A Bacteria (Castro et al., 2012a)
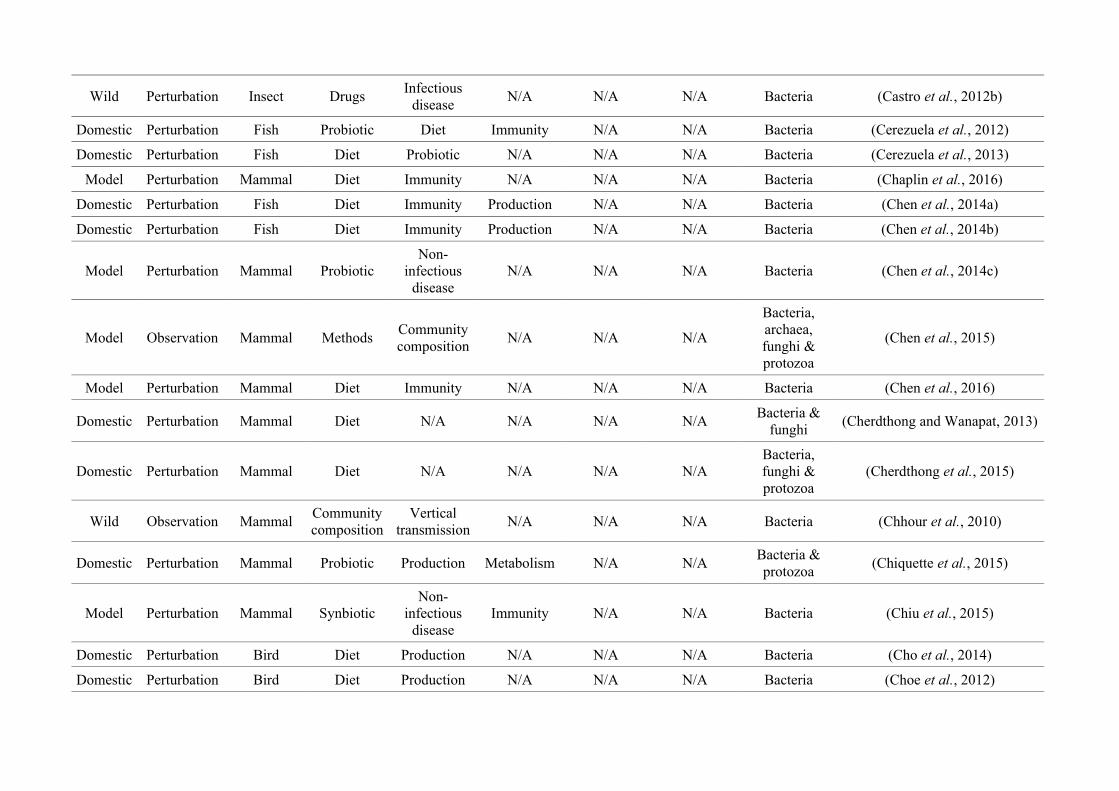
Wild Perturbation Insect DrugsInfectious
diseaseN/A N/A N/A Bacteria (Castro et al., 2012b)
Domestic Perturbation Fish Probiotic Diet Immunity N/A N/A Bacteria (Cerezuela et al., 2012)
Domestic Perturbation Fish Diet Probiotic N/A N/A N/A Bacteria (Cerezuela et al., 2013)
Model Perturbation Mammal Diet Immunity N/A N/A N/A Bacteria (Chaplin et al., 2016)
Domestic Perturbation Fish Diet Immunity Production N/A N/A Bacteria (Chen et al., 2014a)
Domestic Perturbation Fish Diet Immunity Production N/A N/A Bacteria (Chen et al., 2014b)
Model Perturbation Mammal ProbioticNon-
infectiousdisease
N/A N/A N/A Bacteria (Chen et al., 2014c)
Model Observation Mammal MethodsCommunitycomposition
N/A N/A N/A
Bacteria,archaea,funghi &protozoa
(Chen et al., 2015)
Model Perturbation Mammal Diet Immunity N/A N/A N/A Bacteria (Chen et al., 2016)
Domestic Perturbation Mammal Diet N/A N/A N/A N/ABacteria &
funghi(Cherdthong and Wanapat, 2013)
Domestic Perturbation Mammal Diet N/A N/A N/A N/ABacteria,funghi &protozoa
(Cherdthong et al., 2015)
Wild Observation MammalCommunitycomposition
Verticaltransmission
N/A N/A N/A Bacteria (Chhour et al., 2010)
Domestic Perturbation Mammal Probiotic Production Metabolism N/A N/ABacteria &protozoa
(Chiquette et al., 2015)
Model Perturbation Mammal SynbioticNon-
infectiousdisease
Immunity N/A N/A Bacteria (Chiu et al., 2015)
Domestic Perturbation Bird Diet Production N/A N/A N/A Bacteria (Cho et al., 2014)
Domestic Perturbation Bird Diet Production N/A N/A N/A Bacteria (Choe et al., 2012)
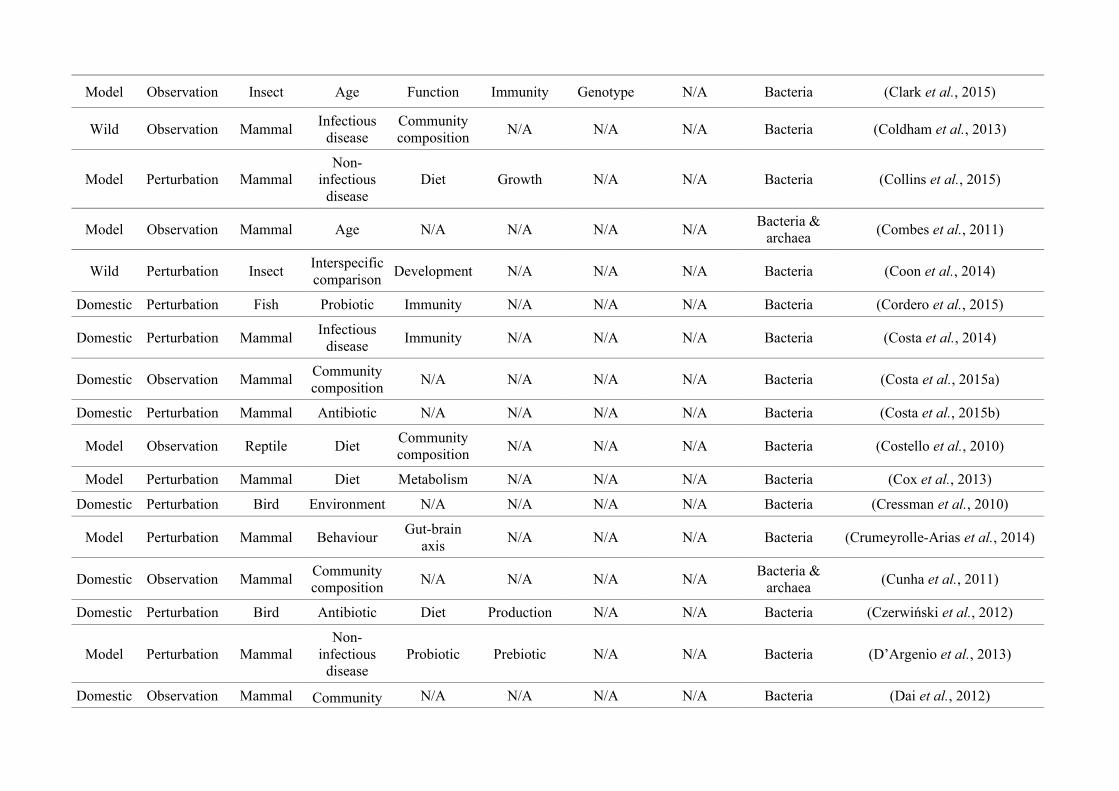
Model Observation Insect Age Function Immunity Genotype N/A Bacteria (Clark et al., 2015)
Wild Observation MammalInfectious
diseaseCommunitycomposition
N/A N/A N/A Bacteria (Coldham et al., 2013)
Model Perturbation MammalNon-
infectiousdisease
Diet Growth N/A N/A Bacteria (Collins et al., 2015)
Model Observation Mammal Age N/A N/A N/A N/ABacteria &
archaea(Combes et al., 2011)
Wild Perturbation InsectInterspecificcomparison
Development N/A N/A N/A Bacteria (Coon et al., 2014)
Domestic Perturbation Fish Probiotic Immunity N/A N/A N/A Bacteria (Cordero et al., 2015)
Domestic Perturbation MammalInfectious
diseaseImmunity N/A N/A N/A Bacteria (Costa et al., 2014)
Domestic Observation MammalCommunitycomposition
N/A N/A N/A N/A Bacteria (Costa et al., 2015a)
Domestic Perturbation Mammal Antibiotic N/A N/A N/A N/A Bacteria (Costa et al., 2015b)
Model Observation Reptile DietCommunitycomposition
N/A N/A N/A Bacteria (Costello et al., 2010)
Model Perturbation Mammal Diet Metabolism N/A N/A N/A Bacteria (Cox et al., 2013)
Domestic Perturbation Bird Environment N/A N/A N/A N/A Bacteria (Cressman et al., 2010)
Model Perturbation Mammal BehaviourGut-brain
axisN/A N/A N/A Bacteria (Crumeyrolle-Arias et al., 2014)
Domestic Observation MammalCommunitycomposition
N/A N/A N/A N/ABacteria &
archaea(Cunha et al., 2011)
Domestic Perturbation Bird Antibiotic Diet Production N/A N/A Bacteria (Czerwiński et al., 2012)
Model Perturbation MammalNon-
infectiousdisease
Probiotic Prebiotic N/A N/A Bacteria (D’Argenio et al., 2013)
Domestic Observation Mammal Community N/A N/A N/A N/A Bacteria (Dai et al., 2012)
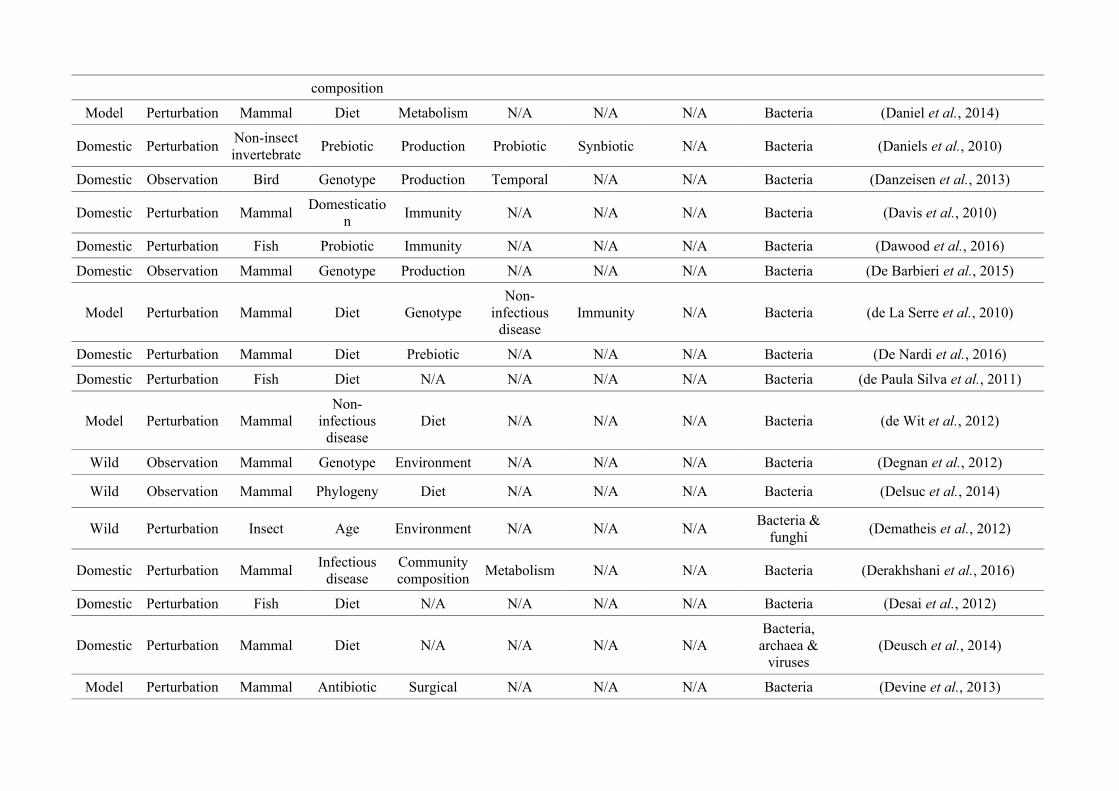
composition
Model Perturbation Mammal Diet Metabolism N/A N/A N/A Bacteria (Daniel et al., 2014)
Domestic PerturbationNon-insectinvertebrate
Prebiotic Production Probiotic Synbiotic N/A Bacteria (Daniels et al., 2010)
Domestic Observation Bird Genotype Production Temporal N/A N/A Bacteria (Danzeisen et al., 2013)
Domestic Perturbation MammalDomesticatio
nImmunity N/A N/A N/A Bacteria (Davis et al., 2010)
Domestic Perturbation Fish Probiotic Immunity N/A N/A N/A Bacteria (Dawood et al., 2016)
Domestic Observation Mammal Genotype Production N/A N/A N/A Bacteria (De Barbieri et al., 2015)
Model Perturbation Mammal Diet GenotypeNon-
infectiousdisease
Immunity N/A Bacteria (de La Serre et al., 2010)
Domestic Perturbation Mammal Diet Prebiotic N/A N/A N/A Bacteria (De Nardi et al., 2016)
Domestic Perturbation Fish Diet N/A N/A N/A N/A Bacteria (de Paula Silva et al., 2011)
Model Perturbation MammalNon-
infectiousdisease
Diet N/A N/A N/A Bacteria (de Wit et al., 2012)
Wild Observation Mammal Genotype Environment N/A N/A N/A Bacteria (Degnan et al., 2012)
Wild Observation Mammal Phylogeny Diet N/A N/A N/A Bacteria (Delsuc et al., 2014)
Wild Perturbation Insect Age Environment N/A N/A N/ABacteria &
funghi(Dematheis et al., 2012)
Domestic Perturbation MammalInfectious
diseaseCommunitycomposition
Metabolism N/A N/A Bacteria (Derakhshani et al., 2016)
Domestic Perturbation Fish Diet N/A N/A N/A N/A Bacteria (Desai et al., 2012)
Domestic Perturbation Mammal Diet N/A N/A N/A N/ABacteria,
archaea &viruses
(Deusch et al., 2014)
Model Perturbation Mammal Antibiotic Surgical N/A N/A N/A Bacteria (Devine et al., 2013)
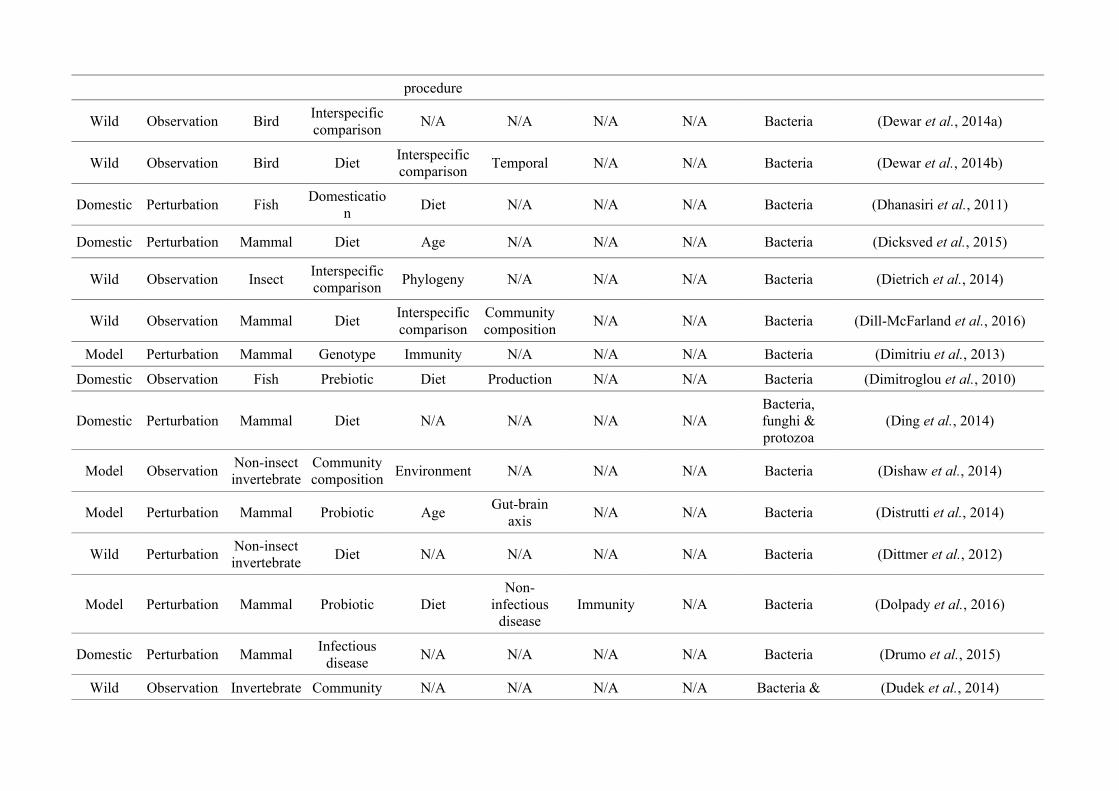
procedure
Wild Observation BirdInterspecificcomparison
N/A N/A N/A N/A Bacteria (Dewar et al., 2014a)
Wild Observation Bird DietInterspecificcomparison
Temporal N/A N/A Bacteria (Dewar et al., 2014b)
Domestic Perturbation FishDomesticatio
nDiet N/A N/A N/A Bacteria (Dhanasiri et al., 2011)
Domestic Perturbation Mammal Diet Age N/A N/A N/A Bacteria (Dicksved et al., 2015)
Wild Observation InsectInterspecificcomparison
Phylogeny N/A N/A N/A Bacteria (Dietrich et al., 2014)
Wild Observation Mammal DietInterspecificcomparison
Communitycomposition
N/A N/A Bacteria (Dill-McFarland et al., 2016)
Model Perturbation Mammal Genotype Immunity N/A N/A N/A Bacteria (Dimitriu et al., 2013)
Domestic Observation Fish Prebiotic Diet Production N/A N/A Bacteria (Dimitroglou et al., 2010)
Domestic Perturbation Mammal Diet N/A N/A N/A N/ABacteria,funghi &protozoa
(Ding et al., 2014)
Model ObservationNon-insectinvertebrate
Communitycomposition
Environment N/A N/A N/A Bacteria (Dishaw et al., 2014)
Model Perturbation Mammal Probiotic AgeGut-brain
axisN/A N/A Bacteria (Distrutti et al., 2014)
Wild PerturbationNon-insectinvertebrate
Diet N/A N/A N/A N/A Bacteria (Dittmer et al., 2012)
Model Perturbation Mammal Probiotic DietNon-
infectiousdisease
Immunity N/A Bacteria (Dolpady et al., 2016)
Domestic Perturbation MammalInfectious
diseaseN/A N/A N/A N/A Bacteria (Drumo et al., 2015)
Wild Observation Invertebrate Community N/A N/A N/A N/A Bacteria & (Dudek et al., 2014)
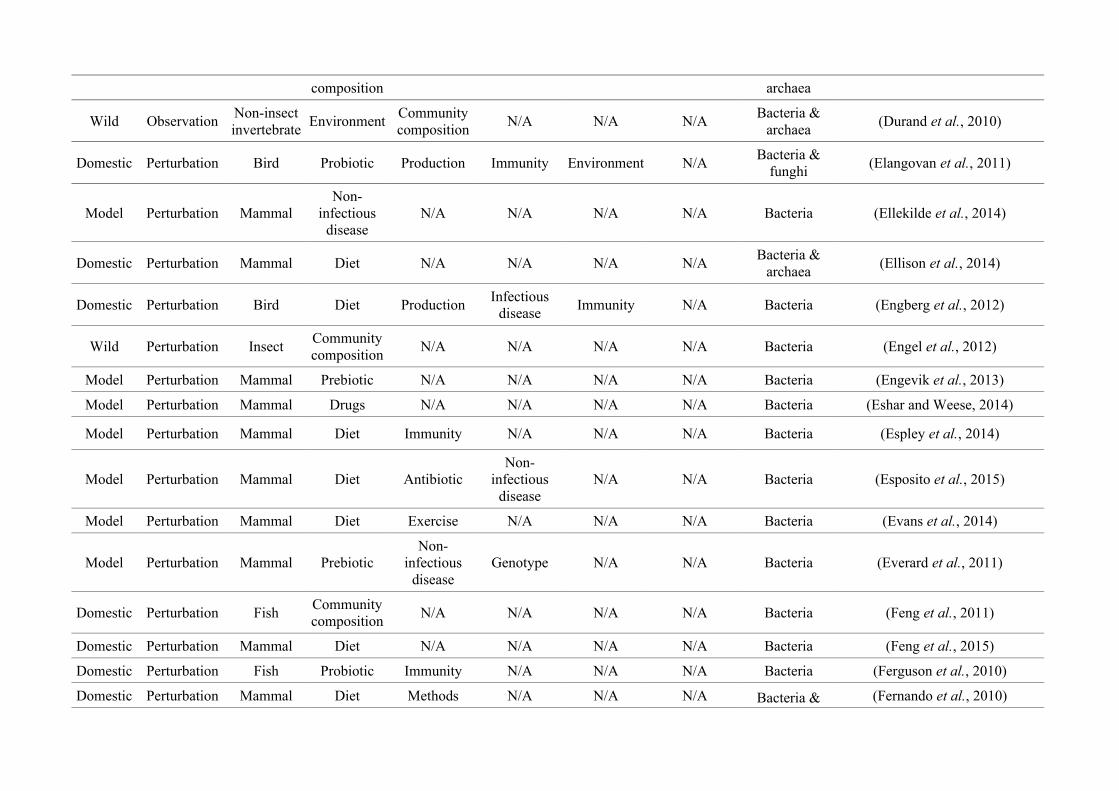
composition archaea
Wild ObservationNon-insectinvertebrate
EnvironmentCommunitycomposition
N/A N/A N/ABacteria &
archaea(Durand et al., 2010)
Domestic Perturbation Bird Probiotic Production Immunity Environment N/ABacteria &
funghi(Elangovan et al., 2011)
Model Perturbation MammalNon-
infectiousdisease
N/A N/A N/A N/A Bacteria (Ellekilde et al., 2014)
Domestic Perturbation Mammal Diet N/A N/A N/A N/ABacteria &
archaea(Ellison et al., 2014)
Domestic Perturbation Bird Diet ProductionInfectious
diseaseImmunity N/A Bacteria (Engberg et al., 2012)
Wild Perturbation InsectCommunitycomposition
N/A N/A N/A N/A Bacteria (Engel et al., 2012)
Model Perturbation Mammal Prebiotic N/A N/A N/A N/A Bacteria (Engevik et al., 2013)
Model Perturbation Mammal Drugs N/A N/A N/A N/A Bacteria (Eshar and Weese, 2014)
Model Perturbation Mammal Diet Immunity N/A N/A N/A Bacteria (Espley et al., 2014)
Model Perturbation Mammal Diet AntibioticNon-
infectiousdisease
N/A N/A Bacteria (Esposito et al., 2015)
Model Perturbation Mammal Diet Exercise N/A N/A N/A Bacteria (Evans et al., 2014)
Model Perturbation Mammal PrebioticNon-
infectiousdisease
Genotype N/A N/A Bacteria (Everard et al., 2011)
Domestic Perturbation FishCommunitycomposition
N/A N/A N/A N/A Bacteria (Feng et al., 2011)
Domestic Perturbation Mammal Diet N/A N/A N/A N/A Bacteria (Feng et al., 2015)
Domestic Perturbation Fish Probiotic Immunity N/A N/A N/A Bacteria (Ferguson et al., 2010)
Domestic Perturbation Mammal Diet Methods N/A N/A N/A Bacteria & (Fernando et al., 2010)
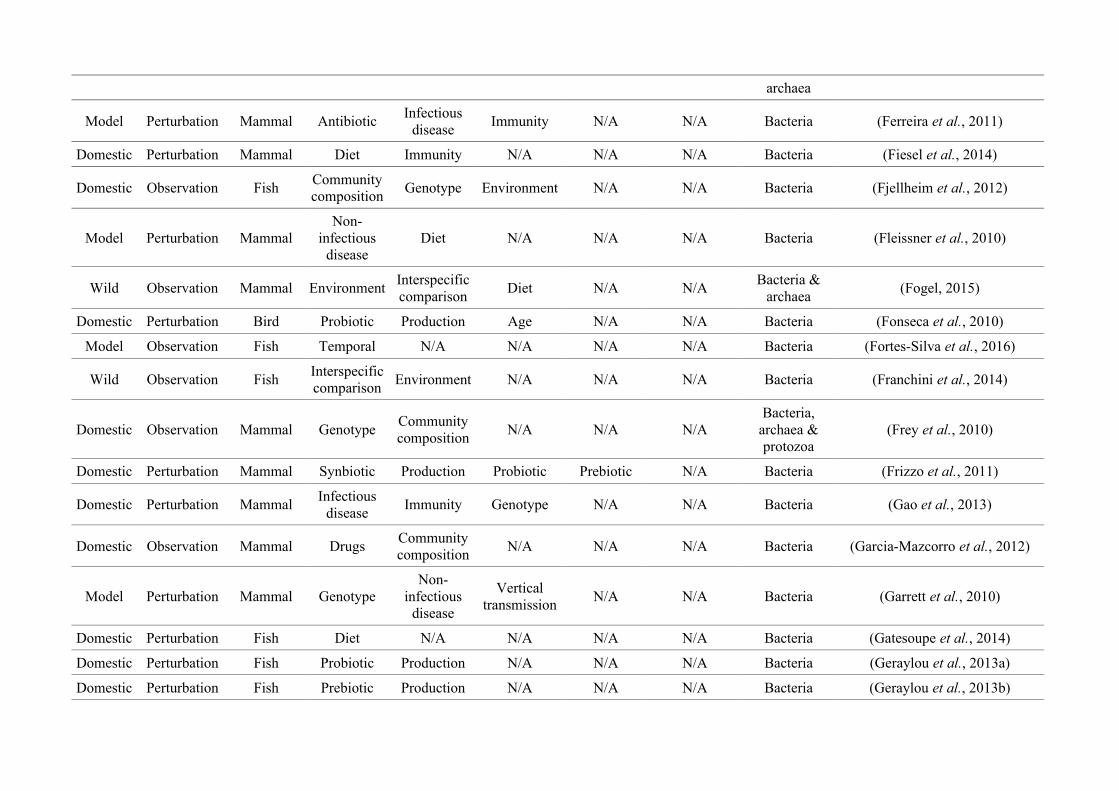
archaea
Model Perturbation Mammal AntibioticInfectious
diseaseImmunity N/A N/A Bacteria (Ferreira et al., 2011)
Domestic Perturbation Mammal Diet Immunity N/A N/A N/A Bacteria (Fiesel et al., 2014)
Domestic Observation FishCommunitycomposition
Genotype Environment N/A N/A Bacteria (Fjellheim et al., 2012)
Model Perturbation MammalNon-
infectiousdisease
Diet N/A N/A N/A Bacteria (Fleissner et al., 2010)
Wild Observation Mammal EnvironmentInterspecificcomparison
Diet N/A N/ABacteria &
archaea(Fogel, 2015)
Domestic Perturbation Bird Probiotic Production Age N/A N/A Bacteria (Fonseca et al., 2010)
Model Observation Fish Temporal N/A N/A N/A N/A Bacteria (Fortes-Silva et al., 2016)
Wild Observation FishInterspecificcomparison
Environment N/A N/A N/A Bacteria (Franchini et al., 2014)
Domestic Observation Mammal GenotypeCommunitycomposition
N/A N/A N/ABacteria,
archaea &protozoa
(Frey et al., 2010)
Domestic Perturbation Mammal Synbiotic Production Probiotic Prebiotic N/A Bacteria (Frizzo et al., 2011)
Domestic Perturbation MammalInfectious
diseaseImmunity Genotype N/A N/A Bacteria (Gao et al., 2013)
Domestic Observation Mammal DrugsCommunitycomposition
N/A N/A N/A Bacteria (Garcia-Mazcorro et al., 2012)
Model Perturbation Mammal GenotypeNon-
infectiousdisease
Verticaltransmission
N/A N/A Bacteria (Garrett et al., 2010)
Domestic Perturbation Fish Diet N/A N/A N/A N/A Bacteria (Gatesoupe et al., 2014)
Domestic Perturbation Fish Probiotic Production N/A N/A N/A Bacteria (Geraylou et al., 2013a)
Domestic Perturbation Fish Prebiotic Production N/A N/A N/A Bacteria (Geraylou et al., 2013b)
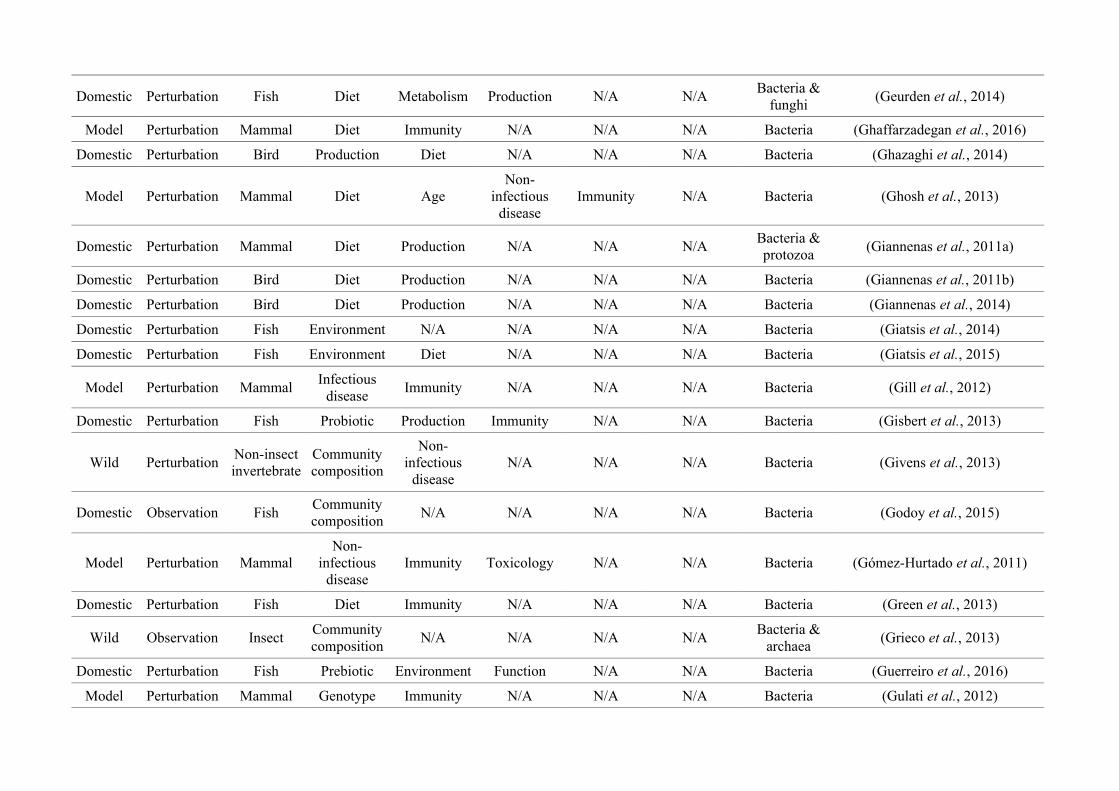
Domestic Perturbation Fish Diet Metabolism Production N/A N/ABacteria &
funghi(Geurden et al., 2014)
Model Perturbation Mammal Diet Immunity N/A N/A N/A Bacteria (Ghaffarzadegan et al., 2016)
Domestic Perturbation Bird Production Diet N/A N/A N/A Bacteria (Ghazaghi et al., 2014)
Model Perturbation Mammal Diet AgeNon-
infectiousdisease
Immunity N/A Bacteria (Ghosh et al., 2013)
Domestic Perturbation Mammal Diet Production N/A N/A N/ABacteria &protozoa
(Giannenas et al., 2011a)
Domestic Perturbation Bird Diet Production N/A N/A N/A Bacteria (Giannenas et al., 2011b)
Domestic Perturbation Bird Diet Production N/A N/A N/A Bacteria (Giannenas et al., 2014)
Domestic Perturbation Fish Environment N/A N/A N/A N/A Bacteria (Giatsis et al., 2014)
Domestic Perturbation Fish Environment Diet N/A N/A N/A Bacteria (Giatsis et al., 2015)
Model Perturbation MammalInfectious
diseaseImmunity N/A N/A N/A Bacteria (Gill et al., 2012)
Domestic Perturbation Fish Probiotic Production Immunity N/A N/A Bacteria (Gisbert et al., 2013)
Wild PerturbationNon-insectinvertebrate
Communitycomposition
Non-infectious
diseaseN/A N/A N/A Bacteria (Givens et al., 2013)
Domestic Observation FishCommunitycomposition
N/A N/A N/A N/A Bacteria (Godoy et al., 2015)
Model Perturbation MammalNon-
infectiousdisease
Immunity Toxicology N/A N/A Bacteria (Gómez-Hurtado et al., 2011)
Domestic Perturbation Fish Diet Immunity N/A N/A N/A Bacteria (Green et al., 2013)
Wild Observation InsectCommunitycomposition
N/A N/A N/A N/ABacteria &
archaea(Grieco et al., 2013)
Domestic Perturbation Fish Prebiotic Environment Function N/A N/A Bacteria (Guerreiro et al., 2016)
Model Perturbation Mammal Genotype Immunity N/A N/A N/A Bacteria (Gulati et al., 2012)
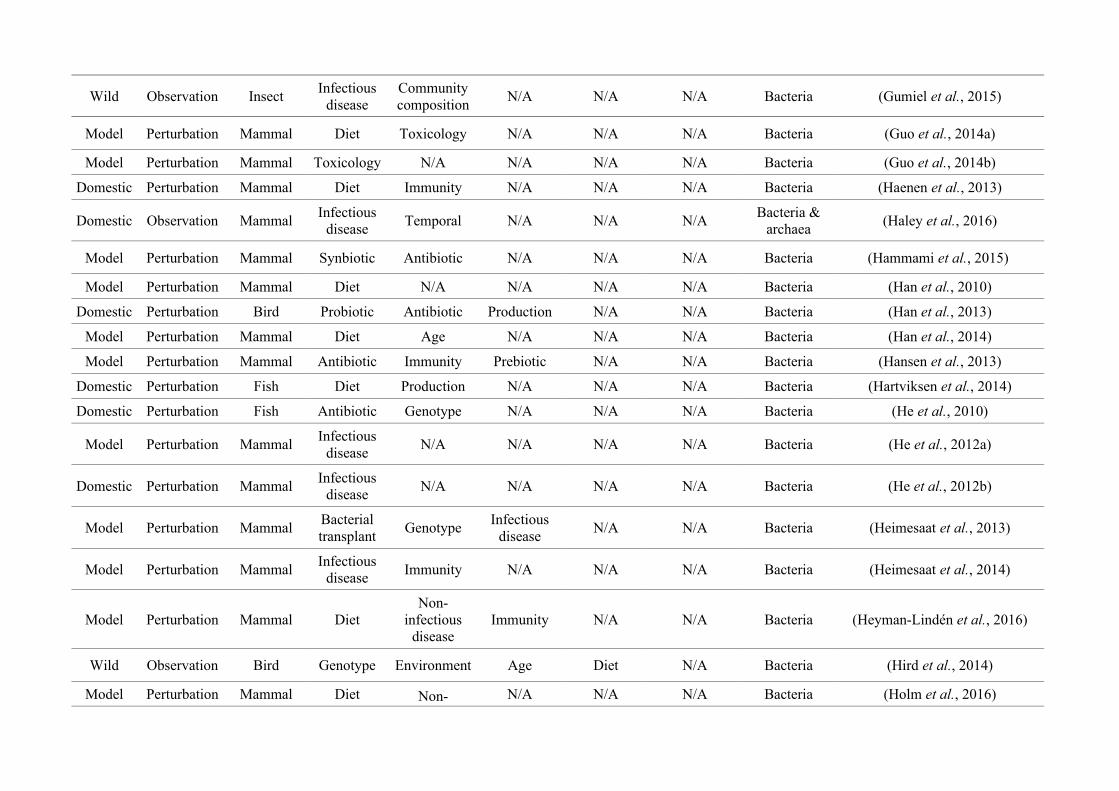
Wild Observation InsectInfectious
diseaseCommunitycomposition
N/A N/A N/A Bacteria (Gumiel et al., 2015)
Model Perturbation Mammal Diet Toxicology N/A N/A N/A Bacteria (Guo et al., 2014a)
Model Perturbation Mammal Toxicology N/A N/A N/A N/A Bacteria (Guo et al., 2014b)
Domestic Perturbation Mammal Diet Immunity N/A N/A N/A Bacteria (Haenen et al., 2013)
Domestic Observation MammalInfectious
diseaseTemporal N/A N/A N/A
Bacteria &archaea
(Haley et al., 2016)
Model Perturbation Mammal Synbiotic Antibiotic N/A N/A N/A Bacteria (Hammami et al., 2015)
Model Perturbation Mammal Diet N/A N/A N/A N/A Bacteria (Han et al., 2010)
Domestic Perturbation Bird Probiotic Antibiotic Production N/A N/A Bacteria (Han et al., 2013)
Model Perturbation Mammal Diet Age N/A N/A N/A Bacteria (Han et al., 2014)
Model Perturbation Mammal Antibiotic Immunity Prebiotic N/A N/A Bacteria (Hansen et al., 2013)
Domestic Perturbation Fish Diet Production N/A N/A N/A Bacteria (Hartviksen et al., 2014)
Domestic Perturbation Fish Antibiotic Genotype N/A N/A N/A Bacteria (He et al., 2010)
Model Perturbation MammalInfectious
diseaseN/A N/A N/A N/A Bacteria (He et al., 2012a)
Domestic Perturbation MammalInfectious
diseaseN/A N/A N/A N/A Bacteria (He et al., 2012b)
Model Perturbation MammalBacterialtransplant
GenotypeInfectious
diseaseN/A N/A Bacteria (Heimesaat et al., 2013)
Model Perturbation MammalInfectious
diseaseImmunity N/A N/A N/A Bacteria (Heimesaat et al., 2014)
Model Perturbation Mammal DietNon-
infectiousdisease
Immunity N/A N/A Bacteria (Heyman-Lindén et al., 2016)
Wild Observation Bird Genotype Environment Age Diet N/A Bacteria (Hird et al., 2014)
Model Perturbation Mammal Diet Non- N/A N/A N/A Bacteria (Holm et al., 2016)

infectiousdisease
Domestic Perturbation Bird Antibiotic Diet Immunity Production N/A Bacteria (Hong et al., 2012)
Domestic Perturbation Mammal Diet Metabolism N/A N/A N/A Bacteria (Hooda et al., 2013)
Domestic Perturbation Fish Diet Production Immunity N/A N/A Bacteria (Hoseinifar et al., 2011)
Domestic Perturbation Fish Prebiotic Production N/A N/A N/A Bacteria (Hoseinifar et al., 2013)
Domestic Perturbation Fish Prebiotic Immunity Production N/A N/A Bacteria (Hoseinifar et al., 2014a)
Domestic Perturbation Fish Diet Production Immunity Prebiotic N/A Bacteria (Hoseinifar et al., 2014b)
Domestic Perturbation Bird Diet N/A N/A N/A N/A Bacteria (Hosseintabar et al., 2014)
Model Perturbation Mammal Diet N/A N/A N/A N/A Bacteria (Hu et al., 2013)
Model Perturbation Mammal Diet Immunity N/A N/A N/A Bacteria (Huang et al., 2013)
Model Observation Mammal Genotype N/A N/A N/A N/A Bacteria (Hufeldt et al., 2010a)
Model Observation Mammal Genotype Environment N/A N/A N/A Bacteria (Hufeldt et al., 2010b)
Domestic Perturbation Mammal Diet Production N/A N/A N/A Bacteria (Huws et al., 2012)
Model Perturbation Mammal AntibioticNon-
infectiousdisease
Metabolism N/A N/A Bacteria (Hwang et al., 2015)
Domestic PerturbationNon-insectinvertebrate
Probiotic N/A N/A N/A N/A Bacteria (Iehata et al., 2014)
Domestic Perturbation Mammal Antibiotic N/A N/A N/A N/A Bacteria (Igarashi et al., 2014)
Wild Observation Mammal DietCommunitycomposition
Age N/A N/ABacteria &
archaea(Ilmberger et al., 2014)
Model Perturbation Mammal Drugs N/A N/A N/A N/A Bacteria (Imaeda et al., 2012)
Model Observation Mammal Methods N/A N/A N/A N/A Bacteria (Indugu et al., 2016)
Domestic Perturbation Fish Diet Probiotic N/A N/A N/A Bacteria (Ingerslev et al., 2014)
Domestic Observation MammalCommunitycomposition
N/A N/A N/A N/A Bacteria (Ishaq and Wright, 2012)
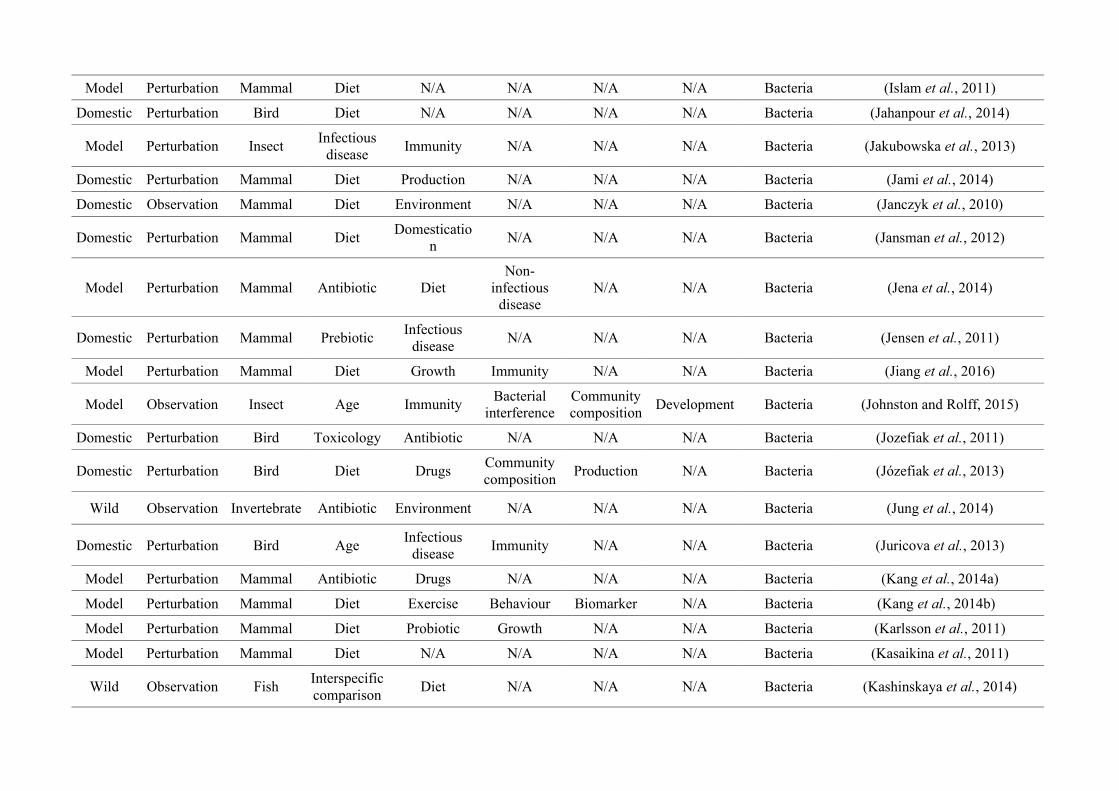
Model Perturbation Mammal Diet N/A N/A N/A N/A Bacteria (Islam et al., 2011)
Domestic Perturbation Bird Diet N/A N/A N/A N/A Bacteria (Jahanpour et al., 2014)
Model Perturbation InsectInfectious
diseaseImmunity N/A N/A N/A Bacteria (Jakubowska et al., 2013)
Domestic Perturbation Mammal Diet Production N/A N/A N/A Bacteria (Jami et al., 2014)
Domestic Observation Mammal Diet Environment N/A N/A N/A Bacteria (Janczyk et al., 2010)
Domestic Perturbation Mammal DietDomesticatio
nN/A N/A N/A Bacteria (Jansman et al., 2012)
Model Perturbation Mammal Antibiotic DietNon-
infectiousdisease
N/A N/A Bacteria (Jena et al., 2014)
Domestic Perturbation Mammal PrebioticInfectious
diseaseN/A N/A N/A Bacteria (Jensen et al., 2011)
Model Perturbation Mammal Diet Growth Immunity N/A N/A Bacteria (Jiang et al., 2016)
Model Observation Insect Age ImmunityBacterial
interferenceCommunitycomposition
Development Bacteria (Johnston and Rolff, 2015)
Domestic Perturbation Bird Toxicology Antibiotic N/A N/A N/A Bacteria (Jozefiak et al., 2011)
Domestic Perturbation Bird Diet DrugsCommunitycomposition
Production N/A Bacteria (Józefiak et al., 2013)
Wild Observation Invertebrate Antibiotic Environment N/A N/A N/A Bacteria (Jung et al., 2014)
Domestic Perturbation Bird AgeInfectious
diseaseImmunity N/A N/A Bacteria (Juricova et al., 2013)
Model Perturbation Mammal Antibiotic Drugs N/A N/A N/A Bacteria (Kang et al., 2014a)
Model Perturbation Mammal Diet Exercise Behaviour Biomarker N/A Bacteria (Kang et al., 2014b)
Model Perturbation Mammal Diet Probiotic Growth N/A N/A Bacteria (Karlsson et al., 2011)
Model Perturbation Mammal Diet N/A N/A N/A N/A Bacteria (Kasaikina et al., 2011)
Wild Observation FishInterspecificcomparison
Diet N/A N/A N/A Bacteria (Kashinskaya et al., 2014)
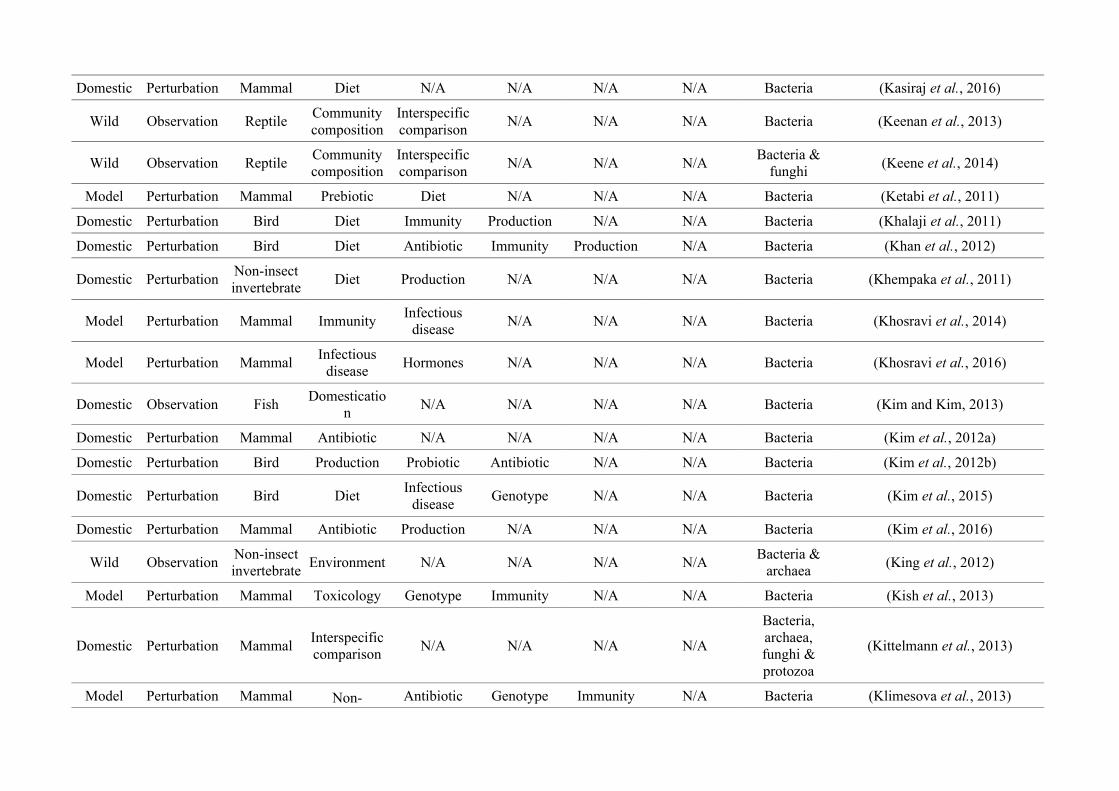
Domestic Perturbation Mammal Diet N/A N/A N/A N/A Bacteria (Kasiraj et al., 2016)
Wild Observation ReptileCommunitycomposition
Interspecificcomparison
N/A N/A N/A Bacteria (Keenan et al., 2013)
Wild Observation ReptileCommunitycomposition
Interspecificcomparison
N/A N/A N/ABacteria &
funghi(Keene et al., 2014)
Model Perturbation Mammal Prebiotic Diet N/A N/A N/A Bacteria (Ketabi et al., 2011)
Domestic Perturbation Bird Diet Immunity Production N/A N/A Bacteria (Khalaji et al., 2011)
Domestic Perturbation Bird Diet Antibiotic Immunity Production N/A Bacteria (Khan et al., 2012)
Domestic PerturbationNon-insectinvertebrate
Diet Production N/A N/A N/A Bacteria (Khempaka et al., 2011)
Model Perturbation Mammal ImmunityInfectious
diseaseN/A N/A N/A Bacteria (Khosravi et al., 2014)
Model Perturbation MammalInfectious
diseaseHormones N/A N/A N/A Bacteria (Khosravi et al., 2016)
Domestic Observation FishDomesticatio
nN/A N/A N/A N/A Bacteria (Kim and Kim, 2013)
Domestic Perturbation Mammal Antibiotic N/A N/A N/A N/A Bacteria (Kim et al., 2012a)
Domestic Perturbation Bird Production Probiotic Antibiotic N/A N/A Bacteria (Kim et al., 2012b)
Domestic Perturbation Bird DietInfectious
diseaseGenotype N/A N/A Bacteria (Kim et al., 2015)
Domestic Perturbation Mammal Antibiotic Production N/A N/A N/A Bacteria (Kim et al., 2016)
Wild ObservationNon-insectinvertebrate
Environment N/A N/A N/A N/ABacteria &
archaea(King et al., 2012)
Model Perturbation Mammal Toxicology Genotype Immunity N/A N/A Bacteria (Kish et al., 2013)
Domestic Perturbation MammalInterspecificcomparison
N/A N/A N/A N/A
Bacteria,archaea,funghi &protozoa
(Kittelmann et al., 2013)
Model Perturbation Mammal Non- Antibiotic Genotype Immunity N/A Bacteria (Klimesova et al., 2013)
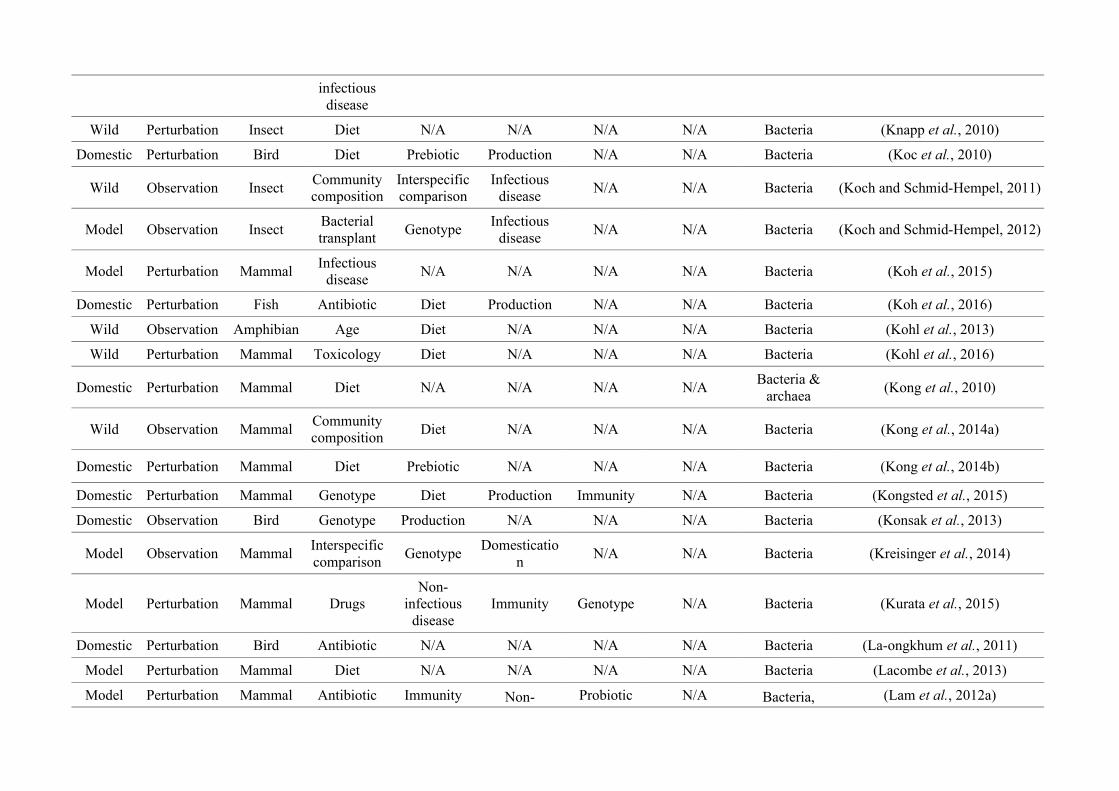
infectiousdisease
Wild Perturbation Insect Diet N/A N/A N/A N/A Bacteria (Knapp et al., 2010)
Domestic Perturbation Bird Diet Prebiotic Production N/A N/A Bacteria (Koc et al., 2010)
Wild Observation InsectCommunitycomposition
Interspecificcomparison
Infectiousdisease
N/A N/A Bacteria (Koch and Schmid-Hempel, 2011)
Model Observation InsectBacterialtransplant
GenotypeInfectious
diseaseN/A N/A Bacteria (Koch and Schmid-Hempel, 2012)
Model Perturbation MammalInfectious
diseaseN/A N/A N/A N/A Bacteria (Koh et al., 2015)
Domestic Perturbation Fish Antibiotic Diet Production N/A N/A Bacteria (Koh et al., 2016)
Wild Observation Amphibian Age Diet N/A N/A N/A Bacteria (Kohl et al., 2013)
Wild Perturbation Mammal Toxicology Diet N/A N/A N/A Bacteria (Kohl et al., 2016)
Domestic Perturbation Mammal Diet N/A N/A N/A N/ABacteria &
archaea(Kong et al., 2010)
Wild Observation MammalCommunitycomposition
Diet N/A N/A N/A Bacteria (Kong et al., 2014a)
Domestic Perturbation Mammal Diet Prebiotic N/A N/A N/A Bacteria (Kong et al., 2014b)
Domestic Perturbation Mammal Genotype Diet Production Immunity N/A Bacteria (Kongsted et al., 2015)
Domestic Observation Bird Genotype Production N/A N/A N/A Bacteria (Konsak et al., 2013)
Model Observation MammalInterspecificcomparison
GenotypeDomesticatio
nN/A N/A Bacteria (Kreisinger et al., 2014)
Model Perturbation Mammal DrugsNon-
infectiousdisease
Immunity Genotype N/A Bacteria (Kurata et al., 2015)
Domestic Perturbation Bird Antibiotic N/A N/A N/A N/A Bacteria (La-ongkhum et al., 2011)
Model Perturbation Mammal Diet N/A N/A N/A N/A Bacteria (Lacombe et al., 2013)
Model Perturbation Mammal Antibiotic Immunity Non- Probiotic N/A Bacteria, (Lam et al., 2012a)
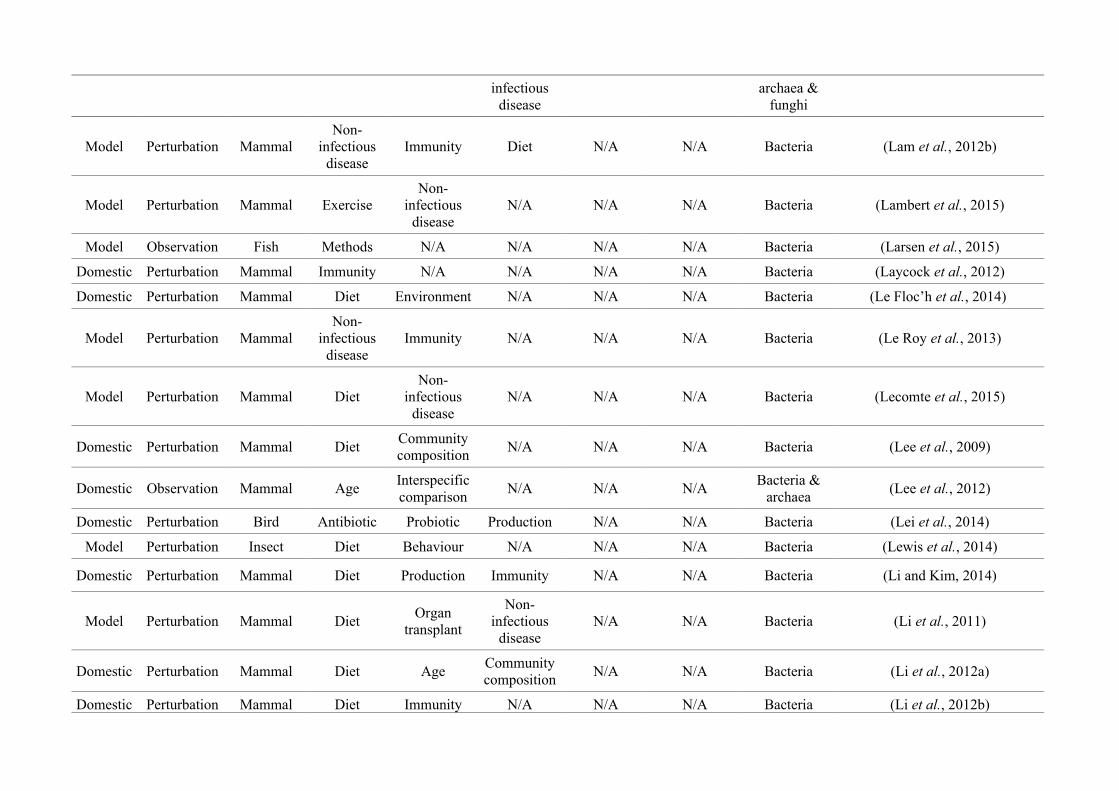
infectiousdisease
archaea &funghi
Model Perturbation MammalNon-
infectiousdisease
Immunity Diet N/A N/A Bacteria (Lam et al., 2012b)
Model Perturbation Mammal ExerciseNon-
infectiousdisease
N/A N/A N/A Bacteria (Lambert et al., 2015)
Model Observation Fish Methods N/A N/A N/A N/A Bacteria (Larsen et al., 2015)
Domestic Perturbation Mammal Immunity N/A N/A N/A N/A Bacteria (Laycock et al., 2012)
Domestic Perturbation Mammal Diet Environment N/A N/A N/A Bacteria (Le Floc’h et al., 2014)
Model Perturbation MammalNon-
infectiousdisease
Immunity N/A N/A N/A Bacteria (Le Roy et al., 2013)
Model Perturbation Mammal DietNon-
infectiousdisease
N/A N/A N/A Bacteria (Lecomte et al., 2015)
Domestic Perturbation Mammal DietCommunitycomposition
N/A N/A N/A Bacteria (Lee et al., 2009)
Domestic Observation Mammal AgeInterspecificcomparison
N/A N/A N/ABacteria &
archaea(Lee et al., 2012)
Domestic Perturbation Bird Antibiotic Probiotic Production N/A N/A Bacteria (Lei et al., 2014)
Model Perturbation Insect Diet Behaviour N/A N/A N/A Bacteria (Lewis et al., 2014)
Domestic Perturbation Mammal Diet Production Immunity N/A N/A Bacteria (Li and Kim, 2014)
Model Perturbation Mammal DietOrgan
transplant
Non-infectious
diseaseN/A N/A Bacteria (Li et al., 2011)
Domestic Perturbation Mammal Diet AgeCommunitycomposition
N/A N/A Bacteria (Li et al., 2012a)
Domestic Perturbation Mammal Diet Immunity N/A N/A N/A Bacteria (Li et al., 2012b)
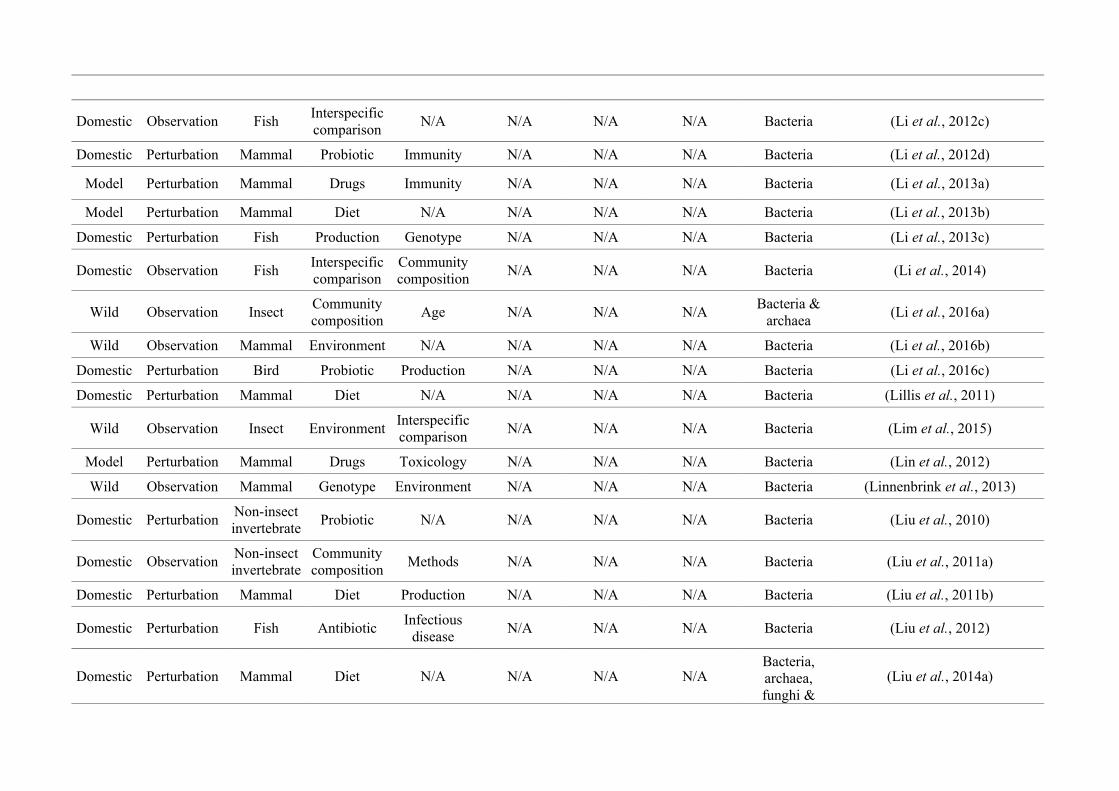
Domestic Observation FishInterspecificcomparison
N/A N/A N/A N/A Bacteria (Li et al., 2012c)
Domestic Perturbation Mammal Probiotic Immunity N/A N/A N/A Bacteria (Li et al., 2012d)
Model Perturbation Mammal Drugs Immunity N/A N/A N/A Bacteria (Li et al., 2013a)
Model Perturbation Mammal Diet N/A N/A N/A N/A Bacteria (Li et al., 2013b)
Domestic Perturbation Fish Production Genotype N/A N/A N/A Bacteria (Li et al., 2013c)
Domestic Observation FishInterspecificcomparison
Communitycomposition
N/A N/A N/A Bacteria (Li et al., 2014)
Wild Observation InsectCommunitycomposition
Age N/A N/A N/ABacteria &
archaea(Li et al., 2016a)
Wild Observation Mammal Environment N/A N/A N/A N/A Bacteria (Li et al., 2016b)
Domestic Perturbation Bird Probiotic Production N/A N/A N/A Bacteria (Li et al., 2016c)
Domestic Perturbation Mammal Diet N/A N/A N/A N/A Bacteria (Lillis et al., 2011)
Wild Observation Insect EnvironmentInterspecificcomparison
N/A N/A N/A Bacteria (Lim et al., 2015)
Model Perturbation Mammal Drugs Toxicology N/A N/A N/A Bacteria (Lin et al., 2012)
Wild Observation Mammal Genotype Environment N/A N/A N/A Bacteria (Linnenbrink et al., 2013)
Domestic PerturbationNon-insectinvertebrate
Probiotic N/A N/A N/A N/A Bacteria (Liu et al., 2010)
Domestic ObservationNon-insectinvertebrate
Communitycomposition
Methods N/A N/A N/A Bacteria (Liu et al., 2011a)
Domestic Perturbation Mammal Diet Production N/A N/A N/A Bacteria (Liu et al., 2011b)
Domestic Perturbation Fish AntibioticInfectious
diseaseN/A N/A N/A Bacteria (Liu et al., 2012)
Domestic Perturbation Mammal Diet N/A N/A N/A N/ABacteria,archaea,funghi &
(Liu et al., 2014a)
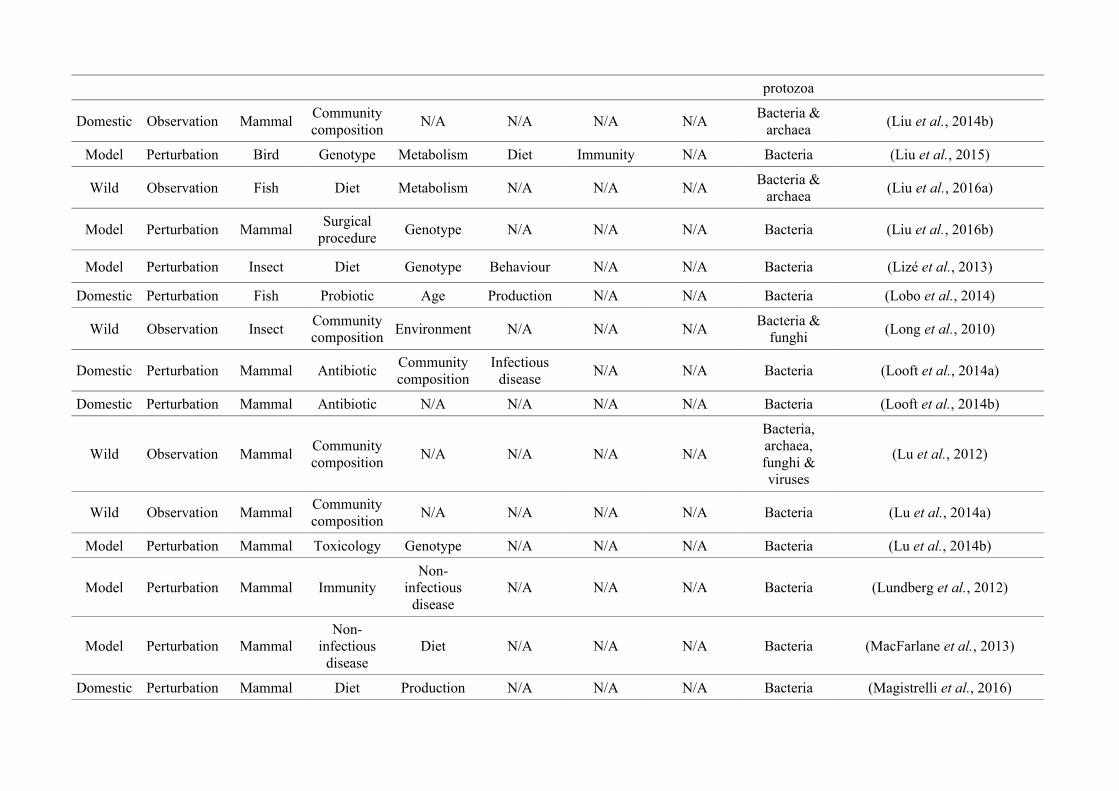
protozoa
Domestic Observation MammalCommunitycomposition
N/A N/A N/A N/ABacteria &
archaea(Liu et al., 2014b)
Model Perturbation Bird Genotype Metabolism Diet Immunity N/A Bacteria (Liu et al., 2015)
Wild Observation Fish Diet Metabolism N/A N/A N/ABacteria &
archaea(Liu et al., 2016a)
Model Perturbation MammalSurgical
procedureGenotype N/A N/A N/A Bacteria (Liu et al., 2016b)
Model Perturbation Insect Diet Genotype Behaviour N/A N/A Bacteria (Lizé et al., 2013)
Domestic Perturbation Fish Probiotic Age Production N/A N/A Bacteria (Lobo et al., 2014)
Wild Observation InsectCommunitycomposition
Environment N/A N/A N/ABacteria &
funghi(Long et al., 2010)
Domestic Perturbation Mammal AntibioticCommunitycomposition
Infectiousdisease
N/A N/A Bacteria (Looft et al., 2014a)
Domestic Perturbation Mammal Antibiotic N/A N/A N/A N/A Bacteria (Looft et al., 2014b)
Wild Observation MammalCommunitycomposition
N/A N/A N/A N/A
Bacteria,archaea,funghi &viruses
(Lu et al., 2012)
Wild Observation MammalCommunitycomposition
N/A N/A N/A N/A Bacteria (Lu et al., 2014a)
Model Perturbation Mammal Toxicology Genotype N/A N/A N/A Bacteria (Lu et al., 2014b)
Model Perturbation Mammal ImmunityNon-
infectiousdisease
N/A N/A N/A Bacteria (Lundberg et al., 2012)
Model Perturbation MammalNon-
infectiousdisease
Diet N/A N/A N/A Bacteria (MacFarlane et al., 2013)
Domestic Perturbation Mammal Diet Production N/A N/A N/A Bacteria (Magistrelli et al., 2016)
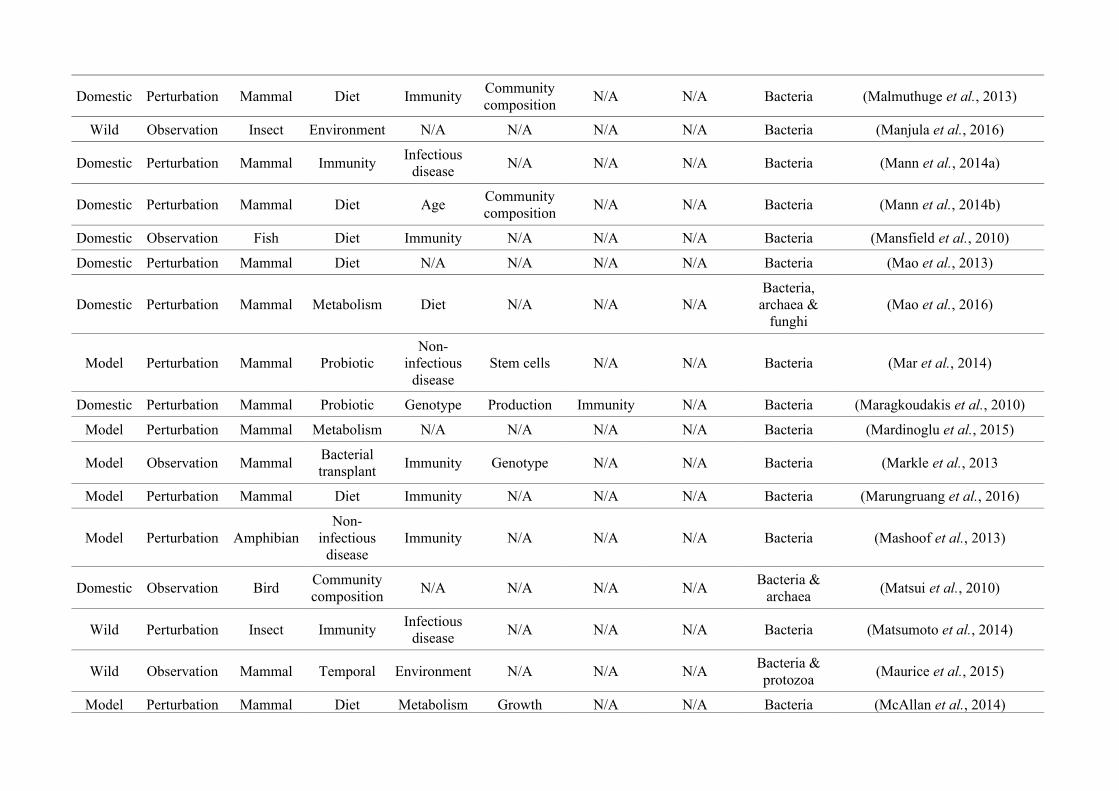
Domestic Perturbation Mammal Diet ImmunityCommunitycomposition
N/A N/A Bacteria (Malmuthuge et al., 2013)
Wild Observation Insect Environment N/A N/A N/A N/A Bacteria (Manjula et al., 2016)
Domestic Perturbation Mammal ImmunityInfectious
diseaseN/A N/A N/A Bacteria (Mann et al., 2014a)
Domestic Perturbation Mammal Diet AgeCommunitycomposition
N/A N/A Bacteria (Mann et al., 2014b)
Domestic Observation Fish Diet Immunity N/A N/A N/A Bacteria (Mansfield et al., 2010)
Domestic Perturbation Mammal Diet N/A N/A N/A N/A Bacteria (Mao et al., 2013)
Domestic Perturbation Mammal Metabolism Diet N/A N/A N/ABacteria,
archaea &funghi
(Mao et al., 2016)
Model Perturbation Mammal ProbioticNon-
infectiousdisease
Stem cells N/A N/A Bacteria (Mar et al., 2014)
Domestic Perturbation Mammal Probiotic Genotype Production Immunity N/A Bacteria (Maragkoudakis et al., 2010)
Model Perturbation Mammal Metabolism N/A N/A N/A N/A Bacteria (Mardinoglu et al., 2015)
Model Observation MammalBacterialtransplant
Immunity Genotype N/A N/A Bacteria (Markle et al., 2013
Model Perturbation Mammal Diet Immunity N/A N/A N/A Bacteria (Marungruang et al., 2016)
Model Perturbation AmphibianNon-
infectiousdisease
Immunity N/A N/A N/A Bacteria (Mashoof et al., 2013)
Domestic Observation BirdCommunitycomposition
N/A N/A N/A N/ABacteria &
archaea(Matsui et al., 2010)
Wild Perturbation Insect ImmunityInfectious
diseaseN/A N/A N/A Bacteria (Matsumoto et al., 2014)
Wild Observation Mammal Temporal Environment N/A N/A N/ABacteria &protozoa
(Maurice et al., 2015)
Model Perturbation Mammal Diet Metabolism Growth N/A N/A Bacteria (McAllan et al., 2014)
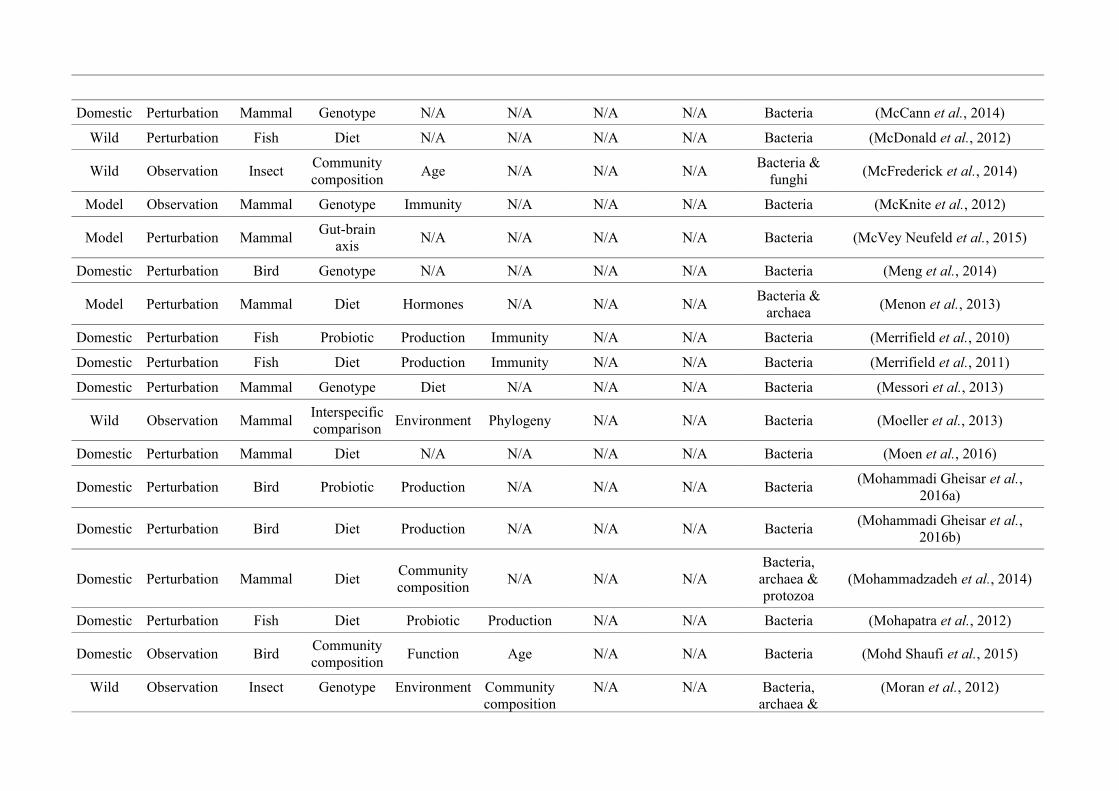
Domestic Perturbation Mammal Genotype N/A N/A N/A N/A Bacteria (McCann et al., 2014)
Wild Perturbation Fish Diet N/A N/A N/A N/A Bacteria (McDonald et al., 2012)
Wild Observation InsectCommunitycomposition
Age N/A N/A N/ABacteria &
funghi(McFrederick et al., 2014)
Model Observation Mammal Genotype Immunity N/A N/A N/A Bacteria (McKnite et al., 2012)
Model Perturbation MammalGut-brain
axisN/A N/A N/A N/A Bacteria (McVey Neufeld et al., 2015)
Domestic Perturbation Bird Genotype N/A N/A N/A N/A Bacteria (Meng et al., 2014)
Model Perturbation Mammal Diet Hormones N/A N/A N/ABacteria &
archaea(Menon et al., 2013)
Domestic Perturbation Fish Probiotic Production Immunity N/A N/A Bacteria (Merrifield et al., 2010)
Domestic Perturbation Fish Diet Production Immunity N/A N/A Bacteria (Merrifield et al., 2011)
Domestic Perturbation Mammal Genotype Diet N/A N/A N/A Bacteria (Messori et al., 2013)
Wild Observation MammalInterspecificcomparison
Environment Phylogeny N/A N/A Bacteria (Moeller et al., 2013)
Domestic Perturbation Mammal Diet N/A N/A N/A N/A Bacteria (Moen et al., 2016)
Domestic Perturbation Bird Probiotic Production N/A N/A N/A Bacteria(Mohammadi Gheisar et al.,
2016a)
Domestic Perturbation Bird Diet Production N/A N/A N/A Bacteria(Mohammadi Gheisar et al.,
2016b)
Domestic Perturbation Mammal DietCommunitycomposition
N/A N/A N/ABacteria,
archaea &protozoa
(Mohammadzadeh et al., 2014)
Domestic Perturbation Fish Diet Probiotic Production N/A N/A Bacteria (Mohapatra et al., 2012)
Domestic Observation BirdCommunitycomposition
Function Age N/A N/A Bacteria (Mohd Shaufi et al., 2015)
Wild Observation Insect Genotype Environment Communitycomposition
N/A N/A Bacteria,archaea &
(Moran et al., 2012)
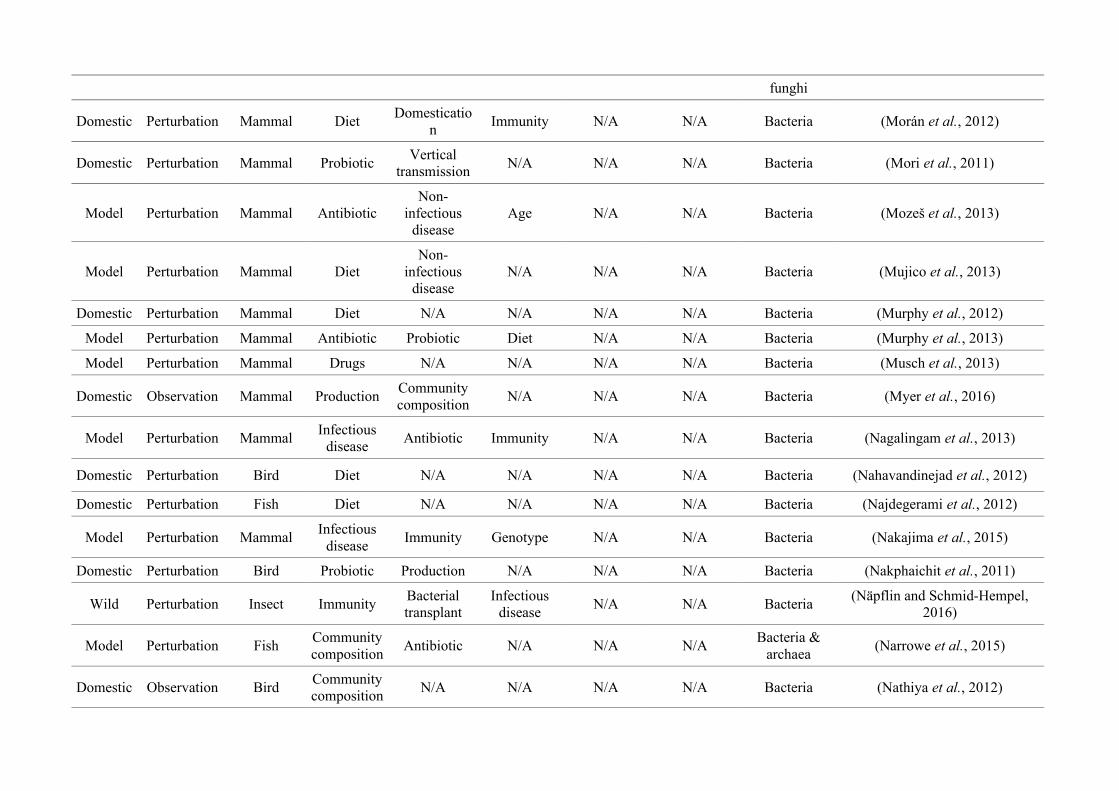
funghi
Domestic Perturbation Mammal DietDomesticatio
nImmunity N/A N/A Bacteria (Morán et al., 2012)
Domestic Perturbation Mammal ProbioticVertical
transmissionN/A N/A N/A Bacteria (Mori et al., 2011)
Model Perturbation Mammal AntibioticNon-
infectiousdisease
Age N/A N/A Bacteria (Mozeš et al., 2013)
Model Perturbation Mammal DietNon-
infectiousdisease
N/A N/A N/A Bacteria (Mujico et al., 2013)
Domestic Perturbation Mammal Diet N/A N/A N/A N/A Bacteria (Murphy et al., 2012)
Model Perturbation Mammal Antibiotic Probiotic Diet N/A N/A Bacteria (Murphy et al., 2013)
Model Perturbation Mammal Drugs N/A N/A N/A N/A Bacteria (Musch et al., 2013)
Domestic Observation Mammal ProductionCommunitycomposition
N/A N/A N/A Bacteria (Myer et al., 2016)
Model Perturbation MammalInfectious
diseaseAntibiotic Immunity N/A N/A Bacteria (Nagalingam et al., 2013)
Domestic Perturbation Bird Diet N/A N/A N/A N/A Bacteria (Nahavandinejad et al., 2012)
Domestic Perturbation Fish Diet N/A N/A N/A N/A Bacteria (Najdegerami et al., 2012)
Model Perturbation MammalInfectious
diseaseImmunity Genotype N/A N/A Bacteria (Nakajima et al., 2015)
Domestic Perturbation Bird Probiotic Production N/A N/A N/A Bacteria (Nakphaichit et al., 2011)
Wild Perturbation Insect ImmunityBacterialtransplant
Infectiousdisease
N/A N/A Bacteria(Näpflin and Schmid-Hempel,
2016)
Model Perturbation FishCommunitycomposition
Antibiotic N/A N/A N/ABacteria &
archaea(Narrowe et al., 2015)
Domestic Observation BirdCommunitycomposition
N/A N/A N/A N/A Bacteria (Nathiya et al., 2012)
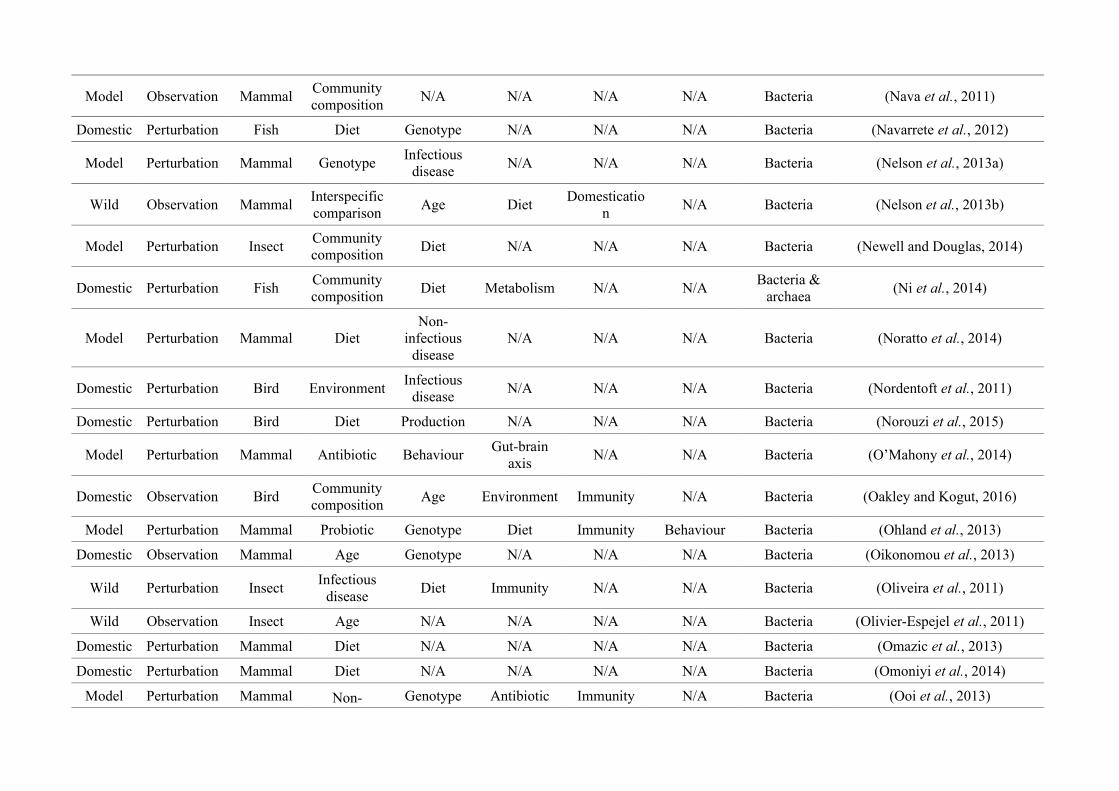
Model Observation MammalCommunitycomposition
N/A N/A N/A N/A Bacteria (Nava et al., 2011)
Domestic Perturbation Fish Diet Genotype N/A N/A N/A Bacteria (Navarrete et al., 2012)
Model Perturbation Mammal GenotypeInfectious
diseaseN/A N/A N/A Bacteria (Nelson et al., 2013a)
Wild Observation MammalInterspecificcomparison
Age DietDomesticatio
nN/A Bacteria (Nelson et al., 2013b)
Model Perturbation InsectCommunitycomposition
Diet N/A N/A N/A Bacteria (Newell and Douglas, 2014)
Domestic Perturbation FishCommunitycomposition
Diet Metabolism N/A N/ABacteria &
archaea(Ni et al., 2014)
Model Perturbation Mammal DietNon-
infectiousdisease
N/A N/A N/A Bacteria (Noratto et al., 2014)
Domestic Perturbation Bird EnvironmentInfectious
diseaseN/A N/A N/A Bacteria (Nordentoft et al., 2011)
Domestic Perturbation Bird Diet Production N/A N/A N/A Bacteria (Norouzi et al., 2015)
Model Perturbation Mammal Antibiotic BehaviourGut-brain
axisN/A N/A Bacteria (O’Mahony et al., 2014)
Domestic Observation BirdCommunitycomposition
Age Environment Immunity N/A Bacteria (Oakley and Kogut, 2016)
Model Perturbation Mammal Probiotic Genotype Diet Immunity Behaviour Bacteria (Ohland et al., 2013)
Domestic Observation Mammal Age Genotype N/A N/A N/A Bacteria (Oikonomou et al., 2013)
Wild Perturbation InsectInfectious
diseaseDiet Immunity N/A N/A Bacteria (Oliveira et al., 2011)
Wild Observation Insect Age N/A N/A N/A N/A Bacteria (Olivier-Espejel et al., 2011)
Domestic Perturbation Mammal Diet N/A N/A N/A N/A Bacteria (Omazic et al., 2013)
Domestic Perturbation Mammal Diet N/A N/A N/A N/A Bacteria (Omoniyi et al., 2014)
Model Perturbation Mammal Non- Genotype Antibiotic Immunity N/A Bacteria (Ooi et al., 2013)

infectiousdisease
Domestic Perturbation Fish Diet Prebiotic Production N/A N/A Bacteria (Ortiz et al., 2013)
Wild Observation InsectInfectious
diseaseInterspecificcomparison
Communitycomposition
N/A N/A Bacteria (Osei-Poku et al., 2012)
Domestic Perturbation MammalInfectious
diseaseDrugs N/A N/A N/A Bacteria (Paddock et al., 2014)
Domestic Observation MammalInterspecificcomparison
Genotype N/A N/A N/A Bacteria (Pajarillo et al., 2014)
Model Perturbation Mammal DietNon-
infectiousdisease
N/A N/A N/A Bacteria (Palmnäs et al., 2014)
Model Perturbation Mammal Genotype N/A N/A N/A N/A Bacteria (Pang et al., 2012a)
Model Observation MammalCommunitycomposition
Age N/A N/A N/A Bacteria (Pang et al., 2012b)
Model Perturbation Mammal AgeVertical
transmissionN/A N/A N/A Bacteria (Pantoja-Feliciano et al., 2013)
Domestic Perturbation Mammal Diet Metabolism N/A N/A N/A Bacteria (Papadomichelakis et al., 2012)
Model Perturbation Mammal Probiotic Immunity N/A N/A N/A Bacteria (Park et al., 2013)
Domestic Observation MammalCommunitycomposition
Genotype N/A N/A N/A Bacteria (Park et al., 2014)
Domestic Perturbation Bird Prebiotic N/A N/A N/A N/ABacteria &
archaea(Park et al., 2016)
Domestic Perturbation Mammal DietVertical
transmissionN/A N/A N/A Bacteria (Paßlack et al., 2015)
Model Perturbation Mammal Diet Immunity N/A N/A N/A Bacteria (Patrone et al., 2012)
Model Perturbation Mammal Diet N/A N/A N/A N/A Bacteria (Patterson et al., 2014)
Model Observation BirdCommunitycomposition
N/A N/A N/A N/A Bacteria (Pauwels et al., 2015)
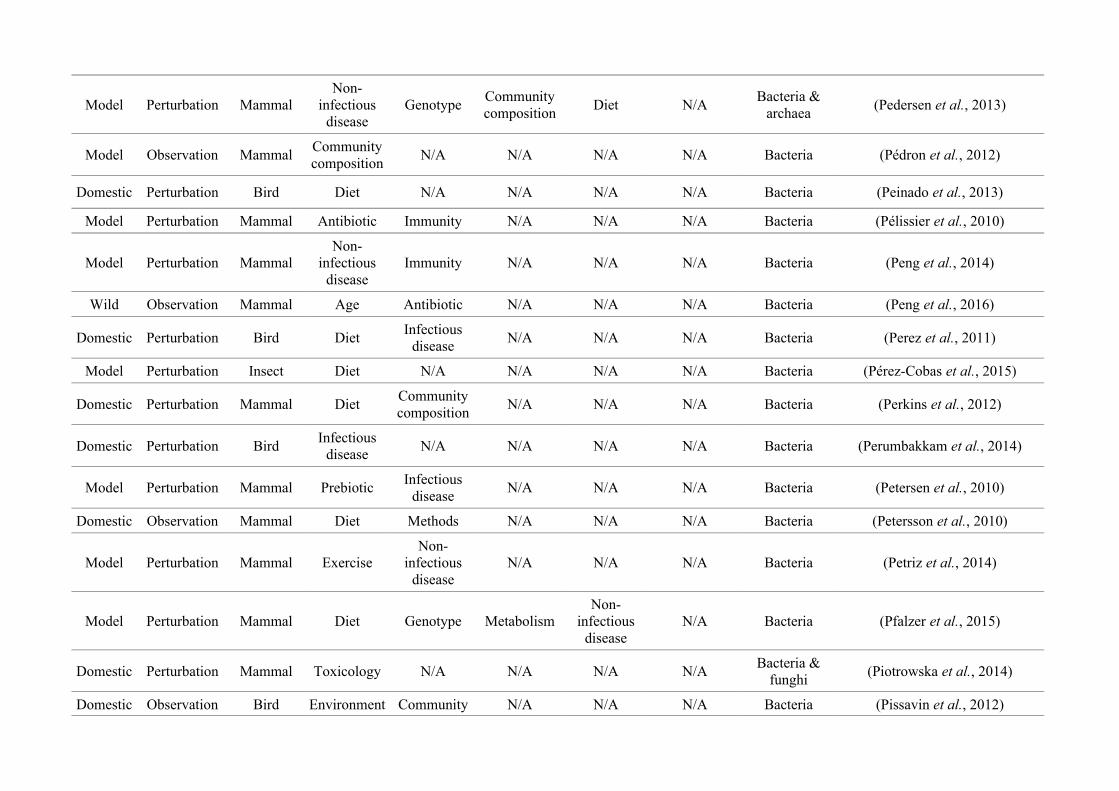
Model Perturbation MammalNon-
infectiousdisease
GenotypeCommunitycomposition
Diet N/ABacteria &
archaea(Pedersen et al., 2013)
Model Observation MammalCommunitycomposition
N/A N/A N/A N/A Bacteria (Pédron et al., 2012)
Domestic Perturbation Bird Diet N/A N/A N/A N/A Bacteria (Peinado et al., 2013)
Model Perturbation Mammal Antibiotic Immunity N/A N/A N/A Bacteria (Pélissier et al., 2010)
Model Perturbation MammalNon-
infectiousdisease
Immunity N/A N/A N/A Bacteria (Peng et al., 2014)
Wild Observation Mammal Age Antibiotic N/A N/A N/A Bacteria (Peng et al., 2016)
Domestic Perturbation Bird DietInfectious
diseaseN/A N/A N/A Bacteria (Perez et al., 2011)
Model Perturbation Insect Diet N/A N/A N/A N/A Bacteria (Pérez-Cobas et al., 2015)
Domestic Perturbation Mammal DietCommunitycomposition
N/A N/A N/A Bacteria (Perkins et al., 2012)
Domestic Perturbation BirdInfectious
diseaseN/A N/A N/A N/A Bacteria (Perumbakkam et al., 2014)
Model Perturbation Mammal PrebioticInfectious
diseaseN/A N/A N/A Bacteria (Petersen et al., 2010)
Domestic Observation Mammal Diet Methods N/A N/A N/A Bacteria (Petersson et al., 2010)
Model Perturbation Mammal ExerciseNon-
infectiousdisease
N/A N/A N/A Bacteria (Petriz et al., 2014)
Model Perturbation Mammal Diet Genotype MetabolismNon-
infectiousdisease
N/A Bacteria (Pfalzer et al., 2015)
Domestic Perturbation Mammal Toxicology N/A N/A N/A N/ABacteria &
funghi(Piotrowska et al., 2014)
Domestic Observation Bird Environment Community N/A N/A N/A Bacteria (Pissavin et al., 2012)
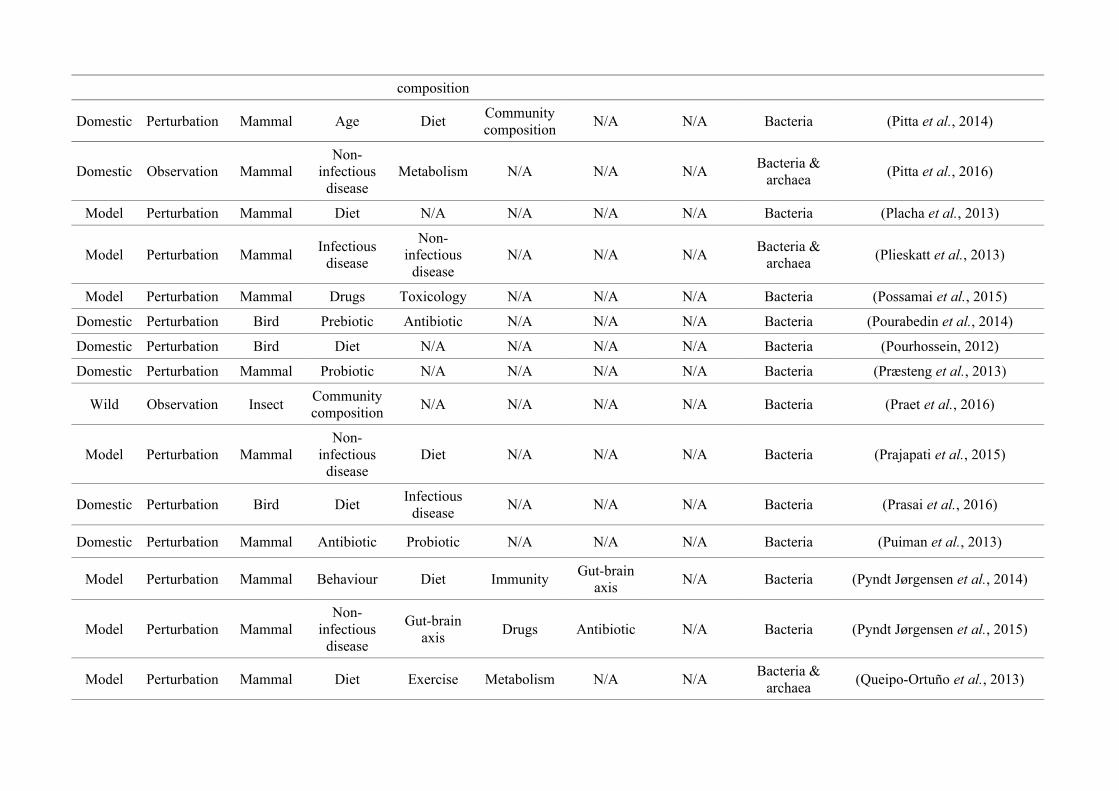
composition
Domestic Perturbation Mammal Age DietCommunitycomposition
N/A N/A Bacteria (Pitta et al., 2014)
Domestic Observation MammalNon-
infectiousdisease
Metabolism N/A N/A N/ABacteria &
archaea(Pitta et al., 2016)
Model Perturbation Mammal Diet N/A N/A N/A N/A Bacteria (Placha et al., 2013)
Model Perturbation MammalInfectious
disease
Non-infectious
diseaseN/A N/A N/A
Bacteria &archaea
(Plieskatt et al., 2013)
Model Perturbation Mammal Drugs Toxicology N/A N/A N/A Bacteria (Possamai et al., 2015)
Domestic Perturbation Bird Prebiotic Antibiotic N/A N/A N/A Bacteria (Pourabedin et al., 2014)
Domestic Perturbation Bird Diet N/A N/A N/A N/A Bacteria (Pourhossein, 2012)
Domestic Perturbation Mammal Probiotic N/A N/A N/A N/A Bacteria (Præsteng et al., 2013)
Wild Observation InsectCommunitycomposition
N/A N/A N/A N/A Bacteria (Praet et al., 2016)
Model Perturbation MammalNon-
infectiousdisease
Diet N/A N/A N/A Bacteria (Prajapati et al., 2015)
Domestic Perturbation Bird DietInfectious
diseaseN/A N/A N/A Bacteria (Prasai et al., 2016)
Domestic Perturbation Mammal Antibiotic Probiotic N/A N/A N/A Bacteria (Puiman et al., 2013)
Model Perturbation Mammal Behaviour Diet ImmunityGut-brain
axisN/A Bacteria (Pyndt Jørgensen et al., 2014)
Model Perturbation MammalNon-
infectiousdisease
Gut-brainaxis
Drugs Antibiotic N/A Bacteria (Pyndt Jørgensen et al., 2015)
Model Perturbation Mammal Diet Exercise Metabolism N/A N/ABacteria &
archaea(Queipo-Ortuño et al., 2013)
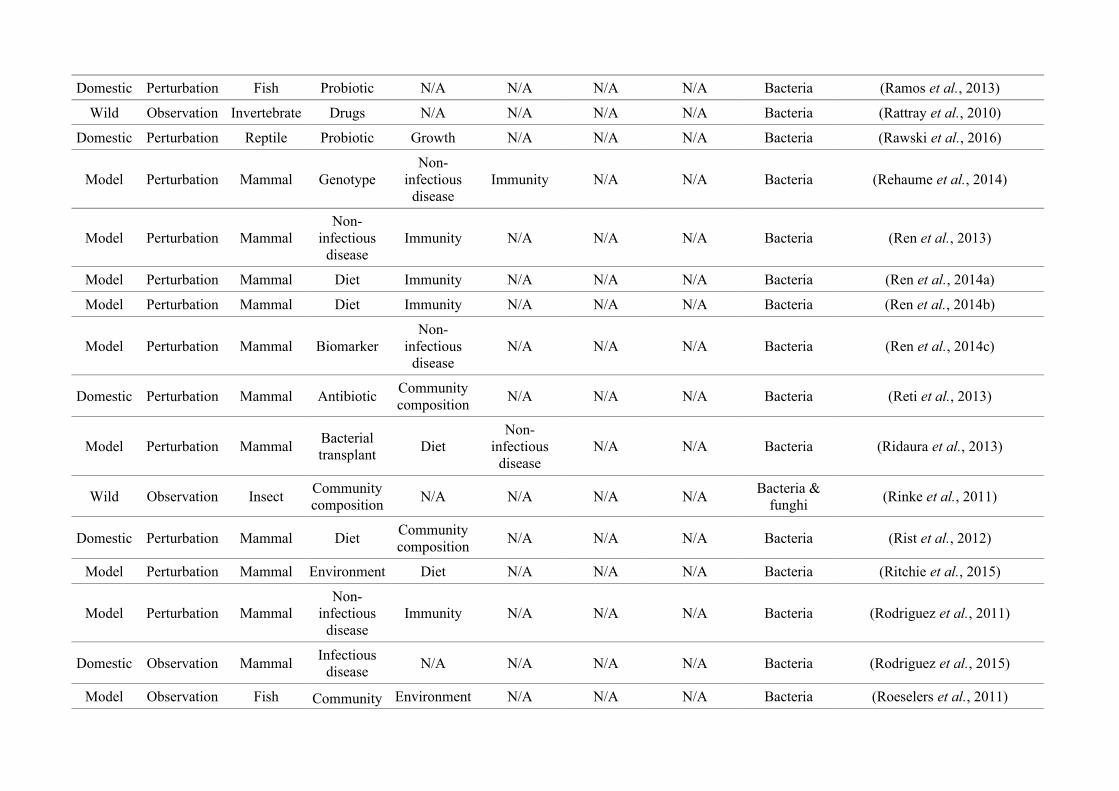
Domestic Perturbation Fish Probiotic N/A N/A N/A N/A Bacteria (Ramos et al., 2013)
Wild Observation Invertebrate Drugs N/A N/A N/A N/A Bacteria (Rattray et al., 2010)
Domestic Perturbation Reptile Probiotic Growth N/A N/A N/A Bacteria (Rawski et al., 2016)
Model Perturbation Mammal GenotypeNon-
infectiousdisease
Immunity N/A N/A Bacteria (Rehaume et al., 2014)
Model Perturbation MammalNon-
infectiousdisease
Immunity N/A N/A N/A Bacteria (Ren et al., 2013)
Model Perturbation Mammal Diet Immunity N/A N/A N/A Bacteria (Ren et al., 2014a)
Model Perturbation Mammal Diet Immunity N/A N/A N/A Bacteria (Ren et al., 2014b)
Model Perturbation Mammal BiomarkerNon-
infectiousdisease
N/A N/A N/A Bacteria (Ren et al., 2014c)
Domestic Perturbation Mammal AntibioticCommunitycomposition
N/A N/A N/A Bacteria (Reti et al., 2013)
Model Perturbation MammalBacterialtransplant
DietNon-
infectiousdisease
N/A N/A Bacteria (Ridaura et al., 2013)
Wild Observation InsectCommunitycomposition
N/A N/A N/A N/ABacteria &
funghi(Rinke et al., 2011)
Domestic Perturbation Mammal DietCommunitycomposition
N/A N/A N/A Bacteria (Rist et al., 2012)
Model Perturbation Mammal Environment Diet N/A N/A N/A Bacteria (Ritchie et al., 2015)
Model Perturbation MammalNon-
infectiousdisease
Immunity N/A N/A N/A Bacteria (Rodriguez et al., 2011)
Domestic Observation MammalInfectious
diseaseN/A N/A N/A N/A Bacteria (Rodriguez et al., 2015)
Model Observation Fish Community Environment N/A N/A N/A Bacteria (Roeselers et al., 2011)
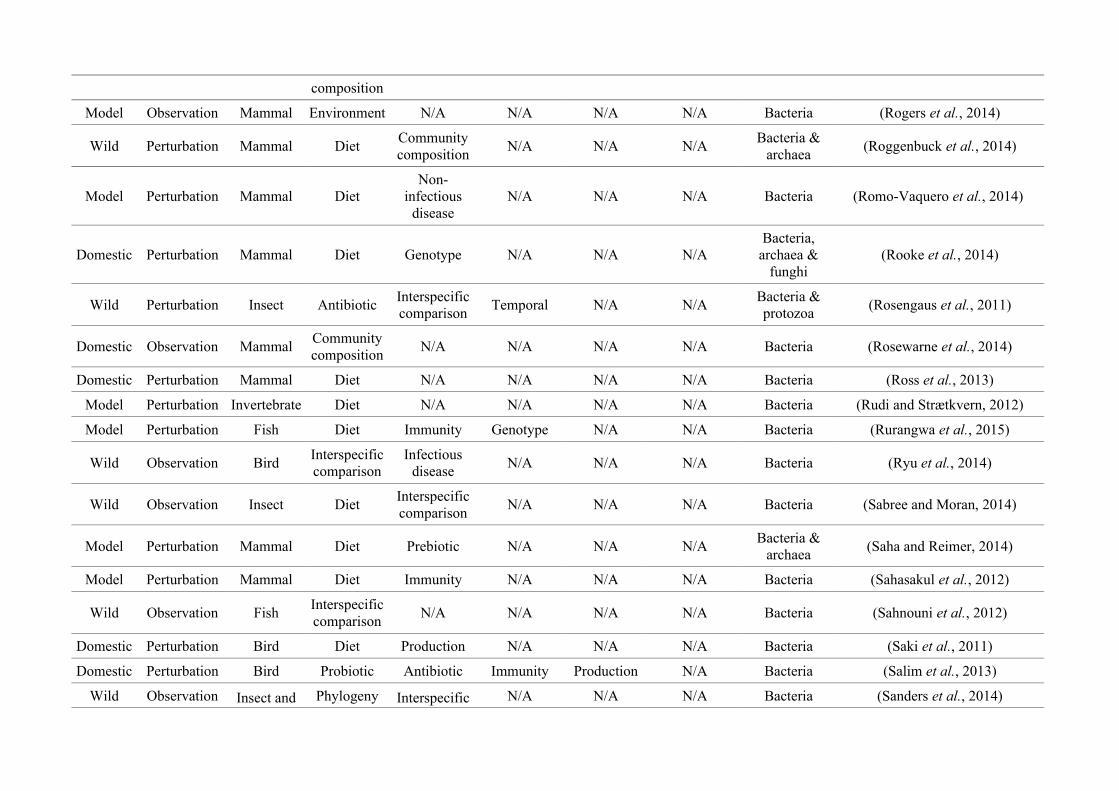
composition
Model Observation Mammal Environment N/A N/A N/A N/A Bacteria (Rogers et al., 2014)
Wild Perturbation Mammal DietCommunitycomposition
N/A N/A N/ABacteria &
archaea(Roggenbuck et al., 2014)
Model Perturbation Mammal DietNon-
infectiousdisease
N/A N/A N/A Bacteria (Romo-Vaquero et al., 2014)
Domestic Perturbation Mammal Diet Genotype N/A N/A N/ABacteria,
archaea &funghi
(Rooke et al., 2014)
Wild Perturbation Insect AntibioticInterspecificcomparison
Temporal N/A N/ABacteria &protozoa
(Rosengaus et al., 2011)
Domestic Observation MammalCommunitycomposition
N/A N/A N/A N/A Bacteria (Rosewarne et al., 2014)
Domestic Perturbation Mammal Diet N/A N/A N/A N/A Bacteria (Ross et al., 2013)
Model Perturbation Invertebrate Diet N/A N/A N/A N/A Bacteria (Rudi and Strætkvern, 2012)
Model Perturbation Fish Diet Immunity Genotype N/A N/A Bacteria (Rurangwa et al., 2015)
Wild Observation BirdInterspecificcomparison
Infectiousdisease
N/A N/A N/A Bacteria (Ryu et al., 2014)
Wild Observation Insect DietInterspecificcomparison
N/A N/A N/A Bacteria (Sabree and Moran, 2014)
Model Perturbation Mammal Diet Prebiotic N/A N/A N/ABacteria &
archaea(Saha and Reimer, 2014)
Model Perturbation Mammal Diet Immunity N/A N/A N/A Bacteria (Sahasakul et al., 2012)
Wild Observation FishInterspecificcomparison
N/A N/A N/A N/A Bacteria (Sahnouni et al., 2012)
Domestic Perturbation Bird Diet Production N/A N/A N/A Bacteria (Saki et al., 2011)
Domestic Perturbation Bird Probiotic Antibiotic Immunity Production N/A Bacteria (Salim et al., 2013)
Wild Observation Insect and Phylogeny Interspecific N/A N/A N/A Bacteria (Sanders et al., 2014)
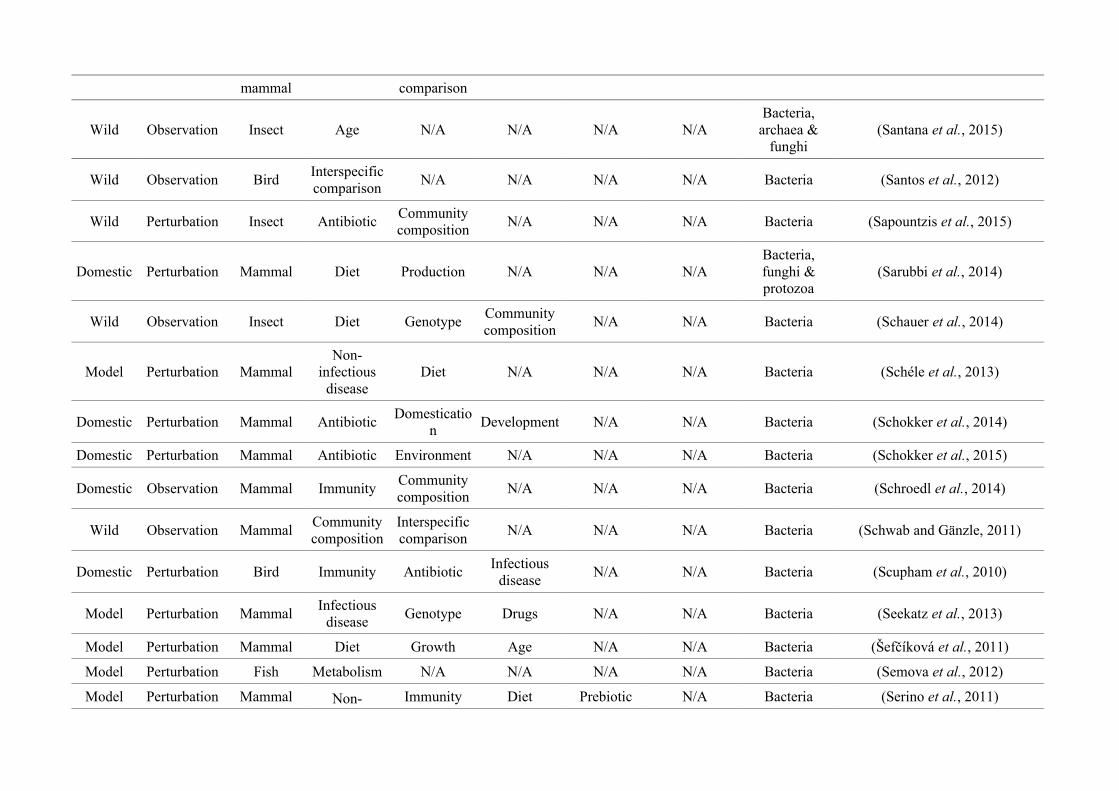
mammal comparison
Wild Observation Insect Age N/A N/A N/A N/ABacteria,
archaea &funghi
(Santana et al., 2015)
Wild Observation BirdInterspecificcomparison
N/A N/A N/A N/A Bacteria (Santos et al., 2012)
Wild Perturbation Insect AntibioticCommunitycomposition
N/A N/A N/A Bacteria (Sapountzis et al., 2015)
Domestic Perturbation Mammal Diet Production N/A N/A N/ABacteria,funghi &protozoa
(Sarubbi et al., 2014)
Wild Observation Insect Diet GenotypeCommunitycomposition
N/A N/A Bacteria (Schauer et al., 2014)
Model Perturbation MammalNon-
infectiousdisease
Diet N/A N/A N/A Bacteria (Schéle et al., 2013)
Domestic Perturbation Mammal AntibioticDomesticatio
nDevelopment N/A N/A Bacteria (Schokker et al., 2014)
Domestic Perturbation Mammal Antibiotic Environment N/A N/A N/A Bacteria (Schokker et al., 2015)
Domestic Observation Mammal ImmunityCommunitycomposition
N/A N/A N/A Bacteria (Schroedl et al., 2014)
Wild Observation MammalCommunitycomposition
Interspecificcomparison
N/A N/A N/A Bacteria (Schwab and Gänzle, 2011)
Domestic Perturbation Bird Immunity AntibioticInfectious
diseaseN/A N/A Bacteria (Scupham et al., 2010)
Model Perturbation MammalInfectious
diseaseGenotype Drugs N/A N/A Bacteria (Seekatz et al., 2013)
Model Perturbation Mammal Diet Growth Age N/A N/A Bacteria (Šefčíková et al., 2011)
Model Perturbation Fish Metabolism N/A N/A N/A N/A Bacteria (Semova et al., 2012)
Model Perturbation Mammal Non- Immunity Diet Prebiotic N/A Bacteria (Serino et al., 2011)
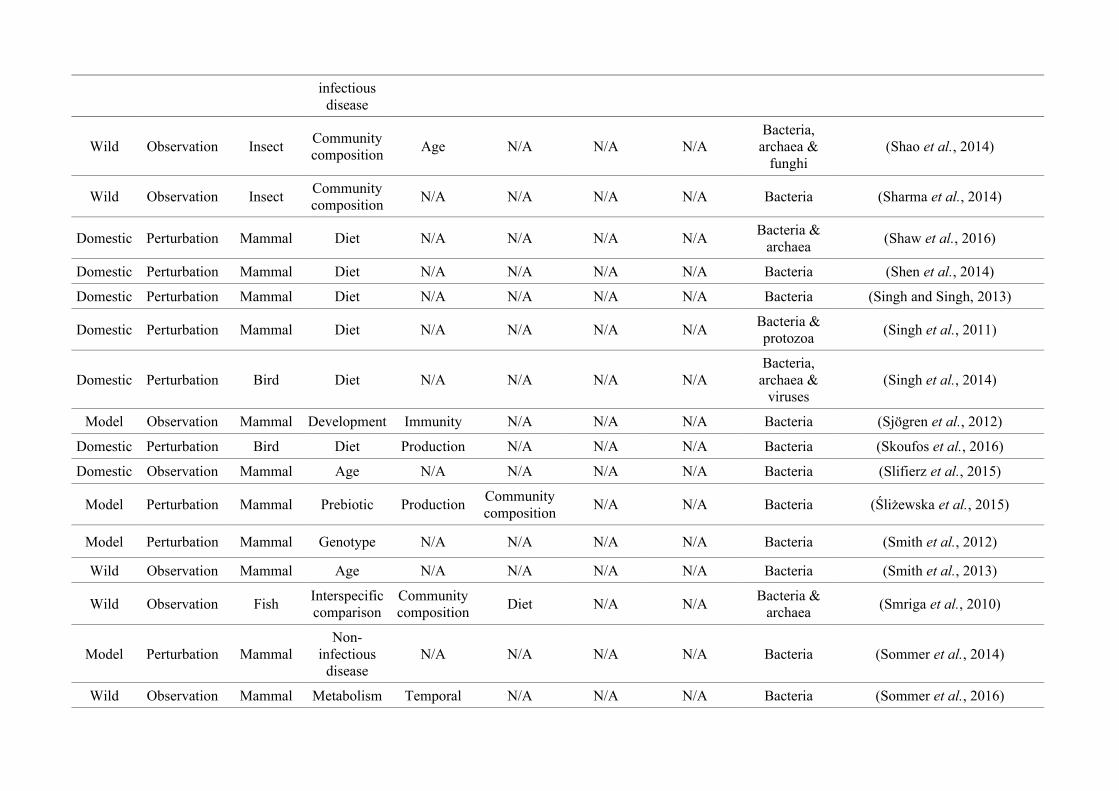
infectiousdisease
Wild Observation InsectCommunitycomposition
Age N/A N/A N/ABacteria,
archaea &funghi
(Shao et al., 2014)
Wild Observation InsectCommunitycomposition
N/A N/A N/A N/A Bacteria (Sharma et al., 2014)
Domestic Perturbation Mammal Diet N/A N/A N/A N/ABacteria &
archaea(Shaw et al., 2016)
Domestic Perturbation Mammal Diet N/A N/A N/A N/A Bacteria (Shen et al., 2014)
Domestic Perturbation Mammal Diet N/A N/A N/A N/A Bacteria (Singh and Singh, 2013)
Domestic Perturbation Mammal Diet N/A N/A N/A N/ABacteria &protozoa
(Singh et al., 2011)
Domestic Perturbation Bird Diet N/A N/A N/A N/ABacteria,
archaea &viruses
(Singh et al., 2014)
Model Observation Mammal Development Immunity N/A N/A N/A Bacteria (Sjögren et al., 2012)
Domestic Perturbation Bird Diet Production N/A N/A N/A Bacteria (Skoufos et al., 2016)
Domestic Observation Mammal Age N/A N/A N/A N/A Bacteria (Slifierz et al., 2015)
Model Perturbation Mammal Prebiotic ProductionCommunitycomposition
N/A N/A Bacteria (Śliżewska et al., 2015)
Model Perturbation Mammal Genotype N/A N/A N/A N/A Bacteria (Smith et al., 2012)
Wild Observation Mammal Age N/A N/A N/A N/A Bacteria (Smith et al., 2013)
Wild Observation FishInterspecificcomparison
Communitycomposition
Diet N/A N/ABacteria &
archaea(Smriga et al., 2010)
Model Perturbation MammalNon-
infectiousdisease
N/A N/A N/A N/A Bacteria (Sommer et al., 2014)
Wild Observation Mammal Metabolism Temporal N/A N/A N/A Bacteria (Sommer et al., 2016)
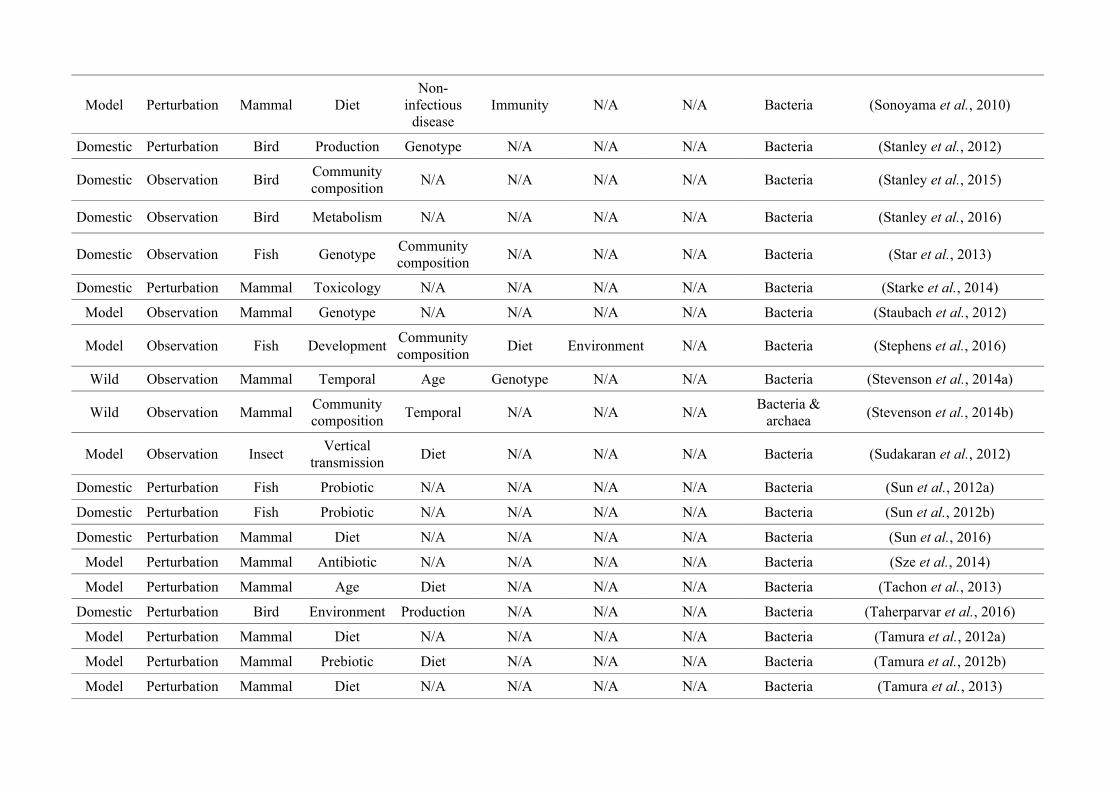
Model Perturbation Mammal DietNon-
infectiousdisease
Immunity N/A N/A Bacteria (Sonoyama et al., 2010)
Domestic Perturbation Bird Production Genotype N/A N/A N/A Bacteria (Stanley et al., 2012)
Domestic Observation BirdCommunitycomposition
N/A N/A N/A N/A Bacteria (Stanley et al., 2015)
Domestic Observation Bird Metabolism N/A N/A N/A N/A Bacteria (Stanley et al., 2016)
Domestic Observation Fish GenotypeCommunitycomposition
N/A N/A N/A Bacteria (Star et al., 2013)
Domestic Perturbation Mammal Toxicology N/A N/A N/A N/A Bacteria (Starke et al., 2014)
Model Observation Mammal Genotype N/A N/A N/A N/A Bacteria (Staubach et al., 2012)
Model Observation Fish DevelopmentCommunitycomposition
Diet Environment N/A Bacteria (Stephens et al., 2016)
Wild Observation Mammal Temporal Age Genotype N/A N/A Bacteria (Stevenson et al., 2014a)
Wild Observation MammalCommunitycomposition
Temporal N/A N/A N/ABacteria &
archaea(Stevenson et al., 2014b)
Model Observation InsectVertical
transmissionDiet N/A N/A N/A Bacteria (Sudakaran et al., 2012)
Domestic Perturbation Fish Probiotic N/A N/A N/A N/A Bacteria (Sun et al., 2012a)
Domestic Perturbation Fish Probiotic N/A N/A N/A N/A Bacteria (Sun et al., 2012b)
Domestic Perturbation Mammal Diet N/A N/A N/A N/A Bacteria (Sun et al., 2016)
Model Perturbation Mammal Antibiotic N/A N/A N/A N/A Bacteria (Sze et al., 2014)
Model Perturbation Mammal Age Diet N/A N/A N/A Bacteria (Tachon et al., 2013)
Domestic Perturbation Bird Environment Production N/A N/A N/A Bacteria (Taherparvar et al., 2016)
Model Perturbation Mammal Diet N/A N/A N/A N/A Bacteria (Tamura et al., 2012a)
Model Perturbation Mammal Prebiotic Diet N/A N/A N/A Bacteria (Tamura et al., 2012b)
Model Perturbation Mammal Diet N/A N/A N/A N/A Bacteria (Tamura et al., 2013)
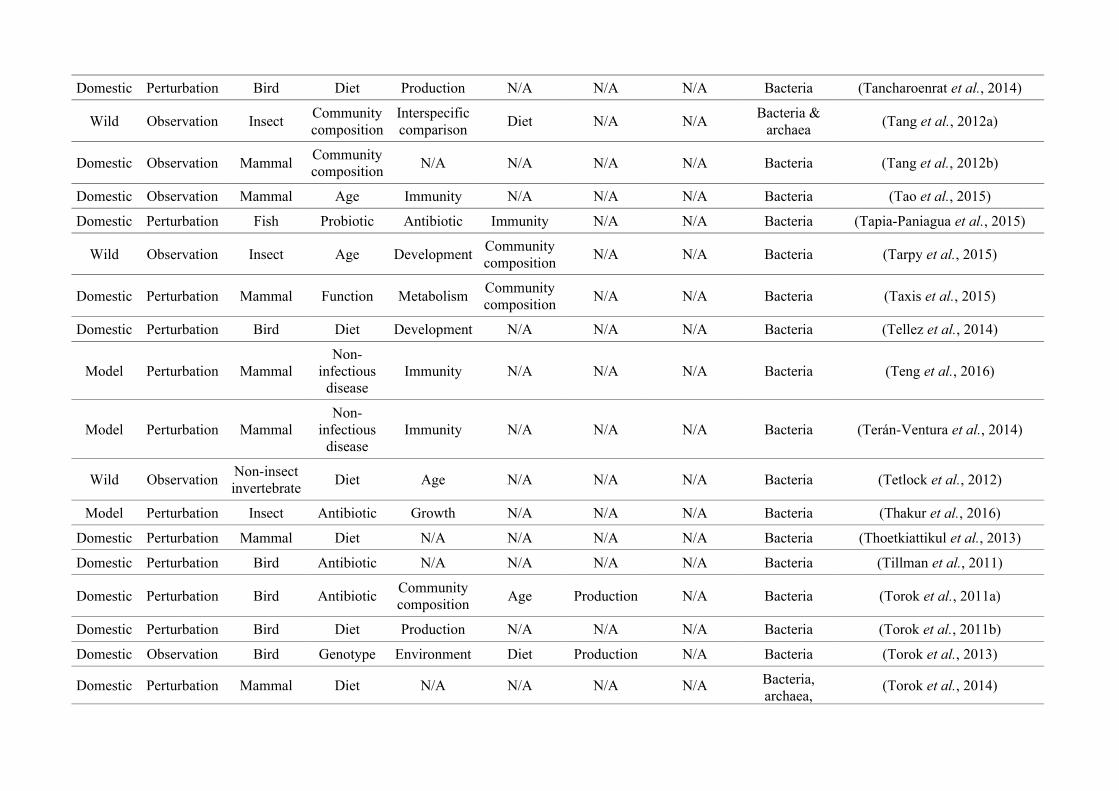
Domestic Perturbation Bird Diet Production N/A N/A N/A Bacteria (Tancharoenrat et al., 2014)
Wild Observation InsectCommunitycomposition
Interspecificcomparison
Diet N/A N/ABacteria &
archaea(Tang et al., 2012a)
Domestic Observation MammalCommunitycomposition
N/A N/A N/A N/A Bacteria (Tang et al., 2012b)
Domestic Observation Mammal Age Immunity N/A N/A N/A Bacteria (Tao et al., 2015)
Domestic Perturbation Fish Probiotic Antibiotic Immunity N/A N/A Bacteria (Tapia-Paniagua et al., 2015)
Wild Observation Insect Age DevelopmentCommunitycomposition
N/A N/A Bacteria (Tarpy et al., 2015)
Domestic Perturbation Mammal Function MetabolismCommunitycomposition
N/A N/A Bacteria (Taxis et al., 2015)
Domestic Perturbation Bird Diet Development N/A N/A N/A Bacteria (Tellez et al., 2014)
Model Perturbation MammalNon-
infectiousdisease
Immunity N/A N/A N/A Bacteria (Teng et al., 2016)
Model Perturbation MammalNon-
infectiousdisease
Immunity N/A N/A N/A Bacteria (Terán-Ventura et al., 2014)
Wild ObservationNon-insectinvertebrate
Diet Age N/A N/A N/A Bacteria (Tetlock et al., 2012)
Model Perturbation Insect Antibiotic Growth N/A N/A N/A Bacteria (Thakur et al., 2016)
Domestic Perturbation Mammal Diet N/A N/A N/A N/A Bacteria (Thoetkiattikul et al., 2013)
Domestic Perturbation Bird Antibiotic N/A N/A N/A N/A Bacteria (Tillman et al., 2011)
Domestic Perturbation Bird AntibioticCommunitycomposition
Age Production N/A Bacteria (Torok et al., 2011a)
Domestic Perturbation Bird Diet Production N/A N/A N/A Bacteria (Torok et al., 2011b)
Domestic Observation Bird Genotype Environment Diet Production N/A Bacteria (Torok et al., 2013)
Domestic Perturbation Mammal Diet N/A N/A N/A N/A Bacteria,archaea,
(Torok et al., 2014)
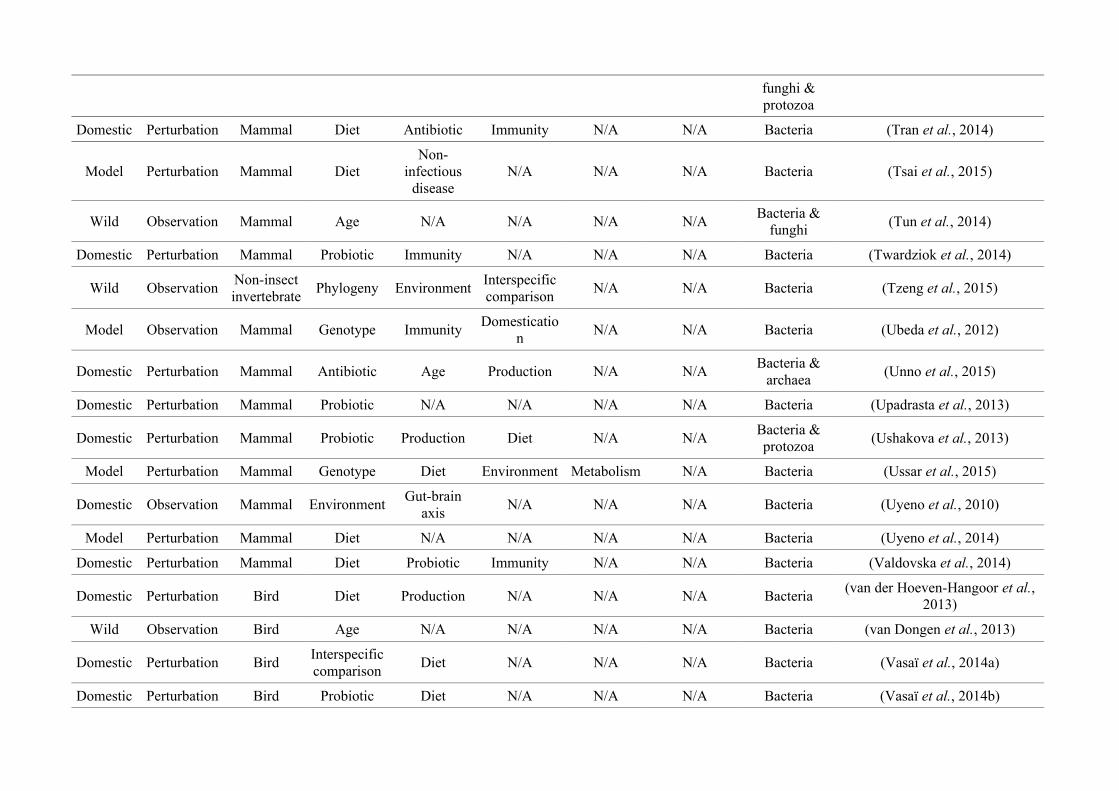
funghi &protozoa
Domestic Perturbation Mammal Diet Antibiotic Immunity N/A N/A Bacteria (Tran et al., 2014)
Model Perturbation Mammal DietNon-
infectiousdisease
N/A N/A N/A Bacteria (Tsai et al., 2015)
Wild Observation Mammal Age N/A N/A N/A N/ABacteria &
funghi(Tun et al., 2014)
Domestic Perturbation Mammal Probiotic Immunity N/A N/A N/A Bacteria (Twardziok et al., 2014)
Wild ObservationNon-insectinvertebrate
Phylogeny EnvironmentInterspecificcomparison
N/A N/A Bacteria (Tzeng et al., 2015)
Model Observation Mammal Genotype ImmunityDomesticatio
nN/A N/A Bacteria (Ubeda et al., 2012)
Domestic Perturbation Mammal Antibiotic Age Production N/A N/ABacteria &
archaea(Unno et al., 2015)
Domestic Perturbation Mammal Probiotic N/A N/A N/A N/A Bacteria (Upadrasta et al., 2013)
Domestic Perturbation Mammal Probiotic Production Diet N/A N/ABacteria &protozoa
(Ushakova et al., 2013)
Model Perturbation Mammal Genotype Diet Environment Metabolism N/A Bacteria (Ussar et al., 2015)
Domestic Observation Mammal EnvironmentGut-brain
axisN/A N/A N/A Bacteria (Uyeno et al., 2010)
Model Perturbation Mammal Diet N/A N/A N/A N/A Bacteria (Uyeno et al., 2014)
Domestic Perturbation Mammal Diet Probiotic Immunity N/A N/A Bacteria (Valdovska et al., 2014)
Domestic Perturbation Bird Diet Production N/A N/A N/A Bacteria(van der Hoeven-Hangoor et al.,
2013)
Wild Observation Bird Age N/A N/A N/A N/A Bacteria (van Dongen et al., 2013)
Domestic Perturbation BirdInterspecificcomparison
Diet N/A N/A N/A Bacteria (Vasaï et al., 2014a)
Domestic Perturbation Bird Probiotic Diet N/A N/A N/A Bacteria (Vasaï et al., 2014b)
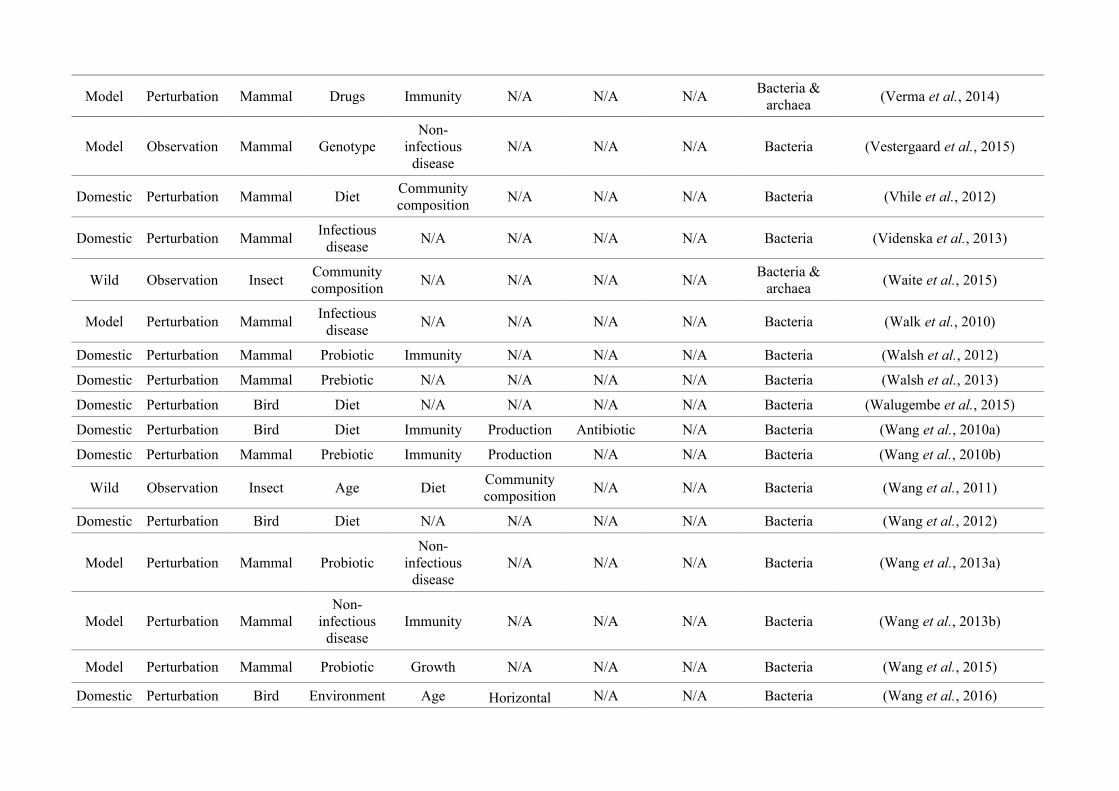
Model Perturbation Mammal Drugs Immunity N/A N/A N/ABacteria &
archaea(Verma et al., 2014)
Model Observation Mammal GenotypeNon-
infectiousdisease
N/A N/A N/A Bacteria (Vestergaard et al., 2015)
Domestic Perturbation Mammal DietCommunitycomposition
N/A N/A N/A Bacteria (Vhile et al., 2012)
Domestic Perturbation MammalInfectious
diseaseN/A N/A N/A N/A Bacteria (Videnska et al., 2013)
Wild Observation InsectCommunitycomposition
N/A N/A N/A N/ABacteria &
archaea(Waite et al., 2015)
Model Perturbation MammalInfectious
diseaseN/A N/A N/A N/A Bacteria (Walk et al., 2010)
Domestic Perturbation Mammal Probiotic Immunity N/A N/A N/A Bacteria (Walsh et al., 2012)
Domestic Perturbation Mammal Prebiotic N/A N/A N/A N/A Bacteria (Walsh et al., 2013)
Domestic Perturbation Bird Diet N/A N/A N/A N/A Bacteria (Walugembe et al., 2015)
Domestic Perturbation Bird Diet Immunity Production Antibiotic N/A Bacteria (Wang et al., 2010a)
Domestic Perturbation Mammal Prebiotic Immunity Production N/A N/A Bacteria (Wang et al., 2010b)
Wild Observation Insect Age DietCommunitycomposition
N/A N/A Bacteria (Wang et al., 2011)
Domestic Perturbation Bird Diet N/A N/A N/A N/A Bacteria (Wang et al., 2012)
Model Perturbation Mammal ProbioticNon-
infectiousdisease
N/A N/A N/A Bacteria (Wang et al., 2013a)
Model Perturbation MammalNon-
infectiousdisease
Immunity N/A N/A N/A Bacteria (Wang et al., 2013b)
Model Perturbation Mammal Probiotic Growth N/A N/A N/A Bacteria (Wang et al., 2015)
Domestic Perturbation Bird Environment Age Horizontal N/A N/A Bacteria (Wang et al., 2016)
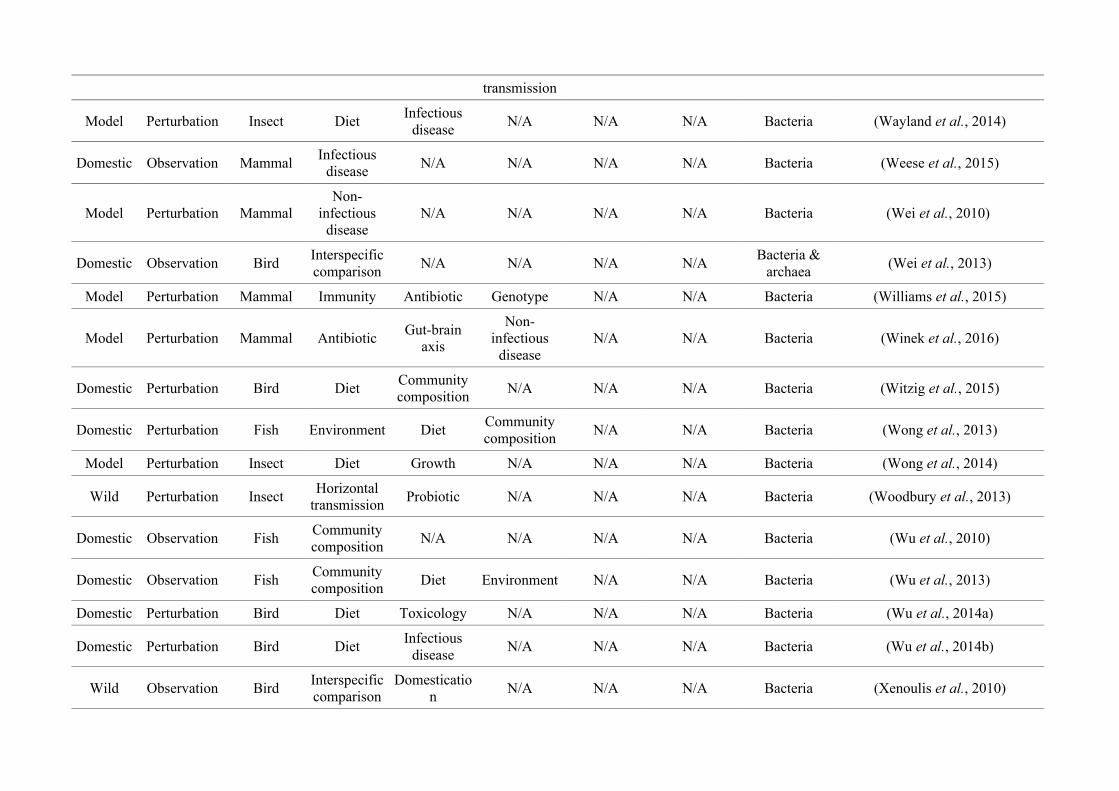
transmission
Model Perturbation Insect DietInfectious
diseaseN/A N/A N/A Bacteria (Wayland et al., 2014)
Domestic Observation MammalInfectious
diseaseN/A N/A N/A N/A Bacteria (Weese et al., 2015)
Model Perturbation MammalNon-
infectiousdisease
N/A N/A N/A N/A Bacteria (Wei et al., 2010)
Domestic Observation BirdInterspecificcomparison
N/A N/A N/A N/ABacteria &
archaea(Wei et al., 2013)
Model Perturbation Mammal Immunity Antibiotic Genotype N/A N/A Bacteria (Williams et al., 2015)
Model Perturbation Mammal AntibioticGut-brain
axis
Non-infectious
diseaseN/A N/A Bacteria (Winek et al., 2016)
Domestic Perturbation Bird DietCommunitycomposition
N/A N/A N/A Bacteria (Witzig et al., 2015)
Domestic Perturbation Fish Environment DietCommunitycomposition
N/A N/A Bacteria (Wong et al., 2013)
Model Perturbation Insect Diet Growth N/A N/A N/A Bacteria (Wong et al., 2014)
Wild Perturbation InsectHorizontal
transmissionProbiotic N/A N/A N/A Bacteria (Woodbury et al., 2013)
Domestic Observation FishCommunitycomposition
N/A N/A N/A N/A Bacteria (Wu et al., 2010)
Domestic Observation FishCommunitycomposition
Diet Environment N/A N/A Bacteria (Wu et al., 2013)
Domestic Perturbation Bird Diet Toxicology N/A N/A N/A Bacteria (Wu et al., 2014a)
Domestic Perturbation Bird DietInfectious
diseaseN/A N/A N/A Bacteria (Wu et al., 2014b)
Wild Observation BirdInterspecificcomparison
Domestication
N/A N/A N/A Bacteria (Xenoulis et al., 2010)
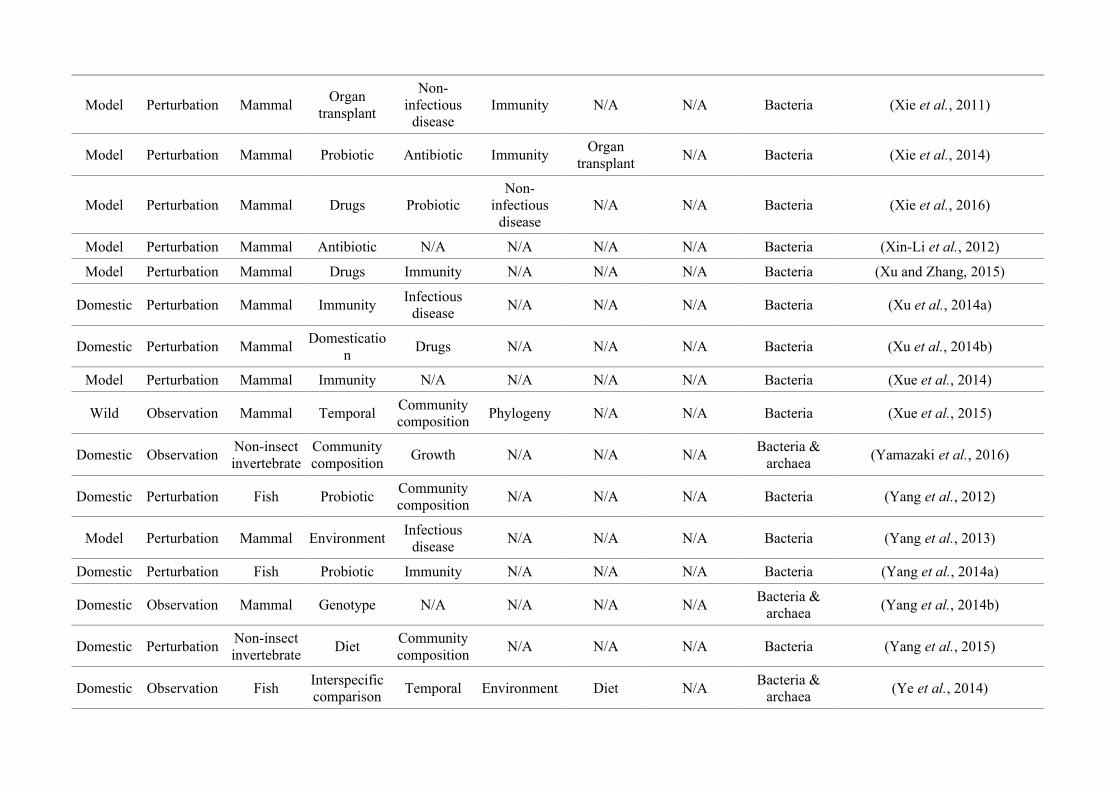
Model Perturbation MammalOrgan
transplant
Non-infectious
diseaseImmunity N/A N/A Bacteria (Xie et al., 2011)
Model Perturbation Mammal Probiotic Antibiotic ImmunityOrgan
transplantN/A Bacteria (Xie et al., 2014)
Model Perturbation Mammal Drugs ProbioticNon-
infectiousdisease
N/A N/A Bacteria (Xie et al., 2016)
Model Perturbation Mammal Antibiotic N/A N/A N/A N/A Bacteria (Xin-Li et al., 2012)
Model Perturbation Mammal Drugs Immunity N/A N/A N/A Bacteria (Xu and Zhang, 2015)
Domestic Perturbation Mammal ImmunityInfectious
diseaseN/A N/A N/A Bacteria (Xu et al., 2014a)
Domestic Perturbation MammalDomesticatio
nDrugs N/A N/A N/A Bacteria (Xu et al., 2014b)
Model Perturbation Mammal Immunity N/A N/A N/A N/A Bacteria (Xue et al., 2014)
Wild Observation Mammal TemporalCommunitycomposition
Phylogeny N/A N/A Bacteria (Xue et al., 2015)
Domestic ObservationNon-insectinvertebrate
Communitycomposition
Growth N/A N/A N/ABacteria &
archaea(Yamazaki et al., 2016)
Domestic Perturbation Fish ProbioticCommunitycomposition
N/A N/A N/A Bacteria (Yang et al., 2012)
Model Perturbation Mammal EnvironmentInfectious
diseaseN/A N/A N/A Bacteria (Yang et al., 2013)
Domestic Perturbation Fish Probiotic Immunity N/A N/A N/A Bacteria (Yang et al., 2014a)
Domestic Observation Mammal Genotype N/A N/A N/A N/ABacteria &
archaea(Yang et al., 2014b)
Domestic PerturbationNon-insectinvertebrate
DietCommunitycomposition
N/A N/A N/A Bacteria (Yang et al., 2015)
Domestic Observation FishInterspecificcomparison
Temporal Environment Diet N/ABacteria &
archaea(Ye et al., 2014)
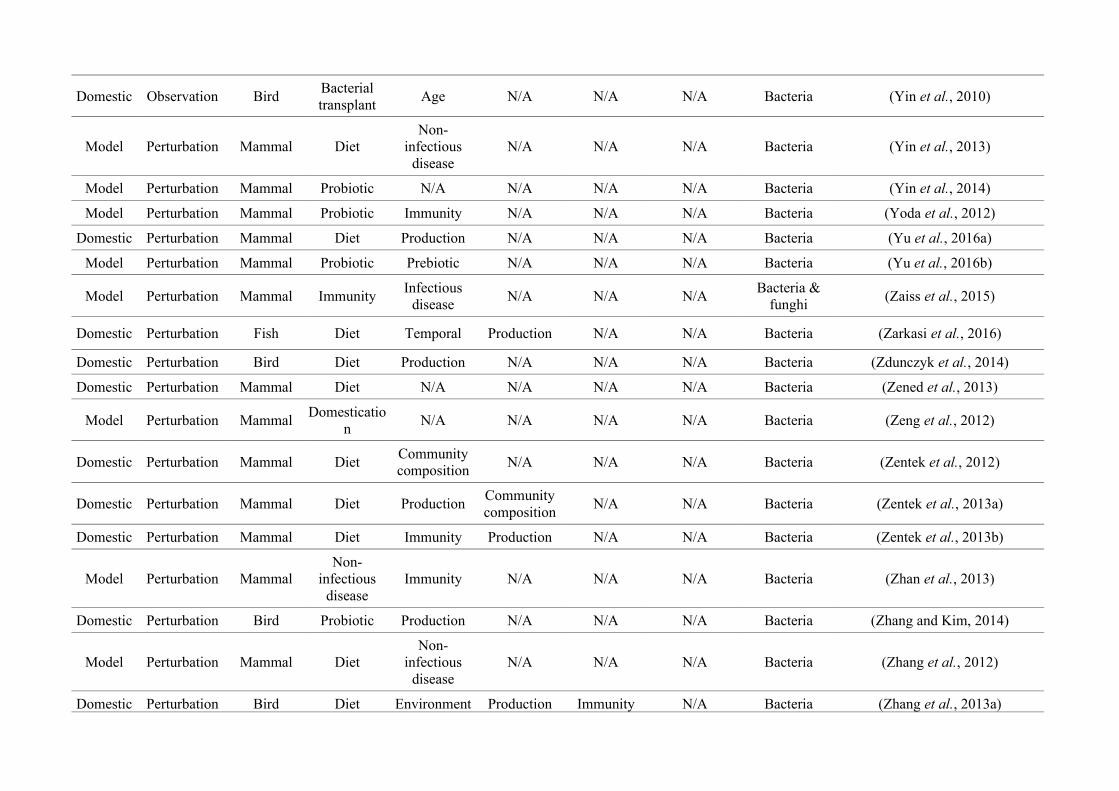
Domestic Observation BirdBacterialtransplant
Age N/A N/A N/A Bacteria (Yin et al., 2010)
Model Perturbation Mammal DietNon-
infectiousdisease
N/A N/A N/A Bacteria (Yin et al., 2013)
Model Perturbation Mammal Probiotic N/A N/A N/A N/A Bacteria (Yin et al., 2014)
Model Perturbation Mammal Probiotic Immunity N/A N/A N/A Bacteria (Yoda et al., 2012)
Domestic Perturbation Mammal Diet Production N/A N/A N/A Bacteria (Yu et al., 2016a)
Model Perturbation Mammal Probiotic Prebiotic N/A N/A N/A Bacteria (Yu et al., 2016b)
Model Perturbation Mammal ImmunityInfectious
diseaseN/A N/A N/A
Bacteria &funghi
(Zaiss et al., 2015)
Domestic Perturbation Fish Diet Temporal Production N/A N/A Bacteria (Zarkasi et al., 2016)
Domestic Perturbation Bird Diet Production N/A N/A N/A Bacteria (Zdunczyk et al., 2014)
Domestic Perturbation Mammal Diet N/A N/A N/A N/A Bacteria (Zened et al., 2013)
Model Perturbation MammalDomesticatio
nN/A N/A N/A N/A Bacteria (Zeng et al., 2012)
Domestic Perturbation Mammal DietCommunitycomposition
N/A N/A N/A Bacteria (Zentek et al., 2012)
Domestic Perturbation Mammal Diet ProductionCommunitycomposition
N/A N/A Bacteria (Zentek et al., 2013a)
Domestic Perturbation Mammal Diet Immunity Production N/A N/A Bacteria (Zentek et al., 2013b)
Model Perturbation MammalNon-
infectiousdisease
Immunity N/A N/A N/A Bacteria (Zhan et al., 2013)
Domestic Perturbation Bird Probiotic Production N/A N/A N/A Bacteria (Zhang and Kim, 2014)
Model Perturbation Mammal DietNon-
infectiousdisease
N/A N/A N/A Bacteria (Zhang et al., 2012)
Domestic Perturbation Bird Diet Environment Production Immunity N/A Bacteria (Zhang et al., 2013a)
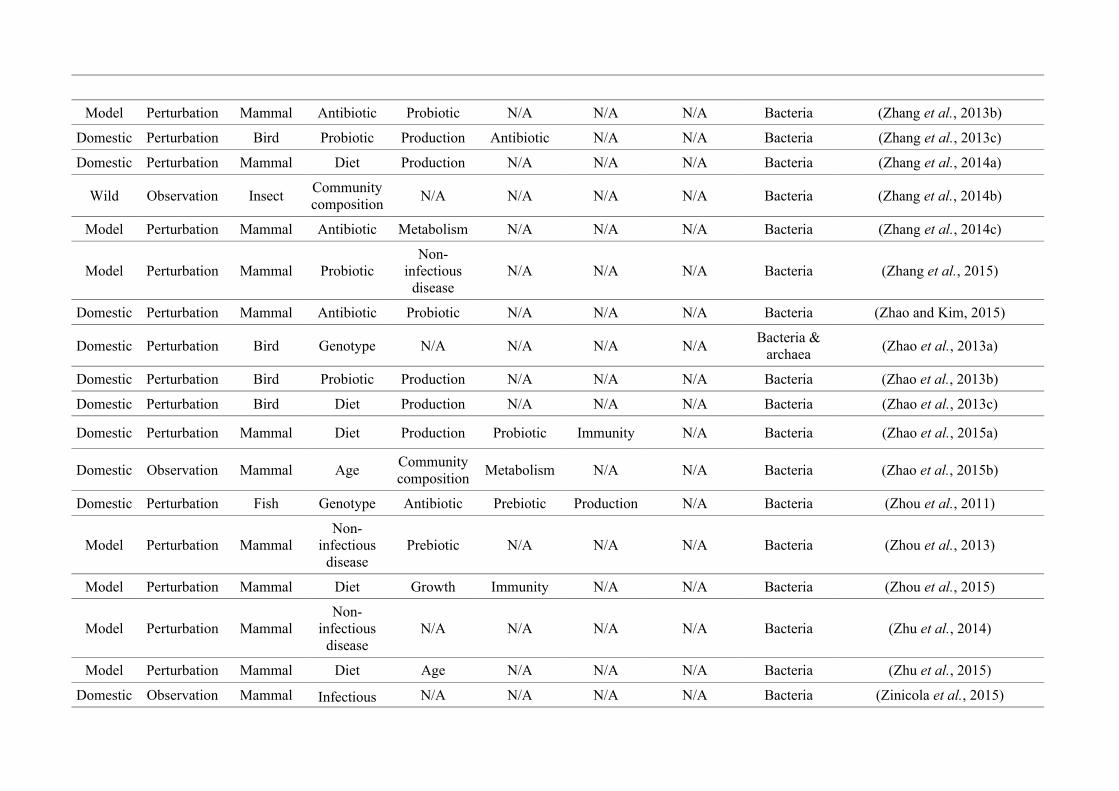
Model Perturbation Mammal Antibiotic Probiotic N/A N/A N/A Bacteria (Zhang et al., 2013b)
Domestic Perturbation Bird Probiotic Production Antibiotic N/A N/A Bacteria (Zhang et al., 2013c)
Domestic Perturbation Mammal Diet Production N/A N/A N/A Bacteria (Zhang et al., 2014a)
Wild Observation InsectCommunitycomposition
N/A N/A N/A N/A Bacteria (Zhang et al., 2014b)
Model Perturbation Mammal Antibiotic Metabolism N/A N/A N/A Bacteria (Zhang et al., 2014c)
Model Perturbation Mammal ProbioticNon-
infectiousdisease
N/A N/A N/A Bacteria (Zhang et al., 2015)
Domestic Perturbation Mammal Antibiotic Probiotic N/A N/A N/A Bacteria (Zhao and Kim, 2015)
Domestic Perturbation Bird Genotype N/A N/A N/A N/ABacteria &
archaea(Zhao et al., 2013a)
Domestic Perturbation Bird Probiotic Production N/A N/A N/A Bacteria (Zhao et al., 2013b)
Domestic Perturbation Bird Diet Production N/A N/A N/A Bacteria (Zhao et al., 2013c)
Domestic Perturbation Mammal Diet Production Probiotic Immunity N/A Bacteria (Zhao et al., 2015a)
Domestic Observation Mammal AgeCommunitycomposition
Metabolism N/A N/A Bacteria (Zhao et al., 2015b)
Domestic Perturbation Fish Genotype Antibiotic Prebiotic Production N/A Bacteria (Zhou et al., 2011)
Model Perturbation MammalNon-
infectiousdisease
Prebiotic N/A N/A N/A Bacteria (Zhou et al., 2013)
Model Perturbation Mammal Diet Growth Immunity N/A N/A Bacteria (Zhou et al., 2015)
Model Perturbation MammalNon-
infectiousdisease
N/A N/A N/A N/A Bacteria (Zhu et al., 2014)
Model Perturbation Mammal Diet Age N/A N/A N/A Bacteria (Zhu et al., 2015)
Domestic Observation Mammal Infectious N/A N/A N/A N/A Bacteria (Zinicola et al., 2015)
disease
References
Abd El-Khalek E, Kalmar ID, De Vroey M, Ducatelle R, Pasmans F, Werquin G, et al. (2012). Indirect evidence for microbiota reduction through dietary mannanoligosaccharides in the pigeon, an avian species without functional caeca. J Anim Physiol Anim Nutr 96: 1084–90.
Abdel-Wareth AAA, Kehraus S, Hippenstiel F, Südekum K-H. (2012). Effects of thyme and oregano on growth performance of broilers from 4 to 42 days of age and on microbial counts in crop, small intestine and caecum of 42-day-old broilers. Anim Feed Sci Technol 178: 198–202.
Abdollahi-Roodsaz S, Rogier R, Ederveen T, Wopereis H, Oozeer R, Koenders M, et al. (2014). A8.29 Commensal intestinal microbiota drives spontaneous interleukin-1- and T helper 17-mediated arthritis in mice. Ann Rheum Dis 73: A87–A88.
Abdul Rahman N, Parks DH, Willner DL, Engelbrektson AL, Goffredi SK, Warnecke F, et al. (2015). A molecular survey of Australian and North American termitegenera indicates that vertical inheritance is the primary force shaping termite gut microbiomes. Microbiome 3. e-pub ahead of print, doi: 10.1186/s40168-015-0067-8.
Abecia L, Martín-García AI, Martínez G, Newbold CJ, Yáñez-Ruiz DR. (2013). Nutritional intervention in early life to manipulate rumen microbial colonization andmethane output by kid goats postweaning. J Anim Sci 91: 4832–4840.
Aguilera E, Yany G, Romero J. (2013). Cultivable intestinal microbiota of yellowtail juveniles (Seriola lalandi) in an aquaculture system. Lat Am J Aquat Res 41: 395.
Ahmed HA, Sirohi SK, Dagar SS, Puniya AK, Singh N. (2014). Effect of supplementation of Selenomonas ruminantium NDRI-PAPB 4 as direct fed microbial on rumen microbial population in Karan Fries male calves. Indian J Anim Nutr 31: 20–26.
Aidy SE, Kunze W, Bienenstock J, Kleerebezem M. (2012). The microbiota and the gut-brain axis: insights from the temporal and spatial mucosal alterations duringcolonisation of the germfree mouse intestine. Benef Microbes 3: 251–259.
Akbarian A, Kazerani HR, Mohri M, Raji A R, Jamshidi A, Golian a. (2014). Exogenous melatonin improves growth performance, intestinal microbiota, and morphology in temporarily feed restricted broilers. Livest Sci 167: 400–407.
Aksoy E, Telleria EL, Echodu R, Wu Y, Okedi LM, Weiss BL, et al. (2014). Analysis of multiple tsetse fly populations in Uganda reveals limited diversity and species-specific gut microbiota. Appl Environ Microbiol 80: 4301–4312.
Akter MN, Sutriana A, Talpur AD, Hashim R. (2016). Dietary supplementation with mannan oligosaccharide influences growth, digestive enzymes, gut morphology, and microbiota in juvenile striped catfish, Pangasianodon hypophthalmus. Aquac Int 24: 127–144.
Al-Asmakh M, Stukenborg J-B, Reda A, Anuar F, Strand M-L, Hedin L, et al. (2014). The gut microbiota and developmental programming of the testis in mice. PLoS ONE 9: e103809.
Alkanani AK, Hara N, Lien E, Ir D, Kotter CV, Robertson CE, et al. (2014). Induction of diabetes in the RIP-B7.1 mouse model is critically dependent on TLR3 andMyD88 pathways and is associated with alterations in the intestinal microbiome. Diabetes 63: 619–631.
Amato KR, Yeoman CJ, Kent A, Righini N, Carbonero F, Estrada A, et al. (2013). Habitat degradation impacts black howler monkey (Alouatta pigra) gastrointestinal microbiomes. ISME J 7: 1344–53.
Amerah AM, Péron A, Zaefarian F, Ravindran V. (2011). Influence of whole wheat inclusion and a blend of essential oils on the performance, nutrient utilisation, digestive tract development and ileal microbiota profile of broiler chickens. Br Poult Sci 52: 124–32.
Anantasook N, Wanapat M, Cherdthong A, Gunun P. (2013). Changes of microbial population in the rumen of dairy steers as influenced by plant containing tannins and saponins and roughage to concentrate ratio. Asian-Australas J Anim Sci 26: 1583–91.
Andersen AD, Mølbak L, Thymann T, Michaelsen KF, Lauritzen L. (2011). Dietary long-chain n-3 PUFA, gut microbiota and fat mass in early postnatal piglet development–exploring a potential interplay. Prostaglandins Leukot Essent Fatty Acids 85: 345–51.
Angelakis E, Bastelica D, Ben Amara A, El Filali A, Dutour A, Mege J-L, et al. (2012). An evaluation of the effects of Lactobacillus ingluviei on body weight, the intestinal microbiome and metabolism in mice. Microb Pathog 52: 61–8.
Anuta JD, Buentello A, Patnaik S, Lawrence AL, Mustafa A, Hume ME, et al. (2011). Effect of dietary supplementation of acidic calcium sulfate (Vitoxal) on growth, survival, immune response and gut microbiota of the pacific white shrimp, Litopenaeus vannamei. J World Aquac Soc 42: 834–844.
Ardeshir A, Sankaran S, Oslund K, Hartigan-O’Connor D, Lerche N, Hyde D, et al. (2014). Inulin treatment leads to changes in intestinal microbiota and resolution of idiopathic chronic diarrhea in rhesus macaques. Ann Am Thorac Soc 11: S75–S75.
Arias-Cordero E, Ping L, Reichwald K, Delb H, Platzer M, Boland W. (2012). Comparative evaluation of the gut microbiota associated with the below- and above-ground life stages (larvae and beetles) of the forest cockchafer, Melolontha hippocastani. PLoS ONE 7: e51557.
Arimatsu K, Yamada H, Miyazawa H, Minagawa T, Nakajima M, Ryder MI, et al. (2014). Oral pathobiont induces systemic inflammation and metabolic changes associated with alteration of gut microbiota. Sci Rep 4: 4828.
Arrazuria R, Elguezabal N, Juste RA, Derakhshani H, Khafipour E. (2016). Mycobacterium avium subspecies paratuberculosis infection modifies gut microbiota under different dietary conditions in a rabbit model. Front Microbiol 7: 446.
Askarian F, Kousha A, Salma W, Ringø E. (2011). The effect of lactic acid bacteria administration on growth, digestive enzyme activity and gut microbiota in Persian sturgeon (Acipenser persicus) and beluga (Huso huso) fry. Aquac Nutr 17: 488–497.
Axling U, Olsson C, Xu J, Fernandez C, Larsson S, Ström K, et al. (2012). Green tea powder and Lactobacillus plantarum affect gut microbiota, lipid metabolism and inflammation in high-fat fed C57BL/6J mice. Nutr Metab 9: 105.
Bacanu G, Oprea L. (2013). Differences in the gut microbiota between wild and domestic Acipenser ruthenus evaluated by denaturing gradient gel electrophoresis. Romanian Biotechnol Lett 18: 8069–8076.
Bailey MT, Dowd SE, Galley JD, Hufnagle AR, Allen RG, Lyte M. (2011). Exposure to a social stressor alters the structure of the intestinal microbiota: implicationsfor stressor-induced immunomodulation. Brain Behav Immun 25: 397–407.
Bailey MT, Dowd SE, Parry NMA, Galley JD, Schauer DB, Lyte M. (2010). Stressor exposure disrupts commensal microbial populations in the intestines and leads to increased colonization by Citrobacter rodentium. Infect Immun 78: 1509–19.
Baker AA, Davis E, Spencer JD, Moser R, Rehberger T. (2013). The effect of a Bacillus-based direct-fed microbial supplemented to sows on the gastrointestinal microbiota of their neonatal piglets. J Anim Sci 91: 3390–9.
Baldwin J, Collins B, Wolf PG, Martinez K, Shen W, Chuang C-C, et al. (2016). Table grape consumption reduces adiposity and markers of hepatic lipogenesis and alters gut microbiota in butter fat-fed mice. J Nutr Biochem 27: 123–135.
Bangsgaard Bendtsen KM, Krych L, Sørensen DB, Pang W, Nielsen DS, Josefsen K, et al. (2012). Gut microbiota composition is correlated to grid floor induced stress and behavior in the BALB/c mouse. PLoS ONE 7: e46231.
Barfod KK, Roggenbuck M, Hansen LH, Schjørring S, Larsen ST, Sørensen SJ, et al. (2013). The murine lung microbiome in relation to the intestinal and vaginal bacterial communities. BMC Microbiol 13. e-pub ahead of print, doi: 10.1186/1471-2180-13-303.
Barouei J, Moussavi M, Hodgson DM. (2012). Effect of maternal probiotic intervention on HPA axis, immunity and gut microbiota in a rat model of irritable bowel syndrome. PLoS ONE 7: e46051.
Barron Pastor HJ, Gordon DM. (2016). Effects of dispersal limitation in the face of intense selection via dietary intervention on the faecal microbiota of rats. Environ Microbiol Rep 8: 187–95.
Batista S, Ozório ROA, Kollias S, Dhanasiri AK, Lokesh J, Kiron V, et al. (2016). Changes in intestinal microbiota, immune- and stress-related transcript levels in Senegalese sole (Solea senegalensis) fed plant ingredient diets intercropped with probiotics or immunostimulants. Aquaculture 458: 149–157.
Baurhoo N, Baurhoo B, Zhao X. (2011). Effects of exogenous enzymes in corn-based and Canadian pearl millet-based diets with reduced soybean meal on growth performance, intestinal nutrient digestibility, villus development, and selected microbial populations in broiler chickens. J Anim Sci 89: 4100–8.
Bazett M, Bergeron M-E, Haston CK. (2016). Streptomycin treatment alters the intestinal microbiome, pulmonary T cell profile and airway hyperresponsiveness in acystic fibrosis mouse model. Sci Rep 6: 19189.
Bearson SMD, Allen HK, Bearson BL, Looft T, Brunelle BW, Kich JD, et al. (2013). Profiling the gastrointestinal microbiota in response to Salmonella: low versus high Salmonella shedding in the natural porcine host. Infect Genet Evol J Mol Epidemiol Evol Genet Infect Dis 16: 330–40.
Belanche A, de la Fuente G, Pinloche E, Newbold CJ, Balcells J. (2012). Effect of diet and absence of protozoa on the rumen microbial community and on the representativeness of bacterial fractions used in the determination of microbial protein synthesis. J Anim Sci 90: 3924–36.
Belcheva A, Irrazabal T, Robertson SJ, Streutker C, Maughan H, Rubino S, et al. (2014). Gut microbial metabolism drives transformation of Msh2-deficient colon epithelial cells. Cell 158: 288–299.
Bennett DC, Tun HM, Kim JE, Leung FC, Cheng KM. (2013). Characterization of cecal microbiota of the emu (Dromaius novaehollandiae). Vet Microbiol 166: 304–10.
Bereswill S, Kühl AA, Alutis M, Fischer A, Möhle L, Struck D, et al. (2014). The impact of Toll-like-receptor-9 on intestinal microbiota composition and extra-intestinal sequelae in experimental Toxoplasma gondii induced ileitis. Gut Pathog 6: 19.
Berg Miller ME, Yeoman CJ, Chia N, Tringe SG, Angly FE, Edwards RA, et al. (2012). Phage-bacteria relationships and CRISPR elements revealed by a metagenomic survey of the rumen microbiome. Environ Microbiol 14: 207–27.
Bhat RS, Al-daihan S. (2016). Liver injury from ampicillin-induced intestinal microbiota distresses in rats fed carbohydrate- and protein-rich diets. Trop J Pharm Res 15: 709–716.
Bolnick DI, Snowberg LK, Hirsch PE, Lauber CL, Knight R, Caporaso JG, et al. (2014). Individuals’ diet diversity influences gut microbial diversity in two freshwater fish (threespine stickleback and Eurasian perch). Ecol Lett 17: 979–87.
Bomhof MR, Saha DC, Reid DT, Paul HA, Reimer RA. (2014). Combined effects of oligofructose and Bifidobacterium animalis on gut microbiota and glycemia in obese rats. Obes Silver Spring Md 22: 763–71.
Bongers G, Pacer ME, Geraldino TH, Chen L, He Z, Hashimoto D, et al. (2014). Interplay of host microbiota, genetic perturbations, and inflammation promotes local development of intestinal neoplasms in mice. J Exp Med 211: 457–72.
Bonos E, Christaki E, Abrahim A, Soultos N. (2011). Effect of dietary supplementation of mannan oligosaccharides on hydrogen ion concentration of the digestive tract and microbial populations of the ceca of Japanese quail (Coturnix japonica). Turk J Vet Anim Sci 35: 263–269.
Borewicz KA, Kim HB, Singer RS, Gebhart CJ, Sreevatsan S, Johnson T, et al. (2015). Changes in the porcine intestinal microbiome in response to infection with Salmonella enterica and Lawsonia intracellularis. PLoS ONE 10: e0139106.
Boroojeni FG, Vahjen W, Mader A, Knorr F, Ruhnke I, Röhe I, et al. (2014). The effects of different thermal treatments and organic acid levels in feed on microbial composition and activity in gastrointestinal tract of broilers. Poult Sci 93: 1440–52.
Bortoluzzi C, Menten JFM, Pereira R, Fagundes NS, Napty GS, Pedroso AA, et al. (2015). Hops beta-acids and zinc bacitracin affect the performance and intestinal microbiota of broilers challenged with Eimeria acervulina and Eimeria tenella. Anim Feed Sci Technol 207: 181–189.
Bosi P, Merialdi G, Scandurra S, Messori S, Bardasi L, Nisi I, et al. (2011). Feed supplemented with 3 different antibiotics improved food intake and decreased the activation of the humoral immune response in healthy weaned pigs but had differing effects on intestinal microbiota. J Anim Sci 89: 4043–53.
Breton J, Massart S, Vandamme P, De Brandt E, Pot B, Foligné B. (2013). Ecotoxicology inside the gut: impact of heavy metals on the mouse microbiome. BMC Pharmacol Toxicol 14: 62.
Brinkman BM, Becker A, Ayiseh RB, Hildebrand F, Raes J, Huys G, et al. (2013). Gut microbiota affects sensitivity to acute DSS-induced colitis independently of host genotype. Inflamm Bowel Dis 19: 2560–7.
Brinkman BM, Hildebrand F, Kubica M, Goosens D, Del Favero J, Declercq W, et al. (2011). Caspase deficiency alters the murine gut microbiome. Cell Death Dis 2: e220.
Broadhurst MJ, Ardeshir A, Kanwar B, Mirpuri J, Gundra UM, Leung JM, et al. (2012). Therapeutic helminth infection of macaques with idiopathic chronic diarrhea alters the inflammatory signature and mucosal microbiota of the colon. PLoS Pathog 8: e1003000.
Broderick NA, Buchon N, Lemaitre B. (2014). Microbiota-induced changes in Drosophila melanogaster host gene expression and gut morphology. mBio 5: e01117–14.
Bull-Otterson L, Feng W, Kirpich I, Wang Y, Qin X, Liu Y, et al. (2013). Metagenomic analyses of alcohol induced pathogenic alterations in the intestinal microbiome and the effect of Lactobacillus rhamnosus GG treatment. PLoS ONE 8: e53028.
Burel C, Tanguy M, Guerre P, Boilletot E, Cariolet R, Queguiner M, et al. (2013). Effect of low dose of fumonisins on pig health: immune status, intestinal microbiota and sensitivity to Salmonella. Toxins 5: 841–64.
Burr G, Hume M, Ricke S, Nisbet D, Gatlin D. (2010). In vitro and in vivo evaluation of the prebiotics GroBiotic-A, inulin, mannanoligosaccharide, and galactooligosaccharide on the digestive microbiota and performance of hybrid striped bass (Morone chrysops x Morone saxatilis). Microb Ecol 59: 187–198.
Buzoianu SG, Walsh MC, Rea MC, O’Sullivan O, Crispie F, Cotter PD, et al. (2012). The effect of feeding Bt MON810 maize to pigs for 110 days on intestinal microbiota. PLoS ONE 7: e33668.
Buzoianu SG, Walsh MC, Rea MC, Quigley L, O’Sullivan O, Cotter PD, et al. (2013). Sequence-based analysis of the intestinal microbiota of sows and their offspring fed genetically modified maize expressing a truncated form of Bacillus thuringiensis Cry1Ab protein (Bt Maize). Appl Environ Microbiol 79: 7735–44.
Campbell JH, Foster CM, Vishnivetskaya T, Campbell AG, Yang ZK, Wymore A, et al. (2012). Host genetic and environmental effects on mouse intestinal microbiota. ISME J 6: 2033–44.
Campbell SC, Wisniewski PJ, Noji M, McGuinness LR, Häggblom MM, Lightfoot SA, et al. (2016). The effect of diet and exercise on intestinal integrity and microbial diversity in mice. PLoS ONE 11: e0150502.
Canesso MCC, Lacerda NL, Ferreira CM, Gonçalves JL, Almeida D, Gamba C, et al. (2014). Comparing the effects of acute alcohol consumption in germ-free and conventional mice: the role of the gut microbiota. BMC Microbiol 14: 240.
Cantas L, Fraser TWK, Fjelldal PG, Mayer I, Sørum H. (2011). The culturable intestinal microbiota of triploid and diploid juvenile Atlantic salmon (Salmo salar) - acomparison of composition and drug resistance. BMC Vet Res 7: 71.
Cantas L, Sørby JRT, Aleström P, Sørum H. (2012). Culturable gut microbiota diversity in zebrafish. Zebrafish 9: 26–37.
Cao KF, Zhang HH, Han HH, Song Y, Bai XL, Sun H. (2016a). Effect of dietary protein sources on the small intestine microbiome of weaned piglets based on high-throughput sequencing. Lett Appl Microbiol 62: 392–8.
Cao Y, Liu Y, Mao W, Chen R, He S, Gao X, et al. (2014). Effect of dietary N-acyl homoserin lactonase on the immune response and the gut microbiota of zebrafish, Danio rerio, infected with Aeromonas hydrophila. J World Aquac Soc 45: 149–162.
Cao Y, Pan Q, Cai W, Shen F, Chen G-Y, Xu L-M, et al. (2016b). Modulation of gut microbiota by berberine improves steatohepatitis in high-fat diet-fed BALB/C mice. Arch Iran Med 19: 197–203.
Carey HV, Walters WA, Knight R. (2013). Seasonal restructuring of the ground squirrel gut microbiota over the annual hibernation cycle. Am J Physiol Regul IntegrComp Physiol 304: R33–42.
Carvalho BM, Guadagnini D, Tsukumo DML, Schenka AA, Latuf-Filho P, Vassallo J, et al. (2012). Modulation of gut microbiota by antibiotics improves insulin signalling in high-fat fed mice. Diabetologia 55: 2823–34.
Castillo-Lopez E, Ramirez Ramirez HA, Klopfenstein TJ, Anderson CL, Aluthge ND, Fernando SC, et al. (2014). Effect of feeding dried distillers grains with solubles on ruminal biohydrogenation, intestinal fatty acid profile, and gut microbial diversity evaluated through DNA pyro-sequencing. J Anim Sci 92: 733–43.
Castro DP, Moraes CS, Gonzalez MS, Ratcliffe NA, Azambuja P, Garcia ES. (2012a). Trypanosoma cruzi immune response modulation decreases microbiota in Rhodnius prolixus gut and is crucial for parasite survival and development. PLoS ONE 7: e36591.
Castro DP, Moraes CS, Gonzalez MS, Ribeiro IM, Tomassini TCB, Azambuja P, et al. (2012b). Physalin B inhibits Trypanosoma cruzi infection in the gut of Rhodnius prolixus by affecting the immune system and microbiota. J Insect Physiol 58: 1620–5.
Cerezuela R, Fumanal M, Tapia-Paniagua ST, Meseguer J, Moriñigo MÁ, Esteban MÁ. (2013). Changes in intestinal morphology and microbiota caused by dietary administration of inulin and Bacillus subtilis in gilthead sea bream (Sparus aurata L.) specimens. Fish Shellfish Immunol 34: 1063–70.
Cerezuela R, Fumanal M, Tapia-Paniagua ST, Meseguer J, Moriñigo MA, Esteban MA. (2012). Histological alterations and microbial ecology of the intestine in gilthead seabream (Sparus aurata L.) fed dietary probiotics and microalgae. Cell Tissue Res 350: 477–89.
Chaplin A, Parra P, Laraichi S, Serra F, Palou A. (2016). Calcium supplementation modulates gut microbiota in a prebiotic manner in dietary obese mice. Mol Nutr Food Res 60: 468–80.
Chen J-R, Chen Y-L, Peng H-C, Lu Y-A, Chuang H-L, Chang H-Y, et al. (2016). Fish oil reduces hepatic injury by maintaining normal intestinal permeability and microbiota in chronic ethanol-fed rats. Gastroenterol Res Pract 2016: 4694726.
Chen Y, Zhu X, Yang Y, Han D, Jin J, Xie S. (2014a). Effect of dietary chitosan on growth performance, haematology, immune response, intestine morphology, intestine microbiota and disease resistance in gibel carp (Carassius auratus gibelio). Aquac Nutr 20: 532–546.
Chen Y, Zhu X, Yang Y, Han D, Jin J, Xie S. (2014b). Effect of dietary lysozyme on growth, immune response, intestine microbiota, intestine morphology and resistance to Aeromonas hydrophilia in gibel carp (Carassius auratus gibelio). Aquac Nutr 20: 229–241.
Chen Y-B, Lan D-L, Tang C, Yang X-N, Li J. (2015). Effect of DNA extraction methods on the apparent structure of yak rumen microbial communities as revealed by 16S rDNA sequencing. Pol J Microbiol 64: 29–36.
Chen Z, Guo L, Zhang Y, Walzem RL, Pendergast JS, Printz RL, et al. (2014c). Incorporation of therapeutically modified bacteria into gut microbiota inhibits obesity. J Clin Invest 124: 3391–406.
Cherdthong A, Wanapat M. (2013). Rumen microbes and microbial protein synthesis in Thai native beef cattle fed with feed blocks supplemented with a urea-calcium sulphate mixture. Arch Anim Nutr 67: 448–60.
Cherdthong A, Wanapat M, Saenkamsorn A, Supapong C, Anantasook N, Gunun P. (2015). Improving rumen ecology and microbial population by dried rumen digesta in beef cattle. Trop Anim Health Prod 47: 921–6.
Chhour K-L, Hinds LA, Jacques NA, Deane EM. (2010). An observational study of the microbiome of the maternal pouch and saliva of the tammar wallaby, Macropus eugenii, and of the gastrointestinal tract of the pouch young. Microbiol Read Engl 156: 798–808.
Chiquette J, Lagrost J, Girard CL, Talbot G, Li S, Plaizier JC, et al. (2015). Efficacy of the direct-fed microbial Enterococcus faecium alone or in combination with Saccharomyces cerevisiae or Lactococcus lactis during induced subacute ruminal acidosis. J Dairy Sci 98: 190–203.
Chiu W-C, Huang Y-L, Chen Y-L, Peng H-C, Liao W-H, Chuang H-L, et al. (2015). Synbiotics reduce ethanol-induced hepatic steatosis and inflammation by improving intestinal permeability and microbiota in rats. Food Funct 6: 1692–700.
Cho JH, Kim HJ, Kim IH. (2014). Effects of phytogenic feed additive on growth performance, digestibility, blood metabolites, intestinal microbiota, meat color and relative organ weight after oral challenge with Clostridium perfringens in broilers. Livest Sci 160: 82–88.
Choe DW, Loh TC, Foo HL, Hair-Bejo M, Awis QS. (2012). Egg production, faecal pH and microbial population, small intestine morphology, and plasma and yolk cholesterol in laying hens given liquid metabolites produced by Lactobacillus plantarum strains. Br Poult Sci 53: 106–15.
Clark RI, Salazar A, Yamada R, Fitz-Gibbon S, Morselli M, Alcaraz J, et al. (2015). Distinct shifts in microbiota composition during Drosophila aging impair intestinal function and drive mortality. Cell Rep 12: 1656–67.
Coldham T, Rose K, O’Rourke J, Neilan BA, Dalton H, Lee A, et al. (2013). Detection of Helicobacter species in the gastrointestinal tract of ringtail possum and koala: possible influence of diet, on the gut microbiota. Vet Microbiol 166: 429–37.
Collins KH, Paul HA, Reimer RA, Seerattan RA, Hart DA, Herzog W. (2015). Relationship between inflammation, the gut microbiota, and metabolic osteoarthritis development: studies in a rat model. Osteoarthritis Cartilage 23: 1989–1998.
Combes S, Michelland RJ, Monteils V, Cauquil L, Soulié V, Tran NU, et al. (2011). Postnatal development of the rabbit caecal microbiota composition and activity. FEMS Microbiol Ecol 77: 680–9.
Coon KL, Vogel KJ, Brown MR, Strand MR. (2014). Mosquitoes rely on their gut microbiota for development. Mol Ecol 23: 2727–39.
Cordero H, Guardiola FA, Tapia-Paniagua ST, Cuesta A, Meseguer J, Balebona MC, et al. (2015). Modulation of immunity and gut microbiota after dietary administration of alginate encapsulated Shewanella putrefaciens Pdp11 to gilthead seabream (Sparus aurata L.). Fish Shellfish Immunol 45: 608–618.
Costa MC, Silva G, Ramos RV, Staempfli HR, Arroyo LG, Kim P, et al. (2015a). Characterization and comparison of the bacterial microbiota in different gastrointestinal tract compartments in horses. Vet J 205: 74–80.
Costa MC, Stämpfli HR, Arroyo LG, Allen-Vercoe E, Gomes RG, Weese J. (2015b). Changes in the equine fecal microbiota associated with the use of systemic antimicrobial drugs. BMC Vet Res 11. e-pub ahead of print, doi: 10.1186/s12917-015-0335-7.
Costa MO, Chaban B, Harding JCS, Hill JE. (2014). Characterization of the fecal microbiota of pigs before and after inoculation with Brachyspira hampsonii. PLoS ONE 9: e106399.
Costello EK, Gordon JI, Secor SM, Knight R. (2010). Postprandial remodeling of the gut microbiota in Burmese pythons. ISME J 4: 1375–85.
Cox LM, Cho I, Young SA, Anderson WHK, Waters BJ, Hung S-C, et al. (2013). The nonfermentable dietary fiber hydroxypropyl methylcellulose modulates intestinal microbiota. FASEB J Off Publ Fed Am Soc Exp Biol 27: 692–702.
Cressman MD, Yu Z, Nelson MC, Moeller SJ, Lilburn MS, Zerby HN. (2010). Interrelations between the microbiotas in the litter and in the intestines of commercialbroiler chickens. Appl Environ Microbiol 76: 6572–82.
Crumeyrolle-Arias M, Jaglin M, Bruneau A, Vancassel S, Cardona A, Daugé V, et al. (2014). Absence of the gut microbiota enhances anxiety-like behavior and neuroendocrine response to acute stress in rats. Psychoneuroendocrinology 42: 207–17.
Cunha IS, Barreto CC, Costa OYA, Bomfim MA, Castro AP, Kruger RH, et al. (2011). Bacteria and Archaea community structure in the rumen microbiome of goats (Capra hircus) from the semiarid region of Brazil. Anaerobe 17: 118–24.
Czerwiński J, Højberg O, Smulikowska S, Engberg RM, Mieczkowska A. (2012). Effects of sodium butyrate and salinomycin upon intestinal microbiota, mucosal morphology and performance of broiler chickens. Arch Anim Nutr 66: 102–16.
Dai X, Zhu Y, Luo Y, Song L, Liu D, Liu L, et al. (2012). Metagenomic insights into the fibrolytic microbiome in yak rumen. PLoS ONE 7: e40430.
Daniel H, Moghaddas Gholami A, Berry D, Desmarchelier C, Hahne H, Loh G, et al. (2014). High-fat diet alters gut microbiota physiology in mice. ISME J 8: 295–308.
Daniels CL, Merrifield DL, Boothroyd DP, Davies SJ, Factor JR, Arnold KE. (2010). Effect of dietary Bacillus spp. and mannan oligosaccharides (MOS) on European lobster (Homarus gammarus L.) larvae growth performance, gut morphology and gut microbiota. Aquaculture 304: 49–57.
Danzeisen JL, Calvert AJ, Noll SL, McComb B, Sherwood JS, Logue CM, et al. (2013). Succession of the turkey gastrointestinal bacterial microbiome related to weight gain. PeerJ 1: e237.
D’Argenio G, Cariello R, Tuccillo C, Mazzone G, Federico A, Funaro A, et al. (2013). Symbiotic formulation in experimentally induced liver fibrosis in rats: intestinal microbiota as a key point to treat liver damage? Liver Int Off J Int Assoc Study Liver 33: 687–97.
Davis E, Rehberger J, King M, Brown DC, Maxwell CV, Rehberger T. (2010). Characterization of gastrointestinal microbial and immune populations post-weaning in conventionally-reared and segregated early weaned pigs. Livest Sci 133: 92–94.
Dawood MAO, Koshio S, Ishikawa M, Yokoyama S, El Basuini MF, Hossain MS, et al. (2016). Effects of dietary supplementation of Lactobacillus rhamnosus or/and Lactococcus lactis on the growth, gut microbiota and immune responses of red sea bream, Pagrus major. Fish Shellfish Immunol 49: 275–285.
De Barbieri I, Gulino L, Hegarty RS, Oddy VH, Maguire A, Li L, et al. (2015). Production attributes of Merino sheep genetically divergent for wool growth are reflected in differing rumen microbiotas. Livest Sci 178: 119–129.
De Nardi R, Marchesini G, Li S, Khafipour E, Plaizier KJC, Gianesella M, et al. (2016). Metagenomic analysis of rumen microbial population in dairy heifers fed a high grain diet supplemented with dicarboxylic acids or polyphenols. BMC Vet Res 12. e-pub ahead of print, doi: 10.1186/s12917-016-0653-4.
Degnan PH, Pusey AE, Lonsdorf EV, Goodall J, Wroblewski EE, Wilson ML, et al. (2012). Factors associated with the diversification of the gut microbial communities within chimpanzees from Gombe National Park. Proc Natl Acad Sci U S A 109: 13034–9.
Delsuc F, Metcalf JL, Wegener Parfrey L, Song SJ, González A, Knight R. (2014). Convergence of gut microbiomes in myrmecophagous mammals. Mol Ecol 23: 1301–17.
Dematheis F, Kurtz B, Vidal S, Smalla K. (2012). Microbial communities associated with the larval gut and eggs of the Western corn rootworm. PLoS ONE 7: e44685.
Derakhshani H, De Buck J, Mortier R, Barkema HW, Krause DO, Khafipour E. (2016). The features of fecal and ileal mucosa-associated microbiota in dairy calves during early infection with Mycobacterium avium Subspecies paratuberculosis. Front Microbiol 7: 426.
Desai AR, Links MG, Collins SA, Mansfield GS, Drew MD, Van Kessel AG, et al. (2012). Effects of plant-based diets on the distal gut microbiome of rainbow trout (Oncorhynchus mykiss). Aquaculture 350–353: 134–142.
Deusch O, O’Flynn C, Colyer A, Morris P, Allaway D, Jones PG, et al. (2014). Deep Illumina-based shotgun sequencing reveals dietary effects on the structure and function of the fecal microbiome of growing kittens. PLoS ONE 9: e101021.
Devine AA, Gonzalez A, Speck KE, Knight R, Helmrath M, Lund PK, et al. (2013). Impact of ileocecal resection and concomitant antibiotics on the microbiome of the murine jejunum and colon. PLoS ONE 8: e73140.
Dewar ML, Arnould JPY, Krause L, Dann P, Smith SC. (2014a). Interspecific variations in the faecal microbiota of Procellariiform seabirds. FEMS Microbiol Ecol 89: 47–55.
Dewar ML, Arnould JPY, Krause L, Trathan P, Dann P, Smith SC. (2014b). Influence of fasting during moult on the faecal microbiota of penguins. PLoS ONE 9: e99996.
Dhanasiri AKS, Brunvold L, Brinchmann MF, Korsnes K, Bergh Ø, Kiron V. (2011). Changes in the intestinal microbiota of wild Atlantic cod Gadus morhua L. upon captive rearing. Microb Ecol 61: 20–30.
Dicksved J, Jansson JK, Lindberg JE. (2015). Fecal microbiome of growing pigs fed a cereal based diet including chicory (Cichorium intybus L.) or ribwort (Plantago lanceolata L.) forage. J Anim Sci Biotechnol 6: 53.
Dietrich C, Kohler T, Brune A. (2014). The cockroach origin of the termite gut microbiota: patterns in bacterial community structure reflect major evolutionary events. Appl Environ Microbiol 80: 2261–2269.
Dill-McFarland KA, Weimer PJ, Pauli JN, Peery MZ, Suen G. (2016). Diet specialization selects for an unusual and simplified gut microbiota in two- and three-toedsloths. Environ Microbiol 18: 1391–402.
Dimitriu PA, Boyce G, Samarakoon A, Hartmann M, Johnson P, Mohn WW. (2013). Temporal stability of the mouse gut microbiota in relation to innate and adaptive immunity. Environ Microbiol Rep 5: 200–10.
Dimitroglou A, Merrifield DL, Spring P, Sweetman J, Moate R, Davies SJ. (2010). Effects of mannan oligosaccharide (MOS) supplementation on growth performance, feed utilisation, intestinal histology and gut microbiota of gilthead sea bream (Sparus aurata). Aquaculture 300: 182–188.
Ding G, Chang Y, Zhao L, Zhou Z, Ren L, Meng Q. (2014). Effect of Saccharomyces cerevisiae on alfalfa nutrient degradation characteristics and rumen microbial populations of steers fed diets with different concentrate-to-forage ratios. J Anim Sci Biotechnol 5: 24.
Dishaw LJ, Flores-Torres J, Lax S, Gemayel K, Leigh B, Melillo D, et al. (2014). The gut of geographically disparate Ciona intestinalis harbors a core microbiota. PLoS ONE 9: e93386.
Distrutti E, O’Reilly J-A, McDonald C, Cipriani S, Renga B, Lynch M a., et al. (2014). Modulation of intestinal microbiota by the probiotic VSL#3 resets brain geneexpression and ameliorates the age-related deficit in LTP. PLoS ONE 9: e106503.
Dittmer J, Lesobre J, Raimond R, Zimmer M, Bouchon D. (2012). Influence of changing plant food sources on the gut microbiota of saltmarsh detritivores. Microb Ecol 64: 814–25.
Dolpady J, Sorini C, Di Pietro C, Cosorich I, Ferrarese R, Saita D, et al. (2016). Oral probiotic VSL#3 prevents autoimmune diabetes by modulating microbiota and promoting indoleamine 2,3-dioxygenase-enriched tolerogenic intestinal environment. J Diabetes Res 2016: 7569431.
van Dongen WFD, White J, Brandl HB, Moodley Y, Merkling T, Leclaire S, et al. (2013). Age-related differences in the cloacal microbiota of a wild bird species. BMC Ecol 13: 11.
Drumo R, Pesciaroli M, Ruggeri J, Tarantino M, Chirullo B, Pistoia C, et al. (2015). Salmonella enterica serovar Typhimurium exploits inflammation to modify swine intestinal microbiota. Front Cell Infect Microbiol 5. e-pub ahead of print, doi: 10.3389/fcimb.2015.00106.
Dudek M, Adams J, Swain M, Hegarty M, Huws S, Gallagher J. (2014). Metaphylogenomic and potential functionality of the limpet Patella pellucida’s gastrointestinal tract microbiome. Int J Mol Sci 15: 18819–39.
Durand L, Zbinden M, Cueff-Gauchard V, Duperron S, Roussel EG, Shillito B, et al. (2010). Microbial diversity associated with the hydrothermal shrimp Rimicaris exoculata gut and occurrence of a resident microbial community. FEMS Microbiol Ecol 71: 291–303.
Elangovan AV, Mandal AB, Shrivastav AK, Yadhav AS. (2011). Supplementing probiotics (GalliPro) to broiler chicken on growth performance, immunity and gut microbial population. Anim Nutr Feed Technol 11: 169–176.
Ellekilde M, Krych L, Hansen CH, Hufeldt MR, Dahl K, Hansen LH, et al. (2014). Characterization of the gut microbiota in leptin deficient obese mice - correlationto inflammatory and diabetic parameters. Res Vet Sci 96: 241–50.
Ellison MJ, Conant GC, Cockrum RR, Austin KJ, Truong H, Becchi M, et al. (2014). Diet alters both the structure and taxonomy of the ovine gut microbial ecosystem. DNA Res 21: 115–25.
Engberg RM, Grevsen K, Ivarsen E, Fretté X, Christensen LP er, Højberg O, et al. (2012). The effect of Artemisia annua on broiler performance, on intestinal microbiota and on the course of a Clostridium perfringens infection applying a necrotic enteritis disease model. Avian Pathol 41: 369–76.
Engel P, Martinson VG, Moran NA. (2012). Functional diversity within the simple gut microbiota of the honey bee. Proc Natl Acad Sci U S A 109: 11002–7.
Engevik MA, Faletti CJ, Paulmichl M, Worrell RT. (2013). Prebiotic properties of galursan HF 7K on mouse gut microbiota. Cell Physiol Biochem Int J Exp Cell Physiol Biochem Pharmacol 32: 96–110.
Eshar D, Weese JS. (2014). Molecular analysis of the microbiota in hard feces from healthy rabbits (Oryctolagus cuniculus) medicated with long term oral meloxicam. BMC Vet Res 10: 62.
Espley RV, Butts CA, Laing WA, Martell S, Smith H, McGhie TK, et al. (2014). Dietary flavonoids from modified apple reduce inflammation markers and modulate gut microbiota in mice. J Nutr 144: 146–54.
Esposito D, Damsud T, Wilson M, Grace MH, Strauch R, Li X, et al. (2015). Black currant anthocyanins attenuate weight gain and improve glucose metabolism in diet-induced obese mice with intact, but not disrupted, gut microbiome. J Agric Food Chem 63: 6172–80.
Evans CC, LePard KJ, Kwak JW, Stancukas MC, Laskowski S, Dougherty J, et al. (2014). Exercise prevents weight gain and alters the gut microbiota in a mouse model of high fat diet-induced obesity. PLoS ONE 9: e92193.
Everard A, Lazarevic V, Derrien M, Girard M, Muccioli GG, Neyrinck AM, et al. (2011). Responses of gut microbiota and glucose and lipid metabolism to prebiotics in genetic obese and diet-induced leptin-resistant mice. Diabetes 60: 2775–86.
Feng J-B, Luo P, Dong J-D, Hu C-Q. (2011). Intestinal microbiota of mangrove red snapper (Lutjanus argentimaculatus Forsskål, 1775) reared in sea cages. Aquac Res 42: 1703–1713.
Feng Z-M, Li T-J, Wu L, Xiao D-F, Blachier F, Yin Y-L. (2015). Monosodium L-glutamate and dietary fat differently modify the composition of the intestinal microbiota in growing pigs. Obes Facts 8: 87–100.
Ferguson RMW, Merrifield DL, Harper GM, Rawling MD, Mustafa S, Picchietti S, et al. (2010). The effect of Pediococcus acidilactici on the gut microbiota and immune status of on-growing red tilapia (Oreochromis niloticus). J Appl Microbiol 109: 851–62.
Fernando SC, Purvis HT, Najar FZ, Sukharnikov LO, Krehbiel CR, Nagaraja TG, et al. (2010). Rumen microbial population dynamics during adaptation to a high-grain diet. Appl Environ Microbiol 76: 7482–90.
Ferreira RBR, Gill N, Willing BP, Antunes LCM, Russell SL, Croxen MA, et al. (2011). The intestinal microbiota plays a role in Salmonella-induced colitis independent of pathogen colonization. PLoS ONE 6: e20338.
Fiesel A, Gessner DK, Most E, Eder K. (2014). Effects of dietary polyphenol-rich plant products from grape or hop on pro-inflammatory gene expression in the intestine, nutrient digestibility and faecal microbiota of weaned pigs. BMC Vet Res 10: 196.
Fjellheim AJ, Playfoot KJ, Skjermo J, Vadstein O. (2012). Inter-individual variation in the dominant intestinal microbiota of reared Atlantic cod (Gadus morhua L.) larvae. Aquac Res 43: 1499–1508.
Fleissner CK, Huebel N, Abd El-Bary MM, Loh G, Klaus S, Blaut M. (2010). Absence of intestinal microbiota does not protect mice from diet-induced obesity. Br JNutr 104: 919–29.
Fogel AT. (2015). The gut microbiome of wild lemurs: a comparison of sympatric Lemur catta and Propithecus verreauxi. Folia Primatol Int J Primatol 86: 85–95.
Fonseca BB, Beletti ME, da Silva MS, da Silva PL, Duarte IN, Rossi DA. (2010). Microbiota of the cecum, ileum morphometry, pH of the crop and performance of broiler chickens supplemented with probiotics. Rev Bras Zootec 39: 1756–1760.
Fortes-Silva R, Oliveira IE, Vieira VP, Winkaler EU, Guerra-Santos B, Cerqueira RB. (2016). Daily rhythms of locomotor activity and the influence of a light and dark cycle on gut microbiota species in tambaqui (Colossoma macropomum). Biol Rhythm Res 47: 183–190.
Franchini P, Fruciano C, Frickey T, Jones JC, Meyer A. (2014). The gut microbial community of Midas cichlid fish in repeatedly evolved limnetic-benthic species pairs. PLoS ONE 9: e95027.
Frey JC, Pell AN, Berthiaume R, Lapierre H, Lee S, Ha JK, et al. (2010). Comparative studies of microbial populations in the rumen, duodenum, ileum and faeces oflactating dairy cows. J Appl Microbiol 108: 1982–93.
Frizzo LS, Soto LP, Zbrun MV, Signorini ML, Bertozzi E, Sequeira G, et al. (2011). Effect of lactic acid bacteria and lactose on growth performance and intestinal microbial balance of artificially reared calves. Livest Sci 140: 246–252.
Gao Y, Han F, Huang X, Rong Y, Yi H, Wang Y. (2013). Changes in gut microbial populations, intestinal morphology, expression of tight junction proteins, and cytokine production between two pig breeds after challenge with Escherichia coli K88: a comparative study. J Anim Sci 91: 5614–25.
Garcia-Mazcorro JF, Suchodolski JS, Jones KR, Clark-Price SC, Dowd SE, Minamoto Y, et al. (2012). Effect of the proton pump inhibitor omeprazole on the gastrointestinal bacterial microbiota of healthy dogs. FEMS Microbiol Ecol 80: 624–36.
Garrett WS, Gallini CA, Yatsunenko T, Michaud M, DuBois A, Delaney ML, et al. (2010). Enterobacteriaceae act in concert with the gut microbiota to induce spontaneous and maternally transmitted colitis. Cell Host Microbe 8: 292–300.
Gatesoupe F-J, Huelvan C, Le Bayon N, Sévère A, Aasen IM, Degnes KF, et al. (2014). The effects of dietary carbohydrate sources and forms on metabolic response and intestinal microbiota in sea bass juveniles, Dicentrarchus labrax. Aquaculture 422–423: 47–53.
Geraylou Z, Souffreau C, Rurangwa E, De Meester L, Courtin CM, Delcour JA, et al. (2013a). Effects of dietary arabinoxylan-oligosaccharides (AXOS) and endogenous probiotics on the growth performance, non-specific immunity and gut microbiota of juvenile Siberian sturgeon (Acipenser baerii). Fish Shellfish Immunol 35: 766–75.
Geraylou Z, Souffreau C, Rurangwa E, Maes GE, Spanier KI, Courtin CM, et al. (2013b). Prebiotic effects of arabinoxylan oligosaccharides on juvenile Siberian sturgeon (Acipenser baerii) with emphasis on the modulation of the gut microbiota using 454 pyrosequencing. FEMS Microbiol Ecol 86: 357–71.
Geurden I, Mennigen J, Plagnes-Juan E, Veron V, Cerezo T, Mazurais D, et al. (2014). High or low dietary carbohydrate:protein ratios during first-feeding affect glucose metabolism and intestinal microbiota in juvenile rainbow trout. J Exp Biol 217: 3396–3406.
Ghaffarzadegan T, Marungruang N, Fåk F, Nyman M. (2016). Molecular properties of guar gum and pectin modify cecal bile acids, microbiota, and plasma lipopolysaccharide-binding protein in rats. PLoS ONE 11: e0157427.
Ghazaghi M, Mehri M, Bagherzadeh-Kasmani F. (2014). Effects of dietary Mentha spicata on performance, blood metabolites, meat quality and microbial ecosystem of small intestine in growing Japanese quail. Anim Feed Sci Technol 194: 89–98.
Ghosh S, Molcan E, DeCoffe D, Dai C, Gibson DL. (2013). Diets rich in n-6 PUFA induce intestinal microbial dysbiosis in aged mice. Br J Nutr 110: 515–23.
Giannenas I, Papaneophytou CP, Tsalie E, Pappas I, Triantafillou E, Tontis D, et al. (2014). Dietary supplementation of benzoic acid and essential oil compounds affects buffering capacity of the feeds, performance of turkey poults and their antioxidant status, pH in the digestive tract, intestinal microbiota and morphology. Asian-Australas J Anim Sci 27: 225–36.
Giannenas I, Skoufos J, Giannakopoulos C, Wiemann M, Gortzi O, Lalas S, et al. (2011a). Effects of essential oils on milk production, milk composition, and rumenmicrobiota in Chios dairy ewes. J Dairy Sci 94: 5569–77.
Giannenas I, Tsalie E, Chronis E, Mavridis S, Tontis D, Kyriazakis I. (2011b). Consumption of Agaricus bisporus mushroom affects the performance, intestinal microbiota composition and morphology, and antioxidant status of turkey poults. Anim Feed Sci Technol 165: 218–229.
Giatsis C, Sipkema D, Smidt H, Heilig H, Benvenuti G, Verreth J, et al. (2015). The impact of rearing environment on the development of gut microbiota in tilapia larvae. Sci Rep 5: 18206.
Giatsis C, Sipkema D, Smidt H, Verreth J, Verdegem M. (2014). The colonization dynamics of the gut microbiota in tilapia larvae. PLoS ONE 9: e103641.
Gill N, Ferreira RBR, Antunes LCM, Willing BP, Sekirov I, Al-Zahrani F, et al. (2012). Neutrophil elastase alters the murine gut microbiota resulting in enhanced Salmonella colonization. PLoS ONE 7: e49646.
Gisbert E, Castillo M, Skalli A, Andree KB, Badiola I. (2013). Bacillus cereus var. toyoi promotes growth, affects the histological organization and microbiota of theintestinal mucosa in rainbow trout fingerlings. J Anim Sci 91: 2766–74.
Givens CE, Burnett KG, Burnett LE, Hollibaugh JT. (2013). Microbial communities of the carapace, gut, and hemolymph of the Atlantic blue crab, Callinectes sapidus. Mar Biol 160: 2841–2851.
Godoy FA, Miranda CD, Wittwer GD, Aranda CP, Calderón R. (2015). High variability of levels of Aliivibrio and lactic acid bacteria in the intestinal microbiota of farmed Atlantic salmon Salmo salar L. Ann Microbiol 65: 2343–2353.
Gómez-Hurtado I, Santacruz A, Peiró G, Zapater P, Gutiérrez A, Pérez-Mateo M, et al. (2011). Gut microbiota dysbiosis is associated with inflammation and bacterial translocation in mice with CCl4-induced fibrosis. PLoS ONE 6: e23037.
Green TJ, Smullen R, Barnes AC. (2013). Dietary soybean protein concentrate-induced intestinal disorder in marine farmed Atlantic salmon, Salmo salar is associated with alterations in gut microbiota. Vet Microbiol 166: 286–92.
Grieco MAB, Cavalcante JJV, Cardoso AM, Vieira RP, Machado EA, Clementino MM, et al. (2013). Microbial community diversity in the gut of the South American termite Cornitermes cumulans (Isoptera: Termitidae). Microb Ecol 65: 197–204.
Guerreiro I, Enes P, Rodiles A, Merrifield D, Oliva-Teles A. (2016). Effects of rearing temperature and dietary short-chain fructooligosaccharides supplementation on allochthonous gut microbiota, digestive enzymes activities and intestine health of turbot (Scophthalmus maximus L.) juveniles. Aquac Nutr 22: 631–642.
Gulati AS, Shanahan MT, Arthur JC, Grossniklaus E, von Furstenberg RJ, Kreuk L, et al. (2012). Mouse background strain profoundly influences Paneth cell function and intestinal microbial composition. PLoS ONE 7: e32403.
Gumiel M, da Mota FF, Rizzo V de S, Sarquis O, de Castro DP, Lima MM, et al. (2015). Characterization of the microbiota in the guts of Triatoma brasiliensis and Triatoma pseudomaculata infected by Trypanosoma cruzi in natural conditions using culture independent methods. Parasit Vectors 8. e-pub ahead of print, doi: 10.1186/s13071-015-0836-z.
Guo M, Huang K, Chen S, Qi X, He X, Cheng WH, et al. (2014a). Combination of metagenomics and culture-based methods to study the interaction between ochratoxin A and gut microbiota. Toxicol Sci Off J Soc Toxicol 141: 314–23.
Guo X, Liu S, Wang Z, Zhang XX, Li M, Wu B. (2014b). Metagenomic profiles and antibiotic resistance genes in gut microbiota of mice exposed to arsenic and iron. Chemosphere 112: 1–8.
Haenen D, Souza da Silva C, Zhang J, Koopmans SJ, Bosch G, Vervoort J, et al. (2013). Resistant starch induces catabolic but suppresses immune and cell division pathways and changes the microbiome in the proximal colon of male pigs. J Nutr 143: 1889–98.
Haley BJ, Pettengill J, Gorham S, Ottesen A, Karns JS, Van Kessel JAS. (2016). Comparison of microbial communities isolated from feces of asymptomatic Salmonella-shedding and non-Salmonella shedding dairy cows. Front Microbiol 7: 691.
Hammami R, Ben Abdallah N, Barbeau J, Fliss I. (2015). Symbiotic maple saps minimize disruption of the mice intestinal microbiota after oral antibiotic administration. Int J Food Sci Nutr 66: 665–71.
Han K-S, Balan P, Hong H-D, Choi W-I, Cho C-W, Lee Y-C, et al. (2014). Korean ginseng modulates the ileal microbiota and mucin gene expression in the growing rat. Food Funct 5: 1506–12.
Han W, Zhang XL, Wang DW, Li LY, Liu GL, Li AK, et al. (2013). Effects of microencapsulated Enterococcus fecalis CG1.0007 on growth performance, antioxidation activity, and intestinal microbiota in broiler chickens. J Anim Sci 91: 4374–82.
Han XY, Du WL, Fan CL, Xu ZR. (2010). Changes in composition a metabolism of caecal microbiota in rats fed diets supplemented with copper-loaded chitosan nanoparticles. J Anim Physiol Anim Nutr 94: e138–44.
Hansen CHF, Holm TL, Krych Ł, Andresen L, Nielsen DS, Rune I, et al. (2013). Gut microbiota regulates NKG2D ligand expression on intestinal epithelial cells. Eur J Immunol 43: 447–57.
Hartviksen M, Vecino JLG, Ringø E, Bakke A-M, Wadsworth S, Krogdahl ÅA., et al. (2014). Alternative dietary protein sources for Atlantic salmon (Salmo salar L.) effect on intestinal microbiota, intestinal and liver histology and growth. J Microbiol Seoul Korea 20: 381–398.
He G-Z, Deng S-X, Qian N. (2012a). Intestinal microbial community diversity between healthy and orally infected rabbit with Entamoeba histolytica by ERIC-PCR.Parasitol Res 111: 1123–6.
He G-Z, Feng Y, Deng S-X. (2012b). Evaluation of the intestinal microbial diversity in miniature pig after orally infected with Entamoeba histolytica. Parasitol Res 111: 939–41.
He S, Zhou Z, Liu Y, Cao Y, Meng K, Shi P, et al. (2010). Effects of the antibiotic growth promoters flavomycin and florfenicol on the autochthonous intestinal microbiota of hybrid tilapia (Oreochromis niloticus ♀ × O. aureus ♂). Arch Microbiol 192: 985–94.
Heimesaat MM, Dunay IR, Alutis M, Fischer A, Möhle L, Göbel UB, et al. (2014). Nucleotide-oligomerization-domain-2 affects commensal gut microbiota composition and intracerebral immunopathology in acute Toxoplasma gondii induced murine ileitis. PLoS ONE 9: e105120.
Heimesaat MM, Plickert R, Fischer A, Göbel UB, Bereswill S. (2013). Can microbiota transplantation abrogate murine colonization resistance against Campylobacter jejuni? Eur J Microbiol Immunol 3: 36–43.
Heyman-Lindén L, Kotowska D, Sand E, Bjursell M, Plaza M, Turner C, et al. (2016). Lingonberries alter the gut microbiota and prevent low-grade inflammation inhigh-fat diet fed mice. Food Nutr Res 60: 29993.
Hird SM, Carstens BC, Cardiff SW, Dittmann DL, Brumfield RT. (2014). Sampling locality is more detectable than taxonomy or ecology in the gut microbiota of the brood-parasitic Brown-headed Cowbird (Molothrus ater). PeerJ 2: e321.
van der Hoeven-Hangoor E, van der Vossen JMBM, Schuren FHJ, Verstegen MWA, de Oliveira JE, Montijn RC, et al. (2013). Ileal microbiota composition of broilers fed various commercial diet compositions. Poult Sci 92: 2713–23.
Holm JB, Rønnevik A, Tastesen HS, Fj\a ere E, Fauske KR, Liisberg U, et al. (2016). Diet-induced obesity, energy metabolism and gut microbiota in C57BL/6J mice fed Western diets based on lean seafood or lean meat mixtures. J Nutr Biochem 31: 127–136.
Hong J-C, Steiner T, Aufy A, Lien T-F. (2012). Effects of supplemental essential oil on growth performance, lipid metabolites and immunity, intestinal characteristics, microbiota and carcass traits in broilers. Livest Sci 144: 253–262.
Hooda S, Vester Boler BM, Kerr KR, Dowd SE, Swanson KS. (2013). The gut microbiome of kittens is affected by dietary protein:carbohydrate ratio and associatedwith blood metabolite and hormone concentrations. Br J Nutr 109: 1637–46.
Hoseinifar SH, Khalili M, Rostami HK, Esteban MÁ. (2013). Dietary galactooligosaccharide affects intestinal microbiota, stress resistance, and performance of Caspian roach (Rutilus rutilus) fry. Fish Shellfish Immunol 35: 1416–20.
Hoseinifar SH, Mirvaghefi A, Merrifield DL. (2011). The effects of dietary inactive brewer’s yeast Saccharomyces cerevisiae var. ellipsoideus on the growth, physiological responses and gut microbiota of juvenile beluga (Huso huso). Aquaculture 318: 90–94.
Hoseinifar SH, Sharifian M, Vesaghi MJ, Khalili M, Esteban MÁ. (2014a). The effects of dietary xylooligosaccharide on mucosal parameters, intestinal microbiota and morphology and growth performance of Caspian white fish (Rutilus frisii kutum) fry. Fish Shellfish Immunol 39: 231–6.
Hoseinifar SH, Soleimani N, Ringø E. (2014b). Effects of dietary fructo-oligosaccharide supplementation on the growth performance, haemato-immunological parameters, gut microbiota and stress resistance of common carp (Cyprinus carpio) fry. Br J Nutr 112: 1296–1302.
Hosseintabar B, Dadashbeiki M, Bouyeh M, Seidavi A. (2014). Is the amount of L-carnitine and methionine-lysine affect on the microbial flora of broiler cecum? J Pure Appl Microbiol 8: 353–360.
Hu X, Xing X, Zhen H. (2013). Enzyme deactivation treatments did not decrease the beneficial role of oat food in intestinal microbiota and short-chain fatty acids: an in vivo study. J Sci Food Agric 93: 504–8.
Huang EY, Leone VA, Devkota S, Wang Y, Brady MJ, Chang EB. (2013). Composition of dietary fat source shapes gut microbiota architecture and alters host inflammatory mediators in mouse adipose tissue. JPEN J Parenter Enteral Nutr 37: 746–54.
Hufeldt MR, Nielsen DS, Vogensen FK, Midtvedt T, Hansen AK. (2010a). Family relationship of female breeders reduce the systematic inter-individual variation in the gut microbiota of inbred laboratory mice. Lab Anim 44: 283–9.
Hufeldt MR, Nielsen DS, Vogensen FK, Midtvedt T, Hansen AK. (2010b). Variation in the gut microbiota of laboratory mice is related to both genetic and environmental factors. Comp Med 60: 336–47.
Huws SA, Chiariotti A, Sarubbi F, Carfì F, Pace V. (2012). Effects of feeding Mediterranean buffalo sorghum silage versus maize silage on the rumen microbiota and milk fatty acid content. J Gen Appl Microbiol 58: 107–12.
Hwang I, Park YJ, Kim Y-R, Kim YN, Ka S, Lee HY, et al. (2015). Alteration of gut microbiota by vancomycin and bacitracin improves insulin resistance via glucagon-like peptide 1 in diet-induced obesity. FASEB J 29: 2397–2411.
Iehata S, Nakano M, Tanaka R, Maeda H. (2014). Modulation of gut microbiota associated with abalone Haliotis gigantea by dietary administration of host-derived Pediococcus sp. Ab1. Fish Sci 80: 323–331.
Igarashi H, Maeda S, Ohno K, Horigome A, Odamaki T, Tsujimoto H. (2014). Effect of oral administration of metronidazole or prednisolone on fecal microbiota in dogs. PLoS ONE 9: e107909.
Ilmberger N, Güllert S, Dannenberg J, Rabausch U, Torres J, Wemheuer B, et al. (2014). A comparative metagenome survey of the fecal microbiota of a breast- and a plant-fed asian elephant reveals an unexpectedly high diversity of glycoside hydrolase family enzymes. PLoS ONE 9: e106707.
Imaeda H, Fujimoto T, Takahashi K, Kasumi E, Fujiyama Y, Andoh A. (2012). Terminal-restriction fragment length polymorphism (T-RFLP) analysis for changes in the gut microbiota profiles of indomethacin- and rebamipide-treated mice. Digestion 86: 250–7.
Indugu N, Bittinger K, Kumar S, Vecchiarelli B, Pitta D. (2016). A comparison of rumen microbial profiles in dairy cows as retrieved by 454 Roche and Ion Torrent (PGM) sequencing platforms. PeerJ 4: e1599.
Ingerslev H-C, von Gersdorff Jørgensen L, Lenz Strube M, Larsen N, Dalsgaard I, Boye M, et al. (2014). The development of the gut microbiota in rainbow trout (Oncorhynchus mykiss) is affected by first feeding and diet type. Aquaculture 424–425: 24–34.
Ishaq SL, Wright A-DG. (2012). Insight into the bacterial gut microbiome of the North American moose (Alces alces). BMC Microbiol 12: 212.
Islam KBMS, Fukiya S, Hagio M, Fujii N, Ishizuka S, Ooka T, et al. (2011). Bile acid is a host factor that regulates the composition of the cecal microbiota in rats. Gastroenterology 141: 1773–81.
Jahanpour H, Seidavi A, Qotbi AAA, Delgado F, Gamboa S. (2014). Effect of intensity and duration of quantitative feed restriction on broiler caecum microbiota. Indian J Anim Sci 84: 554–558.
Jakubowska AK, Vogel H, Herrero S. (2013). Increase in gut microbiota after immune suppression in baculovirus-infected larvae. PLoS Pathog 9: e1003379.
Jami E, Shterzer N, Yosef E, Nikbachat M, Miron J, Mizrahi I. (2014). Effects of including NaOH-treated corn straw as a substitute for wheat hay in the ration of lactating cows on performance, digestibility, and rumen microbial profile. J Dairy Sci 97: 1623–33.

Janczyk P, Pieper R, Smidt H, Souffrant WB. (2010). Effect of alginate and inulin on intestinal microbial ecology of weanling pigs reared under different husbandry conditions. FEMS Microbiol Ecol 72: 132–42.
Jansman AJM, Zhang J, Koopmans SJ, Dekker RA, Smidt H. (2012). Effects of a simple or a complex starter microbiota on intestinal microbiota composition in caesarean derived piglets. J Anim Sci 90 Suppl 4: 433–5.
Jena PK, Singh S, Prajapati B, Nareshkumar G, Mehta T, Seshadri S. (2014). Impact of targeted specific antibiotic delivery for gut microbiota modulation on high-fructose-fed rats. Appl Biochem Biotechnol 172: 3810–26.
Jensen AN, Mejer H, Mølbak L, Langkj\a er M, Jensen TK, Angen Ø, et al. (2011). The effect of a diet with fructan-rich chicory roots on intestinal helminths and microbiota with special focus on Bifidobacteria and Campylobacter in piglets around weaning. Animal 5: 851–60.
Jiang T, Gao X, Wu C, Tian F, Lei Q, Bi J, et al. (2016). Apple-derived pectin modulates gut microbiota, improves gut barrier function, and attenuates metabolic endotoxemia in rats with diet-induced obesity. Nutrients 8: 126.
Johnston PR, Rolff J. (2015). Host and symbiont jointly control gut microbiota during complete metamorphosis. PLoS Pathog 11: e1005246.
Józefiak D, Kierończyk B, Juśkiewicz J, Zduńczyk Z, Rawski M, Długosz J, et al. (2013). Dietary nisin modulates the gastrointestinal microbial ecology and enhances growth performance of the broiler chickens. PLoS ONE 8: e85347.
Jozefiak D, Sip A, Rawski M, Rutkowski A, Kaczmarek S, Hojberg O, et al. (2011). Dietary divercin modifies gastrointestinal microbiota and improves growth performance in broiler chickens. Br Poult Sci 52: 492–9.
Jung J, Heo A, Park YW, Kim YJ, Koh H, Park W. (2014). Gut microbiota of Tenebrio molitor and their response to environmental change. J Microbiol Biotechnol 24: 888–97.
Juricova H, Videnska P, Lukac M, Faldynova M, Babak V, Havlickova H, et al. (2013). Influence of Salmonella enterica serovar enteritidis infection on the development of the cecum microbiota in newly hatched chicks. Appl Environ Microbiol 79: 745–7.
Kang MJ, Ko GS, Oh do G, Kim JS, Noh K, Kang W, et al. (2014a). Role of metabolism by intestinal microbiota in pharmacokinetics of oral baicalin. Arch Pharm Res 37: 371–8.
Kang SS, Jeraldo PR, Kurti A, Miller ME, Cook MD, Whitlock K, et al. (2014b). Diet and exercise orthogonally alter the gut microbiome and reveal independent associations with anxiety and cognition. Mol Neurodegener 9. e-pub ahead of print, doi: 10.1186/1750-1326-9-36.
Karlsson CLJ, Molin G, Fåk F, Johansson Hagslätt M-L, Jakesevic M, Håkansson Å, et al. (2011). Effects on weight gain and gut microbiota in rats given bacterial supplements and a high-energy-dense diet from fetal life through to 6 months of age. Br J Nutr 106: 887–895.
Kasaikina MV, Kravtsova MA, Lee BC, Seravalli J, Peterson DA, Walter J, et al. (2011). Dietary selenium affects host selenoproteome expression by influencing the gut microbiota. FASEB J Off Publ Fed Am Soc Exp Biol 25: 2492–9.
Kashinskaya EN, Suhanova EV, Solov’ev MM, Izvekova GI, Glupov VV. (2014). Diversity of microbial communities of the intestinal mucosa and intestinal contents of fish from Lake Chany (Western Siberia). Inland Water Biol 7: 172–177.
Kasiraj AC, Harmoinen J, Isaiah A, Westermarck E, Steiner JM, Spillmann T, et al. (2016). The effects of feeding and withholding food on the canine small intestinal microbiota. FEMS Microbiol Ecol 92: 606–610.
Keenan SW, Engel AS, Elsey RM. (2013). The alligator gut microbiome and implications for archosaur symbioses. Sci Rep 3: 2877.
Keene E, Soule T, Paladino F. (2014). Microbial isolations from olive ridley (Lepidochelys olivacea) and East Pacific green (Chelonia mydas agassizii) sea turtle nests in Pacific Costa Rica, and testing of cloacal fluid antimicrobial properties. Chelonian Conserv Biol 13: 49–55.
Ketabi A, Dieleman LA, Gänzle MG. (2011). Influence of isomalto-oligosaccharides on intestinal microbiota in rats. J Appl Microbiol 110: 1297–306.
Khalaji S, Zaghari M, Hatami K, Hedari-Dastjerdi S, Lotfi L, Nazarian H. (2011). Black cumin seeds, Artemisia leaves (Artemisia sieberi), and Camellia L. plant extract as phytogenic products in broiler diets and their effects on performance, blood constituents, immunity, and cecal microbial population. Poult Sci 90: 2500–10.
Khan SH, Ansari J, Haq A u., Abbas G. (2012). Black cumin seeds as phytogenic product in broiler diets and its effects on performance, blood constituents, immunity and caecal microbial population. Poult Sci 11: 438–444.
Khempaka S, Chitsatchapong C, Molee W. (2011). Effect of chitin and protein constituents in shrimp head meal on growth performance, nutrient digestibility, intestinal microbial populations, volatile fatty acids, and ammonia production in broilers. J Appl Poult Res 20: 1–11.
Khosravi A, Yáñez A, Price JG, Chow A, Merad M, Goodridge HS, et al. (2014). Gut microbiota promote hematopoiesis to control bacterial infection. Cell Host Microbe 15: 374–81.
Khosravi Y, Bunte RM, Chiow KH, Tan TL, Wong WY, Poh QH, et al. (2016). Helicobacter pylori and gut microbiota modulate energy homeostasis prior to inducing histopathological changes in mice. Gut Microbes 7: 48–53.
Kim D-HD, Kim D-HD. (2013). Microbial diversity in the intestine of olive flounder (Paralichthys olivaceus). Aquaculture 414–415: 103–108.
Kim HB, Borewicz K, White BA, Singer RS, Sreevatsan S, Tu ZJ, et al. (2012a). Microbial shifts in the swine distal gut in response to the treatment with antimicrobial growth promoter, tylosin. Proc Natl Acad Sci U S A 109: 15485–90.
Kim J, Guevarra RB, Nguyen SG, Lee J-H, Jeong DK, Unno T. (2016). Effects of the antibiotics growth promoter tylosin on swine gut microbiota. J Microbiol Biotechnol 26: 876–82.
Kim JE, Lillehoj HS, Hong YH, Kim GB, Lee SH, Lillehoj EP, et al. (2015). Dietary Capsicum and Curcuma longa oleoresins increase intestinal microbiome and necrotic enteritis in three commercial broiler breeds. Res Vet Sci 102: 150–158.
Kim JS, Ingale SL, Kim YW, Kim KH, Sen S, Ryu MH, et al. (2012b). Effect of supplementation of multi-microbe probiotic product on growth performance, apparent digestibility, cecal microbiota and small intestinal morphology of broilers. J Anim Physiol Anim Nutr 96: 618–26.
King GM, Judd C, Kuske CR, Smith C. (2012). Analysis of stomach and gut microbiomes of the eastern oyster (Crassostrea virginica) from coastal Louisiana, USA. PLoS ONE 7: e51475.
Kish L, Hotte N, Kaplan GG, Vincent R, Tso R, Gänzle M, et al. (2013). Environmental particulate matter induces murine intestinal inflammatory responses and alters the gut microbiome. PLoS ONE 8: e62220.
Kittelmann S, Seedorf H, Walters WA, Clemente JC, Knight R, Gordon JI, et al. (2013). Simultaneous amplicon sequencing to explore co-occurrence patterns of bacterial, archaeal and eukaryotic microorganisms in rumen microbial communities. PLoS ONE 8: e47879.
Klimesova K, Kverka M, Zakostelska Z, Hudcovic T, Hrncir T, Stepankova R, et al. (2013). Altered gut microbiota promotes colitis-associated cancer in IL-1 receptor-associated kinase M-deficient mice. Inflamm Bowel Dis 19: 1266–77.
Knapp BA, Seeber J, Rief A, Meyer E, Insam H. (2010). Bacterial community composition of the gut microbiota of Cylindroiulus fulviceps (diplopoda) as revealed by molecular fingerprinting and cloning. Folia Microbiol (Praha) 55: 489–96.
Koc F, Samli H, Okur A, Ozduven H, Akyurek H, Senkoylu N. (2010). Effects of Saccharomyces cerevisiae and/or mannanoligosaccharide on performance, blood parameters and intestinal microbiota of broiler chicks. Bulg J Agric Sci 16: 643–650.
Koch H, Schmid-Hempel P. (2012). Gut microbiota instead of host genotype drive the specificity in the interaction of a natural host-parasite system. Ecol Lett 15: 1095–103.
Koch H, Schmid-Hempel P. (2011). Socially transmitted gut microbiota protect bumble bees against an intestinal parasite. Proc Natl Acad Sci U S A 108: 19288–92.
Koh C-B, Romano N, Zahrah AS, Ng W-K. (2016). Effects of a dietary organic acids blend and oxytetracycline on the growth, nutrient utilization and total cultivable gut microbiota of the red hybrid tilapia, Oreochromis sp., and resistance to Streptococcus agalactiae. Aquac Res 47: 357–369.
Koh H-W, Kim MS, Lee J-S, Kim H, Park S-J. (2015). Changes in the swine gut microbiota in response to porcine epidemic diarrhea infection. Microbes Environ 30: 284–7.
Kohl KD, Cary TL, Karasov WH, Dearing MD. (2013). Restructuring of the amphibian gut microbiota through metamorphosis. Environ Microbiol Rep 5: 899–903.
Kohl KD, Samuni-Blank M, Lymberakis P, Kurnath P, Izhaki I, Arad Z, et al. (2016). Effects of fruit toxins on intestinal and microbial beta-glucosidase activities ofseed-predating and seed-dispersing rodents (Acomys spp.). Physiol Biochem Zool 89: 198–205.
Kong F, Zhao J, Han S, Zeng B, Yang J, Si X, et al. (2014a). Characterization of the gut microbiota in the red panda (Ailurus fulgens). PLoS ONE 9: e87885.
Kong XF, Zhou XL, Lian GQ, Blachier F, Liu G, Tan B., et al. (2014b). Dietary supplementation with chitooligosaccharides alters gut microbiota and modifies intestinal luminal metabolites in weaned Huanjiang mini-piglets. Livest Sci 160: 97–101.
Kong Y, He ML, McAllister TA, Seviour R, Forster RJ. (2010). Quantitative fluorescence in situ hybridization of microbial communities in the rumens of cattle fed different diets. Agric Agri-Food Can AAFC 76: 6933–6938.
Kongsted AG, Nørgaard JV, Jensen SK, Lauridsen C, Juul-Madsen HR, Norup LR, et al. (2015). Influence of genotype and feeding strategy on pig performance, plasma concentrations of micro nutrients, immune responses and faecal microbiota composition of growing-finishing pigs in a forage-based system. Livest Sci 178: 263–271.
Konsak BM, Stanley D, Haring VR, Geier MS, Hughes RJ, Howarth GS, et al. (2013). Identification of differential duodenal gene expression levels and microbiota abundance correlated with differences in energy utilisation in chickens. Anim Prod Sci 53: 1269–1275.
Kreisinger J, Čížková D, Vohánka J, Piálek J. (2014). Gastrointestinal microbiota of wild and inbred individuals of two house mouse subspecies assessed using high-throughput parallel pyrosequencing. Mol Ecol 23: 5048–5060.
Kurata S, Nakashima T, Osaki T, Uematsu N, Shibamori M, Sakurai K, et al. (2015). Rebamipide protects small intestinal mucosal injuries caused by indomethacin by modulating intestinal microbiota and the gene expression in intestinal mucosa in a rat model. J Clin Biochem Nutr 56: 20–7.
de La Serre CB, Ellis CL, Lee J, Hartman AL, Rutledge JC, Raybould HE. (2010). Propensity to high-fat diet-induced obesity in rats is associated with changes in the gut microbiota and gut inflammation. Am J Physiol Gastrointest Liver Physiol 299: G440–8.
Lacombe A, Li RW, Klimis-Zacas D, Kristo AS, Tadepalli S, Krauss E, et al. (2013). Lowbush wild blueberries have the potential to modify gut microbiota and xenobiotic metabolism in the rat colon. PLoS ONE 8: e67497.
Lam V, Su J, Koprowski S, Hsu A, Tweddell JS, Rafiee P, et al. (2012a). Intestinal microbiota determine severity of myocardial infarction in rats. FASEB J Off PublFed Am Soc Exp Biol 26: 1727–35.
Lam YY, Ha CWY, Campbell CR, Mitchell AJ, Dinudom A, Oscarsson J, et al. (2012b). Increased gut permeability and microbiota change associate with mesenteric fat inflammation and metabolic dysfunction in diet-induced obese mice. PLoS ONE 7: e34233.

Lambert JE, Myslicki JP, Bomhof MR, Belke DD, Shearer J, Reimer RA. (2015). Exercise training modifies gut microbiota in normal and diabetic mice. Appl Physiol Nutr Metab 40: 749–752.
La-ongkhum O, Pungsungvorn N, Amornthewaphat N, Nitisinprasert S. (2011). Effect of the antibiotic avilamycin on the structure of the microbial community in the jejunal intestinal tract of broiler chickens. Poult Sci 90: 1532–8.
Larsen AM, Mohammed HH, Arias CR. (2015). Comparison of DNA extraction protocols for the analysis of gut microbiota in fishes. FEMS Microbiol Lett 362: fnu031.
Laycock G, Sait L, Inman C, Lewis M, Smidt H, van Diemen P, et al. (2012). A defined intestinal colonization microbiota for gnotobiotic pigs. Vet Immunol Immunopathol 149: 216–24.
Le Floc’h N, Knudsen C, Gidenne T, Montagne L, Merlot E, Zemb O. (2014). Impact of feed restriction on health, digestion and faecal microbiota of growing pigs housed in good or poor hygiene conditions. Animal 8: 1632–1642.
Le Roy T, Llopis M, Lepage P, Bruneau A, Rabot S, Bevilacqua C, et al. (2013). Intestinal microbiota determines development of non-alcoholic fatty liver disease inmice. Gut 62: 1787–94.
Lecomte V, Kaakoush NO, Maloney CA, Raipuria M, Huinao KD, Mitchell HM, et al. (2015). Changes in gut microbiota in rats fed a high fat diet correlate with obesity-associated metabolic parameters. PLoS ONE 10: e0126931.
Lee HJ, Jung JY, Oh YK, Lee S-S, Madsen EL, Jeon CO. (2012). Comparative survey of rumen microbial communities and metabolites across one caprine and threebovine groups, using bar-coded pyrosequencing and 1H nuclear magnetic resonance spectroscopy. Appl Environ Microbiol 78: 5983–93.
Lee JH, Kouakou B, Kannan G. (2009). Influences of dietary regimens on microbial content in gastrointestinal tracts of meat goats. Livest Sci 125: 249–253.
Lei XJ, Ru YJ, Zhang HF. (2014). Effect of Bacillus amyloliquefaciens-based direct-fed microbials and antibiotic on performance, nutrient digestibility, cecal microflora, and intestinal morphology in broiler chickens. J Appl Poult Res 23: 486–493.
Lewis Z, Heys C, Prescott M, Lizé A. (2014). You are what you eat: Gut microbiota determines kin recognition in Drosophila. Gut Microbes 5: 541–3.
Li H, Dietrich C, Zhu N, Mikaelyan A, Ma B, Pi R, et al. (2016a). Age polyethism drives community structure of the bacterial gut microbiota in the fungus-cultivating termite Odontotermes formosanus. Environ Microbiol 18: 1440–51.
Li H, Qu J, Li T, Li J, Lin Q, Li X. (2016b). Pika population density is associated with the composition and diversity of gut microbiota. Front Microbiol 7: 758.
Li J, Kim IH. (2014). Effects of Saccharomyces cerevisiae cell wall extract and poplar propolis ethanol extract supplementation on growth performance, digestibility, blood profile, fecal microbiota and fecal noxious gas emissions in growing pigs. Anim Sci J 85: 698–705.
Li Q, Zhang Q, Wang C, Tang C, Zhang Y, Li N, et al. (2011). Fish oil enhances recovery of intestinal microbiota and epithelial integrity in chronic rejection of intestinal transplant. PLoS ONE 6: e20460.
Li QR, Wang CY, Tang C, He Q, Li N, Li JS. (2013a). Reciprocal interaction between intestinal microbiota and mucosal lymphocyte in cynomolgus monkeys after alemtuzumab treatment. Am J Transplant 13: 899–910.
Li RW, Connor EE, Li C, Baldwin Vi RL, Sparks ME. (2012a). Characterization of the rumen microbiota of pre-ruminant calves using metagenomic tools. Environ Microbiol 14: 129–39.
Li SY, Ru YJ, Liu M, Xu B, Péron A, Shi XG. (2012b). The effect of essential oils on performance, immunity and gut microbial population in weaner pigs. Livest Sci 145: 119–123.
Li T, Zhong J-Z, Wan J, Liu C-M, Le B-Y, Liu W, et al. (2013b). Effects of micronized okara dietary fiber on cecal microbiota, serum cholesterol and lipid levels in BALB/c mice. Int J Food Sci Nutr 64: 968–73.
Li X, Yan Q, Xie S, Hu W, Yu Y, Hu Z. (2013c). Gut microbiota contributes to the growth of fast-growing transgenic common carp (Cyprinus carpio L.). PLoS ONE 8: e64577.
Li X, Yu Y, Feng W, Yan Q, Gong Y. (2012c). Host species as a strong determinant of the intestinal microbiota of fish larvae. J Microbiol Seoul Korea 50: 29–37.
Li XM, Zhu YJ, Yan QY, Ringø E, Yang DG. (2014). Do the intestinal microbiotas differ between paddlefish (Polyodon spathala) and bighead carp (Aristichthys nobilis) reared in the same pond? J Appl Microbiol 117: 1245–1252.
Li X-Q, Zhu Y-H, Zhang H-F, Yue Y, Cai Z-X, Lu Q-P, et al. (2012d). Risks associated with high-dose Lactobacillus rhamnosus in an Escherichia coli model of piglet diarrhoea: intestinal microbiota and immune imbalances. PLoS ONE 7: e40666.
Li Y, Xu Q, Huang Z, Lv L, Liu X, Yin C, et al. (2016c). Effect of Bacillus subtilis CGMCC 1.1086 on the growth performance and intestinal microbiota of broilers.J Appl Microbiol 120: 195–204.
Lillis L, Boots B, Kenny DA, Petrie K, Boland TM, Clipson N, et al. (2011). The effect of dietary concentrate and soya oil inclusion on microbial diversity in the rumen of cattle. J Appl Microbiol 111: 1426–35.
Lim HC, Chu C-C, Seufferheld MJ, Cameron SA. (2015). Deep sequencing and ecological characterization of gut microbial communities of diverse bumble bee species. PLoS ONE 10: e0118566.
Lin XB, Dieleman LA, Ketabi A, Bibova I, Sawyer MB, Xue H, et al. (2012). Irinotecan (CPT-11) chemotherapy alters intestinal microbiota in tumour bearing rats. PLoS ONE 7: e39764.
Linnenbrink M, Wang J, Hardouin EA, Künzel S, Metzler D, Baines JF. (2013). The role of biogeography in shaping diversity of the intestinal microbiota in house mice. Mol Ecol 22: 1904–16.
Liu H, Guo X, Gooneratne R, Lai R, Zeng C, Zhan F, et al. (2016a). The gut microbiome and degradation enzyme activity of wild freshwater fishes influenced by their trophic levels. Sci Rep 6: 24340.
Liu H, Liu M, Wang B, Jiang K, Jiang S, Sun S, et al. (2010). PCR-DGGE analysis of intestinal bacteria and effect of Bacillus spp. on intestinal microbial diversity in kuruma shrimp (Marsupenaeus japonicus). Chin J Oceanol Limnol 28: 808–814.
Liu H, Wang L, Liu M, Wang B, Jiang K, Ma S, et al. (2011a). The intestinal microbial diversity in Chinese shrimp (Fenneropenaeus chinensis) as determined by PCR–DGGE and clone library analyses. Aquaculture 317: 32–36.
Liu H-X, Rocha CS, Dandekar S, Yvonne Wan Y-J. (2016b). Functional analysis of the relationship between intestinal microbiota and the expression of hepatic genes and pathways during the course of liver regeneration. J Hepatol 64: 641–650.
Liu Q, Wang C, Pei CX, Li HY, Wang YX, Zhang SL, et al. (2014a). Effects of isovalerate supplementation on microbial status and rumen enzyme profile in steers fed on corn stover based diet. Livest Sci 161: 60–68.
Liu S, Bennett DC, Tun HM, Kim J-E, Cheng KM, Zhang H, et al. (2015). The effect of diet and host genotype on ceca microbiota of Japanese quail fed a cholesterol enriched diet. Front Microbiol 6: 1092.
Liu SJ, Bu DP, Wang JQ, Sun P, Wei HY, Zhou LY, et al. (2011b). Effect of ruminal pulse dose of polyunsaturated fatty acids on ruminal microbial populations andduodenal flow and milk profiles of fatty acids. J Dairy Sci 94: 2977–85.
Liu X, Fan H, Ding X, Hong Z, Nei Y, Liu Z, et al. (2014b). Analysis of the gut microbiota by high-throughput sequencing of the V5-V6 regions of the 16S rRNA gene in donkey. Curr Microbiol 68: 657–62.
Liu Y, Zhou Z, Wu N, Tao Y, Xu L, Cao Y, et al. (2012). Gibel carp Carassius auratus gut microbiota after oral administration of trimethoprim/sulfamethoxazole. Dis Aquat Organ 99: 207–13.
Lizé A, McKay R, Lewis Z. (2013). Kin recognition in Drosophila: the importance of ecology and gut microbiota. ISME J 8: 469–477.
Lobo C, Moreno-Ventas X, Tapia-Paniagua S, Rodríguez C, Moriñigo MA, de La Banda IG. (2014). Dietary probiotic supplementation (Shewanella putrefaciens Pdp11) modulates gut microbiota and promotes growth and condition in Senegalese sole larviculture. Fish Physiol Biochem 40: 295–309.
Long Y-H, Xie L, Liu N, Yan X, Li M-H, Fan M-Z, et al. (2010). Comparison of gut-associated and nest-associated microbial communities of a fungus-growing termite (Odontotermes yunnanensis). Insect Sci 17: 265–276.
Looft T, Allen HK, Cantarel BL, Levine UY, Bayles DO, Alt DP, et al. (2014a). Bacteria, phages and pigs: the effects of in-feed antibiotics on the microbiome at different gut locations. ISME J 8: 1566–76.
Looft T, Allen HK, Casey TA, Alt DP, Stanton TB. (2014b). Carbadox has both temporary and lasting effects on the swine gut microbiota. Front Microbiol 5: 276.
Lu H-P, Lai Y-C, Huang S-W, Chen H-C, Hsieh C, Yu H-T. (2014a). Spatial heterogeneity of gut microbiota reveals multiple bacterial communities with distinct characteristics. Sci Rep 4: 6185.
Lu H-P, Wang Y, Huang S-W, Lin C-Y, Wu M, Hsieh C, et al. (2012). Metagenomic analysis reveals a functional signature for biomass degradation by cecal microbiota in the leaf-eating flying squirrel (Petaurista alborufus lena). BMC Genomics 13: 466.
Lu K, Mahbub R, Cable PH, Ru H, Parry NMA, Bodnar WM, et al. (2014b). Gut microbiome phenotypes driven by host genetics affect arsenic metabolism. Chem Res Toxicol 27: 172–4.
Lundberg R, Clausen SK, Pang W, Nielsen DS, Möller K, Josefsen KE, et al. (2012). Gastrointestinal microbiota and local inflammation during oxazolone-induced dermatitis in BALB/cA mice. Comp Med 62: 371–80.
MacFarlane AJ, Behan NA, Matias FMG, Green J, Caldwell D, Brooks SPJ. (2013). Dietary folate does not significantly affect the intestinal microbiome, inflammation or tumorigenesis in azoxymethane-dextran sodium sulphate-treated mice. Br J Nutr 109: 630–8.
Magistrelli D, Zanchi R, Malagutti L, Galassi G, Canzi E, Rosi F. (2016). Effects of cocoa husk feeding on the composition of swine intestinal microbiota. J Agric Food Chem 64: 2046–2052.
Malmuthuge N, Li M, Goonewardene LA, Oba M, Guan LL. (2013). Effect of calf starter feeding on gut microbial diversity and expression of genes involved in host immune responses and tight junctions in dairy calves during weaning transition. J Dairy Sci 96: 3189–200.
Manjula A, Pushpanathan M, Sathyavathi S, Gunasekaran P, Rajendhran J. (2016). Comparative analysis of microbial diversity in termite gut and termite nest using ion sequencing. Curr Microbiol 72: 267–75.
Mann E, Dzieciol M, Metzler-Zebeli BU, Wagner M, Schmitz-Esser S. (2014a). Microbiomes of unreactive and pathologically altered ileocecal lymph nodes of slaughter pigs. Appl Environ Microbiol 80: 193–203.
Mann E, Schmitz-Esser S, Zebeli Q, Wagner M, Ritzmann M, Metzler-Zebeli BU. (2014b). Mucosa-associated bacterial microbiome of the gastrointestinal tract of weaned pigs and dynamics linked to dietary calcium-phosphorus. PLoS ONE 9: e86950.
Mansfield GS, Desai AR, Nilson SA, Van Kessel AG, Drew MD, Hill JE. (2010). Characterization of rainbow trout (Oncorhynchus mykiss) intestinal microbiota and inflammatory marker gene expression in a recirculating aquaculture system. Aquaculture 307: 95–104.
Mao S, Huo W, Zhu W. (2013). Use of pyrosequencing to characterize the microbiota in the ileum of goats fed with increasing proportion of dietary grain. Curr Microbiol 67: 341–50.
Mao S-Y, Huo W-J, Zhu W-Y. (2016). Microbiome-metabolome analysis reveals unhealthy alterations in the composition and metabolism of ruminal microbiota with increasing dietary grain in a goat model. Environ Microbiol 18: 525–41.
Mar JS, Nagalingam NA, Song Y, Onizawa M, Lee JW, Lynch SV. (2014). Amelioration of DSS-induced murine colitis by VSL#3 supplementation is primarily associated with changes in ileal microbiota composition. Gut Microbes 5: 494–503.
Maragkoudakis PA, Mountzouris KC, Rosu C, Zoumpopoulou G, Papadimitriou K, Dalaka E, et al. (2010). Feed supplementation of Lactobacillus plantarum PCA 236 modulates gut microbiota and milk fatty acid composition in dairy goats–a preliminary study. Int J Food Microbiol 141 Suppl: S109–16.
Mardinoglu A, Shoaie S, Bergentall M, Ghaffari P, Zhang C, Larsson E, et al. (2015). The gut microbiota modulates host amino acid and glutathione metabolism in mice. Mol Syst Biol 11: 834.
Markle JGM, Frank DN, Mortin-Toth S, Robertson CE, Feazel LM, Rolle-Kampczyk U, et al. (2013). Sex differences in the gut microbiome drive hormone-dependent regulation of autoimmunity. Science 339: 1084–8.
Marungruang N, F\a ak F, Tareke E. (2016). Heat-treated high-fat diet modifies gut microbiota and metabolic markers in apoe−/− mice. Nutr Metab 13: 22.
Mashoof S, Goodroe A, Du CC, Eubanks JO, Jacobs N, Steiner JM, et al. (2013). Ancient T-independence of mucosal IgX/A: gut microbiota unaffected by larval thymectomy in Xenopus laevis. Mucosal Immunol 6: 358–68.
Matsui H, Kato Y, Chikaraishi T, Moritani M, Ban-Tokuda T, Wakita M. (2010). Microbial diversity in ostrich ceca as revealed by 16S ribosomal RNA gene clone library and detection of novel Fibrobacter species. Anaerobe 16: 83–93.
Matsumoto H, Nomura S, Hayakawa Y. (2014). Changes of RNA virus infection rates and gut microbiota in young worker Apis mellifera (Hymenoptera: Apidae) of a chalkbrood-infected colony after a pollination task in a greenhouse. Appl Entomol Zool 49: 395–402.
Maurice CF, Knowles SC, Ladau J, Pollard KS, Fenton A, Pedersen AB, et al. (2015). Marked seasonal variation in the wild mouse gut microbiota. ISME J 9: 2423–2434.
McAllan L, Skuse P, Cotter PD, O’Connor P, Cryan JF, Ross RP, et al. (2014). Protein quality and the protein to carbohydrate ratio within a high fat diet influences energy balance and the gut microbiota in C57BL/6J mice. PLoS ONE 9: e88904.
McCann JC, Wiley LM, Forbes TD, Rouquette Jr. FM, Tedeschi LO. (2014). Relationship between the rumen microbiome and residual feed intake-efficiency of Brahman bulls stocked on bermudagrass pastures. PLoS ONE 9: e91864.
McDonald R, Schreier HJ, Watts JEM. (2012). Phylogenetic analysis of microbial communities in different regions of the gastrointestinal tract in Panaque nigrolineatus, a wood-eating fish. PLoS ONE 7: e48018.
McFrederick QS, Mueller UG, James RR. (2014). Interactions between fungi and bacteria influence microbial community structure in the Megachile rotundata larval gut. Proc Biol Sci 281: 20132653.
McKnite AM, Perez-Munoz ME, Lu L, Williams EG, Brewer S, Andreux PA, et al. (2012). Murine gut microbiota is defined by host genetics and modulates variation of metabolic traits. PLoS ONE 7: e39191.
McVey Neufeld KA, Perez-Burgos A, Mao YK, Bienenstock J, Kunze WA. (2015). The gut microbiome restores intrinsic and extrinsic nerve function in germ-free mice accompanied by changes in calbindin. Neurogastroenterol Motil 27: 627–36.
Meng H, Zhang Y, Zhao L, Zhao W, He C, Honaker CF, et al. (2014). Body weight selection affects quantitative genetic correlated responses in gut microbiota. PLoS ONE 9: e89862.
Menon R, Watson SE, Thomas LN, Allred CD, Dabney A, Azcarate-Peril MA, et al. (2013). Diet complexity and estrogen receptor β status affect the composition of the murine intestinal microbiota. Appl Environ Microbiol 79: 5763–73.
Merrifield DL, Bradley G, Baker RTM, Davies SJ. (2010). Probiotic applications for rainbow trout (Oncorhynchus mykiss Walbaum) II. Effects on growth performance, feed utilization, intestinal microbiota and related health criteria postantibiotic treatment. Aquac Nutr 16: 496–503.
Merrifield DL, Harper GM, Mustafa S, Carnevali O, Picchietti S, Davies SJ. (2011). Effect of dietary alginic acid on juvenile tilapia (Oreochromis niloticus) intestinal microbial balance, intestinal histology and growth performance. Cell Tissue Res 344: 135–46.
Messori S, Trevisi P, Simongiovanni A, Priori D, Bosi P. (2013). Effect of susceptibility to enterotoxigenic Escherichia coli F4 and of dietary tryptophan on gut microbiota diversity observed in healthy young pigs. Vet Microbiol 162: 173–9.
Moeller AH, Peeters M, Ndjango J-B, Li Y, Hahn BH, Ochman H. (2013). Sympatric chimpanzees and gorillas harbor convergent gut microbial communities. Genome Res 23: 1715–20.
Moen B, Berget I, Rud I, Hole AS, Kjos NP, Sahlstrøm S. (2016). Extrusion of barley and oat influence the fecal microbiota and SCFA profile of growing pigs. Food Funct 7: 1024–32.
Mohammadi Gheisar M, Hosseindoust A, Kim I. (2016a). Effects of dietary Enterococcus faecium on growth performance, carcass characteristics, faecal microbiota,and blood profile in broilers. Veterinární Medicína 61: 28–34.
Mohammadi Gheisar M, Nyachoti C, Hancock J, Kim J. (2016b). Effects of lactulose on growth, carcass characteristics, faecal microbiota, and blood constituents in broilers. Veterinární Medicína 61: 90–96.
Mohammadzadeh H, Yáñez-Ruiz DR, Martínez-Fernandez G, Abecia L. (2014). Molecular comparative assessment of the microbial ecosystem in rumen and faeces of goats fed alfalfa hay alone or combined with oats. Anaerobe 29: 52–58.
Mohapatra S, Chakraborty T, PRUSTY AK, DAS P, PANIPRASAD K, Mohanta KN. (2012). Use of different microbial probiotics in the diet of rohu, Labeo rohita fingerlings: effects on growth, nutrient digestibility and retention, digestive enzyme activities and intestinal microflora. Aquac Nutr 18: 1–11.
Mohd Shaufi M, Sieo CC, Chong CW, Gan HM, Ho YW. (2015). Deciphering chicken gut microbial dynamics based on high-throughput 16S rRNA metagenomics analyses. Gut Pathog 7. e-pub ahead of print, doi: 10.1186/s13099-015-0051-7.
Morán L, Andrés S, Bodas R, Benavides J, Prieto N, Pérez V, et al. (2012). Antioxidants included in the diet of fattening lambs: Effects on immune response, stress, welfare and distal gut microbiota. Anim Feed Sci Technol 173: 177–185.
Moran NA, Hansen AK, Powell JE, Sabree ZL. (2012). Distinctive gut microbiota of honey bees assessed using deep sampling from individual worker bees. PLoS ONE 7: e36393.
Mori K, Ito T, Miyamoto H, Ozawa M, Wada S, Kumagai Y, et al. (2011). Oral administration of multispecies microbial supplements to sows influences the composition of gut microbiota and fecal organic acids in their post-weaned piglets. J Biosci Bioeng 112: 145–50.
Mozeš Š, Šefcíková Z, Bujnáková D, Racek L. (2013). Effect of antibiotic treatment on intestinal microbial and enzymatic development in postnatally overfed obese rats. Obesity 21: 1635–42.
Mujico JR, Baccan GC, Gheorghe A, Díaz LE, Marcos A. (2013). Changes in gut microbiota due to supplemented fatty acids in diet-induced obese mice. Br J Nutr 110: 711–20.
Murphy EF, Cotter PD, Hogan A, O’Sullivan O, Joyce A, Fouhy F, et al. (2013). Divergent metabolic outcomes arising from targeted manipulation of the gut microbiota in diet-induced obesity. Gut 62: 220–6.
Murphy P, Bello FD, O’Doherty JV, Arendt EK, Sweeney T, Coffey A. (2012). Effects of cereal β-glucans and enzyme inclusion on the porcine gastrointestinal tractmicrobiota. Anaerobe 18: 557–65.
Musch MW, Wang Y, Claud EC, Chang EB. (2013). Lubiprostone decreases mouse colonic inner mucus layer thickness and alters intestinal microbiota. Dig Dis Sci 58: 668–677.
Myer PR, Wells JE, Smith TPL, Kuehn LA, Freetly HC. (2016). Microbial community profiles of the jejunum from steers differing in feed efficiency. J Anim Sci 94:327–38.
Nagalingam NA, Robinson CJ, Bergin IL, Eaton KA, Huffnagle GB, Young VB. (2013). The effects of intestinal microbial community structure on disease manifestation in IL-10-/- mice infected with Helicobacter hepaticus. Microbiome 1: 15.
Nahavandinejad M, Seidavi A, Asadpour L. (2012). Temperature treatment of soybean meal on intestinal microbial flora in broilers. Afr J Microbiol Res 6: 5464–5471.
Najdegerami EH, Tiet NT, Defoirdt T, Marzorati M, Sorgeloos P, Boon N, et al. (2012). Effects of poly-β-hydroxybutyrate (PHB) on Siberian sturgeon (Acipenser baerii) fingerlings performance and its gastrointestinal tract microbial community. FEMS Microbiol Ecol 79: 25–33.
Nakajima M, Arimatsu K, Kato T, Matsuda Y, Minagawa T, Takahashi N, et al. (2015). Oral administration of P. gingivalis induces dysbiosis of gut microbiota and impaired barrier function leading to dissemination of enterobacteria to the liver. PLoS ONE 10: e0134234.
Nakphaichit M, Thanomwongwattana S, Phraephaisarn C, Sakamoto N, Keawsompong S, Nakayama J, et al. (2011). The effect of including Lactobacillus reuteri KUB-AC5 during post-hatch feeding on the growth and ileum microbiota of broiler chickens. Poult Sci 90: 2753–65.
Näpflin K, Schmid-Hempel P. (2016). Immune response and gut microbial community structure in bumblebees after microbiota transplants. Proc R Soc B 283: 859–904.
Narrowe AB, Albuthi-Lantz M, Smith EP, Bower KJ, Roane TM, Vajda AM, et al. (2015). Perturbation and restoration of the fathead minnow gut microbiome after low-level triclosan exposure. Microbiome 3. e-pub ahead of print, doi: 10.1186/s40168-015-0069-6.
Nathiya S, Raj GD, Rajasekar A, Vijayalakshmi D, Devasena T. (2012). Identification of microbial diversity in caecal content of broiler chicken. Afr J Microbiol Res 6: 4897–4902.
Nava GM, Friedrichsen HJ, Stappenbeck TS. (2011). Spatial organization of intestinal microbiota in the mouse ascending colon. ISME J 5: 627–38.
Navarrete P, Magne F, Araneda C, Fuentes P, Barros L, Opazo R, et al. (2012). PCR-TTGE analysis of 16S rRNA from rainbow trout (Oncorhynchus mykiss) gut microbiota reveals host-specific communities of active bacteria. PLoS ONE 7: e31335.
Nelson AM, Elftman MD, Pinto AK, Baldridge M, Hooper P, Kuczynski J, et al. (2013a). Murine norovirus infection does not cause major disruptions in the murineintestinal microbiota. Microbiome 1: 7.
Nelson TM, Rogers TL, Carlini AR, Brown MV. (2013b). Diet and phylogeny shape the gut microbiota of Antarctic seals: a comparison of wild and captive animals. Environ Microbiol 15: 1132–45.
Newell PD, Douglas AE. (2014). Interspecies interactions determine the impact of the gut microbiota on nutrient allocation in Drosophila melanogaster. Appl Environ Microbiol 80: 788–96.
Ni J, Yan Q, Yu Y, Zhang T. (2014). Factors influencing the grass carp gut microbiome and its effect on metabolism. FEMS Microbiol Ecol 87: 704–14.
Noratto GD, Garcia-Mazcorro JF, Markel M, Martino HS, Minamoto Y, Steiner JM, et al. (2014). Carbohydrate-free peach (Prunus persica) and plum (Prunus salicina) juice affects fecal microbial ecology in an obese animal model. PLoS ONE 9: e101723.
Nordentoft S, Mølbak L, Bjerrum L, De Vylder J, Van Immerseel F, Pedersen K. (2011). The influence of the cage system and colonisation of Salmonella Enteritidison the microbial gut flora of laying hens studied by T-RFLP and 454 pyrosequencing. BMC Microbiol 11: 187.
Norouzi B, Qotbi AAA, Seidavi A, Schiavone A, Martínez Marín AL. (2015). Effect of different dietary levels of rosemary (Rosmarinus officinalis) and yarrow (Achillea millefolium) on the growth performance, carcass traits and ileal microbiota of broilers. Ital J Anim Sci 14. e-pub ahead of print, doi: 10.4081/ijas.2015.3930.
Oakley BB, Kogut MH. (2016). Spatial and temporal changes in the broiler chicken cecal and fecal microbiomes and correlations of bacterial taxa with cytokine gene expression. Front Vet Sci 3. e-pub ahead of print, doi: 10.3389/fvets.2016.00011.
Ohland CL, Kish L, Bell H, Thiesen A, Hotte N, Pankiv E, et al. (2013). Effects of Lactobacillus helveticus on murine behavior are dependent on diet and genotype and correlate with alterations in the gut microbiome. Psychoneuroendocrinology 38: 1738–47.
Oikonomou G, Teixeira AGV, Foditsch C, Bicalho ML, Machado VS, Bicalho RC. (2013). Fecal microbial diversity in pre-weaned dairy calves as described by pyrosequencing of metagenomic 16S rDNA. Associations of Faecalibacterium species with health and growth. PLoS ONE 8: e63157.
Oliveira JHM, Gonçalves RLS, Lara FA, Dias FA, Gandara ACP, Menna-Barreto RFS, et al. (2011). Blood meal-derived heme decreases ROS levels in the midgut of Aedes aegypti and allows proliferation of intestinal microbiota. PLoS Pathog 7: e1001320.
Olivier-Espejel S, Sabree ZL, Noge K, Becerra JX. (2011). Gut microbiota in nymph and adults of the giant mesquite bug (Thasus neocalifornicus) (Heteroptera: Coreidae) is dominated by Burkholderia acquired de novo every generation. Environ Entomol 40: 1102–10.
O’Mahony SM, Felice VD, Nally K, Savignac HM, Claesson MJ, Scully P, et al. (2014). Disturbance of the gut microbiota in early-life selectively affects visceral pain in adulthood without impacting cognitive or anxiety-related behaviors in male rats. Neuroscience 277: 885–901.
Omazic AW, Tr\a avén M, Roos S, Mellgren E, Holtenius K. (2013). Oral rehydration solution with glycerol to dairy calves: Effects on fluid balance, metabolism, and intestinal microbiota. Acta Agric Scand Sect - Anim Sci 63: 47–56.
Omoniyi LA, Jewell KA, Isah OA, Neumann AP, Onwuka CFI, Onagbesan OM, et al. (2014). An analysis of the ruminal bacterial microbiota in West African Dwarf sheep fed grass- and tree-based diets. J Appl Microbiol 116: 1094–105.
Ooi JH, Li Y, Rogers CJ, Cantorna MT. (2013). Vitamin D regulates the gut microbiome and protects mice from dextran sodium sulfate-induced colitis. J Nutr 143: 1679–86.
Ortiz LT, Rebolé A, Velasco S, Rodríguez ML, Treviño J, Tejedor JL, et al. (2013). Effects of inulin and fructooligosaccharides on growth performance, body chemical composition and intestinal microbiota of farmed rainbow trout (Oncorhynchus mykiss). Aquac Nutr 19: 475–482.
Osei-Poku J, Mbogo CM, Palmer WJ, Jiggins FM. (2012). Deep sequencing reveals extensive variation in the gut microbiota of wild mosquitoes from Kenya. Mol Ecol 21: 5138–50.
Paddock ZD, Renter DG, Cull CA, Shi X, Bai J, Nagaraja TG. (2014). Escherichia coli O26 in feedlot cattle: fecal prevalence, isolation, characterization, and effectsof an E. coli O157 vaccine and a direct-fed microbial. Foodborne Pathog Dis 11: 186–93.
Pajarillo EAB, Chae JP, Balolong MP, Kim HB, Seo K-S, Kang D-K. (2014). Pyrosequencing-based analysis of fecal microbial communities in three purebred pig lines. J Microbiol Seoul Korea 52: 646–51.
Palmnäs MSA, Cowan TE, Bomhof MR, Su J, Reimer RA, Vogel HJ, et al. (2014). Low-dose aspartame consumption differentially affects gut microbiota-host metabolic interactions in the diet-induced obese rat. PLoS ONE 9: e109841.
Pang W, Stradiotto D, Krych L, Karlskov-Mortensen P, Vogensen FK, Nielsen DS, et al. (2012a). Selective inbreeding does not increase gut microbiota similarity inBALB/c mice. Lab Anim 46: 335–7.
Pang W, Vogensen FK, Nielsen DS, Hansen AK. (2012b). Faecal and caecal microbiota profiles of mice do not cluster in the same way. Lab Anim 46: 231–6.
Pantoja-Feliciano IG, Clemente JC, Costello EK, Perez ME, Blaser MJ, Knight R, et al. (2013). Biphasic assembly of the murine intestinal microbiota during early development. ISME J 7: 1112–5.
Papadomichelakis G, Zoidis E, Mountzouris KC, Lippas T, Fegeros K. (2012). Glycerine kinase gene expression, nutrient digestibility and gut microbiota composition in post-weaned pigs fed diets with increasing crude glycerine levels. Anim Feed Sci Technol 177: 247–252.
Park D-Y, Ahn Y-T, Park S-H, Huh C-S, Yoo S-R, Yu R, et al. (2013). Supplementation of Lactobacillus curvatus HY7601 and Lactobacillus plantarum KY1032 in diet-induced obese mice is associated with gut microbial changes and reduction in obesity. PLoS ONE 8: e59470.
Park SH, Lee SI, Ricke SC. (2016). Microbial populations in naked neck chicken ceca raised on pasture flock fed with commercial yeast cell wall prebiotics via an Illumina Miseq platform. PLoS ONE 11: e0151944.
Park S-J, Kim J, Lee J-S, Rhee S-K, Kim H. (2014). Characterization of the fecal microbiome in different swine groups by high-throughput sequencing. Anaerobe 28: 157–62.
Paßlack N, Vahjen W, Zentek J. (2015). Dietary inulin affects the intestinal microbiota in sows and their suckling piglets. BMC Vet Res 11. e-pub ahead of print, doi:10.1186/s12917-015-0351-7.
Patrone V, Ferrari S, Lizier M, Lucchini F, Minuti A, Tondelli B, et al. (2012). Short-term modifications in the distal gut microbiota of weaning mice induced by a high-fat diet. Microbiology 158: 983–92.
Patterson E, O’ Doherty RM, Murphy EF, Wall R, O’ Sullivan O, Nilaweera K, et al. (2014). Impact of dietary fatty acids on metabolic activity and host intestinal microbiota composition in C57BL/6J mice. Br J Nutr 111: 1–13.
de Paula Silva FC, Nicoli JR, Zambonino-Infante JL, Kaushik S, Gatesoupe F-J. (2011). Influence of the diet on the microbial diversity of faecal and gastrointestinalcontents in gilthead sea bream (Sparus aurata) and intestinal contents in goldfish (Carassius auratus). FEMS Microbiol Ecol 78: 285–96.
Pauwels J, Taminiau B, Janssens GPJ, De Beenhouwer M, Delhalle L, Daube G, et al. (2015). Cecal drop reflects the chickens’ cecal microbiome, fecal drop does not. J Microbiol Methods 117: 164–170.
Pedersen R, Ingerslev H-C, Sturek M, Alloosh M, Cirera S, Christoffersen BØ, et al. (2013). Characterisation of gut microbiota in Ossabaw and Göttingen minipigs as models of obesity and metabolic syndrome. PLoS ONE 8: e56612.
Pédron T, Mulet C, Dauga C, Frangeul L, Chervaux C, Grompone G, et al. (2012). A crypt-specific core microbiota resides in the mouse colon. mBio 3: e00116–12.
Peinado MJ, Ruiz R, Echávarri A, Aranda-Olmedo I, Rubio LA. (2013). Garlic derivative PTS-O modulates intestinal microbiota composition and improves digestibility in growing broiler chickens. Anim Feed Sci Technol 181: 87–92.
Pélissier M-A, Vasquez N, Balamurugan R, Pereira E, Dossou-Yovo F, Suau A, et al. (2010). Metronidazole effects on microbiota and mucus layer thickness in the rat gut. FEMS Microbiol Ecol 73: 601–10.
Peng J, Narasimhan S, Marchesi JR, Benson A, Wong FS, Wen L. (2014). Long term effect of gut microbiota transfer on diabetes development. J Autoimmun 53: 85–94.
Peng Z, Zeng D, Wang Q, Niu L, Ni X, Zou F, et al. (2016). Decreased microbial diversity and Lactobacillus group in the intestine of geriatric giant pandas (Ailuropoda melanoleuca). World J Microbiol Biotechnol 32. e-pub ahead of print, doi: 10.1007/s11274-016-2034-3.
Perez VG, Jacobs CM, Barnes J, Jenkins MC, Kuhlenschmidt MS, Fahey Jr GC, et al. (2011). Effect of corn distillers dried grains with solubles and Eimeria acervulina infection on growth performance and the intestinal microbiota of young chicks. Poult Sci 90: 958–64.
Pérez-Cobas AE, Maiques E, Angelova A, Carrasco P, Moya A, Latorre A. (2015). Diet shapes the gut microbiota of the omnivorous cockroach Blattella germanica.FEMS Microbiol Ecol 91. e-pub ahead of print, doi: 10.1093/femsec/fiv022.
Perkins GA, den Bakker HC, Burton AJ, Erb HN, McDonough SP, McDonough PL, et al. (2012). Equine stomachs harbor an abundant and diverse mucosal microbiota. Appl Environ Microbiol 78: 2522–32.
Perumbakkam S, Hunt HD, Cheng HH. (2014). Marek’s disease virus influences the core gut microbiome of the chicken during the early and late phases of viral replication. FEMS Microbiol Ecol 90: 300–312.
Petersen A, Bergström A, Andersen JB, Hansen M, Lahtinen SJ, Wilcks A, et al. (2010). Analysis of the intestinal microbiota of oligosaccharide fed mice exhibitingreduced resistance to Salmonella infection. Benef Microbes 1: 271–81.
Petersson A, Domig KJ, Schedle K, Windisch W, Kneifel W. (2010). Comparison of three methods to enumerate gut microbiota of weanling piglets fed insoluble dietary fibre differing in lignin content. J Agric Sci 148: 225.
Petriz BA, Castro AP, Almeida JA, Gomes CP, Fernandes GR, Kruger RH, et al. (2014). Exercise induction of gut microbiota modifications in obese, non-obese andhypertensive rats. BMC Genomics 15: 511.
Pfalzer AC, Nesbeth P-DC, Parnell LD, Iyer LK, Liu Z, Kane AV, et al. (2015). Diet- and genetically-induced obesity differentially affect the fecal microbiome and metabolome in Apc(1638N) mice. PLoS ONE 10: e0135758.
Piotrowska M, Śliżewska K, Nowak A, Zielonka L, Żakowska Z, Gajęcka M, et al. (2014). The effect of experimental fusarium mycotoxicosis on microbiota diversity in porcine ascending colon contents. Toxins 6: 2064–81.
Pissavin C, Burel C, Gabriel I, Beven V, Mallet S, Maurice R, et al. (2012). Capillary electrophoresis single-strand conformation polymorphism for the monitoring of gastrointestinal microbiota of chicken flocks. Poult Sci 91: 2294–304.
Pitta DW, Kumar S, Vecchiarelli B, Shirley DJ, Bittinger K, Baker LD, et al. (2014). Temporal dynamics in the ruminal microbiome of dairy cows during the transition period. J Anim Sci 92: 4014–22.
Pitta DW, Pinchak WE, Indugu N, Vecchiarelli B, Sinha R, Fulford JD. (2016). Metagenomic analysis of the rumen microbiome of steers with wheat-induced frothybloat. Front Microbiol 7: 689.
Placha I, Chrastinova L, Laukova A, Cobanova K, Takacova J, Strompfova V, et al. (2013). Effect of thyme oil on small intestine integrity and antioxidant status, phagocytic activity and gastrointestinal microbiota in rabbits. Acta Vet Hung 61: 197–208.
Plieskatt JL, Deenonpoe R, Mulvenna JP, Krause L, Sripa B, Bethony JM, et al. (2013). Infection with the carcinogenic liver fluke Opisthorchis viverrini modifies intestinal and biliary microbiome. FASEB J Off Publ Fed Am Soc Exp Biol 27: 4572–84.
Possamai LA, McPhail MJ, Khamri W, Wu B, Concas D, Harrison M, et al. (2015). The role of intestinal microbiota in murine models of acetaminophen-induced hepatotoxicity. Liver Int 35: 764–73.
Pourabedin M, Xu Z, Baurhoo B, Chevaux E, Zhao X. (2014). Effects of mannan oligosaccharide and virginiamycin on the cecal microbial community and intestinalmorphology of chickens raised under suboptimal conditions. Can J Microbiol 60: 255–66.
Pourhossein Z. (2012). Investigation on the effects of different levels of Citrus sinensis peel extract on gastrointestinal microbial population in commercial broilers. Afr J Microbiol Res 6: 6370–6378.
Præsteng KE, Pope PB, Cann IK, Mackie RI, Mathiesen SD, Folkow LP, et al. (2013). Probiotic dosing of Ruminococcus flavefaciens affects rumen microbiome structure and function in reindeer. Microb Ecol 66: 840–9.
Praet J, Aerts M, Brandt ED, Meeus I, Smagghe G, Vandamme P. (2016). Apibacter mensalis sp. nov.: a rare member of the bumblebee gut microbiota. Int J Syst Evol Microbiol 66: 1645–51.
Prajapati B, Rajput P, Jena PK, Seshadri S. (2015). Investigation of chitosan for prevention of diabetic progression through gut microbiota alteration in sugar rich diet induced diabetic rats. Curr Pharm Biotechnol 17: 173–84.
Prasai TP, Walsh KB, Bhattarai SP, Midmore DJ, Van TTH, Moore RJ, et al. (2016). Biochar, bentonite and zeolite supplemented feeding of layer chickens alters intestinal microbiota and reduces Campylobacter load. PLoS ONE 11: e0154061.
Puiman P, Stoll B, Mølbak L, de Bruijn A, Schierbeek H, Boye M, et al. (2013). Modulation of the gut microbiota with antibiotic treatment suppresses whole body urea production in neonatal pigs. Am J Physiol Gastrointest Liver Physiol 304: G300–10.
Pyndt Jørgensen B, Hansen JT, Krych L, Larsen C, Klein AB, Nielsen DS, et al. (2014). A possible link between food and mood: dietary impact on gut microbiota and behavior in BALB/c mice. PLoS ONE 9: e103398.
Pyndt Jørgensen B, Krych L, Pedersen TB, Plath N, Redrobe JP, Hansen AK, et al. (2015). Investigating the long-term effect of subchronic phencyclidine-treatment on novel object recognition and the association between the gut microbiota and behavior in the animal model of schizophrenia. Physiol Behav 141: 32–39.
Queipo-Ortuño MI, Seoane LM, Murri M, Pardo M, Gomez-Zumaquero JM, Cardona F, et al. (2013). Gut microbiota composition in male rat models under different nutritional status and physical activity and its association with serum leptin and ghrelin levels. PLoS ONE 8: e65465.
Ramos MA, Weber B, Gonçalves JF, Santos GA, Rema P, Ozório ROA. (2013). Dietary probiotic supplementation modulated gut microbiota and improved growth of juvenile rainbow trout (Oncorhynchus mykiss). Comp Biochem Physiol A Mol Integr Physiol 166: 302–7.
Rattray RM, Perumbakkam S, Smith F, Craig AM. (2010). Microbiomic comparison of the intestine of the earthworm Eisenia fetida fed ergovaline. Curr Microbiol 60: 229–35.
Rawski M, Kierończyk B, D\lugosz J, Świ\c atkiewicz S, Józefiak D. (2016). Dietary probiotics affect gastrointestinal microbiota, histological structure and shell mineralization in turtles. PLoS ONE 11: e0147859.
Rehaume LM, Mondot S, Aguirre de Cárcer D, Velasco J, Benham H, Hasnain SZ, et al. (2014). ZAP-70 genotype disrupts the relationship between microbiota and host leading to spondyloarthritis and ileitis. Arthritis Rheumatol Hoboken NJ 66: 2780–92.
Ren W, Chen S, Yin J, Duan J, Li T, Liu G, et al. (2014a). Dietary arginine supplementation of mice alters the microbial population and activates intestinal innate immunity. J Nutr 144: 988–95.
Ren W, Duan J, Yin J, Liu G, Cao Z, Xiong X, et al. (2014b). Dietary l-glutamine supplementation modulates microbial community and activates innate immunity in the mouse intestine. Amino Acids 46: 2403–2413.
Ren Z, Cui G, Lu H, Chen X, Jiang J, Liu H, et al. (2013). Liver ischemic preconditioning (IPC) improves intestinal microbiota following liver transplantation in ratsthrough 16s rDNA-based analysis of microbial structure shift. PLoS ONE 8: e75950.
Ren Z, Jiang J, Lu H, Chen X, He Y, Zhang H, et al. (2014c). Intestinal microbial variation may predict early acute rejection after liver transplantation in rats. Transplantation 98: 844–852.
Reti KL, Thomas MC, Yanke LJ, Selinger LB, Inglis GD. (2013). Effect of antimicrobial growth promoter administration on the intestinal microbiota of beef cattle. Gut Pathog 5: 8.
Ridaura VK, Faith JJ, Rey FE, Cheng J, Duncan AE, Kau AL, et al. (2013). Gut microbiota from twins discordant for obesity modulate metabolism in mice. Science 341: 1241214.
Rinke R, Costa AS, Fonseca FPP, Almeida LC, Delalibera Júnior I, Henrique-Silva F. (2011). Microbial diversity in the larval gut of field and laboratory populations of the sugarcane weevil Sphenophorus levis (Coleoptera, Curculionidae). Genet Mol Res GMR 10: 2679–91.
Rist VTS, Eklund M, Bauer E, Sauer N, Mosenthin R. (2012). Effect of feeding level on the composition of the intestinal microbiota in weaned piglets. J Anim Sci 90 Suppl 4: 19–21.
Ritchie LE, Taddeo SS, Weeks BR, Lima F, Bloomfield SA, Azcarate-Peril MA, et al. (2015). Space environmental factor impacts upon murine colon microbiota and mucosal homeostasis. PLoS ONE 10: e0125792.
Rodriguez B, Prioult G, Bibiloni R, Nicolis I, Mercenier A, Butel M-J, et al. (2011). Germ-free status and altered caecal subdominant microbiota are associated with a high susceptibility to cow’s milk allergy in mice. FEMS Microbiol Ecol 76: 133–44.
Rodriguez C, Taminiau B, Brévers B, Avesani V, Van Broeck J, Leroux A, et al. (2015). Faecal microbiota characterisation of horses using 16 rdna barcoded pyrosequencing, and carriage rate of clostridium difficile at hospital admission. BMC Microbiol 15. e-pub ahead of print, doi: 10.1186/s12866-015-0514-5.
Roeselers G, Mittge EK, Stephens WZ, Parichy DM, Cavanaugh CM, Guillemin K, et al. (2011). Evidence for a core gut microbiota in the zebrafish. ISME J 5: 1595–608.
Rogers GB, Kozlowska J, Keeble J, Metcalfe K, Fao M, Dowd SE, et al. (2014). Functional divergence in gastrointestinal microbiota in physically-separated genetically identical mice. Sci Rep 4: 5437.
Roggenbuck M, Sauer C, Poulsen M, Bertelsen MF, Sørensen SJ. (2014). The giraffe (Giraffa camelopardalis) rumen microbiome. FEMS Microbiol Ecol 90: 237–246.
Romo-Vaquero M, Selma M-V, Larrosa M, Obiol M, García-Villalba R, González-Barrio R, et al. (2014). A rosemary extract rich in carnosic acid selectively modulates caecum microbiota and inhibits β-glucosidase activity, altering fiber and short chain fatty acids fecal excretion in lean and obese female rats. PLoS ONE 9: e94687.
Rooke JA, Wallace RJ, Duthie C-A, McKain N, de Souza SM, Hyslop JJ, et al. (2014). Hydrogen and methane emissions from beef cattle and their rumen microbial community vary with diet, time after feeding and genotype. Br J Nutr 112: 398–407.
Rosengaus RB, Zecher CN, Schultheis KF, Brucker RM, Bordenstein SR. (2011). Disruption of the termite gut microbiota and its prolonged consequences for fitness. Appl Environ Microbiol 77: 4303–12.
Rosewarne CP, Pope PB, Cheung JL, Morrison M. (2014). Analysis of the bovine rumen microbiome reveals a diversity of Sus-like polysaccharide utilization loci from the bacterial phylum Bacteroidetes. J Ind Microbiol Biotechnol 41: 601–6.
Ross EM, Moate PJ, Marett L, Cocks BG, Hayes BJ. (2013). Investigating the effect of two methane-mitigating diets on the rumen microbiome using massively parallel sequencing. J Dairy Sci 96: 6030–46.
Rudi K, Strætkvern KO. (2012). Correlations between Lumbricus terrestris survival and gut microbiota. Microb Ecol Health Dis 23. e-pub ahead of print, doi: 10.3402/mehd.v23i0.17316.
Rurangwa E, Sipkema D, Kals J, ter Veld M, Forlenza M, Bacanu GM, et al. (2015). Impact of a novel protein meal on the gastrointestinal microbiota and the host transcriptome of larval zebrafish Danio rerio. Front Physiol 6: 133.
Ryu H, Grond K, Verheijen B, Elk M, Buehler DM, Santo Domingo JW. (2014). Intestinal microbiota and species diversity of Campylobacter and Helicobacter spp.in migrating shorebirds in Delaware Bay. Appl Environ Microbiol 80: 1838–47.
Sabree ZL, Moran NA. (2014). Host-specific assemblages typify gut microbial communities of related insect species. SpringerPlus 3: 138.
Saha DC, Reimer RA. (2014). Long-term intake of a high prebiotic fiber diet but not high protein reduces metabolic risk after a high fat challenge and uniquely alters gut microbiota and hepatic gene expression. Nutr Res N Y N 34: 789–96.
Sahasakul Y, Takemura N, Sonoyama K. (2012). Different impacts of purified and nonpurified diets on microbiota and toll-like receptors in the mouse stomach. Biosci Biotechnol Biochem 76: 1728–32.
Sahnouni F, Matallah-Boutiba A, Chemlal D, Boutiba Z. (2012). Technological characterization of lactic acid bacteria isolated from intestinal microbiota of marine fish in the Oran Algeria coast. Afr J Microbiol Res 6: 3125–3133.
Saki AA, Eftekhari SM, Zamani P, Aliarabi H, Abbasinezhad M. (2011). Effects of an organic acid mixture and methionine supplements on intestinal morphology, protein and nucleic acids content, microbial population and performance of broiler chickens. Anim Prod Sci 51: 1025.
Salim HM, Kang HK, Akter N, Kim DW, Kim JH, Kim MJ, et al. (2013). Supplementation of direct-fed microbials as an alternative to antibiotic on growth performance, immune response, cecal microbial population, and ileal morphology of broiler chickens. Poult Sci 92: 2084–90.
Sanders JG, Powell S, Kronauer DJC, Vasconcelos HL, Frederickson ME, Pierce NE. (2014). Stability and phylogenetic correlation in gut microbiota: lessons from ants and apes. Mol Ecol 23: 1268–83.
Santana RH, Catão ECP, Lopes FAC, Constantino R, Barreto CC, Krüger RH. (2015). The gut microbiota of workers of the litter-feeding termite Syntermes wheeleri (Termitidae: Syntermitinae): archaeal, bacterial, and fungal communities. Microb Ecol 70: 545–556.
Santos SS, Pardal S, Proença DN, Lopes RJ, Ramos JA, Mendes L, et al. (2012). Diversity of cloacal microbial community in migratory shorebirds that use the Tagus estuary as stopover habitat and their potential to harbor and disperse pathogenic microorganisms. FEMS Microbiol Ecol 82: 63–74.
Sapountzis P, Zhukova M, Hansen LH, Sørensen SJ, Schiøtt M, Boomsma JJ. (2015). Acromyrmex leaf-cutting ants have simple gut microbiota with nitrogen-fixing potential. Appl Environ Microbiol 81: 5527–5537.
Sarubbi F, Chiariotti A, Baculo R, Conto G, Huws SA. (2014). Nutritive value of maize and sorghum silages: fibre fraction degradation and rumen microbial densityin buffalo cows. Czech J Anim Sci 59: 278–287.
Schauer C, Thompson C, Brune A. (2014). Pyrotag sequencing of the gut microbiota of the cockroach Shelfordella lateralis reveals a highly dynamic core but only limited effects of diet on community structure. PLoS ONE 9: e85861.
Schéle E, Grahnemo L, Anesten F, Hallén A, Bäckhed F, Jansson J-O. (2013). The gut microbiota reduces leptin sensitivity and the expression of the obesity-suppressing neuropeptides proglucagon (Gcg) and brain-derived neurotrophic factor (Bdnf) in the central nervous system. Endocrinology 154: 3643–51.
Schokker D, Zhang J, Vastenhouw SA, Heilig HGHJ, Smidt H, Rebel JMJ, et al. (2015). Long-lasting effects of early-life antibiotic treatment and routine animal handling on gut microbiota composition and immune system in pigs. PLoS ONE 10: e0116523.
Schokker D, Zhang J, Zhang L-L, Vastenhouw SA, Heilig HGHJ, Smidt H, et al. (2014). Early-life environmental variation affects intestinal microbiota and immunedevelopment in new-born piglets. PLoS ONE 9: e100040.
Schroedl W, Kleessen B, Jaekel L, Shehata AA, Krueger M. (2014). Influence of the gut microbiota on blood acute-phase proteins. Scand J Immunol 79: 299–304.
Schwab C, Gänzle M. (2011). Comparative analysis of fecal microbiota and intestinal microbial metabolic activity in captive polar bears. Can J Microbiol 57: 177–85.
Scupham AJ, Jones JA, Rettedal EA, Weber TE. (2010). Antibiotic manipulation of intestinal microbiota to identify microbes associated with Campylobacter jejuni exclusion in poultry. Appl Environ Microbiol 76: 8026–32.
Seekatz AM, Panda A, Rasko DA, Toapanta FR, Eloe-Fadrosh EA, Khan AQ, et al. (2013). Differential response of the cynomolgus macaque gut microbiota to Shigella infection. PLoS ONE 8: e64212.
Šefčíková Z, Bujňáková D, Raček Ľ, Kmet V, Mozeš Š. (2011). Developmental changes in gut microbiota and enzyme activity predict obesity risk in rats arising from reduced nests. Physiol Res Acad Sci Bohemoslov 60: 337–46.
Semova I, Carten JD, Stombaugh J, Mackey LC, Knight R, Farber SA, et al. (2012). Microbiota regulate intestinal absorption and metabolism of fatty acids in the zebrafish. Cell Host Microbe 12: 277–88.
Serino M, Luche E, Gres S, Baylac A, Bergé M, Cenac C, et al. (2011). Metabolic adaptation to a high-fat diet is associated with a change in the gut microbiota. Gut 61: 543–553.
Shao Y, Arias-Cordero E, Guo H, Bartram S, Boland W. (2014). In vivo Pyro-SIP assessing active gut microbiota of the cotton leafworm, Spodoptera littoralis. PLoS ONE 9: e85948.
Sharma P, Sharma S, Maurya RK, Das De T, Thomas T, Lata S, et al. (2014). Salivary glands harbor more diverse microbial communities than gut in Anopheles culicifacies. Parasit Vectors 7: 235.
Shaw CN, Kim M, Eastridge ML, Yu Z. (2016). Effects of different sources of physically effective fiber on rumen microbial populations. Animal 10: 410–7.
Shen J, Chen Y, Wang Z, Zhou A, He M, Mao L, et al. (2014). Coated zinc oxide improves intestinal immunity function and regulates microbiota composition in weaned piglets. Br J Nutr 111: 2123–34.
Singh KM, Shah TM, Reddy B, Deshpande S, Rank DN, Joshi CG. (2014). Taxonomic and gene-centric metagenomics of the fecal microbiome of low and high feedconversion ratio (FCR) broilers. J Appl Genet 55: 145–54.
Singh S, Gupta A, Singh BB. (2011). Effect of tree foliage supplementation to Cenchrus ciliaris hay diet on rumen microbial population, enzyme activities and water kinetics in sheep. Range Manag Agrofor 32: 113–117.
Singh S, Singh BB. (2013). Effect of supplementation of tree leaves on rumen microbial population, enzyme activity and water kinetics in goats fed Cenchrus ciliaris grass hay. Anim Nutr Feed Technol 13: 131–138.
Sjögren K, Engdahl C, Henning P, Lerner UH, Tremaroli V, Lagerquist MK, et al. (2012). The gut microbiota regulates bone mass in mice. J Bone Miner Res Off J Am Soc Bone Miner Res 27: 1357–67.
Skoufos I, Giannenas I, Tontis D, Bartzanas T, Kittas C, Panagakis P, et al. (2016). Effects of oregano essential oil and attapulgite on growth performance, intestinal microbiota and morphometry in broilers. South Afr J Anim Sci 46: 77–88.
Slifierz MJ, Friendship RM, Weese JS. (2015). Longitudinal study of the early-life fecal and nasal microbiotas of the domestic pig. BMC Microbiol 15: 184.
Śliżewska K, Libudzisz Z, Barczyńska R, Kapuśniak J, Zduńczyk Z, Juśkiewicz J. (2015). Dietary resistant dextrins positively modulate fecal and cecal microbiota composition in young rats. Acta Biochim Pol 62: 677–81.
Smith P, Siddharth J, Pearson R, Holway N, Shaxted M, Butler M, et al. (2012). Host genetics and environmental factors regulate ecological succession of the mouse colon tissue-associated microbiota. PLoS ONE 7: e30273.
Smith SC, Chalker A, Dewar ML, Arnould JPY. (2013). Age-related differences revealed in Australian fur seal Arctocephalus pusillus doriferus gut microbiota. FEMS Microbiol Ecol 86: 246–55.
Smriga S, Sandin SA, Azam F. (2010). Abundance, diversity, and activity of microbial assemblages associated with coral reef fish guts and feces. FEMS Microbiol Ecol 73: 31–42.
Sommer F, Adam N, Johansson MEV, Xia L, Hansson GC, Bäckhed F. (2014). Altered mucus glycosylation in core 1 O-glycan-deficient mice affects microbiota composition and intestinal architecture. PLoS ONE 9: e85254.
Sommer F, Ståhlman M, Ilkayeva O, Arnemo JM, Kindberg J, Josefsson J, et al. (2016). The gut microbiota modulates energy metabolism in the hibernating brown bear Ursus arctos. Cell Rep 14: 1655–1661.
Sonoyama K, Ogasawara T, Goto H, Yoshida T, Takemura N, Fujiwara R, et al. (2010). Comparison of gut microbiota and allergic reactions in BALB/c mice fed different cultivars of rice. Br J Nutr 103: 218–26.
Stanley D, Denman SE, Hughes RJ, Geier MS, Crowley TM, Chen H, et al. (2012). Intestinal microbiota associated with differential feed conversion efficiency in chickens. Appl Microbiol Biotechnol 96: 1361–9.
Stanley D, Geier MS, Chen H, Hughes RJ, Moore RJ. (2015). Comparison of fecal and cecal microbiotas reveals qualitative similarities but quantitative differences. BMC Microbiol 15. e-pub ahead of print, doi: 10.1186/s12866-015-0388-6.
Stanley D, Hughes RJ, Geier MS, Moore RJ. (2016). Bacteria within the gastrointestinal tract microbiota correlated with improved growth and feed conversion: challenges presented for the identification of performance enhancing probiotic bacteria. Front Microbiol 7: 187.
Star B, Haverkamp THA, Jentoft S, Jakobsen KS. (2013). Next generation sequencing shows high variation of the intestinal microbial species composition in Atlantic cod caught at a single location. BMC Microbiol 13: 248.

Starke IC, Pieper R, Neumann K, Zentek J, Vahjen W. (2014). The impact of high dietary zinc oxide on the development of the intestinal microbiota in weaned piglets. FEMS Microbiol Ecol 87: 416–27.
Staubach F, Künzel S, Baines AC, Yee A, McGee BM, Bäckhed F, et al. (2012). Expression of the blood-group-related glycosyltransferase B4galnt2 influences the intestinal microbiota in mice. ISME J 6: 1345–55.
Stephens WZ, Burns AR, Stagaman K, Wong S, Rawls JF, Guillemin K, et al. (2016). The composition of the zebrafish intestinal microbial community varies acrossdevelopment. ISME J 10: 644–654.
Stevenson TJ, Buck CL, Duddleston KN. (2014a). Temporal dynamics of the cecal gut microbiota of juvenile arctic ground squirrels: a strong litter effect across the first active season. Appl Environ Microbiol 80: 4260–8.
Stevenson TJ, Duddleston KN, Buck CL. (2014b). Effects of season and host physiological state on the diversity, density, and activity of the arctic ground squirrel cecal microbiota. Appl Environ Microbiol 80: 5611–22.
Sudakaran S, Salem H, Kost C, Kaltenpoth M. (2012). Geographical and ecological stability of the symbiotic mid-gut microbiota in European firebugs, Pyrrhocoris apterus (Hemiptera, Pyrrhocoridae). Mol Ecol 21: 6134–51.
Sun J, Ren F, Xiong L, Zhao L, Guo H. (2016). Bovine lactoferrin suppresses high-fat diet induced obesity and modulates gut microbiota in C57BL/6J mice. J FunctFoods 22: 189–200.
Sun Y-Z, Yang H-L, Ma R-L, Huang K-P, Ye J-D. (2012a). Culture-independent characterization of the autochthonous gut microbiota of grouper Epinephelus coioides following the administration of probiotic Enterococcus faecium. Aquac Int 20: 791–801.
Sun Y-Z, Yang H-L, Ma R-L, Zhai S-W. (2012b). Does dietary administration of Lactococcus lactis modulate the gut microbiota of grouper, Epinephelus coioides. J World Aquac Soc 43: 198–207.
Sze MA, Tsuruta M, Yang S-WJ, Oh Y, Man SFP, Hogg JC, et al. (2014). Changes in the bacterial microbiota in gut, blood, and lungs following acute LPS instillation into mice lungs. PLoS ONE 9: e111228.
Tachon S, Zhou J, Keenan M, Martin R, Marco ML. (2013). The intestinal microbiota in aged mice is modulated by dietary resistant starch and correlated with improvements in host responses. FEMS Microbiol Ecol 83: 299–309.
Taherparvar G, Seidavi A, Asadpour L, Payan-Carreira R, Laudadio V, Tufarelli V. (2016). Effect of litter treatment on growth performance, intestinal development,and selected cecum microbiota in broiler chickens. Rev Bras Zootec 45: 257–264.
Tamura M, Hori S, Hoshi C, Nakagawa H. (2012a). Effects of rice bran oil on the intestinal microbiota and metabolism of isoflavones in adult mice. Int J Mol Sci 13: 10336–49.
Tamura M, Hoshi C, Hori S. (2013). Xylitol affects the intestinal microbiota and metabolism of daidzein in adult male mice. Int J Mol Sci 14: 23993–4007.
Tamura M, Kurusu Y, Hori S. (2012b). Effect of dietary L-arabinose on the intestinal microbiota and metabolism of dietary daidzein in adult mice. Biosci Microbiota Food Health 31: 59–65.
Tancharoenrat P, Ravindran V, Molan AL, Ravindran G. (2014). Influence of fat source and xylanase supplementation on performance, utilisation of energy and fat, and caecal microbiota counts in broiler starters fed wheat-based diets. J Poult Sci 51: 172–179.
Tang X, Freitak D, Vogel H, Ping L, Shao Y, Cordero EA, et al. (2012a). Complexity and variability of gut commensal microbiota in polyphagous lepidopteran larvae. PLoS ONE 7: e36978.
Tang Y, Manninen TJK, Saris PEJ. (2012b). Dominance of Lactobacillus acidophilus in the facultative jejunal Lactobacillus microbiota of fistulated beagles. Appl Environ Microbiol 78: 7156–9.
Tao X, Xu Z, Wan J. (2015). Intestinal microbiota diversity and expression of pattern recognition receptors in newly weaned piglets. Anaerobe 32: 51–56.
Tapia-Paniagua ST, Vidal S, Lobo C, García de la Banda I, Esteban MA, Balebona MC, et al. (2015). Dietary administration of the probiotic SpPdp11: Effects on the intestinal microbiota and immune-related gene expression of farmed Solea senegalensis treated with oxytetracycline. Fish Shellfish Immunol 46: 449–458.
Tarpy DR, Mattila HR, Newton ILG. (2015). Development of the honey bee gut microbiome throughout the queen-rearing process. Appl Environ Microbiol 81: 3182–91.
Taxis TM, Wolff S, Gregg SJ, Minton NO, Zhang C, Dai J, et al. (2015). The players may change but the game remains: network analyses of ruminal microbiomes suggest taxonomic differences mask functional similarity. Nucleic Acids Res 43: 9600–12.
Tellez G, Latorre JD, Kuttappan VA, Kogut MH, Wolfenden A, Hernandez-Velasco X, et al. (2014). Utilization of rye as energy source affects bacterial translocation, intestinal viscosity, microbiota composition, and bone mineralization in broiler chickens. Front Genet 5: 339.
Teng F, Klinger CN, Felix KM, Bradley CP, Wu E, Tran NL, et al. (2016). Gut microbiota drive autoimmune arthritis by promoting differentiation and migration of Peyer’s patch T follicular helper cells. Immunity 44: 875–888.
Terán-Ventura E, Aguilera M, Vergara P, Martínez V. (2014). Specific changes of gut commensal microbiota and TLRs during indomethacin-induced acute intestinal inflammation in rats. J Crohns Colitis 8: 1043–54.
Tetlock A, Yost CK, Stavrinides J, Manzon RG. (2012). Changes in the gut microbiome of the sea lamprey during metamorphosis. Appl Environ Microbiol 78: 7638–7644.
Thakur A, Dhammi P, Saini HS, Kaur S. (2016). Effect of antibiotic on survival and development of Spodoptera litura (Lepidoptera: Noctuidae) and its gut microbial diversity. Bull Entomol Res 106: 387–94.
Thoetkiattikul H, Mhuantong W, Laothanachareon T, Tangphatsornruang S, Pattarajinda V, Eurwilaichitr L, et al. (2013). Comparative analysis of microbial profilesin cow rumen fed with different dietary fiber by tagged 16S rRNA gene pyrosequencing. Curr Microbiol 67: 130–7.
Tillman GE, Haas GJ, Wise MG, Oakley B, Smith MA, Siragusa GR. (2011). Chicken intestine microbiota following the administration of lupulone, a hop-based antimicrobial. FEMS Microbiol Ecol 77: 395–403.
Torok VA, Allison GE, Percy NJ, Ophel-Keller K, Hughes RJ. (2011a). Influence of antimicrobial feed additives on broiler commensal posthatch gut microbiota development and performance. Appl Environ Microbiol 77: 3380–90.
Torok VA, Dyson C, McKay A, Ophel-Keller K. (2013). Quantitative molecular assays for evaluating changes in broiler gut microbiota linked with diet and performance. Anim Prod Sci 53: 1260–1268.
Torok VA, Hughes RJ, Mikkelsen LL, Perez-Maldonado R, Balding K, MacAlpine R, et al. (2011b). Identification and characterization of potential performance-related gut microbiotas in broiler chickens across various feeding trials. Appl Environ Microbiol 77: 5868–78.
Torok VA, Percy NJ, Moate PJ, Ophel-Keller K. (2014). Influence of dietary docosahexaenoic acid supplementation on the overall rumen microbiota of dairy cows and linkages with production parameters. Can J Microbiol 60: 267–75.
Tran H, Bundy JW, Hinkle EE, Walter J, Burkey TE, Miller PS. (2014). Effects of a yeast-dried milk product in creep and phase-1 nursery diets on growth performance, circulating immunoglobulin A, and fecal microbiota of nursing and nursery pigs. J Anim Sci 92: 4518–4530.
Tsai Y-C, Wang H-T, Hsu J-T, Li Y-H, Chen C-Y. (2015). Yeast with bacteriocin from ruminal bacteria enhances glucose utilization, reduces ectopic fat accumulation, and alters cecal microbiota in dietary-induced obese mice. Food Funct 6: 2727–2735.
Tun HM, Mauroo NF, Yuen CS, Ho JCW, Wong MT, Leung FC-C. (2014). Microbial diversity and evidence of novel homoacetogens in the gut of both geriatric and adult giant pandas (Ailuropoda melanoleuca). PLoS ONE 9: e79902.
Twardziok SO, Pieper R, Aschenbach JR, Bednorz C, Brockmann GA, Fromm M, et al. (2014). Cross-talk between host, microbiome and probiotics: A systems biology approach for analyzing the effects of probiotic Enterococcus faecium NCIMB 10415 in piglets. Mol Inform 33: 171–182.
Tzeng T-D, Pao Y-Y, Chen P-C, Weng FC-H, Jean WD, Wang D. (2015). Effects of host phylogeny and habitats on gut microbiomes of oriental river prawn (Macrobrachium nipponense). PLoS ONE 10: e0132860.
Ubeda C, Lipuma L, Gobourne A, Viale A, Leiner I, Equinda M, et al. (2012). Familial transmission rather than defective innate immunity shapes the distinct intestinal microbiota of TLR-deficient mice. J Exp Med 209: 1445–56.
Unno T, Kim J-M, Guevarra RB, Nguyen SG. (2015). Effects of antibiotic growth promoter and characterization of ecological succession in Swine gut microbiota. JMicrobiol Biotechnol 25: 431–8.
Upadrasta A, O’Sullivan L, O’Sullivan O, Sexton N, Lawlor PG, Hill C, et al. (2013). The effect of dietary supplementation with spent cider yeast on the Swine distal gut microbiome. PLoS ONE 8: e75714.
Ushakova NA, Nekrasov RV, Meleshko NA, Laptev GY, Il’ina LA, Kozlova AA, et al. (2013). Effect of Bacillus subtilis on the rumen microbial community and itscomponents exhibiting high correlation coefficients with the host nutrition, growth, and development. Microbiology 82: 475–481.
Ussar S, Griffin NW, Bezy O, Fujisaka S, Vienberg S, Softic S, et al. (2015). Interactions between gut microbiota, host genetics and diet modulate the predispositionto obesity and metabolic syndrome. Cell Metab 22: 516–530.
Uyeno Y, Katayama S, Nakamura S. (2014). Changes in mouse gastrointestinal microbial ecology with ingestion of kale. Benef Microbes 5: 345–9.
Uyeno Y, Sekiguchi Y, Tajima K, Takenaka A, Kurihara M, Kamagata Y. (2010). An rRNA-based analysis for evaluating the effect of heat stress on the rumen microbial composition of Holstein heifers. Anaerobe 16: 27–33.
Valdovska A, Jemeljanovs A, Pilmane M, Zitare I, Konosonoka IH, Lazdins M. (2014). Alternative for improving gut microbiota: use of Jerusalem artichoke and probiotics in diet of weaned piglets. Pol J Vet Sci 17: 61–9.
Vasaï F, Brugirard Ricaud K, Bernadet MD, Cauquil L, Bouchez O, Combes S, et al. (2014a). Overfeeding and genetics affect the composition of intestinal microbiota in Anas platyrhynchos (Pekin) and Cairina moschata (Muscovy) ducks. FEMS Microbiol Ecol 87: 204–16.
Vasaï F, Ricaud KB, Cauquil L, Daniel P, Peillod C, Gontier K, et al. (2014b). Lactobacillus sakei modulates mule duck microbiota in ileum and ceca during overfeeding. Poult Sci 93: 916–25.
Verma N, Verma R, Kumari R, Ranjha R, Paul J. (2014). Effect of salicin on gut inflammation and on selected groups of gut microbiota in dextran sodium sulfate induced mouse model of colitis. Inflamm Res Off J Eur Histamine Res Soc Al 63: 161–9.
Vestergaard B, Krych Ł, Lund LR, Jørgensen BP, Hansen L, Jensen HE, et al. (2015). Colonic lesions, cytokine profiles, and gut microbiota in plasminogen-deficient mice. Comp Med 65: 382–97.
Vhile SG, Kjos NP, Sørum H, Overland M. (2012). Feeding Jerusalem artichoke reduced skatole level and changed intestinal microbiota in the gut of entire male pigs. Animal 6: 807–14.
Videnska P, Sisak F, Havlickova H, Faldynova M, Rychlik I. (2013). Influence of Salmonella enterica serovar Enteritidis infection on the composition of chicken cecal microbiota. BMC Vet Res 9: 140.
Waite DW, Dsouza M, Biswas K, Ward DF, Deines P, Taylor MW. (2015). Microbial community structure in the gut of the New Zealand insect Auckland tree weta (Hemideina thoracica). Arch Microbiol 197: 603–12.
Walk ST, Blum AM, Ewing SA-S, Weinstock JV, Young VB. (2010). Alteration of the murine gut microbiota during infection with the parasitic helminth Heligmosomoides polygyrus. Inflamm Bowel Dis 16: 1841–9.
Walsh AM, Sweeney T, Bahar B, Flynn B, O’Doherty JV. (2012). The effect of chitooligosaccharide supplementation on intestinal morphology, selected microbial populations, volatile fatty acid concentrations and immune gene expression in the weaned pig. Animal 6: 1620–6.
Walsh AM, Sweeney T, O’Shea CJ, Doyle DN, O’Doherty JV. (2013). Effect of dietary laminarin and fucoidan on selected microbiota, intestinal morphology and immune status of the newly weaned pig. Br J Nutr 110: 1630–8.
Walugembe M, Hsieh JCF, Koszewski NJ, Lamont SJ, Persia ME, Rothschild MF. (2015). Effects of dietary fiber on cecal short-chain fatty acid and cecal microbiota of broiler and laying-hen chicks. Poult Sci 94: 2351–9.
Wang H, Zhang W, Zuo L, Zhu W, Wang B, Li Q, et al. (2013a). Bifidobacteria may be beneficial to intestinal microbiota and reduction of bacterial translocation in mice following ischaemia and reperfusion injury. Br J Nutr 109: 1990–8.
Wang J, Tang H, Zhang C, Zhao Y, Derrien M, Rocher E, et al. (2015). Modulation of gut microbiota during probiotic-mediated attenuation of metabolic syndrome in high fat diet-fed mice. ISME J 9: 1–15.
Wang J-H, Fan S-W, Zhu W-Y. (2013b). Development of gut microbiota in a mouse model of ovalbumin-induced allergic diarrhea under sub-barrier system. Asian-Australas J Anim Sci 26: 545–51.
Wang JP, Lee JH, Yoo JS, Cho JH, Kim HJ, Kim IH. (2010a). Effects of phenyllactic acid on growth performance, intestinal microbiota, relative organ weight, blood characteristics, and meat quality of broiler chicks. Poult Sci 89: 1549–55.
Wang K, Cui H, Deng Y, Peng X, Zuo Z, Fang J, et al. (2012). Effect of dietary vanadium on intestinal microbiota in broiler. Biol Trace Elem Res 149: 212–8.
Wang L, Lilburn M, Yu Z. (2016). Intestinal microbiota of broiler chickens as affected by litter management regimens. Front Microbiol 7: 593.
Wang RL, Hou ZP, Wang B, Lui Z-Q, Fatufe AA. (2010b). Effects of feeding galactomannan oligosaccharides on growth performance, serum antibody levels and intestinal microbiota in newly-weaned pigs. J Food Agric Environ 8: 47–55.
Wang Y, Gilbreath III TM, Kukutla P, Yan G, Xu J. (2011). Dynamic gut microbiome across life history of the malaria mosquito Anopheles gambiae in Kenya. PLoS ONE 6: e24767.
Wayland MT, Defaye A, Rocha J, Jayaram SA, Royet J, Miguel-Aliaga I, et al. (2014). Spotting the differences: Probing host/microbiota interactions with a dedicated software tool for the analysis of faecal outputs in Drosophila. J Insect Physiol 69: 126–35.
Weese JS, Nichols J, Jalali M, Litster A. (2015). The rectal microbiota of cats infected with feline immunodeficiency virus infection and uninfected controls. Vet Microbiol 180: 96–102.
Wei H, Dong L, Wang T, Zhang M, Hua W, Zhang C, et al. (2010). Structural shifts of gut microbiota as surrogate endpoints for monitoring host health changes induced by carcinogen exposure. FEMS Microbiol Ecol 73: 577–86.
Wei S, Morrison M, Yu Z. (2013). Bacterial census of poultry intestinal microbiome. Poult Sci 92: 671–83.
Williams K, Milner J, Boudreau MD, Gokulan K, Cerniglia CE, Khare S. (2015). Effects of subchronic exposure of silver nanoparticles on intestinal microbiota and gut-associated immune responses in the ileum of Sprague-Dawley rats. Nanotoxicology 9: 279–89.
Winek K, Engel O, Koduah P, Heimesaat MM, Fischer A, Bereswill S, et al. (2016). Depletion of cultivatable gut microbiota by broad-spectrum antibiotic pretreatment worsens outcome after murine stroke. Stroke 47: 1354–63.
de Wit N, Derrien M, Bosch-Vermeulen H, Oosterink E, Keshtkar S, Duval C, et al. (2012). Saturated fat stimulates obesity and hepatic steatosis and affects gut microbiota composition by an enhanced overflow of dietary fat to the distal intestine. Am J Physiol Gastrointest Liver Physiol 303: G589–99.
Witzig M, Camarinha da Silva A, Green-Engert R, Hoelzle K, Zeller E, Seifert J, et al. (2015). Spatial variation of the gut microbiota in broiler chickens as affected by dietary available phosphorus and assessed by T-RFLP analysis and 454 pyrosequencing. PLoS ONE 10: e0143442.
Wong AC-N, Dobson AJ, Douglas AE. (2014). Gut microbiota dictates the metabolic response of Drosophila to diet. J Exp Biol 217: 1894–901.
Wong S, Waldrop T, Summerfelt S, Davidson J, Barrows F, Kenney PB, et al. (2013). Aquacultured rainbow trout (Oncorhynchus mykiss) possess a large core intestinal microbiota that is resistant to variation in diet and rearing density. Appl Environ Microbiol 79: 4974–84.
Woodbury N, Moore M, Gries G. (2013). Horizontal transmission of the microbial symbionts Enterobacter cloacae and Mycotypha microspora to their firebrat host.Entomol Exp Appl 147: 160–166.
Wu B, Cui H, Peng X, Pan K, Fang J, Zuo Z, et al. (2014a). Toxicological effects of dietary nickel chloride on intestinal microbiota. Ecotoxicol Environ Saf 109: 70–6.
Wu S, Gao T, Zheng Y, Wang W, Cheng Y, Wang G. (2010). Microbial diversity of intestinal contents and mucus in yellow catfish (Pelteobagrus fulvidraco). Aquaculture 303: 1–7.
Wu S-B, Stanley D, Rodgers N, Swick RA, Moore RJ. (2014b). Two necrotic enteritis predisposing factors, dietary fishmeal and Eimeria infection, induce large changes in the caecal microbiota of broiler chickens. Vet Microbiol 169: 188–97.
Wu S-G, Tian J-Y, Gatesoupe F-J, Li W-X, Zou H, Yang B-J, et al. (2013). Intestinal microbiota of gibel carp (Carassius auratus gibelio) and its origin as revealed by 454 pyrosequencing. World J Microbiol Biotechnol 29: 1585–95.
Xenoulis PG, Gray PL, Brightsmith D, Palculict B, Hoppes S, Steiner JM, et al. (2010). Molecular characterization of the cloacal microbiota of wild and captive parrots. Vet Microbiol 146: 320–5.
Xie J-H, Fan S-T, Nie S-P, Yu Q, Xiong T, Gong D, et al. (2016). Lactobacillus plantarum NCU116 attenuates cyclophosphamide-induced intestinal mucosal injury, metabolism and intestinal microbiota disorders in mice. Food Funct 7: 1584–92.
Xie Y, Chen H, Zhu B, Qin N, Chen Y, Li Z, et al. (2014). Effect of intestinal microbiota alteration on hepatic damage in rats with acute rejection after liver transplantation. Microb Ecol 68: 871–880.
Xie YR, Liu SL, Liu X, Luo ZB, Zhu B, Li ZF, et al. (2011). Intestinal microbiota and innate immunity-related gene alteration in cirrhotic rats with liver transplantation. Transplant Proc 43: 3973–9.
Xin-Li L, Da-Chang W, Cui-Li Z, Yi X. (2012). Effects of levofloxacin hydrochloride on the intestinal microbiota of BALB/c mice by PCR-DGGE. Afr J MicrobiolRes 6: 3455–3460.
Xu C, Wang Y, Sun R, Qiao X, Shang X, Niu W. (2014a). Modulatory effects of vasoactive intestinal peptide on intestinal mucosal immunity and microbial community of weaned piglets challenged by an enterotoxigenic Escherichia coli (K88). PLoS ONE 9: e104183.
Xu CC, Yang SF, Zhu LH, Cai X, Sheng YS, Zhu SW, et al. (2014b). Regulation of N-acetyl cysteine on gut redox status and major microbiota in weaned piglets. J Anim Sci 92: 1504–11.
Xu X, Zhang X. (2015). Effects of cyclophosphamide on immune system and gut microbiota in mice. Microbiol Res 171: 97–106.
Xue X, Cao AT, Cao X, Yao S, Carlsen ED, Soong L, et al. (2014). Downregulation of microRNA-107 in intestinal CD11c(+) myeloid cells in response to microbiota and proinflammatory cytokines increases IL-23p19 expression. Eur J Immunol 44: 673–82.
Xue Z, Zhang W, Wang L, Hou R, Zhang M, Fei L, et al. (2015). The bamboo-eating giant panda harbors a carnivore-like gut microbiota, with excessive seasonal variations. mBio 6: e00022–15.
Yamazaki Y, Meirelles PM, Mino S, Suda W, Oshima K, Hattori M, et al. (2016). Individual Apostichopus japonicus fecal microbiome reveals a link with polyhydroxybutyrate producers in host growth gaps. Sci Rep 6: 21631.
Yang G, Xu Z, Tian X, Dong S, Peng M. (2015). Intestinal microbiota and immune related genes in sea cucumber (Apostichopus japonicus) response to dietary β-glucan supplementation. Biochem Biophys Res Commun 458: 98–103.
Yang H, Xia H, Ye Y, Zou W, Sun Y. (2014a). Probiotic Bacillus pumilus SE5 shapes the intestinal microbiota and mucosal immunity in grouper Epinephelus coioides. Dis Aquat Organ 111: 119–127.
Yang H-L, Sun Y-Z, Ma R-L, Ye J-D. (2012). PCR-DGGE analysis of the autochthonous gut microbiota of grouper Epinephelus coioides following probiotic Bacillus clausii administration. Aquac Res 43: 489–497.
Yang I, Eibach D, Kops F, Brenneke B, Woltemate S, Schulze J, et al. (2013). Intestinal microbiota composition of interleukin-10 deficient C57BL/6J mice and susceptibility to Helicobacter hepaticus-induced colitis. PLoS ONE 8: e70783.
Yang L, Bian G, Su Y, Zhu W. (2014b). Comparison of faecal microbial community of Lantang, Bama, Erhualian, Meishan, Xiaomeishan, Duroc, Landrace, and Yorkshire sows. Asian-Australas J Anim Sci 27: 898–906.
Ye L, Amberg J, Chapman D, Gaikowski M, Liu W-T. (2014). Fish gut microbiota analysis differentiates physiology and behavior of invasive Asian carp and indigenous American fish. ISME J 8: 541–51.
Yin X, Peng J, Zhao L, Yu Y, Zhang X, Liu P, et al. (2013). Structural changes of gut microbiota in a rat non-alcoholic fatty liver disease model treated with a Chinese herbal formula. Syst Appl Microbiol 36: 188–96.
Yin X, Yan Y, Kim EB, Lee B, Marco ML. (2014). Short communication: effect of milk and milk containing Lactobacillus casei on the intestinal microbiota of mice. J Dairy Sci 97: 2049–55.
Yin Y, Lei F, Zhu L, Li S, Wu Z, Zhang R, et al. (2010). Exposure of different bacterial inocula to newborn chicken affects gut microbiota development and ileum gene expression. ISME J 4: 367–76.
Yoda K, He F, Miyazawa K, Kawase M, Kubota A, Hiramatsu M. (2012). Orally administered heat-killed Lactobacillus gasseri TMC0356 alters respiratory immuneresponses and intestinal microbiota of diet-induced obese mice. J Appl Microbiol 113: 155–62.
Yu C, Zhang S, Yang Q, Peng Q, Zhu J, Zeng X, et al. (2016a). Effect of high fibre diets formulated with different fibrous ingredients on performance, nutrient digestibility and faecal microbiota of weaned piglets. Arch Anim Nutr 70: 263–77.
Yu Y-J, Amorim M, Marques C, Calhau C, Pintado M. (2016b). Effects of whey peptide extract on the growth of probiotics and gut microbiota. J Funct Foods 21: 507–516.
Zaiss MM, Rapin A, Lebon L, Dubey LK, Mosconi I, Sarter K, et al. (2015). The intestinal microbiota contributes to the ability of helminths to modulate allergic inflammation. Immunity 43: 998–1010.
Zarkasi KZ, Taylor RS, Abell GCJ, Tamplin ML, Glencross BD, Bowman JP. (2016). Atlantic salmon (Salmo salar L.) gastrointestinal microbial community dynamics in relation to digesta properties and diet. Microb Ecol 71: 589–603.
Zdunczyk Z, Jankowski J, Rutkowski A, Sosnowska E, Drazbo A, Zdunczyk P, et al. (2014). The composition and enzymatic activity of gut microbiota in laying hens fed diets supplemented with blue lupine seeds. Anim Feed Sci Technol 191: 57–66.
Zened A, Combes S, Cauquil L, Mariette J, Klopp C, Bouchez O, et al. (2013). Microbial ecology of the rumen evaluated by 454 GS FLX pyrosequencing is affected by starch and oil supplementation of diets. FEMS Microbiol Ecol 83: 504–14.
Zeng B, Yuan J, Li W, Tang H, Wei H. (2012). The effect of artificial rearing on gut microbiota in a mouse pup-in-a-cup model. Exp Anim 61: 453–60.
Zentek J, Buchheit-Renko S, Männer K, Pieper R, Vahjen W. (2012). Intestinal concentrations of free and encapsulated dietary medium-chain fatty acids and effects on gastric microbial ecology and bacterial metabolic products in the digestive tract of piglets. Arch Anim Nutr 66: 14–26.
Zentek J, Ferrara F, Pieper R, Tedin L, Meyer W, Vahjen W. (2013a). Effects of dietary combinations of organic acids and medium chain fatty acids on the gastrointestinal microbial ecology and bacterial metabolites in the digestive tract of weaning piglets. J Anim Sci 91: 3200–10.
Zentek J, Gärtner S, Tedin L, Männer K, Mader A, Vahjen W. (2013b). Fenugreek seed affects intestinal microbiota and immunological variables in piglets after weaning. Br J Nutr 109: 859–66.
Zhan Y, Chen P-J, Sadler WD, Wang F, Poe S, Núñez G, et al. (2013). Gut microbiota protects against gastrointestinal tumorigenesis caused by epithelial injury. Cancer Res 73: 7199–210.
Zhang C, Zhang M, Pang X, Zhao Y, Wang L, Zhao L. (2012). Structural resilience of the gut microbiota in adult mice under high-fat dietary perturbations. ISME J 6: 1848–57.
Zhang GG, Yang ZB, Wang Y, Yang WR, Zhou HJ. (2014a). Effects of dietary supplementation of multi-enzyme on growth performance, nutrient digestibility, small intestinal digestive enzyme activities, and large intestinal selected microbiota in weanling pigs. J Anim Sci 92: 2063–9.
Zhang HY, Piao XS, Zhang Q, Li P, Yi JQ, Liu JD, et al. (2013a). The effects of Forsythia suspensa extract and berberine on growth performance, immunity, antioxidant activities, and intestinal microbiota in broilers under high stocking density. Poult Sci 92: 1981–8.
Zhang L, Huang Y, Zhou Y, Buckley T, Wang HH. (2013b). Antibiotic administration routes significantly influence the levels of antibiotic resistance in gut microbiota. Antimicrob Agents Chemother 57: 3659–66.
Zhang M, Fan X, Fang B, Zhu C, Zhu J, Ren F. (2015). Effects of Lactobacillus salivarius Ren on cancer prevention and intestinal microbiota in 1, 2-dimethylhydrazine-induced rat model. J Microbiol Seoul Korea 53: 398–405.
Zhang M, Liu N, Qian C, Wang Q, Wang Q, Long Y, et al. (2014b). Phylogenetic and functional analysis of gut microbiota of a fungus-growing higher termite: Bacteroidetes from higher termites are a rich source of β-glucosidase genes. Microb Ecol 68: 416–25.
Zhang Y, Limaye PB, Renaud HJ, Klaassen CD. (2014c). Effect of various antibiotics on modulation of intestinal microbiota and bile acid profile in mice. Toxicol Appl Pharmacol 277: 138–45.
Zhang ZF, Cho JH, Kim IH. (2013c). Effects of Bacillus subtilis UBT-MO2 on growth performance, relative immune organ weight, gas concentration in excreta, and intestinal microbial shedding in broiler chickens. Livest Sci 155: 343–347.
Zhang ZF, Kim IH. (2014). Effects of multistrain probiotics on growth performance, apparent ileal nutrient digestibility, blood characteristics, cecal microbial shedding, and excreta odor contents in broilers. Poult Sci 93: 364–70.
Zhao L, Wang G, Siegel P, He C, Wang H, Zhao W, et al. (2013a). Quantitative genetic background of the host influences gut microbiomes in chickens. Sci Rep 3: 1163.
Zhao P, Upadhaya SD, Li J, Kim I. (2015a). Comparison effects of dietary iron dextran and bacterial-iron supplementation on growth performance, fecal microbial flora, and blood profiles in sows and their litters. Anim Sci J 86: 937–42.
Zhao PY, Kim IH. (2015). Effect of direct-fed microbial on growth performance, nutrient digestibility, fecal noxious gas emission, fecal microbial flora and diarrheascore in weanling pigs. Anim Feed Sci Technol 200: 86–92.
Zhao W, Wang Y, Liu S, Huang J, Zhai Z, He C, et al. (2015b). The dynamic distribution of porcine microbiota across different ages and gastrointestinal tract segments. PLoS ONE 10: e0117441.
Zhao X, Guo Y, Guo S, Tan J. (2013b). Effects of Clostridium butyricum and Enterococcus faecium on growth performance, lipid metabolism, and cecal microbiota of broiler chickens. Appl Microbiol Biotechnol 97: 6477–88.
Zhao XH, He X, Yang XF, Zhong XH. (2013c). Effect of Portulaca oleracea extracts on growth performance and microbial populations in ceca of broilers. Poult Sci 92: 1343–7.
Zhou AL, Hergert N, Rompato G, Lefevre M. (2015). Whole grain oats improve insulin sensitivity and plasma cholesterol profile and modify gut microbiota composition in C57BL/6J mice. J Nutr 145: 222–30.
Zhou X, Ruan Z, Huang X, Zhou Y, Liu S, Yin Y. (2013). The prebiotic lactosucrose modulates gut metabolites and microbiota in intestinal inflammatory rats. Food Sci Biotechnol 23: 157–163.
Zhou Z, He S, Liu Y, Cao Y, Meng K, Yao B, et al. (2011). Gut microbial status induced by antibiotic growth promoter alters the prebiotic effects of dietary DVAQUA® on Aeromonas hydrophila-infected tilapia: production, intestinal bacterial community and non-specific immunity. Vet Microbiol 149: 399–405.
Zhu Q, Jin Z, Wu W, Gao R, Guo B, Gao Z, et al. (2014). Analysis of the intestinal lumen microbiota in an animal model of colorectal cancer. PLoS ONE 9: e90849.
Zhu Y, Wang C, Li F. (2015). Impact of dietary fiber/starch ratio in shaping caecal microbiota in rabbits. Can J Microbiol 61: 771–84.
Zinicola M, Lima F, Lima S, Machado V, Gomez M, Döpfer D, et al. (2015). Altered microbiomes in bovine digital dermatitis lesions, and the gut as a pathogen reservoir. PloS One 10: e0120504.

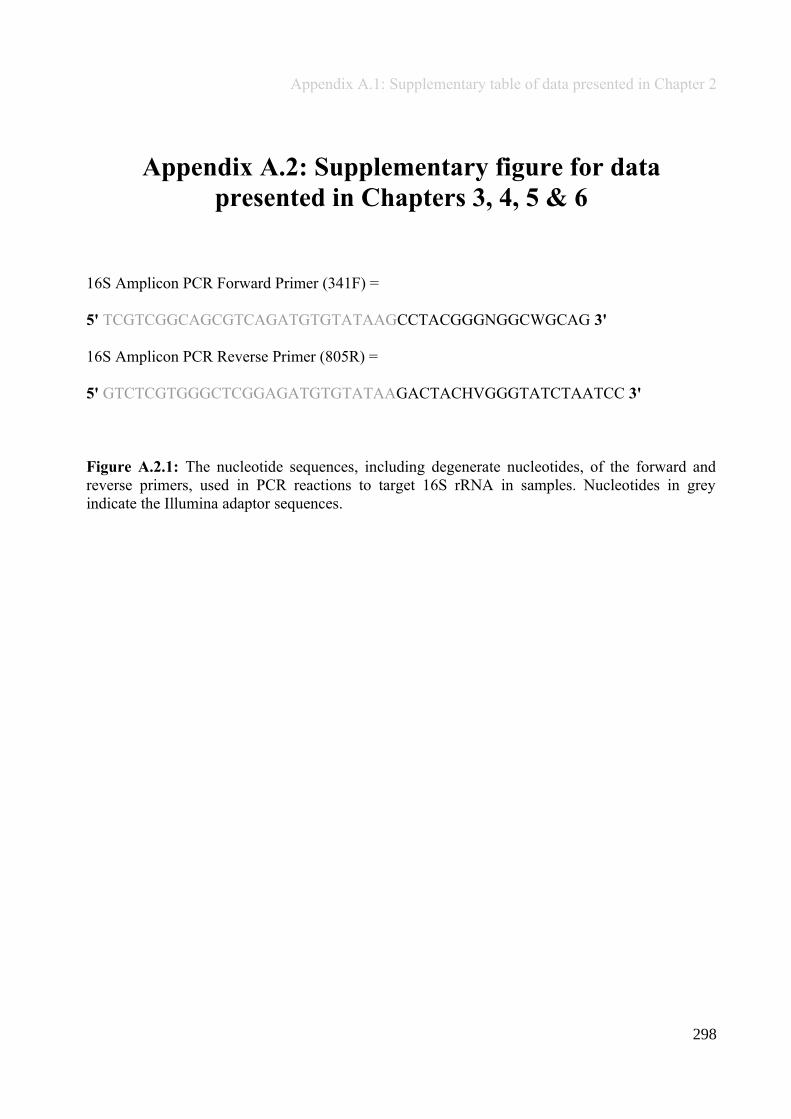
Appendix A.1: Supplementary table of data presented in Chapter 2
Appendix A.2: Supplementary figure for datapresented in Chapters 3, 4, 5 & 6
16S Amplicon PCR Forward Primer (341F) =
5' TCGTCGGCAGCGTCAGATGTGTATAAGCCTACGGGNGGCWGCAG 3'
16S Amplicon PCR Reverse Primer (805R) =
5' GTCTCGTGGGCTCGGAGATGTGTATAAGACTACHVGGGTATCTAATCC 3'
Figure A.2.1: The nucleotide sequences, including degenerate nucleotides, of the forward andreverse primers, used in PCR reactions to target 16S rRNA in samples. Nucleotides in greyindicate the Illumina adaptor sequences.
298
Appendix A.2: Supplementary figure for data presented in Chapters 3, 4, 5 & 6
Appendix A.3: Supplementary tables of data presentedin Chapter 3
Statistical outputs of analyses to test for OTUs that significantly differed in abundance between pre- and
post-treatment individuals in an anthelmintic and a control group, for microbiota of the whole gut (three
gut sections combined), small intestine, caecum, colon and faeces. OTUs were grouped by microbial
phylum and class. Briefly, DESeq was used to identify significantly different (p <0.05) OTU abundances
and their respective fold changes (log2) when comparing pre- and post-treatment mice. Below are the tables
resulting from these analyses.
Note: Abundances of OTUs in the small intestine and colon were not significantly different between pre-and post-treatment individuals in the anthelmintic group.
299
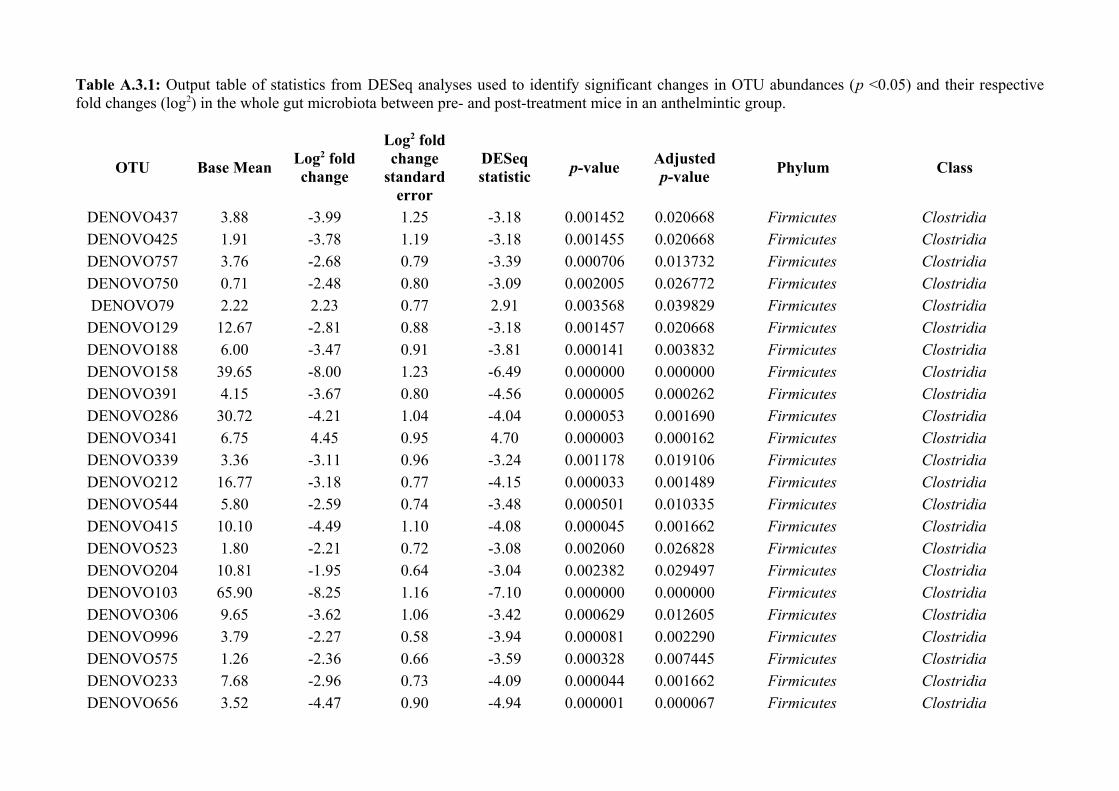
Table A.3.1: Output table of statistics from DESeq analyses used to identify significant changes in OTU abundances (p <0.05) and their respectivefold changes (log2) in the whole gut microbiota between pre- and post-treatment mice in an anthelmintic group.
OTU Base MeanLog2 foldchange
Log2 foldchange
standarderror
DESeqstatistic
p-valueAdjustedp-value
Phylum Class
DENOVO437 3.88 -3.99 1.25 -3.18 0.001452 0.020668 Firmicutes ClostridiaDENOVO425 1.91 -3.78 1.19 -3.18 0.001455 0.020668 Firmicutes ClostridiaDENOVO757 3.76 -2.68 0.79 -3.39 0.000706 0.013732 Firmicutes ClostridiaDENOVO750 0.71 -2.48 0.80 -3.09 0.002005 0.026772 Firmicutes ClostridiaDENOVO79 2.22 2.23 0.77 2.91 0.003568 0.039829 Firmicutes ClostridiaDENOVO129 12.67 -2.81 0.88 -3.18 0.001457 0.020668 Firmicutes ClostridiaDENOVO188 6.00 -3.47 0.91 -3.81 0.000141 0.003832 Firmicutes ClostridiaDENOVO158 39.65 -8.00 1.23 -6.49 0.000000 0.000000 Firmicutes ClostridiaDENOVO391 4.15 -3.67 0.80 -4.56 0.000005 0.000262 Firmicutes ClostridiaDENOVO286 30.72 -4.21 1.04 -4.04 0.000053 0.001690 Firmicutes ClostridiaDENOVO341 6.75 4.45 0.95 4.70 0.000003 0.000162 Firmicutes ClostridiaDENOVO339 3.36 -3.11 0.96 -3.24 0.001178 0.019106 Firmicutes ClostridiaDENOVO212 16.77 -3.18 0.77 -4.15 0.000033 0.001489 Firmicutes ClostridiaDENOVO544 5.80 -2.59 0.74 -3.48 0.000501 0.010335 Firmicutes ClostridiaDENOVO415 10.10 -4.49 1.10 -4.08 0.000045 0.001662 Firmicutes ClostridiaDENOVO523 1.80 -2.21 0.72 -3.08 0.002060 0.026828 Firmicutes ClostridiaDENOVO204 10.81 -1.95 0.64 -3.04 0.002382 0.029497 Firmicutes ClostridiaDENOVO103 65.90 -8.25 1.16 -7.10 0.000000 0.000000 Firmicutes ClostridiaDENOVO306 9.65 -3.62 1.06 -3.42 0.000629 0.012605 Firmicutes ClostridiaDENOVO996 3.79 -2.27 0.58 -3.94 0.000081 0.002290 Firmicutes ClostridiaDENOVO575 1.26 -2.36 0.66 -3.59 0.000328 0.007445 Firmicutes ClostridiaDENOVO233 7.68 -2.96 0.73 -4.09 0.000044 0.001662 Firmicutes ClostridiaDENOVO656 3.52 -4.47 0.90 -4.94 0.000001 0.000067 Firmicutes Clostridia
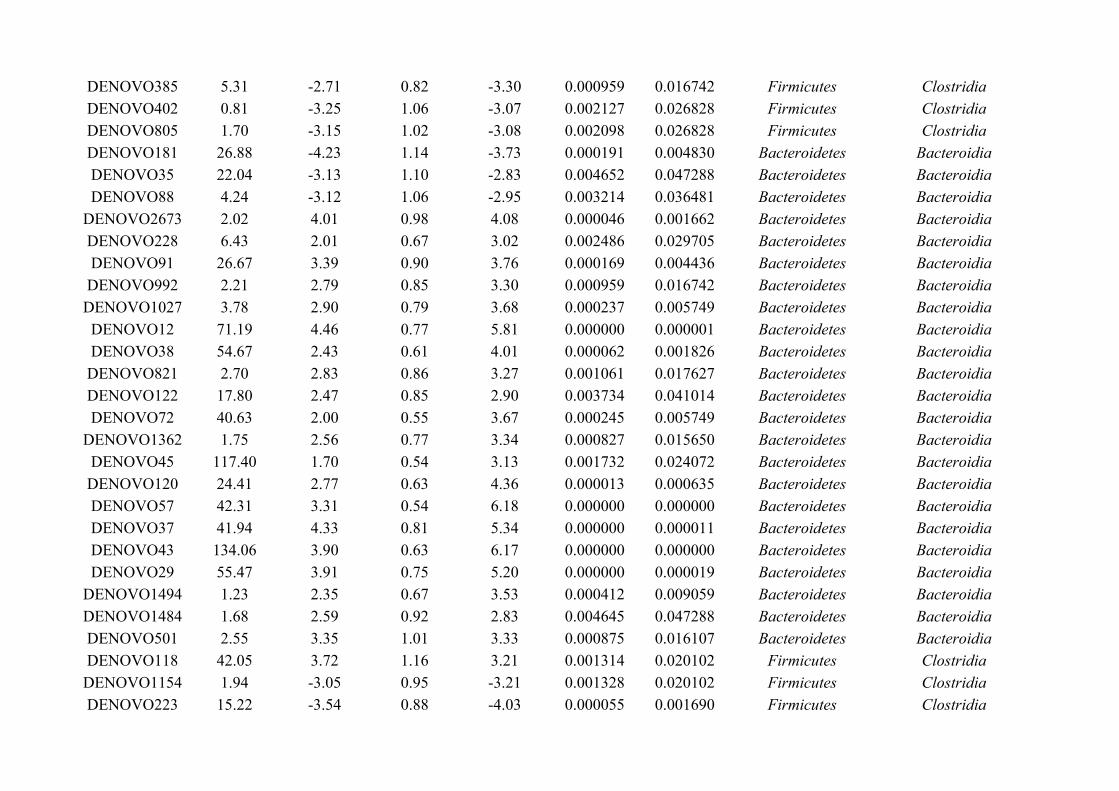
DENOVO385 5.31 -2.71 0.82 -3.30 0.000959 0.016742 Firmicutes ClostridiaDENOVO402 0.81 -3.25 1.06 -3.07 0.002127 0.026828 Firmicutes ClostridiaDENOVO805 1.70 -3.15 1.02 -3.08 0.002098 0.026828 Firmicutes ClostridiaDENOVO181 26.88 -4.23 1.14 -3.73 0.000191 0.004830 Bacteroidetes BacteroidiaDENOVO35 22.04 -3.13 1.10 -2.83 0.004652 0.047288 Bacteroidetes BacteroidiaDENOVO88 4.24 -3.12 1.06 -2.95 0.003214 0.036481 Bacteroidetes Bacteroidia
DENOVO2673 2.02 4.01 0.98 4.08 0.000046 0.001662 Bacteroidetes BacteroidiaDENOVO228 6.43 2.01 0.67 3.02 0.002486 0.029705 Bacteroidetes BacteroidiaDENOVO91 26.67 3.39 0.90 3.76 0.000169 0.004436 Bacteroidetes BacteroidiaDENOVO992 2.21 2.79 0.85 3.30 0.000959 0.016742 Bacteroidetes BacteroidiaDENOVO1027 3.78 2.90 0.79 3.68 0.000237 0.005749 Bacteroidetes BacteroidiaDENOVO12 71.19 4.46 0.77 5.81 0.000000 0.000001 Bacteroidetes BacteroidiaDENOVO38 54.67 2.43 0.61 4.01 0.000062 0.001826 Bacteroidetes BacteroidiaDENOVO821 2.70 2.83 0.86 3.27 0.001061 0.017627 Bacteroidetes BacteroidiaDENOVO122 17.80 2.47 0.85 2.90 0.003734 0.041014 Bacteroidetes BacteroidiaDENOVO72 40.63 2.00 0.55 3.67 0.000245 0.005749 Bacteroidetes Bacteroidia
DENOVO1362 1.75 2.56 0.77 3.34 0.000827 0.015650 Bacteroidetes BacteroidiaDENOVO45 117.40 1.70 0.54 3.13 0.001732 0.024072 Bacteroidetes BacteroidiaDENOVO120 24.41 2.77 0.63 4.36 0.000013 0.000635 Bacteroidetes BacteroidiaDENOVO57 42.31 3.31 0.54 6.18 0.000000 0.000000 Bacteroidetes BacteroidiaDENOVO37 41.94 4.33 0.81 5.34 0.000000 0.000011 Bacteroidetes BacteroidiaDENOVO43 134.06 3.90 0.63 6.17 0.000000 0.000000 Bacteroidetes BacteroidiaDENOVO29 55.47 3.91 0.75 5.20 0.000000 0.000019 Bacteroidetes Bacteroidia
DENOVO1494 1.23 2.35 0.67 3.53 0.000412 0.009059 Bacteroidetes BacteroidiaDENOVO1484 1.68 2.59 0.92 2.83 0.004645 0.047288 Bacteroidetes BacteroidiaDENOVO501 2.55 3.35 1.01 3.33 0.000875 0.016107 Bacteroidetes BacteroidiaDENOVO118 42.05 3.72 1.16 3.21 0.001314 0.020102 Firmicutes ClostridiaDENOVO1154 1.94 -3.05 0.95 -3.21 0.001328 0.020102 Firmicutes ClostridiaDENOVO223 15.22 -3.54 0.88 -4.03 0.000055 0.001690 Firmicutes Clostridia
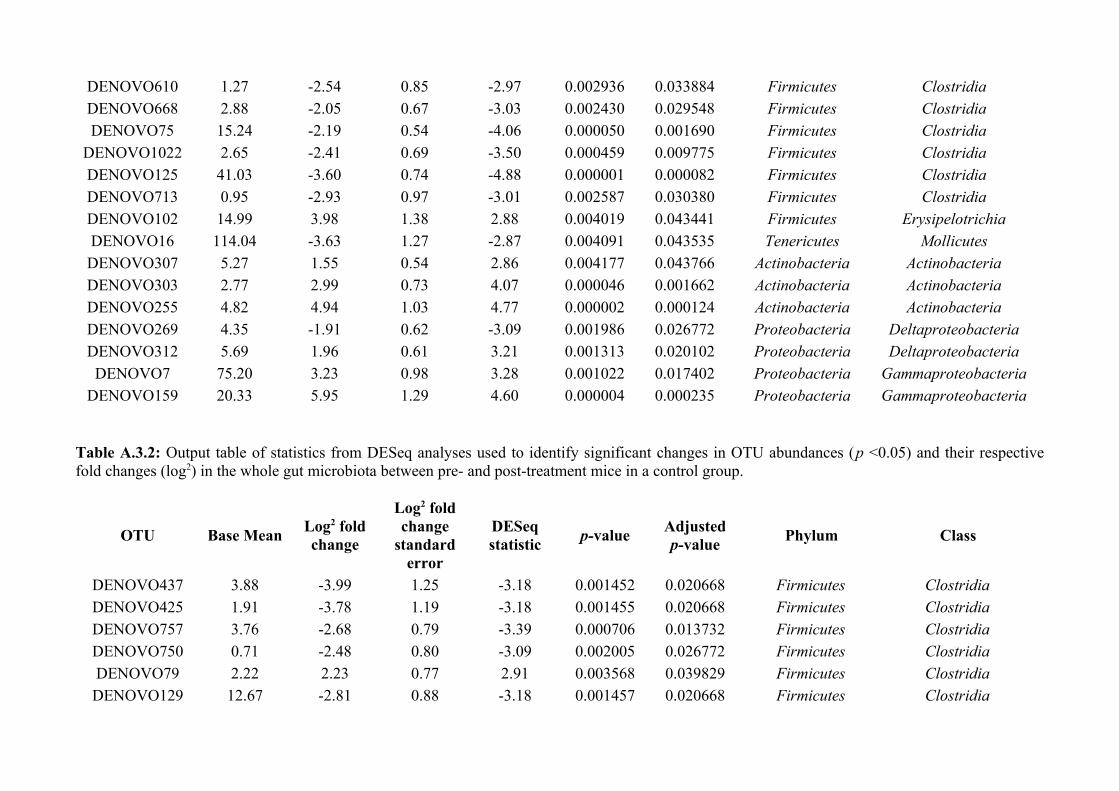
DENOVO610 1.27 -2.54 0.85 -2.97 0.002936 0.033884 Firmicutes ClostridiaDENOVO668 2.88 -2.05 0.67 -3.03 0.002430 0.029548 Firmicutes ClostridiaDENOVO75 15.24 -2.19 0.54 -4.06 0.000050 0.001690 Firmicutes Clostridia
DENOVO1022 2.65 -2.41 0.69 -3.50 0.000459 0.009775 Firmicutes ClostridiaDENOVO125 41.03 -3.60 0.74 -4.88 0.000001 0.000082 Firmicutes ClostridiaDENOVO713 0.95 -2.93 0.97 -3.01 0.002587 0.030380 Firmicutes ClostridiaDENOVO102 14.99 3.98 1.38 2.88 0.004019 0.043441 Firmicutes ErysipelotrichiaDENOVO16 114.04 -3.63 1.27 -2.87 0.004091 0.043535 Tenericutes MollicutesDENOVO307 5.27 1.55 0.54 2.86 0.004177 0.043766 Actinobacteria ActinobacteriaDENOVO303 2.77 2.99 0.73 4.07 0.000046 0.001662 Actinobacteria ActinobacteriaDENOVO255 4.82 4.94 1.03 4.77 0.000002 0.000124 Actinobacteria ActinobacteriaDENOVO269 4.35 -1.91 0.62 -3.09 0.001986 0.026772 Proteobacteria DeltaproteobacteriaDENOVO312 5.69 1.96 0.61 3.21 0.001313 0.020102 Proteobacteria DeltaproteobacteriaDENOVO7 75.20 3.23 0.98 3.28 0.001022 0.017402 Proteobacteria Gammaproteobacteria
DENOVO159 20.33 5.95 1.29 4.60 0.000004 0.000235 Proteobacteria Gammaproteobacteria
Table A.3.2: Output table of statistics from DESeq analyses used to identify significant changes in OTU abundances (p <0.05) and their respectivefold changes (log2) in the whole gut microbiota between pre- and post-treatment mice in a control group.
OTU Base MeanLog2 foldchange
Log2 foldchange
standarderror
DESeqstatistic
p-valueAdjustedp-value
Phylum Class
DENOVO437 3.88 -3.99 1.25 -3.18 0.001452 0.020668 Firmicutes ClostridiaDENOVO425 1.91 -3.78 1.19 -3.18 0.001455 0.020668 Firmicutes ClostridiaDENOVO757 3.76 -2.68 0.79 -3.39 0.000706 0.013732 Firmicutes ClostridiaDENOVO750 0.71 -2.48 0.80 -3.09 0.002005 0.026772 Firmicutes ClostridiaDENOVO79 2.22 2.23 0.77 2.91 0.003568 0.039829 Firmicutes ClostridiaDENOVO129 12.67 -2.81 0.88 -3.18 0.001457 0.020668 Firmicutes Clostridia
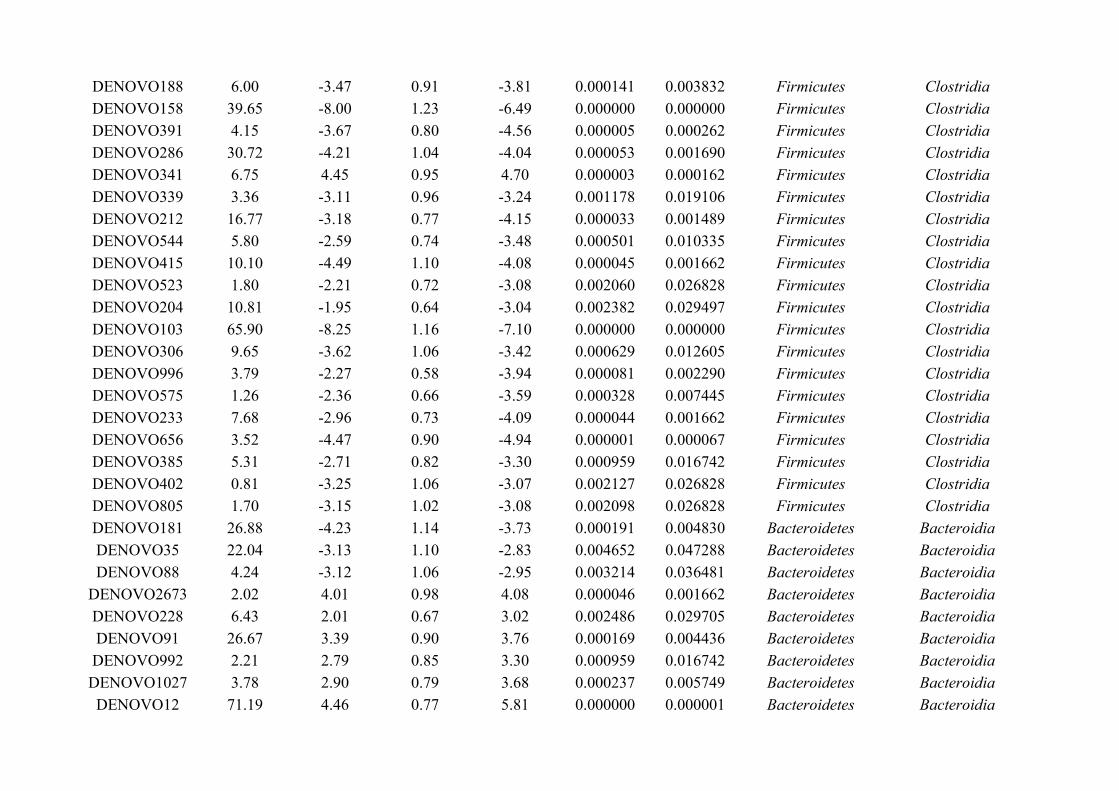
DENOVO188 6.00 -3.47 0.91 -3.81 0.000141 0.003832 Firmicutes ClostridiaDENOVO158 39.65 -8.00 1.23 -6.49 0.000000 0.000000 Firmicutes ClostridiaDENOVO391 4.15 -3.67 0.80 -4.56 0.000005 0.000262 Firmicutes ClostridiaDENOVO286 30.72 -4.21 1.04 -4.04 0.000053 0.001690 Firmicutes ClostridiaDENOVO341 6.75 4.45 0.95 4.70 0.000003 0.000162 Firmicutes ClostridiaDENOVO339 3.36 -3.11 0.96 -3.24 0.001178 0.019106 Firmicutes ClostridiaDENOVO212 16.77 -3.18 0.77 -4.15 0.000033 0.001489 Firmicutes ClostridiaDENOVO544 5.80 -2.59 0.74 -3.48 0.000501 0.010335 Firmicutes ClostridiaDENOVO415 10.10 -4.49 1.10 -4.08 0.000045 0.001662 Firmicutes ClostridiaDENOVO523 1.80 -2.21 0.72 -3.08 0.002060 0.026828 Firmicutes ClostridiaDENOVO204 10.81 -1.95 0.64 -3.04 0.002382 0.029497 Firmicutes ClostridiaDENOVO103 65.90 -8.25 1.16 -7.10 0.000000 0.000000 Firmicutes ClostridiaDENOVO306 9.65 -3.62 1.06 -3.42 0.000629 0.012605 Firmicutes ClostridiaDENOVO996 3.79 -2.27 0.58 -3.94 0.000081 0.002290 Firmicutes ClostridiaDENOVO575 1.26 -2.36 0.66 -3.59 0.000328 0.007445 Firmicutes ClostridiaDENOVO233 7.68 -2.96 0.73 -4.09 0.000044 0.001662 Firmicutes ClostridiaDENOVO656 3.52 -4.47 0.90 -4.94 0.000001 0.000067 Firmicutes ClostridiaDENOVO385 5.31 -2.71 0.82 -3.30 0.000959 0.016742 Firmicutes ClostridiaDENOVO402 0.81 -3.25 1.06 -3.07 0.002127 0.026828 Firmicutes ClostridiaDENOVO805 1.70 -3.15 1.02 -3.08 0.002098 0.026828 Firmicutes ClostridiaDENOVO181 26.88 -4.23 1.14 -3.73 0.000191 0.004830 Bacteroidetes BacteroidiaDENOVO35 22.04 -3.13 1.10 -2.83 0.004652 0.047288 Bacteroidetes BacteroidiaDENOVO88 4.24 -3.12 1.06 -2.95 0.003214 0.036481 Bacteroidetes Bacteroidia
DENOVO2673 2.02 4.01 0.98 4.08 0.000046 0.001662 Bacteroidetes BacteroidiaDENOVO228 6.43 2.01 0.67 3.02 0.002486 0.029705 Bacteroidetes BacteroidiaDENOVO91 26.67 3.39 0.90 3.76 0.000169 0.004436 Bacteroidetes BacteroidiaDENOVO992 2.21 2.79 0.85 3.30 0.000959 0.016742 Bacteroidetes BacteroidiaDENOVO1027 3.78 2.90 0.79 3.68 0.000237 0.005749 Bacteroidetes BacteroidiaDENOVO12 71.19 4.46 0.77 5.81 0.000000 0.000001 Bacteroidetes Bacteroidia

DENOVO38 54.67 2.43 0.61 4.01 0.000062 0.001826 Bacteroidetes BacteroidiaDENOVO821 2.70 2.83 0.86 3.27 0.001061 0.017627 Bacteroidetes BacteroidiaDENOVO122 17.80 2.47 0.85 2.90 0.003734 0.041014 Bacteroidetes BacteroidiaDENOVO72 40.63 2.00 0.55 3.67 0.000245 0.005749 Bacteroidetes Bacteroidia
DENOVO1362 1.75 2.56 0.77 3.34 0.000827 0.015650 Bacteroidetes BacteroidiaDENOVO45 117.40 1.70 0.54 3.13 0.001732 0.024072 Bacteroidetes BacteroidiaDENOVO120 24.41 2.77 0.63 4.36 0.000013 0.000635 Bacteroidetes BacteroidiaDENOVO57 42.31 3.31 0.54 6.18 0.000000 0.000000 Bacteroidetes BacteroidiaDENOVO37 41.94 4.33 0.81 5.34 0.000000 0.000011 Bacteroidetes BacteroidiaDENOVO43 134.06 3.90 0.63 6.17 0.000000 0.000000 Bacteroidetes BacteroidiaDENOVO29 55.47 3.91 0.75 5.20 0.000000 0.000019 Bacteroidetes Bacteroidia
DENOVO1494 1.23 2.35 0.67 3.53 0.000412 0.009059 Bacteroidetes BacteroidiaDENOVO1484 1.68 2.59 0.92 2.83 0.004645 0.047288 Bacteroidetes BacteroidiaDENOVO501 2.55 3.35 1.01 3.33 0.000875 0.016107 Bacteroidetes BacteroidiaDENOVO118 42.05 3.72 1.16 3.21 0.001314 0.020102 Firmicutes ClostridiaDENOVO1154 1.94 -3.05 0.95 -3.21 0.001328 0.020102 Firmicutes ClostridiaDENOVO223 15.22 -3.54 0.88 -4.03 0.000055 0.001690 Firmicutes ClostridiaDENOVO610 1.27 -2.54 0.85 -2.97 0.002936 0.033884 Firmicutes ClostridiaDENOVO668 2.88 -2.05 0.67 -3.03 0.002430 0.029548 Firmicutes ClostridiaDENOVO75 15.24 -2.19 0.54 -4.06 0.000050 0.001690 Firmicutes Clostridia
DENOVO1022 2.65 -2.41 0.69 -3.50 0.000459 0.009775 Firmicutes ClostridiaDENOVO125 41.03 -3.60 0.74 -4.88 0.000001 0.000082 Firmicutes ClostridiaDENOVO713 0.95 -2.93 0.97 -3.01 0.002587 0.030380 Firmicutes ClostridiaDENOVO102 14.99 3.98 1.38 2.88 0.004019 0.043441 Firmicutes ErysipelotrichiaDENOVO16 114.04 -3.63 1.27 -2.87 0.004091 0.043535 Tenericutes MollicutesDENOVO307 5.27 1.55 0.54 2.86 0.004177 0.043766 Actinobacteria ActinobacteriaDENOVO303 2.77 2.99 0.73 4.07 0.000046 0.001662 Actinobacteria ActinobacteriaDENOVO255 4.82 4.94 1.03 4.77 0.000002 0.000124 Actinobacteria ActinobacteriaDENOVO269 4.35 -1.91 0.62 -3.09 0.001986 0.026772 Proteobacteria Deltaproteobacteria
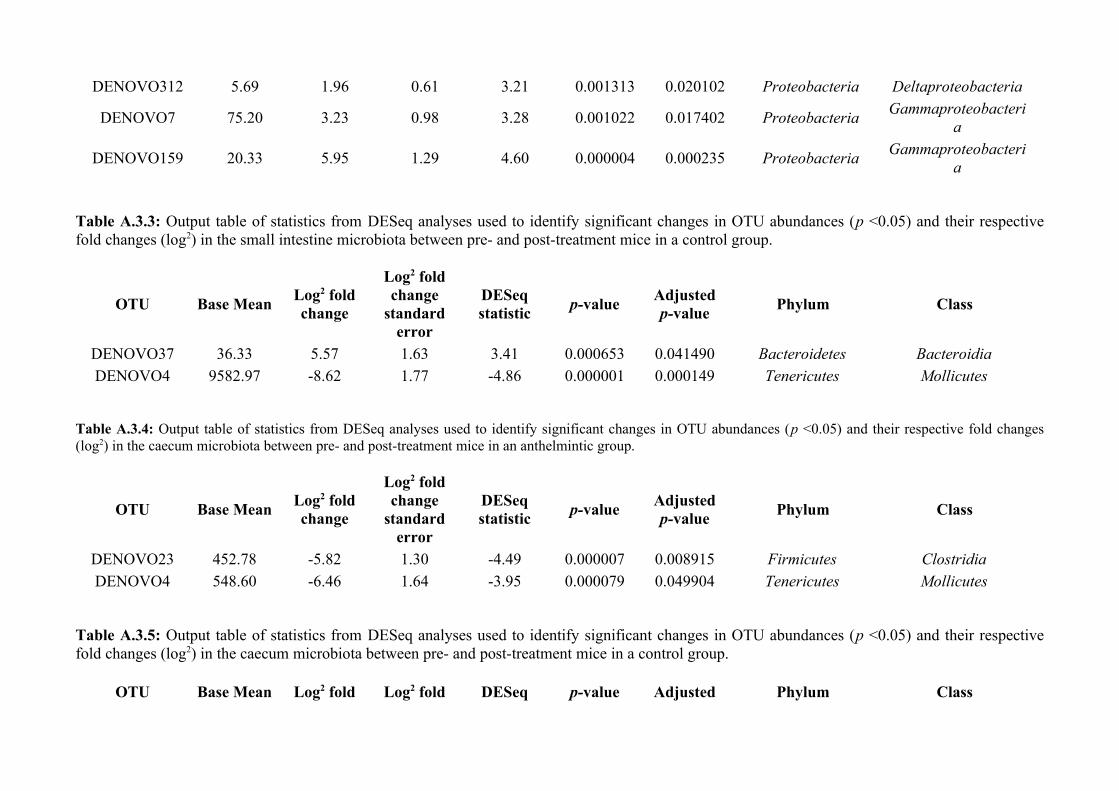
DENOVO312 5.69 1.96 0.61 3.21 0.001313 0.020102 Proteobacteria Deltaproteobacteria
DENOVO7 75.20 3.23 0.98 3.28 0.001022 0.017402 ProteobacteriaGammaproteobacteri
a
DENOVO159 20.33 5.95 1.29 4.60 0.000004 0.000235 ProteobacteriaGammaproteobacteri
a
Table A.3.3: Output table of statistics from DESeq analyses used to identify significant changes in OTU abundances (p <0.05) and their respectivefold changes (log2) in the small intestine microbiota between pre- and post-treatment mice in a control group.
OTU Base MeanLog2 foldchange
Log2 foldchange
standarderror
DESeqstatistic
p-valueAdjustedp-value
Phylum Class
DENOVO37 36.33 5.57 1.63 3.41 0.000653 0.041490 Bacteroidetes BacteroidiaDENOVO4 9582.97 -8.62 1.77 -4.86 0.000001 0.000149 Tenericutes Mollicutes
Table A.3.4: Output table of statistics from DESeq analyses used to identify significant changes in OTU abundances (p <0.05) and their respective fold changes(log2) in the caecum microbiota between pre- and post-treatment mice in an anthelmintic group.
OTU Base MeanLog2 foldchange
Log2 foldchange
standarderror
DESeqstatistic
p-valueAdjustedp-value
Phylum Class
DENOVO23 452.78 -5.82 1.30 -4.49 0.000007 0.008915 Firmicutes ClostridiaDENOVO4 548.60 -6.46 1.64 -3.95 0.000079 0.049904 Tenericutes Mollicutes
Table A.3.5: Output table of statistics from DESeq analyses used to identify significant changes in OTU abundances (p <0.05) and their respectivefold changes (log2) in the caecum microbiota between pre- and post-treatment mice in a control group.
OTU Base Mean Log2 fold Log2 fold DESeq p-value Adjusted Phylum Class
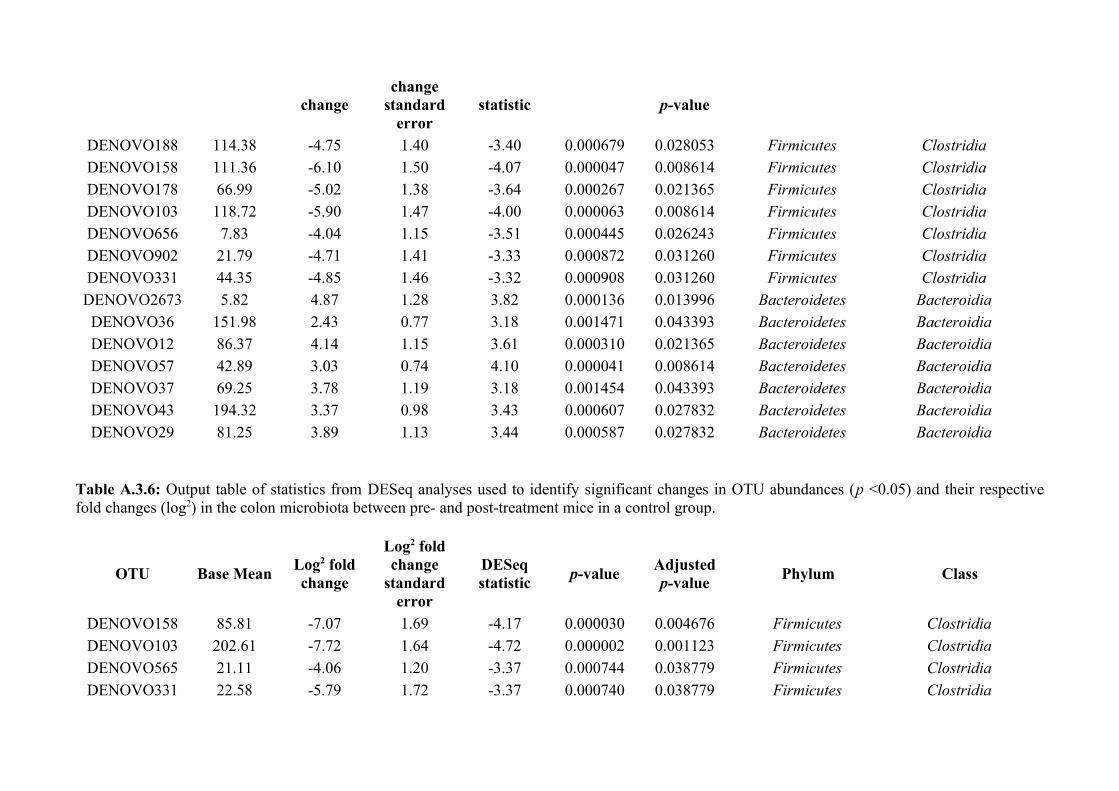
changechange
standarderror
statistic p-value
DENOVO188 114.38 -4.75 1.40 -3.40 0.000679 0.028053 Firmicutes ClostridiaDENOVO158 111.36 -6.10 1.50 -4.07 0.000047 0.008614 Firmicutes ClostridiaDENOVO178 66.99 -5.02 1.38 -3.64 0.000267 0.021365 Firmicutes ClostridiaDENOVO103 118.72 -5.90 1.47 -4.00 0.000063 0.008614 Firmicutes ClostridiaDENOVO656 7.83 -4.04 1.15 -3.51 0.000445 0.026243 Firmicutes ClostridiaDENOVO902 21.79 -4.71 1.41 -3.33 0.000872 0.031260 Firmicutes ClostridiaDENOVO331 44.35 -4.85 1.46 -3.32 0.000908 0.031260 Firmicutes ClostridiaDENOVO2673 5.82 4.87 1.28 3.82 0.000136 0.013996 Bacteroidetes BacteroidiaDENOVO36 151.98 2.43 0.77 3.18 0.001471 0.043393 Bacteroidetes BacteroidiaDENOVO12 86.37 4.14 1.15 3.61 0.000310 0.021365 Bacteroidetes BacteroidiaDENOVO57 42.89 3.03 0.74 4.10 0.000041 0.008614 Bacteroidetes BacteroidiaDENOVO37 69.25 3.78 1.19 3.18 0.001454 0.043393 Bacteroidetes BacteroidiaDENOVO43 194.32 3.37 0.98 3.43 0.000607 0.027832 Bacteroidetes BacteroidiaDENOVO29 81.25 3.89 1.13 3.44 0.000587 0.027832 Bacteroidetes Bacteroidia
Table A.3.6: Output table of statistics from DESeq analyses used to identify significant changes in OTU abundances (p <0.05) and their respectivefold changes (log2) in the colon microbiota between pre- and post-treatment mice in a control group.
OTU Base MeanLog2 foldchange
Log2 foldchange
standarderror
DESeqstatistic
p-valueAdjustedp-value
Phylum Class
DENOVO158 85.81 -7.07 1.69 -4.17 0.000030 0.004676 Firmicutes Clostridia
DENOVO103 202.61 -7.72 1.64 -4.72 0.000002 0.001123 Firmicutes Clostridia
DENOVO565 21.11 -4.06 1.20 -3.37 0.000744 0.038779 Firmicutes Clostridia
DENOVO331 22.58 -5.79 1.72 -3.37 0.000740 0.038779 Firmicutes Clostridia
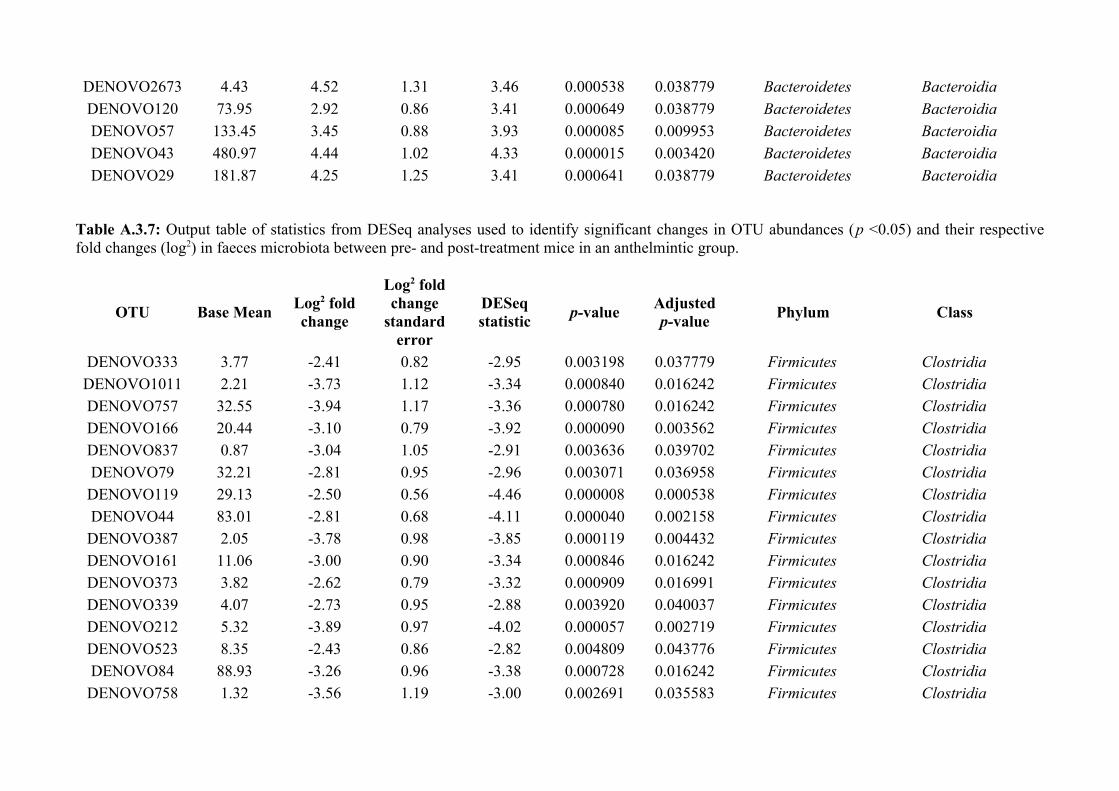
DENOVO2673 4.43 4.52 1.31 3.46 0.000538 0.038779 Bacteroidetes Bacteroidia
DENOVO120 73.95 2.92 0.86 3.41 0.000649 0.038779 Bacteroidetes Bacteroidia
DENOVO57 133.45 3.45 0.88 3.93 0.000085 0.009953 Bacteroidetes Bacteroidia
DENOVO43 480.97 4.44 1.02 4.33 0.000015 0.003420 Bacteroidetes Bacteroidia
DENOVO29 181.87 4.25 1.25 3.41 0.000641 0.038779 Bacteroidetes Bacteroidia
Table A.3.7: Output table of statistics from DESeq analyses used to identify significant changes in OTU abundances (p <0.05) and their respectivefold changes (log2) in faeces microbiota between pre- and post-treatment mice in an anthelmintic group.
OTU Base MeanLog2 foldchange
Log2 foldchange
standarderror
DESeqstatistic
p-valueAdjustedp-value
Phylum Class
DENOVO333 3.77 -2.41 0.82 -2.95 0.003198 0.037779 Firmicutes ClostridiaDENOVO1011 2.21 -3.73 1.12 -3.34 0.000840 0.016242 Firmicutes ClostridiaDENOVO757 32.55 -3.94 1.17 -3.36 0.000780 0.016242 Firmicutes ClostridiaDENOVO166 20.44 -3.10 0.79 -3.92 0.000090 0.003562 Firmicutes ClostridiaDENOVO837 0.87 -3.04 1.05 -2.91 0.003636 0.039702 Firmicutes ClostridiaDENOVO79 32.21 -2.81 0.95 -2.96 0.003071 0.036958 Firmicutes ClostridiaDENOVO119 29.13 -2.50 0.56 -4.46 0.000008 0.000538 Firmicutes ClostridiaDENOVO44 83.01 -2.81 0.68 -4.11 0.000040 0.002158 Firmicutes ClostridiaDENOVO387 2.05 -3.78 0.98 -3.85 0.000119 0.004432 Firmicutes ClostridiaDENOVO161 11.06 -3.00 0.90 -3.34 0.000846 0.016242 Firmicutes ClostridiaDENOVO373 3.82 -2.62 0.79 -3.32 0.000909 0.016991 Firmicutes ClostridiaDENOVO339 4.07 -2.73 0.95 -2.88 0.003920 0.040037 Firmicutes ClostridiaDENOVO212 5.32 -3.89 0.97 -4.02 0.000057 0.002719 Firmicutes ClostridiaDENOVO523 8.35 -2.43 0.86 -2.82 0.004809 0.043776 Firmicutes ClostridiaDENOVO84 88.93 -3.26 0.96 -3.38 0.000728 0.016242 Firmicutes ClostridiaDENOVO758 1.32 -3.56 1.19 -3.00 0.002691 0.035583 Firmicutes Clostridia
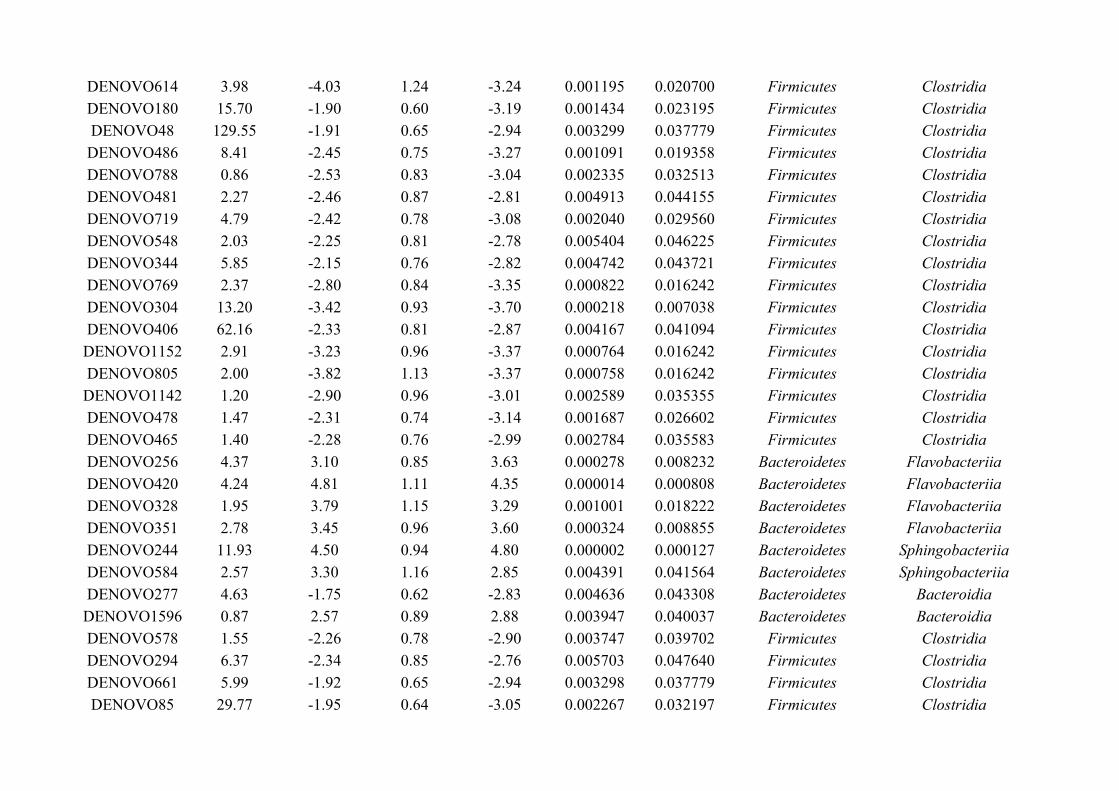
DENOVO614 3.98 -4.03 1.24 -3.24 0.001195 0.020700 Firmicutes ClostridiaDENOVO180 15.70 -1.90 0.60 -3.19 0.001434 0.023195 Firmicutes ClostridiaDENOVO48 129.55 -1.91 0.65 -2.94 0.003299 0.037779 Firmicutes ClostridiaDENOVO486 8.41 -2.45 0.75 -3.27 0.001091 0.019358 Firmicutes ClostridiaDENOVO788 0.86 -2.53 0.83 -3.04 0.002335 0.032513 Firmicutes ClostridiaDENOVO481 2.27 -2.46 0.87 -2.81 0.004913 0.044155 Firmicutes ClostridiaDENOVO719 4.79 -2.42 0.78 -3.08 0.002040 0.029560 Firmicutes ClostridiaDENOVO548 2.03 -2.25 0.81 -2.78 0.005404 0.046225 Firmicutes ClostridiaDENOVO344 5.85 -2.15 0.76 -2.82 0.004742 0.043721 Firmicutes ClostridiaDENOVO769 2.37 -2.80 0.84 -3.35 0.000822 0.016242 Firmicutes ClostridiaDENOVO304 13.20 -3.42 0.93 -3.70 0.000218 0.007038 Firmicutes ClostridiaDENOVO406 62.16 -2.33 0.81 -2.87 0.004167 0.041094 Firmicutes ClostridiaDENOVO1152 2.91 -3.23 0.96 -3.37 0.000764 0.016242 Firmicutes ClostridiaDENOVO805 2.00 -3.82 1.13 -3.37 0.000758 0.016242 Firmicutes ClostridiaDENOVO1142 1.20 -2.90 0.96 -3.01 0.002589 0.035355 Firmicutes ClostridiaDENOVO478 1.47 -2.31 0.74 -3.14 0.001687 0.026602 Firmicutes ClostridiaDENOVO465 1.40 -2.28 0.76 -2.99 0.002784 0.035583 Firmicutes ClostridiaDENOVO256 4.37 3.10 0.85 3.63 0.000278 0.008232 Bacteroidetes FlavobacteriiaDENOVO420 4.24 4.81 1.11 4.35 0.000014 0.000808 Bacteroidetes FlavobacteriiaDENOVO328 1.95 3.79 1.15 3.29 0.001001 0.018222 Bacteroidetes FlavobacteriiaDENOVO351 2.78 3.45 0.96 3.60 0.000324 0.008855 Bacteroidetes FlavobacteriiaDENOVO244 11.93 4.50 0.94 4.80 0.000002 0.000127 Bacteroidetes SphingobacteriiaDENOVO584 2.57 3.30 1.16 2.85 0.004391 0.041564 Bacteroidetes SphingobacteriiaDENOVO277 4.63 -1.75 0.62 -2.83 0.004636 0.043308 Bacteroidetes BacteroidiaDENOVO1596 0.87 2.57 0.89 2.88 0.003947 0.040037 Bacteroidetes BacteroidiaDENOVO578 1.55 -2.26 0.78 -2.90 0.003747 0.039702 Firmicutes ClostridiaDENOVO294 6.37 -2.34 0.85 -2.76 0.005703 0.047640 Firmicutes ClostridiaDENOVO661 5.99 -1.92 0.65 -2.94 0.003298 0.037779 Firmicutes ClostridiaDENOVO85 29.77 -1.95 0.64 -3.05 0.002267 0.032197 Firmicutes Clostridia
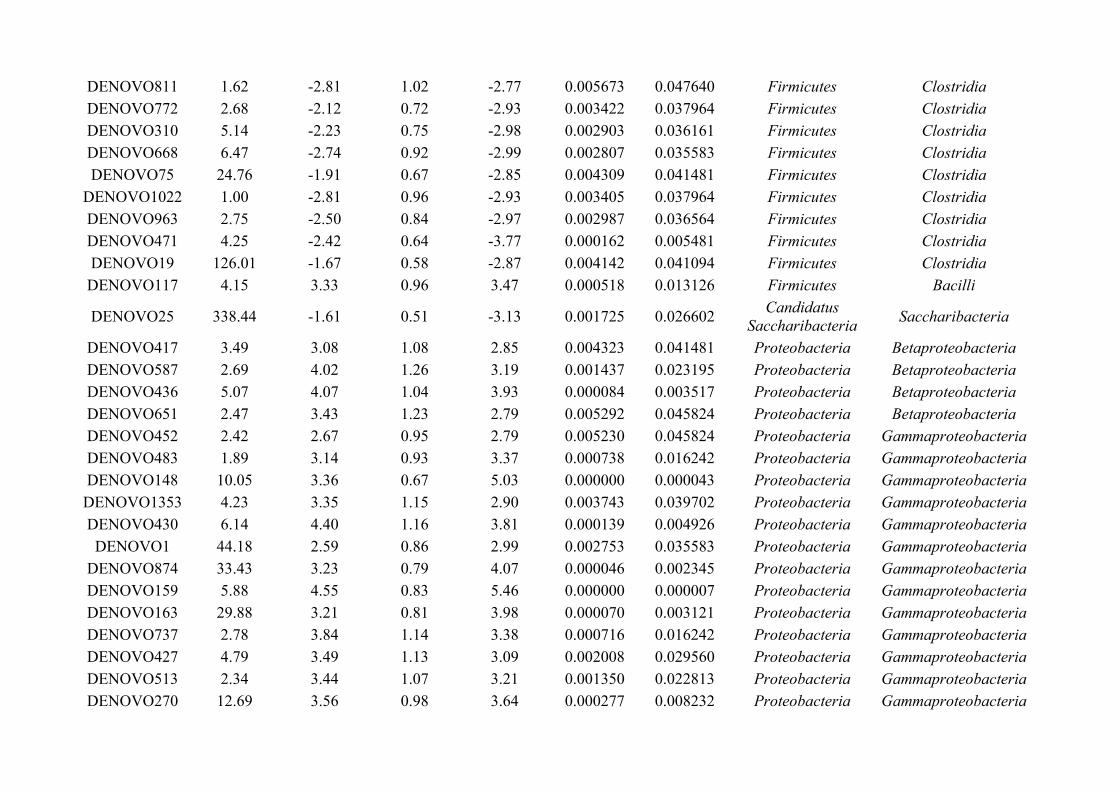
DENOVO811 1.62 -2.81 1.02 -2.77 0.005673 0.047640 Firmicutes ClostridiaDENOVO772 2.68 -2.12 0.72 -2.93 0.003422 0.037964 Firmicutes ClostridiaDENOVO310 5.14 -2.23 0.75 -2.98 0.002903 0.036161 Firmicutes ClostridiaDENOVO668 6.47 -2.74 0.92 -2.99 0.002807 0.035583 Firmicutes ClostridiaDENOVO75 24.76 -1.91 0.67 -2.85 0.004309 0.041481 Firmicutes Clostridia
DENOVO1022 1.00 -2.81 0.96 -2.93 0.003405 0.037964 Firmicutes ClostridiaDENOVO963 2.75 -2.50 0.84 -2.97 0.002987 0.036564 Firmicutes ClostridiaDENOVO471 4.25 -2.42 0.64 -3.77 0.000162 0.005481 Firmicutes ClostridiaDENOVO19 126.01 -1.67 0.58 -2.87 0.004142 0.041094 Firmicutes ClostridiaDENOVO117 4.15 3.33 0.96 3.47 0.000518 0.013126 Firmicutes Bacilli
DENOVO25 338.44 -1.61 0.51 -3.13 0.001725 0.026602Candidatus
SaccharibacteriaSaccharibacteria
DENOVO417 3.49 3.08 1.08 2.85 0.004323 0.041481 Proteobacteria BetaproteobacteriaDENOVO587 2.69 4.02 1.26 3.19 0.001437 0.023195 Proteobacteria BetaproteobacteriaDENOVO436 5.07 4.07 1.04 3.93 0.000084 0.003517 Proteobacteria BetaproteobacteriaDENOVO651 2.47 3.43 1.23 2.79 0.005292 0.045824 Proteobacteria BetaproteobacteriaDENOVO452 2.42 2.67 0.95 2.79 0.005230 0.045824 Proteobacteria GammaproteobacteriaDENOVO483 1.89 3.14 0.93 3.37 0.000738 0.016242 Proteobacteria GammaproteobacteriaDENOVO148 10.05 3.36 0.67 5.03 0.000000 0.000043 Proteobacteria GammaproteobacteriaDENOVO1353 4.23 3.35 1.15 2.90 0.003743 0.039702 Proteobacteria GammaproteobacteriaDENOVO430 6.14 4.40 1.16 3.81 0.000139 0.004926 Proteobacteria GammaproteobacteriaDENOVO1 44.18 2.59 0.86 2.99 0.002753 0.035583 Proteobacteria Gammaproteobacteria
DENOVO874 33.43 3.23 0.79 4.07 0.000046 0.002345 Proteobacteria GammaproteobacteriaDENOVO159 5.88 4.55 0.83 5.46 0.000000 0.000007 Proteobacteria GammaproteobacteriaDENOVO163 29.88 3.21 0.81 3.98 0.000070 0.003121 Proteobacteria GammaproteobacteriaDENOVO737 2.78 3.84 1.14 3.38 0.000716 0.016242 Proteobacteria GammaproteobacteriaDENOVO427 4.79 3.49 1.13 3.09 0.002008 0.029560 Proteobacteria GammaproteobacteriaDENOVO513 2.34 3.44 1.07 3.21 0.001350 0.022813 Proteobacteria GammaproteobacteriaDENOVO270 12.69 3.56 0.98 3.64 0.000277 0.008232 Proteobacteria Gammaproteobacteria
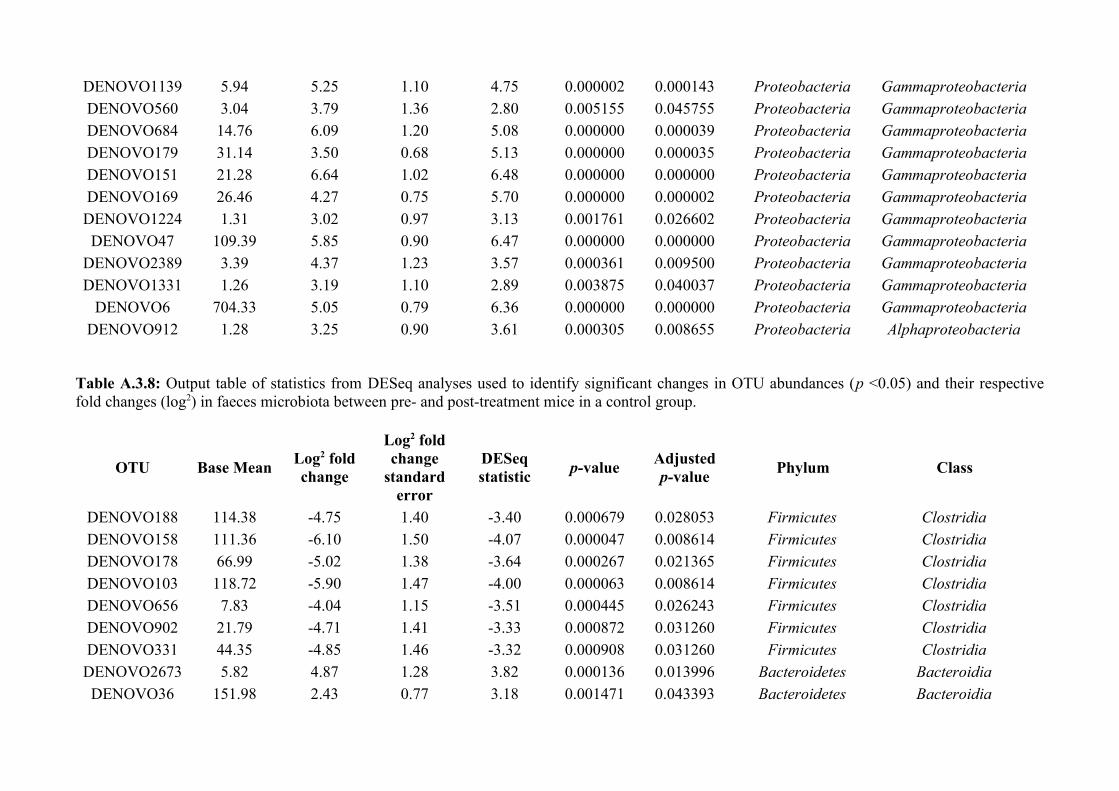
DENOVO1139 5.94 5.25 1.10 4.75 0.000002 0.000143 Proteobacteria GammaproteobacteriaDENOVO560 3.04 3.79 1.36 2.80 0.005155 0.045755 Proteobacteria GammaproteobacteriaDENOVO684 14.76 6.09 1.20 5.08 0.000000 0.000039 Proteobacteria GammaproteobacteriaDENOVO179 31.14 3.50 0.68 5.13 0.000000 0.000035 Proteobacteria GammaproteobacteriaDENOVO151 21.28 6.64 1.02 6.48 0.000000 0.000000 Proteobacteria GammaproteobacteriaDENOVO169 26.46 4.27 0.75 5.70 0.000000 0.000002 Proteobacteria GammaproteobacteriaDENOVO1224 1.31 3.02 0.97 3.13 0.001761 0.026602 Proteobacteria GammaproteobacteriaDENOVO47 109.39 5.85 0.90 6.47 0.000000 0.000000 Proteobacteria Gammaproteobacteria
DENOVO2389 3.39 4.37 1.23 3.57 0.000361 0.009500 Proteobacteria GammaproteobacteriaDENOVO1331 1.26 3.19 1.10 2.89 0.003875 0.040037 Proteobacteria Gammaproteobacteria
DENOVO6 704.33 5.05 0.79 6.36 0.000000 0.000000 Proteobacteria GammaproteobacteriaDENOVO912 1.28 3.25 0.90 3.61 0.000305 0.008655 Proteobacteria Alphaproteobacteria
Table A.3.8: Output table of statistics from DESeq analyses used to identify significant changes in OTU abundances (p <0.05) and their respectivefold changes (log2) in faeces microbiota between pre- and post-treatment mice in a control group.
OTU Base MeanLog2 foldchange
Log2 foldchange
standarderror
DESeqstatistic
p-valueAdjustedp-value
Phylum Class
DENOVO188 114.38 -4.75 1.40 -3.40 0.000679 0.028053 Firmicutes ClostridiaDENOVO158 111.36 -6.10 1.50 -4.07 0.000047 0.008614 Firmicutes ClostridiaDENOVO178 66.99 -5.02 1.38 -3.64 0.000267 0.021365 Firmicutes ClostridiaDENOVO103 118.72 -5.90 1.47 -4.00 0.000063 0.008614 Firmicutes ClostridiaDENOVO656 7.83 -4.04 1.15 -3.51 0.000445 0.026243 Firmicutes ClostridiaDENOVO902 21.79 -4.71 1.41 -3.33 0.000872 0.031260 Firmicutes ClostridiaDENOVO331 44.35 -4.85 1.46 -3.32 0.000908 0.031260 Firmicutes ClostridiaDENOVO2673 5.82 4.87 1.28 3.82 0.000136 0.013996 Bacteroidetes BacteroidiaDENOVO36 151.98 2.43 0.77 3.18 0.001471 0.043393 Bacteroidetes Bacteroidia
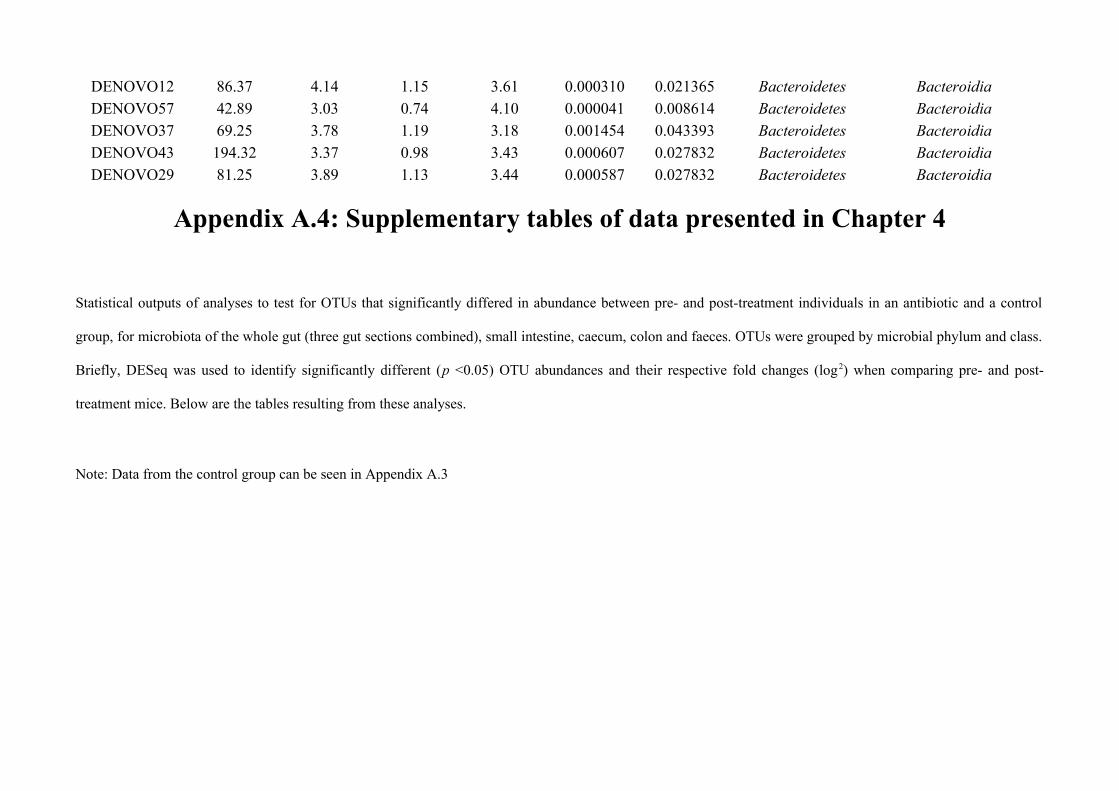
DENOVO12 86.37 4.14 1.15 3.61 0.000310 0.021365 Bacteroidetes BacteroidiaDENOVO57 42.89 3.03 0.74 4.10 0.000041 0.008614 Bacteroidetes BacteroidiaDENOVO37 69.25 3.78 1.19 3.18 0.001454 0.043393 Bacteroidetes BacteroidiaDENOVO43 194.32 3.37 0.98 3.43 0.000607 0.027832 Bacteroidetes BacteroidiaDENOVO29 81.25 3.89 1.13 3.44 0.000587 0.027832 Bacteroidetes Bacteroidia
Appendix A.4: Supplementary tables of data presented in Chapter 4
Statistical outputs of analyses to test for OTUs that significantly differed in abundance between pre- and post-treatment individuals in an antibiotic and a control
group, for microbiota of the whole gut (three gut sections combined), small intestine, caecum, colon and faeces. OTUs were grouped by microbial phylum and class.
Briefly, DESeq was used to identify significantly different (p <0.05) OTU abundances and their respective fold changes (log2) when comparing pre- and post-
treatment mice. Below are the tables resulting from these analyses.
Note: Data from the control group can be seen in Appendix A.3
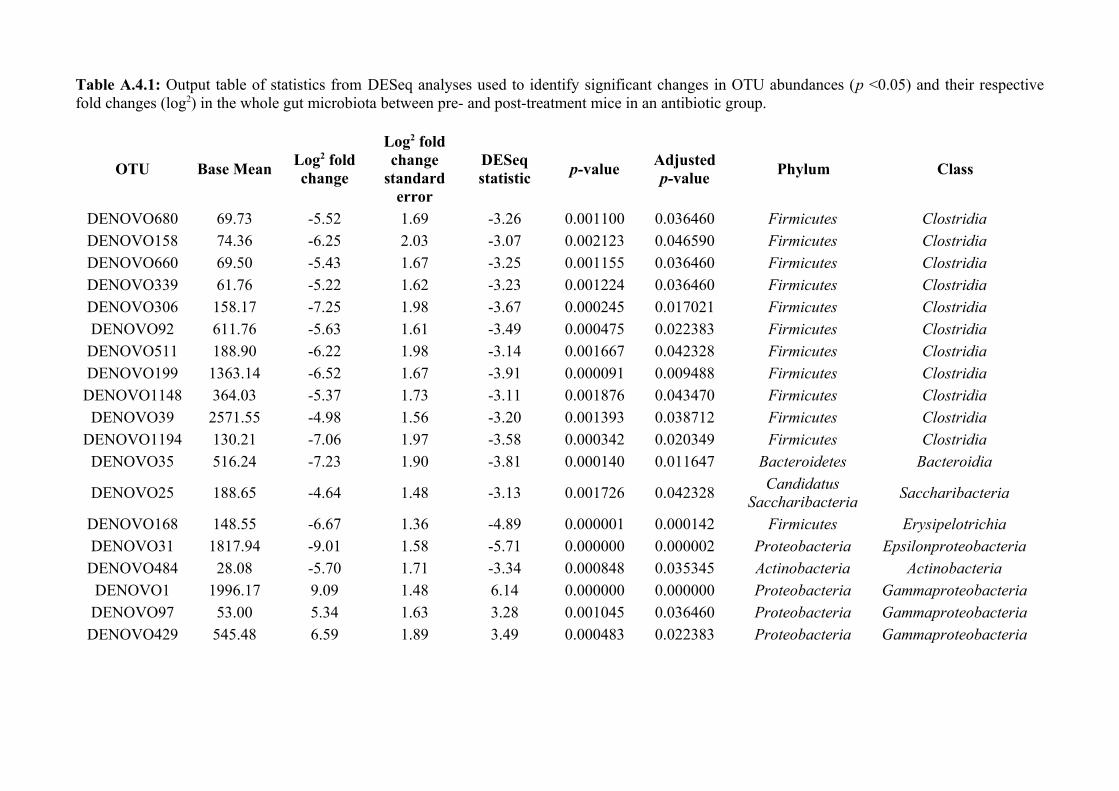
Table A.4.1: Output table of statistics from DESeq analyses used to identify significant changes in OTU abundances (p <0.05) and their respectivefold changes (log2) in the whole gut microbiota between pre- and post-treatment mice in an antibiotic group.
OTU Base MeanLog2 foldchange
Log2 foldchange
standarderror
DESeqstatistic
p-valueAdjustedp-value
Phylum Class
DENOVO680 69.73 -5.52 1.69 -3.26 0.001100 0.036460 Firmicutes ClostridiaDENOVO158 74.36 -6.25 2.03 -3.07 0.002123 0.046590 Firmicutes ClostridiaDENOVO660 69.50 -5.43 1.67 -3.25 0.001155 0.036460 Firmicutes ClostridiaDENOVO339 61.76 -5.22 1.62 -3.23 0.001224 0.036460 Firmicutes ClostridiaDENOVO306 158.17 -7.25 1.98 -3.67 0.000245 0.017021 Firmicutes ClostridiaDENOVO92 611.76 -5.63 1.61 -3.49 0.000475 0.022383 Firmicutes ClostridiaDENOVO511 188.90 -6.22 1.98 -3.14 0.001667 0.042328 Firmicutes ClostridiaDENOVO199 1363.14 -6.52 1.67 -3.91 0.000091 0.009488 Firmicutes ClostridiaDENOVO1148 364.03 -5.37 1.73 -3.11 0.001876 0.043470 Firmicutes ClostridiaDENOVO39 2571.55 -4.98 1.56 -3.20 0.001393 0.038712 Firmicutes Clostridia
DENOVO1194 130.21 -7.06 1.97 -3.58 0.000342 0.020349 Firmicutes ClostridiaDENOVO35 516.24 -7.23 1.90 -3.81 0.000140 0.011647 Bacteroidetes Bacteroidia
DENOVO25 188.65 -4.64 1.48 -3.13 0.001726 0.042328Candidatus
SaccharibacteriaSaccharibacteria
DENOVO168 148.55 -6.67 1.36 -4.89 0.000001 0.000142 Firmicutes ErysipelotrichiaDENOVO31 1817.94 -9.01 1.58 -5.71 0.000000 0.000002 Proteobacteria EpsilonproteobacteriaDENOVO484 28.08 -5.70 1.71 -3.34 0.000848 0.035345 Actinobacteria ActinobacteriaDENOVO1 1996.17 9.09 1.48 6.14 0.000000 0.000000 Proteobacteria GammaproteobacteriaDENOVO97 53.00 5.34 1.63 3.28 0.001045 0.036460 Proteobacteria GammaproteobacteriaDENOVO429 545.48 6.59 1.89 3.49 0.000483 0.022383 Proteobacteria Gammaproteobacteria
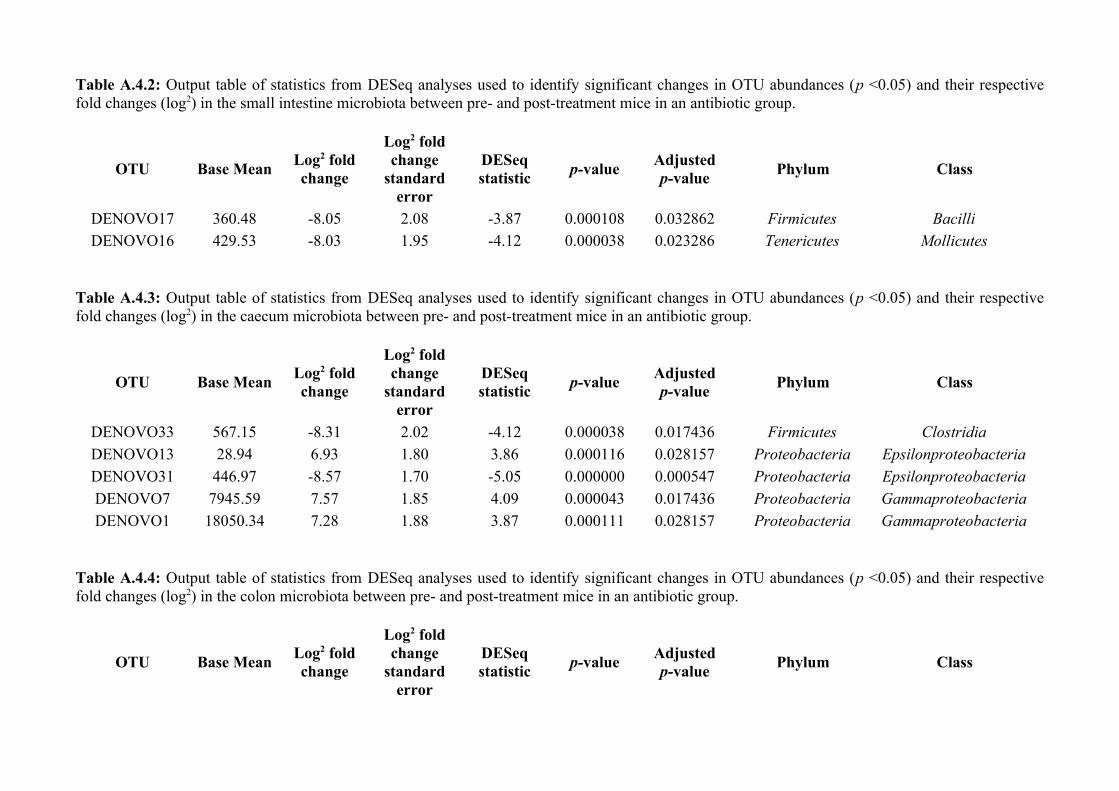
Table A.4.2: Output table of statistics from DESeq analyses used to identify significant changes in OTU abundances (p <0.05) and their respectivefold changes (log2) in the small intestine microbiota between pre- and post-treatment mice in an antibiotic group.
OTU Base MeanLog2 foldchange
Log2 foldchange
standarderror
DESeqstatistic
p-valueAdjustedp-value
Phylum Class
DENOVO17 360.48 -8.05 2.08 -3.87 0.000108 0.032862 Firmicutes BacilliDENOVO16 429.53 -8.03 1.95 -4.12 0.000038 0.023286 Tenericutes Mollicutes
Table A.4.3: Output table of statistics from DESeq analyses used to identify significant changes in OTU abundances (p <0.05) and their respectivefold changes (log2) in the caecum microbiota between pre- and post-treatment mice in an antibiotic group.
OTU Base MeanLog2 foldchange
Log2 foldchange
standarderror
DESeqstatistic
p-valueAdjustedp-value
Phylum Class
DENOVO33 567.15 -8.31 2.02 -4.12 0.000038 0.017436 Firmicutes Clostridia
DENOVO13 28.94 6.93 1.80 3.86 0.000116 0.028157 Proteobacteria Epsilonproteobacteria
DENOVO31 446.97 -8.57 1.70 -5.05 0.000000 0.000547 Proteobacteria Epsilonproteobacteria
DENOVO7 7945.59 7.57 1.85 4.09 0.000043 0.017436 Proteobacteria Gammaproteobacteria
DENOVO1 18050.34 7.28 1.88 3.87 0.000111 0.028157 Proteobacteria Gammaproteobacteria
Table A.4.4: Output table of statistics from DESeq analyses used to identify significant changes in OTU abundances (p <0.05) and their respectivefold changes (log2) in the colon microbiota between pre- and post-treatment mice in an antibiotic group.
OTU Base MeanLog2 foldchange
Log2 foldchange
standarderror
DESeqstatistic
p-valueAdjustedp-value
Phylum Class
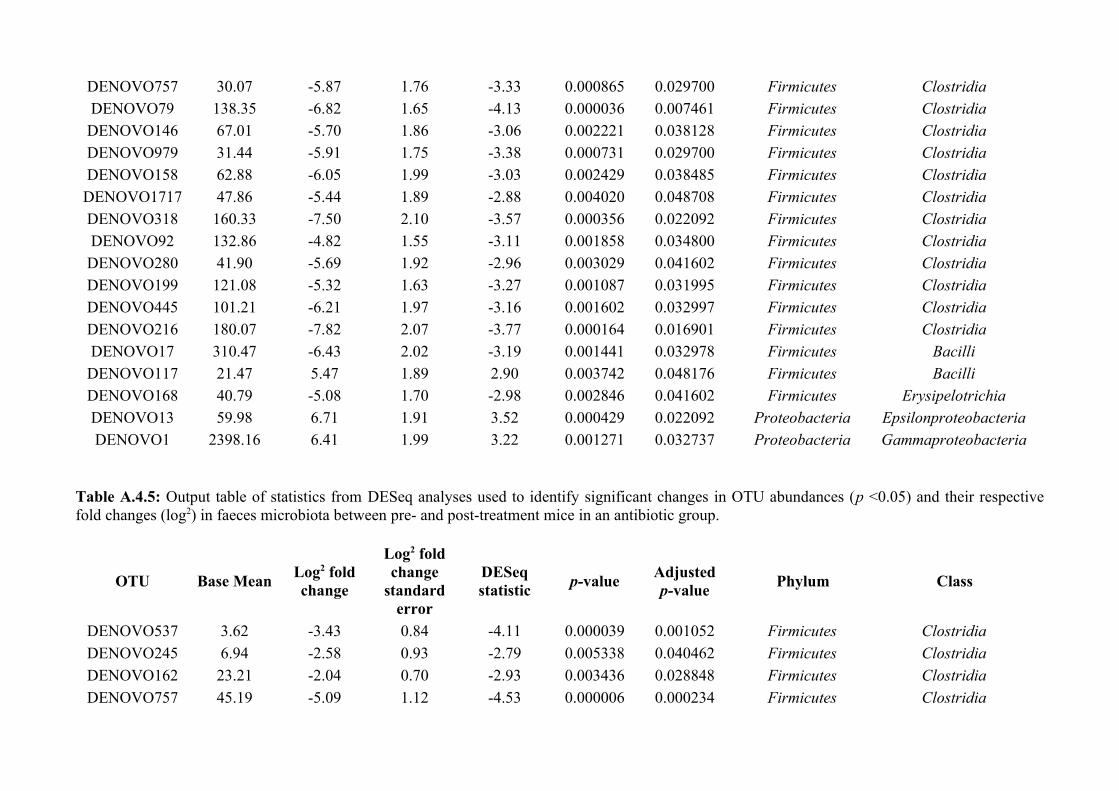
DENOVO757 30.07 -5.87 1.76 -3.33 0.000865 0.029700 Firmicutes ClostridiaDENOVO79 138.35 -6.82 1.65 -4.13 0.000036 0.007461 Firmicutes ClostridiaDENOVO146 67.01 -5.70 1.86 -3.06 0.002221 0.038128 Firmicutes ClostridiaDENOVO979 31.44 -5.91 1.75 -3.38 0.000731 0.029700 Firmicutes ClostridiaDENOVO158 62.88 -6.05 1.99 -3.03 0.002429 0.038485 Firmicutes ClostridiaDENOVO1717 47.86 -5.44 1.89 -2.88 0.004020 0.048708 Firmicutes ClostridiaDENOVO318 160.33 -7.50 2.10 -3.57 0.000356 0.022092 Firmicutes ClostridiaDENOVO92 132.86 -4.82 1.55 -3.11 0.001858 0.034800 Firmicutes ClostridiaDENOVO280 41.90 -5.69 1.92 -2.96 0.003029 0.041602 Firmicutes ClostridiaDENOVO199 121.08 -5.32 1.63 -3.27 0.001087 0.031995 Firmicutes ClostridiaDENOVO445 101.21 -6.21 1.97 -3.16 0.001602 0.032997 Firmicutes ClostridiaDENOVO216 180.07 -7.82 2.07 -3.77 0.000164 0.016901 Firmicutes ClostridiaDENOVO17 310.47 -6.43 2.02 -3.19 0.001441 0.032978 Firmicutes BacilliDENOVO117 21.47 5.47 1.89 2.90 0.003742 0.048176 Firmicutes BacilliDENOVO168 40.79 -5.08 1.70 -2.98 0.002846 0.041602 Firmicutes ErysipelotrichiaDENOVO13 59.98 6.71 1.91 3.52 0.000429 0.022092 Proteobacteria EpsilonproteobacteriaDENOVO1 2398.16 6.41 1.99 3.22 0.001271 0.032737 Proteobacteria Gammaproteobacteria
Table A.4.5: Output table of statistics from DESeq analyses used to identify significant changes in OTU abundances (p <0.05) and their respectivefold changes (log2) in faeces microbiota between pre- and post-treatment mice in an antibiotic group.
OTU Base MeanLog2 foldchange
Log2 foldchange
standarderror
DESeqstatistic
p-valueAdjustedp-value
Phylum Class
DENOVO537 3.62 -3.43 0.84 -4.11 0.000039 0.001052 Firmicutes Clostridia
DENOVO245 6.94 -2.58 0.93 -2.79 0.005338 0.040462 Firmicutes Clostridia
DENOVO162 23.21 -2.04 0.70 -2.93 0.003436 0.028848 Firmicutes Clostridia
DENOVO757 45.19 -5.09 1.12 -4.53 0.000006 0.000234 Firmicutes Clostridia
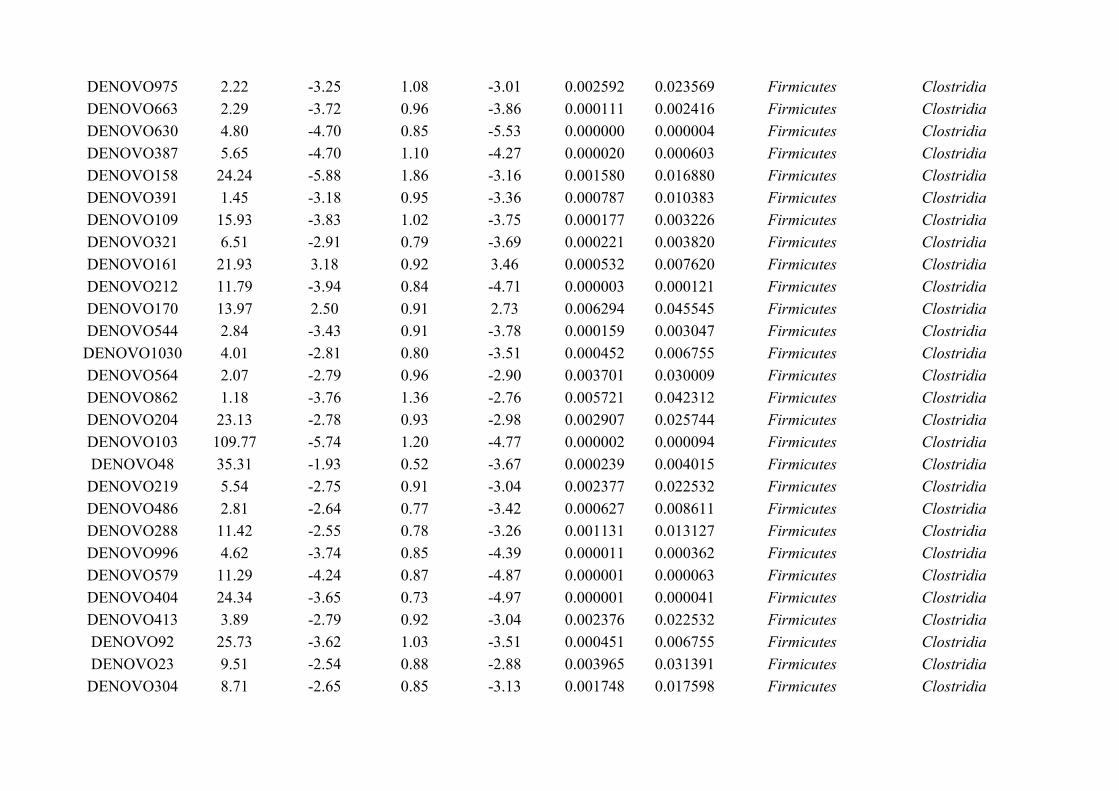
DENOVO975 2.22 -3.25 1.08 -3.01 0.002592 0.023569 Firmicutes Clostridia
DENOVO663 2.29 -3.72 0.96 -3.86 0.000111 0.002416 Firmicutes Clostridia
DENOVO630 4.80 -4.70 0.85 -5.53 0.000000 0.000004 Firmicutes Clostridia
DENOVO387 5.65 -4.70 1.10 -4.27 0.000020 0.000603 Firmicutes Clostridia
DENOVO158 24.24 -5.88 1.86 -3.16 0.001580 0.016880 Firmicutes Clostridia
DENOVO391 1.45 -3.18 0.95 -3.36 0.000787 0.010383 Firmicutes Clostridia
DENOVO109 15.93 -3.83 1.02 -3.75 0.000177 0.003226 Firmicutes Clostridia
DENOVO321 6.51 -2.91 0.79 -3.69 0.000221 0.003820 Firmicutes Clostridia
DENOVO161 21.93 3.18 0.92 3.46 0.000532 0.007620 Firmicutes Clostridia
DENOVO212 11.79 -3.94 0.84 -4.71 0.000003 0.000121 Firmicutes Clostridia
DENOVO170 13.97 2.50 0.91 2.73 0.006294 0.045545 Firmicutes Clostridia
DENOVO544 2.84 -3.43 0.91 -3.78 0.000159 0.003047 Firmicutes Clostridia
DENOVO1030 4.01 -2.81 0.80 -3.51 0.000452 0.006755 Firmicutes Clostridia
DENOVO564 2.07 -2.79 0.96 -2.90 0.003701 0.030009 Firmicutes Clostridia
DENOVO862 1.18 -3.76 1.36 -2.76 0.005721 0.042312 Firmicutes Clostridia
DENOVO204 23.13 -2.78 0.93 -2.98 0.002907 0.025744 Firmicutes Clostridia
DENOVO103 109.77 -5.74 1.20 -4.77 0.000002 0.000094 Firmicutes Clostridia
DENOVO48 35.31 -1.93 0.52 -3.67 0.000239 0.004015 Firmicutes Clostridia
DENOVO219 5.54 -2.75 0.91 -3.04 0.002377 0.022532 Firmicutes Clostridia
DENOVO486 2.81 -2.64 0.77 -3.42 0.000627 0.008611 Firmicutes Clostridia
DENOVO288 11.42 -2.55 0.78 -3.26 0.001131 0.013127 Firmicutes Clostridia
DENOVO996 4.62 -3.74 0.85 -4.39 0.000011 0.000362 Firmicutes Clostridia
DENOVO579 11.29 -4.24 0.87 -4.87 0.000001 0.000063 Firmicutes Clostridia
DENOVO404 24.34 -3.65 0.73 -4.97 0.000001 0.000041 Firmicutes Clostridia
DENOVO413 3.89 -2.79 0.92 -3.04 0.002376 0.022532 Firmicutes Clostridia
DENOVO92 25.73 -3.62 1.03 -3.51 0.000451 0.006755 Firmicutes Clostridia
DENOVO23 9.51 -2.54 0.88 -2.88 0.003965 0.031391 Firmicutes Clostridia
DENOVO304 8.71 -2.65 0.85 -3.13 0.001748 0.017598 Firmicutes Clostridia
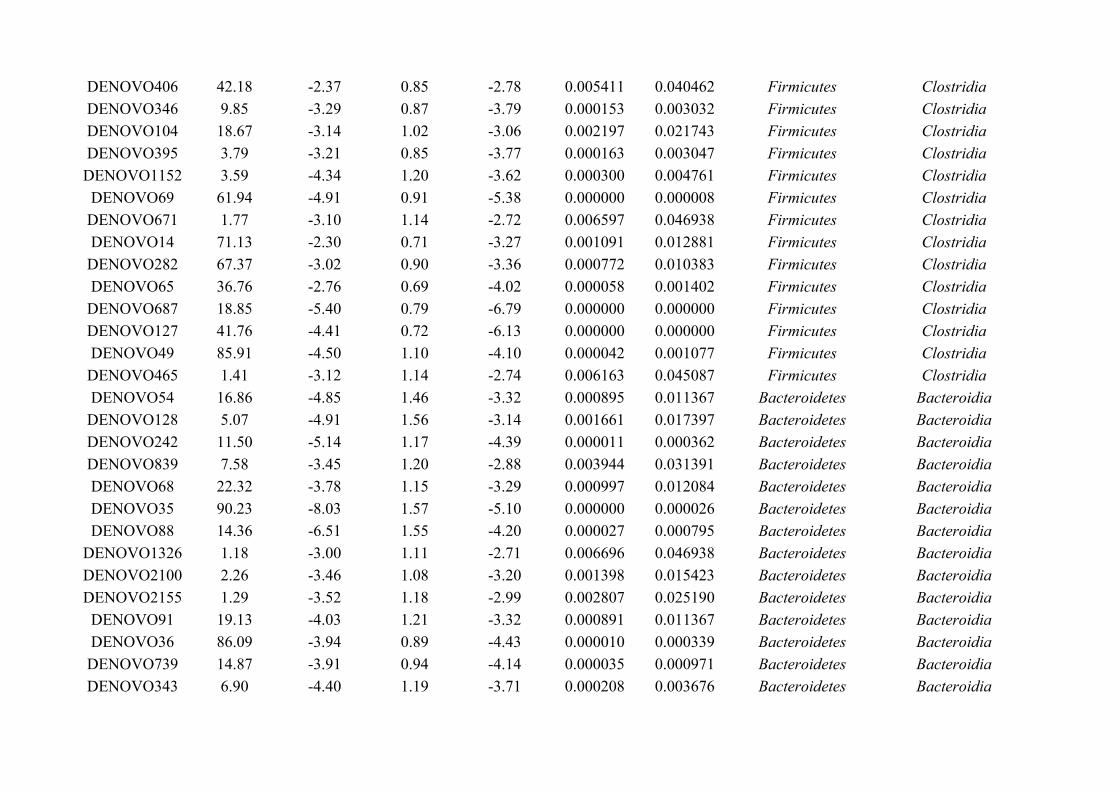
DENOVO406 42.18 -2.37 0.85 -2.78 0.005411 0.040462 Firmicutes Clostridia
DENOVO346 9.85 -3.29 0.87 -3.79 0.000153 0.003032 Firmicutes Clostridia
DENOVO104 18.67 -3.14 1.02 -3.06 0.002197 0.021743 Firmicutes Clostridia
DENOVO395 3.79 -3.21 0.85 -3.77 0.000163 0.003047 Firmicutes Clostridia
DENOVO1152 3.59 -4.34 1.20 -3.62 0.000300 0.004761 Firmicutes Clostridia
DENOVO69 61.94 -4.91 0.91 -5.38 0.000000 0.000008 Firmicutes Clostridia
DENOVO671 1.77 -3.10 1.14 -2.72 0.006597 0.046938 Firmicutes Clostridia
DENOVO14 71.13 -2.30 0.71 -3.27 0.001091 0.012881 Firmicutes Clostridia
DENOVO282 67.37 -3.02 0.90 -3.36 0.000772 0.010383 Firmicutes Clostridia
DENOVO65 36.76 -2.76 0.69 -4.02 0.000058 0.001402 Firmicutes Clostridia
DENOVO687 18.85 -5.40 0.79 -6.79 0.000000 0.000000 Firmicutes Clostridia
DENOVO127 41.76 -4.41 0.72 -6.13 0.000000 0.000000 Firmicutes Clostridia
DENOVO49 85.91 -4.50 1.10 -4.10 0.000042 0.001077 Firmicutes Clostridia
DENOVO465 1.41 -3.12 1.14 -2.74 0.006163 0.045087 Firmicutes Clostridia
DENOVO54 16.86 -4.85 1.46 -3.32 0.000895 0.011367 Bacteroidetes Bacteroidia
DENOVO128 5.07 -4.91 1.56 -3.14 0.001661 0.017397 Bacteroidetes Bacteroidia
DENOVO242 11.50 -5.14 1.17 -4.39 0.000011 0.000362 Bacteroidetes Bacteroidia
DENOVO839 7.58 -3.45 1.20 -2.88 0.003944 0.031391 Bacteroidetes Bacteroidia
DENOVO68 22.32 -3.78 1.15 -3.29 0.000997 0.012084 Bacteroidetes Bacteroidia
DENOVO35 90.23 -8.03 1.57 -5.10 0.000000 0.000026 Bacteroidetes Bacteroidia
DENOVO88 14.36 -6.51 1.55 -4.20 0.000027 0.000795 Bacteroidetes Bacteroidia
DENOVO1326 1.18 -3.00 1.11 -2.71 0.006696 0.046938 Bacteroidetes Bacteroidia
DENOVO2100 2.26 -3.46 1.08 -3.20 0.001398 0.015423 Bacteroidetes Bacteroidia
DENOVO2155 1.29 -3.52 1.18 -2.99 0.002807 0.025190 Bacteroidetes Bacteroidia
DENOVO91 19.13 -4.03 1.21 -3.32 0.000891 0.011367 Bacteroidetes Bacteroidia
DENOVO36 86.09 -3.94 0.89 -4.43 0.000010 0.000339 Bacteroidetes Bacteroidia
DENOVO739 14.87 -3.91 0.94 -4.14 0.000035 0.000971 Bacteroidetes Bacteroidia
DENOVO343 6.90 -4.40 1.19 -3.71 0.000208 0.003676 Bacteroidetes Bacteroidia
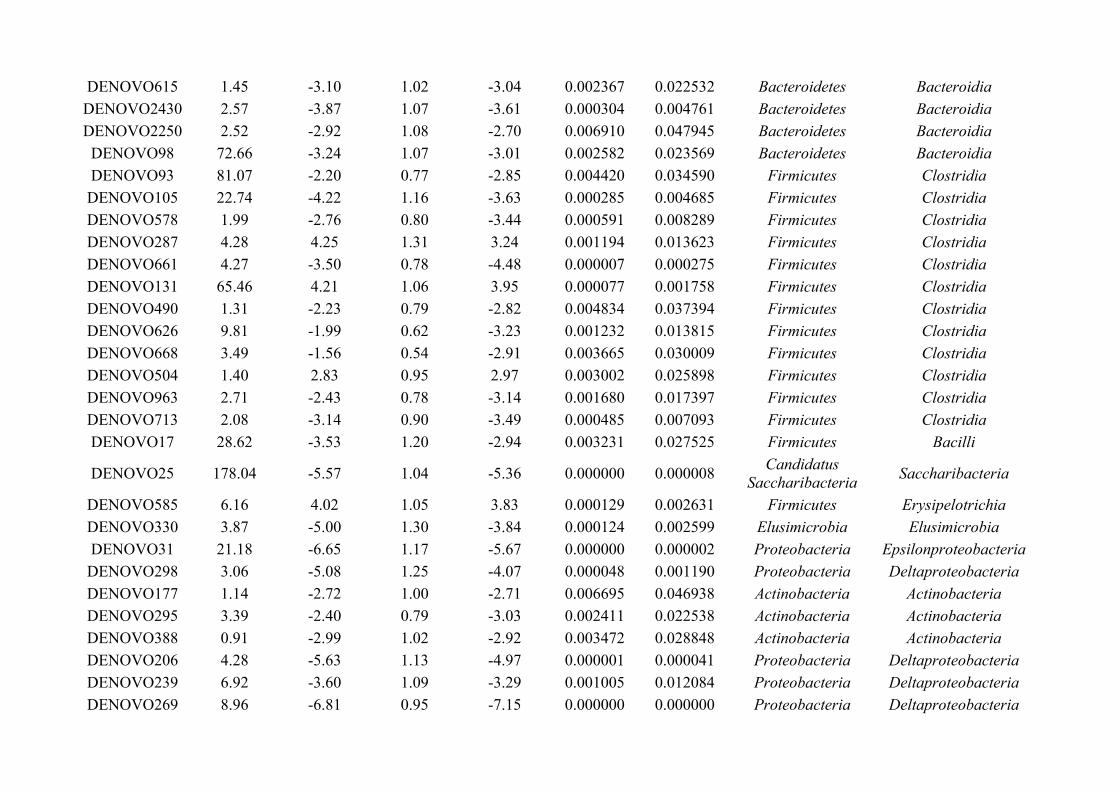
DENOVO615 1.45 -3.10 1.02 -3.04 0.002367 0.022532 Bacteroidetes Bacteroidia
DENOVO2430 2.57 -3.87 1.07 -3.61 0.000304 0.004761 Bacteroidetes Bacteroidia
DENOVO2250 2.52 -2.92 1.08 -2.70 0.006910 0.047945 Bacteroidetes Bacteroidia
DENOVO98 72.66 -3.24 1.07 -3.01 0.002582 0.023569 Bacteroidetes Bacteroidia
DENOVO93 81.07 -2.20 0.77 -2.85 0.004420 0.034590 Firmicutes Clostridia
DENOVO105 22.74 -4.22 1.16 -3.63 0.000285 0.004685 Firmicutes Clostridia
DENOVO578 1.99 -2.76 0.80 -3.44 0.000591 0.008289 Firmicutes Clostridia
DENOVO287 4.28 4.25 1.31 3.24 0.001194 0.013623 Firmicutes Clostridia
DENOVO661 4.27 -3.50 0.78 -4.48 0.000007 0.000275 Firmicutes Clostridia
DENOVO131 65.46 4.21 1.06 3.95 0.000077 0.001758 Firmicutes Clostridia
DENOVO490 1.31 -2.23 0.79 -2.82 0.004834 0.037394 Firmicutes Clostridia
DENOVO626 9.81 -1.99 0.62 -3.23 0.001232 0.013815 Firmicutes Clostridia
DENOVO668 3.49 -1.56 0.54 -2.91 0.003665 0.030009 Firmicutes Clostridia
DENOVO504 1.40 2.83 0.95 2.97 0.003002 0.025898 Firmicutes Clostridia
DENOVO963 2.71 -2.43 0.78 -3.14 0.001680 0.017397 Firmicutes Clostridia
DENOVO713 2.08 -3.14 0.90 -3.49 0.000485 0.007093 Firmicutes Clostridia
DENOVO17 28.62 -3.53 1.20 -2.94 0.003231 0.027525 Firmicutes Bacilli
DENOVO25 178.04 -5.57 1.04 -5.36 0.000000 0.000008Candidatus
SaccharibacteriaSaccharibacteria
DENOVO585 6.16 4.02 1.05 3.83 0.000129 0.002631 Firmicutes Erysipelotrichia
DENOVO330 3.87 -5.00 1.30 -3.84 0.000124 0.002599 Elusimicrobia Elusimicrobia
DENOVO31 21.18 -6.65 1.17 -5.67 0.000000 0.000002 Proteobacteria Epsilonproteobacteria
DENOVO298 3.06 -5.08 1.25 -4.07 0.000048 0.001190 Proteobacteria Deltaproteobacteria
DENOVO177 1.14 -2.72 1.00 -2.71 0.006695 0.046938 Actinobacteria Actinobacteria
DENOVO295 3.39 -2.40 0.79 -3.03 0.002411 0.022538 Actinobacteria Actinobacteria
DENOVO388 0.91 -2.99 1.02 -2.92 0.003472 0.028848 Actinobacteria Actinobacteria
DENOVO206 4.28 -5.63 1.13 -4.97 0.000001 0.000041 Proteobacteria Deltaproteobacteria
DENOVO239 6.92 -3.60 1.09 -3.29 0.001005 0.012084 Proteobacteria Deltaproteobacteria
DENOVO269 8.96 -6.81 0.95 -7.15 0.000000 0.000000 Proteobacteria Deltaproteobacteria
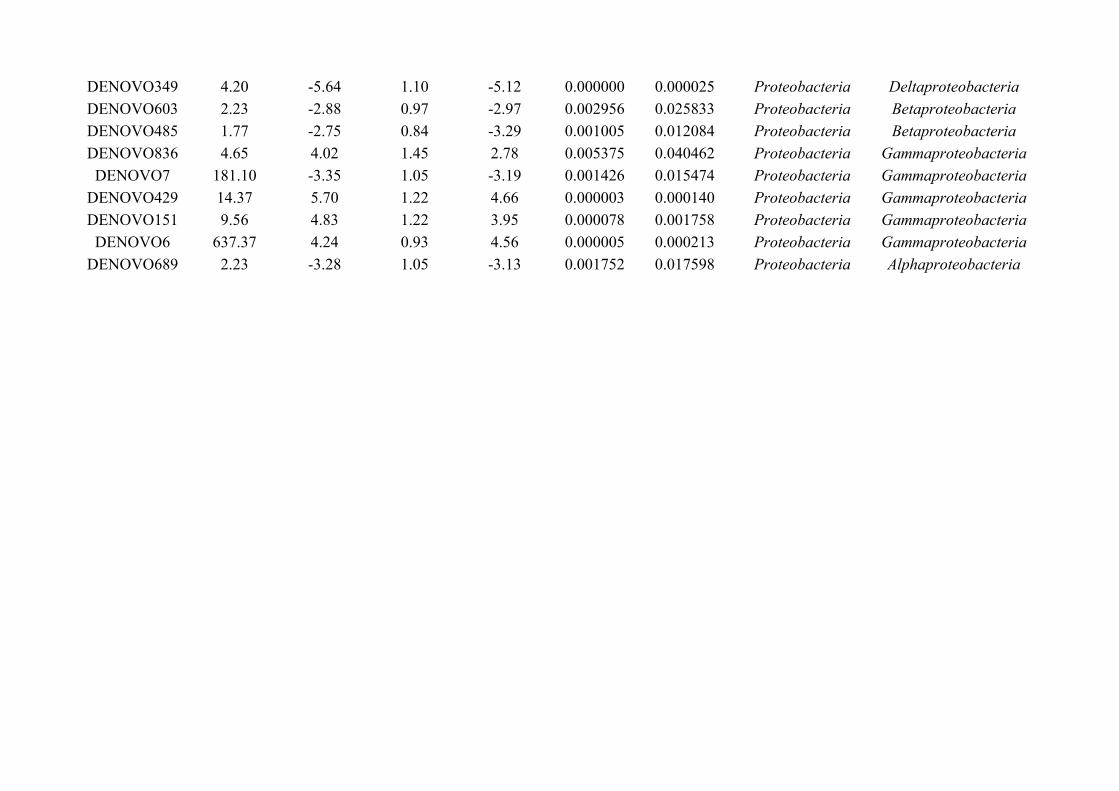
DENOVO349 4.20 -5.64 1.10 -5.12 0.000000 0.000025 Proteobacteria Deltaproteobacteria
DENOVO603 2.23 -2.88 0.97 -2.97 0.002956 0.025833 Proteobacteria Betaproteobacteria
DENOVO485 1.77 -2.75 0.84 -3.29 0.001005 0.012084 Proteobacteria Betaproteobacteria
DENOVO836 4.65 4.02 1.45 2.78 0.005375 0.040462 Proteobacteria Gammaproteobacteria
DENOVO7 181.10 -3.35 1.05 -3.19 0.001426 0.015474 Proteobacteria Gammaproteobacteria
DENOVO429 14.37 5.70 1.22 4.66 0.000003 0.000140 Proteobacteria Gammaproteobacteria
DENOVO151 9.56 4.83 1.22 3.95 0.000078 0.001758 Proteobacteria Gammaproteobacteria
DENOVO6 637.37 4.24 0.93 4.56 0.000005 0.000213 Proteobacteria Gammaproteobacteria
DENOVO689 2.23 -3.28 1.05 -3.13 0.001752 0.017598 Proteobacteria Alphaproteobacteria

Appendix A.4: Supplementary tables of data presented in Chapter 4
Appendix A.5: Supplementary tables of data presentedin Chapter 5
Table A.5.1: Sampling regime of wild mice (Apodemus flavicollis) gut sections sequenced for comparisonof the microbial community with helminth-associated microbiota. The distal colon of Mouse 11 wassequences but was discarded from analyses as it did not meet the criteria for quality filtering (indicated ingrey).
Mouse no. SexBreeding
statusStomach
Smallintestine
CaecumProximal
colonDistalcolon
1 Female Sub-adult 1 1 1 1 1
2 Female Sub-adult 1 1 1 1 1
3 Female Sub-adult 1 1 1 1 1
4 Male Sub-adult 1 1 1 1 1
5 Male Adult 1 1 1 1 1
6 Male Adult 1 1 1 1 1
7 Female Adult 1 1 1 1 1
8 Female Adult 1 1 1 1 1
9 Female Adult 1 1 1 1 1
10 Female Adult 1 1 1 1 1
11 Female Adult 1 1 1 1 1
12 Male Adult 1 1 1 1 1
13 Male Adult 1 1 1 1 1
14 Male Adult 1 1 1 1 1
15 Female Sub-adult 1 1 1 1 1
16 Female Sub-adult 1 1 1 1 1
17 Female Adult 1 1 1 1 1
18 Male Sub-adult 1 1 1 1 1
19 Male Adult 0 1 0 0 0
20 Female Adult 1 1 0 0 0
21 Male Adult 1 1 1 0 0
22 Female Sub-adult 0 1 0 0 0
23 Male Adult 0 1 0 0 0
24 Male Adult 1 1 0 0 0
319
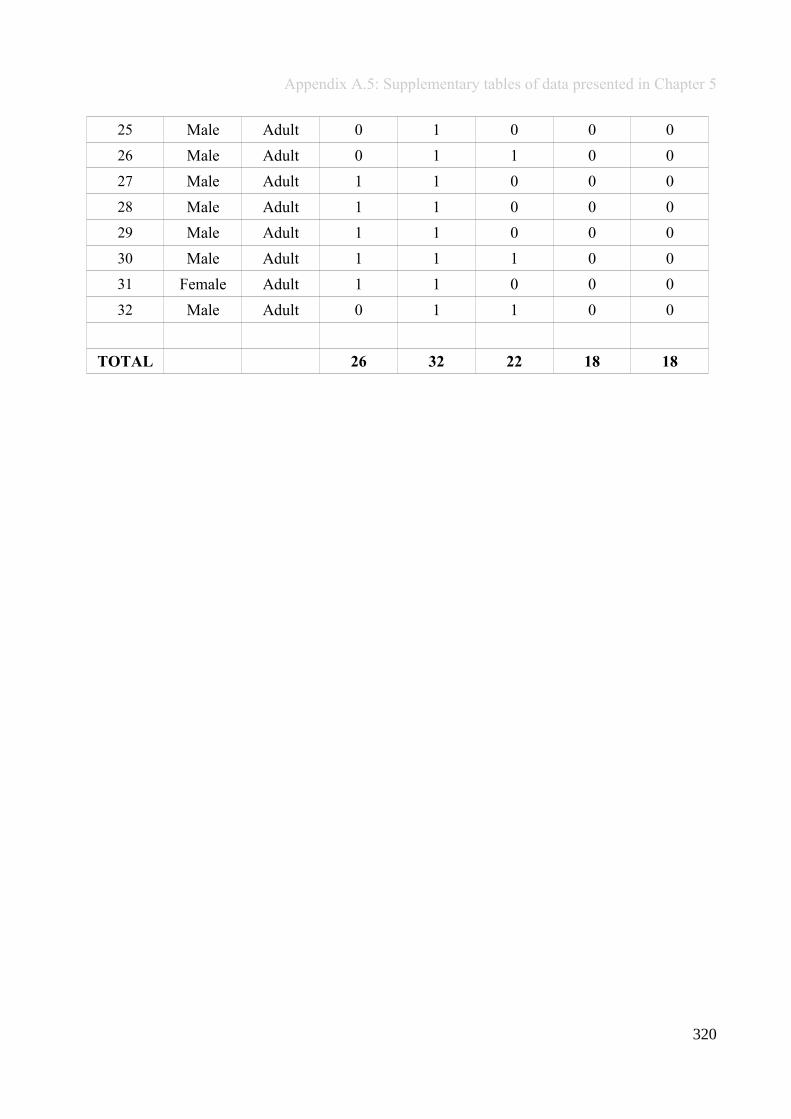
Appendix A.5: Supplementary tables of data presented in Chapter 5
25 Male Adult 0 1 0 0 0
26 Male Adult 0 1 1 0 0
27 Male Adult 1 1 0 0 0
28 Male Adult 1 1 0 0 0
29 Male Adult 1 1 0 0 0
30 Male Adult 1 1 1 0 0
31 Female Adult 1 1 0 0 0
32 Male Adult 0 1 1 0 0
TOTAL 26 32 22 18 18
320
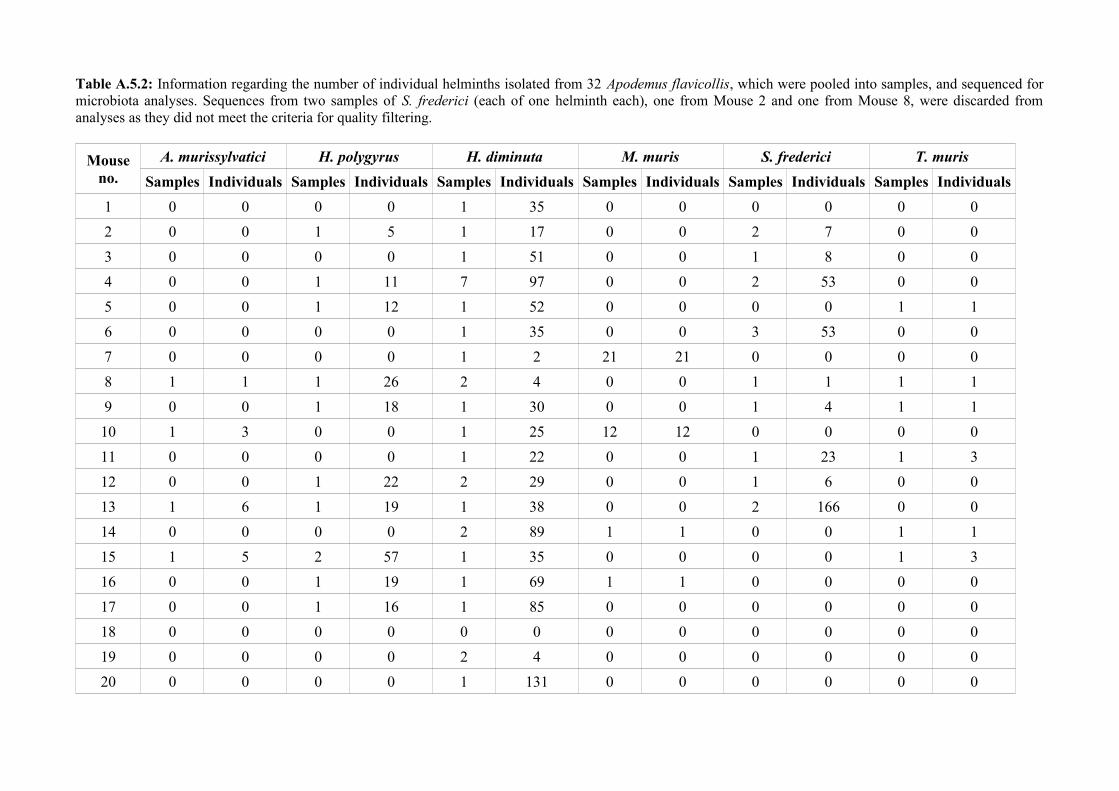
Table A.5.2: Information regarding the number of individual helminths isolated from 32 Apodemus flavicollis, which were pooled into samples, and sequenced formicrobiota analyses. Sequences from two samples of S. frederici (each of one helminth each), one from Mouse 2 and one from Mouse 8, were discarded fromanalyses as they did not meet the criteria for quality filtering.
Mouseno.
A. murissylvatici H. polygyrus H. diminuta M. muris S. frederici T. muris
Samples Individuals Samples Individuals Samples Individuals Samples Individuals Samples Individuals Samples Individuals
1 0 0 0 0 1 35 0 0 0 0 0 0
2 0 0 1 5 1 17 0 0 2 7 0 0
3 0 0 0 0 1 51 0 0 1 8 0 0
4 0 0 1 11 7 97 0 0 2 53 0 0
5 0 0 1 12 1 52 0 0 0 0 1 1
6 0 0 0 0 1 35 0 0 3 53 0 0
7 0 0 0 0 1 2 21 21 0 0 0 0
8 1 1 1 26 2 4 0 0 1 1 1 1
9 0 0 1 18 1 30 0 0 1 4 1 1
10 1 3 0 0 1 25 12 12 0 0 0 0
11 0 0 0 0 1 22 0 0 1 23 1 3
12 0 0 1 22 2 29 0 0 1 6 0 0
13 1 6 1 19 1 38 0 0 2 166 0 0
14 0 0 0 0 2 89 1 1 0 0 1 1
15 1 5 2 57 1 35 0 0 0 0 1 3
16 0 0 1 19 1 69 1 1 0 0 0 0
17 0 0 1 16 1 85 0 0 0 0 0 0
18 0 0 0 0 0 0 0 0 0 0 0 0
19 0 0 0 0 2 4 0 0 0 0 0 0
20 0 0 0 0 1 131 0 0 0 0 0 0

21 0 0 0 0 1 85 0 0 1 98 0 0
22 0 0 0 0 0 0 0 0 0 0 0 0
23 0 0 1 6 1 31 1 1 0 0 0 0
24 1 1 0 0 1 43 0 0 0 0 0 0
25 0 0 0 0 0 0 0 0 0 0 0 0
26 1 1 5 27 0 0 0 0 1 5 1 1
27 0 0 0 0 0 0 0 0 0 0 0 0
28 0 0 1 41 7 7 0 0 0 0 0 0
29 4 5 0 0 10 58 0 0 0 0 0 0
30 1 2 0 0 11 63 0 0 7 43 0 0
31 0 0 0 0 1 105 0 0 0 0 0 0
32 0 0 1 12 2 2 0 0 1 20 0 0
TOTAL 11 24 19 291 63 1,244 36 36 24 487 7 11
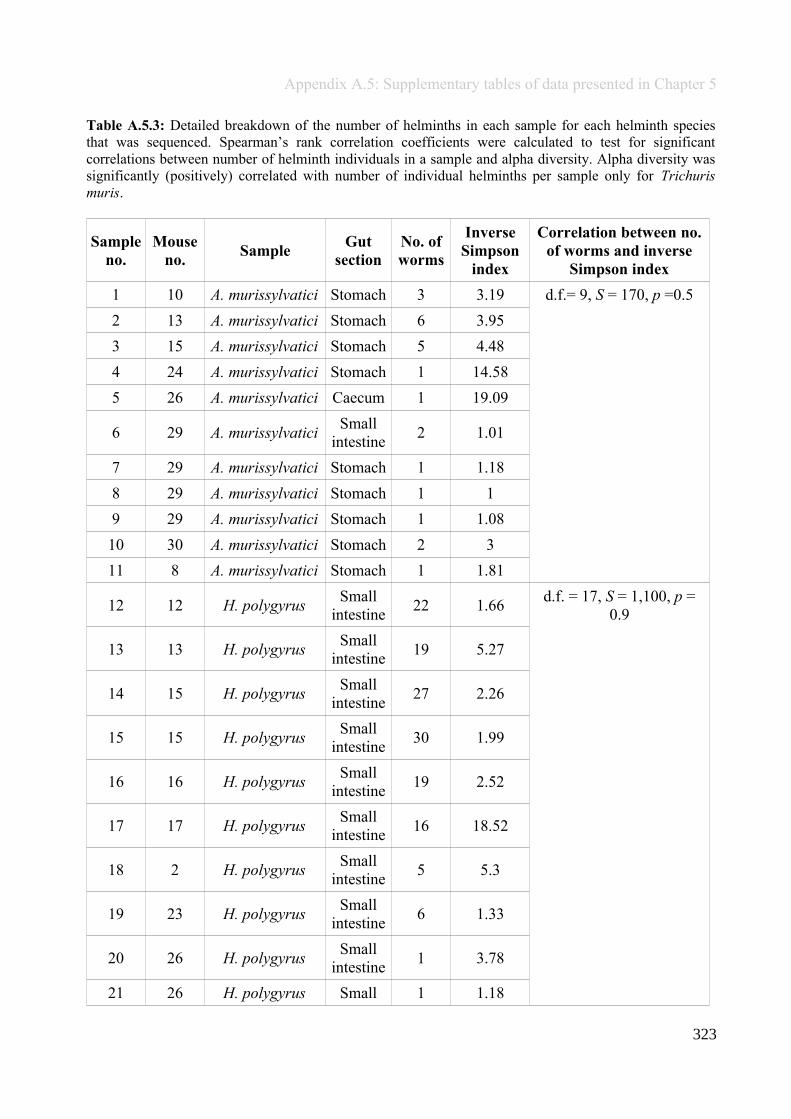
Appendix A.5: Supplementary tables of data presented in Chapter 5
Table A.5.3: Detailed breakdown of the number of helminths in each sample for each helminth speciesthat was sequenced. Spearman’s rank correlation coefficients were calculated to test for significantcorrelations between number of helminth individuals in a sample and alpha diversity. Alpha diversity wassignificantly (positively) correlated with number of individual helminths per sample only for Trichurismuris.
Sampleno.
Mouseno.
SampleGut
sectionNo. ofworms
InverseSimpson
index
Correlation between no.of worms and inverse
Simpson index
1 10 A. murissylvatici Stomach 3 3.19 d.f.= 9, S = 170, p =0.5
2 13 A. murissylvatici Stomach 6 3.95
3 15 A. murissylvatici Stomach 5 4.48
4 24 A. murissylvatici Stomach 1 14.58
5 26 A. murissylvatici Caecum 1 19.09
6 29 A. murissylvaticiSmall
intestine2 1.01
7 29 A. murissylvatici Stomach 1 1.18
8 29 A. murissylvatici Stomach 1 1
9 29 A. murissylvatici Stomach 1 1.08
10 30 A. murissylvatici Stomach 2 3
11 8 A. murissylvatici Stomach 1 1.81
12 12 H. polygyrusSmall
intestine22 1.66
d.f. = 17, S = 1,100, p =0.9
13 13 H. polygyrusSmall
intestine19 5.27
14 15 H. polygyrusSmall
intestine27 2.26
15 15 H. polygyrusSmall
intestine30 1.99
16 16 H. polygyrusSmall
intestine19 2.52
17 17 H. polygyrusSmall
intestine16 18.52
18 2 H. polygyrusSmall
intestine5 5.3
19 23 H. polygyrusSmall
intestine6 1.33
20 26 H. polygyrusSmall
intestine1 3.78
21 26 H. polygyrus Small 1 1.18
323
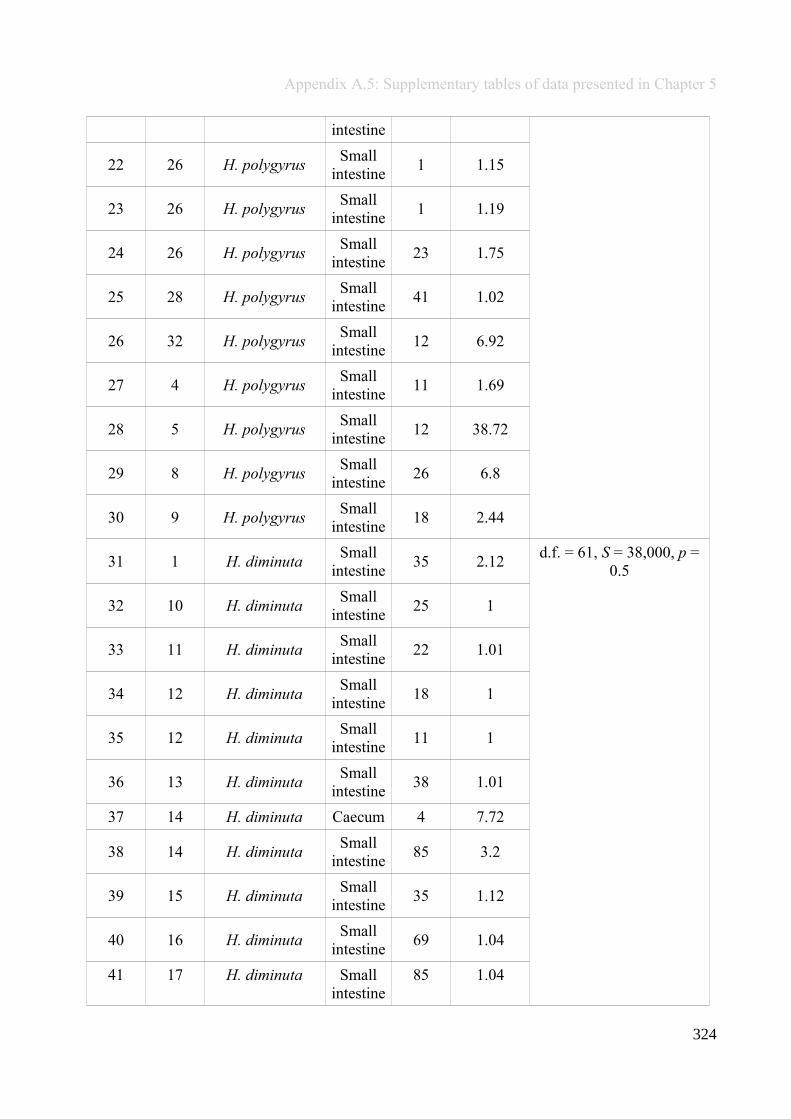
Appendix A.5: Supplementary tables of data presented in Chapter 5
intestine
22 26 H. polygyrusSmall
intestine1 1.15
23 26 H. polygyrusSmall
intestine1 1.19
24 26 H. polygyrusSmall
intestine23 1.75
25 28 H. polygyrusSmall
intestine41 1.02
26 32 H. polygyrusSmall
intestine12 6.92
27 4 H. polygyrusSmall
intestine11 1.69
28 5 H. polygyrusSmall
intestine12 38.72
29 8 H. polygyrusSmall
intestine26 6.8
30 9 H. polygyrusSmall
intestine18 2.44
31 1 H. diminutaSmall
intestine35 2.12
d.f. = 61, S = 38,000, p =0.5
32 10 H. diminutaSmall
intestine25 1
33 11 H. diminutaSmall
intestine22 1.01
34 12 H. diminutaSmall
intestine18 1
35 12 H. diminutaSmall
intestine11 1
36 13 H. diminutaSmall
intestine38 1.01
37 14 H. diminuta Caecum 4 7.72
38 14 H. diminutaSmall
intestine85 3.2
39 15 H. diminutaSmall
intestine35 1.12
40 16 H. diminutaSmall
intestine69 1.04
41 17 H. diminuta Smallintestine
85 1.04
324
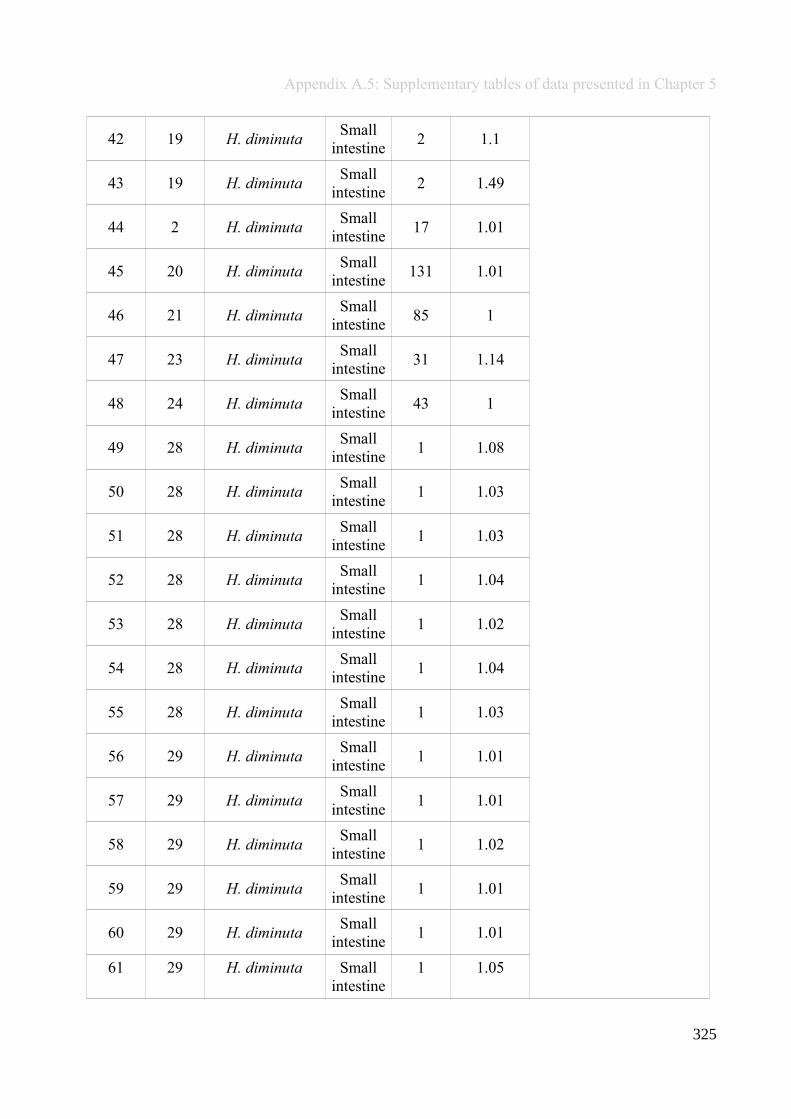
Appendix A.5: Supplementary tables of data presented in Chapter 5
42 19 H. diminutaSmall
intestine2 1.1
43 19 H. diminutaSmall
intestine2 1.49
44 2 H. diminutaSmall
intestine17 1.01
45 20 H. diminutaSmall
intestine131 1.01
46 21 H. diminutaSmall
intestine85 1
47 23 H. diminutaSmall
intestine31 1.14
48 24 H. diminutaSmall
intestine43 1
49 28 H. diminutaSmall
intestine1 1.08
50 28 H. diminutaSmall
intestine1 1.03
51 28 H. diminutaSmall
intestine1 1.03
52 28 H. diminutaSmall
intestine1 1.04
53 28 H. diminutaSmall
intestine1 1.02
54 28 H. diminutaSmall
intestine1 1.04
55 28 H. diminutaSmall
intestine1 1.03
56 29 H. diminutaSmall
intestine1 1.01
57 29 H. diminutaSmall
intestine1 1.01
58 29 H. diminutaSmall
intestine1 1.02
59 29 H. diminutaSmall
intestine1 1.01
60 29 H. diminutaSmall
intestine1 1.01
61 29 H. diminuta Smallintestine
1 1.05
325
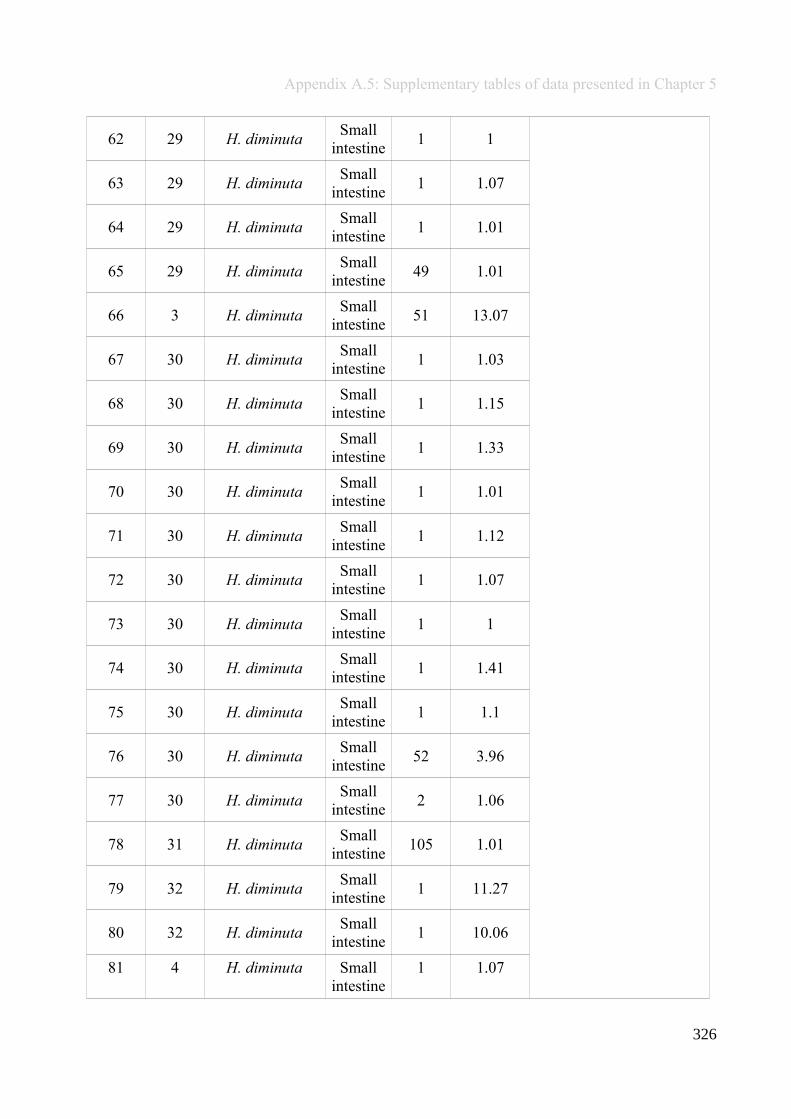
Appendix A.5: Supplementary tables of data presented in Chapter 5
62 29 H. diminutaSmall
intestine1 1
63 29 H. diminutaSmall
intestine1 1.07
64 29 H. diminutaSmall
intestine1 1.01
65 29 H. diminutaSmall
intestine49 1.01
66 3 H. diminutaSmall
intestine51 13.07
67 30 H. diminutaSmall
intestine1 1.03
68 30 H. diminutaSmall
intestine1 1.15
69 30 H. diminutaSmall
intestine1 1.33
70 30 H. diminutaSmall
intestine1 1.01
71 30 H. diminutaSmall
intestine1 1.12
72 30 H. diminutaSmall
intestine1 1.07
73 30 H. diminutaSmall
intestine1 1
74 30 H. diminutaSmall
intestine1 1.41
75 30 H. diminutaSmall
intestine1 1.1
76 30 H. diminutaSmall
intestine52 3.96
77 30 H. diminutaSmall
intestine2 1.06
78 31 H. diminutaSmall
intestine105 1.01
79 32 H. diminutaSmall
intestine1 11.27
80 32 H. diminutaSmall
intestine1 10.06
81 4 H. diminuta Smallintestine
1 1.07
326
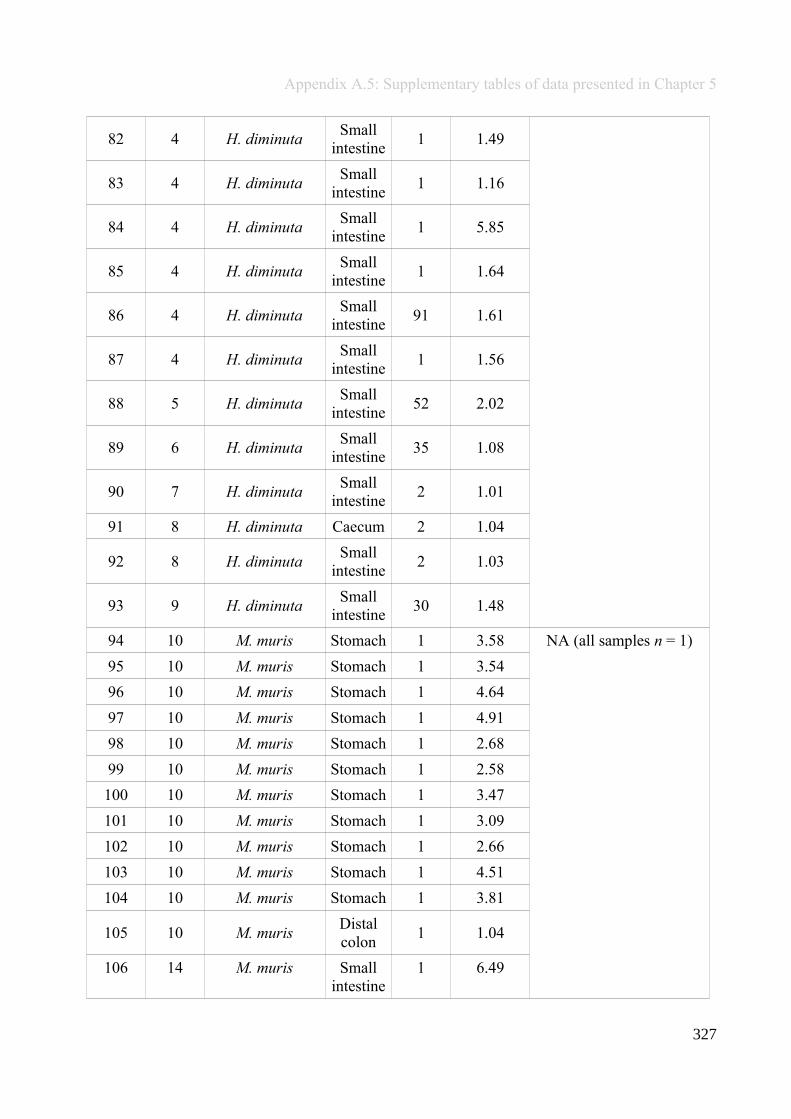
Appendix A.5: Supplementary tables of data presented in Chapter 5
82 4 H. diminutaSmall
intestine1 1.49
83 4 H. diminutaSmall
intestine1 1.16
84 4 H. diminutaSmall
intestine1 5.85
85 4 H. diminutaSmall
intestine1 1.64
86 4 H. diminutaSmall
intestine91 1.61
87 4 H. diminutaSmall
intestine1 1.56
88 5 H. diminutaSmall
intestine52 2.02
89 6 H. diminutaSmall
intestine35 1.08
90 7 H. diminutaSmall
intestine2 1.01
91 8 H. diminuta Caecum 2 1.04
92 8 H. diminutaSmall
intestine2 1.03
93 9 H. diminutaSmall
intestine30 1.48
94 10 M. muris Stomach 1 3.58 NA (all samples n = 1)
95 10 M. muris Stomach 1 3.54
96 10 M. muris Stomach 1 4.64
97 10 M. muris Stomach 1 4.91
98 10 M. muris Stomach 1 2.68
99 10 M. muris Stomach 1 2.58
100 10 M. muris Stomach 1 3.47
101 10 M. muris Stomach 1 3.09
102 10 M. muris Stomach 1 2.66
103 10 M. muris Stomach 1 4.51
104 10 M. muris Stomach 1 3.81
105 10 M. murisDistalcolon
1 1.04
106 14 M. muris Smallintestine
1 6.49
327
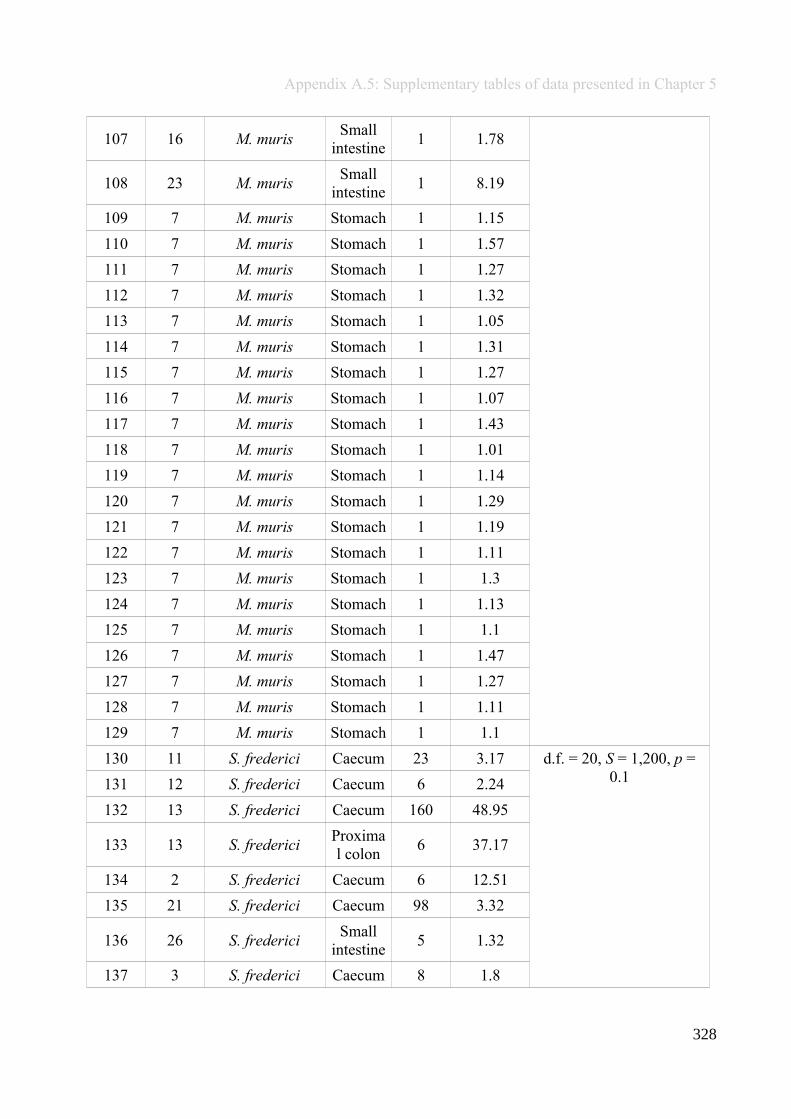
Appendix A.5: Supplementary tables of data presented in Chapter 5
107 16 M. murisSmall
intestine1 1.78
108 23 M. murisSmall
intestine1 8.19
109 7 M. muris Stomach 1 1.15
110 7 M. muris Stomach 1 1.57
111 7 M. muris Stomach 1 1.27
112 7 M. muris Stomach 1 1.32
113 7 M. muris Stomach 1 1.05
114 7 M. muris Stomach 1 1.31
115 7 M. muris Stomach 1 1.27
116 7 M. muris Stomach 1 1.07
117 7 M. muris Stomach 1 1.43
118 7 M. muris Stomach 1 1.01
119 7 M. muris Stomach 1 1.14
120 7 M. muris Stomach 1 1.29
121 7 M. muris Stomach 1 1.19
122 7 M. muris Stomach 1 1.11
123 7 M. muris Stomach 1 1.3
124 7 M. muris Stomach 1 1.13
125 7 M. muris Stomach 1 1.1
126 7 M. muris Stomach 1 1.47
127 7 M. muris Stomach 1 1.27
128 7 M. muris Stomach 1 1.11
129 7 M. muris Stomach 1 1.1
130 11 S. frederici Caecum 23 3.17 d.f. = 20, S = 1,200, p =0.1131 12 S. frederici Caecum 6 2.24
132 13 S. frederici Caecum 160 48.95
133 13 S. fredericiProximal colon
6 37.17
134 2 S. frederici Caecum 6 12.51
135 21 S. frederici Caecum 98 3.32
136 26 S. fredericiSmall
intestine5 1.32
137 3 S. frederici Caecum 8 1.8
328
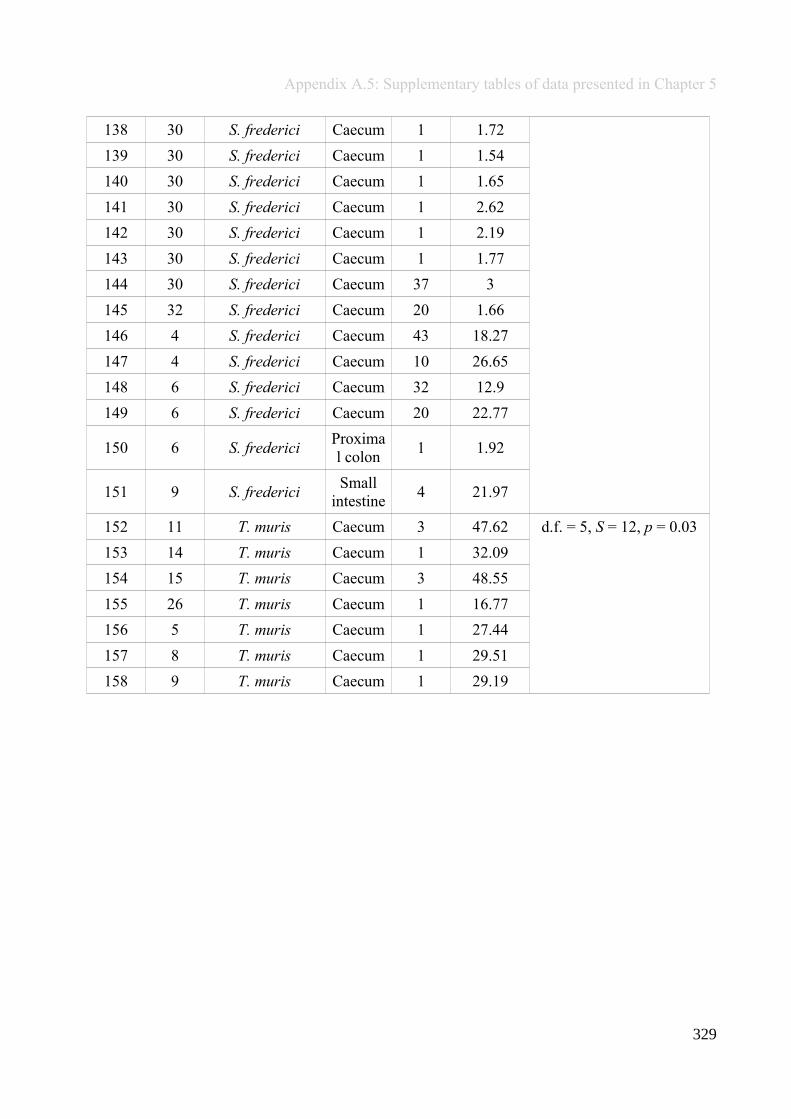
Appendix A.5: Supplementary tables of data presented in Chapter 5
138 30 S. frederici Caecum 1 1.72
139 30 S. frederici Caecum 1 1.54
140 30 S. frederici Caecum 1 1.65
141 30 S. frederici Caecum 1 2.62
142 30 S. frederici Caecum 1 2.19
143 30 S. frederici Caecum 1 1.77
144 30 S. frederici Caecum 37 3
145 32 S. frederici Caecum 20 1.66
146 4 S. frederici Caecum 43 18.27
147 4 S. frederici Caecum 10 26.65
148 6 S. frederici Caecum 32 12.9
149 6 S. frederici Caecum 20 22.77
150 6 S. fredericiProximal colon
1 1.92
151 9 S. fredericiSmall
intestine4 21.97
152 11 T. muris Caecum 3 47.62 d.f. = 5, S = 12, p = 0.03
153 14 T. muris Caecum 1 32.09
154 15 T. muris Caecum 3 48.55
155 26 T. muris Caecum 1 16.77
156 5 T. muris Caecum 1 27.44
157 8 T. muris Caecum 1 29.51
158 9 T. muris Caecum 1 29.19
329
Appendix A.5: Supplementary tables of data presented in Chapter 5
Appendix A.6: Supplementary tables of data presentedin Chapter 5
Statistical outputs of analyses to test for OTUs that significantly differed in abundance between a given gutsection and each helminth species therein. OTUs were grouped by microbial class. Briefly, DESeq wasused to identify significantly changing (p <0.05) OTU abundances and their respective fold changes (log2)when comparing gut location and helminth species. Below are the tables resulting from these analyses.
330
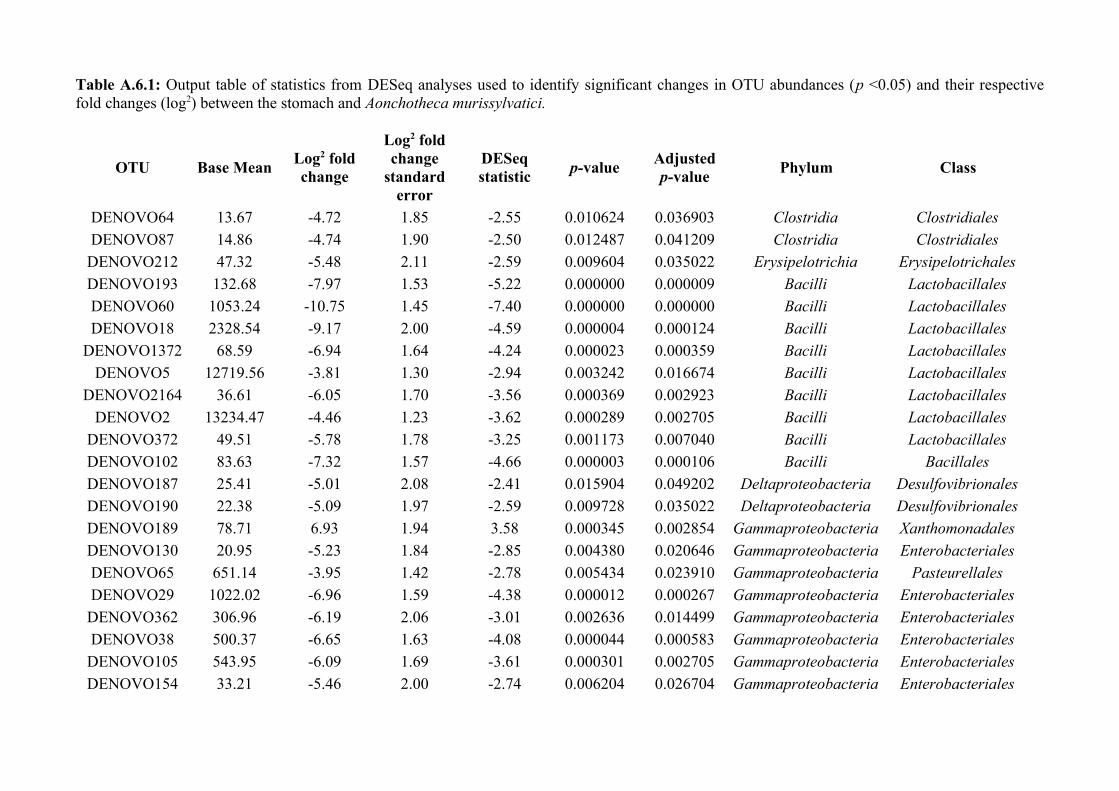
Table A.6.1: Output table of statistics from DESeq analyses used to identify significant changes in OTU abundances (p <0.05) and their respectivefold changes (log2) between the stomach and Aonchotheca murissylvatici.
OTU Base MeanLog2 foldchange
Log2 foldchange
standarderror
DESeqstatistic
p-valueAdjustedp-value
Phylum Class
DENOVO64 13.67 -4.72 1.85 -2.55 0.010624 0.036903 Clostridia Clostridiales
DENOVO87 14.86 -4.74 1.90 -2.50 0.012487 0.041209 Clostridia Clostridiales
DENOVO212 47.32 -5.48 2.11 -2.59 0.009604 0.035022 Erysipelotrichia Erysipelotrichales
DENOVO193 132.68 -7.97 1.53 -5.22 0.000000 0.000009 Bacilli Lactobacillales
DENOVO60 1053.24 -10.75 1.45 -7.40 0.000000 0.000000 Bacilli Lactobacillales
DENOVO18 2328.54 -9.17 2.00 -4.59 0.000004 0.000124 Bacilli Lactobacillales
DENOVO1372 68.59 -6.94 1.64 -4.24 0.000023 0.000359 Bacilli Lactobacillales
DENOVO5 12719.56 -3.81 1.30 -2.94 0.003242 0.016674 Bacilli Lactobacillales
DENOVO2164 36.61 -6.05 1.70 -3.56 0.000369 0.002923 Bacilli Lactobacillales
DENOVO2 13234.47 -4.46 1.23 -3.62 0.000289 0.002705 Bacilli Lactobacillales
DENOVO372 49.51 -5.78 1.78 -3.25 0.001173 0.007040 Bacilli Lactobacillales
DENOVO102 83.63 -7.32 1.57 -4.66 0.000003 0.000106 Bacilli Bacillales
DENOVO187 25.41 -5.01 2.08 -2.41 0.015904 0.049202 Deltaproteobacteria Desulfovibrionales
DENOVO190 22.38 -5.09 1.97 -2.59 0.009728 0.035022 Deltaproteobacteria Desulfovibrionales
DENOVO189 78.71 6.93 1.94 3.58 0.000345 0.002854 Gammaproteobacteria Xanthomonadales
DENOVO130 20.95 -5.23 1.84 -2.85 0.004380 0.020646 Gammaproteobacteria Enterobacteriales
DENOVO65 651.14 -3.95 1.42 -2.78 0.005434 0.023910 Gammaproteobacteria Pasteurellales
DENOVO29 1022.02 -6.96 1.59 -4.38 0.000012 0.000267 Gammaproteobacteria Enterobacteriales
DENOVO362 306.96 -6.19 2.06 -3.01 0.002636 0.014499 Gammaproteobacteria Enterobacteriales
DENOVO38 500.37 -6.65 1.63 -4.08 0.000044 0.000583 Gammaproteobacteria Enterobacteriales
DENOVO105 543.95 -6.09 1.69 -3.61 0.000301 0.002705 Gammaproteobacteria Enterobacteriales
DENOVO154 33.21 -5.46 2.00 -2.74 0.006204 0.026704 Gammaproteobacteria Enterobacteriales
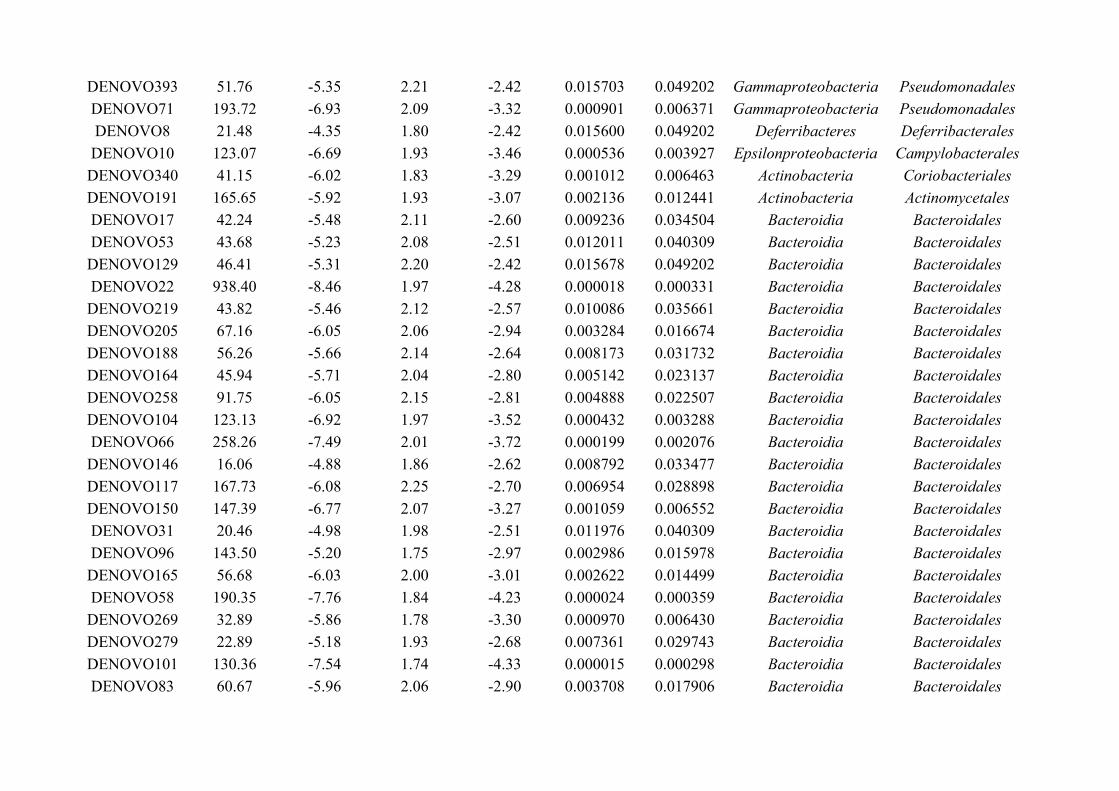
DENOVO393 51.76 -5.35 2.21 -2.42 0.015703 0.049202 Gammaproteobacteria Pseudomonadales
DENOVO71 193.72 -6.93 2.09 -3.32 0.000901 0.006371 Gammaproteobacteria Pseudomonadales
DENOVO8 21.48 -4.35 1.80 -2.42 0.015600 0.049202 Deferribacteres Deferribacterales
DENOVO10 123.07 -6.69 1.93 -3.46 0.000536 0.003927 Epsilonproteobacteria Campylobacterales
DENOVO340 41.15 -6.02 1.83 -3.29 0.001012 0.006463 Actinobacteria Coriobacteriales
DENOVO191 165.65 -5.92 1.93 -3.07 0.002136 0.012441 Actinobacteria Actinomycetales
DENOVO17 42.24 -5.48 2.11 -2.60 0.009236 0.034504 Bacteroidia Bacteroidales
DENOVO53 43.68 -5.23 2.08 -2.51 0.012011 0.040309 Bacteroidia Bacteroidales
DENOVO129 46.41 -5.31 2.20 -2.42 0.015678 0.049202 Bacteroidia Bacteroidales
DENOVO22 938.40 -8.46 1.97 -4.28 0.000018 0.000331 Bacteroidia Bacteroidales
DENOVO219 43.82 -5.46 2.12 -2.57 0.010086 0.035661 Bacteroidia Bacteroidales
DENOVO205 67.16 -6.05 2.06 -2.94 0.003284 0.016674 Bacteroidia Bacteroidales
DENOVO188 56.26 -5.66 2.14 -2.64 0.008173 0.031732 Bacteroidia Bacteroidales
DENOVO164 45.94 -5.71 2.04 -2.80 0.005142 0.023137 Bacteroidia Bacteroidales
DENOVO258 91.75 -6.05 2.15 -2.81 0.004888 0.022507 Bacteroidia Bacteroidales
DENOVO104 123.13 -6.92 1.97 -3.52 0.000432 0.003288 Bacteroidia Bacteroidales
DENOVO66 258.26 -7.49 2.01 -3.72 0.000199 0.002076 Bacteroidia Bacteroidales
DENOVO146 16.06 -4.88 1.86 -2.62 0.008792 0.033477 Bacteroidia Bacteroidales
DENOVO117 167.73 -6.08 2.25 -2.70 0.006954 0.028898 Bacteroidia Bacteroidales
DENOVO150 147.39 -6.77 2.07 -3.27 0.001059 0.006552 Bacteroidia Bacteroidales
DENOVO31 20.46 -4.98 1.98 -2.51 0.011976 0.040309 Bacteroidia Bacteroidales
DENOVO96 143.50 -5.20 1.75 -2.97 0.002986 0.015978 Bacteroidia Bacteroidales
DENOVO165 56.68 -6.03 2.00 -3.01 0.002622 0.014499 Bacteroidia Bacteroidales
DENOVO58 190.35 -7.76 1.84 -4.23 0.000024 0.000359 Bacteroidia Bacteroidales
DENOVO269 32.89 -5.86 1.78 -3.30 0.000970 0.006430 Bacteroidia Bacteroidales
DENOVO279 22.89 -5.18 1.93 -2.68 0.007361 0.029743 Bacteroidia Bacteroidales
DENOVO101 130.36 -7.54 1.74 -4.33 0.000015 0.000298 Bacteroidia Bacteroidales
DENOVO83 60.67 -5.96 2.06 -2.90 0.003708 0.017906 Bacteroidia Bacteroidales
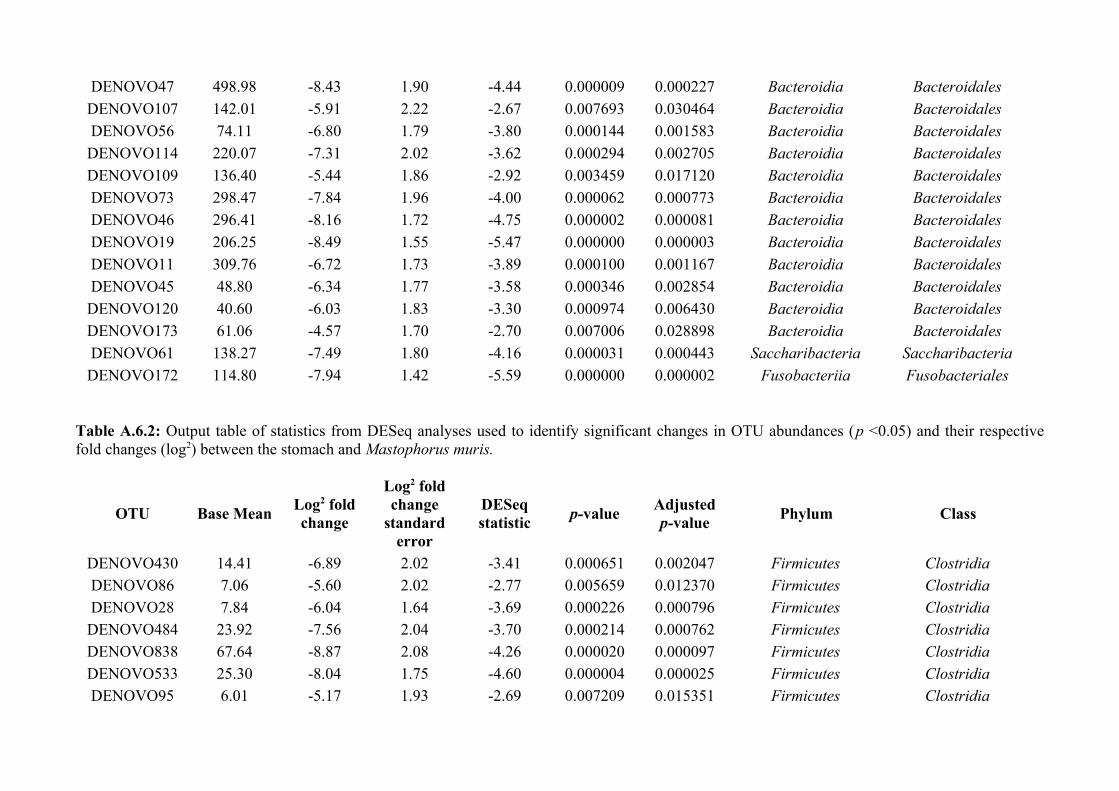
DENOVO47 498.98 -8.43 1.90 -4.44 0.000009 0.000227 Bacteroidia Bacteroidales
DENOVO107 142.01 -5.91 2.22 -2.67 0.007693 0.030464 Bacteroidia Bacteroidales
DENOVO56 74.11 -6.80 1.79 -3.80 0.000144 0.001583 Bacteroidia Bacteroidales
DENOVO114 220.07 -7.31 2.02 -3.62 0.000294 0.002705 Bacteroidia Bacteroidales
DENOVO109 136.40 -5.44 1.86 -2.92 0.003459 0.017120 Bacteroidia Bacteroidales
DENOVO73 298.47 -7.84 1.96 -4.00 0.000062 0.000773 Bacteroidia Bacteroidales
DENOVO46 296.41 -8.16 1.72 -4.75 0.000002 0.000081 Bacteroidia Bacteroidales
DENOVO19 206.25 -8.49 1.55 -5.47 0.000000 0.000003 Bacteroidia Bacteroidales
DENOVO11 309.76 -6.72 1.73 -3.89 0.000100 0.001167 Bacteroidia Bacteroidales
DENOVO45 48.80 -6.34 1.77 -3.58 0.000346 0.002854 Bacteroidia Bacteroidales
DENOVO120 40.60 -6.03 1.83 -3.30 0.000974 0.006430 Bacteroidia Bacteroidales
DENOVO173 61.06 -4.57 1.70 -2.70 0.007006 0.028898 Bacteroidia Bacteroidales
DENOVO61 138.27 -7.49 1.80 -4.16 0.000031 0.000443 Saccharibacteria Saccharibacteria
DENOVO172 114.80 -7.94 1.42 -5.59 0.000000 0.000002 Fusobacteriia Fusobacteriales
Table A.6.2: Output table of statistics from DESeq analyses used to identify significant changes in OTU abundances (p <0.05) and their respectivefold changes (log2) between the stomach and Mastophorus muris.
OTU Base MeanLog2 foldchange
Log2 foldchange
standarderror
DESeqstatistic
p-valueAdjustedp-value
Phylum Class
DENOVO430 14.41 -6.89 2.02 -3.41 0.000651 0.002047 Firmicutes ClostridiaDENOVO86 7.06 -5.60 2.02 -2.77 0.005659 0.012370 Firmicutes ClostridiaDENOVO28 7.84 -6.04 1.64 -3.69 0.000226 0.000796 Firmicutes ClostridiaDENOVO484 23.92 -7.56 2.04 -3.70 0.000214 0.000762 Firmicutes ClostridiaDENOVO838 67.64 -8.87 2.08 -4.26 0.000020 0.000097 Firmicutes ClostridiaDENOVO533 25.30 -8.04 1.75 -4.60 0.000004 0.000025 Firmicutes ClostridiaDENOVO95 6.01 -5.17 1.93 -2.69 0.007209 0.015351 Firmicutes Clostridia
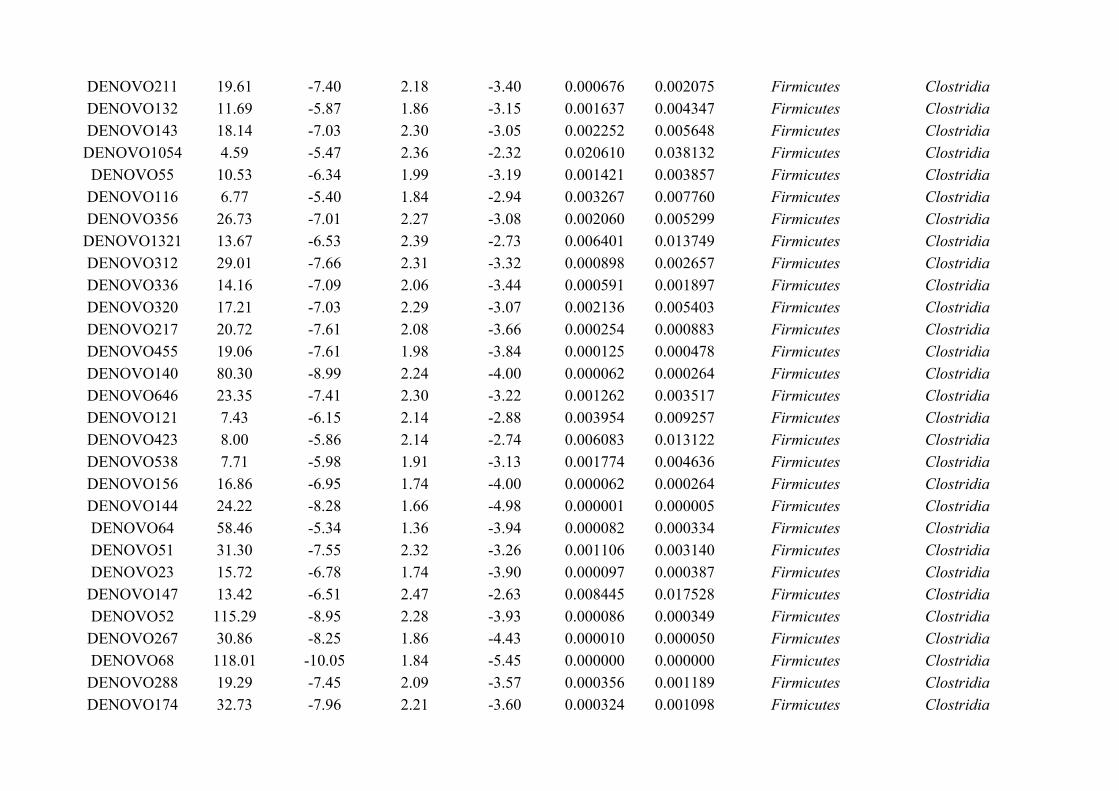
DENOVO211 19.61 -7.40 2.18 -3.40 0.000676 0.002075 Firmicutes ClostridiaDENOVO132 11.69 -5.87 1.86 -3.15 0.001637 0.004347 Firmicutes ClostridiaDENOVO143 18.14 -7.03 2.30 -3.05 0.002252 0.005648 Firmicutes ClostridiaDENOVO1054 4.59 -5.47 2.36 -2.32 0.020610 0.038132 Firmicutes ClostridiaDENOVO55 10.53 -6.34 1.99 -3.19 0.001421 0.003857 Firmicutes ClostridiaDENOVO116 6.77 -5.40 1.84 -2.94 0.003267 0.007760 Firmicutes ClostridiaDENOVO356 26.73 -7.01 2.27 -3.08 0.002060 0.005299 Firmicutes ClostridiaDENOVO1321 13.67 -6.53 2.39 -2.73 0.006401 0.013749 Firmicutes ClostridiaDENOVO312 29.01 -7.66 2.31 -3.32 0.000898 0.002657 Firmicutes ClostridiaDENOVO336 14.16 -7.09 2.06 -3.44 0.000591 0.001897 Firmicutes ClostridiaDENOVO320 17.21 -7.03 2.29 -3.07 0.002136 0.005403 Firmicutes ClostridiaDENOVO217 20.72 -7.61 2.08 -3.66 0.000254 0.000883 Firmicutes ClostridiaDENOVO455 19.06 -7.61 1.98 -3.84 0.000125 0.000478 Firmicutes ClostridiaDENOVO140 80.30 -8.99 2.24 -4.00 0.000062 0.000264 Firmicutes ClostridiaDENOVO646 23.35 -7.41 2.30 -3.22 0.001262 0.003517 Firmicutes ClostridiaDENOVO121 7.43 -6.15 2.14 -2.88 0.003954 0.009257 Firmicutes ClostridiaDENOVO423 8.00 -5.86 2.14 -2.74 0.006083 0.013122 Firmicutes ClostridiaDENOVO538 7.71 -5.98 1.91 -3.13 0.001774 0.004636 Firmicutes ClostridiaDENOVO156 16.86 -6.95 1.74 -4.00 0.000062 0.000264 Firmicutes ClostridiaDENOVO144 24.22 -8.28 1.66 -4.98 0.000001 0.000005 Firmicutes ClostridiaDENOVO64 58.46 -5.34 1.36 -3.94 0.000082 0.000334 Firmicutes ClostridiaDENOVO51 31.30 -7.55 2.32 -3.26 0.001106 0.003140 Firmicutes ClostridiaDENOVO23 15.72 -6.78 1.74 -3.90 0.000097 0.000387 Firmicutes ClostridiaDENOVO147 13.42 -6.51 2.47 -2.63 0.008445 0.017528 Firmicutes ClostridiaDENOVO52 115.29 -8.95 2.28 -3.93 0.000086 0.000349 Firmicutes ClostridiaDENOVO267 30.86 -8.25 1.86 -4.43 0.000010 0.000050 Firmicutes ClostridiaDENOVO68 118.01 -10.05 1.84 -5.45 0.000000 0.000000 Firmicutes ClostridiaDENOVO288 19.29 -7.45 2.09 -3.57 0.000356 0.001189 Firmicutes ClostridiaDENOVO174 32.73 -7.96 2.21 -3.60 0.000324 0.001098 Firmicutes Clostridia
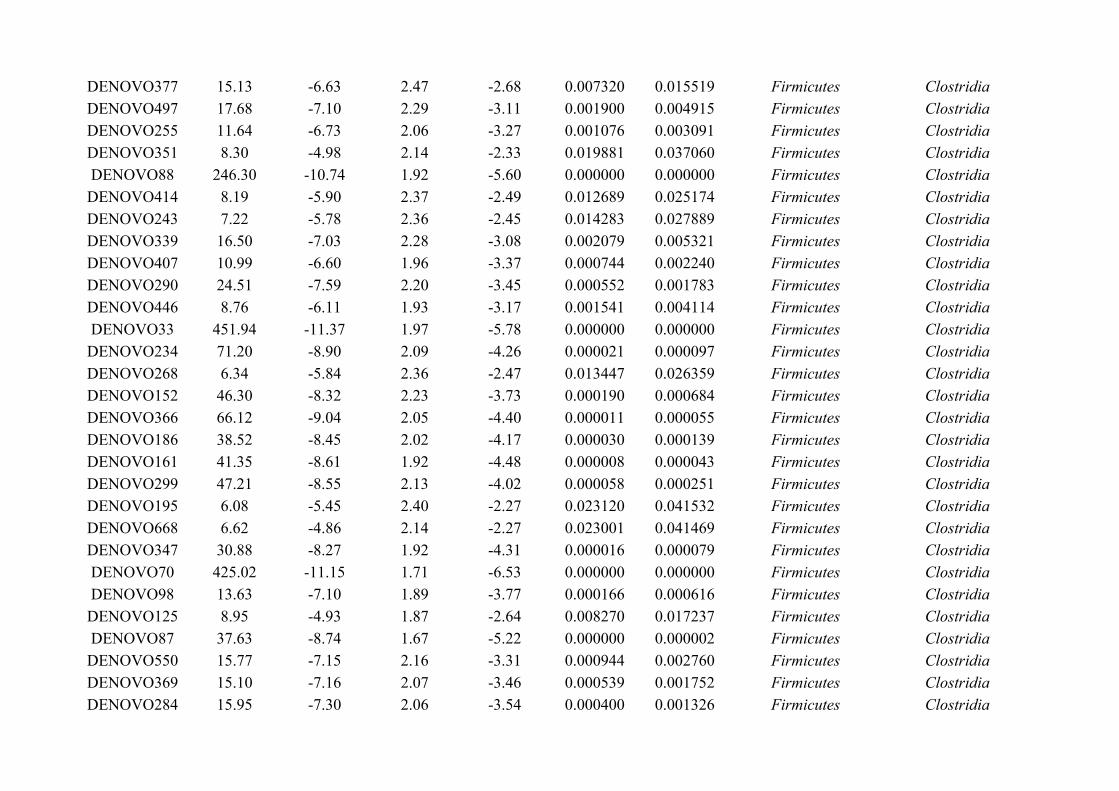
DENOVO377 15.13 -6.63 2.47 -2.68 0.007320 0.015519 Firmicutes ClostridiaDENOVO497 17.68 -7.10 2.29 -3.11 0.001900 0.004915 Firmicutes ClostridiaDENOVO255 11.64 -6.73 2.06 -3.27 0.001076 0.003091 Firmicutes ClostridiaDENOVO351 8.30 -4.98 2.14 -2.33 0.019881 0.037060 Firmicutes ClostridiaDENOVO88 246.30 -10.74 1.92 -5.60 0.000000 0.000000 Firmicutes ClostridiaDENOVO414 8.19 -5.90 2.37 -2.49 0.012689 0.025174 Firmicutes ClostridiaDENOVO243 7.22 -5.78 2.36 -2.45 0.014283 0.027889 Firmicutes ClostridiaDENOVO339 16.50 -7.03 2.28 -3.08 0.002079 0.005321 Firmicutes ClostridiaDENOVO407 10.99 -6.60 1.96 -3.37 0.000744 0.002240 Firmicutes ClostridiaDENOVO290 24.51 -7.59 2.20 -3.45 0.000552 0.001783 Firmicutes ClostridiaDENOVO446 8.76 -6.11 1.93 -3.17 0.001541 0.004114 Firmicutes ClostridiaDENOVO33 451.94 -11.37 1.97 -5.78 0.000000 0.000000 Firmicutes ClostridiaDENOVO234 71.20 -8.90 2.09 -4.26 0.000021 0.000097 Firmicutes ClostridiaDENOVO268 6.34 -5.84 2.36 -2.47 0.013447 0.026359 Firmicutes ClostridiaDENOVO152 46.30 -8.32 2.23 -3.73 0.000190 0.000684 Firmicutes ClostridiaDENOVO366 66.12 -9.04 2.05 -4.40 0.000011 0.000055 Firmicutes ClostridiaDENOVO186 38.52 -8.45 2.02 -4.17 0.000030 0.000139 Firmicutes ClostridiaDENOVO161 41.35 -8.61 1.92 -4.48 0.000008 0.000043 Firmicutes ClostridiaDENOVO299 47.21 -8.55 2.13 -4.02 0.000058 0.000251 Firmicutes ClostridiaDENOVO195 6.08 -5.45 2.40 -2.27 0.023120 0.041532 Firmicutes ClostridiaDENOVO668 6.62 -4.86 2.14 -2.27 0.023001 0.041469 Firmicutes ClostridiaDENOVO347 30.88 -8.27 1.92 -4.31 0.000016 0.000079 Firmicutes ClostridiaDENOVO70 425.02 -11.15 1.71 -6.53 0.000000 0.000000 Firmicutes ClostridiaDENOVO98 13.63 -7.10 1.89 -3.77 0.000166 0.000616 Firmicutes ClostridiaDENOVO125 8.95 -4.93 1.87 -2.64 0.008270 0.017237 Firmicutes ClostridiaDENOVO87 37.63 -8.74 1.67 -5.22 0.000000 0.000002 Firmicutes ClostridiaDENOVO550 15.77 -7.15 2.16 -3.31 0.000944 0.002760 Firmicutes ClostridiaDENOVO369 15.10 -7.16 2.07 -3.46 0.000539 0.001752 Firmicutes ClostridiaDENOVO284 15.95 -7.30 2.06 -3.54 0.000400 0.001326 Firmicutes Clostridia

DENOVO194 1.83 -4.07 1.84 -2.21 0.026915 0.047828 Firmicutes ClostridiaDENOVO79 3.26 -5.40 2.21 -2.44 0.014544 0.028244 Firmicutes ClostridiaDENOVO142 19.81 -6.95 2.47 -2.81 0.004916 0.010939 Firmicutes ClostridiaDENOVO1230 1.51 -4.77 2.07 -2.30 0.021371 0.039247 Firmicutes ClostridiaDENOVO302 17.68 -7.60 1.75 -4.34 0.000014 0.000070 Firmicutes ClostridiaDENOVO220 66.05 -9.15 1.88 -4.87 0.000001 0.000007 Firmicutes ClostridiaDENOVO432 18.03 -6.82 2.47 -2.76 0.005782 0.012583 Firmicutes ClostridiaDENOVO315 6.50 -5.32 2.13 -2.50 0.012400 0.024700 Firmicutes ClostridiaDENOVO385 3.62 -5.33 2.08 -2.56 0.010394 0.021044 Firmicutes ClostridiaDENOVO239 9.20 -5.19 2.04 -2.54 0.010960 0.022098 Firmicutes ClostridiaDENOVO115 5.89 -5.92 1.75 -3.39 0.000695 0.002119 Firmicutes ClostridiaDENOVO647 21.39 -7.75 1.99 -3.89 0.000099 0.000393 Firmicutes ClostridiaDENOVO995 9.68 -5.89 2.05 -2.87 0.004122 0.009560 Firmicutes ClostridiaDENOVO141 121.87 -9.66 2.04 -4.75 0.000002 0.000013 Firmicutes ClostridiaDENOVO308 12.81 -6.76 2.15 -3.14 0.001683 0.004445 Firmicutes ClostridiaDENOVO218 13.26 -7.29 1.88 -3.89 0.000102 0.000401 Firmicutes ClostridiaDENOVO1158 7.16 -5.41 2.36 -2.29 0.021738 0.039773 Firmicutes ClostridiaDENOVO256 36.15 -8.27 2.09 -3.95 0.000077 0.000315 Firmicutes ClostridiaDENOVO355 18.19 -7.52 1.89 -3.98 0.000068 0.000284 Firmicutes ClostridiaDENOVO183 19.98 -6.96 2.47 -2.82 0.004854 0.010851 Firmicutes ClostridiaDENOVO365 8.00 -5.90 1.92 -3.08 0.002093 0.005330 Firmicutes ClostridiaDENOVO176 31.14 -7.74 2.31 -3.34 0.000827 0.002461 Firmicutes ClostridiaDENOVO1188 33.99 -7.83 2.32 -3.38 0.000716 0.002171 Firmicutes ClostridiaDENOVO311 29.94 -7.58 2.32 -3.27 0.001085 0.003098 Firmicutes ClostridiaDENOVO295 8.83 -5.48 1.94 -2.82 0.004758 0.010684 Firmicutes ClostridiaDENOVO406 3.85 -4.88 2.08 -2.34 0.019128 0.035929 Firmicutes ClostridiaDENOVO334 21.42 -7.13 2.41 -2.96 0.003107 0.007486 Firmicutes ClostridiaDENOVO769 44.80 -8.25 2.14 -3.86 0.000112 0.000432 Firmicutes ClostridiaDENOVO35 85.57 -9.13 2.00 -4.56 0.000005 0.000030 Firmicutes Clostridia
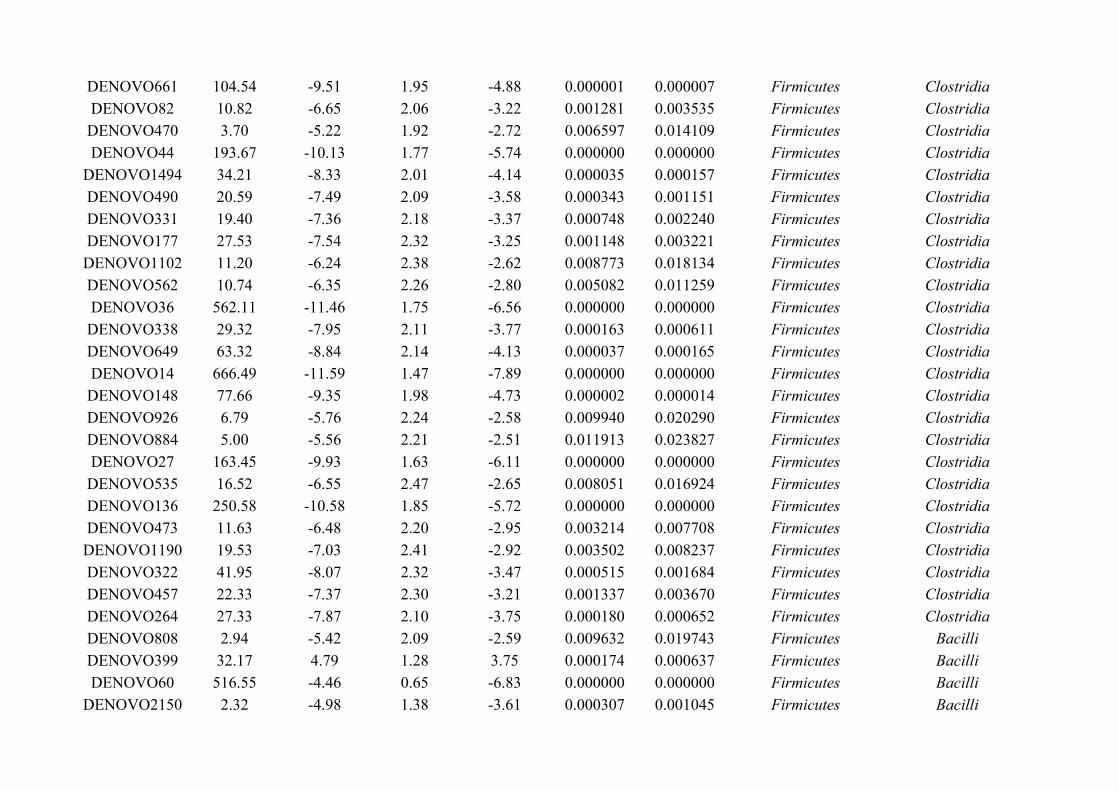
DENOVO661 104.54 -9.51 1.95 -4.88 0.000001 0.000007 Firmicutes ClostridiaDENOVO82 10.82 -6.65 2.06 -3.22 0.001281 0.003535 Firmicutes ClostridiaDENOVO470 3.70 -5.22 1.92 -2.72 0.006597 0.014109 Firmicutes ClostridiaDENOVO44 193.67 -10.13 1.77 -5.74 0.000000 0.000000 Firmicutes Clostridia
DENOVO1494 34.21 -8.33 2.01 -4.14 0.000035 0.000157 Firmicutes ClostridiaDENOVO490 20.59 -7.49 2.09 -3.58 0.000343 0.001151 Firmicutes ClostridiaDENOVO331 19.40 -7.36 2.18 -3.37 0.000748 0.002240 Firmicutes ClostridiaDENOVO177 27.53 -7.54 2.32 -3.25 0.001148 0.003221 Firmicutes ClostridiaDENOVO1102 11.20 -6.24 2.38 -2.62 0.008773 0.018134 Firmicutes ClostridiaDENOVO562 10.74 -6.35 2.26 -2.80 0.005082 0.011259 Firmicutes ClostridiaDENOVO36 562.11 -11.46 1.75 -6.56 0.000000 0.000000 Firmicutes ClostridiaDENOVO338 29.32 -7.95 2.11 -3.77 0.000163 0.000611 Firmicutes ClostridiaDENOVO649 63.32 -8.84 2.14 -4.13 0.000037 0.000165 Firmicutes ClostridiaDENOVO14 666.49 -11.59 1.47 -7.89 0.000000 0.000000 Firmicutes ClostridiaDENOVO148 77.66 -9.35 1.98 -4.73 0.000002 0.000014 Firmicutes ClostridiaDENOVO926 6.79 -5.76 2.24 -2.58 0.009940 0.020290 Firmicutes ClostridiaDENOVO884 5.00 -5.56 2.21 -2.51 0.011913 0.023827 Firmicutes ClostridiaDENOVO27 163.45 -9.93 1.63 -6.11 0.000000 0.000000 Firmicutes ClostridiaDENOVO535 16.52 -6.55 2.47 -2.65 0.008051 0.016924 Firmicutes ClostridiaDENOVO136 250.58 -10.58 1.85 -5.72 0.000000 0.000000 Firmicutes ClostridiaDENOVO473 11.63 -6.48 2.20 -2.95 0.003214 0.007708 Firmicutes ClostridiaDENOVO1190 19.53 -7.03 2.41 -2.92 0.003502 0.008237 Firmicutes ClostridiaDENOVO322 41.95 -8.07 2.32 -3.47 0.000515 0.001684 Firmicutes ClostridiaDENOVO457 22.33 -7.37 2.30 -3.21 0.001337 0.003670 Firmicutes ClostridiaDENOVO264 27.33 -7.87 2.10 -3.75 0.000180 0.000652 Firmicutes ClostridiaDENOVO808 2.94 -5.42 2.09 -2.59 0.009632 0.019743 Firmicutes BacilliDENOVO399 32.17 4.79 1.28 3.75 0.000174 0.000637 Firmicutes BacilliDENOVO60 516.55 -4.46 0.65 -6.83 0.000000 0.000000 Firmicutes Bacilli
DENOVO2150 2.32 -4.98 1.38 -3.61 0.000307 0.001045 Firmicutes Bacilli
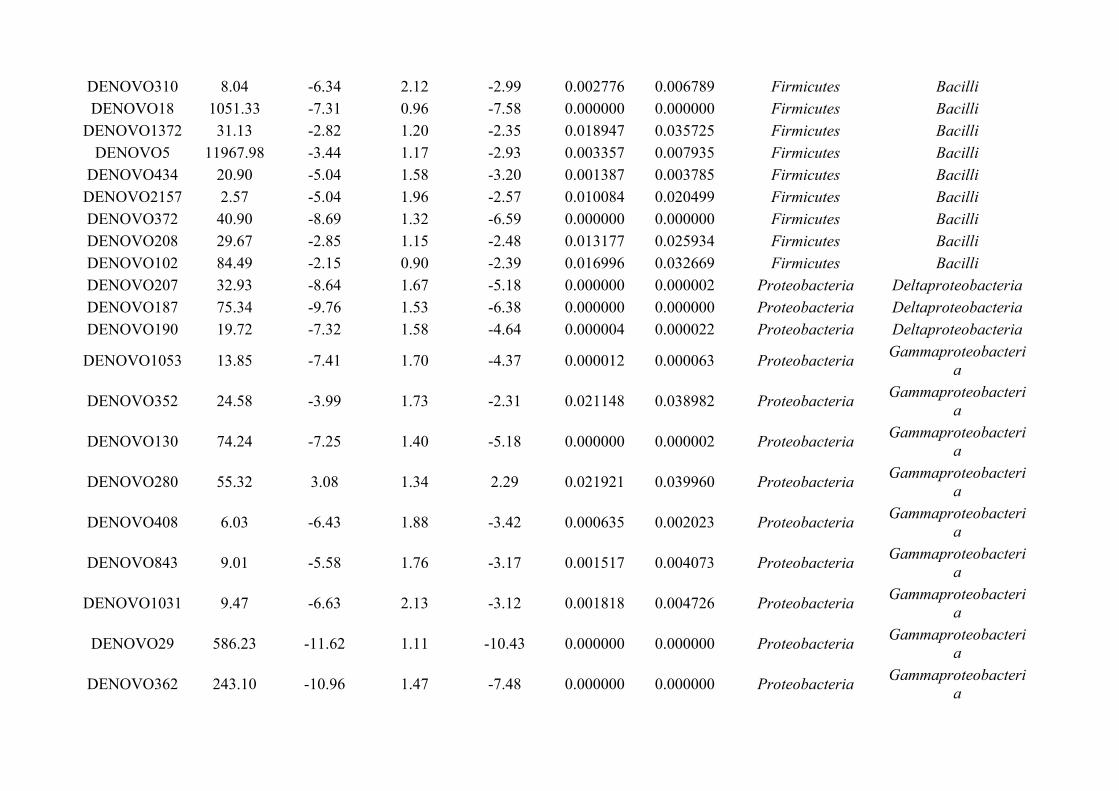
DENOVO310 8.04 -6.34 2.12 -2.99 0.002776 0.006789 Firmicutes BacilliDENOVO18 1051.33 -7.31 0.96 -7.58 0.000000 0.000000 Firmicutes Bacilli
DENOVO1372 31.13 -2.82 1.20 -2.35 0.018947 0.035725 Firmicutes BacilliDENOVO5 11967.98 -3.44 1.17 -2.93 0.003357 0.007935 Firmicutes Bacilli
DENOVO434 20.90 -5.04 1.58 -3.20 0.001387 0.003785 Firmicutes BacilliDENOVO2157 2.57 -5.04 1.96 -2.57 0.010084 0.020499 Firmicutes BacilliDENOVO372 40.90 -8.69 1.32 -6.59 0.000000 0.000000 Firmicutes BacilliDENOVO208 29.67 -2.85 1.15 -2.48 0.013177 0.025934 Firmicutes BacilliDENOVO102 84.49 -2.15 0.90 -2.39 0.016996 0.032669 Firmicutes BacilliDENOVO207 32.93 -8.64 1.67 -5.18 0.000000 0.000002 Proteobacteria DeltaproteobacteriaDENOVO187 75.34 -9.76 1.53 -6.38 0.000000 0.000000 Proteobacteria DeltaproteobacteriaDENOVO190 19.72 -7.32 1.58 -4.64 0.000004 0.000022 Proteobacteria Deltaproteobacteria
DENOVO1053 13.85 -7.41 1.70 -4.37 0.000012 0.000063 ProteobacteriaGammaproteobacteri
a
DENOVO352 24.58 -3.99 1.73 -2.31 0.021148 0.038982 ProteobacteriaGammaproteobacteri
a
DENOVO130 74.24 -7.25 1.40 -5.18 0.000000 0.000002 ProteobacteriaGammaproteobacteri
a
DENOVO280 55.32 3.08 1.34 2.29 0.021921 0.039960 ProteobacteriaGammaproteobacteri
a
DENOVO408 6.03 -6.43 1.88 -3.42 0.000635 0.002023 ProteobacteriaGammaproteobacteri
a
DENOVO843 9.01 -5.58 1.76 -3.17 0.001517 0.004073 ProteobacteriaGammaproteobacteri
a
DENOVO1031 9.47 -6.63 2.13 -3.12 0.001818 0.004726 ProteobacteriaGammaproteobacteri
a
DENOVO29 586.23 -11.62 1.11 -10.43 0.000000 0.000000 ProteobacteriaGammaproteobacteri
a
DENOVO362 243.10 -10.96 1.47 -7.48 0.000000 0.000000 ProteobacteriaGammaproteobacteri
a
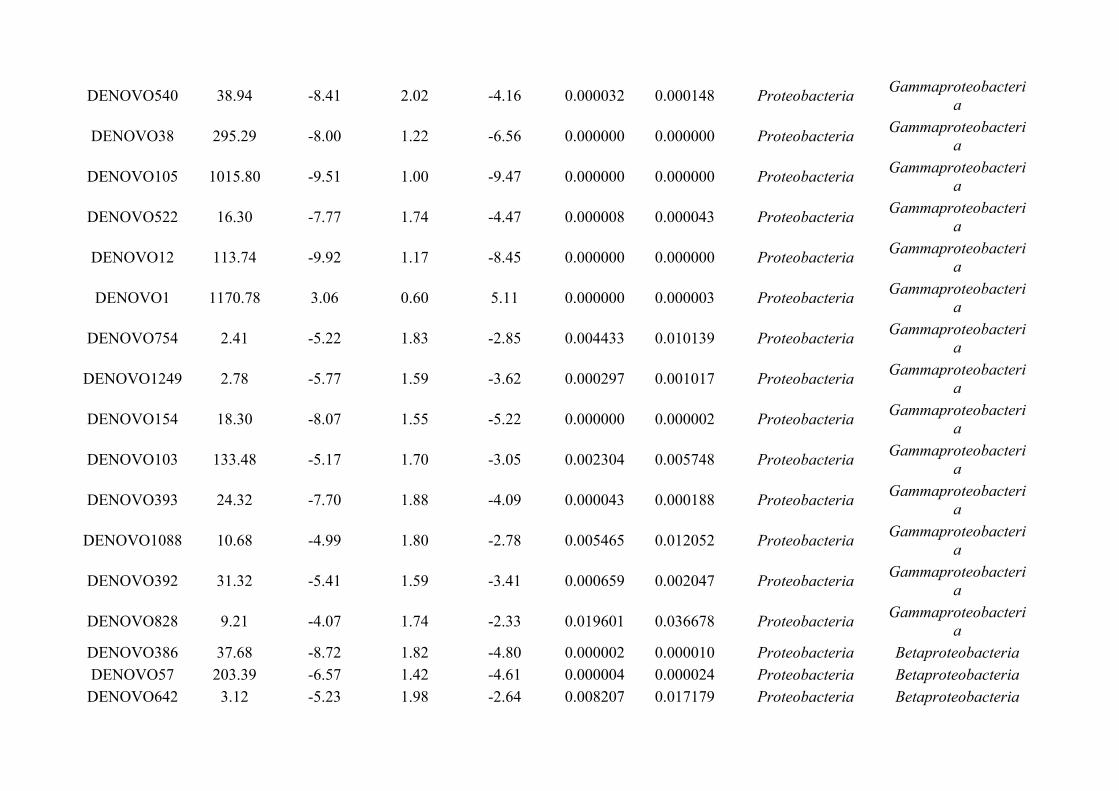
DENOVO540 38.94 -8.41 2.02 -4.16 0.000032 0.000148 ProteobacteriaGammaproteobacteri
a
DENOVO38 295.29 -8.00 1.22 -6.56 0.000000 0.000000 ProteobacteriaGammaproteobacteri
a
DENOVO105 1015.80 -9.51 1.00 -9.47 0.000000 0.000000 ProteobacteriaGammaproteobacteri
a
DENOVO522 16.30 -7.77 1.74 -4.47 0.000008 0.000043 ProteobacteriaGammaproteobacteri
a
DENOVO12 113.74 -9.92 1.17 -8.45 0.000000 0.000000 ProteobacteriaGammaproteobacteri
a
DENOVO1 1170.78 3.06 0.60 5.11 0.000000 0.000003 ProteobacteriaGammaproteobacteri
a
DENOVO754 2.41 -5.22 1.83 -2.85 0.004433 0.010139 ProteobacteriaGammaproteobacteri
a
DENOVO1249 2.78 -5.77 1.59 -3.62 0.000297 0.001017 ProteobacteriaGammaproteobacteri
a
DENOVO154 18.30 -8.07 1.55 -5.22 0.000000 0.000002 ProteobacteriaGammaproteobacteri
a
DENOVO103 133.48 -5.17 1.70 -3.05 0.002304 0.005748 ProteobacteriaGammaproteobacteri
a
DENOVO393 24.32 -7.70 1.88 -4.09 0.000043 0.000188 ProteobacteriaGammaproteobacteri
a
DENOVO1088 10.68 -4.99 1.80 -2.78 0.005465 0.012052 ProteobacteriaGammaproteobacteri
a
DENOVO392 31.32 -5.41 1.59 -3.41 0.000659 0.002047 ProteobacteriaGammaproteobacteri
a
DENOVO828 9.21 -4.07 1.74 -2.33 0.019601 0.036678 ProteobacteriaGammaproteobacteri
aDENOVO386 37.68 -8.72 1.82 -4.80 0.000002 0.000010 Proteobacteria BetaproteobacteriaDENOVO57 203.39 -6.57 1.42 -4.61 0.000004 0.000024 Proteobacteria BetaproteobacteriaDENOVO642 3.12 -5.23 1.98 -2.64 0.008207 0.017179 Proteobacteria Betaproteobacteria
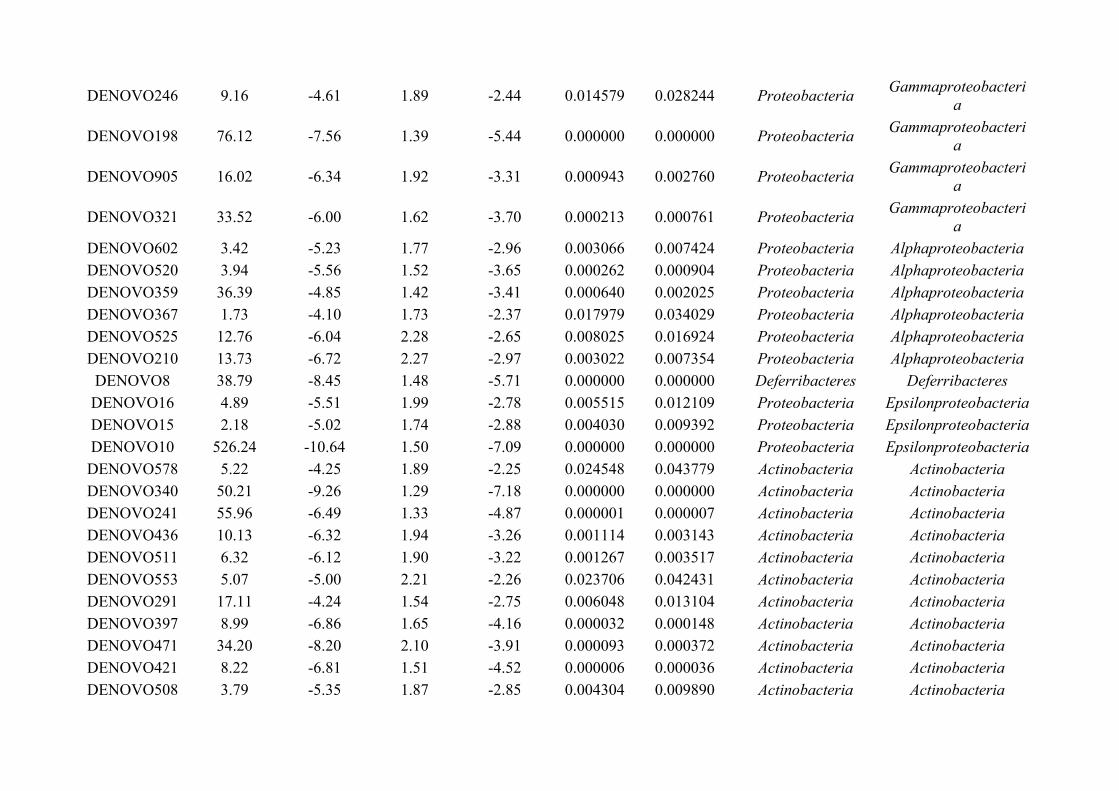
DENOVO246 9.16 -4.61 1.89 -2.44 0.014579 0.028244 ProteobacteriaGammaproteobacteri
a
DENOVO198 76.12 -7.56 1.39 -5.44 0.000000 0.000000 ProteobacteriaGammaproteobacteri
a
DENOVO905 16.02 -6.34 1.92 -3.31 0.000943 0.002760 ProteobacteriaGammaproteobacteri
a
DENOVO321 33.52 -6.00 1.62 -3.70 0.000213 0.000761 ProteobacteriaGammaproteobacteri
aDENOVO602 3.42 -5.23 1.77 -2.96 0.003066 0.007424 Proteobacteria AlphaproteobacteriaDENOVO520 3.94 -5.56 1.52 -3.65 0.000262 0.000904 Proteobacteria AlphaproteobacteriaDENOVO359 36.39 -4.85 1.42 -3.41 0.000640 0.002025 Proteobacteria AlphaproteobacteriaDENOVO367 1.73 -4.10 1.73 -2.37 0.017979 0.034029 Proteobacteria AlphaproteobacteriaDENOVO525 12.76 -6.04 2.28 -2.65 0.008025 0.016924 Proteobacteria AlphaproteobacteriaDENOVO210 13.73 -6.72 2.27 -2.97 0.003022 0.007354 Proteobacteria AlphaproteobacteriaDENOVO8 38.79 -8.45 1.48 -5.71 0.000000 0.000000 Deferribacteres DeferribacteresDENOVO16 4.89 -5.51 1.99 -2.78 0.005515 0.012109 Proteobacteria EpsilonproteobacteriaDENOVO15 2.18 -5.02 1.74 -2.88 0.004030 0.009392 Proteobacteria EpsilonproteobacteriaDENOVO10 526.24 -10.64 1.50 -7.09 0.000000 0.000000 Proteobacteria EpsilonproteobacteriaDENOVO578 5.22 -4.25 1.89 -2.25 0.024548 0.043779 Actinobacteria ActinobacteriaDENOVO340 50.21 -9.26 1.29 -7.18 0.000000 0.000000 Actinobacteria ActinobacteriaDENOVO241 55.96 -6.49 1.33 -4.87 0.000001 0.000007 Actinobacteria ActinobacteriaDENOVO436 10.13 -6.32 1.94 -3.26 0.001114 0.003143 Actinobacteria ActinobacteriaDENOVO511 6.32 -6.12 1.90 -3.22 0.001267 0.003517 Actinobacteria ActinobacteriaDENOVO553 5.07 -5.00 2.21 -2.26 0.023706 0.042431 Actinobacteria ActinobacteriaDENOVO291 17.11 -4.24 1.54 -2.75 0.006048 0.013104 Actinobacteria ActinobacteriaDENOVO397 8.99 -6.86 1.65 -4.16 0.000032 0.000148 Actinobacteria ActinobacteriaDENOVO471 34.20 -8.20 2.10 -3.91 0.000093 0.000372 Actinobacteria ActinobacteriaDENOVO421 8.22 -6.81 1.51 -4.52 0.000006 0.000036 Actinobacteria ActinobacteriaDENOVO508 3.79 -5.35 1.87 -2.85 0.004304 0.009890 Actinobacteria Actinobacteria
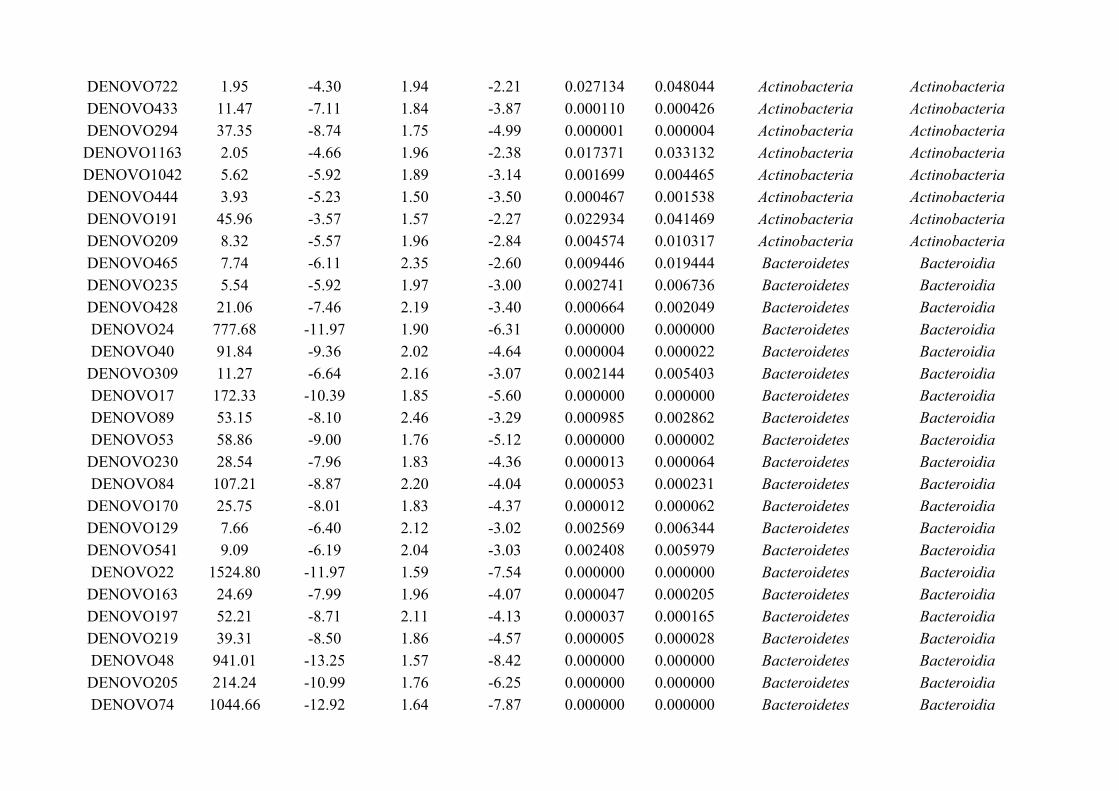
DENOVO722 1.95 -4.30 1.94 -2.21 0.027134 0.048044 Actinobacteria ActinobacteriaDENOVO433 11.47 -7.11 1.84 -3.87 0.000110 0.000426 Actinobacteria ActinobacteriaDENOVO294 37.35 -8.74 1.75 -4.99 0.000001 0.000004 Actinobacteria ActinobacteriaDENOVO1163 2.05 -4.66 1.96 -2.38 0.017371 0.033132 Actinobacteria ActinobacteriaDENOVO1042 5.62 -5.92 1.89 -3.14 0.001699 0.004465 Actinobacteria ActinobacteriaDENOVO444 3.93 -5.23 1.50 -3.50 0.000467 0.001538 Actinobacteria ActinobacteriaDENOVO191 45.96 -3.57 1.57 -2.27 0.022934 0.041469 Actinobacteria ActinobacteriaDENOVO209 8.32 -5.57 1.96 -2.84 0.004574 0.010317 Actinobacteria ActinobacteriaDENOVO465 7.74 -6.11 2.35 -2.60 0.009446 0.019444 Bacteroidetes BacteroidiaDENOVO235 5.54 -5.92 1.97 -3.00 0.002741 0.006736 Bacteroidetes BacteroidiaDENOVO428 21.06 -7.46 2.19 -3.40 0.000664 0.002049 Bacteroidetes BacteroidiaDENOVO24 777.68 -11.97 1.90 -6.31 0.000000 0.000000 Bacteroidetes BacteroidiaDENOVO40 91.84 -9.36 2.02 -4.64 0.000004 0.000022 Bacteroidetes BacteroidiaDENOVO309 11.27 -6.64 2.16 -3.07 0.002144 0.005403 Bacteroidetes BacteroidiaDENOVO17 172.33 -10.39 1.85 -5.60 0.000000 0.000000 Bacteroidetes BacteroidiaDENOVO89 53.15 -8.10 2.46 -3.29 0.000985 0.002862 Bacteroidetes BacteroidiaDENOVO53 58.86 -9.00 1.76 -5.12 0.000000 0.000002 Bacteroidetes BacteroidiaDENOVO230 28.54 -7.96 1.83 -4.36 0.000013 0.000064 Bacteroidetes BacteroidiaDENOVO84 107.21 -8.87 2.20 -4.04 0.000053 0.000231 Bacteroidetes BacteroidiaDENOVO170 25.75 -8.01 1.83 -4.37 0.000012 0.000062 Bacteroidetes BacteroidiaDENOVO129 7.66 -6.40 2.12 -3.02 0.002569 0.006344 Bacteroidetes BacteroidiaDENOVO541 9.09 -6.19 2.04 -3.03 0.002408 0.005979 Bacteroidetes BacteroidiaDENOVO22 1524.80 -11.97 1.59 -7.54 0.000000 0.000000 Bacteroidetes BacteroidiaDENOVO163 24.69 -7.99 1.96 -4.07 0.000047 0.000205 Bacteroidetes BacteroidiaDENOVO197 52.21 -8.71 2.11 -4.13 0.000037 0.000165 Bacteroidetes BacteroidiaDENOVO219 39.31 -8.50 1.86 -4.57 0.000005 0.000028 Bacteroidetes BacteroidiaDENOVO48 941.01 -13.25 1.57 -8.42 0.000000 0.000000 Bacteroidetes BacteroidiaDENOVO205 214.24 -10.99 1.76 -6.25 0.000000 0.000000 Bacteroidetes BacteroidiaDENOVO74 1044.66 -12.92 1.64 -7.87 0.000000 0.000000 Bacteroidetes Bacteroidia
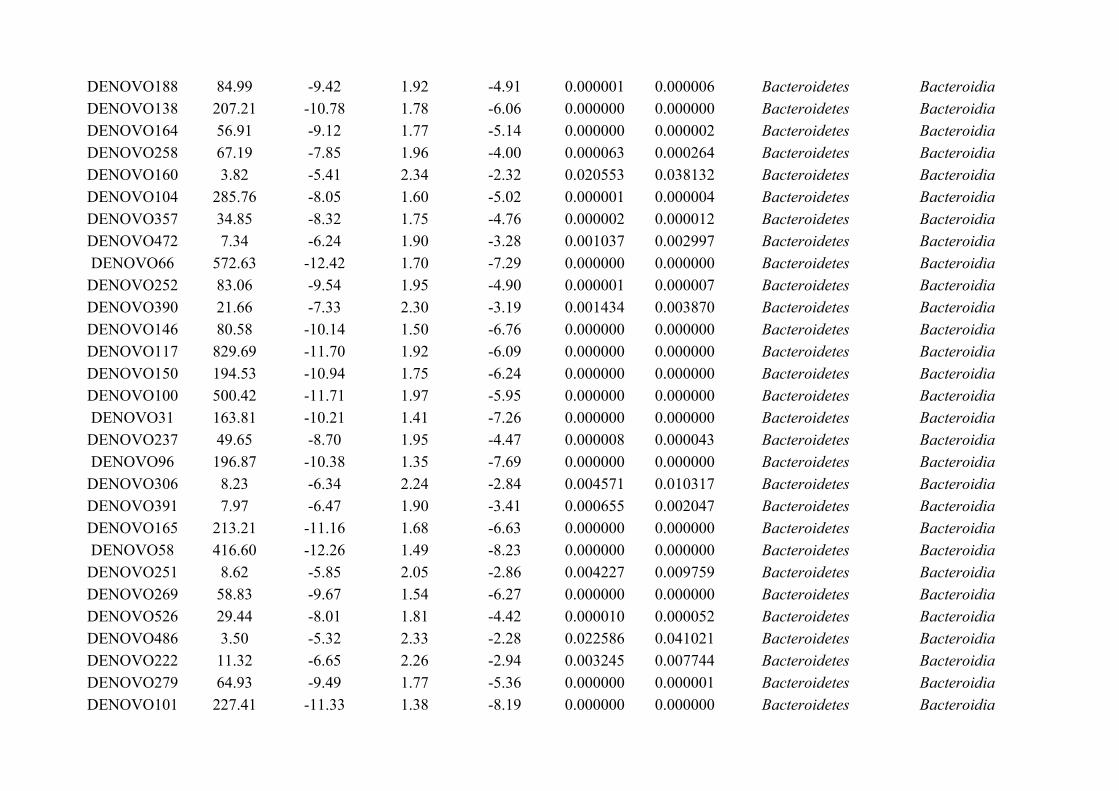
DENOVO188 84.99 -9.42 1.92 -4.91 0.000001 0.000006 Bacteroidetes BacteroidiaDENOVO138 207.21 -10.78 1.78 -6.06 0.000000 0.000000 Bacteroidetes BacteroidiaDENOVO164 56.91 -9.12 1.77 -5.14 0.000000 0.000002 Bacteroidetes BacteroidiaDENOVO258 67.19 -7.85 1.96 -4.00 0.000063 0.000264 Bacteroidetes BacteroidiaDENOVO160 3.82 -5.41 2.34 -2.32 0.020553 0.038132 Bacteroidetes BacteroidiaDENOVO104 285.76 -8.05 1.60 -5.02 0.000001 0.000004 Bacteroidetes BacteroidiaDENOVO357 34.85 -8.32 1.75 -4.76 0.000002 0.000012 Bacteroidetes BacteroidiaDENOVO472 7.34 -6.24 1.90 -3.28 0.001037 0.002997 Bacteroidetes BacteroidiaDENOVO66 572.63 -12.42 1.70 -7.29 0.000000 0.000000 Bacteroidetes BacteroidiaDENOVO252 83.06 -9.54 1.95 -4.90 0.000001 0.000007 Bacteroidetes BacteroidiaDENOVO390 21.66 -7.33 2.30 -3.19 0.001434 0.003870 Bacteroidetes BacteroidiaDENOVO146 80.58 -10.14 1.50 -6.76 0.000000 0.000000 Bacteroidetes BacteroidiaDENOVO117 829.69 -11.70 1.92 -6.09 0.000000 0.000000 Bacteroidetes BacteroidiaDENOVO150 194.53 -10.94 1.75 -6.24 0.000000 0.000000 Bacteroidetes BacteroidiaDENOVO100 500.42 -11.71 1.97 -5.95 0.000000 0.000000 Bacteroidetes BacteroidiaDENOVO31 163.81 -10.21 1.41 -7.26 0.000000 0.000000 Bacteroidetes BacteroidiaDENOVO237 49.65 -8.70 1.95 -4.47 0.000008 0.000043 Bacteroidetes BacteroidiaDENOVO96 196.87 -10.38 1.35 -7.69 0.000000 0.000000 Bacteroidetes BacteroidiaDENOVO306 8.23 -6.34 2.24 -2.84 0.004571 0.010317 Bacteroidetes BacteroidiaDENOVO391 7.97 -6.47 1.90 -3.41 0.000655 0.002047 Bacteroidetes BacteroidiaDENOVO165 213.21 -11.16 1.68 -6.63 0.000000 0.000000 Bacteroidetes BacteroidiaDENOVO58 416.60 -12.26 1.49 -8.23 0.000000 0.000000 Bacteroidetes BacteroidiaDENOVO251 8.62 -5.85 2.05 -2.86 0.004227 0.009759 Bacteroidetes BacteroidiaDENOVO269 58.83 -9.67 1.54 -6.27 0.000000 0.000000 Bacteroidetes BacteroidiaDENOVO526 29.44 -8.01 1.81 -4.42 0.000010 0.000052 Bacteroidetes BacteroidiaDENOVO486 3.50 -5.32 2.33 -2.28 0.022586 0.041021 Bacteroidetes BacteroidiaDENOVO222 11.32 -6.65 2.26 -2.94 0.003245 0.007744 Bacteroidetes BacteroidiaDENOVO279 64.93 -9.49 1.77 -5.36 0.000000 0.000001 Bacteroidetes BacteroidiaDENOVO101 227.41 -11.33 1.38 -8.19 0.000000 0.000000 Bacteroidetes Bacteroidia
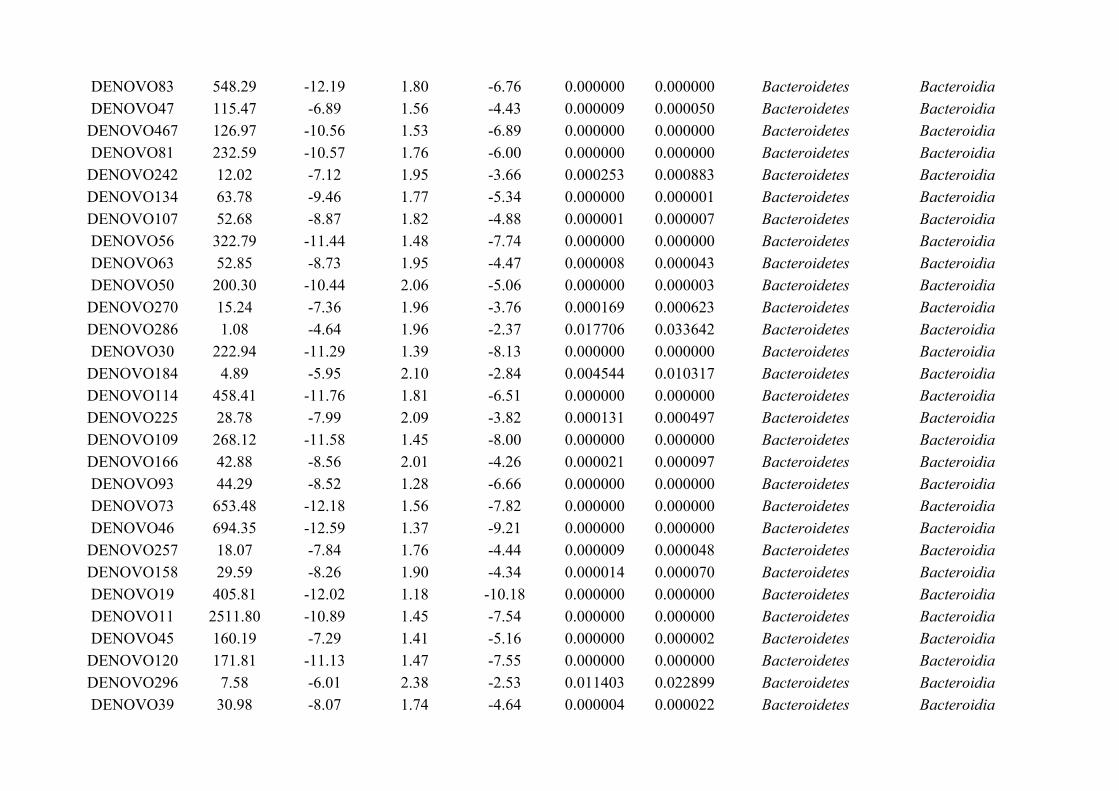
DENOVO83 548.29 -12.19 1.80 -6.76 0.000000 0.000000 Bacteroidetes BacteroidiaDENOVO47 115.47 -6.89 1.56 -4.43 0.000009 0.000050 Bacteroidetes BacteroidiaDENOVO467 126.97 -10.56 1.53 -6.89 0.000000 0.000000 Bacteroidetes BacteroidiaDENOVO81 232.59 -10.57 1.76 -6.00 0.000000 0.000000 Bacteroidetes BacteroidiaDENOVO242 12.02 -7.12 1.95 -3.66 0.000253 0.000883 Bacteroidetes BacteroidiaDENOVO134 63.78 -9.46 1.77 -5.34 0.000000 0.000001 Bacteroidetes BacteroidiaDENOVO107 52.68 -8.87 1.82 -4.88 0.000001 0.000007 Bacteroidetes BacteroidiaDENOVO56 322.79 -11.44 1.48 -7.74 0.000000 0.000000 Bacteroidetes BacteroidiaDENOVO63 52.85 -8.73 1.95 -4.47 0.000008 0.000043 Bacteroidetes BacteroidiaDENOVO50 200.30 -10.44 2.06 -5.06 0.000000 0.000003 Bacteroidetes BacteroidiaDENOVO270 15.24 -7.36 1.96 -3.76 0.000169 0.000623 Bacteroidetes BacteroidiaDENOVO286 1.08 -4.64 1.96 -2.37 0.017706 0.033642 Bacteroidetes BacteroidiaDENOVO30 222.94 -11.29 1.39 -8.13 0.000000 0.000000 Bacteroidetes BacteroidiaDENOVO184 4.89 -5.95 2.10 -2.84 0.004544 0.010317 Bacteroidetes BacteroidiaDENOVO114 458.41 -11.76 1.81 -6.51 0.000000 0.000000 Bacteroidetes BacteroidiaDENOVO225 28.78 -7.99 2.09 -3.82 0.000131 0.000497 Bacteroidetes BacteroidiaDENOVO109 268.12 -11.58 1.45 -8.00 0.000000 0.000000 Bacteroidetes BacteroidiaDENOVO166 42.88 -8.56 2.01 -4.26 0.000021 0.000097 Bacteroidetes BacteroidiaDENOVO93 44.29 -8.52 1.28 -6.66 0.000000 0.000000 Bacteroidetes BacteroidiaDENOVO73 653.48 -12.18 1.56 -7.82 0.000000 0.000000 Bacteroidetes BacteroidiaDENOVO46 694.35 -12.59 1.37 -9.21 0.000000 0.000000 Bacteroidetes BacteroidiaDENOVO257 18.07 -7.84 1.76 -4.44 0.000009 0.000048 Bacteroidetes BacteroidiaDENOVO158 29.59 -8.26 1.90 -4.34 0.000014 0.000070 Bacteroidetes BacteroidiaDENOVO19 405.81 -12.02 1.18 -10.18 0.000000 0.000000 Bacteroidetes BacteroidiaDENOVO11 2511.80 -10.89 1.45 -7.54 0.000000 0.000000 Bacteroidetes BacteroidiaDENOVO45 160.19 -7.29 1.41 -5.16 0.000000 0.000002 Bacteroidetes BacteroidiaDENOVO120 171.81 -11.13 1.47 -7.55 0.000000 0.000000 Bacteroidetes BacteroidiaDENOVO296 7.58 -6.01 2.38 -2.53 0.011403 0.022899 Bacteroidetes BacteroidiaDENOVO39 30.98 -8.07 1.74 -4.64 0.000004 0.000022 Bacteroidetes Bacteroidia
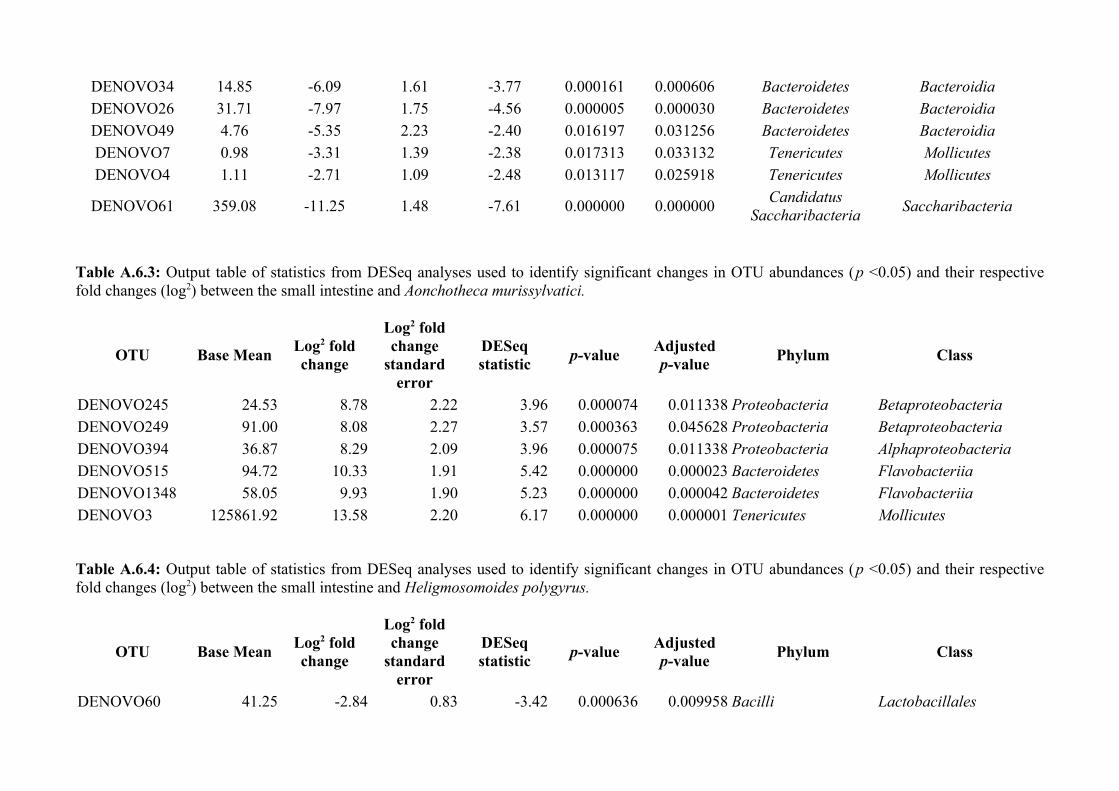
DENOVO34 14.85 -6.09 1.61 -3.77 0.000161 0.000606 Bacteroidetes BacteroidiaDENOVO26 31.71 -7.97 1.75 -4.56 0.000005 0.000030 Bacteroidetes BacteroidiaDENOVO49 4.76 -5.35 2.23 -2.40 0.016197 0.031256 Bacteroidetes BacteroidiaDENOVO7 0.98 -3.31 1.39 -2.38 0.017313 0.033132 Tenericutes MollicutesDENOVO4 1.11 -2.71 1.09 -2.48 0.013117 0.025918 Tenericutes Mollicutes
DENOVO61 359.08 -11.25 1.48 -7.61 0.000000 0.000000Candidatus
SaccharibacteriaSaccharibacteria
Table A.6.3: Output table of statistics from DESeq analyses used to identify significant changes in OTU abundances (p <0.05) and their respectivefold changes (log2) between the small intestine and Aonchotheca murissylvatici.
OTU Base MeanLog2 foldchange
Log2 foldchange
standarderror
DESeqstatistic
p-valueAdjustedp-value
Phylum Class
DENOVO245 24.53 8.78 2.22 3.96 0.000074 0.011338 Proteobacteria BetaproteobacteriaDENOVO249 91.00 8.08 2.27 3.57 0.000363 0.045628 Proteobacteria BetaproteobacteriaDENOVO394 36.87 8.29 2.09 3.96 0.000075 0.011338 Proteobacteria AlphaproteobacteriaDENOVO515 94.72 10.33 1.91 5.42 0.000000 0.000023 Bacteroidetes FlavobacteriiaDENOVO1348 58.05 9.93 1.90 5.23 0.000000 0.000042 Bacteroidetes FlavobacteriiaDENOVO3 125861.92 13.58 2.20 6.17 0.000000 0.000001 Tenericutes Mollicutes
Table A.6.4: Output table of statistics from DESeq analyses used to identify significant changes in OTU abundances (p <0.05) and their respectivefold changes (log2) between the small intestine and Heligmosomoides polygyrus.
OTU Base MeanLog2 foldchange
Log2 foldchange
standarderror
DESeqstatistic
p-valueAdjustedp-value
Phylum Class
DENOVO60 41.25 -2.84 0.83 -3.42 0.000636 0.009958 Bacilli Lactobacillales
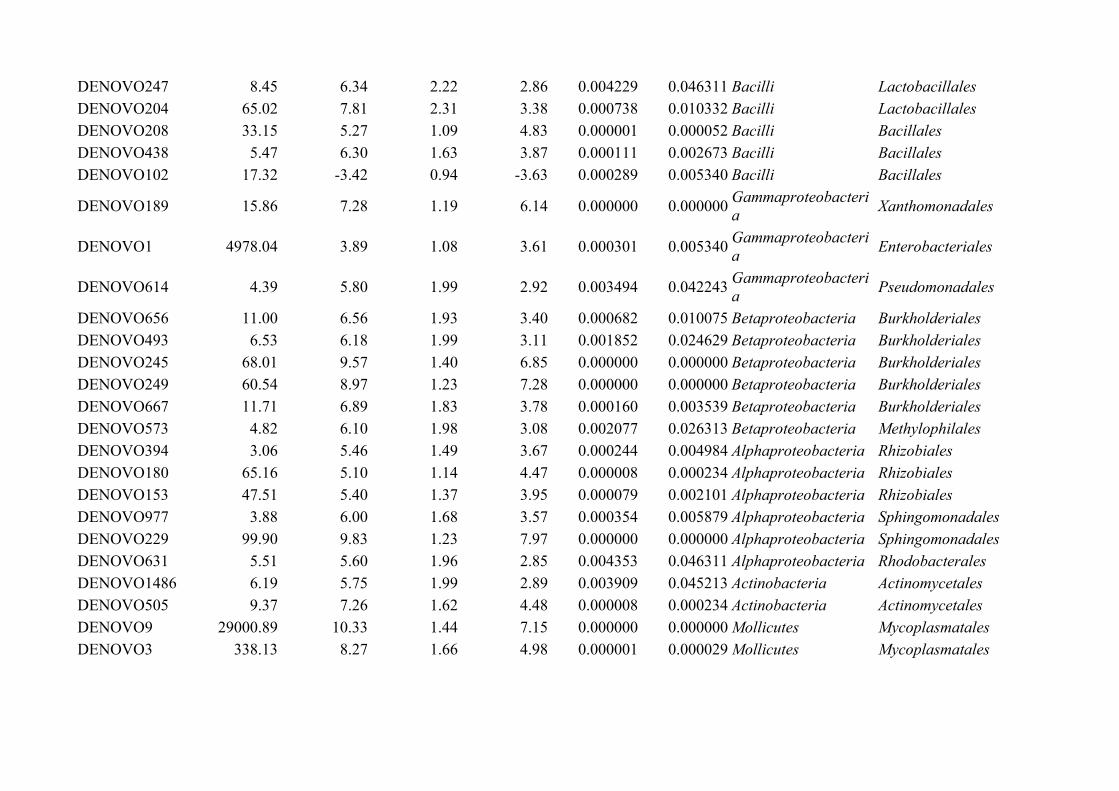
DENOVO247 8.45 6.34 2.22 2.86 0.004229 0.046311 Bacilli LactobacillalesDENOVO204 65.02 7.81 2.31 3.38 0.000738 0.010332 Bacilli LactobacillalesDENOVO208 33.15 5.27 1.09 4.83 0.000001 0.000052 Bacilli BacillalesDENOVO438 5.47 6.30 1.63 3.87 0.000111 0.002673 Bacilli BacillalesDENOVO102 17.32 -3.42 0.94 -3.63 0.000289 0.005340 Bacilli Bacillales
DENOVO189 15.86 7.28 1.19 6.14 0.000000 0.000000Gammaproteobacteria
Xanthomonadales
DENOVO1 4978.04 3.89 1.08 3.61 0.000301 0.005340Gammaproteobacteria
Enterobacteriales
DENOVO614 4.39 5.80 1.99 2.92 0.003494 0.042243Gammaproteobacteria
Pseudomonadales
DENOVO656 11.00 6.56 1.93 3.40 0.000682 0.010075 Betaproteobacteria BurkholderialesDENOVO493 6.53 6.18 1.99 3.11 0.001852 0.024629 Betaproteobacteria BurkholderialesDENOVO245 68.01 9.57 1.40 6.85 0.000000 0.000000 Betaproteobacteria BurkholderialesDENOVO249 60.54 8.97 1.23 7.28 0.000000 0.000000 Betaproteobacteria BurkholderialesDENOVO667 11.71 6.89 1.83 3.78 0.000160 0.003539 Betaproteobacteria BurkholderialesDENOVO573 4.82 6.10 1.98 3.08 0.002077 0.026313 Betaproteobacteria MethylophilalesDENOVO394 3.06 5.46 1.49 3.67 0.000244 0.004984 Alphaproteobacteria RhizobialesDENOVO180 65.16 5.10 1.14 4.47 0.000008 0.000234 Alphaproteobacteria RhizobialesDENOVO153 47.51 5.40 1.37 3.95 0.000079 0.002101 Alphaproteobacteria RhizobialesDENOVO977 3.88 6.00 1.68 3.57 0.000354 0.005879 Alphaproteobacteria SphingomonadalesDENOVO229 99.90 9.83 1.23 7.97 0.000000 0.000000 Alphaproteobacteria SphingomonadalesDENOVO631 5.51 5.60 1.96 2.85 0.004353 0.046311 Alphaproteobacteria RhodobacteralesDENOVO1486 6.19 5.75 1.99 2.89 0.003909 0.045213 Actinobacteria ActinomycetalesDENOVO505 9.37 7.26 1.62 4.48 0.000008 0.000234 Actinobacteria ActinomycetalesDENOVO9 29000.89 10.33 1.44 7.15 0.000000 0.000000 Mollicutes MycoplasmatalesDENOVO3 338.13 8.27 1.66 4.98 0.000001 0.000029 Mollicutes Mycoplasmatales
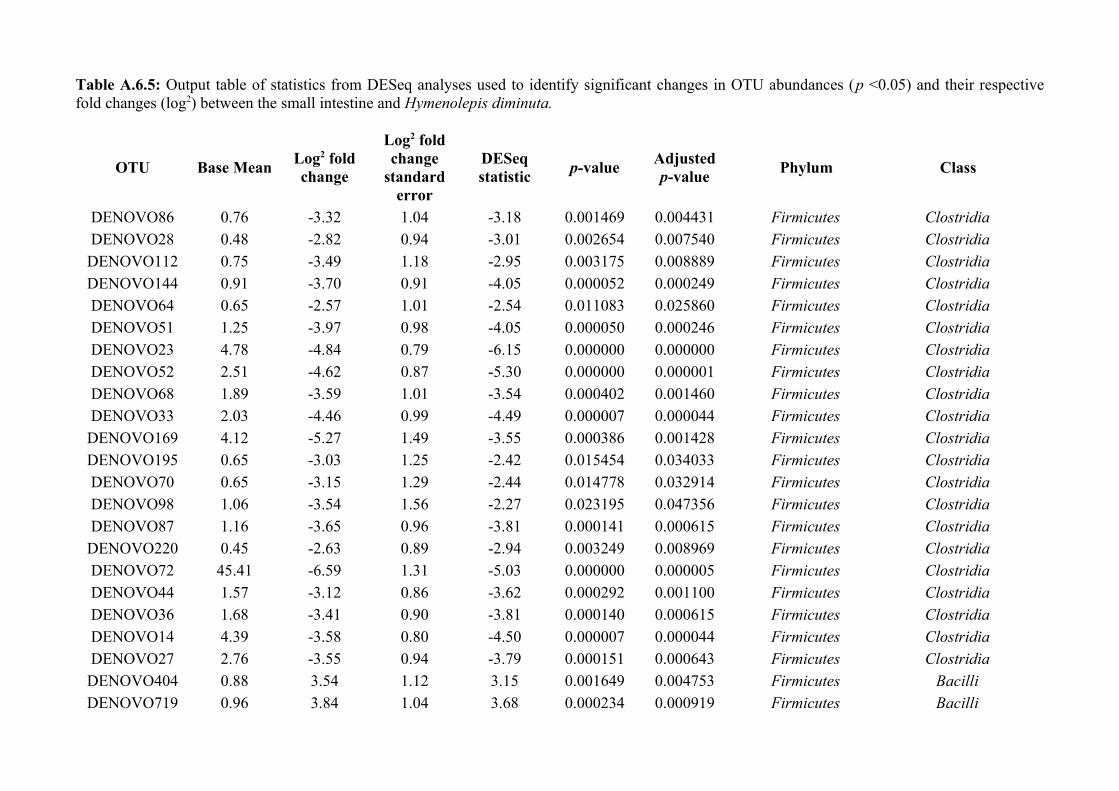
Table A.6.5: Output table of statistics from DESeq analyses used to identify significant changes in OTU abundances (p <0.05) and their respectivefold changes (log2) between the small intestine and Hymenolepis diminuta.
OTU Base MeanLog2 foldchange
Log2 foldchange
standarderror
DESeqstatistic
p-valueAdjustedp-value
Phylum Class
DENOVO86 0.76 -3.32 1.04 -3.18 0.001469 0.004431 Firmicutes ClostridiaDENOVO28 0.48 -2.82 0.94 -3.01 0.002654 0.007540 Firmicutes ClostridiaDENOVO112 0.75 -3.49 1.18 -2.95 0.003175 0.008889 Firmicutes ClostridiaDENOVO144 0.91 -3.70 0.91 -4.05 0.000052 0.000249 Firmicutes ClostridiaDENOVO64 0.65 -2.57 1.01 -2.54 0.011083 0.025860 Firmicutes ClostridiaDENOVO51 1.25 -3.97 0.98 -4.05 0.000050 0.000246 Firmicutes ClostridiaDENOVO23 4.78 -4.84 0.79 -6.15 0.000000 0.000000 Firmicutes ClostridiaDENOVO52 2.51 -4.62 0.87 -5.30 0.000000 0.000001 Firmicutes ClostridiaDENOVO68 1.89 -3.59 1.01 -3.54 0.000402 0.001460 Firmicutes ClostridiaDENOVO33 2.03 -4.46 0.99 -4.49 0.000007 0.000044 Firmicutes ClostridiaDENOVO169 4.12 -5.27 1.49 -3.55 0.000386 0.001428 Firmicutes ClostridiaDENOVO195 0.65 -3.03 1.25 -2.42 0.015454 0.034033 Firmicutes ClostridiaDENOVO70 0.65 -3.15 1.29 -2.44 0.014778 0.032914 Firmicutes ClostridiaDENOVO98 1.06 -3.54 1.56 -2.27 0.023195 0.047356 Firmicutes ClostridiaDENOVO87 1.16 -3.65 0.96 -3.81 0.000141 0.000615 Firmicutes ClostridiaDENOVO220 0.45 -2.63 0.89 -2.94 0.003249 0.008969 Firmicutes ClostridiaDENOVO72 45.41 -6.59 1.31 -5.03 0.000000 0.000005 Firmicutes ClostridiaDENOVO44 1.57 -3.12 0.86 -3.62 0.000292 0.001100 Firmicutes ClostridiaDENOVO36 1.68 -3.41 0.90 -3.81 0.000140 0.000615 Firmicutes ClostridiaDENOVO14 4.39 -3.58 0.80 -4.50 0.000007 0.000044 Firmicutes ClostridiaDENOVO27 2.76 -3.55 0.94 -3.79 0.000151 0.000643 Firmicutes ClostridiaDENOVO404 0.88 3.54 1.12 3.15 0.001649 0.004753 Firmicutes BacilliDENOVO719 0.96 3.84 1.04 3.68 0.000234 0.000919 Firmicutes Bacilli
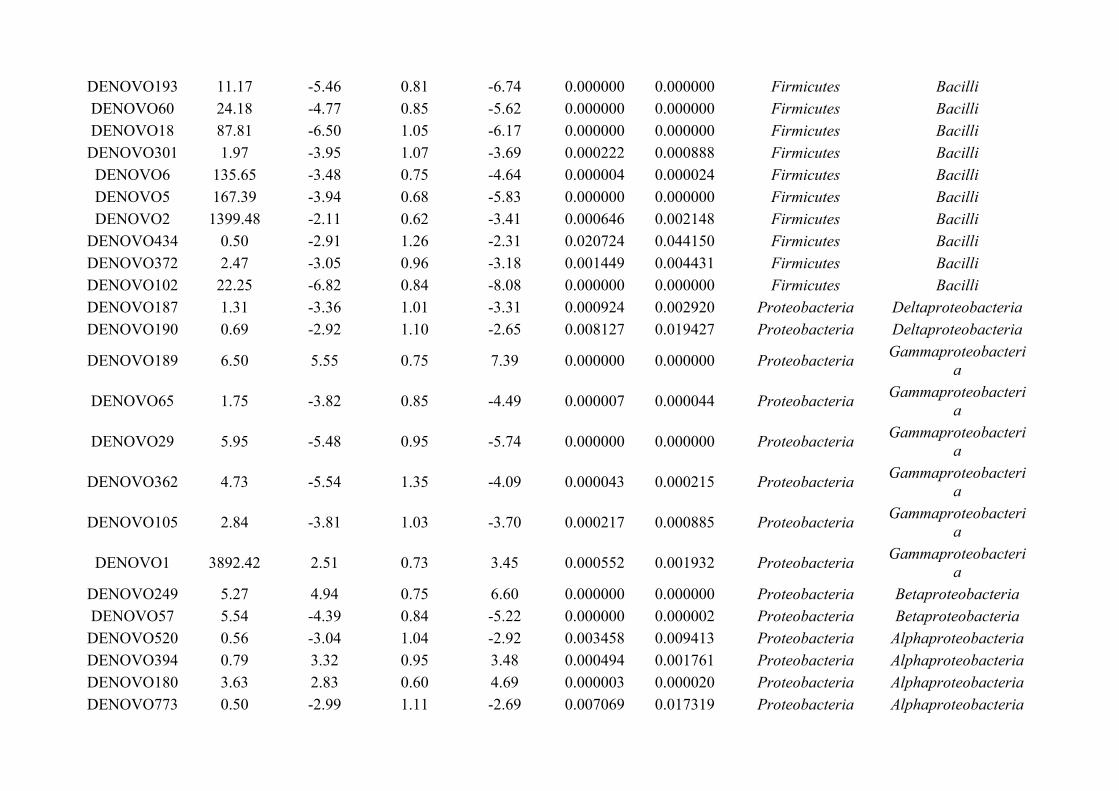
DENOVO193 11.17 -5.46 0.81 -6.74 0.000000 0.000000 Firmicutes BacilliDENOVO60 24.18 -4.77 0.85 -5.62 0.000000 0.000000 Firmicutes BacilliDENOVO18 87.81 -6.50 1.05 -6.17 0.000000 0.000000 Firmicutes BacilliDENOVO301 1.97 -3.95 1.07 -3.69 0.000222 0.000888 Firmicutes BacilliDENOVO6 135.65 -3.48 0.75 -4.64 0.000004 0.000024 Firmicutes BacilliDENOVO5 167.39 -3.94 0.68 -5.83 0.000000 0.000000 Firmicutes BacilliDENOVO2 1399.48 -2.11 0.62 -3.41 0.000646 0.002148 Firmicutes Bacilli
DENOVO434 0.50 -2.91 1.26 -2.31 0.020724 0.044150 Firmicutes BacilliDENOVO372 2.47 -3.05 0.96 -3.18 0.001449 0.004431 Firmicutes BacilliDENOVO102 22.25 -6.82 0.84 -8.08 0.000000 0.000000 Firmicutes BacilliDENOVO187 1.31 -3.36 1.01 -3.31 0.000924 0.002920 Proteobacteria DeltaproteobacteriaDENOVO190 0.69 -2.92 1.10 -2.65 0.008127 0.019427 Proteobacteria Deltaproteobacteria
DENOVO189 6.50 5.55 0.75 7.39 0.000000 0.000000 ProteobacteriaGammaproteobacteri
a
DENOVO65 1.75 -3.82 0.85 -4.49 0.000007 0.000044 ProteobacteriaGammaproteobacteri
a
DENOVO29 5.95 -5.48 0.95 -5.74 0.000000 0.000000 ProteobacteriaGammaproteobacteri
a
DENOVO362 4.73 -5.54 1.35 -4.09 0.000043 0.000215 ProteobacteriaGammaproteobacteri
a
DENOVO105 2.84 -3.81 1.03 -3.70 0.000217 0.000885 ProteobacteriaGammaproteobacteri
a
DENOVO1 3892.42 2.51 0.73 3.45 0.000552 0.001932 ProteobacteriaGammaproteobacteri
aDENOVO249 5.27 4.94 0.75 6.60 0.000000 0.000000 Proteobacteria BetaproteobacteriaDENOVO57 5.54 -4.39 0.84 -5.22 0.000000 0.000002 Proteobacteria BetaproteobacteriaDENOVO520 0.56 -3.04 1.04 -2.92 0.003458 0.009413 Proteobacteria AlphaproteobacteriaDENOVO394 0.79 3.32 0.95 3.48 0.000494 0.001761 Proteobacteria AlphaproteobacteriaDENOVO180 3.63 2.83 0.60 4.69 0.000003 0.000020 Proteobacteria AlphaproteobacteriaDENOVO773 0.50 -2.99 1.11 -2.69 0.007069 0.017319 Proteobacteria Alphaproteobacteria

DENOVO229 1.85 3.27 0.84 3.90 0.000097 0.000453 Proteobacteria AlphaproteobacteriaDENOVO8 6.33 -4.51 0.84 -5.39 0.000000 0.000001 Deferribacteres DeferribacteresDENOVO16 0.63 -2.75 1.11 -2.47 0.013677 0.030968 Proteobacteria EpsilonproteobacteriaDENOVO15 104.13 -9.49 1.11 -8.54 0.000000 0.000000 Proteobacteria EpsilonproteobacteriaDENOVO10 6.86 -4.95 0.75 -6.60 0.000000 0.000000 Proteobacteria EpsilonproteobacteriaDENOVO241 1.03 -3.61 0.76 -4.72 0.000002 0.000018 Actinobacteria ActinobacteriaDENOVO291 1.29 -3.50 1.10 -3.19 0.001422 0.004423 Actinobacteria ActinobacteriaDENOVO444 0.46 -2.93 0.93 -3.17 0.001547 0.004580 Actinobacteria ActinobacteriaDENOVO191 1.70 -4.01 1.05 -3.83 0.000128 0.000583 Actinobacteria ActinobacteriaDENOVO794 0.32 -2.36 1.01 -2.34 0.019164 0.041353 Actinobacteria ActinobacteriaDENOVO22 10.19 -5.06 1.02 -4.97 0.000001 0.000006 Bacteroidetes BacteroidiaDENOVO48 2.85 -4.10 1.19 -3.45 0.000564 0.001938 Bacteroidetes BacteroidiaDENOVO205 1.08 -3.64 1.08 -3.38 0.000737 0.002367 Bacteroidetes BacteroidiaDENOVO74 7.27 -5.13 0.97 -5.28 0.000000 0.000001 Bacteroidetes BacteroidiaDENOVO188 1.14 -3.13 1.37 -2.28 0.022612 0.047148 Bacteroidetes BacteroidiaDENOVO138 1.76 -2.83 1.25 -2.27 0.022997 0.047356 Bacteroidetes BacteroidiaDENOVO164 0.87 -2.92 1.09 -2.67 0.007621 0.018441 Bacteroidetes BacteroidiaDENOVO104 2.90 -4.10 0.94 -4.36 0.000013 0.000074 Bacteroidetes BacteroidiaDENOVO66 7.60 -4.17 1.11 -3.76 0.000172 0.000719 Bacteroidetes BacteroidiaDENOVO117 1.84 -2.69 1.08 -2.49 0.012935 0.029826 Bacteroidetes BacteroidiaDENOVO31 7.54 -3.87 0.89 -4.36 0.000013 0.000074 Bacteroidetes BacteroidiaDENOVO237 0.75 -2.62 1.15 -2.28 0.022516 0.047148 Bacteroidetes BacteroidiaDENOVO96 5.49 -3.90 0.87 -4.47 0.000008 0.000047 Bacteroidetes BacteroidiaDENOVO165 0.59 -2.86 1.06 -2.69 0.007039 0.017319 Bacteroidetes BacteroidiaDENOVO58 6.21 -4.66 0.96 -4.85 0.000001 0.000010 Bacteroidetes BacteroidiaDENOVO269 0.56 -2.63 0.97 -2.71 0.006690 0.017028 Bacteroidetes BacteroidiaDENOVO279 0.35 -2.55 1.03 -2.46 0.013746 0.030968 Bacteroidetes BacteroidiaDENOVO101 3.99 -4.29 0.92 -4.65 0.000003 0.000023 Bacteroidetes BacteroidiaDENOVO83 4.91 -4.20 1.24 -3.39 0.000693 0.002264 Bacteroidetes Bacteroidia
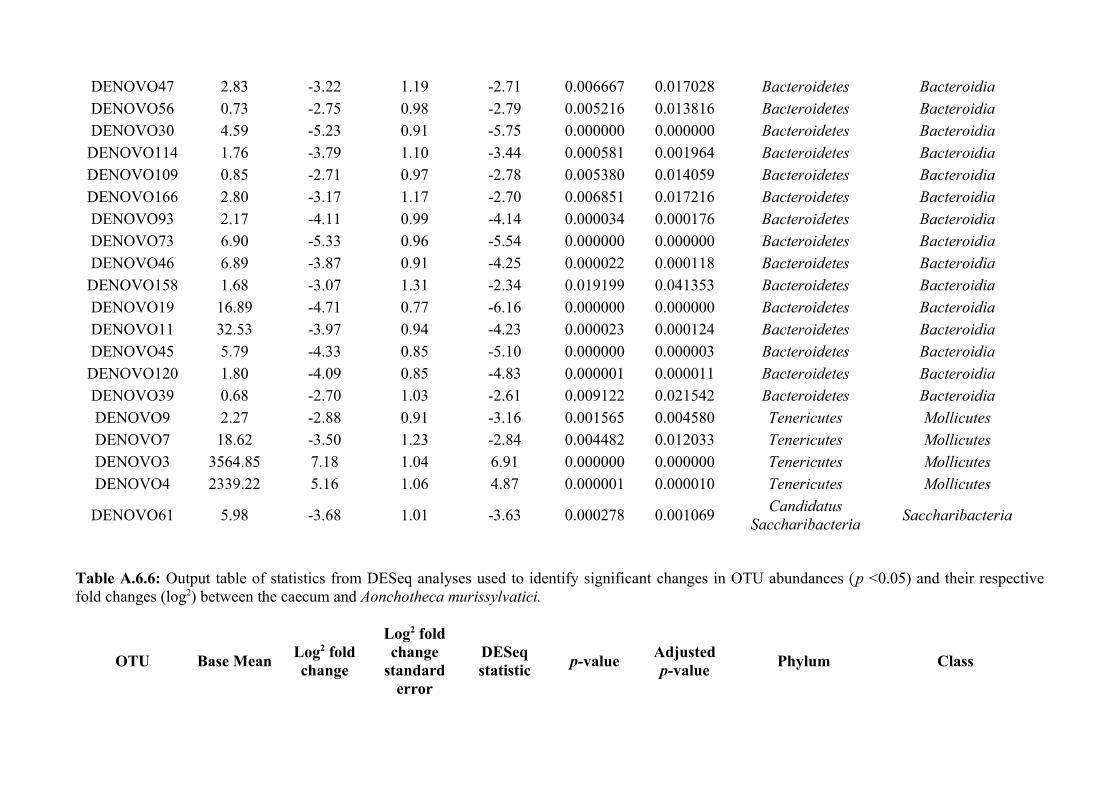
DENOVO47 2.83 -3.22 1.19 -2.71 0.006667 0.017028 Bacteroidetes BacteroidiaDENOVO56 0.73 -2.75 0.98 -2.79 0.005216 0.013816 Bacteroidetes BacteroidiaDENOVO30 4.59 -5.23 0.91 -5.75 0.000000 0.000000 Bacteroidetes BacteroidiaDENOVO114 1.76 -3.79 1.10 -3.44 0.000581 0.001964 Bacteroidetes BacteroidiaDENOVO109 0.85 -2.71 0.97 -2.78 0.005380 0.014059 Bacteroidetes BacteroidiaDENOVO166 2.80 -3.17 1.17 -2.70 0.006851 0.017216 Bacteroidetes BacteroidiaDENOVO93 2.17 -4.11 0.99 -4.14 0.000034 0.000176 Bacteroidetes BacteroidiaDENOVO73 6.90 -5.33 0.96 -5.54 0.000000 0.000000 Bacteroidetes BacteroidiaDENOVO46 6.89 -3.87 0.91 -4.25 0.000022 0.000118 Bacteroidetes BacteroidiaDENOVO158 1.68 -3.07 1.31 -2.34 0.019199 0.041353 Bacteroidetes BacteroidiaDENOVO19 16.89 -4.71 0.77 -6.16 0.000000 0.000000 Bacteroidetes BacteroidiaDENOVO11 32.53 -3.97 0.94 -4.23 0.000023 0.000124 Bacteroidetes BacteroidiaDENOVO45 5.79 -4.33 0.85 -5.10 0.000000 0.000003 Bacteroidetes BacteroidiaDENOVO120 1.80 -4.09 0.85 -4.83 0.000001 0.000011 Bacteroidetes BacteroidiaDENOVO39 0.68 -2.70 1.03 -2.61 0.009122 0.021542 Bacteroidetes BacteroidiaDENOVO9 2.27 -2.88 0.91 -3.16 0.001565 0.004580 Tenericutes MollicutesDENOVO7 18.62 -3.50 1.23 -2.84 0.004482 0.012033 Tenericutes MollicutesDENOVO3 3564.85 7.18 1.04 6.91 0.000000 0.000000 Tenericutes MollicutesDENOVO4 2339.22 5.16 1.06 4.87 0.000001 0.000010 Tenericutes Mollicutes
DENOVO61 5.98 -3.68 1.01 -3.63 0.000278 0.001069Candidatus
SaccharibacteriaSaccharibacteria
Table A.6.6: Output table of statistics from DESeq analyses used to identify significant changes in OTU abundances (p <0.05) and their respectivefold changes (log2) between the caecum and Aonchotheca murissylvatici.
OTU Base MeanLog2 foldchange
Log2 foldchange
standarderror
DESeqstatistic
p-valueAdjustedp-value
Phylum Class
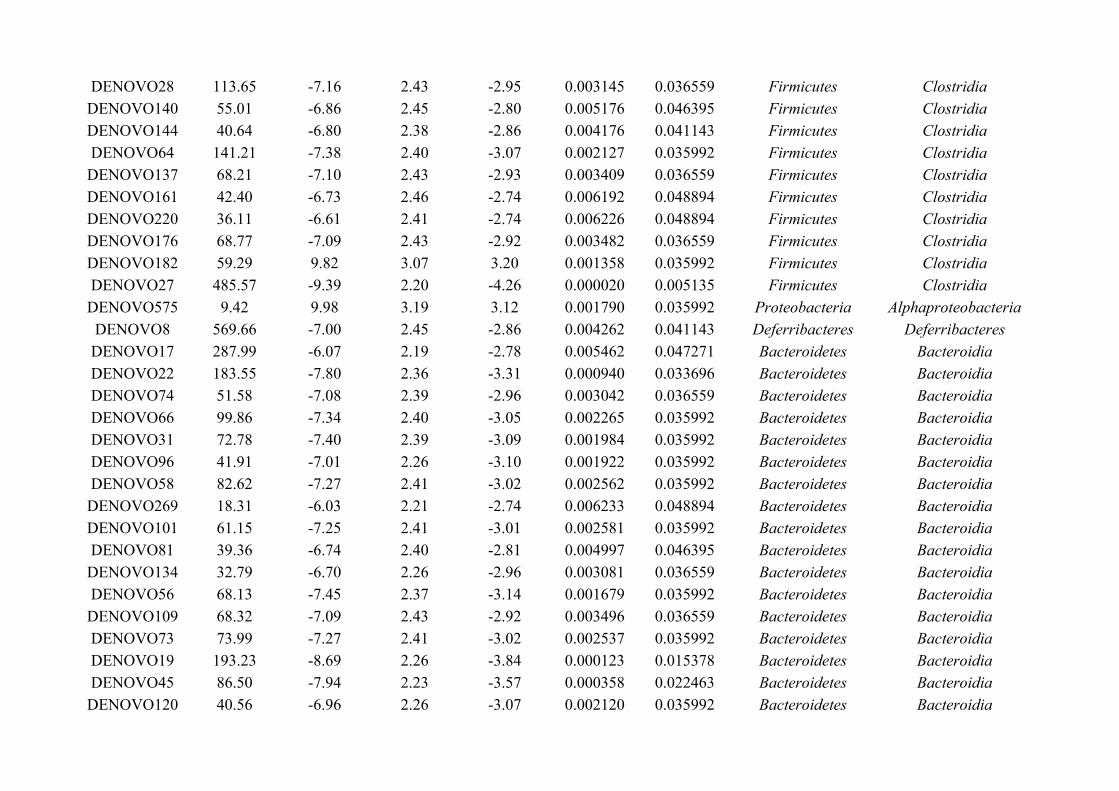
DENOVO28 113.65 -7.16 2.43 -2.95 0.003145 0.036559 Firmicutes ClostridiaDENOVO140 55.01 -6.86 2.45 -2.80 0.005176 0.046395 Firmicutes ClostridiaDENOVO144 40.64 -6.80 2.38 -2.86 0.004176 0.041143 Firmicutes ClostridiaDENOVO64 141.21 -7.38 2.40 -3.07 0.002127 0.035992 Firmicutes ClostridiaDENOVO137 68.21 -7.10 2.43 -2.93 0.003409 0.036559 Firmicutes ClostridiaDENOVO161 42.40 -6.73 2.46 -2.74 0.006192 0.048894 Firmicutes ClostridiaDENOVO220 36.11 -6.61 2.41 -2.74 0.006226 0.048894 Firmicutes ClostridiaDENOVO176 68.77 -7.09 2.43 -2.92 0.003482 0.036559 Firmicutes ClostridiaDENOVO182 59.29 9.82 3.07 3.20 0.001358 0.035992 Firmicutes ClostridiaDENOVO27 485.57 -9.39 2.20 -4.26 0.000020 0.005135 Firmicutes ClostridiaDENOVO575 9.42 9.98 3.19 3.12 0.001790 0.035992 Proteobacteria AlphaproteobacteriaDENOVO8 569.66 -7.00 2.45 -2.86 0.004262 0.041143 Deferribacteres DeferribacteresDENOVO17 287.99 -6.07 2.19 -2.78 0.005462 0.047271 Bacteroidetes BacteroidiaDENOVO22 183.55 -7.80 2.36 -3.31 0.000940 0.033696 Bacteroidetes BacteroidiaDENOVO74 51.58 -7.08 2.39 -2.96 0.003042 0.036559 Bacteroidetes BacteroidiaDENOVO66 99.86 -7.34 2.40 -3.05 0.002265 0.035992 Bacteroidetes BacteroidiaDENOVO31 72.78 -7.40 2.39 -3.09 0.001984 0.035992 Bacteroidetes BacteroidiaDENOVO96 41.91 -7.01 2.26 -3.10 0.001922 0.035992 Bacteroidetes BacteroidiaDENOVO58 82.62 -7.27 2.41 -3.02 0.002562 0.035992 Bacteroidetes BacteroidiaDENOVO269 18.31 -6.03 2.21 -2.74 0.006233 0.048894 Bacteroidetes BacteroidiaDENOVO101 61.15 -7.25 2.41 -3.01 0.002581 0.035992 Bacteroidetes BacteroidiaDENOVO81 39.36 -6.74 2.40 -2.81 0.004997 0.046395 Bacteroidetes BacteroidiaDENOVO134 32.79 -6.70 2.26 -2.96 0.003081 0.036559 Bacteroidetes BacteroidiaDENOVO56 68.13 -7.45 2.37 -3.14 0.001679 0.035992 Bacteroidetes BacteroidiaDENOVO109 68.32 -7.09 2.43 -2.92 0.003496 0.036559 Bacteroidetes BacteroidiaDENOVO73 73.99 -7.27 2.41 -3.02 0.002537 0.035992 Bacteroidetes BacteroidiaDENOVO19 193.23 -8.69 2.26 -3.84 0.000123 0.015378 Bacteroidetes BacteroidiaDENOVO45 86.50 -7.94 2.23 -3.57 0.000358 0.022463 Bacteroidetes BacteroidiaDENOVO120 40.56 -6.96 2.26 -3.07 0.002120 0.035992 Bacteroidetes Bacteroidia
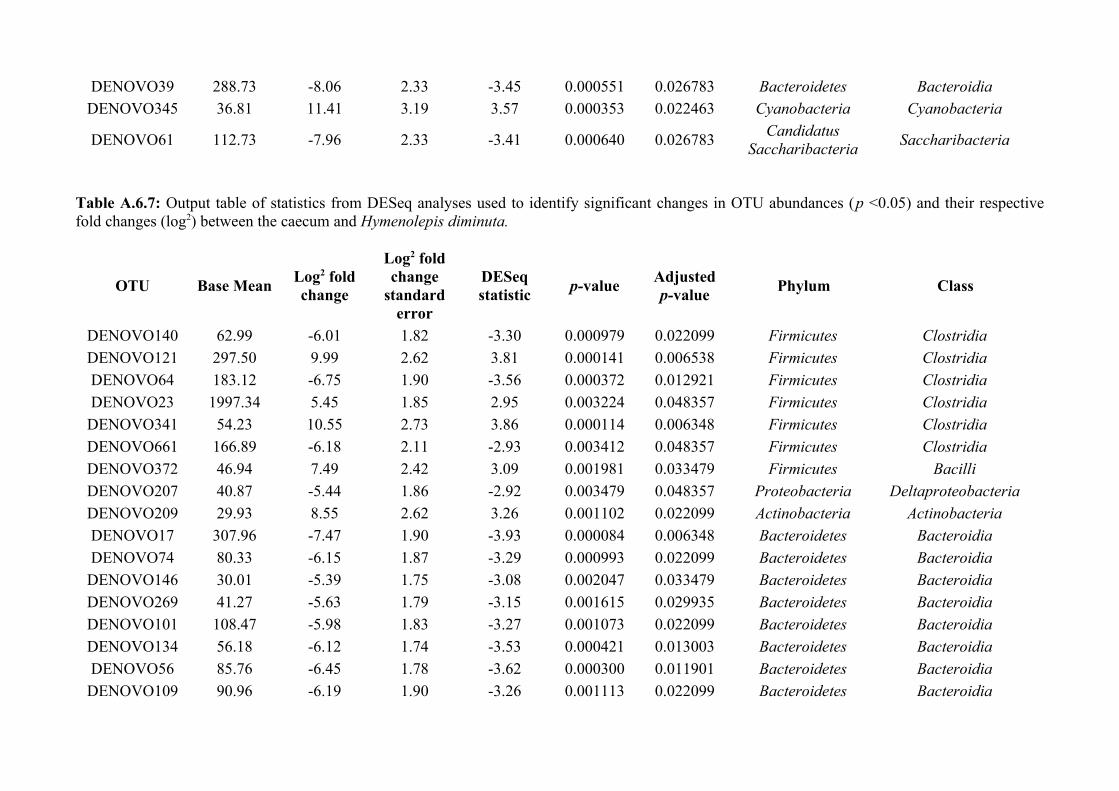
DENOVO39 288.73 -8.06 2.33 -3.45 0.000551 0.026783 Bacteroidetes BacteroidiaDENOVO345 36.81 11.41 3.19 3.57 0.000353 0.022463 Cyanobacteria Cyanobacteria
DENOVO61 112.73 -7.96 2.33 -3.41 0.000640 0.026783Candidatus
SaccharibacteriaSaccharibacteria
Table A.6.7: Output table of statistics from DESeq analyses used to identify significant changes in OTU abundances (p <0.05) and their respectivefold changes (log2) between the caecum and Hymenolepis diminuta.
OTU Base MeanLog2 foldchange
Log2 foldchange
standarderror
DESeqstatistic
p-valueAdjustedp-value
Phylum Class
DENOVO140 62.99 -6.01 1.82 -3.30 0.000979 0.022099 Firmicutes Clostridia
DENOVO121 297.50 9.99 2.62 3.81 0.000141 0.006538 Firmicutes Clostridia
DENOVO64 183.12 -6.75 1.90 -3.56 0.000372 0.012921 Firmicutes Clostridia
DENOVO23 1997.34 5.45 1.85 2.95 0.003224 0.048357 Firmicutes Clostridia
DENOVO341 54.23 10.55 2.73 3.86 0.000114 0.006348 Firmicutes Clostridia
DENOVO661 166.89 -6.18 2.11 -2.93 0.003412 0.048357 Firmicutes Clostridia
DENOVO372 46.94 7.49 2.42 3.09 0.001981 0.033479 Firmicutes Bacilli
DENOVO207 40.87 -5.44 1.86 -2.92 0.003479 0.048357 Proteobacteria Deltaproteobacteria
DENOVO209 29.93 8.55 2.62 3.26 0.001102 0.022099 Actinobacteria Actinobacteria
DENOVO17 307.96 -7.47 1.90 -3.93 0.000084 0.006348 Bacteroidetes Bacteroidia
DENOVO74 80.33 -6.15 1.87 -3.29 0.000993 0.022099 Bacteroidetes Bacteroidia
DENOVO146 30.01 -5.39 1.75 -3.08 0.002047 0.033479 Bacteroidetes Bacteroidia
DENOVO269 41.27 -5.63 1.79 -3.15 0.001615 0.029935 Bacteroidetes Bacteroidia
DENOVO101 108.47 -5.98 1.83 -3.27 0.001073 0.022099 Bacteroidetes Bacteroidia
DENOVO134 56.18 -6.12 1.74 -3.53 0.000421 0.013003 Bacteroidetes Bacteroidia
DENOVO56 85.76 -6.45 1.78 -3.62 0.000300 0.011901 Bacteroidetes Bacteroidia
DENOVO109 90.96 -6.19 1.90 -3.26 0.001113 0.022099 Bacteroidetes Bacteroidia
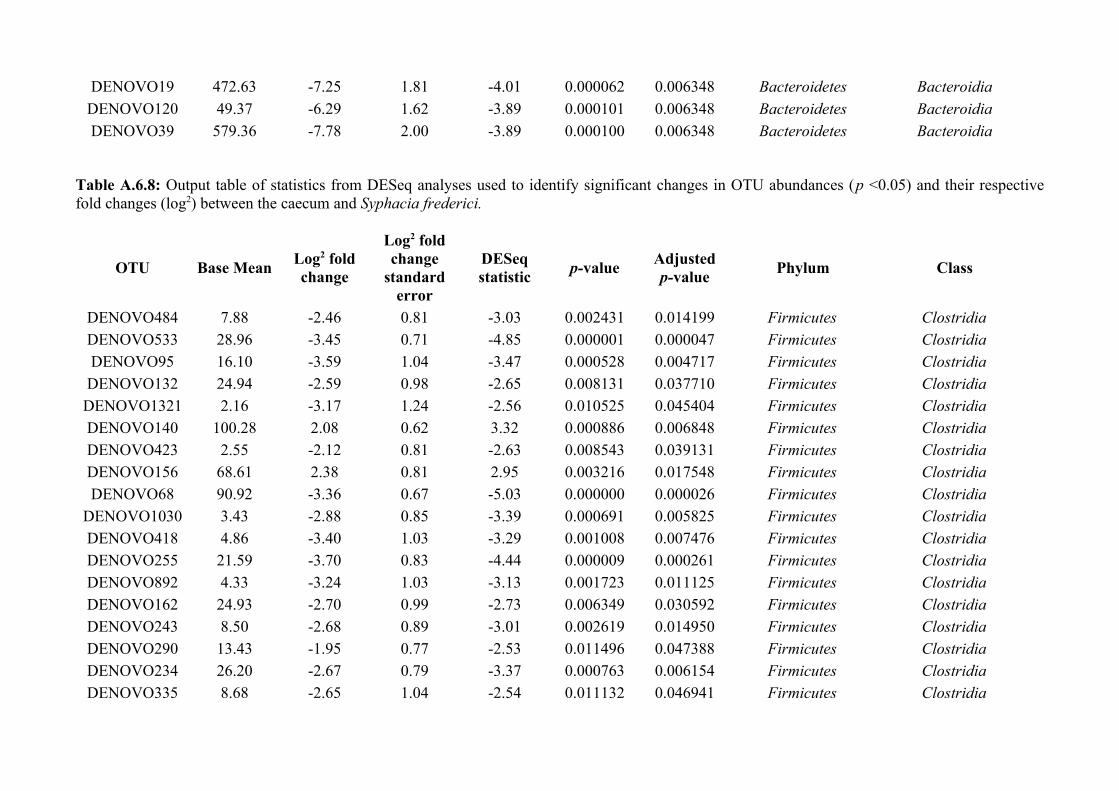
DENOVO19 472.63 -7.25 1.81 -4.01 0.000062 0.006348 Bacteroidetes Bacteroidia
DENOVO120 49.37 -6.29 1.62 -3.89 0.000101 0.006348 Bacteroidetes Bacteroidia
DENOVO39 579.36 -7.78 2.00 -3.89 0.000100 0.006348 Bacteroidetes Bacteroidia
Table A.6.8: Output table of statistics from DESeq analyses used to identify significant changes in OTU abundances (p <0.05) and their respectivefold changes (log2) between the caecum and Syphacia frederici.
OTU Base MeanLog2 foldchange
Log2 foldchange
standarderror
DESeqstatistic
p-valueAdjustedp-value
Phylum Class
DENOVO484 7.88 -2.46 0.81 -3.03 0.002431 0.014199 Firmicutes ClostridiaDENOVO533 28.96 -3.45 0.71 -4.85 0.000001 0.000047 Firmicutes ClostridiaDENOVO95 16.10 -3.59 1.04 -3.47 0.000528 0.004717 Firmicutes ClostridiaDENOVO132 24.94 -2.59 0.98 -2.65 0.008131 0.037710 Firmicutes ClostridiaDENOVO1321 2.16 -3.17 1.24 -2.56 0.010525 0.045404 Firmicutes ClostridiaDENOVO140 100.28 2.08 0.62 3.32 0.000886 0.006848 Firmicutes ClostridiaDENOVO423 2.55 -2.12 0.81 -2.63 0.008543 0.039131 Firmicutes ClostridiaDENOVO156 68.61 2.38 0.81 2.95 0.003216 0.017548 Firmicutes ClostridiaDENOVO68 90.92 -3.36 0.67 -5.03 0.000000 0.000026 Firmicutes Clostridia
DENOVO1030 3.43 -2.88 0.85 -3.39 0.000691 0.005825 Firmicutes ClostridiaDENOVO418 4.86 -3.40 1.03 -3.29 0.001008 0.007476 Firmicutes ClostridiaDENOVO255 21.59 -3.70 0.83 -4.44 0.000009 0.000261 Firmicutes ClostridiaDENOVO892 4.33 -3.24 1.03 -3.13 0.001723 0.011125 Firmicutes ClostridiaDENOVO162 24.93 -2.70 0.99 -2.73 0.006349 0.030592 Firmicutes ClostridiaDENOVO243 8.50 -2.68 0.89 -3.01 0.002619 0.014950 Firmicutes ClostridiaDENOVO290 13.43 -1.95 0.77 -2.53 0.011496 0.047388 Firmicutes ClostridiaDENOVO234 26.20 -2.67 0.79 -3.37 0.000763 0.006154 Firmicutes ClostridiaDENOVO335 8.68 -2.65 1.04 -2.54 0.011132 0.046941 Firmicutes Clostridia

DENOVO161 18.26 -2.91 0.71 -4.12 0.000038 0.000765 Firmicutes ClostridiaDENOVO254 7.29 -3.23 1.17 -2.77 0.005661 0.027637 Firmicutes ClostridiaDENOVO98 10.59 -4.83 1.34 -3.61 0.000309 0.003372 Firmicutes ClostridiaDENOVO550 12.87 -2.15 0.77 -2.79 0.005248 0.025962 Firmicutes ClostridiaDENOVO259 7.30 -3.12 1.21 -2.59 0.009686 0.042276 Firmicutes ClostridiaDENOVO239 17.91 -2.16 0.69 -3.13 0.001764 0.011125 Firmicutes ClostridiaDENOVO115 32.37 -3.09 0.71 -4.36 0.000013 0.000343 Firmicutes ClostridiaDENOVO647 5.30 -3.00 0.83 -3.63 0.000280 0.003188 Firmicutes ClostridiaDENOVO141 32.38 -2.96 0.79 -3.73 0.000190 0.002514 Firmicutes ClostridiaDENOVO308 26.95 1.88 0.66 2.84 0.004500 0.022871 Firmicutes ClostridiaDENOVO218 148.32 6.20 1.04 5.98 0.000000 0.000000 Firmicutes ClostridiaDENOVO439 6.17 -3.99 1.08 -3.68 0.000236 0.003000 Firmicutes ClostridiaDENOVO176 29.28 -3.12 0.75 -4.15 0.000033 0.000719 Firmicutes ClostridiaDENOVO90 25.29 -4.96 1.08 -4.59 0.000004 0.000138 Firmicutes Clostridia
DENOVO1188 8.71 -3.37 0.89 -3.77 0.000166 0.002365 Firmicutes ClostridiaDENOVO295 10.79 -2.90 0.83 -3.49 0.000478 0.004550 Firmicutes ClostridiaDENOVO406 4.82 -2.28 0.74 -3.06 0.002237 0.013490 Firmicutes ClostridiaDENOVO420 5.58 -2.52 0.97 -2.60 0.009361 0.041844 Firmicutes ClostridiaDENOVO769 38.80 -4.05 1.03 -3.94 0.000080 0.001267 Firmicutes ClostridiaDENOVO35 139.19 -2.56 0.81 -3.17 0.001516 0.010042 Firmicutes ClostridiaDENOVO661 38.75 -2.63 0.87 -3.03 0.002449 0.014199 Firmicutes ClostridiaDENOVO82 41.43 -2.19 0.81 -2.72 0.006554 0.031173 Firmicutes ClostridiaDENOVO44 132.81 -2.49 0.66 -3.75 0.000179 0.002456 Firmicutes Clostridia
DENOVO1494 25.40 -3.27 0.78 -4.19 0.000028 0.000688 Firmicutes ClostridiaDENOVO490 16.71 -2.04 0.80 -2.54 0.011134 0.046941 Firmicutes ClostridiaDENOVO177 16.71 -2.57 0.87 -2.96 0.003098 0.017154 Firmicutes ClostridiaDENOVO1102 8.73 -3.01 1.07 -2.81 0.004912 0.024627 Firmicutes ClostridiaDENOVO562 13.62 -2.76 0.75 -3.67 0.000243 0.003000 Firmicutes ClostridiaDENOVO36 132.42 -2.26 0.72 -3.13 0.001769 0.011125 Firmicutes Clostridia

DENOVO338 19.32 -2.81 0.86 -3.25 0.001168 0.008174 Firmicutes ClostridiaDENOVO649 20.27 -3.19 0.78 -4.08 0.000044 0.000824 Firmicutes ClostridiaDENOVO14 370.87 -2.30 0.58 -3.93 0.000085 0.001267 Firmicutes ClostridiaDENOVO926 3.97 -2.97 0.86 -3.46 0.000534 0.004717 Firmicutes ClostridiaDENOVO27 239.93 -1.64 0.63 -2.62 0.008725 0.039474 Firmicutes Clostridia
DENOVO1190 6.53 -2.91 0.89 -3.27 0.001065 0.007598 Firmicutes ClostridiaDENOVO322 9.32 -2.61 0.81 -3.21 0.001337 0.009188 Firmicutes ClostridiaDENOVO457 11.29 -2.56 0.95 -2.70 0.006963 0.032698 Firmicutes ClostridiaDENOVO264 7.65 -3.48 0.98 -3.56 0.000365 0.003758 Firmicutes ClostridiaDENOVO6 106.19 3.79 0.76 4.98 0.000001 0.000028 Firmicutes BacilliDENOVO13 14.62 3.99 0.83 4.79 0.000002 0.000057 Firmicutes BacilliDENOVO2 73.14 1.60 0.44 3.66 0.000255 0.003047 Firmicutes Bacilli
DENOVO207 85.07 2.81 0.71 3.94 0.000082 0.001267 Proteobacteria DeltaproteobacteriaDENOVO187 29.31 2.06 0.70 2.93 0.003407 0.018121 Proteobacteria DeltaproteobacteriaDENOVO480 17.97 4.94 0.94 5.23 0.000000 0.000016 Proteobacteria DeltaproteobacteriaDENOVO383 21.48 3.29 0.94 3.52 0.000431 0.004212 Proteobacteria DeltaproteobacteriaDENOVO189 3.21 4.82 1.33 3.63 0.000284 0.003188 Proteobacteria GammaproteobacteriaDENOVO245 15.31 6.87 1.34 5.12 0.000000 0.000023 Proteobacteria BetaproteobacteriaDENOVO57 6.68 -1.67 0.58 -2.87 0.004127 0.021421 Proteobacteria BetaproteobacteriaDENOVO642 4.76 3.18 1.07 2.97 0.003022 0.016989 Proteobacteria BetaproteobacteriaDENOVO229 4.31 5.32 1.05 5.06 0.000000 0.000025 Proteobacteria AlphaproteobacteriaDENOVO8 10728.81 5.60 0.77 7.30 0.000000 0.000000 Deferribacteres Deferribacteres
DENOVO397 20.52 4.35 0.78 5.61 0.000000 0.000003 Actinobacteria ActinobacteriaDENOVO309 28.20 2.71 0.68 4.01 0.000061 0.001082 Bacteroidetes BacteroidiaDENOVO230 8.06 -2.11 0.66 -3.19 0.001416 0.009550 Bacteroidetes BacteroidiaDENOVO22 81.87 -2.53 0.77 -3.28 0.001045 0.007598 Bacteroidetes BacteroidiaDENOVO219 6.05 -2.74 0.76 -3.59 0.000326 0.003460 Bacteroidetes BacteroidiaDENOVO48 53.62 -2.70 0.77 -3.53 0.000410 0.004115 Bacteroidetes BacteroidiaDENOVO74 23.80 -2.14 0.70 -3.05 0.002254 0.013490 Bacteroidetes Bacteroidia
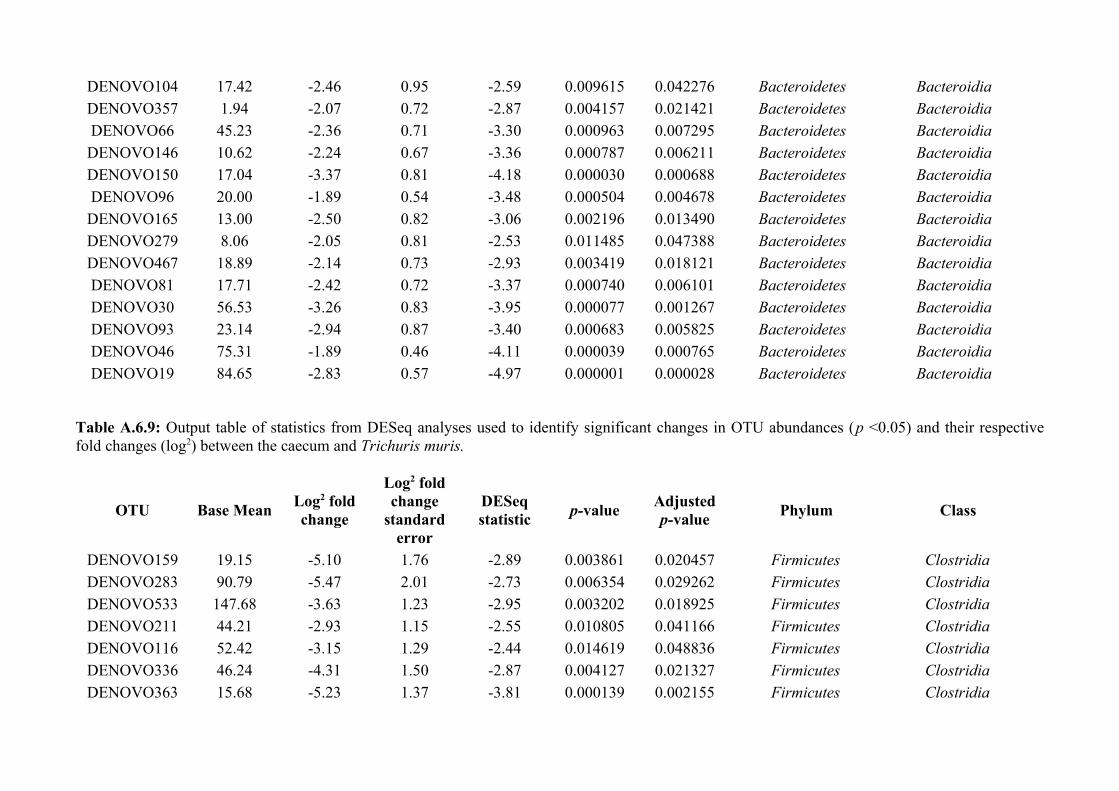
DENOVO104 17.42 -2.46 0.95 -2.59 0.009615 0.042276 Bacteroidetes BacteroidiaDENOVO357 1.94 -2.07 0.72 -2.87 0.004157 0.021421 Bacteroidetes BacteroidiaDENOVO66 45.23 -2.36 0.71 -3.30 0.000963 0.007295 Bacteroidetes BacteroidiaDENOVO146 10.62 -2.24 0.67 -3.36 0.000787 0.006211 Bacteroidetes BacteroidiaDENOVO150 17.04 -3.37 0.81 -4.18 0.000030 0.000688 Bacteroidetes BacteroidiaDENOVO96 20.00 -1.89 0.54 -3.48 0.000504 0.004678 Bacteroidetes BacteroidiaDENOVO165 13.00 -2.50 0.82 -3.06 0.002196 0.013490 Bacteroidetes BacteroidiaDENOVO279 8.06 -2.05 0.81 -2.53 0.011485 0.047388 Bacteroidetes BacteroidiaDENOVO467 18.89 -2.14 0.73 -2.93 0.003419 0.018121 Bacteroidetes BacteroidiaDENOVO81 17.71 -2.42 0.72 -3.37 0.000740 0.006101 Bacteroidetes BacteroidiaDENOVO30 56.53 -3.26 0.83 -3.95 0.000077 0.001267 Bacteroidetes BacteroidiaDENOVO93 23.14 -2.94 0.87 -3.40 0.000683 0.005825 Bacteroidetes BacteroidiaDENOVO46 75.31 -1.89 0.46 -4.11 0.000039 0.000765 Bacteroidetes BacteroidiaDENOVO19 84.65 -2.83 0.57 -4.97 0.000001 0.000028 Bacteroidetes Bacteroidia
Table A.6.9: Output table of statistics from DESeq analyses used to identify significant changes in OTU abundances (p <0.05) and their respectivefold changes (log2) between the caecum and Trichuris muris.
OTU Base MeanLog2 foldchange
Log2 foldchange
standarderror
DESeqstatistic
p-valueAdjustedp-value
Phylum Class
DENOVO159 19.15 -5.10 1.76 -2.89 0.003861 0.020457 Firmicutes ClostridiaDENOVO283 90.79 -5.47 2.01 -2.73 0.006354 0.029262 Firmicutes ClostridiaDENOVO533 147.68 -3.63 1.23 -2.95 0.003202 0.018925 Firmicutes ClostridiaDENOVO211 44.21 -2.93 1.15 -2.55 0.010805 0.041166 Firmicutes ClostridiaDENOVO116 52.42 -3.15 1.29 -2.44 0.014619 0.048836 Firmicutes ClostridiaDENOVO336 46.24 -4.31 1.50 -2.87 0.004127 0.021327 Firmicutes ClostridiaDENOVO363 15.68 -5.23 1.37 -3.81 0.000139 0.002155 Firmicutes Clostridia
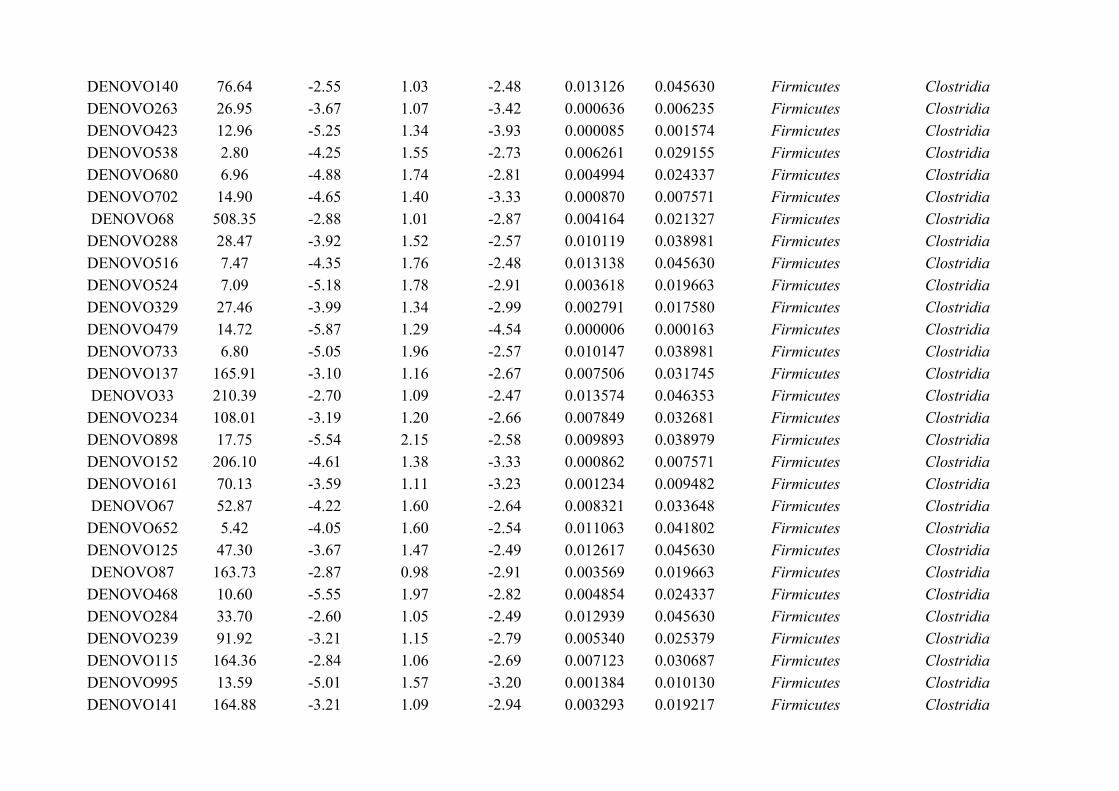
DENOVO140 76.64 -2.55 1.03 -2.48 0.013126 0.045630 Firmicutes ClostridiaDENOVO263 26.95 -3.67 1.07 -3.42 0.000636 0.006235 Firmicutes ClostridiaDENOVO423 12.96 -5.25 1.34 -3.93 0.000085 0.001574 Firmicutes ClostridiaDENOVO538 2.80 -4.25 1.55 -2.73 0.006261 0.029155 Firmicutes ClostridiaDENOVO680 6.96 -4.88 1.74 -2.81 0.004994 0.024337 Firmicutes ClostridiaDENOVO702 14.90 -4.65 1.40 -3.33 0.000870 0.007571 Firmicutes ClostridiaDENOVO68 508.35 -2.88 1.01 -2.87 0.004164 0.021327 Firmicutes ClostridiaDENOVO288 28.47 -3.92 1.52 -2.57 0.010119 0.038981 Firmicutes ClostridiaDENOVO516 7.47 -4.35 1.76 -2.48 0.013138 0.045630 Firmicutes ClostridiaDENOVO524 7.09 -5.18 1.78 -2.91 0.003618 0.019663 Firmicutes ClostridiaDENOVO329 27.46 -3.99 1.34 -2.99 0.002791 0.017580 Firmicutes ClostridiaDENOVO479 14.72 -5.87 1.29 -4.54 0.000006 0.000163 Firmicutes ClostridiaDENOVO733 6.80 -5.05 1.96 -2.57 0.010147 0.038981 Firmicutes ClostridiaDENOVO137 165.91 -3.10 1.16 -2.67 0.007506 0.031745 Firmicutes ClostridiaDENOVO33 210.39 -2.70 1.09 -2.47 0.013574 0.046353 Firmicutes ClostridiaDENOVO234 108.01 -3.19 1.20 -2.66 0.007849 0.032681 Firmicutes ClostridiaDENOVO898 17.75 -5.54 2.15 -2.58 0.009893 0.038979 Firmicutes ClostridiaDENOVO152 206.10 -4.61 1.38 -3.33 0.000862 0.007571 Firmicutes ClostridiaDENOVO161 70.13 -3.59 1.11 -3.23 0.001234 0.009482 Firmicutes ClostridiaDENOVO67 52.87 -4.22 1.60 -2.64 0.008321 0.033648 Firmicutes ClostridiaDENOVO652 5.42 -4.05 1.60 -2.54 0.011063 0.041802 Firmicutes ClostridiaDENOVO125 47.30 -3.67 1.47 -2.49 0.012617 0.045630 Firmicutes ClostridiaDENOVO87 163.73 -2.87 0.98 -2.91 0.003569 0.019663 Firmicutes ClostridiaDENOVO468 10.60 -5.55 1.97 -2.82 0.004854 0.024337 Firmicutes ClostridiaDENOVO284 33.70 -2.60 1.05 -2.49 0.012939 0.045630 Firmicutes ClostridiaDENOVO239 91.92 -3.21 1.15 -2.79 0.005340 0.025379 Firmicutes ClostridiaDENOVO115 164.36 -2.84 1.06 -2.69 0.007123 0.030687 Firmicutes ClostridiaDENOVO995 13.59 -5.01 1.57 -3.20 0.001384 0.010130 Firmicutes ClostridiaDENOVO141 164.88 -3.21 1.09 -2.94 0.003293 0.019217 Firmicutes Clostridia
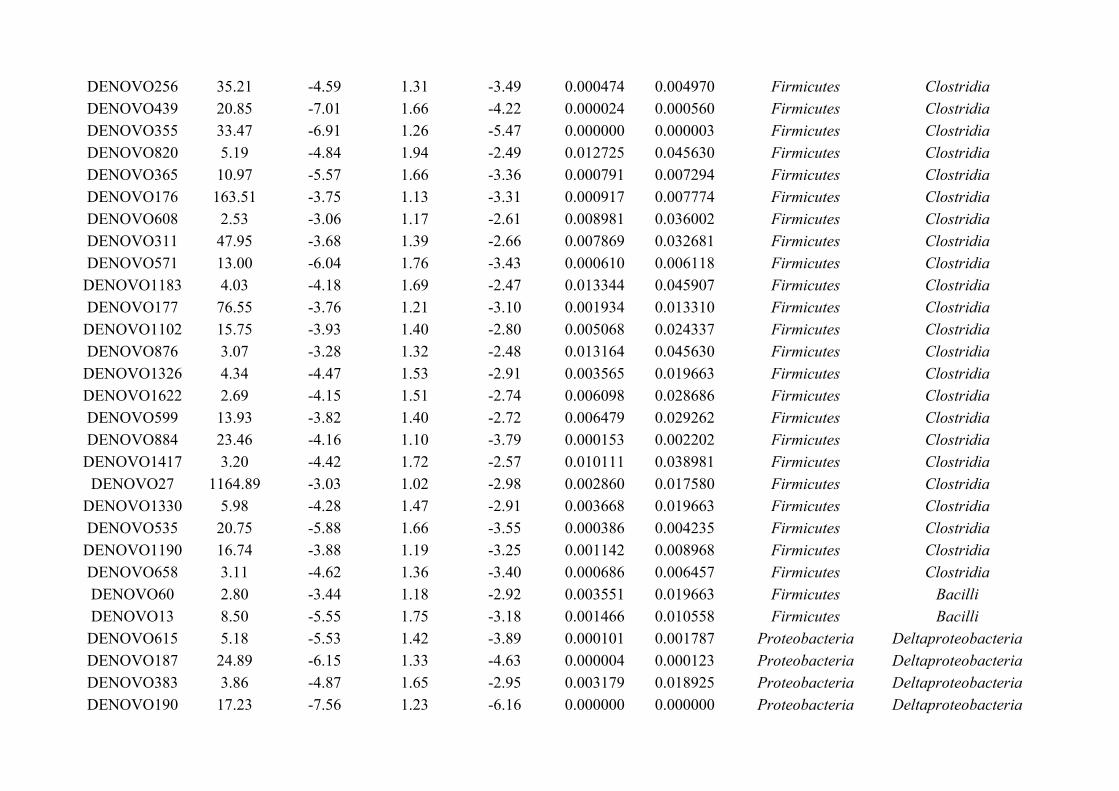
DENOVO256 35.21 -4.59 1.31 -3.49 0.000474 0.004970 Firmicutes ClostridiaDENOVO439 20.85 -7.01 1.66 -4.22 0.000024 0.000560 Firmicutes ClostridiaDENOVO355 33.47 -6.91 1.26 -5.47 0.000000 0.000003 Firmicutes ClostridiaDENOVO820 5.19 -4.84 1.94 -2.49 0.012725 0.045630 Firmicutes ClostridiaDENOVO365 10.97 -5.57 1.66 -3.36 0.000791 0.007294 Firmicutes ClostridiaDENOVO176 163.51 -3.75 1.13 -3.31 0.000917 0.007774 Firmicutes ClostridiaDENOVO608 2.53 -3.06 1.17 -2.61 0.008981 0.036002 Firmicutes ClostridiaDENOVO311 47.95 -3.68 1.39 -2.66 0.007869 0.032681 Firmicutes ClostridiaDENOVO571 13.00 -6.04 1.76 -3.43 0.000610 0.006118 Firmicutes ClostridiaDENOVO1183 4.03 -4.18 1.69 -2.47 0.013344 0.045907 Firmicutes ClostridiaDENOVO177 76.55 -3.76 1.21 -3.10 0.001934 0.013310 Firmicutes ClostridiaDENOVO1102 15.75 -3.93 1.40 -2.80 0.005068 0.024337 Firmicutes ClostridiaDENOVO876 3.07 -3.28 1.32 -2.48 0.013164 0.045630 Firmicutes ClostridiaDENOVO1326 4.34 -4.47 1.53 -2.91 0.003565 0.019663 Firmicutes ClostridiaDENOVO1622 2.69 -4.15 1.51 -2.74 0.006098 0.028686 Firmicutes ClostridiaDENOVO599 13.93 -3.82 1.40 -2.72 0.006479 0.029262 Firmicutes ClostridiaDENOVO884 23.46 -4.16 1.10 -3.79 0.000153 0.002202 Firmicutes ClostridiaDENOVO1417 3.20 -4.42 1.72 -2.57 0.010111 0.038981 Firmicutes ClostridiaDENOVO27 1164.89 -3.03 1.02 -2.98 0.002860 0.017580 Firmicutes Clostridia
DENOVO1330 5.98 -4.28 1.47 -2.91 0.003668 0.019663 Firmicutes ClostridiaDENOVO535 20.75 -5.88 1.66 -3.55 0.000386 0.004235 Firmicutes ClostridiaDENOVO1190 16.74 -3.88 1.19 -3.25 0.001142 0.008968 Firmicutes ClostridiaDENOVO658 3.11 -4.62 1.36 -3.40 0.000686 0.006457 Firmicutes ClostridiaDENOVO60 2.80 -3.44 1.18 -2.92 0.003551 0.019663 Firmicutes BacilliDENOVO13 8.50 -5.55 1.75 -3.18 0.001466 0.010558 Firmicutes BacilliDENOVO615 5.18 -5.53 1.42 -3.89 0.000101 0.001787 Proteobacteria DeltaproteobacteriaDENOVO187 24.89 -6.15 1.33 -4.63 0.000004 0.000123 Proteobacteria DeltaproteobacteriaDENOVO383 3.86 -4.87 1.65 -2.95 0.003179 0.018925 Proteobacteria DeltaproteobacteriaDENOVO190 17.23 -7.56 1.23 -6.16 0.000000 0.000000 Proteobacteria Deltaproteobacteria
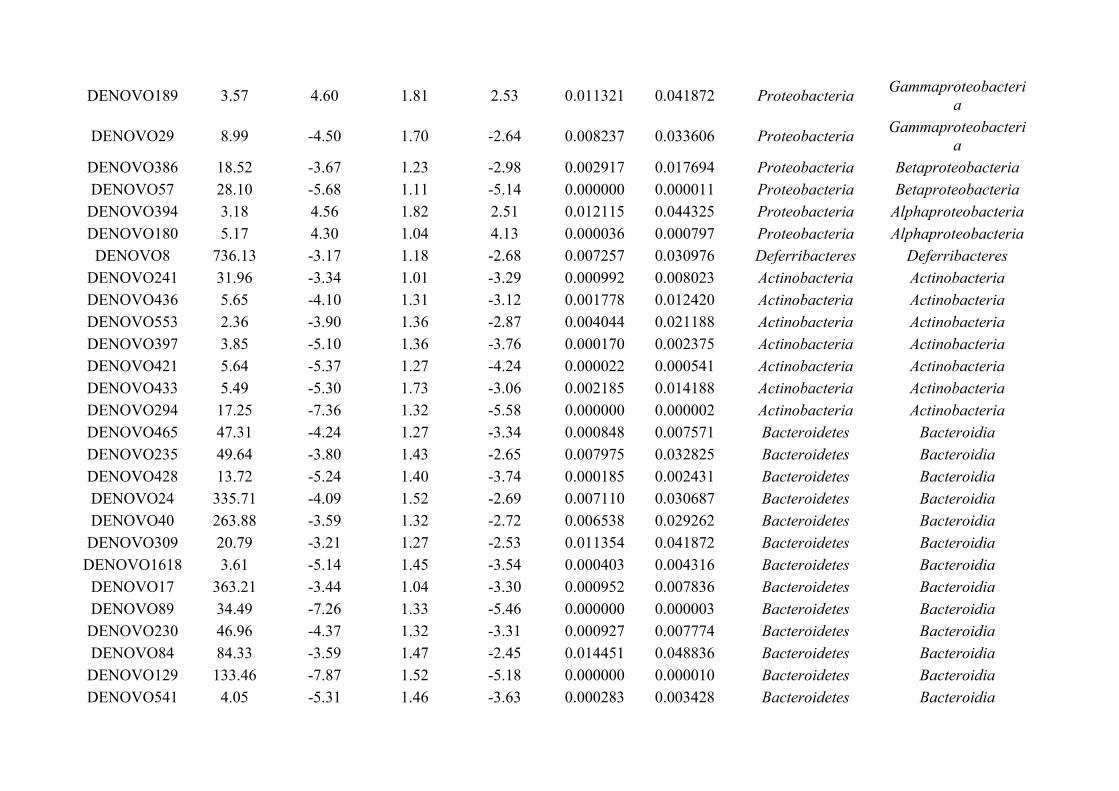
DENOVO189 3.57 4.60 1.81 2.53 0.011321 0.041872 ProteobacteriaGammaproteobacteri
a
DENOVO29 8.99 -4.50 1.70 -2.64 0.008237 0.033606 ProteobacteriaGammaproteobacteri
aDENOVO386 18.52 -3.67 1.23 -2.98 0.002917 0.017694 Proteobacteria BetaproteobacteriaDENOVO57 28.10 -5.68 1.11 -5.14 0.000000 0.000011 Proteobacteria BetaproteobacteriaDENOVO394 3.18 4.56 1.82 2.51 0.012115 0.044325 Proteobacteria AlphaproteobacteriaDENOVO180 5.17 4.30 1.04 4.13 0.000036 0.000797 Proteobacteria AlphaproteobacteriaDENOVO8 736.13 -3.17 1.18 -2.68 0.007257 0.030976 Deferribacteres Deferribacteres
DENOVO241 31.96 -3.34 1.01 -3.29 0.000992 0.008023 Actinobacteria ActinobacteriaDENOVO436 5.65 -4.10 1.31 -3.12 0.001778 0.012420 Actinobacteria ActinobacteriaDENOVO553 2.36 -3.90 1.36 -2.87 0.004044 0.021188 Actinobacteria ActinobacteriaDENOVO397 3.85 -5.10 1.36 -3.76 0.000170 0.002375 Actinobacteria ActinobacteriaDENOVO421 5.64 -5.37 1.27 -4.24 0.000022 0.000541 Actinobacteria ActinobacteriaDENOVO433 5.49 -5.30 1.73 -3.06 0.002185 0.014188 Actinobacteria ActinobacteriaDENOVO294 17.25 -7.36 1.32 -5.58 0.000000 0.000002 Actinobacteria ActinobacteriaDENOVO465 47.31 -4.24 1.27 -3.34 0.000848 0.007571 Bacteroidetes BacteroidiaDENOVO235 49.64 -3.80 1.43 -2.65 0.007975 0.032825 Bacteroidetes BacteroidiaDENOVO428 13.72 -5.24 1.40 -3.74 0.000185 0.002431 Bacteroidetes BacteroidiaDENOVO24 335.71 -4.09 1.52 -2.69 0.007110 0.030687 Bacteroidetes BacteroidiaDENOVO40 263.88 -3.59 1.32 -2.72 0.006538 0.029262 Bacteroidetes BacteroidiaDENOVO309 20.79 -3.21 1.27 -2.53 0.011354 0.041872 Bacteroidetes BacteroidiaDENOVO1618 3.61 -5.14 1.45 -3.54 0.000403 0.004316 Bacteroidetes BacteroidiaDENOVO17 363.21 -3.44 1.04 -3.30 0.000952 0.007836 Bacteroidetes BacteroidiaDENOVO89 34.49 -7.26 1.33 -5.46 0.000000 0.000003 Bacteroidetes BacteroidiaDENOVO230 46.96 -4.37 1.32 -3.31 0.000927 0.007774 Bacteroidetes BacteroidiaDENOVO84 84.33 -3.59 1.47 -2.45 0.014451 0.048836 Bacteroidetes BacteroidiaDENOVO129 133.46 -7.87 1.52 -5.18 0.000000 0.000010 Bacteroidetes BacteroidiaDENOVO541 4.05 -5.31 1.46 -3.63 0.000283 0.003428 Bacteroidetes Bacteroidia
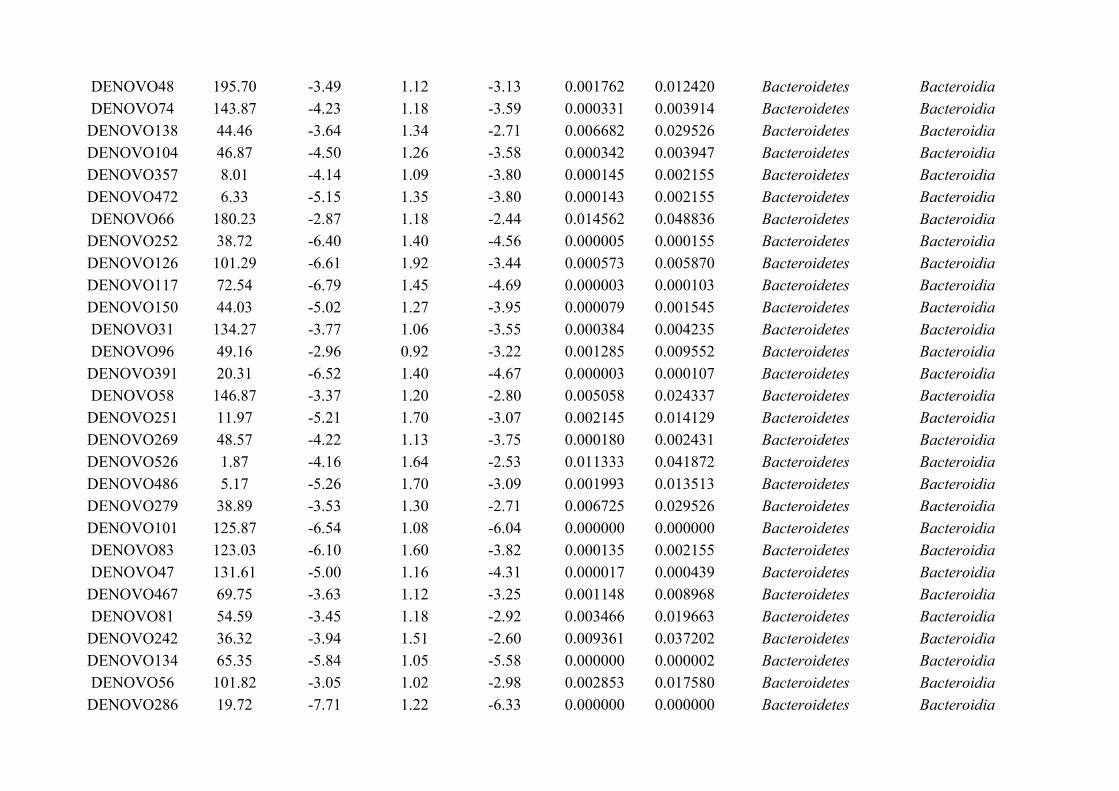
DENOVO48 195.70 -3.49 1.12 -3.13 0.001762 0.012420 Bacteroidetes BacteroidiaDENOVO74 143.87 -4.23 1.18 -3.59 0.000331 0.003914 Bacteroidetes BacteroidiaDENOVO138 44.46 -3.64 1.34 -2.71 0.006682 0.029526 Bacteroidetes BacteroidiaDENOVO104 46.87 -4.50 1.26 -3.58 0.000342 0.003947 Bacteroidetes BacteroidiaDENOVO357 8.01 -4.14 1.09 -3.80 0.000145 0.002155 Bacteroidetes BacteroidiaDENOVO472 6.33 -5.15 1.35 -3.80 0.000143 0.002155 Bacteroidetes BacteroidiaDENOVO66 180.23 -2.87 1.18 -2.44 0.014562 0.048836 Bacteroidetes BacteroidiaDENOVO252 38.72 -6.40 1.40 -4.56 0.000005 0.000155 Bacteroidetes BacteroidiaDENOVO126 101.29 -6.61 1.92 -3.44 0.000573 0.005870 Bacteroidetes BacteroidiaDENOVO117 72.54 -6.79 1.45 -4.69 0.000003 0.000103 Bacteroidetes BacteroidiaDENOVO150 44.03 -5.02 1.27 -3.95 0.000079 0.001545 Bacteroidetes BacteroidiaDENOVO31 134.27 -3.77 1.06 -3.55 0.000384 0.004235 Bacteroidetes BacteroidiaDENOVO96 49.16 -2.96 0.92 -3.22 0.001285 0.009552 Bacteroidetes BacteroidiaDENOVO391 20.31 -6.52 1.40 -4.67 0.000003 0.000107 Bacteroidetes BacteroidiaDENOVO58 146.87 -3.37 1.20 -2.80 0.005058 0.024337 Bacteroidetes BacteroidiaDENOVO251 11.97 -5.21 1.70 -3.07 0.002145 0.014129 Bacteroidetes BacteroidiaDENOVO269 48.57 -4.22 1.13 -3.75 0.000180 0.002431 Bacteroidetes BacteroidiaDENOVO526 1.87 -4.16 1.64 -2.53 0.011333 0.041872 Bacteroidetes BacteroidiaDENOVO486 5.17 -5.26 1.70 -3.09 0.001993 0.013513 Bacteroidetes BacteroidiaDENOVO279 38.89 -3.53 1.30 -2.71 0.006725 0.029526 Bacteroidetes BacteroidiaDENOVO101 125.87 -6.54 1.08 -6.04 0.000000 0.000000 Bacteroidetes BacteroidiaDENOVO83 123.03 -6.10 1.60 -3.82 0.000135 0.002155 Bacteroidetes BacteroidiaDENOVO47 131.61 -5.00 1.16 -4.31 0.000017 0.000439 Bacteroidetes BacteroidiaDENOVO467 69.75 -3.63 1.12 -3.25 0.001148 0.008968 Bacteroidetes BacteroidiaDENOVO81 54.59 -3.45 1.18 -2.92 0.003466 0.019663 Bacteroidetes BacteroidiaDENOVO242 36.32 -3.94 1.51 -2.60 0.009361 0.037202 Bacteroidetes BacteroidiaDENOVO134 65.35 -5.84 1.05 -5.58 0.000000 0.000002 Bacteroidetes BacteroidiaDENOVO56 101.82 -3.05 1.02 -2.98 0.002853 0.017580 Bacteroidetes BacteroidiaDENOVO286 19.72 -7.71 1.22 -6.33 0.000000 0.000000 Bacteroidetes Bacteroidia
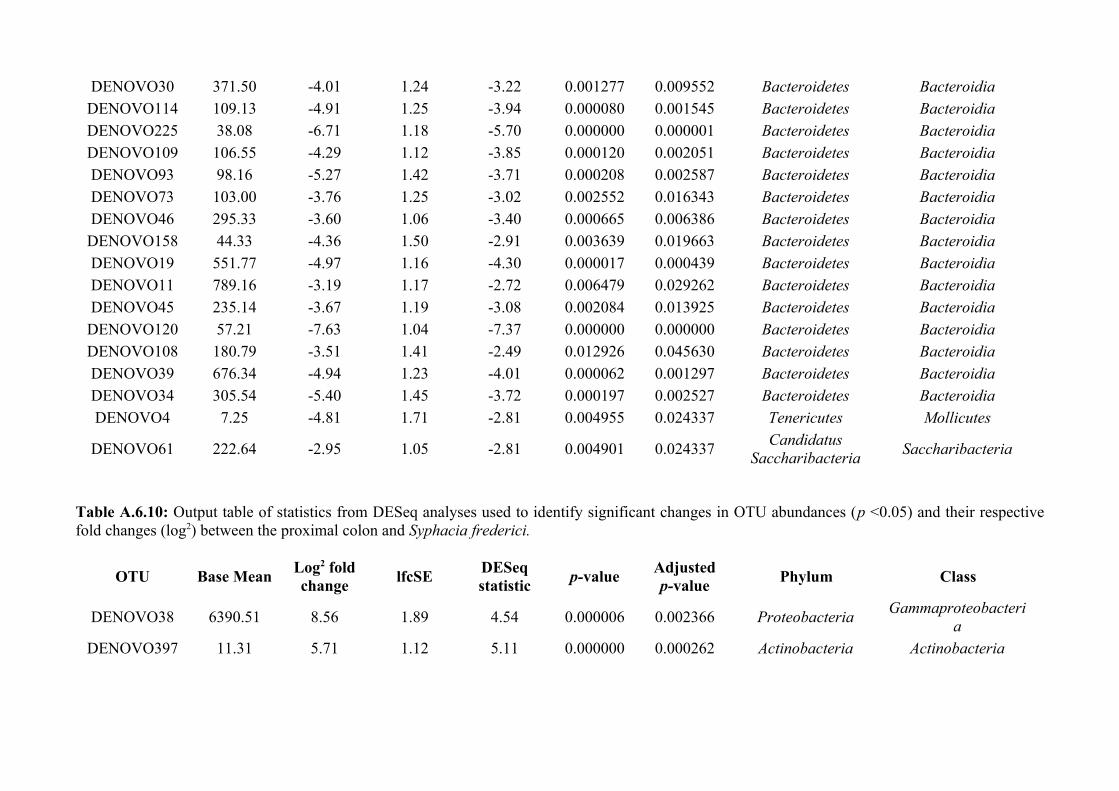
DENOVO30 371.50 -4.01 1.24 -3.22 0.001277 0.009552 Bacteroidetes BacteroidiaDENOVO114 109.13 -4.91 1.25 -3.94 0.000080 0.001545 Bacteroidetes BacteroidiaDENOVO225 38.08 -6.71 1.18 -5.70 0.000000 0.000001 Bacteroidetes BacteroidiaDENOVO109 106.55 -4.29 1.12 -3.85 0.000120 0.002051 Bacteroidetes BacteroidiaDENOVO93 98.16 -5.27 1.42 -3.71 0.000208 0.002587 Bacteroidetes BacteroidiaDENOVO73 103.00 -3.76 1.25 -3.02 0.002552 0.016343 Bacteroidetes BacteroidiaDENOVO46 295.33 -3.60 1.06 -3.40 0.000665 0.006386 Bacteroidetes BacteroidiaDENOVO158 44.33 -4.36 1.50 -2.91 0.003639 0.019663 Bacteroidetes BacteroidiaDENOVO19 551.77 -4.97 1.16 -4.30 0.000017 0.000439 Bacteroidetes BacteroidiaDENOVO11 789.16 -3.19 1.17 -2.72 0.006479 0.029262 Bacteroidetes BacteroidiaDENOVO45 235.14 -3.67 1.19 -3.08 0.002084 0.013925 Bacteroidetes BacteroidiaDENOVO120 57.21 -7.63 1.04 -7.37 0.000000 0.000000 Bacteroidetes BacteroidiaDENOVO108 180.79 -3.51 1.41 -2.49 0.012926 0.045630 Bacteroidetes BacteroidiaDENOVO39 676.34 -4.94 1.23 -4.01 0.000062 0.001297 Bacteroidetes BacteroidiaDENOVO34 305.54 -5.40 1.45 -3.72 0.000197 0.002527 Bacteroidetes BacteroidiaDENOVO4 7.25 -4.81 1.71 -2.81 0.004955 0.024337 Tenericutes Mollicutes
DENOVO61 222.64 -2.95 1.05 -2.81 0.004901 0.024337Candidatus
SaccharibacteriaSaccharibacteria
Table A.6.10: Output table of statistics from DESeq analyses used to identify significant changes in OTU abundances (p <0.05) and their respectivefold changes (log2) between the proximal colon and Syphacia frederici.
OTU Base MeanLog2 foldchange
lfcSEDESeqstatistic
p-valueAdjustedp-value
Phylum Class
DENOVO38 6390.51 8.56 1.89 4.54 0.000006 0.002366 ProteobacteriaGammaproteobacteri
aDENOVO397 11.31 5.71 1.12 5.11 0.000000 0.000262 Actinobacteria Actinobacteria
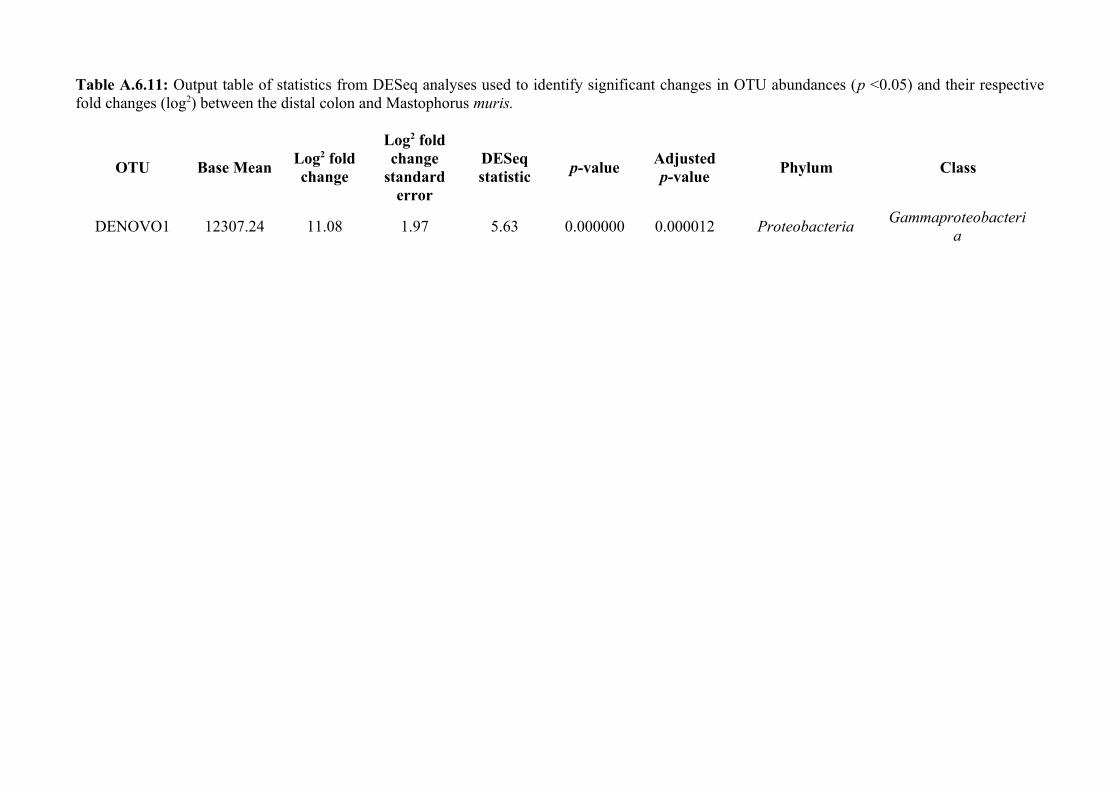
Table A.6.11: Output table of statistics from DESeq analyses used to identify significant changes in OTU abundances (p <0.05) and their respectivefold changes (log2) between the distal colon and Mastophorus muris.
OTU Base MeanLog2 foldchange
Log2 foldchange
standarderror
DESeqstatistic
p-valueAdjustedp-value
Phylum Class
DENOVO1 12307.24 11.08 1.97 5.63 0.000000 0.000012 ProteobacteriaGammaproteobacteri
a
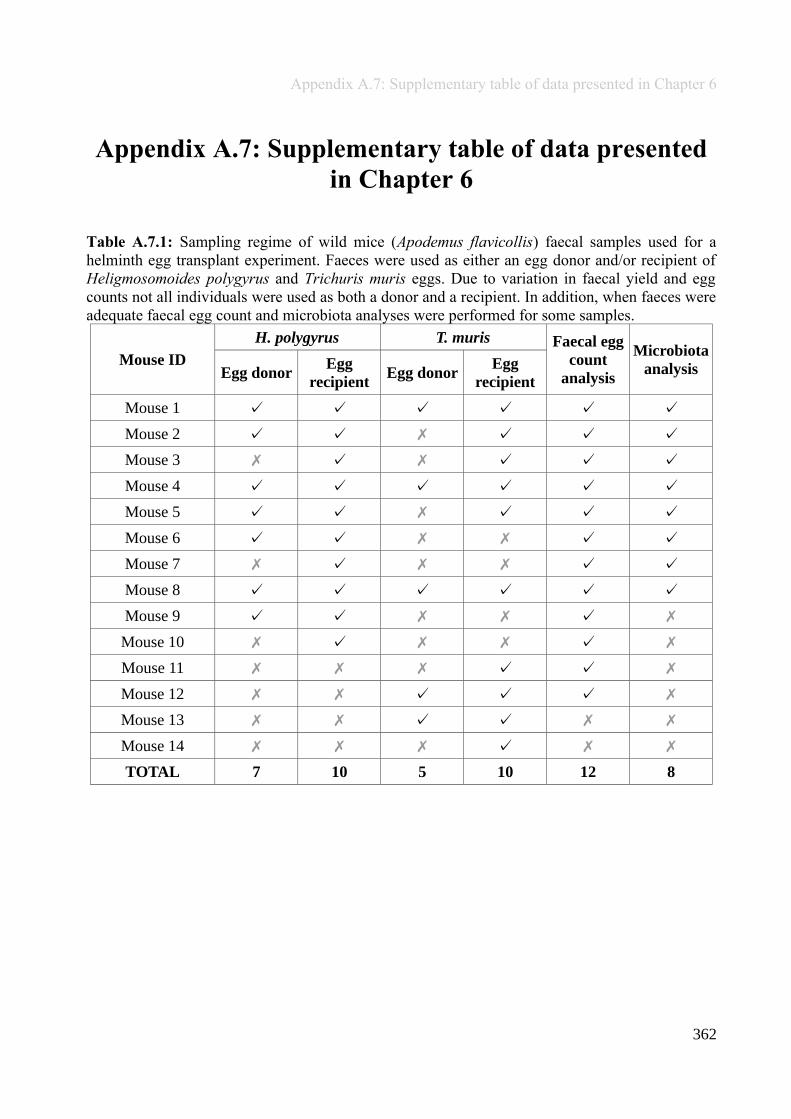
Appendix A.7: Supplementary table of data presented in Chapter 6
Appendix A.7: Supplementary table of data presentedin Chapter 6
Table A.7.1: Sampling regime of wild mice (Apodemus flavicollis) faecal samples used for ahelminth egg transplant experiment. Faeces were used as either an egg donor and/or recipient ofHeligmosomoides polygyrus and Trichuris muris eggs. Due to variation in faecal yield and eggcounts not all individuals were used as both a donor and a recipient. In addition, when faeces wereadequate faecal egg count and microbiota analyses were performed for some samples.
Mouse ID
H. polygyrus T. muris Faecal eggcount
analysis
MicrobiotaanalysisEgg donor
Eggrecipient
Egg donorEgg
recipient
Mouse 1 ✓ ✓ ✓ ✓ ✓ ✓
Mouse 2 ✓ ✓ ✗ ✓ ✓ ✓
Mouse 3 ✗ ✓ ✗ ✓ ✓ ✓
Mouse 4 ✓ ✓ ✓ ✓ ✓ ✓
Mouse 5 ✓ ✓ ✗ ✓ ✓ ✓
Mouse 6 ✓ ✓ ✗ ✗ ✓ ✓
Mouse 7 ✗ ✓ ✗ ✗ ✓ ✓
Mouse 8 ✓ ✓ ✓ ✓ ✓ ✓
Mouse 9 ✓ ✓ ✗ ✗ ✓ ✗
Mouse 10 ✗ ✓ ✗ ✗ ✓ ✗
Mouse 11 ✗ ✗ ✗ ✓ ✓ ✗
Mouse 12 ✗ ✗ ✓ ✓ ✓ ✗
Mouse 13 ✗ ✗ ✓ ✓ ✗ ✗
Mouse 14 ✗ ✗ ✗ ✓ ✗ ✗
TOTAL 7 10 5 10 12 8
362
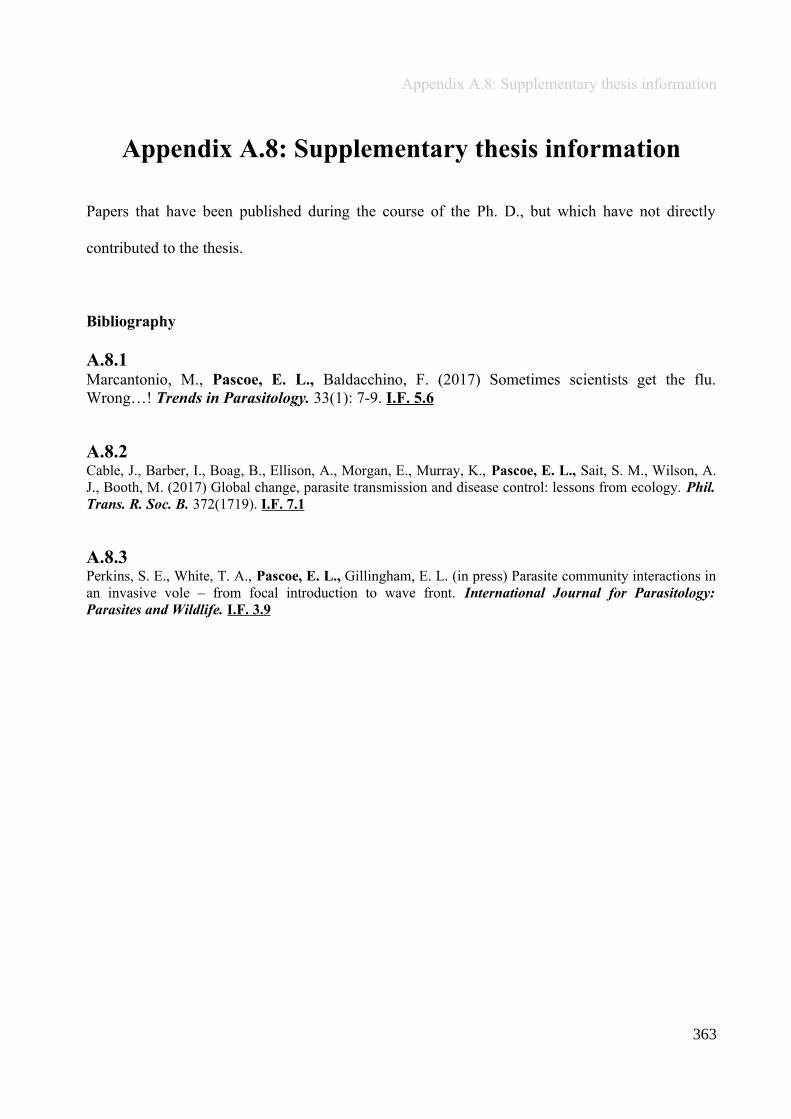
Appendix A.8: Supplementary thesis information
Appendix A.8: Supplementary thesis information
Papers that have been published during the course of the Ph. D., but which have not directly
contributed to the thesis.
Bibliography
A.8.1Marcantonio, M., Pascoe, E. L., Baldacchino, F. (2017) Sometimes scientists get the flu.Wrong…! Trends in Parasitology. 33(1): 7-9. I.F. 5.6
A.8.2Cable, J., Barber, I., Boag, B., Ellison, A., Morgan, E., Murray, K., Pascoe, E. L., Sait, S. M., Wilson, A.J., Booth, M. (2017) Global change, parasite transmission and disease control: lessons from ecology. Phil.Trans. R. Soc. B. 372(1719). I.F. 7.1
A.8.3Perkins, S. E., White, T. A., Pascoe, E. L., Gillingham, E. L. (in press) Parasite community interactions inan invasive vole – from focal introduction to wave front. International Journal for Parasitology:Parasites and Wildlife. I.F. 3.9
363