dietary emulsifiers impact the mouse gut microbiota promoting colitis and metabolic syndrome
TRANSCRIPT

LETTERdoi:10.1038/nature14232
Dietary emulsifiers impact themouse gutmicrobiotapromoting colitis and metabolic syndromeBenoit Chassaing1, Omry Koren2, Julia K. Goodrich3, Angela C. Poole3, Shanthi Srinivasan4, Ruth E. Ley3 & Andrew T. Gewirtz1
The intestinal tract is inhabited by a large and diverse communityofmicrobes collectively referred to as the gutmicrobiota.While thegutmicrobiota provides important benefits to its host, especially inmetabolismand immunedevelopment,disturbanceof themicrobiota–host relationship is associated with numerous chronic inflamma-tory diseases, including inflammatory bowel disease and the groupof obesity-associated diseases collectively referred to as metabolicsyndrome.Aprimarymeansbywhich the intestine isprotected fromits microbiota is via multi-layered mucus structures that cover theintestinal surface, thereby allowing the vastmajority of gut bacteriatobekept ata safedistance fromepithelial cells that line the intestine1.Thus, agents that disrupt mucus–bacterial interactions might havethe potential to promote diseases associatedwith gut inflammation.Consequently, it has been hypothesized that emulsifiers, detergent-like molecules that are a ubiquitous component of processed foodsand that can increasebacterial translocationacross epithelia in vitro2,might be promoting the increase in inflammatory bowel diseaseobserved since the mid-twentieth century3. Here we report that, inmice, relatively lowconcentrationsof twocommonlyused emulsifiers,namely carboxymethylcellulose and polysorbate-80, induced low-grade inflammation and obesity/metabolic syndrome in wild-typehosts and promoted robust colitis in mice predisposed to this dis-order. Emulsifier-inducedmetabolic syndromewas associatedwithmicrobiota encroachment, altered species compositionand increasedpro-inflammatorypotential.Use of germ-freemice and faecal trans-plants indicated that such changes inmicrobiotawere necessary andsufficient forboth low-grade inflammationandmetabolic syndrome.These results support the emerging concept that perturbed host–microbiota interactions resulting in low-grade inflammation canpromote adiposity and its associated metabolic effects. Moreover,they suggest that the broad use of emulsifying agentsmight be con-tributing to an increased societal incidence of obesity/metabolicsyndrome and other chronic inflammatory diseases.Micewere administered the emulsifiers carboxymethylcellulose (CMC)
or polysorbate-80 (P80) via drinking water (1.0% w/v or v/v, respec-tively) for 12weeks. P80 has been studied for toxicity and carcinogenicpotential2,4,5 and is approved by theUSFood andDrugAdministrationforuse in select foods atup to1.0%.CMChasnotbeen extensively studiedbut is deemed ‘generally regarded as safe (GRAS)’ and used in variousfoods at up to 2.0%3,6. We used wild-type C57Bl/6 mice and two engi-neered strains of mice, namely Il102/2 and Tlr52/2, that are prone todeveloping shifts in microbiota composition and inflammation7,8.While observations that loss of Toll-like receptor (TLR) function altersmicrobiota composition and promotes inflammation were suggestedto be an artefact ofmouse husbandry practices9, the fact that epithelial-cell-specific deletion of TLR5 altered microbiota composition relativeto wild-type siblings and resulted in low-grade inflammation/meta-bolic syndrome indicates that, at least for TLR5, this is not the case10.Confocal microscopy, using mucus-preserving Carnoy fixation1,11,
indicated that the closest bacteria resided, onaverage, about 25mmfrom
epithelial cells with no bacteria observed within 10 mm (Fig. 1a, d). Incontrast, emulsifier-treated mice exhibited some bacteria in apparentcontact with the epitheliumwhile the average distance was reduced bymore than 50% (Fig. 1b–d). Suchmicrobiota encroachment correlatedwith reduced mucus thickness. This altered mucus thickness was notcorrelatedwith altered expressionofMUC2 (ExtendedData Fig. 1a–d).Il102/2 and Tlr52/2 mice exhibited basal microbiota encroachmentthatwas enhanced bybothCMCandP80 (Fig. 1e–h andExtendedDataFig. 1e–h). Emulsifiers did not affect total levels of faecal bacteria inwild-type, Il102/2orTlr52/2micebut resulted inmore thana twofold increasein bacteria adherent to the colons ofwild-type and Il102/2mice (Fig. 1i, kand Extended Data Fig. 1i–l). Moreover, interrogation of microbiotacomposition with 16S RNA sequencing, followed by phylogenic ana-lysis, and use of the unweighted UniFrac algorithm to compare com-munity structure12 revealed that both CMC and P80 dramaticallyalteredmicrobiota composition in both faecal and intestinal-adherentbacteria ofwild-type, Il102/2 andTlr52/2mice (Fig. 1j, l andExtendedData Fig. 2a–o and Supplementary Tables 1 and 2).In order to verify that differences in microbiota composition were a
consequence of emulsifier treatment rather than simply reflecting thatmice shared cages during treatment, which results in microbiota com-position clustering in coprophagic animals, multiple litters were splitequally into groups that were to receive water, CMC or P80 (three sep-arate cagesper condition as shown inExtendedDataFig. 3).As expected,this experimental design avoided pre-treatment clustering. However,microbiota composition clustered strongly following treatment irre-spective of cage clustering in bothmale and femalemicewithwild-typeand Tlr52/2 genotypes (Extended Data Fig. 3), confirming that emul-sifiers alter microbiota composition.Alterations in microbiota composition included reduced levels of
Bacteroidales, associatedwithhealth13–15, and increased levels of severalmucolytic operational taxanomicunits (OTUs) includingRuminococcusgnavus16 (Extended Data Figs 2p–t and 4 and Supplementary Tables 1and 2). In Il102/2mice, both CMC and P80 induced a marked reduc-tion inmicrobial diversity, bloom inVerrucomicrobia phyla (especiallyAkkermansiamuciniphila; ExtendedData Fig. 2p–t and SupplementaryTables 1 and 2)17, and enriched mucosa-associated inflammation-promoting Proteobacteria18,19. Emulsifier-induced changes in micro-biota composition were sufficiently uniform such that a low numberof OTUs (,15) afforded a reliable prediction of emulsifier treatment(Extended Data Fig. 4 and Supplementary Tables 1 and 2). Such dis-tinguishing OTUs were spread across the Bacteria domain and severalwere common to all three host genotypes.Whilemost experiments herein used youngmice (4weeks old at the
start of the experiment) based on the notion that microbiota are moreprone to disturbance at an early age18,20, administration of emulsifiersbeginning at 4months of age also destabilized and altered microbiotacomposition (Extended Data Fig. 5h–p). Specifically, both CMC andP80 resulted in decreased alpha diversity and reduced stability, as evi-denced by an increased extent of week-to-week changes in principal
1Center for Inflammation, Immunity and Infection, Institute for Biomedical Sciences, Georgia State University, Atlanta, Georgia 30303, USA. 2Faculty of Medicine, Bar Ilan University, Safed, 13115, Israel.3Department of Molecular Biology and Genetics, Cornell University, Ithaca, New York 14853, USA. 4Digestive Diseases Division, Department of Medicine, Emory University School of Medicine, Atlanta,
Georgia 30322, USA.
0 0 M O N T H 2 0 1 5 | V O L 0 0 0 | N A T U R E | 1
Macmillan Publishers Limited. All rights reserved©2015

coordinates, and a greater extent of change over the course of the exper-iment thatoutweighedeffectsof cageclustering (ExtendedDataFig. 5h–p).Thus, emulsifiers can alter the gut microbiota composition of hosts ofa broad age range.Microbiota composition influences the ability of amicrobiota to acti-
vate innate immunesignalling21. Thus,wemeasured the capacityof faecesfromcontrol and emulsifier-treatedmice to activate pro-inflammatorygene expression via the lipopolysaccharide (LPS) and flagellin receptorsTLR4 and TLR5, respectively. Exposure to emulsifiers increased faecallevels of bioactive LPS and flagellin in wild-type, Il102/2 and Tlr52/2
mice (Fig. 1m–p and Extended Data Fig. 5q–r). Emulsifier treatmentalso increased gut permeability inwild-type and Il102/2mice (Fig. 1q, r),which correlated with increased levels of serum antibodies to flagellinand LPS (ExtendedData Fig. 5s–v), thought to reflect gut permeability22.Thus, chronic exposure to dietary emulsifiers results in erosion of theprotective function of the mucus, increased bacterial adherence and amore pro-inflammatory microbiota.The hallmark of active colitis is the presence of immune cell infil-
trates, which is typically paralleled by changes in gross colon morpho-logy and elevated levels of the leukocyte enzymemyeloperoxidase andpro-inflammatorymarkers.Basedon suchcriteria, emulsifierspromotedthe extent and incidence of colitis in both Il102/2 and Tlr52/2 mice(Fig. 2a–e and Extended Data Figs 6a, b, h and 7a–g). Emulsifiers didnot induce overt colitis in wild-typemice but did result in subtle histo-pathologic andgross evidenceof chronic intestinal inflammation, includ-ing epithelial damage and shortened colons (Fig. 2f–i and ExtendedData Fig. 6c–g). Faecal lipocalin 2 (LCN2) is a sensitive and broadlydynamicmarker of intestinal inflammation inmice23. Emulsifier-treatedwild-typemice exhibitedmodestly elevated faecal LCN2 levels 4weeks
after initial exposure (Fig. 2f). In Il102/2 and Tlr52/2 mice, basallyelevated faecal LCN2 levels were further elevated (approximately ten-fold) by 12weeks of exposure to CMC and P80 (Fig. 2a and ExtendedData Fig. 7a). Such robust colitis in Il102/2, but notTlr52/2, correlatedwith Bilophila and Helicobacter enrichment, analogous to previousobservations in Il102/2 mice (Supplementary Tables 2 and 3)24,25. Theextent of inflammation inversely correlated with bacterial–epithelialdistance in both wild-type and IL102/2 mice (Fig. 2j and ExtendedData Fig. 6i–k). Thus, emulsifiers may promote robust colitis in sus-ceptible hosts and induce low-grade inflammation in wild-type hosts.Metabolic syndrome is associatedwith, andmaybepromotedby, low-
grade inflammation26. Thus, we examinedwhether emulsifier-inducedmicrobial dysbiosis and low-grade inflammation might promote thisdisorder in wild-typemice. Both CMC and P80 resulted inmodest butsignificant gains in overallweight and amarked increase in adiposity asmeasured by fat mass (Fig. 3a, b). Such increased adiposity was associ-atedwith increased food consumption (Fig. 3c) that probably drove theincreased adiposity. Emulsifier treatment also impaired glycaemic con-trol as assessed by fasting blood glucose concentration (Fig. 3d) andglucose/insulin tolerance testing (Extended Data Fig. 7h, i).Human exposure to dietary emulsifiers occurs in liquid and solid
foods.Hence, wenext examinedwhether incorporating emulsifiers intomouse chowwoulddrive similar phenotypes. Supplementationof chowwith1.0%CMCorP80 fullymimicked thepro-inflammatory effects andmetabolic changes induced by emulsifiers in drinking water (Fig. 3e, fand ExtendedData Fig. 7l–t).While human emulsifier consumption isnot awidely trackedparameter, their pervasiveuse inmany foods exceedsthe 1.0% level (in food or water) used herein6. Nonetheless, we nextsought to define theminimum dose of emulsifiers that would produce
a
*
*
* *
b
e f
c
g
d
h
Time (days)
0
5
10
15 Water
CMC
P80
Time (days) Time (days) Time (days)
0
1
2
3
**
*
*
*
*
*
**
*
*
*
* *
*Water
CMC
P80
PC2 (13%)
Water
CMC
P80
PC1 (33%)
PC2 (14%)
m rn o
lj ki
WT
IL10–/–
P80CMCWater
WT
*
*
*
*
p q
Il10–/–WT
Dis
tan
ce o
f b
ac
teri
a f
rom
IE
C (μ
m)
WT
Dis
tan
ce o
f b
acte
ria f
rom
IE
C (μ
m)
PC1 (22%)
50
40
30
20
10
0Water CMC P80
Water CMC P80
Water CMC P80
Water CMC P80 Water CMC P80
Water CMC P80
30
20
10
0
Bacte
ria p
er
mg
of
co
lon
ic m
uco
sa
Bacte
ria p
er
mg
of
co
lon
ic m
uco
sa
106
105
104
105
104
Il10–/–
FliC
(m
g p
er
g f
aeces)
LP
S (μ
g p
er
g f
aeces)
LP
S (μ
g p
er
g f
aeces)
Inte
stinal p
erm
eab
ility
(m
g o
f F
ITC
per
ml)
0
5
10
15
0
4
2
6
8
FliC
(m
g p
er
g f
aeces)
7 56 91 7 56 91 7 49 91 7 56 91
1,200
1,000
800
600
400
200
0
Inte
stinal p
erm
eab
ility
(m
g o
f F
ITC
per
ml)
1,200
1,000
800
600
400
200
0
Il10–/–
Figure 1 | Dietary emulsifiers alter microbiotalocalization, composition, andpro-inflammatorypotential. a-c, e–g, Wild-type (WT; a–c) andIl102/2 (e–g) mice were exposed to drinking watercontaining CMC or P80 (1.0%) for 12weeks.Confocal microscopy analysis of microbiotalocalization: MUC2, green; actin, purple; bacteria,red; and DNA, blue. Scale bar, 20mm. Pictures arerepresentative of 20 biological replicates.d, h, Distances of closest bacteria to intestinalepithelial cells (IEC) per condition over fivehigh-powered fields per mouse. i, k, PCR-basedquantification of bacterial load adhered to colonicmucosa. j, l, Principal coordinates analysis of theUniFrac distance matrix of wild-type (j) andIl102/2 (l)mice. Blackdashed ellipses indicatemicesharing a cage during treatment.m–p, Bioactivelevels of faecal flagellin (FliC) and LPS assayed withTLR5 and TLR4 reporter cells. q–r, Intestinalpermeability measured by levels of serum FITC–dextran (4 kDa) following oral gavage. Data are themeans6s.e.m. or geometric means with 95%confidence interval (for i and k) (n5 20 fora–h andm–p; n5 6 for i except n5 8 for the P80-treated group; n5 5 for j except n5 4 for P80-treated group; n5 6 for k except n5 7 for water-treated group; for l, n5 10, 4 and 5 for water-,CMC- andP80-treated groups, respectively;n5 14for q; for r, n5 10, 11 and 15 for water-, CMC- andP80-treated groups, respectively). Points in i–land q–r are from individual mice. Significance wasdetermined using one-way ANOVA correctedfor multiple comparisons with a Sidak test ortwo-way ANOVA corrected for multiplecomparisons with a Bonferroni test; *P, 0.05compared to water-treated group.
RESEARCH LETTER
2 | N A T U R E | V O L 0 0 0 | 0 0 M O N T H 2 0 1 5
Macmillan Publishers Limited. All rights reserved©2015

evidence of low-grade inflammation/metabolic syndrome. As little as0.1% CMC resulted in modest increases in body weight and fastingglucose, while 0.5% resulted in clear evidence of low-grade inflamma-tion (shortened colon, enlarged spleen) and increased adiposity (Fig. 3i, jand Extended Data Fig. 7u–a9). For P80, as little as 0.1% resulted in
evidence of low-grade inflammation and increased adiposity, while0.5% resulted in mild dysglycaemia (Fig. 3k, l and Extended DataFig. 7b9–h9). Emulsifier-inducedmetabolic syndromewas also observedin oldermice (ExtendedData Fig. 5a–g) andpersisted for at least 6weeksafter stopping emulsifier consumption (Extended Data Fig. 8a–k).
LCN2 (ng per g faeces)
Dis
tan
ce o
f b
acte
ria f
rom
IE
C (μ
m)
0 100 200 300 4000
20
40
Time (days)
LC
N2
(n
g p
er
g f
aeces)
0 28 56 931
10
100
1,000
10,000
100,000WaterCMCP80
* *
a
Co
lon leng
th (cm
)
Water CMC P806
8
10
12
*
*
MP
O (U
per
g c
olo
nic
tis
su
e)
Water CMC P800
20
40
60
*
*
c
d
* *
Time (days)
Co
litis
in
cid
en
ce (%
)
0 20 40 60 80 100
0
20
40
60
80
100
Water
CMC
P80
b
e
Il10–/–
His
tolo
gic
al sco
re
Water CMC P800
10
20
30
40
* *
MP
O (U
per
g c
olo
nic
tis
su
e)
Water CMC P800
20
40
60
f
* * *
g
Co
lon
len
gth
(cm
)
Water CMC P806
7
8
9
10
11
12
*
*
h
*
i
WT
His
tolo
gic
al sco
re
Water CMC P800
2
4
6
8
10
Time (days)
LC
N2
(n
g p
er
g f
aeces)
0 28 56 931
10
100
1,000Water
CMCP80
j
R2 = 0.4196
P < 0.0001
Water
CMC P80
Figure 2 | Dietary emulsifiers promote colitis insusceptible mice and low-grade intestinalinflammation in wild-type mice. a–i, Il102/2
(a–e) and wild-type (WT; f–i) mice were exposedto drinking water containing CMC or P80 (1.0%)for 12weeks. a, f, Faecal levels of the inflammatorymarker LCN2 over time; b, colitis incidence (%)over time; c, g, myeloperoxidase (MPO) levels;d, h, colon lengths; and e, i, histological score after12weeks of exposure. j, Faecal levels of theinflammatory marker LCN2 plotted versusmicrobiota–epithelial distance obtained in Fig. 1d.IEC, intestinal epithelial cells. Data are themeans6s.e.m. or geometric means with 95%confidence intervals (the latter for a and f)(n5 20). Points are from individual mice.Significance was determined using one-wayANOVA corrected for multiple comparisons witha Sidak test or two-way ANOVA corrected formultiple comparisons with a Bonferroni test;*P, 0.05 compared to water-treated group.
Time (days)
Bo
dy w
eig
ht
(re
lative v
alu
es)
0 20 40 60 80 100100
120
140
160
Water
CMC
P80
Time (days)
Bo
dy w
eig
ht
(rela
tive v
alu
es)
0 20 40 60 80 100100
110
120
130
140Control
CMC
P80
Fat
pad
(m
g)
Control CMC P800
100
200
300
400
Time (days)
Bo
dy w
eig
ht
(rela
tive v
alu
es)
0 20 40 60 80100
120
140
160
180
Control
CMC
P80
Fat
pad
(m
g)
Control CMC P800
100
200
300
400
500
a b c d
g h e f
* * * * *
* *
*
*
k l i j
Fat
pad
(m
g)
Water 0.1% 0.5% 1.0% Water 0.1% 0.5% 1.0%0
100
200
300
400
Time (days)
Bo
dy w
eig
ht
(rela
tive v
alu
es)
0 20 40 60 80100
110
120
130
140Water
CMC 0.1%
CMC 0.5%
CMC 1.0%
Time (days)
Bo
dy w
eig
ht
(rela
tive v
alu
es)
0 20 40 60 80100
120
140
160
180Water
P80 0.1%
P80 0.5%
P80 1.0%
Fat
pad
(m
g)
0
100
200
300
400
15 h
fasting
blo
od
glu
co
se (m
g d
l–1)
Water CMC P80
60
80
100
120
Fat
pad
(m
g)
Water CMC P800
100
200
300
400
Fo
od
inta
ke (re
lative v
alu
es)
Water CMC P80
80
100
120
140WT
WT Tlr5–/–
WT WT
* *
*
#
#
# #
# # #
#
# #
# #
CMC concentration P80 concentration
Figure 3 | Dietary emulsifiers promotemetabolic syndrome. a–d, Wild-type (WT) micewere exposed to drinking water containing CMCor P80 (1.0%) for 12weeks. a, Body weight overtime; b, fat-pad mass; c, food intake; and d, 15 hfasting blood glucose concentration. e–h,Wild type(e–f) and Tlr52/2 (g–h) mice were given mousechow containing CMC or P80 (1.0%) for 12weeks.e, g, Body weights over time; f, h, fat-pad mass.i–l,Wild-typemice were exposed to drinkingwatercontaining 0.1–1.0% CMC (i, j) or P80 (k, l) for12weeks. i, k, Body weight over time; j, l, fat-padmass. Data are the means6s.e.m. (n5 20 for a–d,n5 5 for e–l). Significance was determinedusing one-way ANOVA corrected for multiplecomparisons with a Sidak test (*P, 0.05) ortwo-way group ANOVA corrected for multiplecomparisons with a Bonferroni test (#P, 0.05)compared to control group.
LETTER RESEARCH
0 0 M O N T H 2 0 1 5 | V O L 0 0 0 | N A T U R E | 3
Macmillan Publishers Limited. All rights reserved©2015

Promotion of metabolic syndrome was not seen upon exposure tosodium sulfite, which is a common food additive but not an emulsifier(ExtendedData Fig. 8l–s).Tlr52/2mice are prone to developingmeta-bolic syndrome27, which results from poor microbiota management18.Emulsifiersmarkedly promotedmultiple parameters ofmetabolic syn-drome in Tlr52/2mice (Extended Data Figs 7j–k and 8t–w), includinghyperphagia, increased adiposity and glucose dysregulation, and wasobserved upon supplementation of chowor drinkingwaterwith as littleas 0.1% P80 (Fig. 3g, h and Extended Data Fig. 8x–o9). A trend towardsthe development of metabolic syndrome in emulsifier-treated non-colitic Il102/2mice was also observed, which was particularly evidentupon exclusion of colitic mice, which exhibited weight loss (ExtendedData Fig. 9a–f). Emulsifier-inducedmetabolic syndromewas observedinmice frommultiple vivaria and strains, including SwissWebstermice,which, in contrast to C57BL/6mice, are considered obesity-resistant28
(Fig. 4a–d and Extended Data Fig. 9g–k, x–a9).Emulsifier-induced lowgrade inflammationandmetabolic syndrome
required the presence of a microbiota in that administration of emul-sifiers to germ-freemice resulted inneither low-grade inflammation, asassessed by faecal LCN2, colon length and splenomegaly, nor all mea-suredparameters ofmetabolic syndrome includingbodymass, fatmass,food intake and fasting glucose levels (Fig. 4e–h and Extended Data
Fig. 9g–p). This result could reflect direct action of CMC and P80 ongut bacteria composition or metabolism. In accord with both of thesepossibilities, emulsifiers altered faecal levels of short-chain fatty acids(Extended Data Fig. 9q–w), including decreased levels of butyrate,which is thought to play a key role in dampening inflammation29.Emulsifiers also altered bile acid levels (ExtendedData Fig. 9b9–t9), whichinfluence microbiota composition24. However, in germ-free mice,emulsifiers did not alter bile acids, reduce mucus thickness nor alterpenetrance of 0.5 mmbeads into themucus (ExtendedData Figs 9b9–t9and 10a–l), suggesting that these changes are not purely a direct effectof emulsifiers onmucus structures. Collectively, these data suggest thatalterations inmucus in emulsifier-treatedmicemight result, at least inpart, fromaltered gutmicrobiota composition but do not exclude directeffects on the host.Transfer ofmicrobiota fromemulsifier-treatedmice togerm-freemice
(not exposed to emulsifiers) transferredmicrobiota encroachment, low-grade inflammation, increased adiposity and dysglycaemia (Fig. 4i–oandExtendedDataFig. 10s–y).Microbiota transplant fromCMC-treatedmice resulted in a longer-lasting increase in adiposity, paralleling thatadiposity was less rapidly reversible following stoppage of CMC expo-sure (Extended Data Fig. 8a–k). Such transplanted phenotypes corre-lated with the acquisition of elevated levels of faecal LPS and flagellin
Bo
dy w
eig
ht
(rela
tive v
alu
es)
0 20 40 60 80 100
100
150
200
250
300 Water
CMC
P80
e f g h Germ free
Time (days)
Bo
dy w
eig
ht
(rela
tive v
alu
es)
0 20 40 60 80 100
100
120
140
160
Water
CMC
P80
m n o
Fat
pad
(m
g)
0
200
400
600
800
Fo
od
in
take (g
per
24
h p
er
mo
use)
4
5
6
7
15 h
fasting
blo
od
glu
co
se (m
g d
l–1)
60
80
100
120
Conventionala b c d
* *
* *
#
Time (days)
Time (days)
Bo
dy w
eig
ht
(rela
tive v
alu
es)
0 20 40 60 80 100
100
110
120
130
140
150Water
CMC
P80
Water CMC P80Water CMC P80Water CMC P80
Water CMC P80
Water CMC P80 Water CMC P80
Water CMC P80
Water CMC P80Water CMC P80
Fat
pad
(m
g)
0
200
400
600
800
Fo
od
inta
ke (g
per
24 h
per
mo
use)
4
5
6
7
15 h
fasting
blo
od
glu
co
se (m
g d
l–1)
60
80
100
120
* *
* **
Fat
pad
(m
g)
0
500
1,000
1,500
15 h
fasting
blo
od
glu
co
se (m
g d
l–1)
70
80
90
100
110
i j k l Water CMC P80
* *
Dis
tance o
f b
acte
ria f
rom
IE
C (μ
m)
0
10
20
30
40
#
#
Figure 4 | Altered microbiota is necessary andsufficient for emulsifier-induced metabolicsyndrome. a–h, Conventionally housed (a–d)and germ-free (e–h) Swiss Webster mice wereexposed to drinking water containing CMC or P80(1.0%) for 12weeks. a, e, Body weight over time;b, f, fat-pad mass; c, g, food intake; and d, h, 15 hfasting blood glucose concentration. i–o, Germ-free Swiss Webster mice were conventionalized viamicrobiota transplant from mice that receivedstandard drinking water or drinking watercontaining CMC or P80 (1.0%). i–k, Confocalmicroscopy analysis of microbiota localization:MUC2, green; actin, purple; bacteria, red; andDNA, blue. Scale bar, 20mm. Pictures arerepresentative of 10 biological replicates.l, Distances of closest bacteria to intestinalepithelial cells (IEC) per condition over fivehigh-powered fields per mouse. m, Body weightover time; n, fat-padmass; and o, 15 h fasting bloodglucose concentration. Data are the means6s.e.m.(n5 5 for a–l, n5 3 form–o). Points are fromindividualmice. Significancewas determined usingone-way ANOVA corrected for multiplecomparisons with a Sidak test (*P, 0.05) ortwo-way group ANOVA corrected for multiplecomparisons with a Bonferroni test (#P, 0.05)compared to control group.
RESEARCH LETTER
4 | N A T U R E | V O L 0 0 0 | 0 0 M O N T H 2 0 1 5
Macmillan Publishers Limited. All rights reserved©2015

(Extended Data Fig. 10m–r) and altered microbiota composition(Extended Data Fig. 10z–e9). Thus, emulsifier-induced changes in themicrobiota have a role in driving the inflammation and metabolicchanges promoted by these food additives.The lasthalf-centuryhaswitnessed a steady increase in the consump-
tion of food additives, many of which have not been carefully tested astheywere givenGRASstatus at the time that government entities chargedwith regulating food safety were created and/or expanded. Moreover,the testing of food additives that has been performedhas generally usedanimal models designed to detect acute toxicity and/or promotion ofcancer. Our data suggest that such testingmay be inadequate—anotionsupported by the recent observation that artificial sweeteners inducedysglycaemia in humans30.More specifically, our data suggest that oneubiquitous class of food additives, namely emulsifiers, can disturb thehost–microbiota relationship resulting in amicrobiota with enhancedmucolytic andpro-inflammatory activity thatpromotes intestinal inflam-mation. Such chronic gut inflammation canmanifest as colitis ormeta-bolic syndrome.While additional studieswill be needed to determine ifCMC, P80 and/or other emulsifiers impact human health, our obser-vations inmice suggest the possibility that dietary emulsifiersmay havecontributed to the post-mid-twentieth-century increase in incidence ofinflammatory bowel disease, metabolic syndrome, and perhaps otherchronic inflammatory diseases. Notably, this hypothesis does not dis-pute the commonly held assumption that excess caloric consumptionis apredominant factordriving themetabolic syndromeepidemic.Rather,it suggests such hyperphagia may be driven, in part, by food additivesand other factors that might alter gut microbiota and promote low-grade intestinal inflammation.
Online Content Methods, along with any additional Extended Data display itemsandSourceData, are available in theonline versionof thepaper; referencesuniqueto these sections appear only in the online paper.
Received 5 December 2013; accepted 14 January 2015.
Published online 25 February 2015.
1. Johansson, M. E. et al. The inner of the two Muc2mucin-dependentmucus layersin colon is devoid of bacteria.Proc. Natl Acad. Sci. USA105,15064–15069 (2008).
2. Roberts, C. L. et al.Translocation of Crohn’s disease Escherichia coli acrossM-cells:contrasting effects of soluble plant fibres and emulsifiers. Gut 59, 1331–1339(2010).
3. Swidsinski, A., Loening-Baucke, V. & Herber, A. Mucosal flora in Crohn’s diseaseand ulcerative colitis - an overview. J. Physiol. Pharmacol. 60 (Suppl 6), 61–71(2009).
4. Food Safety Commission [of Japan]. Evaluation Report of Food Additives(Polysorbates 20, 60, 65 and 80) (2007) [transl.] https://www.fsc.go.jp/english/evaluationreports/foodadditive/polysorbate_report.pdf.
5. National Toxicology Program. Toxicology and Carcinogenesis Studies ofPolysorbate 80 (CAS No. 9005–65–6) in F344/N Rats and B6C3F1 Mice (FeedStudies). Natl. Toxicol. Program Tech. Rep. Ser. 415, 1–225 (1992).
6. Swidsinski, A. et al.Bacterial overgrowth and inflammation of small intestine aftercarboxymethylcellulose ingestion in genetically susceptible mice. Inflamm. BowelDis. 15, 359–364 (2009).
7. Kuhn, R., Lohler, J., Rennick, D., Rajewsky, K. & Muller, W. Interleukin-10-deficientmice develop chronic enterocolitis. Cell 75, 263–274 (1993).
8. Vijay-Kumar,M.et al.Deletionof TLR5 results in spontaneous colitis inmice. J. Clin.Invest. 117, 3909–3921 (2007).
9. Ubeda, C. et al. Familial transmission rather than defective innate immunityshapes the distinct intestinal microbiota of TLR-deficient mice. J. Exp. Med. 209,1445–1456 (2012).
10. Chassaing, B., Ley, R. E. & Gewirtz, A. T. Intestinal epithelial cell Toll-like receptor 5regulates the intestinal microbiota to prevent low-grade inflammation andmetabolic syndrome in mice. Gastroenterology 147, 1363–1377 (2014).
11. Johansson, M. E. & Hansson, G. C. Preservation of mucus in histological sections,immunostaining of mucins in fixed tissue, and localization of bacteria with FISH.Methods Mol. Biol. 842, 229–235 (2012).
12. Lozupone, C. & Knight, R. UniFrac: a new phylogenetic method for comparingmicrobial communities. Appl. Environ. Microbiol. 71, 8228–8235 (2005).
13. Backhed, F., Ley, R. E., Sonnenburg, J. L., Peterson, D. A. & Gordon, J. I. Host-bacterial mutualism in the human intestine. Science 307, 1915–1920 (2005).
14. Turnbaugh, P. J. et al. An obesity-associated gut microbiome with increasedcapacity for energy harvest. Nature 444, 1027–1031 (2006).
15. Qin, J. et al. A human gut microbial gene catalogue established by metagenomicsequencing. Nature 464, 59–65 (2010).
16. Png, C. W. et al. Mucolytic bacteria with increased prevalence in IBD mucosaaugment in vitro utilization of mucin by other bacteria. Am. J. Gastroenterol. 105,2420–2428 (2010).
17. Arthur, J. C. et al. Intestinal inflammation targets cancer-inducing activity of themicrobiota. Science 338, 120–123 (2012).
18. Carvalho, F. A.et al.Transient inability tomanageproteobacteria promotes chronicgut inflammation in TLR5-deficient mice. Cell Host Microbe 12, 139–152 (2012).
19. Mukhopadhya, I., Hansen, R., El-Omar, E. M. & Hold, G. L. IBD-what role doProteobacteria play? Nature Rev. Gastroenterol. Hepatol. 9, 219–230 (2012).
20. Cox, L. M. et al. Altering the intestinal microbiota during a critical developmentalwindow has lasting metabolic consequences. Cell 158, 705–721 (2014).
21. Chassaing, B., Koren, O., Carvalho, F. A., Ley, R. E. & Gewirtz, A. T. AIEC pathobiontinstigates chronic colitis in susceptible hosts by altering microbiota composition.Gut 63, 1069–1080 (2014).
22. Ziegler, T. R. et al. Detectable serum flagellin and lipopolysaccharide andupregulated anti-flagellin and lipopolysaccharide immunoglobulins in humanshort bowel syndrome. Am. J. Physiol. Regul. Integr. Comp. Physiol. 294,R402–R410 (2008).
23. Chassaing, B. et al. Fecal lipocalin 2, a sensitive and broadly dynamic non-invasivebiomarker for intestinal inflammation. PLoS ONE 7, e44328 (2012).
24. Devkota, S. et al. Dietary-fat-induced taurocholic acid promotes pathobiontexpansion and colitis in Il102/2 mice. Nature 487, 104–108 (2012).
25. Kullberg,M.C. et al.Helicobacter hepaticus triggers colitis in specific-pathogen-freeinterleukin-10 (IL-10)-deficient mice through an IL-12- and gamma interferon-dependent mechanism. Infect. Immun. 66, 5157–5166 (1998).
26. Gregor, M. F. & Hotamisligil, G. S. Inflammatorymechanisms in obesity.Annu. Rev.Immunol. 29, 415–445 (2011).
27. Vijay-Kumar, M. et al.Metabolic syndrome and altered gut microbiota in micelacking Toll-like receptor 5. Science 328, 228–231 (2010).
28. Wong, T. et al. Divergent metabolic adaptations to intestinal parasitic nematodeinfection in mice susceptible or resistant to obesity. Gastroenterology 133,1979–1988 (2007).
29. Furusawa, Y. et al. Commensal microbe-derived butyrate induces thedifferentiation of colonic regulatory T cells. Nature 504, 446–450 (2013).
30. Suez, J. et al. Artificial sweeteners induce glucose intolerance by altering the gutmicrobiota. Nature 514, 181–186 (2014).
Supplementary Information is available in the online version of the paper.
Acknowledgements This work was supported by NIH grant DK099071 andDK083890. B.C. is a recipient of the Research Fellowship award from the Crohn’s andColitis FoundationofAmerica (CCFA).We thankB.Zhang, L. Etienne-Mesmin,H.Q. Tranand E. Viennois for technical assistance.
Author ContributionsB.C. andA.T.G. conceived the project, designed the experiments,interpreted the results, and wrote the manuscript. B.C. performed all experiments andanalysis with advice and guidance from O.K., J.K.G., and A.C.P. S.S. and R.E.L. guidedexperimental design and data interpretation.
Author Information Sequencing data are deposited in the European NucleotideArchive under accession number PRJEB8035. Reprints and permissions informationis available at www.nature.com/reprints. The authors declare no competing financialinterests. Readers are welcome to comment on the online version of the paper.Correspondence and requests for materials should be addressed toA.T.G. ([email protected]).
LETTER RESEARCH
0 0 M O N T H 2 0 1 5 | V O L 0 0 0 | N A T U R E | 5
Macmillan Publishers Limited. All rights reserved©2015

METHODSMice.Wild-type C57BL/6 and Il102/2 mice were purchased from Jackson Labo-ratories. Swiss Webster mice were purchased from Taconic, Inc. Tlr52/2 micewere originally generated by S.Akira (OsakaUniversity, Japan)31 and backcrossed/maintained as previously described27. Allmicewere thenbredandhoused atGeorgiaState University, Atlanta, Georgia, USA under institutionally-approved protocols(Institutional Animal Care and Use Committee no. A14033). For wild-type mice,experiments were also performed on mice purchased directly from the aforemen-tioned providers and used within 3 days of receipt. Mice were fed Purina rodentchow no. 5001, which is commonly used in many vivaria. Mice were weaned at3weeks of age and put into new cages (randomized to littermates) such that eachexperimental group containedmice fromat least two different litters, and that eachlitter were used for at least three experimental groups. Experiments used eithermale or femalemice (comparisonswithin a gender) except for Figs 1m–oand2whichused bothmale and female mice. For littermate control experiments (Extended DataFig3), all themice from10 (ExtendedDataFig. 3a–g) and8 (ExtendedDataFig. 3h–n)different litters (from distinct mothers) were used and placed into cages such thateach litterwas split equally amongst groups thatwere to receivewater,CMCorP80(three (Extended Data Fig. 3a–g) or two (Extended Data Fig. 3h–n) cages per sexper condition). For experiments using older mice (Extended Data Fig. 5a–p), micewereweaned at 3weeks of age, put into newcages, and subjected to emulsifier treat-ment starting 3months later.Materials. Sodium carboxymethylcellulose (CMC, averageMw ,250,000), poly-sorbate-80 (P80) and sodium sulfite were purchased from Sigma (Sigma, St. Louis,Missouri).Emulsifier agent treatment. Mice were exposed to CMC, P80 or sodium sulfitediluted indrinkingwater (1.0%or indicated concentration) (not blinded).The samewater (reverse-osmosis treated Atlanta city water) was used for the water-treated(control) group. These solutions were changed every week. Emulsifier solutionswere autoclaved for experiments presented in Fig. 4a–h. When required, emul-sifier solutions were replaced by water after 6 weeks of treatment for an additional6weeks. Body weights were measured every week and are expressed as a percent-age compared to the initial body weight (day 0) defined as 100%.Mice developingcolitis (LCN2 level$ 500ngper g of faeces)were excluded formetabolic syndromeparameters analysis. Fresh faeces were collected every week for downstream ana-lysis. After 3months of emulsifier treatment,mice were fasted for 5 h, at which timeblood was collected by retrobulbar intraorbital capillary plexus. Haemolysis-freeserumwas generated by centrifugation of blood using serum separator tubes (BectonDickinson,FranklinLakes,NewJersey).Micewere theneuthanizedandcolon length,colon weight, spleen weight and adipose weight were measured. Organs were col-lected for downstream analysis. Incorporation of CMC and P80 into the diet wasperformedbyResearchDiets Inc. (NewBrunswick,NewJersey)usingPurinaRodentChowdiet no. 5001. These diets are now referenced by ResearchDiets as C13050701and C13050702, respectively.Food intake measurement. Groups of mice were placed in a clean cage with aknown amount of food. Twenty-four hours later, the amount of remaining foodwas measured with the difference viewed as food intake per 24 h. Error bars rep-resent s.e.m. of three measurements made one week apart.Overnight fasting blood glucosemeasurement.Mice were placed in a clean cageand fasted for 15 h. Bloodglucose concentrationwas thendeterminedusing aNovaMax Plus Glucose Meter and expressed in mgdl21.Glucose and insulin tolerance test. Wild-type and Tlr52/2 mice were treatedwith CMC or P80 diluted to 1% drinking water for 8weeks. Following a 5-h fast-ing, baseline blood glucose levels were measured using a Nova Max Plus GlucoseMeter and expressed inmgdl21. Micewere then injected intraperitoneallywith 2 gglucose per kg body weight in sterile PBS or with 0.5U insulin per kg body weight(Sigma, St. Louis,Missouri), and blood glucose levels weremeasured 30, 60, 90 and120min after injection, as previously described27.In vivo epithelial barrier permeability. In vivo assay of intestinal barrier functionwas performed using an FITC-labelled dextran method, as previously described32.Mice were deprived of food andwater for 4 h, andwere then gavagedwith 15mg ofpermeability tracer FITC-labelled dextran 4 kDa (FD4, Sigma, St. Louis,Missouri).Blood was collected retro-orbitally after 3 h, and fluorescence intensity was mea-sured in the serum (excitation, 490nm; emission, 520nm; BIOTEK FluorescenceSpectrophotometer). FITC–dextran concentrations were determined using a stan-dard curve generated by serial dilution of FITC–dextran in mice serum.Germ-free experiments. Germ-free Swiss Webster mice were kept under germ-free conditions in aParkBioservices isolator inour germ-free facility.CMCandP80were diluted to 1% in water and then autoclaved for germ-free purpose. The samewater was used for the water-treated (control) group. After 3months of emulsifieragent treatment,mice were fasted for 5 h and then removed from the isolator to beeuthanized. Sampleswere collected as previously described. For the analysis ofmucuslayer integrity, germ-freeC57BL/6mice were kept under germ-free conditions and
treated with CMC or P80 as described above. After 2months of emulsifier agenttreatment,mice were removed from the isolator, and inoculated with 0.5mmgreenfluorescent beads (Polysciences, Warrington, PA). Seven hours post-inoculation,mice were euthanized and colonic tissue was collected and placed in methanol-Carnoy’s fixative solution (60% methanol, 30% chloroform, 10% glacial aceticacid), followed by immunostaining of mucins, as described below.
Microbiota transplantation. Caecal contents from detergent treated mice weresuspended in 30%glycerol diluted inPBS (1.0ml) and stocked at280 uCuntil anal-ysis. Germ-free Swiss Webster mice (4weeks old) were removed from the isolatorandwere orally administered 200ml of faecal suspensionmadeusingglycerol stocks.Transplanted mice were then monitored as previously described.
Colonicmyeloperoxidase assay.Neutrophil influx in tissuewas analysed by assay-ing the enzymatic activity of myeloperoxidase, a marker for neutrophils. In brief,tissue (50mgml21) was thoroughlywashed in PBS andhomogenized in 0.5% hex-adecyltrimethylammonium bromide (Sigma, St. Louis, Missouri) in 50mM PBS(pH6.0), freeze–thawed three times, sonicated and centrifuged. Myeloperoxidasewas assayed in the clear supernatant by adding 1mgml21 of dianisidine dihydro-chloride (Sigma, St. Louis,Missouri) and53 1024%H2O2 and the change inopticaldensitymeasured at 450 nm.Humanneutrophilmyeloperoxidase (Sigma, St. Louis,Missouri) was used as a standard.One unit ofmyeloperoxidase activitywas definedas the amount that degraded 1.0mmol of peroxide per min at 256C33.
Haematoxylin and eosin staining andhistopathologic analysis. Following eutha-nasia, mouse colons and small intestines were fixed in 10% buffered formalin for24 h at room temperature and then embedded in paraffin. Tissues were sectionedat 5mm thickness and stained with haematoxylin and eosin (H&E) using standardprotocols.H&E-stained slideswere scored as follows. Each colonwas assigned fourscores based on the degree of epithelial damage and inflammatory infiltrate in themucosa, submucosa and muscularis/serosa, as previously described34. A slightmodification was made to this scoring system23; each of the four scores was mul-tiplied by 1 if the changewas focal, 2 if it was patchy and 3 if it was diffuse. The fourindividual scores per colon were added, resulting in a total scoring range of 0–36per mouse.
Periodic acid–Schiff staining. Following euthanasia, mouse colons were fixed in10% buffered formalin for 24 h at room temperature and then embedded in par-affin. Tissues were sectioned at 5mmthickness, deparaffinized and oxidized for 5minin 0.5% periodic acid solution (Sigma, St. Louis, Missouri). After rinsing, tissues wereplaced in Schiff reagent (Sigma, St. Louis, Missouri) for 15min, washed in warmwater, and counterstained usinghaematoxylin (Sigma, St. Louis,Missouri) for oneminute.
Immunostaining of mucins and localization of bacteria by fluorescent in situhybridization.Mucus immunostainingwas pairedwith fluorescent in situhybrid-ization (FISH), as previously described11, in order to analyse bacteria localization atthe surface of the intestinalmucosa. Inbrief, colonic tissues (proximal colon, secondcm from the caecum) containing faecal material were placed inmethanol-Carnoy’sfixative solution (60% methanol, 30% chloroform, 10% glacial acetic acid) for aminimum of 3 h at room temperature. Tissue were then washed in methanol23 30min, ethanol 23 15min, ethanol/xylene (1:1) 15min and xylene 23 15min,followed by embedding in paraffin with a vertical orientation. Five-mm sectionswere cut and dewaxed by preheating at 60 uC for 10min, followed by bathing inxylene at 60 uC for 10 min, xylene at room temperature for 10min and 99.5%ethanol for 10min. The hybridization step was performed at 50 uC overnight withan EUB338 probe (59-GCTGCCTCCCGTAGGAGT-39, with a 59Alexa 647 label)diluted to a final concentration of 10mgml21 in hybridization buffer (20mMTris-HCl, pH7.4, 0.9MNaCl, 0.1% SDS, 20% formamide). After washing for 10min inwash buffer (20mMTris-HCl, pH7.4, 0.9MNaCl) and 33 10min in PBS, a PAPpen (Sigma, St. Louis, Missouri) was used to mark around the section and blocksolution (5% FBS in PBS) was added for 30min at 4 uC.Mucin 2 primary antibody(rabbit H-300, Santa Cruz Biotechnology) was diluted to 1:1500 in block solutionand applied overnight at 4 uC.Afterwashing 33 10min inPBS, block solution con-taining anti-rabbit Alexa 488 secondary antibody diluted to 1:1500, Phalloidin–Tetramethylrhodamine B isothiocyanate (Sigma, St. Louis, Missouri) at 1mgml21
and Hoechst 33258 (Sigma, St. Louis, Missouri) at 10mgml21 was applied to thesection for 2 h.Afterwashing33 10min inPBS slidesweremounted usingProlonganti-fade mounting media (Life Technologies). Observations were performed witha Zeiss LSM 700 confocal microscope with software Zen 2011 version 7.1. Thissoftware was used to determine the distance between bacteria and the epithelialcell monolayer, as well as the mucus thickness.
Quantificationof faecal LCN2byELISAanddeterminationof colitis incidence.For quantification of faecal LCN2 by ELISA, frozen faecal samples were reconsti-tuted inPBS containing 0.1%Tween 20 to a final concentration of 100mgml21 andvortexed for 20min to produce a homogenous faecal suspension23. These sampleswere then centrifuged for 10min at 14,000g and 4 uC. Clear supernatants werecollected and stored at 220 uC until analysis. LCN2 levels were estimated in the
RESEARCH LETTER
Macmillan Publishers Limited. All rights reserved©2015

supernatants using Duoset murine LCN2 ELISA kit (R&D Systems, Minneapolis,Minnesota) using the colourimetric peroxidase substrate tetramethylbenzidine,and optical density was read at 450 nm (Versamax microplate reader). For deter-mination of colitis incidence, a faecal LCN2 level$ 500 ng per g of faeceswas usedto determine colitic mice.
Faecal flagellin and LPS load quantification.We quantified flagellin and LPS aspreviously described21 using human embryonic kidney (HEK)-Blue-mTLR5 andHEK-Blue-mTLR4 cells, respectively (Invivogen, SanDiego, California).We resus-pended faecal material in PBS to a final concentration of 100mgml21 and homo-genized for 10 s using aMini-Beadbeater-24 without the addition of beads to avoidbacteria disruption.We then centrifuged the samples at 8000g for 2min and seriallydiluted the resulting supernatant and applied tomammalian cells. PurifiedEscherichiacoli flagellin andLPS (Sigma, StLouis,Missouri)wereused for standardcurvedeter-minationusingHEK-Blue-mTLR5 andHEK-Blue-mTLR4 cells, respectively. After24h of stimulation, we applied cell culture supernatant to QUANTI-Blue medium(Invivogen, San Diego, California) and measured alkaline phosphatase activity at620 nm after 30min.
Serum flagellin- and LPS-specific immunoglobulins. Flagellin- and LPS-specificIgG levels were quantified by ELISA, as previously described22,35. Microtitre plateswere coated overnight with purified E. coli flagellin (100 ng per well) or LPS (1mgper well). Serum samples diluted 1:500 were then applied. After incubation andwashing,wellswere incubatedwith anti-mouse IgG.Quantificationwas performedusing the colourimetric peroxidase substrate tetramethylbenzidine, as describedabove. Data are reported as optical density corrected by subtracting background(determined by readings in samples lacking serum).
Gene expression analysis byquantitative reverse-transcriptionPCR(qRT–PCR).Total RNAs were isolated from colonic tissues using TRIzol (Invitrogen, Carlsbad,California) according to the manufacturer’s instructions. Quantitative RT–PCRwasperformedusing the iScriptTMOne-StepRT–PCRKit with SYBRGreen (Bio-Rad, Hercules, Californai) in a CFX96 apparatus (Bio-Rad, Hercules, California)with specificmouse oligonucleotides. The oligonucleotides used were: 36B4 (sense)59-TCCAGGCTTTGGGCATCA-39 and (antisense) 59-CTTTATTCAGCTGCACATCACTCAGA-39, Tff3 (sense) 59-CCTGGTTGCTGGGTCCTCTGG-39 and(antisense) 59-GTCTCCTGCAGAGGTTTGAAGC-39, Klf4F (sense) 59-TGTGACTATGCAGGCTGTGG-39 and (antisense) 59-AGTGCCTGGTCAGTTCATCG-39. Results were normalized to the housekeeping 36B4 gene.
Bacterial quantification by qPCR. For quantification of total faecal bacterial load,total bacterial DNA was isolated from weighted faeces using QIAamp DNA StoolMini Kit (Qiagen). DNAwas then subjected to quantitative PCR usingQuantiFastSYBRGreenPCRkit (Biorad)with universal 16S rRNAprimers 8F: 59-AGAGTTTGATCCTGGCTCAG-39 and338R: 59-CTGCTGCCTCCCGTAGGAGT-39 tomea-sure total bacteria36. Results are expressed as bacteria number permgof stool, usinga standard curve. For quantification ofmucosa-associated bacteria, total DNAwasisolated from PBS-washed and weighted colonic tissue using DNeasy Blood &Tissue Kit (Qiagen). DNA was then subjected to quantitative PCR as describedabove, and results are expressed as bacteria number permg of colonic tissue, usinga standard curve.
Faecal microbiota analysis by 16S rRNA gene sequencing using Illumina tech-nology. 16S rRNA gene amplification and sequencing were done using the Illu-mina MiSeq technology following the protocol of Earth Microbiome Project withtheir modifications to the MO BIO PowerSoil DNA Isolation Kit procedure forextracting DNA (http://www.earthmicrobiome.org/emp-standard-protocols)37,38.Bulk DNA were extracted from frozen extruded faeces using a PowerSoil-htp kitfromMOBIOLaboratories (Carlsbad,California)withmechanical disruption (beadbeating). The 16S rRNA genes, region V4, were PCR amplified from each sampleusing a composite forwardprimer and a reverse primer containing a unique 12-basebarcode, designed using theGolay error-correcting scheme, whichwas used to tagPCR products from respective samples38. We used the forward primer 515F 59-AATGATACGGCGACCACCGAGATCTACACTATGGTAATTGTGTGCCAGCMGCCGCGGTAA-39; the italicized sequence is the 59 Illumina adaptor B, the boldsequence is the primer pad, the italicized and bold sequence is the primer linkerand the underlined sequence is the conserved bacterial primer 515F. The reverseprimer 806R used was 59-CAAGCAGAAGACGGCATACGAGAT XXXXXXXXXXXXAGTCAGTCAG CCGGACTACHVGGGTWTCTAAT-39; the italicizedsequence is the 39 reverse complement sequence of Illumina adaptor, the 12 Xsequence is the Golay barcode, the bold sequence is the primer pad, the italicizedand bold sequence is the primer linker and the underlined sequence is the con-served bacterial primer 806R. PCR reactions consisted of Hot Master PCR mix(Five Prime), 0.2mMof each primer, 10–100 ng template, and reaction conditionswere 3min at 95 uC, followed by 30 cycles of 45 s at 95 uC, 60 s at 50 uC and 90 s at72 uCon a Biorad thermocycler. Four independent PCRswere performed for eachsample, combined, purifiedwithAmpuremagnetic purification beads (Agencourt),and products were visualized by gel electrophoresis. Products were then quantified
(BIOTEK Fluorescence Spectrophotometer) using a Quant-iT PicoGreen dsDNAassay. Amaster DNA pool was generated from the purified products in equimolarratios. The pooled products were quantified using a Quant-iT PicoGreen dsDNAassay and then sequenced using an Illumina MiSeq sequencer (paired-end reads,23 250 base pairs) at Cornell University, Ithaca.
16S rRNA gene sequence analysis. The sequences were demultiplexed, qualityfiltered using the Quantitative Insights Into Microbial Ecology (QIIME, version1.8.0) software package39, and forward and reverse Illumina reads were joined usingthe fastq-joinmethod (http://code.google.com/p/ea-utils)40.WeusedQIIMEdefaultparameters for quality filtering (reads truncated at first low-quality base and excludedif: (1) there were more than three consecutive low quality base calls; (2) less than75%of read lengthwas consecutive high quality base calls; (3) at least one uncalledbase was present; (4) more than 1.5 errors were present in the barcode; (5) anyPhred qualities were below 20; or (6) the lengthwas less than 75 bases). Sequenceswere assigned to OTUs using the UCLUST algorithm41 with a 97% threshold ofpairwise identity (without the creation of new clusters with sequences that do notmatch the reference sequences), and classified taxonomically using theGreengenesreference database42. A single representative sequence for each OTU was alignedand a phylogenetic tree was built using FastTree43. The phylogenetic tree was usedfor computing the unweightedUniFrac distances between samples12,44, rarefactionwere performed (3,500–20,000 sequences per sample) and used to compare abun-dances of OTUs across samples. Principal coordinates analysis (PCoA) plots wereused to assess the variation between experimental group (beta diversity) and jack-knifed beta diversity was used to estimate the uncertainty in PCoA plots. In addi-tion tousingPCoA, sampleswere clusteredusingUPGMA(unweighted pair groupmethodwith arithmeticmean).Alpha diversity curveswere determined for all sam-ples using the determination of the number of observed species, and the Shannondiversity indexwasused to characterize species diversity in a community. Sequenc-ing data are deposited in the European Nucleotide Archive under accession num-ber PRJEB8035.
Short-chain fatty acids and bile acids composition analysis. Faecal sampleswereused to analyse short-chain fatty acids and bile acid composition at theMetabolomicsCore of the University of Michigan (supported by grant U24 DK097153 of NIHCommon Funds Project to the University of Michigan).
Statistical analysis.All replicates in this studywere biological; that is, repeat exper-iments with additional mice. The D’Agostino–Pearson omnibus test was used toverify that all data were normally distributed. Significance was determined usingt-tests, one-way ANOVA corrected for multiple comparisons with a Sidak test,two-way ANOVA corrected for multiple comparisons with a Bonferroni test, ortwo-waygroupANOVA(GraphPadPrismsoftware, version6.01).Differenceswerenotedas significant atP#0.05.A ‘nearest-shrunkencentroid’ classificationapproachwas performed to detect the OTUs that were particularly representative of eachexperimental group45. The amount of shrinkagewas set tominimize themisclassi-fication error.WhenOTUswere used to classify samples, accuracy of the classifica-tion was perfect (overall error rate5 0). These analyses allowed the identificationof the 15 OTUs whose abundances were the most significantly different betweenexperimental groups, which were then used for heat map generation and sampleclustering. These analyses were performed using the prediction analysis formicro-arrays (PAM) package within R software45. No statistical methods were used topredetermine sample size.
31. Uematsu, S.et al.Detection of pathogenic intestinal bacteria byToll-like receptor5on intestinal CD11c1 lamina propria cells. Nature Immunol. 7, 868–874 (2006).
32. Denizot, J. et al. Adherent-invasive Escherichia coli induce claudin-2 expressionand barrier defect in CEABAC10 mice and Crohn’s disease patients. Inflamm.Bowel Dis. 18, 294–304 (2012).
33. Castaneda, F. E. et al. Targeted deletion of metalloproteinase 9 attenuatesexperimental colitis in mice: central role of epithelial-derived MMP.Gastroenterology 129, 1991–2008 (2005).
34. Katakura, K. et al. Toll-like receptor 9-induced type I IFN protects mice fromexperimental colitis. J. Clin. Invest. 115, 695–702 (2005).
35. Sitaraman, S. V. et al. Elevated flagellin-specific immunoglobulins in Crohn’sdisease. Am. J. Physiol. Gastrointest. Liver Physiol. 288, G403–G406 (2005).
36. Turnbaugh, P. J. et al. A core gutmicrobiome in obese and lean twins.Nature 457,480–484 (2009).
37. Gilbert, J. A. et al. The Earth Microbiome Project: Meeting report of the ‘‘1 EMPmeeting on sample selection and acquisition’’ at Argonne National LaboratoryOctober 6 2010. Stand. Genomic Sci. 3, 249–253 (2010).
38. Caporaso, J. G. et al. Ultra-high-throughput microbial community analysis on theIllumina HiSeq and MiSeq platforms. ISME J. 6, 1621–1624 (2012).
39. Caporaso, J. G. et al. QIIME allows analysis of high-throughput communitysequencing data. Nature Methods 7, 335–336 (2010).
40. Aronesty, E. Comparison of sequencing utility programs. Open Bioinformatics J. 7,1–8 (2013).
41. Edgar, R. C. Search and clustering orders of magnitude faster than BLAST.Bioinformatics 26, 2460–2461 (2010).
LETTER RESEARCH
Macmillan Publishers Limited. All rights reserved©2015

42. McDonald, D. et al. An improved Greengenes taxonomy with explicit ranks forecological and evolutionary analyses of bacteria and archaea. ISME J. 6, 610–618(2012).
43. Price, M. N., Dehal, P. S. & Arkin, A. P. FastTree: computing large minimumevolution trees with profiles instead of a distance matrix.Mol. Biol. Evol. 26,1641–1650 (2009).
44. Lozupone, C., Hamady, M. & Knight, R. UniFrac–an online tool for comparingmicrobial community diversity in a phylogenetic context. BMC Bioinformatics 7,371 (2006).
45. Tibshirani, R., Hastie, T., Narasimhan, B. & Chu, G. Diagnosis of multiple cancertypes by shrunken centroids of gene expression. Proc. Natl Acad. Sci. USA 99,6567–6572 (2002).
RESEARCH LETTER
Macmillan Publishers Limited. All rights reserved©2015

LETTER RESEARCH
Macmillan Publishers Limited. All rights reserved©2015

Extended Data Figure 1 | Effects of emulsifiers on mucus-microbiotainteraction in wild-type, Il102/2 and Tlr52/2mice. a–d, Dietary emulsifiersdid not affect mucus and mucus-related genes expression in wild-type mice.Wild-type (WT) mice were exposed to drinking water containing CMC orP80 (1.0%) for 12weeks. a–c, mRNA expression analysis by qRT–PCR ofMuc2 (a), Tff3 (b) and Klf4 (c) genes in the colonic mucosa. Points are fromindividual mice, bar represent the mean6 s.e.m., (n5 9). d, Colons werestained using periodic acid–Schiff stains. Scale bar, 200mm. Pictures arerepresentative of 10 biological replicates. e–j, Dietary emulsifiers altermicrobiota localization, composition and pro-inflammatory potential inTlr52/2 mice. Tlr52/2 mice were exposed to drinking water containing CMCor P80 (1.0%) for 12weeks. e–g, Confocal microscopy analysis of microbiotalocalization: MUC2, green; actin, purple; bacteria, red; and DNA, blue.
Scale bar, 20mm. Pictures are representative of five biological replicates.h, Distances of closest bacteria to intestinal epithelial cells (IEC) per conditionover five high-powered fields per mouse. i, j, PCR-based quantification oftotal bacterial load (i) and bacterial load adhered to colonicmucosa (j). Data arethe means6 s.e.m., n5 5. Significance was determined using one-wayANOVA corrected for multiple comparisons with a Sidak test; *P, 0.05compared to water-treated group. k, l, Dietary emulsifiers do not modify totalbacterial load in wild-type and Il102/2mice. Wild-type and Il102/2mice wereexposed to drinking water containing CMC or P80 (1.0%) for 12weeks.Total bacterial load in stool of wild-type (k) and Il102/2 (l) mice. Points arefrom individual mice. Data are geometric means with 95% confidence interval(n5 5 for k except n5 4 for CMC- andP80-treated groups; for l, n5 8, 4 and 6for water-, CMC- and P80-treated groups, respectively).
RESEARCH LETTER
Macmillan Publishers Limited. All rights reserved©2015

Extended Data Figure 2 | Emulsifiers alter microbiota composition.a–h, Dietary emulsifiers induce profound alterations in gut microbiotacomposition in wild-type and Il102/2 mice. Wild-type and Il102/2 mice wereexposed to drinking water containing CMC or P80 (1.0%) for 12weeks.a, b, e, f, Day 0 (a, e) and day 93 (b, f) microbiota richness and diversity inwild-type (a, b) and Il102/2 (e, f). c, d, g, h, Principal coordinates analysis(PCoA) of the unweighted UniFrac distance matrix of faecal microbiota (c, g)and mucosa-associated bacteria (d, h) in wild-type (c, d) and Il102/2 (g, h)mice. Treatment of each mouse is indicated by point colour and matchingcoloured circles represent clustering by treatment (blue, water; orange, CMC;purple, P80). Black dashed circles represent mice sharing a cage. Data are themeans6 s.e.m.; n5 5, except n5 4 for P80-treated wild-type mice; n5 4for CMC-treated Il102/2 mice; and n5 9 for water-treated Il102/2 mice.Significance was determined using two-way group ANOVA (#P, 0.05)compared to the water-treated group. i, j, Phylum characterization ofemulsifier-induced alteration of gut microbiota composition in wild-type andIl102/2 mice. Wild-type and Il102/2 mice were exposed to drinking watercontaining CMC or P80 (1.0%) for 12weeks. Relative abundance of phyla arerepresented for faecal microbiota at day 93 (i) and for colonic mucosa-associated bacteria (j). Data are the means6 s.e.m., n5 5. Significance wasdetermined using two-way ANOVA corrected for multiple comparisons with a
Bonferroni test, *P, 0.05 compared to water-treated group. k–o, Dietaryemulsifiers induce profound alterations in gut microbiota composition inTlr52/2 mice. Tlr52/2 mice were exposed to drinking water containing CMCorP80 (1.0%) for 12weeks.k, l, Day 0 (k) andday 93 (l)microbiota richness anddiversity (n5 5). m–o, PCoA of the unweighted UniFrac distance matrix offaecal microbiota at day 0 (m), day 93 (n) and of mucosa-associatedbacteria (o). Data are the means6 s.e.m. (for m, n5 4, 5 and 5 for water-,CMC- and P80-treated groups, respectively; for n, n5 4, 5 and 3 for water-,CMC- and P80-treated groups, respectively; for o, n5 4). Significance wasdetermined using two-way group ANOVA (#P, 0.05) compared to thewater-treated group. p–t, Prevalence analysis of OTUs related to mucolyticbacteria in Il102/2 mice treated with dietary emulsifier. Il102/2 mice wereexposed to drinking water containing CMC or P80 (1.0%) for 12weeks. OTUsProk_MSA# 52947 (p; related toClostridium perfringens), 264696 (q; related toAkkermansia muciniphila), 315982 (r; related to Clostridium perfringens),363731 (s; related to Akkermansia muciniphila), and 178331(t; related toAkkermansiamuciniphila) were analysed. Data are expressed as a percentage ofthe total sequences analysed and are the means6 s.e.m. (n5 6, except n5 9for water-treated Il102/2 mice). Significance was determined using two-wayANOVA corrected for multiple comparisons with a Bonferroni test, *P, 0.05compared to water-treated group.
LETTER RESEARCH
Macmillan Publishers Limited. All rights reserved©2015
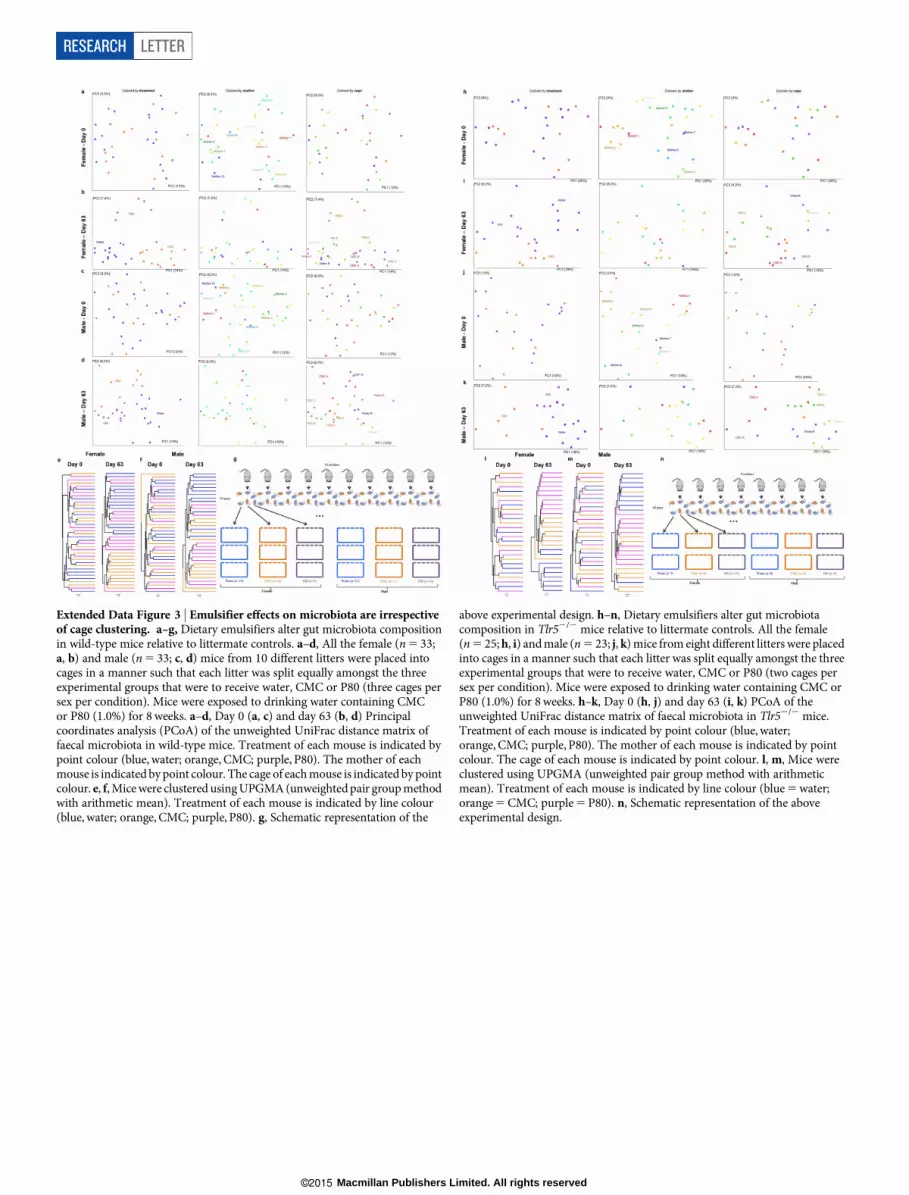
Extended Data Figure 3 | Emulsifier effects on microbiota are irrespectiveof cage clustering. a–g, Dietary emulsifiers alter gut microbiota compositionin wild-type mice relative to littermate controls. a–d, All the female (n5 33;a, b) and male (n5 33; c, d) mice from 10 different litters were placed intocages in a manner such that each litter was split equally amongst the threeexperimental groups that were to receive water, CMC or P80 (three cages persex per condition). Mice were exposed to drinking water containing CMCor P80 (1.0%) for 8weeks. a–d, Day 0 (a, c) and day 63 (b, d) Principalcoordinates analysis (PCoA) of the unweighted UniFrac distance matrix offaecal microbiota in wild-type mice. Treatment of each mouse is indicated bypoint colour (blue, water; orange, CMC; purple, P80). The mother of eachmouse is indicated bypoint colour. The cage of eachmouse is indicated by pointcolour. e, f,Micewere clustered usingUPGMA(unweightedpair groupmethodwith arithmetic mean). Treatment of each mouse is indicated by line colour(blue, water; orange, CMC; purple, P80). g, Schematic representation of the
above experimental design. h–n, Dietary emulsifiers alter gut microbiotacomposition in Tlr52/2 mice relative to littermate controls. All the female(n5 25;h, i) andmale (n5 23; j, k)mice from eight different litters were placedinto cages in a manner such that each litter was split equally amongst the threeexperimental groups that were to receive water, CMC or P80 (two cages persex per condition). Mice were exposed to drinking water containing CMC orP80 (1.0%) for 8weeks. h–k, Day 0 (h, j) and day 63 (i, k) PCoA of theunweighted UniFrac distance matrix of faecal microbiota in Tlr52/2 mice.Treatment of each mouse is indicated by point colour (blue, water;orange, CMC; purple, P80). The mother of each mouse is indicated by pointcolour. The cage of each mouse is indicated by point colour. l, m, Mice wereclustered using UPGMA (unweighted pair group method with arithmeticmean). Treatment of each mouse is indicated by line colour (blue5water;orange5CMC; purple5P80). n, Schematic representation of the aboveexperimental design.
RESEARCH LETTER
Macmillan Publishers Limited. All rights reserved©2015

ExtendedData Figure 4 | OTUs alteredby emulsifiers. a–d,Misclassificationerror rate and heat map representation of the 15 most significantly alteredOTUs in wild-type mice treated with dietary emulsifier. a–d, Wild-type micewere exposed to drinking water containing CMC (a, b) or P80 (c, d) (1.0%)for 12weeks. a, c, Misclassification error rate showing that 15 OTUs weresufficient to successfully discriminate microbiota from each experimentalgroup (error rate5 0). b, d, Heat map representation of the 15 mostsignificantly altered OTUs in wild-type mice treated with dietary emulsifiers.Colours represent relative expression (white and red for underrepresented and
overrepresented, respectively). The 15 OTUs are listed on the right using theirGreengenes Prok_MSA identities, and assigned taxonomy are labelled startingphylum, then class, order, family and genus. Dendrogram on the upper partrepresents sample clustering. e–h, As for a–dwith Il102/2mice. i–l, As for a–dwith Tlr52/2 mice. For a, b, n5 5; for c, d, n5 5 and 4 for water- andP80-treated groups, respectively; for e, f, n5 5 and 4 for water- andCMC-treated groups, respectively; for g, h, n5 5 and 4 for water- andP80-treated groups, respectively; for i, j, n5 4; for k, l, n5 4 and 3 forwater- and P80-treated groups, respectively.
LETTER RESEARCH
Macmillan Publishers Limited. All rights reserved©2015
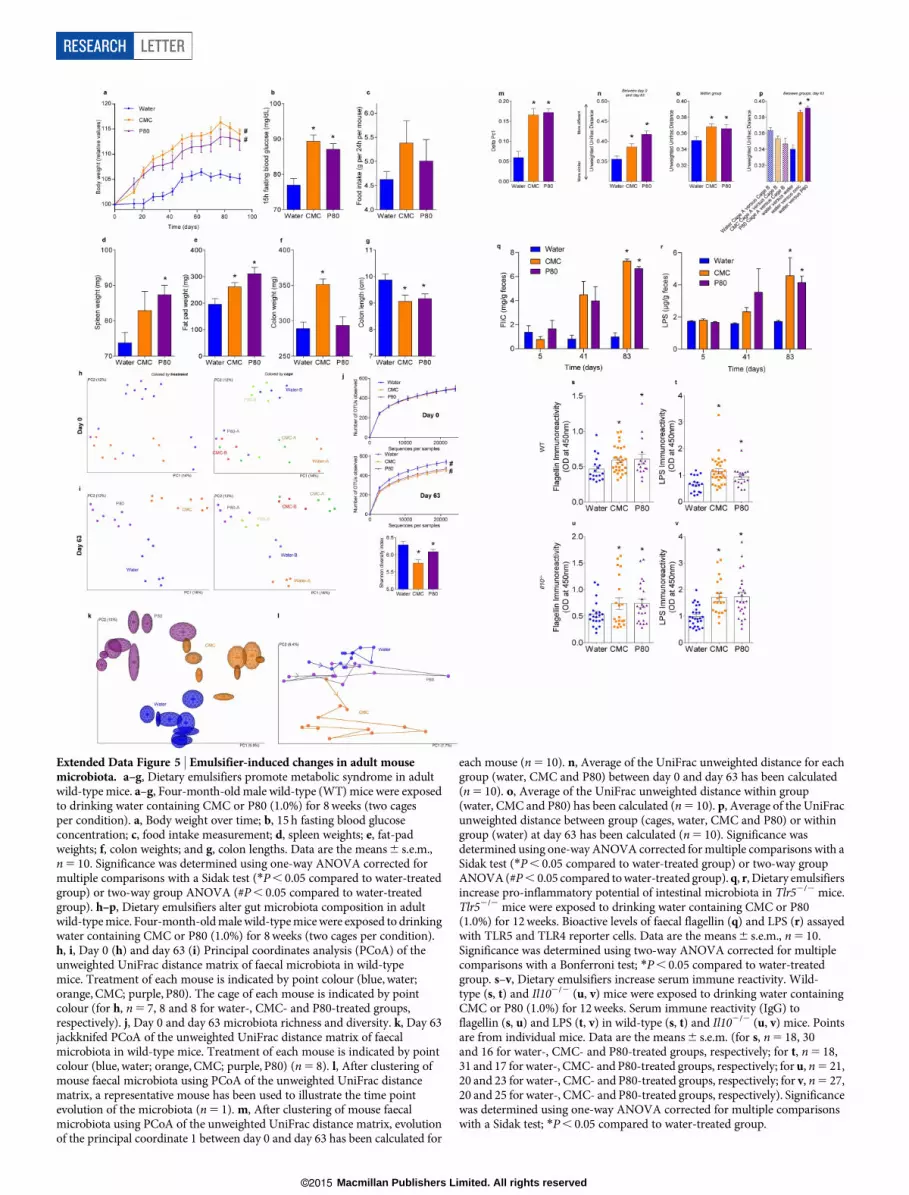
Extended Data Figure 5 | Emulsifier-induced changes in adult mousemicrobiota. a–g, Dietary emulsifiers promote metabolic syndrome in adultwild-typemice. a–g, Four-month-old male wild-type (WT) mice were exposedto drinking water containing CMC or P80 (1.0%) for 8weeks (two cagesper condition). a, Body weight over time; b, 15 h fasting blood glucoseconcentration; c, food intake measurement; d, spleen weights; e, fat-padweights; f, colon weights; and g, colon lengths. Data are the means6 s.e.m.,n5 10. Significance was determined using one-way ANOVA corrected formultiple comparisons with a Sidak test (*P, 0.05 compared to water-treatedgroup) or two-way group ANOVA (#P, 0.05 compared to water-treatedgroup). h–p, Dietary emulsifiers alter gut microbiota composition in adultwild-typemice. Four-month-oldmale wild-typemicewere exposed to drinkingwater containing CMC or P80 (1.0%) for 8weeks (two cages per condition).h, i, Day 0 (h) and day 63 (i) Principal coordinates analysis (PCoA) of theunweighted UniFrac distance matrix of faecal microbiota in wild-typemice. Treatment of each mouse is indicated by point colour (blue, water;orange, CMC; purple, P80). The cage of each mouse is indicated by pointcolour (for h, n5 7, 8 and 8 for water-, CMC- and P80-treated groups,respectively). j, Day 0 and day 63 microbiota richness and diversity. k, Day 63jackknifed PCoA of the unweighted UniFrac distance matrix of faecalmicrobiota in wild-type mice. Treatment of each mouse is indicated by pointcolour (blue, water; orange, CMC; purple, P80) (n5 8). l, After clustering ofmouse faecal microbiota using PCoA of the unweighted UniFrac distancematrix, a representative mouse has been used to illustrate the time pointevolution of the microbiota (n5 1). m, After clustering of mouse faecalmicrobiota using PCoA of the unweighted UniFrac distance matrix, evolutionof the principal coordinate 1 between day 0 and day 63 has been calculated for
each mouse (n5 10). n, Average of the UniFrac unweighted distance for eachgroup (water, CMC and P80) between day 0 and day 63 has been calculated(n5 10). o, Average of the UniFrac unweighted distance within group(water, CMC and P80) has been calculated (n5 10). p, Average of the UniFracunweighted distance between group (cages, water, CMC and P80) or withingroup (water) at day 63 has been calculated (n5 10). Significance wasdetermined using one-way ANOVA corrected formultiple comparisons with aSidak test (*P, 0.05 compared to water-treated group) or two-way groupANOVA(#P, 0.05 compared towater-treated group).q, r, Dietary emulsifiersincrease pro-inflammatory potential of intestinal microbiota in Tlr52/2 mice.Tlr52/2 mice were exposed to drinking water containing CMC or P80(1.0%) for 12weeks. Bioactive levels of faecal flagellin (q) and LPS (r) assayedwith TLR5 and TLR4 reporter cells. Data are the means6 s.e.m., n5 10.Significance was determined using two-way ANOVA corrected for multiplecomparisons with a Bonferroni test; *P, 0.05 compared to water-treatedgroup. s–v, Dietary emulsifiers increase serum immune reactivity. Wild-type (s, t) and Il102/2 (u, v) mice were exposed to drinking water containingCMC or P80 (1.0%) for 12weeks. Serum immune reactivity (IgG) toflagellin (s, u) and LPS (t, v) in wild-type (s, t) and Il102/2 (u, v) mice. Pointsare from individual mice. Data are the means6 s.e.m. (for s, n5 18, 30and 16 for water-, CMC- and P80-treated groups, respectively; for t, n5 18,31 and 17 for water-, CMC- and P80-treated groups, respectively; for u, n5 21,20 and 23 for water-, CMC- and P80-treated groups, respectively; for v, n5 27,20 and 25 for water-, CMC- and P80-treated groups, respectively). Significancewas determined using one-way ANOVA corrected for multiple comparisonswith a Sidak test; *P, 0.05 compared to water-treated group.
RESEARCH LETTER
Macmillan Publishers Limited. All rights reserved©2015

Extended Data Figure 6 | Histopathologic changes in emulsifier-treatedwild-type and Il102/2mice. a, Dietary emulsifiers induce histopathologicallyrobust inflammation in Il102/2mice. a, Il102/2mice were exposed to drinkingwater containing CMC or P80 (1.0%) for 12weeks. Colon and smallintestine were haematoxylin and eosin (H&E) stained. Scale bar, 200mm.Pictures are representatives of 15 biological replicates. b, Dietary emulsifiersinduce histopathologically robust inflammation in Tlr52/2mice. Tlr52/2micewere exposed to drinking water containing CMC or P80 (1.0%) for 12weeks.Colon and small intestine were H&E stained. Scale bar, 200mm. Pictures arerepresentative of five biological replicates. c, Histopathology of emulsifier-treated wild-type (WT) mice. Wild-type mice were exposed to drinking watercontaining CMC or P80 (1.0%) for 12weeks. Colon and small intestine wereH&E stained. Scale bar, 200mm. Pictures are representative of 15 biologicalreplicates. d–h, Dietary emulsifiers elicit low-grade intestinal inflammation inWT and splenomegaly in Il102/2mice. Wild-type (d–g) and Il102/2 (h) micewere exposed to drinking water containing CMC or P80 (1.0%) for 12weeks.d, Colitis incidence over time; e, h, spleen weights; f, epithelial damage; andg, infiltration scores. Points are from individual mice, bars represent the mean.For e–g, n5 14, 27 and 16 for water-, CMC- and P80-treated groups,
respectively; for h, n5 11, 18 and 20 for water-, CMC- and P80-treated groups,respectively. Significance was determined using one-way ANOVA correctedfor multiple comparisons with a Sidak test; *P, 0.05 compared to water-treated group. i–k, Extent of intestinal inflammation correlates withperturbation in microbiota localization in wild-type and Il102/2mice. Il102/2
mice were exposed to drinking water containing CMC (i) or P80 (j) (1.0%)for 12weeks. Faecal levels of the inflammatorymarker LCN2 aswell as confocalmicroscopy analysis of microbiota localization and estimation of the distancesof the closest bacteria to intestinal epithelial cells (IEC) were determined,and plotted in the x and y axis, respectively. Linear regression line wascalculated and R2 was determined; n5 11. k, Analysis of bacterial–epithelialdistance upon stratification of levels of gut inflammatory marker faecal LCN2,using both wild-type and Il102/2 mice exposed to drinking water containingCMC or P80 (1.0%) for 12weeks. Mice were grouped according to theirfaecal LCN2 levels and bacterial–epithelial distances were then plotted(mean 6 s.e.m.). Significance was determined using one-way ANOVAcorrected for multiple comparisons with a Sidak test; *P, 0.05 compared toX, 50 ng per g group.
LETTER RESEARCH
Macmillan Publishers Limited. All rights reserved©2015

Extended Data Figure 7 | Inflammatory and metabolic parameters inemulsifier-treated wild-type and Tlr52/2 mice. a–g, Dietary emulsifierspromote intestinal inflammation in Tlr52/2 mice. a–g, Tlr52/2 mice wereexposed to drinking water containing CMC or P80 (1.0%) for 12weeks.a, Faecal levels of the inflammatorymarker LCN2 over time; b, colitis incidenceover time; c, myeloperoxidase levels; d, histological score; e, colon weights;f, colon lengths; and g, spleenweights.Data are themeans6 s.e.m. or geometricmeans with 95% confidence interval (the latter for a), n5 5. Significancewas determined using one-way ANOVA corrected for multiple comparisonswith a Sidak test or using two-wayANOVAcorrected formultiple comparisonswith a Bonferroni test; *P, 0.05 compared to water-treated group.h–k, Dietary emulsifiers induce metabolic syndrome in wild-type (WT) andTlr52/2mice.Wild-type (h, i) andTlr52/2 (j, k)mice were exposed to drinkingwater containing CMC or P80 (1.0%) for 12weeks. Glucose tolerance (h, j)and insulin sensitivity (i, k) were analysed. Data are the means6 s.e.m., n5 5.Significance was determined using two-way group ANOVA (#P, 0.05)compared to water-treated group. l–t, Emulsifier-supplemented chow elicitslow-grade intestinal inflammation in wild-type mice. Wild-type mice weregiven mouse chow containing CMC or P80 (1.0%) for 12weeks. l, Faecal levels
of the inflammatory marker LCN2 over time; m, myeloperoxidase levels;n, food intake measurement; o, 15 h fasting blood glucose concentration;p, colon weights; q, colon lengths; r, spleen weights; and s, t, PCR-basedquantification of total bacterial load (s) and bacterial load adhered to colonicmucosa (t). Data are the means6 s.e.m. or geometric means with 95%confidence interval (the latter for l), n5 5. Significance was determined usingone-wayANOVAcorrected formultiple comparisonswith a Sidak test or usingtwo-way ANOVA corrected for multiple comparisons with a Bonferronitest; *P, 0.05 compared to control group. u–h9 Dose-responsecharacterization of dietary emulsifiers on intestinal inflammation. Wild-typemice were exposed to drinking water containing 0.1–1.0% CMC (u–a9) orP80 (b9–h9) for 12weeks. u, b9, Faecal levels of the inflammatorymarker LCN2over time; v, c9, myeloperoxidase levels; w, d9, food intake measurement;x, e9, 15 h fasting blood glucose concentration; y, f9, colon weights; z, g9, colonlengths; and a9, h9, spleen weights. Data are the means6 s.e.m., n5 5.Significance was determined using one-way ANOVA corrected for multiplecomparisons with a Sidak test or using two-way ANOVA corrected formultiple comparisons with a Bonferroni test; *P, 0.05 compared towater-treated group.
RESEARCH LETTER
Macmillan Publishers Limited. All rights reserved©2015

Extended Data Figure 8 | Reversibility and dose dependence of emulsifier-induced effects on inflammation and metabolism. a–k, Emulsifier-inducedmetabolic syndrome in Swiss Webster mice is partially reversible by 6weeksafter emulsifier treatment. a, Schematic representation of the experiment.b, c, Body weight over time; d, fat-pad weight; e, faecal levels of theinflammatorymarker LCN2 over time; f, myeloperoxidase levels; g, food intakemeasurement; h, 15 h fasting blood glucose concentration; i, colon weights;j, colon lengths; and k, spleen weights. Data are the means6 s.e.m., n5 5.Significance was determined using one-way ANOVA corrected for multiplecomparisons with a Sidak test (*P, 0.05 compared to water-treated group) ortwo-way group ANOVA (#P, 0.05 compared to water-treated group).l–s, Sodium sulfite did not induce robust or low-grade intestinal inflammation.Wild-type and Il102/2micewere exposed to drinkingwater containing sodiumsulfite (1.0%) for 12weeks. l, m, Body weight over time; n, colon weights;o, colon lengths; p, spleen weights; q, fat-pad weight; r, myeloperoxidase levels;and s, serum levels of the inflammatory marker LCN2. Data are themeans6 s.e.m., n5 5. Points are from individual mice. Significance wasdetermined using one-way ANOVA corrected formultiple comparisons with aSidak test. t–w, Dietary emulsifiers promote metabolic syndrome in Tlr52/2
mice. Tlr52/2 mice were exposed to drinking water containing CMC orP80 (1.0%) for 12weeks. t, Body weight over time; u, fat-pad weight; v, foodintake measurement; andw, 15 h fasting blood glucose concentration. Data arethe means6 s.e.m., n5 5. Significance was determined using one-way
ANOVA corrected for multiple comparisons with a Sidak test (*P, 0.05compared to water-treated group) or two-way group ANOVA (#P, 0.05compared to water-treated group). x–f9, Emulsifier-supplemented chowpromotes intestinal inflammation in Tlr52/2 mice. Tlr52/2 mice were givenmouse chow containing CMC or P80 (1.0%) for 12weeks. x, Faecal levels ofthe inflammatory marker LCN2 over time; y, myeloperoxidase levels; z, foodintake measurement; a9, 15 h fasting blood glucose concentration; b9, colonweights; c9, colon lengths; d9, spleen weights; and e9, f9, PCR-basedquantification of total bacterial load (e9) and bacterial load adhered to colonicmucosa (f9). Data are the means6 s.e.m., n5 5. Significance was determinedusing one-way ANOVA corrected for multiple comparisons with a Sidaktest or using two-way ANOVA corrected for multiple comparisons with aBonferroni test; *P, 0.05 compared to control group. g9–o9, Dose-responsecharacterization of dietary emulsifiers on intestinal inflammation in Tlr52/2
mice. Tlr52/2 mice were exposed to drinking water containing 0.1–1.0%P80 for 12weeks. g9, Body weight over time; h9, fat-pad weight; i9, faecal levelsof the inflammatory marker LCN2 over time; j9, myeloperoxidase levels;k9, food intake measurement; l9, 15 h fasting blood glucose concentration;m9, colon weights; n9, colon lengths; and o9, spleen weights. Data are themeans6 s.e.m., n5 3. Points in d are from individual mice. Significance wasdetermined using one-way ANOVA corrected formultiple comparisons with aSidak test (*P, 0.05 compared to water-treated group) or two-way groupANOVA (#P, 0.05 compared to water-treated group).
LETTER RESEARCH
Macmillan Publishers Limited. All rights reserved©2015

Extended Data Figure 9 | Effects of emulsifiers on metabolic parametersand bile acids in conventional and germ-free mice. a–f, Dietary emulsifierspromotes metabolic syndrome in Il102/2 mice. Il102/2 mice were exposed todrinking water containing CMC or P80 (1.0%) for 12 weeks. a–c, Body weightover time; d, fat-pad weight; e, food intake measurement; and f, 15 h fastingblood glucose concentration. Data are themeans6 s.e.m. (for a, n5 24, 18 and21 for water-, CMC- and P80-treated groups, respectively; for b, n5 14,11 and 8 for water-, CMC- and P80-treated groups, respectively; for c, n5 14, 9and 9 for water-, CMC- and P80-treated groups, respectively; for d, n5 14, 18and 20 for water-, CMC- and P80-treated groups, respectively; for e, n5 15,11 and 12 for water-, CMC- and P80-treated groups, respectively; for f, n5 21,17 and 20 for water-, CMC- and P80-treated groups, respectively). Significancewas determined using one-way ANOVA corrected for multiple comparisonswith a Sidak test (*P, 0.05 compared to water-treated group) or two-waygroup ANOVA (#P, 0.05 compared to water-treated group). Points arefrom individual mice and red points in f represent mice with overt colitis.g–p, Emulsifier-induced low-grade intestinal inflammation was abolishedunder germ-free conditions. Conventionally housed (g–k) and germ-free(l–p) Swiss Webster mice were exposed to drinking water containing CMC orP80 (1.0%) for 12weeks. g, l, Faecal levels of the inflammatory marker LCN2over time; h, m, myeloperoxidase levels; i, n, colon weights; j, o, colonlengths; and k, p, spleen weights. Data are the means6 s.e.m.; n5 8 forconventionally housed mice and n5 4 for germ-free mice. Significance wasdetermined using one-way ANOVA corrected formultiple comparisons with aSidak test or using two-way ANOVA corrected for multiple comparisons witha Bonferroni test, *P, 0.05 compared to control group. q–w, Dietaryemulsifiers induce perturbations in faecal short-chain fatty acid composition.Faecal short-chain fatty acids composition was analysed at the MetabolomicsCore of the University of Michigan. Acetate (q), propionate (r), butyrate (s),isovalerate (t), valerate (u), hexanoate (v) and heptanoate (w) were analysed.Data are the means6 s.e.m. (n5 5, 8 and 7 for water-, CMC- and P80-treatedconventional mice groups, respectively; n5 4, 4 and 5 for water-, CMC- andP80-treated germ-free mice groups, respectively). Significance was
determined using one-way ANOVA corrected formultiple comparisons with aSidak test; *P, 0.05 compared to water-treated group. x–a9, Dietaryemulsifiers promote metabolic syndrome in mice from different vendors.Wild-typemice were exposed to drinkingwater containingCMCor P80 (1.0%)for 12weeks. x, y, Body weight over time of Bl/6 mice used upon receipt fromJackson Laboratories (x) or bred at Georgia State University (y). z, a9, Bodyweight over time of Swiss Webster mice used upon receipt from CharlesRiver company (z) or bred at Georgia State University (a9). Data in x are notused elsewhere in report, while data in y, z, and a9 are from Figs 3a and 4a andExtended Data Fig 8a–k. Data are the means6 s.e.m. n5 8 for Bl/6 miceused upon receipt from Jackson Laboratories, n5 16 for Bl/6 mice bred atGeorgia State University, n5 10 for Swiss Webster mice used upon receiptfrom Charles River company, n5 8 for Swiss Webster mice bred at GeorgiaState University. Significance was determined using two-way group ANOVA(#P, 0.05 compared to water-treated group). b9–t9, Dietary emulsifiersinduce perturbations in faecal bile acids composition. Faecal bile acidscomposition was analysed at the Metabolomics Core of the University ofMichigan. Lithocholic acid (LCA; b9), chenodeoxycholic acid (CDCA; c9),deoxycholic acid (DCA; d9), hyodeoxycholic acid/ursodeoxycholic acid(HDCA/UDCA; e9), a-muricholic acid (a-MCA; f9), b-muricholic acid(b -MCA; g9), cholic acid (CA; h9), hyocholic acid (HCA; i9),v-muricholic acid(v-MCA; j9), glycolithocholic acid (GLCA; k9), glycochenodeoxycholic acid(GCDCA; l9), glycodeoxycholic acid (GDCA;m9), hyodeoxycholic acid/glycoursodeoxycholic acid (HDCA/GUDCA; n9), glycocholic acid (GCA; o9),taurolithocholic acid (TLCA; p9), taurine-conjugated chenodeoxycholic acid(TCDCA; q9), taurodeoxycholic acid/tauroursodeoxycholic acid (TDCA/TUDCA; r9), taurohyodeoxycholic acid (s9), and taurocholic acid (TCA; t9)were analysed. Data are the means6 s.e.m. (n5 5, 8 and 7 for water-,CMC- and P80-treated conventional mice groups, respectively; n5 4, 4 and 5for water-, CMC- and P80-treated germ-free mice groups, respectively).Significance was determined using one-way ANOVA corrected for multiplecomparisons with a Sidak test; *P, 0.05 compared to water-treated group.
RESEARCH LETTER
Macmillan Publishers Limited. All rights reserved©2015

Extended Data Figure 10 | Faecal transplants transfer some effects ofemulsifers. a–h, Dietary emulsifiers do not alter mucus thickness under germ-free conditions. a–h, Conventionally-housed (a–c, g–h) and germ-free SwissWebster (SW; d–f, h) mice were exposed to drinking water containing CMCorP80 (1.0%) for 12weeks. a–f, Confocal microscopy analysis of microbiotalocalization: MUC2, green; actin, purple; bacteria, red; and DNA, blue. Scalebar, 20mm. g, Distances of closest bacteria to intestinal epithelial cells (IEC) percondition over five high-powered fields per mouse. Pictures are representativeof five biological replicates. h, Mucus thickness over five high-poweredfields per mouse. Data are the means6 s.e.m., n5 5. Significance wasdetermined using one-way ANOVA corrected for multiple comparisons witha Sidak test; *P, 0.05 compared to water-treated group. i–l, Dietaryemulsifiers do not induce drastic perturbations of mucus layer integrity undergerm-free conditions. Germ-free SwissWebster mice were exposed to drinkingwater containing CMC or P80 (1.0%) for 8weeks. Mice were removed fromthe isolator, inoculated with 0.5mm green fluorescent beads (Polysciences,Warrington, Pennsylvania), and euthanized 7 h post-inoculation. i–k, Confocalmicroscopy analysis of fluorescent beads localization: MUC2, green; actin,purple; fluorescent beads, red; and DNA, blue. Scale bar, 20mm. l, Distances ofclosest fluorescent beads to intestinal epithelial cells per condition over fivehigh-powered fields per mouse. Pictures are representatives of five biologicalreplicates. Data are the means6 s.e.m., n5 4. Significance was determinedusing one-way ANOVA corrected for multiple comparisons with a Sidak test.m–r, Dietary emulsifiers increase pro-inflammatory potential of intestinalmicrobiota in Swiss Webster mice, transferable to germ-free mice recipients.m,n, Germ-free SwissWebstermicewere exposed todrinkingwater containingCMC or P80 (1.0%) for 12weeks. Bioactive levels of faecal flagellin (m) andLPS (n) were assayed with TLR5 and TLR4 reporter cells. o, p, Swiss Webstermice were exposed to drinking water containing CMC or P80 (1.0%) for12weeks. Bioactive levels of faecal flagellin (o) and LPS (p) were assayed withTLR5 and TLR4 reporter cells. q, r, Germ-free Swiss Webster mice were
conventionalized via microbiota transplant from the Swiss Webster micetreated with emulsifiers described above. Bioactive levels of faecal flagellin (q)and LPS (r) were assayed with TLR5 and TLR4 reporter cells. Data are themeans6 s.e.m. n5 4 for germ-freemice, n5 8 for conventionally housedmiceand n5 5 for conventionalized mice. Significance was determined usingtwo-way ANOVA corrected for multiple comparisons with a Bonferroni test;*P, 0.05 compared to control group. s–y, Microbiota transplant transfersemulsifier-induced low-grade intestinal inflammation. Germ-free SwissWebster mice were conventionalized via microbiota transplant from mice thatreceived standard drinking water or drinking water containing CMC or P80(1.0%). s, Schematic representation of the experiment. t, Faecal levels of theinflammatory marker LCN2 over time; u, myeloperoxidase levels; v, colonweights; w, colon lengths; x, spleen weights; and y, food intake measurement.Data are themeans6 s.e.m.,n5 4. Significancewas determined using one-wayANOVAcorrected formultiple comparisonswith a Sidak test or using two-wayANOVA corrected for multiple comparisons with a Bonferroni test;*P, 0.05 compared to control group. z–e9, Dietary emulsifiers induceprofound alterations in gut microbiota composition in Swiss Webster mice,transferable to germ-free mice recipients. z–b9, Swiss Webster mice wereexposed to drinking water containing CMC or P80 (1.0%) for 12weeks.Principal coordinates analysis (PCoA) of the unweighted UniFrac distancematrix of faecal microbiota at day 0 (z), day 42 (a9) and day 98 (b9).c9–e9, Germ-free Swiss Webster mice were conventionalized via microbiotatransplant from the Swiss Webster mice treated with emulsifiers describedabove. PCoA of the unweighted UniFrac distances of faecal microbiota at day14 (c9), day 42 (d9) and day 98 (e9) post-transplant. For z–b9, n5 5, 8 and 7 forwater-, CMC- and P80-treated groups, respectively; for c9–e9, n5 5, 4 and 3for water-, CMC- and P80-treated groups, respectively. Treatment of eachmouse is indicated by point colour andmatching coloured circles indicate micereceiving the same treatment (blue, water; orange, CMC; purple, P80). Blackdashed circles represent mice sharing a cage.
LETTER RESEARCH
Macmillan Publishers Limited. All rights reserved©2015