adipose tissue nape-pld controls fat mass development by altering the browning process and gut...
TRANSCRIPT

ARTICLE
Received 11 Jul 2014 | Accepted 4 Feb 2015 | Published 11 Mar 2015
Adipose tissue NAPE-PLD controls fat massdevelopment by altering the browning processand gut microbiotaLucie Geurts1, Amandine Everard1,*, Matthias Van Hul1,*, Ahmed Essaghir2, Thibaut Duparc1,
Sebastien Matamoros1, Hubert Plovier1, Julien Castel3, Raphael G.P. Denis3, Marie Bergiers1,
Celine Druart1, Mireille Alhouayek4, Nathalie M. Delzenne1, Giulio G. Muccioli4, Jean-Baptiste Demoulin2,
Serge Luquet3 & Patrice D. Cani1
Obesity is a pandemic disease associated with many metabolic alterations and involves
several organs and systems. The endocannabinoid system (ECS) appears to be a key
regulator of energy homeostasis and metabolism. Here we show that specific deletion of the
ECS synthesizing enzyme, NAPE-PLD, in adipocytes induces obesity, glucose intolerance,
adipose tissue inflammation and altered lipid metabolism. We report that Napepld-deleted
mice present an altered browning programme and are less responsive to cold-induced
browning, highlighting the essential role of NAPE-PLD in regulating energy homeostasis and
metabolism in the physiological state. Our results indicate that these alterations are mediated
by a shift in gut microbiota composition that can partially transfer the phenotype to germ-free
mice. Together, our findings uncover a role of adipose tissue NAPE-PLD on whole-body
metabolism and provide support for targeting NAPE-PLD-derived bioactive lipids to treat
obesity and related metabolic disorders.
DOI: 10.1038/ncomms7495 OPEN
1 Metabolism and Nutrition Research Group, WELBIO-Walloon Excellence in Life Sciences and BIOtechnology, Louvain Drug Research Institute, Universitecatholique de Louvain, Avenue E. Mounier, 73 B1.73.11, 1200 Brussels, Belgium. 2 de Duve Institute, Universite catholique de Louvain, Avenue Hippocrate, 74B1.74.05, 1200 Brussels, Belgium. 3 Universite Paris Diderot, Sorbonne Paris Cite, BFA, UMR8251, CNRS, F-75205 Paris, France. 4 Bioanalysis andPharmacology of Bioactive Lipids Research Group, Louvain Drug Research Institute, Universite catholique de Louvain, Avenue E. Mounier, 72 B1.72.11, 1200Brussels, Belgium. * These authors contributed equally to this work. Correspondence and requests for materials should be addressed to P.D.C.(email: [email protected]).
NATURE COMMUNICATIONS | 6:6495 | DOI: 10.1038/ncomms7495 | www.nature.com/naturecommunications 1
& 2015 Macmillan Publishers Limited. All rights reserved.

Obesity has reached pandemic levels. In addition to beingassociated with a massive expansion of adipose tissue,obesity is also associated with a cluster of metabolic
alterations, such as type 2 diabetes and cardiovascular and hepaticdiseases. Thus, it is of the utmost importance to unravel theunderlying mechanisms that lead to these metabolic alterations todiscover new therapeutic strategies. Obesity can be considered a‘multi-system disease’ because several organs and systemsparticipate in this metabolic condition. Among those, theendocannabinoid system (ECS) appears to be a key regulator ofenergy homeostasis and metabolism.
The ECS is a complex system composed of several bioactivelipids interacting with both membrane-bound and nuclearreceptors, leading to a broad range of physiological effects. ECSactivity is mainly controlled by key synthesis and degradationenzymes1. Anandamide (N-arachidonoylethanolamine, AEA) isone of the best characterized endocannabinoids (eCBs) and isinvolved in regulation of appetite and energy homeostasis2,3. Inaddition to AEA, other related N-acylethanolamines (NAEs),such as N-palmitoylethanolamine (PEA), N-stearoylethanolamine(SEA) and N-oleoylethanolamine (OEA) share biosynthetic anddegrading pathways with AEA. NAEs are typically synthesized bythe enzyme N-acylphosphatidylethanolamine phospholipase D(NAPE-PLD), although alternative pathways exist for AEAbiosynthesis1,4. The eCBs are synthesized from cell membranephospholipids and are released to the extracellular compartmentto target their receptors. eCBs act via an autocrine or a paracrinemechanism5. The principal eCB receptors are the G-coupledreceptors CB1 and CB2, which are mainly targeted by AEA and2-arachidonoylglycerol, the two major eCBs. Other NAEs, such asOEA or PEA, activate non-cannabinoid receptors, includingPPARa, GPR55 or GPR119 (refs 1,6–8). The levels of eCBs areclosely regulated by a balance between synthesis and degradation.After release, eCBs and NAEs are rapidly degraded by a cluster ofdegrading enzymes such as fatty acid amide hydrolase (FAAH) orNAE hydrolyzing acid amidase (NAAA)5. Because they areprimarily synthesized on demand, it is worthwhile to focus oneCB production. NAEs modulate food intake and inflammatoryresponse3,9,10 and thus seem to act as important mediators ofmetabolic homeostasis and inflammation. Studies on totalNapepld knockout (KO) mice revealed no overt phenotype,highlighting alternative synthesis pathways for certain long-chainNAEs such as AEA and suggesting a role for NAPE-PLDin regulating lipid signalling systems4,11. These studies focusedon the central ECS, but the exact role of NAPE-PLDper se in metabolism in peripheral tissues has yet to beinvestigated.
Among the peripheral tissues involved in obesity, the adiposetissue plays a central role. Besides storing excessive energy, theadipose tissue is an active metabolic organ that secretes manymediators, such as hormones and cytokines (for example,adipokines)12,13. We and others have previously underlined arole for the ECS in adipogenesis and adipose tissue function14–17,thereby designating the ECS as an important actor in adiposetissue metabolism. We hypothesize that NAEs produced byadipocytes are key mediators regulating whole-body metabolismand energy homeostasis.
To evaluate the specific role of NAEs produced in adiposetissue, we generated a mouse model of adipocyte-specific deletionof the Napepld gene and investigated the physiological role ofadipose tissue NAPE-PLD under basal (control diet (CT)) andpathological (diet-induced obesity (DIO)) conditions. We foundin this study that Napepld deletion in adipose tissue leads todevelopment of obesity, impairment of glucose and lipidhomeostasis along with altered adipose tissue metabolism andchanges in gut microbiota composition.
ResultsNapepld deletion is specific of adipose tissue. To assess the roleof adipose tissue NAPE-PLD on metabolism, Napepldlox/lox mice(construction in Supplementary Fig. 1) were crossed with Fabp4-Cre mice to generate mice with a conditional adipocyte-specificKO (cKO) of NAPE-PLD. Fabp4-Cre-Napepld cKO mice have anormal postnatal development, in contrast to other Fabp4-Cremice strains that can develop postnatal lethality18. To confirm theinvalidation of the Napepld gene in the adipose tissue of the cKOmice, we assessed the presence of the NAPE-PLD protein byWestern blot analysis in the white adipose tissue (WAT) of wild-type (WT) and cKO mice (Fig. 1a) and found no detectableamounts of NAPE-PLD in the WAT of cKO mice. In contrast, wedid not observe reduced NAPE-PLD levels in the brain, whichdemonstrates the specificity of our model (Supplementary Fig. 2).In addition, the analysis of messenger RNA (mRNA) expressionfrom multiple tissues confirms that the deletion is specific fordifferent depots of WAT (subcutaneous, visceral and epididymal)and brown adipose tissue (BAT; Fig. 1b), without affectingNapepld expression in the liver, colon or muscles, which indicatesthat recombination did not occur in other tissues19. Duringexperiments, WT and cKO mice were fed either a CT (WT-CTand cKO-CT groups) or a high fat diet (HFD; WT-HFD andcKO-HFD groups). Deletion of the Napepld gene was verified incKO groups under both diets (Fig. 1b). Because we observed aresidual expression of Napepld in the adipose tissue, weperformed a separation of the stromal vascular fraction (SVF)and adipocytes enriched fraction in the WAT. This indicated thatdecreased expression of Napepld occurs only in adipocytesfraction and not in the SVF (Supplementary Fig. 2). Somereports in the literature established a Cre activity mediated by theFabp4 promoter in other cell types such as macrophages20. Toverify Napepld expression in macrophages, we isolated peritonealmacrophages from WT and cKO mice. We found thatmacrophages from both genotypes did not differ in Napepldexpression (Supplementary Fig. 2). Finally, to ensure that thedeletion of Napepld is indeed reducing NAE levels we measuredthe levels of NAEs produced by NAPE-PLD. Figure 1c illustratesB60% reduction of PEA, OEA and SEA levels in the adiposetissue of cKO mice compared with WT mice. In contrast, wefound no decrease in NAEs levels in the brain when comparingboth genotypes (Supplementary Fig. 2). The lack of a significantimpact of Napepld deletion on AEA confirms the existence of analternative synthesis pathway for this NAE4,11,21. Importantly, wedetermined that HFD-treated WT mice exhibited similar levels ofNAEs to cKO mice, suggesting that HFD treatment in itself has aNAE lowering effect that was only slightly intensified by the cKOgenotype. Moreover, we found that Napepld deletion in adiposetissue leads to increased NAE precursor levels (that is, NAPEs)in adipose tissue, corroborating results of previous studiesperformed in Napepld� /� mice4,11,21 (Supplementary Fig. 2).
Adipose tissue Napepld-deleted mice develop an obese phenotype.Surprisingly, under the CT diet, cKO mice gained more weightthan WT mice, a phenomenon exacerbated under the HFD(Fig. 2a). Body composition measured by NMR indicated that thecKO mice accumulate more fat mass, which results in a higherpercentage of total body fat and increased fat mass gain (Fig. 2b,c)and a lower percentage of lean mass when compared with theircontrol counterparts after 8 weeks of CT diet (SupplementaryFig. 3). Food intake remains unchanged between the WT andcKO mice but is increased in the HFD-treated groups comparedwith the CT-treated groups (Fig. 2d). The increase in fat massgain observed in cKO mice is associated with an increase inadipocyte size in both mice on the CT diet and HFD (Fig. 2e,f).
ARTICLE NATURE COMMUNICATIONS | DOI: 10.1038/ncomms7495
2 NATURE COMMUNICATIONS | 6:6495 | DOI: 10.1038/ncomms7495 | www.nature.com/naturecommunications
& 2015 Macmillan Publishers Limited. All rights reserved.

This increase is reflected by a higher frequency of larger adipo-cytes in cKO mice and HFD mice compared with WT-CT mice(Fig. 2g). Moreover, the plasma levels of leptin, produced pro-portionally to fat mass, are markedly increased in cKO-CT micecompared with WT-CT mice and are increased even more incKO-HFD mice compared with WT-HFD mice (Fig. 2h). Wenext assessed whether adipose Napepld deletion has an impact onwhole-body glucose metabolism. We observed that cKO-CT miceare hyperglycemic in the fasted state and that these mice developglucose intolerance, as evidenced by an oral glucose tolerance test(OGTT) (Fig. 2i). Importantly, this glucose intolerance is main-tained throughout the duration of the OGTT. In addition, adiposeNapepld deletion exacerbated HFD-induced glucose intolerance
(Fig. 2i). The cKO-CT mice exhibit a twofold higher level ofplasma insulin in the fasted state as well as after the oral glucoseload, and this latter effect is also present during HFD feeding (Fig.2j). These observations are confirmed by the increased insulinresistance index observed in cKO-CT during both CT and HFDdiet feeding, the latter being worsened in cKO-HFD mice com-pared with WT-HFD mice (Fig. 2k).
Adipose tissue Napepld deletion induces insulin resistance.Insulin resistance in cKO mice is suggested by the increasedfasted glycaemia, glucose intolerance, fasted and fed hyper-insulinemia and a higher insulin resistance index (Fig. 2i–k).To explore which organ may be responsible for insulin resistance,
WT cKO
55 kDaNAPE PLD
�-Actin
43 kDa
43 kDa
WT-CTcKO-CT
1.2 1.41.21.00.80.6 * *
**0.4
0.20.0
SATVAT
EATBAT
Liver
Colon
Mus
cle
Nap
e pl
d m
RN
A1.0
0.8
0.6 * * * *0.4
0.2
0.0
100 750aa
a
a
a
bb
b
600
450
300
150
0
WT-C
T
cKO-C
T
WT-H
FD
cKO-H
FD
PE
A (
pmol
g–1
)
75
50
25
0
1,000 600 a
bb
b
500
400
300
200
100
0
SE
A (
pmol
g–1
)
a
b bb
750
500
250
0
WT-C
T
cKO-C
T
WT-H
FD
cKO-H
FD
WT-C
T
cKO-C
T
WT-H
FD
cKO-H
FD
OE
A (
pmol
g–1
)
WT-C
T
cKO-C
T
WT-H
FD
cKO-H
FD
AE
A (
pmol
g–1
)
SATVAT
EATBAT
Liver
Colon
Mus
cle
Nap
e pl
d m
RN
A
WT-HFDcKO-HFD
Figure 1 | Specific deletion of Napepld in adipose tissue. (a) Representative adipose tissue immunoblot of NAPE-PLD and b-actin in WT mice and
cKO mice. (b) mRNA relative expression of Napepld in different adipose tissue deposits (subcutaneous, visceral, epididymal and brown adipose tissue—
SAT, VAT, EAT and BAT), as well as in liver, colon and tibialis muscle under CT diet and HFD in cKO mice and WT mice (n¼ 20–27). These data (a,b)
correspond to the results of three independent experiments. Data with ‘*’ indicate a significant difference (Po0.05) versus WT-CT or WT-HFD according
to the unpaired two-tailed Student’s t-test. (c) SAT levels of AEA, PEA, OEA and SEA (pmol per g tissue) measured by HPLC-MS (n¼ 6–10). Data are
presented as the mean±s.e.m. Data with different superscript letters are significantly different (Po0.05) according to post-hoc one-way analysis of
variance statistical analysis.
NATURE COMMUNICATIONS | DOI: 10.1038/ncomms7495 ARTICLE
NATURE COMMUNICATIONS | 6:6495 | DOI: 10.1038/ncomms7495 | www.nature.com/naturecommunications 3
& 2015 Macmillan Publishers Limited. All rights reserved.

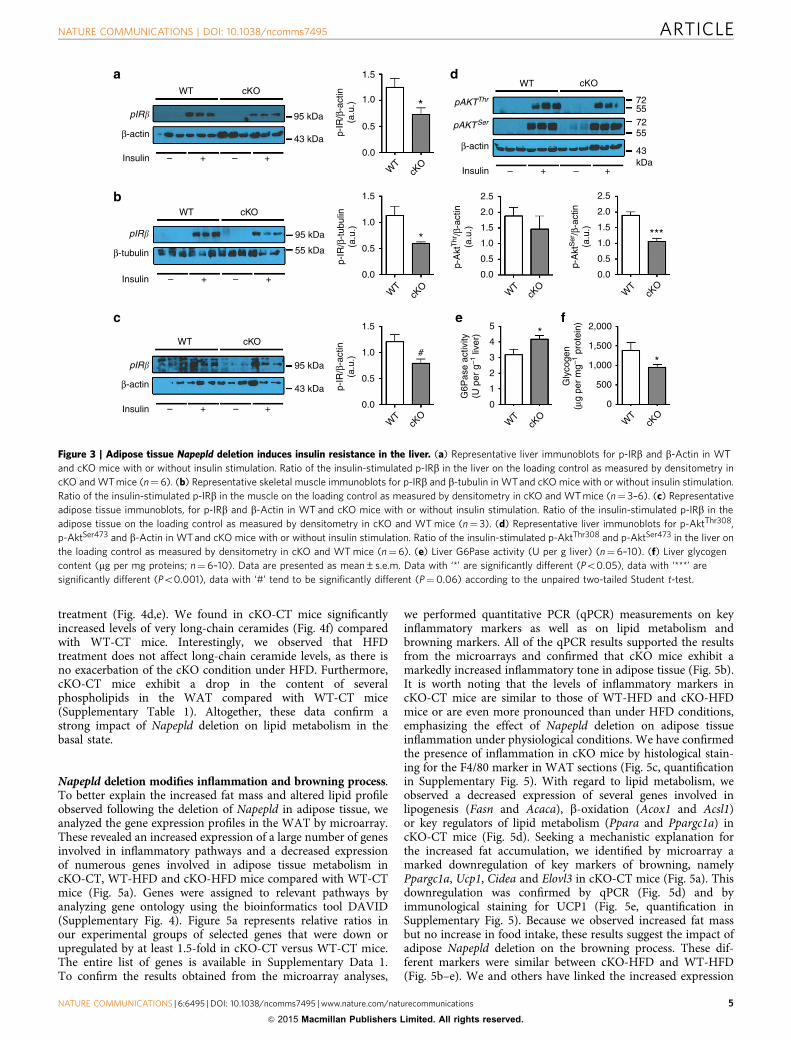
we analyzed insulin-induced phosphorylation of the insulinreceptor (p-IRb). We found that following insulin stimulation,phosphorylation of IRb was strongly reduced in the liver and inthe muscles of cKO mice, whereas the reduced phosphorylationof IRb in adipose tissue was not statistically significant(Fig. 3a–c). To further analyze insulin resistance in the liver, wenext analyzed insulin-induced phosphorylation of Akt (p-Akt),downstream mediator in the insulin signalling pathway. Phos-phorylation of Akt on the serine site after insulin stimulation wasreduced in the liver (Fig. 3d), confirming insulin resistance inthis organ, whereas p-Akt levels were not affected in muscle oradipose tissue (data not shown). Finally, we found that glucose-6-phosphatase activity was increased and glycogen contentdecreased in the liver, confirming insulin resistance in this organ(Fig. 3e,f).
Napepld deletion impacts adipose and whole-body lipid profiles.Napepld deletion leads to decreased synthesis of bioactive
mediators (that is, NAE) which could be involved in the regula-tion of lipid synthesis and release by the adipose tissue. Toexamine this possibility, we performed an analysis of circulatinglipids and adipose tissue lipidomics. We observed increased cir-culating triglycerides (TAG) and cholesterol levels (Fig. 4a,b) incKO mice, whereas circulating non-esterified fatty acids levelswere not affected by the deletion (Fig. 4c). In addition, NAEsshare similar biosynthetic pathways with eicosanoids and theirderivatives (namely prostaglandins (PG)), which are alsoimportant lipid mediators involved in metabolism and inflam-mation22. As we cannot exclude the possibility that adipose tissueNapepld deletion also affects these lipid mediators and that thisinteraction could be an additional mechanism involved inchanges in energy homeostasis and glucose metabolism, wequantified the adipose levels of eicosanoids, PG, ceramides andphospholipids using a lipidomic approach. We observed that thedeletion of Napepld in adipose tissue decreases PG and eicosanoidconcentrations in adipose tissue to the same extent as the HFD
17.515.012.510.0
7.55.0
a
a
e
i j k
f g h
b c d
b
cd 30 9 6
a a
b b
4
2
0
WT-C
T
cKO-C
T
WT-H
FD
cKO-H
FD
Foo
d in
take
per
day
(g)
876543210
WT-C
T
cKO-C
T
WT-H
FD
cKO-H
FD
ab
cc
20
a
b
cc
10
0
WT-C
T
cKO-C
T
WT-H
FD
cKO-H
FD
2.50.0
WT
HF
DC
T
cKO
50
40
30
20
a
b,c bc
20 WT-CTcKO-CTWT-HFDcKO-HFD
20,000
15,000
10,000
5,000
0a b
c
c
WT-C
T
cKO-C
T
WT-H
FD
cKO-H
FD
15
10
5
00 50 100 150
Adipocyte diameter (μm)
10
0
750 70,000 6 1,250
1,000
750
500
250
0
a
b
c
d
**
*#
#
•#
4
2
0
WT-C
T
cKO-C
T
WT-H
FD
cKO-H
FD WT-C
T
cKO-C
T
WT-H
FD
cKO-H
FD15 15 15 15
Insu
lin (
μg I–1
)
Insu
lin r
esis
tanc
ein
dex
(AU
Cgl
ucos
ex
AU
Cin
sulin
) ×1
0–4
a
b
cc
60,00050,00040,00030,00020,00010,000
0
WT-C
T
cKO-C
T
WT-H
FD
cKO-H
FD
Glu
cose
AU
C(m
g l–
1 m
in–1
)
WT-CT
WT-HEDcKO-CT
cKO-HFD
500
250 ##* *
##
###
*** * *
#
#
###
#
0
–30
–15 0 15 30
Time (min)
45 60 75 9010512
0
Pla
sma
gluc
ose
(mg
dl–1
)
WT-C
T
cKO-C
T
WT-H
FD
cKO-H
FD
Adi
pocy
te m
ean
diam
eter
(μm
)
Fre
quen
cy (
%)
Lept
in (
pg m
l–1)
WT-C
T
cKO-C
T
WT-H
FD
cKO-H
FD
Bod
y-w
eigh
t gai
n(g
)
Fat
mas
s(%
Tot
al b
ody
wei
ght)
Fat
mas
s ga
in (
g)
–30
–30
–30
–30
Figure 2 | Adipose tissue Napepld deletion induces an obese-like phenotype. (a) Total body-weight gain (g) (n¼ 20–27). (b) Total fat mass (% of total
body weight) measured by TD-NMR (n¼ 20–27). (c) Total fat mass gain (g) measured by TD-NMR (n¼ 20–27). (d) Mean daily food intake per mouse (g)
(n¼ 20–27). (e) Representative haematoxylin and eosin-stained pictures of SAT deposits. Scale bar, 100mm. (n¼ 6–10). (f) Mean adipocyte diameter (mm)
determined by histological analysis (n¼6–10). (g) Adipocyte distribution and frequency with respect to the mean diameter measured by histological
analysis (n¼6–10). (h) Leptin plasma levels measured in the vena cava (mg ml� 1; n¼6–10). (i) Plasma glucose (mg dl� 1) profile and the mean area under
the curve (AUC) measured between 0 and 120 min after glucose loading (mg dl� 1 min; n¼ 20–27). (j) Plasma insulin levels at 30 min before and 15 min
after glucose loading (n¼ 20–27). (k) Insulin resistance index determined by multiplying the AUC of blood glucose by the AUC of insulin. These data
(a–d and i–k) correspond to the results of three independent experiments. Data are presented as the mean±s.e.m. Data with different superscript letters
are significantly different (Po0.05) according to post-hoc one-way analysis of variance (a–h and k). ‘*’ indicates a significant difference versus WT-CT
(Po0.05) (i) and at both time points (� 30 and 15) versus WT-CT (Po0.05) (j); ‘#’ indicates a significant difference (Po0.05) versus WT-CT and
cKO-CT; and ‘�’ indicates a significant difference versus WT-HFD as determined by a two-way statistical analysis (i,j).
ARTICLE NATURE COMMUNICATIONS | DOI: 10.1038/ncomms7495
4 NATURE COMMUNICATIONS | 6:6495 | DOI: 10.1038/ncomms7495 | www.nature.com/naturecommunications
& 2015 Macmillan Publishers Limited. All rights reserved.
treatment (Fig. 4d,e). We found in cKO-CT mice significantlyincreased levels of very long-chain ceramides (Fig. 4f) comparedwith WT-CT mice. Interestingly, we observed that HFDtreatment does not affect long-chain ceramide levels, as there isno exacerbation of the cKO condition under HFD. Furthermore,cKO-CT mice exhibit a drop in the content of severalphospholipids in the WAT compared with WT-CT mice(Supplementary Table 1). Altogether, these data confirm astrong impact of Napepld deletion on lipid metabolism in thebasal state.
Napepld deletion modifies inflammation and browning process.To better explain the increased fat mass and altered lipid profileobserved following the deletion of Napepld in adipose tissue, weanalyzed the gene expression profiles in the WAT by microarray.These revealed an increased expression of a large number of genesinvolved in inflammatory pathways and a decreased expressionof numerous genes involved in adipose tissue metabolism incKO-CT, WT-HFD and cKO-HFD mice compared with WT-CTmice (Fig. 5a). Genes were assigned to relevant pathways byanalyzing gene ontology using the bioinformatics tool DAVID(Supplementary Fig. 4). Figure 5a represents relative ratios inour experimental groups of selected genes that were down orupregulated by at least 1.5-fold in cKO-CT versus WT-CT mice.The entire list of genes is available in Supplementary Data 1.To confirm the results obtained from the microarray analyses,
we performed quantitative PCR (qPCR) measurements on keyinflammatory markers as well as on lipid metabolism andbrowning markers. All of the qPCR results supported the resultsfrom the microarrays and confirmed that cKO mice exhibit amarkedly increased inflammatory tone in adipose tissue (Fig. 5b).It is worth noting that the levels of inflammatory markers incKO-CT mice are similar to those of WT-HFD and cKO-HFDmice or are even more pronounced than under HFD conditions,emphasizing the effect of Napepld deletion on adipose tissueinflammation under physiological conditions. We have confirmedthe presence of inflammation in cKO mice by histological stain-ing for the F4/80 marker in WAT sections (Fig. 5c, quantificationin Supplementary Fig. 5). With regard to lipid metabolism, weobserved a decreased expression of several genes involved inlipogenesis (Fasn and Acaca), b-oxidation (Acox1 and Acsl1)or key regulators of lipid metabolism (Ppara and Ppargc1a) incKO-CT mice (Fig. 5d). Seeking a mechanistic explanation forthe increased fat accumulation, we identified by microarray amarked downregulation of key markers of browning, namelyPpargc1a, Ucp1, Cidea and Elovl3 in cKO-CT mice (Fig. 5a). Thisdownregulation was confirmed by qPCR (Fig. 5d) and byimmunological staining for UCP1 (Fig. 5e, quantification inSupplementary Fig. 5). Because we observed increased fat massbut no increase in food intake, these results suggest the impact ofadipose Napepld deletion on the browning process. These dif-ferent markers were similar between cKO-HFD and WT-HFD(Fig. 5b–e). We and others have linked the increased expression
pIR�
β-actin
Insulin
WT cKOWT cKO
95 kDa
43 kDa
– –+ +
1.5
1.0
0.5
0.0
p-IR
/β-a
ctin
(a.u
.) *
β-actin
Insulin
pAKTThr
pAKTSer
7255
7255
43kDa
– + – +
pIR�
β-tubulin
Insulin – –+ +
WT cKO
95 kDa
55 kDa
1.5
1.0
0.5
0.0
WT
cKO
WT
cKO
p-IR
/β-t
ubul
in(a
.u.)
*
2.5
2.0
1.5
1.0
0.5
0.0
p-A
ktT
hr/β
-act
in(a
.u.)
WT
cKO
2.5
2.0
1.5***
1.0
0.5
0.0
WT
cKO
p-A
ktS
er/β
-act
in(a
.u.)
pIR�
β-actin
Insulin – –+ +
WT cKO
95 kDa
43 kDa
1.5
1.0
0.5
0.0
p-IR
/β-a
ctin
(a.u
.)
WT
cKO
#
5
4
3
2
1
0
G6P
ase
activ
ity(U
per
g–1
live
r) *
WT
cKO
2,000
1,500
1,000
500
0
Gly
coge
n(μ
g pe
r m
g–1 p
rote
in)
WT
cKO
*
a d
b
c e f
Figure 3 | Adipose tissue Napepld deletion induces insulin resistance in the liver. (a) Representative liver immunoblots for p-IRb and b-Actin in WT
and cKO mice with or without insulin stimulation. Ratio of the insulin-stimulated p-IRb in the liver on the loading control as measured by densitometry in
cKO and WT mice (n¼ 6). (b) Representative skeletal muscle immunoblots for p-IRb and b-tubulin in WTand cKO mice with or without insulin stimulation.
Ratio of the insulin-stimulated p-IRb in the muscle on the loading control as measured by densitometry in cKO and WT mice (n¼ 3–6). (c) Representative
adipose tissue immunoblots, for p-IRb and b-Actin in WT and cKO mice with or without insulin stimulation. Ratio of the insulin-stimulated p-IRb in the
adipose tissue on the loading control as measured by densitometry in cKO and WT mice (n¼ 3). (d) Representative liver immunoblots for p-AktThr308,
p-AktSer473 and b-Actin in WT and cKO mice with or without insulin stimulation. Ratio of the insulin-stimulated p-AktThr308 and p-AktSer473 in the liver on
the loading control as measured by densitometry in cKO and WT mice (n¼ 6). (e) Liver G6Pase activity (U per g liver) (n¼6–10). (f) Liver glycogen
content (mg per mg proteins; n¼6–10). Data are presented as mean±s.e.m. Data with ‘*’ are significantly different (Po0.05), data with ‘***’ are
significantly different (Po0.001), data with ‘#’ tend to be significantly different (P¼0.06) according to the unpaired two-tailed Student t-test.
NATURE COMMUNICATIONS | DOI: 10.1038/ncomms7495 ARTICLE
NATURE COMMUNICATIONS | 6:6495 | DOI: 10.1038/ncomms7495 | www.nature.com/naturecommunications 5
& 2015 Macmillan Publishers Limited. All rights reserved.

of lipopolysaccharide (LPS) binding protein (LBP) in theadipose tissue to inflammation and plasma LPS levels23,24. As LbpmRNA were drastically increased in the adipose tissueof cKO mice according to both microarray and qPCR data,we measured plasma LPS levels, and found that the increasedLbp mRNA expression and the higher inflammation incKO-CT mice were associated with a significant increase inmetabolic endotoxemia (that is, increased plasma LPS levels25)(Fig. 5f).
Napepld deletion impairs adaptation to cold exposure. Toinvestigate whether reduced WAT browning is a causal factor for,or a metabolic consequence of, the phenotype observed, wesubmitted body weight-matched WT and cKO mice (Fig. 6a) tocold exposure for 72 h. Under normal conditions, this effectivelyupregulates Ucp1 and consequent heat-production (‘browning’)in WT mice, in an attempt to counter the drop in environmentaltemperature26. cKO mice maintained a lower body temperaturethroughout cold exposure and had a significantly lower mean
0
WT-C
T
cKO-C
T
cKO-H
FDPGD2
PGE2TXB2
WT-H
FD
20
TA
G (
mg
dl–1
)
Pro
stag
land
ins
(fm
ol m
g–1)
Cho
lest
erol
(m
g dl
–1)
NE
FA
s (m
M)
Eic
osan
oids
(fm
ol m
g–1)
Cer
amid
es (
pmol
mg–1
)
40
60
ab
b b
20
**
#
*
**
* * *
10
0
30
0
50
100
150
ab
c c
050
100150200
* # #
#
#
# #
##
*
* **
250
300350400450500550
0.8
a
a aa0.6
0.4
0.2
0.0 0.0
0.2
0.4
0.6
0.8
1.0
WT-CTcKO-CT
WT-HFDcKO-HFD
WT-CTcKO-CT
WT-HFDcKO-HFD
WT-CTcKO-CT
WT-HFDcKO-HFD
* * * *
*
*
*
WT-C
T
cKO-C
T
cKO-H
FD
12S-H
ETE
13S-H
ODE
15S-H
ETE
9S-H
ODE
6-ke
to-P
GF1a
WT-H
FD
WT-C
T
N-C19
:0-C
er
N-C21
:0-C
er
N-C22
:0-C
er
N-C23
:0-C
er
N-C24
:0-C
er
cKO-C
T
cKO-H
FD
WT-H
FD
Figure 4 | Adipose tissue Napepld deletion alters adipose and whole-body lipid metabolism. (a) Plasma triglyceride content (mg dl� 1; n¼ 20–27).
(b) Plasma cholesterol content (mg dl� 1; n¼ 20–27). (c) Plasma non-esterified fatty acid (NEFA) levels (mM; n¼ 20–27). These data (a–c) correspond to
the results of three independent experiments. (d) SAT prostaglandin content measured by LC-MS/MS in fmol per mg tissue (n¼ 10). (e) SAT eicosanoid
content measured by LC-MS/MS in fmol per mg tissue (n¼ 10). (f) SAT ceramide content measured by ESI-MS/MS in pmol per mg tissue (n¼ 10).
See also Supplementary Table 1. Data are presented as mean±s.e.m. Data with different superscript letters or symbols are significantly different (Po0.05)
according to post-hoc one-way analysis of variance. ‘*’ indicates a significant difference (Po0.05) versus WT-CT, and ‘#’ indicates a significant difference
(Po0.05) versus WT-CT and cKO-CT according to post-hoc one-way analysis of variance.
ARTICLE NATURE COMMUNICATIONS | DOI: 10.1038/ncomms7495
6 NATURE COMMUNICATIONS | 6:6495 | DOI: 10.1038/ncomms7495 | www.nature.com/naturecommunications
& 2015 Macmillan Publishers Limited. All rights reserved.

body temperature after 72 h of cold exposure (Fig. 6b,c). qPCRmarkers of the browning programme in WAT (Ucp1, Elovl3,Cidea and Ppargc1a) indicated that cold exposure resulted innormal browning of the WAT in WT mice, but that thisinduction was impaired in cKO mice (Fig. 6d–g).
Browning phenotype is mainly conserved in ex vivo explants.Because adrenergic stimulation of WAT induces the browning
process, this phenomenon in vivo is considered as a sympatheticevent27. Indeed, many actions of so-called ‘browning agents’ maybe traced back to indirect mechanisms that lead to activation ofthe sympathetic nervous system (SNS) and subsequent inductionof browning27. However, some agents may have an impact onbrowning in a direct and cell-autonomous manner. To furtherunderstand the impact of adipose tissue-specific Napepld deletionon the browning process, we wondered if this phenotype was
6
3
F4/80
Cd11c
Cd68
MCP1
II1b
Cd206
Cd3g
PAI1 Lbp
Fasn
Acaca
Acox
Acsl1Ppa
ra
Pparg
c1a
Ucp1
Cidea
Elovl3
Prdm
16A
dipo
se ti
ssue
mR
NA
leve
ls (
rela
tive
expr
essi
on)
Adi
pose
tiss
ue m
RN
Ale
vels
(re
lativ
e ex
pres
sion
)
0
12
9
15
Sel
ecte
d ge
nes
from
1.5
-fol
d re
gula
ted
in c
KO
-CT
cKO-CT
cKO
cKO-HFD
F4/80
Negative control Negative controlPositive control
WT-HFD
WT
HF
DC
T
HF
DB
AT
CT
cKO
UCP-1
WT
cKO-CT
cKO-HFDWT-HFD
0
1
* *
***
* * *** *
**
*
**** ## ##
****
*** * ***
****#
##
#
##
#
***
2
0
WT-C
T
WT-H
FD
cKO-C
T
cKO-H
FD
Ser
um L
PS
(E
U m
l–1)
2
cKO
.CT
Conditions
log2-ratio
2.5
–2.5
–5.0
0.0
WT
.HF
DcK
O.H
FD
a
b
b
b
4
6
8
LbpPAI1LepPltp
Fabp1Cd68
Wisp2Cd11cCcl11Lyz1
C5ar1Hmgcs2
Plce1Emr4
Cd24aAlox5ap
Bcl6F4/80
Pla2g5Gdpd1Cd86C1qcCcr5Tlr13
Npy1rC4aIl15
Stard6Vpreb2Acnat2Defb5Acot3
Vpreb1Tnfrsf4Defb15
StarCxcl2
Cd79aPgk1
Acat2Gpd1
Otop1Ppargc1a
Acsl5Acss1Ldhb
Hsd17b12Pnliprp1
Ppargc1bMe1
PnlipHadha
PfklAcadvl
Gbe1Mtfp1
Cox8bFabp3Hadhb
Cox7a1Acot4PparaCpt1bPdhbGpd2Mpzl2
Acsm3Slc27a2
Pank1Acot11Cidea
AclyAcacaElovl6Ucp1
Elovl3
Figure 5 | Adipose tissue Napepld deletion induces inflammation and altered metabolism in SAT. (a) Heat map from microarray analysis representing
selected genes involved in inflammation or lipid metabolism, based on the list of genes down or upregulated 1.5-fold in cKO-CT versus WT-CT mice.
See also Supplementary Fig. 4 and Supplementary Data 1. (b) mRNA expression of adipose tissue inflammation markers measured by RT–qPCR
(n¼ 20–27 for F4/80, Cd11c, MCP1 and Il1b and n¼6–10 for the other markers). The black-dotted line represents the WT-CT levels for mRNA expression.
Data in b regarding inflammatory markers correspond to the results of three independent experiments. (c) Representative pictures of staining for F4/80 in
SAT. Scale bar, 100 mm. (n¼6–10). See also Supplementary Fig. 5. (d) mRNA expression of adipose tissue metabolism markers measured by RT–qPCR
(n¼6–10). The black-dotted line represents the WT-CT levels for mRNA expression. (e) Representative images of staining for UCP1 in SAT. Scale bar,
100mm. (n¼6–10). See also Supplementary Fig. 5. (f) Plasma LPS levels (EU per ml) measured in the portal vein (n¼ 6–10). Data are presented as the
mean±s.e.m. Data with different superscript letters are significantly different (Po0.05) according to post-hoc one-way analysis of variance. ‘*’ indicates
a significant difference (Po0.05) versus WT-CT, and ‘#’ indicates a significant difference (Po0.05) versus WT-CT and cKO-CT according to post-hoc
one-way analysis of variance.
NATURE COMMUNICATIONS | DOI: 10.1038/ncomms7495 ARTICLE
NATURE COMMUNICATIONS | 6:6495 | DOI: 10.1038/ncomms7495 | www.nature.com/naturecommunications 7
& 2015 Macmillan Publishers Limited. All rights reserved.

regulated by cell-autonomous functions or was linked to changesin the sympathetic tone in vivo. To address this question, weisolated subcutaneous fat pads (explants) and cultured themex vivo for 24 h to eliminate peripheral adrenergic stimulations.Interestingly we found that after 24 h incubation in culturemedium, adipose tissue explants from cKO mice tend toreproduce the in vivo phenotype on browning markers,although this decrease did not reach statistical significance(Supplementary Fig. 6). These results suggest that the effect ofNapepld deletion on browning cannot entirely be attributed to achange in the sympathetic drive. Furthermore, we did not findany changes in mRNA expression of the b3 receptor in vivo,which could have been expected as b3 receptors are closelyregulated at the expression level by sympathetic inputs(Supplementary Fig. 6).
Adipose tissue Napepld deletion changes gut microbiota. Themetabolic endotoxemia observed in cKO-CT mice indicates aputative shift in gut microbiota composition. Because we pre-viously demonstrated a strong association between adipose tissue,eCB content and gut microbiota14,15, we analyzed the gutmicrobiota using high-throughput sequencing. Consistent withprevious studies24,25,28, we observed a significant change in gutmicrobiota composition under HFD compared with the CT diet.Interestingly, the deletion of Napepld profoundly affected gutmicrobiota under CT diet conditions, as observed in the Principalcoordinates analysis (Fig. 7a). More specifically, the abundanceof 64 operational taxonomic units is significantly different incKO-CT mice compared with WT-CT mice (Fig. 7c). At thetaxonomic level, two phyla, six families and eight genera weresignificantly modified in cKO-CT mice compared with WT-CT
mice (Fig. 7b–d and Supplementary Tables 3–5). Interestingly,gut microbiota from cKO-CT mice differed from that of theWT-CT mice but also from that of the HFD-treated mice(Fig. 7a,d), suggesting that the effects of Napepld deletion on gutmicrobiota may be different than those induced by the HFDtreatment. This finding strongly suggests that the deletion ofNapepld in adipose tissue has a profound influence on gutmicrobiota composition in physiological conditions and therebysuggests for the first time the existence of an adipose tissue to gutmicrobiota axis.
Long-term antibiotic treatment improves glucose homeostasis.To investigate if gut microbiota may influence the phenotypeobserved following Napepld deletion, we treated mice with anti-biotics for 12 weeks. Interestingly we found that long-termantibiotic treatment in cKO mice under CT (cKO-Abx) reducedbody-weight gain and fat mass development (Fig. 8a,b). Antibioticsalso improved glucose tolerance and insulin resistance index incKO mice (Fig. 8c–f), suggesting a direct impact of gut microbiotaon energy and glucose homeostasis.
Gut microbiota transfer partially replicates the phenotype. Tosee whether the altered gut microbiota composition in cKO miceis a causal factor for, or a metabolic consequence of, the phe-notype observed and to further elucidate whether the profoundshift in gut microbiota composition observed in cKO mice maycontribute to the phenotype, we transferred gut microbiota frombody-weight-matched WT or cKO mice into germ-free (GF)recipient mice. Both donors and recipients were kept on a CTdiet. After 4 weeks, we found that gut microbiota transfer from
20
10Bod
y w
eigh
t (g)
Bod
y te
mpe
ratu
re (
°C)
0
WT-C
E
cKO-C
E
40
30
20
AU
C
AU
C
100
4030 *
20
Dis
sect
ion
(RT
)
10
0
40
30
38
36
Acc
limat
izat
ion
34
Day 1 Day 2 Day 3 Day 4
0 2 4 6 18 20 22 24 26 28 30 42
Cold exposure (hours)
44 46 48 50 52 54 66 68 70 72
40
34
Mea
n t°
dur
ing
cold
exp
osur
e (°
C)
32
30
WT-C
E
cKO-C
E
WT-C
E
cKO-R
T
cKO-R
E
38
*36
0
2 a aa
a a
b
b,c
aa,b
a,b
a,c
a
a
bb
b
WT-R
T
WT-C
E
cKO-R
T
cKO-R
E
WT-R
T
WT-C
E
cKO-R
T
cKO-R
E
WT-R
T
WT-C
E
cKO-R
T
cKO-R
E
WT-R
T
4
6
8
10
Ucp
1 m
RN
A
Elo
vl3
mR
NA
Cid
ea m
RN
A
Ppa
rgc1
a m
RN
A
15
10
5
0 0
1
2
3
0
2
4
6
Figure 6 | Adipose tissue Napepld deletion induces an altered response to cold exposure. (a) Total body weight (g; n¼ 7). (b) Body temperature
evolution (�C) during 72-h cold exposure (n¼ 7). Inserts represent the area under the curve (AUC) of day 2 and 3, with baseline set at 34 �C.
(c) Mean body temperature (t�) measured in �C during cold exposure (n¼ 7). (d) Ucp1 mRNA levels, (e) Elovl3 mRNA levels, (f) Cidea mRNA levels and (g)
Ppargc1a mRNA levels (relative expression) in SAT of room temperature (RT) and cold-exposed (CE) WT and cKO mice (n¼ 7). Data are presented as
mean±s.e.m. Two-way repeated-measure analysis of variance (ANOVA; genotype� time) revealed a significant effect of genotype (P¼0.02), a significant
effect of time (Po0.0001), and a non-significant interaction between factors (P¼0.4). Post-hoc pairwise comparisons with Bonferroni correction did not
show significant differences at any of the time points in b. Data with ‘*’ are significantly different (Po0.05) according to the unpaired two-tailed Student t-
test. Data with different superscript letters are significantly different (Po0.05) according to post-hoc one-way analysis of variance.
ARTICLE NATURE COMMUNICATIONS | DOI: 10.1038/ncomms7495
8 NATURE COMMUNICATIONS | 6:6495 | DOI: 10.1038/ncomms7495 | www.nature.com/naturecommunications
& 2015 Macmillan Publishers Limited. All rights reserved.

cKO donors significantly increased fat mass gain and theadiposity index (sum of the weights of the different adipose tissuedepots) (Fig. 9b,c). There was a trend towards increasedtotal body-weight gain but this did not reach statistical sig-nificance (Fig. 9a). We found that gut microbes from cKO miceincrease adipose tissue inflammation (increased Cd11c mRNA
levels—Fig. 9d) and markedly decrease markers of b-oxidationand browning (Acox, Ppargc1a, Cidea, Elovl3, Ucp1—Fig. 9d).To investigate if gut microbiota transfer may also affect insulinsensitivity, we analyzed Slc2a4 (GLUT4) expression in sub-cutaneous adipose tissue (SAT) and muscle and glucose-6-Phosphatase (G6pc) expression in the liver and found that the
0.15
a
d
bPCoA-PC1 vs PC2
PCoA-PC3 vs PC2
0.10
0.05
0.00
PC
2-P
erce
nt v
aria
tion
expl
aine
d 22
.94%
PC
2-P
erce
nt v
aria
tion
expl
aine
d 22
.94%
–0.05
–0.10
0.15
0.10
0.05
0.00
–0.05
–0.10
PC1-Percent variation explained 40.35%
PC3-Percent variation explained 10.27%
–0.1
5–0
.10
–0.0
50.
000.
050.
100.
150.
20
–0.0
8–0
.06
–0.0
4–0
.02
0.00
0.02
0.04 0.
060.
08 0.10
WT-CT
cKO-CT
WT-HFD
cKO-HFD
WT-CT
cKO-CT
WT-HFD
cKO-HFD
16S
rR
NA
seq
uenc
es (
%)
Unclassified FirmicutesUnclassified BacteroidetesOscillospiraAdlercreutziaParabacteroidesPrevotellaPseudomonasRuminococcusSutterellaTuricibacterUnclassifiedUnclassified ActinobacteriaUnclassified AlphaproteobacteriaUnclassified ArchaeaUnclassified BacteriaUnclassified BacteroidaceaeUnclassified BacteroidalesUnclassified Bacteroidales other
AllobaculumAnaerotruncusBilophilaClostridiumDehalobacteriumDelftiaDoreaEnterococcusEscherichiaLactobacillusLactococcusMucispirillumOdoribacterOlsenella
Unclassified BetaproteobacteriaUnclassified BurkholderialesUnclassified ClostridiaUnclassified ClostridiaceaeUnclassified ClostridialesUnclassified CoriobacteriaceaeUnclassified CyanobacteriaUnclassified DeferribacteralesUnclassified DeltaprotobacteriaUnclassified DesulfovibrionaceaeUnclassified DesulfovibrionalesUnclassified Enterobacteriaceae
Unclassified ErysipelotrichaceaeUnclassified F16
Unclassified LachnospiraceaeUnclassified LactobacillaceaeUnclassified Lactobacillaceae otherUnclassified PeptococcaceaeUnclassified Peptostre ptococcaceaeUnclassified PorphyromonadaceaeUnclassified ProteobacteriaUnclassified RickettsialesUnclassified RikenellaceaeUnclassified Rikenellaceae otherUnclassified RuminococcaceaeUnclassified S24-7Unclassified SteptococcaceaeUnclassified Steptophyta
WT-CT cKO-CT WT-HFD cKO-HFD
WT-CT cKO-CT
Bacteroidetes
Proteobacteria
Firmicutes
Deferribacteres
Actinobacteria
Bacteroidaceae
Alcaligenaceae
Families
Clostridiaceae
Coriobacteriaceae
Erysipelotrichaceae
Lachnospiraceae
Rikenellaceae
Ruminococcaceae
S24-7
Non-identified
c
Figure 7 | Adipose tissue Napepld deletion affects gut microbiota composition. (a) PCoA based on the weighted UniFrac analysis on operational
taxonomic units (OTUs; n¼ 6–10). Each symbol representing a single sample is coloured according to the group. (b) Composition of abundant bacterial
phyla identified in the gut microbiota of WT-CT and cKO-CT mice (n¼ 6–10). (c) The different OTUs significantly affected by adipose tissue Napepld
deletion under CT diet. A representative 16S rRNA gene from each of the 64 differentially expressed OTUs in cKO-CT versus WT-CT mice was aligned
and used to infer the phylogenetic tree presented in this figures (n¼6–10). The colour in front of the OTU indicates the family of the OTU.
(d) Relative abundances (percentage of 16S rRNA sequences) of the various bacterial genera in each sample among each group of mice (n¼ 6–10).
In b–d, the different phyla, families and genera are represented by different colour codes. See also Supplementary Tables 3–5.
NATURE COMMUNICATIONS | DOI: 10.1038/ncomms7495 ARTICLE
NATURE COMMUNICATIONS | 6:6495 | DOI: 10.1038/ncomms7495 | www.nature.com/naturecommunications 9
& 2015 Macmillan Publishers Limited. All rights reserved.

microbiota transfer from cKO mice did not affect these para-meters. Furthermore, microbiota transfer did neither alter liverglycogen levels nor G6Pase activity (Fig. 9e,f). Thus, these resultssuggest that gut microbiota transfer is sufficient to rapidlyreproduce the phenotype observed in adipose tissue of Napepld-deleted mice (that is, fat gain and browning), whereas the impacton glucose metabolism is not yet observed. Together, the resultsobtained following antibiotic exposure and microbiota transferconfirm the key role played by gut microbiota in shaping the hostphenotype and demonstrate the critical influence of adipose tissueNAPE-PLD on gut microbiota.
DiscussionThe ECS and its related bioactive lipids such as NAEs play keyroles in the regulation of energy homeostasis. In this paper, wediscovered the essential role of the eCB synthesizing enzymeNAPE-PLD in adipose tissue (summarized in Fig. 10). Mice
lacking the Napepld gene in their adipose tissue are prone toobesity and associated metabolic disorders. Remarkably, thephenotype of cKO mice develops in a physiological state (that is,CT diet). This indicates that NAPE-PLD plays an important rolein the regulation of basal metabolism, energy homeostasis andinflammation. Surprisingly, Napepld-deleted mice under HFDhave higher body-weight gain and insulin resistance index,whereas other metabolic parameters are not exacerbated underthis pathological condition. Since the levels of adipose tissueNAEs are similar between WT and cKO mice under HFD, thismay explain why we do not observe increased inflammation andaltered lipid metabolism under HFD. Nevertheless, Napeplddeletion is effective when differentiation of adipose tissue iscomplete, thus before the beginning of HFD treatment. Thereforeincreased body-weight gain and insulin resistance may be directlyattributed to Napepld deletion whereas other metabolicalterations are probably due to long-term NAEs reduction.
Using different approaches (that is, microarray, qPCR andhistology), we determined that cKO mice develop a markedinflammatory tone. This phenotype may be explained by differentmechanisms, including the fact that Napepld deletion decreasedthe levels of the anti-inflammatory PEA. Indeed, PEA has beenidentified previously as a bioactive lipid with anti-inflammatoryproperties9,10,29. Moreover, the altered regulation of several PGs,phospholipids, ceramides and eicosanoids may contribute toaltering the regulation of inflammatory pathways30. Interestingly,it has been shown that an inflammatory stimulus such as LPSreduces Napepld expression and PEA production in RAW264.7macrophages31. These in vitro data, together with our in vivofindings, support a role for NAPE-PLD in regulating the normalinflammatory response.
The ECS plays an important role in regulating glucosehomeostasis32–34. Accordingly, our findings highlight theimpact of adipose tissue Napepld on glucose metabolism.Perturbations of glucose homeostasis have been linked toadipose tissue inflammation35,36, suggesting that theinflammatory tone developed in our model contributes to theobserved glucose intolerance and insulin resistance. We alsofound that insulin resistance occurs mainly in the liver ratherthan skeletal muscle or adipose tissue. Nevertheless, we cannotexclude that insulin resistance could affect those organs at a latertime since phosphorylation of IRb is also significantly affected inskeletal muscle and there is an important trend towards reducedinsulin-induced phosphorylation of IRb in adipose tissue. Thus,the specific kinetic of development of insulin resistance warrantsfurther investigations.
In addition, we found that Napepld deletion in adipose tissueleads to an increase in circulating TAG and cholesterol levels,underlying perturbations in lipid metabolism. To furtherelucidate the mechanisms linking bioactive lipids produced byNAPE-PLD and other lipid candidates known to play a majorrole in inflammation and insulin resistance, we performed athorough lipidomic analysis, including ceramides, eicosanoidsand PGs. Ceramides link inflammation to insulin resistance37.Moreover, a recent study reported a direct link among long-chainceramides, eCB and insulin action in the liver38. Interestingly weobserved that cKO mice exhibit increased levels of long-chainceramides in their adipose tissue, suggesting that altered NAEproduction in adipose tissue may impact ceramide levels andsubsequently lead to other metabolic disturbances. The eCB andeicosanoid metabolisms are closely related17,39. Eicosanoids andPG are synthesized from arachidonic acid (AA) via the COXpathway, which can also metabolize eCB39. Moreover, in cKO-CTmice, we found an upregulation for several genes involved in theregulation of inflammation and immunity as well as bioactivelipid metabolism (Alox5ap, Pla2g5 and Plce1; Fig. 5a). In contrast,
10
8
Bod
y-w
eigh
t gai
n (g
)
Adi
posi
ty in
dex
(% B
W)
Glu
cose
AU
C(m
g I–1
min
–1)
Insu
lin r
esis
tanc
e in
dex
(AU
Cgl
ucos
exA
UC
insu
lin)
×10–4
Pla
sma
gluc
ose
(mg
dl–1
)In
sulin
(μg
I–1)
6*
*
*
*
*
*
4
2
0
400
300
200
100
0
–30
–15 0 15 30 45 60 75 90 10
512
0
40,000cKO-CTcKO-Abx
30,000
20,000
10,000
0
50
2.0
1.5
1.0
0.5 **
0.0
–30 15 –3
0 150
100
150
250
200
cKO-C
T
cKO-A
bx
cKO-C
T
cKO-A
bx
cKO-C
T
cKO-A
bx
cKO-C
T
cKO-A
bx
8
6
4
2
0
Time (min)
Figure 8 | Antibiotic treatment improves metabolism in adipose tissue
Napepld-deleted mice. (a) Total body-weight gain (g; n¼ 5). (b) Adiposity
index (% Total body weight) after long-term antibiotic treatment (n¼ 5).
(c) Plasma glucose (mg dl� 1) profile and (d) the mean area under the
curve (AUC) measured between 0 and 120 min after glucose loading
(mg l� 1 min� 1; n¼ 5). (e) Plasma insulin levels at 30 min before and
15 min after glucose loading (mg l� 1) (n¼ 5). (f) Insulin resistance index
determined by multiplying the AUC of blood glucose by the AUC of insulin.
Data are presented as mean±s.e.m. Data with ‘*’ are significantly different
(Po0.05) according to the unpaired two-tailed Student t-test, or following
a two-way statistical analysis in c. Data with ‘**’ indicates a significant
difference (Po0.01) versus time point � 30 min in cKO mice in e.
ARTICLE NATURE COMMUNICATIONS | DOI: 10.1038/ncomms7495
10 NATURE COMMUNICATIONS | 6:6495 | DOI: 10.1038/ncomms7495 | www.nature.com/naturecommunications
& 2015 Macmillan Publishers Limited. All rights reserved.

we observed a decrease in eicosanoids and PG in the adiposetissue of cKO mice as well as in the adipose tissue of HFD-treatedmice, where an increase in these pro-inflammatory lipidmediators could have been expected22. However, recent datahave suggested that these lipids may exhibit both pro- and anti-inflammatory properties according to the pathological situation.On the other hand, PG derivatives can be synthesized by the
metabolism of eCB via the COX2 pathway, leading to theformation of PG-glycerol esters or PG-ethanolamides, whichexert anti-inflammatory effects40,41. In addition, these bioactivelipids may act as resolvins, thereby contributing to the complexresolution of inflammation30. Whether the decrease in PGD2 andPGE2 observed here contributes to the modulation of thesecomplex interactions requires further investigation. Finally,
200
1504
6
3
2
1
0
Adi
posi
ty in
dex
(g)
Fat m
ass
(% B
W)
Bod
y-w
eigh
t gai
n (g
)
2
Live
r G
6Pas
e ac
tivity
(U g
–1 li
ver)
Live
r gl
ycog
en(�
g m
g–1 p
rote
ins)
0
100
8
6
42
1
0
SAT
mR
NA
leve
ls
50
0
Elovl3
GF-WT
GF-WT
GF-KO
GF-KO
GF-WT
GF-KO
GF-WT
GF-KO
GF-WT
GF-KO
Cidea
Ucp1
Pparg
c1a
Acox
Cd11c
*** ** ***
*GF-CTGF-KO
6 20
**
15
10
5
4
2
0 0
Figure 9 | Gut microbiota transfer to germ-free (GF) mice reproduces part of the phenotype. (a) Body-weight gain (g) after gut microbiota transfer to
germ-free mice (n¼ 7). (b) Fat mass weight in percentage of body weight after gut microbiota transfer to germ-free mice (%; n¼ 7). (c) Adiposity index
(g) after gut microbiota transfer to germ-free mice (n¼ 7). (d) mRNA expression of Cd11c, Acox, Ppargc1a, Ucp1, Cidea and Elovl3 in SAT (n¼ 7). (e) Liver
glycogen content (mg per mg proteins; n¼ 7). (f) Liver G6Pase activity (U per g liver; n¼ 7). Data are presented as mean±s.e.m. Data with *Po0.05,
**Po0.01 and ***Po0.001 are significantly different according to the unpaired two-tailed Student’s t-test.
Normalbrowning
NAPE-PLD
InflammationLPS
Normal lipid flowNormal glucose homeostasis
Crosstalk
ModifiedCrosstalk
Decreasedbrowning
NAPE-PLD
O
OHNH
NAE
O
OHNH
NAE
«Lean»gut microbiota
Altered glucose and lipid homeostasis
«Altered»gut microbiota
Figure 10 | Schematic overview of the phenotype observed following Napepld deletion in adipocytes. When NAPE-PLD is present and functional,
adipose tissue homeostasis is maintained and this participates in a normal crosstalk between adipose tissue and gut microbiota. Moreover the presence of
NAPE-PLD participates in normal glucose homeostasis and lipid flows. When NAPE-PLD is absent, adipose tissue metabolism is deregulated, with an
increase in inflammation, decrease in the browning capacity and excessive fat mass development. Napepld deletion also induces alterations in glucose
homeostasis and alters normal lipid flows and lipid homeostasis in circulation and in adipose tissue. Altered adipose metabolism following Napepld deletion
induces a dysbiosis of the gut microbiota, which in turn participates in the metabolic alterations observed in the adipose tissue.
NATURE COMMUNICATIONS | DOI: 10.1038/ncomms7495 ARTICLE
NATURE COMMUNICATIONS | 6:6495 | DOI: 10.1038/ncomms7495 | www.nature.com/naturecommunications 11
& 2015 Macmillan Publishers Limited. All rights reserved.

AA levels are unchanged in cKO-CT mice and are decreasedunder HFD compared with WT-CT mice (Supplementary Fig. 7).The global altered lipid profile observed in our model suggeststhat the decreased level of the substrate (AA) may explain whyPGs are not increased. Taken together, these data shed light onthe influence of NAPE-PLD on bioactive lipid levels in adiposetissue and the pronounced altered adipose tissue lipid metabolismin our mice model. Furthermore, we found increased levels ofNAPEs (NAEs precursors, Supplementary Fig. 2) in adiposetissue of cKO mice compared with WT mice, confirming dataobtained in previous studies4,11,21. These lipids could also bepotential contributors to the phenotype observed since someNAPEs have been shown to present metabolic properties, namelyon energy homeostasis42. Nevertheless, this statement warrantsfurther investigation in our model.
cKO mice also exhibited decreased mRNA levels of Ucp1 andother brown fat cell-enriched genes, such as Cidea and Ppargc1a,in their WAT, suggesting that their adipose tissue losesthermogenic potential. This finding was further supported bythe microarray analysis, which indicated a reduction in theexpression of several genes generally associated with brown/beigeadipocytes, such as Eva1 (also known as myelin protein zero-like2, Mpzl2) and the mitochondrial genes Cox7a1 and Cox8b. It hasrecently been suggested that a subset of adipocytes in the SATdeposits can activate a thermogenic programme, namely beige orbrite cells43,44. Animals deficient in functional beige cells developobesity, in conjunction with a huge increase in SAT deposits45.Remarkably, we observed that more than 10 genes involved in theregulation of these metabolic processes were significantly affectedin the absence of NAPE-PLD. Based on these observations, wepropose that the increased fat mass development is associatedwith an altered browning process in the adipose tissue and areduced capacity to develop a normal thermogenic programme.Interestingly, the microarray analysis also revealed thedownregulation of Fabp3 and mitochondrial fatty acidoxidation genes, such as Acss1, Acsl5 and Cpt1b. These enzymeshave been found to be upregulated after cold exposure orb-adrenergic stimulation and are linked to a brown-liketransformation of the WAT46. Their downregulation mightreflect reduced b-oxidation due to the further loss of theBAT-characteristics of the WAT. This defect in b-oxidationmay potentially contribute to the elevated levels of circulatinglipids observed. Moreover, pharmacological blockade of the CB1
receptor induces the activation of BAT thermogenesis associatedwith enhanced glucose and lipid utilization47,48, while OEA hasbeen recently implicated in the enhancement of b-adrenergic-mediated thermogenesis in rats49, linking ECS andthermogenesis. Altogether, the altered lipid metabolismobserved in our model could be linked to the altered browningprocess. For example, PGE2 has recently been identified as a keyregulator of white-to-brown adipogenesis50 and the reducedPGE2 levels observed in the WAT may therefore participate indecreased browning. To further explore the effects of Napeplddeletion on the browning process, we exposed cKO and WT miceto cold exposure and found that Napepld-deleted mice clearlypresent an altered induction of cold-induced browning process.This process seems to be due to Napepld deletion independentlyof a sympathetic drive since adipose tissue explants from cKOdonors tend to develop the same phenotype. Overall, these dataclearly indicate that adipose tissue NAPE-PLD is a key enzymeinvolved in the regulation of energy homeostasis by regulating thebrowning process. Nevertheless, the causal impact ofNapepld deletion on browning process merits furtherinvestigations to ascertain the direct effects on browning,independently of a heat-loss mechanism or sympatheticnervous system activation27.
Using 454-pyrosequencing, we discovered that altering theNAE synthesis in adipose tissue profoundly alters the gutmicrobiota composition. For instance, the genera Lactobacillusand Allobaculum were decreased in cKO-CT mice compared withWT-CT mice (Supplementary Table 5). We have previouslyreported that HFD feeding reduces the abundance of Allobacu-lum, whereas prebiotics increase this genus; reduce fat mass,metabolic inflammation and Lbp mRNA expression; and increaseinsulin sensitivity24. Similarly, the abundance of Allobaculum isincreased in rats that were fed with berberine, which preventsobesity and insulin resistance on HFD treatment51. Several strainsof Lactobacillus are commonly used probiotics52,53. It is thereforenot unconceivable that the effect of Napepld deletion in adiposetissue induces metabolic alterations associated with metabolicfunctions assumed by gut microbes. We also observed asignificant impact of HFD treatment on the gut microbiotacomposition, confirming previously published data24.Furthermore, Napepld deletion leads to an increase in portalLPS, suggesting an altered intestinal barrier function54. We thuspostulate that the decreased production of NAEs in the adiposetissue has an impact on the gut microbiota and the gut barrierfunction14.
By treating cKO mice with antibiotics and by transferring gutmicrobes from cKO and WT mice to GF recipients, we coulddemonstrate the contribution of the gut microbiota on thephenotype observed in cKO mice. These results acknowledge animportant role for the gut microbiota, which seems to beindependent of body weight, as adipocyte-specific Napeplddeletion results in a distinct gut microbiota composition fromthat obtained under HFD conditions and as transfer of gutmicrobiota from body-weight-matched donors is sufficient toeffectively transfer part of the phenotype. However, we may notcompletely rule out the complementary association of bodyweight and gut microbiota modulation over the long term sinceantibiotic treatment reduces body weight and improves glucosehomeostasis in cKO mice. To note, only 4 weeks follow-up aftergut microbiota transfer (compared with 8 weeks in the otherin vivo studies) were enough to partly reproduce the phenotype.Conversely, insulin sensitivity and glucose tolerance may not yetbe affected 4 weeks after gut microbiota transfer in our micemodel, but rather observed after a long-term modulation of gutmicrobiota (that is, antibiotic treatment). Also, whether one orseveral specific gut microbes contribute to this phenotyperequires further investigations.
In conclusion, our study highlights the essential contribution ofthe adipose tissue NAE synthesis pathway, to whole-body energymetabolism and physiology. In the absence of this functionalsynthesis pathway in the basal state, mice develop obesity, adiposetissue inflammation, insulin resistance, glucose intolerance andperturbation of the lipid metabolism. This phenotype is partlymediated by the alteration of gut microbiota composition and byan altered browning programme (Fig. 10). Taken together, thesedata underlie the importance of tissue-specific differences in ECSregulation, with special emphasis on adipose tissue.
MethodsMice. Generation of adipose tissue Napepld cKO mice. Adipose tissue-specificNapepld-deleted mice (cKO mice) were generated by crossing mice bearing theCre recombinase expressed under the control of the Fabp4 promoter (Fabp4-Cre)(C57BL/6 background, Jackson-Laboratory, Bar Harbor, ME, USA) with miceharbouring a loxP-flanked Napepld allele. Napepld loxed mice were generated aspreviously described55. Deletion was effective when adipose tissue reaches maturityand mice were born at normal Mendelian ratios.
All mouse experiments were approved by and performed in accordance with theguidelines of the local ethics committee for animal care of the Health Sector of theUCL under the supervision of Prof. F. Lemaigre and Prof. JP Dehoux and under thespecific number 2010/UCL/MD/022. Housing conditions were specified by the
ARTICLE NATURE COMMUNICATIONS | DOI: 10.1038/ncomms7495
12 NATURE COMMUNICATIONS | 6:6495 | DOI: 10.1038/ncomms7495 | www.nature.com/naturecommunications
& 2015 Macmillan Publishers Limited. All rights reserved.

Belgian Law of 29 May 2013 regarding the protection of laboratory animals(agreement number LA1230314).
cKO experiments. Cohorts of 8-week-old male cKO mice and WT littermateswere housed in groups of two mice per cage (filter-top cages) with free access tofood and water. The mice were fed a CT (AIN93Mi, Research Diet) or a HFD (60%fat, D12492, Research Diet). Treatment continued for 8 weeks. This experimentwas replicated independently three times. The control mice were WT littermatesharbouring the Napepld loxP-flanked allele but not the Cre recombinase. Bodyweight, food intake and water consumption were recorded once a week. Bodycomposition was assessed once a week using 7.5-MHz time-domain NMR(TD-NMR) (LF50 Minispec, Bruker, Rheinstetten, Germany).
After 7 weeks of treatment, an OGTT was performed as previously described infreely moving mice25,32. To analyze the insulin signalling pathway, mice received5 U insulin (Actrapid; Novo Nordisk A/S, Denmark) under anaesthesia (isoflurane,Forene, Abbott, Queenborough, Kent, England), or an equal volume of PBS intothe portal vein to analyze signalling response to insulin. Three minutes afterinjection, mice were killed and liver, SAT and gastrocnemius skeletal muscle wererapidly dissected.
At the end of the treatments, the mice were anaesthetized with isoflurane after a6-h fasting period. Portal and cava vein blood samples were collected for furtheranalysis. After exsanguination, mice were killed by cervical dislocation. Tissueswere precisely dissected, weighed and immediately snap-frozen in N2 and stored at� 80 �C for further analysis.
Cold exposure experiment. Cohorts of 8-week-old male cKO mice and WTlittermates were reared at room temperature under standard housing conditions(filter-top cages) with free access to food and water for 10 weeks. The mice were feda CT diet (AIN93Mi, Research Diet, New Brunswick, NJ, USA). Body weight, foodintake and water consumption were recorded once a week. Body composition wasassessed once a week using 7.5-MHz TD-NMR. After 10 weeks follow-up, twogroups of age- and body weight-matched cKO and WT mice were separated andindividually housed. One half of the animals from each genotype was transferredto a cold room at 8 �C, whereas the other half remained at room temperature(n¼ 7–9/group). Mice were fasted during the day period and fed ad libitum duringthe night. Mice were kept in the cold room for 72 h and after 18 h acclimation inthe cold room, body temperature was monitored at different intervals during twodays with a rectal probe (RET-3, World Precision Instruments, Aston Stevenage,UK). After 72 h, all mice were sacrificed as described above.
Antibiotic treatment experiment. Cohorts of 8-week-old C57/Bl6 female cKOmice were housed in groups of 2 or 3 mice/cage (filter-top cages) with free access tofood and water. The mice were fed a CT diet for 12 weeks. Half of the mice (n¼ 5per group) received antibiotics (1.0 g l� 1 ampicillin (Sigma, St Louis, MO) and0.5 g l� 1 neomycin (Sigma)) in their drinking water during the experimentalperiod14. Body weight was recorded once a week. Body composition was assessedonce a week using 7.5-MHz TD-NMR. After 11 weeks, an OGTT was performed asdescribed above. After 12 weeks follow-up, mice were killed as described above.
Gut microbiota transplantation experiments. The caecal contents of 3 cKO miceand 3 WT littermates (body weight matched) were transplanted into 14 GF mice(7-week-old Swiss-Webster males, Taconic, Hudson, NY, USA) as previouslydescribed56. Each donor was used to transplant two or three GF recipients. Eachcaecal sample (150 mg) was sampled in an anaerobic chamber and suspended inPBS (1.5 ml per caecum). Caecal contents were then immediately administered(0.15 ml per mouse) to the GF mice. GF mice were housed individually inventilated cages (IVC AERO GM500, Tecnilab-BMI, Someren, The Netherlands)and fed a CT diet for 4 weeks. Body weight, food intake and water consumptionwere recorded once a week. Body composition was assessed once a week using7.5-MHz TD-NMR. After 4 weeks follow-up, mice were killed as described above.
Insulin resistance index. The plasma insulin concentrations were measured inplasma collected from tail blood during OGTT using an ELISA Kit (Mercodia,Uppsala, Sweden) according to the manufacturer’s instructions. The insulinresistance index was determined by multiplying the area under the curve of boththe blood glucose (� 30 to 120 min) and the plasma insulin (� 30 to 15 min)obtained from the OGTT.
RNA extraction and real-time qPCR analysis. Total RNA was prepared fromtissues using the TriPure reagent (Roche). The quantification and integrity analysisof the total RNA were performed by running 1 ml of each sample on an Agilent2100 Bioanalyzer (Agilent RNA 6000 Nano Kit, Agilent). The complementaryDNA was prepared by reverse transcription, and real-time qPCR was performedas previously described24. RPL19 RNA was chosen as the housekeeping gene.Primer sequences are provided in the Supplementary Table 2.
Microarray analysis. Equal amounts of RNA from five mice per group werepooled within each group. Microarrays were performed as previously described57.Mouse gene ST microarray chips were used for hybridization (MoGene 1.0 ST,Affymetrix). The WT expression kit (Ambion) was used for complementary RNApreparation from the total RNA. The hybridization, wash and scan were doneaccording to the Affymetrix kits and procedures specific to the mouse gene STchips. After the scan, the quality controls of the hybridization were checked using
the Affymetrix Gene Expression Console software. Using the Affymetrix APT suitetools, we normalized the data by the RMA-Sketch procedure and computed thesignal detection P values using the DABG algorithm. All the probe sets that havethe DABG P value 40.05 in all conditions were discarded from the analysis. Therest of probes sets were kept for fold-change analysis. Functional annotation andpathway analysis was done using the DAVID web tool58. Both tools were fed withthe list of selected official gene names as input, and the threshold of significancewas set by default to P values o0.05.
DNA isolation from mouse caecal samples and qPCR and sequencing. Caecalcontents were collected and kept frozen at � 80 �C until use. Metagenomic DNAwas extracted from the caecal content using the QIAamp DNA Stool mini-kit(Qiagen, Hilden, Germany) according to the manufacturer’s instructions. TheV1-V3 region of the bacterial 16S rRNA gene was amplified using barcodedprimers 27f and 534r (ref. 59), and the high-throughput sequencing results of thepurified amplicons were analyzed on a Roche FLX Genome Sequencer usingtitanium chemistry (DNAVision, Gosselies, Belgium). The resulting reads wereprocessed through the QIIME v1.7.0 pipeline60. The abundance of identified andunclassified taxa was transformed using the Hellinger method after removing taxarepresenting o0.01% of the total abundance. Principal coordinates analysis wascalculated using the weighted UniFrac distance. Operational taxonomic units wereidentified using the uclust consensus taxonomy classifier with a 0.97 thresholdagainst the Greengenes database. Phylogenetic trees were generated using QIIME1.7.0 and visualized using iTOL v2.2.2.
SDS–PAGE and immunoblotting. For the total lysates, tissues were homogenizedwith TissueLyser II (Qiagen) in RIPA buffer61 supplemented with a cocktail ofprotease inhibitors (Sigma) and phosphatase inhibitors. Equal amounts of proteinswere separated by SDS–PAGE and transferred to nitrocellulose membranes. Fordetection of proteins of the insulin pathway, tissues were homogenized in ERKbuffer (Triton X-100 0.1%, HEPES 50 mM, NaCl 5 M, Glycerol 10%, MgCl21.5 mM and DTT 1 mM) supplemented with a cocktail of protease inhibitors andphosphatase inhibitors. Membranes were incubated overnight at 4 �C with thefollowing antibodies diluted in Tris-buffered saline tween-20 containing 1%non-fat dry milk: NAPE-PLD (1:200; ab95397, Abcam, Cambridge, MA, USA),p-IRb (1:1,000; sc-25103, Santa Cruz, CA, USA), p-AktThr308 (1:1,000; #2965L, CellSignaling, Danvers, MA, USA) and p-AktSer473 (1:1,000; #4060L, Cell Signaling).Quantification of phospho-proteins was performed on six animals with insulininjection per group. The loading control was b-actin (1:10,000; ab6276) orb-tubulin for skeletal muscle (1:800; sc-9104). Full unedited blots are availablein Supplementary Fig. 8.
Histological analysis and immunohistochemistry. The tissues were fixed in 4%formaldehyde. Haematoxylin and eosin staining was performed using standardprotocols on 5-mm adipose tissue sections. Adipocyte size (haematoxylin andeosin-stained sections), macrophage infiltration (F4/80: ab6640, Abcam) andUCP1 staining (ab23841, Abcam) were determined using ImageJ (version 1.48r,National Institutes of Health, Bethesda, Maryland, USA).
Separation of adipocytes and the SVF. About 150–300 mg of SAT deposit weredissected and cut in small pieces and digested with collagenase A (Roche) for15 min at 37 �C. Digested tissue was filtered and centrifuged at 400 g for 1 min. Theinfranatant containing the SVF and the supernatant containing adipocytes werewashed three times in a Krebs-BSA1% solution and stored at � 80 �C in TripureReagent (Roche) for further RNA extraction.
Primary peritoneal macrophage isolation. Murine peritoneal macrophages wereobtained by eliciting an acute peripheral inflammatory reaction with an i.p.injection of thioglycolate62. Isolated primary macrophages were incubated at 37 �Cfor 4 h, washed with PBS and then frozen in Tripure Reagent for further RNAextraction.
Adipose tissue explants culture. Subcutaneous adipose depots from 20 mice(10 WT mice and 10 cKO mice) were precisely dissected, and all visible vessels,particles and conjunctive tissues were removed. The fat tissue was then cut intosmall pieces (4 mm3), pooled per genotype and placed into Krebs buffer (pH 7.4)containing 0.5% (w/v) fatty acid-free BSA, penicillin/streptomycin (1:100) andfungizone (1:100) (Invitrogen). A total of 200 mg adipose tissue was rinsed in PBSand incubated in 100-mm Petri dishes containing 10 ml aMEM (Invitrogen)supplemented with 0.5% (w/v) fatty acid-free BSA, penicillin/streptomycin (1:100)and fungizone (1:100). All conditions were repeated in six different dishes. Disheswere cultured for 24 h at 37 �C in a 5% CO2 atmosphere. The basal concentrationof glucose in fresh media was 5 mmol l� 1. At the end of the experiment, adiposematerial was collected and immediately frozen in liquid nitrogen, and stored at� 80 �C until subsequent mRNA analysis.
NATURE COMMUNICATIONS | DOI: 10.1038/ncomms7495 ARTICLE
NATURE COMMUNICATIONS | 6:6495 | DOI: 10.1038/ncomms7495 | www.nature.com/naturecommunications 13
& 2015 Macmillan Publishers Limited. All rights reserved.

Biochemical analyses. Circulating leptin was determined using a multipleximmunoassay kit (Merck Millipore, Brussels, Belgium) and measured usingLuminex technology (Bioplex, Bio-Rad, Belgium) following the manufacturer’sinstructions.
For liver G6Pase activity, liver tissue was homogenized in lysis buffer (HEPES20 mM, sucrose 250 mM, KCl 10 mM, MgCl2 1.5 mM, EDTA 1 mM and DTT1 mM) and sonicated to release membrane-bound G6Pase. Homogenates were thenseparately incubated with 20 mM G6P (Sigma) or 20 mM b-glycerophosphate(Sigma) to measure nonspecific phosphatase activity. Inorganic phosphate wasassayed in each condition at time 0 and 10 min incubation at 37 �C. G6Pase activitywas determined by calculating specific G6Pase–phosphate release as previouslydescribed63.
For the measurement of liver glycogen content, liver was digested in NaOH(1 M) and digestion was stopped with HCl (1 M). Digested liver was diluted insodium acetate (1:4 vol/vol) unsupplemented or supplemented withamyloglucosidase (50 U ml� 1; Merck Millipore) and incubated at 55 �C for 1 h totransform glycogen into glucose. Released glucose was quantified using GlucoseGod FS (Diasys Diagnostic and Systems, Holzheim, Germany) according to themanufacturer’s instructions.
Plasma non-esterified fatty acids, cholesterol and triglyceride concentrationswere measured using kits coupling an enzymatic reaction with spectrophotometricdetection of the reaction end-products (Diasys Diagnostic and Systems) accordingto the manufacturer’s instructions.
The portal plasma LPS concentration was measured using Endosafe-MCS(Charles River Laboratories, Lyon, France) as previously described64.
Lipidomics analysis. Lipidomics were performed in collaboration with Biocrates(Innsbruck, Austria). The most biologically abundant phospholipids, ceramidesand eicosanoids were quantitatively analyzed by a high-throughput flow injectionelectrospray ionization-tandem mass spectrometry (ESI-MS/MS) screening methodor by HPLC-MS/MS(LC-MS/MS).
Measurement of eCB and NAPEs levels. Tissues were homogenized in CHCl3(10 ml), then MeOH (5 ml), H2O (2.5 ml) and HCl 2 N were added and the lipidsextracted by vigorous mixing. The organic layer was recovered and dried under N2.The resulting lipid fraction was pre-purified by solid-phase extraction over silica,and NAPEs were eluted with CHCl3-MeOH (6:4, v/v). The resulting lipid fractionwas analyzed by HPLC-MS using a LTQ Orbitrap mass spectrometer (ThermoFisher Scientific, Waltham, MA, USA) coupled to an Accela HPLC system(Thermo Fisher Scientific). Analyte separation was achieved by using a C-18Kinetex C-18 column (5 mm, 4.6� 150 mm; Phenomenex, Utrecht, Netherlands)and a C-18 pre-column. Mobile phases A and B were composed of MeOH-H2O-NH4OH (75:25:0.1, v/v/v) and MeOH-NH4OH (100:0.1, v/v), respectively. Thegradient (0.5 ml min� 1) was as follows: from 100% A to 100% B in 15 min, fol-lowed by 10 min at 100% B and subsequent re-equilibration at 100% A. Massspectrometry analysis in the negative mode was performed with an ESI source. Themeasurement of eCB were generated as previously described32, and the data werenormalized to tissue sample weight.
Statistical analyses. The data are expressed as the mean±s.e.m. Differencesbetween the groups were assessed using one-way analysis of variance (ANOVA),followed by the Tukey post-hoc test. A two-way ANOVA analysis with a Bonfer-onni post-test on repeated measurements was performed for the evolution of bodyweight, fat mass and glycaemia during the OGTT. The data were analyzed usingGraphPad Prism version 5.00 for Windows (GraphPad Software, San Diego, CA,USA). Data with different superscript letters or symbols are significantly differentat Po0.05 according to the post-hoc ANOVA statistical analysis. Comparisonsbetween the WT-CE and cKO-CE, the cKO and cKO-Abx groups, and the GF-WTand the GF-KO groups were performed using a two-tailed Student’s t-test. Theresults were considered statistically significant when Po0.05.
References1. Muccioli, G. G. Endocannabinoid biosynthesis and inactivation, from simple to
complex. Drug Discov. Today 15, 474–483 (2010).2. Jamshidi, N. & Taylor, D. A. Anandamide administration into the ventromedial
hypothalamus stimulates appetite in rats. Br. J. Pharmacol. 134, 1151–1154(2001).
3. Hansen, H. S. & Diep, T. A. N-acylethanolamines anandamide and food intake.Biochem. Pharmacol. 78, 553–560 (2009).
4. Leung, D., Saghatelian, A., Simon, G. M. & Cravatt, B. F. Inactivation of N-acylphosphatidylethanolamine phospholipase D reveals multiple mechanisms forthe biosynthesis of endocannabinoids. Biochemistry 45, 4720–4726 (2006).
5. Di Marzo, V. Endocannabinoids: synthesis and degradation. Rev. Physiol.Biochem. Pharmacol. 160, 1–24 (2008).
6. Ryberg, E. et al. The orphan receptor GPR55 is a novel cannabinoid receptor.Br. J. Pharmacol. 152, 1092–1101 (2007).
7. Lo Verme, J. et al. The nuclear receptor peroxisome proliferator-activatedreceptor-alpha mediates the anti-inflammatory actions ofpalmitoylethanolamide. Mol. Pharmacol. 67, 15–19 (2005).
8. Syed, S. K. et al. Regulation of GPR119 receptor activity with endocannabinoid-like lipids. Am. J. Physiol. Endocrinol. Metab. 303, E1469–E1478 (2012).
9. Hoareau, L. et al. Anti-inflammatory effect of palmitoylethanolamide onhuman adipocytes. Obesity(SilverSpring) 17, 431–438 (2009).
10. Esposito, G. et al. Palmitoylethanolamide improves colon inflammationthrough an enteric glia/toll like receptor 4-dependent PPAR-alpha activation.Gut 63, 1300–1312 (2014).
11. Simon, G. M. & Cravatt, B. F. Characterization of mice lacking candidateN-acyl ethanolamine biosynthetic enzymes provides evidence for multiplepathways that contribute to endocannabinoid production in vivo. Mol. Biosyst.6, 1411–1418 (2010).
12. Galic, S., Oakhill, J. S. & Steinberg, G. R. Adipose tissue as an endocrine organ.Mol. Cell Endocrinol. 316, 129–139 (2010).
13. Lafontan, M. Adipose tissue and adipocyte dysregulation. Diabetes Metab. 40,16–28 (2014).
14. Muccioli, G. G. et al. The endocannabinoid system links gut microbiota toadipogenesis. Mol. Syst. Biol. 6, 392 (2010).
15. Geurts, L. et al. Altered gut microbiota and endocannabinoid system tone inobese and diabetic leptin-resistant mice: impact on apelin regulation in adiposetissue. Front. Microbiol. 2, 149 (2011).
16. D’Eon, T. M. et al. The role of adipocyte insulin resistance in the pathogenesisof obesity-related elevations in endocannabinoids. Diabetes 57, 1262–1268(2008).
17. Silvestri, C. et al. Anandamide-derived prostamide F2alpha negatively regulatesadipogenesis. J. Biol. Chem. 288, 23307–23321 (2013).
18. Mori, M. A. et al. Altered miRNA processing disrupts brown/white adipocytedetermination and associates with lipodystrophy. J. Clin. Invest. 124,3339–3351 (2014).
19. Lee, K. Y. et al. Lessons on conditional gene targeting in mouse adipose tissue.Diabetes 62, 864–874 (2013).
20. Mullican, S. E. et al. A novel adipose-specific gene deletion model demonstratespotential pitfalls of existing methods. Mol. Endocrinol. 27, 127–134 (2013).
21. Tsuboi, K. et al. Enzymatic formation of N-acylethanolamines fromN-acylethanolamine plasmalogen through N-acylphosphatidylethanolamine-hydrolyzing phospholipase D-dependent and -independent pathways. Biochim.Biophys. Acta 1811, 565–577 2011.
22. Funk, C. D. Prostaglandins and leukotrienes: advances in eicosanoid biology.Science 294, 1871–1875 (2001).
23. Moreno-Navarrete, J. M. et al. A role for adipocyte-derived lipopolysaccharide-binding protein in inflammation- and obesity-associated adipose tissuedysfunction. Diabetologia 56, 2524–2537 (2013).
24. Everard, A. et al. Microbiome of prebiotic-treated mice reveals novel targetsinvolved in host response during obesity. ISME J. 8, 2116–2130 (2014).
25. Cani, P. D. et al. Metabolic endotoxemia initiates obesity and insulin resistance.Diabetes 56, 1761–1772 (2007).
26. Rosen, E. D. & Spiegelman, B. M. What we talk about when we talk about fat.Cell 156, 20–44 (2014).
27. Nedergaard, J. & Cannon, B. The browning of white adipose tissue: someburning issues. Cell Metab. 20, 396–407 (2014).
28. Turnbaugh, P. J., Backhed, F., Fulton, L. & Gordon, J. I. Diet-induced obesity islinked to marked but reversible alterations in the mouse distal gut microbiome.Cell Host Microbe 3, 213–223 (2008).
29. Alhouayek, M. et al. N-Acylethanolamine-hydrolyzing acid amidase inhibitionincreases colon N-palmitoylethanolamine levels and counteracts murine colitis.FASEB J. 29, 650–661 (2015).
30. Buckley, C. D., Gilroy, D. W. & Serhan, C. N. Proresolving lipid mediators andmechanisms in the resolution of acute inflammation. Immunity 40, 315–327(2014).
31. Zhu, C. et al. Proinflammatory stimuli control N-acylphosphatidylethanolamine-specific phospholipase D expression in macrophages. Mol. Pharmacol. 79,786–792 (2011).
32. Geurts, L., Muccioli, G. G., Delzenne, N. M. & Cani, P. D. Chronicendocannabinoid system stimulation induces muscle macrophage and lipidaccumulation in type 2 diabetic mice independently of metabolicendotoxaemia. PLoS ONE 8, e55963 (2013).
33. Li, Z., Schmidt, S. F. & Friedman, J. M. Developmental role forendocannabinoid signaling in regulating glucose metabolism and growth.Diabetes 62, 2359–2367 (2013).
34. Cani, P. D., Geurts, L., Matamoros, S., Plovier, H. & Duparc, T. Glucosemetabolism: Focus on gut microbiota, the endocannabinoid system andbeyond. Diabetes Metab. 40, 246–257 (2014).
35. Wellen, K. E. & Hotamisligil, G. S. Inflammation, stress, and diabetes. J. Clin.Invest. 115, 1111–1119 (2005).
36. Sell, H., Habich, C. & Eckel, J. Adaptive immunity in obesity and insulinresistance. Nat. Rev. Endocrinol. 8, 709–716 (2012).
ARTICLE NATURE COMMUNICATIONS | DOI: 10.1038/ncomms7495
14 NATURE COMMUNICATIONS | 6:6495 | DOI: 10.1038/ncomms7495 | www.nature.com/naturecommunications
& 2015 Macmillan Publishers Limited. All rights reserved.

37. Ussher, J. R. et al. Inhibition of de novo ceramide synthesis reverses diet-induced insulin resistance and enhances whole-body oxygen consumption.Diabetes 59, 2453–2464 (2010).
38. Cinar, R. et al. Hepatic cannabinoid-1 receptors mediate diet-induced insulinresistance by increasing de novo synthesis of long-chain ceramides. Hepatology59, 143–153 (2014).
39. Alhouayek, M. & Muccioli, G. G. COX-2-derived endocannabinoid metabolitesas novel inflammatory mediators. Trends Pharmacol. Sci. 35, 284–292 (2014).
40. Alhouayek, M., Masquelier, J., Cani, P. D., Lambert, D. M. & Muccioli, G. G.Implication of the anti-inflammatory bioactive lipid prostaglandin D2-glycerolester in the control of macrophage activation and inflammation by ABHD6.Proc. Natl Acad. Sci. USA 110, 17558–17563 (2013).
41. Brown, K. L., Davidson, J. & Rotondo, D. Characterisation of the prostaglandinE2-ethanolamide suppression of tumour necrosis factor-alpha production inhuman monocytic cells. Biochim. Biophys. Acta 1831, 1098–1107 2013.
42. Gillum, M. P. et al. N-acylphosphatidylethanolamine, a gut- derivedcirculating factor induced by fat ingestion, inhibits food intake. Cell 135,813–824 (2008).
43. Wu, J. et al. Beige adipocytes are a distinct type of thermogenic fat cell in mouseand human. Cell 150, 366–376 (2012).
44. Ye, L. et al. Fat cells directly sense temperature to activate thermogenesis. Proc.Natl Acad. Sci. USA 110, 12480–12485 (2013).
45. Cohen, P. et al. Ablation of PRDM16 and beige adipose causes metabolicdysfunction and a subcutaneous to visceral fat switch. Cell 156, 304–316 (2014).
46. Nakamura, Y., Sato, T., Shiimura, Y., Miura, Y. & Kojima, M. FABP3 andbrown adipocyte-characteristic mitochondrial fatty acid oxidation enzymes areinduced in beige cells in a different pathway from UCP1. Biochem. Biophys. Res.Commun. 441, 42–46 (2013).
47. Bajzer, M. et al. Cannabinoid receptor 1 (CB1) antagonism enhances glucoseutilisation and activates brown adipose tissue in diet-induced obese mice.Diabetologia 54, 3121–3131 (2011).
48. Boon, M. R. et al. Peripheral cannabinoid 1 receptor blockade activatesbrown adipose tissue and diminishes dyslipidemia and obesity. FASEB J. 28,5361–5375 (2014).
49. Suarez, J. et al. Oleoylethanolamide enhances beta-adrenergic-mediatedthermogenesis and white-to-brown adipocyte phenotype in epididymal whiteadipose tissue in rat. Dis. Model. Mech. 7, 129–141 (2014).
50. Garcia-Alonso, V. et al. Coordinate functional regulation between microsomalprostaglandin E synthase-1 (mPGES-1) and peroxisome proliferator-activatedreceptor gamma (PPARgamma) in the conversion of white-to-brownadipocytes. J. Biol. Chem. 288, 28230–28242 (2013).
51. Zhang, X. et al. Structural changes of gut microbiota during berberine-mediatedprevention of obesity and insulin resistance in high-fat diet-fed rats. PLoS ONE7, e42529 (2012).
52. Geurts, L., Neyrinck, A. M., Delzenne, N. M., Knauf, C. & Cani, P. D. Gutmicrobiota controls adipose tissue expansion, gut barrier and glucosemetabolism: novel insights into molecular targets and interventions usingprebiotics. Benef. Microbes 5, 3–17 (2014).
53. Cani, P. D. & Van Hul, M. Novel opportunities for next-generationprobiotics targeting metabolic syndrome. Curr. Opin. Biotechnol. 32, 21–27(2015).
54. Cani, P. D. et al. Changes in gut microbiota control inflammation in obese micethrough a mechanism involving GLP-2-driven improvement of gutpermeability. Gut 58, 1091–1103 (2009).
55. Liu, J. et al. Multiple pathways involved in the biosynthesis of anandamide.Neuropharmacology 54, 1–7 (2008).
56. Everard, A. et al. Intestinal epithelial MyD88 is a sensor switching hostmetabolism towards obesity according to nutritional status. Nat. Commun. 5,5648 (2014).
57. Essaghir, A., Dif, N., Marbehant, C. Y., Coffer, P. J. & Demoulin, J. B. Thetranscription of FOXO genes is stimulated by FOXO3 and repressed by growthfactors. J. Biol. Chem. 284, 10334–10342 (2009).
58. Huang da, W., Sherman, B. T. & Lempicki, R. A. Systematic and integrativeanalysis of large gene lists using DAVID bioinformatics resources. Nat. Protoc.4, 44–57 (2009).
59. Wu, G. D. et al. Sampling and pyrosequencing methods for characterizingbacterial communities in the human gut using 16S sequence tags. BMCMicrobiol. 10, 206 (2010).
60. Caporaso, J. G. et al. QIIME allows analysis of high-throughput communitysequencing data. Nat. Methods 7, 335–336 (2010).
61. Pachikian, B. D. et al. Hepatic n-3 polyunsaturated fatty acid depletionpromotes steatosis and insulin resistance in mice: genomic analysis of cellulartargets. PLoS ONE 6, e23365 (2011).
62. Zhang, X., Goncalves, R. & Mosser, D. M. The isolation and characterization ofmurine macrophages. Curr. Protoc. Immunol. Chapter 14, Unit 14 11 (2008).
63. Rajas, F., Bruni, N., Montano, S., Zitoun, C. & Mithieux, G. The glucose-6phosphatase gene is expressed in human and rat small intestine: regulation ofexpression in fasted and diabetic rats. Gastroenterology 117, 132–139 (1999).
64. Everard, A. et al. Responses of gut microbiota and glucose and lipid metabolismto prebiotics in genetic obese and diet-induced leptin-resistant mice. Diabetes60, 2775–2786 (2011).
AcknowledgementsWe would like to thank A. Barrois, A. Bever, I. Blave, H. Danthinne, B. Es Saadi andR. Selleslagh for excellent technical assistance. We thank R.M. Goebbels for histologicalassistance. We thank M. Osto for the help in breeding mice. We thank J.F. Collet for theanaerobic chamber. P.D.C. is a research associate at FRS-FNRS (Fonds de la RechercheScientifique), Belgium. A.E. and M.A. are postdoctoral researchers at FRS-FNRS, Bel-gium. H.P. is a doctoral fellow at FRS-FNRS. P.D.C. is the recipient of grants from FNRS(convention J.0084.15, convention 3.4579.11) and PDR (Projet de Recherche, convention: T.0138.14) and ARC (Action de Recherche Concertee—Communaute francaise deBelgique convention : 12/17-047). This work was supported by the Fonds de la RechercheScientifique-FNRS for the FRFS-WELBIO under Grant no. WELBIO-CR-2012S-02R.P.D.C. is a recipient of ERC Starting Grant 2013 (European Research Council, Startinggrant 336452-ENIGMO).
Author contributionsP.D.C. conceived, supervised the project and designed experiments, performed experi-ments and contributed in the interpretation of all the results. S.L. generated Napepldfloxed mice. L.G. contributed to the design of the experiments, performed most of theexperiments, analyzed and interpreted the results. L.G., M.V.H., Ah.E. and S.M.contributed to generate figures and tables; A.E., M.V.H., Ah.E., T.D., S.M., H.P., J.C. andR.G.P.D. performed the experiments. M.B. contributed to the antibiotic treatment. C.D.contributed to isolate SVF. M.A. helped with the isolation of peritoneal macrophages.G.G.M. measured the endocannabinoids and NAPEs. N.M.D., J.-B.D. and S.L. providedreagents and participated in the discussions. L.G. and P.D.C. wrote the manuscript.All authors discussed the results, reviewed and approved the manuscript.
Additional informationAccession codes: Microarray data have been deposited in GEO under accession codeGSE56852.
Supplementary Information accompanies this paper at http://www.nature.com/naturecommunications
Competing financial interests: There are no competing financial interests.
Reprints and permission information is available online at http://npg.nature.com/reprintsandpermissions/
How to cite this article: Geurts, L. et al. Adipose tissue NAPE-PLD controls fat massdevelopment by altering the browning process and gut microbiota. Nat. Commun. 6:6495doi: 10.1038/ncomms7495 (2015).
This work is licensed under a Creative Commons Attribution 4.0International License. The images or other third party material in this
article are included in the article’s Creative Commons license, unless indicated otherwisein the credit line; if the material is not included under the Creative Commons license,users will need to obtain permission from the license holder to reproduce the material.To view a copy of this license, visit http://creativecommons.org/licenses/by/4.0/
NATURE COMMUNICATIONS | DOI: 10.1038/ncomms7495 ARTICLE
NATURE COMMUNICATIONS | 6:6495 | DOI: 10.1038/ncomms7495 | www.nature.com/naturecommunications 15
& 2015 Macmillan Publishers Limited. All rights reserved.