molecular analysis of gut microbiota in obesity among indian individuals
TRANSCRIPT
Molecular analysis of gut microbiota in obesityamong Indian individuals
DEEPAK P PATIL1,† ,DHIRAJ P DHOTRE1, SACHIN G CHAVAN
1,ARMIYA SULTAN1 ,DHAWAL S JAIN2 ,
VIKRAM B LANJEKAR3, JAYSHREE GANGAWANI
4, POONAM S SHAH4 , JAYSHREE S TODKAR
4,
SHASHANK SHAH4 ,DILIP R RANADE3,MILIND S PATOLE1 and YOGESH S SHOUCHE1,*
1National Centre for Cell Science, Ganeshkhind, Pune 411 007, India2Institute of Bioinformatics and Biotechnology, University of Pune, Pune 411 007, India
3Microbial Sciences Division, Agharkar Research Institute, Pune 411 004, India4Laparo Obeso Centre, Ruby Hall Clinic, Sassoon Road, Pune 411 001, India
*Corresponding author (Fax, +91-20-25692259; Email, [email protected])†Present address: Center for RNA biology, The Ohio State University, Columbus, OH 43202,USA
Obesity is a consequence of a complex interplay between the host genome and the prevalent obesogenicfactors among the modern communities. The role of gut microbiota in the pathogenesis of the disorder wasrecently discovered; however, 16S-rRNA-based surveys revealed compelling but community-specific data.Considering this, despite unique diets, dietary habits and an uprising trend in obesity, the Indian counterpartsare poorly studied. Here, we report a comparative analysis and quantification of dominant gut microbiota oflean, normal, obese and surgically treated obese individuals of Indian origin. Representative gut microbialdiversity was assessed by sequencing fecal 16S rRNA libraries for each group (n=5) with a total of over3000 sequences. We detected no evident trend in the distribution of the predominant bacterial phyla,Bacteroidetes and Firmicutes. At the genus level, the bacteria of genus Bacteroides were prominent amongthe obese individuals, which was further confirmed by qPCR (P<0.05). In addition, a remarkably high archaealdensity with elevated fecal SCFA levels was also noted in the obese group. On the contrary, the treated-obeseindividuals exhibited comparatively reduced Bacteroides and archaeal counts along with reduced fecal SCFAs. Inconclusion, the study successfully identified a representative microbial diversity in the Indian subjects and demon-strated the prominence of certain bacterial groups in obese individuals; nevertheless, further studies are essential tounderstand their role in obesity.
[Patil DP, Dhotre DP, Chavan SG, Sultan A, Jain DS, Lanjekar VB, Gangawani J, Shah PS, Todkar JS, Shah S, Ranade DR, Patole MS and ShoucheYS 2012 Molecular analysis of gut microbiota in obesity among Indian individuals. J. Biosci. 37 647–657] DOI 10.1007/s12038-012-9244-0
1. Introduction
Worldwide, approximately 1.6 billion adults are overweightand 500 million adults are obese. This epidemic is not justprevalent among the developed nations; developing nationssuch as India are also no exception, where the disease ismore endemic to the metropolitan cities (Deepa et al. 2009).Cause for such sudden rise in these incidences appearscomplex and multifactorial (Cummings and Schwartz2003); however, a role of the widespread obesogenic factors
cannot be ignored (Hill and Peters 1998). With surgingnumbers, obesity together with the related disorders suchas atherosclerosis, hypertension, type 2 diabetes andcancer, have become a burden to mankind (Thompsonand Wolf 2001; Haslam and James 2005; Shamseddeenet al. 2011).
Fundamentally, obesity is a metabolic disorder caused byuncontrolled food intake accompanied by a sedentary life-style. Dietary restriction and exercise are the preliminarytherapies of choice. Because of their poor performance and
http://www.ias.ac.in/jbiosci J. Biosci. 37(4), September 2012, 647–657, * Indian Academy of Sciences 647
Keywords. Gut microbiota; Indian; microbial diversity; obesity
Published online: 14 August 2012
delayed results, invasive bariatric surgery is the highlysought treatment for morbid or severe obesity (Choban etal. 2002). As the human gut hormonally controls food intake(Murphy and Bloom 2006), these surgeries intend to alter thegut structure, thereby limiting the caloric intake and, in turn,weight gain. Nonetheless, despite high success rates, bariat-ric surgeries are expensive (Terranova et al. 2012) and mostof them permanently alter the gut anatomy. This necessitatesdevelopment of effective and noninvasive therapeuticapproaches, primarily considering the other vital functionsof the gut, such as, regulation of immunity, stimulation ofangiogenesis, intestinal cell proliferation and differentiation,inflammatory immune response, and vitamin supplementa-tion (Stevens and Hume 1998; Rautava and Isolauri 2002;Stappenbeck et al. 2002; Noverr and Huffnagle 2004;Rakoff-Nahoum et al. 2004).
Apart from the above-mentioned functions, the human gutalso harbours trillions of bacteria, which affect our healthand physiology to an inconceivable extent. Discovery ofassociation of gut bacteria with fat storage and obesitythrough sequencing of 16S rRNA libraries is one such ex-ample (Backhed et al. 2004; Ley et al. 2005). Obese gutmicrobiome exhibits an increased transmissible efficiency inharvesting energy from the diet leading to an obese pheno-type; however, no single species of bacteria is identified tovary with weight gain (Turnbaugh et al. 2006). In a diet-based weight-loss model, analysis of gut microbiota over aperiod of time revealed an increase in the bacteria of phylumBacteroidetes with a significant reduction in Firmicutes (Leyet al. 2006), although researchers have failed to detect suchchange in another community (Duncan et al. 2008). A sim-ilar study conducted elsewhere (Nadal et al. 2009) reportedno change in the Bacteroidetes-to-Firmicutes ratio butreported an increase in the Bacteroides-Prevotella group.In a pregnancy model of obesity, weight gain during preg-nancy correlates with an increase in bacteria of genus Bac-teroides in women (Collado et al. 2008). A recent study(Zhang et al. 2009) described the fecal microbiota of patientswith post-gastric bypass anti-obesity surgery. These individ-uals exhibited a high Firmicutes count along with reducedarchaeal densities in comparison with the untreated obese.With diverse models and community-specific reports, explo-ration of the bacterial pathogenesis of obesity remains adaunting task; nevertheless, preliminary identification ofgut bacteria remains a cardinal step.
Obesity-associated changes in bacteria are largely reportedfrom the Western population (Ley et al. 2006; Duncan et al.2008; Nadal et al. 2009); however, despite unique dietaryhabits (Sinha et al. 2003), the Indian counterparts are signif-icantly underexplored. Here, we report for the first time, ananalysis and comparison of gut microbiota by sequencing16S rRNA gene libraries from lean, normal, obese andsurgically treated obese individuals of Indian origin. The
surgically treated group includes individuals who underwentsleeve gastrectomy (SG) and adjustable gastric banding (AGB)surgeries as a treatment for obesity. These two forms of re-strictive bariatric surgeries effectively reduce the stomach size,leading to an early satiety and reduced caloric intake withoutaffecting absorption of the digested food (Schneider and Mun2005). After identification of dominant bacterial groupsusing 16S rRNA gene libraries, we confirmed their promi-nence by real-time PCR across the 20 subjects. Estimation offecal short chain fatty acids (SCFAs) was also carried out inparallel to demonstrate the differences in the fermentationefficiencies of the obese and treated-obese microbiome.
2. Materials and methods
2.1 Collection of samples
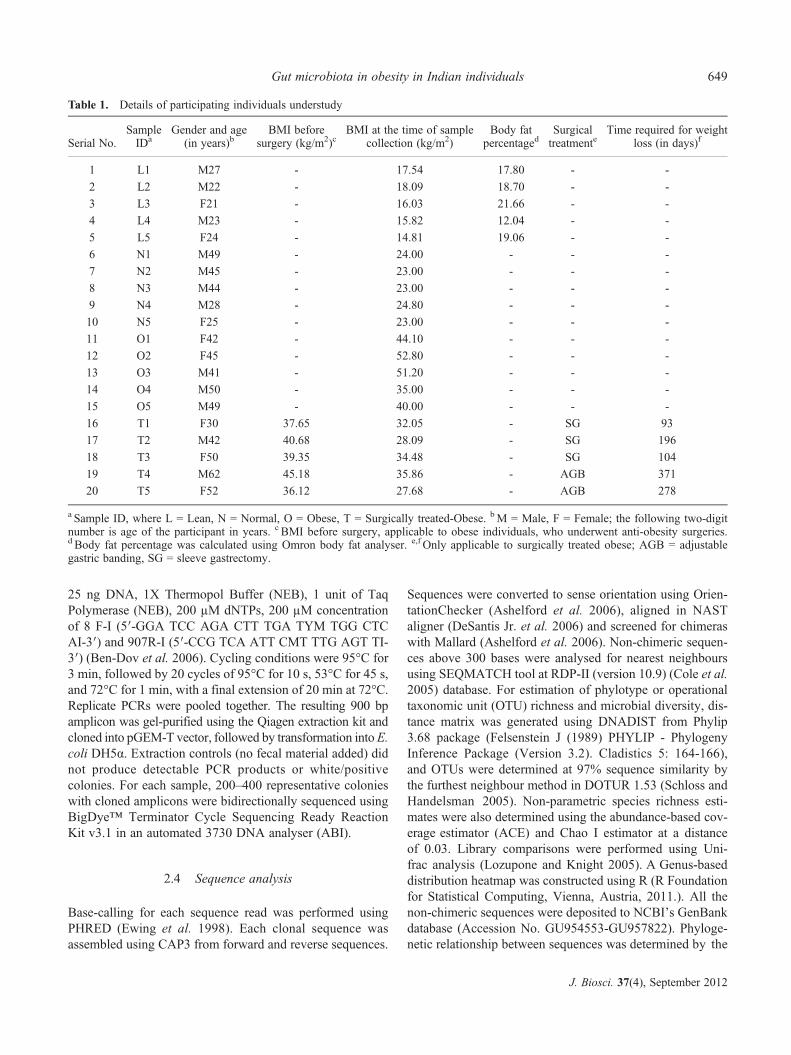
Early morning fecal samples were collected from unrelatedhealthy individuals (21–62 years old) irrespective of gender.These were classified based on their body-mass-index (BMI)into lean (<19 kg/m2, n=5, median age=23 years), normal(18–24 kg/m2, n=5, median age=44 years), obese (25–53 kg/m2, n=5, median age=45 years), and treated obese(25–36 kg/m2, n=5, median age=50 years, these are obeseindividuals regressing to normal BMI after SG and AGBsurgeries). For details refer table 1. Apart from BMI toconfirm leanness among lean subjects, whole body fat per-centage was also determined using OMRON HBF-306Chand-held body fat analyser (Omron healthcare inc., USA)as in reference (Lintsi et al. 2004). No participant used anyantibiotic, pre- or probiotics within the preceding 3 monthsbefore sampling. All the fecal samples were stored at 4°C andtransported to laboratory on ice. The samples were eitherprocessed immediately or stored at −80°C until processed.The study was approved by the Ruby Hall Clinic EthicalCommittee, Pune, India. Accordingly, the participating lab(Laparo Obeso Centre) at Ruby Hall Clinic collected the fecalsamples from the volunteers after a verbal consent.
2.2 DNA extraction
Total DNA was extracted from each stool sample usingQIAamp DNA Stool Mini Kit (Qiagen) with an additional stepof bead beating using a mix of silica beads (diameter 0.1, 0.2and 0.5 mm). Purified DNA samples were qualitatively veri-fied by agarose gel electrophoresis for integrity and concen-trations were estimated by Nanodrop (Thermo Scientific).
2.3 Generation of 16S rRNA gene library and sequencing
Fecal 16S rRNA libraries were generated for each individualseparately. Five replicates of 25 μl PCRs, each containing
648 Deepak P Patil et al.
J. Biosci. 37(4), September 2012
25 ng DNA, 1X Thermopol Buffer (NEB), 1 unit of TaqPolymerase (NEB), 200 μM dNTPs, 200 μM concentrationof 8 F-I (5′-GGA TCC AGA CTT TGA TYM TGG CTCAI-3′) and 907R-I (5′-CCG TCA ATT CMT TTG AGT TI-3′) (Ben-Dov et al. 2006). Cycling conditions were 95°C for3 min, followed by 20 cycles of 95°C for 10 s, 53°C for 45 s,and 72°C for 1 min, with a final extension of 20 min at 72°C.Replicate PCRs were pooled together. The resulting 900 bpamplicon was gel-purified using the Qiagen extraction kit andcloned into pGEM-T vector, followed by transformation intoE.coli DH5α. Extraction controls (no fecal material added) didnot produce detectable PCR products or white/positivecolonies. For each sample, 200–400 representative colonieswith cloned amplicons were bidirectionally sequenced usingBigDye™ Terminator Cycle Sequencing Ready ReactionKit v3.1 in an automated 3730 DNA analyser (ABI).
2.4 Sequence analysis
Base-calling for each sequence read was performed usingPHRED (Ewing et al. 1998). Each clonal sequence wasassembled using CAP3 from forward and reverse sequences.
Sequences were converted to sense orientation using Orien-tationChecker (Ashelford et al. 2006), aligned in NASTaligner (DeSantis Jr. et al. 2006) and screened for chimeraswith Mallard (Ashelford et al. 2006). Non-chimeric sequen-ces above 300 bases were analysed for nearest neighboursusing SEQMATCH tool at RDP-II (version 10.9) (Cole et al.2005) database. For estimation of phylotype or operationaltaxonomic unit (OTU) richness and microbial diversity, dis-tance matrix was generated using DNADIST from Phylip3.68 package (Felsenstein J (1989) PHYLIP - PhylogenyInference Package (Version 3.2). Cladistics 5: 164-166),and OTUs were determined at 97% sequence similarity bythe furthest neighbour method in DOTUR 1.53 (Schloss andHandelsman 2005). Non-parametric species richness esti-mates were also determined using the abundance-based cov-erage estimator (ACE) and Chao I estimator at a distanceof 0.03. Library comparisons were performed using Uni-frac analysis (Lozupone and Knight 2005). A Genus-baseddistribution heatmap was constructed using R (R Foundationfor Statistical Computing, Vienna, Austria, 2011.). All thenon-chimeric sequences were deposited to NCBI’s GenBankdatabase (Accession No. GU954553-GU957822). Phyloge-netic relationship between sequences was determined by the
Table 1. Details of participating individuals understudy
Serial No.SampleIDa
Gender and age(in years)b
BMI beforesurgery (kg/m2)c
BMI at the time of samplecollection (kg/m2)
Body fatpercentaged
Surgicaltreatmente
Time required for weightloss (in days)f
1 L1 M27 - 17.54 17.80 - -
2 L2 M22 - 18.09 18.70 - -
3 L3 F21 - 16.03 21.66 - -
4 L4 M23 - 15.82 12.04 - -
5 L5 F24 - 14.81 19.06 - -
6 N1 M49 - 24.00 - - -
7 N2 M45 - 23.00 - - -
8 N3 M44 - 23.00 - - -
9 N4 M28 - 24.80 - - -
10 N5 F25 - 23.00 - - -
11 O1 F42 - 44.10 - - -
12 O2 F45 - 52.80 - - -
13 O3 M41 - 51.20 - - -
14 O4 M50 - 35.00 - - -
15 O5 M49 - 40.00 - - -
16 T1 F30 37.65 32.05 - SG 93
17 T2 M42 40.68 28.09 - SG 196
18 T3 F50 39.35 34.48 - SG 104
19 T4 M62 45.18 35.86 - AGB 371
20 T5 F52 36.12 27.68 - AGB 278
a Sample ID, where L = Lean, N = Normal, O = Obese, T = Surgically treated-Obese. bM = Male, F = Female; the following two-digitnumber is age of the participant in years. c BMI before surgery, applicable to obese individuals, who underwent anti-obesity surgeries.d Body fat percentage was calculated using Omron body fat analyser. e,f Only applicable to surgically treated obese; AGB = adjustablegastric banding, SG = sleeve gastrectomy.
Gut microbiota in obesity in Indian individuals 649
J. Biosci. 37(4), September 2012
neighbour-joining method. Neighbour-joining tree wasconstructed with 1000 bootstrap and Kimura-2 parameteras a model of nucleotide substitution in MEGA4(Tamura et al. 2007).
2.5 Quantification of genus Bacteroides and archaea
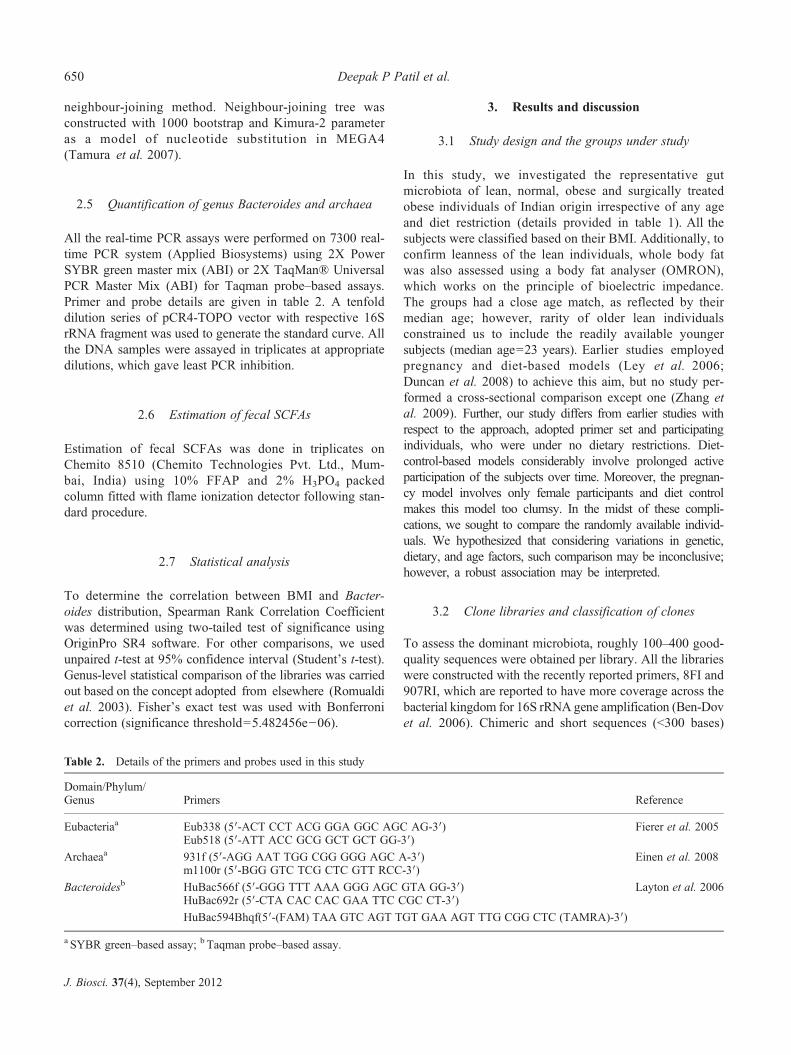
All the real-time PCR assays were performed on 7300 real-time PCR system (Applied Biosystems) using 2X PowerSYBR green master mix (ABI) or 2X TaqMan® UniversalPCR Master Mix (ABI) for Taqman probe–based assays.Primer and probe details are given in table 2. A tenfolddilution series of pCR4-TOPO vector with respective 16SrRNA fragment was used to generate the standard curve. Allthe DNA samples were assayed in triplicates at appropriatedilutions, which gave least PCR inhibition.
2.6 Estimation of fecal SCFAs
Estimation of fecal SCFAs was done in triplicates onChemito 8510 (Chemito Technologies Pvt. Ltd., Mum-bai, India) using 10% FFAP and 2% H3PO4 packedcolumn fitted with flame ionization detector following stan-dard procedure.
2.7 Statistical analysis
To determine the correlation between BMI and Bacter-oides distribution, Spearman Rank Correlation Coefficientwas determined using two-tailed test of significance usingOriginPro SR4 software. For other comparisons, we usedunpaired t-test at 95% confidence interval (Student’s t-test).Genus-level statistical comparison of the libraries was carriedout based on the concept adopted from elsewhere (Romualdiet al. 2003). Fisher’s exact test was used with Bonferronicorrection (significance threshold=5.482456e−06).
3. Results and discussion
3.1 Study design and the groups under study
In this study, we investigated the representative gutmicrobiota of lean, normal, obese and surgically treatedobese individuals of Indian origin irrespective of any ageand diet restriction (details provided in table 1). All thesubjects were classified based on their BMI. Additionally, toconfirm leanness of the lean individuals, whole body fatwas also assessed using a body fat analyser (OMRON),which works on the principle of bioelectric impedance.The groups had a close age match, as reflected by theirmedian age; however, rarity of older lean individualsconstrained us to include the readily available youngersubjects (median age=23 years). Earlier studies employedpregnancy and diet-based models (Ley et al. 2006;Duncan et al. 2008) to achieve this aim, but no study per-formed a cross-sectional comparison except one (Zhang etal. 2009). Further, our study differs from earlier studies withrespect to the approach, adopted primer set and participatingindividuals, who were under no dietary restrictions. Diet-control-based models considerably involve prolonged activeparticipation of the subjects over time. Moreover, the pregnan-cy model involves only female participants and diet controlmakes this model too clumsy. In the midst of these compli-cations, we sought to compare the randomly available individ-uals. We hypothesized that considering variations in genetic,dietary, and age factors, such comparison may be inconclusive;however, a robust association may be interpreted.
3.2 Clone libraries and classification of clones
To assess the dominant microbiota, roughly 100–400 good-quality sequences were obtained per library. All the librarieswere constructed with the recently reported primers, 8FI and907RI, which are reported to have more coverage across thebacterial kingdom for 16S rRNA gene amplification (Ben-Dovet al. 2006). Chimeric and short sequences (<300 bases)
Table 2. Details of the primers and probes used in this study
Domain/Phylum/Genus Primers Reference
Eubacteriaa Eub338 (5′-ACT CCT ACG GGA GGC AGC AG-3′) Fierer et al. 2005Eub518 (5′-ATT ACC GCG GCT GCT GG-3′)
Archaeaa 931f (5′-AGG AAT TGG CGG GGG AGC A-3′) Einen et al. 2008m1100r (5′-BGG GTC TCG CTC GTT RCC-3′)
Bacteroidesb HuBac566f (5′-GGG TTT AAA GGG AGC GTA GG-3′) Layton et al. 2006HuBac692r (5′-CTA CAC CAC GAA TTC CGC CT-3′)
HuBac594Bhqf(5′-(FAM) TAA GTC AGT TGT GAA AGT TTG CGG CTC (TAMRA)-3′)
a SYBR green–based assay; b Taqman probe–based assay.
650 Deepak P Patil et al.
J. Biosci. 37(4), September 2012
were exempted from the analysis. All the non-chimeric sequen-ces were deposited to NCBI (accession number GU954553-GU957822). Identification and classification of these sequen-ces were performed using SEQMATCH tool at the RDP-IIdatabase (Cole et al. 2005) against both total (uncultured)and cultured bacterial isolate databases (for details, refertable 3). The taxonomic assignments were confirmed byphylogenetic analysis. All the individuals showed 80–99%of bacteria with a significant identity (>97%, species level)with the uncultured bacterial database sequences. Surgically
treated individual T4 demonstrated a remarkable compositionwith 19% (31 out of 166) of novel uncultured bacterial species.Moreover, T4 along with N5 had an unusually low sequenceidentity (48.19% and 25.9% respectively) with the culturedbacterial species.
3.3 Estimation of OTU richness
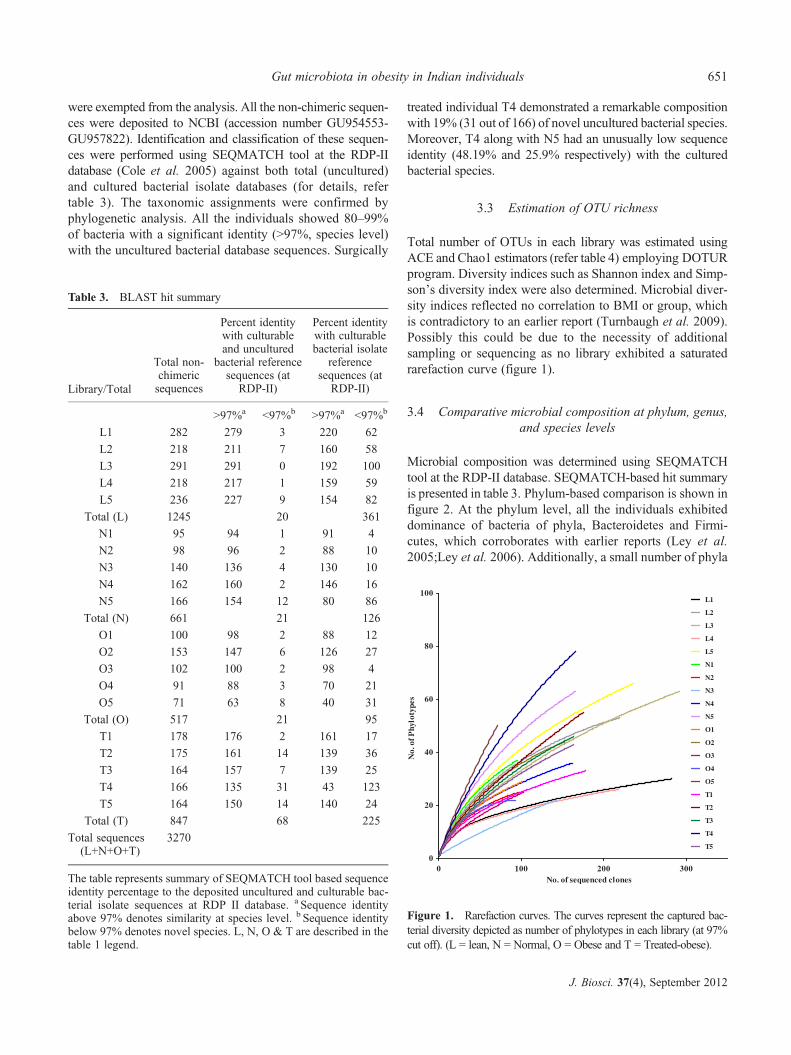
Total number of OTUs in each library was estimated usingACE and Chao1 estimators (refer table 4) employing DOTURprogram. Diversity indices such as Shannon index and Simp-son’s diversity index were also determined. Microbial diver-sity indices reflected no correlation to BMI or group, whichis contradictory to an earlier report (Turnbaugh et al. 2009).Possibly this could be due to the necessity of additionalsampling or sequencing as no library exhibited a saturatedrarefaction curve (figure 1).
3.4 Comparative microbial composition at phylum, genus,and species levels
Microbial composition was determined using SEQMATCHtool at the RDP-II database. SEQMATCH-based hit summaryis presented in table 3. Phylum-based comparison is shown infigure 2. At the phylum level, all the individuals exhibiteddominance of bacteria of phyla, Bacteroidetes and Firmi-cutes, which corroborates with earlier reports (Ley et al.2005;Ley et al. 2006). Additionally, a small number of phyla
0 100 200 3000
20
40
60
80
100L1
L2
L3
L4
L5
N1
N2
N3
N4
N5
O1
O2
O3
O4
O5
T1
T2
T3
T4
T5
No. of sequenced clones
No.
of P
hylo
type
s
Figure 1. Rarefaction curves. The curves represent the captured bac-terial diversity depicted as number of phylotypes in each library (at 97%cut off). (L = lean, N = Normal, O = Obese and T = Treated-obese).
Table 3. BLAST hit summary
Library/Total
Total non-chimericsequences
Percent identitywith culturableand uncultured
bacterial referencesequences (at
RDP-II)
Percent identitywith culturablebacterial isolate
referencesequences (at
RDP-II)
>97%a <97%b >97%a <97%b
L1 282 279 3 220 62
L2 218 211 7 160 58
L3 291 291 0 192 100
L4 218 217 1 159 59
L5 236 227 9 154 82
Total (L) 1245 20 361
N1 95 94 1 91 4
N2 98 96 2 88 10
N3 140 136 4 130 10
N4 162 160 2 146 16
N5 166 154 12 80 86
Total (N) 661 21 126
O1 100 98 2 88 12
O2 153 147 6 126 27
O3 102 100 2 98 4
O4 91 88 3 70 21
O5 71 63 8 40 31
Total (O) 517 21 95
T1 178 176 2 161 17
T2 175 161 14 139 36
T3 164 157 7 139 25
T4 166 135 31 43 123
T5 164 150 14 140 24
Total (T) 847 68 225
Total sequences(L+N+O+T)
3270
The table represents summary of SEQMATCH tool based sequenceidentity percentage to the deposited uncultured and culturable bac-terial isolate sequences at RDP II database. a Sequence identityabove 97% denotes similarity at species level. b Sequence identitybelow 97% denotes novel species. L, N, O & T are described in thetable 1 legend.
Gut microbiota in obesity in Indian individuals 651
J. Biosci. 37(4), September 2012
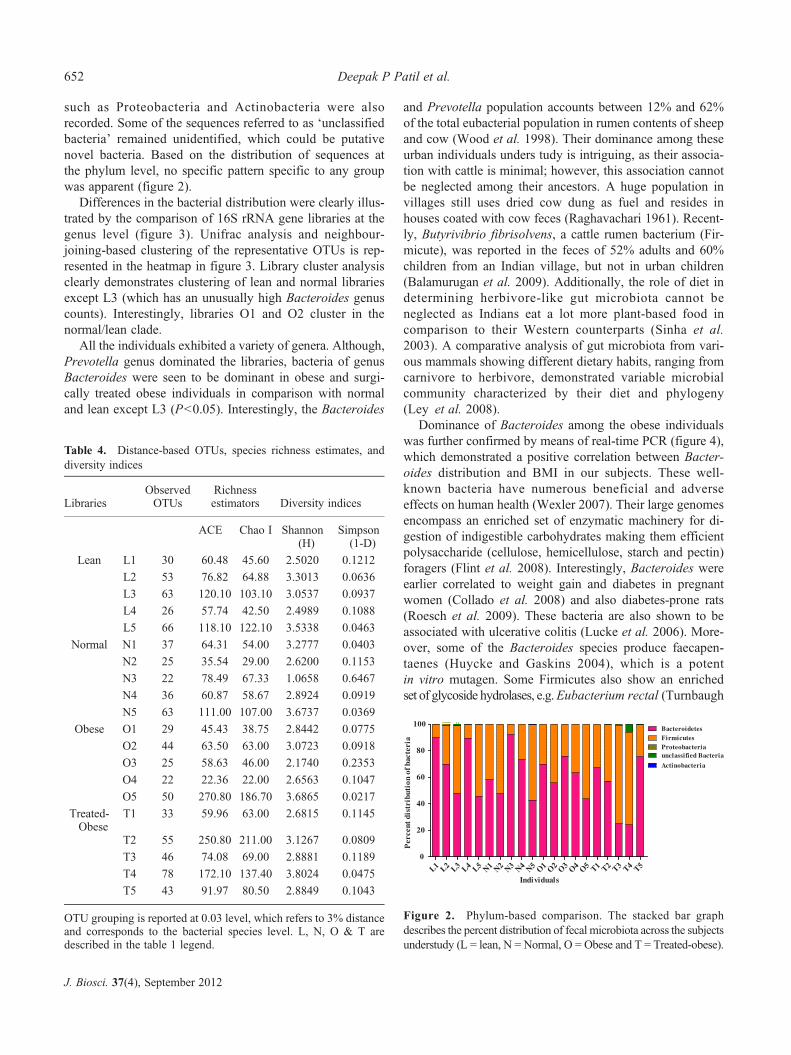
such as Proteobacteria and Actinobacteria were alsorecorded. Some of the sequences referred to as ‘unclassifiedbacteria’ remained unidentified, which could be putativenovel bacteria. Based on the distribution of sequences atthe phylum level, no specific pattern specific to any groupwas apparent (figure 2).
Differences in the bacterial distribution were clearly illus-trated by the comparison of 16S rRNA gene libraries at thegenus level (figure 3). Unifrac analysis and neighbour-joining-based clustering of the representative OTUs is rep-resented in the heatmap in figure 3. Library cluster analysisclearly demonstrates clustering of lean and normal librariesexcept L3 (which has an unusually high Bacteroides genuscounts). Interestingly, libraries O1 and O2 cluster in thenormal/lean clade.
All the individuals exhibited a variety of genera. Although,Prevotella genus dominated the libraries, bacteria of genusBacteroides were seen to be dominant in obese and surgi-cally treated obese individuals in comparison with normaland lean except L3 (P<0.05). Interestingly, the Bacteroides
and Prevotella population accounts between 12% and 62%of the total eubacterial population in rumen contents of sheepand cow (Wood et al. 1998). Their dominance among theseurban individuals unders tudy is intriguing, as their associa-tion with cattle is minimal; however, this association cannotbe neglected among their ancestors. A huge population invillages still uses dried cow dung as fuel and resides inhouses coated with cow feces (Raghavachari 1961). Recent-ly, Butyrivibrio fibrisolvens, a cattle rumen bacterium (Fir-micute), was reported in the feces of 52% adults and 60%children from an Indian village, but not in urban children(Balamurugan et al. 2009). Additionally, the role of diet indetermining herbivore-like gut microbiota cannot beneglected as Indians eat a lot more plant-based food incomparison to their Western counterparts (Sinha et al.2003). A comparative analysis of gut microbiota from vari-ous mammals showing different dietary habits, ranging fromcarnivore to herbivore, demonstrated variable microbialcommunity characterized by their diet and phylogeny(Ley et al. 2008).
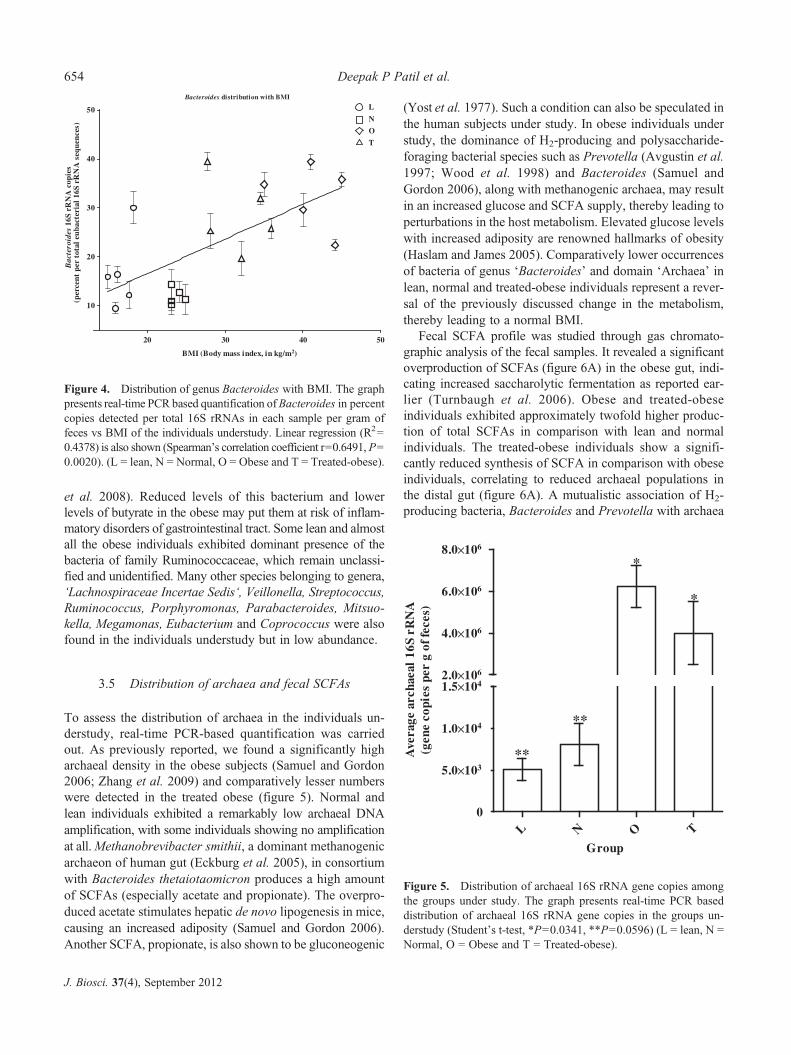
Dominance of Bacteroides among the obese individualswas further confirmed by means of real-time PCR (figure 4),which demonstrated a positive correlation between Bacter-oides distribution and BMI in our subjects. These well-known bacteria have numerous beneficial and adverseeffects on human health (Wexler 2007). Their large genomesencompass an enriched set of enzymatic machinery for di-gestion of indigestible carbohydrates making them efficientpolysaccharide (cellulose, hemicellulose, starch and pectin)foragers (Flint et al. 2008). Interestingly, Bacteroides wereearlier correlated to weight gain and diabetes in pregnantwomen (Collado et al. 2008) and also diabetes-prone rats(Roesch et al. 2009). These bacteria are also shown to beassociated with ulcerative colitis (Lucke et al. 2006). More-over, some of the Bacteroides species produce faecapen-taenes (Huycke and Gaskins 2004), which is a potentin vitro mutagen. Some Firmicutes also show an enrichedset of glycoside hydrolases, e.g.Eubacterium rectal (Turnbaugh
L1 L2 L3 L4 L5 N1 N2 N3 N4 N5 O1 O2 O3 O4 O5 T1 T2 T3 T4 T50
20
40
60
80
100BacteroidetesFirmicutesProteobacteriaunclassified Bacteria
Actinobacteria
Individuals
Per
cent
dis
trib
utio
n of
bac
teri
a
Figure 2. Phylum-based comparison. The stacked bar graphdescribes the percent distribution of fecal microbiota across the subjectsunderstudy (L = lean, N = Normal, O = Obese and T = Treated-obese).
Table 4. Distance-based OTUs, species richness estimates, anddiversity indices
LibrariesObservedOTUs
Richnessestimators Diversity indices
ACE Chao I Shannon(H)
Simpson(1-D)
Lean L1 30 60.48 45.60 2.5020 0.1212
L2 53 76.82 64.88 3.3013 0.0636
L3 63 120.10 103.10 3.0537 0.0937
L4 26 57.74 42.50 2.4989 0.1088
L5 66 118.10 122.10 3.5338 0.0463
Normal N1 37 64.31 54.00 3.2777 0.0403
N2 25 35.54 29.00 2.6200 0.1153
N3 22 78.49 67.33 1.0658 0.6467
N4 36 60.87 58.67 2.8924 0.0919
N5 63 111.00 107.00 3.6737 0.0369
Obese O1 29 45.43 38.75 2.8442 0.0775
O2 44 63.50 63.00 3.0723 0.0918
O3 25 58.63 46.00 2.1740 0.2353
O4 22 22.36 22.00 2.6563 0.1047
O5 50 270.80 186.70 3.6865 0.0217
Treated-Obese
T1 33 59.96 63.00 2.6815 0.1145
T2 55 250.80 211.00 3.1267 0.0809
T3 46 74.08 69.00 2.8881 0.1189
T4 78 172.10 137.40 3.8024 0.0475
T5 43 91.97 80.50 2.8849 0.1043
OTU grouping is reported at 0.03 level, which refers to 3% distanceand corresponds to the bacterial species level. L, N, O & T aredescribed in the table 1 legend.
652 Deepak P Patil et al.
J. Biosci. 37(4), September 2012

et al. 2006). However, we did not find dominance of thisbacterium in any of the obese individuals under study.
Butyrate producing bacteria such as Faecalibacterium wereseen in smaller numbers but comparatively higher percen-tages in the normal gut in comparison with the others. These
bacteria actively participate in butyrate synthesis, which actsas an energy source for colonocytes and is known to exhibitbeneficial effects on the gut health (Flint et al. 2007). Faeca-libacterium prausnitzii is shown to have anti-inflammatoryproperties and epidemiology of Crohn’s disease (Sokol
Alistipes-O5-87 374 bases
Sutterella-LI2-44 374 bases
Comamonas-T3-125 374 bases
unclassified Enterobacteriacea 374 ...
Paracoccus-LI1-102 374 bases
Agrobacterium-T2-48 374 bases
Streptococcus-O2-134 374 bases
Lactobacillus-O5-5 374 bases
Erysipelotrichaceae 374 bases
Allobaculum-N5-126 374 bases
unclassified Erysipelotrichace 374 ...
Catenibacterium-O1-104 374 bases
Coriobacterineae-N5-140 374 bases
Veillonella-T3-31 374 bases
Dialister-O5-188 374 bases
Megasphaera-O5-158 374 bases
Acidaminococcus-O2-181 374 bases
Mitsuokella-O2-43 374 bases
Megamonas-T1-52 374 bases
unclassified Veillonellaceae-T 374 ...
unclassified Ruminococcaceae 374 bases
Papillibacter-O5-174 374 bases
Sporobacter-O2-90 374 bases
Ruminococcaceae 374 bases
Ruminococcus-O5-184 374 bases
Anaerotruncus-LI5-6 374 bases
Subdoligranulum-O5-71 374 bases
Faecalibacterium-O5-157 374 bases
Peptostreptococcaceae 374 bases
Clostridiaceae 374 bases
unclassified Incertae 374 bases
Anaerovorax-O5-92 374 bases
Butyrivibrio-LI5-307 374 bases
Dorea-O5-72 374 bases
Lachnospira-O2-183 374 bases
unclassified Lachnospiraceae 374 bases
Roseburia-O2-186 374 bases
Lachnospiraceae 374 bases
Coprococcus-N2-169 374 bases
0.000.050.100.15
Bacteroides
Parabacteroides
Paludibacter
unclassified Prevotellaceae
unclassified Porphyromonadaceae
Tannerella
Hallella
Prevotella
unclassified Rikenellaceae
Alistipes
Sutterella
Comamonas
unclassified Enterobacteriaceae
Paracoccus
Agrobacterium
Streptococcus
Lactobacillus
Erysipelotrichaceae Incertae Sedis
Allobaculum
unclassified Erysipelotrichaceae
Catenibacterium
Coriobacterineae
Veillonella
Dialister
Megasphaera
Acidaminococcus
Mitsuokella
Megamonas
unclassified Veillonellaceae
unclassified "Ruminococcaceae"
Papillibacter
Sporobacter
Ruminococcaceae Incertae Sedis
Ruminococcus
Anaerotruncus
Subdoligranulum
Faecalibacterium
Peptostreptococcaceae Incertae Sedis
Clostridiaceae
unclassified Incertae Sedis XI
Anaerovorax
Butyrivibrio
Dorea
Lachnospira
unclassified "Lachnospiraceae"
Roseburia
Lachnospiraceae Incertae Sedis
Coprococcus
Bacteroidetes
Firm
icutes
Color key (%)
0
<=1
1-2
2-3
3-4
4-5
5-10
10-20
20-30
30-40
40-50
50-60
60-70
70-80
80-90
90-100
Figure 3. Genus-based comparison and microbial similarities. The heatmap represents clustering of bacterial communities with theirpercent distribution across the subjects at the genus level. The bacterial communities or OTUs were clustered phylogenetically byneighbour-joining method and the libraries were clustered by profile pattern by Unifrac analysis. Color key for the distribution is presentedin the right corner (L = lean, N = Normal, O = Obese and T = Treated-obese).
Gut microbiota in obesity in Indian individuals 653
J. Biosci. 37(4), September 2012
et al. 2008). Reduced levels of this bacterium and lowerlevels of butyrate in the obese may put them at risk of inflam-matory disorders of gastrointestinal tract. Some lean and almostall the obese individuals exhibited dominant presence of thebacteria of family Ruminococcaceae, which remain unclassi-fied and unidentified. Many other species belonging to genera,‘Lachnospiraceae Incertae Sedis‘, Veillonella, Streptococcus,Ruminococcus, Porphyromonas, Parabacteroides, Mitsuo-kella, Megamonas, Eubacterium and Coprococcus were alsofound in the individuals understudy but in low abundance.
3.5 Distribution of archaea and fecal SCFAs
To assess the distribution of archaea in the individuals un-derstudy, real-time PCR-based quantification was carriedout. As previously reported, we found a significantly higharchaeal density in the obese subjects (Samuel and Gordon2006; Zhang et al. 2009) and comparatively lesser numberswere detected in the treated obese (figure 5). Normal andlean individuals exhibited a remarkably low archaeal DNAamplification, with some individuals showing no amplificationat all.Methanobrevibacter smithii, a dominant methanogenicarchaeon of human gut (Eckburg et al. 2005), in consortiumwith Bacteroides thetaiotaomicron produces a high amountof SCFAs (especially acetate and propionate). The overpro-duced acetate stimulates hepatic de novo lipogenesis in mice,causing an increased adiposity (Samuel and Gordon 2006).Another SCFA, propionate, is also shown to be gluconeogenic
(Yost et al. 1977). Such a condition can also be speculated inthe human subjects under study. In obese individuals understudy, the dominance of H2-producing and polysaccharide-foraging bacterial species such as Prevotella (Avgustin et al.1997; Wood et al. 1998) and Bacteroides (Samuel andGordon 2006), along with methanogenic archaea, may resultin an increased glucose and SCFA supply, thereby leading toperturbations in the host metabolism. Elevated glucose levelswith increased adiposity are renowned hallmarks of obesity(Haslam and James 2005). Comparatively lower occurrencesof bacteria of genus ‘Bacteroides’ and domain ‘Archaea’ inlean, normal and treated-obese individuals represent a rever-sal of the previously discussed change in the metabolism,thereby leading to a normal BMI.
Fecal SCFA profile was studied through gas chromato-graphic analysis of the fecal samples. It revealed a significantoverproduction of SCFAs (figure 6A) in the obese gut, indi-cating increased saccharolytic fermentation as reported ear-lier (Turnbaugh et al. 2006). Obese and treated-obeseindividuals exhibited approximately twofold higher produc-tion of total SCFAs in comparison with lean and normalindividuals. The treated-obese individuals show a signifi-cantly reduced synthesis of SCFA in comparison with obeseindividuals, correlating to reduced archaeal populations inthe distal gut (figure 6A). A mutualistic association of H2-producing bacteria, Bacteroides and Prevotella with archaea
Bacteroides distribution with BMI
20 30 40 50
10
20
30
40
50 L
N
O
T
BMI (Body mass index, in kg/m2)
Bac
tero
ides
16S
rR
NA
cop
ies
(per
cent
per
tot
al e
ubac
teri
al 1
6S r
RN
A s
eque
nces
)
Figure 4. Distribution of genus Bacteroides with BMI. The graphpresents real-time PCR based quantification ofBacteroides in percentcopies detected per total 16S rRNAs in each sample per gram offeces vs BMI of the individuals understudy. Linear regression (R2=0.4378) is also shown (Spearman’s correlation coefficient r=0.6491, P=0.0020). (L = lean, N = Normal, O = Obese and T = Treated-obese).
L N O T
0
5.0×10³
1.0×10⁴
1.5×1042.0×106
4.0×10⁶
6.0×10⁶
8.0×10⁶
*
*
**
**
Group
Ave
rage
arc
haea
l 16
S rR
NA
(gen
e co
pies
per
g o
f fec
es)
Figure 5. Distribution of archaeal 16S rRNA gene copies amongthe groups under study. The graph presents real-time PCR baseddistribution of archaeal 16S rRNA gene copies in the groups un-derstudy (Student’s t-test, *P=0.0341, **P=0.0596) (L = lean, N =Normal, O = Obese and T = Treated-obese).
654 Deepak P Patil et al.
J. Biosci. 37(4), September 2012
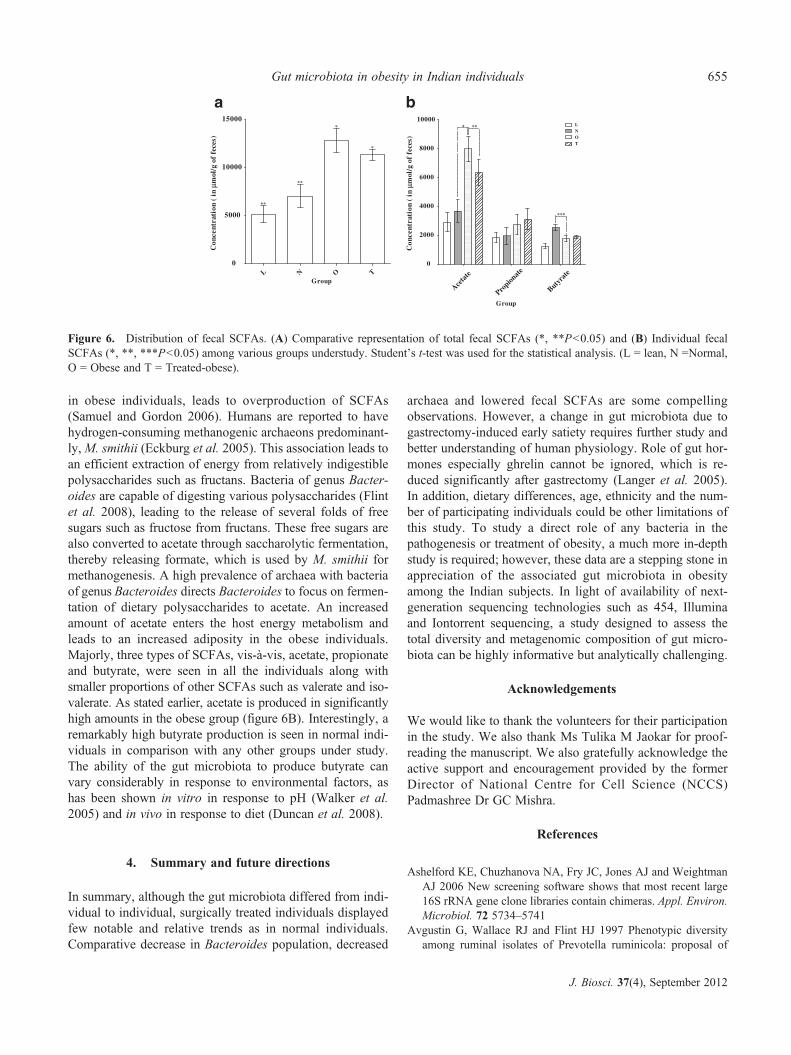
in obese individuals, leads to overproduction of SCFAs(Samuel and Gordon 2006). Humans are reported to havehydrogen-consuming methanogenic archaeons predominant-ly,M. smithii (Eckburg et al. 2005). This association leads toan efficient extraction of energy from relatively indigestiblepolysaccharides such as fructans. Bacteria of genus Bacter-oides are capable of digesting various polysaccharides (Flintet al. 2008), leading to the release of several folds of freesugars such as fructose from fructans. These free sugars arealso converted to acetate through saccharolytic fermentation,thereby releasing formate, which is used by M. smithii formethanogenesis. A high prevalence of archaea with bacteriaof genus Bacteroides directs Bacteroides to focus on fermen-tation of dietary polysaccharides to acetate. An increasedamount of acetate enters the host energy metabolism andleads to an increased adiposity in the obese individuals.Majorly, three types of SCFAs, vis-à-vis, acetate, propionateand butyrate, were seen in all the individuals along withsmaller proportions of other SCFAs such as valerate and iso-valerate. As stated earlier, acetate is produced in significantlyhigh amounts in the obese group (figure 6B). Interestingly, aremarkably high butyrate production is seen in normal indi-viduals in comparison with any other groups under study.The ability of the gut microbiota to produce butyrate canvary considerably in response to environmental factors, ashas been shown in vitro in response to pH (Walker et al.2005) and in vivo in response to diet (Duncan et al. 2008).
4. Summary and future directions
In summary, although the gut microbiota differed from indi-vidual to individual, surgically treated individuals displayedfew notable and relative trends as in normal individuals.Comparative decrease in Bacteroides population, decreased
archaea and lowered fecal SCFAs are some compellingobservations. However, a change in gut microbiota due togastrectomy-induced early satiety requires further study andbetter understanding of human physiology. Role of gut hor-mones especially ghrelin cannot be ignored, which is re-duced significantly after gastrectomy (Langer et al. 2005).In addition, dietary differences, age, ethnicity and the num-ber of participating individuals could be other limitations ofthis study. To study a direct role of any bacteria in thepathogenesis or treatment of obesity, a much more in-depthstudy is required; however, these data are a stepping stone inappreciation of the associated gut microbiota in obesityamong the Indian subjects. In light of availability of next-generation sequencing technologies such as 454, Illuminaand Iontorrent sequencing, a study designed to assess thetotal diversity and metagenomic composition of gut micro-biota can be highly informative but analytically challenging.
Acknowledgements
We would like to thank the volunteers for their participationin the study. We also thank Ms Tulika M Jaokar for proof-reading the manuscript. We also gratefully acknowledge theactive support and encouragement provided by the formerDirector of National Centre for Cell Science (NCCS)Padmashree Dr GC Mishra.
References
Ashelford KE, Chuzhanova NA, Fry JC, Jones AJ and WeightmanAJ 2006 New screening software shows that most recent large16S rRNA gene clone libraries contain chimeras. Appl. Environ.Microbiol. 72 5734–5741
Avgustin G, Wallace RJ and Flint HJ 1997 Phenotypic diversityamong ruminal isolates of Prevotella ruminicola: proposal of
L N O T
0
5000
10000
15000
**
**
*
*
Group
Con
cent
rati
on (
in
µmol
/g o
f fe
ces)
Aceta
te
Propion
ate
Butyra
te0
2000
4000
6000
8000
10000LNOT
* **
***
Group
Con
cent
rati
on (
in
µmol
/g o
f fe
ces)
a b
Figure 6. Distribution of fecal SCFAs. (A) Comparative representation of total fecal SCFAs (*, **P<0.05) and (B) Individual fecalSCFAs (*, **, ***P<0.05) among various groups understudy. Student’s t-test was used for the statistical analysis. (L = lean, N =Normal,O = Obese and T = Treated-obese).
Gut microbiota in obesity in Indian individuals 655
J. Biosci. 37(4), September 2012
Prevotella brevis sp. nov., Prevotella bryantii sp. nov. and Pre-votella albensis sp. nov. and redefinition of Prevotella rumini-cola. Int. J. Syst. Bacteriol. 47 284–288
Backhed F, Ding H, Wang T, Hooper LV, Koh GY, Nagy A,Semenkovich CF and Gordon JI 2004 The gut microbiota asan environmental factor that regulates fat storage. Proc. Natl.Acad. Sci. USA 101 15718–15723
Balamurugan R, Chittaranjan SP, Chandragunasekaran AM andRamakrishna BS 2009 Molecular detection of the ruminal bac-terium, Butyrivibrio fibrisolvens, in feces from rural residencesof Southern India.. Microb. Ecolo. Health Dis. 21 38–43
Ben-Dov E, Shapiro OH, Siboni N and Kushmaro A 2006 Advan-tage of using inosine at the 3' termini of 16S rRNA geneuniversal primers for the study of microbial diversity. Appl.Environ. Microbiol. 72 6902–6906
Choban PS, Jackson B, Poplawski S and Bistolarides P 2002Bariatric surgery for morbid obesity: why, who, when, how,where, and then what?. Cleve. Clin. J. Med. 69 897–903
Cole JR, Chai B, Farris RJ, Wang Q, Kulam SA, McGarrell DM,Garrity GM and Tiedje JM 2005 The Ribosomal DatabaseProject (RDP-II): sequences and tools for high-throughputrRNA analysis. Nucleic Acids Res. 33 D294–D296
Collado MC, Isolauri E, Laitinen K and Salminen S 2008 Distinctcomposition of gut microbiota during pregnancy in overweightand normal-weight women. Am. J. Clin. Nutr. 88 894–899
Cummings DE and Schwartz MW 2003 Genetics and pathophysi-ology of human obesity. Annu. Rev. Med. 54 453–471
Deepa M, Farooq S, Deepa R, Manjula D and Mohan V 2009Prevalence and significance of generalized and central bodyobesity in an urban Asian Indian population in Chennai, India(CURES: 47). Eur. J. Clin. Nutr. 63 259–267
DeSantis TZ, Jr., Hugenholtz P, Keller K, Brodie EL, Larsen N,Piceno YM, Phan R and Andersen GL 2006 NAST: a multiplesequence alignment server for comparative analysis of 16SrRNA genes. Nucleic Acids Res. 34 W394-W399
Duncan SH, Lobley GE, Holtrop G, Ince J, Johnstone AM, Louis Pand Flint HJ 2008 Human colonic microbiota associated with diet,obesity and weight loss. Int. J. Obes. (London) 32 1720–1724
Eckburg PB, Bik EM, Bernstein CN, Purdom E, Dethlefsen L,Sargent M, Gill SR, Nelson KE and Relman DA 2005 Diversityof the human intestinal microbial flora. Science 308 1635–1638
Einen J, Thorseth IH and Ovreas L 2008 Enumeration of Archaeaand Bacteria in seafloor basalt using real-time quantitative PCRand fluorescence microscopy. FEMS Microbiol. Lett. 282 182–187
Ewing B, Hillier L, Wendl MC and Green P 1998 Base-calling ofautomated sequencer traces using phred. I. Accuracy assess-ment. Genome Res. 8 175–185
Fierer N, Jackson JA, Vilgalys R and JacksonRB 2005Assessment ofsoil microbial community structure by use of taxon-specific quan-titative PCR assays. Appl. Environ. Microbiol. 71 4117–4120
Flint HJ, Bayer EA, Rincon MT, Lamed R and White BA 2008Polysaccharide utilization by gut bacteria: potential for newinsights from genomic analysis. Nat. Rev. Microbiol. 6 121–131
Flint HJ, Duncan SH, Scott KP and Louis P 2007 Interactionsand competition within the microbial community of thehuman colon: links between diet and health. Environ. Microbiol.9 1101–1111
Haslam DW and James WP 2005 Obesity. Lancet 366 1197–1209Hill JO and Peters JC 1998 Environmental contributions to the
obesity epidemic. Science 280 1371–1374Huycke MM and Gaskins HR 2004 Commensal bacteria, redox
stress, and colorectal cancer: mechanisms and models. Exp. Biol.Med. (Maywood. ) 229 586–597
Langer FB, Reza Hoda MA, Bohdjalian A, Felberbauer FX,Zacherl J, Wenzl E, Schindler K, Luger A, Ludvik B and PragerG 2005 Sleeve gastrectomy and gastric banding: effects onplasma ghrelin levels. Obes. Surg. 15 1024–1029
Layton A, McKay L, Williams D, Garrett V, Gentry R and Sayler G2006 Development of Bacteroides 16S rRNA gene TaqMan-based real-time PCR assays for estimation of total, human, andbovine fecal pollution in water. Appl. Environ. Microbiol. 724214–4224
Ley RE, Backhed F, Turnbaugh P, Lozupone CA, Knight RD andGordon JI 2005 Obesity alters gut microbial ecology. Proc. Natl.Acad. Sci. USA 102 11070–11075
Ley RE, Hamady M, Lozupone C, Turnbaugh PJ, Ramey RR,Bircher JS, Schlegel ML, Tucker TA, Schrenzel MD, KnightR and Gordon JI 2008 Evolution of mammals and their gutmicrobes. Science 320 1647–1651
Ley RE, Turnbaugh PJ, Klein S and Gordon JI 2006 Microbialecology: human gut microbes associated with obesity. Nature444 1022–1023
Lintsi M, Kaarma H and Kull I 2004 Comparison of hand-to-hand bioimpedance and anthropometry equations versus dual-energy X-ray absorptiometry for the assessment of body fatpercentage in 17–18-year-old conscripts. Clin. Physiol Funct.Imaging 24 85–90
Lozupone C and Knight R 2005 UniFrac: a new phylogeneticmethod for comparing microbial communities. Appl. Environ.Microbiol. 71 8228–8235
Lucke K, Miehlke S, Jacobs E and Schuppler M 2006 Prevalence ofBacteroides and Prevotella spp. in ulcerative colitis. J. Med.Microbiol. 55 617–624
Murphy KG and Bloom SR 2006 Gut hormones and the regulationof energy homeostasis. Nature 444 854–859
Nadal I, Santacruz A, Marcos A, Warnberg J, Garagorri M, MorenoLA, Martin-Matillas M, Campoy C, et al. 2009 Shifts in clos-tridia, bacteroides and immunoglobulin-coating fecal bacteriaassociated with weight loss in obese adolescents. Int. J. Obes.(Lond) 33 758–767
Noverr MC and Huffnagle GB 2004 Does the microbiotaregulate immune responses outside the gut? Trends Micro-biol. 12 562–568
Raghavachari TN S 1961 Cow dung and Insanitary Flooring. JAMA178 680
Rakoff-Nahoum S, Paglino J, Eslami-Varzaneh F, Edberg S andMedzhitov R 2004 Recognition of commensal microflora bytoll-like receptors is required for intestinal homeostasis. Cell118 229–241
Rautava S and Isolauri E 2002 The development of gut immuneresponses and gut microbiota: effects of probiotics in preventionand treatment of allergic disease. Curr. Iss. Intest. Microbiol. 315–22
Roesch LF, Lorca GL, Casella G, Giongo A, Naranjo A, PionzioAM, Li N, Mai V, et al. 2009 Culture-independent identification
656 Deepak P Patil et al.
J. Biosci. 37(4), September 2012
of gut bacteria correlated with the onset of diabetes in a ratmodel. ISME J. 3 536–548
Romualdi C, Bortoluzzi S, D'Alessi F and Danieli GA 2003IDEG6: a web tool for detection of differentially expressedgenes in multiple tag sampling experiments. Physiol Genomics12 159–162
Samuel BS and Gordon JI 2006 A humanized gnotobiotic mousemodel of host-archaeal-bacterial mutualism. Proc. Natl. Acad.Sci. U S A 103 10011–10016
Schloss PD and Handelsman J 2005 Introducing DOTUR, a com-puter program for defining operational taxonomic units andestimating species richness. Appl. Environ. Microbiol. 711501–1506
Schneider BE and Mun EC 2005 Surgical management of morbidobesity. Diabetes Care 28 475–480
Shamseddeen H, Getty JZ, Hamdallah IN and Ali MR 2011 Epi-demiology and economic impact of obesity and type 2 diabetes.Surg. Clin. North Am. 91 1163–72, vii
Sinha R, Anderson DE, McDonald SS and Greenwald P 2003Cancer risk and diet in India. J. Postgrad. Med. 49 222–228
Sokol H, Pigneur B, Watterlot L, Lakhdari O, Bermudez-HumaranLG, Gratadoux JJ, Blugeon S, Bridonneau C, et al. 2008 Fae-calibacterium prausnitzii is an anti-inflammatory commensalbacterium identified by gut microbiota analysis of Crohn diseasepatients. Proc. Natl. Acad. Sci. US A 105 16731–16736
Stappenbeck TS, Hooper LV and Gordon JI 2002 Developmentalregulation of intestinal angiogenesis by indigenous microbes viaPaneth cells. Proc. Natl. Acad. Sci. USA 99 15451–15455
Stevens CE and Hume ID 1998 Contributions of microbes invertebrate gastrointestinal tract to production and conservationof nutrients. Physiol. Rev. 78 393–427
Tamura K, Dudley J, Nei M and Kumar S 2007 MEGA4: Molec-ular Evolutionary Genetics Analysis (MEGA) software version4.0. Mol. Biol. Evol. 24 1596–1599
Terranova L, Busetto L, Vestri A and Zappa MA 2012 Bariatricsurgery: cost-effectiveness and budget impact. Obes. Surg. 22646–653
Thompson D and Wolf AM 2001 The medical-care cost burden ofobesity. Obes. Rev. 2 189–197
Turnbaugh PJ, Hamady M, Yatsunenko T, Cantarel BL, Duncan A,Ley RE, Sogin ML, Jones WJ, et al. 2009 A core gut micro-biome in obese and lean twins. Nature 457 480–484
Turnbaugh PJ, Ley RE, Mahowald MA, Magrini V, Mardis ER andGordon JI 2006 An obesity-associated gut microbiome withincreased capacity for energy harvest. Nature 444 1027–1031
Walker AW, Duncan SH, Leitch ECM, Child MW and Flint HJ 2005pH and peptide supply can radically alter bacterial populations andshort-chain fatty acid ratios withinmicrobial communities from thehuman colon. Appl. Environ. Microbiol. 71 3692–3700
Wexler HM 2007 Bacteroides: the good, the bad and the nitty-gritty. Clin. Microbiol. Rev. 20 593–621
Wood J, Scott KP, Avgustin G, Newbold CJ and Flint HJ 1998Estimation of the relative abundance of different Bacteroidesand Prevotella ribotypes in gut samples by restriction enzymeprofiling of PCR-amplified 16S rRNA gene sequences. Appl.Environ. Microbiol. 64 3683–3689
Yost WM, Young JW, Schmidt SP and McGilliard AD 1977Gluconeogenesis in ruminants: propionic acid production froma high-grain diet fed to cattle. J. Nutr. 107 2036–2043
Zhang H, DiBaise JK, Zuccolo A, Kudrna D, Braidotti M, Yu Y,Parameswaran P, Crowell MD, Wing R, Rittmann BE andKrajmalnik-Brown R 2009 Human gut microbiota in obesity andafter gastric bypass. Proc. Natl. Acad. Sci. USA 106 2365–2370
MS received 12 March 2012; accepted 29 June 2012
Corresponding editor: SUDHA BHATTACHARYA
Gut microbiota in obesity in Indian individuals 657
J. Biosci. 37(4), September 2012