diet and kwashiorkor: a prospective study from rural dr · pdf filediet and kwashiorkor: a...
TRANSCRIPT

Submitted 22 November 2013Accepted 27 March 2014Published 15 April 2014
Corresponding authorHallgeir Kismul,[email protected]
Academic editorJara Perez-Jimenez
Additional Information andDeclarations can be found onpage 13
DOI 10.7717/peerj.350
Copyright2014 Kismul et al.
Distributed underCreative Commons CC-BY 3.0
OPEN ACCESS
Diet and kwashiorkor: a prospectivestudy from rural DR CongoHallgeir Kismul, Jan Van den Broeck and Torleif Markussen Lunde
Centre for International Health, University of Bergen, Norway
ABSTRACTThe etiology of kwashiorkor remains enigmatic and longitudinal studies examiningpotential causes of kwashiorkor are scarce. Using historical, longitudinal study datafrom the rural area of Bwamanda, Democratic Republic of Congo, we investigatedthe potential causal association between diet and the development of kwashiorkorin 5 657 preschool children followed 3-monthly during 15 months. We compareddietary risk factors for kwashiorkor with those of marasmus. Kwashiorkor was diag-nosed as pitting oedema of the ankles; marasmus as abnormal visibility of skeletalstructures and palpable wasting of the gluteus muscle. A 24-h recall was administered3-monthly to record the consumption of the 41 locally most frequent food items.We specified Hanley–Miettinen smooth-in-time risk models containing potentialcausal factors, including food items, special meals prepared for the child, breastfeed-ing, disease status, nutritional status, birth rank, age, season and number of meals.Bayesian Information Criteria identified the most plausible causal model of whysome children developed kwashiorkor. In a descriptive analysis of the diet at the lastdietary assessment prior to development of kwashiorkor, the diet of children whodeveloped kwashiorkor was characterized by low consumption of sweet potatoes,papaya and “other vegetables” [0.0% , 2.3% (95% CI [0.4, 12.1]) and 2.3% (95% CI[0.4, 12.1])] in comparison with children who did not develop kwashiorkor [6.8%(95% CI [6.4, 7.2]), 15.5% (95% CI [15, 16.1]) and 15.1% (95% CI [14.6, 15.7])]or children who developed marasmus [4.5% (95% CI [2.6, 7.5]) 11.8% (95% CI[8.5, 16.0]) and 17.6% (95% CI [13.7, 22.5])]. Sweet potatoes and papayas have highβ-carotene content and so may some of “the other vegetables”. We found that a riskmodel containing an age function, length/height-for age Z-score, consumption ofsweet potatoes, papaya or other vegetables, duration of this consumption and itsinteraction term, was the most plausible model. Among children aged 10–42 months,the risk of developing kwashiorkor increased with longer non-consumption of thesefoods. The analysis was repeated with only children who developed marasmus as thereference series, yielding similar results. Our study supports that β-carotene may playan important role in the protection against kwashiorkor development.
Subjects Epidemiology, Global Health, NutritionKeywords Malnutrition, Kwashiorkor, Marasmus, Food items, β-carotene, Papaya, Sweet potato,Wild vegetables, DR Congo
How to cite this article Kismul et al. (2014), Diet and kwashiorkor: a prospective study from rural DR Congo. PeerJ 2:e350;DOI 10.7717/peerj.350

INTRODUCTIONMalnutrition contributes significantly to the high under-five year mortality in the world
and as an underlying factor it has been estimated that it contributes to over one third of all
child deaths (Lim, 2012). Mortality is very high among children with marasmus, and even
higher among those with kwashiorkor (Briend, Wojtyniak & Rowland, 1987; Prudhon et
al., 1997). Kwashiorkor and marasmus are characterised by different metabolic response to
severe undernutrition (Badaloo et al., 2006; Jahoor et al., 2008).
Kwashiorkor has been linked to diet since its first description. Williams (1935), who
introduced the name kwashiorkor, suggested protein undernutrition as the etiology
of kwashiorkor. The association of kwashiorkor with low protein intake has later been
questioned. So far no research has demonstrated that children with kwashiorkor consume
less protein than children with marasmus. Golden & Ramdath (1987) proposed excess
free radicals as the explanation of clinical findings in kwashiorkor. Relations between
antioxidant depletion and the occurrence of kwashiorkor have been investigated, but the
role of oxidative stress as primary cause of kwashiorkor is still debated (Ciliberto et al.,
2005; Lenhartz et al., 1998; Manary, Leeuwenburgh & Heinecke, 2000). We would like to
remark that there are difficulties with the oxidative hypothesis. As an example oxidative
stress is present in HIV but studies have found oedematous malnutrition to occur in a
minority among HIV seropositive patients who are severely malnourished (Asafo-Agyei,
Antwi & Nguah, 2013).
To our knowledge there are only two observational longitudinal studies that have
examined the relations between diet diversity and kwashiorkor. Investigating protein-
calorie malnutrition, a study following Indian children from birth to 3 years examined
differences in diet between children developing kwashiorkor and children developing
marasmus (Gopalan, 1992). A more recent study examined dietary factors determining
kwashiorkor by assessing diet of one to three years old Malawian children (Lin et al.,
2007). The former study did not find significant differences in diet between children who
developed kwashiorkor and those who developed marasmus, while the latter did not find
differences between those who developed kwashiorkor and those who did not (Gopalan,
1992; Lin et al., 2007).
The overall aim of our study is to investigate, in a large longitudinal population-based
study, the possible association between diet and the development of kwashiorkor. We also
wanted to compare the causal influence of dietary risk factors for kwashiorkor with those
of marasmus. We performed this analysis by applying the causal investigation method
proposed by Miettinen and the statistical approach by Hanley and Miettinen, using a
random sample of person moments from the entire dynamic population as the reference
series (Hanley & Miettinen, 2009; Miettinen, 2010).
METHODThe Bwamanda studyWe did a secondary analysis of the historical data from the Bwamanda study, conducted
from 1989 to 1991 in a rural area of the northwest part of the Democratic Republic
Kismul et al. (2014), PeerJ, DOI 10.7717/peerj.350 2/16

of Congo, (DRC), located at 19.2 degrees east and 3.2 degrees north. The people of
Bwamanda are, up till today, predominantly subsistence farmers and the basic diet consists
of mainly of maize, cassava supplemented with fish, vegetables and fruits. Health care in
the area is provided by a central hospital and 10 minor health centres with a few of these
providing some limited nutritional rehabilitation services. With virtually unchanged living
conditions in the study area, the secondary analysis was viewed to be contemporary and
relevant.
Study designThe Bwamanda study was a dynamic population study with follow-up including
thrice-monthly survey rounds, making up 15 months of follow-up and 6 contacts. At
the first round 4 235 preschool children were enrolled and at the last round a total of
5 657 were enrolled. A full description of the study population can be found in Van den
Broeck, Eeckels & Vuylsteke (1993). Trained interviewers conducted interviews according
to an interviewer’s manual. They determined the children’s age on the basis of birth date
noted on children’s road to health chart or on parents’ identity paper or on the basis of an
interview using a local events calendar.
Children were examined for kwashiorkor by using the presence of pitting oedema of the
feet or ankles as a criterion. All children were examined for marasmus through inspection
of abnormal visibility of skeletal structures and by absence or near-absence of palpable
gluteus muscle. A locally constructed measuring board was used for measuring the length
of children below 24 months, while a microtoise was used for measuring children older
than 24 months. In both cases length was measured to the nearest 0.1 cm. A spring scale
(CMS weighting equipment) was used to weigh the children to the nearest 100 g. We
applied the WHO Child Growth Standard for anthropometric scoring (World Health
Organization, 2006). Z-scores were calculated for weight for length/height (WHZ) and for
length/height for age (HAZ).
At each contact interviewers undertook face-to-face interviews with the most proximal
caregiver of the child, usually the biological mother. The questionnaire included a single
non-quantitative 24-h recall with the 41 locally most consumed food items listed and
interviewees providing “yes or no” answers to the questions if children had consumed the
listed food items during the previous day. The food items had been identified through
a pilot study. The interviewees were also asked about number of meals prepared for the
families, special meals prepared for the child and breastfeeding.
Statistical methodIn an initial descriptive analysis, we tabulated the percentage (95% confidence interval) of
individuals eating the different items, grouped by those who developed kwashiorkor, those
who did not and those who developed marasmus. We used a two-sample test for equality of
proportions to test if the fractions were different.
Here, we were interested in estimation of risks of developing kwashiorkor specific to
age, diet, frequency of food consumption, and infectious diseases. We were also interested
in the duration of a particular diet; did a child eat a food item at each visit occurring
Kismul et al. (2014), PeerJ, DOI 10.7717/peerj.350 3/16

every three months over the last 15 months, or only at, for example, one of the interview
rounds prior to developing kwashiorkor. Smooth-in-time hazard functions as proposed by
Hanley and Miettinen allow this type of analysis (Hanley & Miettinen, 2009). We specified
Hanley–Miettinen smooth-in-time risk models containing all potential causal factors,
including food items, special meals prepared for the child, breastfeeding, disease status,
nutritional status, birth rank, age, season and number of meals. To select a representative
sample from the study population we used the method proposed by Miettinen, and used
the whole study population as reference series (Miettinen, 2010). In the analysis we include
all new cases of kwashiorkor, but use a representative sample of the non-cases. With a
relatively small number of cases, there is little to be gained by letting the number of
non-cases become arbitrarily large, having in mind the computational cost of running
the model. Results are reported as log-odds ratios (LOR) and risk reductions. In line with
this method we took the dataset to consist of 35 person moments (c) where kwashiorkor
was observed as the case series, and a representative sample (b) of the infinite number of
person moments that constitute the 46 397 person-months in the study base. We use a
(b)/(c)-ratio of 150 assuring variances and covariance have minimal errors (less than 1
percentage) compared to using the entire series.
Age function and age as a risk factorGiven that risk is not changing linearly with age, as seen in Fig. 1, we developed an
age variable that accounted for nonlinear change in risk. Such transformations are
required when risk does not change linearly with age. Accordingly age was included as
an independent variable in the model. Based on visual inspection of how kwashiorkor was
distributed according to age, a transformation of the age variable was done:
f (age) = a exp(−b Age) ∗ exp(−a exp(−b Age)). (1)
To find the parameters a and b, we optimized Eq. (2) with binomial errors using logistic
regression.
y = a + b ∗ f (age). (2)
The AIC (Akaike Information criteria Information criteria) was used to compare models.
To find the parameters which minimized AIC we used an algorithm combining the golden
section search and successive parabolic interpolation, an efficient and automated method
to find the best model. Here we used the optimize function in R to find the parameters
which minimized AIC, resulting in a = 11.55, and b = 0.90 (Brent, 1973).
Other risk factorsThe risk factors associated with kwashiorkor were defined in two steps; first we specified
a log-linear hazard model with binomial errors where the independent variables were all
food types, presence or absence of diarrhoea, and stunting and wasting at last visit. We
defined time as the natural logarithm of number of months a person had, or had not,
consumed a specific food item. We assumed that the food items reported at a given point in
Kismul et al. (2014), PeerJ, DOI 10.7717/peerj.350 4/16

Figure 1 Three months prevalence of kwashiorkor according to age in months in intervals of sixmonths. Prevalence of kwashiorkor (y-axis) against age in months (x-axis). Prevalence aggregated byage group. Short vertical blue lines indicate age groups. Black dots indicate age of those children whodeveloped kwashiorkor. Age at first time a child was observed with kwashiorkor was used.
time were consumed up until the next contact, with the interview during the current visit
providing data on any alterations in the consumption patterns since the previous contact.
Each variable was multiplied with the natural logarithm of time the item had been
consumed or not. Next, we used the BIC (Bayesian Information Criteria) implemented
in R’s MASS package (stepAIC) to find the most plausible model based on our data; the
posteriori most probable candidate model. The fitted candidate model corresponding
to the lowest value of BIC is the candidate model corresponding to the highest Bayesian
posterior probability.
Based on the selected model we address the risk of developing kwashiorkor given a prior
personal profile. We report risk reduction estimates on the basis of profiles.
To test if the model could also explain the difference between subjects who developed
marasmus from those who developed kwashiorkor we applied the final selected model,
with the same 35 person moments (c2) where kwashiorkor was observed as the case series,
but this time with the references constituted by a sample of the infinite number of person
moments including 1 173 person-months observed in 372 new cases of marasmus.
RESULTSTable 1 reports the distribution of age, the HAZ score and the WHZ score for children
with different nutritional status. It shows that children with kwashiorkor were younger
Kismul et al. (2014), PeerJ, DOI 10.7717/peerj.350 5/16

Table 1 Age distribution, length/height-for-age Z-scores (HAZ), and weight-for-length/height Z-score (WHZ) for children with different clinical nutritional status. Z-scores based on the WHO-2006Child Growth Standards [17].
Age in month HAZ WHZ
Q10 Q50 Q90 Q10 Q50 Q90 Q10 Q50 Q90
Kwashiorkor 15.9 26.5 38.4 −4.3 −2.3 −0.8 −2.5 −1.0 0.1
Reference population 7.4 35.9 66.5 −2.9 −1.4 −0.1 −1.4 −0.1 1.2
Marasmus 10.8 28.8 64.0 −4.5 −2.7 −1.2 −2.8 −1.3 0.1
Table 2 Disease status (% of children), sex and age distribution at survey round prior to first obser-vation of kwashiorkor or marasmus. The numbers (n) refer to number of observations.
Normal Kwashiorkor Marasmus
n = 20 114 n = 41 n = 451
Coughing (%) 35.5 (34.8, 36.1) 34.1 (20.5, 50.7) 43.0 (39.7, 48.5)
Diarrhoea (%) 5.1 (4.8, 5.4) 14.6 (6.1, 29.9) 12.1 (9.4, 15.4)
Anaemia (%) 17.4 (16.9, 18.0) 39.0 (24.6, 55.5) 23.9 (20.3, 27.9)
Fever (%) 10.8 (10.3, 11.2) 15.4 (6.4, 31.2) 16.9 (13.8, 20.5)
Dehydrated (%) 0.4 (0.3, 0.5) 7.3 (1.9, 21.0) 4.9 (3.2, 7.3)
Sex (% male) 51.2 (49.9, 52.5) 47.7 (32.7, 63.1) 60.7 (55.9, 65.3)
Age in months. First round(Q10, Q50, Q90)
6.9, 32.5, 61.1 8.8, 18.1, 29.4 5.3, 24.8, 60.1
than children with no kwashiorkor and marasmus. HAZ and WHZ scores were lower in
children with kwashiorkor than in children with no kwashiorkor, but HAZ and WHZ
scores were lower in children with marasmus than in children with kwashiorkor. Table 2
shows that the proportion of children with diarrhoea and anaemia was significantly higher
in children with kwashiorkor and marasmus than in normal children. The percentage
of children that were dehydrated was also highest in children with kwashiorkor and
marasmus. In addition the table shows that there were significantly more boys than girls
with marasmus.
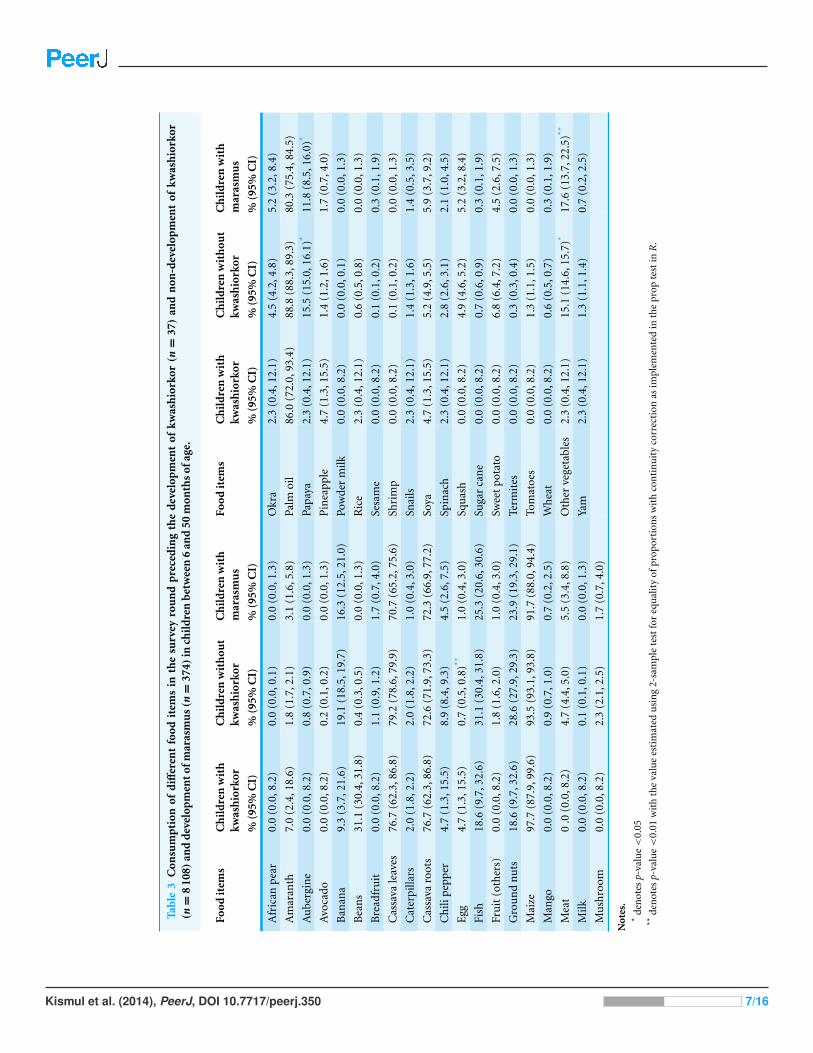
Table 3 reports the consumption of different food items by the children in the survey
round prior to the incidence of kwashiorkor. A high proportion of the children had con-
sumed cassava roots, maize and cassava leaves. The proportion who had consumed cassava
roots and maize was non-significantly higher for those who developed kwashiorkor, but
for cassava leaves the consumption was lowest for the children with kwashiorkor. The
proportion of children who had consumed yam, pineapple, citrus, snails, and eggs was
non-significantly higher for the children who developed kwashiorkor than for the others.
On the other hand the proportion of children with kwashiorkor who had consumed okra,
ground nuts, banana, squash, meat, chili, fish and other vegetables was non-significantly
lower than for the rest. There were no significant differences in proportion of children
who had consumed palm oil between children who developed kwashiorkor and the
Kismul et al. (2014), PeerJ, DOI 10.7717/peerj.350 6/16
Tabl
e3
Con
sum
pti
onof
diff
eren
tfo
odit
ems
inth
esu
rvey
rou
nd
pre
ced
ing
the
dev
elop
men
tof
kwas
hio
rkor
(n=
37)
and
non
-dev
elop
men
tof
kwas
hio
rkor
(n=
810
8)an
dd
evel
opm
ento
fmar
asm
us(n
=37
4)in
chil
dre
nb
etw
een
6an
d50
mon
ths
ofag
e.
Food
item
sC
hil
dre
nw
ith
kwas
hio
rkor
Ch
ild
ren
wit
hou
tkw
ash
iork
orC
hil
dre
nw
ith
mar
asm
us
Food
item
sC
hil
dre
nw
ith
kwas
hio
rkor
Ch
ild
ren
wit
hou
tkw
ash
iork
orC
hil
dre
nw
ith
mar
asm
us
%(9
5%C
I)%
(95%
CI)
%(9
5%C
I)%
(95%
CI)
%(9
5%C
I)%
(95%
CI)
Afr
ican
pea
r0.
0(0
.0,8
.2)
0.0
(0.0
,0.1
)0.
0(0
.0,1
.3)
Okr
a2.
3(0
.4,1
2.1)
4.5
(4.2
,4.8
)5.
2(3
.2,8
.4)
Am
aran
th7.
0(2
.4,1
8.6)
1.8
(1.7
,2.1
)3.
1(1
.6,5
.8)
Palm
oil
86.0
(72.
0,93
.4)
88.8
(88.
3,89
.3)
80.3
(75.
4,84
.5)
Au
berg
ine
0.0
(0.0
,8.2
)0.
8(0
.7,0
.9)
0.0
(0.0
,1.3
)Pa
paya
2.3
(0.4
,12.
1)15
.5(1
5.0,
16.1
)*11
.8(8
.5,1
6.0)
*
Avo
cado
0.0
(0.0
,8.2
)0.
2(0
.1,0
.2)
0.0
(0.0
,1.3
)P
inea
pple
4.7
(1.3
,15.
5)1.
4(1
.2,1
.6)
1.7
(0.7
,4.0
)
Ban
ana
9.3
(3.7
,21.
6)19
.1(1
8.5,
19.7
)16
.3(1
2.5,
21.0
)Po
wde
rm
ilk0.
0(0
.0,8
.2)
0.0
(0.0
,0.1
)0.
0(0
.0,1
.3)
Bea
ns
31.1
(30.
4,31
.8)
0.4
(0.3
,0.5
)0.
0(0
.0,1
.3)
Ric
e2.
3(0
.4,1
2.1)
0.6
(0.5
,0.8
)0.
0(0
.0,1
.3)
Bre
adfr
uit
0.0
(0.0
,8.2
)1.
1(0
.9,1
.2)
1.7
(0.7
,4.0
)Se
sam
e0.
0(0
.0,8
.2)
0.1
(0.1
,0.2
)0.
3(0
.1,1
.9)
Cas
sava
leav
es76
.7(6
2.3,
86.8
)79
.2(7
8.6,
79.9
)70
.7(6
5.2,
75.6
)Sh
rim
p0.
0(0
.0,8
.2)
0.1
(0.1
,0.2
)0.
0(0
.0,1
.3)
Cat
erpi
llars
2.0
(1.8
,2.2
)2.
0(1
.8,2
.2)
1.0
(0.4
,3.0
)Sn
ails
2.3
(0.4
,12.
1)1.
4(1
.3,1
.6)
1.4
(0.5
,3.5
)
Cas
sava
root
s76
.7(6
2.3,
86.8
)72
.6(7
1.9,
73.3
)72
.3(6
6.9,
77.2
)So
ya4.
7(1
.3,1
5.5)
5.2
(4.9
,5.5
)5.
9(3
.7,9
.2)
Ch
ilip
epp
er4.
7(1
.3,1
5.5)
8.9
(8.4
,9.3
)4.
5(2
.6,7
.5)
Spin
ach
2.3
(0.4
,12.
1)2.
8(2
.6,3
.1)
2.1
(1.0
,4.5
)
Egg
4.7
(1.3
,15.
5)0.
7(0
.5,0
.8)**
1.0
(0.4
,3.0
)Sq
uas
h0.
0(0
.0,8
.2)
4.9
(4.6
,5.2
)5.
2(3
.2,8
.4)
Fish
18.6
(9.7
,32.
6)31
.1(3
0.4,
31.8
)25
.3(2
0.6,
30.6
)Su
gar
can
e0.
0(0
.0,8
.2)
0.7
(0.6
,0.9
)0.
3(0
.1,1
.9)
Fru
it(o
ther
s)0.
0(0
.0,8
.2)
1.8
(1.6
,2.0
)1.
0(0
.4,3
.0)
Swee
tpo
tato
0.0
(0.0
,8.2
)6.
8(6
.4,7
.2)
4.5
(2.6
,7.5
)
Gro
un
dn
uts
18.6
(9.7
,32.
6)28
.6(2
7.9,
29.3
)23
.9(1
9.3,
29.1
)Te
rmit
es0.
0(0
.0,8
.2)
0.3
(0.3
,0.4
)0.
0(0
.0,1
.3)
Mai
ze97
.7(8
7.9,
99.6
)93
.5(9
3.1,
93.8
)91
.7(8
8.0,
94.4
)To
mat
oes
0.0
(0.0
,8.2
)1.
3(1
.1,1
.5)
0.0
(0.0
,1.3
)
Man
go0.
0(0
.0,8
.2)
0.9
(0.7
,1.0
)0.
7(0
.2,2
.5)
Wh
eat
0.0
(0.0
,8.2
)0.
6(0
.5,0
.7)
0.3
(0.1
,1.9
)
Mea
t0
.0(0
.0,8
.2)
4.7
(4.4
,5.0
)5.
5(3
.4,8
.8)
Oth
erve
geta
bles
2.3
(0.4
,12.
1)15
.1(1
4.6,
15.7
)*17
.6(1
3.7,
22.5
)**
Milk
0.0
(0.0
,8.2
)0.
1(0
.1,0
.1)
0.0
(0.0
,1.3
)Ya
m2.
3(0
.4,1
2.1)
1.3
(1.1
,1.4
)0.
7(0
.2,2
.5)
Mu
shro
om0.
0(0
.0,8
.2)
2.3
(2.1
,2.5
)1.
7(0
.7,4
.0)
Not
es.
*de
not
esp-
valu
e<
0.05
**de
not
esp-
valu
e<
0.01
wit
hth
eva
lue
esti
mat
edu
sin
g2-
sam
ple
test
for
equ
alit
yof
prop
orti
ons
wit
hco
nti
nu
ity
corr
ecti
onas
impl
emen
ted
inth
epr
opte
stin
R.
Kismul et al. (2014), PeerJ, DOI 10.7717/peerj.350 7/16

other children. The diet of children who developed kwashiorkor was characterized by low
consumption of sweet potatoes, papaya and “other vegetables” [0.0%, 2.3% (95% CI [0.4,
12.1]) and 2.3% (95% CI [0.4, 12.1])]. In comparison the children who did not develop
kwashiorkor had higher consumption of sweet potatoes, papaya and “other vegetables”
[6.8% (95% CI [6.4, 7.2]), 15.5% (95% CI [15, 16.1]) and 15.1% (95% CI [14.6, 15.7])].
The children who developed marasmus also had higher consumption of these food items
than the children who developed kwashiorkor [4.5% (95% CI [2.6, 7.5]) 11.8% (95% CI
[8.5, 16.0]) and 17.6% (95% CI [13.7, 22.5])].
Given that the β-carotene could be the main acting agent in sweet potatoes, papaya
and “other vegetables” we constructed a variable, PaSV (papaya, sweet potato and “other
vegetables”), which combined all these items, weighted by the β-carotene content of 100 g
of each item. The weighting of sweet potatoes equalled 1 and papaya 1/3. The variable
“other vegetables” includes taro, taro leaves and wild vegetables. Taro leaves are rich in
β-carotene and a study from DRC shows that wild vegetables are also rich in β-carotene
(Termote et al., 2012). The PaSV variable did not encompass cassava leaves and amaranth.
Since we have not been able to determine the more precise content of the other vegetables
in our study, we have weighted the “other vegetables” low, with the weighing equal to 1/10.
For the construction of smooth-in-time risk models we defined time for this combined
variable as for the single food items.
The most probable model based on BIC included age, time, PaSV, and HAZ. The two
variables were correlated (R2= 0.50). As seen in Fig. 1 the risk of developing kwashiorkor
was highest in the age interval between 16 and 38 months.
Table 4 shows the coefficients for the non-proportional hazard model with person mo-
ments sampled from the entire population. The log-odds for the continuous variable HAZ;
LOR −0.8 (CI 95% [−1.1, −0.5]), length/height for age Z-score, describes an increased
risk of developing kwashiorkor with lower height for age. Chronic malnourished children
on average have a negative HAZ score, hence the negative log-odds. We found the log-odds
for the time variable to be LOR 4.7 (CI 95% [3.4, 6.1]), for the combined variable for food
items containing β-carotene it was LOR −9.2 (CI 95% [−21.0, −3.1]), for PaSV, and their
interaction it was LOR 8.1 (CI 95% [−11.1, −2.1]). These findings must be understood
together. A child not consuming the PaSV food items will have PaSV = 0, and thus the
interaction term is also zero. The risk of developing kwashiorkor therefore increases the
longer the child does not consume the PaSV food items. On the other hand, as illustrated
in Fig. 2 a child consuming PaSV food items, PaSV >0, will reduce the risk over time. The
overall model fit was good with an AIC of 251.3 and a Nagelkerke R2 index of 0.44.
Table 5 shows the findings from sampling control-moments only from children who
developed marasmus. The table shows that the HAZ score for those who developed
marasmus is the same as the HAZ score for the children who developed kwashiorkor
(LOR = 0.0, CI 95% [−0.1, 0.2]). Then again it shows that there is a difference with regards
to consumption of products containing β-carotene with the LOR for PaSV being −6.8 (CI
95% [−17.8, −1.7]) and for PaSV combined with the time variable T the LOR was −6.3
(CI 95% [−9.0, −0.8]). The age of children who developed kwashiorkor was also different
Kismul et al. (2014), PeerJ, DOI 10.7717/peerj.350 8/16

Table 4 The coefficients for the non-proportional hazard model with person moments sampled fromthe entire population. The age variable is a transformation based on the distribution of kwashiorkoracross age. T is a variable that describes the duration of consuming a food item containing β-carotene.PaSV is a variable that combines papaya, “other vegetables” and sweet potatoes and weighted by theβ-carotene content of 100 g of the item. The height-for-age Z-scores (HAZ) are based on the WHO-2006Child Growth Standards [17].
Term Log odds—estimate Confidence interval, 95%
Intercept −15.5 −18.1, −13.4
Age function of age (months) 10.1 6.1, 14.8
T months 4.7 3.4 , 6.1
PaSV −9.2 −21.0, −3.1
HAZ −0.8 −1.1, −0.5
T ∗ PaSV −8.1 −11.1, −2.1
Figure 2 Risk reduction for developing kwashiorkor showing reduction of consuming β-carotene richproducts according to age in months. The dotted line is risk reduction after two months, dashed line afterfour months, and solid line after six months. (A) shows risk reduction for a child with a height-for-ageZ-score (HAZ) of minus five, (B) for a child with HAZ of minus three, and (C) a child with HAZ of zero.HAZ-scores are based on the WHO-2006 Child Growth Standards [17].
Kismul et al. (2014), PeerJ, DOI 10.7717/peerj.350 9/16

Table 5 The coefficients for the non-proportional hazard model with reference person momentsdrawn from people developing marasmus. The age variable is based on the distribution of kwashiorkoracross age. T is a variable that describes the duration of consuming a food item containing β-carotene.PaSV is a variable that includes papaya, “other vegetables” and sweet potatoes weighted by the β-carotenecontent of 100 g of the item. Height-for-age Z-scores (HAZ) are based on the WHO-2006 Child GrowthStandards [17].
Term Log odds—estimate Confidence interval, 95%
Intercept −9.7 −12.1, −7.7
Age function of age (months) 7.9 4.3, 12.1
T months 4.2 3.2, 5.4
PaSV −6.8 −17.8, −1.7
HAZ 0.0 −0.3, 0.2
T ∗ PaSV −6.3 −9.0, −0.8
from children who developed marasmus with LOR being 7.9 (CI 95% [4.3, 12.1]). The age
of children with marasmus was distributed within the age of 11–64 months, while the age
of children with kwashiorkor mainly fell between 16 and 38 months, reaching a top around
26 months.
Ethical approval for the Bwamanda study was granted by the University of Leuven’s
Tropical Childcare Health Working Group. Community consent was obtained verbally
from community leaders, whereas individual verbal consent was obtained from children’s
caretakers.
DISCUSSIONOur study shows that the children who developed kwashiorkor were mainly stunted
children aged 16–38 months. Their diet was characterized by a low or no consumption
of sweet potatoes, papaya and “other vegetables”. The children who developed marasmus
resembled the children who developed kwashiorkor by being stunted. However, the
consumption of papaya, sweet potatoes and “other vegetables” were lower among children
with kwashiorkor than among marasmic children. Sweet potatoes, papaya and “other
vegetables” are characterised by their high β-carotene content. We found that the risk of
developing kwashiorkor increased the longer the child did not consume these food items.
We emphasize the importance of β-carotene because it is a substance with significant
antioxidant activities. Also, sweet potatoes, papaya and what we have termed “other
vegetables” contain several other carotenoids that have antioxidant activities. As a result
the various carotenoids, the mixture of carotenoids or carotenoids in association with
other antioxidants in these food items can have played important roles in the protective
pathway in kwashiorkor.
Children who developed kwashiorkor also consumed palm oil, with the oil being rich
in β-carotene. In Bwamanda palm oil is extracted locally and mostly stored in bottles,
often being exposed to strong sunlight. Palm oil is used for preparing cassava leaves stew.
The oil is mixed with cassava leaves and boiled in a pot for an hour. Studies show that
carotenoids are vulnerable to degradation. It is especially their unsaturated structures
Kismul et al. (2014), PeerJ, DOI 10.7717/peerj.350 10/16
that make them sensitive to heat, oxygen and light (Leskova et al., 2006). A study from
Nigeria on heating of palm oil demonstrated that the amount of β-carotene declined with
temperature increase and that the destruction of β-carotene was greater when the oil was
heated continuously for 30 min at any given temperature (Mudambi & Rajagopa, 2006).
Another study on heating red palm oil showed that all trans-β-carotene were almost lost
after 20 min (Fillion & Henry, 1998). Thus given that local practices expose palm oil to
sunlight and long duration cooking it is unlikely that palm oil consumption would have
compensated for the lack of provitamin A in the local diet. However we would like to
mention that intervention studies with red palm oil have found improved vitamin A status
(Bhaskaram et al., 2003).
Besides our study there are only two other observational longitudinal studies we know
of that examine the relationship between diet and the development of kwashiorkor: the
Gopalan (1992) study of Indian children up to 10 years and Lin et al. (2007) study on
Malawian children. While our study analyses diet with reference to a variety of food items,
Gopalan’s study concentrated on differences in terms of protein-calorie consumption.
Gopalan did not find evidence that there were any differences in the protein calorie intake
between cases of marasmus and kwashiorkor. The study conducted by Lin et al. (2007)
actually found that the daily intake of vitamin A equivalents was low among children who
developed kwashiorkor, but not significantly lower than in the control group. The diets
of the study population in these studies were monotonous and therefore to some extent
resembled the diet in Bwamanda. The diet of Indian children was based on rice and millet,
while the diet of the Malawian children was corn-based supplemented by small fish. The
diet in Bwamanda consisted to a large extent of maize, cassava roots and cassava leaves.
Golden & Ramdath (1987) suggested that kwashiorkor results from oxidative stress
and a general deficiency in protective mechanism that could reduce the oxidative damage
with most of the protective pathways necessitating micronutrients. Before target specific
antibodies have been produced, immune cells generate and release reactive oxygen species
(Strobel, Tinz & Biesalski, 2007). These oxidative bursts have been shown to be important
in the early phase of for example malaria infections. Oxidative burst can lead to haemolysis
and cellular dysfunction (Isaksson et al., 2013). Since carotenoids can act as important
antioxidants our findings support theories that relate kwashiorkor to oxidative stress and
the importance of micronutrients in the protective pathways (Sergio, 1999; Strobel, Tinz &
Biesalski, 2007).
A case-control study examined the antioxidant hypotheses by comparing the diet in
siblings of children presenting with marasmus and children with kwashiorkor (Sullivan
et al., 2006). It concluded that siblings of children with kwashiorkor consumed egg and
tomatoes less frequently than children with marasmus did. We note that the differences in
consumption between the two were minor.
Studies have questioned the hypothesis that antioxidant depletion causes kwashiorkor.
In a controlled trial from Malawi, Ciliberto et al. (2005) assessed the efficiency of
antioxidant supplementation in preventing kwashiorkor in children aged 1–4 years. The
intervention arm received antioxidant powder containing riboflavin, vitamin E, selenium
Kismul et al. (2014), PeerJ, DOI 10.7717/peerj.350 11/16
and N-acetylcysteine, while the control arm received a placebo of an identical looking
powder. According to Ciliberto et al. (2005) the study showed that the supplementation of
antioxidant powder did not prevent children from developing kwashiorkor. We noted that
the study did not include supplementation of provitamin A and therefore does not address
the efficiency of provitamin A in preventing kwashiorkor. The study did not provide
baseline data about study participants’ diet. The study design does not, therefore, allow
for examining how dietary variables might have influenced the treatment with antioxidant
powder and the influence of such variables on the development of kwashiorkor.
As far as we know the Bwamanda study is, excepting Gopalan (1992) and Lin et al.
(2007), the only observational longitudinal study that describes the diet of children
who develop kwashiorkor and marasmus. The results from our study support the
hypothesis that kwashiorkor is caused by oxidative stress, supporting the role that food
containing carotenoids plays in the protective pathway. In Bwamanda the dietary sources
of preformed vitamin A are limited and pro-vitamin A carotenoid constitutes a major
source of vitamin A. The pro-vitamin A carotenoids including β-carotene, can through
cleavage be converted into retinaldehyde (a form of vitamin A). Studies have shown
that the bioavailability of provitamin A carotenoids is less than of preformed vitamin A
(de Pee et al., 1995; de Pee et al., 1998). Our study proposes that the consumption of fruits
plays a role in reducing the risk of developing kwashiorkor. In comparison with green leafy
vegetables and carrots, fruits are also more effective in improving vitamin A status among
children (de Pee et al., 1998).
Studies have shown that there is a relationship between diet and infection during
the development of kwashiorkor and that recurrent infections contributes to hypo-
albuminaemia and the development of oedema (Frood, 1971; Whitehead, 1977). We also
know that vitamin A modulates many types of specific and non-specific immune system
and those vitamin deficiencies have a negative impact on different types of immunity
functions (Stephensen, 2001; Villamor & Fawzi, 2005). In this manner provitamin A can
play a role in reducing the severity of a number of types of infections and we speculate that
provitamin A played a role in reducing the risk of developing oedema among chronically
malnourished children in Bwamanda.
The strength of our study is that in a large population-based study we have managed to
examine the dietary diversity over a long period of children who developed kwashiorkor
and marasmus. The study design has also some disadvantages. Given that information on
diet was based on 24 h recall we were not able to determine food consumed in between
the follow up period. Furthermore, we have limited information on the quantity of food
consumed and we are therefore not in a position to determine the amount of pro-vitamin
vitamin A consumed by the children. In our analysis we assumed that the food items
reported at a given point in time were consumed up to the next survey round. Given that
food consumption is characterised by individual variances this assumption represents
a weakness. We also realise that our findings require confirmation, preferably in a large
randomised trial that examines the development of kwashiorkor in a trial of carotenoids
supplementation.
Kismul et al. (2014), PeerJ, DOI 10.7717/peerj.350 12/16
In conclusion, this is the first observational longitudinal study that demonstrates
a relationship between diet diversity and the development of kwashiorkor. We have
suggested that the consumption of a diet that includes food items containing carotenoids
reduces the risk in children aged 10–71 months of developing kwashiorkor. Our findings
should be considered as a support to ongoing efforts that aim at promoting a diverse
agricultural and horticulture production and in this manner stimulate consumption of a
more varied diet. In rural communities where there is a shortage of vitamin A rich food it
is in particular important to promote increased production of vegetables and fruits rich in
carotenoids including sweet potatoes and papaya.
ACKNOWLEDGEMENTSWe would like to thank Roger Eeckels who participated in the initiation and conducting of
the Bwamanda study.
ADDITIONAL INFORMATION AND DECLARATIONS
FundingThe study was funded by the University of Bergen and the Nutricia Research Foundation.
The funders had no role in study design, data collection and analysis, decision to publish,
or preparation of the manuscript.
Grant DisclosuresThe following grant information was disclosed by the authors:
University of Bergen and the Nutricia Research Foundation.
Competing InterestsThe authors declare there are no competing interests.
Author Contributions• Hallgeir Kismul conceived and designed the experiments, performed the experiments,
analyzed the data, wrote the paper, prepared figures and/or tables, reviewed drafts of the
paper.
• Jan Van den Broeck conceived and designed the experiments, performed the experi-
ments, contributed reagents/materials/analysis tools, reviewed drafts of the paper.
• Torleif Markussen Lunde conceived and designed the experiments, performed the
experiments, analyzed the data, prepared figures and/or tables, reviewed drafts of the
paper.
Human EthicsThe following information was supplied relating to ethical approvals (i.e., approving body
and any reference numbers):
Ethical approval for the Bwamanda study was granted by the University of Leuven’s
Tropical Childcare Health Working Group.
Kismul et al. (2014), PeerJ, DOI 10.7717/peerj.350 13/16

Data DepositionAs the principle investigator Jan Van den Broeck is the custodian of the Bwamanda dataset.
Please contact Jan Van den Broeck for access to the dataset: [email protected].
Supplemental InformationSupplemental information for this article can be found online at http://dx.doi.org/
10.7717/peerj.350.
REFERENCESAsafo-Agyei SB, Antwi S, Nguah SB. 2013. HIV infection in severely malnourished children in
Kumasi, Ghana: a cross-sectional prospective study. BMC Pediatrics 13:181DOI 10.1186/1471-2431-13-181.
Badaloo AV, Forrester T, Reid M, Jahoor F, Jahoor F. 2006. Lipid kinetic differences betweenchildren with kwashiorkor and those with marasmus. American Journal of Clinical Nutrition83:1283–1288.
Bhaskaram P, Radhika MS, Balakrishna N, Ramalakshmi BA. 2003. Red palm oil supplementa-tion: a feasible diet-based approach to improve maternal and neonatal vitamin A status andhealth. Journal of Womens Health & Gender-Based Medicine 12:428–428.
Brent RP. 1973. Algorithms for minimization without derivatives. Englewood Cliffs, NJ:Prentice-Hall.
Briend A, Wojtyniak B, Rowland MGM. 1987. Arm circumference and other factors in children athigh-risk of death in rural Bangladesh. Lancet 2:725–728 DOI 10.1016/S0140-6736(87)91084-1.
Ciliberto H, Ciliberto M, Briend A, Ashorn P, Bier D, Manary M. 2005. Antioxidantsupplementation for the prevention of kwashiorkor in Malawian children: randomised, doubleblind, placebo controlled trial. BMJ 330:1–5 DOI 10.1136/bmj.38427.404259.8F.
de Pee S, West CE, Muhilal KD, Hautvast JG. 1995. Lack of improvement in vitamin A status withincreased consumption of dark-green leafy vegetables. Lancet 346:75–81DOI 10.1016/S0140-6736(95)92111-7.
de Pee S, West CE, Permaesih D, Martuti S, Muhilal, Hautvast JG. 1998. Orange fruit is moreeffective than are dark-green, leafy vegetables in increasing serum concentrations of retinoland beta-carotene in schoolchildren in Indonesia. American Journal of Clinical Nutrition68:1058–1067.
Fillion L, Henry CJK. 1998. Nutrient losses and gains during frying: a review. International Journalof Food Sciences and Nutrition 49:157–168 DOI 10.3109/09637489809089395.
Frood JD. 1971. Relationship between pattern of infection and development of hypoalbuminaemiaand hypo-beta-lipoproteinaemia in rural Ugandan children. Lancet 2:1047–1049DOI 10.1016/S0140-6736(71)90375-8.
Golden MH, Ramdath D. 1987. Free radicals in the pathogenesis of kwashiorkor. Proceedings ofthe Nutrition Society 46:53–68 DOI 10.1079/PNS19870008.
Gopalan C. 1992. Kwashiorkor and marasmus: evolution and distinguishing features. The NationalMedical Journal of India 5:145–151.
Hanley JA, Miettinen OS. 2009. Fitting smooth-in-time prognostic risk functions via logisticregression. International Journal of Biostatistics 5:Article 3 DOI 10.2202/1557-4679.1125.
Kismul et al. (2014), PeerJ, DOI 10.7717/peerj.350 14/16

Isaksson C, Sepil I, Baramidze V, Sheldon B. 2013. Explaining variance of avian malaria infectionin the wild: the importance of host density, habitat, individual life-history and oxidative stress.BMC Ecology 13:1–11 DOI 10.1186/1472-6785-13-15.
Jahoor F, Badaloo A, Reid M, Forrester T. 2008. Protein metabolism in severe childhoodmalnutrition. Annals of Tropical Paediatrics 28:87–101 DOI 10.1179/146532808X302107.
Lenhartz H, Ndasi R, Anninos A, Botticher D, Mayatepek E, Tetanye E, Leichsenring M.1998. The clinical manifestation of the kwashiorkor syndrome is related to increased lipidperoxidation. Journal of Pediatrics 132:879–881 DOI 10.1016/S0022-3476(98)70324-5.
Leskova E, Kubikova J, Kovacikova E, Kosicka M, Porubska J, Holcikova K. 2006. Vitamin losses:retention during heat treatment and continual changes expressed by mathematical models.Journal of Food Composition and Analysis 19:252–276 DOI 10.1016/j.jfca.2005.04.014.
Lim SS. 2012. A comparative risk assessment of burden of disease and injury attributable to 67 riskfactors and risk factor clusters in 21 regions, 1990–2010: a systematic analysis for the GlobalBurden of Disease Study 2010. Lancet 380:2224–2260 DOI 10.1016/S0140-6736(12)61766-8.
Lin CA, Boslaugh S, Ciliberto HM, Maleta K, Ashorn P, Briend A, Manary MJ. 2007. Aprospective assessment of food and nutrient intake in a population of Malawian childrenat risk for kwashiorkor. Journal of Pediatrics Gastroenterology and Nutrition 44:487–493DOI 10.1097/MPG.0b013e31802c6e57.
Manary MJ, Leeuwenburgh C, Heinecke JW. 2000. Increased oxidative stress in kwashiorkor.Journal of Pediatrics 137:421–424 DOI 10.1067/mpd.2000.107512.
Miettinen OS. 2010. Etiologic study vis-a-vis intervention study. European Journal of Epidemiology25:671–675 DOI 10.1007/s10654-010-9486-9.
Mudambi RS, Rajagopa MV. 2006. Effect of heat on the beta-carotene content of Nigerian palmoil. Journal of Food Science and Technology-Mysore 43:1414–1416.
Prudhon C, Golden MHN, Briend A, Mary JY. 1997. A model to standardise mortality of severelymalnourished children using nutritional status on admission to therapeutic feeding centres.European Journal of Clinical Nutrition 51:771–777 DOI 10.1038/sj.ejcn.1600483.
Sergio AR. 1999. b-carotene and other carotenoids as antioxidants. Journal of the American Collegeof Nutrition 18:426–433 DOI 10.1080/07315724.1999.10718880.
Stephensen CB. 2001. Vitamin A, infection, and immune function. Annual Review of Nutrition21:167–192 DOI 10.1146/annurev.nutr.21.1.167.
Strobel M, Tinz J, Biesalski HK. 2007. The importance of beta-carotene as a source of vitamin Awith special regard to pregnant and breastfeeding women. European Journal Nutrition 46(Suppl 1):1–20 DOI 10.1007/s00394-007-1001-z.
Sullivan J, Ndekha M, Maker D, Hotz C, Manary MJ. 2006. The quality of the diet in Malawianchildren with kwashiorkor and marasmus. Maternal and Child Nutrition 2:114–122DOI 10.1111/j.1740-8709.2006.00053.x.
Termote C, Meyi MB, Djailo BD, Huybregts L, Lachat C, Kolsteren P, Van Damme P. 2012. Abiodiverse rich environment does not contribute to a better diet: a case study from DR Congo.PLoS ONE 7:e30533 DOI 10.1371/journal.pone.0030533.
Van den Broeck J, Eeckels R, Vuylsteke J. 1993. Influence of nutritional-status on child-mortalityin rural Zaire. Lancet 341:1491–1495 DOI 10.1016/0140-6736(93)90632-Q.
Villamor E, Fawzi WW. 2005. Effects of vitamin A supplementation on immune responsesand correlation with clinical outcomes. Clinical Microbiology Reviews 18:446–464DOI 10.1128/CMR.18.3.446-464.2005.
Kismul et al. (2014), PeerJ, DOI 10.7717/peerj.350 15/16

Whitehead RG. 1977. Infection and the development of kwashiorkor and marasmus in Africa.American Journal of Clinical Nutrition 30:1281–1284.
Williams CD. 1935. Kwashiorkor: a nutritional disease of children associated with a maize diet.The Lancet 226:1151–1152 DOI 10.1016/S0140-6736(00)94666-X.
World Health Organization W. 2006. Child growth standards: length/height-for-age,weight-for-age, weight-for-length, weight-for-height and body mass index-for-age: methods anddevelopment. Geneva: World Health Organization.
Kismul et al. (2014), PeerJ, DOI 10.7717/peerj.350 16/16