darfur counting the deaths - cred table of contents list of tables 4 list of figures 4 1introduction...
TRANSCRIPT
1
C R E D
Centre for Research on theEpidemiology of Disasters
University of LouvainSchool of Public Health
30 Clos Chapelle aux Champs1200 Brussels
For paper copies,contact Regina Below([email protected])
Darfur: Counting the Deaths
Debarati Guha-SapirOlivier Degomme
with Mark Phelan*
Mortality Estimates fromMultiple Survey Data
May 26, 2005
2
Debarati Guha-Sapir is the director of the Center for Research on the Epidemiology ofDisasters (CRED) and professor of epidemiology and public health at the UniversitéCatholique de Louvain in Brussels.
Olivier Degomme is a medical doctor and is completing a postgraduate degree in publichealth. As a research analyst at CRED, Dr. Degomme has worked on mortality andhealth statistics in Iraq and is a co-lead in the Complex Emergency Database (CE-DAT)project.
Mark Phelan is a public health specialist with extensive experience in complexhumanitarian emergencies including work in Afghanistan, Iraq and the Thai/Burmeseborder region and most recently in Darfur in 2004, where he participated in a regionwide survey with WFP/Centers for Disease Control estimating malnutrition andmortality. He is currently working at the US Department of State, Washington DC.
Disclaimer: Any opinions and views expressed in this report are entirely those of theauthors alone who bear all responsibility.
*Mr. Phelan has contributed the analyses described as Method 2 and participated in discussions on itsmethodology.
Centre for Research on the Epidemiology of Disasters(CRED)
Catholic University of LouvainSchool of Public Health3094, Clos Chapelle aux Champs1200 Brussels, Belgium
www.cred.be
3
Table of Contents
LIST OF TABLES 4LIST OF FIGURES 41 INTRODUCTION 52 REVIEW OF CONFLICT RELATED MORTALITY ESTIMATES FORDARFUR AND EASTERN CHAD 62.1 Building Blocks 6
2.1.1 State/USAID/CIJ/ABA Interviews 72.1.2 WHO Mortality Survey and WHO Mortality Projection 8
2.2 Mortality Estimations 92.2.1 Coalition for International Justice (CIJ) 92.2.2 Other public offices 10
3 RECENT HISTORY 113.1 Initial outbreak of violence (March-September 2003) 113.2 Breakdown of cease-fire/escalation of conflict (October 2003-March 2004) 113.3 Second cease-fire agreement(April-June 2004) 113.4 Increased international humanitarian response (July 2004-January 2005) 124 CURRENT STATISTICS AND DISCUSSION 135 MATERIALS AND METHODS 145.1 Materials 145.2 Methods 18
5.2.1 Method 1 (Center for Research on the Epidemiology of Disasters) 185.2.1.1 Non-violence related mortality 185.2.1.2 Violence-related mortality 195.2.1.3 Crude mortality rate 195.2.1.4 Reference values 205.2.1.5 Universe 20
5.2.2 Method 2 (US Department of State Estimates) 215.2.2.1 Overview 215.2.2.2 Mortality rate estimation 215.2.2.3 Secondary factors used in determining mortality rate estimates 22♦ Trends in Mortality Survey Data 22♦ Historical data 23♦ Nutrition Levels 25
5.2.2.4 High and Low CMR Estimates 27♦ High Estimate 27♦ Low Estimate 27
5.2.2.5 CMR estimation by phases of the conflict 28♦ Initial outbreak of violence (March-September 2003) 28♦ Breakdown of cease-fire/escalation of conflict (October 2003-March 2004) 29♦ Second cease-fire agreement (April-June 2004) 30
5.2.2.6 Affected resident population (non displaced) 325.2.2.7 Population Estimate. 32
6 RESULTS 336.1.1 Method 1 336.1.2 Method 2 366.1.3 Summary 37
7 DISCUSSION 388 ABBREVIATIONS 439 ACKNOWLEDGEMENTS 43

4
List of TablesTable 1: Estimation of affected IDP and resident population in Darfur ...................................................13Table 2: Child mortality rates and malnutrition for the 3 Darfur states and country average (MICS 2000) 13Table 3: Mortality surveys conducted in Darfur and refugee camps in Chad from CE-DAT database (April
2004 - January 2005) ........................................................................................................................14Table 4: Nutrition surveys conducted in Darfur and refugee camps in Chad from CE-DAT database (April
2000 - January 2005) ........................................................................................................................26Table 5: Summary table of total and excess deaths among affected population in Darfur .........................35Table 6: Estimated total and excess mortality figures based on different methods ....................................37
List of FiguresFigure 1: Surveys in West Darfur (Sep 2003 – Jan 2005)...........................................................................15Figure 2: Surveys in North Darfur (Sep 2003 – Jan 2005).........................................................................15Figure 3: Surveys in South Darfur (Sep 2003 – Jan 2005) .........................................................................16Figure 4: Surveys in refugee sites in Chad (Sep 2003 – Jan 2005) ..............................................................16Figure 5: Map of Darfur showing affected areas, IDP location and survey sites (March 2005) ..................17Figure 6: Non-violence related mortality rate in North and West Darfur ..................................................18Figure 7: Affected population in Darfur (Sept 2003 - Jan 2005)................................................................20Figure 8: Number and cause of death in Zalingei and Murnei camps from 26/10/03 to 19/05/04
(MSF/Epicentre, 2004)....................................................................................................................23Figure 9: Arrivals per month in Zalingei and Murnei camps from 28/08/03 to 19/05/04 (MSF/Epicentre,
2004) ...............................................................................................................................................23Figure 10: Mortality rate trends in selected displaced populations.............................................................24Figure 11: Global Acute Malnutrition in Darfur region (Jan 2003 – March 2005) .....................................25Figure 12: Mortality in West Darfur (Mar 2003 – Jan 2005)......................................................................28Figure 13: Mortality in North Darfur (Mar 2003 – Jan 2005)* ..................................................................29Figure 14: Mortality in South Darfur (Mar 2003 – Jan 2005) ....................................................................31Figure 15: Proportion violence related deaths in North and West Darfur .................................................33Figure 16: Crude Mortality Rate for North and West Darfur ....................................................................33Figure 17: Crude Mortality Rate for South Darfur (Sep 2003 – Jan 2005) .................................................34Figure 18: Estimated number of deaths and CMR....................................................................................34Figure 19: Total deaths and excess deaths in Darfur and the Chad Refugee Camps. High and low estimates,
March 2003 – January 2005..............................................................................................................36Figure 20: Upper bound estimates of excess deaths by Darfur state by month. Death estimates for
populations in Chad refugee camps are not represented in this graphic. ...........................................37
5
1 Introduction
The exact number of deaths in the Darfur region due to the conflict will probably
never be known. But most certainly, it is far too many. Estimating mortality in conflicts
is a notoriously difficult exercise, even more so in Darfur where the conditions causing
death are extremely variable. Malnutrition, epidemics and violence occur sporadically,
claiming many lives in some areas and none in others. Recognising the importance of
tracking mortality and estimating deaths, humanitarian aid agencies working in the region
have undertaken mortality surveys among their beneficiaries at different times to assess
the condition of their status and the severity of the crises. These are based on sound
statistical and epidemiological techniques and provide insights into the varying levels of
mortality over the entire region.
Estimating numbers of deaths from surveys depends on representativeness of the
sample, double counting of deaths, under or over-reporting by respondents. Another key
concern is that intensity of the conflict varies over time and in different areas of Darfur
and therefore a blanket application of rates from a few surveys will invariably distort
results.
The humanitarian assistance, although slow in early stages, since the first half of
2004 in Darfur has been massive and is widely acknowledged to have saved many lives.
As humanitarian needs continue to grow the situation today is deteriorating again and it
is clear to the authors that humanitarian aid has to be increased and important
international measures to end the aggression must be taken.
From a majority of deaths being caused by military/violence in the wars in the first
half of the 20th century, armed conflicts over the last 20 years have taken their toll among
the civil populations. Disease and malnutrition have been the main causes of deaths
among civilians in most of the major conflicts of the past two decades. These include
deaths due to lack of access to health care, to food or harvests leading to starvation,
dehydration and disease during displacement. Direct war-related violence on civilians
leading to death (massacres, shootings), while heinous, contributes a small part of the
total deaths, but remains the only direct evidence of the blunt hostility of armed groups
on unarmed inhabitants.
6
In this paper we present two alternate methods that were used to calculate
estimations of mortality in Darfur. The first one was elaborated by epidemiologists at the
Brussels-based Centre for Research on the Epidemiology of Disasters (CRED). The second one
was performed by the Bureau of Intelligence and Research of the US Department of State.
In summary, the CRED method estimated approximately 134,000 total deaths in
Darfur and Eastern Chad over the 17 months from September 2003 to January 2005. Of
these deaths, 120,000 were excess deaths directly attributable to the conflict, 35,000 of
which were violent deaths. The US State Department method estimated a possible range
of 98,000 – 181,000 total deaths over 23 months - from March 2003 to January 2005.
Estimates of excess deaths due to the conflict ranged from 63,000 – 146,000 over the
same period.
2 Review of conflict related mortality estimates for Darfurand eastern Chad
The conflict in Darfur has given rise to a wide range of estimates, from fairly precise
numbers of dead such as 396,563 persons1 to more general statements such as the UN
Office for the Coordination of Humanitarian Affairs’ (OCHA) figure of 180,000.2
Regardless of the levels of mortality reported, we assume that none of these sources may
be considered as having generated politically motivated or deliberately biased results to
make a point. The validity of estimates instead is dependent on methodological rigour
and soundness of the assumptions on which they are based. Lower estimations, if indeed
valid, do not necessarily diminish the severity of the humanitarian situation or express
callousness to the suffering and death in Darfur.
2.1 Building Blocks
There have been numerous estimates put forth on overall death figures in Darfur.
Although originating from various sources, all are based in whole or in large part on the
same two sources, with extrapolation to the broader Darfur population and the entire
length of the conflict. The first source is a collection of 1,132 interviews conducted with
Darfur refugees in eastern Chad by a US State Department/USAID/Coalition for
1 Coalition for International Justice “New Analysis Claims Darfur Deaths Near 400,000: Experts estimate500 people a day are dying.” April 21,2005.http://www.cij.org/pdf/Press_Release_CIJ_Mortality_Study_April_21_2005.pdf2 “180,000 die from Hunger in Darfur.” The Guardian, March 16, 2005.http://www.guardian.co.uk/sudan/story/0,14658,1438471,00.html
7
International Justice (CIJ)/American Bar Association (ABA), hereafter referred to as the
Atrocities Documentation Team (ADT), in July/August 2004. The second is a UN
World Health Organization (WHO) mortality survey of IDP populations of West and
North Darfur in August 2004 with a two month recall period and the subsequent WHO
mortality projection covering a seven month period (March –September 2003).
2.1.1 State/USAID/CIJ/ABA Interviews
The Atrocities Documentation Team’s project was an important effort to reveal
the widespread atrocities occurring in Darfur at a time when awareness of the tragedy
and international response to the crisis was still very limited. These interviews, however,
were not designed in any way to function as a mortality survey nor was there an overall
systematic sampling methodology3 used that could make it representative of the roughly
200,000 refugees that fled to eastern Chad, much less of the entire 2.4 million people
affected of Darfur.
The interviews were semi-structured and qualitative in nature and there was neither
a sample universe indicated (population of which it is intended to be representative) nor
a defined recall period specified in the questionnaire from which a mortality rate could be
accurately calculated. These interviews, and the derived mortality rate, undoubtedly
represent the most violent period of the conflict, prior to any real international presence
or humanitarian assistance, of a cohort tremendously impacted by violence.
The open-ended and qualitative nature of ADT interviews provides not only a sense
of the overall scope of atrocities but also details of their brutality. The inappropriate
misuse of these interviews, however, as a proxy for the aggregate Darfur population for
the entire conflict (despite the availability of other more reliable data, Table 4) has been a
major basis of overestimation of deaths (common in most estimates).
3 There was no overall sampling methodology that determined selection of settlement/camps and thenumber of interviews to be conducted in each location. Instead, non-probability sampling, factors such asaccess, weather, supplies, etc. determined the location and numbers of interviews conducted. In an effortto reduce selection bias at the camp/settlement level, every 10th household was chosen and then onemember was randomly selected for interview.

8
2.1.2 WHO Mortality Survey and WHO Mortality Projection
WHO Mortality Survey
The September 2004 WHO mortality survey of displaced populations, found the
CMR for North Darfur to be 1.5/10,000/day and 2.9/10,000/day in West Darfur. Non-
displaced affected populations were not included in this survey. Deaths attributed to
“injury or violence” represented 21% of deaths in North Darfur and 12% in West
Darfur. Due to security problems, the survey was completed in only one camp (Kalma)
in South Darfur (3.8/10,000/day) representing 73,658 displaced persons.4
WHO Mortality Projection
The WHO survey was representative of a total of 955,812 IDPs (North Darfur-
382,626, West Darfur-489,528, Kalma camp-73,658) for a two-month recall period (June
15 - August 15, 2004). The higher crude mortality rate (CMR) of 2.6/10,000/day was
estimated (after factoring in a survey of a single camp in South Darfur) for the larger
affected Darfur population. While the exact method used for the extrapolation is not
entirely clear it appears that the 2.6 CMR, derived from approximately 956,000 internally
displaced persons (IDPs), was applied to the total 1.8 million affected (both displaced
and non-displaced) population (affected population in September 2004). Application of
this rate to the larger 1.8 million population, allowing for other available information, was
the basis for projected deaths for the preceding seven-month period.
The WHO estimate of October 15, 2004 states “at the end of September
cumulative excess deaths (since March 1) is between 70,000 and 35,000”.5 Unfortunately,
the plausible range suggested by this estimate has been utterly ignored and instead only
the high end 70,000 (or 10,000/month) figure has been used, in large part, as the basis
for the majority of other extrapolations and therefore this partial reading of the estimate
has also contributed to the overall overestimation of deaths. Application of CMRs from
this two-month period, during the hunger season and an outbreak of dysentery-like
illness in El Geneina, West Darfur, to a broader seven-month period, much less to the
4 World Health Organization. “Retrospective Mortality Survey Among the Internally Displaced PopulationGreater Darfur, Sudan. 2004” August, 2004http://www.who.int/disasters/repo/14656.pdf5 World Health Organization. “Mortality projections for Darfur.” October 15, 2004http://www.who.int/mediacentre/news/briefings/2004/mb5/en/
9
entire 27 month-long conflict, is also likely to have contributed to high-end
miscalculations.
The WHO mortality survey and the WHO mortality projections have often been
confused and misguidedly used interchangeably. This has led some to misinterpret a
WHO statement6 indicating exclusion of violent death from the WHO estimate, as also
meaning violent deaths were not included in the WHO mortality surveys. This wrong
assumption has led to double counting of violent deaths in many subsequent projections.
2.2 Mortality Estimations
The numbers put forth on Darfur deaths include impromptu press statements,
circular reporting of other figures, and actual extrapolations. We have chosen to focus on
the prominent cited numbers.
2.2.1 Coalition for International Justice (CIJ)7
The CIJ report estimates the conflict related deaths in Darfur to be 396,563 dead
based on interviews of 1,136 refugees (assumed violent deaths) to which it adds an
average of the two CMRs from the WHO mortality surveys in West and North Darfur
(health related deaths). The report finds a CMR of 3.3/10,000/day. This rate was then
extrapolated over 26 months (February 2003 to April 2005).
This estimate has some limitations. First, the WHO rates were added to the violent
death numbers from the CIJ interviews, as death rates from non-violent causes only
(disease and malnutrition). However, the WHO survey specifically covers violent deaths
and reports the proportion of violent deaths in N and W Darfur separately.8 This
addition, apart from the differences in period and population, results in double counting,
since both include violent deaths.
Second, the interviews were conducted among refugees in Chad who fled extreme
violence in their villages. Their experience was then converted into rates and applied to 6 “These projections have not sought to detail deaths due to violent incidents within Darfur communities -particularly the kinds of incidents that prompted people to flee their villages. A significant percentage ofdeaths - even between June and August 2004 - is associated with violence, though its origins and naturehave not been determined. We have not been able to estimate violence-related deaths.” David Nabarro,WHO, October 15, 20047 Coalition for International Justice. “Press Release, Darfur Mortality Study, 21 April 2005”.http://www.cij.org/pdf/Press_Release_CIJ_Mortality_Study_April_21_2005.pdf
10
the entire affected Darfur population on the assumption that the entire displaced
population experienced the same level of violence and mortality from March 2003 until
the present day.
Consideration of results from surveys such as the one by MSF/Epicentre9, which
shows violence related mortality rates to drop sharply following arrival in camps or
adjusting for the WHO survey that includes violence related deaths, would refine the CIJ
results significantly. Finally, 3.3/10,000/day mortality rate should be reviewed in the light
of the fact that no mortality survey from different NGOs or UN agencies (see Table 4)
has shown a CMR over 1.2 for all causes since fall of 2004.
2.2.2 Other public offices
A UK Parliament report10 has also issued estimates of numbers of dead in Darfur. It
offers the following statement but no new analysis of mortality:
“The World Health Organization’s widely-quoted mortality estimate of70,000 is a gross underestimate. Jan Egeland, the UN Emergency ReliefCoordinator, has stated that the real figure is likely to be several times thatestimate. That is, we suggest, somewhere around 300,000.”
Jan Egeland, the UN Emergency Relief Coordinator in March 2005 stated “Is it
three times that, is it five times that, I don't know, but it's several times the number of
70,000 that have died altogether”11. A week later Egeland clarified by reporting the
180,000 figure — about 10,000 deaths a month from October 2003 until March 200512.
8 World Health Organization. “Retrospective Mortality Survey Among the Internally Displaced PopulationGreater Darfur, Sudan. 2004” pages 14, 219 Depoortere E, Checchi F, Broillet F, Gerstl S, Minetti A, Gayraud O, et al. “Violence and mortality in WestDarfur, Sudan (2003-04): epidemiological evidence from four surveys.” Lancet 2004;364(9442):1315-20.10 UK House of Commons International Development Committee. “Darfur, Sudan and the Responsibilityto Protect, March 30, 2005.”http://www.publications.parliament.uk/pa/cm200405/cmselect/cmintdev/67/67i.pdf11 Reuters. “UN Envoy says Deaths in Darfur Underestimated.” March 9,200512 The Guardian. “180,000 die from Hunger in Darfur.” March 16, 2005.http://www.guardian.co.uk/sudan/story/0,14658,1438471,00.html

11
3 Recent history
The following brief narrative13 illustrates the complex and evolving nature of the
Darfur conflict through four phases and illustrates the vastly differing conditions specific
to each time frame and region. The varying periods are also used as a framework for
disaggregating mortality accordingly.
3.1 Initial outbreak of violence (March-September 2003)
The conflict between the government and two rebel groups in Darfur began in
February 2003 when the Sudan Liberation Movement/Army (SLM/A) and the Justice
and Equality Movement (JEM) carried out the first major attack against a government
airport in North Darfur. The government and its local militia allies responded; the
conflict then spread to other areas of North Darfur, including Malha and Kabkabiyah as
well as parts of West Darfur. In the early stages, the conflict was relatively limited in
scope and resulted in about 110,000 IDPs in North Darfur and an additional 30,000
IDPs in West Darfur by September 2003. The first Sudanese refugees began to arrive in
Chad during this time.
3.2 Breakdown of cease-fire/escalation of conflict (October 2003-March 2004)
Failure to implement the September 2003 cease-fire agreement among the SLM/A,
JEM, and the government was followed by a swift intensification of the conflict and
increased attacks on civilian villages by Janjaweed and government troops. Large-scale
displacement occurred and refugees began to arrive in Chad in large numbers. The
fighting in South Darfur was relatively light during this period.
3.3 Second cease-fire agreement(April-June 2004)
The April 8 cease-fire agreement among the SLM/A, JEM, and the government,
though often violated, led to a significant decrease in the level of violence in Darfur. The
decline in violence was brought about by increased international pressure, a greater
humanitarian presence in Darfur, and the retreat of rebel forces following a series of
battlefield defeats. Violence as a cause of death therefore decreased, but mortality rates
among displaced populations in both Darfur and Chad remained elevated because of the
13Sudan: Death Toll in Darfur, US Department of State Fact sheet, March 25, 2005.http://www.state.gov/s/inr/rls/fs/2005/45105.htm

12
increasingly weakened condition of persons arriving at camps and deficient humanitarian
assistance. Populations in West Darfur and Chad suffered the highest mortality and
morbidity rates because of their inaccessibility from humanitarian aid workers. The
conflict and violence spread south and the IDP population of South Darfur doubled in
June.
Though region-wide mortality rates dropped, a high number of deaths occurred
because of an increase in the affected population throughout Darfur and higher mortality
rates in South Darfur. Non-displaced populations hosting large numbers of displaced
persons also began to experience elevated mortality rates as their water and food
resources became strained and they became more vulnerable to infectious diseases.
Major battles, resulting in a large loss of combatants on either side, sharply declined.
3.4 Increased international humanitarian response (July 2004-January 2005)
Following increased international pressure, the government gradually lifted most
restrictions on access to Darfur for international aid organizations starting in June 2004.
The number of humanitarian workers in Darfur increased from 200 in March 2004 to
nearly 10,000 (local and international) by March 2005. South Darfur and parts of North
Darfur continue to experience fighting and new displacement. Stabilization of
humanitarian conditions began first in North and then started in West Darfur. Low-level
violence and widespread insecurity have continued throughout the region, with another
surge in fighting in November and December 2004. Because of greater humanitarian
assistance, mortality rates gradually decreased in mid- to late 2004 and early 2005, but
pockets of higher mortality remain, particularly in South Darfur.

13
4 Current statistics and discussion
According to the latest estimates of the Darfur Humanitarian Profile approximately
2.6 million people are affected by the conflict in Darfur. On top of this there are some
200,000 Sudanese refugees in Chadian camps.
Table 1: Estimation of affected IDP and resident population in Darfur(UN Darfur Humanitarian Profile No. 13 - 01 April 2005)State Total number IDPs ResidentsNorth Darfur 754,789 479,342 275,447South Darfur 918,985 770,808 148,177West Darfur 948,714 715,708 233,006TOTAL 2,622,488 1,965,858 656,630
The total population in the three Darfur states was estimated to be 5.6 million in
2001. Bearing in mind an increase of the population, we can assume that the population
in 2005 was approximately 6 million. This means that at this moment almost half of the
total population of Darfur is affected by the conflict.
Prior to the conflict, the nutritional and mortality situation in Darfur was
comparable to other states in Sudan. The Multiple Indicator Cluster Survey 2000 (MICS
2000) of UNICEF reported figures of child mortality showing Darfur to be in the middle
group.
Table 2: Child mortality rates and malnutrition for the 3 Darfur states andcountry average (MICS 2000)
U5MR(/1000 live births)
Underweight(%)
ChronicMalnutrition
(%)
AcuteMalnutrition
(%)North Darfur 101 47.4 44.3 22.5South Darfur 98 39.4 46.7 12.4West Darfur 104 37.4 51.2 8.8Country 104 40.7 43.3 15.7
The numbers on malnutrition show some major differences between the different
states. North Darfur seemed to be the most affected state by acute malnutrition but had
the lowest numbers of chronic malnutrition. West Darfur on the other hand was the
opposite.

14
5 Materials and methods
5.1 Materials
We collected data from 24 surveys conducted during the period April 2004 –
January 2005. Taking the mortality recall period into account, the covered period was
September 2003 – January 2005.
Table 3: Mortality surveys conducted in Darfur and refugee camps in Chad fromCE-DAT database (April 2004 - January 2005)
Location Period CMR U5MR Violence related Conducted byDarfur region Feb – Sep 2004 0.72 (0.44-0.99) 1.03 (0.38-1.68) 35 % CDC, WFP
North DarfurAbu Shok May – Jun 2004 2.15 (NA) 6.76 (NA) ACF-FEntire Province Jun – Aug 2004 1.50 (1.10-1.90) 2.50 (1.60-3.90) 21 % WHO, EpietKabkabiya Jul – Aug 2004 1.20 (0.70-1.80) 2.90 (1.50-5.30) Epicentre,
MSFSerif Umra Sep – Oct 2004 0.80 (0.40-1.30) 1.80 (1.00-3.00) 4 % Epicentre,
MSF
West DarfurZalingei Oct 2003 – Apr 2004 2.20 (1.80-2.70) 1.80 (1.10-3.00) 49 % Epicentre,
MSFMurnei Oct 2003 – May 2004 3.40 (3.10-3.80) 1.60 (1.10-2.20) 75 % Epicentre,
MSFAzirni, Sanidadi,Um Tagouk
Sep 2003 – Sep 2004 0.27 (NA) NA 35 % CIEDRS,World Relief
Mukjar, Wade Saleh Feb – Apr 2004 3.60 (2.70-4.60) 5.20 (1.80-2.60) MSF-HNiertiti Feb – Jun 2004 1.50 (1.20-1.90) 2.10 (1.50-3.00) 27 % Epicentre,
MSFEl Geneina May – June 2004 5.60 (4.10-7.60) 14.10 (9.70-20.10) 10 % Epicentre,
MSFHabilah Jun – Aug 2004 2.60 (1.80-3.60) 6.70 (1.20-11.00) Epicentre,
MSFEntire Province Jun – Aug 2004 2.90 (2.40-3.60) 3.10 (2.10-4.70) 12 % WHO, EpietFur Baranga Oct 2004 – Jan 2005 0.89 (0.54-1.25) 1.80 (0.79-2.81) SCF-USMurnei Oct 2004 – Jan 2005 0.79 (NA) 1.16 (NA) 14 % Concern
South DarfurKass May – Sep 2004 3.20 (2.20-4.10) 5.90 (3.80-8.00) Epicentre,
MSFMuhajiria Feb – Sep 2004 1.20 (0.90-1.40) 0.70 (0.30-1.10) 46 % Epicentre,
MSFMuhajiria Aug – Sep 2004 2.30 (1.20-3.40) 1.00 (0.03-1.90) 72 % Epicentre,
MSFKalma Feb – Sep 2004 1.60 (1.20-2.00) 2.90 (2.00-3.90) 28 % Epicentre,
MSFKalma Aug – Sep 2004 2.00 (1.30-2.70) 3.50 (1.50-5.70) 7 % Epicentre,
MSFKalma Jun – Aug 2004 3.80 (2.90-5.00) 11.70 (7.40-18.10) 10 % WHO, Epiet
ChadIridimi, Touloum Aug – Oct 2004 1.30 (0.80-1.80) 2.20 (1.20-3.10) MSFBahai, Cariari Nov 2003 – Jun 2004 1.07 (0,96-1,18)
0,62 (0,53-0,70)*0.44 (0,31-0,57) UNHCR, CDC,
CNNTAIridimi, Touloum,Kounoungo
Nov 2003 – Jun 2004 2.57 (2,42-2,71)1,56 (1,44-1,67)*
1.64 (1,47-1,81)1,46 (1,30-1,62)*
UNHCR, CDC,CNNTA
* CMR without including missing people

15
Figure 1: Surveys in West Darfur (Sep 2003 – Jan 2005)
Emergency threshold
-
1.00
2.00
3.00
4.00
5.00
6.00
7.00
July-03 October-03 January-04 April-04 July-04 October-04 January-05
Murnei (First period)
El Geneina
Mukjar, Wadi Saleh
Zalingei
PROVINCEHabilah
Murnei (Second period)Niertiti
Murnei
Azirni, Sanidadi, Um Tagouk
Fur Baranga
Entire Darfur region
Cru
de M
orta
lity
Rat
e (/1
0,00
0/da
y)
Figure 2: Surveys in North Darfur (Sep 2003 – Jan 2005)
-
1.00
2.00
3.00
4.00
5.00
6.00
7.00
July-03 October -03 January-04 April-04 July-04 October -04 January-05
Abu Shok
PROVINCE
Kabkabiya Serif UmraEmergency threshold
Entire Darfur region
Cru
de M
orta
lity
Rat
e (/1
0,00
0/da
y)

16
Figure 3: Surveys in South Darfur (Sep 2003 – Jan 2005)
-
1.00
2.00
3.00
4.00
5.00
6.00
7.00
July-03 October -03 January-04 April-04 July-04 October -04 January-05
Kalma
Muhajiria
Kass
Kalma
Muhajiria
Kalma
Emergency threshold
Entire Darfur region
Cru
de M
orta
lity
Rat
e (/1
0,00
0/da
y)
Figure 4: Surveys in refugee sites in Chad (Sep 2003 – Jan 2005)
-
1.00
2.00
3.00
4.00
5.00
6.00
7.00
July-03 October-03 January-04 April-04 July-04 October-04 January-05
Iridimi, Touloum
Iridimi, Touloum, Kounoungo
Bahai, CariariEmergency threshold
Cru
de M
orta
lity
Rat
e (/1
0,00
0/da
y)

17
Figure 5: Map of Darfur showing affected areas, IDP location and survey sites(March 2005)
Data from the different surveys was compiled from the Complex Emergency
Database (CE-DAT (www.cred.be/cedat)). This CRED project aims at improving
evidence-based policy on conflict prevention and response by providing standardized
Boundary representation is not necessarily authorative.
18
and comprehensive data on the human impact of conflict. The project involves
producing an online, publicly accessible database that is a compilation of quantitative and
qualitative information from numerous credible sources on several countries, including
Sudan.
5.2 Methods
Two different approaches were used for calculating the number of deaths. Both will
be illustrated.
5.2.1 Method 1 (Center for Research on the Epidemiology of Disasters)
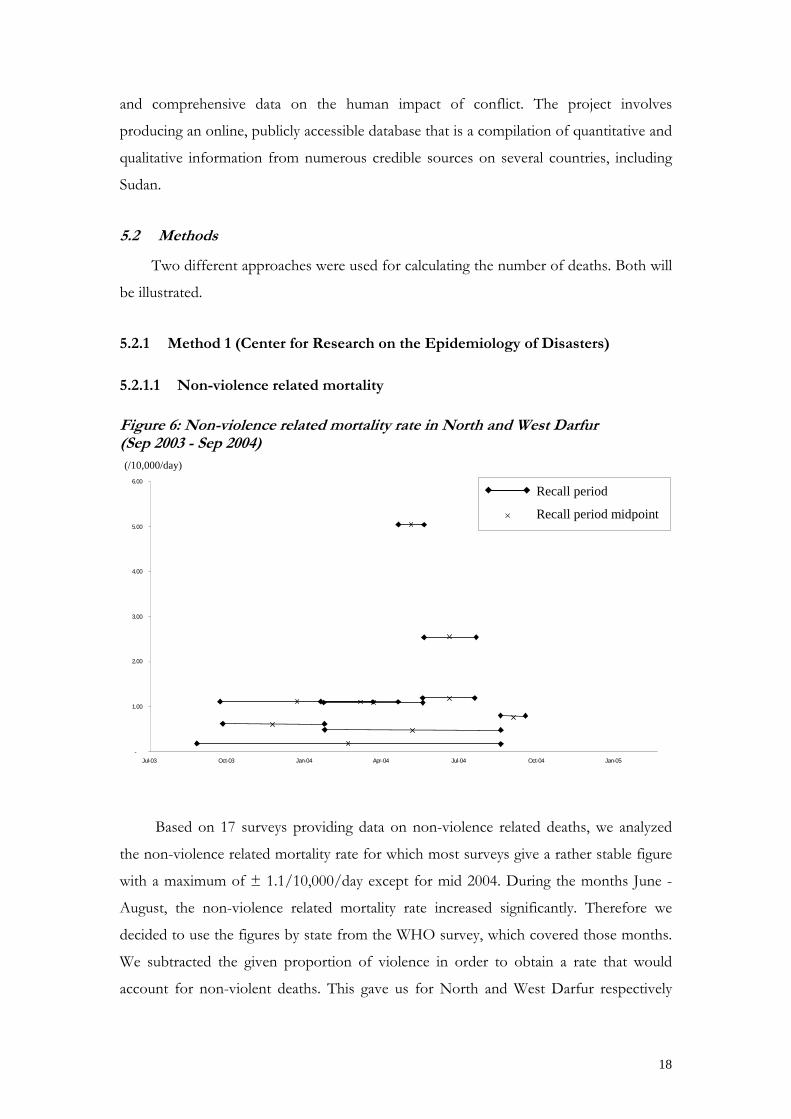
5.2.1.1 Non-violence related mortality
Figure 6: Non-violence related mortality rate in North and West Darfur(Sep 2003 - Sep 2004)
-
1.00
2.00
3.00
4.00
5.00
6.00
Jul-03 Oct-03 Jan-04 Apr-04 Jul-04 Oct-04 Jan-05
Based on 17 surveys providing data on non-violence related deaths, we analyzed
the non-violence related mortality rate for which most surveys give a rather stable figure
with a maximum of ± 1.1/10,000/day except for mid 2004. During the months June -
August, the non-violence related mortality rate increased significantly. Therefore we
decided to use the figures by state from the WHO survey, which covered those months.
We subtracted the given proportion of violence in order to obtain a rate that would
account for non-violent deaths. This gave us for North and West Darfur respectively
(/10,000/day)
Recall period
× Recall period midpoint

19
1.19 and 2.55/10,000/day. The high value for West Darfur also covers a possible
epidemic outbreak in El Geneina during June (MSF/Epicentre El Geneina non violent-
related mortality rate: 5.04/10,000/day).
For South Darfur, WHO only surveyed Kalma camp. However, an MSF survey
covering the same period in Muhajiria showed a lower mortality rate. In order not to
underestimate the mortality in this state, we decided to use the highest value of both,
namely 3.42/10,000/day (non-violence related mortality rate in Kalma).
5.2.1.2 Violence-related mortality
Using the same 17 surveys that were used for the non-violence-related mortality, we
analyzed the violence-related deaths during the period from December 2003 to January
2005, which covers a considerable part of the months with heavy violence.
An exponential regression was performed on all surveys except for the one
conducted in Muhajiria, showing a significantly different pattern than the other ones. We
considered it to be an outlier and did not include it in the regression. A possible
explanation is the presence in South Darfur of “clusters of violence” which cannot be
considered representative for the entire Darfur region.
Since the period September 2003 - November 2003 was not included in the
regression, we applied the proportion of violence we obtained for December, which is
the closest value in time we have.
After September 2004, the same proportion of violence has been applied to South
Darfur as to North and West Darfur. However, there is no survey giving any information
on the level of violence in South Darfur for that period. Therefore, we decided not to
make any unfounded assumptions and to leave the possible higher proportion of
violence related deaths due to outbreaks of violence in South Darfur during that period
out of our calculations.
5.2.1.3 Crude mortality rate
We considered the CMR to be the sum of the violence-related and non-violence-
related mortality. Since an approximation of the proportion of violence-related deaths
was available using the regression and that the non-violence-related mortality rate had

20
been estimated to be rather stable except for the period around harvesting, we were able
to calculate a probable CMR, using the following equation:
deaths related violenceproportion 1ratemortality related cenon violenCMR
−=
5.2.1.4 Reference values
The value that was used to calculate the expected number (without the conflict) of
deaths was the crude mortality rate of 2003. According to UNICEF14 this was, for the
entire country, 11/1,000/year or 0.3/10,000/day. As described in section 3, the under 5
mortality rate (U5MR) in Darfur was similar to the country average. Therefore we
assume that the national data on CMR is applicable to the Darfur region.
5.2.1.5 Universe
The Darfur Humanitarian Profile provides monthly estimations of the affected
population and the number of IDPs in Darfur since September 2003, but not of
refugees.
Figure 7: Affected population in Darfur (Sept 2003 - Jan 2005)
0
500,000
1 million
1.5 million
2 million
2.5 million
3 million
Sep-03 Nov-03 Jan-04 Mar-04 May-04 Jul-04 Sep-04 Nov-04 Jan-05
West DarfurSouth DarfurNorth Darfur
14 UNICEF. (2003) “The State of the World’s Children 2003”

21
The affected population started with a regional total of less than 500,000 in
September 2003, increased steadily from then and reached some 2.4 million in January
2005.
5.2.2 Method 2 (US Department of State Estimates)
5.2.2.1 Overview
This analysis drew on all available information - epidemiological surveys of
mortality and nutrition, displacement trends, patterns of village destruction, remote
sensing data and documentation of attacks reported by the press and human rights
groups - to estimate ranges of mortality rate by region and month throughout the three
Darfur states and eastern Chad from March 2003 to early 2005 based on the progression
of the conflict. "High" and "low" estimates of mortality rates were then applied to UN
data for all affected populations by month. Separate mortality rates were applied to
displaced and otherwise affected populations due to different levels of vulnerability.
Expected baseline mortality for sub-Sahara Africa populations15 (.5/10,000/day) was
subtracted from total deaths and therefore only “excess” deaths attributed to the conflict
are represented. This analysis did not attempt to differentiate between violent and non-
violent deaths but rather estimate upper and lower bounds of a range of plausible all
cause mortality.
5.2.2.2 Mortality rate estimation
We first compiled all available mortality surveys, deemed to have been conducted
with sound epidemiological methods, (Table 3: Mortality surveys conducted in Darfur
and refugee camps in Chad from CE-DAT database (April 2004 - January 2005)) from
the Darfur region and spatially depicted the results by location and time periods of which
they were representative (defined recall periods). This enabled us to construct a
framework of mortality rates on which to base overall crude mortality rates (CMR)
estimations by state, as well as to evaluate existing data and gaps (Figure 1-Figure 4).
Next, areas with existing mortality data were evaluated in terms of displacement
patterns16, village destruction17, ’fire mapping’ remote sensing data18 and retrospective
15 World Health Organization. “World Heath Report, 2004”16 MSF/Epicentre data, ADT data, UN Humanitarian Profiles No. 1-1017 HIU Map http://www.usaid.gov/locations/sub-saharan_africa/sudan/satelliteimages.html, database18 University of Maryland Fire Mapping Center. http://maps.geog.umd.edu/activefire.asp

22
reporting of attacks19, 20, 21 to determine if the existing mortality rates could be applied
as the overall mortality rate estimate to a broader population within that region, or if
a higher, or lower, rate was warranted. Increases in displacement, evidence of village
destruction, and/or reports of attacks, were assumed as indicators of violence and
therefore higher mortality clustered around periods of large-scale displacement.
We then examined regions and/or time periods with data gaps and estimated
mortality rates derived from regions that were judged to have experienced similar levels
of conflict based on secondary evidence. For example, data on mortality for North
Darfur during 2003 and early 2004 was extremely limited, however, levels of
displacement (Figure 7: Affected population in Darfur (Sept 2003 - Jan 2005)) village
destruction (Figure 5: Map of Darfur showing affected areas, IDP location and survey
sites (March 2005)) and area of origin of refugees in Chad22 indicated that the patterns
of conflict and violence in the North were analogous to West Darfur. Therefore,
mortality survey data from West Darfur was used as a basis for estimating mortality rate
estimates in North Darfur for this period.
5.2.2.3 Secondary factors used in determining mortality rate estimates
♦ Trends in Mortality Survey Data
Disaggregated data from mortality studies with longer recall periods and larger
sample sizes were also analyzed for trends in mortality rates to assist in determining
estimates for larger geographic regions and time periods.
Data collected on the month of arrival during October 2003 - March 2004 in three
internally displaced persons camps (Niertiti, Murnei and Zalingei)23,24 indicate the periods
of highest displacement (October 2003-January 2004) and the high number of deaths
clustered around months of peak arrivals, particularly violent deaths. (Figure 8-Figure 9)
19 Human Rights Watch. “Darfur Destroyed: Ethnic Cleansing by Government and Militia Forces inWestern Sudan” HRW Index No.: A1606, May 7, 2004 http://hrw.org/reports/2004/sudan0504/20 Human Rights Watch. “Darfur in Flames: Atrocities in Western Sudan” April 2, 2004http://hrw.org/reports/2004/sudanO404/21 UN Resident Coordinator for Sudan Sitreps, UN Weekly Humanitarian Roundups, UNICEF Sitreps,WFP Emergency Reports, WFP Weekly Sitreps, IRIN Reports (March- May 2004)22 US State Department. “Documenting Atrocities in Darfur.” September, 200423 Epicentre, MSF. “Heath Assessment in Emergencies: Murnei & Zalingei, West Darfur, Sudan” June 200424 Epicentre. “Health and Nutrition Assessment: Niertiti, West Darfur” June 2004

23
Data from theses surveys also indicates that deaths, especially those caused by violence,
decreased significantly after arrival to the camps.
Figure 8: Number and cause of death in Zalingei and Murnei campsfrom 26/10/03 to 19/05/04 (MSF/Epicentre, 2004)
0
20
40
60
80
100
Ra madan(2 6/10-24/11)
Fatur(2 5/11-23/12)
Faturein(2 4/12-22/01)
Da hai(2 3/01-20/02)
Da hai II(2 1/02-21/03)
Wahid(2 2/03-20/04)
Karama(2 1/04-19/05)
Plain: violence ZalingeiGrid: other cause Murnei
Figure 9: Arrivals per month in Zalingei and Murnei camps from28/08/03 to 19/05/04 (MSF/Epicentre, 2004)
0
50
100
150
200
250
300
350
Zalingei Murnei
Ramadan(26/10-24/11)
Fatur(25/11-23/12)
Faturein(24/12-22/01)
Dahai(23/01-20/02)
Dahai II(21/02-21/03)
Wahid(22/03-20/04)
Karama(21/04-19/05)
Rajab(28/08-26/09)
Geseyer(27/09-25/10)
While disaggregated monthly sample sizes are too small to be statistically significant,
UNHCR/CDC data on mortality from refugee camps in Chad also indicates that the
highest number of deaths occurred during the time period of November 2003 -February
2004, decreasing beginning in March 2004. 25
♦ Historical data
25Centers for Disease Control. “Emergency Nutrition and Mortality Surveys Conducted AmongSudanese Refugees and Chadian Villagers, Northeast Chad” June 2004. Unpublished data

24
We also examined historical trends of mortality rates among displaced populations
to determine when mortality rates were likely to peak and diminish in response to
humanitarian interventions and therefore assist in guiding our estimates. Previous studies
suggest the evolution of mortality rates could be expected to gradually return to normal
levels four to six months after an effective humanitarian response.26 Exceptions, such as
Ethiopia in 1999-2000 where mortality rates increased following aid interventions, were a
result of widespread outbreaks of infectious diseases, in this case measles.27 (Figure 9)
The absence of large-scale infectious disease outbreaks such as measles and
diarrhoeal disease and their associated mortality, across greater Darfur, likely contributed
to lower mortality rates than previously projected.28
Figure 10: Mortality rate trends in selected displaced populations29
Application of this historical trend to the Darfur crisis is not uncomplicated due to
the plodding nature of gearing up an effective aid intervention and the progression of the
conflict to certain regions, particularly the South. Nevertheless, taken individually, the
regions of Darfur were found to generally follow historical patterns with the exception of
26 Salama P, Spiegel P, Talley L, Waldman R. “Lessons learned from complex emergencies over pastdecade.” Lancet 2004;364(9447):1801-13.27 Centers for Disease Control. “Mortality During a Famine --- Gode District, Ethiopia” MMWR April20, 2001 / 50(15); 285-8 July 200028 USAID. “Projected Mortality Rates in Darfur, Sudan 2004 – 2005.”http://www.usaid.gov/locations/sub-saharan_africa/sudan/cmr_darfur.pdf29 Spiegel PB, Salama P. War and mortality in Kosovo, 1998-99: an epidemiological testimony. Lancet2000; 355: 2204-09.

25
South Darfur, which has been a mixture of continuing sporadic conflict and new
displacement coinciding with progressively more effective humanitarian assistance. 30,31
♦ Nutrition Levels
Malnutrition levels (measured among children 6 months to 5 years of age) and
mortality rates have a robust correlation but are also highly influenced by other factors
such as disease outbreak.32 Nonetheless, malnourished children are generally used as a
proxy for the health status of the population and were therefore used as a secondary
indicator to guide mortality rate estimates across time periods.33 More than thirty
nutrition surveys were conducted in Darfur and eastern Chad since early 2004, covering
refugee, displaced, resident, and mixed populations. These show global acute
malnutrition (GAM) rates generally declining over time since spring of 2004. Six
surveys completed in early 2005 all showed GAM levels below 10%, indicating an
improved overall health situation. (Figure 11: Global Acute Malnutrition in Darfur region
(Jan 2003 – March 2005))
Figure 11: Global Acute Malnutrition in Darfur region (Jan 2003 – March 2005)
0
5
10
15
20
25
30
35
40
45
jan-03 jul-03 jan-04 jul-04 jan-05
Regionwide
Hunger season
30 Friedman C, Spiegel P. West Timor mission report, Jan 24-Mar 2, 2000. Kupang: United NationsHigh Commissioner for Refugees and Centers for Disease Control and Prevention, 200031 Salama P, Assefa F, Talley L, Spiegel P, Van Der Veen A, Gotway C. Malnutrition, measles, mortality,and the humanitarian response during a famine in Ethiopia. JAMA 2001; 286: 563-71.32 Centers for Disease Control. Famine-Affected, refugee, and displaced populations: recommendationsfor public health issues. MMWR 1992; 41(No. RR-13)33 UN Standing Committee on Nutrition. “5th Report on the World Nutrition Situation (RWNS)” March2004

26
Table 4: Nutrition surveys conducted in Darfur and refugee camps in Chad fromCE-DAT database (April 2000 - January 2005)
Location Start of thesurvey
End of thesurvey
GAM(%) Conducted by
Darfur region Sep 2004 Sep 2004 21.8 CDC, WFP
North DarfurEl Laeit, El Tweisha(IDPs)
Apr 2000 May 2000 19.5 Save The Children-UK
El Laeit, El Tweisha(residents)
Apr 2000 May 2000 13 Save The Children-UK
El Fasher Mar 2001 Apr 2001 26.1 Save The Children-UKEntire state Mar 2001 Apr 2001 23.4 Save The Children-UKAl Malha Feb 2002 Feb 2002 18.5 Save The Children-UKAl Malha Apr 2002 Apr 2002 18.5 Save The Children-UKAl Malha Nov 2002 Nov 2002 19.5 Save The Children-UKAl Malha Apr 2003 Apr 2003 15.5 Save The Children-UKAl Malha Oct 2003 Oct 2003 25 Save The Children-UKKutum Mar 2004 Mar 2004 12.6 Save The Children-UKAl Malha Apr 2004 Apr 2004 26.1 Save The Children-UKAbu Shok Jun 2004 Jun 2004 39 ACF-FAl Malha Jun 2004 Jun 2004 33.4 Save The Children-UKKabkabiya Aug 2004 Aug 2004 17.5 MSF, EpicentreSerif Umra Oct 2004 Oct 2004 14.7 MSF, EpicentreAbu Shok Nov 2004 Nov 2004 27 ACF-F
West DarfurMukjar, Wade Saleh Apr 2004 Apr 2004 21.5 MSF-HZalingei Apr 2004 Apr 2004 23.4 MSF, EpicentreMurnei May 2004 May 2004 20.6 MSF, EpicentreEl Geneina Jun 2004 Jun 2004 25.8 MSF, EpicentreHabilah Aug 2004 Aug 2004 17.2 MSF, EpicentreAzirni, Sanidadi,Um Tagouk
Sep 2004 Sep 2004 8.0 CIEDRS, World Relief
Fur Baranga Jan 2005 Jan 2005 6.6 Save The Children-US
South DarfurKalma Sep 2004 Sep 2004 23.6 MSF, EpicentreKass Sep 2004 Sep 2004 14.1 MSF, EpicentreMuhajiria Sep 2004 Sep 2004 10.7 MSF, EpicentreNyala Sep 2004 Sep 2004 23.6 ACFEd Daein Mar 2005 Mar 2005 25.2 UNICEF, Tearfund, MOH Sudan, Sudan
Social Development Organization (SUDO)
ChadTine Nov 2003 Nov 2003 27.2 MSF-BBahai, Cariari Jun 2004 Jun 2004 39.2 CDC, UNHCR, CNNTAIridimi, Touloum,Kounoungo
Jun 2004 Jun 2004 35.6 CDC, UNHCR, CNNTA
Iridimi, Touloum Oct 2004 Oct 2004 19.6 MSF-BOure Cassoni Dec 2004 Dec 2004 20.5 ACFTreguine Dec 2004 Dec 2004 11.3 ACFBredjing, Farchana Jan 2005 Jan 2005 8 MSF-HMile Jan 2005 Jan 2005 15.6 ACFDjabal Feb 2005 Feb 2005 15.6 ACFGoz Amir Feb 2005 Feb 2005 10.1 ACF

27
High prevalence of infectious diseases, a contributing factor to increased mortality
among malnourished populations, have so far been forestalled and likely suppressed
associated mortality during the hunger season of 2004. Increased humanitarian assistance
has undoubtedly had a positive impact on malnutrition rates, but the poor harvest of
2004 is likely to result in a longer and more severe hunger season this year leading to
increasing malnutrition rates and a progressively more vulnerable population in the
coming months.
5.2.2.4 High and Low CMR Estimates
♦ High Estimate
A `high' estimate of crude mortality was used to assume a worst-case scenario for
each region and month. In this case higher mortality rates from camps or settlements
were generalized to a larger population. In some cases higher mortality rates from one
region were applied to another area lacking reliable mortality data based on evidence
indicating similar levels of conflict. Higher CMRs representing specific stages of longer
survey recall periods were used to capture elevated rates during village and flight periods.
Significant inaccessible populations were also assumed to be worse off and reflected in a
higher CMR estimate for that period/region. If there was conflicting mortality data for a
period or region, the higher rate was used. Corroborating evidence of displacement,
destruction of villages, reports of attacks or disease outbreaks were used to adjust
estimates higher than available survey data in some cases.
♦ Low Estimate
A “low” estimate of CMR was also applied to each Darfur state by month assuming
a best-case scenario. Site-specific mortality was not necessarily assumed to be applicable
to the broader population and a lower rate or average of available rates was used. If
there were conflicting mortality rates for an area or time period the lower rate was
used.
28
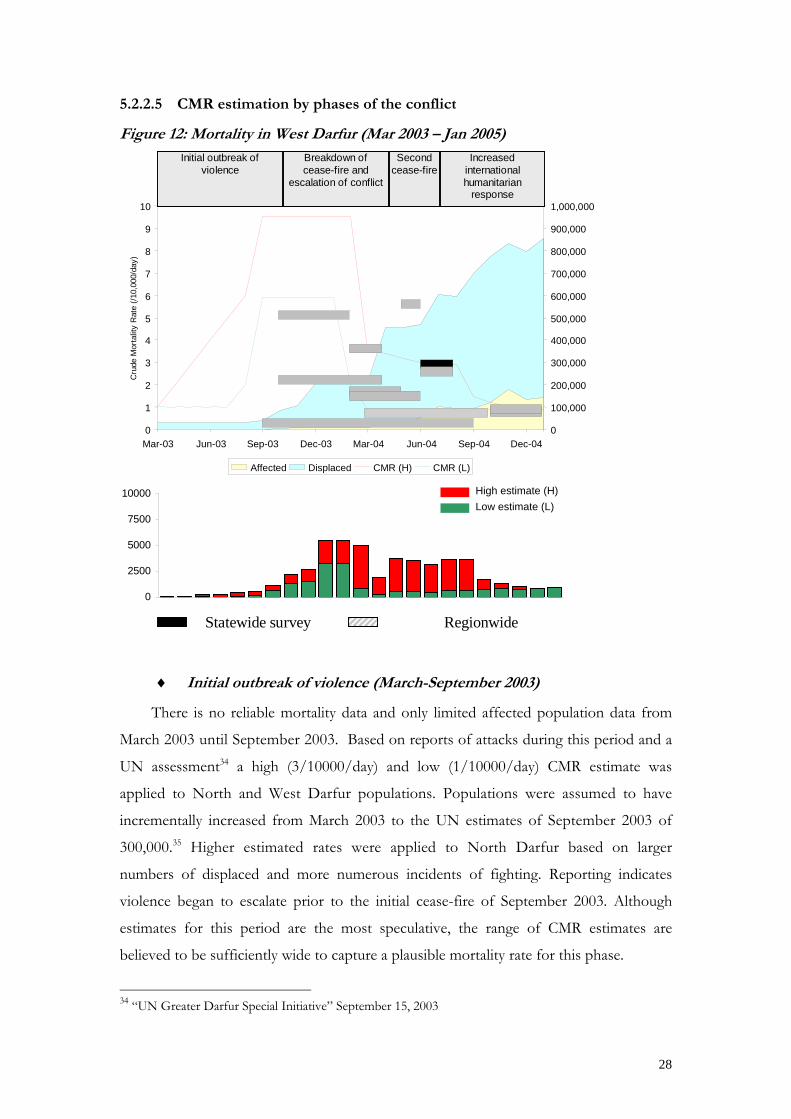
5.2.2.5 CMR estimation by phases of the conflict
Figure 12: Mortality in West Darfur (Mar 2003 – Jan 2005)
0
1
2
3
4
5
6
7
8
9
10
Mar-03 Jun-03 Sep-03 Dec-03 Mar-04 Jun-04 Sep-04 Dec-040
100,000
200,000
300,000
400,000
500,000
600,000
700,000
800,000
900,000
1,000,000
Affected Displaced CMR (H) CMR (L)
0
2500
5000
7500
10000
Mar-03 Sep-03 Mar-04 Sep-04
Initial outbreak of violence
Breakdown of cease-fire and
escalation of conflict
Second cease-fire
Increased international humanitarian
response
Statewide survey Regionwide
Cru
de M
orta
lity
Rat
e (/1
0,00
0/da
y)
♦ Initial outbreak of violence (March-September 2003)
There is no reliable mortality data and only limited affected population data from
March 2003 until September 2003. Based on reports of attacks during this period and a
UN assessment34 a high (3/10000/day) and low (1/10000/day) CMR estimate was
applied to North and West Darfur populations. Populations were assumed to have
incrementally increased from March 2003 to the UN estimates of September 2003 of
300,000.35 Higher estimated rates were applied to North Darfur based on larger
numbers of displaced and more numerous incidents of fighting. Reporting indicates
violence began to escalate prior to the initial cease-fire of September 2003. Although
estimates for this period are the most speculative, the range of CMR estimates are
believed to be sufficiently wide to capture a plausible mortality rate for this phase.
34 “UN Greater Darfur Special Initiative” September 15, 2003
High estimate (H)Low estimate (L)

29
Figure 13: Mortality in North Darfur (Mar 2003 – Jan 2005)*
0
1
2
3
4
5
6
7
8
9
10
Mar-03 Jun-03 Sep-03 Dec-03 Mar-04 Jun-04 Sep-04 Dec-040
100,000
200,000
300,000
400,000
500,000
600,000
700,000
800,000
900,000
1,000,000
Affected Displaced CMR (H) CMR (L)
0
2500
5000
7500
10000
Mar-03 Sep-03 Mar-04 Sep-04
Initial outbreak of violence
Breakdown of cease-fire and
escalation of conflict
Second cease-fire
Increased international humanitarian
response
Statewide survey Regionwide
Cru
de M
orta
lity
Rat
e (/1
0,00
0/da
y)
* As the above graph indicates mortality data for North Darfur was extremely limited prior to April 2004. Estimation of
extremely high CMR rates for the late 2003 through early was done so based on high CMRs found by MSF/Epicentre in West Darfur
during this period. Application of these mortality rates to the affected North Darfur population was considered justified due to
comparable displacement and village destruction patterns.
♦ Breakdown of cease-fire/escalation of conflict (October 2003-March2004)
All available data indicates that this period was the most violent period of the
conflict with elevated CMRs throughout large parts of North Darfur, West Darfur and in
refugees fleeing to Chad. Three Médecins Sans Frontières (MSF) mortality surveys
conducted in West Darfur provided the most extensive information on this period and
were therefore utilized as the primary basis for CMR estimation36. While overall CMRs
from these three surveys ranged from 1.5 –3.4/10,000/day the higher “village and flight” 35 “UN Greater Darfur Special Initiative” September 15, 2003
High estimate (H)Low estimate (L)

30
period mortality rates (Low 5.9/10,000/day and High 9.5) were applied to both North
and West Darfur during this phase in an effort to capture the fullest extent of mortality,
particularly violent deaths. The overall UNHCR/CDC mortality rates (Low-
1.56/10,000/day and High-2.57/10,000/day (Including missing family members)) were
used as a constant for the refugee population in Chad for the entire recall period of
November through June. Mortality rate estimates for South Darfur begin to increase at
the end of this phase as the first major attacks in the region were reported and
displacement began to increase.
♦ Second cease-fire agreement (April-June 2004)
Data on mortality rates became increasingly available after April as restrictions on
access to the region eased. Most mortality surveys were representative of individual or
small numbers of displaced settlements or camps, but two surveys covered broader
populations within Darfur. WHO conducted two mortality surveys of displaced
populations in West and North Darfur with a two month recall period, June 15 - August
15, 2004 and WFP/CDC conducted a Darfur-wide nutrition and mortality survey of
both displaced and non-displaced conflict affected populations. The recall period for the
WFP/CDC survey covered a longer period, February -September 2004. The WHO CMR
rates for North and West Darfur were used for the high estimates for the June-August
time frame. Various surveys indicated more elevated high CMR estimates in South
Darfur during summer and fall 2004. (Figure 14: Mortality in South Darfur (Mar 2003 –
Jan 2005)) The WFP/CDC rate was used as the basis for the low estimate for displaced
populations, adjusted slightly upwards based on other evidence, for all three states during
the seven-month recall period. Multiple surveys, malnutrition levels, historic trends and
reports from the UN indicate gradually decreasing mortality rates, dropping below
emergency thresholds in late 2004 and early 2005.
36 Depoortere E, Checchi F, Broillet F, Gerstl S, Minetti A, Gayraud O, et al. “Violence and mortality in WestDarfur, Sudan (2003-04): epidemiological evidence from four surveys.” Lancet 2004;364(9442):1315-20.

31
Figure 14: Mortality in South Darfur (Mar 2003 – Jan 2005)
0
2500
5000
7500
10000
Mar-03 Sep-03 Mar-04 Sep-04
Initial outbreak ofviolence
Breakdown ofcease-fire and
escalation of conflict
Secondcease-fire
Increasedinternationalhumanitarian
response
Cru
de M
orta
lity
Rat
e (/1
0,00
0/da
y)
Statewide survey Regionwide
0
1
2
3
4
5
6
7
8
9
10
Mar-03 Jun-03 Sep-03 Dec-03 Mar-04 Jun-04 Sep-04 Dec-040
100,000
200,000
300,000
400,000
500,000
600,000
700,000
800,000
900,000
1,000,000
Affected Displaced CMR (H) CMR (L)
Differences between the WHO and WFP/CDC mortality rates are noteworthy and
represent a discrepancy that cannot be easily explained but can be viewed in the
following context. The WHO and WFP/CDC surveys represent different
populations and time periods and therefore cannot be directly compared. The WHO
CMR for North Darfur (1.5/10000/day) and West Darfur (2.9/10000/day)
represented displaced populations but not non-displaced affected populations.
Despite the fact that it was representative of a total of 881,154 IDPs (North Darfur-
382,626 West Darfur-489,528) for a two month recall period, a higher CMR of
2.6/10000/day (after factoring in a survey of a single camp in South Darfur, 74,658) was
assumed representative of the entire affected Darfur Population of 1.8 million
(displaced and non-displaced) for a period of over seven months. The WFP/CDC
nutrition/mortality survey (CMR 0.72/10,000/day; GAM 21.8%) was representative of
the 1.4 million affected (displaced and non-displaced) persons in Darfur (excluding
High estimate (H)Low estimate (L)

32
refugees in Chad) and resulting mortality rates were applied to this population for
the seven month recall period of the survey.
5.2.2.6 Affected resident population (non displaced)
We assumed non-displaced affected resident populations to have slightly lower
mortality rates than displaced population due to lower exposure to violence as well as
more retained resources and coping strategies. The only major survey of both displaced
and non-displaced affected populations indicated lower CMR among non-displaced
affected population37. For non-displaced affected populations we used 0.8 of the CMR
for displaced population.
5.2.2.7 Population Estimate.
We used the UN humanitarian profile monthly population estimates (separated by
displaced and affected populations) for each Darfur state from September 2003 till
January 2005. No source of reliable information was available for affected populations
prior to September 2003, so an incremental increase from March 2003 was assumed. For
Chad, UNHCR data for spontaneous settlement and camp data was used.
37 CDC. WFP. “Emergency Nutrition Assessment of Crisis Affected Populations Darfur Region,Sudan.” August-September 2004http://www.cdc.gov/nceh/ierh/Research&Survey/DarfurNutritionReport.pdf

33
6 Results
6.1.1 Method 1
The regression showed a high level of correlation (R²=0.6993). (Figure 15)
Figure 15: Proportion violence related deaths in North and West Darfur(Dec 2003 - Sep 2004)
R2 = 0.6993
0%
10%
20%
30%
40%
50%
60%
70%
80%
90%
100%
Jul-03 Oct-03 Jan-04 Apr-04 Jul-04 Oct-04 Jan-05
Figure 16: Crude Mortality Rate for North and West Darfur(Sep 2003 – Jan 2005)
-
1.00
2.00
3.00
4.00
5.00
6.00
7.00
Jul-03 Oct-03 Jan-04 Apr-04 Jul-04 Oct-04 Jan-05
West Darfur
North Darfur
Recall period
× Recall period midpoint
(/10,
000/
day) West Darfur
North Darfur

34
Figure 17: Crude Mortality Rate for South Darfur (Sep 2003 – Jan 2005)
-
1.00
2.00
3.00
4.00
5.00
6.00
7.00
Jul-03 Oct-03 Jan-04 Apr-04 Jul-04 Oct-04 Jan-05
Applying the approximated crude mortality rates (Figure 16-Figure 17) to the
affected population as mentioned in the Humanitarian Profile from September 2003 until
January 2005, we arrive at a total estimated number of deaths of 121,582. This is the
number of people that died during this period in Darfur. It does not take refugees into
account. Figure 18 shows the calculated monthly CMR and number of deaths.
Figure 18: Estimated number of deaths and CMR(September 2003 – January 2005)
-
1.00
2.00
3.00
4.00
5.00
6.00
7.00
Sep-03 Dec-03 Mar-04 Jun-04 Sep-04 Dec-04
CM
R (/
10,0
00/d
ay)
0
2,000
4,000
6,000
8,000
10,000
12,000
14,000
num
ber o
f dea
ths
estimated deaths total CMR (/10000/day)
(/10,
000/
day)

35
There are ± 200,000 refugees in Chad, accounting for approximately 10% of the
affected population within Darfur (2,300,000). Assuming that these refugees present
comparable rates of mortality, we can add 10% to our subtotal arriving at 133,740 deaths
for September 2003 – January 2005 (Table 5).
We excluded the number of those who would have died without the war in any
using an expected death rate of 0.3/10,000/day (UNICEF 2003). This number was
subtracted from the ± 134,000, which gave us 118,142. These deaths may be attributed
directly as a consequence of the war.
Using the rates of violence-related mortality we calculated through regression
analysis, we estimate the number of violence-related deaths to be ± 35,000.
As mentioned before, these figures do not take into account:
• the number of people killed before September 2003• deaths from isolated areas with high violence rates in South Darfur after
September 2004
Table 5: Summary table of total and excess deaths among affected population inDarfur
Total number of deaths in Darfur (Sep 2003 - Jan 2005) 121,582
Total number of excess deaths in Darfur (Sep 2003 - Jan 2005) 107,402
Addition of 10 % for refugees in Chad 10,740
Total number of excess deaths (Sep 2003 - Jan 2005) 118,142

36
6.1.2 Method 2
Based on the application of ‘low’ and ‘high’ CMR monthly estimates to UN
population figures for each region it is estimated that 98-181,000 people have died since
March 2003 to January 2005 in the conflict-affected area of Darfur and eastern Chad.
Excluding an expected “normal” base mortality total of 35,000 deaths for this
population, 63-146,000 “excess” deaths can be attributed to violence, disease, and
malnutrition because of the conflict during this period.
Figure 19 displays the monthly breakdown of total and excess death estimates.
Figure 19: Total deaths and excess deaths in Darfur and the Chad RefugeeCamps. High and low estimates, March 2003 – January 2005

37
Figure 20: Upper bound estimates of excess deaths by Darfur state bymonth. Death estimates for populations in Chad refugee camps are notrepresented in this graphic.
6.1.3 Summary
Table 6: Estimated total and excess mortality figures based on different methods
Method 1
Sep 03–Jan 05
Method 2(low est.)
March 03–Jan 05
Method 2(high est.)
March 03–Jan 05Total number of deaths 134,000 98,000 181,000
Excess number of deaths 120,000 63,000 146,000
Deaths due to violence 35,000 - -

38
7 Discussion
We have attempted to go beyond simply calculating deaths, by uniformly
extrapolating rates derived from limited populations and/or time periods to the total
Darfur population and duration of the conflict. Instead, these two methods endeavoured
to use every reliable available estimate along with contextual information to arrive at the
soundest possible approximation of the reality for various periods and geographic
locations.
There are several limitations to our estimations.
First, the variability of mortality across the vast Darfur region as well as the
variability in different periods of the year is far from completely captured in our
estimates. The design effect for surveys representing state or Darfur-wide populations
indicate that mortality was significantly clustered. We attempted to account for this by
estimating an average rate for the state, or in the State Department method, by estimating
upper and lower bounds by region. Both methods attempt to capture this variability
down to the state and month levels, increasing the accuracy of the study.
Second, biases regarding under- or over-estimations are worth examining.
In the first of the two methods, we have systematically retained the higher values
when multiple rates were available for a specific area at a specific time. In certain
circumstances, this could lead to over-estimations. The State Department method
estimated the lower and upper bounds of a range of plausible deaths and should be
viewed in this light.
There has been much debate over inaccessible populations and how to represent
them in mortality estimates. The Humanitarian Profiles of the UN Office in Darfur
includes affected populations, in secure and insecure areas. Our estimations of mortality
rates have been applied to both these accessible and inaccessible communities and they
are therefore captured in our estimates.
Finally, some of the surveys used in these analyses used recall periods that were
limited largely to the time that populations were in IDP camps. This could be a source of
underestimation of deaths, particularly during earlier periods of the conflict.

39
Third, the issue of the denominator and its validity.
The estimations of affected population could have been lower than in reality, or
experienced a lag in identification by aid organizations, particularly when the
international presence in Darfur was still limited. This again is a potential source of
underestimation. If the number of affected was assumed to be 20 percent higher for the
September 2003 – August 2004 period in North and West Darfur and through October
2004 for South Darfur, approximately 5,000 – 19,000 total deaths and 4,000 - 18,000
excess deaths could be added to the total estimate. This is one of the important reasons
why rates are a more reliable and valid indicator than absolute numbers, which will vary
according to the denominator used.
UN population estimates are primarily based on WFP figures for food rations. In the
more recent stages of the conflict, they are likely inflated in some areas due to double
registration or registration of non-affected populations. This will result in overestimation
of recent deaths. A WFP re-registration exercise is currently underway and will provide
more accurate information in the near future. UNHCR has lowered its registered refugee
population in Chad by nearly 30,000 after similar verifications were conducted. Initial
WFP re-registration numbers show a slight decrease in the overall affected population.
The CRED method covered September 2003 to January 2005 and does not
included deaths that occurred before September 2003 or deaths since January 2005. The
State Department method does not include deaths after January 2005. If high and low
CMR estimates for January are applied to UN population estimates for February-April,
the range for total deaths and excess deaths would reach 118,000 - 205,000 and 70,000 –
157,000 respectively since February 2003.
The surveys utilized in our estimates, although statistically and epidemiologically
sound, have their own limitations that are therefore present in our calculations. For
example, “missing persons” is vaguely defined here and in all complex emergency
situations. Family members may be temporarily away, left behind or have gone and some
may have died. It is very difficult in sample survey situations to correctly assess the
contribution of this category to total deaths. Sample household surveys also do not
account for deaths of whole families.
.
40
A final methodological issue is related to the use of baselines. Excess deaths can
only be calculated against a “normal” threshold. The lower this threshold is, the higher
the excess deaths are. Method 1 (CRED) compared the Infant Mortality Rate and >5
mortality rate from the UNICEF Multiple Cluster Survey (MICS 2000) in Darfur to
national averages of that year. The UNICEF Darfur regional survey values were not
significantly different from the national values and hence the national CMR of
11/1000/year or 0.3/10000/day was used as a baseline. Method 2 (State Department)
used the WHO regional Sub-Saharan baseline of 0.5/10 000/day to calculate its excess
deaths. This difference in baseline mortality results in a higher number of estimated
deaths in method 1 (CRED), relative to the lower estimates of method 2 (State). Failure
of many other estimates to account for baseline mortality results in total death estimates
being tens of thousands higher that a more accurate count that only includes deaths
attributable to the conflict.
Mortality in Darfur, like in most other complex emergencies today, is largely caused
by infectious diseases and malnutrition, not direct violence. A well–known study in the
Democratic Republic of Congo estimated from a direct household survey, that 200,000
out of 1.7 million excess deaths were attributable to acts of violence. The majority was
due to the war-related collapse of the region’s health infrastructure and of the delivery of
health and nutrition services. 38 Population surveys in Somalia determined that 4 to 11%
of deaths over ten months during 1992-93 were caused by war-related trauma.39
Both CRED and State Department estimates demonstrate enormous loss of life in the
Darfur population. Overall deaths also do not reflect the sum-total of the widespread
sexual violence against girls and women and torture since much of these did not
terminate in death. Our approaches taking into account a wide variety of surveys
undertaken by professional staffs specialised in statistical and epidemiological methods,
are most likely the nearest approximation to the truth possible based on current available
information.
Violence related deaths have occurred over short intervals and generally in
concentrated areas as indicated in the map (Figure 5: Map of Darfur showing affected
38 Burnett Institute, International Rescue Committee. (2004). "Mortality in the Democratic Republic ofCongo: Results from a Nationwide Survey."
39 Toole, M. J. (2000) “Displaced persons and war” in Levy, B. S. & V. W. Sidel, eds., 197-212. War andPublic Health. Washington, DC: APHA

41
areas, IDP location and survey sites (March 2005)). Separating out the two broad causes
of death not only helps to understand the pattern of the war but also provides very
useful indicators for operational approaches in that region. High violence-related death
rates indicate the need for surgical interventions, blood transfusions and other trauma-
related health care. On the other hand, high CMRs without high violence-related deaths
will require services for children, including nutritional and vaccination programmes. The
non violence-related mortality suggests that the period from May-July is a very vulnerable
period for people in Darfur. Loss of livelihoods has a tremendous effect on a delicate
situation, as was the case in Darfur before the conflict.
Conclusion
Today, the people of Darfur are some of the very poorest in the world. Among
these, a third have been driven from their homes or live amidst terror, aggression and
violence. As the conflict continues, the proportion of the conflict-affected population
will continue to grow.
The international humanitarian community must be prepared for a period of
increasing mortality in the coming months, due more to hunger and health-related causes
than to violence.
The light rainy season of 2004 may have helped to save lives in the camps, but its
negative impact on the harvest will be felt throughout Darfur in the coming months.
Food stocks from the 2004 harvest are estimated to be only 20-50% of those of previous
years and are becoming exhausted, creating increased food insecurity and malnutrition
and possible new displacements as rural populations travel in search of food.
Mortality levels are likely to increase among resident populations as well when food
shortages spread to rural areas. Substantial new arrivals caused by food shortages will
overwhelm already overstretched humanitarian services, increasing the risk of disease
outbreaks and causing mortality rates to spike again.
The interruption of traditional livestock and grain trading mechanisms has
debilitated the local economy, further deepening vulnerability and the risk of “aid pull”
displacement.
42
Though fighting calmed down in recent months, general lawlessness—and resulting
attacks on aid workers—are rising. Further deterioration of the security situation or
increased direct targeting of humanitarian workers, resulting in a significant interruption
of aid access, would be disastrous to the Darfur population in the precarious months
ahead.

43
8 Abbreviations
ACF-F Action Contre la Faim (French section)CDC Centers for Disease Control and PreventionCIEDRS Center for International Emergency, Disaster, and Refugee StudiesCMR Crude Mortality RateEpiet European Programme for Intervention Epidemiology TrainingIDP Internally Displaced PersonJEM Justice and Equality MovementMICS Multiple Indicator Cluster SurveyMSF Médecins Sans FrontièresMSF-H Médecins Sans Frontières (Dutch section)SCF-US Save the Children Fund (US section)SLM/A Sudan Liberation Movement/ArmyU5MR Under 5 Mortality RateUN United NationsUNHCR United Nations High Commissioner for RefugeesUNICEF United Nations International Children's Emergency FundUNOCHA United Nations Office for the Coordination of Humanitarian AffairsWFP World Food ProgramWHO World Health Organization
9 Acknowledgements
We would like to thank to the Bureau of Population, Refugees and Migration forgenerously supporting the CEDAT project. We would also like to thank Dr. EvelynDepoortere for insights into the Darfur situation and RNIS/NICS for the excellent workthey are doing, especially Dr. Claudine Prudhon.
The cartography in this report has benefited enormously from the work done byHumanitarian Information Unit.
Finally we are also grateful to the following humanitarian aid agencies that havetaken the trouble of undertaking statistically sound surveys in extremely difficultcircumstances and sharing their results for further analysis.
ACF-FCDCCIEDRSCNNTAConcern
EpicentreEpietMSFSCF-UK and SCF-USTearfund
UNHCRUNICEFWFPWHOWorld Relief