agribusiness monthly july 2018 - rabobank au
TRANSCRIPT
RaboResearch Food & Agribusiness July 2018
Australia
Agribusiness Monthly July 2018
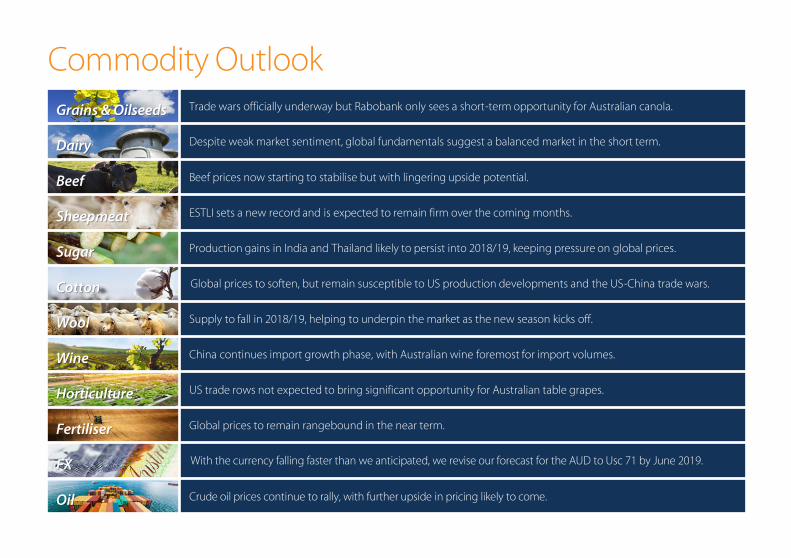
Grains & Oilseeds Trade wars officially underway but Rabobank only sees a short-term opportunity for Australian canola.
Dairy Despite weak market sentiment, global fundamentals suggest a balanced market in the short term.
Beef Beef prices now starting to stabilise but with lingering upside potential.
Sheepmeat ESTLI sets a new record and is expected to remain firm over the coming months.
Sugar Production gains in India and Thailand likely to persist into 2018/19, keeping pressure on global prices.
Cotton Global prices to soften, but remain susceptible to US production developments and the US-China trade wars.
Wool Supply to fall in 2018/19, helping to underpin the market as the new season kicks off.
Wine China continues import growth phase, with Australian wine foremost for import volumes.
Horticulture US trade rows not expected to bring significant opportunity for Australian table grapes.
Fertiliser Global prices to remain rangebound in the near term.
FX With the currency falling faster than we anticipated, we revise our forecast for the AUD to Usc 71 by June 2019.
Oil Crude oil prices continue to rally, with further upside in pricing likely to come.
Commodity Outlook
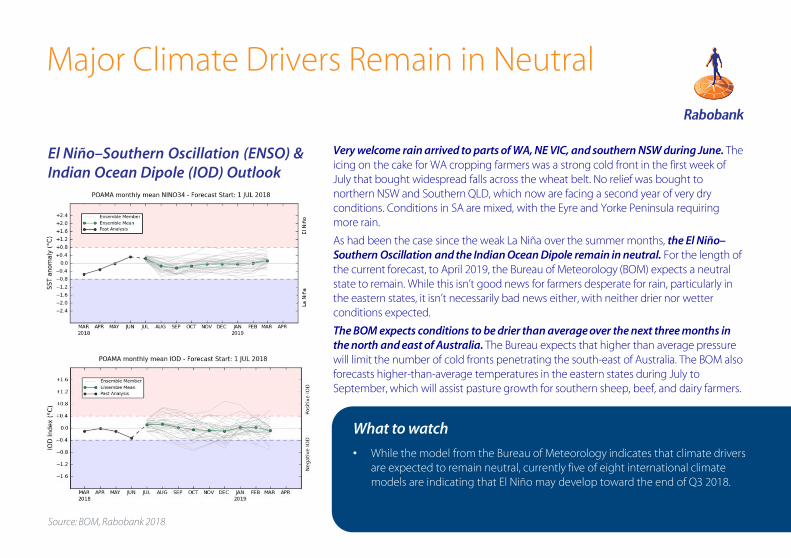
Very welcome rain arrived to parts of WA, NE VIC, and southern NSW during June. The icing on the cake for WA cropping farmers was a strong cold front in the first week of July that bought widespread falls across the wheat belt. No relief was bought to northern NSW and Southern QLD, which now are facing a second year of very dry conditions. Conditions in SA are mixed, with the Eyre and Yorke Peninsula requiring more rain.
As had been the case since the weak La Niña over the summer months, the El Niño–Southern Oscillation and the Indian Ocean Dipole remain in neutral. For the length of the current forecast, to April 2019, the Bureau of Meteorology (BOM) expects a neutral state to remain. While this isn’t good news for farmers desperate for rain, particularly in the eastern states, it isn’t necessarily bad news either, with neither drier nor wetter conditions expected.
The BOM expects conditions to be drier than average over the next three months in the north and east of Australia. The Bureau expects that higher than average pressure will limit the number of cold fronts penetrating the south-east of Australia. The BOM also forecasts higher-than-average temperatures in the eastern states during July to September, which will assist pasture growth for southern sheep, beef, and dairy farmers.
What to watch
• While the model from the Bureau of Meteorology indicates that climate drivers are expected to remain neutral, currently five of eight international climate models are indicating that El Niño may develop toward the end of Q3 2018.
Source: BOM, Rabobank 2018
El Niño–Southern Oscillation (ENSO) & Indian Ocean Dipole (IOD) Outlook
Major Climate Drivers Remain in Neutral
Source: BOM, Rabobank 2018
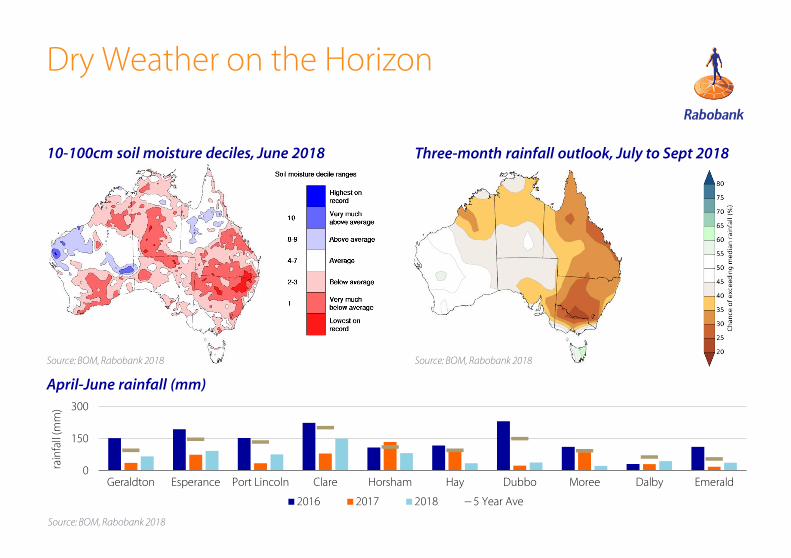
10-100cm soil moisture deciles, June 2018 Three-month rainfall outlook, July to Sept 2018
Source: BOM, Rabobank 2018
Source: BOM, Rabobank 2018
0
150
300
Geraldton Esperance Port Lincoln Clare Horsham Hay Dubbo Moree Dalby Emerald
rain
fall
(mm
)
2016 2017 2018 5 Year Ave
Dry Weather on the Horizon
April-June rainfall (mm)
Grains & Oilseeds
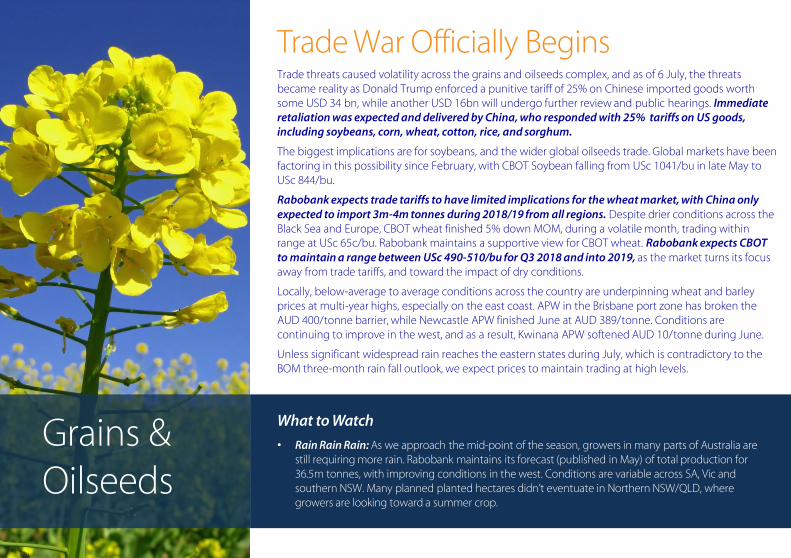
Trade War Officially BeginsTrade threats caused volatility across the grains and oilseeds complex, and as of 6 July, the threats became reality as Donald Trump enforced a punitive tariff of 25% on Chinese imported goods worth some USD 34 bn, while another USD 16bn will undergo further review and public hearings. Immediate retaliation was expected and delivered by China, who responded with 25% tariffs on US goods, including soybeans, corn, wheat, cotton, rice, and sorghum.
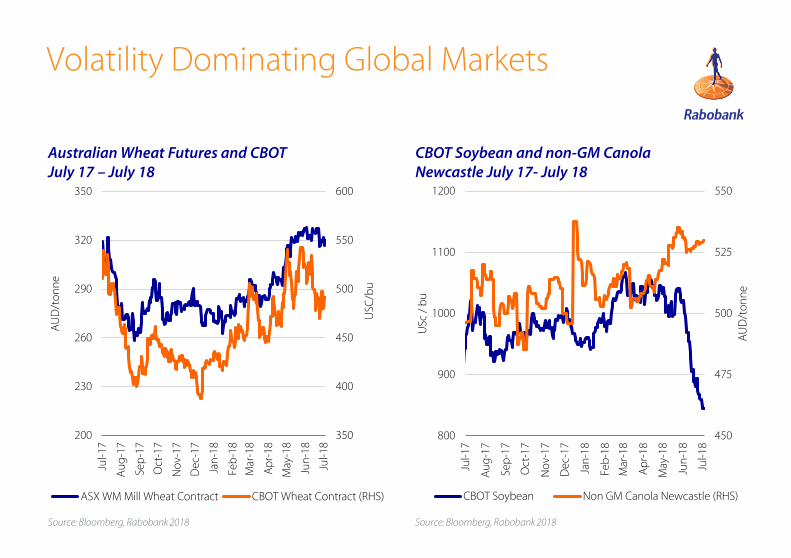
The biggest implications are for soybeans, and the wider global oilseeds trade. Global markets have been factoring in this possibility since February, with CBOT Soybean falling from USc 1041/bu in late May to USc 844/bu.
Rabobank expects trade tariffs to have limited implications for the wheat market, with China only expected to import 3m-4m tonnes during 2018/19 from all regions. Despite drier conditions across the Black Sea and Europe, CBOT wheat finished 5% down MOM, during a volatile month, trading within range at USc 65c/bu. Rabobank maintains a supportive view for CBOT wheat. Rabobank expects CBOT to maintain a range between USc 490-510/bu for Q3 2018 and into 2019, as the market turns its focus away from trade tariffs, and toward the impact of dry conditions.
Locally, below-average to average conditions across the country are underpinning wheat and barley prices at multi-year highs, especially on the east coast. APW in the Brisbane port zone has broken the AUD 400/tonne barrier, while Newcastle APW finished June at AUD 389/tonne. Conditions are continuing to improve in the west, and as a result, Kwinana APW softened AUD 10/tonne during June.
Unless significant widespread rain reaches the eastern states during July, which is contradictory to the BOM three-month rain fall outlook, we expect prices to maintain trading at high levels.
What to Watch
• Rain Rain Rain: As we approach the mid-point of the season, growers in many parts of Australia are still requiring more rain. Rabobank maintains its forecast (published in May) of total production for 36.5m tonnes, with improving conditions in the west. Conditions are variable across SA, Vic and southern NSW. Many planned planted hectares didn’t eventuate in Northern NSW/QLD, where growers are looking toward a summer crop.
Source: Bloomberg, Rabobank 2018 Source: Bloomberg, Rabobank 2018
Australian Wheat Futures and CBOT July 17 – July 18
CBOT Soybean and non-GM Canola Newcastle July 17- July 18
350
400
450
500
550
600
200
230
260
290
320
350
Jul-1
7
Au
g-1
7
Sep
-17
Oct
-17
No
v-17
Dec
-17
Jan
-18
Feb
-18
Mar
-18
Ap
r-18
May
-18
Jun
-18
Jul-1
8
USC
/bu
AU
D/t
on
ne
ASX WM Mill Wheat Contract CBOT Wheat Contract (RHS)
450
475
500
525
550
800
900
1000
1100
1200
Jul-1
7
Au
g-1
7
Sep
-17
Oct
-17
No
v-17
Dec
-17
Jan
-18
Feb
-18
Mar
-18
Ap
r-18
May
-18
Jun
-18
Jul-1
8
AU
D/t
on
ne
USc
/ b
u
CBOT Soybean Non GM Canola Newcastle (RHS)
Volatility Dominating Global Markets
Dairy
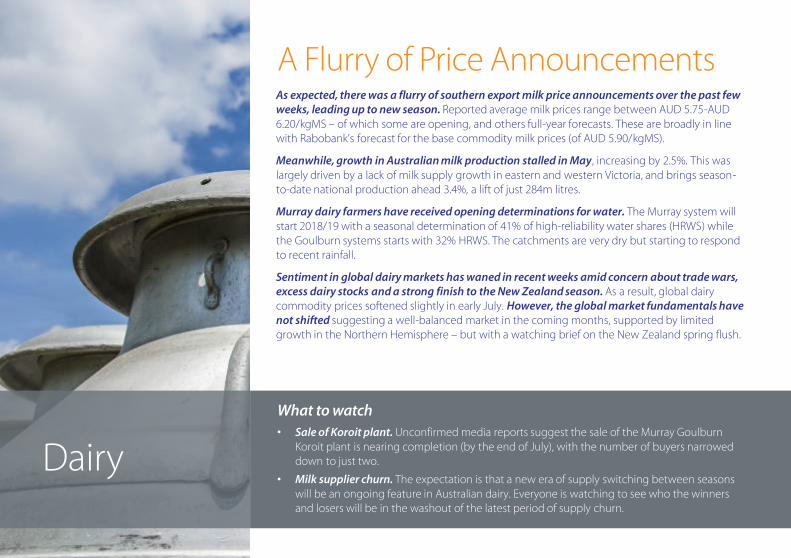
A Flurry of Price AnnouncementsAs expected, there was a flurry of southern export milk price announcements over the past few weeks, leading up to new season. Reported average milk prices range between AUD 5.75-AUD 6.20/kgMS – of which some are opening, and others full-year forecasts. These are broadly in line with Rabobank’s forecast for the base commodity milk prices (of AUD 5.90/kgMS).
Meanwhile, growth in Australian milk production stalled in May, increasing by 2.5%. This was largely driven by a lack of milk supply growth in eastern and western Victoria, and brings season-to-date national production ahead 3.4%, a lift of just 284m litres.
Murray dairy farmers have received opening determinations for water. The Murray system will start 2018/19 with a seasonal determination of 41% of high-reliability water shares (HRWS) while the Goulburn systems starts with 32% HRWS. The catchments are very dry but starting to respond to recent rainfall.
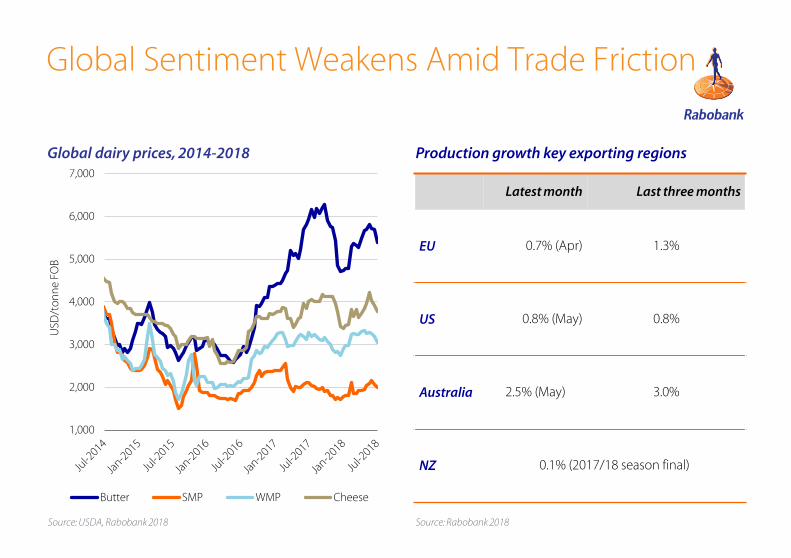
Sentiment in global dairy markets has waned in recent weeks amid concern about trade wars, excess dairy stocks and a strong finish to the New Zealand season. As a result, global dairy commodity prices softened slightly in early July. However, the global market fundamentals have not shifted suggesting a well-balanced market in the coming months, supported by limited growth in the Northern Hemisphere – but with a watching brief on the New Zealand spring flush.
What to watch• Sale of Koroit plant. Unconfirmed media reports suggest the sale of the Murray Goulburn
Koroit plant is nearing completion (by the end of July), with the number of buyers narrowed down to just two.
• Milk supplier churn. The expectation is that a new era of supply switching between seasons will be an ongoing feature in Australian dairy. Everyone is watching to see who the winners and losers will be in the washout of the latest period of supply churn.
Source: USDA, Rabobank 2018 Source: Rabobank 2018
Latest month Last three months
EU 0.7% (Apr) 1.3%
US 0.8% (May) 0.8%
Australia 2.5% (May) 3.0%
NZ 0.1% (2017/18 season final)
Production growth key exporting regions
1,000
2,000
3,000
4,000
5,000
6,000
7,000
USD
/to
nn
e FO
B
Butter SMP WMP Cheese
Global dairy prices, 2014-2018
Global Sentiment Weakens Amid Trade Friction
Beef
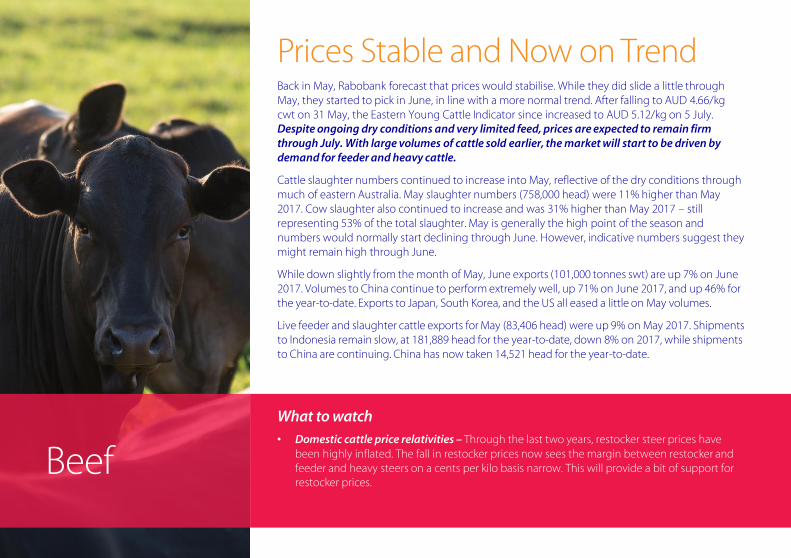
Prices Stable and Now on TrendBack in May, Rabobank forecast that prices would stabilise. While they did slide a little through May, they started to pick in June, in line with a more normal trend. After falling to AUD 4.66/kg cwt on 31 May, the Eastern Young Cattle Indicator since increased to AUD 5.12/kg on 5 July. Despite ongoing dry conditions and very limited feed, prices are expected to remain firm through July. With large volumes of cattle sold earlier, the market will start to be driven by demand for feeder and heavy cattle.
Cattle slaughter numbers continued to increase into May, reflective of the dry conditions through much of eastern Australia. May slaughter numbers (758,000 head) were 11% higher than May 2017. Cow slaughter also continued to increase and was 31% higher than May 2017 – still representing 53% of the total slaughter. May is generally the high point of the season and numbers would normally start declining through June. However, indicative numbers suggest they might remain high through June.
While down slightly from the month of May, June exports (101,000 tonnes swt) are up 7% on June 2017. Volumes to China continue to perform extremely well, up 71% on June 2017, and up 46% for the year-to-date. Exports to Japan, South Korea, and the US all eased a little on May volumes.
Live feeder and slaughter cattle exports for May (83,406 head) were up 9% on May 2017. Shipments to Indonesia remain slow, at 181,889 head for the year-to-date, down 8% on 2017, while shipments to China are continuing. China has now taken 14,521 head for the year-to-date.
What to watch
• Domestic cattle price relativities – Through the last two years, restocker steer prices have been highly inflated. The fall in restocker prices now sees the margin between restocker and feeder and heavy steers on a cents per kilo basis narrow. This will provide a bit of support for restocker prices.
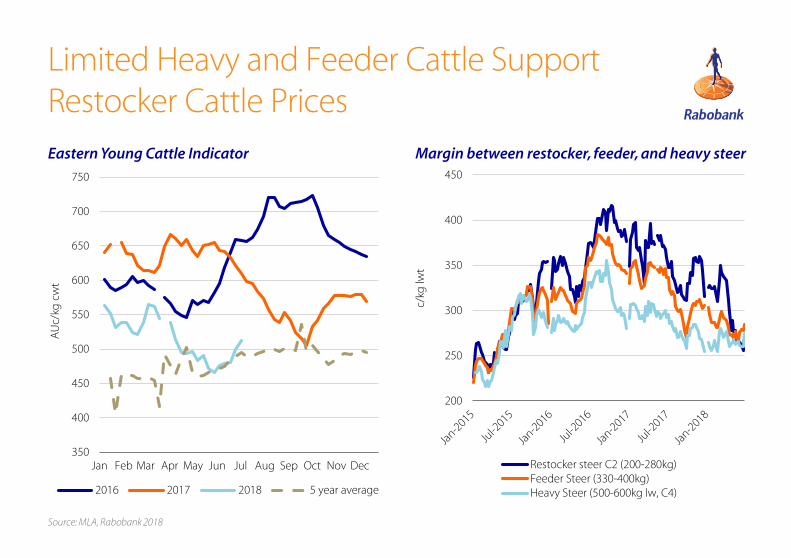
Limited Heavy and Feeder Cattle Support Restocker Cattle Prices
Eastern Young Cattle Indicator
Source: MLA, Rabobank 2018
Margin between restocker, feeder, and heavy steer
200
250
300
350
400
450
c/kg
lwt
Restocker steer C2 (200-280kg)Feeder Steer (330-400kg)Heavy Steer (500-600kg lw, C4)
350
400
450
500
550
600
650
700
750
Jan Feb Mar Apr May Jun Jul Aug Sep Oct Nov Dec
AU
c/kg
cw
t
2016 2017 2018 5 year average
Sheepmeat
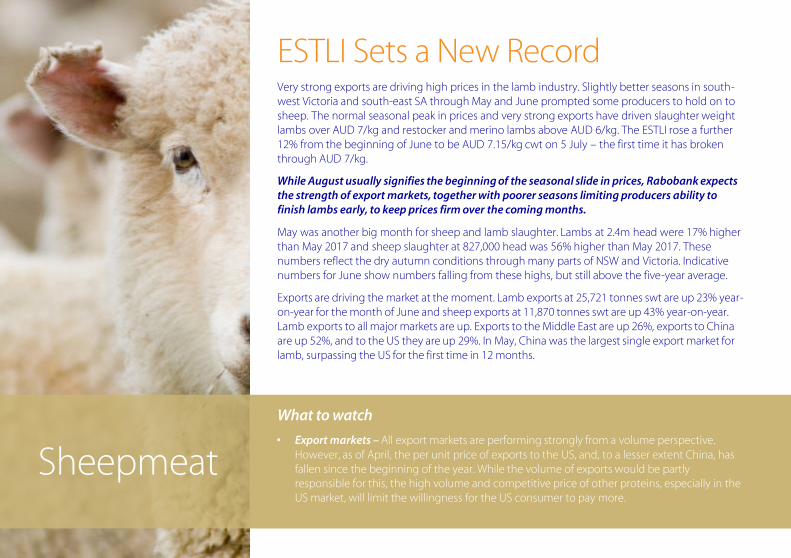
ESTLI Sets a New RecordVery strong exports are driving high prices in the lamb industry. Slightly better seasons in south-west Victoria and south-east SA through May and June prompted some producers to hold on to sheep. The normal seasonal peak in prices and very strong exports have driven slaughter weight lambs over AUD 7/kg and restocker and merino lambs above AUD 6/kg. The ESTLI rose a further 12% from the beginning of June to be AUD 7.15/kg cwt on 5 July – the first time it has broken through AUD 7/kg.
While August usually signifies the beginning of the seasonal slide in prices, Rabobank expects the strength of export markets, together with poorer seasons limiting producers ability to finish lambs early, to keep prices firm over the coming months.
May was another big month for sheep and lamb slaughter. Lambs at 2.4m head were 17% higher than May 2017 and sheep slaughter at 827,000 head was 56% higher than May 2017. These numbers reflect the dry autumn conditions through many parts of NSW and Victoria. Indicative numbers for June show numbers falling from these highs, but still above the five-year average.
Exports are driving the market at the moment. Lamb exports at 25,721 tonnes swt are up 23% year-on-year for the month of June and sheep exports at 11,870 tonnes swt are up 43% year-on-year. Lamb exports to all major markets are up. Exports to the Middle East are up 26%, exports to China are up 52%, and to the US they are up 29%. In May, China was the largest single export market for lamb, surpassing the US for the first time in 12 months.
What to watch
• Export markets – All export markets are performing strongly from a volume perspective. However, as of April, the per unit price of exports to the US, and, to a lesser extent China, has fallen since the beginning of the year. While the volume of exports would be partly responsible for this, the high volume and competitive price of other proteins, especially in the US market, will limit the willingness for the US consumer to pay more.
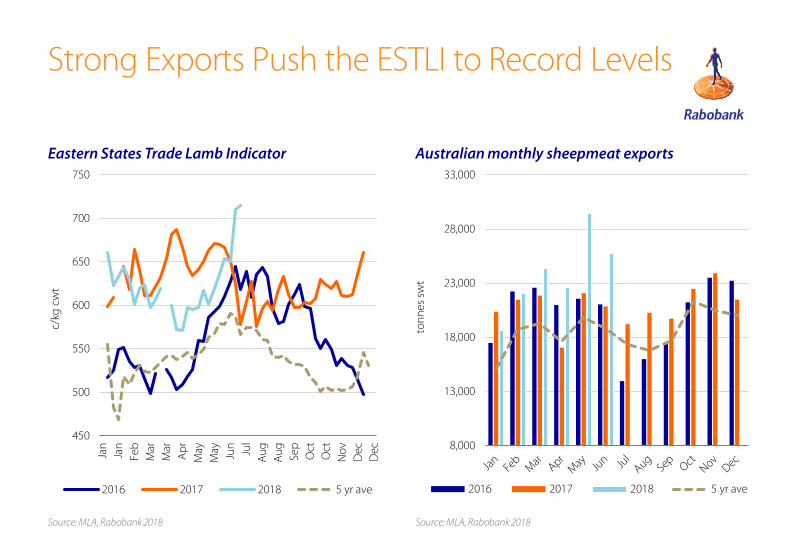
Strong Exports Push the ESTLI to Record Levels
Source: MLA, Rabobank 2018 Source: MLA, Rabobank 2018
450
500
550
600
650
700
750
Jan
Jan
Feb
Mar
Mar
Ap
r
May
May
Jun
Jul
Au
g
Au
g
Sep
Oct
Oct
No
v
Dec
Dec
c/kg
cw
t
2016 2017 2018 5 yr ave
8,000
13,000
18,000
23,000
28,000
33,000
ton
nes
sw
t
2016 2017 2018 5 yr ave
Eastern States Trade Lamb Indicator Australian monthly sheepmeat exports
Sugar
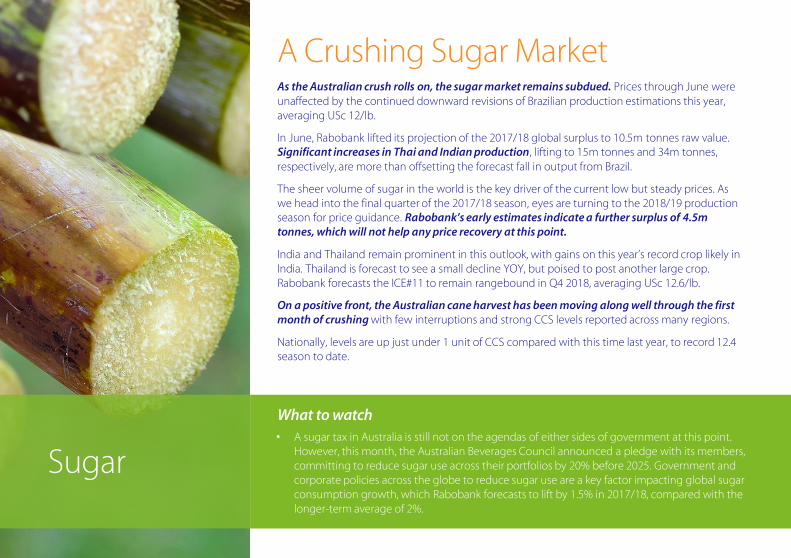
A Crushing Sugar MarketAs the Australian crush rolls on, the sugar market remains subdued. Prices through June were unaffected by the continued downward revisions of Brazilian production estimations this year, averaging USc 12/lb.
In June, Rabobank lifted its projection of the 2017/18 global surplus to 10.5m tonnes raw value. Significant increases in Thai and Indian production, lifting to 15m tonnes and 34m tonnes, respectively, are more than offsetting the forecast fall in output from Brazil.
The sheer volume of sugar in the world is the key driver of the current low but steady prices. As we head into the final quarter of the 2017/18 season, eyes are turning to the 2018/19 production season for price guidance. Rabobank’s early estimates indicate a further surplus of 4.5m tonnes, which will not help any price recovery at this point.
India and Thailand remain prominent in this outlook, with gains on this year’s record crop likely in India. Thailand is forecast to see a small decline YOY, but poised to post another large crop. Rabobank forecasts the ICE#11 to remain rangebound in Q4 2018, averaging USc 12.6/lb.
On a positive front, the Australian cane harvest has been moving along well through the first month of crushing with few interruptions and strong CCS levels reported across many regions.
Nationally, levels are up just under 1 unit of CCS compared with this time last year, to record 12.4 season to date.
What to watch• A sugar tax in Australia is still not on the agendas of either sides of government at this point.
However, this month, the Australian Beverages Council announced a pledge with its members, committing to reduce sugar use across their portfolios by 20% before 2025. Government and corporate policies across the globe to reduce sugar use are a key factor impacting global sugar consumption growth, which Rabobank forecasts to lift by 1.5% in 2017/18, compared with the longer-term average of 2%.
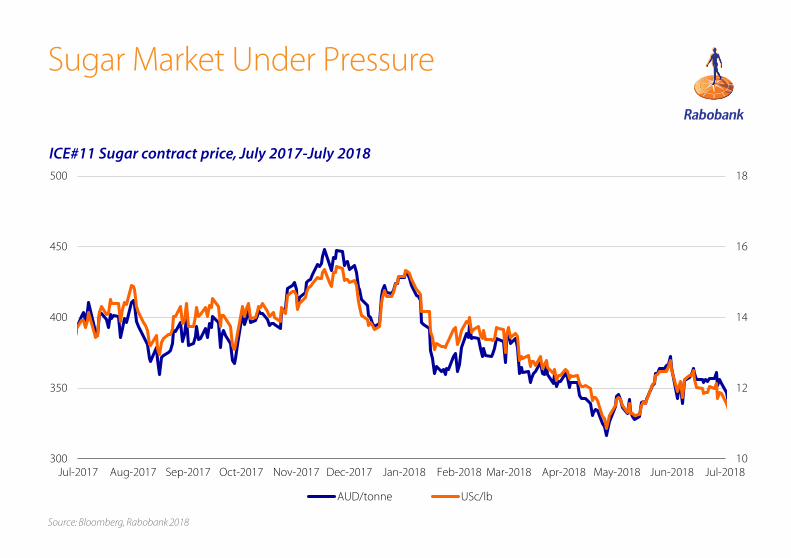
Sugar Market Under Pressure
Source: Bloomberg, Rabobank 2018
ICE#11 Sugar contract price, July 2017-July 2018
10
12
14
16
18
300
350
400
450
500
Jul-2017 Aug-2017 Sep-2017 Oct-2017 Nov-2017 Dec-2017 Jan-2018 Feb-2018 Mar-2018 Apr-2018 May-2018 Jun-2018 Jul-2018
AUD/tonne USc/lb
Cotton
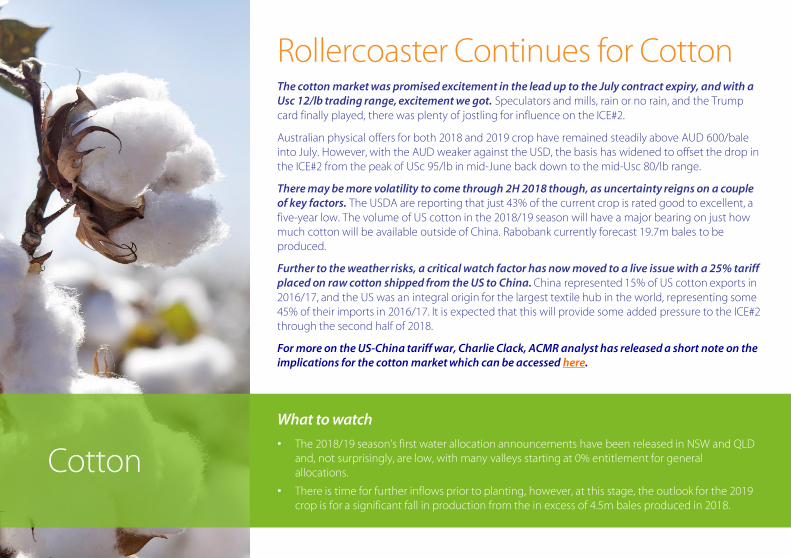
Rollercoaster Continues for CottonThe cotton market was promised excitement in the lead up to the July contract expiry, and with a Usc 12/lb trading range, excitement we got. Speculators and mills, rain or no rain, and the Trump card finally played, there was plenty of jostling for influence on the ICE#2.
Australian physical offers for both 2018 and 2019 crop have remained steadily above AUD 600/bale into July. However, with the AUD weaker against the USD, the basis has widened to offset the drop in the ICE#2 from the peak of USc 95/lb in mid-June back down to the mid-Usc 80/lb range.
There may be more volatility to come through 2H 2018 though, as uncertainty reigns on a couple of key factors. The USDA are reporting that just 43% of the current crop is rated good to excellent, a five-year low. The volume of US cotton in the 2018/19 season will have a major bearing on just how much cotton will be available outside of China. Rabobank currently forecast 19.7m bales to be produced.
Further to the weather risks, a critical watch factor has now moved to a live issue with a 25% tariff placed on raw cotton shipped from the US to China. China represented 15% of US cotton exports in 2016/17, and the US was an integral origin for the largest textile hub in the world, representing some 45% of their imports in 2016/17. It is expected that this will provide some added pressure to the ICE#2 through the second half of 2018.
For more on the US-China tariff war, Charlie Clack, ACMR analyst has released a short note on the implications for the cotton market which can be accessed here.
What to watch
• The 2018/19 season’s first water allocation announcements have been released in NSW and QLD and, not surprisingly, are low, with many valleys starting at 0% entitlement for general allocations.
• There is time for further inflows prior to planting, however, at this stage, the outlook for the 2019 crop is for a significant fall in production from the in excess of 4.5m bales produced in 2018.
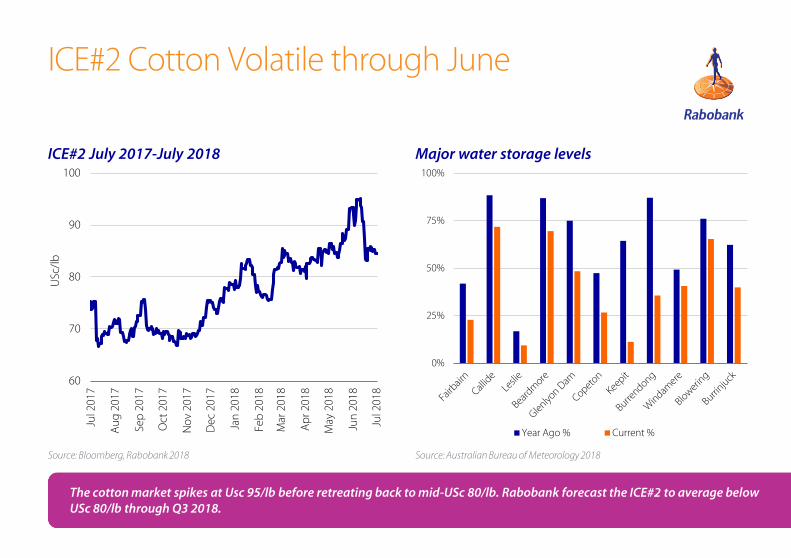
ICE#2 Cotton Volatile through June
The cotton market spikes at Usc 95/lb before retreating back to mid-USc 80/lb. Rabobank forecast the ICE#2 to average below
USc 80/lb through Q3 2018.
Source: Bloomberg, Rabobank 2018
60
70
80
90
100
Jul 2
017
Au
g 2
017
Sep
201
7
Oct
201
7
No
v 20
17
Dec
201
7
Jan
201
8
Feb
201
8
Mar
201
8
Ap
r 20
18
May
201
8
Jun
201
8
Jul 2
018
USc
/lb
0%
25%
50%
75%
100%
Year Ago % Current %
Source: Australian Bureau of Meteorology 2018
ICE#2 July 2017-July 2018 Major water storage levels
Wool
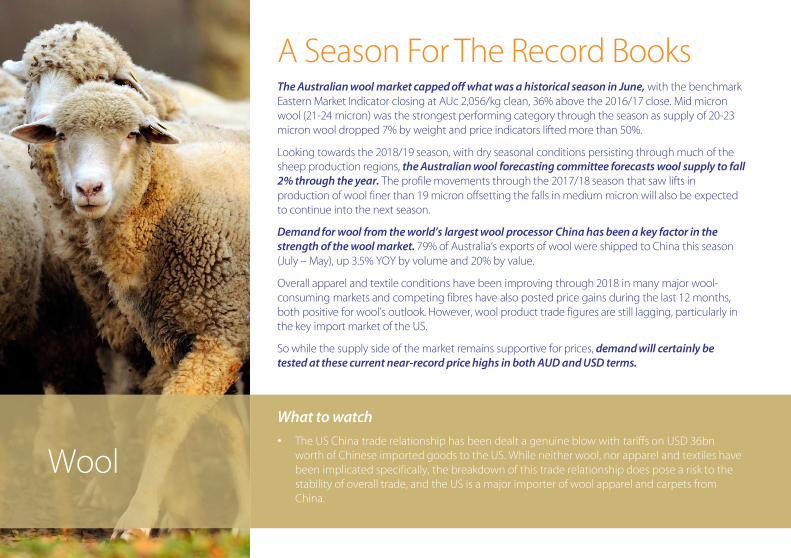
A Season For The Record BooksThe Australian wool market capped off what was a historical season in June, with the benchmark Eastern Market Indicator closing at AUc 2,056/kg clean, 36% above the 2016/17 close. Mid micron wool (21-24 micron) was the strongest performing category through the season as supply of 20-23 micron wool dropped 7% by weight and price indicators lifted more than 50%.
Looking towards the 2018/19 season, with dry seasonal conditions persisting through much of the sheep production regions, the Australian wool forecasting committee forecasts wool supply to fall 2% through the year. The profile movements through the 2017/18 season that saw lifts in production of wool finer than 19 micron offsetting the falls in medium micron will also be expected to continue into the next season.
Demand for wool from the world’s largest wool processor China has been a key factor in the strength of the wool market. 79% of Australia’s exports of wool were shipped to China this season (July – May), up 3.5% YOY by volume and 20% by value.
Overall apparel and textile conditions have been improving through 2018 in many major wool-consuming markets and competing fibres have also posted price gains during the last 12 months, both positive for wool’s outlook. However, wool product trade figures are still lagging, particularly in the key import market of the US.
So while the supply side of the market remains supportive for prices, demand will certainly be tested at these current near-record price highs in both AUD and USD terms.
What to watch
• The US China trade relationship has been dealt a genuine blow with tariffs on USD 36bn worth of Chinese imported goods to the US. While neither wool, nor apparel and textiles have been implicated specifically, the breakdown of this trade relationship does pose a risk to the stability of overall trade, and the US is a major importer of wool apparel and carpets from China.
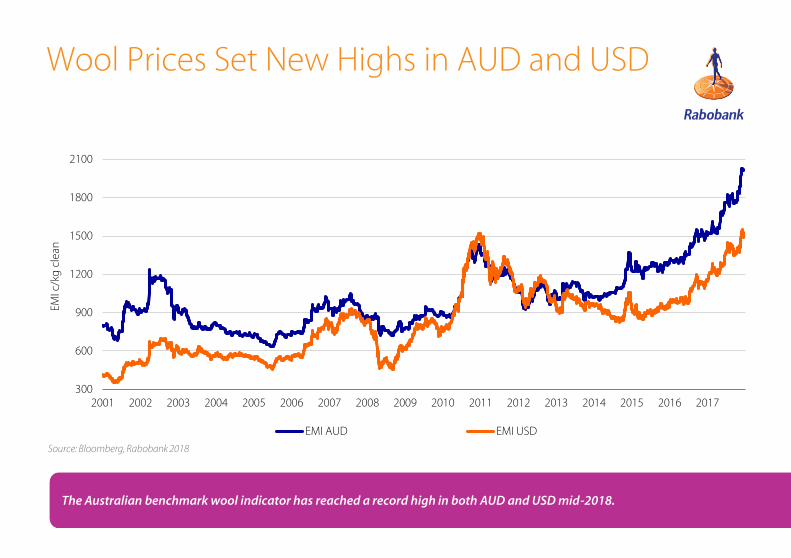
The Australian benchmark wool indicator has reached a record high in both AUD and USD mid-2018.
Source: Bloomberg, Rabobank 2018
Wool Prices Set New Highs in AUD and USD
300
600
900
1200
1500
1800
2100
2001 2002 2003 2004 2005 2006 2007 2008 2009 2010 2011 2012 2013 2014 2015 2016 2017
EMI c
/kg
cle
an
EMI AUD EMI USD
Wine
What to watch
• US-China trade. On 23 March 2018, wine from the US was included in the initial list of
proposed products to attract an increased tariff from China. This potentially created an
opportunity for Australian exporters into China, as noted in our April Agribusiness Monthly.
However, on 16 June, wine from the US was no longer on the list of products. Whether this
evolves again in the ongoing tit-for-tat interactions will be of interest to Australian exporters.
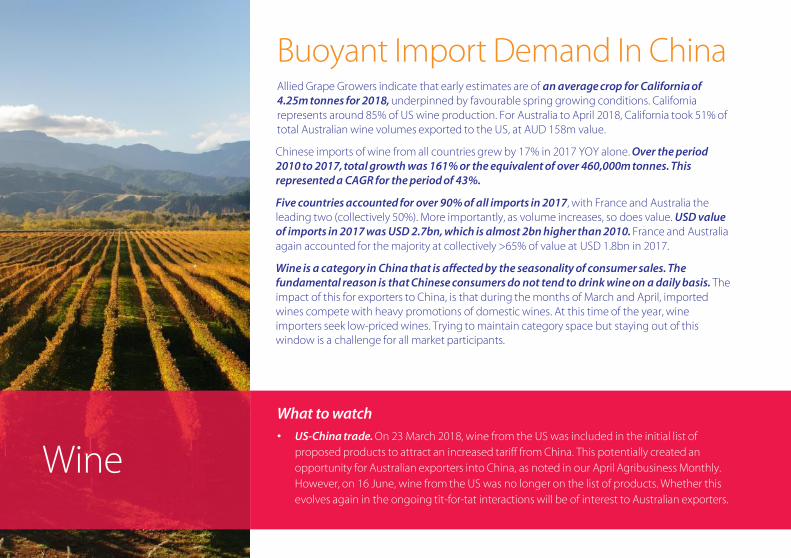
Buoyant Import Demand In China Allied Grape Growers indicate that early estimates are of an average crop for California of 4.25m tonnes for 2018, underpinned by favourable spring growing conditions. California represents around 85% of US wine production. For Australia to April 2018, California took 51% of total Australian wine volumes exported to the US, at AUD 158m value.
Chinese imports of wine from all countries grew by 17% in 2017 YOY alone. Over the period 2010 to 2017, total growth was 161% or the equivalent of over 460,000m tonnes. This represented a CAGR for the period of 43%.
Five countries accounted for over 90% of all imports in 2017, with France and Australia the leading two (collectively 50%). More importantly, as volume increases, so does value. USD value of imports in 2017 was USD 2.7bn, which is almost 2bn higher than 2010. France and Australia again accounted for the majority at collectively >65% of value at USD 1.8bn in 2017.
Wine is a category in China that is affected by the seasonality of consumer sales. The fundamental reason is that Chinese consumers do not tend to drink wine on a daily basis. The impact of this for exporters to China, is that during the months of March and April, imported wines compete with heavy promotions of domestic wines. At this time of the year, wine importers seek low-priced wines. Trying to maintain category space but staying out of this window is a challenge for all market participants.
430
440
450
460
470
480
-
1,000
2,000
3,000
4,000
5,000
2008 2009 2010 2011 2012 2013 2014 2015 2016 2017 2018 (fcst)
pro
du
cin
g h
ecta
res
(th
ou
san
ds)
ton
nes
cru
shed
(mill
ion
)
California Tonnes (RHS) California ha
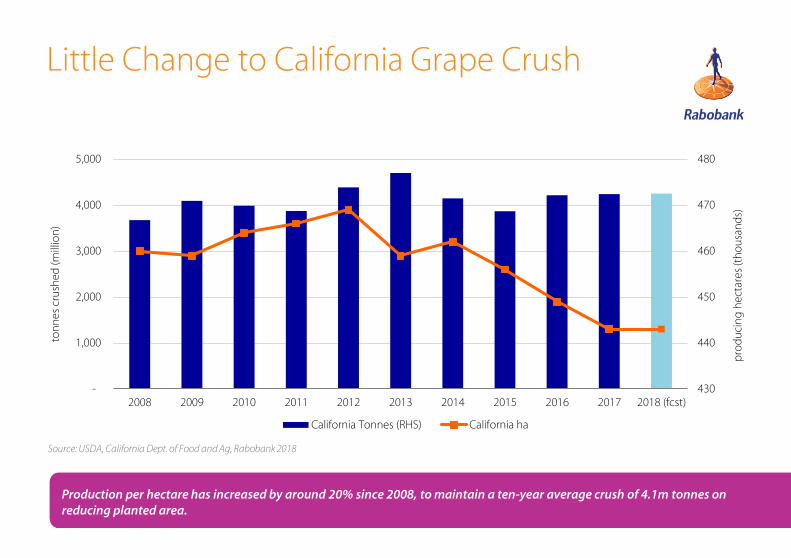
Little Change to California Grape Crush
Source: USDA, California Dept. of Food and Ag, Rabobank 2018
Production per hectare has increased by around 20% since 2008, to maintain a ten-year average crush of 4.1m tonnes on reducing planted area.
Horticulture
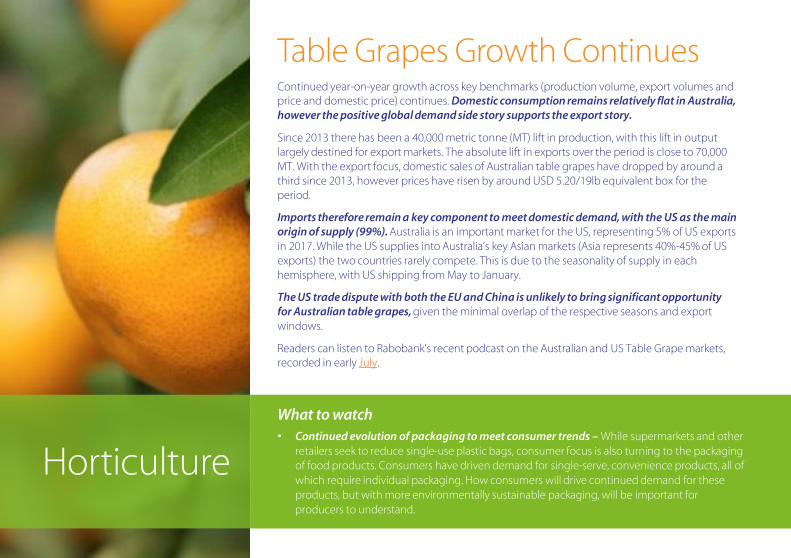
What to watch• Continued evolution of packaging to meet consumer trends – While supermarkets and other
retailers seek to reduce single-use plastic bags, consumer focus is also turning to the packaging of food products. Consumers have driven demand for single-serve, convenience products, all of which require individual packaging. How consumers will drive continued demand for these products, but with more environmentally sustainable packaging, will be important for producers to understand.
Table Grapes Growth ContinuesContinued year-on-year growth across key benchmarks (production volume, export volumes and price and domestic price) continues. Domestic consumption remains relatively flat in Australia, however the positive global demand side story supports the export story.
Since 2013 there has been a 40,000 metric tonne (MT) lift in production, with this lift in output largely destined for export markets. The absolute lift in exports over the period is close to 70,000 MT. With the export focus, domestic sales of Australian table grapes have dropped by around a third since 2013, however prices have risen by around USD 5.20/19lb equivalent box for the period.
Imports therefore remain a key component to meet domestic demand, with the US as the main origin of supply (99%). Australia is an important market for the US, representing 5% of US exports in 2017. While the US supplies into Australia’s key Asian markets (Asia represents 40%-45% of US exports) the two countries rarely compete. This is due to the seasonality of supply in each hemisphere, with US shipping from May to January.
The US trade dispute with both the EU and China is unlikely to bring significant opportunity for Australian table grapes, given the minimal overlap of the respective seasons and export windows.
Readers can listen to Rabobank's recent podcast on the Australian and US Table Grape markets, recorded in early July.
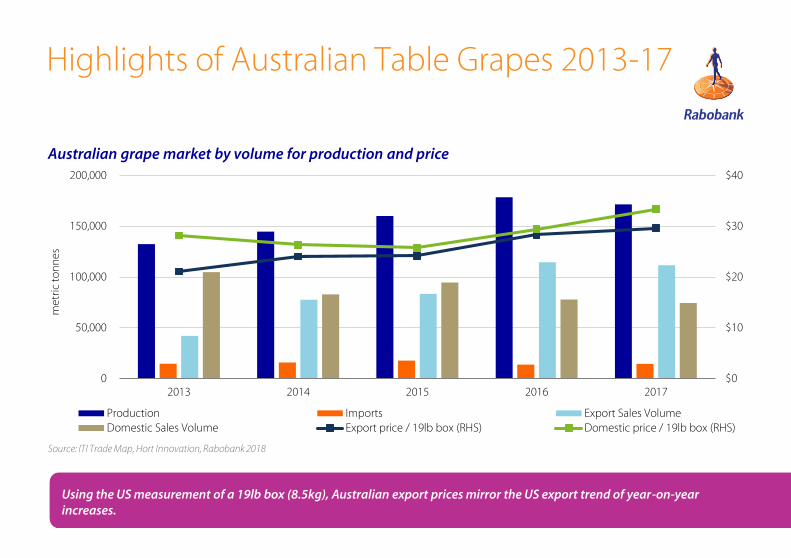
Highlights of Australian Table Grapes 2013-17
$0
$10
$20
$30
$40
0
50,000
100,000
150,000
200,000
2013 2014 2015 2016 2017
met
ric
ton
nes
Production Imports Export Sales VolumeDomestic Sales Volume Export price / 19lb box (RHS) Domestic price / 19lb box (RHS)
Australian grape market by volume for production and price
Source: ITI Trade Map, Hort Innovation, Rabobank 2018
Using the US measurement of a 19lb box (8.5kg), Australian export prices mirror the US export trend of year-on-year increases.
Fertiliser
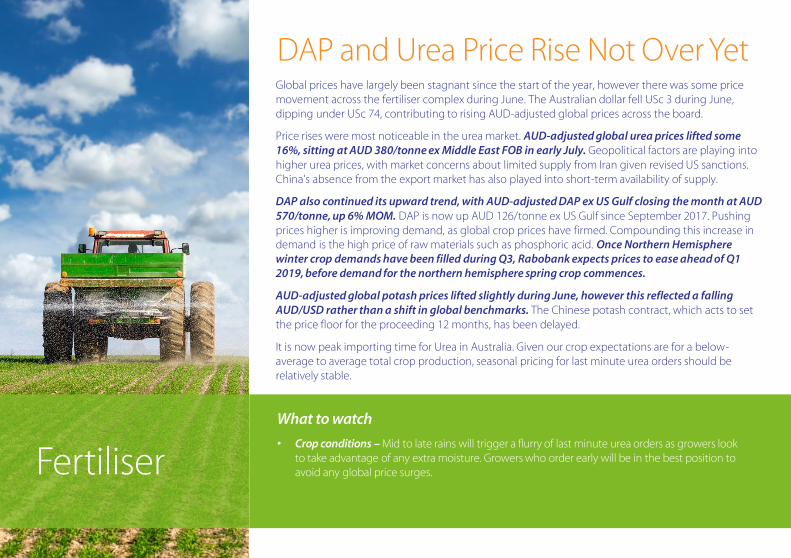
DAP and Urea Price Rise Not Over YetGlobal prices have largely been stagnant since the start of the year, however there was some price movement across the fertiliser complex during June. The Australian dollar fell USc 3 during June, dipping under USc 74, contributing to rising AUD-adjusted global prices across the board.
Price rises were most noticeable in the urea market. AUD-adjusted global urea prices lifted some 16%, sitting at AUD 380/tonne ex Middle East FOB in early July. Geopolitical factors are playing into higher urea prices, with market concerns about limited supply from Iran given revised US sanctions. China’s absence from the export market has also played into short-term availability of supply.
DAP also continued its upward trend, with AUD-adjusted DAP ex US Gulf closing the month at AUD 570/tonne, up 6% MOM. DAP is now up AUD 126/tonne ex US Gulf since September 2017. Pushing prices higher is improving demand, as global crop prices have firmed. Compounding this increase in demand is the high price of raw materials such as phosphoric acid. Once Northern Hemisphere winter crop demands have been filled during Q3, Rabobank expects prices to ease ahead of Q1 2019, before demand for the northern hemisphere spring crop commences.
AUD-adjusted global potash prices lifted slightly during June, however this reflected a falling AUD/USD rather than a shift in global benchmarks. The Chinese potash contract, which acts to set the price floor for the proceeding 12 months, has been delayed.
It is now peak importing time for Urea in Australia. Given our crop expectations are for a below-average to average total crop production, seasonal pricing for last minute urea orders should be relatively stable.
What to watch
• Crop conditions – Mid to late rains will trigger a flurry of last minute urea orders as growers look to take advantage of any extra moisture. Growers who order early will be in the best position to avoid any global price surges.
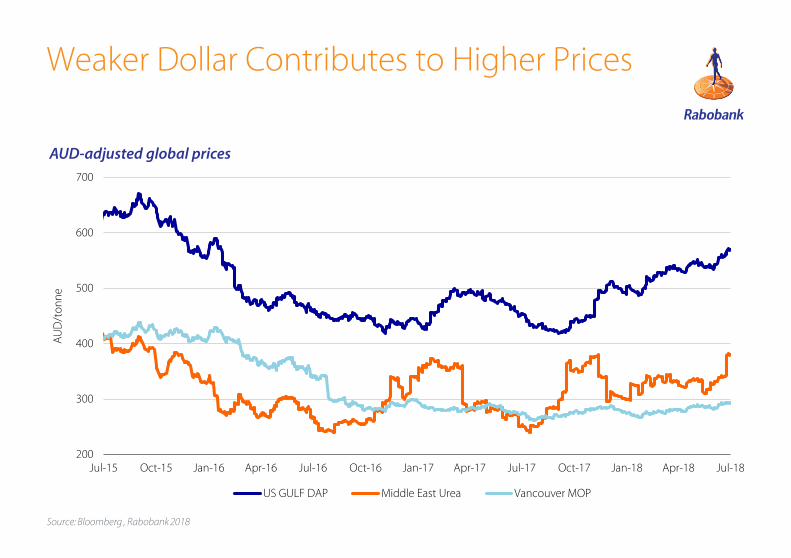
Source: Bloomberg , Rabobank 2018
AUD-adjusted global prices
200
300
400
500
600
700
Jul-15 Oct-15 Jan-16 Apr-16 Jul-16 Oct-16 Jan-17 Apr-17 Jul-17 Oct-17 Jan-18 Apr-18 Jul-18
AU
D/t
on
ne
US GULF DAP Middle East Urea Vancouver MOP
Weaker Dollar Contributes to Higher Prices
FX
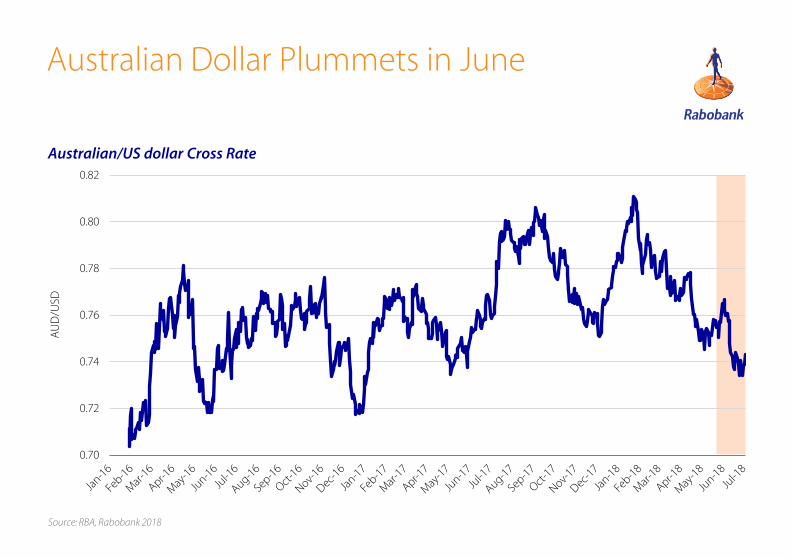
AUD Plummets, Boosting Export Competitiveness The AUD lost a massive 3 cents against the USD through June. As Americans were toasting 4 July, Australian exporters were celebrating a currency that had fallen below USc 74: its lowest level since late 2016.
In the US, as anticipated, the Fed raised the target range for the federal funds rate to 1.75%-2.00% from 1.50%-1.75% in June – the second rate hike this year. For now we are sticking with our expectation that there will be one more US rate hike this year (likely September). We are more sanguine about the outlook for the US economy as it pushes into 2019 than many commentators, and for now expect no rate hike in the first half of that year.
By contrast, in Australia, Rabobank expects that there is a slightly more than 50:50 chance that the next move by the RBA will be a rate cut, rather than a hike. Wage growth is negligible in real terms, the housing market is softening (and is likely to do so further), growth in the Chinese economy is easing, and the chances are that the global trade environment will deteriorate further in the coming year.
The sharp depreciation of the AUD through June has brought the value of the currency close to our previous 12-month forecast rate of USc 73 far sooner than we had anticipated. But, with economic fundamentals set to diverge more than we expected a month ago, Rabobank now expects the AUD to fall to USc 71 by June 2019.
What to watch• The Chinese RMB. Unusually, the PBOC allowed the Chinese currency to depreciate
significantly against the USD through June, rather than carefully managing movements. The RMB dropped 3.5% against the US dollar in just a few weeks as weaker domestic economic data, and concerns over the impacts of a trade war, came to bear. If the RMB continues to weaken in coming months, it will partly offset the benefit of increased export competitiveness for Australian producers – as Chinese purchasing power wanes.
Source: RBA, Rabobank 2018
Australian/US dollar Cross Rate
0.70
0.72
0.74
0.76
0.78
0.80
0.82
AU
D/U
SDAustralian Dollar Plummets in June
Oil & Freight
Turm‘oil’Brent Crude oil prices have dropped down to USD 73.44/bbl in the first half of June, however has since risen to where it currently sits at USD 77.70/bbl, up 1% MOM. The upward trend in oil prices at the end of June came in the aftermath of the 22 June OPEC meeting, which resulted in an agreement to boost oil production. The decision for an increase in production was due to the likelihood that Iranian production will slow in light of new sanctions from the US, pushing for all countries to end Iranian oil imports. The decision was also made given that Venezuelan production continues to decrease. Nonetheless, there is still scepticism as to how quickly production will increase given that only a number of countries have the ability to increase production.
Saudi Arabia has indicated that it will produce 11 mbpd in July, and Russia will increase production by at least 200 kbpd. Moving forward, world oil demand is likely to decrease as global growth momentum decreases, however production is forecast to fall more quickly, which argues for higher prices. Rabobank forecasts an average Brent Crude price has been lifted from USD 71/bbl to USD 78.33/bbl for the remainder of 2018.
The Baltic Dry Index surged 48% since the beginning of July. The Index rose 522 points to 1622 points, due to intensifying demand for larger ships to cart ore to China as it ramps up iron ore imports.
High oil prices are increasing fuel costs for freight companies, which will contribute to an upward trend in oil prices moving forward.
What to watch
• Fighting in Libya. Political parties in Libya are fighting over control of their vast oil wealth,
which has led to drop in production. Further production disruptions will apply further upward
pressure to crude oil prices.
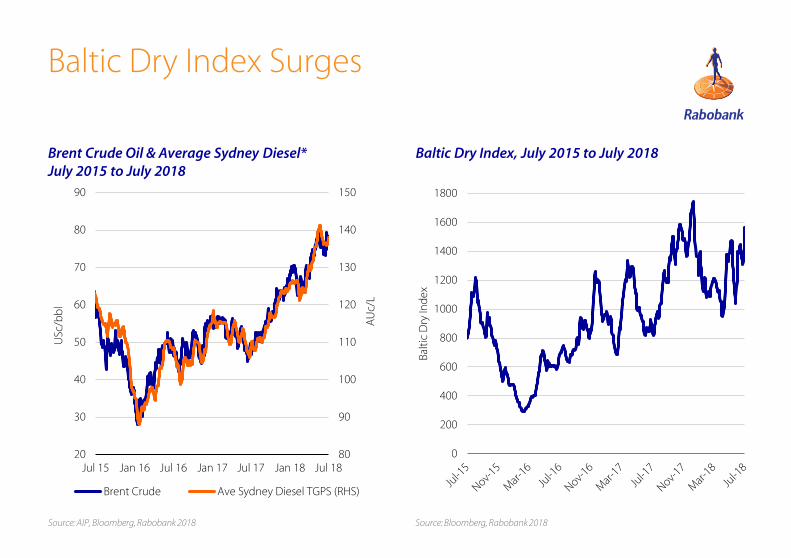
Brent Crude Oil & Average Sydney Diesel*July 2015 to July 2018
Baltic Dry Index, July 2015 to July 2018
Baltic Dry Index Surges
80
90
100
110
120
130
140
150
20
30
40
50
60
70
80
90
Jul 15 Jan 16 Jul 16 Jan 17 Jul 17 Jan 18 Jul 18
AU
c/L
USc
/bb
l
Brent Crude Ave Sydney Diesel TGPS (RHS)
0
200
400
600
800
1000
1200
1400
1600
1800
Balt
ic D
ry In
dex
Source: Bloomberg, Rabobank 2018Source: AIP, Bloomberg, Rabobank 2018
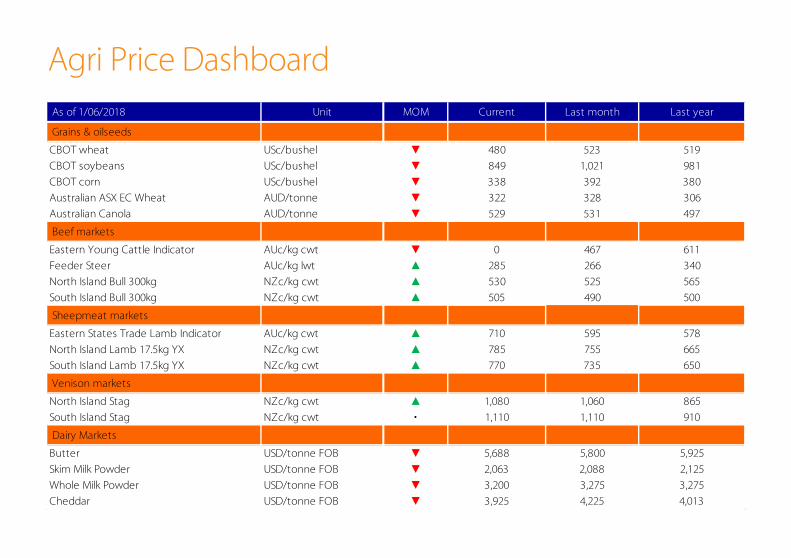
Agri Price Dashboard
As of 1/06/2018 Unit MOM Current Last month Last year
Grains & oilseeds
CBOT wheat USc/bushel ▼ 480 523 519
CBOT soybeans USc/bushel ▼ 849 1,021 981
CBOT corn USc/bushel ▼ 338 392 380
Australian ASX EC Wheat AUD/tonne ▼ 322 328 306
Australian Canola AUD/tonne ▼ 529 531 497
Beef markets
Eastern Young Cattle Indicator AUc/kg cwt ▼ 0 467 611
Feeder Steer AUc/kg lwt ▲ 285 266 340
North Island Bull 300kg NZc/kg cwt ▲ 530 525 565
South Island Bull 300kg NZc/kg cwt ▲ 505 490 500
Sheepmeat markets
Eastern States Trade Lamb Indicator AUc/kg cwt ▲ 710 595 578
North Island Lamb 17.5kg YX NZc/kg cwt ▲ 785 755 665
South Island Lamb 17.5kg YX NZc/kg cwt ▲ 770 735 650
Venison markets
North Island Stag NZc/kg cwt ▲ 1,080 1,060 865
South Island Stag NZc/kg cwt • 1,110 1,110 910
Dairy Markets
Butter USD/tonne FOB ▼ 5,688 5,800 5,925
Skim Milk Powder USD/tonne FOB ▼ 2,063 2,088 2,125
Whole Milk Powder USD/tonne FOB ▼ 3,200 3,275 3,275
Cheddar USD/tonne FOB ▼ 3,925 4,225 4,013
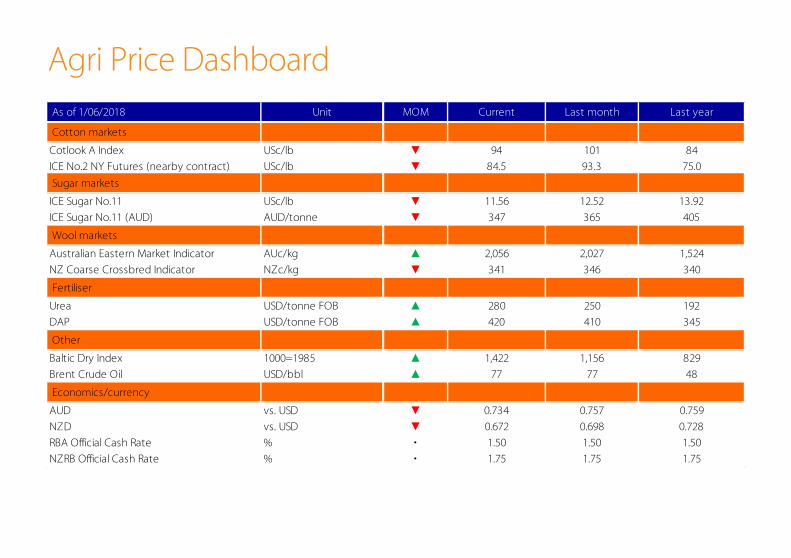
Agri Price Dashboard
As of 1/06/2018 Unit MOM Current Last month Last year
Cotton markets
Cotlook A Index USc/lb ▼ 94 101 84
ICE No.2 NY Futures (nearby contract) USc/lb ▼ 84.5 93.3 75.0
Sugar markets
ICE Sugar No.11 USc/lb ▼ 11.56 12.52 13.92
ICE Sugar No.11 (AUD) AUD/tonne ▼ 347 365 405
Wool markets
Australian Eastern Market Indicator AUc/kg ▲ 2,056 2,027 1,524
NZ Coarse Crossbred Indicator NZc/kg ▼ 341 346 340
Fertiliser
Urea USD/tonne FOB ▲ 280 250 192
DAP USD/tonne FOB ▲ 420 410 345
Other
Baltic Dry Index 1000=1985 ▲ 1,422 1,156 829
Brent Crude Oil USD/bbl ▲ 77 77 48
Economics/currency
AUD vs. USD ▼ 0.734 0.757 0.759
NZD vs. USD ▼ 0.672 0.698 0.728
RBA Official Cash Rate % • 1.50 1.50 1.50
NZRB Official Cash Rate % • 1.75 1.75 1.75
RaboResearch Food & AgribusinessAustralia and New Zealand
Rabobank AustraliaNearest branch call 1300 30 30 33www.rabobank.com.au
Tim HuntHead of Food & Agribusiness Research and Advisory, Australia and New Zealand+61 3 9940 [email protected]
Angus Gidley-BairdSenior Analyst – Animal Protein+ 61 2 8115 [email protected]
Michael HarveySenior Analyst – Dairy +61 3 9940 [email protected]
Cheryl Kalisch GordonSenior Analyst – Grains & Oilseeds+61 2 6363 [email protected]
Hayden Higgins Senior Analyst - Horticulture and Wine+64 6 974 [email protected]
Wes LefroyAgricultural Analyst+61 2 8115 [email protected]
Georgia TwomeyCommodity Analyst+61 2 8115 [email protected]
Blake HolgateAnimal Protein and Sustainability Analyst+64 3 955 [email protected]
Emma HigginsDairy Analyst+64 3 961 [email protected]
Ollie Ridge Intern+61 2 8115 [email protected]
Catherine KeoBusiness Coordinator+61 2 8115 [email protected]
This document is issued by a Rabobank Group member. The information and opinions contained in this document have been compiled or arrived at from sources believed to be reliable, but no representation or warranty, express or implied, is made as to their accuracy, completeness or correctness. This document is for information purposes only and is not, and should not be construed as, an offer or a commitment by any Rabobank Group member to enter into a transaction. This information is not professional advice and has not been prepared to be used as the basis for, and should not be used as the basis for, any financial or strategic decisions. This information is general in nature only and does not take into account an individual’s personal circumstances. All opinions expressed in this document are subject to change without notice. No Rabobank Group member accepts any liability whatsoever for any direct, indirect, consequential or other loss or damage howsoever arising from any use of this document or its contents or otherwise arising in connection therewith. This document may not be reproduced, distributed or published, in whole or in part, for any purpose, except with the prior written consent of a Rabobank Group member. By accepting this document you agree to be bound by the foregoing restrictions. All copyright is reserved ©