au agribusiness monthly
TRANSCRIPT

Prices Staying Sky High
Australia Agribusiness Monthly
RaboResearch
Food & Agribusiness
October 2021
Commodities
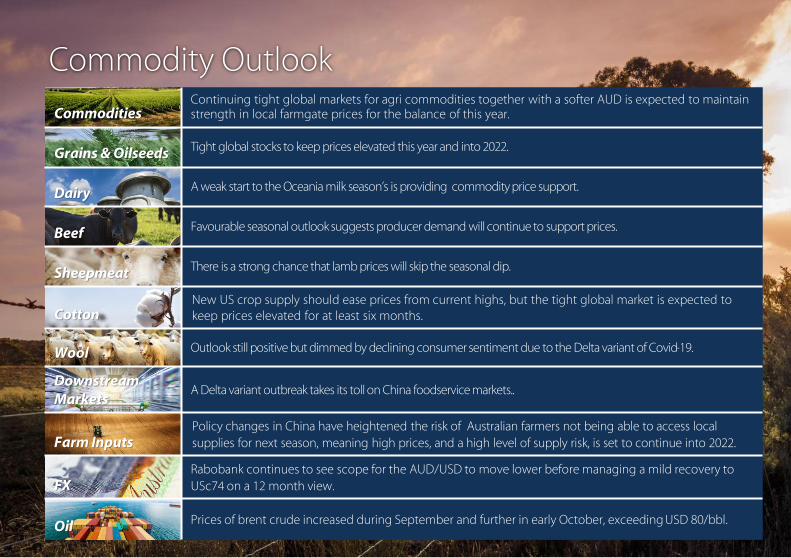
Continuing tight global markets for agri commodities together with a softer AUD is expected to maintain strength in local farmgate prices for the balance of this year.
Grains & OilseedsTight global stocks to keep prices elevated this year and into 2022.
DairyA weak start to the Oceania milk season’s is providing commodity price support.
BeefFavourable seasonal outlook suggests producer demand will continue to support prices.
SheepmeatThere is a strong chance that lamb prices will skip the seasonal dip.
Cotton
New US crop supply should ease prices from current highs, but the tight global market is expected to keep prices elevated for at least six months.
WoolOutlook still positive but dimmed by declining consumer sentiment due to the Delta variant of Covid-19.
Downstream
Markets
A Delta variant outbreak takes its toll on China foodservice markets..
Farm Inputs
Policy changes in China have heightened the risk of Australian farmers not being able to access local supplies for next season, meaning high prices, and a high level of supply risk, is set to continue into 2022.
FX
Rabobank continues to see scope for the AUD/USD to move lower before managing a mild recovery to USc74 on a 12 month view.
OilPrices of brent crude increased during September and further in early October, exceeding USD 80/bbl.
Commodity Outlook

Source: Bloomberg, MLA, Rabobank 2021 Note: Our Index, calculated since 2009, is comprised of local prices for wheat, barley, canola, sorghum, beef, lamb, dairy, wool, sugar and cotton, expressed in Australian currency and weighted according to their share of the value of production of Australian farmers (using the sum of the value of these products as the denominator).
Staying High
Rabobank Rural Commodity Index (AUD-based)
Australian agriculture’s exuberant pricing complex
continued in September, so that our index gained another
1.5% over the month.
Another 10% MOM gain in canola pricing along with a
further 3.2% MOM gain for cotton pricing has been
accompanied by more modest gains for beef, lamb,
wheat and sorghum. The softening of the AUD over the
month helped to keep the decline in barley, sugar and
wool prices below 1.5% and all of our rural commodity
prices remain up between 8.5% (milk) and 53.3% (sugar)
YTD, except sorghum, down just 2.9%.
With a downside view on the AUD and still strong global
demand for agri commodities, but harvest pressure
coming to bear locally, we expect our index to be flat, or
move only modestly during October. Concerns about the
Chinese economy and expected global grains resupply
tempers our, though still strong, expectations for 2022,
while the availability and cost of farm inputs is becoming
an increasingly real challenge for Australian agriculture in
the year ahead.
70
110
150
190
230
com
mo
dit
y in
dex
(100
= S
ep 2
009)
Frost Bite
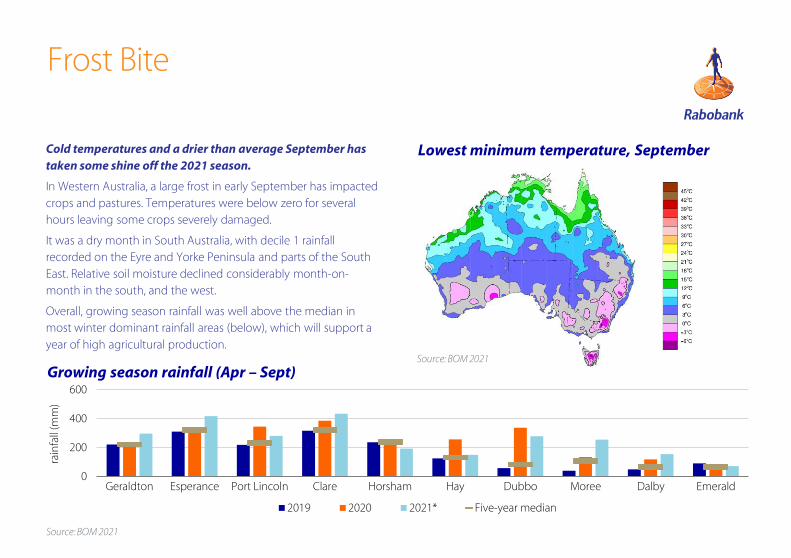
Cold temperatures and a drier than average September has
taken some shine off the 2021 season.
In Western Australia, a large frost in early September has impacted
crops and pastures. Temperatures were below zero for several
hours leaving some crops severely damaged.
It was a dry month in South Australia, with decile 1 rainfall
recorded on the Eyre and Yorke Peninsula and parts of the South
East. Relative soil moisture declined considerably month-on-
month in the south, and the west.
Overall, growing season rainfall was well above the median in
most winter dominant rainfall areas (below), which will support a
year of high agricultural production.
Lowest minimum temperature, September
Growing season rainfall (Apr – Sept)
Source: BOM 2021
Source: BOM 2021
0
200
400
600
Geraldton Esperance Port Lincoln Clare Horsham Hay Dubbo Moree Dalby Emerald
rain
fall
(mm
)
2019 2020 2021* Five-year median
La Niña Probability Increased
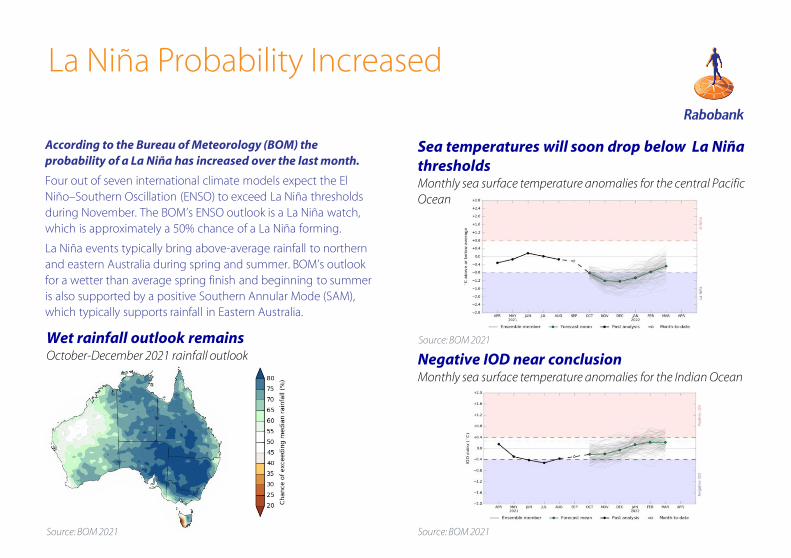
According to the Bureau of Meteorology (BOM) the
probability of a La Niña has increased over the last month.
Four out of seven international climate models expect the El Niño–Southern Oscillation (ENSO) to exceed La Niña thresholds during November. The BOM’s ENSO outlook is a La Niña watch, which is approximately a 50% chance of a La Niña forming.
La Niña events typically bring above-average rainfall to northern and eastern Australia during spring and summer. BOM’s outlook for a wetter than average spring finish and beginning to summer is also supported by a positive Southern Annular Mode (SAM), which typically supports rainfall in Eastern Australia.
Sea temperatures will soon drop below La Niña
thresholds
Monthly sea surface temperature anomalies for the central Pacific Ocean
Negative IOD near conclusion
Monthly sea surface temperature anomalies for the Indian Ocean
Source: BOM 2021
Source: BOM 2021Source: BOM 2021
Wet rainfall outlook remains
October-December 2021 rainfall outlook
Grains & Oilseeds
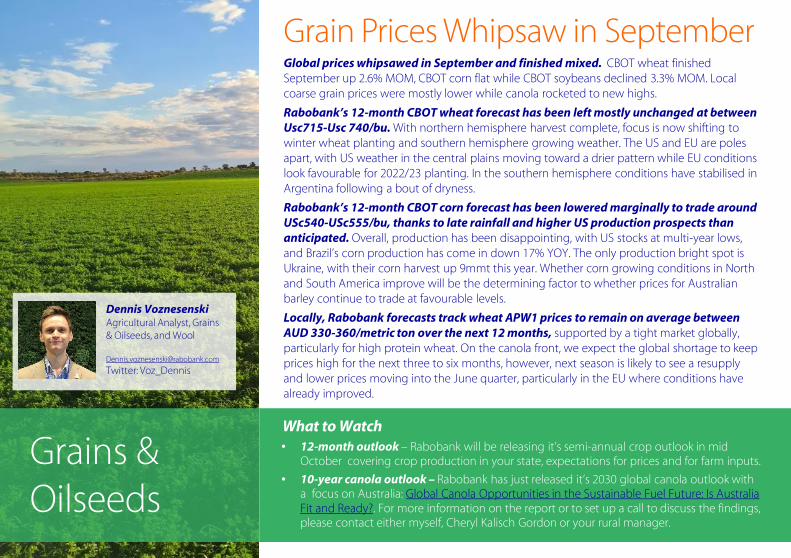
What to Watch
• 12-month outlook – Rabobank will be releasing it’s semi-annual crop outlook in mid October covering crop production in your state, expectations for prices and for farm inputs.
• 10-year canola outlook – Rabobank has just released it’s 2030 global canola outlook with a focus on Australia: Global Canola Opportunities in the Sustainable Fuel Future: Is Australia Fit and Ready?. For more information on the report or to set up a call to discuss the findings, please contact either myself, Cheryl Kalisch Gordon or your rural manager.
Grain Prices Whipsaw in SeptemberGlobal prices whipsawed in September and finished mixed. CBOT wheat finished September up 2.6% MOM, CBOT corn flat while CBOT soybeans declined 3.3% MOM. Local coarse grain prices were mostly lower while canola rocketed to new highs.
Rabobank’s 12-month CBOT wheat forecast has been left mostly unchanged at between
Usc715-Usc 740/bu. With northern hemisphere harvest complete, focus is now shifting to winter wheat planting and southern hemisphere growing weather. The US and EU are poles apart, with US weather in the central plains moving toward a drier pattern while EU conditions look favourable for 2022/23 planting. In the southern hemisphere conditions have stabilised in Argentina following a bout of dryness.
Rabobank’s 12-month CBOT corn forecast has been lowered marginally to trade around
USc540-USc555/bu, thanks to late rainfall and higher US production prospects than
anticipated. Overall, production has been disappointing, with US stocks at multi-year lows, and Brazil’s corn production has come in down 17% YOY. The only production bright spot is Ukraine, with their corn harvest up 9mmt this year. Whether corn growing conditions in North and South America improve will be the determining factor to whether prices for Australian barley continue to trade at favourable levels.
Locally, Rabobank forecasts track wheat APW1 prices to remain on average between
AUD 330-360/metric ton over the next 12 months, supported by a tight market globally, particularly for high protein wheat. On the canola front, we expect the global shortage to keep prices high for the next three to six months, however, next season is likely to see a resupply and lower prices moving into the June quarter, particularly in the EU where conditions have already improved.
Dennis Voznesenski
Agricultural Analyst, Grains & Oilseeds, and Wool
Twitter: Voz_Dennis
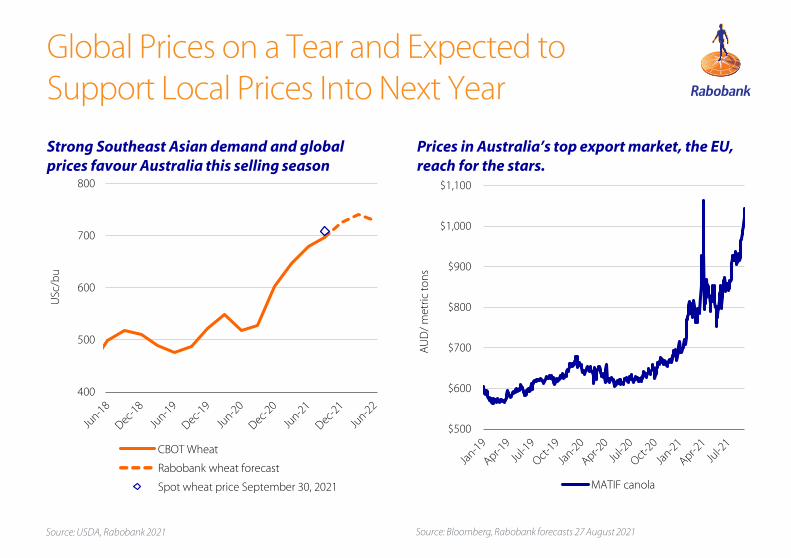
Global Prices on a Tear and Expected to Support Local Prices Into Next Year
Prices in Australia’s top export market, the EU,
reach for the stars.
Source: USDA, Rabobank 2021 Source: Bloomberg, Rabobank forecasts 27 August 2021
400
500
600
700
800
USc
/bu
CBOT Wheat
Rabobank wheat forecast
Spot wheat price September 30, 2021
Strong Southeast Asian demand and global
prices favour Australia this selling season
$500
$600
$700
$800
$900
$1,000
$1,100
AU
D/
met
ric
ton
s
MATIF canola
Dairy
A Sluggish Start for Oceania SeasonGlobal commodity prices have enjoyed a period of strength in September. The global
market fundamentals remain well-balanced, but with several moving parts. Nonetheless, a
slowdown in milk production in key production regions, and buoyant import purchasing from
Asian buyers, has seen commodity prices lift through September. A slow start to milk
production in New Zealand could certainly help provide further price support in the near-term.
Northern hemisphere milk production is losing steam. In the United States, milk production
expanded by 1.1% in August, which was below the recent trendline. In Europe, milk production
hit a snag in some key producing member states. The EU-27 milk production was down 0.6% in
July YOY.
Looking closer to home, Australia’s milk production has started the 2021/22 season sluggishly.
July milk production was down 3.5% compared to July 2020. Pasture production has been
impacted by wetter-than-normal conditions through winter. There is however still time for
production to turnaround this season.
Meanwhile New Zealand farmers have been battling a prolonged wet winter and early
spring. In August 2021, milk production was down 4.8% YOY (-4.2% on a milk solids basis). This
means New Zealand milk production for the season-to-date was down 2.4% (-1.8% on a milk
solids basis).
What to watch
• A weak Australian dollar. A weaker local currency against the US dollar has been welcome
news for Australian dairy export returns so far this season. Falling iron ore prices on the back of
Chinese steel production curbs, and Covid-19-related restrictions will keep the pressure on the
currency in the weeks ahead when there is a season lift in export orders being are locked in.
Michael Harvey
Senior AnalystDairy
+61 3 9940 [email protected]
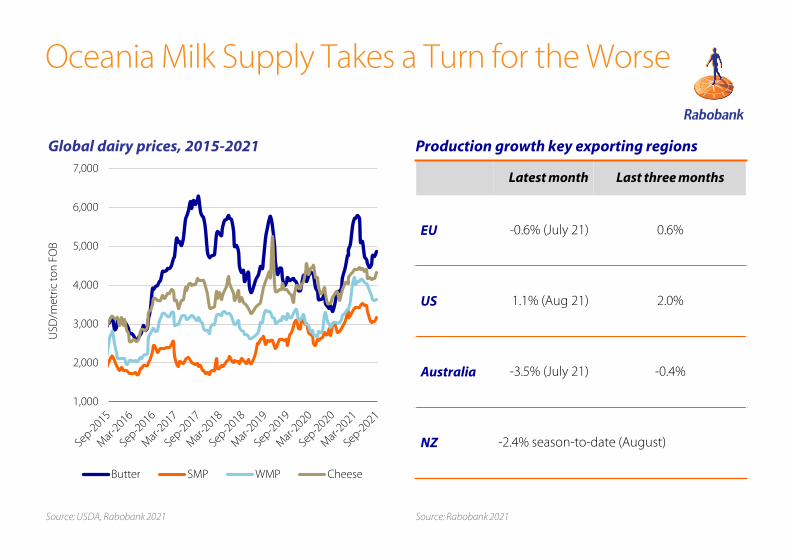
Oceania Milk Supply Takes a Turn for the Worse
Source: USDA, Rabobank 2021 Source: Rabobank 2021
Latest month Last three months
EU -0.6% (July 21) 0.6%
US 1.1% (Aug 21) 2.0%
Australia -3.5% (July 21) -0.4%
NZ -2.4% season-to-date (August)
Production growth key exporting regionsGlobal dairy prices, 2015-2021
1,000
2,000
3,000
4,000
5,000
6,000
7,000
USD
/met
ric to
n F
OB
Butter SMP WMP Cheese

Beef
Strong Prices Remain on the CardsThe EYCI hit another record on September 30 at AUc 1042/kg. National saleyard prices across all cattle classes continue to remain strong, but heavy steer prices dropped 4% over the two weeks to September 23. US import prices for lean trimming (AUD 8.21/kg on September 23) and Japanese import prices for the month of August (latest reported) remained strong. With
above average rainfall forecast for much of eastern Australia over the coming three
months, pasture growth is expected to be good, supporting ongoing producer demand
for cattle and continued strong cattle prices.
East coast weekly cattle slaughter edged up over 100,000 head again to 101,321 head in the week ending September 18 – only the ninth time this year. However, numbers continue to remain low, tracking 25% below the five-year average for the four weeks in September. While remaining relatively stable for most of 2021 they are now starting to line up with weekly numbers of 2020, which fell to their low point (88,758 head) in October last year.
August export volumes (77,150mt swt) were only down 1% on 2020 volumes, but this is more a reflection of the lower volumes in 2020 rather than any improvement in volumes in 2021. Across the markets, most showed similar volumes to 2020 for August, but the US, with a lower proportion of lean trimmings being produced in Australia, is down 26% on 2020 volumes. Volumes or distribution across the markets are not expected to improve until production lifts.
Live export numbers dropped 6% YOY for the month of August and are 23% down YTD on last year. Vietnam received the first boatload of Brazilian cattle this month, but it is difficult to see this trade being economically viable longer term.
What to watch
• Herd rebuild back on the cards – The percentage of female cattle in the total NSW slaughter number has been in the high 40s since May. Possibly reflecting the sale of cattle purchased in late 2020 as a trading venture. With numbers dropping into the lower 40s in late September it may signal an end to these trade cattle and producers now turning their minds to herd rebuilding. If so, we would expect the urgent producer demand that is fueling cattle prices to begin to dissipate.
Angus Gidley-Baird
Senior AnalystAnimal Protein
+61 2 8115 [email protected]
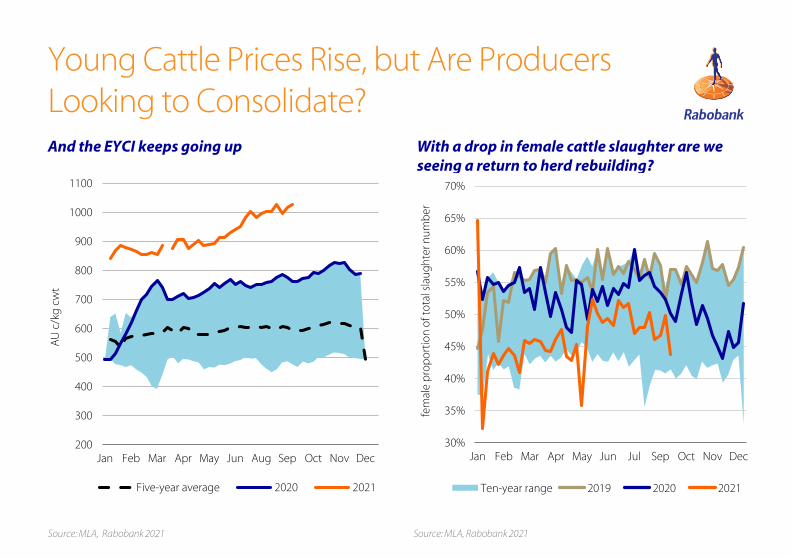
Young Cattle Prices Rise, but Are Producers Looking to Consolidate?And the EYCI keeps going up
Source: MLA, Rabobank 2021 Source: MLA, Rabobank 2021
With a drop in female cattle slaughter are we
seeing a return to herd rebuilding?
200
300
400
500
600
700
800
900
1000
1100
Jan Feb Mar Apr May Jun Aug Sep Oct Nov Dec
AU
c/k
g c
wt
Five-year average 2020 2021
30%
35%
40%
45%
50%
55%
60%
65%
70%
Jan Feb Mar Apr May Jun Jul Sep Oct Nov Dec
fem
ale
pro
po
rtio
n o
f to
tal s
lau
gh
ter n
um
ber
Ten-year range 2019 2020 2021
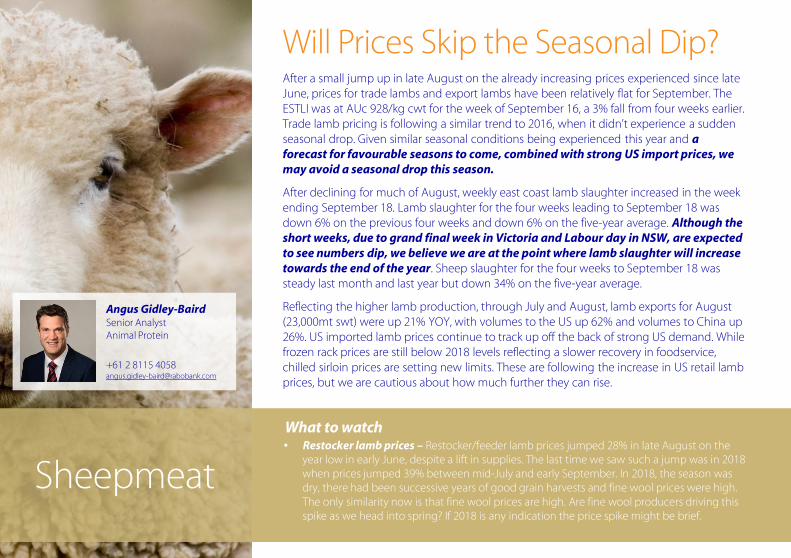
Will Prices Skip the Seasonal Dip? After a small jump up in late August on the already increasing prices experienced since late June, prices for trade lambs and export lambs have been relatively flat for September. The ESTLI was at AUc 928/kg cwt for the week of September 16, a 3% fall from four weeks earlier. Trade lamb pricing is following a similar trend to 2016, when it didn’t experience a sudden seasonal drop. Given similar seasonal conditions being experienced this year and a
forecast for favourable seasons to come, combined with strong US import prices, we
may avoid a seasonal drop this season.
After declining for much of August, weekly east coast lamb slaughter increased in the week ending September 18. Lamb slaughter for the four weeks leading to September 18 was down 6% on the previous four weeks and down 6% on the five-year average. Although the
short weeks, due to grand final week in Victoria and Labour day in NSW, are expected
to see numbers dip, we believe we are at the point where lamb slaughter will increase
towards the end of the year. Sheep slaughter for the four weeks to September 18 was steady last month and last year but down 34% on the five-year average.
Reflecting the higher lamb production, through July and August, lamb exports for August (23,000mt swt) were up 21% YOY, with volumes to the US up 62% and volumes to China up 26%. US imported lamb prices continue to track up off the back of strong US demand. While frozen rack prices are still below 2018 levels reflecting a slower recovery in foodservice, chilled sirloin prices are setting new limits. These are following the increase in US retail lamb prices, but we are cautious about how much further they can rise.
What to watch
• Restocker lamb prices – Restocker/feeder lamb prices jumped 28% in late August on the year low in early June, despite a lift in supplies. The last time we saw such a jump was in 2018 when prices jumped 39% between mid-July and early September. In 2018, the season was dry, there had been successive years of good grain harvests and fine wool prices were high. The only similarity now is that fine wool prices are high. Are fine wool producers driving this spike as we head into spring? If 2018 is any indication the price spike might be brief.
Angus Gidley-Baird
Senior AnalystAnimal Protein
+61 2 8115 [email protected]
Sheepmeat
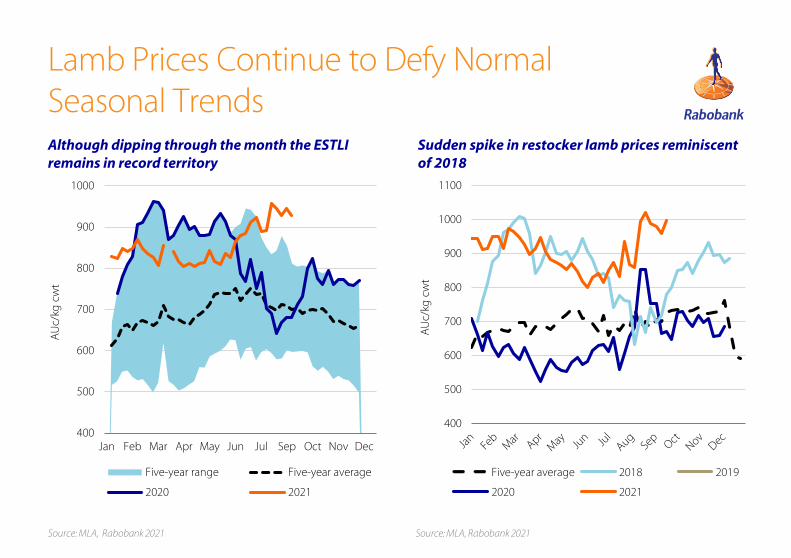
Lamb Prices Continue to Defy Normal Seasonal TrendsAlthough dipping through the month the ESTLI
remains in record territory
Source: MLA, Rabobank 2021 Source: MLA, Rabobank 2021
Sudden spike in restocker lamb prices reminiscent
of 2018
400
500
600
700
800
900
1000
Jan Feb Mar Apr May Jun Jul Sep Oct Nov Dec
AU
c/kg
cw
t
Five-year range Five-year average
2020 2021
400
500
600
700
800
900
1000
1100
AU
c/kg
cw
t
Five-year average 2018 2019
2020 2021

Delta Variant Weighs on OutlookRabobank still sees a positive outlook for wool. However, the outbreak of the delta
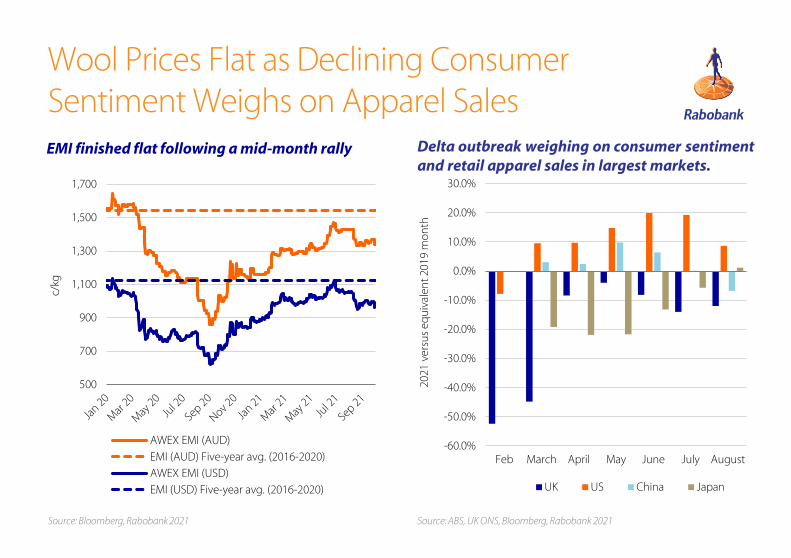
variant has already caused a tangible negative impact on demand. The EMI moved higher mid-month, but ended the month flat after key end consumer demand indicators sagged and power cuts in China reportedly resulted in reduced wool processing capacity. Rabobank has lowered its EMI forecast to trade between AUc 1350-AUc 1500/kg over the next 12 months, and if the demand recovery slows further, we will revise lower.
August retail apparel sales showed that the recent slowdown in demand recovery was
not just a July phenomena. In the US, 2021 August retail apparel sales were 8.7% higher than in August 2019, however, it has been the second month in a row of a decline in the recovery speed. US retail sales in June 2021 were 20% higher than June 2019, in July 19% higher, and in August now only 8.7% higher. China saw a similar trend. May and June retail apparel sales were notably higher than even pre-pandemic levels, but have now slipped below 2019 levels, with August recording -6.7% versus August 2019. In the UK retail apparel sales stayed relatively stable at -12% in August versus equivalent 2019 levels. US suit imports appear to be the only bright spot: in July, woollen suit imports hitting the highest level since February 2020, and only 34% lower than pre-pandemic levels. Other markets saw lower woollen suit imports in July.
July 2021 Australian wool export volumes (35.5m kg) were up a substantial 84% on July
2020. Trade reliance on China has increased for a second month in a row, from 85.7% in June to 86.7% in July. National wool tested data for July shows the weight of wool tested up 27% MOM and up 20% YOY.
What to watch – consumer confidence recovery fizzling
• Due to the outbreak of the delta variant and the flow on impact on consumers, we have seen a
reversal in the recovery of consumer confidence in both the US and China. In the latest July data
for China, consumer confidence reached it’s lowest level since March 2020, but remains above
the lows of June 2020. In the US, September data from the Bloomberg consumer comfort index
showed a decline. If data in both the US and China continue to worsen and the impact of delta
proves to be more permanent, it is expected to weigh on all apparel demand.
Dennis Voznesenski
Agricultural Analyst, Wool and Grains & Oilseeds
Twitter: Voz_Dennis
Wool
Wool Prices Flat as Declining Consumer Sentiment Weighs on Apparel Sales
Source: ABS, UK ONS, Bloomberg, Rabobank 2021
Delta outbreak weighing on consumer sentiment
and retail apparel sales in largest markets.
EMI finished flat following a mid-month rally
Source: Bloomberg, Rabobank 2021
500
700
900
1,100
1,300
1,500
1,700
c/kg
AWEX EMI (AUD)
EMI (AUD) Five-year avg. (2016-2020)
AWEX EMI (USD)
EMI (USD) Five-year avg. (2016-2020)
-60.0%
-50.0%
-40.0%
-30.0%
-20.0%
-10.0%
0.0%
10.0%
20.0%
30.0%
Feb March April May June July August
2021
ver
sus
equ
ival
ent 2
019
mo
nth
UK US China Japan
Cotton
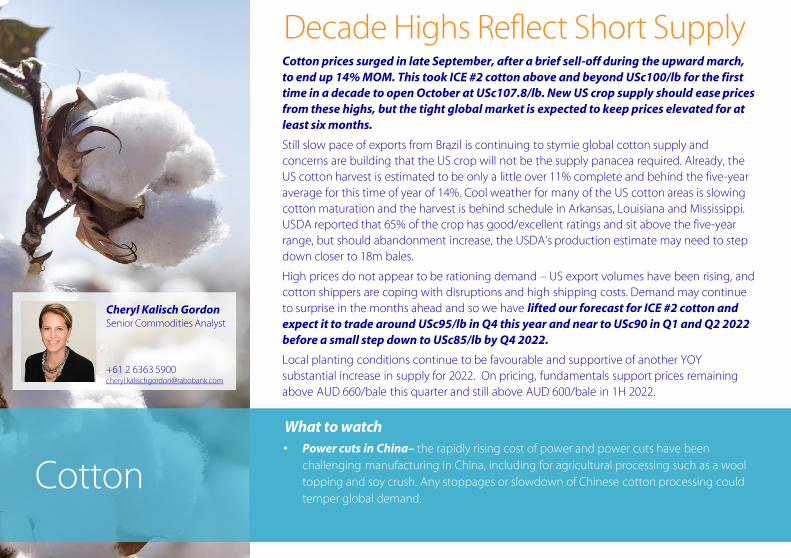
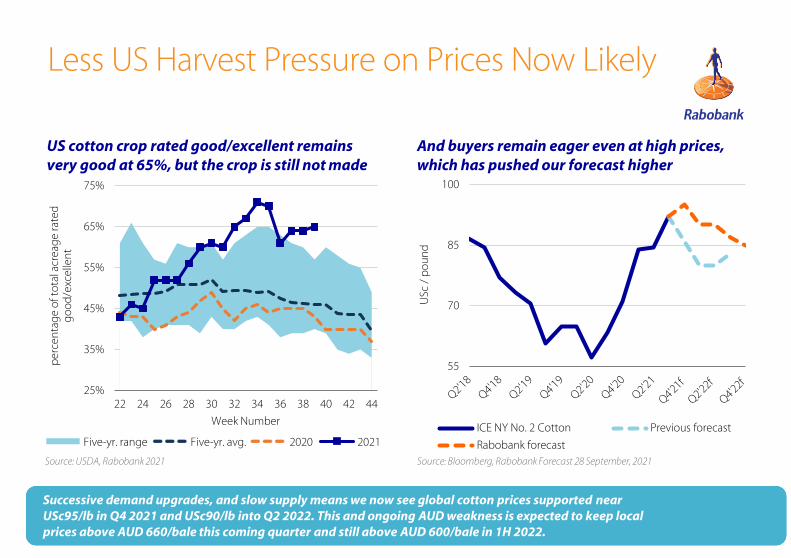
Decade Highs Reflect Short SupplyCotton prices surged in late September, after a brief sell-off during the upward march,
to end up 14% MOM. This took ICE #2 cotton above and beyond USc100/lb for the first
time in a decade to open October at USc107.8/lb. New US crop supply should ease prices
from these highs, but the tight global market is expected to keep prices elevated for at
least six months.
Still slow pace of exports from Brazil is continuing to stymie global cotton supply and concerns are building that the US crop will not be the supply panacea required. Already, the US cotton harvest is estimated to be only a little over 11% complete and behind the five-year average for this time of year of 14%. Cool weather for many of the US cotton areas is slowing cotton maturation and the harvest is behind schedule in Arkansas, Louisiana and Mississippi. USDA reported that 65% of the crop has good/excellent ratings and sit above the five-year range, but should abandonment increase, the USDA’s production estimate may need to step down closer to 18m bales.
High prices do not appear to be rationing demand – US export volumes have been rising, and cotton shippers are coping with disruptions and high shipping costs. Demand may continue to surprise in the months ahead and so we have lifted our forecast for ICE #2 cotton and
expect it to trade around USc95/lb in Q4 this year and near to USc90 in Q1 and Q2 2022
before a small step down to USc85/lb by Q4 2022.
Local planting conditions continue to be favourable and supportive of another YOY substantial increase in supply for 2022. On pricing, fundamentals support prices remaining above AUD 660/bale this quarter and still above AUD 600/bale in 1H 2022.
What to watch
• Power cuts in China– the rapidly rising cost of power and power cuts have been
challenging manufacturing in China, including for agricultural processing such as a wool
topping and soy crush. Any stoppages or slowdown of Chinese cotton processing could
temper global demand.
Cheryl Kalisch Gordon
Senior Commodities Analyst
+61 2 6363 [email protected]
55
70
85
100
USc
/ p
ou
nd
ICE NY No. 2 Cotton Previous forecast
Rabobank forecast
25%
35%
45%
55%
65%
75%
22 24 26 28 30 32 34 36 38 40 42 44
per
cen
tag
e o
f to
tal a
crea
ge
rate
d
go
od
/exc
elle
nt
Week Number
Five-yr. range Five-yr. avg. 2020 2021
Less US Harvest Pressure on Prices Now Likely
Source: Bloomberg, Rabobank Forecast 28 September, 2021
Successive demand upgrades, and slow supply means we now see global cotton prices supported near
USc95/lb in Q4 2021 and USc90/lb into Q2 2022. This and ongoing AUD weakness is expected to keep local
prices above AUD 660/bale this coming quarter and still above AUD 600/bale in 1H 2022.
US cotton crop rated good/excellent remains
very good at 65%, but the crop is still not made
Source: USDA, Rabobank 2021
And buyers remain eager even at high prices,
which has pushed our forecast higher
Downstream Markets
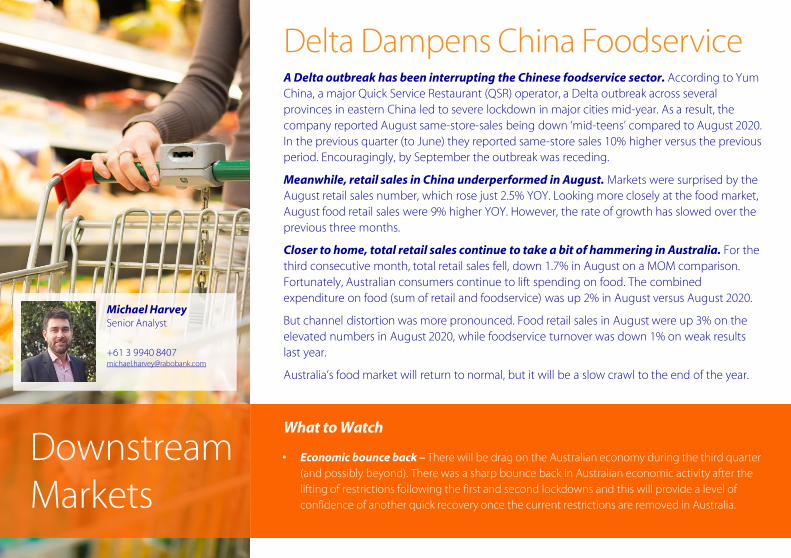
Delta Dampens China Foodservice A Delta outbreak has been interrupting the Chinese foodservice sector. According to Yum China, a major Quick Service Restaurant (QSR) operator, a Delta outbreak across several provinces in eastern China led to severe lockdown in major cities mid-year. As a result, the company reported August same-store-sales being down ‘mid-teens’ compared to August 2020. In the previous quarter (to June) they reported same-store sales 10% higher versus the previous period. Encouragingly, by September the outbreak was receding.
Meanwhile, retail sales in China underperformed in August. Markets were surprised by the August retail sales number, which rose just 2.5% YOY. Looking more closely at the food market, August food retail sales were 9% higher YOY. However, the rate of growth has slowed over the previous three months.
Closer to home, total retail sales continue to take a bit of hammering in Australia. For the third consecutive month, total retail sales fell, down 1.7% in August on a MOM comparison. Fortunately, Australian consumers continue to lift spending on food. The combined expenditure on food (sum of retail and foodservice) was up 2% in August versus August 2020.
But channel distortion was more pronounced. Food retail sales in August were up 3% on the elevated numbers in August 2020, while foodservice turnover was down 1% on weak results last year.
Australia’s food market will return to normal, but it will be a slow crawl to the end of the year.
• Economic bounce back – There will be drag on the Australian economy during the third quarter
(and possibly beyond). There was a sharp bounce back in Australian economic activity after the
lifting of restrictions following the first and second lockdowns and this will provide a level of
confidence of another quick recovery once the current restrictions are removed in Australia.
What to Watch
Michael Harvey
Senior Analyst
+61 3 9940 [email protected]

COVID-19
Underlying Food Retail Sales in China Slow
Sources: National Bureau of Statistics China, Rabobank, 2021Seasonally adjusted
Year-on-Year change in Chinese food retail sales
0%
5%
10%
15%
20%
chan
ge
Farm Inputs
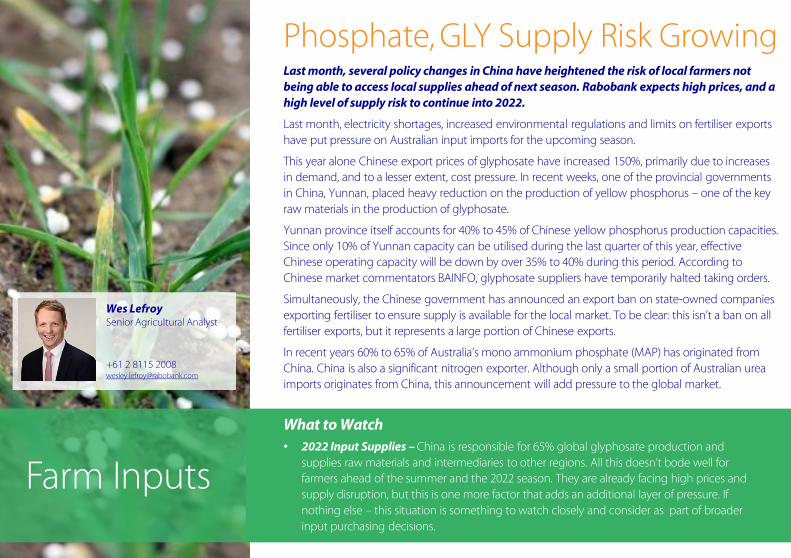
Phosphate, GLY Supply Risk GrowingLast month, several policy changes in China have heightened the risk of local farmers not
being able to access local supplies ahead of next season. Rabobank expects high prices, and a
high level of supply risk to continue into 2022.
Last month, electricity shortages, increased environmental regulations and limits on fertiliser exports have put pressure on Australian input imports for the upcoming season.
This year alone Chinese export prices of glyphosate have increased 150%, primarily due to increases in demand, and to a lesser extent, cost pressure. In recent weeks, one of the provincial governments in China, Yunnan, placed heavy reduction on the production of yellow phosphorus – one of the key raw materials in the production of glyphosate.
Yunnan province itself accounts for 40% to 45% of Chinese yellow phosphorus production capacities. Since only 10% of Yunnan capacity can be utilised during the last quarter of this year, effective Chinese operating capacity will be down by over 35% to 40% during this period. According to Chinese market commentators BAINFO, glyphosate suppliers have temporarily halted taking orders.
Simultaneously, the Chinese government has announced an export ban on state-owned companies exporting fertiliser to ensure supply is available for the local market. To be clear: this isn’t a ban on all fertiliser exports, but it represents a large portion of Chinese exports.
In recent years 60% to 65% of Australia’s mono ammonium phosphate (MAP) has originated from China. China is also a significant nitrogen exporter. Although only a small portion of Australian urea imports originates from China, this announcement will add pressure to the global market.
What to Watch
• 2022 Input Supplies – China is responsible for 65% global glyphosate production and supplies raw materials and intermediaries to other regions. All this doesn’t bode well for farmers ahead of the summer and the 2022 season. They are already facing high prices and supply disruption, but this is one more factor that adds an additional layer of pressure. If nothing else – this situation is something to watch closely and consider as part of broader input purchasing decisions.
Wes Lefroy
Senior Agricultural Analyst
+61 2 8115 [email protected]

MAP Imports From China Have Been Increasing
Source: Bloomberg, Rabobank 2021
AUD-adjusted global phosphate prices (left), MAP imports and origin (right)
Source: Bloomberg, Rabobank 2021
0
400
800
1,200
1,600
AU
D/m
etri
c to
n
Morocco spot (DAP) China spot (MAP)
Morocco spot (MAP) Morocco spot (TSP)
0
200
400
600
800
1,000
1,200
16/17 17/18 18/19 19/20 20/21
‘000
met
ric
ton
*Sept - AugChina Other sources
FX
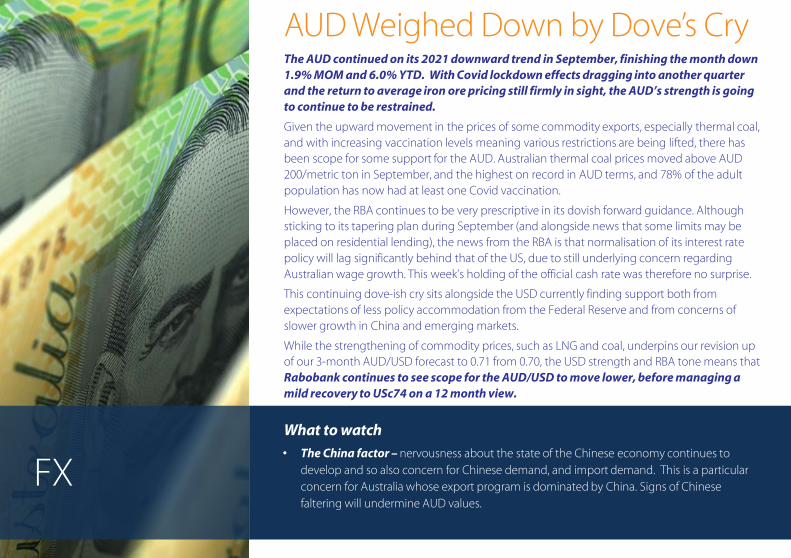
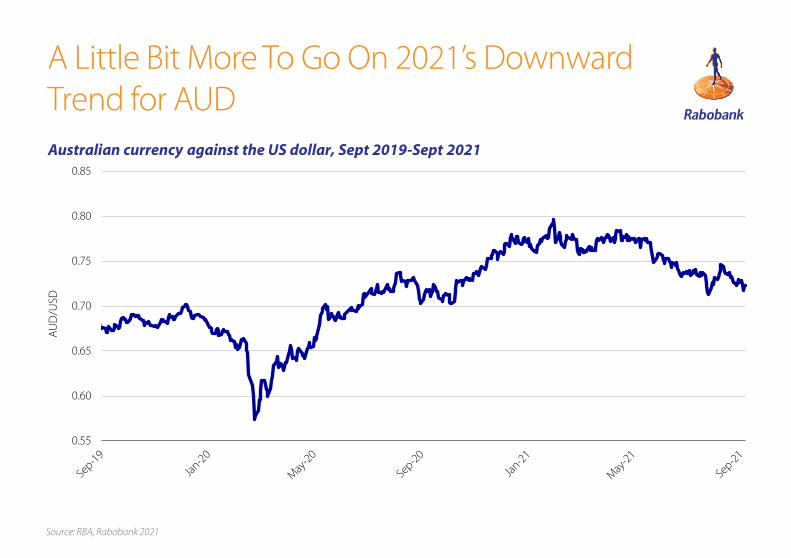
AUD Weighed Down by Dove’s CryThe AUD continued on its 2021 downward trend in September, finishing the month down
1.9% MOM and 6.0% YTD. With Covid lockdown effects dragging into another quarter
and the return to average iron ore pricing still firmly in sight, the AUD’s strength is going
to continue to be restrained.
Given the upward movement in the prices of some commodity exports, especially thermal coal, and with increasing vaccination levels meaning various restrictions are being lifted, there has been scope for some support for the AUD. Australian thermal coal prices moved above AUD 200/metric ton in September, and the highest on record in AUD terms, and 78% of the adult population has now had at least one Covid vaccination.
However, the RBA continues to be very prescriptive in its dovish forward guidance. Although sticking to its tapering plan during September (and alongside news that some limits may be placed on residential lending), the news from the RBA is that normalisation of its interest rate policy will lag significantly behind that of the US, due to still underlying concern regarding Australian wage growth. This week’s holding of the official cash rate was therefore no surprise.
This continuing dove-ish cry sits alongside the USD currently finding support both from expectations of less policy accommodation from the Federal Reserve and from concerns of slower growth in China and emerging markets.
While the strengthening of commodity prices, such as LNG and coal, underpins our revision up of our 3-month AUD/USD forecast to 0.71 from 0.70, the USD strength and RBA tone means that Rabobank continues to see scope for the AUD/USD to move lower, before managing a
mild recovery to USc74 on a 12 month view.
What to watch
• The China factor – nervousness about the state of the Chinese economy continues to
develop and so also concern for Chinese demand, and import demand. This is a particular
concern for Australia whose export program is dominated by China. Signs of Chinese
faltering will undermine AUD values.
Source: RBA, Rabobank 2021
A Little Bit More To Go On 2021’s Downward Trend for AUD
Australian currency against the US dollar, Sept 2019-Sept 2021
0.55
0.60
0.65
0.70
0.75
0.80
0.85
AU
D/U
SD

Source: Bloomberg, Rabobank 2021Source: AIP, Bloomberg, Rabobank 2021
Full Throttle for Brent CrudePrices of brent crude increased during September, and in early October, exceeding
USD 80/bbl.
All eyes were on the OPEC+ meeting on October 4 to see how Saudi Arabia would react
to China’s response to release strategic oil reserves. Despite gas shortages in Europe
boosting demand for crude, the Saudis announced that they will continue with only
gradual production increases. This resulted in another price hike, with brent crude
breaking a new three-year high to above USD 80/bbl. As this is still unfolding, our
updated forecasts will be released shortly.
Brent Crude Oil & Average Sydney Diesel,
Oct 2019-Oct 2021
Oil & Freight
Baltic Dry Index, Oct 2019-Oct 2021
60
90
120
150
180
0
25
50
75
100
AU
c/
L
USD
/bb
l
Brent/ Diesel Spread (RHS)
Brent Crude (USD/bbl) (LHS)
Ave Sydney Diesel TGPS (RHS)
0
1,500
3,000
4,500
6,000
Balt
ic D
ry In
dex

Agri Price Dashboard As of 30/09/2021 Unit MOM Current Last month Last year
Grains & oilseeds
CBOT wheat USc/bushel ▲ 726 707 578
CBOT soybean USc/bushel ▼ 1,256 1,299 1,024
CBOT corn USc/bushel ▲ 537 534 379
Australian ASX EC Wheat AUD/tonne ▼ 339 355 299
Non-GM Canola Newcastle AUD/tonne ▲ 954 869 585
Feed Barley F1 Geelong AUD/tonne ▼ 260 271 217
Beef markets
Eastern Young Cattle Indicator AUc/kg cwt ▲ 1,030 995 776
Feeder Steer AUc/kg lwt ▲ 555 530 398
North Island Bull 300kg NZc/kg cwt ▲ 625 615 565
South Island Bull 300kg NZc/kg cwt • 590 590 515
Sheepmeat markets
Eastern States Trade Lamb Indicator AUc/kg cwt ▼ 928 946 732
North Island Lamb 17.5kg YX NZc/kg cwt ▲ 945 925 720
South Island Lamb 17.5kg YX NZc/kg cwt ▲ 935 915 710
Venison markets
North Island Stag NZc/kg cwt ▲ 655 640 620
South Island Stag NZc/kg cwt ▲ 675 630 665
Dairy Markets
Butter USD/tonne FOB ▲ 4,875 4,775 3,325
Skim Milk Powder USD/tonne FOB ▲ 3,175 3,075 2,950
Whole Milk Powder USD/tonne FOB ▲ 3,638 3,625 3,000
Cheddar USD/tonne FOB ▲ 4,325 4,163 3,675
AUD/metric ton
AUD/metric ton
AUD/metric ton
USD/metric ton
USD/metric ton
USD/metric ton
USD/metric ton
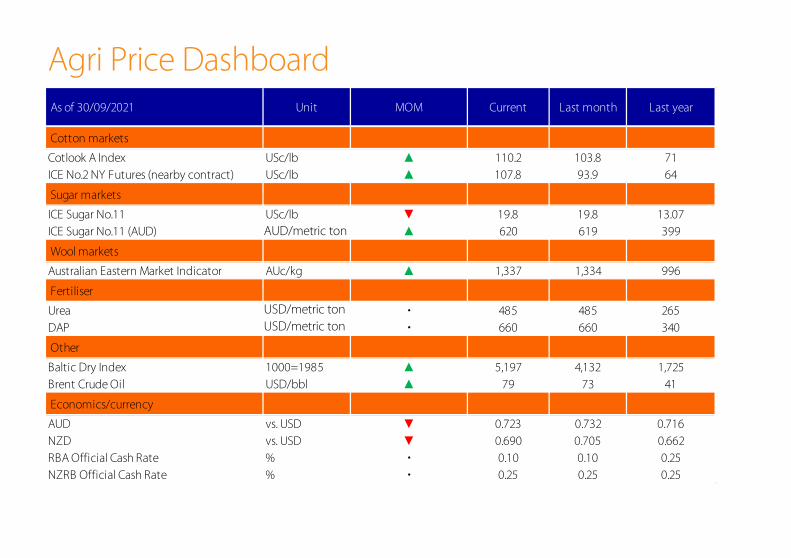
Agri Price Dashboard As of 30/09/2021 Unit MOM Current Last month Last year
Cotton markets
Cotlook A Index USc/lb ▲ 110.2 103.8 71
ICE No.2 NY Futures (nearby contract) USc/lb ▲ 107.8 93.9 64
Sugar markets
ICE Sugar No.11 USc/lb ▼ 19.8 19.8 13.07
ICE Sugar No.11 (AUD) AUD/tonne ▲ 620 619 399
Wool markets
Australian Eastern Market Indicator AUc/kg ▲ 1,337 1,334 996
Fertiliser
Urea USD/tonne FOB • 485 485 265
DAP USD/tonne FOB • 660 660 340
Other
Baltic Dry Index 1000=1985 ▲ 5,197 4,132 1,725
Brent Crude Oil USD/bbl ▲ 79 73 41
Economics/currency
AUD vs. USD ▼ 0.723 0.732 0.716
NZD vs. USD ▼ 0.690 0.705 0.662
RBA Official Cash Rate % • 0.10 0.10 0.25
NZRB Official Cash Rate % • 0.25 0.25 0.25
AUD/metric ton
USD/metric ton
USD/metric ton

PodcastsHere’s how to access our podcasts:
• Simply search for “Rabobank” in your podcast app
• Click on our food & agribusiness podcast channel
• Hit subscribe!
Want to Keep up to Date With the
Latest Food & Agribusiness Insights?Make our insights your advantage – Stay ahead of developments in your industry by
subscribing to our podcast channel on your favourite podcast app.
Our podcasts are a fast and easy way to engage with our latest research findings and
industry developments, right on your phone.
Most Apple devices have the Podcasts app pre-installed – if not, you can find it in the
App Store. On Android devices, Stitcher and TuneIn Radio are popular podcast apps.

RaboResearch Food & AgribusinessAustralia and New Zealand
Rabobank Australia
Nearest branch call 1800 025 484https://www.rabobank.com.au
Cheryl Kalisch Gordon
Interim General Manager Senior Commodities Analyst+61 2 6363 [email protected]
Angus Gidley-Baird
Senior Animal Protein Analyst + 61 2 8115 [email protected]
Michael Harvey
Senior Dairy & Consumer Food Analyst+61 3 9940 [email protected]
Wes Lefroy
Senior Agriculture Analyst +61 2 8115 [email protected]
Emma Higgins
Senior Agriculture Analyst +64 3 961 [email protected]
Genevieve Steven
Agriculture Analyst +64 3 961 [email protected]
Dennis Voznesenski
Agriculture Analyst+61 2 8115 [email protected]
Catherine Keo
Business Coordinator+61 2 8115 [email protected]

This document is issued by a Rabobank Group member. The information and opinions contained in this document have been compiled or arrived at from sources believed to be reliable, but no representation or warranty, express or implied, is made as to their accuracy, completeness or correctness. This document is for information purposes only and is not, and should not be construed as, an offer or a commitment by any Rabobank Group member to enter into a transaction. This information is not professional advice and has not been prepared to be used as the basis for, and should not be used as the basis for, any financial or strategic decisions. This information is general in nature only and does not take into account an individual’s personal circumstances. All opinions expressed in this document are subject to change without notice. No Rabobank Group member accepts any liability whatsoever for any direct, indirect, consequential or other loss or damage howsoever arising from any use of this document or its contents or otherwise arising in connection therewith. This document may not be reproduced, distributed or published, in whole or in part, for any purpose, except with the prior written consent of a Rabobank Group member. By accepting this document you agree to be bound by the foregoing restrictions. All copyright is reserved © 2021