agribusiness monthly november 2018 - rabobank
TRANSCRIPT
RaboResearch Food & Agribusiness November 2018
Australia
Agribusiness Monthly November 2018
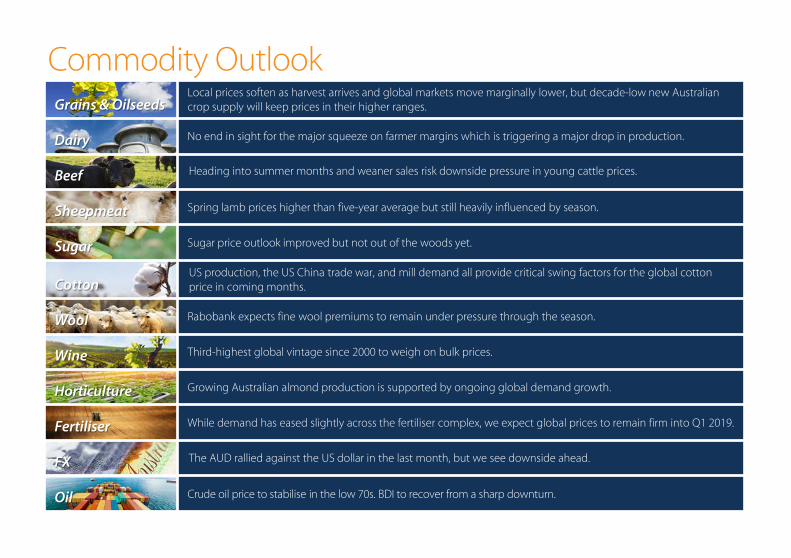
Grains & OilseedsLocal prices soften as harvest arrives and global markets move marginally lower, but decade-low new Australian crop supply will keep prices in their higher ranges.
Dairy No end in sight for the major squeeze on farmer margins which is triggering a major drop in production.
Beef Heading into summer months and weaner sales risk downside pressure in young cattle prices.
Sheepmeat Spring lamb prices higher than five-year average but still heavily influenced by season.
Sugar Sugar price outlook improved but not out of the woods yet.
CottonUS production, the US China trade war, and mill demand all provide critical swing factors for the global cotton price in coming months.
Wool Rabobank expects fine wool premiums to remain under pressure through the season.
Wine Third-highest global vintage since 2000 to weigh on bulk prices.
Horticulture Growing Australian almond production is supported by ongoing global demand growth.
Fertiliser While demand has eased slightly across the fertiliser complex, we expect global prices to remain firm into Q1 2019.
FX The AUD rallied against the US dollar in the last month, but we see downside ahead.
Oil Crude oil price to stabilise in the low 70s. BDI to recover from a sharp downturn.
Commodity Outlook
0
200
400
Geraldton Esperance Port Lincoln Clare Horsham Hay Dubbo Moree Dalby Emerald
rain
fall
(mm
)
2016 2017 2018 5 Year Ave
Rain Finally Arrives – Too Little, Too Late
Source: BOM, Rabobank 2018
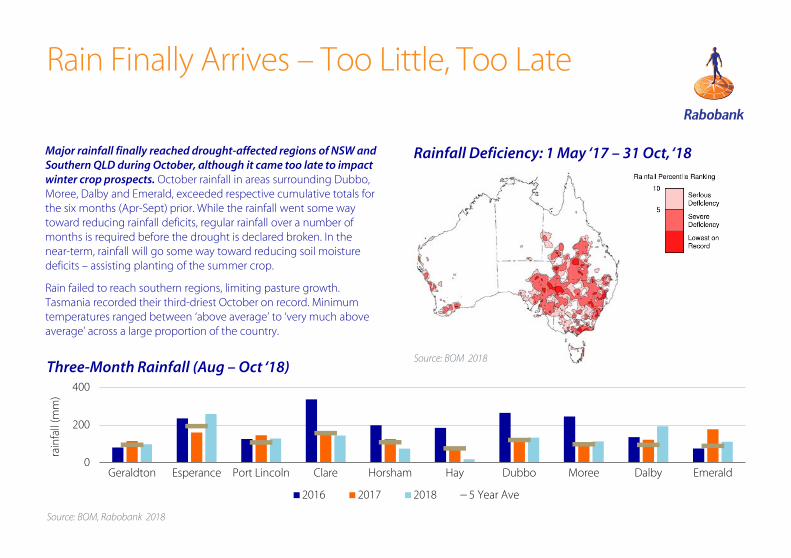
Major rainfall finally reached drought-affected regions of NSW and Southern QLD during October, although it came too late to impact winter crop prospects. October rainfall in areas surrounding Dubbo, Moree, Dalby and Emerald, exceeded respective cumulative totals for the six months (Apr-Sept) prior. While the rainfall went some way toward reducing rainfall deficits, regular rainfall over a number of months is required before the drought is declared broken. In the near-term, rainfall will go some way toward reducing soil moisture deficits – assisting planting of the summer crop.
Rain failed to reach southern regions, limiting pasture growth. Tasmania recorded their third-driest October on record. Minimum temperatures ranged between ‘above average’ to ‘very much above average’ across a large proportion of the country.
Rainfall Deficiency: 1 May ‘17 – 31 Oct, ‘18
Three-Month Rainfall (Aug – Oct ‘18)Source: BOM 2018
El Niño Alert – Dry Conditions Forecast
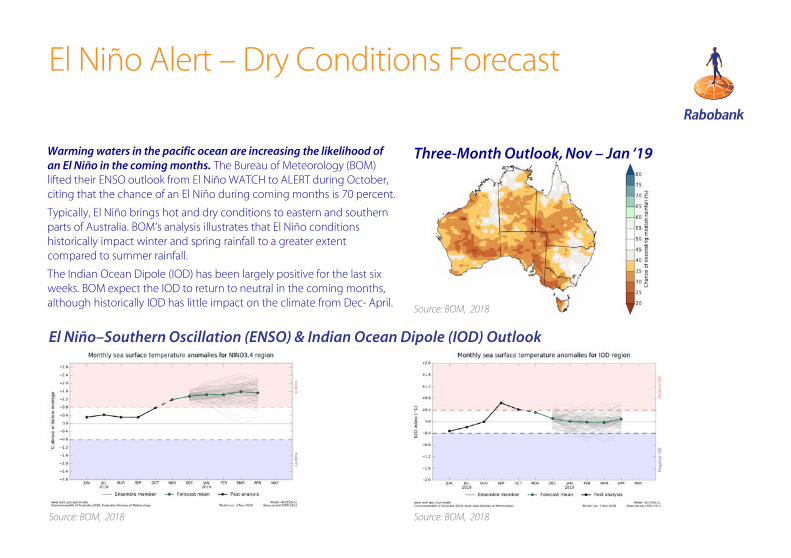
Three-Month Outlook, Nov – Jan ‘19
Source: BOM, 2018
El Niño–Southern Oscillation (ENSO) & Indian Ocean Dipole (IOD) Outlook
What to watch
XXX| XXX
Source: BOM, 2018
Source: BOM, 2018
Warming waters in the pacific ocean are increasing the likelihood of an El Niño in the coming months. The Bureau of Meteorology (BOM) lifted their ENSO outlook from El Niño WATCH to ALERT during October, citing that the chance of an El Niño during coming months is 70 percent.
Typically, El Niño brings hot and dry conditions to eastern and southern parts of Australia. BOM’s analysis illustrates that El Niño conditions historically impact winter and spring rainfall to a greater extent compared to summer rainfall.
The Indian Ocean Dipole (IOD) has been largely positive for the last six weeks. BOM expect the IOD to return to neutral in the coming months, although historically IOD has little impact on the climate from Dec- April.

Grains & Oilseeds
What to Watch
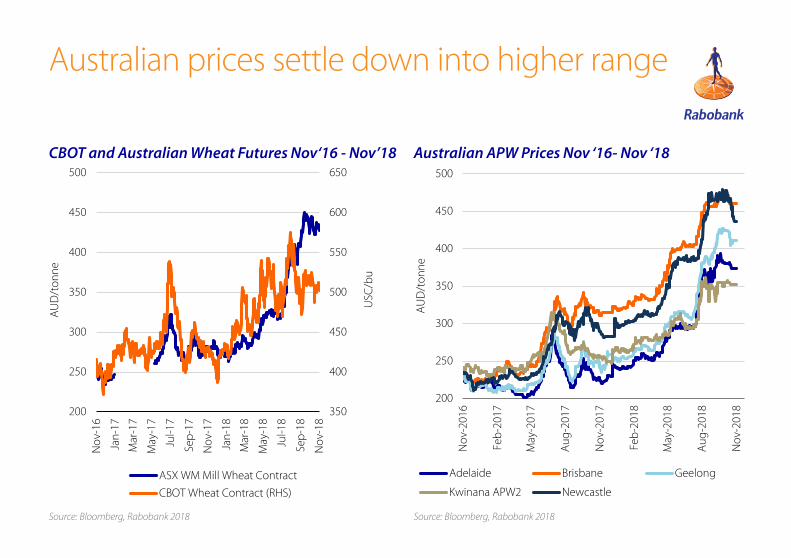
Decade-low production will keep Australian G&O prices highVery low new crop supply will keep Australian grain prices in their elevated range well into 2019. As the Australian winter harvest 2018/19 gets going, or doesn’t as is the case in many regions, all eyes are on just how low production will be in the most dry areas of Qld, NSW, Vic and also SA. We forecast a total winter crop near to 29m tonnes, down 23% YOY and 30% on the five-year average. Wheat tonnes of just 16.8m tonnes - down 21% YOY and 32% on the five-year average - are expected mostly (52%) from WA.
The start of harvest, accompanied by a marginal weakening of global prices, has softened local prices moderately. Newcastle APW found AUD 437/tonne by the second week of November, down 7% MOM, and at Adelaide at AUD 373, down 1.7% MOM. However, prices remain up YOY across the country, ranging between +38% in WA (KWI) and +66% in Victoria (Geel).
Favourable, though not drought-breaking, rain in parts of central and northern NSW and southern Qld has also helped prices lower. The rain brings with it the prospect of lower livestock feed grain demandand higher summer grain crop production. However rainfall has been patchy and the three-month forecast is not favourable so expectations for sorghum production are in the order of 1.5m tonnes, with upside to 2m tonnes. This volume will not loosen the feed grain balance sheet so as to lead grain prices significantly lower.
Australian grain prices continue to trade substantially over export parity. East coast ports have kept APW basis of AUD200/t in sight, while ~AUD90/t for Kwinana keeps up the flow of grain from west to east. CBOT Wheat sits at US506c/bu, lower by 2% MOM as at writing. Tightened global fundamentals remain supportive of global markets so that CBOT will remain above US500c/bu in Q4’18 and Q1’19, but fall back to 490c/bu in Q2’19 on expectations of expanded northern hemisphere plantings. This may drag on local prices but domestic factors will keep local harvest softening of Aussie prices in check and prices in their elevated ranges well into 2019.
• Grain Quality – Grain quality is season long in the making, but can be completely undone by unseasonal conditions in the run into harvest. The quantity of grain being delivered by segregation will now be closely scrutinised, especially by local end users.
• AUD strength – The AUD broke out its 2018 downward trend in early November. Critical to whether international grain imports stack up, any movement above USD 0.73 will prompt recalculations on sourcing grain in 2019.
Source: Bloomberg, Rabobank 2018 Source: Bloomberg, Rabobank 2018
350
400
450
500
550
600
650
200
250
300
350
400
450
500
Nov
-16
Jan-
17
Mar
-17
May
-17
Jul-1
7
Sep
-17
Nov
-17
Jan-
18
Mar
-18
May
-18
Jul-1
8
Sep
-18
Nov
-18
USC
/bu
AU
D/t
onne
ASX WM Mill Wheat Contract
CBOT Wheat Contract (RHS)
200
250
300
350
400
450
500
Nov
-201
6
Feb
-201
7
May
-201
7
Aug
-201
7
Nov
-201
7
Feb
-201
8
May
-201
8
Aug
-201
8
Nov
-201
8
AU
D/t
onne
Adelaide Brisbane Geelong
Kwinana APW2 Newcastle
Australian prices settle down into higher range
CBOT and Australian Wheat Futures Nov‘16 - Nov’18 Australian APW Prices Nov ‘16- Nov ‘18
Dairy
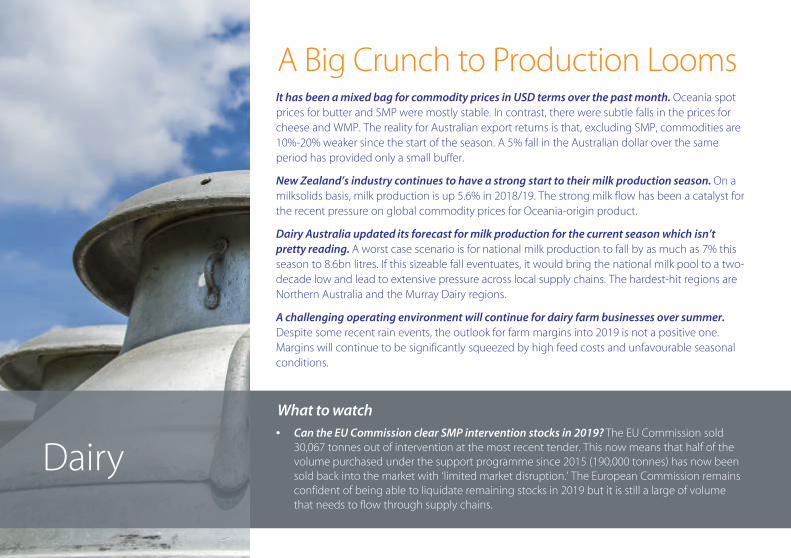
A Big Crunch to Production LoomsIt has been a mixed bag for commodity prices in USD terms over the past month. Oceania spot prices for butter and SMP were mostly stable. In contrast, there were subtle falls in the prices for cheese and WMP. The reality for Australian export returns is that, excluding SMP, commodities are 10%-20% weaker since the start of the season. A 5% fall in the Australian dollar over the same period has provided only a small buffer.
New Zealand’s industry continues to have a strong start to their milk production season. On a milksolids basis, milk production is up 5.6% in 2018/19. The strong milk flow has been a catalyst for the recent pressure on global commodity prices for Oceania-origin product.
Dairy Australia updated its forecast for milk production for the current season which isn’t pretty reading. A worst case scenario is for national milk production to fall by as much as 7% this season to 8.6bn litres. If this sizeable fall eventuates, it would bring the national milk pool to a two-decade low and lead to extensive pressure across local supply chains. The hardest-hit regions are Northern Australia and the Murray Dairy regions.
A challenging operating environment will continue for dairy farm businesses over summer. Despite some recent rain events, the outlook for farm margins into 2019 is not a positive one. Margins will continue to be significantly squeezed by high feed costs and unfavourable seasonal conditions.
What to watch• Can the EU Commission clear SMP intervention stocks in 2019? The EU Commission sold
30,067 tonnes out of intervention at the most recent tender. This now means that half of the volume purchased under the support programme since 2015 (190,000 tonnes) has now been sold back into the market with ‘limited market disruption.’ The European Commission remains confident of being able to liquidate remaining stocks in 2019 but it is still a large of volume that needs to flow through supply chains.

Source: USDA, Rabobank 2018 Source: Rabobank 2018
Latest month Last three months
EU -0.1% (Aug) 0.5%
US 1.3% (Sept) 0.9%
Australia -4.1% (Aug) -2.9%
NZ 5.8% (season to 30 September 2018)
Production growth key exporting regionsGlobal dairy prices, 2014 - 2018
1000
2000
3000
4000
5000
6000
7000
USD
/ton
ne F
OB
Butter SMP WMP Cheese
Growth Slows, Except for New Zealand Milk Supply
Beef
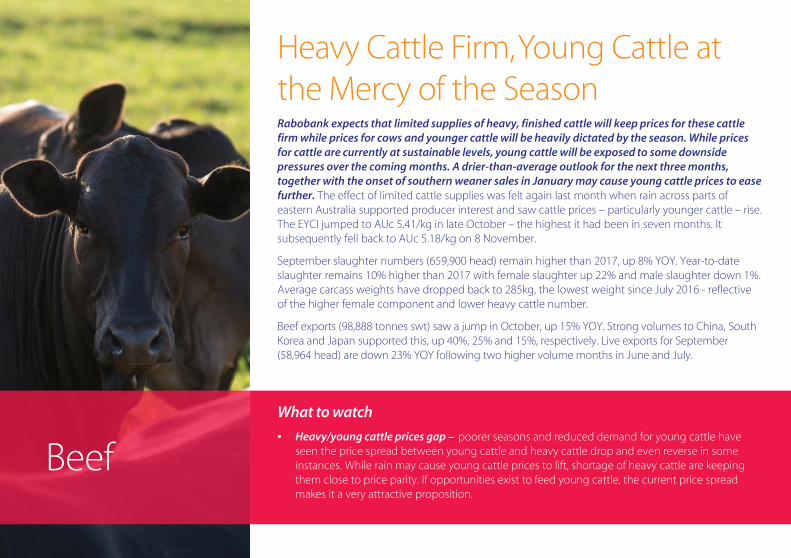
Heavy Cattle Firm, Young Cattle at the Mercy of the SeasonRabobank expects that limited supplies of heavy, finished cattle will keep prices for these cattle firm while prices for cows and younger cattle will be heavily dictated by the season. While prices for cattle are currently at sustainable levels, young cattle will be exposed to some downside pressures over the coming months. A drier-than-average outlook for the next three months, together with the onset of southern weaner sales in January may cause young cattle prices to ease further. The effect of limited cattle supplies was felt again last month when rain across parts of eastern Australia supported producer interest and saw cattle prices – particularly younger cattle – rise. The EYCI jumped to AUc 5.41/kg in late October – the highest it had been in seven months. It subsequently fell back to AUc 5.18/kg on 8 November.
September slaughter numbers (659,900 head) remain higher than 2017, up 8% YOY. Year-to-date slaughter remains 10% higher than 2017 with female slaughter up 22% and male slaughter down 1%. Average carcass weights have dropped back to 285kg, the lowest weight since July 2016 - reflective of the higher female component and lower heavy cattle number.
Beef exports (98,888 tonnes swt) saw a jump in October, up 15% YOY. Strong volumes to China, South Korea and Japan supported this, up 40%, 25% and 15%, respectively. Live exports for September (58,964 head) are down 23% YOY following two higher volume months in June and July.
What to watch
• Heavy/young cattle prices gap – poorer seasons and reduced demand for young cattle have seen the price spread between young cattle and heavy cattle drop and even reverse in some instances. While rain may cause young cattle prices to lift, shortage of heavy cattle are keeping them close to price parity. If opportunities exist to feed young cattle, the current price spread makes it a very attractive proposition.
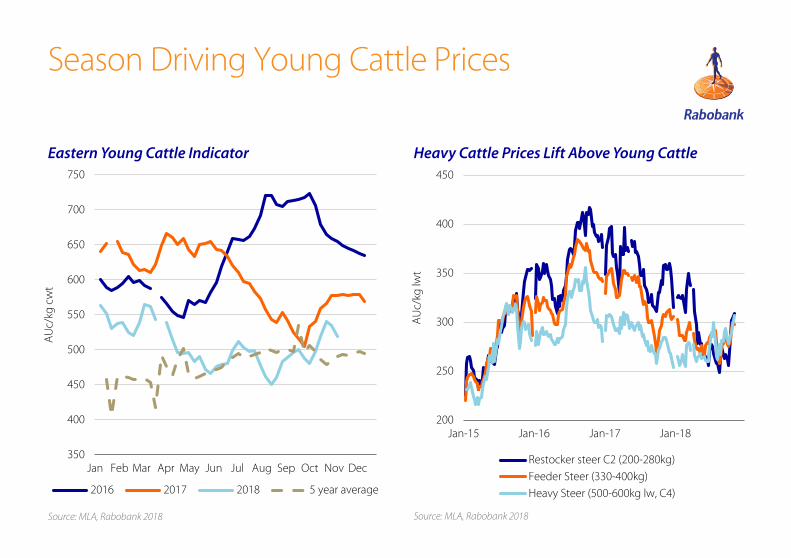
Season Driving Young Cattle Prices
Eastern Young Cattle Indicator
Source: MLA, Rabobank 2018
Heavy Cattle Prices Lift Above Young Cattle
Source: MLA, Rabobank 2018
350
400
450
500
550
600
650
700
750
Jan Feb Mar Apr May Jun Jul Aug Sep Oct Nov Dec
AU
c/kg
cw
t
2016 2017 2018 5 year average
200
250
300
350
400
450
Jan-15 Jan-16 Jan-17 Jan-18
AU
c/kg
lwt
Restocker steer C2 (200-280kg)
Feeder Steer (330-400kg)
Heavy Steer (500-600kg lw, C4)
Sheepmeat
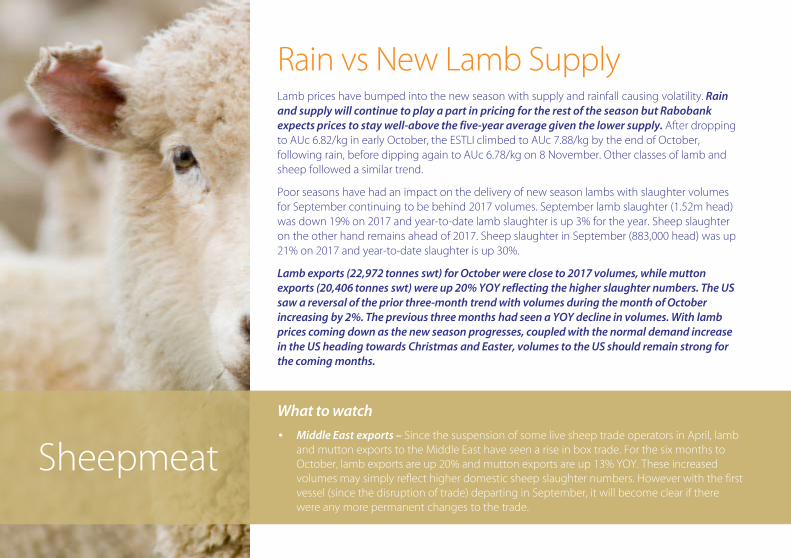
Rain vs New Lamb SupplyLamb prices have bumped into the new season with supply and rainfall causing volatility. Rain and supply will continue to play a part in pricing for the rest of the season but Rabobank expects prices to stay well-above the five-year average given the lower supply. After dropping to AUc 6.82/kg in early October, the ESTLI climbed to AUc 7.88/kg by the end of October, following rain, before dipping again to AUc 6.78/kg on 8 November. Other classes of lamb and sheep followed a similar trend.
Poor seasons have had an impact on the delivery of new season lambs with slaughter volumes for September continuing to be behind 2017 volumes. September lamb slaughter (1.52m head) was down 19% on 2017 and year-to-date lamb slaughter is up 3% for the year. Sheep slaughter on the other hand remains ahead of 2017. Sheep slaughter in September (883,000 head) was up 21% on 2017 and year-to-date slaughter is up 30%.
Lamb exports (22,972 tonnes swt) for October were close to 2017 volumes, while mutton exports (20,406 tonnes swt) were up 20% YOY reflecting the higher slaughter numbers. The US saw a reversal of the prior three-month trend with volumes during the month of October increasing by 2%. The previous three months had seen a YOY decline in volumes. With lamb prices coming down as the new season progresses, coupled with the normal demand increase in the US heading towards Christmas and Easter, volumes to the US should remain strong for the coming months.
What to watch
• Middle East exports – Since the suspension of some live sheep trade operators in April, lamb and mutton exports to the Middle East have seen a rise in box trade. For the six months to October, lamb exports are up 20% and mutton exports are up 13% YOY. These increased volumes may simply reflect higher domestic sheep slaughter numbers. However with the first vessel (since the disruption of trade) departing in September, it will become clear if there were any more permanent changes to the trade.
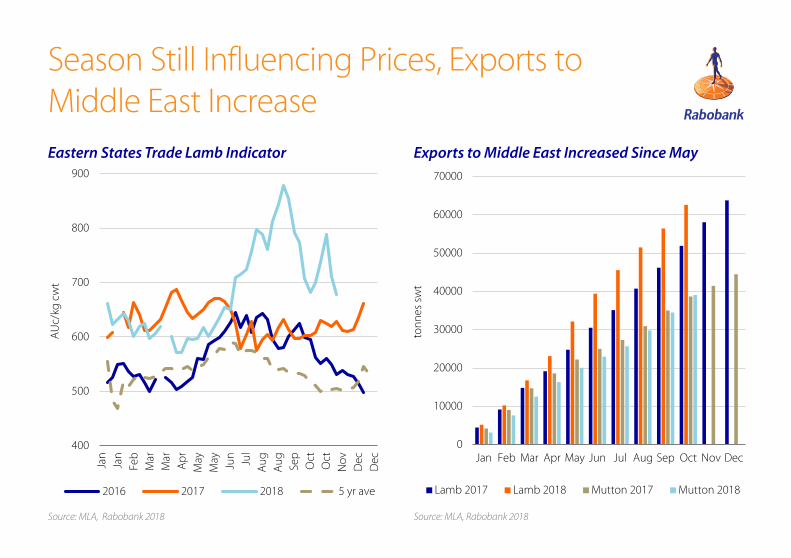
Season Still Influencing Prices, Exports to Middle East IncreaseEastern States Trade Lamb Indicator
Source: MLA, Rabobank 2018 Source: MLA, Rabobank 2018
Exports to Middle East Increased Since May
400
500
600
700
800
900
Jan
Jan
Feb
Mar
Mar
Ap
rM
ayM
ay Jun Jul
Aug
Aug Se
pO
ctO
ctN
ovD
ecD
ec
AU
c/kg
cw
t
2016 2017 2018 5 yr ave
0
10000
20000
30000
40000
50000
60000
70000
Jan Feb Mar Apr May Jun Jul Aug Sep Oct Nov Dec
tonn
es s
wt
Lamb 2017 Lamb 2018 Mutton 2017 Mutton 2018
Sugar
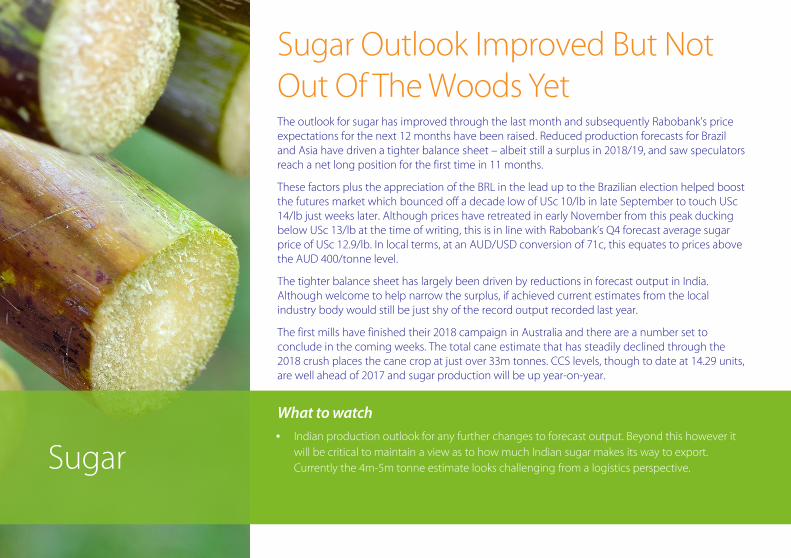
Sugar Outlook Improved But Not Out Of The Woods YetThe outlook for sugar has improved through the last month and subsequently Rabobank’s price expectations for the next 12 months have been raised. Reduced production forecasts for Brazil and Asia have driven a tighter balance sheet – albeit still a surplus in 2018/19, and saw speculators reach a net long position for the first time in 11 months.
These factors plus the appreciation of the BRL in the lead up to the Brazilian election helped boost the futures market which bounced off a decade low of USc 10/lb in late September to touch USc14/lb just weeks later. Although prices have retreated in early November from this peak ducking below USc 13/lb at the time of writing, this is in line with Rabobank’s Q4 forecast average sugar price of USc 12.9/lb. In local terms, at an AUD/USD conversion of 71c, this equates to prices above the AUD 400/tonne level.
The tighter balance sheet has largely been driven by reductions in forecast output in India. Although welcome to help narrow the surplus, if achieved current estimates from the local industry body would still be just shy of the record output recorded last year.
The first mills have finished their 2018 campaign in Australia and there are a number set to conclude in the coming weeks. The total cane estimate that has steadily declined through the 2018 crush places the cane crop at just over 33m tonnes. CCS levels, though to date at 14.29 units, are well ahead of 2017 and sugar production will be up year-on-year.
What to watch
• Indian production outlook for any further changes to forecast output. Beyond this however it will be critical to maintain a view as to how much Indian sugar makes its way to export. Currently the 4m-5m tonne estimate looks challenging from a logistics perspective.
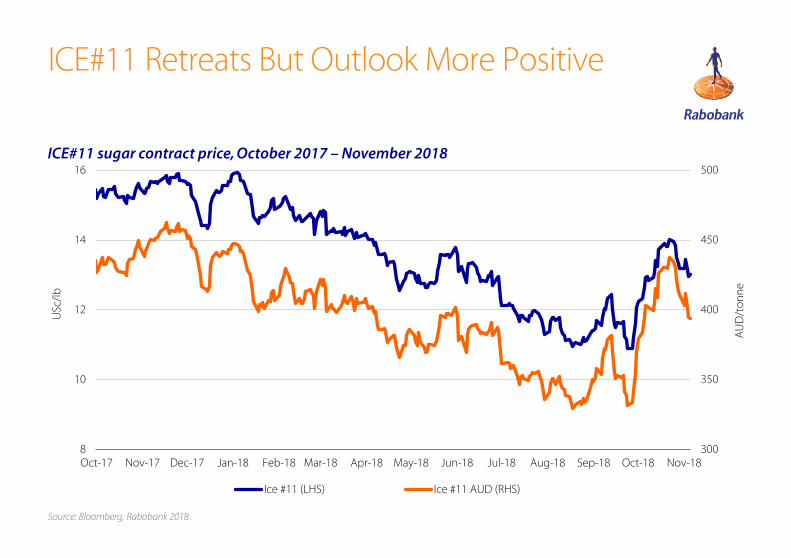
ICE#11 Retreats But Outlook More Positive
Source: Bloomberg, Rabobank 2018
ICE#11 sugar contract price, October 2017 – November 2018
300
350
400
450
500
8
10
12
14
16
Oct-17 Nov-17 Dec-17 Jan-18 Feb-18 Mar-18 Apr-18 May-18 Jun-18 Jul-18 Aug-18 Sep-18 Oct-18 Nov-18
AU
D/t
onne
USc
/lb
Ice #11 (LHS) Ice #11 AUD (RHS)
Cotton
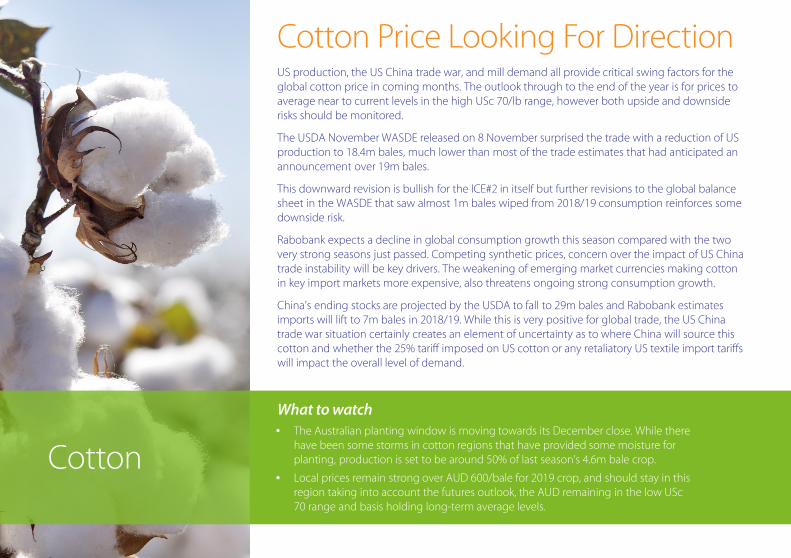
Cotton Price Looking For DirectionUS production, the US China trade war, and mill demand all provide critical swing factors for the global cotton price in coming months. The outlook through to the end of the year is for prices to average near to current levels in the high USc 70/lb range, however both upside and downside risks should be monitored.
The USDA November WASDE released on 8 November surprised the trade with a reduction of US production to 18.4m bales, much lower than most of the trade estimates that had anticipated an announcement over 19m bales.
This downward revision is bullish for the ICE#2 in itself but further revisions to the global balance sheet in the WASDE that saw almost 1m bales wiped from 2018/19 consumption reinforces some downside risk.
Rabobank expects a decline in global consumption growth this season compared with the two very strong seasons just passed. Competing synthetic prices, concern over the impact of US China trade instability will be key drivers. The weakening of emerging market currencies making cotton in key import markets more expensive, also threatens ongoing strong consumption growth.
China’s ending stocks are projected by the USDA to fall to 29m bales and Rabobank estimates imports will lift to 7m bales in 2018/19. While this is very positive for global trade, the US China trade war situation certainly creates an element of uncertainty as to where China will source this cotton and whether the 25% tariff imposed on US cotton or any retaliatory US textile import tariffs will impact the overall level of demand.
What to watch• The Australian planting window is moving towards its December close. While there
have been some storms in cotton regions that have provided some moisture for planting, production is set to be around 50% of last season’s 4.6m bale crop.
• Local prices remain strong over AUD 600/bale for 2019 crop, and should stay in this region taking into account the futures outlook, the AUD remaining in the low USc70 range and basis holding long-term average levels.
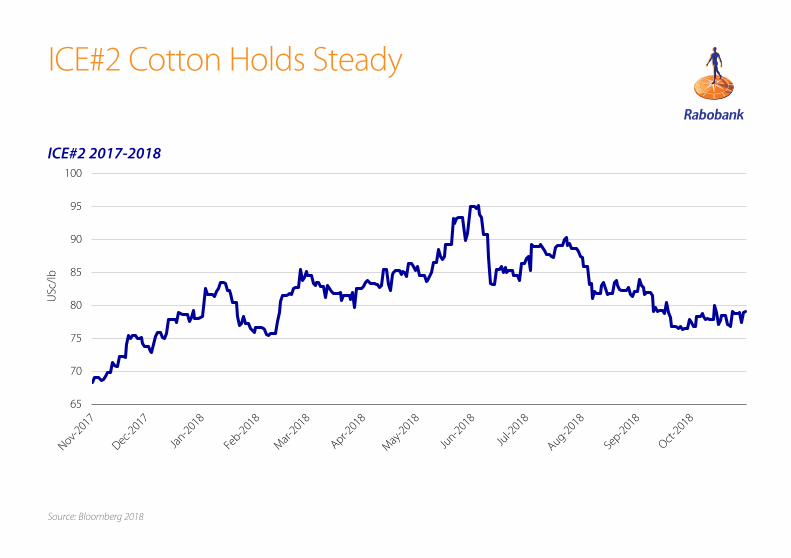
ICE#2 Cotton Holds Steady
Rabobank’s forecast for the last quarter is USc78/lb, in line with the current market. The current outlook sees improvement for prices in the 2nd and third quarter of 2019.
Source: Bloomberg 2018
65
70
75
80
85
90
95
100
USc
/lb
ICE#2 2017-2018
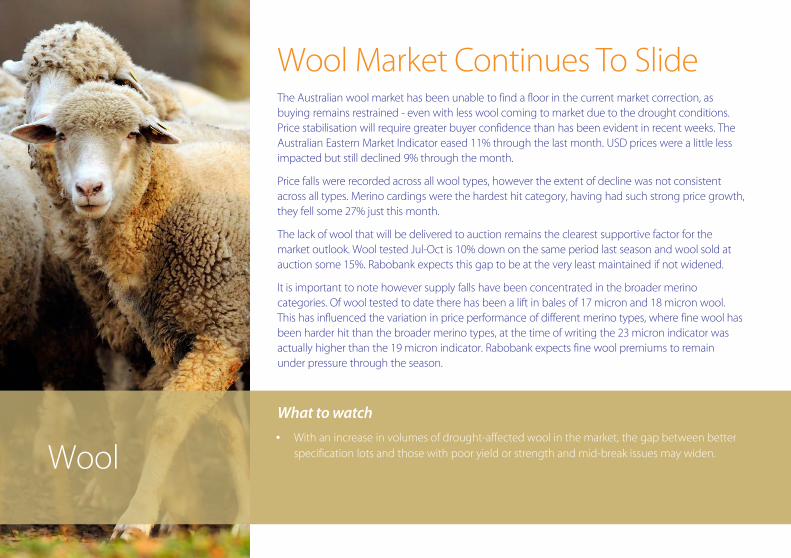
Wool
Wool Market Continues To SlideThe Australian wool market has been unable to find a floor in the current market correction, as buying remains restrained - even with less wool coming to market due to the drought conditions. Price stabilisation will require greater buyer confidence than has been evident in recent weeks. The Australian Eastern Market Indicator eased 11% through the last month. USD prices were a little less impacted but still declined 9% through the month.
Price falls were recorded across all wool types, however the extent of decline was not consistent across all types. Merino cardings were the hardest hit category, having had such strong price growth, they fell some 27% just this month.
The lack of wool that will be delivered to auction remains the clearest supportive factor for the market outlook. Wool tested Jul-Oct is 10% down on the same period last season and wool sold at auction some 15%. Rabobank expects this gap to be at the very least maintained if not widened.
It is important to note however supply falls have been concentrated in the broader merino categories. Of wool tested to date there has been a lift in bales of 17 micron and 18 micron wool. This has influenced the variation in price performance of different merino types, where fine wool has been harder hit than the broader merino types, at the time of writing the 23 micron indicator was actually higher than the 19 micron indicator. Rabobank expects fine wool premiums to remain under pressure through the season.
What to watch
• With an increase in volumes of drought-affected wool in the market, the gap between better specification lots and those with poor yield or strength and mid-break issues may widen.

Supply in Australia remains a critical cause for concern for both buyers and sellers
Source: Bloomberg, Rabobank 2018
1,000
1,200
1,400
1,600
1,800
2,000
2,200
AU
c/kg
2015 2016 2017 2018
Wool Yet To Find A Floor

Wine
What to watch
• Chinese wine imports – With the increase in overall global volumes, including in both Chile and Argentina (both lifting by an estimated 36% and 27%, respectively), increased competition can be expected between supplying markets for China’s wine imports over 2018-19.
Near-Record 2018 World Vintage To Weigh On Global Bulk Wine PricesWith significant growth in some key European wine-producing regions at higher levels than the five-year average, we expect to see a softening in global generic bulk prices through 2019.
The International organisation Of Vine and Wine (OIV) indicates it expects 2018 will be the third-highest world vintage since 2000. Recently released OIV data indicates that, in Europe, total harvest volume is estimated to be 19% higher than in 2017.
Italy and Spain reportedly have high volume with good quality and are both following a strategy of selling increased volumes of wine at the expense of value. Buyers are changing from longer to medium-term buying patterns brought on by last year’s shortage, to short-term strategies: they are waiting to see if prices drop further before committing to more volumes. This will bring a departure from the scenario seen in the calendar years 2017 and 2018, where buyers were having to pay increasingly higher prices for wine given the shortage from the 2017 vintage.
The above factors are expected to impact the bulk market over the balance of 2018 and into 2019. With Australia exporting around 55% of its wine as bulk in the year to June 2018, a downside risk to recent buoyant prices enjoyed by Australia exists.
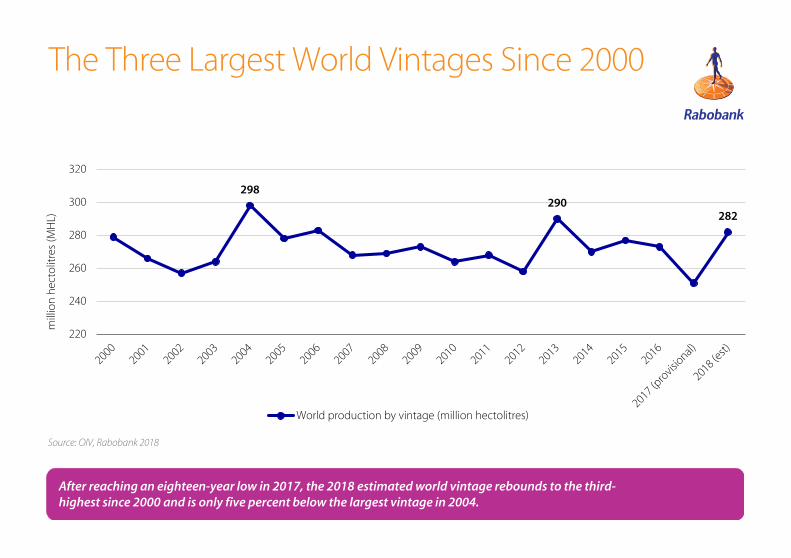
Source: OIV, Rabobank 2018
After reaching an eighteen-year low in 2017, the 2018 estimated world vintage rebounds to the third-highest since 2000 and is only five percent below the largest vintage in 2004.
298290
282
220
240
260
280
300
320
mill
ion
hect
olitr
es (M
HL)
World production by vintage (million hectolitres)
The Three Largest World Vintages Since 2000
HorticultureWhat to watch
• Trade disputes – Potential flow-on effects from ongoing trade dispute between China and the US: Many SE Asian economies rely on China for their own trade and exports. Should trade tensions continue to escalate the impacts of this could flow into other SE Asian economies affecting GDP and the disposable income of consumers in those countries.
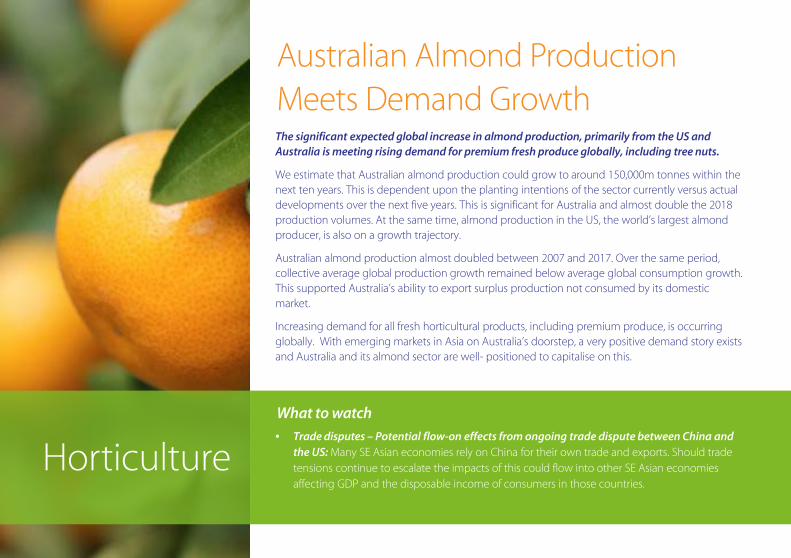
Australian Almond Production Meets Demand GrowthThe significant expected global increase in almond production, primarily from the US and Australia is meeting rising demand for premium fresh produce globally, including tree nuts.
We estimate that Australian almond production could grow to around 150,000m tonnes within the next ten years. This is dependent upon the planting intentions of the sector currently versus actual developments over the next five years. This is significant for Australia and almost double the 2018 production volumes. At the same time, almond production in the US, the world’s largest almond producer, is also on a growth trajectory.
Australian almond production almost doubled between 2007 and 2017. Over the same period, collective average global production growth remained below average global consumption growth. This supported Australia’s ability to export surplus production not consumed by its domestic market.
Increasing demand for all fresh horticultural products, including premium produce, is occurring globally. With emerging markets in Asia on Australia’s doorstep, a very positive demand story exists and Australia and its almond sector are well- positioned to capitalise on this.
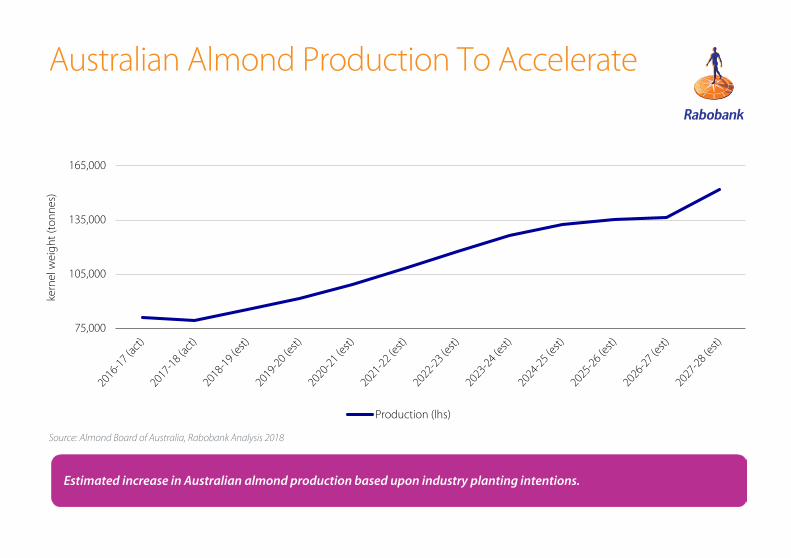
Estimated increase in Australian almond production based upon industry planting intentions.
Source: Almond Board of Australia, Rabobank Analysis 2018
75,000
105,000
135,000
165,000
kern
el w
eigh
t (to
nnes
)
Production (lhs)
Australian Almond Production To Accelerate
Fertiliser
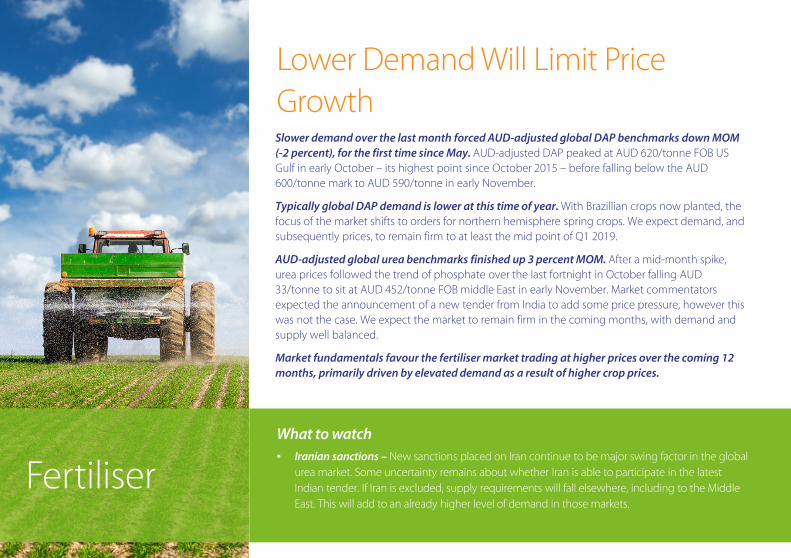
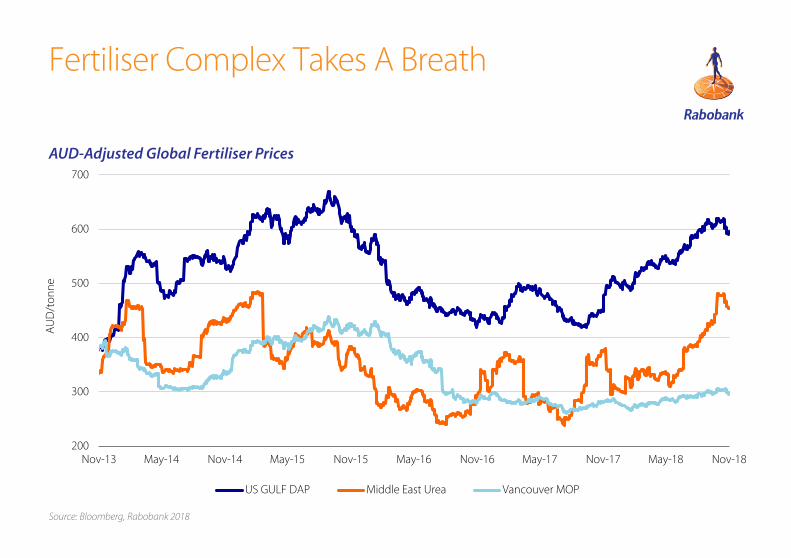
Lower Demand Will Limit Price GrowthSlower demand over the last month forced AUD-adjusted global DAP benchmarks down MOM (-2 percent), for the first time since May. AUD-adjusted DAP peaked at AUD 620/tonne FOB US Gulf in early October – its highest point since October 2015 – before falling below the AUD 600/tonne mark to AUD 590/tonne in early November.
Typically global DAP demand is lower at this time of year. With Brazillian crops now planted, the focus of the market shifts to orders for northern hemisphere spring crops. We expect demand, and subsequently prices, to remain firm to at least the mid point of Q1 2019.
AUD-adjusted global urea benchmarks finished up 3 percent MOM. After a mid-month spike, urea prices followed the trend of phosphate over the last fortnight in October falling AUD 33/tonne to sit at AUD 452/tonne FOB middle East in early November. Market commentators expected the announcement of a new tender from India to add some price pressure, however this was not the case. We expect the market to remain firm in the coming months, with demand and supply well balanced.
Market fundamentals favour the fertiliser market trading at higher prices over the coming 12 months, primarily driven by elevated demand as a result of higher crop prices.
What to watch • Iranian sanctions – New sanctions placed on Iran continue to be major swing factor in the global
urea market. Some uncertainty remains about whether Iran is able to participate in the latest Indian tender. If Iran is excluded, supply requirements will fall elsewhere, including to the Middle East. This will add to an already higher level of demand in those markets.
Source: Bloomberg, Rabobank 2018
200
300
400
500
600
700
Nov-13 May-14 Nov-14 May-15 Nov-15 May-16 Nov-16 May-17 Nov-17 May-18 Nov-18
AU
D/t
onne
US GULF DAP Middle East Urea Vancouver MOP
Fertiliser Complex Takes A Breath
AUD-Adjusted Global Fertiliser Prices
Oil & Freight
Oil to Stabilize Despite DownturnRabobank forecasts that crude oil prices will stabilise in the low 70s in the near term.
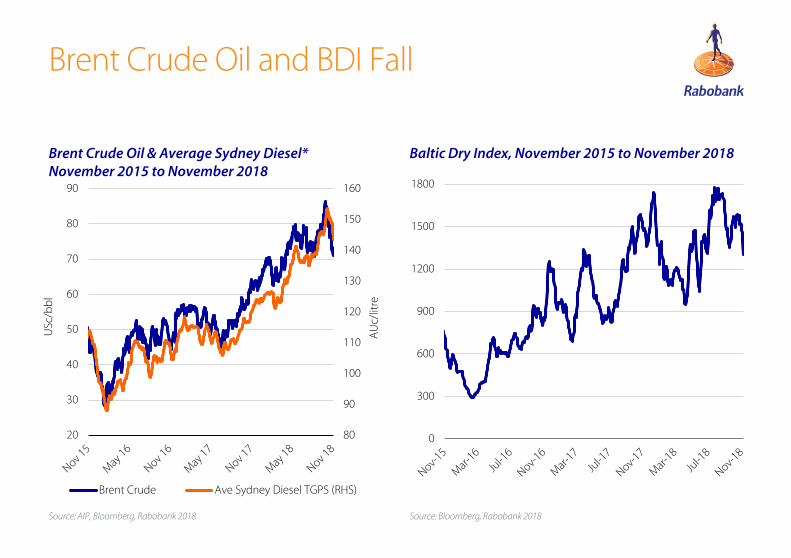
Brent Crude oil prices have decreased to a seven-month low, down 17% MOM. Oil prices are currently USD 70.65/bbl and a combination of the following supply and demand pressures has exacerbated the weak macro picture facing oil. The US has granted waivers to large oil consumers importing from Iran, such as India and China, which has significantly increased supply. Similarly, the oil market has seen increased production from unlikely sources in recent months, such as Libya and Syria, which is undermining previous narratives of tight supply. Although focus in recent months has been on supply issues, demand concerns are placing downward pressure on the market. Crude stocks are above the five-year average in the US and Europe, as refiners perform maintenance ahead of winter. Adding to that, car sales in China are negative YOY, which is also placing downward pressure on oil prices.
BHP has indicated that exports will resume in the coming days, which will place upward pressure on the Baltic Dry Index as demand for Capesize ships increases.
The Baltic Dry Index has fallen to a five-month low, down 16% MOM. The index remained steady for almost all of October, but has plummeted to 1304 in the past week. The downfall came after an out-of-control train carrying iron-ore was deliberately derailed in Western Australia’s remote Pilbara region. BHP has announced that stockpile reserves will not be large enough to cover the time taken until the railway is repaired. This means that demand for Capesize ships to cart iron-ore from Australia to China has fallen, which has placed downward pressure on the index.
What to watch
• Nigerian oil production– Nigerian oil production is set to approach 2m barrels/day into year-end as a major offshore field is brought online capable of producing 200,000 barrels/day, which will place downward pressure on prices.
80
90
100
110
120
130
140
150
160
20
30
40
50
60
70
80
90
AU
c/lit
re
USc
/bb
l
Brent Crude Ave Sydney Diesel TGPS (RHS)
0
300
600
900
1200
1500
1800
Brent Crude Oil and BDI Fall
Brent Crude Oil & Average Sydney Diesel*November 2015 to November 2018
Baltic Dry Index, November 2015 to November 2018
Source: Bloomberg, Rabobank 2018Source: AIP, Bloomberg, Rabobank 2018
FX
AUD Rallies, But We See DownsideDespite rallying against the US dollar in the last month, we expect the AUD to slide to USc 69 by October 2019, as monetary policy in the US tightens and Australian settings likely remain unchanged or loosen.
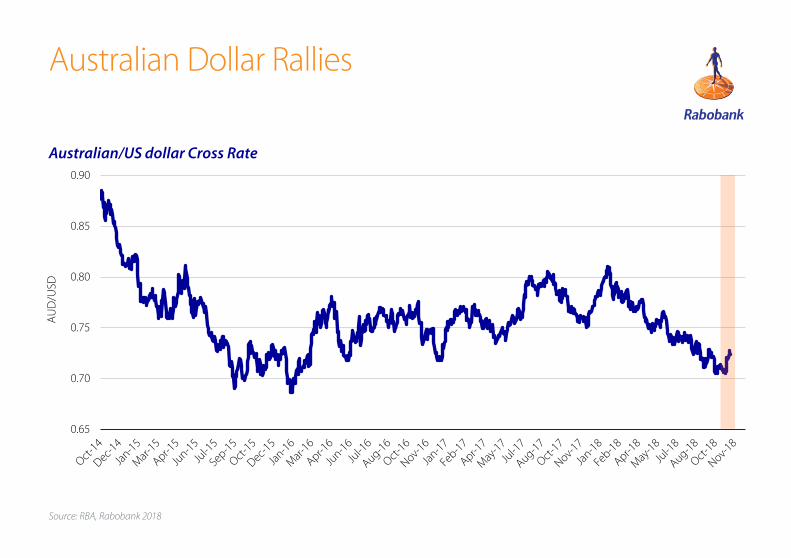
After six months of fairly steady decline against the US dollar, the AUD rallied one cent from mid October: to close at USc 72.17 on 12 November.
At its November meeting, the US Federal Reserve left monetary policy unchanged, with the target range for the fed funds rate at 2.00%-2.25%. The Fed meeting occurred almost as the results of US mid-term election came through. But the election outcome is not likely to have changed the Fed’s outlook, nor has it changed our Fed view. Buoyed by strong recent GDP growth and low unemployment, we expect another US federal funds rate hike in December, then another hike in March 2019. Beyond that, we see a pause in the tightening cycle – based on our concerns of a slowdown in the US economy as the tax cuts fade, the trade war with China bites, and the yield curve inverts.
Meanwhile in Australia, the RBA left its overnight cash rate (OCR) unchanged in November at 1.5%. The RBA noted that inflation remains low and stable, with only a gradual pick up expected in coming years. We continue to expect that the next move in the OCR will be a cut, based on low labour utilisation, a further deterioration in the housing market, and soft spots in the world economy.
As monetary policy in the US tightens and Australian settings likely remain unchanged or loosen, we hold our 12-month forecast for the NZD soften to USc 69 by October 2019.
What to watch• The Chinese economy. The outlook for the Chinese economy deteriorated on every front in the
last month. The economy continues to slow, the stock market reached its lowest point since 2015 and the currency weakened to within a hair’s breadth of the psychological 7 level versus USD.
• For those who want to be optimistic on the growth outlook, it seems almost certain that there will be much more fiscal stimulus ahead and perhaps a trade deal can be reached with the US. But with no trade deal, there is no easy way out for China from its deepening predicament.
0.65
0.70
0.75
0.80
0.85
0.90
AU
D/U
SD
Source: RBA, Rabobank 2018
Australian/US dollar Cross Rate
Australian Dollar Rallies
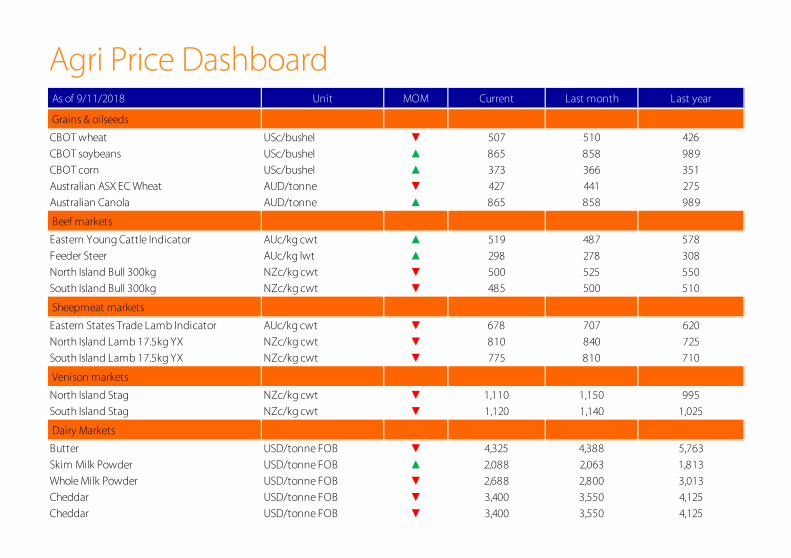
As of 9/11/2018 Unit MOM Current Last month Last year
Grains & oilseeds
CBOT wheat USc/bushel ▼ 507 510 426
CBOT soybeans USc/bushel ▲ 865 858 989
CBOT corn USc/bushel ▲ 373 366 351
Australian ASX EC Wheat AUD/tonne ▼ 427 441 275
Australian Canola AUD/tonne ▲ 865 858 989
Beef markets
Eastern Young Cattle Indicator AUc/kg cwt ▲ 519 487 578
Feeder Steer AUc/kg lwt ▲ 298 278 308
North Island Bull 300kg NZc/kg cwt ▼ 500 525 550
South Island Bull 300kg NZc/kg cwt ▼ 485 500 510
Sheepmeat markets
Eastern States Trade Lamb Indicator AUc/kg cwt ▼ 678 707 620
North Island Lamb 17.5kg YX NZc/kg cwt ▼ 810 840 725
South Island Lamb 17.5kg YX NZc/kg cwt ▼ 775 810 710
Venison markets
North Island Stag NZc/kg cwt ▼ 1,110 1,150 995
South Island Stag NZc/kg cwt ▼ 1,120 1,140 1,025
Dairy Markets
Butter USD/tonne FOB ▼ 4,325 4,388 5,763
Skim Milk Powder USD/tonne FOB ▲ 2,088 2,063 1,813
Whole Milk Powder USD/tonne FOB ▼ 2,688 2,800 3,013
Cheddar USD/tonne FOB ▼ 3,400 3,550 4,125
Cheddar USD/tonne FOB ▼ 3,400 3,550 4,125
Agri Price Dashboard
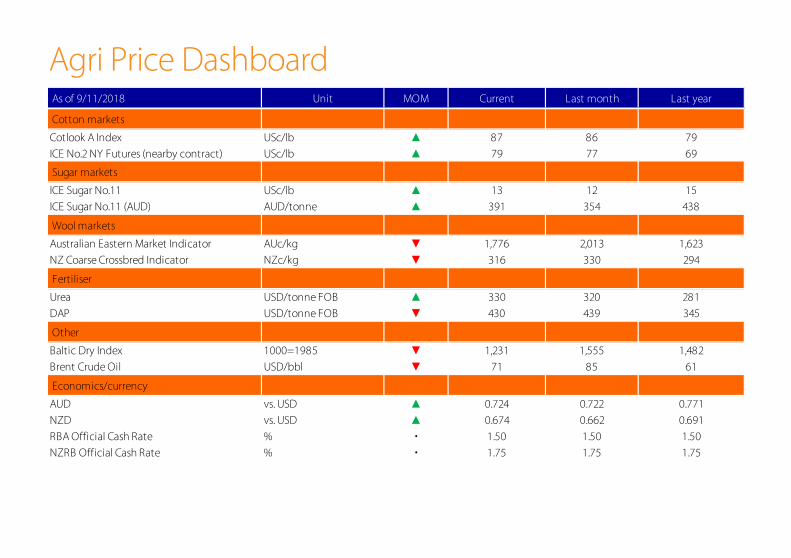
As of 9/11/2018 Unit MOM Current Last month Last year
Cotton markets
Cotlook A Index USc/lb ▲ 87 86 79
ICE No.2 NY Futures (nearby contract) USc/lb ▲ 79 77 69
Sugar markets
ICE Sugar No.11 USc/lb ▲ 13 12 15
ICE Sugar No.11 (AUD) AUD/tonne ▲ 391 354 438
Wool markets
Australian Eastern Market Indicator AUc/kg ▼ 1,776 2,013 1,623
NZ Coarse Crossbred Indicator NZc/kg ▼ 316 330 294
Fertiliser
Urea USD/tonne FOB ▲ 330 320 281
DAP USD/tonne FOB ▼ 430 439 345
Other
Baltic Dry Index 1000=1985 ▼ 1,231 1,555 1,482
Brent Crude Oil USD/bbl ▼ 71 85 61
Economics/currency
AUD vs. USD ▲ 0.724 0.722 0.771
NZD vs. USD ▲ 0.674 0.662 0.691
RBA Official Cash Rate % • 1.50 1.50 1.50
NZRB Official Cash Rate % • 1.75 1.75 1.75
Agri Price Dashboard
RaboResearch Food & AgribusinessAustralia and New Zealand
Rabobank AustraliaNearest branch call 1300 30 30 33www.rabobank.com.au
Tim HuntHead of Food & Agribusiness Research and Advisory, Australia and New Zealand+61 3 9940 [email protected]
Angus Gidley-BairdSenior Analyst – Animal Protein+ 61 2 8115 [email protected]
Michael HarveySenior Analyst – Dairy +61 3 9940 [email protected]
Cheryl Kalisch GordonSenior Analyst – Grains & Oilseeds+61 2 6363 [email protected]
Hayden Higgins Senior Analyst - Horticulture and Wine+64 6 974 [email protected]
Wes LefroyAgricultural Analyst+61 2 8115 [email protected]
Georgia TwomeyCommodity Analyst+61 2 8115 [email protected]
Blake HolgateAnimal Protein and Sustainability Analyst+64 3 955 [email protected]
Emma HigginsDairy Analyst+64 3 961 [email protected]
Ollie Ridge Intern+61 2 8115 [email protected]
Catherine KeoBusiness Coordinator+61 2 8115 [email protected]
This document is issued by a Rabobank Group member. The information and opinions contained in this document have been compiled or arrived at from sources believed to be reliable, but no representation or warranty, express or implied, is made as to their accuracy, completeness or correctness. This document is for information purposes only and is not, and should not be construed as, an offer or a commitment by any Rabobank Group member to enter into a transaction. This information is not professional advice and has not been prepared to be used as the basis for, and should not be used as the basis for, any financial or strategic decisions. This information is general in nature only and does not take into account an individual’s personal circumstances. All opinions expressed in this document are subject to change without notice. No Rabobank Group member accepts any liability whatsoever for any direct, indirect, consequential or other loss or damage howsoever arising from any use of this document or its contents or otherwise arising in connection therewith. This document may not be reproduced, distributed or published, in whole or in part, for any purpose, except with the prior written consent of a Rabobank Group member. By accepting this document you agree to be bound by the foregoing restrictions. All copyright is reserved ©