china’s changing net trade position in seafood and … rabobank: globally leading food and...
TRANSCRIPT
China’s changing net trade position in seafood and implications
Dr. Beyhan de JongReykjavik, November 2017
The Dragon’s changing appetite

Toronto
New York
Mexico City
Sao Paulo
Buenos Aires SydneySantiago de Chile
Willemstad
Calgary
Washington DC
Chicago
Atlanta
DallasEl Centro
San Francisco
Tasmania
Melbourne
Wellington
Cedar Falls
St Louis London
Madrid
Milan
AntwerpFrankfurt
Warsaw
Utrecht
Hong Kong
Singapore
Mumbai
Kolkata
Jakarta
Tokyo
Beijing
Delhi
Kuala Lumpur
Moscow
Istanbul
Dublin
Lubuan
Amsterdam
Paris
Bangalore
Shanghai
MaputoChimoio
Beira
Tete
Ulónguè
Malema
Maxixe
Nampula
Kigali
Asuncion
46 Countries Over 600 Offices Over 55,000 Employees
Rabobank: Globally leading food and agribusiness lender and financial services provider

In volume terms China’s seafood consumption dwarfs that of the western countries
Source: OECD-FAO, Rabobank 2017
0
10
20
30
40
50
60
70
80
North America Europe Africa Latin America & Caribbean China Asia excl. China
Million tonnes2006
2007
2008
2009
2010
2011
2012
2013
2014
2015
2016
2017
2018
2019
2020
2021
2022
2023
2024
2025
2026
China has a high seafood consumption, estimated at 44 kg per person, which is forecasted to reach 50 kg in 2026
35% of global consumption
1
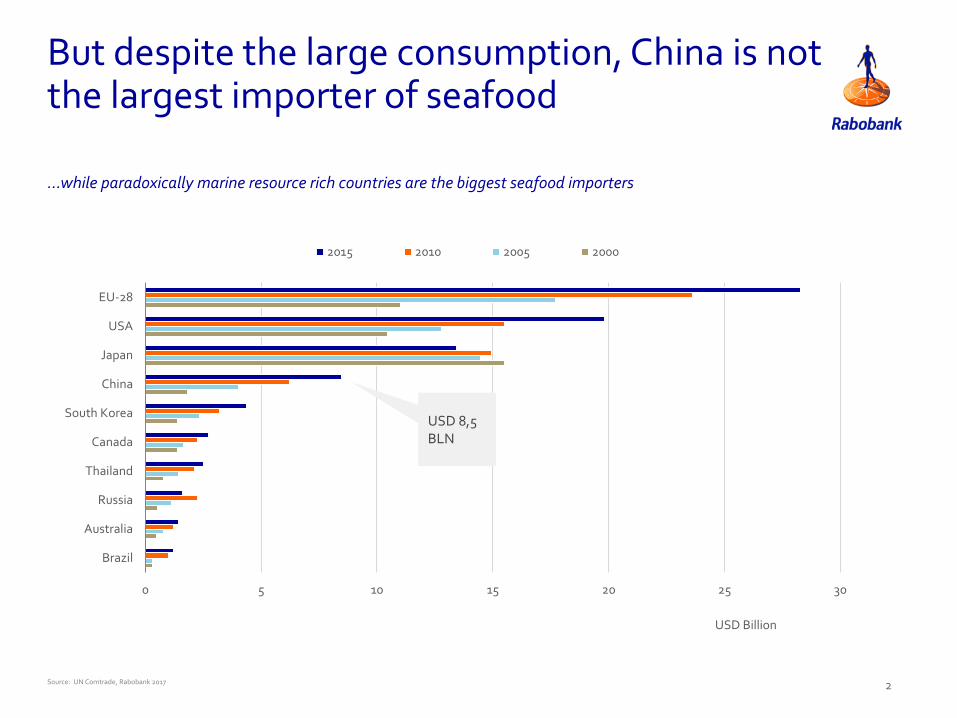
But despite the large consumption, China is not the largest importer of seafood
…while paradoxically marine resource rich countries are the biggest seafood importers
0 5 10 15 20 25 30
Brazil
Australia
Russia
Thailand
Canada
South Korea
China
Japan
USA
EU-28
USD Billion
2015 2010 2005 2000
Source: UN Comtrade, Rabobank 2017
USD 8,5 BLN
2
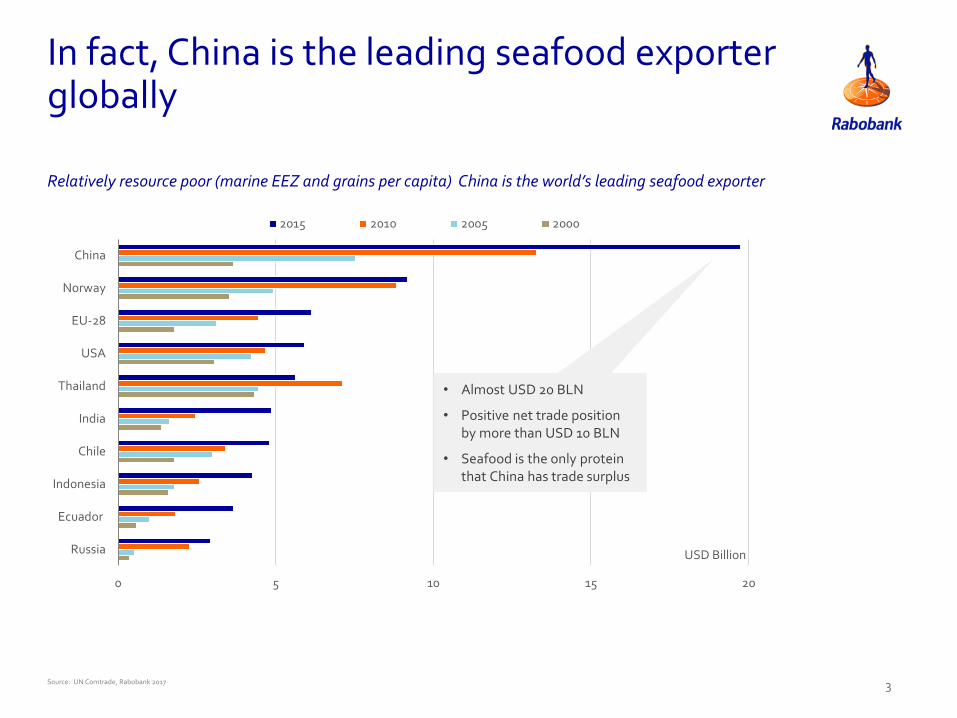
In fact, China is the leading seafood exporter globally
Source: UN Comtrade, Rabobank 2017
Relatively resource poor (marine EEZ and grains per capita) China is the world’s leading seafood exporter
0 5 10 15 20
Russia
Ecuador
Indonesia
Chile
India
Thailand
USA
EU-28
Norway
China
USD Billion
2015 2010 2005 2000
• Almost USD 20 BLN
• Positive net trade position by more than USD 10 BLN
• Seafood is the only protein that China has trade surplus
3
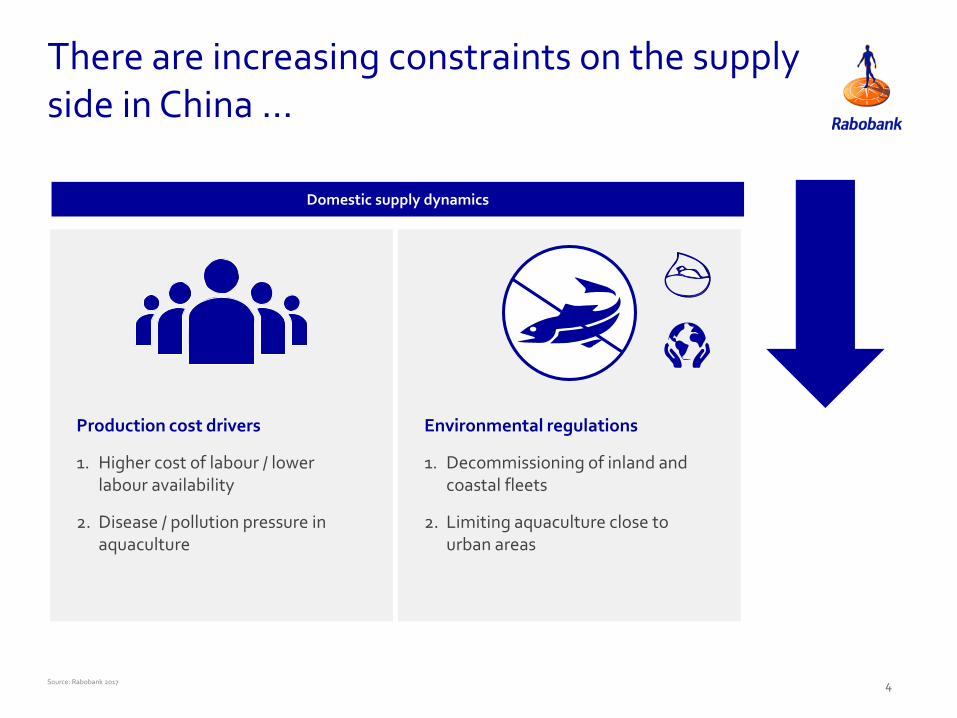
Domestic supply dynamics
Production cost drivers
1. Higher cost of labour / lower labour availability
2. Disease / pollution pressure in aquaculture
Environmental regulations
1. Decommissioning of inland and coastal fleets
2. Limiting aquaculture close to urban areas
There are increasing constraints on the supply side in China …
Source: Rabobank 2017 4

Import demand drivers
1. Income growth and strong currency
2. Distrust of locally produced seafood (due to pollution and scandals)
Import enablers
1. On-line seafood trade
2. Improving logistical infrastructure / urbanisation
Import demand dynamics
…while the drivers on the demand side accelerate import demand
Source: Rabobank 2017 5

Domestic seafood supply to stagnate or
contract
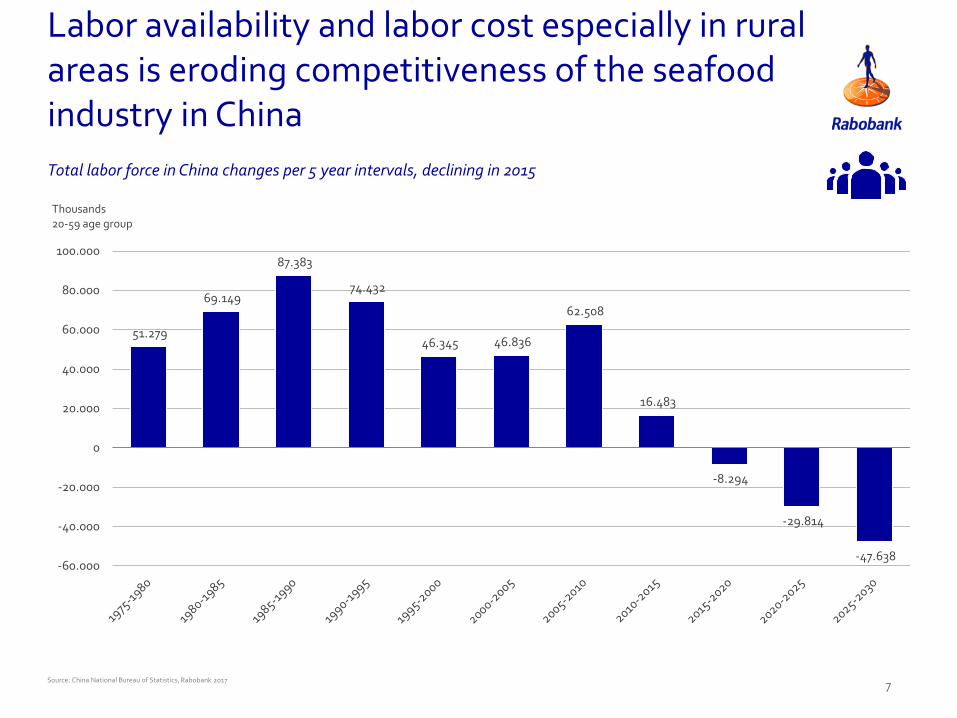
Source: China National Bureau of Statistics, Rabobank 2017
51.279
69.149
87.383
74.432
46.345 46.836
62.508
16.483
-8.294
-29.814
-47.638 -60.000
-40.000
-20.000
0
20.000
40.000
60.000
80.000
100.000
Thousands20-59 age group
Total labor force in China changes per 5 year intervals, declining in 2015
Labor availability and labor cost especially in rural areas is eroding competitiveness of the seafood industry in China
7
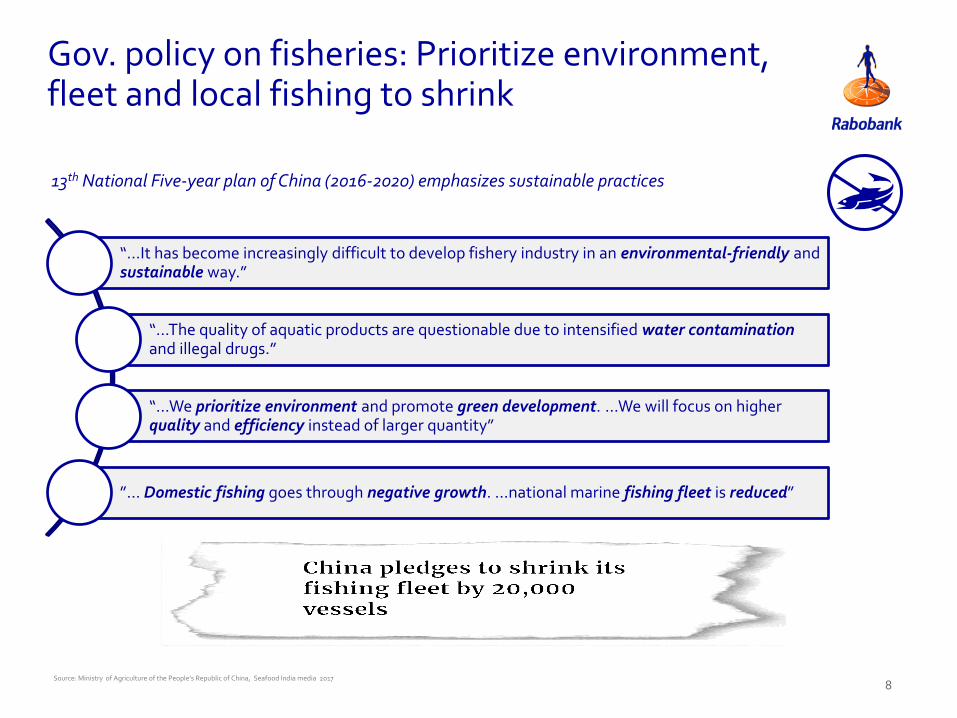
Gov. policy on fisheries: Prioritize environment, fleet and local fishing to shrink
Source: Ministry of Agriculture of the People’s Republic of China, Seafood India media 2017
“…It has become increasingly difficult to develop fishery industry in an environmental-friendly and sustainable way.”
“…The quality of aquatic products are questionable due to intensified water contamination and illegal drugs.”
“…We prioritize environment and promote green development. …We will focus on higher quality and efficiency instead of larger quantity”
”… Domestic fishing goes through negative growth. …national marine fishing fleet is reduced”
13th National Five-year plan of China (2016-2020) emphasizes sustainable practices
8

0
10
20
30
40
50
60
70
80
Million tonnes
Wild catch Marine Farmed Freshwater Farmed
Overall we expect Chinese seafood production to experience a gradual decline, after years of growth
Source: China National Bureau of Statistics, OECD-FAO, Rabobank 2017
China’s wild catch production is expected to decline as targeted in the latest fisheries policy
• Next five year plan targets a decrease in total seafood production from 67 million tonnes to 66 million.
• Domestic wild catch (inland and near coastal areas) to be decreased and aquaculture to be increased.
• By using modern technologies and intensive farming, aquaculture is targeted to be increased.
9

Import demand to grow faster than ever before

-3%
-9%
-24%
-31%
-44%
-22%
-19%
-3%
-50%
-40%
-30%
-20%
-10%
0%
2013-2017 currency change
Thai Baht Indian Rupee Mexican Peso Brazilian Real Russian Ruble Indonesian Rupiah Chilean Peso Vietnamese Dong
Nearly all developing countries have had devaluating currencies vs the Chinese Yuan, impacting competitiveness
Source: Bloomberg, Rabobank 2017
Weak currency is no longer a key gov. policy in China
Value of developing country currencies vs the Chinese Yuan 2013 September vs. 2017 September
11
0%
3%
6%
9%
12%
15%
18%
21%
0
5.000
10.000
15.000
20.000
25.000
30.000
35.000
40.000
20
04
20
05
20
06
20
07
20
08
20
09
20
10
20
11
20
12
20
13
20
14
20
15
20
16
Urban Disposable Income per capita (RMB) Growth Rate
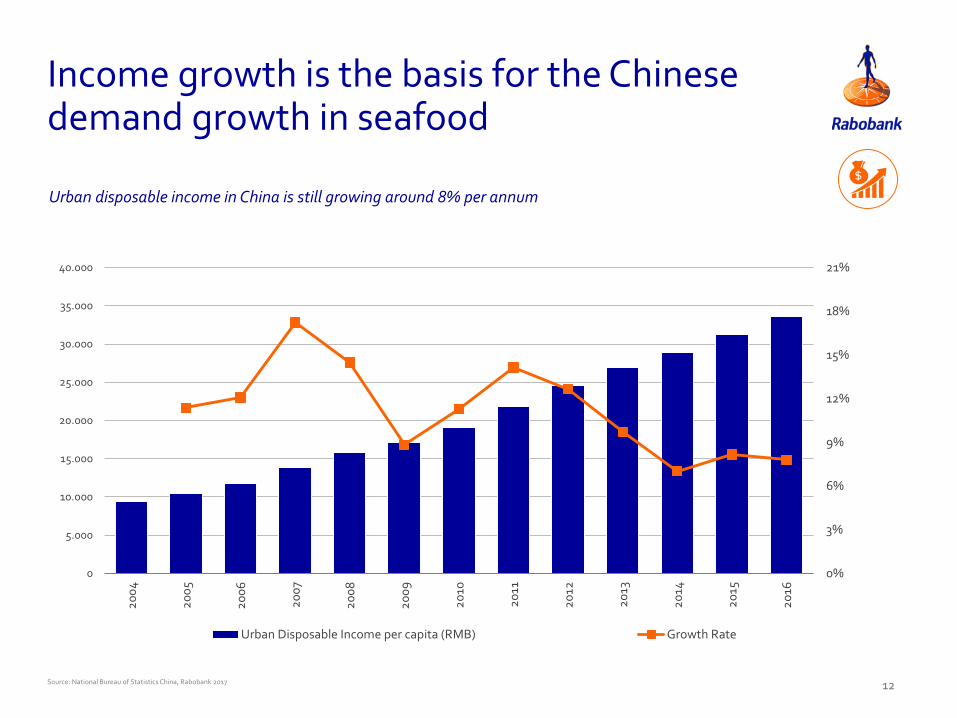
Income growth is the basis for the Chinese demand growth in seafood
Source: National Bureau of Statistics China, Rabobank 2017
Urban disposable income in China is still growing around 8% per annum
12

4%
5%
6%
7%
8%
12%
14%
16%
18%
20%
22%
24%
Lowest Low Lower Middle Middle Upper Middle High Highest
Seafood expenditure shareMeat expenditure share
Meat, Poultry and Processed Products (LHS) Aquatic Products (RHS)
The demand growth is accelerated by a high income elasticity of seafood demand in China
Source: National Bureau of Statistics, Nielsen, BCG, Rabobank 2017
Share of seafood (right) and meat (left) expenditure increases per income group
13
Source: Euromonitor; Iresearchchina, Rabobank 2017
0
1.000
2.000
3.000
4.000
5.000
6.000
2012 2013 2014 2015 2016 2017e 2018f
Retail fresh food sales (RMB bln) Online fresh food sales (RMB bln)
14
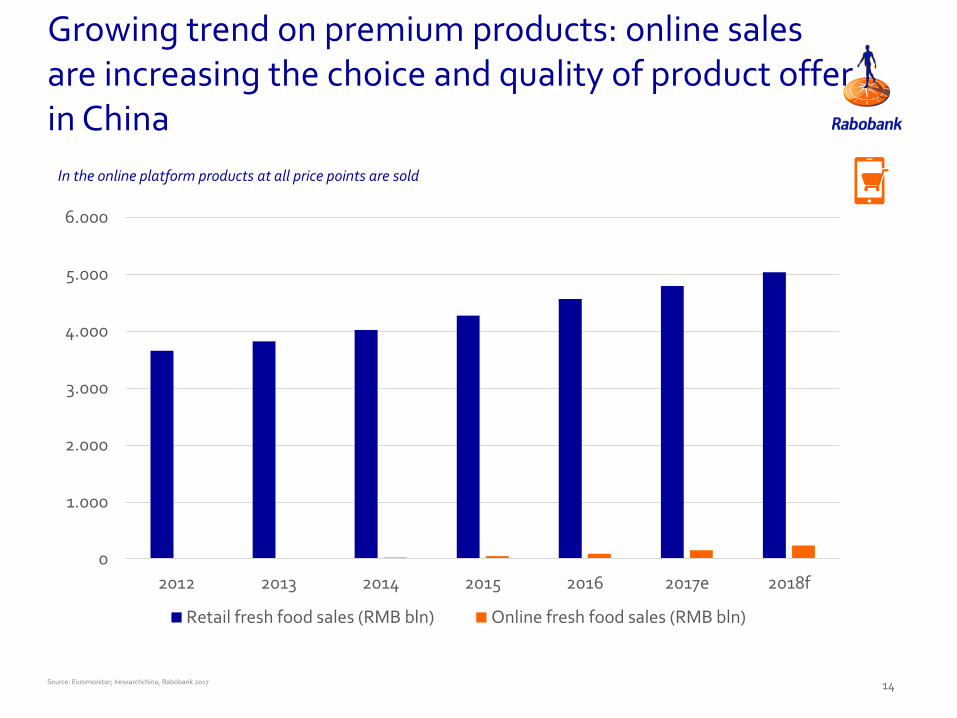
Growing trend on premium products: online sales are increasing the choice and quality of product offer in China
In the online platform products at all price points are sold

Source: Euromonitor; Iresearchchina, Rabobank 2017
0
50
100
150
200
250
2012 2013 2014 2015 2016 2017e 2018f
Online fresh food sales (RMB bln)
Online value proposition of seafood in China:
Variety
Convenience / delivery
Information
No crowds
Food safety
Authenticity
15
Seafood is the second most sold food category on the online market after imported fruits
RMB 237 BLN = USD 35 BLN
+82%
RMB 153 BLN = USD 23 BLN

Imported seafood sales are rapidly increasing through e-commerce
Source: JD, Tmall, Gfresh, Rabobank 2017
Tmall - largest B2C platform in China JD has the largest e-commerce logistics
infrastructure in China • By November 8th, 263 pages with 60 seafood items per page
• New seafood listings everyday
• 198 million active users in 2016
17
0
200
400
600
800
1.000
1.200
1.400
1.600
2015 2016 2017 e 2018 f
Sales in USD million
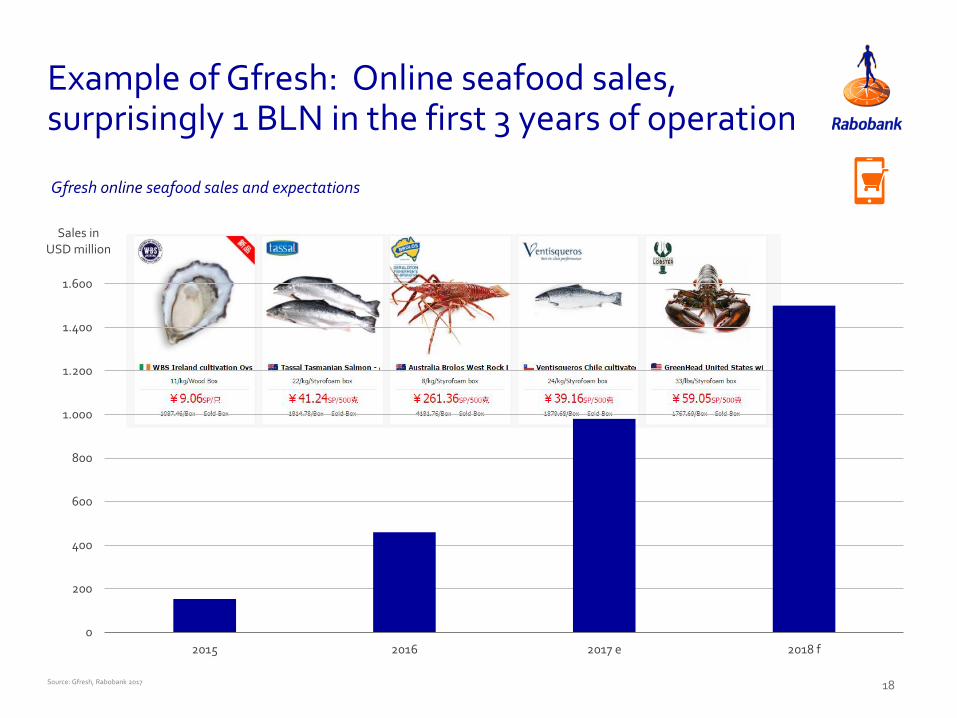
Example of Gfresh: Online seafood sales, surprisingly 1 BLN in the first 3 years of operation
Source: Gfresh, Rabobank 2017
Gfresh online seafood sales and expectations
18

Still China can be very challenging especially for trade of frozen and chilled seafood
Source: China Bureau of Statistics, GCCA, Rabobank, 2017
0
50
100
150
200
250
300
350
2007 2008 2009 2010 2011 2012 2013 2014 2015 2016e 2017f 2018f 2019f 2020f
Storage capacity in China Number of refrigirated vehicles
Million m3 / ‘000 Vehicles
Cold chain infrastructure is growing by 15-30% p.a. in China – major changes are occurring, partly driven by
online retailers
19

Implications: New seafood consumers in China
and perhaps new East-West partnerships

Having at least one of these features seems to be the recipe for success in the Chinese seafood market (but there are exceptions)
Source: Rabobank 2017
Marine
Crustaceans
Wild Caught
Marine
• Marine fish is perceived as healthier than fresh water fish
• China currently has relatively low availability of marine seafood
Premium
• Especially on-line and in modern retail premium products are ordered and are often imported
• Most locally produced products are sold on wet markets and are not premium
Crustaceans
• Cultural preference for shell fish
• Huge range of products already known to Chinese consumers
Wild Caught
• Wild seafood is perceived as heathier than farmed
• In China far less available thanelsewhere in the world
Premium
21
0
200
400
600
800
1.000
1.200
EU US China
tonnes
Thousands
2010 2011 2012 2013 2014 2015 2016 2017e
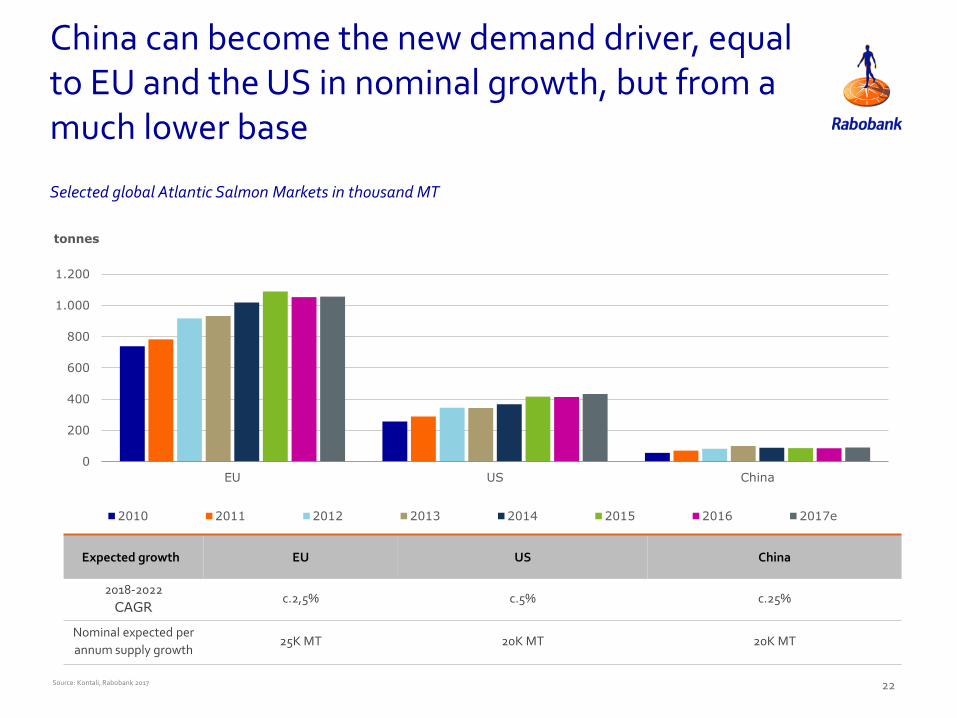
Source: Kontali, Rabobank 2017
Selected global Atlantic Salmon Markets in thousand MT
Expected growth EU US China
2018-2022
CAGRc.2,5% c.5% c.25%
Nominal expected per
annum supply growth25K MT 20K MT 20K MT
China can become the new demand driver, equal to EU and the US in nominal growth, but from a much lower base
22
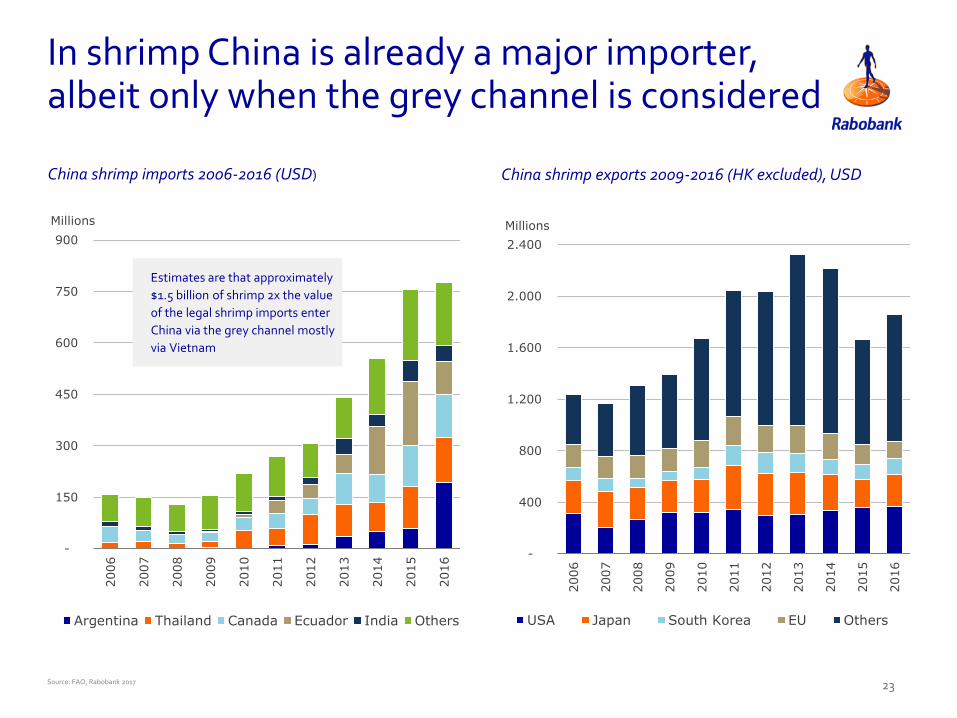
In shrimp China is already a major importer, albeit only when the grey channel is considered
China shrimp exports 2009-2016 (HK excluded), USD
Source: FAO, Rabobank 2017
China shrimp imports 2006-2016 (USD)
-
150
300
450
600
750
900
2006
2007
2008
2009
2010
2011
2012
2013
2014
2015
2016
Millions
Argentina Thailand Canada Ecuador India Others
-
400
800
1.200
1.600
2.000
2.400
2006
2007
2008
2009
2010
2011
2012
2013
2014
2015
2016
Millions
USA Japan South Korea EU Others
Estimates are that approximately
$1.5 billion of shrimp 2x the value
of the legal shrimp imports enter
China via the grey channel mostly
via Vietnam
23
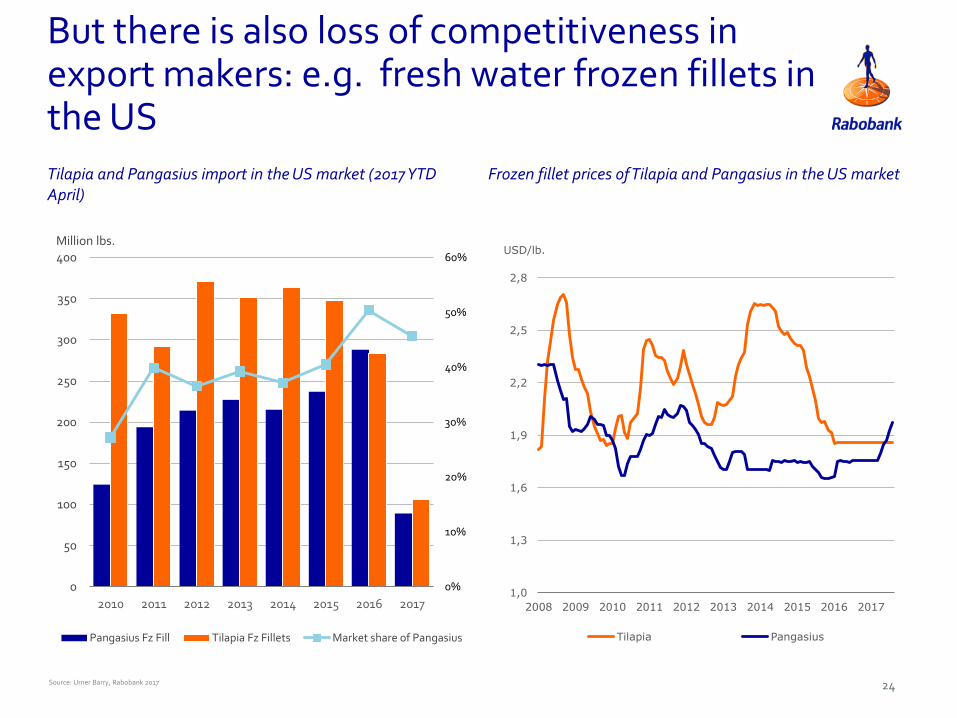
But there is also loss of competitiveness in export makers: e.g. fresh water frozen fillets in the US
Frozen fillet prices of Tilapia and Pangasius in the US marketTilapia and Pangasius import in the US market (2017 YTD April)
Source: Urner Barry, Rabobank 2017
0%
10%
20%
30%
40%
50%
60%
0
50
100
150
200
250
300
350
400
2010 2011 2012 2013 2014 2015 2016 2017
Million lbs.
Pangasius Fz Fill Tilapia Fz Fillets Market share of Pangasius
1,0
1,3
1,6
1,9
2,2
2,5
2,8
2008 2009 2010 2011 2012 2013 2014 2015 2016 2017
USD/lb.
Tilapia Pangasius
24

0
50
100
150
200
250
300
350
400
450
2012 2013 2014 2015 2016 2017E
Millions USD
And surpassingly in a few years China has become the No.1 market for Vietnamese pangasius
Source: UN Comtrade, VASEP, Rabobank 2017
Vietnamese pangasius exports to China in value
26

Why West to China M&A is not very likely
• Barriers: language, culture, business environment
• High Chinese value expectations
• Synergies are not always obvious
• JVs` are the current choice for cooperation
• E.g. Western seafood companies and on-line retailers
• E.g. Western and local technology aquaculture companies (e.g. feed)
M&A from West to China is not highly likely
Source: Bloomberg, Rabobank 2017
EV/EBITDA multiples in European and Chinese listed seafood companies
8.5x 8.5x
12.9x
18.0x
8.3x
5.9x
14.8x13.8x
11.5x
21.8x
18.4x
13.1x
36.8x
49.7x
13.2x
39.9x
58.0x
26.0x
7.1x
Europe average: 10.5x China average: 28.4x
7.3x
27
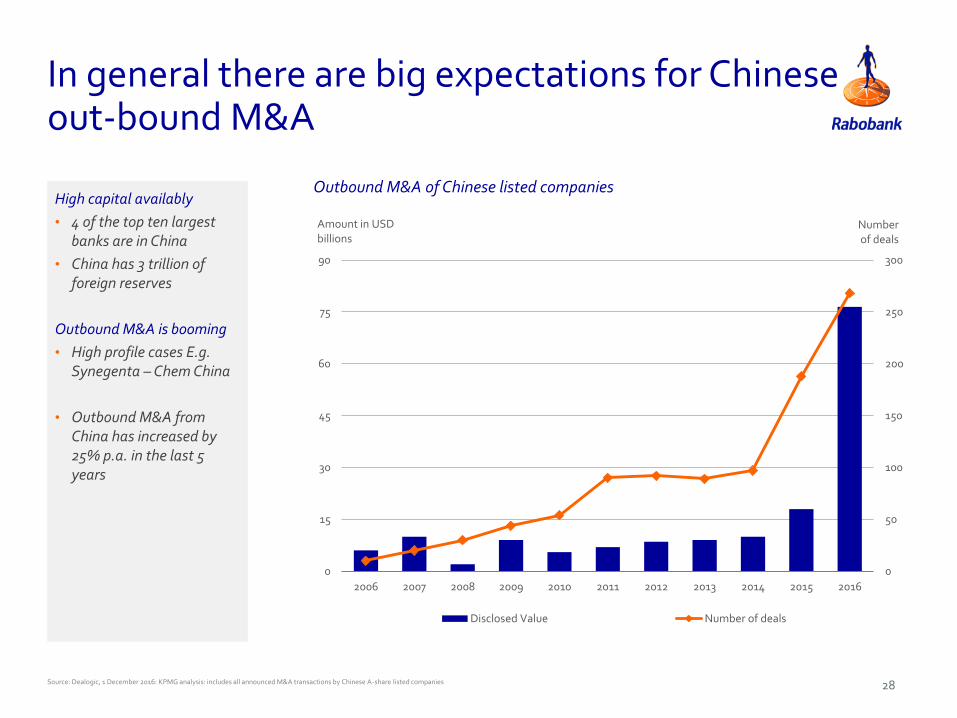
0
50
100
150
200
250
300
0
15
30
45
60
75
90
2006 2007 2008 2009 2010 2011 2012 2013 2014 2015 2016
Number of deals
Amount in USD billions
Disclosed Value Number of deals
Outbound M&A of Chinese listed companies
Source: Dealogic, 1 December 2016: KPMG analysis: includes all announced M&A transactions by Chinese A-share listed companies
In general there are big expectations for Chinese out-bound M&A
High capital availably
• 4 of the top ten largest banks are in China
• China has 3 trillion of foreign reserves
Outbound M&A is booming
• High profile cases E.g. Synegenta – Chem China
• Outbound M&A from China has increased by 25% p.a. in the last 5 years
28
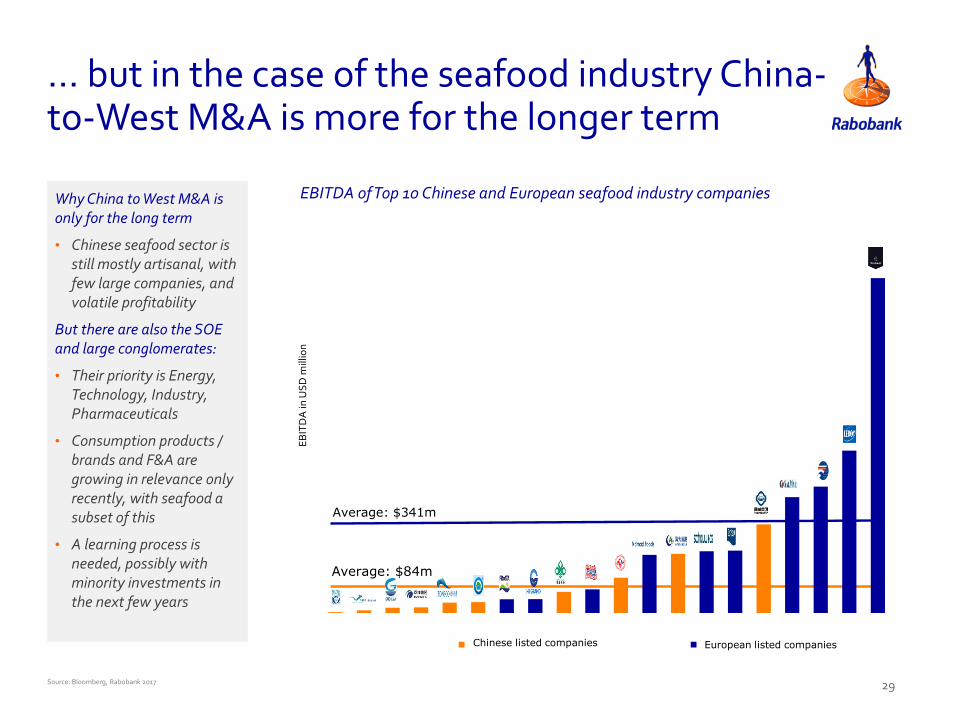
China Marine Food Group Ltd Frosta
Source: Bloomberg, Rabobank 2017
… but in the case of the seafood industry China-to-West M&A is more for the longer term
EBITDA of Top 10 Chinese and European seafood industry companies
Average: $84m
Average: $341m
EB
ITD
A in
US
D m
illio
n
Chinese listed companies European listed companies
Why China to West M&A is only for the long term
• Chinese seafood sector is still mostly artisanal, with few large companies, and volatile profitability
But there are also the SOE and large conglomerates:
• Their priority is Energy, Technology, Industry, Pharmaceuticals
• Consumption products / brands and F&A are growing in relevance only recently, with seafood a subset of this
• A learning process is needed, possibly with minority investments in the next few years
29

30
This document is meant exclusively for you and does not carry any right of publication or disclosure other than to Coöperatieve Rabobank U.A. (“Rabobank”), registered in Amsterdam. Neither this document nor any of its contents may be distributed, reproduced, or used for any other purpose without the prior written consent of Rabobank. The information in this document reflects prevailing market conditions and our judgement as of this date, all of which may be subject to change. This document is based on public information. The information and opinions contained in this document have been compiled or derived from sources believed to be reliable; however, Rabobank does not guarantee the correctness or completeness of this document, and does not accept any liability in this respect. The information and opinions contained in this document are indicative and for discussion purposes only. No rights may be derived from any potential offers, transactions, commercial ideas, et cetera contained in this document. This document does not constitute an offer, invitation, or recommendation. This document shall not form the basis of, or cannot be relied upon in connection with, any contract or commitment whatsoever. The information in this document is not intended, and may not be understood, as an advice (including, without limitation, an advice within the meaning of article 1:1 and article 4:23 of the Dutch Financial Supervision Act). This document is governed by Dutch law. The competent court in Amsterdam, the Netherlands has exclusive jurisdiction to settle any dispute which may arise out of, or in connection with, this document and/or any discussions or negotiations based on it. This report has been published in line with Rabobank’s long-term commitment to international food and agribusiness. It is one of a series of publications undertaken by the global department of RaboResearch Food & Agribusiness. ©2017 - All Rights Reserved.
Dr. Beyhan de JongAssociate Analyst Animal ProteinRabobank, Utrecht, The [email protected]