agribusiness monthly & covid-19 update july 2020
TRANSCRIPT

RaboResearch Food & Agribusiness 9 July 2020
Australia
Agribusiness Monthly & Covid-19 Update July 2020

Covid-19 Infections are on the rise again but ag prices hold firm.
Grains & OilseedsDownward pressure on wheat prices as Northern Hemisphere harvests pick up pace, plus diminishing weather risk means we now expect CBOT wheat to trade between 485-495USc/bu in the coming year.
Dairy Minimum milk price offers for the 2020/21 season provide a solid platform for farmgate profitability.
Beef Cattle prices expected to remain strong despite easing US import prices.
Sheepmeat Restockers possibly backing out of lamb market may see prices fall further.
Sugar Forecast rainfall highlights the possibility of a late-season finish to the 2020 crushing campaign.
CottonRabobank has lowered its local price forecast, amid a darkening global fundamental outlook and ongoing AUD/USD strength.
Wool Wool prices steady and while a long way to go, retail apparel sales show signs of improvement.
Wine Rabobank expects recovery in US on-premise channel post 2021.
Horticulture Rabobank expects competition from Chile to emerge in China for some citrus exports.
Farm InputsBelow-average prices, favourable seasonal conditions and uninterrupted supply chains will support farmers applying urea this season.
FX We have tempered our forecast and now expect the AUD to bottom out at USc 64 by Christmas.
OilDespite the extra buying seen during June, the fundamentals of the oil market remain weak. We expect prices of Brent Crude to spend 2H ’20 trading between USD 30 and USD 40/bbl.
Commodity outlook

Covid-19
Global infections are again risingThe last month has been a reminder that the virus is not yet on the wane, second waves will occur in some places, and lockdowns will come and go.
After six weeks of relative stability, global infection rates rose rapidly through June and into early July. By early July, global infections were well-above 200,000 per day, 57% above the levels we were seeing just a month earlier.
In contrast to the trend evident in May, infection rates are rising again in many of Australia’s key F&A markets. New outbreaks occurred in cities like Beijing, Leicester and Melbourne, while infection rates rose in 38 US states and in Japan. To what extent this is due to increased testing may be irrelevant for F&A producers. Governments may respond in either case with increased lockdowns.
Easing is being delayed, or lockdowns re-introduced, in some cities and states as a result.
While more countries are easing restrictions than reimposing or delaying them, June has reminded us that this will not be one-way traffic.
Daily reported new cases of Covid-19 by continent
Source: European Centre for Disease Prevention and Control, May 29, 2020
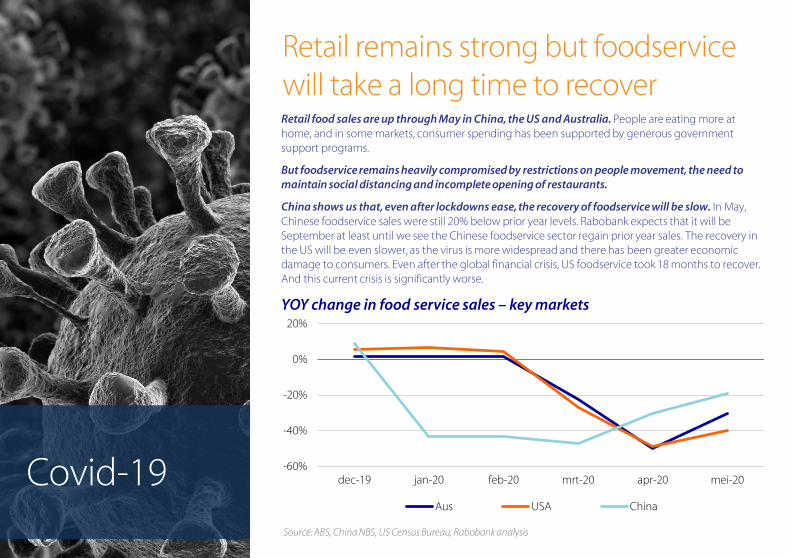
Retail remains strong but foodservice will take a long time to recover Retail food sales are up through May in China, the US and Australia. People are eating more at home, and in some markets, consumer spending has been supported by generous government support programs.
But foodservice remains heavily compromised by restrictions on people movement, the need to maintain social distancing and incomplete opening of restaurants.
China shows us that, even after lockdowns ease, the recovery of foodservice will be slow. In May, Chinese foodservice sales were still 20% below prior year levels. Rabobank expects that it will be September at least until we see the Chinese foodservice sector regain prior year sales. The recovery in the US will be even slower, as the virus is more widespread and there has been greater economic damage to consumers. Even after the global financial crisis, US foodservice took 18 months to recover. And this current crisis is significantly worse.
-60%
-40%
-20%
0%
20%
dec-19 jan-20 feb-20 mrt-20 apr-20 mei-20
Aus USA China
YOY change in food service sales – key markets
Covid-19Source: ABS, China NBS, US Census Bureau, Rabobank analysis

Supply chain disruptions in June were more company and plant specificOne of the features of the crisis so far has been the supply-side shocks. As covered in previous
reports, earlier months saw ag supply chains in various regions impacted by labour shortages,
processing problems, transport bottlenecks, port slowdowns or even government export bans.
Broad-based supply-side disruptions from Covid-19 dissipated through June. Most notably,
the US meat processing industry had returned to more normal operations by the end of the
month.
But company or plant-specific disruptions remain common. Following the outbreak of
infection at a Beijing wholesale food market, Chinese authorities have become concerned by
the (scientifically unproven) potential for the virus to be transported on meat. This led to
inspection of imported meat at several ports and banning blocking market access for around 20
plants around the world with known high infection rates of workers. Covid pressures have also
helped push Chinese trader, and significant buyer of Australian cotton, Weilin into voluntary
administration, causing headaches for growers. Several cases at a Coles distribution centre in
Laverton also caused temporary shortages of various fresh and frozen product lines at that
retailer’s Melbourne stores.
While none of these disruptions have the same breath of impact as those we saw in the market
through May, they can still be highly impactful for those supplying these companies or plants.
And for those not directly impacted, they are a reminder of the heightened risk environment in
which businesses operate in 2020 – even in food and agriculture.Covid-19

Commodity prices continue to holdDespite heavily compromised end-consumption of F&A products around the world at the moment, markets for most commodities which Australia exports held their ground through June.For sheep and beef, weak end demand has been offset by supply disruptions in other markets, including ASF (African Swine Fever) in China, US meat processing plant restrictions, and heavy falls in Australian production as the industry restocks after years of drought. Demand for dairy products has been supported by government intervention in the US and the EU.
The combination of government support for consumers, supply-side shocks and market intervention have helped keep USD commodity prices firm. This has underpinned farmgate prices that for most Australian producers remain above breakeven, despite the lack of significant softening in the AUD.
We remain wary of what might happen if government support for consumers and market intervention wanes in coming months. But so far, Australian ag is doing remarkably well in this crisis.
Covid-19
Index of various ag commodity prices in AUD terms since 20 January 2020
0,65
0,75
0,85
0,95
1,05
1,15
21-1
-202
026
-1-2
020
31-1
-202
05-
2-20
2010
-2-2
020
15-2
-202
020
-2-2
020
25-2
-202
01-
3-20
206-
3-20
2011
-3-2
020
16-3
-202
021
-3-2
020
26-3
-202
031
-3-2
020
5-4-
2020
10-4
-202
015
-4-2
020
20-4
-202
025
-4-2
020
30-4
-202
05-
5-20
2010
-5-2
020
15-5
-202
020
-5-2
020
25-5
-202
030
-5-2
020
4-6-
2020
9-6-
2020
14-6
-202
019
-6-2
020
24-6
-202
029
-6-2
020
ind
ex -
wh
ere
1 =
pric
e o
n 2
1 Ja
n 2
020
CME wheat generic 1st Cotton No.2 Future Active contract
NZX Whole Milk Pwd Futures Oct20 ICE 11 sugar - Active Contract
US imported Cow Meat (90CL) EMI Wool
Feed barley Geelong, VIC track price,
Watching for La Niña
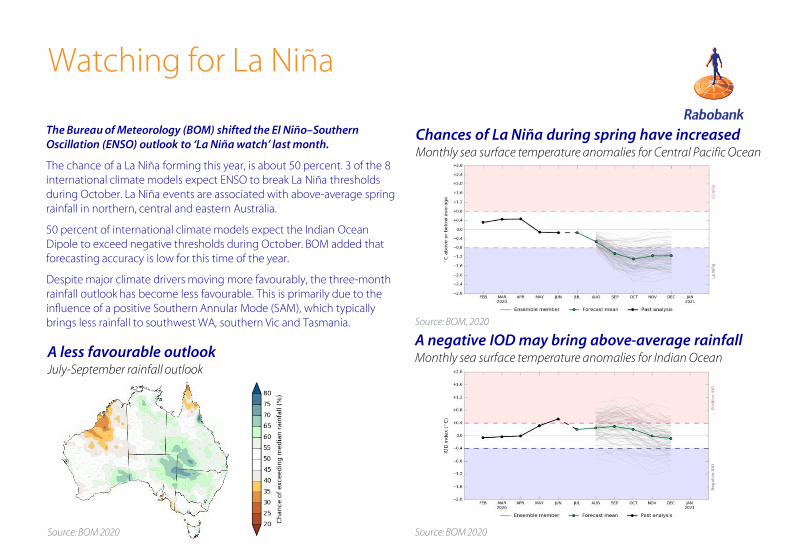
The Bureau of Meteorology (BOM) shifted the El Niño–Southern Oscillation (ENSO) outlook to ‘La Niña watch’ last month.
The chance of a La Niña forming this year, is about 50 percent. 3 of the 8international climate models expect ENSO to break La Niña thresholds during October. La Niña events are associated with above-average spring rainfall in northern, central and eastern Australia.
50 percent of international climate models expect the Indian Ocean Dipole to exceed negative thresholds during October. BOM added that forecasting accuracy is low for this time of the year.
Despite major climate drivers moving more favourably, the three-month rainfall outlook has become less favourable. This is primarily due to the influence of a positive Southern Annular Mode (SAM), which typically brings less rainfall to southwest WA, southern Vic and Tasmania.
Chances of La Niña during spring have increasedMonthly sea surface temperature anomalies for Central Pacific Ocean
A negative IOD may bring above-average rainfall Monthly sea surface temperature anomalies for Indian Ocean
Source: BOM, 2020
Source: BOM 2020Source: BOM 2020
A less favourable outlookJuly-September rainfall outlook
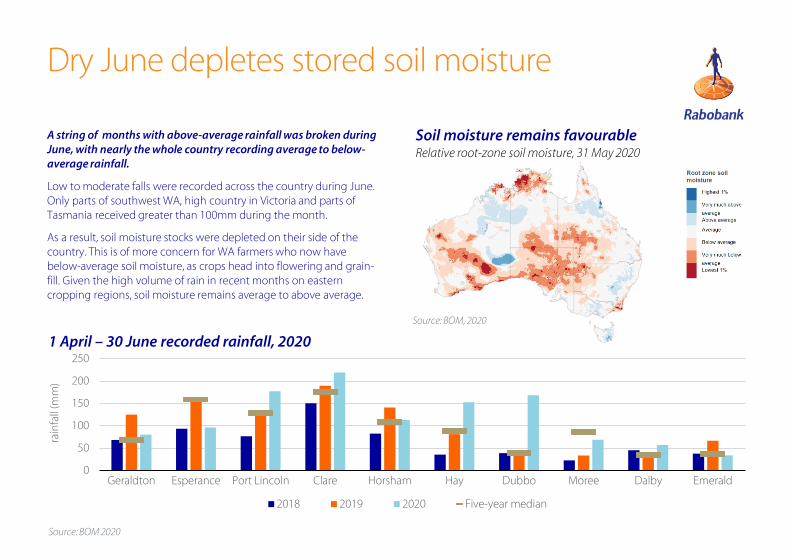
Dry June depletes stored soil moisture
A string of months with above-average rainfall was broken during June, with nearly the whole country recording average to below-average rainfall.
Low to moderate falls were recorded across the country during June. Only parts of southwest WA, high country in Victoria and parts of Tasmania received greater than 100mm during the month.
As a result, soil moisture stocks were depleted on their side of the country. This is of more concern for WA farmers who now have below-average soil moisture, as crops head into flowering and grain-fill. Given the high volume of rain in recent months on eastern cropping regions, soil moisture remains average to above average.
Soil moisture remains favourableRelative root-zone soil moisture, 31 May 2020
1 April – 30 June recorded rainfall, 2020
Source: BOM, 2020
Source: BOM 2020
0
50
100
150
200
250
Geraldton Esperance Port Lincoln Clare Horsham Hay Dubbo Moree Dalby Emerald
rain
fall
(mm
)
2018 2019 2020 Five-year median
Grains & Oilseeds
What to Watch• La Niña – the chance of La Niña forming is now 50%, and double the average likelihood, according to the Bureau of
Meteorology. If the weather system eventuates, it will bring increased rainfall, particularly in central, eastern and northern parts of Australia. In contrast, La Niña typically delivers reduced rainfall to Argentina which the USDA continues to slate for record wheat production, despite already dry conditions.
• India lentil tariff reduction – India has temporarily reduced its tariff on lentil imports from 33% to 11% until 31 August, meaning we expect local demand to be supported during July. With 2020 Indian lentil production having come in well-below government targets, we don’t discount the potential for an extension of the tariff relief on lentils.
Global grains to reach new heightsNorthern hemisphere harvest pressure has pushed global wheat prices 5% lower MOM, with demand proving
inadequate to keep CBOT prices above USc 500/bu. The passing of key weather risk windows supports global grain
production forecasts for 2020/21 that exceed 2.2bn tonnes. This new height in production, together with lacklustre
demand growth prospects, has pushed our 12-month grain forecasts lower.
Covid-19-related uncertainty continues to play on global grain and oilseed markets, as does ongoing tête-à-tête in the US-China
relationship. However, this month, growing confidence in supply was the major influence on markets. In particular, late May
rains halted further downside for EU and Russian winter wheat production. Russian spring wheat will require nearby rainfall to
maintain yield prospects, but as it represents only 30% of the total Russian wheat crop, remaining risk is limited. Condition
ratings for the US spring and winter wheat crops have been average to above-average and while annual production will be
down YOY, conditions have been supportive of meeting market expectations. Australia’s outlook for supply recovery continues
to support Southern hemisphere supply, despite dryness concerns for Argentina. We now expect CBOT wheat to trade
between 485-495USc/bu over the coming year.
CBOT corn prices moved mostly sideways in the sub-USc 340 range, but did open July with a move above USc 340/bu in
response to the USDA planted area of corn estimate being revised down an unexpected 5% in their 30 June update. On the
demand side, US ethanol production is returning to 78% of last year, and US feed grain demand increasing, as processing plants
bring capacity back online, is keeping corn prices off April lows. Despite these demand improvements, Rabobank forecasts
CBOT corn prices in the range of USc 320 - USc 340/bu through the next 12 months – a decline from last month.
Locally, wheat prices fell by between 7% (NWC) and 13% (KWI) last month, in line with global decline and declining basis.
Conditions in Victoria, South Australia and most of NSW continue to support yield upside, although regions of Western Australia,
southern Qld and western NSW will need rain in the next fortnight to avoid yield downgrades. East coast barley markets remain
choppy in their ‘post-Chinese tariff lower ranges’, as buyers reconcile near-term demands with new crop supply firming in the
wings. Export zones are, and will continue, to trade flat as demand from international feed markets drives prospects. With our
revised lower outlook for global wheat and corn prices, but still with expectations of AUD softening (though to mid USc 60
range rather than our previous low USc 60 range), we now see APW NWC trading at AUD 320/tonne in Q4 this year.
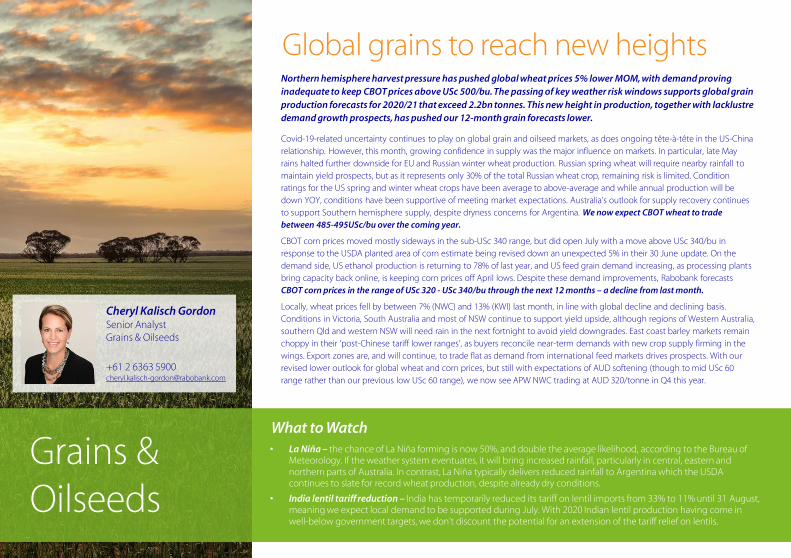
Cheryl Kalisch GordonSenior AnalystGrains & Oilseeds
+61 2 6363 [email protected]
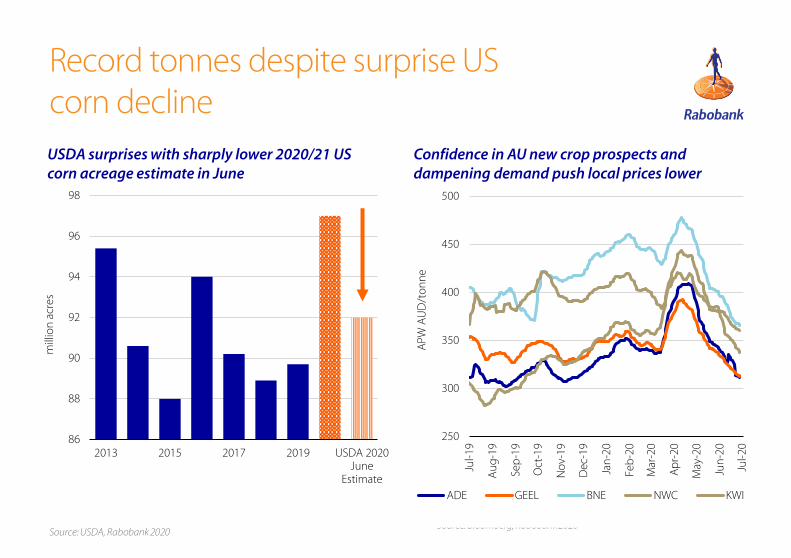
Record tonnes despite surprise US corn decline
Source: USDA, Rabobank 2020Source: Bloomberg, Rabobank 2020
Confidence in AU new crop prospects and dampening demand push local prices lower
USDA surprises with sharply lower 2020/21 US corn acreage estimate in June
86
88
90
92
94
96
98
2013 2015 2017 2019 USDA 2020June
Estimate
mill
ion
acr
es
250
300
350
400
450
500
Jul-1
9
Au
g-1
9
Sep
-19
Oct
-19
No
v-19
Dec
-19
Jan
-20
Feb
-20
Mar
-20
Ap
r-20
May
-20
Jun
-20
Jul-2
0
APW
AU
D/t
on
ne
ADE GEEL BNE NWC KWI
Dairy
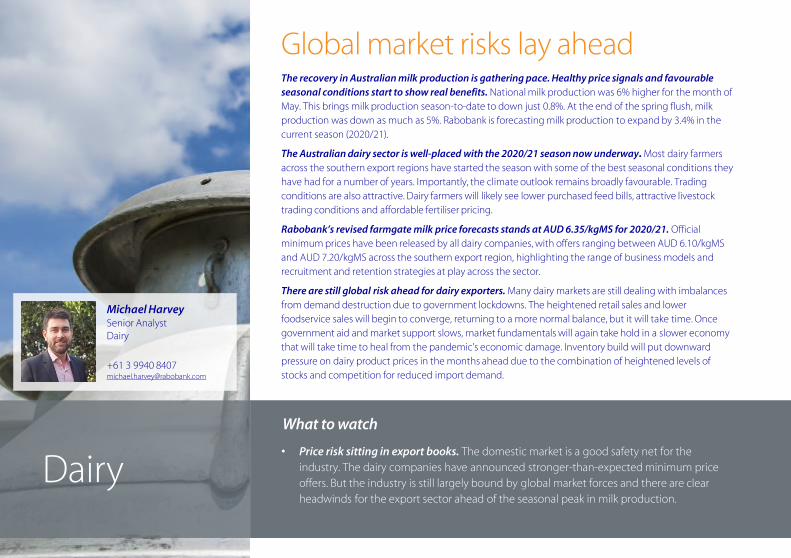
Global market risks lay aheadThe recovery in Australian milk production is gathering pace. Healthy price signals and favourable
seasonal conditions start to show real benefits. National milk production was 6% higher for the month of
May. This brings milk production season-to-date to down just 0.8%. At the end of the spring flush, milk
production was down as much as 5%. Rabobank is forecasting milk production to expand by 3.4% in the
current season (2020/21).
The Australian dairy sector is well-placed with the 2020/21 season now underway. Most dairy farmers
across the southern export regions have started the season with some of the best seasonal conditions they
have had for a number of years. Importantly, the climate outlook remains broadly favourable. Trading
conditions are also attractive. Dairy farmers will likely see lower purchased feed bills, attractive livestock
trading conditions and affordable fertiliser pricing.
Rabobank’s revised farmgate milk price forecasts stands at AUD 6.35/kgMS for 2020/21. Official
minimum prices have been released by all dairy companies, with offers ranging between AUD 6.10/kgMS
and AUD 7.20/kgMS across the southern export region, highlighting the range of business models and
recruitment and retention strategies at play across the sector.
There are still global risk ahead for dairy exporters. Many dairy markets are still dealing with imbalances
from demand destruction due to government lockdowns. The heightened retail sales and lower
foodservice sales will begin to converge, returning to a more normal balance, but it will take time. Once
government aid and market support slows, market fundamentals will again take hold in a slower economy
that will take time to heal from the pandemic's economic damage. Inventory build will put downward
pressure on dairy product prices in the months ahead due to the combination of heightened levels of
stocks and competition for reduced import demand.
What to watch
• Price risk sitting in export books. The domestic market is a good safety net for the
industry. The dairy companies have announced stronger-than-expected minimum price
offers. But the industry is still largely bound by global market forces and there are clear
headwinds for the export sector ahead of the seasonal peak in milk production.
Michael HarveySenior AnalystDairy
+61 3 9940 [email protected]

Resilient production growth across export regions
Source: USDA, Rabobank 2020 Source: Rabobank 2020* February data is adjusted for leap year
Latest month Last three months
EU 0.4% (Apr 20) 1.1%*
US -1.1% (May 20) 0.9%
Australia 6.0% (May 20) 6.5%
NZ 0.4% (2019/20 full season)
Production growth key exporting regionsGlobal dairy prices, 2015-2020
1.000
2.000
3.000
4.000
5.000
6.000
7.000
USD
/to
nn
e FO
B
Butter SMP WMP Cheese

Beef
Cattle prices staying highAfter the resumption of saleyard reporting, the EYCI continues to reflect limited cattle numbers and strong
demand from producers. The restocker portion of the purchasers buying cattle that make up the EYCI has
jumped to 46% in June, the highest proportion since July 2017. The EYCI was AUD 7.63/kg cwt on 2 July.
All other cattle categories continued to experience strong prices through June but we saw US import
prices fall following the drop in US domestic beef prices and the return to more normal processing
volumes. While seasons continue to remain favourable, we believe strong producer demand and
limited cattle supplies will continue to keep cattle prices high. However, with US production back
online and US import prices dropping back towards pre Covid-19 levels, easing US import prices might
start to work their way back up the supply chain.
East coast weekly cattle slaughter numbers continue to be very low. The weekly slaughter numbers for
May and June, with no volume over 130,000 head, are some of the lowest consecutive volumes seen since
2016. Female cattle slaughter in Queensland and NSW now represents 34% of the total cattle slaughter
with female slaughter volumes down 20% for the year-to-date (end June). National monthly slaughter for
April was up 2%, as April 2019 was a lower volume. Year-to-date national cattle slaughter is down 2%.
May beef export volumes, reflecting the lower slaughter numbers, were down 7% year-on-year. Volumes
to Japan and the US were down 12%, respectively, while exports to China were up 6% and to South Korea
up 2% year-on-year. Live cattle exports were down 14% in May year-on-year, with volumes to Indonesia
down 25%, although volumes to Vietnam were up 14%. Live cattle export prices out of Darwin to
Indonesia (AUD 3.40/kg lwt) have lifted to some of the highest levels for this time of year. The Indonesia-
Australia trade agreement entered into force on 5 July, reducing the tariff on live cattle from 5% to 0%
which will help importers.
What to watch• China safeguard trigger – Australia reached the safeguard trigger for beef under the 2015
Chinese trade agreement (179,687 tonnes) at the beginning of July, and tariffs will increase from 4.8% to 12% (for most cuts). This now brings us back into line with the other major exporters that don’t have trade agreements. We reached the safeguard trigger in August last year but due to demand from China we continued to export record volumes. We expect export volumes to China (recognising there are other limitations) to continue to remain strong.
Angus Gidley-BairdSenior AnalystAnimal Protein
+61 2 8115 [email protected]

Producers continue to dominate buying and keep Australian cattle prices high
The EYCI continues to trade in rarified air after recording took a small break
Source: MLA, Rabobank 2020 Source: MLA, Rabobank 2020
Restockers dominate the young cattle (EYCI) market
0%
20%
40%
60%
80%
100%
Jan
May
Sep
Jan
May
Sep
Jan
May
Sep
Jan
May
Sep
Jan
May
Sep
Jan
May
2015 2016 2017 2018 2019 2020
Perc
enta
ge
of b
uye
rs
Restocker Feeder Processor
350
450
550
650
750
850
Jan Feb Mar Apr May Jun Jul Aug Sep Oct Nov Dec
AU
c/kg
cw
t
2018 2019 2020 Five-year avg.
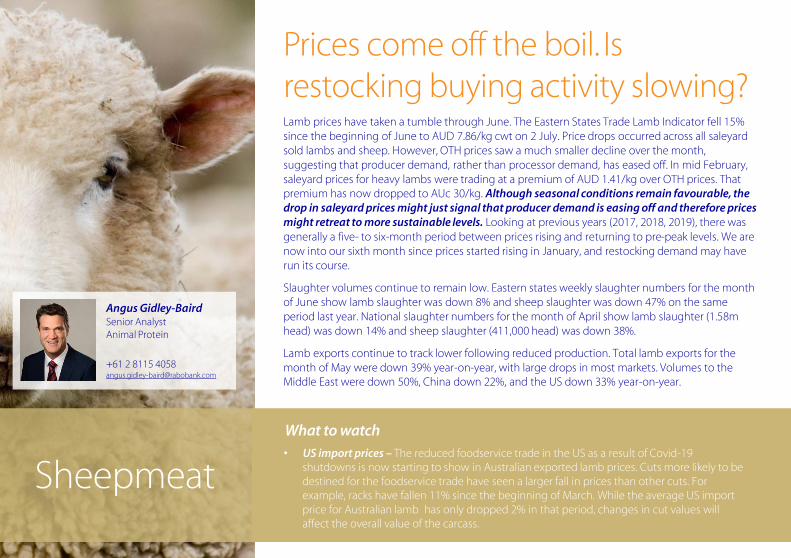
Sheepmeat
Prices come off the boil. Is restocking buying activity slowing?Lamb prices have taken a tumble through June. The Eastern States Trade Lamb Indicator fell 15% since the beginning of June to AUD 7.86/kg cwt on 2 July. Price drops occurred across all saleyard sold lambs and sheep. However, OTH prices saw a much smaller decline over the month, suggesting that producer demand, rather than processor demand, has eased off. In mid February, saleyard prices for heavy lambs were trading at a premium of AUD 1.41/kg over OTH prices. That premium has now dropped to AUc 30/kg. Although seasonal conditions remain favourable, the drop in saleyard prices might just signal that producer demand is easing off and therefore prices might retreat to more sustainable levels. Looking at previous years (2017, 2018, 2019), there was generally a five- to six-month period between prices rising and returning to pre-peak levels. We are now into our sixth month since prices started rising in January, and restocking demand may have run its course.
Slaughter volumes continue to remain low. Eastern states weekly slaughter numbers for the month of June show lamb slaughter was down 8% and sheep slaughter was down 47% on the same period last year. National slaughter numbers for the month of April show lamb slaughter (1.58m head) was down 14% and sheep slaughter (411,000 head) was down 38%.
Lamb exports continue to track lower following reduced production. Total lamb exports for the month of May were down 39% year-on-year, with large drops in most markets. Volumes to the Middle East were down 50%, China down 22%, and the US down 33% year-on-year.
What to watch
• US import prices – The reduced foodservice trade in the US as a result of Covid-19 shutdowns is now starting to show in Australian exported lamb prices. Cuts more likely to be destined for the foodservice trade have seen a larger fall in prices than other cuts. For example, racks have fallen 11% since the beginning of March. While the average US import price for Australian lamb has only dropped 2% in that period, changes in cut values will affect the overall value of the carcass.
Angus Gidley-BairdSenior AnalystAnimal Protein
+61 2 8115 [email protected]
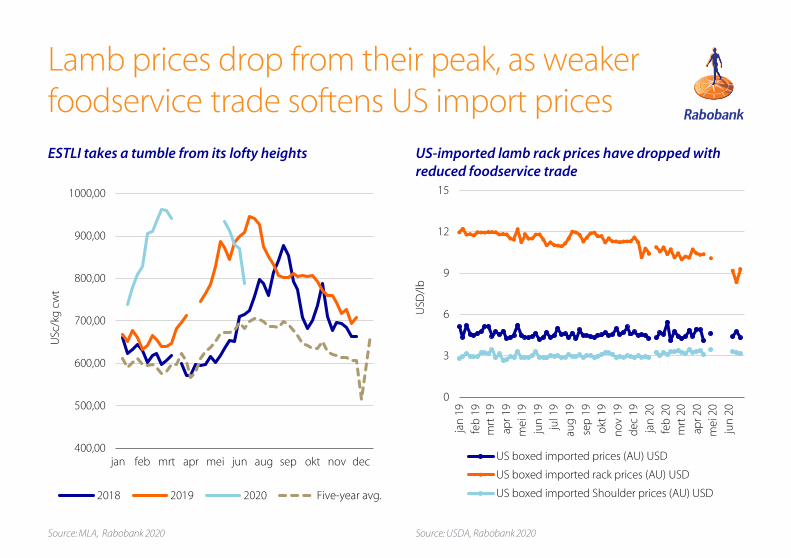
Lamb prices drop from their peak, as weaker foodservice trade softens US import prices
ESTLI takes a tumble from its lofty heights
Source: MLA, Rabobank 2020 Source: USDA, Rabobank 2020
US-imported lamb rack prices have dropped with reduced foodservice trade
0
3
6
9
12
15
jan
19
feb
19
mrt
19
apr
19
mei
19
jun
19
jul 1
9
aug
19
sep
19
okt
19
no
v 19
dec
19
jan
20
feb
20
mrt
20
apr
20
mei
20
jun
20
USD
/lb
US boxed imported prices (AU) USD
US boxed imported rack prices (AU) USD
US boxed imported Shoulder prices (AU) USD
400,00
500,00
600,00
700,00
800,00
900,00
1000,00
jan feb mrt apr mei jun aug sep okt nov dec
USc
/kg
cw
t
2018 2019 2020 Five-year avg.
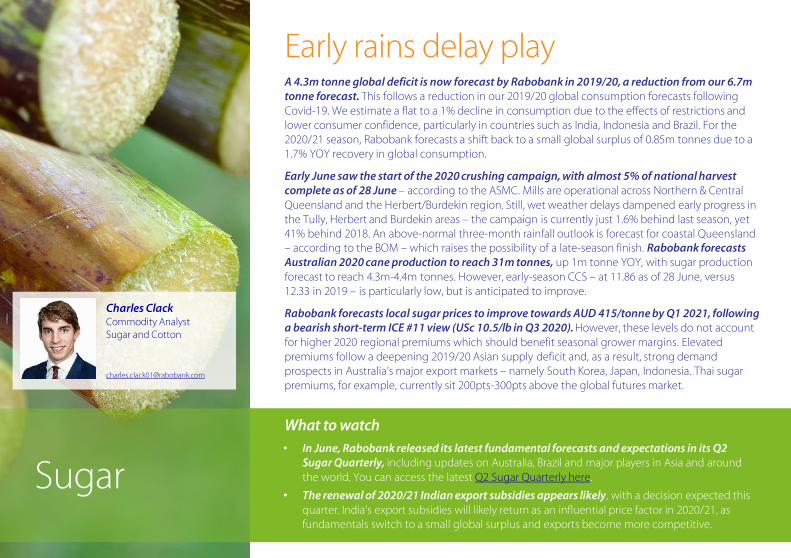
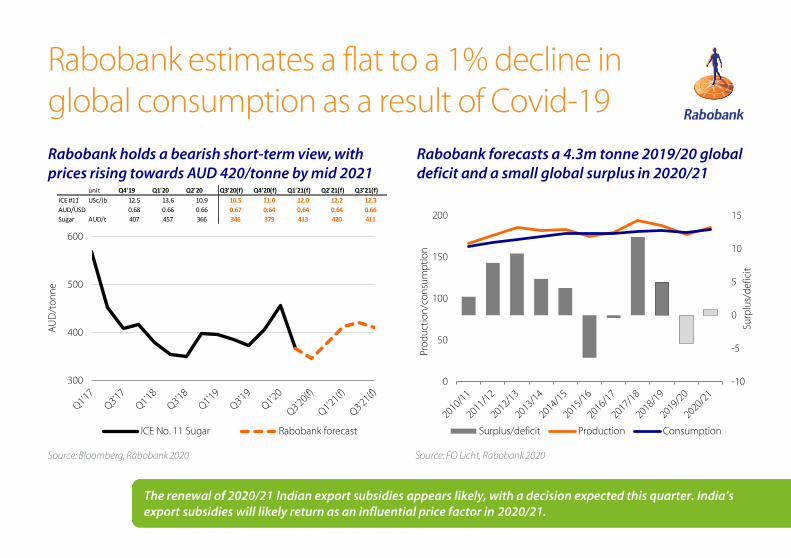
Early rains delay playA 4.3m tonne global deficit is now forecast by Rabobank in 2019/20, a reduction from our 6.7m tonne forecast. This follows a reduction in our 2019/20 global consumption forecasts following Covid-19. We estimate a flat to a 1% decline in consumption due to the effects of restrictions and lower consumer confidence, particularly in countries such as India, Indonesia and Brazil. For the 2020/21 season, Rabobank forecasts a shift back to a small global surplus of 0.85m tonnes due to a 1.7% YOY recovery in global consumption.
Early June saw the start of the 2020 crushing campaign, with almost 5% of national harvest complete as of 28 June – according to the ASMC. Mills are operational across Northern & Central Queensland and the Herbert/Burdekin region. Still, wet weather delays dampened early progress in the Tully, Herbert and Burdekin areas – the campaign is currently just 1.6% behind last season, yet 41% behind 2018. An above-normal three-month rainfall outlook is forecast for coastal Queensland – according to the BOM – which raises the possibility of a late-season finish. Rabobank forecasts Australian 2020 cane production to reach 31m tonnes, up 1m tonne YOY, with sugar production forecast to reach 4.3m-4.4m tonnes. However, early-season CCS – at 11.86 as of 28 June, versus 12.33 in 2019 – is particularly low, but is anticipated to improve.
Rabobank forecasts local sugar prices to improve towards AUD 415/tonne by Q1 2021, following a bearish short-term ICE #11 view (USc 10.5/lb in Q3 2020). However, these levels do not account for higher 2020 regional premiums which should benefit seasonal grower margins. Elevated premiums follow a deepening 2019/20 Asian supply deficit and, as a result, strong demand prospects in Australia’s major export markets – namely South Korea, Japan, Indonesia. Thai sugar premiums, for example, currently sit 200pts-300pts above the global futures market.
What to watch
• In June, Rabobank released its latest fundamental forecasts and expectations in its Q2 Sugar Quarterly, including updates on Australia, Brazil and major players in Asia and around the world. You can access the latest Q2 Sugar Quarterly here.
• The renewal of 2020/21 Indian export subsidies appears likely, with a decision expected this quarter. India’s export subsidies will likely return as an influential price factor in 2020/21, as fundamentals switch to a small global surplus and exports become more competitive.
Sugar
Charles ClackCommodity AnalystSugar and Cotton
Rabobank estimates a flat to a 1% decline in global consumption as a result of Covid-19
Source: Bloomberg, Rabobank 2020
The renewal of 2020/21 Indian export subsidies appears likely, with a decision expected this quarter. India’s export subsidies will likely return as an influential price factor in 2020/21.
Rabobank holds a bearish short-term view, with prices rising towards AUD 420/tonne by mid 2021
Source: FO Licht, Rabobank 2020
Rabobank forecasts a 4.3m tonne 2019/20 global deficit and a small global surplus in 2020/21
300
400
500
600
AU
D/t
on
ne
ICE No. 11 Sugar Rabobank forecast
unit Q4'19 Q1'20 Q2'20 Q3'20(f) Q4'20(f) Q1'21(f) Q2'21(f) Q3'21(f)
ICE #11 USc/lb 12.5 13.6 10.9 10.5 11.0 12.0 12.2 12.3
AUD/USD 0.68 0.66 0.66 0.67 0.64 0.64 0.64 0.66
Sugar AUD/t 407 457 366 346 379 413 420 411
-10
-5
0
5
10
15
0
50
100
150
200
Surp
lus/
def
icit
Pro
du
ctio
n/c
on
sum
pti
on
Surplus/deficit Production Consumption
Cotton
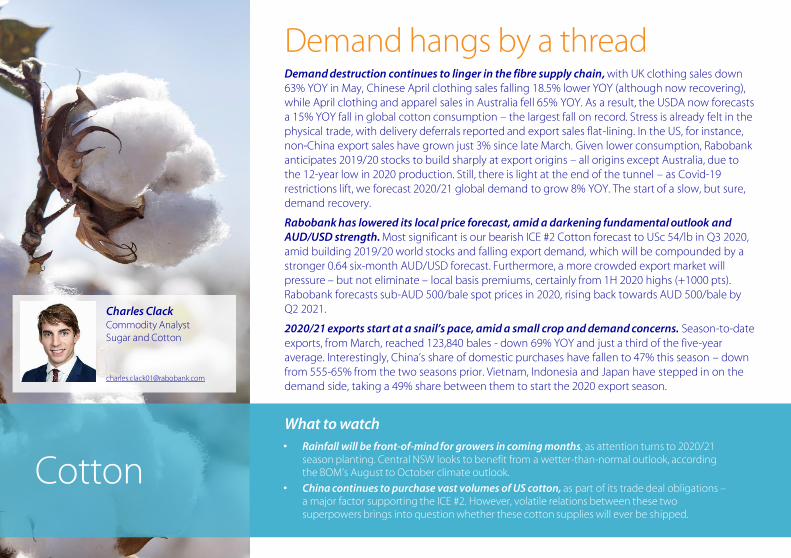
Demand hangs by a threadDemand destruction continues to linger in the fibre supply chain, with UK clothing sales down 63% YOY in May, Chinese April clothing sales falling 18.5% lower YOY (although now recovering), while April clothing and apparel sales in Australia fell 65% YOY. As a result, the USDA now forecasts a 15% YOY fall in global cotton consumption – the largest fall on record. Stress is already felt in the physical trade, with delivery deferrals reported and export sales flat-lining. In the US, for instance, non-China export sales have grown just 3% since late March. Given lower consumption, Rabobank anticipates 2019/20 stocks to build sharply at export origins – all origins except Australia, due to the 12-year low in 2020 production. Still, there is light at the end of the tunnel – as Covid-19 restrictions lift, we forecast 2020/21 global demand to grow 8% YOY. The start of a slow, but sure, demand recovery.
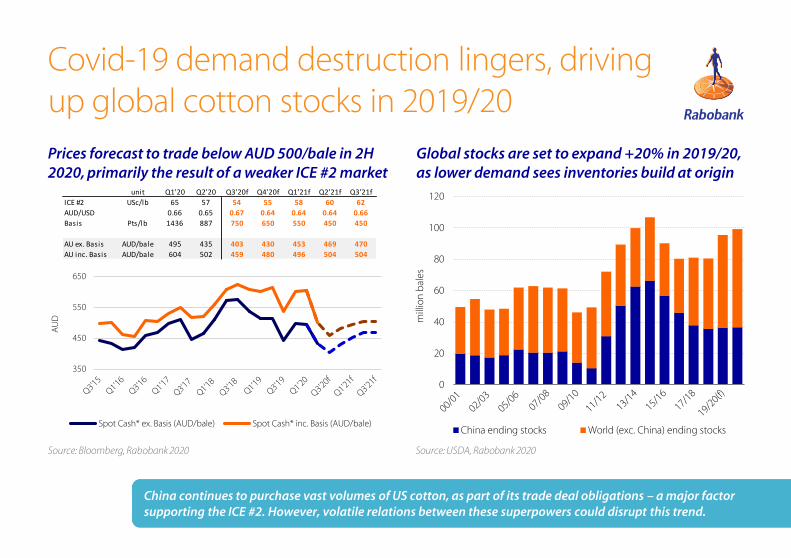
Rabobank has lowered its local price forecast, amid a darkening fundamental outlook and AUD/USD strength. Most significant is our bearish ICE #2 Cotton forecast to USc 54/lb in Q3 2020, amid building 2019/20 world stocks and falling export demand, which will be compounded by a stronger 0.64 six-month AUD/USD forecast. Furthermore, a more crowded export market will pressure – but not eliminate – local basis premiums, certainly from 1H 2020 highs (+1000 pts). Rabobank forecasts sub-AUD 500/bale spot prices in 2020, rising back towards AUD 500/bale by Q2 2021.
2020/21 exports start at a snail’s pace, amid a small crop and demand concerns. Season-to-date exports, from March, reached 123,840 bales - down 69% YOY and just a third of the five-year average. Interestingly, China’s share of domestic purchases have fallen to 47% this season – down from 555-65% from the two seasons prior. Vietnam, Indonesia and Japan have stepped in on the demand side, taking a 49% share between them to start the 2020 export season.
What to watch
• Rainfall will be front-of-mind for growers in coming months, as attention turns to 2020/21 season planting. Central NSW looks to benefit from a wetter-than-normal outlook, according the BOM’s August to October climate outlook.
• China continues to purchase vast volumes of US cotton, as part of its trade deal obligations –a major factor supporting the ICE #2. However, volatile relations between these two superpowers brings into question whether these cotton supplies will ever be shipped.
Charles ClackCommodity AnalystSugar and Cotton
0
20
40
60
80
100
120
mill
ion
bal
esChina ending stocks World (exc. China) ending stocks
Covid-19 demand destruction lingers, driving up global cotton stocks in 2019/20
Prices forecast to trade below AUD 500/bale in 2H 2020, primarily the result of a weaker ICE #2 market
Global stocks are set to expand +20% in 2019/20, as lower demand sees inventories build at origin
Source: USDA, Rabobank 2020Source: Bloomberg, Rabobank 2020
unit Q1'20 Q2'20 Q3'20f Q4'20f Q1'21f Q2'21f Q3'21f
ICE #2 USc/lb 65 57 54 55 58 60 62
AUD/USD 0.66 0.65 0.67 0.64 0.64 0.64 0.66
Basis Pts/lb 1436 887 750 650 550 450 450
AU ex. Basis AUD/bale 495 435 403 430 453 469 470
AU inc. Basis AUD/bale 604 502 459 480 496 504 504
China continues to purchase vast volumes of US cotton, as part of its trade deal obligations – a major factor supporting the ICE #2. However, volatile relations between these superpowers could disrupt this trend.
350
450
550
650
AU
D
Spot Cash* ex. Basis (AUD/bale) Spot Cash* inc. Basis (AUD/bale)
Wool prices steadyWool prices continued their decline over June. The EMI started at AUc 1183/kg on 5 June and drifted down 5.8% to AUc 1114/kg by 1 July. The end of June saw the lowest EMI price (AUc1110/kg) since April 2015. Prices across all microns declined, with falls relatively evenly distributed across fine and coarse wool. The sharpest decline was observed in 25 micron wool, recording a 9% MOM fall. The May retail apparel sales data shows marked improvements on previous months. Although not back to pre-Covid-19 levels they do provide some comfort as the Northern Hemisphere prepares for the winter fashion season. Looking to the month ahead, we see the EMI hovering around AUc 1100/kg before starting a slow recovery in August.
Wool test data for June showed the weight of wool tested was up 4.4% for the month on 2019 levels but this was off the back of a very low month in April. The total wool tested for the 2019/20 year was 1.65m bales, down 7.4% on the previous year. Generally, wool test data across all microns was down in 2019/20, although 13.5 micron and finer volumes were up and 19.6-20.5 micron was steady. 22.6-23.5 micron saw the largest drop, with bales tested down 20.5%.
May wool export volumes (17.9m kg) were down 27% on 2019 volumes, as reduced production meant less wool available but also lower prices meant some producers withholding wool from sale. China increased its dominance of the export market, accounting for 92% of total exports. Although not taking larger volumes, China’s growth in market share is accounted for by reduced exports to other countries such as India, Italy and the Czech Republic where May volumes were down 85%, 52%, and 98% respectively year-on-year.
What to watch• Apparel sales on the up – May retail apparel sales show strong improvements in China ( -
0.6% YOY, up from -19% in April), Australia (-19% YOY vs -65% in April) and US (-63% YOY vs -87% in April). As lockdowns ease, we expect retail sales to continue improving. However, we do not expect sales to return to pre-Covid levels as deteriorating economic conditions continue to weigh on consumer sentiment, especially for spending on non-discretionary items such as wool clothing.
Angus Gidley-BairdSenior AnalystAnimal Protein
+61 2 8115 [email protected]
Wool
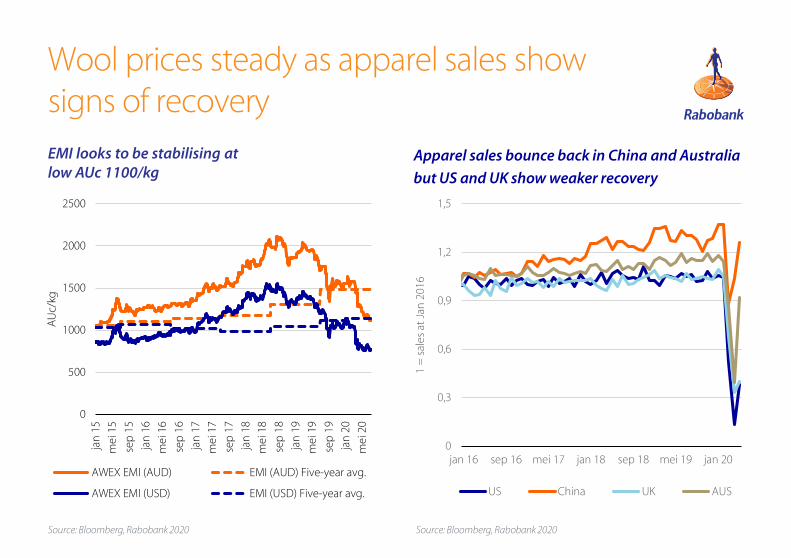
Wool prices steady as apparel sales show signs of recovery
Source: Bloomberg, Rabobank 2020
EMI looks to be stabilising at low AUc 1100/kg
Apparel sales bounce back in China and Australia
but US and UK show weaker recovery
Source: Bloomberg, Rabobank 2020
0
0,3
0,6
0,9
1,2
1,5
jan 16 sep 16 mei 17 jan 18 sep 18 mei 19 jan 20
1 =
sal
es a
t Ja
n 2
016
US China UK AUS
0
500
1000
1500
2000
2500
jan
15
mei
15
sep
15
jan
16
mei
16
sep
16
jan
17
mei
17
sep
17
jan
18
mei
18
sep
18
jan
19
mei
19
sep
19
jan
20
mei
20
AU
c/kg
AWEX EMI (AUD) EMI (AUD) Five-year avg.
AWEX EMI (USD) EMI (USD) Five-year avg.
Wine
What to watch
• Opening up, then closing down again, of US markets – Recent re-opening of restaurants
and bars in states such as Florida and Texas showed positive early signs of recovery for US on-
premise sales. Resurgence of Covid-19 and reimplementation of containment measures
could reverse this.
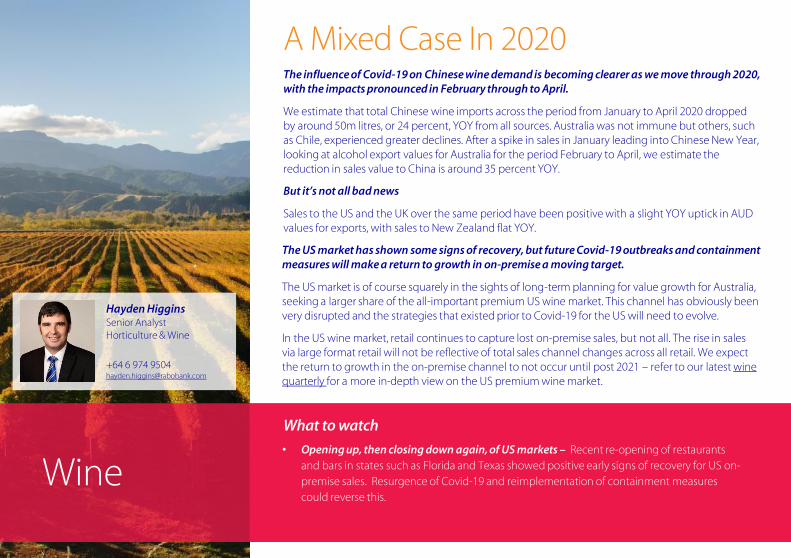
A Mixed Case In 2020The influence of Covid-19 on Chinese wine demand is becoming clearer as we move through 2020, with the impacts pronounced in February through to April.
We estimate that total Chinese wine imports across the period from January to April 2020 dropped by around 50m litres, or 24 percent, YOY from all sources. Australia was not immune but others, such as Chile, experienced greater declines. After a spike in sales in January leading into Chinese New Year, looking at alcohol export values for Australia for the period February to April, we estimate the reduction in sales value to China is around 35 percent YOY.
But it’s not all bad news
Sales to the US and the UK over the same period have been positive with a slight YOY uptick in AUD values for exports, with sales to New Zealand flat YOY.
The US market has shown some signs of recovery, but future Covid-19 outbreaks and containment measures will make a return to growth in on-premise a moving target.
The US market is of course squarely in the sights of long-term planning for value growth for Australia, seeking a larger share of the all-important premium US wine market. This channel has obviously been very disrupted and the strategies that existed prior to Covid-19 for the US will need to evolve.
In the US wine market, retail continues to capture lost on-premise sales, but not all. The rise in sales via large format retail will not be reflective of total sales channel changes across all retail. We expect the return to growth in the on-premise channel to not occur until post 2021 – refer to our latest wine quarterly for a more in-depth view on the US premium wine market.
Hayden HigginsSenior AnalystHorticulture & Wine
+64 6 974 [email protected]
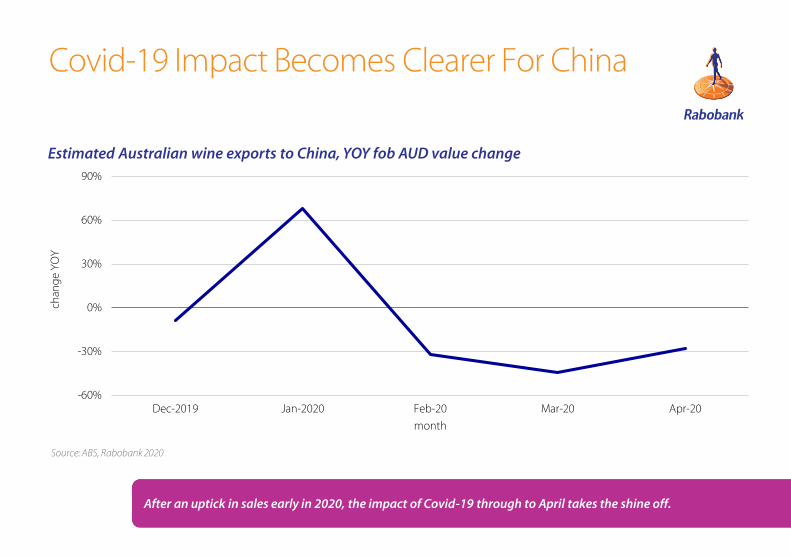
Covid-19 Impact Becomes Clearer For China
Source: ABS, Rabobank 2020
-60%
-30%
0%
30%
60%
90%
Dec-2019 Jan-2020 Feb-20 Mar-20 Apr-20
chan
ge
YOY
month
Estimated Australian wine exports to China, YOY fob AUD value change
After an uptick in sales early in 2020, the impact of Covid-19 through to April takes the shine off.
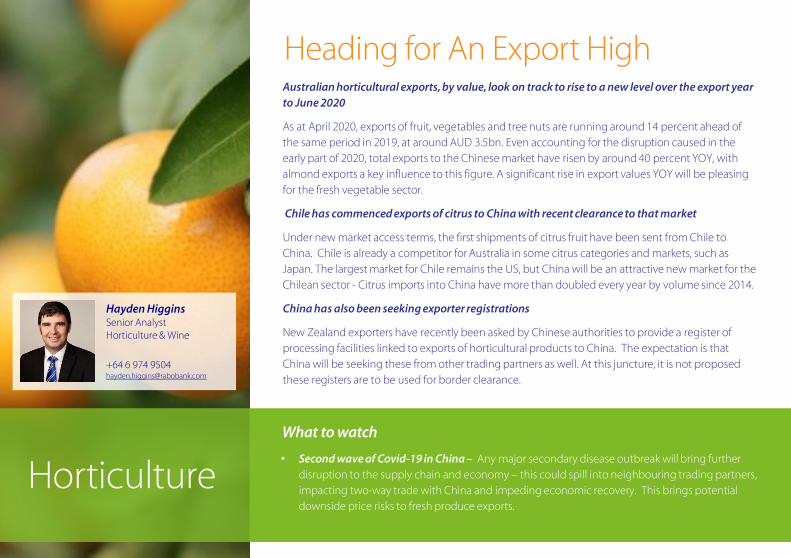
HorticultureWhat to watch
• Second wave of Covid-19 in China – Any major secondary disease outbreak will bring further
disruption to the supply chain and economy – this could spill into neighbouring trading partners,
impacting two-way trade with China and impeding economic recovery. This brings potential
downside price risks to fresh produce exports.
Heading for An Export HighAustralian horticultural exports, by value, look on track to rise to a new level over the export year
to June 2020
As at April 2020, exports of fruit, vegetables and tree nuts are running around 14 percent ahead of
the same period in 2019, at around AUD 3.5bn. Even accounting for the disruption caused in the
early part of 2020, total exports to the Chinese market have risen by around 40 percent YOY, with
almond exports a key influence to this figure. A significant rise in export values YOY will be pleasing
for the fresh vegetable sector.
Chile has commenced exports of citrus to China with recent clearance to that market
Under new market access terms, the first shipments of citrus fruit have been sent from Chile to
China. Chile is already a competitor for Australia in some citrus categories and markets, such as
Japan. The largest market for Chile remains the US, but China will be an attractive new market for the
Chilean sector - Citrus imports into China have more than doubled every year by volume since 2014.
China has also been seeking exporter registrations
New Zealand exporters have recently been asked by Chinese authorities to provide a register of
processing facilities linked to exports of horticultural products to China. The expectation is that
China will be seeking these from other trading partners as well. At this juncture, it is not proposed
these registers are to be used for border clearance.
Hayden HigginsSenior AnalystHorticulture & Wine
+64 6 974 [email protected]
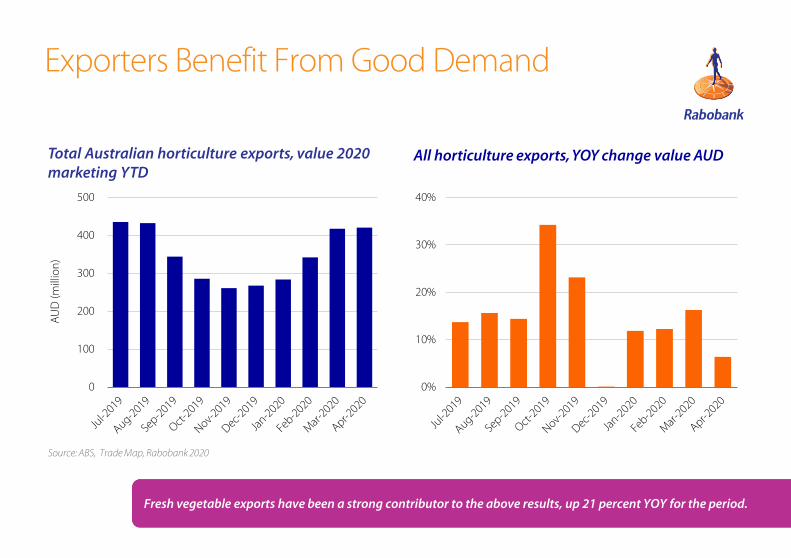
Exporters Benefit From Good Demand
Source: ABS, Trade Map, Rabobank 2020
0
100
200
300
400
500
AU
D (m
illio
n)
0%
10%
20%
30%
40%
Total Australian horticulture exports, value 2020 marketing YTD
All horticulture exports, YOY change value AUD
Fresh vegetable exports have been a strong contributor to the above results, up 21 percent YOY for the period.
Farm Inputs
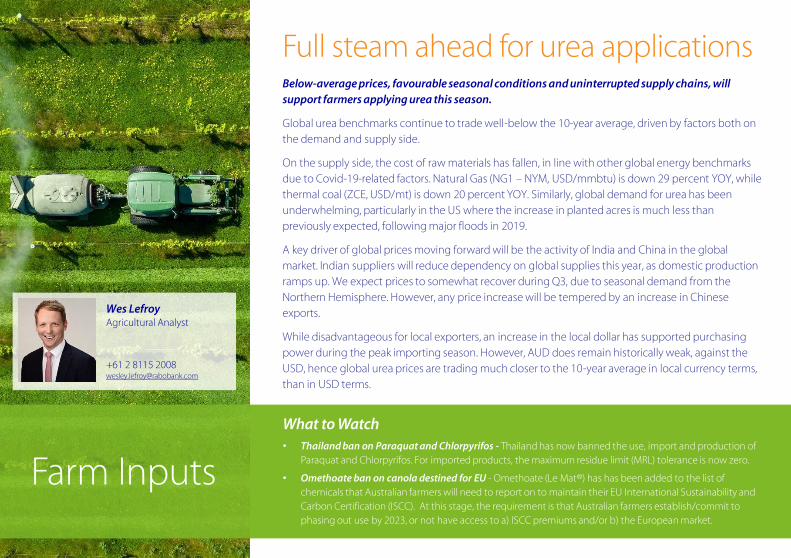
Full steam ahead for urea applicationsBelow-average prices, favourable seasonal conditions and uninterrupted supply chains, will
support farmers applying urea this season.
Global urea benchmarks continue to trade well-below the 10-year average, driven by factors both on
the demand and supply side.
On the supply side, the cost of raw materials has fallen, in line with other global energy benchmarks
due to Covid-19-related factors. Natural Gas (NG1 – NYM, USD/mmbtu) is down 29 percent YOY, while
thermal coal (ZCE, USD/mt) is down 20 percent YOY. Similarly, global demand for urea has been
underwhelming, particularly in the US where the increase in planted acres is much less than
previously expected, following major floods in 2019.
A key driver of global prices moving forward will be the activity of India and China in the global
market. Indian suppliers will reduce dependency on global supplies this year, as domestic production
ramps up. We expect prices to somewhat recover during Q3, due to seasonal demand from the
Northern Hemisphere. However, any price increase will be tempered by an increase in Chinese
exports.
While disadvantageous for local exporters, an increase in the local dollar has supported purchasing
power during the peak importing season. However, AUD does remain historically weak, against the
USD, hence global urea prices are trading much closer to the 10-year average in local currency terms,
than in USD terms.
Wes LefroyAgricultural Analyst
+61 2 8115 [email protected]
What to Watch• Thailand ban on Paraquat and Chlorpyrifos - Thailand has now banned the use, import and production of
Paraquat and Chlorpyrifos. For imported products, the maximum residue limit (MRL) tolerance is now zero.
• Omethoate ban on canola destined for EU - Omethoate (Le Mat®) has has been added to the list of
chemicals that Australian farmers will need to report on to maintain their EU International Sustainability and
Carbon Certification (ISCC). At this stage, the requirement is that Australian farmers establish/commit to
phasing out use by 2023, or not have access to a) ISCC premiums and/or b) the European market.
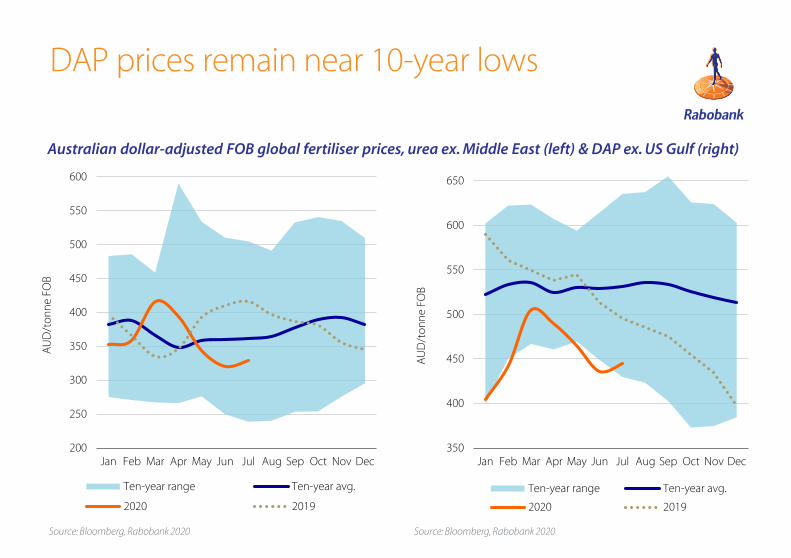
DAP prices remain near 10-year lows
Australian dollar-adjusted FOB global fertiliser prices, urea ex. Middle East (left) & DAP ex. US Gulf (right)
Source: Bloomberg, Rabobank 2020 Source: Bloomberg, Rabobank 2020
200
250
300
350
400
450
500
550
600
Jan Feb Mar Apr May Jun Jul Aug Sep Oct Nov Dec
AU
D/t
on
ne
FOB
Ten-year range Ten-year avg.
2020 2019
350
400
450
500
550
600
650
Jan Feb Mar Apr May Jun Jul Aug Sep Oct Nov Dec
AU
D/t
on
ne
FOB
Ten-year range Ten-year avg.
2020 2019
Rates & FX
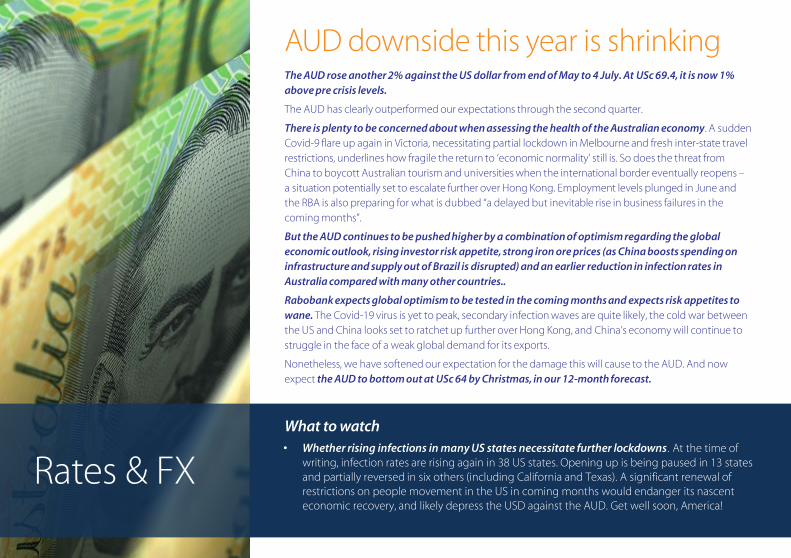
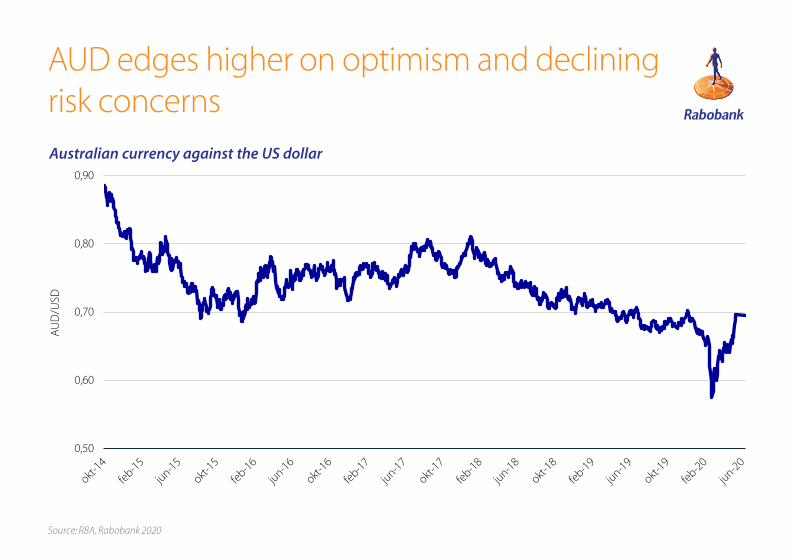
AUD downside this year is shrinkingThe AUD rose another 2% against the US dollar from end of May to 4 July. At USc 69.4, it is now 1%
above pre crisis levels.
The AUD has clearly outperformed our expectations through the second quarter.
There is plenty to be concerned about when assessing the health of the Australian economy. A sudden
Covid-9 flare up again in Victoria, necessitating partial lockdown in Melbourne and fresh inter-state travel
restrictions, underlines how fragile the return to ‘economic normality’ still is. So does the threat from
China to boycott Australian tourism and universities when the international border eventually reopens –
a situation potentially set to escalate further over Hong Kong. Employment levels plunged in June and
the RBA is also preparing for what is dubbed “a delayed but inevitable rise in business failures in the
coming months”.
But the AUD continues to be pushed higher by a combination of optimism regarding the global
economic outlook, rising investor risk appetite, strong iron ore prices (as China boosts spending on
infrastructure and supply out of Brazil is disrupted) and an earlier reduction in infection rates in
Australia compared with many other countries..
Rabobank expects global optimism to be tested in the coming months and expects risk appetites to
wane. The Covid-19 virus is yet to peak, secondary infection waves are quite likely, the cold war between
the US and China looks set to ratchet up further over Hong Kong, and China’s economy will continue to
struggle in the face of a weak global demand for its exports.
Nonetheless, we have softened our expectation for the damage this will cause to the AUD. And now
expect the AUD to bottom out at USc 64 by Christmas, in our 12-month forecast.
What to watch• Whether rising infections in many US states necessitate further lockdowns. At the time of
writing, infection rates are rising again in 38 US states. Opening up is being paused in 13 states and partially reversed in six others (including California and Texas). A significant renewal of restrictions on people movement in the US in coming months would endanger its nascent economic recovery, and likely depress the USD against the AUD. Get well soon, America!
0,50
0,60
0,70
0,80
0,90
AU
D/U
SD
Source: RBA, Rabobank 2020
AUD edges higher on optimism and declining risk concerns
Australian currency against the US dollar
Source: Bloomberg, Rabobank 2020Source: AIP, Bloomberg, Rabobank 2020
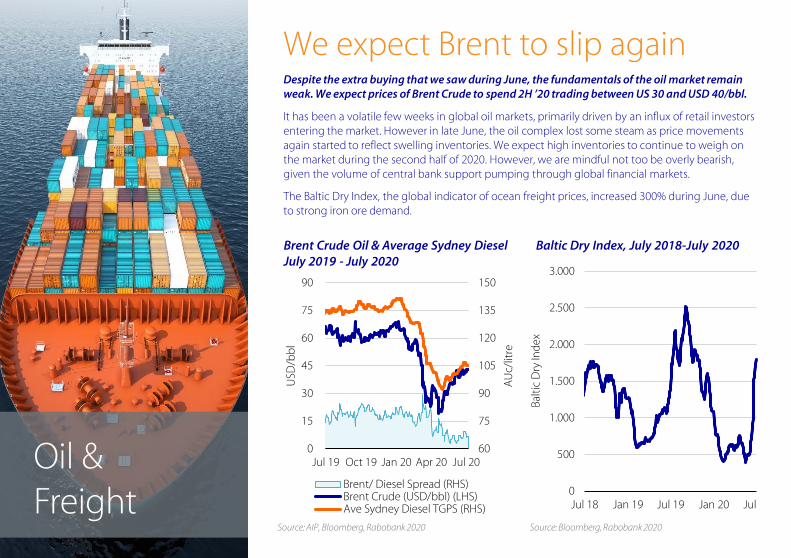
We expect Brent to slip againDespite the extra buying that we saw during June, the fundamentals of the oil market remain weak. We expect prices of Brent Crude to spend 2H ’20 trading between US 30 and USD 40/bbl.
It has been a volatile few weeks in global oil markets, primarily driven by an influx of retail investors entering the market. However in late June, the oil complex lost some steam as price movements again started to reflect swelling inventories. We expect high inventories to continue to weigh on the market during the second half of 2020. However, we are mindful not too be overly bearish, given the volume of central bank support pumping through global financial markets.
The Baltic Dry Index, the global indicator of ocean freight prices, increased 300% during June, due to strong iron ore demand.
Brent Crude Oil & Average Sydney Diesel July 2019 - July 2020
Baltic Dry Index, July 2018-July 2020
Oil & Freight
60
75
90
105
120
135
150
0
15
30
45
60
75
90
Jul 19 Oct 19 Jan 20 Apr 20 Jul 20
AU
c/lit
re
USD
/bb
l
Brent/ Diesel Spread (RHS)Brent Crude (USD/bbl) (LHS)Ave Sydney Diesel TGPS (RHS)
0
500
1.000
1.500
2.000
2.500
3.000
Jul 18 Jan 19 Jul 19 Jan 20 Jul 20
Balt
ic D
ry In
dex
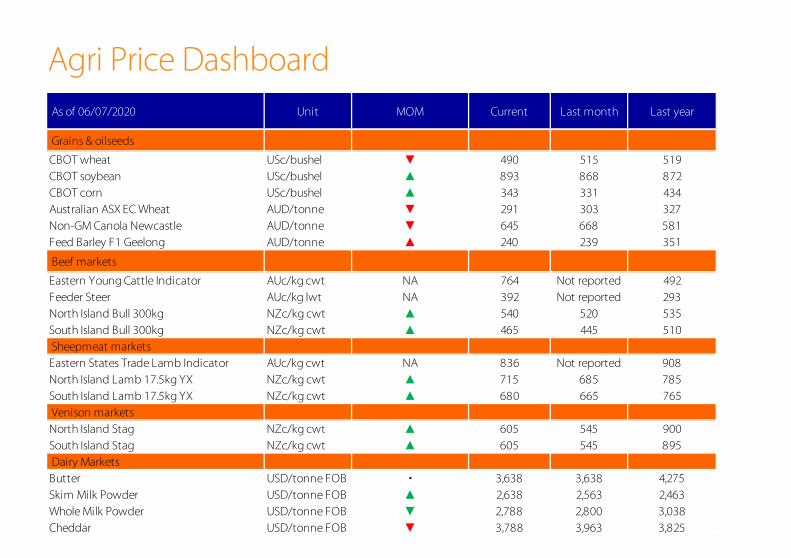
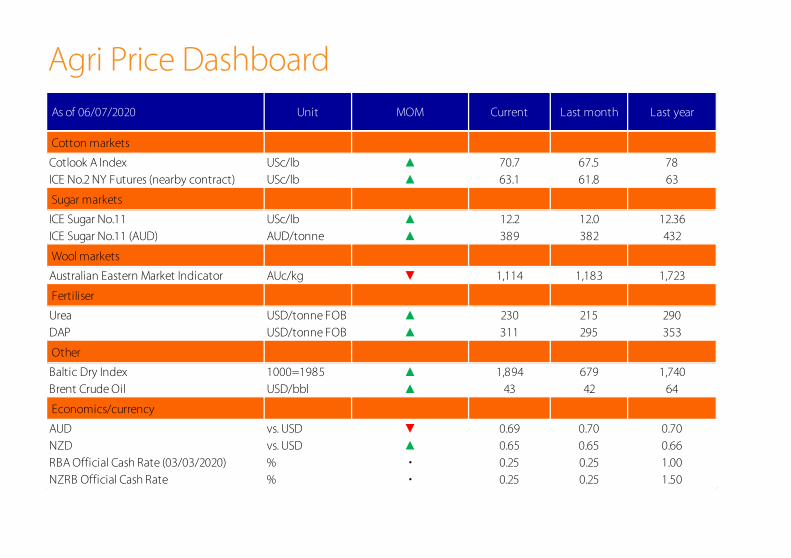
Agri Price Dashboard
As of 06/07/2020 Unit MOM Current Last month Last year
Grains & oilseeds
CBOT wheat USc/bushel ▼ 490 515 519
CBOT soybean USc/bushel ▲ 893 868 872
CBOT corn USc/bushel ▲ 343 331 434
Australian ASX EC Wheat AUD/tonne ▼ 291 303 327
Non-GM Canola Newcastle AUD/tonne ▼ 645 668 581
Feed Barley F1 Geelong AUD/tonne ▲ 240 239 351
Beef markets
Eastern Young Cattle Indicator AUc/kg cwt NA 764 Not reported 492
Feeder Steer AUc/kg lwt NA 392 Not reported 293
North Island Bull 300kg NZc/kg cwt ▲ 540 520 535
South Island Bull 300kg NZc/kg cwt ▲ 465 445 510
Sheepmeat markets
Eastern States Trade Lamb Indicator AUc/kg cwt NA 836 Not reported 908
North Island Lamb 17.5kg YX NZc/kg cwt ▲ 715 685 785
South Island Lamb 17.5kg YX NZc/kg cwt ▲ 680 665 765
Venison markets
North Island Stag NZc/kg cwt ▲ 605 545 900
South Island Stag NZc/kg cwt ▲ 605 545 895
Dairy Markets
Butter USD/tonne FOB • 3,638 3,638 4,275
Skim Milk Powder USD/tonne FOB ▲ 2,638 2,563 2,463
Whole Milk Powder USD/tonne FOB ▼ 2,788 2,800 3,038
Cheddar USD/tonne FOB ▼ 3,788 3,963 3,825
Agri Price Dashboard
As of 06/07/2020 Unit MOM Current Last month Last year
Cotton markets
Cotlook A Index USc/lb ▲ 70.7 67.5 78
ICE No.2 NY Futures (nearby contract) USc/lb ▲ 63.1 61.8 63
Sugar markets
ICE Sugar No.11 USc/lb ▲ 12.2 12.0 12.36
ICE Sugar No.11 (AUD) AUD/tonne ▲ 389 382 432
Wool markets
Australian Eastern Market Indicator AUc/kg ▼ 1,114 1,183 1,723
Fertiliser
Urea USD/tonne FOB ▲ 230 215 290
DAP USD/tonne FOB ▲ 311 295 353
Other
Baltic Dry Index 1000=1985 ▲ 1,894 679 1,740
Brent Crude Oil USD/bbl ▲ 43 42 64
Economics/currency
AUD vs. USD ▼ 0.69 0.70 0.70
NZD vs. USD ▲ 0.65 0.65 0.66
RBA Official Cash Rate (03/03/2020) % • 0.25 0.25 1.00
NZRB Official Cash Rate % • 0.25 0.25 1.50

Podcasts
Here’s how to access our podcasts:
• Simply search for “Rabobank” in your podcast app
• Click on our food & agribusiness podcast channel
• Hit subscribe!
Want to keep up-to-date with the latest food & agribusiness insights?
Make our insights your advantage – Stay ahead of developments in your industry by subscribing to our podcast channel on your favourite podcast app.
Our podcasts are a fast and easy way to engage with our latest research findings and industry developments, right on your phone.
Most Apple devices have the Podcasts app pre-installed – if not, you can find it in the App Store. On Android devices, Stitcher and TuneIn Radio are popular podcast apps.
RaboResearch Food & AgribusinessAustralia and New Zealand
Rabobank AustraliaNearest branch call 1300 30 30 33www.rabobank.com.au
Tim HuntHead of Food & Agribusiness Research and Advisory, Australia and New Zealand+61 3 9940 [email protected]
Angus Gidley-BairdSenior Analyst – Animal Protein+ 61 2 8115 [email protected]
Michael HarveySenior Analyst – Dairy+61 3 9940 [email protected]
Cheryl Kalisch GordonSenior Analyst – Grains & Oilseeds+61 2 6363 [email protected]
Hayden Higgins Senior Analyst – Horticulture and Wine+64 6 974 [email protected]
Wes LefroyAgricultural Analyst+61 2 8115 [email protected]
Emma HigginsAnalyst – Dairy+64 3 961 [email protected]
Blake HolgateAnalyst – Animal Protein and Sustainability+64 3 955 [email protected]
Charlie ClackCommodity Analyst+61 2 8115 [email protected]
Dennis VoznesenskiAssociate Analyst+61 2 8115 [email protected]
Catherine KeoBusiness Coordinator+61 2 8115 [email protected]

This document is issued by a Rabobank Group member. The information and opinions contained in this document have been compiled or arrived at from sources believed to be reliable, but no representation or warranty, express or implied, is made as to their accuracy, completeness or correctness. This document is for information purposes only and is not, and should not be construed as, an offer or a commitment by any Rabobank Group member to enter into a transaction. This information is not professional advice and has not been prepared to be used as the basis for, and should not be used as the basis for, any financial or strategic decisions. This information is general in nature only and does not take into account an individual’s personal circumstances. All opinions expressed in this document are subject to change without notice. No Rabobank Group member accepts any liability whatsoever for any direct, indirect, consequential or other loss or damage howsoever arising from any use of this document or its contents or otherwise arising in connection therewith. This document may not be reproduced, distributed or published, in whole or in part, for any purpose, except with the prior written consent of a Rabobank Group member. By accepting this document you agree to be bound by the foregoing restrictions. All copyright is reserved © 2020