vodacom group limited preliminary...
TRANSCRIPT
Vodacom Group Limited
Preliminary Resultsfor the year ended31 March 2018
The future is exciting.
Ready?
Our sustained investment in customer and network experience across our operations was a major factor in attracting the additional 4.5 million customers in South Africa and 2.5 million internationally. Safaricom added 1.4 million customers to push the combined total to over 103 million customers. Securing an outright Net Promoter Score (NPS) lead over competitors in all our operations is another key milestone attainedthis year.
Despite a tougher economic environment in South Africa, ‘Big Data’ led innovations contributed to robust demand for personalised bundles and a 4.9% growth in service revenue. Strong device sales, cost optimisation measures and the effective execution of our pricing transformation programme also played a major role in the sound commercial performance in our largest market.
This was a solid achievement given the revenue impact from reducing out-of-bundle data prices by as much as 50% in October last year as well as the early phase investments in new revenue streams, including fibre, content propositions and financial services. Over the past three years, we have reduced effective voice and data prices by 36.3% and 42.5% respectively, while maintaining revenue growth. Our accelerated rural coverage programme was instrumental in Vodacom becoming the continent’s first operator to reach 80% population coverage on a 4G network.
In our International operations, it was a particularly pleasing year for Mozambique and Lesotho, while our commercial actions in Tanzania and DRC continue to show good momentum. This portfolio produced a 7.4%* increase in normalised service revenue on the back of rising customer numbers, strong demand for data and the accelerated uptake of M-Pesa.
Despite a turbulent political context, Safaricom delivered net profit growth of 14.1% for the year. This was underpinned by strong growth in data and M-Pesa revenues and a 5.1% increase in customers to 29.6 million. Safaricom contributed R1.5 billion profit for the eight months since acquisition, after deducting the amortisation of fair valued assets and before minority interest.
Revenue from mobile money has become a significant contributor to the Group. The combined customer base, including Safaricom, grew 11.5% in the past year and now exceeds 32.3 million. During this period, the M-Pesa platform in our International operations, processed transactions worth USD1.9 billion, generating a 19.6% increase in M-Pesa revenue to R2.3 billion. In addition, Safaricom showed impressive results processing USD6.5 billion worth of transactions for the year and grew M-Pesa revenue by 14.2% to KES63 billion.
Our investment and efforts to drive revenue diversification and digital transformation across the Group are having the desired effect. Changing the way we operate, means we are well positioned to drive new and exciting growth opportunities as we seek to change people’s lives through building a connected society.
Looking ahead, we are encouraged by the renewed economic and political stability in South Africa and larger International operations, including Kenya. Our operations benefit from stability in foreign exchange and macro-economic environments and this is expected to bring a greater degree of predictability to the results across our markets.
We are encouraged by these developments and are reaffirming our three year targets1 of mid-single digit service revenue growth, mid-to-high single digit EBIT growth and capital intensity of 12% – 14% of Group revenue, to build on this momentum.
This has been an extraordinary year for Vodacom. In addition to completing the acquisition of a strategic 34.94% stake in Safaricom and a record-breaking listing in Tanzania, over 8.4 million customers joined the Vodacom and Safaricom networks.
Vodacom Group CEO commented:
SHAMEEL JOOSUB
1. These targets are on average, over the next three years and are on a normalised basis in constant currency, excluding spectrum purchases and any merger and acquisition activity. This assumes broadly stable currencies in each of our markets and stable macro and regulatory environments. Excluding effects from IFRS 15 and IFRS 16 implementation.
1
Highlights
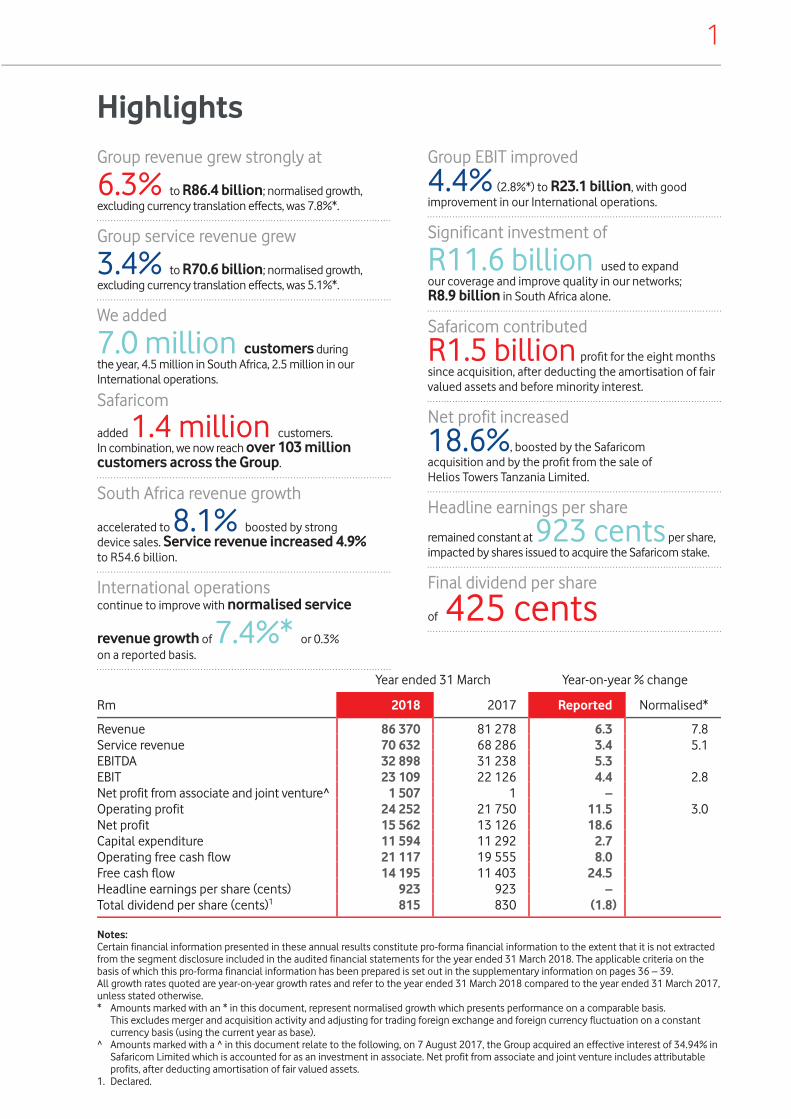
Year ended 31 March Year-on-year % change
Rm 2018 2017 Reported Normalised*
Revenue 86 370 81 278 6.3 7.8Service revenue 70 632 68 286 3.4 5.1EBITDA 32 898 31 238 5.3EBIT 23 109 22 126 4.4 2.8Net profit from associate and joint venture^� 1 507 1 –Operating profit 24 252 21 750 11.5 3.0Net profit 15 562 13 126 18.6Capital expenditure 11 594 11 292 2.7Operating free cash flow 21 117 19 555 8.0Free cash flow 14 195 11 403 24.5Headline earnings per share (cents) 923 923 –Total dividend per share (cents)1 815 830 (1.8)
Notes: Certain financial information presented in these annual results constitute pro-forma financial information to the extent that it is not extracted from the segment disclosure included in the audited financial statements for the year ended 31 March 2018. The applicable criteria on the basis of which this pro-forma financial information has been prepared is set out in the supplementary information on pages 36 – 39.All growth rates quoted are year-on-year growth rates and refer to the year ended 31 March 2018 compared to the year ended 31 March 2017, unless stated otherwise.* Amounts marked with an * in this document, represent normalised growth which presents performance on a comparable basis.
This excludes merger and acquisition activity and adjusting for trading foreign exchange and foreign currency fluctuation on a constant currency basis (using the current year as base).
^ Amounts marked with a ^ in this document relate to the following, on 7 August 2017, the Group acquired an effective interest of 34.94% in Safaricom Limited which is accounted for as an investment in associate. Net profit from associate and joint venture includes attributable profits, after deducting amortisation of fair valued assets.
1. Declared.
Group revenue grew strongly at
6.3% to R86.4 billion; normalised growth, excluding currency translation effects, was 7.8%*.
South Africa revenue growth
accelerated to 8.1% boosted by strong device sales. Service revenue increased 4.9% to R54.6 billion.
Group service revenue grew
3.4% to R70.6 billion; normalised growth, excluding currency translation effects, was 5.1%*.
Headline earnings per share
remained constant at 923 cents per share, impacted by shares issued to acquire the Safaricom stake.
Final dividend per share
of 425 cents
Group EBIT improved
4.4% (2.8%*) to R23.1 billion, with good improvement in our International operations.
Significant investment of
R11.6 billion used to expand our coverage and improve quality in our networks; R8.9 billion in South Africa alone.
Safaricom contributed
R1.5 billion profi t for the eight months since acquisition, after deducting the amortisation of fair valued assets and before minority interest.
Net profit increased
18.6%, boosted by the Safaricomacquisition and by the profi t from the sale of Helios Towers Tanzania Limited.
International operationscontinue to improve with normalised service
revenue growth of 7.4%* or 0.3%on a reported basis.
We added
7.0 million customers during the year, 4.5 million in South Africa, 2.5 million in our International operations.
Safaricom
added 1.4 million customers. In combination, we now reach over 103 million customers across the Group.

South Africa South Africa delivered robust performance, despite ongoing data pricing transformation and a low economic growth environment. Service revenue increased 4.9% to R54.6 billion, supported by strong customer additions, a higher contribution from data revenue and growth in enterprise services. Revenue grew strongly by 8.1% to R70.0 billion, as a result of equipment revenue growth of 15.2%, underpinned by smart device sales which constitute 70.0% of total devices sold, in-line with our strategy of driving the uptake of smart devices.
We continue to see positive outcomes from our segmented acquisition strategy. Our Youth proposition, NXTLVL, has now attracted over 3.3 million new and existing Youth customers. The expansion of our new Siyakha platform is helping improve the lives of customers, through products such as zero rated career portals, Facebook Flex, free health information for expectant mothers and prepaid funeral cover. These propositions, supported by personalised value offers through our ‘Just 4 You’ platform have seen us attracting 4.5 million new customers this year, closing at 41.6 million, up 12.1%. Prepaid customers increased 4.3 million, up 13.4%, supporting the 6.4% prepaid customer revenue growth. We added 229 000 contract customers. Progress on our pricing transformation strategy has resulted in short-term pressure on contract ARPU, which declined 4.4% to R390. This was as a result of higher roll over of unused data bundles as we continue to migrate customers to ‘more value’ contracts, with 43.4% of the base now signed up for these contracts. ARPU was also impacted by changes in deal structures in the first half of the year, and a reduction of the out-of-bundle data rates in October 2017.
Our industry leading application of Big Data and machine learning, created to deliver personalised bundle offers based on customer behaviour, continues to differentiate us from our competitors. Through our ‘Just 4 You’ platform we have accelerated the uptake of bundle offers, driving the sale of 2.3 billion bundles in the year, up 51.3%. Of these, 62.2% of bundle purchases are made through the platform. Customers using bundles have grown 13.9% to 18.7 million.
Data revenue grew strongly at 12.8% to R23.4 billion, contributing 42.8% of service revenue. This represents strong growth as we transform pricing for customers by reducing out-of-bundle spend. This was achieved by improving customer data usage notifications, reducing of out-of-bundle rates by as much as 50%, and introducing more value offers on our contract plans. In the second half, 12% of data revenue was out-of-bundle revenue, down from 22% in the first half last year. Data traffic growth remains robust at 43.7%. This was enabled through growing our data network coverage and capacity as well as focussing our device strategy on increasing 3G and 4G device uptake. 4G customers on our network increased 44.8% to 7.3 million, while the average megabyte per smart device increased 18.4% to 784MB. Our bundle strategy continues to resound well with our customers, who have a choice of buying appropriate bundles based on validity period or size to suit their needs. Data bundle purchases increased 54.7% to 766 million. Improved in-bundle usage has helped us to reduce the overall effective price per megabyte by 21.6% this year.
Enterprise service revenue grew 10.8% now contributing 25.7% of service revenue. Mobile enterprise customer revenue was flat, as the upgrade cycle on the government tender awarded to Vodacom in October 2016 progressed well, while new sign ups to compensate for the greater discount were slower than originally anticipated. We expect this trend to improve in the year ahead. Service revenue growth from fixed services increased 55.6%, driven by the inclusion of wholesale transit revenue (a new low margin business), connectivity revenue and cloud and hosting services.
EBITDA grew 4.7% to R28.1 billion and delivered a margin of 40.1%. We have contained inflationary pressures on operating expenses, through cost saving initiatives under our ‘Fit for growth’ programme, maintaining total operating expense growth of 2.1%, which is 2.8ppts below service revenue growth. EBITDA margins have however contracted 1.3ppts, impacted by the roaming agreement with Rain diluting margins by 0.7ppts, as we move cost of capacity to direct expenses from depreciation; the increased contribution from lower margin handset sales has impacted margin by 0.8ppts. EBIT growth of 2.6% was below EBITDA growth as a result of higher growth in depreciation and amortisation costs, in line with our capital expenditure guidance to deliver our network leadership position.
Operating review
2 Vodacom Group Limited Preliminary results for the year ended 31 March 2018
3
Our capital expenditure of R8.9 billion was focused on widening our network coverage, improving network performance to support increased data demand and enhancing overall customer experience. Significant investment was made in our IT systems with deep machine learning capabilities aimed at providing a seamless and personalised customer experience, enabling us to deliver on our strategic ambition of being the leading digital telco in South Africa. We have extended our 3G population coverage to 99.4% and 4G coverage to 80.1%, up from 75.8% a year ago. Vodacom is now the first African operator to extend 4G coverage to more than 80% of its population.
InternationalService revenue increased by 0.3%, with strong normalised growth of 7.4%* to R16.8 billion with pleasing growth in our strategic focus areas of data and M-Pesa. Reported numbers have been impacted by the strengthening of the Rand against each country’s currency.
Tanzania continued to execute on its strategy, delivering good revenue and customer growth despite a highly competitive environment. We have continued to invest in enhanced registration processes and to suspend customers until they update personal registration details, as required by law. Mozambique and Lesotho delivered strong results supported by good execution in monetising growing demand in data and M-Pesa, while performance in the DRC has improved as the currency and economic environment began stabilising in the second half of the year. Our focus on improving customer experience by addressing points of detraction has resulted in NPS leadership in all markets, in line with our strategy of providing the best customer experience.
We added 2.5 million customers for the year, up 8.6% to 32.2 million. This was supported by good customer growth in the DRC, up 13.8%, recovering to levels seen prior to the disconnections done in 2016 in compliance with customer registration requirements, while Mozambique grew customers by 18.7%.
Data revenue grew strongly by 12.0% (18.7%*). We continue to make excellent progress in meeting the growing demand for data, by expanding our data networks to new areas and constantly improving the network experience in high demand areas such as major towns and cities. We are actively driving access to more affordable smart devices, especially Vodacom-branded devices resulting in smartphone adoption rates increasing to 31.9%. Our digital social media partnerships, as well as bundled offers through ‘Just 4 You’ allowed us to tailor targeted data propositions to better monetise the data demand, all of which resulted in an increase of 3.6 million data customers, to 16.6 million up 27.5%. Data monetisation remains a key focus area in all markets as demand grows rapidly.
M-Pesa revenue grew strongly by 19.6% (30.4%*) to R2.3 billion, contributing 13.8% of International service revenue. We added 1.8 million customers1 for the year, reaching 11.8 million. We continuously add new services to the platform expanding consumers’ payment options. In Tanzania, we have introduced Lipa-Kwa, our merchant payment solution, which is showing very strong merchant take up. This platform gives customers the convenience to transact with M-Pesa at more points of sale. The equivalent of over USD160 million was transacted through this system this year. In Mozambique, we have expanded our agent network to more than 20 000 agents, while in DRC and Lesotho we continue to incentivise customers to increase uptake. On average, USD1.9 billion was processed monthly through the M-Pesa system.
The EBITDA margin improved 2.0ppts, while EBIT increased 27.2% (26.5%*) to R2.1 billion, and EBIT margin expanded by 2.5ppts to 12.0%. We have entrenched a culture of strong cost containment in all our operations, leveraging from programmes such as ‘Fit for growth’. Improved revenue growth, savings on commissions from airtime purchases through M-Pesa, continued savings in network operating expenses, and improving foreign exchange rates, are key drivers for margin growth.
Capital expenditure of R2.7 billion was focused on improving customer experience on our networks by extending voice and data coverage, improving data network speeds and investing in Business Intelligence tools to drive growth. We rolled out additional 4G sites in Tanzania and Lesotho and expanded 3G coverage in DRC and Mozambique. As part of our digital transformation, we continue to invest in enhancing our IT systems to support our personalised pricing offers and to deliver on our segmentation strategy.
1. 30-day active M-Pesa customers.
Operating review continued
SafaricomDuring the year, we concluded our acquisition of a 34.94% indirect stake in Safaricom, the number one mobile operator in Kenya. In the eight months since acquisition, Safaricom has contributed a profit of R1.5 billion which represents the net amount of earnings from Safaricom of R1.9 billion and an amortisation charge of R383 million in relation to fair valued assets and before minority interest.
Safaricom finished the year with great momentum, reporting annual service revenue growth of 10.0% to KES225 billion and EBIT growth of 12.6% (18.3% excluding a one-off adjustment in the prior year relating to a KES3.4 billion excise duty refund) to KES79 billion. Underpinning the results was strong expansion of Safaricom’s customer base by 5.1% to 29.6 million customers. Strong growth in both data and M-Pesa revenue continues as data customers increased by 6.2% to 17.7 million customers, and 30-day active M-Pesa customers increased 8.0% to 20.5 million. M-Pesa revenue grew 14.2% while data revenue grew by 24.0%. M-Pesa revenue contributed 28.0% to service revenue, while data revenue contributed 16.2% to service revenue. Investment in capital expenditure of KES36.4 billion resulted in 3G sites increasing 18.9% and 4G sites increasing 49.4% year on year.
These results are available on www.safaricom.co.ke/investor-relation/financials/reports/financial-results.
Regulatory mattersElectronic Communications Amendment Bill (ECA Bill)The Ministry of Telecommunications and Postal Services (Ministry) published a White Paper, as approved by cabinet, on 2 October 2016. On 17 November 2017, the Department of Telecommunications and Postal Services (DTPS) gazetted amendments to the Electronic Communications Act as a Bill, the first step to giving effect to the White Paper. Disappointingly, the amendments did not fully reflect proposals previously submitted by the industry. As part of a public participation process, affected parties submitted comments on the ECA Bill, to the Ministry on 31 January 2018, and participated in public hearings on 6 and 7 March 2018. Our submissions reiterated our support for a hybrid model, establishing a competitive wholesale open access network (WOAN) alongside the assignment of spectrum to the current players. On the basis of an independent economic impact assessment, we also noted the negative impacts the draft legislation could have on investment in the sector, GDP growth and job creation. The Ministry will consider all submissions before submitting a revised Bill to cabinet for approval to be tabled in Parliament for further consultation and debate.
Amendment to End-user and Subscriber Service Charter RegulationsOn 30 April 2018, the Independent Communications Authority of South Africa (ICASA) published final amendments to the End-user and Subscriber Service Charter Regulations, with the main objective to address consumer concerns with regard to out of bundle charges and expiry rules. The final amendments follow a consultation process between ICASA and industry stakeholders. The salient points of the new regulations are as follows:• Bundle depletion notices are to be sent to customers at 50%, 80% and 100% depletion• Operators are not allowed to default to out-of-bundle charges on depletion of bundles, unless specific opt-in
from the customer is obtained• Operators should allow customers the option to roll over unused data before expiry and also provide customers
with an option to transfer data to another customer on the same network
The regulation will take effect from 8 June 2018.
ICASA priority market review In June 2017, ICASA gave notice of its intention to conduct an inquiry to identify priority markets in the Electronic Communications Sector (ECS). The purpose of the enquiry is to identify relevant wholesale and retail markets or market segments in the ECS that are generally prone to ex ante regulations, and to determine from these markets and market segments those that the Authority intends to prioritise for market reviews and potential regulation. These studies are in line with similar processes in other markets around the world. The final phase of the inquiry would be the publication of a findings document, which is expected in the second half of FY2019.
4 Vodacom Group Limited Preliminary results for the year ended 31 March 2018

5
Competition Commission investigation into complaint on the National Treasury government transversal contract for mobile communication services On 14 March 2016, National Treasury issued a tender for the supply and delivery of mobile communication services to national and provincial government departments for the period 15 September 2016 to 31 August 2020. Vodacom was selected as the preferred supplier on a non-exclusive basis after the other bidders were eliminated at different phases of the competitive bidding process. The Competition Commission has initiated an investigation against Vodacom Group for alleged abuse of dominance in terms of section 8 of the Competition Act. The tender process was initiated and controlled by National Treasury through strict governance procedures, and we are confident that we followed due process in a fiercely contested and transparent bidding process.
United States Department of Commerce’s denial order against ZTEFollowing the denial order issued by the US Department of Commerce against ZTE, the Group is in the process of assessing the impact on its networks and implementing the required contingency plans.
OutlookLooking ahead, our strategy to become a leading digital company and empower a connected society remains a key focus. We anticipate that our investments in Big Data, digital services platforms and sophisticated machine learning will increasingly allow us to provide customers with relevant propositions based on customers’ needs. Our adoption and application of this technology puts us at the forefront of global developments and remains a key differentiator to our competitors. In turn, this should continue to drive revenue and customer growth across all markets.
We are encouraged by the renewed economic and political stability in South Africa and larger International operations, including Kenya. Stability in foreign exchange and macroeconomic environments benefits our operations and is expected to support more predictable results across our operations. However, unexpected volatility in political environment, economic growth, currency and regulatory uncertainty continue to pose a risk.
In South Africa, we will continue to manage the process for pricing transformation in data. The priority is to manage out-of-bundle exposure in accordance with ICASA’s recently published End-user and Subscriber Service Charter regulation, effectively improving the cost to communicate for customers. We will manage this change through increased elasticity, driven by our content platforms, digital social media partnerships and increased penetration of data-capable devices.
Transforming our revenue into new verticals, such as content, fibre, financial services and digital services, will also be a focal point. These services are complimentary to traditional revenue streams such as voice, messaging and data, but also to further leverage our strong brand, reach and reputation in the countries where we operate.
In our International operations, we continue to focus on data monetisation and growing financial services, through M-Pesa. The opportunity for growth in both these revenues streams is significant, while we introduce new services across our markets. M-Pesa is becoming a key driver of growth for us, with total M-Pesa customers now at 32.3 million including Safaricom, which makes us the biggest mobile money operator across the continent. M-Pesa now contributes 13.8% to our service revenue in International, and 28.0% to service revenue in Safaricom. We still see huge potential in getting all countries to the same level of sophistication as Safaricom and further growing M-Pesa capabilities.
Access to spectrum at reasonable market related pricing remains crucial in making communication services more affordable and delivering new technological advances to customers in the countries where we operate. We are expecting progress in gaining access in South Africa, Mozambique and Tanzania in the year ahead. We will engage constructively in these processes with regulators and government to ensure a speedy and fair resolution for the industry at large.
We maintain our targets1 for Group service revenue growth of mid-single digit growth, Group EBIT growth of mid-to-high single digit and capital intensity of 12% – 14% of Group revenue over the next three years. For completeness, guidance from Safaricom is EBIT of KES85 – KES89 billion and capital expenditure of KES35 – KES38 billion for the year.
1. These targets are on average, over the next three years and are on a normalised basis in constant currency, excluding spectrum purchases and any merger and acquisition activity. This assumes broadly stable currencies in each of our markets and stable macro and regulatory environments. Excluding effects from IFRS 15 and IFRS 16 implementation.
Financial review
Summary financial informationYear ended 31 March Year-on-year % change
Rm 2018 2017 Reported Normalised*
Revenue 86 370 81 278 6.3 7.8Service revenue 70 632 68 286 3.4 5.1EBITDA 32 898 31 238 5.3EBIT 23 109 22 126 4.4 2.8Net profit from associate and joint venture� 1 507 1 –Operating profit 24 252 21 750 11.5 3.0Net profit 15 562 13 126 18.6Capital expenditure 11 594 11 292 2.7Operating free cash flow 21 117 19 555 8.0Free cash flow 14 195 11 403 24.5Net debt 19 892 22 484 (11.5)Basic earnings per share (cents) 947 915 3.5Headline earnings per share (cents) 923 923 –
Contribution margin (%) 61.0 62.5 (1.5ppt)EBITDA margin (%) 38.1 38.4 (0.3ppt)EBIT margin (%) 26.8 27.2 (0.4ppt)Operating profit margin (%) 28.1 26.8 1.3pptEffective tax rate (%) 29.6 31.7 (2.1ppt)Net profit margin (%) 18.0 16.1 1.9pptCapital intensity (%) 13.4 13.9 (0.5ppt)Net debt/EBITDA (times) 0.6 0.7 (0.1 times)
Service revenueYear ended 31 March % change
Rm 2018 2017 17/18
South Africa 54 622 52 071 4.9International 16 828 16 775 0.3Corporate and eliminations (818) (560) (46.1)
Group service revenue 70 632 68 286 3.4
Safaricom1 18 999 – –
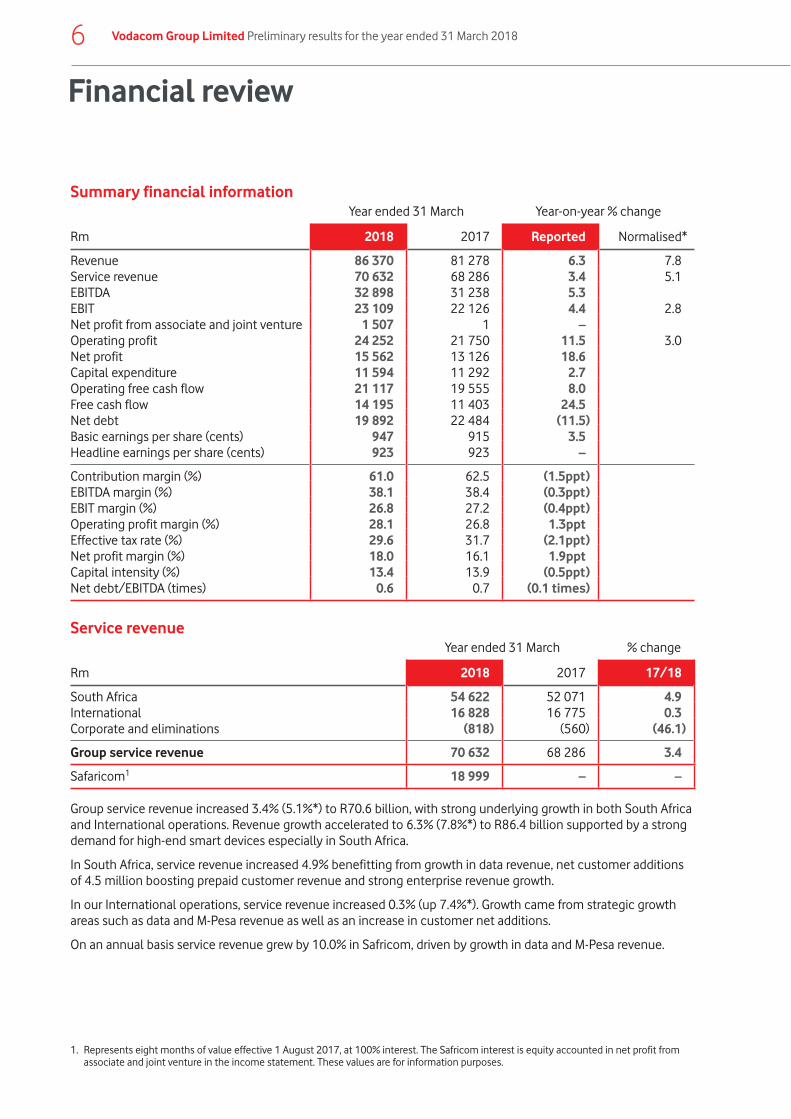
Group service revenue increased 3.4% (5.1%*) to R70.6 billion, with strong underlying growth in both South Africa and International operations. Revenue growth accelerated to 6.3% (7.8%*) to R86.4 billion supported by a strong demand for high-end smart devices especially in South Africa.
In South Africa, service revenue increased 4.9% benefitting from growth in data revenue, net customer additions of 4.5 million boosting prepaid customer revenue and strong enterprise revenue growth.
In our International operations, service revenue increased 0.3% (up 7.4%*). Growth came from strategic growth areas such as data and M-Pesa revenue as well as an increase in customer net additions.
On an annual basis service revenue grew by 10.0% in Safricom, driven by growth in data and M-Pesa revenue.
1. Represents eight months of value effective 1 August 2017, at 100% interest. The Safricom interest is equity accounted in net profit from associate and joint venture in the income statement. These values are for information purposes.
6 Vodacom Group Limited Preliminary results for the year ended 31 March 2018

7
Total expenses1 Year ended 31 March % change
Rm 2018 2017 17/18
South Africa 41 912 37 945 10.5International 12 557 12 853 (2.3)Corporate and eliminations (937) (679) (38.0)
Group total expenses 53 532 50 119 6.8
Group total expenses increased 6.8% to R53.5 billion, which includes a foreign exchange gain of R56 million (2017: foreign exchange loss of R331 million).
In South Africa, we have maintained operating expenditure growth at 2.1% despite inflationary cost pressure. Direct expenses increased 14.6% as a result of higher equipment costs (+14.0%), including costs related to our roaming agreement with Rain and increase in wholesale transit expenses (a new lower margin business area), excluding which direct expenses grew by 5.6%. The remainder of the increase was as a result of commissions relating to the high volume of new prepaid connections during the year.
In our International operations, total expenses decreased by 2.3% (up 5.7%*) with continued focus on cost containment through initiatives such as ‘Fit for growth’ and moving airtime purchases to M-Pesa, to reduce distribution cost, has assisted in keeping cost growth below revenue growth.
EBITYear ended 31 March % change
Rm 2018 2017 17/18
South Africa 21 124 20 593 2.6International 2 096 1 648 27.2Corporate and eliminations (111) (115) 3.5
Group EBIT 23 109 22 126 4.4
Safaricom2 6 799 – –
Group EBIT increased 4.4% (up 2.8%*) with the Group EBIT margin decreasing by 0.4ppts to 26.8%. South Africa EBIT increased by 2.6% with margins contracting 1.6ppts to 30.2%. Margins were impacted by higher depreciation and amortisation costs and increased contribution from lower margin equipment sales. In our International operations, EBIT increased 27.2% (26.5%*) with the EBIT margin expanding by 2.5ppts to 12.0%. Margins were aided by improved revenue growth in these operations following declines in the prior year and strong management execution in containing costs.
In Safaricom, EBIT increased 12.6% (18.3% excluding one-off adjustments in the prior year relating to a KES3.4 billion excise duty refund) for the financial year as a result of the higher service revenue contribution.
1. Excluding depreciation, amortisation, impairments and share based payment charges.2. Represents eight months of value effective 1 August 2017, at 100% interest. The Safricom interest is equity accounted in net profit from
associate and joint venture in the income statement. These values are for information purposes.
Financial review continued
Operating profitYear ended 31 March % change
Rm 2018 2017 17/18
South Africa 20 860 20 238 3.1International 1 997 1 627 22.7Safricom^� 1 506 – –Corporate and eliminations (111) (115) 3.5
Group operating profit 24 252 21 750 11.5
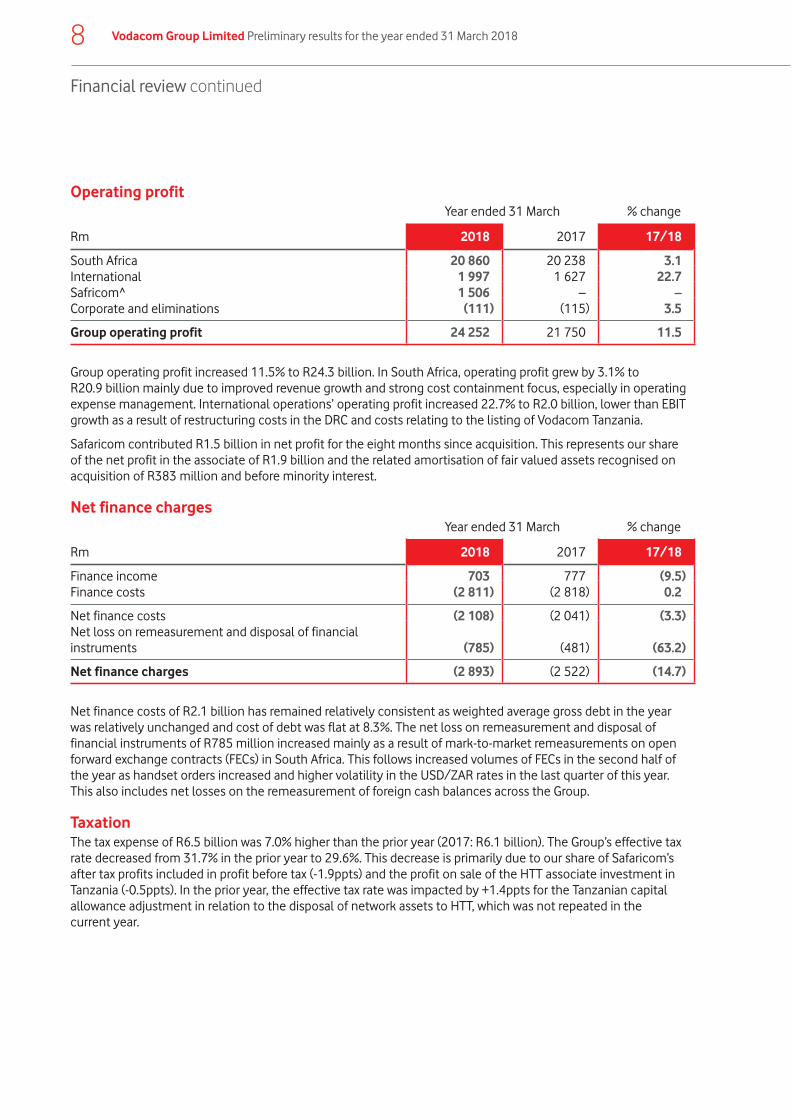
Group operating profit increased 11.5% to R24.3 billion. In South Africa, operating profit grew by 3.1% to R20.9 billion mainly due to improved revenue growth and strong cost containment focus, especially in operating expense management. International operations’ operating profit increased 22.7% to R2.0 billion, lower than EBIT growth as a result of restructuring costs in the DRC and costs relating to the listing of Vodacom Tanzania.
Safaricom contributed R1.5 billion in net profit for the eight months since acquisition. This represents our share of the net profit in the associate of R1.9 billion and the related amortisation of fair valued assets recognised on acquisition of R383 million and before minority interest.
Net finance chargesYear ended 31 March % change
Rm 2018 2017 17/18
Finance income 703 777 (9.5)Finance costs (2 811) (2 818) 0.2
Net finance costs (2 108) (2 041) (3.3)Net loss on remeasurement and disposal of financial instruments (785) (481) (63.2)
Net finance charges (2 893) (2 522) (14.7)
Net finance costs of R2.1 billion has remained relatively consistent as weighted average gross debt in the year was relatively unchanged and cost of debt was flat at 8.3%. The net loss on remeasurement and disposal of financial instruments of R785 million increased mainly as a result of mark-to-market remeasurements on open forward exchange contracts (FECs) in South Africa. This follows increased volumes of FECs in the second half of the year as handset orders increased and higher volatility in the USD/ZAR rates in the last quarter of this year. This also includes net losses on the remeasurement of foreign cash balances across the Group.
TaxationThe tax expense of R6.5 billion was 7.0% higher than the prior year (2017: R6.1 billion). The Group’s effective tax rate decreased from 31.7% in the prior year to 29.6%. This decrease is primarily due to our share of Safaricom’s after tax profits included in profit before tax (-1.9ppts) and the profit on sale of the HTT associate investment in Tanzania (-0.5ppts). In the prior year, the effective tax rate was impacted by +1.4ppts for the Tanzanian capital allowance adjustment in relation to the disposal of network assets to HTT, which was not repeated in the current year.
8 Vodacom Group Limited Preliminary results for the year ended 31 March 2018

9
EarningsYear ended 31 March % change
Rm 2018 2017 17/18
Headline earnings 14 946 13 540 10.4Adjusted forNet Profit from associate and joint venture (1 506) – –
Attributable profits from Safaricom 1 889 – – Amortisation on assets, net of tax (383) – –
With-holding tax 132 –Minority interest and other 191 –
Adjusted headline earnings(used for dividend calculations) 13 763 13 540 1.6
Earnings per share (EPS) (cents) 947 915 3.5
Headline earnings per share (HEPS) (cents) 923 923 –
Weighted average number of ordinary share outstanding for the purpose of calculating EPS and HEPS 1 620 1 467 10.4
Headline earnings for the year was up 10.4%, boosted by the contribution from our share of Safaricom’s earnings. Headline earnings per share was flat year on year. This is mainly due to the dilution from the issue of 233.5 million shares as consideration for the acquisition of our interest in Safaricom. The dilution effect of 89 cents per share (cps), was fully compensated for by our share of Safaricom’s earnings (+94cps), net of the associated withholding tax and minority interest. The amortisation of the fair valued assets (net of minority interest), relating to the Safaricom acquisition, negatively impacted HEPS by 21cps. Excluding the effects from the intangible asset amortisation, HEPS increased 2.3%.
Capital expenditureYear ended 31 March % change
Rm 2018 2017 17/18
South Africa 8 884 8 471 4.9International 2 707 2 833 (4.4)Corporate and eliminations 3 (12) 125.0
Group capital expenditure 11 594 11 292 2.7
Group capital intensity1 (%) 13.4 13.9 (0.5ppt)
Safaricom 2 933 –
The Group’s capital expenditure was R11.6 billion, representing 13.4% of revenue. In South Africa, capital expenditure was directed at accelerating our 3G capacity and extending 4G coverage to 80.1% of the population. In our International operations, the focus remained on increasing both coverage and capacity thereby adding 261 4G sites, 454 3G sites and 253 2G sites since March 2017. In Safaricom, capital expenditure was focused on increasing 3G and 4G sites by 18.9% and 49.4% respectively.
1. Capital expenditure as a percentage of revenue.
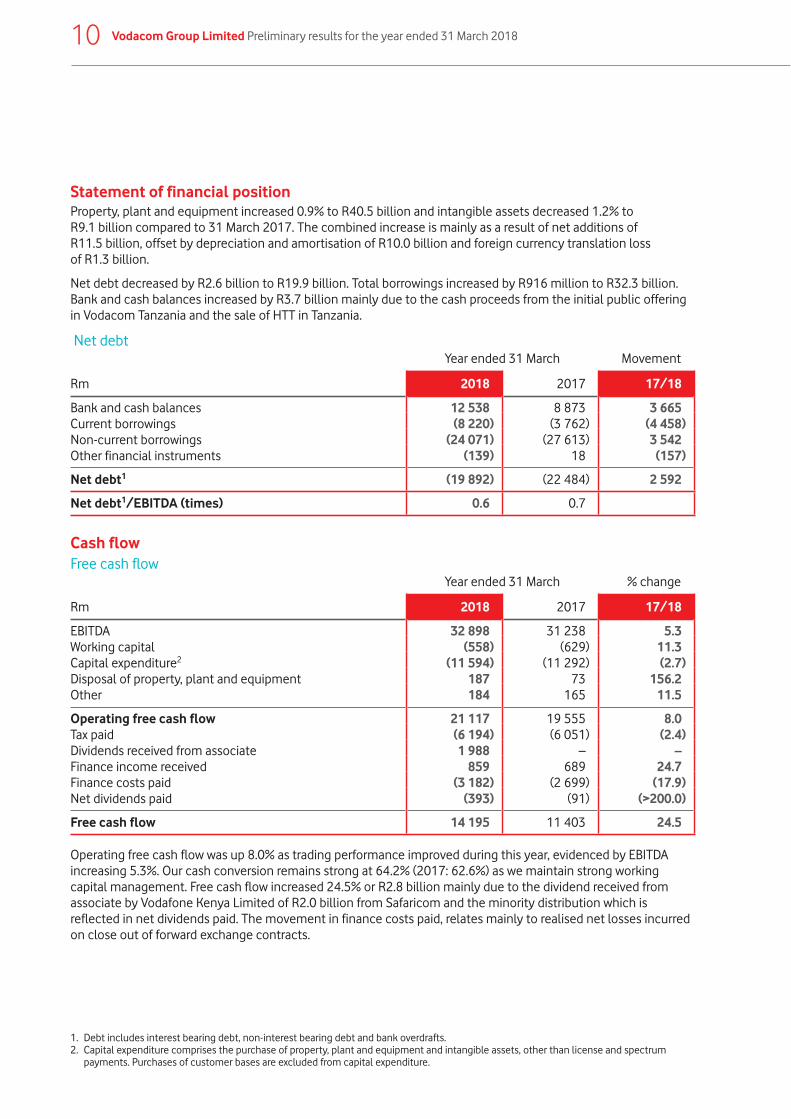
Statement of financial positionProperty, plant and equipment increased 0.9% to R40.5 billion and intangible assets decreased 1.2% to R9.1 billion compared to 31 March 2017. The combined increase is mainly as a result of net additions of R11.5 billion, offset by depreciation and amortisation of R10.0 billion and foreign currency translation loss of R1.3 billion.
Net debt decreased by R2.6 billion to R19.9 billion. Total borrowings increased by R916 million to R32.3 billion. Bank and cash balances increased by R3.7 billion mainly due to the cash proceeds from the initial public offering in Vodacom Tanzania and the sale of HTT in Tanzania.
Net debtYear ended 31 March Movement
Rm 2018 2017 17/18
Bank and cash balances 12 538 8 873 3 665Current borrowings (8 220) (3 762) (4 458)Non-current borrowings (24 071) (27 613) 3 542Other financial instruments (139) 18 (157)
Net debt1 (19 892) (22 484) 2 592
Net debt1/EBITDA (times) 0.6 0.7
Cash flow Free cash flow
Year ended 31 March % change
Rm 2018 2017 17/18
EBITDA 32 898 31 238 5.3Working capital (558) (629) 11.3Capital expenditure2 (11 594) (11 292) (2.7)Disposal of property, plant and equipment 187 73 156.2Other 184 165 11.5
Operating free cash flow 21 117 19 555 8.0Tax paid (6 194) (6 051) (2.4)Dividends received from associate 1 988 – –Finance income received 859 689 24.7Finance costs paid (3 182) (2 699) (17.9)Net dividends paid (393) (91) (>200.0)
Free cash flow 14 195 11 403 24.5
Operating free cash flow was up 8.0% as trading performance improved during this year, evidenced by EBITDA increasing 5.3%. Our cash conversion remains strong at 64.2% (2017: 62.6%) as we maintain strong working capital management. Free cash flow increased 24.5% or R2.8 billion mainly due to the dividend received from associate by Vodafone Kenya Limited of R2.0 billion from Safaricom and the minority distribution which is reflected in net dividends paid. The movement in finance costs paid, relates mainly to realised net losses incurred on close out of forward exchange contracts.
1. Debt includes interest bearing debt, non-interest bearing debt and bank overdrafts.2. Capital expenditure comprises the purchase of property, plant and equipment and intangible assets, other than license and spectrum
payments. Purchases of customer bases are excluded from capital expenditure.
10 Vodacom Group Limited Preliminary results for the year ended 31 March 2018
11
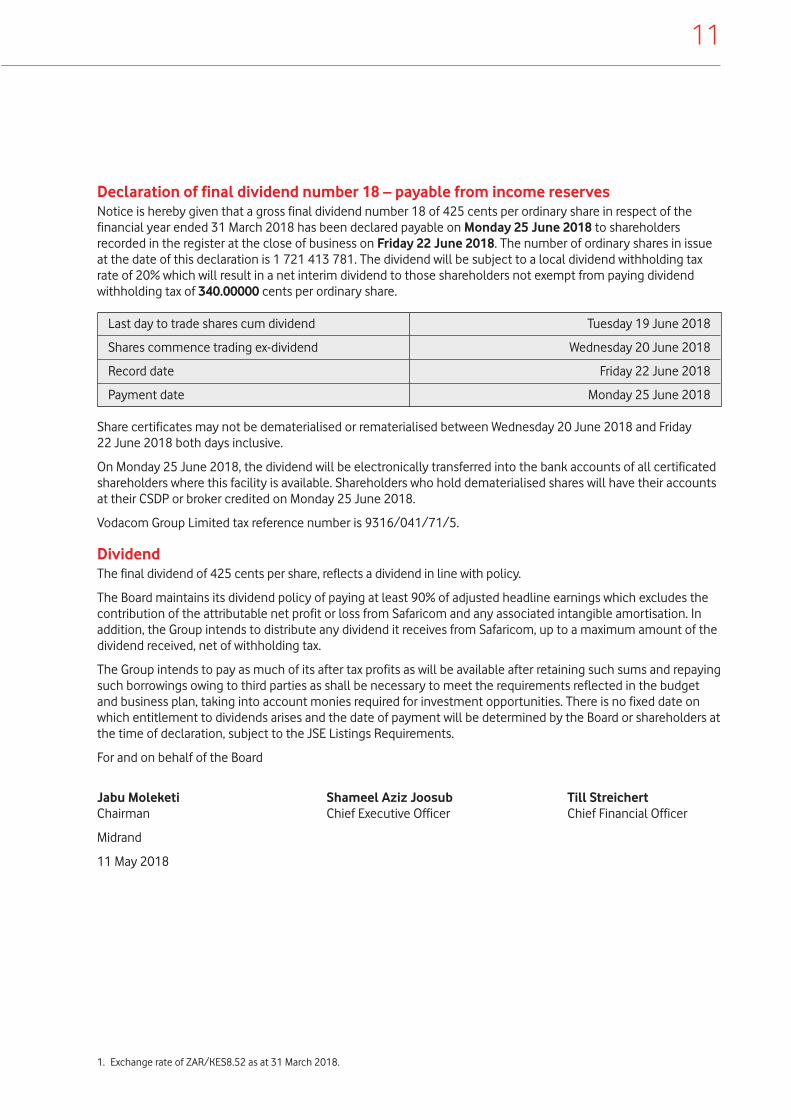
Declaration of final dividend number 18 – payable from income reservesNotice is hereby given that a gross final dividend number 18 of 425 cents per ordinary share in respect of the financial year ended 31 March 2018 has been declared payable on Monday 25 June 2018 to shareholders recorded in the register at the close of business on Friday 22 June 2018. The number of ordinary shares in issue at the date of this declaration is 1 721 413 781. The dividend will be subject to a local dividend withholding tax rate of 20% which will result in a net interim dividend to those shareholders not exempt from paying dividend withholding tax of 340.00000 cents per ordinary share.
Last day to trade shares cum dividend Tuesday 19 June 2018
Shares commence trading ex-dividend Wednesday 20 June 2018
Record date Friday 22 June 2018
Payment date Monday 25 June 2018
Share certificates may not be dematerialised or rematerialised between Wednesday 20 June 2018 and Friday 22 June 2018 both days inclusive.
On Monday 25 June 2018, the dividend will be electronically transferred into the bank accounts of all certificated shareholders where this facility is available. Shareholders who hold dematerialised shares will have their accounts at their CSDP or broker credited on Monday 25 June 2018.
Vodacom Group Limited tax reference number is 9316/041/71/5.
Dividend The final dividend of 425 cents per share, reflects a dividend in line with policy.
The Board maintains its dividend policy of paying at least 90% of adjusted headline earnings which excludes the contribution of the attributable net profit or loss from Safaricom and any associated intangible amortisation. In addition, the Group intends to distribute any dividend it receives from Safaricom, up to a maximum amount of the dividend received, net of withholding tax.
The Group intends to pay as much of its after tax profits as will be available after retaining such sums and repaying such borrowings owing to third parties as shall be necessary to meet the requirements reflected in the budget and business plan, taking into account monies required for investment opportunities. There is no fixed date on which entitlement to dividends arises and the date of payment will be determined by the Board or shareholders at the time of declaration, subject to the JSE Listings Requirements.
For and on behalf of the Board
Jabu Moleketi Shameel Aziz Joosub Till StreichertChairman Chief Executive Officer Chief Financial Officer
Midrand
11 May 2018
1. Exchange rate of ZAR/KES8.52 as at 31 March 2018.

Independent auditor’sreview report
To the shareholders of Vodacom Group LimitedWe have reviewed the preliminary condensed consolidated financial statements of Vodacom Group Limited, set out on pages 13 to 26 of the preliminary report, which comprise the condensed consolidated statement of financial position as at 31 March 2018 and the related condensed consolidated income statement, condensed consolidated statement of comprehensive income, condensed consolidated statement of changes in equity and condensed consolidated statement of cash flows for the year then ended, and selected explanatory notes.
Directors’ responsibility for the preliminary condensed consolidated financial statementsThe directors are responsible for the preparation and presentation of these preliminary condensed consolidated financial statements in accordance with the requirements of the JSE Limited Listings Requirements for preliminary reports, as set out in note 1 to the preliminary condensed consolidated financial statements, and the requirements of the Companies Act of South Africa, and for such internal control as the directors determine is necessary to enable the preparation of financial statements that are free from material misstatement, whether due to fraud or error.
Auditor’s responsibilityOur responsibility is to express a conclusion on these preliminary condensed consolidated financial statements. We conducted our review in accordance with International Standard on Review Engagements (ISRE) 2410, which applies to a review of historical financial information performed by the independent auditor of the entity. ISRE 2410 requires us to conclude whether anything has come to our attention that causes us to believe that the financial statements are not prepared in all material respects in accordance with the applicable financial reporting framework. This standard also requires us to comply with relevant ethical requirements.
A review of financial statements in accordance with ISRE 2410 is a limited assurance engagement. We perform procedures, primarily consisting of making inquiries of management and others within the entity, as appropriate, and applying analytical procedures, and evaluate the evidence obtained. The procedures performed in a review are substantially less than those performed in an audit conducted in accordance with International Standards on Auditing. Accordingly, we do not express an audit opinion on these preliminary condensed consolidated financial statements.
ConclusionBased on our review, nothing has come to our attention that causes us to believe that the preliminary condensed consolidated financial statements of Vodacom Group Limited for the year ended 31 March 2018 are not prepared, in all material respects, in accordance with the requirements of the JSE Limited Listings Requirements for preliminary reports, as set out in note 1 to the preliminary condensed consolidated financial statements, and the requirements of the Companies Act of South Africa.
PricewaterhouseCoopers Inc.Director: D B von HoesslinRegistered AuditorJohannesburg
11 May 2018
12 Vodacom Group Limited Preliminary results for the year ended 31 March 2018

13
Condensed consolidated income statementfor the year ended 31 March
Rm Notes2018
Reviewed2017
Audited
Revenue 3 86 370 81 278 Direct expenses (33 669) (30 483)Staff expenses (5 509) (5 472)Publicity expenses (1 913) (1 971)Other operating expenses (12 441) (12 193)Share-based payment charges (130) (75)Depreciation and amortisation (9 959) (9 251)Impairment losses (4) (84)Net profit from associate and joint venture 8 1 507 1
Operating profit 24 252 21 750 Profit on sale of associate 9 734 –Finance income 703 777 Finance costs (2 811) (2 818)Net loss on remeasurement and disposal of financial instruments (785) (481)
Profit before tax 22 093 19 228 Taxation (6 531) (6 102)
Net profit 15 562 13 126
Attributable to:Equity shareholders 15 344 13 418 Non-controlling interests 218 (292)
15 562 13 126
Cents2018
Reviewed2017
Audited
Basic earnings per share 4 947 915 Diluted earnings per share 4 919 886
14 Vodacom Group Limited Preliminary results for the year ended 31 March 2018
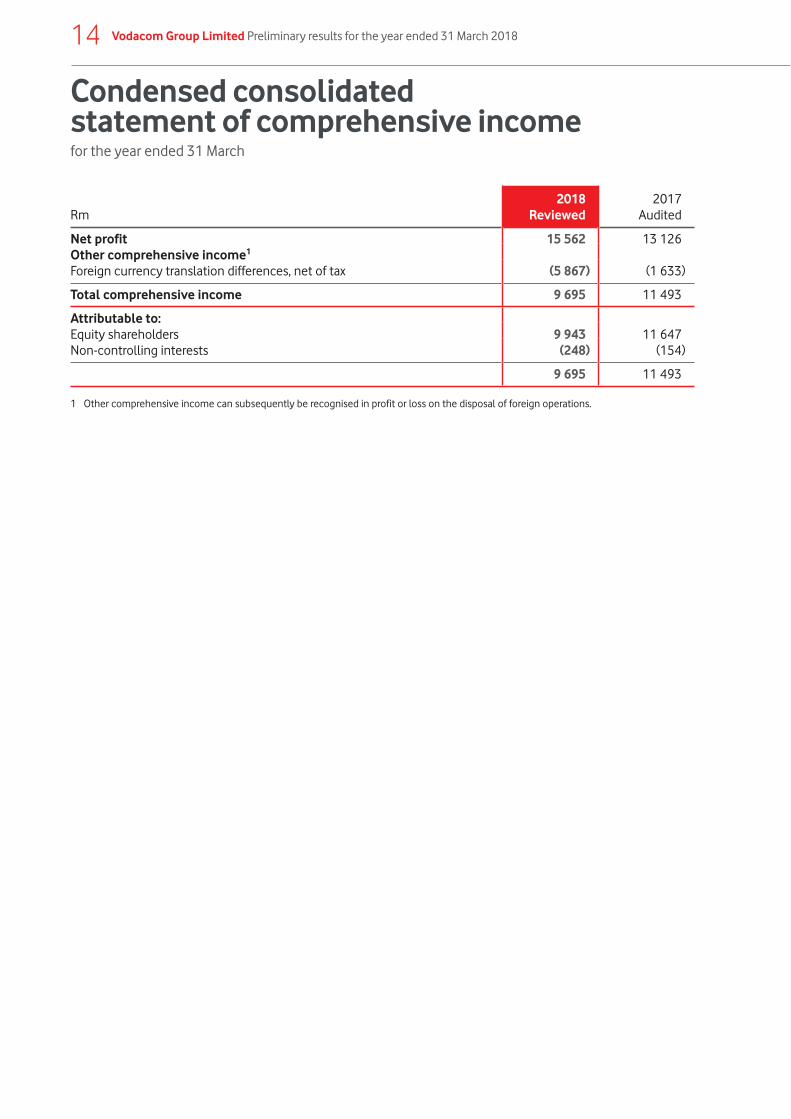
Condensed consolidatedstatement of comprehensive incomefor the year ended 31 March
Rm2018
Reviewed2017
Audited
Net profit 15 562 13 126 Other comprehensive income1
Foreign currency translation differences, net of tax (5 867) (1 633)
Total comprehensive income 9 695 11 493
Attributable to:Equity shareholders 9 943 11 647 Non-controlling interests (248) (154)
9 695 11 493
1 Other comprehensive income can subsequently be recognised in profit or loss on the disposal of foreign operations.
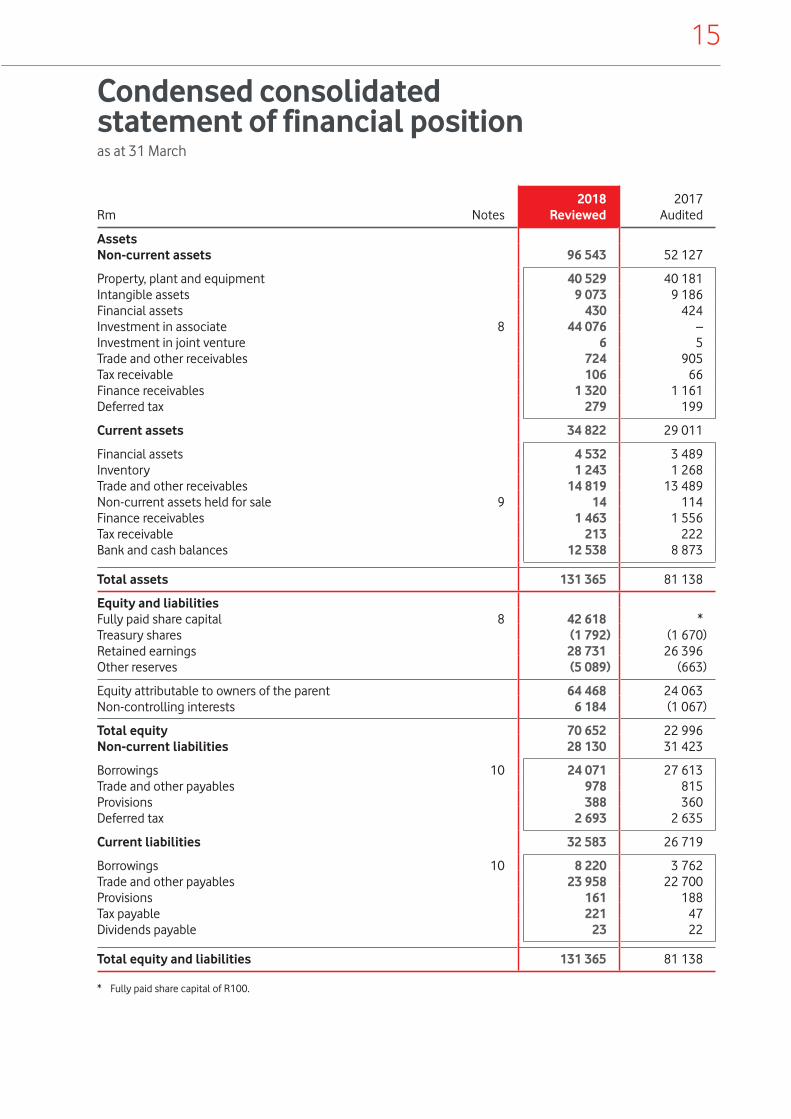
15
Rm Notes2018
Reviewed2017
Audited
AssetsNon-current assets 96 543 52 127
Property, plant and equipment 40 529 40 181 Intangible assets 9 073 9 186 Financial assets 430 424 Investment in associate 8 44 076 –Investment in joint venture 6 5 Trade and other receivables 724 905 Tax receivable 106 66 Finance receivables 1 320 1 161 Deferred tax 279 199
Current assets 34 822 29 011
Financial assets 4 532 3 489 Inventory 1 243 1 268 Trade and other receivables 14 819 13 489 Non-current assets held for sale 9 14 114 Finance receivables 1 463 1 556 Tax receivable 213 222 Bank and cash balances 12 538 8 873
Total assets 131 365 81 138
Equity and liabilitiesFully paid share capital 8 42 618 *Treasury shares (1 792) (1 670)Retained earnings 28 731 26 396 Other reserves (5 089) (663)
Equity attributable to owners of the parent 64 468 24 063 Non-controlling interests 6 184 (1 067)
Total equity 70 652 22 996 Non-current liabilities 28 130 31 423
Borrowings 10 24 071 27 613 Trade and other payables 978 815 Provisions 388 360 Deferred tax 2 693 2 635
Current liabilities 32 583 26 719
Borrowings 10 8 220 3 762 Trade and other payables 23 958 22 700 Provisions 161 188 Tax payable 221 47 Dividends payable 23 22
Total equity and liabilities 131 365 81 138
* Fully paid share capital of R100.
Condensed consolidated statement of financial positionas at 31 March

16 Vodacom Group Limited Preliminary results for the year ended 31 March 2018
Condensed consolidated statementof changes in equity for the year ended 31 March
Rm Note
Equityattributableto owners of
the parent
Non-controlling
interests Total
equity
31 March 2016 – Audited 24 158 (1 134) 23 024 Total comprehensive income 11 647 (154) 11 493 Dividends (11 657) (91) (11 748)Repurchase, vesting and sale of shares (134) – (134)Share-based payments 123 – 123 Changes in subsidiary holdings (74) 312 238
31 March 2017 – Audited 24 063 (1 067) 22 996 Total comprehensive income 9 943 (248) 9 695 Dividends (13 009) (393) (13 402)Shares issued on acquisition of subsidiary and associate net of share issue cost 8 42 618 – 42 618 Repurchase, vesting and sale of shares (269) – (269)Share-based payments 138 – 138 Changes in subsidiary holdings 984 1 788 2 772 Acquisition of subsidiary and associate 8 – 6 104 6 104
31 March 2018 – Reviewed 64 468 6 184 70 652
17
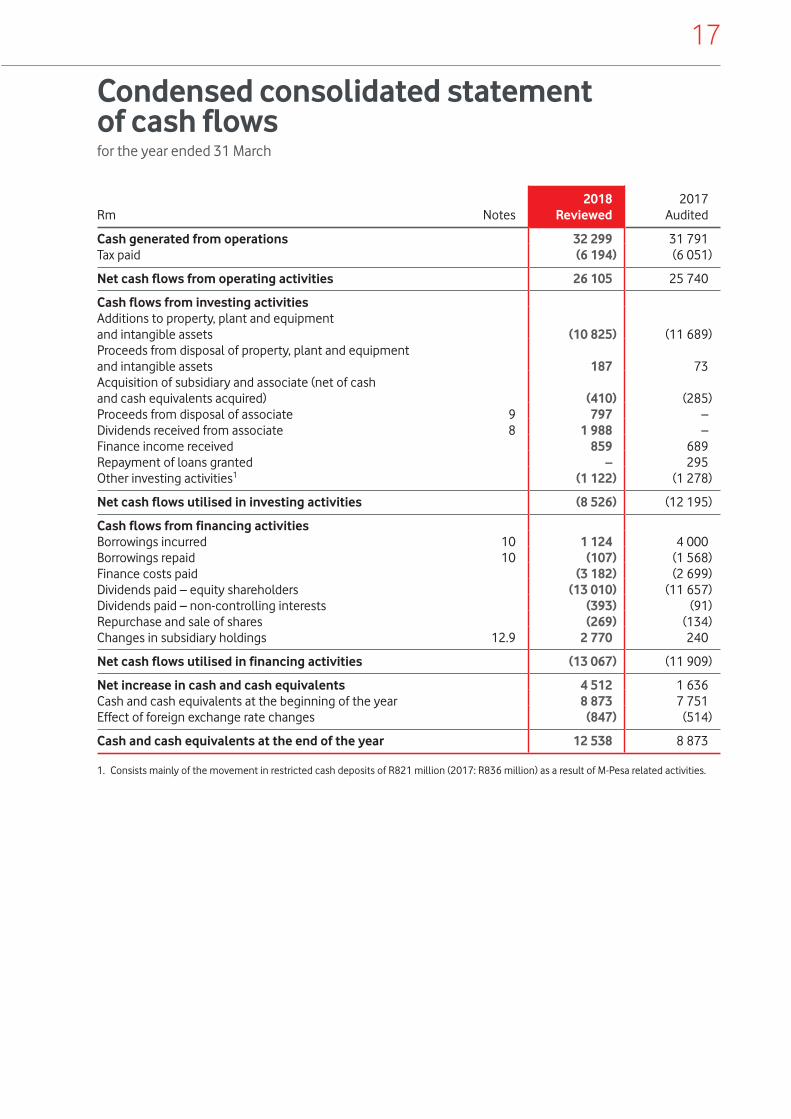
Condensed consolidated statementof cash flowsfor the year ended 31 March
Rm Notes2018
Reviewed2017
Audited
Cash generated from operations 32 299 31 791 Tax paid (6 194) (6 051)
Net cash flows from operating activities 26 105 25 740
Cash flows from investing activitiesAdditions to property, plant and equipment and intangible assets (10 825) (11 689)Proceeds from disposal of property, plant and equipment and intangible assets 187 73 Acquisition of subsidiary and associate (net of cash and cash equivalents acquired) (410) (285)Proceeds from disposal of associate 9 797 – Dividends received from associate 8 1 988 – Finance income received 859 689 Repayment of loans granted – 295 Other investing activities1 (1 122) (1 278)
Net cash flows utilised in investing activities (8 526) (12 195)
Cash flows from financing activitiesBorrowings incurred 10 1 124 4 000 Borrowings repaid 10 (107) (1 568)Finance costs paid (3 182) (2 699)Dividends paid – equity shareholders (13 010) (11 657)Dividends paid – non-controlling interests (393) (91)Repurchase and sale of shares (269) (134)Changes in subsidiary holdings 12.9 2 770 240
Net cash flows utilised in financing activities (13 067) (11 909)
Net increase in cash and cash equivalents 4 512 1 636 Cash and cash equivalents at the beginning of the year 8 873 7 751 Effect of foreign exchange rate changes (847) (514)
Cash and cash equivalents at the end of the year 12 538 8 873
1. Consists mainly of the movement in restricted cash deposits of R821 million (2017: R836 million) as a result of M-Pesa related activities.

18 Vodacom Group Limited Preliminary results for the year ended 31 March 2018
Notes to the preliminary condensed consolidated financial statementsfor the year ended 31 March 2018
1. Basis of preparation The preliminary condensed consolidated financial statements for the year ended 31 March 2018,
presented on pages 13 to 26, have been prepared in accordance with the framework concepts, the recognition and measurement criteria of International Financial Reporting Standards (IFRS) and in accordance with and containing the information required by the International Accounting Standard 34: Interim Financial Reporting (IAS 34) as issued by the International Accounting Standards Board (IASB), the Financial Reporting Guides as issued by the South African Institute of Chartered Accountants’ (SAICA) Accounting Practices Committee, Financial Pronouncements as issued by the Financial Reporting Standards Council, the JSE Limited (JSE) Listings Requirements and the requirements of the Companies Act of 2008, as amended. They have been prepared on the historical cost basis, except for certain financial instruments which are measured at fair value or at amortised cost, and are presented in South African rand, which is the parent Company’s functional and presentation currency.
The significant accounting policies and methods of computation are consistent in all material respects with those applied in the previous year, except as disclosed in Note 2. The significant accounting policies are available for inspection at the Group’s registered office.
The preparation of these preliminary condensed consolidated financial statements was supervised by the Chief Financial Officer, Dr. phil. T Streichert.
The financial information has been reviewed by PwC, whose unmodified review report is presented on page 12.
2. Changes in accounting policies The Group adopted the new, revised or amended accounting pronouncements as issued by the IASB,
which were effective and applicable to the Group from 1 April 2017, none of which had any material impact on the Group’s financial results for the year.
Full details on changes in accounting policies will be disclosed in the Group’s consolidated annual financial statements for the year ended 31 March 2018, which will be available online by 15 June 2018.
Rm2018
Reviewed2017
Audited
3. Segment analysisExternal customer segment revenue 86 370 81 278
South Africa 69 541 64 415 International 16 829 16 863 Corporate and eliminations – –
Safaricom1 19 768 –
Inter-segment revenue – –
South Africa (426) (314) International (631) (487) Corporate and eliminations 1 057 801
1. On 7 August 2017, the Group acquired an effective interest of 34.94% in Safaricom Limited (Safaricom), which is accounted for as an investment in associate. Due to the significance of this investment, and the information available for review by the chief operating decision maker, Safaricom is presented as a separate segment. The above results represent 100% of the results of Safaricom from the date of acquisition, including the impact of net fair value adjustments on tangible and intangible assets and goodwill (Note 8).

19
Rm2018
Reviewed2017
Audited
3. Segment analysis continuedEBITDA 32 898 31 238
South Africa 28 088 26 815 International 4 930 4 545 Corporate and eliminations (120) (122)
Safaricom1 9 620 –
EBIT 23 109 22 126
South Africa 21 124 20 593 International 2 096 1 648 Corporate and eliminations (111) (115)
Safaricom1 6 799 –
Reconciliation of segment resultsEBITDA 32 898 31 238 Depreciation and amortisation excluding acquired brands and customer bases (9 798) (9 054)Net profit/(loss) on disposal of property, plant and equipment and intangible assets 9 (58)
EBIT 23 109 22 126 Acquired brand and customer base amortisation (161) (197)Impairment losses (4) (84)Share-based payment charges (130) (75)Net profit from associate and joint venture 1 507 1 Other (69) (21)
Operating profit2 24 252 21 750
Total assets 131 365 81 138
South Africa 60 426 51 930 International 24 756 23 104 Corporate and eliminations 46 183 6 104
Safaricom3 51 000 –
Total liabilities (60 713) (58 142)
South Africa (51 068) (43 134) International (15 169) (16 413) Corporate and eliminations 5 524 1 405
Safaricom3 (13 179) –
2. For a reconciliation of operating profit to net profit for the year, refer to the Condensed consolidated income statement on page 13.3. On 7 August 2017, the Group acquired an effective interest of 34.94% in Safaricom Limited (Safaricom), which is accounted for as
an investment in associate. Due to the significance of this investment, and the information available for review by the chief operating decision maker, Safaricom is presented as a separate segment. The above results represent 100% of the results of Safaricom as at 31 March 2018, including the impact of net fair value adjustments on tangible and intangible assets and goodwill (Note 8).

20 Vodacom Group Limited Preliminary results for the year ended 31 March 2018
Cents2018
Reviewed2017
Audited
4. Per share calculations4.1 Earnings and dividends per share
Basic earnings per share 947 915 Diluted earnings per share 919 886 Headline earnings per share 923 923 Diluted headline earnings per share 895 894 Dividends per share1 825 795
Million2018
Reviewed2017
Audited
4.2 Weighted average number of ordinary shares outstandingfor the purpose of calculating:Basic and headline earnings per share 1 620 1 467Diluted earnings and diluted headline earnings per share 1 622 1 469
4.3 Ordinary shares for the purpose of calculating:Dividends per share 400 cents per share declared on 13 May 2016 – 1 488 395 cents per share declared on 11 November 2016 – 1 488 435 cents per share declared on 12 May 20171 1 488 – 390 cents per share declared on 10 November 2017 1 721 –
1. The final dividend for the year ended 31 March 2017 was declared and paid prior to the issue of shares for the Safaricom acquisition (Note 8).
Vodacom Group Limited acquired 2 108 969 shares in the market during the year at an average price of R165.07 per share. Share repurchases did not exceed 1% of Vodacom Group Limited’s issued share capital.
Dividend per share calculations are based on a dividend paid of R13 186 million (31 March 2017: R11 829 million) of which R44 million (31 March 2017: R44 million) was offset against the forfeitable share plan reserve, R6 million (31 March 2017: R5 million) expensed as staff expenses and R127 million (31 March 2017: R123 million) paid to Wheatfields Investments 276 (Pty) Limited, a wholly-owned subsidiary holding treasury shares on behalf of the Group. The Group declared a final dividend in respect of the year ending 31 March 2018 after the reporting period (Note 13).
21
Rm2018
Reviewed2017
Audited
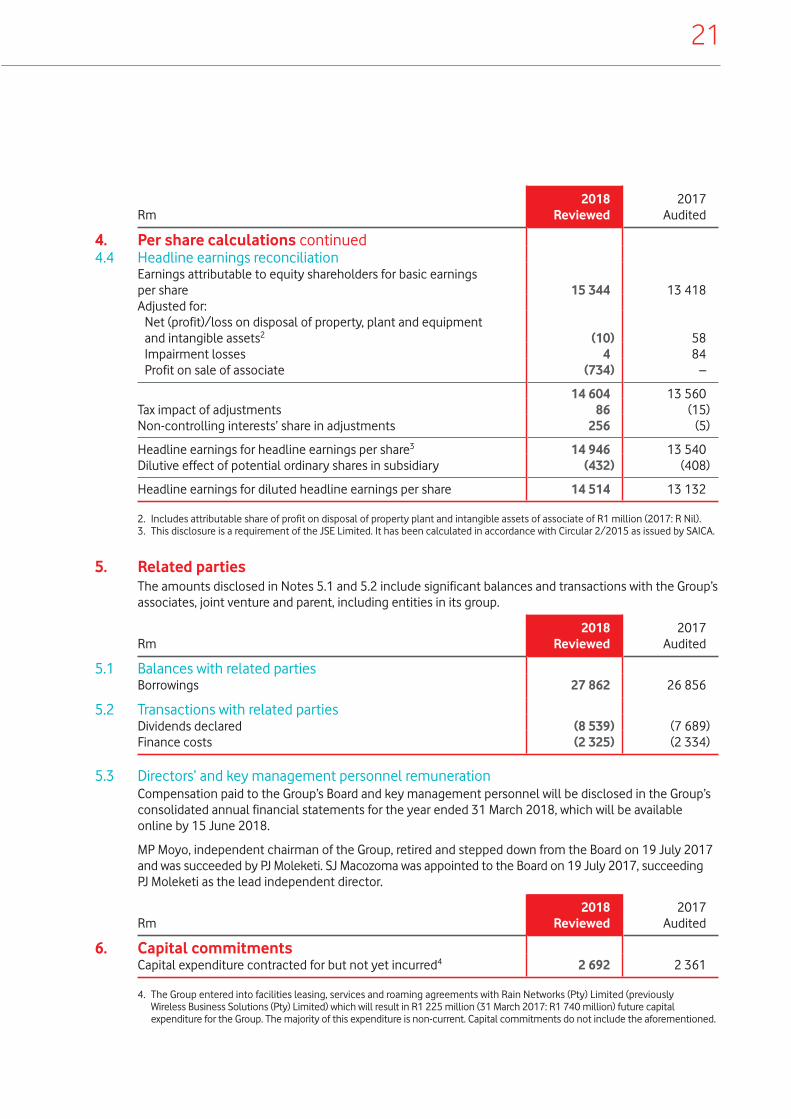
4. Per share calculations continued4.4 Headline earnings reconciliation
Earnings attributable to equity shareholders for basic earnings per share 15 344 13 418 Adjusted for: Net (profit)/loss on disposal of property, plant and equipment
and intangible assets2 (10) 58 Impairment losses 4 84 Profit on sale of associate (734) –
14 604 13 560 Tax impact of adjustments 86 (15)Non-controlling interests’ share in adjustments 256 (5)
Headline earnings for headline earnings per share3 14 946 13 540 Dilutive effect of potential ordinary shares in subsidiary (432) (408)
Headline earnings for diluted headline earnings per share 14 514 13 132
2. Includes attributable share of profit on disposal of property plant and intangible assets of associate of R1 million (2017: R Nil).3. This disclosure is a requirement of the JSE Limited. It has been calculated in accordance with Circular 2/2015 as issued by SAICA.
5. Related parties The amounts disclosed in Notes 5.1 and 5.2 include significant balances and transactions with the Group’s
associates, joint venture and parent, including entities in its group.
Rm2018
Reviewed2017
Audited
5.1 Balances with related partiesBorrowings 27 862 26 856
5.2 Transactions with related partiesDividends declared (8 539) (7 689)Finance costs (2 325) (2 334)
5.3 Directors’ and key management personnel remuneration Compensation paid to the Group’s Board and key management personnel will be disclosed in the Group’s
consolidated annual financial statements for the year ended 31 March 2018, which will be available online by 15 June 2018.
MP Moyo, independent chairman of the Group, retired and stepped down from the Board on 19 July 2017 and was succeeded by PJ Moleketi. SJ Macozoma was appointed to the Board on 19 July 2017, succeeding PJ Moleketi as the lead independent director.
Rm2018
Reviewed2017
Audited
6. Capital commitmentsCapital expenditure contracted for but not yet incurred4 2 692 2 361
4. The Group entered into facilities leasing, services and roaming agreements with Rain Networks (Pty) Limited (previously Wireless Business Solutions (Pty) Limited) which will result in R1 225 million (31 March 2017: R1 740 million) future capital expenditure for the Group. The majority of this expenditure is non-current. Capital commitments do not include the aforementioned.
22 Vodacom Group Limited Preliminary results for the year ended 31 March 2018
Rm2018
Reviewed2017
Audited
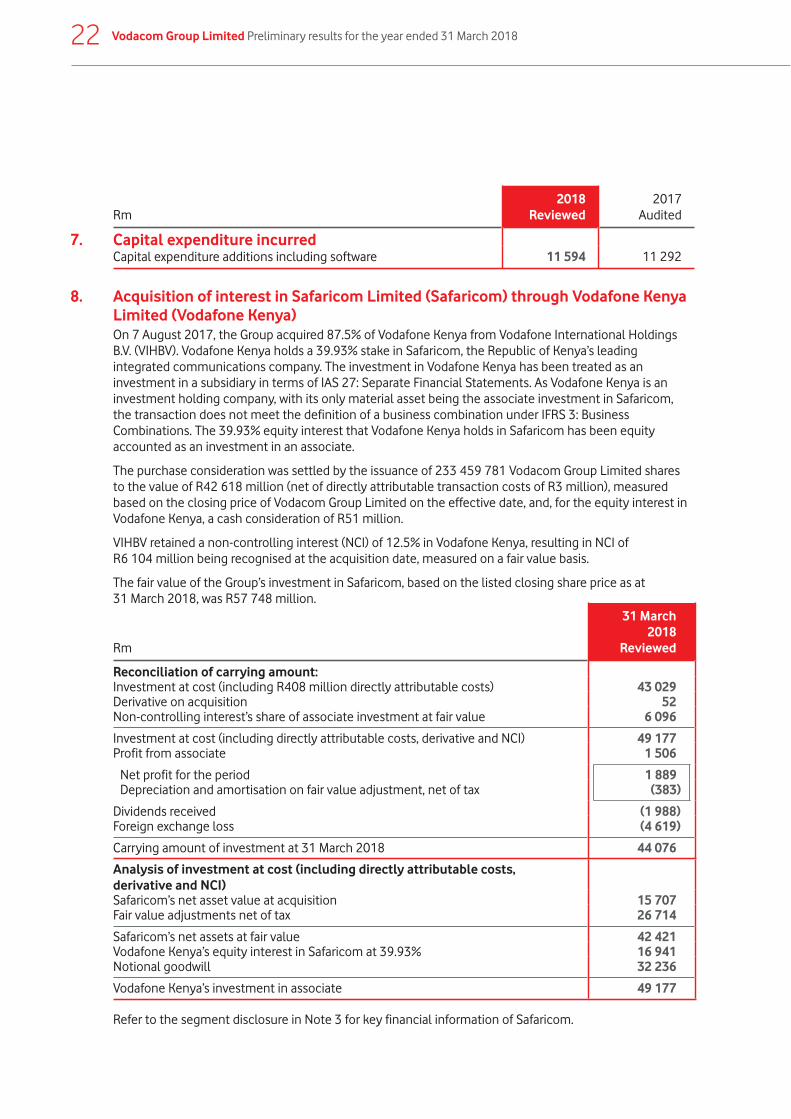
7. Capital expenditure incurredCapital expenditure additions including software 11 594 11 292
8. Acquisition of interest in Safaricom Limited (Safaricom) through Vodafone Kenya Limited (Vodafone Kenya)
On 7 August 2017, the Group acquired 87.5% of Vodafone Kenya from Vodafone International Holdings B.V. (VIHBV). Vodafone Kenya holds a 39.93% stake in Safaricom, the Republic of Kenya’s leading integrated communications company. The investment in Vodafone Kenya has been treated as an investment in a subsidiary in terms of IAS 27: Separate Financial Statements. As Vodafone Kenya is an investment holding company, with its only material asset being the associate investment in Safaricom, the transaction does not meet the definition of a business combination under IFRS 3: Business Combinations. The 39.93% equity interest that Vodafone Kenya holds in Safaricom has been equity accounted as an investment in an associate.
The purchase consideration was settled by the issuance of 233 459 781 Vodacom Group Limited shares to the value of R42 618 million (net of directly attributable transaction costs of R3 million), measured based on the closing price of Vodacom Group Limited on the effective date, and, for the equity interest in Vodafone Kenya, a cash consideration of R51 million.
VIHBV retained a non-controlling interest (NCI) of 12.5% in Vodafone Kenya, resulting in NCI of R6 104 million being recognised at the acquisition date, measured on a fair value basis.
The fair value of the Group’s investment in Safaricom, based on the listed closing share price as at 31 March 2018, was R57 748 million.
Rm
31 March2018
Reviewed
Reconciliation of carrying amount:Investment at cost (including R408 million directly attributable costs) 43 029 Derivative on acquisition 52 Non-controlling interest’s share of associate investment at fair value 6 096
Investment at cost (including directly attributable costs, derivative and NCI) 49 177 Profit from associate 1 506
Net profit for the period 1 889 Depreciation and amortisation on fair value adjustment, net of tax (383)
Dividends received (1 988)Foreign exchange loss (4 619)
Carrying amount of investment at 31 March 2018 44 076
Analysis of investment at cost (including directly attributable costs, derivative and NCI)Safaricom’s net asset value at acquisition 15 707 Fair value adjustments net of tax 26 714
Safaricom’s net assets at fair value 42 421 Vodafone Kenya’s equity interest in Safaricom at 39.93% 16 941 Notional goodwill 32 236
Vodafone Kenya’s investment in associate 49 177
Refer to the segment disclosure in Note 3 for key financial information of Safaricom.

23
9. Sale of investment in Helios Towers Tanzania Limited (Helios) Vodacom Tanzania Public Company Limited sold its 24.06% investment in Helios to Helios Towers Africa
Holding Limited (HTA) during October 2017 for total cash proceeds of R797 million. This investment was included in non-current asset held for sale as at 31 March 2017. The sale resulted in a pre-tax profit on sale of R734 million being recognised. The remaining balance of loans receivable from Helios to the value of R42 million have also been sold to HTA.
10. Borrowings During the current year, the Group modified two of the existing loan facilities received from
Vodafone Investments Luxembourg s.a.r.l. (Vodafone Luxembourg). On 3 May 2017, R8 000 million and R4 000 million loan facilities were revised from variable interest rate loans to fixed interest rate loans. The loan facilities bear interest at fixed rates of 8.703% and 8.991% and are repayable on 26 November 2019 and 26 July 2021 respectively.
Additionally, an existing fixed rate facility of R3 000 million was re-financed with a floating rate facility of R3 000 million at a rate of 3 month Jibar +1.50% with a repayment date of 24 May 2022.
The Group also re-financed a R1 530 million facility on 24 November 2017 and increased the facility with an additional R1 000 million draw down. This R2 530 million loan bears interest at 3 month JIBAR plus 1.50% and is repayable on 24 November 2024.
11. Contingent liabilities11.1 Guarantees The Group has various guarantees in issue, relating to external financial obligations of its subsidiaries,
which amounted to R116 million (31 March 2017: R119 million).
Foreign denominated guarantees amounting to R889 million (31 March 2017: R1 005 million) are in issue in support of Vodacom Congo (RDC) SA relating to liabilities included in the consolidated statement of financial position.
11.2 Tax matters The Group is regularly subject to an evaluation by tax authorities of its direct and indirect tax filings. The
consequence of such reviews is that disputes can arise with tax authorities over the interpretation or application of certain tax rules to the Group’s business. These disputes may not necessarily be resolved in a manner that is favourable to the Group. In addition, the resolution of the disputes could result in obligations to the Group. The Group has made sufficient provision for any losses arising from potential tax exposures that are more likely to occur than not.
11.3 Legal contingencies The Group is currently involved in various legal proceedings and has, in consultation with its legal counsel,
assessed the outcome of these proceedings. Following this assessment, the Group’s management has determined, that adequate provision has been made in respect of these legal proceedings as at 31 March 2018.
11.4 Kenneth Makate (Mr Makate) vs Vodacom (Pty) Limited Negotiations in accordance with the Constitutional Court order to determine a reasonable compensation
for Mr Makate for a business idea that led to a product known as ‘Please Call Me’ have deadlocked and the matter has been referred to the Group’s Chief Executive Officer to determine reasonable compensation in accordance with the Constitutional Court order.

24 Vodacom Group Limited Preliminary results for the year ended 31 March 2018
12. Other matters12.1 Competition Commission investigations12.1.1 Competition complaint on the National Treasury government transversal contract for mobile
communications services On 14 March 2016, National Treasury issued a tender for the supply and delivery of mobile
communication services to national and provincial government departments in South Africa. The tender was awarded to the Group, for the period 15 September 2016 to 31 August 2020, after an open and transparent process. The Competition Commission has initiated an investigation against the Group under sections 8(c) and 8(d)(i) of the Competition Act, which is ongoing.
12.1.2 Facilities leasing and roaming agreements between Vodacom (Pty) Limited (the Company) and Rain Networks (Pty) Limited (Rain) (previously Wireless Business Solutions (Pty) Limited)
A number of the Group’s competitors lodged complaints with the Independent Communications Authority of South Africa (ICASA) and the Competition Commission relating to the facilities leasing and roaming arrangements with Rain. On 25 April 2018, the Competition Commission ruled that these arrangements did not constitute a merger and that the transaction was not notifiable as contemplated in section 13A(1) of the Competition Act, Act 89 of 1998. ICASA’s investigation, on the other hand, is still ongoing.
12.2 G.H. Investments (GHI) and Vodacom Congo (RDC) SA (Vodacom Congo) Vodacom Congo contracted GHI to install ultra-low cost base stations on a revenue share basis. Shortly
after rolling out the first sites GHI sought to renegotiate the contractual terms, which Vodacom Congo declined. GHI then accused Vodacom Congo of infringing its intellectual property rights and demanded payment of compensation in the sum of US$1.16 billion. In July 2016, Vodacom Congo filed a request for arbitration with the International Chamber of Commerce’s International Court of Arbitration (ICC). GHI failed to pay its share of the arbitration fees to the ICC, resulting in the matter being struck out from the ICC roll.
12.3 Mr Puati vs Vodacom Congo A patent infringement claim was filed in July 2016 against Vodacom Congo. The plaintiff was asking the
Commercial Court of Kinshasa/Gombe, inter alia, to prohibit Vodacom Congo from providing the M-Pesa service and to order Vodacom Congo to pay damages in excess of USD200 million for losses resulting from the alleged patent infringement. On 22 November 2017, the Commercial Court issued a judgment in favour of Vodacom Congo, barring the action and claim that the plaintiff had initiated against Vodacom Congo.
12.4 Customer registration The Group has made considerable strides in complying with customer registration requirements in all its
markets in line with applicable laws. In Tanzania, significant measures are being taken to achieve full compliance. The Group will maintain full compliance with customer registration requirements in markets where it has already been achieved.
12.5 Radio frequency spectrum licences On 30 September 2016 the Pretoria High Court granted an application by the Ministry of
Telecommunications and Postal Services (the Ministry) interdicting ICASA from implementing the spectrum licensing process contemplated in the Invitation to Apply (ITA) for the licensing of spectrum in the 700MHz, 800MHz and 2600MHz bands, pending the outcome of a judicial review on the lawfulness of the ICASA ITA.
12.6 Electronic Communications Amendment Bill (ECA bill) On 17 November 2017, the Ministry, published an invitation to provide comments on the ECA bill, having
its origins in the Integrated information and communication technology ICT Policy White Paper of 2 October 2016. Stakeholders made representations to the Ministry at public hearings held on 6 and 7 March 2018. After considering comments submitted and presentations at hearings, the Ministry will soon submit the ECA bill for adoption by Cabinet and later table it in Parliament.

25
12.7 ICASA priority market review In June 2017, ICASA published a notice of intention to conduct an inquiry to identify priority markets in
terms of section 4B of the ICASA Act. The purpose of the study is to identify markets to be prioritised for a potential market review. The final phase of the inquiry would be the publication of a findings document, which is expected in the second half of 2019.
12.8 Amendment to End-user and Subscriber Service Charter Regulations On 30 April 2018, ICASA published final amendments to the End-user and Subscriber Service Charter
Regulations, which will take effect on 8 June 2018, with the main objective to address consumer concerns with regard to out-of-bundle charges and expiry rules. The final amendments follows a consultation process between ICASA and industry stakeholders. The salient points of the new regulations are as follows:
• Bundle depletion notices are to be sent to customers at 50%, 80% and 100% depletion; • Operators are not allowed to default to out-of-bundle charges on depletion of bundles, unless specific
opt-in from the customer is obtained; and • Operators should allow customers the option to roll over unused data before expiry and also provide
customers with an option to transfer data to another customer on the same network.
12.9 Vodacom Tanzania Public Limited Company (Vodacom Tanzania) In June 2016, the Parliament of Tanzania passed the Finance Act, 2016 which amends listing
requirements under the Electronic and Postal Communication Act, 2010 (EPOCA), to introduce mandatory listing requirements and require licensed telecommunications operators to list 25% of their authorised share capital through an initial public offering (IPO) on the Dar Es Salaam Stock Exchange (DSE).
On 15 August 2017, Vodacom Tanzania listed on the Main Investment Market Segment (MIMS) of the DSE under the ticker VODA, and became the first telecommunications operator to comply with these regulatory changes. The listing was the largest initial public offering (IPO) in the 19-year history of the DSE, and raised net proceeds after underwriting costs of R2 770 million (TZS470 billion).
The Group has entered into an agreement with its local Tanzanian partner, Mirambo Limited (Mirambo), and certain of Mirambo’s shareholders, under the terms of which the Group will acquire all of Mirambo’s 588 million shares in Vodacom Tanzania. This will result in the Group increasing its total interest in Vodacom Tanzania from 61.6% to 75%. The transaction close is subject to conditions precedent, including requisite regulatory approvals in Tanzania.
12.10 Mobile termination rates (MTR) Regulators in Tanzania and Mozambique cut termination rates this year, with industry submissions and a
new cost study in Mozambique leading to a positive outcome where the regulator revised MTRs upward with retrospective effect, and set a revised glide path to 2020. In Tanzania, the Group has filed an appeal against the regulator’s new five year glide path with the Fair Competition Commission on the grounds that new MTRs were modelled using data that was not representative of actual costs incurred by operators and the glide path sets MTRs below cost. In South Africa, ICASA is in the process of constructing cost models that will inform MTRs to be applied from October 2018.
12.11 Vodacom Congo Vodacom Congo is not in compliance with the minimum capital requirements as set out under the
Organisation for the Harmonisation of Business Law in Africa (OHADA). Vodacom Congo has to increase its share capital to meet the minimum OHADA requirements. The Board and shareholders of Vodacom Congo are in negotiations to address the recapitalisation of the company.
12.12 Unwind of Vodacom (Pty) Limited Black Economic Empowerment (BEE) deal In 2008, the Group facilitated a BEE ownership transaction (the BEE transaction) through the sale of an
effective 6.25% in the issued share capital of Vodacom (Pty) Limited (Vodacom SA) to Royal Bafokeng Holdings, Thebe Investment Corporation and YeboYethu (RF) Limited through notional vendor finance (NVF). The NVF maturity date for the BEE transaction is 30 September 2018. The Group is currently in the process of negotiating a new BEE transaction.

26 Vodacom Group Limited Preliminary results for the year ended 31 March 2018
13. Events after the reporting period The Board is not aware of any matter or circumstance arising since the end of the reporting period, not
otherwise dealt with herein, which significantly affects the financial position of the Group or the results of its operations or cash flows for the period, other than the following:
13.1 Dividend declared after the reporting date and not recognised as a liability A final dividend of R7 316 million (425 cents per ordinary share) for the year ending 31 March 2018, was
declared on 11 May 2018, payable on 25 June 2018 to shareholders recorded in the register at the close of business on 22 June 2018. The net dividend after taking into account dividend withholding tax for those shareholders not exempt from dividend withholding tax is 340.00000 cents per share.
13.2 US Department of Commerce denial order against ZTE Following the denial order issued by the US Department of Commerce against ZTE, the Group is in the
process of assessing the impact on its networks and implementing the required contingency plans.
14. Fair value hierarchy The table below sets out the valuation basis of financial instruments measured at fair value:
Rm2018
Reviewed2017
Audited
Level one1 Financial assets and liabilities at fair value through profit or loss, classified as held for tradingUnit trust investments 328 244 Level two2
Derivative financial assets 67 108 Derivative financial liabilities (207) (89)
188 263
1. Level one classification is used when the valuation is determined using quoted prices in an active market. 2. Level two classification is used when valuation inputs used to determine fair value are observable for the asset/(liability), either
directly as prices or indirectly when derived from prices.

27
Supplementary information
Operating results for the year ended 31 March 2018
RmSouth Africa
%Inter-
national
%Corporate/
Eliminations Group
%
Safaricom217/18 17/18 17/18
Mobile contract revenue 23 589 (0.8) 1 081 3.9 (5) 24 665 (0.6) 2 364Mobile prepaid revenue 23 247 6.4 12 769 3.2 – 36 016 5.2 14 888
Customer service revenue 46 836 2.6 13 850 3.2 (5) 60 681 2.8 17 252
Mobile interconnect 1 790 (4.0) 1 245 (11.5) (492) 2 543 (14.5) 611Fixed service revenue 2 282 57.5 1 546 (10.6) (295) 3 533 19.8 571Other service revenue 3 714 18.9 187 (16.1) (26) 3 875 16.8 565
Service revenue 54 622 4.9 16 828 0.3 (818) 70 632 3.4 18 999
Equipment revenue 13 187 15.2 342 6.2 (64) 13 465 15.1 490Non-service revenue 2 158 78.2 290 14.6 (175) 2 273 75.8 279
Revenue 69 967 8.1 17 460 0.6 (1 057) 86 370 6.3 19 768Direct expenses (29 057) (14.6) (5 502) 4.3 890 (33 669) (10.5) (5 772)Staff expenses (3 651) (3.8) (1 476) 5.2 (382) (5 509) (0.7) (1 092)Publicity expenses (1 345) (5.2) (554) 16.7 (14) (1 913) 2.9 (471)Other operating expenses (7 859) (0.8) (5 025) (3.0) 443 (12 441) (2.0) (2 810)Share based payment charges (93) (24.0) (39) – 2 (130) (73.3) 1Depreciation and amortisation (7 103) (11.2) (2 863) 0.2 7 (9 959) (7.7) (2 832)Impairment charges – 100.0 (4) – – (4) 95.2 –Net profit from associate and joint venture 1 – – – 1 506 1 507 – –
Operating profit 20 860 3.1 1 997 22.8 1 395 24 252 11.5 6 792
EBITDA 28 088 4.7 4 930 8.5 (120) 32 898 5.3 9 620EBITDA margin (%) 40.1 (1.3ppt) 28.2 2.0ppt 38.1 (0.3ppt) 48.7EBIT 21 124 2.6 2 096 27.2 (111) 23 109 4.4 6 799EBIT margin (%) 30.2 (1.6ppt) 12.0 2.5ppt 26.8 (0.4ppt) 34.4
Included in service revenue:Mobile voice 22 154 (4.6) 8 675 (2.5) (6) 30 823 (4.0) –Mobile data1 23 355 12.8 2 429 12.0 – 25 784 12.8 –Mobile messaging 2 194 (12.6) 450 4.9 1 2 645 (10.0) –M-Pesa revenue1 – – 2 327 19.6 – 2 327 19.6 –
1. Mobile data revenue and M-Pesa revenue were previously reported in aggregate. These items are now separately disclosed.2. Represents eight months of value effective 1 August 2017, at 100% interest. The Safaricom interest is equity accounted in net profit from
associate and joint venture. These values are for information purposes.
Supplementary information continued
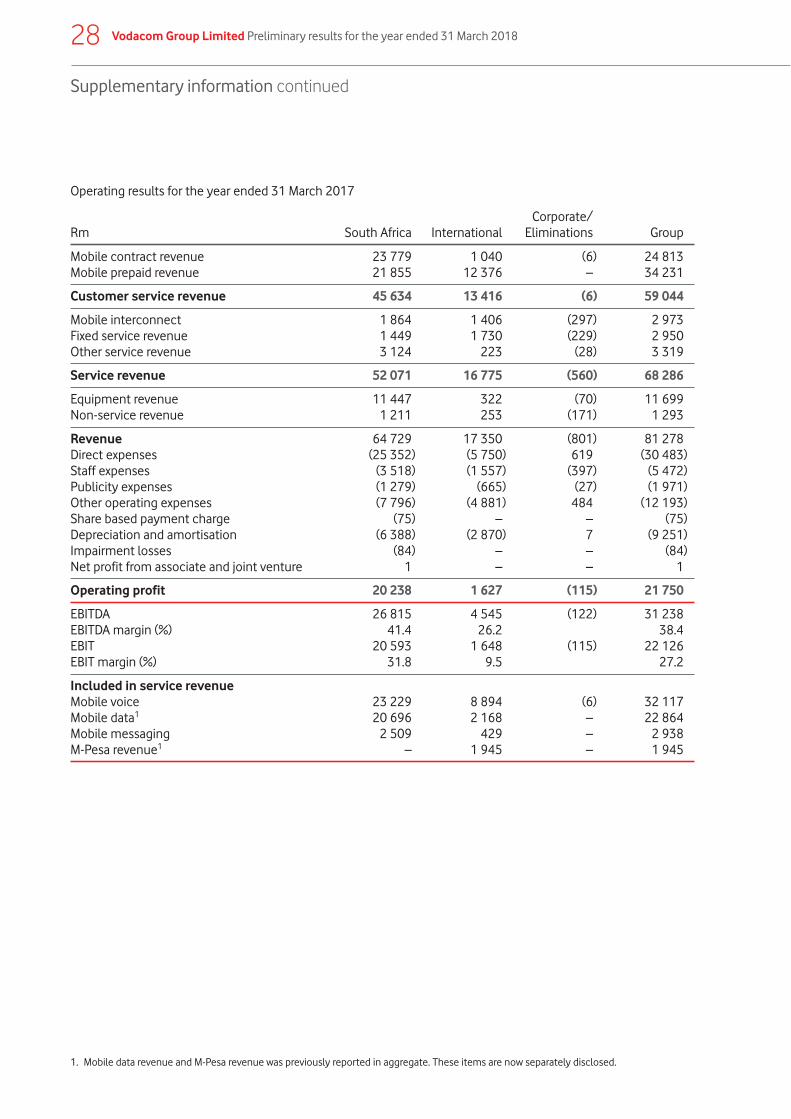
1. Mobile data revenue and M-Pesa revenue was previously reported in aggregate. These items are now separately disclosed.
Operating results for the year ended 31 March 2017
Rm South Africa InternationalCorporate/
Eliminations Group
Mobile contract revenue 23 779 1 040 (6) 24 813Mobile prepaid revenue 21 855 12 376 – 34 231
Customer service revenue 45 634 13 416 (6) 59 044
Mobile interconnect 1 864 1 406 (297) 2 973Fixed service revenue 1 449 1 730 (229) 2 950Other service revenue 3 124 223 (28) 3 319
Service revenue 52 071 16 775 (560) 68 286
Equipment revenue 11 447 322 (70) 11 699Non-service revenue 1 211 253 (171) 1 293
Revenue 64 729 17 350 (801) 81 278Direct expenses (25 352) (5 750) 619 (30 483)Staff expenses (3 518) (1 557) (397) (5 472)Publicity expenses (1 279) (665) (27) (1 971)Other operating expenses (7 796) (4 881) 484 (12 193)Share based payment charge (75) – – (75)Depreciation and amortisation (6 388) (2 870) 7 (9 251)Impairment losses (84) – – (84)Net profit from associate and joint venture 1 – – 1
Operating profit 20 238 1 627 (115) 21 750
EBITDA 26 815 4 545 (122) 31 238EBITDA margin (%) 41.4 26.2 38.4EBIT 20 593 1 648 (115) 22 126EBIT margin (%) 31.8 9.5 27.2
Included in service revenueMobile voice 23 229 8 894 (6) 32 117Mobile data1 20 696 2 168 – 22 864Mobile messaging 2 509 429 – 2 938M-Pesa revenue1 – 1 945 – 1 945
28 Vodacom Group Limited Preliminary results for the year ended 31 March 2018

29
South Africa key indicatorsYear ended 31 March % change
2018 2017 17/18
Customers1 (thousand) 41 635 37 131 12.1 Prepaid 36 275 32 000 13.4Contract 5 360 5 131 4.5
Data customers2 (thousand) 20 347 19 549 4.1
Internet of Things connections3 (thousand) 3 628 2 979 21.8
Traffic4 (millions of minutes) 61 155 58 409 4.7Outgoing 51 798 48 900 5.9Incoming 9 357 9 509 (1.6)
MOU per month5 127 136 (6.6)Prepaid 117 128 (8.6)Contract 197 190 3.7
Total ARPU6 (rand per month) 101 111 (9.0)Prepaid 58 62 (6.5)Contract 390 408 (4.4)
Messaging (million) 6 987 4 337 61.1
Number of employees 5 007 5 038 (0.6)
Notes:1. Customers are based on the total number of mobile customers using any service during the last three months. This includes customers
paying a monthly fee that entitles them to use the service even if they do not actually use the service and those customers who are active whilst roaming.
2. Data customers are based on the number of unique users generating billable data traffic during the month. Also included are users on integrated tariff plans, or who have access to corporate APNs, and users who have been allocated a revenue generating data bundle during the month. A user is defined as being active if they are paying a contractual monthly fee for this service or have used the service during the reported month.
3. Internet of Things connections (IoT), is the remote wireless interchange between two or more predefined devices or a central station without direct relationship with an end customer, in order to support a specific business process or product.
4. Traffic comprises total traffic registered on Vodacom‘s mobile network, including bundled minutes, promotional minutes and outgoing international roaming calls, but excluding national roaming calls, incoming international roaming calls and calls to free services.
5. Minutes of use (MOU) per month is calculated by dividing the average monthly minutes (traffic) during the period by the average monthly customers during the period.
6. Total ARPU is calculated by dividing the average monthly service revenue by the average monthly customers during the period. Prepaid and contract ARPU only include service revenue generated from Vodacom mobile customers.
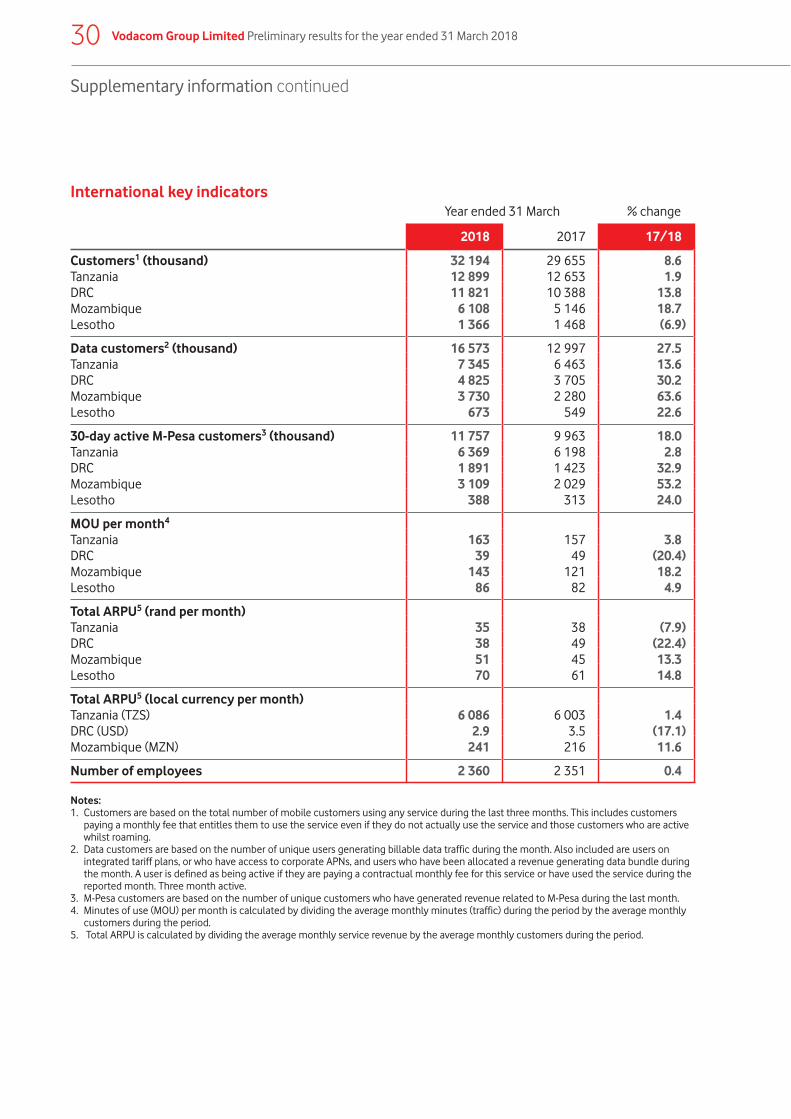
30 Vodacom Group Limited Preliminary results for the year ended 31 March 2018
Supplementary information continued
International key indicatorsYear ended 31 March % change
2018 2017 17/18
Customers1 (thousand) 32 194 29 655 8.6Tanzania 12 899 12 653 1.9DRC 11 821 10 388 13.8Mozambique 6 108 5 146 18.7Lesotho 1 366 1 468 (6.9)
Data customers2 (thousand) 16 573 12 997 27.5Tanzania 7 345 6 463 13.6DRC 4 825 3 705 30.2Mozambique 3 730 2 280 63.6Lesotho 673 549 22.6
30-day active M-Pesa customers3 (thousand) 11 757 9 963 18.0Tanzania 6 369 6 198 2.8DRC 1 891 1 423 32.9Mozambique 3 109 2 029 53.2Lesotho 388 313 24.0
MOU per month4
Tanzania 163 157 3.8DRC 39 49 (20.4)Mozambique 143 121 18.2Lesotho 86 82 4.9
Total ARPU5 (rand per month)Tanzania 35 38 (7.9)DRC 38 49 (22.4)Mozambique 51 45 13.3Lesotho 70 61 14.8
Total ARPU5 (local currency per month)Tanzania (TZS) 6 086 6 003 1.4DRC (USD) 2.9 3.5 (17.1)Mozambique (MZN) 241 216 11.6
Number of employees 2 360 2 351 0.4
Notes:1. Customers are based on the total number of mobile customers using any service during the last three months. This includes customers
paying a monthly fee that entitles them to use the service even if they do not actually use the service and those customers who are active whilst roaming.
2. Data customers are based on the number of unique users generating billable data traffic during the month. Also included are users on integrated tariff plans, or who have access to corporate APNs, and users who have been allocated a revenue generating data bundle during the month. A user is defined as being active if they are paying a contractual monthly fee for this service or have used the service during the reported month. Three month active.
3. M-Pesa customers are based on the number of unique customers who have generated revenue related to M-Pesa during the last month.4. Minutes of use (MOU) per month is calculated by dividing the average monthly minutes (traffic) during the period by the average monthly
customers during the period. 5. Total ARPU is calculated by dividing the average monthly service revenue by the average monthly customers during the period.
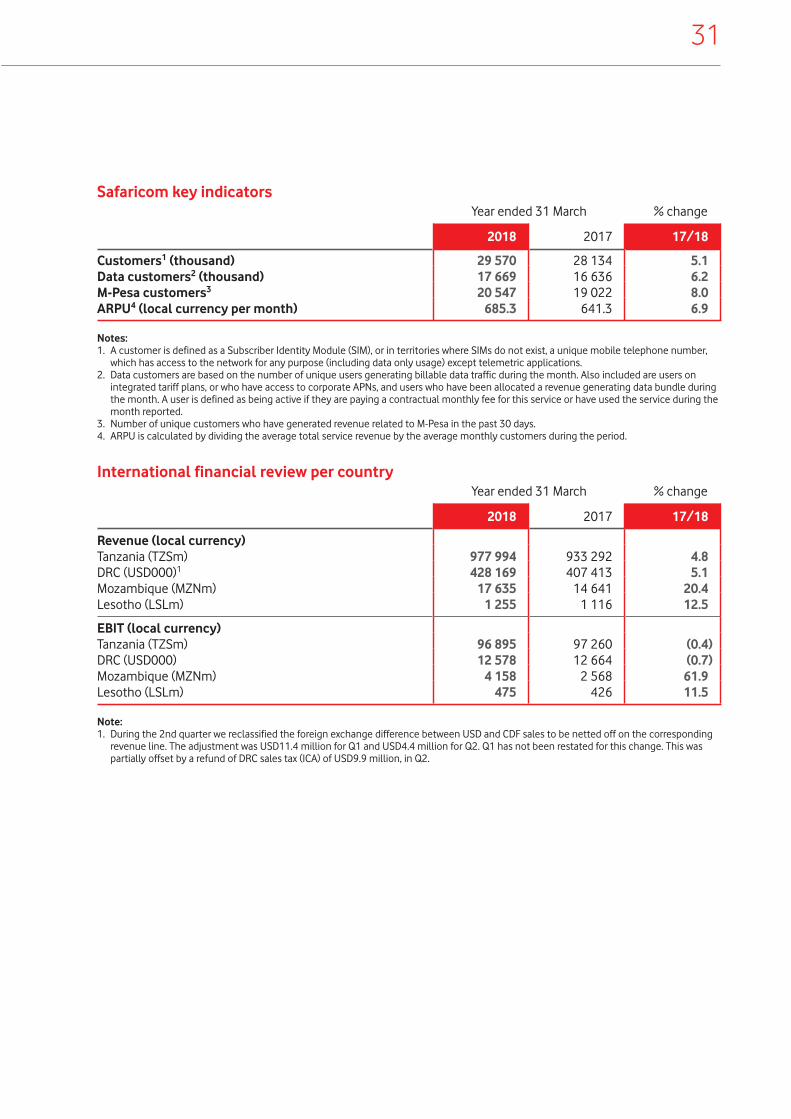
31
Safaricom key indicators Year ended 31 March % change
2018 2017 17/18
Customers1 (thousand) 29 570 28 134 5.1Data customers2 (thousand) 17 669 16 636 6.2M-Pesa customers3 20 547 19 022 8.0ARPU4 (local currency per month) 685.3 641.3 6.9
Notes:1. A customer is defined as a Subscriber Identity Module (SIM), or in territories where SIMs do not exist, a unique mobile telephone number,
which has access to the network for any purpose (including data only usage) except telemetric applications. 2. Data customers are based on the number of unique users generating billable data traffic during the month. Also included are users on
integrated tariff plans, or who have access to corporate APNs, and users who have been allocated a revenue generating data bundle during the month. A user is defined as being active if they are paying a contractual monthly fee for this service or have used the service during the month reported.
3. Number of unique customers who have generated revenue related to M-Pesa in the past 30 days.4. ARPU is calculated by dividing the average total service revenue by the average monthly customers during the period.
International financial review per countryYear ended 31 March % change
2018 2017 17/18
Revenue (local currency)Tanzania (TZSm) 977 994 933 292 4.8DRC (USD000)1 428 169 407 413 5.1Mozambique (MZNm) 17 635 14 641 20.4Lesotho (LSLm) 1 255 1 116 12.5
EBIT (local currency)Tanzania (TZSm) 96 895 97 260 (0.4)DRC (USD000) 12 578 12 664 (0.7)Mozambique (MZNm) 4 158 2 568 61.9Lesotho (LSLm) 475 426 11.5
Note:1. During the 2nd quarter we reclassified the foreign exchange difference between USD and CDF sales to be netted off on the corresponding
revenue line. The adjustment was USD11.4 million for Q1 and USD4.4 million for Q2. Q1 has not been restated for this change. This was partially offset by a refund of DRC sales tax (ICA) of USD9.9 million, in Q2.
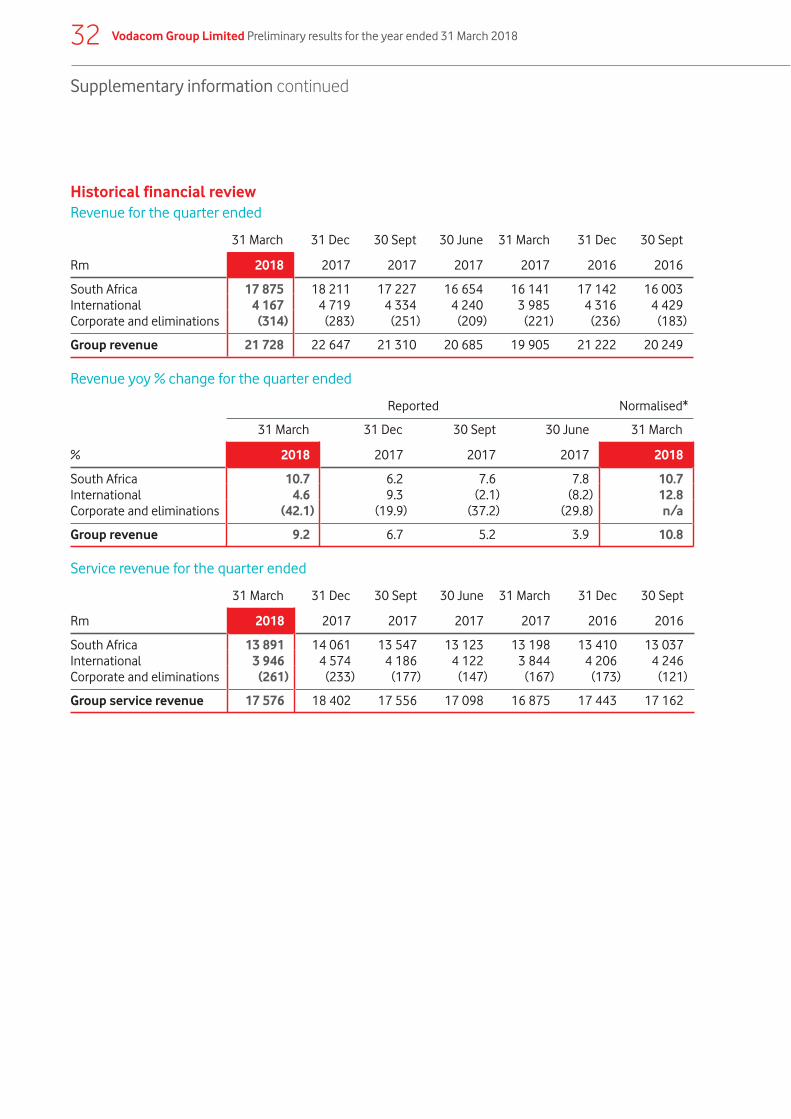
32 Vodacom Group Limited Preliminary results for the year ended 31 March 2018
Supplementary information continued
Historical financial reviewRevenue for the quarter ended
Rm
31 March 31 Dec 30 Sept 30 June 31 March 31 Dec 30 Sept
2018 2017 2017 2017 2017 2016 2016
South Africa 17 875 18 211 17 227 16 654 16 141 17 142 16 003International 4 167 4 719 4 334 4 240 3 985 4 316 4 429Corporate and eliminations (314) (283) (251) (209) (221) (236) (183)
Group revenue 21 728 22 647 21 310 20 685 19 905 21 222 20 249
Revenue yoy % change for the quarter ended
%
Reported Normalised*
31 March 31 Dec 30 Sept 30 June 31 March
2018 2017 2017 2017 2018
South Africa 10.7 6.2 7.6 7.8 10.7International 4.6 9.3 (2.1) (8.2) 12.8Corporate and eliminations (42.1) (19.9) (37.2) (29.8) n/a
Group revenue 9.2 6.7 5.2 3.9 10.8
Service revenue for the quarter ended
Rm
31 March 31 Dec 30 Sept 30 June 31 March 31 Dec 30 Sept
2018 2017 2017 2017 2017 2016 2016
South Africa 13 891 14 061 13 547 13 123 13 198 13 410 13 037International 3 946 4 574 4 186 4 122 3 844 4 206 4 246Corporate and eliminations (261) (233) (177) (147) (167) (173) (121)
Group service revenue 17 576 18 402 17 556 17 098 16 875 17 443 17 162
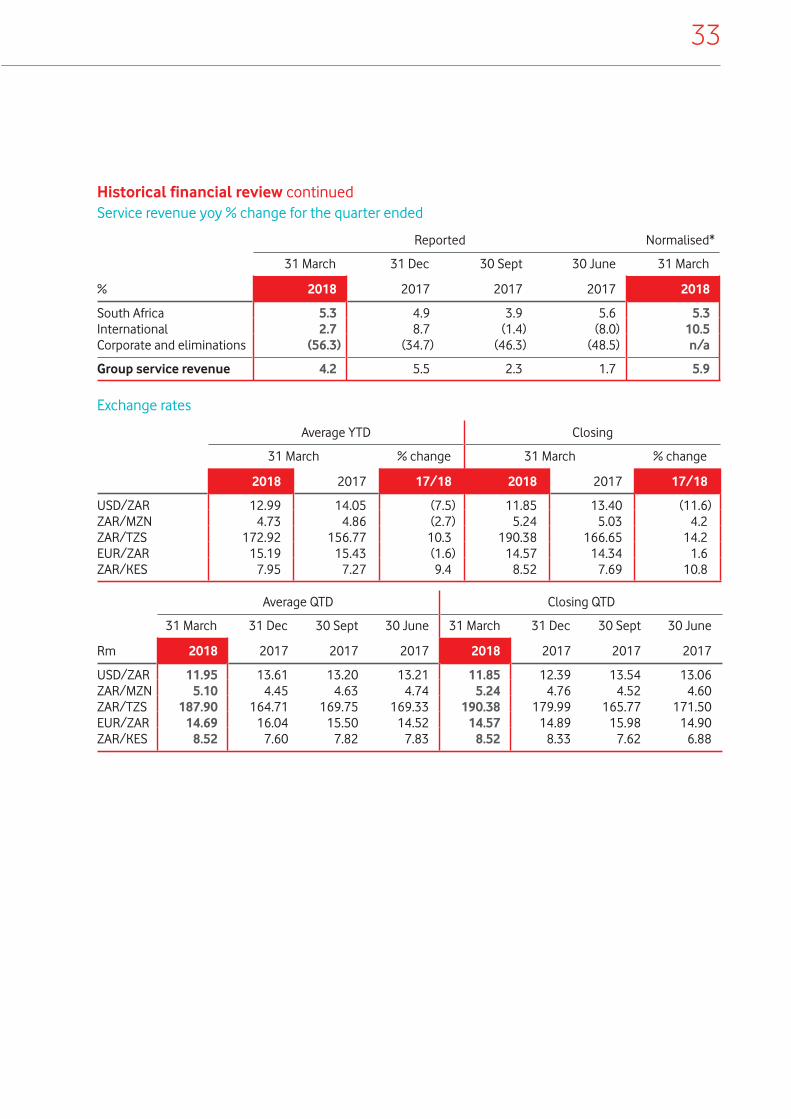
33
Historical financial review continuedService revenue yoy % change for the quarter ended
%
Reported Normalised*
31 March 31 Dec 30 Sept 30 June 31 March
2018 2017 2017 2017 2018
South Africa 5.3 4.9 3.9 5.6 5.3International 2.7 8.7 (1.4) (8.0) 10.5Corporate and eliminations (56.3) (34.7) (46.3) (48.5) n/a
Group service revenue 4.2 5.5 2.3 1.7 5.9
Exchange rates
Average YTD Closing
31 March % change 31 March % change
2018 2017 17/18 2018 2017 17/18
USD/ZAR 12.99 14.05 (7.5) 11.85 13.40 (11.6)ZAR/MZN 4.73 4.86 (2.7) 5.24 5.03 4.2ZAR/TZS 172.92 156.77 10.3 190.38 166.65 14.2EUR/ZAR 15.19 15.43 (1.6) 14.57 14.34 1.6ZAR/KES 7.95 7.27 9.4 8.52 7.69 10.8
Average QTD Closing QTD
Rm
31 March 31 Dec 30 Sept 30 June 31 March 31 Dec 30 Sept 30 June
2018 2017 2017 2017 2018 2017 2017 2017
USD/ZAR 11.95 13.61 13.20 13.21 11.85 12.39 13.54 13.06 ZAR/MZN 5.10 4.45 4.63 4.74 5.24 4.76 4.52 4.60 ZAR/TZS 187.90 164.71 169.75 169.33 190.38 179.99 165.77 171.50 EUR/ZAR 14.69 16.04 15.50 14.52 14.57 14.89 15.98 14.90 ZAR/KES 8.52 7.60 7.82 7.83 8.52 8.33 7.62 6.88

34 Vodacom Group Limited Preliminary results for the year ended 31 March 2018
Supplementary information continued
Historical key indicatorsSouth Africa for the quarter ended
31 March 31 Dec 30 Sept 30 June 31 March 31 Dec 30 Sept
2018 2017 2017 2017 2017 2016 2016
Customers1
(thousand) 41 635 41 602 40 000 39 381 37 131 36 375 35 685Prepaid 36 275 36 283 34 762 34 248 32 000 31 188 30 641Contract 5 360 5 319 5 238 5 133 5 131 5 187 5 044
Data customers2 (thousand) 20 347 20 503 19 905 19 167 19 549 19 261 18 158
Internet of Things connections3 (thousand) 3 628 3 495 3 271 3 100 2 979 2 810 2 626
Traffic4 (millions of minutes) 15 385 16 013 15 331 14 426 14 462 15 550 14 458Outgoing 13 101 13 612 12 976 12 109 12 105 13 158 12 062Incoming 2 284 2 401 2 355 2 317 2 357 2 392 2 396
MOU per month5 124 131 128 125 131 145 136Prepaid 113 120 118 115 122 138 127Contract 199 202 199 190 190 187 192
Total ARPU6
(rand per month) 99 102 101 103 109 114 112Prepaid 57 59 58 58 61 64 63Contract 381 393 391 393 401 414 415
Notes:1. Customers are based on the total number of mobile customers using any service during the last three months. This includes customers
paying a monthly fee that entitles them to use the service even if they do not actually use the service and those customers who are active whilst roaming.
2. Data customers are based on the number of unique users generating billable data traffic during the month. Also included are users on integrated tariff plans, or who have access to corporate APNs, and users who have been allocated a revenue generating data bundle during the month. A user is defined as being active if they are paying a contractual monthly fee for this service or have used the service during the reported month.
3. Internet of Things connections (IoT), is the remote wireless interchange between two or more predefined devices or a central station without direct relationship with an end customer, in order to support a specific business process or product.
4. Traffic comprises total traffic registered on Vodacom‘s mobile network, including bundled minutes, promotional minutes and outgoing international roaming calls, but excluding national roaming calls, incoming international roaming calls and calls to free services.
5. Minutes of use (MOU) per month is calculated by dividing the average monthly minutes (traffic) during the period by the average monthly customers during the period.
6. Total ARPU is calculated by dividing the average monthly service revenue by the average monthly customers during the period. Prepaid and contract ARPU only include service revenue generated from Vodacom mobile customers.

35
Historical key indicators continuedInternational for the quarter ended
31 March 31 Dec 30 Sept 30 June 31 March 31 Dec 30 Sept
2018 2017 2017 2017 2017 2016 2016
Customers1
(thousand) 32 194 32 012 31 092 29 936 29 655 28 794 27 918Tanzania 12 899 12 901 12 857 12 611 12 653 12 419 12 354DRC 11 821 11 982 11 453 10 792 10 388 9 702 9 204Mozambique 6 108 5 712 5 421 5 147 5 146 5 208 4 987Lesotho 1 366 1 417 1 361 1 386 1 468 1 465 1 373
Data customers2 (thousand) 16 573 16 013 14 755 13 807 12 997 12 620 11 965Tanzania 7 345 7 317 7 072 6 767 6 463 6 484 6 021DRC 4 825 4 470 4 175 3 982 3 705 3 354 3 191Mozambique 3 730 3 501 2 904 2 470 2 280 2 196 2 236Lesotho 673 725 604 588 549 586 517
MOU per month3
Tanzania 161 171 167 153 146 162 162DRC 36 36 42 44 44 48 56Mozambique 144 152 144 130 130 122 123Lesotho 83 92 86 81 79 90 81
30-day active M-Pesa customers4 (thousand) 11 757 11 117 10 755 10 089 9 963 8 848 8 508 Tanzania 6 369 6 266 6 189 5 934 6 198 5 555 5 541DRC 1 891 1 600 1 613 1 494 1 423 1 203 1 082Mozambique 3 109 2 908 2 625 2 343 2 029 1 804 1 637Lesotho 388 343 328 318 313 286 248
Total ARPU5
(rand per month)Tanzania 31 39 37 35 34 40 40DRC 34 39 37 42 37 48 56Mozambique 47 57 53 48 40 41 44Lesotho 71 77 69 64 54 66 63
Total ARPU5 (local currency per month)Tanzania (TZS) 5 734 6 369 6 295 5 946 5 674 6 279 6 187DRC (USD) 2.9 2.9 2.8 3.2 2.8 3.4 3.9Mozambique (MZN) 238 253 244 228 209 223 223
Notes:1. Customers are based on the total number of mobile customers using any service during the last three months. This includes customers
paying a monthly fee that entitles them to use the service even if they do not actually use the service and those customers who are active whilst roaming.
2. Data customers are based on the number of unique users generating billable data traffic during the month. Also included are users on integrated tariff plans, or who have access to corporate APNs, and users who have been allocated a revenue generating data bundle during the month. A user is defined as being active if they are paying a contractual monthly fee for this service or have used the service during the reported month.
3. Minutes of use (MOU) per month is calculated by dividing the average monthly minutes (traffic) during the period by the average monthly customers during the period.
4. M-Pesa customers are based on the number of unique customers who have generated revenue related to M-Pesa during the last month.5. Total ARPU is calculated by dividing the average monthly service revenue by the average monthly active customers during the period.
Prepaid and contract ARPU only include service revenue generated from Vodacom mobile customers.
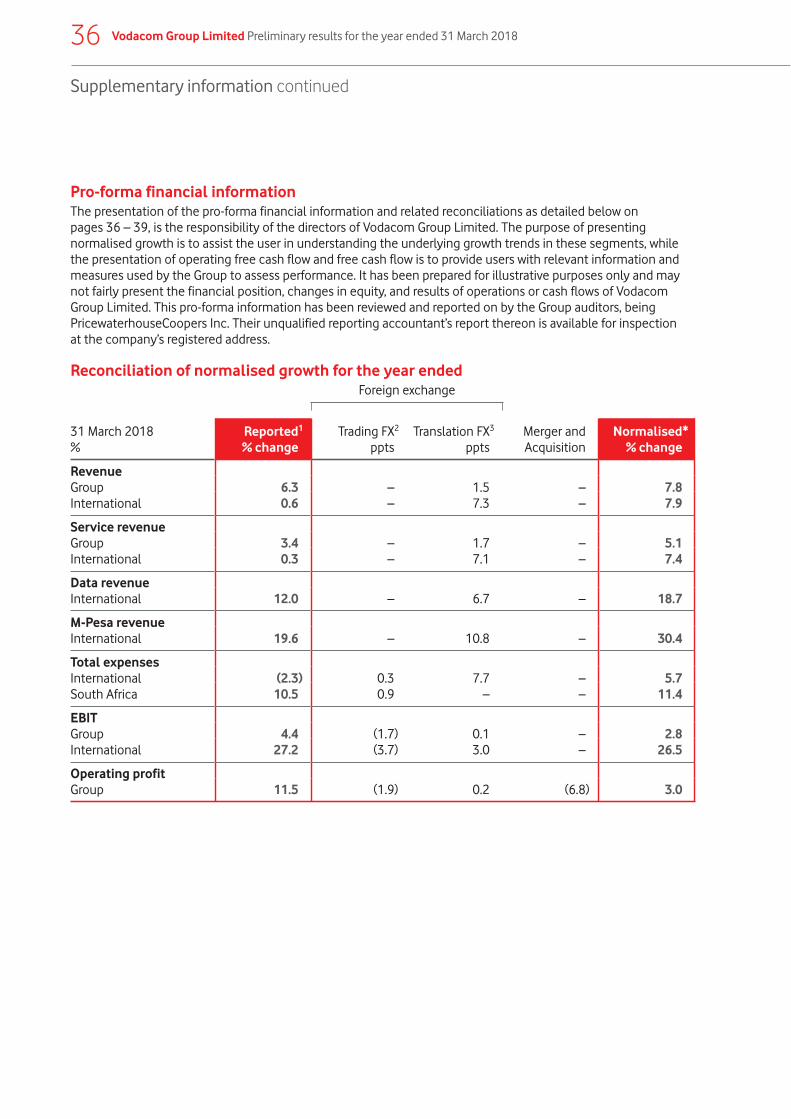
36 Vodacom Group Limited Preliminary results for the year ended 31 March 2018
Supplementary information continued
Pro-forma financial informationThe presentation of the pro-forma financial information and related reconciliations as detailed below on pages 36 – 39, is the responsibility of the directors of Vodacom Group Limited. The purpose of presenting normalised growth is to assist the user in understanding the underlying growth trends in these segments, while the presentation of operating free cash flow and free cash flow is to provide users with relevant information and measures used by the Group to assess performance. It has been prepared for illustrative purposes only and may not fairly present the financial position, changes in equity, and results of operations or cash flows of Vodacom Group Limited. This pro-forma information has been reviewed and reported on by the Group auditors, being PricewaterhouseCoopers Inc. Their unqualified reporting accountant’s report thereon is available for inspection at the company’s registered address.
Reconciliation of normalised growth for the year endedForeign exchange
31 March 2018%
Reported1
% changeTrading FX2
pptsTranslation FX3
pptsMerger andAcquisition
Normalised*% change
RevenueGroup 6.3 – 1.5 – 7.8International 0.6 – 7.3 – 7.9
Service revenueGroup 3.4 – 1.7 – 5.1International 0.3 – 7.1 – 7.4
Data revenueInternational 12.0 – 6.7 – 18.7
M-Pesa revenueInternational 19.6 – 10.8 – 30.4
Total expensesInternational (2.3) 0.3 7.7 – 5.7South Africa 10.5 0.9 – – 11.4
EBITGroup 4.4 (1.7) 0.1 – 2.8International 27.2 (3.7) 3.0 – 26.5
Operating profitGroup 11.5 (1.9) 0.2 (6.8) 3.0
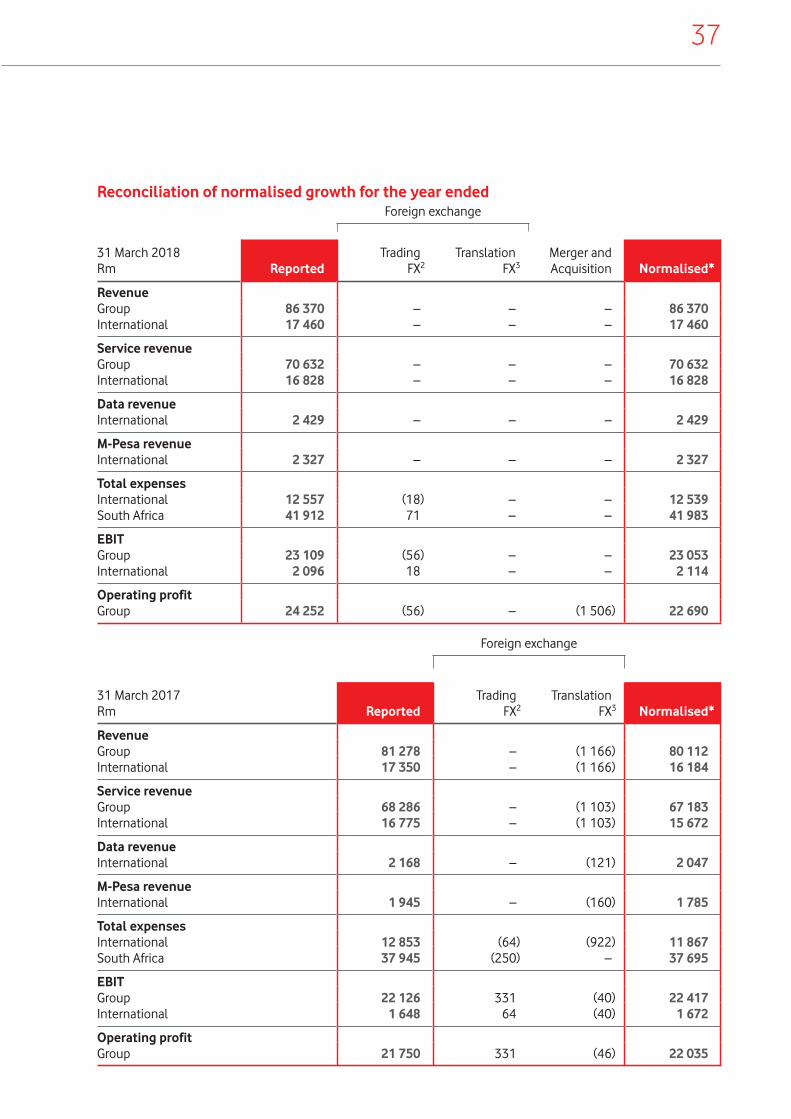
37
Reconciliation of normalised growth for the year endedForeign exchange
31 March 2018Rm Reported
TradingFX2
TranslationFX3
Merger andAcquisition Normalised*
RevenueGroup 86 370 – – – 86 370International 17 460 – – – 17 460
Service revenueGroup 70 632 – – – 70 632International 16 828 – – – 16 828
Data revenueInternational 2 429 – – – 2 429
M-Pesa revenueInternational 2 327 – – – 2 327
Total expensesInternational 12 557 (18) – – 12 539South Africa 41 912 71 – – 41 983
EBITGroup 23 109 (56) – – 23 053International 2 096 18 – – 2 114
Operating profitGroup 24 252 (56) – (1 506) 22 690
Foreign exchange
31 March 2017Rm Reported
TradingFX2
TranslationFX3 Normalised*
RevenueGroup 81 278 – (1 166) 80 112International 17 350 – (1 166) 16 184
Service revenueGroup 68 286 – (1 103) 67 183International 16 775 – (1 103) 15 672
Data revenueInternational 2 168 – (121) 2 047
M-Pesa revenueInternational 1 945 – (160) 1 785
Total expensesInternational 12 853 (64) (922) 11 867South Africa 37 945 (250) – 37 695
EBITGroup 22 126 331 (40) 22 417International 1 648 64 (40) 1 672
Operating profitGroup 21 750 331 (46) 22 035
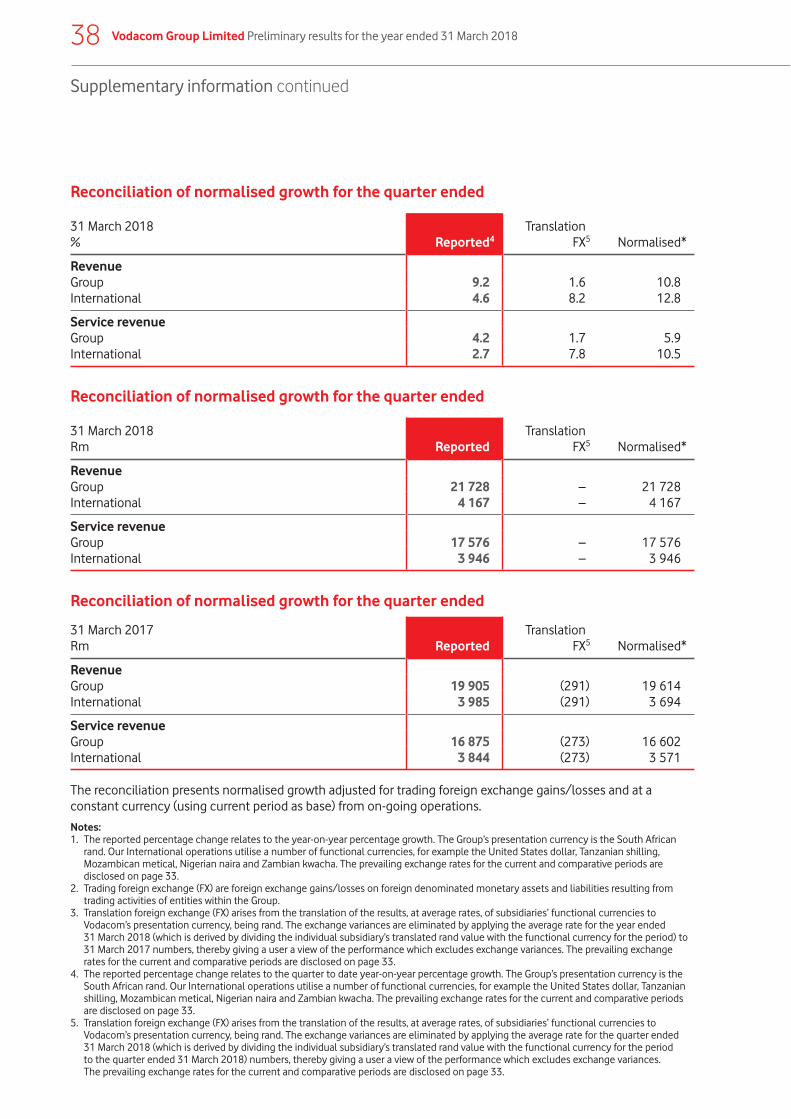
38 Vodacom Group Limited Preliminary results for the year ended 31 March 2018
Supplementary information continued
Reconciliation of normalised growth for the quarter ended
31 March 2018% Reported4
TranslationFX5 Normalised*
RevenueGroup 9.2 1.6 10.8International 4.6 8.2 12.8
Service revenueGroup 4.2 1.7 5.9International 2.7 7.8 10.5
Reconciliation of normalised growth for the quarter ended
31 March 2018Rm Reported
TranslationFX5 Normalised*
RevenueGroup 21 728 – 21 728International 4 167 – 4 167
Service revenueGroup 17 576 – 17 576International 3 946 – 3 946
Reconciliation of normalised growth for the quarter ended
31 March 2017Rm Reported
TranslationFX5 Normalised*
RevenueGroup 19 905 (291) 19 614International 3 985 (291) 3 694
Service revenueGroup 16 875 (273) 16 602International 3 844 (273) 3 571
The reconciliation presents normalised growth adjusted for trading foreign exchange gains/losses and at a constant currency (using current period as base) from on-going operations.
Notes:1. The reported percentage change relates to the year-on-year percentage growth. The Group’s presentation currency is the South African
rand. Our International operations utilise a number of functional currencies, for example the United States dollar, Tanzanian shilling, Mozambican metical, Nigerian naira and Zambian kwacha. The prevailing exchange rates for the current and comparative periods are disclosed on page 33.
2. Trading foreign exchange (FX) are foreign exchange gains/losses on foreign denominated monetary assets and liabilities resulting from trading activities of entities within the Group.
3. Translation foreign exchange (FX) arises from the translation of the results, at average rates, of subsidiaries’ functional currencies to Vodacom’s presentation currency, being rand. The exchange variances are eliminated by applying the average rate for the year ended 31 March 2018 (which is derived by dividing the individual subsidiary’s translated rand value with the functional currency for the period) to 31 March 2017 numbers, thereby giving a user a view of the performance which excludes exchange variances. The prevailing exchange rates for the current and comparative periods are disclosed on page 33.
4. The reported percentage change relates to the quarter to date year-on-year percentage growth. The Group’s presentation currency is the South African rand. Our International operations utilise a number of functional currencies, for example the United States dollar, Tanzanian shilling, Mozambican metical, Nigerian naira and Zambian kwacha. The prevailing exchange rates for the current and comparative periods are disclosed on page 33.
5. Translation foreign exchange (FX) arises from the translation of the results, at average rates, of subsidiaries’ functional currencies to Vodacom’s presentation currency, being rand. The exchange variances are eliminated by applying the average rate for the quarter ended 31 March 2018 (which is derived by dividing the individual subsidiary’s translated rand value with the functional currency for the period to the quarter ended 31 March 2018) numbers, thereby giving a user a view of the performance which excludes exchange variances. The prevailing exchange rates for the current and comparative periods are disclosed on page 33.
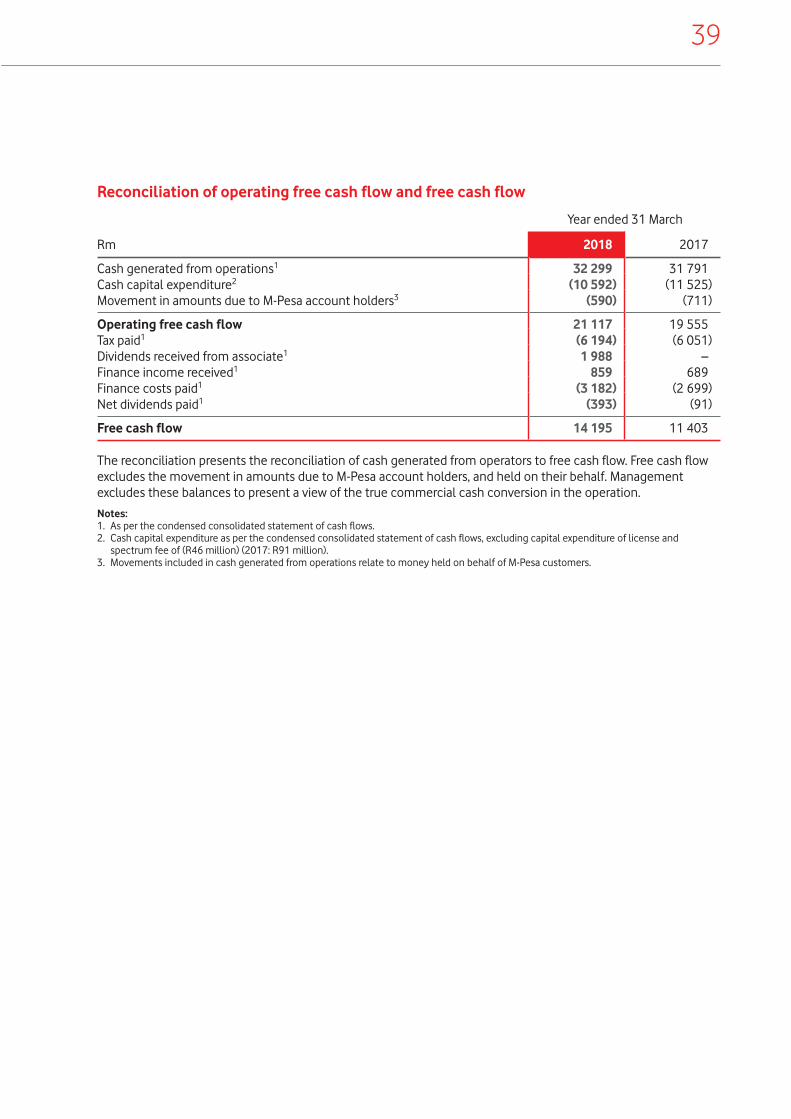
39
Reconciliation of operating free cash flow and free cash flow
Year ended 31 March
Rm 2018 2017
Cash generated from operations1 32 299 31 791Cash capital expenditure2 (10 592) (11 525)Movement in amounts due to M-Pesa account holders3 (590) (711)
Operating free cash flow 21 117 19 555Tax paid1 (6 194) (6 051)Dividends received from associate1 1 988 –Finance income received1 859 689Finance costs paid1 (3 182) (2 699)Net dividends paid1 (393) (91)
Free cash flow 14 195 11 403
The reconciliation presents the reconciliation of cash generated from operators to free cash flow. Free cash flow excludes the movement in amounts due to M-Pesa account holders, and held on their behalf. Management excludes these balances to present a view of the true commercial cash conversion in the operation.
Notes:1. As per the condensed consolidated statement of cash flows.2. Cash capital expenditure as per the condensed consolidated statement of cash flows, excluding capital expenditure of license and
spectrum fee of (R46 million) (2017: R91 million). 3. Movements included in cash generated from operations relate to money held on behalf of M-Pesa customers.

40 Vodacom Group Limited Preliminary results for the year ended 31 March 2018
Additional financial and operational measuresThis announcement contains certain financial (i.e. service revenue, enterprise service revenue, EBITDA and EBIT) and operational (i.e. customers, ARPUs and number of employees) measures which are presented in addition to the financial information disclosed in the preliminary condensed consolidated financial statements and the audited financial statements for the year ended 31 March 2018 which have been prepared in terms of IFRS. The Group’s management believes these measures provide valuable additional information in understanding the performance of the Group or the Group’s businesses because they provide measures used by the Group to assess performance. However, this additional information presented is not uniformly defined by all companies, including those in the Group’s industry. Accordingly, it may not be comparable with similarly titled measures and disclosures by other companies. Additionally, although these measures are important in the management of the business, they should not be viewed in isolation or as replacements for or alternatives to, but rather as complementary to, the preliminary condensed consolidated financial statements and the audited financial statements for the year ended 31 March 2018. The financial measures have been extracted from the management accounts upon which the preliminary condensed consolidated financial statements and the audited financial statements for the year ended 31 March 2018 are based. Refer to pages 6 to 9 for details relating to service revenue, EBIT and headline earnings per share and the supplementary information on pages 27 to 39 for a reconciliation thereof to the reported results included in this announcement.
TrademarksVodafone, the Vodafone logo, M-PESA, Connected Farmer, Vodafone Supernet, Vodafone Mobile Broadband, Vodafone WebBox, Vodafone Passport, Vodafone live!, Power to You, Vodacom, Vodacom 4 Less and Vodacom Change the World are trademarks of Vodafone Group Plc (or have applications pending). Other product and company names mentioned herein may be the trademarks of their respective owners.
Forward-looking statementsThis announcement which sets out the annual results for Vodacom Group Limited for the year ended 31 March 2018 contains ‘forward-looking statements’, which have not been reviewed or reported on by the Group’s auditors, with respect to the Group’s financial condition, results of operations and businesses and certain of the Group’s plans and objectives. In particular, such forward-looking statements include, but are not limited to, statements with respect to: expectations regarding the Group’s financial condition or results of operations including the confirmation of the Group’s targets, expectations for the Group’s future performance generally; expectations regarding the operating environment and market conditions and trends; intentions and expectations regarding the development, launch and expansion of products, services and technologies; growth in customers and usage; expectations regarding spectrum licence acquisitions; expectations regarding adjusted EBITDA, capital additions, free cash flow, and foreign exchange rate movements; and expectations regarding the integration or performance of current and future investments, associates, joint ventures, non-controlled interests and newly acquired businesses.
Forward-looking statements are sometimes, but not always, identified by their use of a date in the future or such words as “will”, “anticipates”, “aims”, “could”, “may”, “should”, “expects”, “believes”, “intends”, “plans” or “targets” (including in their negative form). By their nature, forward-looking statements are inherently predictive, speculative and involve risk and uncertainty because they relate to events and depend on circumstances that may or may not occur in the future. There are a number of factors that could cause actual results and developments to differ materially from those expressed or implied by these forward-looking statements. These factors include, but are not limited to, the following: changes in economic or political conditions in markets served by operations of the Group; greater than anticipated competitive activity; higher than expected costs or capital expenditures; slower than expected customer growth and reduced customer retention; changes in the spending patterns of new and existing customers; the Group’s ability to expand its spectrum position or renew or obtain necessary licences; the Group’s ability to achieve cost savings; the Group’s ability to execute its strategy in fibre deployment, network expansion, new product and service roll-outs, mobile data, Enterprise and broadband; changes in foreign exchange rates, as well as changes in interest rates; the Group’s ability to realise benefits from entering into partnerships or joint ventures and entering into service franchising and brand licensing; unfavourable consequences to the Group of making and integrating acquisitions or disposals; changes to the regulatory framework in which the Group operates; the impact of legal or other proceedings; loss of suppliers or disruption of supply chains; developments in the Group’s financial condition, earnings and distributable funds and other factors that the Board takes into account when determining levels of dividends; the Group’s ability to satisfy working capital and other requirements; changes in statutory tax rates or profit mix; and/or changes in tax legislation or final resolution of open tax issues.
All subsequent written or oral forward-looking statements attributable to the Company, to any member of the Group or to any persons acting on their behalf are expressly qualified in their entirety by the factors referred to above. No assurances can be given that the forward-looking statements in this document will be realised. Subject to compliance with applicable law and regulations, Vodacom does not intend to update these forward-looking statements and does not undertake any obligation to do so.
Corporate information
41
Vodacom Group Limited(Incorporated in the Republic of South Africa)Registration number: 1993/005461/06(ISIN: ZAE000132577 Share code: VOD)(ISIN: US92858D2009 ADR code: VDMCY)(Vodacom)
DirectorsPJ Moleketi (Chairman), MS Aziz Joosub (CEO), T Streichert (CFO)1, V Badrinath2, DH Brown, M Joseph3, BP Mabelane, SJ Macozoma, TM Mokgosi-Mwantembe, JWL Otty4, M Pieters5, RAW Schellekens5
1. German 2. French 3. American 4. British 5. Dutch
Registered officeVodacom Corporate Park,082 Vodacom Boulevard,Midrand 1685(Private Bag X9904, Sandton 2146)
Transfer secretaryComputershare Investor Services (Proprietary) Limited(Registration number 2004/003647/07)Rosebank Towers15 Biermann AvenueRosebank 2196South Africa(PO Box 61051, Marshalltown 2107, South Africa)
SponsorUBS South Africa (Pty) Limited
ADR depository bankDeutsche Bank Trust Company Americas
Company secretary SF Linford
Media relationsByron Kennedy
Investor relationsShaun van Biljon