using diffraction imaging for prospect evaluation in the ... · pdf file• lateral...
TRANSCRIPT

Using Diffraction Imaging for
Prospect Evaluation in the Dutch Offshore
David Bréthaut, Bob Hartstra, Makky Jaya, Tijmen Jan Moser
EBN Dutch Exploration Day, 23 November 2017

2SGS Subsurface Consultancy
Presentation content
Setting the scene
Diffraction Imaging – basic principles
Case study
• Fault interpretation
• How can DI assist in well planning?
Conclusions

3SGS Subsurface Consultancy
PSTM reprocessed in 2015SW NE
Top Bunter
Top Keuper
ZOOM NEXT SLIDE
500m
Black = AI increase
• Offshore Netherlands
General structural setting
• Rifting and subsequent
inversion with strike-slip
movements
• Flower structure
• Complex fault
geometries
Field information
• Bunter reservoir / Gas
• 3-way dip closure
• NW-SE boundary fault
BCU
Geological setting
4SGS Subsurface Consultancy
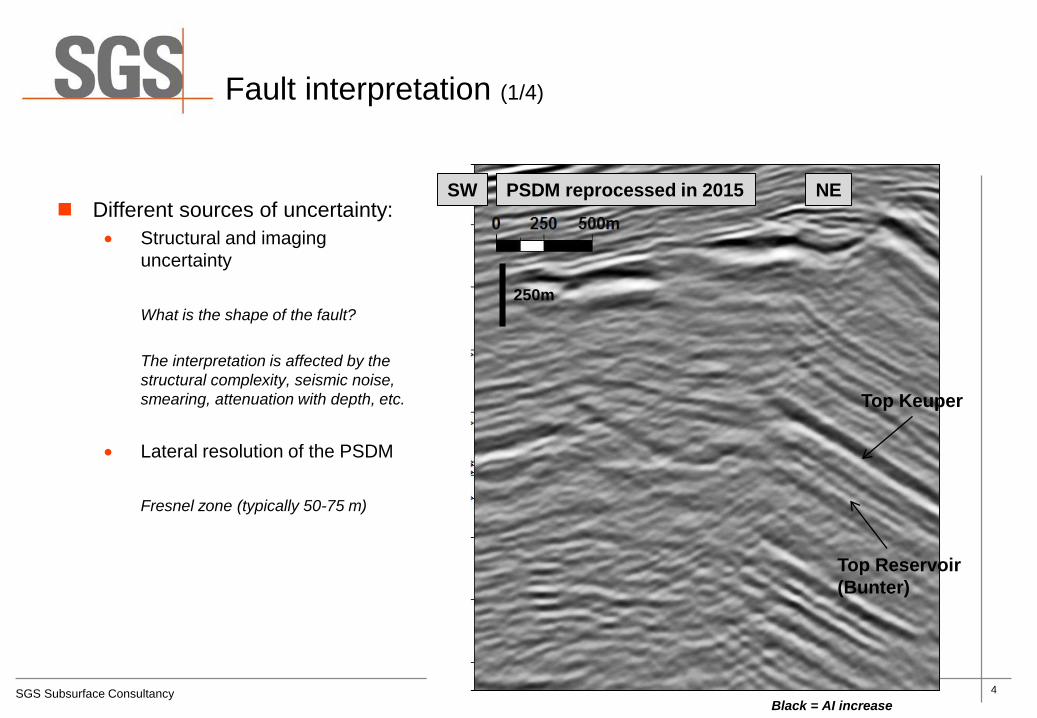
Fault interpretation (1/4)
PSDM reprocessed in 2015 NE
Top Reservoir
(Bunter)
Top Keuper
Black = AI increase
Different sources of uncertainty:
• Structural and imaging
uncertainty
What is the shape of the fault?
The interpretation is affected by the
structural complexity, seismic noise,
smearing, attenuation with depth, etc.
• Lateral resolution of the PSDM
Fresnel zone (typically 50-75 m)
250m
SW

5SGS Subsurface Consultancy
Fault interpretation (1/4)
PSDM reprocessed in 2015 NE
Top Reservoir
(Bunter)
Top Keuper
Black = AI increase
Different sources of uncertainty:
• Structural and imaging
uncertainty
What is the shape of the fault?
The interpretation is affected by the
structural complexity, seismic noise,
smearing, attenuation with depth, etc.
• Lateral resolution of the PSDM
Fresnel zone (typically 50-75 m)
SW
250m

6SGS Subsurface Consultancy
i r
Snell's law: i = r
Diffraction:
The process by which a beam of waves is
spread out as a result of passing through a
narrow aperture or across an edge.
• What is diffraction?
• Reflections satisfy Snell’s law
• Diffractions do not
Diffraction Imaging – what is it? (1/2)

7SGS Subsurface Consultancy
Wiggles: Reflections
Colour: Diffraction multi-poles
Diffraction Imaging – what is it? (2/2)
Diffractions are created at discontinuities:
• Edges (result in lines)
• Tips (result in points)
In the subsurface, such discontinuities can reveal:
• Faults
• Pinch-outs
• Contacts, etc…
Diffractions are imaged as multi-poles

8SGS Subsurface Consultancy
Improved lateral positioning
• The position of discontinuities is better defined with Diffraction Imaging:
– Zero-width Fresnel zone (at diffraction depth)
– No tuning limitations as with specular reflections (next slide)
Superior illumination
Specular reflection + Fresnel zone
• Smearing of detail
• Depends on mirror orientation
Diffraction + Fresnel zone
• No smearing (zero-width Fresnel zone)
• No mirror (superior illumination)
Diffraction Imaging – lateral resolution (1/2)

9SGS Subsurface Consultancy
Reflection tuning might
limit the imaging of
discontinuities
In such cases, Diffraction
Imaging can help identify
with more precision:
• Pinch-outs
• Fluid contact features
Pinch-out
Large uncertainty
Improved accuracy
Diffraction Imaging
Model
Lateral positioning of a pinch-out
Standard migration
Diffraction Imaging – lateral resolution (2/2)

10SGS Subsurface Consultancy
Processing workflow
PSDM DI
Raw data
Pre-processing
Gathers / CDP
Velocity analysis
Large part of DI processing
workflow is shared with
PSDM processing
Time/Cost effective

11SGS Subsurface Consultancy
Fault interpretation (1/4)
PSDM reprocessed in 2015 NE
Top Reservoir
(Bunter)
Before drilling, there was a large
uncertainty regarding the position
of the prospect boundary fault
Alternative interpretations:
• Mid case
• Conservative case
• Upside case
Prospect
boundary
fault
SW
Black = AI increase
250m

12SGS Subsurface Consultancy
Fault interpretation (2/4)
Top Reservoir
(Bunter)
Before drilling, there was a large
uncertainty regarding the position
of the prospect boundary fault
Alternative interpretations:
• Mid case
• Conservative case
• Upside case
Prospect
boundary
fault
PSDM reprocessed in 2015 NESW
Black = AI increase
250m

13SGS Subsurface Consultancy
Fault interpretation (3/4)
Top Reservoir
(Bunter)
Before drilling, there was a large
uncertainty regarding the position
of the prospect boundary fault
Alternative interpretations:
• Mid case
• Conservative case
• Upside case
Prospect
boundary
fault
PSDM reprocessed in 2015 NESW
Black = AI increase
250m

14SGS Subsurface Consultancy
Fault interpretation (4/4)
Two wells have been drilled:
• Well X
– Reached the downthrown block
• Sidetrack
– Successfully reached the reservoir
– Pinpointed the fault, which is found in
a more easterly position than
suggested by PSDM
Well X
Well X sidetrack
TOP BUNTER DEPTH MAP
PSDM reprocessed in 2015SW NE
Top Reservoir
(Bunter)
Keuper marker
Bunter marker
Well X
Sidetrack
Top Keuper
Black = AI increase

15SGS Subsurface Consultancy
Diffraction Imaging
Diffraction Imaging 2015 NE Diffraction poles (red/blue)
at discontinuities
Strong diffractivity at
reservoir level
Red = positive; Blue = negative
SW
250m
16SGS Subsurface Consultancy
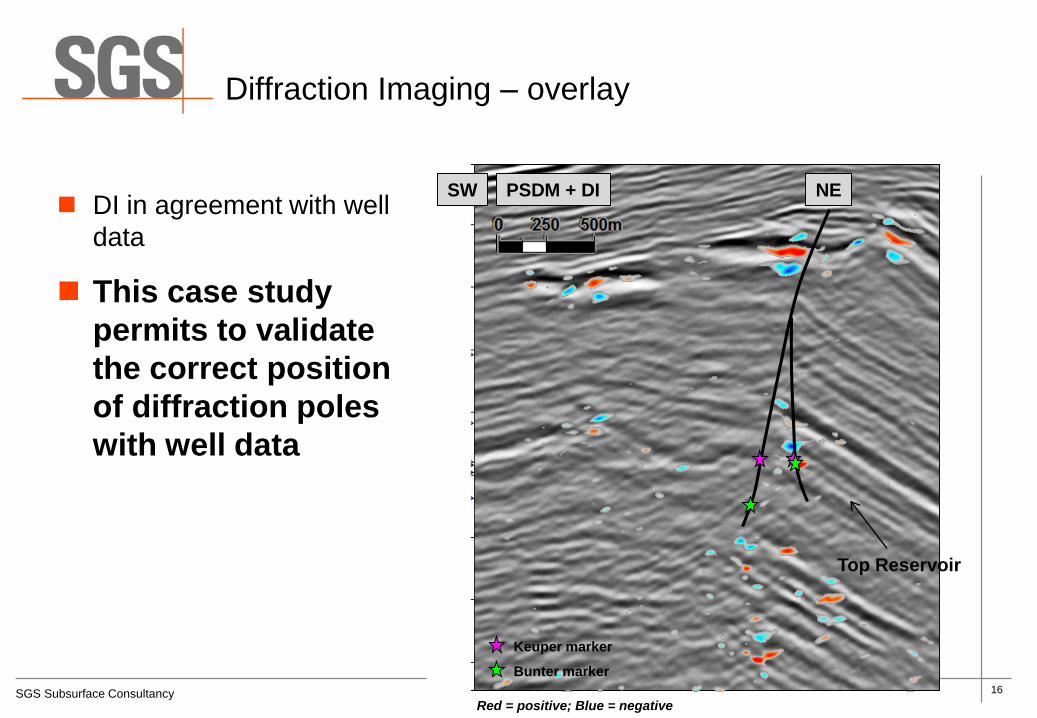
Diffraction Imaging – overlay
PSDM + DI NE
Top Reservoir
Red = positive; Blue = negative
Keuper marker
Bunter marker
DI in agreement with well
data
This case study
permits to validate
the correct position
of diffraction poles
with well data
SW

17SGS Subsurface Consultancy
PSDM + DI NE
Top Reservoir
Red = positive; Blue = negative
Keuper marker
Bunter marker
PSDM lateral resolution
uncertainty bar
The use of DI permits to
adjust the fault
interpretation
Final fault position on the
outer edge of the Fresnel
zone of the conservative
scenario
SW
Diffraction Imaging – interpretation

18SGS Subsurface Consultancy
Attribute extractions
Purple = high; Grey = low
• The shape of the fault is revealed by the DI attributes
• The fault location is in agreement with the well data
Improved fault positioning
Top Keuper marker
Red = positive; Blue = negative
• Various discontinuities observed
• Local PSDM imprints similar to faults
Does not allow accurate fault
positioning
Variance – depth slice Maximum magnitude – depth slice +/-70m Amplitude – extracted @ top reservoir
PSDM attribute Diffraction Imaging attributes

19SGS Subsurface Consultancy
Attribute extractions
Purple = high; Grey = low
• The shape of the fault is revealed by the DI attributes
• The fault location is in agreement with the well data
Improved fault positioning
Top Keuper marker
Red = positive; Blue = negative
• Various discontinuities observed
• Local PSDM imprints similar to faults
Does not allow accurate fault
positioning
Variance – depth slice Maximum magnitude – depth slice +/-70m Amplitude – extracted @ top reservoir
PSDM attribute Diffraction Imaging attributes
Brightening with gas

20SGS Subsurface Consultancy
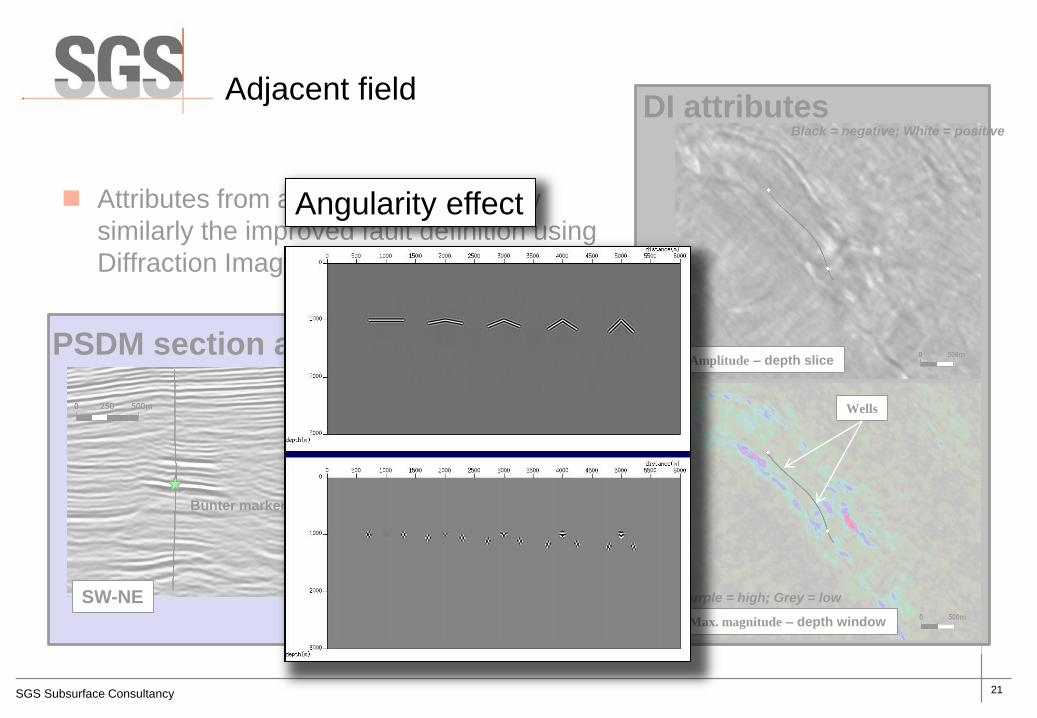
Adjacent field
SW-NE
Bunter marker
DI attributes
PSDM section and attribute
Variance – depth slice
Amplitude – depth slice
Max. magnitude – depth window
Wells
Black = negative; White = positive
Purple = high; Grey = low
Seismic section
Attributes from an adjacent field show
similarly the improved fault definition using
Diffraction Imaging
21SGS Subsurface Consultancy
SW-NE
Bunter marker
DI attributes
PSDM section and attribute
Variance – depth slice
Amplitude – depth slice
Max. magnitude – depth window
Wells
Black = negative; White = positive
Purple = high; Grey = low
Seismic section
Attributes from an adjacent field show
similarly the improved fault definition using
Diffraction Imaging
Adjacent field
Angularity effect

22SGS Subsurface Consultancy
Conclusions
1. Diffraction Imaging allows locating the position of faults with an
improved accuracy compared to reflection data
• Validation through the case study
2. Diffraction Imaging is a valuable complementary source of
information for seismic interpretation
• Fault positioning
• Positioning of well targets
• Delineation of field edges
• Reduction of drilling risk for narrow fault-bounded prospects