the price history of english agriculture, 1209-1914the price history of english agriculture,...
TRANSCRIPT
The Price History of English Agriculture, 1209-1914
Gregory Clark University of California, Davis
October 9, 2003 The paper constructs an annual price series for English net agricultural output in the years 1200-1914 using 26 component series: wheat, barley, oats, rye, peas, beans, potatoes, hops, straw, mustard seed, saffron, hay, beef, mutton, pork, bacon, tallow, eggs, milk, cheese, butter, wool, firewood, timber, cider, and honey. I also construct sub-series for arable, pasture and wood products. The main innovation is in using a consistent method to form series from existing published sources. But fresh archival data is also incorporated. The implications of the movements of these series for agrarian history are explored.
Introduction Despite the considerable research conducted on the price history of England since James
Thorold Rogers’ classic nineteenth century work there is no aggregate series available on the
movement of agricultural prices over these years. Lord Beveridge gave price series for a large
number of commodities in the years 1540 to 1830, but no overall aggregate. The extensive
volumes of the Agrarian History of England and Wales all contain considerable price evidence.
But the years 1200 to 1914 are covered by six different volumes all of which treated price
information differently. The medieval volumes have individual price series constructed by
David Farmer, but again no aggregate series. The volumes for 1500-1640 and 1640-1750 both
give overall price indices constructed by Peter Bowden. But because of the untimely death of A.
H. John the 1750-1850 volume gave only price series for individual commodities. The volume
for 1850-1914 has a general series constructed by Bethany Afton and Michael Turner starting in
1867. Thus there is no continuous series available most of the years 1209-1914, which include
those of the reputed agricultural revolution.

This paper constructs such an index that combines the available published price series
and collections with archival sources. The main published sources of prices before 1750 have
been Thorold Rogers (1866, 1882, 1888, 1902), Beveridge (1939), and the series compiled by
David Farmer for the Agrarian History of England and Wales, volumes 2 and 3 (Farmer (1988,
1991b)). The main sources thereafter have been the series published in the Agrarian History of
England and Wales volumes 6 and 7 (John (1989), Afton and Turner (2000)), and the Board of
Trade Report of 1903 (Parliamentary Papers (1903)). But these sources have been supplemented
with prices from printed churchwarden’s and town treasurer’s accounts, and from the printed
records of the Carpenters Company (Marsh (1915-39)).
Beveridge also accumulated much unpublished material for the projected second volume
of his Price History which would deal with the manorial era. Most of this unpublished price
material, now at the Robbins Library at LSE has been incorporated. For the most important
commodity in the years before 1500, wheat, the underlying data from the Farmer series was
obtained from the Farmer Archive at the University of Saskatchewan Library, Saskatoon,
Saskatchewan, and combined with other sources such as Thorold Rogers, and Beveridge’s Exeter
prices to form a new series. Prices for hay, firewood and timber were also collected for the years
after 1780 from a variety of archival sources, including the King’s College, Cambridge, Mundum
Books.
The Method of Construction The index aimed for here is of the price of the net output of products of the agricultural
sector of the economy. Thus products such as oats and hay that were used, for example, as
animal fodder within the farm sector will get less weight than they would if the index was
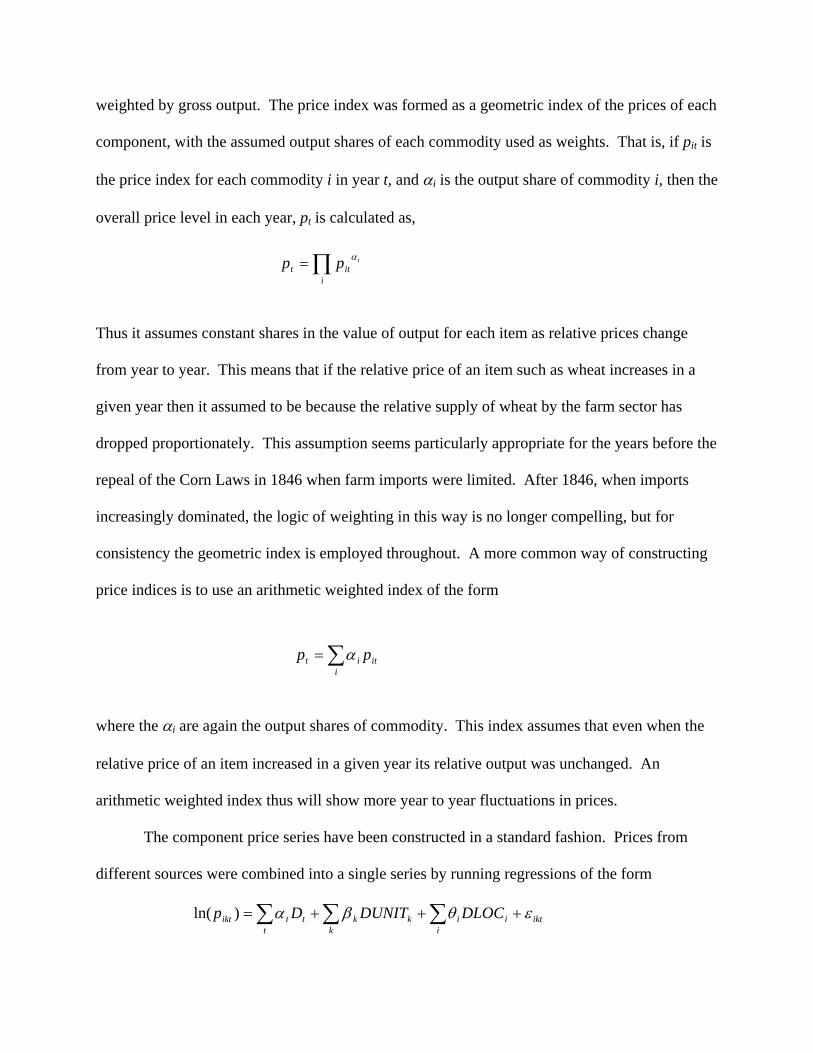
weighted by gross output. The price index was formed as a geometric index of the prices of each
component, with the assumed output shares of each commodity used as weights. That is, if pit is
the price index for each commodity i in year t, and αi is the output share of commodity i, then the
overall price level in each year, pt is calculated as,
Thus it assumes constant shares in the value of output for each item as relative prices change
from year to year. This means that if the relative price of an item such as wheat increases in a
given year then it assumed to be because the relative supply of wheat by the farm sector has
dropped proportionately. This assumption seems particularly appropriate for the years before the
repeal of the Corn Laws in 1846 when farm imports were limited. After 1846, when imports
increasingly dominated, the logic of weighting in this way is no longer compelling, but for
consistency the geometric index is employed throughout. A more common way of constructing
price indices is to use an arithmetic weighted index of the form
where the αi are again the output shares of commodity. This index assumes that even when the
relative price of an item increased in a given year its relative output was unchanged. An
arithmetic weighted index thus will show more year to year fluctuations in prices.
The component price series have been constructed in a standard fashion. Prices from
different sources were combined into a single series by running regressions of the form
iktik i
ikktt
tikt LOCDDUNITDp εθβα +++= ∑ ∑∑)ln(
∏=i
ittipp α
∑=i
itit pp α
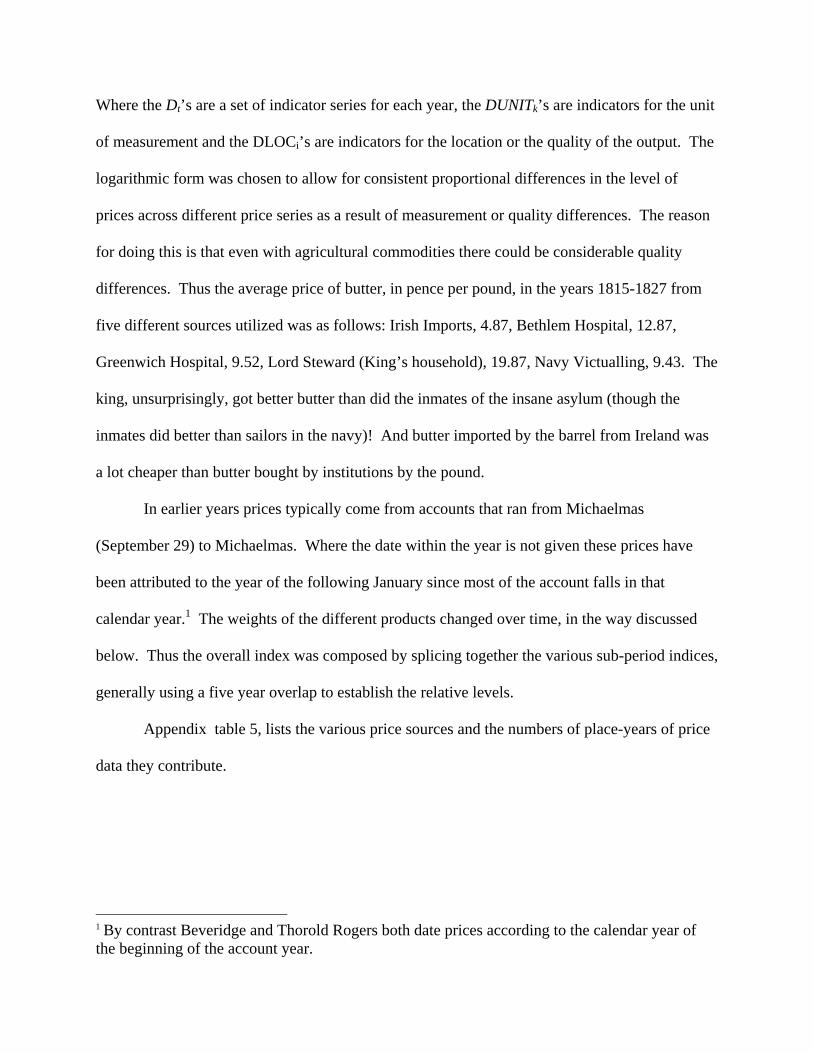
Where the Dt’s are a set of indicator series for each year, the DUNITk’s are indicators for the unit
of measurement and the DLOCi’s are indicators for the location or the quality of the output. The
logarithmic form was chosen to allow for consistent proportional differences in the level of
prices across different price series as a result of measurement or quality differences. The reason
for doing this is that even with agricultural commodities there could be considerable quality
differences. Thus the average price of butter, in pence per pound, in the years 1815-1827 from
five different sources utilized was as follows: Irish Imports, 4.87, Bethlem Hospital, 12.87,
Greenwich Hospital, 9.52, Lord Steward (King’s household), 19.87, Navy Victualling, 9.43. The
king, unsurprisingly, got better butter than did the inmates of the insane asylum (though the
inmates did better than sailors in the navy)! And butter imported by the barrel from Ireland was
a lot cheaper than butter bought by institutions by the pound.
In earlier years prices typically come from accounts that ran from Michaelmas
(September 29) to Michaelmas. Where the date within the year is not given these prices have
been attributed to the year of the following January since most of the account falls in that
calendar year.1 The weights of the different products changed over time, in the way discussed
below. Thus the overall index was composed by splicing together the various sub-period indices,
generally using a five year overlap to establish the relative levels.
Appendix table 5, lists the various price sources and the numbers of place-years of price
data they contribute.
1 By contrast Beveridge and Thorold Rogers both date prices according to the calendar year of the beginning of the account year.

Output Weights The shares of commodities in net output in English agriculture changed over time. Since
the price of individual commodities moved in different ways, the weighting thus matters to the
movement of the overall price index. There are a number of sources on weights for the late
nineteenth century, after agricultural statistics were established in 1866.2 Before 1866 the
weightings have to be inferred indirectly. Since before the late eighteenth century there were
few imports or exports of food products I infer some of the weightings of farm output from the
consumption patterns of workers in mid-nineteenth century England. Henry Rew, for example,
estimates that in 1892 the British population consumed 12 lbs. of cheese, 15 lbs. of butter and 15
gallons of milk per capita (Rew (1892), p. 272). This implies relative weights for cheese, butter
and milk for the years before 1866 of .2, .39 and .41 based on relative prices in the nineteenth
century. Rew (1904) also reports on late nineteenth century studies of meat consumption relative
to dairy products.
One important consideration is the much greater importance of wood products before
1760. In the years after 1810, as witnessed by charity farmland holdings, timber was a small
share of output from English agriculture: construction timber was mainly imported. Further coal
had replaced firewood as the main source of heat and energy. But before the great rise of coal
output and of timber imports in the eighteenth century, all the wood for construction and most of
the energy for heating homes, making bricks, and smelting iron was produced domestically.
Wood output must have been a much greater share of agricultural production. I estimate, for the
reasons enumerated below in the section on wood and fuel, that 10 percent of output from
English agriculture in the years before 1760 was wood. Since wood land required little labor
input, the gross output per acre had to be much higher on arable and pasture land to equalize
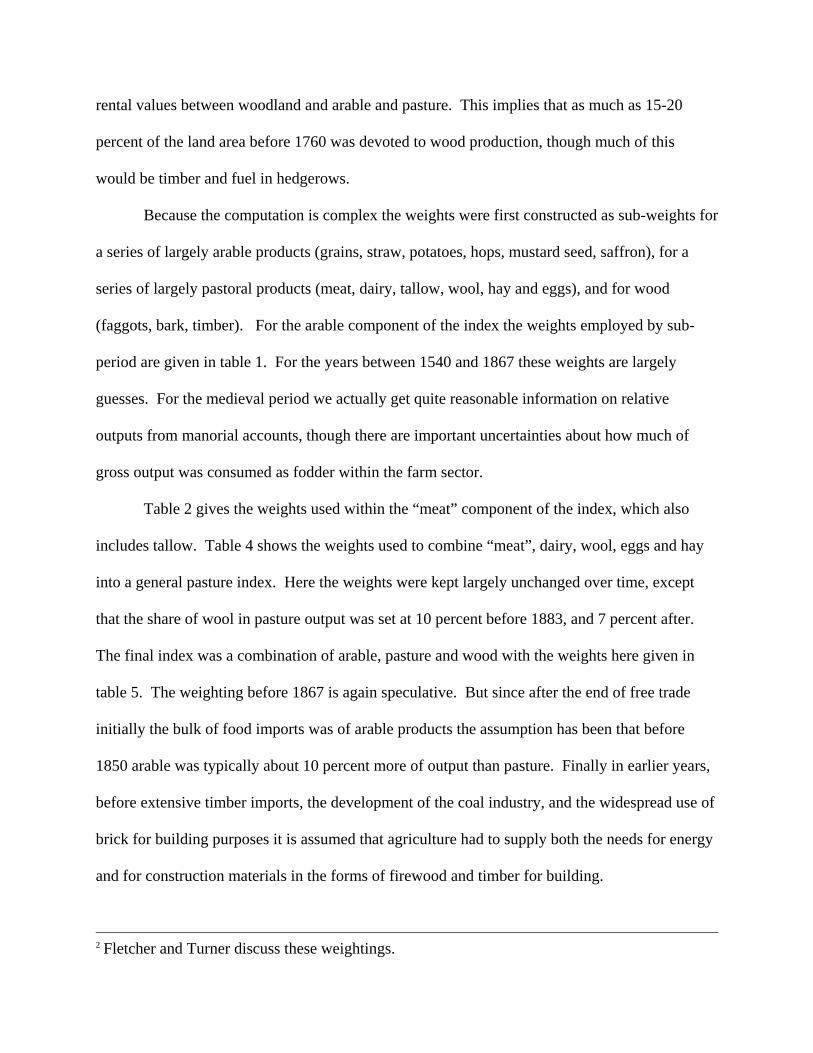
rental values between woodland and arable and pasture. This implies that as much as 15-20
percent of the land area before 1760 was devoted to wood production, though much of this
would be timber and fuel in hedgerows.
Because the computation is complex the weights were first constructed as sub-weights for
a series of largely arable products (grains, straw, potatoes, hops, mustard seed, saffron), for a
series of largely pastoral products (meat, dairy, tallow, wool, hay and eggs), and for wood
(faggots, bark, timber). For the arable component of the index the weights employed by sub-
period are given in table 1. For the years between 1540 and 1867 these weights are largely
guesses. For the medieval period we actually get quite reasonable information on relative
outputs from manorial accounts, though there are important uncertainties about how much of
gross output was consumed as fodder within the farm sector.
Table 2 gives the weights used within the “meat” component of the index, which also
includes tallow. Table 4 shows the weights used to combine “meat”, dairy, wool, eggs and hay
into a general pasture index. Here the weights were kept largely unchanged over time, except
that the share of wool in pasture output was set at 10 percent before 1883, and 7 percent after.
The final index was a combination of arable, pasture and wood with the weights here given in
table 5. The weighting before 1867 is again speculative. But since after the end of free trade
initially the bulk of food imports was of arable products the assumption has been that before
1850 arable was typically about 10 percent more of output than pasture. Finally in earlier years,
before extensive timber imports, the development of the coal industry, and the widespread use of
brick for building purposes it is assumed that agriculture had to supply both the needs for energy
and for construction materials in the forms of firewood and timber for building.
2 Fletcher and Turner discuss these weightings.

Arable Product Prices
Appendix table 1 gives the detailed price series for eleven arable products, counting
saffron as arable. Hops prices are quoted net of the excise tax levied between the 1660s and
1860s.3 In constructing an index of arable prices overall where individual price quotes were
missing the index was interpolated using the prices of the other products.
Within the arable sector relative prices changed significantly over the years. Figure 1
shows, as a 10 year average, the prices of barley, peas and oats, relative to wheat. After 1810-9,
with increasing imports of grains into Britain, from Ireland and from Europe and later the
Americas, the relative prices of all other grains increased steadily relative to wheat. From 1200
to 1800 the general trend is a modest decline in other grain prices relative to wheat.
Campbell et al. (1993) report the kcal content per bushel of various grains if they were
completely milled. These imply, for our bushel measure, that a bushel of barley had 82% of the
calorie content of a bushel of wheat, while a bushel of oats had 74% of the calorie content.4 This
in turn implies that throughout the pre-industrial period both barley and oats were a much
cheaper source of food energy than wheat. In the years before 1350 oats cost only 54% as much
per calorie as wheat. From 1350 to 1550 the cost was only 47% in calorie terms. Only in the
late nineteenth century did the relative costs of barley and oats approach their relative calorie
content. The relatively high prices of wheat calories in the pre-industrial period seems to reflect
just the constraints of arable rotations in Europe where it was impossible to produce a wheat crop
more than once every three or four years on arable land, despite the strong preference for wheat
in consumption. Thus the poor ate porridge and the rich wheat bread.
3 The details of the tax were obtained from Dowell (1884). 4 Campbell et al. (1993), p. 41.

Pasture Prices
Appendix table 2 gives the detailed price series for eleven pasture products (where I have
including eggs in pasture). In forming these series into an overall pasture series the butter,
cheese and milk/cream series were first formed into a dairy series (weighting each series
equally), and beef, mutton, pork, bacon, tallow and eggs were formed into a meat series
(weighting as in table 2). Before 1600 it is very hard to find meat prices by the pound as most
meat was sold by the animal, or the joint. Peter Bowden uses these animal prices to estimate the
movement of meat prices (Bowden (1967)). But an unstated assumption in that case is that the
weights of animals did not change over time. Here I prefer to extend the meat price series in
earlier years by using the prices of tallow, an animal product sold by the pound, and of eggs.
Appendix table 4 shows these meat and dairy series, in each case set to average 100 in
1860-9. As with arable outputs the relative prices of the different pastoral outputs were changing
over time. Figure 2 shows pasture prices relative to the cost of hay, which indexes the cost of
fodder, a major cost in the production of animal products, with 1860-9 set to 1. Interestingly
there is little trend in this series all the way from 1600-9 to 1910-4. A pound of meat or a gallon
of milk cost the same relative to a ton of hay in the early twentieth century as in the early
seventeenth century. If there had been major gains through animal breeding in the efficiency
with which animals converted fodder into animal products then we would expect to see these
ratios fall over time. Thus the price series here suggest little productivity growth in the pastoral
sector in the years 1600-1914. Before the sixteenth century, however, pasture outputs were
relatively expensive compared to hay, suggesting possible improvements in livestock breeding
and husbandry practices in these years. Thus the relative price of pastoral products compared to
hay was between two and three times as great in 1300-99 as in 1600-99. This implies that
sometime in the sixteenth century there must have been significant gains in the efficiency of the
production of pastoral products.
Figure 3 shows the ratio of arable to pasture prices by decade. From 1209 to 1500 there
is little change in this ratio. But from 1500 to 1600 arable prices rose much more than pastoral
prices. Since the inputs for arable and pasture were not that dissimilar it implies that
productivity growth was much greater in the pastoral sector in these years. After 1600 the ratio
of arable to pastoral prices changed little until the 1810-19 decade. Again this implies little
change in the relative productivity of the arable and pastoral sectors in these years. After the
1810s the prices of arable products fall steadily relative to those of pasture. This fall pre-dates
the well known decline in arable relative to pasture prices of the late nineteenth century.5
The source of this longer term decline in relative arable prices is at least in part the increasing
importance of imports of foodstuffs and raw materials. Before refrigerated ships arable products
were more easily transportable so imports reduced arable prices more. Also Britain seems to
have had a comparative advantage in the production of pastoral products. Thus as imports
increased and arable prices fell relative to pasture prices English agriculture became increasingly
focused on pastoral production. But these price trends may also reflect in part differential
productivity gains in the arable and pastoral sector of the farm economy, with the arable gains
greater. For a lot of land in England can be used for either arable or pasture, so if there had not
been some gains in relative arable productivity an even more complete conversion to pasture
crops would have occurred.
5 See Turner (2000), pp. 302-5.

Wood Products
The wood index was constructed as an equally weighted index of firewood (faggots,
bavins, billets, etc. as well as turf) and of construction wood. Construction timber was sold by
the cubic foot, the load, and the ton. The load was sometimes 50 cubic feet of wood, and
sometimes 40. The construction timber series was constructed as the price per cubic foot of
timber. The principle woods mentioned are oak, ash and elm. Oak was more expensive than ash
or elm and this is controlled for in the regression estimates. Material described as “timber” was
used though this may also have covered planks and other more manufactured outputs. Because
of a scarcity of prices in some years “deals” prices were included even though these are
manufactured timber products.
Firewood was sold in various forms. The price here is given as the average price in
shillings per “hundred” bundles of faggots, where “hundred” probably means 120. Appendix
table 3 gives the price series each type of wood, and for wood overall as an index.
Now that we have price series for timber and firewood we can consider the likely share of
output from wood production in pre-industrial England. By the 1860s coal consumption per
person in England and Wales was nearly 3.5 tons per year. Most of this was not consumed for
domestic heating, but coal consumption per capita for domestic purposes was at least 0.73 tons
(Church (1983, p. 19) reports this figure for 1855). Coal used for domestic consumption is
estimated for Britain in 1700 at as low as 0.2 tons per capita (Hatcher (1983, p. 68, p. 409)).
Incomes were lower in 1700, as Clark (2003) shows. But if we assume an income elasticity of
demand for fuel of 1, and that the relative price of fuel and other goods did not change then
consumers in 1700 would be expected to consume at least the equivalent of 0.5 tons of coal per
capita. Thus they would have to consume the equivalent of 0.3 tons of coal in the form of wood

and turf. Assuming that a pound of coal contains 12,000 Btu. and a pound of wood (dry weight)
8,600 Btu., and also that a cubic foot of firewood weighs 29.4 pounds, this implies that
agriculture in 1700 should have been producing 2.3 million tons of firewood (dry weight), the
equivalent of 175 million cubic feet of firewood.6
Wood was also used for fuel in brick making, iron and steel, salt making and pottery
making. Iron production in England in the early eighteenth century was a very modest 17,000
tons annually. Yet each ton seems to have required about 1,800 cubic feet of wood. That implies
that 30.6 m. cubic feet of firewood were used for iron production each year in 1700. Thus in
total we expect the agricultural sector would have had to produce at least 200 million cubic feet
of firewood per year circa 1700.
The construction industry in the 1860s imported annually into England the equivalent of
6.9 cubic feet of timber per person.7 Again with an income elasticity of 1 the average person in
1700 would consume nearly 5 cubic feet of construction timber. That would imply that
agriculture produced 27 million cubic feet of construction timber circa 1700.
To estimate how many acres of land this required and the value of this output is difficult
because of the irregularity of measures of firewood. This, as noted, was often sold by the
hundred faggots (which actually equaled 120) where the size of the bundle and its density is
unknown. Alternately it was sold as the load of faggots or billets, the load of firewood, or
occasionally by a recognized volume measure such as the cord. Thus to estimate the amount of
land required and the cost per unit of energy for firewood I instead use modern estimates of the
productivity of coppiced woodland in England as a basis for the estimate. The average reported
annual yield of coppiced wood of different species in recent years, including an allowance for the
6 On the weight of wood per cubic foot see Rollinson and Evans (1987).
small branches which would be bundled into faggots, is 1.27 tons per acre of dried wood, or 92.5
cubic feet of wood.8 To produce 200 million cubic feet of firewood annually through coppices in
1700 would thus require 2.16 million acres of land devoted to firewood and iron production
(330,000 acres for iron production alone).
As a check on this method we can also consider the cost of a Btu derived from firewood
compared to a Btu derived from coal. In 1700-1749 the average retail cost per million Btu for
coal was 9.03 d. The output of firewood per acre Q, measured in cubic feet, must be such that
Rent = pQ - wL - rK
=> Q = (Rent + wL + rK)/p
The average rental of land (including tithe and taxes) was about 9 shillings per year (Clark
(2002)). I assume, somewhat arbitrarily, that 25 percent of the cost of firewood was in cutting,
binding and carting. Since firewood was cut only once every 12 years or more, there was also a
considerable capital cost involved in production of such fuel. The rent had to be paid long in
advance of receipts. When all this is factored in the value of firewood per acre would have to
average 14 shillings per year to produce a net rent of 9 shillings. This implies that a cubic foot of
firewood sold for 1.82 d in 1700-49. Consequently firewood cost 0.062 pence per dry pound, or
7.18 d. per million Btu. This implies that energy from wood and coal had about the same cost
per btu before 1700, but that after 1700 at the time when coal was increasing greatly in use, its
cost per btu was also rising relative to wood. Figure 4 shows, for comparison, the price per
million Btu from of coal compared to the price per million Btu from firewood by decade from
1480-9 to 1860-9.
7 This is assuming that UK imports were distributed according to population except that the Irish consumed half as much per head because of lower incomes. 8 See Begley and Coates (1961), Evans (1984), Rollinson and Evans (1987). Hammersley (1973), pp. 604-5, notes that woodland can produce “up to 100 cubic feet per year.”
In part the strange price behavior of wood relative to coal after 1700 may be explained by
the fact that coal and firewood sold in different markets: coal in cities such as London where
people were concentrated and transport was cheap, firewood in the smaller towns and the
countryside close to the sources of firewood where transport costs were minimized. Oliver
Rackham estimates that firewood was rarely consumed more than 20 miles from where it was
produced.9 The cost of firewood in London may have been much greater than I estimate here
where I assumed cutting and carting costs were only 25 percent of the final delivered cost.
A final check on the reasonableness of these production and acreage estimates comes from the
price of firewood per cord at Harting in Sussex in the early eighteenth century, one of the few
occasions where the price was given by a clear volume. Assuming a cord contained 80 cubic
feet of actual timber (as in modern estimates), the average price of 8.4 shillings per cord implies
a price of 1.26 d. per cubic foot, which is even lower than my rent based estimate of 1.82 d.
Figure 5 below just shows an index of coal, firewood and construction wood prices
relative to the general price index for farm output from 1500 to 1829 as a way of comparing
trends in costs. Firewood and coal were both relatively cheap compared to all farm output in the
late sixteenth and early seventeenth centuries, and both got relatively expensive in the early
eighteenth century.
Construction timber was more expensive per cubic foot than firewood, and production
rates must have been much lower. Here I can again estimate the number of acres required by
comparison of the price per cubic foot circa 1700 (about 11.5 d.) with the annual rent and tithe of
land. Since construction timber was cut only once every 25 years or more, the capital cost
involved in production of such wood was greater. But cutting and carting costs were said to be
somewhat lower. Assuming that cutting and carting costs were 20 percent of the final cost of
9 Rackham (1980), p. 144.

timber, this again implies that the net value of output per acre would have to be about 14
shillings to produce a net rent of 9 shillings. This implies output would be only 14.7 cubic feet
per acre. Thus the 27 million cubic feet of construction timber would have required an
additional 1.84 million acres of woodland.
Adding firewood and construction timber we find that at least an implied 4 million acres
of land was devoted to wood and fuel production circa 1700, or 15 percent of the farmland area
of England and Wales. About half the output was for each type of product. Thus I weight the
wood index equally for firewood and construction timber.
The Overall Index The last column of appendix table 4 reports the overall annual price index. Figure 6
shows how this index compares with the Bowden indices for the years 1500 to 1749. Even
though the series have important common components there is a fair amount of divergence from
that series by year and by longer periods. In particular prices on the Bowden series rise by about
20 percent more between 1500 and 1750 than they do on this new series. Table 5 shows the
Bowden index by decade relative to the new index. As can be seen deviations by decade are
significant for the sixteenth century. These deviations imply that attempts to measure
productivity growth in English agriculture using the ratio of input prices (rents, wages and
returns on capital) to output prices would show much less productivity growth from 1500-1750
on the Bowden series than on the new series constructed here.
For the other period where we have other series to compare with this new series, the fit is
better. The new series corresponds reasonably well with series constructed by Bellerby, and by
Afton and Turner for 1867-1914. Figure 7 shows these other two series relative to the new one

for these years. But even though here all three series use substantially the same data, differences
in the weighting of the component series, the treatment of the data, and the splicing of individual
series, still lead to some deviations even within this relatively short period. Thus prices decline
about 10% more on my new series between the 1860s and the 1890s than on the Afton and
Turner or Bellerby series.

Sources
Archival Cheshire Record Office. DTW/2343/1/3/1 (Hay, 1810-20)
Dorset Record Office. PE/SYM/IN/6 (Suet, Butter, Cheese, 1750-63)
Essex Record Office. D/DBe/A1-A13 (Hay, 1748-50, 1753-5, 1769-79, 1782, 1791-1800),
D/DE/A10 (Hay, 1804, 1808, 1815, 1819), Bassom Mss. D/DU 84/18-20 (Hay, 1832-6, 1847-
50), D/DU 224/1 (Hay, 1804-10, 1816).
Guildhall Library, London. Brewer’s Company, Pratt’s Almshouse, Accounts. Mss. 5491/1-3,
5473/1-5 (firewood).
King’s College Library, Cambridge. King’s College Bursar, Mundum Books, 1786-1866 (hay,
timber, firewood).
Lancashire Record Office. DDF/37 (Hay, 1782, 1789), DDHe/62/25-29, 37a (Hay, 1820-3,
1825, 1847, 1854-66), PR 2851/5/11-12 (Hay, 1841, 1843, 1847-8, 1852-9, 1861-6).
London School of Economics, Robbins Library. Beveridge Papers. Bishopric of Winchester
Estates, 1208-1453 (A40-A42). Durham, 1278-1534 (C4, C5). Canterbury Cathedral, 1274-
1385 (D2). Cambridge, King’s College, 1501-1559 (G2). Cambridge, King’s Hall, 1344-1543
(G2). Cambridge, Trinity College, 1547-1718 (G2). Norwich Cathedral, 1273-1536 (G5).
Hull Grain Prices, 1708-1799 (I14). Nottingham Guildhall Records, 1485-1787 (I15). Norwich,
1552-1603, York City, 1584-1763 (I15). Croyland Abbey, 1253-1322 (G12). Hinderclay
Manor, 1262-1404 (G14). Battle Abbey, 1309-1533 (H5-H11). Pelham Papers, Wadron,
Brightling and Bibleham Iron Works, 1628-1715 (H12). Dover Almshouse, 1629-1690 (H13).
Sion Monestary, 1441-1539 (I4). Bath Town Accounts, 1568-1664 (I10).
University of Saskatchewan Library, Saskatoon, Saskatchewan. Farmer Papers (Wheat Prices
1209-1499).
Stafford Record Office. D260/M/E/160-1, 169, 207 (Hay, 1850-1, 1861-2, 1865-74, 1876-79,
1881).
Printed
Afton, Bethanie and Michael Turner. 2000. “The Statistical Base of Agricultural Performance
in England and Wales, 1850-1914” in E. J. T. Collins (ed.), The Agrarian History of England and
Wales, Volume VII 1850-1914 (Part II), pp. 1,757-2,140. Cambridge: Cambridge University
Press.
Atkins, P. J. 1977. The Milk Trade of London, c. 1790-1914. PhD thesis, University of
Cambridge, 1977.
Bailey, Francis A. 1953. The churchwarden's accounts of Prescot, Lancashire, 1523-1607.
Preston: Record Society for the Publication of Original Documents Relating to Lancashire and
Cheshire. Publications v. 104.
Barmby, James. 1888. Churchwardens’ Accounts of Pittington and other Parishes in the
Diocese of Durham, 1580-1700. Publications of the Surtees Society, Vol. 84. Durham:
Andrews and Company.
Barmby, James. 1896. Memorials of St Gile’s, Durham. Publications of the Surtees Society,
Vol. 95. Durham: Andrews and Company.
Begley, C. D. and A. E. Coates. 1961. “Estimating Yield of Hardwood Coppice for Pulpwood
Growing.” Forestry Commission Report on Forest Research 1959/60, pp. 189-196. London:
Her Majesty’s Stationary Office.

Beveridge, William H. 1929. “A Statistical Crime of the Seventeenth Century,” Journal of
Economic and Business History.
Beveridge, William H. 1939. Prices and Wages in England, Vol 1: The Mercantilist Era.
London: Longmans and Green.
Botelho, Lynn A. 1999. Churchwardens' accounts of Cratfield, 1640-1660. Woodbridge :
Boydell & Brewer, Suffolk Records Society, v. 42.
Boulton, Jeremy. 2000. “Food prices and the standard of living in London in the ‘century of
revolution,’ 1580-1700” Economic History Review, 53 (3), 455-492.
Bowden, Peter J. 1967. “Statistical Appendix,” in Joan Thirsk (ed.), The Agrarian History of
England and Wales, Vol. IV, 814-70. Cambridge: Cambridge University Press.
Bowden, Peter J. 1985. “Statistical Appendix,” in Joan Thirsk (ed.), The Agrarian History of
England and Wales, Vol. V.II, 827-902. Cambridge: Cambridge University Press.
Brinkworth, Edwin R. C. 1964. South Newington churchwardens' accounts, 1553-1684.
Banbury, Oxford: Banbury Historical Society. Records publications v. 6.
Burgess, Clive. 2000. The Pre-Reformation Records of All Saints’, Bristol. Vol 2. Stroud:
Bristol Record Society, Publications, Vol. 53.
Campbell, Bruce, James Galloway, Derek Keene, and Margaret Murphy. 1993. A Medieval
Capital and Its Grain Supply: Agrarian Production and Distribution in the London Region c.
1300. Historical Geography Research Series, #30 (London, Institute of British Geographers).
Clark, Gregory. 1991 "Labour Productivity in English Agriculture, 1300-1860," in B.M.S.
Campbell and Mark Overton, Agricultural Productivity in the European Past. Manchester:
Manchester University Press, pp. 211-235.

Clark, Gregory. 2002. “Land Rental Values and the Agrarian Economy: England and Wales,
1500-1912” European Review of Economic History, 6 (3) (December 2002): 281-309.
Clark, Gregory. 2003. “The Condition of the Working-Class in England, 1200-2000: Magna
Carta to Tony Blair” Working Paper, UC-Davis.
Church, Roy. 1986. The History of the British Coal Industry. Vol 3, 1830-1913. Oxford:
Clarendon Press.
Coleman, M. Clare. 1984. Coleman-in-the-Isle: A Study of an Ecclesiastical Manor in the
Thirteenth and Fourteenth Centuries. Woodbridge, Suffolk: Boydell Press.
Doree, Stephen G. 1994. The early churchwardens' accounts of Bishops Stortford, 1431-1558.
Hertfordshire record publications; v. 10. Hitchin, Hertfordshire: Hertfordshire Record Society.
Dowell, Stephen. 1884. A History of Taxation and Taxes in England. Volume 2. London:
Longmans Green.
Erskine, Audrey M. 1981. The Accounts of the Fabric of Exeter Cathedral, 1279-1353. Part 1:
1279-1326. Torquay: Devon and Cornwall Record Society, New Series, Vol. 24.
Erskine, Audrey M. 1983. The Accounts of the Fabric of Exeter Cathedral, 1279-1353. Part 2:
1328-1353. Torquay: Devon and Cornwall Record Society, New Series, Vol. 26.
Evans, J. 1984. Silviculture of Broadleaved Woodland. Forestry Commission Bulletin 62.
London: Her Majesty’s Stationary Office.
Farmer, David L. 1988. “Prices and Wages,” in H. E. Hallam (ed.), The Agrarian History of
England and Wales, Vol. II, 1042-1350. Cambridge: Cambridge University Press.
Farmer, David L. 1991a. “Marketing the Produce of the Countryside, 1200-1500,” in Edward
Miller (ed.), The Agrarian History of England and Wales, Vol. III, 1348-1500. Cambridge:
Cambridge University Press, 324-430.

Farmer, David L. 1991b. “Prices and Wages, 1350-1500,” in Edward Miller (ed.), The Agrarian
History of England and Wales, Vol. III, 1348-1500. Cambridge: Cambridge University Press,
431-525.
Finberg, H. P. R. 1951. Tavistock Abbey: A Study in the Social and Economic History of
Devon. Cambridge: Cambridge University Press.
Fletcher, T. W. 1961. “The Great Depression of English Agriculture, 1873-1896” Economic
History Review, 13: 417-32.
Flinn, Michael W. 1984. The History of the British Coal Industry. Vol. 2,1700-1830. Oxford.
Clarendon Press.
Gayer, A. D., Walt Rostow and Anna J. Schwartz. 1953. The Growth and Fluctuations of the
British Economy, 1790-1850. Oxford.
Grant, John. 1845. “A Few Remarks on the Large Hedges and Small Enclosures of Devonshire
and the Adjoining Counties” Journal of the Agricultural Society of England, 5, 420-429.
Gras, N. S. B. 1915. The Evolution of the English Corn Market. Cambridge, Mass.: Harvard
University Press.
Hill, J. W. F. 1956. Tudor and Stuart Lincoln. Cambridge, Cambridge University Press.
Hill, J. W. F. 1966. Georgian Lincoln. Cambridge, Cambridge University Press.
Hall, Hubert. 1903. The Pipe Roll of the Bishopric of Winchester, 1208-9. London: King and
Son.
Hammersley, G. 1973. “The Charcoal Iron Industry and its Fuel, 1540-1750.” Economic
History Review, 24: 593-613.
Hatcher, John. 1993. The History of the British Coal Industry, Vol. 1, Before 1700: Towards
the Age of Coal. Oxford: Clarendon Press.

Holt, N. R. 1964. The Pipe Roll of the Bishopric of Winchester, 1210-11. Manchester:
Manchester University Press.
John. A. H. 1989. “Statistical Appendix,” in G. E. Mingay (ed.), Agrarian History of England
and Wales, Vol. VI, 1750-1850, pp. 1156-1177. Cambridge: Cambridge University Press.
Marsh, Bower. 1913-39. Records of the Worshipful Company of Carpenters, 6 Volumes.
Oxford: Oxford University Press.
Mellows, William T. 1939. Peterborough local administration; parochial government before the
reformation. Churchwardens' accounts, 1467-1573. Northamptonshire Record Society,
Publications v. 9. Kettering, Printed for the Northamptonshire Record Society by the
Northamptonshire Print. and Pub. Co.,
Mercer, Francis Robert. 1928. Churchwardens' accounts at Betrysden, 1515-1573. Kent
Archaeological Society. Records Branch. Kent records vol. v, pt.3. Ashford, Printed for the
Records Branch by Headley brothers.
Mitchell, B. R. and Phyllis Deane. 1971. Abstract of British Historical Statistics. Cambridge:
Cambridge University Press.
Northeast, Peter. 1982. Boxford churchwardens' accounts, 1530-1561. Suffolk Records
Society, vol. 23. Woodbridge, Suffolk : Boydell Press for the Suffolk Records Society.
Parliamentary Papers. 1903. Report on Wholesale and Retail Prices in the United Kingdom in
1902 with Comparative Statistical Tables for a Series of Years. Vol. LXVIII.
Plomer, Henry R. 1915. The churchwardens' accounts of St. Nicholas, Strood. (B.M. add. ms.
36,937.). Kent Archaeological Society. Records Branch. Kent records, vol. V.
Rackham, Oliver. 1980. Ancient Woodland: Its History, Vegetation and Uses in England.
London: Edward Arnold.
Rappaport, Steve. 1989. Worlds Within Worlds: Structures of Life in Sixteenth-Century
London. Cambridge: Cambridge University Press.
Rew, R. Henry. 1892. “An Inquiry into the Statistics of the Production and Consumption of
Milk and Milk Products in Great Britain.” Journal of the Royal Statistical Society, 55 (2), 244-
286.
Rew, R. Henry. 1904. “Observations on the Production and Consumption of Meat and Dairy
Products.” Journal of the Royal Statistical Society, 67 (3), 413-427.
Rollinson, T. J. D. and J. Evans. 1987. The Yield of Sweet Chestnut Coppice. Forestry
Commission Bulletin, 64. London: Her Majesty’s Stationary Office.
Sauerbeck, Augustus. 1886. “Prices of Commodities and Precious Metals.” Journal of the
Statistical Society of London, 49(3) (Sept.): 581-648.
Stallard, Arthur D. 1922. The transcript of the churchwardens' accounts of the parish of Tilney
All Saints, Norfolk, 1443 to 1589. London, Mitchell Hughes and Clarke.
Swayne, Henry J. F. 1896. Churchwardens' accounts of S. Edmund & S. Thomas, Sarum, 1443-
1702, with other documents. Wilts Record Society. Publications. Salisbury, Bennett Brothers.
Thorold Rogers, J. E. 1866. A History of Agriculture and Prices in England. Volume 2.
Oxford: Clarendon Press.
Thorold Rogers, J. E. 1882. A History of Agriculture and Prices in England. Volume 3.
Oxford: Clarendon Press.
Thorold Rogers, J. E. 1888. A History of Agriculture and Prices in England. Volume 6.
Oxford: Clarendon Press.
Thorold Rogers, J. E. 1902. A History of Agriculture and Prices in England. Volume 7, Part 1.
Oxford: Clarendon Press.
Tooke, Thomas and William Newmarsh. 1857. A history of prices and of the state of the
circulation from 1792 to 1856. New York: Adelphi.
Turner, Michael. 2000. “Agricultural output, income, and productivity” in E. J. T. Collins (ed.),
The Agrarian History of England and Wales, Volume VII 1850-1914 (Part I), pp. 224-320.
Cambridge: Cambridge University Press.
Wardle, F. D. 1923. The Accounts of the Chamberlains of the City of Bath, 1568-1602.
Somerset Record Society, Vol. 38. London: Butler and Tanner.
Weatherill, Lorna. 1990. The account book of Richard Latham, 1724-1767. Oxford: Published
for the British Academy by Oxford University Press.
Weaver, Frederic W., and George N. Clark. 1925. Churchwardens' accounts of Marston,
Spelsbury, and Pyrton. Oxfordshire Record Society, record series v. 6. Oxford, Issued for the
Society.
Woodward, Donald. 1995. Men at Work: Labourers and Building Craftsmen in the Towns of
Northern England, 1450-1750. Cambridge: Cambridge University Press.
Wrigley, E. A. 1985. "Urban Growth and Agricultural Change: England and the Continent in the
Early Modern Period." Journal of Interdisciplinary History 15: 683-728.
Wrigley, E. A. 1988. Continuity, Chance and Change. Cambridge: Cambridge University
Press.

Table 1: Weights of the arable components of the index by period.
1209-1550
1551-1760
1760-1850
1851-82
1883-1914
Price
1860-9
Wheat .530 .450 .418 .406 .219 6.269 s./bu. Rye .000 .018 .018 .000 .000 - Barley .244 .234 .212 .206 .219 4.379 s./bu. Oats .108 .126 .109 .107 .193 2.892 s./bu. Peas .049 .018 .018 .016 .016 4.768 s/bu. Beans .000 .018 .018 .016 .016 5.087 s/bu. Potatoes .000 .000 .051 .115 .184 6.039 s/cwt Hops .000 .027 .027 .030 .051 137.52 s./cwt. Straw .049 .100 .128 .103 .102 21.65 s/ton Mustard Seed .010 .010 .000 .000 .000 - Saffron .010 .000 .000 .000 .000 -
Sources: Post 1851, Fletcher (1961) and Turner (2000), pp. 283-295. 1551-1851 weights were
obtained by keeping the grain and straw proportions similar to those post 1851, but reducing the
potato and hops output. For 1200-1550 weights were obtained from the production figures
derived from manorial accounts in Clark (1991).

Table 2: Weights of the components of the “meat” index by period.
Period
Beef
Mutton
Pork
Bacon
Tallow
Eggs
1209-1549 0.00 0.00 0.00 0.00 0.67 0.33 1550-1849 0.30 0.30 0.20 0.05 0.10 0.05 1850-1882 0.29 0.24 0.24 0.08 0.10 0.05 1883-1914 0.31 0.19 0.35 0.00 0.10 0.05
Prices
1860-09 6.675 d./lb. 6.346 d./lb. 6.521 d./lb. 16.313
d./lb. 5.071 d./lb. 8.352
d./doz. Sources: Post 1851, Fletcher (1961) and Turner (2000), pp. 283-295. Pre-1851 Clark (1991).
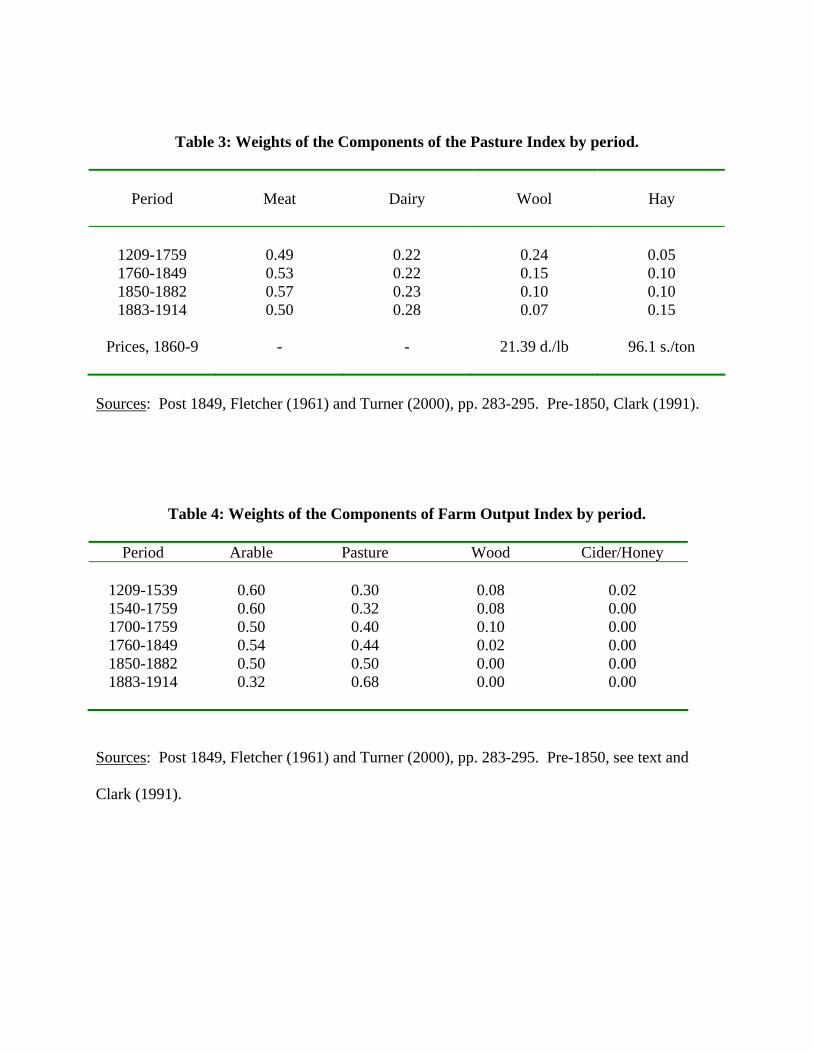
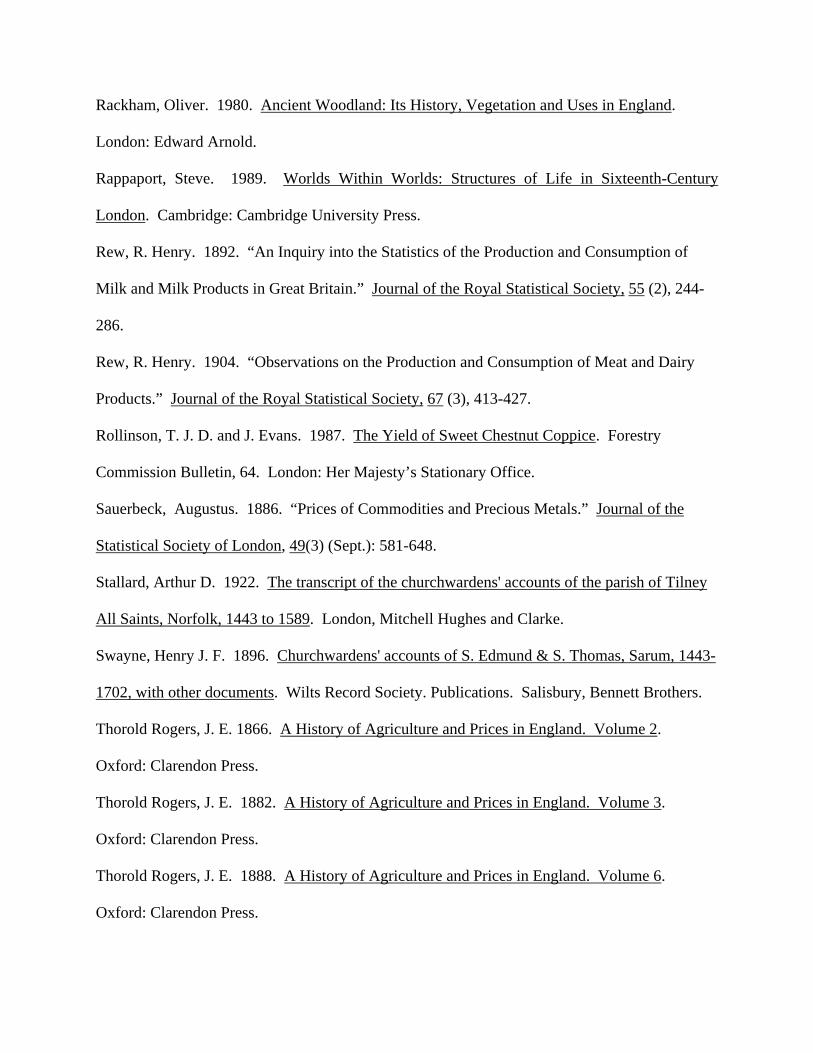
Table 3: Weights of the Components of the Pasture Index by period.
Period
Meat
Dairy
Wool
Hay
1209-1759 0.49 0.22 0.24 0.05 1760-1849 0.53 0.22 0.15 0.10 1850-1882 0.57 0.23 0.10 0.10 1883-1914 0.50 0.28 0.07 0.15
Prices, 1860-9 - - 21.39 d./lb 96.1 s./ton
Sources: Post 1849, Fletcher (1961) and Turner (2000), pp. 283-295. Pre-1850, Clark (1991).
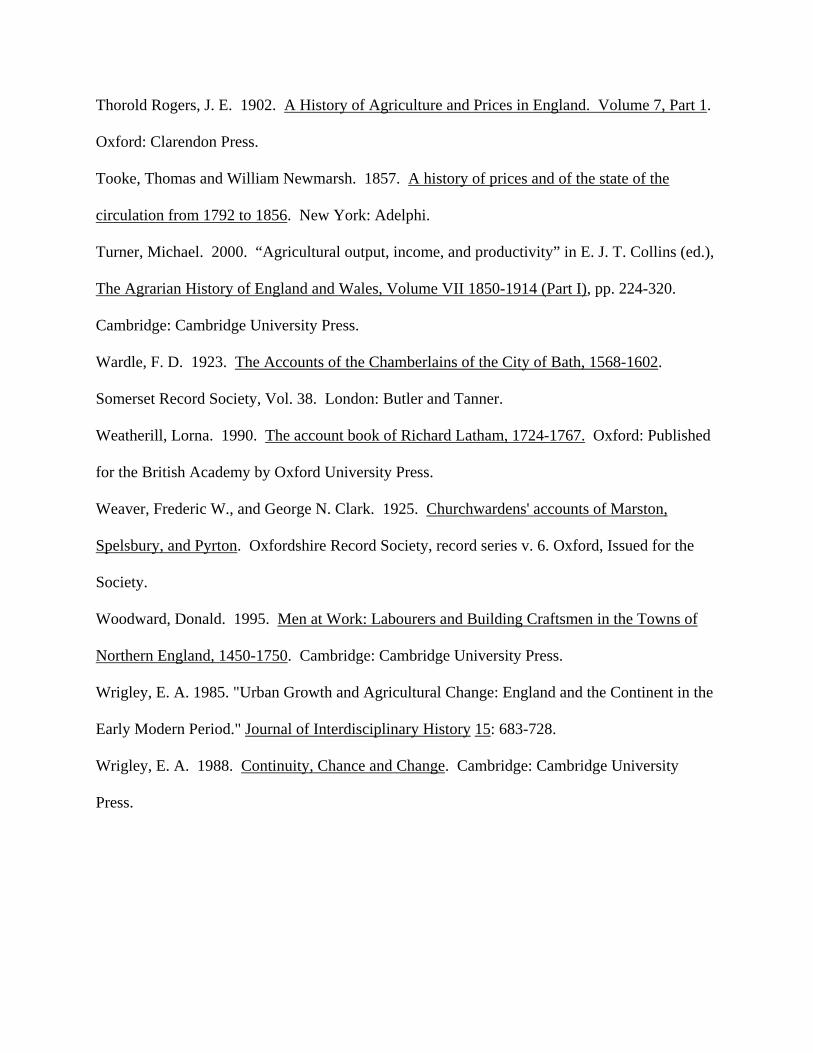
Table 4: Weights of the Components of Farm Output Index by period.
Period Arable Pasture Wood Cider/Honey
1209-1539 0.60 0.30 0.08 0.02 1540-1759 0.60 0.32 0.08 0.00 1700-1759 0.50 0.40 0.10 0.00 1760-1849 0.54 0.44 0.02 0.00 1850-1882 0.50 0.50 0.00 0.00 1883-1914 0.32 0.68 0.00 0.00
Sources: Post 1849, Fletcher (1961) and Turner (2000), pp. 283-295. Pre-1850, see text and
Clark (1991).

Table 5: The Bowden Farm Price Index relative to the New Index by Decade
Decade
Bowden/Clark (set equal to 1.00
in 1740-9)
1500 0.78 1510 0.80 1520 0.77 1530 0.79 1540 0.83 1550 0.80 1560 0.84 1570 0.90 1580 0.92 1590 0.84 1600 0.84 1610 0.85 1620 0.84 1630 0.85 1640 0.83 1650 0.89 1660 0.85 1670 0.86 1680 0.92 1690 0.89 1700 0.97 1710 0.96 1720 0.95 1730 0.99 1740 1.00
Figure 1: Barley, Peas and Oats Prices Relative to Wheat, 1209-1909
Source: Appendix table 1.

Figure 2: Pasture Output Prices relative to Hay Prices, 1300-1900
Source: Appendix table 3.

Figure 3: Arable Prices Relative to Pasture (1860-9 = 100)

Figure 4: Coal and Firewood Prices (d. per m. btu)
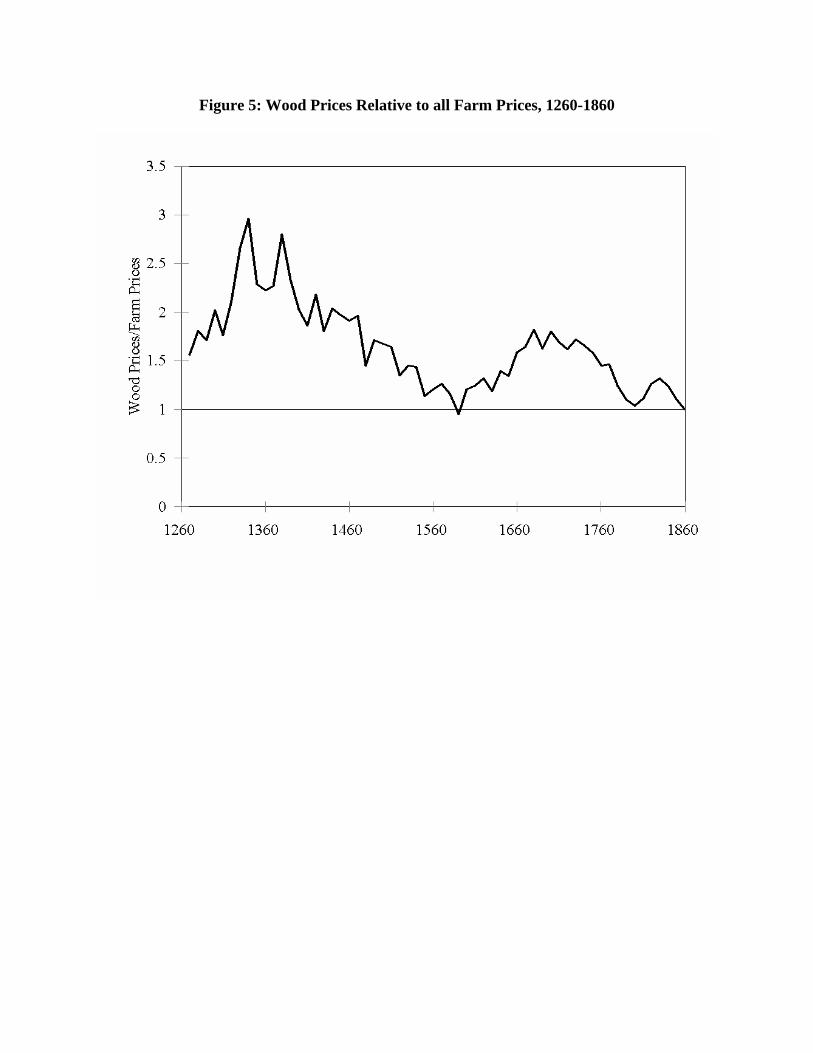
Figure 5: Wood Prices Relative to all Farm Prices, 1260-1860
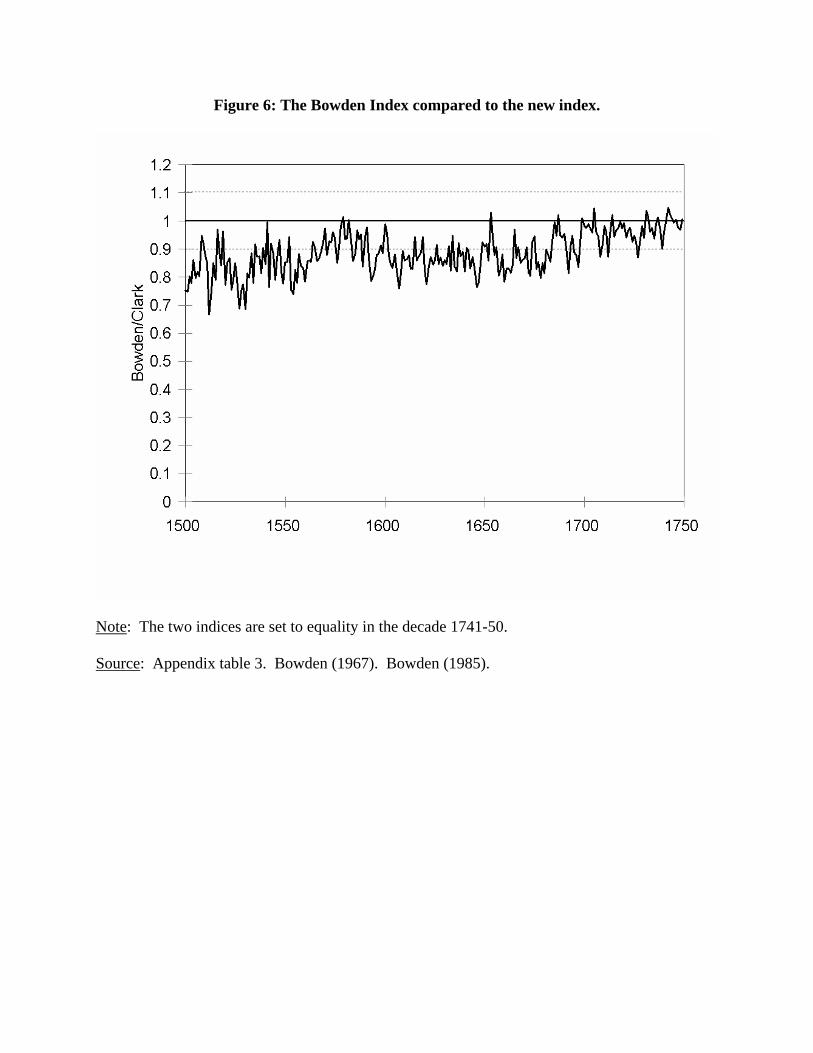
Figure 6: The Bowden Index compared to the new index.
Note: The two indices are set to equality in the decade 1741-50. Source: Appendix table 3. Bowden (1967). Bowden (1985).

Figure 7: Price Indices for 1867-1914
Sources: Appendix table 3. Afton and Turner (2000), pp. 1910-1911.

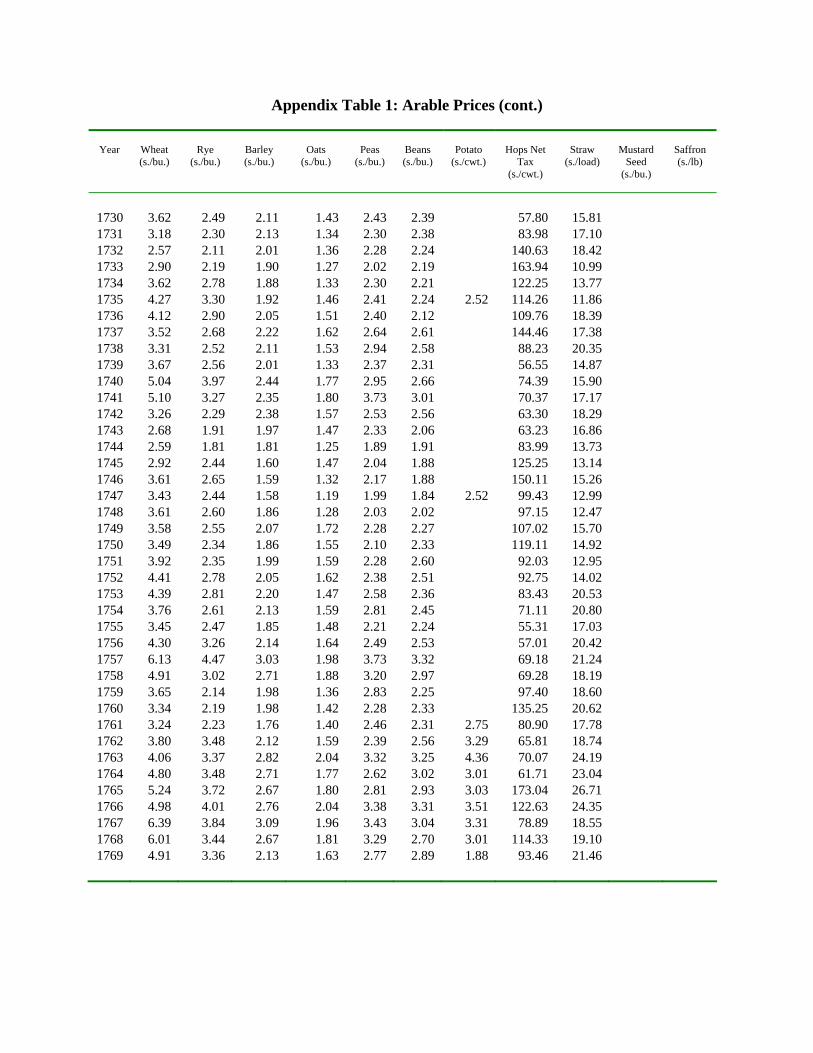
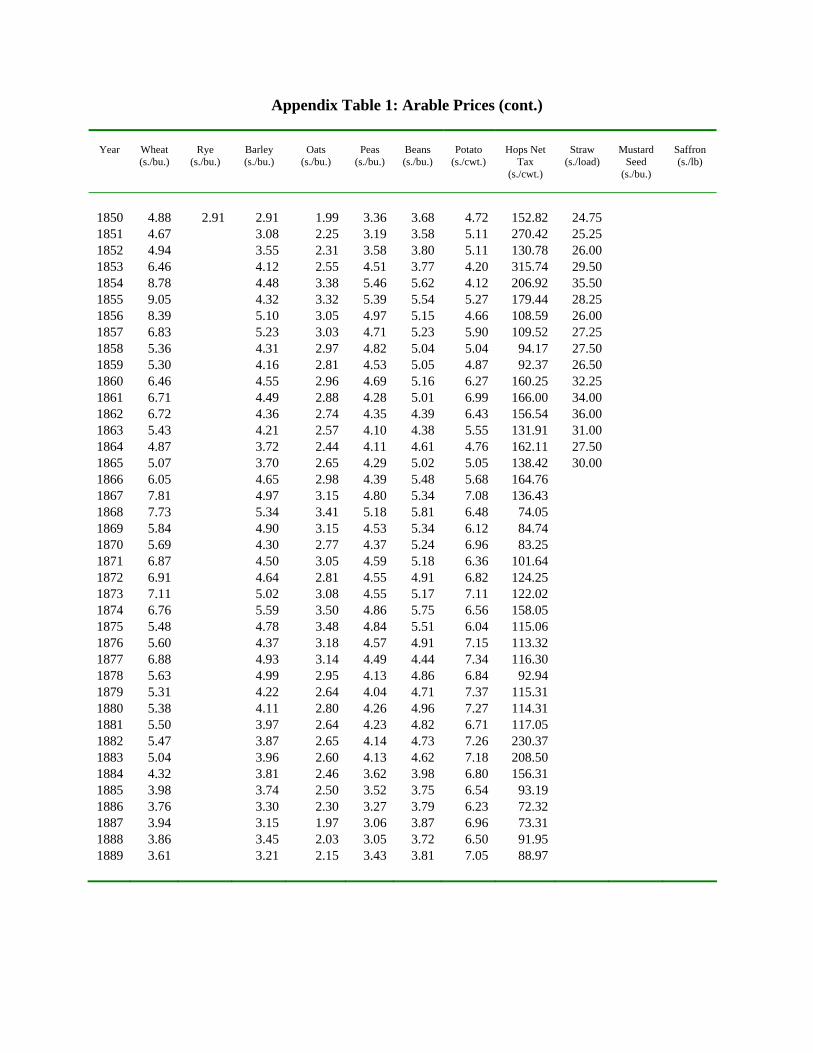
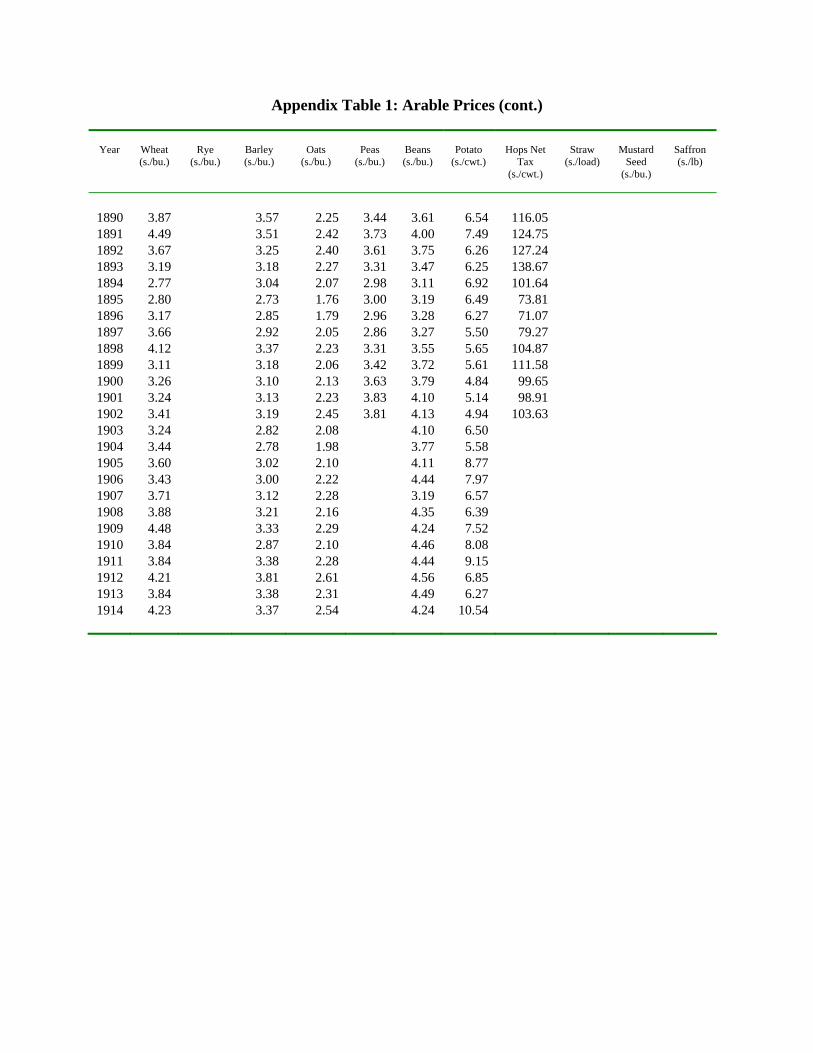
Appendix Table 1: Arable Prices
Year
Wheat (s./bu.)
Rye
(s./bu.)
Barley (s./bu.)
Oats
(s./bu.)
Peas
(s./bu.)
Beans (s./bu.)
Potato
(s./cwt.)
Hops Net
Tax (s./cwt.)
Straw
(s./load)
Mustard
Seed (s./bu.)
Saffron (s./lb)
1209 0.29 0.21 0.10 0.22 1210 1211 0.36 0.24 0.12 0.35 1212 0.28 0.18 0.11 0.25 1213 1214 0.24 0.16 0.12 0.20 1215 1216 0.30 0.18 0.12 0.33 1217 0.46 1218 0.52 0.38 0.18 0.43 1219 0.52 0.34 0.18 0.40 1220 0.39 0.24 0.14 0.34 1221 0.54 0.33 0.16 0.39 1222 1223 0.22 1224 0.29 0.17 0.10 0.22 1225 0.61 0.39 0.18 0.37 1226 0.50 0.36 0.19 0.72 1227 0.58 0.36 0.20 0.53 1228 1229 1230 1231 0.46 1232 0.43 0.32 0.18 0.46 1233 0.38 0.27 0.18 0.40 1234 1235 0.38 1236 0.38 0.21 0.16 0.30 1237 0.42 0.30 0.22 0.39 1238 1239 1240 1241 1242 1243 1244 1245 0.25 0.16 0.12 0.25 1246 0.35 0.22 0.16 0.29 1247 0.65 0.42 0.25 0.62 1248 0.62 0.47 0.26 0.69 1249 0.34 0.22 0.15 0.27
Appendix Table 1: Arable Prices (cont.)
Year
Wheat (s./bu.)
Rye
(s./bu.)
Barley (s./bu.)
Oats
(s./bu.)
Peas
(s./bu.)
Beans (s./bu.)
Potato
(s./cwt.)
Hops Net
Tax (s./cwt.)
Straw
(s./load)
Mustard
Seed (s./bu.)
Saffron (s./lb)
1250 1251 0.35 0.33 0.46 1252 0.36 0.24 0.19 0.33 1253 0.54 0.43 0.27 0.60 1254 0.35 0.21 0.14 0.29 1255 0.31 0.19 0.14 0.29 1256 1257 0.75 0.52 0.26 0.72 1258 0.85 0.54 0.29 0.75 1259 1260 0.45 1261 0.47 1262 0.51 1263 0.44 0.32 0.22 0.44 1264 0.42 1265 0.47 0.37 0.20 0.44 11.09 1266 0.46 0.31 0.17 0.36 1267 0.52 1268 0.40 0.27 0.17 0.28 1269 0.54 0.39 0.27 0.53 1270 0.61 0.34 0.27 0.60 1271 0.85 0.45 0.22 0.62 1272 0.85 0.61 0.29 0.83 1273 0.61 0.46 0.26 0.67 1274 0.77 0.51 0.29 0.75 1275 0.80 0.54 0.29 0.64 1276 0.63 0.40 0.27 0.44 7.37 1277 0.81 0.54 0.32 0.79 1278 0.57 0.43 0.26 0.60 1279 0.52 0.37 0.24 0.42 6.00 1280 0.63 0.40 0.22 0.49 1281 0.61 0.37 0.22 0.48 1282 0.77 0.39 0.28 0.61 1283 0.77 0.51 0.26 0.57 1284 0.76 0.50 0.26 0.72 1285 0.52 0.35 0.22 0.46 5.00 1286 0.65 0.44 0.27 0.51 4.39 1287 0.51 0.37 0.24 0.48 1288 0.32 0.23 0.17 0.26 1289 0.36 0.27 0.19 0.30
Appendix Table 1: Arable Prices (cont.)
Year
Wheat (s./bu.)
Rye
(s./bu.)
Barley (s./bu.)
Oats
(s./bu.)
Peas
(s./bu.)
Beans (s./bu.)
Potato
(s./cwt.)
Hops Net
Tax (s./cwt.)
Straw
(s./load)
Mustard
Seed (s./bu.)
Saffron (s./lb)
1290 0.56 0.37 0.24 0.47 1291 0.74 0.46 0.29 0.63 1292 0.65 0.45 0.25 0.63 1293 0.69 0.45 0.28 0.46 1294 0.96 0.54 0.26 0.70 1295 1.01 0.61 0.32 1.07 8.00 1296 0.98 0.67 0.26 0.88 1297 0.61 0.41 0.19 0.63 1298 0.75 0.50 0.31 0.67 1299 0.62 0.57 0.31 0.62 1300 0.62 0.44 0.26 0.51 1301 0.59 0.37 0.21 0.39 1302 0.58 0.37 0.21 0.39 1303 0.53 0.27 0.22 0.40 1304 0.46 0.34 0.18 0.44 1305 0.64 0.43 0.24 0.58 1306 0.60 0.45 0.24 0.63 6.00 1307 0.52 0.40 0.23 0.53 5.00 1308 0.65 0.44 0.25 0.48 1309 0.82 0.50 0.25 0.68 1310 0.88 0.58 0.34 0.84 1311 0.93 0.53 0.35 0.68 1312 0.58 0.43 0.25 0.53 1313 0.57 0.41 0.28 0.48 1314 0.63 0.45 0.28 0.55 1315 0.79 0.54 0.32 0.56 1316 1.75 1.05 0.79 1.61 4.95 1317 1.72 1.12 0.47 1.50 1318 0.90 0.62 0.31 0.83 3.33 1319 0.48 0.33 0.22 0.36 1320 0.59 0.39 0.22 0.48 1321 0.71 0.52 0.33 0.48 1322 1.47 0.87 0.39 0.95 1323 1.04 0.64 0.32 0.82 1324 0.78 0.43 0.24 0.50 1325 0.86 0.59 0.35 0.72 1326 0.59 0.42 0.25 0.55 4.67 1327 0.45 0.32 0.25 0.54 4.98 1328 0.54 0.33 0.22 0.47 6.18 1329 0.73 0.37 0.27 0.71 5.42

Appendix Table 1: Arable Prices (cont.)
Year
Wheat (s./bu.)
Rye
(s./bu.)
Barley (s./bu.)
Oats
(s./bu.)
Peas
(s./bu.)
Beans (s./bu.)
Potato
(s./cwt.)
Hops Net
Tax (s./cwt.)
Straw
(s./load)
Mustard
Seed (s./bu.)
Saffron (s./lb)
1330 0.74 0.44 0.25 0.58 3.54 1331 0.81 0.50 0.31 0.85 1332 0.90 0.60 0.37 0.93 1333 0.61 0.40 0.26 0.65 1334 0.50 0.34 0.22 1335 0.51 0.35 0.22 0.48 1336 0.57 0.39 0.22 0.44 1337 0.51 0.35 0.20 0.44 1338 0.43 0.26 0.18 0.34 1339 0.39 0.20 0.13 0.27 1340 0.68 0.39 0.19 0.53 1341 0.46 0.33 0.22 0.44 1342 0.52 0.36 0.22 0.40 1343 0.48 0.36 0.22 0.42 3.08 1344 0.68 0.44 0.27 0.55 1.84 1345 0.44 0.34 0.21 0.39 3.33 1346 0.49 0.36 0.24 0.44 1.38 6.32 1347 0.82 0.51 0.28 0.65 1348 0.77 0.52 0.29 0.61 2.07 4.00 1349 0.49 0.26 0.16 0.34 1350 0.71 0.45 0.29 0.53 1.67 1351 0.97 0.70 0.46 0.78 2.42 18.00 1352 1.30 0.80 0.48 0.85 1353 0.63 0.61 0.44 0.82 2.42 1354 0.53 0.70 0.25 0.40 2.59 19.00 1355 0.69 0.32 0.26 0.43 2.76 1356 0.74 0.50 0.27 0.55 2.42 1357 0.77 0.56 0.37 0.89 1358 0.84 0.58 0.35 0.69 3.03 1359 0.71 0.67 0.29 0.54 1360 0.77 0.59 0.25 0.48 1361 0.74 0.69 0.31 0.65 13.33 1362 0.59 0.81 0.34 0.67 1363 0.86 0.77 0.36 0.82 1364 1.08 0.74 0.33 0.69 1365 0.85 0.71 0.29 0.54 1366 0.65 0.66 0.28 0.48 1367 0.64 0.72 0.32 0.69 1368 0.89 0.57 0.33 0.71 1369 0.83 0.60 0.34 0.74

Appendix Table 1: Arable Prices (cont.)
Year
Wheat (s./bu.)
Rye
(s./bu.)
Barley (s./bu.)
Oats
(s./bu.)
Peas
(s./bu.)
Beans (s./bu.)
Potato
(s./cwt.)
Hops Net
Tax (s./cwt.)
Straw
(s./load)
Mustard
Seed (s./bu.)
Saffron (s./lb)
1370 1.82 1.12 0.50 1.24 1371 0.86 0.76 0.36 0.72 6.00 1372 0.74 0.51 0.26 0.44 1373 0.93 0.58 0.30 0.60 12.00 1374 0.67 0.45 0.26 0.55 20.00 1375 1.06 0.60 0.35 0.70 20.00 1376 0.98 0.64 0.36 0.81 20.00 1377 0.53 0.47 0.25 0.49 17.49 1378 0.47 0.37 0.22 0.46 3.73 18.00 1379 0.46 0.32 0.22 0.44 16.00 1380 0.71 0.39 0.24 0.46 16.00 1381 0.74 0.41 0.27 0.47 16.00 1382 0.62 0.39 0.24 0.48 16.00 1383 0.60 0.39 0.23 0.43 13.33 1384 0.59 0.46 0.29 0.57 13.33 1385 0.51 0.39 0.26 0.53 13.33 1386 0.64 0.40 0.28 0.69 13.33 1387 0.53 0.36 0.19 0.37 13.33 1388 0.43 0.29 0.18 0.37 14.60 1389 0.41 0.27 0.19 0.40 13.82 1390 0.71 0.40 0.26 0.50 6.67 1391 1.05 0.68 0.38 0.84 14.00 1392 0.61 0.41 0.25 0.44 1393 0.39 0.32 0.21 0.43 12.59 1394 0.45 0.33 0.23 0.42 14.00 1395 0.46 0.40 0.24 0.48 12.00 1396 0.53 0.39 0.23 0.53 10.32 1397 0.75 0.46 0.28 0.60 2.39 14.00 1398 0.65 0.54 0.35 0.61 2.62 16.00 1399 0.60 0.40 0.24 0.55 19.60 1400 0.67 0.44 0.26 0.51 18.47 1401 0.84 0.45 0.26 0.54 18.00 1402 1.06 0.66 0.30 0.64 18.00 1403 0.72 0.51 0.29 0.68 2.52 18.00 1404 0.54 0.42 0.24 0.41 2.45 1.13 15.16 1405 0.51 0.37 0.21 0.41 2.54 1406 0.43 0.34 0.22 0.47 2.76 14.69 1407 0.49 0.32 0.21 0.42 2.16 13.73 1408 0.69 0.39 0.24 0.48 2.53 14.00 1409 0.80 0.47 0.34 0.53 2.56 2.50 14.00
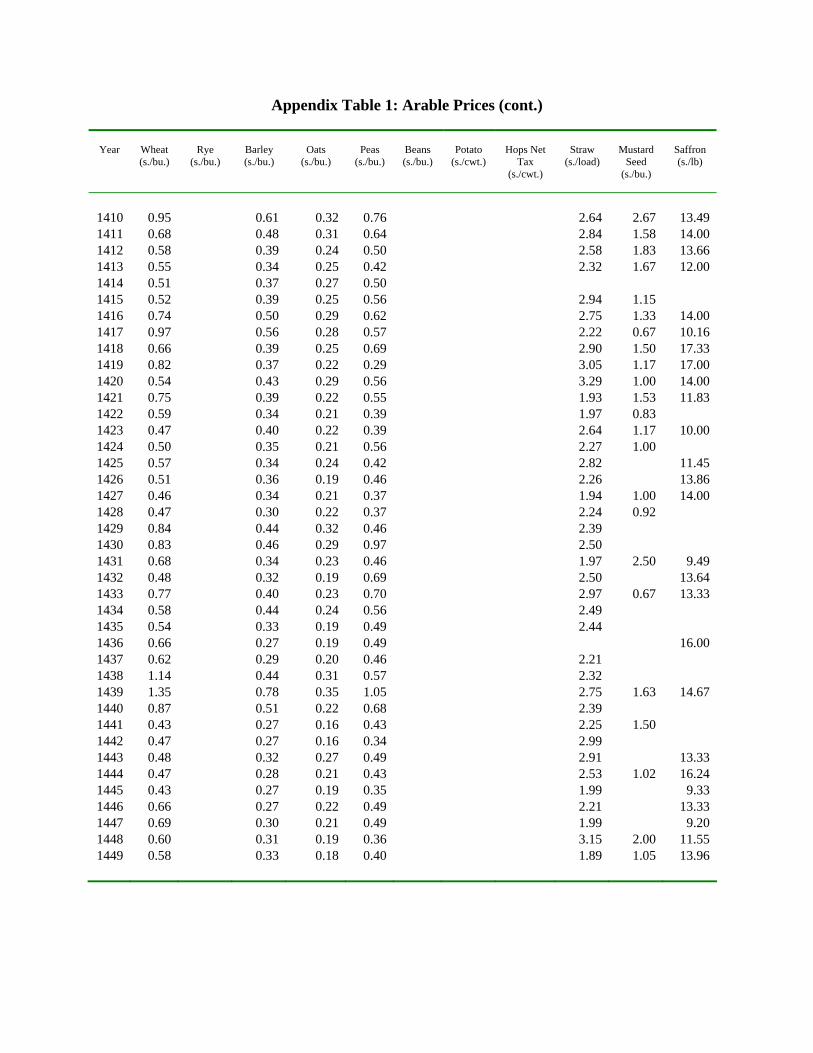
Appendix Table 1: Arable Prices (cont.)
Year
Wheat (s./bu.)
Rye
(s./bu.)
Barley (s./bu.)
Oats
(s./bu.)
Peas
(s./bu.)
Beans (s./bu.)
Potato
(s./cwt.)
Hops Net
Tax (s./cwt.)
Straw
(s./load)
Mustard
Seed (s./bu.)
Saffron (s./lb)
1410 0.95 0.61 0.32 0.76 2.64 2.67 13.49 1411 0.68 0.48 0.31 0.64 2.84 1.58 14.00 1412 0.58 0.39 0.24 0.50 2.58 1.83 13.66 1413 0.55 0.34 0.25 0.42 2.32 1.67 12.00 1414 0.51 0.37 0.27 0.50 1415 0.52 0.39 0.25 0.56 2.94 1.15 1416 0.74 0.50 0.29 0.62 2.75 1.33 14.00 1417 0.97 0.56 0.28 0.57 2.22 0.67 10.16 1418 0.66 0.39 0.25 0.69 2.90 1.50 17.33 1419 0.82 0.37 0.22 0.29 3.05 1.17 17.00 1420 0.54 0.43 0.29 0.56 3.29 1.00 14.00 1421 0.75 0.39 0.22 0.55 1.93 1.53 11.83 1422 0.59 0.34 0.21 0.39 1.97 0.83 1423 0.47 0.40 0.22 0.39 2.64 1.17 10.00 1424 0.50 0.35 0.21 0.56 2.27 1.00 1425 0.57 0.34 0.24 0.42 2.82 11.45 1426 0.51 0.36 0.19 0.46 2.26 13.86 1427 0.46 0.34 0.21 0.37 1.94 1.00 14.00 1428 0.47 0.30 0.22 0.37 2.24 0.92 1429 0.84 0.44 0.32 0.46 2.39 1430 0.83 0.46 0.29 0.97 2.50 1431 0.68 0.34 0.23 0.46 1.97 2.50 9.49 1432 0.48 0.32 0.19 0.69 2.50 13.64 1433 0.77 0.40 0.23 0.70 2.97 0.67 13.33 1434 0.58 0.44 0.24 0.56 2.49 1435 0.54 0.33 0.19 0.49 2.44 1436 0.66 0.27 0.19 0.49 16.00 1437 0.62 0.29 0.20 0.46 2.21 1438 1.14 0.44 0.31 0.57 2.32 1439 1.35 0.78 0.35 1.05 2.75 1.63 14.67 1440 0.87 0.51 0.22 0.68 2.39 1441 0.43 0.27 0.16 0.43 2.25 1.50 1442 0.47 0.27 0.16 0.34 2.99 1443 0.48 0.32 0.27 0.49 2.91 13.33 1444 0.47 0.28 0.21 0.43 2.53 1.02 16.24 1445 0.43 0.27 0.19 0.35 1.99 9.33 1446 0.66 0.27 0.22 0.49 2.21 13.33 1447 0.69 0.30 0.21 0.49 1.99 9.20 1448 0.60 0.31 0.19 0.36 3.15 2.00 11.55 1449 0.58 0.33 0.18 0.40 1.89 1.05 13.96
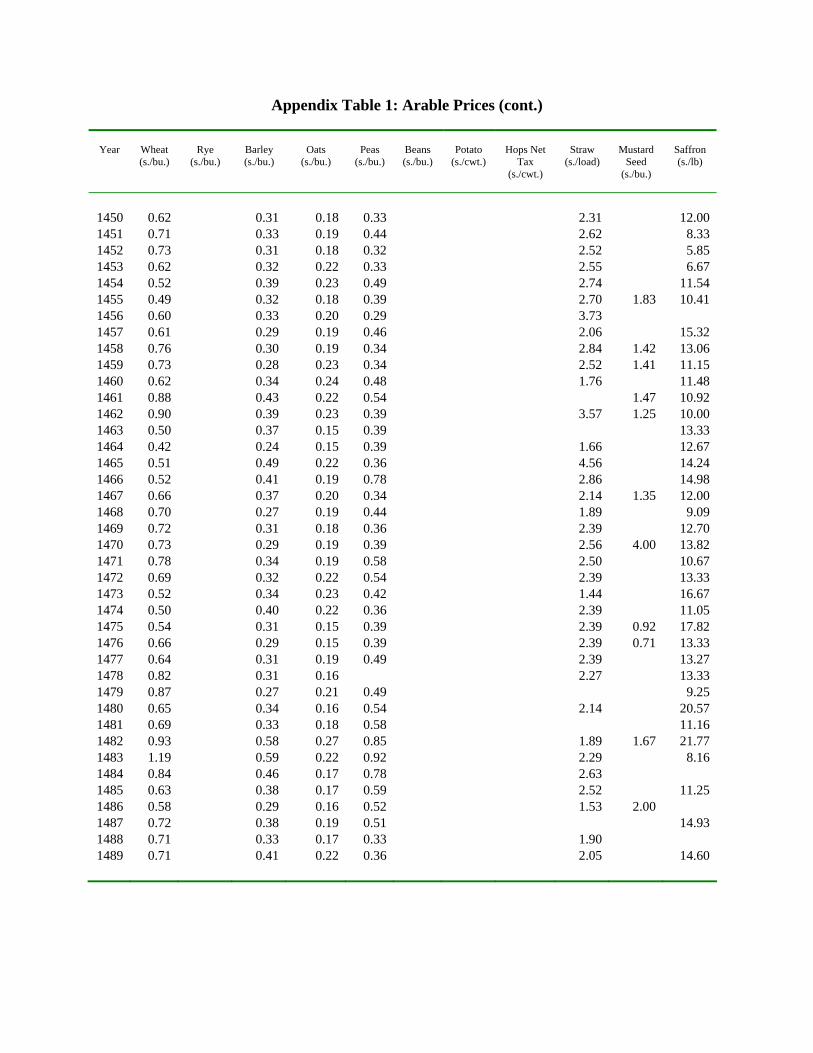
Appendix Table 1: Arable Prices (cont.)
Year
Wheat (s./bu.)
Rye
(s./bu.)
Barley (s./bu.)
Oats
(s./bu.)
Peas
(s./bu.)
Beans (s./bu.)
Potato
(s./cwt.)
Hops Net
Tax (s./cwt.)
Straw
(s./load)
Mustard
Seed (s./bu.)
Saffron (s./lb)
1450 0.62 0.31 0.18 0.33 2.31 12.00 1451 0.71 0.33 0.19 0.44 2.62 8.33 1452 0.73 0.31 0.18 0.32 2.52 5.85 1453 0.62 0.32 0.22 0.33 2.55 6.67 1454 0.52 0.39 0.23 0.49 2.74 11.54 1455 0.49 0.32 0.18 0.39 2.70 1.83 10.41 1456 0.60 0.33 0.20 0.29 3.73 1457 0.61 0.29 0.19 0.46 2.06 15.32 1458 0.76 0.30 0.19 0.34 2.84 1.42 13.06 1459 0.73 0.28 0.23 0.34 2.52 1.41 11.15 1460 0.62 0.34 0.24 0.48 1.76 11.48 1461 0.88 0.43 0.22 0.54 1.47 10.92 1462 0.90 0.39 0.23 0.39 3.57 1.25 10.00 1463 0.50 0.37 0.15 0.39 13.33 1464 0.42 0.24 0.15 0.39 1.66 12.67 1465 0.51 0.49 0.22 0.36 4.56 14.24 1466 0.52 0.41 0.19 0.78 2.86 14.98 1467 0.66 0.37 0.20 0.34 2.14 1.35 12.00 1468 0.70 0.27 0.19 0.44 1.89 9.09 1469 0.72 0.31 0.18 0.36 2.39 12.70 1470 0.73 0.29 0.19 0.39 2.56 4.00 13.82 1471 0.78 0.34 0.19 0.58 2.50 10.67 1472 0.69 0.32 0.22 0.54 2.39 13.33 1473 0.52 0.34 0.23 0.42 1.44 16.67 1474 0.50 0.40 0.22 0.36 2.39 11.05 1475 0.54 0.31 0.15 0.39 2.39 0.92 17.82 1476 0.66 0.29 0.15 0.39 2.39 0.71 13.33 1477 0.64 0.31 0.19 0.49 2.39 13.27 1478 0.82 0.31 0.16 2.27 13.33 1479 0.87 0.27 0.21 0.49 9.25 1480 0.65 0.34 0.16 0.54 2.14 20.57 1481 0.69 0.33 0.18 0.58 11.16 1482 0.93 0.58 0.27 0.85 1.89 1.67 21.77 1483 1.19 0.59 0.22 0.92 2.29 8.16 1484 0.84 0.46 0.17 0.78 2.63 1485 0.63 0.38 0.17 0.59 2.52 11.25 1486 0.58 0.29 0.16 0.52 1.53 2.00 1487 0.72 0.38 0.19 0.51 14.93 1488 0.71 0.33 0.17 0.33 1.90 1489 0.71 0.41 0.22 0.36 2.05 14.60

Appendix Table 1: Arable Prices (cont.)
Year
Wheat (s./bu.)
Rye
(s./bu.)
Barley (s./bu.)
Oats
(s./bu.)
Peas
(s./bu.)
Beans (s./bu.)
Potato
(s./cwt.)
Hops Net
Tax (s./cwt.)
Straw
(s./load)
Mustard
Seed (s./bu.)
Saffron (s./lb)
1490 0.70 0.33 0.19 0.40 1.94 0.91 18.47 1491 0.74 0.38 0.19 0.58 2.04 14.60 1492 0.75 0.37 0.22 0.43 1.93 17.52 1493 0.62 0.39 0.16 1.90 8.72 1494 0.59 0.29 0.17 0.39 1.90 14.97 1495 0.56 0.27 0.17 0.32 2.61 0.77 1496 0.50 0.26 0.21 0.34 2.74 1.25 18.21 1497 0.76 0.28 0.20 0.33 2.09 21.33 1498 0.67 0.30 0.26 0.34 2.41 17.82 1499 0.67 0.32 0.26 0.61 2.97 11.55 1500 0.58 0.31 0.20 0.36 0.30 2.12 0.75 11.63 1501 0.92 0.31 0.23 2.01 8.54 1502 0.97 0.39 0.21 0.53 0.27 2.54 1.00 10.38 1503 0.85 0.32 0.25 0.28 2.19 6.71 1504 0.88 0.38 0.23 0.55 0.38 2.55 2.36 9.42 1505 0.71 0.41 0.27 2.66 17.85 1506 0.68 0.38 0.21 0.34 0.38 2.02 18.47 1507 0.71 0.27 0.22 0.45 0.35 1.81 26.40 1508 0.75 0.32 0.23 0.40 0.31 2.09 0.92 18.67 1509 0.39 0.40 0.21 0.43 0.25 2.45 10.60 1510 0.45 0.33 0.20 0.42 0.25 1.77 1.25 11.15 1511 0.53 0.24 0.22 0.34 1.90 1.70 13.75 1512 0.75 0.26 0.22 0.35 2.06 13.33 1513 1.11 0.60 2.39 14.67 1514 0.71 0.57 0.47 2.15 12.53 1515 0.66 0.31 0.66 2.35 11.53 1516 0.85 0.49 0.27 0.49 2.37 13.99 1517 0.58 0.42 0.23 0.52 2.82 11.76 1518 0.79 0.43 0.66 2.94 16.00 1519 0.74 0.39 0.25 0.68 0.38 3.41 1.75 14.17 1520 1.02 0.45 0.29 0.84 0.73 2.17 2.00 14.60 1521 1.13 0.61 0.35 1.12 0.45 3.41 11.55 1522 0.89 0.47 0.31 0.69 0.32 2.52 1.49 17.33 1523 0.84 0.33 0.25 0.62 0.40 1.92 1.50 34.67 1524 0.81 0.30 0.27 2.01 1525 0.63 0.33 0.38 0.70 0.29 2.22 1.65 16.65 1526 0.63 0.34 0.27 0.70 0.46 1.64 3.11 16.00 1527 0.82 0.50 0.32 0.79 0.58 2.75 18.43 1528 1.87 0.79 0.50 1.06 0.78 2.99 2.44 19.60 1529 1.12 0.77 0.25 0.62 1.72 15.49
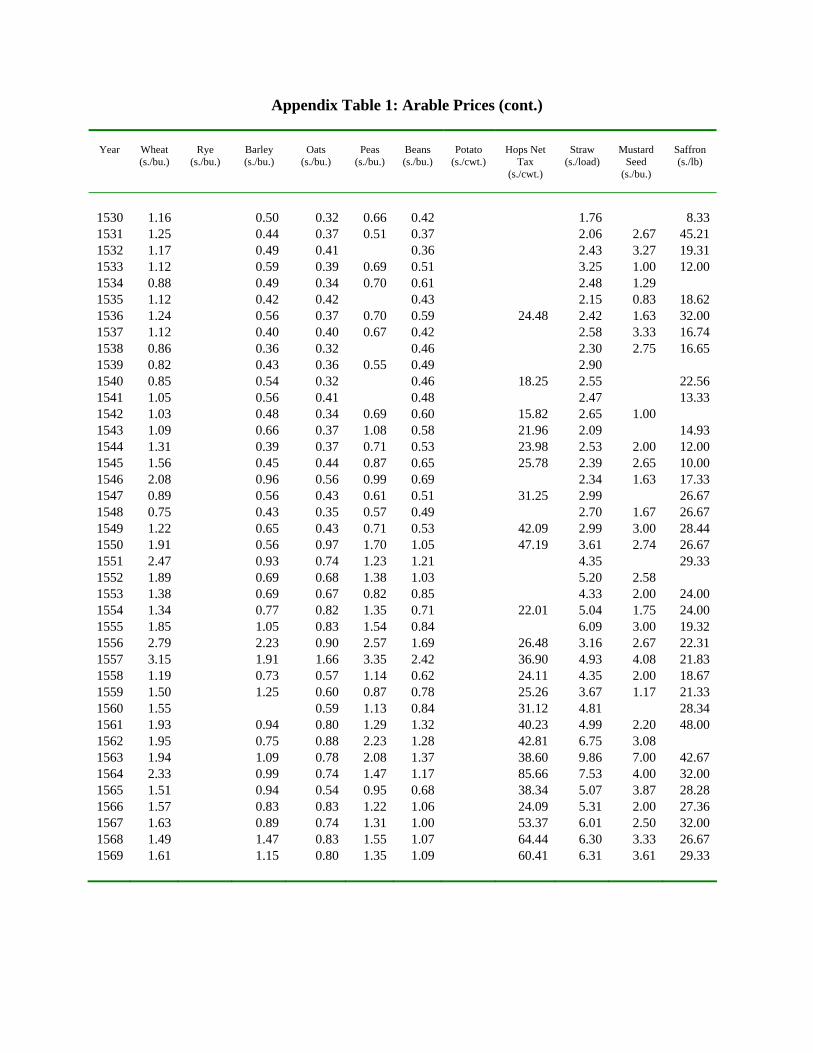
Appendix Table 1: Arable Prices (cont.)
Year
Wheat (s./bu.)
Rye
(s./bu.)
Barley (s./bu.)
Oats
(s./bu.)
Peas
(s./bu.)
Beans (s./bu.)
Potato
(s./cwt.)
Hops Net
Tax (s./cwt.)
Straw
(s./load)
Mustard
Seed (s./bu.)
Saffron (s./lb)
1530 1.16 0.50 0.32 0.66 0.42 1.76 8.33 1531 1.25 0.44 0.37 0.51 0.37 2.06 2.67 45.21 1532 1.17 0.49 0.41 0.36 2.43 3.27 19.31 1533 1.12 0.59 0.39 0.69 0.51 3.25 1.00 12.00 1534 0.88 0.49 0.34 0.70 0.61 2.48 1.29 1535 1.12 0.42 0.42 0.43 2.15 0.83 18.62 1536 1.24 0.56 0.37 0.70 0.59 24.48 2.42 1.63 32.00 1537 1.12 0.40 0.40 0.67 0.42 2.58 3.33 16.74 1538 0.86 0.36 0.32 0.46 2.30 2.75 16.65 1539 0.82 0.43 0.36 0.55 0.49 2.90 1540 0.85 0.54 0.32 0.46 18.25 2.55 22.56 1541 1.05 0.56 0.41 0.48 2.47 13.33 1542 1.03 0.48 0.34 0.69 0.60 15.82 2.65 1.00 1543 1.09 0.66 0.37 1.08 0.58 21.96 2.09 14.93 1544 1.31 0.39 0.37 0.71 0.53 23.98 2.53 2.00 12.00 1545 1.56 0.45 0.44 0.87 0.65 25.78 2.39 2.65 10.00 1546 2.08 0.96 0.56 0.99 0.69 2.34 1.63 17.33 1547 0.89 0.56 0.43 0.61 0.51 31.25 2.99 26.67 1548 0.75 0.43 0.35 0.57 0.49 2.70 1.67 26.67 1549 1.22 0.65 0.43 0.71 0.53 42.09 2.99 3.00 28.44 1550 1.91 0.56 0.97 1.70 1.05 47.19 3.61 2.74 26.67 1551 2.47 0.93 0.74 1.23 1.21 4.35 29.33 1552 1.89 0.69 0.68 1.38 1.03 5.20 2.58 1553 1.38 0.69 0.67 0.82 0.85 4.33 2.00 24.00 1554 1.34 0.77 0.82 1.35 0.71 22.01 5.04 1.75 24.00 1555 1.85 1.05 0.83 1.54 0.84 6.09 3.00 19.32 1556 2.79 2.23 0.90 2.57 1.69 26.48 3.16 2.67 22.31 1557 3.15 1.91 1.66 3.35 2.42 36.90 4.93 4.08 21.83 1558 1.19 0.73 0.57 1.14 0.62 24.11 4.35 2.00 18.67 1559 1.50 1.25 0.60 0.87 0.78 25.26 3.67 1.17 21.33 1560 1.55 0.59 1.13 0.84 31.12 4.81 28.34 1561 1.93 0.94 0.80 1.29 1.32 40.23 4.99 2.20 48.00 1562 1.95 0.75 0.88 2.23 1.28 42.81 6.75 3.08 1563 1.94 1.09 0.78 2.08 1.37 38.60 9.86 7.00 42.67 1564 2.33 0.99 0.74 1.47 1.17 85.66 7.53 4.00 32.00 1565 1.51 0.94 0.54 0.95 0.68 38.34 5.07 3.87 28.28 1566 1.57 0.83 0.83 1.22 1.06 24.09 5.31 2.00 27.36 1567 1.63 0.89 0.74 1.31 1.00 53.37 6.01 2.50 32.00 1568 1.49 1.47 0.83 1.55 1.07 64.44 6.30 3.33 26.67 1569 1.61 1.15 0.80 1.35 1.09 60.41 6.31 3.61 29.33

Appendix Table 1: Arable Prices (cont.)
Year
Wheat (s./bu.)
Rye
(s./bu.)
Barley (s./bu.)
Oats
(s./bu.)
Peas
(s./bu.)
Beans (s./bu.)
Potato
(s./cwt.)
Hops Net
Tax (s./cwt.)
Straw
(s./load)
Mustard
Seed (s./bu.)
Saffron (s./lb)
1570 1.61 0.79 0.67 1.11 0.76 80.78 4.98 2.17 22.63 1571 1.35 0.71 0.66 1.07 0.73 54.63 5.07 2.08 1572 1.79 0.93 0.70 1.09 0.70 63.93 5.74 3.33 1573 1.97 0.94 0.74 1.88 1.20 54.29 5.97 1574 2.78 1.47 0.87 2.03 1.53 57.10 5.49 4.00 1575 1.95 0.94 0.71 1.65 1.15 40.28 4.87 5.00 1576 2.07 1.01 0.72 1.27 0.89 42.63 4.92 4.50 1577 2.28 1.20 0.78 1.35 1.09 43.99 5.75 4.67 1578 1.98 1.26 0.76 1.40 1.04 37.49 5.30 4.00 1579 2.03 0.96 0.60 1.41 0.85 37.47 5.65 2.75 1580 1.65 0.97 0.84 1.54 1.07 81.17 6.45 1581 2.40 1.21 0.67 1.36 0.99 57.16 7.26 3.00 1582 2.29 1.11 0.74 1.64 1.18 54.13 6.60 1583 2.06 1.04 0.83 1.57 1.12 44.11 6.29 1584 1.92 1.08 0.85 1.63 1.19 43.79 6.84 2.75 1585 2.35 1.05 0.81 1.67 1.10 46.57 6.43 5.00 1586 3.28 1.51 0.98 2.40 1.68 57.26 6.79 2.75 1587 3.14 1.20 1.34 2.49 1.81 49.65 7.25 3.00 1588 2.00 1.16 1.05 1.61 1.16 42.64 5.08 2.00 1589 2.23 1.05 1.15 1.91 1.29 54.98 4.84 3.75 1590 2.79 1.46 1.31 2.20 1.54 85.45 6.72 3.38 1591 2.57 1.87 1.59 3.23 2.22 35.28 9.13 7.26 1592 2.01 1.11 1.17 1.99 1.44 65.78 7.38 6.00 1593 2.32 1.13 0.88 1.69 1.19 90.50 7.85 3.00 1594 3.37 1.26 0.92 1.75 1.30 45.70 9.38 3.19 1595 4.21 2.00 1.61 2.74 1.95 40.54 12.10 3.50 1596 4.77 2.11 1.56 2.38 1.82 62.50 9.09 3.78 1597 5.83 2.90 1.84 3.44 2.77 42.91 10.45 5.49 1598 4.79 2.11 1.47 3.07 2.26 46.65 9.61 4.04 1599 2.97 1.57 1.14 1.91 1.27 41.69 7.51 5.68 1600 3.20 1.74 0.96 1.99 1.21 51.52 9.62 3.50 1601 3.20 1.96 1.78 2.78 1.88 54.41 10.63 5.02 1602 2.89 1.42 0.83 2.76 2.00 99.08 9.05 4.04 1603 3.05 1.19 0.86 1.93 1.30 169.39 8.24 3.35 1604 3.01 1.24 1.07 1.98 1.36 104.80 8.70 4.08 1605 3.26 1.62 1.13 1.78 1.36 90.31 7.85 4.08 1606 3.06 1.57 1.16 2.06 1.60 95.40 13.44 4.04 1607 3.34 1.52 1.14 2.14 1.25 89.58 12.43 4.67 1608 4.81 1.95 1.17 2.40 1.54 128.86 11.90 5.81 1609 4.58 2.14 1.37 2.79 2.17 66.54 10.75 4.08

Appendix Table 1: Arable Prices (cont.)
Year
Wheat (s./bu.)
Rye
(s./bu.)
Barley (s./bu.)
Oats
(s./bu.)
Peas
(s./bu.)
Beans
(s./bu.)
Potato
(s./cwt.)
Hops Net
Tax (s./cwt.)
Straw
(s./load)
Mustard
Seed (s./bu.)
Saffron
(s./lb)
1610 3.49 1.81 1.28 2.76 1.74 58.04 12.41 4.08 1611 3.77 1.65 1.31 2.28 1.57 29.86 10.93 4.92 1612 3.98 2.06 1.78 3.01 2.53 38.23 19.16 10.55 1613 4.56 2.25 1.52 3.00 2.71 57.71 16.12 5.82 1614 4.57 2.28 1.65 2.98 50.91 11.48 5.69 1615 3.93 2.22 1.70 2.89 2.68 76.77 12.98 4.40 1616 3.89 2.16 2.02 3.61 2.23 67.10 14.87 4.85 1617 4.63 1.86 1.30 2.48 1.72 76.39 12.29 4.85 1618 4.47 1.82 1.27 1.92 1.32 75.08 10.73 4.85 1619 3.55 1.57 1.22 2.03 1.49 111.34 13.63 4.85 1620 2.98 1.36 1.24 2.04 1.70 97.06 12.82 4.85 1621 3.52 1.47 1.12 2.24 1.76 123.19 14.84 8.53 1622 4.80 2.37 1.35 3.07 2.48 101.80 15.11 5.26 1623 4.95 3.12 2.36 1.25 2.54 1.87 94.04 13.80 4.85 1624 4.23 3.12 1.86 1.25 2.21 1.74 48.03 12.86 4.76 1625 4.70 3.47 1.97 1.31 2.52 1.85 39.97 13.45 5.32 1626 4.43 3.47 2.13 1.65 2.80 1.96 44.19 12.74 7.64 1627 3.66 3.22 1.54 0.97 1.76 1.53 68.04 12.74 6.96 1628 3.31 3.15 1.63 1.27 2.29 1.92 98.05 12.83 6.71 1629 3.75 3.25 2.17 1.37 2.95 2.62 165.95 13.87 8.24 1630 5.01 2.70 1.84 3.55 2.28 65.71 17.22 10.78 1631 5.75 2.88 2.06 4.56 59.98 15.99 8.27 1632 4.92 4.69 2.33 1.35 2.58 2.35 68.88 13.34 9.69 1633 4.77 4.70 2.34 1.42 2.50 2.14 102.33 13.81 9.69 1634 4.90 5.10 2.62 1.62 3.23 2.98 101.94 14.94 9.69 1635 4.83 4.69 2.36 1.50 3.07 100.63 14.96 9.69 1636 4.76 2.71 2.37 1.61 3.42 2.98 98.56 15.97 8.04 1637 4.88 4.70 3.15 1.90 4.33 4.13 98.08 15.96 7.63 1638 5.09 3.25 1.91 4.44 88.98 19.31 8.81 1639 4.12 5.09 2.26 1.42 2.95 60.57 13.67 7.78 1640 3.74 2.00 1.14 2.06 58.63 10.94 8.04 1641 4.45 2.19 1.47 2.81 3.34 81.44 17.79 8.53 1642 4.04 2.10 1.38 2.13 1.85 107.15 14.99 8.53 1643 4.30 1.79 1.62 2.66 1.76 196.72 13.57 7.50 1644 4.06 1.89 1.16 1.77 2.28 85.61 15.57 1645 4.04 2.11 1.26 2.54 2.04 71.29 14.99 1646 4.51 2.30 1.54 2.42 1.56 49.70 12.82 1647 6.33 3.09 1.79 3.09 3.15 63.19 15.35 1648 7.31 3.48 2.55 4.35 3.07 102.06 19.74 1649 6.79 3.16 2.01 4.58 2.68 101.95 16.69

Appendix Table 1: Arable Prices (cont.)
Year
Wheat (s./bu.)
Rye
(s./bu.)
Barley (s./bu.)
Oats
(s./bu.)
Peas
(s./bu.)
Beans (s./bu.)
Potato
(s./cwt.)
Hops Net
Tax (s./cwt.)
Straw
(s./load)
Mustard
Seed (s./bu.)
Saffron (s./lb)
1650 6.49 2.67 2.41 5.25 2.38 179.70 16.12 1651 5.98 2.30 1.42 3.01 2.02 46.05 13.38 1652 4.94 2.19 1.80 3.74 114.99 14.05 1653 3.64 2.17 2.05 4.13 4.00 72.62 15.80 1654 2.79 1.57 1.27 3.01 1.67 117.30 14.13 1655 2.71 1.59 1.13 2.40 1.67 136.30 15.93 1656 4.17 3.39 2.01 1.31 2.72 2.24 134.00 18.60 1657 4.44 3.91 2.54 1.59 3.44 2.08 177.90 19.29 1658 5.63 3.91 2.50 1.63 3.24 2.76 105.17 14.66 1659 5.93 2.81 2.11 3.29 2.38 104.38 12.38 1660 5.42 3.47 2.51 1.55 3.21 2.46 71.75 14.93 1661 6.19 6.25 2.85 1.50 2.96 1.63 77.12 14.18 1662 6.73 4.17 3.01 1.95 3.43 2.27 62.53 14.64 1663 4.93 2.55 1.67 3.14 2.25 64.58 14.79 1664 4.80 2.14 1.52 2.99 2.39 104.04 14.10 1665 4.14 3.12 2.00 1.47 2.14 1.64 86.20 15.30 1666 3.35 1.74 1.76 1.46 2.76 1.99 135.91 20.17 1667 3.08 1.96 1.77 1.15 2.11 2.15 78.19 16.01 1668 3.30 2.21 1.77 1.37 2.19 1.81 76.04 10.56 1669 4.36 3.12 2.20 1.28 2.33 1.95 69.44 13.82 1670 3.93 3.12 2.07 1.34 2.68 2.29 75.80 13.40 1671 4.01 1.80 1.44 3.13 2.33 68.30 13.38 1672 3.77 1.71 1.19 2.19 1.92 71.85 13.19 1673 4.11 3.65 1.97 1.30 2.87 1.99 144.42 15.22 1674 5.93 4.86 2.72 1.43 3.49 2.78 112.00 14.84 1675 5.21 3.39 2.34 1.52 2.77 2.31 104.24 14.83 1676 3.47 2.34 1.84 1.33 2.60 2.00 122.37 12.18 1677 3.73 3.47 2.25 1.49 3.09 2.29 75.41 16.23 1678 4.77 2.60 2.16 1.43 2.76 2.50 60.60 14.27 1679 5.02 2.34 2.05 1.38 2.42 1.87 54.06 15.41 1680 3.99 2.08 1.76 1.28 2.74 2.10 43.64 14.77 1681 4.40 4.17 2.06 1.50 2.60 2.08 99.38 15.10 1682 4.12 3.47 2.42 1.63 3.12 2.76 112.00 15.29 1683 4.00 2.60 2.05 1.43 3.21 2.24 89.18 14.24 1684 4.14 3.43 2.15 1.56 2.64 2.47 110.05 14.48 1685 4.36 2.60 2.14 1.60 3.95 3.29 120.90 23.91 1686 3.41 3.65 2.21 1.57 2.90 2.68 134.97 15.51 1687 3.48 2.08 1.92 1.33 2.03 2.37 196.85 12.07 1688 2.93 2.08 1.71 1.28 2.78 2.38 108.82 15.21 1689 2.85 2.34 1.50 1.11 1.97 1.65 66.02 10.41
Appendix Table 1: Arable Prices (cont.)
Year
Wheat (s./bu.)
Rye
(s./bu.)
Barley (s./bu.)
Oats
(s./bu.)
Peas
(s./bu.)
Beans
(s./bu.)
Potato
(s./cwt.)
Hops Net
Tax (s./cwt.)
Straw
(s./load)
Mustard
Seed (s./bu.)
Saffron
(s./lb)
1690 3.27 2.34 1.40 1.26 2.07 1.69 45.79 14.40 1691 3.11 2.34 1.33 1.23 1.79 1.78 42.33 12.22 1692 4.45 2.80 1.76 1.42 2.21 2.12 69.11 14.68 1693 5.44 3.12 2.56 1.69 3.31 2.64 70.50 14.81 1694 5.32 3.12 2.18 1.54 3.32 2.55 77.34 14.81 1695 4.34 2.86 1.98 1.42 2.82 2.75 112.44 13.34 1696 5.27 2.60 2.12 1.56 3.21 3.02 179.54 14.61 1697 5.93 4.17 2.30 1.31 3.16 2.60 203.59 14.61 1698 6.69 4.56 2.70 1.70 3.60 2.93 240.82 15.20 1699 5.65 3.12 2.81 1.53 3.53 2.87 208.85 22.03 1700 4.24 2.86 2.11 1.68 3.49 2.62 115.90 16.01 1701 3.38 2.08 1.80 1.32 2.24 1.64 68.34 13.53 1702 2.93 1.96 1.85 1.42 2.64 1.94 113.56 14.23 1703 2.88 1.96 1.67 1.33 2.17 1.94 88.31 15.43 1704 3.72 1.78 1.35 2.42 2.02 72.81 17.26 1705 3.10 1.63 1.42 2.36 1.96 147.66 14.29 1706 2.89 1.92 1.64 3.04 2.09 110.63 15.43 1707 2.97 2.08 2.02 1.28 2.40 2.14 109.04 13.94 1708 3.89 2.88 2.27 1.60 2.23 2.51 98.79 15.85 1709 6.63 5.21 2.65 1.59 3.41 2.16 97.79 13.32 1710 6.92 3.86 2.85 1.56 3.95 2.41 143.93 14.82 1711 4.77 3.50 2.57 1.55 3.68 2.44 120.34 15.99 1712 4.13 2.84 2.17 1.64 3.37 2.29 71.47 14.16 1713 4.39 3.33 2.00 1.46 2.88 2.01 89.11 14.13 1714 5.22 3.38 2.35 1.51 2.98 2.51 147.43 15.58 1715 3.69 2.82 2.41 1.42 3.20 2.76 167.40 13.89 1716 4.38 2.64 2.16 1.41 2.71 2.41 146.74 13.89 1717 4.17 2.76 2.04 1.37 2.50 2.17 138.32 14.66 1718 3.66 2.47 1.90 1.35 2.45 2.09 91.26 14.47 1719 3.30 2.29 2.23 1.42 2.49 2.22 154.67 14.66 1720 3.98 2.68 2.65 1.62 3.66 2.74 93.28 16.39 1721 3.72 2.27 2.28 1.40 2.43 2.23 75.72 16.54 1722 3.49 2.15 1.83 1.25 2.33 1.86 50.97 13.61 1723 3.72 2.76 1.90 1.28 2.53 2.11 89.35 13.15 1724 3.55 2.84 2.34 1.63 3.31 2.52 101.71 15.25 1725 4.28 3.21 2.28 1.42 3.33 2.42 103.75 14.90 1726 4.81 3.39 2.29 1.37 2.71 2.50 136.69 17.20 1727 4.32 3.73 2.48 1.37 3.05 2.20 69.63 17.94 1728 5.84 4.44 3.22 1.66 2.99 2.66 65.84 15.81 1729 4.94 3.53 2.88 1.81 3.03 2.73 63.04 15.81
Appendix Table 1: Arable Prices (cont.)
Year
Wheat (s./bu.)
Rye
(s./bu.)
Barley (s./bu.)
Oats
(s./bu.)
Peas
(s./bu.)
Beans (s./bu.)
Potato
(s./cwt.)
Hops Net
Tax (s./cwt.)
Straw
(s./load)
Mustard
Seed (s./bu.)
Saffron (s./lb)
1730 3.62 2.49 2.11 1.43 2.43 2.39 57.80 15.81 1731 3.18 2.30 2.13 1.34 2.30 2.38 83.98 17.10 1732 2.57 2.11 2.01 1.36 2.28 2.24 140.63 18.42 1733 2.90 2.19 1.90 1.27 2.02 2.19 163.94 10.99 1734 3.62 2.78 1.88 1.33 2.30 2.21 122.25 13.77 1735 4.27 3.30 1.92 1.46 2.41 2.24 2.52 114.26 11.86 1736 4.12 2.90 2.05 1.51 2.40 2.12 109.76 18.39 1737 3.52 2.68 2.22 1.62 2.64 2.61 144.46 17.38 1738 3.31 2.52 2.11 1.53 2.94 2.58 88.23 20.35 1739 3.67 2.56 2.01 1.33 2.37 2.31 56.55 14.87 1740 5.04 3.97 2.44 1.77 2.95 2.66 74.39 15.90 1741 5.10 3.27 2.35 1.80 3.73 3.01 70.37 17.17 1742 3.26 2.29 2.38 1.57 2.53 2.56 63.30 18.29 1743 2.68 1.91 1.97 1.47 2.33 2.06 63.23 16.86 1744 2.59 1.81 1.81 1.25 1.89 1.91 83.99 13.73 1745 2.92 2.44 1.60 1.47 2.04 1.88 125.25 13.14 1746 3.61 2.65 1.59 1.32 2.17 1.88 150.11 15.26 1747 3.43 2.44 1.58 1.19 1.99 1.84 2.52 99.43 12.99 1748 3.61 2.60 1.86 1.28 2.03 2.02 97.15 12.47 1749 3.58 2.55 2.07 1.72 2.28 2.27 107.02 15.70 1750 3.49 2.34 1.86 1.55 2.10 2.33 119.11 14.92 1751 3.92 2.35 1.99 1.59 2.28 2.60 92.03 12.95 1752 4.41 2.78 2.05 1.62 2.38 2.51 92.75 14.02 1753 4.39 2.81 2.20 1.47 2.58 2.36 83.43 20.53 1754 3.76 2.61 2.13 1.59 2.81 2.45 71.11 20.80 1755 3.45 2.47 1.85 1.48 2.21 2.24 55.31 17.03 1756 4.30 3.26 2.14 1.64 2.49 2.53 57.01 20.42 1757 6.13 4.47 3.03 1.98 3.73 3.32 69.18 21.24 1758 4.91 3.02 2.71 1.88 3.20 2.97 69.28 18.19 1759 3.65 2.14 1.98 1.36 2.83 2.25 97.40 18.60 1760 3.34 2.19 1.98 1.42 2.28 2.33 135.25 20.62 1761 3.24 2.23 1.76 1.40 2.46 2.31 2.75 80.90 17.78 1762 3.80 3.48 2.12 1.59 2.39 2.56 3.29 65.81 18.74 1763 4.06 3.37 2.82 2.04 3.32 3.25 4.36 70.07 24.19 1764 4.80 3.48 2.71 1.77 2.62 3.02 3.01 61.71 23.04 1765 5.24 3.72 2.67 1.80 2.81 2.93 3.03 173.04 26.71 1766 4.98 4.01 2.76 2.04 3.38 3.31 3.51 122.63 24.35 1767 6.39 3.84 3.09 1.96 3.43 3.04 3.31 78.89 18.55 1768 6.01 3.44 2.67 1.81 3.29 2.70 3.01 114.33 19.10 1769 4.91 3.36 2.13 1.63 2.77 2.89 1.88 93.46 21.46

Appendix Table 1: Arable Prices (cont.)
Year
Wheat (s./bu.)
Rye
(s./bu.)
Barley (s./bu.)
Oats
(s./bu.)
Peas
(s./bu.)
Beans (s./bu.)
Potato
(s./cwt.)
Hops Net
Tax (s./cwt.)
Straw
(s./load)
Mustard
Seed (s./bu.)
Saffron (s./lb)
1770 4.72 3.70 2.23 1.70 2.88 2.75 1.88 147.54 22.03 1771 5.85 4.87 2.95 2.03 3.50 3.16 2.24 121.87 20.08 1772 6.37 5.06 2.99 1.98 3.91 3.52 2.59 170.55 24.23 1773 6.48 4.07 3.36 2.04 3.95 3.55 2.14 148.53 29.89 1774 6.58 4.45 3.46 2.11 3.86 4.00 2.50 145.98 24.15 1775 6.21 4.25 3.22 2.05 3.72 3.35 2.24 97.31 30.10 1776 4.75 3.51 2.63 1.88 3.57 3.14 2.06 105.97 30.68 1777 5.41 3.58 2.39 1.83 3.60 3.29 2.34 89.27 34.21 1778 5.31 3.33 2.63 1.74 3.84 3.03 2.61 97.82 20.53 1779 4.17 2.84 2.36 1.74 3.52 2.78 2.14 62.11 21.54 1780 4.35 2.70 2.14 1.66 3.15 2.60 2.34 61.29 24.42 1781 5.71 3.53 2.08 1.69 3.41 2.70 3.71 62.65 25.09 1782 6.10 3.61 2.69 1.76 3.12 2.86 2.92 63.08 22.69 1783 6.55 4.27 3.62 2.43 4.09 4.27 3.28 131.16 21.88 1784 6.20 4.23 3.46 2.25 3.73 3.91 2.54 113.21 35.41 1785 5.62 3.64 3.01 2.07 3.68 3.79 2.03 111.40 23.94 1786 4.99 3.45 3.09 2.30 3.93 4.34 2.46 104.52 32.48 1787 5.22 3.66 2.83 2.05 4.00 4.01 2.40 128.11 27.81 1788 5.62 3.48 2.80 1.99 3.47 3.14 1.80 192.12 26.69 1789 6.31 3.83 2.74 1.90 3.31 3.02 2.21 152.54 29.97 1790 6.64 4.15 3.01 2.32 3.67 3.82 1.93 127.57 22.83 1791 5.97 4.13 3.15 2.26 3.70 3.55 3.02 109.48 23.05 1792 5.49 3.72 3.43 2.23 3.92 3.95 2.12 117.52 26.37 1793 5.98 4.52 3.95 2.61 4.72 4.18 1.79 109.88 1794 6.24 4.88 4.10 2.83 5.56 4.21 2.61 217.55 1795 8.05 6.00 4.19 3.11 6.26 5.29 4.13 100.30 1796 9.74 6.03 4.34 2.79 5.39 4.56 2.52 117.27 44.25 1797 6.73 4.16 3.61 2.21 3.79 3.10 2.45 124.24 38.38 1798 6.56 4.04 3.69 2.42 3.64 3.42 2.24 124.48 23.38 1799 7.84 4.56 4.13 3.23 4.73 5.14 2.96 279.94 38.00 1800 12.86 7.11 6.92 4.44 7.86 7.43 6.38 374.67 43.50 1801 14.84 9.87 8.69 4.49 7.92 7.84 4.73 322.40 49.00 1802 8.22 5.38 4.55 2.47 4.55 4.17 2.52 91.09 38.12 1803 7.15 4.62 3.26 2.61 4.57 3.87 2.99 171.17 50.17 1804 7.25 4.65 3.72 2.94 4.72 4.46 2.86 108.30 34.25 1805 10.49 6.78 5.94 3.44 5.42 5.29 2.24 108.54 53.62 1806 9.56 6.04 5.10 3.34 5.54 5.26 2.38 155.82 37.25 1807 9.47 6.26 5.24 3.44 7.38 5.56 2.80 116.19 55.92 1808 9.39 7.23 5.26 4.04 10.90 6.66 3.36 95.43 42.38 1809 11.64 7.09 5.70 3.81 9.80 7.12 3.22 90.20 39.75
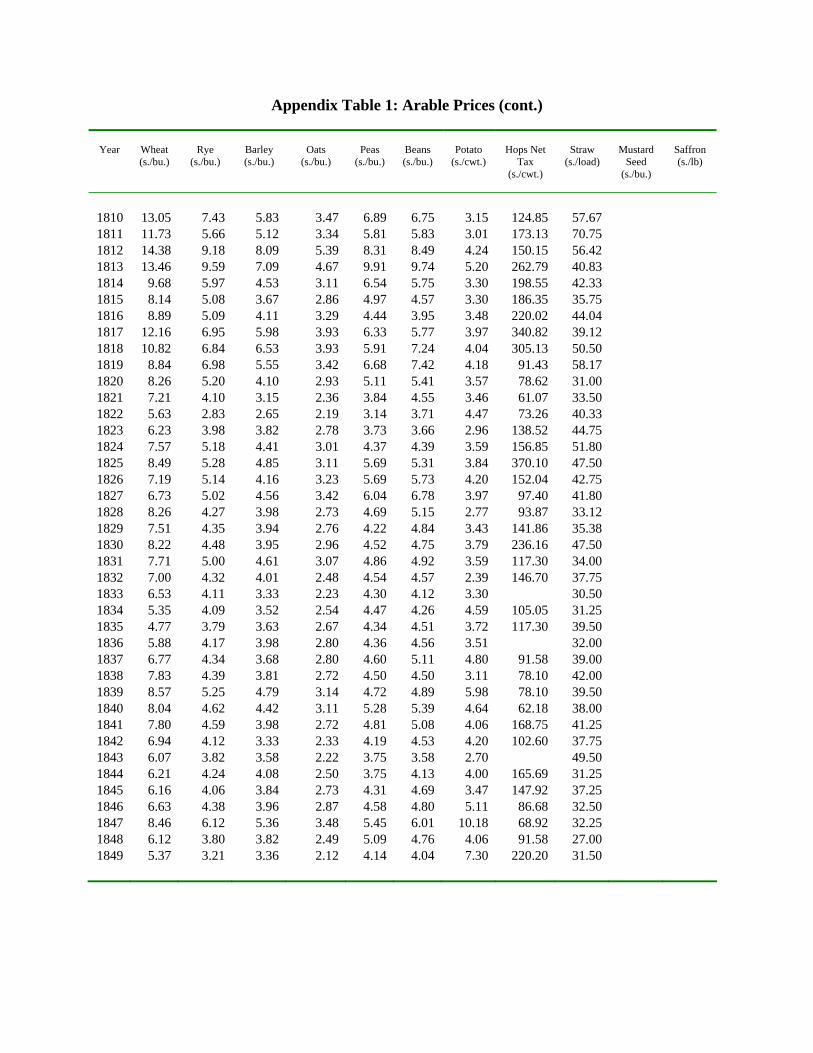
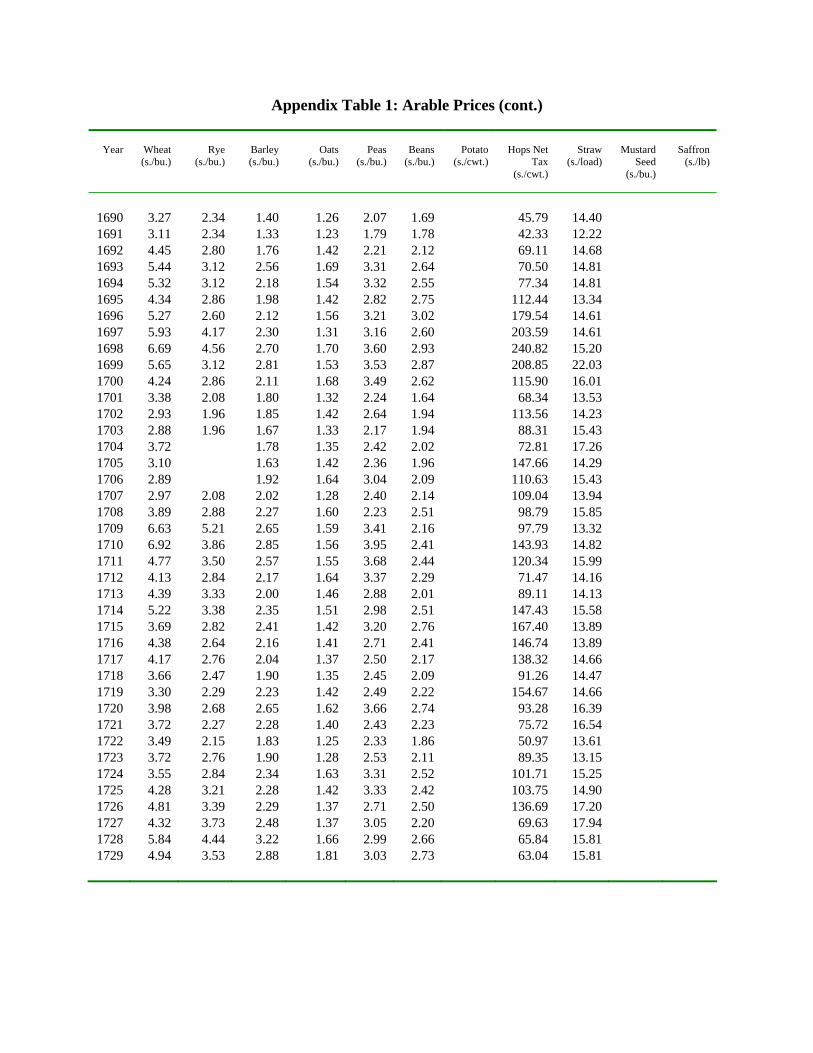
Appendix Table 1: Arable Prices (cont.)
Year
Wheat (s./bu.)
Rye
(s./bu.)
Barley (s./bu.)
Oats
(s./bu.)
Peas
(s./bu.)
Beans (s./bu.)
Potato
(s./cwt.)
Hops Net
Tax (s./cwt.)
Straw
(s./load)
Mustard
Seed (s./bu.)
Saffron (s./lb)
1810 13.05 7.43 5.83 3.47 6.89 6.75 3.15 124.85 57.67 1811 11.73 5.66 5.12 3.34 5.81 5.83 3.01 173.13 70.75 1812 14.38 9.18 8.09 5.39 8.31 8.49 4.24 150.15 56.42 1813 13.46 9.59 7.09 4.67 9.91 9.74 5.20 262.79 40.83 1814 9.68 5.97 4.53 3.11 6.54 5.75 3.30 198.55 42.33 1815 8.14 5.08 3.67 2.86 4.97 4.57 3.30 186.35 35.75 1816 8.89 5.09 4.11 3.29 4.44 3.95 3.48 220.02 44.04 1817 12.16 6.95 5.98 3.93 6.33 5.77 3.97 340.82 39.12 1818 10.82 6.84 6.53 3.93 5.91 7.24 4.04 305.13 50.50 1819 8.84 6.98 5.55 3.42 6.68 7.42 4.18 91.43 58.17 1820 8.26 5.20 4.10 2.93 5.11 5.41 3.57 78.62 31.00 1821 7.21 4.10 3.15 2.36 3.84 4.55 3.46 61.07 33.50 1822 5.63 2.83 2.65 2.19 3.14 3.71 4.47 73.26 40.33 1823 6.23 3.98 3.82 2.78 3.73 3.66 2.96 138.52 44.75 1824 7.57 5.18 4.41 3.01 4.37 4.39 3.59 156.85 51.80 1825 8.49 5.28 4.85 3.11 5.69 5.31 3.84 370.10 47.50 1826 7.19 5.14 4.16 3.23 5.69 5.73 4.20 152.04 42.75 1827 6.73 5.02 4.56 3.42 6.04 6.78 3.97 97.40 41.80 1828 8.26 4.27 3.98 2.73 4.69 5.15 2.77 93.87 33.12 1829 7.51 4.35 3.94 2.76 4.22 4.84 3.43 141.86 35.38 1830 8.22 4.48 3.95 2.96 4.52 4.75 3.79 236.16 47.50 1831 7.71 5.00 4.61 3.07 4.86 4.92 3.59 117.30 34.00 1832 7.00 4.32 4.01 2.48 4.54 4.57 2.39 146.70 37.75 1833 6.53 4.11 3.33 2.23 4.30 4.12 3.30 30.50 1834 5.35 4.09 3.52 2.54 4.47 4.26 4.59 105.05 31.25 1835 4.77 3.79 3.63 2.67 4.34 4.51 3.72 117.30 39.50 1836 5.88 4.17 3.98 2.80 4.36 4.56 3.51 32.00 1837 6.77 4.34 3.68 2.80 4.60 5.11 4.80 91.58 39.00 1838 7.83 4.39 3.81 2.72 4.50 4.50 3.11 78.10 42.00 1839 8.57 5.25 4.79 3.14 4.72 4.89 5.98 78.10 39.50 1840 8.04 4.62 4.42 3.11 5.28 5.39 4.64 62.18 38.00 1841 7.80 4.59 3.98 2.72 4.81 5.08 4.06 168.75 41.25 1842 6.94 4.12 3.33 2.33 4.19 4.53 4.20 102.60 37.75 1843 6.07 3.82 3.58 2.22 3.75 3.58 2.70 49.50 1844 6.21 4.24 4.08 2.50 3.75 4.13 4.00 165.69 31.25 1845 6.16 4.06 3.84 2.73 4.31 4.69 3.47 147.92 37.25 1846 6.63 4.38 3.96 2.87 4.58 4.80 5.11 86.68 32.50 1847 8.46 6.12 5.36 3.48 5.45 6.01 10.18 68.92 32.25 1848 6.12 3.80 3.82 2.49 5.09 4.76 4.06 91.58 27.00 1849 5.37 3.21 3.36 2.12 4.14 4.04 7.30 220.20 31.50
Appendix Table 1: Arable Prices (cont.)
Year
Wheat (s./bu.)
Rye
(s./bu.)
Barley (s./bu.)
Oats
(s./bu.)
Peas
(s./bu.)
Beans (s./bu.)
Potato
(s./cwt.)
Hops Net
Tax (s./cwt.)
Straw
(s./load)
Mustard
Seed (s./bu.)
Saffron (s./lb)
1850 4.88 2.91 2.91 1.99 3.36 3.68 4.72 152.82 24.75 1851 4.67 3.08 2.25 3.19 3.58 5.11 270.42 25.25 1852 4.94 3.55 2.31 3.58 3.80 5.11 130.78 26.00 1853 6.46 4.12 2.55 4.51 3.77 4.20 315.74 29.50 1854 8.78 4.48 3.38 5.46 5.62 4.12 206.92 35.50 1855 9.05 4.32 3.32 5.39 5.54 5.27 179.44 28.25 1856 8.39 5.10 3.05 4.97 5.15 4.66 108.59 26.00 1857 6.83 5.23 3.03 4.71 5.23 5.90 109.52 27.25 1858 5.36 4.31 2.97 4.82 5.04 5.04 94.17 27.50 1859 5.30 4.16 2.81 4.53 5.05 4.87 92.37 26.50 1860 6.46 4.55 2.96 4.69 5.16 6.27 160.25 32.25 1861 6.71 4.49 2.88 4.28 5.01 6.99 166.00 34.00 1862 6.72 4.36 2.74 4.35 4.39 6.43 156.54 36.00 1863 5.43 4.21 2.57 4.10 4.38 5.55 131.91 31.00 1864 4.87 3.72 2.44 4.11 4.61 4.76 162.11 27.50 1865 5.07 3.70 2.65 4.29 5.02 5.05 138.42 30.00 1866 6.05 4.65 2.98 4.39 5.48 5.68 164.76 1867 7.81 4.97 3.15 4.80 5.34 7.08 136.43 1868 7.73 5.34 3.41 5.18 5.81 6.48 74.05 1869 5.84 4.90 3.15 4.53 5.34 6.12 84.74 1870 5.69 4.30 2.77 4.37 5.24 6.96 83.25 1871 6.87 4.50 3.05 4.59 5.18 6.36 101.64 1872 6.91 4.64 2.81 4.55 4.91 6.82 124.25 1873 7.11 5.02 3.08 4.55 5.17 7.11 122.02 1874 6.76 5.59 3.50 4.86 5.75 6.56 158.05 1875 5.48 4.78 3.48 4.84 5.51 6.04 115.06 1876 5.60 4.37 3.18 4.57 4.91 7.15 113.32 1877 6.88 4.93 3.14 4.49 4.44 7.34 116.30 1878 5.63 4.99 2.95 4.13 4.86 6.84 92.94 1879 5.31 4.22 2.64 4.04 4.71 7.37 115.31 1880 5.38 4.11 2.80 4.26 4.96 7.27 114.31 1881 5.50 3.97 2.64 4.23 4.82 6.71 117.05 1882 5.47 3.87 2.65 4.14 4.73 7.26 230.37 1883 5.04 3.96 2.60 4.13 4.62 7.18 208.50 1884 4.32 3.81 2.46 3.62 3.98 6.80 156.31 1885 3.98 3.74 2.50 3.52 3.75 6.54 93.19 1886 3.76 3.30 2.30 3.27 3.79 6.23 72.32 1887 3.94 3.15 1.97 3.06 3.87 6.96 73.31 1888 3.86 3.45 2.03 3.05 3.72 6.50 91.95 1889 3.61 3.21 2.15 3.43 3.81 7.05 88.97
Appendix Table 1: Arable Prices (cont.)
Year
Wheat (s./bu.)
Rye
(s./bu.)
Barley (s./bu.)
Oats
(s./bu.)
Peas
(s./bu.)
Beans (s./bu.)
Potato
(s./cwt.)
Hops Net
Tax (s./cwt.)
Straw
(s./load)
Mustard
Seed (s./bu.)
Saffron (s./lb)
1890 3.87 3.57 2.25 3.44 3.61 6.54 116.05 1891 4.49 3.51 2.42 3.73 4.00 7.49 124.75 1892 3.67 3.25 2.40 3.61 3.75 6.26 127.24 1893 3.19 3.18 2.27 3.31 3.47 6.25 138.67 1894 2.77 3.04 2.07 2.98 3.11 6.92 101.64 1895 2.80 2.73 1.76 3.00 3.19 6.49 73.81 1896 3.17 2.85 1.79 2.96 3.28 6.27 71.07 1897 3.66 2.92 2.05 2.86 3.27 5.50 79.27 1898 4.12 3.37 2.23 3.31 3.55 5.65 104.87 1899 3.11 3.18 2.06 3.42 3.72 5.61 111.58 1900 3.26 3.10 2.13 3.63 3.79 4.84 99.65 1901 3.24 3.13 2.23 3.83 4.10 5.14 98.91 1902 3.41 3.19 2.45 3.81 4.13 4.94 103.63 1903 3.24 2.82 2.08 4.10 6.50 1904 3.44 2.78 1.98 3.77 5.58 1905 3.60 3.02 2.10 4.11 8.77 1906 3.43 3.00 2.22 4.44 7.97 1907 3.71 3.12 2.28 3.19 6.57 1908 3.88 3.21 2.16 4.35 6.39 1909 4.48 3.33 2.29 4.24 7.52 1910 3.84 2.87 2.10 4.46 8.08 1911 3.84 3.38 2.28 4.44 9.15 1912 4.21 3.81 2.61 4.56 6.85 1913 3.84 3.38 2.31 4.49 6.27 1914
4.23 3.37 2.54 4.24 10.54
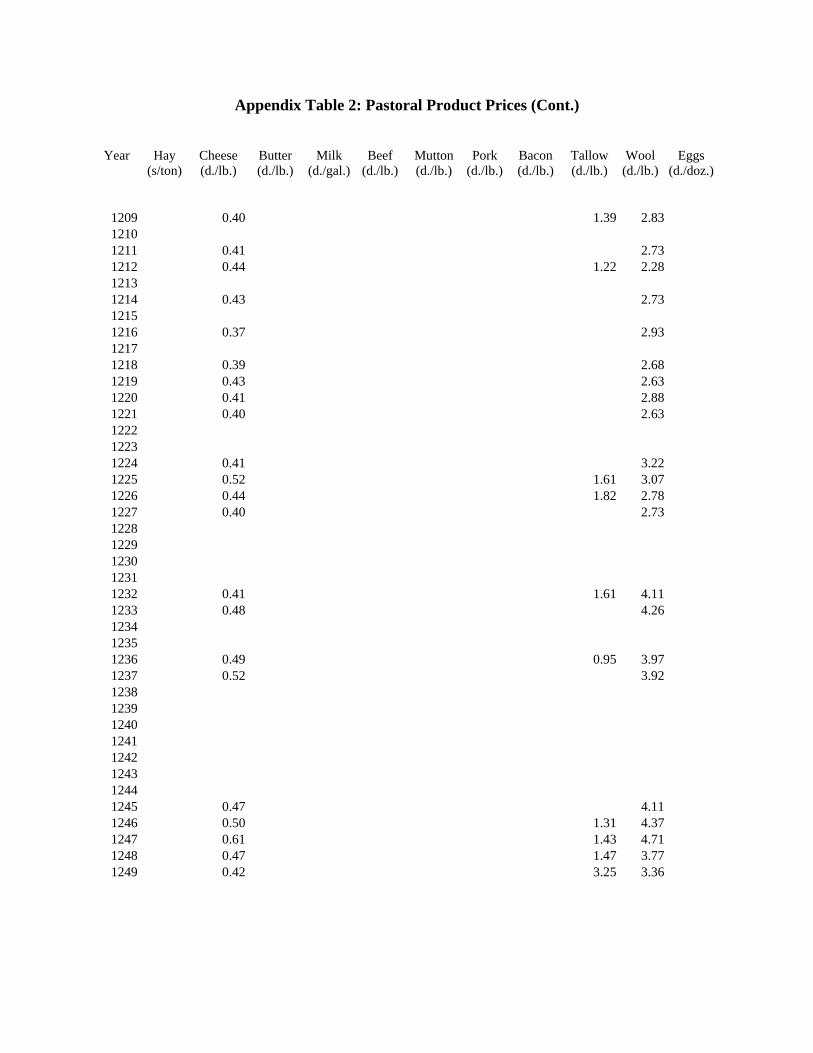
Appendix Table 2: Pastoral Product Prices (Cont.)
Year
Hay
(s/ton)
Cheese (d./lb.)
Butter (d./lb.)
Milk
(d./gal.)
Beef
(d./lb.)
Mutton (d./lb.)
Pork
(d./lb.)
Bacon (d./lb.)
Tallow (d./lb.)
Wool
(d./lb.)
Eggs
(d./doz.)
1209 0.40 1.39 2.83 1210 1211 0.41 2.73 1212 0.44 1.22 2.28 1213 1214 0.43 2.73 1215 1216 0.37 2.93 1217 1218 0.39 2.681219 0.43 2.63 1220 0.41 2.88 1221 0.40 2.63 1222 1223 1224 0.41 3.22 1225 0.52 1.61 3.07 1226 0.44 1.82 2.78 1227 0.40 2.73 1228 1229 1230 1231 1232 0.41 1.61 4.11 1233 0.48 4.26 1234 1235 1236 0.49 0.95 3.97 1237 0.52 3.92 1238 1239 1240 1241 1242 1243 1244 1245 0.47 4.11 1246 0.50 1.31 4.37 1247 0.61 1.43 4.71 1248 0.47 1.47 3.77 1249 0.42 3.25 3.36
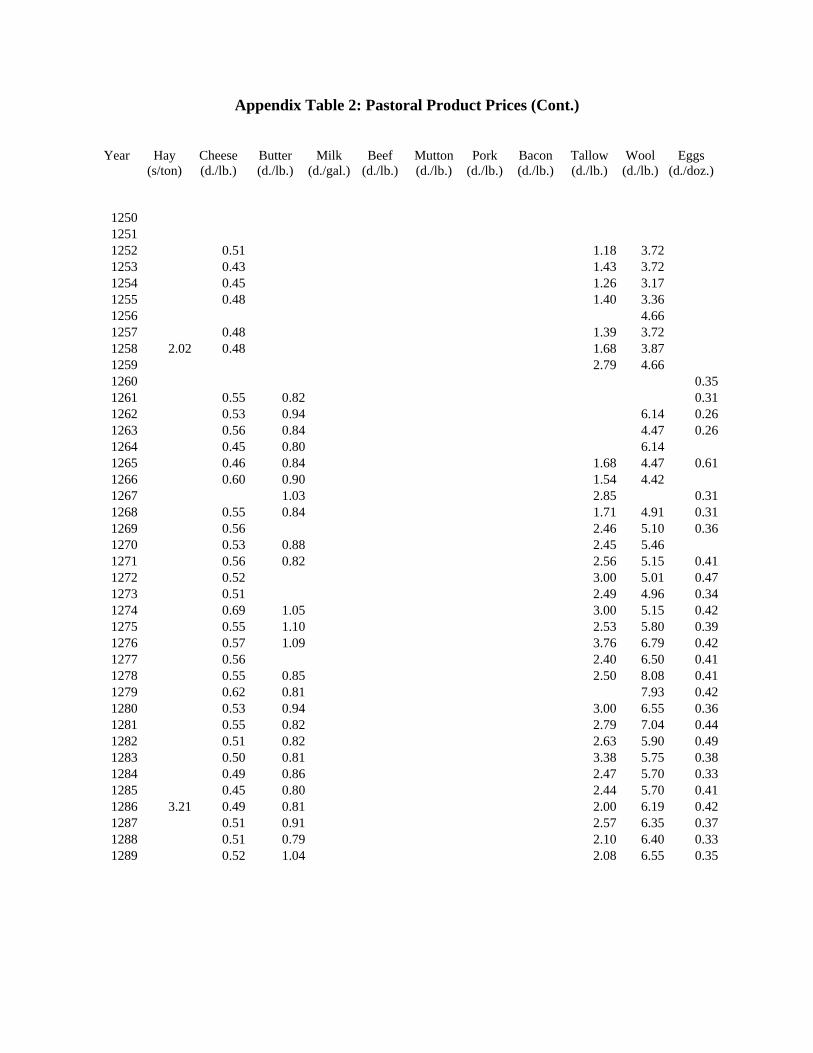
Appendix Table 2: Pastoral Product Prices (Cont.)
Year
Hay
(s/ton)
Cheese (d./lb.)
Butter (d./lb.)
Milk
(d./gal.)
Beef
(d./lb.)
Mutton (d./lb.)
Pork
(d./lb.)
Bacon (d./lb.)
Tallow (d./lb.)
Wool
(d./lb.)
Eggs
(d./doz.)
1250 1251 1252 0.51 1.18 3.72 1253 0.43 1.43 3.72 1254 0.45 1.26 3.17 1255 0.48 1.40 3.36 1256 4.66 1257 0.48 1.39 3.72 1258 2.02 0.48 1.68 3.87 1259 2.79 4.66 1260 0.35 1261 0.55 0.82 0.31 1262 0.53 0.94 6.14 0.26 1263 0.56 0.84 4.47 0.26 1264 0.45 0.80 6.14 1265 0.46 0.84 1.68 4.47 0.61 1266 0.60 0.90 1.54 4.42 1267 1.03 2.85 0.31 1268 0.55 0.84 1.71 4.91 0.31 1269 0.56 2.46 5.10 0.36 1270 0.53 0.88 2.45 5.46 1271 0.56 0.82 2.56 5.15 0.41 1272 0.52 3.00 5.01 0.47 1273 0.51 2.49 4.96 0.34 1274 0.69 1.05 3.00 5.15 0.42 1275 0.55 1.10 2.53 5.80 0.39 1276 0.57 1.09 3.76 6.79 0.42 1277 0.56 2.40 6.50 0.41 1278 0.55 0.85 2.50 8.08 0.41 1279 0.62 0.81 7.93 0.42 1280 0.53 0.94 3.00 6.55 0.36 1281 0.55 0.82 2.79 7.04 0.44 1282 0.51 0.82 2.63 5.90 0.49 1283 0.50 0.81 3.38 5.75 0.38 1284 0.49 0.86 2.47 5.70 0.33 1285 0.45 0.80 2.44 5.70 0.41 1286 3.21 0.49 0.81 2.00 6.19 0.42 1287 0.51 0.91 2.57 6.35 0.37 1288 0.51 0.79 2.10 6.40 0.33 1289 0.52 1.04 2.08 6.55 0.35

Appendix Table 2: Pastoral Product Prices (Cont.)
Year
Hay
(s/ton)
Cheese (d./lb.)
Butter (d./lb.)
Milk
(d./gal.)
Beef
(d./lb.)
Mutton (d./lb.)
Pork
(d./lb.)
Bacon (d./lb.)
Tallow (d./lb.)
Wool
(d./lb.)
Eggs
(d./doz.)
1290 0.51 0.85 1.85 6.94 0.39 1291 0.51 0.87 2.12 6.50 0.33 1292 0.52 0.88 2.09 5.66 0.39 1293 0.51 0.83 2.34 6.14 0.35 1294 0.53 0.90 2.55 5.51 0.39 1295 0.59 0.92 2.74 3.77 0.36 1296 0.50 0.85 2.40 5.05 0.35 1297 0.52 0.88 2.39 4.86 0.37 1298 0.49 0.83 2.19 5.70 0.39 1299 0.59 1.16 2.09 7.30 0.40 1300 4.96 0.56 0.94 3.30 6.65 0.39 1301 0.56 0.90 1.44 2.66 6.19 0.39 1302 5.24 0.54 0.86 1.62 2.30 5.51 0.41 1303 4.29 0.53 0.89 1.20 2.16 5.56 0.36 1304 9.65 0.51 0.82 1.34 1.60 5.70 0.41 1305 0.54 0.73 1.34 2.17 6.50 0.43 1306 0.63 1.00 1.78 2.81 7.04 0.41 1307 4.98 0.53 1.04 1.44 1.86 7.49 0.64 1308 0.61 0.95 1.34 2.38 7.88 0.16 1309 6.24 0.60 1.11 1.42 3.07 8.03 0.48 1310 5.55 0.70 1.41 1.35 3.19 7.39 0.60 1311 5.17 0.68 1.38 1.35 2.99 6.35 0.46 1312 0.68 1.18 1.34 3.15 5.46 0.46 1313 5.35 0.65 1.29 1.31 2.52 5.85 0.45 1314 4.68 0.69 0.98 1.36 2.36 6.70 0.51 1315 0.69 1.38 1.37 2.72 6.60 0.49 1316 0.78 1.50 2.00 3.33 6.31 0.49 1317 3.63 0.76 1.33 1.65 4.03 6.65 0.69 1318 4.66 0.63 1.26 4.17 7.25 0.43 1319 2.81 0.58 1.11 1.37 3.32 7.13 0.39 1320 1.90 0.75 1.29 2.91 8.58 0.45 1321 1.49 0.76 1.29 1.37 2.31 9.43 0.46 1322 2.98 0.67 1.59 2.93 7.44 0.53 1323 1.57 3.45 7.44 0.54 1324 5.08 0.61 1.23 1.67 3.66 7.74 0.45 1325 5.62 0.74 1.18 1.50 3.49 8.13 0.52 1326 15.69 0.83 1.21 1.78 3.05 6.99 0.52 1327 5.45 0.58 0.76 2.67 7.35 0.43 1328 0.59 1.30 2.43 6.74 0.61 1329 4.29 0.63 1.20 1.78 2.54 6.19 0.45

Appendix Table 2: Pastoral Product Prices (Cont.)
Year
Hay
(s/ton)
Cheese (d./lb.)
Butter (d./lb.)
Milk
(d./gal.)
Beef
(d./lb.)
Mutton (d./lb.)
Pork
(d./lb.)
Bacon (d./lb.)
Tallow (d./lb.)
Wool
(d./lb.)
Eggs
(d./doz.)
1330 6.11 0.65 1.06 1.78 2.59 6.05 0.47 1331 10.16 0.71 0.98 2.83 6.35 0.45 1332 5.12 0.56 0.97 2.62 6.14 0.42 1333 0.54 1.00 2.67 5.41 0.46 1334 6.91 0.55 1.14 2.49 4.37 0.44 1335 0.56 1.19 2.49 4.66 0.43 1336 3.84 0.55 1.18 1.60 2.58 5.70 0.44 1337 1.52 0.52 1.04 2.40 4.91 0.41 1338 1.01 0.53 1.10 1.50 2.26 3.82 0.40 1339 0.48 0.93 2.04 4.21 0.37 1340 10.60 0.64 1.06 1.44 2.28 4.21 0.39 1341 4.97 0.49 1.11 2.23 4.26 0.47 1342 0.50 0.96 2.03 5.15 0.45 1343 3.91 0.51 0.93 2.22 4.21 0.45 1344 0.49 1.17 2.32 5.41 0.42 1345 6.29 0.46 1.47 2.58 5.05 0.38 1346 5.32 0.65 1.25 1.32 2.38 5.51 0.39 1347 0.60 1.35 2.78 5.05 0.41 1348 3.57 0.53 1.17 2.43 5.15 0.50 1349 5.19 0.44 1.21 2.71 3.07 0.49 1350 0.55 1.05 1.35 2.36 3.87 0.45 1351 3.45 0.65 1.05 1.08 2.61 4.06 0.44 1352 5.34 0.84 0.91 0.82 2.54 4.31 0.50 1353 5.57 0.65 1.11 3.03 3.97 0.70 1354 5.02 0.64 1.28 3.04 4.11 0.47 1355 3.92 0.65 1.16 1.44 2.78 4.57 0.53 1356 5.98 0.81 1.17 2.65 4.16 0.46 1357 5.18 0.67 1.18 1.61 2.73 4.47 1358 3.22 0.74 1.17 2.96 4.62 1359 5.25 0.62 1.11 2.83 3.62 0.51 1360 4.40 0.76 1.44 1.46 2.86 4.81 0.46 1361 5.98 0.79 1.27 1.45 2.86 4.26 0.52 1362 0.65 1.14 2.78 4.76 0.49 1363 0.51 1.35 1.23 2.74 4.16 1364 3.92 0.55 1.29 2.69 4.31 0.42 1365 0.61 1.30 1.33 3.02 5.61 0.52 1366 5.57 0.60 1.32 1.18 2.77 5.61 0.40 1367 1.30 1.15 2.82 6.45 0.46 1368 4.99 0.61 1.36 2.83 6.31 0.45 1369 3.53 0.51 1.37 1.23 2.80 5.46 0.54
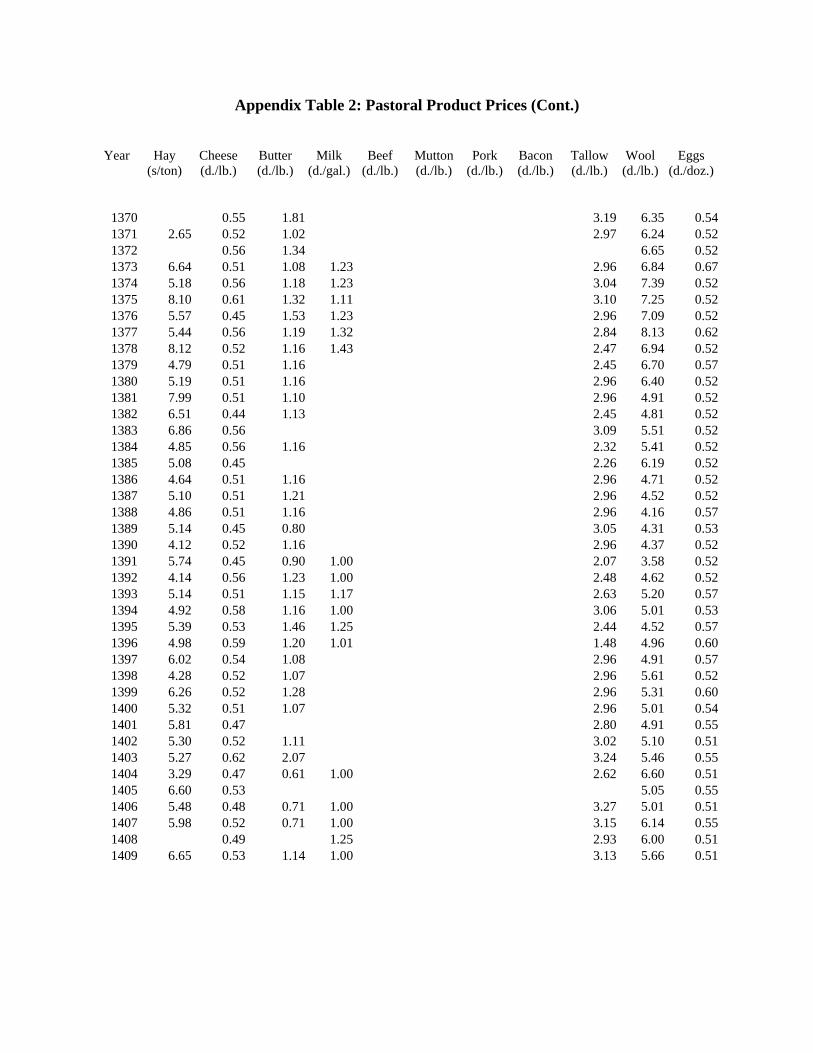
Appendix Table 2: Pastoral Product Prices (Cont.)
Year
Hay
(s/ton)
Cheese (d./lb.)
Butter (d./lb.)
Milk
(d./gal.)
Beef
(d./lb.)
Mutton (d./lb.)
Pork
(d./lb.)
Bacon (d./lb.)
Tallow (d./lb.)
Wool
(d./lb.)
Eggs
(d./doz.)
1370 0.55 1.81 3.19 6.35 0.54 1371 2.65 0.52 1.02 2.97 6.24 0.52 1372 0.56 1.34 6.65 0.52 1373 6.64 0.51 1.08 1.23 2.96 6.84 0.67 1374 5.18 0.56 1.18 1.23 3.04 7.39 0.52 1375 8.10 0.61 1.32 1.11 3.10 7.25 0.52 1376 5.57 0.45 1.53 1.23 2.96 7.09 0.52 1377 5.44 0.56 1.19 1.32 2.84 8.13 0.62 1378 8.12 0.52 1.16 1.43 2.47 6.94 0.52 1379 4.79 0.51 1.16 2.45 6.70 0.57 1380 5.19 0.51 1.16 2.96 6.40 0.52 1381 7.99 0.51 1.10 2.96 4.91 0.52 1382 6.51 0.44 1.13 2.45 4.81 0.52 1383 6.86 0.56 3.09 5.51 0.52 1384 4.85 0.56 1.16 2.32 5.41 0.52 1385 5.08 0.45 2.26 6.19 0.52 1386 4.64 0.51 1.16 2.96 4.71 0.52 1387 5.10 0.51 1.21 2.96 4.52 0.52 1388 4.86 0.51 1.16 2.96 4.16 0.57 1389 5.14 0.45 0.80 3.05 4.31 0.53 1390 4.12 0.52 1.16 2.96 4.37 0.52 1391 5.74 0.45 0.90 1.00 2.07 3.58 0.52 1392 4.14 0.56 1.23 1.00 2.48 4.62 0.52 1393 5.14 0.51 1.15 1.17 2.63 5.20 0.57 1394 4.92 0.58 1.16 1.00 3.06 5.01 0.53 1395 5.39 0.53 1.46 1.25 2.44 4.52 0.57 1396 4.98 0.59 1.20 1.01 1.48 4.96 0.60 1397 6.02 0.54 1.08 2.96 4.91 0.57 1398 4.28 0.52 1.07 2.96 5.61 0.52 1399 6.26 0.52 1.28 2.96 5.31 0.60 1400 5.32 0.51 1.07 2.96 5.01 0.54 1401 5.81 0.47 2.80 4.91 0.55 1402 5.30 0.52 1.11 3.02 5.10 0.51 1403 5.27 0.62 2.07 3.24 5.46 0.55 1404 3.29 0.47 0.61 1.00 2.62 6.60 0.51 1405 6.60 0.53 5.05 0.55 1406 5.48 0.48 0.71 1.00 3.27 5.01 0.51 1407 5.98 0.52 0.71 1.00 3.15 6.14 0.55 1408 0.49 1.25 2.93 6.00 0.51 1409 6.65 0.53 1.14 1.00 3.13 5.66 0.51

Appendix Table 2: Pastoral Product Prices (Cont.)
Year
Hay
(s/ton)
Cheese (d./lb.)
Butter (d./lb.)
Milk
(d./gal.)
Beef
(d./lb.)
Mutton (d./lb.)
Pork
(d./lb.)
Bacon (d./lb.)
Tallow (d./lb.)
Wool
(d./lb.)
Eggs
(d./doz.)
1410 5.12 0.51 1.00 3.21 6.99 0.51 1411 4.77 0.51 3.28 6.50 0.54 1412 5.27 0.51 3.16 5.80 0.43 1413 6.04 0.58 1.24 1.05 3.20 6.55 0.52 1414 5.15 0.53 1.32 1.00 3.20 5.31 0.55 1415 5.64 0.56 1.24 1.00 3.23 4.91 0.55 1416 5.20 0.60 3.21 5.20 0.55 1417 5.79 0.45 1.38 3.16 4.62 0.52 1418 4.15 0.52 3.04 4.01 0.54 1419 7.98 0.48 3.22 4.06 0.56 1420 5.21 0.56 3.06 4.37 0.49 1421 4.94 0.43 1.43 2.99 6.19 0.41 1422 6.43 0.58 3.11 4.52 0.46 1423 6.99 0.52 3.20 3.92 0.51 1424 6.19 0.52 0.83 3.06 4.21 0.51 1425 6.34 0.63 0.83 3.25 4.71 0.55 1426 6.25 0.61 3.22 4.01 0.56 1427 5.35 0.57 3.33 4.42 0.55 1428 6.00 0.51 1.24 2.98 4.31 0.53 1429 7.09 0.56 3.15 5.25 0.55 1430 5.67 0.67 3.16 6.70 0.45 1431 6.94 0.65 0.44 3.09 5.51 0.56 1432 6.65 0.52 3.04 5.36 0.53 1433 6.39 0.65 3.13 5.41 0.56 1434 6.20 1.24 3.26 4.21 0.67 1435 5.69 0.79 3.70 4.66 0.56 1436 5.51 0.79 1.24 3.41 5.05 0.65 1437 6.02 2.31 4.16 0.55 1438 6.71 0.65 3.50 4.11 0.56 1439 6.44 0.79 2.98 5.46 0.62 1440 2.53 4.96 0.65 1441 5.15 2.66 5.01 0.62 1442 6.70 0.50 1.24 2.58 4.91 0.62 1443 6.56 2.55 4.26 0.46 1444 9.14 2.83 4.57 0.65 1445 5.73 0.65 3.04 3.72 0.60 1446 6.70 0.52 2.60 4.26 0.45 1447 7.01 0.54 1.25 1.00 2.68 5.41 0.41 1448 6.17 0.42 1.51 1.00 3.00 4.31 0.55 1449 6.12 0.61 1.51 1.00 2.71 4.37 0.62
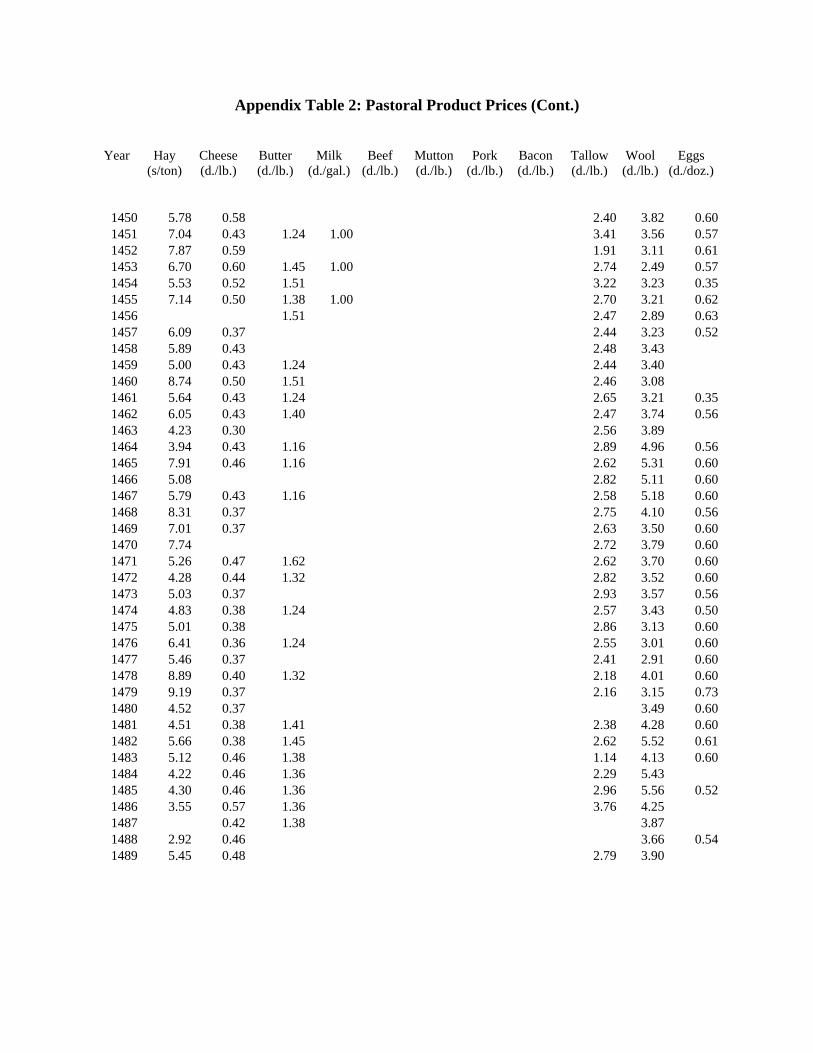
Appendix Table 2: Pastoral Product Prices (Cont.)
Year
Hay
(s/ton)
Cheese (d./lb.)
Butter (d./lb.)
Milk
(d./gal.)
Beef
(d./lb.)
Mutton (d./lb.)
Pork
(d./lb.)
Bacon (d./lb.)
Tallow (d./lb.)
Wool
(d./lb.)
Eggs
(d./doz.)
1450 5.78 0.58 2.40 3.82 0.60 1451 7.04 0.43 1.24 1.00 3.41 3.56 0.57 1452 7.87 0.59 1.91 3.11 0.61 1453 6.70 0.60 1.45 1.00 2.74 2.49 0.57 1454 5.53 0.52 1.51 3.22 3.23 0.35 1455 7.14 0.50 1.38 1.00 2.70 3.21 0.62 1456 1.51 2.47 2.89 0.63 1457 6.09 0.37 2.44 3.23 0.52 1458 5.89 0.43 2.48 3.43 1459 5.00 0.43 1.24 2.44 3.40 1460 8.74 0.50 1.51 2.46 3.08 1461 5.64 0.43 1.24 2.65 3.21 0.35 1462 6.05 0.43 1.40 2.47 3.74 0.56 1463 4.23 0.30 2.56 3.89 1464 3.94 0.43 1.16 2.89 4.96 0.56 1465 7.91 0.46 1.16 2.62 5.31 0.60 1466 5.08 2.82 5.11 0.60 1467 5.79 0.43 1.16 2.58 5.18 0.60 1468 8.31 0.37 2.75 4.10 0.56 1469 7.01 0.37 2.63 3.50 0.60 1470 7.74 2.72 3.79 0.60 1471 5.26 0.47 1.62 2.62 3.70 0.60 1472 4.28 0.44 1.32 2.82 3.52 0.60 1473 5.03 0.37 2.93 3.57 0.56 1474 4.83 0.38 1.24 2.57 3.43 0.50 1475 5.01 0.38 2.86 3.13 0.60 1476 6.41 0.36 1.24 2.55 3.01 0.60 1477 5.46 0.37 2.41 2.91 0.60 1478 8.89 0.40 1.32 2.18 4.01 0.60 1479 9.19 0.37 2.16 3.15 0.73 1480 4.52 0.37 3.49 0.60 1481 4.51 0.38 1.41 2.38 4.28 0.60 1482 5.66 0.38 1.45 2.62 5.52 0.61 1483 5.12 0.46 1.38 1.14 4.13 0.60 1484 4.22 0.46 1.36 2.29 5.43 1485 4.30 0.46 1.36 2.96 5.56 0.52 1486 3.55 0.57 1.36 3.76 4.25 1487 0.42 1.38 3.87 1488 2.92 0.46 3.66 0.54 1489 5.45 0.48 2.79 3.90
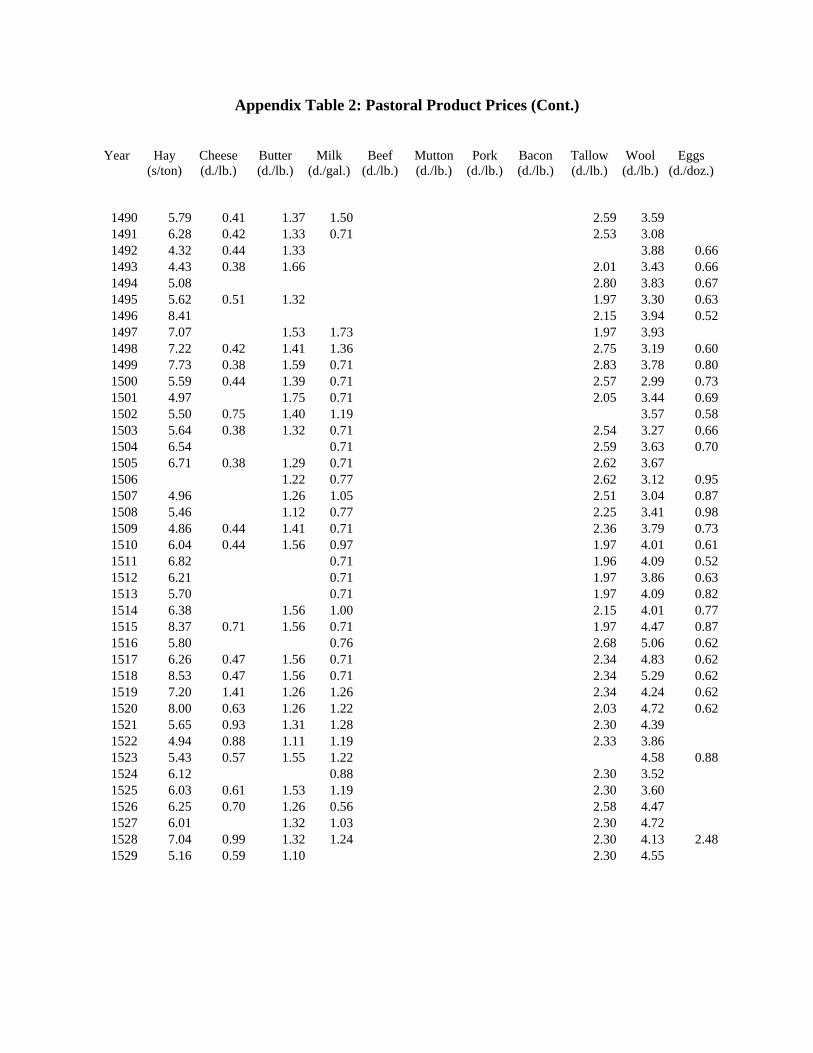
Appendix Table 2: Pastoral Product Prices (Cont.)
Year
Hay
(s/ton)
Cheese (d./lb.)
Butter (d./lb.)
Milk
(d./gal.)
Beef
(d./lb.)
Mutton (d./lb.)
Pork
(d./lb.)
Bacon (d./lb.)
Tallow (d./lb.)
Wool
(d./lb.)
Eggs
(d./doz.)
1490 5.79 0.41 1.37 1.50 2.59 3.59 1491 6.28 0.42 1.33 0.71 2.53 3.08 1492 4.32 0.44 1.33 3.88 0.66 1493 4.43 0.38 1.66 2.01 3.43 0.66 1494 5.08 2.80 3.83 0.67 1495 5.62 0.51 1.32 1.97 3.30 0.63 1496 8.41 2.15 3.94 0.52 1497 7.07 1.53 1.73 1.97 3.93 1498 7.22 0.42 1.41 1.36 2.75 3.19 0.60 1499 7.73 0.38 1.59 0.71 2.83 3.78 0.80 1500 5.59 0.44 1.39 0.71 2.57 2.99 0.73 1501 4.97 1.75 0.71 2.05 3.44 0.69 1502 5.50 0.75 1.40 1.19 3.57 0.58 1503 5.64 0.38 1.32 0.71 2.54 3.27 0.66 1504 6.54 0.71 2.59 3.63 0.70 1505 6.71 0.38 1.29 0.71 2.62 3.67 1506 1.22 0.77 2.62 3.12 0.95 1507 4.96 1.26 1.05 2.51 3.04 0.87 1508 5.46 1.12 0.77 2.25 3.41 0.98 1509 4.86 0.44 1.41 0.71 2.36 3.79 0.73 1510 6.04 0.44 1.56 0.97 1.97 4.01 0.61 1511 6.82 0.71 1.96 4.09 0.52 1512 6.21 0.71 1.97 3.86 0.63 1513 5.70 0.71 1.97 4.09 0.82 1514 6.38 1.56 1.00 2.15 4.01 0.77 1515 8.37 0.71 1.56 0.71 1.97 4.47 0.87 1516 5.80 0.76 2.68 5.06 0.62 1517 6.26 0.47 1.56 0.71 2.34 4.83 0.62 1518 8.53 0.47 1.56 0.71 2.34 5.29 0.62 1519 7.20 1.41 1.26 1.26 2.34 4.24 0.62 1520 8.00 0.63 1.26 1.22 2.03 4.72 0.62 1521 5.65 0.93 1.31 1.28 2.30 4.39 1522 4.94 0.88 1.11 1.19 2.33 3.86 1523 5.43 0.57 1.55 1.22 4.58 0.88 1524 6.12 0.88 2.30 3.52 1525 6.03 0.61 1.53 1.19 2.30 3.60 1526 6.25 0.70 1.26 0.56 2.58 4.47 1527 6.01 1.32 1.03 2.30 4.72 1528 7.04 0.99 1.32 1.24 2.30 4.13 2.48 1529 5.16 0.59 1.10 2.30 4.55

Appendix Table 2: Pastoral Product Prices (Cont.)
Year
Hay
(s/ton)
Cheese (d./lb.)
Butter (d./lb.)
Milk
(d./gal.)
Beef
(d./lb.)
Mutton (d./lb.)
Pork
(d./lb.)
Bacon (d./lb.)
Tallow (d./lb.)
Wool
(d./lb.)
Eggs
(d./doz.)
1530 6.06 0.57 1.29 2.30 3.82 1531 6.52 0.67 1.12 0.92 2.00 3.27 1532 6.81 0.54 1.11 4.36 1533 5.39 1.03 1.81 2.87 4.91 1.44 1534 6.58 1.00 1.35 2.56 5.48 1535 6.30 1.06 3.07 5.10 1.93 1536 7.67 0.94 0.97 4.55 0.58 1537 7.69 1.03 1.26 0.88 2.60 5.63 0.58 1538 4.82 0.50 1.87 1.57 1.96 4.39 1539 5.93 0.50 1.59 0.99 4.05 1540 6.49 1.15 2.37 4.20 1541 8.72 1.33 7.13 1542 8.48 1.06 5.82 1543 8.21 1544 7.57 1.96 5.63 1545 7.41 1.06 2.93 5.29 1546 7.32 1.59 1.96 6.75 1.75 1547 7.07 1.24 0.91 4.72 1.60 1548 7.18 1.18 2.56 1.57 1.03 3.14 4.51 1.46 1549 11.00 1.10 2.20 1.76 1.30 2.75 1.69 1550 11.37 1.77 2.67 1.89 6.30 1.75 1551 14.24 1.98 10.54 2.91 1552 11.22 2.29 10.04 1553 14.31 1.96 7.21 2.33 1554 11.11 4.01 2.12 4.64 2.04 1555 19.44 3.11 6.22 2.91 1556 17.52 2.47 4.35 5.99 2.48 1557 2.74 9.84 2.91 1558 12.32 1.69 2.79 1.14 7.37 10.20 2.65 1559 9.62 1.72 3.17 3.03 4.15 4.69 2.45 1560 14.50 1.75 5.07 2.87 7.08 3.60 1561 15.95 3.47 3.13 5.75 2.36 1562 18.96 3.47 3.36 4.12 8.26 2.48 1563 18.18 1.81 3.86 3.28 1.29 3.46 5.63 2.91 1564 19.06 1.81 3.75 3.57 1.25 4.01 6.45 2.61 1565 15.49 1.37 3.25 3.00 1.21 5.52 5.99 3.31 1566 17.52 1.58 3.15 2.88 1.29 5.13 8.22 2.51 1567 21.64 1.53 2.32 3.03 2.18 1568 22.47 1.55 2.82 2.91 4.51 10.23 2.70 1569 19.90 1.64 2.89 2.14 1.71 4.30 8.66 2.61

Appendix Table 2: Pastoral Product Prices (Cont.)
Year
Hay
(s/ton)
Cheese (d./lb.)
Butter (d./lb.)
Milk
(d./gal.)
Beef
(d./lb.)
Mutton (d./lb.)
Pork
(d./lb.)
Bacon (d./lb.)
Tallow (d./lb.)
Wool
(d./lb.)
Eggs
(d./doz.)
1570 14.91 1.40 3.20 1.95 1.25 4.21 8.73 2.33 1571 15.75 1.56 2.12 1.21 4.38 7.10 3.78 1572 14.97 1.48 3.47 2.23 1.23 4.43 8.77 2.52 1573 17.33 1.33 1.22 4.68 7.38 1574 15.96 1.95 3.78 2.70 1.45 4.68 8.22 3.52 1575 21.73 1.53 2.58 3.19 1.38 5.04 8.48 2.25 1576 18.95 1.75 3.01 2.16 1.41 5.02 8.84 1577 18.89 2.33 3.82 2.23 1.43 4.86 9.42 2.65 1578 20.04 1.71 3.87 2.27 1.46 4.39 9.53 2.19 1579 16.66 1.50 3.48 2.47 1.43 4.94 9.84 2.68 1580 21.31 1.62 3.31 2.44 1.40 4.16 10.50 1.94 1581 16.06 1.64 3.24 3.12 1.34 5.41 9.64 2.11 1582 19.70 1.68 3.20 2.98 1.41 4.65 8.77 1.88 1583 21.30 1.65 3.70 2.93 1.31 4.98 9.93 1.92 1584 26.63 1.45 3.65 2.65 1.38 6.02 8.77 2.36 1585 15.50 1.72 3.27 2.19 1.41 5.16 7.91 2.41 1586 13.66 3.49 2.64 1.72 5.20 8.03 2.23 1587 22.28 2.16 4.17 2.60 1.78 5.74 6.72 3.40 1588 15.46 1.63 3.63 2.47 1.83 6.41 7.02 2.37 1589 13.86 1.80 3.62 2.23 1.79 5.97 8.14 2.30 1590 31.28 2.33 4.68 2.57 1.78 6.10 9.38 2.38 1591 24.27 2.62 4.18 2.38 2.04 6.84 11.66 2.50 1592 20.08 2.12 2.12 6.38 12.08 3.11 1593 26.74 3.67 2.48 1.92 6.72 12.52 2.35 1594 19.43 2.02 3.65 2.61 1.80 6.21 12.90 2.41 1595 27.38 3.03 3.75 2.53 1.91 6.17 12.97 2.35 1596 26.21 3.77 2.74 1.82 6.64 12.19 3.48 1597 23.71 2.74 4.70 2.69 1.99 6.69 12.16 3.52 1598 18.41 2.25 4.07 2.83 2.15 7.18 10.46 3.74 1599 21.84 2.33 4.24 2.76 2.07 7.28 10.84 2.51 1600 32.97 2.33 4.03 2.77 2.20 6.88 10.35 3.27 1601 34.79 2.33 4.46 2.72 2.01 7.91 11.11 3.51 1602 29.73 2.42 4.76 2.65 1.95 2.05 7.29 11.93 2.82 1603 26.86 2.06 4.21 2.94 1.78 2.28 6.52 13.87 3.06 1604 27.45 2.53 4.25 2.71 1.82 2.28 6.72 15.45 2.22 1605 34.93 2.02 4.31 2.47 2.07 2.28 6.88 13.91 2.42 1606 28.08 1.87 4.68 2.74 1.91 2.28 7.29 13.58 2.91 1607 33.48 2.16 4.61 3.06 2.00 2.28 7.22 13.35 2.80 1608 38.16 2.16 4.86 3.06 2.14 2.28 7.26 13.66 3.25 1609 37.50 2.29 4.93 2.82 2.20 2.28 7.06 12.52 3.07
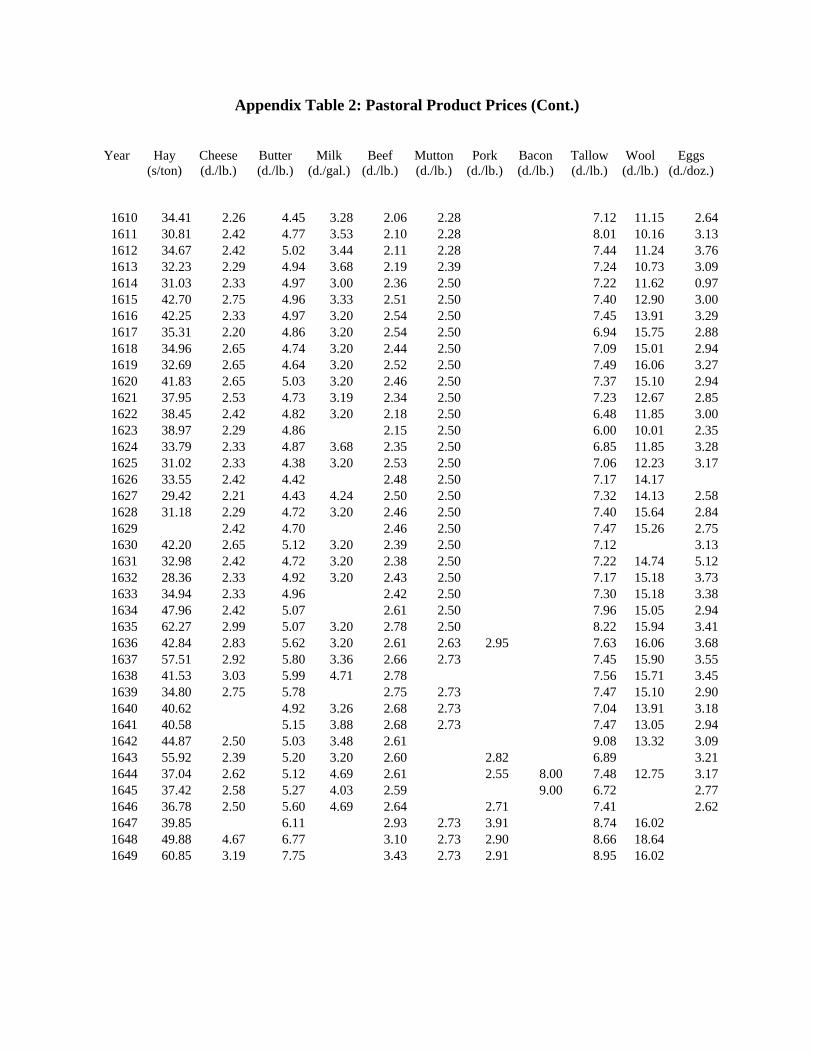
Appendix Table 2: Pastoral Product Prices (Cont.)
Year
Hay
(s/ton)
Cheese (d./lb.)
Butter (d./lb.)
Milk
(d./gal.)
Beef
(d./lb.)
Mutton (d./lb.)
Pork
(d./lb.)
Bacon (d./lb.)
Tallow (d./lb.)
Wool
(d./lb.)
Eggs
(d./doz.)
1610 34.41 2.26 4.45 3.28 2.06 2.28 7.12 11.15 2.64 1611 30.81 2.42 4.77 3.53 2.10 2.28 8.01 10.16 3.13 1612 34.67 2.42 5.02 3.44 2.11 2.28 7.44 11.24 3.761613 32.23 2.29 4.94 3.68 2.19 2.39 7.24 10.73 3.09 1614 31.03 2.33 4.97 3.00 2.36 2.50 7.22 11.62 0.97 1615 42.70 2.75 4.96 3.33 2.51 2.50 7.40 12.90 3.00 1616 42.25 2.33 4.97 3.20 2.54 2.50 7.45 13.91 3.29 1617 35.31 2.20 4.86 3.20 2.54 2.50 6.94 15.75 2.88 1618 34.96 2.65 4.74 3.20 2.44 2.50 7.09 15.01 2.94 1619 32.69 2.65 4.64 3.20 2.52 2.50 7.49 16.06 3.27 1620 41.83 2.65 5.03 3.20 2.46 2.50 7.37 15.10 2.94 1621 37.95 2.53 4.73 3.19 2.34 2.50 7.23 12.67 2.85 1622 38.45 2.42 4.82 3.20 2.18 2.50 6.48 11.85 3.00 1623 38.97 2.29 4.86 2.15 2.50 6.00 10.01 2.35 1624 33.79 2.33 4.87 3.68 2.35 2.50 6.85 11.85 3.28 1625 31.02 2.33 4.38 3.20 2.53 2.50 7.06 12.23 3.17 1626 33.55 2.42 4.42 2.48 2.50 7.17 14.17 1627 29.42 2.21 4.43 4.24 2.50 2.50 7.32 14.13 2.58 1628 31.18 2.29 4.72 3.20 2.46 2.50 7.40 15.64 2.84 1629 2.42 4.70 2.46 2.50 7.47 15.26 2.75 1630 42.20 2.65 5.12 3.20 2.39 2.50 7.12 3.13 1631 32.98 2.42 4.72 3.20 2.38 2.50 7.22 14.74 5.12 1632 28.36 2.33 4.92 3.20 2.43 2.50 7.17 15.18 3.73 1633 34.94 2.33 4.96 2.42 2.50 7.30 15.18 3.38 1634 47.96 2.42 5.07 2.61 2.50 7.96 15.05 2.94 1635 62.27 2.99 5.07 3.20 2.78 2.50 8.22 15.94 3.41 1636 42.84 2.83 5.62 3.20 2.61 2.63 2.95 7.63 16.06 3.68 1637 57.51 2.92 5.80 3.36 2.66 2.73 7.45 15.90 3.55 1638 41.53 3.03 5.99 4.71 2.78 7.56 15.71 3.45 1639 34.80 2.75 5.78 2.75 2.73 7.47 15.10 2.90 1640 40.62 4.92 3.26 2.68 2.73 7.04 13.91 3.18 1641 40.58 5.15 3.88 2.68 2.73 7.47 13.05 2.94 1642 44.87 2.50 5.03 3.48 2.61 9.08 13.32 3.09 1643 55.92 2.39 5.20 3.20 2.60 2.82 6.89 3.21 1644 37.04 2.62 5.12 4.69 2.61 2.55 8.00 7.48 12.75 3.17 1645 37.42 2.58 5.27 4.03 2.59 9.00 6.72 2.77 1646 36.78 2.50 5.60 4.69 2.64 2.71 7.41 2.62 1647 39.85 6.11 2.93 2.73 3.91 8.74 16.02 1648 49.88 4.67 6.77 3.10 2.73 2.90 8.66 18.64 1649 60.85 3.19 7.75 3.43 2.73 2.91 8.95 16.02

Appendix Table 2: Pastoral Product Prices (Cont.)
Year
Hay
(s/ton)
Cheese (d./lb.)
Butter (d./lb.)
Milk
(d./gal.)
Beef
(d./lb.)
Mutton (d./lb.)
Pork
(d./lb.)
Bacon (d./lb.)
Tallow (d./lb.)
Wool
(d./lb.)
Eggs
(d./doz.)
1650 74.72 2.49 7.74 5.25 3.31 3.80 3.11 8.70 3.52 1651 44.93 4.08 6.26 2.83 4.09 8.47 12.97 3.52 1652 43.99 1.65 5.98 3.13 2.80 3.86 9.02 11.88 1653 55.45 1.98 5.53 5.65 2.84 3.41 8.84 8.46 3.29 1654 44.98 1.96 5.60 2.56 3.17 7.21 1655 38.01 2.22 4.97 2.42 2.97 1.88 6.91 1656 42.38 2.45 5.85 2.43 2.97 1.88 6.97 8.92 1657 41.40 2.45 6.11 2.67 2.97 1.92 7.43 9.10 1658 40.66 2.27 6.52 2.74 3.32 3.01 8.42 9.18 1659 43.17 2.60 6.91 3.03 3.20 8.34 8.55 1660 45.65 2.22 6.14 5.19 3.04 3.26 3.24 12.00 8.70 7.57 2.85 1661 38.57 2.30 5.99 5.19 2.91 3.26 3.24 12.00 9.09 10.71 3.49 1662 38.53 2.12 5.83 5.40 2.93 3.09 2.92 10.67 8.86 9.99 3.24 1663 54.43 2.59 5.77 5.24 2.93 3.09 2.64 10.00 9.71 12.06 3.57 1664 41.64 2.59 6.00 5.74 2.98 3.23 3.41 10.73 8.89 10.09 3.55 1665 47.88 2.33 6.36 4.69 3.09 3.41 2.45 10.00 8.92 8.01 4.08 1666 45.42 2.49 6.26 5.19 2.84 3.15 3.00 10.00 8.93 3.32 1667 35.73 3.21 6.25 5.41 2.77 3.29 3.00 10.00 8.57 3.53 1668 34.42 2.57 6.49 4.94 2.72 3.32 7.69 8.01 3.52 1669 36.63 2.15 6.20 4.71 2.65 3.15 6.55 13.95 3.75 1670 31.58 2.92 6.23 5.06 2.76 3.23 2.51 9.00 7.59 8.37 3.87 1671 45.66 2.33 6.04 5.21 2.72 3.06 2.51 9.00 7.54 3.70 1672 43.43 2.37 5.95 5.64 2.70 3.06 2.51 9.00 6.72 15.04 3.24 1673 47.68 2.40 6.01 5.94 2.82 2.91 2.51 9.00 8.15 8.64 3.44 1674 40.63 2.76 6.23 6.17 2.76 3.20 2.51 9.00 8.03 7.39 3.70 1675 39.19 2.70 6.19 5.64 2.91 3.06 2.51 9.00 7.85 7.74 3.82 1676 44.65 2.92 5.84 2.75 3.12 7.41 6.57 3.57 1677 46.37 2.08 5.90 2.78 3.12 2.51 9.00 8.05 12.97 3.76 1678 37.76 2.26 5.96 2.81 3.12 2.85 9.00 8.01 5.31 3.49 1679 36.12 2.20 6.04 2.86 3.06 2.51 9.00 7.28 3.54 1680 49.63 2.04 6.01 5.65 2.73 3.06 2.75 9.00 7.28 7.02 3.54 1681 46.66 2.04 5.91 2.88 3.06 2.51 9.00 7.63 10.09 3.54 1682 39.78 1.76 6.00 2.92 3.06 2.64 9.00 7.44 8.28 3.87 1683 39.05 1.98 5.86 8.47 2.70 3.12 2.51 9.00 7.32 3.54 1684 45.26 1.89 5.37 8.47 2.92 3.23 2.63 9.00 7.41 4.58 1685 49.39 2.03 6.02 8.47 2.97 3.41 2.89 10.00 8.12 8.10 4.18 1686 40.80 1.75 5.41 5.64 2.76 3.26 2.95 10.00 7.95 4.26 1687 42.74 1.87 5.44 5.64 2.76 3.00 2.52 8.50 6.68 4.26 1688 35.58 1.75 5.84 6.46 2.83 2.97 2.47 8.50 6.98 6.04 4.06 1689 39.62 2.06 5.63 5.64 2.74 2.97 2.60 7.47 4.36

Appendix Table 2: Pastoral Product Prices (Cont.)
Year
Hay
(s/ton)
Cheese (d./lb.)
Butter (d./lb.)
Milk
(d./gal.)
Beef
(d./lb.)
Mutton (d./lb.)
Pork
(d./lb.)
Bacon (d./lb.)
Tallow (d./lb.)
Wool
(d./lb.)
Eggs
(d./doz.)
1690 41.45 2.18 5.27 2.65 2.91 2.87 9.00 7.41 5.94 3.06 1691 43.58 2.28 5.45 5.64 2.66 2.85 2.62 10.00 6.99 7.21 4.13 1692 44.01 2.13 5.67 5.64 2.63 2.88 2.59 9.73 7.37 7.92 4.13 1693 38.98 2.25 6.18 5.64 2.90 3.15 2.83 10.00 7.61 8.24 3.91 1694 35.13 2.32 6.24 5.64 2.85 3.17 3.29 12.00 8.30 8.24 4.44 1695 42.31 2.29 6.11 5.64 3.03 3.41 3.45 12.00 8.56 9.09 4.86 1696 47.31 2.27 6.25 5.64 3.02 3.35 3.34 12.00 8.24 11.32 4.25 1697 43.67 2.27 6.08 5.19 2.97 2.97 3.41 6.95 9.90 4.27 1698 44.79 2.49 6.10 5.19 3.00 3.15 3.62 7.91 10.89 5.30 1699 46.47 2.46 5.99 5.64 2.97 3.15 3.60 10.00 7.75 10.27 5.30 1700 46.03 1.75 5.65 5.64 2.82 3.03 3.66 10.00 8.18 9.45 5.30 1701 44.58 1.80 5.61 5.64 2.94 3.06 3.54 9.78 8.16 9.72 4.56 1702 45.92 1.97 5.88 6.46 2.88 3.09 3.35 8.51 9.81 4.46 1703 48.54 1.93 5.74 5.04 2.84 2.79 3.03 8.50 7.67 8.55 4.07 1704 35.42 1.89 5.12 5.04 2.72 2.76 2.85 8.50 7.28 9.81 4.01 1705 38.25 1.68 4.91 5.31 2.72 2.64 2.90 8.50 7.48 4.24 1706 40.88 1.98 5.90 5.04 2.74 2.61 2.83 8.50 7.50 7.89 4.42 1707 44.94 1.82 5.37 5.04 2.70 2.49 2.77 8.50 7.30 6.88 4.42 1708 38.64 1.74 5.07 4.87 2.77 2.64 2.96 9.00 6.83 6.66 4.42 1709 35.38 1.87 5.43 4.87 2.78 2.64 3.32 9.00 7.42 5.67 4.25 1710 35.59 2.07 5.65 5.04 2.81 2.76 4.35 9.00 7.85 6.39 4.25 1711 38.69 2.77 7.12 5.04 2.88 2.94 4.29 9.00 7.82 5.58 5.56 1712 38.16 2.00 5.65 4.87 2.88 2.91 3.26 9.00 7.29 6.06 4.42 1713 48.08 1.83 5.32 5.04 2.93 2.73 3.18 9.00 7.92 7.11 4.37 1714 45.31 1.76 4.70 5.04 2.95 2.55 2.90 9.00 7.28 7.59 3.93 1715 41.53 1.70 4.24 5.04 2.96 2.79 2.93 9.00 7.35 7.29 4.55 1716 52.73 1.85 4.77 5.04 2.94 2.79 3.11 9.00 7.75 7.21 4.88 1717 39.14 1.79 4.65 5.04 3.05 3.00 3.08 9.00 8.28 8.53 4.73 1718 42.98 1.76 4.89 5.04 2.90 2.94 3.07 9.00 8.15 10.20 4.86 1719 46.55 1.82 4.83 5.27 2.83 2.82 2.91 8.00 7.99 9.53 4.71 1720 51.30 1.86 4.96 5.51 3.11 2.82 3.27 8.00 7.70 8.70 4.82 1721 40.72 1.96 5.04 5.51 2.81 2.79 3.55 8.50 7.88 8.22 4.61 1722 32.75 1.92 5.01 5.51 2.67 2.76 2.93 8.50 8.18 7.28 4.61 1723 36.68 1.82 4.85 5.51 2.62 2.70 2.55 8.50 7.47 7.26 4.61 1724 46.00 1.81 5.06 5.56 2.86 2.76 2.53 8.50 7.69 6.61 4.61 1725 45.09 1.97 5.42 5.49 2.80 2.79 3.49 8.50 6.97 6.10 4.54 1726 40.08 1.92 5.53 5.48 2.89 2.91 3.49 8.75 7.34 6.51 4.54 1727 40.41 1.96 5.66 5.49 2.83 2.85 3.22 8.75 7.64 6.43 4.54 1728 44.20 1.90 5.47 5.46 2.92 3.03 3.08 8.75 7.70 6.81 4.54 1729 40.83 2.09 5.89 5.48 3.11 3.03 3.70 8.75 7.64 7.32 4.54

Appendix Table 2: Pastoral Product Prices (Cont.)
Year
Hay
(s/ton)
Cheese (d./lb.)
Butter (d./lb.)
Milk
(d./gal.)
Beef
(d./lb.)
Mutton (d./lb.)
Pork
(d./lb.)
Bacon (d./lb.)
Tallow (d./lb.)
Wool
(d./lb.)
Eggs
(d./doz.)
1730 35.01 1.99 5.95 5.46 3.10 3.06 3.06 9.00 8.25 7.05 4.61 1731 46.72 1.80 5.92 5.06 2.98 3.00 2.85 9.00 8.32 7.79 4.61 1732 58.14 1.79 5.65 5.06 2.92 2.79 2.52 9.00 8.05 7.48 4.72 1733 49.39 1.71 5.32 5.06 2.68 2.64 2.62 9.23 7.79 7.56 4.72 1734 37.90 1.69 5.33 5.06 2.61 2.52 2.50 8.27 6.24 6.95 4.72 1735 38.27 1.67 5.39 5.25 2.54 2.49 2.41 9.41 7.04 6.38 4.72 1736 39.89 1.69 5.37 5.25 2.80 2.67 2.58 9.16 7.05 5.75 4.72 1737 45.97 1.81 5.68 5.25 2.74 2.64 2.66 9.23 8.32 5.88 4.72 1738 49.29 1.77 5.63 5.25 2.79 2.67 2.96 9.00 6.35 5.52 4.54 1739 42.56 1.87 5.50 5.25 2.81 2.64 2.88 8.43 7.51 5.32 4.32 1740 66.21 1.88 5.80 5.25 3.03 2.79 3.07 8.63 7.43 5.53 4.32 1741 51.54 2.20 6.87 5.25 3.42 2.97 3.54 9.00 7.96 5.48 4.46 1742 66.21 2.26 6.92 5.18 3.28 2.88 3.51 9.00 8.16 5.81 4.46 1743 47.29 1.84 6.20 5.06 3.06 2.85 2.98 9.00 7.88 7.29 4.27 1744 44.34 1.73 5.61 4.96 2.84 2.73 2.68 9.00 8.02 7.82 4.41 1745 41.38 1.62 5.65 4.91 2.73 2.70 2.63 9.00 7.88 7.18 4.41 1746 39.41 1.82 6.17 4.98 2.80 2.73 2.74 9.00 7.57 7.12 4.41 1747 39.51 1.90 6.68 5.44 2.96 2.67 2.83 9.00 7.60 6.99 4.37 1748 35.49 1.94 6.51 5.21 3.06 2.76 2.82 9.00 7.64 7.24 4.82 1749 40.39 1.98 6.63 4.96 2.89 2.73 2.92 9.00 7.57 7.66 4.82 1750 48.33 1.91 6.39 5.06 2.85 2.52 2.78 9.00 7.69 8.02 4.82 1751 40.98 1.81 6.09 5.06 2.93 2.62 2.97 7.99 7.10 8.26 4.82 1752 40.98 1.82 6.26 5.06 2.93 2.62 3.04 8.63 6.59 8.85 4.82 1753 50.40 1.89 6.36 5.06 2.91 2.59 2.91 9.00 7.01 6.17 4.82 1754 60.74 1.87 6.90 5.06 3.13 2.96 3.15 9.00 7.66 6.46 4.82 1755 48.04 1.92 6.95 5.06 3.06 2.70 3.39 9.00 7.98 6.22 4.05 1756 39.41 1.94 6.82 5.06 3.06 2.73 3.30 9.00 7.95 6.27 4.82 1757 48.00 1.96 6.94 5.06 3.15 2.90 3.46 8.63 7.92 7.88 4.82 1758 54.42 1.94 7.11 5.06 3.17 3.24 3.71 9.23 7.70 8.85 4.82 1759 48.73 2.03 7.03 5.06 3.15 3.18 3.74 9.79 7.80 8.03 4.82 1760 51.67 1.93 6.78 5.07 3.00 2.93 3.09 9.79 8.06 7.75 4.82 1761 47.43 1.90 6.95 5.26 3.03 2.90 3.33 8.63 8.16 6.70 4.61 1762 48.25 1.90 6.89 5.06 2.99 2.76 3.58 7.54 7.44 6.55 4.82 1763 51.49 1.92 6.73 5.06 2.95 2.84 3.58 8.14 7.28 7.77 4.381764 51.33 1.88 6.54 5.06 3.09 3.07 3.58 8.39 7.39 8.03 4.61 1765 53.24 2.03 6.91 4.84 3.03 3.18 3.93 9.23 7.43 7.85 4.72 1766 55.48 2.00 6.71 5.16 3.33 3.36 4.02 9.78 7.72 8.35 4.72 1767 43.75 2.06 6.74 5.65 3.69 3.69 3.95 10.32 7.91 7.69 5.11 1768 43.08 1.98 6.65 5.65 3.68 3.47 4.31 10.13 7.77 6.53 5.11 1769 45.09 2.03 6.68 5.65 3.59 3.36 3.87 10.13 7.77 6.32 5.05

Appendix Table 2: Pastoral Product Prices (Cont.)
Year
Hay
(s/ton)
Cheese (d./lb.)
Butter (d./lb.)
Milk
(d./gal.)
Beef
(d./lb.)
Mutton (d./lb.)
Pork
(d./lb.)
Bacon (d./lb.)
Tallow (d./lb.)
Wool
(d./lb.)
Eggs
(d./doz.)
1770 47.67 2.10 6.80 5.65 3.52 3.47 4.09 9.32 7.71 6.27 4.80 1771 49.49 2.14 6.95 5.50 3.65 3.64 4.35 10.13 7.62 6.95 5.11 1772 65.78 2.41 7.14 6.42 3.84 3.81 4.59 10.87 7.95 6.53 5.25 1773 72.60 2.41 7.29 6.42 3.78 3.87 4.82 10.32 7.84 6.83 5.34 1774 57.44 2.36 7.14 6.70 3.72 3.92 4.16 10.13 7.60 7.40 5.66 1775 57.59 2.32 6.66 6.70 3.69 3.85 4.50 9.74 7.65 7.71 5.36 1776 74.20 2.36 6.93 6.70 3.70 3.69 4.41 9.74 7.78 7.58 6.56 1777 72.55 2.38 7.32 6.97 3.73 3.69 4.44 9.74 7.77 7.19 5.75 1778 58.93 2.45 7.88 7.22 3.68 3.87 4.56 10.00 7.76 6.35 5.56 1779 52.92 2.43 7.88 7.32 3.77 3.87 4.06 10.00 8.65 5.76 6.48 1780 59.31 2.32 7.32 7.42 3.78 3.64 4.07 10.00 8.45 6.29 6.48 1781 63.27 2.16 6.90 7.42 3.73 3.64 3.97 10.00 8.14 5.80 5.94 1782 63.01 2.11 6.94 7.42 3.73 3.29 3.96 10.00 8.16 5.21 6.48 1783 70.19 2.25 7.06 7.26 3.84 3.70 4.10 10.00 7.57 6.06 5.70 1784 78.37 2.27 7.31 7.09 3.93 3.75 4.31 10.00 8.14 6.97 6.01 1785 84.25 2.22 7.03 7.39 4.20 4.09 4.52 10.00 7.61 6.46 6.44 1786 80.10 2.26 7.34 7.83 4.13 3.98 4.31 10.00 6.40 6.79 5.89 1787 60.84 2.28 7.23 7.83 4.36 4.15 4.36 10.00 8.12 8.66 5.89 1788 66.00 2.33 6.97 7.83 4.40 4.04 4.90 10.00 8.37 8.68 5.89 1789 73.67 2.26 6.66 7.83 4.43 4.04 4.56 9.50 7.50 8.68 5.89 1790 63.47 2.27 7.31 7.83 4.36 4.04 5.05 9.00 7.53 9.13 5.89 1791 57.30 2.43 7.33 7.83 4.45 4.04 5.61 9.00 7.37 8.95 5.89 1792 72.04 2.40 7.38 7.83 4.66 4.21 5.24 9.00 7.10 11.38 5.89 1793 80.03 2.56 7.77 7.83 4.61 4.32 5.47 9.92 7.14 8.88 5.89 1794 81.11 2.49 8.08 7.83 4.58 4.27 5.58 10.00 7.16 9.16 5.89 1795 84.02 2.47 8.63 7.83 4.94 4.38 5.64 10.00 8.05 10.04 6.43 1796 99.87 2.74 8.73 8.58 5.68 4.67 7.23 10.83 9.37 10.44 6.19 1797 84.30 3.02 9.36 10.86 6.48 5.67 7.45 11.00 9.47 10.13 6.68 1798 60.91 3.17 9.18 10.86 6.31 5.69 6.32 10.33 8.57 9.70 6.19 1799 78.94 3.10 9.61 10.86 6.18 5.56 5.65 9.83 8.70 12.44 7.17 1800 106.03 3.42 11.38 10.86 7.05 6.32 6.93 11.58 10.22 12.28 7.56 1801 105.10 3.98 11.78 10.86 7.91 7.20 9.95 15.21 10.94 13.64 8.69 1802 91.24 4.11 10.78 10.86 8.36 7.35 8.60 15.67 11.03 14.16 8.79 1803 104.03 3.94 11.19 10.86 7.88 7.16 7.45 13.17 11.25 14.07 8.55 1804 97.23 4.10 11.43 11.57 7.90 6.83 6.78 11.92 11.38 15.55 7.66 1805 87.20 4.15 11.73 12.43 7.92 6.65 6.78 12.00 10.63 17.27 8.60 1806 82.91 4.02 11.51 13.10 7.97 6.42 7.24 12.08 10.78 16.05 7.86 1807 91.23 4.08 12.37 13.74 7.51 6.77 7.08 12.00 9.81 14.31 8.10 1808 104.40 4.22 13.31 14.23 7.58 7.05 7.52 12.04 12.09 13.18 8.87 1809 104.35 4.24 13.42 14.47 7.89 6.94 8.49 13.00 14.45 17.52 9.09
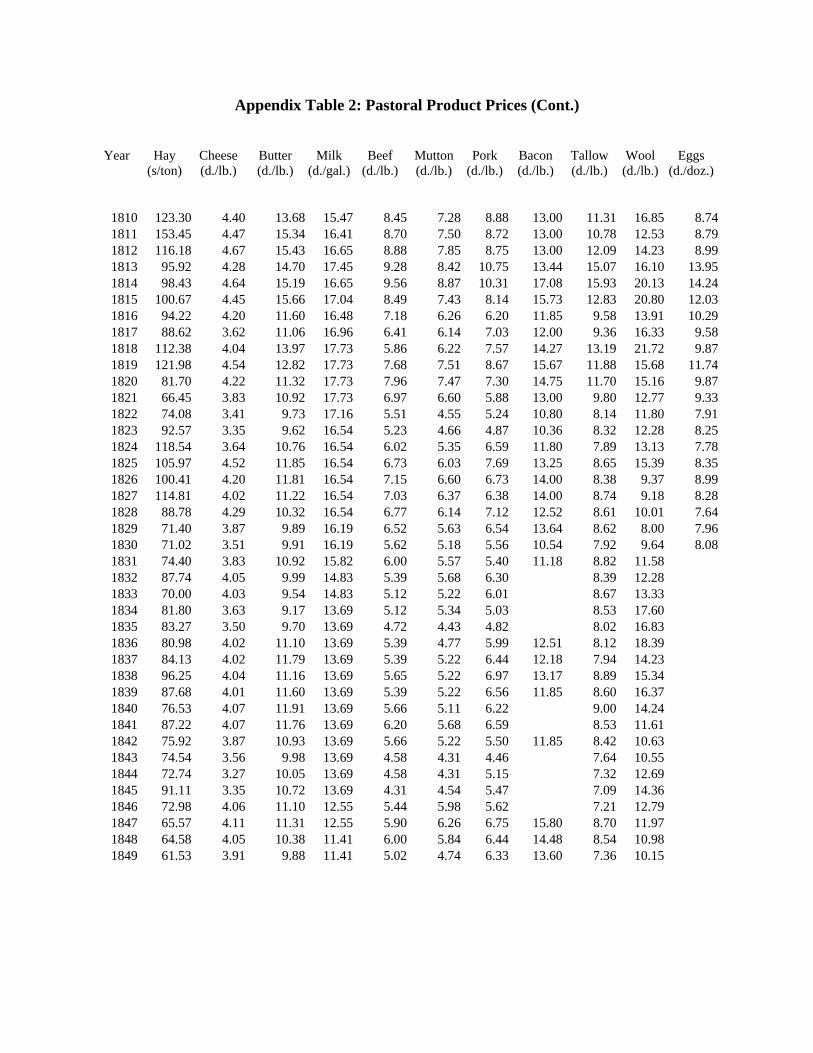
Appendix Table 2: Pastoral Product Prices (Cont.)
Year
Hay
(s/ton)
Cheese (d./lb.)
Butter (d./lb.)
Milk
(d./gal.)
Beef
(d./lb.)
Mutton (d./lb.)
Pork
(d./lb.)
Bacon (d./lb.)
Tallow (d./lb.)
Wool
(d./lb.)
Eggs
(d./doz.)
1810 123.30 4.40 13.68 15.47 8.45 7.28 8.88 13.00 11.31 16.85 8.74 1811 153.45 4.47 15.34 16.41 8.70 7.50 8.72 13.00 10.78 12.53 8.79 1812 116.18 4.67 15.43 16.65 8.88 7.85 8.75 13.00 12.09 14.23 8.99 1813 95.92 4.28 14.70 17.45 9.28 8.42 10.75 13.44 15.07 16.10 13.95 1814 98.43 4.64 15.19 16.65 9.56 8.87 10.31 17.08 15.93 20.13 14.24 1815 100.67 4.45 15.66 17.04 8.49 7.43 8.14 15.73 12.83 20.80 12.03 1816 94.22 4.20 11.60 16.48 7.18 6.26 6.20 11.85 9.58 13.91 10.29 1817 88.62 3.62 11.06 16.96 6.41 6.14 7.03 12.00 9.36 16.33 9.58 1818 112.38 4.04 13.97 17.73 5.86 6.22 7.57 14.27 13.19 21.72 9.87 1819 121.98 4.54 12.82 17.73 7.68 7.51 8.67 15.67 11.88 15.68 11.74 1820 81.70 4.22 11.32 17.73 7.96 7.47 7.30 14.75 11.70 15.16 9.87 1821 66.45 3.83 10.92 17.73 6.97 6.60 5.88 13.00 9.80 12.77 9.33 1822 74.08 3.41 9.73 17.16 5.51 4.55 5.24 10.80 8.14 11.80 7.91 1823 92.57 3.35 9.62 16.54 5.23 4.66 4.87 10.36 8.32 12.28 8.25 1824 118.54 3.64 10.76 16.54 6.02 5.35 6.59 11.80 7.89 13.13 7.78 1825 105.97 4.52 11.85 16.54 6.73 6.03 7.69 13.25 8.65 15.39 8.35 1826 100.41 4.20 11.81 16.54 7.15 6.60 6.73 14.00 8.38 9.37 8.99 1827 114.81 4.02 11.22 16.54 7.03 6.37 6.38 14.00 8.74 9.18 8.28 1828 88.78 4.29 10.32 16.54 6.77 6.14 7.12 12.52 8.61 10.01 7.64 1829 71.40 3.87 9.89 16.19 6.52 5.63 6.54 13.64 8.62 8.00 7.96 1830 71.02 3.51 9.91 16.19 5.62 5.18 5.56 10.54 7.92 9.64 8.08 1831 74.40 3.83 10.92 15.82 6.00 5.57 5.40 11.18 8.82 11.58 1832 87.74 4.05 9.99 14.83 5.39 5.68 6.30 8.39 12.28 1833 70.00 4.03 9.54 14.83 5.12 5.22 6.01 8.67 13.33 1834 81.80 3.63 9.17 13.69 5.12 5.34 5.03 8.53 17.60 1835 83.27 3.50 9.70 13.69 4.72 4.43 4.82 8.02 16.83 1836 80.98 4.02 11.10 13.69 5.39 4.77 5.99 12.51 8.12 18.39 1837 84.13 4.02 11.79 13.69 5.39 5.22 6.44 12.18 7.94 14.23 1838 96.25 4.04 11.16 13.69 5.65 5.22 6.97 13.17 8.89 15.34 1839 87.68 4.01 11.60 13.69 5.39 5.22 6.56 11.85 8.60 16.37 1840 76.53 4.07 11.91 13.69 5.66 5.11 6.22 9.00 14.24 1841 87.22 4.07 11.76 13.69 6.20 5.68 6.59 8.53 11.61 1842 75.92 3.87 10.93 13.69 5.66 5.22 5.50 11.85 8.42 10.63 1843 74.54 3.56 9.98 13.69 4.58 4.31 4.46 7.64 10.55 1844 72.74 3.27 10.05 13.69 4.58 4.31 5.15 7.32 12.69 1845 91.11 3.35 10.72 13.69 4.31 4.54 5.47 7.09 14.36 1846 72.98 4.06 11.10 12.55 5.44 5.98 5.62 7.21 12.79 1847 65.57 4.11 11.31 12.55 5.90 6.26 6.75 15.80 8.70 11.97 1848 64.58 4.05 10.38 11.41 6.00 5.84 6.44 14.48 8.54 10.98 1849 61.53 3.91 9.88 11.41 5.02 4.74 6.33 13.60 7.36 10.15

Appendix Table 2: Pastoral Product Prices (Cont.)
Year
Hay
(s/ton)
Cheese (d./lb.)
Butter (d./lb.)
Milk
(d./gal.)
Beef
(d./lb.)
Mutton (d./lb.)
Pork
(d./lb.)
Bacon (d./lb.)
Tallow (d./lb.)
Wool
(d./lb.)
Eggs
(d./doz.)
1850 57.49 3.77 8.95 11.41 4.77 4.61 5.57 13.83 6.83 11.06 1851 69.59 3.31 9.15 9.13 4.59 4.74 5.04 12.50 1852 51.53 3.22 9.13 7.99 4.71 4.74 5.04 13.17 7.53 13.62 1853 80.07 3.50 9.83 9.13 5.77 5.84 5.58 13.17 7.95 16.00 1854 84.37 4.09 11.71 8.56 6.39 5.84 6.14 7.85 15.50 1855 86.63 3.91 11.26 11.73 6.62 5.78 6.12 15.80 8.95 13.00 7.89 1856 83.53 4.30 12.13 12.12 6.31 5.78 6.50 15.80 9.25 16.00 7.89 1857 64.63 4.10 12.24 12.07 6.40 5.78 6.78 15.80 9.57 20.50 8.30 1858 63.95 4.03 11.49 11.46 6.16 5.50 6.08 15.80 8.65 15.62 7.47 1859 72.21 4.09 11.46 11.16 6.25 5.84 6.07 15.80 9.36 18.62 8.24 1860 102.52 4.56 12.10 11.01 6.49 6.26 6.79 15.80 9.51 20.12 8.43 1861 97.06 3.94 11.66 12.08 6.37 6.26 6.80 15.80 8.71 19.50 8.44 1862 71.35 3.82 11.37 12.23 6.04 5.98 6.62 15.80 7.80 20.50 8.04 1863 62.93 3.95 11.30 11.61 6.46 5.98 6.34 6.91 22.62 8.01 1864 65.65 3.88 11.62 11.92 6.82 6.39 6.46 15.80 7.69 27.38 8.21 1865 88.95 4.18 12.32 14.63 7.00 7.22 7.00 15.80 9.18 25.75 8.07 1866 78.19 4.08 12.85 15.28 7.18 6.88 6.74 17.12 9.82 23.50 7.76 1867 76.30 3.66 12.14 14.06 6.80 6.26 5.64 17.12 8.69 18.88 8.26 1868 78.80 4.03 11.65 13.40 6.53 5.84 5.71 17.12 9.69 17.50 9.45 1869 101.60 4.06 13.62 13.06 7.07 6.39 7.11 16.46 9.90 18.12 8.85 1870 80.60 4.10 13.25 11.99 7.22 6.53 7.89 15.80 9.47 16.75 9.37 1871 111.79 4.04 14.05 12.17 7.89 7.36 6.39 15.80 8.78 21.38 10.82 1872 66.59 3.94 13.55 12.85 7.81 7.63 6.62 7.53 25.62 11.79 1873 62.05 4.04 13.40 13.73 8.73 7.84 6.76 7.32 24.50 11.86 1874 42.79 3.63 14.20 15.35 8.13 6.60 6.72 7.47 20.75 11.87 1875 3.76 14.03 15.35 8.22 7.36 7.34 8.65 19.75 11.47 1876 87.95 3.60 14.53 15.35 8.16 7.22 7.57 8.39 17.75 11.55 1877 83.19 4.09 14.57 15.71 7.40 6.74 6.64 7.82 16.25 10.93 1878 73.57 3.54 13.85 15.71 7.44 6.88 6.54 6.74 15.00 9.37 1879 65.73 3.08 12.20 15.28 7.00 6.53 6.30 5.95 12.50 8.34 1880 67.60 3.87 12.34 13.40 7.35 6.74 6.96 6.41 15.12 9.93 1881 71.36 3.54 14.27 13.40 7.16 7.15 7.38 7.29 12.38 8.60 1882 87.68 3.59 13.87 13.40 7.60 7.49 7.03 8.12 11.25 9.23 1883 62.70 3.70 13.67 13.84 7.94 7.63 6.72 7.90 10.00 10.65 1884 66.13 3.59 13.51 12.67 7.55 6.60 6.18 6.97 10.00 9.74 1885 60.25 3.87 12.35 12.44 6.89 5.84 5.75 5.82 9.88 9.08 1886 67.11 3.16 12.27 12.00 6.39 6.25 5.31 5.09 10.00 8.99 1887 69.80 3.54 12.66 11.88 6.09 5.25 5.03 4.98 10.50 9.07 1888 85.72 3.32 12.84 11.85 6.11 5.88 4.86 5.48 10.38 8.66 1889 75.92 3.21 12.84 11.28 6.20 6.25 5.25 5.32 11.00 8.83

Appendix Table 2: Pastoral Product Prices (Cont.)
Year
Hay
(s/ton)
Cheese (d./lb.)
Butter (d./lb.)
Milk
(d./gal.)
Beef
(d./lb.)
Mutton (d./lb.)
Pork
(d./lb.)
Bacon (d./lb.)
Tallow (d./lb.)
Wool
(d./lb.)
Eggs
(d./doz.)
1890 57.80 3.10 12.10 11.21 6.03 5.63 4.84 4.90 11.00 8.72 1891 56.82 3.05 12.70 11.14 6.67 5.25 4.71 4.98 9.75 9.67 1892 77.08 2.99 12.83 12.17 6.28 5.25 5.59 5.16 8.75 9.20 1893 111.22 2.89 11.95 12.35 6.44 5.25 6.07 6.38 10.25 9.58 1894 102.04 2.89 11.12 12.06 6.08 5.25 5.58 5.42 10.12 9.46 1895 67.31 2.56 10.61 10.89 5.89 5.50 4.50 4.84 12.00 8.94 1896 63.74 2.18 10.71 9.79 5.29 4.88 4.16 4.03 11.50 9.07 1897 67.61 2.77 10.61 9.91 5.51 5.13 5.21 3.58 9.62 8.63 1898 65.66 2.34 10.32 9.74 5.31 4.63 5.46 4.05 8.75 9.08 1899 63.04 2.89 10.90 9.94 5.79 5.13 4.35 8.25 8.82 1900 69.84 2.89 11.30 10.26 6.22 5.63 5.25 5.08 7.88 9.59 1901 79.19 2.77 11.30 10.92 5.91 5.50 5.47 5.61 6.88 9.68 1902 84.78 2.94 11.23 11.19 6.37 5.50 5.38 6.67 6.25 9.26 1903 73.47 12.06 6.04 5.88 5.47 7.25 9.60 1904 68.58 12.85 5.91 6.25 4.91 10.12 10.02 1905 67.11 12.32 5.97 6.38 5.00 12.38 10.34 1906 64.03 8.51 5.91 6.63 5.56 13.38 11.35 1907 65.97 8.84 5.97 6.75 6.42 12.25 11.28 1908 60.54 13.37 8.98 5.97 6.50 5.81 8.50 11.02 1909 62.09 13.11 9.02 6.24 5.75 5.88 9.00 11.36 1910 62.09 13.11 8.88 6.44 6.50 6.54 9.88 11.23 1911 77.61 12.58 9.24 6.04 6.13 6.40 10.00 11.66 1912 89.26 13.90 9.71 6.98 6.44 10.50 12.00 1913 83.44 14.16 9.70 6.85 6.53 12.38 12.21 1914 60.15 9.31 7.25 6.33 12.62 13.10

Appendix Table 3: Firewood, Timber and Miscellaneous Product Prices
Year
Firewood
(s./c.)
Timber (s/ft3)
Cider
(d./gallon)
Honey
(d./gallon)
1209 1210 1211 1212 1213 1214 0.31 1215 1216 1217 1218 1219 1220 1221 0.40 1222 1223 1224 0.35 1225 1.00 1226 0.49 1227 0.40 1228 1229 1230 1231 1232 1233 0.36 1234 1235 1236 0.43 1237 0.42 1238 1239 1240 1241 1242 1243 1244 1245 1246 0.45 1247 0.51 1248 0.51 1249 0.32

Appendix Table 3: Firewood, Timber and Miscellaneous Product Prices (cont.)
Year
Firewood
(s./c.)
Timber (s/ft3)
Cider
(d./gallon)
Honey
(d./gallon)
1250 1251 1252 0.38 1253 0.30 1254 0.39 1255 0.30 1256 1257 6.06 0.31 1258 4.69 0.38 1259 1260 1261 1262 0.37 1263 0.39 1264 1265 0.40 1266 0.38 1267 1268 0.34 1269 0.31 1270 7.25 1271 7.06 0.72 1272 0.65 1273 0.57 1274 0.50 1275 7.12 0.55 2.00 1276 1277 7.68 0.55 1278 6.04 0.61 1.25 1279 7.27 0.71 1280 10.40 0.61 2.00 1281 8.07 0.61 1282 8.23 1283 5.17 0.58 1284 5.24 0.67 1.08 1285 7.08 0.61 1.11 1286 7.24 0.62 1.22 1287 7.06 0.55 1.06 1288 7.30 0.84 1289 7.49 0.58
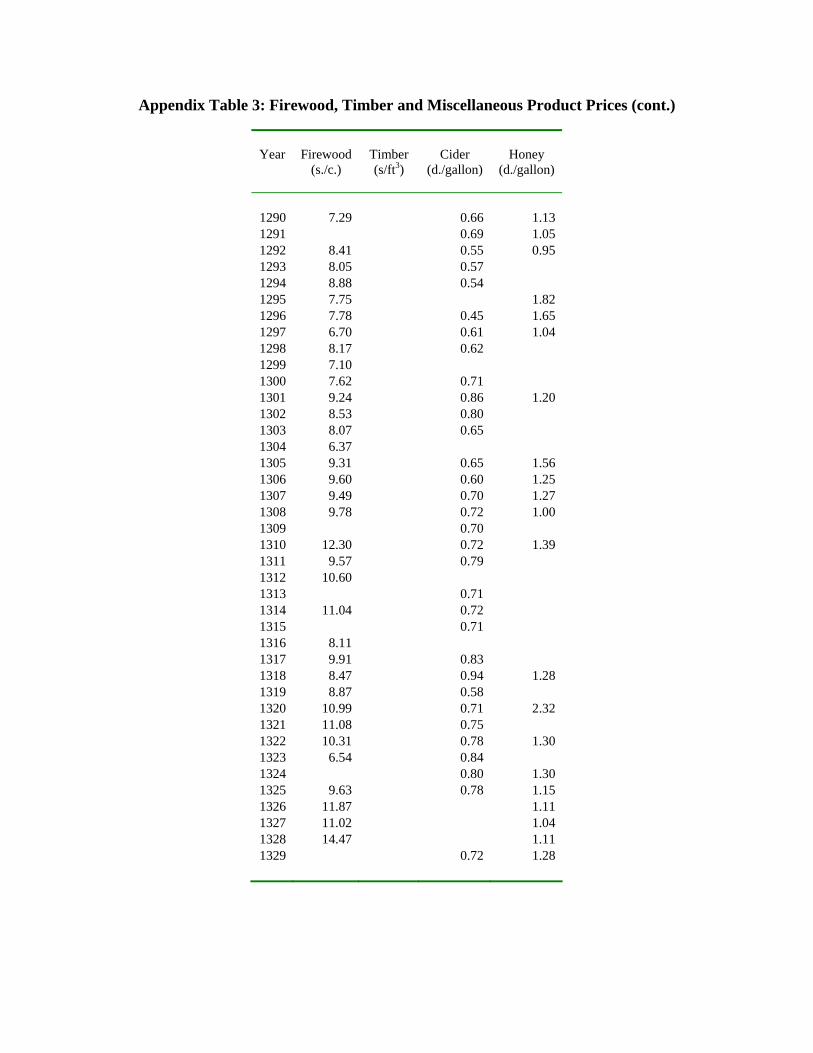
Appendix Table 3: Firewood, Timber and Miscellaneous Product Prices (cont.)
Year
Firewood
(s./c.)
Timber (s/ft3)
Cider
(d./gallon)
Honey
(d./gallon)
1290 7.29 0.66 1.13 1291 0.69 1.05 1292 8.41 0.55 0.95 1293 8.05 0.57 1294 8.88 0.54 1295 7.75 1.82 1296 7.78 0.45 1.65 1297 6.70 0.61 1.04 1298 8.17 0.62 1299 7.10 1300 7.62 0.71 1301 9.24 0.86 1.20 1302 8.53 0.80 1303 8.07 0.65 1304 6.37 1305 9.31 0.65 1.56 1306 9.60 0.60 1.25 1307 9.49 0.70 1.27 1308 9.78 0.72 1.00 1309 0.70 1310 12.30 0.72 1.39 1311 9.57 0.79 1312 10.60 1313 0.71 1314 11.04 0.72 1315 0.71 1316 8.11 1317 9.91 0.83 1318 8.47 0.94 1.28 1319 8.87 0.58 1320 10.99 0.71 2.32 1321 11.08 0.75 1322 10.31 0.78 1.30 1323 6.54 0.84 1324 0.80 1.30 1325 9.63 0.78 1.15 1326 11.87 1.11 1327 11.02 1.04 1328 14.47 1.11 1329 0.72 1.28
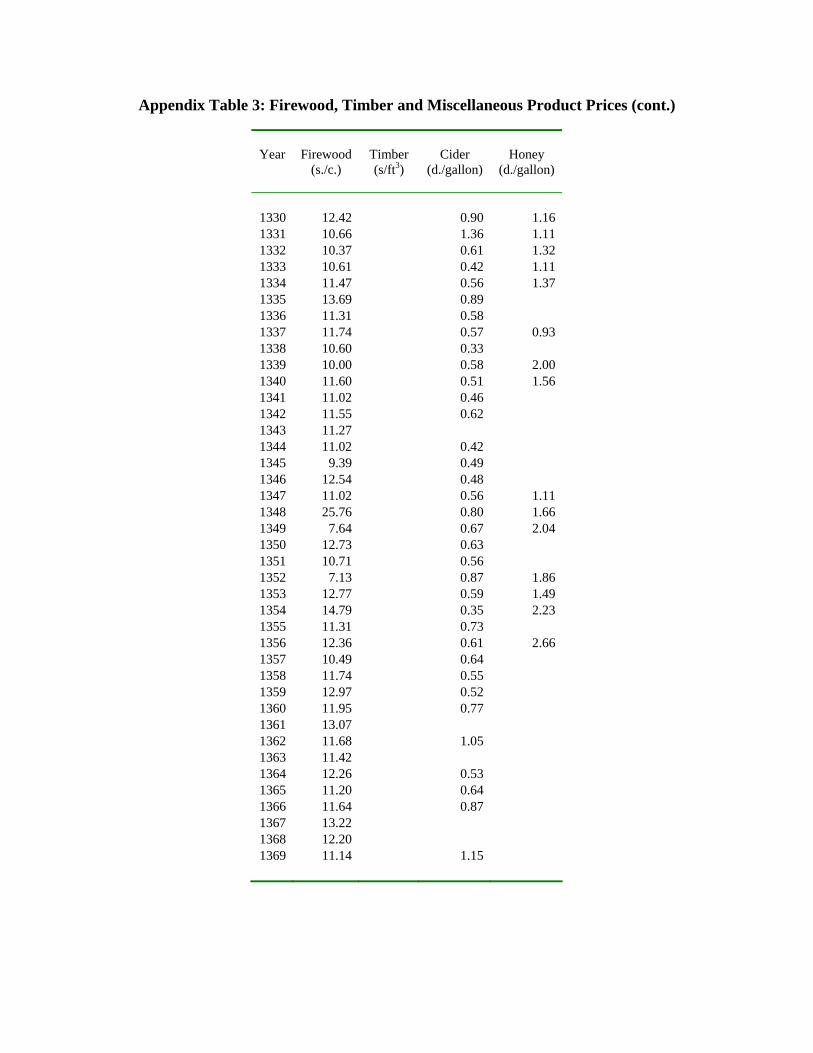
Appendix Table 3: Firewood, Timber and Miscellaneous Product Prices (cont.)
Year
Firewood
(s./c.)
Timber (s/ft3)
Cider
(d./gallon)
Honey
(d./gallon)
1330 12.42 0.90 1.16 1331 10.66 1.36 1.11 1332 10.37 0.61 1.32 1333 10.61 0.42 1.11 1334 11.47 0.56 1.37 1335 13.69 0.89 1336 11.31 0.58 1337 11.74 0.57 0.93 1338 10.60 0.33 1339 10.00 0.58 2.00 1340 11.60 0.51 1.56 1341 11.02 0.46 1342 11.55 0.62 1343 11.27 1344 11.02 0.42 1345 9.39 0.49 1346 12.54 0.48 1347 11.02 0.56 1.11 1348 25.76 0.80 1.66 1349 7.64 0.67 2.04 1350 12.73 0.63 1351 10.71 0.56 1352 7.13 0.87 1.86 1353 12.77 0.59 1.49 1354 14.79 0.35 2.23 1355 11.31 0.73 1356 12.36 0.61 2.66 1357 10.49 0.64 1358 11.74 0.55 1359 12.97 0.52 1360 11.95 0.77 1361 13.07 1362 11.68 1.05 1363 11.42 1364 12.26 0.53 1365 11.20 0.64 1366 11.64 0.87 1367 13.22 1368 12.20 1369 11.14 1.15

Appendix Table 3: Firewood, Timber and Miscellaneous Product Prices (cont.)
Year
Firewood
(s./c.)
Timber (s/ft3)
Cider
(d./gallon)
Honey
(d./gallon)
1370 13.01 0.80 1.58 1371 12.71 1372 10.59 0.59 1373 10.67 0.66 2.69 1374 12.66 2.00 1375 13.61 3.72 1376 12.69 0.77 1377 13.59 2.69 1378 12.94 0.64 1379 10.04 2.37 1380 10.97 0.74 1381 10.61 0.78 1382 12.26 0.50 1383 12.67 1.86 1384 13.09 0.54 1385 14.38 0.56 1.77 1386 11.57 0.59 1387 10.42 1.86 1388 11.76 0.58 2.30 1389 13.34 1390 12.36 0.61 1.67 1391 12.80 1392 11.47 1393 9.64 1394 10.71 1395 9.61 1396 9.44 0.61 2.69 1397 9.63 2.53 1398 9.59 0.73 2.53 1399 9.33 2.75 1400 8.51 0.73 2.31 1401 9.59 2.53 1402 9.33 2.53 1403 9.46 0.56 2.04 1404 9.73 0.56 2.33 1405 9.94 1406 9.67 0.44 2.47 1407 9.64 2.03 1408 8.75 2.17 1409 9.34 2.44

Appendix Table 3: Firewood, Timber and Miscellaneous Product Prices (cont.)
Year
Firewood
(s./c.)
Timber (s/ft3)
Cider
(d./gallon)
Honey
(d./gallon)
1410 9.34 1.11 2.46 1411 8.48 2.27 1412 9.01 0.54 2.43 1413 8.77 1.94 1414 8.79 0.44 2.04 1415 9.01 0.67 2.05 1416 9.65 2.67 1417 8.54 2.22 1418 8.10 2.08 1419 8.83 1.58 1420 9.22 1421 8.63 0.56 1.70 1422 9.26 1.66 1423 8.88 0.56 1424 9.03 2.66 1425 9.02 1426 9.75 1.86 1427 9.70 1.78 1428 9.66 2.16 1429 9.83 2.00 1430 8.59 1.77 1431 8.53 1.81 1432 8.98 2.24 1433 8.26 1434 8.13 2.03 1435 8.07 2.23 1436 8.23 1.43 1437 8.36 1438 9.83 1439 9.69 0.89 2.39 1440 9.11 2.20 1441 7.97 0.37 2.31 1442 8.29 2.32 1443 8.70 0.84 0.74 1444 8.54 2.05 1445 8.06 1.96 1446 8.37 2.14 1447 8.98 2.22 0.67 1.82 1448 6.75 1.64 1449 9.66 2.02

Appendix Table 3: Firewood, Timber and Miscellaneous Product Prices (cont.)
Year
Firewood
(s./c.)
Timber (s/ft3)
Cider
(d./gallon)
Honey
(d./gallon)
1450 6.40 2.38 1451 8.24 1.85 1452 7.89 1.50 1453 8.77 2.15 1454 8.58 2.66 1455 8.25 2.03 1456 9.44 1.81 0.52 1457 7.00 1.76 1458 7.67 1.79 0.44 2.32 1459 7.50 2.01 1460 8.36 2.10 1461 9.44 0.53 3.00 1462 8.99 1.90 1463 1.90 1464 0.33 2.36 1465 7.67 0.84 1.11 1466 8.22 2.14 1467 8.16 2.19 1468 7.92 0.74 1.99 1469 7.65 1.00 1.99 1470 8.49 1.79 0.74 2.66 1471 7.66 2.41 1472 8.12 1.89 1473 1.79 0.40 3.53 1474 7.85 2.56 1475 7.95 2.60 1476 8.48 2.37 1477 7.74 0.48 2.30 1478 8.04 2.33 1479 7.14 2.49 1480 6.24 0.89 2.44 1481 6.48 0.67 2.33 1482 6.62 2.72 1483 6.28 1.47 1484 7.47 2.57 1485 6.43 0.56 2.58 1486 3.93 1.79 2.83 1487 4.19 1488 4.25 1.79 2.33 1489 7.00 2.25 2.18

Appendix Table 3: Firewood, Timber and Miscellaneous Product Prices (cont.)
Year
Firewood
(s./c.)
Timber (s/ft3)
Cider
(d./gallon)
Honey
(d./gallon)
1490 6.78 2.41 1491 5.73 2.49 1492 5.43 1.63 2.64 1493 7.55 2.54 1494 6.00 1.79 2.31 1495 5.49 1.68 1496 8.35 2.14 2.36 1497 7.06 1.79 2.34 1498 6.34 2.36 1499 7.90 1500 7.92 1.79 1.50 1501 7.82 2.66 1502 7.48 1.65 2.36 1503 8.08 1.14 2.33 1504 7.45 1.37 1505 7.43 1506 7.27 1.79 1507 9.71 1.08 1508 6.91 1.41 2.46 1509 6.95 1.24 1510 7.14 1.25 1511 7.19 3.33 1512 8.20 1.47 2.62 1513 7.87 1.65 1514 7.58 1.79 2.73 1515 7.77 1.58 1516 7.38 1517 7.73 1.69 1518 7.90 3.33 1519 7.84 1.40 3.76 1520 8.03 1.47 3.28 1521 7.89 1.79 1522 8.02 0.67 1.86 1523 8.12 1.66 3.01 1524 7.80 1525 7.96 0.75 3.23 1526 7.88 2.48 1527 8.75 1.97 1528 7.65 1.71 1529 7.90 1.45
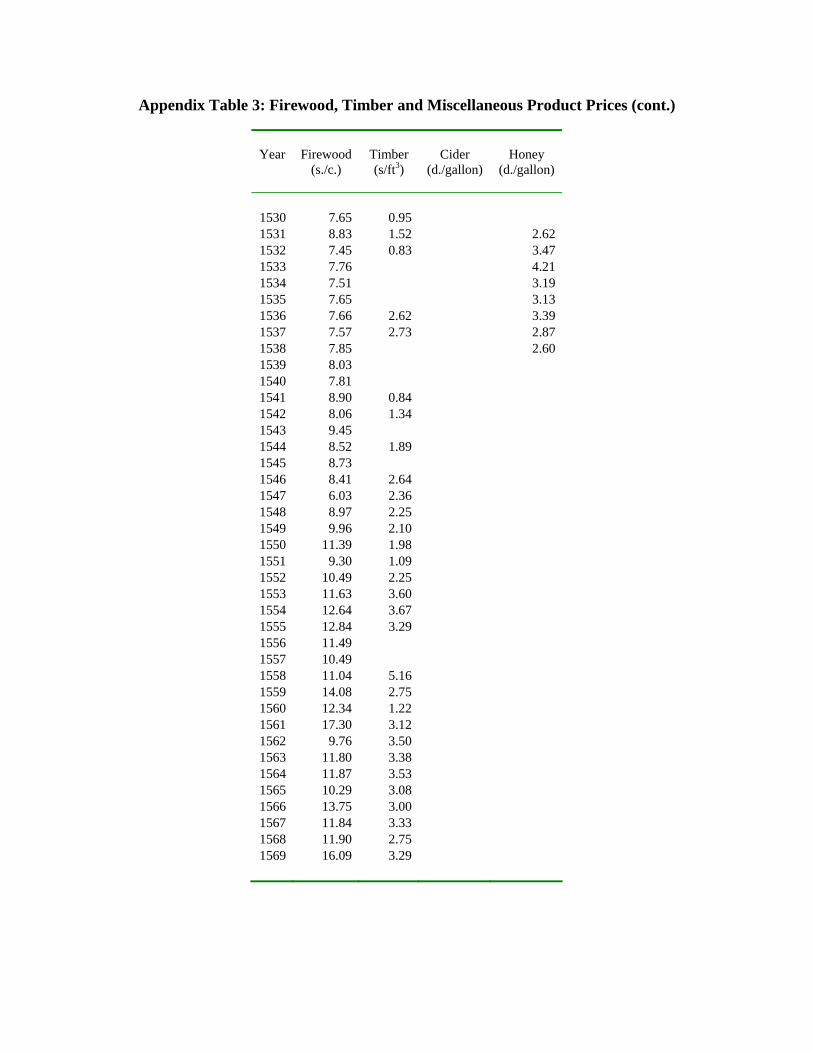
Appendix Table 3: Firewood, Timber and Miscellaneous Product Prices (cont.)
Year
Firewood
(s./c.)
Timber (s/ft3)
Cider
(d./gallon)
Honey
(d./gallon)
1530 7.65 0.95 1531 8.83 1.52 2.62 1532 7.45 0.83 3.47 1533 7.76 4.21 1534 7.51 3.19 1535 7.65 3.13 1536 7.66 2.62 3.39 1537 7.57 2.73 2.87 1538 7.85 2.60 1539 8.03 1540 7.81 1541 8.90 0.84 1542 8.06 1.34 1543 9.45 1544 8.52 1.89 1545 8.73 1546 8.41 2.64 1547 6.03 2.36 1548 8.97 2.25 1549 9.96 2.10 1550 11.39 1.98 1551 9.30 1.09 1552 10.49 2.25 1553 11.63 3.60 1554 12.64 3.67 1555 12.84 3.29 1556 11.49 1557 10.49 1558 11.04 5.16 1559 14.08 2.75 1560 12.34 1.22 1561 17.30 3.12 1562 9.76 3.50 1563 11.80 3.38 1564 11.87 3.53 1565 10.29 3.08 1566 13.75 3.00 1567 11.84 3.33 1568 11.90 2.75 1569 16.09 3.29
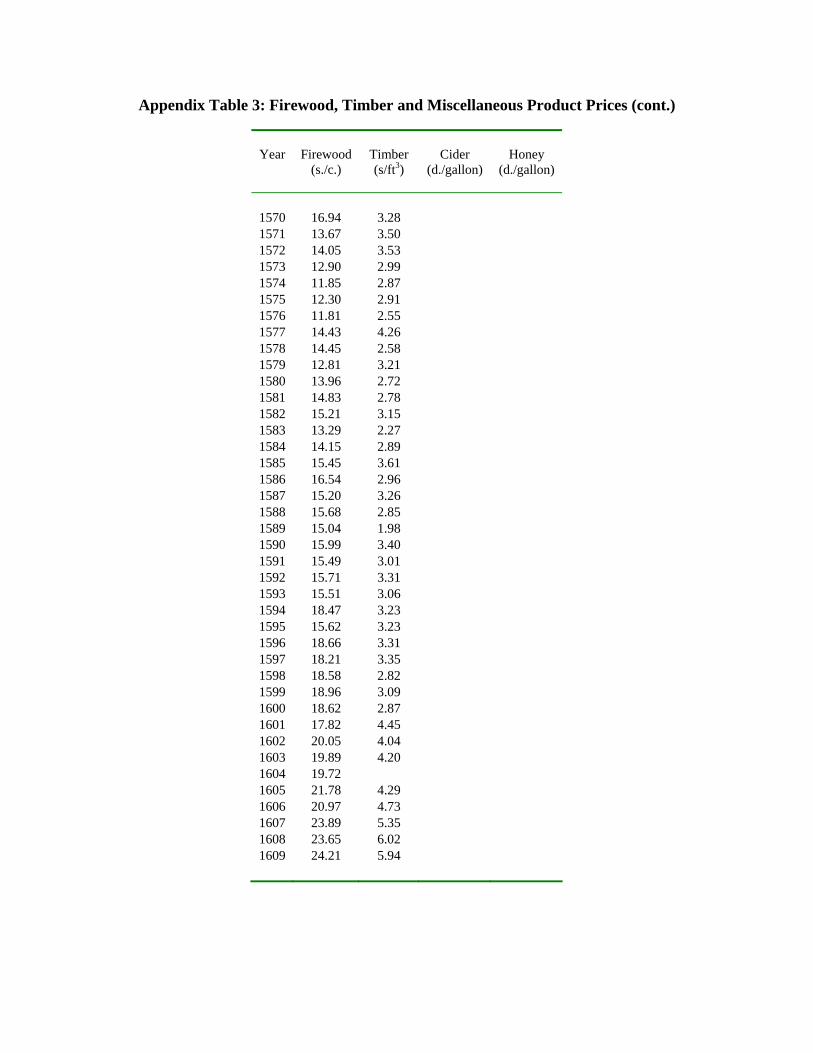
Appendix Table 3: Firewood, Timber and Miscellaneous Product Prices (cont.)
Year
Firewood
(s./c.)
Timber (s/ft3)
Cider
(d./gallon)
Honey
(d./gallon)
1570 16.94 3.28 1571 13.67 3.50 1572 14.05 3.53 1573 12.90 2.99 1574 11.85 2.87 1575 12.30 2.91 1576 11.81 2.55 1577 14.43 4.26 1578 14.45 2.58 1579 12.81 3.21 1580 13.96 2.72 1581 14.83 2.78 1582 15.21 3.15 1583 13.29 2.27 1584 14.15 2.89 1585 15.45 3.61 1586 16.54 2.96 1587 15.20 3.26 1588 15.68 2.85 1589 15.04 1.98 1590 15.99 3.40 1591 15.49 3.01 1592 15.71 3.31 1593 15.51 3.06 1594 18.47 3.23 1595 15.62 3.23 1596 18.66 3.31 1597 18.21 3.35 1598 18.58 2.82 1599 18.96 3.09 1600 18.62 2.87 1601 17.82 4.45 1602 20.05 4.04 1603 19.89 4.20 1604 19.72 1605 21.78 4.29 1606 20.97 4.73 1607 23.89 5.35 1608 23.65 6.02 1609 24.21 5.94
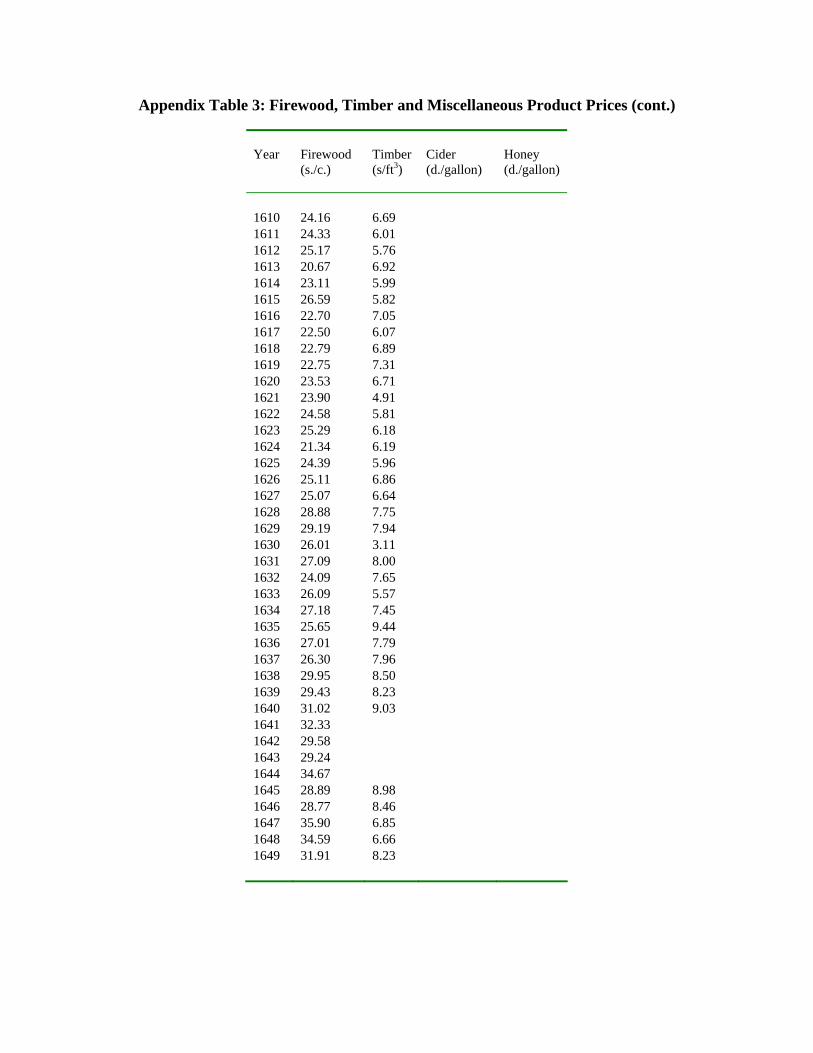
Appendix Table 3: Firewood, Timber and Miscellaneous Product Prices (cont.)
Year
Firewood (s./c.)
Timber (s/ft3)
Cider (d./gallon)
Honey (d./gallon)
1610 24.16 6.69 1611 24.33 6.01 1612 25.17 5.76 1613 20.67 6.92 1614 23.11 5.99 1615 26.59 5.82 1616 22.70 7.05 1617 22.50 6.07 1618 22.79 6.89 1619 22.75 7.31 1620 23.53 6.71 1621 23.90 4.91 1622 24.58 5.81 1623 25.29 6.18 1624 21.34 6.19 1625 24.39 5.96 1626 25.11 6.86 1627 25.07 6.64 1628 28.88 7.75 1629 29.19 7.94 1630 26.01 3.11 1631 27.09 8.00 1632 24.09 7.65 1633 26.09 5.57 1634 27.18 7.45 1635 25.65 9.44 1636 27.01 7.79 1637 26.30 7.96 1638 29.95 8.50 1639 29.43 8.23 1640 31.02 9.03 1641 32.33 1642 29.58 1643 29.24 1644 34.67 1645 28.89 8.98 1646 28.77 8.46 1647 35.90 6.85 1648 34.59 6.66 1649 31.91 8.23
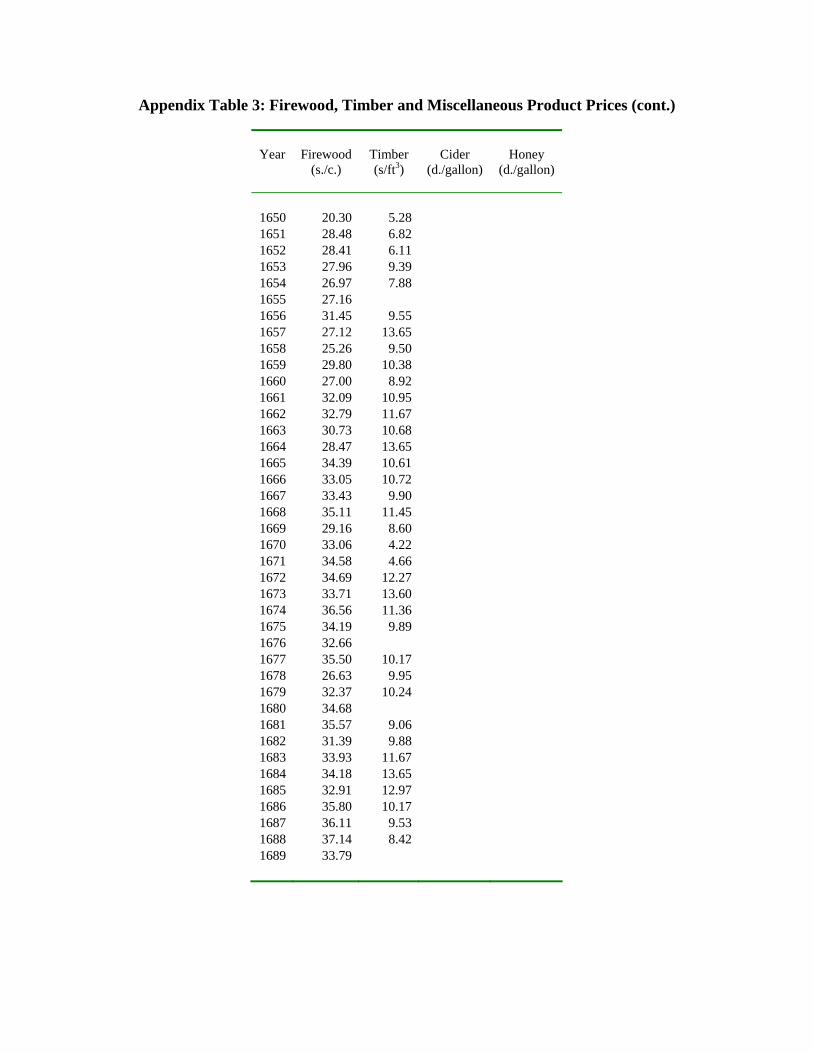
Appendix Table 3: Firewood, Timber and Miscellaneous Product Prices (cont.)
Year
Firewood
(s./c.)
Timber (s/ft3)
Cider
(d./gallon)
Honey
(d./gallon)
1650 20.30 5.28 1651 28.48 6.82 1652 28.41 6.11 1653 27.96 9.39 1654 26.97 7.88 1655 27.16 1656 31.45 9.55 1657 27.12 13.65 1658 25.26 9.50 1659 29.80 10.38 1660 27.00 8.92 1661 32.09 10.95 1662 32.79 11.67 1663 30.73 10.68 1664 28.47 13.65 1665 34.39 10.61 1666 33.05 10.72 1667 33.43 9.90 1668 35.11 11.45 1669 29.16 8.60 1670 33.06 4.22 1671 34.58 4.66 1672 34.69 12.27 1673 33.71 13.60 1674 36.56 11.36 1675 34.19 9.89 1676 32.66 1677 35.50 10.17 1678 26.63 9.95 1679 32.37 10.24 1680 34.68 1681 35.57 9.06 1682 31.39 9.88 1683 33.93 11.67 1684 34.18 13.65 1685 32.91 12.97 1686 35.80 10.17 1687 36.11 9.53 1688 37.14 8.42 1689 33.79

Appendix Table 3: Firewood, Timber and Miscellaneous Product Prices (cont.)
Year
Firewood
(s./c.)
Timber (s/ft3)
Cider
(d./gallon)
Honey
(d./gallon)
1690 34.00 7.14 1691 33.03 10.24 1692 33.63 11.40 1693 33.51 10.80 1694 33.76 10.24 1695 33.61 10.24 1696 35.93 10.24 1697 35.21 10.24 1698 37.94 10.78 1699 34.25 10.24 1700 34.00 16.64 1701 32.13 1702 33.06 10.24 1703 36.19 6.93 1704 33.41 8.96 1705 34.14 7.89 1706 29.58 9.50 1707 30.37 1708 32.05 9.50 1709 32.20 10.32 1710 35.09 9.50 1711 33.75 8.91 1712 35.07 12.07 1713 35.15 9.29 1714 34.02 10.45 1715 35.72 10.14 1716 32.36 7.98 1717 31.65 9.00 1718 30.75 8.64 1719 32.05 9.12 1720 31.47 8.85 1721 29.37 7.99 1722 31.59 9.69 1723 31.43 8.68 1724 30.88 8.72 1725 31.59 8.57 1726 33.66 10.24 1727 33.44 7.37 1728 32.91 1729 33.77 9.23

Appendix Table 3: Firewood, Timber and Miscellaneous Product Prices (cont.)
Year
Firewood
(s./c.)
Timber (s/ft3)
Cider
(d./gallon)
Honey
(d./gallon)
1730 33.43 8.69 1731 33.04 8.67 1732 32.66 6.44 1733 32.06 8.41 1734 33.83 8.29 1735 29.05 7.78 1736 32.91 7.78 1737 31.06 7.78 1738 31.06 8.26 1739 31.06 7.41 1740 32.15 8.05 1741 32.63 7.41 1742 32.63 7.31 1743 31.16 7.83 1744 29.78 7.31 1745 33.22 7.83 1746 34.08 7.31 1747 29.17 8.02 1748 29.53 8.76 1749 30.46 7.76 1750 31.62 8.55 1751 28.20 8.27 1752 34.43 9.53 1753 32.15 9.77 1754 37.58 8.41 1755 29.53 9.28 1756 26.95 7.90 1757 32.71 8.88 1758 30.46 9.19 1759 29.22 8.97 1760 31.65 8.74 1761 27.14 8.19 1762 26.87 9.42 1763 29.38 9.14 1764 29.13 9.38 1765 37.34 9.32 1766 28.49 10.17 1767 26.87 10.18 1768 32.11 9.06 1769 29.38 9.76
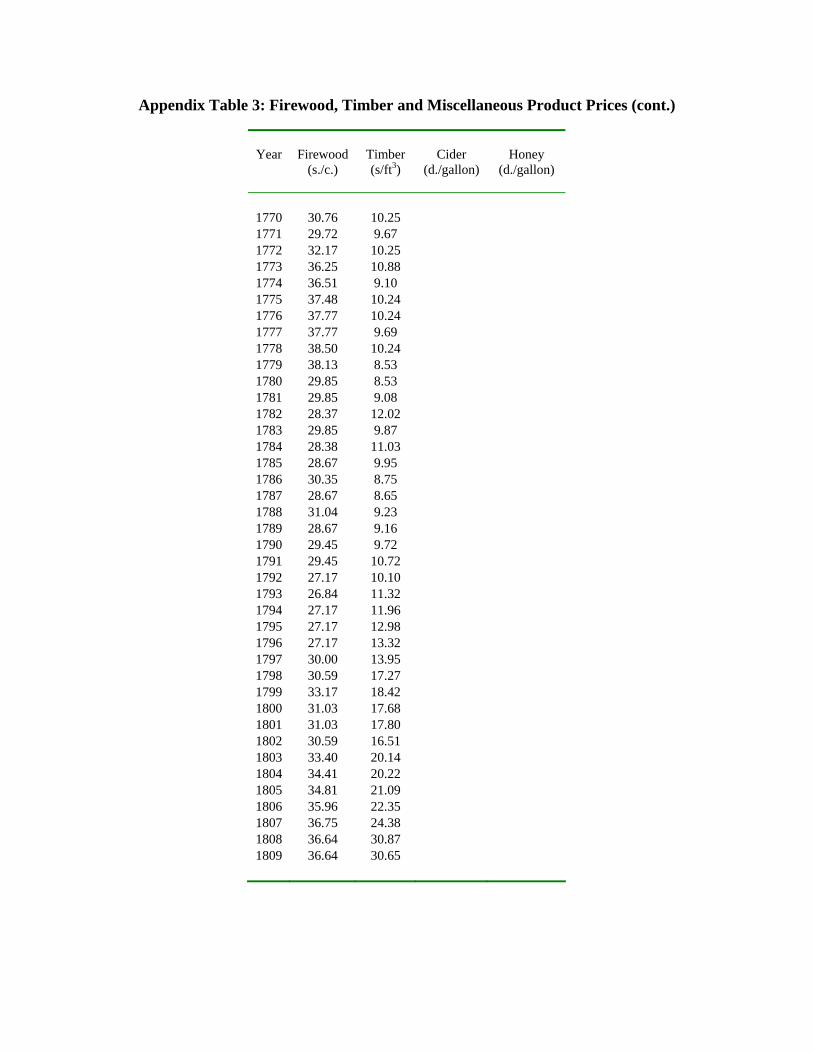
Appendix Table 3: Firewood, Timber and Miscellaneous Product Prices (cont.)
Year
Firewood
(s./c.)
Timber (s/ft3)
Cider
(d./gallon)
Honey
(d./gallon)
1770 30.76 10.25 1771 29.72 9.67 1772 32.17 10.25 1773 36.25 10.88 1774 36.51 9.10 1775 37.48 10.24 1776 37.77 10.24 1777 37.77 9.69 1778 38.50 10.24 1779 38.13 8.53 1780 29.85 8.53 1781 29.85 9.08 1782 28.37 12.02 1783 29.85 9.87 1784 28.38 11.03 1785 28.67 9.95 1786 30.35 8.75 1787 28.67 8.65 1788 31.04 9.23 1789 28.67 9.16 1790 29.45 9.72 1791 29.45 10.72 1792 27.17 10.10 1793 26.84 11.32 1794 27.17 11.96 1795 27.17 12.98 1796 27.17 13.32 1797 30.00 13.95 1798 30.59 17.27 1799 33.17 18.42 1800 31.03 17.68 1801 31.03 17.80 1802 30.59 16.51 1803 33.40 20.14 1804 34.41 20.22 1805 34.81 21.09 1806 35.96 22.35 1807 36.75 24.38 1808 36.64 30.87 1809 36.64 30.65

Appendix Table 3: Firewood, Timber and Miscellaneous Product Prices (cont.)
Year
Firewood
(s./c.)
Timber (s/ft3)
Cider
(d./gallon)
Honey
(d./gallon)
1810 37.12 35.91 1811 37.17 28.73 1812 42.12 26.46 1813 44.59 27.67 1814 44.59 28.87 1815 44.77 24.76 1816 42.12 19.63 1817 41.13 18.82 1818 40.79 23.63 1819 39.56 18.62 1820 40.79 17.01 1821 38.47 18.17 1822 37.51 18.52 1823 38.09 21.15 1824 40.23 17.48 1825 40.23 16.76 1826 40.23 17.80 1827 39.61 14.30 1828 40.23 14.82 1829 40.23 15.11 1830 40.23 13.73 1831 40.23 13.53 1832 13.83 1833 13.54 1834 45.80 16.63 1835 40.48 15.75 1836 38.95 15.28 1837 40.48 17.30 1838 38.95 17.11 1839 40.48 18.62 1840 40.48 17.43 1841 40.48 15.47 1842 40.48 14.13 1843 40.48 14.37 1844 40.48 14.91 1845 42.07 13.32 1846 42.07 10.91 1847 40.48 8.75 1848 40.48 7.13 1849 40.48 7.82
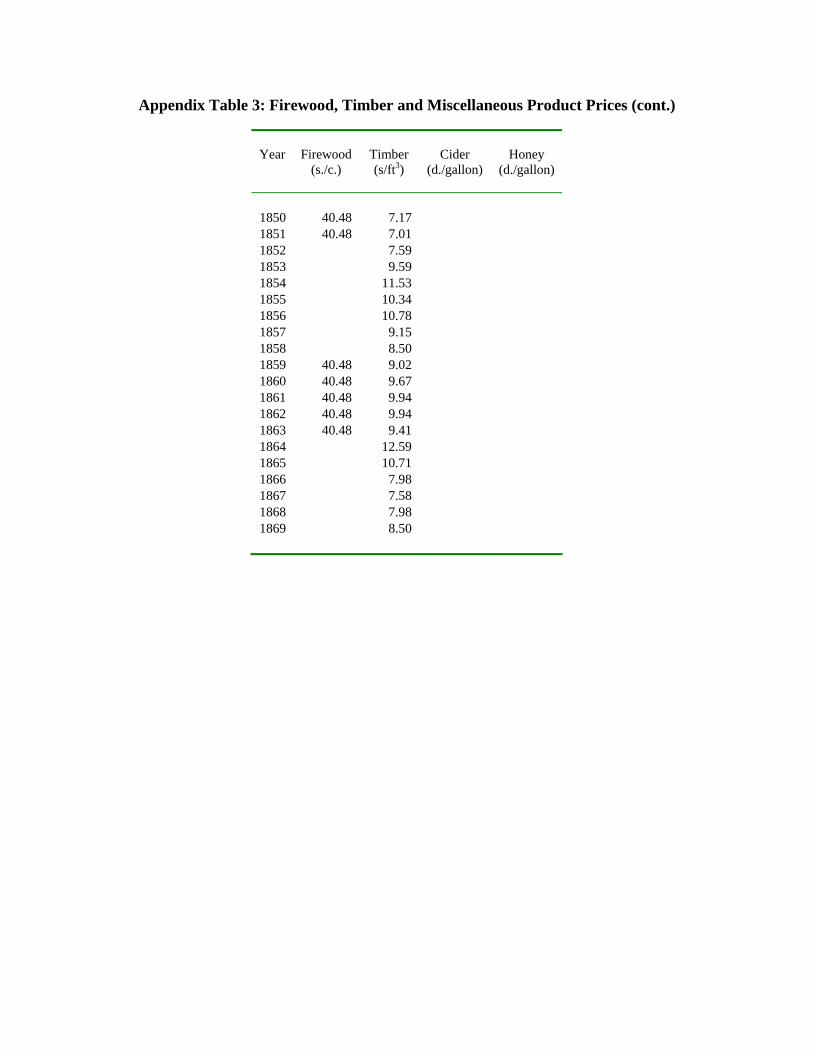
Appendix Table 3: Firewood, Timber and Miscellaneous Product Prices (cont.)
Year
Firewood
(s./c.)
Timber (s/ft3)
Cider
(d./gallon)
Honey
(d./gallon)
1850 40.48 7.17 1851 40.48 7.01 1852 7.59 1853 9.59 1854 11.53 1855 10.34 1856 10.78 1857 9.15 1858 8.50 1859 40.48 9.02 1860 40.48 9.67 1861 40.48 9.94 1862 40.48 9.94 1863 40.48 9.41 1864 12.59 1865 10.71 1866 7.98 1867 7.58 1868 7.98 1869 8.50
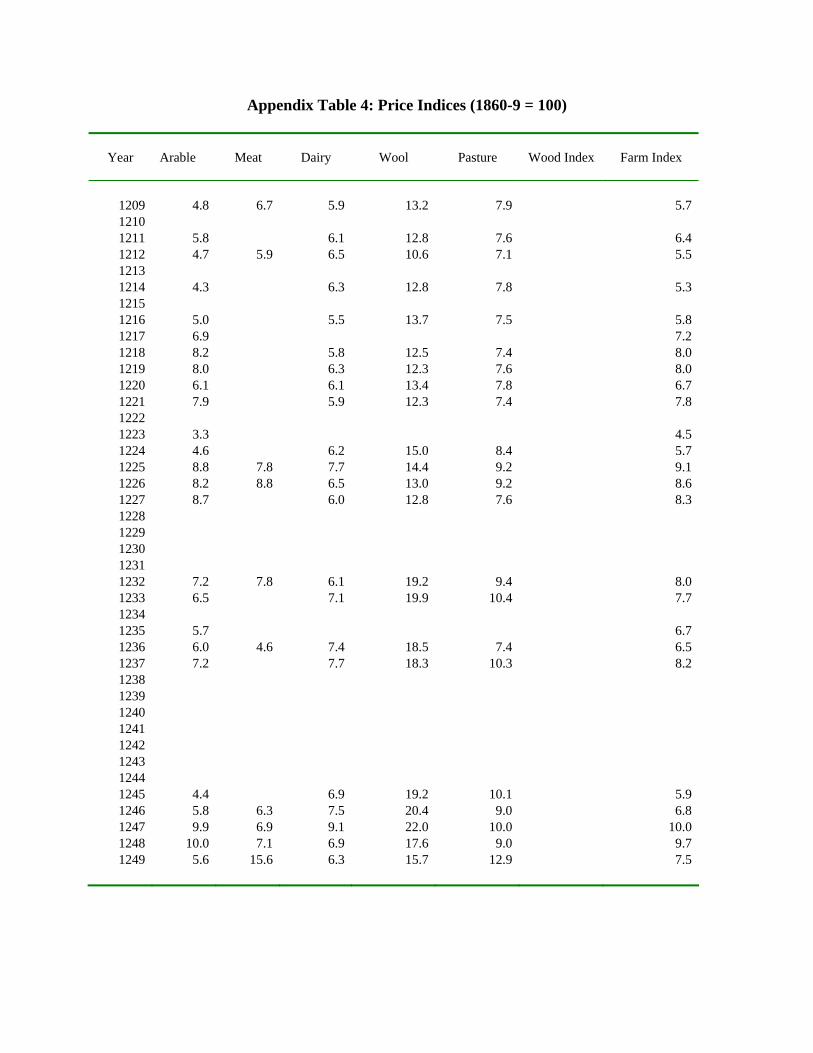
Appendix Table 4: Price Indices (1860-9 = 100)
Year
Arable
Meat
Dairy
Wool
Pasture
Wood Index
Farm Index
1209 4.8 6.7 5.9 13.2 7.9 5.7 1210 1211 5.8 6.1 12.8 7.6 6.4 1212 4.7 5.9 6.5 10.6 7.1 5.5 1213 1214 4.3 6.3 12.8 7.8 5.3 1215 1216 5.0 5.5 13.7 7.5 5.8 1217 6.9 7.2 1218 8.2 5.8 12.5 7.4 8.0 1219 8.0 6.3 12.3 7.6 8.0 1220 6.1 6.1 13.4 7.8 6.7 1221 7.9 5.9 12.3 7.4 7.8 1222 1223 3.3 4.5 1224 4.6 6.2 15.0 8.4 5.7 1225 8.8 7.8 7.7 14.4 9.2 9.1 1226 8.2 8.8 6.5 13.0 9.2 8.6 1227 8.7 6.0 12.8 7.6 8.3 1228 1229 1230 1231 1232 7.2 7.8 6.1 19.2 9.4 8.0 1233 6.5 7.1 19.9 10.4 7.7 1234 1235 5.7 6.7 1236 6.0 4.6 7.4 18.5 7.4 6.5 1237 7.2 7.7 18.3 10.3 8.2 1238 1239 1240 1241 1242 1243 1244 1245 4.4 6.9 19.2 10.1 5.9 1246 5.8 6.3 7.5 20.4 9.0 6.8 1247 9.9 6.9 9.1 22.0 10.0 10.0 1248 10.0 7.1 6.9 17.6 9.0 9.7 1249 5.6 15.6 6.3 15.7 12.9 7.5
Appendix Table 4: Price Indices (cont.)
Year
Arable
Meat
Dairy
Wool
Pasture
Wood Index
Farm Index
1250 1251 6.7 7.9 1252 6.1 5.7 7.6 17.4 8.2 6.8 1253 9.2 6.9 6.4 17.4 8.7 8.9 1254 5.6 6.0 6.8 14.8 7.9 6.4 1255 5.2 6.7 7.2 15.7 8.7 6.2 1256 21.8 11.2 9.9 1257 11.2 6.7 7.2 17.4 8.8 15.4 10.1 1258 12.1 8.1 7.2 18.1 9.6 11.9 10.7 1259 13.4 21.8 13.7 12.1 1260 6.7 5.1 6.1 6.6 1261 7.0 4.5 8.5 7.0 7.1 1262 7.6 3.7 8.9 28.7 7.8 7.7 1263 7.4 3.7 8.7 20.9 7.1 7.4 1264 6.3 7.6 28.7 15.6 8.6 1265 7.9 9.7 7.9 20.9 11.4 9.0 1266 7.2 6.8 9.3 20.7 9.9 8.0 1267 7.8 11.0 10.8 14.0 9.5 1268 6.5 7.8 8.6 22.9 10.7 7.7 1269 8.9 10.4 8.4 23.9 12.5 9.8 1270 9.1 9.1 8.7 25.5 11.9 18.4 10.1 1271 11.1 11.2 8.6 24.1 13.1 17.9 11.8 1272 12.5 13.0 7.7 23.4 13.6 13.0 1273 9.9 10.4 7.6 23.2 12.1 10.7 1274 11.5 12.5 10.8 24.1 14.6 12.4 1275 11.7 10.9 9.8 27.1 13.7 18.1 12.2 1276 9.5 14.6 10.0 31.8 16.6 11.5 1277 12.1 10.8 8.3 30.4 13.4 19.5 12.5 1278 9.3 11.0 8.7 37.8 14.5 15.3 10.6 1279 8.3 9.9 9.0 37.1 13.8 18.5 10.1 1280 9.4 11.9 8.9 30.6 14.4 26.4 11.3 1281 9.0 12.1 8.5 32.9 14.7 20.5 10.8 1282 10.5 12.1 8.2 27.6 13.9 20.9 11.7 1283 11.1 13.2 8.1 26.9 14.4 13.1 11.8 1284 11.2 10.2 8.3 26.7 12.6 13.3 11.2 1285 8.2 10.8 7.6 26.7 12.8 18.0 9.6 1286 9.8 9.6 8.0 28.9 12.2 18.4 10.6 1287 8.4 10.9 8.6 29.7 13.6 17.9 9.9 1288 5.6 9.1 8.0 29.9 12.2 18.5 7.6 1289 6.3 9.3 9.3 30.6 12.8 19.0 8.4

Appendix Table 4: Price Indices (cont.)
Year
Arable
Meat
Dairy
Wool
Pasture
Wood Index
Farm Index
1290 8.7 8.9 8.3 32.4 12.4 18.5 9.9 1291 10.9 9.2 8.4 30.4 12.5 11.4 1292 10.0 9.6 8.6 26.4 12.4 21.4 10.8 1293 10.2 10.0 8.3 28.7 12.8 20.4 11.2 1294 12.6 10.9 8.8 25.8 13.2 22.6 12.9 1295 13.8 11.2 9.3 17.6 12.3 19.7 13.0 1296 13.6 10.2 8.3 23.6 12.2 19.8 12.8 1297 9.2 10.4 8.6 22.7 12.4 17.0 10.1 1298 11.3 9.9 8.1 26.7 12.4 20.7 11.8 1299 10.7 9.7 10.5 34.1 13.9 18.0 11.8 1300 9.7 13.0 9.2 31.1 15.3 19.4 11.5 1301 8.7 11.3 10.5 28.9 14.4 23.5 10.7 1302 8.6 10.4 10.6 25.8 13.5 21.7 10.4 1303 7.7 9.6 9.7 26.0 12.6 20.5 9.5 1304 7.5 8.1 9.6 26.7 12.2 16.2 9.1 1305 9.8 10.2 9.5 30.4 13.5 23.7 11.1 1306 9.5 11.9 12.1 32.9 15.8 24.4 11.5 1307 8.6 10.5 10.8 35.0 14.7 24.1 10.6 1308 9.9 7.7 10.8 36.8 12.6 24.8 11.0 1309 11.5 13.4 11.5 37.5 17.2 13.5 1310 12.9 14.7 12.9 34.6 18.0 31.2 14.6 1311 12.8 12.9 12.7 29.7 16.2 24.3 14.1 1312 9.3 13.4 12.0 25.5 15.7 26.9 11.6 1313 9.2 11.4 12.1 27.4 14.8 11.3 1314 10.0 11.4 11.4 31.3 15.0 28.0 11.9 1315 11.7 12.4 12.8 30.8 16.1 13.3 1316 23.0 14.2 15.5 29.5 17.8 20.6 20.2 1317 22.1 18.0 13.9 31.1 19.3 25.2 20.5 1318 12.8 15.7 11.3 33.9 17.8 21.5 14.2 1319 7.7 13.1 11.2 33.4 15.8 22.5 10.2 1320 9.0 12.6 12.4 40.1 16.3 27.9 11.5 1321 11.0 10.9 12.9 44.1 15.4 28.1 12.8 1322 18.4 13.4 13.1 34.8 16.7 26.2 17.3 1323 14.2 14.9 16.1 34.8 19.2 16.6 15.3 1324 10.6 14.7 12.6 36.2 18.0 12.8 1325 12.8 14.9 12.8 38.0 18.5 24.5 14.3 1326 9.2 13.6 14.2 32.7 18.4 30.2 12.0 1327 7.7 11.7 8.6 34.3 14.7 28.0 10.0 1328 8.2 12.3 11.4 31.5 15.7 36.7 10.8 1329 10.0 11.5 12.9 28.9 15.1 11.9
Appendix Table 4: Price Indices (cont.)
Year
Arable
Meat
Dairy
Wool
Pasture
Wood Index
Farm Index
1330 10.4 11.8 12.5 28.3 15.4 31.5 12.3 1331 11.9 12.4 10.8 29.7 15.8 27.1 13.4 1332 13.4 11.5 9.6 28.7 14.2 26.3 13.6 1333 9.5 11.9 9.5 25.3 14.0 26.9 11.0 1334 7.8 11.3 10.2 20.4 13.4 29.1 9.9 1335 8.2 11.2 10.6 21.8 13.4 34.8 10.5 1336 8.8 11.6 11.9 26.7 14.5 28.7 11.0 1337 8.0 10.8 9.5 22.9 12.3 29.8 9.7 1338 6.7 10.3 11.2 17.9 11.5 26.9 8.5 1339 5.7 9.3 8.7 19.7 11.3 25.4 7.9 1340 9.4 10.2 11.6 19.7 13.3 29.5 11.0 1341 7.7 10.7 8.2 19.9 12.2 28.0 9.5 1342 8.2 9.9 7.7 24.1 11.9 29.3 10.0 1343 7.9 10.5 7.7 19.7 11.7 28.6 9.6 1344 10.1 10.6 8.5 25.3 12.8 28.0 11.3 1345 7.4 11.0 9.2 23.6 13.3 23.8 9.4 1346 7.8 10.5 12.0 25.8 14.0 31.8 10.1 1347 11.6 11.9 10.1 23.6 13.9 28.0 12.5 1348 11.3 11.6 8.8 24.1 13.2 65.4 13.1 1349 7.0 12.3 8.2 14.4 12.1 19.4 8.8 1350 10.3 10.9 10.7 18.1 12.6 32.3 11.7 1351 14.9 11.6 10.6 19.0 13.0 27.2 14.4 1352 17.4 11.9 10.0 20.1 13.5 18.1 15.4 1353 11.9 15.0 10.2 18.5 14.9 32.4 13.1 1354 10.3 13.1 11.1 19.2 14.3 37.6 12.0 1355 9.6 12.9 12.0 21.3 14.6 28.7 11.6 1356 11.1 11.9 11.6 19.5 13.9 31.4 12.5 1357 12.2 10.6 12.7 20.9 13.5 26.6 13.0 1358 13.0 11.1 11.1 21.6 13.2 29.8 13.4 1359 11.6 12.9 9.9 16.9 13.4 32.9 12.7 1360 11.3 12.6 13.7 22.5 15.1 30.4 13.0 1361 12.1 13.0 13.3 19.9 15.0 33.2 13.7 1362 11.6 12.6 10.3 22.3 14.2 29.7 13.0 1363 13.8 10.6 11.1 19.5 12.8 29.0 14.0 1364 14.8 11.7 10.1 20.1 13.2 31.1 14.5 1365 12.8 13.5 11.9 26.2 15.9 28.4 14.1 1366 11.0 11.7 11.5 26.2 14.7 29.5 12.7 1367 11.6 12.4 11.8 30.2 15.8 33.6 13.5 1368 12.7 12.4 11.9 29.5 15.6 31.0 14.2 1369 12.6 13.1 11.1 25.5 15.0 28.3 13.9

Appendix Table 4: Price Indices (cont.)
Year
Arable
Meat
Dairy
Wool
Pasture
Wood Index
Farm Index
1370 22.6 14.2 13.0 29.7 17.2 33.0 20.0 1371 13.5 13.4 9.5 29.2 14.9 32.3 14.3 1372 10.8 11.5 11.4 31.1 15.2 26.9 12.4 1373 12.7 14.6 10.3 32.0 16.9 27.1 14.2 1374 10.1 13.6 10.9 34.6 16.7 32.1 12.5 1375 14.0 13.7 11.2 33.9 17.1 34.6 15.7 1376 14.0 13.3 11.1 33.1 16.4 32.2 15.2 1377 9.1 13.8 11.3 38.0 17.3 34.5 12.1 1378 7.9 11.8 11.2 32.4 15.7 32.9 10.7 1379 7.6 12.1 10.0 31.3 15.0 25.5 10.1 1380 9.9 13.3 10.0 29.9 15.7 27.9 12.1 1381 10.3 13.3 9.8 22.9 14.9 26.9 12.2 1382 9.3 11.7 9.0 22.5 13.5 31.1 11.1 1383 9.0 13.7 9.6 25.8 15.4 32.2 11.4 1384 9.8 11.3 10.3 25.3 13.9 33.2 11.6 1385 8.6 11.1 7.6 28.9 13.4 36.5 10.7 1386 9.8 13.3 9.8 22.0 14.4 29.4 11.7 1387 8.1 13.3 10.0 21.1 14.4 26.5 10.3 1388 7.0 13.8 9.8 19.5 14.2 29.9 9.6 1389 6.7 13.8 7.6 20.1 13.6 33.9 9.2 1390 10.0 13.3 9.9 20.4 14.1 31.4 11.7 1391 14.7 10.5 8.7 16.7 11.8 32.5 14.3 1392 9.3 11.8 10.3 21.6 13.6 29.1 11.2 1393 7.0 12.7 10.3 24.3 14.6 24.5 9.4 1394 7.6 13.8 10.3 23.4 15.0 27.2 10.1 1395 8.2 12.1 11.6 21.1 14.2 24.4 10.3 1396 8.6 8.8 10.5 23.2 12.1 24.0 10.1 1397 11.0 13.8 9.8 22.9 14.9 24.5 12.5 1398 11.2 13.3 9.5 26.2 14.8 24.4 12.6 1399 9.3 14.0 10.4 24.8 15.6 23.7 11.5 1400 10.0 13.5 9.4 23.4 14.6 21.6 11.7 1401 11.1 13.1 8.0 22.9 13.9 24.4 12.4 1402 14.0 13.5 9.6 23.9 14.8 23.7 14.4 1403 11.3 14.5 14.4 25.5 17.0 24.0 13.0 1404 9.0 12.2 7.7 30.8 13.9 24.7 10.8 1405 8.3 11.9 9.1 23.6 13.8 25.2 10.3 1406 7.7 14.2 8.2 23.4 14.6 24.6 10.0 1407 7.8 14.2 8.4 28.7 15.5 24.5 10.3 1408 10.0 13.2 10.1 28.0 15.4 22.2 11.8 1409 11.8 13.7 9.9 26.4 15.6 23.7 13.2

Appendix Table 4: Price Indices (cont.)
Year
Arable
Meat
Dairy
Wool
Pasture
Wood Index
Farm Index
1410 13.7 14.0 9.2 32.7 16.0 23.7 14.6 1411 11.0 14.4 8.6 30.4 15.7 21.5 12.6 1412 9.3 13.1 8.6 27.1 14.7 22.9 11.1 1413 8.7 14.1 10.7 30.6 16.5 22.3 11.1 1414 8.5 14.3 10.4 24.8 15.6 22.3 10.7 1415 9.0 14.4 10.4 22.9 15.4 22.9 11.1 1416 11.4 14.4 10.2 24.3 15.5 24.5 12.9 1417 12.7 14.0 10.0 21.6 14.9 21.7 13.5 1418 10.1 13.8 8.9 18.8 13.7 20.6 11.4 1419 10.4 14.5 8.1 19.0 14.2 22.4 11.7 1420 9.7 13.4 9.6 20.4 14.2 23.4 11.4 1421 10.0 12.5 10.2 28.9 15.0 21.9 11.6 1422 8.5 13.3 9.9 21.1 14.5 23.5 10.5 1423 8.3 14.0 8.9 18.3 14.1 22.5 10.3 1424 8.2 13.5 8.1 19.7 13.7 22.9 10.2 1425 8.8 14.5 8.9 22.0 14.9 22.9 10.9 1426 8.2 14.4 10.7 18.8 14.9 24.8 10.4 1427 7.6 14.7 9.9 20.7 15.0 24.6 10.0 1428 7.5 13.5 9.9 20.1 14.4 24.5 9.8 1429 11.5 14.2 9.8 24.5 15.5 25.0 13.0 1430 11.9 13.3 11.7 31.3 16.4 21.8 13.3 1431 9.3 14.1 6.6 25.8 14.4 21.6 11.1 1432 7.9 13.7 9.1 25.1 15.0 22.8 10.3 1433 10.8 14.2 11.4 25.3 16.1 21.0 12.5 1434 9.6 15.5 10.8 19.7 15.9 20.6 11.5 1435 8.2 15.9 13.7 21.8 17.0 20.5 10.8 1436 8.4 15.8 12.3 23.6 16.8 20.9 10.8 1437 8.5 11.5 19.5 13.1 21.2 10.1 1438 13.3 15.3 11.4 19.2 15.7 25.0 14.3 1439 17.5 14.2 13.7 25.5 16.8 24.6 17.0 1440 11.8 12.9 23.2 14.9 23.1 13.0 1441 6.9 13.2 23.4 14.9 20.2 9.2 1442 7.3 12.9 9.8 22.9 14.5 21.1 9.6 1443 8.3 11.7 19.9 13.3 16.7 9.9 1444 7.6 13.9 21.3 15.6 21.7 10.0 1445 6.8 14.3 11.4 17.4 14.7 20.5 9.2 1446 8.6 11.7 9.1 19.9 13.2 21.2 10.3 1447 8.9 11.6 10.2 25.3 14.3 23.6 10.8 1448 8.6 13.7 10.1 20.1 14.6 17.1 10.4 1449 8.2 13.3 11.4 20.4 14.8 24.5 10.4

Appendix Table 4: Price Indices (cont.)
Year
Arable
Meat
Dairy
Wool
Pasture
Wood Index
Farm Index
1450 8.4 12.2 10.1 17.9 13.3 16.2 10.0 1451 9.3 15.2 9.5 16.6 14.5 20.9 11.1 1452 9.0 10.5 10.2 14.5 12.0 20.0 10.1 1453 8.7 13.1 11.2 11.6 12.8 22.3 10.3 1454 8.8 12.4 11.0 15.1 13.1 21.8 10.5 1455 7.8 13.3 10.3 15.0 13.6 21.0 9.7 1456 8.8 12.7 13.2 13.5 13.2 22.7 10.4 1457 8.3 11.7 6.5 15.1 11.4 17.8 9.5 1458 9.4 12.0 7.5 16.0 12.0 19.7 10.3 1459 9.2 11.7 9.1 15.9 12.3 19.1 10.4 1460 8.8 11.8 10.8 14.4 12.9 21.2 10.3 1461 11.0 10.9 9.1 15.0 11.8 15.1 11.3 1462 11.4 12.1 9.6 17.5 13.1 22.8 12.2 1463 7.7 10.3 5.2 18.2 10.5 8.9 1464 6.3 13.4 8.8 23.2 14.1 8.6 1465 9.5 12.9 9.1 24.8 14.7 19.5 11.1 1466 8.9 13.6 23.9 13.1 20.9 10.5 1467 9.1 12.8 8.8 24.2 14.2 20.7 10.8 1468 8.6 13.0 6.5 19.2 12.9 20.1 10.2 1469 9.0 12.9 6.5 16.4 12.3 19.4 10.4 1470 9.2 13.3 17.7 12.3 21.1 10.6 1471 9.9 12.9 10.8 17.3 12.5 19.8 11.0 1472 9.3 13.6 9.4 16.4 12.2 20.9 10.5 1473 7.9 13.6 8.5 16.7 13.2 20.1 9.7 1474 8.4 12.0 8.5 16.0 12.3 19.9 9.9 1475 7.8 13.7 8.7 14.6 12.9 20.2 9.6 1476 8.3 12.7 8.3 14.1 12.3 21.5 9.9 1477 8.8 12.2 8.5 13.6 12.0 19.7 10.0 1478 9.3 11.4 9.1 18.7 13.0 20.4 10.7 1479 9.7 12.1 8.5 14.7 12.5 18.1 10.8 1480 8.8 10.2 8.5 16.3 10.0 15.8 9.5 1481 9.0 12.1 9.0 20.0 13.1 16.5 10.3 1482 12.8 13.0 10.5 25.8 15.1 16.8 13.4 1483 14.1 7.4 11.3 19.3 10.9 16.2 12.9 1484 11.2 11.0 11.2 25.4 13.9 19.0 12.1 1485 9.2 13.3 11.2 26.0 15.4 16.3 10.9 1486 7.7 18.1 12.5 19.9 17.0 12.6 10.0 1487 9.5 10.8 18.1 12.2 13.5 10.3 1488 8.8 7.8 10.4 17.1 10.2 13.3 9.3 1489 9.7 13.4 11.0 18.2 14.3 20.0 11.3

Appendix Table 4: Price Indices (cont.)
Year
Arable
Meat
Dairy
Wool
Pasture
Wood Index
Farm Index
1490 8.9 12.5 11.0 16.8 13.5 17.2 10.4 1491 9.8 12.2 8.6 14.4 12.3 14.5 10.6 1492 9.8 10.9 10.9 18.1 12.7 15.2 10.7 1493 8.9 11.2 9.8 16.0 12.2 19.2 10.2 1494 7.9 14.0 17.9 13.4 16.7 9.6 1495 7.8 10.9 11.6 15.4 12.5 15.4 9.2 1496 7.6 10.8 18.4 11.8 22.2 9.3 1497 9.0 9.3 15.0 18.4 12.9 18.7 10.4 1498 9.0 13.4 10.9 14.9 13.7 16.1 10.5 1499 9.7 15.0 8.8 17.7 14.5 20.0 11.3 1500 8.2 13.6 8.9 14.0 12.9 20.1 9.8 1501 10.6 11.5 10.3 16.1 12.6 18.9 11.4 1502 11.3 10.4 12.6 16.7 12.7 18.9 11.9 1503 10.0 13.0 8.3 15.3 12.7 17.5 11.0 1504 11.1 13.5 6.7 17.0 12.7 17.7 11.7 1505 10.6 12.1 8.2 17.2 12.6 17.5 11.4 1506 9.4 15.1 10.4 14.6 14.2 19.0 11.0 1507 8.8 14.2 12.4 14.2 14.1 19.5 10.5 1508 9.5 13.7 10.0 15.9 13.7 17.0 10.9 1509 7.5 12.9 8.9 17.7 13.2 16.3 9.2 1510 7.3 10.8 10.2 18.8 12.7 16.7 9.0 1511 7.5 10.1 6.7 19.1 11.4 17.4 9.0 1512 9.0 10.9 6.7 18.1 11.6 19.3 10.1 1513 15.1 11.8 6.7 19.1 12.2 19.5 14.1 1514 11.1 12.3 13.4 18.8 14.5 19.6 12.3 1515 9.4 12.1 10.8 20.9 14.2 19.1 11.0 1516 11.7 13.3 7.2 23.7 13.8 18.8 12.5 1517 9.4 12.1 9.4 22.6 13.9 19.5 10.9 1518 11.4 12.1 9.4 24.7 14.4 19.0 12.5 1519 10.7 12.1 15.3 19.8 15.1 18.4 12.2 1520 12.7 9.4 11.6 22.1 12.9 19.0 12.9 1521 15.3 23.0 13.6 20.5 20.0 24.5 16.6 1522 12.1 23.3 12.3 18.1 19.0 14.6 13.6 1523 10.4 11.4 12.0 21.4 14.0 20.0 11.7 1524 10.2 23.0 8.3 16.5 17.1 16.6 12.1 1525 9.7 23.0 12.1 16.8 18.7 15.1 12.0 1526 9.2 25.8 9.3 20.9 19.7 20.0 12.1 1527 12.3 23.0 12.4 22.1 20.0 22.2 14.4 1528 21.5 16.1 13.8 19.3 16.8 19.4 19.3 1529 14.5 23.0 10.7 21.3 19.1 18.8 15.7
Appendix Table 4: Price Indices (cont.)
Year
Arable
Meat
Dairy
Wool
Pasture
Wood Index
Farm Index
1530 13.4 23.0 11.4 17.9 18.7 15.9 14.7 1531 14.1 20.0 10.3 15.3 16.5 25.7 15.1 1532 14.3 10.2 20.4 16.7 15.0 14.7 1533 15.0 15.6 16.0 22.9 17.6 19.7 15.8 1534 12.6 12.3 13.6 25.6 15.7 19.1 13.6 1535 13.3 18.0 11.7 23.8 17.9 19.4 14.7 1536 15.1 10.7 10.9 21.3 13.4 25.8 14.8 1537 13.5 10.8 12.3 26.3 14.6 25.5 14.2 1538 11.3 9.4 13.3 20.5 12.8 19.9 12.0 1539 11.9 10.8 18.9 13.7 20.4 12.6 1540 12.2 11.4 11.1 19.7 13.5 19.8 12.8 1541 14.2 12.8 33.4 19.9 16.9 15.5 1542 13.1 10.2 27.2 16.4 18.5 14.0 1543 14.7 19.7 20.7 16.1 1544 14.1 9.4 26.3 13.2 28.7 14.3 1545 16.4 14.1 10.2 24.7 15.7 23.3 16.2 1546 23.2 12.9 15.3 31.6 17.4 23.9 20.8 1547 13.5 15.5 11.9 22.1 16.5 18.4 14.4 1548 11.4 19.1 19.7 21.1 20.2 30.6 14.3 1549 16.4 21.6 19.0 23.8 24.8 18.5 1550 22.6 25.2 24.3 29.4 26.9 26.6 23.6 1551 28.1 42.0 17.3 49.3 36.7 19.0 28.8 1552 23.3 20.1 47.0 32.7 26.2 25.4 1553 19.5 33.6 17.2 33.7 30.0 32.9 22.6 1554 20.4 29.4 26.8 21.7 27.5 35.0 22.8 1555 26.6 42.0 27.3 29.1 36.3 34.1 29.1 1556 36.9 24.0 21.7 28.0 25.8 33.0 32.1 1557 43.5 42.0 24.0 46.0 38.8 31.0 39.9 1558 17.8 26.1 28.0 47.7 31.8 35.8 21.9 1559 22.2 23.9 29.8 21.9 25.3 34.1 23.3 1560 22.3 51.9 34.4 33.1 43.1 23.8 26.6 1561 25.9 34.1 30.2 26.9 32.5 40.8 28.1 1562 26.2 23.1 31.3 38.6 29.8 29.0 26.8 1563 29.3 22.6 33.3 26.3 27.2 32.5 28.2 1564 29.9 23.0 33.9 30.1 28.5 33.1 29.0 1565 21.7 25.4 27.8 28.0 27.9 28.7 23.3 1566 22.7 25.1 28.4 38.4 30.3 34.6 25.0 1567 23.9 25.5 25.9 30.3 32.4 25.6 1568 26.7 26.0 27.4 47.8 32.6 30.5 28.0 1569 25.9 28.3 25.3 40.5 31.9 39.6 27.8

Appendix Table 4: Price Indices (cont.)
Year
Arable
Meat
Dairy
Wool
Pasture
Wood Index
Farm Index
1570 22.2 23.0 24.1 40.8 28.2 40.9 24.5 1571 19.8 24.0 23.8 33.2 27.3 36.3 22.4 1572 24.7 23.4 26.4 41.0 29.0 37.0 26.1 1573 26.8 24.1 22.3 34.5 27.4 33.1 26.8 1574 35.7 27.1 31.8 38.4 32.0 30.8 33.3 1575 25.8 25.7 27.2 39.7 30.9 31.8 27.0 1576 26.7 26.4 26.3 41.3 31.2 29.6 27.5 1577 30.1 26.4 31.7 44.0 33.0 40.1 30.9 1578 28.1 25.5 28.8 44.6 31.9 34.0 28.9 1579 25.7 26.6 27.5 46.0 32.2 33.7 27.4 1580 25.5 24.1 27.6 49.1 31.6 33.8 27.1 1581 30.9 25.6 29.9 45.1 32.0 35.4 30.8 1582 30.0 25.0 29.5 41.0 31.1 37.6 30.1 1583 28.2 24.4 30.6 46.4 32.1 30.8 28.8 1584 28.0 27.2 28.2 41.0 32.6 34.8 29.1 1585 30.2 26.4 27.0 37.0 30.2 39.7 30.1 1586 40.1 29.6 29.4 37.5 32.5 38.9 36.7 1587 39.0 32.5 33.5 31.4 34.3 38.0 36.5 1588 28.8 32.9 28.6 32.8 33.1 37.1 29.9 1589 30.2 31.7 28.6 38.1 33.5 31.9 30.6 1590 38.7 31.9 35.6 43.8 38.0 39.9 37.6 1591 42.2 36.0 34.7 54.5 41.7 37.5 40.7 1592 30.9 36.8 22.3 56.5 38.2 39.0 32.8 1593 31.8 34.3 29.7 58.5 40.2 37.7 33.8 1594 39.1 32.3 31.4 60.3 39.2 43.2 38.5 1595 54.5 33.3 35.9 60.7 41.8 38.6 47.8 1596 56.7 34.4 31.7 57.0 40.6 43.8 49.0 1597 70.6 36.5 38.2 56.8 43.3 43.3 57.2 1598 57.1 39.3 34.6 48.9 41.8 41.4 49.5 1599 39.5 37.0 35.3 50.7 41.5 43.3 39.4 1600 41.9 38.8 34.7 48.4 42.7 41.7 41.1 1601 48.4 38.6 35.7 51.9 43.7 46.9 45.7 1602 38.5 34.5 36.5 55.8 42.0 49.1 39.3 1603 37.2 34.1 34.5 64.8 42.5 49.5 38.7 1604 38.4 34.0 36.1 72.2 44.1 49.6 39.9 1605 42.1 36.2 32.6 65.0 43.8 52.9 42.4 1606 43.4 35.7 33.7 63.5 43.2 53.3 43.0 1607 44.1 36.3 36.6 62.4 44.5 60.6 44.3 1608 56.1 37.6 37.2 63.9 46.0 62.6 52.0 1609 56.5 37.7 37.1 58.5 45.0 63.3 52.0
Appendix Table 4: Price Indices (cont.)
Year
Arable
Meat
Dairy
Wool
Pasture
Wood Index
Farm Index
1610 47.9 36.5 37.6 52.1 43.0 65.8 46.4 1611 47.1 38.0 40.3 47.5 43.3 63.8 45.9 1612 57.8 37.8 40.6 52.6 44.7 64.3 52.7 1613 60.7 38.6 40.6 50.2 44.4 59.9 53.9 1614 59.3 38.2 38.2 54.3 44.4 61.5 53.2 1615 56.3 41.6 41.8 60.3 49.2 66.9 53.5 1616 57.7 42.0 39.0 65.0 49.5 64.2 54.3 1617 54.9 41.2 38.0 73.6 49.8 60.7 52.4 1618 52.2 40.8 40.1 70.2 49.5 63.9 51.0 1619 46.9 42.0 39.8 75.1 50.8 65.1 48.1 1620 41.6 41.2 40.9 70.6 50.5 64.7 44.6 1621 46.5 40.2 39.4 59.2 47.2 58.9 46.5 1622 62.1 38.3 39.1 55.4 45.4 63.5 55.3 1623 60.8 37.1 42.3 46.8 43.6 66.0 54.1 1624 52.1 40.1 40.6 55.4 46.5 59.0 49.7 1625 56.1 41.5 37.4 57.2 46.5 63.7 52.3 1626 57.4 41.2 41.4 66.3 49.3 68.0 54.3 1627 45.5 41.1 40.5 66.1 48.7 67.2 46.8 1628 46.5 41.2 38.2 73.1 49.4 77.8 48.2 1629 54.9 41.2 42.7 71.3 50.6 79.0 53.8 1630 69.2 40.6 41.1 50.3 53.5 60.1 1631 76.4 41.6 38.8 68.9 49.3 75.3 65.3 1632 61.5 41.3 38.9 71.0 49.1 68.6 56.6 1633 61.8 41.2 42.5 71.0 50.5 65.1 57.1 1634 66.7 42.8 43.8 70.3 52.6 73.7 61.1 1635 63.8 44.5 42.7 74.5 54.7 76.8 60.3 1636 63.8 43.8 43.4 75.1 53.6 74.5 59.8 1637 71.8 44.6 45.0 74.4 55.2 73.8 64.9 1638 75.7 45.4 51.6 73.5 56.3 82.2 68.0 1639 56.9 44.7 52.0 70.6 54.9 80.4 56.5 1640 49.3 43.9 37.1 65.0 50.0 85.9 50.5 1641 60.7 44.3 41.4 61.0 50.6 86.3 57.7 1642 55.2 45.7 41.2 62.3 51.8 81.3 54.6 1643 56.1 43.8 39.9 44.0 80.7 52.4 1644 52.6 43.0 46.6 59.6 50.7 90.4 53.1 1645 54.5 43.6 44.5 44.4 81.7 51.7 1646 58.2 43.6 47.3 45.5 79.9 54.2 1647 78.0 51.2 55.6 74.9 60.8 86.3 71.2 1648 93.7 48.2 72.7 87.2 65.7 83.4 81.5 1649 84.2 50.0 64.3 74.9 63.4 84.8 75.5

Appendix Table 4: Price Indices (cont.)
Year
Arable
Meat
Dairy
Wool
Pasture
Wood Index
Farm Index
1650 81.7 55.5 54.6 57.8 54.1 69.5 1651 66.4 55.1 65.4 60.6 62.5 73.9 64.2 1652 64.7 53.7 36.7 55.5 53.2 71.1 60.0 1653 57.7 51.5 46.3 39.6 51.1 81.2 55.8 1654 43.0 45.9 42.8 45.6 74.7 44.7 1655 42.4 39.8 43.0 41.9 81.6 43.5 1656 57.2 39.9 49.0 41.7 45.6 88.3 54.1 1657 64.9 41.7 50.0 42.5 47.0 90.1 59.1 1658 69.6 49.6 49.7 42.9 51.2 76.2 62.4 1659 74.0 49.8 54.8 40.0 51.7 87.6 65.7 1660 67.2 51.8 48.4 35.4 49.9 78.0 60.7 1661 73.1 51.9 48.6 50.1 53.9 93.6 66.4 1662 79.5 49.5 47.5 46.7 51.5 97.0 69.2 1663 65.4 49.2 50.1 56.4 55.3 90.2 62.3 1664 61.4 52.3 52.3 47.2 54.4 93.0 59.7 1665 55.5 50.4 48.2 37.4 50.0 97.1 54.9 1666 50.7 49.5 50.6 50.8 94.8 52.0 1667 45.6 49.7 55.9 51.9 93.1 49.0 1668 46.1 47.8 51.0 37.4 48.5 100.9 48.6 1669 56.4 45.6 46.5 65.2 53.2 81.1 55.7 1670 53.6 46.7 52.9 39.1 48.6 69.5 51.9 1671 53.3 45.6 49.0 48.1 74.0 51.8 1672 49.2 44.4 50.4 70.3 54.9 102.5 52.7 1673 55.6 45.7 51.6 40.4 49.3 104.0 55.0 1674 72.1 46.8 55.4 34.5 48.4 103.4 64.3 1675 65.1 46.8 53.3 36.2 48.4 94.4 59.9 1676 49.0 46.1 63.9 30.7 48.4 93.0 50.1 1677 55.4 46.6 54.3 60.6 55.4 97.7 56.6 1678 59.6 47.8 56.8 24.8 45.2 80.1 54.8 1679 59.6 45.9 56.4 50.2 92.1 57.2 1680 51.0 46.1 48.1 32.8 46.4 95.0 50.8 1681 58.5 46.3 53.8 47.2 51.9 94.2 57.2 1682 60.1 47.0 50.2 38.7 48.7 89.2 56.8 1683 54.9 45.4 54.0 49.4 99.3 54.4 1684 57.6 48.2 51.7 50.5 105.1 56.7 1685 62.8 50.9 55.0 37.9 51.9 100.8 60.1 1686 54.0 49.2 44.1 47.4 98.3 53.2 1687 49.9 44.9 45.2 45.9 96.7 50.1 1688 45.3 45.1 47.3 28.2 43.4 94.6 46.3 1689 40.0 45.9 47.1 43.9 90.2 42.9
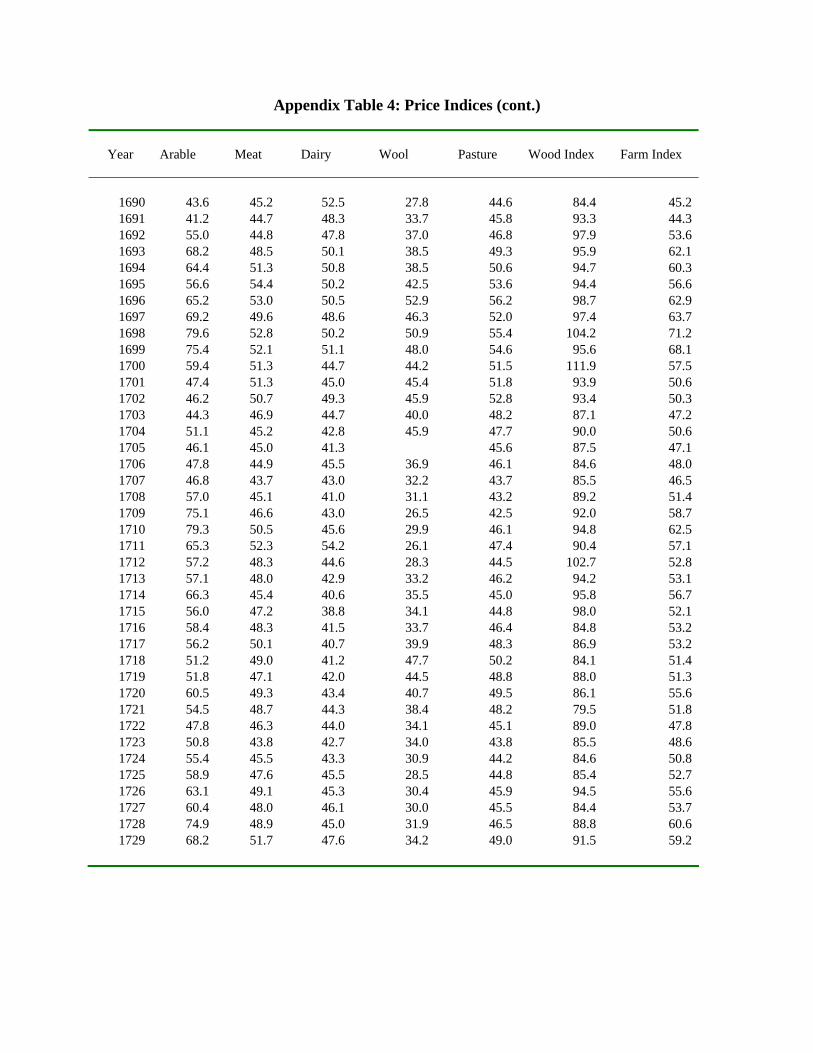
Appendix Table 4: Price Indices (cont.)
Year
Arable
Meat
Dairy
Wool
Pasture
Wood Index
Farm Index
1690 43.6 45.2 52.5 27.8 44.6 84.4 45.2 1691 41.2 44.7 48.3 33.7 45.8 93.3 44.3 1692 55.0 44.8 47.8 37.0 46.8 97.9 53.6 1693 68.2 48.5 50.1 38.5 49.3 95.9 62.1 1694 64.4 51.3 50.8 38.5 50.6 94.7 60.3 1695 56.6 54.4 50.2 42.5 53.6 94.4 56.6 1696 65.2 53.0 50.5 52.9 56.2 98.7 62.9 1697 69.2 49.6 48.6 46.3 52.0 97.4 63.7 1698 79.6 52.8 50.2 50.9 55.4 104.2 71.2 1699 75.4 52.1 51.1 48.0 54.6 95.6 68.1 1700 59.4 51.3 44.7 44.2 51.5 111.9 57.5 1701 47.4 51.3 45.0 45.4 51.8 93.9 50.6 1702 46.2 50.7 49.3 45.9 52.8 93.4 50.3 1703 44.3 46.9 44.7 40.0 48.2 87.1 47.2 1704 51.1 45.2 42.8 45.9 47.7 90.0 50.6 1705 46.1 45.0 41.3 45.6 87.5 47.1 1706 47.8 44.9 45.5 36.9 46.1 84.6 48.0 1707 46.8 43.7 43.0 32.2 43.7 85.5 46.5 1708 57.0 45.1 41.0 31.1 43.2 89.2 51.4 1709 75.1 46.6 43.0 26.5 42.5 92.0 58.7 1710 79.3 50.5 45.6 29.9 46.1 94.8 62.5 1711 65.3 52.3 54.2 26.1 47.4 90.4 57.1 1712 57.2 48.3 44.6 28.3 44.5 102.7 52.8 1713 57.1 48.0 42.9 33.2 46.2 94.2 53.1 1714 66.3 45.4 40.6 35.5 45.0 95.8 56.7 1715 56.0 47.2 38.8 34.1 44.8 98.0 52.1 1716 58.4 48.3 41.5 33.7 46.4 84.8 53.2 1717 56.2 50.1 40.7 39.9 48.3 86.9 53.2 1718 51.2 49.0 41.2 47.7 50.2 84.1 51.4 1719 51.8 47.1 42.0 44.5 48.8 88.0 51.3 1720 60.5 49.3 43.4 40.7 49.5 86.1 55.6 1721 54.5 48.7 44.3 38.4 48.2 79.5 51.8 1722 47.8 46.3 44.0 34.1 45.1 89.0 47.8 1723 50.8 43.8 42.7 34.0 43.8 85.5 48.6 1724 55.4 45.5 43.3 30.9 44.2 84.6 50.8 1725 58.9 47.6 45.5 28.5 44.8 85.4 52.7 1726 63.1 49.1 45.3 30.4 45.9 94.5 55.6 1727 60.4 48.0 46.1 30.0 45.5 84.4 53.7 1728 74.9 48.9 45.0 31.9 46.5 88.8 60.6 1729 68.2 51.7 47.6 34.2 49.0 91.5 59.2

Appendix Table 4: Price Indices (cont.)
Year
Arable
Meat
Dairy
Wool
Pasture
Wood Index
Farm Index
1730 52.5 50.5 47.0 32.9 47.5 89.1 51.2 1731 50.0 49.0 44.2 36.4 48.0 88.3 50.1 1732 45.7 46.4 43.5 35.0 46.6 79.4 46.8 1733 44.9 44.6 42.0 35.3 45.1 85.7 46.2 1734 51.0 41.6 41.9 32.5 42.1 88.4 48.0 1735 55.2 41.8 42.3 29.8 41.5 78.2 49.1 1736 57.6 44.6 42.4 26.9 41.9 85.0 50.7 1737 55.4 45.5 44.2 27.5 43.2 81.8 50.2 1738 53.0 44.9 43.8 25.8 42.3 83.4 48.8 1739 51.4 45.5 44.2 24.9 42.0 80.5 47.7 1740 66.3 47.9 45.1 25.8 44.7 84.6 55.8 1741 66.9 52.7 50.3 25.6 47.3 83.1 57.2 1742 53.1 51.7 50.7 27.2 48.2 82.8 51.4 1743 45.3 48.5 45.2 34.1 47.3 82.1 47.1 1744 42.0 46.0 42.6 36.5 46.1 77.9 44.6 1745 44.5 45.0 41.6 33.6 44.3 85.7 45.6 1746 49.5 45.7 44.8 33.3 45.1 85.2 48.4 1747 46.1 46.4 48.0 32.7 46.0 79.2 46.8 1748 49.4 47.6 47.2 33.8 46.5 82.2 48.9 1749 54.0 46.9 47.1 35.8 47.1 80.6 51.2 1750 51.1 45.3 46.3 37.5 47.1 85.4 50.1 1751 53.9 46.0 44.8 38.6 47.0 78.2 51.0 1752 58.2 45.8 45.3 41.4 47.8 93.7 54.3 1753 60.4 45.7 46.0 28.8 44.4 90.3 53.5 1754 56.3 50.0 47.1 30.2 47.6 95.3 53.4 1755 50.2 49.0 47.7 29.1 46.3 83.8 49.2 1756 59.8 49.3 47.5 29.3 46.0 74.8 53.0 1757 80.3 50.9 48.0 36.9 50.0 88.5 64.6 1758 68.4 53.5 48.2 41.4 53.0 85.3 60.8 1759 53.1 53.4 48.8 37.5 51.6 82.3 52.8 1760 52.2 49.6 47.4 36.2 48.6 86.1 50.9 1761 48.9 50.0 48.1 31.3 47.5 76.0 48.5 1762 56.3 49.0 47.3 30.6 46.8 79.1 52.0 1763 66.9 49.0 47.2 36.3 48.3 83.1 58.0 1764 67.7 51.2 46.4 37.6 49.5 83.4 59.0 1765 73.7 52.8 47.8 36.7 50.6 98.2 62.6 1766 73.2 55.9 48.1 39.1 53.0 84.4 63.4 1767 78.7 59.9 50.1 35.9 53.5 81.2 66.1 1768 74.0 59.6 49.3 30.5 51.7 88.0 63.2 1769 63.0 57.2 49.7 29.5 50.7 85.0 57.4

Appendix Table 4: Price Indices (cont.)
Year
Arable
Meat
Dairy
Wool
Pasture
Wood Index
Farm Index
1770 64.0 57.6 50.6 29.3 51.3 89.1 58.2 1771 75.9 60.2 50.8 32.5 53.6 85.4 65.0 1772 82.3 63.4 56.2 30.5 57.4 91.8 70.1 1773 86.1 63.8 56.6 31.9 58.7 101.4 72.7 1774 86.1 61.8 56.6 34.6 57.0 96.0 71.7 1775 83.1 61.9 55.0 36.1 57.1 101.6 70.4 1776 70.1 61.8 56.0 35.4 58.6 102.1 65.0 1777 73.6 61.6 57.9 33.6 58.3 100.2 66.6 1778 69.8 62.5 60.7 29.7 57.1 103.4 64.1 1779 60.4 62.8 60.8 26.9 55.8 96.7 58.6 1780 60.9 61.6 58.7 29.4 56.2 82.1 58.9 1781 70.2 60.5 56.2 27.1 54.8 83.8 62.9 1782 74.8 59.0 55.8 24.3 53.1 89.0 64.3 1783 88.1 61.0 56.9 28.3 56.2 86.2 71.9 1784 88.1 63.1 57.4 32.6 59.2 86.5 73.6 1785 76.2 66.6 57.0 30.2 60.5 84.1 68.7 1786 77.5 63.3 59.3 31.7 59.6 83.8 68.9 1787 75.4 67.4 59.2 40.5 62.1 80.3 69.0 1788 76.0 68.9 58.8 40.6 63.3 86.5 70.0 1789 80.5 67.0 57.4 40.6 62.7 81.9 71.9 1790 82.5 67.8 59.3 42.7 63.1 85.0 73.1 1791 80.9 69.6 60.7 41.9 63.4 87.8 72.5 1792 79.6 70.2 60.6 53.2 67.6 81.6 73.8 1793 88.8 71.5 63.0 41.5 67.0 84.1 78.1 1794 95.9 71.4 63.3 42.8 67.4 86.3 81.6 1795 109.6 75.4 64.5 47.0 70.9 88.7 89.7 1796 119.5 86.2 69.1 48.8 79.1 89.5 98.7 1797 92.4 96.6 79.0 47.4 84.7 97.1 88.7 1798 86.7 90.9 79.8 45.3 79.1 105.6 83.3 1799 110.5 88.3 80.4 58.2 83.1 113.9 97.1 1800 171.4 102.9 87.9 57.4 94.4 107.4 130.1 1801 191.8 123.0 93.5 63.7 106.8 107.7 145.9 1802 107.4 122.8 91.7 66.2 105.4 104.0 106.0 1803 100.5 115.2 91.6 65.8 103.1 117.9 101.6 1804 99.2 110.6 95.5 72.7 102.6 120.4 100.6 1805 137.7 109.5 99.0 80.7 103.4 123.0 120.6 1806 123.3 109.8 99.1 75.0 101.9 128.2 113.0 1807 131.5 107.8 103.6 66.9 101.1 133.9 116.7 1808 131.0 114.2 108.7 61.6 105.5 144.5 118.9 1809 143.0 121.2 109.8 81.9 113.9 144.2 128.9

Appendix Table 4: Price Indices (cont.)
Year
Arable
Meat
Dairy
Wool
Pasture
Wood Index
Farm Index
1810 156.7 122.8 114.3 78.8 117.0 153.3 137.1 1811 148.4 124.0 121.8 58.6 116.6 142.5 132.8 1812 188.9 128.5 124.4 66.5 118.3 150.6 152.4 1813 174.2 146.1 120.7 75.3 125.7 158.8 150.0 1814 125.4 151.5 123.5 94.1 133.5 161.1 129.0 1815 106.7 126.8 124.0 97.3 122.5 153.5 113.7 1816 118.6 101.9 108.8 65.0 99.1 136.4 109.4 1817 152.5 99.5 102.9 76.3 98.4 132.4 124.9 1818 153.0 103.8 117.1 101.5 110.7 142.0 132.0 1819 132.5 123.3 118.3 73.3 116.7 128.5 124.7 1820 106.5 118.7 110.7 70.9 107.7 127.3 107.0 1821 91.9 101.7 105.9 59.7 93.9 125.1 93.0 1822 81.6 79.0 97.0 55.2 80.5 123.8 81.4 1823 96.1 77.3 95.0 57.4 81.5 130.7 89.5 1824 113.1 89.4 101.3 61.4 92.4 127.3 103.3 1825 124.5 101.2 112.5 71.9 102.2 125.5 113.7 1826 109.3 103.5 109.6 43.8 94.9 128.0 102.6 1827 107.5 100.9 106.2 42.9 94.0 117.8 101.1 1828 104.5 99.5 105.5 46.8 92.0 120.4 98.7 1829 103.1 94.8 99.8 37.4 83.8 121.2 94.1 1830 114.4 83.4 96.7 45.1 79.9 117.4 97.4 1831 108.8 87.9 102.0 54.2 85.9 116.9 97.8 1832 98.4 89.0 98.8 57.4 88.0 120.5 93.7 1833 89.1 84.7 97.1 62.3 84.6 119.7 87.2 1834 85.6 81.4 90.0 82.3 86.2 136.5 86.3 1835 84.4 73.6 90.7 78.7 81.5 123.4 83.4 1836 91.3 82.3 99.3 86.0 89.1 119.1 90.5 1837 99.5 85.5 101.4 66.5 88.3 127.3 94.5 1838 104.1 89.8 99.7 71.7 92.5 123.7 98.8 1839 118.9 86.6 100.7 76.5 91.0 130.5 105.5 1840 111.2 88.1 102.1 66.6 89.0 127.7 100.7 1841 108.8 94.4 101.7 54.3 90.6 122.7 100.2 1842 95.2 84.7 97.6 49.7 82.5 119.0 89.4 1843 92.3 70.5 92.1 49.3 73.7 119.7 83.7 1844 94.1 72.7 89.7 59.3 76.4 121.2 85.9 1845 95.0 73.2 92.4 67.1 80.3 119.7 88.3 1846 96.6 86.5 96.8 59.8 85.3 112.0 91.3 1847 125.2 96.2 97.8 55.9 88.5 101.4 106.6 1848 87.6 93.2 91.6 51.3 84.6 94.7 86.1 1849 88.2 80.6 89.1 47.5 76.6 97.7 82.7

Appendix Table 4: Price Indices (cont.)
Year
Arable
Meat
Dairy
Wool
Pasture
Wood Index
Farm Index
1850 74.3 75.9 85.2 51.7 74.6 94.9 74.8 1851 76.9 74.5 76.3 58.4 74.2 94.2 75.9 1852 79.9 75.5 72.2 63.7 72.2 79.5 76.2 1853 94.8 88.2 79.6 74.8 85.8 100.4 90.5 1854 114.2 93.2 86.9 72.5 90.5 120.8 102.1 1855 114.5 95.6 93.9 60.8 92.1 108.2 103.0 1856 109.4 96.0 100.4 74.8 95.3 112.9 102.5 1857 104.3 98.1 99.1 95.8 96.1 95.8 100.3 1858 88.7 91.7 94.8 73.0 89.0 89.0 89.1 1859 86.3 94.7 94.3 87.1 93.3 102.5 90.1 1860 102.4 100.5 99.1 94.1 101.9 104.9 102.5 1861 105.2 99.1 96.2 91.2 99.5 105.8 102.6 1862 103.3 94.5 94.8 95.8 94.1 105.8 98.9 1863 89.9 94.3 94.0 105.8 93.5 104.0 92.1 1864 81.5 99.0 95.2 128.0 98.7 131.9 90.3 1865 84.6 106.9 106.6 120.4 108.4 112.2 96.2 1866 99.9 106.6 108.7 109.9 106.4 83.5 103.1 1867 117.3 96.9 100.1 88.3 96.5 79.4 106.4 1868 116.9 96.1 100.3 81.8 95.6 83.5 105.8 1869 99.0 106.0 105.0 84.7 105.2 89.0 102.2 1870 94.6 109.7 101.5 78.3 103.2 100.6 1871 105.2 110.0 103.5 100.0 109.9 108.7 1872 106.6 110.9 103.2 119.8 106.7 107.0 1873 111.8 116.0 106.0 114.5 108.9 110.1 1874 114.0 108.7 108.3 97.0 99.9 104.5 1875 97.7 117.0 109.2 92.3 109.0 105.5 1876 97.1 117.1 108.8 83.0 110.5 106.3 1877 109.9 105.8 114.5 76.0 104.0 106.1 1878 98.2 103.6 107.3 70.1 99.2 99.1 1879 91.9 97.3 97.3 58.4 90.9 91.4 1880 92.6 104.7 100.9 70.7 97.6 96.2 1881 91.3 108.1 102.8 57.9 98.4 96.3 1882 93.2 111.2 102.3 52.6 101.0 98.7 1883 91.5 111.6 104.0 46.8 96.8 95.3 1884 83.6 101.5 99.6 46.8 92.0 89.4 1885 78.9 91.7 98.4 46.2 85.8 83.8 1886 72.3 86.8 90.7 46.8 83.0 79.6 1887 71.3 80.7 94.8 49.1 81.8 78.5 1888 72.9 82.2 93.3 48.5 84.7 80.9 1889 72.5 85.9 90.7 51.4 84.7 80.8
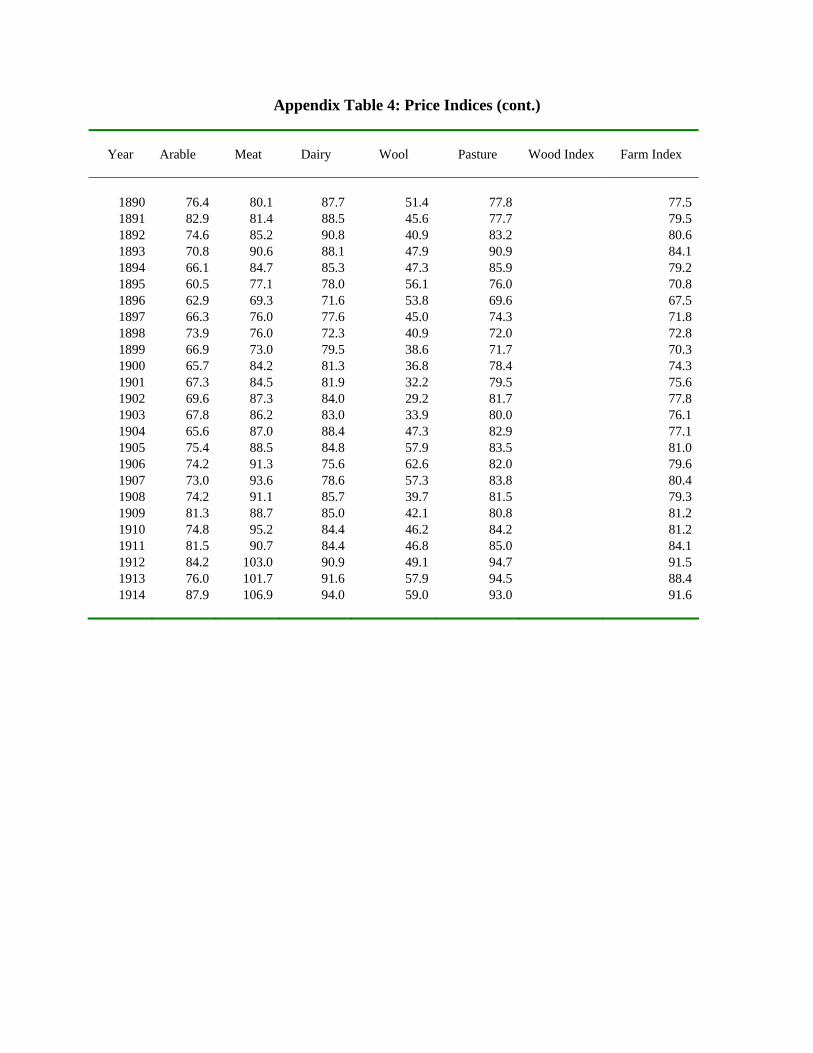
Appendix Table 4: Price Indices (cont.)
Year
Arable
Meat
Dairy
Wool
Pasture
Wood Index
Farm Index
1890 76.4 80.1 87.7 51.4 77.8 77.5 1891 82.9 81.4 88.5 45.6 77.7 79.5 1892 74.6 85.2 90.8 40.9 83.2 80.6 1893 70.8 90.6 88.1 47.9 90.9 84.1 1894 66.1 84.7 85.3 47.3 85.9 79.2 1895 60.5 77.1 78.0 56.1 76.0 70.8 1896 62.9 69.3 71.6 53.8 69.6 67.5 1897 66.3 76.0 77.6 45.0 74.3 71.8 1898 73.9 76.0 72.3 40.9 72.0 72.8 1899 66.9 73.0 79.5 38.6 71.7 70.3 1900 65.7 84.2 81.3 36.8 78.4 74.3 1901 67.3 84.5 81.9 32.2 79.5 75.6 1902 69.6 87.3 84.0 29.2 81.7 77.8 1903 67.8 86.2 83.0 33.9 80.0 76.1 1904 65.6 87.0 88.4 47.3 82.9 77.1 1905 75.4 88.5 84.8 57.9 83.5 81.0 1906 74.2 91.3 75.6 62.6 82.0 79.6 1907 73.0 93.6 78.6 57.3 83.8 80.4 1908 74.2 91.1 85.7 39.7 81.5 79.3 1909 81.3 88.7 85.0 42.1 80.8 81.2 1910 74.8 95.2 84.4 46.2 84.2 81.2 1911 81.5 90.7 84.4 46.8 85.0 84.1 1912 84.2 103.0 90.9 49.1 94.7 91.5 1913 76.0 101.7 91.6 57.9 94.5 88.4 1914
87.9 106.9 94.0 59.0 93.0 91.6

Table 5: The Source of Price Data
Source
Wheat
Archival Sources
Beveridge Mss, LSE
Wheat (387), Rye (84), Barley (107), Oats (85), Peas (62), Beans (83), Straw (49), Saffron (53), Hay (258), Fats (918), Milk (85), Butter (92), Cheese (10), Wool (13), Firewood (246), Timber (260), Cider (221), Honey (126)
Cheshire Record Office
Hay (11)
Dorset Record Office
Suet (8), Butter (22), Cheese (7)
Essex Record Office
Hay (46)
Farmer Mss
Wheat (8,501)
Guildhall Library
Firewood (52)
Kings College, Cambridge
Hay (28), Firewood (5), Timber (47)
Lancashire Record Office Hay (43)
Staffordshire Record Office
Hay (19)
Printed Sources
Afton and Turner (2000)
Wheat (64), Barley (64), Oats (64), Beans (80), Potatoes (61), Beef (65), Mutton (66), Pork (52), Tallow (60), Eggs (96), Milk (17), Butter (61), Cheese (25), Wool (69)
Atkins (1977)
Hay (60)
Bailey (1953)
Grease (2)
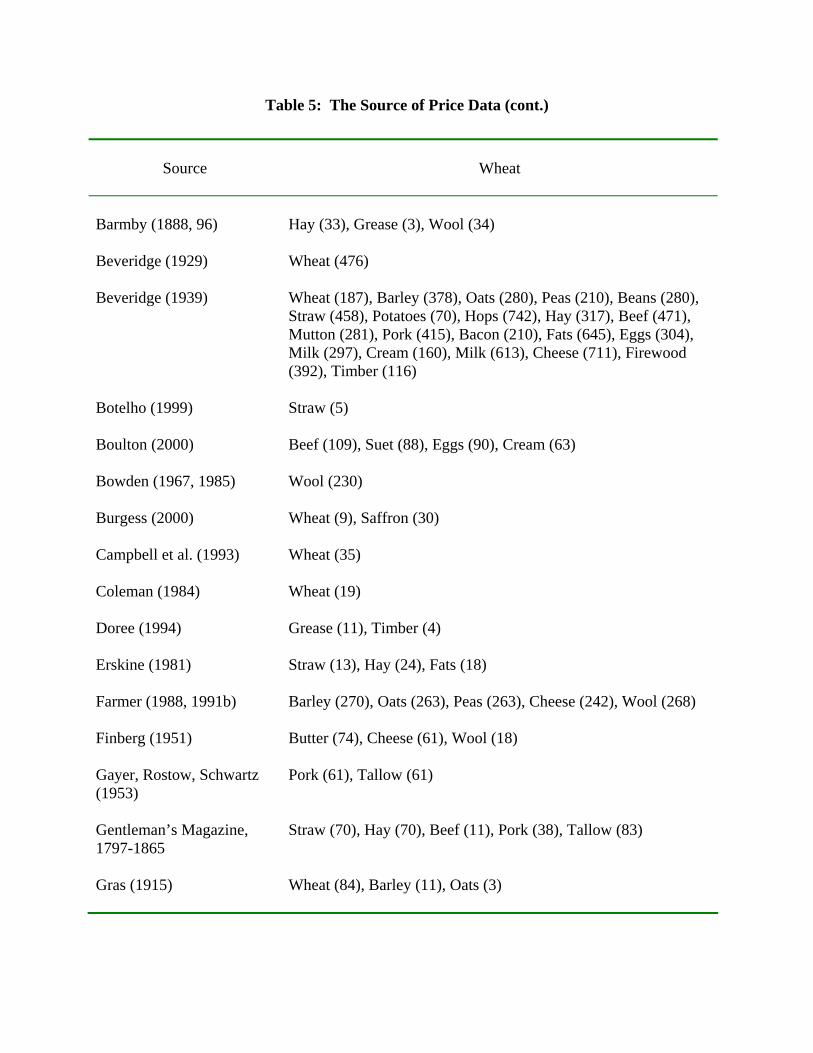
Table 5: The Source of Price Data (cont.)
Source
Wheat
Barmby (1888, 96)
Hay (33), Grease (3), Wool (34)
Beveridge (1929)
Wheat (476)
Beveridge (1939)
Wheat (187), Barley (378), Oats (280), Peas (210), Beans (280), Straw (458), Potatoes (70), Hops (742), Hay (317), Beef (471), Mutton (281), Pork (415), Bacon (210), Fats (645), Eggs (304), Milk (297), Cream (160), Milk (613), Cheese (711), Firewood (392), Timber (116)
Botelho (1999)
Straw (5)
Boulton (2000)
Beef (109), Suet (88), Eggs (90), Cream (63)
Bowden (1967, 1985)
Wool (230)
Burgess (2000)
Wheat (9), Saffron (30)
Campbell et al. (1993)
Wheat (35)
Coleman (1984)
Wheat (19)
Doree (1994)
Grease (11), Timber (4)
Erskine (1981)
Straw (13), Hay (24), Fats (18)
Farmer (1988, 1991b)
Barley (270), Oats (263), Peas (263), Cheese (242), Wool (268)
Finberg (1951)
Butter (74), Cheese (61), Wool (18)
Gayer, Rostow, Schwartz (1953)
Pork (61), Tallow (61)
Gentleman’s Magazine, 1797-1865
Straw (70), Hay (70), Beef (11), Pork (38), Tallow (83)
Gras (1915)
Wheat (84), Barley (11), Oats (3)
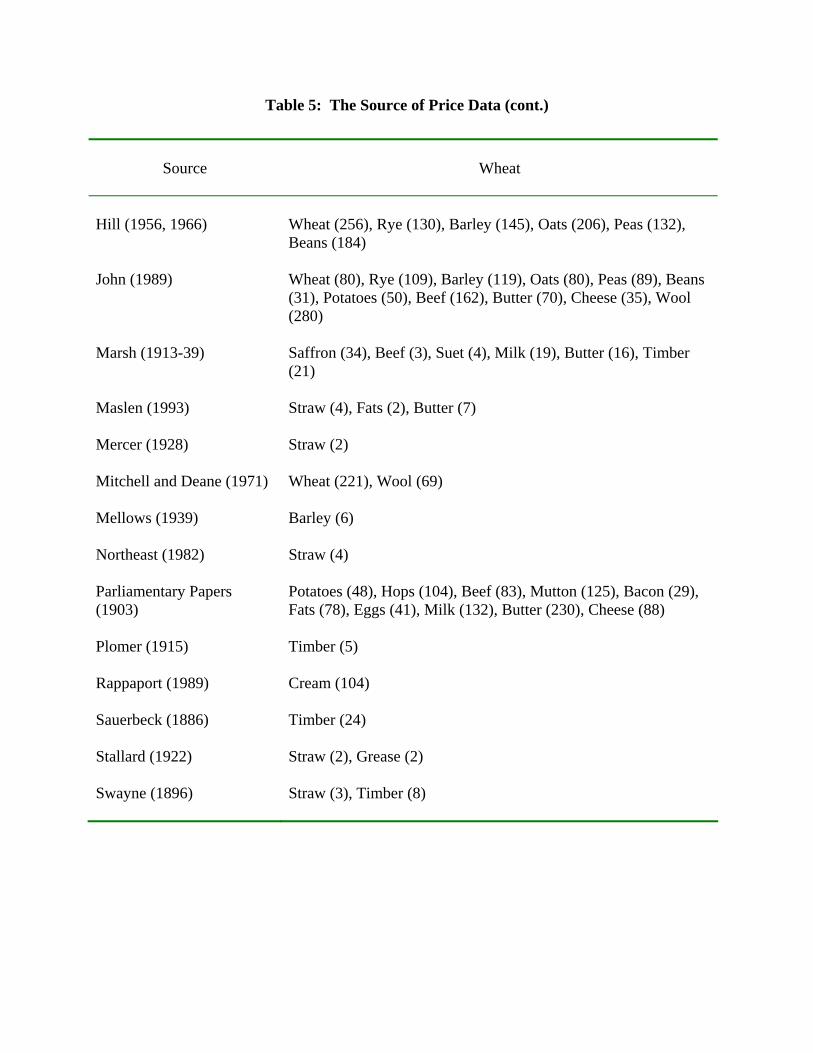
Table 5: The Source of Price Data (cont.)
Source
Wheat
Hill (1956, 1966)
Wheat (256), Rye (130), Barley (145), Oats (206), Peas (132), Beans (184)
John (1989)
Wheat (80), Rye (109), Barley (119), Oats (80), Peas (89), Beans (31), Potatoes (50), Beef (162), Butter (70), Cheese (35), Wool (280)
Marsh (1913-39)
Saffron (34), Beef (3), Suet (4), Milk (19), Butter (16), Timber (21)
Maslen (1993) Straw (4), Fats (2), Butter (7)
Mercer (1928) Straw (2)
Mitchell and Deane (1971)
Wheat (221), Wool (69)
Mellows (1939)
Barley (6)
Northeast (1982) Straw (4)
Parliamentary Papers (1903)
Potatoes (48), Hops (104), Beef (83), Mutton (125), Bacon (29), Fats (78), Eggs (41), Milk (132), Butter (230), Cheese (88)
Plomer (1915)
Timber (5)
Rappaport (1989)
Cream (104)
Sauerbeck (1886)
Timber (24)
Stallard (1922)
Straw (2), Grease (2)
Swayne (1896) Straw (3), Timber (8)
Table 5: The Source of Price Data (cont.)
Source
Wheat
Thorold Rogers (1862, 1882, 1888, 1902)
Wheat (2,321), Rye (108), Barley (699), Oats (421), Peas (441), Beans (484), Straw (642), Potatoes (48), Hops (28), Mustard Seed (207), Saffron (136), Hay (890), Beef (214), Fats (622), Eggs (394), Milk (28), Cream (66), Butter (419), Cheese (58), Wool (161), Firewood (960), Timber (257), Cider (115), Honey (146)
Tooke and Newmarsh
(1857)
Timber (75)
Wardle (1923) Tallow (2), Firewood (22)
Weatherill (1990) Fats (5)
Weaver and Clark (1925) Barley (2)