project planning methods_gantt
TRANSCRIPT

1
Project planning methods
and
GANTT CHARTS

2
Project Planning
• A plan must be stated as a
– Set of targets
– The achievement or non achievement can be measured
– Target start and completion date for each activity
– Visibility of start and completion of activities • Achieved by producing something tangible such as a product
or deliverable
In Class!!
Why Plan a project?

3
Why project planning• Ensure that the appropriate resources will be available precisely when
required
• Avoid different activities competing for the same resources at the same time
• Produce a detailed schedule showing which staff carry out each activity
• Produce a detailed plan against which actual achievement may be measured
• Produce a timed cash flow forecast
• Replan the project during its life to correct drift from the target

4
Objectives of planning
• Feasibility assessment
• Resource allocation
• Detailed costing
• Motivation
• Co-ordination

5
Feasibility assessment
• Is the project possible: – within required timescales
– Resource constraints
• Project plans allow us to forecast a completion date with any reasonable knowledge of its achievability.
• If a project is estimated for 2 work years effort, could it be done with eight people in three months?

6
Resource allocation
• What is the most effective ways of allocating resources to the project and when should they be available?
• The Project plan allows us to investigate the relationship between timescales and resource availability

7
Detailed costing
• How much will the project cost and when is the expenditure likely to take place?
• Detailed estimates of costs and timelines can be achieved after producing:
– activity plan
– resource schedule

8
Motivation
Providing targets and
being seen to monitor achievement against targets is an effective way of motivating staff
particularly when they have been involved in setting those targets in the first place.

9
Co-ordination
• Project plans provide effective
– communication and
– co-ordination
among teams
– Particularly where staff may need to be transferred between project teams or different departments

10
When to plan
• Feasibility study– Estimate timescales
– Risk• Not achieving target completion dates
• Not keeping within budget
• Post Feasibility study– Production of activity plans for resource availability
– Cash flow control
• Monitoring and replanning must continue to correct any drift that might prevent meeting time or cost targets
11
Project Schedules
• Construct an ideal activity plan– Plan activities where resources are not a constraint
• Risk Analysis– Identify potential problems– Might suggest alterations to the ideal plan
• Resource allocation– May place constraints on when activities can be carried out
• Schedule production– Indicates planned start and completion dates, resources
requirements for each activity

12
Identifying activities
Activity based approach:
• Work Breakdown Structure (WBS)– Identify the main tasks required to complete a project
– Break the tasks down into a lower level of tasks
– Each branch should be broken down at least to a level where each leaf may be assigned to an individual or responsible section within an organisation
– Higher nodes represent a collection of activities
– Leaves comprise of the list of activities.

13
Example of Activity based WBS
Project
Analyse Design Build
Data Design
ProcessDesign
PhysicalDesign
RelationalData Analysis
Logical Data Design

14
Work Breakdown Structure - Example1.1 Software Systems Engineering
1.1.1 Support to Systems Engineering1.1.2 Support to Hardware Engineering1.1.3 Software Engineering Trade Studies1.1.4 System Requirements Analysis1.1.5 Software Requirements Analysis1.1.6 Interface Analysis1.1.7 Support to Systems Test
1.2 Software Development1.2.1 Deliverable Software1.2.1.1 Requirements Analysis1.2.1.2 Architectural Design1.2.1.3 Procedural Design1.2.1.4 Code1.2.1.5 Unit Test1.2.1.6 Software Integration Test1.2.1.7 Technical Reviews1.2.1.8 Technical Training1.2.2 Non-deliverable Software1.2.3 Purchased Software1.2.3.1 Package Evaluation1.2.4 Development facilities and tools
1.3 Software Test and Evaluation1.3.1 Software Dev. Test & Evaluation1.3.2 End-Product Acceptance Test1.3.3 Tool Support1.3.4 Test Data Management
1.4 Management1.4.1 Project Management1.4.2 Administrative Support1.4.3 Management Tools1.4.4 Management Reviews1.4.5 Management Training
1.5 Product Assurance1.5.1 Configuration Management1.5.2 Library Operations1.5.3 Interface Control1.5.4 Data Management1.5.5 Quality Assurance1.5.6 Quality Control
1.6 Operations and SupportEtc ...

15
Sequencing and scheduling activities
• Schedule indicates– Planned Project activities
– Resources required and when
• Techniques– Milestones
– Gantt charts
– PERT

16
Milestones
• Project estimation is the business of establishing project milestones.
• An essential aspect of project milestones is that they are specific measurable events.
• We estimate Checkpoints or milestones to allow progress to be periodically reviewed.

17
Milestones
Task/Deliverable Assigned Plan Date
Actual Date
Status
Prep Cover, Executive Summary,
Contents, etc.
Draft Introductions, Appendices, etc.
Final Introductions, Appendices, etc.
Full Edit of Final Report
Edit, Assemble, Distribute Final Copies
Write Status Report 1
Write Status Report 2
Write Status Report 3
Write Status Report 4
Write Status Report 5Write Status Report 6
Draft Decomposition Diagram
TEAM PROJECT - Recommended Milestone Management Plan

18
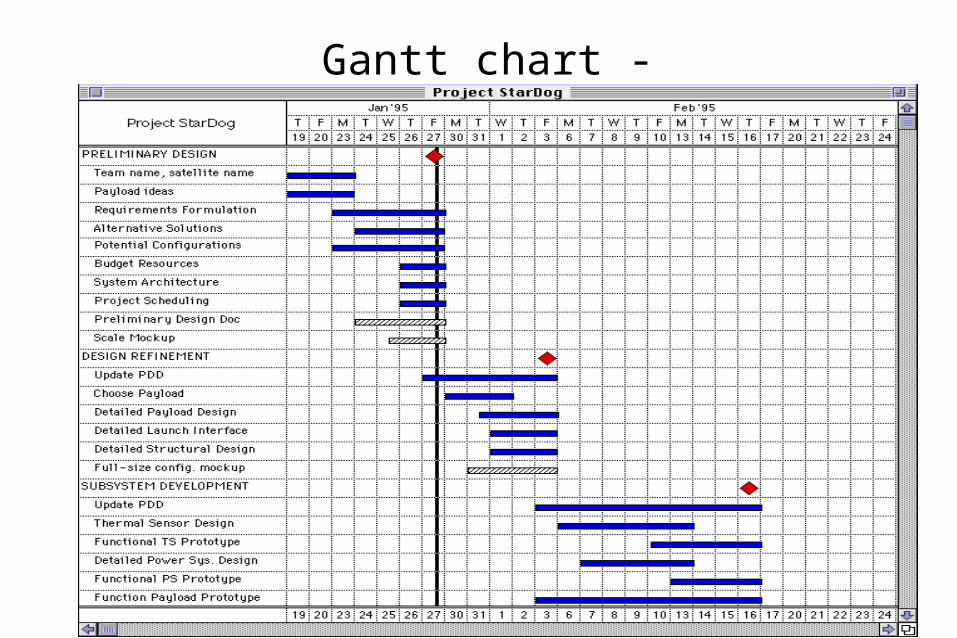
Gantt Charts
• These are a graphical project management technique.
• A Gantt chart is a bar chart, with each bar representing a project task.
• The horizontal axis represents time & should include dates to signify the start & end of the particular tasks that we list along the vertical axis.

19
Gantt Charts in Scheduling
There are two basic scheduling approaches 1. Forward scheduling
– Establish a project start-date & then schedule forward from that date. – Based on the planned duration of tasks, & the allocation of resources
to complete those tasks, a project completion date is calculated.
2. Reverse scheduling – Establish a project deadline & then schedule backward from that date. – This means the tasks, their duration, & resources must be chosen to
ensure that we can complete the project by the deadline.– We use the reverse scheduling strategy in most information system
projects.

20
Gantt chart - example
Room Assignments
12AM 1 AM 2 AM 3 AM 4 AM 5 AM 6 AM 7 AM 8 AM 9 AM
10AM
11AM
12PM 1 PM 2 PM 3 PM 4 PM 5 PM 6 PM 7 PM 8 PM 9 PM
10PM
11PM
12AM 1 AM
1
2
3
4
Gantt chart - example

22
The benefits of using Gantt Charts in controlling information systems projects
1. Gantt charts clearly show the overlap of scheduled tasks, which is quite a common occurrence in systems development.
2. A nice feature of Gantt charts is the ability to factor a top-level chart into
one or more lower levels of chart.
3. Gantt Charts can be used in scheduling
4. Gantt Charts can be used in resource assignment & management
5. Gantt Chart can be used in progress evaluation

23
Project Management Using Gantt Charts• Developed by Henry L. Gantt in 1917, they remain a popular and effective
method of project scheduling and progress evaluation.
• A Gantt chart is a horizontal bar chart, with each bar representing a project task.
• The horizontal axis represents time and should include dates to signify the start and end of the particular tasks that we list along the vertical axis.
• On a Gantt chart, the horizontal axis is a calendar timeline.
• After we have identified the project team, we can also establish personal calendars to block out individual commitments.
• Unlike PERT charts, which we will look at next, they do not show the dependency of one task on another.

24
Gantt Charts in Resource Assignment and
Management• It is possible to enhance the Gantt Chart in several ways.
• For example, we can enter the number of staff required to do a task into the bar on the diagram.
• Resources complete the tasks that you have included in a Gantt Chart.
• Resources are people, material, and tools that you assign to the completion of a task.
• We can assign costs to resources to assist in budgeting for the project. If we record actual time spent on tasks, we can compare budgets to actual expenses.

25
Gantt Charts in Progress Evaluation
• Project managers are frequently required to report project progress • Gantt charts often feature in progress reports because of their simplicity and
ability to compare the planned schedule with the actual performance.
• To facilitate this we need to extend our notation slightly: • If you have completed a task, completely shade in the bar that represents it.• If a task has been partially completed shade in a proportion of the bar
representing the proportion of the task that has been completed. • Non shaded bars represent tasks that have not begun.• Draw a bold vertical line at right angles to the horizontal axis, intersecting
the axis at the current date. • We can now evaluate project progress.